
| Portfolio | Costs of a $10,000 investment | Costs paid as a percentage of a $10,000 investment (annualized) | ||
| AVIP Bond Portfolio | $30 | 0.61% |
| Net assets | $217,950,532% |
| Total number of portfolio holdings | $143% |
| Portfolio turnover rate | $6% |
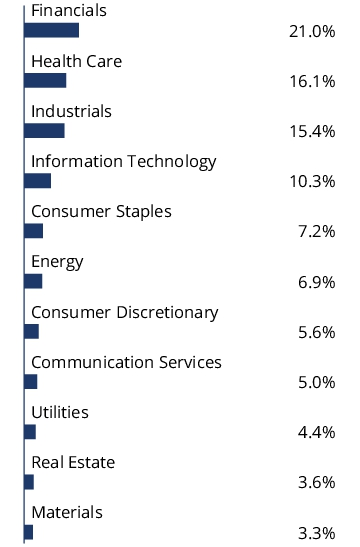
| Lear Corp. 4.250%, 05/15/2029 | 1.8% |
| Marriott International, Inc. 4.900%, 04/15/2029 | 1.4% |
| Amgen, Inc. 5.600%, 03/02/2043 | 1.4% |
| Kinross Gold Corp. 4.500%, 07/15/2027 | 1.3% |
| Ares Capital Corp. 3.200%, 11/15/2031 | 1.3% |
| MPLX LP 5.000%, 03/01/2033 | 1.3% |
| Hasbro, Inc. 3.900%, 11/19/2029 | 1.3% |
| Consolidated Edison Co. of New York, Inc. 5.700%, 05/15/2054 | 1.1% |
| RPM International, Inc. 4.250%, 01/15/2048 | 1.1% |
| Philip Morris International, Inc. 3.375%, 08/15/2029 | 1.1% |
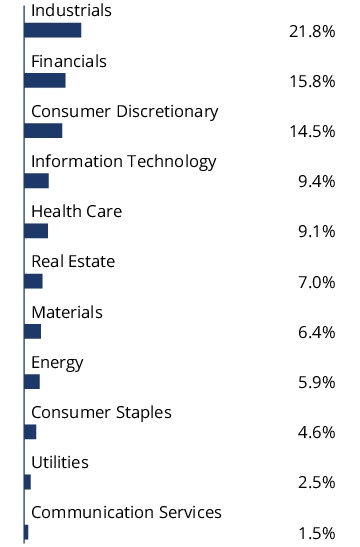
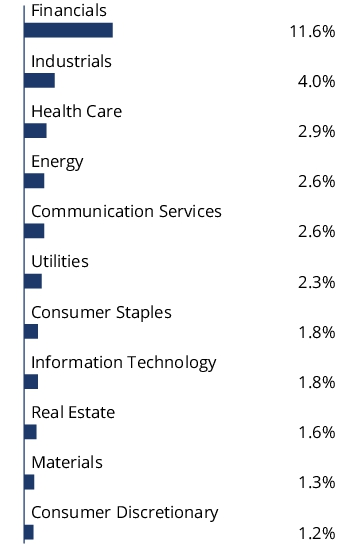
Sector Allocation
| Portfolio | Costs of a $10,000 investment | Costs paid as a percentage of a $10,000 investment (annualized) | ||
| AVIP BlackRock Balanced Allocation Portfolio | $30 | 0.57% |
| Net assets | $415,729,340% |
| Total number of portfolio holdings | $201% |
| Portfolio turnover rate | $29% |
| Microsoft Corp. | 6.4% |
| Apple, Inc. | 5.9% |
| NVIDIA Corp. | 5.1% |
| Amazon.com, Inc. | 3.8% |
| Alphabet, Inc. Class A | 2.3% |
| Meta Platforms, Inc. Class A | 1.7% |
| Alphabet, Inc. Class C | 1.5% |
| Eli Lilly & Co. | 1.5% |
| Mastercard, Inc. Class A | 1.4% |
| Visa, Inc. | 1.3% |
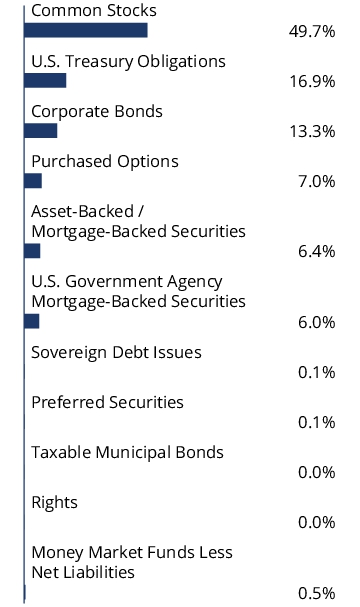
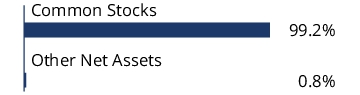
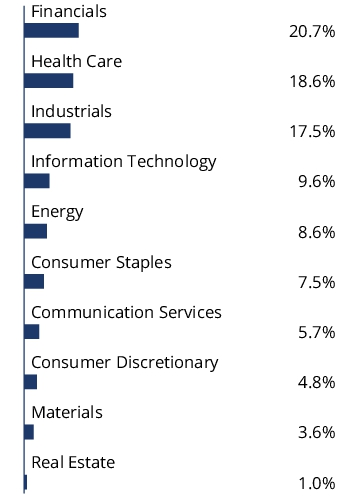
Sector Allocation
| Portfolio | Costs of a $10,000 investment | Costs paid as a percentage of a $10,000 investment (annualized) | ||
| AVIP BlackRock Advantage International Equity Portfolio | $44 | 0.85% |
| Net assets | $349,771,297% |
| Total number of portfolio holdings | $246% |
| Portfolio turnover rate | $75% |
| % of Net Assets | |
| Japan | 20.3 |
| United Kingdom | 14.7 |
| Germany | 10.2 |
| France | 8.9 |
| Switzerland | 7.8 |
| Netherlands | 6.0 |
| Australia | 5.9 |
| Denmark | 4.2 |
| Spain | 4.1 |
| Sweden | 3.2 |
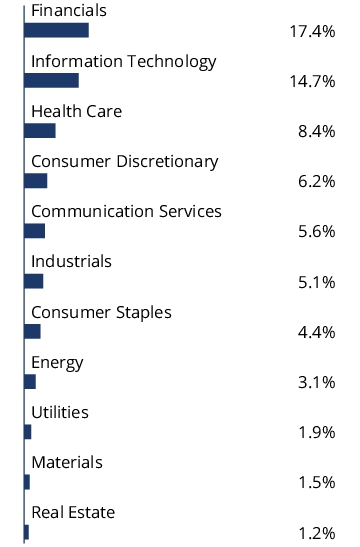
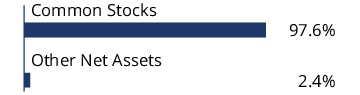
Sector Allocation
| Portfolio | Costs of a $10,000 investment | Costs paid as a percentage of a $10,000 investment (annualized) | ||
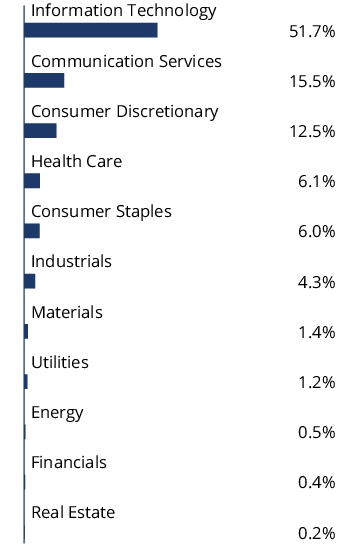
| AVIP Fidelity Institutional AM® Equity Growth Portfolio | $43 | 0.78% |
| Net assets | $130,853,596% |
| Total number of portfolio holdings | $121% |
| Portfolio turnover rate | $25% |
| Microsoft Corp. | 13.3% |
| Apple, Inc. | 11.7% |
| Alphabet, Inc. Class A | 5.2% |
| Amazon.com, Inc. | 5.1% |
| NVIDIA Corp. | 4.7% |
| Uber Technologies, Inc. | 4.2% |
| Eli Lilly & Co. | 2.9% |
| Boston Scientific Corp. | 2.6% |
| Taiwan Semiconductor Manufacturing Co. Ltd. – ADR | 2.3% |
| Netflix, Inc. | 2.0% |
Sector Allocation
| Portfolio | Costs of a $10,000 investment | Costs paid as a percentage of a $10,000 investment (annualized) | ||
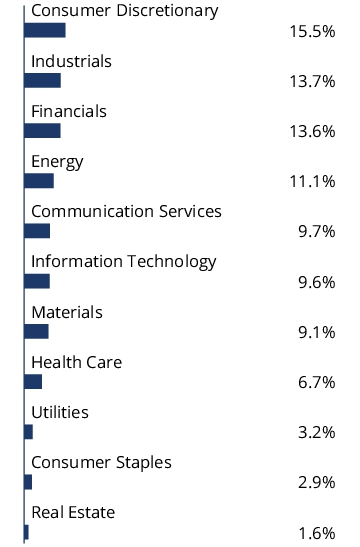
| AVIP AB Small Cap Portfolio | $44 | 0.88% |
| Net assets | $112,659,497% |
| Total number of portfolio holdings | $496% |
| Portfolio turnover rate | $56% |
| Fabrinet | 1.3% |
| SPX Technologies, Inc. | 1.2% |
| SPS Commerce, Inc. | 1.2% |
| Boot Barn Holdings, Inc. | 1.0% |
| AeroVironment, Inc. | 0.9% |
| Altair Engineering, Inc. Class A | 0.9% |
| StepStone Group, Inc. Class A | 0.9% |
| Meritage Homes Corp. | 0.8% |
| PROCEPT BioRobotics Corp. | 0.8% |
| Chefs' Warehouse, Inc. / The | 0.8% |
Sector Allocation
| Portfolio | Costs of a $10,000 investment | Costs paid as a percentage of a $10,000 investment (annualized) | ||
| AVIP AB Mid Cap Core Portfolio | $46 | 0.91% |
| Net assets | $78,294,655% |
| Total number of portfolio holdings | $584% |
| Portfolio turnover rate | $40% |
| Stifel Financial Corp. | 0.8% |
| Lennox International, Inc. | 0.7% |
| Manhattan Associates, Inc. | 0.6% |
| Pure Storage, Inc. Class A | 0.6% |
| TechnipFMC PLC | 0.6% |
| Wingstop, Inc. | 0.6% |
| Viking Holdings Ltd. | 0.6% |
| Natera, Inc. | 0.6% |
| Monolithic Power Systems, Inc. | 0.6% |
| First Citizens BancShares, Inc. Class A | 0.6% |

Sector Allocation
| Portfolio | Costs of a $10,000 investment | Costs paid as a percentage of a $10,000 investment (annualized) | ||
| AVIP S&P 500® Index Portfolio | $20 | 0.38% |
| Net assets | $1,212,679,392% |
| Total number of portfolio holdings | $505% |
| Portfolio turnover rate | $1% |
| Microsoft Corp. | 7.2% |
| NVIDIA Corp. | 6.6% |
| Apple, Inc. | 6.6% |
| Amazon.com, Inc. | 3.8% |
| Meta Platforms, Inc. Class A | 2.4% |
| Alphabet, Inc. Class A | 2.3% |
| Alphabet, Inc. Class C | 2.0% |
| Berkshire Hathaway, Inc. Class B | 1.6% |
| Eli Lilly & Co. | 1.6% |
| Broadcom, Inc. | 1.5% |
Sector Allocation

| Portfolio | Costs of a $10,000 investment | Costs paid as a percentage of a $10,000 investment (annualized) | ||
| AVIP BlackRock Advantage Large Cap Value Portfolio | $38 | 0.74% |
| Net assets | $196,831,626% |
| Total number of portfolio holdings | $153% |
| Portfolio turnover rate | $37% |
| Berkshire Hathaway, Inc. Class B | 2.8% |
| JPMorgan Chase & Co. | 2.5% |
| Comcast Corp. Class A | 1.8% |
| Medtronic PLC | 1.6% |
| Walmart, Inc. | 1.5% |
| Exxon Mobil Corp. | 1.5% |
| Stryker Corp. | 1.5% |
| Gilead Sciences, Inc. | 1.5% |
| Eaton Corp. PLC | 1.4% |
| Chevron Corp. | 1.3% |

Sector Allocation
| Portfolio | Costs of a $10,000 investment | Costs paid as a percentage of a $10,000 investment (annualized) | ||
| AVIP Federated High Income Bond Portfolio | $43 | 0.86% |
| Net assets | $120,947,862% |
| Total number of portfolio holdings | $437% |
| Portfolio turnover rate | $18% |
| Allied Universal Holdco LLC / Allied Universal Finance Corp. 9.750%, 07/15/2027 | 1.1% |
| Clydesdale Acquisition Holdings, Inc. 8.750%, 04/15/2030 | 1.1% |
| McAfee Corp. 7.375%, 02/15/2030 | 1.0% |
| BroadStreet Partners, Inc. 5.875%, 04/15/2029 | 1.0% |
| Clarios Global LP / Clarios U.S. Finance Co. 8.500%, 05/15/2027 | 1.0% |
| AthenaHealth Group, Inc. 6.500%, 02/15/2030 | 1.0% |
| Garda World Security Corp. 9.500%, 11/01/2027 | 0.9% |
| Medline Borrower LP 5.250%, 10/01/2029 | 0.9% |
| 1011778 B.C. ULC / New Red Finance, Inc. 4.000%, 10/15/2030 | 0.9% |
| Ardonagh Group Finance Ltd. 8.875%, 02/15/2032 | 0.9% |
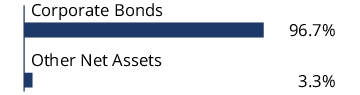
Sector Allocation
| Portfolio | Costs of a $10,000 investment | Costs paid as a percentage of a $10,000 investment (annualized) | ||
| AVIP Nasdaq-100® Index Portfolio | $23 | 0.43% |
| Net assets | $273,466,892% |
| Total number of portfolio holdings | $104% |
| Portfolio turnover rate | $2% |
| Microsoft Corp. | 8.6% |
| Apple, Inc. | 8.4% |
| NVIDIA Corp. | 7.9% |
| Amazon.com, Inc. | 5.2% |
| Broadcom, Inc. | 5.0% |
| Meta Platforms, Inc. Class A | 4.5% |
| Alphabet, Inc. Class A | 2.8% |
| Alphabet, Inc. Class C | 2.7% |
| Costco Wholesale Corp. | 2.5% |
| Tesla, Inc. | 2.5% |

Sector Allocation
| Portfolio | Costs of a $10,000 investment | Costs paid as a percentage of a $10,000 investment (annualized) | ||
| AVIP BlackRock Advantage Large Cap Core Portfolio | $37 | 0.69% |
| Net assets | $340,824,651% |
| Total number of portfolio holdings | $114% |
| Portfolio turnover rate | $36% |
| Microsoft Corp. | 8.3% |
| Apple, Inc. | 7.6% |
| NVIDIA Corp. | 6.7% |
| Amazon.com, Inc. | 5.0% |
| Alphabet, Inc. Class A | 3.1% |
| Meta Platforms, Inc. Class A | 2.1% |
| Alphabet, Inc. Class C | 1.9% |
| Mastercard, Inc. Class A | 1.9% |
| Eli Lilly & Co. | 1.9% |
| Visa, Inc. | 1.8% |
Sector Allocation
| Portfolio | Costs of a $10,000 investment | Costs paid as a percentage of a $10,000 investment (annualized) | ||
| AVIP BlackRock Advantage Small Cap Growth Portfolio | $44 | 0.87% |
| Net assets | $136,836,506% |
| Total number of portfolio holdings | $330% |
| Portfolio turnover rate | $25% |
| Franklin Electric Co., Inc. | 1.3% |
| UFP Industries, Inc. | 1.2% |
| Abercrombie & Fitch Co. Class A | 1.1% |
| Boise Cascade Co. | 1.0% |
| EMCOR Group, Inc. | 0.9% |
| Ensign Group, Inc. / The | 0.9% |
| Comfort Systems U.S.A., Inc. | 0.9% |
| Varonis Systems, Inc. | 0.9% |
| Applied Industrial Technologies, Inc. | 0.9% |
| ExlService Holdings, Inc. | 0.9% |
Sector Allocation
| Portfolio | Costs of a $10,000 investment | Costs paid as a percentage of a $10,000 investment (annualized) | ||
| AVIP S&P MidCap 400® Index Portfolio | $21 | 0.41% |
| Net assets | $528,945,880% |
| Total number of portfolio holdings | $403% |
| Portfolio turnover rate | $10% |
| Pure Storage, Inc. Class A | 0.7% |
| Carlisle Cos., Inc. | 0.7% |
| Williams-Sonoma, Inc. | 0.7% |
| EMCOR Group, Inc. | 0.6% |
| Lennox International, Inc. | 0.6% |
| Illumina, Inc. | 0.6% |
| Reliance, Inc. | 0.6% |
| BioMarin Pharmaceutical, Inc. | 0.6% |
| Burlington Stores, Inc. | 0.6% |
| Manhattan Associates, Inc. | 0.6% |

Sector Allocation
| Portfolio | Costs of a $10,000 investment | Costs paid as a percentage of a $10,000 investment (annualized) | ||
| AVIP BlackRock Advantage Large Cap Growth Portfolio | $39 | 0.71% |
| Net assets | $502,923,835% |
| Total number of portfolio holdings | $90% |
| Portfolio turnover rate | $61% |
| NVIDIA Corp. | 9.8% |
| Microsoft Corp. | 8.5% |
| Apple, Inc. | 6.3% |
| Amazon.com, Inc. | 4.9% |
| Meta Platforms, Inc. Class A | 4.8% |
| Broadcom, Inc. | 3.8% |
| Alphabet, Inc. Class C | 3.2% |
| Eli Lilly & Co. | 3.2% |
| Mastercard, Inc. Class A | 2.6% |
| Costco Wholesale Corp. | 2.1% |

Sector Allocation

| Portfolio | Costs of a $10,000 investment | Costs paid as a percentage of a $10,000 investment (annualized) | ||
| AVIP AB Risk Managed Balanced Portfolio | $43 | 0.84% |
| Net assets | $1,359,622,706% |
| Total number of portfolio holdings | $927% |
| Portfolio turnover rate | $54% |
| Microsoft Corp. | 3.4% |
| U.S. Treasury Note 1.875%, 02/15/2032 | 2.3% |
| NVIDIA Corp. | 2.3% |
| Alphabet, Inc. Class C | 2.0% |
| U.S. Treasury Note 3.375%, 05/15/2033 | 1.8% |
| Amazon.com, Inc. | 1.6% |
| U.S. Treasury Note 3.875%, 08/15/2033 | 1.5% |
| U.S. Treasury Note 3.250%, 05/15/2042 | 1.5% |
| S&P 500 Index Call Option, Expiration December 2025, Exercise price $4,500 | 1.4% |
| S&P 500 Index Call Option, Expiration December 2025, Exercise price $4,700 | 1.3% |
Sector Allocation
| Portfolio | Costs of a $10,000 investment | Costs paid as a percentage of a $10,000 investment (annualized) | ||
| AVIP Federated Core Plus Bond Portfolio | $28 | 0.57% |
| Net assets | $565,446,096% |
| Total number of portfolio holdings | $810% |
| Portfolio turnover rate | $26% |
| Federated Hermes Core Trust III - Federated Project and Trade Finance Core Fund | 4.5% |
| U.S. Treasury Note 2.875%, 05/15/2052 | 4.0% |
| U.S. Treasury Note 3.875%, 11/30/2027 | 3.6% |
| Federated Hermes Core Trust - Emerging Markets Core Fund | 3.1% |
| U.S. Treasury Note 0.875%, 06/30/2026 | 2.9% |
| U.S. Treasury Note 2.750%, 04/30/2027 | 2.1% |
| U.S. Treasury Note 4.000%, 01/31/2029 | 2.1% |
| U.S. Treasury Note 4.375%, 11/30/2030 | 1.7% |
| U.S. Treasury Note 4.500%, 11/15/2033 | 1.3% |
| Fannie Mae Pool FN MA4562 2.000%, 03/01/2052 | 1.2% |
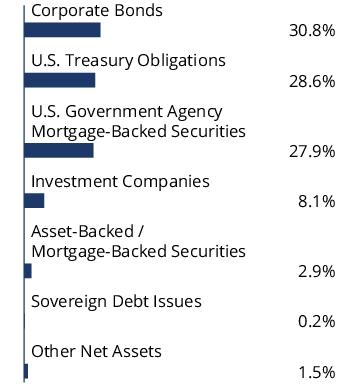
Sector Allocation
| Portfolio | Costs of a $10,000 investment | Costs paid as a percentage of a $10,000 investment (annualized) | ||
| AVIP Intech U.S. Low Volatility Portfolio | $32 | 0.61% |
| Net assets | $665,700,440% |
| Total number of portfolio holdings | $132% |
| Portfolio turnover rate | $26% |
| Microsoft Corp. | 5.1% |
| Apple, Inc. | 4.6% |
| NVIDIA Corp. | 3.6% |
| Walmart, Inc. | 3.5% |
| AbbVie, Inc. | 3.1% |
| Lockheed Martin Corp. | 2.7% |
| McKesson Corp. | 2.4% |
| Merck & Co., Inc. | 2.3% |
| Kroger Co. / The | 2.0% |
| Altria Group, Inc. | 2.0% |
Sector Allocation

| Portfolio | Costs of a $10,000 investment | Costs paid as a percentage of a $10,000 investment (annualized) | ||
| AVIP AB Relative Value Portfolio | $38 | 0.73% |
| Net assets | $125,230,523% |
| Total number of portfolio holdings | $68% |
| Portfolio turnover rate | $27% |
| Regeneron Pharmaceuticals, Inc. | 3.7% |
| JPMorgan Chase & Co. | 3.7% |
| Walmart, Inc. | 3.6% |
| Berkshire Hathaway, Inc. Class B | 3.6% |
| Wells Fargo & Co. | 3.6% |
| Elevance Health, Inc. | 3.4% |
| QUALCOMM, Inc. | 3.0% |
| Philip Morris International, Inc. | 3.0% |
| Cencora, Inc. | 2.9% |
| Fiserv, Inc. | 2.7% |
Sector Allocation
| Portfolio | Costs of a $10,000 investment | Costs paid as a percentage of a $10,000 investment (annualized) | ||
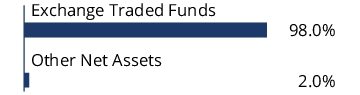
| AVIP iShares Managed Risk Balanced Portfolio | $30 | 0.59% |
| Net assets | $568,454,696% |
| Total number of portfolio holdings | $23% |
| Portfolio turnover rate | $1% |
| iShares Core U.S. Aggregate Bond ETF | 36.6% |
| iShares Core S&P 500 ETF | 17.8% |
| iShares Russell 1000 ETF | 13.8% |
| BlackRock Ultra Short-Term Bond ETF | 9.3% |
| iShares Core MSCI EAFE ETF | 6.1% |
| iShares iBoxx $ Investment Grade Corporate Bond ETF | 4.7% |
| iShares MSCI EAFE ETF | 4.6% |
| iShares Core MSCI Emerging Markets ETF | 2.5% |
| iShares Russell 1000 Value ETF | 1.9% |
| iShares MSCI Emerging Markets ETF | 0.7% |
| Portfolio | Costs of a $10,000 investment | Costs paid as a percentage of a $10,000 investment (annualized) | ||
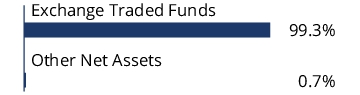
| AVIP iShares Managed Risk Moderate Growth Portfolio | $30 | 0.59% |
| Net assets | $492,182,028% |
| Total number of portfolio holdings | $19% |
| Portfolio turnover rate | $3% |
| iShares Core U.S. Aggregate Bond ETF | 35.1% |
| iShares Core S&P 500 ETF | 29.8% |
| iShares Russell 1000 ETF | 12.4% |
| iShares Core MSCI EAFE ETF | 10.8% |
| iShares Core MSCI Emerging Markets ETF | 4.7% |
| iShares MSCI EAFE ETF | 2.8% |
| iShares Russell 1000 Value ETF | 2.0% |
| iShares MSCI Emerging Markets ETF | 1.0% |
| BlackRock Ultra Short-Term Bond ETF | 0.7% |
| Portfolio | Costs of a $10,000 investment | Costs paid as a percentage of a $10,000 investment (annualized) | ||
| AVIP iShares Managed Risk Growth Portfolio | $31 | 0.60% |
| Net assets | $448,244,689% |
| Total number of portfolio holdings | $19% |
| Portfolio turnover rate | $2% |
| iShares Core S&P 500 ETF | 41.5% |
| iShares Core MSCI EAFE ETF | 17.0% |
| iShares Core U.S. Aggregate Bond ETF | 15.0% |
| iShares Russell 1000 ETF | 10.9% |
| iShares Core MSCI Emerging Markets ETF | 7.3% |
| BlackRock Ultra Short-Term Bond ETF | 2.3% |
| iShares MSCI EAFE ETF | 1.9% |
| iShares Russell 1000 Value ETF | 1.8% |
| iShares MSCI Emerging Markets ETF | 0.9% |

| Portfolio | Costs of a $10,000 investment | Costs paid as a percentage of a $10,000 investment (annualized) | ||
| AVIP Moderately Conservative Model Portfolio | $23 | 0.46% |
| Net assets | $188,638,582% |
| Total number of portfolio holdings | $19% |
| Portfolio turnover rate | $4% |
| AVIP Federated Core Plus Bond Portfolio | 15.0% |
| AVIP S&P 500® Index Portfolio | 14.0% |
| AVIP AB Small Cap Portfolio | 13.0% |
| AVIP AB Mid Cap Core Portfolio | 12.0% |
| AVIP Bond Portfolio | 8.0% |
| PIMCO Total Return Institutional | 7.0% |
| AVIP S&P MidCap 400® Index Portfolio | 7.0% |
| AVIP Federated High Income Bond Portfolio | 5.0% |
| AVIP BlackRock Advantage International Equity Portfolio | 4.0% |
| DFA International Core Equity Portfolio Institutional | 3.1% |

| Portfolio | Costs of a $10,000 investment | Costs paid as a percentage of a $10,000 investment (annualized) | ||
| AVIP Balanced Model Portfolio | $23 | 0.45% |
| Net assets | $755,956,622% |
| Total number of portfolio holdings | $21% |
| Portfolio turnover rate | $3% |
| AVIP S&P 500® Index Portfolio | 16.0% |
| AVIP Federated Core Plus Bond Portfolio | 10.0% |
| AVIP S&P MidCap 400® Index Portfolio | 10.0% |
| AVIP AB Small Cap Portfolio | 9.0% |
| AVIP AB Mid Cap Core Portfolio | 8.0% |
| AVIP BlackRock Advantage International Equity Portfolio | 7.0% |
| AVIP Bond Portfolio | 6.0% |
| DFA International Core Equity Portfolio Institutional | 5.0% |
| PIMCO Total Return Institutional | 5.0% |
| AVIP BlackRock Advantage Large Cap Value Portfolio | 4.0% |

| Portfolio | Costs of a $10,000 investment | Costs paid as a percentage of a $10,000 investment (annualized) | ||
| AVIP Moderate Growth Model Portfolio | $22 | 0.42% |
| Net assets | $1,448,199,686% |
| Total number of portfolio holdings | $21% |
| Portfolio turnover rate | $3% |
| AVIP S&P 500® Index Portfolio | 18.9% |
| AVIP S&P MidCap 400® Index Portfolio | 12.0% |
| AVIP BlackRock Advantage International Equity Portfolio | 8.0% |
| DFA International Core Equity Portfolio Institutional | 7.1% |
| AVIP Federated Core Plus Bond Portfolio | 7.0% |
| AVIP BlackRock Advantage Large Cap Value Portfolio | 6.0% |
| AVIP AB Small Cap Portfolio | 5.0% |
| AVIP AB Relative Value Portfolio | 5.0% |
| AVIP BlackRock Advantage Large Cap Core Portfolio | 4.0% |
| AVIP Bond Portfolio | 4.0% |

| Portfolio | Costs of a $10,000 investment | Costs paid as a percentage of a $10,000 investment (annualized) | ||
| AVIP Growth Model Portfolio | $23 | 0.44% |
| Net assets | $346,502,823% |
| Total number of portfolio holdings | $20% |
| Portfolio turnover rate | $3% |
| AVIP S&P 500® Index Portfolio | 18.9% |
| AVIP S&P MidCap 400® Index Portfolio | 14.0% |
| AVIP BlackRock Advantage International Equity Portfolio | 11.0% |
| DFA International Core Equity Portfolio Institutional | 9.1% |
| AVIP BlackRock Advantage Large Cap Value Portfolio | 7.0% |
| AVIP AB Relative Value Portfolio | 6.0% |
| AVIP BlackRock Advantage Large Cap Core Portfolio | 6.0% |
| AVIP BlackRock Advantage Small Cap Growth Portfolio | 4.0% |
| DFA Emerging Markets Portfolio Institutional | 3.0% |
| AVIP AB Small Cap Portfolio | 3.0% |

(b) Not applicable.
Item 2. Code Of Ethics.
Not applicable for semiannual reports.
Item 3. Audit Committee Financial Expert.
Not applicable for semiannual reports.
Item 4. Principal Accountant Fees And Services.
Not applicable for semiannual reports.
Item 5. Audit Committee Of Listed Registrants.
Not applicable for semiannual reports.
Item 6. Investments.
The information required is disclosed as part of the financial statements included in Item 7.
Item 7. Financial Statements and Financial Highlights for Open-End Management Investment Companies.

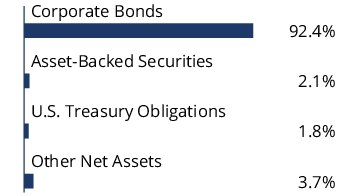
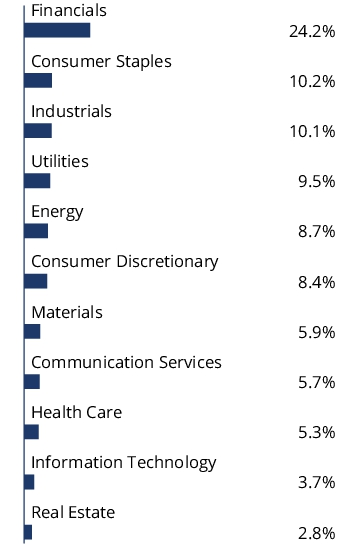
Corporate Bonds–92.4% | Rate | Maturity | Face Amount | Value | |
Communication Services–5.7% | |||||
AT&T, Inc. (Diversified Telecom. Svs.) | 4.900% | 08/15/2037 | $1,000,000 | $936,039 | |
Charter Communications Operating LLC / Charter Communications Operating Capital Corp. (Media) | 3.700% | 04/01/2051 | 1,000,000 | 608,092 | |
Comcast Corp. (Media) | 3.250% | 11/01/2039 | 3,000,000 | 2,308,708 | |
Cox Communications, Inc. (Media) | (a) | 4.500% | 06/30/2043 | 2,500,000 | 2,007,538 |
Meta Platforms, Inc. (Interactive Media & Svs.) | 4.950% | 05/15/2033 | 1,000,000 | 1,005,008 | |
Time Warner Cable LLC (Media) | 6.550% | 05/01/2037 | 2,000,000 | 1,894,009 | |
T-Mobile U.S.A., Inc. (Wireless Telecom. Svs.) | 3.875% | 04/15/2030 | 1,800,000 | 1,682,688 | |
Verizon Communications, Inc. (Diversified Telecom. Svs.) | 4.400% | 11/01/2034 | 1,500,000 | 1,389,962 | |
Verizon Communications, Inc. (Diversified Telecom. Svs.) | 2.875% | 11/20/2050 | 1,000,000 | 629,047 | |
12,461,091 | |||||
Consumer Discretionary–8.4% | |||||
Amazon.com, Inc. (Broadline Retail) | 3.875% | 08/22/2037 | 1,000,000 | 883,061 | |
Aptiv PLC (Automobile Components) | 4.350% | 03/15/2029 | 1,000,000 | 965,669 | |
Aptiv PLC / Aptiv Corp. (Automobile Components) | 3.250% | 03/01/2032 | 2,000,000 | 1,734,052 | |
Expedia Group, Inc. (Hotels, Restaurants & Leisure) | 4.625% | 08/01/2027 | 1,000,000 | 981,910 | |
Hasbro, Inc. (Leisure Products) | 3.900% | 11/19/2029 | 3,000,000 | 2,766,878 | |
Home Depot, Inc. / The (Specialty Retail) | 2.375% | 03/15/2051 | 2,000,000 | 1,148,503 | |
Lear Corp. (Automobile Components) | 4.250% | 05/15/2029 | 4,000,000 | 3,812,534 | |
Lowe's Cos., Inc. (Specialty Retail) | 3.000% | 10/15/2050 | 2,000,000 | 1,250,612 | |
M.D.C. Holdings, Inc. (Household Durables) | 3.850% | 01/15/2030 | 2,000,000 | 1,902,147 | |
Marriott International, Inc. (Hotels, Restaurants & Leisure) | 4.900% | 04/15/2029 | 3,000,000 | 2,967,996 | |
18,413,362 | |||||
Consumer Staples–10.2% | |||||
Anheuser-Busch Cos. LLC / Anheuser-Busch InBev Worldwide, Inc. (Beverages) | 4.700% | 02/01/2036 | 2,000,000 | 1,906,750 | |
Anheuser-Busch Cos. LLC / Anheuser-Busch InBev Worldwide, Inc. (Beverages) | 4.900% | 02/01/2046 | 1,000,000 | 921,960 | |
Anheuser-Busch InBev Worldwide, Inc. (Beverages) | 4.600% | 04/15/2048 | 2,000,000 | 1,768,855 | |
B.A.T. Capital Corp. (Tobacco) | 3.215% | 09/06/2026 | 1,000,000 | 954,390 | |
B.A.T. Capital Corp. (Tobacco) | 4.700% | 04/02/2027 | 2,000,000 | 1,968,821 | |
Brown-Forman Corp. (Beverages) | 4.750% | 04/15/2033 | 2,000,000 | 1,957,055 | |
Coca-Cola Co. / The (Beverages) | 3.000% | 03/05/2051 | 1,000,000 | 676,391 | |
Coca-Cola Co. / The (Beverages) | 2.500% | 03/15/2051 | 1,000,000 | 606,042 | |
Constellation Brands, Inc. (Beverages) | 5.000% | 02/02/2026 | 500,000 | 498,756 | |
Hershey Co. / The (Food Products) | 1.700% | 06/01/2030 | 1,800,000 | 1,505,065 | |
JBS U.S.A. Holding Lux SARL / JBS U.S.A. Food Co. / JBS Lux Co. SARL (Food Products) | 5.750% | 04/01/2033 | 1,090,000 | 1,087,396 | |
Kimberly-Clark Corp. (Household Products) | 1.050% | 09/15/2027 | 2,000,000 | 1,773,511 | |
Kraft Heinz Foods Co. (Food Products) | 4.625% | 10/01/2039 | 1,200,000 | 1,062,964 | |
Philip Morris International, Inc. (Tobacco) | 3.375% | 08/15/2029 | 2,500,000 | 2,309,807 | |
Pilgrim's Pride Corp. (Food Products) | 6.250% | 07/01/2033 | 1,500,000 | 1,527,980 | |
Smithfield Foods, Inc. (Food Products) | (a) | 3.000% | 10/15/2030 | 2,000,000 | 1,698,063 |
22,223,806 | |||||
Energy–8.7% | |||||
Baker Hughes Holdings LLC / Baker Hughes Co-Obligor, Inc. (Energy Equip. & Svs.) | 4.080% | 12/15/2047 | 2,000,000 | 1,599,321 | |
BP Capital Markets America, Inc. (Oil, Gas & Consumable Fuels) | 3.017% | 01/16/2027 | 1,000,000 | 950,136 | |
BP Capital Markets America, Inc. (Oil, Gas & Consumable Fuels) | 1.749% | 08/10/2030 | 1,000,000 | 830,146 | |
Chevron Corp. (Oil, Gas & Consumable Fuels) | 2.236% | 05/11/2030 | 1,800,000 | 1,558,040 | |
Energy Transfer LP (Oil, Gas & Consumable Fuels) | 4.950% | 06/15/2028 | 2,000,000 | 1,973,576 | |
Halliburton Co. (Energy Equip. & Svs.) | 4.850% | 11/15/2035 | 1,000,000 | 951,154 | |
Kinder Morgan, Inc. (Oil, Gas & Consumable Fuels) | 5.300% | 12/01/2034 | 1,000,000 | 969,239 | |
Marathon Petroleum Corp. (Oil, Gas & Consumable Fuels) | 4.750% | 09/15/2044 | 1,000,000 | 852,612 | |
MPLX LP (Oil, Gas & Consumable Fuels) | 5.000% | 03/01/2033 | 3,000,000 | 2,866,163 | |
ONEOK, Inc. (Oil, Gas & Consumable Fuels) | 5.850% | 01/15/2026 | 1,000,000 | 1,005,083 | |
ONEOK, Inc. (Oil, Gas & Consumable Fuels) | 6.000% | 06/15/2035 | 1,000,000 | 1,019,989 | |
Shell International Finance B.V. (Oil, Gas & Consumable Fuels) | 4.000% | 05/10/2046 | 1,000,000 | 804,280 | |
Tennessee Gas Pipeline Co. LLC (Oil, Gas & Consumable Fuels) | (a) | 2.900% | 03/01/2030 | 1,000,000 | 873,839 |
Texas Eastern Transmission LP (Oil, Gas & Consumable Fuels) | (a) | 4.150% | 01/15/2048 | 1,000,000 | 765,747 |
Williams Cos., Inc. / The (Oil, Gas & Consumable Fuels) | 3.750% | 06/15/2027 | 1,000,000 | 959,800 | |
Williams Cos., Inc. / The (Oil, Gas & Consumable Fuels) | 5.400% | 03/04/2044 | 1,000,000 | 942,317 | |
18,921,442 | |||||
Financials–24.2% | |||||
AerCap Ireland Capital DAC / AerCap Global Aviation Trust (Financial Services) | 3.300% | 01/30/2032 | 1,500,000 | 1,288,825 | |
American Express Co. (Rate is fixed until 08/03/2032, at which point, the rate becomes SOFR + 176) (Consumer Finance) | (b) | 4.420% | 08/03/2033 | 1,800,000 | 1,698,198 |
Ares Capital Corp. (Capital Markets) | 3.200% | 11/15/2031 | 3,500,000 | 2,886,389 | |
Bank of America Corp. (Banks) | 3.875% | 08/01/2025 | 1,000,000 | 984,695 | |
Corporate Bonds (Continued) | Rate | Maturity | Face Amount | Value | |
Financials (continued) | |||||
Bank of America Corp. (Rate is fixed until 03/08/2032, at which point, the rate becomes H15T5Y + 200) (Banks) | (b) | 3.846% | 03/08/2037 | $1,000,000 | $876,368 |
Bank of Montreal (Rate is fixed until 12/15/2027, at which point, the rate becomes USSW5 + 143) (Banks) | (b) | 3.803% | 12/15/2032 | 2,000,000 | 1,879,125 |
BlackRock, Inc. (Capital Markets) | 2.400% | 04/30/2030 | 1,000,000 | 873,011 | |
BlackRock, Inc. (Capital Markets) | 2.100% | 02/25/2032 | 2,000,000 | 1,628,181 | |
Capital One Bank U.S.A. N.A. (Rate is fixed until 01/28/2025, at which point, the rate becomes SOFR + 91) (Consumer Finance) | (b) | 2.280% | 01/28/2026 | 1,500,000 | 1,469,108 |
Charles Schwab Corp. / The (Capital Markets) | 3.300% | 04/01/2027 | 2,000,000 | 1,908,549 | |
Citigroup, Inc. (Banks) | 3.700% | 01/12/2026 | 1,000,000 | 973,896 | |
Citigroup, Inc. (Banks) | 4.450% | 09/29/2027 | 2,000,000 | 1,949,468 | |
Discover Bank (Banks) | USISOA05 + 173 | 08/09/2028 | 2,000,000 | 1,997,479 | |
General Motors Financial Co., Inc. (Consumer Finance) | 6.400% | 01/09/2033 | 2,000,000 | 2,075,704 | |
Intercontinental Exchange, Inc. (Capital Markets) | 3.750% | 12/01/2025 | 1,000,000 | 977,675 | |
Jefferies Financial Group, Inc. (Capital Markets) | 4.850% | 01/15/2027 | 1,800,000 | 1,776,132 | |
JPMorgan Chase & Co. (Banks) | 3.625% | 12/01/2027 | 2,000,000 | 1,913,234 | |
JPMorgan Chase & Co. (Rate is fixed until 05/13/2030, at which point, the rate becomes TSFR3M + 252) (Banks) | (b) | 2.956% | 05/13/2031 | 2,000,000 | 1,752,838 |
KeyCorp (Rate is fixed until 06/01/2032, at which point, the rate becomes SOFRINDX + 206) (Banks) | (b) | 4.789% | 06/01/2033 | 2,500,000 | 2,282,456 |
Mitsubishi UFJ Financial Group, Inc. (Rate is fixed until 02/22/2033, at which point, the rate becomes H15T1Y + 163) (Banks) | (b) | 5.441% | 02/22/2034 | 2,000,000 | 2,017,044 |
Morgan Stanley (Capital Markets) | 3.950% | 04/23/2027 | 1,000,000 | 965,764 | |
Morgan Stanley (Rate is fixed until 10/18/2027, at which point, the rate becomes SOFR + 224) (Capital Markets) | (b) | 6.296% | 10/18/2028 | 2,000,000 | 2,063,510 |
PNC Bank N.A. (Banks) | 2.700% | 10/22/2029 | 2,500,000 | 2,180,616 | |
State Street Corp. (Capital Markets) | 2.200% | 03/03/2031 | 2,000,000 | 1,679,507 | |
Synchrony Financial (Consumer Finance) | 4.250% | 08/15/2024 | 1,000,000 | 997,591 | |
Synchrony Financial (Consumer Finance) | 5.150% | 03/19/2029 | 2,000,000 | 1,920,408 | |
Truist Financial Corp. (Rate is fixed until 10/28/2032, at which point, the rate becomes SOFR + 230) (Banks) | (b) | 6.123% | 10/28/2033 | 1,000,000 | 1,022,557 |
U.S. Bancorp (Banks) | 1.375% | 07/22/2030 | 2,000,000 | 1,611,223 | |
U.S. Bancorp (Rate is fixed until 01/23/2034, at which point, the rate becomes SOFR + 186) (Banks) | (b) | 5.678% | 01/23/2035 | 700,000 | 702,685 |
UBS AG (Banks) | 7.950% | 01/09/2025 | 2,000,000 | 2,021,006 | |
Wells Fargo & Co. (Rate is fixed until 04/30/2040, at which point, the rate becomes SOFR + 253) (Banks) | (b) | 3.068% | 04/30/2041 | 1,500,000 | 1,099,923 |
Wells Fargo & Co. (Banks) | 4.650% | 11/04/2044 | 1,000,000 | 844,736 | |
Westpac Banking Corp. (Rate is fixed until 02/04/2025, at which point, the rate becomes H15T5Y + 135) (Banks) | (b) | 2.894% | 02/04/2030 | 1,500,000 | 1,470,521 |
Westpac Banking Corp. (Rate is fixed until 11/23/2026, at which point, the rate becomes USISOA05 + 224) (Banks) | (b) | 4.322% | 11/23/2031 | 1,000,000 | 965,157 |
52,753,579 | |||||
Health Care–5.3% | |||||
AbbVie, Inc. (Biotechnology) | 3.200% | 11/21/2029 | 1,000,000 | 917,602 | |
AbbVie, Inc. (Biotechnology) | 4.250% | 11/21/2049 | 2,000,000 | 1,666,710 | |
Amgen, Inc. (Biotechnology) | 5.600% | 03/02/2043 | 3,000,000 | 2,956,579 | |
Quest Diagnostics, Inc. (Health Care Providers & Svs.) | 2.950% | 06/30/2030 | 2,000,000 | 1,775,758 | |
Quest Diagnostics, Inc. (Health Care Providers & Svs.) | 2.800% | 06/30/2031 | 1,000,000 | 855,983 | |
Regeneron Pharmaceuticals, Inc. (Biotechnology) | 1.750% | 09/15/2030 | 1,800,000 | 1,482,499 | |
UnitedHealth Group, Inc. (Health Care Providers & Svs.) | 5.050% | 04/15/2053 | 2,000,000 | 1,852,482 | |
11,507,613 | |||||
Industrials–8.0% | |||||
Air Lease Corp. (Trading Companies & Distributors) | 2.300% | 02/01/2025 | 2,000,000 | 1,957,240 | |
BAE Systems PLC (Aerospace & Defense) | (a) | 1.900% | 02/15/2031 | 2,000,000 | 1,624,653 |
Boeing Co. / The (Aerospace & Defense) | (a) | 6.298% | 05/01/2029 | 2,100,000 | 2,129,526 |
Canadian Pacific Railway Co. (Ground Transportation) | 2.050% | 03/05/2030 | 1,300,000 | 1,108,871 | |
FedEx Corp. (Air Freight & Logistics) | 4.900% | 01/15/2034 | 2,000,000 | 1,946,932 | |
Lockheed Martin Corp. (Aerospace & Defense) | 1.850% | 06/15/2030 | 1,000,000 | 842,427 | |
Lockheed Martin Corp. (Aerospace & Defense) | 3.600% | 03/01/2035 | 1,000,000 | 876,932 | |
Northrop Grumman Corp. (Aerospace & Defense) | 2.930% | 01/15/2025 | 1,000,000 | 985,752 | |
Parker-Hannifin Corp. (Machinery) | 4.200% | 11/21/2034 | 1,400,000 | 1,278,244 | |
TTX Co. (Ground Transportation) | (a) | 5.650% | 12/01/2052 | 2,000,000 | 2,028,344 |
Union Pacific Corp. (Ground Transportation) | 3.250% | 08/15/2025 | 1,000,000 | 977,076 | |
Waste Connections, Inc. (Commercial Svs. & Supplies) | 4.250% | 12/01/2028 | 1,800,000 | 1,738,040 | |
17,494,037 | |||||
Corporate Bonds (Continued) | Rate | Maturity | Face Amount | Value | |
Information Technology–3.7% | |||||
Broadcom, Inc. (Semiconductors & Equip.) | (a) | 2.600% | 02/15/2033 | $2,000,000 | $1,620,811 |
Intel Corp. (Semiconductors & Equip.) | 4.875% | 02/10/2026 | 2,000,000 | 1,988,053 | |
Micron Technology, Inc. (Semiconductors & Equip.) | 6.750% | 11/01/2029 | 2,000,000 | 2,127,239 | |
VMware LLC (Software) | 2.200% | 08/15/2031 | 2,800,000 | 2,275,126 | |
8,011,229 | |||||
Materials–5.9% | |||||
Anglo American Capital PLC (Metals & Mining) | (a) | 4.750% | 04/10/2027 | 1,000,000 | 981,514 |
Anglo American Capital PLC (Metals & Mining) | (a) | 4.000% | 09/11/2027 | 800,000 | 766,428 |
Dow Chemical Co. / The (Chemicals) | 4.250% | 10/01/2034 | 1,402,000 | 1,279,713 | |
Glencore Funding LLC (Metals & Mining) | (a) | 2.850% | 04/27/2031 | 2,000,000 | 1,684,178 |
Kinross Gold Corp. (Metals & Mining) | 4.500% | 07/15/2027 | 3,000,000 | 2,913,132 | |
Nutrien Ltd. (Chemicals) | 4.200% | 04/01/2029 | 1,900,000 | 1,818,030 | |
RPM International, Inc. (Chemicals) | 4.250% | 01/15/2048 | 3,000,000 | 2,472,772 | |
Steel Dynamics, Inc. (Metals & Mining) | 3.250% | 01/15/2031 | 1,000,000 | 885,394 | |
12,801,161 | |||||
Real Estate–2.8% | |||||
Alexandria Real Estate Equities, Inc. (Health Care REITs) | 3.950% | 01/15/2028 | 1,000,000 | 957,256 | |
Healthcare Realty Holdings LP (Health Care REITs) | 3.875% | 05/01/2025 | 1,400,000 | 1,373,156 | |
Healthcare Realty Holdings LP (Health Care REITs) | 3.625% | 01/15/2028 | 1,000,000 | 924,238 | |
VICI Properties LP / VICI Note Co., Inc. (Specialized REITs) | (a) | 4.625% | 12/01/2029 | 1,000,000 | 946,374 |
Welltower OP LLC (Health Care REITs) | 4.250% | 04/01/2026 | 1,000,000 | 979,425 | |
Welltower OP LLC (Health Care REITs) | 2.700% | 02/15/2027 | 1,000,000 | 942,260 | |
6,122,709 | |||||
Utilities–9.5% | |||||
AEP Transmission Co. LLC (Electric Utilities) | 4.000% | 12/01/2046 | 1,000,000 | 793,400 | |
AEP Transmission Co. LLC (Electric Utilities) | 3.750% | 12/01/2047 | 1,351,000 | 1,003,534 | |
Ameren Corp. (Multi-Utilities) | 3.500% | 01/15/2031 | 2,000,000 | 1,803,065 | |
Berkshire Hathaway Energy Co. (Multi-Utilities) | 3.250% | 04/15/2028 | 1,900,000 | 1,782,312 | |
Commonwealth Edison Co. (Electric Utilities) | 4.350% | 11/15/2045 | 2,000,000 | 1,681,071 | |
Commonwealth Edison Co. (Electric Utilities) | 5.650% | 06/01/2054 | 2,000,000 | 1,987,638 | |
Connecticut Light & Power Co. / The (Electric Utilities) | 4.000% | 04/01/2048 | 1,000,000 | 797,219 | |
Consolidated Edison Co. of New York, Inc. (Electric Utilities) | 5.700% | 05/15/2054 | 2,500,000 | 2,494,057 | |
Duke Energy Corp. (Electric Utilities) | 3.750% | 09/01/2046 | 1,000,000 | 727,833 | |
Duke Energy Indiana LLC (Electric Utilities) | 5.400% | 04/01/2053 | 500,000 | 473,413 | |
Eversource Energy (Electric Utilities) | 3.300% | 01/15/2028 | 1,000,000 | 934,018 | |
FirstEnergy Transmission LLC (Electric Utilities) | (a) | 4.550% | 04/01/2049 | 2,000,000 | 1,652,958 |
Florida Power & Light Co. (Electric Utilities) | 3.150% | 10/01/2049 | 2,000,000 | 1,359,961 | |
NiSource, Inc. (Multi-Utilities) | 5.250% | 03/30/2028 | 2,000,000 | 1,997,829 | |
Public Service Electric & Gas Co. (Multi-Utilities) | 3.600% | 12/01/2047 | 1,500,000 | 1,116,094 | |
20,604,402 | |||||
Total Corporate Bonds (Cost $222,623,723) | $201,314,431 | ||||
Asset-Backed Securities–2.1% | Rate | Maturity | Face Amount | Value | |
Industrials–2.1% | |||||
Air Canada 2017-1 Class B Pass Through Trust | (a) | 3.700% | 01/15/2026 | $1,154,100 | $1,102,449 |
FedEx Corp. 2020-1 Class AA Pass Through Trust | 1.875% | 02/20/2034 | 2,438,538 | 2,022,965 | |
United Airlines 2016-1 Class B Pass Through Trust | 3.650% | 01/07/2026 | 875,000 | 845,626 | |
United Airlines 2019-2 Class AA Pass Through Trust | 2.700% | 05/01/2032 | 807,944 | 698,964 | |
Total Asset-Backed Securities (Cost $5,275,582) | $4,670,004 | ||||
U.S. Treasury Obligations–1.8% | Rate | Maturity | Face Amount | Value | |
U.S. Treasury Note | 4.500% | 11/15/2025 | $2,000,000 | $1,987,890 | |
U.S. Treasury Note | 3.375% | 05/15/2033 | 2,000,000 | 1,853,516 | |
Total U.S. Treasury Obligations (Cost $3,918,339) | $3,841,406 | ||||
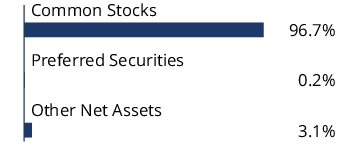
Total Investments – 96.3% (Cost $231,817,644) | (c) | $209,825,841 | |||
Other Assets in Excess of Liabilities – 3.7% | 8,124,691 | ||||
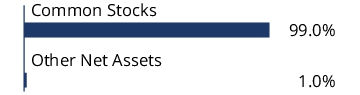
Net Assets – 100.0% | $217,950,532 | ||||
Percentages are stated as a percent of net assets. |
Abbreviations: | ||
H15T1Y: | U.S. Treasury Yield Curve Rate T-Note Constant Maturity 1 Year, 5.090% at 6/30/2024 | |
H15T5Y: | U.S. Treasury Yield Curve Rate T-Note Constant Maturity 5 Year, 4.330% at 6/30/2024 | |
REITs: | Real Estate Investment Trusts | |
SOFR: | Secured Overnight Financing Rate, 5.330% at 6/30/2024 | |
SOFRINDX: | Secured Overnight Financing Rate ("SOFR") Compounded Index, 1.145% at 6/30/2024 | |
TSFR3M: | Quarterly CME Term Secured Overnight Financing Rate ("SOFR"), 5.325% at 6/30/2024 | |
USISOA05: | 5 Year Secured Overnight Financing Rate ("SOFR") Spread-Adjusted ICE Swap Rate, 4.335% at 6/30/2024 | |
USSW5: | USD Swap Semi 30/360 5 Year. This rate is linked to U.S. LIBOR, which is no longer published. An alternate reference rate will be determined by the issuer prior to the date the security becomes a variable rate instrument. | |
Footnotes: | ||
(a) | Security exempt from registration under Regulation D of the Securities Act of 1933. These securities may be resold in transactions exempt from registration, normally to qualified buyers under Rule 144A. At June 30, 2024, the value of these securities totaled $19,882,422, or 9.1% of the Portfolio’s net assets. | |
(b) | Security is a fixed-then-variable rate instrument in which the coupon or dividend rate is fixed until a later specified date, then is adjusted periodically. Rates stated, including interest rate caps and floors, if any, are those in effect at June 30, 2024. | |
(c) | Represents cost for financial reporting purposes, which may differ from cost basis for federal income tax purposes. See also Note 7 of the Notes to Financial Statements. | |
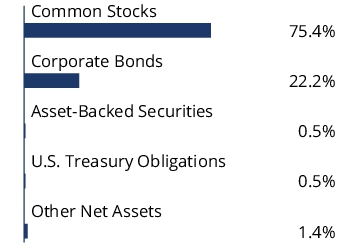
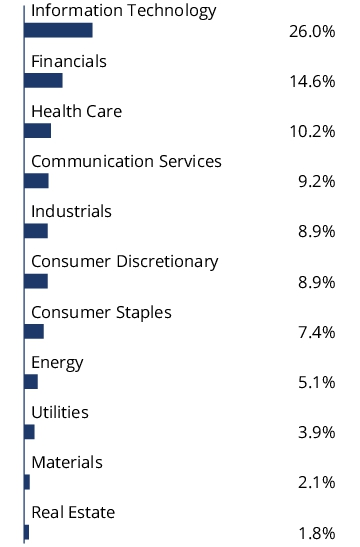
Common Stocks–75.4% | Shares | Value | |
Communication Services–7.5% | |||
Alphabet, Inc. Class A (Interactive Media & Svs.) | 53,701 | $9,781,637 | |
Alphabet, Inc. Class C (Interactive Media & Svs.) | 33,881 | 6,214,453 | |
Comcast Corp. Class A (Media) | 115,161 | 4,509,705 | |
Fox Corp. Class A (Media) | 74,887 | 2,573,866 | |
Fox Corp. Class B (Media) | 905 | 28,978 | |
Meta Platforms, Inc. Class A (Interactive Media & Svs.) | 14,203 | 7,161,437 | |
Netflix, Inc. (Entertainment) | (a) | 1,091 | 736,294 |
31,006,370 | |||
Consumer Discretionary–7.6% | |||
Amazon.com, Inc. (Broadline Retail) | (a) | 81,574 | 15,764,175 |
AutoNation, Inc. (Specialty Retail) | (a) | 4,929 | 785,584 |
Carnival Corp. (Hotels, Restaurants & Leisure) | (a) | 32,103 | 600,968 |
D.R. Horton, Inc. (Household Durables) | 10,165 | 1,432,553 | |
General Motors Co. (Automobiles) | 37,950 | 1,763,157 | |
Home Depot, Inc. / The (Specialty Retail) | 13,854 | 4,769,101 | |
Lear Corp. (Automobile Components) | 2,636 | 301,058 | |
MGM Resorts International (Hotels, Restaurants & Leisure) | (a) | 17,948 | 797,609 |
NIKE, Inc. Class B (Textiles, Apparel & Luxury Goods) | 27,066 | 2,039,964 | |
Tesla, Inc. (Automobiles) | (a) | 5,969 | 1,181,146 |
Toll Brothers, Inc. (Household Durables) | 19,292 | 2,222,053 | |
31,657,368 | |||
Consumer Staples–4.3% | |||
Colgate-Palmolive Co. (Household Products) | 11,770 | 1,142,161 | |
Costco Wholesale Corp. (Consumer Staples Distribution & Retail) | 5,412 | 4,600,146 | |
Hershey Co. / The (Food Products) | 8,587 | 1,578,548 | |
Kimberly-Clark Corp. (Household Products) | 26,666 | 3,685,241 | |
Kroger Co. / The (Consumer Staples Distribution & Retail) | 36,396 | 1,817,252 | |
Monster Beverage Corp. (Beverages) | (a) | 16,432 | 820,779 |
PepsiCo, Inc. (Beverages) | 16,814 | 2,773,133 | |
Walmart, Inc. (Consumer Staples Distribution & Retail) | 21,158 | 1,432,608 | |
17,849,868 | |||
Energy–2.5% | |||
Chevron Corp. (Oil, Gas & Consumable Fuels) | 8,893 | 1,391,043 | |
ConocoPhillips (Oil, Gas & Consumable Fuels) | 6,460 | 738,895 | |
Devon Energy Corp. (Oil, Gas & Consumable Fuels) | 32,990 | 1,563,726 | |
EOG Resources, Inc. (Oil, Gas & Consumable Fuels) | 10,685 | 1,344,921 | |
Exxon Mobil Corp. (Oil, Gas & Consumable Fuels) | 13,665 | 1,573,115 | |
Marathon Petroleum Corp. (Oil, Gas & Consumable Fuels) | 8,773 | 1,521,940 | |
Schlumberger N.V. (Energy Equip. & Svs.) | 49,624 | 2,341,260 | |
10,474,900 | |||
Financials–8.9% | |||
Berkshire Hathaway, Inc. Class B (Financial Services) | (a) | 10,026 | 4,078,577 |
Invesco Ltd. (Capital Markets) | 74,625 | 1,116,390 | |
JPMorgan Chase & Co. (Banks) | 20,707 | 4,188,198 | |
KeyCorp (Banks) | 76,879 | 1,092,450 | |
Marsh & McLennan Cos., Inc. (Insurance) | 20,593 | 4,339,357 | |
Mastercard, Inc. Class A (Financial Services) | 13,497 | 5,954,336 | |
Moody's Corp. (Capital Markets) | 2,789 | 1,173,974 | |
Nasdaq, Inc. (Capital Markets) | 44,572 | 2,685,909 | |
Progressive Corp. / The (Insurance) | 13,322 | 2,767,113 | |
Reinsurance Group of America, Inc. (Insurance) | 3,971 | 815,127 | |
S&P Global, Inc. (Capital Markets) | 5,269 | 2,349,974 | |
Travelers Cos., Inc. / The (Insurance) | 4,920 | 1,000,433 | |
Visa, Inc. (Financial Services) | 21,353 | 5,604,522 | |
37,166,360 | |||
Health Care–9.3% | |||
Amgen, Inc. (Biotechnology) | 5,396 | 1,685,980 | |
Biogen, Inc. (Biotechnology) | (a) | 2,093 | 485,199 |
Bristol-Myers Squibb Co. (Pharmaceuticals) | 44,506 | 1,848,334 | |
Cardinal Health, Inc. (Health Care Providers & Svs.) | 14,127 | 1,388,967 | |
Centene Corp. (Health Care Providers & Svs.) | (a) | 5,941 | 393,888 |
Cigna Group / The (Health Care Providers & Svs.) | 1,596 | 520,727 | |
Dexcom, Inc. (Health Care Equip. & Supplies) | (a) | 3,932 | 445,810 |
Elevance Health, Inc. (Health Care Providers & Svs.) | 6,049 | 3,277,711 | |
Common Stocks (Continued) | Shares | Value | |
Health Care (continued) | |||
Eli Lilly & Co. (Pharmaceuticals) | 6,699 | $6,065,141 | |
Gilead Sciences, Inc. (Biotechnology) | 60,105 | 4,123,804 | |
Incyte Corp. (Biotechnology) | (a) | 28,823 | 1,747,250 |
Labcorp Holdings, Inc. (Health Care Providers & Svs.) | 3,447 | 701,499 | |
Medtronic PLC (Health Care Equip. & Supplies) | 48,644 | 3,828,769 | |
Merck & Co., Inc. (Pharmaceuticals) | 11,454 | 1,418,005 | |
Neurocrine Biosciences, Inc. (Biotechnology) | (a) | 3,545 | 488,040 |
Pfizer, Inc. (Pharmaceuticals) | 47,715 | 1,335,066 | |
Regeneron Pharmaceuticals, Inc. (Biotechnology) | (a) | 850 | 893,376 |
Stryker Corp. (Health Care Equip. & Supplies) | 8,417 | 2,863,884 | |
Thermo Fisher Scientific, Inc. (Life Sciences Tools & Svs.) | 2,154 | 1,191,162 | |
UnitedHealth Group, Inc. (Health Care Providers & Svs.) | 5,857 | 2,982,736 | |
Zoetis, Inc. (Pharmaceuticals) | 5,094 | 883,096 | |
38,568,444 | |||
Industrials–6.6% | |||
AECOM (Construction & Engineering) | 15,692 | 1,383,093 | |
American Airlines Group, Inc. (Passenger Airlines) | (a) | 77,231 | 875,027 |
Builders FirstSource, Inc. (Building Products) | (a) | 2,724 | 377,029 |
Cintas Corp. (Commercial Svs. & Supplies) | 4,521 | 3,165,875 | |
CNH Industrial N.V. (Machinery) | 46,029 | 466,274 | |
Cummins, Inc. (Machinery) | 1,383 | 382,994 | |
Eaton Corp. PLC (Electrical Equip.) | 8,788 | 2,755,477 | |
Expeditors International of Washington, Inc. (Air Freight & Logistics) | 7,329 | 914,586 | |
Lockheed Martin Corp. (Aerospace & Defense) | 8,896 | 4,155,322 | |
Old Dominion Freight Line, Inc. (Ground Transportation) | 5,076 | 896,422 | |
Oshkosh Corp. (Machinery) | 28,123 | 3,042,909 | |
Parker-Hannifin Corp. (Machinery) | 7,103 | 3,592,768 | |
W.W. Grainger, Inc. (Trading Companies & Distributors) | 1,985 | 1,790,946 | |
Waste Management, Inc. (Commercial Svs. & Supplies) | 10,631 | 2,268,018 | |
Watsco, Inc. (Trading Companies & Distributors) | 2,479 | 1,148,372 | |
WESCO International, Inc. (Trading Companies & Distributors) | 2,061 | 326,710 | |
27,541,822 | |||
Information Technology–24.9% | |||
Adobe, Inc. (Software) | (a) | 2,785 | 1,547,179 |
Apple, Inc. (Tech. Hardware, Storage & Periph.) | 116,300 | 24,495,106 | |
Applied Materials, Inc. (Semiconductors & Equip.) | 4,533 | 1,069,743 | |
Atlassian Corp. Class A (Software) | (a) | 4,769 | 843,541 |
Broadcom, Inc. (Semiconductors & Equip.) | 1,604 | 2,575,270 | |
Crowdstrike Holdings, Inc. Class A (Software) | (a) | 2,804 | 1,074,465 |
Fortinet, Inc. (Software) | (a) | 19,687 | 1,186,535 |
Intel Corp. (Semiconductors & Equip.) | 31,575 | 977,878 | |
Lam Research Corp. (Semiconductors & Equip.) | 4,188 | 4,459,592 | |
Manhattan Associates, Inc. (Software) | (a) | 13,675 | 3,373,349 |
Micron Technology, Inc. (Semiconductors & Equip.) | 14,635 | 1,924,941 | |
Microsoft Corp. (Software) | 59,242 | 26,478,212 | |
Monolithic Power Systems, Inc. (Semiconductors & Equip.) | 2,460 | 2,021,333 | |
NVIDIA Corp. (Semiconductors & Equip.) | 170,470 | 21,059,864 | |
QUALCOMM, Inc. (Semiconductors & Equip.) | 23,711 | 4,722,757 | |
ServiceNow, Inc. (Software) | (a) | 2,430 | 1,911,608 |
TE Connectivity Ltd. (Electronic Equip., Instr. & Comp.) | 26,169 | 3,936,602 | |
103,657,975 | |||
Materials–1.2% | |||
Ecolab, Inc. (Chemicals) | 8,973 | 2,135,574 | |
Louisiana-Pacific Corp. (Paper & Forest Products) | 12,617 | 1,038,757 | |
Nucor Corp. (Metals & Mining) | 10,660 | 1,685,133 | |
4,859,464 | |||
Real Estate–1.3% | |||
Camden Property Trust (Residential REITs) | 15,060 | 1,643,197 | |
Equinix, Inc. (Specialized REITs) | 2,913 | 2,203,976 | |
Simon Property Group, Inc. (Retail REITs) | 9,979 | 1,514,812 | |
5,361,985 | |||
Utilities–1.3% | |||
AES Corp. / The (Ind. Power & Renewable Elec.) | 110,565 | 1,942,627 | |
CMS Energy Corp. (Multi-Utilities) | 15,738 | 936,883 | |
Common Stocks (Continued) | Shares | Value | |
Utilities (continued) | |||
OGE Energy Corp. (Electric Utilities) | 25,164 | $898,355 | |
PPL Corp. (Electric Utilities) | 55,427 | 1,532,557 | |
5,310,422 | |||
Total Common Stocks (Cost $240,224,259) | $313,454,978 | ||
Corporate Bonds–22.2% | Rate | Maturity | Face Amount | Value | |
Communication Services–1.7% | |||||
AT&T, Inc. (Diversified Telecom. Svs.) | 4.900% | 08/15/2037 | $1,000,000 | $936,039 | |
Comcast Corp. (Media) | 3.250% | 11/01/2039 | 2,000,000 | 1,539,139 | |
Cox Communications, Inc. (Media) | (b) | 4.500% | 06/30/2043 | 1,000,000 | 803,015 |
Time Warner Cable LLC (Media) | 6.550% | 05/01/2037 | 1,000,000 | 947,004 | |
T-Mobile U.S.A., Inc. (Wireless Telecom. Svs.) | 3.875% | 04/15/2030 | 1,200,000 | 1,121,792 | |
Verizon Communications, Inc. (Diversified Telecom. Svs.) | 4.400% | 11/01/2034 | 1,000,000 | 926,642 | |
Verizon Communications, Inc. (Diversified Telecom. Svs.) | 2.875% | 11/20/2050 | 1,000,000 | 629,047 | |
6,902,678 | |||||
Consumer Discretionary–1.3% | |||||
Amazon.com, Inc. (Broadline Retail) | 3.875% | 08/22/2037 | 1,000,000 | 883,061 | |
Expedia Group, Inc. (Hotels, Restaurants & Leisure) | 4.625% | 08/01/2027 | 1,000,000 | 981,909 | |
Hasbro, Inc. (Leisure Products) | 3.900% | 11/19/2029 | 2,000,000 | 1,844,586 | |
Lear Corp. (Automobile Components) | 3.500% | 05/30/2030 | 1,000,000 | 902,096 | |
Lowe's Cos., Inc. (Specialty Retail) | 3.000% | 10/15/2050 | 1,000,000 | 625,306 | |
5,236,958 | |||||
Consumer Staples–3.1% | |||||
Anheuser-Busch Cos. LLC / Anheuser-Busch InBev Worldwide, Inc. (Beverages) | 4.700% | 02/01/2036 | 2,000,000 | 1,906,750 | |
B.A.T. Capital Corp. (Tobacco) | 3.215% | 09/06/2026 | 1,000,000 | 954,390 | |
B.A.T. Capital Corp. (Tobacco) | 4.700% | 04/02/2027 | 1,000,000 | 984,410 | |
Coca-Cola Co. / The (Beverages) | 3.000% | 03/05/2051 | 2,000,000 | 1,352,782 | |
Diageo Capital PLC (Beverages) | 2.375% | 10/24/2029 | 2,000,000 | 1,767,618 | |
Hershey Co. / The (Food Products) | 1.700% | 06/01/2030 | 1,200,000 | 1,003,377 | |
JBS U.S.A. Holding Lux SARL / JBS U.S.A. Food Co. / JBS Lux Co. SARL (Food Products) | 5.750% | 04/01/2033 | 727,000 | 725,263 | |
Kraft Heinz Foods Co. (Food Products) | 4.625% | 10/01/2039 | 800,000 | 708,643 | |
Philip Morris International, Inc. (Tobacco) | 3.375% | 08/15/2029 | 1,000,000 | 923,923 | |
Pilgrim's Pride Corp. (Food Products) | 6.250% | 07/01/2033 | 1,000,000 | 1,018,653 | |
Target Corp. (Consumer Staples Distribution & Retail) | 2.350% | 02/15/2030 | 2,000,000 | 1,752,938 | |
13,098,747 | |||||
Energy–2.6% | |||||
Baker Hughes Holdings LLC / Baker Hughes Co-Obligor, Inc. (Energy Equip. & Svs.) | 3.337% | 12/15/2027 | 1,000,000 | 945,324 | |
BP Capital Markets America, Inc. (Oil, Gas & Consumable Fuels) | 3.017% | 01/16/2027 | 1,000,000 | 950,136 | |
Chevron Corp. (Oil, Gas & Consumable Fuels) | 2.236% | 05/11/2030 | 1,200,000 | 1,038,693 | |
Energy Transfer LP (Oil, Gas & Consumable Fuels) | 4.950% | 06/15/2028 | 1,000,000 | 986,788 | |
Halliburton Co. (Energy Equip. & Svs.) | 4.850% | 11/15/2035 | 1,000,000 | 951,154 | |
Kinder Morgan, Inc. (Oil, Gas & Consumable Fuels) | 5.300% | 12/01/2034 | 1,000,000 | 969,239 | |
MPLX LP (Oil, Gas & Consumable Fuels) | 5.000% | 03/01/2033 | 2,000,000 | 1,910,775 | |
Shell International Finance B.V. (Oil, Gas & Consumable Fuels) | 4.000% | 05/10/2046 | 1,500,000 | 1,206,420 | |
Tennessee Gas Pipeline Co. LLC (Oil, Gas & Consumable Fuels) | (b) | 2.900% | 03/01/2030 | 1,000,000 | 873,839 |
Williams Cos., Inc. / The (Oil, Gas & Consumable Fuels) | 3.750% | 06/15/2027 | 1,000,000 | 959,800 | |
10,792,168 | |||||
Financials–5.7% | |||||
AerCap Ireland Capital DAC / AerCap Global Aviation Trust (Financial Services) | 3.300% | 01/30/2032 | 1,000,000 | 859,216 | |
American Express Co. (Rate is fixed until 08/03/2032, at which point, the rate becomes SOFR + 176) (Consumer Finance) | (c) | 4.420% | 08/03/2033 | 1,200,000 | 1,132,132 |
Ares Capital Corp. (Capital Markets) | 3.200% | 11/15/2031 | 1,500,000 | 1,237,024 | |
BlackRock, Inc. (Capital Markets) | 2.100% | 02/25/2032 | 1,000,000 | 814,090 | |
Capital One Bank U.S.A. N.A. (Rate is fixed until 01/28/2025, at which point, the rate becomes SOFR + 91) (Consumer Finance) | (c) | 2.280% | 01/28/2026 | 1,000,000 | 979,405 |
Charles Schwab Corp. / The (Capital Markets) | 3.300% | 04/01/2027 | 1,000,000 | 954,275 | |
Citigroup, Inc. (Rate is fixed until 05/01/2031, at which point, the rate becomes SOFR + 117) (Banks) | (c) | 2.561% | 05/01/2032 | 2,000,000 | 1,666,715 |
Discover Bank (Banks) | 2.450% | 09/12/2024 | 1,000,000 | 993,020 | |
Discover Bank (Banks) | USISOA05 + 173 | 08/09/2028 | 250,000 | 249,685 | |
General Motors Financial Co., Inc. (Consumer Finance) | 2.700% | 06/10/2031 | 2,000,000 | 1,653,525 | |
JPMorgan Chase & Co. (Banks) | 3.625% | 12/01/2027 | 1,000,000 | 956,617 | |
JPMorgan Chase & Co. (Rate is fixed until 05/13/2030, at which point, the rate becomes TSFR3M + 252) (Banks) | (c) | 2.956% | 05/13/2031 | 1,000,000 | 876,419 |
Morgan Stanley (Capital Markets) | 3.950% | 04/23/2027 | 1,000,000 | 965,764 | |
Corporate Bonds (Continued) | Rate | Maturity | Face Amount | Value | |
Financials (continued) | |||||
Morgan Stanley (Rate is fixed until 01/22/2030, at which point, the rate becomes SOFR + 114) (Capital Markets) | (c) | 2.699% | 01/22/2031 | $1,500,000 | $1,314,870 |
PNC Bank N.A. (Banks) | 4.050% | 07/26/2028 | 1,500,000 | 1,426,050 | |
State Street Corp. (Capital Markets) | 2.200% | 03/03/2031 | 1,000,000 | 839,754 | |
Synchrony Financial (Consumer Finance) | 4.250% | 08/15/2024 | 1,000,000 | 997,591 | |
Truist Bank (Rate is fixed until 09/17/2024, at which point, the rate becomes H15T5Y + 115) (Banks) | (c) | 2.636% | 09/17/2029 | 2,500,000 | 2,446,366 |
U.S. Bancorp (Banks) | 1.375% | 07/22/2030 | 1,000,000 | 805,612 | |
U.S. Bancorp (Rate is fixed until 01/23/2034, at which point, the rate becomes SOFR + 186) (Banks) | (c) | 5.678% | 01/23/2035 | 300,000 | 301,151 |
Wells Fargo & Co. (Rate is fixed until 04/30/2040, at which point, the rate becomes SOFR + 253) (Banks) | (c) | 3.068% | 04/30/2041 | 1,000,000 | 733,282 |
Westpac Banking Corp. (Rate is fixed until 02/04/2025, at which point, the rate becomes H15T5Y + 135) (Banks) | (c) | 2.894% | 02/04/2030 | 1,500,000 | 1,470,521 |
23,673,084 | |||||
Health Care–0.9% | |||||
AbbVie, Inc. (Biotechnology) | 3.200% | 11/21/2029 | 1,000,000 | 917,603 | |
Regeneron Pharmaceuticals, Inc. (Biotechnology) | 1.750% | 09/15/2030 | 1,200,000 | 988,332 | |
UnitedHealth Group, Inc. (Health Care Providers & Svs.) | 3.875% | 12/15/2028 | 2,000,000 | 1,916,192 | |
3,822,127 | |||||
Industrials–1.8% | |||||
Air Lease Corp. (Trading Companies & Distributors) | 2.300% | 02/01/2025 | 2,000,000 | 1,957,240 | |
Boeing Co. / The (Aerospace & Defense) | (b) | 6.298% | 05/01/2029 | 900,000 | 912,654 |
FedEx Corp. (Air Freight & Logistics) | 4.900% | 01/15/2034 | 1,000,000 | 973,466 | |
TTX Co. (Ground Transportation) | (b) | 5.650% | 12/01/2052 | 1,000,000 | 1,014,172 |
United Rentals North America, Inc. (Trading Companies & Distributors) | 4.875% | 01/15/2028 | 1,000,000 | 969,198 | |
Waste Connections, Inc. (Commercial Svs. & Supplies) | 2.600% | 02/01/2030 | 2,000,000 | 1,761,482 | |
7,588,212 | |||||
Information Technology–1.1% | |||||
Broadcom, Inc. (Semiconductors & Equip.) | (b) | 2.600% | 02/15/2033 | 1,000,000 | 810,406 |
HP, Inc. (Tech. Hardware, Storage & Periph.) | 2.650% | 06/17/2031 | 2,000,000 | 1,695,030 | |
Oracle Corp. (Software) | 4.300% | 07/08/2034 | 1,000,000 | 910,707 | |
VMware LLC (Software) | 2.200% | 08/15/2031 | 1,200,000 | 975,054 | |
4,391,197 | |||||
Materials–0.9% | |||||
Dow Chemical Co. / The (Chemicals) | 4.250% | 10/01/2034 | 1,402,000 | 1,279,714 | |
Glencore Funding LLC (Metals & Mining) | (b) | 2.850% | 04/27/2031 | 2,000,000 | 1,684,178 |
Kinross Gold Corp. (Metals & Mining) | 4.500% | 07/15/2027 | 1,000,000 | 971,044 | |
3,934,936 | |||||
Real Estate–0.5% | |||||
Alexandria Real Estate Equities, Inc. (Health Care REITs) | 3.950% | 01/15/2028 | 1,000,000 | 957,256 | |
American Tower Corp. (Specialized REITs) | 2.750% | 01/15/2027 | 1,000,000 | 938,195 | |
1,895,451 | |||||
Utilities–2.6% | |||||
AEP Transmission Co. LLC (Electric Utilities) | 4.000% | 12/01/2046 | 1,000,000 | 793,400 | |
AEP Transmission Co. LLC (Electric Utilities) | 3.750% | 12/01/2047 | 1,000,000 | 742,808 | |
Ameren Corp. (Multi-Utilities) | 3.500% | 01/15/2031 | 1,000,000 | 901,532 | |
Black Hills Corp. (Multi-Utilities) | 3.050% | 10/15/2029 | 1,000,000 | 888,965 | |
Commonwealth Edison Co. (Electric Utilities) | 4.350% | 11/15/2045 | 1,000,000 | 840,535 | |
Commonwealth Edison Co. (Electric Utilities) | 5.650% | 06/01/2054 | 1,000,000 | 993,819 | |
Connecticut Light & Power Co. / The (Electric Utilities) | 4.000% | 04/01/2048 | 1,000,000 | 797,219 | |
Consolidated Edison Co. of New York, Inc. (Electric Utilities) | 5.700% | 05/15/2054 | 1,000,000 | 997,623 | |
Duke Energy Corp. (Electric Utilities) | 3.750% | 09/01/2046 | 1,500,000 | 1,091,750 | |
Duke Energy Indiana LLC (Electric Utilities) | 3.250% | 10/01/2049 | 1,000,000 | 669,026 | |
FirstEnergy Transmission LLC (Electric Utilities) | (b) | 4.550% | 04/01/2049 | 1,000,000 | 826,479 |
Florida Power & Light Co. (Electric Utilities) | 3.150% | 10/01/2049 | 1,000,000 | 679,981 | |
Public Service Electric & Gas Co. (Multi-Utilities) | 3.600% | 12/01/2047 | 1,000,000 | 744,063 | |
10,967,200 | |||||
Total Corporate Bonds (Cost $105,994,878) | $92,302,758 | ||||
Asset-Backed Securities–0.5% | Rate | Maturity | Face Amount | Value | |
Industrials–0.5% | |||||
FedEx Corp. 2020-1 Class AA Pass Through Trust | 1.875% | 02/20/2034 | $1,625,692 | $1,348,643 | |
Asset-Backed Securities (Continued) | Rate | Maturity | Face Amount | Value | |
Industrials (continued) | |||||
United Airlines 2016-1 Class B Pass Through Trust | 3.650% | 01/07/2026 | $97,222 | $93,959 | |
United Airlines 2019-2 Class AA Pass Through Trust | 2.700% | 05/01/2032 | 807,944 | 698,964 | |
Total Asset-Backed Securities (Cost $2,530,857) | $2,141,566 | ||||
U.S. Treasury Obligations–0.5% | Rate | Maturity | Face Amount | Value | |
U.S. Treasury Note | 4.500% | 11/15/2033 | $2,000,000 | $2,018,437 | |
Total U.S. Treasury Obligations (Cost $2,103,494) | $2,018,437 | ||||
Total Investments – 98.6% (Cost $350,853,488) | (d) | $409,917,739 | |||
Other Assets in Excess of Liabilities – 1.4% | (e) | 5,811,601 | |||
Net Assets – 100.0% | $415,729,340 | ||||
Percentages are stated as a percent of net assets. |
Abbreviations: | ||
H15T5Y: | U.S. Treasury Yield Curve Rate T-Note Constant Maturity 5 Year, 4.330% at 6/30/2024 | |
REITs: | Real Estate Investment Trusts | |
SOFR: | Secured Overnight Financing Rate, 5.330% at 6/30/2024 | |
TSFR3M: | Quarterly CME Term Secured Overnight Financing Rate ("SOFR"), 5.325% at 6/30/2024 | |
USISOA05: | 5 Year Secured Overnight Financing Rate ("SOFR") Spread-Adjusted ICE Swap Rate, 4.335% at 6/30/2024 | |
Footnotes: | ||
(a) | Non-income producing security. | |
(b) | Security exempt from registration under Regulation D of the Securities Act of 1933. These securities may be resold in transactions exempt from registration, normally to qualified buyers under Rule 144A. At June 30, 2024, the value of these securities totaled $6,924,743, or 1.7% of the Portfolio’s net assets. | |
(c) | Security is a fixed-then-variable rate instrument in which the coupon or dividend rate is fixed until a later specified date, then is adjusted periodically. Rates stated, including interest rate caps and floors, if any, are those in effect at June 30, 2024. | |
(d) | Represents cost for financial reporting purposes, which may differ from cost basis for federal income tax purposes. See also Note 7 of the Notes to Financial Statements. | |
(e) | Includes $188,800 of cash pledged as collateral for the futures contracts outstanding at June 30, 2024. See also the following Schedule of Open Futures Contracts. | |
Description | Number of contracts | Expiration Date | Notional Amount | Value | Unrealized Appreciation (Depreciation) | Variation Margin Receivable (Payable) |
CME E-mini S&P 500 Index - Long | 18 | September 20, 2024 | $4,965,967 | $4,969,350 | $3,383 | $(20,820 ) |
Common Stocks–96.7% | Shares | Value | |
Japan–20.3% | |||
Asahi Group Holdings Ltd. (Consumer Staples) | (a) | 3,700 | $130,695 |
Asahi Kasei Corp. (Materials) | (a) | 10,600 | 67,869 |
Canon, Inc. (Information Technology) | (a) | 27,900 | 758,105 |
Central Japan Railway Co. (Industrials) | (a) | 61,100 | 1,318,927 |
Concordia Financial Group Ltd. (Financials) | (a) | 13,800 | 81,183 |
Dai-ichi Life Holdings, Inc. (Financials) | (a) | 18,400 | 494,007 |
Daiichi Sankyo Co. Ltd. (Health Care) | (a) | 20,400 | 712,646 |
Daikin Industries Ltd. (Industrials) | (a) | 300 | 41,443 |
Daiwa House Industry Co. Ltd. (Real Estate) | (a) | 54,900 | 1,394,485 |
Fujitsu Ltd. (Information Technology) | (a) | 29,000 | 455,644 |
Hitachi Ltd. (Industrials) | (a) | 236,500 | 5,331,057 |
Honda Motor Co. Ltd. (Consumer Discretionary) | (a) | 31,000 | 333,488 |
Hoya Corp. (Health Care) | (a) | 1,400 | 163,811 |
J. Front Retailing Co. Ltd. (Consumer Discretionary) | (a) | 10,900 | 113,922 |
Japan Post Bank Co. Ltd. (Financials) | (a) | 30,900 | 292,519 |
Japan Post Holdings Co. Ltd. (Financials) | (a) | 42,400 | 421,418 |
Kansai Electric Power Co., Inc. / The (Utilities) | (a) | 25,400 | 427,815 |
KDDI Corp. (Communication Services) | (a) | 18,400 | 487,604 |
Marubeni Corp. (Industrials) | (a) | 23,800 | 444,576 |
Mitsubishi Chemical Group Corp. (Materials) | (a) | 107,700 | 599,894 |
Mitsubishi HC Capital, Inc. (Financials) | (a) | 17,000 | 112,508 |
Mitsubishi UFJ Financial Group, Inc. (Financials) | (a) | 605,000 | 6,527,291 |
Mitsui Fudosan Co. Ltd. (Real Estate) | (a) | 24,700 | 227,195 |
Mizuho Financial Group, Inc. (Financials) | (a) | 240,800 | 5,042,439 |
MS&AD Insurance Group Holdings, Inc. (Financials) | (a) | 26,300 | 587,466 |
Murata Manufacturing Co. Ltd. (Information Technology) | (a) | 110,200 | 2,287,408 |
Nintendo Co. Ltd. (Communication Services) | (a) | 6,800 | 363,330 |
Nippon Telegraph & Telephone Corp. (Communication Services) | (a) | 2,865,100 | 2,707,936 |
Nomura Holdings, Inc. (Financials) | (a) | 61,200 | 353,124 |
Nomura Research Institute Ltd. (Information Technology) | (a) | 44,600 | 1,259,080 |
Oji Holdings Corp. (Materials) | (a) | 33,700 | 133,291 |
Ono Pharmaceutical Co. Ltd. (Health Care) | (a) | 38,900 | 531,161 |
ORIX Corp. (Financials) | (a) | 24,000 | 532,448 |
Pan Pacific International Holdings Corp. (Consumer Discretionary) | (a) | 4,000 | 93,857 |
Panasonic Holdings Corp. (Consumer Discretionary) | (a) | 232,600 | 1,911,027 |
Recruit Holdings Co. Ltd. (Industrials) | (a) | 86,000 | 4,628,413 |
Renesas Electronics Corp. (Information Technology) | (a) | 27,400 | 517,340 |
Resona Holdings, Inc. (Financials) | (a) | 44,000 | 292,163 |
Sankyo Co. Ltd. (Consumer Discretionary) | (a) | 56,400 | 612,877 |
Shimizu Corp. (Industrials) | (a) | 4,000 | 22,533 |
Shionogi & Co. Ltd. (Health Care) | (a) | 2,100 | 82,137 |
SoftBank Corp. (Communication Services) | (a) | 58,500 | 715,814 |
SoftBank Group Corp. (Communication Services) | (a) | 20,900 | 1,362,577 |
Sojitz Corp. (Industrials) | (a) | 1,300 | 31,705 |
Sompo Holdings, Inc. (Financials) | (a) | 33,900 | 724,344 |
Sony Group Corp. (Consumer Discretionary) | (a) | 24,600 | 2,090,310 |
Sumitomo Chemical Co. Ltd. (Materials) | (a) | 477,700 | 1,024,253 |
Common Stocks (Continued) | Shares | Value | |
Japan (continued) | |||
Sumitomo Corp. (Industrials) | (a) | 121,800 | $3,058,755 |
Sumitomo Mitsui Financial Group, Inc. (Financials) | (a) | 54,500 | 3,645,467 |
Sumitomo Mitsui Trust Holdings, Inc. (Financials) | (a) | 15,600 | 356,293 |
T&D Holdings, Inc. (Financials) | (a) | 10,200 | 178,794 |
Tokio Marine Holdings, Inc. (Financials) | (a) | 111,500 | 4,185,219 |
Tokyo Electron Ltd. (Information Technology) | (a) | 27,100 | 5,951,082 |
Toyota Industries Corp. (Industrials) | (a) | 4,600 | 389,413 |
Toyota Motor Corp. (Consumer Discretionary) | (a) | 76,300 | 1,570,887 |
Toyota Tsusho Corp. (Industrials) | (a) | 90,900 | 1,780,011 |
Unicharm Corp. (Consumer Staples) | (a) | 32,800 | 1,050,856 |
71,011,912 | |||
United Kingdom–14.7% | |||
3i Group PLC (Financials) | (a) | 1,026 | 39,566 |
AstraZeneca PLC (Health Care) | (a) | 18,459 | 2,877,684 |
Auto Trader Group PLC (Communication Services) | (a) | 123,564 | 1,245,494 |
BAE Systems PLC (Industrials) | (a) | 212,377 | 3,546,156 |
BP PLC (Energy) | (a) | 361,710 | 2,179,477 |
British American Tobacco PLC (Consumer Staples) | (a) | 71,278 | 2,191,095 |
British Land Co. PLC / The (Real Estate) | (a) | 55,803 | 289,408 |
BT Group PLC (Communication Services) | (a) | 148,893 | 264,320 |
Bunzl PLC (Industrials) | (a) | 36,248 | 1,375,011 |
Centrica PLC (Utilities) | (a) | 39,522 | 67,199 |
Compass Group PLC (Consumer Discretionary) | (a) | 154,778 | 4,213,989 |
Drax Group PLC (Utilities) | (a) | 10,519 | 65,431 |
GSK PLC (Health Care) | (a) | 209,962 | 4,046,580 |
Halma PLC (Information Technology) | (a) | 4,526 | 154,087 |
HSBC Holdings PLC (Financials) | (a) | 69,107 | 598,052 |
IG Group Holdings PLC (Financials) | (a) | 9,449 | 97,884 |
IMI PLC (Industrials) | (a) | 7,328 | 163,537 |
Imperial Brands PLC (Consumer Staples) | (a) | 54,420 | 1,393,360 |
Informa PLC (Communication Services) | (a) | 274,240 | 2,968,989 |
International Consolidated Airlines Group SA (Industrials) | (a)(b) | 24,386 | 50,069 |
J Sainsbury PLC (Consumer Staples) | (a) | 59,987 | 193,527 |
Johnson Matthey PLC (Materials) | (a) | 45,899 | 906,610 |
London Stock Exchange Group PLC (Financials) | (a) | 16,892 | 2,002,324 |
Marks & Spencer Group PLC (Consumer Staples) | (a) | 59,732 | 215,116 |
Reckitt Benckiser Group PLC (Consumer Staples) | (a) | 2,605 | 140,577 |
RELX PLC (Industrials) | (a) | 66,224 | 3,035,778 |
Rio Tinto PLC (Materials) | (a) | 8,495 | 559,189 |
Rolls-Royce Holdings PLC (Industrials) | (a)(b) | 9,170 | 53,006 |
Shell PLC (Energy) | (a) | 194,667 | 6,995,831 |
Smiths Group PLC (Industrials) | (a) | 69,501 | 1,499,218 |
Spectris PLC (Information Technology) | (a) | 24,715 | 869,163 |
Standard Chartered PLC (Financials) | (a) | 152,940 | 1,378,032 |
Tesco PLC (Consumer Staples) | (a) | 1,013,696 | 3,924,502 |
Unilever PLC (Consumer Staples) | (a) | 29,960 | 1,649,527 |
Vodafone Group PLC (Communication Services) | (a) | 21,093 | 18,583 |
51,268,371 | |||
Germany–10.0% | |||
adidas AG (Consumer Discretionary) | (a) | 2,319 | 553,459 |
Allianz SE (Financials) | (a) | 21,524 | 5,980,323 |
Bayer AG (Health Care) | (a) | 136,990 | 3,873,935 |
Deutsche Bank AG (Financials) | (a) | 29,492 | 470,461 |
Deutsche Lufthansa AG (Industrials) | (a) | 56,258 | 344,043 |
Common Stocks (Continued) | Shares | Value | |
Germany (continued) | |||
Deutsche Post AG (Industrials) | (a) | 2,649 | $107,182 |
Deutsche Telekom AG (Communication Services) | (a) | 198,204 | 4,985,995 |
Fresenius Medical Care AG (Health Care) | (a) | 9,621 | 367,934 |
Fresenius SE & Co. KGaA (Health Care) | (a)(b) | 34,567 | 1,032,466 |
Henkel AG & Co. KGaA (Consumer Staples) | (a) | 1,800 | 141,652 |
Nemetschek SE (Information Technology) | (a) | 7,353 | 723,086 |
Nordex SE (Industrials) | (a)(b) | 23,782 | 291,256 |
SAP SE (Information Technology) | (a) | 39,182 | 7,955,315 |
Scout24 SE (Communication Services) | (a) | 600 | 45,749 |
Siemens AG (Industrials) | (a) | 36,211 | 6,734,853 |
Siemens Energy AG (Industrials) | (a)(b) | 41,989 | 1,092,961 |
Volkswagen AG (Consumer Discretionary) | (a) | 741 | 88,908 |
Zalando SE (Consumer Discretionary) | (a)(b) | 6,708 | 156,809 |
34,946,387 | |||
France–8.9% | |||
Air Liquide SA (Materials) | (a) | 5,972 | 1,028,152 |
Amundi SA (Financials) | (a) | 6,019 | 386,225 |
BNP Paribas SA (Financials) | (a) | 62,572 | 4,009,612 |
Capgemini SE (Information Technology) | (a) | 5,733 | 1,135,544 |
Carrefour SA (Consumer Staples) | (a) | 188,765 | 2,667,287 |
Credit Agricole SA (Financials) | (a) | 20,619 | 280,365 |
Danone SA (Consumer Staples) | (a) | 67,773 | 4,136,192 |
Dassault Systemes SE (Information Technology) | (a) | 58,950 | 2,219,138 |
Eiffage SA (Industrials) | (a) | 14,157 | 1,307,035 |
Engie SA (Utilities) | (a) | 6,877 | 97,949 |
EssilorLuxottica SA (Health Care) | (a) | 3,699 | 793,687 |
Eurazeo SE (Financials) | (a) | 2,759 | 220,799 |
Gecina SA (Real Estate) | (a) | 971 | 89,655 |
Hermes International SCA (Consumer Discretionary) | (a) | 562 | 1,293,558 |
Legrand SA (Industrials) | (a) | 2,761 | 275,143 |
L'Oreal SA (Consumer Staples) | (a) | 324 | 142,467 |
LVMH Moet Hennessy Louis Vuitton SE (Consumer Discretionary) | (a) | 2,368 | 1,818,509 |
Publicis Groupe SA (Communication Services) | (a) | 5,297 | 561,447 |
Sanofi (Health Care) | (a) | 19,749 | 1,898,300 |
Schneider Electric SE (Industrials) | (a) | 12,324 | 2,940,553 |
TotalEnergies SE (Energy) | (a) | 3,163 | 210,811 |
Ubisoft Entertainment SA (Communication Services) | (a)(b) | 25,977 | 570,505 |
Valeo SE (Consumer Discretionary) | (a) | 64,268 | 687,435 |
Veolia Environnement SA (Utilities) | (a) | 77,600 | 2,329,896 |
31,100,264 | |||
Switzerland–7.8% | |||
ABB Ltd. (Industrials) | (a) | 98,213 | 5,436,881 |
Chocoladefabriken Lindt & Spruengli AG (Consumer Staples) | (a) | 112 | 1,308,034 |
Givaudan SA (Materials) | (a) | 286 | 1,356,678 |
Glencore PLC (Materials) | (a) | 51,678 | 294,657 |
Holcim AG (Materials) | (a) | 22,173 | 1,966,606 |
Logitech International SA (Information Technology) | (a) | 9,354 | 900,121 |
Nestle SA (Consumer Staples) | (a) | 30,441 | 3,107,342 |
Novartis AG (Health Care) | (a) | 75,785 | 8,119,028 |
Roche Holding Ltd. (Health Care) | (a) | 521 | 158,924 |
Roche Holding Ltd. NVS (Health Care) | (a) | 6,626 | 1,838,810 |
Schindler Holding AG (Industrials) | (a) | 573 | 143,574 |
Sonova Holding AG (Health Care) | (a) | 3,808 | 1,171,602 |
Common Stocks (Continued) | Shares | Value | |
Switzerland (continued) | |||
UBS Group AG (Financials) | (a) | 42,062 | $1,231,221 |
Zurich Insurance Group AG (Financials) | (a) | 781 | 415,500 |
27,448,978 | |||
Netherlands–6.0% | |||
Adyen N.V. (Financials) | (a)(b) | 307 | 366,021 |
Argenx SE (Health Care) | (a)(b) | 846 | 365,709 |
ASML Holding N.V. (Information Technology) | (a) | 11,897 | 12,274,106 |
Euronext N.V. (Financials) | (a) | 7,310 | 674,849 |
EXOR N.V. (Financials) | (a) | 1,907 | 198,751 |
Koninklijke Philips N.V. (Health Care) | (a)(b) | 49,796 | 1,252,182 |
NN Group N.V. (Financials) | (a) | 41,196 | 1,916,217 |
Signify N.V. (Industrials) | (a) | 4,339 | 108,206 |
Stellantis N.V. (Consumer Discretionary) | (a) | 80,398 | 1,581,252 |
Wolters Kluwer N.V. (Industrials) | (a) | 12,691 | 2,097,964 |
20,835,257 | |||
Australia–5.9% | |||
AGL Energy Ltd. (Utilities) | (a) | 127,060 | 915,406 |
Aristocrat Leisure Ltd. (Consumer Discretionary) | (a) | 47,604 | 1,573,988 |
BHP Group Ltd. (Materials) | (a) | 233,624 | 6,692,489 |
Brambles Ltd. (Industrials) | (a) | 11,132 | 108,147 |
Cochlear Ltd. (Health Care) | (a) | 2,716 | 599,776 |
Coles Group Ltd. (Consumer Staples) | (a) | 18,051 | 205,050 |
Computershare Ltd. (Industrials) | (a) | 5,017 | 88,131 |
CSL Ltd. (Health Care) | (a) | 10,800 | 2,117,862 |
Macquarie Group Ltd. (Financials) | (a) | 6,573 | 896,549 |
REA Group Ltd. (Communication Services) | (a) | 8,160 | 1,064,483 |
Rio Tinto Ltd. (Materials) | (a) | 25,665 | 2,036,751 |
South32 Ltd. (Materials) | (a) | 99,114 | 241,878 |
Transurban Group (Industrials) | (a) | 37,301 | 308,451 |
Wesfarmers Ltd. (Consumer Discretionary) | (a) | 63,606 | 2,754,391 |
Woodside Energy Group Ltd. (Energy) | (a) | 28,928 | 545,504 |
Worley Ltd. (Industrials) | (a) | 52,412 | 521,751 |
20,670,607 | |||
Denmark–4.2% | |||
DSV A/S (Industrials) | (a) | 6,662 | 1,019,456 |
Genmab A/S (Health Care) | (a)(b) | 2,019 | 506,323 |
Novo Nordisk A/S Class B (Health Care) | (a) | 85,857 | 12,265,202 |
Pandora A/S (Consumer Discretionary) | (a) | 4,801 | 721,259 |
Vestas Wind Systems A/S (Industrials) | (a)(b) | 5,389 | 124,364 |
14,636,604 | |||
Spain–4.1% | |||
ACS Actividades de Construccion y Servicios SA (Industrials) | (a) | 33,351 | 1,437,587 |
Banco Bilbao Vizcaya Argentaria SA (Financials) | (a) | 86,121 | 859,170 |
Banco Santander SA (Financials) | (a) | 1,019,206 | 4,723,873 |
Iberdrola SA (Utilities) | (a) | 120,109 | 1,558,114 |
Industria de Diseno Textil SA (Consumer Discretionary) | (a) | 81,786 | 4,041,668 |
Repsol SA (Energy) | (a) | 108,672 | 1,712,899 |
14,333,311 | |||
Sweden–3.2% | |||
Assa Abloy AB Class B (Industrials) | (a) | 31,272 | 886,251 |
Atlas Copco AB Class A (Industrials) | (a) | 67,739 | 1,276,630 |
Atlas Copco AB Class B (Industrials) | (a) | 66,246 | 1,072,909 |
Electrolux AB Class B (Consumer Discretionary) | (a)(b) | 57,322 | 472,201 |
Evolution AB (Consumer Discretionary) | (a) | 2,200 | 229,260 |
Common Stocks (Continued) | Shares | Value | |
Sweden (continued) | |||
Hexagon AB Class B (Information Technology) | (a) | 194,364 | $2,181,786 |
Industrivarden AB Class C (Financials) | (a) | 12,187 | 412,423 |
Industrivarden AB Class A (Financials) | (a) | 1,237 | 41,950 |
Investor AB Class B (Financials) | (a) | 117,755 | 3,232,592 |
Trelleborg AB Class B (Industrials) | (a) | 21,888 | 848,013 |
Volvo AB Class B (Industrials) | (a) | 19,506 | 500,403 |
11,154,418 | |||
Italy–2.4% | |||
A2A SpA (Utilities) | (a) | 400,697 | 794,661 |
Amplifon SpA (Health Care) | (a) | 4,559 | 161,716 |
Banca Monte dei Paschi di Siena SpA (Financials) | (a) | 186,320 | 869,221 |
Banco BPM SpA (Financials) | (a) | 10,706 | 69,256 |
Enel SpA (Utilities) | (a) | 45,100 | 314,596 |
Ferrari N.V. (Consumer Discretionary) | (a) | 7,033 | 2,875,499 |
Generali (Financials) | (a) | 21,263 | 528,803 |
Intesa Sanpaolo SpA (Financials) | (a) | 190,831 | 712,547 |
Mediobanca Banca di Credito Finanziario SpA (Financials) | (a) | 11,001 | 161,915 |
Moncler SpA (Consumer Discretionary) | (a) | 1,526 | 93,454 |
Poste Italiane SpA (Financials) | (a) | 9,074 | 115,900 |
Recordati Industria Chimica e Farmaceutica SpA (Health Care) | (a) | 8,556 | 447,406 |
UniCredit SpA (Financials) | (a) | 36,714 | 1,367,980 |
8,512,954 | |||
Hong Kong–2.4% | |||
AIA Group Ltd. (Financials) | (a) | 471,200 | 3,195,184 |
BOC Hong Kong Holdings Ltd. (Financials) | (a) | 14,500 | 44,758 |
Budweiser Brewing Co. APAC Ltd. (Consumer Staples) | (a) | 310,000 | 364,946 |
CK Asset Holdings Ltd. (Real Estate) | (a) | 256,500 | 960,199 |
CK Hutchison Holdings Ltd. (Industrials) | (a) | 613,500 | 2,936,643 |
Jardine Matheson Holdings Ltd. (Industrials) | (a) | 10,000 | 353,440 |
Sino Land Co. Ltd. (Real Estate) | (a) | 20,000 | 20,615 |
Sun Hung Kai Properties Ltd. (Real Estate) | (a) | 2,500 | 21,614 |
Swire Properties Ltd. (Real Estate) | (a) | 67,600 | 107,640 |
Wharf Real Estate Investment Co. Ltd. (Real Estate) | (a) | 160,000 | 422,853 |
8,427,892 | |||
Singapore–1.7% | |||
DBS Group Holdings Ltd. (Financials) | (a) | 1,600 | 42,161 |
Seatrium Ltd. (Industrials) | (a)(b) | 18,800 | 19,108 |
Singapore Telecommunications Ltd. (Communication Services) | (a) | 2,182,700 | 4,414,332 |
United Overseas Bank Ltd. (Financials) | (a) | 25,600 | 591,145 |
Wilmar International Ltd. (Consumer Staples) | (a) | 47,600 | 108,510 |
Yangzijiang Shipbuilding Holdings Ltd. (Industrials) | (a) | 488,800 | 885,050 |
6,060,306 | |||
Common Stocks (Continued) | Shares | Value | |
Ireland–1.0% | |||
Experian PLC (Industrials) | (a) | 76,350 | $3,540,640 |
Norway–1.0% | |||
DNB Bank ASA (Financials) | (a) | 8,519 | 167,283 |
Equinor ASA (Energy) | (a) | 112,528 | 3,215,228 |
Yara International ASA (Materials) | (a) | 1,959 | 56,420 |
3,438,931 | |||
Finland–0.8% | |||
Nordea Bank Abp (Financials) | (a) | 184,903 | 2,194,858 |
Stora Enso Oyj (Materials) | (a) | 5,721 | 78,232 |
Wartsila OYJ Abp (Industrials) | (a) | 28,405 | 546,613 |
2,819,703 | |||
Luxembourg–0.6% | |||
ArcelorMittal SA (Materials) | (a) | 97,558 | 2,224,155 |
Austria–0.6% | |||
BAWAG Group AG (Financials) | (a) | 6,469 | 408,243 |
Erste Group Bank AG (Financials) | (a) | 20,388 | 965,598 |
OMV AG (Energy) | (a) | 15,824 | 688,203 |
2,062,044 | |||
New Zealand–0.4% | |||
Xero Ltd. (Information Technology) | (a)(b) | 15,994 | 1,448,391 |
Israel–0.4% | |||
Elbit Systems Ltd. (Industrials) | (a) | 1,238 | 215,865 |
Mizrahi Tefahot Bank Ltd. (Financials) | (a) | 859 | 29,072 |
Nice Ltd. (Information Technology) | (a)(b) | 5,752 | 992,558 |
1,237,495 | |||
Belgium–0.3% | |||
Groupe Bruxelles Lambert N.V. (Financials) | (a) | 245 | 17,430 |
KBC Group N.V. (Financials) | (a) | 13,556 | 956,220 |
Sofina SA (Financials) | (a) | 614 | 140,112 |
1,113,762 | |||
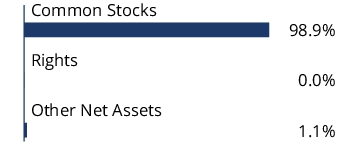
Total Common Stocks (Cost $303,957,799) | $338,292,382 | ||
Preferred Securities–0.2% | Rate | Quantity | Value | |
Germany–0.2% | ||||
Porsche Automobil Holding SE (Consumer Discretionary) | (a) | 7.301% (c) | 11,477 | $518,793 |
Volkswagen AG (Consumer Discretionary) | (a) | 8.604% (c) | 898 | 101,320 |
Total Preferred Securities (Cost $706,682) | $620,113 | |||
Total Investments – 96.9% (Cost $304,664,481) | (d) | $338,912,495 | ||
Other Assets in Excess of Liabilities – 3.1% | (e) | 10,858,802 | ||
Net Assets – 100.0% | $349,771,297 | |||
Percentages are stated as a percent of net assets. |
Abbreviations: | ||
NVS: | Non Voting Shares | |
Footnotes: | ||
(a) | Security traded on a foreign exchange has been valued at an estimate of fair value that is different than the local market close price. These fair value estimates are determined by an independent fair valuation service that has been approved by the Board or its designee. These securities represent $338,912,495 or 96.9% of the Portfolio’s net assets. | |
(b) | Non-income producing security. | |
(c) | Represents twelve-month dividend yield. Rates are determined by actual distributions, which are impacted by factors unique to each preference share such as board authorization, distributable earnings, and preferred payout features compared to other classes of equity. | |
(d) | Represents cost for financial reporting purposes, which may differ from cost basis for federal income tax purposes. See also Note 7 of the Notes to Financial Statements. | |
(e) | Includes $233,220 of cash pledged as collateral for the futures contracts outstanding at June 30, 2024. See also the following Schedule of Open Futures Contracts. | |
Description | Number of contracts | Expiration Date | Notional Amount | Value | Unrealized Appreciation (Depreciation) | Variation Margin Receivable (Payable) |
MSCI EAFE Index - Long | 57 | September 20, 2024 | $6,635,146 | $6,678,120 | $42,974 | $9,120 |
Common Stocks–99.1% | Shares | Value | |
Communication Services–11.2% | |||
Alphabet, Inc. Class A (Interactive Media & Svs.) | 37,068 | $6,751,936 | |
Live Nation Entertainment, Inc. (Entertainment) | (a) | 3,851 | 360,993 |
Meta Platforms, Inc. Class A (Interactive Media & Svs.) | 4,072 | 2,053,184 | |
Netflix, Inc. (Entertainment) | (a) | 3,853 | 2,600,313 |
Universal Music Group N.V. (Entertainment) | (b) | 73,328 | 2,173,684 |
Warner Music Group Corp. Class A (Entertainment) | 22,948 | 703,356 | |
14,643,466 | |||
Consumer Discretionary–9.3% | |||
Airbnb, Inc. Class A (Hotels, Restaurants & Leisure) | (a) | 10,316 | 1,564,215 |
Amazon.com, Inc. (Broadline Retail) | (a) | 34,558 | 6,678,334 |
BYD Co. Ltd. (Automobiles) | (b) | 13,425 | 398,423 |
Domino's Pizza, Inc. (Hotels, Restaurants & Leisure) | 1,463 | 755,391 | |
Duolingo, Inc. (Diversified Consumer Svs.) | (a) | 706 | 147,321 |
Kura Sushi U.S.A., Inc. Class A (Hotels, Restaurants & Leisure) | (a) | 1,571 | 99,114 |
LVMH Moet Hennessy Louis Vuitton SE (Textiles, Apparel & Luxury Goods) | (b) | 586 | 450,019 |
MercadoLibre, Inc. (Broadline Retail) | (a) | 703 | 1,155,310 |
Mobileye Global, Inc. Class A (Automobile Components) | (a) | 4,222 | 118,575 |
PDD Holdings, Inc. – ADR (Broadline Retail) | (a) | 4,200 | 558,390 |
Savers Value Village, Inc. (Broadline Retail) | (a) | 9,105 | 111,445 |
TopBuild Corp. (Household Durables) | (a) | 162 | 62,414 |
Trip.com Group Ltd. – ADR (Hotels, Restaurants & Leisure) | (a) | 2,288 | 107,536 |
12,206,487 | |||
Consumer Staples–0.7% | |||
Monster Beverage Corp. (Beverages) | (a) | 15,883 | 793,356 |
Puig Brands SA Class B (Personal Care Products) | (a)(c) | 2,300 | 64,289 |
857,645 | |||
Energy–2.5% | |||
Canadian Natural Resources Ltd. (Oil, Gas & Consumable Fuels) | 6,356 | 226,273 | |
Cheniere Energy, Inc. (Oil, Gas & Consumable Fuels) | 6,540 | 1,143,388 | |
Range Resources Corp. (Oil, Gas & Consumable Fuels) | 18,224 | 611,051 | |
Reliance Industries Ltd. – GDR (Oil, Gas & Consumable Fuels) | 17,318 | 1,291,923 | |
3,272,635 | |||
Financials–5.7% | |||
Arthur J. Gallagher & Co. (Insurance) | 3,653 | 947,259 | |
Baldwin Insurance Group, Inc. / The (Insurance) | (a) | 8,730 | 309,653 |
Capital One Financial Corp. (Consumer Finance) | 4,030 | 557,953 | |
Corebridge Financial, Inc. (Financial Services) | 10,547 | 307,129 | |
Fiserv, Inc. (Financial Services) | (a) | 1,636 | 243,829 |
Global Payments, Inc. (Financial Services) | 5,968 | 577,106 | |
LPL Financial Holdings, Inc. (Capital Markets) | 494 | 137,974 | |
Mastercard, Inc. Class A (Financial Services) | 4,793 | 2,114,480 | |
Morgan Stanley (Capital Markets) | 643 | 62,493 | |
MSCI, Inc. (Capital Markets) | 116 | 55,883 | |
Rocket Cos., Inc. Class A (Financial Services) | (a) | 16,561 | 226,886 |
Visa, Inc. (Financial Services) | 7,514 | 1,972,200 | |
7,512,845 | |||
Health Care–15.3% | |||
Aclaris Therapeutics, Inc. (Pharmaceuticals) | (a) | 2,837 | 3,121 |
Common Stocks (Continued) | Shares | Value | |
Health Care (continued) | |||
Align Technology, Inc. (Health Care Equip. & Supplies) | (a) | 2,135 | $515,453 |
Alnylam Pharmaceuticals, Inc. (Biotechnology) | (a) | 4,928 | 1,197,504 |
Arcellx, Inc. (Biotechnology) | (a) | 792 | 43,710 |
Arrowhead Pharmaceuticals, Inc. (Biotechnology) | (a) | 3,155 | 81,998 |
Beam Therapeutics, Inc. (Biotechnology) | (a) | 985 | 23,079 |
BioNTech SE – ADR (Biotechnology) | (a) | 1,983 | 159,354 |
Bio-Techne Corp. (Life Sciences Tools & Svs.) | 3,257 | 233,364 | |
Blueprint Medicines Corp. (Biotechnology) | (a) | 492 | 53,028 |
Boston Scientific Corp. (Health Care Equip. & Supplies) | (a) | 43,716 | 3,366,569 |
Bruker Corp. (Life Sciences Tools & Svs.) | 13,422 | 856,458 | |
Chemometec A/S (Life Sciences Tools & Svs.) | (b) | 1,509 | 65,674 |
Chugai Pharmaceutical Co. Ltd. (Pharmaceuticals) | (b) | 7,600 | 271,296 |
Codexis, Inc. (Life Sciences Tools & Svs.) | (a) | 19,371 | 60,050 |
Cytokinetics, Inc. (Biotechnology) | (a) | 2,313 | 125,318 |
Danaher Corp. (Life Sciences Tools & Svs.) | 4,055 | 1,013,142 | |
Eli Lilly & Co. (Pharmaceuticals) | 4,216 | 3,817,082 | |
Exact Sciences Corp. (Biotechnology) | (a) | 17,058 | 720,700 |
Galapagos N.V. – ADR (Biotechnology) | (a) | 5,545 | 137,405 |
Glaukos Corp. (Health Care Equip. & Supplies) | (a) | 2,741 | 324,397 |
HealthEquity, Inc. (Health Care Providers & Svs.) | (a) | 14,011 | 1,207,748 |
Hologic, Inc. (Health Care Equip. & Supplies) | (a) | 5,090 | 377,932 |
Hookipa Pharma, Inc. (Biotechnology) | (a) | 6,797 | 4,022 |
Immunocore Holdings PLC – ADR (Biotechnology) | (a) | 2,525 | 85,572 |
Insmed, Inc. (Biotechnology) | (a) | 13,409 | 898,403 |
Janux Therapeutics, Inc. (Biotechnology) | (a) | 300 | 12,567 |
Krystal Biotech, Inc. (Biotechnology) | (a) | 476 | 87,413 |
Lantheus Holdings, Inc. (Health Care Equip. & Supplies) | (a) | 1,206 | 96,830 |
Legend Biotech Corp. – ADR (Biotechnology) | (a) | 2,931 | 129,814 |
MaxCyte, Inc. (Life Sciences Tools & Svs.) | (a) | 13,873 | 54,382 |
Moderna, Inc. (Biotechnology) | (a) | 1,305 | 154,969 |
Penumbra, Inc. (Health Care Equip. & Supplies) | (a) | 970 | 174,571 |
Pulmonx Corp. (Health Care Equip. & Supplies) | (a) | 2,790 | 17,689 |
Regeneron Pharmaceuticals, Inc. (Biotechnology) | (a) | 1,243 | 1,306,430 |
Repligen Corp. (Life Sciences Tools & Svs.) | (a) | 475 | 59,879 |
RxSight, Inc. (Health Care Equip. & Supplies) | (a) | 763 | 45,910 |
Sarepta Therapeutics, Inc. (Biotechnology) | (a) | 765 | 120,870 |
Sartorius Stedim Biotech (Life Sciences Tools & Svs.) | (b) | 807 | 131,859 |
Teva Pharmaceutical Industries Ltd. – ADR (Pharmaceuticals) | (a) | 46,086 | 748,897 |
Thermo Fisher Scientific, Inc. (Life Sciences Tools & Svs.) | 1,538 | 850,514 | |
UCB SA (Pharmaceuticals) | (b) | 1,522 | 225,557 |
Vor BioPharma, Inc. (Biotechnology) | (a) | 6,484 | 6,484 |
XOMA Corp. (Biotechnology) | (a) | 3,682 | 87,227 |
19,954,241 | |||
Industrials–11.6% | |||
Chart Industries, Inc. (Machinery) | (a) | 907 | 130,916 |
Eaton Corp. PLC (Electrical Equip.) | 4,735 | 1,484,659 | |
Energy Recovery, Inc. (Machinery) | (a) | 4,041 | 53,705 |
Equifax, Inc. (Professional Svs.) | 6,546 | 1,587,143 | |
Ferguson PLC (Trading Companies & Distributors) | (b) | 5,461 | 1,049,473 |
GE Vernova, Inc. (Electrical Equip.) | (a) | 5,089 | 872,814 |
General Electric Co. (Aerospace & Defense) | 11,773 | 1,871,554 | |
Ingersoll Rand, Inc. (Machinery) | 14,463 | 1,313,819 | |
Loar Holdings, Inc. (Aerospace & Defense) | (a) | 200 | 10,682 |
Common Stocks (Continued) | Shares | Value | |
Industrials (continued) | |||
Montrose Environmental Group, Inc. (Commercial Svs. & Supplies) | (a) | 1,100 | $49,016 |
RELX PLC – ADR (Professional Svs.) | 12,657 | 580,703 | |
Uber Technologies, Inc. (Ground Transportation) | (a) | 74,807 | 5,436,973 |
UL Solutions, Inc. Class A (Professional Svs.) | 8,196 | 345,789 | |
Westinghouse Air Brake Technologies Corp. (Machinery) | 2,456 | 388,171 | |
15,175,417 | |||
Information Technology–42.6% | |||
Allegro MicroSystems, Inc. (Semiconductors & Equip.) | (a) | 18,803 | 530,997 |
Apple, Inc. (Tech. Hardware, Storage & Periph.) | 72,777 | 15,328,292 | |
ASML Holding N.V. (Semiconductors & Equip.) | 1,916 | 1,959,551 | |
Astera Labs, Inc. (Semiconductors & Equip.) | (a) | 200 | 12,102 |
Autodesk, Inc. (Software) | (a) | 582 | 144,016 |
BE Semiconductor Industries N.V. (Semiconductors & Equip.) | (b) | 6,671 | 1,114,588 |
Coherent Corp. (Electronic Equip., Instr. & Comp.) | (a) | 1,926 | 139,558 |
Fabrinet (Electronic Equip., Instr. & Comp.) | (a) | 547 | 133,900 |
Gartner, Inc. (IT Svs.) | (a) | 1,074 | 482,290 |
HubSpot, Inc. (Software) | (a) | 2,057 | 1,213,198 |
Jabil, Inc. (Electronic Equip., Instr. & Comp.) | 5,607 | 609,986 | |
Manhattan Associates, Inc. (Software) | (a) | 3,369 | 831,065 |
Marvell Technology, Inc. (Semiconductors & Equip.) | 4,197 | 293,370 | |
Micron Technology, Inc. (Semiconductors & Equip.) | 6,684 | 879,147 | |
Common Stocks (Continued) | Shares | Value | |
Information Technology (continued) | |||
Microsoft Corp. (Software) | 39,067 | $17,460,996 | |
MongoDB, Inc. (IT Svs.) | (a) | 6,581 | 1,644,987 |
Nice Ltd. – ADR (Software) | (a) | 2,783 | 478,592 |
NVIDIA Corp. (Semiconductors & Equip.) | 49,978 | 6,174,282 | |
QUALCOMM, Inc. (Semiconductors & Equip.) | 4,346 | 865,636 | |
ServiceNow, Inc. (Software) | (a) | 951 | 748,123 |
SiTime Corp. (Semiconductors & Equip.) | (a) | 6,782 | 843,545 |
Taiwan Semiconductor Manufacturing Co. Ltd. – ADR (Semiconductors & Equip.) | 17,698 | 3,076,089 | |
Universal Display Corp. (Semiconductors & Equip.) | 3,545 | 745,336 | |
Volue ASA (Software) | (a)(b) | 14,937 | 41,891 |
55,751,537 | |||
Materials–0.2% | |||
Aspen Aerogels, Inc. (Chemicals) | (a) | 6,519 | 155,478 |
International Paper Co. (Containers & Packaging) | 2,824 | 121,856 | |
277,334 | |||
Total Common Stocks (Cost $102,224,820) | $129,651,607 | ||
Rights–0.0% | Quantity | Value | |
Health Care–0.0% | |||
Gamida Cell Ltd. CVR (Biotechnology) | 33,274 | $0 | |
Total Rights (Cost $44,288) | $0 | ||
Total Investments – 99.1% (Cost $102,269,108) | (d) | $129,651,607 | |
Other Assets in Excess of Liabilities – 0.9% | 1,201,989 | ||
Net Assets – 100.0% | $130,853,596 | ||
Percentages are stated as a percent of net assets. |
Abbreviations: | ||
ADR: | American Depositary Receipts | |
CVR: | Contingent Value Right | |
GDR: | Global Depositary Receipts | |
Footnotes: | ||
(a) | Non-income producing security. | |
(b) | Security traded on a foreign exchange has been valued at an estimate of fair value that is different than the local market close price. These fair value estimates are determined by an independent fair valuation service that has been approved by the Board or its designee. These securities represent $5,922,464 or 4.5% of the Portfolio’s net assets. | |
(c) | As discussed in Note 2 of the Notes to Financial Statements, not all investments that are traded on a foreign exchange are valued at an estimate that is different from the local close price. In some instances, the independent fair valuation service uses a stock’s local close price because the service’s measure of predictability related to their valuation model of a stock is below a chosen threshold. These securities represent $64,289 or 0.0% of the Portfolio’s net assets. Other Portfolio securities are not subjected to fair valuation procedures because they are traded on domestic or foreign exchanges that have close times that are consistent with the U.S. market close, normally 4:00 pm Eastern Time. | |
(d) | Represents cost for financial reporting purposes, which may differ from cost basis for federal income tax purposes. See also Note 7 of the Notes to Financial Statements. | |
Common Stocks–98.5% | Shares | Value | |
Communication Services–1.7% | |||
AMC Networks, Inc. Class A (Media) | (a) | 3,530 | $34,100 |
Cable One, Inc. (Media) | 225 | 79,650 | |
Cars.com, Inc. (Interactive Media & Svs.) | (a) | 5,115 | 100,766 |
Cinemark Holdings, Inc. (Entertainment) | (a) | 6,250 | 135,125 |
Cogent Communications Holdings, Inc. (Diversified Telecom. Svs.) | 2,160 | 121,910 | |
EchoStar Corp. Class A (Media) | (a) | 4,929 | 87,785 |
Gogo, Inc. (Wireless Telecom. Svs.) | (a) | 10,030 | 96,489 |
IAC, Inc. (Interactive Media & Svs.) | (a) | 3,403 | 159,431 |
John Wiley & Sons, Inc. Class A (Media) | 2,630 | 107,041 | |
Lumen Technologies, Inc. (Diversified Telecom. Svs.) | (a) | 72,340 | 79,574 |
Madison Square Garden Sports Corp. (Entertainment) | (a) | 1,040 | 195,655 |
Shenandoah Telecommunications Co. (Diversified Telecom. Svs.) | 5,370 | 87,692 | |
Shutterstock, Inc. (Interactive Media & Svs.) | 2,280 | 88,236 | |
TechTarget, Inc. (Media) | (a) | 2,320 | 72,314 |
Telephone & Data Systems, Inc. (Wireless Telecom. Svs.) | 5,150 | 106,760 | |
TripAdvisor, Inc. (Interactive Media & Svs.) | (a) | 7,442 | 132,542 |
Yelp, Inc. (Interactive Media & Svs.) | (a) | 4,550 | 168,122 |
1,853,192 | |||
Consumer Discretionary–14.4% | |||
Abercrombie & Fitch Co. Class A (Specialty Retail) | (a) | 2,470 | 439,265 |
Academy Sports & Outdoors, Inc. (Specialty Retail) | 4,209 | 224,129 | |
Adtalem Global Education, Inc. (Diversified Consumer Svs.) | (a) | 1,900 | 129,599 |
Advance Auto Parts, Inc. (Specialty Retail) | 2,510 | 158,958 | |
American Eagle Outfitters, Inc. (Specialty Retail) | 9,400 | 187,624 | |
Asbury Automotive Group, Inc. (Specialty Retail) | (a) | 1,046 | 238,352 |
BJ's Restaurants, Inc. (Hotels, Restaurants & Leisure) | (a) | 3,030 | 105,141 |
Boot Barn Holdings, Inc. (Specialty Retail) | (a) | 9,000 | 1,160,370 |
Brinker International, Inc. (Hotels, Restaurants & Leisure) | (a) | 2,080 | 150,571 |
Buckle, Inc. / The (Specialty Retail) | 2,318 | 85,627 | |
Caleres, Inc. (Specialty Retail) | 2,870 | 96,432 | |
Cava Group, Inc. (Hotels, Restaurants & Leisure) | (a) | 6,038 | 560,024 |
Cavco Industries, Inc. (Household Durables) | (a) | 270 | 93,466 |
Century Communities, Inc. (Household Durables) | 1,830 | 149,438 | |
Cheesecake Factory, Inc. / The (Hotels, Restaurants & Leisure) | 3,690 | 144,980 | |
Cracker Barrel Old Country Store, Inc. (Hotels, Restaurants & Leisure) | 1,380 | 58,181 | |
Dana, Inc. (Automobile Components) | 7,540 | 91,385 | |
Dorman Products, Inc. (Automobile Components) | (a) | 1,300 | 118,924 |
Duolingo, Inc. (Diversified Consumer Svs.) | (a) | 3,216 | 671,083 |
Dutch Bros, Inc. Class A (Hotels, Restaurants & Leisure) | (a) | 13,897 | 575,336 |
Foot Locker, Inc. (Specialty Retail) | 4,430 | 110,396 | |
Fox Factory Holding Corp. (Automobile Components) | (a) | 1,529 | 73,683 |
Frontdoor, Inc. (Diversified Consumer Svs.) | (a) | 2,561 | 86,536 |
Gentherm, Inc. (Automobile Components) | (a) | 2,190 | 108,011 |
G-III Apparel Group Ltd. (Textiles, Apparel & Luxury Goods) | (a) | 3,240 | 87,707 |
Golden Entertainment, Inc. (Hotels, Restaurants & Leisure) | 2,690 | 83,686 | |
Common Stocks (Continued) | Shares | Value | |
Consumer Discretionary (continued) | |||
Green Brick Partners, Inc. (Household Durables) | (a) | 2,040 | $116,770 |
Group 1 Automotive, Inc. (Specialty Retail) | 612 | 181,935 | |
Guess?, Inc. (Specialty Retail) | 1,070 | 21,828 | |
Hanesbrands, Inc. (Textiles, Apparel & Luxury Goods) | (a) | 90 | 444 |
Hibbett, Inc. (Specialty Retail) | 1,510 | 131,687 | |
Installed Building Products, Inc. (Household Durables) | 1,188 | 244,348 | |
Jack in the Box, Inc. (Hotels, Restaurants & Leisure) | 1,410 | 71,825 | |
Kohl's Corp. (Broadline Retail) | 5,490 | 126,215 | |
Kontoor Brands, Inc. (Textiles, Apparel & Luxury Goods) | 2,300 | 152,145 | |
La-Z-Boy, Inc. (Household Durables) | 4,820 | 179,690 | |
LCI Industries (Automobile Components) | 1,220 | 126,124 | |
Leggett & Platt, Inc. (Household Durables) | 8,100 | 92,826 | |
Leslie's, Inc. (Specialty Retail) | (a) | 9,849 | 41,267 |
LGI Homes, Inc. (Household Durables) | (a) | 1,070 | 95,754 |
M/I Homes, Inc. (Household Durables) | (a) | 1,420 | 173,439 |
Meritage Homes Corp. (Household Durables) | 5,704 | 923,192 | |
Mister Car Wash, Inc. (Diversified Consumer Svs.) | (a) | 18,480 | 131,578 |
Modine Manufacturing Co. (Automobile Components) | (a) | 8,423 | 843,900 |
Monarch Casino & Resort, Inc. (Hotels, Restaurants & Leisure) | 1,660 | 113,096 | |
National Vision Holdings, Inc. (Specialty Retail) | (a) | 5,680 | 74,351 |
Newell Brands, Inc. (Household Durables) | 18,500 | 118,585 | |
ODP Corp. / The (Specialty Retail) | (a) | 2,070 | 81,289 |
Ollie's Bargain Outlet Holdings, Inc. (Broadline Retail) | (a) | 5,713 | 560,845 |
Oxford Industries, Inc. (Textiles, Apparel & Luxury Goods) | 950 | 95,142 | |
Patrick Industries, Inc. (Automobile Components) | 1,060 | 115,063 | |
Penn Entertainment, Inc. (Hotels, Restaurants & Leisure) | (a) | 6,980 | 135,098 |
Shake Shack, Inc. Class A (Hotels, Restaurants & Leisure) | (a) | 1,950 | 175,500 |
SharkNinja, Inc. (Household Durables) | 10,430 | 783,814 | |
Signet Jewelers Ltd. (Specialty Retail) | 2,160 | 193,493 | |
Six Flags Entertainment Corp. (Hotels, Restaurants & Leisure) | 5,473 | 181,375 | |
Skyline Champion Corp. (Household Durables) | (a) | 8,416 | 570,184 |
Sonic Automotive, Inc. Class A (Specialty Retail) | 120 | 6,536 | |
Sonos, Inc. (Household Durables) | (a) | 9,149 | 135,039 |
Steven Madden Ltd. (Textiles, Apparel & Luxury Goods) | 3,220 | 136,206 | |
Strategic Education, Inc. (Diversified Consumer Svs.) | 1,120 | 123,939 | |
Stride, Inc. (Diversified Consumer Svs.) | (a) | 2,230 | 157,215 |
Sturm Ruger & Co., Inc. (Leisure Products) | 210 | 8,747 | |
Texas Roadhouse, Inc. (Hotels, Restaurants & Leisure) | 3,937 | 676,022 | |
Topgolf Callaway Brands Corp. (Leisure Products) | (a) | 6,600 | 100,980 |
Tri Pointe Homes, Inc. (Household Durables) | (a) | 4,813 | 179,284 |
Urban Outfitters, Inc. (Specialty Retail) | (a) | 4,130 | 169,536 |
V.F. Corp. (Textiles, Apparel & Luxury Goods) | 15,944 | 215,244 | |
Victoria's Secret & Co. (Specialty Retail) | (a) | 3,273 | 57,834 |
Wayfair, Inc. Class A (Specialty Retail) | (a) | 10,437 | 550,343 |
Wingstop, Inc. (Hotels, Restaurants & Leisure) | 1,476 | 623,846 | |
Winnebago Industries, Inc. (Automobiles) | 1,670 | 90,514 | |
Common Stocks (Continued) | Shares | Value | |
Consumer Discretionary (continued) | |||
Wolverine World Wide, Inc. (Textiles, Apparel & Luxury Goods) | 180 | $2,434 | |
Worthington Enterprises, Inc. (Household Durables) | 1,800 | 85,194 | |
XPEL, Inc. (Automobile Components) | (a) | 2,201 | 78,268 |
16,238,887 | |||
Consumer Staples–4.0% | |||
Andersons, Inc. / The (Consumer Staples Distribution & Retail) | 1,920 | 95,232 | |
BellRing Brands, Inc. (Personal Care Products) | (a) | 12,875 | 735,678 |
Cal-Maine Foods, Inc. (Food Products) | 870 | 53,166 | |
Chefs' Warehouse, Inc. / The (Consumer Staples Distribution & Retail) | (a) | 23,359 | 913,571 |
Energizer Holdings, Inc. (Household Products) | 3,360 | 99,254 | |
Fresh Del Monte Produce, Inc. (Food Products) | 60 | 1,311 | |
Freshpet, Inc. (Food Products) | (a) | 5,745 | 743,346 |
Grocery Outlet Holding Corp. (Consumer Staples Distribution & Retail) | (a) | 30,227 | 668,621 |
J & J Snack Foods Corp. (Food Products) | 540 | 87,680 | |
John B. Sanfilippo & Son, Inc. (Food Products) | 990 | 96,198 | |
MGP Ingredients, Inc. (Beverages) | 1,020 | 75,888 | |
Nu Skin Enterprises, Inc. Class A (Personal Care Products) | 5,740 | 60,500 | |
Simply Good Foods Co. / The (Food Products) | (a) | 4,410 | 159,333 |
SpartanNash Co. (Consumer Staples Distribution & Retail) | 5,320 | 99,803 | |
Tootsie Roll Industries, Inc. (Food Products) | 3,368 | 102,960 | |
TreeHouse Foods, Inc. (Food Products) | (a) | 2,560 | 93,798 |
United Natural Foods, Inc. (Consumer Staples Distribution & Retail) | (a) | 4,820 | 63,142 |
Universal Corp. (Tobacco) | 2,030 | 97,826 | |
Vector Group Ltd. (Tobacco) | 13,620 | 143,963 | |
WD-40 Co. (Household Products) | 630 | 138,373 | |
4,529,643 | |||
Energy–5.4% | |||
Archrock, Inc. (Energy Equip. & Svs.) | 6,930 | 140,125 | |
Bristow Group, Inc. (Energy Equip. & Svs.) | (a) | 3,900 | 130,767 |
Cactus, Inc. Class A (Energy Equip. & Svs.) | 3,070 | 161,912 | |
California Resources Corp. (Oil, Gas & Consumable Fuels) | 3,000 | 159,660 | |
Comstock Resources, Inc. (Oil, Gas & Consumable Fuels) | 12,450 | 129,231 | |
CONSOL Energy, Inc. (Oil, Gas & Consumable Fuels) | (a) | 1,230 | 125,497 |
Core Laboratories, Inc. (Energy Equip. & Svs.) | 7,290 | 147,914 | |
CVR Energy, Inc. (Oil, Gas & Consumable Fuels) | 3,470 | 92,892 | |
Gulfport Energy Corp. (Oil, Gas & Consumable Fuels) | (a) | 3,983 | 601,433 |
Helix Energy Solutions Group, Inc. (Energy Equip. & Svs.) | (a) | 11,100 | 132,534 |
Helmerich & Payne, Inc. (Energy Equip. & Svs.) | 3,900 | 140,946 | |
Liberty Energy, Inc. (Energy Equip. & Svs.) | 8,530 | 178,192 | |
Magnolia Oil & Gas Corp. Class A (Oil, Gas & Consumable Fuels) | 9,380 | 237,689 | |
Matador Resources Co. (Oil, Gas & Consumable Fuels) | 13,912 | 829,155 | |
Northern Oil & Gas, Inc. (Oil, Gas & Consumable Fuels) | 4,380 | 162,804 | |
Oceaneering International, Inc. (Energy Equip. & Svs.) | (a) | 6,440 | 152,370 |
Par Pacific Holdings, Inc. (Oil, Gas & Consumable Fuels) | (a) | 2,840 | 71,710 |
Patterson-UTI Energy, Inc. (Energy Equip. & Svs.) | 5,894 | 61,062 | |
Peabody Energy Corp. (Oil, Gas & Consumable Fuels) | 5,557 | 122,921 | |
Common Stocks (Continued) | Shares | Value | |
Energy (continued) | |||
Permian Resources Corp. (Oil, Gas & Consumable Fuels) | 42,428 | $685,212 | |
RPC, Inc. (Energy Equip. & Svs.) | 15,490 | 96,812 | |
SM Energy Co. (Oil, Gas & Consumable Fuels) | 5,500 | 237,765 | |
Talos Energy, Inc. (Oil, Gas & Consumable Fuels) | (a) | 7,240 | 87,966 |
TechnipFMC PLC (Energy Equip. & Svs.) | 32,685 | 854,713 | |
Tidewater, Inc. (Energy Equip. & Svs.) | (a) | 2,270 | 216,127 |
U.S. Silica Holdings, Inc. (Energy Equip. & Svs.) | (a) | 4,776 | 73,789 |
World Kinect Corp. (Oil, Gas & Consumable Fuels) | 3,740 | 96,492 | |
6,127,690 | |||
Financials–12.2% | |||
Ameris Bancorp (Banks) | 3,520 | 177,232 | |
Apollo Commercial Real Estate Finance, Inc. (Mortgage REIT) | 400 | 3,916 | |
Arbor Realty Trust, Inc. (Mortgage REIT) | 10,954 | 157,190 | |
Artisan Partners Asset Management, Inc. Class A (Capital Markets) | 4,150 | 171,270 | |
Assured Guaranty Ltd. (Insurance) | 2,640 | 203,676 | |
Atlantic Union Bankshares Corp. (Banks) | 4,630 | 152,095 | |
Axos Financial, Inc. (Banks) | (a) | 2,460 | 140,589 |
BancFirst Corp. (Banks) | 671 | 58,847 | |
Bancorp, Inc. / The (Banks) | (a) | 2,710 | 102,330 |
Bank of Hawaii Corp. (Banks) | 2,400 | 137,304 | |
BankUnited, Inc. (Banks) | 3,490 | 102,152 | |
Banner Corp. (Banks) | 2,240 | 111,194 | |
BGC Group, Inc. Class A (Capital Markets) | 19,580 | 162,514 | |
Blackstone Mortgage Trust, Inc. Class A (Mortgage REIT) | 9,480 | 165,142 | |
Bread Financial Holdings, Inc. (Consumer Finance) | 3,242 | 144,463 | |
Brightsphere Investment Group, Inc. (Capital Markets) | 2,827 | 62,675 | |
Brookline Bancorp, Inc. (Banks) | 11,040 | 92,184 | |
Capitol Federal Financial, Inc. (Banks) | 19,420 | 106,616 | |
Cathay General Bancorp (Banks) | 3,990 | 150,503 | |
Cohen & Steers, Inc. (Capital Markets) | 1,510 | 109,566 | |
Comerica, Inc. (Banks) | 6,190 | 315,938 | |
Community Financial System, Inc. (Banks) | 4,580 | 216,222 | |
Customers Bancorp, Inc. (Banks) | (a) | 2,500 | 119,950 |
CVB Financial Corp. (Banks) | 10,890 | 187,744 | |
Dime Community Bancshares, Inc. (Banks) | 5,370 | 109,548 | |
Donnelley Financial Solutions, Inc. (Capital Markets) | (a) | 1,710 | 101,950 |
EVERTEC, Inc. (Financial Services) | 5,340 | 177,555 | |
FB Financial Corp. (Banks) | 3,190 | 124,506 | |
First BanCorp (Banks) | 8,240 | 150,710 | |
First Financial Bancorp (Banks) | 7,980 | 177,316 | |
First Hawaiian, Inc. (Banks) | 5,920 | 122,899 | |
Fulton Financial Corp. (Banks) | 10,030 | 170,309 | |
Genworth Financial, Inc. (Insurance) | (a) | 23,130 | 139,705 |
Hannon Armstrong Sustainable Infrastructure Capital, Inc. (Financial Services) | 5,890 | 174,344 | |
Hilltop Holdings, Inc. (Banks) | 3,760 | 117,613 | |
Houlihan Lokey, Inc. (Capital Markets) | 4,891 | 659,600 | |
Independent Bank Corp. (Banks) | 3,783 | 191,874 | |
Independent Bank Group, Inc. (Banks) | 2,520 | 114,710 | |
Jackson Financial, Inc. Class A (Financial Services) | 3,367 | 250,033 | |
Kinsale Capital Group, Inc. (Insurance) | 77 | 29,667 | |
KKR Real Estate Finance Trust, Inc. (Mortgage REIT) | 20 | 181 | |
Lincoln National Corp. (Insurance) | 8,300 | 258,130 | |
Mercury General Corp. (Insurance) | 2,800 | 148,792 | |
Moelis & Co. Class A (Capital Markets) | 4,030 | 229,146 | |
Mr. Cooper Group, Inc. (Financial Services) | (a) | 3,970 | 322,483 |
Navient Corp. (Consumer Finance) | 6,040 | 87,942 | |
Common Stocks (Continued) | Shares | Value | |
Financials (continued) | |||
NMI Holdings, Inc. (Financial Services) | (a) | 3,740 | $127,310 |
Northwest Bancshares, Inc. (Banks) | 9,360 | 108,108 | |
OFG Bancorp (Banks) | 2,960 | 110,852 | |
Pathward Financial, Inc. (Banks) | 2,070 | 117,100 | |
Payoneer Global, Inc. (Financial Services) | (a) | 21,150 | 117,171 |
Piper Sandler Cos. (Capital Markets) | 830 | 191,041 | |
PJT Partners, Inc. Class A (Capital Markets) | 1,160 | 125,176 | |
ProAssurance Corp. (Insurance) | (a) | 7,110 | 86,884 |
PROG Holdings, Inc. (Consumer Finance) | 3,690 | 127,969 | |
Radian Group, Inc. (Financial Services) | 7,440 | 231,384 | |
Ready Capital Corp. (Mortgage REIT) | 9,780 | 80,000 | |
Renasant Corp. (Banks) | 4,640 | 141,706 | |
RLI Corp. (Insurance) | 3,971 | 558,680 | |
ServisFirst Bancshares, Inc. (Banks) | 2,190 | 138,386 | |
Shift4 Payments, Inc. Class A (Financial Services) | (a) | 7,573 | 555,479 |
Simmons First National Corp. Class A (Banks) | 9,350 | 164,373 | |
SiriusPoint Ltd. (Insurance) | (a) | 7,640 | 93,208 |
Southside Bancshares, Inc. (Banks) | 4,430 | 122,312 | |
StepStone Group, Inc. Class A (Capital Markets) | 20,878 | 958,091 | |
Stewart Information Services Corp. (Insurance) | 3,030 | 188,102 | |
Stifel Financial Corp. (Capital Markets) | 8,673 | 729,833 | |
StoneX Group, Inc. (Capital Markets) | (a) | 2,070 | 155,892 |
Triumph Financial, Inc. (Banks) | (a) | 2,360 | 192,930 |
Trupanion, Inc. (Insurance) | (a) | 2,899 | 85,231 |
Trustmark Corp. (Banks) | 4,200 | 126,168 | |
Two Harbors Investment Corp. (Mortgage REIT) | 10,558 | 139,471 | |
United Community Banks, Inc. (Banks) | 4,336 | 110,394 | |
WaFd, Inc. (Banks) | 3,860 | 110,319 | |
Walker & Dunlop, Inc. (Financial Services) | 1,420 | 139,444 | |
Westamerica BanCorp (Banks) | 2,230 | 108,222 | |
WisdomTree, Inc. (Capital Markets) | 11,740 | 116,343 | |
WSFS Financial Corp. (Banks) | 2,801 | 131,647 | |
13,699,551 | |||
Health Care–16.2% | |||
AdaptHealth Corp. (Health Care Providers & Svs.) | (a) | 11,140 | 111,400 |
Addus HomeCare Corp. (Health Care Providers & Svs.) | (a) | 1,090 | 126,560 |
Akero Therapeutics, Inc. (Biotechnology) | (a) | 8,526 | 200,020 |
Alkermes PLC (Biotechnology) | (a) | 8,690 | 209,429 |
Amphastar Pharmaceuticals, Inc. (Pharmaceuticals) | (a) | 2,530 | 101,200 |
ANI Pharmaceuticals, Inc. (Pharmaceuticals) | (a) | 1,630 | 103,798 |
Apogee Therapeutics, Inc. (Biotechnology) | (a) | 5,490 | 216,031 |
Arcus Biosciences, Inc. (Biotechnology) | (a) | 5,810 | 88,486 |
Ascendis Pharma A/S – ADR (Biotechnology) | (a) | 2,323 | 316,811 |
Astrana Health, Inc. (Health Care Providers & Svs.) | (a) | 2,540 | 103,022 |
AtriCure, Inc. (Health Care Equip. & Supplies) | (a) | 19,554 | 445,245 |
Blueprint Medicines Corp. (Biotechnology) | (a) | 5,322 | 573,605 |
Bridgebio Pharma, Inc. (Biotechnology) | (a) | 11,327 | 286,913 |
BrightSpring Health Services, Inc. (Health Care Providers & Svs.) | (a) | 27,101 | 307,867 |
Catalyst Pharmaceuticals, Inc. (Biotechnology) | (a) | 6,422 | 99,477 |
Certara, Inc. (Health Care Technology) | (a) | 6,570 | 90,995 |
CG Oncology, Inc. (Biotechnology) | (a) | 8,036 | 253,697 |
CONMED Corp. (Health Care Equip. & Supplies) | 1,540 | 106,753 | |
Corcept Therapeutics, Inc. (Pharmaceuticals) | (a) | 4,590 | 149,129 |
CorVel Corp. (Health Care Providers & Svs.) | (a) | 440 | 111,879 |
Cullinan Therapeutics, Inc. (Biotechnology) | (a) | 11,650 | 203,176 |
Cytokinetics, Inc. (Biotechnology) | (a) | 8,549 | 463,185 |
Denali Therapeutics, Inc. (Biotechnology) | (a) | 15,890 | 368,966 |
Common Stocks (Continued) | Shares | Value | |
Health Care (continued) | |||
Dynavax Technologies Corp. (Biotechnology) | (a) | 7,903 | $88,751 |
Embecta Corp. (Health Care Equip. & Supplies) | 4,021 | 50,263 | |
Enhabit, Inc. (Health Care Providers & Svs.) | (a) | 3,459 | 30,854 |
Ensign Group, Inc. / The (Health Care Providers & Svs.) | 3,090 | 382,202 | |
Fortrea Holdings, Inc. (Life Sciences Tools & Svs.) | (a) | 5,295 | 123,585 |
Glaukos Corp. (Health Care Equip. & Supplies) | (a) | 2,349 | 278,004 |
Halozyme Therapeutics, Inc. (Biotechnology) | (a) | 13,413 | 702,305 |
Harmony Biosciences Holdings, Inc. (Pharmaceuticals) | (a) | 3,450 | 104,087 |
ICU Medical, Inc. (Health Care Equip. & Supplies) | (a) | 960 | 114,000 |
Inari Medical, Inc. (Health Care Equip. & Supplies) | (a) | 13,919 | 670,200 |
Insmed, Inc. (Biotechnology) | (a) | 11,251 | 753,817 |
Integer Holdings Corp. (Health Care Equip. & Supplies) | (a) | 1,710 | 198,001 |
Intellia Therapeutics, Inc. (Biotechnology) | (a) | 7,839 | 175,437 |
Intra-Cellular Therapies, Inc. (Pharmaceuticals) | (a) | 6,478 | 443,678 |
iRhythm Technologies, Inc. (Health Care Equip. & Supplies) | (a) | 6,114 | 658,111 |
Ironwood Pharmaceuticals, Inc. (Biotechnology) | (a) | 10,510 | 68,525 |
Krystal Biotech, Inc. (Biotechnology) | (a) | 1,160 | 213,022 |
Legend Biotech Corp. – ADR (Biotechnology) | (a) | 5,215 | 230,972 |
Ligand Pharmaceuticals, Inc. (Pharmaceuticals) | (a) | 1,460 | 123,020 |
Merit Medical Systems, Inc. (Health Care Equip. & Supplies) | (a) | 2,800 | 240,660 |
Merus N.V. (Biotechnology) | (a) | 4,483 | 265,259 |
MoonLake Immunotherapeutics (Biotechnology) | (a) | 4,809 | 211,452 |
Myriad Genetics, Inc. (Biotechnology) | (a) | 6,470 | 158,256 |
Natera, Inc. (Biotechnology) | (a) | 7,559 | 818,564 |
National HealthCare Corp. (Health Care Providers & Svs.) | 1,130 | 122,492 | |
NeoGenomics, Inc. (Health Care Providers & Svs.) | (a) | 10,157 | 140,878 |
Omnicell, Inc. (Health Care Equip. & Supplies) | (a) | 2,490 | 67,404 |
Organon & Co. (Pharmaceuticals) | 13,104 | 271,253 | |
Owens & Minor, Inc. (Health Care Providers & Svs.) | (a) | 5,160 | 69,660 |
Patterson Cos., Inc. (Health Care Providers & Svs.) | 4,286 | 103,378 | |
Premier, Inc. Class A (Health Care Providers & Svs.) | 6,550 | 122,288 | |
Prestige Consumer Healthcare, Inc. (Pharmaceuticals) | (a) | 2,480 | 170,748 |
Privia Health Group, Inc. (Health Care Providers & Svs.) | (a) | 5,845 | 101,586 |
PROCEPT BioRobotics Corp. (Health Care Equip. & Supplies) | (a) | 14,992 | 915,861 |
Quanterix Corp. (Life Sciences Tools & Svs.) | (a) | 28,928 | 382,139 |
RadNet, Inc. (Health Care Providers & Svs.) | (a) | 3,050 | 179,706 |
Rapport Therapeutics, Inc. (Pharmaceuticals) | (a) | 9,059 | 210,712 |
REGENXBIO, Inc. (Biotechnology) | (a) | 5,120 | 59,904 |
Repligen Corp. (Life Sciences Tools & Svs.) | (a) | 3,412 | 430,117 |
Schrodinger, Inc. (Health Care Technology) | (a) | 3,290 | 63,629 |
Select Medical Holdings Corp. (Health Care Providers & Svs.) | 5,070 | 177,754 | |
Supernus Pharmaceuticals, Inc. (Pharmaceuticals) | (a) | 3,810 | 101,918 |
Tandem Diabetes Care, Inc. (Health Care Equip. & Supplies) | (a) | 3,020 | 121,676 |
Tempus AI, Inc. (Life Sciences Tools & Svs.) | (a) | 8,523 | 298,305 |
UFP Technologies, Inc. (Health Care Equip. & Supplies) | (a) | 650 | 171,515 |
Common Stocks (Continued) | Shares | Value | |
Health Care (continued) | |||
Ultragenyx Pharmaceutical, Inc. (Biotechnology) | (a) | 5,458 | $224,324 |
Vaxcyte, Inc. (Biotechnology) | (a) | 8,194 | 618,729 |
Vericel Corp. (Biotechnology) | (a) | 2,430 | 111,488 |
Viking Therapeutics, Inc. (Biotechnology) | (a) | 5,688 | 301,521 |
Vir Biotechnology, Inc. (Biotechnology) | (a) | 9,590 | 85,351 |
Viridian Therapeutics, Inc. (Biotechnology) | (a) | 15,934 | 207,301 |
Xenon Pharmaceuticals, Inc. (Biotechnology) | (a) | 6,781 | 264,391 |
18,236,697 | |||
Industrials–18.6% | |||
AAR Corp. (Aerospace & Defense) | (a) | 1,710 | 124,317 |
ABM Industries, Inc. (Commercial Svs. & Supplies) | 3,410 | 172,444 | |
ACV Auctions, Inc. Class A (Commercial Svs. & Supplies) | (a) | 46,364 | 846,143 |
AeroVironment, Inc. (Aerospace & Defense) | (a) | 5,440 | 990,950 |
Air Lease Corp. (Trading Companies & Distributors) | 5,230 | 248,582 | |
Alamo Group, Inc. (Machinery) | 510 | 88,230 | |
Alaska Air Group, Inc. (Passenger Airlines) | (a) | 5,295 | 213,918 |
Albany International Corp. Class A (Machinery) | 1,390 | 117,385 | |
Apogee Enterprises, Inc. (Building Products) | 230 | 14,452 | |
ArcBest Corp. (Ground Transportation) | 6,411 | 686,490 | |
Arcosa, Inc. (Construction & Engineering) | 2,680 | 223,539 | |
Armstrong World Industries, Inc. (Building Products) | 2,300 | 260,452 | |
AZEK Co., Inc. / The (Building Products) | (a) | 14,476 | 609,874 |
AZZ, Inc. (Building Products) | 1,410 | 108,922 | |
Boise Cascade Co. (Trading Companies & Distributors) | 2,020 | 240,824 | |
Brady Corp. Class A (Commercial Svs. & Supplies) | 850 | 56,117 | |
Centuri Holdings, Inc. (Construction & Engineering) | (a) | 9,211 | 179,430 |
Comfort Systems U.S.A., Inc. (Construction & Engineering) | 2,340 | 711,641 | |
Construction Partners, Inc. Class A (Construction & Engineering) | (a) | 14,672 | 810,041 |
CSG Systems International, Inc. (Professional Svs.) | 2,350 | 96,749 | |
CSW Industrials, Inc. (Building Products) | 2,815 | 746,848 | |
Curtiss-Wright Corp. (Aerospace & Defense) | 2,976 | 806,436 | |
Deluxe Corp. (Commercial Svs. & Supplies) | 5,150 | 115,669 | |
Dycom Industries, Inc. (Construction & Engineering) | (a) | 1,490 | 251,452 |
Encore Wire Corp. (Electrical Equip.) | 780 | 226,067 | |
Enerpac Tool Group Corp. (Machinery) | 3,400 | 129,812 | |
Enpro, Inc. (Machinery) | 410 | 59,684 | |
Enviri Corp. (Commercial Svs. & Supplies) | (a) | 14,070 | 121,424 |
Esab Corp. (Machinery) | 5,965 | 563,275 | |
ESCO Technologies, Inc. (Machinery) | 1,330 | 139,703 | |
Federal Signal Corp. (Machinery) | 3,100 | 259,377 | |
Forward Air Corp. (Air Freight & Logistics) | 2,420 | 46,077 | |
Franklin Electric Co., Inc. (Machinery) | 2,190 | 210,941 | |
FTI Consulting, Inc. (Professional Svs.) | (a) | 2,747 | 592,061 |
Gibraltar Industries, Inc. (Building Products) | (a) | 1,840 | 126,132 |
GMS, Inc. (Trading Companies & Distributors) | (a) | 1,940 | 156,383 |
Granite Construction, Inc. (Construction & Engineering) | 2,280 | 141,292 | |
Greenbrier Cos., Inc. / The (Machinery) | 150 | 7,433 | |
Griffon Corp. (Building Products) | 1,840 | 117,502 | |
Hayward Holdings, Inc. (Building Products) | (a) | 8,719 | 107,244 |
Hillenbrand, Inc. (Machinery) | 4,220 | 168,884 | |
Hub Group, Inc. Class A (Air Freight & Logistics) | 790 | 34,010 | |
ITT, Inc. (Machinery) | 5,665 | 731,805 | |
JetBlue Airways Corp. (Passenger Airlines) | (a) | 16,980 | 103,408 |
John Bean Technologies Corp. (Machinery) | 1,755 | 166,672 | |
Common Stocks (Continued) | Shares | Value | |
Industrials (continued) | |||
Kirby Corp. (Marine Transportation) | (a) | 4,767 | $570,753 |
Korn Ferry (Professional Svs.) | 2,740 | 183,964 | |
Leonardo DRS, Inc. (Aerospace & Defense) | (a) | 35,266 | 899,636 |
Lindsay Corp. (Machinery) | 810 | 99,533 | |
Loar Holdings, Inc. (Aerospace & Defense) | (a) | 5,195 | 277,465 |
Marten Transport Ltd. (Ground Transportation) | 4,660 | 85,977 | |
Masterbrand, Inc. (Building Products) | (a) | 6,500 | 95,420 |
Matson, Inc. (Marine Transportation) | 1,597 | 209,159 | |
Matthews International Corp. Class A (Commercial Svs. & Supplies) | 3,870 | 96,943 | |
Mercury Systems, Inc. (Aerospace & Defense) | (a) | 3,385 | 91,361 |
Moog, Inc. Class A (Aerospace & Defense) | 1,390 | 232,547 | |
Mueller Industries, Inc. (Machinery) | 4,020 | 228,899 | |
MYR Group, Inc. (Construction & Engineering) | (a) | 1,370 | 185,923 |
NV5 Global, Inc. (Professional Svs.) | (a) | 779 | 72,424 |
OPENLANE, Inc. (Commercial Svs. & Supplies) | (a) | 420 | 6,968 |
Pitney Bowes, Inc. (Commercial Svs. & Supplies) | 28,820 | 146,406 | |
Powell Industries, Inc. (Electrical Equip.) | 900 | 129,060 | |
Resideo Technologies, Inc. (Building Products) | (a) | 7,490 | 146,504 |
Robert Half, Inc. (Professional Svs.) | 4,830 | 309,023 | |
Rush Enterprises, Inc. Class A (Trading Companies & Distributors) | 3,026 | 126,699 | |
RXO, Inc. (Ground Transportation) | (a) | 7,405 | 193,641 |
SkyWest, Inc. (Passenger Airlines) | (a) | 1,100 | 90,277 |
SPX Technologies, Inc. (Machinery) | (a) | 9,616 | 1,366,818 |
Sun Country Airlines Holdings, Inc. (Passenger Airlines) | (a) | 7,020 | 88,171 |
Sunrun, Inc. (Electrical Equip.) | (a) | 11,012 | 130,602 |
Tennant Co. (Machinery) | 1,190 | 117,144 | |
Tetra Tech, Inc. (Commercial Svs. & Supplies) | 3,759 | 768,640 | |
Titan International, Inc. (Machinery) | (a) | 7,860 | 58,243 |
Trinity Industries, Inc. (Machinery) | 4,060 | 121,475 | |
Triumph Group, Inc. (Aerospace & Defense) | (a) | 7,260 | 111,877 |
UniFirst Corp. (Commercial Svs. & Supplies) | 1,270 | 217,843 | |
Verra Mobility Corp. (Professional Svs.) | (a) | 8,958 | 243,658 |
Vestis Corp. (Commercial Svs. & Supplies) | 6,810 | 83,286 | |
Wabash National Corp. (Machinery) | 4,220 | 92,165 | |
Werner Enterprises, Inc. (Ground Transportation) | 2,960 | 106,057 | |
20,914,652 | |||
Information Technology–17.2% | |||
ACI Worldwide, Inc. (Software) | (a) | 5,916 | 234,215 |
Advanced Energy Industries, Inc. (Electronic Equip., Instr. & Comp.) | 2,190 | 238,184 | |
Agilysys, Inc. (Software) | (a) | 20 | 2,083 |
Alarm.com Holdings, Inc. (Software) | (a) | 2,300 | 146,142 |
Altair Engineering, Inc. Class A (Software) | (a) | 9,899 | 970,894 |
Astera Labs, Inc. (Semiconductors & Equip.) | (a) | 3,047 | 184,374 |
Axcelis Technologies, Inc. (Semiconductors & Equip.) | (a) | 1,810 | 257,364 |
Badger Meter, Inc. (Electronic Equip., Instr. & Comp.) | 1,780 | 331,703 | |
BlackLine, Inc. (Software) | (a) | 2,570 | 124,517 |
Box, Inc. Class A (Software) | (a) | 7,270 | 192,219 |
Braze, Inc. Class A (Software) | (a) | 13,511 | 524,767 |
Calix, Inc. (Communications Equip.) | (a) | 3,460 | 122,588 |
Clearwater Analytics Holdings, Inc. Class A (Software) | (a) | 38,785 | 718,298 |
Cohu, Inc. (Semiconductors & Equip.) | (a) | 4,400 | 145,640 |
Corsair Gaming, Inc. (Tech. Hardware, Storage & Periph.) | (a) | 9,060 | 100,022 |
Digi International, Inc. (Communications Equip.) | (a) | 4,380 | 100,433 |
DigitalOcean Holdings, Inc. (IT Svs.) | (a) | 2,581 | 89,690 |
Diodes, Inc. (Semiconductors & Equip.) | (a) | 2,320 | 166,878 |
DoubleVerify Holdings, Inc. (Software) | (a) | 7,452 | 145,090 |
DXC Technology Co. (IT Svs.) | (a) | 8,350 | 159,402 |
Envestnet, Inc. (Software) | (a) | 2,708 | 169,494 |
Common Stocks (Continued) | Shares | Value | |
Information Technology (continued) | |||
ePlus, Inc. (Electronic Equip., Instr. & Comp.) | (a) | 1,350 | $99,468 |
Extreme Networks, Inc. (Communications Equip.) | (a) | 6,490 | 87,291 |
Fabrinet (Electronic Equip., Instr. & Comp.) | (a) | 6,138 | 1,502,521 |
Five9, Inc. (Software) | (a) | 9,013 | 397,473 |
FormFactor, Inc. (Semiconductors & Equip.) | (a) | 4,000 | 242,120 |
Freshworks, Inc. Class A (Software) | (a) | 38,986 | 494,732 |
Impinj, Inc. (Semiconductors & Equip.) | (a) | 5,081 | 796,548 |
Insight Enterprises, Inc. (Electronic Equip., Instr. & Comp.) | (a) | 1,350 | 267,786 |
Intapp, Inc. (Software) | (a) | 13,569 | 497,575 |
InterDigital, Inc. (Software) | 1,260 | 146,866 | |
Itron, Inc. (Electronic Equip., Instr. & Comp.) | (a) | 2,360 | 233,546 |
Klaviyo, Inc. Class A (Software) | (a) | 24,010 | 597,609 |
Kulicke & Soffa Industries, Inc. (Semiconductors & Equip.) | 3,430 | 168,722 | |
LiveRamp Holdings, Inc. (Software) | (a) | 4,660 | 144,180 |
MACOM Technology Solutions Holdings, Inc. (Semiconductors & Equip.) | (a) | 7,862 | 876,377 |
Marathon Digital Holdings, Inc. (Software) | (a) | 10,906 | 216,484 |
MaxLinear, Inc. (Semiconductors & Equip.) | (a) | 4,640 | 93,450 |
Monday.com Ltd. (Software) | (a) | 2,918 | 702,538 |
NetScout Systems, Inc. (Communications Equip.) | (a) | 5,976 | 109,301 |
Novanta, Inc. (Electronic Equip., Instr. & Comp.) | (a) | 4,021 | 655,865 |
Onto Innovation, Inc. (Semiconductors & Equip.) | (a) | 3,765 | 826,643 |
OSI Systems, Inc. (Electronic Equip., Instr. & Comp.) | (a) | 770 | 105,890 |
Perficient, Inc. (IT Svs.) | (a) | 2,710 | 202,681 |
Photronics, Inc. (Semiconductors & Equip.) | (a) | 3,990 | 98,433 |
Plexus Corp. (Electronic Equip., Instr. & Comp.) | (a) | 1,470 | 151,675 |
Progress Software Corp. (Software) | 2,020 | 109,605 | |
Rubrik, Inc. Class A (Software) | (a) | 18,564 | 569,172 |
Sanmina Corp. (Electronic Equip., Instr. & Comp.) | (a) | 3,720 | 246,450 |
Semtech Corp. (Semiconductors & Equip.) | (a) | 26,433 | 789,818 |
SiTime Corp. (Semiconductors & Equip.) | (a) | 1,190 | 148,012 |
SPS Commerce, Inc. (Software) | (a) | 7,262 | 1,366,418 |
TTM Technologies, Inc. (Electronic Equip., Instr. & Comp.) | (a) | 7,070 | 137,370 |
Ultra Clean Holdings, Inc. (Semiconductors & Equip.) | (a) | 2,100 | 102,900 |
Universal Display Corp. (Semiconductors & Equip.) | 3,891 | 818,083 | |
Veeco Instruments, Inc. (Semiconductors & Equip.) | (a) | 2,720 | 127,051 |
Viasat, Inc. (Communications Equip.) | (a) | 4,730 | 60,071 |
Viavi Solutions, Inc. (Communications Equip.) | (a) | 14,570 | 100,096 |
19,414,817 | |||
Materials–3.7% | |||
Alpha Metallurgical Resources, Inc. (Metals & Mining) | 663 | 185,991 | |
Arch Resources, Inc. (Metals & Mining) | 890 | 135,485 | |
ATI, Inc. (Metals & Mining) | (a) | 5,978 | 331,480 |
Balchem Corp. (Chemicals) | 1,600 | 246,320 | |
Carpenter Technology Corp. (Metals & Mining) | 1,550 | 169,849 | |
Century Aluminum Co. (Metals & Mining) | (a) | 1,450 | 24,288 |
Compass Minerals International, Inc. (Metals & Mining) | 4,740 | 48,964 | |
Element Solutions, Inc. (Chemicals) | 24,583 | 666,691 | |
H.B. Fuller Co. (Chemicals) | 2,182 | 167,927 | |
Hawkins, Inc. (Chemicals) | 1,560 | 141,960 | |
Ingevity Corp. (Chemicals) | (a) | 2,070 | 90,480 |
Innospec, Inc. (Chemicals) | 1,210 | 149,544 | |
Kaiser Aluminum Corp. (Metals & Mining) | 1,580 | 138,882 | |
Koppers Holdings, Inc. (Chemicals) | 2,080 | 76,939 | |
Materion Corp. (Metals & Mining) | 1,030 | 111,374 | |
Common Stocks (Continued) | Shares | Value | |
Materials (continued) | |||
Minerals Technologies, Inc. (Chemicals) | 1,740 | $144,698 | |
O-I Glass, Inc. (Containers & Packaging) | (a) | 7,907 | 88,005 |
Olympic Steel, Inc. (Metals & Mining) | 30 | 1,345 | |
Quaker Chemical Corp. (Chemicals) | 550 | 93,335 | |
Sealed Air Corp. (Containers & Packaging) | 4,570 | 158,990 | |
Sensient Technologies Corp. (Chemicals) | 2,050 | 152,089 | |
Summit Materials, Inc. Class A (Construction Materials) | (a) | 13,024 | 476,809 |
Sylvamo Corp. (Paper & Forest Products) | 1,720 | 117,992 | |
Warrior Met Coal, Inc. (Metals & Mining) | 2,540 | 159,436 | |
Worthington Steel, Inc. (Metals & Mining) | 3,590 | 119,762 | |
4,198,635 | |||
Real Estate–4.1% | |||
Acadia Realty Trust (Retail REITs) | 6,240 | 111,821 | |
American Assets Trust, Inc. (Diversified REITs) | 5,070 | 113,467 | |
Apple Hospitality REIT, Inc. (Hotel & Resort REITs) | 11,700 | 170,118 | |
CareTrust REIT, Inc. (Health Care REITs) | 8,080 | 202,808 | |
Cushman & Wakefield PLC (Real Estate Mgmt. & Development) | (a) | 10,490 | 109,096 |
DigitalBridge Group, Inc. (Real Estate Mgmt. & Development) | 42,631 | 584,045 | |
Douglas Emmett, Inc. (Office REITs) | 10,290 | 136,960 | |
Essential Properties Realty Trust, Inc. (Diversified REITs) | 9,500 | 263,245 | |
eXp World Holdings, Inc. (Real Estate Mgmt. & Development) | 6,330 | 71,434 | |
Four Corners Property Trust, Inc. (Specialized REITs) | 6,770 | 167,016 | |
Getty Realty Corp. (Retail REITs) | 4,240 | 113,038 | |
Highwoods Properties, Inc. (Office REITs) | 5,810 | 152,629 | |
Innovative Industrial Properties, Inc. (Industrial REITs) | 920 | 100,482 | |
JBG SMITH Properties (Office REITs) | 6,370 | 97,015 | |
Kennedy-Wilson Holdings, Inc. (Real Estate Mgmt. & Development) | 10,190 | 99,047 | |
LXP Industrial Trust (Industrial REITs) | 23,230 | 211,857 | |
Macerich Co. / The (Retail REITs) | 13,030 | 201,183 | |
Marcus & Millichap, Inc. (Real Estate Mgmt. & Development) | 2,590 | 81,637 | |
Medical Properties Trust, Inc. (Health Care REITs) | 30,330 | 130,722 | |
NexPoint Residential Trust, Inc. (Residential REITs) | 1,600 | 63,216 | |
Pebblebrook Hotel Trust (Hotel & Resort REITs) | 230 | 3,162 | |
Phillips Edison & Co., Inc. (Retail REITs) | 7,110 | 232,568 | |
Retail Opportunity Investments Corp. (Retail REITs) | 6,930 | 86,140 | |
Safehold, Inc. (Specialized REITs) | 4,830 | 93,171 | |
SITE Centers Corp. (Retail REITs) | 14,460 | 209,670 | |
SL Green Realty Corp. (Office REITs) | 3,120 | 176,717 | |
Sunstone Hotel Investors, Inc. (Hotel & Resort REITs) | 15,043 | 157,350 | |
Tanger, Inc. (Retail REITs) | 5,790 | 156,967 | |
Uniti Group, Inc. (Specialized REITs) | 20,270 | 59,188 | |
Urban Edge Properties (Retail REITs) | 8,010 | 147,945 | |
Veris Residential, Inc. (Residential REITs) | 5,360 | 80,400 | |
4,584,114 | |||
Utilities–1.0% | |||
American States Water Co. (Water Utilities) | 2,000 | 145,140 | |
Avista Corp. (Multi-Utilities) | 2,860 | 98,985 | |
California Water Service Group (Water Utilities) | 4,230 | 205,113 | |
Chesapeake Utilities Corp. (Gas Utilities) | 1,180 | 125,316 | |
Clearway Energy, Inc. Class C (Ind. Power & Renewable Elec.) | 3,850 | 95,056 | |
MGE Energy, Inc. (Electric Utilities) | 1,133 | 84,658 | |
Northwest Natural Holding Co. (Gas Utilities) | 2,830 | 102,191 | |
Common Stocks (Continued) | Shares | Value | |
Utilities (continued) | |||
Otter Tail Corp. (Electric Utilities) | 2,051 | $179,647 | |
SJW Group (Water Utilities) | 1,800 | 97,596 | |
1,133,702 | |||
Total Common Stocks (Cost $103,714,153) | $110,931,580 | ||
Exchange Traded Funds–0.7% | Shares | Value | |
iShares Core S&P Small-Cap ETF | 7,615 | $812,216 | |
Total Exchange Traded Funds (Cost $819,488) | $812,216 | ||
Total Investments – 99.2% (Cost $104,533,641) | (b) | $111,743,796 | |
Other Assets in Excess of Liabilities – 0.8% | 915,701 | ||
Net Assets – 100.0% | $112,659,497 | ||
Percentages are stated as a percent of net assets. |
Abbreviations: | ||
ADR: | American Depositary Receipts | |
ETF: | Exchange Traded Fund | |
REITs: | Real Estate Investment Trusts | |
Footnotes: | ||
(a) | Non-income producing security. | |
(b) | Represents cost for financial reporting purposes, which may differ from cost basis for federal income tax purposes. See also Note 7 of the Notes to Financial Statements. | |
Common Stocks–99.2% | Shares | Value | |
Communication Services–2.3% | |||
Charter Communications, Inc. Class A (Media) | (a) | 280 | $82,886 |
Criteo SA – ADR (Media) | (a) | 7,250 | 273,470 |
Electronic Arts, Inc. (Entertainment) | 400 | 55,732 | |
Fox Corp. Class A (Media) | 2,040 | 70,115 | |
Frontier Communications Parent, Inc. (Diversified Telecom. Svs.) | (a) | 2,690 | 70,424 |
Interpublic Group of Cos., Inc. / The (Media) | 2,400 | 69,816 | |
Liberty Broadband Corp. Class A (Media) | (a) | 480 | 26,208 |
Liberty Broadband Corp. Class C (Media) | (a) | 660 | 36,181 |
Liberty Media Corp-Liberty SiriusXM (Media) | (a) | 1,980 | 43,877 |
Match Group, Inc. (Interactive Media & Svs.) | (a) | 920 | 27,950 |
News Corp. Class A (Media) | 2,370 | 65,341 | |
Nexstar Media Group, Inc. (Media) | 1,990 | 330,360 | |
Omnicom Group, Inc. (Media) | 930 | 83,421 | |
Paramount Global Class B (Media) | 5,130 | 53,301 | |
Pinterest, Inc. Class A (Interactive Media & Svs.) | (a) | 1,690 | 74,478 |
ROBLOX Corp. Class A (Entertainment) | (a) | 1,750 | 65,117 |
Sirius XM Holdings, Inc. (Media) | 31,050 | 87,871 | |
Take-Two Interactive Software, Inc. (Entertainment) | (a) | 470 | 73,080 |
TKO Group Holdings, Inc. (Entertainment) | 600 | 64,794 | |
Trade Desk, Inc. / The Class A (Media) | (a) | 1,120 | 109,390 |
Warner Bros. Discovery, Inc. (Entertainment) | (a) | 7,731 | 57,519 |
ZoomInfo Technologies, Inc. (Interactive Media & Svs.) | (a) | 1,570 | 20,049 |
1,841,380 | |||
Consumer Discretionary–13.4% | |||
Adient PLC (Automobile Components) | (a) | 11,229 | 277,469 |
ADT, Inc. (Diversified Consumer Svs.) | 45,315 | 344,394 | |
Amer Sports, Inc. (Textiles, Apparel & Luxury Goods) | (a) | 4,020 | 49,888 |
Aptiv PLC (Automobile Components) | (a) | 810 | 57,040 |
Aramark (Hotels, Restaurants & Leisure) | 1,962 | 66,747 | |
AutoNation, Inc. (Specialty Retail) | (a) | 2,132 | 339,798 |
Bath & Body Works, Inc. (Specialty Retail) | 7,390 | 288,579 | |
Best Buy Co., Inc. (Specialty Retail) | 940 | 79,233 | |
Birkenstock Holding PLC (Textiles, Apparel & Luxury Goods) | (a) | 4,803 | 261,331 |
BorgWarner, Inc. (Automobile Components) | 10,246 | 330,331 | |
Brunswick Corp. (Leisure Products) | 3,389 | 246,618 | |
Burlington Stores, Inc. (Specialty Retail) | (a) | 264 | 63,360 |
CarMax, Inc. (Specialty Retail) | (a) | 820 | 60,139 |
Cava Group, Inc. (Hotels, Restaurants & Leisure) | (a) | 3,557 | 329,912 |
Coupang, Inc. (Broadline Retail) | (a) | 3,690 | 77,306 |
Crocs, Inc. (Textiles, Apparel & Luxury Goods) | (a) | 1,175 | 171,479 |
D.R. Horton, Inc. (Household Durables) | 970 | 136,702 | |
Darden Restaurants, Inc. (Hotels, Restaurants & Leisure) | 530 | 80,200 | |
Deckers Outdoor Corp. (Textiles, Apparel & Luxury Goods) | (a) | 325 | 314,584 |
Dick's Sporting Goods, Inc. (Specialty Retail) | 1,739 | 373,624 | |
Dine Brands Global, Inc. (Hotels, Restaurants & Leisure) | 3,610 | 130,682 | |
Domino's Pizza, Inc. (Hotels, Restaurants & Leisure) | 715 | 369,176 | |
DraftKings, Inc. Class A (Hotels, Restaurants & Leisure) | (a) | 1,448 | 55,270 |
Duolingo, Inc. (Diversified Consumer Svs.) | (a) | 1,530 | 319,265 |
eBay, Inc. (Broadline Retail) | 1,920 | 103,142 | |
Etsy, Inc. (Broadline Retail) | (a) | 484 | 28,546 |
Expedia Group, Inc. (Hotels, Restaurants & Leisure) | (a) | 570 | 71,814 |
Five Below, Inc. (Specialty Retail) | (a) | 300 | 32,691 |
GameStop Corp. Class A (Specialty Retail) | (a) | 2,136 | 52,738 |
Gap, Inc. / The (Specialty Retail) | 2,190 | 52,319 | |
Garmin Ltd. (Household Durables) | 460 | 74,943 | |
Gentex Corp. (Automobile Components) | 370 | 12,473 | |
Genuine Parts Co. (Distributors) | 610 | 84,375 | |
Hilton Worldwide Holdings, Inc. (Hotels, Restaurants & Leisure) | 661 | 144,230 | |
Hyatt Hotels Corp. Class A (Hotels, Restaurants & Leisure) | 536 | 81,429 | |
Las Vegas Sands Corp. (Hotels, Restaurants & Leisure) | 1,300 | 55,744 | |
Lennar Corp. Class A (Household Durables) | 740 | 110,904 | |
Common Stocks (Continued) | Shares | Value | |
Consumer Discretionary (continued) | |||
LKQ Corp. (Distributors) | 1,630 | $67,792 | |
Lucid Group, Inc. (Automobiles) | (a) | 7,858 | 20,509 |
MGM Resorts International (Hotels, Restaurants & Leisure) | (a) | 1,930 | 85,769 |
Mohawk Industries, Inc. (Household Durables) | (a) | 370 | 42,028 |
Norwegian Cruise Line Holdings Ltd. (Hotels, Restaurants & Leisure) | (a) | 3,400 | 63,886 |
NVR, Inc. (Household Durables) | (a) | 43 | 326,308 |
Ollie's Bargain Outlet Holdings, Inc. (Broadline Retail) | (a) | 2,652 | 260,347 |
Penske Automotive Group, Inc. (Specialty Retail) | 380 | 56,628 | |
PulteGroup, Inc. (Household Durables) | 2,950 | 324,795 | |
PVH Corp. (Textiles, Apparel & Luxury Goods) | 2,375 | 251,441 | |
Ralph Lauren Corp. (Textiles, Apparel & Luxury Goods) | 2,003 | 350,645 | |
Rivian Automotive, Inc. Class A (Automobiles) | (a) | 2,290 | 30,732 |
Ross Stores, Inc. (Specialty Retail) | 990 | 143,867 | |
Royal Caribbean Cruises Ltd. (Hotels, Restaurants & Leisure) | (a) | 690 | 110,007 |
Service Corp. International (Diversified Consumer Svs.) | 790 | 56,193 | |
SharkNinja, Inc. (Household Durables) | 4,400 | 330,660 | |
Tapestry, Inc. (Textiles, Apparel & Luxury Goods) | 8,210 | 351,306 | |
Taylor Morrison Home Corp. (Household Durables) | (a) | 4,326 | 239,833 |
Tempur Sealy International, Inc. (Household Durables) | 1,140 | 53,968 | |
Toll Brothers, Inc. (Household Durables) | 560 | 64,501 | |
Tractor Supply Co. (Specialty Retail) | 240 | 64,800 | |
Ulta Beauty, Inc. (Specialty Retail) | (a) | 110 | 42,446 |
Under Armour, Inc. Class A (Textiles, Apparel & Luxury Goods) | (a) | 3,140 | 20,944 |
V.F. Corp. (Textiles, Apparel & Luxury Goods) | 1,330 | 17,955 | |
Vail Resorts, Inc. (Hotels, Restaurants & Leisure) | 237 | 42,691 | |
Viking Holdings Ltd. (Hotels, Restaurants & Leisure) | (a) | 14,052 | 476,925 |
Wayfair, Inc. Class A (Specialty Retail) | (a) | 4,805 | 253,368 |
Williams-Sonoma, Inc. (Specialty Retail) | 193 | 54,497 | |
Wingstop, Inc. (Hotels, Restaurants & Leisure) | 1,135 | 479,719 | |
Yum! Brands, Inc. (Hotels, Restaurants & Leisure) | 720 | 95,371 | |
10,508,406 | |||
Consumer Staples–4.7% | |||
Albertsons Cos., Inc. Class A (Consumer Staples Distribution & Retail) | 2,510 | 49,573 | |
Archer-Daniels-Midland Co. (Food Products) | 1,490 | 90,354 | |
BellRing Brands, Inc. (Personal Care Products) | (a) | 5,286 | 302,042 |
BJ's Wholesale Club Holdings, Inc. (Consumer Staples Distribution & Retail) | (a) | 640 | 55,546 |
Boston Beer Co., Inc. / The Class A (Beverages) | (a) | 60 | 18,303 |
Bunge Global SA (Food Products) | 70 | 7,474 | |
Campbell Soup Co. (Food Products) | 1,600 | 72,304 | |
Casey's General Stores, Inc. (Consumer Staples Distribution & Retail) | 190 | 72,496 | |
Celsius Holdings, Inc. (Beverages) | (a) | 6,728 | 384,102 |
Church & Dwight Co., Inc. (Household Products) | 727 | 75,375 | |
Clorox Co. / The (Household Products) | 385 | 52,541 | |
Conagra Brands, Inc. (Food Products) | 2,060 | 58,545 | |
Coty, Inc. Class A (Personal Care Products) | (a) | 5,620 | 54,851 |
Dollar General Corp. (Consumer Staples Distribution & Retail) | 660 | 86,183 | |
Dollar Tree, Inc. (Consumer Staples Distribution & Retail) | (a) | 570 | 60,859 |
Freshpet, Inc. (Food Products) | (a) | 2,632 | 340,554 |
General Mills, Inc. (Food Products) | 1,710 | 108,243 | |
Grocery Outlet Holding Corp. (Consumer Staples Distribution & Retail) | (a) | 11,012 | 243,585 |
Hershey Co. / The (Food Products) | 450 | 82,102 | |
Hormel Foods Corp. (Food Products) | 1,650 | 50,308 | |
J.M. Smucker Co. / The (Food Products) | 530 | 58,570 | |
Kellanova (Food Products) | 1,220 | 70,370 | |
Common Stocks (Continued) | Shares | Value | |
Consumer Staples (continued) | |||
Kenvue, Inc. (Personal Care Products) | 5,780 | $103,751 | |
Kroger Co. / The (Consumer Staples Distribution & Retail) | 1,860 | 92,870 | |
Lamb Weston Holdings, Inc. (Food Products) | 3,220 | 270,738 | |
Maplebear, Inc. (Consumer Staples Distribution & Retail) | (a) | 1,510 | 48,531 |
McCormick & Co., Inc. (Food Products) | 1,010 | 71,649 | |
Molson Coors Beverage Co. Class B (Beverages) | 930 | 47,272 | |
Nomad Foods Ltd. (Food Products) | 15,772 | 259,923 | |
Performance Food Group Co. (Consumer Staples Distribution & Retail) | (a) | 810 | 53,549 |
Pilgrim's Pride Corp. (Food Products) | (a) | 1,490 | 56,978 |
Sysco Corp. (Consumer Staples Distribution & Retail) | 1,500 | 104,820 | |
Tyson Foods, Inc. Class A (Food Products) | 1,180 | 67,425 | |
U.S. Foods Holding Corp. (Consumer Staples Distribution & Retail) | (a) | 1,110 | 58,808 |
Walgreens Boots Alliance, Inc. (Consumer Staples Distribution & Retail) | 2,410 | 29,149 | |
3,659,743 | |||
Energy–5.2% | |||
APA Corp. (Oil, Gas & Consumable Fuels) | 1,750 | 51,520 | |
Baker Hughes Co. (Energy Equip. & Svs.) | 3,020 | 106,214 | |
Cameco Corp. (Oil, Gas & Consumable Fuels) | 6,730 | 331,116 | |
ChampionX Corp. (Energy Equip. & Svs.) | 5,770 | 191,622 | |
Cheniere Energy, Inc. (Oil, Gas & Consumable Fuels) | 692 | 120,982 | |
Chesapeake Energy Corp. (Oil, Gas & Consumable Fuels) | 700 | 57,533 | |
Chord Energy Corp. (Oil, Gas & Consumable Fuels) | 340 | 57,684 | |
Coterra Energy, Inc. (Oil, Gas & Consumable Fuels) | 2,820 | 75,209 | |
Devon Energy Corp. (Oil, Gas & Consumable Fuels) | 700 | 33,180 | |
Diamondback Energy, Inc. (Oil, Gas & Consumable Fuels) | 530 | 106,101 | |
Halliburton Co. (Energy Equip. & Svs.) | 2,300 | 77,694 | |
Hess Corp. (Oil, Gas & Consumable Fuels) | 820 | 120,967 | |
HF Sinclair Corp. (Oil, Gas & Consumable Fuels) | 4,094 | 218,374 | |
International Seaways, Inc. (Oil, Gas & Consumable Fuels) | 1,480 | 87,512 | |
Kinder Morgan, Inc. (Oil, Gas & Consumable Fuels) | 5,860 | 115,970 | |
Magnolia Oil & Gas Corp. Class A (Oil, Gas & Consumable Fuels) | 12,074 | 305,955 | |
Marathon Oil Corp. (Oil, Gas & Consumable Fuels) | 2,720 | 77,982 | |
Northern Oil & Gas, Inc. (Oil, Gas & Consumable Fuels) | 4,959 | 184,326 | |
ONEOK, Inc. (Oil, Gas & Consumable Fuels) | 1,810 | 147,606 | |
Permian Resources Corp. (Oil, Gas & Consumable Fuels) | 23,327 | 376,731 | |
Range Resources Corp. (Oil, Gas & Consumable Fuels) | 1,810 | 60,689 | |
Southwestern Energy Co. (Oil, Gas & Consumable Fuels) | (a) | 52,566 | 353,769 |
Targa Resources Corp. (Oil, Gas & Consumable Fuels) | 650 | 83,707 | |
TechnipFMC PLC (Energy Equip. & Svs.) | 18,462 | 482,781 | |
Texas Pacific Land Corp. (Oil, Gas & Consumable Fuels) | 120 | 88,112 | |
Williams Cos., Inc. / The (Oil, Gas & Consumable Fuels) | 3,340 | 141,950 | |
4,055,286 | |||
Financials–14.2% | |||
Aflac, Inc. (Insurance) | 1,930 | 172,368 | |
AGNC Investment Corp. (Mortgage REIT) | 4,250 | 40,545 | |
Allstate Corp. / The (Insurance) | 790 | 126,131 | |
Ally Financial, Inc. (Consumer Finance) | 1,520 | 60,298 | |
American Financial Group, Inc. (Insurance) | 2,523 | 310,380 | |
Ameriprise Financial, Inc. (Capital Markets) | 330 | 140,973 | |
Annaly Capital Management, Inc. (Mortgage REIT) | 2,850 | 53,181 | |
Common Stocks (Continued) | Shares | Value | |
Financials (continued) | |||
Arch Capital Group Ltd. (Insurance) | (a) | 1,160 | $117,032 |
Ares Management Corp. Class A (Capital Markets) | 380 | 50,646 | |
Arthur J. Gallagher & Co. (Insurance) | 650 | 168,552 | |
Bank of New York Mellon Corp. / The (Capital Markets) | 2,270 | 135,950 | |
BankUnited, Inc. (Banks) | 7,055 | 206,500 | |
Block, Inc. (Financial Services) | (a) | 1,820 | 117,372 |
Brown & Brown, Inc. (Insurance) | 750 | 67,058 | |
Carlyle Group, Inc. / The (Capital Markets) | 170 | 6,826 | |
CBOE Global Markets, Inc. (Capital Markets) | 1,770 | 301,006 | |
Cincinnati Financial Corp. (Insurance) | 520 | 61,412 | |
Citizens Financial Group, Inc. (Banks) | 1,740 | 62,692 | |
CNA Financial Corp. (Insurance) | 1,360 | 62,655 | |
Coinbase Global, Inc. Class A (Capital Markets) | (a) | 633 | 140,672 |
Comerica, Inc. (Banks) | 6,487 | 331,097 | |
Corebridge Financial, Inc. (Financial Services) | 2,630 | 76,586 | |
Corpay, Inc. (Financial Services) | (a) | 340 | 90,579 |
Credit Acceptance Corp. (Consumer Finance) | (a) | 120 | 61,762 |
Cullen / Frost Bankers, Inc. (Banks) | 540 | 54,880 | |
Discover Financial Services (Consumer Finance) | 770 | 100,724 | |
East West Bancorp, Inc. (Banks) | 1,000 | 73,230 | |
Euronet Worldwide, Inc. (Financial Services) | (a) | 536 | 55,476 |
Everest Group Ltd. (Insurance) | 620 | 236,232 | |
FactSet Research Systems, Inc. (Capital Markets) | 120 | 48,992 | |
Fidelity National Financial, Inc. (Insurance) | 1,050 | 51,891 | |
Fidelity National Information Services, Inc. (Financial Services) | 1,990 | 149,966 | |
Fifth Third Bancorp (Banks) | 2,010 | 73,345 | |
First BanCorp (Banks) | 15,510 | 283,678 | |
First Citizens BancShares, Inc. Class A (Banks) | 259 | 436,055 | |
First Hawaiian, Inc. (Banks) | 13,153 | 273,056 | |
First Horizon Corp. (Banks) | 2,360 | 37,217 | |
Franklin Resources, Inc. (Capital Markets) | 2,540 | 56,769 | |
Global Payments, Inc. (Financial Services) | 960 | 92,832 | |
Globe Life, Inc. (Insurance) | 480 | 39,494 | |
Hanover Insurance Group, Inc. / The (Insurance) | 1,420 | 178,125 | |
Hartford Financial Services Group, Inc. / The (Insurance) | 850 | 85,459 | |
Huntington Bancshares, Inc. (Banks) | 4,980 | 65,636 | |
Invesco Ltd. (Capital Markets) | 19,091 | 285,601 | |
Jack Henry & Associates, Inc. (Financial Services) | 470 | 78,029 | |
Jefferies Financial Group, Inc. (Capital Markets) | 1,330 | 66,181 | |
Kemper Corp. (Insurance) | 2,620 | 155,445 | |
Loews Corp. (Insurance) | 670 | 50,076 | |
LPL Financial Holdings, Inc. (Capital Markets) | 280 | 78,204 | |
M&T Bank Corp. (Banks) | 130 | 19,677 | |
Markel Group, Inc. (Insurance) | (a) | 40 | 63,026 |
Moelis & Co. Class A (Capital Markets) | 3,137 | 178,370 | |
Morningstar, Inc. (Capital Markets) | 190 | 56,212 | |
MSCI, Inc. (Capital Markets) | 219 | 105,503 | |
Nasdaq, Inc. (Capital Markets) | 1,120 | 67,491 | |
NCR Atleos Corp. (Financial Services) | (a) | 6,470 | 174,819 |
Northern Trust Corp. (Capital Markets) | 780 | 65,504 | |
NU Holdings Ltd. Class A (Banks) | (a) | 7,760 | 100,026 |
PJT Partners, Inc. Class A (Capital Markets) | 2,363 | 254,991 | |
Principal Financial Group, Inc. (Insurance) | 1,190 | 93,356 | |
Prudential Financial, Inc. (Insurance) | 1,080 | 126,565 | |
Raymond James Financial, Inc. (Capital Markets) | 370 | 45,736 | |
Regions Financial Corp. (Banks) | 3,530 | 70,741 | |
RenaissanceRe Holdings Ltd. (Insurance) | 260 | 58,113 | |
Robinhood Markets, Inc. Class A (Capital Markets) | (a) | 4,680 | 106,283 |
Rocket Cos., Inc. Class A (Financial Services) | (a) | 5,490 | 75,213 |
Ryan Specialty Holdings, Inc. (Insurance) | 6,277 | 363,501 | |
SEI Investments Co. (Capital Markets) | 840 | 54,340 | |
Shift4 Payments, Inc. Class A (Financial Services) | (a) | 3,817 | 279,977 |
SoFi Technologies, Inc. (Consumer Finance) | (a) | 8,180 | 54,070 |
State Street Corp. (Capital Markets) | 610 | 45,140 | |
Stifel Financial Corp. (Capital Markets) | 7,093 | 596,876 | |
T. Rowe Price Group, Inc. (Capital Markets) | 420 | 48,430 | |
Texas Capital Bancshares, Inc. (Banks) | (a) | 3,789 | 231,659 |
Common Stocks (Continued) | Shares | Value | |
Financials (continued) | |||
Toast, Inc. Class A (Financial Services) | (a) | 2,210 | $56,267 |
TPG, Inc. (Capital Markets) | 6,649 | 275,601 | |
Voya Financial, Inc. (Financial Services) | 820 | 58,343 | |
W.R. Berkley Corp. (Insurance) | 652 | 51,234 | |
Walker & Dunlop, Inc. (Financial Services) | 2,718 | 266,908 | |
Webster Financial Corp. (Banks) | 5,267 | 229,589 | |
Western Alliance Bancorp (Banks) | 940 | 59,051 | |
Willis Towers Watson PLC (Insurance) | 330 | 86,506 | |
Wintrust Financial Corp. (Banks) | 2,910 | 286,810 | |
XP, Inc. Class A (Capital Markets) | 2,360 | 41,512 | |
Zions Bancorp N.A. (Banks) | 7,300 | 316,601 | |
11,132,907 | |||
Health Care–11.6% | |||
Acadia Healthcare Co., Inc. (Health Care Providers & Svs.) | (a) | 2,150 | 145,211 |
Agilent Technologies, Inc. (Life Sciences Tools & Svs.) | 820 | 106,297 | |
Akero Therapeutics, Inc. (Biotechnology) | (a) | 2,938 | 68,926 |
Align Technology, Inc. (Health Care Equip. & Supplies) | (a) | 270 | 65,186 |
Alnylam Pharmaceuticals, Inc. (Biotechnology) | (a) | 540 | 131,220 |
AMN Healthcare Services, Inc. (Health Care Providers & Svs.) | (a) | 3,323 | 170,237 |
Apogee Therapeutics, Inc. (Biotechnology) | (a) | 1,760 | 69,256 |
Arcus Biosciences, Inc. (Biotechnology) | (a) | 4,967 | 75,647 |
Ascendis Pharma A/S – ADR (Biotechnology) | (a) | 845 | 115,241 |
AtriCure, Inc. (Health Care Equip. & Supplies) | (a) | 7,576 | 172,506 |
Avantor, Inc. (Life Sciences Tools & Svs.) | (a) | 12,516 | 265,339 |
Baxter International, Inc. (Health Care Equip. & Supplies) | 1,700 | 56,865 | |
Biogen, Inc. (Biotechnology) | (a) | 500 | 115,910 |
BioMarin Pharmaceutical, Inc. (Biotechnology) | (a) | 640 | 52,691 |
Bio-Rad Laboratories, Inc. Class A (Life Sciences Tools & Svs.) | (a) | 120 | 32,773 |
Bio-Techne Corp. (Life Sciences Tools & Svs.) | 860 | 61,619 | |
Blueprint Medicines Corp. (Biotechnology) | (a) | 1,617 | 174,280 |
Bridgebio Pharma, Inc. (Biotechnology) | (a) | 3,716 | 94,126 |
BrightSpring Health Services, Inc. (Health Care Providers & Svs.) | (a) | 10,960 | 124,506 |
Bruker Corp. (Life Sciences Tools & Svs.) | 710 | 45,305 | |
Cardinal Health, Inc. (Health Care Providers & Svs.) | 950 | 93,404 | |
Cencora, Inc. (Health Care Providers & Svs.) | 630 | 141,939 | |
Centene Corp. (Health Care Providers & Svs.) | (a) | 1,610 | 105,197 |
Cerevel Therapeutics Holdings, Inc. (Biotechnology) | (a) | 1,460 | 60,371 |
Charles River Laboratories International, Inc. (Life Sciences Tools & Svs.) | (a) | 230 | 47,513 |
Cooper Cos., Inc. / The (Health Care Equip. & Supplies) | 804 | 70,189 | |
Cytokinetics, Inc. (Biotechnology) | (a) | 2,604 | 141,085 |
DaVita, Inc. (Health Care Providers & Svs.) | (a) | 650 | 90,071 |
Dexcom, Inc. (Health Care Equip. & Supplies) | (a) | 1,030 | 116,781 |
Exact Sciences Corp. (Biotechnology) | (a) | 3,719 | 157,128 |
Fortrea Holdings, Inc. (Life Sciences Tools & Svs.) | (a) | 7,468 | 174,303 |
GE HealthCare Technologies, Inc. (Health Care Equip. & Supplies) | 1,290 | 98,375 | |
GRAIL, Inc. (Biotechnology) | (a) | 88 | 1,358 |
Halozyme Therapeutics, Inc. (Biotechnology) | (a) | 4,177 | 218,708 |
Humana, Inc. (Health Care Providers & Svs.) | 360 | 134,456 | |
ICON PLC (Life Sciences Tools & Svs.) | (a) | 1,043 | 326,949 |
IDEXX Laboratories, Inc. (Health Care Equip. & Supplies) | (a) | 230 | 112,056 |
Illumina, Inc. (Life Sciences Tools & Svs.) | (a) | 530 | 55,321 |
Inari Medical, Inc. (Health Care Equip. & Supplies) | (a) | 4,225 | 203,434 |
Incyte Corp. (Biotechnology) | (a) | 740 | 44,859 |
Insmed, Inc. (Biotechnology) | (a) | 3,327 | 222,909 |
Insulet Corp. (Health Care Equip. & Supplies) | (a) | 271 | 54,688 |
Integra LifeSciences Holdings Corp. (Health Care Equip. & Supplies) | (a) | 6,687 | 194,859 |
Intellia Therapeutics, Inc. (Biotechnology) | (a) | 2,874 | 64,320 |
Intra-Cellular Therapies, Inc. (Pharmaceuticals) | (a) | 2,306 | 157,938 |
Common Stocks (Continued) | Shares | Value | |
Health Care (continued) | |||
IQVIA Holdings, Inc. (Life Sciences Tools & Svs.) | (a) | 550 | $116,292 |
iRhythm Technologies, Inc. (Health Care Equip. & Supplies) | (a) | 2,224 | 239,391 |
Labcorp Holdings, Inc. (Health Care Providers & Svs.) | 400 | 81,404 | |
Legend Biotech Corp. – ADR (Biotechnology) | (a) | 1,909 | 84,550 |
Masimo Corp. (Health Care Equip. & Supplies) | (a) | 330 | 41,560 |
Medpace Holdings, Inc. (Life Sciences Tools & Svs.) | (a) | 150 | 61,778 |
Mettler-Toledo International, Inc. (Life Sciences Tools & Svs.) | (a) | 90 | 125,783 |
Molina Healthcare, Inc. (Health Care Providers & Svs.) | (a) | 300 | 89,190 |
MoonLake Immunotherapeutics (Biotechnology) | (a) | 1,811 | 79,630 |
Natera, Inc. (Biotechnology) | (a) | 4,354 | 471,495 |
Neurocrine Biosciences, Inc. (Biotechnology) | (a) | 2,769 | 381,208 |
Pediatrix Medical Group, Inc. (Health Care Providers & Svs.) | (a) | 14,880 | 112,344 |
Penumbra, Inc. (Health Care Equip. & Supplies) | (a) | 310 | 55,791 |
QIAGEN N.V. (Life Sciences Tools & Svs.) | 1,532 | 62,950 | |
Quest Diagnostics, Inc. (Health Care Providers & Svs.) | 30 | 4,106 | |
Repligen Corp. (Life Sciences Tools & Svs.) | (a) | 1,557 | 196,275 |
ResMed, Inc. (Health Care Equip. & Supplies) | 590 | 112,938 | |
Revvity, Inc. (Life Sciences Tools & Svs.) | 420 | 44,041 | |
Roivant Sciences Ltd. (Biotechnology) | (a) | 5,000 | 52,850 |
Royalty Pharma PLC Class A (Pharmaceuticals) | 2,130 | 55,785 | |
Sarepta Therapeutics, Inc. (Biotechnology) | (a) | 490 | 77,420 |
STERIS PLC (Health Care Equip. & Supplies) | 346 | 75,961 | |
Teleflex, Inc. (Health Care Equip. & Supplies) | 1,240 | 260,809 | |
Ultragenyx Pharmaceutical, Inc. (Biotechnology) | (a) | 2,848 | 117,053 |
Vaxcyte, Inc. (Biotechnology) | (a) | 2,538 | 191,644 |
Veeva Systems, Inc. Class A (Health Care Technology) | (a) | 560 | 102,486 |
Viatris, Inc. (Pharmaceuticals) | 5,730 | 60,910 | |
Viking Therapeutics, Inc. (Biotechnology) | (a) | 2,151 | 114,025 |
Waters Corp. (Life Sciences Tools & Svs.) | (a) | 253 | 73,400 |
West Pharmaceutical Services, Inc. (Life Sciences Tools & Svs.) | 300 | 98,817 | |
Xenon Pharmaceuticals, Inc. (Biotechnology) | (a) | 2,696 | 105,117 |
Zimmer Biomet Holdings, Inc. (Health Care Equip. & Supplies) | 850 | 92,251 | |
9,070,606 | |||
Industrials–20.1% | |||
A. O. Smith Corp. (Building Products) | 1,130 | 92,411 | |
ABM Industries, Inc. (Commercial Svs. & Supplies) | 5,234 | 264,683 | |
Advanced Drainage Systems, Inc. (Building Products) | 360 | 57,740 | |
AECOM (Construction & Engineering) | 670 | 59,054 | |
AGCO Corp. (Machinery) | 520 | 50,898 | |
Alaska Air Group, Inc. (Passenger Airlines) | (a) | 7,834 | 316,494 |
Allegion PLC (Building Products) | 570 | 67,345 | |
Allison Transmission Holdings, Inc. (Machinery) | 740 | 56,166 | |
AMETEK, Inc. (Electrical Equip.) | 623 | 103,860 | |
API Group Corp. (Construction & Engineering) | (a) | 8,001 | 301,078 |
ArcBest Corp. (Ground Transportation) | 3,189 | 341,478 | |
Axon Enterprise, Inc. (Aerospace & Defense) | (a) | 1,263 | 371,625 |
AZEK Co., Inc. / The (Building Products) | (a) | 6,091 | 256,614 |
Booz Allen Hamilton Holding Corp. (Professional Svs.) | 420 | 64,638 | |
Broadridge Financial Solutions, Inc. (Professional Svs.) | 477 | 93,969 | |
Builders FirstSource, Inc. (Building Products) | (a) | 2,170 | 300,350 |
BWX Technologies, Inc. (Aerospace & Defense) | 3,356 | 318,820 | |
C.H. Robinson Worldwide, Inc. (Air Freight & Logistics) | 150 | 13,218 | |
Carlisle Cos., Inc. (Building Products) | 836 | 338,756 | |
Clarivate PLC (Professional Svs.) | (a) | 4,040 | 22,988 |
Common Stocks (Continued) | Shares | Value | |
Industrials (continued) | |||
Clean Harbors, Inc. (Commercial Svs. & Supplies) | (a) | 250 | $55,157 |
CNH Industrial N.V. (Machinery) | 4,960 | 50,245 | |
Comfort Systems U.S.A., Inc. (Construction & Engineering) | 1,386 | 421,510 | |
Core & Main, Inc. Class A (Trading Companies & Distributors) | (a) | 4,750 | 232,465 |
Cummins, Inc. (Machinery) | 410 | 113,541 | |
Curtiss-Wright Corp. (Aerospace & Defense) | 1,256 | 340,351 | |
Delta Air Lines, Inc. (Passenger Airlines) | 1,400 | 66,416 | |
Dover Corp. (Machinery) | 590 | 106,465 | |
Dycom Industries, Inc. (Construction & Engineering) | (a) | 1,528 | 257,865 |
EMCOR Group, Inc. (Construction & Engineering) | 260 | 94,921 | |
Equifax, Inc. (Professional Svs.) | 490 | 118,805 | |
Expeditors International of Washington, Inc. (Air Freight & Logistics) | 540 | 67,387 | |
Fastenal Co. (Trading Companies & Distributors) | 1,470 | 92,375 | |
Ferguson PLC (Trading Companies & Distributors) | 690 | 133,618 | |
Fluor Corp. (Construction & Engineering) | (a) | 7,160 | 311,818 |
Fortive Corp. (Machinery) | 1,210 | 89,661 | |
FTI Consulting, Inc. (Professional Svs.) | (a) | 1,275 | 274,801 |
Gates Industrial Corp. PLC (Machinery) | (a) | 17,980 | 284,264 |
Generac Holdings, Inc. (Electrical Equip.) | (a) | 250 | 33,055 |
Graco, Inc. (Machinery) | 990 | 78,487 | |
HEICO Corp. (Aerospace & Defense) | 250 | 55,147 | |
HEICO Corp. Class A (Aerospace & Defense) | 420 | 74,558 | |
Herc Holdings, Inc. (Trading Companies & Distributors) | 1,753 | 233,657 | |
Howmet Aerospace, Inc. (Aerospace & Defense) | 4,590 | 356,322 | |
Hubbell, Inc. (Electrical Equip.) | 180 | 65,786 | |
Huntington Ingalls Industries, Inc. (Aerospace & Defense) | 260 | 64,046 | |
IDEX Corp. (Machinery) | 350 | 70,420 | |
Ingersoll Rand, Inc. (Machinery) | 4,480 | 406,963 | |
ITT, Inc. (Machinery) | 2,380 | 307,448 | |
J.B. Hunt Transport Services, Inc. (Ground Transportation) | 260 | 41,600 | |
Jacobs Solutions, Inc. (Professional Svs.) | 500 | 69,855 | |
John Bean Technologies Corp. (Machinery) | 2,460 | 233,626 | |
Kirby Corp. (Marine Transportation) | (a) | 2,540 | 304,114 |
Knight-Swift Transportation Holdings, Inc. (Ground Transportation) | 1,010 | 50,419 | |
L3Harris Technologies, Inc. (Aerospace & Defense) | 570 | 126,517 | |
Landstar System, Inc. (Ground Transportation) | 310 | 57,189 | |
Leidos Holdings, Inc. (Professional Svs.) | 400 | 58,352 | |
Lennox International, Inc. (Building Products) | 957 | 511,976 | |
Lyft, Inc. Class A (Ground Transportation) | (a) | 1,370 | 19,317 |
MasTec, Inc. (Construction & Engineering) | (a) | 3,973 | 425,071 |
Middleby Corp. / The (Machinery) | (a) | 2,875 | 352,504 |
MillerKnoll, Inc. (Commercial Svs. & Supplies) | 10,448 | 276,768 | |
Moog, Inc. Class A (Aerospace & Defense) | 1,652 | 276,380 | |
MSC Industrial Direct Co., Inc. Class A (Trading Companies & Distributors) | 680 | 53,931 | |
nVent Electric PLC (Electrical Equip.) | 1,000 | 76,610 | |
Old Dominion Freight Line, Inc. (Ground Transportation) | 260 | 45,916 | |
Oshkosh Corp. (Machinery) | 1,478 | 159,920 | |
Otis Worldwide Corp. (Machinery) | 1,080 | 103,961 | |
Owens Corning (Building Products) | 390 | 67,751 | |
Parsons Corp. (Professional Svs.) | (a) | 700 | 56,140 |
Paychex, Inc. (Professional Svs.) | 840 | 99,590 | |
Paycom Software, Inc. (Professional Svs.) | 170 | 24,317 | |
Paylocity Holding Corp. (Professional Svs.) | (a) | 400 | 52,740 |
Pentair PLC (Machinery) | 3,602 | 276,165 | |
Quanta Services, Inc. (Construction & Engineering) | 430 | 109,259 | |
Regal Rexnord Corp. (Electrical Equip.) | 2,060 | 278,553 | |
Robert Half, Inc. (Professional Svs.) | 4,569 | 292,325 | |
Rockwell Automation, Inc. (Electrical Equip.) | 270 | 74,326 | |
Rollins, Inc. (Commercial Svs. & Supplies) | 2,040 | 99,532 | |
Saia, Inc. (Ground Transportation) | (a) | 483 | 229,082 |
Common Stocks (Continued) | Shares | Value | |
Industrials (continued) | |||
Sensata Technologies Holding PLC (Electrical Equip.) | 6,131 | $229,238 | |
Snap-on, Inc. (Machinery) | 210 | 54,892 | |
Southwest Airlines Co. (Passenger Airlines) | 2,410 | 68,950 | |
SS&C Technologies Holdings, Inc. (Professional Svs.) | 1,030 | 64,550 | |
Tetra Tech, Inc. (Commercial Svs. & Supplies) | 1,731 | 353,955 | |
Toro Co. / The (Machinery) | 670 | 62,652 | |
TransUnion (Professional Svs.) | 780 | 57,845 | |
Trex Co., Inc. (Building Products) | (a) | 610 | 45,213 |
U-Haul Holding Co. NVS (Ground Transportation) | 900 | 54,018 | |
United Rentals, Inc. (Trading Companies & Distributors) | 108 | 69,847 | |
Veralto Corp. (Commercial Svs. & Supplies) | 750 | 71,587 | |
Verisk Analytics, Inc. (Professional Svs.) | 449 | 121,028 | |
Vertiv Holdings Co. Class A (Electrical Equip.) | 1,090 | 94,361 | |
Vestis Corp. (Commercial Svs. & Supplies) | 981 | 11,998 | |
W.W. Grainger, Inc. (Trading Companies & Distributors) | 120 | 108,269 | |
WESCO International, Inc. (Trading Companies & Distributors) | 350 | 55,482 | |
Westinghouse Air Brake Technologies Corp. (Machinery) | 170 | 26,869 | |
WillScot Mobile Mini Holdings Corp. (Construction & Engineering) | (a) | 7,306 | 274,998 |
WNS Holdings Ltd. (Professional Svs.) | (a) | 3,900 | 204,750 |
Woodward, Inc. (Aerospace & Defense) | 320 | 54,851 | |
XPO, Inc. (Ground Transportation) | (a) | 2,933 | 311,338 |
Xylem, Inc. (Machinery) | 730 | 99,010 | |
15,749,246 | |||
Information Technology–15.9% | |||
ACI Worldwide, Inc. (Software) | (a) | 6,998 | 277,051 |
Amdocs Ltd. (IT Svs.) | 1,000 | 78,920 | |
Amkor Technology, Inc. (Semiconductors & Equip.) | 8,580 | 343,372 | |
ANSYS, Inc. (Software) | (a) | 350 | 112,525 |
AppLovin Corp. Class A (Software) | (a) | 790 | 67,008 |
Arrow Electronics, Inc. (Electronic Equip., Instr. & Comp.) | (a) | 440 | 53,134 |
Aspen Technology, Inc. (Software) | (a) | 310 | 61,575 |
Astera Labs, Inc. (Semiconductors & Equip.) | (a) | 1,020 | 58,691 |
Avnet, Inc. (Electronic Equip., Instr. & Comp.) | 4,359 | 224,445 | |
Belden, Inc. (Electronic Equip., Instr. & Comp.) | 2,760 | 258,888 | |
Bentley Systems, Inc. Class B (Software) | 1,100 | 54,296 | |
BILL Holdings, Inc. (Software) | (a) | 490 | 25,784 |
Calix, Inc. (Communications Equip.) | (a) | 6,760 | 239,507 |
CCC Intelligent Solutions Holdings, Inc. (Software) | (a) | 4,820 | 53,550 |
CDW Corp. (Electronic Equip., Instr. & Comp.) | 350 | 78,344 | |
Cloudflare, Inc. Class A (IT Svs.) | (a) | 900 | 74,547 |
Cognizant Technology Solutions Corp. Class A (IT Svs.) | 1,710 | 116,280 | |
Coherent Corp. (Electronic Equip., Instr. & Comp.) | (a) | 1,487 | 107,748 |
CommVault Systems, Inc. (Software) | (a) | 2,539 | 308,666 |
Corning, Inc. (Electronic Equip., Instr. & Comp.) | 2,270 | 88,190 | |
Crane NXT Co. (Electronic Equip., Instr. & Comp.) | 980 | 60,192 | |
Datadog, Inc. Class A (Software) | (a) | 924 | 119,834 |
Dynatrace, Inc. (Software) | (a) | 1,460 | 65,320 |
Entegris, Inc. (Semiconductors & Equip.) | 680 | 92,072 | |
EPAM Systems, Inc. (IT Svs.) | (a) | 220 | 41,384 |
Fabrinet (Electronic Equip., Instr. & Comp.) | (a) | 1,649 | 403,659 |
Fair Isaac Corp. (Software) | (a) | 242 | 360,256 |
First Solar, Inc. (Semiconductors & Equip.) | (a) | 370 | 83,420 |
Five9, Inc. (Software) | (a) | 4,392 | 193,687 |
FormFactor, Inc. (Semiconductors & Equip.) | (a) | 4,780 | 289,333 |
Freshworks, Inc. Class A (Software) | (a) | 14,044 | 178,218 |
Gartner, Inc. (IT Svs.) | (a) | 230 | 103,284 |
Gen Digital, Inc. (Software) | 15,970 | 398,931 | |
GLOBALFOUNDRIES, Inc. (Semiconductors & Equip.) | (a) | 860 | 43,482 |
GoDaddy, Inc. Class A (IT Svs.) | (a) | 490 | 68,458 |
Hewlett Packard Enterprise Co. (Tech. Hardware, Storage & Periph.) | 5,300 | 112,201 | |
Common Stocks (Continued) | Shares | Value | |
Information Technology (continued) | |||
HP, Inc. (Tech. Hardware, Storage & Periph.) | 2,550 | $89,301 | |
HubSpot, Inc. (Software) | (a) | 474 | 279,560 |
Informatica, Inc. Class A (Software) | (a) | 1,900 | 57,855 |
Juniper Networks, Inc. (Communications Equip.) | 1,590 | 58,433 | |
Keysight Technologies, Inc. (Electronic Equip., Instr. & Comp.) | (a) | 760 | 103,930 |
Klaviyo, Inc. Class A (Software) | (a) | 9,778 | 243,374 |
Lumentum Holdings, Inc. (Communications Equip.) | (a) | 4,810 | 244,925 |
MACOM Technology Solutions Holdings, Inc. (Semiconductors & Equip.) | (a) | 3,146 | 350,685 |
Manhattan Associates, Inc. (Software) | (a) | 2,053 | 506,434 |
Microchip Technology, Inc. (Semiconductors & Equip.) | 1,376 | 125,904 | |
MicroStrategy, Inc. Class A (Software) | (a) | 50 | 68,299 |
Monday.com Ltd. (Software) | (a) | 1,168 | 281,208 |
MongoDB, Inc. (IT Svs.) | (a) | 228 | 56,991 |
Monolithic Power Systems, Inc. (Semiconductors & Equip.) | 533 | 437,955 | |
NetApp, Inc. (Tech. Hardware, Storage & Periph.) | 640 | 82,432 | |
Novanta, Inc. (Electronic Equip., Instr. & Comp.) | (a) | 1,395 | 227,538 |
Nutanix, Inc. Class A (Software) | (a) | 5,330 | 303,010 |
ON Semiconductor Corp. (Semiconductors & Equip.) | (a) | 1,404 | 96,244 |
Onto Innovation, Inc. (Semiconductors & Equip.) | (a) | 260 | 56,937 |
Palantir Technologies, Inc. Class A (Software) | (a) | 6,290 | 159,326 |
Procore Technologies, Inc. (Software) | (a) | 840 | 55,700 |
PTC, Inc. (Software) | (a) | 2,333 | 423,836 |
Pure Storage, Inc. Class A (Tech. Hardware, Storage & Periph.) | (a) | 7,869 | 505,268 |
Qorvo, Inc. (Semiconductors & Equip.) | (a) | 470 | 54,539 |
Samsara, Inc. Class A (Software) | (a) | 5,375 | 181,138 |
Semtech Corp. (Semiconductors & Equip.) | (a) | 8,978 | 268,263 |
Skyworks Solutions, Inc. (Semiconductors & Equip.) | 680 | 72,474 | |
Super Micro Computer, Inc. (Tech. Hardware, Storage & Periph.) | (a) | 150 | 133,554 |
Synaptics, Inc. (Semiconductors & Equip.) | (a) | 2,855 | 251,811 |
TD SYNNEX Corp. (Electronic Equip., Instr. & Comp.) | 2,558 | 295,193 | |
Teledyne Technologies, Inc. (Electronic Equip., Instr. & Comp.) | (a) | 175 | 67,897 |
Teradyne, Inc. (Semiconductors & Equip.) | 680 | 100,837 | |
Tyler Technologies, Inc. (Software) | (a) | 180 | 90,500 |
Unity Software, Inc. (Software) | (a) | 2,300 | 37,398 |
Universal Display Corp. (Semiconductors & Equip.) | 1,826 | 383,916 | |
VeriSign, Inc. (IT Svs.) | (a) | 410 | 72,898 |
Western Digital Corp. (Tech. Hardware, Storage & Periph.) | (a) | 1,250 | 94,713 |
Wolfspeed, Inc. (Semiconductors & Equip.) | (a) | 772 | 17,571 |
Zebra Technologies Corp. Class A (Electronic Equip., Instr. & Comp.) | (a) | 220 | 67,965 |
Zoom Video Communications, Inc. Class A (Software) | (a) | 870 | 51,495 |
Zscaler, Inc. (Software) | (a) | 370 | 71,110 |
12,424,669 | |||
Materials–3.2% | |||
Alcoa Corp. (Metals & Mining) | 2,283 | 90,818 | |
Amcor PLC (Containers & Packaging) | 6,490 | 63,472 | |
Avery Dennison Corp. (Containers & Packaging) | 260 | 56,849 | |
Avient Corp. (Chemicals) | 6,639 | 289,792 | |
Ball Corp. (Containers & Packaging) | 930 | 55,819 | |
Berry Global Group, Inc. (Containers & Packaging) | 3,220 | 189,497 | |
Celanese Corp. (Chemicals) | 490 | 66,096 | |
Cleveland-Cliffs, Inc. (Metals & Mining) | (a) | 219 | 3,370 |
Corteva, Inc. (Chemicals) | 2,083 | 112,357 | |
Crown Holdings, Inc. (Containers & Packaging) | 630 | 46,866 | |
Dow, Inc. (Chemicals) | 2,130 | 112,102 | |
DuPont de Nemours, Inc. (Chemicals) | 1,282 | 103,188 | |
Common Stocks (Continued) | Shares | Value | |
Materials (continued) | |||
Eastman Chemical Co. (Chemicals) | 660 | $64,660 | |
Element Solutions, Inc. (Chemicals) | 10,991 | 298,076 | |
Graphic Packaging Holding Co. (Containers & Packaging) | 50 | 1,311 | |
International Flavors & Fragrances, Inc. (Chemicals) | 759 | 72,264 | |
Louisiana-Pacific Corp. (Paper & Forest Products) | 750 | 61,748 | |
LyondellBasell Industries N.V. Class A (Chemicals) | 1,050 | 100,443 | |
Martin Marietta Materials, Inc. (Construction Materials) | 150 | 81,270 | |
Nucor Corp. (Metals & Mining) | 730 | 115,398 | |
Packaging Corp. of America (Containers & Packaging) | 520 | 94,931 | |
PPG Industries, Inc. (Chemicals) | 700 | 88,123 | |
Royal Gold, Inc. (Metals & Mining) | 500 | 62,580 | |
Sealed Air Corp. (Containers & Packaging) | 1,230 | 42,792 | |
Steel Dynamics, Inc. (Metals & Mining) | 480 | 62,160 | |
United States Steel Corp. (Metals & Mining) | 1,210 | 45,738 | |
Vulcan Materials Co. (Construction Materials) | 320 | 79,578 | |
Westrock Co. (Containers & Packaging) | 1,370 | 68,856 | |
2,530,154 | |||
Real Estate–5.3% | |||
Alexandria Real Estate Equities, Inc. (Health Care REITs) | 550 | 64,333 | |
American Homes 4 Rent Class A (Residential REITs) | 2,060 | 76,550 | |
Americold Realty Trust, Inc. (Industrial REITs) | 1,890 | 48,271 | |
AvalonBay Communities, Inc. (Residential REITs) | 420 | 86,894 | |
Boston Properties, Inc. (Office REITs) | 700 | 43,092 | |
Brixmor Property Group, Inc. (Retail REITs) | 2,660 | 61,419 | |
Broadstone Net Lease, Inc. (Diversified REITs) | 9,181 | 145,702 | |
Camden Property Trust (Residential REITs) | 590 | 64,375 | |
CBRE Group, Inc. Class A (Real Estate Mgmt. & Development) | (a) | 710 | 63,268 |
CoStar Group, Inc. (Real Estate Mgmt. & Development) | (a) | 1,620 | 120,107 |
Crown Castle, Inc. (Specialized REITs) | 1,310 | 125,734 | |
CubeSmart (Specialized REITs) | 4,569 | 206,382 | |
Digital Realty Trust, Inc. (Specialized REITs) | 980 | 149,009 | |
Equity LifeStyle Properties, Inc. (Residential REITs) | 1,100 | 71,643 | |
Equity Residential (Residential REITs) | 1,140 | 79,048 | |
Essex Property Trust, Inc. (Residential REITs) | 270 | 73,494 | |
Extra Space Storage, Inc. (Specialized REITs) | 689 | 107,077 | |
First Industrial Realty Trust, Inc. (Industrial REITs) | 3,911 | 185,812 | |
Gaming & Leisure Properties, Inc. (Specialized REITs) | 1,640 | 74,144 | |
Healthpeak Properties, Inc. (Health Care REITs) | 2,220 | 43,512 | |
Independence Realty Trust, Inc. (Residential REITs) | 16,590 | 310,896 | |
Invitation Homes, Inc. (Residential REITs) | 2,300 | 82,547 | |
Iron Mountain, Inc. (Specialized REITs) | 940 | 84,243 | |
Jones Lang LaSalle, Inc. (Real Estate Mgmt. & Development) | (a) | 1,831 | 375,868 |
Kimco Realty Corp. (Retail REITs) | 3,630 | 70,640 | |
Mid-America Apartment Communities, Inc. (Residential REITs) | 480 | 68,453 | |
Realty Income Corp. (Retail REITs) | 2,650 | 139,973 | |
Regency Centers Corp. (Retail REITs) | 950 | 59,090 | |
Ryman Hospitality Properties, Inc. (Hotel & Resort REITs) | 2,392 | 238,865 | |
SBA Communications Corp. (Specialized REITs) | 320 | 62,816 | |
Simon Property Group, Inc. (Retail REITs) | 950 | 144,210 | |
STAG Industrial, Inc. (Industrial REITs) | 7,500 | 270,450 | |
Sun Communities, Inc. (Residential REITs) | 20 | 2,407 | |
Ventas, Inc. (Health Care REITs) | 1,530 | 78,428 | |
VICI Properties, Inc. (Specialized REITs) | 3,360 | 96,230 | |
W.P. Carey, Inc. (Diversified REITs) | 1,020 | 56,151 | |
Common Stocks (Continued) | Shares | Value | |
Real Estate (continued) | |||
Weyerhaeuser Co. (Specialized REITs) | 2,170 | $61,606 | |
Zillow Group, Inc. Class C (Real Estate Mgmt. & Development) | (a) | 1,290 | 59,843 |
4,152,582 | |||
Utilities–3.3% | |||
Ameren Corp. (Multi-Utilities) | 1,010 | 71,821 | |
American Water Works Co., Inc. (Water Utilities) | 750 | 96,870 | |
Atmos Energy Corp. (Gas Utilities) | 490 | 56,830 | |
Avangrid, Inc. (Electric Utilities) | 1,500 | 53,295 | |
Brookfield Renewable Corp. Class A (Ind. Power & Renewable Elec.) | 2,408 | 68,339 | |
CenterPoint Energy, Inc. (Multi-Utilities) | 8,110 | 251,248 | |
CMS Energy Corp. (Multi-Utilities) | 1,180 | 70,245 | |
Consolidated Edison, Inc. (Multi-Utilities) | 810 | 72,430 | |
DTE Energy Co. (Multi-Utilities) | 790 | 87,698 | |
Edison International (Electric Utilities) | 1,470 | 105,561 | |
Entergy Corp. (Electric Utilities) | 830 | 88,810 | |
Essential Utilities, Inc. (Water Utilities) | 1,620 | 60,474 | |
Evergy, Inc. (Electric Utilities) | 1,160 | 61,445 | |
Eversource Energy (Electric Utilities) | 1,400 | 79,394 | |
Exelon Corp. (Electric Utilities) | 3,020 | 104,341 | |
FirstEnergy Corp. (Electric Utilities) | 2,210 | 84,577 | |
Common Stocks (Continued) | Shares | Value | |
Utilities (continued) | |||
IDACORP, Inc. (Electric Utilities) | 2,240 | $208,656 | |
NiSource, Inc. (Multi-Utilities) | 2,130 | 61,365 | |
OGE Energy Corp. (Electric Utilities) | 1,760 | 62,832 | |
PG&E Corp. (Electric Utilities) | 7,056 | 123,198 | |
Portland General Electric Co. (Electric Utilities) | 5,830 | 252,089 | |
PPL Corp. (Electric Utilities) | 3,140 | 86,821 | |
Public Service Enterprise Group, Inc. (Multi-Utilities) | 1,170 | 86,229 | |
Vistra Corp. (Ind. Power & Renewable Elec.) | 1,110 | 95,438 | |
WEC Energy Group, Inc. (Multi-Utilities) | 930 | 72,968 | |
Xcel Energy, Inc. (Electric Utilities) | 1,680 | 89,729 | |
2,552,703 | |||
Total Common Stocks (Cost $73,988,219) | $77,677,682 | ||
Exchange Traded Funds–0.3% | Shares | Value | |
iShares Russell Mid-Cap ETF | 2,995 | $242,835 | |
Total Exchange Traded Funds (Cost $243,370) | $242,835 | ||
Total Investments – 99.5% (Cost $74,231,589) | (b) | $77,920,517 | |
Other Assets in Excess of Liabilities – 0.5% | 374,138 | ||
Net Assets – 100.0% | $78,294,655 | ||
Percentages are stated as a percent of net assets. |
Abbreviations: | ||
ADR: | American Depositary Receipts | |
ETF: | Exchange Traded Fund | |
NVS: | Non Voting Shares | |
REITs: | Real Estate Investment Trusts | |
Footnotes: | ||
(a) | Non-income producing security. | |
(b) | Represents cost for financial reporting purposes, which may differ from cost basis for federal income tax purposes. See also Note 7 of the Notes to Financial Statements. | |
Common Stocks–99.5% | Shares | Value | |
Communication Services–9.3% | |||
Alphabet, Inc. Class A (Interactive Media & Svs.) | 154,604 | $28,161,119 | |
Alphabet, Inc. Class C (Interactive Media & Svs.) | 128,554 | 23,579,375 | |
AT&T, Inc. (Diversified Telecom. Svs.) | 188,659 | 3,605,273 | |
Charter Communications, Inc. Class A (Media) | (a) | 2,577 | 770,420 |
Comcast Corp. Class A (Media) | 102,978 | 4,032,618 | |
Electronic Arts, Inc. (Entertainment) | 6,404 | 892,269 | |
Fox Corp. Class A (Media) | 6,248 | 214,744 | |
Fox Corp. Class B (Media) | 3,226 | 103,297 | |
Interpublic Group of Cos., Inc. / The (Media) | 9,993 | 290,696 | |
Live Nation Entertainment, Inc. (Entertainment) | (a) | 3,774 | 353,775 |
Match Group, Inc. (Interactive Media & Svs.) | (a) | 7,005 | 212,812 |
Meta Platforms, Inc. Class A (Interactive Media & Svs.) | 57,665 | 29,075,846 | |
Netflix, Inc. (Entertainment) | (a) | 11,338 | 7,651,789 |
News Corp. Class A (Media) | 9,839 | 271,261 | |
News Corp. Class B (Media) | 3,134 | 88,974 | |
Omnicom Group, Inc. (Media) | 5,175 | 464,198 | |
Paramount Global Class B (Media) | 13,117 | 136,286 | |
Take-Two Interactive Software, Inc. (Entertainment) | (a) | 4,178 | 649,637 |
T-Mobile U.S., Inc. (Wireless Telecom. Svs.) | 13,566 | 2,390,058 | |
Verizon Communications, Inc. (Diversified Telecom. Svs.) | 110,758 | 4,567,660 | |
Walt Disney Co. / The (Entertainment) | 47,968 | 4,762,743 | |
Warner Bros. Discovery, Inc. (Entertainment) | (a) | 58,604 | 436,014 |
112,710,864 | |||
Consumer Discretionary–9.9% | |||
Airbnb, Inc. Class A (Hotels, Restaurants & Leisure) | (a) | 11,619 | 1,761,789 |
Amazon.com, Inc. (Broadline Retail) | (a) | 240,979 | 46,569,192 |
Aptiv PLC (Automobile Components) | (a) | 7,146 | 503,221 |
AutoZone, Inc. (Specialty Retail) | (a) | 456 | 1,351,630 |
Bath & Body Works, Inc. (Specialty Retail) | 5,848 | 228,364 | |
Best Buy Co., Inc. (Specialty Retail) | 5,056 | 426,170 | |
Booking Holdings, Inc. (Hotels, Restaurants & Leisure) | 893 | 3,537,619 | |
BorgWarner, Inc. (Automobile Components) | 6,048 | 194,988 | |
Caesars Entertainment, Inc. (Hotels, Restaurants & Leisure) | (a) | 5,681 | 225,763 |
CarMax, Inc. (Specialty Retail) | (a) | 4,123 | 302,381 |
Carnival Corp. (Hotels, Restaurants & Leisure) | (a) | 26,586 | 497,690 |
Chipotle Mexican Grill, Inc. (Hotels, Restaurants & Leisure) | (a) | 36,137 | 2,263,983 |
D.R. Horton, Inc. (Household Durables) | 7,804 | 1,099,818 | |
Darden Restaurants, Inc. (Hotels, Restaurants & Leisure) | 3,155 | 477,415 | |
Deckers Outdoor Corp. (Textiles, Apparel & Luxury Goods) | (a) | 675 | 653,366 |
Domino's Pizza, Inc. (Hotels, Restaurants & Leisure) | 922 | 476,056 | |
eBay, Inc. (Broadline Retail) | 13,320 | 715,550 | |
Etsy, Inc. (Broadline Retail) | (a) | 3,059 | 180,420 |
Expedia Group, Inc. (Hotels, Restaurants & Leisure) | (a) | 3,328 | 419,295 |
Ford Motor Co. (Automobiles) | 103,195 | 1,294,065 | |
Garmin Ltd. (Household Durables) | 4,043 | 658,686 | |
General Motors Co. (Automobiles) | 30,023 | 1,394,869 | |
Genuine Parts Co. (Distributors) | 3,672 | 507,911 | |
Hasbro, Inc. (Leisure Products) | 3,438 | 201,123 | |
Hilton Worldwide Holdings, Inc. (Hotels, Restaurants & Leisure) | 6,579 | 1,435,538 | |
Home Depot, Inc. / The (Specialty Retail) | 26,079 | 8,977,435 | |
Las Vegas Sands Corp. (Hotels, Restaurants & Leisure) | 9,572 | 423,561 | |
Lennar Corp. Class A (Household Durables) | 6,449 | 966,512 | |
LKQ Corp. (Distributors) | 6,976 | 290,132 | |
Common Stocks (Continued) | Shares | Value | |
Consumer Discretionary (continued) | |||
Lowe's Cos., Inc. (Specialty Retail) | 15,060 | $3,320,128 | |
Lululemon Athletica, Inc. (Textiles, Apparel & Luxury Goods) | (a) | 3,016 | 900,879 |
Marriott International, Inc. Class A (Hotels, Restaurants & Leisure) | 6,313 | 1,526,294 | |
McDonald's Corp. (Hotels, Restaurants & Leisure) | 18,963 | 4,832,531 | |
MGM Resorts International (Hotels, Restaurants & Leisure) | (a) | 6,660 | 295,970 |
Mohawk Industries, Inc. (Household Durables) | (a) | 1,377 | 156,413 |
NIKE, Inc. Class B (Textiles, Apparel & Luxury Goods) | 31,877 | 2,402,569 | |
Norwegian Cruise Line Holdings Ltd. (Hotels, Restaurants & Leisure) | (a) | 11,208 | 210,598 |
NVR, Inc. (Household Durables) | (a) | 82 | 622,262 |
O'Reilly Automotive, Inc. (Specialty Retail) | (a) | 1,550 | 1,636,893 |
Pool Corp. (Distributors) | 1,015 | 311,940 | |
PulteGroup, Inc. (Household Durables) | 5,532 | 609,073 | |
Ralph Lauren Corp. (Textiles, Apparel & Luxury Goods) | 1,026 | 179,612 | |
Ross Stores, Inc. (Specialty Retail) | 8,827 | 1,282,740 | |
Royal Caribbean Cruises Ltd. (Hotels, Restaurants & Leisure) | (a) | 6,231 | 993,408 |
Starbucks Corp. (Hotels, Restaurants & Leisure) | 29,807 | 2,320,475 | |
Tapestry, Inc. (Textiles, Apparel & Luxury Goods) | 6,091 | 260,634 | |
Tesla, Inc. (Automobiles) | (a) | 73,012 | 14,447,615 |
TJX Cos., Inc. / The (Specialty Retail) | 29,805 | 3,281,530 | |
Tractor Supply Co. (Specialty Retail) | 2,835 | 765,450 | |
Ulta Beauty, Inc. (Specialty Retail) | (a) | 1,258 | 485,424 |
Wynn Resorts Ltd. (Hotels, Restaurants & Leisure) | 2,465 | 220,617 | |
Yum! Brands, Inc. (Hotels, Restaurants & Leisure) | 7,410 | 981,529 | |
120,079,126 | |||
Consumer Staples–5.7% | |||
Altria Group, Inc. (Tobacco) | 45,202 | 2,058,951 | |
Archer-Daniels-Midland Co. (Food Products) | 13,015 | 786,757 | |
Brown-Forman Corp. Class B (Beverages) | 4,766 | 205,844 | |
Bunge Global SA (Food Products) | 3,713 | 396,437 | |
Campbell Soup Co. (Food Products) | 5,198 | 234,898 | |
Church & Dwight Co., Inc. (Household Products) | 6,435 | 667,181 | |
Clorox Co. / The (Household Products) | 3,271 | 446,393 | |
Coca-Cola Co. / The (Beverages) | 102,000 | 6,492,300 | |
Colgate-Palmolive Co. (Household Products) | 21,585 | 2,094,608 | |
Conagra Brands, Inc. (Food Products) | 12,553 | 356,756 | |
Constellation Brands, Inc. Class A (Beverages) | 4,237 | 1,090,095 | |
Costco Wholesale Corp. (Consumer Staples Distribution & Retail) | 11,670 | 9,919,383 | |
Dollar General Corp. (Consumer Staples Distribution & Retail) | 5,783 | 764,686 | |
Dollar Tree, Inc. (Consumer Staples Distribution & Retail) | (a) | 5,441 | 580,936 |
Estee Lauder Cos., Inc. / The Class A (Personal Care Products) | 6,135 | 652,764 | |
General Mills, Inc. (Food Products) | 14,862 | 940,170 | |
Hershey Co. / The (Food Products) | 3,887 | 714,547 | |
Hormel Foods Corp. (Food Products) | 7,631 | 232,669 | |
J.M. Smucker Co. / The (Food Products) | 2,773 | 302,368 | |
Kellanova (Food Products) | 6,949 | 400,818 | |
Kenvue, Inc. (Personal Care Products) | 50,392 | 916,127 | |
Keurig Dr Pepper, Inc. (Beverages) | 27,462 | 917,231 | |
Kimberly-Clark Corp. (Household Products) | 8,861 | 1,224,590 | |
Kraft Heinz Co. / The (Food Products) | 20,766 | 669,081 | |
Kroger Co. / The (Consumer Staples Distribution & Retail) | 17,617 | 879,617 | |
Lamb Weston Holdings, Inc. (Food Products) | 3,775 | 317,402 | |
Common Stocks (Continued) | Shares | Value | |
Consumer Staples (continued) | |||
McCormick & Co., Inc. (Food Products) | 6,629 | $470,261 | |
Molson Coors Beverage Co. Class B (Beverages) | 4,797 | 243,832 | |
Mondelez International, Inc. Class A (Food Products) | 35,299 | 2,309,967 | |
Monster Beverage Corp. (Beverages) | (a) | 18,670 | 932,566 |
PepsiCo, Inc. (Beverages) | 36,174 | 5,966,178 | |
Philip Morris International, Inc. (Tobacco) | 40,907 | 4,145,106 | |
Procter & Gamble Co. / The (Household Products) | 62,097 | 10,241,037 | |
Sysco Corp. (Consumer Staples Distribution & Retail) | 13,108 | 935,780 | |
Target Corp. (Consumer Staples Distribution & Retail) | 12,174 | 1,802,239 | |
Tyson Foods, Inc. Class A (Food Products) | 7,546 | 431,178 | |
Walgreens Boots Alliance, Inc. (Consumer Staples Distribution & Retail) | 18,981 | 229,575 | |
Walmart, Inc. (Consumer Staples Distribution & Retail) | 112,398 | 7,610,469 | |
69,580,797 | |||
Energy–3.6% | |||
APA Corp. (Oil, Gas & Consumable Fuels) | 9,565 | 281,594 | |
Baker Hughes Co. (Energy Equip. & Svs.) | 26,265 | 923,740 | |
Chevron Corp. (Oil, Gas & Consumable Fuels) | 45,099 | 7,054,386 | |
ConocoPhillips (Oil, Gas & Consumable Fuels) | 30,773 | 3,519,816 | |
Coterra Energy, Inc. (Oil, Gas & Consumable Fuels) | 19,553 | 521,478 | |
Devon Energy Corp. (Oil, Gas & Consumable Fuels) | 16,639 | 788,689 | |
Diamondback Energy, Inc. (Oil, Gas & Consumable Fuels) | 4,692 | 939,291 | |
EOG Resources, Inc. (Oil, Gas & Consumable Fuels) | 15,124 | 1,903,658 | |
EQT Corp. (Oil, Gas & Consumable Fuels) | 11,590 | 428,598 | |
Exxon Mobil Corp. (Oil, Gas & Consumable Fuels) | 118,038 | 13,588,535 | |
Halliburton Co. (Energy Equip. & Svs.) | 23,311 | 787,446 | |
Hess Corp. (Oil, Gas & Consumable Fuels) | 7,275 | 1,073,208 | |
Kinder Morgan, Inc. (Oil, Gas & Consumable Fuels) | 50,785 | 1,009,098 | |
Marathon Oil Corp. (Oil, Gas & Consumable Fuels) | 14,817 | 424,803 | |
Marathon Petroleum Corp. (Oil, Gas & Consumable Fuels) | 9,272 | 1,608,507 | |
Occidental Petroleum Corp. (Oil, Gas & Consumable Fuels) | 17,504 | 1,103,277 | |
ONEOK, Inc. (Oil, Gas & Consumable Fuels) | 15,353 | 1,252,037 | |
Phillips 66 (Oil, Gas & Consumable Fuels) | 11,155 | 1,574,751 | |
Schlumberger N.V. (Energy Equip. & Svs.) | 37,618 | 1,774,817 | |
Targa Resources Corp. (Oil, Gas & Consumable Fuels) | 5,834 | 751,302 | |
Valero Energy Corp. (Oil, Gas & Consumable Fuels) | 8,605 | 1,348,920 | |
Williams Cos., Inc. / The (Oil, Gas & Consumable Fuels) | 32,062 | 1,362,635 | |
44,020,586 | |||
Financials–12.4% | |||
Aflac, Inc. (Insurance) | 13,606 | 1,215,152 | |
Allstate Corp. / The (Insurance) | 6,944 | 1,108,679 | |
American Express Co. (Consumer Finance) | 14,953 | 3,462,367 | |
American International Group, Inc. (Insurance) | 17,465 | 1,296,602 | |
Ameriprise Financial, Inc. (Capital Markets) | 2,614 | 1,116,675 | |
Aon PLC Class A (Insurance) | 5,723 | 1,680,158 | |
Arch Capital Group Ltd. (Insurance) | (a) | 9,843 | 993,060 |
Arthur J. Gallagher & Co. (Insurance) | 5,751 | 1,491,292 | |
Assurant, Inc. (Insurance) | 1,371 | 227,929 | |
Bank of America Corp. (Banks) | 179,032 | 7,120,103 | |
Common Stocks (Continued) | Shares | Value | |
Financials (continued) | |||
Bank of New York Mellon Corp. / The (Capital Markets) | 19,674 | $1,178,276 | |
Berkshire Hathaway, Inc. Class B (Financial Services) | (a) | 47,637 | 19,378,732 |
BlackRock, Inc. (Capital Markets) | 3,676 | 2,894,188 | |
Blackstone, Inc. (Capital Markets) | 18,807 | 2,328,307 | |
Brown & Brown, Inc. (Insurance) | 6,208 | 555,057 | |
Capital One Financial Corp. (Consumer Finance) | 10,056 | 1,392,253 | |
CBOE Global Markets, Inc. (Capital Markets) | 2,761 | 469,536 | |
Charles Schwab Corp. / The (Capital Markets) | 39,287 | 2,895,059 | |
Chubb Ltd. (Insurance) | 10,685 | 2,725,530 | |
Cincinnati Financial Corp. (Insurance) | 4,105 | 484,800 | |
Citigroup, Inc. (Banks) | 50,190 | 3,185,057 | |
Citizens Financial Group, Inc. (Banks) | 11,965 | 431,099 | |
CME Group, Inc. (Capital Markets) | 9,475 | 1,862,785 | |
Corpay, Inc. (Financial Services) | (a) | 1,846 | 491,793 |
Discover Financial Services (Consumer Finance) | 6,596 | 862,823 | |
Everest Group Ltd. (Insurance) | 1,145 | 436,268 | |
FactSet Research Systems, Inc. (Capital Markets) | 1,004 | 409,903 | |
Fidelity National Information Services, Inc. (Financial Services) | 14,640 | 1,103,270 | |
Fifth Third Bancorp (Banks) | 17,958 | 655,287 | |
Fiserv, Inc. (Financial Services) | (a) | 15,399 | 2,295,067 |
Franklin Resources, Inc. (Capital Markets) | 7,871 | 175,917 | |
Global Payments, Inc. (Financial Services) | 6,721 | 649,921 | |
Globe Life, Inc. (Insurance) | 2,187 | 179,946 | |
Goldman Sachs Group, Inc. / The (Capital Markets) | 8,485 | 3,837,935 | |
Hartford Financial Services Group, Inc. / The (Insurance) | 7,785 | 782,704 | |
Huntington Bancshares, Inc. (Banks) | 38,298 | 504,768 | |
Intercontinental Exchange, Inc. (Capital Markets) | 15,093 | 2,066,081 | |
Invesco Ltd. (Capital Markets) | 11,784 | 176,289 | |
Jack Henry & Associates, Inc. (Financial Services) | 1,906 | 316,434 | |
JPMorgan Chase & Co. (Banks) | 75,564 | 15,283,575 | |
KeyCorp (Banks) | 24,909 | 353,957 | |
KKR & Co., Inc. (Capital Markets) | 17,514 | 1,843,173 | |
Loews Corp. (Insurance) | 4,784 | 357,556 | |
M&T Bank Corp. (Banks) | 4,379 | 662,805 | |
MarketAxess Holdings, Inc. (Capital Markets) | 998 | 200,129 | |
Marsh & McLennan Cos., Inc. (Insurance) | 12,967 | 2,732,406 | |
Mastercard, Inc. Class A (Financial Services) | 21,603 | 9,530,379 | |
MetLife, Inc. (Insurance) | 15,720 | 1,103,387 | |
Moody's Corp. (Capital Markets) | 4,133 | 1,739,704 | |
Morgan Stanley (Capital Markets) | 32,930 | 3,200,467 | |
MSCI, Inc. (Capital Markets) | 2,086 | 1,004,930 | |
Nasdaq, Inc. (Capital Markets) | 10,000 | 602,600 | |
Northern Trust Corp. (Capital Markets) | 5,414 | 454,668 | |
PayPal Holdings, Inc. (Financial Services) | (a) | 27,532 | 1,597,682 |
PNC Financial Services Group, Inc. / The (Banks) | 10,472 | 1,628,187 | |
Principal Financial Group, Inc. (Insurance) | 5,662 | 444,184 | |
Progressive Corp. / The (Insurance) | 15,412 | 3,201,226 | |
Prudential Financial, Inc. (Insurance) | 9,445 | 1,106,859 | |
Raymond James Financial, Inc. (Capital Markets) | 4,909 | 606,801 | |
Regions Financial Corp. (Banks) | 24,136 | 483,685 | |
S&P Global, Inc. (Capital Markets) | 8,423 | 3,756,658 | |
State Street Corp. (Capital Markets) | 7,930 | 586,820 | |
Synchrony Financial (Consumer Finance) | 10,552 | 497,949 | |
T. Rowe Price Group, Inc. (Capital Markets) | 5,861 | 675,832 | |
Travelers Cos., Inc. / The (Insurance) | 6,027 | 1,225,530 | |
Truist Financial Corp. (Banks) | 35,212 | 1,367,986 | |
U.S. Bancorp (Banks) | 41,067 | 1,630,360 | |
Visa, Inc. (Financial Services) | 41,421 | 10,871,770 | |
Common Stocks (Continued) | Shares | Value | |
Financials (continued) | |||
W.R. Berkley Corp. (Insurance) | 5,343 | $419,853 | |
Wells Fargo & Co. (Banks) | 91,738 | 5,448,320 | |
Willis Towers Watson PLC (Insurance) | 2,691 | 705,419 | |
149,761,959 | |||
Health Care–11.7% | |||
Abbott Laboratories (Health Care Equip. & Supplies) | 45,775 | 4,756,480 | |
AbbVie, Inc. (Biotechnology) | 46,465 | 7,969,677 | |
Agilent Technologies, Inc. (Life Sciences Tools & Svs.) | 7,711 | 999,577 | |
Align Technology, Inc. (Health Care Equip. & Supplies) | (a) | 1,837 | 443,507 |
Amgen, Inc. (Biotechnology) | 14,115 | 4,410,232 | |
Baxter International, Inc. (Health Care Equip. & Supplies) | 13,401 | 448,263 | |
Becton Dickinson & Co. (Health Care Equip. & Supplies) | 7,605 | 1,777,364 | |
Biogen, Inc. (Biotechnology) | (a) | 3,832 | 888,334 |
Bio-Rad Laboratories, Inc. Class A (Life Sciences Tools & Svs.) | (a) | 541 | 147,752 |
Bio-Techne Corp. (Life Sciences Tools & Svs.) | 4,178 | 299,354 | |
Boston Scientific Corp. (Health Care Equip. & Supplies) | (a) | 38,683 | 2,978,978 |
Bristol-Myers Squibb Co. (Pharmaceuticals) | 53,343 | 2,215,335 | |
Cardinal Health, Inc. (Health Care Providers & Svs.) | 6,408 | 630,034 | |
Catalent, Inc. (Pharmaceuticals) | (a) | 4,769 | 268,161 |
Cencora, Inc. (Health Care Providers & Svs.) | 4,356 | 981,407 | |
Centene Corp. (Health Care Providers & Svs.) | (a) | 14,045 | 931,183 |
Charles River Laboratories International, Inc. (Life Sciences Tools & Svs.) | (a) | 1,360 | 280,949 |
Cigna Group / The (Health Care Providers & Svs.) | 7,475 | 2,471,011 | |
Cooper Cos., Inc. / The (Health Care Equip. & Supplies) | 5,255 | 458,761 | |
CVS Health Corp. (Health Care Providers & Svs.) | 33,035 | 1,951,047 | |
Danaher Corp. (Life Sciences Tools & Svs.) | 17,344 | 4,333,398 | |
DaVita, Inc. (Health Care Providers & Svs.) | (a) | 1,373 | 190,257 |
Dexcom, Inc. (Health Care Equip. & Supplies) | (a) | 10,466 | 1,186,635 |
Edwards Lifesciences Corp. (Health Care Equip. & Supplies) | (a) | 15,859 | 1,464,896 |
Elevance Health, Inc. (Health Care Providers & Svs.) | 6,116 | 3,314,016 | |
Eli Lilly & Co. (Pharmaceuticals) | 21,007 | 19,019,318 | |
GE HealthCare Technologies, Inc. (Health Care Equip. & Supplies) | 11,173 | 870,600 | |
Gilead Sciences, Inc. (Biotechnology) | 32,783 | 2,249,242 | |
HCA Healthcare, Inc. (Health Care Providers & Svs.) | 5,100 | 1,638,528 | |
Henry Schein, Inc. (Health Care Providers & Svs.) | (a) | 3,356 | 215,120 |
Hologic, Inc. (Health Care Equip. & Supplies) | (a) | 6,128 | 455,004 |
Humana, Inc. (Health Care Providers & Svs.) | 3,171 | 1,184,844 | |
IDEXX Laboratories, Inc. (Health Care Equip. & Supplies) | (a) | 2,174 | 1,059,173 |
Incyte Corp. (Biotechnology) | (a) | 4,218 | 255,695 |
Insulet Corp. (Health Care Equip. & Supplies) | (a) | 1,834 | 370,101 |
Intuitive Surgical, Inc. (Health Care Equip. & Supplies) | (a) | 9,334 | 4,152,230 |
IQVIA Holdings, Inc. (Life Sciences Tools & Svs.) | (a) | 4,795 | 1,013,855 |
Johnson & Johnson (Pharmaceuticals) | 63,326 | 9,255,728 | |
Labcorp Holdings, Inc. (Health Care Providers & Svs.) | 2,211 | 449,961 | |
McKesson Corp. (Health Care Providers & Svs.) | 3,420 | 1,997,417 | |
Medtronic PLC (Health Care Equip. & Supplies) | 34,939 | 2,750,049 | |
Common Stocks (Continued) | Shares | Value | |
Health Care (continued) | |||
Merck & Co., Inc. (Pharmaceuticals) | 66,645 | $8,250,651 | |
Mettler-Toledo International, Inc. (Life Sciences Tools & Svs.) | (a) | 562 | 785,445 |
Moderna, Inc. (Biotechnology) | (a) | 8,774 | 1,041,912 |
Molina Healthcare, Inc. (Health Care Providers & Svs.) | (a) | 1,537 | 456,950 |
Pfizer, Inc. (Pharmaceuticals) | 149,107 | 4,172,014 | |
Quest Diagnostics, Inc. (Health Care Providers & Svs.) | 2,924 | 400,237 | |
Regeneron Pharmaceuticals, Inc. (Biotechnology) | (a) | 2,791 | 2,933,425 |
ResMed, Inc. (Health Care Equip. & Supplies) | 3,867 | 740,221 | |
Revvity, Inc. (Life Sciences Tools & Svs.) | 3,238 | 339,537 | |
Solventum Corp. (Health Care Equip. & Supplies) | (a) | 3,636 | 192,272 |
STERIS PLC (Health Care Equip. & Supplies) | 2,598 | 570,365 | |
Stryker Corp. (Health Care Equip. & Supplies) | 8,921 | 3,035,370 | |
Teleflex, Inc. (Health Care Equip. & Supplies) | 1,249 | 262,702 | |
Thermo Fisher Scientific, Inc. (Life Sciences Tools & Svs.) | 10,043 | 5,553,779 | |
UnitedHealth Group, Inc. (Health Care Providers & Svs.) | 24,219 | 12,333,768 | |
Universal Health Services, Inc. Class B (Health Care Providers & Svs.) | 1,583 | 292,744 | |
Vertex Pharmaceuticals, Inc. (Biotechnology) | (a) | 6,790 | 3,182,609 |
Viatris, Inc. (Pharmaceuticals) | 31,395 | 333,729 | |
Waters Corp. (Life Sciences Tools & Svs.) | (a) | 1,561 | 452,877 |
West Pharmaceutical Services, Inc. (Life Sciences Tools & Svs.) | 1,917 | 631,441 | |
Zimmer Biomet Holdings, Inc. (Health Care Equip. & Supplies) | 5,413 | 587,473 | |
Zoetis, Inc. (Pharmaceuticals) | 12,007 | 2,081,533 | |
141,364,527 | |||
Industrials–8.1% | |||
3M Co. (Industrial Conglomerates) | 14,563 | 1,488,193 | |
A. O. Smith Corp. (Building Products) | 3,190 | 260,878 | |
Allegion PLC (Building Products) | 2,283 | 269,736 | |
American Airlines Group, Inc. (Passenger Airlines) | (a) | 17,253 | 195,476 |
AMETEK, Inc. (Electrical Equip.) | 6,097 | 1,016,431 | |
Automatic Data Processing, Inc. (Professional Svs.) | 10,772 | 2,571,169 | |
Axon Enterprise, Inc. (Aerospace & Defense) | (a) | 1,866 | 549,052 |
Boeing Co. / The (Aerospace & Defense) | (a) | 15,186 | 2,764,004 |
Broadridge Financial Solutions, Inc. (Professional Svs.) | 3,101 | 610,897 | |
Builders FirstSource, Inc. (Building Products) | (a) | 3,228 | 446,787 |
C.H. Robinson Worldwide, Inc. (Air Freight & Logistics) | 3,089 | 272,203 | |
Carrier Global Corp. (Building Products) | 22,055 | 1,391,229 | |
Caterpillar, Inc. (Machinery) | 12,869 | 4,286,664 | |
Cintas Corp. (Commercial Svs. & Supplies) | 2,270 | 1,589,590 | |
Copart, Inc. (Commercial Svs. & Supplies) | (a) | 23,038 | 1,247,738 |
CSX Corp. (Ground Transportation) | 51,446 | 1,720,869 | |
Cummins, Inc. (Machinery) | 3,600 | 996,948 | |
Dayforce, Inc. (Professional Svs.) | (a) | 4,122 | 204,451 |
Deere & Co. (Machinery) | 6,812 | 2,545,168 | |
Delta Air Lines, Inc. (Passenger Airlines) | 16,986 | 805,816 | |
Dover Corp. (Machinery) | 3,617 | 652,688 | |
Eaton Corp. PLC (Electrical Equip.) | 10,523 | 3,299,487 | |
Emerson Electric Co. (Electrical Equip.) | 15,060 | 1,659,010 | |
Equifax, Inc. (Professional Svs.) | 3,255 | 789,207 | |
Expeditors International of Washington, Inc. (Air Freight & Logistics) | 3,711 | 463,096 | |
Fastenal Co. (Trading Companies & Distributors) | 15,070 | 946,999 | |
FedEx Corp. (Air Freight & Logistics) | 5,958 | 1,786,447 | |
Fortive Corp. (Machinery) | 9,242 | 684,832 | |
GE Vernova, Inc. (Electrical Equip.) | (a) | 7,214 | 1,237,273 |
Common Stocks (Continued) | Shares | Value | |
Industrials (continued) | |||
Generac Holdings, Inc. (Electrical Equip.) | (a) | 1,583 | $209,304 |
General Dynamics Corp. (Aerospace & Defense) | 5,981 | 1,735,327 | |
General Electric Co. (Aerospace & Defense) | 28,803 | 4,578,813 | |
Honeywell International, Inc. (Industrial Conglomerates) | 17,137 | 3,659,435 | |
Howmet Aerospace, Inc. (Aerospace & Defense) | 10,205 | 792,214 | |
Hubbell, Inc. (Electrical Equip.) | 1,406 | 513,865 | |
Huntington Ingalls Industries, Inc. (Aerospace & Defense) | 1,045 | 257,415 | |
IDEX Corp. (Machinery) | 1,990 | 400,388 | |
Illinois Tool Works, Inc. (Machinery) | 7,145 | 1,693,079 | |
Ingersoll Rand, Inc. (Machinery) | 10,619 | 964,630 | |
J.B. Hunt Transport Services, Inc. (Ground Transportation) | 2,137 | 341,920 | |
Jacobs Solutions, Inc. (Professional Svs.) | 3,282 | 458,528 | |
Johnson Controls International PLC (Building Products) | 17,731 | 1,178,580 | |
L3Harris Technologies, Inc. (Aerospace & Defense) | 4,992 | 1,121,103 | |
Leidos Holdings, Inc. (Professional Svs.) | 3,557 | 518,895 | |
Lockheed Martin Corp. (Aerospace & Defense) | 5,619 | 2,624,635 | |
Masco Corp. (Building Products) | 5,780 | 385,353 | |
Nordson Corp. (Machinery) | 1,420 | 329,355 | |
Norfolk Southern Corp. (Ground Transportation) | 5,946 | 1,276,547 | |
Northrop Grumman Corp. (Aerospace & Defense) | 3,661 | 1,596,013 | |
Old Dominion Freight Line, Inc. (Ground Transportation) | 4,690 | 828,254 | |
Otis Worldwide Corp. (Machinery) | 10,641 | 1,024,303 | |
PACCAR, Inc. (Machinery) | 13,792 | 1,419,748 | |
Parker-Hannifin Corp. (Machinery) | 3,383 | 1,711,155 | |
Paychex, Inc. (Professional Svs.) | 8,435 | 1,000,054 | |
Paycom Software, Inc. (Professional Svs.) | 1,261 | 180,373 | |
Pentair PLC (Machinery) | 4,396 | 337,041 | |
Quanta Services, Inc. (Construction & Engineering) | 3,855 | 979,517 | |
Republic Services, Inc. (Commercial Svs. & Supplies) | 5,390 | 1,047,493 | |
Rockwell Automation, Inc. (Electrical Equip.) | 3,003 | 826,666 | |
Rollins, Inc. (Commercial Svs. & Supplies) | 7,368 | 359,485 | |
RTX Corp. (Aerospace & Defense) | 34,983 | 3,511,943 | |
Snap-on, Inc. (Machinery) | 1,386 | 362,286 | |
Southwest Airlines Co. (Passenger Airlines) | 15,738 | 450,264 | |
Stanley Black & Decker, Inc. (Machinery) | 4,075 | 325,552 | |
Textron, Inc. (Aerospace & Defense) | 5,008 | 429,987 | |
Trane Technologies PLC (Building Products) | 5,956 | 1,959,107 | |
TransDigm Group, Inc. (Aerospace & Defense) | 1,473 | 1,881,919 | |
Uber Technologies, Inc. (Ground Transportation) | (a) | 54,987 | 3,996,455 |
Union Pacific Corp. (Ground Transportation) | 16,054 | 3,632,378 | |
United Airlines Holdings, Inc. (Passenger Airlines) | (a) | 8,650 | 420,909 |
United Parcel Service, Inc. Class B (Air Freight & Logistics) | 19,195 | 2,626,836 | |
United Rentals, Inc. (Trading Companies & Distributors) | 1,753 | 1,133,718 | |
Veralto Corp. (Commercial Svs. & Supplies) | 5,765 | 550,385 | |
Verisk Analytics, Inc. (Professional Svs.) | 3,757 | 1,012,699 | |
W.W. Grainger, Inc. (Trading Companies & Distributors) | 1,151 | 1,038,478 | |
Waste Management, Inc. (Commercial Svs. & Supplies) | 9,606 | 2,049,344 | |
Westinghouse Air Brake Technologies Corp. (Machinery) | 4,640 | 733,352 | |
Xylem, Inc. (Machinery) | 6,380 | 865,319 | |
98,082,757 | |||
Common Stocks (Continued) | Shares | Value | |
Information Technology–32.3% | |||
Accenture PLC Class A (IT Svs.) | 16,545 | $5,019,918 | |
Adobe, Inc. (Software) | (a) | 11,789 | 6,549,261 |
Advanced Micro Devices, Inc. (Semiconductors & Equip.) | (a) | 42,533 | 6,899,278 |
Akamai Technologies, Inc. (IT Svs.) | (a) | 4,014 | 361,581 |
Amphenol Corp. Class A (Electronic Equip., Instr. & Comp.) | 31,614 | 2,129,835 | |
Analog Devices, Inc. (Semiconductors & Equip.) | 13,050 | 2,978,793 | |
ANSYS, Inc. (Software) | (a) | 2,298 | 738,807 |
Apple, Inc. (Tech. Hardware, Storage & Periph.) | 379,289 | 79,885,849 | |
Applied Materials, Inc. (Semiconductors & Equip.) | 21,865 | 5,159,921 | |
Arista Networks, Inc. (Communications Equip.) | (a) | 6,679 | 2,340,856 |
Autodesk, Inc. (Software) | (a) | 5,631 | 1,393,391 |
Broadcom, Inc. (Semiconductors & Equip.) | 11,463 | 18,404,190 | |
Cadence Design Systems, Inc. (Software) | (a) | 7,162 | 2,204,106 |
CDW Corp. (Electronic Equip., Instr. & Comp.) | 3,533 | 790,827 | |
Cisco Systems, Inc. (Communications Equip.) | 106,539 | 5,061,668 | |
Cognizant Technology Solutions Corp. Class A (IT Svs.) | 13,089 | 890,052 | |
Corning, Inc. (Electronic Equip., Instr. & Comp.) | 20,295 | 788,461 | |
Crowdstrike Holdings, Inc. Class A (Software) | (a) | 6,070 | 2,325,963 |
Enphase Energy, Inc. (Semiconductors & Equip.) | (a) | 3,578 | 356,762 |
EPAM Systems, Inc. (IT Svs.) | (a) | 1,525 | 286,868 |
F5, Inc. (Communications Equip.) | (a) | 1,553 | 267,473 |
Fair Isaac Corp. (Software) | (a) | 650 | 967,629 |
First Solar, Inc. (Semiconductors & Equip.) | (a) | 2,816 | 634,895 |
Fortinet, Inc. (Software) | (a) | 16,691 | 1,005,967 |
Gartner, Inc. (IT Svs.) | (a) | 2,044 | 917,879 |
Gen Digital, Inc. (Software) | 14,415 | 360,087 | |
GoDaddy, Inc. Class A (IT Svs.) | (a) | 3,704 | 517,486 |
Hewlett Packard Enterprise Co. (Tech. Hardware, Storage & Periph.) | 34,204 | 724,099 | |
HP, Inc. (Tech. Hardware, Storage & Periph.) | 22,703 | 795,059 | |
Intel Corp. (Semiconductors & Equip.) | 112,021 | 3,469,290 | |
International Business Machines Corp. (IT Svs.) | 24,172 | 4,180,547 | |
Intuit, Inc. (Software) | 7,368 | 4,842,323 | |
Jabil, Inc. (Electronic Equip., Instr. & Comp.) | 3,152 | 342,906 | |
Juniper Networks, Inc. (Communications Equip.) | 8,546 | 311,587 | |
Keysight Technologies, Inc. (Electronic Equip., Instr. & Comp.) | (a) | 4,599 | 628,913 |
KLA Corp. (Semiconductors & Equip.) | 3,543 | 2,921,239 | |
Lam Research Corp. (Semiconductors & Equip.) | 3,441 | 3,664,149 | |
Microchip Technology, Inc. (Semiconductors & Equip.) | 14,225 | 1,301,588 | |
Micron Technology, Inc. (Semiconductors & Equip.) | 29,140 | 3,832,784 | |
Microsoft Corp. (Software) | 195,573 | 87,411,352 | |
Monolithic Power Systems, Inc. (Semiconductors & Equip.) | 1,281 | 1,052,572 | |
Motorola Solutions, Inc. (Communications Equip.) | 4,388 | 1,693,987 | |
NetApp, Inc. (Tech. Hardware, Storage & Periph.) | 5,427 | 698,998 | |
NVIDIA Corp. (Semiconductors & Equip.) | 647,278 | 79,964,724 | |
NXP Semiconductors N.V. (Semiconductors & Equip.) | 6,729 | 1,810,707 | |
ON Semiconductor Corp. (Semiconductors & Equip.) | (a) | 11,327 | 776,466 |
Oracle Corp. (Software) | 41,949 | 5,923,199 | |
Palo Alto Networks, Inc. (Software) | (a) | 8,503 | 2,882,602 |
PTC, Inc. (Software) | (a) | 3,140 | 570,444 |
Qorvo, Inc. (Semiconductors & Equip.) | (a) | 2,520 | 292,421 |
QUALCOMM, Inc. (Semiconductors & Equip.) | 29,419 | 5,859,676 | |
Common Stocks (Continued) | Shares | Value | |
Information Technology (continued) | |||
Roper Technologies, Inc. (Software) | 2,817 | $1,587,830 | |
Salesforce, Inc. (Software) | 25,559 | 6,571,219 | |
Seagate Technology Holdings PLC (Tech. Hardware, Storage & Periph.) | 5,158 | 532,667 | |
ServiceNow, Inc. (Software) | (a) | 5,395 | 4,244,085 |
Skyworks Solutions, Inc. (Semiconductors & Equip.) | 4,220 | 449,768 | |
Super Micro Computer, Inc. (Tech. Hardware, Storage & Periph.) | (a) | 1,325 | 1,085,639 |
Synopsys, Inc. (Software) | (a) | 4,015 | 2,389,166 |
TE Connectivity Ltd. (Electronic Equip., Instr. & Comp.) | 8,063 | 1,212,917 | |
Teledyne Technologies, Inc. (Electronic Equip., Instr. & Comp.) | (a) | 1,247 | 483,811 |
Teradyne, Inc. (Semiconductors & Equip.) | 4,106 | 608,879 | |
Texas Instruments, Inc. (Semiconductors & Equip.) | 23,959 | 4,660,744 | |
Trimble, Inc. (Electronic Equip., Instr. & Comp.) | (a) | 6,385 | 357,049 |
Tyler Technologies, Inc. (Software) | (a) | 1,117 | 561,605 |
VeriSign, Inc. (IT Svs.) | (a) | 2,270 | 403,606 |
Western Digital Corp. (Tech. Hardware, Storage & Periph.) | (a) | 8,591 | 650,940 |
Zebra Technologies Corp. Class A (Electronic Equip., Instr. & Comp.) | (a) | 1,354 | 418,291 |
391,407,651 | |||
Materials–2.1% | |||
Air Products & Chemicals, Inc. (Chemicals) | 5,851 | 1,509,851 | |
Albemarle Corp. (Chemicals) | 3,072 | 293,437 | |
Amcor PLC (Containers & Packaging) | 37,991 | 371,552 | |
Avery Dennison Corp. (Containers & Packaging) | 2,129 | 465,506 | |
Ball Corp. (Containers & Packaging) | 8,158 | 489,643 | |
Celanese Corp. (Chemicals) | 2,631 | 354,896 | |
CF Industries Holdings, Inc. (Chemicals) | 4,783 | 354,516 | |
Corteva, Inc. (Chemicals) | 18,347 | 989,637 | |
Dow, Inc. (Chemicals) | 18,510 | 981,955 | |
DuPont de Nemours, Inc. (Chemicals) | 11,006 | 885,873 | |
Eastman Chemical Co. (Chemicals) | 3,115 | 305,177 | |
Ecolab, Inc. (Chemicals) | 6,689 | 1,591,982 | |
FMC Corp. (Chemicals) | 3,277 | 188,591 | |
Freeport-McMoRan, Inc. (Metals & Mining) | 37,802 | 1,837,177 | |
International Flavors & Fragrances, Inc. (Chemicals) | 6,721 | 639,906 | |
International Paper Co. (Containers & Packaging) | 9,106 | 392,924 | |
Linde PLC (Chemicals) | 12,650 | 5,550,946 | |
LyondellBasell Industries N.V. Class A (Chemicals) | 6,772 | 647,810 | |
Martin Marietta Materials, Inc. (Construction Materials) | 1,622 | 878,800 | |
Mosaic Co. / The (Chemicals) | 8,435 | 243,772 | |
Newmont Corp. (Metals & Mining) | 30,344 | 1,270,503 | |
Nucor Corp. (Metals & Mining) | 6,309 | 997,327 | |
Packaging Corp. of America (Containers & Packaging) | 2,346 | 428,286 | |
PPG Industries, Inc. (Chemicals) | 6,199 | 780,392 | |
Sherwin-Williams Co. / The (Chemicals) | 6,140 | 1,832,360 | |
Steel Dynamics, Inc. (Metals & Mining) | 3,886 | 503,237 | |
Vulcan Materials Co. (Construction Materials) | 3,481 | 865,655 | |
Westrock Co. (Containers & Packaging) | 6,818 | 342,673 | |
25,994,384 | |||
Real Estate–2.1% | |||
Alexandria Real Estate Equities, Inc. (Health Care REITs) | 4,162 | 486,829 | |
American Tower Corp. (Specialized REITs) | 12,289 | 2,388,736 | |
AvalonBay Communities, Inc. (Residential REITs) | 3,737 | 773,148 | |
Common Stocks (Continued) | Shares | Value | |
Real Estate (continued) | |||
Boston Properties, Inc. (Office REITs) | 3,814 | $234,790 | |
Camden Property Trust (Residential REITs) | 2,787 | 304,090 | |
CBRE Group, Inc. Class A (Real Estate Mgmt. & Development) | (a) | 7,940 | 707,533 |
CoStar Group, Inc. (Real Estate Mgmt. & Development) | (a) | 10,748 | 796,857 |
Crown Castle, Inc. (Specialized REITs) | 11,435 | 1,117,199 | |
Digital Realty Trust, Inc. (Specialized REITs) | 8,540 | 1,298,507 | |
Equinix, Inc. (Specialized REITs) | 2,498 | 1,889,987 | |
Equity Residential (Residential REITs) | 9,078 | 629,469 | |
Essex Property Trust, Inc. (Residential REITs) | 1,695 | 461,379 | |
Extra Space Storage, Inc. (Specialized REITs) | 5,572 | 865,945 | |
Federal Realty Investment Trust (Retail REITs) | 1,985 | 200,425 | |
Healthpeak Properties, Inc. (Health Care REITs) | 18,585 | 364,266 | |
Host Hotels & Resorts, Inc. (Hotel & Resort REITs) | 18,477 | 332,216 | |
Invitation Homes, Inc. (Residential REITs) | 15,095 | 541,760 | |
Iron Mountain, Inc. (Specialized REITs) | 7,696 | 689,716 | |
Kimco Realty Corp. (Retail REITs) | 17,447 | 339,519 | |
Mid-America Apartment Communities, Inc. (Residential REITs) | 3,077 | 438,811 | |
Prologis, Inc. (Industrial REITs) | 24,365 | 2,736,433 | |
Public Storage (Specialized REITs) | 4,162 | 1,197,199 | |
Realty Income Corp. (Retail REITs) | 22,915 | 1,210,370 | |
Regency Centers Corp. (Retail REITs) | 4,362 | 271,316 | |
SBA Communications Corp. (Specialized REITs) | 2,829 | 555,333 | |
Simon Property Group, Inc. (Retail REITs) | 8,576 | 1,301,837 | |
UDR, Inc. (Residential REITs) | 7,915 | 325,702 | |
Ventas, Inc. (Health Care REITs) | 10,654 | 546,124 | |
VICI Properties, Inc. (Specialized REITs) | 27,457 | 786,368 | |
Welltower, Inc. (Health Care REITs) | 15,730 | 1,639,852 | |
Weyerhaeuser Co. (Specialized REITs) | 19,172 | 544,293 | |
25,976,009 | |||
Utilities–2.3% | |||
AES Corp. / The (Ind. Power & Renewable Elec.) | 18,609 | 326,960 | |
Alliant Energy Corp. (Electric Utilities) | 6,786 | 345,407 | |
Ameren Corp. (Multi-Utilities) | 7,002 | 497,912 | |
American Electric Power Co., Inc. (Electric Utilities) | 13,876 | 1,217,480 | |
American Water Works Co., Inc. (Water Utilities) | 5,131 | 662,720 | |
Atmos Energy Corp. (Gas Utilities) | 3,984 | 464,734 | |
CenterPoint Energy, Inc. (Multi-Utilities) | 16,814 | 520,898 | |
CMS Energy Corp. (Multi-Utilities) | 7,844 | 466,953 | |
Consolidated Edison, Inc. (Multi-Utilities) | 9,113 | 814,885 | |
Constellation Energy Corp. (Electric Utilities) | 8,295 | 1,661,240 | |
Dominion Energy, Inc. (Multi-Utilities) | 22,064 | 1,081,136 | |
DTE Energy Co. (Multi-Utilities) | 5,436 | 603,450 | |
Duke Energy Corp. (Electric Utilities) | 20,306 | 2,035,270 | |
Edison International (Electric Utilities) | 10,125 | 727,076 | |
Entergy Corp. (Electric Utilities) | 5,623 | 601,661 | |
Evergy, Inc. (Electric Utilities) | 6,010 | 318,350 | |
Eversource Energy (Electric Utilities) | 9,260 | 525,135 | |
Exelon Corp. (Electric Utilities) | 26,325 | 911,108 | |
FirstEnergy Corp. (Electric Utilities) | 13,641 | 522,041 | |
NextEra Energy, Inc. (Electric Utilities) | 54,067 | 3,828,484 | |
NiSource, Inc. (Multi-Utilities) | 11,733 | 338,028 | |
NRG Energy, Inc. (Electric Utilities) | 5,470 | 425,894 | |
PG&E Corp. (Electric Utilities) | 56,290 | 982,824 | |
Pinnacle West Capital Corp. (Electric Utilities) | 2,993 | 228,605 | |
PPL Corp. (Electric Utilities) | 19,355 | 535,166 | |
Public Service Enterprise Group, Inc. (Multi-Utilities) | 13,112 | 966,355 | |
Sempra (Multi-Utilities) | 16,664 | 1,267,464 | |
Southern Co. / The (Electric Utilities) | 28,776 | 2,232,154 | |
Common Stocks (Continued) | Shares | Value | |
Utilities (continued) | |||
Vistra Corp. (Ind. Power & Renewable Elec.) | 8,600 | $739,428 | |
WEC Energy Group, Inc. (Multi-Utilities) | 8,320 | 652,787 | |
Xcel Energy, Inc. (Electric Utilities) | 14,631 | 781,442 | |
27,283,047 | |||
Total Common Stocks (Cost $675,358,886) | $1,206,261,707 | ||
U.S. Treasury Obligations–0.0% | Rate | Maturity | Face Amount | Value | |
U.S. Treasury Bill | (b) | 0.000% | 08/22/2024 | $401,000 | $397,973 |
Total U.S. Treasury Obligations (Cost $397,964) | $397,973 | ||||
Total Investments – 99.5% (Cost $675,756,850) | (c) | $1,206,659,680 | |||
Other Assets in Excess of Liabilities – 0.5% | (b) | 6,019,712 | |||
Net Assets – 100.0% | $1,212,679,392 | ||||
Percentages are stated as a percent of net assets. |
Abbreviations: | ||
REITs: | Real Estate Investment Trusts | |
Footnotes: | ||
(a) | Non-income producing security. | |
(b) | Security is partially pledged, in addition to $288,349 of the Portfolio’s cash holdings, as collateral for the futures contracts outstanding at June 30, 2024. The value of securities pledged totaled $268,954. See also the following Schedule of Open Futures Contracts. | |
(c) | Represents cost for financial reporting purposes, which may differ from cost basis for federal income tax purposes. See also Note 7 of the Notes to Financial Statements. | |
Description | Number of contracts | Expiration Date | Notional Amount | Value | Unrealized Appreciation (Depreciation) | Variation Margin Receivable (Payable) |
CME E-mini S&P 500 Index - Long | 47 | September 20, 2024 | $13,007,430 | $12,975,525 | $(31,905 ) | $(20,296 ) |
Common Stocks–98.8% | Shares | Value | |
Communication Services–5.0% | |||
Alphabet, Inc. Class A (Interactive Media & Svs.) | 12,270 | $2,234,981 | |
AT&T, Inc. (Diversified Telecom. Svs.) | 38,392 | 733,671 | |
Comcast Corp. Class A (Media) | 91,283 | 3,574,642 | |
Electronic Arts, Inc. (Entertainment) | 6,991 | 974,056 | |
Fox Corp. Class A (Media) | 68,603 | 2,357,885 | |
Fox Corp. Class B (Media) | 1,332 | 42,651 | |
Ibotta, Inc. Class A (Media) | (a) | 263 | 19,767 |
9,937,653 | |||
Consumer Discretionary–5.6% | |||
Amazon.com, Inc. (Broadline Retail) | (a) | 11,521 | 2,226,433 |
Boyd Gaming Corp. (Hotels, Restaurants & Leisure) | 10,054 | 553,975 | |
Carnival Corp. (Hotels, Restaurants & Leisure) | (a) | 44,233 | 828,042 |
D.R. Horton, Inc. (Household Durables) | 12,607 | 1,776,705 | |
General Motors Co. (Automobiles) | 46,191 | 2,146,034 | |
Home Depot, Inc. / The (Specialty Retail) | 2,951 | 1,015,852 | |
Leggett & Platt, Inc. (Household Durables) | 8,792 | 100,756 | |
NIKE, Inc. Class B (Textiles, Apparel & Luxury Goods) | 11,680 | 880,322 | |
Toll Brothers, Inc. (Household Durables) | 12,665 | 1,458,755 | |
Under Armour, Inc. Class C (Textiles, Apparel & Luxury Goods) | (a) | 1,848 | 12,067 |
10,998,941 | |||
Consumer Staples–7.2% | |||
Coca-Cola Co. / The (Beverages) | 9,058 | 576,542 | |
Colgate-Palmolive Co. (Household Products) | 16,138 | 1,566,031 | |
Costco Wholesale Corp. (Consumer Staples Distribution & Retail) | 990 | 841,490 | |
Hershey Co. / The (Food Products) | 6,855 | 1,260,155 | |
Kimberly-Clark Corp. (Household Products) | 15,598 | 2,155,643 | |
Kroger Co. / The (Consumer Staples Distribution & Retail) | 24,769 | 1,236,716 | |
Monster Beverage Corp. (Beverages) | (a) | 6,501 | 324,725 |
PepsiCo, Inc. (Beverages) | 12,542 | 2,068,552 | |
Procter & Gamble Co. / The (Household Products) | 6,837 | 1,127,558 | |
Walmart, Inc. (Consumer Staples Distribution & Retail) | 44,756 | 3,030,429 | |
14,187,841 | |||
Energy–6.9% | |||
Chevron Corp. (Oil, Gas & Consumable Fuels) | 16,778 | 2,624,415 | |
ConocoPhillips (Oil, Gas & Consumable Fuels) | 22,576 | 2,582,243 | |
Devon Energy Corp. (Oil, Gas & Consumable Fuels) | 30,702 | 1,455,275 | |
EOG Resources, Inc. (Oil, Gas & Consumable Fuels) | 7,670 | 965,423 | |
Exxon Mobil Corp. (Oil, Gas & Consumable Fuels) | 25,934 | 2,985,522 | |
Marathon Petroleum Corp. (Oil, Gas & Consumable Fuels) | 10,377 | 1,800,202 | |
Schlumberger N.V. (Energy Equip. & Svs.) | 9,807 | 462,694 | |
Valero Energy Corp. (Oil, Gas & Consumable Fuels) | 4,775 | 748,529 | |
13,624,303 | |||
Financials–21.0% | |||
Bank of America Corp. (Banks) | 10,709 | 425,897 | |
Berkshire Hathaway, Inc. Class B (Financial Services) | (a) | 13,542 | 5,508,886 |
Citigroup, Inc. (Banks) | 20,144 | 1,278,338 | |
Citizens Financial Group, Inc. (Banks) | 49,190 | 1,772,316 | |
Euronet Worldwide, Inc. (Financial Services) | (a) | 5,749 | 595,021 |
Franklin Resources, Inc. (Capital Markets) | 42,415 | 947,975 | |
Globe Life, Inc. (Insurance) | 4,834 | 397,741 | |
Invesco Ltd. (Capital Markets) | 128,246 | 1,918,560 | |
JPMorgan Chase & Co. (Banks) | 24,099 | 4,874,264 | |
Common Stocks (Continued) | Shares | Value | |
Financials (continued) | |||
KeyCorp (Banks) | 154,189 | $2,191,026 | |
Marsh & McLennan Cos., Inc. (Insurance) | 11,919 | 2,511,572 | |
Mastercard, Inc. Class A (Financial Services) | 4,643 | 2,048,306 | |
MetLife, Inc. (Insurance) | 11,845 | 831,401 | |
Moody's Corp. (Capital Markets) | 2,177 | 916,365 | |
Morgan Stanley (Capital Markets) | 2,976 | 289,237 | |
Nasdaq, Inc. (Capital Markets) | 38,029 | 2,291,628 | |
OneMain Holdings, Inc. (Consumer Finance) | 15,827 | 767,451 | |
Progressive Corp. / The (Insurance) | 8,192 | 1,701,560 | |
Reinsurance Group of America, Inc. (Insurance) | 9,573 | 1,965,050 | |
S&P Global, Inc. (Capital Markets) | 3,935 | 1,755,010 | |
T. Rowe Price Group, Inc. (Capital Markets) | 1,957 | 225,662 | |
Travelers Cos., Inc. / The (Insurance) | 11,248 | 2,287,168 | |
Unum Group (Insurance) | 27,415 | 1,401,181 | |
Valley National Bancorp (Banks) | 52,478 | 366,296 | |
Visa, Inc. (Financial Services) | 7,837 | 2,056,977 | |
41,324,888 | |||
Health Care–16.1% | |||
Alto Neuroscience, Inc. (Pharmaceuticals) | (a) | 27 | 289 |
Amgen, Inc. (Biotechnology) | 3,193 | 997,653 | |
Biogen, Inc. (Biotechnology) | (a) | 4,906 | 1,137,309 |
Bristol-Myers Squibb Co. (Pharmaceuticals) | 39,212 | 1,628,474 | |
Cardinal Health, Inc. (Health Care Providers & Svs.) | 4,999 | 491,502 | |
Centene Corp. (Health Care Providers & Svs.) | (a) | 20,660 | 1,369,758 |
Cigna Group / The (Health Care Providers & Svs.) | 2,742 | 906,423 | |
Dexcom, Inc. (Health Care Equip. & Supplies) | (a) | 2,427 | 275,173 |
Elevance Health, Inc. (Health Care Providers & Svs.) | 4,575 | 2,479,009 | |
Eli Lilly & Co. (Pharmaceuticals) | 300 | 271,614 | |
Exelixis, Inc. (Biotechnology) | (a) | 27,388 | 615,408 |
Gilead Sciences, Inc. (Biotechnology) | 41,569 | 2,852,049 | |
HCA Healthcare, Inc. (Health Care Providers & Svs.) | 1,607 | 516,297 | |
Incyte Corp. (Biotechnology) | (a) | 18,703 | 1,133,776 |
Johnson & Johnson (Pharmaceuticals) | 11,216 | 1,639,330 | |
Labcorp Holdings, Inc. (Health Care Providers & Svs.) | 1,674 | 340,676 | |
Medtronic PLC (Health Care Equip. & Supplies) | 38,556 | 3,034,743 | |
Merck & Co., Inc. (Pharmaceuticals) | 6,074 | 751,961 | |
Neurocrine Biosciences, Inc. (Biotechnology) | (a) | 4,977 | 685,184 |
Pfizer, Inc. (Pharmaceuticals) | 85,615 | 2,395,508 | |
Quest Diagnostics, Inc. (Health Care Providers & Svs.) | 3,839 | 525,482 | |
Regeneron Pharmaceuticals, Inc. (Biotechnology) | (a) | 561 | 589,628 |
Stryker Corp. (Health Care Equip. & Supplies) | 8,715 | 2,965,279 | |
Teladoc Health, Inc. (Health Care Technology) | (a) | 39,700 | 388,266 |
Thermo Fisher Scientific, Inc. (Life Sciences Tools & Svs.) | 2,320 | 1,282,960 | |
UnitedHealth Group, Inc. (Health Care Providers & Svs.) | 4,090 | 2,023,118 | |
Zoetis, Inc. (Pharmaceuticals) | 2,591 | 449,176 | |
31,746,045 | |||
Industrials–15.4% | |||
A. O. Smith Corp. (Building Products) | 4,533 | 370,709 | |
AECOM (Construction & Engineering) | 24,851 | 2,190,367 | |
AMETEK, Inc. (Electrical Equip.) | 6,295 | 1,049,439 | |
Builders FirstSource, Inc. (Building Products) | (a) | 2,230 | 308,654 |
Cintas Corp. (Commercial Svs. & Supplies) | 2,905 | 2,034,255 | |
CNH Industrial N.V. (Machinery) | 95,644 | 968,874 | |
Cummins, Inc. (Machinery) | 2,796 | 774,296 | |
Eaton Corp. PLC (Electrical Equip.) | 9,014 | 2,826,340 | |
Expeditors International of Washington, Inc. (Air Freight & Logistics) | 14,448 | 1,802,966 | |
Flowserve Corp. (Machinery) | 13,430 | 645,983 | |
Common Stocks (Continued) | Shares | Value | |
Industrials (continued) | |||
HEICO Corp. Class A (Aerospace & Defense) | 2,491 | $442,202 | |
Illinois Tool Works, Inc. (Machinery) | 3,942 | 934,096 | |
Loar Holdings, Inc. (Aerospace & Defense) | (a) | 148 | 7,905 |
Lockheed Martin Corp. (Aerospace & Defense) | 4,824 | 2,253,290 | |
Northrop Grumman Corp. (Aerospace & Defense) | 514 | 224,078 | |
Old Dominion Freight Line, Inc. (Ground Transportation) | 6,066 | 1,071,256 | |
Oshkosh Corp. (Machinery) | 19,776 | 2,139,763 | |
Parker-Hannifin Corp. (Machinery) | 3,051 | 1,543,226 | |
Quanta Services, Inc. (Construction & Engineering) | 1,228 | 312,022 | |
Snap-on, Inc. (Machinery) | 1,988 | 519,643 | |
Textron, Inc. (Aerospace & Defense) | 13,408 | 1,151,211 | |
UFP Industries, Inc. (Building Products) | 2,813 | 315,056 | |
United Airlines Holdings, Inc. (Passenger Airlines) | (a) | 6,989 | 340,085 |
W.W. Grainger, Inc. (Trading Companies & Distributors) | 1,419 | 1,280,279 | |
Waste Connections, Inc. (Commercial Svs. & Supplies) | 4,035 | 707,578 | |
Waste Management, Inc. (Commercial Svs. & Supplies) | 3,808 | 812,399 | |
Watsco, Inc. (Trading Companies & Distributors) | 2,853 | 1,321,624 | |
WESCO International, Inc. (Trading Companies & Distributors) | 3,940 | 624,569 | |
Xylem, Inc. (Machinery) | 9,533 | 1,292,961 | |
30,265,126 | |||
Information Technology–10.3% | |||
Amdocs Ltd. (IT Svs.) | 7,095 | 559,937 | |
Apple, Inc. (Tech. Hardware, Storage & Periph.) | 8,949 | 1,884,838 | |
Avnet, Inc. (Electronic Equip., Instr. & Comp.) | 6,512 | 335,303 | |
Flex Ltd. (Electronic Equip., Instr. & Comp.) | (a) | 14,816 | 436,924 |
Fortinet, Inc. (Software) | (a) | 5,240 | 315,815 |
Hewlett Packard Enterprise Co. (Tech. Hardware, Storage & Periph.) | 54,730 | 1,158,634 | |
Intel Corp. (Semiconductors & Equip.) | 46,359 | 1,435,738 | |
Juniper Networks, Inc. (Communications Equip.) | 8,188 | 298,535 | |
Lam Research Corp. (Semiconductors & Equip.) | 1,986 | 2,114,792 | |
Manhattan Associates, Inc. (Software) | (a) | 4,299 | 1,060,477 |
Micron Technology, Inc. (Semiconductors & Equip.) | 17,464 | 2,297,040 | |
Common Stocks (Continued) | Shares | Value | |
Information Technology (continued) | |||
Microsoft Corp. (Software) | 4,762 | $2,128,376 | |
Monolithic Power Systems, Inc. (Semiconductors & Equip.) | 1,199 | 985,194 | |
QUALCOMM, Inc. (Semiconductors & Equip.) | 10,656 | 2,122,462 | |
Rubrik, Inc. Class A (Software) | (a) | 2,050 | 62,853 |
ServiceNow, Inc. (Software) | (a) | 1,132 | 890,511 |
TE Connectivity Ltd. (Electronic Equip., Instr. & Comp.) | 14,376 | 2,162,582 | |
20,250,011 | |||
Materials–3.3% | |||
Ecolab, Inc. (Chemicals) | 5,858 | 1,394,204 | |
Louisiana-Pacific Corp. (Paper & Forest Products) | 9,007 | 741,546 | |
LyondellBasell Industries N.V. Class A (Chemicals) | 22,179 | 2,121,643 | |
Mosaic Co. / The (Chemicals) | 18,579 | 536,933 | |
Nucor Corp. (Metals & Mining) | 6,261 | 989,739 | |
Packaging Corp. of America (Containers & Packaging) | 1,223 | 223,271 | |
Westlake Corp. (Chemicals) | 3,097 | 448,508 | |
6,455,844 | |||
Real Estate–3.6% | |||
Camden Property Trust (Residential REITs) | 20,485 | 2,235,118 | |
Equinix, Inc. (Specialized REITs) | 738 | 558,371 | |
Equity Residential (Residential REITs) | 26,012 | 1,803,672 | |
First Industrial Realty Trust, Inc. (Industrial REITs) | 17,822 | 846,723 | |
Kimco Realty Corp. (Retail REITs) | 50,950 | 991,487 | |
Simon Property Group, Inc. (Retail REITs) | 4,346 | 659,723 | |
7,095,094 | |||
Utilities–4.4% | |||
AES Corp. / The (Ind. Power & Renewable Elec.) | 63,494 | 1,115,590 | |
CMS Energy Corp. (Multi-Utilities) | 27,349 | 1,628,086 | |
DTE Energy Co. (Multi-Utilities) | 8,547 | 948,802 | |
Exelon Corp. (Electric Utilities) | 35,559 | 1,230,697 | |
OGE Energy Corp. (Electric Utilities) | 49,329 | 1,761,045 | |
PPL Corp. (Electric Utilities) | 68,018 | 1,880,698 | |
8,564,918 | |||
Total Common Stocks (Cost $180,371,067) | $194,450,664 | ||
Total Investments – 98.8% (Cost $180,371,067) | (b) | $194,450,664 | |
Other Assets in Excess of Liabilities – 1.2% | (c) | 2,380,962 | |
Net Assets – 100.0% | $196,831,626 | ||
Percentages are stated as a percent of net assets. |
Abbreviations: | ||
REITs: | Real Estate Investment Trusts | |
Footnotes: | ||
(a) | Non-income producing security. | |
(b) | Represents cost for financial reporting purposes, which may differ from cost basis for federal income tax purposes. See also Note 7 of the Notes to Financial Statements. | |
(c) | Includes $142,780 of cash pledged as collateral for the futures contracts outstanding at June 30, 2024. See also the following Schedule of Open Futures Contracts. | |
Description | Number of contracts | Expiration Date | Notional Amount | Value | Unrealized Appreciation (Depreciation) | Variation Margin Receivable (Payable) |
CME E-mini S&P 500 Index - Long | 10 | September 20, 2024 | $2,757,286 | $2,760,750 | $3,464 | $(14,317 ) |
Corporate Bonds–96.7% | Rate | Maturity | Face Amount | Value | |
Communication Services–9.7% | |||||
Audacy Capital Corp. (Acquired 03/11/2021 through 07/09/2021, Cost $357,500) (Media) | (a)(b) | 6.750% | 03/31/2029 | $350,000 | $12,250 |
Cars.com, Inc. (Interactive Media & Svs.) | (a) | 6.375% | 11/01/2028 | 375,000 | 368,372 |
CCO Holdings LLC / CCO Holdings Capital Corp. (Media) | (a) | 5.125% | 05/01/2027 | 200,000 | 192,029 |
CCO Holdings LLC / CCO Holdings Capital Corp. (Media) | (a) | 5.000% | 02/01/2028 | 650,000 | 607,680 |
CCO Holdings LLC / CCO Holdings Capital Corp. (Media) | (a) | 5.375% | 06/01/2029 | 125,000 | 113,721 |
CCO Holdings LLC / CCO Holdings Capital Corp. (Media) | (a) | 4.750% | 03/01/2030 | 1,075,000 | 931,086 |
CCO Holdings LLC / CCO Holdings Capital Corp. (Media) | (a) | 4.500% | 08/15/2030 | 250,000 | 211,644 |
CCO Holdings LLC / CCO Holdings Capital Corp. (Media) | (a) | 7.375% | 03/01/2031 | 325,000 | 320,452 |
CMG Media Corp. (Media) | (a) | 8.875% | 12/15/2027 | 400,000 | 228,135 |
CSC Holdings LLC (Media) | (a) | 5.500% | 04/15/2027 | 500,000 | 405,570 |
CSC Holdings LLC (Media) | (a) | 4.125% | 12/01/2030 | 200,000 | 129,269 |
CSC Holdings LLC (Media) | (a) | 4.625% | 12/01/2030 | 375,000 | 136,576 |
CSC Holdings LLC (Media) | (a) | 3.375% | 02/15/2031 | 200,000 | 124,818 |
CSC Holdings LLC (Media) | (a) | 4.500% | 11/15/2031 | 150,000 | 96,783 |
DISH DBS Corp. (Media) | 7.375% | 07/01/2028 | 100,000 | 42,528 | |
DISH DBS Corp. (Media) | 5.125% | 06/01/2029 | 600,000 | 237,606 | |
Gray Television, Inc. (Media) | (a) | 5.375% | 11/15/2031 | 175,000 | 99,203 |
iHeartCommunications, Inc. (Media) | (a) | 4.750% | 01/15/2028 | 100,000 | 50,652 |
Lamar Media Corp. (Media) | 4.875% | 01/15/2029 | 150,000 | 144,140 | |
Lamar Media Corp. (Media) | 3.625% | 01/15/2031 | 100,000 | 87,952 | |
Match Group Holdings II LLC (Interactive Media & Svs.) | (a) | 5.000% | 12/15/2027 | 200,000 | 191,727 |
Match Group Holdings II LLC (Interactive Media & Svs.) | (a) | 4.625% | 06/01/2028 | 75,000 | 70,179 |
Match Group Holdings II LLC (Interactive Media & Svs.) | (a) | 4.125% | 08/01/2030 | 350,000 | 309,673 |
Match Group Holdings II LLC (Interactive Media & Svs.) | (a) | 3.625% | 10/01/2031 | 150,000 | 127,054 |
Nexstar Media, Inc. (Media) | (a) | 4.750% | 11/01/2028 | 250,000 | 222,276 |
ROBLOX Corp. (Entertainment) | (a) | 3.875% | 05/01/2030 | 275,000 | 244,336 |
Scripps Escrow II, Inc. (Media) | (a) | 5.375% | 01/15/2031 | 125,000 | 55,455 |
Sinclair Television Group, Inc. (Media) | (a) | 5.500% | 03/01/2030 | 150,000 | 91,233 |
Sirius XM Radio, Inc. (Media) | (a) | 3.125% | 09/01/2026 | 225,000 | 211,689 |
Sirius XM Radio, Inc. (Media) | (a) | 5.000% | 08/01/2027 | 75,000 | 71,792 |
Sirius XM Radio, Inc. (Media) | (a) | 4.000% | 07/15/2028 | 200,000 | 180,671 |
Sirius XM Radio, Inc. (Media) | (a) | 4.125% | 07/01/2030 | 475,000 | 405,705 |
Sirius XM Radio, Inc. (Media) | (a) | 3.875% | 09/01/2031 | 300,000 | 244,900 |
Stagwell Global LLC (Media) | (a) | 5.625% | 08/15/2029 | 1,000,000 | 923,618 |
Sunrise FinCo I B.V. (Media) | (a) | 4.875% | 07/15/2031 | 600,000 | 544,809 |
TEGNA, Inc. (Media) | 5.000% | 09/15/2029 | 275,000 | 242,830 | |
Telenet Finance Luxembourg Notes SARL (Media) | (a) | 5.500% | 03/01/2028 | 600,000 | 568,303 |
Univision Communications, Inc. (Media) | (a) | 8.000% | 08/15/2028 | 300,000 | 292,569 |
Univision Communications, Inc. (Media) | (a) | 4.500% | 05/01/2029 | 275,000 | 231,129 |
Univision Communications, Inc. (Media) | (a) | 7.375% | 06/30/2030 | 150,000 | 139,525 |
Virgin Media Secured Finance PLC (Media) | (a) | 4.500% | 08/15/2030 | 200,000 | 169,587 |
Virgin Media Vendor Financing Notes IV DAC (Media) | (a) | 5.000% | 07/15/2028 | 450,000 | 400,413 |
Vmed O2 U.K. Financing I PLC (Wireless Telecom. Svs.) | (a) | 4.250% | 01/31/2031 | 200,000 | 165,976 |
Vmed O2 U.K. Financing I PLC (Wireless Telecom. Svs.) | (a) | 4.750% | 07/15/2031 | 400,000 | 337,350 |
VZ Secured Financing B.V. (Media) | (a) | 5.000% | 01/15/2032 | 400,000 | 341,068 |
WMG Acquisition Corp. (Entertainment) | (a) | 3.750% | 12/01/2029 | 125,000 | 113,228 |
WMG Acquisition Corp. (Entertainment) | (a) | 3.875% | 07/15/2030 | 75,000 | 66,946 |
Ziggo Bond Co. B.V. (Diversified Telecom. Svs.) | (a) | 6.000% | 01/15/2027 | 200,000 | 196,168 |
11,700,675 | |||||
Consumer Discretionary–15.5% | |||||
1011778 B.C. ULC / New Red Finance, Inc. (Hotels, Restaurants & Leisure) | (a) | 6.125% | 06/15/2029 | 200,000 | 200,725 |
1011778 B.C. ULC / New Red Finance, Inc. (Hotels, Restaurants & Leisure) | (a) | 4.000% | 10/15/2030 | 1,225,000 | 1,078,368 |
Academy Ltd. (Specialty Retail) | (a) | 6.000% | 11/15/2027 | 450,000 | 443,055 |
Adient Global Holdings Ltd. (Automobile Components) | (a) | 4.875% | 08/15/2026 | 300,000 | 291,772 |
Adient Global Holdings Ltd. (Automobile Components) | (a) | 7.000% | 04/15/2028 | 100,000 | 102,356 |
Adient Global Holdings Ltd. (Automobile Components) | (a) | 8.250% | 04/15/2031 | 125,000 | 130,452 |
Affinity Interactive (Hotels, Restaurants & Leisure) | (a) | 6.875% | 12/15/2027 | 200,000 | 176,352 |
Aramark Services, Inc. (Hotels, Restaurants & Leisure) | (a) | 5.000% | 02/01/2028 | 100,000 | 96,712 |
Asbury Automotive Group, Inc. (Specialty Retail) | (a) | 4.625% | 11/15/2029 | 325,000 | 300,388 |
Asbury Automotive Group, Inc. (Specialty Retail) | (a) | 5.000% | 02/15/2032 | 200,000 | 181,201 |
Boyd Gaming Corp. (Hotels, Restaurants & Leisure) | 4.750% | 12/01/2027 | 275,000 | 264,679 | |
Boyd Gaming Corp. (Hotels, Restaurants & Leisure) | (a) | 4.750% | 06/15/2031 | 200,000 | 181,261 |
Caesars Entertainment, Inc. (Hotels, Restaurants & Leisure) | (a) | 8.125% | 07/01/2027 | 450,000 | 459,149 |
Caesars Entertainment, Inc. (Hotels, Restaurants & Leisure) | (a) | 4.625% | 10/15/2029 | 300,000 | 275,031 |
Caesars Entertainment, Inc. (Hotels, Restaurants & Leisure) | (a) | 7.000% | 02/15/2030 | 150,000 | 153,252 |
Caesars Entertainment, Inc. (Hotels, Restaurants & Leisure) | (a) | 6.500% | 02/15/2032 | 150,000 | 150,736 |
Carnival Corp. (Hotels, Restaurants & Leisure) | (a) | 6.000% | 05/01/2029 | 300,000 | 296,346 |
Carnival Corp. (Hotels, Restaurants & Leisure) | (a) | 7.000% | 08/15/2029 | 75,000 | 77,744 |
Churchill Downs, Inc. (Hotels, Restaurants & Leisure) | (a) | 5.500% | 04/01/2027 | 175,000 | 172,183 |
Corporate Bonds (Continued) | Rate | Maturity | Face Amount | Value | |
Consumer Discretionary (continued) | |||||
Churchill Downs, Inc. (Hotels, Restaurants & Leisure) | (a) | 6.750% | 05/01/2031 | $125,000 | $125,677 |
Clarios Global LP / Clarios U.S. Finance Co. (Automobile Components) | (a) | 6.250% | 05/15/2026 | 112,000 | 111,888 |
Clarios Global LP / Clarios U.S. Finance Co. (Automobile Components) | (a) | 8.500% | 05/15/2027 | 1,250,000 | 1,257,051 |
Dana, Inc. (Automobile Components) | 4.250% | 09/01/2030 | 250,000 | 218,236 | |
Dana, Inc. (Automobile Components) | 4.500% | 02/15/2032 | 100,000 | 85,881 | |
Dornoch Debt Merger Sub, Inc. (Automobile Components) | (a) | 6.625% | 10/15/2029 | 625,000 | 531,405 |
Gap, Inc. / The (Specialty Retail) | (a) | 3.625% | 10/01/2029 | 175,000 | 151,505 |
Garda World Security Corp. (Diversified Consumer Svs.) | (a) | 9.500% | 11/01/2027 | 1,103,000 | 1,108,104 |
Hilton Domestic Operating Co., Inc. (Hotels, Restaurants & Leisure) | (a) | 5.750% | 05/01/2028 | 50,000 | 49,751 |
Hilton Domestic Operating Co., Inc. (Hotels, Restaurants & Leisure) | 4.875% | 01/15/2030 | 75,000 | 71,983 | |
Hilton Domestic Operating Co., Inc. (Hotels, Restaurants & Leisure) | (a) | 3.625% | 02/15/2032 | 200,000 | 173,076 |
IHO Verwaltungs GmbH (Automobile Components) | (a)(c) | 4.750%, 5.500% PIK | 09/15/2026 | 400,000 | 387,616 |
IHO Verwaltungs GmbH (Automobile Components) | (a)(c) | 6.000%, 6.750% PIK | 05/15/2027 | 500,000 | 492,011 |
JB Poindexter & Co., Inc. (Automobile Components) | (a) | 8.750% | 12/15/2031 | 400,000 | 414,396 |
KFC Holding Co. / Pizza Hut Holdings LLC / Taco Bell of America LLC (Hotels, Restaurants & Leisure) | (a) | 4.750% | 06/01/2027 | 200,000 | 194,979 |
Kontoor Brands, Inc. (Textiles, Apparel & Luxury Goods) | (a) | 4.125% | 11/15/2029 | 200,000 | 181,050 |
LCM Investments Holdings II LLC (Specialty Retail) | (a) | 4.875% | 05/01/2029 | 350,000 | 327,156 |
LCM Investments Holdings II LLC (Specialty Retail) | (a) | 8.250% | 08/01/2031 | 225,000 | 234,783 |
Light & Wonder International, Inc. (Hotels, Restaurants & Leisure) | (a) | 7.250% | 11/15/2029 | 275,000 | 280,859 |
Light & Wonder International, Inc. (Hotels, Restaurants & Leisure) | (a) | 7.500% | 09/01/2031 | 150,000 | 154,983 |
MGM Resorts International (Hotels, Restaurants & Leisure) | 4.625% | 09/01/2026 | 198,000 | 193,192 | |
MGM Resorts International (Hotels, Restaurants & Leisure) | 4.750% | 10/15/2028 | 75,000 | 71,405 | |
MGM Resorts International (Hotels, Restaurants & Leisure) | 6.500% | 04/15/2032 | 300,000 | 298,614 | |
Midwest Gaming Borrower LLC / Midwest Gaming Finance Corp. (Hotels, Restaurants & Leisure) | (a) | 4.875% | 05/01/2029 | 200,000 | 186,298 |
Mohegan Tribal Gaming Authority (Hotels, Restaurants & Leisure) | (a) | 8.000% | 02/01/2026 | 850,000 | 805,842 |
NCL Corp. Ltd. (Hotels, Restaurants & Leisure) | (a) | 8.125% | 01/15/2029 | 125,000 | 130,969 |
NCL Corp. Ltd. (Hotels, Restaurants & Leisure) | (a) | 7.750% | 02/15/2029 | 250,000 | 259,925 |
NCL Finance Ltd. (Hotels, Restaurants & Leisure) | (a) | 6.125% | 03/15/2028 | 275,000 | 271,572 |
Ontario Gaming GTA LP / OTG Co-Issuer, Inc. (Hotels, Restaurants & Leisure) | (a) | 8.000% | 08/01/2030 | 275,000 | 282,219 |
Penn Entertainment, Inc. (Hotels, Restaurants & Leisure) | (a) | 4.125% | 07/01/2029 | 275,000 | 235,858 |
Raptor Acquisition Corp. / Raptor Co-Issuer LLC (Hotels, Restaurants & Leisure) | (a) | 4.875% | 11/01/2026 | 50,000 | 48,372 |
Real Hero Merger Sub 2, Inc. (Automobile Components) | (a) | 6.250% | 02/01/2029 | 475,000 | 405,443 |
Royal Caribbean Cruises Ltd. (Hotels, Restaurants & Leisure) | (a) | 5.500% | 08/31/2026 | 275,000 | 271,942 |
Royal Caribbean Cruises Ltd. (Hotels, Restaurants & Leisure) | (a) | 6.250% | 03/15/2032 | 75,000 | 75,630 |
Sally Holdings LLC / Sally Capital, Inc. (Specialty Retail) | 6.750% | 03/01/2032 | 400,000 | 395,171 | |
Scientific Games Holdings LP / Scientific Games U.S. FinCo, Inc. (Hotels, Restaurants & Leisure) | (a) | 6.625% | 03/01/2030 | 400,000 | 389,927 |
SeaWorld Parks & Entertainment, Inc. (Hotels, Restaurants & Leisure) | (a) | 5.250% | 08/15/2029 | 475,000 | 448,815 |
Six Flags Entertainment Corp. (Hotels, Restaurants & Leisure) | (a) | 5.500% | 04/15/2027 | 275,000 | 272,216 |
Six Flags Theme Parks, Inc. (Hotels, Restaurants & Leisure) | (a) | 7.000% | 07/01/2025 | 25,000 | 25,079 |
Station Casinos LLC (Hotels, Restaurants & Leisure) | (a) | 4.500% | 02/15/2028 | 200,000 | 188,187 |
Station Casinos LLC (Hotels, Restaurants & Leisure) | (a) | 4.625% | 12/01/2031 | 200,000 | 178,261 |
Station Casinos LLC (Hotels, Restaurants & Leisure) | (a) | 6.625% | 03/15/2032 | 125,000 | 124,386 |
Velocity Vehicle Group LLC (Specialty Retail) | (a) | 8.000% | 06/01/2029 | 75,000 | 77,141 |
William Carter Co. / The (Textiles, Apparel & Luxury Goods) | (a) | 5.625% | 03/15/2027 | 275,000 | 271,247 |
Wyndham Hotels & Resorts, Inc. (Hotels, Restaurants & Leisure) | (a) | 4.375% | 08/15/2028 | 325,000 | 302,979 |
Wynn Resorts Finance LLC / Wynn Resorts Capital Corp. (Hotels, Restaurants & Leisure) | (a) | 7.125% | 02/15/2031 | 325,000 | 337,000 |
Yum! Brands, Inc. (Hotels, Restaurants & Leisure) | (a) | 4.750% | 01/15/2030 | 75,000 | 71,435 |
Yum! Brands, Inc. (Hotels, Restaurants & Leisure) | 4.625% | 01/31/2032 | 100,000 | 91,968 | |
Yum! Brands, Inc. (Hotels, Restaurants & Leisure) | 5.375% | 04/01/2032 | 150,000 | 144,191 | |
ZF North America Capital, Inc. (Automobile Components) | (a) | 6.875% | 04/14/2028 | 200,000 | 203,869 |
ZF North America Capital, Inc. (Automobile Components) | (a) | 6.750% | 04/23/2030 | 125,000 | 127,305 |
18,770,610 | |||||
Consumer Staples–2.9% | |||||
Albertsons Cos., Inc. / Safeway, Inc. / New Albertsons LP / Albertsons LLC (Consumer Staples Distribution & Retail) | (a) | 5.875% | 02/15/2028 | 100,000 | 98,839 |
Albertsons Cos., Inc. / Safeway, Inc. / New Albertsons LP / Albertsons LLC (Consumer Staples Distribution & Retail) | (a) | 3.500% | 03/15/2029 | 150,000 | 134,931 |
BellRing Brands, Inc. (Personal Care Products) | (a) | 7.000% | 03/15/2030 | 550,000 | 563,634 |
Edgewell Personal Care Co. (Personal Care Products) | (a) | 5.500% | 06/01/2028 | 175,000 | 170,747 |
Edgewell Personal Care Co. (Personal Care Products) | (a) | 4.125% | 04/01/2029 | 200,000 | 184,106 |
Energizer Holdings, Inc. (Household Products) | (a) | 6.500% | 12/31/2027 | 100,000 | 99,882 |
Energizer Holdings, Inc. (Household Products) | (a) | 4.750% | 06/15/2028 | 250,000 | 234,035 |
Energizer Holdings, Inc. (Household Products) | (a) | 4.375% | 03/31/2029 | 425,000 | 384,475 |
Performance Food Group, Inc. (Consumer Staples Distribution & Retail) | (a) | 5.500% | 10/15/2027 | 150,000 | 146,715 |
Performance Food Group, Inc. (Consumer Staples Distribution & Retail) | (a) | 4.250% | 08/01/2029 | 250,000 | 227,602 |
Post Holdings, Inc. (Food Products) | (a) | 5.625% | 01/15/2028 | 450,000 | 443,023 |
Post Holdings, Inc. (Food Products) | (a) | 6.250% | 02/15/2032 | 125,000 | 125,162 |
Corporate Bonds (Continued) | Rate | Maturity | Face Amount | Value | |
Consumer Staples (continued) | |||||
U.S. Foods, Inc. (Consumer Staples Distribution & Retail) | (a) | 6.875% | 09/15/2028 | $225,000 | $230,044 |
U.S. Foods, Inc. (Consumer Staples Distribution & Retail) | (a) | 4.750% | 02/15/2029 | 350,000 | 331,968 |
U.S. Foods, Inc. (Consumer Staples Distribution & Retail) | (a) | 4.625% | 06/01/2030 | 175,000 | 162,586 |
3,537,749 | |||||
Energy–11.1% | |||||
Antero Midstream Partners LP / Antero Midstream Finance Corp. (Oil, Gas & Consumable Fuels) | (a) | 5.750% | 03/01/2027 | 250,000 | 247,981 |
Antero Midstream Partners LP / Antero Midstream Finance Corp. (Oil, Gas & Consumable Fuels) | (a) | 5.750% | 01/15/2028 | 625,000 | 614,425 |
Antero Midstream Partners LP / Antero Midstream Finance Corp. (Oil, Gas & Consumable Fuels) | (a) | 5.375% | 06/15/2029 | 625,000 | 605,848 |
Antero Resources Corp. (Oil, Gas & Consumable Fuels) | (a) | 5.375% | 03/01/2030 | 225,000 | 217,744 |
Archrock Partners LP / Archrock Partners Finance Corp. (Oil, Gas & Consumable Fuels) | (a) | 6.875% | 04/01/2027 | 500,000 | 501,993 |
Archrock Partners LP / Archrock Partners Finance Corp. (Oil, Gas & Consumable Fuels) | (a) | 6.250% | 04/01/2028 | 450,000 | 445,672 |
Ascent Resources Utica Holdings LLC / ARU Finance Corp. (Oil, Gas & Consumable Fuels) | (a) | 7.000% | 11/01/2026 | 425,000 | 425,291 |
Ascent Resources Utica Holdings LLC / ARU Finance Corp. (Oil, Gas & Consumable Fuels) | (a) | 8.250% | 12/31/2028 | 125,000 | 128,062 |
Ascent Resources Utica Holdings LLC / ARU Finance Corp. (Oil, Gas & Consumable Fuels) | (a) | 5.875% | 06/30/2029 | 75,000 | 73,295 |
Berry Petroleum Co. LLC (Oil, Gas & Consumable Fuels) | (a) | 7.000% | 02/15/2026 | 175,000 | 172,701 |
Blue Racer Midstream LLC / Blue Racer Finance Corp. (Oil, Gas & Consumable Fuels) | (a) | 7.000% | 07/15/2029 | 75,000 | 76,379 |
Blue Racer Midstream LLC / Blue Racer Finance Corp. (Oil, Gas & Consumable Fuels) | (a) | 7.250% | 07/15/2032 | 200,000 | 205,630 |
Cheniere Energy Partners LP (Oil, Gas & Consumable Fuels) | 4.000% | 03/01/2031 | 200,000 | 181,880 | |
Cheniere Energy Partners LP (Oil, Gas & Consumable Fuels) | 3.250% | 01/31/2032 | 150,000 | 128,029 | |
Cheniere Energy, Inc. (Oil, Gas & Consumable Fuels) | 4.625% | 10/15/2028 | 50,000 | 48,525 | |
Chesapeake Energy Corp. (Oil, Gas & Consumable Fuels) | (a) | 5.500% | 02/01/2026 | 50,000 | 49,521 |
Chesapeake Energy Corp. (Oil, Gas & Consumable Fuels) | (a) | 5.875% | 02/01/2029 | 50,000 | 49,497 |
Chord Energy Corp. (Oil, Gas & Consumable Fuels) | (a) | 6.375% | 06/01/2026 | 75,000 | 74,980 |
Civitas Resources, Inc. (Oil, Gas & Consumable Fuels) | (a) | 8.375% | 07/01/2028 | 250,000 | 261,957 |
Civitas Resources, Inc. (Oil, Gas & Consumable Fuels) | (a) | 8.625% | 11/01/2030 | 150,000 | 160,833 |
Civitas Resources, Inc. (Oil, Gas & Consumable Fuels) | (a) | 8.750% | 07/01/2031 | 50,000 | 53,548 |
CNX Midstream Partners LP (Oil, Gas & Consumable Fuels) | (a) | 4.750% | 04/15/2030 | 650,000 | 585,756 |
Comstock Resources, Inc. (Oil, Gas & Consumable Fuels) | (a) | 6.750% | 03/01/2029 | 500,000 | 484,560 |
Comstock Resources, Inc. (Oil, Gas & Consumable Fuels) | (a) | 5.875% | 01/15/2030 | 100,000 | 93,052 |
DT Midstream, Inc. (Oil, Gas & Consumable Fuels) | (a) | 4.375% | 06/15/2031 | 275,000 | 250,476 |
Endeavor Energy Resources LP / EER Finance, Inc. (Oil, Gas & Consumable Fuels) | (a) | 5.750% | 01/30/2028 | 100,000 | 100,940 |
Energy Transfer LP (Oil, Gas & Consumable Fuels) | (a) | 7.375% | 02/01/2031 | 25,000 | 26,087 |
EQM Midstream Partners LP (Oil, Gas & Consumable Fuels) | (a) | 7.500% | 06/01/2027 | 150,000 | 153,182 |
EQM Midstream Partners LP (Oil, Gas & Consumable Fuels) | (a) | 6.500% | 07/01/2027 | 275,000 | 277,952 |
EQM Midstream Partners LP (Oil, Gas & Consumable Fuels) | 5.500% | 07/15/2028 | 225,000 | 221,567 | |
EQM Midstream Partners LP (Oil, Gas & Consumable Fuels) | (a) | 4.500% | 01/15/2029 | 100,000 | 94,372 |
EQM Midstream Partners LP (Oil, Gas & Consumable Fuels) | (a) | 4.750% | 01/15/2031 | 525,000 | 490,899 |
EQM Midstream Partners LP (Oil, Gas & Consumable Fuels) | 6.500% | 07/15/2048 | 75,000 | 75,718 | |
Hess Midstream Operations LP (Oil, Gas & Consumable Fuels) | (a) | 5.125% | 06/15/2028 | 425,000 | 411,509 |
Hess Midstream Operations LP (Oil, Gas & Consumable Fuels) | (a) | 6.500% | 06/01/2029 | 100,000 | 101,376 |
Hess Midstream Operations LP (Oil, Gas & Consumable Fuels) | (a) | 4.250% | 02/15/2030 | 100,000 | 91,791 |
Hess Midstream Operations LP (Oil, Gas & Consumable Fuels) | (a) | 5.500% | 10/15/2030 | 100,000 | 96,632 |
HF Sinclair Corp. (Oil, Gas & Consumable Fuels) | (a) | 6.375% | 04/15/2027 | 175,000 | 175,370 |
HF Sinclair Corp. (Oil, Gas & Consumable Fuels) | (a) | 5.000% | 02/01/2028 | 300,000 | 290,638 |
Kodiak Gas Services LLC (Energy Equip. & Svs.) | (a) | 7.250% | 02/15/2029 | 100,000 | 102,508 |
Matador Resources Co. (Oil, Gas & Consumable Fuels) | (a) | 6.500% | 04/15/2032 | 300,000 | 300,022 |
Nabors Industries Ltd. (Energy Equip. & Svs.) | (a) | 7.250% | 01/15/2026 | 125,000 | 126,824 |
Nabors Industries Ltd. (Energy Equip. & Svs.) | (a) | 7.500% | 01/15/2028 | 350,000 | 333,971 |
Nabors Industries, Inc. (Oil, Gas & Consumable Fuels) | (a) | 7.375% | 05/15/2027 | 50,000 | 50,860 |
Nabors Industries, Inc. (Energy Equip. & Svs.) | (a) | 9.125% | 01/31/2030 | 50,000 | 51,797 |
Northriver Midstream Finance LP (Oil, Gas & Consumable Fuels) | (a) | 6.750% | 07/15/2032 | 150,000 | 150,263 |
Permian Resources Operating LLC (Oil, Gas & Consumable Fuels) | (a) | 7.000% | 01/15/2032 | 300,000 | 308,180 |
Precision Drilling Corp. (Energy Equip. & Svs.) | (a) | 7.125% | 01/15/2026 | 146,000 | 145,999 |
Precision Drilling Corp. (Energy Equip. & Svs.) | (a) | 6.875% | 01/15/2029 | 175,000 | 173,119 |
Range Resources Corp. (Oil, Gas & Consumable Fuels) | 4.875% | 05/15/2025 | 75,000 | 74,538 | |
Range Resources Corp. (Oil, Gas & Consumable Fuels) | 8.250% | 01/15/2029 | 225,000 | 233,153 | |
Range Resources Corp. (Oil, Gas & Consumable Fuels) | (a) | 4.750% | 02/15/2030 | 125,000 | 117,294 |
Rockcliff Energy II LLC (Oil, Gas & Consumable Fuels) | (a) | 5.500% | 10/15/2029 | 200,000 | 187,210 |
Sitio Royalties Operating Partnership LP / Sitio Finance Corp. (Oil, Gas & Consumable Fuels) | (a) | 7.875% | 11/01/2028 | 100,000 | 103,397 |
SM Energy Co. (Oil, Gas & Consumable Fuels) | 6.750% | 09/15/2026 | 275,000 | 275,091 | |
SM Energy Co. (Oil, Gas & Consumable Fuels) | 6.625% | 01/15/2027 | 25,000 | 24,901 | |
SM Energy Co. (Oil, Gas & Consumable Fuels) | 6.500% | 07/15/2028 | 175,000 | 173,495 | |
Southwestern Energy Co. (Oil, Gas & Consumable Fuels) | 8.375% | 09/15/2028 | 250,000 | 258,484 | |
Southwestern Energy Co. (Oil, Gas & Consumable Fuels) | 5.375% | 03/15/2030 | 75,000 | 72,456 | |
Southwestern Energy Co. (Oil, Gas & Consumable Fuels) | 4.750% | 02/01/2032 | 75,000 | 68,994 | |
Targa Resources Partners LP / Targa Resources Partners Finance Corp. (Oil, Gas & Consumable Fuels) | 5.000% | 01/15/2028 | 300,000 | 293,840 | |
Corporate Bonds (Continued) | Rate | Maturity | Face Amount | Value | |
Energy (continued) | |||||
Targa Resources Partners LP / Targa Resources Partners Finance Corp. (Oil, Gas & Consumable Fuels) | 4.875% | 02/01/2031 | $75,000 | $71,569 | |
U.S.A. Compression Partners LP / U.S.A. Compression Finance Corp. (Energy Equip. & Svs.) | 6.875% | 09/01/2027 | 150,000 | 150,281 | |
U.S.A. Compression Partners LP / U.S.A. Compression Finance Corp. (Energy Equip. & Svs.) | (a) | 7.125% | 03/15/2029 | 325,000 | 327,473 |
Western Midstream Operating LP (Oil, Gas & Consumable Fuels) | 5.300% | 03/01/2048 | 500,000 | 431,709 | |
13,353,096 | |||||
Financials–13.6% | |||||
Acrisure LLC / Acrisure Finance, Inc. (Financial Services) | (a) | 6.000% | 08/01/2029 | 150,000 | 138,395 |
Acrisure LLC / Acrisure Finance, Inc. (Financial Services) | (a) | 7.500% | 11/06/2030 | 325,000 | 325,225 |
Alliant Holdings Intermediate LLC / Alliant Holdings Co-Issuer (Insurance) | (a) | 5.875% | 11/01/2029 | 150,000 | 140,362 |
Alliant Holdings Intermediate LLC / Alliant Holdings Co-Issuer (Insurance) | (a) | 7.000% | 01/15/2031 | 550,000 | 555,623 |
Ally Financial, Inc. (Consumer Finance) | 5.750% | 11/20/2025 | 125,000 | 124,211 | |
AmWINS Group, Inc. (Insurance) | (a) | 6.375% | 02/15/2029 | 275,000 | 275,750 |
AmWINS Group, Inc. (Insurance) | (a) | 4.875% | 06/30/2029 | 600,000 | 558,159 |
Ardonagh Finco Ltd. (Insurance) | (a) | 7.750% | 02/15/2031 | 200,000 | 197,713 |
Ardonagh Group Finance Ltd. (Insurance) | (a) | 8.875% | 02/15/2032 | 1,075,000 | 1,049,964 |
AssuredPartners, Inc. (Insurance) | (a) | 5.625% | 01/15/2029 | 200,000 | 187,081 |
AssuredPartners, Inc. (Insurance) | (a) | 7.500% | 02/15/2032 | 275,000 | 276,037 |
Baldwin Insurance Group Holdings LLC / Baldwin Insurance Group Holdings Finance (Insurance) | (a) | 7.125% | 05/15/2031 | 450,000 | 455,229 |
Boost Newco Borrower LLC (Financial Services) | (a) | 7.500% | 01/15/2031 | 525,000 | 547,392 |
BroadStreet Partners, Inc. (Insurance) | (a) | 5.875% | 04/15/2029 | 1,350,000 | 1,259,663 |
Ford Motor Credit Co. LLC (Consumer Finance) | 4.063% | 11/01/2024 | 225,000 | 223,644 | |
Ford Motor Credit Co. LLC (Consumer Finance) | 3.375% | 11/13/2025 | 575,000 | 556,488 | |
Ford Motor Credit Co. LLC (Consumer Finance) | 2.700% | 08/10/2026 | 200,000 | 187,853 | |
Ford Motor Credit Co. LLC (Consumer Finance) | 4.271% | 01/09/2027 | 450,000 | 433,597 | |
Ford Motor Credit Co. LLC (Consumer Finance) | 7.350% | 11/04/2027 | 225,000 | 234,449 | |
Ford Motor Credit Co. LLC (Consumer Finance) | 5.113% | 05/03/2029 | 400,000 | 386,431 | |
Ford Motor Credit Co. LLC (Consumer Finance) | 4.000% | 11/13/2030 | 350,000 | 312,450 | |
GTCR AP Finance, Inc. (Insurance) | (a) | 8.000% | 05/15/2027 | 550,000 | 551,266 |
HUB International Ltd. (Insurance) | (a) | 5.625% | 12/01/2029 | 650,000 | 614,705 |
HUB International Ltd. (Insurance) | (a) | 7.250% | 06/15/2030 | 575,000 | 589,450 |
HUB International Ltd. (Insurance) | (a) | 7.375% | 01/31/2032 | 900,000 | 912,674 |
Jones Deslauriers Insurance Management, Inc. (Insurance) | (a) | 8.500% | 03/15/2030 | 325,000 | 338,933 |
Jones Deslauriers Insurance Management, Inc. (Insurance) | (a) | 10.500% | 12/15/2030 | 475,000 | 510,080 |
Macquarie Airfinance Holdings Ltd. (Capital Markets) | (a) | 6.500% | 03/26/2031 | 300,000 | 308,494 |
Navient Corp. (Consumer Finance) | 6.750% | 06/25/2025 | 175,000 | 174,916 | |
Navient Corp. (Consumer Finance) | 6.750% | 06/15/2026 | 200,000 | 200,694 | |
Navient Corp. (Consumer Finance) | 5.500% | 03/15/2029 | 350,000 | 319,557 | |
NCR Atleos Corp. (Financial Services) | (a) | 9.500% | 04/01/2029 | 250,000 | 270,185 |
Panther Escrow Issuer LLC (Insurance) | (a) | 7.125% | 06/01/2031 | 625,000 | 632,146 |
Rocket Mortgage LLC / Rocket Mortgage Co-Issuer, Inc. (Financial Services) | (a) | 3.625% | 03/01/2029 | 250,000 | 226,781 |
Rocket Mortgage LLC / Rocket Mortgage Co-Issuer, Inc. (Financial Services) | (a) | 3.875% | 03/01/2031 | 350,000 | 305,019 |
Rocket Mortgage LLC / Rocket Mortgage Co-Issuer, Inc. (Financial Services) | (a) | 4.000% | 10/15/2033 | 400,000 | 337,076 |
Ryan Specialty LLC (Insurance) | (a) | 4.375% | 02/01/2030 | 275,000 | 254,694 |
United Wholesale Mortgage LLC (Financial Services) | (a) | 5.500% | 11/15/2025 | 325,000 | 322,649 |
United Wholesale Mortgage LLC (Financial Services) | (a) | 5.750% | 06/15/2027 | 175,000 | 170,843 |
United Wholesale Mortgage LLC (Financial Services) | (a) | 5.500% | 04/15/2029 | 225,000 | 213,764 |
USI, Inc. (Insurance) | (a) | 7.500% | 01/15/2032 | 775,000 | 787,124 |
16,466,766 | |||||
Health Care–6.7% | |||||
AHP Health Partners, Inc. (Health Care Providers & Svs.) | (a) | 5.750% | 07/15/2029 | 375,000 | 355,986 |
Avantor Funding, Inc. (Health Care Equip. & Supplies) | (a) | 4.625% | 07/15/2028 | 450,000 | 428,219 |
Avantor Funding, Inc. (Health Care Equip. & Supplies) | (a) | 3.875% | 11/01/2029 | 300,000 | 272,809 |
Bausch Health Cos., Inc. (Pharmaceuticals) | (a) | 6.125% | 02/01/2027 | 200,000 | 166,500 |
Centene Corp. (Health Care Providers & Svs.) | 4.250% | 12/15/2027 | 175,000 | 167,088 | |
Centene Corp. (Health Care Providers & Svs.) | 4.625% | 12/15/2029 | 300,000 | 283,747 | |
Centene Corp. (Health Care Providers & Svs.) | 3.375% | 02/15/2030 | 50,000 | 44,381 | |
CHS / Community Health Systems, Inc. (Health Care Providers & Svs.) | (a) | 6.000% | 01/15/2029 | 50,000 | 44,125 |
CHS / Community Health Systems, Inc. (Health Care Providers & Svs.) | (a) | 6.875% | 04/15/2029 | 125,000 | 95,588 |
CHS / Community Health Systems, Inc. (Health Care Providers & Svs.) | (a) | 6.125% | 04/01/2030 | 150,000 | 104,964 |
CHS / Community Health Systems, Inc. (Health Care Providers & Svs.) | (a) | 5.250% | 05/15/2030 | 225,000 | 185,511 |
Concentra Escrow Issuer Corp. (Health Care Providers & Svs.) | (a) | 6.875% | 07/15/2032 | 100,000 | 101,316 |
Embecta Corp. (Health Care Equip. & Supplies) | (a) | 6.750% | 02/15/2030 | 100,000 | 86,919 |
Grifols SA (Biotechnology) | (a) | 4.750% | 10/15/2028 | 875,000 | 755,103 |
HealthEquity, Inc. (Health Care Providers & Svs.) | (a) | 4.500% | 10/01/2029 | 525,000 | 490,707 |
IQVIA, Inc. (Health Care Technology) | (a) | 5.000% | 10/15/2026 | 200,000 | 196,235 |
IQVIA, Inc. (Life Sciences Tools & Svs.) | (a) | 6.500% | 05/15/2030 | 325,000 | 329,888 |
LifePoint Health, Inc. (Health Care Providers & Svs.) | (a) | 5.375% | 01/15/2029 | 475,000 | 417,390 |
Corporate Bonds (Continued) | Rate | Maturity | Face Amount | Value | |
Health Care (continued) | |||||
Medline Borrower LP (Health Care Equip. & Supplies) | (a) | 3.875% | 04/01/2029 | $325,000 | $299,296 |
Medline Borrower LP (Health Care Equip. & Supplies) | (a) | 5.250% | 10/01/2029 | 1,150,000 | 1,097,476 |
Medline Borrower LP / Medline Co-Issuer, Inc. (Health Care Equip. & Supplies) | (a) | 6.250% | 04/01/2029 | 125,000 | 126,415 |
Neogen Food Safety Corp. (Health Care Equip. & Supplies) | (a) | 8.625% | 07/20/2030 | 100,000 | 107,959 |
Organon & Co. / Organon Foreign Debt Co-Issuer B.V. (Pharmaceuticals) | (a) | 5.125% | 04/30/2031 | 450,000 | 404,213 |
Organon & Co. / Organon Foreign Debt Co-Issuer B.V. (Pharmaceuticals) | (a) | 7.875% | 05/15/2034 | 250,000 | 256,876 |
Prestige Brands, Inc. (Pharmaceuticals) | (a) | 3.750% | 04/01/2031 | 175,000 | 152,313 |
Tenet Healthcare Corp. (Health Care Providers & Svs.) | 6.250% | 02/01/2027 | 125,000 | 124,918 | |
Tenet Healthcare Corp. (Health Care Providers & Svs.) | 5.125% | 11/01/2027 | 425,000 | 415,919 | |
Tenet Healthcare Corp. (Health Care Providers & Svs.) | 6.125% | 10/01/2028 | 325,000 | 323,375 | |
Tenet Healthcare Corp. (Health Care Providers & Svs.) | 4.250% | 06/01/2029 | 150,000 | 139,690 | |
Tenet Healthcare Corp. (Health Care Providers & Svs.) | 6.750% | 05/15/2031 | 125,000 | 126,876 | |
8,101,802 | |||||
Industrials–13.7% | |||||
Allied Universal Holdco LLC (Commercial Svs. & Supplies) | (a) | 7.875% | 02/15/2031 | 275,000 | 275,716 |
Allied Universal Holdco LLC / Allied Universal Finance Corp. (Commercial Svs. & Supplies) | (a) | 6.625% | 07/15/2026 | 7,000 | 6,979 |
Allied Universal Holdco LLC / Allied Universal Finance Corp. (Commercial Svs. & Supplies) | (a) | 9.750% | 07/15/2027 | 1,300,000 | 1,292,063 |
American Airlines, Inc. / AAdvantage Loyalty IP Ltd. (Passenger Airlines) | (a) | 5.500% | 04/20/2026 | 133,333 | 132,148 |
American Airlines, Inc. / AAdvantage Loyalty IP Ltd. (Passenger Airlines) | (a) | 5.750% | 04/20/2029 | 150,000 | 145,930 |
American Builders & Contractors Supply Co., Inc. (Trading Companies & Distributors) | (a) | 4.000% | 01/15/2028 | 175,000 | 163,379 |
Artera Services LLC (Construction & Engineering) | (a) | 8.500% | 02/15/2031 | 125,000 | 128,687 |
BCPE Empire Holdings, Inc. (Commercial Svs. & Supplies) | (a) | 7.625% | 05/01/2027 | 850,000 | 823,652 |
Beacon Roofing Supply, Inc. (Trading Companies & Distributors) | (a) | 6.500% | 08/01/2030 | 250,000 | 252,252 |
Brink's Co. / The (Commercial Svs. & Supplies) | (a) | 6.500% | 06/15/2029 | 200,000 | 202,097 |
Brink's Co. / The (Commercial Svs. & Supplies) | (a) | 6.750% | 06/15/2032 | 200,000 | 201,468 |
Camelot Return Merger Sub, Inc. (Building Products) | (a) | 8.750% | 08/01/2028 | 100,000 | 98,040 |
Clarivate Science Holdings Corp. (Professional Svs.) | (a) | 3.875% | 07/01/2028 | 75,000 | 69,658 |
Clarivate Science Holdings Corp. (Professional Svs.) | (a) | 4.875% | 07/01/2029 | 700,000 | 649,644 |
CP Atlas Buyer, Inc. (Building Products) | (a) | 7.000% | 12/01/2028 | 400,000 | 341,934 |
Dun & Bradstreet Corp. / The (Professional Svs.) | (a) | 5.000% | 12/15/2029 | 325,000 | 301,869 |
EMRLD Borrower LP / Emerald Co-Issuer, Inc. (Electrical Equip.) | (a) | 6.625% | 12/15/2030 | 650,000 | 655,071 |
EMRLD Borrower LP / Emerald Co-Issuer, Inc. (Electrical Equip.) | (a) | 6.750% | 07/15/2031 | 100,000 | 101,250 |
Foundation Building Materials, Inc. (Trading Companies & Distributors) | (a) | 6.000% | 03/01/2029 | 600,000 | 532,467 |
Garda World Security Corp. (Commercial Svs. & Supplies) | (a) | 4.625% | 02/15/2027 | 175,000 | 167,223 |
Garda World Security Corp. (Commercial Svs. & Supplies) | (a) | 7.750% | 02/15/2028 | 150,000 | 152,773 |
Garda World Security Corp. (Commercial Svs. & Supplies) | (a) | 6.000% | 06/01/2029 | 300,000 | 273,698 |
Gates Corp. (Machinery) | (a) | 6.875% | 07/01/2029 | 450,000 | 457,848 |
GYP Holdings III Corp. (Building Products) | (a) | 4.625% | 05/01/2029 | 325,000 | 300,767 |
H&E Equipment Services, Inc. (Trading Companies & Distributors) | (a) | 3.875% | 12/15/2028 | 175,000 | 157,897 |
Hillenbrand, Inc. (Machinery) | 6.250% | 02/15/2029 | 350,000 | 351,678 | |
Interface, Inc. (Commercial Svs. & Supplies) | (a) | 5.500% | 12/01/2028 | 200,000 | 187,509 |
Madison IAQ LLC (Commercial Svs. & Supplies) | (a) | 4.125% | 06/30/2028 | 50,000 | 46,631 |
Madison IAQ LLC (Commercial Svs. & Supplies) | (a) | 5.875% | 06/30/2029 | 900,000 | 837,359 |
Masterbrand, Inc. (Building Products) | (a) | 7.000% | 07/15/2032 | 100,000 | 101,130 |
Miter Brands Acquisition Holdco, Inc. / MIWD Borrower LLC (Building Products) | (a) | 6.750% | 04/01/2032 | 250,000 | 251,778 |
MIWD Holdco II LLC / MIWD Finance Corp. (Building Products) | (a) | 5.500% | 02/01/2030 | 75,000 | 69,217 |
Science Applications International Corp. (Professional Svs.) | (a) | 4.875% | 04/01/2028 | 75,000 | 71,574 |
Sensata Technologies B.V. (Electrical Equip.) | (a) | 5.875% | 09/01/2030 | 200,000 | 195,859 |
Sensata Technologies, Inc. (Electrical Equip.) | (a) | 4.375% | 02/15/2030 | 125,000 | 114,800 |
Sensata Technologies, Inc. (Electrical Equip.) | (a) | 3.750% | 02/15/2031 | 25,000 | 21,790 |
Sensata Technologies, Inc. (Electrical Equip.) | (a) | 6.625% | 07/15/2032 | 200,000 | 201,431 |
Solaris Midstream Holdings LLC (Commercial Svs. & Supplies) | (a) | 7.625% | 04/01/2026 | 525,000 | 526,832 |
SPX FLOW, Inc. (Machinery) | (a) | 8.750% | 04/01/2030 | 500,000 | 513,275 |
SS&C Technologies, Inc. (Professional Svs.) | (a) | 5.500% | 09/30/2027 | 600,000 | 590,824 |
SS&C Technologies, Inc. (Professional Svs.) | (a) | 6.500% | 06/01/2032 | 125,000 | 126,087 |
Stena International SA (Marine Transportation) | (a) | 7.250% | 01/15/2031 | 200,000 | 204,436 |
TransDigm, Inc. (Aerospace & Defense) | 5.500% | 11/15/2027 | 150,000 | 147,291 | |
TransDigm, Inc. (Aerospace & Defense) | 4.625% | 01/15/2029 | 125,000 | 116,630 | |
TransDigm, Inc. (Aerospace & Defense) | (a) | 6.375% | 03/01/2029 | 150,000 | 150,756 |
TransDigm, Inc. (Aerospace & Defense) | 4.875% | 05/01/2029 | 425,000 | 398,093 | |
TransDigm, Inc. (Aerospace & Defense) | (a) | 6.875% | 12/15/2030 | 725,000 | 740,116 |
TransDigm, Inc. (Aerospace & Defense) | (a) | 6.625% | 03/01/2032 | 475,000 | 479,778 |
United Rentals North America, Inc. (Trading Companies & Distributors) | 5.500% | 05/15/2027 | 25,000 | 24,808 | |
United Rentals North America, Inc. (Trading Companies & Distributors) | 4.875% | 01/15/2028 | 200,000 | 193,840 | |
United Rentals North America, Inc. (Trading Companies & Distributors) | 5.250% | 01/15/2030 | 75,000 | 72,679 | |
United Rentals North America, Inc. (Trading Companies & Distributors) | 3.875% | 02/15/2031 | 50,000 | 44,608 | |
United Rentals North America, Inc. (Trading Companies & Distributors) | 3.750% | 01/15/2032 | 150,000 | 130,509 | |
United Rentals North America, Inc. (Trading Companies & Distributors) | (a) | 6.125% | 03/15/2034 | 100,000 | 99,635 |
Watco Cos. LLC / Watco Finance Corp. (Ground Transportation) | (a) | 6.500% | 06/15/2027 | 400,000 | 398,369 |
WESCO Distribution, Inc. (Trading Companies & Distributors) | (a) | 7.250% | 06/15/2028 | 250,000 | 254,485 |
Corporate Bonds (Continued) | Rate | Maturity | Face Amount | Value | |
Industrials (continued) | |||||
WESCO Distribution, Inc. (Trading Companies & Distributors) | (a) | 6.375% | 03/15/2029 | $175,000 | $175,632 |
WESCO Distribution, Inc. (Trading Companies & Distributors) | (a) | 6.625% | 03/15/2032 | 75,000 | 75,789 |
White Cap Buyer LLC (Building Products) | (a) | 6.875% | 10/15/2028 | 475,000 | 458,323 |
White Cap Parent LLC (Building Products) | (a)(c) | 8.250%, 9.000% PIK | 03/15/2026 | 325,000 | 325,007 |
16,583,068 | |||||
Information Technology–9.6% | |||||
ams-OSRAM AG (Semiconductors & Equip.) | (a) | 12.250% | 03/30/2029 | 175,000 | 181,201 |
AthenaHealth Group, Inc. (Software) | (a) | 6.500% | 02/15/2030 | 1,250,000 | 1,150,874 |
Boxer Parent Co., Inc. (Software) | (a) | 9.125% | 03/01/2026 | 325,000 | 325,253 |
Capstone Borrower, Inc. (Software) | (a) | 8.000% | 06/15/2030 | 300,000 | 309,810 |
Central Parent LLC / CDK Global II LLC / CDK Financing Co., Inc. (Software) | (a) | 8.000% | 06/15/2029 | 125,000 | 126,918 |
Central Parent, Inc. / CDK Global, Inc. (Software) | (a) | 7.250% | 06/15/2029 | 550,000 | 547,282 |
Ciena Corp. (Communications Equip.) | (a) | 4.000% | 01/31/2030 | 75,000 | 67,790 |
Cloud Software Group, Inc. (Software) | (a) | 6.500% | 03/31/2029 | 400,000 | 384,126 |
Cloud Software Group, Inc. (Software) | (a) | 9.000% | 09/30/2029 | 475,000 | 460,855 |
Cloud Software Group, Inc. (Software) | (a) | 8.250% | 06/30/2032 | 75,000 | 76,443 |
Coherent Corp. (Electronic Equip., Instr. & Comp.) | (a) | 5.000% | 12/15/2029 | 675,000 | 638,803 |
Consensus Cloud Solutions, Inc. (Software) | (a) | 6.000% | 10/15/2026 | 200,000 | 195,074 |
Consensus Cloud Solutions, Inc. (Software) | (a) | 6.500% | 10/15/2028 | 350,000 | 326,773 |
Elastic N.V. (Software) | (a) | 4.125% | 07/15/2029 | 500,000 | 456,531 |
Entegris, Inc. (Semiconductors & Equip.) | (a) | 4.750% | 04/15/2029 | 350,000 | 334,865 |
Entegris, Inc. (Semiconductors & Equip.) | (a) | 5.950% | 06/15/2030 | 250,000 | 247,516 |
Fortress Intermediate 3, Inc. (IT Svs.) | (a) | 7.500% | 06/01/2031 | 150,000 | 153,682 |
Go Daddy Operating Co. LLC / GD Finance Co., Inc. (IT Svs.) | (a) | 5.250% | 12/01/2027 | 225,000 | 220,305 |
Insight Enterprises, Inc. (Electronic Equip., Instr. & Comp.) | (a) | 6.625% | 05/15/2032 | 125,000 | 126,933 |
McAfee Corp. (Software) | (a) | 7.375% | 02/15/2030 | 1,375,000 | 1,270,298 |
NCR Voyix Corp. (Software) | (a) | 5.000% | 10/01/2028 | 225,000 | 212,441 |
NCR Voyix Corp. (Software) | (a) | 5.125% | 04/15/2029 | 50,000 | 47,088 |
NCR Voyix Corp. (Software) | (a) | 5.250% | 10/01/2030 | 325,000 | 297,050 |
Open Text Corp. (Software) | (a) | 6.900% | 12/01/2027 | 175,000 | 181,624 |
Open Text Corp. (Software) | (a) | 3.875% | 12/01/2029 | 350,000 | 313,450 |
Rocket Software, Inc. (Software) | (a) | 9.000% | 11/28/2028 | 125,000 | 127,031 |
Rocket Software, Inc. (Software) | (a) | 6.500% | 02/15/2029 | 625,000 | 544,946 |
Seagate HDD Cayman (Tech. Hardware, Storage & Periph.) | 8.250% | 12/15/2029 | 150,000 | 160,875 | |
Seagate HDD Cayman (Tech. Hardware, Storage & Periph.) | 9.625% | 12/01/2032 | 525,250 | 599,121 | |
Synaptics, Inc. (Semiconductors & Equip.) | (a) | 4.000% | 06/15/2029 | 250,000 | 226,529 |
TTM Technologies, Inc. (Electronic Equip., Instr. & Comp.) | (a) | 4.000% | 03/01/2029 | 450,000 | 412,911 |
UKG, Inc. (Software) | (a) | 6.875% | 02/01/2031 | 475,000 | 480,952 |
Viavi Solutions, Inc. (Communications Equip.) | (a) | 3.750% | 10/01/2029 | 275,000 | 232,254 |
Zebra Technologies Corp. (Electronic Equip., Instr. & Comp.) | (a) | 6.500% | 06/01/2032 | 125,000 | 126,407 |
11,564,011 | |||||
Materials–9.1% | |||||
ARD Finance SA (Containers & Packaging) | (a)(c) | 6.500%, 7.250% PIK | 06/30/2027 | 603,176 | 149,346 |
Ardagh Metal Packaging Finance U.S.A. LLC / Ardagh Metal Packaging Finance PLC (Containers & Packaging) | (a) | 4.000% | 09/01/2029 | 775,000 | 655,848 |
Ardagh Packaging Finance PLC / Ardagh Holdings U.S.A., Inc. (Containers & Packaging) | (a) | 5.250% | 08/15/2027 | 450,000 | 279,145 |
Ardagh Packaging Finance PLC / Ardagh Holdings U.S.A., Inc. (Containers & Packaging) | (a) | 5.250% | 08/15/2027 | 200,000 | 124,064 |
Axalta Coating Systems Dutch Holding B B.V. (Chemicals) | (a) | 7.250% | 02/15/2031 | 150,000 | 155,767 |
Axalta Coating Systems LLC (Chemicals) | (a) | 3.375% | 02/15/2029 | 175,000 | 156,569 |
Axalta Coating Systems LLC / Axalta Coating Systems Dutch Holding B B.V. (Chemicals) | (a) | 4.750% | 06/15/2027 | 150,000 | 145,849 |
Ball Corp. (Containers & Packaging) | 6.875% | 03/15/2028 | 25,000 | 25,659 | |
Ball Corp. (Containers & Packaging) | 6.000% | 06/15/2029 | 100,000 | 100,537 | |
Ball Corp. (Containers & Packaging) | 2.875% | 08/15/2030 | 175,000 | 148,667 | |
Ball Corp. (Containers & Packaging) | 3.125% | 09/15/2031 | 75,000 | 63,433 | |
Berry Global, Inc. (Containers & Packaging) | (a) | 5.625% | 07/15/2027 | 150,000 | 147,574 |
Cleveland-Cliffs, Inc. (Metals & Mining) | (a) | 4.875% | 03/01/2031 | 325,000 | 286,568 |
Cleveland-Cliffs, Inc. (Metals & Mining) | (a) | 7.000% | 03/15/2032 | 150,000 | 148,302 |
Clydesdale Acquisition Holdings, Inc. (Containers & Packaging) | (a) | 8.750% | 04/15/2030 | 1,300,000 | 1,272,252 |
Coeur Mining, Inc. (Metals & Mining) | (a) | 5.125% | 02/15/2029 | 400,000 | 374,873 |
Crown Americas LLC / Crown Americas Capital Corp. V (Containers & Packaging) | 4.250% | 09/30/2026 | 50,000 | 48,177 | |
Crown Americas LLC / Crown Americas Capital Corp. VI (Containers & Packaging) | 4.750% | 02/01/2026 | 275,000 | 270,267 | |
Element Solutions, Inc. (Chemicals) | (a) | 3.875% | 09/01/2028 | 300,000 | 275,703 |
Graphic Packaging International LLC (Containers & Packaging) | (a) | 4.750% | 07/15/2027 | 150,000 | 146,377 |
Graphic Packaging International LLC (Containers & Packaging) | (a) | 3.500% | 03/15/2028 | 100,000 | 92,205 |
Graphic Packaging International LLC (Containers & Packaging) | (a) | 3.500% | 03/01/2029 | 125,000 | 112,028 |
Graphic Packaging International LLC (Containers & Packaging) | (a) | 3.750% | 02/01/2030 | 75,000 | 66,958 |
H.B. Fuller Co. (Chemicals) | 4.250% | 10/15/2028 | 125,000 | 117,815 | |
Herens Holdco SARL (Chemicals) | (a) | 4.750% | 05/15/2028 | 650,000 | 563,836 |
Mauser Packaging Solutions Holding Co. (Containers & Packaging) | (a) | 7.875% | 04/15/2027 | 325,000 | 331,497 |
Corporate Bonds (Continued) | Rate | Maturity | Face Amount | Value | |
Materials (continued) | |||||
Mauser Packaging Solutions Holding Co. (Containers & Packaging) | (a) | 9.250% | 04/15/2027 | $300,000 | $300,193 |
OI European Group B.V. (Containers & Packaging) | (a) | 4.750% | 02/15/2030 | 225,000 | 205,706 |
Olympus Water U.S. Holding Corp. (Chemicals) | (a) | 7.125% | 10/01/2027 | 200,000 | 200,760 |
Olympus Water U.S. Holding Corp. (Chemicals) | (a) | 4.250% | 10/01/2028 | 200,000 | 181,934 |
Olympus Water U.S. Holding Corp. (Chemicals) | (a) | 9.750% | 11/15/2028 | 275,000 | 290,942 |
Olympus Water U.S. Holding Corp. (Chemicals) | (a) | 6.250% | 10/01/2029 | 400,000 | 365,125 |
Owens-Brockway Glass Container, Inc. (Containers & Packaging) | (a) | 6.625% | 05/13/2027 | 38,000 | 37,923 |
Owens-Brockway Glass Container, Inc. (Containers & Packaging) | (a) | 7.250% | 05/15/2031 | 175,000 | 174,696 |
Owens-Brockway Glass Container, Inc. (Containers & Packaging) | (a) | 7.375% | 06/01/2032 | 300,000 | 300,348 |
Sealed Air Corp. (Containers & Packaging) | (a) | 4.000% | 12/01/2027 | 200,000 | 187,966 |
Sealed Air Corp. (Containers & Packaging) | (a) | 5.000% | 04/15/2029 | 75,000 | 71,379 |
Sealed Air Corp. (Containers & Packaging) | (a) | 6.500% | 07/15/2032 | 125,000 | 124,299 |
Sealed Air Corp. / Sealed Air Corp. U.S. (Containers & Packaging) | (a) | 7.250% | 02/15/2031 | 75,000 | 77,220 |
SNF Group SACA (Chemicals) | (a) | 3.375% | 03/15/2030 | 200,000 | 172,483 |
Standard Industries, Inc. (Construction Materials) | (a) | 5.000% | 02/15/2027 | 800,000 | 777,650 |
Standard Industries, Inc. (Construction Materials) | (a) | 4.750% | 01/15/2028 | 25,000 | 23,787 |
Trivium Packaging Finance B.V. (Containers & Packaging) | (a) | 5.500% | 08/15/2026 | 200,000 | 195,957 |
Trivium Packaging Finance B.V. (Containers & Packaging) | (a) | 8.500% | 08/15/2027 | 725,000 | 719,592 |
W.R. Grace Holdings LLC (Chemicals) | (a) | 4.875% | 06/15/2027 | 100,000 | 96,433 |
W.R. Grace Holdings LLC (Chemicals) | (a) | 5.625% | 08/15/2029 | 250,000 | 230,424 |
10,994,133 | |||||
Real Estate–1.6% | |||||
Iron Mountain, Inc. (Specialized REITs) | (a) | 7.000% | 02/15/2029 | 300,000 | 305,277 |
Outfront Media Capital LLC / Outfront Media Capital Corp. (Specialized REITs) | (a) | 5.000% | 08/15/2027 | 50,000 | 48,401 |
Outfront Media Capital LLC / Outfront Media Capital Corp. (Specialized REITs) | (a) | 4.250% | 01/15/2029 | 400,000 | 364,728 |
Outfront Media Capital LLC / Outfront Media Capital Corp. (Specialized REITs) | (a) | 4.625% | 03/15/2030 | 225,000 | 202,600 |
Outfront Media Capital LLC / Outfront Media Capital Corp. (Specialized REITs) | (a) | 7.375% | 02/15/2031 | 75,000 | 78,053 |
RHP Hotel Properties LP / RHP Finance Corp. (Hotel & Resort REITs) | (a) | 7.250% | 07/15/2028 | 325,000 | 336,075 |
RHP Hotel Properties LP / RHP Finance Corp. (Hotel & Resort REITs) | (a) | 6.500% | 04/01/2032 | 125,000 | 125,009 |
VICI Properties LP / VICI Note Co., Inc. (Specialized REITs) | (a) | 4.250% | 12/01/2026 | 175,000 | 168,768 |
VICI Properties LP / VICI Note Co., Inc. (Specialized REITs) | (a) | 4.625% | 12/01/2029 | 225,000 | 212,934 |
VICI Properties LP / VICI Note Co., Inc. (Specialized REITs) | (a) | 4.125% | 08/15/2030 | 100,000 | 90,946 |
1,932,791 | |||||
Utilities–3.2% | |||||
AmeriGas Partners LP / AmeriGas Finance Corp. (Gas Utilities) | 5.875% | 08/20/2026 | 425,000 | 411,817 | |
Calpine Corp. (Ind. Power & Renewable Elec.) | (a) | 5.250% | 06/01/2026 | 50,000 | 49,446 |
Calpine Corp. (Ind. Power & Renewable Elec.) | (a) | 4.500% | 02/15/2028 | 300,000 | 285,026 |
Calpine Corp. (Ind. Power & Renewable Elec.) | (a) | 4.625% | 02/01/2029 | 150,000 | 139,170 |
Calpine Corp. (Ind. Power & Renewable Elec.) | (a) | 5.000% | 02/01/2031 | 100,000 | 93,330 |
Calpine Corp. (Ind. Power & Renewable Elec.) | (a) | 3.750% | 03/01/2031 | 300,000 | 265,133 |
NextEra Energy Operating Partners LP (Electric Utilities) | (a) | 7.250% | 01/15/2029 | 175,000 | 179,457 |
NRG Energy, Inc. (Electric Utilities) | 6.625% | 01/15/2027 | 76,000 | 75,849 | |
NRG Energy, Inc. (Electric Utilities) | (a) | 3.375% | 02/15/2029 | 25,000 | 22,239 |
NRG Energy, Inc. (Electric Utilities) | (a) | 3.625% | 02/15/2031 | 25,000 | 21,440 |
NRG Energy, Inc. (Electric Utilities) | (a) | 3.875% | 02/15/2032 | 70,000 | 60,102 |
Suburban Propane Partners LP / Suburban Energy Finance Corp. (Gas Utilities) | 5.875% | 03/01/2027 | 325,000 | 321,612 | |
Suburban Propane Partners LP / Suburban Energy Finance Corp. (Gas Utilities) | (a) | 5.000% | 06/01/2031 | 125,000 | 112,567 |
TerraForm Power Operating LLC (Ind. Power & Renewable Elec.) | (a) | 5.000% | 01/31/2028 | 750,000 | 716,380 |
TransAlta Corp. (Ind. Power & Renewable Elec.) | 7.750% | 11/15/2029 | 350,000 | 365,231 | |
Vistra Operations Co. LLC (Ind. Power & Renewable Elec.) | (a) | 5.500% | 09/01/2026 | 225,000 | 221,885 |
Vistra Operations Co. LLC (Ind. Power & Renewable Elec.) | (a) | 5.000% | 07/31/2027 | 250,000 | 241,836 |
Vistra Operations Co. LLC (Ind. Power & Renewable Elec.) | (a) | 7.750% | 10/15/2031 | 300,000 | 312,417 |
3,894,937 | |||||
Total Corporate Bonds (Cost $122,717,574) | $116,899,638 | ||||
Total Investments – 96.7% (Cost $122,717,574) | (d) | $116,899,638 | |||
Other Assets in Excess of Liabilities – 3.3% | 4,048,224 | ||||
Net Assets – 100.0% | $120,947,862 | ||||
Percentages are stated as a percent of net assets. |
Abbreviations: | ||
PIK: | Payment-in-Kind | |
REITs: | Real Estate Investment Trusts | |
Footnotes: | ||
(a) | Security exempt from registration under Regulation D of the Securities Act of 1933. These securities may be resold in transactions exempt from registration, normally to qualified buyers under Rule 144A. At June 30, 2024, the value of these securities totaled $102,555,552, or 84.8% of the Portfolio’s net assets. | |
(b) | Represents a security that is in default and deemed to be non-income producing. | |
(c) | Issuer of the security has the option to make coupon payments in cash or in additional par value of this bond (Payment-in-Kind). | |
(d) | Represents cost for financial reporting purposes, which may differ from cost basis for federal income tax purposes. See also Note 7 of the Notes to Financial Statements. | |
Common Stocks–99.8% | Shares | Value | |
Communication Services–15.5% | |||
Alphabet, Inc. Class A (Interactive Media & Svs.) | 41,705 | $7,596,566 | |
Alphabet, Inc. Class C (Interactive Media & Svs.) | 39,880 | 7,314,789 | |
Charter Communications, Inc. Class A (Media) | (a) | 2,641 | 789,553 |
Comcast Corp. Class A (Media) | 71,779 | 2,810,866 | |
Electronic Arts, Inc. (Entertainment) | 4,885 | 680,627 | |
Meta Platforms, Inc. Class A (Interactive Media & Svs.) | 24,753 | 12,480,958 | |
Netflix, Inc. (Entertainment) | (a) | 7,902 | 5,332,902 |
Take-Two Interactive Software, Inc. (Entertainment) | (a) | 3,143 | 488,705 |
T-Mobile U.S., Inc. (Wireless Telecom. Svs.) | 21,490 | 3,786,108 | |
Trade Desk, Inc. / The Class A (Media) | (a) | 8,164 | 797,378 |
Warner Bros. Discovery, Inc. (Entertainment) | (a) | 44,934 | 334,309 |
42,412,761 | |||
Consumer Discretionary–12.5% | |||
Airbnb, Inc. Class A (Hotels, Restaurants & Leisure) | (a) | 8,096 | 1,227,596 |
Amazon.com, Inc. (Broadline Retail) | (a) | 73,886 | 14,278,469 |
Booking Holdings, Inc. (Hotels, Restaurants & Leisure) | 622 | 2,464,053 | |
DoorDash, Inc. Class A (Hotels, Restaurants & Leisure) | (a) | 6,999 | 761,351 |
Lululemon Athletica, Inc. (Textiles, Apparel & Luxury Goods) | (a) | 2,215 | 661,621 |
Marriott International, Inc. Class A (Hotels, Restaurants & Leisure) | 5,238 | 1,266,391 | |
MercadoLibre, Inc. (Broadline Retail) | (a) | 930 | 1,528,362 |
O'Reilly Automotive, Inc. (Specialty Retail) | (a) | 1,080 | 1,140,545 |
PDD Holdings, Inc. – ADR (Broadline Retail) | (a) | 12,249 | 1,628,505 |
Ross Stores, Inc. (Specialty Retail) | 6,149 | 893,573 | |
Starbucks Corp. (Hotels, Restaurants & Leisure) | 20,772 | 1,617,100 | |
Tesla, Inc. (Automobiles) | (a) | 34,274 | 6,782,139 |
34,249,705 | |||
Consumer Staples–6.0% | |||
Coca-Cola Europacific Partners PLC (Beverages) | 8,421 | 613,638 | |
Costco Wholesale Corp. (Consumer Staples Distribution & Retail) | 8,133 | 6,912,969 | |
Dollar Tree, Inc. (Consumer Staples Distribution & Retail) | (a) | 4,000 | 427,080 |
Keurig Dr Pepper, Inc. (Beverages) | 24,859 | 830,291 | |
Kraft Heinz Co. / The (Food Products) | 22,268 | 717,475 | |
Mondelez International, Inc. Class A (Food Products) | 24,598 | 1,609,693 | |
Monster Beverage Corp. (Beverages) | (a) | 19,103 | 954,195 |
PepsiCo, Inc. (Beverages) | 25,211 | 4,158,050 | |
Walgreens Boots Alliance, Inc. (Consumer Staples Distribution & Retail) | 15,820 | 191,343 | |
16,414,734 | |||
Energy–0.5% | |||
Baker Hughes Co. (Energy Equip. & Svs.) | 18,301 | 643,646 | |
Diamondback Energy, Inc. (Oil, Gas & Consumable Fuels) | 3,270 | 654,622 | |
1,298,268 | |||
Financials–0.4% | |||
PayPal Holdings, Inc. (Financial Services) | (a) | 19,182 | 1,113,131 |
Health Care–6.1% | |||
Amgen, Inc. (Biotechnology) | 9,837 | 3,073,571 | |
AstraZeneca PLC – ADR (Pharmaceuticals) | 10,678 | 832,777 | |
Biogen, Inc. (Biotechnology) | (a) | 2,670 | 618,959 |
Dexcom, Inc. (Health Care Equip. & Supplies) | (a) | 7,293 | 826,880 |
Common Stocks (Continued) | Shares | Value | |
Health Care (continued) | |||
GE HealthCare Technologies, Inc. (Health Care Equip. & Supplies) | 8,371 | $652,268 | |
Gilead Sciences, Inc. (Biotechnology) | 22,847 | 1,567,533 | |
GRAIL, Inc. (Biotechnology) | (a) | 501 | 7,703 |
IDEXX Laboratories, Inc. (Health Care Equip. & Supplies) | (a) | 1,514 | 737,621 |
Illumina, Inc. (Life Sciences Tools & Svs.) | (a) | 2,921 | 304,894 |
Intuitive Surgical, Inc. (Health Care Equip. & Supplies) | (a) | 6,505 | 2,893,749 |
Moderna, Inc. (Biotechnology) | (a) | 7,028 | 834,575 |
Regeneron Pharmaceuticals, Inc. (Biotechnology) | (a) | 1,987 | 2,088,397 |
Vertex Pharmaceuticals, Inc. (Biotechnology) | (a) | 4,732 | 2,217,983 |
16,656,910 | |||
Industrials–4.3% | |||
Automatic Data Processing, Inc. (Professional Svs.) | 7,506 | 1,791,607 | |
Cintas Corp. (Commercial Svs. & Supplies) | 1,861 | 1,303,184 | |
Copart, Inc. (Commercial Svs. & Supplies) | (a) | 17,647 | 955,762 |
CSX Corp. (Ground Transportation) | 35,850 | 1,199,182 | |
Fastenal Co. (Trading Companies & Distributors) | 10,499 | 659,757 | |
Honeywell International, Inc. (Industrial Conglomerates) | 11,941 | 2,549,881 | |
Old Dominion Freight Line, Inc. (Ground Transportation) | 3,985 | 703,751 | |
PACCAR, Inc. (Machinery) | 9,612 | 989,459 | |
Paychex, Inc. (Professional Svs.) | 6,601 | 782,615 | |
Verisk Analytics, Inc. (Professional Svs.) | 2,616 | 705,143 | |
11,640,341 | |||
Information Technology–51.7% | |||
Adobe, Inc. (Software) | (a) | 8,215 | 4,563,761 |
Advanced Micro Devices, Inc. (Semiconductors & Equip.) | (a) | 29,640 | 4,807,904 |
Analog Devices, Inc. (Semiconductors & Equip.) | 9,100 | 2,077,166 | |
ANSYS, Inc. (Software) | (a) | 1,601 | 514,722 |
Apple, Inc. (Tech. Hardware, Storage & Periph.) | 108,870 | 22,930,199 | |
Applied Materials, Inc. (Semiconductors & Equip.) | 15,183 | 3,583,036 | |
ARM Holdings PLC – ADR (Semiconductors & Equip.) | (a) | 2,168 | 354,728 |
ASML Holding N.V. (Semiconductors & Equip.) | 1,669 | 1,706,936 | |
Atlassian Corp. Class A (Software) | (a) | 2,921 | 516,666 |
Autodesk, Inc. (Software) | (a) | 3,951 | 977,675 |
Broadcom, Inc. (Semiconductors & Equip.) | 8,498 | 13,643,794 | |
Cadence Design Systems, Inc. (Software) | (a) | 4,990 | 1,535,673 |
CDW Corp. (Electronic Equip., Instr. & Comp.) | 2,465 | 551,766 | |
Cisco Systems, Inc. (Communications Equip.) | 73,881 | 3,510,086 | |
Cognizant Technology Solutions Corp. Class A (IT Svs.) | 9,118 | 620,024 | |
Crowdstrike Holdings, Inc. Class A (Software) | (a) | 4,230 | 1,620,894 |
Datadog, Inc. Class A (Software) | (a) | 5,656 | 733,527 |
Fortinet, Inc. (Software) | (a) | 14,009 | 844,322 |
GLOBALFOUNDRIES, Inc. (Semiconductors & Equip.) | (a) | 10,115 | 511,414 |
Intel Corp. (Semiconductors & Equip.) | 78,065 | 2,417,673 | |
Intuit, Inc. (Software) | 5,126 | 3,368,858 | |
KLA Corp. (Semiconductors & Equip.) | 2,469 | 2,035,715 | |
Lam Research Corp. (Semiconductors & Equip.) | 2,398 | 2,553,510 | |
Marvell Technology, Inc. (Semiconductors & Equip.) | 15,873 | 1,109,523 | |
Microchip Technology, Inc. (Semiconductors & Equip.) | 9,845 | 900,818 | |
Common Stocks (Continued) | Shares | Value | |
Information Technology (continued) | |||
Micron Technology, Inc. (Semiconductors & Equip.) | 20,307 | $2,670,980 | |
Microsoft Corp. (Software) | 52,769 | 23,585,105 | |
MongoDB, Inc. (IT Svs.) | (a) | 1,345 | 336,196 |
NVIDIA Corp. (Semiconductors & Equip.) | 174,646 | 21,575,767 | |
NXP Semiconductors N.V. (Semiconductors & Equip.) | 4,689 | 1,261,763 | |
ON Semiconductor Corp. (Semiconductors & Equip.) | (a) | 7,890 | 540,860 |
Palo Alto Networks, Inc. (Software) | (a) | 5,938 | 2,013,041 |
QUALCOMM, Inc. (Semiconductors & Equip.) | 20,465 | 4,076,219 | |
Roper Technologies, Inc. (Software) | 1,963 | 1,106,465 | |
Synopsys, Inc. (Software) | (a) | 2,810 | 1,672,119 |
Texas Instruments, Inc. (Semiconductors & Equip.) | 16,696 | 3,247,873 | |
Workday, Inc. Class A (Software) | (a) | 3,888 | 869,201 |
Zscaler, Inc. (Software) | (a) | 2,748 | 528,138 |
141,474,117 | |||
Materials–1.4% | |||
Linde PLC (Chemicals) | 8,815 | 3,868,110 | |
Common Stocks (Continued) | Shares | Value | |
Real Estate–0.2% | |||
CoStar Group, Inc. (Real Estate Mgmt. & Development) | (a) | 7,491 | $555,383 |
Utilities–1.2% | |||
American Electric Power Co., Inc. (Electric Utilities) | 9,666 | 848,095 | |
Constellation Energy Corp. (Electric Utilities) | 5,781 | 1,157,761 | |
Exelon Corp. (Electric Utilities) | 18,339 | 634,713 | |
Xcel Energy, Inc. (Electric Utilities) | 10,189 | 544,194 | |
3,184,763 | |||
Total Common Stocks (Cost $154,792,620) | $272,868,223 | ||
U.S. Treasury Obligations–0.0% | Rate | Maturity | Face Amount | Value | |
U.S. Treasury Bill | (b) | 0.000% | 08/22/2024 | $111,000 | $110,162 |
Total U.S. Treasury Obligations (Cost $110,160) | $110,162 | ||||
Total Investments – 99.8% (Cost $154,902,780) | (c) | $272,978,385 | |||
Other Assets in Excess of Liabilities – 0.2% | 488,507 | ||||
Net Assets – 100.0% | $273,466,892 | ||||
Percentages are stated as a percent of net assets. |
Abbreviations: | ||
ADR: | American Depositary Receipts | |
Footnotes: | ||
(a) | Non-income producing security. | |
(b) | Security is fully pledged as collateral for the futures contracts outstanding at June 30, 2024. The value of securities pledged totaled $110,162. See also the following Schedule of Open Futures Contracts. | |
(c) | Represents cost for financial reporting purposes, which may differ from cost basis for federal income tax purposes. See also Note 7 of the Notes to Financial Statements. | |
Description | Number of contracts | Expiration Date | Notional Amount | Value | Unrealized Appreciation (Depreciation) | Variation Margin Receivable (Payable) |
CME E-mini Nasdaq-100 Index - Long | 5 | September 20, 2024 | $1,974,820 | $1,992,726 | $17,906 | $(11,225 ) |
Common Stocks–99.0% | Shares | Value | |
Communication Services–9.8% | |||
Alphabet, Inc. Class A (Interactive Media & Svs.) | 58,243 | $10,608,962 | |
Alphabet, Inc. Class C (Interactive Media & Svs.) | 36,464 | 6,688,227 | |
Comcast Corp. Class A (Media) | 124,193 | 4,863,398 | |
Fox Corp. Class A (Media) | 85,023 | 2,922,241 | |
Fox Corp. Class B (Media) | 977 | 31,284 | |
Meta Platforms, Inc. Class A (Interactive Media & Svs.) | 14,497 | 7,309,677 | |
Netflix, Inc. (Entertainment) | (a) | 1,451 | 979,251 |
33,403,040 | |||
Consumer Discretionary–10.2% | |||
Amazon.com, Inc. (Broadline Retail) | (a) | 87,980 | 17,002,135 |
AutoNation, Inc. (Specialty Retail) | (a) | 3,233 | 515,276 |
Carnival Corp. (Hotels, Restaurants & Leisure) | (a) | 30,164 | 564,670 |
D.R. Horton, Inc. (Household Durables) | 12,337 | 1,738,653 | |
General Motors Co. (Automobiles) | 43,122 | 2,003,448 | |
Home Depot, Inc. / The (Specialty Retail) | 15,763 | 5,426,255 | |
Lear Corp. (Automobile Components) | 3,060 | 349,483 | |
MGM Resorts International (Hotels, Restaurants & Leisure) | (a) | 11,309 | 502,572 |
NIKE, Inc. Class B (Textiles, Apparel & Luxury Goods) | 29,959 | 2,258,010 | |
Tesla, Inc. (Automobiles) | (a) | 6,446 | 1,275,534 |
TJX Cos., Inc. / The (Specialty Retail) | 4,073 | 448,437 | |
Toll Brothers, Inc. (Household Durables) | 21,716 | 2,501,249 | |
34,585,722 | |||
Consumer Staples–5.6% | |||
Colgate-Palmolive Co. (Household Products) | 9,684 | 939,735 | |
Costco Wholesale Corp. (Consumer Staples Distribution & Retail) | 5,641 | 4,794,794 | |
Hershey Co. / The (Food Products) | 9,934 | 1,826,167 | |
Kimberly-Clark Corp. (Household Products) | 28,729 | 3,970,348 | |
Kroger Co. / The (Consumer Staples Distribution & Retail) | 46,939 | 2,343,664 | |
Monster Beverage Corp. (Beverages) | (a) | 16,864 | 842,357 |
PepsiCo, Inc. (Beverages) | 23,217 | 3,829,180 | |
Walmart, Inc. (Consumer Staples Distribution & Retail) | 9,793 | 663,084 | |
19,209,329 | |||
Energy–3.2% | |||
Chevron Corp. (Oil, Gas & Consumable Fuels) | 9,275 | 1,450,795 | |
ConocoPhillips (Oil, Gas & Consumable Fuels) | 6,652 | 760,856 | |
Devon Energy Corp. (Oil, Gas & Consumable Fuels) | 40,529 | 1,921,075 | |
EOG Resources, Inc. (Oil, Gas & Consumable Fuels) | 11,005 | 1,385,199 | |
Exxon Mobil Corp. (Oil, Gas & Consumable Fuels) | 15,054 | 1,733,016 | |
Marathon Petroleum Corp. (Oil, Gas & Consumable Fuels) | 8,049 | 1,396,341 | |
Schlumberger N.V. (Energy Equip. & Svs.) | 50,722 | 2,393,064 | |
11,040,346 | |||
Financials–11.8% | |||
Berkshire Hathaway, Inc. Class B (Financial Services) | (a) | 10,230 | 4,161,564 |
Invesco Ltd. (Capital Markets) | 73,239 | 1,095,655 | |
JPMorgan Chase & Co. (Banks) | 20,783 | 4,203,570 | |
KeyCorp (Banks) | 109,323 | 1,553,480 | |
Marsh & McLennan Cos., Inc. (Insurance) | 20,996 | 4,424,277 | |
Mastercard, Inc. Class A (Financial Services) | 14,496 | 6,395,055 | |
Moody's Corp. (Capital Markets) | 2,632 | 1,107,888 | |
Nasdaq, Inc. (Capital Markets) | 47,059 | 2,835,775 | |
Progressive Corp. / The (Insurance) | 18,307 | 3,802,547 | |
Reinsurance Group of America, Inc. (Insurance) | 3,298 | 676,981 | |
Common Stocks (Continued) | Shares | Value | |
Financials (continued) | |||
S&P Global, Inc. (Capital Markets) | 6,397 | $2,853,062 | |
Travelers Cos., Inc. / The (Insurance) | 4,859 | 988,029 | |
Visa, Inc. (Financial Services) | 23,140 | 6,073,556 | |
40,171,439 | |||
Health Care–12.2% | |||
Amgen, Inc. (Biotechnology) | 5,990 | 1,871,576 | |
Biogen, Inc. (Biotechnology) | (a) | 2,283 | 529,245 |
Bristol-Myers Squibb Co. (Pharmaceuticals) | 47,063 | 1,954,526 | |
Cardinal Health, Inc. (Health Care Providers & Svs.) | 15,134 | 1,487,975 | |
Centene Corp. (Health Care Providers & Svs.) | (a) | 5,942 | 393,955 |
Cigna Group / The (Health Care Providers & Svs.) | 1,482 | 483,532 | |
Dexcom, Inc. (Health Care Equip. & Supplies) | (a) | 3,966 | 449,665 |
Elevance Health, Inc. (Health Care Providers & Svs.) | 6,537 | 3,542,139 | |
Eli Lilly & Co. (Pharmaceuticals) | 7,047 | 6,380,213 | |
Exelixis, Inc. (Biotechnology) | (a) | 38,620 | 867,791 |
Gilead Sciences, Inc. (Biotechnology) | 64,819 | 4,447,232 | |
Incyte Corp. (Biotechnology) | (a) | 30,605 | 1,855,275 |
Labcorp Holdings, Inc. (Health Care Providers & Svs.) | 4,684 | 953,241 | |
Medtronic PLC (Health Care Equip. & Supplies) | 52,917 | 4,165,097 | |
Merck & Co., Inc. (Pharmaceuticals) | 9,159 | 1,133,884 | |
Neurocrine Biosciences, Inc. (Biotechnology) | (a) | 6,112 | 841,439 |
Pfizer, Inc. (Pharmaceuticals) | 68,437 | 1,914,867 | |
Stryker Corp. (Health Care Equip. & Supplies) | 9,029 | 3,072,117 | |
Thermo Fisher Scientific, Inc. (Life Sciences Tools & Svs.) | 2,791 | 1,543,423 | |
UnitedHealth Group, Inc. (Health Care Providers & Svs.) | 6,281 | 3,198,662 | |
Zoetis, Inc. (Pharmaceuticals) | 3,241 | 561,860 | |
41,647,714 | |||
Industrials–8.6% | |||
AECOM (Construction & Engineering) | 20,446 | 1,802,110 | |
American Airlines Group, Inc. (Passenger Airlines) | (a) | 99,939 | 1,132,309 |
Builders FirstSource, Inc. (Building Products) | (a) | 2,870 | 397,237 |
Cintas Corp. (Commercial Svs. & Supplies) | 4,919 | 3,444,579 | |
CNH Industrial N.V. (Machinery) | 41,088 | 416,221 | |
Cummins, Inc. (Machinery) | 1,382 | 382,717 | |
Eaton Corp. PLC (Electrical Equip.) | 8,346 | 2,616,888 | |
Expeditors International of Washington, Inc. (Air Freight & Logistics) | 11,538 | 1,439,827 | |
Lockheed Martin Corp. (Aerospace & Defense) | 9,713 | 4,536,942 | |
Old Dominion Freight Line, Inc. (Ground Transportation) | 2,588 | 457,041 | |
Oshkosh Corp. (Machinery) | 24,652 | 2,667,346 | |
Parker-Hannifin Corp. (Machinery) | 7,413 | 3,749,570 | |
W.W. Grainger, Inc. (Trading Companies & Distributors) | 2,157 | 1,946,132 | |
Waste Management, Inc. (Commercial Svs. & Supplies) | 9,766 | 2,083,479 | |
Watsco, Inc. (Trading Companies & Distributors) | 2,291 | 1,061,283 | |
WESCO International, Inc. (Trading Companies & Distributors) | 2,179 | 345,415 | |
Xylem, Inc. (Machinery) | 5,675 | 769,700 | |
29,248,796 | |||
Information Technology–32.5% | |||
Adobe, Inc. (Software) | (a) | 2,629 | 1,460,515 |
Apple, Inc. (Tech. Hardware, Storage & Periph.) | 123,858 | 26,086,972 | |
Applied Materials, Inc. (Semiconductors & Equip.) | 5,078 | 1,198,357 | |
Atlassian Corp. Class A (Software) | (a) | 5,000 | 884,400 |
Common Stocks (Continued) | Shares | Value | |
Information Technology (continued) | |||
Broadcom, Inc. (Semiconductors & Equip.) | 1,758 | $2,822,522 | |
Crowdstrike Holdings, Inc. Class A (Software) | (a) | 2,946 | 1,128,878 |
Fortinet, Inc. (Software) | (a) | 21,665 | 1,305,750 |
Intel Corp. (Semiconductors & Equip.) | 33,664 | 1,042,574 | |
Lam Research Corp. (Semiconductors & Equip.) | 4,267 | 4,543,715 | |
Manhattan Associates, Inc. (Software) | (a) | 14,162 | 3,493,482 |
Micron Technology, Inc. (Semiconductors & Equip.) | 17,121 | 2,251,925 | |
Microsoft Corp. (Software) | 63,079 | 28,193,159 | |
Monolithic Power Systems, Inc. (Semiconductors & Equip.) | 2,606 | 2,141,298 | |
NVIDIA Corp. (Semiconductors & Equip.) | 184,060 | 22,738,772 | |
QUALCOMM, Inc. (Semiconductors & Equip.) | 26,767 | 5,331,451 | |
ServiceNow, Inc. (Software) | (a) | 2,779 | 2,186,156 |
TE Connectivity Ltd. (Electronic Equip., Instr. & Comp.) | 27,126 | 4,080,564 | |
110,890,490 | |||
Materials–1.7% | |||
Ecolab, Inc. (Chemicals) | 7,251 | 1,725,738 | |
Louisiana-Pacific Corp. (Paper & Forest Products) | 12,892 | 1,061,398 | |
LyondellBasell Industries N.V. Class A (Chemicals) | 12,911 | 1,235,066 | |
Nucor Corp. (Metals & Mining) | 11,931 | 1,886,053 | |
5,908,255 | |||
Common Stocks (Continued) | Shares | Value | |
Real Estate–1.7% | |||
Camden Property Trust (Residential REITs) | 11,756 | $1,282,697 | |
Equinix, Inc. (Specialized REITs) | 3,701 | 2,800,177 | |
Simon Property Group, Inc. (Retail REITs) | 10,108 | 1,534,394 | |
5,617,268 | |||
Utilities–1.7% | |||
AES Corp. / The (Ind. Power & Renewable Elec.) | 127,925 | 2,247,642 | |
CMS Energy Corp. (Multi-Utilities) | 22,743 | 1,353,891 | |
OGE Energy Corp. (Electric Utilities) | 37,696 | 1,345,747 | |
PPL Corp. (Electric Utilities) | 28,169 | 778,873 | |
5,726,153 | |||
Total Common Stocks (Cost $258,871,553) | $337,448,552 | ||
Total Investments – 99.0% (Cost $258,871,553) | (b) | $337,448,552 | |
Other Assets in Excess of Liabilities – 1.0% | (c) | 3,376,099 | |
Net Assets – 100.0% | $340,824,651 | ||
Percentages are stated as a percent of net assets. |
Abbreviations: | ||
REITs: | Real Estate Investment Trusts | |
Footnotes: | ||
(a) | Non-income producing security. | |
(b) | Represents cost for financial reporting purposes, which may differ from cost basis for federal income tax purposes. See also Note 7 of the Notes to Financial Statements. | |
(c) | Includes $188,800 of cash pledged as collateral for the futures contracts outstanding at June 30, 2024. See also the following Schedule of Open Futures Contracts. | |
Description | Number of contracts | Expiration Date | Notional Amount | Value | Unrealized Appreciation (Depreciation) | Variation Margin Receivable (Payable) |
CME E-mini S&P 500 Index - Long | 18 | September 20, 2024 | $4,967,454 | $4,969,350 | $1,896 | $(21,435 ) |
Common Stocks–98.9% | Shares | Value | |
Communication Services–2.3% | |||
Bandwidth, Inc. Class A (Diversified Telecom. Svs.) | (a) | 12,048 | $203,370 |
Bumble, Inc. Class A (Interactive Media & Svs.) | (a) | 9,827 | 103,282 |
Cargurus, Inc. (Interactive Media & Svs.) | (a) | 27,657 | 724,614 |
Eventbrite, Inc. Class A (Entertainment) | (a) | 9,898 | 47,906 |
EverQuote, Inc. Class A (Interactive Media & Svs.) | (a) | 3,933 | 82,042 |
Ibotta, Inc. Class A (Media) | (a) | 268 | 20,143 |
IDT Corp. Class B (Diversified Telecom. Svs.) | 8,567 | 307,727 | |
Integral Ad Science Holding Corp. (Media) | (a) | 14,747 | 143,341 |
Paramount Global Class B (Media) | 8,956 | 93,053 | |
Roku, Inc. (Entertainment) | (a) | 3,440 | 206,159 |
Shutterstock, Inc. (Interactive Media & Svs.) | 8,642 | 334,445 | |
Yelp, Inc. (Interactive Media & Svs.) | (a) | 15,775 | 582,886 |
ZipRecruiter, Inc. Class A (Interactive Media & Svs.) | (a) | 26,513 | 241,003 |
3,089,971 | |||
Consumer Discretionary–12.2% | |||
1-800-Flowers.com, Inc. Class A (Specialty Retail) | (a) | 25,190 | 239,809 |
2U, Inc. (Diversified Consumer Svs.) | (a) | 906 | 4,648 |
Abercrombie & Fitch Co. Class A (Specialty Retail) | (a) | 8,216 | 1,461,133 |
Academy Sports & Outdoors, Inc. (Specialty Retail) | 5,455 | 290,479 | |
Accel Entertainment, Inc. (Hotels, Restaurants & Leisure) | (a) | 32,387 | 332,291 |
American Eagle Outfitters, Inc. (Specialty Retail) | 14,564 | 290,697 | |
Boot Barn Holdings, Inc. (Specialty Retail) | (a) | 3,607 | 469,379 |
Brinker International, Inc. (Hotels, Restaurants & Leisure) | (a) | 5,184 | 376,099 |
Carvana Co. (Specialty Retail) | (a) | 2,846 | 366,337 |
Dana, Inc. (Automobile Components) | 48,327 | 585,723 | |
Dillard's, Inc. Class A (Broadline Retail) | 1,117 | 491,916 | |
Frontdoor, Inc. (Diversified Consumer Svs.) | (a) | 21,586 | 729,391 |
GoPro, Inc. Class A (Household Durables) | (a) | 57,623 | 81,825 |
Hilton Grand Vacations, Inc. (Hotels, Restaurants & Leisure) | (a) | 12,735 | 514,876 |
Installed Building Products, Inc. (Household Durables) | 5,283 | 1,086,607 | |
Laureate Education, Inc. (Diversified Consumer Svs.) | 54,352 | 812,019 | |
Malibu Boats, Inc. Class A (Leisure Products) | (a) | 7,438 | 260,628 |
Marriott Vacations Worldwide Corp. (Hotels, Restaurants & Leisure) | 3,159 | 275,844 | |
Modine Manufacturing Co. (Automobile Components) | (a) | 8,864 | 888,084 |
Murphy U.S.A., Inc. (Specialty Retail) | 1,036 | 486,361 | |
Ollie's Bargain Outlet Holdings, Inc. (Broadline Retail) | (a) | 2,743 | 269,280 |
Patrick Industries, Inc. (Automobile Components) | 5,880 | 638,274 | |
Revolve Group, Inc. (Specialty Retail) | (a) | 11,844 | 188,438 |
Rush Street Interactive, Inc. (Hotels, Restaurants & Leisure) | (a) | 10,070 | 96,571 |
Shake Shack, Inc. Class A (Hotels, Restaurants & Leisure) | (a) | 5,836 | 525,240 |
Sonic Automotive, Inc. Class A (Specialty Retail) | 7,317 | 398,557 | |
Stitch Fix, Inc. Class A (Specialty Retail) | (a) | 14,615 | 60,652 |
Sweetgreen, Inc. Class A (Hotels, Restaurants & Leisure) | (a) | 7,512 | 220,327 |
Texas Roadhouse, Inc. (Hotels, Restaurants & Leisure) | 5,199 | 892,720 | |
Toll Brothers, Inc. (Household Durables) | 3,662 | 421,789 | |
Common Stocks (Continued) | Shares | Value | |
Consumer Discretionary (continued) | |||
Tri Pointe Homes, Inc. (Household Durables) | (a) | 6,337 | $230,667 |
Urban Outfitters, Inc. (Specialty Retail) | (a) | 11,998 | 492,518 |
Visteon Corp. (Automobile Components) | (a) | 7,217 | 770,054 |
Warby Parker, Inc. Class A (Specialty Retail) | (a) | 18,712 | 300,515 |
Wayfair, Inc. Class A (Specialty Retail) | (a) | 6,931 | 365,472 |
Wingstop, Inc. (Hotels, Restaurants & Leisure) | 1,881 | 795,023 | |
16,710,243 | |||
Consumer Staples–3.0% | |||
Andersons, Inc. / The (Consumer Staples Distribution & Retail) | 6,606 | 327,658 | |
Cal-Maine Foods, Inc. (Food Products) | 5,910 | 361,160 | |
Central Garden & Pet Co. Class A (Household Products) | (a) | 11,923 | 393,817 |
Lancaster Colony Corp. (Food Products) | 3,748 | 708,259 | |
MGP Ingredients, Inc. (Beverages) | 4,866 | 362,030 | |
Sprouts Farmers Market, Inc. (Consumer Staples Distribution & Retail) | (a) | 11,913 | 996,642 |
Vital Farms, Inc. (Food Products) | (a) | 20,905 | 977,727 |
4,127,293 | |||
Energy–3.6% | |||
Archrock, Inc. (Energy Equip. & Svs.) | 13,671 | 276,564 | |
Borr Drilling Ltd. (Energy Equip. & Svs.) | 52,269 | 337,135 | |
CVR Energy, Inc. (Oil, Gas & Consumable Fuels) | 8,403 | 224,948 | |
Delek U.S. Holdings, Inc. (Oil, Gas & Consumable Fuels) | 16,793 | 415,795 | |
Evolution Petroleum Corp. (Oil, Gas & Consumable Fuels) | 10,048 | 52,953 | |
Helix Energy Solutions Group, Inc. (Energy Equip. & Svs.) | (a) | 36,120 | 431,273 |
Liberty Energy, Inc. (Energy Equip. & Svs.) | 27,022 | 564,490 | |
Magnolia Oil & Gas Corp. Class A (Oil, Gas & Consumable Fuels) | 28,570 | 723,964 | |
Murphy Oil Corp. (Oil, Gas & Consumable Fuels) | 8,632 | 355,984 | |
Oceaneering International, Inc. (Energy Equip. & Svs.) | (a) | 22,935 | 542,642 |
SM Energy Co. (Oil, Gas & Consumable Fuels) | 11,506 | 497,404 | |
Smart Sand, Inc. (Energy Equip. & Svs.) | (a) | 47,289 | 99,780 |
Tidewater, Inc. (Energy Equip. & Svs.) | (a) | 4,273 | 391,834 |
4,914,766 | |||
Financials–6.0% | |||
Artisan Partners Asset Management, Inc. Class A (Capital Markets) | 11,722 | 483,767 | |
Cohen & Steers, Inc. (Capital Markets) | 6,162 | 447,115 | |
Euronet Worldwide, Inc. (Financial Services) | (a) | 2,230 | 227,861 |
Federal Agricultural Mortgage Corp. Class C (Financial Services) | 2,495 | 451,146 | |
First Financial Bankshares, Inc. (Banks) | 12,534 | 370,129 | |
FirstCash Holdings, Inc. (Consumer Finance) | 7,517 | 788,383 | |
Hamilton Lane, Inc. Class A (Capital Markets) | 8,509 | 1,051,542 | |
Houlihan Lokey, Inc. (Capital Markets) | 5,872 | 791,898 | |
Mercury General Corp. (Insurance) | 7,311 | 388,507 | |
Moelis & Co. Class A (Capital Markets) | 7,339 | 417,296 | |
Oscar Health, Inc. Class A (Insurance) | (a) | 33,062 | 524,694 |
Pagseguro Digital Ltd. Class A (Financial Services) | (a) | 90,404 | 1,056,823 |
Reinsurance Group of America, Inc. (Insurance) | 1,100 | 225,797 | |
Selective Insurance Group, Inc. (Insurance) | 3,048 | 285,994 | |
Selectquote, Inc. (Insurance) | (a) | 8,673 | 23,937 |
StoneCo Ltd. Class A (Financial Services) | (a) | 54,368 | 651,872 |
8,186,761 | |||
Common Stocks (Continued) | Shares | Value | |
Health Care–24.8% | |||
ACADIA Pharmaceuticals, Inc. (Biotechnology) | (a) | 12,690 | $206,213 |
Adaptive Biotechnologies Corp. (Life Sciences Tools & Svs.) | (a) | 22,888 | 82,855 |
ADMA Biologics, Inc. (Biotechnology) | (a) | 35,525 | 410,314 |
Alector, Inc. (Biotechnology) | (a) | 11,265 | 51,143 |
Alkermes PLC (Biotechnology) | (a) | 18,733 | 451,465 |
Alto Neuroscience, Inc. (Pharmaceuticals) | (a) | 28 | 299 |
ALX Oncology Holdings, Inc. (Biotechnology) | (a) | 1,291 | 7,785 |
Amarin Corp. PLC – ADR (Biotechnology) | (a) | 17,101 | 11,765 |
American Well Corp. Class A (Health Care Technology) | (a) | 51,120 | 16,604 |
Amicus Therapeutics, Inc. (Biotechnology) | (a) | 33,288 | 330,217 |
AMN Healthcare Services, Inc. (Health Care Providers & Svs.) | (a) | 6,486 | 332,278 |
Amphastar Pharmaceuticals, Inc. (Pharmaceuticals) | (a) | 4,323 | 172,920 |
Arcellx, Inc. (Biotechnology) | (a) | 6,355 | 350,732 |
Arrowhead Pharmaceuticals, Inc. (Biotechnology) | (a) | 8,746 | 227,309 |
Arvinas, Inc. (Pharmaceuticals) | (a) | 11,258 | 299,688 |
AtriCure, Inc. (Health Care Equip. & Supplies) | (a) | 7,765 | 176,809 |
Atrion Corp. (Health Care Equip. & Supplies) | 585 | 264,672 | |
Avidity Biosciences, Inc. (Biotechnology) | (a) | 16,716 | 690,036 |
Axonics, Inc. (Health Care Equip. & Supplies) | (a) | 5,883 | 395,514 |
Axsome Therapeutics, Inc. (Pharmaceuticals) | (a) | 3,039 | 244,640 |
Beam Therapeutics, Inc. (Biotechnology) | (a) | 12,092 | 283,316 |
Beyondspring, Inc. (Biotechnology) | (a) | 5,417 | 13,001 |
BioCryst Pharmaceuticals, Inc. (Biotechnology) | (a) | 27,957 | 172,774 |
Biohaven Ltd. (Biotechnology) | (a) | 6,859 | 242,191 |
Blueprint Medicines Corp. (Biotechnology) | (a) | 8,833 | 952,021 |
Bridgebio Pharma, Inc. (Biotechnology) | (a) | 5,692 | 144,178 |
CareDx, Inc. (Biotechnology) | (a) | 4,195 | 65,148 |
Castle Biosciences, Inc. (Health Care Providers & Svs.) | (a) | 12,794 | 271,105 |
Catalyst Pharmaceuticals, Inc. (Biotechnology) | (a) | 17,361 | 268,922 |
Cerus Corp. (Health Care Equip. & Supplies) | (a) | 42,400 | 74,624 |
Codexis, Inc. (Life Sciences Tools & Svs.) | (a) | 17,805 | 55,196 |
Coherus Biosciences, Inc. (Biotechnology) | (a) | 29,534 | 51,094 |
Collegium Pharmaceutical, Inc. (Pharmaceuticals) | (a) | 14,885 | 479,297 |
Corcept Therapeutics, Inc. (Pharmaceuticals) | (a) | 32,545 | 1,057,387 |
Crinetics Pharmaceuticals, Inc. (Biotechnology) | (a) | 8,502 | 391,687 |
Cytokinetics, Inc. (Biotechnology) | (a) | 2,466 | 133,608 |
Denali Therapeutics, Inc. (Biotechnology) | (a) | 19,493 | 452,627 |
Dynavax Technologies Corp. (Biotechnology) | (a) | 17,383 | 195,211 |
Dyne Therapeutics, Inc. (Biotechnology) | (a) | 13,337 | 473,330 |
Editas Medicine, Inc. (Biotechnology) | (a) | 20,268 | 94,652 |
Enanta Pharmaceuticals, Inc. (Biotechnology) | (a) | 3,463 | 44,915 |
Ensign Group, Inc. / The (Health Care Providers & Svs.) | 10,169 | 1,257,804 | |
Evolent Health, Inc. Class A (Health Care Technology) | (a) | 15,911 | 304,218 |
Fate Therapeutics, Inc. (Biotechnology) | (a) | 35,418 | 116,171 |
FibroGen, Inc. (Biotechnology) | (a) | 7,167 | 6,395 |
Foghorn Therapeutics, Inc. (Biotechnology) | (a) | 8,256 | 47,472 |
Guardant Health, Inc. (Health Care Providers & Svs.) | (a) | 23,763 | 686,275 |
Haemonetics Corp. (Health Care Equip. & Supplies) | (a) | 3,813 | 315,449 |
Halozyme Therapeutics, Inc. (Biotechnology) | (a) | 15,658 | 819,853 |
Harmony Biosciences Holdings, Inc. (Pharmaceuticals) | (a) | 5,031 | 151,785 |
HealthEquity, Inc. (Health Care Providers & Svs.) | (a) | 10,303 | 888,119 |
Common Stocks (Continued) | Shares | Value | |
Health Care (continued) | |||
Heron Therapeutics, Inc. (Biotechnology) | (a) | 34,692 | $121,422 |
Hims & Hers Health, Inc. (Health Care Providers & Svs.) | (a) | 28,229 | 569,944 |
Ideaya Biosciences, Inc. (Biotechnology) | (a) | 12,928 | 453,902 |
Immunovant, Inc. (Biotechnology) | (a) | 2,595 | 68,508 |
Inari Medical, Inc. (Health Care Equip. & Supplies) | (a) | 6,930 | 333,680 |
Incyte Corp. (Biotechnology) | (a) | 3,945 | 239,146 |
Inmode Ltd. (Health Care Equip. & Supplies) | (a) | 25,644 | 467,747 |
Insmed, Inc. (Biotechnology) | (a) | 14,652 | 981,684 |
Intellia Therapeutics, Inc. (Biotechnology) | (a) | 9,714 | 217,399 |
Intra-Cellular Therapies, Inc. (Pharmaceuticals) | (a) | 6,714 | 459,842 |
iRhythm Technologies, Inc. (Health Care Equip. & Supplies) | (a) | 1,936 | 208,391 |
iTeos Therapeutics, Inc. (Biotechnology) | (a) | 9,073 | 134,643 |
Kiniksa Pharmaceuticals International PLC (Biotechnology) | (a) | 17,844 | 333,147 |
Krystal Biotech, Inc. (Biotechnology) | (a) | 1,667 | 306,128 |
Kymera Therapeutics, Inc. (Biotechnology) | (a) | 9,175 | 273,874 |
Lantheus Holdings, Inc. (Health Care Equip. & Supplies) | (a) | 8,317 | 667,772 |
Madrigal Pharmaceuticals, Inc. (Biotechnology) | (a) | 1,758 | 492,521 |
Medpace Holdings, Inc. (Life Sciences Tools & Svs.) | (a) | 571 | 235,166 |
Merit Medical Systems, Inc. (Health Care Equip. & Supplies) | (a) | 10,935 | 939,863 |
MiNK Therapeutics, Inc. (Biotechnology) | (a) | 952 | 904 |
Natera, Inc. (Biotechnology) | (a) | 2,143 | 232,065 |
Neurogene, Inc. (Biotechnology) | (a) | 450 | 16,376 |
Nevro Corp. (Health Care Equip. & Supplies) | (a) | 3,665 | 30,859 |
Novocure Ltd. (Health Care Equip. & Supplies) | (a) | 25,156 | 436,457 |
Omnicell, Inc. (Health Care Equip. & Supplies) | (a) | 8,954 | 242,385 |
Option Care Health, Inc. (Health Care Providers & Svs.) | (a) | 25,449 | 704,937 |
OraSure Technologies, Inc. (Health Care Equip. & Supplies) | (a) | 4,376 | 18,642 |
Pacific Biosciences of California, Inc. (Life Sciences Tools & Svs.) | (a) | 41,546 | 56,918 |
Pacira BioSciences, Inc. (Pharmaceuticals) | (a) | 4,474 | 128,001 |
PetIQ, Inc. (Health Care Providers & Svs.) | (a) | 11,688 | 257,837 |
Phreesia, Inc. (Health Care Technology) | (a) | 11,187 | 237,164 |
Privia Health Group, Inc. (Health Care Providers & Svs.) | (a) | 8,041 | 139,753 |
Progyny, Inc. (Health Care Providers & Svs.) | (a) | 27,989 | 800,765 |
Protagonist Therapeutics, Inc. (Biotechnology) | (a) | 7,090 | 245,669 |
Prothena Corp. PLC (Biotechnology) | (a) | 8,334 | 172,014 |
PTC Therapeutics, Inc. (Biotechnology) | (a) | 13,290 | 406,408 |
Recursion Pharmaceuticals, Inc. Class A (Biotechnology) | (a) | 32,111 | 239,548 |
REGENXBIO, Inc. (Biotechnology) | (a) | 13,117 | 153,469 |
Relay Therapeutics, Inc. (Biotechnology) | (a) | 14,951 | 97,481 |
Revance Therapeutics, Inc. (Pharmaceuticals) | (a) | 8,096 | 20,807 |
REVOLUTION Medicines, Inc. (Biotechnology) | (a) | 11,061 | 429,277 |
Rhythm Pharmaceuticals, Inc. (Biotechnology) | (a) | 8,457 | 347,244 |
Rigel Pharmaceuticals, Inc. (Biotechnology) | (a) | 8,867 | 72,886 |
Sage Therapeutics, Inc. (Biotechnology) | (a) | 6,247 | 67,842 |
Scilex Holding Co. (Acquired January 06, 2023, Cost $66,789) (Pharmaceuticals) | (a)(b) | 6,373 | 12,300 |
Seer, Inc. (Life Sciences Tools & Svs.) | (a) | 2,905 | 4,880 |
Silk Road Medical, Inc. (Health Care Equip. & Supplies) | (a) | 9,629 | 259,502 |
Sorrento Therapeutics, Inc. (Biotechnology) | (a) | 45,196 | 429 |
Common Stocks (Continued) | Shares | Value | |
Health Care (continued) | |||
SpringWorks Therapeutics, Inc. (Biotechnology) | (a) | 8,324 | $313,565 |
STAAR Surgical Co. (Health Care Equip. & Supplies) | (a) | 7,224 | 343,935 |
Supernus Pharmaceuticals, Inc. (Pharmaceuticals) | (a) | 13,380 | 357,915 |
Sutro Biopharma, Inc. (Biotechnology) | (a) | 13,219 | 38,732 |
Syndax Pharmaceuticals, Inc. (Biotechnology) | (a) | 17,740 | 364,202 |
Tactile Systems Technology, Inc. (Health Care Equip. & Supplies) | (a) | 6,253 | 74,661 |
Tandem Diabetes Care, Inc. (Health Care Equip. & Supplies) | (a) | 11,816 | 466,141 |
Teladoc Health, Inc. (Health Care Technology) | (a) | 23,501 | 229,840 |
TG Therapeutics, Inc. (Biotechnology) | (a) | 13,620 | 242,300 |
TransMedics Group, Inc. (Health Care Equip. & Supplies) | (a) | 3,190 | 480,478 |
Travere Therapeutics, Inc. (Biotechnology) | (a) | 23,811 | 195,726 |
Twist Bioscience Corp. (Biotechnology) | (a) | 7,164 | 353,042 |
Ultragenyx Pharmaceutical, Inc. (Biotechnology) | (a) | 3,613 | 148,494 |
United Therapeutics Corp. (Biotechnology) | (a) | 764 | 243,372 |
Vaxcyte, Inc. (Biotechnology) | (a) | 9,547 | 720,894 |
Vericel Corp. (Biotechnology) | (a) | 5,321 | 244,127 |
Viemed Healthcare, Inc. (Health Care Providers & Svs.) | (a) | 11,958 | 78,325 |
Viking Therapeutics, Inc. (Biotechnology) | (a) | 4,090 | 216,811 |
Xencor, Inc. (Biotechnology) | (a) | 9,329 | 176,598 |
Zentalis Pharmaceuticals, Inc. (Biotechnology) | (a) | 1,298 | 5,309 |
33,865,148 | |||
Industrials–21.4% | |||
AeroVironment, Inc. (Aerospace & Defense) | (a) | 3,107 | 545,807 |
Albany International Corp. Class A (Machinery) | 4,267 | 360,348 | |
Applied Industrial Technologies, Inc. (Trading Companies & Distributors) | 6,420 | 1,245,480 | |
Atkore, Inc. (Electrical Equip.) | 8,424 | 1,136,650 | |
Blue Bird Corp. (Machinery) | (a) | 6,317 | 321,472 |
Boise Cascade Co. (Trading Companies & Distributors) | 11,159 | 1,330,376 | |
Chart Industries, Inc. (Machinery) | (a) | 1,779 | 249,185 |
Comfort Systems U.S.A., Inc. (Construction & Engineering) | 4,132 | 1,256,624 | |
CSG Systems International, Inc. (Professional Svs.) | 14,966 | 616,150 | |
CSW Industrials, Inc. (Building Products) | 1,066 | 280,944 | |
Dycom Industries, Inc. (Construction & Engineering) | (a) | 4,407 | 743,725 |
EMCOR Group, Inc. (Construction & Engineering) | 3,488 | 1,273,399 | |
Encore Wire Corp. (Electrical Equip.) | 1,454 | 421,413 | |
EnerSys (Electrical Equip.) | 10,246 | 1,060,666 | |
ExlService Holdings, Inc. (Professional Svs.) | (a) | 39,131 | 1,227,148 |
Federal Signal Corp. (Machinery) | 2,784 | 229,262 | |
Flowserve Corp. (Machinery) | 16,766 | 806,445 | |
Fluor Corp. (Construction & Engineering) | (a) | 17,143 | 746,578 |
Franklin Covey Co. (Professional Svs.) | (a) | 18,952 | 720,176 |
Franklin Electric Co., Inc. (Machinery) | 18,390 | 1,771,325 | |
FTAI Aviation Ltd. (Trading Companies & Distributors) | 4,709 | 494,445 | |
Gibraltar Industries, Inc. (Building Products) | (a) | 7,546 | 517,278 |
GMS, Inc. (Trading Companies & Distributors) | (a) | 8,004 | 645,202 |
Griffon Corp. (Building Products) | 4,946 | 316,890 | |
Herc Holdings, Inc. (Trading Companies & Distributors) | 5,735 | 764,418 | |
Huntington Ingalls Industries, Inc. (Aerospace & Defense) | 805 | 198,296 | |
Insperity, Inc. (Professional Svs.) | 12,093 | 1,103,002 | |
Common Stocks (Continued) | Shares | Value | |
Industrials (continued) | |||
JELD-WEN Holding, Inc. (Building Products) | (a) | 7,549 | $101,685 |
Kforce, Inc. (Professional Svs.) | 15,644 | 971,962 | |
Korn Ferry (Professional Svs.) | 7,206 | 483,811 | |
Loar Holdings, Inc. (Aerospace & Defense) | (a) | 147 | 7,851 |
Manitowoc Co., Inc. / The (Machinery) | (a) | 2,982 | 34,382 |
Maximus, Inc. (Professional Svs.) | 2,617 | 222,157 | |
McGrath RentCorp (Trading Companies & Distributors) | 2,629 | 280,120 | |
Moog, Inc. Class A (Aerospace & Defense) | 2,483 | 415,406 | |
Mueller Industries, Inc. (Machinery) | 13,983 | 796,192 | |
MYR Group, Inc. (Construction & Engineering) | (a) | 3,900 | 529,269 |
NEXTracker, Inc. Class A (Electrical Equip.) | (a) | 9,568 | 448,548 |
Oshkosh Corp. (Machinery) | 3,654 | 395,363 | |
Parsons Corp. (Professional Svs.) | (a) | 5,196 | 425,085 |
Radiant Logistics, Inc. (Air Freight & Logistics) | (a) | 10,231 | 58,214 |
Sterling Infrastructure, Inc. (Construction & Engineering) | (a) | 2,143 | 253,603 |
Terex Corp. (Machinery) | 12,190 | 668,500 | |
UFP Industries, Inc. (Building Products) | 13,919 | 1,558,928 | |
Watts Water Technologies, Inc. Class A (Machinery) | 3,831 | 702,490 | |
Xylem, Inc. (Machinery) | 2,347 | 318,324 | |
Zurn Elkay Water Solutions Corp. (Building Products) | 8,847 | 254,440 | |
29,309,034 | |||
Information Technology–21.5% | |||
8x8, Inc. (Software) | (a) | 13,109 | 29,102 |
ACI Worldwide, Inc. (Software) | (a) | 21,294 | 843,029 |
Alarm.com Holdings, Inc. (Software) | (a) | 7,025 | 446,368 |
Ambarella, Inc. (Semiconductors & Equip.) | (a) | 4,857 | 262,035 |
Amkor Technology, Inc. (Semiconductors & Equip.) | 9,172 | 367,063 | |
Appfolio, Inc. Class A (Software) | (a) | 2,103 | 514,331 |
Appian Corp. Class A (Software) | (a) | 6,661 | 205,558 |
Avnet, Inc. (Electronic Equip., Instr. & Comp.) | 4,833 | 248,851 | |
Axcelis Technologies, Inc. (Semiconductors & Equip.) | (a) | 6,539 | 929,780 |
Badger Meter, Inc. (Electronic Equip., Instr. & Comp.) | 1,999 | 369,355 | |
Bit Digital, Inc. (Software) | (a) | 92,312 | 293,552 |
BlackLine, Inc. (Software) | (a) | 6,296 | 305,041 |
Box, Inc. Class A (Software) | (a) | 29,007 | 766,945 |
C3.ai, Inc. Class A (Software) | (a) | 15,181 | 439,642 |
Calix, Inc. (Communications Equip.) | (a) | 12,357 | 437,809 |
Cleanspark, Inc. (Software) | (a) | 28,184 | 505,057 |
Clear Secure, Inc. Class A (Software) | 29,375 | 549,606 | |
CommVault Systems, Inc. (Software) | (a) | 7,744 | 941,438 |
Credo Technology Group Holding Ltd. (Semiconductors & Equip.) | (a) | 17,152 | 547,835 |
Diodes, Inc. (Semiconductors & Equip.) | (a) | 3,409 | 245,209 |
Domo, Inc. Class B (Software) | (a) | 2,462 | 19,007 |
ePlus, Inc. (Electronic Equip., Instr. & Comp.) | (a) | 6,028 | 444,143 |
Everbridge, Inc. (Software) | (a) | 4,342 | 151,927 |
Fabrinet (Electronic Equip., Instr. & Comp.) | (a) | 3,630 | 888,588 |
Fastly, Inc. Class A (IT Svs.) | (a) | 17,550 | 129,344 |
FormFactor, Inc. (Semiconductors & Equip.) | (a) | 7,991 | 483,695 |
Gitlab, Inc. Class A (Software) | (a) | 9,218 | 458,319 |
Hackett Group, Inc. / The (IT Svs.) | 6,448 | 140,051 | |
Ichor Holdings Ltd. (Semiconductors & Equip.) | (a) | 12,313 | 474,666 |
Impinj, Inc. (Semiconductors & Equip.) | (a) | 3,079 | 482,695 |
Insight Enterprises, Inc. (Electronic Equip., Instr. & Comp.) | (a) | 4,136 | 820,417 |
Intapp, Inc. (Software) | (a) | 4,993 | 183,093 |
Itron, Inc. (Electronic Equip., Instr. & Comp.) | (a) | 8,161 | 807,613 |
Marathon Digital Holdings, Inc. (Software) | (a) | 17,063 | 338,701 |
MaxLinear, Inc. (Semiconductors & Equip.) | (a) | 13,361 | 269,091 |
NETGEAR, Inc. (Communications Equip.) | (a) | 7,988 | 122,216 |
Onto Innovation, Inc. (Semiconductors & Equip.) | (a) | 3,695 | 811,274 |
Common Stocks (Continued) | Shares | Value | |
Information Technology (continued) | |||
Ooma, Inc. (Software) | (a) | 7,140 | $70,900 |
OSI Systems, Inc. (Electronic Equip., Instr. & Comp.) | (a) | 6,439 | 885,491 |
PC Connection, Inc. (Electronic Equip., Instr. & Comp.) | 12,205 | 783,561 | |
Power Integrations, Inc. (Semiconductors & Equip.) | 14,247 | 999,997 | |
PROS Holdings, Inc. (Software) | (a) | 9,570 | 274,180 |
Q2 Holdings, Inc. (Software) | (a) | 16,618 | 1,002,564 |
Qualys, Inc. (Software) | (a) | 4,453 | 634,998 |
Rambus, Inc. (Semiconductors & Equip.) | (a) | 4,125 | 242,385 |
Rapid7, Inc. (Software) | (a) | 12,977 | 560,996 |
Rubrik, Inc. Class A (Software) | (a) | 2,035 | 62,393 |
Sanmina Corp. (Electronic Equip., Instr. & Comp.) | (a) | 15,460 | 1,024,225 |
SentinelOne, Inc. Class A (Software) | (a) | 9,330 | 196,397 |
Silicon Laboratories, Inc. (Semiconductors & Equip.) | (a) | 6,592 | 729,273 |
Sprout Social, Inc. Class A (Software) | (a) | 10,080 | 359,654 |
SPS Commerce, Inc. (Software) | (a) | 3,866 | 727,427 |
Squarespace, Inc. Class A (IT Svs.) | (a) | 4,940 | 215,038 |
Synaptics, Inc. (Semiconductors & Equip.) | (a) | 4,828 | 425,830 |
Tenable Holdings, Inc. (Software) | (a) | 14,175 | 617,746 |
Varonis Systems, Inc. (Software) | (a) | 26,002 | 1,247,316 |
Verint Systems, Inc. (Software) | (a) | 21,098 | 679,356 |
Workiva, Inc. (Software) | (a) | 9,431 | 688,369 |
Yext, Inc. (Software) | (a) | 54,759 | 292,961 |
Zeta Global Holdings Corp. Class A (Software) | (a) | 25,817 | 469,869 |
29,463,372 | |||
Materials–2.7% | |||
Alcoa Corp. (Metals & Mining) | 8,369 | 332,919 | |
Cabot Corp. (Chemicals) | 10,769 | 989,563 | |
Century Aluminum Co. (Metals & Mining) | (a) | 17,740 | 295,726 |
Common Stocks (Continued) | Shares | Value | |
Materials (continued) | |||
Cleveland-Cliffs, Inc. (Metals & Mining) | (a) | 27,300 | $420,147 |
Constellium SE (Metals & Mining) | (a) | 21,954 | 413,833 |
Ingevity Corp. (Chemicals) | (a) | 4,255 | 185,986 |
Kaiser Aluminum Corp. (Metals & Mining) | 2,868 | 250,290 | |
Materion Corp. (Metals & Mining) | 1,864 | 201,554 | |
Novagold Resources, Inc. (Metals & Mining) | (a) | 65,935 | 228,135 |
Quaker Chemical Corp. (Chemicals) | 1,818 | 308,515 | |
Radius Recycling, Inc. (Metals & Mining) | 7,765 | 118,572 | |
3,745,240 | |||
Real Estate–1.4% | |||
Braemar Hotels & Resorts, Inc. (Hotel & Resort REITs) | 51,306 | 130,830 | |
COPT Defense Properties (Office REITs) | 16,908 | 423,207 | |
Marcus & Millichap, Inc. (Real Estate Mgmt. & Development) | 10,682 | 336,697 | |
NexPoint Residential Trust, Inc. (Residential REITs) | 17,140 | 677,201 | |
Outfront Media, Inc. (Specialized REITs) | 20,772 | 297,040 | |
1,864,975 | |||
Total Common Stocks (Cost $136,967,236) | $135,276,803 | ||
Rights–0.0% | Quantity | Value | |
Health Care–0.0% | |||
Flexion Therapeutics, Inc. CVR (Biotechnology) | 6,185 | $3,835 | |
Prevail Therapeutics, Inc. CVR (Biotechnology) | 2,231 | 1,115 | |
Total Rights (Cost $4,950) | $4,950 | ||
Total Investments – 98.9% (Cost $136,972,186) | (c) | $135,281,753 | |
Other Assets in Excess of Liabilities – 1.1% | (d) | 1,554,753 | |
Net Assets – 100.0% | $136,836,506 | ||
Percentages are stated as a percent of net assets. |
Abbreviations: | ||
ADR: | American Depositary Receipts | |
CVR: | Contingent Value Right | |
REITs: | Real Estate Investment Trusts | |
Footnotes: | ||
(a) | Non-income producing security. | |
(b) | Represents a security deemed to be restricted. At June 30, 2024, the value of restricted securities in the Portfolio totaled $12,300, or 0.0% of the Portfolio’s net assets. | |
(c) | Represents cost for financial reporting purposes, which may differ from cost basis for federal income tax purposes. See also Note 7 of the Notes to Financial Statements. | |
(d) | Includes $110,500 of cash pledged as collateral for the futures contracts outstanding at June 30, 2024. See also the following Schedule of Open Futures Contracts. | |
Description | Number of contracts | Expiration Date | Notional Amount | Value | Unrealized Appreciation (Depreciation) | Variation Margin Receivable (Payable) |
CME E-mini Russell 2000 Index - Long | 17 | September 20, 2024 | $1,729,100 | $1,755,250 | $26,150 | $(4,925 ) |
Common Stocks–98.5% | Shares | Value | |
Communication Services–1.5% | |||
Frontier Communications Parent, Inc. (Diversified Telecom. Svs.) | (a) | 43,803 | $1,146,762 |
Iridium Communications, Inc. (Diversified Telecom. Svs.) | 23,777 | 632,944 | |
New York Times Co. / The Class A (Media) | 32,021 | 1,639,795 | |
Nexstar Media Group, Inc. (Media) | 6,107 | 1,013,823 | |
TEGNA, Inc. (Media) | 33,211 | 462,961 | |
TKO Group Holdings, Inc. (Entertainment) | 11,534 | 1,245,557 | |
Warner Music Group Corp. Class A (Entertainment) | 27,727 | 849,833 | |
Ziff Davis, Inc. (Interactive Media & Svs.) | (a) | 9,032 | 497,212 |
ZoomInfo Technologies, Inc. (Interactive Media & Svs.) | (a) | 55,646 | 710,599 |
8,199,486 | |||
Consumer Discretionary–14.5% | |||
Adient PLC (Automobile Components) | (a) | 17,589 | 434,624 |
Aramark (Hotels, Restaurants & Leisure) | 51,497 | 1,751,928 | |
Autoliv, Inc. (Automobile Components) | 14,181 | 1,517,225 | |
AutoNation, Inc. (Specialty Retail) | (a) | 4,810 | 766,618 |
Boyd Gaming Corp. (Hotels, Restaurants & Leisure) | 13,190 | 726,769 | |
Brunswick Corp. (Leisure Products) | 13,230 | 962,747 | |
Burlington Stores, Inc. (Specialty Retail) | (a) | 12,506 | 3,001,440 |
Capri Holdings Ltd. (Textiles, Apparel & Luxury Goods) | (a) | 22,825 | 755,051 |
Carter's, Inc. (Textiles, Apparel & Luxury Goods) | 7,147 | 442,900 | |
Choice Hotels International, Inc. (Hotels, Restaurants & Leisure) | 4,679 | 556,801 | |
Churchill Downs, Inc. (Hotels, Restaurants & Leisure) | 13,098 | 1,828,481 | |
Columbia Sportswear Co. (Textiles, Apparel & Luxury Goods) | 6,599 | 521,849 | |
Crocs, Inc. (Textiles, Apparel & Luxury Goods) | (a) | 11,886 | 1,734,643 |
Dick's Sporting Goods, Inc. (Specialty Retail) | 11,401 | 2,449,505 | |
Duolingo, Inc. (Diversified Consumer Svs.) | (a) | 7,243 | 1,511,397 |
Five Below, Inc. (Specialty Retail) | (a) | 10,807 | 1,177,639 |
Floor & Decor Holdings, Inc. Class A (Specialty Retail) | (a) | 20,954 | 2,083,037 |
GameStop Corp. Class A (Specialty Retail) | (a) | 52,761 | 1,302,669 |
Gap, Inc. / The (Specialty Retail) | 42,420 | 1,013,414 | |
Gentex Corp. (Automobile Components) | 45,269 | 1,526,018 | |
Goodyear Tire & Rubber Co. / The (Automobile Components) | (a) | 55,745 | 632,706 |
Graham Holdings Co. Class B (Diversified Consumer Svs.) | 680 | 475,694 | |
Grand Canyon Education, Inc. (Diversified Consumer Svs.) | (a) | 5,741 | 803,223 |
H&R Block, Inc. (Diversified Consumer Svs.) | 27,322 | 1,481,672 | |
Harley-Davidson, Inc. (Automobiles) | 23,968 | 803,887 | |
Helen of Troy Ltd. (Household Durables) | (a) | 4,662 | 432,354 |
Hilton Grand Vacations, Inc. (Hotels, Restaurants & Leisure) | (a) | 13,402 | 541,843 |
Hyatt Hotels Corp. Class A (Hotels, Restaurants & Leisure) | 8,847 | 1,344,036 | |
KB Home (Household Durables) | 14,398 | 1,010,452 | |
Lear Corp. (Automobile Components) | 11,120 | 1,270,015 | |
Light & Wonder, Inc. (Hotels, Restaurants & Leisure) | (a) | 17,650 | 1,851,132 |
Lithia Motors, Inc. (Specialty Retail) | 5,366 | 1,354,647 | |
Macy's, Inc. (Broadline Retail) | 53,879 | 1,034,477 | |
Marriott Vacations Worldwide Corp. (Hotels, Restaurants & Leisure) | 6,404 | 559,197 | |
Mattel, Inc. (Leisure Products) | (a) | 67,379 | 1,095,582 |
Common Stocks (Continued) | Shares | Value | |
Consumer Discretionary (continued) | |||
Murphy U.S.A., Inc. (Specialty Retail) | 3,692 | $1,733,246 | |
Nordstrom, Inc. (Broadline Retail) | 19,181 | 407,021 | |
Ollie's Bargain Outlet Holdings, Inc. (Broadline Retail) | (a) | 12,002 | 1,178,236 |
Penske Automotive Group, Inc. (Specialty Retail) | 3,798 | 565,978 | |
Planet Fitness, Inc. Class A (Hotels, Restaurants & Leisure) | (a) | 17,139 | 1,261,259 |
Polaris, Inc. (Leisure Products) | 10,402 | 814,581 | |
PVH Corp. (Textiles, Apparel & Luxury Goods) | 11,085 | 1,173,569 | |
RH (Specialty Retail) | (a) | 3,017 | 737,475 |
Service Corp. International (Diversified Consumer Svs.) | 28,513 | 2,028,130 | |
Skechers U.S.A., Inc. Class A (Textiles, Apparel & Luxury Goods) | (a) | 25,925 | 1,791,936 |
Taylor Morrison Home Corp. (Household Durables) | (a) | 20,710 | 1,148,162 |
Tempur Sealy International, Inc. (Household Durables) | 33,998 | 1,609,465 | |
Texas Roadhouse, Inc. (Hotels, Restaurants & Leisure) | 13,079 | 2,245,795 | |
Thor Industries, Inc. (Automobiles) | 10,442 | 975,805 | |
Toll Brothers, Inc. (Household Durables) | 20,398 | 2,349,442 | |
TopBuild Corp. (Household Durables) | (a) | 6,194 | 2,386,362 |
Travel + Leisure Co. (Hotels, Restaurants & Leisure) | 13,954 | 627,651 | |
Under Armour, Inc. Class A (Textiles, Apparel & Luxury Goods) | (a) | 36,938 | 246,376 |
Under Armour, Inc. Class C (Textiles, Apparel & Luxury Goods) | (a) | 37,400 | 244,222 |
Vail Resorts, Inc. (Hotels, Restaurants & Leisure) | 7,435 | 1,339,266 | |
Valvoline, Inc. (Specialty Retail) | (a) | 25,231 | 1,089,979 |
Visteon Corp. (Automobile Components) | (a) | 5,404 | 576,607 |
Wendy's Co. / The (Hotels, Restaurants & Leisure) | 32,536 | 551,810 | |
Whirlpool Corp. (Household Durables) | 10,698 | 1,093,336 | |
Williams-Sonoma, Inc. (Specialty Retail) | 12,581 | 3,552,496 | |
Wingstop, Inc. (Hotels, Restaurants & Leisure) | 5,751 | 2,430,718 | |
Wyndham Hotels & Resorts, Inc. (Hotels, Restaurants & Leisure) | 15,778 | 1,167,572 | |
YETI Holdings, Inc. (Leisure Products) | (a) | 16,691 | 636,762 |
76,718,929 | |||
Consumer Staples–4.6% | |||
BellRing Brands, Inc. (Personal Care Products) | (a) | 25,541 | 1,459,413 |
BJ's Wholesale Club Holdings, Inc. (Consumer Staples Distribution & Retail) | (a) | 26,035 | 2,286,914 |
Boston Beer Co., Inc. / The Class A (Beverages) | (a) | 1,790 | 546,040 |
Casey's General Stores, Inc. (Consumer Staples Distribution & Retail) | 7,248 | 2,765,547 | |
Celsius Holdings, Inc. (Beverages) | (a) | 29,210 | 1,667,599 |
Coca-Cola Consolidated, Inc. (Beverages) | 918 | 996,030 | |
Coty, Inc. Class A (Personal Care Products) | (a) | 71,372 | 715,147 |
Darling Ingredients, Inc. (Food Products) | (a) | 31,287 | 1,149,797 |
e.l.f. Beauty, Inc. (Personal Care Products) | (a) | 10,869 | 2,290,316 |
Flowers Foods, Inc. (Food Products) | 37,623 | 835,231 | |
Ingredion, Inc. (Food Products) | 12,855 | 1,474,468 | |
Lancaster Colony Corp. (Food Products) | 3,989 | 753,801 | |
Performance Food Group Co. (Consumer Staples Distribution & Retail) | (a) | 30,470 | 2,014,372 |
Pilgrim's Pride Corp. (Food Products) | (a) | 7,887 | 303,571 |
Post Holdings, Inc. (Food Products) | (a) | 9,847 | 1,025,664 |
Common Stocks (Continued) | Shares | Value | |
Consumer Staples (continued) | |||
Sprouts Farmers Market, Inc. (Consumer Staples Distribution & Retail) | (a) | 19,675 | $1,646,010 |
U.S. Foods Holding Corp. (Consumer Staples Distribution & Retail) | (a) | 44,292 | 2,346,590 |
24,276,510 | |||
Energy–5.9% | |||
Antero Midstream Corp. (Oil, Gas & Consumable Fuels) | 66,906 | 986,194 | |
Antero Resources Corp. (Oil, Gas & Consumable Fuels) | (a) | 57,208 | 1,866,697 |
ChampionX Corp. (Energy Equip. & Svs.) | 37,283 | 1,238,168 | |
Chesapeake Energy Corp. (Oil, Gas & Consumable Fuels) | 21,812 | 1,792,728 | |
Chord Energy Corp. (Oil, Gas & Consumable Fuels) | 12,176 | 2,041,672 | |
Civitas Resources, Inc. (Oil, Gas & Consumable Fuels) | 18,031 | 1,244,139 | |
CNX Resources Corp. (Oil, Gas & Consumable Fuels) | (a) | 30,007 | 729,170 |
DT Midstream, Inc. (Oil, Gas & Consumable Fuels) | 19,015 | 1,350,635 | |
Equitrans Midstream Corp. (Oil, Gas & Consumable Fuels) | 84,916 | 1,102,210 | |
HF Sinclair Corp. (Oil, Gas & Consumable Fuels) | 29,349 | 1,565,476 | |
Matador Resources Co. (Oil, Gas & Consumable Fuels) | 22,723 | 1,354,291 | |
Murphy Oil Corp. (Oil, Gas & Consumable Fuels) | 28,383 | 1,170,515 | |
NOV, Inc. (Energy Equip. & Svs.) | 77,451 | 1,472,344 | |
Ovintiv, Inc. (Oil, Gas & Consumable Fuels) | 48,741 | 2,284,491 | |
PBF Energy, Inc. Class A (Oil, Gas & Consumable Fuels) | 20,663 | 950,911 | |
Permian Resources Corp. (Oil, Gas & Consumable Fuels) | 100,570 | 1,624,206 | |
Range Resources Corp. (Oil, Gas & Consumable Fuels) | 47,509 | 1,592,977 | |
Southwestern Energy Co. (Oil, Gas & Consumable Fuels) | (a) | 215,928 | 1,453,195 |
Texas Pacific Land Corp. (Oil, Gas & Consumable Fuels) | 3,646 | 2,677,148 | |
Valaris Ltd. (Energy Equip. & Svs.) | (a) | 12,194 | 908,453 |
Weatherford International PLC (Energy Equip. & Svs.) | (a) | 14,324 | 1,753,974 |
31,159,594 | |||
Financials–15.8% | |||
Affiliated Managers Group, Inc. (Capital Markets) | 6,239 | 974,719 | |
Ally Financial, Inc. (Consumer Finance) | 53,571 | 2,125,162 | |
American Financial Group, Inc. (Insurance) | 12,809 | 1,575,763 | |
Annaly Capital Management, Inc. (Mortgage REIT) | 97,993 | 1,867,747 | |
Associated Banc-Corp (Banks) | 29,030 | 613,984 | |
Bank OZK (Banks) | 20,657 | 846,937 | |
Brighthouse Financial, Inc. (Insurance) | (a) | 12,162 | 527,101 |
Cadence Bank (Banks) | 35,771 | 1,011,604 | |
Carlyle Group, Inc. / The (Capital Markets) | 42,281 | 1,697,582 | |
CNO Financial Group, Inc. (Insurance) | 21,199 | 587,636 | |
Columbia Banking System, Inc. (Banks) | 40,999 | 815,470 | |
Commerce Bancshares, Inc. (Banks) | 23,082 | 1,287,514 | |
Cullen / Frost Bankers, Inc. (Banks) | 12,582 | 1,278,709 | |
East West Bancorp, Inc. (Banks) | 27,246 | 1,995,225 | |
Equitable Holdings, Inc. (Financial Services) | 59,866 | 2,446,125 | |
Erie Indemnity Co. Class A (Insurance) | 4,884 | 1,769,962 | |
Essent Group Ltd. (Financial Services) | 20,888 | 1,173,697 | |
Euronet Worldwide, Inc. (Financial Services) | (a) | 8,533 | 883,165 |
Evercore, Inc. Class A (Capital Markets) | 6,939 | 1,446,296 | |
Common Stocks (Continued) | Shares | Value | |
Financials (continued) | |||
Federated Hermes, Inc. (Capital Markets) | 15,717 | $516,775 | |
Fidelity National Financial, Inc. (Insurance) | 50,828 | 2,511,920 | |
First American Financial Corp. (Insurance) | 20,310 | 1,095,724 | |
First Financial Bankshares, Inc. (Banks) | 25,173 | 743,359 | |
First Horizon Corp. (Banks) | 107,084 | 1,688,715 | |
FirstCash Holdings, Inc. (Consumer Finance) | 7,301 | 765,729 | |
FNB Corp. (Banks) | 70,444 | 963,674 | |
Glacier Bancorp, Inc. (Banks) | 22,203 | 828,616 | |
Hancock Whitney Corp. (Banks) | 16,963 | 811,340 | |
Hanover Insurance Group, Inc. / The (Insurance) | 7,038 | 882,847 | |
Home BancShares, Inc. (Banks) | 36,480 | 874,061 | |
Houlihan Lokey, Inc. (Capital Markets) | 10,254 | 1,382,854 | |
Interactive Brokers Group, Inc. Class A (Capital Markets) | 20,973 | 2,571,290 | |
International Bancshares Corp. (Banks) | 10,471 | 599,046 | |
Janus Henderson Group PLC (Capital Markets) | 25,136 | 847,335 | |
Jefferies Financial Group, Inc. (Capital Markets) | 33,217 | 1,652,878 | |
Kemper Corp. (Insurance) | 11,849 | 703,001 | |
Kinsale Capital Group, Inc. (Insurance) | 4,330 | 1,668,262 | |
MGIC Investment Corp. (Financial Services) | 52,201 | 1,124,931 | |
Morningstar, Inc. (Capital Markets) | 5,106 | 1,510,610 | |
New York Community Bancorp, Inc. (Banks) | 152,671 | 491,601 | |
Old National Bancorp (Banks) | 61,834 | 1,062,926 | |
Old Republic International Corp. (Insurance) | 49,502 | 1,529,612 | |
Pinnacle Financial Partners, Inc. (Banks) | 14,978 | 1,198,839 | |
Primerica, Inc. (Insurance) | 6,738 | 1,594,076 | |
Prosperity Bancshares, Inc. (Banks) | 18,786 | 1,148,576 | |
Reinsurance Group of America, Inc. (Insurance) | 12,883 | 2,644,493 | |
RenaissanceRe Holdings Ltd. (Insurance) | 10,354 | 2,314,222 | |
RLI Corp. (Insurance) | 7,877 | 1,108,215 | |
Ryan Specialty Holdings, Inc. (Insurance) | 20,049 | 1,161,038 | |
SEI Investments Co. (Capital Markets) | 19,553 | 1,264,884 | |
Selective Insurance Group, Inc. (Insurance) | 11,904 | 1,116,952 | |
SLM Corp. (Consumer Finance) | 43,023 | 894,448 | |
SouthState Corp. (Banks) | 14,918 | 1,140,034 | |
Starwood Property Trust, Inc. (Mortgage REIT) | 58,776 | 1,113,217 | |
Stifel Financial Corp. (Capital Markets) | 20,062 | 1,688,217 | |
Synovus Financial Corp. (Banks) | 28,675 | 1,152,448 | |
Texas Capital Bancshares, Inc. (Banks) | (a) | 9,135 | 558,514 |
UMB Financial Corp. (Banks) | 8,590 | 716,578 | |
United Bankshares, Inc. (Banks) | 26,410 | 856,740 | |
Unum Group (Insurance) | 34,859 | 1,781,643 | |
Valley National Bancorp (Banks) | 83,752 | 584,589 | |
Voya Financial, Inc. (Financial Services) | 19,719 | 1,403,007 | |
Webster Financial Corp. (Banks) | 33,579 | 1,463,709 | |
Western Union Co. / The (Financial Services) | 66,250 | 809,575 | |
WEX, Inc. (Financial Services) | (a) | 8,205 | 1,453,434 |
Wintrust Financial Corp. (Banks) | 12,092 | 1,191,787 | |
Zions Bancorp N.A. (Banks) | 28,913 | 1,253,957 | |
83,364,696 | |||
Health Care–9.1% | |||
Acadia Healthcare Co., Inc. (Health Care Providers & Svs.) | (a) | 18,167 | 1,226,999 |
Amedisys, Inc. (Health Care Providers & Svs.) | (a) | 6,390 | 586,602 |
Arrowhead Pharmaceuticals, Inc. (Biotechnology) | (a) | 24,320 | 632,077 |
Azenta, Inc. (Life Sciences Tools & Svs.) | (a) | 10,558 | 555,562 |
BioMarin Pharmaceutical, Inc. (Biotechnology) | (a) | 37,181 | 3,061,112 |
Bruker Corp. (Life Sciences Tools & Svs.) | 19,067 | 1,216,665 | |
Chemed Corp. (Health Care Providers & Svs.) | 2,964 | 1,608,207 | |
Cytokinetics, Inc. (Biotechnology) | (a) | 22,451 | 1,216,395 |
DENTSPLY SIRONA, Inc. (Health Care Equip. & Supplies) | 40,657 | 1,012,766 | |
Common Stocks (Continued) | Shares | Value | |
Health Care (continued) | |||
Doximity, Inc. Class A (Health Care Technology) | (a) | 23,921 | $669,070 |
Encompass Health Corp. (Health Care Providers & Svs.) | 19,715 | 1,691,350 | |
Enovis Corp. (Health Care Equip. & Supplies) | (a) | 9,774 | 441,785 |
Envista Holdings Corp. (Health Care Equip. & Supplies) | (a) | 33,652 | 559,633 |
Exelixis, Inc. (Biotechnology) | (a) | 57,039 | 1,281,666 |
Globus Medical, Inc. Class A (Health Care Equip. & Supplies) | (a) | 22,054 | 1,510,479 |
Haemonetics Corp. (Health Care Equip. & Supplies) | (a) | 9,945 | 822,750 |
Halozyme Therapeutics, Inc. (Biotechnology) | (a) | 24,922 | 1,304,916 |
HealthEquity, Inc. (Health Care Providers & Svs.) | (a) | 17,038 | 1,468,676 |
Illumina, Inc. (Life Sciences Tools & Svs.) | (a) | 31,193 | 3,255,926 |
Jazz Pharmaceuticals PLC (Pharmaceuticals) | (a) | 12,344 | 1,317,475 |
Lantheus Holdings, Inc. (Health Care Equip. & Supplies) | (a) | 13,572 | 1,089,696 |
LivaNova PLC (Health Care Equip. & Supplies) | (a) | 10,604 | 581,311 |
Masimo Corp. (Health Care Equip. & Supplies) | (a) | 8,732 | 1,099,708 |
Medpace Holdings, Inc. (Life Sciences Tools & Svs.) | (a) | 4,611 | 1,899,040 |
Neogen Corp. (Health Care Equip. & Supplies) | (a) | 38,597 | 603,271 |
Neurocrine Biosciences, Inc. (Biotechnology) | (a) | 19,706 | 2,712,925 |
Option Care Health, Inc. (Health Care Providers & Svs.) | (a) | 34,035 | 942,770 |
Penumbra, Inc. (Health Care Equip. & Supplies) | (a) | 7,591 | 1,366,152 |
Perrigo Co. PLC (Pharmaceuticals) | 26,693 | 685,476 | |
Progyny, Inc. (Health Care Providers & Svs.) | (a) | 16,222 | 464,111 |
QuidelOrtho Corp. (Health Care Equip. & Supplies) | (a) | 9,704 | 322,367 |
R1 RCM, Inc. (Health Care Providers & Svs.) | (a) | 38,769 | 486,939 |
Repligen Corp. (Life Sciences Tools & Svs.) | (a) | 10,175 | 1,282,661 |
Roivant Sciences Ltd. (Biotechnology) | (a) | 66,274 | 700,516 |
Sarepta Therapeutics, Inc. (Biotechnology) | (a) | 18,509 | 2,924,422 |
Sotera Health Co. (Life Sciences Tools & Svs.) | (a) | 24,389 | 289,497 |
Tenet Healthcare Corp. (Health Care Providers & Svs.) | (a) | 19,128 | 2,544,598 |
United Therapeutics Corp. (Biotechnology) | (a) | 8,685 | 2,766,607 |
48,202,178 | |||
Industrials–21.8% | |||
AAON, Inc. (Building Products) | 13,361 | 1,165,614 | |
Acuity Brands, Inc. (Electrical Equip.) | 5,972 | 1,441,880 | |
Advanced Drainage Systems, Inc. (Building Products) | 13,342 | 2,139,923 | |
AECOM (Construction & Engineering) | 26,655 | 2,349,372 | |
AGCO Corp. (Machinery) | 12,128 | 1,187,089 | |
Applied Industrial Technologies, Inc. (Trading Companies & Distributors) | 7,559 | 1,466,446 | |
Avis Budget Group, Inc. (Ground Transportation) | 3,560 | 372,091 | |
Brink's Co. / The (Commercial Svs. & Supplies) | 8,706 | 891,494 | |
BWX Technologies, Inc. (Aerospace & Defense) | 17,899 | 1,700,405 | |
CACI International, Inc. Class A (Professional Svs.) | (a) | 4,366 | 1,877,948 |
Carlisle Cos., Inc. (Building Products) | 9,296 | 3,766,832 | |
Chart Industries, Inc. (Machinery) | (a) | 8,232 | 1,188,207 |
Clean Harbors, Inc. (Commercial Svs. & Supplies) | (a) | 9,822 | 2,221,245 |
Comfort Systems U.S.A., Inc. (Construction & Engineering) | 6,973 | 2,120,629 | |
Concentrix Corp. (Professional Svs.) | 9,175 | 580,594 | |
Core & Main, Inc. Class A (Trading Companies & Distributors) | (a) | 33,487 | 1,638,854 |
Crane Co. (Machinery) | 9,625 | 1,395,432 | |
Common Stocks (Continued) | Shares | Value | |
Industrials (continued) | |||
Curtiss-Wright Corp. (Aerospace & Defense) | 7,499 | $2,032,079 | |
Donaldson Co., Inc. (Machinery) | 23,570 | 1,686,669 | |
EMCOR Group, Inc. (Construction & Engineering) | 9,202 | 3,359,466 | |
EnerSys (Electrical Equip.) | 7,914 | 819,257 | |
Esab Corp. (Machinery) | 11,122 | 1,050,250 | |
ExlService Holdings, Inc. (Professional Svs.) | (a) | 31,807 | 997,468 |
Exponent, Inc. (Professional Svs.) | 9,922 | 943,781 | |
Flowserve Corp. (Machinery) | 25,780 | 1,240,018 | |
Fluor Corp. (Construction & Engineering) | (a) | 33,521 | 1,459,840 |
Fortune Brands Innovations, Inc. (Building Products) | 24,492 | 1,590,510 | |
FTI Consulting, Inc. (Professional Svs.) | (a) | 6,869 | 1,480,476 |
GATX Corp. (Trading Companies & Distributors) | 6,971 | 922,682 | |
Genpact Ltd. (Professional Svs.) | 32,423 | 1,043,696 | |
Graco, Inc. (Machinery) | 33,119 | 2,625,674 | |
GXO Logistics, Inc. (Air Freight & Logistics) | (a) | 23,386 | 1,180,993 |
Hexcel Corp. (Aerospace & Defense) | 16,275 | 1,016,374 | |
Insperity, Inc. (Professional Svs.) | 7,005 | 638,926 | |
ITT, Inc. (Machinery) | 16,115 | 2,081,736 | |
KBR, Inc. (Professional Svs.) | 26,293 | 1,686,433 | |
Kirby Corp. (Marine Transportation) | (a) | 11,416 | 1,366,838 |
Knight-Swift Transportation Holdings, Inc. (Ground Transportation) | 31,645 | 1,579,718 | |
Landstar System, Inc. (Ground Transportation) | 7,003 | 1,291,913 | |
Lennox International, Inc. (Building Products) | 6,278 | 3,358,604 | |
Lincoln Electric Holdings, Inc. (Machinery) | 11,143 | 2,102,016 | |
ManpowerGroup, Inc. (Professional Svs.) | 9,341 | 652,002 | |
MasTec, Inc. (Construction & Engineering) | (a) | 11,898 | 1,272,967 |
Maximus, Inc. (Professional Svs.) | 11,905 | 1,020,259 | |
MDU Resources Group, Inc. (Construction & Engineering) | 39,924 | 1,002,092 | |
Middleby Corp. / The (Machinery) | (a) | 10,529 | 1,290,961 |
MSA Safety, Inc. (Commercial Svs. & Supplies) | 7,249 | 1,360,565 | |
MSC Industrial Direct Co., Inc. Class A (Trading Companies & Distributors) | 8,930 | 708,238 | |
NEXTracker, Inc. Class A (Electrical Equip.) | (a) | 24,063 | 1,128,073 |
nVent Electric PLC (Electrical Equip.) | 32,509 | 2,490,514 | |
Oshkosh Corp. (Machinery) | 12,806 | 1,385,609 | |
Owens Corning (Building Products) | 16,969 | 2,947,855 | |
Paylocity Holding Corp. (Professional Svs.) | (a) | 8,508 | 1,121,780 |
RB Global, Inc. (Commercial Svs. & Supplies) | 35,974 | 2,746,975 | |
RBC Bearings, Inc. (Machinery) | (a) | 5,686 | 1,533,969 |
Regal Rexnord Corp. (Electrical Equip.) | 13,025 | 1,761,240 | |
Ryder System, Inc. (Ground Transportation) | 8,582 | 1,063,138 | |
Saia, Inc. (Ground Transportation) | (a) | 5,206 | 2,469,154 |
Science Applications International Corp. (Professional Svs.) | 10,040 | 1,180,202 | |
Sensata Technologies Holding PLC (Electrical Equip.) | 29,517 | 1,103,641 | |
Simpson Manufacturing Co., Inc. (Building Products) | 8,255 | 1,391,215 | |
Stericycle, Inc. (Commercial Svs. & Supplies) | (a) | 18,168 | 1,056,106 |
Terex Corp. (Machinery) | 13,178 | 722,682 | |
Tetra Tech, Inc. (Commercial Svs. & Supplies) | 10,475 | 2,141,928 | |
Timken Co. / The (Machinery) | 12,685 | 1,016,449 | |
Toro Co. / The (Machinery) | 20,444 | 1,911,718 | |
Trex Co., Inc. (Building Products) | (a) | 21,283 | 1,577,496 |
UFP Industries, Inc. (Building Products) | 12,092 | 1,354,304 | |
Valmont Industries, Inc. (Construction & Engineering) | 3,954 | 1,085,175 | |
Watsco, Inc. (Trading Companies & Distributors) | 6,268 | 2,903,588 | |
Watts Water Technologies, Inc. Class A (Machinery) | 5,368 | 984,330 | |
WESCO International, Inc. (Trading Companies & Distributors) | 8,559 | 1,356,773 | |
Common Stocks (Continued) | Shares | Value | |
Industrials (continued) | |||
Woodward, Inc. (Aerospace & Defense) | 11,929 | $2,080,179 | |
XPO, Inc. (Ground Transportation) | (a) | 22,779 | 2,417,991 |
115,298,640 | |||
Information Technology–9.4% | |||
Allegro MicroSystems, Inc. (Semiconductors & Equip.) | (a) | 13,992 | 395,134 |
Altair Engineering, Inc. Class A (Software) | (a) | 11,151 | 1,093,690 |
Amkor Technology, Inc. (Semiconductors & Equip.) | 20,245 | 810,205 | |
Appfolio, Inc. Class A (Software) | (a) | 4,110 | 1,005,183 |
Arrow Electronics, Inc. (Electronic Equip., Instr. & Comp.) | (a) | 10,423 | 1,258,681 |
ASGN, Inc. (IT Svs.) | (a) | 8,988 | 792,472 |
Aspen Technology, Inc. (Software) | (a) | 5,456 | 1,083,725 |
Avnet, Inc. (Electronic Equip., Instr. & Comp.) | 17,698 | 911,270 | |
Belden, Inc. (Electronic Equip., Instr. & Comp.) | 7,965 | 747,117 | |
Blackbaud, Inc. (Software) | (a) | 7,915 | 602,885 |
Ciena Corp. (Communications Equip.) | (a) | 28,315 | 1,364,217 |
Cirrus Logic, Inc. (Semiconductors & Equip.) | (a) | 10,561 | 1,348,217 |
Cognex Corp. (Electronic Equip., Instr. & Comp.) | 33,614 | 1,571,791 | |
Coherent Corp. (Electronic Equip., Instr. & Comp.) | (a) | 25,973 | 1,882,004 |
CommVault Systems, Inc. (Software) | (a) | 8,498 | 1,033,102 |
Crane NXT Co. (Electronic Equip., Instr. & Comp.) | 9,508 | 583,981 | |
Dolby Laboratories, Inc. Class A (Software) | 11,700 | 926,991 | |
Dropbox, Inc. Class A (Software) | (a) | 47,317 | 1,063,213 |
Dynatrace, Inc. (Software) | (a) | 47,101 | 2,107,299 |
IPG Photonics Corp. (Electronic Equip., Instr. & Comp.) | (a) | 5,621 | 474,356 |
Kyndryl Holdings, Inc. (IT Svs.) | (a) | 45,057 | 1,185,450 |
Lattice Semiconductor Corp. (Semiconductors & Equip.) | (a) | 26,933 | 1,561,845 |
Littelfuse, Inc. (Electronic Equip., Instr. & Comp.) | 4,853 | 1,240,378 | |
Lumentum Holdings, Inc. (Communications Equip.) | (a) | 13,237 | 674,028 |
MACOM Technology Solutions Holdings, Inc. (Semiconductors & Equip.) | (a) | 10,731 | 1,196,185 |
Manhattan Associates, Inc. (Software) | (a) | 12,056 | 2,973,974 |
MKS Instruments, Inc. (Semiconductors & Equip.) | 12,369 | 1,615,144 | |
Novanta, Inc. (Electronic Equip., Instr. & Comp.) | (a) | 7,028 | 1,146,337 |
Onto Innovation, Inc. (Semiconductors & Equip.) | (a) | 9,649 | 2,118,534 |
Power Integrations, Inc. (Semiconductors & Equip.) | 11,115 | 780,162 | |
Pure Storage, Inc. Class A (Tech. Hardware, Storage & Periph.) | (a) | 59,838 | 3,842,198 |
Qualys, Inc. (Software) | (a) | 7,233 | 1,031,426 |
Rambus, Inc. (Semiconductors & Equip.) | (a) | 21,105 | 1,240,130 |
Silicon Laboratories, Inc. (Semiconductors & Equip.) | (a) | 6,251 | 691,548 |
Synaptics, Inc. (Semiconductors & Equip.) | (a) | 7,734 | 682,139 |
TD SYNNEX Corp. (Electronic Equip., Instr. & Comp.) | 15,217 | 1,756,042 | |
Teradata Corp. (Software) | (a) | 18,935 | 654,394 |
Universal Display Corp. (Semiconductors & Equip.) | 8,546 | 1,796,796 | |
Vishay Intertechnology, Inc. (Electronic Equip., Instr. & Comp.) | 24,504 | 546,439 | |
Vontier Corp. (Electronic Equip., Instr. & Comp.) | 30,233 | 1,154,901 | |
Wolfspeed, Inc. (Semiconductors & Equip.) | (a) | 24,644 | 560,897 |
49,504,480 | |||
Common Stocks (Continued) | Shares | Value | |
Materials–6.4% | |||
Alcoa Corp. (Metals & Mining) | 35,160 | $1,398,665 | |
AptarGroup, Inc. (Containers & Packaging) | 12,975 | 1,827,010 | |
Arcadium Lithium PLC (Chemicals) | (a) | 202,115 | 679,106 |
Ashland, Inc. (Chemicals) | 9,816 | 927,514 | |
Avient Corp. (Chemicals) | 17,869 | 779,982 | |
Axalta Coating Systems Ltd. (Chemicals) | (a) | 43,205 | 1,476,315 |
Berry Global Group, Inc. (Containers & Packaging) | 22,401 | 1,318,299 | |
Cabot Corp. (Chemicals) | 10,820 | 994,250 | |
Chemours Co. / The (Chemicals) | 29,156 | 658,051 | |
Cleveland-Cliffs, Inc. (Metals & Mining) | (a) | 93,104 | 1,432,870 |
Commercial Metals Co. (Metals & Mining) | 22,657 | 1,245,908 | |
Crown Holdings, Inc. (Containers & Packaging) | 23,363 | 1,737,974 | |
Eagle Materials, Inc. (Construction Materials) | 6,746 | 1,466,985 | |
Graphic Packaging Holding Co. (Containers & Packaging) | 60,172 | 1,577,108 | |
Greif, Inc. Class A (Containers & Packaging) | 5,048 | 290,108 | |
Knife River Corp. (Construction Materials) | (a) | 11,085 | 777,502 |
Louisiana-Pacific Corp. (Paper & Forest Products) | 12,491 | 1,028,384 | |
MP Materials Corp. (Metals & Mining) | (a) | 26,221 | 333,793 |
NewMarket Corp. (Chemicals) | 1,353 | 697,566 | |
Olin Corp. (Chemicals) | 23,384 | 1,102,556 | |
Reliance, Inc. (Metals & Mining) | 11,245 | 3,211,572 | |
Royal Gold, Inc. (Metals & Mining) | 12,871 | 1,610,934 | |
RPM International, Inc. (Chemicals) | 25,213 | 2,714,936 | |
Scotts Miracle-Gro Co. / The (Chemicals) | 8,230 | 535,444 | |
Silgan Holdings, Inc. (Containers & Packaging) | 15,890 | 672,624 | |
Sonoco Products Co. (Containers & Packaging) | 19,240 | 975,853 | |
United States Steel Corp. (Metals & Mining) | 43,809 | 1,655,980 | |
Westlake Corp. (Chemicals) | 6,294 | 911,497 | |
34,038,786 | |||
Real Estate–7.0% | |||
Agree Realty Corp. (Retail REITs) | 19,659 | 1,217,679 | |
American Homes 4 Rent Class A (Residential REITs) | 63,013 | 2,341,563 | |
Brixmor Property Group, Inc. (Retail REITs) | 58,998 | 1,362,264 | |
COPT Defense Properties (Office REITs) | 22,011 | 550,935 | |
Cousins Properties, Inc. (Office REITs) | 29,778 | 689,361 | |
CubeSmart (Specialized REITs) | 44,052 | 1,989,829 | |
EastGroup Properties, Inc. (Industrial REITs) | 9,412 | 1,600,981 | |
EPR Properties (Specialized REITs) | 14,818 | 622,060 | |
Equity LifeStyle Properties, Inc. (Residential REITs) | 36,518 | 2,378,417 | |
First Industrial Realty Trust, Inc. (Industrial REITs) | 25,914 | 1,231,174 | |
Gaming & Leisure Properties, Inc. (Specialized REITs) | 53,162 | 2,403,454 | |
Healthcare Realty Trust, Inc. (Health Care REITs) | 74,124 | 1,221,564 | |
Independence Realty Trust, Inc. (Residential REITs) | 43,993 | 824,429 | |
Jones Lang LaSalle, Inc. (Real Estate Mgmt. & Development) | (a) | 9,313 | 1,911,773 |
Kilroy Realty Corp. (Office REITs) | 20,914 | 651,889 | |
Kite Realty Group Trust (Retail REITs) | 43,001 | 962,362 | |
Lamar Advertising Co. Class A (Specialized REITs) | 17,196 | 2,055,438 | |
National Storage Affiliates Trust (Specialized REITs) | 13,648 | 562,571 | |
NNN REIT, Inc. (Retail REITs) | 35,902 | 1,529,425 | |
Omega Healthcare Investors, Inc. (Health Care REITs) | 48,385 | 1,657,186 | |
Park Hotels & Resorts, Inc. (Hotel & Resort REITs) | 41,238 | 617,745 | |
Common Stocks (Continued) | Shares | Value | |
Real Estate (continued) | |||
PotlatchDeltic Corp. (Specialized REITs) | 15,569 | $613,263 | |
Rayonier, Inc. (Specialized REITs) | 26,820 | 780,194 | |
Rexford Industrial Realty, Inc. (Industrial REITs) | 42,566 | 1,898,018 | |
Sabra Health Care REIT, Inc. (Health Care REITs) | 45,330 | 698,082 | |
STAG Industrial, Inc. (Industrial REITs) | 35,654 | 1,285,683 | |
Vornado Realty Trust (Office REITs) | 31,331 | 823,692 | |
W.P. Carey, Inc. (Diversified REITs) | 42,849 | 2,358,837 | |
36,839,868 | |||
Utilities–2.5% | |||
ALLETE, Inc. (Electric Utilities) | 11,297 | 704,368 | |
Black Hills Corp. (Multi-Utilities) | 13,498 | 734,021 | |
Essential Utilities, Inc. (Water Utilities) | 49,275 | 1,839,436 | |
IDACORP, Inc. (Electric Utilities) | 9,927 | 924,700 | |
National Fuel Gas Co. (Gas Utilities) | 17,999 | 975,366 | |
New Jersey Resources Corp. (Gas Utilities) | 19,351 | 827,062 | |
Northwestern Energy Group, Inc. (Multi-Utilities) | 12,001 | 601,010 | |
OGE Energy Corp. (Electric Utilities) | 39,270 | 1,401,939 | |
Common Stocks (Continued) | Shares | Value | |
Utilities (continued) | |||
ONE Gas, Inc. (Gas Utilities) | 11,077 | $707,266 | |
Ormat Technologies, Inc. (Ind. Power & Renewable Elec.) | 10,530 | 755,001 | |
PNM Resources, Inc. (Electric Utilities) | 17,662 | 652,788 | |
Portland General Electric Co. (Electric Utilities) | 20,174 | 872,324 | |
Southwest Gas Holdings, Inc. (Gas Utilities) | 11,788 | 829,639 | |
Spire, Inc. (Gas Utilities) | 11,308 | 686,735 | |
UGI Corp. (Gas Utilities) | 41,047 | 939,976 | |
13,451,631 | |||
Total Common Stocks (Cost $444,359,112) | $521,054,798 | ||
U.S. Treasury Obligations–0.0% | Rate | Maturity | Face Amount | Value | |
U.S. Treasury Bill | (b) | 0.000% | 08/22/2024 | $186,000 | $184,596 |
Total U.S. Treasury Obligations (Cost $184,592) | $184,596 | ||||
Total Investments – 98.5% (Cost $444,543,704) | (c) | $521,239,394 | |||
Other Assets in Excess of Liabilities – 1.5% | (b) | 7,706,486 | |||
Net Assets – 100.0% | $528,945,880 | ||||
Percentages are stated as a percent of net assets. |
Abbreviations: | ||
REITs: | Real Estate Investment Trusts | |
Footnotes: | ||
(a) | Non-income producing security. | |
(b) | Security is fully pledged, in addition to $104,159 of the Portfolio’s cash holdings, as collateral for the futures contracts outstanding at June 30, 2024. See also the following Schedule of Open Futures Contracts. | |
(c) | Represents cost for financial reporting purposes, which may differ from cost basis for federal income tax purposes. See also Note 7 of the Notes to Financial Statements. | |
Description | Number of contracts | Expiration Date | Notional Amount | Value | Unrealized Appreciation (Depreciation) | Variation Margin Receivable (Payable) |
CME E-mini S&P MidCap 400 Index - Long | 19 | September 20, 2024 | $5,624,131 | $5,620,390 | $(3,741 ) | $6,112 |
Common Stocks–99.0% | Shares | Value | |
Communication Services–12.9% | |||
Alphabet, Inc. Class A (Interactive Media & Svs.) | 45,260 | $8,244,109 | |
Alphabet, Inc. Class C (Interactive Media & Svs.) | 88,550 | 16,241,841 | |
Comcast Corp. Class A (Media) | 63,821 | 2,499,230 | |
Electronic Arts, Inc. (Entertainment) | 4,447 | 619,601 | |
Meta Platforms, Inc. Class A (Interactive Media & Svs.) | 48,087 | 24,246,427 | |
Netflix, Inc. (Entertainment) | (a) | 9,075 | 6,124,536 |
Pinterest, Inc. Class A (Interactive Media & Svs.) | (a) | 71,616 | 3,156,117 |
Snap, Inc. Class A (Interactive Media & Svs.) | (a) | 119,537 | 1,985,510 |
Spotify Technology SA (Entertainment) | (a) | 5,366 | 1,683,797 |
64,801,168 | |||
Consumer Discretionary–13.1% | |||
Amazon.com, Inc. (Broadline Retail) | (a) | 126,278 | 24,403,223 |
AutoNation, Inc. (Specialty Retail) | (a) | 13,471 | 2,147,008 |
Booking Holdings, Inc. (Hotels, Restaurants & Leisure) | 1,545 | 6,120,517 | |
D.R. Horton, Inc. (Household Durables) | 20,309 | 2,862,147 | |
Domino's Pizza, Inc. (Hotels, Restaurants & Leisure) | 2,465 | 1,272,753 | |
Home Depot, Inc. / The (Specialty Retail) | 23,491 | 8,086,542 | |
Lear Corp. (Automobile Components) | 10,718 | 1,224,103 | |
MercadoLibre, Inc. (Broadline Retail) | (a) | 2,494 | 4,098,640 |
MGM Resorts International (Hotels, Restaurants & Leisure) | (a) | 23,538 | 1,046,029 |
NIKE, Inc. Class B (Textiles, Apparel & Luxury Goods) | 19,729 | 1,486,975 | |
O'Reilly Automotive, Inc. (Specialty Retail) | (a) | 1,232 | 1,301,066 |
Pool Corp. (Distributors) | 1,833 | 563,336 | |
Ross Stores, Inc. (Specialty Retail) | 3,870 | 562,388 | |
Tesla, Inc. (Automobiles) | (a) | 30,729 | 6,080,655 |
TJX Cos., Inc. / The (Specialty Retail) | 31,675 | 3,487,418 | |
Toll Brothers, Inc. (Household Durables) | 12,073 | 1,390,568 | |
66,133,368 | |||
Consumer Staples–3.7% | |||
Costco Wholesale Corp. (Consumer Staples Distribution & Retail) | 12,496 | 10,621,475 | |
Kimberly-Clark Corp. (Household Products) | 27,242 | 3,764,844 | |
Monster Beverage Corp. (Beverages) | (a) | 55,891 | 2,791,756 |
Procter & Gamble Co. / The (Household Products) | 8,083 | 1,315,266 | |
18,493,341 | |||
Energy–0.2% | |||
Schlumberger N.V. (Energy Equip. & Svs.) | 20,773 | 980,070 | |
Financials–6.2% | |||
Mastercard, Inc. Class A (Financial Services) | 30,101 | 13,279,357 | |
Nasdaq, Inc. (Capital Markets) | 14,178 | 854,366 | |
Progressive Corp. / The (Insurance) | 10,448 | 2,170,154 | |
S&P Global, Inc. (Capital Markets) | 12,280 | 5,476,880 | |
Visa, Inc. (Financial Services) | 35,193 | 9,237,107 | |
31,017,864 | |||
Health Care–8.7% | |||
Cardinal Health, Inc. (Health Care Providers & Svs.) | 14,680 | 1,443,338 | |
Dexcom, Inc. (Health Care Equip. & Supplies) | (a) | 7,818 | 886,405 |
Eli Lilly & Co. (Pharmaceuticals) | 17,471 | 15,817,894 | |
Gilead Sciences, Inc. (Biotechnology) | 86,204 | 5,914,456 | |
Incyte Corp. (Biotechnology) | (a) | 45,775 | 2,774,880 |
Merck & Co., Inc. (Pharmaceuticals) | 25,596 | 3,168,785 | |
Neurocrine Biosciences, Inc. (Biotechnology) | (a) | 14,843 | 2,043,436 |
Stryker Corp. (Health Care Equip. & Supplies) | 10,150 | 3,453,537 | |
Common Stocks (Continued) | Shares | Value | |
Health Care (continued) | |||
Thermo Fisher Scientific, Inc. (Life Sciences Tools & Svs.) | 1,088 | $601,664 | |
UnitedHealth Group, Inc. (Health Care Providers & Svs.) | 12,510 | 6,370,843 | |
Vertex Pharmaceuticals, Inc. (Biotechnology) | (a) | 2,301 | 1,078,525 |
43,553,763 | |||
Industrials–4.7% | |||
Cintas Corp. (Commercial Svs. & Supplies) | 8,544 | 5,983,022 | |
EMCOR Group, Inc. (Construction & Engineering) | 4,474 | 1,633,368 | |
Lockheed Martin Corp. (Aerospace & Defense) | 10,074 | 4,705,565 | |
Parker-Hannifin Corp. (Machinery) | 10,476 | 5,298,866 | |
Uber Technologies, Inc. (Ground Transportation) | (a) | 38,237 | 2,779,065 |
W.W. Grainger, Inc. (Trading Companies & Distributors) | 1,706 | 1,539,221 | |
Waste Management, Inc. (Commercial Svs. & Supplies) | 8,500 | 1,813,390 | |
23,752,497 | |||
Information Technology–49.0% | |||
Adobe, Inc. (Software) | (a) | 12,241 | 6,800,365 |
Advanced Micro Devices, Inc. (Semiconductors & Equip.) | (a) | 59,665 | 9,678,260 |
Akamai Technologies, Inc. (IT Svs.) | (a) | 5,335 | 480,577 |
Apple, Inc. (Tech. Hardware, Storage & Periph.) | 151,049 | 31,813,940 | |
Applied Materials, Inc. (Semiconductors & Equip.) | 15,120 | 3,568,169 | |
Atlassian Corp. Class A (Software) | (a) | 16,826 | 2,976,183 |
Broadcom, Inc. (Semiconductors & Equip.) | 11,758 | 18,877,822 | |
Crowdstrike Holdings, Inc. Class A (Software) | (a) | 8,414 | 3,224,161 |
Datadog, Inc. Class A (Software) | (a) | 11,097 | 1,448,158 |
Dell Technologies, Inc. Class C (Tech. Hardware, Storage & Periph.) | 12,606 | 1,800,389 | |
Flex Ltd. (Electronic Equip., Instr. & Comp.) | (a) | 56,351 | 1,671,371 |
Fortinet, Inc. (Software) | (a) | 85,407 | 5,147,480 |
Hewlett Packard Enterprise Co. (Tech. Hardware, Storage & Periph.) | 55,394 | 1,172,137 | |
HP, Inc. (Tech. Hardware, Storage & Periph.) | 24,795 | 867,081 | |
HubSpot, Inc. (Software) | (a) | 1,583 | 938,054 |
Intuit, Inc. (Software) | 5,267 | 3,427,606 | |
Lam Research Corp. (Semiconductors & Equip.) | 7,137 | 7,599,834 | |
Manhattan Associates, Inc. (Software) | (a) | 12,243 | 3,020,103 |
Microsoft Corp. (Software) | 95,518 | 42,691,770 | |
Monolithic Power Systems, Inc. (Semiconductors & Equip.) | 3,087 | 2,536,526 | |
Motorola Solutions, Inc. (Communications Equip.) | 5,435 | 2,099,921 | |
NetApp, Inc. (Tech. Hardware, Storage & Periph.) | 53,919 | 7,022,411 | |
NVIDIA Corp. (Semiconductors & Equip.) | 400,508 | 49,478,758 | |
Oracle Corp. (Software) | 19,614 | 2,806,567 | |
Pure Storage, Inc. Class A (Tech. Hardware, Storage & Periph.) | (a) | 17,224 | 1,128,344 |
QUALCOMM, Inc. (Semiconductors & Equip.) | 29,551 | 5,885,968 | |
Salesforce, Inc. (Software) | 20,492 | 5,268,493 | |
ServiceNow, Inc. (Software) | (a) | 12,559 | 9,879,789 |
Snowflake, Inc. Class A (IT Svs.) | (a) | 4,423 | 631,472 |
Super Micro Computer, Inc. (Tech. Hardware, Storage & Periph.) | (a) | 5,729 | 4,694,056 |
Synopsys, Inc. (Software) | (a) | 1,879 | 1,118,118 |
TE Connectivity Ltd. (Electronic Equip., Instr. & Comp.) | 33,675 | 5,065,730 | |
Common Stocks (Continued) | Shares | Value | |
Information Technology (continued) | |||
VeriSign, Inc. (IT Svs.) | (a) | 5,769 | $1,025,728 |
Workday, Inc. Class A (Software) | (a) | 3,459 | 773,294 |
246,618,635 | |||
Materials–0.2% | |||
Louisiana-Pacific Corp. (Paper & Forest Products) | 11,317 | 931,728 | |
Common Stocks (Continued) | Shares | Value | |
Real Estate–0.3% | |||
Equinix, Inc. (Specialized REITs) | 2,020 | $1,528,332 | |
Total Common Stocks (Cost $400,198,671) | $497,810,766 | ||
Total Investments – 99.0% (Cost $400,198,671) | (b) | $497,810,766 | |
Other Assets in Excess of Liabilities – 1.0% | (c) | 5,113,069 | |
Net Assets – 100.0% | $502,923,835 | ||
Percentages are stated as a percent of net assets. |
Abbreviations: | ||
REITs: | Real Estate Investment Trusts | |
Footnotes: | ||
(a) | Non-income producing security. | |
(b) | Represents cost for financial reporting purposes, which may differ from cost basis for federal income tax purposes. See also Note 7 of the Notes to Financial Statements. | |
(c) | Includes $194,700 of cash pledged as collateral for the futures contracts outstanding at June 30, 2024. See also the following Schedule of Open Futures Contracts. | |
Description | Number of contracts | Expiration Date | Notional Amount | Value | Unrealized Appreciation (Depreciation) | Variation Margin Receivable (Payable) |
CME E-mini Nasdaq-100 Index - Long | 16 | September 20, 2024 | $6,440,220 | $6,376,720 | $(63,500 ) | $(29,278 ) |
Common Stocks–49.7% | Shares | Value | |
Communication Services–5.0% | |||
Alphabet, Inc. Class C (Interactive Media & Svs.) | 150,648 | $27,631,856 | |
AT&T, Inc. (Diversified Telecom. Svs.) | 81,265 | 1,552,974 | |
Charter Communications, Inc. Class A (Media) | (a) | 1,665 | 497,768 |
Comcast Corp. Class A (Media) | 105,349 | 4,125,467 | |
Electronic Arts, Inc. (Entertainment) | 19,217 | 2,677,505 | |
Match Group, Inc. (Interactive Media & Svs.) | (a) | 13,575 | 412,408 |
Meta Platforms, Inc. Class A (Interactive Media & Svs.) | 35,530 | 17,914,937 | |
Netflix, Inc. (Entertainment) | (a) | 11,552 | 7,796,214 |
New York Times Co. / The Class A (Media) | 28,261 | 1,447,246 | |
Verizon Communications, Inc. (Diversified Telecom. Svs.) | 67,652 | 2,789,968 | |
Walt Disney Co. / The (Entertainment) | 17,359 | 1,723,575 | |
68,569,918 | |||
Consumer Discretionary–4.7% | |||
Amazon.com, Inc. (Broadline Retail) | (a) | 110,962 | 21,443,406 |
AutoZone, Inc. (Specialty Retail) | (a) | 1,281 | 3,797,012 |
Best Buy Co., Inc. (Specialty Retail) | 7,248 | 610,934 | |
Booking Holdings, Inc. (Hotels, Restaurants & Leisure) | 905 | 3,585,158 | |
Burlington Stores, Inc. (Specialty Retail) | (a) | 2,841 | 681,840 |
Chipotle Mexican Grill, Inc. (Hotels, Restaurants & Leisure) | (a) | 61,100 | 3,827,915 |
Compass Group PLC – ADR (Hotels, Restaurants & Leisure) | 83,382 | 2,310,515 | |
Coupang, Inc. (Broadline Retail) | (a) | 31,139 | 652,362 |
eBay, Inc. (Broadline Retail) | 12,374 | 664,731 | |
Ferrari N.V. (Automobiles) | 4,800 | 1,960,176 | |
Ford Motor Co. (Automobiles) | 77,342 | 969,869 | |
General Motors Co. (Automobiles) | 24,707 | 1,147,887 | |
Home Depot, Inc. / The (Specialty Retail) | 19,926 | 6,859,326 | |
Lowe's Cos., Inc. (Specialty Retail) | 5,032 | 1,109,355 | |
Lululemon Athletica, Inc. (Textiles, Apparel & Luxury Goods) | (a) | 10,201 | 3,047,039 |
NIKE, Inc. Class B (Textiles, Apparel & Luxury Goods) | 14,102 | 1,062,868 | |
On Holding AG Class A (Textiles, Apparel & Luxury Goods) | (a) | 33,633 | 1,304,960 |
O'Reilly Automotive, Inc. (Specialty Retail) | (a) | 842 | 889,203 |
Ross Stores, Inc. (Specialty Retail) | 5,781 | 840,095 | |
Tractor Supply Co. (Specialty Retail) | 12,733 | 3,437,910 | |
Ulta Beauty, Inc. (Specialty Retail) | (a) | 3,282 | 1,266,425 |
Yum! Brands, Inc. (Hotels, Restaurants & Leisure) | 14,794 | 1,959,613 | |
63,428,599 | |||
Consumer Staples–3.4% | |||
Altria Group, Inc. (Tobacco) | 55,153 | 2,512,219 | |
Archer-Daniels-Midland Co. (Food Products) | 14,211 | 859,055 | |
BJ's Wholesale Club Holdings, Inc. (Consumer Staples Distribution & Retail) | (a) | 8,658 | 760,519 |
Bunge Global SA (Food Products) | 5,184 | 553,496 | |
Celsius Holdings, Inc. (Beverages) | (a) | 23,745 | 1,355,602 |
Coca-Cola Co. / The (Beverages) | 48,088 | 3,060,801 | |
Colgate-Palmolive Co. (Household Products) | 12,630 | 1,225,615 | |
Conagra Brands, Inc. (Food Products) | 17,423 | 495,162 | |
Costco Wholesale Corp. (Consumer Staples Distribution & Retail) | 10,065 | 8,555,149 | |
Kenvue, Inc. (Personal Care Products) | 36,489 | 663,370 | |
Keurig Dr Pepper, Inc. (Beverages) | 45,713 | 1,526,814 | |
Kimberly-Clark Corp. (Household Products) | 10,589 | 1,463,400 | |
Koninklijke Ahold Delhaize N.V. – ADR (Consumer Staples Distribution & Retail) | 44,660 | 1,321,489 | |
Kroger Co. / The (Consumer Staples Distribution & Retail) | 28,087 | 1,402,384 | |
Molson Coors Beverage Co. Class B (Beverages) | 7,838 | 398,406 | |
Monster Beverage Corp. (Beverages) | (a) | 135,981 | 6,792,251 |
Performance Food Group Co. (Consumer Staples Distribution & Retail) | (a) | 6,373 | 421,319 |
Philip Morris International, Inc. (Tobacco) | 32,195 | 3,262,319 | |
Procter & Gamble Co. / The (Household Products) | 20,091 | 3,313,408 | |
Sysco Corp. (Consumer Staples Distribution & Retail) | 15,562 | 1,110,971 | |
Target Corp. (Consumer Staples Distribution & Retail) | 11,518 | 1,705,125 | |
Walgreens Boots Alliance, Inc. (Consumer Staples Distribution & Retail) | 23,013 | 278,342 | |
Walmart, Inc. (Consumer Staples Distribution & Retail) | 42,434 | 2,873,206 | |
45,910,422 | |||
Energy–1.6% | |||
Baker Hughes Co. (Energy Equip. & Svs.) | 23,393 | 822,732 | |
Cheniere Energy, Inc. (Oil, Gas & Consumable Fuels) | 3,152 | 551,064 | |
Chesapeake Energy Corp. (Oil, Gas & Consumable Fuels) | 5,951 | 489,113 | |
Chevron Corp. (Oil, Gas & Consumable Fuels) | 18,529 | 2,898,306 | |
Common Stocks (Continued) | Shares | Value | |
Energy (continued) | |||
Devon Energy Corp. (Oil, Gas & Consumable Fuels) | 15,585 | $738,729 | |
EOG Resources, Inc. (Oil, Gas & Consumable Fuels) | 9,779 | 1,230,883 | |
Exxon Mobil Corp. (Oil, Gas & Consumable Fuels) | 31,777 | 3,658,168 | |
Halliburton Co. (Energy Equip. & Svs.) | 19,281 | 651,312 | |
Kinder Morgan, Inc. (Oil, Gas & Consumable Fuels) | 41,414 | 822,896 | |
Marathon Oil Corp. (Oil, Gas & Consumable Fuels) | 20,175 | 578,417 | |
Marathon Petroleum Corp. (Oil, Gas & Consumable Fuels) | 8,744 | 1,516,909 | |
Ovintiv, Inc. (Oil, Gas & Consumable Fuels) | 9,960 | 466,825 | |
Phillips 66 (Oil, Gas & Consumable Fuels) | 10,346 | 1,460,545 | |
Shell PLC – ADR (Oil, Gas & Consumable Fuels) | 55,572 | 4,011,187 | |
Valero Energy Corp. (Oil, Gas & Consumable Fuels) | 9,685 | 1,518,221 | |
21,415,307 | |||
Financials–6.2% | |||
Ally Financial, Inc. (Consumer Finance) | 13,226 | 524,675 | |
American Financial Group, Inc. (Insurance) | 7,903 | 972,227 | |
Ameriprise Financial, Inc. (Capital Markets) | 3,084 | 1,317,454 | |
Ares Management Corp. Class A (Capital Markets) | 9,218 | 1,228,575 | |
Assurant, Inc. (Insurance) | 2,696 | 448,210 | |
Bank of America Corp. (Banks) | 56,186 | 2,234,517 | |
Bank of New York Mellon Corp. / The (Capital Markets) | 26,054 | 1,560,374 | |
Berkshire Hathaway, Inc. Class B (Financial Services) | (a) | 12,381 | 5,036,591 |
Capital One Financial Corp. (Consumer Finance) | 15,366 | 2,127,423 | |
CBOE Global Markets, Inc. (Capital Markets) | 8,609 | 1,464,047 | |
Charles Schwab Corp. / The (Capital Markets) | 32,932 | 2,426,759 | |
Cincinnati Financial Corp. (Insurance) | 4,321 | 510,310 | |
Citizens Financial Group, Inc. (Banks) | 15,586 | 561,564 | |
CME Group, Inc. (Capital Markets) | 9,185 | 1,805,771 | |
Corpay, Inc. (Financial Services) | (a) | 4,359 | 1,161,281 |
Everest Group Ltd. (Insurance) | 7,554 | 2,878,225 | |
FactSet Research Systems, Inc. (Capital Markets) | 2,607 | 1,064,360 | |
Fiserv, Inc. (Financial Services) | (a) | 22,790 | 3,396,622 |
Global Payments, Inc. (Financial Services) | 10,778 | 1,042,233 | |
Jack Henry & Associates, Inc. (Financial Services) | 2,824 | 468,840 | |
JPMorgan Chase & Co. (Banks) | 31,679 | 6,407,394 | |
Loews Corp. (Insurance) | 6,512 | 486,707 | |
LPL Financial Holdings, Inc. (Capital Markets) | 4,526 | 1,264,112 | |
M&T Bank Corp. (Banks) | 9,575 | 1,449,272 | |
Markel Group, Inc. (Insurance) | (a) | 873 | 1,375,551 |
Marsh & McLennan Cos., Inc. (Insurance) | 13,138 | 2,768,439 | |
Mastercard, Inc. Class A (Financial Services) | 4,254 | 1,876,695 | |
MSCI, Inc. (Capital Markets) | 3,984 | 1,919,292 | |
Nasdaq, Inc. (Capital Markets) | 23,197 | 1,397,851 | |
Northern Trust Corp. (Capital Markets) | 6,011 | 504,804 | |
PayPal Holdings, Inc. (Financial Services) | (a) | 30,157 | 1,750,011 |
PNC Financial Services Group, Inc. / The (Banks) | 14,663 | 2,279,803 | |
Progressive Corp. / The (Insurance) | 9,478 | 1,968,675 | |
Reinsurance Group of America, Inc. (Insurance) | 8,555 | 1,756,085 | |
RenaissanceRe Holdings Ltd. (Insurance) | 2,180 | 487,252 | |
S&P Global, Inc. (Capital Markets) | 3,355 | 1,496,330 | |
State Street Corp. (Capital Markets) | 17,940 | 1,327,560 | |
Synchrony Financial (Consumer Finance) | 11,846 | 559,013 | |
T. Rowe Price Group, Inc. (Capital Markets) | 11,933 | 1,375,994 | |
Truist Financial Corp. (Banks) | 59,335 | 2,305,165 | |
Unum Group (Insurance) | 9,894 | 505,682 | |
Visa, Inc. (Financial Services) | 56,436 | 14,812,757 | |
Willis Towers Watson PLC (Insurance) | 5,527 | 1,448,848 | |
83,753,350 | |||
Health Care–8.0% | |||
AbbVie, Inc. (Biotechnology) | 27,175 | 4,661,056 | |
Avantor, Inc. (Life Sciences Tools & Svs.) | (a) | 27,465 | 582,258 |
Baxter International, Inc. (Health Care Equip. & Supplies) | 15,378 | 514,394 | |
Becton Dickinson & Co. (Health Care Equip. & Supplies) | 7,774 | 1,816,862 | |
Biogen, Inc. (Biotechnology) | (a) | 3,984 | 923,571 |
Bristol-Myers Squibb Co. (Pharmaceuticals) | 44,578 | 1,851,324 | |
Cardinal Health, Inc. (Health Care Providers & Svs.) | 5,447 | 535,549 | |
Cencora, Inc. (Health Care Providers & Svs.) | 7,209 | 1,624,188 | |
Centene Corp. (Health Care Providers & Svs.) | (a) | 9,852 | 653,188 |
Cigna Group / The (Health Care Providers & Svs.) | 12,586 | 4,160,554 | |
Common Stocks (Continued) | Shares | Value | |
Health Care (continued) | |||
CVS Health Corp. (Health Care Providers & Svs.) | 26,984 | $1,593,675 | |
Edwards Lifesciences Corp. (Health Care Equip. & Supplies) | (a) | 64,930 | 5,997,584 |
Eli Lilly & Co. (Pharmaceuticals) | 12,823 | 11,609,688 | |
GE HealthCare Technologies, Inc. (Health Care Equip. & Supplies) | 7,944 | 618,997 | |
Genmab A/S – ADR (Biotechnology) | (a) | 44,347 | 1,114,440 |
Gilead Sciences, Inc. (Biotechnology) | 48,823 | 3,349,746 | |
Humana, Inc. (Health Care Providers & Svs.) | 2,059 | 769,345 | |
IDEXX Laboratories, Inc. (Health Care Equip. & Supplies) | (a) | 10,903 | 5,311,942 |
Incyte Corp. (Biotechnology) | (a) | 11,242 | 681,490 |
Insulet Corp. (Health Care Equip. & Supplies) | (a) | 2,983 | 601,969 |
Intuitive Surgical, Inc. (Health Care Equip. & Supplies) | (a) | 17,433 | 7,755,070 |
McKesson Corp. (Health Care Providers & Svs.) | 9,470 | 5,530,859 | |
Medtronic PLC (Health Care Equip. & Supplies) | 47,661 | 3,751,397 | |
Merck & Co., Inc. (Pharmaceuticals) | 47,570 | 5,889,166 | |
Mettler-Toledo International, Inc. (Life Sciences Tools & Svs.) | (a) | 1,240 | 1,733,012 |
ResMed, Inc. (Health Care Equip. & Supplies) | 3,120 | 597,230 | |
Royalty Pharma PLC Class A (Pharmaceuticals) | 22,328 | 588,789 | |
Teleflex, Inc. (Health Care Equip. & Supplies) | 2,196 | 461,885 | |
Thermo Fisher Scientific, Inc. (Life Sciences Tools & Svs.) | 1,376 | 760,928 | |
United Therapeutics Corp. (Biotechnology) | (a) | 2,785 | 887,162 |
UnitedHealth Group, Inc. (Health Care Providers & Svs.) | 17,540 | 8,932,420 | |
Veeva Systems, Inc. Class A (Health Care Technology) | (a) | 18,882 | 3,455,595 |
Vertex Pharmaceuticals, Inc. (Biotechnology) | (a) | 21,127 | 9,902,648 |
Waters Corp. (Life Sciences Tools & Svs.) | (a) | 4,875 | 1,414,335 |
West Pharmaceutical Services, Inc. (Life Sciences Tools & Svs.) | 4,960 | 1,633,774 | |
Zimmer Biomet Holdings, Inc. (Health Care Equip. & Supplies) | 5,355 | 581,178 | |
Zoetis, Inc. (Pharmaceuticals) | 35,790 | 6,204,554 | |
109,051,822 | |||
Industrials–4.2% | |||
AECOM (Construction & Engineering) | 14,249 | 1,255,907 | |
Allegion PLC (Building Products) | 3,840 | 453,696 | |
American Airlines Group, Inc. (Passenger Airlines) | (a) | 31,203 | 353,530 |
AMETEK, Inc. (Electrical Equip.) | 8,733 | 1,455,879 | |
Automatic Data Processing, Inc. (Professional Svs.) | 9,064 | 2,163,486 | |
Carrier Global Corp. (Building Products) | 30,055 | 1,895,869 | |
CNH Industrial N.V. (Machinery) | 40,942 | 414,743 | |
Copart, Inc. (Commercial Svs. & Supplies) | (a) | 110,915 | 6,007,156 |
CSX Corp. (Ground Transportation) | 48,105 | 1,609,112 | |
Deere & Co. (Machinery) | 4,986 | 1,862,919 | |
Eaton Corp. PLC (Electrical Equip.) | 2,766 | 867,279 | |
Experian PLC – ADR (Professional Svs.) | 42,175 | 1,967,042 | |
FedEx Corp. (Air Freight & Logistics) | 7,057 | 2,115,971 | |
Ferguson PLC (Trading Companies & Distributors) | 3,659 | 708,565 | |
Fortune Brands Innovations, Inc. (Building Products) | 6,015 | 390,614 | |
Genpact Ltd. (Professional Svs.) | 52,308 | 1,683,795 | |
Honeywell International, Inc. (Industrial Conglomerates) | 10,936 | 2,335,274 | |
Huntington Ingalls Industries, Inc. (Aerospace & Defense) | 1,678 | 413,342 | |
J.B. Hunt Transport Services, Inc. (Ground Transportation) | 2,371 | 379,360 | |
Jacobs Solutions, Inc. (Professional Svs.) | 4,187 | 584,966 | |
Johnson Controls International PLC (Building Products) | 12,860 | 854,804 | |
L3Harris Technologies, Inc. (Aerospace & Defense) | 13,857 | 3,112,005 | |
Lockheed Martin Corp. (Aerospace & Defense) | 4,113 | 1,921,182 | |
Masco Corp. (Building Products) | 6,373 | 424,888 | |
Old Dominion Freight Line, Inc. (Ground Transportation) | 6,617 | 1,168,562 | |
Otis Worldwide Corp. (Machinery) | 40,758 | 3,923,365 | |
Owens Corning (Building Products) | 3,279 | 569,628 | |
Paychex, Inc. (Professional Svs.) | 15,231 | 1,805,787 | |
Paycom Software, Inc. (Professional Svs.) | 2,688 | 384,492 | |
RELX PLC – ADR (Professional Svs.) | 20,374 | 934,759 | |
RTX Corp. (Aerospace & Defense) | 24,874 | 2,497,101 | |
Snap-on, Inc. (Machinery) | 1,775 | 463,967 | |
Stanley Black & Decker, Inc. (Machinery) | 5,528 | 441,632 | |
Trex Co., Inc. (Building Products) | (a) | 15,899 | 1,178,434 |
Uber Technologies, Inc. (Ground Transportation) | (a) | 22,155 | 1,610,225 |
United Airlines Holdings, Inc. (Passenger Airlines) | (a) | 10,755 | 523,338 |
United Parcel Service, Inc. Class B (Air Freight & Logistics) | 13,118 | 1,795,198 | |
Common Stocks (Continued) | Shares | Value | |
Industrials (continued) | |||
Veralto Corp. (Commercial Svs. & Supplies) | 7,147 | $682,324 | |
Verisk Analytics, Inc. (Professional Svs.) | 14,430 | 3,889,607 | |
57,099,803 | |||
Information Technology–13.6% | |||
Adobe, Inc. (Software) | (a) | 12,354 | 6,863,141 |
Amdocs Ltd. (IT Svs.) | 29,616 | 2,337,295 | |
Amphenol Corp. Class A (Electronic Equip., Instr. & Comp.) | 18,674 | 1,258,067 | |
Analog Devices, Inc. (Semiconductors & Equip.) | 8,501 | 1,940,438 | |
Apple, Inc. (Tech. Hardware, Storage & Periph.) | 51,476 | 10,841,875 | |
Applied Materials, Inc. (Semiconductors & Equip.) | 8,428 | 1,988,924 | |
Arista Networks, Inc. (Communications Equip.) | (a) | 20,451 | 7,167,666 |
ASML Holding N.V. (Semiconductors & Equip.) | 2,935 | 3,001,713 | |
Bentley Systems, Inc. Class B (Software) | 9,524 | 470,105 | |
Broadcom, Inc. (Semiconductors & Equip.) | 6,941 | 11,143,984 | |
Cadence Design Systems, Inc. (Software) | (a) | 8,036 | 2,473,079 |
Cisco Systems, Inc. (Communications Equip.) | 63,883 | 3,035,081 | |
Crowdstrike Holdings, Inc. Class A (Software) | (a) | 6,775 | 2,596,112 |
DocuSign, Inc. (Software) | (a) | 9,184 | 491,344 |
Dolby Laboratories, Inc. Class A (Software) | 19,847 | 1,572,478 | |
Dynatrace, Inc. (Software) | (a) | 9,874 | 441,763 |
Entegris, Inc. (Semiconductors & Equip.) | 8,209 | 1,111,499 | |
Gen Digital, Inc. (Software) | 67,880 | 1,695,642 | |
Hewlett Packard Enterprise Co. (Tech. Hardware, Storage & Periph.) | 44,438 | 940,752 | |
HP, Inc. (Tech. Hardware, Storage & Periph.) | 36,746 | 1,286,845 | |
Intuit, Inc. (Software) | 5,405 | 3,552,220 | |
Manhattan Associates, Inc. (Software) | (a) | 8,628 | 2,128,355 |
Microchip Technology, Inc. (Semiconductors & Equip.) | 22,379 | 2,047,679 | |
Microsoft Corp. (Software) | 104,504 | 46,708,063 | |
Motorola Solutions, Inc. (Communications Equip.) | 15,003 | 5,791,908 | |
NetApp, Inc. (Tech. Hardware, Storage & Periph.) | 20,859 | 2,686,639 | |
Nice Ltd. – ADR (Software) | (a) | 3,436 | 590,889 |
NVIDIA Corp. (Semiconductors & Equip.) | 248,836 | 30,741,199 | |
ON Semiconductor Corp. (Semiconductors & Equip.) | (a) | 14,288 | 979,442 |
Oracle Corp. (Software) | 27,849 | 3,932,279 | |
QUALCOMM, Inc. (Semiconductors & Equip.) | 35,993 | 7,169,086 | |
ServiceNow, Inc. (Software) | (a) | 5,614 | 4,416,365 |
Skyworks Solutions, Inc. (Semiconductors & Equip.) | 4,663 | 496,983 | |
Synopsys, Inc. (Software) | (a) | 3,311 | 1,970,244 |
Texas Instruments, Inc. (Semiconductors & Equip.) | 25,750 | 5,009,148 | |
Twilio, Inc. Class A (IT Svs.) | (a) | 8,210 | 466,410 |
VeriSign, Inc. (IT Svs.) | (a) | 11,675 | 2,075,815 |
Zoom Video Communications, Inc. Class A (Software) | (a) | 14,407 | 852,750 |
184,273,277 | |||
Materials–1.0% | |||
Air Products & Chemicals, Inc. (Chemicals) | 9,028 | 2,329,675 | |
Amcor PLC (Containers & Packaging) | 54,002 | 528,140 | |
Ball Corp. (Containers & Packaging) | 10,252 | 615,325 | |
Celanese Corp. (Chemicals) | 3,219 | 434,211 | |
Cleveland-Cliffs, Inc. (Metals & Mining) | (a) | 23,522 | 362,004 |
Eastman Chemical Co. (Chemicals) | 5,625 | 551,081 | |
Freeport-McMoRan, Inc. (Metals & Mining) | 56,259 | 2,734,188 | |
International Paper Co. (Containers & Packaging) | 13,836 | 597,023 | |
LyondellBasell Industries N.V. Class A (Chemicals) | 7,052 | 674,594 | |
Mosaic Co. / The (Chemicals) | 15,806 | 456,793 | |
PPG Industries, Inc. (Chemicals) | 5,005 | 630,080 | |
Sherwin-Williams Co. / The (Chemicals) | 14,302 | 4,268,146 | |
14,181,260 | |||
Real Estate–0.8% | |||
Boston Properties, Inc. (Office REITs) | 9,340 | 574,971 | |
Camden Property Trust (Residential REITs) | 6,149 | 670,917 | |
CBRE Group, Inc. Class A (Real Estate Mgmt. & Development) | (a) | 14,835 | 1,321,947 |
CoStar Group, Inc. (Real Estate Mgmt. & Development) | (a) | 15,415 | 1,142,868 |
Crown Castle, Inc. (Specialized REITs) | 8,191 | 800,261 | |
First Industrial Realty Trust, Inc. (Industrial REITs) | 15,600 | 741,156 | |
Gaming & Leisure Properties, Inc. (Specialized REITs) | 13,372 | 604,548 | |
Kimco Realty Corp. (Retail REITs) | 31,285 | 608,806 | |
Mid-America Apartment Communities, Inc. (Residential REITs) | 4,979 | 710,055 | |
Common Stocks (Continued) | Shares | Value | |
Real Estate (continued) | |||
Public Storage (Specialized REITs) | 4,927 | $1,417,252 | |
Rexford Industrial Realty, Inc. (Industrial REITs) | 11,585 | 516,575 | |
UDR, Inc. (Residential REITs) | 16,681 | 686,423 | |
VICI Properties, Inc. (Specialized REITs) | 49,041 | 1,404,534 | |
11,200,313 | |||
Utilities–1.2% | |||
Ameren Corp. (Multi-Utilities) | 9,322 | 662,888 | |
American Electric Power Co., Inc. (Electric Utilities) | 33,850 | 2,969,999 | |
CenterPoint Energy, Inc. (Multi-Utilities) | 71,887 | 2,227,059 | |
Consolidated Edison, Inc. (Multi-Utilities) | 15,220 | 1,360,972 | |
Dominion Energy, Inc. (Multi-Utilities) | 29,129 | 1,427,321 | |
Entergy Corp. (Electric Utilities) | 12,484 | 1,335,788 | |
Evergy, Inc. (Electric Utilities) | 9,999 | 529,647 | |
NextEra Energy, Inc. (Electric Utilities) | 34,074 | 2,412,780 | |
NiSource, Inc. (Multi-Utilities) | 18,774 | 540,879 | |
Sempra (Multi-Utilities) | 29,215 | 2,222,093 | |
Xcel Energy, Inc. (Electric Utilities) | 14,597 | 779,626 | |
16,469,052 | |||
Total Common Stocks (Cost $531,687,258) | $675,353,123 | ||
U.S. Treasury Obligations–16.9% | Rate | Maturity | Face Amount | Value | |
U.S. Treasury Bill | 0.000% | 07/25/2024 | $11,774,500 | $11,733,407 | |
U.S. Treasury Bill | 0.000% | 09/12/2024 | 1,624,100 | 1,606,850 | |
U.S. Treasury Bill | 0.000% | 11/21/2024 | 13,054,400 | 12,787,865 | |
U.S. Treasury Inflation Indexed Bond | 0.250% | 07/15/2029 | 7,136,721 | 6,553,124 | |
U.S. Treasury Note | 2.250% | 11/15/2024 | 1,865,000 | 1,843,436 | |
U.S. Treasury Note | 4.125% | 10/31/2027 | 2,729,700 | 2,699,098 | |
U.S. Treasury Note | 3.625% | 05/31/2028 | 10,302,600 | 10,009,217 | |
U.S. Treasury Note | 4.125% | 07/31/2028 | 17,700,400 | 17,513,025 | |
U.S. Treasury Note | 4.625% | 09/30/2028 | 1,960,700 | 1,977,320 | |
U.S. Treasury Note | 4.875% | 10/31/2028 | 3,607,400 | 3,674,757 | |
U.S. Treasury Note | 4.375% | 11/30/2028 | 3,234,200 | 3,233,695 | |
U.S. Treasury Note | 4.000% | 01/31/2029 | 1,079,600 | 1,062,984 | |
U.S. Treasury Note | 4.250% | 02/28/2029 | 2,173,700 | 2,163,935 | |
U.S. Treasury Note | 4.625% | 04/30/2029 | 7,425,400 | 7,510,676 | |
U.S. Treasury Note | (b) | 1.875% | 02/15/2032 | 37,869,800 | 31,789,922 |
U.S. Treasury Note | 3.375% | 05/15/2033 | 26,500,000 | 24,559,082 | |
U.S. Treasury Note | 3.875% | 08/15/2033 | 20,764,300 | 19,975,905 | |
U.S. Treasury Note | 4.500% | 11/15/2033 | 1,168,100 | 1,178,868 | |
U.S. Treasury Note | 4.000% | 02/15/2034 | 5,997,900 | 5,821,712 | |
U.S. Treasury Note | 3.250% | 05/15/2042 | 23,856,400 | 19,838,088 | |
U.S. Treasury Note | 4.000% | 11/15/2042 | 4,422,000 | 4,075,149 | |
U.S. Treasury Note | 3.875% | 05/15/2043 | 5,624,900 | 5,075,154 | |
U.S. Treasury Note | 4.375% | 08/15/2043 | 2,998,200 | 2,893,966 | |
U.S. Treasury Note | 4.750% | 11/15/2043 | 4,140,100 | 4,195,086 | |
U.S. Treasury Note | 2.250% | 08/15/2049 | 1,246,800 | 805,842 | |
U.S. Treasury Note | 2.375% | 11/15/2049 | 338,600 | 224,825 | |
U.S. Treasury Note | 2.375% | 05/15/2051 | 338,200 | 222,736 | |
U.S. Treasury Note | 2.250% | 02/15/2052 | 15,250,700 | 9,715,172 | |
U.S. Treasury Note | 2.875% | 05/15/2052 | 1,371,700 | 1,005,360 | |
U.S. Treasury Note | 4.125% | 08/15/2053 | 9,642,900 | 8,979,574 | |
U.S. Treasury Note | 4.750% | 11/15/2053 | 1,377,600 | 1,424,094 | |
U.S. Treasury Note | 4.250% | 02/15/2054 | 2,064,600 | 1,965,886 | |
U.S. Treasury Note | 4.625% | 05/15/2054 | 1,439,900 | 1,459,924 | |
Total U.S. Treasury Obligations (Cost $242,529,546) | $229,575,734 | ||||
Corporate Bonds–13.3% | Rate | Maturity | Face Amount | Value | |
Communication Services–0.6% | |||||
AT&T, Inc. (Diversified Telecom. Svs.) | 2.250% | 02/01/2032 | $17,000 | $13,790 | |
AT&T, Inc. (Diversified Telecom. Svs.) | 2.550% | 12/01/2033 | 279,000 | 221,846 | |
AT&T, Inc. (Diversified Telecom. Svs.) | 5.400% | 02/15/2034 | 392,000 | 392,004 | |
AT&T, Inc. (Diversified Telecom. Svs.) | 4.500% | 05/15/2035 | 280,000 | 257,853 | |
Charter Communications Operating LLC / Charter Communications Operating Capital Corp. (Media) | 5.050% | 03/30/2029 | 519,000 | 499,118 | |
Charter Communications Operating LLC / Charter Communications Operating Capital Corp. (Media) | 6.384% | 10/23/2035 | 858,000 | 836,550 | |
Corporate Bonds (Continued) | Rate | Maturity | Face Amount | Value | |
Communication Services (continued) | |||||
Charter Communications Operating LLC / Charter Communications Operating Capital Corp. (Media) | 6.484% | 10/23/2045 | $62,000 | $56,630 | |
Cox Communications, Inc. (Diversified Telecom. Svs.) | (c) | 5.700% | 06/15/2033 | 282,000 | 280,476 |
Discovery Communications LLC (Media) | 5.200% | 09/20/2047 | 75,000 | 58,257 | |
Discovery Communications LLC (Media) | 5.300% | 05/15/2049 | 35,000 | 27,297 | |
DISH DBS Corp. (Media) | (c) | 5.250% | 12/01/2026 | 1,021,000 | 805,357 |
DISH DBS Corp. (Media) | (c) | 5.750% | 12/01/2028 | 158,000 | 109,544 |
Globo Comunicacao e Participacoes SA (Media) | 4.875% | 01/22/2030 | 794,000 | 703,311 | |
Level 3 Financing, Inc. (Diversified Telecom. Svs.) | (c) | 3.875% | 11/15/2029 | 309,000 | 92,125 |
Meta Platforms, Inc. (Interactive Media & Svs.) | 4.950% | 05/15/2033 | 410,000 | 412,053 | |
Tencent Holdings Ltd. (Interactive Media & Svs.) | (c) | 3.240% | 06/03/2050 | 201,000 | 131,204 |
Time Warner Cable LLC (Media) | 7.300% | 07/01/2038 | 811,000 | 820,701 | |
T-Mobile U.S.A., Inc. (Wireless Telecom. Svs.) | 2.625% | 04/15/2026 | 70,000 | 66,574 | |
T-Mobile U.S.A., Inc. (Wireless Telecom. Svs.) | 3.875% | 04/15/2030 | 192,000 | 179,487 | |
Verizon Communications, Inc. (Diversified Telecom. Svs.) | 2.550% | 03/21/2031 | 402,000 | 341,542 | |
Verizon Communications, Inc. (Diversified Telecom. Svs.) | 4.500% | 08/10/2033 | 619,000 | 581,929 | |
Warnermedia Holdings, Inc. (Media) | 4.279% | 03/15/2032 | 1,122,000 | 979,313 | |
7,866,961 | |||||
Consumer Discretionary–1.5% | |||||
Alibaba Group Holding Ltd. (Broadline Retail) | 2.125% | 02/09/2031 | 200,000 | 165,231 | |
Alibaba Group Holding Ltd. (Broadline Retail) | 4.500% | 11/28/2034 | 271,000 | 249,643 | |
Bath & Body Works, Inc. (Specialty Retail) | (c) | 6.625% | 10/01/2030 | 995,000 | 998,106 |
Booking Holdings, Inc. (Hotels, Restaurants & Leisure) | 4.625% | 04/13/2030 | 1,302,000 | 1,282,333 | |
Caesars Entertainment, Inc. (Hotels, Restaurants & Leisure) | (c) | 7.000% | 02/15/2030 | 235,000 | 240,095 |
Cedar Fair LP / Canada's Wonderland Co. / Magnum Management Corp. / Millennium Operations LLC (Hotels, Restaurants & Leisure) | 5.375% | 04/15/2027 | 1,000,000 | 991,073 | |
Ford Motor Co. (Automobiles) | 3.250% | 02/12/2032 | 1,145,000 | 946,266 | |
General Motors Co. (Automobiles) | 6.125% | 10/01/2025 | 79,000 | 79,411 | |
Gohl Capital Ltd. (Hotels, Restaurants & Leisure) | 4.250% | 01/24/2027 | 518,000 | 497,349 | |
Hasbro, Inc. (Leisure Products) | 3.550% | 11/19/2026 | 1,539,000 | 1,468,827 | |
Hilton Domestic Operating Co., Inc. (Hotels, Restaurants & Leisure) | (c) | 5.875% | 04/01/2029 | 291,000 | 291,395 |
Hilton Domestic Operating Co., Inc. (Hotels, Restaurants & Leisure) | (c) | 6.125% | 04/01/2032 | 168,000 | 168,815 |
Jaguar Land Rover Automotive PLC (Automobiles) | (c) | 5.500% | 07/15/2029 | 1,227,000 | 1,176,016 |
Las Vegas Sands Corp. (Hotels, Restaurants & Leisure) | 3.900% | 08/08/2029 | 1,789,000 | 1,636,404 | |
LKQ Corp. (Distributors) | 5.750% | 06/15/2028 | 520,000 | 524,898 | |
LKQ Corp. (Distributors) | 6.250% | 06/15/2033 | 305,000 | 313,041 | |
M.D.C. Holdings, Inc. (Household Durables) | 2.500% | 01/15/2031 | 898,000 | 795,245 | |
Marriott International, Inc. (Hotels, Restaurants & Leisure) | 5.750% | 05/01/2025 | 1,264,000 | 1,264,948 | |
Mattel, Inc. (Leisure Products) | (c) | 3.375% | 04/01/2026 | 128,000 | 122,880 |
Mattel, Inc. (Leisure Products) | (c) | 5.875% | 12/15/2027 | 1,578,000 | 1,580,750 |
McDonald's Corp. (Hotels, Restaurants & Leisure) | 3.500% | 07/01/2027 | 272,000 | 260,662 | |
McDonald's Corp. (Hotels, Restaurants & Leisure) | 2.625% | 09/01/2029 | 1,700,000 | 1,523,936 | |
McDonald's Corp. (Hotels, Restaurants & Leisure) | 3.625% | 09/01/2049 | 90,000 | 65,237 | |
MDC Holdings, Inc. (Household Durables) | 6.000% | 01/15/2043 | 1,150,000 | 1,209,495 | |
Nissan Motor Co. Ltd. (Automobiles) | (c) | 4.345% | 09/17/2027 | 430,000 | 410,560 |
Prosus N.V. (Broadline Retail) | (c) | 3.257% | 01/19/2027 | 629,000 | 588,692 |
Prosus N.V. (Broadline Retail) | 3.680% | 01/21/2030 | 256,000 | 227,518 | |
Prosus N.V. (Broadline Retail) | 3.061% | 07/13/2031 | 711,000 | 588,621 | |
Ross Stores, Inc. (Specialty Retail) | 4.700% | 04/15/2027 | 280,000 | 276,808 | |
Royal Caribbean Cruises Ltd. (Hotels, Restaurants & Leisure) | (c) | 8.250% | 01/15/2029 | 416,000 | 439,246 |
Tapestry, Inc. (Textiles, Apparel & Luxury Goods) | 7.700% | 11/27/2030 | 13,000 | 13,584 | |
Wynn Macau Ltd. (Hotels, Restaurants & Leisure) | (c) | 5.625% | 08/26/2028 | 292,000 | 273,836 |
20,670,921 | |||||
Consumer Staples–1.0% | |||||
Albertsons Cos., Inc. / Safeway, Inc. / New Albertsons LP / Albertsons LLC (Consumer Staples Distribution & Retail) | (c) | 3.500% | 03/15/2029 | 156,000 | 140,329 |
Albertsons Cos., Inc. / Safeway, Inc. / New Albertsons LP / Albertsons LLC (Consumer Staples Distribution & Retail) | (c) | 4.875% | 02/15/2030 | 971,000 | 917,596 |
Alimentation Couche-Tard, Inc. (Consumer Staples Distribution & Retail) | (c) | 2.950% | 01/25/2030 | 77,000 | 68,859 |
Altria Group, Inc. (Tobacco) | 3.400% | 05/06/2030 | 1,934,000 | 1,749,778 | |
B.A.T. Capital Corp. (Tobacco) | 2.259% | 03/25/2028 | 1,123,000 | 1,006,173 | |
Campbell Soup Co. (Food Products) | 3.950% | 03/15/2025 | 113,000 | 111,619 | |
Cargill, Inc. (Food Products) | (c) | 2.125% | 04/23/2030 | 1,301,000 | 1,116,435 |
Cencosud SA | (c) | 5.950% | 05/28/2031 | 235,000 | 235,994 |
Coca-Cola Co. / The (Beverages) | 3.375% | 03/25/2027 | 1,376,000 | 1,328,567 | |
Coca-Cola Co. / The (Beverages) | 3.450% | 03/25/2030 | 182,000 | 170,204 | |
General Mills, Inc. (Food Products) | 4.700% | 01/30/2027 | 330,000 | 325,857 | |
Imperial Brands Finance PLC (Tobacco) | (c) | 5.875% | 07/01/2034 | 970,000 | 950,835 |
Corporate Bonds (Continued) | Rate | Maturity | Face Amount | Value | |
Consumer Staples (continued) | |||||
JBS U.S.A. Holding Lux SARL / JBS U.S.A. Food Co. / JBS Lux Co. SARL (Food Products) | (c) | 6.750% | 03/15/2034 | $559,000 | $592,600 |
MARB BondCo PLC (Food Products) | 3.950% | 01/29/2031 | 613,000 | 509,482 | |
Mars, Inc. (Food Products) | (c) | 2.700% | 04/01/2025 | 113,000 | 110,800 |
Mondelez International Holdings Netherlands B.V. (Food Products) | (c) | 2.250% | 09/19/2024 | 249,000 | 247,019 |
Mondelez International, Inc. (Food Products) | 2.750% | 04/13/2030 | 19,000 | 16,841 | |
PepsiCo, Inc. (Beverages) | 2.625% | 03/19/2027 | 58,000 | 54,660 | |
Philip Morris International, Inc. (Tobacco) | 5.000% | 11/17/2025 | 602,000 | 598,967 | |
Philip Morris International, Inc. (Tobacco) | 4.875% | 02/13/2026 | 496,000 | 492,093 | |
Philip Morris International, Inc. (Tobacco) | 5.625% | 11/17/2029 | 109,000 | 111,329 | |
Philip Morris International, Inc. (Tobacco) | 5.375% | 02/15/2033 | 999,000 | 991,932 | |
Pilgrim's Pride Corp. (Food Products) | 4.250% | 04/15/2031 | 1,000,000 | 910,134 | |
Procter & Gamble Co. / The (Household Products) | 3.000% | 03/25/2030 | 68,000 | 62,568 | |
Sysco Corp. (Consumer Staples Distribution & Retail) | 2.400% | 02/15/2030 | 72,000 | 62,381 | |
Tyson Foods, Inc. (Food Products) | 5.700% | 03/15/2034 | 391,000 | 389,490 | |
13,272,542 | |||||
Energy–1.5% | |||||
Apache Corp. (Oil, Gas & Consumable Fuels) | 4.250% | 01/15/2030 | 1,850,000 | 1,725,807 | |
BP Capital Markets America, Inc. (Oil, Gas & Consumable Fuels) | 5.017% | 11/17/2027 | 561,000 | 560,377 | |
BP Capital Markets America, Inc. (Oil, Gas & Consumable Fuels) | 2.939% | 06/04/2051 | 1,333,000 | 846,235 | |
Canadian Natural Resources Ltd. (Oil, Gas & Consumable Fuels) | 5.850% | 02/01/2035 | 860,000 | 853,071 | |
Cheniere Corpus Christi Holdings LLC (Oil, Gas & Consumable Fuels) | 3.700% | 11/15/2029 | 557,000 | 514,670 | |
Continental Resources, Inc. (Oil, Gas & Consumable Fuels) | (c) | 5.750% | 01/15/2031 | 1,132,000 | 1,113,067 |
Continental Resources, Inc. (Oil, Gas & Consumable Fuels) | (c) | 2.875% | 04/01/2032 | 654,000 | 528,123 |
Devon Energy Corp. (Oil, Gas & Consumable Fuels) | 5.600% | 07/15/2041 | 195,000 | 181,409 | |
Ecopetrol SA (Oil, Gas & Consumable Fuels) | 8.625% | 01/19/2029 | 575,000 | 605,225 | |
Energy Transfer LP (Oil, Gas & Consumable Fuels) | 5.600% | 09/01/2034 | 1,183,000 | 1,175,159 | |
EQT Corp. (Oil, Gas & Consumable Fuels) | (c) | 3.625% | 05/15/2031 | 1,224,000 | 1,079,803 |
GNL Quintero SA (Oil, Gas & Consumable Fuels) | 4.634% | 07/31/2029 | 581,186 | 567,406 | |
Hess Corp. (Oil, Gas & Consumable Fuels) | 4.300% | 04/01/2027 | 1,806,000 | 1,760,916 | |
Marathon Oil Corp. (Oil, Gas & Consumable Fuels) | 6.800% | 03/15/2032 | 1,575,000 | 1,713,394 | |
Oleoducto Central SA (Oil, Gas & Consumable Fuels) | (c) | 4.000% | 07/14/2027 | 207,000 | 191,867 |
ONEOK Partners LP (Oil, Gas & Consumable Fuels) | 6.125% | 02/01/2041 | 975,000 | 974,111 | |
ONEOK, Inc. (Oil, Gas & Consumable Fuels) | 6.350% | 01/15/2031 | 127,000 | 132,998 | |
ONEOK, Inc. (Oil, Gas & Consumable Fuels) | 6.100% | 11/15/2032 | 37,000 | 38,241 | |
Ovintiv, Inc. (Oil, Gas & Consumable Fuels) | 7.375% | 11/01/2031 | 985,000 | 1,073,088 | |
Plains All American Pipeline LP / PAA Finance Corp. (Oil, Gas & Consumable Fuels) | 5.700% | 09/15/2034 | 1,189,000 | 1,178,079 | |
Suncor Energy, Inc. (Oil, Gas & Consumable Fuels) | 6.800% | 05/15/2038 | 1,561,000 | 1,665,916 | |
Sunoco LP (Oil, Gas & Consumable Fuels) | (c) | 7.000% | 05/01/2029 | 189,000 | 193,703 |
Sunoco LP (Oil, Gas & Consumable Fuels) | (c) | 7.250% | 05/01/2032 | 259,000 | 267,899 |
Sunoco LP / Sunoco Finance Corp. (Oil, Gas & Consumable Fuels) | 4.500% | 05/15/2029 | 44,000 | 41,150 | |
Var Energi ASA (Oil, Gas & Consumable Fuels) | (c) | 7.500% | 01/15/2028 | 636,000 | 668,823 |
Var Energi ASA (Oil, Gas & Consumable Fuels) | (c) | 8.000% | 11/15/2032 | 784,000 | 877,653 |
20,528,190 | |||||
Financials–4.7% | |||||
AerCap Ireland Capital DAC / AerCap Global Aviation Trust (Financial Services) | 6.500% | 07/15/2025 | 271,000 | 273,072 | |
AIB Group PLC (Rate is fixed until 10/14/2025, at which point, the rate becomes SOFR + 346) (Banks) | (c)(d) | 7.583% | 10/14/2026 | 755,000 | 771,273 |
AIB Group PLC (Rate is fixed until 09/13/2028, at which point, the rate becomes SOFR + 233) (Banks) | (c)(d) | 6.608% | 09/13/2029 | 324,000 | 334,440 |
Ally Financial, Inc. (Rate is fixed until 06/13/2028, at which point, the rate becomes SOFR + 326) (Consumer Finance) | (d) | 6.992% | 06/13/2029 | 573,000 | 594,587 |
American Express Co. (Rate is fixed until 02/16/2027, at which point, the rate becomes SOFR + 100) (Consumer Finance) | (d) | 5.098% | 02/16/2028 | 1,190,000 | 1,184,698 |
Argentum Netherlands B.V. for Swiss Re Ltd. (Rate is fixed until 08/15/2025, at which point, the rate becomes QL + 359) (Insurance) | (d) | 5.750% | 08/15/2050 | 1,500,000 | 1,485,000 |
Athene Global Funding (Insurance) | (c) | 5.620% | 05/08/2026 | 703,000 | 703,510 |
Athene Global Funding (Insurance) | (c) | 1.985% | 08/19/2028 | 392,000 | 341,225 |
Athene Global Funding (Insurance) | (c) | 2.717% | 01/07/2029 | 148,000 | 131,285 |
Athene Global Funding (Insurance) | (c) | 5.583% | 01/09/2029 | 64,000 | 64,259 |
Athene Global Funding (Insurance) | (c) | 2.550% | 11/19/2030 | 82,000 | 68,460 |
Aviation Capital Group LLC (Financial Services) | (c) | 5.500% | 12/15/2024 | 114,000 | 113,701 |
Aviation Capital Group LLC (Financial Services) | (c) | 4.125% | 08/01/2025 | 3,000 | 2,943 |
Aviation Capital Group LLC (Financial Services) | (c) | 4.875% | 10/01/2025 | 57,000 | 56,241 |
Aviation Capital Group LLC (Financial Services) | (c) | 1.950% | 01/30/2026 | 181,000 | 170,317 |
Aviation Capital Group LLC (Financial Services) | (c) | 1.950% | 09/20/2026 | 2,008,000 | 1,850,594 |
Aviation Capital Group LLC (Financial Services) | (c) | 3.500% | 11/01/2027 | 40,000 | 37,443 |
Aviation Capital Group LLC (Financial Services) | (c) | 6.375% | 07/15/2030 | 11,000 | 11,371 |
Banco Bilbao Vizcaya Argentaria SA (Banks) | 5.381% | 03/13/2029 | 200,000 | 200,661 | |
Corporate Bonds (Continued) | Rate | Maturity | Face Amount | Value | |
Financials (continued) | |||||
Banco Bilbao Vizcaya Argentaria SA (Rate is fixed until 11/15/2033, at which point, the rate becomes H15T1Y + 330) (Banks) | (d) | 7.883% | 11/15/2034 | $200,000 | $217,923 |
Banco de Credito del Peru SA (Rate is fixed until 07/01/2025, at which point, the rate becomes H15T5Y + 300) (Banks) | (c)(d) | 3.125% | 07/01/2030 | 244,000 | 234,758 |
Banco Santander SA (Rate is fixed until 11/21/2033, at which point, the rate becomes H15T5Y + 530) (Banks) | (d) | 9.625% | Perpetual | 400,000 | 443,402 |
Banco Santander SA (Rate is fixed until 03/24/2027, at which point, the rate becomes H15T1Y + 200) (Banks) | (d) | 4.175% | 03/24/2028 | 1,800,000 | 1,734,918 |
Bank of America Corp. (Rate is fixed until 03/05/2028, at which point, the rate becomes TSFR3M + 133) (Banks) | (d) | 3.970% | 03/05/2029 | 177,000 | 169,237 |
Bank of America Corp. (Rate is fixed until 04/29/2030, at which point, the rate becomes SOFR + 215) (Banks) | (d) | 2.592% | 04/29/2031 | 1,441,000 | 1,245,911 |
Bank of America Corp. (Rate is fixed until 02/04/2032, at which point, the rate becomes SOFR + 133) (Banks) | (d) | 2.972% | 02/04/2033 | 28,000 | 23,696 |
Bank of Ireland Group PLC (Rate is fixed until 09/16/2025, at which point, the rate becomes H15T1Y + 265) (Banks) | (c)(d) | 6.253% | 09/16/2026 | 354,000 | 355,718 |
Bank of Ireland Group PLC (Rate is fixed until 03/20/2029, at which point, the rate becomes SOFR + 162) (Banks) | (c)(d) | 5.601% | 03/20/2030 | 280,000 | 278,564 |
Barclays PLC (Rate is fixed until 03/12/2027, at which point, the rate becomes SOFR + 149) (Banks) | (d) | 5.674% | 03/12/2028 | 275,000 | 275,420 |
Barclays PLC (Rate is fixed until 05/09/2033, at which point, the rate becomes SOFR + 298) (Banks) | (d) | 6.224% | 05/09/2034 | 453,000 | 464,158 |
Block, Inc. (Financial Services) | (c) | 6.500% | 05/15/2032 | 371,000 | 375,968 |
BNP Paribas SA (Rate is fixed until 02/25/2031, at which point, the rate becomes H15T5Y + 334) (Banks) | (d) | 4.625% | Perpetual | 229,000 | 183,377 |
BNP Paribas SA (Rate is fixed until 08/19/2025, at which point, the rate becomes USSW5 + 515) (Banks) | (d) | 7.375% | Perpetual | 200,000 | 199,501 |
BNP Paribas SA (Rate is fixed until 11/19/2024, at which point, the rate becomes TSFR3M + 137) (Banks) | (c)(d) | 2.819% | 11/19/2025 | 2,170,000 | 2,142,982 |
BNP Paribas SA (Rate is fixed until 01/13/2030, at which point, the rate becomes SOFR + 151) (Banks) | (c)(d) | 3.052% | 01/13/2031 | 333,000 | 291,710 |
BPCE SA (Rate is fixed until 01/18/2034, at which point, the rate becomes H15T1Y + 279) (Banks) | (c)(d) | 6.508% | 01/18/2035 | 1,193,000 | 1,194,284 |
CaixaBank SA (Rate is fixed until 09/13/2026, at which point, the rate becomes SOFR + 208) (Banks) | (c)(d) | 6.684% | 09/13/2027 | 696,000 | 709,291 |
CaixaBank SA (Rate is fixed until 06/15/2034, at which point, the rate becomes SOFR + 226) (Banks) | (c)(d) | 6.037% | 06/15/2035 | 467,000 | 467,948 |
Capital One Financial Corp. (Rate is fixed until 03/01/2029, at which point, the rate becomes SOFR + 179) (Consumer Finance) | (d) | 3.273% | 03/01/2030 | 1,651,000 | 1,490,272 |
Citigroup, Inc. (Rate is fixed until 04/23/2028, at which point, the rate becomes TSFR3M + 145) (Banks) | (d) | 4.075% | 04/23/2029 | 212,000 | 203,238 |
Citigroup, Inc. (Rate is fixed until 05/01/2031, at which point, the rate becomes SOFR + 117) (Banks) | (d) | 2.561% | 05/01/2032 | 1,506,000 | 1,255,036 |
Cloverie PLC for Zurich Insurance Co. Ltd. (Rate is fixed until 06/24/2026, at which point, the rate becomes QL + 492) (Insurance) | (d) | 5.625% | 06/24/2046 | 1,116,000 | 1,103,518 |
Cooperatieve Rabobank UA (Rate is fixed until 02/28/2028, at which point, the rate becomes H15T1Y + 140) (Banks) | (c)(d) | 5.564% | 02/28/2029 | 1,027,000 | 1,030,900 |
Credit Agricole SA (Rate is fixed until 01/10/2034, at which point, the rate becomes SOFR + 267) (Banks) | (c)(d) | 6.251% | 01/10/2035 | 967,000 | 972,809 |
Danske Bank A/S (Rate is fixed until 04/01/2027, at which point, the rate becomes H15T1Y + 175) (Banks) | (c)(d) | 4.298% | 04/01/2028 | 1,829,000 | 1,770,457 |
Deutsche Bank AG (Rate is fixed until 07/14/2025, at which point, the rate becomes SOFR + 319) (Capital Markets) | (d) | 6.119% | 07/14/2026 | 256,000 | 256,225 |
Deutsche Bank AG (Rate is fixed until 07/13/2026, at which point, the rate becomes SOFR + 252) (Capital Markets) | (d) | 7.146% | 07/13/2027 | 396,000 | 405,638 |
Deutsche Bank AG (Rate is fixed until 01/07/2027, at which point, the rate becomes SOFR + 132) (Capital Markets) | (d) | 2.552% | 01/07/2028 | 204,000 | 188,648 |
Ford Motor Credit Co. LLC (Consumer Finance) | 2.700% | 08/10/2026 | 338,000 | 317,471 | |
Ford Motor Credit Co. LLC (Consumer Finance) | 6.125% | 03/08/2034 | 238,000 | 235,408 | |
General Motors Financial Co., Inc. (Consumer Finance) | 5.750% | 02/08/2031 | 1,200,000 | 1,203,202 | |
Global Payments, Inc. (Financial Services) | 3.200% | 08/15/2029 | 75,000 | 67,381 | |
Goldman Sachs Group, Inc. / The (Rate is fixed until 04/22/2031, at which point, the rate becomes SOFR + 128) (Capital Markets) | (d) | 2.615% | 04/22/2032 | 1,344,000 | 1,129,979 |
Goldman Sachs Group, Inc. / The (Rate is fixed until 10/21/2031, at which point, the rate becomes SOFR + 126) (Capital Markets) | (d) | 2.650% | 10/21/2032 | 94,000 | 78,145 |
Harley-Davidson Financial Services, Inc. (Consumer Finance) | (c) | 3.050% | 02/14/2027 | 912,000 | 856,012 |
Harley-Davidson Financial Services, Inc. (Consumer Finance) | (c) | 6.500% | 03/10/2028 | 153,000 | 156,325 |
Harley-Davidson Financial Services, Inc. (Consumer Finance) | (c) | 5.950% | 06/11/2029 | 82,000 | 81,826 |
Corporate Bonds (Continued) | Rate | Maturity | Face Amount | Value | |
Financials (continued) | |||||
HSBC Holdings PLC (Rate is fixed until 11/03/2025, at which point, the rate becomes SOFR + 303) (Banks) | (d) | 7.336% | 11/03/2026 | $371,000 | $378,953 |
HSBC Holdings PLC (Rate is fixed until 03/13/2027, at which point, the rate becomes TSFR3M + 181) (Banks) | (d) | 4.041% | 03/13/2028 | 265,000 | 255,300 |
HSBC Holdings PLC (Rate is fixed until 11/03/2027, at which point, the rate becomes SOFR + 335) (Banks) | (d) | 7.390% | 11/03/2028 | 682,000 | 721,225 |
HSBC Holdings PLC (Rate is fixed until 05/24/2031, at which point, the rate becomes SOFR + 119) (Banks) | (d) | 2.804% | 05/24/2032 | 334,000 | 279,489 |
HSBC Holdings PLC (Rate is fixed until 11/03/2032, at which point, the rate becomes SOFR + 425) (Banks) | (d) | 8.113% | 11/03/2033 | 478,000 | 539,973 |
HSBC Holdings PLC (Rate is fixed until 11/13/2033, at which point, the rate becomes SOFR + 302) (Banks) | (d) | 7.399% | 11/13/2034 | 303,000 | 328,211 |
Hyundai Capital America (Consumer Finance) | (c) | 5.250% | 01/08/2027 | 279,000 | 277,872 |
Hyundai Capital America (Consumer Finance) | (c) | 5.300% | 03/19/2027 | 257,000 | 256,354 |
Hyundai Capital America (Consumer Finance) | (c) | 6.100% | 09/21/2028 | 621,000 | 637,686 |
ING Groep N.V. (Rate is fixed until 09/11/2026, at which point, the rate becomes SOFR + 156) (Banks) | (d) | 6.083% | 09/11/2027 | 858,000 | 867,522 |
Intesa Sanpaolo SpA (Banks) | (c) | 7.200% | 11/28/2033 | 624,000 | 667,159 |
JPMorgan Chase & Co. (Rate is fixed until 01/25/2032, at which point, the rate becomes SOFR + 126) (Banks) | (d) | 2.963% | 01/25/2033 | 1,682,000 | 1,434,086 |
KBC Group N.V. (Rate is fixed until 01/19/2028, at which point, the rate becomes H15T1Y + 210) (Banks) | (c)(d) | 5.796% | 01/19/2029 | 336,000 | 338,381 |
Lloyds Banking Group PLC (Rate is fixed until 09/27/2025, at which point, the rate becomes USISDA05 + 450) (Banks) | (d) | 7.500% | Perpetual | 806,000 | 805,709 |
Lloyds Banking Group PLC (Rate is fixed until 03/06/2028, at which point, the rate becomes H15T1Y + 170) (Banks) | (d) | 5.871% | 03/06/2029 | 331,000 | 335,580 |
Lloyds Banking Group PLC (Rate is fixed until 08/11/2032, at which point, the rate becomes H15T1Y + 230) (Banks) | (d) | 4.976% | 08/11/2033 | 476,000 | 454,791 |
Lloyds Banking Group PLC (Rate is fixed until 11/15/2032, at which point, the rate becomes H15T1Y + 375) (Banks) | (d) | 7.953% | 11/15/2033 | 1,217,000 | 1,365,588 |
Magyar Export-Import Bank Zrt (Banks) | (c) | 6.125% | 12/04/2027 | 825,000 | 827,386 |
Mastercard, Inc. (Financial Services) | 3.350% | 03/26/2030 | 1,713,000 | 1,585,029 | |
Mizuho Financial Group, Inc. (Rate is fixed until 05/26/2029, at which point, the rate becomes H15T1Y + 112) (Banks) | (d) | 5.376% | 05/26/2030 | 394,000 | 393,763 |
Morgan Stanley Bank N.A. (Rate is fixed until 05/26/2027, at which point, the rate becomes SOFR + 87) (Capital Markets) | (d) | 5.504% | 05/26/2028 | 1,169,000 | 1,177,000 |
Nationwide Building Society (Financial Services) | (c) | 4.000% | 09/14/2026 | 1,299,000 | 1,248,268 |
Nationwide Building Society (Rate is fixed until 02/16/2027, at which point, the rate becomes SOFR + 129) (Financial Services) | (c)(d) | 2.972% | 02/16/2028 | 368,000 | 344,927 |
NatWest Group PLC (Rate is fixed until 05/10/2034, at which point, the rate becomes H15T5Y + 375) (Banks) | (d) | 8.125% | Perpetual | 266,000 | 268,752 |
NatWest Group PLC (Rate is fixed until 11/28/2030, at which point, the rate becomes H15T5Y + 235) (Banks) | (d) | 3.032% | 11/28/2035 | 298,000 | 249,466 |
Nomura Holdings, Inc. (Capital Markets) | 2.999% | 01/22/2032 | 1,330,000 | 1,111,849 | |
PayPal Holdings, Inc. (Financial Services) | 2.850% | 10/01/2029 | 1,440,000 | 1,298,138 | |
Principal Life Global Funding II (Insurance) | (c) | 5.100% | 01/25/2029 | 810,000 | 805,292 |
Santander Holdings U.S.A., Inc. (Rate is fixed until 01/06/2027, at which point, the rate becomes SOFR + 125) (Banks) | (d) | 2.490% | 01/06/2028 | 605,000 | 557,539 |
Santander U.K. Group Holdings PLC (Rate is fixed until 01/11/2027, at which point, the rate becomes SOFR + 122) (Banks) | (d) | 2.469% | 01/11/2028 | 1,374,000 | 1,267,608 |
Skandinaviska Enskilda Banken AB (Banks) | (c) | 5.125% | 03/05/2027 | 351,000 | 350,904 |
Societe Generale SA (Rate is fixed until 01/19/2027, at which point, the rate becomes H15T1Y + 150) (Banks) | (c)(d) | 5.519% | 01/19/2028 | 1,196,000 | 1,180,931 |
Standard Chartered PLC (Rate is fixed until 03/30/2025, at which point, the rate becomes H15T1Y + 165) (Banks) | (c)(d) | 3.971% | 03/30/2026 | 1,839,000 | 1,812,783 |
Standard Chartered PLC (Rate is fixed until 03/15/2028, at which point, the rate becomes USISDA05 + 197) (Banks) | (c)(d) | 4.866% | 03/15/2033 | 664,000 | 635,314 |
Swedbank AB (Rate is fixed until 09/17/2024, at which point, the rate becomes H15T5Y + 413) (Banks) | (d) | 5.625% | Perpetual | 200,000 | 199,000 |
Swiss Re Finance Luxembourg SA (Rate is fixed until 04/02/2029, at which point, the rate becomes H15T5Y + 358) (Insurance) | (d) | 5.000% | 04/02/2049 | 200,000 | 192,500 |
Trane Technologies Financing Ltd. (Consumer Finance) | 5.250% | 03/03/2033 | 241,000 | 242,737 | |
UBS Group AG (Rate is fixed until 11/13/2028, at which point, the rate becomes H15T5Y + 475) (Capital Markets) | (c)(d) | 9.250% | Perpetual | 277,000 | 298,025 |
UBS Group AG (Rate is fixed until 11/13/2033, at which point, the rate becomes H15T5Y + 476) (Capital Markets) | (c)(d) | 9.250% | Perpetual | 216,000 | 241,897 |
UBS Group AG (Rate is fixed until 05/12/2025, at which point, the rate becomes H15T1Y + 155) (Capital Markets) | (c)(d) | 4.488% | 05/12/2026 | 267,000 | 263,851 |
Corporate Bonds (Continued) | Rate | Maturity | Face Amount | Value | |
Financials (continued) | |||||
UBS Group AG (Rate is fixed until 06/05/2025, at which point, the rate becomes SOFR + 204) (Capital Markets) | (c)(d) | 2.193% | 06/05/2026 | $1,445,000 | $1,396,417 |
UBS Group AG (Rate is fixed until 07/15/2025, at which point, the rate becomes SOFR + 334) (Capital Markets) | (c)(d) | 6.373% | 07/15/2026 | 753,000 | 756,643 |
UniCredit SpA (Rate is fixed until 06/03/2031, at which point, the rate becomes H15T1Y + 155) (Banks) | (c)(d) | 3.127% | 06/03/2032 | 200,000 | 169,451 |
Visa, Inc. (Financial Services) | 1.900% | 04/15/2027 | 452,000 | 417,242 | |
Visa, Inc. (Financial Services) | 2.050% | 04/15/2030 | 220,000 | 188,900 | |
Wells Fargo & Co. (Rate is fixed until 07/25/2028, at which point, the rate becomes SOFR + 174) (Banks) | (d) | 5.574% | 07/25/2029 | 1,007,000 | 1,016,136 |
Wells Fargo & Co. (Rate is fixed until 03/02/2032, at which point, the rate becomes SOFR + 150) (Banks) | (d) | 3.350% | 03/02/2033 | 765,000 | 663,412 |
63,311,375 | |||||
Health Care–0.4% | |||||
AbbVie, Inc. (Biotechnology) | 2.600% | 11/21/2024 | 165,000 | 163,181 | |
AbbVie, Inc. (Biotechnology) | 3.600% | 05/14/2025 | 1,489,000 | 1,464,915 | |
Amgen, Inc. (Biotechnology) | 3.350% | 02/22/2032 | 159,000 | 141,019 | |
Bayer U.S. Finance LLC (Pharmaceuticals) | (c) | 6.125% | 11/21/2026 | 282,000 | 285,008 |
Bristol-Myers Squibb Co. (Pharmaceuticals) | 3.400% | 07/26/2029 | 624,000 | 581,466 | |
Centene Corp. (Health Care Providers & Svs.) | 4.625% | 12/15/2029 | 376,000 | 355,630 | |
Centene Corp. (Health Care Providers & Svs.) | 3.375% | 02/15/2030 | 212,000 | 188,174 | |
Cigna Group / The (Health Care Providers & Svs.) | 3.200% | 03/15/2040 | 52,000 | 38,465 | |
Cigna Group / The (Health Care Providers & Svs.) | 3.400% | 03/15/2050 | 78,000 | 53,189 | |
CVS Health Corp. (Health Care Providers & Svs.) | 3.000% | 08/15/2026 | 33,000 | 31,446 | |
CVS Health Corp. (Health Care Providers & Svs.) | 5.700% | 06/01/2034 | 812,000 | 809,808 | |
DH Europe Finance II SARL (Health Care Equip. & Supplies) | 2.200% | 11/15/2024 | 129,000 | 127,431 | |
DH Europe Finance II SARL (Health Care Equip. & Supplies) | 2.600% | 11/15/2029 | 71,000 | 63,317 | |
Humana, Inc. (Health Care Providers & Svs.) | 5.375% | 04/15/2031 | 325,000 | 323,275 | |
Medline Borrower LP (Health Care Equip. & Supplies) | (c) | 3.875% | 04/01/2029 | 240,000 | 221,018 |
Pfizer, Inc. (Pharmaceuticals) | 2.625% | 04/01/2030 | 1,080,000 | 958,083 | |
5,805,425 | |||||
Industrials–0.9% | |||||
Air Lease Corp. (Trading Companies & Distributors) | 2.875% | 01/15/2026 | 28,000 | 26,864 | |
Air Lease Corp. (Trading Companies & Distributors) | 3.625% | 04/01/2027 | 15,000 | 14,150 | |
Air Lease Corp. (Trading Companies & Distributors) | 2.100% | 09/01/2028 | 107,000 | 93,956 | |
Aircastle Ltd. (Trading Companies & Distributors) | (c) | 5.250% | 08/11/2025 | 914,000 | 906,963 |
Aircastle Ltd. (Trading Companies & Distributors) | 4.250% | 06/15/2026 | 21,000 | 20,457 | |
Aircastle Ltd. (Trading Companies & Distributors) | (c) | 2.850% | 01/26/2028 | 690,000 | 624,297 |
Boeing Co. / The (Aerospace & Defense) | 3.250% | 02/01/2028 | 150,000 | 137,370 | |
Boeing Co. / The (Aerospace & Defense) | (c) | 6.298% | 05/01/2029 | 252,000 | 255,543 |
Boeing Co. / The (Aerospace & Defense) | 5.150% | 05/01/2030 | 162,000 | 155,566 | |
Boeing Co. / The (Aerospace & Defense) | 3.625% | 02/01/2031 | 182,000 | 159,291 | |
Boeing Co. / The (Aerospace & Defense) | (c) | 6.528% | 05/01/2034 | 364,000 | 372,699 |
Carrier Global Corp. (Building Products) | 2.242% | 02/15/2025 | 21,000 | 20,554 | |
Carrier Global Corp. (Building Products) | 2.493% | 02/15/2027 | 26,000 | 24,343 | |
CNH Industrial Capital LLC (Machinery) | 5.100% | 04/20/2029 | 734,000 | 731,053 | |
Cummins, Inc. (Machinery) | 5.150% | 02/20/2034 | 1,180,000 | 1,181,261 | |
Delta Air Lines, Inc. / SkyMiles IP Ltd. (Passenger Airlines) | (c) | 4.500% | 10/20/2025 | 429,529 | 424,327 |
Delta Air Lines, Inc. / SkyMiles IP Ltd. (Passenger Airlines) | (c) | 4.750% | 10/20/2028 | 156,000 | 151,930 |
ENA Master Trust (Transportation Infrastructure) | (c) | 4.000% | 05/19/2048 | 203,000 | 143,886 |
Equifax, Inc. (Professional Svs.) | 2.600% | 12/01/2024 | 1,138,000 | 1,122,934 | |
Equifax, Inc. (Professional Svs.) | 2.600% | 12/15/2025 | 147,000 | 140,809 | |
Equifax, Inc. (Professional Svs.) | 3.100% | 05/15/2030 | 240,000 | 213,991 | |
ERAC U.S.A. Finance LLC (Ground Transportation) | (c) | 4.600% | 05/01/2028 | 306,000 | 301,161 |
ERAC U.S.A. Finance LLC (Ground Transportation) | (c) | 4.900% | 05/01/2033 | 715,000 | 695,873 |
Flowserve Corp. (Machinery) | 2.800% | 01/15/2032 | 1,801,000 | 1,478,042 | |
Huntington Ingalls Industries, Inc. (Aerospace & Defense) | 3.844% | 05/01/2025 | 205,000 | 201,725 | |
Lima Metro Line 2 Finance Ltd. (Ground Transportation) | 5.875% | 07/05/2034 | 470,363 | 463,221 | |
Regal Rexnord Corp. (Electrical Equip.) | 6.050% | 02/15/2026 | 824,000 | 826,019 | |
Ryder System, Inc. (Ground Transportation) | 5.375% | 03/15/2029 | 949,000 | 952,737 | |
Westinghouse Air Brake Technologies Corp. (Machinery) | 3.200% | 06/15/2025 | 45,000 | 43,912 | |
11,884,934 | |||||
Information Technology–1.1% | |||||
Apple, Inc. (Tech. Hardware, Storage & Periph.) | 1.250% | 08/20/2030 | 1,070,000 | 876,053 | |
Apple, Inc. (Tech. Hardware, Storage & Periph.) | 4.100% | 08/08/2062 | 663,000 | 536,353 | |
Broadcom, Inc. (Semiconductors & Equip.) | (c) | 4.000% | 04/15/2029 | 36,000 | 34,299 |
Broadcom, Inc. (Semiconductors & Equip.) | (c) | 4.926% | 05/15/2037 | 180,000 | 169,292 |
Corporate Bonds (Continued) | Rate | Maturity | Face Amount | Value | |
Information Technology (continued) | |||||
CDW LLC / CDW Finance Corp. (Electronic Equip., Instr. & Comp.) | 4.250% | 04/01/2028 | $1,196,000 | $1,141,667 | |
Entegris, Inc. (Semiconductors & Equip.) | (c) | 4.750% | 04/15/2029 | 209,000 | 199,962 |
Infor, Inc. (Software) | (c) | 1.750% | 07/15/2025 | 1,696,000 | 1,626,062 |
Kyndryl Holdings, Inc. (IT Svs.) | 2.050% | 10/15/2026 | 2,046,000 | 1,886,843 | |
Lam Research Corp. (Semiconductors & Equip.) | 4.000% | 03/15/2029 | 816,000 | 784,947 | |
NXP B.V. / NXP Funding LLC (Semiconductors & Equip.) | 5.550% | 12/01/2028 | 125,000 | 126,661 | |
Oracle Corp. (Software) | 2.950% | 04/01/2030 | 1,796,000 | 1,597,267 | |
Oracle Corp. (Software) | 3.900% | 05/15/2035 | 1,039,000 | 900,757 | |
Oracle Corp. (Software) | 3.600% | 04/01/2040 | 134,000 | 102,994 | |
Oracle Corp. (Software) | 3.650% | 03/25/2041 | 77,000 | 58,907 | |
Skyworks Solutions, Inc. (Semiconductors & Equip.) | 3.000% | 06/01/2031 | 1,331,000 | 1,127,786 | |
VMware LLC (Software) | 4.500% | 05/15/2025 | 954,000 | 944,737 | |
VMware LLC (Software) | 4.650% | 05/15/2027 | 293,000 | 288,364 | |
Western Digital Corp. (Tech. Hardware, Storage & Periph.) | 2.850% | 02/01/2029 | 2,792,000 | 2,422,954 | |
Xiaomi Best Time International Ltd. (Tech. Hardware, Storage & Periph.) | 2.875% | 07/14/2031 | 640,000 | 534,339 | |
15,360,244 | |||||
Materials–0.5% | |||||
AngloGold Ashanti Holdings PLC (Metals & Mining) | 3.750% | 10/01/2030 | 576,000 | 502,620 | |
Braskem Netherlands Finance B.V. (Chemicals) | 4.500% | 01/10/2028 | 865,000 | 787,521 | |
Celanese U.S. Holdings LLC (Chemicals) | 6.350% | 11/15/2028 | 121,000 | 124,325 | |
Celanese U.S. Holdings LLC (Chemicals) | 6.550% | 11/15/2030 | 291,000 | 304,093 | |
Corp. Nacional del Cobre de Chile (Metals & Mining) | 6.440% | 01/26/2036 | 936,000 | 966,254 | |
CSN Resources SA (Metals & Mining) | 5.875% | 04/08/2032 | 787,000 | 653,253 | |
Freeport Indonesia PT (Metals & Mining) | (c) | 4.763% | 04/14/2027 | 749,000 | 733,532 |
Freeport Indonesia PT (Metals & Mining) | 4.763% | 04/14/2027 | 350,000 | 342,772 | |
Glencore Funding LLC (Metals & Mining) | (c) | 5.338% | 04/04/2027 | 813,000 | 811,344 |
Glencore Funding LLC (Metals & Mining) | (c) | 6.500% | 10/06/2033 | 342,000 | 356,255 |
Inversiones CMPC SA (Paper & Forest Products) | 6.125% | 06/23/2033 | 242,000 | 246,286 | |
Nexa Resources SA (Metals & Mining) | (c) | 6.750% | 04/09/2034 | 476,000 | 483,704 |
Stillwater Mining Co. (Metals & Mining) | (c) | 4.000% | 11/16/2026 | 300,000 | 273,750 |
Volcan Cia Minera S.A.A. (Metals & Mining) | (c) | 4.375% | 02/11/2026 | 31,000 | 24,001 |
W.R. Grace Holdings LLC (Chemicals) | (c) | 4.875% | 06/15/2027 | 551,000 | 531,347 |
7,141,057 | |||||
Real Estate–0.4% | |||||
American Tower Corp. (Specialized REITs) | 3.650% | 03/15/2027 | 75,000 | 71,826 | |
American Tower Corp. (Specialized REITs) | 3.800% | 08/15/2029 | 1,455,000 | 1,352,405 | |
Crown Castle, Inc. (Specialized REITs) | 5.600% | 06/01/2029 | 264,000 | 266,254 | |
Crown Castle, Inc. (Specialized REITs) | 5.800% | 03/01/2034 | 279,000 | 281,827 | |
Equinix, Inc. (Specialized REITs) | 3.200% | 11/18/2029 | 1,689,000 | 1,521,815 | |
GLP Capital LP / GLP Financing II, Inc. (Specialized REITs) | 4.000% | 01/15/2031 | 501,000 | 449,169 | |
GLP Capital LP / GLP Financing II, Inc. (Specialized REITs) | 3.250% | 01/15/2032 | 1,468,000 | 1,233,622 | |
Trust Fibra Uno (Diversified REITs) | 5.250% | 01/30/2026 | 232,000 | 226,472 | |
5,403,390 | |||||
Utilities–0.7% | |||||
Aegea Finance SARL (Water Utilities) | 6.750% | 05/20/2029 | 304,000 | 295,624 | |
AES Panama Generation Holdings SRL (Electric Utilities) | (c) | 4.375% | 05/31/2030 | 275,062 | 239,189 |
AES Panama Generation Holdings SRL (Electric Utilities) | 4.375% | 05/31/2030 | 232,597 | 202,261 | |
Alexander Funding Trust II (Electric Utilities) | (c) | 7.467% | 07/31/2028 | 118,000 | 124,862 |
Ameren Corp. (Multi-Utilities) | 3.500% | 01/15/2031 | 669,000 | 603,125 | |
American Electric Power Co., Inc. (Rate is fixed until 12/15/2034, at which point, the rate becomes H15T5Y + 268) (Electric Utilities) | (d) | 6.950% | 12/15/2054 | 440,000 | 437,708 |
American Water Capital Corp. (Water Utilities) | 2.800% | 05/01/2030 | 1,002,000 | 882,144 | |
Comision Federal de Electricidad (Electric Utilities) | (c) | 4.688% | 05/15/2029 | 221,000 | 206,925 |
Duke Energy Carolinas NC Storm Funding LLC (Electric Utilities) | 2.617% | 07/01/2041 | 200,000 | 155,497 | |
Electricite de France SA (Rate is fixed until 06/15/2033, at which point, the rate becomes H15T5Y + 541) (Electric Utilities) | (c)(d) | 9.125% | Perpetual | 253,000 | 275,163 |
Enel Chile SA (Electric Utilities) | 4.875% | 06/12/2028 | 688,000 | 665,088 | |
Enel Finance International N.V. (Electric Utilities) | (c) | 7.500% | 10/14/2032 | 800,000 | 884,850 |
Enel Finance International N.V. (Electric Utilities) | (c) | 5.500% | 06/26/2034 | 285,000 | 277,714 |
Engie Energia Chile SA (Electric Utilities) | 3.400% | 01/28/2030 | 673,000 | 585,793 | |
Engie Energia Chile SA (Electric Utilities) | (c) | 6.375% | 04/17/2034 | 200,000 | 202,626 |
NextEra Energy Capital Holdings, Inc. (Rate is fixed until 09/01/2029, at which point, the rate becomes H15T5Y + 236) (Electric Utilities) | (d) | 6.700% | 09/01/2054 | 153,000 | 152,942 |
Niagara Mohawk Power Corp. (Electric Utilities) | (c) | 5.290% | 01/17/2034 | 434,000 | 421,734 |
NRG Energy, Inc. (Electric Utilities) | (c) | 7.000% | 03/15/2033 | 760,000 | 802,257 |
Pacific Gas & Electric Co. (Electric Utilities) | 5.550% | 05/15/2029 | 221,000 | 221,497 | |
Corporate Bonds (Continued) | Rate | Maturity | Face Amount | Value | |
Utilities (continued) | |||||
Pacific Gas & Electric Co. (Electric Utilities) | 4.400% | 03/01/2032 | $985,000 | $900,808 | |
Vistra Operations Co. LLC (Ind. Power & Renewable Elec.) | (c) | 6.950% | 10/15/2033 | 812,000 | 869,072 |
9,406,879 | |||||
Total Corporate Bonds (Cost $182,948,167) | $180,651,918 | ||||
Purchased Options–7.0% | Notional Amount | Expiration | Exercise Price | Contracts (e) | Value | |
S&P 500 Index Call Option | $68,208,569 | December 2025 | $4,500 | 143 | $19,246,370 | |
S&P 500 Index Call Option | 40,543,555 | December 2025 | 4,600 | 85 | 10,471,150 | |
S&P 500 Index Call Option | 76,317,280 | December 2025 | 4,700 | 160 | 18,420,800 | |
S&P 500 Index Call Option | 60,576,841 | December 2025 | 4,800 | 127 | 13,618,210 | |
S&P 500 Index Call Option | 42,451,487 | December 2025 | 4,900 | 89 | 8,854,610 | |
S&P 500 Index Call Option | 47,698,300 | December 2025 | 5,000 | 100 | 9,466,000 | |
S&P 500 Index Call Option | 14,309,490 | December 2026 | 5,600 | 30 | 2,210,700 | |
S&P 500 Index Put Option | 14,786,473 | December 2025 | 4,400 | 31 | 285,665 | |
S&P 500 Index Put Option | 68,208,569 | December 2025 | 4,500 | 143 | 1,430,000 | |
S&P 500 Index Put Option | 84,425,991 | December 2025 | 4,600 | 177 | 2,021,340 | |
S&P 500 Index Put Option | 76,317,280 | December 2025 | 4,700 | 160 | 1,992,000 | |
S&P 500 Index Put Option | 53,422,096 | December 2025 | 4,800 | 112 | 1,562,400 | |
S&P 500 Index Put Option | 42,451,487 | December 2025 | 4,900 | 89 | 1,368,820 | |
S&P 500 Index Put Option | 47,698,300 | December 2025 | 5,000 | 100 | 1,715,000 | |
S&P 500 Index Put Option | 20,033,286 | December 2026 | 5,300 | 42 | 1,282,344 | |
S&P 500 Index Put Option | 14,309,490 | December 2026 | 5,600 | 30 | 1,128,300 | |
Total Purchased Options (Cost $71,434,489) | $95,073,709 | |||||
Asset-Backed / Mortgage-Backed Securities–6.4% | Rate | Maturity | Face Amount | Value | |
Consumer Discretionary–0.0% | |||||
Hardee's Funding LLC 2018-1A A23 | (c) | 5.710% | 06/20/2048 | $125,944 | $120,138 |
Hardee's Funding LLC 2020-1A A2 | (c) | 3.981% | 12/20/2050 | 130,315 | 118,435 |
238,573 | |||||
Financials–6.4% | |||||
AB Issuer LLC 2021-1 A2 | (c) | 3.734% | 07/30/2051 | 312,800 | 276,770 |
ACHV ABS TRUST 2023-4CP B | (c) | 7.240% | 11/25/2030 | 1,163,000 | 1,169,169 |
ACM Auto Trust 2024-1A A | (c) | 7.710% | 01/21/2031 | 535,827 | 537,863 |
Affirm Asset Securitization Trust 2021-Z1 A | (c) | 1.070% | 08/15/2025 | 925 | 923 |
Affirm Asset Securitization Trust 2021-Z2 A | (c) | 1.170% | 11/16/2026 | 8,628 | 8,490 |
Affirm Asset Securitization Trust 2023-B A | (c) | 6.820% | 09/15/2028 | 1,400,000 | 1,416,679 |
AGL CLO 10 Ltd. 2021-10A A | (c) | TSFR3M + 139 | 04/15/2034 | 963,750 | 965,150 |
Amur Equipment Finance Receivables XI LLC 2022-2A A2 | (c) | 5.300% | 06/21/2028 | 260,527 | 259,868 |
AREIT 2022-CRE6 A | (c) | SOFR30A + 125 | 01/20/2037 | 406,673 | 403,369 |
Arivo Acceptance Auto Loan Receivables Trust 2024-1A A | (c) | 6.460% | 04/17/2028 | 223,133 | 223,413 |
Atalaya Equipment Leasing Trust 2021-1A C | (c) | 2.690% | 06/15/2028 | 300,000 | 294,244 |
Bain Capital Credit CLO 2021-4A D | (c) | TSFR3M + 336 | 10/20/2034 | 250,000 | 247,383 |
Balboa Bay Loan Funding 2020-1A AR | (c) | TSFR3M + 138 | 01/20/2032 | 1,490,811 | 1,490,811 |
Ballyrock CLO 15 Ltd. 2021-1A C | (c) | TSFR3M + 336 | 04/15/2034 | 250,000 | 250,660 |
Ballyrock CLO 17 Ltd. 2021-17A A1A | (c) | TSFR3M + 141 | 10/20/2034 | 1,000,000 | 1,001,562 |
Ballyrock CLO 17 Ltd. 2021-17A C | (c) | TSFR3M + 331 | 10/20/2034 | 250,000 | 250,693 |
BBCMS 2020-BID A | (c) | TSFR1M + 225 | 10/15/2037 | 301,000 | 300,750 |
Bellemeade Re 2021-3A A2 | (c) | SOFR30A + 100 | 09/25/2031 | 286,223 | 286,222 |
Bellemeade Re 2022-1 M1C | (c) | SOFR30A + 370 | 01/26/2032 | 327,948 | 336,211 |
Bellemeade Re 2022-2 M1A | (c) | SOFR30A + 400 | 09/27/2032 | 959,476 | 983,981 |
BFLD Trust 2021-FPM A | (c) | TSFR1M + 171 | 06/15/2038 | 462,000 | 462,000 |
Brex Commercial Charge Card Master Trust 2024-1 A1 | (c) | 6.050% | 07/15/2027 | 745,000 | 744,123 |
BX Commercial Mortgage Trust 2019-IMC E | (c) | TSFR1M + 220 | 04/15/2034 | 320,787 | 312,807 |
Cajun Global LLC 2021-1 A2 | (c) | 3.931% | 11/20/2051 | 60,140 | 54,737 |
Carvana Auto Receivables Trust 2021-N3 C | 1.020% | 06/12/2028 | 25,362 | 23,889 | |
Carvana Auto Receivables Trust 2021-N4 D | 2.300% | 09/11/2028 | 69,660 | 67,217 | |
Carvana Auto Receivables Trust 2023-N3 A | (c) | 6.410% | 09/10/2027 | 772,877 | 775,105 |
CIFC Funding 2020-4A A | (c) | TSFR3M + 158 | 01/15/2034 | 260,000 | 260,484 |
CNH Equipment Trust 2022-C A2 | 5.420% | 07/15/2026 | 306,572 | 306,365 | |
College Ave Student Loans 2021-C C | (c) | 3.060% | 07/26/2055 | 136,161 | 121,205 |
COMM 2015-LC23 C | 4.696% | 10/10/2048 | 100,000 | 94,700 | |
Connecticut Avenue Securities Trust 2019-R04 2B1 | (c) | SOFR30A + 536 | 06/25/2039 | 723,386 | 772,510 |
Connecticut Avenue Securities Trust 2019-R06 2B1 | (c) | SOFR30A + 386 | 09/25/2039 | 859,130 | 893,890 |
Connecticut Avenue Securities Trust 2021-R01 1M2 | (c) | SOFR30A + 155 | 10/25/2041 | 437,560 | 439,498 |
Connecticut Avenue Securities Trust 2021-R03 1M2 | (c) | SOFR30A + 165 | 12/25/2041 | 117,550 | 118,358 |
Asset-Backed / Mortgage-Backed Securities (Continued) | Rate | Maturity | Face Amount | Value | |
Financials (continued) | |||||
Connecticut Avenue Securities Trust 2022-R01 1B1 | (c) | SOFR30A + 315 | 12/25/2041 | $305,277 | $315,734 |
Connecticut Avenue Securities Trust 2022-R02 2M1 | (c) | SOFR30A + 120 | 01/25/2042 | 154,295 | 154,343 |
Connecticut Avenue Securities Trust 2022-R02 2M2 | (c) | SOFR30A + 300 | 01/25/2042 | 960,000 | 985,432 |
Connecticut Avenue Securities Trust 2022-R03 1M1 | (c) | SOFR30A + 210 | 03/25/2042 | 871,546 | 886,222 |
Connecticut Avenue Securities Trust 2022-R03 1M2 | (c) | SOFR30A + 350 | 03/25/2042 | 253,631 | 266,963 |
Connecticut Avenue Securities Trust 2022-R04 1M2 | (c) | SOFR30A + 310 | 03/25/2042 | 63,262 | 65,895 |
Connecticut Avenue Securities Trust 2022-R05 2M2 | (c) | SOFR30A + 300 | 04/25/2042 | 599,367 | 620,552 |
Connecticut Avenue Securities Trust 2022-R06 1M1 | (c) | SOFR30A + 275 | 05/25/2042 | 976,360 | 1,003,710 |
Connecticut Avenue Securities Trust 2022-R07 1M1 | (c) | SOFR30A + 295 | 06/25/2042 | 848,588 | 877,159 |
Connecticut Avenue Securities Trust 2022-R08 1M1 | (c) | SOFR30A + 255 | 07/25/2042 | 811,237 | 834,363 |
Connecticut Avenue Securities Trust 2023-R01 1M1 | (c) | SOFR30A + 240 | 12/25/2042 | 663,281 | 682,841 |
Connecticut Avenue Securities Trust 2023-R02 1M1 | (c) | SOFR30A + 230 | 01/25/2043 | 1,284,231 | 1,317,034 |
Connecticut Avenue Securities Trust 2023-R03 2M1 | (c) | SOFR30A + 250 | 04/25/2043 | 1,355,108 | 1,386,658 |
Connecticut Avenue Securities Trust 2023-R04 1M1 | (c) | SOFR30A + 230 | 05/25/2043 | 923,341 | 948,781 |
Conn's Receivables Funding 2024-A A | (c) | 7.050% | 01/16/2029 | 214,967 | 215,172 |
CPS Auto Receivables Trust 2021-C D | (c) | 1.690% | 06/15/2027 | 189,276 | 184,230 |
CPS Auto Receivables Trust 2022-D A | (c) | 6.090% | 01/15/2027 | 204,125 | 204,237 |
CPS Auto Receivables Trust 2023-A A | (c) | 5.540% | 03/16/2026 | 49,928 | 49,921 |
Dext ABS 2021-1 C | (c) | 2.290% | 09/15/2028 | 264,000 | 250,697 |
Dext ABS 2021-1 D | (c) | 2.810% | 03/15/2029 | 133,000 | 123,132 |
Diamond Issuer 2021-1A B | (c) | 2.701% | 11/20/2051 | 271,624 | 233,511 |
DT Auto Owner Trust 2023-1A A | (c) | 5.480% | 04/15/2027 | 207,982 | 207,862 |
Elmwood CLO 15 Ltd. 2022-2A A1 | (c) | TSFR3M + 134 | 04/22/2035 | 1,145,062 | 1,147,222 |
Elmwood CLO IX Ltd. 2021-2A D | (c) | TSFR3M + 321 | 07/20/2034 | 250,000 | 250,930 |
Enterprise Fleet Financing 2023-2 A2 | (c) | 5.560% | 04/22/2030 | 864,689 | 864,698 |
Fannie Mae Connecticut Avenue Securities 2015-C04 1M2 | SOFR30A + 581 | 04/25/2028 | 41,435 | 43,606 | |
Fannie Mae Connecticut Avenue Securities 2018-C05 1M2 | SOFR30A + 246 | 01/25/2031 | 526,860 | 538,715 | |
Fannie Mae Connecticut Avenue Securities 2018-C06 1M2 | SOFR30A + 211 | 03/25/2031 | 106,551 | 107,684 | |
Fannie Mae Connecticut Avenue Securities 2021-R02 2B1 | (c) | SOFR30A + 330 | 11/25/2041 | 211,036 | 218,459 |
Fannie Mae Connecticut Avenue Securities 2021-R02 2M2 | (c) | SOFR30A + 200 | 11/25/2041 | 1,000,000 | 1,007,551 |
FHF Trust 2021-2A A | (c) | 0.830% | 12/15/2026 | 22,525 | 22,058 |
FHF Trust 2023-1A A2 | (c) | 6.570% | 06/15/2028 | 297,174 | 299,009 |
First Investors Auto Owner Trust 2022-2A A | (c) | 6.260% | 07/15/2027 | 307,671 | 308,179 |
Flagship Credit Auto Trust 2023-1 A2 | (c) | 5.380% | 12/15/2026 | 187,936 | 187,635 |
Flagship Credit Auto Trust 2023-2 A2 | (c) | 5.760% | 04/15/2027 | 393,934 | 393,652 |
Flatiron CLO 2021-1A D | (c) | TSFR3M + 316 | 07/19/2034 | 250,000 | 250,892 |
Ford Credit Auto Owner Trust 2021-1 D | (c) | 2.310% | 10/17/2033 | 230,000 | 213,411 |
Foursight Capital Automobile Receivables Trust 2023-1 A2 | (c) | 5.430% | 10/15/2026 | 154,963 | 154,857 |
Freddie Mac Multifamily Structured Credit Risk 2021-MN1 M1 | (c) | SOFR30A + 200 | 01/25/2051 | 24,242 | 24,093 |
Freddie Mac REMICS FHR 4981 HS | (f) | SOFR30A + 599 | 06/25/2050 | 599,515 | 52,287 |
Freddie Mac STACR REMIC Trust 2021-DNA3 B1 | (c) | SOFR30A + 350 | 10/25/2033 | 278,276 | 313,240 |
Freddie Mac STACR REMIC Trust 2021-DNA5 B1 | (c) | SOFR30A + 305 | 01/25/2034 | 1,000,000 | 1,068,877 |
Freddie Mac STACR REMIC Trust 2021-DNA5 M2 | (c) | SOFR30A + 165 | 01/25/2034 | 392,790 | 395,347 |
Freddie Mac STACR REMIC Trust 2021-DNA6 M2 | (c) | SOFR30A + 150 | 10/25/2041 | 996,342 | 1,001,293 |
Freddie Mac STACR REMIC Trust 2021-DNA7 M2 | (c) | SOFR30A + 180 | 11/25/2041 | 986,480 | 996,622 |
Freddie Mac STACR REMIC Trust 2021-HQA3 M2 | (c) | SOFR30A + 210 | 09/25/2041 | 1,000,000 | 1,008,643 |
Freddie Mac STACR REMIC Trust 2021-HQA4 M2 | (c) | SOFR30A + 235 | 12/25/2041 | 1,046,349 | 1,059,236 |
Freddie Mac STACR REMIC Trust 2022-DNA1 M1B | (c) | SOFR30A + 185 | 01/25/2042 | 1,600,000 | 1,617,959 |
Freddie Mac STACR REMIC Trust 2022-DNA2 M1B | (c) | SOFR30A + 240 | 02/25/2042 | 1,437,266 | 1,473,158 |
Freddie Mac STACR REMIC Trust 2022-DNA2 M2 | (c) | SOFR30A + 375 | 02/25/2042 | 295,064 | 309,815 |
Freddie Mac STACR REMIC Trust 2022-DNA3 M1A | (c) | SOFR30A + 200 | 04/25/2042 | 782,801 | 794,481 |
Freddie Mac STACR REMIC Trust 2022-DNA3 M1B | (c) | SOFR30A + 290 | 04/25/2042 | 1,600,000 | 1,662,879 |
Freddie Mac STACR REMIC Trust 2022-DNA3 M2 | (c) | SOFR30A + 435 | 04/25/2042 | 200,000 | 213,532 |
Freddie Mac STACR REMIC Trust 2022-DNA4 M1B | (c) | SOFR30A + 335 | 05/25/2042 | 1,621,038 | 1,701,833 |
Freddie Mac STACR REMIC Trust 2022-DNA5 M1B | (c) | SOFR30A + 450 | 06/25/2042 | 1,331,433 | 1,444,311 |
Freddie Mac STACR REMIC Trust 2022-DNA7 M1A | (c) | SOFR30A + 250 | 03/25/2052 | 722,308 | 735,023 |
Freddie Mac STACR REMIC Trust 2022-HQA1 M1B | (c) | SOFR30A + 350 | 03/25/2042 | 65,368 | 68,696 |
Freddie Mac STACR REMIC Trust 2022-HQA3 M1A | (c) | SOFR30A + 230 | 08/25/2042 | 1,220,978 | 1,251,325 |
Freddie Mac STACR REMIC Trust 2023-DNA1 M1A | (c) | SOFR30A + 210 | 03/25/2043 | 460,952 | 469,262 |
Freddie Mac STACR REMIC Trust 2023-HQA1 M1A | (c) | SOFR30A + 200 | 05/25/2043 | 953,100 | 967,503 |
Freddie Mac STACR REMIC Trust 2024-DNA1 M1 | (c) | SOFR30A + 135 | 02/25/2044 | 903,434 | 906,779 |
Freddie Mac Structured Agency Credit Risk Debt Notes 2022-HQA2 M1A | (c) | SOFR30A + 265 | 07/25/2042 | 1,187,716 | 1,222,513 |
Freddie Mac Structured Agency Credit Risk Debt Notes 2023-DNA2 M1A | (c) | SOFR30A + 210 | 04/25/2043 | 1,463,816 | 1,497,984 |
Freddie Mac Structured Agency Credit Risk Debt Notes 2023-HQA2 M1B | (c) | SOFR30A + 335 | 06/25/2043 | 1,200,000 | 1,268,995 |
FREED ABS Trust 2021-2 C | (c) | 1.940% | 06/19/2028 | 43,869 | 43,785 |
Galaxy 30 CLO Ltd. 2022-30A D | (c) | TSFR3M + 335 | 04/15/2035 | 400,000 | 401,230 |
GCI Funding I LLC 2021-1 A | (c) | 2.380% | 06/18/2046 | 122,691 | 108,842 |
Goldentree Loan Management U.S. CLO 7 Ltd. 2020-7A AR | (c) | TSFR3M + 133 | 04/20/2034 | 250,000 | 249,880 |
Asset-Backed / Mortgage-Backed Securities (Continued) | Rate | Maturity | Face Amount | Value | |
Financials (continued) | |||||
Granite Park Equipment Leasing 2023-1A A3 | (c) | 6.460% | 09/20/2032 | $544,000 | $554,376 |
Hertz Vehicle Financing III LLC 2022-1A C | (c) | 2.630% | 06/25/2026 | 220,000 | 212,544 |
HFX Funding Issuer 2017-1 | (c) | 3.622% | 03/15/2035 | 280,000 | 276,600 |
Invesco CLO 2021-1A A1 | (c) | TSFR3M + 126 | 04/15/2034 | 1,700,000 | 1,702,839 |
JPMBB Commercial Mortgage Securities Trust 2014-C21 C | 4.818% | 08/15/2047 | 295,000 | 280,069 | |
JPMBB Commercial Mortgage Securities Trust 2015-C27 AS | 3.634% | 02/15/2048 | 130,694 | 122,235 | |
Kings Park CLO Ltd. 2021-1A A | (c) | TSFR3M + 139 | 01/21/2035 | 1,518,568 | 1,521,453 |
Kubota Credit Owner Trust 2023-1A A2 | (c) | 5.400% | 02/17/2026 | 584,717 | 584,145 |
LAD Auto Receivables Trust 2022-1A A | (c) | 5.210% | 06/15/2027 | 256,280 | 255,431 |
Lendbuzz Securitization Trust 2023-1A A2 | (c) | 6.920% | 08/15/2028 | 903,611 | 910,746 |
Lendbuzz Securitization Trust 2023-2A A2 | (c) | 7.090% | 10/16/2028 | 397,821 | 401,170 |
Lendbuzz Securitization Trust 2023-3A A2 | (c) | 7.500% | 12/15/2028 | 449,838 | 455,684 |
Lendbuzz Securitization Trust 2024-1A A1 | (c) | 5.789% | 01/15/2025 | 74,786 | 74,789 |
Lobel Automobile Receivables Trust 2023-2 A | (c) | 7.590% | 04/16/2029 | 837,868 | 843,289 |
Marlette Funding Trust 2023-3A B | (c) | 6.710% | 09/15/2033 | 727,000 | 731,015 |
Mission Lane Credit Card Master Trust 2024-A A1 | (c) | 6.200% | 08/15/2029 | 529,000 | 528,474 |
Morgan Stanley Capital I Trust 2018-H3 AS | 4.429% | 07/15/2051 | 270,000 | 255,427 | |
MVW 2021-2A C | (c) | 2.230% | 05/20/2039 | 185,776 | 170,931 |
Neighborly Issuer 2022-1A A2 | (c) | 3.695% | 01/30/2052 | 222,870 | 195,975 |
Neighborly Issuer 2023-1A A2 | (c) | 7.308% | 01/30/2053 | 823,575 | 829,900 |
Nelnet Student Loan Trust 2021-BA B | (c) | 2.680% | 04/20/2062 | 100,000 | 82,802 |
Nelnet Student Loan Trust 2021-DA C | (c) | 3.500% | 04/20/2062 | 100,000 | 79,114 |
Neuberger Berman Loan Advisers CLO 2021-42A D | (c) | TSFR3M + 306 | 07/16/2035 | 301,613 | 301,874 |
Neuberger Berman Loan Advisers CLO 43 Ltd. 2021-43A D | (c) | TSFR3M + 336 | 07/17/2035 | 250,000 | 250,686 |
NMEF Funding 2022-B A2 | (c) | 6.070% | 06/15/2029 | 180,399 | 180,717 |
NMEF Funding 2023-A A2 | (c) | 6.570% | 06/17/2030 | 1,095,649 | 1,101,734 |
Oaktown Re VII Ltd. 2021-2 M1A | (c) | SOFR30A + 160 | 04/25/2034 | 92,630 | 92,703 |
OCP CLO 2020-18A AR | (c) | TSFR3M + 135 | 07/20/2032 | 322,000 | 322,158 |
Octane Receivables Trust 2021-2A C | (c) | 2.530% | 05/21/2029 | 209,000 | 198,101 |
OneMain Direct Auto Receivables Trust 2022-1A C | (c) | 5.310% | 06/14/2029 | 1,100,000 | 1,081,128 |
Pagaya AI Debt Trust 2023-5 A | (c) | 7.179% | 04/15/2031 | 293,226 | 293,887 |
Pagaya AI Debt Trust 2024-1 A | (c) | 6.660% | 07/15/2031 | 791,795 | 795,320 |
PMT Credit Risk Transfer Trust 2019-2R A | (c) | TSFR1M + 386 | 05/30/2025 | 92,570 | 92,618 |
Regatta XIX Funding Ltd. 2022-1A A1 | (c) | TSFR3M + 132 | 04/20/2035 | 616,754 | 617,454 |
Regatta XX Funding Ltd. 2021-2A A | (c) | TSFR3M + 142 | 10/15/2034 | 450,431 | 450,712 |
Regatta XXIV Funding Ltd. 2021-5A D | (c) | TSFR3M + 336 | 01/20/2035 | 450,000 | 451,176 |
Research-Driven Pagaya Motor Asset Trust 2023-3A A | (c) | 7.130% | 01/26/2032 | 1,047,212 | 1,052,965 |
Research-Driven Pagaya Motor Asset Trust 2023-4A A | (c) | 7.540% | 03/25/2032 | 1,102,564 | 1,113,217 |
Research-Driven Pagaya Motor Asset Trust VII 2022-3A A | (c) | 5.380% | 11/25/2030 | 329,342 | 327,561 |
Rockford Tower CLO 2021-1A D | (c) | TSFR3M + 326 | 07/20/2034 | 306,626 | 306,003 |
Rockford Tower CLO 2021-2A A1 | (c) | TSFR3M + 142 | 07/20/2034 | 250,000 | 250,162 |
Santander Bank Auto Credit-Linked Notes Series 2022-A B | (c) | 5.281% | 05/15/2032 | 174,188 | 173,278 |
Santander Bank Auto Credit-Linked Notes Series 2022-B B | (c) | 5.721% | 08/16/2032 | 153,962 | 153,900 |
Santander Bank Auto Credit-Linked Notes Series 2022-C B | (c) | 6.451% | 12/15/2032 | 348,754 | 349,140 |
Santander Drive Auto Receivables Trust 2023-3 B | 5.610% | 07/17/2028 | 488,000 | 488,389 | |
SEB Funding LLC 2021-1A A2 | (c) | 4.969% | 01/30/2052 | 331,170 | 316,088 |
SG Commercial Mortgage Securities Trust 2016-C5 A4 | 3.055% | 10/10/2048 | 250,000 | 235,253 | |
Signal Peak CLO 2022-12A C | (c) | TSFR3M + 345 | 07/18/2034 | 1,115,000 | 1,118,487 |
Tesla Auto Lease Trust 2024-A A3 | (c) | 5.300% | 06/21/2027 | 386,000 | 384,991 |
TICP CLO XV Ltd. 2020-15A A | (c) | TSFR3M + 154 | 04/20/2033 | 1,600,000 | 1,601,377 |
Tricolor Auto Securitization Trust 2024-2A A | (c) | 6.360% | 12/15/2027 | 481,276 | 481,570 |
U.S. Bank N.A. 2023-1 B | (c) | 6.789% | 08/25/2032 | 738,797 | 741,836 |
United Auto Credit Securitization Trust 2024-1 A | (c) | 6.170% | 08/10/2026 | 157,946 | 158,001 |
VASA Trust 2021-VASA A | (c) | TSFR1M + 101 | 07/15/2039 | 460,000 | 425,232 |
Wells Fargo Commercial Mortgage Trust 2016-C35 B | 3.438% | 07/15/2048 | 270,000 | 252,358 | |
Westlake Automobile Receivables Trust 2023-1A A2A | (c) | 5.510% | 06/15/2026 | 301,734 | 301,648 |
Westlake Automobile Receivables Trust Series 2023-P1 B | (c) | 6.110% | 03/15/2027 | 580,000 | 581,506 |
86,415,767 | |||||
Industrials–0.0% | |||||
Avis Budget Rental Car Funding AESOP LLC 2023-5A B | (c) | 6.120% | 04/20/2028 | 464,000 | 467,349 |
Total Asset-Backed / Mortgage-Backed Securities (Cost $85,597,863) | $87,121,689 | ||||
U.S. Government Agency Mortgage-Backed Securities–6.0% | Rate | Maturity | Face Amount | Value | |
Fannie Mae or Freddie Mac UMBS TBA | 2.000% | 07/15/2054 | $3,650,277 | $2,854,346 | |
Fannie Mae or Freddie Mac UMBS TBA | 2.500% | 07/15/2054 | 13,501,145 | 11,022,946 | |
Fannie Mae or Freddie Mac UMBS TBA | 3.000% | 07/15/2054 | 3,024,412 | 2,572,404 | |
U.S. Government Agency Mortgage-Backed Securities (Continued) | Rate | Maturity | Face Amount | Value | |
Fannie Mae or Freddie Mac UMBS TBA | 3.500% | 07/15/2054 | $3,942,359 | $3,488,988 | |
Fannie Mae or Freddie Mac UMBS TBA | 4.000% | 07/15/2054 | 2,881,017 | 2,636,018 | |
Fannie Mae or Freddie Mac UMBS TBA | 4.500% | 07/15/2054 | 2,854,498 | 2,690,922 | |
Fannie Mae or Freddie Mac UMBS TBA | 5.500% | 07/15/2054 | 7,612,000 | 7,507,038 | |
Fannie Mae or Freddie Mac UMBS TBA | 6.000% | 07/15/2054 | 3,519,000 | 3,528,760 | |
Fannie Mae Pool FN AL5310 | 3.500% | 04/01/2044 | 1,816 | 1,654 | |
Fannie Mae Pool FN AL5887 | 4.500% | 10/01/2044 | 10,757 | 10,417 | |
Fannie Mae Pool FN AL6542 | 4.500% | 03/01/2045 | 16,722 | 16,180 | |
Fannie Mae Pool FN AL6620 | 4.500% | 08/01/2042 | 96,517 | 92,804 | |
Fannie Mae Pool FN AL6997 | 4.500% | 11/01/2042 | 7,385 | 7,174 | |
Fannie Mae Pool FN AL8855 | 3.500% | 07/01/2046 | 6,154 | 5,571 | |
Fannie Mae Pool FN AS7168 | 3.500% | 05/01/2046 | 13,084 | 11,842 | |
Fannie Mae Pool FN AS7587 | 3.500% | 07/01/2046 | 76,690 | 69,435 | |
Fannie Mae Pool FN AS7822 | 3.500% | 08/01/2046 | 146,983 | 132,792 | |
Fannie Mae Pool FN AZ9203 | 3.000% | 10/01/2045 | 11,860 | 10,401 | |
Fannie Mae Pool FN BA2885 | 3.000% | 10/01/2045 | 33,933 | 29,602 | |
Fannie Mae Pool FN BA4752 | 3.000% | 01/01/2046 | 4,775 | 4,177 | |
Fannie Mae Pool FN BC1520 | 3.500% | 08/01/2046 | 120,664 | 109,225 | |
Fannie Mae Pool FN BC2468 | 3.000% | 03/01/2046 | 86,730 | 75,557 | |
Fannie Mae Pool FN BC2488 | 3.000% | 03/01/2046 | 95,028 | 82,850 | |
Fannie Mae Pool FN BC9077 | 3.500% | 12/01/2046 | 8,775 | 7,942 | |
Fannie Mae Pool FN BH1902 | 3.500% | 12/01/2047 | 7,538 | 6,861 | |
Fannie Mae Pool FN BH3892 | 3.500% | 08/01/2047 | 18,845 | 17,029 | |
Fannie Mae Pool FN BH6940 | 3.500% | 08/01/2047 | 17,016 | 15,402 | |
Fannie Mae Pool FN BJ1692 | 3.500% | 12/01/2047 | 36,221 | 32,904 | |
Fannie Mae Pool FN BJ1695 | 3.500% | 12/01/2047 | 5,198 | 4,703 | |
Fannie Mae Pool FN BJ4558 | 3.500% | 01/01/2048 | 27,318 | 24,818 | |
Fannie Mae Pool FN BJ4559 | 3.500% | 01/01/2048 | 9,784 | 8,873 | |
Fannie Mae Pool FN BJ4566 | 4.000% | 01/01/2048 | 88,628 | 83,760 | |
Fannie Mae Pool FN BJ4567 | 4.000% | 01/01/2048 | 129,784 | 122,402 | |
Fannie Mae Pool FN BJ5170 | 3.500% | 03/01/2048 | 7,483 | 6,820 | |
Fannie Mae Pool FN BK1964 | 4.000% | 03/01/2048 | 26,236 | 24,795 | |
Fannie Mae Pool FN BK1975 | 3.500% | 03/01/2048 | 16,402 | 14,903 | |
Fannie Mae Pool FN BK3211 | 4.500% | 03/01/2048 | 26,523 | 25,435 | |
Fannie Mae Pool FN BK4157 | 4.000% | 05/01/2048 | 34,604 | 32,355 | |
Fannie Mae Pool FN BM3282 | 3.500% | 12/01/2047 | 4,640 | 4,235 | |
Fannie Mae Pool FN BM3511 | 4.500% | 02/01/2046 | 59,008 | 57,319 | |
Fannie Mae Pool FN BM3912 | 3.000% | 03/01/2047 | 94,726 | 82,800 | |
Fannie Mae Pool FN BM4427 | 3.500% | 04/01/2048 | 58,672 | 53,070 | |
Fannie Mae Pool FN BM4735 | 3.500% | 04/01/2048 | 68,021 | 61,793 | |
Fannie Mae Pool FN BM4896 | 3.000% | 02/01/2047 | 637,043 | 561,897 | |
Fannie Mae Pool FN BM5138 | 3.500% | 11/01/2048 | 125,341 | 113,950 | |
Fannie Mae Pool FN BM5334 | 3.500% | 01/01/2049 | 29,612 | 26,735 | |
Fannie Mae Pool FN BN0012 | 4.500% | 08/01/2048 | 14,750 | 14,073 | |
Fannie Mae Pool FN BO3223 | 3.000% | 10/01/2034 | 19,925 | 18,540 | |
Fannie Mae Pool FN BO4725 | 2.500% | 11/01/2034 | 33,677 | 30,698 | |
Fannie Mae Pool FN BO5957 | 3.000% | 12/01/2034 | 4,132 | 3,847 | |
Fannie Mae Pool FN BO7717 | 3.000% | 11/01/2034 | 4,535 | 4,226 | |
Fannie Mae Pool FN BU1240 | 3.000% | 03/01/2052 | 949,362 | 817,216 | |
Fannie Mae Pool FN BU1349 | 3.000% | 02/01/2052 | 737,852 | 635,152 | |
Fannie Mae Pool FN BU8919 | 2.500% | 04/01/2052 | 611,586 | 506,867 | |
Fannie Mae Pool FN BU8922 | 2.500% | 04/01/2052 | 573,449 | 473,738 | |
Fannie Mae Pool FN CA0108 | 3.500% | 08/01/2047 | 15,589 | 14,228 | |
Fannie Mae Pool FN CB1113 | 2.000% | 07/01/2051 | 1,013,354 | 796,688 | |
Fannie Mae Pool FN CB2538 | 2.500% | 01/01/2052 | 622,729 | 516,158 | |
Fannie Mae Pool FN CB3564 | 2.500% | 05/01/2052 | 526,755 | 436,603 | |
Fannie Mae Pool FN CB3565 | 2.500% | 05/01/2052 | 419,009 | 346,194 | |
Fannie Mae Pool FN FM0029 | 3.000% | 09/01/2046 | 158,872 | 140,135 | |
Fannie Mae Pool FN FM1036 | 3.000% | 05/01/2043 | 79,242 | 70,195 | |
Fannie Mae Pool FN FS0967 | 2.500% | 03/01/2052 | 686,215 | 566,596 | |
Fannie Mae Pool FN MA3211 | 4.000% | 12/01/2047 | 37,234 | 34,798 | |
Fannie Mae Pool FN MA3239 | 4.000% | 01/01/2048 | 5,950 | 5,546 | |
Fannie Mae Pool FN MA4492 | 2.000% | 12/01/2051 | 5,885,953 | 4,615,270 | |
Freddie Mac Gold Pool FG G60658 | 3.500% | 07/01/2046 | 152,567 | 139,046 | |
Freddie Mac Gold Pool FG G61360 | 3.500% | 03/01/2048 | 33,698 | 30,492 | |
Freddie Mac Gold Pool FG G61737 | 3.500% | 11/01/2048 | 135,012 | 122,276 | |
Freddie Mac Gold Pool FG Q54793 | 4.500% | 03/01/2048 | 24,415 | 23,318 | |
Freddie Mac Gold Pool FG Q55394 | 3.500% | 04/01/2048 | 10,082 | 9,129 | |
Freddie Mac Pool FR QD8682 | 3.000% | 03/01/2052 | 612,777 | 525,967 | |
Freddie Mac Pool FR QE0805 | 2.500% | 04/01/2052 | 575,492 | 473,998 | |
U.S. Government Agency Mortgage-Backed Securities (Continued) | Rate | Maturity | Face Amount | Value | |
Freddie Mac Pool FR QE0808 | 2.500% | 04/01/2052 | $616,702 | $511,109 | |
Freddie Mac Pool FR QN0783 | 3.000% | 10/01/2034 | 24,170 | 22,503 | |
Freddie Mac Pool FR QN0786 | 3.000% | 10/01/2034 | 49,753 | 46,362 | |
Freddie Mac Pool FR QN0951 | 2.500% | 11/01/2034 | 36,220 | 33,016 | |
Freddie Mac Pool FR RA6963 | 2.000% | 03/01/2052 | 947,221 | 747,363 | |
Freddie Mac Pool FR SB0040 | 2.500% | 12/01/2033 | 153,336 | 143,263 | |
Freddie Mac Pool FR SB0116 | 2.500% | 11/01/2034 | 38,411 | 35,051 | |
Freddie Mac Pool FR SD0932 | 2.500% | 04/01/2052 | 629,363 | 519,437 | |
Freddie Mac Pool FR SD8213 | 3.000% | 05/01/2052 | 2,745,457 | 2,337,954 | |
Freddie Mac Pool FR ZA4718 | 3.000% | 10/01/2046 | 115,845 | 101,206 | |
Freddie Mac Pool FR ZK8962 | 3.000% | 09/01/2032 | 40,496 | 38,208 | |
Freddie Mac Pool FR ZK9009 | 3.000% | 10/01/2032 | 14,321 | 13,510 | |
Freddie Mac Pool FR ZK9163 | 3.000% | 01/01/2033 | 21,774 | 20,519 | |
Freddie Mac Pool FR ZM1434 | 3.500% | 07/01/2046 | 18,809 | 17,076 | |
Freddie Mac Pool FR ZM4821 | 3.500% | 11/01/2047 | 21,026 | 19,031 | |
Freddie Mac Pool FR ZM4939 | 3.500% | 11/01/2047 | 37,698 | 34,261 | |
Freddie Mac Pool FR ZM5102 | 3.500% | 12/01/2047 | 47,670 | 43,098 | |
Freddie Mac Pool FR ZM5228 | 3.500% | 12/01/2047 | 27,516 | 25,007 | |
Freddie Mac Pool FR ZM5705 | 3.500% | 02/01/2048 | 12,300 | 11,173 | |
Freddie Mac Pool FR ZM5707 | 3.500% | 02/01/2048 | 8,755 | 7,909 | |
Freddie Mac Pool FR ZM5945 | 4.000% | 03/01/2048 | 23,833 | 22,524 | |
Freddie Mac Pool FR ZM6220 | 4.000% | 04/01/2048 | 11,381 | 10,571 | |
Freddie Mac Pool FR ZM6276 | 4.000% | 04/01/2048 | 33,824 | 31,901 | |
Freddie Mac Pool FR ZM6427 | 4.000% | 05/01/2048 | 76,105 | 70,966 | |
Freddie Mac Pool FR ZN2165 | 4.500% | 12/01/2048 | 35,873 | 34,711 | |
Freddie Mac Pool FR ZS4598 | 3.000% | 01/01/2045 | 14,757 | 12,922 | |
Freddie Mac Pool FR ZS7403 | 3.000% | 05/01/2031 | 107,655 | 102,477 | |
Freddie Mac Pool FR ZS9830 | 3.500% | 10/01/2046 | 150,004 | 135,780 | |
Freddie Mac Pool FR ZT0272 | 3.500% | 02/01/2047 | 91,221 | 82,585 | |
Freddie Mac Pool FR ZT0337 | 3.500% | 12/01/2044 | 15,241 | 13,866 | |
Freddie Mac Pool FR ZT0537 | 3.500% | 03/01/2048 | 120,285 | 108,796 | |
Freddie Mac Pool FR ZT1633 | 4.000% | 03/01/2047 | 7,893 | 7,390 | |
Ginnie Mae II Jumbo TBA | 3.000% | 07/15/2054 | 1,154,251 | 1,005,551 | |
Ginnie Mae II Jumbo TBA | 4.000% | 07/15/2054 | 263,682 | 243,648 | |
Ginnie Mae II Jumbo TBA | 4.500% | 07/15/2054 | 8,761,097 | 8,328,470 | |
Ginnie Mae II Jumbo TBA | 5.000% | 07/15/2054 | 8,131,040 | 7,916,837 | |
Ginnie Mae II Jumbo TBA | 5.500% | 07/15/2054 | 6,478,601 | 6,427,416 | |
Ginnie Mae II Pool G2 MA8801 | 5.500% | 04/20/2053 | 2,233,305 | 2,216,736 | |
Total U.S. Government Agency Mortgage-Backed Securities (Cost $83,140,428) | $81,223,101 | ||||
Sovereign Debt Issues–0.1% | Rate | Maturity | Face Amount | Value | |
Colombia Government International Bond | 3.125% | 04/15/2031 | $1,868,000 | $1,470,208 | |
Dominican Republic International Bond | (c) | 4.875% | 09/23/2032 | 250,000 | 223,657 |
Total Sovereign Debt Issues (Cost $1,854,229) | $1,693,865 | ||||
Preferred Securities–0.1% | Rate | Quantity | Value | |
Financials–0.1% | ||||
Charles Schwab Corp. / The DR (Rate is fixed until 06/01/2026, at which point, the rate becomes H15T5Y + 317) (Capital Markets) | (d) | 4.000% | 455,000 | $426,907 |
Citigroup, Inc. DR (Rate is fixed until 05/15/2025, at which point, the rate becomes TSFR3M + 417) (Banks) | (d) | 5.950% | 142,000 | 141,072 |
Citigroup, Inc. (Rate is fixed until 12/10/2025, at which point, the rate becomes H15T5Y + 360) (Banks) | (d) | 4.000% | 101,000 | 96,725 |
Citigroup, Inc. DR (Rate is fixed until 11/15/2028, at which point, the rate becomes H15T5Y + 321) (Banks) | (d) | 7.625% | 15,000 | 15,618 |
Goldman Sachs Group, Inc. / The DR (Capital Markets) | TSFR3M + 314 | 195,000 | 195,347 | |
Goldman Sachs Group, Inc. / The DR (Rate is fixed until 11/10/2026, at which point, the rate becomes H15T5Y + 295) (Capital Markets) | (d) | 4.125% | 120,000 | 112,230 |
PNC Financial Services Group, Inc. / The DR (Banks) | TSFR3M + 330 | 283,000 | 284,323 | |
1,272,222 | ||||
Utilities–0.0% | ||||
Vistra Corp. (Rate is fixed until 12/15/2026, at which point, the rate becomes H15T5Y + 574) (Ind. Power & Renewable Elec.) | (c)(d) | 7.000% | 107,000 | 106,070 |
Total Preferred Securities (Cost $1,428,743) | $1,378,292 | |||
Taxable Municipal Bonds–0.0% | Rate | Maturity | Face Amount | Value | |
Ochsner LSU Health System of North Louisiana | 2.510% | 05/15/2031 | $230,000 | $161,401 | |
University of California | 3.071% | 05/15/2051 | 310,000 | 211,926 | |
Total Taxable Municipal Bonds (Cost $537,139) | $373,327 | ||||
Rights–0.0% | Quantity | Value | |
Health Care–0.0% | |||
ABIOMED, Inc. CVR (Health Care Technology) | 4,357 | $4,444 | |
Total Rights (Cost $4,444) | $4,444 | ||
Money Market Funds–3.3% | Shares | Value | |
State Street Institutional Liquid Reserves Fund, 5.361% | (g) | 22,143,969 | $22,150,613 |
State Street Institutional U.S. Government Money Market Fund, 5.254% | (g) | 23,076,619 | 23,076,619 |
Total Money Market Funds (Cost $45,225,797) | $45,227,232 | ||
Total Investments – 102.8% (Cost $1,246,388,103) | (h) | $1,397,676,434 | |
Liabilities in Excess of Other Assets – (2.8)% | (38,053,728 ) | ||
Net Assets – 100.0% | $1,359,622,706 | ||
Percentages are stated as a percent of net assets. |
Abbreviations: | ||
ADR: | American Depositary Receipts | |
CLO: | Collaterized Loan Obligation | |
CVR: | Contingent Value Right | |
DR: | Depositary Receipt | |
H15T1Y: | U.S. Treasury Yield Curve Rate T-Note Constant Maturity 1 Year, 5.090% at 6/30/2024 | |
H15T5Y: | U.S. Treasury Yield Curve Rate T-Note Constant Maturity 5 Year, 4.330% at 6/30/2024 | |
QL: | Quarterly U.S. LIBOR Rate. This rate is linked to U.S. LIBOR, which is no longer published. An alternate reference rate will be determined by the issuer prior to the date the security becomes a variable rate instrument. | |
REITs: | Real Estate Investment Trusts | |
SOFR: | Secured Overnight Financing Rate, 5.330% at 6/30/2024 | |
SOFR30A: | 30 Day Average Secured Overnight Financing Rate ("SOFR"), 5.336% at 6/30/2024 | |
TSFR1M: | Monthly CME Term Secured Overnight Financing Rate ("SOFR"), 5.337% at 6/30/2024 | |
TSFR3M: | Quarterly CME Term Secured Overnight Financing Rate ("SOFR"), 5.325% at 6/30/2024 | |
UMBS TBA: | Uniform Mortgage-Backed Security To Be Announced ("TBA"); the securities backed by fixed rate mortgage loans that are delivered on a future settlement date could be issued by Fannie Mae, Freddie Mac, or a combination thereof. | |
USISDA05: | USD ICE Swap Rate 11:00am NY 5 Year. This rate is linked to U.S. LIBOR, which is no longer published. An alternate reference rate will be determined by the issuer prior to the date the security becomes a variable rate instrument. | |
USSW5: | USD Swap Semi 30/360 5 Year. This rate is linked to U.S. LIBOR, which is no longer published. An alternate reference rate will be determined by the issuer prior to the date the security becomes a variable rate instrument. | |
Footnotes: | ||
(a) | Non-income producing security. | |
(b) | Security is partially pledged as collateral for the futures contracts outstanding at June 30, 2024. The value of securities pledged totaled $18,768,577. See also the following Schedule of Open Futures Contracts. | |
(c) | Security exempt from registration under Regulation D of the Securities Act of 1933. These securities may be resold in transactions exempt from registration, normally to qualified buyers under Rule 144A. At June 30, 2024, the value of these securities totaled $143,610,524, or 10.6% of the Portfolio’s net assets. | |
(d) | Security is a fixed-then-variable rate instrument in which the coupon or dividend rate is fixed until a later specified date, then is adjusted periodically. Rates stated, including interest rate caps and floors, if any, are those in effect at June 30, 2024. | |
(e) | 100 shares per contract. | |
(f) | Interest-only security | |
(g) | Rate represents the seven-day yield at June 30, 2024. | |
(h) | Represents cost for financial reporting purposes, which may differ from cost basis for federal income tax purposes. See also Note 7 of the Notes to Financial Statements. | |
Description | Number of contracts | Expiration Date | Notional Amount | Value | Unrealized Appreciation (Depreciation) | Variation Margin Receivable (Payable) |
CBT 10-Year U.S. Treasury Note - Long | 3,579 | September 19, 2024 | $390,807,183 | $393,634,078 | $2,826,895 | $(950,673 ) |
CBT 10-Year U.S. Ultra Bond - Long | 41 | September 19, 2024 | 4,608,074 | 4,654,781 | 46,707 | (19,859 ) |
CBT U.S. Long Bond - Long | 370 | September 19, 2024 | 43,266,394 | 43,775,625 | 509,231 | (370,000 ) |
CME E-mini S&P 500 Index - Long | 81 | September 20, 2024 | 22,318,320 | 22,362,075 | 43,755 | (99,225 ) |
Description | Number of contracts | Expiration Date | Notional Amount | Value | Unrealized Appreciation (Depreciation) | Variation Margin Receivable (Payable) |
CME Micro E-mini S&P 500 Index - Long | 79 | September 20, 2024 | $2,157,460 | $2,180,993 | $23,533 | $(9,902 ) |
CBT 5-Year U.S. Treasury Note - Long | 801 | September 30, 2024 | 84,908,955 | 85,369,078 | 460,123 | (87,609 ) |
$548,066,386 | $551,976,630 | $3,910,244 | $(1,537,268 ) |
Description | Number of contracts | Expiration Date | Notional Amount | Value | Unrealized Appreciation (Depreciation) | Variation Margin Receivable (Payable) |
CBT 2-Year U.S. Treasury Note - Short | 60 | September 30, 2024 | $(12,226,025 ) | $(12,253,125 ) | $(27,100 ) | $1,406 |
Total Futures Contracts | $535,840,361 | $539,723,505 | $3,883,144 | $(1,535,862 ) |
Corporate Bonds–30.8% | Rate | Maturity | Face Amount | Value | |
Communication Services–2.6% | |||||
Alphabet, Inc. (Interactive Media & Svs.) | 2.050% | 08/15/2050 | $750,000 | $426,465 | |
America Movil S.A.B. de C.V. (Wireless Telecom. Svs.) | 2.875% | 05/07/2030 | 275,000 | 242,329 | |
AT&T, Inc. (Diversified Telecom. Svs.) | 1.700% | 03/25/2026 | 800,000 | 750,973 | |
AT&T, Inc. (Diversified Telecom. Svs.) | 3.800% | 12/01/2057 | 2,045,000 | 1,428,710 | |
Audacy Capital Corp. (Acquired 06/28/2021, Cost $77,861) (Media) | (a)(b) | 6.750% | 03/31/2029 | 75,000 | 2,625 |
Cars.com, Inc. (Interactive Media & Svs.) | (a) | 6.375% | 11/01/2028 | 50,000 | 49,116 |
CCO Holdings LLC / CCO Holdings Capital Corp. (Media) | (a) | 5.000% | 02/01/2028 | 100,000 | 93,489 |
CCO Holdings LLC / CCO Holdings Capital Corp. (Media) | (a) | 4.500% | 08/15/2030 | 125,000 | 105,822 |
CCO Holdings LLC / CCO Holdings Capital Corp. (Media) | (a) | 4.250% | 02/01/2031 | 125,000 | 102,055 |
CCO Holdings LLC / CCO Holdings Capital Corp. (Media) | (a) | 7.375% | 03/01/2031 | 25,000 | 24,650 |
CCO Holdings LLC / CCO Holdings Capital Corp. (Media) | (a) | 4.500% | 06/01/2033 | 75,000 | 59,034 |
Charter Communications Operating LLC / Charter Communications Operating Capital (Media) | 6.550% | 06/01/2034 | 220,000 | 220,073 | |
Charter Communications Operating LLC / Charter Communications Operating Capital Corp. (Media) | 6.484% | 10/23/2045 | 750,000 | 685,035 | |
CMG Media Corp. (Media) | (a) | 8.875% | 12/15/2027 | 50,000 | 28,517 |
Comcast Corp. (Media) | 3.450% | 02/01/2050 | 1,575,000 | 1,111,246 | |
DISH DBS Corp. (Media) | 7.375% | 07/01/2028 | 25,000 | 10,632 | |
DISH DBS Corp. (Media) | 5.125% | 06/01/2029 | 75,000 | 29,701 | |
Gray Television, Inc. (Media) | (a) | 4.750% | 10/15/2030 | 50,000 | 30,004 |
Gray Television, Inc. (Media) | (a) | 5.375% | 11/15/2031 | 75,000 | 42,516 |
iHeartCommunications, Inc. (Media) | (a) | 5.250% | 08/15/2027 | 50,000 | 26,548 |
Interpublic Group of Cos., Inc. / The (Media) | 5.375% | 06/15/2033 | 480,000 | 472,953 | |
Lamar Media Corp. (Media) | 4.875% | 01/15/2029 | 25,000 | 24,023 | |
Match Group Holdings II LLC (Interactive Media & Svs.) | (a) | 5.000% | 12/15/2027 | 100,000 | 95,864 |
Match Group Holdings II LLC (Interactive Media & Svs.) | (a) | 3.625% | 10/01/2031 | 25,000 | 21,176 |
Meta Platforms, Inc. (Interactive Media & Svs.) | 4.450% | 08/15/2052 | 630,000 | 543,102 | |
Paramount Global (Media) | 4.200% | 05/19/2032 | 525,000 | 428,812 | |
ROBLOX Corp. (Entertainment) | (a) | 3.875% | 05/01/2030 | 50,000 | 44,425 |
Rogers Communications, Inc. (Wireless Telecom. Svs.) | 4.500% | 03/15/2042 | 915,000 | 774,744 | |
Sinclair Television Group, Inc. (Media) | (a) | 5.500% | 03/01/2030 | 25,000 | 15,205 |
Sirius XM Radio, Inc. (Media) | (a) | 3.875% | 09/01/2031 | 200,000 | 163,267 |
Sky Ltd. (Media) | (a) | 3.750% | 09/16/2024 | 375,000 | 373,371 |
Sprint LLC (Wireless Telecom. Svs.) | 7.625% | 03/01/2026 | 50,000 | 51,379 | |
Stagwell Global LLC (Media) | (a) | 5.625% | 08/15/2029 | 150,000 | 138,543 |
Sunrise FinCo I B.V. (Media) | (a) | 4.875% | 07/15/2031 | 200,000 | 181,603 |
TEGNA, Inc. (Media) | 4.625% | 03/15/2028 | 25,000 | 22,526 | |
TEGNA, Inc. (Media) | 5.000% | 09/15/2029 | 25,000 | 22,075 | |
T-Mobile U.S.A., Inc. (Wireless Telecom. Svs.) | 3.500% | 04/15/2031 | 350,000 | 314,446 | |
T-Mobile U.S.A., Inc. (Wireless Telecom. Svs.) | 5.150% | 04/15/2034 | 385,000 | 378,403 | |
T-Mobile U.S.A., Inc. (Wireless Telecom. Svs.) | 3.300% | 02/15/2051 | 500,000 | 337,560 | |
T-Mobile U.S.A., Inc. (Wireless Telecom. Svs.) | 5.650% | 01/15/2053 | 335,000 | 330,035 | |
Univision Communications, Inc. (Media) | (a) | 8.000% | 08/15/2028 | 75,000 | 73,142 |
Univision Communications, Inc. (Media) | (a) | 7.375% | 06/30/2030 | 50,000 | 46,508 |
Verizon Communications, Inc. (Diversified Telecom. Svs.) | 4.000% | 03/22/2050 | 1,300,000 | 1,012,587 | |
Virgin Media Secured Finance PLC (Media) | (a) | 5.500% | 05/15/2029 | 200,000 | 182,830 |
Vodafone Group PLC (Wireless Telecom. Svs.) | 4.125% | 05/30/2025 | 325,000 | 321,065 | |
Vodafone Group PLC (Wireless Telecom. Svs.) | 5.250% | 05/30/2048 | 450,000 | 414,582 | |
Vodafone Group PLC (Wireless Telecom. Svs.) | 5.750% | 06/28/2054 | 350,000 | 338,954 | |
Walt Disney Co. / The (Entertainment) | 3.800% | 03/22/2030 | 175,000 | 165,751 | |
Walt Disney Co. / The (Entertainment) | 4.700% | 03/23/2050 | 325,000 | 293,628 | |
Walt Disney Co. / The (Entertainment) | 3.600% | 01/13/2051 | 525,000 | 391,299 | |
Warnermedia Holdings, Inc. (Media) | 4.279% | 03/15/2032 | 600,000 | 523,697 | |
Warnermedia Holdings, Inc. (Media) | 5.050% | 03/15/2042 | 720,000 | 585,654 | |
14,552,749 | |||||
Consumer Discretionary–1.2% | |||||
1011778 B.C. ULC / New Red Finance, Inc. (Hotels, Restaurants & Leisure) | (a) | 4.375% | 01/15/2028 | 50,000 | 47,159 |
1011778 B.C. ULC / New Red Finance, Inc. (Hotels, Restaurants & Leisure) | (a) | 6.125% | 06/15/2029 | 50,000 | 50,181 |
1011778 B.C. ULC / New Red Finance, Inc. (Hotels, Restaurants & Leisure) | (a) | 4.000% | 10/15/2030 | 125,000 | 110,038 |
Academy Ltd. (Specialty Retail) | (a) | 6.000% | 11/15/2027 | 75,000 | 73,842 |
Adient Global Holdings Ltd. (Automobile Components) | (a) | 7.000% | 04/15/2028 | 25,000 | 25,589 |
Adient Global Holdings Ltd. (Automobile Components) | (a) | 8.250% | 04/15/2031 | 75,000 | 78,271 |
Advance Auto Parts, Inc. (Specialty Retail) | 3.900% | 04/15/2030 | 675,000 | 610,102 | |
Affinity Interactive (Hotels, Restaurants & Leisure) | (a) | 6.875% | 12/15/2027 | 25,000 | 22,044 |
Amazon.com, Inc. (Broadline Retail) | 3.875% | 08/22/2037 | 475,000 | 419,454 | |
Amazon.com, Inc. (Broadline Retail) | 2.500% | 06/03/2050 | 900,000 | 550,372 | |
Aramark Services, Inc. (Hotels, Restaurants & Leisure) | (a) | 5.000% | 04/01/2025 | 25,000 | 24,832 |
Corporate Bonds (Continued) | Rate | Maturity | Face Amount | Value | |
Consumer Discretionary (continued) | |||||
Aramark Services, Inc. (Hotels, Restaurants & Leisure) | (a) | 5.000% | 02/01/2028 | $50,000 | $48,356 |
Asbury Automotive Group, Inc. (Specialty Retail) | (a) | 4.625% | 11/15/2029 | 25,000 | 23,107 |
Asbury Automotive Group, Inc. (Specialty Retail) | (a) | 5.000% | 02/15/2032 | 50,000 | 45,300 |
Boyd Gaming Corp. (Hotels, Restaurants & Leisure) | 4.750% | 12/01/2027 | 50,000 | 48,124 | |
Caesars Entertainment, Inc. (Hotels, Restaurants & Leisure) | (a) | 8.125% | 07/01/2027 | 75,000 | 76,525 |
Caesars Entertainment, Inc. (Hotels, Restaurants & Leisure) | (a) | 4.625% | 10/15/2029 | 50,000 | 45,839 |
Caesars Entertainment, Inc. (Hotels, Restaurants & Leisure) | (a) | 7.000% | 02/15/2030 | 25,000 | 25,542 |
Caesars Entertainment, Inc. (Hotels, Restaurants & Leisure) | (a) | 6.500% | 02/15/2032 | 25,000 | 25,123 |
Carnival Corp. (Hotels, Restaurants & Leisure) | (a) | 6.000% | 05/01/2029 | 50,000 | 49,391 |
Carnival Corp. (Hotels, Restaurants & Leisure) | (a) | 7.000% | 08/15/2029 | 25,000 | 25,915 |
Churchill Downs, Inc. (Hotels, Restaurants & Leisure) | (a) | 5.500% | 04/01/2027 | 25,000 | 24,598 |
Churchill Downs, Inc. (Hotels, Restaurants & Leisure) | (a) | 6.750% | 05/01/2031 | 25,000 | 25,135 |
Clarios Global LP (Automobiles) | (a) | 6.750% | 05/15/2025 | 22,000 | 21,993 |
Clarios Global LP / Clarios U.S. Finance Co. (Automobile Components) | (a) | 8.500% | 05/15/2027 | 175,000 | 175,987 |
Daimler Truck Finance North America LLC (Automobiles) | (a) | 2.000% | 12/14/2026 | 540,000 | 499,093 |
Daimler Truck Finance North America LLC (Automobiles) | (a) | 2.375% | 12/14/2028 | 180,000 | 160,379 |
Dana Financing Luxembourg SARL (Automobile Components) | (a) | 5.750% | 04/15/2025 | 12,000 | 11,961 |
Dana, Inc. (Automobile Components) | 4.500% | 02/15/2032 | 50,000 | 42,940 | |
Dornoch Debt Merger Sub, Inc. (Automobile Components) | (a) | 6.625% | 10/15/2029 | 100,000 | 85,025 |
Expedia Group, Inc. (Hotels, Restaurants & Leisure) | 2.950% | 03/15/2031 | 415,000 | 358,784 | |
Gap, Inc. / The (Specialty Retail) | (a) | 3.625% | 10/01/2029 | 25,000 | 21,644 |
Garda World Security Corp. (Diversified Consumer Svs.) | (a) | 9.500% | 11/01/2027 | 175,000 | 175,810 |
Hilton Domestic Operating Co., Inc. (Hotels, Restaurants & Leisure) | (a) | 5.750% | 05/01/2028 | 50,000 | 49,751 |
Hilton Domestic Operating Co., Inc. (Hotels, Restaurants & Leisure) | (a) | 3.625% | 02/15/2032 | 50,000 | 43,269 |
Home Depot, Inc. / The (Specialty Retail) | 3.300% | 04/15/2040 | 1,040,000 | 810,132 | |
IHO Verwaltungs GmbH (Automobile Components) | (a)(c) | 6.000%, 6.750% PIK | 05/15/2027 | 200,000 | 196,804 |
JB Poindexter & Co., Inc. (Automobile Components) | (a) | 8.750% | 12/15/2031 | 50,000 | 51,800 |
Kontoor Brands, Inc. (Textiles, Apparel & Luxury Goods) | (a) | 4.125% | 11/15/2029 | 25,000 | 22,631 |
LCM Investments Holdings II LLC (Specialty Retail) | (a) | 4.875% | 05/01/2029 | 50,000 | 46,737 |
LCM Investments Holdings II LLC (Specialty Retail) | (a) | 8.250% | 08/01/2031 | 50,000 | 52,174 |
Light & Wonder International, Inc. (Hotels, Restaurants & Leisure) | (a) | 7.250% | 11/15/2029 | 50,000 | 51,065 |
Light & Wonder International, Inc. (Hotels, Restaurants & Leisure) | (a) | 7.500% | 09/01/2031 | 25,000 | 25,831 |
MGM Resorts International (Hotels, Restaurants & Leisure) | 6.500% | 04/15/2032 | 50,000 | 49,769 | |
Midwest Gaming Borrower LLC / Midwest Gaming Finance Corp. (Hotels, Restaurants & Leisure) | (a) | 4.875% | 05/01/2029 | 50,000 | 46,575 |
Mohegan Tribal Gaming Authority (Hotels, Restaurants & Leisure) | (a) | 8.000% | 02/01/2026 | 150,000 | 142,207 |
NCL Corp. Ltd. (Hotels, Restaurants & Leisure) | (a) | 8.125% | 01/15/2029 | 25,000 | 26,194 |
NCL Corp. Ltd. (Hotels, Restaurants & Leisure) | (a) | 7.750% | 02/15/2029 | 50,000 | 51,985 |
NCL Finance Ltd. (Hotels, Restaurants & Leisure) | (a) | 6.125% | 03/15/2028 | 25,000 | 24,688 |
Ontario Gaming GTA LP / OTG Co-Issuer, Inc. (Hotels, Restaurants & Leisure) | (a) | 8.000% | 08/01/2030 | 50,000 | 51,313 |
Penn Entertainment, Inc. (Hotels, Restaurants & Leisure) | (a) | 4.125% | 07/01/2029 | 25,000 | 21,442 |
Raptor Acquisition Corp. / Raptor Co-Issuer LLC (Hotels, Restaurants & Leisure) | (a) | 4.875% | 11/01/2026 | 25,000 | 24,186 |
Real Hero Merger Sub 2, Inc. (Automobile Components) | (a) | 6.250% | 02/01/2029 | 75,000 | 64,017 |
Royal Caribbean Cruises Ltd. (Hotels, Restaurants & Leisure) | (a) | 5.500% | 08/31/2026 | 50,000 | 49,444 |
Royal Caribbean Cruises Ltd. (Hotels, Restaurants & Leisure) | (a) | 6.250% | 03/15/2032 | 50,000 | 50,420 |
Sally Holdings LLC / Sally Capital, Inc. (Specialty Retail) | 6.750% | 03/01/2032 | 75,000 | 74,094 | |
Scientific Games Holdings LP / Scientific Games U.S. FinCo, Inc. (Hotels, Restaurants & Leisure) | (a) | 6.625% | 03/01/2030 | 75,000 | 73,111 |
SeaWorld Parks & Entertainment, Inc. (Hotels, Restaurants & Leisure) | (a) | 5.250% | 08/15/2029 | 75,000 | 70,866 |
Six Flags Entertainment Corp. (Hotels, Restaurants & Leisure) | (a) | 5.500% | 04/15/2027 | 50,000 | 49,494 |
Station Casinos LLC (Hotels, Restaurants & Leisure) | (a) | 4.500% | 02/15/2028 | 50,000 | 47,047 |
Station Casinos LLC (Hotels, Restaurants & Leisure) | (a) | 4.625% | 12/01/2031 | 50,000 | 44,565 |
Station Casinos LLC (Hotels, Restaurants & Leisure) | (a) | 6.625% | 03/15/2032 | 25,000 | 24,877 |
Velocity Vehicle Group LLC (Specialty Retail) | (a) | 8.000% | 06/01/2029 | 25,000 | 25,714 |
William Carter Co. / The (Textiles, Apparel & Luxury Goods) | (a) | 5.625% | 03/15/2027 | 25,000 | 24,659 |
Wyndham Hotels & Resorts, Inc. (Hotels, Restaurants & Leisure) | (a) | 4.375% | 08/15/2028 | 50,000 | 46,612 |
Wynn Resorts Finance LLC / Wynn Resorts Capital Corp. (Hotels, Restaurants & Leisure) | (a) | 7.125% | 02/15/2031 | 50,000 | 51,846 |
Yum! Brands, Inc. (Hotels, Restaurants & Leisure) | 4.625% | 01/31/2032 | 75,000 | 68,976 | |
ZF North America Capital, Inc. (Automobile Components) | (a) | 6.875% | 04/14/2028 | 150,000 | 152,902 |
6,735,652 | |||||
Consumer Staples–1.8% | |||||
Albertsons Cos., Inc. / Safeway, Inc. / New Albertsons LP / Albertsons LLC (Consumer Staples Distribution & Retail) | (a) | 5.875% | 02/15/2028 | 75,000 | 74,129 |
Alimentation Couche-Tard, Inc. (Consumer Staples Distribution & Retail) | (a) | 3.800% | 01/25/2050 | 625,000 | 466,804 |
Altria Group, Inc. (Tobacco) | 3.875% | 09/16/2046 | 925,000 | 666,223 | |
Anheuser-Busch InBev Worldwide, Inc. (Beverages) | 4.350% | 06/01/2040 | 300,000 | 264,408 | |
B.A.T. Capital Corp. (Tobacco) | 4.540% | 08/15/2047 | 1,000,000 | 769,984 | |
BellRing Brands, Inc. (Personal Care Products) | (a) | 7.000% | 03/15/2030 | 75,000 | 76,859 |
Corporate Bonds (Continued) | Rate | Maturity | Face Amount | Value | |
Consumer Staples (continued) | |||||
Coca-Cola Europacific Partners PLC (Beverages) | (a) | 1.500% | 01/15/2027 | $600,000 | $548,153 |
Coca-Cola Femsa S.A.B. de CV (Beverages) | 2.750% | 01/22/2030 | 750,000 | 666,120 | |
Constellation Brands, Inc. (Beverages) | 4.800% | 01/15/2029 | 145,000 | 142,848 | |
Constellation Brands, Inc. (Beverages) | 3.750% | 05/01/2050 | 550,000 | 405,597 | |
Dollar General Corp. (Consumer Staples Distribution & Retail) | 3.875% | 04/15/2027 | 625,000 | 600,984 | |
Edgewell Personal Care Co. (Personal Care Products) | (a) | 5.500% | 06/01/2028 | 25,000 | 24,392 |
Edgewell Personal Care Co. (Personal Care Products) | (a) | 4.125% | 04/01/2029 | 25,000 | 23,013 |
Energizer Holdings, Inc. (Household Products) | (a) | 6.500% | 12/31/2027 | 25,000 | 24,971 |
Energizer Holdings, Inc. (Household Products) | (a) | 4.375% | 03/31/2029 | 75,000 | 67,849 |
Flowers Foods, Inc. (Food Products) | 3.500% | 10/01/2026 | 675,000 | 648,065 | |
Flowers Foods, Inc. (Food Products) | 2.400% | 03/15/2031 | 185,000 | 154,124 | |
Grupo Bimbo S.A.B. de C.V. (Food Products) | (a) | 4.875% | 06/27/2044 | 925,000 | 828,239 |
Kenvue, Inc. (Personal Care Products) | 5.050% | 03/22/2028 | 360,000 | 361,965 | |
Kenvue, Inc. (Personal Care Products) | 4.900% | 03/22/2033 | 400,000 | 395,598 | |
Keurig Dr Pepper, Inc. (Beverages) | 4.417% | 05/25/2025 | 36,000 | 35,638 | |
Kraft Heinz Foods Co. (Food Products) | 4.375% | 06/01/2046 | 425,000 | 345,643 | |
Kroger Co. / The (Consumer Staples Distribution & Retail) | 3.950% | 01/15/2050 | 475,000 | 366,271 | |
Performance Food Group, Inc. (Consumer Staples Distribution & Retail) | (a) | 4.250% | 08/01/2029 | 50,000 | 45,520 |
Philip Morris International, Inc. (Tobacco) | 3.875% | 08/21/2042 | 915,000 | 712,033 | |
Post Holdings, Inc. (Food Products) | (a) | 6.250% | 02/15/2032 | 50,000 | 50,065 |
Sysco Corp. (Consumer Staples Distribution & Retail) | 4.450% | 03/15/2048 | 825,000 | 685,548 | |
Tyson Foods, Inc. (Food Products) | 5.700% | 03/15/2034 | 500,000 | 498,069 | |
U.S. Foods, Inc. (Consumer Staples Distribution & Retail) | (a) | 4.750% | 02/15/2029 | 50,000 | 47,424 |
U.S. Foods, Inc. (Consumer Staples Distribution & Retail) | (a) | 4.625% | 06/01/2030 | 75,000 | 69,680 |
10,066,216 | |||||
Energy–2.6% | |||||
Antero Midstream Partners LP / Antero Midstream Finance Corp. (Oil, Gas & Consumable Fuels) | (a) | 5.750% | 03/01/2027 | 25,000 | 24,798 |
Antero Midstream Partners LP / Antero Midstream Finance Corp. (Oil, Gas & Consumable Fuels) | (a) | 5.750% | 01/15/2028 | 50,000 | 49,154 |
Antero Midstream Partners LP / Antero Midstream Finance Corp. (Oil, Gas & Consumable Fuels) | (a) | 5.375% | 06/15/2029 | 75,000 | 72,702 |
Antero Midstream Partners LP / Antero Midstream Finance Corp. (Oil, Gas & Consumable Fuels) | (a) | 6.625% | 02/01/2032 | 50,000 | 50,450 |
Antero Resources Corp. (Oil, Gas & Consumable Fuels) | (a) | 5.375% | 03/01/2030 | 50,000 | 48,388 |
Archrock Partners LP / Archrock Partners Finance Corp. (Oil, Gas & Consumable Fuels) | (a) | 6.875% | 04/01/2027 | 75,000 | 75,299 |
Archrock Partners LP / Archrock Partners Finance Corp. (Oil, Gas & Consumable Fuels) | (a) | 6.250% | 04/01/2028 | 50,000 | 49,519 |
Ascent Resources Utica Holdings LLC / ARU Finance Corp. (Oil, Gas & Consumable Fuels) | (a) | 7.000% | 11/01/2026 | 25,000 | 25,017 |
Ascent Resources Utica Holdings LLC / ARU Finance Corp. (Oil, Gas & Consumable Fuels) | (a) | 5.875% | 06/30/2029 | 100,000 | 97,727 |
Blue Racer Midstream LLC / Blue Racer Finance Corp. (Oil, Gas & Consumable Fuels) | (a) | 7.250% | 07/15/2032 | 50,000 | 51,407 |
Boardwalk Pipelines LP (Oil, Gas & Consumable Fuels) | 3.400% | 02/15/2031 | 550,000 | 481,570 | |
BP Capital Markets America, Inc. (Oil, Gas & Consumable Fuels) | 3.588% | 04/14/2027 | 825,000 | 793,354 | |
Canadian Natural Resources Ltd. (Oil, Gas & Consumable Fuels) | 2.050% | 07/15/2025 | 525,000 | 505,595 | |
Cenovus Energy, Inc. (Oil, Gas & Consumable Fuels) | 4.250% | 04/15/2027 | 525,000 | 510,483 | |
Cheniere Energy Partners LP (Oil, Gas & Consumable Fuels) | 4.500% | 10/01/2029 | 50,000 | 47,632 | |
Cheniere Energy, Inc. (Oil, Gas & Consumable Fuels) | 4.625% | 10/15/2028 | 25,000 | 24,263 | |
Chevron Corp. (Oil, Gas & Consumable Fuels) | 3.078% | 05/11/2050 | 475,000 | 324,218 | |
Civitas Resources, Inc. (Oil, Gas & Consumable Fuels) | (a) | 8.375% | 07/01/2028 | 50,000 | 52,391 |
Civitas Resources, Inc. (Oil, Gas & Consumable Fuels) | (a) | 8.625% | 11/01/2030 | 25,000 | 26,806 |
CNX Midstream Partners LP (Oil, Gas & Consumable Fuels) | (a) | 4.750% | 04/15/2030 | 100,000 | 90,116 |
Columbia Pipelines Holding Co. LLC (Oil, Gas & Consumable Fuels) | (a) | 5.681% | 01/15/2034 | 425,000 | 418,160 |
Comstock Resources, Inc. (Oil, Gas & Consumable Fuels) | (a) | 6.750% | 03/01/2029 | 100,000 | 96,912 |
Diamondback Energy, Inc. (Oil, Gas & Consumable Fuels) | 6.250% | 03/15/2033 | 490,000 | 512,493 | |
Diamondback Energy, Inc. (Oil, Gas & Consumable Fuels) | 5.750% | 04/18/2054 | 290,000 | 281,138 | |
DT Midstream, Inc. (Oil, Gas & Consumable Fuels) | (a) | 4.375% | 06/15/2031 | 50,000 | 45,541 |
Eastern Gas Transmission & Storage, Inc. (Oil, Gas & Consumable Fuels) | 3.900% | 11/15/2049 | 150,000 | 105,969 | |
Enbridge Energy Partners LP (Oil, Gas & Consumable Fuels) | 5.500% | 09/15/2040 | 750,000 | 715,199 | |
Endeavor Energy Resources LP / EER Finance, Inc. (Oil, Gas & Consumable Fuels) | (a) | 5.750% | 01/30/2028 | 25,000 | 25,235 |
Energy Transfer LP (Oil, Gas & Consumable Fuels) | 3.750% | 05/15/2030 | 500,000 | 459,952 | |
Energy Transfer LP (Oil, Gas & Consumable Fuels) | 5.750% | 02/15/2033 | 400,000 | 404,120 | |
Energy Transfer LP (Oil, Gas & Consumable Fuels) | 5.550% | 05/15/2034 | 210,000 | 207,833 | |
Eni SpA (Oil, Gas & Consumable Fuels) | (a) | 5.500% | 05/15/2034 | 355,000 | 351,734 |
Eni SpA (Oil, Gas & Consumable Fuels) | (a) | 5.950% | 05/15/2054 | 225,000 | 220,990 |
EQM Midstream Partners LP (Oil, Gas & Consumable Fuels) | 5.500% | 07/15/2028 | 50,000 | 49,237 | |
EQM Midstream Partners LP (Oil, Gas & Consumable Fuels) | (a) | 4.500% | 01/15/2029 | 50,000 | 47,186 |
EQM Midstream Partners LP (Oil, Gas & Consumable Fuels) | (a) | 4.750% | 01/15/2031 | 50,000 | 46,752 |
EQM Midstream Partners LP (Oil, Gas & Consumable Fuels) | 6.500% | 07/15/2048 | 75,000 | 75,718 | |
Hess Corp. (Oil, Gas & Consumable Fuels) | 5.600% | 02/15/2041 | 700,000 | 697,728 | |
Corporate Bonds (Continued) | Rate | Maturity | Face Amount | Value | |
Energy (continued) | |||||
Hess Midstream Operations LP (Oil, Gas & Consumable Fuels) | (a) | 5.125% | 06/15/2028 | $50,000 | $48,413 |
Hess Midstream Operations LP (Oil, Gas & Consumable Fuels) | (a) | 6.500% | 06/01/2029 | 50,000 | 50,688 |
Hess Midstream Operations LP (Oil, Gas & Consumable Fuels) | (a) | 4.250% | 02/15/2030 | 25,000 | 22,948 |
HF Sinclair Corp. (Oil, Gas & Consumable Fuels) | (a) | 5.000% | 02/01/2028 | 75,000 | 72,660 |
Kinder Morgan, Inc. (Oil, Gas & Consumable Fuels) | 3.250% | 08/01/2050 | 420,000 | 267,777 | |
Kodiak Gas Services LLC (Energy Equip. & Svs.) | (a) | 7.250% | 02/15/2029 | 25,000 | 25,627 |
Marathon Petroleum Corp. (Oil, Gas & Consumable Fuels) | 4.750% | 09/15/2044 | 625,000 | 532,882 | |
Matador Resources Co. (Oil, Gas & Consumable Fuels) | (a) | 6.500% | 04/15/2032 | 50,000 | 50,004 |
MPLX LP (Oil, Gas & Consumable Fuels) | 4.950% | 03/14/2052 | 675,000 | 572,187 | |
Nabors Industries Ltd. (Energy Equip. & Svs.) | (a) | 7.250% | 01/15/2026 | 25,000 | 25,365 |
Nabors Industries Ltd. (Energy Equip. & Svs.) | (a) | 7.500% | 01/15/2028 | 25,000 | 23,855 |
Nabors Industries, Inc. (Energy Equip. & Svs.) | (a) | 9.125% | 01/31/2030 | 50,000 | 51,797 |
Northriver Midstream Finance LP (Oil, Gas & Consumable Fuels) | (a) | 6.750% | 07/15/2032 | 50,000 | 50,088 |
Occidental Petroleum Corp. (Oil, Gas & Consumable Fuels) | 6.450% | 09/15/2036 | 75,000 | 78,338 | |
ONEOK, Inc. (Oil, Gas & Consumable Fuels) | 2.200% | 09/15/2025 | 175,000 | 168,026 | |
ONEOK, Inc. (Oil, Gas & Consumable Fuels) | 4.500% | 03/15/2050 | 700,000 | 553,685 | |
ONEOK, Inc. (Oil, Gas & Consumable Fuels) | 6.625% | 09/01/2053 | 275,000 | 293,462 | |
Ovintiv, Inc. (Oil, Gas & Consumable Fuels) | 7.100% | 07/15/2053 | 550,000 | 603,272 | |
Permian Resources Operating LLC (Oil, Gas & Consumable Fuels) | (a) | 7.000% | 01/15/2032 | 50,000 | 51,363 |
Phillips 66 (Oil, Gas & Consumable Fuels) | 3.850% | 04/09/2025 | 300,000 | 296,026 | |
Phillips 66 (Oil, Gas & Consumable Fuels) | 4.875% | 11/15/2044 | 375,000 | 332,034 | |
Plains All American Pipeline LP / PAA Finance Corp. (Oil, Gas & Consumable Fuels) | 5.150% | 06/01/2042 | 475,000 | 420,752 | |
Precision Drilling Corp. (Energy Equip. & Svs.) | (a) | 6.875% | 01/15/2029 | 50,000 | 49,463 |
Range Resources Corp. (Oil, Gas & Consumable Fuels) | 8.250% | 01/15/2029 | 50,000 | 51,812 | |
Rockcliff Energy II LLC (Oil, Gas & Consumable Fuels) | (a) | 5.500% | 10/15/2029 | 25,000 | 23,401 |
Sitio Royalties Operating Partnership LP / Sitio Finance Corp. (Oil, Gas & Consumable Fuels) | (a) | 7.875% | 11/01/2028 | 25,000 | 25,849 |
SM Energy Co. (Oil, Gas & Consumable Fuels) | 6.750% | 09/15/2026 | 50,000 | 50,017 | |
SM Energy Co. (Oil, Gas & Consumable Fuels) | 6.500% | 07/15/2028 | 50,000 | 49,570 | |
Southwestern Energy Co. (Oil, Gas & Consumable Fuels) | 5.375% | 03/15/2030 | 25,000 | 24,152 | |
Targa Resources Corp. (Oil, Gas & Consumable Fuels) | 4.200% | 02/01/2033 | 555,000 | 499,043 | |
U.S.A. Compression Partners LP / U.S.A. Compression Finance Corp. (Energy Equip. & Svs.) | (a) | 7.125% | 03/15/2029 | 100,000 | 100,761 |
Valero Energy Corp. (Oil, Gas & Consumable Fuels) | 4.350% | 06/01/2028 | 375,000 | 362,879 | |
Western Midstream Operating LP (Oil, Gas & Consumable Fuels) | 5.300% | 03/01/2048 | 75,000 | 64,756 | |
Williams Cos., Inc. / The (Oil, Gas & Consumable Fuels) | 3.750% | 06/15/2027 | 675,000 | 647,865 | |
Williams Cos., Inc. / The (Oil, Gas & Consumable Fuels) | 5.150% | 03/15/2034 | 225,000 | 219,516 | |
14,923,119 | |||||
Financials–8.7% | |||||
Acrisure LLC / Acrisure Finance, Inc. (Financial Services) | (a) | 6.000% | 08/01/2029 | 25,000 | 23,066 |
Acrisure LLC / Acrisure Finance, Inc. (Financial Services) | (a) | 7.500% | 11/06/2030 | 50,000 | 50,035 |
AerCap Ireland Capital DAC / AerCap Global Aviation Trust (Financial Services) | 3.000% | 10/29/2028 | 315,000 | 286,263 | |
AerCap Ireland Capital DAC / AerCap Global Aviation Trust (Financial Services) | 5.300% | 01/19/2034 | 600,000 | 587,638 | |
AIA Group Ltd. (Insurance) | (a) | 4.950% | 04/04/2033 | 260,000 | 255,119 |
Alliant Holdings Intermediate LLC / Alliant Holdings Co-Issuer (Insurance) | (a) | 5.875% | 11/01/2029 | 25,000 | 23,394 |
Alliant Holdings Intermediate LLC / Alliant Holdings Co-Issuer (Insurance) | (a) | 7.000% | 01/15/2031 | 100,000 | 101,022 |
Ally Financial, Inc. (Consumer Finance) | 5.750% | 11/20/2025 | 25,000 | 24,842 | |
Ally Financial, Inc. (Rate is fixed until 01/03/2029, at which point, the rate becomes SOFR + 282) (Consumer Finance) | (d) | 6.848% | 01/03/2030 | 405,000 | 416,152 |
American Express Co. (Consumer Finance) | 3.300% | 05/03/2027 | 875,000 | 832,482 | |
American Honda Finance Corp. (Consumer Finance) | 5.800% | 10/03/2025 | 400,000 | 401,984 | |
AmWINS Group, Inc. (Insurance) | (a) | 6.375% | 02/15/2029 | 75,000 | 75,205 |
AmWINS Group, Inc. (Insurance) | (a) | 4.875% | 06/30/2029 | 75,000 | 69,770 |
Aon North America, Inc. (Insurance) | 5.750% | 03/01/2054 | 500,000 | 489,028 | |
Ardonagh Group Finance Ltd. (Insurance) | (a) | 8.875% | 02/15/2032 | 200,000 | 195,342 |
AssuredPartners, Inc. (Insurance) | (a) | 5.625% | 01/15/2029 | 100,000 | 93,540 |
AssuredPartners, Inc. (Insurance) | (a) | 7.500% | 02/15/2032 | 25,000 | 25,094 |
Baldwin Insurance Group Holdings LLC / Baldwin Insurance Group Holdings Finance (Insurance) | (a) | 7.125% | 05/15/2031 | 75,000 | 75,871 |
Bank of America Corp. (Rate is fixed until 02/13/2025, at which point, the rate becomes TSFR3M + 90) (Banks) | (d) | 2.015% | 02/13/2026 | 1,625,000 | 1,587,808 |
Bank of America Corp. (Rate is fixed until 04/29/2030, at which point, the rate becomes SOFR + 215) (Banks) | (d) | 2.592% | 04/29/2031 | 1,900,000 | 1,642,770 |
Bank of America Corp. (Rate is fixed until 04/22/2031, at which point, the rate becomes SOFR + 132) (Banks) | (d) | 2.687% | 04/22/2032 | 650,000 | 549,329 |
Bank of America Corp. (Rate is fixed until 04/25/2033, at which point, the rate becomes SOFR + 191) (Banks) | (d) | 5.288% | 04/25/2034 | 300,000 | 296,851 |
Bank of America Corp. (Rate is fixed until 01/23/2034, at which point, the rate becomes SOFR + 165) (Banks) | (d) | 5.468% | 01/23/2035 | 495,000 | 494,499 |
Corporate Bonds (Continued) | Rate | Maturity | Face Amount | Value | |
Financials (continued) | |||||
Bank of New York Mellon Corp. / The (Rate is fixed until 06/13/2027, at which point, the rate becomes SOFR + 115) (Capital Markets) | (d) | 3.992% | 06/13/2028 | $300,000 | $290,127 |
BlackRock, Inc. (Capital Markets) | 1.900% | 01/28/2031 | 425,000 | 352,034 | |
Boost Newco Borrower LLC (Financial Services) | (a) | 7.500% | 01/15/2031 | 200,000 | 208,530 |
BroadStreet Partners, Inc. (Insurance) | (a) | 5.875% | 04/15/2029 | 200,000 | 186,617 |
Capital One Financial Corp. (Rate is fixed until 02/01/2033, at which point, the rate becomes SOFR + 260) (Consumer Finance) | (d) | 5.817% | 02/01/2034 | 350,000 | 346,408 |
Chubb INA Holdings LLC (Insurance) | 3.350% | 05/03/2026 | 425,000 | 411,249 | |
Citigroup, Inc. (Rate is fixed until 01/29/2030, at which point, the rate becomes SOFR + 115) (Banks) | (d) | 2.666% | 01/29/2031 | 1,800,000 | 1,567,445 |
Citigroup, Inc. (Rate is fixed until 02/13/2034, at which point, the rate becomes SOFR + 206) (Banks) | (d) | 5.827% | 02/13/2035 | 650,000 | 643,232 |
Citizens Bank N.A. (Banks) | 3.750% | 02/18/2026 | 725,000 | 700,852 | |
CNA Financial Corp. (Insurance) | 5.500% | 06/15/2033 | 600,000 | 598,275 | |
Comerica, Inc. (Banks) | 3.800% | 07/22/2026 | 475,000 | 452,012 | |
Comerica, Inc. (Rate is fixed until 01/30/2029, at which point, the rate becomes SOFR + 216) (Banks) | (d) | 5.982% | 01/30/2030 | 320,000 | 315,309 |
Corebridge Financial, Inc. (Financial Services) | 5.750% | 01/15/2034 | 320,000 | 322,123 | |
Corebridge Global Funding (Financial Services) | (a) | 5.900% | 09/19/2028 | 400,000 | 408,375 |
Fidelity National Information Services, Inc. (Financial Services) | 3.100% | 03/01/2041 | 605,000 | 434,433 | |
Fifth Third Bancorp (Rate is fixed until 01/29/2031, at which point, the rate becomes SOFR + 184) (Banks) | (d) | 5.631% | 01/29/2032 | 570,000 | 565,036 |
Fiserv, Inc. (Financial Services) | 3.500% | 07/01/2029 | 425,000 | 392,925 | |
Fiserv, Inc. (Financial Services) | 5.600% | 03/02/2033 | 170,000 | 171,399 | |
FNB Corp. (Banks) | 5.150% | 08/25/2025 | 320,000 | 315,494 | |
Ford Motor Credit Co. LLC (Consumer Finance) | 6.950% | 03/06/2026 | 500,000 | 508,075 | |
Ford Motor Credit Co. LLC (Consumer Finance) | 7.350% | 11/04/2027 | 200,000 | 208,399 | |
Ford Motor Credit Co. LLC (Consumer Finance) | 6.798% | 11/07/2028 | 200,000 | 206,659 | |
Ford Motor Credit Co. LLC (Consumer Finance) | 5.113% | 05/03/2029 | 200,000 | 193,216 | |
Ford Motor Credit Co. LLC (Consumer Finance) | 7.122% | 11/07/2033 | 200,000 | 211,335 | |
Ford Motor Credit Co. LLC (Consumer Finance) | 6.125% | 03/08/2034 | 450,000 | 445,099 | |
General Motors Financial Co., Inc. (Consumer Finance) | 2.900% | 02/26/2025 | 425,000 | 417,006 | |
General Motors Financial Co., Inc. (Consumer Finance) | 5.000% | 04/09/2027 | 360,000 | 356,326 | |
General Motors Financial Co., Inc. (Consumer Finance) | 5.750% | 02/08/2031 | 625,000 | 626,668 | |
Goldman Sachs Group, Inc. / The (Capital Markets) | 3.800% | 03/15/2030 | 1,550,000 | 1,449,144 | |
Goldman Sachs Group, Inc. / The (Rate is fixed until 01/27/2031, at which point, the rate becomes SOFR + 109) (Capital Markets) | (d) | 1.992% | 01/27/2032 | 500,000 | 405,774 |
Goldman Sachs Group, Inc. / The (Rate is fixed until 04/25/2034, at which point, the rate becomes SOFR + 155) (Capital Markets) | (d) | 5.851% | 04/25/2035 | 550,000 | 563,380 |
GTCR AP Finance, Inc. (Insurance) | (a) | 8.000% | 05/15/2027 | 75,000 | 75,173 |
HSBC Holdings PLC (Banks) | 3.900% | 05/25/2026 | 975,000 | 948,088 | |
HUB International Ltd. (Insurance) | (a) | 5.625% | 12/01/2029 | 375,000 | 354,638 |
HUB International Ltd. (Insurance) | (a) | 7.250% | 06/15/2030 | 25,000 | 25,628 |
Huntington Bancshares, Inc. (Rate is fixed until 08/04/2027, at which point, the rate becomes SOFR + 197) (Banks) | (d) | 4.443% | 08/04/2028 | 650,000 | 629,628 |
Huntington Bancshares, Inc. (Rate is fixed until 02/02/2034, at which point, the rate becomes SOFRINDX + 187) (Banks) | (d) | 5.709% | 02/02/2035 | 275,000 | 270,730 |
Hyundai Capital America (Consumer Finance) | (a) | 5.300% | 01/08/2029 | 875,000 | 871,481 |
Jefferies Financial Group, Inc. (Capital Markets) | 2.750% | 10/15/2032 | 380,000 | 303,621 | |
Jefferies Financial Group, Inc. (Capital Markets) | 6.200% | 04/14/2034 | 575,000 | 582,371 | |
John Deere Capital Corp. (Consumer Finance) | 5.050% | 03/03/2026 | 450,000 | 449,981 | |
John Deere Capital Corp. (Consumer Finance) | 3.450% | 03/07/2029 | 270,000 | 254,449 | |
John Deere Capital Corp. (Consumer Finance) | 2.800% | 07/18/2029 | 630,000 | 570,753 | |
Jones Deslauriers Insurance Management, Inc. (Insurance) | (a) | 8.500% | 03/15/2030 | 50,000 | 52,144 |
Jones Deslauriers Insurance Management, Inc. (Insurance) | (a) | 10.500% | 12/15/2030 | 75,000 | 80,539 |
JPMorgan Chase & Co. (Banks) | 3.125% | 01/23/2025 | 525,000 | 517,834 | |
JPMorgan Chase & Co. (Rate is fixed until 04/22/2030, at which point, the rate becomes SOFR + 204) (Banks) | (d) | 2.522% | 04/22/2031 | 1,025,000 | 885,935 |
JPMorgan Chase & Co. (Rate is fixed until 11/19/2030, at which point, the rate becomes TSFR3M + 111) (Banks) | (d) | 1.764% | 11/19/2031 | 100,000 | 81,345 |
JPMorgan Chase & Co. (Rate is fixed until 04/22/2031, at which point, the rate becomes TSFR3M + 125) (Banks) | (d) | 2.580% | 04/22/2032 | 100,000 | 84,459 |
JPMorgan Chase & Co. (Rate is fixed until 01/25/2032, at which point, the rate becomes SOFR + 126) (Banks) | (d) | 2.963% | 01/25/2033 | 1,200,000 | 1,023,129 |
JPMorgan Chase & Co. (Rate is fixed until 09/14/2032, at which point, the rate becomes SOFR + 258) (Banks) | (d) | 5.717% | 09/14/2033 | 300,000 | 304,153 |
JPMorgan Chase & Co. (Rate is fixed until 06/01/2033, at which point, the rate becomes SOFR + 185) (Banks) | (d) | 5.350% | 06/01/2034 | 400,000 | 398,227 |
Corporate Bonds (Continued) | Rate | Maturity | Face Amount | Value | |
Financials (continued) | |||||
JPMorgan Chase & Co. (Rate is fixed until 10/23/2033, at which point, the rate becomes SOFR + 181) (Banks) | (d) | 6.254% | 10/23/2034 | $100,000 | $106,061 |
JPMorgan Chase & Co. (Rate is fixed until 01/23/2034, at which point, the rate becomes SOFR + 162) (Banks) | (d) | 5.336% | 01/23/2035 | 285,000 | 283,296 |
KeyCorp (Rate is fixed until 03/06/2034, at which point, the rate becomes SOFRINDX + 242) (Banks) | (d) | 6.401% | 03/06/2035 | 450,000 | 456,227 |
Lincoln National Corp. (Insurance) | 3.400% | 01/15/2031 | 60,000 | 52,815 | |
M&T Bank Corp. (Rate is fixed until 10/30/2028, at which point, the rate becomes SOFR + 280) (Banks) | (d) | 7.413% | 10/30/2029 | 225,000 | 236,738 |
M&T Bank Corp. (Rate is fixed until 03/13/2031, at which point, the rate becomes SOFR + 226) (Banks) | (d) | 6.082% | 03/13/2032 | 295,000 | 294,044 |
M&T Bank Corp. (Rate is fixed until 01/27/2033, at which point, the rate becomes SOFR + 185) (Banks) | (d) | 5.053% | 01/27/2034 | 400,000 | 370,196 |
Macquarie Airfinance Holdings Ltd. (Capital Markets) | (a) | 6.500% | 03/26/2031 | 50,000 | 51,416 |
Mercedes-Benz Finance North America LLC (Consumer Finance) | (a) | 4.800% | 03/30/2026 | 750,000 | 743,469 |
MetLife, Inc. (Insurance) | 5.375% | 07/15/2033 | 400,000 | 403,228 | |
Metropolitan Life Global Funding I (Insurance) | (a) | 5.150% | 03/28/2033 | 230,000 | 227,143 |
Morgan Stanley (Capital Markets) | 6.250% | 08/09/2026 | 775,000 | 788,941 | |
Morgan Stanley (Rate is fixed until 01/24/2028, at which point, the rate becomes TSFR3M + 140) (Capital Markets) | (d) | 3.772% | 01/24/2029 | 900,000 | 856,717 |
Morgan Stanley (Rate is fixed until 02/13/2031, at which point, the rate becomes SOFR + 103) (Capital Markets) | (d) | 1.794% | 02/13/2032 | 295,000 | 236,751 |
Morgan Stanley (Rate is fixed until 04/28/2031, at which point, the rate becomes SOFR + 102) (Capital Markets) | (d) | 1.928% | 04/28/2032 | 250,000 | 200,866 |
Morgan Stanley (Rate is fixed until 07/20/2032, at which point, the rate becomes SOFR + 208) (Capital Markets) | (d) | 4.889% | 07/20/2033 | 440,000 | 424,164 |
Morgan Stanley (Rate is fixed until 04/21/2033, at which point, the rate becomes SOFR + 187) (Capital Markets) | (d) | 5.250% | 04/21/2034 | 195,000 | 191,949 |
Morgan Stanley (Rate is fixed until 07/21/2033, at which point, the rate becomes SOFR + 188) (Capital Markets) | (d) | 5.424% | 07/21/2034 | 100,000 | 99,496 |
Morgan Stanley (Rate is fixed until 01/18/2034, at which point, the rate becomes SOFR + 173) (Capital Markets) | (d) | 5.466% | 01/18/2035 | 140,000 | 139,635 |
Morgan Stanley (Rate is fixed until 04/19/2034, at which point, the rate becomes SOFR + 158) (Capital Markets) | (d) | 5.851% | 04/19/2035 | 200,000 | 205,015 |
Navient Corp. (Consumer Finance) | 4.875% | 03/15/2028 | 75,000 | 68,829 | |
Navient Corp. (Consumer Finance) | 5.500% | 03/15/2029 | 50,000 | 45,651 | |
NCR Atleos Corp. (Financial Services) | (a) | 9.500% | 04/01/2029 | 50,000 | 54,037 |
Northern Trust Corp. (Capital Markets) | 6.125% | 11/02/2032 | 380,000 | 399,021 | |
Pacific Life Global Funding II (Insurance) | (a) | 4.900% | 01/11/2029 | 700,000 | 693,841 |
Panther Escrow Issuer LLC (Insurance) | (a) | 7.125% | 06/01/2031 | 100,000 | 101,143 |
PNC Bank N.A. (Banks) | 3.875% | 04/10/2025 | 475,000 | 468,034 | |
PNC Financial Services Group, Inc. / The (Rate is fixed until 06/06/2032, at which point, the rate becomes SOFRINDX + 185) (Banks) | (d) | 4.626% | 06/06/2033 | 830,000 | 768,468 |
Prudential Financial, Inc. (Insurance) | 3.700% | 03/13/2051 | 650,000 | 471,336 | |
Raymond James Financial, Inc. (Capital Markets) | 4.650% | 04/01/2030 | 100,000 | 97,740 | |
Regions Financial Corp. (Banks) | 2.250% | 05/18/2025 | 345,000 | 334,580 | |
Regions Financial Corp. (Rate is fixed until 06/06/2029, at which point, the rate becomes SOFR + 149) (Banks) | (d) | 5.722% | 06/06/2030 | 330,000 | 329,803 |
Rocket Mortgage LLC / Rocket Mortgage Co-Issuer, Inc. (Financial Services) | (a) | 2.875% | 10/15/2026 | 50,000 | 46,694 |
Rocket Mortgage LLC / Rocket Mortgage Co-Issuer, Inc. (Financial Services) | (a) | 3.625% | 03/01/2029 | 75,000 | 68,034 |
Rocket Mortgage LLC / Rocket Mortgage Co-Issuer, Inc. (Financial Services) | (a) | 4.000% | 10/15/2033 | 50,000 | 42,134 |
Ryan Specialty LLC (Insurance) | (a) | 4.375% | 02/01/2030 | 50,000 | 46,308 |
S&P Global, Inc. (Capital Markets) | 2.900% | 03/01/2032 | 390,000 | 337,009 | |
Stifel Financial Corp. (Capital Markets) | 4.000% | 05/15/2030 | 200,000 | 184,110 | |
Synovus Bank (Banks) | 5.625% | 02/15/2028 | 600,000 | 579,721 | |
Toyota Motor Credit Corp. (Consumer Finance) | 3.950% | 06/30/2025 | 600,000 | 591,489 | |
Travelers Cos., Inc. / The (Insurance) | 5.450% | 05/25/2053 | 180,000 | 180,131 | |
Truist Financial Corp. (Rate is fixed until 10/28/2025, at which point, the rate becomes SOFR + 163) (Banks) | (d) | 5.900% | 10/28/2026 | 550,000 | 551,378 |
Truist Financial Corp. (Rate is fixed until 01/26/2033, at which point, the rate becomes SOFR + 185) (Banks) | (d) | 5.122% | 01/26/2034 | 100,000 | 95,777 |
Truist Financial Corp. (Rate is fixed until 06/08/2033, at which point, the rate becomes SOFR + 236) (Banks) | (d) | 5.867% | 06/08/2034 | 300,000 | 302,279 |
Truist Financial Corp. (Rate is fixed until 01/24/2034, at which point, the rate becomes SOFR + 192) (Banks) | (d) | 5.711% | 01/24/2035 | 140,000 | 139,389 |
U.S. Bancorp (Rate is fixed until 07/22/2032, at which point, the rate becomes SOFR + 211) (Banks) | (d) | 4.967% | 07/22/2033 | 625,000 | 589,361 |
U.S. Bancorp (Rate is fixed until 06/10/2033, at which point, the rate becomes SOFR + 226) (Banks) | (d) | 5.836% | 06/12/2034 | 400,000 | 405,561 |
Corporate Bonds (Continued) | Rate | Maturity | Face Amount | Value | |
Financials (continued) | |||||
United Wholesale Mortgage LLC (Financial Services) | (a) | 5.500% | 11/15/2025 | $100,000 | $99,277 |
USI, Inc. (Insurance) | (a) | 7.500% | 01/15/2032 | 125,000 | 126,956 |
Wells Fargo & Co. (Rate is fixed until 07/25/2028, at which point, the rate becomes SOFR + 174) (Banks) | (d) | 5.574% | 07/25/2029 | 250,000 | 252,268 |
Wells Fargo & Co. (Rate is fixed until 02/11/2030, at which point, the rate becomes TSFR3M + 126) (Banks) | (d) | 2.572% | 02/11/2031 | 1,675,000 | 1,449,663 |
Wells Fargo & Co. (Rate is fixed until 07/25/2032, at which point, the rate becomes SOFR + 210) (Banks) | (d) | 4.897% | 07/25/2033 | 550,000 | 529,025 |
Wells Fargo & Co. (Rate is fixed until 04/24/2033, at which point, the rate becomes SOFR + 202) (Banks) | (d) | 5.389% | 04/24/2034 | 150,000 | 148,285 |
Wells Fargo & Co. (Rate is fixed until 10/23/2033, at which point, the rate becomes SOFR + 206) (Banks) | (d) | 6.491% | 10/23/2034 | 200,000 | 213,211 |
Wells Fargo & Co. (Rate is fixed until 01/23/2034, at which point, the rate becomes SOFR + 178) (Banks) | (d) | 5.499% | 01/23/2035 | 500,000 | 498,247 |
49,311,323 | |||||
Health Care–2.9% | |||||
Abbott Laboratories (Health Care Equip. & Supplies) | 3.750% | 11/30/2026 | 510,000 | 497,432 | |
AbbVie, Inc. (Biotechnology) | 4.250% | 11/21/2049 | 750,000 | 625,016 | |
AHP Health Partners, Inc. (Health Care Providers & Svs.) | (a) | 5.750% | 07/15/2029 | 50,000 | 47,465 |
Alcon Finance Corp. (Health Care Equip. & Supplies) | (a) | 2.600% | 05/27/2030 | 600,000 | 522,708 |
Amgen, Inc. (Biotechnology) | 5.250% | 03/02/2033 | 340,000 | 339,009 | |
Amgen, Inc. (Biotechnology) | 3.375% | 02/21/2050 | 500,000 | 352,093 | |
Amgen, Inc. (Biotechnology) | 5.650% | 03/02/2053 | 440,000 | 433,331 | |
AstraZeneca PLC (Pharmaceuticals) | 3.125% | 06/12/2027 | 810,000 | 769,921 | |
AstraZeneca PLC (Pharmaceuticals) | 1.375% | 08/06/2030 | 225,000 | 183,885 | |
Avantor Funding, Inc. (Health Care Equip. & Supplies) | (a) | 4.625% | 07/15/2028 | 75,000 | 71,370 |
Avantor Funding, Inc. (Health Care Equip. & Supplies) | (a) | 3.875% | 11/01/2029 | 25,000 | 22,734 |
Bausch Health Cos., Inc. (Pharmaceuticals) | (a) | 6.125% | 02/01/2027 | 25,000 | 20,813 |
Bayer U.S. Finance LLC (Pharmaceuticals) | (a) | 3.375% | 10/08/2024 | 775,000 | 769,402 |
Becton Dickinson & Co. (Health Care Equip. & Supplies) | 4.685% | 12/15/2044 | 364,000 | 320,698 | |
Becton Dickinson & Co. (Health Care Equip. & Supplies) | 3.794% | 05/20/2050 | 168,000 | 127,122 | |
Biogen, Inc. (Biotechnology) | 3.150% | 05/01/2050 | 900,000 | 579,800 | |
Bristol-Myers Squibb Co. (Pharmaceuticals) | 0.750% | 11/13/2025 | 245,000 | 230,563 | |
Bristol-Myers Squibb Co. (Pharmaceuticals) | 3.900% | 02/20/2028 | 1,025,000 | 989,790 | |
Bristol-Myers Squibb Co. (Pharmaceuticals) | 4.250% | 10/26/2049 | 275,000 | 223,854 | |
Bristol-Myers Squibb Co. (Pharmaceuticals) | 3.700% | 03/15/2052 | 270,000 | 197,853 | |
Bristol-Myers Squibb Co. (Pharmaceuticals) | 5.550% | 02/22/2054 | 185,000 | 182,388 | |
Centene Corp. (Health Care Providers & Svs.) | 4.250% | 12/15/2027 | 50,000 | 47,739 | |
CHS / Community Health Systems, Inc. (Health Care Providers & Svs.) | (a) | 5.625% | 03/15/2027 | 25,000 | 23,280 |
CHS / Community Health Systems, Inc. (Health Care Providers & Svs.) | (a) | 6.125% | 04/01/2030 | 25,000 | 17,494 |
CHS / Community Health Systems, Inc. (Health Care Providers & Svs.) | (a) | 5.250% | 05/15/2030 | 75,000 | 61,837 |
Concentra Escrow Issuer Corp. (Health Care Providers & Svs.) | (a) | 6.875% | 07/15/2032 | 50,000 | 50,658 |
CVS Health Corp. (Health Care Providers & Svs.) | 2.875% | 06/01/2026 | 525,000 | 499,888 | |
CVS Health Corp. (Health Care Providers & Svs.) | 4.250% | 04/01/2050 | 550,000 | 418,412 | |
CVS Health Corp. (Health Care Providers & Svs.) | 6.050% | 06/01/2054 | 300,000 | 294,211 | |
Danaher Corp. (Life Sciences Tools & Svs.) | 2.600% | 10/01/2050 | 820,000 | 501,876 | |
Elevance Health, Inc. (Health Care Providers & Svs.) | 4.750% | 02/15/2033 | 580,000 | 560,090 | |
Embecta Corp. (Health Care Equip. & Supplies) | (a) | 6.750% | 02/15/2030 | 25,000 | 21,730 |
GE HealthCare Technologies, Inc. (Health Care Equip. & Supplies) | 6.377% | 11/22/2052 | 505,000 | 548,021 | |
Gilead Sciences, Inc. (Biotechnology) | 5.250% | 10/15/2033 | 190,000 | 191,388 | |
Grifols SA (Biotechnology) | (a) | 4.750% | 10/15/2028 | 200,000 | 172,595 |
HCA, Inc. (Health Care Providers & Svs.) | 5.200% | 06/01/2028 | 115,000 | 114,545 | |
HCA, Inc. (Health Care Providers & Svs.) | 3.500% | 07/15/2051 | 600,000 | 401,027 | |
HCA, Inc. (Health Care Providers & Svs.) | 6.000% | 04/01/2054 | 535,000 | 528,597 | |
HealthEquity, Inc. (Health Care Providers & Svs.) | (a) | 4.500% | 10/01/2029 | 75,000 | 70,101 |
LifePoint Health, Inc. (Health Care Providers & Svs.) | (a) | 5.375% | 01/15/2029 | 75,000 | 65,904 |
Medline Borrower LP (Health Care Equip. & Supplies) | (a) | 3.875% | 04/01/2029 | 50,000 | 46,045 |
Medline Borrower LP (Health Care Equip. & Supplies) | (a) | 5.250% | 10/01/2029 | 175,000 | 167,007 |
Medline Borrower LP / Medline Co-Issuer, Inc. (Health Care Equip. & Supplies) | (a) | 6.250% | 04/01/2029 | 25,000 | 25,283 |
Neogen Food Safety Corp. (Health Care Equip. & Supplies) | (a) | 8.625% | 07/20/2030 | 25,000 | 26,990 |
Pfizer Investment Enterprises Pte. Ltd. (Pharmaceuticals) | 4.450% | 05/19/2028 | 400,000 | 392,997 | |
Pfizer Investment Enterprises Pte. Ltd. (Pharmaceuticals) | 4.750% | 05/19/2033 | 350,000 | 341,012 | |
Pfizer Investment Enterprises Pte. Ltd. (Pharmaceuticals) | 5.300% | 05/19/2053 | 275,000 | 265,242 | |
Prestige Brands, Inc. (Pharmaceuticals) | (a) | 5.125% | 01/15/2028 | 75,000 | 72,748 |
Regeneron Pharmaceuticals, Inc. (Biotechnology) | 2.800% | 09/15/2050 | 777,000 | 476,164 | |
Stryker Corp. (Health Care Equip. & Supplies) | 3.500% | 03/15/2026 | 450,000 | 436,656 | |
Takeda Pharmaceutical Co. Ltd. (Pharmaceuticals) | 2.050% | 03/31/2030 | 350,000 | 295,371 | |
Takeda Pharmaceutical Co. Ltd. (Pharmaceuticals) | 3.025% | 07/09/2040 | 650,000 | 470,727 | |
Corporate Bonds (Continued) | Rate | Maturity | Face Amount | Value | |
Health Care (continued) | |||||
Tenet Healthcare Corp. (Health Care Providers & Svs.) | 6.125% | 10/01/2028 | $75,000 | $74,625 | |
Tenet Healthcare Corp. (Health Care Providers & Svs.) | 4.250% | 06/01/2029 | 25,000 | 23,282 | |
Tenet Healthcare Corp. (Health Care Providers & Svs.) | 6.750% | 05/15/2031 | 25,000 | 25,375 | |
Thermo Fisher Scientific, Inc. (Life Sciences Tools & Svs.) | 1.215% | 10/18/2024 | 350,000 | 345,494 | |
UnitedHealth Group, Inc. (Health Care Providers & Svs.) | 5.050% | 04/15/2053 | 500,000 | 463,120 | |
Zoetis, Inc. (Pharmaceuticals) | 3.000% | 05/15/2050 | 800,000 | 521,308 | |
16,566,086 | |||||
Industrials–4.0% | |||||
Air Lease Corp. (Trading Companies & Distributors) | 5.850% | 12/15/2027 | 570,000 | 577,134 | |
Air Lease Corp. (Trading Companies & Distributors) | 5.100% | 03/01/2029 | 300,000 | 296,834 | |
Airbus SE (Aerospace & Defense) | (a) | 3.150% | 04/10/2027 | 800,000 | 763,066 |
Allegion PLC (Building Products) | 3.500% | 10/01/2029 | 885,000 | 817,192 | |
Allied Universal Holdco LLC (Commercial Svs. & Supplies) | (a) | 7.875% | 02/15/2031 | 75,000 | 75,195 |
Allied Universal Holdco LLC / Allied Universal Finance Corp. (Commercial Svs. & Supplies) | (a) | 6.625% | 07/15/2026 | 2,000 | 1,994 |
Allied Universal Holdco LLC / Allied Universal Finance Corp. (Commercial Svs. & Supplies) | (a) | 6.000% | 06/01/2029 | 200,000 | 175,077 |
American Builders & Contractors Supply Co., Inc. (Trading Companies & Distributors) | (a) | 4.000% | 01/15/2028 | 25,000 | 23,340 |
Artera Services LLC (Construction & Engineering) | (a) | 8.500% | 02/15/2031 | 25,000 | 25,737 |
Ashtead Capital, Inc. (Trading Companies & Distributors) | (a) | 5.550% | 05/30/2033 | 405,000 | 394,617 |
Ashtead Capital, Inc. (Trading Companies & Distributors) | (a) | 5.800% | 04/15/2034 | 200,000 | 198,480 |
BAE Systems PLC (Aerospace & Defense) | (a) | 3.000% | 09/15/2050 | 700,000 | 451,765 |
BCPE Empire Holdings, Inc. (Commercial Svs. & Supplies) | (a) | 7.625% | 05/01/2027 | 125,000 | 121,125 |
Beacon Roofing Supply, Inc. (Trading Companies & Distributors) | (a) | 6.500% | 08/01/2030 | 50,000 | 50,450 |
Boeing Co. / The (Aerospace & Defense) | 2.196% | 02/04/2026 | 1,025,000 | 963,372 | |
Boeing Co. / The (Aerospace & Defense) | 2.950% | 02/01/2030 | 250,000 | 214,032 | |
Boeing Co. / The (Aerospace & Defense) | (a) | 6.528% | 05/01/2034 | 220,000 | 225,258 |
Boeing Co. / The (Aerospace & Defense) | 5.805% | 05/01/2050 | 350,000 | 315,420 | |
Boeing Co. / The (Aerospace & Defense) | (a) | 6.858% | 05/01/2054 | 230,000 | 236,020 |
Brink's Co. / The (Commercial Svs. & Supplies) | (a) | 6.500% | 06/15/2029 | 50,000 | 50,524 |
Brink's Co. / The (Commercial Svs. & Supplies) | (a) | 6.750% | 06/15/2032 | 25,000 | 25,183 |
Burlington Northern Santa Fe LLC (Ground Transportation) | 3.000% | 04/01/2025 | 475,000 | 466,765 | |
Burlington Northern Santa Fe LLC (Ground Transportation) | 5.200% | 04/15/2054 | 350,000 | 335,280 | |
Camelot Return Merger Sub, Inc. (Building Products) | (a) | 8.750% | 08/01/2028 | 25,000 | 24,510 |
Canadian Pacific Railway Co. (Ground Transportation) | 1.750% | 12/02/2026 | 90,000 | 83,030 | |
Canadian Pacific Railway Co. (Ground Transportation) | 2.050% | 03/05/2030 | 175,000 | 149,271 | |
Canadian Pacific Railway Co. (Ground Transportation) | 3.000% | 12/02/2041 | 75,000 | 64,741 | |
Canadian Pacific Railway Co. (Ground Transportation) | 3.500% | 05/01/2050 | 675,000 | 485,986 | |
Carrier Global Corp. (Building Products) | 5.900% | 03/15/2034 | 130,000 | 135,677 | |
Carrier Global Corp. (Building Products) | 6.200% | 03/15/2054 | 260,000 | 278,367 | |
Clarivate Science Holdings Corp. (Professional Svs.) | (a) | 4.875% | 07/01/2029 | 125,000 | 116,008 |
CNH Industrial N.V. (Machinery) | 3.850% | 11/15/2027 | 625,000 | 598,527 | |
Concentrix Corp. (Professional Svs.) | 6.650% | 08/02/2026 | 245,000 | 247,539 | |
CP Atlas Buyer, Inc. (Building Products) | (a) | 7.000% | 12/01/2028 | 50,000 | 42,742 |
Dun & Bradstreet Corp. / The (Professional Svs.) | (a) | 5.000% | 12/15/2029 | 50,000 | 46,441 |
EMRLD Borrower LP / Emerald Co-Issuer, Inc. (Electrical Equip.) | (a) | 6.625% | 12/15/2030 | 125,000 | 125,975 |
EMRLD Borrower LP / Emerald Co-Issuer, Inc. (Electrical Equip.) | (a) | 6.750% | 07/15/2031 | 25,000 | 25,312 |
Equifax, Inc. (Professional Svs.) | 2.600% | 12/15/2025 | 750,000 | 718,414 | |
ERAC U.S.A. Finance LLC (Ground Transportation) | (a) | 4.600% | 05/01/2028 | 150,000 | 147,628 |
ERAC U.S.A. Finance LLC (Ground Transportation) | (a) | 4.900% | 05/01/2033 | 215,000 | 209,249 |
ERAC U.S.A. Finance LLC (Ground Transportation) | (a) | 5.200% | 10/30/2034 | 600,000 | 594,190 |
Experian Finance PLC (Professional Svs.) | (a) | 4.250% | 02/01/2029 | 350,000 | 336,752 |
Foundation Building Materials, Inc. (Trading Companies & Distributors) | (a) | 6.000% | 03/01/2029 | 100,000 | 88,745 |
Garda World Security Corp. (Commercial Svs. & Supplies) | (a) | 4.625% | 02/15/2027 | 50,000 | 47,778 |
Garda World Security Corp. (Commercial Svs. & Supplies) | (a) | 6.000% | 06/01/2029 | 50,000 | 45,616 |
Gates Corp. (Machinery) | (a) | 6.875% | 07/01/2029 | 75,000 | 76,308 |
General Dynamics Corp. (Aerospace & Defense) | 1.150% | 06/01/2026 | 745,000 | 692,536 | |
GXO Logistics, Inc. (Air Freight & Logistics) | 2.650% | 07/15/2031 | 770,000 | 624,372 | |
GYP Holdings III Corp. (Building Products) | (a) | 4.625% | 05/01/2029 | 75,000 | 69,408 |
H&E Equipment Services, Inc. (Trading Companies & Distributors) | (a) | 3.875% | 12/15/2028 | 25,000 | 22,557 |
HEICO Corp. (Aerospace & Defense) | 5.350% | 08/01/2033 | 430,000 | 426,145 | |
Hillenbrand, Inc. (Machinery) | 6.250% | 02/15/2029 | 75,000 | 75,359 | |
Honeywell International, Inc. (Industrial Conglomerates) | 1.350% | 06/01/2025 | 440,000 | 424,303 | |
Honeywell International, Inc. (Industrial Conglomerates) | 2.800% | 06/01/2050 | 370,000 | 243,680 | |
Huntington Ingalls Industries, Inc. (Aerospace & Defense) | 3.483% | 12/01/2027 | 910,000 | 857,378 | |
Ingersoll Rand, Inc. (Machinery) | 5.450% | 06/15/2034 | 110,000 | 110,954 | |
Ingersoll Rand, Inc. (Machinery) | 5.700% | 06/15/2054 | 280,000 | 281,823 | |
Interface, Inc. (Commercial Svs. & Supplies) | (a) | 5.500% | 12/01/2028 | 50,000 | 46,877 |
Madison IAQ LLC (Commercial Svs. & Supplies) | (a) | 4.125% | 06/30/2028 | 25,000 | 23,316 |
Madison IAQ LLC (Commercial Svs. & Supplies) | (a) | 5.875% | 06/30/2029 | 125,000 | 116,300 |
Corporate Bonds (Continued) | Rate | Maturity | Face Amount | Value | |
Industrials (continued) | |||||
Masco Corp. (Building Products) | 3.500% | 11/15/2027 | $400,000 | $377,986 | |
Masterbrand, Inc. (Building Products) | (a) | 7.000% | 07/15/2032 | 25,000 | 25,283 |
Miter Brands Acquisition Holdco, Inc. / MIWD Borrower LLC (Building Products) | (a) | 6.750% | 04/01/2032 | 50,000 | 50,356 |
MIWD Holdco II LLC / MIWD Finance Corp. (Building Products) | (a) | 5.500% | 02/01/2030 | 25,000 | 23,072 |
Northrop Grumman Corp. (Aerospace & Defense) | 3.250% | 01/15/2028 | 825,000 | 776,968 | |
Penske Truck Leasing Co. LP / PTL Finance Corp. (Ground Transportation) | (a) | 3.450% | 07/01/2024 | 500,000 | 500,000 |
Penske Truck Leasing Co. LP / PTL Finance Corp. (Ground Transportation) | (a) | 5.350% | 01/12/2027 | 125,000 | 124,767 |
RTX Corp. (Aerospace & Defense) | 5.150% | 02/27/2033 | 780,000 | 771,899 | |
Ryder System, Inc. (Ground Transportation) | 5.250% | 06/01/2028 | 650,000 | 651,288 | |
Solaris Midstream Holdings LLC (Commercial Svs. & Supplies) | (a) | 7.625% | 04/01/2026 | 75,000 | 75,262 |
SPX FLOW, Inc. (Machinery) | (a) | 8.750% | 04/01/2030 | 75,000 | 76,991 |
SS&C Technologies, Inc. (Professional Svs.) | (a) | 5.500% | 09/30/2027 | 100,000 | 98,471 |
SS&C Technologies, Inc. (Professional Svs.) | (a) | 6.500% | 06/01/2032 | 25,000 | 25,217 |
Textron, Inc. (Aerospace & Defense) | 3.650% | 03/15/2027 | 650,000 | 622,808 | |
TransDigm, Inc. (Aerospace & Defense) | 5.500% | 11/15/2027 | 200,000 | 196,388 | |
TransDigm, Inc. (Aerospace & Defense) | (a) | 6.750% | 08/15/2028 | 25,000 | 25,306 |
TransDigm, Inc. (Aerospace & Defense) | (a) | 6.375% | 03/01/2029 | 25,000 | 25,126 |
TransDigm, Inc. (Aerospace & Defense) | (a) | 6.875% | 12/15/2030 | 25,000 | 25,521 |
TransDigm, Inc. (Aerospace & Defense) | (a) | 6.625% | 03/01/2032 | 50,000 | 50,503 |
Union Pacific Corp. (Ground Transportation) | 2.375% | 05/20/2031 | 585,000 | 496,528 | |
United Parcel Service, Inc. (Air Freight & Logistics) | 4.875% | 03/03/2033 | 450,000 | 443,084 | |
United Rentals North America, Inc. (Trading Companies & Distributors) | 4.875% | 01/15/2028 | 75,000 | 72,690 | |
United Rentals North America, Inc. (Trading Companies & Distributors) | 5.250% | 01/15/2030 | 25,000 | 24,226 | |
United Rentals North America, Inc. (Trading Companies & Distributors) | 3.875% | 02/15/2031 | 25,000 | 22,304 | |
Valmont Industries, Inc. (Construction & Engineering) | 5.000% | 10/01/2044 | 40,000 | 36,306 | |
Verisk Analytics, Inc. (Professional Svs.) | 4.125% | 03/15/2029 | 600,000 | 576,796 | |
Watco Cos. LLC / Watco Finance Corp. (Ground Transportation) | (a) | 6.500% | 06/15/2027 | 50,000 | 49,796 |
WESCO Distribution, Inc. (Trading Companies & Distributors) | (a) | 7.250% | 06/15/2028 | 100,000 | 101,794 |
WESCO Distribution, Inc. (Trading Companies & Distributors) | (a) | 6.375% | 03/15/2029 | 25,000 | 25,090 |
White Cap Buyer LLC (Building Products) | (a) | 6.875% | 10/15/2028 | 75,000 | 72,367 |
White Cap Parent LLC (Building Products) | (a)(c) | 8.250%, 9.000% PIK | 03/15/2026 | 50,000 | 50,001 |
Xylem, Inc. (Machinery) | 2.250% | 01/30/2031 | 755,000 | 633,476 | |
22,635,344 | |||||
Information Technology–1.8% | |||||
Apple, Inc. (Tech. Hardware, Storage & Periph.) | 2.900% | 09/12/2027 | 600,000 | 566,665 | |
Apple, Inc. (Tech. Hardware, Storage & Periph.) | 4.000% | 05/10/2028 | 625,000 | 612,017 | |
Apple, Inc. (Tech. Hardware, Storage & Periph.) | 2.375% | 02/08/2041 | 475,000 | 328,024 | |
AthenaHealth Group, Inc. (Software) | (a) | 6.500% | 02/15/2030 | 200,000 | 184,140 |
Boxer Parent Co., Inc. (Software) | (a) | 9.125% | 03/01/2026 | 50,000 | 50,039 |
Broadcom, Inc. (Semiconductors & Equip.) | 4.150% | 11/15/2030 | 285,000 | 269,167 | |
Broadcom, Inc. (Semiconductors & Equip.) | (a) | 3.469% | 04/15/2034 | 585,000 | 498,709 |
Broadcom, Inc. (Semiconductors & Equip.) | (a) | 3.187% | 11/15/2036 | 15,000 | 11,870 |
Capstone Borrower, Inc. (Software) | (a) | 8.000% | 06/15/2030 | 50,000 | 51,635 |
CDW LLC / CDW Finance Corp. (Electronic Equip., Instr. & Comp.) | 2.670% | 12/01/2026 | 480,000 | 448,393 | |
Central Parent LLC / CDK Global II LLC / CDK Financing Co., Inc. (Software) | (a) | 8.000% | 06/15/2029 | 50,000 | 50,767 |
Central Parent, Inc. / CDK Global, Inc. (Software) | (a) | 7.250% | 06/15/2029 | 75,000 | 74,629 |
Cloud Software Group, Inc. (Software) | (a) | 6.500% | 03/31/2029 | 50,000 | 48,016 |
Cloud Software Group, Inc. (Software) | (a) | 9.000% | 09/30/2029 | 100,000 | 97,022 |
Cloud Software Group, Inc. (Software) | (a) | 8.250% | 06/30/2032 | 25,000 | 25,481 |
Coherent Corp. (Electronic Equip., Instr. & Comp.) | (a) | 5.000% | 12/15/2029 | 100,000 | 94,637 |
Consensus Cloud Solutions, Inc. (Software) | (a) | 6.000% | 10/15/2026 | 25,000 | 24,384 |
Consensus Cloud Solutions, Inc. (Software) | (a) | 6.500% | 10/15/2028 | 50,000 | 46,682 |
Elastic N.V. (Software) | (a) | 4.125% | 07/15/2029 | 75,000 | 68,480 |
Entegris, Inc. (Semiconductors & Equip.) | (a) | 4.750% | 04/15/2029 | 25,000 | 23,919 |
Entegris, Inc. (Semiconductors & Equip.) | (a) | 5.950% | 06/15/2030 | 50,000 | 49,503 |
Fortinet, Inc. (Software) | 1.000% | 03/15/2026 | 720,000 | 668,354 | |
Fortress Intermediate 3, Inc. (IT Svs.) | (a) | 7.500% | 06/01/2031 | 50,000 | 51,227 |
Go Daddy Operating Co. LLC / GD Finance Co., Inc. (IT Svs.) | (a) | 5.250% | 12/01/2027 | 25,000 | 24,478 |
Insight Enterprises, Inc. (Electronic Equip., Instr. & Comp.) | (a) | 6.625% | 05/15/2032 | 50,000 | 50,773 |
Leidos, Inc. (IT Svs.) | 3.625% | 05/15/2025 | 220,000 | 216,088 | |
Leidos, Inc. (IT Svs.) | 4.375% | 05/15/2030 | 575,000 | 543,586 | |
McAfee Corp. (Software) | (a) | 7.375% | 02/15/2030 | 200,000 | 184,771 |
Microchip Technology, Inc. (Semiconductors & Equip.) | 5.050% | 03/15/2029 | 395,000 | 391,836 | |
NCR Voyix Corp. (Software) | (a) | 5.000% | 10/01/2028 | 25,000 | 23,605 |
NCR Voyix Corp. (Software) | (a) | 5.250% | 10/01/2030 | 50,000 | 45,700 |
Open Text Corp. (Software) | (a) | 6.900% | 12/01/2027 | 25,000 | 25,946 |
Open Text Corp. (Software) | (a) | 3.875% | 12/01/2029 | 50,000 | 44,779 |
Oracle Corp. (Software) | 6.250% | 11/09/2032 | 600,000 | 635,046 | |
Corporate Bonds (Continued) | Rate | Maturity | Face Amount | Value | |
Information Technology (continued) | |||||
Oracle Corp. (Software) | 3.600% | 04/01/2050 | $900,000 | $629,887 | |
Rocket Software, Inc. (Software) | (a) | 9.000% | 11/28/2028 | 25,000 | 25,406 |
Rocket Software, Inc. (Software) | (a) | 6.500% | 02/15/2029 | 100,000 | 87,191 |
Roper Technologies, Inc. (Software) | 1.000% | 09/15/2025 | 525,000 | 497,341 | |
Seagate HDD Cayman (Tech. Hardware, Storage & Periph.) | 8.250% | 12/15/2029 | 25,000 | 26,813 | |
Seagate HDD Cayman (Tech. Hardware, Storage & Periph.) | 9.625% | 12/01/2032 | 89,000 | 101,517 | |
Skyworks Solutions, Inc. (Semiconductors & Equip.) | 1.800% | 06/01/2026 | 50,000 | 46,497 | |
Synaptics, Inc. (Semiconductors & Equip.) | (a) | 4.000% | 06/15/2029 | 50,000 | 45,306 |
Trimble, Inc. (Electronic Equip., Instr. & Comp.) | 6.100% | 03/15/2033 | 350,000 | 362,428 | |
TTM Technologies, Inc. (Electronic Equip., Instr. & Comp.) | (a) | 4.000% | 03/01/2029 | 75,000 | 68,818 |
UKG, Inc. (Software) | (a) | 6.875% | 02/01/2031 | 75,000 | 75,940 |
VeriSign, Inc. (IT Svs.) | 2.700% | 06/15/2031 | 660,000 | 552,310 | |
Viavi Solutions, Inc. (Communications Equip.) | (a) | 3.750% | 10/01/2029 | 50,000 | 42,228 |
VMware LLC (Software) | 1.400% | 08/15/2026 | 240,000 | 220,987 | |
VMware LLC (Software) | 2.200% | 08/15/2031 | 190,000 | 154,384 | |
Vontier Corp. (Electronic Equip., Instr. & Comp.) | 1.800% | 04/01/2026 | 515,000 | 481,367 | |
Zebra Technologies Corp. (Electronic Equip., Instr. & Comp.) | (a) | 6.500% | 06/01/2032 | 50,000 | 50,563 |
9,999,351 | |||||
Materials–1.3% | |||||
Albemarle Corp. (Chemicals) | 5.450% | 12/01/2044 | 400,000 | 364,085 | |
Anglo American Capital PLC (Metals & Mining) | (a) | 2.875% | 03/17/2031 | 775,000 | 658,558 |
Ardagh Metal Packaging Finance U.S.A. LLC / Ardagh Metal Packaging Finance PLC (Containers & Packaging) | (a) | 4.000% | 09/01/2029 | 200,000 | 169,251 |
Ball Corp. (Containers & Packaging) | 6.875% | 03/15/2028 | 25,000 | 25,659 | |
Ball Corp. (Containers & Packaging) | 6.000% | 06/15/2029 | 25,000 | 25,134 | |
Ball Corp. (Containers & Packaging) | 3.125% | 09/15/2031 | 25,000 | 21,144 | |
Clearwater Paper Corp. (Paper & Forest Products) | (a) | 4.750% | 08/15/2028 | 50,000 | 46,219 |
Cleveland-Cliffs, Inc. (Metals & Mining) | (a) | 4.875% | 03/01/2031 | 50,000 | 44,087 |
Cleveland-Cliffs, Inc. (Metals & Mining) | (a) | 7.000% | 03/15/2032 | 25,000 | 24,717 |
Clydesdale Acquisition Holdings, Inc. (Containers & Packaging) | (a) | 8.750% | 04/15/2030 | 275,000 | 269,130 |
Coeur Mining, Inc. (Metals & Mining) | (a) | 5.125% | 02/15/2029 | 50,000 | 46,859 |
Crown Americas LLC / Crown Americas Capital Corp. V (Containers & Packaging) | 4.250% | 09/30/2026 | 25,000 | 24,089 | |
Element Solutions, Inc. (Chemicals) | (a) | 3.875% | 09/01/2028 | 50,000 | 45,950 |
Freeport-McMoRan, Inc. (Metals & Mining) | 5.400% | 11/14/2034 | 550,000 | 540,965 | |
Glencore Funding LLC (Metals & Mining) | (a) | 1.625% | 04/27/2026 | 475,000 | 444,074 |
Glencore Funding LLC (Metals & Mining) | (a) | 3.375% | 09/23/2051 | 550,000 | 356,577 |
Graphic Packaging International LLC (Containers & Packaging) | (a) | 3.500% | 03/01/2029 | 50,000 | 44,811 |
Graphic Packaging International LLC (Containers & Packaging) | (a) | 3.750% | 02/01/2030 | 25,000 | 22,319 |
International Flavors & Fragrances, Inc. (Chemicals) | (a) | 1.832% | 10/15/2027 | 450,000 | 401,773 |
Mauser Packaging Solutions Holding Co. (Containers & Packaging) | (a) | 7.875% | 04/15/2027 | 50,000 | 51,000 |
Mauser Packaging Solutions Holding Co. (Containers & Packaging) | (a) | 9.250% | 04/15/2027 | 50,000 | 50,032 |
OI European Group B.V. (Containers & Packaging) | (a) | 4.750% | 02/15/2030 | 50,000 | 45,713 |
Olympus Water U.S. Holding Corp. (Chemicals) | (a) | 9.750% | 11/15/2028 | 200,000 | 211,594 |
Owens-Brockway Glass Container, Inc. (Containers & Packaging) | (a) | 6.625% | 05/13/2027 | 38,000 | 37,923 |
Owens-Brockway Glass Container, Inc. (Containers & Packaging) | (a) | 7.250% | 05/15/2031 | 25,000 | 24,957 |
Owens-Brockway Glass Container, Inc. (Containers & Packaging) | (a) | 7.375% | 06/01/2032 | 25,000 | 25,029 |
Packaging Corp. of America (Containers & Packaging) | 3.650% | 09/15/2024 | 675,000 | 671,673 | |
RPM International, Inc. (Chemicals) | 4.550% | 03/01/2029 | 525,000 | 507,612 | |
Sealed Air Corp. (Containers & Packaging) | (a) | 4.000% | 12/01/2027 | 50,000 | 46,991 |
Sealed Air Corp. (Containers & Packaging) | (a) | 6.500% | 07/15/2032 | 25,000 | 24,860 |
Sealed Air Corp. / Sealed Air Corp. U.S. (Containers & Packaging) | (a) | 7.250% | 02/15/2031 | 25,000 | 25,740 |
Smurfit Kappa Treasury ULC (Containers & Packaging) | (a) | 5.777% | 04/03/2054 | 500,000 | 497,196 |
Standard Industries, Inc. (Construction Materials) | (a) | 5.000% | 02/15/2027 | 125,000 | 121,508 |
Steel Dynamics, Inc. (Metals & Mining) | 5.375% | 08/15/2034 | 300,000 | 294,866 | |
Trivium Packaging Finance B.V. (Containers & Packaging) | (a) | 8.500% | 08/15/2027 | 225,000 | 223,322 |
W.R. Grace Holdings LLC (Chemicals) | (a) | 4.875% | 06/15/2027 | 25,000 | 24,108 |
W.R. Grace Holdings LLC (Chemicals) | (a) | 5.625% | 08/15/2029 | 50,000 | 46,085 |
WRKCo, Inc. (Containers & Packaging) | 4.000% | 03/15/2028 | 650,000 | 622,416 | |
7,128,026 | |||||
Real Estate–1.6% | |||||
Alexandria Real Estate Equities, Inc. (Health Care REITs) | 1.875% | 02/01/2033 | 1,030,000 | 774,896 | |
American Tower Corp. (Specialized REITs) | 2.700% | 04/15/2031 | 700,000 | 592,012 | |
AvalonBay Communities, Inc. (Residential REITs) | 3.350% | 05/15/2027 | 725,000 | 691,526 | |
Boston Properties LP (Office REITs) | 3.650% | 02/01/2026 | 650,000 | 627,290 | |
Camden Property Trust (Residential REITs) | 4.900% | 01/15/2034 | 500,000 | 478,380 | |
Crown Castle, Inc. (Specialized REITs) | 3.250% | 01/15/2051 | 1,000,000 | 663,971 | |
Healthcare Realty Holdings LP (Health Care REITs) | 2.000% | 03/15/2031 | 525,000 | 413,669 | |
Host Hotels & Resorts LP (Hotel & Resort REITs) | 5.700% | 07/01/2034 | 400,000 | 393,107 | |
Corporate Bonds (Continued) | Rate | Maturity | Face Amount | Value | |
Real Estate (continued) | |||||
Iron Mountain, Inc. (Specialized REITs) | (a) | 7.000% | 02/15/2029 | $50,000 | $50,880 |
Kimco Realty OP LLC (Retail REITs) | 2.700% | 10/01/2030 | 650,000 | 561,642 | |
Mid-America Apartments LP (Residential REITs) | 4.000% | 11/15/2025 | 725,000 | 711,239 | |
Outfront Media Capital LLC / Outfront Media Capital Corp. (Specialized REITs) | (a) | 5.000% | 08/15/2027 | 25,000 | 24,200 |
Outfront Media Capital LLC / Outfront Media Capital Corp. (Specialized REITs) | (a) | 4.250% | 01/15/2029 | 50,000 | 45,591 |
Outfront Media Capital LLC / Outfront Media Capital Corp. (Specialized REITs) | (a) | 7.375% | 02/15/2031 | 25,000 | 26,018 |
Piedmont Operating Partnership LP (Office REITs) | 2.750% | 04/01/2032 | 300,000 | 220,027 | |
Regency Centers LP (Retail REITs) | 2.950% | 09/15/2029 | 875,000 | 785,480 | |
RHP Hotel Properties LP / RHP Finance Corp. (Hotel & Resort REITs) | (a) | 7.250% | 07/15/2028 | 50,000 | 51,704 |
RHP Hotel Properties LP / RHP Finance Corp. (Hotel & Resort REITs) | (a) | 6.500% | 04/01/2032 | 25,000 | 25,002 |
UDR, Inc. (Residential REITs) | 3.500% | 01/15/2028 | 800,000 | 753,865 | |
VICI Properties LP / VICI Note Co., Inc. (Specialized REITs) | (a) | 4.625% | 06/15/2025 | 25,000 | 24,673 |
W.P. Carey, Inc. (Diversified REITs) | 3.850% | 07/15/2029 | 350,000 | 326,787 | |
W.P. Carey, Inc. (Diversified REITs) | 5.375% | 06/30/2034 | 500,000 | 486,309 | |
Welltower OP LLC (Health Care REITs) | 4.250% | 04/01/2026 | 475,000 | 465,227 | |
9,193,495 | |||||
Utilities–2.3% | |||||
Ameren Corp. (Multi-Utilities) | 1.750% | 03/15/2028 | 1,000,000 | 882,455 | |
American Electric Power Co., Inc. (Electric Utilities) | 5.625% | 03/01/2033 | 380,000 | 378,600 | |
AmeriGas Partners LP / AmeriGas Finance Corp. (Gas Utilities) | 5.500% | 05/20/2025 | 13,000 | 12,947 | |
Black Hills Corp. (Multi-Utilities) | 2.500% | 06/15/2030 | 370,000 | 311,830 | |
Calpine Corp. (Ind. Power & Renewable Elec.) | (a) | 4.500% | 02/15/2028 | 25,000 | 23,752 |
Calpine Corp. (Ind. Power & Renewable Elec.) | (a) | 5.125% | 03/15/2028 | 50,000 | 48,087 |
Calpine Corp. (Ind. Power & Renewable Elec.) | (a) | 5.000% | 02/01/2031 | 50,000 | 46,665 |
Calpine Corp. (Ind. Power & Renewable Elec.) | (a) | 3.750% | 03/01/2031 | 25,000 | 22,094 |
Constellation Energy Generation LLC (Electric Utilities) | 5.800% | 03/01/2033 | 400,000 | 408,132 | |
Constellation Energy Generation LLC (Electric Utilities) | 6.125% | 01/15/2034 | 90,000 | 93,772 | |
Constellation Energy Generation LLC (Electric Utilities) | 6.500% | 10/01/2053 | 115,000 | 122,060 | |
Dominion Energy, Inc. (Multi-Utilities) | 1.450% | 04/15/2026 | 670,000 | 623,949 | |
Duke Energy Corp. (Electric Utilities) | 3.750% | 09/01/2046 | 650,000 | 473,092 | |
Duke Energy Corp. (Electric Utilities) | 4.200% | 06/15/2049 | 825,000 | 634,506 | |
Electricite de France SA (Electric Utilities) | (a) | 6.250% | 05/23/2033 | 445,000 | 460,339 |
Emera U.S. Finance LP (Electric Utilities) | 3.550% | 06/15/2026 | 400,000 | 383,591 | |
Emera U.S. Finance LP (Electric Utilities) | 4.750% | 06/15/2046 | 400,000 | 329,152 | |
Enel Finance International N.V. (Electric Utilities) | (a) | 2.250% | 07/12/2031 | 750,000 | 611,700 |
Eversource Energy (Electric Utilities) | 3.350% | 03/15/2026 | 670,000 | 643,660 | |
Exelon Corp. (Electric Utilities) | 4.050% | 04/15/2030 | 1,175,000 | 1,102,626 | |
Exelon Corp. (Electric Utilities) | 4.100% | 03/15/2052 | 155,000 | 119,152 | |
FirstEnergy Corp. (Electric Utilities) | 2.650% | 03/01/2030 | 250,000 | 217,313 | |
National Fuel Gas Co. (Gas Utilities) | 5.500% | 01/15/2026 | 450,000 | 448,560 | |
National Fuel Gas Co. (Gas Utilities) | 2.950% | 03/01/2031 | 320,000 | 268,486 | |
NextEra Energy Capital Holdings, Inc. (Electric Utilities) | 3.550% | 05/01/2027 | 600,000 | 572,848 | |
NextEra Energy Capital Holdings, Inc. (Electric Utilities) | 2.250% | 06/01/2030 | 600,000 | 511,544 | |
NextEra Energy Operating Partners LP (Electric Utilities) | (a) | 7.250% | 01/15/2029 | 25,000 | 25,637 |
NiSource, Inc. (Multi-Utilities) | 5.250% | 03/30/2028 | 105,000 | 104,886 | |
NiSource, Inc. (Multi-Utilities) | 5.400% | 06/30/2033 | 500,000 | 494,890 | |
NRG Energy, Inc. (Electric Utilities) | 5.750% | 01/15/2028 | 50,000 | 49,610 | |
NRG Energy, Inc. (Electric Utilities) | (a) | 3.875% | 02/15/2032 | 3,000 | 2,576 |
PPL Capital Funding, Inc. (Electric Utilities) | 3.100% | 05/15/2026 | 200,000 | 191,914 | |
Puget Energy, Inc. (Electric Utilities) | 2.379% | 06/15/2028 | 685,000 | 611,377 | |
Sempra (Multi-Utilities) | 3.700% | 04/01/2029 | 590,000 | 552,587 | |
Southern Co. / The (Rate is fixed until 01/15/2026, at which point, the rate becomes H15T5Y + 373) (Electric Utilities) | (d) | 4.000% | 01/15/2051 | 700,000 | 678,674 |
Suburban Propane Partners LP / Suburban Energy Finance Corp. (Gas Utilities) | 5.875% | 03/01/2027 | 50,000 | 49,479 | |
Suburban Propane Partners LP / Suburban Energy Finance Corp. (Gas Utilities) | (a) | 5.000% | 06/01/2031 | 25,000 | 22,513 |
TerraForm Power Operating LLC (Ind. Power & Renewable Elec.) | (a) | 5.000% | 01/31/2028 | 75,000 | 71,638 |
TransAlta Corp. (Ind. Power & Renewable Elec.) | 7.750% | 11/15/2029 | 75,000 | 78,264 | |
Vistra Operations Co. LLC (Ind. Power & Renewable Elec.) | (a) | 5.500% | 09/01/2026 | 75,000 | 73,962 |
Vistra Operations Co. LLC (Ind. Power & Renewable Elec.) | (a) | 7.750% | 10/15/2031 | 50,000 | 52,069 |
WEC Energy Group, Inc. (Multi-Utilities) | 2.200% | 12/15/2028 | 190,000 | 167,568 | |
12,978,556 | |||||
Total Corporate Bonds (Cost $192,093,415) | $174,089,917 | ||||
U.S. Treasury Obligations–28.6% | Rate | Maturity | Face Amount | Value | |
U.S. Treasury Note | 3.000% | 07/31/2024 | $8,000,000 | $7,984,221 | |
U.S. Treasury Note | 4.750% | 07/31/2025 | 4,000,000 | 3,985,781 | |
U.S. Treasury Note | 0.375% | 12/31/2025 | 3,000,000 | 2,805,586 | |
U.S. Treasury Note | 0.875% | 06/30/2026 | 18,000,000 | 16,697,813 | |
U.S. Treasury Obligations (Continued) | Rate | Maturity | Face Amount | Value | |
U.S. Treasury Note | 0.625% | 07/31/2026 | $2,400,000 | $2,207,813 | |
U.S. Treasury Note | 1.500% | 01/31/2027 | 3,500,000 | 3,239,141 | |
U.S. Treasury Note | 2.500% | 03/31/2027 | 5,900,000 | 5,592,324 | |
U.S. Treasury Note | (e) | 0.500% | 04/30/2027 | 3,600,000 | 3,217,359 |
U.S. Treasury Note | 2.750% | 04/30/2027 | 12,600,000 | 12,004,453 | |
U.S. Treasury Note | 2.625% | 05/31/2027 | 1,500,000 | 1,422,539 | |
U.S. Treasury Note | 3.875% | 11/30/2027 | 20,500,000 | 20,110,019 | |
U.S. Treasury Note | 1.250% | 03/31/2028 | 575,000 | 512,087 | |
U.S. Treasury Note | 4.125% | 07/31/2028 | 2,000,000 | 1,978,828 | |
U.S. Treasury Note | 1.375% | 12/31/2028 | 3,650,000 | 3,205,299 | |
U.S. Treasury Note | 4.000% | 01/31/2029 | 11,800,000 | 11,618,391 | |
U.S. Treasury Note | 2.375% | 03/31/2029 | 500,000 | 457,402 | |
U.S. Treasury Note | 3.875% | 11/30/2029 | 1,600,000 | 1,562,750 | |
U.S. Treasury Note | 4.375% | 11/30/2030 | 9,700,000 | 9,707,957 | |
U.S. Treasury Note | 1.125% | 02/15/2031 | 405,000 | 331,198 | |
U.S. Treasury Note | 4.625% | 04/30/2031 | 6,000,000 | 6,096,563 | |
U.S. Treasury Note | 4.500% | 11/15/2033 | 7,500,000 | 7,569,141 | |
U.S. Treasury Note | 4.000% | 02/15/2034 | 3,000,000 | 2,911,875 | |
U.S. Treasury Note | 1.375% | 11/15/2040 | 525,000 | 331,263 | |
U.S. Treasury Note | 1.875% | 02/15/2041 | 180,000 | 123,166 | |
U.S. Treasury Note | 4.000% | 11/15/2042 | 1,600,000 | 1,474,500 | |
U.S. Treasury Note | 2.000% | 02/15/2050 | 3,750,000 | 2,277,393 | |
U.S. Treasury Note | 1.875% | 02/15/2051 | 3,940,000 | 2,300,898 | |
U.S. Treasury Note | 2.875% | 05/15/2052 | 30,800,000 | 22,574,234 | |
U.S. Treasury Note | 4.000% | 11/15/2052 | 2,800,000 | 2,550,844 | |
U.S. Treasury Note | 4.125% | 08/15/2053 | 5,500,000 | 5,121,660 | |
Total U.S. Treasury Obligations (Cost $177,564,082) | $161,972,498 | ||||
U.S. Government Agency Mortgage-Backed Securities–27.9% | Rate | Maturity | Face Amount | Value | |
Fannie Mae Pool FN BM4333 | 3.500% | 12/01/2047 | $842,425 | $762,488 | |
Fannie Mae Pool FN BN6715 | 4.000% | 06/01/2049 | 2,512,770 | 2,336,584 | |
Fannie Mae Pool FN BP2797 | 2.500% | 05/01/2050 | 1,295,869 | 1,068,129 | |
Fannie Mae Pool FN BP6700 | 2.500% | 09/01/2050 | 3,439,962 | 2,862,577 | |
Fannie Mae Pool FN BP8188 | 2.000% | 09/01/2050 | 5,501,735 | 4,358,898 | |
Fannie Mae Pool FN BQ4558 | 2.000% | 03/01/2051 | 1,860,937 | 1,466,355 | |
Fannie Mae Pool FN BR1844 | 2.500% | 01/01/2051 | 1,043,618 | 866,433 | |
Fannie Mae Pool FN BR4390 | 2.000% | 03/01/2051 | 3,211,058 | 2,531,076 | |
Fannie Mae Pool FN BR9750 | 2.000% | 04/01/2051 | 3,336,889 | 2,621,816 | |
Fannie Mae Pool FN BT7183 | 2.500% | 08/01/2051 | 1,412,344 | 1,166,360 | |
Fannie Mae Pool FN BU3058 | 2.500% | 12/01/2051 | 5,558,245 | 4,553,195 | |
Fannie Mae Pool FN BW7264 | 5.500% | 11/01/2052 | 2,714,040 | 2,682,903 | |
Fannie Mae Pool FN BW7449 | 5.000% | 11/01/2052 | 964,844 | 933,200 | |
Fannie Mae Pool FN BW9916 | 5.000% | 10/01/2052 | 668,959 | 646,973 | |
Fannie Mae Pool FN BX5678 | 5.500% | 01/01/2053 | 1,481,809 | 1,463,676 | |
Fannie Mae Pool FN CA4819 | 4.000% | 12/01/2049 | 854,352 | 791,669 | |
Fannie Mae Pool FN CA5348 | 3.500% | 03/01/2050 | 1,256,967 | 1,126,779 | |
Fannie Mae Pool FN CA5706 | 2.500% | 05/01/2050 | 1,675,173 | 1,383,877 | |
Fannie Mae Pool FN CA6998 | 3.000% | 09/01/2050 | 2,633,031 | 2,261,516 | |
Fannie Mae Pool FN CA8118 | 2.000% | 12/01/2050 | 1,648,342 | 1,300,822 | |
Fannie Mae Pool FN CA9293 | 2.500% | 02/01/2051 | 2,175,035 | 1,798,706 | |
Fannie Mae Pool FN CA9390 | 2.500% | 03/01/2051 | 2,704,401 | 2,209,312 | |
Fannie Mae Pool FN CB1867 | 2.500% | 10/01/2051 | 4,883,813 | 4,004,721 | |
Fannie Mae Pool FN CB3026 | 3.500% | 03/01/2052 | 2,522,937 | 2,234,054 | |
Fannie Mae Pool FN CB3335 | 4.500% | 04/01/2052 | 4,405,347 | 4,240,477 | |
Fannie Mae Pool FN CB3586 | 3.000% | 05/01/2052 | 3,484,169 | 2,977,569 | |
Fannie Mae Pool FN FM2778 | 3.000% | 03/01/2050 | 1,911,365 | 1,650,180 | |
Fannie Mae Pool FN FM3734 | 3.500% | 09/01/2049 | 992,947 | 900,001 | |
Fannie Mae Pool FN FM3919 | 4.000% | 05/01/2049 | 617,918 | 579,102 | |
Fannie Mae Pool FN FM4122 | 2.000% | 08/01/2050 | 5,689,486 | 4,514,428 | |
Fannie Mae Pool FN FM4317 | 3.000% | 09/01/2050 | 2,464,550 | 2,124,330 | |
Fannie Mae Pool FN FM4532 | 3.000% | 09/01/2050 | 2,788,325 | 2,407,295 | |
Fannie Mae Pool FN FM6708 | 2.500% | 01/01/2051 | 2,762,686 | 2,293,642 | |
Fannie Mae Pool FN FM7293 | 2.500% | 05/01/2051 | 1,113,347 | 923,113 | |
Fannie Mae Pool FN FM7706 | 3.500% | 08/01/2050 | 2,781,435 | 2,493,559 | |
Fannie Mae Pool FN FS2037 | 1.500% | 05/01/2037 | 3,938,835 | 3,366,397 | |
Fannie Mae Pool FN FS2041 | 2.000% | 08/01/2051 | 3,567,616 | 2,806,542 | |
Fannie Mae Pool FN FS2099 | 1.500% | 04/01/2052 | 1,214,891 | 908,026 | |
Fannie Mae Pool FN FS3813 | 4.500% | 11/01/2052 | 1,107,304 | 1,045,421 | |
Fannie Mae Pool FN FS4377 | 3.000% | 04/01/2052 | 1,782,292 | 1,517,718 | |
Fannie Mae Pool FN MA4138 | 1.500% | 09/01/2050 | 3,924,872 | 2,948,233 | |
U.S. Government Agency Mortgage-Backed Securities (Continued) | Rate | Maturity | Face Amount | Value | |
Fannie Mae Pool FN MA4255 | 2.000% | 02/01/2051 | $1,494,760 | $1,173,756 | |
Fannie Mae Pool FN MA4562 | 2.000% | 03/01/2052 | 8,356,556 | 6,554,872 | |
Fannie Mae Pool FN MA4593 | 4.000% | 03/01/2052 | 679,723 | 622,884 | |
Fannie Mae Pool FN MA4804 | 4.000% | 11/01/2052 | 754,663 | 691,008 | |
Fannie Mae Pool FN MA5167 | 6.500% | 10/01/2053 | 1,344,433 | 1,369,009 | |
Fannie Mae Pool FN MA5389 | 6.000% | 06/01/2054 | 1,492,455 | 1,496,905 | |
Freddie Mac Pool FR QF1237 | 5.000% | 10/01/2052 | 2,475,834 | 2,395,804 | |
Freddie Mac Pool FR QF1648 | 5.000% | 10/01/2052 | 737,974 | 715,142 | |
Freddie Mac Pool FR QF5585 | 4.500% | 11/01/2052 | 725,797 | 685,822 | |
Freddie Mac Pool FR RA3575 | 2.000% | 09/01/2050 | 5,189,837 | 4,111,576 | |
Freddie Mac Pool FR RA5286 | 2.500% | 05/01/2051 | 4,341,148 | 3,552,207 | |
Freddie Mac Pool FR RA5761 | 2.000% | 06/01/2051 | 2,164,545 | 1,704,818 | |
Freddie Mac Pool FR RA7279 | 3.500% | 05/01/2052 | 2,549,744 | 2,272,409 | |
Freddie Mac Pool FR SB8148 | 2.000% | 04/01/2037 | 1,958,002 | 1,720,262 | |
Freddie Mac Pool FR SB8149 | 2.500% | 04/01/2037 | 1,951,817 | 1,764,060 | |
Freddie Mac Pool FR SB8153 | 2.000% | 05/01/2037 | 2,946,301 | 2,588,561 | |
Freddie Mac Pool FR SD0451 | 3.000% | 10/01/2050 | 788,518 | 675,183 | |
Freddie Mac Pool FR SD0625 | 2.500% | 05/01/2051 | 1,928,796 | 1,592,878 | |
Freddie Mac Pool FR SD0977 | 3.500% | 02/01/2052 | 4,627,980 | 4,138,973 | |
Freddie Mac Pool FR SD1966 | 4.000% | 11/01/2052 | 917,605 | 841,060 | |
Freddie Mac Pool FR SD2018 | 3.000% | 11/01/2050 | 1,685,424 | 1,442,769 | |
Freddie Mac Pool FR SD4550 | 2.500% | 10/01/2053 | 1,848,743 | 1,510,907 | |
Freddie Mac Pool FR SD7505 | 4.500% | 08/01/2049 | 636,444 | 611,043 | |
Freddie Mac Pool FR SD8104 | 1.500% | 11/01/2050 | 1,915,150 | 1,432,006 | |
Freddie Mac Pool FR SD8121 | 2.000% | 01/01/2051 | 1,470,306 | 1,160,359 | |
Freddie Mac Pool FR SD8148 | 3.000% | 05/01/2051 | 2,660,151 | 2,275,657 | |
Freddie Mac Pool FR SD8210 | 4.000% | 03/01/2052 | 685,254 | 628,185 | |
Freddie Mac Pool FR SD8214 | 3.500% | 05/01/2052 | 571,619 | 506,257 | |
Freddie Mac Pool FR SD8219 | 2.500% | 06/01/2052 | 1,131,633 | 924,929 | |
Freddie Mac Pool FR SD8273 | 3.500% | 11/01/2052 | 3,952,891 | 3,500,275 | |
Freddie Mac Pool FR SD8368 | 6.000% | 10/01/2053 | 1,870,350 | 1,875,916 | |
Freddie Mac Pool FR SD8395 | 5.500% | 01/01/2054 | 1,337,560 | 1,319,370 | |
Freddie Mac Pool FR SD8409 | 6.000% | 03/01/2054 | 1,317,721 | 1,321,649 | |
Freddie Mac Pool FR SD8439 | 6.000% | 06/01/2054 | 1,487,647 | 1,492,082 | |
Freddie Mac Pool FR ZT1257 | 3.000% | 01/01/2046 | 626,706 | 552,756 | |
Ginnie Mae II Pool G2 MA6866 | 3.000% | 09/20/2050 | 1,192,057 | 1,042,547 | |
Ginnie Mae II Pool G2 MA8800 | 5.000% | 04/20/2053 | 3,009,130 | 2,931,241 | |
Ginnie Mae II Pool G2 MA8945 | 4.000% | 06/20/2053 | 3,234,572 | 2,989,012 | |
Ginnie Mae II Pool G2 MA8946 | 4.500% | 06/20/2053 | 846,210 | 804,771 | |
Ginnie Mae II Pool G2 MA8948 | 5.500% | 06/20/2053 | 1,411,630 | 1,401,168 | |
Ginnie Mae II Pool G2 MA8949 | 6.000% | 06/20/2053 | 870,698 | 874,876 | |
Ginnie Mae II Pool G2 MA9105 | 5.000% | 08/20/2053 | 1,359,277 | 1,323,931 | |
Total U.S. Government Agency Mortgage-Backed Securities (Cost $175,188,032) | $157,717,047 | ||||
Investment Companies–8.1% | Shares | Value | |
Federated Hermes Core Trust - Bank Loan Core Fund (Acquired 06/28/2021 through 02/27/2024, Cost $3,046,662) | (f)(g) | 340,213 | $2,970,058 |
Federated Hermes Core Trust - Emerging Markets Core Fund (Acquired 06/28/2021 through 02/27/2024, Cost $17,522,731) | (f)(g) | 2,094,661 | 17,595,155 |
Federated Hermes Core Trust III - Federated Project and Trade Finance Core Fund (Acquired 05/01/2020 through 04/10/2024, Cost $25,222,113) | (g)(h) | 2,859,577 | 25,278,663 |
Total Investment Companies (Cost $45,791,506) | $45,843,876 | ||
Asset-Backed / Mortgage-Backed Securities–2.9% | Rate | Maturity | Face Amount | Value | |
Financials–2.9% | |||||
AmeriCredit Automobile Receivables Trust 2020-2 D | 2.130% | 03/18/2026 | $180,000 | $177,838 | |
AmeriCredit Automobile Receivables Trust 2020-3 D | 1.490% | 09/18/2026 | 175,000 | 169,969 | |
BANK 2022-BNK40 A4 | 3.506% | 03/15/2064 | 660,000 | 580,591 | |
BBCMS Mortgage Trust 2024-5C27 A2 | 5.550% | 07/15/2057 | 1,380,000 | 1,390,090 | |
Benchmark 2020-B19 A5 | 1.850% | 09/15/2053 | 1,150,000 | 927,711 | |
Benchmark 2021-B26 A2 | 1.957% | 06/15/2054 | 520,000 | 476,561 | |
Carmax Auto Owner Trust 2021-1 D | 1.280% | 07/15/2027 | 100,000 | 96,535 | |
Chesapeake Funding II LLC 2020-1A D | (a) | 2.830% | 08/15/2032 | 150,000 | 149,561 |
Freddie Mac Multifamily Structured Pass Through Certificates K108 A2 | 1.517% | 03/25/2030 | 400,000 | 337,162 | |
Freddie Mac Multifamily Structured Pass Through Certificates K109 A2 | 1.558% | 04/25/2030 | 400,000 | 336,591 | |
GM Financial Consumer Automobile Receivables Trust 2020-3 D | 1.910% | 09/16/2027 | 400,000 | 399,171 | |
GS Mortgage-Backed Securities Trust 2022-PJ3 A4 | (a) | 2.500% | 08/25/2052 | 1,727,277 | 1,371,363 |
Home Partners of America 2022-1 B | (a) | 4.330% | 04/17/2039 | 729,361 | 700,423 |
J.P. Morgan Mortgage Trust 2022-1 A2 | (a) | 3.000% | 07/25/2052 | 1,281,126 | 1,060,632 |
JP Morgan Mortgage Trust 2022-2 A3 | (a) | 2.500% | 08/25/2052 | 1,736,384 | 1,378,594 |
JP Morgan Mortgage Trust 2022-3 A3 | (a) | 2.500% | 08/25/2052 | 1,701,156 | 1,350,624 |
Asset-Backed / Mortgage-Backed Securities (Continued) | Rate | Maturity | Face Amount | Value | |
Financials (continued) | |||||
MMAF Equipment Finance LLC 2020-A A5 | (a) | 1.560% | 10/09/2042 | $750,000 | $671,943 |
Navient Private Education Refi Loan Trust 2020-FA A | (a) | 1.220% | 07/15/2069 | 114,532 | 103,778 |
Progress Residential 2022-SFR1 E1 | (a) | 3.930% | 02/17/2041 | 900,000 | 801,575 |
Progress Residential 2022-SFR2 D | (a) | 3.945% | 04/17/2027 | 1,000,000 | 939,692 |
Progress Residential 2022-SFR4 B | (a) | 4.788% | 05/17/2041 | 800,000 | 774,280 |
Progress Residential 2023-SFR2 D | (a) | 4.500% | 10/17/2040 | 150,000 | 139,965 |
Progress Residential 2023-SFR2 E1 | (a) | 4.750% | 10/17/2040 | 200,000 | 183,579 |
Progress Residential 2024-SFR1 D | (a) | 3.750% | 02/17/2041 | 500,000 | 450,948 |
Santander Consumer Auto Receivables Trust 2020-BA D | (a) | 2.140% | 12/15/2026 | 400,859 | 397,990 |
Santander Drive Auto Receivables Trust 2020-3 D | 1.640% | 11/16/2026 | 177,204 | 175,748 | |
Sierra Timeshare 2020-2A A | (a) | 1.330% | 07/20/2037 | 109,454 | 105,756 |
SMB Private Education Loan Trust 2020-B A1A | (a) | 1.290% | 07/15/2053 | 286,918 | 262,857 |
World Omni Select Auto Trust 2020-A D | 1.700% | 10/15/2026 | 250,000 | 247,677 | |
Total Asset-Backed / Mortgage-Backed Securities (Cost $17,993,548) | $16,159,204 | ||||
Sovereign Debt Issues–0.2% | Rate | Maturity | Face Amount | Value | |
Mexico Government International Bond | 3.750% | 01/11/2028 | $625,000 | $590,702 | |
Mexico Government International Bond | 4.500% | 01/31/2050 | 775,000 | 580,956 | |
Total Sovereign Debt Issues (Cost $1,474,617) | $1,171,658 | ||||
Total Investments – 98.5% (Cost $610,105,200) | (i) | $556,954,200 | |||
Other Assets in Excess of Liabilities – 1.5% | 8,491,896 | ||||
Net Assets – 100.0% | $565,446,096 | ||||
Percentages are stated as a percent of net assets. |
Abbreviations: | ||
H15T5Y: | U.S. Treasury Yield Curve Rate T-Note Constant Maturity 5 Year, 4.330% at 6/30/2024 | |
PIK: | Payment-in-Kind | |
REITs: | Real Estate Investment Trusts | |
SOFR: | Secured Overnight Financing Rate, 5.330% at 6/30/2024 | |
SOFRINDX: | Secured Overnight Financing Rate ("SOFR") Compounded Index, 1.145% at 6/30/2024 | |
TSFR3M: | Quarterly CME Term Secured Overnight Financing Rate ("SOFR"), 5.325% at 6/30/2024 | |
Footnotes: | ||
(a) | Security exempt from registration under Regulation D of the Securities Act of 1933. These securities may be resold in transactions exempt from registration, normally to qualified buyers under Rule 144A. At June 30, 2024, the value of these securities totaled $43,694,231, or 7.7% of the Portfolio’s net assets. | |
(b) | Represents a security that is in default and deemed to be non-income producing. | |
(c) | Issuer of the security has the option to make coupon payments in cash or in additional par value of this bond (Payment-in-Kind). | |
(d) | Security is a fixed-then-variable rate instrument in which the coupon or dividend rate is fixed until a later specified date, then is adjusted periodically. Rates stated, including interest rate caps and floors, if any, are those in effect at June 30, 2024. | |
(e) | Security is partially pledged as collateral for the futures contracts outstanding at June 30, 2024. The value of securities pledged totaled $1,072,453. See also the following Schedule of Open Futures Contracts. | |
(f) | Shares of this fund have not been registered and are issued in reliance on Section 4(a)(2) and Regulation D of the Securities Act of 1933. Investments in this fund may only be made by investment companies, insurance company separate accounts, common or commingled trust funds or similar organizations or entities that are “accredited investors” within the meaning of Regulation D of the 1933 Act. | |
(g) | Represents a security deemed to be restricted. At June 30, 2024, the value of restricted securities in the Portfolio totaled $45,843,876, or 8.1% of the Portfolio’s net assets. | |
(h) | Open-end extended payment fund. Beneficial interests in this fund are issued solely in private placement transactions which do not involve any “public offering” within the meaning of Section 4(a)(2) and Regulation D of the Securities Act of 1933. Investments in this fund may only be made by organizations or entities that are “accredited investors” within the meaning of Regulation D of the 1933 Act and that are also “qualified purchasers” as defined in Section 2(a)(51) of the Investment Company Act of 1940, as amended (“Eligible Investors”). This fund has adopted policies to limit the transfer of its shares, which may occur only pursuant to authorization by this fund's Board of Directors, and only to Eligible Investors.When a redeeming shareholder of this fund presents shares to the fund's transfer agent in proper order for redemption, the fund will have up to 31 days to make payment to the redeeming shareholder. The price of redeemed shares will be determined as of the closing net asset value of the fund 24 days after receipt of a shareholder redemption request or, if such date is a weekend or holiday, on the preceding business day. The fund's NAV is calculated each day the NYSE is open. | |
(i) | Represents cost for financial reporting purposes, which may differ from cost basis for federal income tax purposes. See also Note 7 of the Notes to Financial Statements. | |
Description | Number of contracts | Expiration Date | Notional Amount | Value | Unrealized Appreciation (Depreciation) | Variation Margin Receivable (Payable) |
CBT 10-Year U.S. Treasury Note - Long | 80 | September 19, 2024 | $8,718,296 | $8,798,750 | $80,454 | $(21,250 ) |
CBT 10-Year U.S. Ultra Bond - Long | 53 | September 19, 2024 | 5,957,901 | 6,017,156 | 59,255 | (25,672 ) |
CBT 2-Year U.S. Treasury Note - Long | 250 | September 30, 2024 | 50,925,002 | 51,054,688 | 129,686 | (5,861 ) |
CBT 5-Year U.S. Treasury Note - Long | 465 | September 30, 2024 | 49,338,273 | 49,558,828 | 220,555 | (50,859 ) |
$114,939,472 | $115,429,422 | $489,950 | $(103,642 ) |
Description | Number of contracts | Expiration Date | Notional Amount | Value | Unrealized Appreciation (Depreciation) | Variation Margin Receivable (Payable) |
CBT U.S. Ultra Bond - Short | 182 | September 19, 2024 | $(22,476,129 ) | $(22,812,563 ) | $(336,434 ) | $301,438 |
CBT U.S. Long Bond - Short | 4 | September 19, 2024 | (468,196 ) | (473,250 ) | (5,054 ) | 15,306 |
$(22,944,325 ) | $(23,285,813 ) | $(341,488 ) | $316,744 | |||
Total Futures Contracts | $91,995,147 | $92,143,609 | $148,462 | $213,102 |
Common Stocks–99.2% | Shares | Value | |
Communication Services–6.6% | |||
Alphabet, Inc. Class A (Interactive Media & Svs.) | 37,339 | $6,801,299 | |
Alphabet, Inc. Class C (Interactive Media & Svs.) | 26,947 | 4,942,619 | |
AT&T, Inc. (Diversified Telecom. Svs.) | 36,708 | 701,490 | |
Electronic Arts, Inc. (Entertainment) | 87,762 | 12,227,880 | |
Take-Two Interactive Software, Inc. (Entertainment) | (a) | 32,566 | 5,063,687 |
T-Mobile U.S., Inc. (Wireless Telecom. Svs.) | 33,212 | 5,851,290 | |
Verizon Communications, Inc. (Diversified Telecom. Svs.) | 209,492 | 8,639,450 | |
44,227,715 | |||
Consumer Discretionary–7.8% | |||
Amazon.com, Inc. (Broadline Retail) | (a) | 42,870 | 8,284,627 |
AutoZone, Inc. (Specialty Retail) | (a) | 2,270 | 6,728,507 |
Chipotle Mexican Grill, Inc. (Hotels, Restaurants & Leisure) | (a) | 34,750 | 2,177,087 |
Deckers Outdoor Corp. (Textiles, Apparel & Luxury Goods) | (a) | 1,004 | 971,822 |
Domino's Pizza, Inc. (Hotels, Restaurants & Leisure) | 14,247 | 7,356,154 | |
Hilton Worldwide Holdings, Inc. (Hotels, Restaurants & Leisure) | 24,019 | 5,240,946 | |
McDonald's Corp. (Hotels, Restaurants & Leisure) | 27,040 | 6,890,874 | |
O'Reilly Automotive, Inc. (Specialty Retail) | (a) | 8,468 | 8,942,716 |
Ulta Beauty, Inc. (Specialty Retail) | (a) | 5,532 | 2,134,633 |
Yum! Brands, Inc. (Hotels, Restaurants & Leisure) | 26,364 | 3,492,175 | |
52,219,541 | |||
Consumer Staples–18.3% | |||
Altria Group, Inc. (Tobacco) | 294,936 | 13,434,335 | |
Brown-Forman Corp. Class B (Beverages) | 22,761 | 983,048 | |
Church & Dwight Co., Inc. (Household Products) | 93,081 | 9,650,638 | |
Clorox Co. / The (Household Products) | 17,434 | 2,379,218 | |
Coca-Cola Co. / The (Beverages) | 25,071 | 1,595,769 | |
Colgate-Palmolive Co. (Household Products) | 56,423 | 5,475,288 | |
Constellation Brands, Inc. Class A (Beverages) | 7,598 | 1,954,813 | |
Costco Wholesale Corp. (Consumer Staples Distribution & Retail) | 8,516 | 7,238,515 | |
Dollar Tree, Inc. (Consumer Staples Distribution & Retail) | (a) | 3,390 | 361,950 |
General Mills, Inc. (Food Products) | 93,927 | 5,941,822 | |
Hershey Co. / The (Food Products) | 3,517 | 646,530 | |
Hormel Foods Corp. (Food Products) | 123,748 | 3,773,077 | |
J.M. Smucker Co. / The (Food Products) | 8,096 | 882,788 | |
Kellanova (Food Products) | 71,999 | 4,152,902 | |
Kenvue, Inc. (Personal Care Products) | 505,266 | 9,185,736 | |
Keurig Dr Pepper, Inc. (Beverages) | 22,125 | 738,975 | |
Kimberly-Clark Corp. (Household Products) | 47,029 | 6,499,408 | |
Kraft Heinz Co. / The (Food Products) | 38,226 | 1,231,642 | |
Kroger Co. / The (Consumer Staples Distribution & Retail) | 270,285 | 13,495,330 | |
Mondelez International, Inc. Class A (Food Products) | 25,577 | 1,673,759 | |
Monster Beverage Corp. (Beverages) | (a) | 60,410 | 3,017,480 |
PepsiCo, Inc. (Beverages) | 7,383 | 1,217,678 | |
Philip Morris International, Inc. (Tobacco) | 3,116 | 315,744 | |
Procter & Gamble Co. / The (Household Products) | 5,659 | 933,282 | |
Tyson Foods, Inc. Class A (Food Products) | 29,267 | 1,672,316 | |
Walmart, Inc. (Consumer Staples Distribution & Retail) | 341,413 | 23,117,074 | |
121,569,117 | |||
Financials–10.0% | |||
Aon PLC Class A (Insurance) | 10,977 | 3,222,628 | |
Common Stocks (Continued) | Shares | Value | |
Financials (continued) | |||
Arch Capital Group Ltd. (Insurance) | (a) | 81,856 | $8,258,452 |
Arthur J. Gallagher & Co. (Insurance) | 21,430 | 5,557,013 | |
Assurant, Inc. (Insurance) | 20,338 | 3,381,192 | |
Berkshire Hathaway, Inc. Class B (Financial Services) | (a) | 20,207 | 8,220,207 |
Brown & Brown, Inc. (Insurance) | 29,068 | 2,598,970 | |
CBOE Global Markets, Inc. (Capital Markets) | 28,379 | 4,826,133 | |
CME Group, Inc. (Capital Markets) | 9,460 | 1,859,836 | |
FactSet Research Systems, Inc. (Capital Markets) | 4,407 | 1,799,246 | |
Fiserv, Inc. (Financial Services) | (a) | 20,657 | 3,078,719 |
Globe Life, Inc. (Insurance) | 16,799 | 1,382,222 | |
Intercontinental Exchange, Inc. (Capital Markets) | 2,055 | 281,309 | |
Loews Corp. (Insurance) | 71,341 | 5,332,026 | |
Marsh & McLennan Cos., Inc. (Insurance) | 20,186 | 4,253,594 | |
Mastercard, Inc. Class A (Financial Services) | 3,431 | 1,513,620 | |
Travelers Cos., Inc. / The (Insurance) | 26,308 | 5,349,469 | |
Visa, Inc. (Financial Services) | 6,423 | 1,685,845 | |
W.R. Berkley Corp. (Insurance) | 37,458 | 2,943,450 | |
Willis Towers Watson PLC (Insurance) | 3,299 | 864,800 | |
66,408,731 | |||
Health Care–24.2% | |||
AbbVie, Inc. (Biotechnology) | 119,772 | 20,543,293 | |
Amgen, Inc. (Biotechnology) | 34,447 | 10,762,965 | |
Becton Dickinson & Co. (Health Care Equip. & Supplies) | 51,187 | 11,962,914 | |
Biogen, Inc. (Biotechnology) | (a) | 4,181 | 969,239 |
Boston Scientific Corp. (Health Care Equip. & Supplies) | (a) | 47,482 | 3,656,589 |
Bristol-Myers Squibb Co. (Pharmaceuticals) | 264,198 | 10,972,143 | |
Cencora, Inc. (Health Care Providers & Svs.) | 38,644 | 8,706,493 | |
Eli Lilly & Co. (Pharmaceuticals) | 976 | 883,651 | |
Gilead Sciences, Inc. (Biotechnology) | 142,839 | 9,800,184 | |
Henry Schein, Inc. (Health Care Providers & Svs.) | (a) | 48,135 | 3,085,454 |
Hologic, Inc. (Health Care Equip. & Supplies) | (a) | 53,145 | 3,946,016 |
Humana, Inc. (Health Care Providers & Svs.) | 14,623 | 5,463,884 | |
Incyte Corp. (Biotechnology) | (a) | 68,910 | 4,177,324 |
Johnson & Johnson (Pharmaceuticals) | 91,300 | 13,344,408 | |
Labcorp Holdings, Inc. (Health Care Providers & Svs.) | 4,398 | 895,037 | |
McKesson Corp. (Health Care Providers & Svs.) | 27,699 | 16,177,324 | |
Merck & Co., Inc. (Pharmaceuticals) | 124,786 | 15,448,507 | |
Molina Healthcare, Inc. (Health Care Providers & Svs.) | (a) | 11,463 | 3,407,950 |
Pfizer, Inc. (Pharmaceuticals) | 44,895 | 1,256,162 | |
Quest Diagnostics, Inc. (Health Care Providers & Svs.) | 40,155 | 5,496,416 | |
Regeneron Pharmaceuticals, Inc. (Biotechnology) | (a) | 6,218 | 6,535,305 |
UnitedHealth Group, Inc. (Health Care Providers & Svs.) | 2,472 | 1,258,891 | |
Universal Health Services, Inc. Class B (Health Care Providers & Svs.) | 427 | 78,965 | |
Vertex Pharmaceuticals, Inc. (Biotechnology) | (a) | 4,535 | 2,125,645 |
160,954,759 | |||
Industrials–11.8% | |||
AMETEK, Inc. (Electrical Equip.) | 19,350 | 3,225,838 | |
Broadridge Financial Solutions, Inc. (Professional Svs.) | 4,841 | 953,677 | |
Builders FirstSource, Inc. (Building Products) | (a) | 2,802 | 387,825 |
Cintas Corp. (Commercial Svs. & Supplies) | 4,215 | 2,951,596 | |
Copart, Inc. (Commercial Svs. & Supplies) | (a) | 58,876 | 3,188,724 |
Fortive Corp. (Machinery) | 5,397 | 399,918 | |
GE Vernova, Inc. (Electrical Equip.) | (a) | 5,390 | 924,439 |
General Electric Co. (Aerospace & Defense) | 5,776 | 918,211 | |
Common Stocks (Continued) | Shares | Value | |
Industrials (continued) | |||
Howmet Aerospace, Inc. (Aerospace & Defense) | 9,591 | $744,549 | |
Huntington Ingalls Industries, Inc. (Aerospace & Defense) | 3,790 | 933,591 | |
Ingersoll Rand, Inc. (Machinery) | 24,276 | 2,205,232 | |
L3Harris Technologies, Inc. (Aerospace & Defense) | 12,165 | 2,732,016 | |
Leidos Holdings, Inc. (Professional Svs.) | 54,031 | 7,882,042 | |
Lockheed Martin Corp. (Aerospace & Defense) | 37,946 | 17,724,577 | |
Northrop Grumman Corp. (Aerospace & Defense) | 10,204 | 4,448,434 | |
Republic Services, Inc. (Commercial Svs. & Supplies) | 49,665 | 9,651,896 | |
Rollins, Inc. (Commercial Svs. & Supplies) | 96,988 | 4,732,044 | |
Snap-on, Inc. (Machinery) | 6,081 | 1,589,512 | |
TransDigm Group, Inc. (Aerospace & Defense) | 1,436 | 1,834,648 | |
Verisk Analytics, Inc. (Professional Svs.) | 12,789 | 3,447,275 | |
W.W. Grainger, Inc. (Trading Companies & Distributors) | 1,280 | 1,154,867 | |
Waste Management, Inc. (Commercial Svs. & Supplies) | 30,429 | 6,491,723 | |
78,522,634 | |||
Information Technology–19.1% | |||
Akamai Technologies, Inc. (IT Svs.) | (a) | 39,174 | 3,528,794 |
Apple, Inc. (Tech. Hardware, Storage & Periph.) | 143,771 | 30,281,048 | |
Arista Networks, Inc. (Communications Equip.) | (a) | 855 | 299,660 |
F5, Inc. (Communications Equip.) | (a) | 4,672 | 804,659 |
Fair Isaac Corp. (Software) | (a) | 4,228 | 6,294,055 |
Gartner, Inc. (IT Svs.) | (a) | 2,434 | 1,093,012 |
Common Stocks (Continued) | Shares | Value | |
Information Technology (continued) | |||
Gen Digital, Inc. (Software) | 1,987 | $49,635 | |
International Business Machines Corp. (IT Svs.) | 74,843 | 12,944,097 | |
Microsoft Corp. (Software) | 76,589 | 34,231,454 | |
NVIDIA Corp. (Semiconductors & Equip.) | 195,680 | 24,174,307 | |
Oracle Corp. (Software) | 4,877 | 688,632 | |
Palo Alto Networks, Inc. (Software) | (a) | 1,034 | 350,536 |
PTC, Inc. (Software) | (a) | 9,572 | 1,738,945 |
Roper Technologies, Inc. (Software) | 8,528 | 4,806,892 | |
ServiceNow, Inc. (Software) | (a) | 206 | 162,054 |
Teledyne Technologies, Inc. (Electronic Equip., Instr. & Comp.) | (a) | 4,204 | 1,631,068 |
VeriSign, Inc. (IT Svs.) | (a) | 22,611 | 4,020,236 |
127,099,084 | |||
Materials–0.1% | |||
Sherwin-Williams Co. / The (Chemicals) | 2,119 | 632,373 | |
Utilities–1.3% | |||
Ameren Corp. (Multi-Utilities) | 12,844 | 913,337 | |
Atmos Energy Corp. (Gas Utilities) | 17,531 | 2,044,991 | |
CenterPoint Energy, Inc. (Multi-Utilities) | 35,467 | 1,098,768 | |
Consolidated Edison, Inc. (Multi-Utilities) | 26,193 | 2,342,178 | |
DTE Energy Co. (Multi-Utilities) | 12,010 | 1,333,230 | |
NRG Energy, Inc. (Electric Utilities) | 15,344 | 1,194,684 | |
8,927,188 | |||
Total Common Stocks (Cost $579,363,535) | $660,561,142 | ||
Total Investments – 99.2% (Cost $579,363,535) | (b) | $660,561,142 | |
Other Assets in Excess of Liabilities – 0.8% | 5,139,298 | ||
Net Assets – 100.0% | $665,700,440 | ||
Percentages are stated as a percent of net assets. |
Footnotes: | ||
(a) | Non-income producing security. | |
(b) | Represents cost for financial reporting purposes, which may differ from cost basis for federal income tax purposes. See also Note 7 of the Notes to Financial Statements. | |
Common Stocks–97.6% | Shares | Value | |
Communication Services–5.7% | |||
Alphabet, Inc. Class C (Interactive Media & Svs.) | 11,305 | $2,073,563 | |
Comcast Corp. Class A (Media) | 64,245 | 2,515,834 | |
Electronic Arts, Inc. (Entertainment) | 18,636 | 2,596,554 | |
7,185,951 | |||
Consumer Discretionary–4.8% | |||
Aptiv PLC (Automobile Components) | (a) | 11,909 | 838,632 |
BorgWarner, Inc. (Automobile Components) | 34,950 | 1,126,788 | |
D.R. Horton, Inc. (Household Durables) | 4,982 | 702,113 | |
LKQ Corp. (Distributors) | 22,854 | 950,498 | |
Ross Stores, Inc. (Specialty Retail) | 16,432 | 2,387,898 | |
6,005,929 | |||
Consumer Staples–7.5% | |||
Casey's General Stores, Inc. (Consumer Staples Distribution & Retail) | 2,771 | 1,057,303 | |
Philip Morris International, Inc. (Tobacco) | 36,550 | 3,703,611 | |
Walmart, Inc. (Consumer Staples Distribution & Retail) | 67,453 | 4,567,243 | |
9,328,157 | |||
Energy–8.6% | |||
Cactus, Inc. Class A (Energy Equip. & Svs.) | 8,801 | 464,165 | |
ChampionX Corp. (Energy Equip. & Svs.) | 23,745 | 788,571 | |
Chevron Corp. (Oil, Gas & Consumable Fuels) | 9,463 | 1,480,203 | |
ConocoPhillips (Oil, Gas & Consumable Fuels) | 11,722 | 1,340,762 | |
EOG Resources, Inc. (Oil, Gas & Consumable Fuels) | 20,526 | 2,583,608 | |
Helmerich & Payne, Inc. (Energy Equip. & Svs.) | 29,716 | 1,073,936 | |
Phillips 66 (Oil, Gas & Consumable Fuels) | 21,942 | 3,097,552 | |
10,828,797 | |||
Financials–20.7% | |||
American International Group, Inc. (Insurance) | 9,393 | 697,336 | |
Axis Capital Holdings Ltd. (Insurance) | 31,524 | 2,227,171 | |
Bank OZK (Banks) | 3,695 | 151,495 | |
Berkshire Hathaway, Inc. Class B (Financial Services) | (a) | 11,015 | 4,480,902 |
Citigroup, Inc. (Banks) | 37,363 | 2,371,056 | |
Fiserv, Inc. (Financial Services) | (a) | 22,668 | 3,378,439 |
JPMorgan Chase & Co. (Banks) | 23,186 | 4,689,600 | |
Mastercard, Inc. Class A (Financial Services) | 4,149 | 1,830,373 | |
MetLife, Inc. (Insurance) | 10,409 | 730,608 | |
MGIC Investment Corp. (Financial Services) | 43,450 | 936,347 | |
Wells Fargo & Co. (Banks) | 74,986 | 4,453,419 | |
25,946,746 | |||
Health Care–18.6% | |||
Amgen, Inc. (Biotechnology) | 5,573 | 1,741,284 | |
Cencora, Inc. (Health Care Providers & Svs.) | 16,024 | 3,610,207 | |
Elevance Health, Inc. (Health Care Providers & Svs.) | 7,949 | 4,307,245 | |
GE HealthCare Technologies, Inc. (Health Care Equip. & Supplies) | 26,712 | 2,081,399 | |
Gilead Sciences, Inc. (Biotechnology) | 18,051 | 1,238,479 | |
Merck & Co., Inc. (Pharmaceuticals) | 24,577 | 3,042,633 | |
Regeneron Pharmaceuticals, Inc. (Biotechnology) | (a) | 4,475 | 4,703,359 |
Common Stocks (Continued) | Shares | Value | |
Health Care (continued) | |||
Roche Holding AG – ADR (Pharmaceuticals) | 29,988 | $1,039,684 | |
United Therapeutics Corp. (Biotechnology) | (a) | 4,939 | 1,573,319 |
23,337,609 | |||
Industrials–17.5% | |||
A. O. Smith Corp. (Building Products) | 10,881 | 889,848 | |
Allegion PLC (Building Products) | 7,932 | 937,166 | |
Builders FirstSource, Inc. (Building Products) | (a) | 6,181 | 855,512 |
Curtiss-Wright Corp. (Aerospace & Defense) | 2,033 | 550,902 | |
Dover Corp. (Machinery) | 4,817 | 869,228 | |
EMCOR Group, Inc. (Construction & Engineering) | 2,170 | 792,224 | |
Emerson Electric Co. (Electrical Equip.) | 15,827 | 1,743,502 | |
Ferguson PLC (Trading Companies & Distributors) | 8,486 | 1,643,314 | |
Generac Holdings, Inc. (Electrical Equip.) | (a) | 4,451 | 588,511 |
J.B. Hunt Transport Services, Inc. (Ground Transportation) | 7,902 | 1,264,320 | |
nVent Electric PLC (Electrical Equip.) | 15,250 | 1,168,302 | |
Oshkosh Corp. (Machinery) | 11,484 | 1,242,569 | |
PACCAR, Inc. (Machinery) | 9,516 | 979,577 | |
Robert Half, Inc. (Professional Svs.) | 28,990 | 1,854,780 | |
RTX Corp. (Aerospace & Defense) | 20,069 | 2,014,727 | |
Textron, Inc. (Aerospace & Defense) | 12,973 | 1,113,862 | |
United Parcel Service, Inc. Class B (Air Freight & Logistics) | 8,316 | 1,138,045 | |
Veralto Corp. (Commercial Svs. & Supplies) | 14,356 | 1,370,567 | |
Westinghouse Air Brake Technologies Corp. (Machinery) | 5,301 | 837,823 | |
21,854,779 | |||
Information Technology–9.6% | |||
Accenture PLC Class A (IT Svs.) | 7,456 | 2,262,225 | |
Cisco Systems, Inc. (Communications Equip.) | 9,834 | 467,213 | |
QUALCOMM, Inc. (Semiconductors & Equip.) | 18,711 | 3,726,857 | |
Taiwan Semiconductor Manufacturing Co. Ltd. – ADR (Semiconductors & Equip.) | 12,154 | 2,112,487 | |
TE Connectivity Ltd. (Electronic Equip., Instr. & Comp.) | 10,352 | 1,557,251 | |
Texas Instruments, Inc. (Semiconductors & Equip.) | 9,436 | 1,835,585 | |
11,961,618 | |||
Materials–3.6% | |||
CF Industries Holdings, Inc. (Chemicals) | 7,219 | 535,072 | |
LyondellBasell Industries N.V. Class A (Chemicals) | 8,281 | 792,161 | |
PPG Industries, Inc. (Chemicals) | 10,052 | 1,265,446 | |
Steel Dynamics, Inc. (Metals & Mining) | 15,027 | 1,945,997 | |
4,538,676 | |||
Real Estate–1.0% | |||
Public Storage (Specialized REITs) | 4,230 | 1,216,759 | |
Total Common Stocks (Cost $103,445,611) | $122,205,021 | ||
Total Investments – 97.6% (Cost $103,445,611) | (b) | $122,205,021 | |
Other Assets in Excess of Liabilities – 2.4% | 3,025,502 | ||
Net Assets – 100.0% | $125,230,523 | ||
Percentages are stated as a percent of net assets. |
Abbreviations: | ||
ADR: | American Depositary Receipts | |
REITs: | Real Estate Investment Trusts | |
Footnotes: | ||
(a) | Non-income producing security. | |
(b) | Represents cost for financial reporting purposes, which may differ from cost basis for federal income tax purposes. See also Note 7 of the Notes to Financial Statements. | |
Exchange Traded Funds–98.0% | Shares | Value | |
BlackRock Ultra Short-Term Bond ETF | 1,044,691 | $52,798,683 | |
iShares Core MSCI EAFE ETF | 475,405 | 34,533,419 | |
iShares Core MSCI Emerging Markets ETF | 263,302 | 14,094,556 | |
iShares Core S&P 500 ETF | 185,615 | 101,574,097 | |
iShares Core U.S. Aggregate Bond ETF | 2,144,768 | 208,192,630 | |
iShares iBoxx $ Investment Grade Corporate Bond ETF | 249,317 | 26,706,837 | |
iShares MSCI EAFE ETF | 332,276 | 26,027,179 | |
iShares MSCI Emerging Markets ETF | 89,968 | 3,831,737 | |
iShares Russell 1000 ETF | 263,153 | 78,298,544 | |
iShares Russell 1000 Value ETF | 62,490 | 10,902,630 | |
Total Exchange Traded Funds (Cost $499,439,255) | $556,960,312 | ||
Total Investments – 98.0% (Cost $499,439,255) | (a) | $556,960,312 | |
Other Assets in Excess of Liabilities – 2.0% | (b) | 11,494,384 | |
Net Assets – 100.0% | $568,454,696 | ||
Percentages are stated as a percent of net assets. |
Abbreviations: | ||
ETF: | Exchange Traded Fund | |
Footnotes: | ||
(a) | Represents cost for financial reporting purposes, which may differ from cost basis for federal income tax purposes. See also Note 7 of the Notes to Financial Statements. | |
(b) | Includes $3,384,856 of cash pledged as collateral for the futures contracts outstanding at June 30, 2024. See also the following Schedule of Open Futures Contracts. | |
Description | Number of contracts | Expiration Date | Notional Amount | Value | Unrealized Appreciation (Depreciation) | Variation Margin Receivable (Payable) |
AUD Currency Future - Long | 268 | September 16, 2024 | $17,838,782 | $17,910,440 | $71,658 | $56,280 |
EUR Currency Future - Long | 98 | September 16, 2024 | 13,217,492 | 13,171,200 | (46,292 ) | 7,963 |
CAD Currency Future - Long | 199 | September 17, 2024 | 14,518,686 | 14,566,800 | 48,114 | 5,970 |
CBT 10-Year U.S. Treasury Note - Long | 299 | September 19, 2024 | 32,476,324 | 32,885,328 | 409,004 | (79,422 ) |
MOD S&P TSX 60 Index - Long | 48 | September 19, 2024 | 9,127,497 | 9,196,155 | 68,658 | (39,186 ) |
CME E-mini S&P 500 Index - Long | 20 | September 20, 2024 | 5,502,921 | 5,521,500 | 18,579 | (24,500 ) |
EUX Euro Stoxx 50 Index - Long | 118 | September 20, 2024 | 6,197,205 | 6,225,092 | 27,887 | (15,141 ) |
MSCI EAFE Index - Long | 29 | September 20, 2024 | 3,382,522 | 3,397,640 | 15,118 | 4,640 |
MSCI Emerging Markets Index - Long | 213 | September 20, 2024 | 11,499,071 | 11,589,330 | 90,259 | 21,300 |
$113,760,500 | $114,463,485 | $702,985 | $(62,096 ) |
Description | Number of contracts | Expiration Date | Notional Amount | Value | Unrealized Appreciation (Depreciation) | Variation Margin Receivable (Payable) |
JPY Currency Future - Short | 13 | September 16, 2024 | $(1,050,122 ) | $(1,022,531 ) | $27,591 | $325 |
EUR Currency Future - Short | 3 | September 16, 2024 | (404,636 ) | (403,200 ) | 1,436 | (244 ) |
CBT U.S. Ultra Bond - Short | 135 | September 19, 2024 | (16,571,702 ) | (16,921,406 ) | (349,704 ) | 223,594 |
CBT U.S. Long Bond - Short | 103 | September 19, 2024 | (12,004,509 ) | (12,186,188 ) | (181,679 ) | 103,000 |
$(30,030,969 ) | $(30,533,325 ) | $(502,356 ) | $326,675 | |||
Total Futures Contracts | $83,729,531 | $83,930,160 | $200,629 | $264,579 |
Exchange Traded Funds–99.3% | Shares | Value | |
BlackRock Ultra Short-Term Bond ETF | 68,041 | $3,438,792 | |
iShares Core MSCI EAFE ETF | 733,294 | 53,266,476 | |
iShares Core MSCI Emerging Markets ETF | 434,746 | 23,271,953 | |
iShares Core S&P 500 ETF | 268,048 | 146,683,907 | |
iShares Core U.S. Aggregate Bond ETF | 1,777,792 | 172,570,173 | |
iShares MSCI EAFE ETF | 171,847 | 13,460,776 | |
iShares MSCI Emerging Markets ETF | 115,281 | 4,909,818 | |
iShares Russell 1000 ETF | 205,454 | 61,130,783 | |
iShares Russell 1000 Value ETF | 56,553 | 9,866,802 | |
Total Exchange Traded Funds (Cost $392,289,815) | $488,599,480 | ||
Total Investments – 99.3% (Cost $392,289,815) | (a) | $488,599,480 | |
Other Assets in Excess of Liabilities – 0.7% | (b) | 3,582,548 | |
Net Assets – 100.0% | $492,182,028 | ||
Percentages are stated as a percent of net assets. |
Abbreviations: | ||
ETF: | Exchange Traded Fund | |
Footnotes: | ||
(a) | Represents cost for financial reporting purposes, which may differ from cost basis for federal income tax purposes. See also Note 7 of the Notes to Financial Statements. | |
(b) | Includes $2,344,669 of cash pledged as collateral for the futures contracts outstanding at June 30, 2024. See also the following Schedule of Open Futures Contracts. | |
Description | Number of contracts | Expiration Date | Notional Amount | Value | Unrealized Appreciation (Depreciation) | Variation Margin Receivable (Payable) |
AUD Currency Future - Long | 225 | September 16, 2024 | $14,976,590 | $15,036,750 | $60,160 | $47,250 |
EUR Currency Future - Long | 78 | September 16, 2024 | 10,520,045 | 10,483,200 | (36,845 ) | 6,338 |
CAD Currency Future - Long | 159 | September 17, 2024 | 11,600,357 | 11,638,800 | 38,443 | 4,770 |
MOD S&P TSX 60 Index - Long | 51 | September 19, 2024 | 9,697,966 | 9,770,915 | 72,949 | (41,636 ) |
CME E-mini S&P 500 Index - Long | 3 | September 20, 2024 | 825,438 | 828,225 | 2,787 | (3,675 ) |
EUX Euro Stoxx 50 Index - Long | 99 | September 20, 2024 | 5,199,237 | 5,222,747 | 23,510 | (12,703 ) |
MSCI EAFE Index - Long | 42 | September 20, 2024 | 4,898,825 | 4,920,720 | 21,895 | 6,720 |
MSCI Emerging Markets Index - Long | 86 | September 20, 2024 | 4,643,253 | 4,679,260 | 36,007 | 8,600 |
$62,361,711 | $62,580,617 | $218,906 | $15,664 |
Description | Number of contracts | Expiration Date | Notional Amount | Value | Unrealized Appreciation (Depreciation) | Variation Margin Receivable (Payable) |
CBT U.S. Ultra Bond - Short | 117 | September 19, 2024 | $(14,361,396 ) | $(14,665,219 ) | $(303,823 ) | $193,782 |
CBT U.S. Long Bond - Short | 85 | September 19, 2024 | (9,906,634 ) | (10,056,563 ) | (149,929 ) | 85,000 |
$(24,268,030 ) | $(24,721,782 ) | $(453,752 ) | $278,782 | |||
Total Futures Contracts | $38,093,681 | $37,858,835 | $(234,846 ) | $294,446 |
Exchange Traded Funds–98.6% | Shares | Value | |
BlackRock Ultra Short-Term Bond ETF | 201,578 | $10,187,752 | |
iShares Core MSCI EAFE ETF | 1,051,441 | 76,376,674 | |
iShares Core MSCI Emerging Markets ETF | 611,134 | 32,714,003 | |
iShares Core S&P 500 ETF | 339,689 | 185,888,012 | |
iShares Core U.S. Aggregate Bond ETF | 693,890 | 67,355,902 | |
iShares MSCI EAFE ETF | 107,703 | 8,436,376 | |
iShares MSCI Emerging Markets ETF | 94,839 | 4,039,193 | |
iShares Russell 1000 ETF | 164,834 | 49,044,708 | |
iShares Russell 1000 Value ETF | 45,759 | 7,983,573 | |
Total Exchange Traded Funds (Cost $333,166,650) | $442,026,193 | ||
Total Investments – 98.6% (Cost $333,166,650) | (a) | $442,026,193 | |
Other Assets in Excess of Liabilities – 1.4% | (b) | 6,218,496 | |
Net Assets – 100.0% | $448,244,689 | ||
Percentages are stated as a percent of net assets. |
Abbreviations: | ||
ETF: | Exchange Traded Fund | |
Footnotes: | ||
(a) | Represents cost for financial reporting purposes, which may differ from cost basis for federal income tax purposes. See also Note 7 of the Notes to Financial Statements. | |
(b) | Includes $2,790,814 of cash pledged as collateral for the futures contracts outstanding at June 30, 2024. See also the following Schedule of Open Futures Contracts. | |
Description | Number of contracts | Expiration Date | Notional Amount | Value | Unrealized Appreciation (Depreciation) | Variation Margin Receivable (Payable) |
AUD Currency Future - Long | 199 | September 16, 2024 | $13,245,961 | $13,299,170 | $53,209 | $41,790 |
EUR Currency Future - Long | 68 | September 16, 2024 | 9,171,321 | 9,139,200 | (32,121 ) | 5,525 |
CAD Currency Future - Long | 216 | September 17, 2024 | 15,758,978 | 15,811,203 | 52,225 | 6,480 |
MOD S&P TSX 60 Index - Long | 70 | September 19, 2024 | 13,310,934 | 13,411,060 | 100,126 | (57,147 ) |
CME E-mini S&P 500 Index - Long | 46 | September 20, 2024 | 12,656,719 | 12,699,450 | 42,731 | (56,350 ) |
EUX Euro Stoxx 50 Index - Long | 88 | September 20, 2024 | 4,621,672 | 4,642,442 | 20,770 | (11,291 ) |
MSCI EAFE Index - Long | 4 | September 20, 2024 | 466,555 | 468,640 | 2,085 | 640 |
MSCI Emerging Markets Index - Long | 28 | September 20, 2024 | 1,511,724 | 1,523,480 | 11,756 | 2,800 |
$70,743,864 | $70,994,645 | $250,781 | $(67,553 ) |
Description | Number of contracts | Expiration Date | Notional Amount | Value | Unrealized Appreciation (Depreciation) | Variation Margin Receivable (Payable) |
CBT U.S. Ultra Bond - Short | 105 | September 19, 2024 | $(12,888,390 ) | $(13,161,094 ) | $(272,704 ) | $173,906 |
CBT U.S. Long Bond - Short | 82 | September 19, 2024 | (9,556,988 ) | (9,701,625 ) | (144,637 ) | 82,000 |
$(22,445,378 ) | $(22,862,719 ) | $(417,341 ) | $255,906 | |||
Total Futures Contracts | $48,298,486 | $48,131,926 | $(166,560 ) | $188,353 |
Open-End Mutual Funds–37.1% | Shares | Value | |
AVIP AB Mid Cap Core Portfolio | 2,476,553 | $22,685,232 | |
AVIP AB Small Cap Portfolio | 2,895,829 | 24,585,587 | |
DFA Emerging Markets Portfolio Institutional | 64,403 | 1,895,382 | |
DFA International Core Equity Portfolio Institutional | 364,333 | 5,727,310 | |
PIMCO Low Duration Institutional | 17,173 | 1,884,259 | |
PIMCO Total Return Institutional | 1,441,938 | 13,236,989 | |
Total Open-End Mutual Funds | $70,014,759 | ||
Total Investments in Securities of Unaffiliated Issuers – 37.1% (Cost $77,152,199) | $70,014,759 | ||
Total Investments in Affiliates – 62.9% (Cost $112,670,699) (see schedule below) | 118,708,317 | ||
Liabilities in Excess of Other Assets – 0.0% | (84,494 ) | ||
Net Assets – 100.0% | $188,638,582 | ||
Percentages are stated as a percent of net assets. |
Affiliate | Value at January 1, 2024 | Cost of Purchases | Proceeds from Sales | Net Realized Gain (Loss) | Change in Unrealized Appreciation (Depreciation) | Income Distributions | Shares at June 30, 2024 | Value at June 30, 2024 | |
Open-End Mutual Funds – 62.9% | |||||||||
AVIP AB Mid Cap Core Portfolio | (a) | $1,965,298 | $94,211 | $271,864 | $(217,803 ) | $314,417 | $ — | 61,337 | $1,884,259 |
AVIP AB Relative Value Portfolio | (a) | 1,965,298 | 48,688 | 293,378 | 43,933 | 119,718 | — | 156,370 | 1,884,259 |
AVIP AB Small Cap Portfolio | (a) | 1,965,298 | 125,264 | 270,246 | 37,290 | 26,653 | — | 146,749 | 1,884,259 |
AVIP BlackRock Advantage International Equity Portfolio | (a) | 7,861,191 | 159,410 | 999,619 | 208,670 | 307,384 | — | 461,828 | 7,537,036 |
AVIP BlackRock Advantage Large Cap Core Portfolio | (a) | 3,930,595 | 103,753 | 889,047 | (77,544 ) | 700,761 | — | 100,307 | 3,768,518 |
AVIP BlackRock Advantage Large Cap Value Portfolio | (a) | 5,895,893 | 146,720 | 893,971 | 52,357 | 451,778 | — | 289,293 | 5,652,777 |
AVIP Bond Portfolio | (a) | 15,722,381 | 432,833 | 1,075,663 | (16,601 ) | 11,122 | — | 889,326 | 15,074,072 |
AVIP Federated Core Plus Bond Portfolio | (a) | 29,479,465 | 858,556 | 1,904,490 | (223,169 ) | 53,523 | — | 3,133,468 | 28,263,885 |
AVIP Federated High Income Bond Portfolio | (a) | 9,826,488 | 195,391 | 815,321 | 15,581 | 199,156 | — | 483,143 | 9,421,295 |
AVIP Nasdaq-100® Index Portfolio | (a) | 1,965,298 | 105,396 | 497,654 | 139,431 | 171,788 | — | 91,513 | 1,884,259 |
AVIP S&P 500® Index Portfolio | (a) | 27,514,167 | 602,608 | 5,562,525 | 1,749,108 | 2,076,268 | — | 590,280 | 26,379,626 |
AVIP S&P MidCap 400® Index Portfolio | (a) | 13,757,084 | 687,091 | 2,071,663 | (86,301 ) | 903,602 | — | 605,315 | 13,189,813 |
Fidelity Advisor® Real Estate I | (a) | 1,965,298 | 232,884 | 264,581 | (59,189 ) | 9,847 | 6,064 | 113,990 | 1,884,259 |
Total Open-End Mutual Funds | $1,565,763 | $5,346,017 | $6,064 | $118,708,317 |
Percentages are stated as a percent of net assets. |
Footnotes: | ||
(a) | Pursuant to Section 2(a)(3) of the Investment Company Act of 1940, the investment meets the definition of “affiliated person”, as the Portfolio directly or indirectly owns, controls, or holds with power to vote 5 percent or more of the outstanding voting securities of the holding at June 30, 2024. | |
Open-End Mutual Funds–31.1% | Shares | Value | |
AVIP AB Mid Cap Core Portfolio | 6,616,028 | $60,602,819 | |
AVIP AB Small Cap Portfolio | 8,033,699 | 68,206,108 | |
DFA Emerging Markets Portfolio Institutional | 516,157 | 15,190,501 | |
DFA International Core Equity Portfolio Institutional | 2,433,361 | 38,252,428 | |
PIMCO Low Duration Institutional | 137,632 | 15,101,029 | |
PIMCO Total Return Institutional | 4,127,257 | 37,888,214 | |
Total Open-End Mutual Funds | $235,241,099 | ||
Total Investments in Securities of Unaffiliated Issuers – 31.1% (Cost $252,180,719) | $235,241,099 | ||
Total Investments in Affiliates – 68.9% (Cost $465,716,368) (see schedule below) | 520,985,507 | ||
Liabilities in Excess of Other Assets – 0.0% | (269,984 ) | ||
Net Assets – 100.0% | $755,956,622 | ||
Percentages are stated as a percent of net assets. |
Affiliate | Value at January 1, 2024 | Cost of Purchases | Proceeds from Sales | Net Realized Gain (Loss) | Change in Unrealized Appreciation (Depreciation) | Income Distributions | Shares at June 30, 2024 | Value at June 30, 2024 | |
Open-End Mutual Funds – 68.9% | |||||||||
AVIP AB Mid Cap Core Portfolio | (a) | $7,761,879 | $178,376 | $771,896 | $(293,353 ) | $675,509 | $ — | 245,785 | $7,550,515 |
AVIP AB Relative Value Portfolio | (a) | 31,047,515 | 208,042 | 3,654,458 | 543,721 | 2,057,238 | — | 2,506,395 | 30,202,058 |
AVIP AB Small Cap Portfolio | (a) | 7,761,879 | 281,402 | 744,521 | (673,209 ) | 924,964 | — | 588,046 | 7,550,515 |
AVIP BlackRock Advantage International Equity Portfolio | (a) | 54,333,150 | 312,332 | 5,410,261 | 262,926 | 3,355,455 | — | 3,238,579 | 52,853,602 |
AVIP BlackRock Advantage Large Cap Core Portfolio | (a) | 15,523,757 | 35,757 | 2,946,260 | 213,220 | 2,274,555 | — | 401,944 | 15,101,029 |
AVIP BlackRock Advantage Large Cap Growth Portfolio | (a) | 7,761,879 | 90,630 | 1,737,268 | 492,331 | 942,943 | — | 684,543 | 7,550,515 |
AVIP BlackRock Advantage Large Cap Value Portfolio | (a) | 31,047,515 | 95,480 | 3,619,871 | 957,407 | 1,721,527 | — | 1,545,653 | 30,202,058 |
AVIP BlackRock Advantage Small Cap Growth Portfolio | (a) | 15,523,757 | 663,963 | 1,822,791 | (90,476 ) | 826,576 | — | 649,786 | 15,101,029 |
AVIP Bond Portfolio | (a) | 46,571,272 | 1,772,292 | 3,028,689 | (106,422 ) | 94,634 | — | 2,672,748 | 45,303,087 |
AVIP Federated Core Plus Bond Portfolio | (a) | 77,618,786 | 3,243,840 | 4,912,596 | (588,560 ) | 143,676 | — | 8,370,859 | 75,505,146 |
AVIP Federated High Income Bond Portfolio | (a) | 23,285,636 | 704,185 | 1,855,828 | 72,551 | 445,000 | — | 1,161,618 | 22,651,544 |
AVIP Nasdaq-100® Index Portfolio | (a) | 7,761,879 | 145,925 | 1,597,513 | (516,369 ) | 1,756,593 | — | 366,708 | 7,550,515 |
AVIP S&P 500® Index Portfolio | (a) | 124,190,058 | 155,015 | 20,974,804 | 6,556,938 | 10,881,026 | — | 2,703,250 | 120,808,233 |
AVIP S&P MidCap 400® Index Portfolio | (a) | 77,618,786 | 2,083,402 | 8,854,965 | 1,636,089 | 3,021,834 | — | 3,465,128 | 75,505,146 |
Fidelity Advisor® Real Estate I | (a) | 7,761,879 | 815,335 | 821,741 | (316,845 ) | 111,887 | 24,313 | 456,776 | 7,550,515 |
Total Open-End Mutual Funds | $8,149,949 | $29,233,417 | $24,313 | $520,985,507 |
Percentages are stated as a percent of net assets. |
Footnotes: | ||
(a) | Pursuant to Section 2(a)(3) of the Investment Company Act of 1940, the investment meets the definition of “affiliated person”, as the Portfolio directly or indirectly owns, controls, or holds with power to vote 5 percent or more of the outstanding voting securities of the holding at June 30, 2024. | |
Open-End Mutual Funds–22.1% | Shares | Value | |
AVIP AB Mid Cap Core Portfolio | 4,753,375 | $43,540,917 | |
AVIP AB Small Cap Portfolio | 8,550,974 | 72,597,771 | |
DFA Emerging Markets Portfolio Institutional | 988,913 | 29,103,699 | |
DFA International Core Equity Portfolio Institutional | 6,526,627 | 102,598,568 | |
PIMCO Low Duration Institutional | 263,694 | 28,932,475 | |
PIMCO Total Return Institutional | 4,744,438 | 43,553,944 | |
Total Open-End Mutual Funds | $320,327,374 | ||
Total Investments in Securities of Unaffiliated Issuers – 22.1% (Cost $321,937,817) | $320,327,374 | ||
Total Investments in Affiliates – 77.9% (Cost $991,436,168) (see schedule below) | 1,128,366,528 | ||
Liabilities in Excess of Other Assets – 0.0% | (494,216 ) | ||
Net Assets – 100.0% | $1,448,199,686 | ||
Percentages are stated as a percent of net assets. |
Affiliate | Value at January 1, 2024 | Cost of Purchases | Proceeds from Sales | Net Realized Gain (Loss) | Change in Unrealized Appreciation (Depreciation) | Income Distributions | Shares at June 30, 2024 | Value at June 30, 2024 | |
Open-End Mutual Funds – 77.9% | |||||||||
AVIP AB Mid Cap Core Portfolio | (a) | $14,811,234 | $249,265 | $1,318,687 | $(478,514 ) | $1,202,940 | $ — | 470,906 | $14,466,238 |
AVIP AB Relative Value Portfolio | (a) | 74,056,170 | 372,780 | 8,302,066 | 1,230,261 | 4,974,043 | — | 6,002,588 | 72,331,188 |
AVIP AB Small Cap Portfolio | (a) | 29,622,468 | 944,668 | 2,584,479 | (5,766,916 ) | 6,716,734 | — | 2,253,308 | 28,932,475 |
AVIP BlackRock Advantage International Equity Portfolio | (a) | 118,489,871 | 1,345,860 | 11,994,186 | 586,323 | 7,302,032 | — | 7,091,293 | 115,729,900 |
AVIP BlackRock Advantage Large Cap Core Portfolio | (a) | 59,244,936 | 73,220 | 10,949,408 | 1,406,278 | 8,089,924 | — | 1,540,190 | 57,864,950 |
AVIP BlackRock Advantage Large Cap Growth Portfolio | (a) | 29,622,468 | 327,046 | 6,495,399 | 1,835,677 | 3,642,683 | — | 2,623,071 | 28,932,475 |
AVIP BlackRock Advantage Large Cap Value Portfolio | (a) | 88,867,403 | 187,082 | 9,924,753 | 1,710,590 | 5,957,103 | — | 4,442,038 | 86,797,425 |
AVIP BlackRock Advantage Small Cap Growth Portfolio | (a) | 44,433,702 | 1,630,927 | 4,759,333 | (1,086,140 ) | 3,179,557 | — | 1,867,415 | 43,398,713 |
AVIP Bond Portfolio | (a) | 59,244,936 | 2,819,384 | 4,181,534 | (467,563 ) | 449,727 | — | 3,413,861 | 57,864,950 |
AVIP Federated Core Plus Bond Portfolio | (a) | 103,678,637 | 5,290,766 | 7,104,644 | (859,365 ) | 258,269 | — | 11,226,570 | 101,263,663 |
AVIP Federated High Income Bond Portfolio | (a) | 29,622,468 | 1,160,566 | 2,508,659 | 90,117 | 567,983 | — | 1,483,717 | 28,932,475 |
AVIP Nasdaq-100® Index Portfolio | (a) | 29,622,468 | 436,575 | 5,855,573 | (2,139,881 ) | 6,868,886 | — | 1,405,171 | 28,932,475 |
AVIP S&P 500® Index Portfolio | (a) | 281,413,444 | — | 46,058,031 | 12,516,512 | 26,986,588 | — | 6,150,336 | 274,858,513 |
AVIP S&P MidCap 400® Index Portfolio | (a) | 177,734,807 | 3,973,838 | 18,731,031 | 3,451,276 | 7,165,960 | — | 7,966,721 | 173,594,850 |
Fidelity Advisor® Real Estate I | (a) | 14,811,234 | 1,468,219 | 1,416,248 | (402,854 ) | 5,887 | 46,439 | 875,151 | 14,466,238 |
Total Open-End Mutual Funds | $11,625,801 | $83,368,316 | $46,439 | $1,128,366,528 |
Percentages are stated as a percent of net assets. |
Footnotes: | ||
(a) | Pursuant to Section 2(a)(3) of the Investment Company Act of 1940, the investment meets the definition of “affiliated person”, as the Portfolio directly or indirectly owns, controls, or holds with power to vote 5 percent or more of the outstanding voting securities of the holding at June 30, 2024. | |
Open-End Mutual Funds–17.1% | Shares | Value | |
AVIP AB Mid Cap Core Portfolio | 379,108 | $3,472,630 | |
AVIP AB Small Cap Portfolio | 818,389 | 6,948,122 | |
DFA Emerging Markets Portfolio Institutional | 354,924 | 10,445,430 | |
DFA International Core Equity Portfolio Institutional | 2,007,759 | 31,561,964 | |
PIMCO Low Duration Institutional | 63,093 | 6,922,598 | |
Total Open-End Mutual Funds | $59,350,744 | ||
Total Investments in Securities of Unaffiliated Issuers – 17.1% (Cost $55,549,259) | $59,350,744 | ||
Total Investments in Affiliates – 82.9% (Cost $250,757,879) (see schedule below) | 287,287,816 | ||
Liabilities in Excess of Other Assets – 0.0% | (135,737 ) | ||
Net Assets – 100.0% | $346,502,823 | ||
Percentages are stated as a percent of net assets. |
Affiliate | Value at January 1, 2024 | Cost of Purchases | Proceeds from Sales | Net Realized Gain (Loss) | Change in Unrealized Appreciation (Depreciation) | Income Distributions | Shares at June 30, 2024 | Value at June 30, 2024 | |
Open-End Mutual Funds – 82.9% | |||||||||
AVIP AB Mid Cap Core Portfolio | (a) | $3,432,499 | $70,255 | $207,890 | $(76,081 ) | $242,516 | $ — | 112,672 | $3,461,299 |
AVIP AB Relative Value Portfolio | (a) | 20,594,996 | 42,118 | 1,594,631 | 223,140 | 1,502,171 | — | 1,723,468 | 20,767,794 |
AVIP AB Small Cap Portfolio | (a) | 10,297,498 | 361,517 | 599,845 | (1,431,714 ) | 1,756,441 | — | 808,715 | 10,383,897 |
AVIP BlackRock Advantage International Equity Portfolio | (a) | 37,757,493 | 749,604 | 2,955,814 | 127,773 | 2,395,233 | — | 2,332,983 | 38,074,289 |
AVIP BlackRock Advantage Large Cap Core Portfolio | (a) | 20,594,996 | 2,745 | 3,167,072 | 215,134 | 3,121,991 | — | 552,776 | 20,767,794 |
AVIP BlackRock Advantage Large Cap Growth Portfolio | (a) | 6,864,999 | 119,683 | 1,348,878 | 381,907 | 904,887 | — | 627,615 | 6,922,598 |
AVIP BlackRock Advantage Large Cap Value Portfolio | (a) | 24,027,495 | 147,433 | 2,025,921 | 159,001 | 1,921,085 | — | 1,239,974 | 24,229,093 |
AVIP BlackRock Advantage Small Cap Growth Portfolio | (a) | 13,729,997 | 487,972 | 1,011,341 | (235,637 ) | 874,205 | — | 595,749 | 13,845,196 |
AVIP Bond Portfolio | (a) | 6,864,999 | 550,694 | 492,543 | (70,932 ) | 70,380 | — | 408,413 | 6,922,598 |
AVIP Federated Core Plus Bond Portfolio | (a) | 10,297,498 | 861,648 | 718,010 | (44,727 ) | (12,512 ) | — | 1,151,208 | 10,383,897 |
AVIP Federated High Income Bond Portfolio | (a) | 3,432,499 | 243,736 | 292,884 | (1,276 ) | 79,224 | — | 177,503 | 3,461,299 |
AVIP Nasdaq-100® Index Portfolio | (a) | 10,297,498 | 263,964 | 1,847,223 | (673,347 ) | 2,343,005 | — | 504,317 | 10,383,897 |
AVIP S&P 500® Index Portfolio | (a) | 65,217,487 | 6,722 | 8,709,321 | 2,396,299 | 6,853,493 | — | 1,471,575 | 65,764,680 |
AVIP S&P MidCap 400® Index Portfolio | (a) | 48,054,991 | 1,171,933 | 3,629,486 | 668,161 | 2,192,587 | — | 2,223,873 | 48,458,186 |
Fidelity Advisor® Real Estate I | (a) | 3,432,499 | 388,100 | 267,158 | (81,450 ) | (10,692 ) | 11,079 | 209,395 | 3,461,299 |
Total Open-End Mutual Funds | $1,556,251 | $24,234,014 | $11,079 | $287,287,816 |
Percentages are stated as a percent of net assets. |
Footnotes: | ||
(a) | Pursuant to Section 2(a)(3) of the Investment Company Act of 1940, the investment meets the definition of “affiliated person”, as the Portfolio directly or indirectly owns, controls, or holds with power to vote 5 percent or more of the outstanding voting securities of the holding at June 30, 2024. | |
AVIP Bond Portfolio | AVIP BlackRock Balanced Allocation Portfolio | AVIP BlackRock Advantage International Equity Portfolio | AVIP Fidelity Institutional AM® Equity Growth Portfolio | AVIP AB Small Cap Portfolio | AVIP AB Mid Cap Core Portfolio | AVIP S&P 500® Index Portfolio | AVIP BlackRock Advantage Large Cap Value Portfolio | AVIP Federated High Income Bond Portfolio | |
Assets: | |||||||||
Investments in securities of unaffiliated issuers, at value* | $209,825,841 | $409,917,739 | $338,912,495 | $129,651,607 | $111,743,796 | $77,920,517 | $1,206,659,680 | $194,450,664 | $116,899,638 |
Cash | 5,678,571 | 3,858,590 | 6,992,781 | 1,412,158 | 523,817 | 551,829 | 2,480,689 | 2,793,192 | 2,926,404 |
Cash subject to usage restrictions | — | 188,800 | 233,220 | — | — | — | 288,349 | 142,780 | — |
Foreign currencies, at value | — | — | 366,303 | 48,917 | — | 2,386 | — | 173 | — |
Receivable for securities sold | 419,744 | 6,018,633 | 10,921,804 | 142,731 | 989,265 | 4,010,105 | 9,981,236 | 5,071,691 | 180,042 |
Receivable for fund shares sold | 29,484 | 342,227 | 1,808,775 | 6,475 | 151,765 | 67,244 | 101,903 | 6,680 | 10,841 |
Receivable for variation margin on futures contracts | — | — | 9,120 | — | — | — | — | — | — |
Dividends and accrued interest receivable | 2,475,323 | 1,149,824 | 343,705 | 25,846 | 60,250 | 62,172 | 625,221 | 178,203 | 2,060,526 |
Foreign tax reclaim receivable | — | — | 1,686,031 | 726 | — | — | — | 124,190 | — |
Prepaid expenses and other assets | 2,602 | 5,008 | 4,777 | 2,137 | 2,056 | 1,460 | 15,739 | 2,810 | 1,334 |
Total assets | 218,431,565 | 421,480,821 | 361,279,011 | 131,290,597 | 113,470,949 | 82,615,713 | 1,220,152,817 | 202,770,383 | 122,078,785 |
Liabilities: | |||||||||
Payable for securities purchased | — | 5,170,148 | 11,145,817 | 276,773 | 640,886 | 4,219,361 | — | 5,141,064 | 350,000 |
Payable for fund shares redeemed | 354,911 | 347,342 | 59,428 | 58,823 | 71,195 | 24,543 | 7,043,969 | 647,137 | 676,813 |
Payable for investment management services | 98,391 | 170,305 | 204,178 | 71,492 | 67,219 | 45,858 | 338,442 | 108,736 | 72,973 |
Payable for variation margin on futures contracts | — | 20,820 | — | — | — | — | 20,296 | 14,317 | — |
Accrued custody expense | 959 | 9,045 | 52,482 | 5,203 | 9,265 | 8,832 | 15,394 | 2,964 | 918 |
Accrued professional fees | 8,149 | 8,225 | 8,202 | 8,109 | 8,105 | 8,091 | 8,542 | 8,139 | 8,109 |
Accrued accounting fees | 7,558 | 13,135 | 10,052 | 3,545 | 4,586 | 4,199 | 26,135 | 5,289 | 11,515 |
Accrued administration fees | 8,378 | 8,148 | 17,894 | 7,988 | 8,304 | 8,648 | 8,669 | 8,564 | 8,453 |
Other liabilities | 2,687 | 4,313 | 3,797 | 1,892 | 1,818 | 1,526 | 10,929 | 2,547 | 2,142 |
Withholding tax payable | — | — | 5,864 | 3,176 | 74 | — | 1,049 | — | — |
Total liabilities | 481,033 | 5,751,481 | 11,507,714 | 437,001 | 811,452 | 4,321,058 | 7,473,425 | 5,938,757 | 1,130,923 |
Net assets | $217,950,532 | $415,729,340 | $349,771,297 | $130,853,596 | $112,659,497 | $78,294,655 | $1,212,679,392 | $196,831,626 | $120,947,862 |
Net assets consist of: | |||||||||
Paid in capital | 232,417,923 | 319,126,154 | 323,576,063 | 81,878,071 | 125,112,897 | 78,030,015 | 516,013,984 | 163,174,337 | 134,591,477 |
Total distributable earnings | (14,467,391 ) | 96,603,186 | 26,195,234 | 48,975,525 | (12,453,400 ) | 264,640 | 696,665,408 | 33,657,289 | (13,643,615 ) |
Net assets | $217,950,532 | $415,729,340 | $349,771,297 | $130,853,596 | $112,659,497 | $78,294,655 | $1,212,679,392 | $196,831,626 | $120,947,862 |
*Investments in securities of unaffiliated issuers, at cost | $231,817,644 | $350,853,488 | $304,664,481 | $102,269,108 | $104,533,641 | $74,231,589 | $675,756,850 | $180,371,067 | $122,717,574 |
Foreign currencies, at cost | $ — | $ — | $363,404 | $48,953 | $ — | $2,230 | $ — | $178 | $ — |
Shares outstanding, par value, $1 per share | 12,859,246 | 11,323,474 | 21,426,847 | 70,514,479 | 8,775,631 | 2,549,069 | 27,132,339 | 10,075,429 | 6,203,277 |
Authorized Fund shares allocated to Portfolio | 22,000,000 | 20,000,000 | 35,000,000 | 134,000,000 | 17,000,000 | 6,000,000 | 50,000,000 | 21,000,000 | 13,000,000 |
Net asset value per share | $16.95 | $36.71 | $16.32 | $1.86 | $12.84 | $30.72 | $44.69 | $19.54 | $19.50 |
AVIP Nasdaq-100® Index Portfolio | AVIP BlackRock Advantage Large Cap Core Portfolio | AVIP BlackRock Advantage Small Cap Growth Portfolio | AVIP S&P MidCap 400® Index Portfolio | AVIP BlackRock Advantage Large Cap Growth Portfolio | AVIP AB Risk Managed Balanced Portfolio | AVIP Federated Core Plus Bond Portfolio | AVIP Intech U.S. Low Volatility Portfolio | AVIP AB Relative Value Portfolio | |
Assets: | |||||||||
Investments in securities of unaffiliated issuers, at value* | $272,978,385 | $337,448,552 | $135,281,753 | $521,239,394 | $497,810,766 | $1,397,676,434 | $556,954,200 | $660,561,142 | $122,205,021 |
Cash | 1,792,983 | 4,200,275 | 2,326,918 | 3,935,789 | 3,835,039 | 21,169,225 | 5,034,054 | 5,547,889 | 3,340,053 |
Cash subject to usage restrictions | — | 188,800 | 110,500 | 104,159 | 194,700 | — | — | — | — |
Receivable for securities sold | — | 5,844,120 | 15,062,049 | 1,111,516 | 70,643,942 | 47,089 | 2,033,420 | — | 121,225 |
Receivable for fund shares sold | 30,273 | 41,824 | 58,232 | 2,425,584 | 3,605 | 27,602 | 34,044 | 28,558 | — |
Receivable for variation margin on futures contracts | — | — | — | 6,112 | — | — | 213,102 | — | — |
Dividends and accrued interest receivable | 41,726 | 155,549 | 26,161 | 500,988 | 91,911 | 5,313,700 | 4,134,617 | 528,434 | 103,369 |
Foreign tax reclaim receivable | — | — | — | — | — | — | 1,127 | — | 39,701 |
Prepaid expenses and other assets | 3,728 | 4,627 | 2,036 | 7,122 | 6,475 | 16,879 | 7,227 | 9,342 | 2,028 |
Total assets | 274,847,095 | 347,883,747 | 152,867,649 | 529,330,664 | 572,586,438 | 1,424,250,929 | 568,411,791 | 666,675,365 | 125,811,397 |
Liabilities: | |||||||||
Payable for securities purchased | — | 5,191,491 | 15,739,995 | — | 67,971,983 | 61,518,559 | 1,816,850 | — | — |
Payable for fund shares redeemed | 1,255,671 | 1,635,125 | 173,354 | 184,258 | 1,355,506 | 605,016 | 857,505 | 622,634 | 489,251 |
Payable for investment management services | 82,328 | 179,480 | 86,432 | 150,933 | 270,038 | 882,751 | 236,426 | 312,869 | 66,141 |
Payable for variation margin on futures contracts | 11,225 | 21,435 | 4,925 | — | 29,278 | 1,535,862 | — | — | — |
Accrued custody expense | 4,627 | 3,856 | 3,168 | 13,953 | 4,505 | 16,292 | 4,608 | 2,905 | 2,450 |
Accrued professional fees | 8,165 | 8,193 | 8,114 | 8,275 | 8,250 | 10,043 | 9,735 | 8,330 | 8,110 |
Accrued accounting fees | 6,137 | 7,324 | 4,719 | 13,694 | 9,778 | 39,114 | 26,637 | 13,676 | 3,118 |
Accrued administration fees | 8,268 | 8,509 | 8,400 | 8,210 | 8,405 | 8,202 | 8,356 | 7,975 | 8,318 |
Other liabilities | 3,055 | 3,683 | 2,036 | 5,461 | 4,860 | 12,215 | 5,578 | 6,536 | 1,918 |
Withholding tax payable | 727 | — | — | — | — | 169 | — | — | 1,568 |
Total liabilities | 1,380,203 | 7,059,096 | 16,031,143 | 384,784 | 69,662,603 | 64,628,223 | 2,965,695 | 974,925 | 580,874 |
Net assets | $273,466,892 | $340,824,651 | $136,836,506 | $528,945,880 | $502,923,835 | $1,359,622,706 | $565,446,096 | $665,700,440 | $125,230,523 |
Net assets consist of: | |||||||||
Paid in capital | 86,905,474 | 224,557,947 | 141,090,565 | 405,576,796 | 278,154,745 | 1,178,795,334 | 645,894,295 | 553,280,564 | 102,192,814 |
Total distributable earnings | 186,561,418 | 116,266,704 | (4,254,059 ) | 123,369,084 | 224,769,090 | 180,827,372 | (80,448,199 ) | 112,419,876 | 23,037,709 |
Net assets | $273,466,892 | $340,824,651 | $136,836,506 | $528,945,880 | $502,923,835 | $1,359,622,706 | $565,446,096 | $665,700,440 | $125,230,523 |
*Investments in securities of unaffiliated issuers, at cost | $154,902,780 | $258,871,553 | $136,972,186 | $444,543,704 | $400,198,671 | $1,246,388,103 | $610,105,200 | $579,363,535 | $103,445,611 |
Shares outstanding, par value, $1 per share | 13,279,057 | 9,070,613 | 5,887,600 | 24,270,065 | 45,575,409 | 89,391,373 | 62,674,367 | 57,395,778 | 10,388,821 |
Authorized Fund shares allocated to Portfolio | 27,000,000 | 19,000,000 | 12,000,000 | 41,000,000 | 82,000,000 | 170,000,000 | 115,000,000 | 105,000,000 | 20,000,000 |
Net asset value per share | $20.59 | $37.57 | $23.24 | $21.79 | $11.03 | $15.21 | $9.02 | $11.60 | $12.05 |
AVIP iShares Managed Risk Balanced Portfolio | AVIP iShares Managed Risk Moderate Growth Portfolio | AVIP iShares Managed Risk Growth Portfolio | AVIP Moderately Conservative Model Portfolio | AVIP Balanced Model Portfolio | AVIP Moderate Growth Model Portfolio | AVIP Growth Model Portfolio | |
Assets: | |||||||
Investments in securities of unaffiliated issuers, at value* | $556,960,312 | $488,599,480 | $442,026,193 | $70,014,759 | $235,241,099 | $320,327,374 | $59,350,744 |
Investments in affiliates, at value** | — | — | — | 118,708,317 | 520,985,507 | 1,128,366,528 | 287,287,816 |
Cash | 3,085,307 | 1,182,359 | 1,347,845 | — | — | — | — |
Cash subject to usage restrictions | 3,384,856 | 2,344,669 | 2,790,814 | — | — | — | — |
Foreign currencies, at value | 233,732 | 180,684 | 574,678 | — | — | — | — |
Receivable for securities sold | 5,181,026 | — | 1,800,310 | 600,208 | 4,195,048 | 7,067,402 | 2,309,554 |
Receivable for fund shares sold | 14,217 | 6,752 | 1,460 | 267 | 6,794 | 161,271 | 420 |
Receivable for variation margin on futures contracts | 264,579 | 294,446 | 188,353 | — | — | — | — |
Dividends and accrued interest receivable | — | — | — | 250,085 | 1,040,101 | 1,916,832 | 509,232 |
Prepaid expenses and other assets | 7,998 | 6,667 | 6,029 | 3,068 | 10,701 | 19,584 | 4,763 |
Total assets | 569,132,027 | 492,615,057 | 448,735,682 | 189,576,704 | 761,479,250 | 1,457,858,991 | 349,462,529 |
Liabilities: | |||||||
Cash overdraft | — | — | — | 117,167 | 314,536 | 253,555 | 36,855 |
Payable for securities purchased | — | — | — | 490,684 | 2,756,383 | 8,528,922 | 2,725,692 |
Payable for fund shares redeemed | 390,150 | 181,756 | 260,138 | 242,728 | 2,171,079 | 363,077 | 56,663 |
Payable for investment management services | 257,690 | 222,842 | 202,479 | 62,141 | 249,991 | 476,951 | 113,863 |
Accrued custody expense | 4,692 | 4,009 | 4,356 | 2,987 | 3,124 | 3,096 | 2,830 |
Accrued professional fees | 7,123 | 7,091 | 7,071 | 6,967 | 7,201 | 7,481 | 7,030 |
Accrued accounting fees | 4,147 | 4,471 | 4,482 | 3,848 | 3,856 | 3,856 | 3,852 |
Accrued administration fees | 7,882 | 7,879 | 7,879 | 9,171 | 9,171 | 9,171 | 9,171 |
Other liabilities | 5,647 | 4,981 | 4,588 | 2,429 | 7,287 | 13,196 | 3,750 |
Total liabilities | 677,331 | 433,029 | 490,993 | 938,122 | 5,522,628 | 9,659,305 | 2,959,706 |
Net assets | $568,454,696 | $492,182,028 | $448,244,689 | $188,638,582 | $755,956,622 | $1,448,199,686 | $346,502,823 |
Net assets consist of: | |||||||
Paid in capital | 510,843,638 | 361,778,121 | 307,465,870 | 188,089,215 | 717,304,093 | 1,348,713,621 | 320,618,838 |
Total distributable earnings | 57,611,058 | 130,403,907 | 140,778,819 | 549,367 | 38,652,529 | 99,486,065 | 25,883,985 |
Net assets | $568,454,696 | $492,182,028 | $448,244,689 | $188,638,582 | $755,956,622 | $1,448,199,686 | $346,502,823 |
*Investments in securities of unaffiliated issuers, at cost | $499,439,255 | $392,289,815 | $333,166,650 | $77,152,199 | $252,180,719 | $321,937,817 | $55,549,259 |
**Investments in affiliates, at cost | $ — | $ — | $ — | $112,670,699 | $465,716,368 | $991,436,168 | $250,757,879 |
Foreign currencies, at cost | $234,639 | $202,751 | $599,231 | $ — | $ — | $ — | $ — |
Shares outstanding, par value, $1 per share | 56,162,907 | 37,298,310 | 32,220,193 | 17,064,889 | 67,022,172 | 124,531,289 | 29,063,610 |
Authorized Fund shares allocated to Portfolio | 123,000,000 | 70,000,000 | 65,000,000 | 28,000,000 | 107,000,000 | 200,000,000 | 48,000,000 |
Net asset value per share | $10.12 | $13.20 | $13.91 | $11.05 | $11.28 | $11.63 | $11.92 |
AVIP Bond Portfolio | AVIP BlackRock Balanced Allocation Portfolio | AVIP BlackRock Advantage International Equity Portfolio | AVIP Fidelity Institutional AM® Equity Growth Portfolio | AVIP AB Small Cap Portfolio | AVIP AB Mid Cap Core Portfolio | AVIP S&P 500® Index Portfolio | AVIP BlackRock Advantage Large Cap Value Portfolio | AVIP Federated High Income Bond Portfolio | |
Investment income: | |||||||||
Interest | $4,726,438 | $2,004,728 | $157,143 | $14,813 | $17,310 | $13,716 | $151,620 | $67,541 | $3,946,592 |
Dividends from unaffiliated issuers, net of taxes withheld* | — | 2,039,031 | 6,452,271 | 297,537 | 565,734 | 513,524 | 8,486,047 | 2,108,844 | — |
Total investment income | 4,726,438 | 4,043,759 | 6,609,414 | 312,350 | 583,044 | 527,240 | 8,637,667 | 2,176,385 | 3,946,592 |
Expenses: | |||||||||
Management fees | 600,688 | 1,029,878 | 1,250,908 | 419,661 | 415,727 | 282,975 | 2,027,301 | 666,920 | 447,345 |
Custodian fees | 2,857 | 37,481 | 143,578 | 18,009 | 29,733 | 27,126 | 45,828 | 8,628 | 2,722 |
Directors' fees | 8,512 | 15,899 | 13,550 | 4,737 | 4,356 | 3,033 | 45,997 | 7,682 | 4,756 |
Professional fees | 10,788 | 12,096 | 11,704 | 10,129 | 10,072 | 9,828 | 17,489 | 10,649 | 10,118 |
Accounting fees | 22,751 | 39,897 | 32,833 | 10,768 | 13,852 | 12,595 | 79,749 | 16,090 | 34,612 |
Administration fees | 14,413 | 17,125 | 26,777 | 10,816 | 12,572 | 12,485 | 17,490 | 12,412 | 12,943 |
Printing and filing fees | 8,047 | 10,127 | 8,463 | 6,200 | 5,736 | 5,645 | 17,533 | 6,843 | 7,568 |
Compliance expense | 5,130 | 5,130 | 5,130 | 5,130 | 5,130 | 5,130 | 5,130 | 5,130 | 5,130 |
Other | 2,638 | 6,055 | 5,303 | 1,269 | 1,712 | 1,179 | 16,874 | 2,925 | 1,495 |
Total expenses | 675,824 | 1,173,688 | 1,498,246 | 486,719 | 498,890 | 359,996 | 2,273,391 | 737,279 | 526,689 |
Net investment income (loss) | 4,050,614 | 2,870,071 | 5,111,168 | (174,369 ) | 84,154 | 167,244 | 6,364,276 | 1,439,106 | 3,419,903 |
Realized/unrealized gain (loss) on investments, futures contracts, and foreign currency related transactions: | |||||||||
Net realized gain (loss) on: | |||||||||
Investments in securities of unaffiliated issuers | (998,898 ) | 23,342,083 | 16,112,945 | 13,781,965 | 6,442,550 | 5,407,362 | 72,550,579 | 11,918,589 | (1,852,800 ) |
Futures contracts | — | 551,544 | 267,292 | — | — | — | 884,962 | 359,945 | — |
Foreign currency related transactions | — | — | (52,524 ) | (2,206 ) | — | — | — | (1 ) | — |
Change in unrealized appreciation/depreciation on: | |||||||||
Investments in securities of unaffiliated issuers | (3,079,529 ) | 23,015,732 | 2,617,410 | 12,786,345 | (2,984,036 ) | (1,785,145 ) | 89,533,212 | 3,640,015 | 1,156,403 |
Futures contracts | — | (97,709 ) | (170,328 ) | — | — | — | (44,366 ) | (74,430 ) | — |
Foreign currency related transactions | — | — | (81,215 ) | (464 ) | — | (73 ) | — | (3,828 ) | — |
Net realized/unrealized gain (loss) on investments, futures contracts, and foreign currency related transactions | (4,078,427 ) | 46,811,650 | 18,693,580 | 26,565,640 | 3,458,514 | 3,622,144 | 162,924,387 | 15,840,290 | (696,397 ) |
Change in net assets from operations | $(27,813 ) | $49,681,721 | $23,804,748 | $26,391,271 | $3,542,668 | $3,789,388 | $169,288,663 | $17,279,396 | $2,723,506 |
*Taxes withheld | $ — | $ — | $694,341 | $12,600 | $437 | $573 | $2,150 | $173 | $ — |
AVIP Nasdaq-100® Index Portfolio | AVIP BlackRock Advantage Large Cap Core Portfolio | AVIP BlackRock Advantage Small Cap Growth Portfolio | AVIP S&P MidCap 400® Index Portfolio | AVIP BlackRock Advantage Large Cap Growth Portfolio | AVIP AB Risk Managed Balanced Portfolio | AVIP Federated Core Plus Bond Portfolio | AVIP Intech U.S. Low Volatility Portfolio | AVIP AB Relative Value Portfolio | |
Investment income: | |||||||||
Interest | $42,208 | $108,517 | $55,710 | $68,973 | $153,548 | $14,021,108 | $9,585,553 | $116,322 | $86,790 |
Dividends from unaffiliated issuers, net of taxes withheld* | 1,117,271 | 2,238,137 | 450,049 | 4,227,779 | 1,843,563 | 6,085,566 | 1,519,903 | 5,710,254 | 1,148,421 |
Total investment income | 1,159,479 | 2,346,654 | 505,759 | 4,296,752 | 1,997,111 | 20,106,674 | 11,105,456 | 5,826,576 | 1,235,211 |
Expenses: | |||||||||
Management fees | 487,933 | 1,072,464 | 533,134 | 933,542 | 1,597,705 | 5,371,593 | 1,440,299 | 1,915,237 | 405,816 |
Custodian fees | 13,771 | 11,565 | 9,834 | 47,885 | 13,622 | 50,546 | 14,123 | 8,591 | 7,856 |
Directors' fees | 10,102 | 12,854 | 5,277 | 20,573 | 18,476 | 52,295 | 22,022 | 26,055 | 4,876 |
Professional fees | 11,096 | 11,570 | 10,240 | 12,993 | 12,572 | 20,008 | 14,619 | 13,877 | 10,151 |
Accounting fees | 18,901 | 22,487 | 14,489 | 41,413 | 30,262 | 119,225 | 80,086 | 41,840 | 9,484 |
Administration fees | 12,127 | 12,849 | 11,652 | 13,596 | 13,011 | 32,224 | 19,649 | 12,883 | 11,435 |
Printing and filing fees | 7,208 | 8,003 | 6,185 | 10,519 | 9,516 | 21,557 | 12,480 | 11,728 | 5,767 |
Compliance expense | 5,130 | 5,130 | 5,130 | 5,130 | 5,130 | 5,130 | 5,130 | 5,130 | 5,130 |
Other | 3,706 | 4,768 | 2,036 | 6,826 | 6,519 | 50,871 | 7,103 | 10,328 | 1,883 |
Total expenses | 569,974 | 1,161,690 | 597,977 | 1,092,477 | 1,706,813 | 5,723,449 | 1,615,511 | 2,045,669 | 462,398 |
Net investment income (loss) | 589,505 | 1,184,964 | (92,218 ) | 3,204,275 | 290,298 | 14,383,225 | 9,489,945 | 3,780,907 | 772,813 |
Realized/unrealized gain (loss) on investments and futures contracts: | |||||||||
Net realized gain (loss) on: | |||||||||
Investments in securities of unaffiliated issuers | 17,999,160 | 27,315,911 | 7,833,102 | 28,027,590 | 78,266,096 | 40,280,697 | (5,033,976 ) | 28,642,571 | 5,315,681 |
Futures contracts | 264,490 | 628,607 | 40,666 | 132,379 | 1,121,471 | 10,149,444 | (1,511,792 ) | — | — |
Change in unrealized appreciation/depreciation on: | |||||||||
Investments in securities of unaffiliated issuers | 23,717,545 | 25,014,578 | (1,400,333 ) | 660,175 | 10,609,952 | 51,343,107 | (5,661,488 ) | 34,112,019 | 4,577,979 |
Futures contracts | (547 ) | (139,231 ) | 19,583 | 43,214 | (207,247 ) | (22,077,901 ) | (410,600 ) | — | — |
Net realized/unrealized gain (loss) on investments and futures contracts | 41,980,648 | 52,819,865 | 6,493,018 | 28,863,358 | 89,790,272 | 79,695,347 | (12,617,856 ) | 62,754,590 | 9,893,660 |
Change in net assets from operations | $42,570,153 | $54,004,829 | $6,400,800 | $32,067,633 | $90,080,570 | $94,078,572 | $(3,127,911 ) | $66,535,497 | $10,666,473 |
*Taxes withheld | $2,367 | $ — | $331 | $ — | $ — | $6,688 | $ — | $ — | $16,092 |
AVIP iShares Managed Risk Balanced Portfolio | AVIP iShares Managed Risk Moderate Growth Portfolio | AVIP iShares Managed Risk Growth Portfolio | AVIP Moderately Conservative Model Portfolio | AVIP Balanced Model Portfolio | AVIP Moderate Growth Model Portfolio | AVIP Growth Model Portfolio | |
Investment income: | |||||||
Interest | $162,251 | $144,803 | $208,317 | $— | $4 | $— | $— |
Dividend income from unaffiliated issuers | 7,517,479 | 5,591,145 | 4,661,318 | 1,430,181 | 4,359,540 | 5,264,724 | 763,358 |
Dividends from affililiates | — | — | — | 6,064 | 24,313 | 46,439 | 11,079 |
Total investment income | 7,679,730 | 5,735,948 | 4,869,635 | 1,436,245 | 4,383,857 | 5,311,163 | 774,437 |
Expenses: | |||||||
Management fees | 1,580,682 | 1,357,282 | 1,226,421 | 380,664 | 1,530,341 | 2,923,645 | 687,088 |
Custodian fees | 16,866 | 13,380 | 16,393 | 9,162 | 9,376 | 9,249 | 8,349 |
Directors' fees | 22,247 | 19,072 | 17,199 | 7,358 | 29,520 | 56,357 | 13,178 |
Professional fees | 12,049 | 11,495 | 11,169 | 9,413 | 13,372 | 18,160 | 10,474 |
Accounting fees | 12,480 | 13,466 | 13,484 | 11,543 | 11,567 | 11,567 | 11,555 |
Administration fees | 12,301 | 11,900 | 11,664 | 14,002 | 15,697 | 17,756 | 14,447 |
Printing and filing fees | 10,913 | 9,945 | 9,421 | 6,550 | 12,773 | 20,201 | 8,095 |
Compliance expense | 5,130 | 5,130 | 5,130 | 5,130 | 5,130 | 5,130 | 5,130 |
Recoupment of previously reimbursed expenses | — | — | — | (3,500 ) | 68,000 | — | — |
Other | 27,783 | 25,858 | 28,446 | 2,351 | 9,321 | 17,459 | 3,958 |
Total expenses | 1,700,451 | 1,467,528 | 1,339,327 | 442,673 | 1,705,097 | 3,079,524 | 762,274 |
Less expenses reduced or reimbursed by advisor | — | — | — | (2,500 ) | — | — | — |
Net expenses | 1,700,451 | 1,467,528 | 1,339,327 | 440,173 | 1,705,097 | 3,079,524 | 762,274 |
Net investment income | 5,979,279 | 4,268,420 | 3,530,308 | 996,072 | 2,678,760 | 2,231,639 | 12,163 |
Realized/unrealized gain on investments, futures contracts, and foreign currency related transactions: | |||||||
Net realized gain (loss) on: | |||||||
Investments in securities of unaffiliated issuers | (16,019 ) | 6,878,262 | 6,027,848 | (605,881 ) | (1,554,162 ) | (2,525,731 ) | (187,187 ) |
Investments in affiliates | — | — | — | 1,565,763 | 8,149,949 | 11,625,801 | 1,556,251 |
Futures contracts | 5,096,113 | 3,431,757 | 4,635,087 | — | — | — | — |
Foreign currency related transactions | (34,547 ) | (13,622 ) | 7,188 | — | — | — | — |
Change in unrealized appreciation/depreciation on: | |||||||
Investments in securities of unaffiliated issuers | 21,458,166 | 20,852,241 | 28,504,005 | (103,189 ) | 1,623,951 | 6,168,059 | 2,098,215 |
Investments in affiliates | — | — | — | 5,346,017 | 29,233,417 | 83,368,316 | 24,234,014 |
Futures contracts | (1,868,776 ) | (697,665 ) | (1,047,223 ) | — | — | — | — |
Foreign currency related transactions | (18,402 ) | (9,399 ) | (19,638 ) | — | — | — | — |
Net realized/unrealized gain on investments, futures contracts, and foreign currency related transactions | 24,616,535 | 30,441,574 | 38,107,267 | 6,202,710 | 37,453,155 | 98,636,445 | 27,701,293 |
Change in net assets from operations | $30,595,814 | $34,709,994 | $41,637,575 | $7,198,782 | $40,131,915 | $100,868,084 | $27,713,456 |
AVIP Bond Portfolio | AVIP BlackRock Balanced Allocation Portfolio | AVIP BlackRock Advantage International Equity Portfolio | AVIP Fidelity Institutional AM® Equity Growth Portfolio | |||||
Six-Month Period | Year Ended | Six-Month Period | Year Ended | Six-Month Period | Year Ended | Six-Month Period | Year Ended | |
Ended June 30, 2024 (Unaudited) | December 31, 2023 | Ended June 30, 2024 (Unaudited) | December 31, 2023 | Ended June 30, 2024 (Unaudited) | December 31, 2023 | Ended June 30, 2024 (Unaudited) | December 31, 2023 | |
Increase (Decrease) in net assets: | ||||||||
Operations: | ||||||||
Net investment income (loss) | $4,050,614 | $8,029,904 | $2,870,071 | $6,486,923 | $5,111,168 | $7,368,667 | $(174,369 ) | $(58,404 ) |
Net realized gain (loss) on investments, futures contracts, and foreign currency related transactions | (998,898 ) | (1,201,099 ) | 23,893,627 | 6,420,967 | 16,327,713 | 24,213,609 | 13,779,759 | 9,560,178 |
Change in unrealized appreciation/depreciation on investments, futures contracts, and foreign currency related transactions | (3,079,529 ) | 10,503,846 | 22,918,023 | 66,990,985 | 2,365,867 | 29,908,309 | 12,785,881 | 12,667,810 |
Change in net assets from operations | (27,813 ) | 17,332,651 | 49,681,721 | 79,898,875 | 23,804,748 | 61,490,585 | 26,391,271 | 22,169,584 |
Distributions: | ||||||||
Distributions to shareholders | — | (7,069,354 ) | — | (7,063,412 ) | — | (12,519,043 ) | — | (10,656,713 ) |
Capital transactions: | ||||||||
Received from shares sold | 14,627,994 | 20,888,041 | 7,109,010 | 14,394,034 | 6,385,081 | 12,685,880 | 3,051,668 | 63,189,595 |
Received from dividends reinvested | — | 7,069,354 | — | 7,063,412 | — | 12,519,043 | — | 10,656,713 |
Paid for shares redeemed | (21,590,101 ) | (34,760,839 ) | (54,461,166 ) | (99,623,689 ) | (36,418,271 ) | (72,748,267 ) | (14,877,986 ) | (13,199,336 ) |
Change in net assets from capital transactions | (6,962,107 ) | (6,803,444 ) | (47,352,156 ) | (78,166,243 ) | (30,033,190 ) | (47,543,344 ) | (11,826,318 ) | 60,646,972 |
Change in net assets | (6,989,920 ) | 3,459,853 | 2,329,565 | (5,330,780 ) | (6,228,442 ) | 1,428,198 | 14,564,953 | 72,159,843 |
Net assets: | ||||||||
Beginning of period | 224,940,452 | 221,480,599 | 413,399,775 | 418,730,555 | 355,999,739 | 354,571,541 | 116,288,643 | 44,128,800 |
End of period | $217,950,532 | $224,940,452 | $415,729,340 | $413,399,775 | $349,771,297 | $355,999,739 | $130,853,596 | $116,288,643 |
AVIP AB Small Cap Portfolio | AVIP AB Mid Cap Core Portfolio | AVIP S&P 500® Index Portfolio | AVIP BlackRock Advantage Large Cap Value Portfolio | |||||
Six-Month Period | Year Ended | Six-Month Period | Year Ended | Six-Month Period | Year Ended | Six-Month Period | Year Ended | |
Ended June 30, 2024 (Unaudited) | December 31, 2023 | Ended June 30, 2024 (Unaudited) | December 31, 2023 | Ended June 30, 2024 (Unaudited) | December 31, 2023 | Ended June 30, 2024 (Unaudited) | December 31, 2023 | |
Increase (Decrease) in net assets: | ||||||||
Operations: | ||||||||
Net investment income | $84,154 | $358,787 | $167,244 | $429,963 | $6,364,276 | $14,297,522 | $1,439,106 | $3,126,490 |
Net realized gain (loss) on investments, futures contracts, and foreign currency related transactions | 6,442,550 | (7,824,655 ) | 5,407,362 | (2,247,220 ) | 73,435,541 | 82,094,393 | 12,278,533 | 3,852,746 |
Change in unrealized appreciation/depreciation on investments, futures contracts, and foreign currency related transactions | (2,984,036 ) | 26,320,489 | (1,785,218 ) | 14,359,708 | 89,488,846 | 154,877,728 | 3,561,757 | 17,924,190 |
Change in net assets from operations | 3,542,668 | 18,854,621 | 3,789,388 | 12,542,451 | 169,288,663 | 251,269,643 | 17,279,396 | 24,903,426 |
Distributions: | ||||||||
Distributions to shareholders | — | — | — | (357,918 ) | — | (61,084,220 ) | — | (5,994,188 ) |
Capital transactions: | ||||||||
Received from shares sold | 3,868,637 | 9,355,330 | 1,949,327 | 4,594,051 | 22,092,216 | 142,999,531 | 1,502,594 | 6,870,804 |
Received from dividends reinvested | — | — | — | 357,918 | — | 61,084,220 | — | 5,994,188 |
Paid for shares redeemed | (11,899,495 ) | (24,754,410 ) | (7,870,073 ) | (14,504,245 ) | (164,366,651 ) | (232,184,380 ) | (22,642,193 ) | (30,023,750 ) |
Change in net assets from capital transactions | (8,030,858 ) | (15,399,080 ) | (5,920,746 ) | (9,552,276 ) | (142,274,435 ) | (28,100,629 ) | (21,139,599 ) | (17,158,758 ) |
Change in net assets | (4,488,190 ) | 3,455,541 | (2,131,358 ) | 2,632,257 | 27,014,228 | 162,084,794 | (3,860,203 ) | 1,750,480 |
Net assets: | ||||||||
Beginning of period | 117,147,687 | 113,692,146 | 80,426,013 | 77,793,756 | 1,185,665,164 | 1,023,580,370 | 200,691,829 | 198,941,349 |
End of period | $112,659,497 | $117,147,687 | $78,294,655 | $80,426,013 | $1,212,679,392 | $1,185,665,164 | $196,831,626 | $200,691,829 |
AVIP Federated High Income Bond Portfolio | AVIP Nasdaq-100® Index Portfolio | AVIP BlackRock Advantage Large Cap Core Portfolio | AVIP BlackRock Advantage Small Cap Growth Portfolio | |||||
Six-Month Period | Year Ended | Six-Month Period | Year Ended | Six-Month Period | Year Ended | Six-Month Period | Year Ended | |
Ended June 30, 2024 (Unaudited) | December 31, 2023 | Ended June 30, 2024 (Unaudited) | December 31, 2023 | Ended June 30, 2024 (Unaudited) | December 31, 2023 | Ended June 30, 2024 (Unaudited) | December 31, 2023 | |
Increase (Decrease) in net assets: | ||||||||
Operations: | ||||||||
Net investment income (loss) | $3,419,903 | $7,018,876 | $589,505 | $1,266,204 | $1,184,964 | $2,880,690 | $(92,218 ) | $161,160 |
Net realized gain (loss) on investments and futures contracts | (1,852,800 ) | (4,390,604 ) | 18,263,650 | 49,356,014 | 27,944,518 | 5,882,616 | 7,873,768 | (367,215 ) |
Change in unrealized appreciation/depreciation on investments and futures contracts | 1,156,403 | 12,069,516 | 23,716,998 | 53,239,760 | 24,875,347 | 65,346,851 | (1,380,750 ) | 26,432,153 |
Change in net assets from operations | 2,723,506 | 14,697,788 | 42,570,153 | 103,861,978 | 54,004,829 | 74,110,157 | 6,400,800 | 26,226,098 |
Distributions: | ||||||||
Distributions to shareholders | — | (7,303,133 ) | — | (21,987,143 ) | — | (4,330,487 ) | — | — |
Capital transactions: | ||||||||
Received from shares sold | 5,486,660 | 9,258,071 | 14,263,251 | 23,001,284 | 3,312,709 | 7,424,198 | 4,304,507 | 10,590,836 |
Received from dividends reinvested | — | 7,303,133 | — | 21,987,143 | — | 4,330,487 | — | — |
Paid for shares redeemed | (12,574,402 ) | (22,198,645 ) | (46,065,998 ) | (72,675,705 ) | (45,780,686 ) | (66,044,595 ) | (14,628,978 ) | (31,057,951 ) |
Change in net assets from capital transactions | (7,087,742 ) | (5,637,441 ) | (31,802,747 ) | (27,687,278 ) | (42,467,977 ) | (54,289,910 ) | (10,324,471 ) | (20,467,115 ) |
Change in net assets | (4,364,236 ) | 1,757,214 | 10,767,406 | 54,187,557 | 11,536,852 | 15,489,760 | (3,923,671 ) | 5,758,983 |
Net assets: | ||||||||
Beginning of period | 125,312,098 | 123,554,884 | 262,699,486 | 208,511,929 | 329,287,799 | 313,798,039 | 140,760,177 | 135,001,194 |
End of period | $120,947,862 | $125,312,098 | $273,466,892 | $262,699,486 | $340,824,651 | $329,287,799 | $136,836,506 | $140,760,177 |
AVIP S&P MidCap 400® Index Portfolio | AVIP BlackRock Advantage Large Cap Growth Portfolio | AVIP AB Risk Managed Balanced Portfolio | AVIP Federated Core Plus Bond Portfolio | |||||
Six-Month Period | Year Ended | Six-Month Period | Year Ended | Six-Month Period | Year Ended | Six-Month Period | Year Ended | |
Ended June 30, 2024 (Unaudited) | December 31, 2023 | Ended June 30, 2024 (Unaudited) | December 31, 2023 | Ended June 30, 2024 (Unaudited) | December 31, 2023 | Ended June 30, 2024 (Unaudited) | December 31, 2023 | |
Increase (Decrease) in net assets: | ||||||||
Operations: | ||||||||
Net investment income | $3,204,275 | $5,973,118 | $290,298 | $1,119,383 | $14,383,225 | $25,098,693 | $9,489,945 | $16,776,336 |
Net realized gain (loss) on investments and futures contracts | 28,159,969 | 20,533,840 | 79,387,567 | 48,407,799 | 50,430,141 | (18,199,975 ) | (6,545,768 ) | (10,769,460 ) |
Change in unrealized appreciation/depreciation on investments and futures contracts | 703,389 | 41,553,191 | 10,402,705 | 94,999,688 | 29,265,206 | 150,322,284 | (6,072,088 ) | 22,921,591 |
Change in net assets from operations | 32,067,633 | 68,060,149 | 90,080,570 | 144,526,870 | 94,078,572 | 157,221,002 | (3,127,911 ) | 28,928,467 |
Distributions: | ||||||||
Distributions to shareholders | — | (24,997,583 ) | — | (3,467,142 ) | — | (13,033,001 ) | — | (13,552,610 ) |
Capital transactions: | ||||||||
Received from shares sold | 10,864,190 | 193,105,054 | 2,855,837 | 46,468,903 | 16,160,630 | 328,185,195 | 35,343,144 | 92,280,723 |
Received from dividends reinvested | — | 24,997,583 | — | 3,467,142 | — | 13,033,001 | — | 13,552,610 |
Paid for shares redeemed | (56,438,434 ) | (88,193,474 ) | (64,745,739 ) | (91,386,497 ) | (149,648,205 ) | (225,587,997 ) | (51,866,422 ) | (87,213,748 ) |
Change in net assets from capital transactions | (45,574,244 ) | 129,909,163 | (61,889,902 ) | (41,450,452 ) | (133,487,575 ) | 115,630,199 | (16,523,278 ) | 18,619,585 |
Change in net assets | (13,506,611 ) | 172,971,729 | 28,190,668 | 99,609,276 | (39,409,003 ) | 259,818,200 | (19,651,189 ) | 33,995,442 |
Net assets: | ||||||||
Beginning of period | 542,452,491 | 369,480,762 | 474,733,167 | 375,123,891 | 1,399,031,709 | 1,139,213,509 | 585,097,285 | 551,101,843 |
End of period | $528,945,880 | $542,452,491 | $502,923,835 | $474,733,167 | $1,359,622,706 | $1,399,031,709 | $565,446,096 | $585,097,285 |
AVIP Intech U.S. Low Volatility Portfolio | AVIP AB Relative Value Portfolio | AVIP iShares Managed Risk Balanced Portfolio | AVIP iShares Managed Risk Moderate Growth Portfolio | |||||
Six-Month Period | Year Ended | Six-Month Period | Year Ended | Six-Month Period | Year Ended | Six-Month Period | Year Ended | |
Ended June 30, 2024 (Unaudited) | December 31, 2023 | Ended June 30, 2024 (Unaudited) | December 31, 2023 | Ended June 30, 2024 (Unaudited) | December 31, 2023 | Ended June 30, 2024 (Unaudited) | December 31, 2023 | |
Increase (Decrease) in net assets: | ||||||||
Operations: | ||||||||
Net investment income | $3,780,907 | $9,399,929 | $772,813 | $2,036,179 | $5,979,279 | $14,519,326 | $4,268,420 | $10,446,890 |
Net realized gain (loss) on investments, futures contracts, foreign currency related transactions, and capital gain distributions received from underlying mutual funds | 28,642,571 | (3,674,270 ) | 5,315,681 | (1,276,901 ) | 5,045,547 | 3,966,908 | 10,296,397 | 8,524,303 |
Change in unrealized appreciation on investments, futures contracts, and foreign currency related transactions | 34,112,019 | 38,554,777 | 4,577,979 | 13,499,704 | 19,570,988 | 58,746,295 | 20,145,177 | 55,130,828 |
Change in net assets from operations | 66,535,497 | 44,280,436 | 10,666,473 | 14,258,982 | 30,595,814 | 77,232,529 | 34,709,994 | 74,102,021 |
Distributions: | ||||||||
Distributions to shareholders | — | (8,163,527 ) | — | (1,395,666 ) | — | (6,229,046 ) | — | — |
Capital transactions: | ||||||||
Received from shares sold | 8,878,198 | 33,075,436 | 671,629 | 6,190,927 | 10,450,384 | 12,537,918 | 7,341,069 | 19,208,147 |
Received from dividends reinvested | — | 8,163,527 | — | 1,395,666 | — | 6,229,046 | — | — |
Paid for shares redeemed | (78,134,238 ) | (147,360,918 ) | (13,829,034 ) | (18,451,190 ) | (59,754,373 ) | (114,243,445 ) | (48,345,725 ) | (85,831,527 ) |
Change in net assets from capital transactions | (69,256,040 ) | (106,121,955 ) | (13,157,405 ) | (10,864,597 ) | (49,303,989 ) | (95,476,481 ) | (41,004,656 ) | (66,623,380 ) |
Change in net assets | (2,720,543 ) | (70,005,046 ) | (2,490,932 ) | 1,998,719 | (18,708,175 ) | (24,472,998 ) | (6,294,662 ) | 7,478,641 |
Net assets: | ||||||||
Beginning of period | 668,420,983 | 738,426,029 | 127,721,455 | 125,722,736 | 587,162,871 | 611,635,869 | 498,476,690 | 490,998,049 |
End of period | $665,700,440 | $668,420,983 | $125,230,523 | $127,721,455 | $568,454,696 | $587,162,871 | $492,182,028 | $498,476,690 |
AVIP iShares Managed Risk Growth Portfolio | AVIP Moderately Conservative Model Portfolio | AVIP Balanced Model Portfolio | AVIP Moderate Growth Model Portfolio | |||||
Six-Month Period | Year Ended | Six-Month Period | Year Ended | Six-Month Period | Year Ended | Six-Month Period | Year Ended | |
Ended June 30, 2024 (Unaudited) | December 31, 2023 | Ended June 30, 2024 (Unaudited) | December 31, 2023 | Ended June 30, 2024 (Unaudited) | December 31, 2023 | Ended June 30, 2024 (Unaudited) | December 31, 2023 | |
Increase (Decrease) in net assets: | ||||||||
Operations: | ||||||||
Net investment income | $3,530,308 | $8,378,932 | $996,072 | $4,732,904 | $2,678,760 | $15,357,299 | $2,231,639 | $23,627,916 |
Net realized gain (loss) on investments, futures contracts, foreign currency related transactions, and capital gain distributions received from underlying mutual funds | 10,670,123 | 10,424,946 | 959,882 | 94,161 | 6,595,787 | (1,274,738 ) | 9,100,070 | (16,061,237 ) |
Change in unrealized appreciation on investments, futures contracts, and foreign currency related transactions | 27,437,144 | 59,257,300 | 5,242,828 | 17,640,400 | 30,857,368 | 87,187,260 | 89,536,375 | 216,792,135 |
Change in net assets from operations | 41,637,575 | 78,061,178 | 7,198,782 | 22,467,465 | 40,131,915 | 101,269,821 | 100,868,084 | 224,358,814 |
Distributions: | ||||||||
Distributions to shareholders | — | — | — | (15,593,898 ) | — | (85,661,107 ) | — | (208,393,538 ) |
Capital transactions: | ||||||||
Received from shares sold | 6,659,762 | 15,260,634 | 4,790,986 | 4,967,509 | 9,731,685 | 15,044,601 | 4,760,997 | 16,254,872 |
Received from dividends reinvested | — | — | — | 15,593,898 | — | 85,661,107 | — | 208,393,538 |
Paid for shares redeemed | (44,861,267 ) | (75,074,240 ) | (20,007,801 ) | (44,209,932 ) | (70,378,240 ) | (127,785,739 ) | (138,609,595 ) | (204,609,746 ) |
Change in net assets from capital transactions | (38,201,505 ) | (59,813,606 ) | (15,216,815 ) | (23,648,525 ) | (60,646,555 ) | (27,080,031 ) | (133,848,598 ) | 20,038,664 |
Change in net assets | 3,436,070 | 18,247,572 | (8,018,033 ) | (16,774,958 ) | (20,514,640 ) | (11,471,317 ) | (32,980,514 ) | 36,003,940 |
Net assets: | ||||||||
Beginning of period | 444,808,619 | 426,561,047 | 196,656,615 | 213,431,573 | 776,471,262 | 787,942,579 | 1,481,180,200 | 1,445,176,260 |
End of period | $448,244,689 | $444,808,619 | $188,638,582 | $196,656,615 | $755,956,622 | $776,471,262 | $1,448,199,686 | $1,481,180,200 |
AVIP Growth Model Portfolio | ||
Six-Month Period | Year Ended | |
Ended June 30, 2024 (Unaudited) | December 31, 2023 | |
Increase (Decrease) in net assets: | ||
Operations: | ||
Net investment income | $12,163 | $4,506,813 |
Net realized gain on investments and capital gain distributions received from underlying mutual funds | 1,369,064 | (5,623,683 ) |
Change in unrealized appreciation on investments | 26,332,229 | 58,660,367 |
Change in net assets from operations | 27,713,456 | 57,543,497 |
Distributions: | ||
Distributions to shareholders | — | (57,106,337 ) |
Capital transactions: | ||
Received from shares sold | 1,286,602 | 3,619,095 |
Received from dividends reinvested | — | 57,106,337 |
Paid for shares redeemed | (25,640,843 ) | (48,942,170 ) |
Change in net assets from capital transactions | (24,354,241 ) | 11,783,262 |
Change in net assets | 3,359,215 | 12,220,422 |
Net assets: | ||
Beginning of period | 343,143,608 | 330,923,186 |
End of period | $346,502,823 | $343,143,608 |
Selected per-share data | Ratios and supplemental data | |||||||||||
Operations | Distributions | Ratios to average net assets | ||||||||||
Ratios net of expenses reduced or reimbursed by adviser | Ratios assuming no expenses reduced or reimbursed by adviser | |||||||||||
Net asset value, beginning of year or period | Net investment income (loss) | Net realized and unrealized gain (loss) | Total from operations | Distributions to shareholders | Net asset value, end of year or period | Total Return# | Expenses | Net investment income (loss) | Expenses | Net assets, end of year or period (millions) | Portfolio turnover rate | |
AVIP Bond Portfolio | ||||||||||||
Six-Month Period Ended June 30, 2024+ | $16.95 | 0.33 | (0.33 ) | — | — | $16.95 | — %* | 0.61 %** | 3.68 %** | 0.61 %** | $218.0 | 6 %* |
Year Ended December 31, 2023 | $16.17 | 0.62 | 0.69 | 1.31 | (0.53 ) | $16.95 | 8.30 % | 0.61 % | 3.64 % | 0.61 % | $224.9 | 21 % |
Year Ended December 31, 2022 | $19.88 | 0.58 | (3.60 ) | (3.02 ) | (0.69 ) | $16.17 | (15.19 )% | 0.61 % | 3.11 % | 0.61 % | $221.5 | 21 % |
Year Ended December 31, 2021 | $20.79 | 0.54 | (0.85 ) | (0.31 ) | (0.60 ) | $19.88 | (1.52 )% | 0.59 % | 2.56 % | 0.59 % | $277.4 | 13 % |
Year Ended December 31, 2020 | $19.10 | 0.55 | 1.28 | 1.83 | (0.14 ) | $20.79 | 9.59 % | 0.60 % | 2.72 % | 0.60 % | $295.1 | 69 % |
AVIP BlackRock Balanced Allocation Portfolio | ||||||||||||
Six-Month Period Ended June 30, 2024+ | $32.57 | 0.32 | 3.82 | 4.14 | — | $36.71 | 12.71 %* | 0.57 %** | 1.39 %** | 0.57 %** | $415.7 | 29 %* |
Year Ended December 31, 2023 | $27.36 | 0.58 | 5.16 | 5.74 | (0.53 ) | $32.57 | 21.13 % | 0.56 % | 1.56 % | 0.56 % | $413.4 | 65 % |
Year Ended December 31, 2022 | $42.43 | 0.50 | (8.21 ) | (7.71 ) | (7.36 ) | $27.36 | (18.41 )% | 0.55 % | 1.57 % | 0.55 % | $418.7 | 70 % |
Year Ended December 31, 2021 | $39.40 | 0.58 | 6.66 | 7.24 | (4.21 ) | $42.43 | 19.06 % | 0.54 % | 1.22 % | 0.54 % | $551.8 | 105 % |
Year Ended December 31, 2020 | $34.30 | 0.60 | 4.75 | 5.35 | (0.25 ) | $39.40 | 15.65 % | 0.55 % | 1.57 % | 0.55 % | $533.7 | 121 % |
AVIP BlackRock Advantage International Equity Portfolio | ||||||||||||
Six-Month Period Ended June 30, 2024+ | $15.27 | 0.27 | 0.78 | 1.05 | — | $16.32 | 6.88 %* | 0.85 %** | 2.91 %** | 0.85 %** | $349.8 | 75 %* |
Year Ended December 31, 2023 | $13.32 | 0.37 | 2.11 | 2.48 | (0.53 ) | $15.27 | 18.94 % | 0.89 % | 2.09 % | 0.89 % | $356.0 | 153 % |
Year Ended December 31, 2022 | $18.44 | 0.42 | (3.11 ) | (2.69 ) | (2.43 ) | $13.32 | (13.47 )% | 0.89 % | 2.53 % | 0.89 % | $354.6 | 134 % |
Year Ended December 31, 2021 | $16.47 | 0.36 | 1.86 | 2.22 | (0.25 ) | $18.44 | 13.49 % | 0.89 % | 1.84 % | 0.89 % | $507.5 | 196 % |
Year Ended December 31, 2020 | $15.52 | 0.20 | 0.83 | 1.03 | (0.08 ) | $16.47 | 6.74 % | 0.91 % | 1.40 % | 0.91 % | $504.4 | 238 % |
AVIP Fidelity Institutional AM® Equity Growth Portfolio | ||||||||||||
Six-Month Period Ended June 30, 2024+ | $1.50 | (— )(a) | 0.36 | 0.36 | — | $1.86 | 24.00 %* | 0.78 %** | (0.28 )%** | 0.78 %** | $130.9 | 25 %* |
Year Ended December 31, 2023 | $1.19 | (— )(a) | 0.45 | 0.45 | (0.14 ) | $1.50 | 39.39 % | 0.86 % | (0.08 )% | 0.86 % | $116.3 | 98 %(b) |
Year Ended December 31, 2022 | $36.43 | 0.02 | (11.42 ) | (11.40 ) | (23.84 ) | $1.19 | (33.92 )% | 0.85 % | (0.19 )% | 0.85 % | $44.1 | 51 % |
Year Ended December 31, 2021 | $35.13 | (0.17 ) | 7.07 | 6.90 | (5.60 ) | $36.43 | 19.70 % | 0.78 % | (0.33 )% | 0.78 % | $142.2 | 31 % |
Year Ended December 31, 2020 | $26.06 | (0.08 ) | 9.87 | 9.79 | (0.72 ) | $35.13 | 37.87 % | 0.79 % | (0.24 )% | 0.79 % | $203.6 | 36 % |
+ | Unaudited |
* | Not annualized |
** | Annualized |
(a) | The absolute value of per share or ratio data is less than $0.005 per share, or 0.005%, respectively. |
(b) | Effective July 29, 2023, the sub-adviser to the AVIP Fidelity Institutional AM® Equity Growth Portfolio changed from Janus Henderson Investors U.S. LLC to FIAM LLC. Costs of purchases and proceeds from sales of portfolio securities associated with the change in sub-adviser may have contributed to a higher portfolio turnover rate for the year ended December 31, 2023 than for prior years. |
# Performance does not include fees and expenses imposed by a variable annuity contract. Had those fees and expenses been included, performance would have been lower than the returns presented.
Selected per-share data | Ratios and supplemental data | |||||||||||
Operations | Distributions | Ratios to average net assets | ||||||||||
Ratios net of expenses reduced or reimbursed by adviser | Ratios assuming no expenses reduced or reimbursed by adviser | |||||||||||
Net asset value, beginning of year or period | Net investment income (loss) | Net realized and unrealized gain (loss) | Total from operations | Distributions to shareholders | Net asset value, end of year or period | Total Return# | Expenses | Net investment income (loss) | Expenses | Net assets, end of year or period (millions) | Portfolio turnover rate | |
AVIP AB Small Cap Portfolio | ||||||||||||
Six-Month Period Ended June 30, 2024+ | $12.46 | 0.01 | 0.37 | 0.38 | — | $12.84 | 3.05 %* | 0.88 %** | 0.15 %** | 0.88 %** | $112.7 | 56 %* |
Year Ended December 31, 2023 | $10.63 | 0.04 | 1.79 | 1.83 | — | $12.46 | 17.22 % | 0.86 % | 0.31 % | 0.86 % | $117.1 | 59 % |
Year Ended December 31, 2022 | $42.63 | 0.01 | (11.42 ) | (11.41 ) | (20.59 ) | $10.63 | (28.73 )% | 0.85 % | 0.07 % | 0.85 % | $113.7 | 58 % |
Year Ended December 31, 2021 | $44.52 | (0.01 ) | 3.43 | 3.42 | (5.31 ) | $42.63 | 8.17 % | 0.85 % | (0.03 )% | 0.85 % | $169.3 | 136 %(a) |
Year Ended December 31, 2020 | $33.89 | (0.22 ) | 11.55 | 11.33 | (0.70 ) | $44.52 | 34.04 % | 0.89 % | (0.48 )% | 0.89 % | $182.5 | 26 % |
AVIP AB Mid Cap Core Portfolio | ||||||||||||
Six-Month Period Ended June 30, 2024+ | $29.31 | 0.08 | 1.33 | 1.41 | — | $30.72 | 4.81 %* | 0.91 %** | 0.42 %** | 0.91 %** | $78.3 | 40 %* |
Year Ended December 31, 2023 | $25.16 | 0.17 | 4.11 | 4.28 | (0.13 ) | $29.31 | 17.05 % | 0.90 % | 0.55 % | 0.90 % | $80.4 | 46 % |
Year Ended December 31, 2022 | $62.45 | 0.14 | (14.02 ) | (13.88 ) | (23.41 ) | $25.16 | (23.31 )% | 0.88 % | 0.53 % | 0.88 % | $77.8 | 41 % |
Year Ended December 31, 2021 | $56.98 | 0.18 | 9.18 | 9.36 | (3.89 ) | $62.45 | 16.79 % | 0.89 % | 0.30 % | 0.89 % | $104.7 | 125 %(a) |
Year Ended December 31, 2020 | $48.53 | (0.06 ) | 9.21 | 9.15 | (0.70 ) | $56.98 | 19.15 % | 0.98 % | (0.12 )% | 0.98 % | $109.2 | 14 % |
AVIP S&P 500® Index Portfolio | ||||||||||||
Six-Month Period Ended June 30, 2024+ | $38.84 | 0.29 | 5.56 | 5.85 | — | $44.69 | 15.06 %* | 0.38 %** | 1.06 %** | 0.38 %** | $1,212.7 | 1 %* |
Year Ended December 31, 2023 | $32.61 | 0.48 | 7.76 | 8.24 | (2.01 ) | $38.84 | 25.72 % | 0.38 % | 1.31 % | 0.38 % | $1,185.7 | 12 % |
Year Ended December 31, 2022 | $46.20 | 0.47 | (8.86 ) | (8.39 ) | (5.20 ) | $32.61 | (18.42 )% | 0.38 % | 1.27 % | 0.38 % | $1,023.6 | 4 % |
Year Ended December 31, 2021 | $38.72 | 0.54 | 10.09 | 10.63 | (3.15 ) | $46.20 | 28.25 % | 0.37 % | 1.05 % | 0.37 % | $1,325.0 | 5 % |
Year Ended December 31, 2020 | $33.29 | 0.54 | 5.40 | 5.94 | (0.51 ) | $38.72 | 17.99 % | 0.39 % | 1.49 % | 0.39 % | $1,228.8 | 6 % |
AVIP BlackRock Advantage Large Cap Value Portfolio | ||||||||||||
Six-Month Period Ended June 30, 2024+ | $17.94 | 0.17 | 1.43 | 1.60 | — | $19.54 | 8.92 %* | 0.74 %** | 1.45 %** | 0.74 %** | $196.8 | 37 %* |
Year Ended December 31, 2023 | $16.32 | 0.30 | 1.85 | 2.15 | (0.53 ) | $17.94 | 13.37 % | 0.74 % | 1.58 % | 0.74 % | $200.7 | 91 % |
Year Ended December 31, 2022 | $23.67 | 0.38 | (2.64 ) | (2.26 ) | (5.09 ) | $16.32 | (8.97 )% | 0.73 % | 1.51 % | 0.73 % | $198.9 | 94 % |
Year Ended December 31, 2021 | $19.13 | 0.31 | 4.52 | 4.83 | (0.29 ) | $23.67 | 25.39 % | 0.73 % | 1.25 % | 0.73 % | $325.9 | 153 % |
Year Ended December 31, 2020 | $18.75 | 0.30 | 0.35 | 0.65 | (0.27 ) | $19.13 | 3.66 % | 0.74 % | 1.70 % | 0.74 % | $316.5 | 150 % |
+ | Unaudited |
* | Not annualized |
** | Annualized |
(a) | Effective May 1, 2021, the sub-adviser to the AVIP AB Small Cap Portfolio and AVIP AB Mid Cap Core Portfolio changed from Janus Capital Management LLC to AllianceBernstein, L.P. Costs of purchases and proceeds from sales of portfolio securities associated with the change in the sub-adviser may have contributed to a higher portfolio turnover rate for the year ended December 31, 2021 than for prior years. |
# Performance does not include fees and expenses imposed by a variable annuity contract. Had those fees and expenses been included, performance would have been lower than the returns presented.
Selected per-share data | Ratios and supplemental data | |||||||||||
Operations | Distributions | Ratios to average net assets | ||||||||||
Ratios net of expenses reduced or reimbursed by adviser | Ratios assuming no expenses reduced or reimbursed by adviser | |||||||||||
Net asset value, beginning of year or period | Net investment income (loss) | Net realized and unrealized gain (loss) | Total from operations | Distributions to shareholders | Net asset value, end of year or period | Total Return# | Expenses | Net investment income (loss) | Expenses | Net assets, end of year or period (millions) | Portfolio turnover rate | |
AVIP Federated High Income Bond Portfolio | ||||||||||||
Six-Month Period Ended June 30, 2024+ | $19.06 | 0.62 | (0.18 ) | 0.44 | — | $19.50 | 2.31 %* | 0.86 %** | 5.58 %** | 0.86 %** | $120.9 | 18 %* |
Year Ended December 31, 2023 | $17.97 | 1.13 | 1.09 | 2.22 | (1.13 ) | $19.06 | 12.68 % | 0.86 % | 5.66 % | 0.86 % | $125.3 | 15 % |
Year Ended December 31, 2022 | $21.58 | 1.18 | (3.65 ) | (2.47 ) | (1.14 ) | $17.97 | (11.43 )% | 0.84 % | 5.05 % | 0.84 % | $123.6 | 13 % |
Year Ended December 31, 2021 | $21.65 | 1.05 | 0.02 | 1.07 | (1.14 ) | $21.58 | 4.97 % | 0.82 % | 4.50 % | 0.82 % | $170.2 | 36 % |
Year Ended December 31, 2020 | $20.69 | 1.12 | 0.16 | 1.28 | (0.32 ) | $21.65 | 6.26 % | 0.83 % | 4.97 % | 0.83 % | $175.6 | 33 % |
AVIP Nasdaq-100® Index Portfolio | ||||||||||||
Six-Month Period Ended June 30, 2024+ | $17.57 | 0.06 | 2.96 | 3.02 | — | $20.59 | 17.19 %* | 0.43 %** | 0.44 %** | 0.43 %** | $273.5 | 2 %* |
Year Ended December 31, 2023 | $12.46 | 0.10 | 6.53 | 6.63 | (1.52 ) | $17.57 | 54.44 % | 0.43 % | 0.52 % | 0.43 % | $262.7 | 22 % |
Year Ended December 31, 2022 | $28.58 | 0.08 | (8.66 ) | (8.58 ) | (7.54 ) | $12.46 | (32.57 )% | 0.43 % | 0.46 % | 0.43 % | $208.5 | 9 % |
Year Ended December 31, 2021 | $28.08 | 0.12 | 6.89 | 7.01 | (6.51 ) | $28.58 | 26.99 % | 0.41 % | 0.28 % | 0.41 % | $356.5 | 7 % |
Year Ended December 31, 2020 | $19.83 | 0.13 | 9.30 | 9.43 | (1.18 ) | $28.08 | 48.32 % | 0.42 % | 0.49 % | 0.42 % | $383.0 | 10 % |
AVIP BlackRock Advantage Large Cap Core Portfolio | ||||||||||||
Six-Month Period Ended June 30, 2024+ | $32.02 | 0.17 | 5.38 | 5.55 | — | $37.57 | 17.33 %* | 0.69 %** | 0.71 %** | 0.69 %** | $340.8 | 36 %* |
Year Ended December 31, 2023 | $25.79 | 0.32 | 6.31 | 6.63 | (0.40 ) | $32.02 | 25.84 % | 0.69 % | 0.89 % | 0.69 % | $329.3 | 82 % |
Year Ended December 31, 2022 | $44.84 | 0.30 | (8.89 ) | (8.59 ) | (10.46 ) | $25.79 | (19.56 )% | 0.69 % | 0.97 % | 0.69 % | $313.8 | 90 % |
Year Ended December 31, 2021 | $38.66 | 0.35 | 10.24 | 10.59 | (4.41 ) | $44.84 | 28.49 % | 0.69 % | 0.66 % | 0.69 % | $437.3 | 135 % |
Year Ended December 31, 2020 | $32.95 | 0.38 | 5.39 | 5.77 | (0.06 ) | $38.66 | 17.55 % | 0.70 % | 1.04 % | 0.70 % | $418.5 | 137 % |
AVIP BlackRock Advantage Small Cap Growth Portfolio | ||||||||||||
Six-Month Period Ended June 30, 2024+ | $22.24 | (0.01 ) | 1.01 | 1.00 | — | $23.24 | 4.50 %* | 0.87 %** | (0.13 )%** | 0.87 %** | $136.8 | 25 %* |
Year Ended December 31, 2023 | $18.49 | 0.03 | 3.72 | 3.75 | — | $22.24 | 20.28 % | 0.86 % | 0.12 % | 0.86 % | $140.8 | 34 % |
Year Ended December 31, 2022 | $37.99 | 0.01 | (9.57 ) | (9.56 ) | (9.94 ) | $18.49 | (26.12 )% | 0.86 % | 0.03 % | 0.86 % | $135.0 | 49 % |
Year Ended December 31, 2021 | $41.69 | (0.13 ) | 1.88 | 1.75 | (5.45 ) | $37.99 | 4.05 % | 0.85 % | (0.33 )% | 0.85 % | $196.2 | 87 % |
Year Ended December 31, 2020 | $31.42 | (0.06 ) | 10.73 | 10.67 | (0.40 ) | $41.69 | 34.34 % | 0.86 % | (0.17 )% | 0.86 % | $209.8 | 87 % |
+ | Unaudited |
* | Not annualized |
** | Annualized |
# Performance does not include fees and expenses imposed by a variable annuity contract. Had those fees and expenses been included, performance would have been lower than the returns presented.
Selected per-share data | Ratios and supplemental data | |||||||||||
Operations | Distributions | Ratios to average net assets | ||||||||||
Ratios net of expenses reduced or reimbursed by adviser | Ratios assuming no expenses reduced or reimbursed by adviser | |||||||||||
Net asset value, beginning of year or period | Net investment income | Net realized and unrealized gain (loss) | Total from operations | Distributions to shareholders | Net asset value, end of year or period | Total Return# | Expenses | Net investment income (loss) | Expenses | Net assets, end of year or period (millions) | Portfolio turnover rate | |
AVIP S&P MidCap 400® Index Portfolio | ||||||||||||
Six-Month Period Ended June 30, 2024+ | $20.57 | 0.15 | 1.07 | 1.22 | — | $21.79 | 5.93 %* | 0.41 %** | 1.20 %** | 0.41 %** | $528.9 | 10 %* |
Year Ended December 31, 2023 | $18.71 | 0.18 | 2.63 | 2.81 | (0.95 ) | $20.57 | 15.50 % | 0.41 % | 1.41 % | 0.41 % | $542.5 | 34 % |
Year Ended December 31, 2022 | $26.22 | 0.26 | (3.79 ) | (3.53 ) | (3.98 ) | $18.71 | (13.40 )% | 0.42 % | 1.30 % | 0.42 % | $369.5 | 26 % |
Year Ended December 31, 2021 | $21.70 | 0.29 | 4.90 | 5.19 | (0.67 ) | $26.22 | 24.18 % | 0.41 % | 0.99 % | 0.41 % | $437.6 | 21 % |
Year Ended December 31, 2020 | $19.25 | 0.27 | 2.27 | 2.54 | (0.09 ) | $21.70 | 13.33 % | 0.42 % | 1.31 % | 0.42 % | $428.2 | 28 % |
AVIP BlackRock Advantage Large Cap Growth Portfolio | ||||||||||||
Six-Month Period Ended June 30, 2024+ | $9.18 | 0.01 | 1.84 | 1.85 | — | $11.03 | 20.15 %* | 0.71 %** | 0.12 %** | 0.71 %** | $502.9 | 61 %* |
Year Ended December 31, 2023 | $6.57 | 0.02 | 2.65 | 2.67 | (0.06 ) | $9.18 | 40.78 % | 0.71 % | 0.26 % | 0.71 % | $474.7 | 97 % |
Year Ended December 31, 2022 | $33.65 | 0.01 | (9.13 ) | (9.12 ) | (17.96 ) | $6.57 | (32.56 )% | 0.75 % | 0.49 % | 0.75 % | $375.1 | 135 % |
Year Ended December 31, 2021 | $36.36 | 0.01 | 8.69 | 8.70 | (11.41 ) | $33.65 | 26.69 % | 0.78 % | (0.09 )% | 0.78 % | $81.5 | 138 % |
Year Ended December 31, 2020 | $27.54 | 0.08 | 9.22 | 9.30 | (0.48 ) | $36.36 | 33.97 % | 0.79 % | 0.21 % | 0.79 % | $116.8 | 143 % |
AVIP AB Risk Managed Balanced Portfolio | ||||||||||||
Six-Month Period Ended June 30, 2024+ | $14.19 | 0.19 | 0.83 | 1.02 | — | $15.21 | 7.19 %* | 0.84 %** | 2.12 %** | 0.84 %** | $1,359.6 | 54 %* |
Year Ended December 31, 2023 | $12.69 | 0.24 | 1.39 | 1.63 | (0.13 ) | $14.19 | 12.90 % | 0.85 % | 2.09 % | 0.85 % | $1,399.0 | 132 % |
Year Ended December 31, 2022 | $17.16 | 0.09 | (3.96 ) | (3.87 ) | (0.60 ) | $12.69 | (22.62 )% | 0.87 % | 1.48 % | 0.87 % | $1,139.2 | 124 % |
Year Ended December 31, 2021 | $17.63 | 0.09 | 2.43 | 2.52 | (2.99 ) | $17.16 | 15.04 % | 0.95 % | 0.48 % | 0.95 % | $447.0 | 51 % |
Year Ended December 31, 2020 | $14.81 | 0.13 | 3.12 | 3.25 | (0.43 ) | $17.63 | 22.15 % | 0.98 % | 0.76 % | 0.98 % | $443.8 | 114 %(a), (b) |
AVIP Federated Core Plus Bond Portfolio | ||||||||||||
Six-Month Period Ended June 30, 2024+ | $9.07 | 0.16 | (0.21 ) | (0.05 ) | — | $9.02 | (0.55 )%* | 0.57 %** | 3.33 %** | 0.57 %** | $565.4 | 26 %* |
Year Ended December 31, 2023 | $8.83 | 0.25 | 0.20 | 0.45 | (0.21 ) | $9.07 | 5.18 % | 0.57 % | 3.01 % | 0.57 % | $585.1 | 32 % |
Year Ended December 31, 2022 | $10.30 | 0.23 | (1.54 ) | (1.31 ) | (0.16 ) | $8.83 | (12.78 )% | 0.56 % | 2.22 % | 0.56 % | $551.1 | 81 % |
Year Ended December 31, 2021 | $10.47 | 0.06 | (0.19 ) | (0.13 ) | (0.04 ) | $10.30 | (1.27 )% | 0.57 % | 1.85 % | 0.57 % | $716.5 | 40 % |
Period From May 1, 2020 (inception) to December 31, 2020 | $10.00 | 0.11 | 0.36 | 0.47 | — | $10.47 | 4.70 %* | 0.65 %** | 1.65 %** | 0.65 %** | $239.9 | 30 %* |
+ | Unaudited |
* | Not annualized |
** | Annualized |
(a) | Effective May 1, 2020, the sub-adviser(s) to the AVIP AB Risk Managed Balanced Portfolio changed from Janus Capital Management LLC and AnchorPath Financial, LLC to AllianceBernstein, L.P. Costs of purchases and proceeds from sales of portfolio securities associated with the change in the sub-adviser may have contributed to a higher portfolio turnover rate for the year ended December 31, 2020 than for prior years. |
(b) | The portfolio turnover calculation in a previous year includes purchases and sales from mortgage dollar roll transactions. Without the effect of mortgage dollar roll transactions, the portfolio turnover rate would have been 102% for the year ended December 31, 2020 (see Note 2 of the Notes to Financial Statements). |
# Performance does not include fees and expenses imposed by a variable annuity contract. Had those fees and expenses been included, performance would have been lower than the returns presented.
Selected per-share data | Ratios and supplemental data | |||||||||||
Operations | Distributions | Ratios to average net assets | ||||||||||
Ratios net of expenses reduced or reimbursed by adviser | Ratios assuming no expenses reduced or reimbursed by adviser | |||||||||||
Net asset value, beginning of year or period | Net investment income | Net realized and unrealized gain (loss) | Total from operations | Distributions to shareholders | Net asset value, end of year or period | Total Return# | Expenses | Net investment income | Expenses | Net assets, end of year or period (millions) | Portfolio turnover rate | |
AVIP Intech U.S. Low Volatility Portfolio | ||||||||||||
Six-Month Period Ended June 30, 2024+ | $10.51 | 0.08 | 1.01 | 1.09 | — | $11.60 | 10.37 %* | 0.61 %** | 1.12 %** | 0.61 %** | $665.7 | 26 %* |
Year Ended December 31, 2023 | $9.98 | 0.16 | 0.49 | 0.65 | (0.12 ) | $10.51 | 6.59 % | 0.61 % | 1.34 % | 0.61 % | $668.4 | 55 % |
Year Ended December 31, 2022 | $11.12 | 0.13 | (0.95 ) | (0.82 ) | (0.32 ) | $9.98 | (7.33 )% | 0.62 % | 1.06 % | 0.62 % | $738.4 | 78 % |
Period from June 25, 2021 (inception) to December 31, 2021 | $10.00 | 0.05 | 1.07 | 1.12 | — | $11.12 | 11.20 %* | 0.62 %** | 0.89 %** | 0.62 %** | $983.6 | 32 %* |
AVIP AB Relative Value Portfolio | ||||||||||||
Six-Month Period Ended June 30, 2024+ | $11.09 | 0.09 | 0.87 | 0.96 | — | $12.05 | 8.66 %* | 0.73 %** | 1.22 %** | 0.73 %** | $125.2 | 27 %* |
Year Ended December 31, 2023 | $10.04 | 0.18 | 0.99 | 1.17 | (0.12 ) | $11.09 | 11.71 % | 0.73 % | 1.62 % | 0.73 % | $127.7 | 71 % |
Year Ended December 31, 2022 | $10.52 | 0.12 | (0.59 ) | (0.47 ) | (0.01 ) | $10.04 | (4.50 )% | 0.74 % | 1.44 % | 0.74 % | $125.7 | 81 % |
Period from December 2, 2021 (inception) to December 31, 2021 | $10.00 | — (a) | 0.52 | 0.52 | — | $10.52 | 5.20 %* | 1.19 %** | 0.38 %** | 1.19 %** | $77.6 | 5 %* |
AVIP iShares Managed Risk Balanced Portfolio | ||||||||||||
Six-Month Period Ended June 30, 2024+ | $9.60 | 0.13 | 0.39 | 0.52 | — | $10.12 | 5.42 %* | 0.59 %**† | 2.08 %**† | 0.59 %**† | $568.5 | 1 %* |
Year Ended December 31, 2023 | $8.52 | 0.25 | 0.93 | 1.18 | (0.10 ) | $9.60 | 13.89 % | 0.59 %† | 2.43 %† | 0.59 %† | $587.2 | 3 % |
Year Ended December 31, 2022 | $10.23 | 0.10 | (1.72 ) | (1.62 ) | (0.09 ) | $8.52 | (15.84 )% | 0.61 %† | 1.58 %† | 0.61 %† | $611.6 | 48 % |
Period from June 25, 2021 (inception) to December 31, 2021 | $10.00 | 0.06 | 0.17 | 0.23 | — | $10.23 | 2.30 %* | 0.62 %**, † | 1.22 %**, † | 0.62 %**, † | $412.0 | 15 %* |
AVIP iShares Managed Risk Moderate Growth Portfolio | ||||||||||||
Six-Month Period Ended June 30, 2024+ | $12.30 | 0.14 | 0.76 | 0.90 | — | $13.20 | 7.32 %* | 0.59 %**† | 1.73 %**† | 0.59 %**† | $492.2 | 3 %* |
Year Ended December 31, 2023 | $10.59 | 0.26 | 1.45 | 1.71 | — | $12.30 | 16.15 % | 0.59 %† | 2.13 %† | 0.59 %† | $498.5 | 4 % |
Period from October 14, 2022 (inception) to December 31, 2022 | $10.00 | 0.06 | 0.53 | 0.59 | — | $10.59 | 5.90 %* | 0.61 %**, † | 2.58 %**, † | 0.61 %**, † | $491.0 | 49 %* |
AVIP iShares Managed Risk Growth Portfolio | ||||||||||||
Six-Month Period Ended June 30, 2024+ | $12.68 | 0.13 | 1.10 | 1.23 | — | $13.91 | 9.70 %* | 0.60 %**† | 1.58 %**† | 0.60 %**† | $448.2 | 2 %* |
Year Ended December 31, 2023 | $10.60 | 0.24 | 1.84 | 2.08 | — | $12.68 | 19.62 % | 0.59 %† | 1.93 %† | 0.59 %† | $444.8 | 3 % |
Period from October 14, 2022 (inception) to December 31, 2022 | $10.00 | 0.05 | 0.55 | 0.60 | — | $10.60 | 6.00 %* | 0.61 %**, † | 2.45 %**, † | 0.61 %**, † | $426.6 | 47 %* |
+ | Unaudited |
* | Not annualized |
** | Annualized |
† | The ratios presented only reflect the direct income and expenses for the Portfolio, and do not include the indirect expenses related to the underlying funds in which the Portfolio invests. |
(a) | The absolute value of per share or ratio data is less than $0.005 per share, or 0.005%, respectively. |
# Performance does not include fees and expenses imposed by a variable annuity contract. Had those fees and expenses been included, performance would have been lower than the returns presented.
Selected per-share data | Ratios and supplemental data | |||||||||||
Operations | Distributions | Ratios to average net assets | ||||||||||
Ratios net of expenses reduced or reimbursed by adviser | Ratios assuming no expenses reduced or reimbursed by adviser | |||||||||||
Net asset value, beginning of year or period | Net investment income | Net realized and unrealized gain (loss) | Total from operations | Distributions to shareholders | Net asset value, end of year or period | Total Return# | Expenses† | Net investment income† | Expenses† | Net assets, end of year or period (millions) | Portfolio turnover rate | |
AVIP Moderately Conservative Model Portfolio | ||||||||||||
Six-Month Period Ended June 30, 2024+ | $10.65 | 0.08 | 0.32 | 0.40 | — | $11.05 | 3.76 %* | 0.46 %** | 1.05 %** | 0.47 %** | $188.6 | 4 %* |
Year Ended December 31, 2023 | $10.35 | 0.32 | 0.85 | 1.17 | (0.87 ) | $10.65 | 11.77 % | 0.47 % | 2.32 % | 0.47 % | $196.7 | 8 % |
Year Ended December 31, 2022 | $13.32 | 0.23 | (2.24 ) | (2.01 ) | (0.96 ) | $10.35 | (15.12 )% | 0.47 % | 1.91 % | 0.47 % | $213.4 | 29 % |
Year Ended December 31, 2021 | $12.67 | 0.20 | 0.79 | 0.99 | (0.34 ) | $13.32 | 7.90 % | 0.43 % | 1.29 % | 0.45 % | $281.6 | 13 % |
Year Ended December 31, 2020 | $11.37 | 0.09 | 1.21 | 1.30 | — | $12.67 | 11.43 % | 0.40 % | 0.97 % | 0.47 % | $303.5 | 23 %(a) |
AVIP Balanced Model Portfolio | ||||||||||||
Six-Month Period Ended June 30, 2024+ | $10.71 | 0.06 | 0.51 | 0.57 | — | $11.28 | 5.32 %* | 0.45 %** | 0.70 %** | 0.45 %** | $756.0 | 3 %* |
Year Ended December 31, 2023 | $10.59 | 0.27 | 1.12 | 1.39 | (1.27 ) | $10.71 | 13.95 % | 0.46 % | 1.97 % | 0.46 % | $776.5 | 9 % |
Year Ended December 31, 2022 | $14.22 | 0.22 | (2.46 ) | (2.24 ) | (1.39 ) | $10.59 | (15.75 )% | 0.44 % | 1.58 % | 0.44 % | $787.9 | 27 % |
Year Ended December 31, 2021 | $13.06 | 0.18 | 1.25 | 1.43 | (0.27 ) | $14.22 | 11.03 % | 0.42 % | 1.14 % | 0.43 % | $1,092.5 | 12 % |
Year Ended December 31, 2020 | $11.48 | 0.08 | 1.50 | 1.58 | — | $13.06 | 13.76 % | 0.39 % | 0.67 % | 0.43 % | $1,127.8 | 22 % |
AVIP Moderate Growth Model Portfolio | ||||||||||||
Six-Month Period Ended June 30, 2024+ | $10.86 | 0.03 | 0.74 | 0.77 | — | $11.63 | 7.09 %* | 0.42 %** | 0.31 %** | 0.42 %** | $1,448.2 | 3 %* |
Year Ended December 31, 2023 | $10.88 | 0.23 | 1.46 | 1.69 | (1.71 ) | $10.86 | 16.67 % | 0.42 % | 1.62 % | 0.42 % | $1,481.2 | 9 % |
Year Ended December 31, 2022 | $15.26 | 0.18 | (2.81 ) | (2.63 ) | (1.75 ) | $10.88 | (17.17 )% | 0.42 % | 1.27 % | 0.42 % | $1,445.2 | 32 % |
Year Ended December 31, 2021 | $13.46 | 0.16 | 1.83 | 1.99 | (0.19 ) | $15.26 | 14.83 % | 0.42 % | 0.98 % | 0.42 % | $1,977.3 | 15 % |
Year Ended December 31, 2020 | $11.63 | 0.04 | 1.79 | 1.83 | — | $13.46 | 15.74 % | 0.44 % | 0.35 % | 0.45 % | $1,987.4 | 16 % |
AVIP Growth Model Portfolio | ||||||||||||
Six-Month Period Ended June 30, 2024+ | $11.00 | 0.01 | 0.91 | 0.92 | — | $11.92 | 8.36 %* | 0.44 %** | 0.01 %** | 0.44 %** | $346.5 | 3 %* |
Year Ended December 31, 2023 | $11.18 | 0.22 | 1.72 | 1.94 | (2.12 ) | $11.00 | 18.73 % | 0.44 % | 1.34 % | 0.44 % | $343.1 | 8 % |
Year Ended December 31, 2022 | $16.47 | 0.15 | (3.18 ) | (3.03 ) | (2.26 ) | $11.18 | (18.29 )% | 0.44 % | 1.01 % | 0.44 % | $330.9 | 28 % |
Year Ended December 31, 2021 | $14.17 | 0.13 | 2.35 | 2.48 | (0.18 ) | $16.47 | 17.58 % | 0.49 % | 0.78 % | 0.49 % | $448.2 | 18 % |
Year Ended December 31, 2020 | $11.94 | 0.02 | 2.21 | 2.23 | — | $14.17 | 18.68 % | 0.46 % | 0.16 % | 0.47 % | $443.1 | 11 % |
+ | Unaudited |
* | Not annualized |
** | Annualized |
(a) | The cost of purchases and proceeds from sales of Portfolio securities that were incurred to realign the Portfolio’s holdings subsequent to the December 4, 2020 reorganization are excluded from the portfolio turnover rate calculation. If such amounts had not been excluded, the portfolio turnover rate would have been 28%. |
# Performance does not include fees and expenses imposed by a variable annuity contract. Had those fees and expenses been included, performance would have been lower than the returns presented.
Portfolio | Authorized Shares | Portfolio | Authorized Shares |
AVIP Bond | 22,000,000 | AVIP BlackRock Advantage Large Cap Growth | 82,000,000 |
AVIP BlackRock Balanced Allocation | 20,000,000 | AVIP AB Risk Managed Balanced | 170,000,000 |
AVIP BlackRock Advantage International Equity | 35,000,000 | AVIP Federated Core Plus Bond | 115,000,000 |
AVIP Fidelity Institutional AM® Equity Growth | 134,000,000 | AVIP Intech U.S. Low Volatility | 105,000,000 |
AVIP AB Small Cap | 17,000,000 | AVIP AB Relative Value | 20,000,000 |
AVIP AB Mid Cap Core | 6,000,000 | AVIP iShares Managed Risk Balanced | 123,000,000 |
AVIP S&P 500® Index | 50,000,000 | AVIP iShares Managed Risk Moderate Growth | 70,000,000 |
AVIP BlackRock Advantage Large Cap Value | 21,000,000 | AVIP iShares Managed Risk Growth | 65,000,000 |
AVIP Federated High Income Bond | 13,000,000 | AVIP Moderately Conservative Model | 28,000,000 |
AVIP Nasdaq-100® Index | 27,000,000 | AVIP Balanced Model | 107,000,000 |
AVIP BlackRock Advantage Large Cap Core | 19,000,000 | AVIP Moderate Growth Model | 200,000,000 |
AVIP BlackRock Advantage Small Cap Growth | 12,000,000 | AVIP Growth Model | 48,000,000 |
AVIP S&P MidCap 400® Index | 41,000,000 |
Portfolio | Financial Instrument Type | Level 1 | Level 2 | Level 3 |
AVIP Bond | Corporate Bonds*** | $— | $201,314,431 | $— |
Asset-Backed Securities*** | — | 4,670,004 | — | |
U.S. Treasury Obligations | — | 3,841,406 | — | |
$ — | $209,825,841 | $ — | ||
AVIP BlackRock Balanced Allocation | Common Stocks*** | $313,454,978 | $— | $— |
Corporate Bonds*** | — | 92,302,758 | — | |
Asset-Backed Securities*** | — | 2,141,566 | — | |
U.S. Treasury Obligations | — | 2,018,437 | — | |
$313,454,978 | $96,462,761 | $ — | ||
Long Futures Contracts | $3,383 | $— | $— | |
AVIP BlackRock Advantage International Equity | Common Stocks*** | $— | $338,292,382 | $— |
Preferred Securities*** | — | 620,113 | — | |
$ — | $338,912,495 | $ — | ||
Long Futures Contracts | $42,974 | $— | $— | |
AVIP Fidelity Institutional AM® Equity Growth | Common Stocks*** | $123,729,143 | $5,922,464 | $— |
$123,729,143 | $5,922,464 | $ — | ||
AVIP AB Small Cap | Common Stocks*** | $110,931,580 | $— | $— |
Exchange Traded Funds | 812,216 | — | — | |
$111,743,796 | $ — | $ — | ||
AVIP AB Mid Cap Core | Common Stocks*** | $77,677,682 | $— | $— |
Exchange Traded Funds | 242,835 | — | — | |
$77,920,517 | $ — | $ — | ||
AVIP S&P 500® Index | Common Stocks*** | $1,206,261,707 | $— | $— |
U.S. Treasury Obligations | — | 397,973 | — | |
$1,206,261,707 | $397,973 | $ — | ||
Long Futures Contracts | $(31,905 ) | $— | $— |
Portfolio | Financial Instrument Type | Level 1 | Level 2 | Level 3 |
AVIP BlackRock Advantage Large Cap Value | Common Stocks*** | $194,450,664 | $— | $— |
Long Futures Contracts | $3,464 | $— | $— | |
AVIP Federated High Income Bond | Corporate Bonds*** | $— | $116,899,638 | $— |
AVIP Nasdaq-100® Index | Common Stocks*** | $272,868,223 | $— | $— |
U.S. Treasury Obligations | — | 110,162 | — | |
$272,868,223 | $110,162 | $ — | ||
Long Futures Contracts | $17,906 | $— | $— | |
AVIP BlackRock Advantage Large Cap Core | Common Stocks*** | $337,448,552 | $— | $— |
Long Futures Contracts | $1,896 | $— | $— | |
AVIP BlackRock Advantage Small Cap Growth | Common Stocks*** | $135,276,803 | $— | $— |
Rights*** | — | 4,950 | — | |
$135,276,803 | $4,950 | $ — | ||
Long Futures Contracts | $26,150 | $— | $— | |
AVIP S&P MidCap 400® Index | Common Stocks*** | $521,054,798 | $— | $— |
U.S. Treasury Obligations | — | 184,596 | — | |
$521,054,798 | $184,596 | $ — | ||
Long Futures Contracts | $(3,741 ) | $— | $— | |
AVIP BlackRock Advantage Large Cap Growth | Common Stocks*** | $497,810,766 | $— | $— |
Long Futures Contracts | $(63,500 ) | $— | $— | |
AVIP AB Risk Managed Balanced | Common Stocks*** | $675,353,123 | $— | $— |
U.S. Treasury Obligations | — | 229,575,734 | — | |
Corporate Bonds*** | — | 180,651,918 | — | |
Purchased Options | 39,001,119 | 56,072,590 | — | |
Asset-Backed / Mortgage-Backed Securities*** | — | 87,121,689 | — | |
U.S. Government Agency Mortgage-Backed Securities | — | 81,223,101 | — | |
Sovereign Debt Issues | — | 1,693,865 | — | |
Preferred Securities*** | — | 1,378,292 | — | |
Taxable Municipal Bonds | — | 373,327 | — | |
Rights*** | — | 4,444 | — | |
Money Market Funds | 45,227,232 | — | — | |
$759,581,474 | $638,094,960 | $ — | ||
Long Futures Contracts | $3,910,244 | $— | $— | |
Short Futures Contracts | $(27,100 ) | $— | $— |
Portfolio | Financial Instrument Type | Level 1 | Level 2 | Level 3 |
AVIP Federated Core Plus Bond | Corporate Bonds*** | $— | $174,089,917 | $— |
U.S. Treasury Obligations | — | 161,972,498 | — | |
U.S. Government Agency Mortgage-Backed Securities | — | 157,717,047 | — | |
Investment Companies | 45,843,876 | — | — | |
Asset-Backed / Mortgage-Backed Securities*** | — | 16,159,204 | — | |
Sovereign Debt Issues | — | 1,171,658 | — | |
$45,843,876 | $511,110,324 | $ — | ||
Long Futures Contracts | $489,950 | $— | $— | |
Short Futures Contracts | $(341,488 ) | $— | $— | |
AVIP Intech U.S. Low Volatility | Common Stocks*** | $660,561,142 | $— | $— |
AVIP AB Relative Value | Common Stocks*** | $122,205,021 | $— | $— |
AVIP iShares Managed Risk Balanced | Exchange Traded Funds | $556,960,312 | $— | $— |
Long Futures Contracts | $702,985 | $— | $— | |
Short Futures Contracts | $(502,356 ) | $— | $— | |
AVIP iShares Managed Risk Moderate Growth | Exchange Traded Funds | $488,599,480 | $— | $— |
Long Futures Contracts | $218,906 | $— | $— | |
Short Futures Contracts | $(453,752 ) | $— | $— | |
AVIP iShares Managed Risk Growth | Exchange Traded Funds | $442,026,193 | $— | $— |
Long Futures Contracts | $250,781 | $— | $— | |
Short Futures Contracts | $(417,341 ) | $— | $— | |
AVIP Moderately Conservative Model | Open-End Mutual Funds | $188,723,076 | $— | $— |
AVIP Balanced Model | Open-End Mutual Funds | $756,226,606 | $— | $— |
AVIP Moderate Growth Model | Open-End Mutual Funds | $1,448,693,902 | $— | $— |
AVIP Growth Model | Open-End Mutual Funds | $346,638,560 | $— | $— |
*** | Each of the Portfolio's Schedule of Investments includes detailed industry descriptions. |
AVIP Bond |
0.60% of first $100 million |
0.50% of next $150 million |
0.45% of next $250 million |
0.40% of next $500 million |
0.30% of next $1 billion |
0.25% over $2 billion |
AVIP BlackRock Balanced Allocation |
0.58% of first $100 million |
0.50% of next $150 million |
0.45% of next $250 million |
0.40% of next $500 million |
0.30% of next $1 billion |
0.25% over $2 billion |
AVIP BlackRock Advantage International Equity |
0.72% of first $200 million |
0.70% of next $800 million |
0.66% over $1 billion |
AVIP Fidelity Institutional AM® Equity Growth |
0.68% of first $100 million |
0.65% over $100 million |
AVIP AB Small Cap |
0.73% of first $400 million |
0.675% of next $200 million |
0.63% over $600 million |
AVIP AB Mid Cap Core |
0.715% of first $100 million |
0.71% of next $200 million |
0.69% of next $200 million |
0.66% over $500 million |
AVIP S&P 500® Index |
0.40% of first $100 million |
0.35% of next $150 million |
0.33% over $250 million |
AVIP BlackRock Advantage Large Cap Value |
0.67% of first $500 million |
0.65% over $500 million |
AVIP Federated High Income Bond |
0.75% of first $75 million |
0.70% of next $75 million |
0.65% of next $75 million |
0.60% over $225 million |
AVIP Nasdaq-100® Index |
0.40% of first $100 million |
0.35% of next $150 million |
0.33% over $250 million |
AVIP BlackRock Advantage Large Cap Core |
0.64% of first $500 million |
0.62% over $500 million |
AVIP BlackRock Advantage Small Cap Growth |
0.78% of first $100 million |
0.75% of next $400 million |
0.70% over $500 million |
AVIP S&P MidCap 400® Index |
0.40% of first $100 million |
0.35% of next $150 million |
0.33% over $250 million |
AVIP BlackRock Advantage Large Cap Growth |
0.66% of first $500 million |
0.64% over $500 million |
AVIP AB Risk Managed Balanced |
0.88% of first $500 million |
0.74% of next $1.3 billion |
0.72% over $1.8 billion |
AVIP Federated Core Plus Bond |
0.56% of first $100 million |
0.54% of next $150 million |
0.50% of next $150 million |
0.45% of next $350 million |
0.43% over $750 million |
AVIP Intech U.S. Low Volatility |
0.575% of first $500 million |
0.555% over $500 million |
AVIP AB Relative Value |
0.65% of first $100 million |
0.61% of next $200 million |
0.59% over $300 million |
AVIP iShares Managed Risk Balanced |
0.55% of first $1.5 billion |
0.53% over $1.5 billion |
AVIP iShares Managed Risk Moderate Growth |
0.55% of first $1.5 billion |
0.53% over $1.5 billion |
AVIP iShares Managed Risk Growth |
0.55% of first $1.5 billion |
0.53% over $1.5 billion |
AVIP Model Portfolios |
0.40% of all net assets |
AllianceBernsterin, L.P. ("AB") |
AVIP AB Small Cap |
AVIP AB Mid Cap Core |
AVIP AB Risk Managed Balanced |
AVIP AB Relative Value |
BlackRock Investment Management, LLC ("BlackRock") |
AVIP BlackRock Balanced Allocation |
AVIP BlackRock Advantage International Equity |
AVIP BlackRock Advantage Large Cap Value |
AVIP BlackRock Advantage Large Cap Core |
BlackRock (continued) |
AVIP BlackRock Advantage Small Cap Growth |
AVIP BlackRock Advantage Large Cap Growth |
AVIP iShares Managed Risk Balanced |
AVIP iShares Managed Risk Moderate Growth |
AVIP iShares Managed Risk Growth |
Federated Investment Management Company ("Federated") |
AVIP Federated High Income Bond |
AVIP Federated Core Plus Bond |
FIAM LLC ("FIAM") |
AVIP Fidelity Institutional AM® Equity Growth |
Geode Capital Management, LLC ("Geode") |
AVIP S&P 500® Index |
AVIP Nasdaq-100® Index |
AVIP S&P MidCap 400® Index |
Intech Investment Management LLC ("Intech") |
AVIP Intech U.S. Low Volatility |
Portfolio | May 1, 2023 to April 30, 2024 | May 1, 2022 to April 30, 2023 |
AVIP Moderately Conservative Model | 1.00% | 1.00% |
AVIP Balanced Model | 1.00% | 1.00% |
AVIP Moderate Growth Model | * | 1.07% |
AVIP Growth Model | * | 1.14% |
Substitution 3 Unaffiliated Funds | Substitution 3 Replacement AuguStarSM Variable Insurance Products Fund Portfolios |
Fidelity® VIP Contrafund® Portfolio (Service Class 2) | AVIP BlackRock Advantage Large Cap Growth Portfolio |
TOPS® Managed Risk Balanced ETF Portfolio (Class 2 and Class 3 Shares) | AVIP iShares Managed Risk Balanced Portfolio |
TOPS® Managed Risk Moderate Growth ETF Portfolio (Class 2 and Class 3 Shares) | AVIP iShares Managed Risk Moderate Growth Portfolio |
TOPS® Managed Risk Growth ETF Portfolio (Class 2 and Class 3 Shares) | AVIP iShares Managed Risk Growth Portfolio |
Portfolio | Expense Limitation |
AVIP BlackRock Advantage Large Cap Growth | 0.85% |
AVIP iShares Managed Risk Balanced | 0.75% |
AVIP iShares Managed Risk Moderate Growth | 0.74% |
AVIP iShares Managed Risk Growth | 0.74% |
Substitution 4 Unaffiliated Funds | Substitution 4 Replacement AuguStarSM Variable Insurance Products Fund Portfolios |
PSF PGIM Jennison Focused Blend Portfolio (Class II) | AVIP Fidelity Institutional AM® Equity Growth Portfolio |
Goldman Sachs Large Cap Value Fund (Institutional Shares and Service Shares) | AVIP S&P 500® Index Portfolio |
PSF PGIM Jennison Growth Portfolio (Class II) | AVIP BlackRock Advantage Large Cap Growth Portfolio |
LVIP JPMorgan Mid Cap Value Fund (Standard Class) | AVIP S&P MidCap 400® Index Portfolio |
Allspring VT Discovery SMID Cap Growth Fund (Class 2) | AVIP S&P MidCap 400® Index Portfolio |
Invesco V.I. Balanced-Risk Allocation Fund (Series II) | AVIP AB Risk Managed Balanced Portfolio |
Western Asset Core Plus VIT Portfolio (Class II) | AVIP Federated Core Plus Bond Portfolio |
Portfolio | Expense Limitation |
AVIP Fidelity Institutional AM® Equity Growth | 1.26% |
AVIP S&P 500® Index Portfolio | 0.71% |
AVIP S&P MidCap 400® Index | 0.73% |
AVIP BlackRock Advantage Large Cap Growth | 1.02% |
AVIP AB Risk Managed Balanced | 1.13% |
AVIP Federated Core Plus Bond | 0.76% |
Portfolio | Purchases | Sales | Realized gain (loss) |
AVIP Fidelity Institutional AM® Equity Growth | $988,131 | $1,001,307 | $231,288 |
AVIP Bond | AVIP BlackRock Balanced Allocation | AVIP BlackRock Advantage International Equity | ||||
Six-Month Period Ended | Year Ended | Six-Month Period Ended | Year Ended | Six-Month Period Ended | Year Ended | |
June 30, 2024 (Unaudited) | December 31, 2023 | June 30, 2024 (Unaudited) | December 31, 2023 | June 30, 2024 (Unaudited) | December 31, 2023 | |
Capital shares issued on sales | 871,555 | 1,259,723 | 207,180 | 480,921 | 400,150 | 883,221 |
Capital shares issued on reinvested distributions | — | 441,835 | — | 231,891 | — | 880,383 |
Capital shares redeemed | (1,285,631 ) | (2,126,271 ) | (1,576,829 ) | (3,326,007 ) | (2,292,585 ) | (5,063,296 ) |
Net increase (decrease) | (414,076 ) | (424,713 ) | (1,369,649 ) | (2,613,195 ) | (1,892,435 ) | (3,299,692 ) |
AVIP Fidelity Institutional AM® Equity Growth | AVIP AB Small Cap | AVIP AB Mid Cap Core | ||||
Six-Month Period Ended | Year Ended | Six-Month Period Ended | Year Ended | Six-Month Period Ended | Year Ended | |
June 30, 2024 (Unaudited) | December 31, 2023 | June 30, 2024 (Unaudited) | December 31, 2023 | June 30, 2024 (Unaudited) | December 31, 2023 | |
Capital shares issued on sales | 1,830,840 | 42,248,905 | 308,065 | 846,860 | 64,268 | 177,293 |
Capital shares issued on reinvested distributions | — | 7,778,623 | — | — | — | 13,410 |
Capital shares redeemed | (8,834,211 ) | (9,594,793 ) | (936,705 ) | (2,138,098 ) | (258,841 ) | (538,919 ) |
Net increase (decrease) | (7,003,371 ) | 40,432,735 | (628,640 ) | (1,291,238 ) | (194,573 ) | (348,216 ) |
AVIP S&P 500® Index | AVIP BlackRock Advantage Large Cap Value | AVIP Federated High Income Bond | ||||
Six-Month Period Ended | Year Ended | Six-Month Period Ended | Year Ended | Six-Month Period Ended | Year Ended | |
June 30, 2024 (Unaudited) | December 31, 2023 | June 30, 2024 (Unaudited) | December 31, 2023 | June 30, 2024 (Unaudited) | December 31, 2023 | |
Capital shares issued on sales | 532,035 | 3,848,159 | 79,800 | 415,564 | 286,550 | 493,699 |
Capital shares issued on reinvested distributions | — | 1,685,082 | — | 356,797 | — | 404,830 |
Capital shares redeemed | (3,923,403 ) | (6,397,100 ) | (1,192,660 ) | (1,772,857 ) | (656,238 ) | (1,202,913 ) |
Net increase (decrease) | (3,391,368 ) | (863,859 ) | (1,112,860 ) | (1,000,496 ) | (369,688 ) | (304,384 ) |
AVIP Nasdaq-100® Index | AVIP BlackRock Advantage Large Cap Core | AVIP BlackRock Advantage Small Cap Growth | ||||
Six-Month Period Ended | Year Ended | Six-Month Period Ended | Year Ended | Six-Month Period Ended | Year Ended | |
June 30, 2024 (Unaudited) | December 31, 2023 | June 30, 2024 (Unaudited) | December 31, 2023 | June 30, 2024 (Unaudited) | December 31, 2023 | |
Capital shares issued on sales | 767,902 | 1,446,326 | 96,376 | 262,682 | 191,599 | 548,707 |
Capital shares issued on reinvested distributions | — | 1,373,338 | — | 144,929 | — | — |
Capital shares redeemed | (2,440,808 ) | (4,601,601 ) | (1,309,636 ) | (2,289,703 ) | (632,558 ) | (1,522,104 ) |
Net increase (decrease) | (1,672,906 ) | (1,781,937 ) | (1,213,260 ) | (1,882,092 ) | (440,959 ) | (973,397 ) |
AVIP S&P MidCap 400® Index | AVIP BlackRock Advantage Large Cap Growth | AVIP AB Risk Managed Balanced | ||||
Six-Month Period Ended | Year Ended | Six-Month Period Ended | Year Ended | Six-Month Period Ended | Year Ended | |
June 30, 2024 (Unaudited) | December 31, 2023 | June 30, 2024 (Unaudited) | December 31, 2023 | June 30, 2024 (Unaudited) | December 31, 2023 | |
Capital shares issued on sales | 511,961 | 9,740,582 | 291,723 | 5,715,104 | 1,101,404 | 24,878,946 |
Capital shares issued on reinvested distributions | — | 1,325,429 | — | 412,755 | — | 989,598 |
Capital shares redeemed | (2,612,069 ) | (4,448,554 ) | (6,447,626 ) | (11,451,146 ) | (10,271,159 ) | (17,105,486 ) |
Net increase (decrease) | (2,100,108 ) | 6,617,457 | (6,155,903 ) | (5,323,287 ) | (9,169,755 ) | 8,763,058 |
AVIP Federated Core Plus Bond | AVIP Intech U.S. Low Volatility | AVIP AB Relative Value | ||||
Six-Month Period Ended | Year Ended | Six-Month Period Ended | Year Ended | Six-Month Period Ended | Year Ended | |
June 30, 2024 (Unaudited) | December 31, 2023 | June 30, 2024 (Unaudited) | December 31, 2023 | June 30, 2024 (Unaudited) | December 31, 2023 | |
Capital shares issued on sales | 3,951,970 | 10,380,878 | 811,704 | 3,272,998 | 57,539 | 616,649 |
Capital shares issued on reinvested distributions | — | 1,563,161 | — | 805,876 | — | 133,684 |
Capital shares redeemed | (5,802,944 ) | (9,855,471 ) | (7,006,763 ) | (14,467,474 ) | (1,180,348 ) | (1,764,060 ) |
Net increase (decrease) | (1,850,974 ) | 2,088,568 | (6,195,059 ) | (10,388,600 ) | (1,122,809 ) | (1,013,727 ) |
AVIP iShares Managed Risk Balanced | AVIP iShares Managed Risk Moderate Growth | AVIP iShares Managed Risk Growth | ||||
Six-Month Period Ended | Year Ended | Six-Month Period Ended | Year Ended | Six-Month Period Ended | Year Ended | |
June 30, 2024 (Unaudited) | December 31, 2023 | June 30, 2024 (Unaudited) | December 31, 2023 | June 30, 2024 (Unaudited) | December 31, 2023 | |
Capital shares issued on sales | 1,066,898 | 1,384,998 | 586,097 | 1,689,959 | 510,189 | 1,317,313 |
Capital shares issued on reinvested distributions | — | 688,292 | — | — | — | — |
Capital shares redeemed | (6,078,372 ) | (12,683,920 ) | (3,802,386 ) | (7,550,750 ) | (3,371,554 ) | (6,484,962 ) |
Net increase (decrease) | (5,011,474 ) | (10,610,630 ) | (3,216,289 ) | (5,860,791 ) | (2,861,365 ) | (5,167,649 ) |
AVIP Moderately Conservative Model | AVIP Balanced Model | AVIP Moderate Growth Model | ||||
Six-Month Period Ended | Year Ended | Six-Month Period Ended | Year Ended | Six-Month Period Ended | Year Ended | |
June 30, 2024 (Unaudited) | December 31, 2023 | June 30, 2024 (Unaudited) | December 31, 2023 | June 30, 2024 (Unaudited) | December 31, 2023 | |
Capital shares issued on sales | 440,494 | 472,694 | 894,906 | 1,396,393 | 424,199 | 1,460,234 |
Capital shares issued on reinvested distributions | — | 1,550,089 | — | 8,515,020 | — | 20,531,383 |
Capital shares redeemed | (1,847,726 ) | (4,170,427 ) | (6,406,062 ) | (11,815,189 ) | (12,291,391 ) | (18,442,948 ) |
Net increase (decrease) | (1,407,232 ) | (2,147,644 ) | (5,511,156 ) | (1,903,776 ) | (11,867,192 ) | 3,548,669 |
AVIP Growth Model | ||
Six-Month Period Ended | Year Ended | |
June 30, 2024 (Unaudited) | December 31, 2023 | |
Capital shares issued on sales | 109,883 | 316,085 |
Capital shares issued on reinvested distributions | — | 5,576,790 |
Capital shares redeemed | (2,238,618 ) | (4,293,218 ) |
Net increase (decrease) | (2,128,735 ) | 1,599,657 |
AVIP Bond | AVIP BlackRock Balanced Allocation | AVIP BlackRock Advantage International Equity | AVIP Fidelity Institutional AM® Equity Growth | AVIP AB Small Cap | |
Cost of purchases | $12,474,894 | $116,521,843 | $258,723,073 | $31,479,562 | $64,111,410 |
Proceeds from sales | $16,586,981 | $151,563,090 | $286,747,578 | $44,635,349 | $72,612,290 |
AVIP AB Mid Cap Core | AVIP S&P 500® Index | AVIP BlackRock Advantage Large Cap Value | AVIP Federated High Income Bond | AVIP Nasdaq-100® Index | |
Cost of purchases | $31,660,309 | $11,332,150 | $72,585,920 | $21,217,380 | $6,118,189 |
Proceeds from sales | $37,394,789 | $149,123,257 | $91,646,713 | $22,417,954 | $35,626,324 |
AVIP BlackRock Advantage Large Cap Core | AVIP BlackRock Advantage Small Cap Growth | AVIP S&P MidCap 400® Index | AVIP BlackRock Advantage Large Cap Growth | AVIP AB Risk Managed Balanced | |
Cost of purchases | $119,575,213 | $34,386,538 | $53,919,233 | $291,715,639 | $435,494,596 |
Proceeds from sales | $158,219,700 | $45,580,503 | $100,153,249 | $350,528,734 | $520,835,312 |
AVIP Federated Core Plus Bond | AVIP Intech U.S. Low Volatility | AVIP AB Relative Value | AVIP iShares Managed Risk Balanced | AVIP iShares Managed Risk Moderate Growth | |
Cost of purchases | $109,564,241 | $174,159,530 | $33,502,771 | $4,452,905 | $13,370,333 |
Proceeds from sales | $76,992,767 | $237,507,956 | $43,671,339 | $46,240,471 | $42,801,769 |
AVIP iShares Managed Risk Growth | AVIP Moderately Conservative Model | AVIP Balanced Model | AVIP Moderate Growth Model | AVIP Growth Model | |
Cost of purchases | $6,627,381 | $7,595,469 | $24,718,409 | $40,510,477 | $9,466,193 |
Proceeds from sales | $30,212,583 | $21,824,740 | $82,723,255 | $172,138,155 | $33,812,100 |
AVIP BlackRock Balanced Allocation | AVIP AB Risk Managed Balanced | AVIP Federated Core Plus Bond | |
Cost of purchases | $— | $274,650,556 | $33,898,277 |
Proceeds from sales | $8,091,100 | $284,372,791 | $72,623,993 |
Portfolio | Collateral Pledged | Futures Contracts Opened (in millions) | Futures Contracts Closed (in millions) |
AVIP BlackRock Balanced Allocation | Portions of cash holdings | $37.5 | $37.2 |
AVIP BlackRock Advantage International Equity | Portions of cash holdings | 39.7 | 39.1 |
AVIP S&P 500® Index | Portions of cash holdings and securities | 151.9 | 142.5 |
AVIP BlackRock Advantage Large Cap Value | Portions of cash holdings | 25.7 | 25.7 |
AVIP Nasdaq-100® Index | Portions of securities | 28.7 | 28.8 |
AVIP BlackRock Advantage Large Cap Core | Portions of cash holdings | 46.5 | 46.5 |
AVIP BlackRock Advantage Small Cap Growth | Portions of cash holdings | 21.3 | 21.2 |
AVIP S&P MidCap 400® Index | Portions of cash holdings and securities | 49.7 | 49.2 |
AVIP BlackRock Advantage Large Cap Growth | Portions of cash holdings | 79.9 | 80.4 |
AVIP AB Risk Managed Balanced | Portions of securities | 1,320.7 | 1,477.0 |
AVIP Federated Core Plus Bond | Portions of securities | 494.7 | 486.1 |
AVIP iShares Managed Risk Balanced | Portions of cash holdings | 335.5 | 348.5 |
AVIP iShares Managed Risk Moderate Growth | Portions of cash holdings | 230.3 | 233.6 |
AVIP iShares Managed Risk Growth | Portions of cash holdings | 238.0 | 241.1 |
Portfolio | Instrument | Primary Risk Type | Fair Value- Asset Derivatives | Fair Value- Liability Derivatives | Location on Statements of Assets and Liabilities |
AVIP BlackRock Balanced Allocation | Futures contracts | Equity price | $3,383 | $ — | (1 ) |
AVIP BlackRock Advantage International Equity | Futures contracts | Equity price | 42,974 | — | (1 ) |
AVIP S&P 500® Index | Futures contracts | Equity price | — | (31,905 ) | (1 ) |
AVIP BlackRock Advantage Large Cap Value | Futures contracts | Equity price | 3,464 | — | (1 ) |
AVIP Nasdaq-100® Index | Futures contracts | Equity price | 17,906 | — | (1 ) |
AVIP BlackRock Advantage Large Cap Core | Futures contracts | Equity price | 1,896 | — | (1 ) |
AVIP BlackRock Advantage Small Cap Growth | Futures contracts | Equity price | 26,150 | — | (1 ) |
AVIP S&P MidCap 400® Index | Futures contracts | Equity price | — | (3,741 ) | (1 ) |
AVIP BlackRock Advantage Large Cap Growth | Futures contracts | Equity price | — | (63,500 ) | (1 ) |
AVIP AB Risk Managed Balanced | Futures contracts | Equity price | 67,288 | — | (1 ) |
Futures contracts | Interest rate | 3,842,956 | (27,100 ) | (1 ) | |
Purchased options | Equity price | 95,073,709 | — | (2 ) | |
AVIP Federated Core Plus Bond | Futures contracts | Interest rate | 489,950 | (341,488 ) | (1 ) |
Portfolio | Instrument | Primary Risk Type | Fair Value- Asset Derivatives | Fair Value- Liability Derivatives | Location on Statements of Assets and Liabilities |
AVIP iShares Managed Risk Balanced | Futures contracts | Equity price | $220,501 | $— | (1 ) |
Futures contracts | Interest rate | 409,004 | (531,383 ) | (1 ) | |
Futures contracts | Foreign currency | 148,799 | (46,292 ) | (1 ) | |
AVIP iShares Managed Risk Moderate Growth | Futures contracts | Equity price | 157,148 | — | (1 ) |
Futures contracts | Interest rate | — | (453,752 ) | (1 ) | |
Futures contracts | Foreign currency | 98,603 | (36,845 ) | (1 ) | |
AVIP iShares Managed Risk Growth | Futures contracts | Equity price | 177,468 | — | (1 ) |
Futures contracts | Interest rate | — | (417,341 ) | (1 ) | |
Futures contracts | Foreign currency | 105,434 | (32,121 ) | (1 ) |
Portfolio | Instrument | Primary Risk Type | Realized Gain (Loss) on Derivatives Recognized in Income | Change in Unrealized Appreciation/ Depreciation on Derivatives Recognized in Income | Location on Statements of Operations |
AVIP BlackRock Balanced Allocation | Futures contracts | Equity price | $551,544 | $(97,709 ) | (1 ),(2) |
AVIP BlackRock Advantage International Equity | Futures contracts | Equity price | 267,292 | (170,328 ) | (1 ),(2) |
AVIP S&P 500® Index | Futures contracts | Equity price | 884,962 | (44,366 ) | (1 ),(2) |
AVIP BlackRock Advantage Large Cap Value | Futures contracts | Equity price | 359,945 | (74,430 ) | (1 ),(2) |
AVIP Nasdaq-100® Index | Futures contracts | Equity price | 264,490 | (547 ) | (1 ),(2) |
AVIP BlackRock Advantage Large Cap Core | Futures contracts | Equity price | 628,607 | (139,231 ) | (1 ),(2) |
AVIP BlackRock Advantage Small Cap Growth | Futures contracts | Equity price | 40,666 | 19,583 | (1 ),(2) |
AVIP S&P MidCap 400® Index | Futures contracts | Equity price | 132,379 | 43,214 | (1 ),(2) |
AVIP BlackRock Advantage Large Cap Growth | Futures contracts | Equity price | 1,121,471 | (207,247 ) | (1 ),(2) |
AVIP AB Risk Managed Balanced | Futures contracts | Equity price | 13,401,436 | (6,647,094 ) | (1 ),(2) |
Futures contracts | Interest rate | (3,251,992 ) | (15,430,807 ) | (1 ),(2) | |
Purchased options | Equity price | 1,303,587 | 20,043,656 | (3 ),(4) | |
AVIP Federated Core Plus Bond | Futures contracts | Interest rate | (1,511,792 ) | (410,600 ) | (1 ),(2) |
AVIP iShares Managed Risk Balanced | Futures contracts | Equity price | 4,945,179 | (1,568,482 ) | (1 ),(2) |
Futures contracts | Interest rate | 506,500 | 419,901 | (1 ),(2) | |
Futures contracts | Foreign currency | (355,566 ) | (720,195 ) | (1 ),(2) |
Portfolio | Instrument | Primary Risk Type | Realized Gain (Loss) on Derivatives Recognized in Income | Change in Unrealized Appreciation/ Depreciation on Derivatives Recognized in Income | Location on Statements of Operations |
AVIP iShares Managed Risk Moderate Growth | Futures contracts | Equity price | $3,050,803 | $(1,027,545 ) | (1 ),(2) |
Futures contracts | Interest rate | 763,242 | 961,447 | (1 ),(2) | |
Futures contracts | Foreign currency | (382,288 ) | (631,567 ) | (1 ),(2) | |
AVIP iShares Managed Risk Growth | Futures contracts | Equity price | 4,351,060 | (1,202,252 ) | (1 ),(2) |
Futures contracts | Interest rate | 698,417 | 832,789 | (1 ),(2) | |
Futures contracts | Foreign currency | (414,390 ) | (677,760 ) | (1 ),(2) |
AVIP Bond | AVIP BlackRock Balanced Allocation | AVIP BlackRock Advantage International Equity | AVIP Fidelity Institutional AM® Equity Growth | AVIP AB Small Cap | AVIP AB Mid Cap Core | |
Gross unrealized: | ||||||
Appreciation | $427,149 | $79,425,216 | $48,831,492 | $30,366,665 | $17,389,791 | $10,613,600 |
Depreciation | (22,481,763 ) | (22,743,786 ) | (18,799,322 ) | (3,491,679 ) | (13,438,310 ) | (9,026,659 ) |
Net unrealized appreciation (depreciation) | $(22,054,614 ) | $56,681,430 | $30,032,170 | $26,874,986 | $3,951,481 | $1,586,941 |
Aggregate cost of investments: | $231,880,455 | $353,239,692 | $308,923,299 | $102,776,621 | $107,792,315 | $76,333,576 |
AVIP S&P 500® Index | AVIP BlackRock Advantage Large Cap Value | AVIP Federated High Income Bond | AVIP Nasdaq-100® Index | AVIP BlackRock Advantage Large Cap Core | AVIP BlackRock Advantage Small Cap Growth | |
Gross unrealized: | ||||||
Appreciation | $563,419,954 | $22,096,156 | $1,109,741 | $123,994,856 | $85,111,837 | $25,185,974 |
Depreciation | (43,213,868 ) | (8,921,204 ) | (7,079,197 ) | (7,351,667 ) | (8,852,184 ) | (26,934,272 ) |
Net unrealized appreciation (depreciation) | $520,206,086 | $13,174,952 | $(5,969,456 ) | $116,643,189 | $76,259,653 | $(1,748,298 ) |
Aggregate cost of investments: | $686,421,689 | $181,279,176 | $122,869,094 | $156,353,102 | $261,190,795 | $137,056,201 |
AVIP S&P MidCap 400® Index | AVIP BlackRock Advantage Large Cap Growth | AVIP AB Risk Managed Balanced | AVIP Federated Core Plus Bond | AVIP Intech U.S. Low Volatility | AVIP AB Relative Value | |
Gross unrealized: | ||||||
Appreciation | $100,913,802 | $102,961,240 | $210,999,986 | $2,007,233 | $104,419,771 | $20,790,180 |
Depreciation | (35,493,727 ) | (6,862,717 ) | (91,233,008 ) | (56,662,878 ) | (26,211,613 ) | (2,940,563 ) |
Net unrealized appreciation (depreciation) | $65,420,075 | $96,098,523 | $119,766,978 | $(54,655,645 ) | $78,208,158 | $17,849,617 |
Aggregate cost of investments: | $455,815,578 | $401,648,743 | $1,281,792,600 | $611,758,307 | $582,352,984 | $104,355,404 |
AVIP iShares Managed Risk Balanced | AVIP iShares Managed Risk Moderate Growth | AVIP iShares Managed Risk Growth | AVIP Moderately Conservative Model | AVIP Balanced Model | AVIP Moderate Growth Model | |
Gross unrealized: | ||||||
Appreciation | $65,983,994 | $96,565,470 | $109,142,492 | $10,837,452 | $71,677,326 | $169,646,728 |
Depreciation | (17,707,588 ) | (1,194,078 ) | (2,580,389 ) | (11,937,274 ) | (33,347,807 ) | (34,326,811 ) |
Net unrealized appreciation (depreciation) | $48,276,406 | $95,371,392 | $106,562,103 | $(1,099,822 ) | $38,329,519 | $135,319,917 |
Aggregate cost of investments: | $508,884,535 | $392,993,242 | $335,297,530 | $189,822,898 | $717,897,087 | $1,313,373,985 |
AVIP Growth Model | |
Gross unrealized: | |
Appreciation | $43,885,648 |
Depreciation | (3,554,226 ) |
Net unrealized appreciation | $40,331,422 |
Aggregate cost of investments: | $306,307,138 |

Item 8. Changes in and Disagreements with Accountants for Open-End Management Investment Companies.
Not applicable.
Item 9. Proxy Disclosures for Open-End Management Investment Companies.
Not applicable.
Item 10. Remuneration Paid to Directors, Officers, and Others of Open-End Management Investment Companies.
The information required is disclosed as part of the financial statements included in Item 7.
Item 11. Statement Regarding Basis for Approval of Investment Advisory Contract.
There were no approvals by the Board of any investment advisory contracts during the most recent fiscal half-year
Item 12. Disclosure Of Proxy Voting Policies And Procedures For Closed-End Management Investment Companies.
Not applicable for open-end investment companies.
Item 13. Portfolio Managers of Closed-End Management Investment Companies.
Not applicable for open-end investment companies.
Item 14. Purchases of Equity Securities by Closed-End Management Investment Company and Affiliated Purchasers.
Not applicable for open-end investment companies.
Item 15. Submission of Matters to a Vote of Security Holders.
There were no material changes to the procedures by which shareholders may recommend nominees to the Fund’s Board of Directors.
Item 16. Controls and Procedures.
The Fund’s principal executive officer and principal financial officer have concluded, based on their evaluation conducted as of a date within 90 days of the filing of this report, that the Fund’s disclosure controls and procedures are adequately designed and are operating effectively to ensure (i) that material information relating to the Fund, including its consolidated subsidiaries, is made known to them by others within those entities, particularly during the period in which this report is being prepared; and (ii) that information required to be disclosed by the Fund on Form N-CSR is recorded, processed, summarized and reported within the time periods specified in the Securities and Exchange Commission’s rules and forms.
There were no changes in the Fund’s internal control over financial reporting that occurred during the period covered by this report that have materially affected, or are reasonably likely to materially affect, the Fund’s internal control over financial reporting.
Item 17. Disclosure of Securities Lending Activities for Closed-End Management Investment Companies.
Not applicable.
Item 18. Recovery of Erroneously Awarded Compensation.
Not applicable.
Item 19. Exhibits.
a.1. Not applicable for semiannual reports.
a.2. A separate certification for each principal executive officer and principal financial officer of the Fund as required by Rule 30a-2(a) under the Investment Company Act of 1940 (17 CFR 270.30a-2(a)) is attached hereto as EX-99.CERT.
a.3. The certifications required by Section 906 of the Sarbanes-Oxley Act of 2002 are attached hereto as EX-99.906CERT.
SIGNATURES
Pursuant to the requirements of the Securities Exchange Act of 1934 and the Investment Company Act of 1940, the registrant has duly caused this report to be signed on its behalf by the undersigned, thereunto duly authorized.
AuguStarSM Variable Insurance Products Fund, Inc.
| By: | /s/ Thomas G. Mooney |
| Thomas G. Mooney | |
| Interim President | |
| (Principal Executive Officer) | |
| Date: | September 4, 2024 |
Pursuant to the requirements of the Securities Exchange Act of 1934 and the Investment Company Act of 1940, this report has been signed below by the following persons on behalf of the registrant and in the capacities and on the dates indicated.
| By: | /s/ Thomas G. Mooney |
| Thomas G. Mooney | |
| Interim President | |
| (Principal Executive Officer) | |
| Date: | September 4, 2024 |
| By: | /s/ R. Todd Brockman |
| R. Todd Brockman | |
| Treasurer | |
| (Principal Financial Officer) | |
| Date: | September 4, 2024 |
[THIS PAGE LEFT INTENTIONALLY BLANK]