UNITED STATES
SECURITIES AND EXCHANGE COMMISSION
Washington, D.C. 20549
FORM N-CSR
CERTIFIED SHAREHOLDER REPORT OF REGISTERED
MANAGEMENT INVESTMENT COMPANIES
Investment Company Act file number 811-03015
Ohio National Fund, Inc.
(Exact name of registrant as specified in charter)
| | |
| One Financial Way, Cincinnati, Ohio | | 45242 |
| | |
| (Address of principal executive offices) | | (Zip code) |
CT Corporation 300 E. Lombard St. Suite 1400 Baltimore, MD 21202
(Name and address of agent for service)
Registrant’s telephone number, including area code: 513-794-6971
Date of fiscal year end: December 31
Date of reporting period: June 30, 2022
Item 1. Reports To Stockholders.
(a)

Ohio National Fund, Inc.
SEMIANNUAL REPORT June 30, 2022
Jeffery A. Bley Jr., CRCP
President, Ohio National Fund, Inc.
Dear Investor:
Multiple factors combined in the first half of 2022 to create substantial headwinds that resulted in poor market performance, and virtually every asset class declining by double digits. Commodities were the only major exception, led by strong energy markets. This was a marked turnaround from 2021, which seems like a distant memory now. Geopolitical risk, a spike in inflation, and the response from central banks across the globe were the major story lines during the first half of 2022. Lower corporate profits and a potential recession may be the story lines during the second half of the year.
Russia’s invasion of Ukraine highlighted how significant geopolitical risk can be. In response to the invasion, the western world has ostracized Russia economically, financially, and politically. The downstream impacts are being felt worldwide, in the energy, agricultural, and broader financial markets. At this point, there has clearly been a paradigm shift that will last decades.
The combination of supply chain bottlenecks, a spike in energy prices and a tight labor market has unleashed a global spike in inflation that is proving not to be transitory. The U.S. inflation rate hit 9.1% in June, which is the highest rate in over 40 years. Clearly, this rate of inflation is unacceptable, and the Federal Reserve is taking action in an effort to curb it.
The Federal Reserve is raising interest rates aggressively to combat inflation. Central banks worldwide are doing the same, to various degrees. Importantly, the Federal Reserve is prioritizing the fight against inflation above economic growth at this point in time, and is willing to cause a recession, if that is required to curb the rate of inflation. Given that raising interest rates will not solve the supply chain or energy issues, it appears that demand destruction will be required to reduce the inflation rate.
Equity Markets
Equity markets declined substantially during the first half of 2022. Domestic indices generally underperformed international and emerging market indices during the period. Within the domestic equity market, the S&P 500®, S&P MidCap 400® and Russell 2000® indices all posted negative returns, ranging from -19.5% to -23.4%. Value stocks outperformed growth stocks by a wide margin during the period, which is a reversal from the last several years. The S&P 500® Value Index provided a return of -11.4%, while the S&P 500® Growth Index provided a return of -27.6%. Within foreign equity markets for the six month period, international indices of developed countries outperformed emerging market indices slightly.
A summary of returns for key equity benchmarks is presented below:
| Index | | 06/30/22 YTD U.S. Dollar Total Return
(price and dividend) |
| S&P 500® | | -20.0% |
| S&P 500® Growth | | -27.6% |
| S&P 500® Value | | -11.4% |
| S&P MidCap 400® | | -19.5% |
| Russell 2000® | | -23.4% |
| Index | | 06/30/22 YTD U.S. Dollar Total Return
(price and dividend) |
| MSCI All Country World Ex-USA (Net - USD) | | -18.4% |
| MSCI Emerging Markets | | -19.2% |
Fixed Income Markets
Fixed income markets registered large negative returns during the first half of 2022. The Federal Reserve has raised the Fed Funds rate aggressively in 2022 in an attempt to curb inflation, and has indicated that it will continue to raise the Fed Funds rate until inflation is under control. Interest rates increased across the curve during the period, in response to the Federal Reserve’s policy to aggressively combat inflation. Short-term interest rates increased more than long term interest rates, which caused the Treasury curve to invert from two years to ten years. Historically, an inverted yield curve has preceded a recession. Corporate credit spreads also widened during the period, as credit markets are pricing in additional stress in the future. As bond prices react negatively to rising interest rates, these factors combined to create substantial negative returns for fixed income investors in the first half of 2022.
The Bloomberg U.S. Aggregate Bond Index posted a total return of -10.4% in the first half of 2022. Lower quality indices, like the Bloomberg Corporate Index and the Bloomberg U.S. Corporate High Yield Index provided total returns of -14.4% and -14.2%, respectively. Other higher quality, shorter duration indices, such as the Bloomberg U.S. Securitized Index, provided a return of -8.7% for the period. The table below illustrates the returns of the various indices.
| Index | | 06/30/22 YTD U.S. Dollar Total Return
(price and interest) |
| Bloomberg U.S. Aggregate Bond | | -10.4% |
| Bloomberg U.S. Treasury | | -14.8% |
| Bloomberg U.S. Securitized | | -8.7% |
| Bloomberg U.S. Corporate Bond | | -14.4% |
| Bloomberg U.S. Corporate High Yield Bond | | -14.2% |
The Ohio National Fund, Inc.
The Ohio National Fund continues to offer a wide array of investment options that can be used to build a diversified portfolio. During the first half of 2022, six of the 20 actively managed Portfolios beat their respective peer groups. In addition, the returns of the three index portfolios, before expenses, performed in line with their respective indices during the period.
Looking Ahead
The second half of 2022 will likely be a volatile period. The Federal Reserve has moved from being accommodative to being restrictive, and short-term interest rates are expected to increase further. Economic growth is slowing domestically and internationally, and a recession appears more likely than not. Inflation is not under control at this point in time, and geopolitical risks continue to pressure the market. In addition, corporate profit margins and earnings will likely decline. Having said that, financial markets are forward looking, discounting mechanisms. Much of the above has been discounted during the first half of 2022, as evidenced by the negative returns for the period. Performance in the second half of the year will likely be driven by changing expectations around interest rates, inflation, earnings, and the depth/length of a potential recession.
In this environment, we believe that staying the course in a well-diversified portfolio will serve one well over the long term.
Thank you for entrusting your assets to the Ohio National Fund, Inc. We look forward to continuing to serve your financial needs.
| Ohio National Fund, Inc. | ON Bond Portfolio (Unaudited) |
The ON Bond Portfolio seeks a high level of income and opportunity for capital appreciation consistent with preservation of capital by investing, under normal circumstances, at least 80% of its net assets in corporate debt securities.
Performance as of June 30, 2022
| Average Annual returns | |
| One year | -14.26% |
| Five years | 1.10% |
| Ten years | 2.20% |
Past performance does not guarantee future results. The performance data quoted represents past performance and current returns may be lower or higher. Total return figures include change in share price and reinvestment of dividends and capital gains. The investment return and principal value will fluctuate so that an investor’s shares, when redeemed, may be worth more or less than the original cost. To obtain performance information up to the most recent month end, call toll-free 1-877-781-6392.
The Portfolio is not open to direct retail investment. Beneficial interest in the Portfolio’s shares is obtained either through an allocation to the Portfolio as an investment vehicle within variable life insurance policies or annuity contracts, or as an underlying investment by the ON Model Portfolios. Actual performance results for variable annuity and variable universal life contracts will be lower due to contract charges. Consult your contract for applicable charges.
Total expense ratio is 0.59% per the Fund’s prospectus dated April 29, 2022. Additional information pertaining to the Portfolio’s expense ratio as of June 30, 2022 can be found in the Portfolio’s Financial Highlights.
Q. How did the Portfolio perform in comparison to its benchmark during the reporting period?
A. For the six-month period ended June 30, 2022, the Portfolio returned -14.03% versus -13.93% for its benchmark, the ICE BofA U.S. Corporate Master Index.
Q. Were there specific market conditions, investment strategies, or techniques that materially affected the Portfolio’s benchmark-relative performance during the reporting period?
A. Fixed income markets registered negative returns during the first half of 2022. The Federal Reserve has raised the Fed Funds rate aggressively in 2022 in an attempt to curb inflation, and has indicated that it will continue to raise the Fed Funds rate until inflation is under control. Interest rates increased across the entire yield curve, but short-term interest rates increased at a faster rate. Even so, shorter duration bonds outperformed longer duration bonds during the period. The yield curve has become inverted between the 2 year and 10 year Treasury rate, which can be a harbinger of a recession. Credit spreads widened during the period, and lower quality bonds generally underperformed higher quality bonds.
From an investment strategy perspective, the Portfolio was positioned with a slightly shorter duration than the benchmark during the period, which enhanced performance. In terms of bond quality, the Portfolio was slightly overweight lower rated bonds, which detracted from performance. (1)
Q. How did sector allocation and security selection each impact the Portfolio’s performance relative to its benchmark?
A. Sector allocation was a slight positive for the Portfolio’s relative performance for the six-month period. The overweights to U.S. Treasuries and Consumer Discretionary sectors enhanced performance. The overweight to the Materials sector, and underweight to the Financials sector, detracted from performance. Security selection, in aggregate, slightly detracted.(1)
Q. Which securities contributed the most to, and detracted the most from, the Portfolio’s benchmark-relative performance?
A. The top three contributors to the Portfolio’s performance relative to the benchmark were Southwest Gas Corp. 3.875% due 04/01/2022, American Airlines 2015-1 Class B Pass Through Trust 3.700% due 05/01/2023, and General Motors Financial Co., Inc. QL + 89 due 01/05/2023. Each of these bonds are shorter duration bonds. The top three detractors from the Portfolio’s performance relative to the benchmark were Charter Communications Operating LLC / Charter Communications Operating 3.700% due 04/01/2051, Lowe’s Cos., Inc. 3.000% due 10/15/2050, and FirstEnergy Transmission 4.550% due 04/01/2049. Each of these bonds are longer duration bonds, which performed poorly due to rising interest rates. (1)
| (1) | The Portfolio’s composition is subject to change. Holdings and weightings are as of June 30, 2022. |
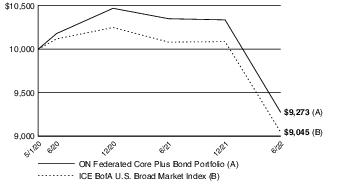
Change in Value of $10,000 Investment
Hypothetical illustration based on past performance. Future performance will vary. The Portfolio’s returns reflect reinvested dividends. The Portfolio’s holdings may differ significantly from the securities in the index. The index is unmanaged and therefore does not reflect the cost of portfolio management and accounting.
The ICE BofA U.S. Corporate Master Index tracks the performance of all U.S. dollar-denominated, investment grade corporate public debt issued in the U.S. domestic bond market. Qualifying bonds must have an investment grade rating (based on an average of Moody’s, S&P, and Fitch). In addition, qualifying securities must have at least one year remaining term to maturity, a fixed coupon schedule, and a minimum amount outstanding of $250 million.
Past performance is no guarantee of future results. Redemption of fund shares could have tax implications unique to each shareholder.
| Ohio National Fund, Inc. | ON Bond Portfolio (Unaudited) (Continued) |
| Portfolio Composition as of June 30, 2022 (1) |
| | % of Net Assets |
| Corporate Bonds (4) | 96.4 |
| Asset-Backed Securities (4) | 2.9 |
Money Market Funds
Less Net Liabilities | 0.7 |
| | 100.0 |
| Top 10 Portfolio Holdings as of June 30, 2022 (1) (2) (3) |
| | | % of Net Assets |
| 1. | Campbell Soup Co. 4.150%, 03/15/2028 | 1.8 |
| 2. | Lear Corp. 4.250%, 05/15/2029 | 1.7 |
| 3. | Mosaic Co. / The 4.050%, 11/15/2027 | 1.4 |
| 4. | Kinross Gold Corp. 4.500%, 07/15/2027 | 1.4 |
| 5. | Hasbro, Inc. 3.900%, 11/19/2029 | 1.3 |
| 6. | AbbVie, Inc. 4.250%, 11/21/2049 | 1.2 |
| 7. | Boeing Co. / The 3.200%, 03/01/2029 | 1.2 |
| 8. | Bank of Montreal 3.803%, 12/15/2032 | 1.2 |
| 9. | Ares Capital Corp. 3.200%, 11/15/2031 | 1.2 |
| 10. | RPM International, Inc. 4.250%, 01/15/2048 | 1.2 |
| | |
| (1) | Composition of Portfolio subject to change. |
| (2) | Short-term investments have been excluded from the list of Top 10 Portfolio Holdings. |
| (3) | Top 10 Portfolio Holdings is presented at an individual security level. Total investment exposure by issuer may be higher. |
| (4) | Sectors (Corporate Bonds, Asset-Backed Securities): |
| | % of Net Assets |
| Financials | 27.5 |
| Industrials | 13.3 |
| Consumer Staples | 10.4 |
| Consumer Discretionary | 8.8 |
| Energy | 8.1 |
| Materials | 7.9 |
| Utilities | 7.8 |
| Communication Services | 5.9 |
| Health Care | 4.1 |
| Real Estate | 3.8 |
| Information Technology | 1.7 |
| | 99.3 |
| Ohio National Fund, Inc. | ON Bond Portfolio |
| Schedule of Investments | June 30, 2022 (Unaudited) |
| Corporate Bonds–96.4% | Rate | Maturity | Face Amount | Value |
Communication Services–5.9%
| | | | | |
AT&T, Inc. (Diversified Telecom. Svs.)
| | 4.900% | 08/15/2037 | $1,000,000 | $ 996,001 |
Charter Communications Operating LLC / Charter Communications Operating Capital (Media)
| | 3.700% | 04/01/2051 | 2,800,000 | 1,894,747 |
Comcast Corp. (Media)
| | 3.250% | 11/01/2039 | 3,000,000 | 2,465,681 |
Lamar Media Corp. (Media)
| | 4.875% | 01/15/2029 | 1,200,000 | 1,080,139 |
Rogers Communications, Inc. (Wireless Telecom. Svs.)
| | 3.700% | 11/15/2049 | 2,100,000 | 1,600,337 |
Time Warner Cable LLC (Media)
| | 6.550% | 05/01/2037 | 850,000 | 851,084 |
T-Mobile U.S.A., Inc. (Wireless Telecom. Svs.)
| | 3.875% | 04/15/2030 | 1,800,000 | 1,679,861 |
Verizon Communications, Inc. (Diversified Telecom. Svs.)
| | 4.400% | 11/01/2034 | 1,500,000 | 1,437,311 |
Verizon Communications, Inc. (Diversified Telecom. Svs.)
| | 2.875% | 11/20/2050 | 1,000,000 | 709,610 |
| | | | | | 12,714,771 |
Consumer Discretionary–8.8%
| | | | | |
Amazon.com, Inc. (Internet & Direct Marketing Retail)
| | 3.875% | 08/22/2037 | 1,000,000 | 947,915 |
Aptiv PLC (Auto Components)
| | 4.350% | 03/15/2029 | 1,000,000 | 945,917 |
Aptiv PLC / Aptiv Corp. (Auto Components)
| | 3.250% | 03/01/2032 | 2,000,000 | 1,699,181 |
Best Buy Co., Inc. (Specialty Retail)
| | 1.950% | 10/01/2030 | 3,000,000 | 2,382,799 |
Expedia Group, Inc. (Hotels, Restaurants & Leisure)
| | 4.625% | 08/01/2027 | 1,000,000 | 960,753 |
Hasbro, Inc. (Leisure Products)
| | 3.900% | 11/19/2029 | 3,000,000 | 2,754,798 |
Home Depot, Inc. / The (Specialty Retail)
| | 2.375% | 03/15/2051 | 2,000,000 | 1,352,502 |
Lear Corp. (Auto Components)
| | 4.250% | 05/15/2029 | 4,000,000 | 3,673,866 |
Lowe's Cos., Inc. (Specialty Retail)
| | 3.000% | 10/15/2050 | 2,000,000 | 1,393,556 |
M.D.C. Holdings, Inc. (Household Durables)
| | 3.850% | 01/15/2030 | 2,000,000 | 1,657,265 |
Magna International, Inc. (Auto Components)
| | 3.625% | 06/15/2024 | 1,000,000 | 999,618 |
| | | | | | 18,768,170 |
Consumer Staples–10.4%
| | | | | |
Anheuser-Busch Cos. LLC / Anheuser-Busch InBev Worldwide, Inc. (Beverages)
| | 4.700% | 02/01/2036 | 2,000,000 | 1,916,054 |
Anheuser-Busch Cos. LLC / Anheuser-Busch InBev Worldwide, Inc. (Beverages)
| | 4.900% | 02/01/2046 | 1,000,000 | 939,890 |
Anheuser-Busch InBev Worldwide, Inc. (Beverages)
| | 4.600% | 04/15/2048 | 2,000,000 | 1,795,585 |
B.A.T. Capital Corp. (Tobacco)
| | 3.215% | 09/06/2026 | 1,000,000 | 933,996 |
B.A.T. Capital Corp. (Tobacco)
| | 4.700% | 04/02/2027 | 2,000,000 | 1,953,622 |
Campbell Soup Co. (Food Products)
| | 4.150% | 03/15/2028 | 4,000,000 | 3,928,034 |
Coca-Cola Co. / The (Beverages)
| | 3.000% | 03/05/2051 | 1,000,000 | 807,464 |
Coca-Cola Co. / The (Beverages)
| | 2.500% | 03/15/2051 | 1,000,000 | 724,220 |
Hershey Co. / The (Food Products)
| | 1.700% | 06/01/2030 | 1,800,000 | 1,518,099 |
JBS U.S.A. LUX SA / JBS U.S.A. Food Co. / JBS U.S.A. Finance, Inc. (Food Products)
| (a) | 5.750% | 04/01/2033 | 1,200,000 | 1,142,748 |
Kimberly-Clark Corp. (Household Products)
| | 1.050% | 09/15/2027 | 2,000,000 | 1,746,032 |
Kraft Heinz Foods Co. (Food Products)
| | 4.625% | 10/01/2039 | 1,200,000 | 1,053,106 |
Philip Morris International, Inc. (Tobacco)
| | 3.375% | 08/15/2029 | 2,500,000 | 2,255,300 |
Smithfield Foods, Inc. (Food Products)
| (a) | 3.000% | 10/15/2030 | 2,000,000 | 1,657,994 |
| | | | | | 22,372,144 |
Energy–8.1%
| | | | | |
Baker Hughes Holdings LLC / Baker Hughes Co-Obligor, Inc. (Energy Equip. & Svs.)
| | 4.080% | 12/15/2047 | 2,000,000 | 1,690,789 |
BP Capital Markets America, Inc. (Oil, Gas & Consumable Fuels)
| | 3.017% | 01/16/2027 | 1,000,000 | 952,731 |
BP Capital Markets America, Inc. (Oil, Gas & Consumable Fuels)
| | 1.749% | 08/10/2030 | 1,000,000 | 818,467 |
Chevron Corp. (Oil, Gas & Consumable Fuels)
| | 2.236% | 05/11/2030 | 1,800,000 | 1,579,697 |
Energy Transfer LP (Oil, Gas & Consumable Fuels)
| | 4.950% | 06/15/2028 | 2,000,000 | 1,970,771 |
Exxon Mobil Corp. (Oil, Gas & Consumable Fuels)
| | 4.114% | 03/01/2046 | 900,000 | 820,659 |
Halliburton Co. (Energy Equip. & Svs.)
| | 4.850% | 11/15/2035 | 1,000,000 | 961,550 |
Kinder Morgan, Inc. (Oil, Gas & Consumable Fuels)
| | 5.300% | 12/01/2034 | 1,000,000 | 976,838 |
Marathon Petroleum Corp. (Oil, Gas & Consumable Fuels)
| | 4.750% | 09/15/2044 | 1,000,000 | 880,980 |
ONEOK, Inc. (Oil, Gas & Consumable Fuels)
| | 5.850% | 01/15/2026 | 1,200,000 | 1,243,861 |
ONEOK, Inc. (Oil, Gas & Consumable Fuels)
| | 6.000% | 06/15/2035 | 1,000,000 | 976,056 |
Shell International Finance B.V. (Oil, Gas & Consumable Fuels)
| | 4.000% | 05/10/2046 | 1,000,000 | 890,471 |
Tennessee Gas Pipeline Co. LLC (Oil, Gas & Consumable Fuels)
| (a) | 2.900% | 03/01/2030 | 1,000,000 | 863,800 |
Texas Eastern Transmission LP (Oil, Gas & Consumable Fuels)
| (a) | 4.150% | 01/15/2048 | 1,000,000 | 827,730 |
Williams Cos., Inc. / The (Oil, Gas & Consumable Fuels)
| | 3.750% | 06/15/2027 | 1,000,000 | 954,900 |
Williams Cos., Inc. / The (Oil, Gas & Consumable Fuels)
| | 5.400% | 03/04/2044 | 1,000,000 | 952,527 |
| | | | | | 17,361,827 |
Financials–27.5%
| | | | | |
AerCap Ireland Capital DAC / AerCap Global Aviation Trust (Diversified Financial Svs.)
| | 3.300% | 01/23/2023 | 2,000,000 | 1,992,040 |
AerCap Ireland Capital DAC / AerCap Global Aviation Trust (Diversified Financial Svs.)
| | 3.300% | 01/30/2032 | 1,500,000 | 1,200,737 |
Ares Capital Corp. (Capital Markets)
| | 3.200% | 11/15/2031 | 3,500,000 | 2,543,123 |
Bank of America Corp. (Banks)
| | 3.875% | 08/01/2025 | 1,000,000 | 995,656 |
Bank of America Corp. (Rate is fixed until 03/08/2032, at which point, the rate becomes H15T5Y + 200) (Banks)
| (b) | 3.846% | 03/08/2037 | 1,000,000 | 864,349 |
| Ohio National Fund, Inc. | ON Bond Portfolio (Continued) |
| Schedule of Investments | June 30, 2022 (Unaudited) |
| Corporate Bonds (Continued) | Rate | Maturity | Face Amount | Value |
| Financials (continued) | | | | | |
Bank of America Corp. (Rate is fixed until 04/24/2037, at which point, the rate becomes QL + 181) (Banks)
| (b) | 4.244% | 04/24/2038 | $1,000,000 | $ 916,116 |
Bank of Montreal (Rate is fixed until 12/15/2027, at which point, the rate becomes USSW5 + 143) (Banks)
| (b) | 3.803% | 12/15/2032 | 2,800,000 | 2,595,278 |
BlackRock, Inc. (Capital Markets)
| | 2.400% | 04/30/2030 | 1,000,000 | 875,613 |
BlackRock, Inc. (Capital Markets)
| | 2.100% | 02/25/2032 | 2,000,000 | 1,651,801 |
Capital One Bank U.S.A. N.A. (Rate is fixed until 01/28/2025, at which point, the rate becomes SOFR + 91) (Consumer Finance)
| (b) | 2.280% | 01/28/2026 | 1,500,000 | 1,424,362 |
Charles Schwab Corp. / The (Capital Markets)
| | 3.300% | 04/01/2027 | 2,000,000 | 1,941,460 |
Citigroup, Inc. (Banks)
| | 4.400% | 06/10/2025 | 2,000,000 | 1,997,013 |
Citigroup, Inc. (Banks)
| | 3.700% | 01/12/2026 | 1,000,000 | 979,894 |
Citigroup, Inc. (Banks)
| | 4.450% | 09/29/2027 | 2,000,000 | 1,958,663 |
Discover Bank (Rate is fixed until 08/09/2023, at which point, the rate becomes USSW5 + 173) (Banks)
| (b) | 4.682% | 08/09/2028 | 2,000,000 | 1,944,300 |
General Motors Financial Co., Inc. (Consumer Finance)
| | QL + 99 | 01/05/2023 | 2,000,000 | 1,998,345 |
Goldman Sachs Group, Inc. / The (Capital Markets)
| | 3.750% | 05/22/2025 | 2,000,000 | 1,976,021 |
Intercontinental Exchange, Inc. (Capital Markets)
| | 3.750% | 12/01/2025 | 1,000,000 | 991,966 |
Jefferies Group LLC / Jefferies Group Capital Finance, Inc. (Diversified Financial Svs.)
| | 4.850% | 01/15/2027 | 1,800,000 | 1,800,617 |
JPMorgan Chase & Co. (Banks)
| | 3.625% | 12/01/2027 | 2,000,000 | 1,920,015 |
JPMorgan Chase & Co. (Rate is fixed until 05/13/2030, at which point, the rate becomes SOFR + 252) (Banks)
| (b) | 2.956% | 05/13/2031 | 2,000,000 | 1,726,767 |
KeyCorp (Rate is fixed until 06/01/2032, at which point, the rate becomes SOFRINDX + 206) (Banks)
| (b) | 4.789% | 06/01/2033 | 2,500,000 | 2,466,518 |
Marsh & McLennan Cos., Inc. (Insurance)
| | 3.500% | 06/03/2024 | 1,400,000 | 1,395,377 |
Morgan Stanley (Capital Markets)
| | 3.950% | 04/23/2027 | 1,000,000 | 968,336 |
Morgan Stanley (Rate is fixed until 01/23/2029, at which point, the rate becomes QL + 163) (Capital Markets)
| (b) | 4.431% | 01/23/2030 | 2,000,000 | 1,943,248 |
Morgan Stanley Domestic Holdings, Inc. (Capital Markets)
| | 2.950% | 08/24/2022 | 1,000,000 | 1,000,276 |
PNC Bank N.A. (Banks)
| | 2.700% | 10/22/2029 | 2,500,000 | 2,178,503 |
State Street Corp. (Capital Markets)
| | 2.200% | 03/03/2031 | 2,000,000 | 1,635,528 |
Synchrony Financial (Consumer Finance)
| | 4.250% | 08/15/2024 | 1,000,000 | 993,791 |
Synchrony Financial (Consumer Finance)
| | 5.150% | 03/19/2029 | 2,000,000 | 1,871,125 |
Truist Bank (Banks)
| | 3.625% | 09/16/2025 | 1,000,000 | 979,028 |
U.S. Bancorp (Banks)
| | 1.375% | 07/22/2030 | 2,000,000 | 1,593,721 |
Wells Fargo & Co. (Banks)
| | 3.000% | 04/22/2026 | 1,000,000 | 951,566 |
Wells Fargo & Co. (Rate is fixed until 10/30/2029, at which point, the rate becomes SOFR + 143) (Banks)
| (b) | 2.879% | 10/30/2030 | 2,000,000 | 1,758,751 |
Wells Fargo & Co. (Rate is fixed until 04/30/2040, at which point, the rate becomes SOFR + 253) (Banks)
| (b) | 3.068% | 04/30/2041 | 1,200,000 | 929,298 |
Wells Fargo & Co. (Banks)
| | 4.650% | 11/04/2044 | 1,000,000 | 899,375 |
Westpac Banking Corp. (Rate is fixed until 02/04/2025, at which point, the rate becomes H15T5Y + 135) (Banks)
| (b) | 2.894% | 02/04/2030 | 1,500,000 | 1,421,186 |
Westpac Banking Corp. (Rate is fixed until 11/23/2026, at which point, the rate becomes USISDA05 + 224) (Banks)
| (b) | 4.322% | 11/23/2031 | 1,800,000 | 1,730,832 |
| | | | | | 59,010,595 |
Health Care–4.1%
| | | | | |
AbbVie, Inc. (Biotechnology)
| | 3.200% | 11/21/2029 | 1,000,000 | 919,941 |
AbbVie, Inc. (Biotechnology)
| | 4.250% | 11/21/2049 | 3,000,000 | 2,663,195 |
HCA, Inc. (Health Care Providers & Svs.)
| | 5.250% | 06/15/2026 | 1,000,000 | 994,921 |
Quest Diagnostics, Inc. (Health Care Providers & Svs.)
| | 2.950% | 06/30/2030 | 2,000,000 | 1,759,914 |
Quest Diagnostics, Inc. (Health Care Providers & Svs.)
| | 2.800% | 06/30/2031 | 1,200,000 | 1,027,973 |
Regeneron Pharmaceuticals, Inc. (Biotechnology)
| | 1.750% | 09/15/2030 | 1,800,000 | 1,443,138 |
| | | | | | 8,809,082 |
Industrials–10.4%
| | | | | |
Air Lease Corp. (Trading Companies & Distributors)
| | 2.250% | 01/15/2023 | 2,000,000 | 1,979,683 |
Air Lease Corp. (Trading Companies & Distributors)
| | 2.300% | 02/01/2025 | 2,000,000 | 1,871,798 |
BAE Systems PLC (Aerospace & Defense)
| (a) | 1.900% | 02/15/2031 | 2,000,000 | 1,608,793 |
Boeing Co. / The (Aerospace & Defense)
| | 3.200% | 03/01/2029 | 3,000,000 | 2,595,851 |
Burlington Northern Santa Fe LLC (Road & Rail)
| | 4.550% | 09/01/2044 | 900,000 | 865,036 |
Canadian Pacific Railway Co. (Road & Rail)
| | 2.050% | 03/05/2030 | 1,300,000 | 1,100,099 |
FedEx Corp. (Air Freight & Logistics)
| | 4.900% | 01/15/2034 | 2,000,000 | 1,998,710 |
Lockheed Martin Corp. (Aerospace & Defense)
| | 1.850% | 06/15/2030 | 1,200,000 | 1,024,097 |
Lockheed Martin Corp. (Aerospace & Defense)
| | 3.600% | 03/01/2035 | 1,000,000 | 925,090 |
Northrop Grumman Corp. (Aerospace & Defense)
| | 2.930% | 01/15/2025 | 2,500,000 | 2,444,877 |
Parker-Hannifin Corp. (Machinery)
| | 4.200% | 11/21/2034 | 1,400,000 | 1,300,366 |
Union Pacific Corp. (Road & Rail)
| | 3.250% | 08/15/2025 | 1,000,000 | 987,797 |
United Rentals North America, Inc. (Trading Companies & Distributors)
| | 5.250% | 01/15/2030 | 2,000,000 | 1,855,000 |
Waste Connections, Inc. (Commercial Svs. & Supplies)
| | 4.250% | 12/01/2028 | 1,800,000 | 1,775,479 |
| | | | | | 22,332,676 |
| Ohio National Fund, Inc. | ON Bond Portfolio (Continued) |
| Schedule of Investments | June 30, 2022 (Unaudited) |
| Corporate Bonds (Continued) | Rate | Maturity | Face Amount | Value |
Information Technology–1.7%
| | | | | |
Broadcom, Inc. (Semiconductors & Equip.)
| (a) | 2.600% | 02/15/2033 | $2,000,000 | $ 1,537,816 |
VMware, Inc. (Software)
| | 2.200% | 08/15/2031 | 2,800,000 | 2,204,795 |
| | | | | | 3,742,611 |
Materials–7.9%
| | | | | |
Anglo American Capital PLC (Metals & Mining)
| (a) | 4.750% | 04/10/2027 | 1,000,000 | 987,919 |
Anglo American Capital PLC (Metals & Mining)
| (a) | 4.000% | 09/11/2027 | 800,000 | 760,546 |
Dow Chemical Co. / The (Chemicals)
| | 4.250% | 10/01/2034 | 1,402,000 | 1,329,834 |
Glencore Funding LLC (Metals & Mining)
| (a) | 2.850% | 04/27/2031 | 2,000,000 | 1,651,239 |
Kinross Gold Corp. (Metals & Mining)
| | 4.500% | 07/15/2027 | 3,000,000 | 2,922,360 |
Mosaic Co. / The (Chemicals)
| | 4.050% | 11/15/2027 | 3,000,000 | 2,934,297 |
Nutrien Ltd. (Chemicals)
| | 4.200% | 04/01/2029 | 1,900,000 | 1,845,695 |
RPM International, Inc. (Chemicals)
| | 4.250% | 01/15/2048 | 3,000,000 | 2,521,133 |
Steel Dynamics, Inc. (Metals & Mining)
| | 3.250% | 01/15/2031 | 1,200,000 | 1,041,313 |
Syngenta Finance N.V. (Chemicals)
| (a) | 5.182% | 04/24/2028 | 1,000,000 | 1,012,266 |
| | | | | | 17,006,602 |
Real Estate–3.8%
| | | | | |
Alexandria Real Estate Equities, Inc. (Equity REIT)
| | 3.950% | 01/15/2028 | 1,000,000 | 968,041 |
Federal Realty Investment Trust (Equity REIT)
| | 3.250% | 07/15/2027 | 2,000,000 | 1,880,183 |
Healthcare Realty Trust, Inc. (Equity REIT)
| | 3.875% | 05/01/2025 | 1,400,000 | 1,372,476 |
Healthcare Realty Trust, Inc. (Equity REIT)
| | 3.625% | 01/15/2028 | 1,000,000 | 932,915 |
VICI Properties LP / VICI Note Co., Inc. (Equity REIT)
| (a) | 4.625% | 12/01/2029 | 1,300,000 | 1,162,141 |
Welltower, Inc. (Equity REIT)
| | 4.250% | 04/01/2026 | 1,000,000 | 989,158 |
Welltower, Inc. (Equity REIT)
| | 2.700% | 02/15/2027 | 1,000,000 | 923,512 |
| | | | | | 8,228,426 |
Utilities–7.8%
| | | | | |
AEP Transmission Co. LLC (Electric Utilities)
| | 4.000% | 12/01/2046 | 1,000,000 | 883,310 |
AEP Transmission Co. LLC (Electric Utilities)
| | 3.750% | 12/01/2047 | 1,351,000 | 1,147,774 |
Ameren Corp. (Multi-Utilities)
| | 3.500% | 01/15/2031 | 2,000,000 | 1,832,020 |
American Water Capital Corp. (Water Utilities)
| | 4.300% | 12/01/2042 | 1,400,000 | 1,290,933 |
Berkshire Hathaway Energy Co. (Multi-Utilities)
| | 3.250% | 04/15/2028 | 1,900,000 | 1,806,144 |
Commonwealth Edison Co. (Electric Utilities)
| | 4.350% | 11/15/2045 | 2,000,000 | 1,846,055 |
Connecticut Light & Power Co. / The (Electric Utilities)
| | 4.000% | 04/01/2048 | 1,000,000 | 905,248 |
Duke Energy Corp. (Electric Utilities)
| | 3.750% | 09/01/2046 | 1,000,000 | 787,496 |
Eversource Energy (Electric Utilities)
| | 3.300% | 01/15/2028 | 1,000,000 | 939,927 |
FirstEnergy Transmission LLC (Electric Utilities)
| (a) | 4.550% | 04/01/2049 | 1,800,000 | 1,448,323 |
Florida Power & Light Co. (Electric Utilities)
| | 3.150% | 10/01/2049 | 2,000,000 | 1,588,492 |
Jersey Central Power & Light Co. (Electric Utilities)
| (a) | 4.300% | 01/15/2026 | 900,000 | 888,914 |
Public Service Electric & Gas Co. (Multi-Utilities)
| | 3.600% | 12/01/2047 | 1,500,000 | 1,268,713 |
| | | �� | | | 16,633,349 |
Total Corporate Bonds (Cost $230,839,212)
| | | | | $206,980,253 |
| Asset-Backed Securities–2.9% | Rate | Maturity | Face Amount | Value |
Industrials–2.9%
| | | | | |
Air Canada 2017-1 Class B Pass Through Trust
| (a) | 3.700% | 01/15/2026 | $1,643,518 | $ 1,537,474 |
American Airlines 2015-1 Class B Pass Through Trust
| | 3.700% | 05/01/2023 | 390,549 | 377,607 |
FedEx Corp. 2020-1 Class AA Pass Through Trust
| | 1.875% | 02/20/2034 | 2,759,373 | 2,393,780 |
United Airlines 2016-1 Class B Pass Through Trust
| | 3.650% | 01/07/2026 | 1,183,333 | 1,076,722 |
United Airlines 2019-2 Class AA Pass Through Trust
| | 2.700% | 05/01/2032 | 910,051 | 775,935 |
Total Asset-Backed Securities (Cost $6,886,897)
| | | | | $ 6,161,518 |
| Money Market Funds–2.3% | Shares | Value |
State Street Institutional Liquid Reserves Fund Institutional Class, 1.494%
| (c) | 4,896,314 | $ 4,895,824 |
Total Money Market Funds (Cost $4,896,214)
| | | $ 4,895,824 |
Total Investments – 101.6% (Cost $242,622,323)
| (d) | | $218,037,595 |
Liabilities in Excess of Other Assets – (1.6)%
| | | (3,445,478) |
| Net Assets – 100.0% | | | $214,592,117 |
Percentages are stated as a percent of net assets. |
| Abbreviations: | |
| H15T5Y: | U.S. Treasury Yield Curve Rate T-Note Constant Maturity 5 Year, 3.010% at 06/30/2022 |
| QL: | Quarterly U.S. LIBOR Rate, 2.285% at 06/30/2022 |
| SOFR: | Secured Overnight Financing Rate, 1.500% at 06/30/2022 |
| USISDA05: | USD ICE Swap Rate 11:00am NY 5 Year, 3.091% at 06/30/2022 |
| USSW5: | USD Swap Semi 30/360 5 Year, 3.075% at 06/30/2022 |
| Ohio National Fund, Inc. | ON Bond Portfolio (Continued) |
| Schedule of Investments | June 30, 2022 (Unaudited) |
| Footnotes: | |
| (a) | Security exempt from registration under Regulation D of the Securities Act of 1933. These securities may be resold in transactions exempt from registration, normally to qualified buyers under Rule 144A. At June 30, 2022, the value of these securities totaled $17,087,703, or 8.0% of the Portfolio’s net assets. |
| (b) | Security is a fixed-then-variable rate instrument in which the coupon or dividend rate is fixed until a later specified date, then is adjusted periodically. Rates stated, including interest rate caps and floors, if any, are those in effect at June 30, 2022. |
| (c) | Rate represents the seven-day yield at June 30, 2022. |
| (d) | Represents cost for financial reporting purposes, which may differ from cost basis for federal income tax purposes. See also Note 7 of the Notes to Financial Statements. |
The accompanying notes are an integral part of these financial statements.
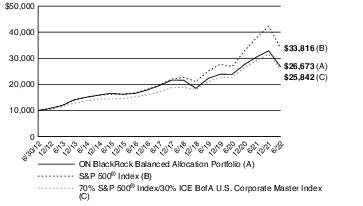
| Ohio National Fund, Inc. | ON BlackRock Balanced Allocation Portfolio (Unaudited) |
The ON BlackRock Balanced Allocation Portfolio seeks a high level of long-term total return consistent with preservation of capital by investing in stocks, bonds, and money market instruments.
Performance as of June 30, 2022
| Average Annual returns | |
| One year | -12.45% |
| Five years | 6.43% |
| Ten years | 10.31% |
Past performance does not guarantee future results. The performance data quoted represents past performance and current returns may be lower or higher. Total return figures include change in share price and reinvestment of dividends and capital gains. The investment return and principal value will fluctuate so that an investor’s shares, when redeemed, may be worth more or less than the original cost. To obtain performance information up to the most recent month end, call toll-free 1-877-781-6392.
The Portfolio is not open to direct retail investment. Beneficial interest in the Portfolio’s shares is obtained either through an allocation to the Portfolio as an investment vehicle within variable life insurance policies or annuity contracts, or as an underlying investment by the ON Model Portfolios. Actual performance results for variable annuity and variable universal life contracts will be lower due to contract charges. Consult your contract for applicable charges.
Total expense ratio is 0.54% per the Fund’s prospectus dated April 29, 2022. Additional information pertaining to the Portfolio’s expense ratio as of June 30, 2022 can be found in the Portfolio’s Financial Highlights.
Comments from Sub-Adviser/Adviser
Q. How did the Portfolio perform in comparison to its benchmark during the reporting period?
A. For the six-month period ended June 30, 2022, the Portfolio returned -18.90% versus -19.96%% for its benchmark, the S&P 500® Index. The Portfolio’s secondary benchmark, which is comprised of 70% S&P 500® Index and 30% ICE BofA U.S. Corporate Master Index, returned -18.11% for the six-month period ended June 30, 2022.
Q. Were there specific market conditions, investment strategies, or techniques that materially affected the Portfolio’s benchmark-relative performance during the reporting period?
A. The Portfolio’s equity sleeve underperformed the primary benchmark for the six-month period, while the Portfolio’s fixed income sleeve significantly outperformed the primary benchmark but underperformed the fixed income portion of the secondary benchmark. While both fixed income and equity returns were negative for the period, fixed income performed significantly better than equities. As such, the Portfolio’s allocation to fixed income securities aided performance during the period as compared to the primary, equity-only benchmark.
Despite positive relative performance in the second quarter, relative weakness at the start of the year led to the Portfolio’s equity underperformance for the period. Early performance from positioning capturing policy normalization quickly eroded amid the conflict in the Ukraine. Equity underperformance was driven by non-traditional fundamental quality measures, particularly environmental, social, and governance (“ESG”) insights, while fundamental value measures aided performance.
Fundamental quality insights with a growth flavor led the detraction. Insights evaluating managerial quality, corporate culture, and favoring founder-led ownership structures all detracted. Nontraditional fundamental quality measures, specifically ESG insights, struggled as markets continued to focus on macro dynamics over company results. Insights designed to track company controversies detracted, as it was
incorrectly positioned around select consumer names that had sales exposure to Russia. Also, measures that evaluate carbon emissions intensity and track companies across green patent filings detracted, as those measures helped to motivate an overweight across Industrials.
Additionally, given the market rotations, sentiment-based stock selection that captures trends across participants struggled to gain direction. Specifically, text analyses designed to capture both short-term results and long-term fundamentals struggled, and helped motivate an unsuccessful overweight stance across Health Care. Elsewhere, positioning based on informed investor views detracted as the shared exposures ran against rising style volatility. Conversely, capturing sentiment from bond markets benefitted gains, given rate volatility.
Finally, fundamental value insights provided ballast for the period, as they benefitted from the market style preference. Traditional valuation measuring company ownership structures and sources of financing, cash usage efficiency, and other financial statement metrics motivated a successful overweight to Energy names, benefitting performance. (1)
As it relates to the fixed income sleeve of the Portfolio, interest rates rose during the first half of 2022, as the Federal Reserve raised the Fed Funds rate aggressively in 2022 in an attempt to curb inflation, and has indicated that it will continue to raise the Fed Funds rate until inflation is under control. Interest rates increased across the entire yield curve, but short-term interest rates increased at a faster rate. Even so, shorter duration bonds outperformed longer duration bonds during the period. The yield curve has become inverted between the 2 year and 10 year Treasury rate, which can be a harbinger of a recession. Credit spreads widened during the period, and lower quality bonds generally underperformed higher quality bonds. From an investment strategy perspective, the portfolio was positioned with a slightly shorter duration than the benchmark throughout the year, which enhanced performance slightly. (1)
Q. How did sector allocation and security selection each impact the Portfolio’s performance relative to its benchmark?
A. The portfolio management team targets a relatively sector-neutral approach and seeks to derive the majority of any excess return from security selection. During the six-month period, however, sector allocation decisions contributed to relative returns. A slight underweight position within Consumer Discretionary names contributed to relative performance, as the market was more focused on durables. Security selection, however, had a more meaningful impact on the Portfolio’s overall relative underperformance. Security selection was weakest in Industrials and Consumer Staples, but was somewhat offset by stronger security selection in Communication Services. (1)
For the fixed income sleeve of the Portfolio, security selection was a slight contributor to the Portfolio’s fixed income performance against the fixed income sleeve of the secondary benchmark. Sector allocation was a slight detractor from performance. Taken together, security selection and sector allocation did not meaningfully impact performance of the fixed income portion of the Portfolio. (1)
Q. Which securities contributed the most to, and detracted the most from, the Portfolio’s benchmark-relative performance?
A. From an equity security standpoint, the Portfolio’s overweight position in EOG Resources, Inc., a Texas-based Energy company, was a top contributor to relative performance for the six-month period. The stock benefitted from the broader Energy rally and run up in commodities prices. An underweight to Netflix, Inc. was also a top contributor, as the stock struggled amid a stagnant user base.
| Ohio National Fund, Inc. | ON BlackRock Balanced Allocation Portfolio (Unaudited) (Continued) |
In contrast, an underweight to Chevron Corp. was a key equity detractor from relative performance for the period, as the stock benefitted from the broader Energy rally and runup in commodities prices. Further hindering results was an overweight stance in IDEXX Laboratories, Inc., as the company missed on its first quarter earnings estimates. (1)
For the fixed income sleeve of the Portfolio, the top three contributors to the Portfolio’s performance relative to the fixed income portion of the secondary benchmark were AerCap Ireland Capital DAC / AerCap Global Aviation Trust 3.300% due 1/23/2023, Ford Motor Credit Co. LLC 3.087% due 01/09/2023, and Air Lease Corp 2.250% due 01/15/2023. Each of these bonds are shorter duration bonds. The top three detractors to the Portfolio’s relative performance were Charter Communications Operating LLC / Charter Communications Operating 3.700% due 04/01/2051, Lowe’s Cos., Inc. 3.000% due 10/15/2050, and FirstEnergy Transmission 4.550% due 04/01/2049. Each of these bonds are longer duration bonds. (1)
Q. How did the Portfolio’s use of derivative instruments and initial public offerings (IPOs), if any, impact performance?
A. Pursuant to the Portfolio’s investment strategy, futures contracts were used to prevent a cash drag on performance. The futures contracts detracted 20 basis points from the absolute return of the Portfolio for the six-month period. The Portfolio did not participate in any IPOs during the period. (1)
| (1) | The Portfolio’s composition is subject to change. Holdings and weightings are as of June 30, 2022. |
Change in Value of $10,000 Investment
Hypothetical illustration based on past performance. Future performance will vary. The Portfolio’s returns reflect reinvested dividends. The Portfolio’s holdings may differ significantly from the securities in the index. The index is unmanaged and therefore does not reflect the cost of portfolio management and accounting.
The S&P 500® Index is a capitalization-weighted index designed to measure performance of the broad domestic market through changes in the aggregate market value of 500 stocks representing all major industries. The index presented includes the effects of reinvested dividends.
The ICE BofA U.S. Corporate Master Index tracks the performance of all U.S. dollar-denominated, investment grade corporate public debt issued in the U.S. domestic bond market. Qualifying bonds must have an investment grade rating (based on an average of Moody’s, S&P, and Fitch). In addition, qualifying securities must have at least one year remaining term to maturity, a fixed coupon schedule, and a minimum amount outstanding of $250 million.
Past performance is no guarantee of future results. Redemption of fund shares could have tax implications unique to each shareholder.
| Ohio National Fund, Inc. | ON BlackRock Balanced Allocation Portfolio (Unaudited) (Continued) |
| Portfolio Composition as of June 30, 2022 (1) |
| | % of Net Assets |
| Common Stocks (4) | 69.8 |
| Corporate Bonds (4) | 27.0 |
| Asset-Backed Securities (4) | 0.6 |
| U.S. Treasury Obligations | 0.2 |
Money Market Funds and
Other Net Assets | 2.4 |
| | 100.0 |
| Top 10 Portfolio Holdings as of June 30, 2022 (1) (2) (3) |
| | | % of Net Assets |
| 1. | Microsoft Corp. | 4.8 |
| 2. | Apple, Inc. | 4.5 |
| 3. | Amazon.com, Inc. | 1.9 |
| 4. | Alphabet, Inc. Class A | 1.8 |
| 5. | Alphabet, Inc. Class C | 1.3 |
| 6. | Exxon Mobil Corp. | 1.3 |
| 7. | UnitedHealth Group, Inc. | 1.3 |
| 8. | Tesla, Inc. | 1.3 |
| 9. | Visa, Inc. | 1.2 |
| 10. | Johnson & Johnson | 1.1 |
| | |
| (1) | Composition of Portfolio subject to change. |
| (2) | Short-term investments have been excluded from the list of Top 10 Portfolio Holdings. |
| (3) | Top 10 Portfolio Holdings is presented at an individual security level. Total investment exposure by issuer may be higher. |
| (4) | Sectors (Common Stocks, Corporate Bonds, Asset-Backed Securities): |
| | % of Net Assets |
| Information Technology | 20.5 |
| Financials | 15.1 |
| Health Care | 12.7 |
| Consumer Discretionary | 9.0 |
| Industrials | 8.4 |
| Consumer Staples | 8.0 |
| Communication Services | 7.7 |
| Energy | 5.5 |
| Utilities | 4.7 |
| Materials | 3.2 |
| Real Estate | 2.6 |
| | 97.4 |
| Ohio National Fund, Inc. | ON BlackRock Balanced Allocation Portfolio |
| Schedule of Investments | June 30, 2022 (Unaudited) |
| Common Stocks–69.8% | Shares | Value |
Communication Services–5.8%
| | | |
Alphabet, Inc. Class A (Interactive Media & Svs.)
| (a) | 3,615 | $ 7,878,025 |
Alphabet, Inc. Class C (Interactive Media & Svs.)
| (a) | 2,628 | 5,748,619 |
Charter Communications, Inc. Class A (Media)
| (a) | 1,888 | 884,585 |
Comcast Corp. Class A (Media)
| | 84,138 | 3,301,575 |
Electronic Arts, Inc. (Entertainment)
| | 3,042 | 370,059 |
Fox Corp. Class A (Media)
| | 73,956 | 2,378,425 |
Fox Corp. Class B (Media)
| | 1,543 | 45,827 |
Meta Platforms, Inc. Class A (Interactive Media & Svs.)
| (a) | 22,016 | 3,550,080 |
Verizon Communications, Inc. (Diversified Telecom. Svs.)
| | 11,854 | 601,590 |
Walt Disney Co. / The (Entertainment)
| (a) | 4,844 | 457,274 |
Warner Bros Discovery, Inc. (Entertainment)
| (a) | 13,519 | 181,425 |
| | | | 25,397,484 |
Consumer Discretionary–7.0%
| | | |
Amazon.com, Inc. (Internet & Direct Marketing Retail)
| (a) | 77,648 | 8,246,994 |
AutoNation, Inc. (Specialty Retail)
| (a) | 3,079 | 344,109 |
Best Buy Co., Inc. (Specialty Retail)
| | 1,949 | 127,055 |
Choice Hotels International, Inc. (Hotels, Restaurants & Leisure)
| | 2,418 | 269,921 |
Dollar General Corp. (Multiline Retail)
| | 2,094 | 513,951 |
Expedia Group, Inc. (Hotels, Restaurants & Leisure)
| (a) | 471 | 44,665 |
Ford Motor Co. (Automobiles)
| | 12,906 | 143,644 |
General Motors Co. (Automobiles)
| (a) | 24,556 | 779,898 |
Home Depot, Inc. / The (Specialty Retail)
| | 14,551 | 3,990,903 |
Lowe's Cos., Inc. (Specialty Retail)
| | 8,456 | 1,477,009 |
McDonald's Corp. (Hotels, Restaurants & Leisure)
| | 6,584 | 1,625,458 |
NIKE, Inc. Class B (Textiles, Apparel & Luxury Goods)
| | 7,938 | 811,264 |
Ralph Lauren Corp. (Textiles, Apparel & Luxury Goods)
| | 2,758 | 247,255 |
Target Corp. (Multiline Retail)
| | 15,694 | 2,216,464 |
Tesla, Inc. (Automobiles)
| (a) | 8,211 | 5,529,452 |
TJX Cos., Inc. / The (Specialty Retail)
| | 8,418 | 470,145 |
Travel + Leisure Co. (Hotels, Restaurants & Leisure)
| | 44,055 | 1,710,215 |
Whirlpool Corp. (Household Durables)
| | 5,131 | 794,638 |
Yum! Brands, Inc. (Hotels, Restaurants & Leisure)
| | 8,780 | 996,618 |
| | | | 30,339,658 |
Consumer Staples–5.1%
| | | |
Altria Group, Inc. (Tobacco)
| | 28,032 | 1,170,897 |
Brown-Forman Corp. Class B (Beverages)
| | 38,081 | 2,671,763 |
Bunge Ltd. (Food Products)
| | 5,645 | 511,945 |
Coca-Cola Co. / The (Beverages)
| | 1,691 | 106,381 |
Colgate-Palmolive Co. (Household Products)
| | 44,053 | 3,530,408 |
Costco Wholesale Corp. (Food & Staples Retailing)
| | 4,543 | 2,177,369 |
Hershey Co. / The (Food Products)
| | 416 | 89,507 |
Kellogg Co. (Food Products)
| | 12,057 | 860,146 |
Keurig Dr Pepper, Inc. (Beverages)
| | 37,208 | 1,316,791 |
McCormick & Co., Inc. (Food Products)
| | 6,567 | 546,703 |
PepsiCo, Inc. (Beverages)
| | 18,946 | 3,157,540 |
Philip Morris International, Inc. (Tobacco)
| | 5,083 | 501,895 |
Procter & Gamble Co. / The (Household Products)
| | 33,168 | 4,769,227 |
Tyson Foods, Inc. Class A (Food Products)
| | 6,290 | 541,317 |
| | | | 21,951,889 |
Energy–3.2%
| | | |
Chevron Corp. (Oil, Gas & Consumable Fuels)
| | 11,485 | 1,662,798 |
EOG Resources, Inc. (Oil, Gas & Consumable Fuels)
| | 21,705 | 2,397,100 |
Exxon Mobil Corp. (Oil, Gas & Consumable Fuels)
| | 66,197 | 5,669,111 |
Halliburton Co. (Energy Equip. & Svs.)
| | 27,494 | 862,212 |
Marathon Oil Corp. (Oil, Gas & Consumable Fuels)
| | 57,905 | 1,301,705 |
Occidental Petroleum Corp. (Oil, Gas & Consumable Fuels)
| | 7,338 | 432,062 |
Schlumberger N.V. (Energy Equip. & Svs.)
| | 34,092 | 1,219,130 |
Valero Energy Corp. (Oil, Gas & Consumable Fuels)
| | 3,901 | 414,598 |
| | | | 13,958,716 |
Financials–7.6%
| | | |
American Express Co. (Consumer Finance)
| | 12,597 | 1,746,196 |
Bank of America Corp. (Banks)
| | 152,269 | 4,740,134 |
Bank of New York Mellon Corp. / The (Capital Markets)
| | 22,374 | 933,220 |
Berkshire Hathaway, Inc. Class B (Diversified Financial Svs.)
| (a) | 13,670 | 3,732,183 |
Capital One Financial Corp. (Consumer Finance)
| | 3,559 | 370,812 |
| Ohio National Fund, Inc. | ON BlackRock Balanced Allocation Portfolio (Continued) |
| Schedule of Investments | June 30, 2022 (Unaudited) |
| Common Stocks (Continued) | Shares | Value |
| Financials (continued) | | | |
Charles Schwab Corp. / The (Capital Markets)
| | 13,899 | $ 878,139 |
Citigroup, Inc. (Banks)
| | 29,210 | 1,343,368 |
JPMorgan Chase & Co. (Banks)
| | 40,276 | 4,535,480 |
Marsh & McLennan Cos., Inc. (Insurance)
| | 9,692 | 1,504,683 |
MetLife, Inc. (Insurance)
| | 59,622 | 3,743,665 |
Moody's Corp. (Capital Markets)
| | 2,789 | 758,524 |
Pinnacle Financial Partners, Inc. (Banks)
| | 5,254 | 379,917 |
PNC Financial Services Group, Inc. / The (Banks)
| | 4,172 | 658,217 |
Regions Financial Corp. (Banks)
| | 75,027 | 1,406,756 |
Stifel Financial Corp. (Capital Markets)
| | 603 | 33,780 |
Travelers Cos., Inc. / The (Insurance)
| | 14,056 | 2,377,291 |
Voya Financial, Inc. (Diversified Financial Svs.)
| | 53,305 | 3,173,247 |
Wells Fargo & Co. (Banks)
| | 20,446 | 800,870 |
| | | | 33,116,482 |
Health Care–10.8%
| | | |
Abbott Laboratories (Health Care Equip. & Supplies)
| | 18,088 | 1,965,261 |
AbbVie, Inc. (Biotechnology)
| | 8,363 | 1,280,877 |
Agilent Technologies, Inc. (Life Sciences Tools & Svs.)
| | 22,560 | 2,679,451 |
AmerisourceBergen Corp. (Health Care Providers & Svs.)
| | 7,591 | 1,073,975 |
Amgen, Inc. (Biotechnology)
| | 9,485 | 2,307,700 |
Boston Scientific Corp. (Health Care Equip. & Supplies)
| (a) | 45,966 | 1,713,153 |
Cigna Corp. (Health Care Providers & Svs.)
| | 4,878 | 1,285,451 |
CVS Health Corp. (Health Care Providers & Svs.)
| | 11,095 | 1,028,063 |
Danaher Corp. (Life Sciences Tools & Svs.)
| | 7,868 | 1,994,695 |
Elevance Health, Inc. (Health Care Providers & Svs.)
| | 6,343 | 3,061,005 |
Eli Lilly & Co. (Pharmaceuticals)
| | 6,521 | 2,114,304 |
Johnson & Johnson (Pharmaceuticals)
| | 26,957 | 4,785,137 |
McKesson Corp. (Health Care Providers & Svs.)
| | 2,659 | 867,392 |
Medtronic PLC (Health Care Equip. & Supplies)
| | 13,542 | 1,215,394 |
Merck & Co., Inc. (Pharmaceuticals)
| | 41,371 | 3,771,794 |
Mettler-Toledo International, Inc. (Life Sciences Tools & Svs.)
| (a) | 671 | 770,825 |
Pfizer, Inc. (Pharmaceuticals)
| | 52,656 | 2,760,754 |
Syneos Health, Inc. (Life Sciences Tools & Svs.)
| (a) | 27,103 | 1,942,743 |
Thermo Fisher Scientific, Inc. (Life Sciences Tools & Svs.)
| | 3,635 | 1,974,823 |
UnitedHealth Group, Inc. (Health Care Providers & Svs.)
| | 10,776 | 5,534,877 |
Zoetis, Inc. (Pharmaceuticals)
| | 16,065 | 2,761,413 |
| | | | 46,889,087 |
Industrials–5.8%
| | | |
AMETEK, Inc. (Electrical Equip.)
| | 2,840 | 312,088 |
Caterpillar, Inc. (Machinery)
| | 2,919 | 521,800 |
CSX Corp. (Road & Rail)
| | 21,911 | 636,734 |
Cummins, Inc. (Machinery)
| | 1,679 | 324,937 |
Curtiss-Wright Corp. (Aerospace & Defense)
| | 7,669 | 1,012,768 |
Deere & Co. (Machinery)
| | 1,169 | 350,080 |
Delta Air Lines, Inc. (Airlines)
| (a) | 18,176 | 526,559 |
Eaton Corp. PLC (Electrical Equip.)
| | 16,338 | 2,058,425 |
Expeditors International of Washington, Inc. (Air Freight & Logistics)
| | 2,276 | 221,819 |
General Dynamics Corp. (Aerospace & Defense)
| | 17,411 | 3,852,184 |
HEICO Corp. (Aerospace & Defense)
| | 4,184 | 548,606 |
HEICO Corp. Class A (Aerospace & Defense)
| | 13,730 | 1,446,867 |
Honeywell International, Inc. (Industrial Conglomerates)
| | 3,776 | 656,306 |
Illinois Tool Works, Inc. (Machinery)
| | 16,350 | 2,979,787 |
Landstar System, Inc. (Road & Rail)
| | 7,271 | 1,057,349 |
Lennox International, Inc. (Building Products)
| | 227 | 46,896 |
Lockheed Martin Corp. (Aerospace & Defense)
| | 5,627 | 2,419,385 |
Masco Corp. (Building Products)
| | 8,923 | 451,504 |
Norfolk Southern Corp. (Road & Rail)
| | 740 | 168,195 |
Old Dominion Freight Line, Inc. (Road & Rail)
| | 501 | 128,396 |
Owens Corning (Building Products)
| | 1,902 | 141,338 |
PACCAR, Inc. (Machinery)
| | 5,974 | 491,899 |
SiteOne Landscape Supply, Inc. (Trading Companies & Distributors)
| (a) | 10,592 | 1,259,071 |
Tetra Tech, Inc. (Commercial Svs. & Supplies)
| | 863 | 117,843 |
Union Pacific Corp. (Road & Rail)
| | 2,816 | 600,596 |
United Parcel Service, Inc. Class B (Air Freight & Logistics)
| | 15,000 | 2,738,100 |
| | | | 25,069,532 |
Information Technology–19.1%
| | | |
Accenture PLC Class A (IT Svs.)
| | 692 | 192,134 |
| Ohio National Fund, Inc. | ON BlackRock Balanced Allocation Portfolio (Continued) |
| Schedule of Investments | June 30, 2022 (Unaudited) |
| Common Stocks (Continued) | Shares | Value |
Information Technology (continued)
| | | |
Adobe, Inc. (Software)
| (a) | 5,168 | $ 1,891,798 |
Advanced Micro Devices, Inc. (Semiconductors & Equip.)
| (a) | 19,048 | 1,456,601 |
Analog Devices, Inc. (Semiconductors & Equip.)
| | 9,388 | 1,371,493 |
Apple, Inc. (Tech. Hardware, Storage & Periph.)
| | 143,900 | 19,674,008 |
Applied Materials, Inc. (Semiconductors & Equip.)
| | 13,342 | 1,213,855 |
Automatic Data Processing, Inc. (IT Svs.)
| | 4,391 | 922,286 |
Broadcom, Inc. (Semiconductors & Equip.)
| | 1,837 | 892,433 |
Ciena Corp. (Communications Equip.)
| (a) | 3,284 | 150,079 |
Cognizant Technology Solutions Corp. Class A (IT Svs.)
| | 7,802 | 526,557 |
Dell Technologies, Inc. Class C (Tech. Hardware, Storage & Periph.)
| | 31,874 | 1,472,898 |
Fidelity National Information Services, Inc. (IT Svs.)
| | 8,438 | 773,511 |
Global Payments, Inc. (IT Svs.)
| | 4,903 | 542,468 |
Hewlett Packard Enterprise Co. (Tech. Hardware, Storage & Periph.)
| | 84,999 | 1,127,087 |
HP, Inc. (Tech. Hardware, Storage & Periph.)
| | 46,487 | 1,523,844 |
Intel Corp. (Semiconductors & Equip.)
| | 103,053 | 3,855,213 |
Intuit, Inc. (Software)
| | 1,336 | 514,948 |
Juniper Networks, Inc. (Communications Equip.)
| | 27,381 | 780,358 |
KLA Corp. (Semiconductors & Equip.)
| | 2,391 | 762,920 |
Lam Research Corp. (Semiconductors & Equip.)
| | 2,692 | 1,147,196 |
Mastercard, Inc. Class A (IT Svs.)
| | 3,410 | 1,075,787 |
Micron Technology, Inc. (Semiconductors & Equip.)
| | 10,154 | 561,313 |
Microsoft Corp. (Software)
| | 81,838 | 21,018,454 |
NetApp, Inc. (Tech. Hardware, Storage & Periph.)
| | 6,654 | 434,107 |
NVIDIA Corp. (Semiconductors & Equip.)
| | 22,779 | 3,453,069 |
PayPal Holdings, Inc. (IT Svs.)
| (a) | 14,067 | 982,439 |
QUALCOMM, Inc. (Semiconductors & Equip.)
| | 15,998 | 2,043,584 |
Salesforce, Inc. (Software)
| (a) | 9,088 | 1,499,883 |
ServiceNow, Inc. (Software)
| (a) | 5,608 | 2,666,716 |
Silicon Laboratories, Inc. (Semiconductors & Equip.)
| (a) | 6,970 | 977,333 |
TE Connectivity Ltd. (Electronic Equip., Instr. & Comp.)
| | 2,766 | 312,973 |
Teradyne, Inc. (Semiconductors & Equip.)
| | 287 | 25,701 |
Texas Instruments, Inc. (Semiconductors & Equip.)
| | 6,670 | 1,024,845 |
Visa, Inc. (IT Svs.)
| | 25,289 | 4,979,151 |
Workday, Inc. Class A (Software)
| (a) | 5,909 | 824,778 |
| | | | 82,671,820 |
Materials–1.7%
| | | |
Corteva, Inc. (Chemicals)
| | 12,306 | 666,247 |
Ecolab, Inc. (Chemicals)
| | 17,862 | 2,746,461 |
Freeport-McMoRan, Inc. (Metals & Mining)
| | 12,571 | 367,828 |
Linde PLC (Chemicals)
| | 10,923 | 3,140,690 |
LyondellBasell Industries N.V. Class A (Chemicals)
| | 5,122 | 447,970 |
| | | | 7,369,196 |
Real Estate–1.6%
| | | |
CBRE Group, Inc. Class A (Real Estate Mgmt. & Development)
| (a) | 8,098 | 596,094 |
Crown Castle International Corp. (Equity REIT)
| | 8,999 | 1,515,252 |
CubeSmart (Equity REIT)
| | 17,656 | 754,264 |
Extra Space Storage, Inc. (Equity REIT)
| | 7,344 | 1,249,361 |
Mid-America Apartment Communities, Inc. (Equity REIT)
| | 2,632 | 459,731 |
Prologis, Inc. (Equity REIT)
| | 21,529 | 2,532,887 |
| | | | 7,107,589 |
Utilities–2.1%
| | | |
CMS Energy Corp. (Multi-Utilities)
| | 33,942 | 2,291,085 |
DTE Energy Co. (Multi-Utilities)
| | 16,196 | 2,052,843 |
Entergy Corp. (Electric Utilities)
| | 22,339 | 2,516,265 |
NextEra Energy, Inc. (Electric Utilities)
| | 12,596 | 975,686 |
NRG Energy, Inc. (Ind. Power & Renewable Elec.)
| | 13,699 | 522,891 |
OGE Energy Corp. (Electric Utilities)
| | 19,558 | 754,156 |
| | | | 9,112,926 |
Total Common Stocks (Cost $322,057,730)
| | | $302,984,379 |
| Corporate Bonds–27.0% | Rate | Maturity | Face Amount | Value |
Communication Services–1.9%
| | | | | |
AT&T, Inc. (Diversified Telecom. Svs.)
| | 4.900% | 08/15/2037 | $1,000,000 | $ 996,001 |
Charter Communications Operating LLC / Charter Communications Operating Capital (Media)
| | 3.700% | 04/01/2051 | 1,200,000 | 812,034 |
Comcast Corp. (Media)
| | 3.250% | 11/01/2039 | 2,000,000 | 1,643,788 |
Lamar Media Corp. (Media)
| | 4.875% | 01/15/2029 | 800,000 | 720,093 |
| Ohio National Fund, Inc. | ON BlackRock Balanced Allocation Portfolio (Continued) |
| Schedule of Investments | June 30, 2022 (Unaudited) |
| Corporate Bonds (Continued) | Rate | Maturity | Face Amount | Value |
Communication Services (continued)
| | | | | |
Rogers Communications, Inc. (Wireless Telecom. Svs.)
| | 3.700% | 11/15/2049 | $1,400,000 | $ 1,066,892 |
Time Warner Cable LLC (Media)
| | 6.550% | 05/01/2037 | 150,000 | 150,191 |
T-Mobile U.S.A., Inc. (Wireless Telecom. Svs.)
| | 3.875% | 04/15/2030 | 1,200,000 | 1,119,907 |
Verizon Communications, Inc. (Diversified Telecom. Svs.)
| | 4.400% | 11/01/2034 | 1,000,000 | 958,207 |
Verizon Communications, Inc. (Diversified Telecom. Svs.)
| | 2.875% | 11/20/2050 | 1,000,000 | 709,610 |
| | | | | | 8,176,723 |
Consumer Discretionary–2.0%
| | | | | |
Amazon.com, Inc. (Internet & Direct Marketing Retail)
| | 3.875% | 08/22/2037 | 1,000,000 | 947,915 |
Best Buy Co., Inc. (Specialty Retail)
| | 1.950% | 10/01/2030 | 2,000,000 | 1,588,533 |
Expedia Group, Inc. (Hotels, Restaurants & Leisure)
| | 4.625% | 08/01/2027 | 1,000,000 | 960,754 |
Hasbro, Inc. (Leisure Products)
| | 3.900% | 11/19/2029 | 2,000,000 | 1,836,532 |
Lear Corp. (Auto Components)
| | 3.500% | 05/30/2030 | 1,000,000 | 872,364 |
Lowe's Cos., Inc. (Specialty Retail)
| | 3.000% | 10/15/2050 | 1,000,000 | 696,778 |
Target Corp. (Multiline Retail)
| | 2.350% | 02/15/2030 | 2,000,000 | 1,766,271 |
| | | | | | 8,669,147 |
Consumer Staples–2.9%
| | | | | |
Anheuser-Busch Cos. LLC / Anheuser-Busch InBev Worldwide, Inc. (Beverages)
| | 4.700% | 02/01/2036 | 2,000,000 | 1,916,054 |
B.A.T. Capital Corp. (Tobacco)
| | 3.215% | 09/06/2026 | 1,000,000 | 933,996 |
B.A.T. Capital Corp. (Tobacco)
| | 4.700% | 04/02/2027 | 1,000,000 | 976,811 |
Campbell Soup Co. (Food Products)
| | 4.150% | 03/15/2028 | 2,000,000 | 1,964,017 |
Coca-Cola Co. / The (Beverages)
| | 3.000% | 03/05/2051 | 2,000,000 | 1,614,929 |
Diageo Capital PLC (Beverages)
| | 2.375% | 10/24/2029 | 2,000,000 | 1,775,549 |
Hershey Co. / The (Food Products)
| | 1.700% | 06/01/2030 | 1,200,000 | 1,012,066 |
JBS U.S.A. LUX SA / JBS U.S.A. Food Co. / JBS U.S.A. Finance, Inc. (Food Products)
| (b) | 5.750% | 04/01/2033 | 800,000 | 761,832 |
Kraft Heinz Foods Co. (Food Products)
| | 4.625% | 10/01/2039 | 800,000 | 702,071 |
Philip Morris International, Inc. (Tobacco)
| | 3.375% | 08/15/2029 | 1,000,000 | 902,120 |
| | | | | | 12,559,445 |
Energy–2.3%
| | | | | |
Baker Hughes Holdings LLC / Baker Hughes Co-Obligor, Inc. (Energy Equip. & Svs.)
| | 3.337% | 12/15/2027 | 1,000,000 | 944,171 |
BP Capital Markets America, Inc. (Oil, Gas & Consumable Fuels)
| | 3.017% | 01/16/2027 | 1,000,000 | 952,731 |
Chevron Corp. (Oil, Gas & Consumable Fuels)
| | 2.236% | 05/11/2030 | 1,200,000 | 1,053,132 |
Energy Transfer LP (Oil, Gas & Consumable Fuels)
| | 4.950% | 06/15/2028 | 1,000,000 | 985,386 |
Halliburton Co. (Energy Equip. & Svs.)
| | 4.850% | 11/15/2035 | 1,000,000 | 961,550 |
Kinder Morgan, Inc. (Oil, Gas & Consumable Fuels)
| | 5.300% | 12/01/2034 | 1,000,000 | 976,838 |
ONEOK, Inc. (Oil, Gas & Consumable Fuels)
| | 5.850% | 01/15/2026 | 800,000 | 829,241 |
Shell International Finance B.V. (Oil, Gas & Consumable Fuels)
| | 4.000% | 05/10/2046 | 1,500,000 | 1,335,707 |
Tennessee Gas Pipeline Co. LLC (Oil, Gas & Consumable Fuels)
| (b) | 2.900% | 03/01/2030 | 1,000,000 | 863,800 |
Williams Cos., Inc. / The (Oil, Gas & Consumable Fuels)
| | 3.750% | 06/15/2027 | 1,000,000 | 954,900 |
Williams Cos., Inc. / The (Oil, Gas & Consumable Fuels)
| | 5.400% | 03/04/2044 | 100,000 | 95,253 |
| | | | | | 9,952,709 |
Financials–7.5%
| | | | | |
AerCap Ireland Capital DAC / AerCap Global Aviation Trust (Diversified Financial Svs.)
| | 3.300% | 01/23/2023 | 1,000,000 | 996,020 |
AerCap Ireland Capital DAC / AerCap Global Aviation Trust (Diversified Financial Svs.)
| | 4.875% | 01/16/2024 | 1,000,000 | 994,773 |
AerCap Ireland Capital DAC / AerCap Global Aviation Trust (Diversified Financial Svs.)
| | 3.300% | 01/30/2032 | 1,000,000 | 800,491 |
Ares Capital Corp. (Capital Markets)
| | 3.200% | 11/15/2031 | 1,500,000 | 1,089,910 |
Bank of Montreal (Rate is fixed until 12/15/2027, at which point, the rate becomes USSW5 + 143) (Banks)
| (c) | 3.803% | 12/15/2032 | 200,000 | 185,377 |
BlackRock, Inc. (Capital Markets)
| | 2.100% | 02/25/2032 | 1,000,000 | 825,900 |
Capital One Bank U.S.A. N.A. (Rate is fixed until 01/28/2025, at which point, the rate becomes SOFR + 91) (Consumer Finance)
| (c) | 2.280% | 01/28/2026 | 1,000,000 | 949,575 |
Charles Schwab Corp. / The (Capital Markets)
| | 3.300% | 04/01/2027 | 1,000,000 | 970,730 |
Citigroup, Inc. (Banks)
| | 4.125% | 07/25/2028 | 1,000,000 | 959,213 |
Citigroup, Inc. (Rate is fixed until 11/05/2029, at which point, the rate becomes SOFR + 142) (Banks)
| (c) | 2.976% | 11/05/2030 | 1,000,000 | 872,810 |
Citigroup, Inc. (Rate is fixed until 05/01/2031, at which point, the rate becomes SOFR + 117) (Banks)
| (c) | 2.561% | 05/01/2032 | 2,000,000 | 1,646,724 |
Discover Bank (Banks)
| | 2.450% | 09/12/2024 | 1,000,000 | 961,715 |
Discover Bank (Rate is fixed until 08/09/2023, at which point, the rate becomes USSW5 + 173) (Banks)
| (c) | 4.682% | 08/09/2028 | 250,000 | 243,038 |
Ford Motor Credit Co. LLC (Consumer Finance)
| | 3.087% | 01/09/2023 | 2,000,000 | 1,980,145 |
General Motors Financial Co., Inc. (Consumer Finance)
| | 2.700% | 06/10/2031 | 3,000,000 | 2,363,730 |
Goldman Sachs Group, Inc. / The (Capital Markets)
| | 3.750% | 05/22/2025 | 1,000,000 | 988,010 |
JPMorgan Chase & Co. (Banks)
| | 3.625% | 12/01/2027 | 1,000,000 | 960,008 |
JPMorgan Chase & Co. (Rate is fixed until 05/13/2030, at which point, the rate becomes SOFR + 252) (Banks)
| (c) | 2.956% | 05/13/2031 | 1,000,000 | 863,384 |
Morgan Stanley (Capital Markets)
| | 3.950% | 04/23/2027 | 1,000,000 | 968,336 |
Morgan Stanley (Rate is fixed until 01/22/2030, at which point, the rate becomes SOFR + 114) (Capital Markets)
| (c) | 2.699% | 01/22/2031 | 1,500,000 | 1,299,180 |
Nasdaq, Inc. (Capital Markets)
| | 3.850% | 06/30/2026 | 1,000,000 | 993,052 |
| Ohio National Fund, Inc. | ON BlackRock Balanced Allocation Portfolio (Continued) |
| Schedule of Investments | June 30, 2022 (Unaudited) |
| Corporate Bonds (Continued) | Rate | Maturity | Face Amount | Value |
| Financials (continued) | | | | | |
PNC Bank N.A. (Banks)
| | 4.050% | 07/26/2028 | $1,950,000 | $ 1,887,132 |
State Street Corp. (Capital Markets)
| | 2.200% | 03/03/2031 | 1,000,000 | 817,764 |
Synchrony Financial (Consumer Finance)
| | 4.250% | 08/15/2024 | 1,000,000 | 993,791 |
Truist Bank (Rate is fixed until 09/17/2024, at which point, the rate becomes H15T5Y + 115) (Banks)
| (c) | 2.636% | 09/17/2029 | 2,500,000 | 2,377,368 |
U.S. Bancorp (Banks)
| | 1.375% | 07/22/2030 | 1,000,000 | 796,861 |
Wells Fargo & Co. (Banks)
| | 3.000% | 04/22/2026 | 1,500,000 | 1,427,349 |
Wells Fargo & Co. (Rate is fixed until 04/30/2040, at which point, the rate becomes SOFR + 253) (Banks)
| (c) | 3.068% | 04/30/2041 | 800,000 | 619,532 |
Westpac Banking Corp. (Rate is fixed until 02/04/2025, at which point, the rate becomes H15T5Y + 135) (Banks)
| (c) | 2.894% | 02/04/2030 | 1,500,000 | 1,421,186 |
Westpac Banking Corp. (Rate is fixed until 11/23/2026, at which point, the rate becomes USISDA05 + 224) (Banks)
| (c) | 4.322% | 11/23/2031 | 200,000 | 192,315 |
| | | | | | 32,445,419 |
Health Care–1.9%
| | | | | |
AbbVie, Inc. (Biotechnology)
| | 3.200% | 11/21/2029 | 1,000,000 | 919,941 |
AbbVie, Inc. (Biotechnology)
| | 4.250% | 11/21/2049 | 2,000,000 | 1,775,463 |
HCA, Inc. (Health Care Providers & Svs.)
| | 5.250% | 06/15/2026 | 2,000,000 | 1,989,843 |
Quest Diagnostics, Inc. (Health Care Providers & Svs.)
| | 2.800% | 06/30/2031 | 800,000 | 685,315 |
Regeneron Pharmaceuticals, Inc. (Biotechnology)
| | 1.750% | 09/15/2030 | 1,200,000 | 962,092 |
UnitedHealth Group, Inc. (Health Care Providers & Svs.)
| | 3.875% | 12/15/2028 | 2,000,000 | 1,989,224 |
| | | | | | 8,321,878 |
Industrials–2.0%
| | | | | |
Air Lease Corp. (Trading Companies & Distributors)
| | 2.250% | 01/15/2023 | 1,000,000 | 989,842 |
Air Lease Corp. (Trading Companies & Distributors)
| | 2.300% | 02/01/2025 | 2,000,000 | 1,871,798 |
Boeing Co. / The (Aerospace & Defense)
| | 3.200% | 03/01/2029 | 1,500,000 | 1,297,926 |
Burlington Northern Santa Fe LLC (Road & Rail)
| | 4.550% | 09/01/2044 | 100,000 | 96,115 |
FedEx Corp. (Air Freight & Logistics)
| | 4.900% | 01/15/2034 | 1,000,000 | 999,355 |
Lockheed Martin Corp. (Aerospace & Defense)
| | 1.850% | 06/15/2030 | 800,000 | 682,731 |
United Rentals North America, Inc. (Trading Companies & Distributors)
| | 4.875% | 01/15/2028 | 1,000,000 | 945,480 |
Waste Connections, Inc. (Commercial Svs. & Supplies)
| | 2.600% | 02/01/2030 | 2,000,000 | 1,749,835 |
| | | | | | 8,633,082 |
Information Technology–1.4%
| | | | | |
Broadcom, Inc. (Semiconductors & Equip.)
| (b) | 2.600% | 02/15/2033 | 1,000,000 | 768,908 |
HP, Inc. (Tech. Hardware, Storage & Periph.)
| | 2.650% | 06/17/2031 | 3,000,000 | 2,409,896 |
Oracle Corp. (Software)
| | 4.300% | 07/08/2034 | 2,100,000 | 1,832,069 |
VMware, Inc. (Software)
| | 2.200% | 08/15/2031 | 1,200,000 | 944,912 |
| | | | | | 5,955,785 |
Materials–1.5%
| | | | | |
Dow Chemical Co. / The (Chemicals)
| | 4.250% | 10/01/2034 | 1,402,000 | 1,329,834 |
Glencore Funding LLC (Metals & Mining)
| (b) | 2.850% | 04/27/2031 | 3,000,000 | 2,476,859 |
Kinross Gold Corp. (Metals & Mining)
| | 4.500% | 07/15/2027 | 1,000,000 | 974,120 |
Mosaic Co. / The (Chemicals)
| | 4.050% | 11/15/2027 | 1,000,000 | 978,099 |
Steel Dynamics, Inc. (Metals & Mining)
| | 3.250% | 01/15/2031 | 800,000 | 694,208 |
| | | | | | 6,453,120 |
Real Estate–1.0%
| | | | | |
Alexandria Real Estate Equities, Inc. (Equity REIT)
| | 3.950% | 01/15/2028 | 1,000,000 | 968,041 |
American Tower Corp. (Equity REIT)
| | 2.750% | 01/15/2027 | 2,000,000 | 1,829,023 |
VICI Properties LP / VICI Note Co., Inc. (Equity REIT)
| (b) | 4.625% | 12/01/2029 | 700,000 | 625,769 |
Welltower, Inc. (Equity REIT)
| | 2.700% | 02/15/2027 | 1,000,000 | 923,512 |
| | | | | | 4,346,345 |
Utilities–2.6%
| | | | | |
AEP Transmission Co. LLC (Electric Utilities)
| | 4.000% | 12/01/2046 | 1,000,000 | 883,310 |
AEP Transmission Co. LLC (Electric Utilities)
| | 3.750% | 12/01/2047 | 1,000,000 | 849,574 |
Ameren Corp. (Multi-Utilities)
| | 2.500% | 09/15/2024 | 1,000,000 | 969,195 |
Ameren Corp. (Multi-Utilities)
| | 3.500% | 01/15/2031 | 1,000,000 | 916,010 |
American Water Capital Corp. (Water Utilities)
| | 4.300% | 12/01/2042 | 100,000 | 92,209 |
Black Hills Corp. (Multi-Utilities)
| | 3.050% | 10/15/2029 | 2,500,000 | 2,237,311 |
Commonwealth Edison Co. (Electric Utilities)
| | 4.350% | 11/15/2045 | 1,000,000 | 923,027 |
Connecticut Light & Power Co. / The (Electric Utilities)
| | 4.000% | 04/01/2048 | 1,000,000 | 905,248 |
Duke Energy Corp. (Electric Utilities)
| | 3.750% | 09/01/2046 | 1,500,000 | 1,181,244 |
Duke Energy Indiana LLC (Electric Utilities)
| | 3.250% | 10/01/2049 | 1,000,000 | 773,031 |
FirstEnergy Transmission LLC (Electric Utilities)
| (b) | 4.550% | 04/01/2049 | 200,000 | 160,925 |
| Ohio National Fund, Inc. | ON BlackRock Balanced Allocation Portfolio (Continued) |
| Schedule of Investments | June 30, 2022 (Unaudited) |
| Corporate Bonds (Continued) | Rate | Maturity | Face Amount | Value |
| Utilities (continued) | | | | | |
Florida Power & Light Co. (Electric Utilities)
| | 3.150% | 10/01/2049 | $1,000,000 | $ 794,246 |
Public Service Electric & Gas Co. (Multi-Utilities)
| | 3.600% | 12/01/2047 | 1,000,000 | 845,809 |
| | | | | | 11,531,139 |
Total Corporate Bonds (Cost $134,424,954)
| | | | | $117,044,792 |
| Asset-Backed Securities–0.6% | Rate | Maturity | Face Amount | Value |
Industrials–0.6%
| | | | | |
FedEx Corp. 2020-1 Class AA Pass Through Trust
| | 1.875% | 02/20/2034 | $1,839,582 | $ 1,595,853 |
United Airlines 2016-1 Class B Pass Through Trust
| | 3.650% | 01/07/2026 | 131,481 | 119,636 |
United Airlines 2019-2 Class AA Pass Through Trust
| | 2.700% | 05/01/2032 | 910,051 | 775,935 |
Total Asset-Backed Securities (Cost $2,881,115)
| | | | | $ 2,491,424 |
| U.S. Treasury Obligations–0.2% | Rate | Maturity | Face Amount | Value |
U.S. Treasury Note
| | 1.875% | 02/15/2032 | $1,000,000 | $ 905,937 |
Total U.S. Treasury Obligations (Cost $952,779)
| | | | | $ 905,937 |
| Money Market Funds–1.8% | Shares | Value |
State Street Institutional Liquid Reserves Fund Institutional Class, 1.494%
| (d) | 7,925,656 | $ 7,924,863 |
Total Money Market Funds (Cost $7,925,464)
| | | $ 7,924,863 |
Total Investments – 99.4% (Cost $468,242,042)
| (e) | | $431,351,395 |
Other Assets in Excess of Liabilities – 0.6%
| (f) | | 2,484,241 |
| Net Assets – 100.0% | | | $433,835,636 |
Percentages are stated as a percent of net assets. |
| Abbreviations: | |
| H15T5Y: | U.S. Treasury Yield Curve Rate T-Note Constant Maturity 5 Year, 3.010% at 06/30/2022 |
| SOFR: | Secured Overnight Financing Rate, 1.500% at 06/30/2022 |
| USISDA05: | USD ICE Swap Rate 11:00am NY 5 Year, 3.091% at 06/30/2022 |
| USSW5: | USD Swap Semi 30/360 5 Year, 3.075% at 06/30/2022 |
| Footnotes: | |
| (a) | Non-income producing security. |
| (b) | Security exempt from registration under Regulation D of the Securities Act of 1933. These securities may be resold in transactions exempt from registration, normally to qualified buyers under Rule 144A. At June 30, 2022, the value of these securities totaled $5,658,093, or 1.3% of the Portfolio’s net assets. |
| (c) | Security is a fixed-then-variable rate instrument in which the coupon or dividend rate is fixed until a later specified date, then is adjusted periodically. Rates stated, including interest rate caps and floors, if any, are those in effect at June 30, 2022. |
| (d) | Rate represents the seven-day yield at June 30, 2022. |
| (e) | Represents cost for financial reporting purposes, which may differ from cost basis for federal income tax purposes. See also Note 7 of the Notes to Financial Statements. |
| (f) | Includes $273,000 of cash pledged as collateral for the futures contracts outstanding at June 30, 2022. See also the following Schedule of Open Futures Contracts. |
The accompanying notes are an integral part of these financial statements.
| Schedule of Open Futures Contracts | June 30, 2022 (Unaudited) |
| Description | | Number of
contracts | | Expiration Date | | Notional
Amount | | Value | | Unrealized
Appreciation
(Depreciation) | | Variation Margin
Receivable
(Payable) |
| CME E-mini S&P 500 Index - Long | | 26 | | September 16, 2022 | | $5,017,907 | | $4,926,350 | | $(91,557) | | $(41,275) |
The accompanying notes are an integral part of these financial statements.
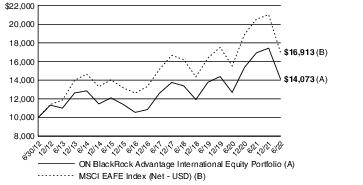
| Ohio National Fund, Inc. | ON BlackRock Advantage International Equity Portfolio (Unaudited) |
The ON Blackrock Advantage International Equity Portfolio seeks long-term growth of capital by investing, under normal circumstances, at least 80% of its net assets in non-U.S. equity securities and equity-like instruments of companies that are components of, or have characteristics similar to, the companies included in the MSCI EAFE Index (Net - USD).
Performance as of June 30, 2022
| Average Annual returns | |
| One year | -16.94% |
| Five years | 2.24% |
| Ten years | 3.48% |
Past performance does not guarantee future results. The performance data quoted represents past performance and current returns may be lower or higher. Total return figures include change in share price and reinvestment of dividends and capital gains. The investment return and principal value will fluctuate so that an investor’s shares, when redeemed, may be worth more or less than the original cost. To obtain performance information up to the most recent month end, call toll-free 1-877-781-6392.
The Portfolio is not open to direct retail investment. Beneficial interest in the Portfolio’s shares is obtained either through an allocation to the Portfolio as an investment vehicle within variable life insurance policies or annuity contracts, or as an underlying investment by the ON Model Portfolios. Actual performance results for variable annuity and variable universal life contracts will be lower due to contract charges. Consult your contract for applicable charges.
Total expense ratio is 0.89% per the Fund’s prospectus dated April 29, 2022. Additional information pertaining to the Portfolio’s expense ratio as of June 30, 2022 can be found in the Portfolio’s Financial Highlights.
Comments from Sub-Adviser
Q. How did the Portfolio perform in comparison to its benchmark during the reporting period?
A. For the six-month period ended June 30, 2022, the Portfolio returned -19.31% versus -19.57% for its benchmark, the MSCI EAFE Index (Net - USD).
Q. Were there specific market conditions, investment strategies, or techniques that materially affected the Portfolio’s benchmark-relative performance during the reporting period?
A. Early performance from positioning that captures policy normalization initially withstood the rotation and benefitted performance. Performance was strong through the start of the year, as positioning reflected a policy normalization theme. Insights that collectively captured the rising inflationary backdrop drove gains across both bottom-up valuation and top-down macro dimensions. However, the emergence of the conflict in the Ukraine prompted a sharp reversal in performance with losses for the first quarter coming from the final week of February. Overweights to European value names, which drove gains earlier, were sharp detractors, as sentiment in the region deteriorated quickly.
Performance was supported by fundamental value insights, which benefitted from the market style preference. Traditional valuation measuring company ownership structures and sources of financing, cash usage efficiency, and other financial statement metrics all did best, and motivated a successful underweight to select Consumer Discretionary names, benefitting performance.
Conversely, non-traditional measures of quality with a growth flavor, such as environmental, social, and governance (“ESG”) insights, struggled. Risk mitigation insights that predict firm-level controversy struggled, as markets continued to focus on macro dynamics over
company results. Elsewhere, environmental insights that evaluate "green" bond issuance struggled across Materials.
Lastly, given the market rotations, sentiment-based stock selection that captures trends across participants struggled to gain direction. Specifically, positioning based on informed investor views detracted as the shared exposures ran against rising style volatility. (1)
Q. How did country selection impact the Portfolio’s performance relative to its benchmark?
A. The portfolio management team targets a relatively neutral approach to country weighting and seeks to derive the majority of any excess return from security selection. During the six-month period, however, country allocation decisions slightly detracted from relative returns. Underweight positions to the United Kingdom detracted most from relative performance. Notably, however, security selection had a meaningful positive impact to relative performance. Singapore and Sweden stocks were additive with strong security selection within the countries. (1)
Q. How did sector allocation and security selection each impact the Portfolio’s performance relative to its benchmark?
A. The portfolio management team targets a relatively sector-neutral approach and seeks to derive the majority of any excess return from security selection. Overweights to Consumer Staples and Energy, as well as security selection within each of those sectors, led the Portfolio’s outperformance. An overweight to Information Technology, and selection within the sector, detracted from overall returns.(1)
Q. Which securities contributed the most to, and detracted the most from, the Portfolio’s benchmark-relative performance?
A. The Portfolio’s overweight position in Singapore-based Jardine Cycle & Carriage Ltd. was a top contributor to relative performance for the six-month period, as higher commodity prices and economic recovery boosted earnings. An overweight to Equinor ASA, a Norway based petroleum refining company, was also a top contributor, as the stock benefitted from the broader Energy rally and runup in commodities prices.
In contrast, an overweight to British industrial equipment rental company Ashtead Group PLC was a key detractor from relative performance for the period, as the stock struggled with economic growth concerns that increased during the period. Further hindering results was an underweight stance in HSBC Holdings PLC, as investors shrugged off China and geopolitical risk concerns. (1)
Q. How did the Portfolio’s use of derivative instruments and initial public offerings (IPOs), if any, impact performance?
A. Pursuant to the Portfolio’s investment strategy, futures contracts were used to prevent a cash drag on performance. The futures contracts detracted 33 basis points from the Portfolio’s absolute return for the six-month period. (1)
| (1) | The Portfolio’s composition is subject to change. Holdings and weightings are as of June 30, 2022. |
| Ohio National Fund, Inc. | ON BlackRock Advantage International Equity Portfolio (Unaudited) (Continued) |
Change in Value of $10,000 Investment
Hypothetical illustration based on past performance. Future performance will vary. The Portfolio’s returns reflect reinvested dividends. The Portfolio’s holdings may differ significantly from the securities in the index. The index is unmanaged and therefore does not reflect the cost of portfolio management and accounting.
The MSCI EAFE Index (Net-USD) is a free-float-adjusted market-capitalization weighted index that is designed to measure the equity market performance of 21 developed markets, including countries in Europe, Australasia and the Far East, excluding the U.S. and Canada. The returns for this index include the effects of reinvested dividends, net of taxes, and adjustment to U.S. Dollar denomination.
Past performance is no guarantee of future results. Redemption of fund shares could have tax implications unique to each shareholder.
| Portfolio Composition as of June 30, 2022 (1) |
| | % of Net Assets |
| Common Stocks (4) (5) | 96.1 |
| Preferred Securities (4) (5) | 1.1 |
Money Market Funds and
Other Net Assets | 2.8 |
| | 100.0 |
| Top 10 Portfolio Holdings as of June 30, 2022 (1) (2) (3) |
| | | % of Net Assets |
| 1. | Nestle SA | 2.6 |
| 2. | Roche Holding AG | 2.4 |
| 3. | ASML Holding N.V. | 2.2 |
| 4. | Novo Nordisk A/S Class B | 2.2 |
| 5. | Shell PLC | 1.9 |
| 6. | BHP Group Ltd. | 1.8 |
| 7. | British American Tobacco PLC | 1.6 |
| 8. | AIA Group Ltd. | 1.4 |
| 9. | LVMH Moet Hennessy Louis Vuitton SE | 1.4 |
| 10. | Diageo PLC | 1.3 |
| | |
| (1) | Composition of Portfolio subject to change. |
| (2) | Short-term investments have been excluded from the list of Top 10 Portfolio Holdings. |
| (3) | Top 10 Portfolio Holdings is presented at an individual security level. Total investment exposure by issuer may be higher. |
| (4) | Top 10 Country Weightings (Common Stocks, Preferred Securities): |
| | % of Net Assets |
| Japan | 19.9 |
| United Kingdom | 13.5 |
| France | 9.8 |
| Germany | 9.1 |
| Switzerland | 8.5 |
| Australia | 7.8 |
| Netherlands | 5.1 |
| Denmark | 3.6 |
| Italy | 3.2 |
| Hong Kong | 2.9 |
| (5) | Sectors (Common Stocks, Preferred Securities): |
| | % of Net Assets |
| Financials | 15.8 |
| Health Care | 14.1 |
| Industrials | 13.7 |
| Consumer Staples | 11.2 |
| Information Technology | 9.0 |
| Consumer Discretionary | 8.2 |
| Materials | 7.0 |
| Energy | 6.2 |
| Communication Services | 5.1 |
| Utilities | 4.6 |
| Real Estate | 2.3 |
| | 97.2 |
| Ohio National Fund, Inc. | ON BlackRock Advantage International Equity Portfolio |
| Schedule of Investments | June 30, 2022 (Unaudited) |
| Common Stocks–96.1% | Shares | Value |
Japan–19.9%
| | | |
Advantest Corp. (Information Technology)
| (a) | 16,500 | $ 887,316 |
Amada Co. Ltd. (Industrials)
| (a) | 188,600 | 1,390,416 |
Anritsu Corp. (Information Technology)
| (a) | 40,700 | 440,642 |
Aozora Bank Ltd. (Financials)
| (a) | 20,500 | 398,948 |
Astellas Pharma, Inc. (Health Care)
| (a) | 75,600 | 1,179,488 |
Casio Computer Co. Ltd. (Consumer Discretionary)
| (a) | 103,600 | 961,303 |
Central Japan Railway Co. (Industrials)
| (a) | 1,600 | 183,893 |
Coca-Cola Bottlers Japan Holdings, Inc. (Consumer Staples)
| (a) | 2,400 | 28,689 |
Daifuku Co. Ltd. (Industrials)
| (a) | 13,400 | 766,885 |
Daiichi Sankyo Co. Ltd. (Health Care)
| (a) | 50,800 | 1,291,970 |
Daito Trust Construction Co. Ltd. (Real Estate)
| (a) | 4,200 | 363,325 |
Daiwa House Industry Co. Ltd. (Real Estate)
| (a) | 25,500 | 596,369 |
DMG Mori Co. Ltd. (Industrials)
| (a) | 72,500 | 901,688 |
East Japan Railway Co. (Industrials)
| (a) | 7,600 | 388,733 |
Ebara Corp. (Industrials)
| (a) | 4,800 | 179,364 |
Eisai Co. Ltd. (Health Care)
| (a) | 23,000 | 972,442 |
Fuji Media Holdings, Inc. (Communication Services)
| (a) | 24,200 | 204,970 |
Fuji Oil Holdings, Inc. (Consumer Staples)
| (a) | 18,500 | 292,386 |
FUJIFILM Holdings Corp. (Information Technology)
| (a) | 19,600 | 1,053,136 |
Fujitsu Ltd. (Information Technology)
| (a) | 7,400 | 925,946 |
Hisamitsu Pharmaceutical Co., Inc. (Health Care)
| (a) | 2,400 | 62,039 |
Hitachi Ltd. (Industrials)
| (a) | 1,300 | 61,841 |
Honda Motor Co. Ltd. (Consumer Discretionary)
| (a) | 46,500 | 1,121,165 |
Hoya Corp. (Health Care)
| (a) | 17,700 | 1,514,817 |
Inpex Corp. (Energy)
| (a) | 64,100 | 687,170 |
ITOCHU Corp. (Industrials)
| (a) | 90,100 | 2,430,714 |
Itochu Techno-Solutions Corp. (Information Technology)
| (a) | 8,400 | 206,532 |
Japan Post Bank Co. Ltd. (Financials)
| (a) | 91,400 | 711,591 |
Japan Tobacco, Inc. (Consumer Staples)
| (a) | 187,200 | 3,243,947 |
Kakaku.com, Inc. (Communication Services)
| (a) | 4,100 | 68,097 |
Kamigumi Co. Ltd. (Industrials)
| (a) | 5,700 | 110,189 |
Kandenko Co. Ltd. (Industrials)
| (a) | 12,200 | 75,992 |
Kao Corp. (Consumer Staples)
| (a) | 41,400 | 1,678,748 |
Kawasaki Kisen Kaisha Ltd. (Industrials)
| (a) | 1,900 | 116,260 |
KDDI Corp. (Communication Services)
| (a) | 47,500 | 1,497,882 |
Keisei Electric Railway Co. Ltd. (Industrials)
| (a) | 7,700 | 212,613 |
Kuraray Co. Ltd. (Materials)
| (a) | 11,400 | 91,974 |
Kyocera Corp. (Information Technology)
| (a) | 3,400 | 181,752 |
Kyushu Electric Power Co., Inc. (Utilities)
| (a) | 38,400 | 246,892 |
Lion Corp. (Consumer Staples)
| (a) | 46,200 | 511,483 |
Marubeni Corp. (Industrials)
| (a) | 16,100 | 144,442 |
Mitsubishi Corp. (Industrials)
| (a) | 80,700 | 2,403,341 |
Mitsubishi HC Capital, Inc. (Financials)
| (a) | 12,400 | 57,231 |
Mitsui & Co. Ltd. (Industrials)
| (a) | 125,900 | 2,766,593 |
Mitsui Fudosan Co. Ltd. (Real Estate)
| (a) | 25,500 | 547,864 |
Mizuho Financial Group, Inc. (Financials)
| (a) | 126,100 | 1,435,638 |
MS&AD Insurance Group Holdings, Inc. (Financials)
| (a) | 17,300 | 530,476 |
Murata Manufacturing Co. Ltd. (Information Technology)
| (a) | 29,300 | 1,594,720 |
NEC Corp. (Information Technology)
| (a) | 48,300 | 1,884,519 |
NET One Systems Co. Ltd. (Information Technology)
| (a) | 11,800 | 262,244 |
Nintendo Co. Ltd. (Communication Services)
| (a) | 1,900 | 817,107 |
Nippon Telegraph & Telephone Corp. (Communication Services)
| (a) | 69,200 | 1,988,334 |
Nippon Yusen KK (Industrials)
| (a) | 5,500 | 377,107 |
Nitto Denko Corp. (Materials)
| (a) | 2,100 | 135,825 |
Nomura Real Estate Holdings, Inc. (Real Estate)
| (a) | 1,300 | 31,805 |
Nomura Research Institute Ltd. (Information Technology)
| (a) | 13,200 | 354,242 |
| Common Stocks (Continued) | Shares | Value |
| Japan (continued) | | | |
Obayashi Corp. (Industrials)
| (a) | 13,500 | $ 98,189 |
Obic Co. Ltd. (Information Technology)
| (a) | 1,700 | 241,750 |
Omron Corp. (Information Technology)
| (a) | 48,600 | 2,473,580 |
Otsuka Holdings Co. Ltd. (Health Care)
| (a) | 18,700 | 667,528 |
Pigeon Corp. (Consumer Staples)
| (a) | 1,600 | 22,014 |
Pola Orbis Holdings, Inc. (Consumer Staples)
| (a) | 2,700 | 33,420 |
Recruit Holdings Co. Ltd. (Industrials)
| (a) | 41,100 | 1,210,413 |
Ricoh Co. Ltd. (Information Technology)
| (a) | 18,700 | 145,994 |
Rohm Co. Ltd. (Information Technology)
| (a) | 3,500 | 245,349 |
Sankyu, Inc. (Industrials)
| (a) | 700 | 20,154 |
Santen Pharmaceutical Co. Ltd. (Health Care)
| (a) | 23,300 | 183,812 |
SBI Holdings, Inc. (Financials)
| (a) | 16,000 | 312,634 |
SCREEN Holdings Co. Ltd. (Information Technology)
| (a) | 1,100 | 74,638 |
Sega Sammy Holdings, Inc. (Consumer Discretionary)
| (a) | 9,200 | 147,773 |
Sekisui Chemical Co. Ltd. (Consumer Discretionary)
| (a) | 2,300 | 31,533 |
Sekisui House Ltd. (Consumer Discretionary)
| (a) | 65,900 | 1,156,897 |
SG Holdings Co. Ltd. (Industrials)
| (a) | 1,500 | 25,365 |
Shin-Etsu Chemical Co. Ltd. (Materials)
| (a) | 14,400 | 1,618,717 |
Shionogi & Co. Ltd. (Health Care)
| (a) | 9,100 | 464,450 |
SoftBank Corp. (Communication Services)
| (a) | 81,100 | 900,415 |
SoftBank Group Corp. (Communication Services)
| (a) | 33,700 | 1,306,161 |
Sony Group Corp. (Consumer Discretionary)
| (a) | 7,600 | 619,831 |
Sumitomo Chemical Co. Ltd. (Materials)
| (a) | 714,000 | 2,794,378 |
Sumitomo Corp. (Industrials)
| (a) | 133,300 | 1,812,005 |
Sumitomo Mitsui Financial Group, Inc. (Financials)
| (a) | 115,100 | 3,421,358 |
Sundrug Co. Ltd. (Consumer Staples)
| (a) | 14,700 | 328,746 |
Suzuki Motor Corp. (Consumer Discretionary)
| (a) | 17,100 | 537,588 |
Sysmex Corp. (Health Care)
| (a) | 1,200 | 72,409 |
Takeda Pharmaceutical Co. Ltd. (Health Care)
| (a) | 124,300 | 3,491,379 |
TBS Holdings, Inc. (Communication Services)
| (a) | 16,400 | 205,821 |
Terumo Corp. (Health Care)
| (a) | 40,800 | 1,234,243 |
Tohoku Electric Power Co., Inc. (Utilities)
| (a) | 6,800 | 36,499 |
Tokio Marine Holdings, Inc. (Financials)
| (a) | 29,500 | 1,720,202 |
Tokyo Century Corp. (Financials)
| (a) | 1,000 | 33,222 |
Tokyo Electron Ltd. (Information Technology)
| (a) | 5,500 | 1,795,162 |
Tokyo Tatemono Co. Ltd. (Real Estate)
| (a) | 5,900 | 81,394 |
Tokyu Fudosan Holdings Corp. (Real Estate)
| (a) | 7,600 | 39,995 |
Toshiba Corp. (Industrials)
| (a) | 10,900 | 442,870 |
Toyota Industries Corp. (Industrials)
| (a) | 1,500 | 93,011 |
Toyota Motor Corp. (Consumer Discretionary)
| (a) | 97,000 | 1,496,643 |
Trend Micro, Inc. (Information Technology)
| (a) | 7,900 | 386,479 |
Tsuruha Holdings, Inc. (Consumer Staples)
| (a) | 600 | 32,649 |
Ulvac, Inc. (Information Technology)
| (a) | 600 | 20,436 |
Unicharm Corp. (Consumer Staples)
| (a) | 41,900 | 1,406,047 |
Yamada Holdings Co. Ltd. (Consumer Discretionary)
| (a) | 37,400 | 134,496 |
Yaskawa Electric Corp. (Industrials)
| (a) | 9,500 | 306,833 |
| | | | 77,495,577 |
United Kingdom–13.5%
| | | |
Anglo American PLC (Materials)
| (a) | 35,778 | 1,279,012 |
Ashtead Group PLC (Industrials)
| (a) | 56,122 | 2,360,971 |
Associated British Foods PLC (Consumer Staples)
| (a) | 19,860 | 383,210 |
AstraZeneca PLC (Health Care)
| (a) | 38,504 | 5,079,514 |
Bellway PLC (Consumer Discretionary)
| (a) | 7,746 | 203,661 |
BP PLC (Energy)
| (a) | 718,113 | 3,371,896 |
British American Tobacco PLC (Consumer Staples)
| (a) | 140,816 | 6,035,974 |
BT Group PLC (Communication Services)
| (a) | 146,238 | 332,363 |
Centrica PLC (Utilities)
| (a)(b) | 554,998 | 541,976 |
Croda International PLC (Materials)
| (a) | 4,886 | 386,199 |
Diageo PLC (Consumer Staples)
| (a) | 118,918 | 5,136,390 |
Direct Line Insurance Group PLC (Financials)
| (a) | 31,644 | 97,129 |
| Ohio National Fund, Inc. | ON BlackRock Advantage International Equity Portfolio (Continued) |
| Schedule of Investments | June 30, 2022 (Unaudited) |
| Common Stocks (Continued) | Shares | Value |
United Kingdom (continued)
| | | |
easyJet PLC (Industrials)
| (a)(b) | 3,730 | $ 16,754 |
Greggs PLC (Consumer Discretionary)
| (a) | 6,506 | 144,067 |
GSK PLC (Health Care)
| (a) | 81,182 | 1,749,601 |
Hargreaves Lansdown PLC (Financials)
| (a) | 12,147 | 117,200 |
HSBC Holdings PLC (Financials)
| (a) | 83,356 | 544,525 |
IG Group Holdings PLC (Financials)
| (a) | 30,945 | 261,177 |
IMI PLC (Industrials)
| (a) | 23,155 | 332,105 |
ITV PLC (Communication Services)
| (a) | 658,010 | 525,462 |
Lloyds Banking Group PLC (Financials)
| (a) | 3,072,958 | 1,581,057 |
NatWest Group PLC (Financials)
| (a) | 40,771 | 108,523 |
RELX PLC (Industrials)
| (a) | 77,272 | 2,098,039 |
Rightmove PLC (Communication Services)
| (a) | 75,923 | 526,134 |
Rio Tinto PLC (Materials)
| (a) | 30,019 | 1,794,735 |
Rolls-Royce Holdings PLC (Industrials)
| (a)(b) | 84,480 | 85,972 |
Segro PLC (Real Estate)
| (a) | 7,200 | 85,952 |
Shell PLC (Energy)
| (a) | 280,722 | 7,310,781 |
Smiths Group PLC (Industrials)
| (a) | 37,177 | 635,759 |
Spectris PLC (Information Technology)
| (a) | 24,233 | 802,829 |
Spirax-Sarco Engineering PLC (Industrials)
| (a) | 1,711 | 206,361 |
SSE PLC (Utilities)
| (a) | 128,427 | 2,534,549 |
Standard Chartered PLC (Financials)
| (a) | 38,778 | 292,750 |
Taylor Wimpey PLC (Consumer Discretionary)
| (a) | 25,439 | 36,236 |
Tesco PLC (Consumer Staples)
| (a) | 635,103 | 1,979,364 |
Unilever PLC (Consumer Staples)
| (a) | 47,915 | 2,183,956 |
Unilever PLC (Consumer Staples)
| (a) | 1,943 | 88,252 |
UNITE Group PLC / The (Real Estate)
| (a) | 1,630 | 21,188 |
Whitbread PLC (Consumer Discretionary)
| (a) | 37,293 | 1,130,896 |
WPP PLC (Communication Services)
| (a) | 5,923 | 59,830 |
| | | | 52,462,349 |
France–9.8%
| | | |
Accor SA (Consumer Discretionary)
| (a)(b) | 5,451 | 148,712 |
Air France-KLM (Industrials)
| (a)(b) | 29,308 | 34,614 |
Air Liquide SA (Materials)
| (a) | 7,894 | 1,062,554 |
Amundi SA (Financials)
| (a) | 10,017 | 551,506 |
AXA SA (Financials)
| (a) | 35,374 | 807,996 |
BNP Paribas SA (Financials)
| (a) | 2,974 | 142,252 |
Capgemini SE (Information Technology)
| (a) | 17,038 | 2,938,375 |
Carrefour SA (Consumer Staples)
| (a) | 13,488 | 239,429 |
Covivio (Real Estate)
| (a) | 1,580 | 88,271 |
Dassault Systemes SE (Information Technology)
| (a) | 8,889 | 329,256 |
Electricite de France SA (Utilities)
| (a) | 89,858 | 738,080 |
Engie SA (Utilities)
| (a) | 174,554 | 2,021,154 |
Hermes International (Consumer Discretionary)
| (a) | 1,886 | 2,122,556 |
Ipsen SA (Health Care)
| (a) | 3,727 | 352,884 |
Klepierre SA (Real Estate)
| (a) | 30,237 | 585,146 |
Legrand SA (Industrials)
| (a) | 10,605 | 787,405 |
L'Oreal SA (Consumer Staples)
| (a) | 9,756 | 3,387,335 |
LVMH Moet Hennessy Louis Vuitton SE (Consumer Discretionary)
| (a) | 8,714 | 5,340,615 |
Pernod Ricard SA (Consumer Staples)
| (a) | 10,155 | 1,877,403 |
Publicis Groupe SA (Communication Services)
| (a) | 14,851 | 730,380 |
Rexel SA (Industrials)
| (a) | 2,900 | 44,811 |
Rubis SCA (Utilities)
| (a) | 55,473 | 1,304,714 |
Safran SA (Industrials)
| (a) | 19,122 | 1,903,891 |
Sanofi (Health Care)
| (a) | 12,164 | 1,226,691 |
Sartorius Stedim Biotech (Health Care)
| (a) | 147 | 46,381 |
Schneider Electric SE (Industrials)
| (a) | 5,930 | 706,592 |
Societe Generale SA (Financials)
| (a) | 64,479 | 1,425,611 |
Teleperformance (Industrials)
| (a) | 3,416 | 1,054,806 |
Thales SA (Industrials)
| (a) | 7,377 | 905,726 |
TotalEnergies SE (Energy)
| (a) | 77,769 | 4,093,524 |
Unibail-Rodamco-Westfield (Real Estate)
| (a)(b) | 3,537 | 179,821 |
Vinci SA (Industrials)
| (a) | 9,550 | 857,222 |
Wendel SE (Financials)
| (a) | 382 | 32,017 |
| | | | 38,067,730 |
| Common Stocks (Continued) | Shares | Value |
Switzerland–8.5%
| | | |
ABB Ltd. (Industrials)
| (a) | 8,294 | $ 222,430 |
Banque Cantonale Vaudoise (Financials)
| (a) | 3,361 | 264,135 |
Belimo Holding AG (Industrials)
| (a) | 134 | 47,179 |
Cie Financiere Richemont SA (Consumer Discretionary)
| (a) | 7,467 | 803,174 |
Flughafen Zurich AG (Industrials)
| (a)(b) | 2,320 | 351,537 |
Givaudan SA (Materials)
| (a) | 113 | 398,292 |
Glencore PLC (Materials)
| (a) | 55,190 | 298,933 |
Kuehne + Nagel International AG (Industrials)
| (a) | 1,217 | 289,162 |
Logitech International SA (Information Technology)
| (a) | 1,540 | 80,304 |
Lonza Group AG (Health Care)
| (a) | 726 | 387,784 |
Nestle SA (Consumer Staples)
| (a) | 87,192 | 10,190,362 |
Novartis AG (Health Care)
| (a) | 54,891 | 4,653,691 |
Roche Holding AG (Health Care)
| (a) | 27,925 | 9,335,322 |
Roche Holding AG (Health Care)
| (a) | 1,136 | 439,629 |
Sika AG (Materials)
| (a) | 4,175 | 963,745 |
Swatch Group AG / The (Consumer Discretionary)
| (a) | 6,717 | 1,595,546 |
Temenos AG (Information Technology)
| (a) | 3,274 | 280,189 |
UBS Group AG (Financials)
| (a) | 148,401 | 2,399,159 |
VAT Group AG (Industrials)
| (a) | 865 | 206,870 |
| | | | 33,207,443 |
Germany–8.0%
| | | |
AIXTRON SE (Information Technology)
| (a) | 762 | 19,464 |
Allianz SE (Financials)
| (a) | 15,977 | 3,062,953 |
Bayer AG (Health Care)
| (a) | 42,245 | 2,522,717 |
Bayerische Motoren Werke AG (Consumer Discretionary)
| (a) | 29,078 | 2,254,144 |
Commerzbank AG (Financials)
| (a)(b) | 91,126 | 646,551 |
Daimler Truck Holding AG (Industrials)
| (a)(b) | 3,112 | 81,957 |
Deutsche Bank AG (Financials)
| (a) | 279,954 | 2,460,151 |
Deutsche Boerse AG (Financials)
| (a) | 5,271 | 885,142 |
Deutsche Telekom AG (Communication Services)
| (a) | 12,929 | 257,148 |
DWS Group GmbH & Co. KGaA (Financials)
| (a) | 23,254 | 613,058 |
Evonik Industries AG (Materials)
| (a) | 40,468 | 867,883 |
Freenet AG (Communication Services)
| (a) | 5,027 | 125,364 |
Fresenius Medical Care AG & Co. KGaA (Health Care)
| (a) | 1,256 | 62,927 |
Hannover Rueck SE (Financials)
| (a) | 8,421 | 1,228,243 |
HOCHTIEF AG (Industrials)
| (a) | 29,963 | 1,468,898 |
Infineon Technologies AG (Information Technology)
| (a) | 43,126 | 1,049,062 |
K+S AG (Materials)
| (a) | 3,078 | 74,912 |
LEG Immobilien SE (Real Estate)
| (a) | 5,494 | 457,219 |
Mercedes-Benz Group AG (Consumer Discretionary)
| (a) | 49,029 | 2,847,522 |
Muenchener Rueckversicherungs-Gesellschaft AG in Muenchen (Financials)
| (a) | 1,409 | 333,295 |
Nemetschek SE (Information Technology)
| (a) | 8,940 | 543,880 |
Rational AG (Industrials)
| (a) | 343 | 199,965 |
Rheinmetall AG (Industrials)
| (a) | 778 | 179,535 |
RWE AG (Utilities)
| (a) | 14,265 | 527,606 |
SAP SE (Information Technology)
| (a) | 27,678 | 2,522,861 |
Scout24 SE (Communication Services)
| (a) | 50,209 | 2,586,533 |
Siemens AG (Industrials)
| (a) | 27,777 | 2,855,378 |
Talanx AG (Financials)
| (a) | 758 | 28,974 |
TeamViewer AG (Information Technology)
| (a)(b) | 11,082 | 110,821 |
United Internet AG (Communication Services)
| (a) | 701 | 20,094 |
Volkswagen AG (Consumer Discretionary)
| (a) | 1,244 | 227,509 |
| | | | 31,121,766 |
Australia–7.8%
| | | |
AGL Energy Ltd. (Utilities)
| (a) | 144,314 | 824,955 |
| Ohio National Fund, Inc. | ON BlackRock Advantage International Equity Portfolio (Continued) |
| Schedule of Investments | June 30, 2022 (Unaudited) |
| Common Stocks (Continued) | Shares | Value |
| Australia (continued) | | | |
Aristocrat Leisure Ltd. (Consumer Discretionary)
| (a) | 93,118 | $ 2,214,907 |
Aurizon Holdings Ltd. (Industrials)
| (a) | 248,277 | 652,976 |
Australia & New Zealand Banking Group Ltd. (Financials)
| (a) | 21,472 | 327,034 |
BHP Group Ltd. (Materials)
| (a) | 250,913 | 7,184,544 |
Commonwealth Bank of Australia (Financials)
| (a) | 34,147 | 2,133,386 |
CSL Ltd. (Health Care)
| (a) | 12,335 | 2,290,300 |
Evolution Mining Ltd. (Materials)
| (a) | 119,040 | 194,506 |
Goodman Group (Real Estate)
| (a) | 50,151 | 619,251 |
Incitec Pivot Ltd. (Materials)
| (a) | 59,176 | 136,182 |
JB Hi-Fi Ltd. (Consumer Discretionary)
| (a) | 6,312 | 167,876 |
Macquarie Group Ltd. (Financials)
| (a) | 16,512 | 1,879,989 |
Medibank Pvt Ltd. (Financials)
| (a) | 351,317 | 790,174 |
Mirvac Group (Real Estate)
| (a) | 408,571 | 558,472 |
Newcrest Mining Ltd. (Materials)
| (a) | 50,143 | 714,348 |
Northern Star Resources Ltd. (Materials)
| (a) | 85,434 | 400,746 |
Origin Energy Ltd. (Utilities)
| (a) | 24,339 | 96,615 |
QBE Insurance Group Ltd. (Financials)
| (a) | 110,326 | 927,056 |
REA Group Ltd. (Communication Services)
| (a) | 14,647 | 1,131,051 |
Rio Tinto Ltd. (Materials)
| (a) | 15,870 | 1,132,147 |
Scentre Group (Real Estate)
| (a) | 358,698 | 644,060 |
South32 Ltd. (Materials)
| (a) | 459,574 | 1,245,303 |
Stockland (Real Estate)
| (a) | 191,060 | 477,035 |
Telstra Corp. Ltd. (Communication Services)
| (a) | 434,218 | 1,154,922 |
WiseTech Global Ltd. (Information Technology)
| (a) | 8,852 | 232,119 |
Woodside Energy Group Ltd. (Energy)
| (a) | 97,154 | 2,135,300 |
Worley Ltd. (Energy)
| (a) | 20,555 | 202,672 |
| | | | 30,467,926 |
Netherlands–5.1%
| | | |
Aalberts N.V. (Industrials)
| (a) | 2,122 | 82,403 |
Argenx SE (Health Care)
| (a)(b) | 787 | 296,662 |
ASML Holding N.V. (Information Technology)
| (a) | 18,378 | 8,682,464 |
ASR Nederland N.V. (Financials)
| (a) | 26,634 | 1,073,802 |
Heineken N.V. (Consumer Staples)
| (a) | 14,498 | 1,319,631 |
IMCD N.V. (Industrials)
| (a) | 11,969 | 1,636,575 |
ING Groep N.V. (Financials)
| (a) | 69,679 | 686,450 |
Koninklijke Philips N.V. (Health Care)
| (a) | 22,048 | 472,897 |
Koninklijke Vopak N.V. (Energy)
| (a) | 2,935 | 73,966 |
OCI N.V. (Materials)
| (a) | 9,710 | 319,417 |
QIAGEN N.V. (Health Care)
| (a)(b) | 13,865 | 651,907 |
Randstad N.V. (Industrials)
| (a) | 936 | 45,237 |
Stellantis N.V. (Consumer Discretionary)
| (a) | 18,777 | 233,112 |
Wolters Kluwer N.V. (Industrials)
| (a) | 46,423 | 4,499,221 |
| | | | 20,073,744 |
Denmark–3.6%
| | | |
AP Moller - Maersk A/S Class B (Industrials)
| (a) | 820 | 1,925,030 |
AP Moller - Maersk A/S Class A (Industrials)
| (a) | 207 | 480,438 |
Carlsberg A/S Class B (Consumer Staples)
| (a) | 2,789 | 356,442 |
Coloplast A/S Class B (Health Care)
| (a) | 431 | 49,246 |
DSV A/S (Industrials)
| (a) | 1,913 | 269,001 |
Genmab A/S (Health Care)
| (a)(b) | 2,444 | 792,943 |
H Lundbeck A/S (Health Care)
| (c) | 43,688 | 212,175 |
Novo Nordisk A/S Class B (Health Care)
| (a) | 77,739 | 8,621,434 |
Novozymes A/S (Materials)
| (a) | 6,212 | 373,857 |
Tryg A/S (Financials)
| (a) | 48,235 | 1,086,730 |
| | | | 14,167,296 |
Italy–3.2%
| | | |
Assicurazioni Generali SpA (Financials)
| (a) | 30,766 | 491,418 |
Banca Generali SpA (Financials)
| (a) | 914 | 25,878 |
Banca Mediolanum SpA (Financials)
| (a) | 51,730 | 341,299 |
Enel SpA (Utilities)
| (a) | 480,831 | 2,636,983 |
Eni SpA (Energy)
| (a) | 92,715 | 1,099,661 |
Ferrari N.V. (Consumer Discretionary)
| (a) | 2,742 | 504,631 |
Intesa Sanpaolo SpA (Financials)
| (a) | 545,107 | 1,020,151 |
Italgas SpA (Utilities)
| (a) | 79,679 | 464,954 |
| Common Stocks (Continued) | Shares | Value |
| Italy (continued) | | | |
Leonardo SpA (Industrials)
| (a) | 5,313 | $ 53,905 |
Mediobanca Banca di Credito Finanziario SpA (Financials)
| (a) | 252,136 | 2,186,682 |
Moncler SpA (Consumer Discretionary)
| (a) | 7,881 | 339,561 |
Poste Italiane SpA (Financials)
| (a) | 17,283 | 161,708 |
PRADA SpA (Consumer Discretionary)
| (a) | 42,700 | 240,132 |
Reply SpA (Information Technology)
| (a) | 2,677 | 325,660 |
Snam SpA (Utilities)
| (a) | 360,791 | 1,892,841 |
UniCredit SpA (Financials)
| (a) | 66,375 | 634,302 |
UnipolSai Assicurazioni SpA (Financials)
| (a) | 42,981 | 103,074 |
| | | | 12,522,840 |
Hong Kong–2.9%
| | | |
AIA Group Ltd. (Financials)
| (a) | 504,800 | 5,515,730 |
ASM Pacific Technology Ltd. (Information Technology)
| (a) | 21,200 | 180,439 |
Budweiser Brewing Co. APAC Ltd. (Consumer Staples)
| (a) | 69,300 | 207,948 |
CK Hutchison Holdings Ltd. (Industrials)
| (a) | 86,000 | 583,423 |
Hysan Development Co. Ltd. (Real Estate)
| (a) | 49,000 | 147,829 |
Jardine Matheson Holdings Ltd. (Industrials)
| (a) | 23,500 | 1,234,782 |
Kerry Properties Ltd. (Real Estate)
| (a) | 249,500 | 693,809 |
Link REIT (Real Estate)
| (a) | 2,800 | 22,880 |
New World Development Co. Ltd. (Real Estate)
| (a) | 53,000 | 190,913 |
PCCW Ltd. (Communication Services)
| (a) | 722,000 | 381,697 |
SITC International Holdings Co. Ltd. (Industrials)
| (a) | 15,000 | 42,663 |
Sun Hung Kai Properties Ltd. (Real Estate)
| (a) | 41,500 | 491,362 |
Swire Properties Ltd. (Real Estate)
| (a) | 298,000 | 741,911 |
Techtronic Industries Co. Ltd. (Industrials)
| (a) | 69,000 | 720,508 |
WH Group Ltd. (Consumer Staples)
| (a) | 318,500 | 246,514 |
| | | | 11,402,408 |
Sweden–2.2%
| | | |
Assa Abloy AB Class B (Industrials)
| (a) | 8,962 | 191,250 |
Boliden AB (Materials)
| (a) | 2,093 | 66,935 |
Elekta AB Class B (Health Care)
| (a) | 49,819 | 345,269 |
Epiroc AB Class A (Industrials)
| (a) | 10,940 | 169,625 |
Getinge AB Class B (Health Care)
| (a) | 1,015 | 23,524 |
Hexagon AB Class B (Information Technology)
| (a) | 40,526 | 423,458 |
Industrivarden AB Class C (Financials)
| (a) | 49,874 | 1,114,898 |
Industrivarden AB Class A (Financials)
| (a) | 17,267 | 390,354 |
Investor AB Class B (Financials)
| (a) | 21,672 | 357,409 |
Lundin Energy MergerCo AB (Energy)
| (a)(b) | 28,338 | 1,106,705 |
Saab AB Class B (Industrials)
| (a) | 40,052 | 1,656,246 |
Skanska AB Class B (Industrials)
| (a) | 2,664 | 40,987 |
Tele2 AB Class B (Communication Services)
| (a) | 81,218 | 926,118 |
Telefonaktiebolaget LM Ericsson Class B (Information Technology)
| (a) | 179,001 | 1,336,961 |
Volvo AB Class B (Industrials)
| (a) | 32,367 | 503,611 |
| | | | 8,653,350 |
Norway–1.9%
| | | |
Aker ASA (Industrials)
| (a) | 2,579 | 199,311 |
DNB Bank ASA (Financials)
| (a) | 141,695 | 2,565,184 |
Equinor ASA (Energy)
| (a) | 104,918 | 3,655,908 |
Kongsberg Gruppen ASA (Industrials)
| (a) | 1,771 | 63,694 |
Telenor ASA (Communication Services)
| (a) | 73,894 | 987,462 |
Var Energi ASA (Energy)
| (a) | 8,069 | 31,502 |
| | | | 7,503,061 |
Spain–1.9%
| | | |
Acciona SA (Utilities)
| (a) | 10,642 | 1,960,878 |
Amadeus IT Group SA (Information Technology)
| (a)(b) | 3,919 | 219,441 |
Banco Bilbao Vizcaya Argentaria SA (Financials)
| (a) | 321,094 | 1,458,594 |
Banco Santander SA (Financials)
| (a) | 756,014 | 2,139,076 |
Bankinter SA (Financials)
| (a) | 28,646 | 179,177 |
Grifols SA (Health Care)
| (a) | 4,484 | 85,036 |
| Ohio National Fund, Inc. | ON BlackRock Advantage International Equity Portfolio (Continued) |
| Schedule of Investments | June 30, 2022 (Unaudited) |
| Common Stocks (Continued) | Shares | Value |
| Spain (continued) | | | |
Iberdrola SA (Utilities)
| (a) | 38,040 | $ 396,050 |
Industria de Diseno Textil SA (Consumer Discretionary)
| (a) | 35,012 | 795,664 |
Merlin Properties Socimi SA (Real Estate)
| (a) | 4,115 | 39,851 |
Repsol SA (Energy)
| (a) | 6,599 | 97,282 |
| | | | 7,371,049 |
Singapore–1.9%
| | | |
City Developments Ltd. (Real Estate)
| (a) | 3,900 | 22,907 |
Jardine Cycle & Carriage Ltd. (Consumer Discretionary)
| (a) | 155,300 | 3,165,577 |
Mapletree Commercial Trust (Real Estate)
| (a) | 381,200 | 502,407 |
Singapore Telecommunications Ltd. (Communication Services)
| (a) | 1,563,000 | 2,844,761 |
Suntec Real Estate Investment Trust (Real Estate)
| (a) | 84,500 | 98,589 |
United Overseas Bank Ltd. (Financials)
| (a) | 32,800 | 619,662 |
| | | | 7,253,903 |
Belgium–1.9%
| | | |
Ackermans & van Haaren N.V. (Industrials)
| (a) | 537 | 80,339 |
Anheuser-Busch InBev SA / N.V. (Consumer Staples)
| (a) | 44,911 | 2,418,544 |
Etablissements Franz Colruyt N.V. (Consumer Staples)
| (a) | 2,572 | 69,893 |
Groupe Bruxelles Lambert SA (Financials)
| (a) | 14,182 | 1,188,869 |
KBC Group N.V. (Financials)
| (a) | 13,028 | 732,968 |
Solvay SA (Materials)
| (a) | 16,375 | 1,334,007 |
UCB SA (Health Care)
| (a) | 8,098 | 686,219 |
Warehouses De Pauw CVA (Real Estate)
| (a) | 22,641 | 714,417 |
| | | | 7,225,256 |
Finland–1.0%
| | | |
Kone Oyj Class B (Industrials)
| (a) | 1,220 | 58,310 |
Nokia Oyj (Information Technology)
| (a) | 369,385 | 1,712,117 |
Nordea Bank Abp (Financials)
| (a) | 254,258 | 2,245,993 |
Wartsila OYJ Abp (Industrials)
| (a) | 4,328 | 33,926 |
| | | | 4,050,346 |
Ireland–0.9%
| | | |
AIB Group PLC (Financials)
| (a) | 13,753 | 31,389 |
Bank of Ireland Group PLC (Financials)
| (a) | 39,321 | 248,532 |
Experian PLC (Industrials)
| (a) | 80,969 | 2,377,314 |
James Hardie Industries PLC (Materials)
| (a) | 16,935 | 370,755 |
Kerry Group PLC Class A (Consumer Staples)
| (a) | 366 | 35,001 |
Kingspan Group PLC (Industrials)
| (a) | 7,768 | 467,098 |
| | | | 3,530,089 |
Israel–0.8%
| | | |
Bank Hapoalim BM (Financials)
| (a) | 165,619 | 1,390,740 |
Bezeq The Israeli Telecommunication Corp. Ltd. (Communication Services)
| (a) | 29,486 | 45,961 |
| Common Stocks (Continued) | Shares | Value |
| Israel (continued) | | | |
Israel Discount Bank Ltd. Class A (Financials)
| (a) | 68,342 | $ 357,867 |
Teva Pharmaceutical Industries Ltd. (Health Care)
| (a)(b) | 162,103 | 1,227,103 |
| | | | 3,021,671 |
Austria–0.4%
| | | |
ams-OSRAM AG (Information Technology)
| (a)(b) | 11,097 | 100,394 |
ANDRITZ AG (Industrials)
| (a) | 20,564 | 830,093 |
BAWAG Group AG (Financials)
| (a) | 5,368 | 226,608 |
Erste Group Bank AG (Financials)
| (a) | 9,593 | 243,770 |
OMV AG (Energy)
| (a) | 5,677 | 266,994 |
| | | | 1,667,859 |
Portugal–0.4%
| | | |
EDP - Energias de Portugal SA (Utilities)
| (a) | 357,378 | 1,665,500 |
Luxembourg–0.4%
| | | |
ArcelorMittal SA (Materials)
| (a) | 55,853 | 1,252,525 |
RTL Group SA (Communication Services)
| (a) | 4,846 | 202,981 |
| | | | 1,455,506 |
Mexico–0.1%
| | | |
Fresnillo PLC (Materials)
| (a) | 28,209 | 263,516 |
Czech Republic–0.0%
| | | |
Avast PLC (Information Technology)
| (c) | 18,267 | 114,962 |
Total Common Stocks (Cost $429,196,789)
| | | $374,765,147 |
| Preferred Securities–1.1% | Rate | Quantity | Value |
Germany–1.1%
| | | | |
FUCHS PETROLUB SE (Materials)
| (a) | 3.884% (d) | 14,825 | $ 414,755 |
Porsche Automobil Holding SE (Consumer Discretionary)
| (a) | 4.046% (d) | 4,471 | 297,371 |
Sartorius AG (Health Care)
| (a) | 0.377% (d) | 6,545 | 2,297,089 |
Volkswagen AG (Consumer Discretionary)
| (a) | 5.953% (d) | 8,347 | 1,123,838 |
Total Preferred Securities (Cost $4,872,784)
| | | | $ 4,133,053 |
| Money Market Funds–2.1% | | | Shares | Value |
State Street Institutional Liquid Reserves Fund Institutional Class, 1.494%
| (e) | 8,019,870 | $ 8,019,068 |
Total Money Market Funds (Cost $8,019,956)
| | | $ 8,019,068 |
Total Investments – 99.3% (Cost $442,089,529)
| (f) | | $386,917,268 |
Other Assets in Excess of Liabilities – 0.7%
| (g) | | 2,872,762 |
| Net Assets – 100.0% | | | $389,790,030 |
Percentages are stated as a percent of net assets. |
| Ohio National Fund, Inc. | ON BlackRock Advantage International Equity Portfolio (Continued) |
| Schedule of Investments | June 30, 2022 (Unaudited) |
| Footnotes: | |
| (a) | Security traded on a foreign exchange has been valued at an estimate of fair value that is different than the local market close price. These fair value estimates are determined by an independent fair valuation service that has been approved by the Board. These securities represent $378,571,063 or 97.1% of the Portfolio’s net assets. |
| (b) | Non-income producing security. |
| (c) | As discussed in Note 2 of the Notes to Financial Statements, not all investments that are traded on a foreign exchange are valued at an estimate that is different from the local close price. In some instances, the independent fair valuation service uses a stock’s local close price because the service’s measure of predictability related to their valuation model of a stock is below a chosen threshold. These securities represent $327,137 or 0.1% of the Portfolio’s net assets.
Other Portfolio securities are not subjected to fair valuation procedures because they are traded on domestic or foreign exchanges that have close times that are consistent with the U.S. market close, normally 4:00 pm Eastern Time. |
| (d) | Represents twelve-month dividend yield. Rates are determined by actual distributions, which are impacted by factors unique to each preference share such as board authorization, distributable earnings, and preferred payout features compared to other classes of equity. |
| (e) | Rate represents the seven-day yield at June 30, 2022. |
| (f) | Represents cost for financial reporting purposes, which may differ from cost basis for federal income tax purposes. See also Note 7 of the Notes to Financial Statements. |
| (g) | Includes $456,981 of cash pledged as collateral for the futures contracts outstanding at June 30, 2022. See also the following Schedule of Open Futures Contracts. |
The accompanying notes are an integral part of these financial statements.
| Schedule of Open Futures Contracts | June 30, 2022 (Unaudited) |
| Description | | Number of
contracts | | Expiration Date | | Notional
Amount | | Value | | Unrealized
Appreciation
(Depreciation) | | Variation Margin
Receivable
(Payable) |
| MSCI EAFE Index - Long | | 83 | | September 16, 2022 | | $7,729,334 | | $7,704,890 | | $(24,444) | | $(39,308) |
The accompanying notes are an integral part of these financial statements.
| Ohio National Fund, Inc. | ON Janus Henderson Forty Portfolio (Unaudited) |
The ON Janus Henderson Forty Portfolio seeks long-term capital growth by investing primarily in domestic and foreign equity securities selected for growth potential.
Performance as of June 30, 2022
| Average Annual returns | |
| One year | -30.89% |
| Five years | 10.61% |
| Ten years | 12.98% |
Past performance does not guarantee future results. The performance data quoted represents past performance and current returns may be lower or higher. Total return figures include change in share price and reinvestment of dividends and capital gains. The investment return and principal value will fluctuate so that an investor’s shares, when redeemed, may be worth more or less than the original cost. To obtain performance information up to the most recent month end, call toll-free 1-877-781-6392.
The Portfolio is not open to direct retail investment. Beneficial interest in the Portfolio’s shares is obtained either through an allocation to the Portfolio as an investment vehicle within variable life insurance policies or annuity contracts, or as an underlying investment by the ON Model Portfolios. Actual performance results for variable annuity and variable universal life contracts will be lower due to contract charges. Consult your contract for applicable charges.
Total expense ratio is 0.78% per the Fund’s prospectus dated April 29, 2022. Additional information pertaining to the Portfolio’s expense ratio as of June 30, 2022 can be found in the Portfolio’s Financial Highlights.
Comments from Sub-Adviser
Q. How did the Portfolio perform in comparison to its benchmark during the reporting period?
A. For the six-month period ended June 30, 2022, the Portfolio returned -34.75% versus -28.07% for its benchmark, the Russell 1000® Growth Index.
Q. Were there specific market conditions, investment strategies, or techniques that materially affected the Portfolio’s benchmark-relative performance during the reporting period?
A. Due to the concentrated nature of the Portfolio, its relative underperformance for the six-month period was due largely to individual stocks in the Portfolio, rather than a market condition or investment strategy that worked for or against the Portfolio. (1)
Q. How did sector allocation and security selection each impact the Portfolio’s performance relative to its benchmark?
A. Stock selection in the Communication Services, Information Technology and Health Care sectors were the largest drivers of the Portfolio’s underperformance during the six-month period.
Overall sector allocation also detracted during the period. An underweight allocation to the Consumer Staples sector and overweight allocation to the Communication Services sector detracted from relative performance, while an overweight in Health Care contributed to relative results. (1)
Q. Which securities contributed the most to, and detracted the most from, the Portfolio’s benchmark-relative performance?
A. Social media operator Snap Inc., Class A (“Snap”), an off-benchmark position, was among the top detractors for the six-month period. The company’s stock suffered during the period when the company’s management announced second quarter results below expectations.. Snap has also had a more difficult time than expected gaining market
share amid a weakening environment for advertising revenue. The company continues to expand into areas such as augmented reality, advertising and e-commerce, and to enhance its app with features such as Spotlight and Maps. We believe Snap is still early in its development and that its business model continues to evolve into a core digital advertising platform. Align Technology, Inc. (“Align”), a medical device company that designs, manufactures and markets dentistry products such as Invisalign, was also among the top detractors. During the period, the company suffered on fears that demand for their clear aligner product may have been pulled forward during the pandemic more than previously expected and that consumer spending on big-ticket items would decline as the macroeconomic outlook weakens. Demand for Align’s clear aligners has structurally increased as consumers have trended away from traditional bracket braces. Cloud-based customer engagement platform Twilio, Inc. Class A (“Twilio”) was also among the top relative detractors. Although the company continues to post solid results, high-growth stocks with expected cash flows far out into the future generally fell during the period, on expectations for higher interest rates. Twilio, specifically, dipped on concerns over its ability to expand gross margins and from difficult year-over-year comparisons.
An overweight to payments company Mastercard, Inc. Class A (“Mastercard”) was among the top relative contributors for the period. The company continues to benefit from improvement in cross-border payments and increased travel as COVID restrictions ease. Its business is also somewhat insulated from inflation, as its revenues are tied to transaction size, which could rise as inflation increases. We continue to believe that Mastercard’s network is well positioned as transactions migrate from cash and check to credit card and electronic payments. Biohaven Pharmaceutical Holding Co. Ltd. (“Biohaven”) also contributed positively to performance. The stock climbed after Pfizer, Inc. announced it would acquire Biohaven for nearly $12 billion, a roughly 79% premium. Biohaven’s lead drug, Nurtec, is a novel oral treatment for migraines. Last year, the fast-acting oral tablet (originally used to treat symptoms of migraine) received Food and Drug Administration approval as a preventative medicine. As the only medicine available to both treat and prevent acute migraine attacks, Nurtec has seen significant sales growth. Howmet Aerospace, Inc. a leading provider of engineered products and fasteners for the aerospace, defense, transportation and industrial end markets, was also among the top relative contributors. The company proved to be more resilient than the broad market, as its results and guidance have remained solid despite market volatility and macroeconomic worries. We believe the company’s core aerospace business is a scarce asset with high barriers to entry, and that long-term commercial airline industry fundamentals remain strong. (1)
| (1) | The Portfolio’s composition is subject to change. Holdings and weightings are as of June 30, 2022. |
| Ohio National Fund, Inc. | ON Janus Henderson Forty Portfolio (Unaudited) (Continued) |
Change in Value of $10,000 Investment
Hypothetical illustration based on past performance. Future performance will vary. The Portfolio’s returns reflect reinvested dividends. The Portfolio’s holdings may differ significantly from the securities in the index. The index is unmanaged and therefore does not reflect the cost of portfolio management and accounting.
The Russell 1000® Growth Index is a market-capitalization weighted index of those firms in the Russell 1000® Index with higher price-to-book ratios and higher forecasted growth values. The Russell 1000® Index measures the performance of the large-cap segment of the U.S. equity universe. The index presented includes the effects of reinvested dividends.
Past performance is no guarantee of future results. Redemption of fund shares could have tax implications unique to each shareholder.
| Portfolio Composition as of June 30, 2022 (1) |
| | % of Net Assets |
| Common Stocks (4) | 94.1 |
Money Market Funds and
Other Net Assets | 5.9 |
| | 100.0 |
| Top 10 Portfolio Holdings as of June 30, 2022 (1) (2) (3) |
| | | % of Net Assets |
| 1. | Microsoft Corp. | 11.7 |
| 2. | Amazon.com, Inc. | 7.5 |
| 3. | Mastercard, Inc. Class A | 5.8 |
| 4. | Alphabet, Inc. Class C | 4.8 |
| 5. | Apple, Inc. | 4.7 |
| 6. | Danaher Corp. | 4.2 |
| 7. | American Tower Corp. | 3.7 |
| 8. | Crown Holdings, Inc. | 3.2 |
| 9. | ASML Holding N.V. | 3.1 |
| 10. | AbbVie, Inc. | 3.0 |
| | |
| (1) | Composition of Portfolio subject to change. |
| (2) | Short-term investments have been excluded from the list of Top 10 Portfolio Holdings. |
| (3) | Top 10 Portfolio Holdings is presented at an individual security level. Total investment exposure by issuer may be higher. |
| (4) | Sectors (Common Stocks): |
| | % of Net Assets |
| Information Technology | 34.2 |
| Consumer Discretionary | 16.2 |
| Health Care | 12.3 |
| Communication Services | 11.3 |
| Industrials | 9.4 |
| Materials | 5.8 |
| Real Estate | 3.7 |
| Consumer Staples | 1.2 |
| | 94.1 |
| Ohio National Fund, Inc. | ON Janus Henderson Forty Portfolio |
| Schedule of Investments | June 30, 2022 (Unaudited) |
| Common Stocks–94.1% | Shares | Value |
Communication Services–11.3%
| | | |
Alphabet, Inc. Class C (Interactive Media & Svs.)
| (a) | 1,789 | $ 3,913,348 |
Match Group, Inc. (Interactive Media & Svs.)
| (a) | 18,662 | 1,300,555 |
Meta Platforms, Inc. Class A (Interactive Media & Svs.)
| (a) | 12,777 | 2,060,291 |
Snap, Inc. Class A (Interactive Media & Svs.)
| (a) | 94,375 | 1,239,144 |
Walt Disney Co. / The (Entertainment)
| (a) | 7,852 | 741,229 |
| | | | 9,254,567 |
Consumer Discretionary–16.2%
| | | |
Amazon.com, Inc. (Internet & Direct Marketing Retail)
| (a) | 58,175 | 6,178,767 |
Booking Holdings, Inc. (Internet & Direct Marketing Retail)
| (a) | 965 | 1,687,775 |
Caesars Entertainment, Inc. (Hotels, Restaurants & Leisure)
| (a) | 14,646 | 560,942 |
LVMH Moet Hennessy Louis Vuitton SE (Textiles, Apparel & Luxury Goods)
| (b) | 2,571 | 1,575,708 |
NIKE, Inc. Class B (Textiles, Apparel & Luxury Goods)
| | 9,250 | 945,350 |
Rivian Automotive, Inc. Class A (Automobiles)
| (a) | 14,212 | 365,817 |
TJX Cos., Inc. / The (Specialty Retail)
| | 34,618 | 1,933,415 |
| | | | 13,247,774 |
Consumer Staples–1.2%
| | | |
Olaplex Holdings, Inc. (Personal Products)
| (a) | 69,889 | 984,736 |
Health Care–12.3%
| | | |
AbbVie, Inc. (Biotechnology)
| | 15,908 | 2,436,469 |
Align Technology, Inc. (Health Care Equip. & Supplies)
| (a) | 4,804 | 1,136,963 |
Danaher Corp. (Life Sciences Tools & Svs.)
| | 13,533 | 3,430,886 |
Dexcom, Inc. (Health Care Equip. & Supplies)
| (a) | 15,716 | 1,171,313 |
Horizon Therapeutics PLC (Biotechnology)
| (a) | 24,256 | 1,934,659 |
| | | | 10,110,290 |
Industrials–9.4%
| | | |
Core & Main, Inc. Class A (Trading Companies & Distributors)
| (a) | 81,398 | 1,815,175 |
CoStar Group, Inc. (Professional Svs.)
| (a) | 33,162 | 2,003,317 |
| Common Stocks (Continued) | Shares | Value |
| Industrials (continued) | | | |
Deere & Co. (Machinery)
| | 6,378 | $ 1,910,020 |
Howmet Aerospace, Inc. (Aerospace & Defense)
| | 63,707 | 2,003,585 |
| | | | 7,732,097 |
Information Technology–34.2%
| | | |
Apple, Inc. (Tech. Hardware, Storage & Periph.)
| | 28,354 | 3,876,559 |
ASML Holding N.V. (Semiconductors & Equip.)
| | 5,302 | 2,523,116 |
Atlassian Corp. PLC Class A (Software)
| (a) | 6,115 | 1,145,951 |
Block, Inc. (IT Svs.)
| (a) | 6,150 | 377,979 |
Mastercard, Inc. Class A (IT Svs.)
| | 15,196 | 4,794,034 |
Microsoft Corp. (Software)
| | 37,234 | 9,562,808 |
NVIDIA Corp. (Semiconductors & Equip.)
| | 5,752 | 871,946 |
Texas Instruments, Inc. (Semiconductors & Equip.)
| | 11,817 | 1,815,682 |
Twilio, Inc. Class A (IT Svs.)
| (a) | 14,951 | 1,253,043 |
Workday, Inc. Class A (Software)
| (a) | 12,973 | 1,810,771 |
| | | | 28,031,889 |
Materials–5.8%
| | | |
Crown Holdings, Inc. (Containers & Packaging)
| | 28,800 | 2,654,496 |
Freeport-McMoRan, Inc. (Metals & Mining)
| | 25,762 | 753,796 |
Sherwin-Williams Co. / The (Chemicals)
| | 5,874 | 1,315,247 |
| | | | 4,723,539 |
Real Estate–3.7%
| | | |
American Tower Corp. (Equity REIT)
| | 11,730 | 2,998,071 |
Total Common Stocks (Cost $75,648,862)
| | | $77,082,963 |
| Money Market Funds–1.2% | Shares | Value |
State Street Institutional Liquid Reserves Fund Institutional Class, 1.494%
| (c) | 998,481 | $ 998,381 |
Total Money Market Funds (Cost $998,409)
| | | $ 998,381 |
Total Investments – 95.3% (Cost $76,647,271)
| (d) | | $78,081,344 |
Other Assets in Excess of Liabilities – 4.7%
| | | 3,849,758 |
| Net Assets – 100.0% | | | $81,931,102 |
Percentages are stated as a percent of net assets. |
| Footnotes: | |
| (a) | Non-income producing security. |
| (b) | Security traded on a foreign exchange has been valued at an estimate of fair value that is different than the local market close price. These fair value estimates are determined by an independent fair valuation service that has been approved by the Board. These securities represent $1,575,708 or 1.9% of the Portfolio’s net assets. |
| (c) | Rate represents the seven-day yield at June 30, 2022. |
| (d) | Represents cost for financial reporting purposes, which may differ from cost basis for federal income tax purposes. See also Note 7 of the Notes to Financial Statements. |
The accompanying notes are an integral part of these financial statements.
| Ohio National Fund, Inc. | ON AB Small Cap Portfolio (Unaudited) |
The ON AB Small Cap Portfolio seeks long-term growth of capital by investing, under normal circumstances, at least 80% of its net assets in equity securities of smaller capitalization companies with market capitalizations at the time of investment that fall within the lowest 20% of the total U.S. equity market capitalization (excluding companies with market capitalizations of less than $10 million).
Performance as of June 30, 2022
| Average Annual returns | |
| One year | -27.94% |
| Five years | 6.07% |
| Ten years | 10.49% |
Past performance does not guarantee future results. The performance data quoted represents past performance and current returns may be lower or higher. Total return figures include change in share price and reinvestment of dividends and capital gains. The investment return and principal value will fluctuate so that an investor’s shares, when redeemed, may be worth more or less than the original cost. To obtain performance information up to the most recent month end, call toll-free 1-877-781-6392.
The Portfolio is not open to direct retail investment. Beneficial interest in the Portfolio’s shares is obtained either through an allocation to the Portfolio as an investment vehicle within variable life insurance policies or annuity contracts, or as an underlying investment by the ON Model Portfolios. Actual performance results for variable annuity and variable universal life contracts will be lower due to contract charges. Consult your contract for applicable charges.
Total expense ratio is 0.83% per the Fund’s prospectus dated April 29, 2022. Additional information pertaining to the Portfolio’s expense ratio as of June 30, 2022 can be found in the Portfolio’s Financial Highlights.
Comments from Sub-Adviser
Q. How did the Portfolio perform in comparison to its benchmark during the reporting period?
A. For the six-month period ended June 30, 2022, the Portfolio returned -29.63% versus -23.43% for its benchmark, the Russell 2000® Index.
Q. Were there specific market conditions, investment strategies, or techniques that materially affected the Portfolio’s benchmark-relative performance during the reporting period?
A. The Russell 2000 Index was down 23.43% during the six-month period, which marks the worst first half performance for that index in history. The Federal Reserve raised interest rates three times during the period, including a 0.75% increase in June - its largest since 1994. The growing fear of recession led to sharp declines and periods of widespread volatility across equity markets. Since the start of the year, absolute valuations for small cap growth stocks have corrected sharply, given that their cash flows and earnings are typically further out in the future. As a result, small cap value stocks outperformed their growth counterparts during the period, which was a main driver of underperformance, given the growth-tilt of the Portfolio. (1)
Q. How did sector allocation and security selection each impact the Portfolio’s performance relative to its benchmark?
A. During the six-month period, both sector and security selection detracted from the Portfolio’s relative returns, with security selection driving the majority of underperformance. The Portfolio’s underweights to Energy and Utilities, along with an overweight to Information Technology, detracted from relative performance, while an underweight to Communication Services contributed slightly to relative performance. Security selection in Industrials and Health Care were the main drivers of
underperformance, followed by selection within Financials and Consumer Discretionary. Security selection in Communication Services and Energy slightly contributed to relative performance.(1)
Q. Which securities contributed the most to, and detracted the most from, the Portfolio’s benchmark-relative performance?
A. Matador Resources Co., an oil and gas exploration company with operations in the Delaware Basin, was a key relative contributor for the six-month period. Those shares outperformed as oil and gas prices rose. Demand outstripped supply as producers showed restraint in growing capacity, in addition to the supply disruptions caused by the war in Ukraine. We believe Matador Resources Co. will continue to execute on its capital expenditure plans over the coming year. The Chefs’ Warehouse, Inc., a leading distributor of high-end specialty foods to independent restaurants, was the second largest outperformer. The company performed well as the recovery in high-end dining continued to build momentum. Better than expected results reported toward the end of April confirmed that The Chefs’ Warehouse, Inc. is well positioned to be a significant beneficiary. Switch, Inc. Class A, shares of a manager, operator, and designer of state of the art and proprietary data centers in the U.S., was the third largest relative contributor. The company outperformed due to its lack of economic sensitivity in an increasingly macro concerned backdrop, as well as speculation that the company is entertaining offers to be acquired.
Ranpak Holdings Corp., a producer of biodegradable and recycled paper protection machines for ecommerce and industrial packaging, underperformed during the period. The stock declined as the economic downturn in Europe and in ecommerce has weighed on their outlook. Additionally, the company has a Russian mill that supplies a little over 10% of its paper worldwide. The assumption is that the company will not be able to source from Russia eventually, which could hurt its margins going forward. Kornit Digital Ltd., a company that designs and manufactures digital printing systems and consumables for the textile industry was the second largest detractor. Share of the company gapped lower following the release of its first quarter 2022 earnings results, which included a second quarter outlook below expectations. The company called out a reduction in orders from ecommerce customers that are experiencing slower sales growth due to macroeconomic uncertainty. While we believe in the secular growth opportunities for Kornit Digital Ltd., we are concerned that the slowdown in orders may be an early indication of a prolonged investment downturn and have decided to exit the position and reallocate capital to more timely ideas. Outset Medical, Inc., a medical device company developing and commercializing its proprietary hemodialysis system, Tablo, for kidney failure patients in acute hospitals and at home settings, was the third largest relative detractor. The company reported first-quarter earnings with a modest revenue beat and raised its low end of full-year guidance. Outset Medical, Inc., along with other high-growth high-multiple medical technology companies, came under pressure due to the rising interest rate environment.(1)
Q. Were there any significant changes to the Portfolio’s management team, investment strategy, or selection process during the reporting period?
A. Michael Doherty, Quantitative Analyst on AllianceBerstein L.P.'s ("AB") U.S. Small and SMID Growth team, retired effective June 30, 2022. Lucie Germain, who joined AB in December 2015, has assumed Michael’s role as the team’s quantitative analyst. Lucie previously served as a Senior Associate Portfolio Manager in the Institutional Equity Portfolio Management Group where she covered both U.S. Growth and Developed Market Strategic Core equity platforms.
| (1) | The Portfolio’s composition is subject to change. Holdings and weightings are as of June 30, 2022. |
| Ohio National Fund, Inc. | ON AB Small Cap Portfolio (Unaudited) (Continued) |
Change in Value of $10,000 Investment
Hypothetical illustration based on past performance. Future performance will vary. The Portfolio’s returns reflect reinvested dividends. The Portfolio’s holdings may differ significantly from the securities in the index. The index is unmanaged and therefore does not reflect the cost of portfolio management and accounting.
The Russell 2000® Index measures the performance of the small-cap segment of the U.S. equity universe. The Russell 2000® Index includes the 2,000 firms from the Russell 3000® Index with the smallest market capitalizations. The Russell 3000® Index represents 98% of the investable U.S. equity market.
Past performance is no guarantee of future results. Redemption of fund shares could have tax implications unique to each shareholder.
| Portfolio Composition as of June 30, 2022 (1) |
| | % of Net Assets |
| Common Stocks (4) | 97.2 |
| Exchange Traded Funds | 0.2 |
Money Market Funds and
Other Net Assets | 2.6 |
| | 100.0 |
| Top 10 Portfolio Holdings as of June 30, 2022 (1) (2) (3) |
| | | % of Net Assets |
| 1. | John Bean Technologies Corp. | 1.1 |
| 2. | Chefs' Warehouse, Inc. / The | 1.0 |
| 3. | Helmerich & Payne, Inc. | 0.9 |
| 4. | Novanta, Inc. | 0.9 |
| 5. | Driven Brands Holdings, Inc. | 0.8 |
| 6. | Fox Factory Holding Corp. | 0.8 |
| 7. | Matador Resources Co. | 0.8 |
| 8. | Hilton Grand Vacations, Inc. | 0.8 |
| 9. | Insperity, Inc. | 0.8 |
| 10. | First Financial Bankshares, Inc. | 0.8 |
| | |
| (1) | Composition of Portfolio subject to change. |
| (2) | Short-term investments have been excluded from the list of Top 10 Portfolio Holdings. |
| (3) | Top 10 Portfolio Holdings is presented at an individual security level. Total investment exposure by issuer may be higher. |
| (4) | Sectors (Common Stocks): |
| | % of Net Assets |
| Information Technology | 18.6 |
| Industrials | 17.2 |
| Health Care | 15.6 |
| Financials | 13.9 |
| Consumer Discretionary | 12.6 |
| Energy | 5.3 |
| Consumer Staples | 5.0 |
| Real Estate | 3.7 |
| Materials | 3.1 |
| Utilities | 1.1 |
| Communication Services | 1.1 |
| | 97.2 |
| Ohio National Fund, Inc. | ON AB Small Cap Portfolio |
| Schedule of Investments | June 30, 2022 (Unaudited) |
| Common Stocks–97.2% | Shares | Value |
Communication Services–1.1%
| | | |
AMC Networks, Inc. Class A (Media)
| (a) | 3,530 | $ 102,794 |
Cars.com, Inc. (Interactive Media & Svs.)
| (a) | 5,115 | 48,235 |
Cinemark Holdings, Inc. (Entertainment)
| (a) | 9,019 | 135,465 |
Cogent Communications Holdings, Inc. (Diversified Telecom. Svs.)
| | 3,530 | 214,483 |
EW Scripps Co. / The Class A (Media)
| (a) | 8,220 | 102,503 |
Gogo, Inc. (Wireless Telecom. Svs.)
| (a) | 4,843 | 78,408 |
TechTarget, Inc. (Media)
| (a) | 2,320 | 152,470 |
Vonage Holdings Corp. (Diversified Telecom. Svs.)
| (a) | 19,669 | 370,564 |
Yelp, Inc. (Interactive Media & Svs.)
| (a) | 4,550 | 126,354 |
| | | | 1,331,276 |
Consumer Discretionary–12.6%
| | | |
Abercrombie & Fitch Co. Class A (Specialty Retail)
| (a) | 5,210 | 88,153 |
Academy Sports & Outdoors, Inc. (Specialty Retail)
| | 6,319 | 224,577 |
Adtalem Global Education, Inc. (Diversified Consumer Svs.)
| (a) | 4,134 | 148,700 |
American Axle & Manufacturing Holdings, Inc. (Auto Components)
| (a) | 19,150 | 144,200 |
Asbury Automotive Group, Inc. (Specialty Retail)
| (a) | 1,826 | 309,215 |
Bed Bath & Beyond, Inc. (Specialty Retail)
| (a) | 8,785 | 43,661 |
Bloomin' Brands, Inc. (Hotels, Restaurants & Leisure)
| | 6,750 | 112,185 |
Boot Barn Holdings, Inc. (Specialty Retail)
| (a) | 2,520 | 173,653 |
Brinker International, Inc. (Hotels, Restaurants & Leisure)
| ��(a) | 3,970 | 87,459 |
Buckle, Inc. / The (Specialty Retail)
| | 4,240 | 117,406 |
Century Communities, Inc. (Household Durables)
| | 2,540 | 114,224 |
Cheesecake Factory, Inc. / The (Hotels, Restaurants & Leisure)
| | 3,690 | 97,490 |
Dave & Buster's Entertainment, Inc. (Hotels, Restaurants & Leisure)
| (a) | 3,360 | 110,141 |
Designer Brands, Inc. Class A (Specialty Retail)
| | 10,040 | 131,122 |
Dine Brands Global, Inc. (Hotels, Restaurants & Leisure)
| | 1,840 | 119,747 |
Dorman Products, Inc. (Auto Components)
| (a) | 2,510 | 275,372 |
European Wax Center, Inc. Class A (Diversified Consumer Svs.)
| | 21,392 | 376,927 |
Fisker, Inc. (Automobiles)
| (a) | 29,123 | 249,584 |
Five Below, Inc. (Specialty Retail)
| (a) | 4,594 | 521,097 |
Floor & Decor Holdings, Inc. Class A (Specialty Retail)
| (a) | 7,815 | 492,032 |
Fox Factory Holding Corp. (Auto Components)
| (a) | 12,126 | 976,628 |
Gentherm, Inc. (Auto Components)
| (a) | 2,750 | 171,628 |
Group 1 Automotive, Inc. (Specialty Retail)
| | 1,410 | 239,418 |
Hilton Grand Vacations, Inc. (Hotels, Restaurants & Leisure)
| (a) | 26,890 | 960,780 |
Installed Building Products, Inc. (Household Durables)
| | 1,958 | 162,827 |
iRobot Corp. (Household Durables)
| (a) | 2,450 | 90,038 |
Kontoor Brands, Inc. (Textiles, Apparel & Luxury Goods)
| | 3,960 | 132,145 |
LCI Industries (Auto Components)
| | 2,180 | 243,898 |
LGI Homes, Inc. (Household Durables)
| (a) | 1,930 | 167,717 |
Life Time Group Holdings, Inc. (Hotels, Restaurants & Leisure)
| (a) | 45,278 | 583,181 |
Lithia Motors, Inc. (Specialty Retail)
| | 3,117 | 856,583 |
Lovesac Co. / The (Household Durables)
| (a) | 13,737 | 377,768 |
M.D.C. Holdings, Inc. (Household Durables)
| | 4,850 | 156,704 |
MarineMax, Inc. (Specialty Retail)
| (a) | 3,640 | 131,477 |
Meritage Homes Corp. (Household Durables)
| (a) | 3,170 | 229,825 |
Monarch Casino & Resort, Inc. (Hotels, Restaurants & Leisure)
| (a) | 1,660 | 97,392 |
| Common Stocks (Continued) | Shares | Value |
Consumer Discretionary (continued)
| | | |
National Vision Holdings, Inc. (Specialty Retail)
| (a) | 25,022 | $ 688,105 |
ODP Corp. / The (Specialty Retail)
| (a) | 4,400 | 133,056 |
Oxford Industries, Inc. (Textiles, Apparel & Luxury Goods)
| | 2,010 | 178,367 |
Patrick Industries, Inc. (Auto Components)
| | 1,980 | 102,643 |
Planet Fitness, Inc. Class A (Hotels, Restaurants & Leisure)
| (a) | 12,818 | 871,752 |
Sally Beauty Holdings, Inc. (Specialty Retail)
| (a) | 250 | 2,980 |
Shake Shack, Inc. Class A (Hotels, Restaurants & Leisure)
| (a) | 3,100 | 122,388 |
Shutterstock, Inc. (Internet & Direct Marketing Retail)
| | 2,040 | 116,912 |
Signet Jewelers Ltd. (Specialty Retail)
| | 4,460 | 238,432 |
Skyline Champion Corp. (Household Durables)
| (a) | 17,792 | 843,697 |
Sleep Number Corp. (Specialty Retail)
| (a) | 2,190 | 67,781 |
Sonos, Inc. (Household Durables)
| (a) | 9,149 | 165,048 |
Steven Madden Ltd. (Textiles, Apparel & Luxury Goods)
| | 6,550 | 210,976 |
Strategic Education, Inc. (Diversified Consumer Svs.)
| | 2,073 | 146,312 |
Sturm Ruger & Co., Inc. (Leisure Products)
| | 2,740 | 174,401 |
Texas Roadhouse, Inc. (Hotels, Restaurants & Leisure)
| | 12,212 | 893,918 |
Tri Pointe Homes, Inc. (Household Durables)
| (a) | 7,833 | 132,143 |
Vista Outdoor, Inc. (Leisure Products)
| (a) | 5,450 | 152,055 |
Winnebago Industries, Inc. (Automobiles)
| | 2,890 | 140,338 |
Wolverine World Wide, Inc. (Textiles, Apparel & Luxury Goods)
| | 7,240 | 145,958 |
| | | | 15,042,216 |
Consumer Staples–5.0%
| | | |
B&G Foods, Inc. (Food Products)
| | 6,090 | 144,820 |
Cal-Maine Foods, Inc. (Food Products)
| | 4,760 | 235,192 |
Celsius Holdings, Inc. (Beverages)
| (a) | 3,100 | 202,306 |
Central Garden & Pet Co. Class A (Household Products)
| (a) | 3,610 | 144,436 |
Chefs' Warehouse, Inc. / The (Food & Staples Retailing)
| (a) | 30,867 | 1,200,418 |
Coca-Cola Consolidated, Inc. (Beverages)
| | 340 | 191,726 |
Edgewell Personal Care Co. (Personal Products)
| | 4,650 | 160,518 |
Fresh Del Monte Produce, Inc. (Food Products)
| | 6,300 | 186,039 |
Freshpet, Inc. (Food Products)
| (a) | 11,225 | 582,465 |
Grocery Outlet Holding Corp. (Food & Staples Retailing)
| (a) | 12,421 | 529,507 |
Hostess Brands, Inc. (Food Products)
| (a) | 10,075 | 213,691 |
Inter Parfums, Inc. (Personal Products)
| | 2,410 | 176,075 |
J & J Snack Foods Corp. (Food Products)
| | 1,300 | 181,558 |
Medifast, Inc. (Personal Products)
| | 1,020 | 184,120 |
National Beverage Corp. (Beverages)
| | 2,645 | 129,446 |
PriceSmart, Inc. (Food & Staples Retailing)
| | 1,960 | 140,395 |
Simply Good Foods Co. / The (Food Products)
| (a) | 7,200 | 271,944 |
TreeHouse Foods, Inc. (Food Products)
| (a) | 4,709 | 196,930 |
United Natural Foods, Inc. (Food & Staples Retailing)
| (a) | 4,820 | 189,908 |
USANA Health Sciences, Inc. (Personal Products)
| (a) | 1,970 | 142,549 |
Vector Group Ltd. (Tobacco)
| | 13,620 | 143,010 |
Vital Farms, Inc. (Food Products)
| (a) | 21,846 | 191,153 |
WD-40 Co. (Household Products)
| | 1,140 | 229,550 |
| | | | 5,967,756 |
Energy–5.3%
| | | |
Archrock, Inc. (Energy Equip. & Svs.)
| | 15,360 | 127,027 |
Callon Petroleum Co. (Oil, Gas & Consumable Fuels)
| (a) | 4,750 | 186,200 |
ChampionX Corp. (Energy Equip. & Svs.)
| | 42,148 | 836,638 |
| Ohio National Fund, Inc. | ON AB Small Cap Portfolio (Continued) |
| Schedule of Investments | June 30, 2022 (Unaudited) |
| Common Stocks (Continued) | Shares | Value |
| Energy (continued) | | | |
Civitas Resources, Inc. (Oil, Gas & Consumable Fuels)
| | 5,689 | $ 297,478 |
Core Laboratories N.V. (Energy Equip. & Svs.)
| | 7,290 | 144,415 |
Green Plains, Inc. (Oil, Gas & Consumable Fuels)
| (a) | 5,960 | 161,933 |
Helmerich & Payne, Inc. (Energy Equip. & Svs.)
| | 26,642 | 1,147,205 |
Magnolia Oil & Gas Corp. Class A (Oil, Gas & Consumable Fuels)
| | 38,944 | 817,435 |
Matador Resources Co. (Oil, Gas & Consumable Fuels)
| | 20,775 | 967,907 |
Patterson-UTI Energy, Inc. (Energy Equip. & Svs.)
| | 15,640 | 246,486 |
PBF Energy, Inc. Class A (Oil, Gas & Consumable Fuels)
| (a) | 7,990 | 231,870 |
RPC, Inc. (Energy Equip. & Svs.)
| (a) | 13,550 | 93,630 |
SM Energy Co. (Oil, Gas & Consumable Fuels)
| | 8,360 | 285,828 |
Southwestern Energy Co. (Oil, Gas & Consumable Fuels)
| (a) | 80,110 | 500,687 |
Talos Energy, Inc. (Oil, Gas & Consumable Fuels)
| (a) | 7,240 | 112,003 |
U.S. Silica Holdings, Inc. (Energy Equip. & Svs.)
| (a) | 7,450 | 85,079 |
World Fuel Services Corp. (Oil, Gas & Consumable Fuels)
| | 4,930 | 100,868 |
| | | | 6,342,689 |
Financials–13.9%
| | | |
American Equity Investment Life Holding Co. (Insurance)
| | 7,460 | 272,812 |
Ameris Bancorp (Banks)
| | 5,910 | 237,464 |
Apollo Commercial Real Estate Finance, Inc. (Mortgage REIT)
| | 11,680 | 121,939 |
Assured Guaranty Ltd. (Insurance)
| | 4,380 | 244,360 |
Axos Financial, Inc. (Thrifts & Mortgage Finance)
| (a) | 4,330 | 155,230 |
B. Riley Financial, Inc. (Capital Markets)
| | 2,670 | 112,808 |
BancFirst Corp. (Banks)
| | 1,300 | 124,423 |
BankUnited, Inc. (Banks)
| | 8,010 | 284,916 |
Banner Corp. (Banks)
| | 3,130 | 175,937 |
Brightsphere Investment Group, Inc. (Capital Markets)
| | 2,827 | 50,914 |
Brookline Bancorp, Inc. (Banks)
| | 11,040 | 146,942 |
Columbia Banking System, Inc. (Banks)
| | 6,120 | 175,338 |
Community Bank System, Inc. (Banks)
| | 4,580 | 289,822 |
Customers Bancorp, Inc. (Banks)
| (a) | 2,500 | 84,750 |
CVB Financial Corp. (Banks)
| | 10,890 | 270,181 |
Dime Community Bancshares, Inc. (Banks)
| | 5,370 | 159,220 |
Donnelley Financial Solutions, Inc. (Capital Markets)
| (a) | 310 | 9,080 |
Eagle Bancorp, Inc. (Banks)
| | 3,330 | 157,875 |
Employers Holdings, Inc. (Insurance)
| | 4,390 | 183,897 |
Encore Capital Group, Inc. (Consumer Finance)
| (a) | 3,210 | 185,442 |
Enova International, Inc. (Consumer Finance)
| (a) | 5,190 | 149,576 |
FB Financial Corp. (Banks)
| | 4,240 | 166,293 |
First BanCorp (Banks)
| | 18,380 | 237,286 |
First Financial Bancorp (Banks)
| | 7,980 | 154,812 |
First Financial Bankshares, Inc. (Banks)
| | 23,698 | 930,620 |
First Hawaiian, Inc. (Banks)
| | 11,000 | 249,810 |
Flagstar Bancorp, Inc. (Thrifts & Mortgage Finance)
| | 4,200 | 148,890 |
Genworth Financial, Inc. Class A (Insurance)
| (a) | 48,010 | 169,475 |
Hilltop Holdings, Inc. (Banks)
| | 3,397 | 90,564 |
Hope Bancorp, Inc. (Banks)
| | 11,840 | 163,866 |
Horace Mann Educators Corp. (Insurance)
| | 3,110 | 119,362 |
Houlihan Lokey, Inc. (Capital Markets)
| | 10,307 | 813,532 |
Independent Bank Corp. (Banks)
| | 3,783 | 300,484 |
Independent Bank Group, Inc. (Banks)
| | 3,060 | 207,805 |
James River Group Holdings Ltd. (Insurance)
| | 4,800 | 118,944 |
KKR Real Estate Finance Trust, Inc. (Mortgage REIT)
| | 8,420 | 146,929 |
| Common Stocks (Continued) | Shares | Value |
| Financials (continued) | | | |
Lakeland Financial Corp. (Banks)
| | 1,840 | $ 122,213 |
Live Oak Bancshares, Inc. (Banks)
| | 13,294 | 450,534 |
Mr. Cooper Group, Inc. (Thrifts & Mortgage Finance)
| (a) | 6,180 | 227,053 |
National Bank Holdings Corp. Class A (Banks)
| | 4,450 | 170,301 |
NBT Bancorp, Inc. (Banks)
| | 4,690 | 176,297 |
New York Mortgage Trust, Inc. (Mortgage REIT)
| | 38,720 | 106,867 |
NMI Holdings, Inc. Class A (Thrifts & Mortgage Finance)
| (a) | 7,570 | 126,040 |
Northwest Bancshares, Inc. (Banks)
| | 9,360 | 119,808 |
P10, Inc. Class A (Capital Markets)
| | 26,794 | 297,949 |
Pacific Premier Bancorp, Inc. (Banks)
| | 8,070 | 235,967 |
Park National Corp. (Banks)
| | 1,420 | 172,175 |
Piper Sandler Cos. (Capital Markets)
| | 1,530 | 173,441 |
PRA Group, Inc. (Consumer Finance)
| (a) | 4,720 | 171,619 |
ProAssurance Corp. (Insurance)
| | 7,110 | 168,009 |
PROG Holdings, Inc. (Consumer Finance)
| (a) | 4,081 | 67,337 |
Provident Financial Services, Inc. (Thrifts & Mortgage Finance)
| | 7,540 | 167,840 |
Redwood Trust, Inc. (Mortgage REIT)
| | 16,000 | 123,360 |
Renasant Corp. (Banks)
| | 4,640 | 133,678 |
Ryan Specialty Group Holdings, Inc. Class A (Insurance)
| (a) | 23,483 | 920,299 |
Seacoast Banking Corp. of Florida (Banks)
| | 4,890 | 161,566 |
ServisFirst Bancshares, Inc. (Banks)
| | 3,930 | 310,156 |
Simmons First National Corp. Class A (Banks)
| | 9,350 | 198,781 |
Southside Bancshares, Inc. (Banks)
| | 4,430 | 165,771 |
StepStone Group, Inc. Class A (Capital Markets)
| | 28,845 | 750,835 |
Stewart Information Services Corp. (Insurance)
| | 3,030 | 150,742 |
Stifel Financial Corp. (Capital Markets)
| | 14,154 | 792,907 |
StoneX Group, Inc. (Capital Markets)
| (a) | 2,800 | 218,596 |
Triumph Bancorp, Inc. (Banks)
| (a) | 2,360 | 147,642 |
Trupanion, Inc. (Insurance)
| (a) | 14,110 | 850,269 |
Trustmark Corp. (Banks)
| | 4,200 | 122,598 |
Two Harbors Investment Corp. (Mortgage REIT)
| | 26,710 | 133,016 |
United Community Banks, Inc. (Banks)
| | 8,232 | 248,524 |
Veritex Holdings, Inc. (Banks)
| | 3,580 | 104,751 |
Virtus Investment Partners, Inc. (Capital Markets)
| | 650 | 111,163 |
Walker & Dunlop, Inc. (Thrifts & Mortgage Finance)
| | 2,560 | 246,630 |
WSFS Financial Corp. (Thrifts & Mortgage Finance)
| | 5,151 | 206,504 |
| | | | 16,662,836 |
Health Care–15.6%
| | | |
ADC Therapeutics SA (Biotechnology)
| (a) | 15,034 | 119,520 |
Allscripts Healthcare Solutions, Inc. (Health Care Technology)
| (a) | 11,420 | 169,359 |
AMN Healthcare Services, Inc. (Health Care Providers & Svs.)
| (a) | 4,030 | 442,131 |
Amphastar Pharmaceuticals, Inc. (Pharmaceuticals)
| (a) | 3,480 | 121,069 |
Apollo Medical Holdings, Inc. (Health Care Providers & Svs.)
| (a) | 2,740 | 105,737 |
Arcus Biosciences, Inc. (Biotechnology)
| (a) | 3,299 | 83,597 |
Arrowhead Pharmaceuticals, Inc. (Biotechnology)
| (a) | 13,167 | 463,610 |
Ascendis Pharma A/S – ADR (Biotechnology)
| (a) | 3,346 | 311,044 |
AtriCure, Inc. (Health Care Equip. & Supplies)
| (a) | 19,687 | 804,411 |
Blueprint Medicines Corp. (Biotechnology)
| (a) | 7,866 | 397,312 |
Cardiovascular Systems, Inc. (Health Care Equip. & Supplies)
| (a) | 4,410 | 63,328 |
Certara, Inc. (Health Care Technology)
| (a) | 28,575 | 613,219 |
Coherus Biosciences, Inc. (Biotechnology)
| (a) | 29,167 | 211,169 |
| Ohio National Fund, Inc. | ON AB Small Cap Portfolio (Continued) |
| Schedule of Investments | June 30, 2022 (Unaudited) |
| Common Stocks (Continued) | Shares | Value |
Health Care (continued)
| | | |
Community Health Systems, Inc. (Health Care Providers & Svs.)
| (a) | 15,940 | $ 59,775 |
CONMED Corp. (Health Care Equip. & Supplies)
| | 2,520 | 241,315 |
Corcept Therapeutics, Inc. (Pharmaceuticals)
| (a) | 9,360 | 222,581 |
CorVel Corp. (Health Care Providers & Svs.)
| (a) | 840 | 123,707 |
Covetrus, Inc. (Health Care Providers & Svs.)
| (a) | 8,680 | 180,110 |
Cytokinetics, Inc. (Biotechnology)
| (a) | 6,940 | 272,673 |
Dynavax Technologies Corp. (Biotechnology)
| (a) | 7,903 | 99,499 |
Eagle Pharmaceuticals, Inc. (Biotechnology)
| (a) | 4,065 | 180,608 |
Embecta Corp. (Health Care Equip. & Supplies)
| (a) | 4,021 | 101,812 |
Emergent BioSolutions, Inc. (Biotechnology)
| (a) | 3,789 | 117,611 |
Ensign Group, Inc. / The (Health Care Providers & Svs.)
| | 4,350 | 319,594 |
Erasca, Inc. (Biotechnology)
| (a) | 21,517 | 119,850 |
Fulgent Genetics, Inc. (Health Care Providers & Svs.)
| (a) | 2,310 | 125,964 |
Glaukos Corp. (Health Care Equip. & Supplies)
| (a) | 3,959 | 179,818 |
Harmony Biosciences Holdings, Inc. (Pharmaceuticals)
| (a) | 4,330 | 211,174 |
Health Catalyst, Inc. (Health Care Technology)
| (a) | 39,819 | 576,977 |
Heska Corp. (Health Care Equip. & Supplies)
| (a) | 969 | 91,580 |
Inari Medical, Inc. (Health Care Equip. & Supplies)
| (a) | 13,019 | 885,162 |
Insmed, Inc. (Biotechnology)
| (a) | 20,494 | 404,142 |
Integer Holdings Corp. (Health Care Equip. & Supplies)
| (a) | 2,840 | 200,674 |
Intellia Therapeutics, Inc. (Biotechnology)
| (a) | 8,660 | 448,242 |
Intra-Cellular Therapies, Inc. (Pharmaceuticals)
| (a) | 10,708 | 611,213 |
iRhythm Technologies, Inc. (Health Care Equip. & Supplies)
| (a) | 5,627 | 607,885 |
Ironwood Pharmaceuticals, Inc. (Biotechnology)
| (a) | 10,510 | 121,180 |
iTeos Therapeutics, Inc. (Biotechnology)
| (a) | 5,551 | 114,351 |
Lantheus Holdings, Inc. (Health Care Equip. & Supplies)
| (a) | 4,780 | 315,623 |
Legend Biotech Corp. – ADR (Biotechnology)
| (a) | 6,456 | 355,080 |
Ligand Pharmaceuticals, Inc. (Biotechnology)
| (a) | 1,396 | 124,551 |
MEDNAX, Inc. (Health Care Providers & Svs.)
| (a) | 7,430 | 156,104 |
Merit Medical Systems, Inc. (Health Care Equip. & Supplies)
| (a) | 4,190 | 227,391 |
Mesa Laboratories, Inc. (Health Care Equip. & Supplies)
| | 710 | 144,797 |
ModivCare, Inc. (Health Care Providers & Svs.)
| (a) | 1,273 | 107,568 |
Myriad Genetics, Inc. (Biotechnology)
| (a) | 6,470 | 117,560 |
NeoGenomics, Inc. (Life Sciences Tools & Svs.)
| (a) | 10,157 | 82,779 |
Omnicell, Inc. (Health Care Equip. & Supplies)
| (a) | 3,680 | 418,600 |
Owens & Minor, Inc. (Health Care Providers & Svs.)
| | 6,400 | 201,280 |
Pacira BioSciences, Inc. (Pharmaceuticals)
| (a) | 3,660 | 213,378 |
Prestige Consumer Healthcare, Inc. (Pharmaceuticals)
| (a) | 4,080 | 239,904 |
RadNet, Inc. (Health Care Providers & Svs.)
| (a) | 7,950 | 137,376 |
Recursion Pharmaceuticals, Inc. Class A (Biotechnology)
| (a) | 29,688 | 241,660 |
REGENXBIO, Inc. (Biotechnology)
| (a) | 5,120 | 126,464 |
Relay Therapeutics, Inc. (Biotechnology)
| (a) | 15,862 | 265,688 |
Repligen Corp. (Life Sciences Tools & Svs.)
| (a) | 4,787 | 777,409 |
Select Medical Holdings Corp. (Health Care Providers & Svs.)
| | 9,420 | 222,500 |
Silk Road Medical, Inc. (Health Care Equip. & Supplies)
| (a) | 18,458 | 671,687 |
Supernus Pharmaceuticals, Inc. (Pharmaceuticals)
| (a) | 1,038 | 30,019 |
Surmodics, Inc. (Health Care Equip. & Supplies)
| (a) | 3,320 | 123,604 |
| Common Stocks (Continued) | Shares | Value |
Health Care (continued)
| | | |
Tandem Diabetes Care, Inc. (Health Care Equip. & Supplies)
| (a) | 11,609 | $ 687,137 |
Treace Medical Concepts, Inc. (Health Care Equip. & Supplies)
| (a) | 30,273 | 434,115 |
Ultragenyx Pharmaceutical, Inc. (Biotechnology)
| (a) | 4,927 | 293,945 |
Vericel Corp. (Biotechnology)
| (a) | 3,990 | 100,468 |
Vir Biotechnology, Inc. (Biotechnology)
| (a) | 18,945 | 482,529 |
Xencor, Inc. (Biotechnology)
| (a) | 5,010 | 137,124 |
Y-mAbs Therapeutics, Inc. (Biotechnology)
| (a) | 24,087 | 364,436 |
Zentalis Pharmaceuticals, Inc. (Biotechnology)
| (a) | 11,766 | 330,625 |
Zimvie, Inc. (Health Care Equip. & Supplies)
| (a) | 1,510 | 24,175 |
| | | | 18,678,579 |
Industrials–17.2%
| | | |
AAON, Inc. (Building Products)
| | 3,530 | 193,303 |
AAR Corp. (Aerospace & Defense)
| (a) | 4,420 | 184,933 |
ABM Industries, Inc. (Commercial Svs. & Supplies)
| | 5,880 | 255,310 |
Aerojet Rocketdyne Holdings, Inc. (Aerospace & Defense)
| (a) | 6,090 | 247,254 |
AeroVironment, Inc. (Aerospace & Defense)
| (a) | 1,930 | 158,646 |
Albany International Corp. Class A (Machinery)
| | 2,590 | 204,066 |
Allegiant Travel Co. (Airlines)
| (a) | 1,130 | 127,792 |
Applied Industrial Technologies, Inc. (Trading Companies & Distributors)
| | 3,340 | 321,208 |
ArcBest Corp. (Road & Rail)
| | 2,440 | 171,703 |
Arcosa, Inc. (Construction & Engineering)
| | 4,130 | 191,756 |
Astec Industries, Inc. (Machinery)
| | 2,850 | 116,223 |
Atlas Air Worldwide Holdings, Inc. (Air Freight & Logistics)
| (a) | 2,620 | 161,680 |
Axon Enterprise, Inc. (Aerospace & Defense)
| (a) | 7,891 | 735,204 |
AZEK Co., Inc. / The (Building Products)
| (a) | 27,318 | 457,303 |
AZZ, Inc. (Electrical Equip.)
| | 3,380 | 137,972 |
Barnes Group, Inc. (Machinery)
| | 3,920 | 122,069 |
Boise Cascade Co. (Trading Companies & Distributors)
| | 3,460 | 205,835 |
Brady Corp. Class A (Commercial Svs. & Supplies)
| | 4,230 | 199,825 |
Comfort Systems U.S.A., Inc. (Construction & Engineering)
| | 3,020 | 251,113 |
Curtiss-Wright Corp. (Aerospace & Defense)
| | 4,844 | 639,699 |
Deluxe Corp. (Commercial Svs. & Supplies)
| | 5,150 | 111,601 |
Driven Brands Holdings, Inc. (Commercial Svs. & Supplies)
| (a) | 36,224 | 997,609 |
Encore Wire Corp. (Electrical Equip.)
| | 1,350 | 140,292 |
EnPro Industries, Inc. (Machinery)
| | 2,070 | 169,595 |
ESCO Technologies, Inc. (Machinery)
| | 2,290 | 156,567 |
Exponent, Inc. (Professional Svs.)
| | 4,430 | 405,212 |
Federal Signal Corp. (Machinery)
| | 5,150 | 183,340 |
Forward Air Corp. (Air Freight & Logistics)
| | 2,420 | 222,543 |
Franklin Electric Co., Inc. (Machinery)
| | 3,280 | 240,293 |
GMS, Inc. (Trading Companies & Distributors)
| (a) | 4,070 | 181,115 |
Granite Construction, Inc. (Construction & Engineering)
| | 4,660 | 135,792 |
Greenbrier Cos., Inc. / The (Machinery)
| | 2,870 | 103,291 |
Griffon Corp. (Building Products)
| | 6,550 | 183,596 |
Hayward Holdings, Inc. (Building Products)
| (a) | 47,995 | 690,648 |
Herc Holdings, Inc. (Trading Companies & Distributors)
| | 9,013 | 812,522 |
Hillenbrand, Inc. (Machinery)
| | 6,520 | 267,059 |
HNI Corp. (Commercial Svs. & Supplies)
| | 4,200 | 145,698 |
Hub Group, Inc. Class A (Air Freight & Logistics)
| (a) | 2,970 | 210,692 |
Insperity, Inc. (Professional Svs.)
| | 9,510 | 949,383 |
ITT, Inc. (Machinery)
| | 10,135 | 681,477 |
John Bean Technologies Corp. (Machinery)
| | 11,725 | 1,294,674 |
| Ohio National Fund, Inc. | ON AB Small Cap Portfolio (Continued) |
| Schedule of Investments | June 30, 2022 (Unaudited) |
| Common Stocks (Continued) | Shares | Value |
| Industrials (continued) | | | |
KAR Auction Services, Inc. (Commercial Svs. & Supplies)
| (a) | 9,404 | $ 138,897 |
Korn Ferry (Professional Svs.)
| | 4,710 | 273,274 |
Lindsay Corp. (Machinery)
| | 1,070 | 142,117 |
ManTech International Corp. Class A (Professional Svs.)
| | 2,290 | 218,580 |
Matson, Inc. (Marine)
| | 3,810 | 277,673 |
Meritor, Inc. (Machinery)
| (a) | 7,320 | 265,936 |
Middleby Corp. / The (Machinery)
| (a) | 5,164 | 647,359 |
Moog, Inc. Class A (Aerospace & Defense)
| | 2,460 | 195,299 |
Mueller Industries, Inc. (Machinery)
| | 4,750 | 253,127 |
NV5 Global, Inc. (Construction & Engineering)
| (a) | 779 | 90,940 |
Pitney Bowes, Inc. (Commercial Svs. & Supplies)
| | 23,790 | 86,120 |
Resideo Technologies, Inc. (Building Products)
| (a) | 12,440 | 241,585 |
Saia, Inc. (Road & Rail)
| (a) | 4,810 | 904,280 |
Simpson Manufacturing Co., Inc. (Building Products)
| | 6,983 | 702,560 |
SiteOne Landscape Supply, Inc. (Trading Companies & Distributors)
| (a) | 5,379 | 639,402 |
SPX Corp. (Machinery)
| (a) | 3,807 | 201,162 |
Tennant Co. (Machinery)
| | 2,250 | 133,313 |
Tetra Tech, Inc. (Commercial Svs. & Supplies)
| | 6,574 | 897,680 |
Trinity Industries, Inc. (Machinery)
| | 4,950 | 119,889 |
Triumph Group, Inc. (Aerospace & Defense)
| (a) | 5,664 | 75,275 |
UFP Industries, Inc. (Building Products)
| | 5,290 | 360,461 |
UniFirst Corp. (Commercial Svs. & Supplies)
| | 1,270 | 218,669 |
Veritiv Corp. (Trading Companies & Distributors)
| (a) | 1,060 | 115,063 |
| | | | 20,564,554 |
Information Technology–18.6%
| | | |
3D Systems Corp. (Tech. Hardware, Storage & Periph.)
| (a) | 10,730 | 104,081 |
A10 Networks, Inc. (Software)
| | 4,285 | 61,618 |
ADTRAN, Inc. (Communications Equip.)
| | 10,400 | 182,312 |
Advanced Energy Industries, Inc. (Electronic Equip., Instr. & Comp.)
| | 3,220 | 234,996 |
Alarm.com Holdings, Inc. (Software)
| (a) | 3,760 | 232,594 |
Allegro MicroSystems, Inc. (Semiconductors & Equip.)
| (a) | 26,809 | 554,678 |
Axcelis Technologies, Inc. (Semiconductors & Equip.)
| (a) | 2,350 | 128,874 |
Badger Meter, Inc. (Electronic Equip., Instr. & Comp.)
| | 2,470 | 199,798 |
BigCommerce Holdings, Inc. (IT Svs.)
| (a) | 24,159 | 391,376 |
Blackline, Inc. (Software)
| (a) | 12,215 | 813,519 |
Braze, Inc. Class A (Software)
| (a) | 14,801 | 536,240 |
Cerence, Inc. (Software)
| (a) | 1,979 | 49,930 |
Cohu, Inc. (Semiconductors & Equip.)
| (a) | 4,400 | 122,100 |
CSG Systems International, Inc. (IT Svs.)
| | 2,350 | 140,248 |
Digital Turbine, Inc. (Software)
| (a) | 6,023 | 105,222 |
DigitalOcean Holdings, Inc. (IT Svs.)
| (a) | 11,743 | 485,690 |
Diodes, Inc. (Semiconductors & Equip.)
| (a) | 3,700 | 238,909 |
Elastic N.V. (Software)
| (a) | 7,140 | 483,164 |
Enfusion, Inc. Class A (Software)
| (a) | 22,160 | 226,254 |
EVERTEC, Inc. (IT Svs.)
| | 5,340 | 196,939 |
ExlService Holdings, Inc. (IT Svs.)
| (a) | 2,890 | 425,784 |
Extreme Networks, Inc. (Communications Equip.)
| (a) | 15,620 | 139,330 |
Fabrinet (Electronic Equip., Instr. & Comp.)
| (a) | 3,110 | 252,221 |
FARO Technologies, Inc. (Electronic Equip., Instr. & Comp.)
| (a) | 2,340 | 72,142 |
FormFactor, Inc. (Semiconductors & Equip.)
| (a) | 6,810 | 263,751 |
Insight Enterprises, Inc. (Electronic Equip., Instr. & Comp.)
| (a) | 3,010 | 259,703 |
InterDigital, Inc. (Software)
| | 2,560 | 155,648 |
Itron, Inc. (Electronic Equip., Instr. & Comp.)
| (a) | 3,750 | 185,363 |
Knowles Corp. (Electronic Equip., Instr. & Comp.)
| (a) | 8,500 | 147,305 |
| Common Stocks (Continued) | Shares | Value |
Information Technology (continued)
| | | |
Kulicke & Soffa Industries, Inc. (Semiconductors & Equip.)
| | 5,310 | $ 227,321 |
Lattice Semiconductor Corp. (Semiconductors & Equip.)
| (a) | 17,651 | 856,073 |
Littelfuse, Inc. (Electronic Equip., Instr. & Comp.)
| | 3,109 | 789,810 |
LivePerson, Inc. (Software)
| (a) | 5,529 | 78,180 |
LiveRamp Holdings, Inc. (Software)
| (a) | 4,660 | 120,275 |
MACOM Technology Solutions Holdings, Inc. (Semiconductors & Equip.)
| (a) | 18,280 | 842,708 |
Manhattan Associates, Inc. (Software)
| (a) | 7,794 | 893,192 |
MaxLinear, Inc. (Semiconductors & Equip.)
| (a) | 5,930 | 201,501 |
Monday.com Ltd. (Software)
| (a) | 4,667 | 481,448 |
NetScout Systems, Inc. (Communications Equip.)
| (a) | 5,976 | 202,288 |
Novanta, Inc. (Electronic Equip., Instr. & Comp.)
| (a) | 8,660 | 1,050,198 |
Onto Innovation, Inc. (Semiconductors & Equip.)
| (a) | 12,388 | 863,939 |
OSI Systems, Inc. (Electronic Equip., Instr. & Comp.)
| (a) | 1,837 | 156,953 |
PC Connection, Inc. (Electronic Equip., Instr. & Comp.)
| | 2,690 | 118,495 |
Perficient, Inc. (IT Svs.)
| (a) | 2,710 | 248,480 |
Plantronics, Inc. (Communications Equip.)
| (a) | 3,690 | 146,419 |
Plexus Corp. (Electronic Equip., Instr. & Comp.)
| (a) | 2,500 | 196,250 |
Progress Software Corp. (Software)
| | 3,160 | 143,148 |
Rambus, Inc. (Semiconductors & Equip.)
| (a) | 9,360 | 201,146 |
Rapid7, Inc. (Software)
| (a) | 12,702 | 848,494 |
Rogers Corp. (Electronic Equip., Instr. & Comp.)
| (a) | 1,630 | 427,207 |
Sanmina Corp. (Electronic Equip., Instr. & Comp.)
| (a) | 5,660 | 230,532 |
Semtech Corp. (Semiconductors & Equip.)
| (a) | 9,544 | 524,634 |
Shift4 Payments, Inc. Class A (IT Svs.)
| (a) | 13,914 | 459,997 |
Silicon Laboratories, Inc. (Semiconductors & Equip.)
| (a) | 5,861 | 821,829 |
Smartsheet, Inc. Class A (Software)
| (a) | 16,029 | 503,791 |
SPS Commerce, Inc. (Software)
| (a) | 3,120 | 352,716 |
Switch, Inc. Class A (IT Svs.)
| | 19,274 | 645,679 |
Synaptics, Inc. (Semiconductors & Equip.)
| (a) | 6,193 | 731,084 |
TTEC Holdings, Inc. (IT Svs.)
| | 1,750 | 118,808 |
TTM Technologies, Inc. (Electronic Equip., Instr. & Comp.)
| (a) | 11,850 | 148,125 |
Unisys Corp. (IT Svs.)
| (a) | 8,300 | 99,849 |
Varonis Systems, Inc. (Software)
| (a) | 25,139 | 737,075 |
Viavi Solutions, Inc. (Communications Equip.)
| (a) | 19,550 | 258,646 |
Xperi Holding Corp. (Software)
| | 8,650 | 124,820 |
| | | | 22,240,899 |
Materials–3.1%
| | | |
Allegheny Technologies, Inc. (Metals & Mining)
| (a) | 10,700 | 242,997 |
Arconic Corp. (Metals & Mining)
| (a) | 8,080 | 226,644 |
Balchem Corp. (Chemicals)
| | 2,790 | 361,975 |
Carpenter Technology Corp. (Metals & Mining)
| | 4,690 | 130,898 |
Compass Minerals International, Inc. (Metals & Mining)
| | 2,478 | 87,696 |
Element Solutions, Inc. (Chemicals)
| | 36,520 | 650,056 |
GCP Applied Technologies, Inc. (Chemicals)
| (a) | 3,690 | 115,423 |
H.B. Fuller Co. (Chemicals)
| | 4,520 | 272,149 |
Innospec, Inc. (Chemicals)
| | 2,190 | 209,780 |
Livent Corp. (Chemicals)
| (a) | 12,820 | 290,886 |
O-I Glass, Inc. (Containers & Packaging)
| (a) | 14,010 | 196,140 |
Quaker Chemical Corp. (Chemicals)
| | 1,100 | 164,472 |
Ranpak Holdings Corp. (Containers & Packaging)
| (a) | 23,357 | 163,499 |
Schweitzer-Mauduit International, Inc. (Paper & Forest Products)
| | 3,890 | 97,717 |
Stepan Co. (Chemicals)
| | 1,770 | 179,389 |
| Ohio National Fund, Inc. | ON AB Small Cap Portfolio (Continued) |
| Schedule of Investments | June 30, 2022 (Unaudited) |
| Common Stocks (Continued) | Shares | Value |
| Materials (continued) | | | |
Sylvamo Corp. (Paper & Forest Products)
| | 3,040 | $ 99,347 |
Trinseo PLC (Chemicals)
| | 3,160 | 121,534 |
Warrior Met Coal, Inc. (Metals & Mining)
| | 3,860 | 118,155 |
| | | | 3,728,757 |
Real Estate–3.7%
| | | |
Acadia Realty Trust (Equity REIT)
| | 6,240 | 97,469 |
Agree Realty Corp. (Equity REIT)
| | 5,300 | 382,289 |
American Assets Trust, Inc. (Equity REIT)
| | 5,070 | 150,579 |
Anywhere Real Estate, Inc. (Real Estate Mgmt. & Development)
| (a) | 10,280 | 101,052 |
Brandywine Realty Trust (Equity REIT)
| | 14,450 | 139,298 |
CareTrust REIT, Inc. (Equity REIT)
| | 8,080 | 148,995 |
Community Healthcare Trust, Inc. (Equity REIT)
| | 10 | 362 |
DiamondRock Hospitality Co. (Equity REIT)
| (a) | 18,760 | 154,020 |
Douglas Elliman, Inc. (Real Estate Mgmt. & Development)
| | 6,810 | 32,620 |
Easterly Government Properties, Inc. (Equity REIT)
| | 6,200 | 118,048 |
Essential Properties Realty Trust, Inc. (Equity REIT)
| | 9,500 | 204,155 |
Four Corners Property Trust, Inc. (Equity REIT)
| | 6,770 | 180,014 |
Getty Realty Corp. (Equity REIT)
| | 5,630 | 149,195 |
Global Net Lease, Inc. (Equity REIT)
| | 9,430 | 133,529 |
Industrial Logistics Properties Trust (Equity REIT)
| | 7,170 | 100,954 |
Innovative Industrial Properties, Inc. (Equity REIT)
| | 2,040 | 224,135 |
LTC Properties, Inc. (Equity REIT)
| | 60 | 2,303 |
LXP Industrial Trust (Equity REIT)
| | 23,230 | 249,490 |
Marcus & Millichap, Inc. (Real Estate Mgmt. & Development)
| | 2,590 | 95,804 |
NexPoint Residential Trust, Inc. (Equity REIT)
| | 1,600 | 100,016 |
Office Properties Income Trust (Equity REIT)
| | 6,400 | 127,680 |
Retail Opportunity Investments Corp. (Equity REIT)
| | 10,100 | 159,378 |
Safehold, Inc. (Equity REIT)
| | 3,330 | 117,782 |
SITE Centers Corp. (Equity REIT)
| | 14,460 | 194,776 |
| Common Stocks (Continued) | Shares | Value |
Real Estate (continued)
| | | |
St. Joe Co. / The (Real Estate Mgmt. & Development)
| | 3,880 | $ 153,493 |
Tanger Factory Outlet Centers, Inc. (Equity REIT)
| | 10,180 | 144,760 |
Uniti Group, Inc. (Equity REIT)
| | 20,270 | 190,943 |
Urban Edge Properties (Equity REIT)
| | 8,010 | 121,832 |
Veris Residential, Inc. (Equity REIT)
| (a) | 10,860 | 143,786 |
Washington Real Estate Investment Trust (Equity REIT)
| | 7,650 | 163,022 |
Xenia Hotels & Resorts, Inc. (Equity REIT)
| (a) | 10,060 | 146,172 |
| | | | 4,427,951 |
Utilities–1.1%
| | | |
American States Water Co. (Water Utilities)
| | 3,140 | 255,941 |
Avista Corp. (Multi-Utilities)
| | 5,790 | 251,923 |
California Water Service Group (Water Utilities)
| | 4,230 | 234,977 |
Chesapeake Utilities Corp. (Gas Utilities)
| | 1,500 | 194,325 |
Northwest Natural Holding Co. (Gas Utilities)
| | 2,340 | 124,254 |
South Jersey Industries, Inc. (Gas Utilities)
| | 8,620 | 294,287 |
| | | | 1,355,707 |
Total Common Stocks (Cost $145,975,980)
| | | $116,343,220 |
| Exchange Traded Funds–0.2% | Shares | Value |
iShares Core S&P Small-Cap ETF
| | 2,899 | $ 267,897 |
Total Exchange Traded Funds (Cost $294,286)
| | | $ 267,897 |
| Money Market Funds–1.7% | Shares | Value |
State Street Institutional Liquid Reserves Fund Institutional Class, 1.494%
| (b) | 2,007,728 | $ 2,007,527 |
Total Money Market Funds (Cost $2,007,746)
| | | $ 2,007,527 |
Total Investments – 99.1% (Cost $148,278,012)
| (c) | | $118,618,644 |
Other Assets in Excess of Liabilities – 0.9%
| | | 1,103,578 |
| Net Assets – 100.0% | | | $119,722,222 |
Percentages are stated as a percent of net assets. |
| Abbreviations: | |
| ADR: | American Depositary Receipts |
| Footnotes: | |
| (a) | Non-income producing security. |
| (b) | Rate represents the seven-day yield at June 30, 2022. |
| (c) | Represents cost for financial reporting purposes, which may differ from cost basis for federal income tax purposes. See also Note 7 of the Notes to Financial Statements. |
The accompanying notes are an integral part of these financial statements.
| Ohio National Fund, Inc. | ON AB Mid Cap Core Portfolio (Unaudited) |
The ON AB Mid Cap Core Portfolio seeks long-term growth of capital by investing, under normal circumstances, at least 80% of its net assets in equity securities of mid-capitalization companies with public stock market capitalization at the time of investment that are within the range of market capitalizations of the companies constituting the Russell Midcap® Index.
Performance as of June 30, 2022
| Average Annual returns | |
| One year | -22.62% |
| Five years | 8.34% |
| Ten years | 10.09% |
Past performance does not guarantee future results. The performance data quoted represents past performance and current returns may be lower or higher. Total return figures include change in share price and reinvestment of dividends and capital gains. The investment return and principal value will fluctuate so that an investor’s shares, when redeemed, may be worth more or less than the original cost. To obtain performance information up to the most recent month end, call toll-free 1-877-781-6392.
The Portfolio is not open to direct retail investment. Beneficial interest in the Portfolio’s shares is obtained either through an allocation to the Portfolio as an investment vehicle within variable life insurance policies or annuity contracts, or as an underlying investment by the ON Model Portfolios. Actual performance results for variable annuity and variable universal life contracts will be lower due to contract charges. Consult your contract for applicable charges.
Total expense ratio is 0.84% per the Fund’s prospectus dated April 29, 2022. Additional information pertaining to the Portfolio’s expense ratio as of June 30, 2022 can be found in the Portfolio’s Financial Highlights.
Comments from Sub-Adviser
Q. How did the Portfolio perform in comparison to its benchmark during the reporting period?
A. For the six-month period ended June 30, 2022, the Portfolio returned -26.68% versus -21.57% for its benchmark, the Russell Midcap® Index.
Q. Were there specific market conditions, investment strategies, or techniques that materially affected the Portfolio’s benchmark-relative performance during the reporting period?
A. During the six-month period, macroeconomic concerns significantly weighed on market performance. While the year started with concerns that inflation could be more than just transitory, the subsequent invasion of Ukraine by Russia triggered a global energy and food supply shock that further disrupted already fragile supply chains, exacerbating already high levels of inflation. This culminated in the U.S. Federal Reserve raising interest rates three times during the period, including a 0.75% increase in June, its largest since 1994. The increase in rates had a disproportionate impact on growth stocks in the first half of 2022.
The performance of the Russell Midcap Index for the first half of 2022 was worse than for any full year for that index historically, with the exception of 2008. In this environment, investor risk appetite fell sharply and the Portfolio underperformed significantly, as investors sought safety from the elevated market volatility and inflation. As a result, defensive sectors, such as Consumer Staples and Utilities, and inflation beneficiaries, such as Energy, outperformed. The Energy sector, specifically, outperformed the benchmark by over 50% during the first half of 2022. The Portfolio’s relative underperformance was driven primarily by underweights to defensive sectors and Energy, and its greater exposure to growth stocks. (1)
Q. How did sector allocation and security selection each impact the Portfolio’s performance relative to its benchmark?
A. During the six-month period, both sector and security selection detracted from the Portfolio’s relative returns. Security selection was the primary driver of the Portfolio’s underperformance, specifically within Information Technology, Industrials, Health Care and Consumer Discretionary. Security selection within Utilities and Communication Services was slightly positive, however. The Portfolio’s underweights to Energy and Utilities, overweight to Consumer Discretionary and underweight to Consumer Staples detracted from relative performance, while an underweight to Communication Services contributed to relative performance.(1)
Q. Which securities contributed the most to, and detracted the most from, the Portfolio’s benchmark-relative performance?
A. Matador Resources Co., an oil and gas exploration company with operations in the Delaware Basin, outperformed during the six-month period. Those shares outperformed as oil and gas prices rose. Demand outstripped supply as producers showed restraint in growing capacity, in addition to the supply disruptions caused by the war in Ukraine. We believe Matador Resources Co. will continue to execute on its capital expenditure plans over the coming year. Turning Point Therapeutics, Inc., a biotechnology company focusing on the development of treatments for solid cancer patients, outperformed during the period. On June 3rd, Bristol-Myers Squibb Co. acquired Turning Point Therapeutics, Inc. for $76.00 per share, representing a significant premium. We exited the position just prior to the tender offer that commenced on June 20th. Coterra Energy, Inc. was another top contributor as a result of strong company-specific production levels, in addition to sector level commodity price levels. Coterra Energy, Inc. outperformed after reporting first quarter results that beat consensus estimates and also showed production at the high end of guidance. Additionally, the company announced that it bought back $184 million of its shares, out of a $1.3 billion share repurchase authorization.
Latham Group, Inc., a designer, manufacturer and marketer of in-ground residential swimming pools, underperformed during the six-month period. Latham Group, Inc traded lower despite the release of its fourth quarter 2021 earnings and 2022 outlook that were above street estimates, as a sharp rise in interest rates broadly impacted stocks leveraged to consumer spending on the home. We continue to anticipate accelerating share shifts towards fiberglass pools with Latham Group, Inc., a key beneficiary in 2022 and beyond, as materials and manufacturing bottlenecks ease and pricing increases start to layer in. Trex Co., Inc., a manufacturer of composite decking, also underperformed during the period. The company has been executing well on building additional capacity to meet increasing demand for composite decks, which are taking market share from wood decks. However, its shares were down on the back of confusing messaging from the company's management on the earnings call regarding revenue guidance for the year. Having followed up with the company post-call, we feel confident in its topline guidance. Synaptics Inc., a leader in human interface enabling technologies, underperformed during the period. Its shares detracted in the first half of 2022 as investors significantly reduced their forecasts for the smartphone and tablet business, which is likely to experience softness in the next few quarters.(1)
Q. How did the Portfolio’s use of derivative instruments and initial public offerings (IPOs), if any, impact performance?
A. Stock index futures contracts detracted 4 basis points from the Portfolio’s performance for the six-month period. The Portfolio did not participate in any IPOs during the period.(1)
Q. Were there any significant changes to the Portfolio’s management team, investment strategy, or selection process during the reporting period?
| Ohio National Fund, Inc. | ON AB Mid Cap Core Portfolio (Unaudited) (Continued) |
A. Michael Doherty, Quantitative Analyst on the U.S. Small and SMID Growth team, retired effective June 30, 2022. Lucie Germain, who joined AllianceBernstein L.P. in December 2015, has assumed Michael’s role as the team’s quantitative analyst. Lucie previously served as a Senior Associate Portfolio Manager in the Institutional Equity Portfolio Management Group where she covered both U.S. Growth and Developed Market Strategic Core equity platforms. There has been no change to the investment process or philosophy.
| (1) | The Portfolio’s composition is subject to change. Holdings and weightings are as of June 30, 2022. |
Change in Value of $10,000 Investment
Hypothetical illustration based on past performance. Future performance will vary. The Portfolio’s returns reflect reinvested dividends. The Portfolio’s holdings may differ significantly from the securities in the index. The index is unmanaged and therefore does not reflect the cost of portfolio management and accounting.
The Russell Midcap® Index measures the performance of the mid-cap segment of the US equity universe. The Russell Midcap® Index is a subset of the Russell 1000® Index. It includes approximately 800 of the smallest securities based on a combination of their market cap and current index membership.
Past performance is no guarantee of future results. Redemption of fund shares could have tax implications unique to each shareholder.
| Portfolio Composition as of June 30, 2022 (1) |
| | % of Net Assets |
| Common Stocks (4) | 97.4 |
Money Market Funds and
Other Net Assets | 2.6 |
| | 100.0 |
| Top 10 Portfolio Holdings as of June 30, 2022 (1) (2) (3) |
| | | % of Net Assets |
| 1. | LPL Financial Holdings, Inc. | 0.8 |
| 2. | Pool Corp. | 0.7 |
| 3. | ON Semiconductor Corp. | 0.7 |
| 4. | Dynatrace, Inc. | 0.6 |
| 5. | Entegris, Inc. | 0.6 |
| 6. | Planet Fitness, Inc. Class A | 0.6 |
| 7. | Tetra Tech, Inc. | 0.6 |
| 8. | Repligen Corp. | 0.6 |
| 9. | Manhattan Associates, Inc. | 0.5 |
| 10. | Howmet Aerospace, Inc. | 0.5 |
| | |
| (1) | Composition of Portfolio subject to change. |
| (2) | Short-term investments have been excluded from the list of Top 10 Portfolio Holdings. |
| (3) | Top 10 Portfolio Holdings is presented at an individual security level. Total investment exposure by issuer may be higher. |
| (4) | Sectors (Common Stocks): |
| | % of Net Assets |
| Industrials | 17.7 |
| Information Technology | 16.8 |
| Financials | 14.0 |
| Consumer Discretionary | 13.1 |
| Health Care | 12.2 |
| Real Estate | 5.9 |
| Energy | 5.0 |
| Materials | 4.6 |
| Utilities | 3.3 |
| Consumer Staples | 2.8 |
| Communication Services | 2.0 |
| | 97.4 |
| Ohio National Fund, Inc. | ON AB Mid Cap Core Portfolio |
| Schedule of Investments | June 30, 2022 (Unaudited) |
| Common Stocks–97.4% | Shares | Value |
Communication Services–2.0%
| | | |
Criteo SA – ADR (Media)
| (a) | 8,980 | $ 219,112 |
Electronic Arts, Inc. (Entertainment)
| | 960 | 116,784 |
Fox Corp. Class A (Media)
| | 2,040 | 65,606 |
Interpublic Group of Cos., Inc. / The (Media)
| | 2,400 | 66,072 |
Liberty Broadband Corp. Class A (Media)
| (a) | 480 | 54,504 |
Liberty Broadband Corp. Class C (Media)
| (a) | 660 | 76,322 |
Liberty Media Corp. - Liberty Formula One Class C (Entertainment)
| (a) | 1,385 | 87,906 |
Liberty Media Corp. - Liberty SiriusXM Class A (Media)
| (a) | 1,330 | 47,933 |
Match Group, Inc. (Interactive Media & Svs.)
| (a) | 920 | 64,115 |
Omnicom Group, Inc. (Media)
| | 930 | 59,157 |
Paramount Global Class B (Media)
| | 2,310 | 57,011 |
Pinterest, Inc. Class A (Interactive Media & Svs.)
| (a) | 3,220 | 58,475 |
ROBLOX Corp. Class A (Entertainment)
| (a) | 1,750 | 57,505 |
Roku, Inc. (Entertainment)
| (a) | 450 | 36,963 |
Sirius XM Holdings, Inc. (Media)
| | 10,060 | 61,668 |
Spotify Technology SA (Entertainment)
| (a) | 550 | 51,607 |
Take-Two Interactive Software, Inc. (Entertainment)
| (a) | 470 | 57,589 |
Twitter, Inc. (Interactive Media & Svs.)
| (a) | 3,190 | 119,274 |
Warner Bros Discovery, Inc. (Entertainment)
| (a) | 7,731 | 103,750 |
ZoomInfo Technologies, Inc. (Interactive Media & Svs.)
| (a) | 1,570 | 52,187 |
| | | | 1,513,540 |
Consumer Discretionary–13.1%
| | | |
Advance Auto Parts, Inc. (Specialty Retail)
| | 380 | 65,774 |
Aptiv PLC (Auto Components)
| (a) | 1,100 | 97,977 |
Aramark (Hotels, Restaurants & Leisure)
| | 1,962 | 60,096 |
AutoZone, Inc. (Specialty Retail)
| (a) | 90 | 193,421 |
Best Buy Co., Inc. (Specialty Retail)
| | 940 | 61,279 |
Burlington Stores, Inc. (Specialty Retail)
| (a) | 264 | 35,965 |
Caesars Entertainment, Inc. (Hotels, Restaurants & Leisure)
| (a) | 770 | 29,491 |
CarMax, Inc. (Specialty Retail)
| (a) | 671 | 60,712 |
Carnival Corp. (Hotels, Restaurants & Leisure)
| (a) | 3,130 | 27,075 |
Carter's, Inc. (Textiles, Apparel & Luxury Goods)
| | 3,270 | 230,470 |
Carvana Co. (Specialty Retail)
| (a) | 270 | 6,097 |
Chipotle Mexican Grill, Inc. (Hotels, Restaurants & Leisure)
| (a) | 110 | 143,799 |
D.R. Horton, Inc. (Household Durables)
| | 1,350 | 89,356 |
Dana, Inc. (Auto Components)
| | 11,710 | 164,760 |
Darden Restaurants, Inc. (Hotels, Restaurants & Leisure)
| | 530 | 59,954 |
Dine Brands Global, Inc. (Hotels, Restaurants & Leisure)
| | 3,380 | 219,970 |
Dollar Tree, Inc. (Multiline Retail)
| (a) | 970 | 151,174 |
Domino's Pizza, Inc. (Hotels, Restaurants & Leisure)
| | 180 | 70,148 |
DoorDash, Inc. Class A (Internet & Direct Marketing Retail)
| (a) | 531 | 34,074 |
DraftKings, Inc. Class A (Hotels, Restaurants & Leisure)
| (a) | 3,400 | 39,678 |
Dutch Bros, Inc. Class A (Hotels, Restaurants & Leisure)
| (a) | 5,950 | 188,317 |
eBay, Inc. (Internet & Direct Marketing Retail)
| | 1,920 | 80,006 |
Etsy, Inc. (Internet & Direct Marketing Retail)
| (a) | 484 | 35,434 |
Expedia Group, Inc. (Hotels, Restaurants & Leisure)
| (a) | 570 | 54,053 |
Fisker, Inc. (Automobiles)
| (a) | 10,484 | 89,848 |
Five Below, Inc. (Specialty Retail)
| (a) | 2,806 | 318,285 |
Floor & Decor Holdings, Inc. Class A (Specialty Retail)
| (a) | 4,729 | 297,738 |
Garmin Ltd. (Household Durables)
| | 610 | 59,933 |
Gentex Corp. (Auto Components)
| | 2,170 | 60,695 |
Genuine Parts Co. (Distributors)
| | 610 | 81,130 |
Goodyear Tire & Rubber Co. / The (Auto Components)
| (a) | 20,310 | 217,520 |
Hasbro, Inc. (Leisure Products)
| | 770 | 63,048 |
Hilton Grand Vacations, Inc. (Hotels, Restaurants & Leisure)
| (a) | 4,650 | 166,144 |
Hilton Worldwide Holdings, Inc. (Hotels, Restaurants & Leisure)
| | 1,120 | 124,813 |
| Common Stocks (Continued) | Shares | Value |
Consumer Discretionary (continued)
| | | |
Hyatt Hotels Corp. Class A (Hotels, Restaurants & Leisure)
| (a) | 690 | $ 50,998 |
KB Home (Household Durables)
| | 6,440 | 183,282 |
Latham Group, Inc. (Leisure Products)
| (a) | 29,695 | 205,786 |
Lear Corp. (Auto Components)
| | 419 | 52,748 |
Lennar Corp. Class A (Household Durables)
| | 1,100 | 77,627 |
Light & Wonder, Inc. (Hotels, Restaurants & Leisure)
| (a) | 3,040 | 142,850 |
Lithia Motors, Inc. (Specialty Retail)
| | 1,432 | 393,528 |
LKQ Corp. (Distributors)
| | 1,630 | 80,017 |
Lucid Group, Inc. (Automobiles)
| (a) | 3,020 | 51,823 |
Lululemon Athletica, Inc. (Textiles, Apparel & Luxury Goods)
| (a) | 460 | 125,401 |
MGM Resorts International (Hotels, Restaurants & Leisure)
| | 1,930 | 55,874 |
Mister Car Wash, Inc. (Diversified Consumer Svs.)
| (a) | 20,666 | 224,846 |
Mohawk Industries, Inc. (Household Durables)
| (a) | 370 | 45,913 |
National Vision Holdings, Inc. (Specialty Retail)
| (a) | 7,578 | 208,395 |
NVR, Inc. (Household Durables)
| (a) | 83 | 332,344 |
O'Reilly Automotive, Inc. (Specialty Retail)
| (a) | 290 | 183,210 |
Papa John's International, Inc. (Hotels, Restaurants & Leisure)
| | 2,610 | 217,987 |
Planet Fitness, Inc. Class A (Hotels, Restaurants & Leisure)
| (a) | 6,474 | 440,297 |
Pool Corp. (Distributors)
| | 1,595 | 560,212 |
PulteGroup, Inc. (Household Durables)
| | 8,270 | 327,740 |
Ralph Lauren Corp. (Textiles, Apparel & Luxury Goods)
| | 2,920 | 261,778 |
RH (Specialty Retail)
| (a) | 110 | 23,349 |
Rivian Automotive, Inc. Class A (Automobiles)
| (a) | 1,900 | 48,906 |
Ross Stores, Inc. (Specialty Retail)
| | 1,180 | 82,871 |
Sally Beauty Holdings, Inc. (Specialty Retail)
| (a) | 15,130 | 180,350 |
Tapestry, Inc. (Textiles, Apparel & Luxury Goods)
| | 8,850 | 270,102 |
Taylor Morrison Home Corp. (Household Durables)
| (a) | 5,600 | 130,816 |
Terminix Global Holdings, Inc. (Diversified Consumer Svs.)
| (a) | 1,499 | 60,934 |
TopBuild Corp. (Household Durables)
| (a) | 1,625 | 271,635 |
Tractor Supply Co. (Specialty Retail)
| | 470 | 91,109 |
Ulta Beauty, Inc. (Specialty Retail)
| (a) | 230 | 88,660 |
Under Armour, Inc. Class A (Textiles, Apparel & Luxury Goods)
| (a) | 3,140 | 26,156 |
V.F. Corp. (Textiles, Apparel & Luxury Goods)
| | 1,330 | 58,746 |
Vail Resorts, Inc. (Hotels, Restaurants & Leisure)
| | 1,765 | 384,858 |
Victoria's Secret & Co. (Specialty Retail)
| (a) | 386 | 10,796 |
Wayfair, Inc. Class A (Internet & Direct Marketing Retail)
| (a) | 288 | 12,545 |
Williams-Sonoma, Inc. (Specialty Retail)
| | 2,680 | 297,346 |
Yum! Brands, Inc. (Hotels, Restaurants & Leisure)
| | 1,150 | 130,536 |
| | | | 10,070,605 |
Consumer Staples–2.8%
| | | |
Boston Beer Co., Inc. / The Class A (Beverages)
| (a) | 60 | 18,178 |
Brown-Forman Corp. Class B (Beverages)
| | 1,000 | 70,160 |
Campbell Soup Co. (Food Products)
| | 1,600 | 76,880 |
Church & Dwight Co., Inc. (Household Products)
| | 1,020 | 94,513 |
Clorox Co. / The (Household Products)
| | 510 | 71,900 |
Conagra Brands, Inc. (Food Products)
| | 2,060 | 70,534 |
Freshpet, Inc. (Food Products)
| (a) | 5,398 | 280,102 |
Grocery Outlet Holding Corp. (Food & Staples Retailing)
| (a) | 5,685 | 242,352 |
Hain Celestial Group, Inc. / The (Food Products)
| (a) | 9,600 | 227,904 |
Hershey Co. / The (Food Products)
| | 600 | 129,096 |
Hormel Foods Corp. (Food Products)
| | 1,650 | 78,144 |
J.M. Smucker Co. / The (Food Products)
| | 580 | 74,246 |
Kellogg Co. (Food Products)
| | 1,220 | 87,035 |
Kroger Co. / The (Food & Staples Retailing)
| | 3,100 | 146,723 |
McCormick & Co., Inc. (Food Products)
| | 1,010 | 84,082 |
| Ohio National Fund, Inc. | ON AB Mid Cap Core Portfolio (Continued) |
| Schedule of Investments | June 30, 2022 (Unaudited) |
| Common Stocks (Continued) | Shares | Value |
Consumer Staples (continued)
| | | |
Nomad Foods Ltd. (Food Products)
| (a) | 14,980 | $ 299,450 |
Tyson Foods, Inc. Class A (Food Products)
| | 1,180 | 101,551 |
| | | | 2,152,850 |
Energy–5.0%
| | | |
APA Corp. (Oil, Gas & Consumable Fuels)
| | 1,270 | 44,323 |
Baker Hughes Co. (Energy Equip. & Svs.)
| | 3,800 | 109,706 |
Cactus, Inc. Class A (Energy Equip. & Svs.)
| | 9,081 | 365,692 |
Cameco Corp. (Oil, Gas & Consumable Fuels)
| | 8,850 | 186,027 |
Cheniere Energy, Inc. (Oil, Gas & Consumable Fuels)
| | 980 | 130,369 |
Continental Resources, Inc. (Oil, Gas & Consumable Fuels)
| | 860 | 56,201 |
Coterra Energy, Inc. (Oil, Gas & Consumable Fuels)
| | 7,510 | 193,683 |
Devon Energy Corp. (Oil, Gas & Consumable Fuels)
| | 2,370 | 130,611 |
Diamondback Energy, Inc. (Oil, Gas & Consumable Fuels)
| | 650 | 78,747 |
DT Midstream, Inc. (Oil, Gas & Consumable Fuels)
| | 395 | 19,363 |
Halliburton Co. (Energy Equip. & Svs.)
| | 3,900 | 122,304 |
Helmerich & Payne, Inc. (Energy Equip. & Svs.)
| | 5,306 | 228,476 |
Hess Corp. (Oil, Gas & Consumable Fuels)
| | 1,130 | 119,712 |
HF Sinclair Corp. (Oil, Gas & Consumable Fuels)
| | 6,560 | 296,250 |
Magnolia Oil & Gas Corp. Class A (Oil, Gas & Consumable Fuels)
| | 7,900 | 165,821 |
Marathon Oil Corp. (Oil, Gas & Consumable Fuels)
| | 2,720 | 61,146 |
Matador Resources Co. (Oil, Gas & Consumable Fuels)
| | 6,716 | 312,898 |
ONEOK, Inc. (Oil, Gas & Consumable Fuels)
| | 1,810 | 100,455 |
Ovintiv, Inc. (Oil, Gas & Consumable Fuels)
| | 8,451 | 373,450 |
Patterson-UTI Energy, Inc. (Energy Equip. & Svs.)
| | 19,982 | 314,916 |
Phillips 66 (Oil, Gas & Consumable Fuels)
| | 1,700 | 139,383 |
Targa Resources Corp. (Oil, Gas & Consumable Fuels)
| | 910 | 54,300 |
Texas Pacific Land Corp. (Oil, Gas & Consumable Fuels)
| | 40 | 59,521 |
Williams Cos., Inc. / The (Oil, Gas & Consumable Fuels)
| | 5,010 | 156,362 |
| | | | 3,819,716 |
Financials–14.0%
| | | |
Aflac, Inc. (Insurance)
| | 2,600 | 143,858 |
AGNC Investment Corp. (Mortgage REIT)
| | 4,250 | 47,048 |
Allstate Corp. / The (Insurance)
| | 940 | 119,126 |
Ally Financial, Inc. (Consumer Finance)
| | 1,520 | 50,935 |
American Financial Group, Inc. (Insurance)
| | 2,500 | 347,025 |
Ameriprise Financial, Inc. (Capital Markets)
| | 480 | 114,086 |
Annaly Capital Management, Inc. (Mortgage REIT)
| | 8,400 | 49,644 |
Apollo Global Management, Inc. (Diversified Financial Svs.)
| | 1,322 | 64,091 |
Arch Capital Group Ltd. (Insurance)
| (a) | 1,920 | 87,341 |
Ares Management Corp. Class A (Capital Markets)
| | 6,701 | 381,019 |
Arthur J. Gallagher & Co. (Insurance)
| | 780 | 127,171 |
Bank of New York Mellon Corp. / The (Capital Markets)
| | 2,520 | 105,109 |
BankUnited, Inc. (Banks)
| | 6,960 | 247,567 |
Brown & Brown, Inc. (Insurance)
| | 1,430 | 83,426 |
Carlyle Group, Inc. / The (Capital Markets)
| | 1,790 | 56,671 |
CBOE Global Markets, Inc. (Capital Markets)
| | 734 | 83,081 |
Cincinnati Financial Corp. (Insurance)
| | 680 | 80,906 |
Citizens Financial Group, Inc. (Banks)
| | 1,740 | 62,101 |
Comerica, Inc. (Banks)
| | 5,240 | 384,511 |
Commerce Bancshares, Inc. (Banks)
| | 1,029 | 67,554 |
Discover Financial Services (Consumer Finance)
| | 1,250 | 118,225 |
East West Bancorp, Inc. (Banks)
| | 1,000 | 64,800 |
FactSet Research Systems, Inc. (Capital Markets)
| | 230 | 88,451 |
Fidelity National Financial, Inc. (Insurance)
| | 1,670 | 61,723 |
Fifth Third Bancorp (Banks)
| | 2,900 | 97,440 |
| Common Stocks (Continued) | Shares | Value |
| Financials (continued) | | | |
First BanCorp (Banks)
| | 22,390 | $ 289,055 |
First Citizens BancShares, Inc. Class A (Banks)
| | 610 | 398,806 |
First Hawaiian, Inc. (Banks)
| | 10,990 | 249,583 |
First Republic Bank (Banks)
| | 710 | 102,382 |
Franklin Resources, Inc. (Capital Markets)
| | 2,540 | 59,207 |
Goosehead Insurance, Inc. Class A (Insurance)
| | 2,145 | 97,962 |
Hanover Insurance Group, Inc. / The (Insurance)
| | 1,790 | 261,788 |
Hartford Financial Services Group, Inc. / The (Insurance)
| | 1,470 | 96,182 |
Huntington Bancshares, Inc. (Banks)
| | 4,980 | 59,909 |
Invesco Ltd. (Capital Markets)
| | 2,820 | 45,487 |
Kemper Corp. (Insurance)
| | 3,860 | 184,894 |
KeyCorp (Banks)
| | 3,650 | 62,890 |
Kinsale Capital Group, Inc. (Insurance)
| | 1,675 | 384,647 |
KKR & Co., Inc. (Capital Markets)
| | 2,230 | 103,227 |
Loews Corp. (Insurance)
| | 1,370 | 81,186 |
LPL Financial Holdings, Inc. (Capital Markets)
| | 3,437 | 634,058 |
M&T Bank Corp. (Banks)
| | 520 | 82,883 |
Markel Corp. (Insurance)
| (a) | 60 | 77,595 |
Moelis & Co. Class A (Capital Markets)
| | 5,557 | 218,668 |
MSCI, Inc. (Capital Markets)
| | 329 | 135,597 |
Nasdaq, Inc. (Capital Markets)
| | 470 | 71,694 |
Northern Trust Corp. (Capital Markets)
| | 780 | 75,254 |
Pinnacle Financial Partners, Inc. (Banks)
| | 3,409 | 246,505 |
PJT Partners, Inc. Class A (Capital Markets)
| | 3,453 | 242,677 |
Principal Financial Group, Inc. (Insurance)
| | 1,190 | 79,480 |
Prudential Financial, Inc. (Insurance)
| | 1,630 | 155,958 |
Raymond James Financial, Inc. (Capital Markets)
| | 870 | 77,787 |
Regions Financial Corp. (Banks)
| | 3,530 | 66,188 |
Rocket Cos., Inc. Class A (Thrifts & Mortgage Finance)
| | 5,490 | 40,406 |
Selective Insurance Group, Inc. (Insurance)
| | 2,600 | 226,044 |
Signature Bank (Banks)
| | 1,302 | 233,331 |
State Street Corp. (Capital Markets)
| | 1,440 | 88,776 |
Stifel Financial Corp. (Capital Markets)
| | 3,610 | 202,232 |
SVB Financial Group (Banks)
| (a) | 210 | 82,948 |
Synchrony Financial (Consumer Finance)
| | 2,390 | 66,012 |
Synovus Financial Corp. (Banks)
| | 6,530 | 235,407 |
T. Rowe Price Group, Inc. (Capital Markets)
| | 920 | 104,521 |
Texas Capital Bancshares, Inc. (Banks)
| (a) | 4,870 | 256,357 |
Tradeweb Markets, Inc. Class A (Capital Markets)
| | 940 | 64,155 |
Trupanion, Inc. (Insurance)
| (a) | 4,620 | 278,401 |
Upstart Holdings, Inc. (Consumer Finance)
| (a) | 166 | 5,249 |
W.R. Berkley Corp. (Insurance)
| | 1,432 | 97,748 |
Webster Financial Corp. (Banks)
| | 5,350 | 225,503 |
Willis Towers Watson PLC (Insurance)
| | 530 | 104,617 |
Wintrust Financial Corp. (Banks)
| | 3,660 | 293,349 |
Zions Bancorp N.A. (Banks)
| | 6,710 | 341,539 |
| | | | 10,721,053 |
Health Care–12.2%
| | | |
ABIOMED, Inc. (Health Care Equip. & Supplies)
| (a) | 240 | 59,402 |
Acadia Healthcare Co., Inc. (Health Care Providers & Svs.)
| (a) | 4,870 | 329,358 |
ADC Therapeutics SA (Biotechnology)
| (a) | 5,870 | 46,667 |
Agilent Technologies, Inc. (Life Sciences Tools & Svs.)
| | 1,260 | 149,650 |
Align Technology, Inc. (Health Care Equip. & Supplies)
| (a) | 270 | 63,901 |
Alnylam Pharmaceuticals, Inc. (Biotechnology)
| (a) | 540 | 78,759 |
AmerisourceBergen Corp. (Health Care Providers & Svs.)
| | 630 | 89,132 |
Arcus Biosciences, Inc. (Biotechnology)
| (a) | 5,030 | 127,460 |
Arrowhead Pharmaceuticals, Inc. (Biotechnology)
| (a) | 4,260 | 149,995 |
Ascendis Pharma A/S – ADR (Biotechnology)
| (a) | 1,308 | 121,592 |
AtriCure, Inc. (Health Care Equip. & Supplies)
| (a) | 8,568 | 350,088 |
Avantor, Inc. (Life Sciences Tools & Svs.)
| (a) | 2,380 | 74,018 |
Biogen, Inc. (Biotechnology)
| (a) | 500 | 101,970 |
BioMarin Pharmaceutical, Inc. (Biotechnology)
| (a) | 975 | 80,798 |
Bio-Rad Laboratories, Inc. Class A (Life Sciences Tools & Svs.)
| (a) | 120 | 59,400 |
Blueprint Medicines Corp. (Biotechnology)
| (a) | 2,559 | 129,255 |
Catalent, Inc. (Pharmaceuticals)
| (a) | 679 | 72,850 |
| Ohio National Fund, Inc. | ON AB Mid Cap Core Portfolio (Continued) |
| Schedule of Investments | June 30, 2022 (Unaudited) |
| Common Stocks (Continued) | Shares | Value |
Health Care (continued)
| | | |
Change Healthcare, Inc. (Health Care Technology)
| (a) | 14,220 | $ 327,913 |
Charles River Laboratories International, Inc. (Life Sciences Tools & Svs.)
| (a) | 230 | 49,213 |
Coherus Biosciences, Inc. (Biotechnology)
| (a) | 11,103 | 80,386 |
Cooper Cos., Inc. / The (Health Care Equip. & Supplies)
| | 201 | 62,937 |
DaVita, Inc. (Health Care Providers & Svs.)
| (a) | 650 | 51,974 |
DENTSPLY SIRONA, Inc. (Health Care Equip. & Supplies)
| | 1,134 | 40,518 |
Dexcom, Inc. (Health Care Equip. & Supplies)
| (a) | 1,480 | 110,304 |
Elanco Animal Health, Inc. (Pharmaceuticals)
| (a) | 2,404 | 47,191 |
Envista Holdings Corp. (Health Care Equip. & Supplies)
| (a) | 7,260 | 279,800 |
Erasca, Inc. (Biotechnology)
| (a) | 8,033 | 44,744 |
Guardant Health, Inc. (Health Care Providers & Svs.)
| (a) | 3,974 | 160,311 |
Hologic, Inc. (Health Care Equip. & Supplies)
| (a) | 1,160 | 80,388 |
Horizon Therapeutics PLC (Biotechnology)
| (a) | 810 | 64,606 |
ICON PLC (Life Sciences Tools & Svs.)
| (a) | 1,595 | 345,637 |
ICU Medical, Inc. (Health Care Equip. & Supplies)
| (a) | 274 | 45,043 |
IDEXX Laboratories, Inc. (Health Care Equip. & Supplies)
| (a) | 350 | 122,756 |
Inari Medical, Inc. (Health Care Equip. & Supplies)
| (a) | 5,318 | 361,571 |
Insulet Corp. (Health Care Equip. & Supplies)
| (a) | 841 | 183,288 |
Integra LifeSciences Holdings Corp. (Health Care Equip. & Supplies)
| (a) | 5,150 | 278,255 |
Intellia Therapeutics, Inc. (Biotechnology)
| (a) | 2,947 | 152,537 |
Intra-Cellular Therapies, Inc. (Pharmaceuticals)
| (a) | 3,377 | 192,759 |
IQVIA Holdings, Inc. (Life Sciences Tools & Svs.)
| (a) | 780 | 169,252 |
iRhythm Technologies, Inc. (Health Care Equip. & Supplies)
| (a) | 2,166 | 233,993 |
Laboratory Corp. of America Holdings (Health Care Providers & Svs.)
| | 400 | 93,744 |
Legend Biotech Corp. – ADR (Biotechnology)
| (a) | 2,538 | 139,590 |
Maravai LifeSciences Holdings, Inc. Class A (Life Sciences Tools & Svs.)
| (a) | 1,960 | 55,684 |
Masimo Corp. (Health Care Equip. & Supplies)
| (a) | 330 | 43,121 |
MEDNAX, Inc. (Health Care Providers & Svs.)
| (a) | 14,340 | 301,283 |
Mettler-Toledo International, Inc. (Life Sciences Tools & Svs.)
| (a) | 90 | 103,389 |
Molina Healthcare, Inc. (Health Care Providers & Svs.)
| (a) | 300 | 83,883 |
Neurocrine Biosciences, Inc. (Biotechnology)
| (a) | 802 | 78,179 |
Novocure Ltd. (Health Care Equip. & Supplies)
| (a) | 420 | 29,190 |
Oak Street Health, Inc. (Health Care Providers & Svs.)
| (a) | 1,240 | 20,386 |
PerkinElmer, Inc. (Life Sciences Tools & Svs.)
| | 420 | 59,732 |
QIAGEN N.V. (Life Sciences Tools & Svs.)
| (a) | 1,580 | 74,576 |
Quest Diagnostics, Inc. (Health Care Providers & Svs.)
| | 580 | 77,128 |
R1 RCM, Inc. (Health Care Providers & Svs.)
| (a) | 15,730 | 329,701 |
Repligen Corp. (Life Sciences Tools & Svs.)
| (a) | 2,587 | 420,129 |
ResMed, Inc. (Health Care Equip. & Supplies)
| | 590 | 123,682 |
Royalty Pharma PLC Class A (Pharmaceuticals)
| | 1,730 | 72,729 |
Sarepta Therapeutics, Inc. (Biotechnology)
| (a) | 903 | 67,689 |
Seagen, Inc. (Biotechnology)
| (a) | 530 | 93,778 |
Silk Road Medical, Inc. (Health Care Equip. & Supplies)
| (a) | 7,828 | 284,861 |
STERIS PLC (Health Care Equip. & Supplies)
| | 360 | 74,214 |
Syneos Health, Inc. (Life Sciences Tools & Svs.)
| (a) | 4,330 | 310,374 |
Teladoc Health, Inc. (Health Care Technology)
| (a) | 440 | 14,612 |
Teleflex, Inc. (Health Care Equip. & Supplies)
| | 195 | 47,941 |
Ultragenyx Pharmaceutical, Inc. (Biotechnology)
| (a) | 2,551 | 152,193 |
Universal Health Services, Inc. Class B (Health Care Providers & Svs.)
| | 510 | 51,362 |
Veeva Systems, Inc. Class A (Health Care Technology)
| (a) | 560 | 110,902 |
Viatris, Inc. (Pharmaceuticals)
| | 5,730 | 59,993 |
| Common Stocks (Continued) | Shares | Value |
Health Care (continued)
| | | |
Vir Biotechnology, Inc. (Biotechnology)
| (a) | 5,343 | $ 136,086 |
Waters Corp. (Life Sciences Tools & Svs.)
| (a) | 253 | 83,738 |
West Pharmaceutical Services, Inc. (Health Care Equip. & Supplies)
| | 300 | 90,711 |
Zimmer Biomet Holdings, Inc. (Health Care Equip. & Supplies)
| | 850 | 89,301 |
| | | | 9,343,552 |
Industrials–17.7%
| | | |
A.O. Smith Corp. (Building Products)
| | 1,130 | 61,788 |
ADT, Inc. (Commercial Svs. & Supplies)
| | 28,890 | 177,674 |
AECOM (Construction & Engineering)
| | 4,510 | 294,142 |
AGCO Corp. (Machinery)
| | 520 | 51,324 |
Allegion PLC (Building Products)
| | 570 | 55,803 |
AMERCO (Road & Rail)
| | 100 | 47,823 |
AMETEK, Inc. (Electrical Equip.)
| | 3,685 | 404,945 |
Arcosa, Inc. (Construction & Engineering)
| | 4,890 | 227,043 |
Armstrong World Industries, Inc. (Building Products)
| | 4,370 | 327,575 |
Axon Enterprise, Inc. (Aerospace & Defense)
| (a) | 4,074 | 379,575 |
C.H. Robinson Worldwide, Inc. (Air Freight & Logistics)
| | 790 | 80,082 |
Carlisle Cos., Inc. (Building Products)
| | 1,660 | 396,093 |
Carrier Global Corp. (Building Products)
| | 3,550 | 126,593 |
Cintas Corp. (Commercial Svs. & Supplies)
| | 360 | 134,471 |
Copart, Inc. (Commercial Svs. & Supplies)
| (a) | 844 | 91,709 |
CoStar Group, Inc. (Professional Svs.)
| (a) | 1,620 | 97,864 |
Cummins, Inc. (Machinery)
| | 610 | 118,053 |
Curtiss-Wright Corp. (Aerospace & Defense)
| | 1,992 | 263,064 |
Delta Air Lines, Inc. (Airlines)
| (a) | 2,620 | 75,901 |
Dover Corp. (Machinery)
| | 590 | 71,579 |
Dycom Industries, Inc. (Construction & Engineering)
| (a) | 3,271 | 304,334 |
Equifax, Inc. (Professional Svs.)
| | 490 | 89,562 |
Expeditors International of Washington, Inc. (Air Freight & Logistics)
| | 690 | 67,247 |
Fastenal Co. (Trading Companies & Distributors)
| | 2,350 | 117,312 |
Fortive Corp. (Machinery)
| | 1,210 | 65,800 |
Fortune Brands Home & Security, Inc. (Building Products)
| | 730 | 43,712 |
GATX Corp. (Trading Companies & Distributors)
| | 625 | 58,850 |
Generac Holdings, Inc. (Electrical Equip.)
| (a) | 250 | 52,645 |
Graco, Inc. (Machinery)
| | 990 | 58,816 |
HEICO Corp. Class A (Aerospace & Defense)
| | 600 | 63,228 |
Herc Holdings, Inc. (Trading Companies & Distributors)
| | 2,270 | 204,640 |
Howmet Aerospace, Inc. (Aerospace & Defense)
| | 13,152 | 413,630 |
Hubbell, Inc. (Electrical Equip.)
| | 400 | 71,432 |
IDEX Corp. (Machinery)
| | 1,510 | 274,261 |
Ingersoll Rand, Inc. (Machinery)
| | 8,907 | 374,807 |
ITT, Inc. (Machinery)
| | 4,060 | 272,994 |
J.B. Hunt Transport Services, Inc. (Road & Rail)
| | 450 | 70,862 |
Jacobs Engineering Group, Inc. (Construction & Engineering)
| | 573 | 72,845 |
Kirby Corp. (Marine)
| (a) | 4,570 | 278,039 |
Knight-Swift Transportation Holdings, Inc. (Road & Rail)
| | 6,480 | 299,959 |
Korn Ferry (Professional Svs.)
| | 3,520 | 204,230 |
Leidos Holdings, Inc. (Professional Svs.)
| | 750 | 75,533 |
Lennox International, Inc. (Building Products)
| | 230 | 47,516 |
Lyft, Inc. Class A (Road & Rail)
| (a) | 1,370 | 18,194 |
Masco Corp. (Building Products)
| | 1,190 | 60,214 |
Masonite International Corp. (Building Products)
| (a) | 2,530 | 194,380 |
Middleby Corp. / The (Machinery)
| (a) | 2,378 | 298,106 |
MillerKnoll, Inc. (Commercial Svs. & Supplies)
| | 7,430 | 195,186 |
Nordson Corp. (Machinery)
| | 360 | 72,878 |
Old Dominion Freight Line, Inc. (Road & Rail)
| | 400 | 102,512 |
Oshkosh Corp. (Machinery)
| | 2,450 | 201,243 |
Otis Worldwide Corp. (Machinery)
| | 1,680 | 118,726 |
Owens Corning (Building Products)
| | 790 | 58,705 |
PACCAR, Inc. (Machinery)
| | 1,390 | 114,453 |
Parker-Hannifin Corp. (Machinery)
| | 520 | 127,946 |
Pentair PLC (Machinery)
| | 1,180 | 54,009 |
| Ohio National Fund, Inc. | ON AB Mid Cap Core Portfolio (Continued) |
| Schedule of Investments | June 30, 2022 (Unaudited) |
| Common Stocks (Continued) | Shares | Value |
| Industrials (continued) | | | |
Plug Power, Inc. (Electrical Equip.)
| (a) | 1,870 | $ 30,986 |
Quanta Services, Inc. (Construction & Engineering)
| | 790 | 99,019 |
Regal Rexnord Corp. (Electrical Equip.)
| | 1,880 | 213,418 |
Republic Services, Inc. (Commercial Svs. & Supplies)
| | 860 | 112,548 |
Robert Half International, Inc. (Professional Svs.)
| | 2,210 | 165,507 |
Rockwell Automation, Inc. (Electrical Equip.)
| | 470 | 93,676 |
Rollins, Inc. (Commercial Svs. & Supplies)
| | 2,040 | 71,237 |
Sensata Technologies Holding PLC (Electrical Equip.)
| | 6,471 | 267,317 |
SiteOne Landscape Supply, Inc. (Trading Companies & Distributors)
| (a) | 2,787 | 331,291 |
SkyWest, Inc. (Airlines)
| (a) | 6,440 | 136,850 |
Southwest Airlines Co. (Airlines)
| (a) | 2,410 | 87,049 |
Spirit AeroSystems Holdings, Inc. Class A (Aerospace & Defense)
| | 8,120 | 237,916 |
Stanley Black & Decker, Inc. (Machinery)
| | 630 | 66,062 |
Star Bulk Carriers Corp. (Marine)
| | 7,530 | 188,175 |
Teledyne Technologies, Inc. (Aerospace & Defense)
| (a) | 175 | 65,644 |
Tetra Tech, Inc. (Commercial Svs. & Supplies)
| | 3,087 | 421,530 |
TFI International, Inc. (Road & Rail)
| | 3,426 | 275,039 |
Timken Co. / The (Machinery)
| | 3,430 | 181,961 |
Toro Co. / The (Machinery)
| | 670 | 50,779 |
Trane Technologies PLC (Building Products)
| | 980 | 127,273 |
TransDigm Group, Inc. (Aerospace & Defense)
| (a) | 220 | 118,067 |
TransUnion (Professional Svs.)
| | 780 | 62,392 |
Trex Co., Inc. (Building Products)
| (a) | 6,088 | 331,309 |
United Airlines Holdings, Inc. (Airlines)
| (a) | 1,400 | 49,588 |
United Rentals, Inc. (Trading Companies & Distributors)
| (a) | 298 | 72,387 |
Verisk Analytics, Inc. (Professional Svs.)
| | 649 | 112,335 |
Vertiv Holdings Co. (Electrical Equip.)
| | 23,080 | 189,718 |
W.W. Grainger, Inc. (Trading Companies & Distributors)
| | 180 | 81,797 |
Watsco, Inc. (Trading Companies & Distributors)
| | 260 | 62,093 |
Westinghouse Air Brake Technologies Corp. (Machinery)
| | 930 | 76,334 |
WillScot Mobile Mini Holdings Corp. (Construction & Engineering)
| (a) | 6,790 | 220,132 |
XPO Logistics, Inc. (Road & Rail)
| (a) | 5,510 | 265,362 |
Xylem, Inc. (Machinery)
| | 730 | 57,071 |
| | | | 13,603,769 |
Information Technology–16.8%
| | | |
ACI Worldwide, Inc. (Software)
| (a) | 9,520 | 246,473 |
Akamai Technologies, Inc. (IT Svs.)
| (a) | 610 | 55,711 |
Amdocs Ltd. (IT Svs.)
| | 1,000 | 83,310 |
Amphenol Corp. Class A (Electronic Equip., Instr. & Comp.)
| | 2,390 | 153,868 |
ANSYS, Inc. (Software)
| (a) | 350 | 83,752 |
Arista Networks, Inc. (Communications Equip.)
| (a) | 870 | 81,554 |
Avnet, Inc. (Electronic Equip., Instr. & Comp.)
| | 5,640 | 241,843 |
Belden, Inc. (Electronic Equip., Instr. & Comp.)
| | 3,550 | 189,109 |
Bill.com Holdings, Inc. (Software)
| (a) | 490 | 53,871 |
Black Knight, Inc. (Software)
| (a) | 1,050 | 68,660 |
Booz Allen Hamilton Holding Corp. (IT Svs.)
| | 920 | 83,131 |
Broadridge Financial Solutions, Inc. (IT Svs.)
| | 477 | 67,996 |
Cadence Design Systems, Inc. (Software)
| (a) | 1,130 | 169,534 |
CDW Corp. (Electronic Equip., Instr. & Comp.)
| | 590 | 92,960 |
Ciena Corp. (Communications Equip.)
| (a) | 5,223 | 238,691 |
Citrix Systems, Inc. (Software)
| | 620 | 60,245 |
Cloudflare, Inc. Class A (IT Svs.)
| (a) | 900 | 39,375 |
CommVault Systems, Inc. (Software)
| (a) | 4,276 | 268,960 |
Corning, Inc. (Electronic Equip., Instr. & Comp.)
| | 3,080 | 97,051 |
Coupa Software, Inc. (Software)
| (a) | 300 | 17,130 |
Crowdstrike Holdings, Inc. Class A (Software)
| (a) | 727 | 122,543 |
Datadog, Inc. Class A (Software)
| (a) | 924 | 88,002 |
Dell Technologies, Inc. Class C (Tech. Hardware, Storage & Periph.)
| | 1,120 | 51,755 |
DigitalOcean Holdings, Inc. (IT Svs.)
| (a) | 4,009 | 165,812 |
DocuSign, Inc. (Software)
| (a) | 740 | 42,461 |
Dropbox, Inc. Class A (Software)
| (a) | 2,970 | 62,340 |
Dynatrace, Inc. (Software)
| (a) | 11,633 | 458,806 |
| Common Stocks (Continued) | Shares | Value |
Information Technology (continued)
| | | |
Elastic N.V. (Software)
| (a) | 630 | $ 42,632 |
Enphase Energy, Inc. (Semiconductors & Equip.)
| (a) | 550 | 107,382 |
Entegris, Inc. (Semiconductors & Equip.)
| | 4,950 | 456,044 |
EPAM Systems, Inc. (IT Svs.)
| (a) | 220 | 64,852 |
Euronet Worldwide, Inc. (IT Svs.)
| (a) | 536 | 53,916 |
Fair Isaac Corp. (Software)
| (a) | 148 | 59,333 |
Five9, Inc. (Software)
| (a) | 2,954 | 269,228 |
FleetCor Technologies, Inc. (IT Svs.)
| (a) | 340 | 71,437 |
Flywire Corp. (IT Svs.)
| (a) | 10,611 | 187,072 |
Fortinet, Inc. (Software)
| (a) | 2,700 | 152,766 |
Freshworks, Inc. Class A (Software)
| (a) | 17,196 | 226,127 |
Gartner, Inc. (IT Svs.)
| (a) | 390 | 94,314 |
Genpact Ltd. (IT Svs.)
| | 3,260 | 138,094 |
Global Payments, Inc. (IT Svs.)
| | 960 | 106,214 |
GLOBALFOUNDRIES, Inc. (Semiconductors & Equip.)
| (a) | 860 | 34,692 |
Hewlett Packard Enterprise Co. (Tech. Hardware, Storage & Periph.)
| | 5,300 | 70,278 |
HP, Inc. (Tech. Hardware, Storage & Periph.)
| | 3,620 | 118,664 |
HubSpot, Inc. (Software)
| (a) | 631 | 189,710 |
Jack Henry & Associates, Inc. (IT Svs.)
| | 470 | 84,609 |
Juniper Networks, Inc. (Communications Equip.)
| | 2,480 | 70,680 |
Keysight Technologies, Inc. (Electronic Equip., Instr. & Comp.)
| (a) | 760 | 104,766 |
Kulicke & Soffa Industries, Inc. (Semiconductors & Equip.)
| | 2,660 | 113,875 |
Lattice Semiconductor Corp. (Semiconductors & Equip.)
| (a) | 7,694 | 373,159 |
Littelfuse, Inc. (Electronic Equip., Instr. & Comp.)
| | 1,284 | 326,187 |
Lumentum Holdings, Inc. (Communications Equip.)
| (a) | 3,530 | 280,353 |
MACOM Technology Solutions Holdings, Inc. (Semiconductors & Equip.)
| (a) | 6,845 | 315,555 |
Manhattan Associates, Inc. (Software)
| (a) | 3,628 | 415,769 |
Microchip Technology, Inc. (Semiconductors & Equip.)
| | 2,046 | 118,832 |
MKS Instruments, Inc. (Semiconductors & Equip.)
| | 429 | 44,028 |
Monday.com Ltd. (Software)
| (a) | 1,906 | 196,623 |
MongoDB, Inc. (IT Svs.)
| (a) | 1,511 | 392,105 |
Monolithic Power Systems, Inc. (Semiconductors & Equip.)
| | 741 | 284,574 |
Motorola Solutions, Inc. (Communications Equip.)
| | 700 | 146,720 |
National Instruments Corp. (Electronic Equip., Instr. & Comp.)
| | 1,839 | 57,432 |
NetApp, Inc. (Tech. Hardware, Storage & Periph.)
| | 1,020 | 66,545 |
NortonLifeLock, Inc. (Software)
| | 3,530 | 77,519 |
Novanta, Inc. (Electronic Equip., Instr. & Comp.)
| (a) | 3,087 | 374,360 |
Okta, Inc. (IT Svs.)
| (a) | 480 | 43,392 |
ON Semiconductor Corp. (Semiconductors & Equip.)
| (a) | 10,279 | 517,137 |
Palantir Technologies, Inc. Class A (Software)
| (a) | 6,290 | 57,050 |
Paychex, Inc. (IT Svs.)
| | 1,320 | 150,308 |
Procore Technologies, Inc. (Software)
| (a) | 216 | 9,804 |
PTC, Inc. (Software)
| (a) | 580 | 61,677 |
Qorvo, Inc. (Semiconductors & Equip.)
| (a) | 470 | 44,330 |
Samsara, Inc. Class A (Software)
| (a) | 19,876 | 222,015 |
Shift4 Payments, Inc. Class A (IT Svs.)
| (a) | 6,454 | 213,369 |
Skyworks Solutions, Inc. (Semiconductors & Equip.)
| | 680 | 62,995 |
Smartsheet, Inc. Class A (Software)
| (a) | 8,116 | 255,086 |
Splunk, Inc. (Software)
| (a) | 660 | 58,384 |
SS&C Technologies Holdings, Inc. (IT Svs.)
| | 1,030 | 59,812 |
Synaptics, Inc. (Semiconductors & Equip.)
| (a) | 2,087 | 246,370 |
Synopsys, Inc. (Software)
| (a) | 620 | 188,294 |
Teradyne, Inc. (Semiconductors & Equip.)
| | 680 | 60,894 |
Trade Desk, Inc. / The Class A (Software)
| (a) | 1,700 | 71,213 |
Trimble, Inc. (Electronic Equip., Instr. & Comp.)
| (a) | 1,020 | 59,395 |
Twilio, Inc. Class A (IT Svs.)
| (a) | 620 | 51,962 |
Tyler Technologies, Inc. (Software)
| (a) | 180 | 59,846 |
Ubiquiti, Inc. (Communications Equip.)
| | 200 | 49,642 |
| Ohio National Fund, Inc. | ON AB Mid Cap Core Portfolio (Continued) |
| Schedule of Investments | June 30, 2022 (Unaudited) |
| Common Stocks (Continued) | Shares | Value |
Information Technology (continued)
| | | |
Unity Software, Inc. (Software)
| (a) | 750 | $ 27,615 |
Varonis Systems, Inc. (Software)
| (a) | 9,016 | 264,349 |
VeriSign, Inc. (IT Svs.)
| (a) | 410 | 68,605 |
Western Digital Corp. (Tech. Hardware, Storage & Periph.)
| (a) | 1,250 | 56,038 |
Wix.com Ltd. (IT Svs.)
| (a) | 250 | 16,388 |
Wolfspeed, Inc. (Semiconductors & Equip.)
| (a) | 772 | 48,983 |
Zebra Technologies Corp. Class A (Electronic Equip., Instr. & Comp.)
| (a) | 220 | 64,669 |
Zoom Video Communications, Inc. Class A (Software)
| (a) | 870 | 93,934 |
Zscaler, Inc. (Software)
| (a) | 410 | 61,299 |
| | | | 12,916,244 |
Materials–4.6%
| | | |
Albemarle Corp. (Chemicals)
| | 470 | 98,221 |
Alcoa Corp. (Metals & Mining)
| | 894 | 40,749 |
Allegheny Technologies, Inc. (Metals & Mining)
| (a) | 9,740 | 221,195 |
Amcor PLC (Containers & Packaging)
| | 6,490 | 80,671 |
Avery Dennison Corp. (Containers & Packaging)
| | 360 | 58,273 |
Ball Corp. (Containers & Packaging)
| | 1,300 | 89,401 |
Berry Global Group, Inc. (Containers & Packaging)
| (a) | 6,500 | 355,160 |
Carpenter Technology Corp. (Metals & Mining)
| | 3,821 | 106,644 |
Celanese Corp. (Chemicals)
| | 490 | 57,629 |
CF Industries Holdings, Inc. (Chemicals)
| | 750 | 64,298 |
Corteva, Inc. (Chemicals)
| | 3,080 | 166,751 |
DuPont de Nemours, Inc. (Chemicals)
| | 1,750 | 97,265 |
Eastman Chemical Co. (Chemicals)
| | 660 | 59,248 |
FMC Corp. (Chemicals)
| | 2,866 | 306,691 |
Huntsman Corp. (Chemicals)
| | 7,570 | 214,609 |
Innospec, Inc. (Chemicals)
| | 1,770 | 169,548 |
International Flavors & Fragrances, Inc. (Chemicals)
| | 1,020 | 121,502 |
International Paper Co. (Containers & Packaging)
| | 1,610 | 67,346 |
LyondellBasell Industries N.V. Class A (Chemicals)
| | 1,050 | 91,833 |
Martin Marietta Materials, Inc. (Construction Materials)
| | 250 | 74,810 |
Mosaic Co. / The (Chemicals)
| | 1,320 | 62,344 |
Nucor Corp. (Metals & Mining)
| | 1,230 | 128,424 |
Packaging Corp. of America (Containers & Packaging)
| | 520 | 71,500 |
PPG Industries, Inc. (Chemicals)
| | 970 | 110,910 |
Reliance Steel & Aluminum Co. (Metals & Mining)
| | 1,100 | 186,846 |
Sealed Air Corp. (Containers & Packaging)
| | 4,000 | 230,880 |
Steel Dynamics, Inc. (Metals & Mining)
| | 1,260 | 83,349 |
Vulcan Materials Co. (Construction Materials)
| | 540 | 76,734 |
Westrock Co. (Containers & Packaging)
| | 1,370 | 54,581 |
| | | | 3,547,412 |
Real Estate–5.9%
| | | |
Alexandria Real Estate Equities, Inc. (Equity REIT)
| | 550 | 79,767 |
American Campus Communities, Inc. (Equity REIT)
| | 1,540 | 99,284 |
American Homes 4 Rent Class A (Equity REIT)
| | 2,060 | 73,006 |
Americold Realty Trust, Inc. (Equity REIT)
| | 1,890 | 56,776 |
AvalonBay Communities, Inc. (Equity REIT)
| | 570 | 110,722 |
Boston Properties, Inc. (Equity REIT)
| | 700 | 62,286 |
Broadstone Net Lease, Inc. (Equity REIT)
| | 10,370 | 212,689 |
Camden Property Trust (Equity REIT)
| | 2,280 | 306,614 |
CBRE Group, Inc. Class A (Real Estate Mgmt. & Development)
| (a) | 1,370 | 100,846 |
Cousins Properties, Inc. (Equity REIT)
| | 6,620 | 193,503 |
CubeSmart (Equity REIT)
| | 5,550 | 237,096 |
Duke Realty Corp. (Equity REIT)
| | 1,640 | 90,118 |
Equity LifeStyle Properties, Inc. (Equity REIT)
| | 1,100 | 77,517 |
| Common Stocks (Continued) | Shares | Value |
Real Estate (continued)
| | | |
Equity Residential (Equity REIT)
| | 1,510 | $ 109,052 |
Essex Property Trust, Inc. (Equity REIT)
| | 270 | 70,608 |
Extra Space Storage, Inc. (Equity REIT)
| | 530 | 90,164 |
Gaming and Leisure Properties, Inc. (Equity REIT)
| | 1,640 | 75,210 |
Healthpeak Properties, Inc. (Equity REIT)
| | 2,220 | 57,520 |
Invitation Homes, Inc. (Equity REIT)
| | 2,300 | 81,834 |
Iron Mountain, Inc. (Equity REIT)
| | 1,900 | 92,511 |
Jones Lang LaSalle, Inc. (Real Estate Mgmt. & Development)
| (a) | 410 | 71,693 |
Kimco Realty Corp. (Equity REIT)
| | 3,630 | 71,765 |
Lamar Advertising Co. Class A (Equity REIT)
| | 767 | 67,473 |
Medical Properties Trust, Inc. (Equity REIT)
| | 3,460 | 52,834 |
Mid-America Apartment Communities, Inc. (Equity REIT)
| | 480 | 83,842 |
Physicians Realty Trust (Equity REIT)
| | 20,470 | 357,201 |
Realty Income Corp. (Equity REIT)
| | 2,650 | 180,889 |
Regency Centers Corp. (Equity REIT)
| | 1,200 | 71,172 |
Safehold, Inc. (Equity REIT)
| | 6,079 | 215,014 |
SBA Communications Corp. (Equity REIT)
| | 420 | 134,421 |
Simon Property Group, Inc. (Equity REIT)
| | 1,340 | 127,193 |
STAG Industrial, Inc. (Equity REIT)
| | 4,930 | 152,238 |
STORE Capital Corp. (Equity REIT)
| | 2,130 | 55,550 |
Sun Communities, Inc. (Equity REIT)
| | 460 | 73,306 |
UDR, Inc. (Equity REIT)
| | 1,640 | 75,506 |
Ventas, Inc. (Equity REIT)
| | 1,530 | 78,688 |
VICI Properties, Inc. (Equity REIT)
| | 2,400 | 71,496 |
W.P. Carey, Inc. (Equity REIT)
| | 1,020 | 84,517 |
Welltower, Inc. (Equity REIT)
| | 1,710 | 140,818 |
Weyerhaeuser Co. (Equity REIT)
| | 3,060 | 101,347 |
| | | | 4,544,086 |
Utilities–3.3%
| | | |
Alliant Energy Corp. (Electric Utilities)
| | 1,358 | 79,592 |
Ameren Corp. (Multi-Utilities)
| | 1,010 | 91,264 |
American Water Works Co., Inc. (Water Utilities)
| | 750 | 111,577 |
Avangrid, Inc. (Electric Utilities)
| | 1,500 | 69,180 |
CenterPoint Energy, Inc. (Multi-Utilities)
| | 2,070 | 61,231 |
CMS Energy Corp. (Multi-Utilities)
| | 1,180 | 79,650 |
Consolidated Edison, Inc. (Multi-Utilities)
| | 1,410 | 134,091 |
Constellation Energy Corp. (Electric Utilities)
| | 1,120 | 64,131 |
DTE Energy Co. (Multi-Utilities)
| | 790 | 100,132 |
Edison International (Electric Utilities)
| | 1,470 | 92,963 |
Entergy Corp. (Electric Utilities)
| | 830 | 93,491 |
Essential Utilities, Inc. (Water Utilities)
| | 1,620 | 74,277 |
Evergy, Inc. (Electric Utilities)
| | 1,190 | 77,647 |
Eversource Energy (Electric Utilities)
| | 1,400 | 118,258 |
FirstEnergy Corp. (Electric Utilities)
| | 2,210 | 84,842 |
IDACORP, Inc. (Electric Utilities)
| | 3,450 | 365,424 |
NiSource, Inc. (Multi-Utilities)
| | 20 | 590 |
PG&E Corp. (Electric Utilities)
| (a) | 7,056 | 70,419 |
PPL Corp. (Electric Utilities)
| | 3,140 | 85,188 |
Public Service Enterprise Group, Inc. (Multi-Utilities)
| | 2,070 | 130,990 |
Southwest Gas Holdings, Inc. (Gas Utilities)
| | 2,750 | 239,470 |
WEC Energy Group, Inc. (Multi-Utilities)
| | 1,290 | 129,826 |
Xcel Energy, Inc. (Electric Utilities)
| | 2,150 | 152,134 |
| | | | 2,506,367 |
Total Common Stocks (Cost $92,609,299)
| | | $74,739,194 |
| Money Market Funds–1.5% | Shares | Value |
State Street Institutional Liquid Reserves Fund Institutional Class, 1.494%
| (b) | 1,127,232 | $ 1,127,120 |
Total Money Market Funds (Cost $1,127,171)
| | | $ 1,127,120 |
Total Investments – 98.9% (Cost $93,736,470)
| (c) | | $75,866,314 |
Other Assets in Excess of Liabilities – 1.1%
| (d) | | 862,424 |
| Net Assets – 100.0% | | | $76,728,738 |
Percentages are stated as a percent of net assets. |
| Abbreviations: | |
| ADR: | American Depositary Receipts |
| Ohio National Fund, Inc. | ON AB Mid Cap Core Portfolio (Continued) |
| Schedule of Investments | June 30, 2022 (Unaudited) |
| Footnotes: | |
| (a) | Non-income producing security. |
| (b) | Rate represents the seven-day yield at June 30, 2022. |
| (c) | Represents cost for financial reporting purposes, which may differ from cost basis for federal income tax purposes. See also Note 7 of the Notes to Financial Statements. |
| (d) | Includes $13,500 of cash pledged as collateral for the futures contracts outstanding at June 30, 2022. See also the following Schedule of Open Futures Contracts. |
The accompanying notes are an integral part of these financial statements.
| Schedule of Open Futures Contracts | June 30, 2022 (Unaudited) |
| Description | | Number of
contracts | | Expiration Date | | Notional
Amount | | Value | | Unrealized
Appreciation
(Depreciation) | | Variation Margin
Receivable
(Payable) |
| CME E-mini S&P MidCap 400 Index - Long | | 1 | | September 16, 2022 | | $227,882 | | $226,800 | | $(1,082) | | $(1,080) |
The accompanying notes are an integral part of these financial statements.
| Ohio National Fund, Inc. | ON S&P 500® Index Portfolio (Unaudited) |
The ON S&P 500® Index Portfolio seeks total return approximating that of the Standard & Poor’s 500® Index (S&P 500® Index), at a risk level consistent with that of the S&P 500® Index by investing, under normal circumstances, more than 80% of its net assets in the common stocks and other securities of companies that are included in the S&P 500® Index.
Performance as of June 30, 2022
| Average Annual returns | |
| One year | -10.94% |
| Five years | 10.90% |
| Ten years | 12.48% |
Past performance does not guarantee future results. The performance data quoted represents past performance and current returns may be lower or higher. Total return figures include change in share price and reinvestment of dividends and capital gains. The investment return and principal value will fluctuate so that an investor’s shares, when redeemed, may be worth more or less than the original cost. To obtain performance information up to the most recent month end, call toll-free 1-877-781-6392.
The Portfolio is not open to direct retail investment. Beneficial interest in the Portfolio’s shares is obtained either through an allocation to the Portfolio as an investment vehicle within variable life insurance policies or annuity contracts, or as an underlying investment by the ON Model Portfolios. Actual performance results for variable annuity and variable universal life contracts will be lower due to contract charges. Consult your contract for applicable charges.
Total expense ratio is 0.37% per the Fund’s prospectus dated April 29, 2022. Additional information pertaining to the Portfolio’s expense ratio as of June 30, 2022 can be found in the Portfolio’s Financial Highlights.
Comments from Sub-Adviser
Q. How did the Portfolio perform in comparison to its benchmark during the reporting period?
A. For the six-month period ended June 30, 2022, the Portfolio returned -20.11% versus -19.96% for its benchmark, the S&P 500® Index.
Q. Were there specific market conditions, investment strategies, or techniques that materially affected the Portfolio’s benchmark-relative performance during the reporting period?
A. The Portfolio intends to track the underlying return of the S&P 500® Index. There were no material market events or changes in strategy during the six-month period that materially impacted the Portfolio’s relative return. Sources of return variance were the Portfolio’s expenses and the cumulative impact of investing the day-to-day cash flows in the Portfolio.
Q. How did sector allocation and security selection each impact the Portfolio’s performance relative to its benchmark?
A. There was no impact from either sector allocation or stock selection that caused any significant performance variance between the Portfolio and its benchmark for the six-month period. Information Technology, followed by Consumer Discretionary and Communication Services, were the top detractors from performance. The only sector that contributed for the period was Energy.(1)
Q. Which securities contributed the most to, and detracted the most from, the Portfolio’s benchmark-relative performance?
A. Because the Portfolio weights its holdings to be similar to those utilized by the benchmark, there were no holdings that significantly contributed to, or detracted from, the Portfolio’s benchmark-relative performance for the six-month period. Benchmark constituents that
contributed the most to Portfolio and benchmark returns were Exxon Mobil Corp., Chevron Corp. and Merck & Co., Inc. Apple, Inc., Microsoft Corp., and Amazon.Com, Inc. were leading detractors for the period. (1)
Q. How did the Portfolio’s use of derivative instruments and initial public offerings (IPOs), if any, impact performance?
A. The Portfolio uses long CME E-mini S&P 500 Index futures contracts primarily to equitize open dividend receivables, as well as to manage day-to-day cash flows, to ensure the Portfolio is fully invested. The futures contracts detracted 13 basis points from the Portfolio’s absolute return for the six-month period. (1)
| (1) | The Portfolio’s composition is subject to change. Holdings and weightings are as of June 30, 2022. |
Change in Value of $10,000 Investment
Hypothetical illustration based on past performance. Future performance will vary. The Portfolio’s returns reflect reinvested dividends. The Portfolio’s holdings may differ significantly from the securities in the index. The index is unmanaged and therefore does not reflect the cost of portfolio management and accounting. Investors cannot invest directly in an index, although they can invest in its underlying securities or funds.
The S&P 500® Index is a capitalization-weighted index designed to measure performance of the broad domestic economy through changes in the aggregate market value of 500 stocks representing all major industries. The index presented includes the effects of reinvested dividends.
Past performance is no guarantee of future results. Redemption of fund shares could have tax implications unique to each shareholder.
The S&P 500® Index is a product of S&P Dow Jones Indices LLC or its affiliates (“SPDJI”), and has been licensed for use by Ohio National Investments, Inc. (“ONI”). Standard & Poor’s® and S&P® are registered trademarks of Standard & Poor’s Financial Services LLC (“S&P”); Dow Jones® is a registered trademark of Dow Jones Trademark Holdings LLC (“Dow Jones”); and these trademarks have been licensed for use by SPDJI and sublicensed for certain purposes by ONI. The S&P 500® Index Portfolio of Ohio National Fund, Inc. is not sponsored, endorsed, sold or promoted by SPDJI, Dow Jones, S&P, their respective affiliates, and none of such parties make any representation regarding the advisability of investing in such product(s) nor do they have any liability for any errors, omissions, or interruptions of the S&P 500® Index.
| Ohio National Fund, Inc. | ON S&P 500® Index Portfolio (Unaudited) (Continued) |
| Portfolio Composition as of June 30, 2022 (1) |
| | % of Net Assets |
| Common Stocks (4) | 98.3 |
| U.S. Treasury Obligations | 0.0 |
Money Market Funds and
Other Net Assets | 1.7 |
| | 100.0 |
| Top 10 Portfolio Holdings as of June 30, 2022 (1) (2) (3) |
| | | % of Net Assets |
| 1. | Apple, Inc. | 6.5 |
| 2. | Microsoft Corp. | 5.9 |
| 3. | Amazon.com, Inc. | 2.9 |
| 4. | Alphabet, Inc. Class A | 2.0 |
| 5. | Alphabet, Inc. Class C | 1.9 |
| 6. | Tesla, Inc. | 1.7 |
| 7. | Berkshire Hathaway, Inc. Class B | 1.5 |
| 8. | UnitedHealth Group, Inc. | 1.5 |
| 9. | Johnson & Johnson | 1.4 |
| 10. | NVIDIA Corp. | 1.2 |
| | |
| (1) | Composition of Portfolio subject to change. |
| (2) | Short-term investments have been excluded from the list of Top 10 Portfolio Holdings. |
| (3) | Top 10 Portfolio Holdings is presented at an individual security level. Total investment exposure by issuer may be higher. |
| (4) | Sectors (Common Stocks): |
| | % of Net Assets |
| Information Technology | 26.3 |
| Health Care | 14.9 |
| Financials | 10.7 |
| Consumer Discretionary | 10.4 |
| Communication Services | 8.7 |
| Industrials | 7.7 |
| Consumer Staples | 6.9 |
| Energy | 4.3 |
| Utilities | 3.0 |
| Real Estate | 2.9 |
| Materials | 2.5 |
| | 98.3 |
| Ohio National Fund, Inc. | ON S&P 500® Index Portfolio |
| Schedule of Investments | June 30, 2022 (Unaudited) |
| Common Stocks–98.3% | Shares | Value |
Communication Services–8.7%
| | | |
Activision Blizzard, Inc. (Entertainment)
| | 24,373 | $ 1,897,682 |
Alphabet, Inc. Class A (Interactive Media & Svs.)
| (a) | 9,371 | 20,421,845 |
Alphabet, Inc. Class C (Interactive Media & Svs.)
| (a) | 8,603 | 18,818,632 |
AT&T, Inc. (Diversified Telecom. Svs.)
| | 223,059 | 4,675,317 |
Charter Communications, Inc. Class A (Media)
| (a) | 3,606 | 1,689,519 |
Comcast Corp. Class A (Media)
| | 139,385 | 5,469,467 |
DISH Network Corp. Class A (Media)
| (a) | 7,905 | 141,737 |
Electronic Arts, Inc. (Entertainment)
| | 8,735 | 1,062,613 |
Fox Corp. Class A (Media)
| | 9,617 | 309,283 |
Fox Corp. Class B (Media)
| | 4,730 | 140,481 |
Interpublic Group of Cos., Inc. / The (Media)
| | 12,362 | 340,326 |
Live Nation Entertainment, Inc. (Entertainment)
| (a) | 4,284 | 353,773 |
Lumen Technologies, Inc. (Diversified Telecom. Svs.)
| | 29,318 | 319,859 |
Match Group, Inc. (Interactive Media & Svs.)
| (a) | 8,974 | 625,398 |
Meta Platforms, Inc. Class A (Interactive Media & Svs.)
| (a) | 71,495 | 11,528,569 |
Netflix, Inc. (Entertainment)
| (a) | 13,839 | 2,420,026 |
News Corp. Class A (Media)
| | 12,125 | 188,907 |
News Corp. Class B (Media)
| | 3,846 | 61,113 |
Omnicom Group, Inc. (Media)
| | 6,462 | 411,048 |
Paramount Global Class B (Media)
| | 18,570 | 458,308 |
Take-Two Interactive Software, Inc. (Entertainment)
| (a) | 4,950 | 606,523 |
T-Mobile U.S., Inc. (Wireless Telecom. Svs.)
| (a) | 18,366 | 2,470,962 |
Twitter, Inc. (Interactive Media & Svs.)
| (a) | 23,581 | 881,693 |
Verizon Communications, Inc. (Diversified Telecom. Svs.)
| | 130,956 | 6,646,017 |
Walt Disney Co. / The (Entertainment)
| (a) | 56,776 | 5,359,654 |
Warner Bros Discovery, Inc. (Entertainment)
| (a) | 68,478 | 918,975 |
| | | | 88,217,727 |
Consumer Discretionary–10.4%
| | | |
Advance Auto Parts, Inc. (Specialty Retail)
| | 1,920 | 332,333 |
Amazon.com, Inc. (Internet & Direct Marketing Retail)
| (a) | 272,749 | 28,968,671 |
Aptiv PLC (Auto Components)
| (a) | 8,351 | 743,824 |
AutoZone, Inc. (Specialty Retail)
| (a) | 617 | 1,326,007 |
Bath & Body Works, Inc. (Specialty Retail)
| | 7,495 | 201,765 |
Best Buy Co., Inc. (Specialty Retail)
| | 6,361 | 414,674 |
Booking Holdings, Inc. (Internet & Direct Marketing Retail)
| (a) | 1,264 | 2,210,723 |
BorgWarner, Inc. (Auto Components)
| | 7,530 | 251,276 |
Caesars Entertainment, Inc. (Hotels, Restaurants & Leisure)
| (a) | 6,764 | 259,061 |
CarMax, Inc. (Specialty Retail)
| (a) | 5,020 | 454,210 |
Carnival Corp. (Hotels, Restaurants & Leisure)
| (a) | 25,354 | 219,312 |
Chipotle Mexican Grill, Inc. (Hotels, Restaurants & Leisure)
| (a) | 868 | 1,134,702 |
D.R. Horton, Inc. (Household Durables)
| | 10,039 | 664,481 |
Darden Restaurants, Inc. (Hotels, Restaurants & Leisure)
| | 3,805 | 430,422 |
Dollar General Corp. (Multiline Retail)
| | 7,119 | 1,747,287 |
Dollar Tree, Inc. (Multiline Retail)
| (a) | 6,987 | 1,088,924 |
Domino's Pizza, Inc. (Hotels, Restaurants & Leisure)
| | 1,134 | 441,931 |
eBay, Inc. (Internet & Direct Marketing Retail)
| | 17,587 | 732,850 |
| Common Stocks (Continued) | Shares | Value |
Consumer Discretionary (continued)
| | | |
Etsy, Inc. (Internet & Direct Marketing Retail)
| (a) | 4,006 | $ 293,279 |
Expedia Group, Inc. (Hotels, Restaurants & Leisure)
| (a) | 4,761 | 451,486 |
Ford Motor Co. (Automobiles)
| | 122,784 | 1,366,586 |
Garmin Ltd. (Household Durables)
| | 4,798 | 471,404 |
General Motors Co. (Automobiles)
| (a) | 45,358 | 1,440,570 |
Genuine Parts Co. (Distributors)
| | 4,449 | 591,717 |
Hasbro, Inc. (Leisure Products)
| | 3,952 | 323,590 |
Hilton Worldwide Holdings, Inc. (Hotels, Restaurants & Leisure)
| | 8,726 | 972,425 |
Home Depot, Inc. / The (Specialty Retail)
| | 32,205 | 8,832,865 |
Las Vegas Sands Corp. (Hotels, Restaurants & Leisure)
| (a) | 10,854 | 364,586 |
Lennar Corp. Class A (Household Durables)
| | 7,921 | 558,985 |
LKQ Corp. (Distributors)
| | 8,178 | 401,458 |
Lowe's Cos., Inc. (Specialty Retail)
| | 20,584 | 3,595,407 |
Marriott International, Inc. Class A (Hotels, Restaurants & Leisure)
| | 8,517 | 1,158,397 |
McDonald's Corp. (Hotels, Restaurants & Leisure)
| | 23,049 | 5,690,337 |
MGM Resorts International (Hotels, Restaurants & Leisure)
| | 11,091 | 321,085 |
Mohawk Industries, Inc. (Household Durables)
| (a) | 1,619 | 200,902 |
Newell Brands, Inc. (Household Durables)
| | 11,436 | 217,741 |
NIKE, Inc. Class B (Textiles, Apparel & Luxury Goods)
| | 39,526 | 4,039,557 |
Norwegian Cruise Line Holdings Ltd. (Hotels, Restaurants & Leisure)
| (a) | 13,358 | 148,541 |
NVR, Inc. (Household Durables)
| (a) | 97 | 388,402 |
O'Reilly Automotive, Inc. (Specialty Retail)
| (a) | 2,042 | 1,290,054 |
Penn National Gaming, Inc. (Hotels, Restaurants & Leisure)
| (a) | 5,185 | 157,728 |
Pool Corp. (Distributors)
| | 1,259 | 442,199 |
PulteGroup, Inc. (Household Durables)
| | 7,482 | 296,512 |
PVH Corp. (Textiles, Apparel & Luxury Goods)
| | 2,120 | 120,628 |
Ralph Lauren Corp. (Textiles, Apparel & Luxury Goods)
| | 1,437 | 128,827 |
Ross Stores, Inc. (Specialty Retail)
| | 11,027 | 774,426 |
Royal Caribbean Cruises Ltd. (Hotels, Restaurants & Leisure)
| (a) | 7,088 | 247,442 |
Starbucks Corp. (Hotels, Restaurants & Leisure)
| | 35,719 | 2,728,574 |
Tapestry, Inc. (Textiles, Apparel & Luxury Goods)
| | 7,910 | 241,413 |
Target Corp. (Multiline Retail)
| | 14,406 | 2,034,559 |
Tesla, Inc. (Automobiles)
| (a) | 26,158 | 17,615,320 |
TJX Cos., Inc. / The (Specialty Retail)
| | 36,534 | 2,040,424 |
Tractor Supply Co. (Specialty Retail)
| | 3,516 | 681,577 |
Ulta Beauty, Inc. (Specialty Retail)
| (a) | 1,641 | 632,573 |
V.F. Corp. (Textiles, Apparel & Luxury Goods)
| | 10,183 | 449,783 |
Whirlpool Corp. (Household Durables)
| | 1,769 | 273,965 |
Wynn Resorts Ltd. (Hotels, Restaurants & Leisure)
| (a) | 3,294 | 187,692 |
Yum! Brands, Inc. (Hotels, Restaurants & Leisure)
| | 8,953 | 1,016,255 |
| | | | 104,811,724 |
Consumer Staples–6.9%
| | | |
Altria Group, Inc. (Tobacco)
| | 56,317 | 2,352,361 |
Archer-Daniels-Midland Co. (Food Products)
| | 17,476 | 1,356,138 |
| Ohio National Fund, Inc. | ON S&P 500® Index Portfolio (Continued) |
| Schedule of Investments | June 30, 2022 (Unaudited) |
| Common Stocks (Continued) | Shares | Value |
Consumer Staples (continued)
| | | |
Brown-Forman Corp. Class B (Beverages)
| | 5,721 | $ 401,385 |
Campbell Soup Co. (Food Products)
| | 6,344 | 304,829 |
Church & Dwight Co., Inc. (Household Products)
| | 7,621 | 706,162 |
Clorox Co. / The (Household Products)
| | 3,870 | 545,593 |
Coca-Cola Co. / The (Beverages)
| | 121,714 | 7,657,028 |
Colgate-Palmolive Co. (Household Products)
| | 26,097 | 2,091,413 |
Conagra Brands, Inc. (Food Products)
| | 15,059 | 515,620 |
Constellation Brands, Inc. Class A (Beverages)
| | 5,052 | 1,177,419 |
Costco Wholesale Corp. (Food & Staples Retailing)
| | 13,820 | 6,623,649 |
Estee Lauder Cos., Inc. / The Class A (Personal Products)
| | 7,214 | 1,837,189 |
General Mills, Inc. (Food Products)
| | 18,687 | 1,409,934 |
Hershey Co. / The (Food Products)
| | 4,521 | 972,738 |
Hormel Foods Corp. (Food Products)
| | 8,910 | 421,978 |
J.M. Smucker Co. / The (Food Products)
| | 3,397 | 434,850 |
Kellogg Co. (Food Products)
| | 7,968 | 568,437 |
Keurig Dr Pepper, Inc. (Beverages)
| | 22,748 | 805,052 |
Kimberly-Clark Corp. (Household Products)
| | 10,466 | 1,414,480 |
Kraft Heinz Co. / The (Food Products)
| | 22,306 | 850,751 |
Kroger Co. / The (Food & Staples Retailing)
| | 20,303 | 960,941 |
Lamb Weston Holdings, Inc. (Food Products)
| | 4,528 | 323,571 |
McCormick & Co., Inc. (Food Products)
| | 7,867 | 654,928 |
Molson Coors Beverage Co. Class B (Beverages)
| | 5,960 | 324,880 |
Mondelez International, Inc. Class A (Food Products)
| | 43,158 | 2,679,680 |
Monster Beverage Corp. (Beverages)
| (a) | 11,654 | 1,080,326 |
PepsiCo, Inc. (Beverages)
| | 43,145 | 7,190,546 |
Philip Morris International, Inc. (Tobacco)
| | 48,287 | 4,767,858 |
Procter & Gamble Co. / The (Household Products)
| | 74,814 | 10,757,505 |
Sysco Corp. (Food & Staples Retailing)
| | 15,821 | 1,340,197 |
Tyson Foods, Inc. Class A (Food Products)
| | 9,163 | 788,568 |
Walgreens Boots Alliance, Inc. (Food & Staples Retailing)
| | 22,181 | 840,660 |
Walmart, Inc. (Food & Staples Retailing)
| | 43,822 | 5,327,879 |
| | | | 69,484,545 |
Energy–4.3%
| | | |
APA Corp. (Oil, Gas & Consumable Fuels)
| | 10,631 | 371,022 |
Baker Hughes Co. (Energy Equip. & Svs.)
| | 29,391 | 848,518 |
Chevron Corp. (Oil, Gas & Consumable Fuels)
| | 61,272 | 8,870,960 |
ConocoPhillips (Oil, Gas & Consumable Fuels)
| | 40,335 | 3,622,486 |
Coterra Energy, Inc. (Oil, Gas & Consumable Fuels)
| | 25,276 | 651,868 |
Devon Energy Corp. (Oil, Gas & Consumable Fuels)
| | 19,014 | 1,047,862 |
Diamondback Energy, Inc. (Oil, Gas & Consumable Fuels)
| | 5,242 | 635,068 |
EOG Resources, Inc. (Oil, Gas & Consumable Fuels)
| | 18,262 | 2,016,855 |
Exxon Mobil Corp. (Oil, Gas & Consumable Fuels)
| | 131,364 | 11,250,013 |
Halliburton Co. (Energy Equip. & Svs.)
| | 28,343 | 888,836 |
Hess Corp. (Oil, Gas & Consumable Fuels)
| | 8,553 | 906,105 |
Kinder Morgan, Inc. (Oil, Gas & Consumable Fuels)
| | 60,345 | 1,011,382 |
| Common Stocks (Continued) | Shares | Value |
| Energy (continued) | | | |
Marathon Oil Corp. (Oil, Gas & Consumable Fuels)
| | 22,245 | $ 500,068 |
Marathon Petroleum Corp. (Oil, Gas & Consumable Fuels)
| | 16,822 | 1,382,937 |
Occidental Petroleum Corp. (Oil, Gas & Consumable Fuels)
| | 27,712 | 1,631,683 |
ONEOK, Inc. (Oil, Gas & Consumable Fuels)
| | 14,025 | 778,387 |
Phillips 66 (Oil, Gas & Consumable Fuels)
| | 14,938 | 1,224,767 |
Pioneer Natural Resources Co. (Oil, Gas & Consumable Fuels)
| | 7,004 | 1,562,452 |
Schlumberger N.V. (Energy Equip. & Svs.)
| | 43,912 | 1,570,293 |
Valero Energy Corp. (Oil, Gas & Consumable Fuels)
| | 12,695 | 1,349,225 |
Williams Cos., Inc. / The (Oil, Gas & Consumable Fuels)
| | 37,771 | 1,178,833 |
| | | | 43,299,620 |
Financials–10.7%
| | | |
Aflac, Inc. (Insurance)
| | 18,350 | 1,015,306 |
Allstate Corp. / The (Insurance)
| | 8,520 | 1,079,740 |
American Express Co. (Consumer Finance)
| | 19,016 | 2,635,998 |
American International Group, Inc. (Insurance)
| | 24,595 | 1,257,542 |
Ameriprise Financial, Inc. (Capital Markets)
| | 3,449 | 819,758 |
Aon PLC Class A (Insurance)
| | 6,616 | 1,784,203 |
Arthur J. Gallagher & Co. (Insurance)
| | 6,511 | 1,061,553 |
Assurant, Inc. (Insurance)
| | 1,703 | 294,364 |
Bank of America Corp. (Banks)
| | 221,033 | 6,880,757 |
Bank of New York Mellon Corp. / The (Capital Markets)
| | 23,002 | 959,413 |
Berkshire Hathaway, Inc. Class B (Diversified Financial Svs.)
| (a) | 56,431 | 15,406,792 |
BlackRock, Inc. (Capital Markets)
| | 4,436 | 2,701,701 |
Brown & Brown, Inc. (Insurance)
| | 7,371 | 430,024 |
Capital One Financial Corp. (Consumer Finance)
| | 12,207 | 1,271,847 |
CBOE Global Markets, Inc. (Capital Markets)
| | 3,325 | 376,357 |
Charles Schwab Corp. / The (Capital Markets)
| | 46,994 | 2,969,081 |
Chubb Ltd. (Insurance)
| | 13,216 | 2,598,001 |
Cincinnati Financial Corp. (Insurance)
| | 4,678 | 556,588 |
Citigroup, Inc. (Banks)
| | 60,506 | 2,782,671 |
Citizens Financial Group, Inc. (Banks)
| | 15,358 | 548,127 |
CME Group, Inc. (Capital Markets)
| | 11,199 | 2,292,435 |
Comerica, Inc. (Banks)
| | 4,100 | 300,858 |
Discover Financial Services (Consumer Finance)
| | 8,671 | 820,103 |
Everest Re Group Ltd. (Insurance)
| | 1,231 | 345,025 |
FactSet Research Systems, Inc. (Capital Markets)
| | 1,194 | 459,177 |
Fifth Third Bancorp (Banks)
| | 21,562 | 724,483 |
First Republic Bank (Banks)
| | 5,536 | 798,291 |
Franklin Resources, Inc. (Capital Markets)
| | 8,805 | 205,245 |
Globe Life, Inc. (Insurance)
| | 2,857 | 278,472 |
Goldman Sachs Group, Inc. / The (Capital Markets)
| | 10,701 | 3,178,411 |
Hartford Financial Services Group, Inc. / The (Insurance)
| | 10,338 | 676,415 |
Huntington Bancshares, Inc. (Banks)
| | 45,231 | 544,129 |
Intercontinental Exchange, Inc. (Capital Markets)
| | 17,386 | 1,634,979 |
Invesco Ltd. (Capital Markets)
| | 10,650 | 171,785 |
JPMorgan Chase & Co. (Banks)
| | 91,574 | 10,312,148 |
KeyCorp (Banks)
| | 29,325 | 505,270 |
| Ohio National Fund, Inc. | ON S&P 500® Index Portfolio (Continued) |
| Schedule of Investments | June 30, 2022 (Unaudited) |
| Common Stocks (Continued) | Shares | Value |
| Financials (continued) | | | |
Lincoln National Corp. (Insurance)
| | 5,033 | $ 235,393 |
Loews Corp. (Insurance)
| | 6,074 | 359,945 |
M&T Bank Corp. (Banks)
| | 5,625 | 896,569 |
MarketAxess Holdings, Inc. (Capital Markets)
| | 1,187 | 303,884 |
Marsh & McLennan Cos., Inc. (Insurance)
| | 15,657 | 2,430,749 |
MetLife, Inc. (Insurance)
| | 21,479 | 1,348,666 |
Moody's Corp. (Capital Markets)
| | 4,988 | 1,356,586 |
Morgan Stanley (Capital Markets)
| | 43,603 | 3,316,444 |
MSCI, Inc. (Capital Markets)
| | 2,543 | 1,048,098 |
Nasdaq, Inc. (Capital Markets)
| | 3,625 | 552,958 |
Northern Trust Corp. (Capital Markets)
| | 6,551 | 632,041 |
PNC Financial Services Group, Inc. / The (Banks)
| | 12,873 | 2,030,973 |
Principal Financial Group, Inc. (Insurance)
| | 7,389 | 493,511 |
Progressive Corp. / The (Insurance)
| | 18,227 | 2,119,253 |
Prudential Financial, Inc. (Insurance)
| | 11,621 | 1,111,897 |
Raymond James Financial, Inc. (Capital Markets)
| | 6,087 | 544,239 |
Regions Financial Corp. (Banks)
| | 29,386 | 550,988 |
S&P Global, Inc. (Capital Markets)
| | 10,818 | 3,646,315 |
Signature Bank (Banks)
| | 1,901 | 340,678 |
State Street Corp. (Capital Markets)
| | 11,538 | 711,318 |
SVB Financial Group (Banks)
| (a) | 1,813 | 716,117 |
Synchrony Financial (Consumer Finance)
| | 15,761 | 435,319 |
T. Rowe Price Group, Inc. (Capital Markets)
| | 7,124 | 809,358 |
Travelers Cos., Inc. / The (Insurance)
| | 7,450 | 1,260,019 |
Truist Financial Corp. (Banks)
| | 41,432 | 1,965,120 |
U.S. Bancorp (Banks)
| | 42,119 | 1,938,316 |
W.R. Berkley Corp. (Insurance)
| | 6,554 | 447,376 |
Wells Fargo & Co. (Banks)
| | 118,108 | 4,626,290 |
Willis Towers Watson PLC (Insurance)
| | 3,505 | 691,852 |
Zions Bancorp N.A. (Banks)
| | 4,764 | 242,488 |
| | | | 107,839,809 |
Health Care–14.9%
| | | |
Abbott Laboratories (Health Care Equip. & Supplies)
| | 54,605 | 5,932,833 |
AbbVie, Inc. (Biotechnology)
| | 55,088 | 8,437,278 |
ABIOMED, Inc. (Health Care Equip. & Supplies)
| (a) | 1,430 | 353,939 |
Agilent Technologies, Inc. (Life Sciences Tools & Svs.)
| | 9,308 | 1,105,511 |
Align Technology, Inc. (Health Care Equip. & Supplies)
| (a) | 2,295 | 543,158 |
AmerisourceBergen Corp. (Health Care Providers & Svs.)
| | 4,738 | 670,332 |
Amgen, Inc. (Biotechnology)
| | 16,655 | 4,052,162 |
Baxter International, Inc. (Health Care Equip. & Supplies)
| | 15,590 | 1,001,346 |
Becton Dickinson and Co. (Health Care Equip. & Supplies)
| | 8,888 | 2,191,159 |
Biogen, Inc. (Biotechnology)
| (a) | 4,526 | 923,032 |
Bio-Rad Laboratories, Inc. Class A (Life Sciences Tools & Svs.)
| (a) | 676 | 334,620 |
Bio-Techne Corp. (Life Sciences Tools & Svs.)
| | 1,231 | 426,714 |
Boston Scientific Corp. (Health Care Equip. & Supplies)
| (a) | 44,509 | 1,658,850 |
Bristol-Myers Squibb Co. (Pharmaceuticals)
| | 66,357 | 5,109,489 |
Cardinal Health, Inc. (Health Care Providers & Svs.)
| | 8,561 | 447,483 |
Catalent, Inc. (Pharmaceuticals)
| (a) | 5,617 | 602,648 |
Centene Corp. (Health Care Providers & Svs.)
| (a) | 18,200 | 1,539,902 |
Charles River Laboratories International, Inc. (Life Sciences Tools & Svs.)
| (a) | 1,597 | 341,710 |
| Common Stocks (Continued) | Shares | Value |
Health Care (continued)
| | | |
Cigna Corp. (Health Care Providers & Svs.)
| | 9,884 | $ 2,604,632 |
Cooper Cos., Inc. / The (Health Care Equip. & Supplies)
| | 1,548 | 484,710 |
CVS Health Corp. (Health Care Providers & Svs.)
| | 40,869 | 3,786,922 |
Danaher Corp. (Life Sciences Tools & Svs.)
| | 20,166 | 5,112,484 |
DaVita, Inc. (Health Care Providers & Svs.)
| (a) | 1,898 | 151,764 |
DENTSPLY SIRONA, Inc. (Health Care Equip. & Supplies)
| | 6,408 | 228,958 |
Dexcom, Inc. (Health Care Equip. & Supplies)
| (a) | 12,134 | 904,347 |
Edwards Lifesciences Corp. (Health Care Equip. & Supplies)
| (a) | 19,368 | 1,841,703 |
Elevance Health, Inc. (Health Care Providers & Svs.)
| | 7,511 | 3,624,658 |
Eli Lilly & Co. (Pharmaceuticals)
| | 24,580 | 7,969,573 |
Gilead Sciences, Inc. (Biotechnology)
| | 39,102 | 2,416,895 |
HCA Healthcare, Inc. (Health Care Providers & Svs.)
| | 7,064 | 1,187,176 |
Henry Schein, Inc. (Health Care Providers & Svs.)
| (a) | 4,350 | 333,819 |
Hologic, Inc. (Health Care Equip. & Supplies)
| (a) | 7,828 | 542,480 |
Humana, Inc. (Health Care Providers & Svs.)
| | 3,940 | 1,844,196 |
IDEXX Laboratories, Inc. (Health Care Equip. & Supplies)
| (a) | 2,597 | 910,846 |
Illumina, Inc. (Life Sciences Tools & Svs.)
| (a) | 4,859 | 895,805 |
Incyte Corp. (Biotechnology)
| (a) | 5,892 | 447,615 |
Intuitive Surgical, Inc. (Health Care Equip. & Supplies)
| (a) | 11,184 | 2,244,741 |
IQVIA Holdings, Inc. (Life Sciences Tools & Svs.)
| (a) | 5,876 | 1,275,033 |
Johnson & Johnson (Pharmaceuticals)
| | 82,043 | 14,563,453 |
Laboratory Corp. of America Holdings (Health Care Providers & Svs.)
| | 2,859 | 670,035 |
McKesson Corp. (Health Care Providers & Svs.)
| | 4,520 | 1,474,469 |
Medtronic PLC (Health Care Equip. & Supplies)
| | 41,841 | 3,755,230 |
Merck & Co., Inc. (Pharmaceuticals)
| | 78,827 | 7,186,658 |
Mettler-Toledo International, Inc. (Life Sciences Tools & Svs.)
| (a) | 713 | 819,073 |
Moderna, Inc. (Biotechnology)
| (a) | 10,769 | 1,538,352 |
Molina Healthcare, Inc. (Health Care Providers & Svs.)
| (a) | 1,843 | 515,321 |
Organon & Co. (Pharmaceuticals)
| | 8,013 | 270,439 |
PerkinElmer, Inc. (Life Sciences Tools & Svs.)
| | 3,962 | 563,476 |
Pfizer, Inc. (Pharmaceuticals)
| | 174,872 | 9,168,539 |
Quest Diagnostics, Inc. (Health Care Providers & Svs.)
| | 3,688 | 490,430 |
Regeneron Pharmaceuticals, Inc. (Biotechnology)
| (a) | 3,367 | 1,990,335 |
ResMed, Inc. (Health Care Equip. & Supplies)
| | 4,537 | 951,091 |
STERIS PLC (Health Care Equip. & Supplies)
| | 3,146 | 648,548 |
Stryker Corp. (Health Care Equip. & Supplies)
| | 10,494 | 2,087,571 |
Teleflex, Inc. (Health Care Equip. & Supplies)
| | 1,474 | 362,383 |
Thermo Fisher Scientific, Inc. (Life Sciences Tools & Svs.)
| | 12,200 | 6,628,016 |
UnitedHealth Group, Inc. (Health Care Providers & Svs.)
| | 29,250 | 15,023,678 |
| Ohio National Fund, Inc. | ON S&P 500® Index Portfolio (Continued) |
| Schedule of Investments | June 30, 2022 (Unaudited) |
| Common Stocks (Continued) | Shares | Value |
Health Care (continued)
| | | |
Universal Health Services, Inc. Class B (Health Care Providers & Svs.)
| | 2,110 | $ 212,498 |
Vertex Pharmaceuticals, Inc. (Biotechnology)
| (a) | 7,968 | 2,245,303 |
Viatris, Inc. (Pharmaceuticals)
| | 38,101 | 398,917 |
Waters Corp. (Life Sciences Tools & Svs.)
| (a) | 1,891 | 625,883 |
West Pharmaceutical Services, Inc. (Health Care Equip. & Supplies)
| | 2,332 | 705,127 |
Zimmer Biomet Holdings, Inc. (Health Care Equip. & Supplies)
| | 6,583 | 691,610 |
Zoetis, Inc. (Pharmaceuticals)
| | 14,656 | 2,519,220 |
| | | | 150,586,178 |
Industrials–7.7%
| | | |
3M Co. (Industrial Conglomerates)
| | 17,722 | 2,293,404 |
A.O. Smith Corp. (Building Products)
| | 4,085 | 223,368 |
Alaska Air Group, Inc. (Airlines)
| (a) | 3,937 | 157,677 |
Allegion PLC (Building Products)
| | 2,761 | 270,302 |
American Airlines Group, Inc. (Airlines)
| (a) | 20,371 | 258,304 |
AMETEK, Inc. (Electrical Equip.)
| | 7,238 | 795,384 |
Boeing Co. / The (Aerospace & Defense)
| (a) | 17,334 | 2,369,904 |
C.H. Robinson Worldwide, Inc. (Air Freight & Logistics)
| | 4,011 | 406,595 |
Carrier Global Corp. (Building Products)
| | 26,224 | 935,148 |
Caterpillar, Inc. (Machinery)
| | 16,628 | 2,972,421 |
Cintas Corp. (Commercial Svs. & Supplies)
| | 2,692 | 1,005,543 |
Copart, Inc. (Commercial Svs. & Supplies)
| (a) | 6,581 | 715,091 |
CSX Corp. (Road & Rail)
| | 67,669 | 1,966,461 |
Cummins, Inc. (Machinery)
| | 4,353 | 842,436 |
Deere & Co. (Machinery)
| | 8,701 | 2,605,688 |
Delta Air Lines, Inc. (Airlines)
| (a) | 19,577 | 567,146 |
Dover Corp. (Machinery)
| | 4,526 | 549,094 |
Eaton Corp. PLC (Electrical Equip.)
| | 12,417 | 1,564,418 |
Emerson Electric Co. (Electrical Equip.)
| | 18,495 | 1,471,092 |
Equifax, Inc. (Professional Svs.)
| | 3,845 | 702,789 |
Expeditors International of Washington, Inc. (Air Freight & Logistics)
| | 5,259 | 512,542 |
Fastenal Co. (Trading Companies & Distributors)
| | 17,809 | 889,025 |
FedEx Corp. (Air Freight & Logistics)
| | 7,422 | 1,682,642 |
Fortive Corp. (Machinery)
| | 11,259 | 612,264 |
Fortune Brands Home & Security, Inc. (Building Products)
| | 4,113 | 246,286 |
Generac Holdings, Inc. (Electrical Equip.)
| (a) | 2,006 | 422,423 |
General Dynamics Corp. (Aerospace & Defense)
| | 7,174 | 1,587,247 |
General Electric Co. (Industrial Conglomerates)
| | 34,278 | 2,182,480 |
Honeywell International, Inc. (Industrial Conglomerates)
| | 21,213 | 3,687,032 |
Howmet Aerospace, Inc. (Aerospace & Defense)
| | 11,743 | 369,317 |
Huntington Ingalls Industries, Inc. (Aerospace & Defense)
| | 1,258 | 274,018 |
IDEX Corp. (Machinery)
| | 2,317 | 420,837 |
Illinois Tool Works, Inc. (Machinery)
| | 8,819 | 1,607,263 |
Ingersoll Rand, Inc. (Machinery)
| | 12,758 | ��536,857 |
J.B. Hunt Transport Services, Inc. (Road & Rail)
| | 2,634 | 414,776 |
Jacobs Engineering Group, Inc. (Construction & Engineering)
| | 4,044 | 514,114 |
Johnson Controls International PLC (Building Products)
| | 21,542 | 1,031,431 |
L3Harris Technologies, Inc. (Aerospace & Defense)
| | 5,996 | 1,449,233 |
Leidos Holdings, Inc. (Professional Svs.)
| | 4,297 | 432,751 |
Lockheed Martin Corp. (Aerospace & Defense)
| | 7,386 | 3,175,685 |
| Common Stocks (Continued) | Shares | Value |
| Industrials (continued) | | | |
Masco Corp. (Building Products)
| | 7,381 | $ 373,479 |
Nielsen Holdings PLC (Professional Svs.)
| | 11,203 | 260,134 |
Nordson Corp. (Machinery)
| | 1,700 | 344,148 |
Norfolk Southern Corp. (Road & Rail)
| | 7,415 | 1,685,355 |
Northrop Grumman Corp. (Aerospace & Defense)
| | 4,554 | 2,179,408 |
Old Dominion Freight Line, Inc. (Road & Rail)
| | 2,886 | 739,624 |
Otis Worldwide Corp. (Machinery)
| | 13,086 | 924,788 |
PACCAR, Inc. (Machinery)
| | 10,738 | 884,167 |
Parker-Hannifin Corp. (Machinery)
| | 3,976 | 978,295 |
Pentair PLC (Machinery)
| | 5,232 | 239,469 |
Quanta Services, Inc. (Construction & Engineering)
| | 4,401 | 551,621 |
Raytheon Technologies Corp. (Aerospace & Defense)
| | 46,426 | 4,462,003 |
Republic Services, Inc. (Commercial Svs. & Supplies)
| | 6,438 | 842,541 |
Robert Half International, Inc. (Professional Svs.)
| | 3,472 | 260,018 |
Rockwell Automation, Inc. (Electrical Equip.)
| | 3,660 | 729,475 |
Rollins, Inc. (Commercial Svs. & Supplies)
| | 7,107 | 248,176 |
Snap-on, Inc. (Machinery)
| | 1,673 | 329,631 |
Southwest Airlines Co. (Airlines)
| (a) | 18,605 | 672,013 |
Stanley Black & Decker, Inc. (Machinery)
| | 4,742 | 497,246 |
Teledyne Technologies, Inc. (Aerospace & Defense)
| (a) | 1,472 | 552,162 |
Textron, Inc. (Aerospace & Defense)
| | 6,761 | 412,894 |
Trane Technologies PLC (Building Products)
| | 7,239 | 940,129 |
TransDigm Group, Inc. (Aerospace & Defense)
| (a) | 1,601 | 859,209 |
Union Pacific Corp. (Road & Rail)
| | 19,570 | 4,173,890 |
United Airlines Holdings, Inc. (Airlines)
| (a) | 10,268 | 363,693 |
United Parcel Service, Inc. Class B (Air Freight & Logistics)
| | 22,895 | 4,179,253 |
United Rentals, Inc. (Trading Companies & Distributors)
| (a) | 2,195 | 533,187 |
Verisk Analytics, Inc. (Professional Svs.)
| | 4,875 | 843,814 |
W.W. Grainger, Inc. (Trading Companies & Distributors)
| | 1,348 | 612,572 |
Waste Management, Inc. (Commercial Svs. & Supplies)
| | 11,902 | 1,820,768 |
Westinghouse Air Brake Technologies Corp. (Machinery)
| | 5,739 | 471,057 |
Xylem, Inc. (Machinery)
| | 5,630 | 440,153 |
| | | | 78,124,860 |
Information Technology–26.3%
| | | |
Accenture PLC Class A (IT Svs.)
| | 19,755 | 5,484,976 |
Adobe, Inc. (Software)
| (a) | 14,733 | 5,393,162 |
Advanced Micro Devices, Inc. (Semiconductors & Equip.)
| (a) | 50,479 | 3,860,129 |
Akamai Technologies, Inc. (IT Svs.)
| (a) | 4,893 | 446,878 |
Amphenol Corp. Class A (Electronic Equip., Instr. & Comp.)
| | 18,492 | 1,190,515 |
Analog Devices, Inc. (Semiconductors & Equip.)
| | 16,292 | 2,380,098 |
ANSYS, Inc. (Software)
| (a) | 2,724 | 651,826 |
Apple, Inc. (Tech. Hardware, Storage & Periph.)
| | 479,330 | 65,533,998 |
Applied Materials, Inc. (Semiconductors & Equip.)
| | 27,505 | 2,502,405 |
Arista Networks, Inc. (Communications Equip.)
| (a) | 7,076 | 663,304 |
Autodesk, Inc. (Software)
| (a) | 6,753 | 1,161,246 |
Automatic Data Processing, Inc. (IT Svs.)
| | 13,028 | 2,736,401 |
| Ohio National Fund, Inc. | ON S&P 500® Index Portfolio (Continued) |
| Schedule of Investments | June 30, 2022 (Unaudited) |
| Common Stocks (Continued) | Shares | Value |
Information Technology (continued)
| | | |
Broadcom, Inc. (Semiconductors & Equip.)
| | 12,724 | $ 6,181,446 |
Broadridge Financial Solutions, Inc. (IT Svs.)
| | 3,684 | 525,154 |
Cadence Design Systems, Inc. (Software)
| (a) | 8,577 | 1,286,807 |
CDW Corp. (Electronic Equip., Instr. & Comp.)
| | 4,246 | 669,000 |
Ceridian HCM Holding, Inc. (Software)
| (a) | 4,281 | 201,549 |
Cisco Systems, Inc. (Communications Equip.)
| | 129,484 | 5,521,198 |
Citrix Systems, Inc. (Software)
| | 3,905 | 379,449 |
Cognizant Technology Solutions Corp. Class A (IT Svs.)
| | 16,154 | 1,090,233 |
Corning, Inc. (Electronic Equip., Instr. & Comp.)
| | 23,887 | 752,679 |
DXC Technology Co. (IT Svs.)
| (a) | 7,685 | 232,932 |
Enphase Energy, Inc. (Semiconductors & Equip.)
| (a) | 4,243 | 828,403 |
EPAM Systems, Inc. (IT Svs.)
| (a) | 1,788 | 527,067 |
F5, Inc. (Communications Equip.)
| (a) | 1,903 | 291,235 |
Fidelity National Information Services, Inc. (IT Svs.)
| | 19,030 | 1,744,480 |
Fiserv, Inc. (IT Svs.)
| (a) | 18,113 | 1,611,514 |
FleetCor Technologies, Inc. (IT Svs.)
| (a) | 2,431 | 510,777 |
Fortinet, Inc. (Software)
| (a) | 20,671 | 1,169,565 |
Gartner, Inc. (IT Svs.)
| (a) | 2,531 | 612,072 |
Global Payments, Inc. (IT Svs.)
| | 8,713 | 964,006 |
Hewlett Packard Enterprise Co. (Tech. Hardware, Storage & Periph.)
| | 40,909 | 542,453 |
HP, Inc. (Tech. Hardware, Storage & Periph.)
| | 32,661 | 1,070,628 |
Intel Corp. (Semiconductors & Equip.)
| | 127,460 | 4,768,279 |
International Business Machines Corp. (IT Svs.)
| | 28,046 | 3,959,815 |
Intuit, Inc. (Software)
| | 8,816 | 3,398,039 |
Jack Henry & Associates, Inc. (IT Svs.)
| | 2,291 | 412,426 |
Juniper Networks, Inc. (Communications Equip.)
| | 10,072 | 287,052 |
Keysight Technologies, Inc. (Electronic Equip., Instr. & Comp.)
| (a) | 5,702 | 786,021 |
KLA Corp. (Semiconductors & Equip.)
| | 4,634 | 1,478,617 |
Lam Research Corp. (Semiconductors & Equip.)
| | 4,316 | 1,839,263 |
Mastercard, Inc. Class A (IT Svs.)
| | 26,777 | 8,447,608 |
Microchip Technology, Inc. (Semiconductors & Equip.)
| | 17,222 | 1,000,254 |
Micron Technology, Inc. (Semiconductors & Equip.)
| | 34,773 | 1,922,251 |
Microsoft Corp. (Software)
| | 233,160 | 59,882,483 |
Monolithic Power Systems, Inc. (Semiconductors & Equip.)
| | 1,378 | 529,207 |
Motorola Solutions, Inc. (Communications Equip.)
| | 5,188 | 1,087,405 |
NetApp, Inc. (Tech. Hardware, Storage & Periph.)
| | 6,958 | 453,940 |
NortonLifeLock, Inc. (Software)
| | 17,687 | 388,407 |
NVIDIA Corp. (Semiconductors & Equip.)
| | 78,041 | 11,830,235 |
NXP Semiconductors N.V. (Semiconductors & Equip.)
| | 8,153 | 1,206,889 |
ON Semiconductor Corp. (Semiconductors & Equip.)
| (a) | 13,656 | 687,033 |
Oracle Corp. (Software)
| | 49,098 | 3,430,477 |
Paychex, Inc. (IT Svs.)
| | 9,975 | 1,135,853 |
Paycom Software, Inc. (Software)
| (a) | 1,470 | 411,776 |
PayPal Holdings, Inc. (IT Svs.)
| (a) | 36,092 | 2,520,665 |
PTC, Inc. (Software)
| (a) | 3,309 | 351,879 |
Qorvo, Inc. (Semiconductors & Equip.)
| (a) | 3,425 | 323,046 |
| Common Stocks (Continued) | Shares | Value |
Information Technology (continued)
| | | |
QUALCOMM, Inc. (Semiconductors & Equip.)
| | 34,899 | $ 4,457,998 |
Roper Technologies, Inc. (Software)
| | 3,290 | 1,298,399 |
Salesforce, Inc. (Software)
| (a) | 30,974 | 5,111,949 |
Seagate Technology Holdings PLC (Tech. Hardware, Storage & Periph.)
| | 6,211 | 443,714 |
ServiceNow, Inc. (Software)
| (a) | 6,248 | 2,971,049 |
Skyworks Solutions, Inc. (Semiconductors & Equip.)
| | 5,057 | 468,481 |
SolarEdge Technologies, Inc. (Semiconductors & Equip.)
| (a) | 1,741 | 476,477 |
Synopsys, Inc. (Software)
| (a) | 4,754 | 1,443,790 |
TE Connectivity Ltd. (Electronic Equip., Instr. & Comp.)
| | 9,994 | 1,130,821 |
Teradyne, Inc. (Semiconductors & Equip.)
| | 5,037 | 451,063 |
Texas Instruments, Inc. (Semiconductors & Equip.)
| | 28,746 | 4,416,823 |
Trimble, Inc. (Electronic Equip., Instr. & Comp.)
| (a) | 7,865 | 457,979 |
Tyler Technologies, Inc. (Software)
| (a) | 1,304 | 433,554 |
VeriSign, Inc. (IT Svs.)
| (a) | 2,995 | 501,153 |
Visa, Inc. (IT Svs.)
| | 51,317 | 10,103,804 |
Western Digital Corp. (Tech. Hardware, Storage & Periph.)
| (a) | 9,559 | 428,530 |
Zebra Technologies Corp. Class A (Electronic Equip., Instr. & Comp.)
| (a) | 1,650 | 485,018 |
| | | | 266,337,107 |
Materials–2.5%
| | | |
Air Products & Chemicals, Inc. (Chemicals)
| | 6,899 | 1,659,072 |
Albemarle Corp. (Chemicals)
| | 3,681 | 769,255 |
Amcor PLC (Containers & Packaging)
| | 47,129 | 585,814 |
Avery Dennison Corp. (Containers & Packaging)
| | 2,572 | 416,330 |
Ball Corp. (Containers & Packaging)
| | 10,033 | 689,969 |
Celanese Corp. (Chemicals)
| | 3,386 | 398,227 |
CF Industries Holdings, Inc. (Chemicals)
| | 6,557 | 562,132 |
Corteva, Inc. (Chemicals)
| | 22,708 | 1,229,411 |
Dow, Inc. (Chemicals)
| | 22,590 | 1,165,870 |
DuPont de Nemours, Inc. (Chemicals)
| | 15,712 | 873,273 |
Eastman Chemical Co. (Chemicals)
| | 4,055 | 364,017 |
Ecolab, Inc. (Chemicals)
| | 7,709 | 1,185,336 |
FMC Corp. (Chemicals)
| | 3,947 | 422,368 |
Freeport-McMoRan, Inc. (Metals & Mining)
| | 45,050 | 1,318,163 |
International Flavors & Fragrances, Inc. (Chemicals)
| | 7,885 | 939,261 |
International Paper Co. (Containers & Packaging)
| | 11,648 | 487,236 |
Linde PLC (Chemicals)
| | 15,677 | 4,507,608 |
LyondellBasell Industries N.V. Class A (Chemicals)
| | 8,136 | 711,575 |
Martin Marietta Materials, Inc. (Construction Materials)
| | 1,957 | 585,613 |
Mosaic Co. / The (Chemicals)
| | 11,378 | 537,383 |
Newmont Corp. (Metals & Mining)
| | 24,661 | 1,471,522 |
Nucor Corp. (Metals & Mining)
| | 8,364 | 873,285 |
Packaging Corp. of America (Containers & Packaging)
| | 2,845 | 391,188 |
PPG Industries, Inc. (Chemicals)
| | 7,419 | 848,288 |
Sealed Air Corp. (Containers & Packaging)
| | 4,588 | 264,819 |
Sherwin-Williams Co. / The (Chemicals)
| | 7,448 | 1,667,682 |
| Ohio National Fund, Inc. | ON S&P 500® Index Portfolio (Continued) |
| Schedule of Investments | June 30, 2022 (Unaudited) |
| Common Stocks (Continued) | Shares | Value |
| Materials (continued) | | | |
Vulcan Materials Co. (Construction Materials)
| | 4,181 | $ 594,120 |
Westrock Co. (Containers & Packaging)
| | 8,010 | 319,118 |
| | | | 25,837,935 |
Real Estate–2.9%
| | | |
Alexandria Real Estate Equities, Inc. (Equity REIT)
| | 4,667 | 676,855 |
American Tower Corp. (Equity REIT)
| | 14,492 | 3,704,010 |
AvalonBay Communities, Inc. (Equity REIT)
| | 4,318 | 838,772 |
Boston Properties, Inc. (Equity REIT)
| | 4,485 | 399,075 |
Camden Property Trust (Equity REIT)
| | 3,352 | 450,777 |
CBRE Group, Inc. Class A (Real Estate Mgmt. & Development)
| (a) | 10,066 | 740,958 |
Crown Castle International Corp. (Equity REIT)
| | 13,509 | 2,274,645 |
Digital Realty Trust, Inc. (Equity REIT)
| | 8,836 | 1,147,178 |
Duke Realty Corp. (Equity REIT)
| | 12,084 | 664,016 |
Equinix, Inc. (Equity REIT)
| | 2,838 | 1,864,623 |
Equity Residential (Equity REIT)
| | 10,549 | 761,849 |
Essex Property Trust, Inc. (Equity REIT)
| | 2,048 | 535,573 |
Extra Space Storage, Inc. (Equity REIT)
| | 4,131 | 702,766 |
Federal Realty OP LP (Equity REIT)
| | 2,258 | 216,181 |
Healthpeak Properties, Inc. (Equity REIT)
| | 16,874 | 437,205 |
Host Hotels & Resorts, Inc. (Equity REIT)
| | 22,347 | 350,401 |
Iron Mountain, Inc. (Equity REIT)
| | 9,132 | 444,637 |
Kimco Realty Corp. (Equity REIT)
| | 19,507 | 385,653 |
Mid-America Apartment Communities, Inc. (Equity REIT)
| | 3,622 | 632,655 |
Prologis, Inc. (Equity REIT)
| | 23,082 | 2,715,597 |
Public Storage (Equity REIT)
| | 4,750 | 1,485,183 |
Realty Income Corp. (Equity REIT)
| | 18,680 | 1,275,097 |
Regency Centers Corp. (Equity REIT)
| | 4,875 | 289,136 |
SBA Communications Corp. (Equity REIT)
| | 3,338 | 1,068,327 |
Simon Property Group, Inc. (Equity REIT)
| | 10,161 | 964,482 |
UDR, Inc. (Equity REIT)
| | 9,429 | 434,111 |
Ventas, Inc. (Equity REIT)
| | 12,561 | 646,012 |
VICI Properties, Inc. (Equity REIT)
| | 29,744 | 886,074 |
Vornado Realty Trust (Equity REIT)
| | 5,036 | 143,979 |
Welltower, Inc. (Equity REIT)
| | 14,083 | 1,159,735 |
Weyerhaeuser Co. (Equity REIT)
| | 23,334 | 772,822 |
| | | | 29,068,384 |
Utilities–3.0%
| | | |
AES Corp. / The (Ind. Power & Renewable Elec.)
| | 20,979 | 440,769 |
Alliant Energy Corp. (Electric Utilities)
| | 7,886 | 462,198 |
Ameren Corp. (Multi-Utilities)
| | 8,099 | 731,826 |
American Electric Power Co., Inc. (Electric Utilities)
| | 15,934 | 1,528,708 |
| Common Stocks (Continued) | Shares | Value |
| Utilities (continued) | | | |
American Water Works Co., Inc. (Water Utilities)
| | 5,716 | $ 850,369 |
Atmos Energy Corp. (Gas Utilities)
| | 4,365 | 489,317 |
CenterPoint Energy, Inc. (Multi-Utilities)
| | 19,314 | 571,308 |
CMS Energy Corp. (Multi-Utilities)
| | 9,144 | 617,220 |
Consolidated Edison, Inc. (Multi-Utilities)
| | 10,992 | 1,045,339 |
Constellation Energy Corp. (Electric Utilities)
| | 10,254 | 587,144 |
Dominion Energy, Inc. (Multi-Utilities)
| | 25,282 | 2,017,756 |
DTE Energy Co. (Multi-Utilities)
| | 6,078 | 770,387 |
Duke Energy Corp. (Electric Utilities)
| | 24,009 | 2,574,005 |
Edison International (Electric Utilities)
| | 11,727 | 741,615 |
Entergy Corp. (Electric Utilities)
| | 6,390 | 719,770 |
Evergy, Inc. (Electric Utilities)
| | 7,208 | 470,322 |
Eversource Energy (Electric Utilities)
| | 10,835 | 915,232 |
Exelon Corp. (Electric Utilities)
| | 30,330 | 1,374,556 |
FirstEnergy Corp. (Electric Utilities)
| | 17,934 | 688,486 |
NextEra Energy, Inc. (Electric Utilities)
| | 61,224 | 4,742,411 |
NiSource, Inc. (Multi-Utilities)
| | 12,741 | 375,732 |
NRG Energy, Inc. (Ind. Power & Renewable Elec.)
| | 7,458 | 284,672 |
Pinnacle West Capital Corp. (Electric Utilities)
| | 3,550 | 259,576 |
PPL Corp. (Electric Utilities)
| | 23,108 | 626,920 |
Public Service Enterprise Group, Inc. (Multi-Utilities)
| | 15,675 | 991,914 |
Sempra Energy (Multi-Utilities)
| | 9,771 | 1,468,288 |
Southern Co. / The (Electric Utilities)
| | 33,033 | 2,355,583 |
WEC Energy Group, Inc. (Multi-Utilities)
| | 9,774 | 983,655 |
Xcel Energy, Inc. (Electric Utilities)
| | 16,889 | 1,195,066 |
| | | | 30,880,144 |
Total Common Stocks (Cost $710,591,955)
| | | $ 994,488,033 |
| U.S. Treasury Obligations–0.0% | Rate | Maturity | Face Amount | Value |
| U.S. Treasury Bill | (b) | 0.000% | 01/26/2023 | $ 200,000 | $ 197,173 |
Total U.S. Treasury Obligations (Cost $198,590)
| $ 197,173 |
| Money Market Funds–1.1% | Shares | Value |
State Street Institutional Liquid Reserves Fund Institutional Class, 1.494%
| (c) | 10,757,467 | $ 10,756,391 |
Total Money Market Funds (Cost $10,756,460)
| | | $ 10,756,391 |
Total Investments – 99.4% (Cost $721,547,005)
| (d) | | $1,005,441,597 |
Other Assets in Excess of Liabilities – 0.6%
| (b) | | 5,604,384 |
| Net Assets – 100.0% | | | $1,011,045,981 |
Percentages are stated as a percent of net assets. |
| Footnotes: | |
| (a) | Non-income producing security. |
| (b) | Security is fully pledged, in addition to $445,252 of the Portfolio’s cash holdings, as collateral for the futures contracts outstanding at June 30, 2022. See also the following Schedule of Open Futures Contracts. |
| (c) | Rate represents the seven-day yield at June 30, 2022. |
| (d) | Represents cost for financial reporting purposes, which may differ from cost basis for federal income tax purposes. See also Note 7 of the Notes to Financial Statements. |
The accompanying notes are an integral part of these financial statements.
| Ohio National Fund, Inc. | ON S&P 500® Index Portfolio (Continued) |
| Schedule of Open Futures Contracts | June 30, 2022 (Unaudited) |
| Description | | Number of
contracts | | Expiration Date | | Notional
Amount | | Value | | Unrealized
Appreciation
(Depreciation) | | Variation Margin
Receivable
(Payable) |
| CME E-mini S&P 500 Index - Long | | 61 | | September 16, 2022 | | $11,785,920 | | $11,557,975 | | $(227,945) | | $(80,424) |
The accompanying notes are an integral part of these financial statements.
| Ohio National Fund, Inc. | ON BlackRock Advantage Large Cap Value Portfolio (Unaudited) |
The ON BlackRock Advantage Large Cap Value Portfolio seeks growth of capital by investing under normal circumstances, at least 80% of its net assets in stocks of large capitalization companies with market capitalizations at the time of investment that are within the range of market capitalizations of the companies in the Russell 1000® Value Index for the previous twelve months.
Performance as of June 30, 2022
| Average Annual returns | |
| One year | -7.50% |
| Five years | 5.29% |
| Ten years | 8.40% |
Past performance does not guarantee future results. The performance data quoted represents past performance and current returns may be lower or higher. Total return figures include change in share price and reinvestment of dividends and capital gains. The investment return and principal value will fluctuate so that an investor’s shares, when redeemed, may be worth more or less than the original cost. To obtain performance information up to the most recent month end, call toll-free 1-877-781-6392.
The Portfolio is not open to direct retail investment. Beneficial interest in the Portfolio’s shares is obtained either through an allocation to the Portfolio as an investment vehicle within variable life insurance policies or annuity contracts, or as an underlying investment by the ON Model Portfolios. Actual performance results for variable annuity and variable universal life contracts will be lower due to contract charges. Consult your contract for applicable charges.
Total expense ratio is 0.73% per the Fund’s prospectus dated April 29, 2022. Additional information pertaining to the Portfolio’s expense ratio as of June 30, 2022 can be found in the Portfolio’s Financial Highlights.
Comments from Sub-Adviser
Q. How did the Portfolio perform in comparison to its benchmark during the reporting period?
A. For the six-month period ended June 30, 2022, the Portfolio returned -13.81% versus -12.86% for its benchmark, the Russell 1000® Value Index.
Q. Were there specific market conditions, investment strategies, or techniques that materially affected the Portfolio’s benchmark-relative performance during the reporting period?
A. Early performance from positioning that captures policy normalization initially withstood the rotation and benefitted performance. Performance was strong through the start of the year, as positioning reflected a policy normalization theme. Insights that collectively captured the rising inflationary backdrop drove gains across both bottom-up valuation and top-down macro dimensions. However, the emergence of the conflict in the Ukraine prompted a sharp reversal in performance with losses for the first quarter coming from the final week of February. Overweights to European value names, which drove gains earlier, were sharp detractors, as sentiment in the region deteriorated quickly.
Performance was supported by fundamental value insights, which benefitted from the market style preference. Traditional valuation measuring company ownership structures and sources of financing, cash usage efficiency, and other financial statement metrics all did best, and motivated a successful underweight to select Consumer Discretionary names, benefitting performance.
Conversely, non-traditional measures of quality with a growth flavor, such as environmental, social, and governance (“ESG”) insights, struggled. Risk mitigation insights that predict firm-level controversy
struggled, as markets continued to focus on macro dynamics over company results. Elsewhere, environmental insights that evaluate "green" bond issuance struggled across Materials.
Lastly, given the market rotations, sentiment-based stock selection that captures trends across participants struggled to gain direction. Specifically, positioning based on informed investor views detracted as the shared exposures ran against rising style volatility. (1)
Q. How did sector allocation and security selection each impact the Portfolio’s performance relative to its benchmark?
A. The portfolio management team targets a relatively sector-neutral approach and seeks to derive the majority of any excess return from security selection. During the six-month period, however, overall sector allocation decisions detracted from relative returns. An overweight position within Information Technology detracted from relative performance as the market was more focused on defensive names and value styles. Security selection had a more meaningful impact on underperformance, however. Security selection within Health Care names struggled the most. (1)
Q. Which securities contributed the most to, and detracted the most from, the Portfolio’s benchmark-relative performance?
A. The Portfolio’s overweight position in EOG Resources, Inc. a Texas-based Energy company, was a top contributor to relative performance for the six-month period. An overweight to oilfield services company Schlumberger N.V. was also a top contributor. Both stocks benefitted from the broader Energy sector rally and runup in commodities prices.
In contrast, an overweight to water purification company Ecolab, Inc. was a key detractor from relative performance for the period, as the stock struggled amid broader pandemic themes. Further hindering results was an overweight stance in Idexx Laboratories, Inc., as the company missed on its first quarter earnings. (1)
Q. How did the Portfolio’s use of derivative instruments and initial public offerings (IPOs), if any, impact performance?
A. Pursuant to the Portfolio’s investment strategy, futures contracts were used to prevent a cash drag on performance. The futures contracts detracted 25 basis points from the Portfolio’s absolute return for the six-month period. The Portfolio also participated in two IPOs during the period, which detracted 3 basis points from absolute return in aggregate, led by a 3 basis point detraction from Excelerate Energy, Inc. Class A. (1)
| (1) | The Portfolio’s composition is subject to change. Holdings and weightings are as of June 30, 2022. |
| Ohio National Fund, Inc. | ON BlackRock Advantage Large Cap Value Portfolio (Unaudited) (Continued) |
Change in Value of $10,000 Investment
Hypothetical illustration based on past performance. Future performance will vary. The Portfolio’s returns reflect reinvested dividends. The Portfolio’s holdings may differ significantly from the securities in the index. The index is unmanaged and therefore does not reflect the cost of portfolio management and accounting.
The Russell 1000® Value Index measures the performance of the large-cap value segment of the U.S. equity universe. It includes those Russell 1000® Index companies with lower price-to-book ratios and lower expected and historical growth rates.
Past performance is no guarantee of future results. Redemption of fund shares could have tax implications unique to each shareholder.
| Portfolio Composition as of June 30, 2022 (1) |
| | % of Net Assets |
| Common Stocks (4) | 98.4 |
Money Market Funds and
Other Net Assets | 1.6 |
| | 100.0 |
| Top 10 Portfolio Holdings as of June 30, 2022 (1) (2) (3) |
| | | % of Net Assets |
| 1. | Johnson & Johnson | 2.8 |
| 2. | Exxon Mobil Corp. | 2.5 |
| 3. | JPMorgan Chase & Co. | 2.4 |
| 4. | Berkshire Hathaway, Inc. Class B | 2.3 |
| 5. | Bank of America Corp. | 2.1 |
| 6. | Procter & Gamble Co. / The | 2.0 |
| 7. | Meta Platforms, Inc. Class A | 1.6 |
| 8. | Intel Corp. | 1.6 |
| 9. | Pfizer, Inc. | 1.5 |
| 10. | Merck & Co., Inc. | 1.4 |
| | |
| (1) | Composition of Portfolio subject to change. |
| (2) | Short-term investments have been excluded from the list of Top 10 Portfolio Holdings. |
| (3) | Top 10 Portfolio Holdings is presented at an individual security level. Total investment exposure by issuer may be higher. |
| (4) | Sectors (Common Stocks): |
| | % of Net Assets |
| Financials | 20.1 |
| Health Care | 18.1 |
| Industrials | 10.8 |
| Information Technology | 9.5 |
| Communication Services | 7.5 |
| Consumer Staples | 7.5 |
| Energy | 7.5 |
| Utilities | 5.7 |
| Consumer Discretionary | 4.4 |
| Real Estate | 4.1 |
| Materials | 3.2 |
| | 98.4 |
| Ohio National Fund, Inc. | ON BlackRock Advantage Large Cap Value Portfolio |
| Schedule of Investments | June 30, 2022 (Unaudited) |
| Common Stocks–98.4% | Shares | Value |
Communication Services–7.5%
| | | |
Alphabet, Inc. Class A (Interactive Media & Svs.)
| (a) | 801 | $ 1,745,587 |
Alphabet, Inc. Class C (Interactive Media & Svs.)
| (a) | 524 | 1,146,224 |
AT&T, Inc. (Diversified Telecom. Svs.)
| | 88,155 | 1,847,729 |
Comcast Corp. Class A (Media)
| | 90,994 | 3,570,605 |
Fox Corp. Class A (Media)
| | 67,588 | 2,173,630 |
Fox Corp. Class B (Media)
| | 2,087 | 61,984 |
Liberty Global PLC Class A (Diversified Telecom. Svs.)
| (a) | 18,820 | 396,161 |
Meta Platforms, Inc. Class A (Interactive Media & Svs.)
| (a) | 24,350 | 3,926,438 |
Nexstar Media Group, Inc. Class A (Media)
| | 443 | 72,156 |
ROBLOX Corp. Class A (Entertainment)
| (a) | 16,518 | 542,781 |
Take-Two Interactive Software, Inc. (Entertainment)
| (a) | 299 | 36,636 |
United States Cellular Corp. (Wireless Telecom. Svs.)
| (a) | 17,671 | 511,752 |
Verizon Communications, Inc. (Diversified Telecom. Svs.)
| | 28,210 | 1,431,658 |
Walt Disney Co. / The (Entertainment)
| (a) | 12,061 | 1,138,558 |
Warner Bros Discovery, Inc. (Entertainment)
| (a) | 30,063 | 403,445 |
| | | | 19,005,344 |
Consumer Discretionary–4.4%
| | | |
Advance Auto Parts, Inc. (Specialty Retail)
| | 564 | 97,623 |
Best Buy Co., Inc. (Specialty Retail)
| | 3,292 | 214,605 |
BorgWarner, Inc. (Auto Components)
| | 22,369 | 746,454 |
Carter's, Inc. (Textiles, Apparel & Luxury Goods)
| | 731 | 51,521 |
Choice Hotels International, Inc. (Hotels, Restaurants & Leisure)
| | 344 | 38,401 |
Dick's Sporting Goods, Inc. (Specialty Retail)
| | 4,452 | 335,547 |
Dollar General Corp. (Multiline Retail)
| | 3,519 | 863,703 |
Ford Motor Co. (Automobiles)
| | 10,801 | 120,215 |
General Motors Co. (Automobiles)
| (a) | 42,604 | 1,353,103 |
Home Depot, Inc. / The (Specialty Retail)
| | 2,700 | 740,529 |
Lennar Corp. Class A (Household Durables)
| | 6,384 | 450,519 |
Lowe's Cos., Inc. (Specialty Retail)
| | 2,880 | 503,050 |
McDonald's Corp. (Hotels, Restaurants & Leisure)
| | 3,655 | 902,346 |
PVH Corp. (Textiles, Apparel & Luxury Goods)
| | 1,089 | 61,964 |
Service Corp. International (Diversified Consumer Svs.)
| | 10,123 | 699,702 |
Target Corp. (Multiline Retail)
| | 7,031 | 992,988 |
Travel + Leisure Co. (Hotels, Restaurants & Leisure)
| | 32,332 | 1,255,128 |
Under Armour, Inc. Class C (Textiles, Apparel & Luxury Goods)
| (a) | 2,810 | 21,300 |
Whirlpool Corp. (Household Durables)
| | 6,804 | 1,053,736 |
Yum! Brands, Inc. (Hotels, Restaurants & Leisure)
| | 6,383 | 724,534 |
| | | | 11,226,968 |
Consumer Staples–7.5%
| | | |
Altria Group, Inc. (Tobacco)
| | 20,927 | 874,121 |
Archer-Daniels-Midland Co. (Food Products)
| | 2,583 | 200,441 |
Brown-Forman Corp. Class B (Beverages)
| | 29,923 | 2,099,398 |
Bunge Ltd. (Food Products)
| | 9,664 | 876,428 |
Colgate-Palmolive Co. (Household Products)
| | 16,661 | 1,335,212 |
Costco Wholesale Corp. (Food & Staples Retailing)
| | 452 | 216,634 |
Kellogg Co. (Food Products)
| | 13,703 | 977,572 |
Keurig Dr Pepper, Inc. (Beverages)
| | 49,722 | 1,759,662 |
McCormick & Co., Inc. (Food Products)
| | 12,185 | 1,014,401 |
Molson Coors Beverage Co. Class B (Beverages)
| | 915 | 49,877 |
Mondelez International, Inc. Class A (Food Products)
| | 6,020 | 373,782 |
PepsiCo, Inc. (Beverages)
| | 4,353 | 725,471 |
| Common Stocks (Continued) | Shares | Value |
Consumer Staples (continued)
| | | |
Philip Morris International, Inc. (Tobacco)
| | 12,902 | $ 1,273,943 |
Procter & Gamble Co. / The (Household Products)
| | 35,108 | 5,048,179 |
Tyson Foods, Inc. Class A (Food Products)
| | 10,283 | 884,955 |
Walmart, Inc. (Food & Staples Retailing)
| | 9,903 | 1,204,007 |
| | | | 18,914,083 |
Energy–7.5%
| | | |
Chevron Corp. (Oil, Gas & Consumable Fuels)
| | 22,275 | 3,224,974 |
Devon Energy Corp. (Oil, Gas & Consumable Fuels)
| | 9,583 | 528,119 |
Diamondback Energy, Inc. (Oil, Gas & Consumable Fuels)
| | 1,490 | 180,514 |
EOG Resources, Inc. (Oil, Gas & Consumable Fuels)
| | 22,382 | 2,471,868 |
Excelerate Energy, Inc. Class A (Oil, Gas & Consumable Fuels)
| (a) | 1,473 | 29,342 |
Exxon Mobil Corp. (Oil, Gas & Consumable Fuels)
| | 74,951 | 6,418,804 |
Halliburton Co. (Energy Equip. & Svs.)
| | 36,077 | 1,131,375 |
Marathon Oil Corp. (Oil, Gas & Consumable Fuels)
| | 60,644 | 1,363,277 |
Phillips 66 (Oil, Gas & Consumable Fuels)
| | 14,087 | 1,154,993 |
Schlumberger N.V. (Energy Equip. & Svs.)
| | 32,792 | 1,172,642 |
Valero Energy Corp. (Oil, Gas & Consumable Fuels)
| | 5,600 | 595,168 |
Williams Cos., Inc. / The (Oil, Gas & Consumable Fuels)
| | 16,418 | 512,406 |
| | | | 18,783,482 |
Financials–20.1%
| | | |
Allstate Corp. / The (Insurance)
| | 7,412 | 939,323 |
Ally Financial, Inc. (Consumer Finance)
| | 26,720 | 895,387 |
American Express Co. (Consumer Finance)
| | 9,301 | 1,289,305 |
Bank of America Corp. (Banks)
| | 172,483 | 5,369,396 |
Bank of New York Mellon Corp. / The (Capital Markets)
| | 35,781 | 1,492,425 |
Berkshire Hathaway, Inc. Class B (Diversified Financial Svs.)
| (a) | 21,624 | 5,903,784 |
Capital One Financial Corp. (Consumer Finance)
| | 11,703 | 1,219,336 |
Charles Schwab Corp. / The (Capital Markets)
| | 16,982 | 1,072,923 |
Citigroup, Inc. (Banks)
| | 54,461 | 2,504,661 |
CME Group, Inc. (Capital Markets)
| | 1,867 | 382,175 |
Discover Financial Services (Consumer Finance)
| | 1,505 | 142,343 |
Goldman Sachs Group, Inc. / The (Capital Markets)
| | 1,191 | 353,751 |
Hanover Insurance Group, Inc. / The (Insurance)
| | 2,407 | 352,024 |
Hartford Financial Services Group, Inc. / The (Insurance)
| | 667 | 43,642 |
Huntington Bancshares, Inc. (Banks)
| | 57,486 | 691,557 |
Intercontinental Exchange, Inc. (Capital Markets)
| | 9,812 | 922,720 |
JPMorgan Chase & Co. (Banks)
| | 53,012 | 5,969,681 |
Marsh & McLennan Cos., Inc. (Insurance)
| | 13,513 | 2,097,893 |
MetLife, Inc. (Insurance)
| | 52,882 | 3,320,461 |
Moody's Corp. (Capital Markets)
| | 2,212 | 601,598 |
Pinnacle Financial Partners, Inc. (Banks)
| | 10,458 | 756,218 |
PNC Financial Services Group, Inc. / The (Banks)
| | 10,810 | 1,705,494 |
Radian Group, Inc. (Thrifts & Mortgage Finance)
| | 17,120 | 336,408 |
Regions Financial Corp. (Banks)
| | 86,724 | 1,626,075 |
Reinsurance Group of America, Inc. (Insurance)
| | 6,355 | 745,378 |
Stifel Financial Corp. (Capital Markets)
| | 8,096 | 453,538 |
Travelers Cos., Inc. / The (Insurance)
| | 20,765 | 3,511,984 |
Truist Financial Corp. (Banks)
| | 28,900 | 1,370,727 |
| Ohio National Fund, Inc. | ON BlackRock Advantage Large Cap Value Portfolio (Continued) |
| Schedule of Investments | June 30, 2022 (Unaudited) |
| Common Stocks (Continued) | Shares | Value |
| Financials (continued) | | | |
Voya Financial, Inc. (Diversified Financial Svs.)
| | 45,197 | $ 2,690,577 |
Wells Fargo & Co. (Banks)
| | 43,525 | 1,704,874 |
| | | | 50,465,658 |
Health Care–18.1%
| | | |
Abbott Laboratories (Health Care Equip. & Supplies)
| | 7,207 | 783,041 |
Agilent Technologies, Inc. (Life Sciences Tools & Svs.)
| | 15,865 | 1,884,286 |
AmerisourceBergen Corp. (Health Care Providers & Svs.)
| | 6,729 | 952,019 |
Amgen, Inc. (Biotechnology)
| | 4,267 | 1,038,161 |
Bausch + Lomb Corp. (Health Care Equip. & Supplies)
| (a) | 27,750 | 422,910 |
Biogen, Inc. (Biotechnology)
| (a) | 4,506 | 918,954 |
Boston Scientific Corp. (Health Care Equip. & Supplies)
| (a) | 63,522 | 2,367,465 |
Bristol-Myers Squibb Co. (Pharmaceuticals)
| | 17,412 | 1,340,724 |
Cigna Corp. (Health Care Providers & Svs.)
| | 8,006 | 2,109,741 |
CVS Health Corp. (Health Care Providers & Svs.)
| | 25,763 | 2,387,200 |
Danaher Corp. (Life Sciences Tools & Svs.)
| | 7,470 | 1,893,794 |
Elevance Health, Inc. (Health Care Providers & Svs.)
| | 7,228 | 3,488,088 |
IDEXX Laboratories, Inc. (Health Care Equip. & Supplies)
| (a) | 2,099 | 736,182 |
Johnson & Johnson (Pharmaceuticals)
| | 39,457 | 7,004,012 |
McKesson Corp. (Health Care Providers & Svs.)
| | 2,270 | 740,497 |
Medtronic PLC (Health Care Equip. & Supplies)
| | 18,997 | 1,704,981 |
Merck & Co., Inc. (Pharmaceuticals)
| | 39,243 | 3,577,784 |
Novavax, Inc. (Biotechnology)
| (a) | 7,031 | 361,604 |
Perrigo Co. PLC (Pharmaceuticals)
| | 18,031 | 731,518 |
Pfizer, Inc. (Pharmaceuticals)
| | 69,688 | 3,653,742 |
Syneos Health, Inc. (Life Sciences Tools & Svs.)
| (a) | 24,176 | 1,732,936 |
Thermo Fisher Scientific, Inc. (Life Sciences Tools & Svs.)
| | 4,218 | 2,291,555 |
UnitedHealth Group, Inc. (Health Care Providers & Svs.)
| | 2,842 | 1,459,736 |
Zoetis, Inc. (Pharmaceuticals)
| | 11,406 | 1,960,577 |
| | | | 45,541,507 |
Industrials–10.8%
| | | |
Alaska Air Group, Inc. (Airlines)
| (a) | 14,564 | 583,288 |
AMETEK, Inc. (Electrical Equip.)
| | 8,048 | 884,395 |
Boeing Co. / The (Aerospace & Defense)
| (a) | 6,768 | 925,321 |
Builders FirstSource, Inc. (Building Products)
| (a) | 3,070 | 164,859 |
CSX Corp. (Road & Rail)
| | 3,339 | 97,031 |
Cummins, Inc. (Machinery)
| | 4,473 | 865,660 |
Curtiss-Wright Corp. (Aerospace & Defense)
| | 11,879 | 1,568,741 |
Delta Air Lines, Inc. (Airlines)
| (a) | 1,985 | 57,505 |
Donaldson Co., Inc. (Machinery)
| | 3,285 | 158,140 |
Eaton Corp. PLC (Electrical Equip.)
| | 19,624 | 2,472,428 |
Expeditors International of Washington, Inc. (Air Freight & Logistics)
| | 1,297 | 126,406 |
General Dynamics Corp. (Aerospace & Defense)
| | 16,128 | 3,568,320 |
HEICO Corp. (Aerospace & Defense)
| | 6,649 | 871,817 |
HEICO Corp. Class A (Aerospace & Defense)
| | 12,545 | 1,321,992 |
Honeywell International, Inc. (Industrial Conglomerates)
| | 10,300 | 1,790,243 |
Illinois Tool Works, Inc. (Machinery)
| | 13,381 | 2,438,687 |
JetBlue Airways Corp. (Airlines)
| (a) | 2,396 | 20,055 |
Landstar System, Inc. (Road & Rail)
| | 7,674 | 1,115,953 |
Lennox International, Inc. (Building Products)
| | 437 | 90,280 |
Lockheed Martin Corp. (Aerospace & Defense)
| | 1,969 | 846,591 |
| Common Stocks (Continued) | Shares | Value |
| Industrials (continued) | | | |
Masco Corp. (Building Products)
| | 8,358 | $ 422,915 |
Norfolk Southern Corp. (Road & Rail)
| | 1,494 | 339,571 |
Northrop Grumman Corp. (Aerospace & Defense)
| | 1,551 | 742,262 |
Owens Corning (Building Products)
| | 11,817 | 878,121 |
PACCAR, Inc. (Machinery)
| | 7,931 | 653,039 |
Ryder System, Inc. (Road & Rail)
| | 4,441 | 315,577 |
Schneider National, Inc. Class B (Road & Rail)
| | 17,623 | 394,403 |
SiteOne Landscape Supply, Inc. (Trading Companies & Distributors)
| (a) | 9,172 | 1,090,276 |
Snap-on, Inc. (Machinery)
| | 4,399 | 866,735 |
Stanley Black & Decker, Inc. (Machinery)
| | 4,754 | 498,504 |
Tetra Tech, Inc. (Commercial Svs. & Supplies)
| | 454 | 61,994 |
United Parcel Service, Inc. Class B (Air Freight & Logistics)
| | 4,588 | 837,493 |
| | | | 27,068,602 |
Information Technology–9.5%
| | | |
Analog Devices, Inc. (Semiconductors & Equip.)
| | 6,475 | 945,933 |
Applied Materials, Inc. (Semiconductors & Equip.)
| | 5,465 | 497,206 |
Avnet, Inc. (Electronic Equip., Instr. & Comp.)
| | 6,467 | 277,305 |
Ciena Corp. (Communications Equip.)
| (a) | 5,005 | 228,728 |
Cisco Systems, Inc. (Communications Equip.)
| | 7,987 | 340,566 |
Cognizant Technology Solutions Corp. Class A (IT Svs.)
| | 11,386 | 768,441 |
Dell Technologies, Inc. Class C (Tech. Hardware, Storage & Periph.)
| | 24,736 | 1,143,051 |
Fidelity National Information Services, Inc. (IT Svs.)
| | 14,288 | 1,309,781 |
Global Payments, Inc. (IT Svs.)
| | 6,605 | 730,777 |
Hewlett Packard Enterprise Co. (Tech. Hardware, Storage & Periph.)
| | 94,932 | 1,258,798 |
HP, Inc. (Tech. Hardware, Storage & Periph.)
| | 33,527 | 1,099,015 |
Intel Corp. (Semiconductors & Equip.)
| | 104,713 | 3,917,313 |
Juniper Networks, Inc. (Communications Equip.)
| | 46,328 | 1,320,348 |
Marvell Technology, Inc. (Semiconductors & Equip.)
| | 7,893 | 343,582 |
Micron Technology, Inc. (Semiconductors & Equip.)
| | 10,939 | 604,708 |
Microsoft Corp. (Software)
| | 5,234 | 1,344,248 |
NVIDIA Corp. (Semiconductors & Equip.)
| | 4,190 | 635,162 |
NXP Semiconductors N.V. (Semiconductors & Equip.)
| | 483 | 71,498 |
QUALCOMM, Inc. (Semiconductors & Equip.)
| | 408 | 52,118 |
RingCentral, Inc. Class A (Software)
| (a) | 8,899 | 465,062 |
Roper Technologies, Inc. (Software)
| | 1,614 | 636,965 |
Salesforce, Inc. (Software)
| (a) | 11,264 | 1,859,011 |
ServiceNow, Inc. (Software)
| (a) | 1,963 | 933,446 |
Silicon Laboratories, Inc. (Semiconductors & Equip.)
| (a) | 7,658 | 1,073,805 |
TE Connectivity Ltd. (Electronic Equip., Instr. & Comp.)
| | 947 | 107,153 |
Visa, Inc. (IT Svs.)
| | 6,614 | 1,302,230 |
Workday, Inc. Class A (Software)
| (a) | 4,662 | 650,722 |
| | | | 23,916,972 |
Materials–3.2%
| | | |
Corteva, Inc. (Chemicals)
| | 22,611 | 1,224,160 |
DuPont de Nemours, Inc. (Chemicals)
| | 6,939 | 385,670 |
Ecolab, Inc. (Chemicals)
| | 14,449 | 2,221,678 |
FMC Corp. (Chemicals)
| | 2,447 | 261,854 |
Freeport-McMoRan, Inc. (Metals & Mining)
| | 15,235 | 445,776 |
Huntsman Corp. (Chemicals)
| | 2,238 | 63,447 |
Linde PLC (Chemicals)
| | 7,118 | 2,046,639 |
| Ohio National Fund, Inc. | ON BlackRock Advantage Large Cap Value Portfolio (Continued) |
| Schedule of Investments | June 30, 2022 (Unaudited) |
| Common Stocks (Continued) | Shares | Value |
| Materials (continued) | | | |
LyondellBasell Industries N.V. Class A (Chemicals)
| | 5,764 | $ 504,119 |
Mosaic Co. / The (Chemicals)
| | 4,774 | 225,476 |
Reliance Steel & Aluminum Co. (Metals & Mining)
| | 4,384 | 744,666 |
| | | | 8,123,485 |
Real Estate–4.1%
| | | |
Brixmor Property Group, Inc. (Equity REIT)
| | 5,718 | 115,561 |
CBRE Group, Inc. Class A (Real Estate Mgmt. & Development)
| (a) | 10,644 | 783,505 |
Crown Castle International Corp. (Equity REIT)
| | 5,340 | 899,149 |
CubeSmart (Equity REIT)
| | 27,260 | 1,164,547 |
Equity LifeStyle Properties, Inc. (Equity REIT)
| | 15,194 | 1,070,721 |
Extra Space Storage, Inc. (Equity REIT)
| | 10,137 | 1,724,506 |
Life Storage, Inc. (Equity REIT)
| | 9,940 | 1,109,900 |
Mid-America Apartment Communities, Inc. (Equity REIT)
| | 4,159 | 726,453 |
Prologis, Inc. (Equity REIT)
| | 23,050 | 2,711,833 |
| | | | 10,306,175 |
Utilities–5.7%
| | | |
Black Hills Corp. (Multi-Utilities)
| | 5,773 | 420,101 |
| Common Stocks (Continued) | Shares | Value |
| Utilities (continued) | | | |
CMS Energy Corp. (Multi-Utilities)
| | 43,031 | $ 2,904,593 |
DTE Energy Co. (Multi-Utilities)
| | 25,975 | 3,292,331 |
Entergy Corp. (Electric Utilities)
| | 24,466 | 2,755,850 |
NextEra Energy, Inc. (Electric Utilities)
| | 23,083 | 1,788,009 |
NRG Energy, Inc. (Ind. Power & Renewable Elec.)
| | 13,055 | 498,309 |
OGE Energy Corp. (Electric Utilities)
| | 67,190 | 2,590,847 |
| | | | 14,250,040 |
Total Common Stocks (Cost $271,404,367)
| | | $247,602,316 |
| Money Market Funds–1.0% | Shares | Value |
State Street Institutional Liquid Reserves Fund Institutional Class, 1.494%
| (b) | 2,448,258 | $ 2,448,013 |
Total Money Market Funds (Cost $2,448,183)
| | | $ 2,448,013 |
Total Investments – 99.4% (Cost $273,852,550)
| (c) | | $250,050,329 |
Other Assets in Excess of Liabilities – 0.6%
| (d) | | 1,402,196 |
| Net Assets – 100.0% | | | $251,452,525 |
Percentages are stated as a percent of net assets. |
| Footnotes: | |
| (a) | Non-income producing security. |
| (b) | Rate represents the seven-day yield at June 30, 2022. |
| (c) | Represents cost for financial reporting purposes, which may differ from cost basis for federal income tax purposes. See also Note 7 of the Notes to Financial Statements. |
| (d) | Includes $242,550 of cash pledged as collateral for the futures contracts outstanding at June 30, 2022. See also the following Schedule of Open Futures Contracts. |
The accompanying notes are an integral part of these financial statements.
| Schedule of Open Futures Contracts | June 30, 2022 (Unaudited) |
| Description | | Number of
contracts | | Expiration Date | | Notional
Amount | | Value | | Unrealized
Appreciation
(Depreciation) | | Variation Margin
Receivable
(Payable) |
| CME E-mini S&P 500 Index - Long | | 21 | | September 16, 2022 | | $4,029,208 | | $3,978,975 | | $(50,233) | | $(33,338) |
The accompanying notes are an integral part of these financial statements.
| Ohio National Fund, Inc. | ON Federated High Income Bond Portfolio (Unaudited) |
The ON Federated High Income Bond Portfolio seeks high current income by investing, under normal circumstances, at least 80% of its net assets in lower rated corporate debt obligations commonly referred to as “junk bonds”. The Portfolio’s investments are generally rated BB or lower by Standard & Poor’s or Fitch, or Ba or lower by Moody’s.
Performance as of June 30, 2022
| Average Annual returns | |
| One year | -12.73% |
| Five years | 1.81% |
| Ten years | 4.08% |
Past performance does not guarantee future results. The performance data quoted represents past performance and current returns may be lower or higher. Total return figures include change in share price and reinvestment of dividends and capital gains. The investment return and principal value will fluctuate so that an investor’s shares, when redeemed, may be worth more or less than the original cost. To obtain performance information up to the most recent month end, call toll-free 1-877-781-6392.
The Portfolio is not open to direct retail investment. Beneficial interest in the Portfolio’s shares is obtained either through an allocation to the Portfolio as an investment vehicle within variable life insurance policies or annuity contracts, or as an underlying investment by the ON Model Portfolios. Actual performance results for variable annuity and variable universal life contracts will be lower due to contract charges. Consult your contract for applicable charges.
Total expense ratio is 0.82% per the Fund’s prospectus dated April 29, 2022. Additional information pertaining to the Portfolio’s expense ratio as of June 30, 2022 can be found in the Portfolio’s Financial Highlights.
Comments from Sub-Adviser
Q. How did the Portfolio perform in comparison to its benchmark during the reporting period?
A. For the six-month period ended June 30, 2022, the Portfolio returned -13.67% versus -14.03% for its benchmark, the ICE BofA U.S. High Yield Constrained Index.
Q. Were there specific market conditions, investment strategies, or techniques that materially affected the Portfolio’s benchmark-relative performance during the reporting period?
A. Two main themes dominated the financial markets in the six-month reporting period; the perception that the Federal Reserve (“Fed”) had turned increasingly hawkish and growing concerns around a recession. The Fed appears to have finally realized that it stayed accommodative way too long and is behind the curve on fighting inflation. This led to increasingly hawkish commentary from members of the Fed and the markets to significantly increase their expectations of the number and size of the Fed’s actions over the next 12 to 18 months. This led to a substantial rise in U.S. Treasury interest rates during the period, with the 5-year rate increasing 183 basis points and the 10-year rising 151 basis points.
Towards the end of the reporting period, increasing recession fears for the U.S. negatively impacted high yield prices. The factors causing recession concerns were numerous, including surging inflation (especially for energy and food), a more hawkish Federal Reserve, continuing war in Ukraine, potential recession in Europe, continuing supply chain issues, potential margin pressure if corporations are unable to pass through price increases, demand destruction caused by higher prices, declining consumer confidence and COVID-related lockdowns in China. The ongoing Ukrainian war led to increased volatility, but with
different impact across industry sectors. The war benefitted the Energy sector as oil and natural gas prices skyrocketed, but negatively impacted companies harmed by rising commodity prices and already stressed supply chains.
Given the geopolitical and economic environment, the best returning major sectors in the benchmark for the period (although all negative total returns) were energy, capital goods, and utility. The worst performing major sectors in the benchmark were retail, healthcare (particularly the pharmaceutical subsector), and media. Given growing concerns around recession and inflation, the Portfolio benefitted from its underweight to the retail sector, and media holdings underperformed due to concerns around weakening advertising spending. With the negative return in the high yield market, the Portfolio benefitted from its cash position. Despite higher commodity prices, the energy sector was not a meaningful contributor to relative performance, as negative security selection offset positive sector allocation. (1)
Q. How did sector allocation and security selection each impact the Portfolio’s performance relative to its benchmark?
A. The Portfolio benefitted from both sector allocation and selection decisions during the six-month period. The Portfolio benefitted from its underweight to the poor performing retail sector, as well as security selection in the retail sector. The Portfolio also benefitted from both its overweight to the insurance sector, as well as security selection in the sector. In addition, the Portfolio benefitted from its underweight to the poor performing telecommunications sector. Security selection in the healthcare sector was the largest driver of outperformance. Given the negative market returns for the period, the Portfolio also benefitted from its cash holdings throughout the period.
Detracting from relative performance for the period was the Portfolio’s overweight to the poor performing media sector. Security selection in the technology and electronics and financial services sectors was also a detractor. (1)
Q. Which securities contributed the most to, and detracted the most from, the Portfolio’s benchmark-relative performance?
A. Contributors: Hub International Ltd. 7.000% due 05/01/2026 (“Hub International”): Hub International,a top five insurance broker with a large footprint in both the U.S. and Canada, continues to report strong, consistent earnings. USI, Inc. 6.875% due 05/01/2025: USI, Inc. is a leading insurance broker in the U.S. focused on the middle market and continues to report strong, consistent earnings. Clarios Global LP / Clarios U.S. Finance Co. 8.500% due 05/15/2027 (“Clarios Global”): Clarios Global is a manufacturer of advanced, low-voltage batteries for vehicles and industrial products. The company has been very good about managing its balance sheet.
Detractors: Bausch Health Companies 7.250% due 5/30/2029 (“Bausch”): Bausch underperformed during the period, as the company discussed plans to separate the business with these bonds remaining at RemainCo. Due to weaker than expected proceeds from an IPO of the Bausch + Lomb business, leverage at RemainCo is higher than planned and the bonds underperformed. CMG Media Corp. 8.875% due 12/15/2027: CMG Media Corp. is a North American media company owned by Apollo Global Management, with assets primarily in local broadcasting stations, but also radio stations. The company underperformed during the period due to a potential acquirer being acquired by private equity, likely pushing out a sale of CMG Media Corp. by a few years. Also, revenue from cable operators grew slower than expected. Western Midstream Operating LP 5.300% due 03/01/2048: Western Midstream Operating LP owns
| Ohio National Fund, Inc. | ON Federated High Income Bond Portfolio (Unaudited) (Continued) |
midstream energy assets in the United States. Western Midstream is a fallen angel and these longer duration bonds underperformed with interest rates increasing during the reporting period. (1)
| (1) | The Portfolio’s composition is subject to change. Holdings and weightings are as of June 30, 2022. |
Change in Value of $10,000 Investment
Hypothetical illustration based on past performance. Future performance will vary. All returns reflect reinvested dividends. The Portfolio’s holdings may differ significantly from the securities in the index. The index is unmanaged and therefore does not reflect the cost of portfolio management and accounting.
The ICE BofA U.S. High Yield Constrained Index tracks the performance of below investment grade, but not in default, U.S. dollar denominated corporate bonds publicly issued in the U.S. domestic market, and includes issues with a credit rating of BBB or below, as rated by Moody’s and S&P.
Past performance is no guarantee of future results. Redemption of fund shares could have tax implications unique to each shareholder.
| Portfolio Composition as of June 30, 2022 (1) |
| | % of Net Assets |
| Corporate Bonds (4) | 97.7 |
| Common Stocks (4) | 0.3 |
| Rights (4) | 0.0 |
Money Market Funds and
Other Net Assets | 2.0 |
| | 100.0 |
| Top 10 Portfolio Holdings as of June 30, 2022 (1) (2) (3) |
| | | % of Net Assets |
| 1. | HUB International Ltd. 7.000%, 05/01/2026 | 1.4 |
| 2. | CCO Holdings LLC / CCO Holdings Capital Corp. 4.750%, 03/01/2030 | 1.4 |
| 3. | 1011778 B.C. ULC / New Red Finance, Inc. 4.000%, 10/15/2030 | 1.1 |
| 4. | Clarios Global LP / Clarios U.S. Finance Co. 8.500%, 05/15/2027 | 0.9 |
| 5. | Standard Industries, Inc. 5.000%, 02/15/2027 | 0.9 |
| 6. | Allied Universal Holdco LLC / Allied Universal Finance Corp. 9.750%, 07/15/2027 | 0.8 |
| 7. | Clydesdale Acquisition Holdings, Inc. 8.750%, 04/15/2030 | 0.8 |
| 8. | NFP Corp. 6.875%, 08/15/2028 | 0.8 |
| 9. | USI, Inc. 6.875%, 05/01/2025 | 0.8 |
| 10. | Garda World Security Corp. 9.500%, 11/01/2027 | 0.8 |
| | |
| (1) | Composition of Portfolio subject to change. |
| (2) | Short-term investments have been excluded from the list of Top 10 Portfolio Holdings. |
| (3) | Top 10 Portfolio Holdings is presented at an individual security level. Total investment exposure by issuer may be higher. |
| (4) | Sectors (Common Stocks, Corporate Bonds, Rights): |
| | % of Net Assets |
| Communication Services | 17.7 |
| Energy | 14.0 |
| Consumer Discretionary | 12.0 |
| Health Care | 11.5 |
| Materials | 10.4 |
| Industrials | 10.3 |
| Financials | 9.7 |
| Information Technology | 5.7 |
| Consumer Staples | 3.2 |
| Utilities | 3.0 |
| Real Estate | 0.5 |
| | 98.0 |
| Ohio National Fund, Inc. | ON Federated High Income Bond Portfolio |
| Schedule of Investments | June 30, 2022 (Unaudited) |
| Corporate Bonds–97.7% | Rate | Maturity | Face Amount | Value |
Communication Services–17.7%
| | | | | |
AMC Networks, Inc. (Media)
| | 4.250% | 02/15/2029 | $ 50,000 | $ 40,510 |
Audacy Capital Corp. (Media)
| (a) | 6.500% | 05/01/2027 | 375,000 | 223,165 |
Audacy Capital Corp. (Media)
| (a) | 6.750% | 03/31/2029 | 350,000 | 186,375 |
Cars.com, Inc. (Interactive Media & Svs.)
| (a) | 6.375% | 11/01/2028 | 400,000 | 336,988 |
CCO Holdings LLC / CCO Holdings Capital Corp. (Media)
| (a) | 5.125% | 05/01/2027 | 225,000 | 212,344 |
CCO Holdings LLC / CCO Holdings Capital Corp. (Media)
| (a) | 5.000% | 02/01/2028 | 650,000 | 599,755 |
CCO Holdings LLC / CCO Holdings Capital Corp. (Media)
| (a) | 5.375% | 06/01/2029 | 175,000 | 156,422 |
CCO Holdings LLC / CCO Holdings Capital Corp. (Media)
| (a) | 4.750% | 03/01/2030 | 2,175,000 | 1,860,169 |
CCO Holdings LLC / CCO Holdings Capital Corp. (Media)
| (a) | 4.500% | 08/15/2030 | 250,000 | 207,570 |
CCO Holdings LLC / CCO Holdings Capital Corp. (Media)
| (a) | 4.250% | 01/15/2034 | 100,000 | 77,250 |
CMG Media Corp. (Media)
| (a) | 8.875% | 12/15/2027 | 1,000,000 | 790,010 |
CSC Holdings LLC (Media)
| | 5.250% | 06/01/2024 | 375,000 | 350,625 |
CSC Holdings LLC (Media)
| (a) | 5.500% | 04/15/2027 | 900,000 | 815,589 |
CSC Holdings LLC (Media)
| (a) | 7.500% | 04/01/2028 | 550,000 | 459,250 |
CSC Holdings LLC (Media)
| (a) | 5.750% | 01/15/2030 | 300,000 | 218,259 |
CSC Holdings LLC (Media)
| (a) | 4.125% | 12/01/2030 | 200,000 | 156,000 |
CSC Holdings LLC (Media)
| (a) | 4.625% | 12/01/2030 | 675,000 | 451,399 |
CSC Holdings LLC (Media)
| (a) | 3.375% | 02/15/2031 | 200,000 | 147,862 |
CSC Holdings LLC (Media)
| (a) | 4.500% | 11/15/2031 | 150,000 | 115,672 |
Cumulus Media New Holdings, Inc. (Media)
| (a) | 6.750% | 07/01/2026 | 356,000 | 327,965 |
DIRECTV Holdings LLC / DIRECTV Financing Co., Inc. (Media)
| (a) | 5.875% | 08/15/2027 | 400,000 | 341,228 |
DISH DBS Corp. (Media)
| (a) | 5.250% | 12/01/2026 | 450,000 | 352,728 |
DISH DBS Corp. (Media)
| | 7.375% | 07/01/2028 | 100,000 | 68,020 |
DISH DBS Corp. (Media)
| | 5.125% | 06/01/2029 | 625,000 | 379,775 |
Entegris Escrow Corp. (Media)
| (a) | 5.950% | 06/15/2030 | 225,000 | 214,059 |
Gray Escrow II, Inc. (Media)
| (a) | 5.375% | 11/15/2031 | 175,000 | 140,215 |
Gray Television, Inc. (Media)
| (a) | 5.875% | 07/15/2026 | 750,000 | 701,115 |
Gray Television, Inc. (Media)
| (a) | 4.750% | 10/15/2030 | 75,000 | 58,688 |
iHeartCommunications, Inc. (Media)
| | 6.375% | 05/01/2026 | 41,769 | 38,689 |
iHeartCommunications, Inc. (Media)
| | 8.375% | 05/01/2027 | 1,025,707 | 815,109 |
iHeartCommunications, Inc. (Media)
| (a) | 5.250% | 08/15/2027 | 250,000 | 213,957 |
iHeartCommunications, Inc. (Media)
| (a) | 4.750% | 01/15/2028 | 100,000 | 82,408 |
Lamar Media Corp. (Media)
| | 4.875% | 01/15/2029 | 150,000 | 135,017 |
Lamar Media Corp. (Media)
| | 3.625% | 01/15/2031 | 100,000 | 81,842 |
Match Group Holdings II LLC (Interactive Media & Svs.)
| (a) | 5.000% | 12/15/2027 | 450,000 | 417,139 |
Match Group Holdings II LLC (Interactive Media & Svs.)
| (a) | 4.625% | 06/01/2028 | 75,000 | 67,995 |
Match Group Holdings II LLC (Interactive Media & Svs.)
| (a) | 4.125% | 08/01/2030 | 350,000 | 292,287 |
Match Group Holdings II LLC (Interactive Media & Svs.)
| (a) | 3.625% | 10/01/2031 | 150,000 | 118,125 |
Midas OpCo Holdings LLC (Media)
| (a) | 5.625% | 08/15/2029 | 900,000 | 723,177 |
Millennium Escrow Corp. (Interactive Media & Svs.)
| (a) | 6.625% | 08/01/2026 | 225,000 | 181,588 |
News Corp. (Media)
| (a) | 5.125% | 02/15/2032 | 75,000 | 66,412 |
Nexstar Media, Inc. (Media)
| (a) | 5.625% | 07/15/2027 | 300,000 | 273,750 |
Nexstar Media, Inc. (Media)
| (a) | 4.750% | 11/01/2028 | 750,000 | 643,125 |
Rackspace Technology Global, Inc. (Interactive Media & Svs.)
| (a) | 3.500% | 02/15/2028 | 350,000 | 274,220 |
Rackspace Technology Global, Inc. (Interactive Media & Svs.)
| (a) | 5.375% | 12/01/2028 | 375,000 | 245,051 |
ROBLOX Corp. (Entertainment)
| (a) | 3.875% | 05/01/2030 | 275,000 | 222,893 |
Scripps Escrow II, Inc. (Media)
| (a) | 3.875% | 01/15/2029 | 100,000 | 83,804 |
Scripps Escrow II, Inc. (Media)
| (a) | 5.375% | 01/15/2031 | 300,000 | 239,265 |
Scripps Escrow, Inc. (Media)
| (a) | 5.875% | 07/15/2027 | 350,000 | 306,413 |
Sinclair Television Group, Inc. (Media)
| (a) | 5.125% | 02/15/2027 | 125,000 | 105,391 |
Sinclair Television Group, Inc. (Media)
| (a) | 5.500% | 03/01/2030 | 275,000 | 202,488 |
Sirius XM Radio, Inc. (Media)
| (a) | 3.125% | 09/01/2026 | 225,000 | 200,752 |
Sirius XM Radio, Inc. (Media)
| (a) | 5.000% | 08/01/2027 | 75,000 | 69,564 |
Sirius XM Radio, Inc. (Media)
| (a) | 4.000% | 07/15/2028 | 175,000 | 151,375 |
Sirius XM Radio, Inc. (Media)
| (a) | 4.125% | 07/01/2030 | 475,000 | 396,715 |
Sirius XM Radio, Inc. (Media)
| (a) | 3.875% | 09/01/2031 | 600,000 | 477,750 |
Sprint Corp. (Wireless Telecom. Svs.)
| | 7.625% | 02/15/2025 | 300,000 | 312,695 |
TEGNA, Inc. (Media)
| | 5.000% | 09/15/2029 | 750,000 | 709,387 |
Telenet Finance Luxembourg Notes SARL (Media)
| (a) | 5.500% | 03/01/2028 | 800,000 | 705,920 |
T-Mobile U.S.A., Inc. (Wireless Telecom. Svs.)
| | 2.250% | 02/15/2026 | 200,000 | 179,979 |
T-Mobile U.S.A., Inc. (Wireless Telecom. Svs.)
| | 3.375% | 04/15/2029 | 500,000 | 437,500 |
T-Mobile U.S.A., Inc. (Wireless Telecom. Svs.)
| | 2.875% | 02/15/2031 | 150,000 | 124,534 |
Townsquare Media, Inc. (Media)
| (a) | 6.875% | 02/01/2026 | 100,000 | 89,074 |
Twitter, Inc. (Interactive Media & Svs.)
| (a) | 5.000% | 03/01/2030 | 275,000 | 260,906 |
Univision Communications, Inc. (Media)
| (a) | 4.500% | 05/01/2029 | 275,000 | 230,181 |
Univision Communications, Inc. (Media)
| (a) | 7.375% | 06/30/2030 | 25,000 | 24,438 |
UPC Broadband Finco B.V. (Media)
| (a) | 4.875% | 07/15/2031 | 725,000 | 590,875 |
Urban One, Inc. (Media)
| (a) | 7.375% | 02/01/2028 | 400,000 | 342,500 |
Virgin Media Finance PLC (Media)
| (a) | 5.000% | 07/15/2030 | 200,000 | 158,500 |
Virgin Media Secured Finance PLC (Media)
| (a) | 4.500% | 08/15/2030 | 200,000 | 164,342 |
| Ohio National Fund, Inc. | ON Federated High Income Bond Portfolio (Continued) |
| Schedule of Investments | June 30, 2022 (Unaudited) |
| Corporate Bonds (Continued) | Rate | Maturity | Face Amount | Value |
Communication Services (continued)
| | | | | |
Virgin Media Vendor Financing Notes IV DAC (Media)
| (a) | 5.000% | 07/15/2028 | $ 575,000 | $ 475,795 |
Vmed O2 U.K. Financing I PLC (Wireless Telecom. Svs.)
| (a) | 4.250% | 01/31/2031 | 200,000 | 160,750 |
Vmed O2 U.K. Financing I PLC (Wireless Telecom. Svs.)
| (a) | 4.750% | 07/15/2031 | 400,000 | 323,140 |
VZ Secured Financing B.V. (Media)
| (a) | 5.000% | 01/15/2032 | 550,000 | 456,500 |
WMG Acquisition Corp. (Entertainment)
| (a) | 3.750% | 12/01/2029 | 125,000 | 104,375 |
WMG Acquisition Corp. (Entertainment)
| (a) | 3.875% | 07/15/2030 | 75,000 | 62,366 |
Ziggo Bond Co. B.V. (Diversified Telecom. Svs.)
| (a) | 6.000% | 01/15/2027 | 425,000 | 376,125 |
| | | | | | 23,405,190 |
Consumer Discretionary–12.0%
| �� | | | | |
1011778 B.C. ULC / New Red Finance, Inc. (Hotels, Restaurants & Leisure)
| (a) | 4.000% | 10/15/2030 | 1,800,000 | 1,444,500 |
Academy Ltd. (Specialty Retail)
| (a) | 6.000% | 11/15/2027 | 175,000 | 159,906 |
Adient Global Holdings Ltd. (Auto Components)
| (a) | 4.875% | 08/15/2026 | 775,000 | 680,186 |
Affinity Gaming (Hotels, Restaurants & Leisure)
| (a) | 6.875% | 12/15/2027 | 400,000 | 336,016 |
Aramark Services, Inc. (Hotels, Restaurants & Leisure)
| (a) | 6.375% | 05/01/2025 | 625,000 | 611,469 |
Aramark Services, Inc. (Hotels, Restaurants & Leisure)
| (a) | 5.000% | 02/01/2028 | 100,000 | 90,621 |
Asbury Automotive Group, Inc. (Specialty Retail)
| (a) | 4.625% | 11/15/2029 | 300,000 | 247,875 |
Asbury Automotive Group, Inc. (Specialty Retail)
| (a) | 5.000% | 02/15/2032 | 200,000 | 163,500 |
Boyd Gaming Corp. (Hotels, Restaurants & Leisure)
| | 4.750% | 12/01/2027 | 275,000 | 248,875 |
Boyd Gaming Corp. (Hotels, Restaurants & Leisure)
| (a) | 4.750% | 06/15/2031 | 200,000 | 169,004 |
Caesars Entertainment, Inc. (Hotels, Restaurants & Leisure)
| (a) | 6.250% | 07/01/2025 | 325,000 | 313,212 |
Caesars Entertainment, Inc. (Hotels, Restaurants & Leisure)
| (a) | 8.125% | 07/01/2027 | 450,000 | 434,812 |
Caesars Entertainment, Inc. (Hotels, Restaurants & Leisure)
| (a) | 4.625% | 10/15/2029 | 275,000 | 213,813 |
Caesars Resort Collection LLC / CRC Finco, Inc. (Hotels, Restaurants & Leisure)
| (a) | 5.750% | 07/01/2025 | 50,000 | 47,816 |
Clarios Global LP / Clarios U.S. Finance Co. (Auto Components)
| (a) | 6.250% | 05/15/2026 | 112,000 | 107,800 |
Clarios Global LP / Clarios U.S. Finance Co. (Auto Components)
| (a) | 8.500% | 05/15/2027 | 1,250,000 | 1,208,094 |
Dana, Inc. (Auto Components)
| | 4.250% | 09/01/2030 | 250,000 | 194,051 |
Dana, Inc. (Auto Components)
| | 4.500% | 02/15/2032 | 100,000 | 73,878 |
Dornoch Debt Merger Sub, Inc. (Auto Components)
| (a) | 6.625% | 10/15/2029 | 625,000 | 461,562 |
Gap, Inc. / The (Specialty Retail)
| (a) | 3.625% | 10/01/2029 | 75,000 | 52,665 |
Gap, Inc. / The (Specialty Retail)
| (a) | 3.875% | 10/01/2031 | 175,000 | 122,063 |
Garda World Security Corp. (Diversified Consumer Svs.)
| (a) | 9.500% | 11/01/2027 | 1,103,000 | 1,008,776 |
Gates Global LLC / Gates Corp. (Auto Components)
| (a) | 6.250% | 01/15/2026 | 950,000 | 881,125 |
Hilton Domestic Operating Co., Inc. (Hotels, Restaurants & Leisure)
| (a) | 5.750% | 05/01/2028 | 75,000 | 71,312 |
Hilton Domestic Operating Co., Inc. (Hotels, Restaurants & Leisure)
| | 4.875% | 01/15/2030 | 150,000 | 135,563 |
Hilton Domestic Operating Co., Inc. (Hotels, Restaurants & Leisure)
| (a) | 3.625% | 02/15/2032 | 300,000 | 238,312 |
IHO Verwaltungs GmbH (Auto Components)
| (a)(b) | 4.750%, 5.500% PIK | 09/15/2026 | 400,000 | 343,833 |
IHO Verwaltungs GmbH (Auto Components)
| (a)(b) | 6.000%, 6.750% PIK | 05/15/2027 | 400,000 | 356,018 |
KFC Holding Co. / Pizza Hut Holdings LLC / Taco Bell of America LLC (Hotels, Restaurants & Leisure)
| (a) | 4.750% | 06/01/2027 | 525,000 | 504,892 |
Kontoor Brands, Inc. (Textiles, Apparel & Luxury Goods)
| (a) | 4.125% | 11/15/2029 | 100,000 | 79,412 |
MGM Resorts International (Hotels, Restaurants & Leisure)
| | 4.625% | 09/01/2026 | 248,000 | 220,140 |
MGM Resorts International (Hotels, Restaurants & Leisure)
| | 4.750% | 10/15/2028 | 75,000 | 63,071 |
Midwest Gaming Borrower LLC / Midwest Gaming Finance Corp. (Hotels, Restaurants & Leisure)
| (a) | 4.875% | 05/01/2029 | 200,000 | 163,000 |
Mohegan Gaming & Entertainment (Hotels, Restaurants & Leisure)
| (a) | 8.000% | 02/01/2026 | 850,000 | 722,500 |
Penn National Gaming, Inc. (Hotels, Restaurants & Leisure)
| (a) | 5.625% | 01/15/2027 | 50,000 | 43,875 |
Penn National Gaming, Inc. (Hotels, Restaurants & Leisure)
| (a) | 4.125% | 07/01/2029 | 125,000 | 94,850 |
Raptor Acquisition Corp. / Raptor Co-Issuer LLC (Hotels, Restaurants & Leisure)
| (a) | 4.875% | 11/01/2026 | 50,000 | 43,750 |
Real Hero Merger Sub 2, Inc. (Auto Components)
| (a) | 6.250% | 02/01/2029 | 975,000 | 739,429 |
Scientific Games Holdings LP / Scientific Games U.S. FinCo, Inc. (Hotels, Restaurants & Leisure)
| (a) | 6.625% | 03/01/2030 | 400,000 | 340,000 |
Scientific Games International, Inc. (Hotels, Restaurants & Leisure)
| (a) | 8.625% | 07/01/2025 | 350,000 | 358,785 |
Scientific Games International, Inc. (Hotels, Restaurants & Leisure)
| (a) | 7.250% | 11/15/2029 | 250,000 | 234,452 |
SeaWorld Parks & Entertainment, Inc. (Hotels, Restaurants & Leisure)
| (a) | 5.250% | 08/15/2029 | 500,000 | 423,095 |
Signal Parent, Inc. (Diversified Consumer Svs.)
| (a) | 6.125% | 04/01/2029 | 425,000 | 265,668 |
Six Flags Entertainment Corp. (Hotels, Restaurants & Leisure)
| (a) | 5.500% | 04/15/2027 | 500,000 | 453,760 |
Six Flags Theme Parks, Inc. (Hotels, Restaurants & Leisure)
| (a) | 7.000% | 07/01/2025 | 50,000 | 50,617 |
Station Casinos LLC (Hotels, Restaurants & Leisure)
| (a) | 4.500% | 02/15/2028 | 200,000 | 168,922 |
Station Casinos LLC (Hotels, Restaurants & Leisure)
| (a) | 4.625% | 12/01/2031 | 200,000 | 156,000 |
William Carter Co. / The (Textiles, Apparel & Luxury Goods)
| (a) | 5.625% | 03/15/2027 | 75,000 | 70,231 |
Yum! Brands, Inc. (Hotels, Restaurants & Leisure)
| (a) | 4.750% | 01/15/2030 | 75,000 | 68,063 |
Yum! Brands, Inc. (Hotels, Restaurants & Leisure)
| | 4.625% | 01/31/2032 | 100,000 | 88,350 |
Yum! Brands, Inc. (Hotels, Restaurants & Leisure)
| | 5.375% | 04/01/2032 | 150,000 | 138,390 |
| | | | | | 15,907,909 |
Consumer Staples–3.2%
| | | | | |
Albertsons Cos., Inc. / Safeway, Inc. / New Albertsons LP / Albertsons LLC (Food & Staples Retailing)
| (a) | 5.875% | 02/15/2028 | 100,000 | 93,463 |
Albertsons Cos., Inc. / Safeway, Inc. / New Albertsons LP / Albertsons LLC (Food & Staples Retailing)
| (a) | 3.500% | 03/15/2029 | 425,000 | 343,958 |
| Ohio National Fund, Inc. | ON Federated High Income Bond Portfolio (Continued) |
| Schedule of Investments | June 30, 2022 (Unaudited) |
| Corporate Bonds (Continued) | Rate | Maturity | Face Amount | Value |
Consumer Staples (continued)
| | | | | |
BellRing Brands, Inc. (Personal Products)
| (a) | 7.000% | 03/15/2030 | $ 575,000 | $ 541,937 |
Edgewell Personal Care Co. (Personal Products)
| (a) | 5.500% | 06/01/2028 | 175,000 | 159,233 |
Edgewell Personal Care Co. (Personal Products)
| (a) | 4.125% | 04/01/2029 | 200,000 | 165,074 |
Energizer Holdings, Inc. (Household Products)
| (a) | 6.500% | 12/31/2027 | 100,000 | 87,625 |
Energizer Holdings, Inc. (Household Products)
| (a) | 4.750% | 06/15/2028 | 150,000 | 119,058 |
Energizer Holdings, Inc. (Household Products)
| (a) | 4.375% | 03/31/2029 | 425,000 | 326,285 |
Kraft Heinz Foods Co. (Food Products)
| | 5.200% | 07/15/2045 | 200,000 | 185,085 |
Kraft Heinz Foods Co. (Food Products)
| | 4.375% | 06/01/2046 | 200,000 | 166,681 |
Performance Food Group, Inc. (Food & Staples Retailing)
| (a) | 5.500% | 10/15/2027 | 150,000 | 138,862 |
Performance Food Group, Inc. (Food & Staples Retailing)
| (a) | 4.250% | 08/01/2029 | 250,000 | 208,750 |
Post Holdings, Inc. (Food Products)
| (a) | 5.750% | 03/01/2027 | 230,000 | 222,813 |
Post Holdings, Inc. (Food Products)
| (a) | 5.625% | 01/15/2028 | 500,000 | 474,600 |
Post Holdings, Inc. (Food Products)
| (a) | 4.625% | 04/15/2030 | 150,000 | 126,566 |
Post Holdings, Inc. (Food Products)
| (a) | 4.500% | 09/15/2031 | 350,000 | 286,247 |
U.S. Foods, Inc. (Food & Staples Retailing)
| (a) | 6.250% | 04/15/2025 | 100,000 | 99,750 |
U.S. Foods, Inc. (Food & Staples Retailing)
| (a) | 4.750% | 02/15/2029 | 350,000 | 305,966 |
U.S. Foods, Inc. (Food & Staples Retailing)
| (a) | 4.625% | 06/01/2030 | 175,000 | 147,532 |
| | | | | | 4,199,485 |
Energy–14.0%
| | | | | |
Antero Midstream Partners LP / Antero Midstream Finance Corp. (Oil, Gas & Consumable Fuels)
| (a) | 7.875% | 05/15/2026 | 125,000 | 124,861 |
Antero Midstream Partners LP / Antero Midstream Finance Corp. (Oil, Gas & Consumable Fuels)
| (a) | 5.750% | 03/01/2027 | 250,000 | 232,500 |
Antero Midstream Partners LP / Antero Midstream Finance Corp. (Oil, Gas & Consumable Fuels)
| (a) | 5.750% | 01/15/2028 | 625,000 | 569,012 |
Antero Midstream Partners LP / Antero Midstream Finance Corp. (Oil, Gas & Consumable Fuels)
| (a) | 5.375% | 06/15/2029 | 625,000 | 559,725 |
Antero Resources Corp. (Oil, Gas & Consumable Fuels)
| (a) | 7.625% | 02/01/2029 | 104,000 | 105,796 |
Antero Resources Corp. (Oil, Gas & Consumable Fuels)
| (a) | 5.375% | 03/01/2030 | 225,000 | 205,159 |
Archrock Partners LP / Archrock Partners Finance Corp. (Oil, Gas & Consumable Fuels)
| (a) | 6.875% | 04/01/2027 | 625,000 | 569,919 |
Archrock Partners LP / Archrock Partners Finance Corp. (Oil, Gas & Consumable Fuels)
| (a) | 6.250% | 04/01/2028 | 450,000 | 398,385 |
Ascent Resources Utica Holdings LLC / ARU Finance Corp. (Oil, Gas & Consumable Fuels)
| (a) | 7.000% | 11/01/2026 | 425,000 | 395,250 |
Ascent Resources Utica Holdings LLC / ARU Finance Corp. (Oil, Gas & Consumable Fuels)
| (a) | 8.250% | 12/31/2028 | 100,000 | 95,237 |
Ascent Resources Utica Holdings LLC / ARU Finance Corp. (Oil, Gas & Consumable Fuels)
| (a) | 5.875% | 06/30/2029 | 75,000 | 66,000 |
Berry Petroleum Co. LLC (Oil, Gas & Consumable Fuels)
| (a) | 7.000% | 02/15/2026 | 175,000 | 154,000 |
Callon Petroleum Co. (Oil, Gas & Consumable Fuels)
| | 8.250% | 07/15/2025 | 150,000 | 146,206 |
Callon Petroleum Co. (Oil, Gas & Consumable Fuels)
| | 6.375% | 07/01/2026 | 125,000 | 115,313 |
Centennial Resource Production LLC (Oil, Gas & Consumable Fuels)
| (a) | 6.875% | 04/01/2027 | 350,000 | 332,372 |
Cheniere Energy Partners LP (Oil, Gas & Consumable Fuels)
| | 4.500% | 10/01/2029 | 125,000 | 111,588 |
Cheniere Energy Partners LP (Oil, Gas & Consumable Fuels)
| | 4.000% | 03/01/2031 | 325,000 | 276,347 |
Cheniere Energy Partners LP (Oil, Gas & Consumable Fuels)
| (a) | 3.250% | 01/31/2032 | 150,000 | 118,125 |
Cheniere Energy, Inc. (Oil, Gas & Consumable Fuels)
| | 4.625% | 10/15/2028 | 175,000 | 157,600 |
Chesapeake Energy Corp. (Oil, Gas & Consumable Fuels)
| (a) | 5.500% | 02/01/2026 | 50,000 | 47,614 |
Chesapeake Energy Corp. (Oil, Gas & Consumable Fuels)
| (a) | 5.875% | 02/01/2029 | 50,000 | 47,150 |
CNX Midstream Partners LP (Oil, Gas & Consumable Fuels)
| (a) | 4.750% | 04/15/2030 | 425,000 | 357,000 |
Comstock Resources, Inc. (Oil, Gas & Consumable Fuels)
| (a) | 6.750% | 03/01/2029 | 500,000 | 447,715 |
Comstock Resources, Inc. (Oil, Gas & Consumable Fuels)
| (a) | 5.875% | 01/15/2030 | 100,000 | 86,000 |
Crestwood Midstream Partners LP / Crestwood Midstream Finance Corp. (Oil, Gas & Consumable Fuels)
| (a) | 8.000% | 04/01/2029 | 250,000 | 232,190 |
CrownRock LP / CrownRock Finance, Inc. (Oil, Gas & Consumable Fuels)
| (a) | 5.625% | 10/15/2025 | 600,000 | 564,000 |
CrownRock LP / CrownRock Finance, Inc. (Oil, Gas & Consumable Fuels)
| (a) | 5.000% | 05/01/2029 | 50,000 | 44,842 |
DT Midstream, Inc. (Oil, Gas & Consumable Fuels)
| (a) | 4.375% | 06/15/2031 | 200,000 | 167,500 |
Endeavor Energy Resources LP / EER Finance, Inc. (Oil, Gas & Consumable Fuels)
| (a) | 6.625% | 07/15/2025 | 200,000 | 200,980 |
Endeavor Energy Resources LP / EER Finance, Inc. (Oil, Gas & Consumable Fuels)
| (a) | 5.750% | 01/30/2028 | 100,000 | 95,265 |
Enviva Partners LP / Enviva Partners Finance Corp. (Oil, Gas & Consumable Fuels)
| (a) | 6.500% | 01/15/2026 | 900,000 | 869,625 |
EQM Midstream Partners LP (Oil, Gas & Consumable Fuels)
| (a) | 6.000% | 07/01/2025 | 83,000 | 79,570 |
EQM Midstream Partners LP (Oil, Gas & Consumable Fuels)
| (a) | 7.500% | 06/01/2027 | 275,000 | 265,251 |
EQM Midstream Partners LP (Oil, Gas & Consumable Fuels)
| (a) | 6.500% | 07/01/2027 | 325,000 | 302,185 |
EQM Midstream Partners LP (Oil, Gas & Consumable Fuels)
| | 5.500% | 07/15/2028 | 350,000 | 302,180 |
EQM Midstream Partners LP (Oil, Gas & Consumable Fuels)
| (a) | 4.500% | 01/15/2029 | 225,000 | 182,673 |
EQM Midstream Partners LP (Oil, Gas & Consumable Fuels)
| (a) | 4.750% | 01/15/2031 | 675,000 | 538,312 |
EQM Midstream Partners LP (Oil, Gas & Consumable Fuels)
| | 6.500% | 07/15/2048 | 75,000 | 57,188 |
EQT Corp. (Oil, Gas & Consumable Fuels)
| | 5.000% | 01/15/2029 | 75,000 | 72,606 |
EQT Corp. (Oil, Gas & Consumable Fuels)
| (a) | 3.625% | 05/15/2031 | 125,000 | 108,008 |
Hess Midstream Operations LP (Oil, Gas & Consumable Fuels)
| (a) | 5.125% | 06/15/2028 | 300,000 | 269,250 |
Hess Midstream Operations LP (Oil, Gas & Consumable Fuels)
| (a) | 4.250% | 02/15/2030 | 100,000 | 83,747 |
Hess Midstream Operations LP (Oil, Gas & Consumable Fuels)
| (a) | 5.500% | 10/15/2030 | 100,000 | 89,750 |
Holly Energy Partners LP / Holly Energy Finance Corp. (Oil, Gas & Consumable Fuels)
| (a) | 6.375% | 04/15/2027 | 175,000 | 164,721 |
Holly Energy Partners LP / Holly Energy Finance Corp. (Oil, Gas & Consumable Fuels)
| (a) | 5.000% | 02/01/2028 | 300,000 | 256,932 |
Nabors Industries Ltd. (Energy Equip. & Svs.)
| (a) | 7.250% | 01/15/2026 | 225,000 | 199,541 |
| Ohio National Fund, Inc. | ON Federated High Income Bond Portfolio (Continued) |
| Schedule of Investments | June 30, 2022 (Unaudited) |
| Corporate Bonds (Continued) | Rate | Maturity | Face Amount | Value |
| Energy (continued) | | | | | |
Nabors Industries Ltd. (Energy Equip. & Svs.)
| (a) | 7.500% | 01/15/2028 | $ 275,000 | $ 236,500 |
Nabors Industries, Inc. (Oil, Gas & Consumable Fuels)
| (a) | 7.375% | 05/15/2027 | 100,000 | 95,000 |
NuStar Logistics LP (Oil, Gas & Consumable Fuels)
| | 5.625% | 04/28/2027 | 450,000 | 402,754 |
Oasis Petroleum, Inc. (Oil, Gas & Consumable Fuels)
| (a) | 6.375% | 06/01/2026 | 75,000 | 69,375 |
Occidental Petroleum Corp. (Oil, Gas & Consumable Fuels)
| | 8.000% | 07/15/2025 | 100,000 | 105,250 |
Occidental Petroleum Corp. (Oil, Gas & Consumable Fuels)
| | 5.875% | 09/01/2025 | 225,000 | 224,021 |
Occidental Petroleum Corp. (Oil, Gas & Consumable Fuels)
| | 8.875% | 07/15/2030 | 375,000 | 430,529 |
Occidental Petroleum Corp. (Oil, Gas & Consumable Fuels)
| | 6.625% | 09/01/2030 | 275,000 | 283,250 |
Occidental Petroleum Corp. (Oil, Gas & Consumable Fuels)
| | 6.450% | 09/15/2036 | 225,000 | 230,625 |
PDC Energy, Inc. (Oil, Gas & Consumable Fuels)
| | 6.125% | 09/15/2024 | 75,000 | 74,490 |
PDC Energy, Inc. (Oil, Gas & Consumable Fuels)
| | 5.750% | 05/15/2026 | 250,000 | 233,207 |
Precision Drilling Corp. (Energy Equip. & Svs.)
| (a) | 7.125% | 01/15/2026 | 100,000 | 94,000 |
Precision Drilling Corp. (Energy Equip. & Svs.)
| (a) | 6.875% | 01/15/2029 | 175,000 | 156,625 |
Range Resources Corp. (Oil, Gas & Consumable Fuels)
| | 4.875% | 05/15/2025 | 75,000 | 73,155 |
Range Resources Corp. (Oil, Gas & Consumable Fuels)
| | 8.250% | 01/15/2029 | 200,000 | 203,903 |
Range Resources Corp. (Oil, Gas & Consumable Fuels)
| (a) | 4.750% | 02/15/2030 | 125,000 | 112,104 |
Rattler Midstream LP (Oil, Gas & Consumable Fuels)
| (a) | 5.625% | 07/15/2025 | 200,000 | 199,914 |
Rockcliff Energy II LLC (Oil, Gas & Consumable Fuels)
| (a) | 5.500% | 10/15/2029 | 325,000 | 295,740 |
SM Energy Co. (Oil, Gas & Consumable Fuels)
| | 6.750% | 09/15/2026 | 275,000 | 259,425 |
SM Energy Co. (Oil, Gas & Consumable Fuels)
| | 6.625% | 01/15/2027 | 25,000 | 23,375 |
SM Energy Co. (Oil, Gas & Consumable Fuels)
| | 6.500% | 07/15/2028 | 50,000 | 45,985 |
Southwestern Energy Co. (Oil, Gas & Consumable Fuels)
| | 8.375% | 09/15/2028 | 225,000 | 237,094 |
Southwestern Energy Co. (Oil, Gas & Consumable Fuels)
| | 5.375% | 03/15/2030 | 75,000 | 69,000 |
Southwestern Energy Co. (Oil, Gas & Consumable Fuels)
| | 4.750% | 02/01/2032 | 75,000 | 64,089 |
Tap Rock Resources LLC (Oil, Gas & Consumable Fuels)
| (a) | 7.000% | 10/01/2026 | 325,000 | 306,871 |
Targa Resources Partners LP / Targa Resources Partners Finance Corp. (Oil, Gas & Consumable Fuels)
| | 6.500% | 07/15/2027 | 25,000 | 25,609 |
Targa Resources Partners LP / Targa Resources Partners Finance Corp. (Oil, Gas & Consumable Fuels)
| | 5.000% | 01/15/2028 | 475,000 | 452,209 |
Targa Resources Partners LP / Targa Resources Partners Finance Corp. (Oil, Gas & Consumable Fuels)
| | 5.500% | 03/01/2030 | 475,000 | 453,235 |
Targa Resources Partners LP / Targa Resources Partners Finance Corp. (Oil, Gas & Consumable Fuels)
| | 4.875% | 02/01/2031 | 75,000 | 68,370 |
TransMontaigne Partners LP / TLP Finance Corp. (Oil, Gas & Consumable Fuels)
| | 6.125% | 02/15/2026 | 225,000 | 198,844 |
U.S.A. Compression Partners LP / U.S.A. Compression Finance Corp. (Energy Equip. & Svs.)
| | 6.875% | 04/01/2026 | 925,000 | 841,472 |
U.S.A. Compression Partners LP / U.S.A. Compression Finance Corp. (Energy Equip. & Svs.)
| | 6.875% | 09/01/2027 | 150,000 | 133,125 |
Western Midstream Operating LP (Oil, Gas & Consumable Fuels)
| | 4.650% | 07/01/2026 | 50,000 | 47,125 |
Western Midstream Operating LP (Oil, Gas & Consumable Fuels)
| | 4.500% | 03/01/2028 | 175,000 | 158,375 |
Western Midstream Operating LP (Oil, Gas & Consumable Fuels)
| | 4.750% | 08/15/2028 | 75,000 | 68,522 |
Western Midstream Operating LP (Oil, Gas & Consumable Fuels)
| | 5.450% | 04/01/2044 | 175,000 | 145,450 |
Western Midstream Operating LP (Oil, Gas & Consumable Fuels)
| | 5.300% | 03/01/2048 | 500,000 | 403,075 |
Western Midstream Operating LP (Oil, Gas & Consumable Fuels)
| | 5.500% | 08/15/2048 | 100,000 | 81,500 |
| | | | | | 18,468,382 |
Financials–9.7%
| | | | | |
AmWINS Group, Inc. (Insurance)
| (a) | 4.875% | 06/30/2029 | 400,000 | 327,569 |
AssuredPartners, Inc. (Insurance)
| (a) | 7.000% | 08/15/2025 | 675,000 | 634,004 |
AssuredPartners, Inc. (Insurance)
| (a) | 5.625% | 01/15/2029 | 200,000 | 160,106 |
BroadStreet Partners, Inc. (Insurance)
| (a) | 5.875% | 04/15/2029 | 925,000 | 723,729 |
Ford Motor Credit Co. LLC (Consumer Finance)
| | 4.063% | 11/01/2024 | 375,000 | 355,760 |
Ford Motor Credit Co. LLC (Consumer Finance)
| | 5.125% | 06/16/2025 | 400,000 | 381,968 |
Ford Motor Credit Co. LLC (Consumer Finance)
| | 3.375% | 11/13/2025 | 575,000 | 517,770 |
Ford Motor Credit Co. LLC (Consumer Finance)
| | 4.389% | 01/08/2026 | 225,000 | 207,239 |
Ford Motor Credit Co. LLC (Consumer Finance)
| | 2.700% | 08/10/2026 | 200,000 | 170,430 |
Ford Motor Credit Co. LLC (Consumer Finance)
| | 4.271% | 01/09/2027 | 450,000 | 403,612 |
Ford Motor Credit Co. LLC (Consumer Finance)
| | 4.125% | 08/17/2027 | 300,000 | 264,150 |
Ford Motor Credit Co. LLC (Consumer Finance)
| | 5.113% | 05/03/2029 | 525,000 | 470,649 |
Ford Motor Credit Co. LLC (Consumer Finance)
| | 4.000% | 11/13/2030 | 275,000 | 222,820 |
GTCR AP Finance, Inc. (Insurance)
| (a) | 8.000% | 05/15/2027 | 500,000 | 468,075 |
GYP Holdings III Corp. (Building Products)
| (a) | 4.625% | 05/01/2029 | 325,000 | 253,412 |
HUB International Ltd. (Insurance)
| (a) | 7.000% | 05/01/2026 | 2,000,000 | 1,880,800 |
HUB International Ltd. (Insurance)
| (a) | 5.625% | 12/01/2029 | 575,000 | 474,980 |
LD Holdings Group LLC (Thrifts & Mortgage Finance)
| (a) | 6.125% | 04/01/2028 | 175,000 | 106,696 |
Navient Corp. (Consumer Finance)
| | 6.750% | 06/25/2025 | 175,000 | 157,892 |
Navient Corp. (Consumer Finance)
| | 6.750% | 06/15/2026 | 125,000 | 110,625 |
Navient Corp. (Consumer Finance)
| | 5.500% | 03/15/2029 | 350,000 | 269,819 |
NFP Corp. (Insurance)
| (a) | 6.875% | 08/15/2028 | 1,300,000 | 1,072,552 |
Outfront Media Capital LLC / Outfront Media Capital Corp. (Media)
| (a) | 4.250% | 01/15/2029 | 100,000 | 79,662 |
Outfront Media Capital LLC / Outfront Media Capital Corp. (Media)
| (a) | 4.625% | 03/15/2030 | 225,000 | 177,271 |
Rocket Mortgage LLC / Rocket Mortgage Co-Issuer, Inc. (Thrifts & Mortgage Finance)
| (a) | 3.625% | 03/01/2029 | 200,000 | 157,264 |
Rocket Mortgage LLC / Rocket Mortgage Co-Issuer, Inc. (Thrifts & Mortgage Finance)
| (a) | 3.875% | 03/01/2031 | 350,000 | 262,252 |
| Ohio National Fund, Inc. | ON Federated High Income Bond Portfolio (Continued) |
| Schedule of Investments | June 30, 2022 (Unaudited) |
| Corporate Bonds (Continued) | Rate | Maturity | Face Amount | Value |
| Financials (continued) | | | | | |
Rocket Mortgage LLC / Rocket Mortgage Co-Issuer, Inc. (Thrifts & Mortgage Finance)
| (a) | 4.000% | 10/15/2033 | $ 450,000 | $ 319,500 |
Ryan Specialty Group LLC (Insurance)
| (a) | 4.375% | 02/01/2030 | 275,000 | 239,250 |
United Wholesale Mortgage LLC (Thrifts & Mortgage Finance)
| (a) | 5.500% | 11/15/2025 | 700,000 | 599,613 |
United Wholesale Mortgage LLC (Thrifts & Mortgage Finance)
| (a) | 5.750% | 06/15/2027 | 175,000 | 140,308 |
United Wholesale Mortgage LLC (Thrifts & Mortgage Finance)
| (a) | 5.500% | 04/15/2029 | 225,000 | 172,271 |
USI, Inc. (Insurance)
| (a) | 6.875% | 05/01/2025 | 1,050,000 | 1,013,250 |
| | | | | | 12,795,298 |
Health Care–11.2%
| | | | | |
Acadia Healthcare Co., Inc. (Health Care Providers & Svs.)
| (a) | 5.500% | 07/01/2028 | 25,000 | 23,357 |
Acadia Healthcare Co., Inc. (Health Care Providers & Svs.)
| (a) | 5.000% | 04/15/2029 | 25,000 | 22,443 |
AdaptHealth LLC (Health Care Providers & Svs.)
| (a) | 4.625% | 08/01/2029 | 250,000 | 205,625 |
AdaptHealth LLC (Health Care Providers & Svs.)
| (a) | 5.125% | 03/01/2030 | 325,000 | 273,945 |
AHP Health Partners, Inc. (Health Care Providers & Svs.)
| (a) | 5.750% | 07/15/2029 | 350,000 | 257,145 |
Avantor Funding, Inc. (Health Care Equip. & Supplies)
| (a) | 4.625% | 07/15/2028 | 600,000 | 550,020 |
Avantor Funding, Inc. (Health Care Equip. & Supplies)
| (a) | 3.875% | 11/01/2029 | 300,000 | 262,395 |
Bausch Health Americas, Inc. (Pharmaceuticals)
| (a) | 8.500% | 01/31/2027 | 525,000 | 368,156 |
Bausch Health Cos., Inc. (Pharmaceuticals)
| (a) | 5.500% | 11/01/2025 | 100,000 | 87,829 |
Bausch Health Cos., Inc. (Pharmaceuticals)
| (a) | 9.000% | 12/15/2025 | 425,000 | 314,011 |
Bausch Health Cos., Inc. (Pharmaceuticals)
| (a) | 6.125% | 02/01/2027 | 275,000 | 233,750 |
Bausch Health Cos., Inc. (Pharmaceuticals)
| (a) | 5.000% | 02/15/2029 | 175,000 | 91,000 |
Bausch Health Cos., Inc. (Pharmaceuticals)
| (a) | 6.250% | 02/15/2029 | 175,000 | 93,135 |
Bausch Health Cos., Inc. (Pharmaceuticals)
| (a) | 7.250% | 05/30/2029 | 575,000 | 311,938 |
Bausch Health Cos., Inc. (Pharmaceuticals)
| (a) | 5.250% | 01/30/2030 | 375,000 | 193,755 |
Bausch Health Cos., Inc. (Pharmaceuticals)
| (a) | 5.250% | 02/15/2031 | 225,000 | 115,149 |
Catalent Pharma Solutions, Inc. (Pharmaceuticals)
| (a) | 3.500% | 04/01/2030 | 150,000 | 122,389 |
Centene Corp. (Health Care Providers & Svs.)
| | 4.250% | 12/15/2027 | 800,000 | 746,776 |
Centene Corp. (Health Care Providers & Svs.)
| | 4.625% | 12/15/2029 | 425,000 | 396,313 |
Centene Corp. (Health Care Providers & Svs.)
| | 3.375% | 02/15/2030 | 50,000 | 42,403 |
Centene Corp. (Health Care Providers & Svs.)
| | 2.625% | 08/01/2031 | 200,000 | 159,100 |
Charles River Laboratories International, Inc. (Life Sciences Tools & Svs.)
| (a) | 3.750% | 03/15/2029 | 100,000 | 86,785 |
Charles River Laboratories International, Inc. (Life Sciences Tools & Svs.)
| (a) | 4.000% | 03/15/2031 | 125,000 | 106,556 |
CHS / Community Health Systems, Inc. (Health Care Providers & Svs.)
| (a) | 8.000% | 03/15/2026 | 350,000 | 318,742 |
CHS / Community Health Systems, Inc. (Health Care Providers & Svs.)
| (a) | 5.625% | 03/15/2027 | 150,000 | 126,956 |
CHS / Community Health Systems, Inc. (Health Care Providers & Svs.)
| (a) | 6.000% | 01/15/2029 | 50,000 | 41,421 |
CHS / Community Health Systems, Inc. (Health Care Providers & Svs.)
| (a) | 6.875% | 04/15/2029 | 500,000 | 322,500 |
CHS / Community Health Systems, Inc. (Health Care Providers & Svs.)
| (a) | 6.125% | 04/01/2030 | 150,000 | 91,500 |
CHS / Community Health Systems, Inc. (Health Care Providers & Svs.)
| (a) | 5.250% | 05/15/2030 | 225,000 | 170,977 |
DaVita, Inc. (Health Care Providers & Svs.)
| (a) | 4.625% | 06/01/2030 | 200,000 | 155,972 |
Embecta Corp. (Health Care Equip. & Supplies)
| (a) | 5.000% | 02/15/2030 | 100,000 | 83,944 |
Embecta Corp. (Health Care Equip. & Supplies)
| (a) | 6.750% | 02/15/2030 | 175,000 | 157,558 |
Global Medical Response, Inc. (Health Care Providers & Svs.)
| (a) | 6.500% | 10/01/2025 | 675,000 | 601,411 |
Grifols Escrow Issuer SA (Biotechnology)
| (a) | 4.750% | 10/15/2028 | 200,000 | 173,456 |
HCA, Inc. (Health Care Providers & Svs.)
| | 5.375% | 02/01/2025 | 425,000 | 422,773 |
HCA, Inc. (Health Care Providers & Svs.)
| | 5.875% | 02/15/2026 | 100,000 | 100,513 |
HCA, Inc. (Health Care Providers & Svs.)
| | 3.500% | 09/01/2030 | 375,000 | 319,016 |
HealthEquity, Inc. (Health Care Providers & Svs.)
| (a) | 4.500% | 10/01/2029 | 375,000 | 328,125 |
IQVIA, Inc. (Life Sciences Tools & Svs.)
| (a) | 5.000% | 10/15/2026 | 300,000 | 285,699 |
Legacy LifePoint Health LLC (Health Care Providers & Svs.)
| (a) | 6.750% | 04/15/2025 | 250,000 | 241,653 |
Legacy LifePoint Health LLC (Health Care Providers & Svs.)
| (a) | 4.375% | 02/15/2027 | 125,000 | 107,102 |
LifePoint Health, Inc. (Health Care Providers & Svs.)
| (a) | 5.375% | 01/15/2029 | 25,000 | 18,375 |
Mallinckrodt International Finance SA / Mallinckrodt CB LLC (Pharmaceuticals)
| (a) | 10.000% | 06/15/2029 | 418,060 | 292,642 |
Medline Borrower LP (Health Care Equip. & Supplies)
| (a) | 3.875% | 04/01/2029 | 325,000 | 276,806 |
Medline Borrower LP (Health Care Equip. & Supplies)
| (a) | 5.250% | 10/01/2029 | 775,000 | 636,507 |
MEDNAX, Inc. (Health Care Providers & Svs.)
| (a) | 5.375% | 02/15/2030 | 225,000 | 192,771 |
MPH Acquisition Holdings LLC (Health Care Providers & Svs.)
| (a) | 5.500% | 09/01/2028 | 200,000 | 178,000 |
MPH Acquisition Holdings LLC (Health Care Providers & Svs.)
| (a) | 5.750% | 11/01/2028 | 925,000 | 766,547 |
Organon & Co. / Organon Foreign Debt Co-Issuer B.V. (Pharmaceuticals)
| (a) | 5.125% | 04/30/2031 | 450,000 | 388,274 |
Prestige Brands, Inc. (Pharmaceuticals)
| (a) | 3.750% | 04/01/2031 | 175,000 | 145,110 |
RegionalCare Hospital Partners Holdings, Inc. / LifePoint Health, Inc. (Health Care Providers & Svs.)
| (a) | 9.750% | 12/01/2026 | 750,000 | 729,375 |
Syneos Health, Inc. (Life Sciences Tools & Svs.)
| (a) | 3.625% | 01/15/2029 | 175,000 | 148,195 |
Team Health Holdings, Inc. (Health Care Providers & Svs.)
| (a) | 6.375% | 02/01/2025 | 300,000 | 209,484 |
Tenet Healthcare Corp. (Health Care Providers & Svs.)
| | 6.750% | 06/15/2023 | 300,000 | 308,787 |
Tenet Healthcare Corp. (Health Care Providers & Svs.)
| | 4.625% | 07/15/2024 | 51,000 | 48,946 |
Tenet Healthcare Corp. (Health Care Providers & Svs.)
| (a) | 4.875% | 01/01/2026 | 300,000 | 276,000 |
Tenet Healthcare Corp. (Health Care Providers & Svs.)
| (a) | 6.250% | 02/01/2027 | 125,000 | 115,052 |
Tenet Healthcare Corp. (Health Care Providers & Svs.)
| (a) | 5.125% | 11/01/2027 | 425,000 | 382,500 |
Tenet Healthcare Corp. (Health Care Providers & Svs.)
| (a) | 6.125% | 10/01/2028 | 300,000 | 256,734 |
| Ohio National Fund, Inc. | ON Federated High Income Bond Portfolio (Continued) |
| Schedule of Investments | June 30, 2022 (Unaudited) |
| Corporate Bonds (Continued) | Rate | Maturity | Face Amount | Value |
Health Care (continued)
| | | | | |
Tenet Healthcare Corp. (Health Care Providers & Svs.)
| (a) | 4.250% | 06/01/2029 | $ 150,000 | $ 126,332 |
Tenet Healthcare Corp. (Health Care Providers & Svs.)
| (a) | 6.125% | 06/15/2030 | 150,000 | 138,387 |
| | | | | | 14,748,117 |
Industrials–10.3%
| | | | | |
Allied Universal Holdco LLC / Allied Universal Finance Corp. (Commercial Svs. & Supplies)
| (a) | 6.625% | 07/15/2026 | 200,000 | 183,526 |
Allied Universal Holdco LLC / Allied Universal Finance Corp. (Commercial Svs. & Supplies)
| (a) | 9.750% | 07/15/2027 | 1,300,000 | 1,100,242 |
American Airlines, Inc. / AAdvantage Loyalty IP Ltd. (Airlines)
| (a) | 5.500% | 04/20/2026 | 450,000 | 413,453 |
American Airlines, Inc. / AAdvantage Loyalty IP Ltd. (Airlines)
| (a) | 5.750% | 04/20/2029 | 150,000 | 128,064 |
American Builders & Contractors Supply Co., Inc. (Trading Companies & Distributors)
| (a) | 4.000% | 01/15/2028 | 50,000 | 42,826 |
BCPE Empire Holdings, Inc. (Commercial Svs. & Supplies)
| (a) | 7.625% | 05/01/2027 | 850,000 | 691,972 |
Brink's Co. / The (Commercial Svs. & Supplies)
| (a) | 5.500% | 07/15/2025 | 75,000 | 72,166 |
Clarivate Science Holdings Corp. (Professional Svs.)
| (a) | 3.875% | 07/01/2028 | 75,000 | 62,663 |
Clarivate Science Holdings Corp. (Professional Svs.)
| (a) | 4.875% | 07/01/2029 | 400,000 | 328,400 |
Cornerstone Building Brands, Inc. (Building Products)
| (a) | 6.125% | 01/15/2029 | 200,000 | 128,489 |
CP Atlas Buyer, Inc. (Building Products)
| (a) | 7.000% | 12/01/2028 | 825,000 | 595,798 |
Dun & Bradstreet Corp. / The (Professional Svs.)
| (a) | 5.000% | 12/15/2029 | 475,000 | 410,281 |
Foundation Building Materials, Inc. (Trading Companies & Distributors)
| (a) | 6.000% | 03/01/2029 | 800,000 | 586,000 |
Garda World Security Corp. (Commercial Svs. & Supplies)
| (a) | 4.625% | 02/15/2027 | 175,000 | 150,500 |
Garda World Security Corp. (Commercial Svs. & Supplies)
| (a) | 6.000% | 06/01/2029 | 300,000 | 230,625 |
H&E Equipment Services, Inc. (Trading Companies & Distributors)
| (a) | 3.875% | 12/15/2028 | 300,000 | 242,625 |
Interface, Inc. (Commercial Svs. & Supplies)
| (a) | 5.500% | 12/01/2028 | 125,000 | 105,889 |
KAR Auction Services, Inc. (Commercial Svs. & Supplies)
| (a) | 5.125% | 06/01/2025 | 375,000 | 356,591 |
Madison IAQ LLC (Commercial Svs. & Supplies)
| (a) | 4.125% | 06/30/2028 | 50,000 | 41,297 |
Madison IAQ LLC (Commercial Svs. & Supplies)
| (a) | 5.875% | 06/30/2029 | 900,000 | 689,688 |
MIWD Holdco II LLC / MIWD Finance Corp. (Building Products)
| (a) | 5.500% | 02/01/2030 | 75,000 | 60,357 |
Nielsen Finance LLC / Nielsen Finance Co. (Professional Svs.)
| (a) | 5.625% | 10/01/2028 | 100,000 | 92,870 |
Nielsen Finance LLC / Nielsen Finance Co. (Professional Svs.)
| (a) | 5.875% | 10/01/2030 | 500,000 | 459,080 |
Nielsen Finance LLC / Nielsen Finance Co. (Professional Svs.)
| (a) | 4.750% | 07/15/2031 | 175,000 | 157,426 |
Sensata Technologies, Inc. (Electrical Equip.)
| (a) | 4.375% | 02/15/2030 | 125,000 | 106,397 |
Sensata Technologies, Inc. (Electrical Equip.)
| (a) | 3.750% | 02/15/2031 | 25,000 | 20,037 |
Solaris Midstream Holdings LLC (Commercial Svs. & Supplies)
| (a) | 7.625% | 04/01/2026 | 400,000 | 378,268 |
SPX FLOW, Inc. (Machinery)
| (a) | 8.750% | 04/01/2030 | 475,000 | 397,812 |
Stena International SA (Transportation Infrastructure)
| (a) | 6.125% | 02/01/2025 | 300,000 | 285,115 |
TK Elevator Holdco GmbH (Building Products)
| (a) | 7.625% | 07/15/2028 | 269,000 | 241,428 |
TK Elevator U.S. Newco, Inc. (Building Products)
| (a) | 5.250% | 07/15/2027 | 325,000 | 289,759 |
TransDigm U.K. Holdings PLC (Aerospace & Defense)
| | 6.875% | 05/15/2026 | 275,000 | 256,437 |
TransDigm, Inc. (Aerospace & Defense)
| (a) | 6.250% | 03/15/2026 | 625,000 | 602,344 |
TransDigm, Inc. (Aerospace & Defense)
| | 6.375% | 06/15/2026 | 550,000 | 514,250 |
TransDigm, Inc. (Aerospace & Defense)
| | 5.500% | 11/15/2027 | 150,000 | 127,257 |
TransDigm, Inc. (Aerospace & Defense)
| | 4.625% | 01/15/2029 | 125,000 | 100,628 |
TransDigm, Inc. (Aerospace & Defense)
| | 4.875% | 05/01/2029 | 425,000 | 345,967 |
Trident TPI Holdings, Inc. (Machinery)
| (a) | 9.250% | 08/01/2024 | 175,000 | 160,097 |
Trident TPI Holdings, Inc. (Machinery)
| (a) | 6.625% | 11/01/2025 | 700,000 | 642,250 |
United Rentals North America, Inc. (Trading Companies & Distributors)
| | 5.500% | 05/15/2027 | 25,000 | 24,517 |
United Rentals North America, Inc. (Trading Companies & Distributors)
| | 4.875% | 01/15/2028 | 325,000 | 307,281 |
United Rentals North America, Inc. (Trading Companies & Distributors)
| | 5.250% | 01/15/2030 | 100,000 | 92,750 |
United Rentals North America, Inc. (Trading Companies & Distributors)
| | 3.875% | 02/15/2031 | 50,000 | 42,179 |
United Rentals North America, Inc. (Trading Companies & Distributors)
| | 3.750% | 01/15/2032 | 150,000 | 123,157 |
Watco Cos. LLC / Watco Finance Corp. (Road & Rail)
| (a) | 6.500% | 06/15/2027 | 400,000 | 366,369 |
WESCO Distribution, Inc. (Trading Companies & Distributors)
| (a) | 7.125% | 06/15/2025 | 100,000 | 99,783 |
WESCO Distribution, Inc. (Trading Companies & Distributors)
| (a) | 7.250% | 06/15/2028 | 225,000 | 222,525 |
White Cap Buyer LLC (Building Products)
| (a) | 6.875% | 10/15/2028 | 425,000 | 340,000 |
White Cap Parent LLC (Building Products)
| (a)(b) | 8.250%, 9.000% PIK | 03/15/2026 | 325,000 | 270,562 |
| | | | | | 13,687,997 |
Information Technology–5.7%
| | | | | |
Black Knight InfoServ LLC (IT Svs.)
| (a) | 3.625% | 09/01/2028 | 275,000 | 237,875 |
Booz Allen Hamilton, Inc. (IT Svs.)
| (a) | 3.875% | 09/01/2028 | 75,000 | 66,375 |
Booz Allen Hamilton, Inc. (IT Svs.)
| (a) | 4.000% | 07/01/2029 | 50,000 | 43,596 |
Boxer Parent Co., Inc. (Software)
| (a) | 9.125% | 03/01/2026 | 75,000 | 70,066 |
Central Parent, Inc. / Central Merger Sub, Inc. (Software)
| (a) | 7.250% | 06/15/2029 | 550,000 | 529,375 |
Ciena Corp. (Communications Equip.)
| (a) | 4.000% | 01/31/2030 | 75,000 | 64,735 |
Condor Merger Sub, Inc. (Software)
| (a) | 7.375% | 02/15/2030 | 875,000 | 711,174 |
Elastic N.V. (Software)
| (a) | 4.125% | 07/15/2029 | 425,000 | 354,781 |
Fair Isaac Corp. (Software)
| (a) | 4.000% | 06/15/2028 | 125,000 | 110,730 |
Gartner, Inc. (IT Svs.)
| (a) | 4.500% | 07/01/2028 | 50,000 | 45,910 |
Gartner, Inc. (IT Svs.)
| (a) | 3.750% | 10/01/2030 | 125,000 | 106,406 |
Go Daddy Operating Co. LLC / GD Finance Co., Inc. (IT Svs.)
| (a) | 5.250% | 12/01/2027 | 350,000 | 320,250 |
Helios Software Holdings, Inc. / ION Corporate Solutions Finance SARL (Software)
| (a) | 4.625% | 05/01/2028 | 375,000 | 297,615 |
II-VI, Inc. (Electronic Equip., Instr. & Comp.)
| (a) | 5.000% | 12/15/2029 | 300,000 | 261,750 |
| Ohio National Fund, Inc. | ON Federated High Income Bond Portfolio (Continued) |
| Schedule of Investments | June 30, 2022 (Unaudited) |
| Corporate Bonds (Continued) | Rate | Maturity | Face Amount | Value |
Information Technology (continued)
| | | | | |
LogMeIn, Inc. (Software)
| (a) | 5.500% | 09/01/2027 | $ 425,000 | $ 295,913 |
Minerva Merger Sub, Inc. (Software)
| (a) | 6.500% | 02/15/2030 | 825,000 | 686,062 |
NCR Corp. (Tech. Hardware, Storage & Periph.)
| (a) | 5.000% | 10/01/2028 | 225,000 | 190,777 |
NCR Corp. (Tech. Hardware, Storage & Periph.)
| (a) | 5.125% | 04/15/2029 | 50,000 | 42,287 |
NCR Corp. (Tech. Hardware, Storage & Periph.)
| (a) | 6.125% | 09/01/2029 | 50,000 | 43,243 |
NCR Corp. (Tech. Hardware, Storage & Periph.)
| (a) | 5.250% | 10/01/2030 | 350,000 | 301,875 |
Open Text Corp. (Software)
| (a) | 3.875% | 12/01/2029 | 350,000 | 294,577 |
PTC, Inc. (Software)
| (a) | 3.625% | 02/15/2025 | 25,000 | 23,645 |
Rocket Software, Inc. (Software)
| (a) | 6.500% | 02/15/2029 | 625,000 | 451,762 |
Science Applications International Corp. (IT Svs.)
| (a) | 4.875% | 04/01/2028 | 75,000 | 69,938 |
Seagate HDD Cayman (Tech. Hardware, Storage & Periph.)
| | 3.125% | 07/15/2029 | 300,000 | 235,413 |
Seagate HDD Cayman (Tech. Hardware, Storage & Periph.)
| | 3.375% | 07/15/2031 | 250,000 | 194,292 |
SS&C Technologies, Inc. (Software)
| (a) | 5.500% | 09/30/2027 | 600,000 | 559,536 |
Synaptics, Inc. (Semiconductors & Equip.)
| (a) | 4.000% | 06/15/2029 | 125,000 | 101,498 |
TTM Technologies, Inc. (Electronic Equip., Instr. & Comp.)
| (a) | 4.000% | 03/01/2029 | 450,000 | 378,428 |
Veritas U.S., Inc. / Veritas Bermuda Ltd. (Software)
| (a) | 7.500% | 09/01/2025 | 475,000 | 356,461 |
Viavi Solutions, Inc. (Communications Equip.)
| (a) | 3.750% | 10/01/2029 | 75,000 | 62,814 |
| | | | | | 7,509,159 |
Materials–10.4%
| | | | | |
ARD Finance SA (Containers & Packaging)
| (a)(b) | 6.500%, 7.250% PIK | 06/30/2027 | 653,176 | 484,500 |
Ardagh Metal Packaging Finance U.S.A. LLC / Ardagh Metal Packaging Finance PLC (Containers & Packaging)
| (a) | 4.000% | 09/01/2029 | 475,000 | 381,187 |
Ardagh Packaging Finance PLC / Ardagh Holdings U.S.A., Inc. (Containers & Packaging)
| (a) | 5.250% | 08/15/2027 | 775,000 | 552,621 |
Ardagh Packaging Finance PLC / Ardagh Holdings U.S.A., Inc. (Containers & Packaging)
| (a) | 5.250% | 08/15/2027 | 275,000 | 196,092 |
Axalta Coating Systems LLC (Chemicals)
| (a) | 3.375% | 02/15/2029 | 150,000 | 122,456 |
Axalta Coating Systems LLC / Axalta Coating Systems Dutch Holding B B.V. (Chemicals)
| (a) | 4.750% | 06/15/2027 | 150,000 | 134,790 |
Ball Corp. (Containers & Packaging)
| | 2.875% | 08/15/2030 | 325,000 | 261,595 |
Berry Global, Inc. (Containers & Packaging)
| (a) | 5.625% | 07/15/2027 | 275,000 | 263,158 |
Clearwater Paper Corp. (Paper & Forest Products)
| (a) | 5.375% | 02/01/2025 | 575,000 | 559,187 |
Cleveland-Cliffs, Inc. (Metals & Mining)
| (a) | 4.625% | 03/01/2029 | 400,000 | 353,000 |
Cleveland-Cliffs, Inc. (Metals & Mining)
| (a) | 4.875% | 03/01/2031 | 325,000 | 286,542 |
Clydesdale Acquisition Holdings, Inc. (Containers & Packaging)
| (a) | 8.750% | 04/15/2030 | 1,250,000 | 1,078,212 |
Coeur Mining, Inc. (Metals & Mining)
| (a) | 5.125% | 02/15/2029 | 325,000 | 225,140 |
Compass Minerals International, Inc. (Metals & Mining)
| (a) | 4.875% | 07/15/2024 | 450,000 | 417,529 |
Compass Minerals International, Inc. (Metals & Mining)
| (a) | 6.750% | 12/01/2027 | 50,000 | 45,250 |
Crown Americas LLC / Crown Americas Capital Corp. VI (Containers & Packaging)
| | 4.750% | 02/01/2026 | 275,000 | 261,695 |
Diamond B.C. B.V. (Chemicals)
| (a) | 4.625% | 10/01/2029 | 375,000 | 299,887 |
Element Solutions, Inc. (Chemicals)
| (a) | 3.875% | 09/01/2028 | 300,000 | 247,539 |
Freeport-McMoRan, Inc. (Metals & Mining)
| | 5.000% | 09/01/2027 | 175,000 | 173,635 |
Freeport-McMoRan, Inc. (Metals & Mining)
| | 4.625% | 08/01/2030 | 150,000 | 139,167 |
Graphic Packaging International LLC (Containers & Packaging)
| (a) | 4.750% | 07/15/2027 | 150,000 | 141,629 |
Graphic Packaging International LLC (Containers & Packaging)
| (a) | 3.500% | 03/15/2028 | 100,000 | 86,001 |
Graphic Packaging International LLC (Containers & Packaging)
| (a) | 3.500% | 03/01/2029 | 100,000 | 83,970 |
Graphic Packaging International LLC (Containers & Packaging)
| (a) | 3.750% | 02/01/2030 | 25,000 | 21,189 |
H.B. Fuller Co. (Chemicals)
| | 4.250% | 10/15/2028 | 125,000 | 104,883 |
Herens Holdco SARL (Chemicals)
| (a) | 4.750% | 05/15/2028 | 500,000 | 415,400 |
Illuminate Buyer LLC / Illuminate Holdings IV, Inc. (Chemicals)
| (a) | 9.000% | 07/01/2028 | 150,000 | 118,500 |
Koppers, Inc. (Chemicals)
| (a) | 6.000% | 02/15/2025 | 900,000 | 835,794 |
Mauser Packaging Solutions Holding Co. (Containers & Packaging)
| (a) | 5.500% | 04/15/2024 | 300,000 | 286,500 |
Mauser Packaging Solutions Holding Co. (Containers & Packaging)
| (a) | 7.250% | 04/15/2025 | 225,000 | 196,313 |
OI European Group B.V. (Containers & Packaging)
| (a) | 4.750% | 02/15/2030 | 300,000 | 251,250 |
Olympus Water U.S. Holding Corp. (Chemicals)
| (a) | 4.250% | 10/01/2028 | 200,000 | 156,650 |
Olympus Water U.S. Holding Corp. (Chemicals)
| (a) | 6.250% | 10/01/2029 | 400,000 | 277,934 |
Owens-Brockway Glass Container, Inc. (Containers & Packaging)
| (a) | 5.375% | 01/15/2025 | 175,000 | 164,500 |
Owens-Brockway Glass Container, Inc. (Containers & Packaging)
| (a) | 6.375% | 08/15/2025 | 475,000 | 453,250 |
Owens-Brockway Glass Container, Inc. (Containers & Packaging)
| (a) | 6.625% | 05/13/2027 | 38,000 | 35,465 |
Polar U.S. Borrower LLC / Schenectady International Group, Inc. (Chemicals)
| (a) | 6.750% | 05/15/2026 | 500,000 | 349,128 |
Sealed Air Corp. (Containers & Packaging)
| (a) | 4.000% | 12/01/2027 | 175,000 | 157,764 |
Sealed Air Corp. (Containers & Packaging)
| (a) | 5.000% | 04/15/2029 | 75,000 | 70,125 |
SPCM SA (Chemicals)
| (a) | 3.375% | 03/15/2030 | 200,000 | 156,500 |
SRS Distribution, Inc. (Construction Materials)
| (a) | 6.125% | 07/01/2029 | 200,000 | 157,795 |
SRS Distribution, Inc. (Construction Materials)
| (a) | 6.000% | 12/01/2029 | 625,000 | 490,769 |
Standard Industries, Inc. (Construction Materials)
| (a) | 5.000% | 02/15/2027 | 1,250,000 | 1,115,696 |
Standard Industries, Inc. (Construction Materials)
| (a) | 4.750% | 01/15/2028 | 25,000 | 21,375 |
Trivium Packaging Finance B.V. (Containers & Packaging)
| (a) | 5.500% | 08/15/2026 | 200,000 | 188,942 |
Trivium Packaging Finance B.V. (Containers & Packaging)
| (a) | 8.500% | 08/15/2027 | 675,000 | 632,882 |
W.R. Grace Holdings LLC (Chemicals)
| (a) | 4.875% | 06/15/2027 | 125,000 | 108,780 |
W.R. Grace Holdings LLC (Chemicals)
| (a) | 5.625% | 08/15/2029 | 250,000 | 184,063 |
| | | | | | 13,746,229 |
| Ohio National Fund, Inc. | ON Federated High Income Bond Portfolio (Continued) |
| Schedule of Investments | June 30, 2022 (Unaudited) |
| Corporate Bonds (Continued) | Rate | Maturity | Face Amount | Value |
Real Estate–0.5%
| | | | | |
VICI Properties LP / VICI Note Co., Inc. (Equity REIT)
| (a) | 3.500% | 02/15/2025 | $ 25,000 | $ 23,385 |
VICI Properties LP / VICI Note Co., Inc. (Equity REIT)
| (a) | 4.625% | 06/15/2025 | 100,000 | 95,125 |
VICI Properties LP / VICI Note Co., Inc. (Equity REIT)
| (a) | 4.250% | 12/01/2026 | 225,000 | 205,495 |
VICI Properties LP / VICI Note Co., Inc. (Equity REIT)
| (a) | 3.875% | 02/15/2029 | 50,000 | 43,004 |
VICI Properties LP / VICI Note Co., Inc. (Equity REIT)
| (a) | 4.625% | 12/01/2029 | 275,000 | 245,838 |
VICI Properties LP / VICI Note Co., Inc. (Equity REIT)
| (a) | 4.125% | 08/15/2030 | 100,000 | 86,292 |
| | | | | | 699,139 |
Utilities–3.0%
| | | | | |
AmeriGas Partners LP / AmeriGas Finance Corp. (Gas Utilities)
| | 5.875% | 08/20/2026 | 425,000 | 396,476 |
AmeriGas Partners LP / AmeriGas Finance Corp. (Gas Utilities)
| | 5.750% | 05/20/2027 | 100,000 | 91,500 |
Calpine Corp. (Ind. Power & Renewable Elec.)
| (a) | 5.250% | 06/01/2026 | 50,000 | 47,500 |
Calpine Corp. (Ind. Power & Renewable Elec.)
| (a) | 4.500% | 02/15/2028 | 425,000 | 385,848 |
Calpine Corp. (Ind. Power & Renewable Elec.)
| (a) | 4.625% | 02/01/2029 | 150,000 | 124,841 |
Calpine Corp. (Ind. Power & Renewable Elec.)
| (a) | 5.000% | 02/01/2031 | 100,000 | 80,843 |
Calpine Corp. (Ind. Power & Renewable Elec.)
| (a) | 3.750% | 03/01/2031 | 300,000 | 244,020 |
NRG Energy, Inc. (Electric Utilities)
| | 6.625% | 01/15/2027 | 76,000 | 74,433 |
NRG Energy, Inc. (Electric Utilities)
| (a) | 3.375% | 02/15/2029 | 25,000 | 20,160 |
NRG Energy, Inc. (Electric Utilities)
| (a) | 3.625% | 02/15/2031 | 25,000 | 19,600 |
NRG Energy, Inc. (Electric Utilities)
| (a) | 3.875% | 02/15/2032 | 775,000 | 615,569 |
Suburban Propane Partners LP / Suburban Energy Finance Corp. (Gas Utilities)
| | 5.875% | 03/01/2027 | 600,000 | 565,926 |
Suburban Propane Partners LP / Suburban Energy Finance Corp. (Gas Utilities)
| (a) | 5.000% | 06/01/2031 | 125,000 | 106,297 |
TerraForm Power Operating LLC (Ind. Power & Renewable Elec.)
| (a) | 5.000% | 01/31/2028 | 750,000 | 679,305 |
Vistra Operations Co. LLC (Ind. Power & Renewable Elec.)
| (a) | 5.500% | 09/01/2026 | 225,000 | 212,475 |
Vistra Operations Co. LLC (Ind. Power & Renewable Elec.)
| (a) | 5.000% | 07/31/2027 | 375,000 | 340,916 |
| | | | | | 4,005,709 |
Total Corporate Bonds (Cost $151,318,101)
| | | | | $129,172,614 |
| Common Stocks–0.3% | Shares | Value |
Communication Services–0.0%
| | | |
iHeartMedia, Inc. Class A (Media)
| (c) | 7,387 | $ 58,283 |
Health Care–0.3%
| | | |
Mallinckrodt PLC (Pharmaceuticals)
| (c) | 14,683 | 364,649 |
Total Common Stocks (Cost $450,136)
| | | $ 422,932 |
| Rights –0.0% | Quantity | Value |
Communication Services–0.0%
| | | |
Intelsat Jackson Holdings SA Series B CVR (Diversified Telecom. Svs.)
| (c) | 591 | $ 2,216 |
Total Rights (Cost $0)
| | | $ 2,216 |
| Money Market Funds–0.9% | Shares | Value |
State Street Institutional Liquid Reserves Fund Institutional Class, 1.494%
| (d) | 1,167,212 | $ 1,167,096 |
Total Money Market Funds (Cost $1,167,096)
| | | $ 1,167,096 |
Total Investments – 98.9% (Cost $152,935,333)
| (e) | | $130,764,858 |
Other Assets in Excess of Liabilities – 1.1%
| | | 1,512,965 |
| Net Assets – 100.0% | | | $132,277,823 |
Percentages are stated as a percent of net assets. |
| Abbreviations: | |
| CVR: | Contingent Value Right |
| PIK: | Payment-in-Kind |
| Footnotes: | |
| (a) | Security exempt from registration under Regulation D of the Securities Act of 1933. These securities may be resold in transactions exempt from registration, normally to qualified buyers under Rule 144A. At June 30, 2022, the value of these securities totaled $106,197,958, or 80.3% of the Portfolio’s net assets. |
| (b) | Issuer of the security has the option to make coupon payments in cash or in additional par value of this bond (Payment-in-Kind). |
| (c) | Non-income producing security. |
| (d) | Rate represents the seven-day yield at June 30, 2022. |
| (e) | Represents cost for financial reporting purposes, which may differ from cost basis for federal income tax purposes. See also Note 7 of the Notes to Financial Statements. |
The accompanying notes are an integral part of these financial statements.
| Ohio National Fund, Inc. | ON Nasdaq-100® Index Portfolio (Unaudited) |
The ON Nasdaq-100® Index Portfolio seeks long-term growth of capital by investing, under normal circumstances, more than 80% of its net assets in the common stocks of companies that are included in the Nasdaq-100® Index.
Performance as of June 30, 2022
| Average Annual returns | |
| One year | -20.71% |
| Five years | 15.89% |
| Ten years | 16.71% |
Past performance does not guarantee future results. The performance data quoted represents past performance and current returns may be lower or higher. Total return figures include change in share price and reinvestment of dividends and capital gains. The investment return and principal value will fluctuate so that an investor’s shares, when redeemed, may be worth more or less than the original cost. To obtain performance information up to the most recent month end, call toll-free 1-877-781-6392.
The Portfolio is not open to direct retail investment. Beneficial interest in the Portfolio’s shares is obtained either through an allocation to the Portfolio as an investment vehicle within variable life insurance policies or annuity contracts, or as an underlying investment by the ON Model Portfolios. Actual performance results for variable annuity and variable universal life contracts will be lower due to contract charges. Consult your contract for applicable charges.
Total expense ratio is 0.41% per the Fund’s prospectus dated April 29, 2022. Additional information pertaining to the Portfolio’s expense ratio as of June 30, 2022 can be found in the Portfolio’s Financial Highlights.
Comments from Sub-Adviser
Q. How did the Portfolio perform in comparison to its benchmark during the reporting period?
A. For the six-month period ended June 30, 2022, the Portfolio returned -29.36% versus -29.22% for its benchmark, the Nasdaq-100® Index.
Q. Were there specific market conditions, investment strategies, or techniques that materially affected the Portfolio’s benchmark-relative performance during the reporting period?
A. The Portfolio intends to track the underlying return of the Nasdaq-100® Index. There were no material market events or changes in strategy during the six-month period that materially impacted the Portfolio’s relative return. Sources of return variance were the Portfolio’s expenses and the cumulative impact of investing the day-to-day cash flows in the Portfolio.
Q. How did sector allocation and security selection each impact the Portfolio’s performance relative to its benchmark?
A. There was no impact from either sector allocation or stock selection that caused any significant performance variance between the Portfolio and its benchmark during the six-month period. Information Technology, followed by Communication Services and Consumer Discretionary, were the top detractors from performance. The only sector that contributed for the period was Utilities.(1)
Q. Which securities contributed the most to, and detracted the most from, the Portfolio’s benchmark-relative performance?
A. Because the Portfolio weights its holdings to be similar to those utilized by the benchmark, there were no holdings that significantly contributed to, or detracted from, the Portfolio’s benchmark-relative performance for the six-month period. Benchmark constituents that
contributed the most to Portfolio and benchmark returns were T-Mobile U.S., Inc., Vertex Pharmaceuticals, Inc., and Amgen, Inc. Apple, Inc., Amazon.Com, Inc. and Meta Platforms, Inc. Class A were leading detractors. (1)
Q. How did the Portfolio’s use of derivative instruments and initial public offerings (IPOs), if any, impact performance?
A. The Portfolio uses long CME E-mini Nasdaq-100 Index futures contracts primarily to equitize open dividend receivables, as well as to manage day-to-day cash flows, to ensure the Portfolio is fully invested. The futures contracts detracted 33 basis points from the Portfolio’s absolute return for the six-month period. (1)
| (1) | The Portfolio’s composition is subject to change. Holdings and weightings are as of June 30, 2022. |
Change in Value of $10,000 Investment
Hypothetical illustration based on past performance. Future performance will vary. The Portfolio’s returns reflect reinvested dividends. The Portfolio’s holdings may differ significantly from the securities in the index. The index is unmanaged and therefore does not reflect the cost of portfolio management and accounting.
The Nasdaq-100® Index is a modified capitalization-weighted index of the 100 largest domestic and international non-financial companies listed on the NASDAQ® Stock Market. The index presented includes the effects of reinvested dividends.
Past performance is no guarantee of future results. Redemption of fund shares could have tax implications unique to each shareholder.
The Nasdaq-100®, Nasdaq-100 Index®, and Nasdaq® are registered trademarks of The NASDAQ OMX Group, Inc. (which with its affiliates is referred to as “NASDAQ OMX”). Ohio National Investments, Inc. has licensed these marks for the Portfolio’s use. NASDAQ OMX has not passed on the Portfolio’s legality or suitability. NASDAQ OMX does not sponsor, endorse, sell or promote the Portfolio. NASDAQ OMX MAKES NO WARRANTIES AND BEARS NO LIABILITY WITH RESPECT TO THE PORTFOLIO.
| Ohio National Fund, Inc. | ON Nasdaq-100® Index Portfolio (Unaudited) (Continued) |
| Portfolio Composition as of June 30, 2022 (1) |
| | % of Net Assets |
| Common Stocks (4) | 97.4 |
| U.S. Treasury Obligations | 0.1 |
Money Market Funds and
Other Net Assets | 2.5 |
| | 100.0 |
| Top 10 Portfolio Holdings as of June 30, 2022 (1) (2) (3) |
| | | % of Net Assets |
| 1. | Apple, Inc. | 12.3 |
| 2. | Microsoft Corp. | 10.6 |
| 3. | Amazon.com, Inc. | 6.0 |
| 4. | Tesla, Inc. | 3.9 |
| 5. | Alphabet, Inc. Class C | 3.8 |
| 6. | Alphabet, Inc. Class A | 3.6 |
| 7. | Meta Platforms, Inc. Class A | 3.1 |
| 8. | NVIDIA Corp. | 3.0 |
| 9. | PepsiCo, Inc. | 2.1 |
| 10. | Costco Wholesale Corp. | 1.9 |
| | |
| (1) | Composition of Portfolio subject to change. |
| (2) | Short-term investments have been excluded from the list of Top 10 Portfolio Holdings. |
| (3) | Top 10 Portfolio Holdings is presented at an individual security level. Total investment exposure by issuer may be higher. |
| (4) | Sectors (Common Stocks): |
| | % of Net Assets |
| Information Technology | 48.6 |
| Communication Services | 16.8 |
| Consumer Discretionary | 14.6 |
| Consumer Staples | 6.5 |
| Health Care | 6.2 |
| Industrials | 3.3 |
| Utilities | 1.4 |
| | 97.4 |
| Ohio National Fund, Inc. | ON Nasdaq-100® Index Portfolio |
| Schedule of Investments | June 30, 2022 (Unaudited) |
| Common Stocks–97.4% | Shares | Value |
Communication Services–16.8%
| | | |
Activision Blizzard, Inc. (Entertainment)
| | 17,812 | $ 1,386,842 |
Alphabet, Inc. Class A (Interactive Media & Svs.)
| (a) | 4,127 | 8,993,806 |
Alphabet, Inc. Class C (Interactive Media & Svs.)
| (a) | 4,304 | 9,414,785 |
Baidu, Inc. – ADR (Interactive Media & Svs.)
| (a) | 4,923 | 732,198 |
Charter Communications, Inc. Class A (Media)
| (a) | 3,823 | 1,791,190 |
Comcast Corp. Class A (Media)
| | 101,825 | 3,995,613 |
Electronic Arts, Inc. (Entertainment)
| | 6,377 | 775,762 |
Match Group, Inc. (Interactive Media & Svs.)
| (a) | 6,507 | 453,473 |
Meta Platforms, Inc. Class A (Interactive Media & Svs.)
| (a) | 47,147 | 7,602,454 |
NetEase, Inc. – ADR (Entertainment)
| | 4,115 | 384,176 |
Netflix, Inc. (Entertainment)
| (a) | 10,118 | 1,769,335 |
Sirius XM Holdings, Inc. (Media)
| | 89,461 | 548,396 |
T-Mobile U.S., Inc. (Wireless Telecom. Svs.)
| (a) | 28,550 | 3,841,117 |
| | | | 41,689,147 |
Consumer Discretionary–14.6%
| | | |
Airbnb, Inc. Class A (Hotels, Restaurants & Leisure)
| (a) | 8,706 | 775,530 |
Amazon.com, Inc. (Internet & Direct Marketing Retail)
| (a) | 139,675 | 14,834,882 |
Booking Holdings, Inc. (Internet & Direct Marketing Retail)
| (a) | 925 | 1,617,816 |
Dollar Tree, Inc. (Multiline Retail)
| (a) | 5,113 | 796,861 |
eBay, Inc. (Internet & Direct Marketing Retail)
| | 12,723 | 530,167 |
JD.com, Inc. – ADR (Internet & Direct Marketing Retail)
| | 11,542 | 741,227 |
Lucid Group, Inc. (Automobiles)
| (a) | 37,986 | 651,840 |
Lululemon Athletica, Inc. (Textiles, Apparel & Luxury Goods)
| (a) | 2,797 | 762,490 |
Marriott International, Inc. Class A (Hotels, Restaurants & Leisure)
| | 7,458 | 1,014,363 |
MercadoLibre, Inc. (Internet & Direct Marketing Retail)
| (a) | 1,148 | 731,127 |
O'Reilly Automotive, Inc. (Specialty Retail)
| (a) | 1,497 | 945,745 |
Pinduoduo, Inc. – ADR (Internet & Direct Marketing Retail)
| (a) | 10,094 | 623,809 |
Ross Stores, Inc. (Specialty Retail)
| | 8,003 | 562,051 |
Starbucks Corp. (Hotels, Restaurants & Leisure)
| | 26,123 | 1,995,536 |
Tesla, Inc. (Automobiles)
| (a) | 14,222 | 9,577,379 |
| | | | 36,160,823 |
Consumer Staples–6.5%
| | | |
Costco Wholesale Corp. (Food & Staples Retailing)
| | 10,095 | 4,838,332 |
Keurig Dr Pepper, Inc. (Beverages)
| | 32,309 | 1,143,415 |
Kraft Heinz Co. / The (Food Products)
| | 27,874 | 1,063,114 |
Mondelez International, Inc. Class A (Food Products)
| | 31,525 | 1,957,387 |
Monster Beverage Corp. (Beverages)
| (a) | 12,063 | 1,118,240 |
PepsiCo, Inc. (Beverages)
| | 31,492 | 5,248,457 |
Walgreens Boots Alliance, Inc. (Food & Staples Retailing)
| | 19,672 | 745,569 |
| | | | 16,114,514 |
Health Care–6.2%
| | | |
Align Technology, Inc. (Health Care Equip. & Supplies)
| (a) | 1,803 | 426,716 |
Amgen, Inc. (Biotechnology)
| | 12,167 | 2,960,231 |
AstraZeneca PLC – ADR (Pharmaceuticals)
| | 13,162 | 869,613 |
Biogen, Inc. (Biotechnology)
| (a) | 3,335 | 680,140 |
Dexcom, Inc. (Health Care Equip. & Supplies)
| (a) | 8,938 | 666,149 |
Gilead Sciences, Inc. (Biotechnology)
| | 28,569 | 1,765,850 |
IDEXX Laboratories, Inc. (Health Care Equip. & Supplies)
| (a) | 1,912 | 670,596 |
Illumina, Inc. (Life Sciences Tools & Svs.)
| (a) | 3,577 | 659,456 |
| Common Stocks (Continued) | Shares | Value |
Health Care (continued)
| | | |
Intuitive Surgical, Inc. (Health Care Equip. & Supplies)
| (a) | 8,174 | $ 1,640,604 |
Moderna, Inc. (Biotechnology)
| (a) | 9,059 | 1,294,078 |
Regeneron Pharmaceuticals, Inc. (Biotechnology)
| (a) | 2,460 | 1,454,180 |
Seagen, Inc. (Biotechnology)
| (a) | 4,193 | 741,909 |
Vertex Pharmaceuticals, Inc. (Biotechnology)
| (a) | 5,825 | 1,641,427 |
| | | | 15,470,949 |
Industrials–3.3%
| | | |
Cintas Corp. (Commercial Svs. & Supplies)
| | 2,331 | 870,698 |
Copart, Inc. (Commercial Svs. & Supplies)
| (a) | 5,413 | 588,177 |
CSX Corp. (Road & Rail)
| | 49,528 | 1,439,284 |
Fastenal Co. (Trading Companies & Distributors)
| | 13,112 | 654,551 |
Honeywell International, Inc. (Industrial Conglomerates)
| | 15,504 | 2,694,750 |
Old Dominion Freight Line, Inc. (Road & Rail)
| | 2,580 | 661,202 |
PACCAR, Inc. (Machinery)
| | 7,918 | 651,968 |
Verisk Analytics, Inc. (Professional Svs.)
| | 3,596 | 622,432 |
| | | | 8,183,062 |
Information Technology–48.6%
| | | |
Adobe, Inc. (Software)
| (a) | 10,762 | 3,939,538 |
Advanced Micro Devices, Inc. (Semiconductors & Equip.)
| (a) | 36,906 | 2,822,202 |
Analog Devices, Inc. (Semiconductors & Equip.)
| | 11,838 | 1,729,413 |
ANSYS, Inc. (Software)
| (a) | 1,974 | 472,358 |
Apple, Inc. (Tech. Hardware, Storage & Periph.)
| | 222,188 | 30,377,543 |
Applied Materials, Inc. (Semiconductors & Equip.)
| | 19,811 | 1,802,405 |
ASML Holding N.V. (Semiconductors & Equip.)
| | 1,951 | 928,442 |
Atlassian Corp. PLC Class A (Software)
| (a) | 3,256 | 610,174 |
Autodesk, Inc. (Software)
| (a) | 4,956 | 852,234 |
Automatic Data Processing, Inc. (IT Svs.)
| | 9,516 | 1,998,741 |
Broadcom, Inc. (Semiconductors & Equip.)
| | 9,299 | 4,517,547 |
Cadence Design Systems, Inc. (Software)
| (a) | 6,284 | 942,789 |
Cisco Systems, Inc. (Communications Equip.)
| | 94,311 | 4,021,421 |
Cognizant Technology Solutions Corp. Class A (IT Svs.)
| | 11,858 | 800,296 |
Crowdstrike Holdings, Inc. Class A (Software)
| (a) | 4,860 | 819,202 |
Datadog, Inc. Class A (Software)
| (a) | 6,449 | 614,203 |
DocuSign, Inc. (Software)
| (a) | 4,538 | 260,390 |
Fiserv, Inc. (IT Svs.)
| (a) | 14,725 | 1,310,083 |
Fortinet, Inc. (Software)
| (a) | 18,286 | 1,034,622 |
Intel Corp. (Semiconductors & Equip.)
| | 93,122 | 3,483,694 |
Intuit, Inc. (Software)
| | 6,425 | 2,476,452 |
KLA Corp. (Semiconductors & Equip.)
| | 3,399 | 1,084,553 |
Lam Research Corp. (Semiconductors & Equip.)
| | 3,159 | 1,346,208 |
Marvell Technology, Inc. (Semiconductors & Equip.)
| | 19,355 | 842,523 |
Microchip Technology, Inc. (Semiconductors & Equip.)
| | 12,628 | 733,434 |
Micron Technology, Inc. (Semiconductors & Equip.)
| | 25,429 | 1,405,715 |
Microsoft Corp. (Software)
| | 102,673 | 26,369,507 |
NVIDIA Corp. (Semiconductors & Equip.)
| | 48,298 | 7,321,494 |
NXP Semiconductors N.V. (Semiconductors & Equip.)
| | 5,979 | 885,071 |
Okta, Inc. (IT Svs.)
| (a) | 3,459 | 312,694 |
Palo Alto Networks, Inc. (Software)
| (a) | 2,270 | 1,121,244 |
Paychex, Inc. (IT Svs.)
| | 8,225 | 936,581 |
PayPal Holdings, Inc. (IT Svs.)
| (a) | 26,374 | 1,841,960 |
QUALCOMM, Inc. (Semiconductors & Equip.)
| | 25,507 | 3,258,264 |
Skyworks Solutions, Inc. (Semiconductors & Equip.)
| | 3,690 | 341,842 |
| Ohio National Fund, Inc. | ON Nasdaq-100® Index Portfolio (Continued) |
| Schedule of Investments | June 30, 2022 (Unaudited) |
| Common Stocks (Continued) | Shares | Value |
Information Technology (continued)
| | | |
Splunk, Inc. (Software)
| (a) | 3,640 | $ 321,994 |
Synopsys, Inc. (Software)
| (a) | 3,486 | 1,058,698 |
Texas Instruments, Inc. (Semiconductors & Equip.)
| | 21,000 | 3,226,650 |
VeriSign, Inc. (IT Svs.)
| (a) | 2,488 | 416,317 |
Workday, Inc. Class A (Software)
| (a) | 4,533 | 632,716 |
Zoom Video Communications, Inc. Class A (Software)
| (a) | 5,733 | 618,992 |
Zscaler, Inc. (Software)
| (a) | 3,207 | 479,479 |
| | | | 120,369,685 |
Utilities–1.4%
| | | |
American Electric Power Co., Inc. (Electric Utilities)
| | 11,690 | 1,121,539 |
Constellation Energy Corp. (Electric Utilities)
| | 7,470 | 427,732 |
Exelon Corp. (Electric Utilities)
| | 22,318 | 1,011,452 |
Xcel Energy, Inc. (Electric Utilities)
| | 12,398 | 877,282 |
| | | | 3,438,005 |
Total Common Stocks (Cost $177,803,305)
| | | $241,426,185 |
| U.S. Treasury Obligations–0.1% | Rate | Maturity | Face Amount | Value |
| U.S. Treasury Bill | (b) | 0.000% | 01/26/2023 | $ 100,000 | $ 98,586 |
Total U.S. Treasury Obligations (Cost $99,295)
| $ 98,586 |
| Money Market Funds–0.8% | Shares | Value |
State Street Institutional Liquid Reserves Fund Institutional Class, 1.494%
| (c) | 2,008,760 | $ 2,008,559 |
State Street Institutional U.S. Government Money Market Fund, 1.434%
| (c) | 15,019 | 15,019 |
Total Money Market Funds (Cost $2,023,578)
| | | $ 2,023,578 |
Total Investments – 98.3% (Cost $179,926,178)
| (d) | | $243,548,349 |
Other Assets in Excess of Liabilities – 1.7%
| (b) | | 4,265,790 |
| Net Assets – 100.0% | | | $247,814,139 |
Percentages are stated as a percent of net assets. |
| Abbreviations: | |
| ADR: | American Depositary Receipts |
| Footnotes: | |
| (a) | Non-income producing security. |
| (b) | Security is fully pledged, in addition to $37,377 of the Portfolio’s cash holdings, as collateral for the futures contracts outstanding at June 30, 2022. See also the following Schedule of Open Futures Contracts. |
| (c) | Rate represents the seven-day yield at June 30, 2022. |
| (d) | Represents cost for financial reporting purposes, which may differ from cost basis for federal income tax purposes. See also Note 7 of the Notes to Financial Statements. |
The accompanying notes are an integral part of these financial statements.
| Schedule of Open Futures Contracts | June 30, 2022 (Unaudited) |
| Description | | Number of
contracts | | Expiration Date | | Notional
Amount | | Value | | Unrealized
Appreciation
(Depreciation) | | Variation Margin
Receivable
(Payable) |
| CME E-mini Nasdaq-100 Index - Long | | 9 | | September 16, 2022 | | $2,167,031 | | $2,075,310 | | $(91,721) | | $(29,070) |
The accompanying notes are an integral part of these financial statements.
| Ohio National Fund, Inc. | ON BlackRock Advantage Large Cap Core Portfolio (Unaudited) |
The ON BlackRock Advantage Large Cap Core Portfolio seeks long-term growth of capital by investing, under normal circumstances, at least 80% of its net assets in common stocks of the 1,000 largest publicly traded U.S. companies in terms of market capitalization.
Performance as of June 30, 2022
| Average Annual returns | |
| One year | -11.66% |
| Five years | 8.24% |
| Ten years | 13.00% |
Past performance does not guarantee future results. The performance data quoted represents past performance and current returns may be lower or higher. Total return figures include change in share price and reinvestment of dividends and capital gains. The investment return and principal value will fluctuate so that an investor’s shares, when redeemed, may be worth more or less than the original cost. To obtain performance information up to the most recent month end, call toll-free 1-877-781-6392.
The Portfolio is not open to direct retail investment. Beneficial interest in the Portfolio’s shares is obtained either through an allocation to the Portfolio as an investment vehicle within variable life insurance policies or annuity contracts, or as an underlying investment by the ON Model Portfolios. Actual performance results for variable annuity and variable universal life contracts will be lower due to contract charges. Consult your contract for applicable charges.
Total expense ratio is 0.69% per the Fund’s prospectus dated April 29, 2022. Additional information pertaining to the Portfolio’s expense ratio as of June 30, 2022 can be found in the Portfolio’s Financial Highlights.
Comments from Sub-Adviser
Q. How did the Portfolio perform in comparison to its benchmark during the reporting period?
A. For the six-month period ended June 30, 2022, the Portfolio returned -20.72% versus -19.96% for its benchmark, the S&P 500® Index.
Q. Were there specific market conditions, investment strategies, or techniques that materially affected the Portfolio’s benchmark-relative performance during the reporting period?
A. Despite positive performance in the second quarter, weakness at the start of the period led to a underperformance for the six-month period. Early performance from positioning capturing policy normalization quickly eroded amid the conflict in the Ukraine. Underperformance was driven by non-traditional fundamental quality measures, particularly environmental, social, and governance (“ESG”) insights, while fundamental value measures aided performance.
Fundamental quality insights with a growth flavor led the detraction. Insights evaluating managerial quality, corporate culture, and favoring founder-led ownership structures all detracted. Non-traditional fundamental quality measures, specifically ESG insights, struggled as markets continued to focus on macro dynamics over company results. Insights designed to track company controversies detracted, as it was incorrectly positioned around select consumer names that had sales exposure to Russia. Also, measures that evaluate carbon emissions intensity and track companies across green patent filings detracted, as those measures helped to motivate an overweight across Industrials.
Additionally, given the market rotations, sentiment-based stock selection that captures trends across participants struggled to gain direction. Specifically, text analyses designed to capture both short-term results and long-term fundamentals struggled, and helped motivate an unsuccessful underweight stance across Health Care. Also, positioning
based on informed investor views detracted as the shared exposures ran against rising style volatility.. Conversely, capturing sentiment from bond markets benefitted gains, given interest rate volatility.
Finally, fundamental value insights provided ballast for the period, as they benefitted from the market style preference. Traditional valuation measuring company ownership structures and sources of financing, cash usage efficiency, and other financial statement metrics motivated a successful overweight to Energy names, benefitting performance. (1)
Q. How did sector allocation and security selection each impact the Portfolio’s performance relative to its benchmark?
A. The portfolio management team targets a relatively sector-neutral approach and seeks to derive the majority of any excess return from security selection. During the six-month period, however, overall sector allocation decisions contributed to relative returns. An underweight position within Consumer Discretionary names contributed to relative performance as the market was more focused on durables. Security selection had a more meaningful impact to overall relative underperformance. Security selections in Industrials and Consumer Staples were the largest detractors, offset somewhat by the positive selection in the Communication Services sector. (1)
Q. Which securities contributed the most to, and detracted the most from, the Portfolio’s benchmark-relative performance?
A. For the six-month period, the Portfolio’s overweight position in EOG Resources, Inc. a Texas-based Energy company, was a top contributor to relative performance. The stock benefitted from the broader Energy sector rally and runup in commodities prices. An underweight to Netflix, Inc. was also a top contributor, as the stock struggled amid a stagnant user base.
In contrast, In contrast, an overweight to IDEXX Laboratories, Inc. was a key detractor from relative performance, as the company missed on its first quarter earnings. Further hindering results was an underweight stance in Chevron Corp., as the stock benefitted from the broader Energy rally and runup in commodities prices. (1)
Q. How did the Portfolio’s use of derivative instruments and initial public offerings (IPOs), if any, impact performance?
A. Pursuant to the Portfolio’s investment strategy, futures contracts were used to prevent a cash drag on performance. The futures contracts detracted 25 basis points from the Portfolio’s absolute return for the six-month period. The Portfolio did not participate in any IPOs during the period. (1)
| (1) | The Portfolio’s composition is subject to change. Holdings and weightings are as of June 30, 2022. |
| Ohio National Fund, Inc. | ON BlackRock Advantage Large Cap Core Portfolio (Unaudited) (Continued) |
Change in Value of $10,000 Investment
Hypothetical illustration based on past performance. Future performance will vary. The Portfolio’s returns reflect reinvested dividends. The Portfolio’s holdings may differ significantly from the securities in the index. The index is unmanaged and therefore does not reflect the cost of portfolio management and accounting.
The S&P 500® Index is a capitalization-weighted index designed to measure performance of the broad domestic economy through changes in the aggregate market value of 500 stocks representing all major industries. The index presented includes the effects of reinvested dividends.
Past performance is no guarantee of future results. Redemption of fund shares could have tax implications unique to each shareholder.
| Portfolio Composition as of June 30, 2022 (1) |
| | % of Net Assets |
| Common Stocks (4) | 97.5 |
Money Market Funds and
Other Net Assets | 2.5 |
| | 100.0 |
| Top 10 Portfolio Holdings as of June 30, 2022 (1) (2) (3) |
| | | % of Net Assets |
| 1. | Microsoft Corp. | 6.8 |
| 2. | Apple, Inc. | 6.4 |
| 3. | Amazon.com, Inc. | 2.7 |
| 4. | Alphabet, Inc. Class A | 2.5 |
| 5. | Alphabet, Inc. Class C | 1.8 |
| 6. | Exxon Mobil Corp. | 1.8 |
| 7. | Tesla, Inc. | 1.8 |
| 8. | UnitedHealth Group, Inc. | 1.8 |
| 9. | Procter & Gamble Co. / The | 1.7 |
| 10. | Visa, Inc. | 1.6 |
| | |
| (1) | Composition of Portfolio subject to change. |
| (2) | Short-term investments have been excluded from the list of Top 10 Portfolio Holdings. |
| (3) | Top 10 Portfolio Holdings is presented at an individual security level. Total investment exposure by issuer may be higher. |
| (4) | Sectors (Common Stocks): |
| | % of Net Assets |
| Information Technology | 26.6 |
| Health Care | 15.3 |
| Financials | 10.6 |
| Consumer Discretionary | 9.8 |
| Communication Services | 8.2 |
| Industrials | 7.9 |
| Consumer Staples | 7.2 |
| Energy | 4.5 |
| Utilities | 2.9 |
| Materials | 2.3 |
| Real Estate | 2.2 |
| | 97.5 |
| Ohio National Fund, Inc. | ON BlackRock Advantage Large Cap Core Portfolio |
| Schedule of Investments | June 30, 2022 (Unaudited) |
| Common Stocks–97.5% | Shares | Value |
Communication Services–8.2%
| | | |
Alphabet, Inc. Class A (Interactive Media & Svs.)
| (a) | 3,731 | $ 8,130,819 |
Alphabet, Inc. Class C (Interactive Media & Svs.)
| (a) | 2,798 | 6,120,485 |
Charter Communications, Inc. Class A (Media)
| (a) | 2,317 | 1,085,584 |
Comcast Corp. Class A (Media)
| | 87,900 | 3,449,196 |
Electronic Arts, Inc. (Entertainment)
| | 4,385 | 533,435 |
Fox Corp. Class A (Media)
| | 77,418 | 2,489,763 |
Fox Corp. Class B (Media)
| | 1,637 | 48,619 |
Meta Platforms, Inc. Class A (Interactive Media & Svs.)
| (a) | 23,181 | 3,737,936 |
Verizon Communications, Inc. (Diversified Telecom. Svs.)
| | 14,184 | 719,838 |
Walt Disney Co. / The (Entertainment)
| (a) | 4,576 | 431,975 |
Warner Bros Discovery, Inc. (Entertainment)
| (a) | 13,819 | 185,451 |
| | | | 26,933,101 |
Consumer Discretionary–9.8%
| | | |
Amazon.com, Inc. (Internet & Direct Marketing Retail)
| (a) | 84,707 | 8,996,730 |
AutoNation, Inc. (Specialty Retail)
| (a) | 3,910 | 436,982 |
Best Buy Co., Inc. (Specialty Retail)
| | 2,176 | 141,853 |
Choice Hotels International, Inc. (Hotels, Restaurants & Leisure)
| | 2,376 | 265,233 |
Dollar General Corp. (Multiline Retail)
| | 2,198 | 539,477 |
Ford Motor Co. (Automobiles)
| | 11,159 | 124,200 |
General Motors Co. (Automobiles)
| (a) | 26,646 | 846,277 |
Home Depot, Inc. / The (Specialty Retail)
| | 15,428 | 4,231,438 |
Lowe's Cos., Inc. (Specialty Retail)
| | 9,005 | 1,572,903 |
McDonald's Corp. (Hotels, Restaurants & Leisure)
| | 6,825 | 1,684,956 |
NIKE, Inc. Class B (Textiles, Apparel & Luxury Goods)
| | 7,504 | 766,909 |
Ralph Lauren Corp. (Textiles, Apparel & Luxury Goods)
| | 3,085 | 276,570 |
Target Corp. (Multiline Retail)
| | 16,057 | 2,267,730 |
Tesla, Inc. (Automobiles)
| (a) | 8,814 | 5,935,524 |
TJX Cos., Inc. / The (Specialty Retail)
| | 8,136 | 454,396 |
Travel + Leisure Co. (Hotels, Restaurants & Leisure)
| | 50,104 | 1,945,037 |
Whirlpool Corp. (Household Durables)
| | 5,716 | 885,237 |
Yum! Brands, Inc. (Hotels, Restaurants & Leisure)
| | 9,214 | 1,045,881 |
| | | | 32,417,333 |
Consumer Staples–7.2%
| | | |
Altria Group, Inc. (Tobacco)
| | 29,829 | 1,245,957 |
Brown-Forman Corp. Class B (Beverages)
| | 39,469 | 2,769,145 |
Bunge Ltd. (Food Products)
| | 5,936 | 538,336 |
Coca-Cola Co. / The (Beverages)
| | 3,271 | 205,779 |
Colgate-Palmolive Co. (Household Products)
| | 45,923 | 3,680,269 |
Costco Wholesale Corp. (Food & Staples Retailing)
| | 5,061 | 2,425,636 |
Hershey Co. / The (Food Products)
| | 731 | 157,282 |
Kellogg Co. (Food Products)
| | 11,472 | 818,412 |
Keurig Dr Pepper, Inc. (Beverages)
| | 38,535 | 1,363,754 |
McCormick & Co., Inc. (Food Products)
| | 8,563 | 712,870 |
PepsiCo, Inc. (Beverages)
| | 19,460 | 3,243,203 |
Philip Morris International, Inc. (Tobacco)
| | 5,086 | 502,192 |
Procter & Gamble Co. / The (Household Products)
| | 38,127 | 5,482,281 |
Tyson Foods, Inc. Class A (Food Products)
| | 6,814 | 586,413 |
| | | | 23,731,529 |
Energy–4.5%
| | | |
Chevron Corp. (Oil, Gas & Consumable Fuels)
| | 11,503 | 1,665,404 |
EOG Resources, Inc. (Oil, Gas & Consumable Fuels)
| | 23,388 | 2,582,971 |
Exxon Mobil Corp. (Oil, Gas & Consumable Fuels)
| | 70,843 | 6,066,994 |
| Common Stocks (Continued) | Shares | Value |
| Energy (continued) | | | |
Halliburton Co. (Energy Equip. & Svs.)
| | 29,974 | $ 939,985 |
Marathon Oil Corp. (Oil, Gas & Consumable Fuels)
| | 60,927 | 1,369,639 |
Occidental Petroleum Corp. (Oil, Gas & Consumable Fuels)
| | 6,792 | 399,913 |
Schlumberger N.V. (Energy Equip. & Svs.)
| | 37,137 | 1,328,019 |
Valero Energy Corp. (Oil, Gas & Consumable Fuels)
| | 4,171 | 443,294 |
| | | | 14,796,219 |
Financials–10.6%
| | | |
American Express Co. (Consumer Finance)
| | 13,780 | 1,910,183 |
Bank of America Corp. (Banks)
| | 165,693 | 5,158,023 |
Bank of New York Mellon Corp. / The (Capital Markets)
| | 20,270 | 845,462 |
Berkshire Hathaway, Inc. Class B (Diversified Financial Svs.)
| (a) | 14,394 | 3,929,850 |
Capital One Financial Corp. (Consumer Finance)
| | 4,008 | 417,593 |
Charles Schwab Corp. / The (Capital Markets)
| | 13,467 | 850,845 |
Citigroup, Inc. (Banks)
| | 32,020 | 1,472,600 |
Discover Financial Services (Consumer Finance)
| | 346 | 32,725 |
JPMorgan Chase & Co. (Banks)
| | 41,828 | 4,710,251 |
Marsh & McLennan Cos., Inc. (Insurance)
| | 10,528 | 1,634,472 |
MetLife, Inc. (Insurance)
| | 62,297 | 3,911,629 |
Moody's Corp. (Capital Markets)
| | 2,972 | 808,295 |
Pinnacle Financial Partners, Inc. (Banks)
| | 5,551 | 401,393 |
PNC Financial Services Group, Inc. / The (Banks)
| | 4,727 | 745,779 |
Regions Financial Corp. (Banks)
| | 73,236 | 1,373,175 |
Stifel Financial Corp. (Capital Markets)
| | 696 | 38,990 |
Travelers Cos., Inc. / The (Insurance)
| | 15,259 | 2,580,755 |
Voya Financial, Inc. (Diversified Financial Svs.)
| | 56,197 | 3,345,407 |
Wells Fargo & Co. (Banks)
| | 22,490 | 880,933 |
| | | | 35,048,360 |
Health Care–15.3%
| | | |
Abbott Laboratories (Health Care Equip. & Supplies)
| | 22,628 | 2,458,532 |
AbbVie, Inc. (Biotechnology)
| | 8,668 | 1,327,591 |
Agilent Technologies, Inc. (Life Sciences Tools & Svs.)
| | 23,137 | 2,747,981 |
AmerisourceBergen Corp. (Health Care Providers & Svs.)
| | 8,512 | 1,204,278 |
Amgen, Inc. (Biotechnology)
| | 10,466 | 2,546,378 |
Boston Scientific Corp. (Health Care Equip. & Supplies)
| (a) | 49,237 | 1,835,063 |
Bristol-Myers Squibb Co. (Pharmaceuticals)
| | 5,591 | 430,507 |
Bruker Corp. (Life Sciences Tools & Svs.)
| | 506 | 31,757 |
Cigna Corp. (Health Care Providers & Svs.)
| | 5,860 | 1,544,227 |
CVS Health Corp. (Health Care Providers & Svs.)
| | 12,742 | 1,180,674 |
Danaher Corp. (Life Sciences Tools & Svs.)
| | 8,100 | 2,053,512 |
Elevance Health, Inc. (Health Care Providers & Svs.)
| | 6,305 | 3,042,667 |
Eli Lilly & Co. (Pharmaceuticals)
| | 7,153 | 2,319,217 |
Johnson & Johnson (Pharmaceuticals)
| | 29,154 | 5,175,127 |
McKesson Corp. (Health Care Providers & Svs.)
| | 1,587 | 517,695 |
Medtronic PLC (Health Care Equip. & Supplies)
| | 14,290 | 1,282,527 |
Merck & Co., Inc. (Pharmaceuticals)
| | 45,290 | 4,129,089 |
Mettler-Toledo International, Inc. (Life Sciences Tools & Svs.)
| (a) | 719 | 825,966 |
Pfizer, Inc. (Pharmaceuticals)
| | 57,055 | 2,991,394 |
Syneos Health, Inc. (Life Sciences Tools & Svs.)
| (a) | 28,381 | 2,034,350 |
Thermo Fisher Scientific, Inc. (Life Sciences Tools & Svs.)
| | 3,830 | 2,080,762 |
| Ohio National Fund, Inc. | ON BlackRock Advantage Large Cap Core Portfolio (Continued) |
| Schedule of Investments | June 30, 2022 (Unaudited) |
| Common Stocks (Continued) | Shares | Value |
Health Care (continued)
| | | |
UnitedHealth Group, Inc. (Health Care Providers & Svs.)
| | 11,375 | $ 5,842,541 |
Zoetis, Inc. (Pharmaceuticals)
| | 17,090 | 2,937,600 |
| | | | 50,539,435 |
Industrials–7.9%
| | | |
AMETEK, Inc. (Electrical Equip.)
| | 3,158 | 347,033 |
Caterpillar, Inc. (Machinery)
| | 2,536 | 453,335 |
CSX Corp. (Road & Rail)
| | 21,465 | 623,773 |
Cummins, Inc. (Machinery)
| | 1,853 | 358,611 |
Curtiss-Wright Corp. (Aerospace & Defense)
| | 8,193 | 1,081,968 |
Deere & Co. (Machinery)
| | 1,724 | 516,286 |
Delta Air Lines, Inc. (Airlines)
| (a) | 17,884 | 518,099 |
Eaton Corp. PLC (Electrical Equip.)
| | 17,540 | 2,209,865 |
Expeditors International of Washington, Inc. (Air Freight & Logistics)
| | 2,233 | 217,628 |
General Dynamics Corp. (Aerospace & Defense)
| | 18,467 | 4,085,824 |
HEICO Corp. (Aerospace & Defense)
| | 4,628 | 606,823 |
HEICO Corp. Class A (Aerospace & Defense)
| | 15,571 | 1,640,872 |
Honeywell International, Inc. (Industrial Conglomerates)
| | 3,950 | 686,550 |
Illinois Tool Works, Inc. (Machinery)
| | 17,761 | 3,236,942 |
Landstar System, Inc. (Road & Rail)
| | 8,300 | 1,206,986 |
Lennox International, Inc. (Building Products)
| | 229 | 47,309 |
Lockheed Martin Corp. (Aerospace & Defense)
| | 5,763 | 2,477,860 |
Norfolk Southern Corp. (Road & Rail)
| | 671 | 152,512 |
Old Dominion Freight Line, Inc. (Road & Rail)
| | 575 | 147,361 |
Owens Corning (Building Products)
| | 2,023 | 150,329 |
PACCAR, Inc. (Machinery)
| | 5,922 | 487,617 |
SiteOne Landscape Supply, Inc. (Trading Companies & Distributors)
| (a) | 11,268 | 1,339,427 |
Union Pacific Corp. (Road & Rail)
| | 2,819 | 601,236 |
United Parcel Service, Inc. Class B (Air Freight & Logistics)
| | 16,244 | 2,965,180 |
| | | | 26,159,426 |
Information Technology–26.6%
| | | |
Accenture PLC Class A (IT Svs.)
| | 732 | 203,240 |
Adobe, Inc. (Software)
| (a) | 5,316 | 1,945,975 |
Advanced Micro Devices, Inc. (Semiconductors & Equip.)
| (a) | 19,568 | 1,496,365 |
Analog Devices, Inc. (Semiconductors & Equip.)
| | 10,401 | 1,519,482 |
Apple, Inc. (Tech. Hardware, Storage & Periph.)
| | 154,247 | 21,088,650 |
Applied Materials, Inc. (Semiconductors & Equip.)
| | 19,014 | 1,729,894 |
Automatic Data Processing, Inc. (IT Svs.)
| | 4,503 | 945,810 |
Broadcom, Inc. (Semiconductors & Equip.)
| | 1,924 | 934,698 |
Ciena Corp. (Communications Equip.)
| (a) | 3,515 | 160,636 |
Cognizant Technology Solutions Corp. Class A (IT Svs.)
| | 7,665 | 517,311 |
Dell Technologies, Inc. Class C (Tech. Hardware, Storage & Periph.)
| | 32,410 | 1,497,666 |
Fidelity National Information Services, Inc. (IT Svs.)
| | 11,809 | 1,082,531 |
Global Payments, Inc. (IT Svs.)
| | 4,922 | 544,570 |
Hewlett Packard Enterprise Co. (Tech. Hardware, Storage & Periph.)
| | 89,567 | 1,187,658 |
HP, Inc. (Tech. Hardware, Storage & Periph.)
| | 50,230 | 1,646,539 |
Intel Corp. (Semiconductors & Equip.)
| | 109,795 | 4,107,431 |
Intuit, Inc. (Software)
| | 1,356 | 522,657 |
| Common Stocks (Continued) | Shares | Value |
Information Technology (continued)
| | | |
Juniper Networks, Inc. (Communications Equip.)
| | 30,699 | $ 874,922 |
KLA Corp. (Semiconductors & Equip.)
| | 2,212 | 705,805 |
Lam Research Corp. (Semiconductors & Equip.)
| | 1,790 | 762,809 |
Mastercard, Inc. Class A (IT Svs.)
| | 4,025 | 1,269,807 |
Micron Technology, Inc. (Semiconductors & Equip.)
| | 11,012 | 608,743 |
Microsoft Corp. (Software)
| | 87,782 | 22,545,051 |
NVIDIA Corp. (Semiconductors & Equip.)
| | 24,460 | 3,707,891 |
PayPal Holdings, Inc. (IT Svs.)
| (a) | 14,600 | 1,019,664 |
QUALCOMM, Inc. (Semiconductors & Equip.)
| | 17,245 | 2,202,876 |
Salesforce, Inc. (Software)
| (a) | 8,821 | 1,455,818 |
ServiceNow, Inc. (Software)
| (a) | 5,781 | 2,748,981 |
Silicon Laboratories, Inc. (Semiconductors & Equip.)
| (a) | 7,384 | 1,035,384 |
TE Connectivity Ltd. (Electronic Equip., Instr. & Comp.)
| | 2,404 | 272,013 |
Texas Instruments, Inc. (Semiconductors & Equip.)
| | 7,305 | 1,122,413 |
Visa, Inc. (IT Svs.)
| | 26,538 | 5,225,067 |
Workday, Inc. Class A (Software)
| (a) | 6,553 | 914,668 |
| | | | 87,603,025 |
Materials–2.3%
| | | |
Corteva, Inc. (Chemicals)
| | 13,184 | 713,782 |
Ecolab, Inc. (Chemicals)
| | 20,685 | 3,180,526 |
Freeport-McMoRan, Inc. (Metals & Mining)
| | 13,604 | 398,053 |
Linde PLC (Chemicals)
| | 11,116 | 3,196,183 |
| | | | 7,488,544 |
Real Estate–2.2%
| | | |
CBRE Group, Inc. Class A (Real Estate Mgmt. & Development)
| (a) | 8,798 | 647,621 |
Crown Castle International Corp. (Equity REIT)
| | 6,607 | 1,112,487 |
CubeSmart (Equity REIT)
| | 23,498 | 1,003,834 |
Extra Space Storage, Inc. (Equity REIT)
| | 7,840 | 1,333,741 |
Mid-America Apartment Communities, Inc. (Equity REIT)
| | 2,403 | 419,732 |
Prologis, Inc. (Equity REIT)
| | 23,281 | 2,739,010 |
| | | | 7,256,425 |
Utilities–2.9%
| | | |
CMS Energy Corp. (Multi-Utilities)
| | 35,702 | 2,409,885 |
DTE Energy Co. (Multi-Utilities)
| | 17,052 | 2,161,341 |
Entergy Corp. (Electric Utilities)
| | 23,364 | 2,631,721 |
NextEra Energy, Inc. (Electric Utilities)
| | 13,727 | 1,063,293 |
NRG Energy, Inc. (Ind. Power & Renewable Elec.)
| | 13,681 | 522,204 |
OGE Energy Corp. (Electric Utilities)
| | 21,686 | 836,212 |
| | | | 9,624,656 |
Total Common Stocks (Cost $342,640,017)
| | | $321,598,053 |
| Money Market Funds–1.1% | Shares | Value |
State Street Institutional Liquid Reserves Fund Institutional Class, 1.494%
| (b) | 3,707,973 | $ 3,707,602 |
Total Money Market Funds (Cost $3,707,989)
| | | $ 3,707,602 |
Total Investments – 98.6% (Cost $346,348,006)
| (c) | | $325,305,655 |
Other Assets in Excess of Liabilities – 1.4%
| (d) | | 4,702,663 |
| Net Assets – 100.0% | | | $330,008,318 |
Percentages are stated as a percent of net assets. |
| Ohio National Fund, Inc. | ON BlackRock Advantage Large Cap Core Portfolio (Continued) |
| Schedule of Investments | June 30, 2022 (Unaudited) |
| Footnotes: | |
| (a) | Non-income producing security. |
| (b) | Rate represents the seven-day yield at June 30, 2022. |
| (c) | Represents cost for financial reporting purposes, which may differ from cost basis for federal income tax purposes. See also Note 7 of the Notes to Financial Statements. |
| (d) | Includes $273,000 of cash pledged as collateral for the futures contracts outstanding at June 30, 2022. See also the following Schedule of Open Futures Contracts. |
The accompanying notes are an integral part of these financial statements.
| Schedule of Open Futures Contracts | June 30, 2022 (Unaudited) |
| Description | | Number of
contracts | | Expiration Date | | Notional
Amount | | Value | | Unrealized
Appreciation
(Depreciation) | | Variation Margin
Receivable
(Payable) |
| CME E-mini S&P 500 Index - Long | | 26 | | September 16, 2022 | | $5,015,842 | | $4,926,350 | | $(89,492) | | $(41,275) |
The accompanying notes are an integral part of these financial statements.
| Ohio National Fund, Inc. | ON BlackRock Advantage Small Cap Growth Portfolio (Unaudited) |
The ON BlackRock Advantage Small Cap Growth Portfolio seeks long-term growth of capital by investing, under normal circumstances, at least 80% of its net assets in stocks of small capitalization companies with a market capitalization at the time of investment that is no greater than the largest market capitalization of a company in the Russell 2000® Index for the previous twelve months.
Performance as of June 30, 2022
| Average Annual returns | |
| One year | -32.21% |
| Five years | 6.76% |
| Ten years | 9.03% |
Past performance does not guarantee future results. The performance data quoted represents past performance and current returns may be lower or higher. Total return figures include change in share price and reinvestment of dividends and capital gains. The investment return and principal value will fluctuate so that an investor’s shares, when redeemed, may be worth more or less than the original cost. To obtain performance information up to the most recent month end, call toll-free 1-877-781-6392.
The Portfolio is not open to direct retail investment. Beneficial interest in the Portfolio’s shares is obtained either through an allocation to the Portfolio as an investment vehicle within variable life insurance policies or annuity contracts, or as an underlying investment by the ON Model Portfolios. Actual performance results for variable annuity and variable universal life contracts will be lower due to contract charges. Consult your contract for applicable charges.
Total expense ratio is 0.85% per the Fund’s prospectus dated April 29, 2022. Additional information pertaining to the Portfolio’s expense ratio as of June 30, 2022 can be found in the Portfolio’s Financial Highlights.
Comments from Sub-Adviser
Q. How did the Portfolio perform in comparison to its benchmark during the reporting period?
A. For the six-month period ended June 30, 2022, the Portfolio returned -28.95% versus -29.45% for its benchmark, the Russell 2000® Growth Index.
Q. Were there specific market conditions, investment strategies, or techniques that materially affected the Portfolio’s benchmark-relative performance during the reporting period?
A. The Portfolio performed well amid the volatile market backdrop. Fundamental insights with a preference for attractively priced growth companies drove the Portfolio’s outperformance for the six-month period.
Traditional fundamental insights led positive performance for the period, as they benefitted from the market style preference. Traditional valuation metrics measuring company earnings yield, sales across valuations, and other financial statement metrics all did well. Those insights helped motivate successful security selection within Energy names, benefitting performance. Additionally, stability related fundamental measures, such as insights with a preference for lower volatility stocks, performed well amid the broader risk-off market tone.
Elsewhere, performance from sentiment-based measures was modestly positive. Text-based measures evaluating conference call data, as well as other trend-based measures, contributed to gains, as those measures helped to correctly position the Portfolio amid the market rotations.
Conversely, fundamental quality insights with a growth flavor struggled. Insight evaluating managerial quality, corporate culture, as well as measures favoring founder-led ownership structures all detracted. Nontraditional fundamental quality measures, specifically
environmental, social, and governance (“ESG”) insights, struggled as markets continued to focus on macro dynamics over company results. Namely, measures that evaluate carbon emissions intensity, as well as other social related ESG measures detracted, as those measures helped to motivate an overweight to select Consumer Discretionary names. (1)
Q. How did sector allocation and security selection each impact the Portfolio’s performance relative to its benchmark?
A. The portfolio management team targets a relatively sector-neutral approach and seeks to derive the majority of any excess return from security selection. During the six-month period, however, overall sector allocation decisions slightly detracted from relative returns. Security selection had a more meaningful impact to relative performance. Security selection was strongest in Health Care, leading the Portfolio’s outperformance, whereas security selection in Consumer Discretion detracted from relative results. (1)
Q. Which securities contributed the most to, and detracted the most from, the Portfolio’s benchmark-relative performance?
A. For the six-month period, the Portfolio’s overweight position in Amphastar Pharmaceuticals, Inc. was a top contributor to relative performance, as the stock benefitted from acquisition headlines, new FDA approvals, and pending product launches. An overweight to pharmaceutical company Zogenix, Inc. was also a top contributor as a result of its UCB SA acquisition.
In contrast, an overweight to SiteOne Landscape Supply, Inc. was a key detractor from relative performance for the period, as the stock struggled amid broader economic uncertainty. Further hindering results was an overweight stance in Bandwidth, Inc. Class A, due to the company’s poor 2022 guidance on the back of its cyber security attack in the prior year. (1)
Q. How did the Portfolio’s use of derivative instruments and initial public offerings (IPOs), if any, impact performance?
A. Pursuant to the Portfolio’s investment strategy, futures contracts were used to prevent a cash drag on performance. The futures contracts detracted 61 basis points from the Portfolio’s absolute return for the six-month period. The Portfolio participated in two IPOs during the period, which detracted 2 basis points from the Portfolio’s total return in aggregate. Individually, each IPO had a fairly minor impact on the Portfolio’s return. (1)
| (1) | The Portfolio’s composition is subject to change. Holdings and weightings are as of June 30, 2022. |
| Ohio National Fund, Inc. | ON BlackRock Advantage Small Cap Growth Portfolio (Unaudited) (Continued) |
Change in Value of $10,000 Investment
Hypothetical illustration based on past performance. Future performance will vary. The Portfolio’s returns reflect reinvested dividends. The Portfolio’s holdings may differ significantly from the securities in the index. The index is unmanaged and therefore does not reflect the cost of portfolio management and accounting.
The Russell 2000® Growth Index measures the performance of the small-cap growth segment of the U.S. equity universe. It includes the Russell 2000® Index companies with higher price-to-value ratios and higher forecasted growth values. The Russell 2000® Index includes the 2000 firms from the Russell 3000® Index with the smallest market capitalizations. The Russell 3000® Index represents 98% of the investable U.S. equity market. The index presented includes the effects of reinvested dividends.
Past performance is no guarantee of future results. Redemption of fund shares could have tax implications unique to each shareholder.
| Portfolio Composition as of June 30, 2022 (1) |
| | % of Net Assets |
| Common Stocks (4) | 91.0 |
| Rights (4) | 0.0 |
Money Market Funds and
Other Net Assets | 9.0 |
| | 100.0 |
| Top 10 Portfolio Holdings as of June 30, 2022 (1) (2) (3) |
| | | % of Net Assets |
| 1. | Applied Industrial Technologies, Inc. | 1.3 |
| 2. | Franklin Electric Co., Inc. | 1.0 |
| 3. | Silicon Laboratories, Inc. | 1.0 |
| 4. | Sanderson Farms, Inc. | 1.0 |
| 5. | Power Integrations, Inc. | 1.0 |
| 6. | Insperity, Inc. | 1.0 |
| 7. | EMCOR Group, Inc. | 0.9 |
| 8. | EastGroup Properties, Inc. | 0.8 |
| 9. | Omnicell, Inc. | 0.8 |
| 10. | Kforce, Inc. | 0.8 |
| | |
| (1) | Composition of Portfolio subject to change. |
| (2) | Short-term investments have been excluded from the list of Top 10 Portfolio Holdings. |
| (3) | Top 10 Portfolio Holdings is presented at an individual security level. Total investment exposure by issuer may be higher. |
| (4) | Sectors (Common Stocks, Rights): |
| | % of Net Assets |
| Health Care | 21.8 |
| Information Technology | 20.0 |
| Industrials | 16.5 |
| Consumer Discretionary | 10.7 |
| Energy | 5.3 |
| Financials | 4.3 |
| Consumer Staples | 3.5 |
| Materials | 3.4 |
| Communication Services | 2.2 |
| Utilities | 1.7 |
| Real Estate | 1.6 |
| | 91.0 |
| Ohio National Fund, Inc. | ON BlackRock Advantage Small Cap Growth Portfolio |
| Schedule of Investments | June 30, 2022 (Unaudited) |
| Common Stocks–91.0% | Shares | Value |
Communication Services–2.2%
| | | |
Bandwidth, Inc. Class A (Diversified Telecom. Svs.)
| (a) | 12,048 | $ 226,743 |
Cargurus, Inc. (Interactive Media & Svs.)
| (a) | 3,519 | 75,623 |
Cinemark Holdings, Inc. (Entertainment)
| (a) | 22,619 | 339,737 |
Eventbrite, Inc. Class A (Interactive Media & Svs.)
| (a) | 9,898 | 101,652 |
EverQuote, Inc. Class A (Interactive Media & Svs.)
| (a) | 3,933 | 34,768 |
fuboTV, Inc. (Interactive Media & Svs.)
| (a) | 22,799 | 56,314 |
IDT Corp. Class B (Diversified Telecom. Svs.)
| (a) | 8,567 | 215,460 |
Iridium Communications, Inc. (Diversified Telecom. Svs.)
| (a) | 23,988 | 900,989 |
Ooma, Inc. (Diversified Telecom. Svs.)
| (a) | 7,140 | 84,538 |
Vonage Holdings Corp. (Diversified Telecom. Svs.)
| (a) | 29,688 | 559,322 |
Yelp, Inc. (Interactive Media & Svs.)
| (a) | 3,270 | 90,808 |
Ziff Davis, Inc. (Interactive Media & Svs.)
| (a) | 5,782 | 430,933 |
| | | | 3,116,887 |
Consumer Discretionary–10.7%
| | | |
1-800-Flowers.com, Inc. Class A (Internet & Direct Marketing Retail)
| (a) | 25,190 | 239,557 |
2U, Inc. (Diversified Consumer Svs.)
| (a) | 27,237 | 285,171 |
Accel Entertainment, Inc. (Hotels, Restaurants & Leisure)
| (a) | 32,387 | 343,950 |
Asbury Automotive Group, Inc. (Specialty Retail)
| (a) | 1,831 | 310,062 |
Bloomin' Brands, Inc. (Hotels, Restaurants & Leisure)
| | 27,697 | 460,324 |
Boot Barn Holdings, Inc. (Specialty Retail)
| (a) | 5,371 | 370,116 |
Cheesecake Factory, Inc. / The (Hotels, Restaurants & Leisure)
| | 10,931 | 288,797 |
Crocs, Inc. (Textiles, Apparel & Luxury Goods)
| (a) | 7,805 | 379,869 |
Dave & Buster's Entertainment, Inc. (Hotels, Restaurants & Leisure)
| (a) | 3,650 | 119,647 |
Designer Brands, Inc. Class A (Specialty Retail)
| | 7,040 | 91,942 |
Dillard's, Inc. Class A (Multiline Retail)
| | 2,035 | 448,860 |
Duolingo, Inc. (Diversified Consumer Svs.)
| (a) | 1,719 | 150,498 |
Fisker, Inc. (Automobiles)
| (a) | 22,399 | 191,959 |
Fox Factory Holding Corp. (Auto Components)
| (a) | 5,638 | 454,085 |
GoPro, Inc. Class A (Household Durables)
| (a) | 57,623 | 318,655 |
Helen of Troy Ltd. (Household Durables)
| (a) | 1,421 | 230,785 |
Hilton Grand Vacations, Inc. (Hotels, Restaurants & Leisure)
| (a) | 17,716 | 632,993 |
International Game Technology PLC (Hotels, Restaurants & Leisure)
| | 36,242 | 672,652 |
iRobot Corp. (Household Durables)
| (a) | 7,489 | 275,221 |
Kontoor Brands, Inc. (Textiles, Apparel & Luxury Goods)
| | 3,782 | 126,205 |
LCI Industries (Auto Components)
| | 6,080 | 680,230 |
M.D.C. Holdings, Inc. (Household Durables)
| | 25,074 | 810,141 |
Malibu Boats, Inc. Class A (Leisure Products)
| (a) | 7,654 | 403,442 |
MarineMax, Inc. (Specialty Retail)
| (a) | 9,818 | 354,626 |
Murphy U.S.A., Inc. (Specialty Retail)
| | 3,888 | 905,399 |
Papa John's International, Inc. (Hotels, Restaurants & Leisure)
| | 8,993 | 751,095 |
Patrick Industries, Inc. (Auto Components)
| | 6,155 | 319,075 |
RealReal, Inc. / The (Internet & Direct Marketing Retail)
| (a) | 25,373 | 63,179 |
Rush Street Interactive, Inc. (Hotels, Restaurants & Leisure)
| (a) | 10,070 | 47,027 |
Shake Shack, Inc. Class A (Hotels, Restaurants & Leisure)
| (a) | 11,724 | 462,864 |
Shutterstock, Inc. (Internet & Direct Marketing Retail)
| | 5,226 | 299,502 |
Signet Jewelers Ltd. (Specialty Retail)
| | 4,659 | 249,070 |
Sonic Automotive, Inc. Class A (Specialty Retail)
| | 11,479 | 420,476 |
| Common Stocks (Continued) | Shares | Value |
Consumer Discretionary (continued)
| | | |
Sonos, Inc. (Household Durables)
| (a) | 22,456 | $ 405,106 |
Steven Madden Ltd. (Textiles, Apparel & Luxury Goods)
| | 6,292 | 202,665 |
Stitch Fix, Inc. Class A (Internet & Direct Marketing Retail)
| (a) | 14,615 | 72,198 |
Texas Roadhouse, Inc. (Hotels, Restaurants & Leisure)
| | 12,471 | 912,877 |
Urban Outfitters, Inc. (Specialty Retail)
| (a) | 15,645 | 291,936 |
Visteon Corp. (Auto Components)
| (a) | 2,461 | 254,910 |
Wingstop, Inc. (Hotels, Restaurants & Leisure)
| | 8,422 | 629,713 |
Winnebago Industries, Inc. (Automobiles)
| | 7,494 | 363,909 |
| | | | 15,290,788 |
Consumer Staples–3.5%
| | | |
Andersons, Inc. / The (Food & Staples Retailing)
| | 15,777 | 520,483 |
BellRing Brands, Inc. (Personal Products)
| (a) | 11,298 | 281,207 |
Cal-Maine Foods, Inc. (Food Products)
| | 5,910 | 292,013 |
Celsius Holdings, Inc. (Beverages)
| (a) | 2,452 | 160,018 |
Central Garden & Pet Co. Class A (Household Products)
| (a) | 9,778 | 391,218 |
Coca-Cola Consolidated, Inc. (Beverages)
| | 546 | 307,889 |
Hostess Brands, Inc. (Food Products)
| (a) | 17,404 | 369,139 |
Medifast, Inc. (Personal Products)
| | 5,444 | 982,697 |
Sanderson Farms, Inc. (Food Products)
| | 6,634 | 1,429,826 |
Sprouts Farmers Market, Inc. (Food & Staples Retailing)
| (a) | 3,892 | 98,545 |
Vital Farms, Inc. (Food Products)
| (a) | 20,905 | 182,919 |
| | | | 5,015,954 |
Energy–5.3%
| | | |
Cactus, Inc. Class A (Energy Equip. & Svs.)
| | 6,749 | 271,782 |
Centennial Resource Development, Inc. Class A (Oil, Gas & Consumable Fuels)
| (a) | 23,038 | 137,767 |
ChampionX Corp. (Energy Equip. & Svs.)
| | 12,609 | 250,289 |
Chord Energy Corp. (Oil, Gas & Consumable Fuels)
| | 4,953 | 602,532 |
CVR Energy, Inc. (Oil, Gas & Consumable Fuels)
| | 6,065 | 203,178 |
Delek U.S. Holdings, Inc. (Oil, Gas & Consumable Fuels)
| (a) | 15,414 | 398,298 |
Denbury, Inc. (Oil, Gas & Consumable Fuels)
| (a) | 3,933 | 235,941 |
Energy Fuels, Inc. (Oil, Gas & Consumable Fuels)
| (a) | 14,224 | 69,840 |
Evolution Petroleum Corp. (Oil, Gas & Consumable Fuels)
| | 29,730 | 162,326 |
Excelerate Energy, Inc. Class A (Oil, Gas & Consumable Fuels)
| (a) | 833 | 16,593 |
Kosmos Energy Ltd. (Oil, Gas & Consumable Fuels)
| (a) | 33,186 | 205,421 |
Liberty Energy, Inc. (Energy Equip. & Svs.)
| (a) | 26,005 | 331,824 |
Matador Resources Co. (Oil, Gas & Consumable Fuels)
| | 14,881 | 693,306 |
Murphy Oil Corp. (Oil, Gas & Consumable Fuels)
| | 8,632 | 260,600 |
NexTier Oilfield Solutions, Inc. (Energy Equip. & Svs.)
| (a) | 25,671 | 244,131 |
Oceaneering International, Inc. (Energy Equip. & Svs.)
| (a) | 23,528 | 251,279 |
Ovintiv, Inc. (Oil, Gas & Consumable Fuels)
| | 12,825 | 566,737 |
Patterson-UTI Energy, Inc. (Energy Equip. & Svs.)
| | 26,374 | 415,654 |
PBF Energy, Inc. Class A (Oil, Gas & Consumable Fuels)
| (a) | 8,027 | 232,944 |
ProPetro Holding Corp. (Energy Equip. & Svs.)
| (a) | 15,350 | 153,500 |
SM Energy Co. (Oil, Gas & Consumable Fuels)
| | 26,944 | 921,215 |
Smart Sand, Inc. (Energy Equip. & Svs.)
| (a) | 47,289 | 94,578 |
| Ohio National Fund, Inc. | ON BlackRock Advantage Small Cap Growth Portfolio (Continued) |
| Schedule of Investments | June 30, 2022 (Unaudited) |
| Common Stocks (Continued) | Shares | Value |
| Energy (continued) | | | |
Valaris Ltd. (Energy Equip. & Svs.)
| (a) | 13,116 | $ 554,020 |
W&T Offshore, Inc. (Oil, Gas & Consumable Fuels)
| (a) | 71,513 | 308,936 |
| | | | 7,582,691 |
Financials–4.3%
| | | |
Artisan Partners Asset Management, Inc. Class A (Capital Markets)
| | 12,462 | 443,273 |
Cohen & Steers, Inc. (Capital Markets)
| | 6,316 | 401,634 |
Essent Group Ltd. (Thrifts & Mortgage Finance)
| | 9,196 | 357,724 |
Federal Agricultural Mortgage Corp. Class C (Thrifts & Mortgage Finance)
| | 5,490 | 536,099 |
First Financial Bankshares, Inc. (Banks)
| | 18,320 | 719,426 |
Hamilton Lane, Inc. Class A (Capital Markets)
| | 10,125 | 680,198 |
Houlihan Lokey, Inc. (Capital Markets)
| | 4,024 | 317,614 |
LendingTree, Inc. (Consumer Finance)
| (a) | 3,863 | 169,277 |
Moelis & Co. Class A (Capital Markets)
| | 7,763 | 305,474 |
Open Lending Corp. Class A (Capital Markets)
| (a) | 11,268 | 115,272 |
Radian Group, Inc. (Thrifts & Mortgage Finance)
| | 6,647 | 130,614 |
Republic First Bancorp, Inc. (Banks)
| (a) | 75,938 | 289,324 |
RLI Corp. (Insurance)
| | 4,710 | 549,139 |
Selectquote, Inc. (Insurance)
| (a) | 8,673 | 21,509 |
ServisFirst Bancshares, Inc. (Banks)
| | 2,809 | 221,686 |
Stifel Financial Corp. (Capital Markets)
| | 9,064 | 507,765 |
Trupanion, Inc. (Insurance)
| (a) | 5,319 | 320,523 |
| | | | 6,086,551 |
Health Care–21.8%
| | | |
1Life Healthcare, Inc. (Health Care Providers & Svs.)
| (a) | 25,769 | 202,029 |
ACADIA Pharmaceuticals, Inc. (Biotechnology)
| (a) | 12,690 | 178,802 |
Accuray, Inc. (Health Care Equip. & Supplies)
| (a) | 41,890 | 82,104 |
Aclaris Therapeutics, Inc. (Pharmaceuticals)
| (a) | 7,879 | 109,991 |
Agenus, Inc. (Biotechnology)
| (a) | 65,236 | 126,558 |
Alector, Inc. (Biotechnology)
| (a) | 11,265 | 114,452 |
Alkermes PLC (Biotechnology)
| (a) | 19,720 | 587,459 |
Allscripts Healthcare Solutions, Inc. (Health Care Technology)
| (a) | 14,011 | 207,783 |
ALX Oncology Holdings, Inc. (Biotechnology)
| (a) | 1,291 | 10,444 |
Amarin Corp. PLC – ADR (Biotechnology)
| (a) | 17,101 | 25,480 |
American Well Corp. Class A (Health Care Technology)
| (a) | 51,120 | 220,838 |
Amicus Therapeutics, Inc. (Biotechnology)
| (a) | 34,993 | 375,825 |
AMN Healthcare Services, Inc. (Health Care Providers & Svs.)
| (a) | 6,660 | 730,669 |
Amphastar Pharmaceuticals, Inc. (Pharmaceuticals)
| (a) | 23,639 | 822,401 |
Apellis Pharmaceuticals, Inc. (Biotechnology)
| (a) | 8,810 | 398,388 |
Applied Molecular Transport, Inc. (Biotechnology)
| (a) | 2,404 | 6,996 |
Aptinyx, Inc. (Biotechnology)
| (a) | 28,141 | 15,700 |
Arcutis Biotherapeutics, Inc. (Biotechnology)
| (a) | 5,941 | 126,603 |
Arrowhead Pharmaceuticals, Inc. (Biotechnology)
| (a) | 8,746 | 307,947 |
Arvinas, Inc. (Pharmaceuticals)
| (a) | 3,865 | 162,678 |
Atara Biotherapeutics, Inc. (Biotechnology)
| (a) | 26,563 | 206,926 |
Athenex, Inc. (Biotechnology)
| (a) | 11,735 | 4,804 |
Athersys, Inc. (Biotechnology)
| (a) | 60,257 | 15,667 |
AtriCure, Inc. (Health Care Equip. & Supplies)
| (a) | 7,974 | 325,818 |
Atrion Corp. (Health Care Equip. & Supplies)
| | 585 | 367,883 |
Avidity Biosciences, Inc. (Biotechnology)
| (a) | 5,306 | 77,096 |
Avrobio, Inc. (Biotechnology)
| (a) | 9,661 | 8,888 |
Axonics, Inc. (Health Care Equip. & Supplies)
| (a) | 6,527 | 369,885 |
Bausch + Lomb Corp. (Health Care Equip. & Supplies)
| (a) | 15,701 | 239,283 |
| Common Stocks (Continued) | Shares | Value |
Health Care (continued)
| | | |
Beam Therapeutics, Inc. (Biotechnology)
| (a) | 4,803 | $ 185,924 |
Berkeley Lights, Inc. (Life Sciences Tools & Svs.)
| (a) | 19,349 | 96,165 |
Beyondspring, Inc. (Biotechnology)
| (a) | 8,867 | 12,768 |
Biohaven Pharmaceutical Holding Co. Ltd. (Biotechnology)
| (a) | 4,750 | 692,122 |
Bionano Genomics, Inc. (Life Sciences Tools & Svs.)
| (a) | 24,308 | 33,545 |
Blueprint Medicines Corp. (Biotechnology)
| (a) | 11,921 | 602,130 |
Bridgebio Pharma, Inc. (Biotechnology)
| (a) | 17,777 | 161,415 |
C4 Therapeutics, Inc. (Biotechnology)
| (a) | 6,485 | 48,897 |
Cardiovascular Systems, Inc. (Health Care Equip. & Supplies)
| (a) | 15,260 | 219,134 |
CareDx, Inc. (Biotechnology)
| (a) | 4,195 | 90,109 |
Cerus Corp. (Health Care Equip. & Supplies)
| (a) | 42,400 | 224,296 |
Codexis, Inc. (Life Sciences Tools & Svs.)
| (a) | 17,805 | 186,240 |
Coherus Biosciences, Inc. (Biotechnology)
| (a) | 29,534 | 213,826 |
Collegium Pharmaceutical, Inc. (Pharmaceuticals)
| (a) | 15,250 | 270,230 |
Community Health Systems, Inc. (Health Care Providers & Svs.)
| (a) | 7,252 | 27,195 |
Corcept Therapeutics, Inc. (Pharmaceuticals)
| (a) | 13,346 | 317,368 |
Cue Biopharma, Inc. (Biotechnology)
| (a) | 9,963 | 24,808 |
Cytokinetics, Inc. (Biotechnology)
| (a) | 3,206 | 125,964 |
Deciphera Pharmaceuticals, Inc. (Biotechnology)
| (a) | 9,562 | 125,740 |
Denali Therapeutics, Inc. (Biotechnology)
| (a) | 19,937 | 586,746 |
Editas Medicine, Inc. (Biotechnology)
| (a) | 20,268 | 239,770 |
Enanta Pharmaceuticals, Inc. (Biotechnology)
| (a) | 3,463 | 163,696 |
Ensign Group, Inc. / The (Health Care Providers & Svs.)
| | 11,622 | 853,868 |
Evolent Health, Inc. Class A (Health Care Technology)
| (a) | 10,751 | 330,163 |
Fate Therapeutics, Inc. (Biotechnology)
| (a) | 15,656 | 387,956 |
Foghorn Therapeutics, Inc. (Biotechnology)
| (a) | 8,256 | 112,282 |
Frequency Therapeutics, Inc. (Biotechnology)
| (a) | 11,635 | 17,452 |
Glaukos Corp. (Health Care Equip. & Supplies)
| (a) | 2,764 | 125,541 |
Global Blood Therapeutics, Inc. (Biotechnology)
| (a) | 4,069 | 130,005 |
Globus Medical, Inc. Class A (Health Care Equip. & Supplies)
| (a) | 1,270 | 71,298 |
Haemonetics Corp. (Health Care Equip. & Supplies)
| (a) | 7,130 | 464,733 |
Halozyme Therapeutics, Inc. (Biotechnology)
| (a) | 18,533 | 815,452 |
Hanger, Inc. (Health Care Providers & Svs.)
| (a) | 15,100 | 216,232 |
Harmony Biosciences Holdings, Inc. (Pharmaceuticals)
| (a) | 5,031 | 245,362 |
Harpoon Therapeutics, Inc. (Biotechnology)
| (a) | 9,978 | 19,058 |
HealthEquity, Inc. (Health Care Providers & Svs.)
| (a) | 11,939 | 732,935 |
Heron Therapeutics, Inc. (Biotechnology)
| (a) | 34,692 | 96,791 |
Heska Corp. (Health Care Equip. & Supplies)
| (a) | 3,015 | 284,948 |
Insmed, Inc. (Biotechnology)
| (a) | 22,842 | 450,444 |
Inspire Medical Systems, Inc. (Health Care Technology)
| (a) | 4,369 | 798,085 |
Integer Holdings Corp. (Health Care Equip. & Supplies)
| (a) | 4,325 | 305,604 |
Intellia Therapeutics, Inc. (Biotechnology)
| (a) | 8,046 | 416,461 |
Intercept Pharmaceuticals, Inc. (Biotechnology)
| (a) | 6,783 | 93,673 |
Intra-Cellular Therapies, Inc. (Pharmaceuticals)
| (a) | 8,120 | 463,490 |
Invitae Corp. (Health Care Providers & Svs.)
| (a) | 17,449 | 42,576 |
iRhythm Technologies, Inc. (Health Care Equip. & Supplies)
| (a) | 1,936 | 209,146 |
Ironwood Pharmaceuticals, Inc. (Biotechnology)
| (a) | 39,694 | 457,672 |
Karuna Therapeutics, Inc. (Biotechnology)
| (a) | 607 | 76,792 |
| Ohio National Fund, Inc. | ON BlackRock Advantage Small Cap Growth Portfolio (Continued) |
| Schedule of Investments | June 30, 2022 (Unaudited) |
| Common Stocks (Continued) | Shares | Value |
Health Care (continued)
| | | |
Karyopharm Therapeutics, Inc. (Biotechnology)
| (a) | 38,594 | $ 174,059 |
Kiniksa Pharmaceuticals Ltd. Class A (Biotechnology)
| (a) | 17,844 | 172,908 |
Kymera Therapeutics, Inc. (Biotechnology)
| (a) | 1,184 | 23,313 |
Lantheus Holdings, Inc. (Health Care Equip. & Supplies)
| (a) | 9,563 | 631,445 |
LeMaitre Vascular, Inc. (Health Care Equip. & Supplies)
| | 2,251 | 102,533 |
LHC Group, Inc. (Health Care Providers & Svs.)
| (a) | 4,069 | 633,706 |
LivaNova PLC (Health Care Equip. & Supplies)
| (a) | 1,609 | 100,514 |
MacroGenics, Inc. (Biotechnology)
| (a) | 3,552 | 10,478 |
MannKind Corp. (Biotechnology)
| (a) | 38,144 | 145,329 |
Medpace Holdings, Inc. (Life Sciences Tools & Svs.)
| (a) | 4,861 | 727,546 |
Merit Medical Systems, Inc. (Health Care Equip. & Supplies)
| (a) | 7,911 | 429,330 |
Mirum Pharmaceuticals, Inc. (Biotechnology)
| (a) | 7,949 | 154,688 |
Neogen Corp. (Health Care Equip. & Supplies)
| (a) | 9,757 | 235,046 |
Neoleukin Therapeutics, Inc. (Biotechnology)
| (a) | 9,004 | 9,274 |
Nevro Corp. (Health Care Equip. & Supplies)
| (a) | 3,665 | 160,637 |
NextCure, Inc. (Biotechnology)
| (a) | 8,883 | 41,750 |
NGM Biopharmaceuticals, Inc. (Pharmaceuticals)
| (a) | 9,360 | 119,995 |
NuVasive, Inc. (Health Care Equip. & Supplies)
| (a) | 4,359 | 214,288 |
Omnicell, Inc. (Health Care Equip. & Supplies)
| (a) | 10,099 | 1,148,761 |
Option Care Health, Inc. (Health Care Providers & Svs.)
| (a) | 9,393 | 261,031 |
OraSure Technologies, Inc. (Health Care Equip. & Supplies)
| (a) | 4,376 | 11,859 |
Oyster Point Pharma, Inc. (Biotechnology)
| (a) | 9,003 | 38,983 |
Pacira BioSciences, Inc. (Pharmaceuticals)
| (a) | 4,474 | 260,834 |
Passage Bio, Inc. (Biotechnology)
| (a) | 8,622 | 20,348 |
Personalis, Inc. (Life Sciences Tools & Svs.)
| (a) | 22,434 | 77,397 |
Phreesia, Inc. (Health Care Technology)
| (a) | 11,187 | 279,787 |
Poseida Therapeutics, Inc. (Biotechnology)
| (a) | 3,813 | 9,838 |
Precision BioSciences, Inc. (Biotechnology)
| (a) | 17,540 | 28,064 |
Progyny, Inc. (Health Care Providers & Svs.)
| (a) | 15,151 | 440,137 |
PTC Therapeutics, Inc. (Biotechnology)
| (a) | 13,616 | 545,457 |
Puma Biotechnology, Inc. (Biotechnology)
| (a) | 19,032 | 54,241 |
R1 RCM, Inc. (Health Care Providers & Svs.)
| (a) | 14,225 | 298,156 |
Recursion Pharmaceuticals, Inc. Class A (Biotechnology)
| (a) | 7,184 | 58,478 |
Relay Therapeutics, Inc. (Biotechnology)
| (a) | 14,951 | 250,429 |
Relmada Therapeutics, Inc. (Pharmaceuticals)
| (a) | 5,208 | 98,900 |
Revance Therapeutics, Inc. (Pharmaceuticals)
| (a) | 8,096 | 111,887 |
Rigel Pharmaceuticals, Inc. (Biotechnology)
| (a) | 88,669 | 100,196 |
Rocket Pharmaceuticals, Inc. (Biotechnology)
| (a) | 2,755 | 37,909 |
Sangamo Therapeutics, Inc. (Biotechnology)
| (a) | 18,515 | 76,652 |
Seer, Inc. (Life Sciences Tools & Svs.)
| (a) | 2,905 | 26,000 |
Select Medical Holdings Corp. (Health Care Providers & Svs.)
| | 17,520 | 413,822 |
Seres Therapeutics, Inc. (Biotechnology)
| (a) | 16,907 | 57,991 |
Shockwave Medical, Inc. (Health Care Equip. & Supplies)
| (a) | 5,684 | 1,086,610 |
Silk Road Medical, Inc. (Health Care Equip. & Supplies)
| (a) | 4,376 | 159,243 |
Sorrento Therapeutics, Inc. (Biotechnology)
| (a) | 45,196 | 90,844 |
STAAR Surgical Co. (Health Care Equip. & Supplies)
| (a) | 8,570 | 607,870 |
Sutro Biopharma, Inc. (Biotechnology)
| (a) | 13,219 | 68,871 |
Tactile Systems Technology, Inc. (Health Care Equip. & Supplies)
| (a) | 6,253 | 45,647 |
TG Therapeutics, Inc. (Biotechnology)
| (a) | 15,198 | 64,591 |
Theravance Biopharma, Inc. (Pharmaceuticals)
| (a) | 18,256 | 165,399 |
Twist Bioscience Corp. (Biotechnology)
| (a) | 8,104 | 283,316 |
Vericel Corp. (Biotechnology)
| (a) | 5,321 | 133,983 |
| Common Stocks (Continued) | Shares | Value |
Health Care (continued)
| | | |
Viemed Healthcare, Inc. (Health Care Providers & Svs.)
| (a) | 11,958 | $ 64,334 |
Y-mAbs Therapeutics, Inc. (Biotechnology)
| (a) | 4,746 | 71,807 |
Zentalis Pharmaceuticals, Inc. (Biotechnology)
| (a) | 1,298 | 36,474 |
Zynex, Inc. (Health Care Equip. & Supplies)
| | 4,771 | 38,073 |
| | | | 31,006,562 |
Industrials–16.5%
| | | |
Aerojet Rocketdyne Holdings, Inc. (Aerospace & Defense)
| (a) | 13,166 | 534,540 |
Altra Industrial Motion Corp. (Machinery)
| | 4,205 | 148,226 |
Ameresco, Inc. Class A (Construction & Engineering)
| (a) | 5,464 | 248,940 |
Applied Industrial Technologies, Inc. (Trading Companies & Distributors)
| | 18,745 | 1,802,707 |
ASGN, Inc. (Professional Svs.)
| (a) | 5,466 | 493,306 |
Astec Industries, Inc. (Machinery)
| | 4,471 | 182,327 |
Atkore, Inc. (Electrical Equip.)
| (a) | 9,433 | 783,033 |
Bloom Energy Corp. Class A (Electrical Equip.)
| (a) | 26,514 | 437,481 |
Builders FirstSource, Inc. (Building Products)
| (a) | 7,503 | 402,911 |
Chart Industries, Inc. (Machinery)
| (a) | 4,586 | 767,605 |
Cimpress PLC (Commercial Svs. & Supplies)
| (a) | 1,170 | 45,513 |
Comfort Systems U.S.A., Inc. (Construction & Engineering)
| | 1,618 | 134,537 |
Desktop Metal, Inc. Class A (Machinery)
| (a) | 19,562 | 43,036 |
Dycom Industries, Inc. (Construction & Engineering)
| (a) | 2,423 | 225,436 |
EMCOR Group, Inc. (Construction & Engineering)
| | 12,173 | 1,253,332 |
Evoqua Water Technologies Corp. (Machinery)
| (a) | 20,195 | 656,539 |
Fluor Corp. (Construction & Engineering)
| (a) | 22,247 | 541,492 |
Forrester Research, Inc. (Professional Svs.)
| (a) | 4,676 | 223,700 |
Franklin Covey Co. (Professional Svs.)
| (a) | 19,876 | 917,874 |
Franklin Electric Co., Inc. (Machinery)
| | 20,468 | 1,499,486 |
Herc Holdings, Inc. (Trading Companies & Distributors)
| | 842 | 75,906 |
Hub Group, Inc. Class A (Air Freight & Logistics)
| (a) | 9,416 | 667,971 |
Hyliion Holdings Corp. (Machinery)
| (a) | 21,888 | 70,479 |
Insperity, Inc. (Professional Svs.)
| | 13,789 | 1,376,556 |
JELD-WEN Holding, Inc. (Building Products)
| (a) | 7,549 | 110,140 |
KBR, Inc. (Professional Svs.)
| | 10,010 | 484,384 |
Kforce, Inc. (Professional Svs.)
| | 18,664 | 1,144,850 |
Manitowoc Co., Inc. / The (Machinery)
| (a) | 2,982 | 31,400 |
Meritor, Inc. (Machinery)
| (a) | 7,808 | 283,665 |
Moog, Inc. Class A (Aerospace & Defense)
| | 3,771 | 299,380 |
Proto Labs, Inc. (Machinery)
| (a) | 3,538 | 169,258 |
Radiant Logistics, Inc. (Air Freight & Logistics)
| (a) | 10,231 | 75,914 |
Rush Enterprises, Inc. Class A (Trading Companies & Distributors)
| | 7,764 | 374,225 |
Saia, Inc. (Road & Rail)
| (a) | 5,283 | 993,204 |
Shoals Technologies Group, Inc. Class A (Electrical Equip.)
| (a) | 13,269 | 218,673 |
SiteOne Landscape Supply, Inc. (Trading Companies & Distributors)
| (a) | 5,885 | 699,550 |
Terex Corp. (Machinery)
| | 25,018 | 684,743 |
Tetra Tech, Inc. (Commercial Svs. & Supplies)
| | 7,410 | 1,011,835 |
TriNet Group, Inc. (Professional Svs.)
| (a) | 6,586 | 511,205 |
UFP Industries, Inc. (Building Products)
| | 14,971 | 1,020,124 |
Upwork, Inc. (Professional Svs.)
| (a) | 12,018 | 248,532 |
Watts Water Technologies, Inc. Class A (Machinery)
| | 4,055 | 498,116 |
Welbilt, Inc. (Machinery)
| (a) | 16,589 | 394,984 |
Werner Enterprises, Inc. (Road & Rail)
| | 17,653 | 680,347 |
| | | | 23,467,462 |
Information Technology–20.0%
| | | |
8x8, Inc. (Software)
| (a) | 13,109 | 67,511 |
| Ohio National Fund, Inc. | ON BlackRock Advantage Small Cap Growth Portfolio (Continued) |
| Schedule of Investments | June 30, 2022 (Unaudited) |
| Common Stocks (Continued) | Shares | Value |
Information Technology (continued)
| | | |
ACI Worldwide, Inc. (Software)
| (a) | 22,258 | $ 576,260 |
Alarm.com Holdings, Inc. (Software)
| (a) | 7,198 | 445,268 |
Altair Engineering, Inc. Class A (Software)
| (a) | 14,660 | 769,650 |
Ambarella, Inc. (Semiconductors & Equip.)
| (a) | 4,999 | 327,234 |
Amkor Technology, Inc. (Semiconductors & Equip.)
| | 9,172 | 155,465 |
Appian Corp. (Software)
| (a) | 6,661 | 315,465 |
Asana, Inc. Class A (Software)
| (a) | 9,833 | 172,864 |
Avaya Holdings Corp. (Software)
| (a) | 6,658 | 14,914 |
Axcelis Technologies, Inc. (Semiconductors & Equip.)
| (a) | 3,820 | 209,489 |
Badger Meter, Inc. (Electronic Equip., Instr. & Comp.)
| | 909 | 73,529 |
BigCommerce Holdings, Inc. (IT Svs.)
| (a) | 5,689 | 92,162 |
Blackline, Inc. (Software)
| (a) | 6,296 | 419,314 |
Box, Inc. Class A (Software)
| (a) | 30,486 | 766,418 |
BTRS Holdings, Inc. (Software)
| (a) | 17,554 | 87,419 |
Calix, Inc. (Communications Equip.)
| (a) | 14,377 | 490,831 |
CMC Materials, Inc. (Semiconductors & Equip.)
| | 3,747 | 653,814 |
CSG Systems International, Inc. (IT Svs.)
| | 16,044 | 957,506 |
Digital Turbine, Inc. (Software)
| (a) | 13,930 | 243,357 |
DigitalOcean Holdings, Inc. (IT Svs.)
| (a) | 4,907 | 202,953 |
Envestnet, Inc. (Software)
| (a) | 4,458 | 235,249 |
ePlus, Inc. (Electronic Equip., Instr. & Comp.)
| (a) | 11,882 | 631,172 |
ExlService Holdings, Inc. (IT Svs.)
| (a) | 2,229 | 328,399 |
Extreme Networks, Inc. (Communications Equip.)
| (a) | 22,134 | 197,435 |
FARO Technologies, Inc. (Electronic Equip., Instr. & Comp.)
| (a) | 240 | 7,399 |
Flywire Corp. (IT Svs.)
| (a) | 4,699 | 82,843 |
Hackett Group, Inc. / The (IT Svs.)
| | 6,448 | 122,319 |
Ichor Holdings Ltd. (Semiconductors & Equip.)
| (a) | 12,609 | 327,582 |
Insight Enterprises, Inc. (Electronic Equip., Instr. & Comp.)
| (a) | 5,306 | 457,802 |
International Money Express, Inc. (IT Svs.)
| (a) | 6,445 | 131,929 |
Itron, Inc. (Electronic Equip., Instr. & Comp.)
| (a) | 9,900 | 489,357 |
Kulicke & Soffa Industries, Inc. (Semiconductors & Equip.)
| | 7,518 | 321,846 |
Lattice Semiconductor Corp. (Semiconductors & Equip.)
| (a) | 23,514 | 1,140,429 |
LivePerson, Inc. (Software)
| (a) | 17,807 | 251,791 |
Marqeta, Inc. Class A (IT Svs.)
| (a) | 55,363 | 448,994 |
MaxLinear, Inc. (Semiconductors & Equip.)
| (a) | 13,361 | 454,007 |
Momentive Global, Inc. (Software)
| (a) | 15,542 | 136,770 |
NETGEAR, Inc. (Communications Equip.)
| (a) | 9,607 | 177,922 |
Onto Innovation, Inc. (Semiconductors & Equip.)
| (a) | 1,729 | 120,580 |
OSI Systems, Inc. (Electronic Equip., Instr. & Comp.)
| (a) | 11,988 | 1,024,255 |
PagerDuty, Inc. (Software)
| (a) | 32,016 | 793,356 |
PC Connection, Inc. (Electronic Equip., Instr. & Comp.)
| | 12,511 | 551,109 |
Perficient, Inc. (IT Svs.)
| (a) | 6,636 | 608,455 |
Power Integrations, Inc. (Semiconductors & Equip.)
| | 18,755 | 1,406,812 |
Progress Software Corp. (Software)
| | 16,369 | 741,516 |
PROS Holdings, Inc. (Software)
| (a) | 9,570 | 251,021 |
Q2 Holdings, Inc. (Software)
| (a) | 10,094 | 389,326 |
Qualys, Inc. (Software)
| (a) | 3,401 | 429,002 |
Rapid7, Inc. (Software)
| (a) | 13,590 | 907,812 |
Sailpoint Technologies Holdings, Inc. (Software)
| (a) | 12,074 | 756,798 |
Semtech Corp. (Semiconductors & Equip.)
| (a) | 7,428 | 408,317 |
| Common Stocks (Continued) | Shares | Value |
Information Technology (continued)
| | | |
Silicon Laboratories, Inc. (Semiconductors & Equip.)
| (a) | 10,650 | $ 1,493,343 |
Sprout Social, Inc. Class A (Software)
| (a) | 10,567 | 613,626 |
SPS Commerce, Inc. (Software)
| (a) | 4,067 | 459,774 |
SunPower Corp. (Semiconductors & Equip.)
| (a) | 8,593 | 135,855 |
Synaptics, Inc. (Semiconductors & Equip.)
| (a) | 5,081 | 599,812 |
Tenable Holdings, Inc. (Software)
| (a) | 19,521 | 886,449 |
TTEC Holdings, Inc. (IT Svs.)
| | 6,055 | 411,074 |
Ultra Clean Holdings, Inc. (Semiconductors & Equip.)
| (a) | 8,538 | 254,176 |
Varonis Systems, Inc. (Software)
| (a) | 30,100 | 882,532 |
Verra Mobility Corp. (IT Svs.)
| (a) | 10,734 | 168,631 |
Workiva, Inc. (Software)
| (a) | 12,530 | 826,855 |
Yext, Inc. (Software)
| (a) | 70,778 | 338,319 |
| | | | 28,443,473 |
Materials–3.4%
| | | |
Alpha Metallurgical Resources, Inc. (Metals & Mining)
| | 2,111 | 272,593 |
Avient Corp. (Chemicals)
| | 17,816 | 714,065 |
Cabot Corp. (Chemicals)
| | 12,355 | 788,126 |
Constellium SE (Metals & Mining)
| (a) | 29,879 | 394,702 |
H.B. Fuller Co. (Chemicals)
| | 9,020 | 543,094 |
Hawkins, Inc. (Chemicals)
| | 2,602 | 93,750 |
Ingevity Corp. (Chemicals)
| (a) | 4,255 | 268,661 |
Livent Corp. (Chemicals)
| (a) | 29,382 | 666,678 |
Novagold Resources, Inc. (Metals & Mining)
| (a) | 65,935 | 317,147 |
Quaker Chemical Corp. (Chemicals)
| | 1,818 | 271,827 |
Schnitzer Steel Industries, Inc. Class A (Metals & Mining)
| | 7,765 | 255,003 |
Stepan Co. (Chemicals)
| | 1,768 | 179,187 |
Venator Materials PLC (Chemicals)
| (a) | 55,792 | 116,047 |
| | | | 4,880,880 |
Real Estate–1.6%
| | | |
Braemar Hotels & Resorts, Inc. (Equity REIT)
| | 51,306 | 220,103 |
Broadstone Net Lease, Inc. (Equity REIT)
| | 2 | 41 |
Corporate Office Properties Trust (Equity REIT)
| | 6,503 | 170,314 |
Cushman & Wakefield PLC (Real Estate Mgmt. & Development)
| (a) | 11,168 | 170,200 |
EastGroup Properties, Inc. (Equity REIT)
| | 7,606 | 1,173,834 |
Marcus & Millichap, Inc. (Real Estate Mgmt. & Development)
| | 10,682 | 395,127 |
Outfront Media, Inc. (Equity REIT)
| | 5,507 | 93,344 |
Redfin Corp. (Real Estate Mgmt. & Development)
| (a) | 4,977 | 41,010 |
| | | | 2,263,973 |
Utilities–1.7%
| | | |
Black Hills Corp. (Multi-Utilities)
| | 5,648 | 411,005 |
Brookfield Infrastructure Corp. Class A (Gas Utilities)
| | 20,753 | 882,002 |
Clearway Energy, Inc. Class A (Ind. Power & Renewable Elec.)
| | 5,330 | 170,400 |
ONE Gas, Inc. (Gas Utilities)
| | 2,872 | 233,178 |
Portland General Electric Co. (Electric Utilities)
| | 6,714 | 324,487 |
Sunnova Energy International, Inc. (Ind. Power & Renewable Elec.)
| (a) | 18,441 | 339,868 |
| | | | 2,360,940 |
Total Common Stocks (Cost $167,555,782)
| | | $129,516,161 |
| Ohio National Fund, Inc. | ON BlackRock Advantage Small Cap Growth Portfolio (Continued) |
| Schedule of Investments | June 30, 2022 (Unaudited) |
| Rights –0.0% | Quantity | Value |
Health Care–0.0%
| | | |
Flexion Therapeutics, Inc. CVR (Biotechnology)
| | 6,185 | $ 3,835 |
Prevail Therapeutics, Inc. CVR (Biotechnology)
| | 2,231 | 1,115 |
Total Rights (Cost $4,950)
| | | $ 4,950 |
| Money Market Funds–6.2% | Shares | Value |
State Street Institutional Liquid Reserves Fund Institutional Class, 1.494%
| (b) | 8,843,194 | $ 8,842,310 |
Total Money Market Funds (Cost $8,843,175)
| | | $ 8,842,310 |
Total Investments – 97.2% (Cost $176,403,907)
| (c) | | $138,363,421 |
Other Assets in Excess of Liabilities – 2.8%
| (d) | | 3,920,362 |
| Net Assets – 100.0% | | | $142,283,783 |
Percentages are stated as a percent of net assets. |
| Abbreviations: | |
| ADR: | American Depositary Receipts |
| CVR: | Contingent Value Right |
| Footnotes: | |
| (a) | Non-income producing security. |
| (b) | Rate represents the seven-day yield at June 30, 2022. |
| (c) | Represents cost for financial reporting purposes, which may differ from cost basis for federal income tax purposes. See also Note 7 of the Notes to Financial Statements. |
| (d) | Includes $605,000 of cash pledged as collateral for the futures contracts outstanding at June 30, 2022. See also the following Schedule of Open Futures Contracts. |
The accompanying notes are an integral part of these financial statements.
| Schedule of Open Futures Contracts | June 30, 2022 (Unaudited) |
| Description | | Number of
contracts | | Expiration Date | | Notional
Amount | | Value | | Unrealized
Appreciation
(Depreciation) | | Variation Margin
Receivable
(Payable) |
| CME E-mini Russell 2000 Index - Long | | 110 | | September 16, 2022 | | $9,756,174 | | $9,394,000 | | $(362,174) | | $(73,700) |
The accompanying notes are an integral part of these financial statements.
| Ohio National Fund, Inc. | ON S&P MidCap 400® Index Portfolio (Unaudited) |
The ON S&P MidCap 400® Index Portfolio seeks total return approximating that of the Standard & Poor’s MidCap 400® Index (S&P MidCap 400® Index), including reinvestment of dividends, at a risk level consistent with that of the S&P MidCap 400® Index by investing, under normal circumstances, more than 80% of its net assets in the common stocks and other securities included in the S& P MidCap 400® Index.
Performance as of June 30, 2022
| Average Annual returns | |
| One year | -15.03% |
| Five years | 6.54% |
| Ten years | 9.08% |
Past performance does not guarantee future results. The performance data quoted represents past performance and current returns may be lower or higher. Total return figures include change in share price and reinvestment of dividends and capital gains. The investment return and principal value will fluctuate so that an investor’s shares, when redeemed, may be worth more or less than the original cost. To obtain performance information up to the most recent month end, call toll-free 1-877-781-6392.
The Portfolio is not open to direct retail investment. Beneficial interest in the Portfolio’s shares is obtained either through an allocation to the Portfolio as an investment vehicle within variable life insurance policies or annuity contracts, or as an underlying investment by the ON Model Portfolios. Actual performance results for variable annuity and variable universal life contracts will be lower due to contract charges. Consult your contract for applicable charges.
Total expense ratio is 0.41% per the Fund’s prospectus dated April 29, 2022. Additional information pertaining to the Portfolio’s expense ratio as of June 30, 2022 can be found in the Portfolio’s Financial Highlights.
Comments from Sub-Adviser
Q. How did the Portfolio perform in comparison to its benchmark during the reporting period?
A. For the six-month period ended June 30, 2022, the Portfolio returned -19.72% versus -19.54% for its benchmark, the S&P MidCap 400® Index.
Q. Were there specific market conditions, investment strategies, or techniques that materially affected the Portfolio’s benchmark-relative performance during the reporting period?
A. The Portfolio intends to track the underlying return of the S&P MidCap 400® Index. There were no material market events or changes in strategy during the six-month period that materially impacted the Portfolio’s relative return. Sources of return variance were the Portfolio’s expenses and the cumulative impact of investing the day-to-day cash flows in the Portfolio.
Q. How did sector allocation and security selection each impact the Portfolio’s performance relative to its benchmark?
A. There was no impact from either sector allocation or stock selection that caused any significant performance variance between the Portfolio and its benchmark for the six-month period. Consumer Discretionary, followed by Industrials and Information Technology, were the top detractors from performance. The only sector that contributed for the period was Energy.(1)
Q. Which securities contributed the most to, and detracted the most from, the Portfolio’s benchmark-relative performance?
A. Because the Portfolio weights its holdings to be similar to those utilized by the benchmark, there were no holdings that significantly contributed to, or detracted from, the Portfolio’s benchmark-relative
performance. Benchmark constituents that contributed the most to Portfolio and benchmark returns for the six-month period were EQT Corp., First Horizon Corp. and Alleghany Corp. Trex Co., Inc., Masimo Corp., and Synaptics, Inc. were leading detractors. (1)
Q. How did the Portfolio’s use of derivative instruments and initial public offerings (IPOs), if any, impact performance?
A. The Portfolio uses long CME E-mini S&P MidCap 400 Index futures contracts primarily to equitize open dividend receivables, as well as to manage day-to-day cash flows, to ensure the Portfolio is fully invested. The futures contracts detracted 16 basis points from the Portfolio’s absolute return for the six-month period. (1)
| (1) | The Portfolio’s composition is subject to change. Holdings and weightings are as of June 30, 2022. |
Change in Value of $10,000 Investment
Hypothetical illustration based on past performance. Future performance will vary. The Portfolio’s returns reflect reinvested dividends. The Portfolio’s holdings may differ significantly from the securities in the index. The index is unmanaged and therefore does not reflect the cost of portfolio management and accounting.
The S&P MidCap 400® Index is a capitalization-weighted index of 400 common stocks representing all major industries in the mid-range of the U.S. stock market. The index presented includes the effects of reinvested dividends.
Past performance is no guarantee of future results. Redemption of fund shares could have tax implications unique to each shareholder.
Prior to December 16, 2016, the Portfolio was known as the Target VIP Portfolio. The strategy of the Target VIP Portfolio was to seek above average total return by investing in common stocks of companies which were identified by a model that applied separate uniquely specialized strategies.
The S&P MidCap 400® Index is a product of S&P Dow Jones Indices LLC or its affiliates (“SPDJI”), and has been licensed for use by Ohio National Investments, Inc. (“ONI”). Standard & Poor’s® and S&P® are registered trademarks of Standard & Poor’s Financial Services LLC (“S&P”); Dow Jones® is a registered trademark of Dow Jones Trademark Holdings LLC (“Dow Jones”); and these trademarks have been licensed for use by SPDJI and sublicensed for certain purposes by ONI. The S&P MidCap 400® Index Portfolio of Ohio National Fund, Inc. is not sponsored, endorsed, sold or promoted by SPDJI, Dow Jones, S&P, their respective affiliates, and none of such parties make any representation regarding the advisability of investing in such product(s) nor do they have any liability for any errors, omissions, or interruptions of the S&P MidCap 400® Index.
| Ohio National Fund, Inc. | ON S&P MidCap 400® Index Portfolio (Unaudited) (Continued) |
| Portfolio Composition as of June 30, 2022 (1) |
| | % of Net Assets |
| Common Stocks (4) | 97.2 |
| U.S. Treasury Obligations | 0.0 |
Money Market Funds and
Other Net Assets | 2.8 |
| | 100.0 |
| Top 10 Portfolio Holdings as of June 30, 2022 (1) (2) (3) |
| | | % of Net Assets |
| 1. | Targa Resources Corp. | 0.7 |
| 2. | Carlisle Cos., Inc. | 0.6 |
| 3. | Steel Dynamics, Inc. | 0.6 |
| 4. | First Horizon Corp. | 0.6 |
| 5. | Alleghany Corp. | 0.6 |
| 6. | Service Corp. International | 0.6 |
| 7. | United Therapeutics Corp. | 0.5 |
| 8. | Essential Utilities, Inc. | 0.5 |
| 9. | Reliance Steel & Aluminum Co. | 0.5 |
| 10. | Fair Isaac Corp. | 0.5 |
| | |
| (1) | Composition of Portfolio subject to change. |
| (2) | Short-term investments have been excluded from the list of Top 10 Portfolio Holdings. |
| (3) | Top 10 Portfolio Holdings is presented at an individual security level. Total investment exposure by issuer may be higher. |
| (4) | Sectors (Common Stocks): |
| | % of Net Assets |
| Industrials | 17.5 |
| Financials | 14.5 |
| Consumer Discretionary | 13.3 |
| Information Technology | 13.2 |
| Health Care | 9.7 |
| Real Estate | 9.0 |
| Materials | 6.7 |
| Utilities | 4.0 |
| Consumer Staples | 3.9 |
| Energy | 3.9 |
| Communication Services | 1.5 |
| | 97.2 |
| Ohio National Fund, Inc. | ON S&P MidCap 400® Index Portfolio |
| Schedule of Investments | June 30, 2022 (Unaudited) |
| Common Stocks–97.2% | Shares | Value |
Communication Services–1.5%
| | | |
Cable One, Inc. (Media)
| | 818 | $ 1,054,664 |
Iridium Communications, Inc. (Diversified Telecom. Svs.)
| (a) | 21,310 | 800,403 |
John Wiley & Sons, Inc. Class A (Media)
| | 7,226 | 345,114 |
New York Times Co. / The Class A (Media)
| | 27,754 | 774,337 |
TEGNA, Inc. (Media)
| | 36,841 | 772,556 |
TripAdvisor, Inc. (Interactive Media & Svs.)
| (a) | 16,680 | 296,904 |
World Wrestling Entertainment, Inc. Class A (Entertainment)
| | 7,200 | 449,928 |
Ziff Davis, Inc. (Interactive Media & Svs.)
| (a) | 7,874 | 586,849 |
| | | | 5,080,755 |
Consumer Discretionary–13.3%
| | | |
Adient PLC (Auto Components)
| (a) | 15,785 | 467,710 |
American Eagle Outfitters, Inc. (Specialty Retail)
| | 25,645 | 286,711 |
AutoNation, Inc. (Specialty Retail)
| (a) | 5,923 | 661,954 |
Boyd Gaming Corp. (Hotels, Restaurants & Leisure)
| | 13,319 | 662,620 |
Brunswick Corp. (Leisure Products)
| | 12,608 | 824,311 |
Callaway Golf Co. (Leisure Products)
| (a) | 19,373 | 395,209 |
Capri Holdings Ltd. (Textiles, Apparel & Luxury Goods)
| (a) | 24,577 | 1,007,903 |
Carter's, Inc. (Textiles, Apparel & Luxury Goods)
| | 6,708 | 472,780 |
Choice Hotels International, Inc. (Hotels, Restaurants & Leisure)
| | 5,478 | 611,509 |
Churchill Downs, Inc. (Hotels, Restaurants & Leisure)
| | 5,698 | 1,091,338 |
Columbia Sportswear Co. (Textiles, Apparel & Luxury Goods)
| | 5,548 | 397,126 |
Cracker Barrel Old Country Store, Inc. (Hotels, Restaurants & Leisure)
| | 3,867 | 322,856 |
Crocs, Inc. (Textiles, Apparel & Luxury Goods)
| (a) | 10,252 | 498,965 |
Dana, Inc. (Auto Components)
| | 23,864 | 335,766 |
Deckers Outdoor Corp. (Textiles, Apparel & Luxury Goods)
| (a) | 4,535 | 1,158,012 |
Dick's Sporting Goods, Inc. (Specialty Retail)
| | 9,665 | 728,451 |
Five Below, Inc. (Specialty Retail)
| (a) | 9,242 | 1,048,320 |
Foot Locker, Inc. (Specialty Retail)
| | 13,918 | 351,430 |
Fox Factory Holding Corp. (Auto Components)
| (a) | 7,017 | 565,149 |
GameStop Corp. Class A (Specialty Retail)
| (a) | 10,295 | 1,259,078 |
Gap, Inc. / The (Specialty Retail)
| | 35,093 | 289,166 |
Gentex Corp. (Auto Components)
| | 39,035 | 1,091,809 |
Goodyear Tire & Rubber Co. / The (Auto Components)
| (a) | 47,028 | 503,670 |
Graham Holdings Co. Class B (Diversified Consumer Svs.)
| | 652 | 369,580 |
Grand Canyon Education, Inc. (Diversified Consumer Svs.)
| (a) | 5,381 | 506,836 |
H&R Block, Inc. (Diversified Consumer Svs.)
| | 26,571 | 938,488 |
Hanesbrands, Inc. (Textiles, Apparel & Luxury Goods)
| | 58,068 | 597,520 |
Harley-Davidson, Inc. (Automobiles)
| | 24,537 | 776,841 |
Helen of Troy Ltd. (Household Durables)
| (a) | 3,970 | 644,768 |
KB Home (Household Durables)
| | 14,443 | 411,048 |
Kohl's Corp. (Multiline Retail)
| | 21,409 | 764,087 |
Lear Corp. (Auto Components)
| | 9,953 | 1,252,983 |
Leggett & Platt, Inc. (Household Durables)
| | 22,237 | 768,955 |
Light & Wonder, Inc. (Hotels, Restaurants & Leisure)
| (a) | 15,927 | 748,410 |
Lithia Motors, Inc. (Specialty Retail)
| | 4,817 | 1,323,760 |
Macy's, Inc. (Multiline Retail)
| | 47,427 | 868,863 |
Marriott Vacations Worldwide Corp. (Hotels, Restaurants & Leisure)
| | 6,898 | 801,548 |
Mattel, Inc. (Leisure Products)
| (a) | 58,687 | 1,310,481 |
Murphy U.S.A., Inc. (Specialty Retail)
| | 3,707 | 863,249 |
| Common Stocks (Continued) | Shares | Value |
Consumer Discretionary (continued)
| | | |
Nordstrom, Inc. (Multiline Retail)
| | 18,577 | $ 392,532 |
Ollie's Bargain Outlet Holdings, Inc. (Multiline Retail)
| (a) | 9,713 | 570,639 |
Papa John's International, Inc. (Hotels, Restaurants & Leisure)
| | 5,304 | 442,990 |
Polaris, Inc. (Leisure Products)
| | 9,311 | 924,396 |
RH (Specialty Retail)
| (a) | 2,928 | 621,497 |
Service Corp. International (Diversified Consumer Svs.)
| | 26,428 | 1,826,703 |
Six Flags Entertainment Corp. (Hotels, Restaurants & Leisure)
| (a) | 12,953 | 281,080 |
Skechers U.S.A., Inc. Class A (Textiles, Apparel & Luxury Goods)
| (a) | 22,457 | 799,020 |
Taylor Morrison Home Corp. (Household Durables)
| (a) | 19,919 | 465,308 |
Tempur Sealy International, Inc. (Household Durables)
| | 29,227 | 624,581 |
Texas Roadhouse, Inc. (Hotels, Restaurants & Leisure)
| | 11,349 | 830,747 |
Thor Industries, Inc. (Automobiles)
| | 9,162 | 684,676 |
Toll Brothers, Inc. (Household Durables)
| | 18,358 | 818,767 |
TopBuild Corp. (Household Durables)
| (a) | 5,457 | 912,192 |
Travel + Leisure Co. (Hotels, Restaurants & Leisure)
| | 14,221 | 552,059 |
Under Armour, Inc. Class A (Textiles, Apparel & Luxury Goods)
| (a) | 31,412 | 261,662 |
Under Armour, Inc. Class C (Textiles, Apparel & Luxury Goods)
| (a) | 33,751 | 255,833 |
Victoria's Secret & Co. (Specialty Retail)
| (a) | 11,308 | 316,285 |
Visteon Corp. (Auto Components)
| (a) | 4,680 | 484,754 |
Wendy's Co. / The (Hotels, Restaurants & Leisure)
| | 28,536 | 538,760 |
Williams-Sonoma, Inc. (Specialty Retail)
| | 11,660 | 1,293,677 |
Wingstop, Inc. (Hotels, Restaurants & Leisure)
| | 4,974 | 371,906 |
Wyndham Hotels & Resorts, Inc. (Hotels, Restaurants & Leisure)
| | 15,334 | 1,007,750 |
YETI Holdings, Inc. (Leisure Products)
| (a) | 14,345 | 620,708 |
| | | | 43,877,782 |
Consumer Staples–3.9%
| | | |
BellRing Brands, Inc. (Personal Products)
| (a) | 18,162 | 452,052 |
BJ's Wholesale Club Holdings, Inc. (Food & Staples Retailing)
| (a) | 22,461 | 1,399,769 |
Boston Beer Co., Inc. / The Class A (Beverages)
| (a) | 1,565 | 474,148 |
Casey's General Stores, Inc. (Food & Staples Retailing)
| | 6,179 | 1,142,991 |
Coty, Inc. Class A (Personal Products)
| (a) | 57,284 | 458,845 |
Darling Ingredients, Inc. (Food Products)
| (a) | 26,891 | 1,608,082 |
Energizer Holdings, Inc. (Household Products)
| | 10,914 | 309,412 |
Flowers Foods, Inc. (Food Products)
| | 33,183 | 873,377 |
Grocery Outlet Holding Corp. (Food & Staples Retailing)
| (a) | 14,600 | 622,398 |
Hain Celestial Group, Inc. / The (Food Products)
| (a) | 14,950 | 354,913 |
Ingredion, Inc. (Food Products)
| | 11,025 | 971,964 |
Lancaster Colony Corp. (Food Products)
| | 3,299 | 424,845 |
Nu Skin Enterprises, Inc. Class A (Personal Products)
| | 8,359 | 361,945 |
Performance Food Group Co. (Food & Staples Retailing)
| (a) | 25,807 | 1,186,606 |
Pilgrim's Pride Corp. (Food Products)
| (a) | 8,003 | 249,934 |
Post Holdings, Inc. (Food Products)
| (a) | 9,304 | 766,184 |
Sanderson Farms, Inc. (Food Products)
| | 3,532 | 761,252 |
Sprouts Farmers Market, Inc. (Food & Staples Retailing)
| (a) | 18,251 | 462,115 |
| | | | 12,880,832 |
| Ohio National Fund, Inc. | ON S&P MidCap 400® Index Portfolio (Continued) |
| Schedule of Investments | June 30, 2022 (Unaudited) |
| Common Stocks (Continued) | Shares | Value |
Energy–3.9%
| | | |
Antero Midstream Corp. (Oil, Gas & Consumable Fuels)
| | 54,166 | $ 490,202 |
ChampionX Corp. (Energy Equip. & Svs.)
| | 33,865 | 672,220 |
CNX Resources Corp. (Oil, Gas & Consumable Fuels)
| (a) | 32,475 | 534,539 |
DT Midstream, Inc. (Oil, Gas & Consumable Fuels)
| | 16,105 | 789,467 |
EQT Corp. (Oil, Gas & Consumable Fuels)
| | 49,220 | 1,693,168 |
Equitrans Midstream Corp. (Oil, Gas & Consumable Fuels)
| | 67,728 | 430,750 |
HF Sinclair Corp. (Oil, Gas & Consumable Fuels)
| | 24,901 | 1,124,529 |
Matador Resources Co. (Oil, Gas & Consumable Fuels)
| | 18,487 | 861,309 |
Murphy Oil Corp. (Oil, Gas & Consumable Fuels)
| | 24,316 | 734,100 |
NOV, Inc. (Energy Equip. & Svs.)
| | 65,397 | 1,105,863 |
PDC Energy, Inc. (Oil, Gas & Consumable Fuels)
| | 15,888 | 978,860 |
Range Resources Corp. (Oil, Gas & Consumable Fuels)
| (a) | 43,154 | 1,068,062 |
Targa Resources Corp. (Oil, Gas & Consumable Fuels)
| | 37,958 | 2,264,954 |
| | | | 12,748,023 |
Financials–14.5%
| | | |
Affiliated Managers Group, Inc. (Capital Markets)
| | 6,439 | 750,787 |
Alleghany Corp. (Insurance)
| (a) | 2,240 | 1,866,144 |
American Financial Group, Inc. (Insurance)
| | 11,052 | 1,534,128 |
Associated Banc-Corp. (Banks)
| | 24,981 | 456,153 |
Bank of Hawaii Corp. (Banks)
| | 6,708 | 499,075 |
Bank OZK (Banks)
| | 18,799 | 705,526 |
Brighthouse Financial, Inc. (Insurance)
| (a) | 12,469 | 511,478 |
Cadence Bank (Banks)
| | 30,549 | 717,291 |
Cathay General Bancorp (Banks)
| | 12,512 | 489,845 |
CNO Financial Group, Inc. (Insurance)
| | 19,295 | 349,047 |
Commerce Bancshares, Inc. (Banks)
| | 18,292 | 1,200,870 |
Cullen / Frost Bankers, Inc. (Banks)
| | 9,498 | 1,106,042 |
East West Bancorp, Inc. (Banks)
| | 23,626 | 1,530,965 |
Essent Group Ltd. (Thrifts & Mortgage Finance)
| | 17,915 | 696,893 |
Evercore, Inc. Class A (Capital Markets)
| | 6,759 | 632,710 |
Federated Hermes, Inc. (Capital Markets)
| | 15,262 | 485,179 |
First American Financial Corp. (Insurance)
| | 17,882 | 946,315 |
First Financial Bankshares, Inc. (Banks)
| | 21,385 | 839,789 |
First Horizon Corp. (Banks)
| | 89,052 | 1,946,677 |
FirstCash Holdings, Inc. (Consumer Finance)
| | 6,559 | 455,916 |
FNB Corp. (Banks)
| | 56,176 | 610,071 |
Fulton Financial Corp. (Banks)
| | 26,764 | 386,740 |
Glacier Bancorp, Inc. (Banks)
| | 18,072 | 856,974 |
Hancock Whitney Corp. (Banks)
| | 14,380 | 637,465 |
Hanover Insurance Group, Inc. / The (Insurance)
| | 5,925 | 866,531 |
Home BancShares, Inc. (Banks)
| | 31,498 | 654,213 |
Interactive Brokers Group, Inc. Class A (Capital Markets)
| | 14,560 | 800,946 |
International Bancshares Corp. (Banks)
| | 8,835 | 354,107 |
Janus Henderson Group PLC (Capital Markets)
| | 27,935 | 656,752 |
Jefferies Financial Group, Inc. (Capital Markets)
| | 31,900 | 881,078 |
Kemper Corp. (Insurance)
| | 9,985 | 478,282 |
Kinsale Capital Group, Inc. (Insurance)
| | 3,585 | 823,259 |
Mercury General Corp. (Insurance)
| | 4,425 | 196,028 |
MGIC Investment Corp. (Thrifts & Mortgage Finance)
| | 51,546 | 649,480 |
Navient Corp. (Consumer Finance)
| | 24,622 | 344,462 |
New York Community Bancorp, Inc. (Thrifts & Mortgage Finance)
| | 77,758 | 709,931 |
Old National Bancorp (Banks)
| | 48,775 | 721,382 |
| Common Stocks (Continued) | Shares | Value |
| Financials (continued) | | | |
Old Republic International Corp. (Insurance)
| | 47,737 | $ 1,067,399 |
PacWest Bancorp (Banks)
| | 19,554 | 521,310 |
Pinnacle Financial Partners, Inc. (Banks)
| | 12,717 | 919,566 |
Primerica, Inc. (Insurance)
| | 6,407 | 766,854 |
Prosperity Bancshares, Inc. (Banks)
| | 15,348 | 1,047,808 |
Reinsurance Group of America, Inc. (Insurance)
| | 11,153 | 1,308,135 |
RenaissanceRe Holdings Ltd. (Insurance)
| | 7,357 | 1,150,414 |
RLI Corp. (Insurance)
| | 6,639 | 774,041 |
SEI Investments Co. (Capital Markets)
| | 17,369 | 938,273 |
Selective Insurance Group, Inc. (Insurance)
| | 10,048 | 873,573 |
SLM Corp. (Consumer Finance)
| | 44,822 | 714,463 |
Stifel Financial Corp. (Capital Markets)
| | 17,744 | 994,019 |
Synovus Financial Corp. (Banks)
| | 24,198 | 872,338 |
Texas Capital Bancshares, Inc. (Banks)
| (a) | 8,445 | 444,545 |
UMB Financial Corp. (Banks)
| | 7,172 | 617,509 |
Umpqua Holdings Corp. (Banks)
| | 36,136 | 606,001 |
United Bankshares, Inc. (Banks)
| | 22,596 | 792,442 |
Unum Group (Insurance)
| | 33,481 | 1,139,024 |
Valley National Bancorp (Banks)
| | 69,965 | 728,336 |
Voya Financial, Inc. (Diversified Financial Svs.)
| | 17,011 | 1,012,665 |
Washington Federal, Inc. (Banks)
| | 10,873 | 326,407 |
Webster Financial Corp. (Banks)
| | 29,652 | 1,249,832 |
Wintrust Financial Corp. (Banks)
| | 10,034 | 804,225 |
| | | | 48,017,710 |
Health Care–9.7%
| | | |
Acadia Healthcare Co., Inc. (Health Care Providers & Svs.)
| (a) | 15,072 | 1,019,319 |
Amedisys, Inc. (Health Care Providers & Svs.)
| (a) | 5,423 | 570,066 |
Arrowhead Pharmaceuticals, Inc. (Biotechnology)
| (a) | 17,604 | 619,837 |
Bruker Corp. (Life Sciences Tools & Svs.)
| | 16,649 | 1,044,891 |
Chemed Corp. (Health Care Providers & Svs.)
| | 2,492 | 1,169,720 |
Encompass Health Corp. (Health Care Providers & Svs.)
| | 16,616 | 931,327 |
Enovis Corp. (Health Care Equip. & Supplies)
| (a) | 7,826 | 430,430 |
Envista Holdings Corp. (Health Care Equip. & Supplies)
| (a) | 27,075 | 1,043,471 |
Exelixis, Inc. (Biotechnology)
| (a) | 53,401 | 1,111,809 |
Globus Medical, Inc. Class A (Health Care Equip. & Supplies)
| (a) | 13,202 | 741,160 |
Haemonetics Corp. (Health Care Equip. & Supplies)
| (a) | 8,510 | 554,682 |
Halozyme Therapeutics, Inc. (Biotechnology)
| (a) | 22,967 | 1,010,548 |
HealthEquity, Inc. (Health Care Providers & Svs.)
| (a) | 14,046 | 862,284 |
ICU Medical, Inc. (Health Care Equip. & Supplies)
| (a) | 3,342 | 549,391 |
Inari Medical, Inc. (Health Care Equip. & Supplies)
| (a) | 5,661 | 384,891 |
Integra LifeSciences Holdings Corp. (Health Care Equip. & Supplies)
| (a) | 11,903 | 643,119 |
Jazz Pharmaceuticals PLC (Pharmaceuticals)
| (a) | 10,376 | 1,618,760 |
LHC Group, Inc. (Health Care Providers & Svs.)
| (a) | 5,166 | 804,553 |
LivaNova PLC (Health Care Equip. & Supplies)
| (a) | 8,897 | 555,796 |
Masimo Corp. (Health Care Equip. & Supplies)
| (a) | 8,502 | 1,110,956 |
Medpace Holdings, Inc. (Life Sciences Tools & Svs.)
| (a) | 4,482 | 670,821 |
Neogen Corp. (Health Care Equip. & Supplies)
| (a) | 17,951 | 432,440 |
Neurocrine Biosciences, Inc. (Biotechnology)
| (a) | 15,913 | 1,551,199 |
NuVasive, Inc. (Health Care Equip. & Supplies)
| (a) | 8,664 | 425,922 |
Option Care Health, Inc. (Health Care Providers & Svs.)
| (a) | 23,082 | 641,449 |
Patterson Cos., Inc. (Health Care Providers & Svs.)
| | 14,465 | 438,290 |
Penumbra, Inc. (Health Care Equip. & Supplies)
| (a) | 5,897 | 734,294 |
Perrigo Co. PLC (Pharmaceuticals)
| | 22,402 | 908,849 |
Progyny, Inc. (Health Care Providers & Svs.)
| (a) | 11,787 | 342,412 |
| Ohio National Fund, Inc. | ON S&P MidCap 400® Index Portfolio (Continued) |
| Schedule of Investments | June 30, 2022 (Unaudited) |
| Common Stocks (Continued) | Shares | Value |
Health Care (continued)
| | | |
QuidelOrtho Corp. (Health Care Equip. & Supplies)
| (a) | 8,328 | $ 809,315 |
R1 RCM, Inc. (Health Care Providers & Svs.)
| (a) | 22,353 | 468,519 |
Repligen Corp. (Life Sciences Tools & Svs.)
| (a) | 8,583 | 1,393,879 |
Shockwave Medical, Inc. (Health Care Equip. & Supplies)
| (a) | 5,959 | 1,139,182 |
Sotera Health Co. (Life Sciences Tools & Svs.)
| (a) | 16,480 | 322,843 |
STAAR Surgical Co. (Health Care Equip. & Supplies)
| (a) | 7,960 | 564,603 |
Syneos Health, Inc. (Life Sciences Tools & Svs.)
| (a) | 17,078 | 1,224,151 |
Tandem Diabetes Care, Inc. (Health Care Equip. & Supplies)
| (a) | 10,649 | 630,314 |
Tenet Healthcare Corp. (Health Care Providers & Svs.)
| (a) | 17,935 | 942,664 |
United Therapeutics Corp. (Biotechnology)
| (a) | 7,542 | 1,777,197 |
| | | | 32,195,353 |
Industrials–17.5%
| | | |
Acuity Brands, Inc. (Electrical Equip.)
| | 5,757 | 886,808 |
AECOM (Construction & Engineering)
| | 23,532 | 1,534,757 |
AGCO Corp. (Machinery)
| | 10,177 | 1,004,470 |
ASGN, Inc. (Professional Svs.)
| (a) | 8,508 | 767,847 |
Avis Budget Group, Inc. (Road & Rail)
| (a) | 5,708 | 839,533 |
Axon Enterprise, Inc. (Aerospace & Defense)
| (a) | 11,823 | 1,101,549 |
Brink's Co. / The (Commercial Svs. & Supplies)
| | 7,829 | 475,299 |
Builders FirstSource, Inc. (Building Products)
| (a) | 28,764 | 1,544,627 |
CACI International, Inc. Class A (Professional Svs.)
| (a) | 3,898 | 1,098,378 |
Carlisle Cos., Inc. (Building Products)
| | 8,607 | 2,053,716 |
Chart Industries, Inc. (Machinery)
| (a) | 5,969 | 999,091 |
Clean Harbors, Inc. (Commercial Svs. & Supplies)
| (a) | 8,337 | 730,905 |
Crane Holdings Co. (Machinery)
| | 7,933 | 694,613 |
Curtiss-Wright Corp. (Aerospace & Defense)
| | 6,401 | 845,316 |
Donaldson Co., Inc. (Machinery)
| | 20,571 | 990,288 |
Dycom Industries, Inc. (Construction & Engineering)
| (a) | 4,933 | 458,966 |
EMCOR Group, Inc. (Construction & Engineering)
| | 8,515 | 876,704 |
EnerSys (Electrical Equip.)
| | 6,868 | 404,937 |
Esab Corp. (Machinery)
| | 7,596 | 332,325 |
Flowserve Corp. (Machinery)
| | 21,751 | 622,731 |
Fluor Corp. (Construction & Engineering)
| (a) | 23,643 | 575,471 |
FTI Consulting, Inc. (Professional Svs.)
| (a) | 5,739 | 1,037,898 |
GATX Corp. (Trading Companies & Distributors)
| | 5,927 | 558,086 |
Graco, Inc. (Machinery)
| | 28,175 | 1,673,877 |
GXO Logistics, Inc. (Air Freight & Logistics)
| (a) | 16,942 | 733,080 |
Hexcel Corp. (Aerospace & Defense)
| | 13,994 | 732,026 |
Hubbell, Inc. (Electrical Equip.)
| | 8,934 | 1,595,434 |
IAA, Inc. (Commercial Svs. & Supplies)
| (a) | 22,311 | 731,131 |
Insperity, Inc. (Professional Svs.)
| | 5,932 | 592,192 |
ITT, Inc. (Machinery)
| | 13,902 | 934,771 |
JetBlue Airways Corp. (Airlines)
| (a) | 53,409 | 447,033 |
KBR, Inc. (Professional Svs.)
| | 23,236 | 1,124,390 |
Kennametal, Inc. (Machinery)
| | 13,759 | 319,622 |
Kirby Corp. (Marine)
| (a) | 10,039 | 610,773 |
Knight-Swift Transportation Holdings, Inc. (Road & Rail)
| | 27,233 | 1,260,616 |
Landstar System, Inc. (Road & Rail)
| | 6,181 | 898,841 |
Lennox International, Inc. (Building Products)
| | 5,500 | 1,136,245 |
Lincoln Electric Holdings, Inc. (Machinery)
| | 9,673 | 1,193,261 |
ManpowerGroup, Inc. (Professional Svs.)
| | 8,781 | 670,956 |
MasTec, Inc. (Construction & Engineering)
| (a) | 9,514 | 681,773 |
MDU Resources Group, Inc. (Construction & Engineering)
| | 33,856 | 913,773 |
Mercury Systems, Inc. (Aerospace & Defense)
| (a) | 9,602 | 617,697 |
Middleby Corp. / The (Machinery)
| (a) | 9,055 | 1,135,135 |
| Common Stocks (Continued) | Shares | Value |
| Industrials (continued) | | | |
MillerKnoll, Inc. (Commercial Svs. & Supplies)
| | 12,619 | $ 331,501 |
MSA Safety, Inc. (Commercial Svs. & Supplies)
| | 6,091 | 737,437 |
MSC Industrial Direct Co., Inc. Class A (Trading Companies & Distributors)
| | 7,856 | 590,064 |
nVent Electric PLC (Electrical Equip.)
| | 27,695 | 867,684 |
Oshkosh Corp. (Machinery)
| | 10,954 | 899,762 |
Owens Corning (Building Products)
| | 16,163 | 1,201,073 |
Regal Rexnord Corp. (Electrical Equip.)
| | 11,156 | 1,266,429 |
Ryder System, Inc. (Road & Rail)
| | 8,514 | 605,005 |
Saia, Inc. (Road & Rail)
| (a) | 4,397 | 826,636 |
Simpson Manufacturing Co., Inc. (Building Products)
| | 7,186 | 722,983 |
Stericycle, Inc. (Commercial Svs. & Supplies)
| (a) | 15,332 | 672,308 |
Sunrun, Inc. (Electrical Equip.)
| (a) | 34,982 | 817,180 |
Terex Corp. (Machinery)
| | 11,538 | 315,795 |
Tetra Tech, Inc. (Commercial Svs. & Supplies)
| | 8,938 | 1,220,484 |
Timken Co. / The (Machinery)
| | 11,231 | 595,805 |
Toro Co. / The (Machinery)
| | 17,405 | 1,319,125 |
Trex Co., Inc. (Building Products)
| (a) | 18,847 | 1,025,654 |
Univar Solutions, Inc. (Trading Companies & Distributors)
| (a) | 28,176 | 700,737 |
Valmont Industries, Inc. (Construction & Engineering)
| | 3,548 | 796,987 |
Vicor Corp. (Electrical Equip.)
| (a) | 3,593 | 196,645 |
Watsco, Inc. (Trading Companies & Distributors)
| | 5,522 | 1,318,764 |
Watts Water Technologies, Inc. Class A (Machinery)
| | 4,567 | 561,010 |
Werner Enterprises, Inc. (Road & Rail)
| | 9,857 | 379,889 |
Woodward, Inc. (Aerospace & Defense)
| | 10,097 | 933,872 |
XPO Logistics, Inc. (Road & Rail)
| (a) | 16,469 | 793,147 |
| | | | 58,132,917 |
Information Technology–13.2%
| | | |
ACI Worldwide, Inc. (Software)
| (a) | 19,111 | 494,784 |
Amkor Technology, Inc. (Semiconductors & Equip.)
| | 16,709 | 283,218 |
Arrow Electronics, Inc. (Electronic Equip., Instr. & Comp.)
| (a) | 10,995 | 1,232,430 |
Aspen Technology, Inc. (Software)
| (a) | 4,661 | 856,133 |
Avnet, Inc. (Electronic Equip., Instr. & Comp.)
| | 16,263 | 697,357 |
Azenta, Inc. (Semiconductors & Equip.)
| | 12,484 | 900,096 |
Belden, Inc. (Electronic Equip., Instr. & Comp.)
| | 7,368 | 392,493 |
Blackbaud, Inc. (Software)
| (a) | 7,581 | 440,229 |
Bread Financial Holdings, Inc. (IT Svs.)
| | 8,287 | 307,116 |
Calix, Inc. (Communications Equip.)
| (a) | 9,251 | 315,829 |
CDK Global, Inc. (Software)
| | 19,444 | 1,064,948 |
Ciena Corp. (Communications Equip.)
| (a) | 25,328 | 1,157,490 |
Cirrus Logic, Inc. (Semiconductors & Equip.)
| (a) | 9,537 | 691,814 |
CMC Materials, Inc. (Semiconductors & Equip.)
| | 4,764 | 831,270 |
Cognex Corp. (Electronic Equip., Instr. & Comp.)
| | 28,926 | 1,229,934 |
Coherent, Inc. (Electronic Equip., Instr. & Comp.)
| (a) | 4,131 | 1,099,755 |
CommVault Systems, Inc. (Software)
| (a) | 7,426 | 467,095 |
Concentrix Corp. (IT Svs.)
| | 7,163 | 971,589 |
Envestnet, Inc. (Software)
| (a) | 9,188 | 484,851 |
Euronet Worldwide, Inc. (IT Svs.)
| (a) | 8,416 | 846,565 |
Fair Isaac Corp. (Software)
| (a) | 4,317 | 1,730,685 |
First Solar, Inc. (Semiconductors & Equip.)
| (a) | 16,503 | 1,124,349 |
Genpact Ltd. (IT Svs.)
| | 28,360 | 1,201,330 |
II-VI, Inc. (Electronic Equip., Instr. & Comp.)
| (a) | 17,724 | 903,038 |
IPG Photonics Corp. (Electronic Equip., Instr. & Comp.)
| (a) | 5,786 | 544,636 |
Jabil, Inc. (Electronic Equip., Instr. & Comp.)
| | 23,511 | 1,203,998 |
Kyndryl Holdings, Inc. (IT Svs.)
| (a) | 29,909 | 292,510 |
| Ohio National Fund, Inc. | ON S&P MidCap 400® Index Portfolio (Continued) |
| Schedule of Investments | June 30, 2022 (Unaudited) |
| Common Stocks (Continued) | Shares | Value |
Information Technology (continued)
| | | |
Lattice Semiconductor Corp. (Semiconductors & Equip.)
| (a) | 22,911 | $ 1,111,184 |
Littelfuse, Inc. (Electronic Equip., Instr. & Comp.)
| | 4,119 | 1,046,391 |
Lumentum Holdings, Inc. (Communications Equip.)
| (a) | 11,488 | 912,377 |
Manhattan Associates, Inc. (Software)
| (a) | 10,508 | 1,204,217 |
Maximus, Inc. (IT Svs.)
| | 10,225 | 639,165 |
MKS Instruments, Inc. (Semiconductors & Equip.)
| | 9,267 | 951,072 |
National Instruments Corp. (Electronic Equip., Instr. & Comp.)
| | 21,839 | 682,032 |
NCR Corp. (Tech. Hardware, Storage & Periph.)
| (a) | 22,743 | 707,535 |
Paylocity Holding Corp. (Software)
| (a) | 6,608 | 1,152,567 |
Power Integrations, Inc. (Semiconductors & Equip.)
| | 9,708 | 728,197 |
Qualys, Inc. (Software)
| (a) | 5,560 | 701,338 |
Sabre Corp. (IT Svs.)
| (a) | 54,341 | 316,808 |
Sailpoint Technologies Holdings, Inc. (Software)
| (a) | 15,696 | 983,825 |
Science Applications International Corp. (IT Svs.)
| | 9,293 | 865,178 |
Semtech Corp. (Semiconductors & Equip.)
| (a) | 10,567 | 580,868 |
Silicon Laboratories, Inc. (Semiconductors & Equip.)
| (a) | 6,090 | 853,940 |
SiTime Corp. (Semiconductors & Equip.)
| (a) | 2,592 | 422,574 |
SunPower Corp. (Semiconductors & Equip.)
| (a) | 13,894 | 219,664 |
Synaptics, Inc. (Semiconductors & Equip.)
| (a) | 6,594 | 778,422 |
TD SYNNEX Corp. (Electronic Equip., Instr. & Comp.)
| | 6,880 | 626,768 |
Teradata Corp. (Software)
| (a) | 17,432 | 645,158 |
Universal Display Corp. (Semiconductors & Equip.)
| | 7,232 | 731,445 |
Viasat, Inc. (Communications Equip.)
| (a) | 12,393 | 379,598 |
Vishay Intertechnology, Inc. (Electronic Equip., Instr. & Comp.)
| | 21,965 | 391,416 |
Vontier Corp. (Electronic Equip., Instr. & Comp.)
| | 26,806 | 616,270 |
Western Union Co. / The (IT Svs.)
| | 64,271 | 1,058,543 |
WEX, Inc. (IT Svs.)
| (a) | 7,490 | 1,165,144 |
Wolfspeed, Inc. (Semiconductors & Equip.)
| (a) | 20,584 | 1,306,055 |
Xerox Holdings Corp. (Tech. Hardware, Storage & Periph.)
| | 19,853 | 294,817 |
| | | | 43,838,110 |
Materials–6.7%
| | | |
Alcoa Corp. (Metals & Mining)
| | 30,709 | 1,399,716 |
AptarGroup, Inc. (Containers & Packaging)
| | 10,917 | 1,126,744 |
Ashland Global Holdings, Inc. (Chemicals)
| | 8,444 | 870,154 |
Avient Corp. (Chemicals)
| | 15,222 | 610,098 |
Cabot Corp. (Chemicals)
| | 9,396 | 599,371 |
Chemours Co. / The (Chemicals)
| | 25,884 | 828,806 |
Cleveland-Cliffs, Inc. (Metals & Mining)
| (a) | 79,501 | 1,221,930 |
Commercial Metals Co. (Metals & Mining)
| | 20,228 | 669,547 |
Eagle Materials, Inc. (Construction Materials)
| | 6,577 | 723,075 |
Greif, Inc. Class A (Containers & Packaging)
| | 4,429 | 276,281 |
Ingevity Corp. (Chemicals)
| (a) | 6,452 | 407,379 |
Louisiana-Pacific Corp. (Paper & Forest Products)
| | 13,672 | 716,550 |
Minerals Technologies, Inc. (Chemicals)
| | 5,489 | 336,695 |
NewMarket Corp. (Chemicals)
| | 1,127 | 339,182 |
Olin Corp. (Chemicals)
| | 23,107 | 1,069,392 |
Reliance Steel & Aluminum Co. (Metals & Mining)
| | 10,314 | 1,751,936 |
Royal Gold, Inc. (Metals & Mining)
| | 10,928 | 1,166,892 |
RPM International, Inc. (Chemicals)
| | 21,560 | 1,697,203 |
Scotts Miracle-Gro Co. / The (Chemicals)
| | 6,732 | 531,761 |
Sensient Technologies Corp. (Chemicals)
| | 6,998 | 563,759 |
| Common Stocks (Continued) | Shares | Value |
| Materials (continued) | | | |
Silgan Holdings, Inc. (Containers & Packaging)
| | 14,020 | $ 579,727 |
Sonoco Products Co. (Containers & Packaging)
| | 16,232 | 925,873 |
Steel Dynamics, Inc. (Metals & Mining)
| | 29,844 | 1,974,181 |
United States Steel Corp. (Metals & Mining)
| | 43,393 | 777,169 |
Valvoline, Inc. (Chemicals)
| | 29,668 | 855,328 |
Worthington Industries, Inc. (Metals & Mining)
| | 5,342 | 235,582 |
| | | | 22,254,331 |
Real Estate–9.0%
| | | |
American Campus Communities, Inc. (Equity REIT)
| | 23,223 | 1,497,187 |
Apartment Income REIT Corp. (Equity REIT)
| | 26,155 | 1,088,048 |
Brixmor Property Group, Inc. (Equity REIT)
| | 49,870 | 1,007,873 |
Corporate Office Properties Trust (Equity REIT)
| | 18,716 | 490,172 |
Cousins Properties, Inc. (Equity REIT)
| | 24,768 | 723,969 |
Douglas Emmett, Inc. (Equity REIT)
| | 29,267 | 654,995 |
EastGroup Properties, Inc. (Equity REIT)
| | 6,939 | 1,070,896 |
EPR Properties (Equity REIT)
| | 12,482 | 585,780 |
First Industrial Realty Trust, Inc. (Equity REIT)
| | 21,977 | 1,043,468 |
Healthcare Realty Trust, Inc. (Equity REIT)
| | 25,241 | 686,555 |
Highwoods Properties, Inc. (Equity REIT)
| | 17,507 | 598,564 |
Hudson Pacific Properties, Inc. (Equity REIT)
| | 24,079 | 357,332 |
Independence Realty Trust, Inc. (Equity REIT)
| | 36,778 | 762,408 |
JBG SMITH Properties (Equity REIT)
| | 18,101 | 427,908 |
Jones Lang LaSalle, Inc. (Real Estate Mgmt. & Development)
| (a) | 8,135 | 1,422,486 |
Kilroy Realty Corp. (Equity REIT)
| | 17,489 | 915,199 |
Kite Realty Group Trust (Equity REIT)
| | 36,468 | 630,532 |
Lamar Advertising Co. Class A (Equity REIT)
| | 14,495 | 1,275,125 |
Life Storage, Inc. (Equity REIT)
| | 14,046 | 1,568,376 |
Macerich Co. / The (Equity REIT)
| | 35,737 | 311,269 |
Medical Properties Trust, Inc. (Equity REIT)
| | 99,911 | 1,525,641 |
National Retail Properties, Inc. (Equity REIT)
| | 29,288 | 1,259,384 |
National Storage Affiliates Trust (Equity REIT)
| | 14,009 | 701,431 |
Omega Healthcare Investors, Inc. (Equity REIT)
| | 39,162 | 1,103,977 |
Park Hotels & Resorts, Inc. (Equity REIT)
| | 38,854 | 527,249 |
Pebblebrook Hotel Trust (Equity REIT)
| | 21,869 | 362,369 |
Physicians Realty Trust (Equity REIT)
| | 37,510 | 654,550 |
PotlatchDeltic Corp. (Equity REIT)
| | 11,550 | 510,395 |
PS Business Parks, Inc. (Equity REIT)
| | 3,358 | 628,450 |
Rayonier, Inc. (Equity REIT)
| | 24,357 | 910,465 |
Rexford Industrial Realty, Inc. (Equity REIT)
| | 27,475 | 1,582,285 |
Sabra Health Care REIT, Inc. (Equity REIT)
| | 38,452 | 537,174 |
SL Green Realty Corp. (Equity REIT)
| | 10,676 | 492,697 |
Spirit Realty Capital, Inc. (Equity REIT)
| | 22,361 | 844,799 |
STORE Capital Corp. (Equity REIT)
| | 42,041 | 1,096,429 |
| | | | 29,855,437 |
Utilities–4.0%
| | | |
ALLETE, Inc. (Electric Utilities)
| | 9,488 | 557,705 |
Black Hills Corp. (Multi-Utilities)
| | 10,794 | 785,479 |
Essential Utilities, Inc. (Water Utilities)
| | 38,333 | 1,757,568 |
Hawaiian Electric Industries, Inc. (Electric Utilities)
| | 18,219 | 745,157 |
IDACORP, Inc. (Electric Utilities)
| | 8,418 | 891,635 |
National Fuel Gas Co. (Gas Utilities)
| | 15,227 | 1,005,743 |
New Jersey Resources Corp. (Gas Utilities)
| | 16,009 | 712,881 |
NorthWestern Corp. (Multi-Utilities)
| | 9,014 | 531,195 |
OGE Energy Corp. (Electric Utilities)
| | 33,332 | 1,285,282 |
ONE Gas, Inc. (Gas Utilities)
| | 9,006 | 731,197 |
PNM Resources, Inc. (Electric Utilities)
| | 14,291 | 682,824 |
Portland General Electric Co. (Electric Utilities)
| | 14,854 | 717,894 |
Southwest Gas Holdings, Inc. (Gas Utilities)
| | 11,130 | 969,200 |
| Ohio National Fund, Inc. | ON S&P MidCap 400® Index Portfolio (Continued) |
| Schedule of Investments | June 30, 2022 (Unaudited) |
| Common Stocks (Continued) | Shares | Value |
| Utilities (continued) | | | |
Spire, Inc. (Gas Utilities)
| | 8,678 | $ 645,383 |
UGI Corp. (Gas Utilities)
| | 34,962 | 1,349,883 |
| | | | 13,369,026 |
Total Common Stocks (Cost $298,339,531)
| | | $322,250,276 |
| U.S. Treasury Obligations–0.0% | Rate | Maturity | Face Amount | Value |
| U.S. Treasury Bill | (b) | 0.000% | 01/26/2023 | $ 100,000 | $ 98,586 |
Total U.S. Treasury Obligations (Cost $99,295)
| $ 98,586 |
| Money Market Funds–0.8% | Shares | Value |
State Street Institutional Liquid Reserves Fund Institutional Class, 1.494%
| (c) | 2,712,757 | $ 2,712,485 |
Total Money Market Funds (Cost $2,712,746)
| | | $ 2,712,485 |
Total Investments – 98.0% (Cost $301,151,572)
| (d) | | $325,061,347 |
Other Assets in Excess of Liabilities – 2.0%
| (b) | | 6,502,944 |
| Net Assets – 100.0% | | | $331,564,291 |
Percentages are stated as a percent of net assets. |
| Footnotes: | |
| (a) | Non-income producing security. |
| (b) | Security is fully pledged, in addition to $77,876 of the Portfolio’s cash holdings, as collateral for the futures contracts outstanding at June 30, 2022. See also the following Schedule of Open Futures Contracts. |
| (c) | Rate represents the seven-day yield at June 30, 2022. |
| (d) | Represents cost for financial reporting purposes, which may differ from cost basis for federal income tax purposes. See also Note 7 of the Notes to Financial Statements. |
The accompanying notes are an integral part of these financial statements.
| Schedule of Open Futures Contracts | June 30, 2022 (Unaudited) |
| Description | | Number of
contracts | | Expiration Date | | Notional
Amount | | Value | | Unrealized
Appreciation
(Depreciation) | | Variation Margin
Receivable
(Payable) |
| CME E-mini S&P MidCap 400 Index - Long | | 13 | | September 16, 2022 | | $2,995,005 | | $2,948,400 | | $(46,605) | | $(28,860) |
The accompanying notes are an integral part of these financial statements.
| Ohio National Fund, Inc. | ON BlackRock Advantage Large Cap Growth Portfolio (Unaudited) |
The ON BlackRock Advantage Large Cap Growth Portfolio seeks long-term growth of capital by investing, under normal circumstances, at least 80% of its net assets in stocks of large capitalization companies with market capitalizations at the time of investment that are within the range of market capitalizations of the companies in the Russell 1000® Growth Index for the previous twelve months.
Performance as of June 30, 2022
| Average Annual returns | |
| One year | -20.20% |
| Five years | 10.29% |
| Ten years | 13.32% |
Past performance does not guarantee future results. The performance data quoted represents past performance and current returns may be lower or higher. Total return figures include change in share price and reinvestment of dividends and capital gains. The investment return and principal value will fluctuate so that an investor’s shares, when redeemed, may be worth more or less than the original cost. To obtain performance information up to the most recent month end, call toll-free 1-877-781-6392.
The Portfolio is not open to direct retail investment. Beneficial interest in the Portfolio’s shares is obtained either through an allocation to the Portfolio as an investment vehicle within variable life insurance policies or annuity contracts, or as an underlying investment by the ON Model Portfolios. Actual performance results for variable annuity and variable universal life contracts will be lower due to contract charges. Consult your contract for applicable charges.
Total expense ratio is 0.78% per the Fund’s prospectus dated April 29, 2022. Additional information pertaining to the Portfolio’s expense ratio as of June 30, 2022 can be found in the Portfolio’s Financial Highlights.
Comments from Sub-Adviser
Q. How did the Portfolio perform in comparison to its benchmark during the reporting period?
A. For the six-month period ended June 30, 2022, the Portfolio returned -28.56% versus -28.07% for its benchmark, the Russell 1000® Growth Index.
Q. Were there specific market conditions, investment strategies, or techniques that materially affected the Portfolio’s benchmark-relative performance during the reporting period?
A. Despite positive performance in the second quarter, weakness at the start of the year led to a slight underperformance for the six-month period. Underperformance was driven by non-traditional fundamental quality measures, particularly environmental, social, and governance (“ESG”) insights, while fundamental measures with a preference for attractively priced growth companies that evaluate securities across relative valuation measures helped performance.
Fundamental quality insights that look toward growth of forward-looking fundamentals detracted. Insights evaluating corporate culture, as well as measures favoring founder-led ownership structures, detracted across Information Technology stocks. Nontraditional fundamental quality measures, specifically ESG insights, struggled as markets continued to focus on macro dynamics over company results. Insights designed to track company controversies detracted, as it was incorrectly positioned around select consumer names that had sales exposure to Russia. Also, measures that evaluate carbon emissions intensity and track companies across green patent filings detracted, as those measures helped to motivate an underweight across Consumer Staples.
Additionally, trend-based sentiment stock selection insights incorrectly positioned the Portfolio amid the changeable market backdrop. Specifically, text analyses designed to capture both short-term results
and long-term fundamentals struggled and helped motivate an unsuccessful underweight stance across Health Care. Additionally, positioning based on informed investor views detracted as the shared exposures ran against rising style volatility. Conversely, capturing sentiment from bond markets benefitted gains, given interest rate volatility.
Finally, fundamental insights with a preference for attractively priced growth companies provided ballast for the period, as those insights benefitted from the market style preference. Traditional valuation metrics measuring company ownership structures and sources of financing, cash usage efficiency, research expenditures across price, and other financial statement metrics all did well and motivated a successful overweight to Energy names, benefitting performance. (1)
Q. How did sector allocation and security selection each impact the Portfolio’s performance relative to its benchmark?
A. The portfolio management team targets a relatively sector-neutral approach and seeks to derive the majority of any excess return from security selection. During the six-month period, however, sector allocation decisions contributed to relative returns during the six-month period. An overweight position within Utilities names contributed to relative performance, as the market was more focused on defensive names and value styles. Security selection had a more meaningful impact to relative performance, leading the Portfolio’s slight underperformance. Selection within Industrials, Consumer Staples, and Health Care were key detractors, while security selection in Communication Services and Consumer Discretionary contributed. (1)
Q. Which securities contributed the most to, and detracted the most from, the Portfolio’s benchmark-relative performance?
A. From a security standpoint, the Portfolio’s underweight position in Netflix, Inc. was a top contributor to relative performance for the six-month period, as the stock struggled amid a stagnant user base. An overweight to Visa, Inc. was also a top contributor. That stock benefitted from the broader inflationary themes.
In contrast, an underweight to biotech company AbbVie, Inc. was a key detractor from relative performance, as the stock benefitted from getting closer to approval in the European Union for a spinal condition treatment. Further hindering relative results was an underweight stance in The Coca-Cola Co., as the market exhibited preference for consumer durables. (1)
Q. How did the Portfolio’s use of derivative instruments and initial public offerings (IPOs), if any, impact performance?
A. Pursuant to the Portfolio’s investment strategy, futures contracts were used to prevent a cash drag on performance. The futures contracts detracted 36 basis points from the Portfolio’s absolute return for the six-month period. The Portfolio did not participate in any IPOs during the period. (1)
| (1) | The Portfolio’s composition is subject to change. Holdings and weightings are as of June 30, 2022. |
| Ohio National Fund, Inc. | ON BlackRock Advantage Large Cap Growth Portfolio (Unaudited) (Continued) |
Change in Value of $10,000 Investment
Hypothetical illustration based on past performance. Future performance will vary. The Portfolio’s returns reflect reinvested dividends. The Portfolio’s holdings may differ significantly from the securities in the index. The index is unmanaged and therefore does not reflect the cost of portfolio management and accounting.
The Russell 1000® Growth Index is a market-capitalization weighted index of those firms in the Russell 1000® Index with higher price-to-book ratios and higher forecasted growth values. The Russell 1000® Index measures the performance of the large-cap segment of the U.S. equity universe. The index presented includes the effects of reinvested dividends.
Past performance is no guarantee of future results. Redemption of fund shares could have tax implications unique to each shareholder.
| Portfolio Composition as of June 30, 2022 (1) |
| | % of Net Assets |
| Common Stocks (4) | 96.3 |
Money Market Funds and
Other Net Assets | 3.7 |
| | 100.0 |
| Top 10 Portfolio Holdings as of June 30, 2022 (1) (2) (3) |
| | | % of Net Assets |
| 1. | Microsoft Corp. | 9.7 |
| 2. | Apple, Inc. | 9.7 |
| 3. | Amazon.com, Inc. | 4.9 |
| 4. | Tesla, Inc. | 3.4 |
| 5. | Alphabet, Inc. Class C | 2.9 |
| 6. | Visa, Inc. | 2.5 |
| 7. | NVIDIA Corp. | 2.2 |
| 8. | Home Depot, Inc. / The | 2.1 |
| 9. | UnitedHealth Group, Inc. | 2.1 |
| 10. | Alphabet, Inc. Class A | 1.8 |
| | |
| (1) | Composition of Portfolio subject to change. |
| (2) | Short-term investments have been excluded from the list of Top 10 Portfolio Holdings. |
| (3) | Top 10 Portfolio Holdings is presented at an individual security level. Total investment exposure by issuer may be higher. |
| (4) | Sectors (Common Stocks): |
| | % of Net Assets |
| Information Technology | 42.5 |
| Consumer Discretionary | 14.9 |
| Health Care | 12.4 |
| Communication Services | 7.4 |
| Industrials | 6.4 |
| Consumer Staples | 6.1 |
| Financials | 2.7 |
| Materials | 1.4 |
| Real Estate | 1.3 |
| Energy | 1.2 |
| | 96.3 |
| Ohio National Fund, Inc. | ON BlackRock Advantage Large Cap Growth Portfolio |
| Schedule of Investments | June 30, 2022 (Unaudited) |
| Common Stocks–96.3% | Shares | Value |
Communication Services–7.4%
| | | |
Alphabet, Inc. Class A (Interactive Media & Svs.)
| (a) | 400 | $ 871,704 |
Alphabet, Inc. Class C (Interactive Media & Svs.)
| (a) | 655 | 1,432,780 |
Charter Communications, Inc. Class A (Media)
| (a) | 397 | 186,006 |
Electronic Arts, Inc. (Entertainment)
| | 724 | 88,075 |
Fox Corp. Class A (Media)
| | 8,496 | 273,231 |
Meta Platforms, Inc. Class A (Interactive Media & Svs.)
| (a) | 3,902 | 629,197 |
Spotify Technology SA (Entertainment)
| (a) | 1,291 | 121,135 |
Take-Two Interactive Software, Inc. (Entertainment)
| (a) | 50 | 6,127 |
| | | | 3,608,255 |
Consumer Discretionary–14.9%
| | | |
Amazon.com, Inc. (Internet & Direct Marketing Retail)
| (a) | 22,316 | 2,370,182 |
Booking Holdings, Inc. (Internet & Direct Marketing Retail)
| (a) | 56 | 97,943 |
Choice Hotels International, Inc. (Hotels, Restaurants & Leisure)
| | 911 | 101,695 |
Dollar General Corp. (Multiline Retail)
| | 527 | 129,347 |
eBay, Inc. (Internet & Direct Marketing Retail)
| | 2,435 | 101,466 |
Home Depot, Inc. / The (Specialty Retail)
| | 3,707 | 1,016,719 |
Lowe's Cos., Inc. (Specialty Retail)
| | 1,849 | 322,965 |
Marriott International, Inc. Class A (Hotels, Restaurants & Leisure)
| | 865 | 117,649 |
NIKE, Inc. Class B (Textiles, Apparel & Luxury Goods)
| | 2,492 | 254,682 |
Pool Corp. (Distributors)
| | 43 | 15,103 |
Ralph Lauren Corp. (Textiles, Apparel & Luxury Goods)
| | 650 | 58,273 |
Target Corp. (Multiline Retail)
| | 1,171 | 165,380 |
Tesla, Inc. (Automobiles)
| (a) | 2,471 | 1,664,021 |
Texas Roadhouse, Inc. (Hotels, Restaurants & Leisure)
| | 147 | 10,760 |
TJX Cos., Inc. / The (Specialty Retail)
| | 3,328 | 185,869 |
Travel + Leisure Co. (Hotels, Restaurants & Leisure)
| | 8,804 | 341,771 |
Whirlpool Corp. (Household Durables)
| | 458 | 70,931 |
Yum! Brands, Inc. (Hotels, Restaurants & Leisure)
| | 1,769 | 200,799 |
| | | | 7,225,555 |
Consumer Staples–6.1%
| | | |
Altria Group, Inc. (Tobacco)
| | 2,920 | 121,968 |
Brown-Forman Corp. Class B (Beverages)
| | 4,869 | 341,609 |
Coca-Cola Co. / The (Beverages)
| | 1,407 | 88,514 |
Colgate-Palmolive Co. (Household Products)
| | 5,507 | 441,331 |
Costco Wholesale Corp. (Food & Staples Retailing)
| | 1,543 | 739,529 |
Estee Lauder Cos., Inc. / The Class A (Personal Products)
| | 974 | 248,049 |
PepsiCo, Inc. (Beverages)
| | 3,355 | 559,144 |
Procter & Gamble Co. / The (Household Products)
| | 3,026 | 435,109 |
| | | | 2,975,253 |
Energy–1.2%
| | | |
Devon Energy Corp. (Oil, Gas & Consumable Fuels)
| | 1,588 | 87,515 |
EOG Resources, Inc. (Oil, Gas & Consumable Fuels)
| | 2,957 | 326,571 |
Halliburton Co. (Energy Equip. & Svs.)
| | 2,459 | 77,114 |
Schlumberger N.V. (Energy Equip. & Svs.)
| | 2,326 | 83,178 |
| | | | 574,378 |
Financials–2.7%
| | | |
American Express Co. (Consumer Finance)
| | 3,010 | 417,246 |
Bank of America Corp. (Banks)
| | 4,350 | 135,415 |
| Common Stocks (Continued) | Shares | Value |
| Financials (continued) | | | |
Blackstone, Inc. (Capital Markets)
| | 1,034 | $ 94,332 |
Charles Schwab Corp. / The (Capital Markets)
| | 942 | 59,516 |
Discover Financial Services (Consumer Finance)
| | 918 | 86,824 |
Moody's Corp. (Capital Markets)
| | 715 | 194,459 |
Voya Financial, Inc. (Diversified Financial Svs.)
| | 5,104 | 303,841 |
| | | | 1,291,633 |
Health Care–12.4%
| | | |
Abbott Laboratories (Health Care Equip. & Supplies)
| | 2,604 | 282,925 |
AbbVie, Inc. (Biotechnology)
| | 3,416 | 523,195 |
Agilent Technologies, Inc. (Life Sciences Tools & Svs.)
| | 3,581 | 425,315 |
Align Technology, Inc. (Health Care Equip. & Supplies)
| (a) | 416 | 98,455 |
AmerisourceBergen Corp. (Health Care Providers & Svs.)
| | 583 | 82,483 |
Amgen, Inc. (Biotechnology)
| | 1,358 | 330,401 |
Boston Scientific Corp. (Health Care Equip. & Supplies)
| (a) | 3,941 | 146,881 |
Bruker Corp. (Life Sciences Tools & Svs.)
| | 1,264 | 79,329 |
Cigna Corp. (Health Care Providers & Svs.)
| | 659 | 173,660 |
Danaher Corp. (Life Sciences Tools & Svs.)
| | 574 | 145,520 |
Edwards Lifesciences Corp. (Health Care Equip. & Supplies)
| (a) | 1,515 | 144,061 |
Elevance Health, Inc. (Health Care Providers & Svs.)
| | 193 | 93,138 |
Eli Lilly & Co. (Pharmaceuticals)
| | 2,113 | 685,098 |
IDEXX Laboratories, Inc. (Health Care Equip. & Supplies)
| (a) | 541 | 189,745 |
McKesson Corp. (Health Care Providers & Svs.)
| | 415 | 135,377 |
Merck & Co., Inc. (Pharmaceuticals)
| | 2,917 | 265,943 |
Mettler-Toledo International, Inc. (Life Sciences Tools & Svs.)
| (a) | 213 | 244,688 |
Molina Healthcare, Inc. (Health Care Providers & Svs.)
| (a) | 136 | 38,027 |
Syneos Health, Inc. (Life Sciences Tools & Svs.)
| (a) | 2,931 | 210,094 |
Thermo Fisher Scientific, Inc. (Life Sciences Tools & Svs.)
| | 304 | 165,157 |
UnitedHealth Group, Inc. (Health Care Providers & Svs.)
| | 1,977 | 1,015,447 |
Zoetis, Inc. (Pharmaceuticals)
| | 3,216 | 552,798 |
| | | | 6,027,737 |
Industrials–6.4%
| | | |
Caterpillar, Inc. (Machinery)
| | 942 | 168,392 |
Deere & Co. (Machinery)
| | 618 | 185,072 |
Eaton Corp. PLC (Electrical Equip.)
| | 1,317 | 165,929 |
Expeditors International of Washington, Inc. (Air Freight & Logistics)
| | 325 | 31,675 |
General Dynamics Corp. (Aerospace & Defense)
| | 2,202 | 487,192 |
HEICO Corp. (Aerospace & Defense)
| | 333 | 43,663 |
HEICO Corp. Class A (Aerospace & Defense)
| | 1,534 | 161,653 |
Illinois Tool Works, Inc. (Machinery)
| | 1,605 | 292,511 |
Lockheed Martin Corp. (Aerospace & Defense)
| | 708 | 304,412 |
Old Dominion Freight Line, Inc. (Road & Rail)
| | 417 | 106,869 |
Owens Corning (Building Products)
| | 920 | 68,365 |
SiteOne Landscape Supply, Inc. (Trading Companies & Distributors)
| (a) | 1,748 | 207,785 |
Tetra Tech, Inc. (Commercial Svs. & Supplies)
| | 864 | 117,979 |
Uber Technologies, Inc. (Road & Rail)
| (a) | 2,716 | 55,569 |
Union Pacific Corp. (Road & Rail)
| | 471 | 100,455 |
United Parcel Service, Inc. Class B (Air Freight & Logistics)
| | 3,170 | 578,652 |
| | | | 3,076,173 |
| Ohio National Fund, Inc. | ON BlackRock Advantage Large Cap Growth Portfolio (Continued) |
| Schedule of Investments | June 30, 2022 (Unaudited) |
| Common Stocks (Continued) | Shares | Value |
Information Technology–42.5%
| | | |
Accenture PLC Class A (IT Svs.)
| | 1,146 | $ 318,187 |
Adobe, Inc. (Software)
| (a) | 1,559 | 570,687 |
Advanced Micro Devices, Inc. (Semiconductors & Equip.)
| (a) | 5,842 | 446,738 |
Analog Devices, Inc. (Semiconductors & Equip.)
| | 577 | 84,294 |
Apple, Inc. (Tech. Hardware, Storage & Periph.)
| | 34,273 | 4,685,804 |
Applied Materials, Inc. (Semiconductors & Equip.)
| | 3,605 | 327,983 |
Autodesk, Inc. (Software)
| (a) | 922 | 158,547 |
Automatic Data Processing, Inc. (IT Svs.)
| | 945 | 198,488 |
Broadcom, Inc. (Semiconductors & Equip.)
| | 812 | 394,478 |
Cadence Design Systems, Inc. (Software)
| (a) | 2,056 | 308,462 |
CDW Corp. (Electronic Equip., Instr. & Comp.)
| | 584 | 92,015 |
Ciena Corp. (Communications Equip.)
| (a) | 737 | 33,681 |
Cognizant Technology Solutions Corp. Class A (IT Svs.)
| | 1,822 | 122,967 |
Crowdstrike Holdings, Inc. Class A (Software)
| (a) | 522 | 87,988 |
Dell Technologies, Inc. Class C (Tech. Hardware, Storage & Periph.)
| | 4,897 | 226,290 |
Fortinet, Inc. (Software)
| (a) | 2,895 | 163,799 |
Gartner, Inc. (IT Svs.)
| (a) | 422 | 102,052 |
Hewlett Packard Enterprise Co. (Tech. Hardware, Storage & Periph.)
| | 8,373 | 111,026 |
HP, Inc. (Tech. Hardware, Storage & Periph.)
| | 10,453 | 342,649 |
HubSpot, Inc. (Software)
| (a) | 360 | 108,234 |
Intel Corp. (Semiconductors & Equip.)
| | 4,820 | 180,316 |
Intuit, Inc. (Software)
| | 1,031 | 397,389 |
Keysight Technologies, Inc. (Electronic Equip., Instr. & Comp.)
| (a) | 1,107 | 152,600 |
KLA Corp. (Semiconductors & Equip.)
| | 698 | 222,718 |
Lam Research Corp. (Semiconductors & Equip.)
| | 454 | 193,472 |
Lattice Semiconductor Corp. (Semiconductors & Equip.)
| (a) | 1,172 | 56,842 |
Manhattan Associates, Inc. (Software)
| (a) | 172 | 19,711 |
Mastercard, Inc. Class A (IT Svs.)
| | 1,928 | 608,245 |
MaxLinear, Inc. (Semiconductors & Equip.)
| (a) | 1,049 | 35,645 |
Microsoft Corp. (Software)
| | 18,360 | 4,715,399 |
Monolithic Power Systems, Inc. (Semiconductors & Equip.)
| | 339 | 130,190 |
NetApp, Inc. (Tech. Hardware, Storage & Periph.)
| | 3,032 | 197,808 |
NVIDIA Corp. (Semiconductors & Equip.)
| | 7,082 | 1,073,560 |
Oracle Corp. (Software)
| | 1,132 | 79,093 |
| Common Stocks (Continued) | Shares | Value |
Information Technology (continued)
| | | |
Palo Alto Networks, Inc. (Software)
| (a) | 472 | $ 233,140 |
Paycom Software, Inc. (Software)
| (a) | 572 | 160,229 |
PayPal Holdings, Inc. (IT Svs.)
| (a) | 1,086 | 75,846 |
Pure Storage, Inc. Class A (Tech. Hardware, Storage & Periph.)
| (a) | 3,737 | 96,078 |
QUALCOMM, Inc. (Semiconductors & Equip.)
| | 4,212 | 538,041 |
Salesforce, Inc. (Software)
| (a) | 840 | 138,634 |
ServiceNow, Inc. (Software)
| (a) | 1,370 | 651,462 |
Silicon Laboratories, Inc. (Semiconductors & Equip.)
| (a) | 925 | 129,703 |
TE Connectivity Ltd. (Electronic Equip., Instr. & Comp.)
| | 1,312 | 148,453 |
Teradyne, Inc. (Semiconductors & Equip.)
| | 327 | 29,283 |
Visa, Inc. (IT Svs.)
| | 6,070 | 1,195,122 |
Workday, Inc. Class A (Software)
| (a) | 1,853 | 258,642 |
Zebra Technologies Corp. Class A (Electronic Equip., Instr. & Comp.)
| (a) | 146 | 42,917 |
| | | | 20,644,907 |
Materials–1.4%
| | | |
Ecolab, Inc. (Chemicals)
| | 2,741 | 421,456 |
Freeport-McMoRan, Inc. (Metals & Mining)
| | 1,261 | 36,897 |
Linde PLC (Chemicals)
| | 773 | 222,261 |
| | | | 680,614 |
Real Estate–1.3%
| | | |
American Tower Corp. (Equity REIT)
| | 456 | 116,549 |
Crown Castle International Corp. (Equity REIT)
| | 1,466 | 246,845 |
Extra Space Storage, Inc. (Equity REIT)
| | 487 | 82,849 |
Mid-America Apartment Communities, Inc. (Equity REIT)
| | 123 | 21,484 |
Prologis, Inc. (Equity REIT)
| | 1,368 | 160,945 |
Zillow Group, Inc. Class A (Real Estate Mgmt. & Development)
| (a) | 152 | 4,835 |
| | | | 633,507 |
Total Common Stocks (Cost $52,563,517)
| | | $46,738,012 |
| Money Market Funds–1.5% | Shares | Value |
State Street Institutional Liquid Reserves Fund Institutional Class, 1.494%
| (b) | 732,783 | $ 732,709 |
Total Money Market Funds (Cost $732,775)
| | | $ 732,709 |
Total Investments – 97.8% (Cost $53,296,292)
| (c) | | $47,470,721 |
Other Assets in Excess of Liabilities – 2.2%
| (d) | | 1,068,363 |
| Net Assets – 100.0% | | | $48,539,084 |
Percentages are stated as a percent of net assets. |
| Footnotes: | |
| (a) | Non-income producing security. |
| (b) | Rate represents the seven-day yield at June 30, 2022. |
| (c) | Represents cost for financial reporting purposes, which may differ from cost basis for federal income tax purposes. See also Note 7 of the Notes to Financial Statements. |
| (d) | Includes $45,000 of cash pledged as collateral for the futures contracts outstanding at June 30, 2022. See also the following Schedule of Open Futures Contracts. |
The accompanying notes are an integral part of these financial statements.
| Schedule of Open Futures Contracts | June 30, 2022 (Unaudited) |
| Description | | Number of
contracts | | Expiration Date | | Notional
Amount | | Value | | Unrealized
Appreciation
(Depreciation) | | Variation Margin
Receivable
(Payable) |
| CME E-mini Nasdaq-100 Index - Long | | 3 | | September 16, 2022 | | $700,992 | | $691,770 | | $(9,222) | | $(9,690) |
The accompanying notes are an integral part of these financial statements.
| Ohio National Fund, Inc. | ON Risk Managed Balanced Portfolio (Unaudited) |
The ON Risk Managed Balanced Portfolio seeks long-term capital growth, consistent with preservation of capital and balanced by current income. The Portfolio invests in a balanced portfolio of equity and fixed-income securities (the “Balanced Component”) and a risk management portfolio intended to enhance the risk adjusted return of the Portfolio (the “Risk Management Component”).
Performance as of June 30, 2022
| Average Annual returns | |
| One year | -14.06% |
| Five years | 8.68% |
| Since inception (5/1/14) | 7.56% |
Past performance does not guarantee future results. The performance data quoted represents past performance and current returns may be lower or higher. Total return figures include change in share price and reinvestment of dividends and capital gains. The investment return and principal value will fluctuate so that an investor’s shares, when redeemed, may be worth more or less than the original cost. To obtain performance information up to the most recent month end, call toll-free 1-877-781-6392.
The Portfolio is not open to direct retail investment. Beneficial interest in the Portfolio’s shares is obtained either through an allocation to the Portfolio as an investment vehicle within variable life insurance policies or annuity contracts, or as an underlying investment by the ON Model Portfolios. Actual performance results for variable annuity and variable universal life contracts will be lower due to contract charges. Consult your contract for applicable charges.
Total expense ratio is 0.96% per the Fund’s prospectus dated April 29, 2022. Additional information pertaining to the Portfolio’s expense ratio as of June 30, 2022 can be found in the Portfolio’s Financial Highlights.
Comments from Sub-Advisers
Q. How did the Portfolio perform in comparison to its benchmark during the reporting period?
A. For the six-month period ended June 30, 2022, the Portfolio returned -20.34% versus -19.96% for its benchmark, the S&P 500® Index. The Portfolio’s secondary benchmark, which is comprised of 55% S&P 500® Index/ 45% ICE BofA U.S. Broad Market Index, returned -15.62% for the period.
Q. Were there specific market conditions, investment strategies, or techniques that materially affected the Portfolio’s benchmark-relative performance during the reporting period?
A. The Portfolio's underperformance was limited, due mainly to the Portfolio’s allocation to bonds in a period when equities experienced significant underperformance. The Portfolio ended the period with roughly 40% allocated to fixed income and 60% to equities and cash. The asset allocation may vary based on market conditions, and positioning reflects the portfolio managers’ belief that equities offered greater risk-adjusted opportunities versus fixed income over the period.
The equity sleeve of the Balanced Component underperformed the primary benchmark for the six-month period. The underperformance was driven primarily by the U.S. Large Cap Growth sleeve that returned -28.41% versus -19.96% for the benchmark. The U.S. Systematic Value sleeve, which was incepted on May 23, 2022, also was a detractor, returning -5.70% relative to -2.77% for the primary benchmark for that time period. The Strategic Core Equity sleeve helped offset some of the underperformance from those sleeves, generating 6.85% of outperformance during the period
The fixed income sleeve of the Balanced Component underperformed the fixed income portion of the secondary benchmark, but outperformed the primary benchmark. Markets have been buoyed by volatility and a
risk-off tone thus far in 2022. As such, the sleeve’s overweight to spread sectors, including allocations to investment grade and high-yield corporates and securitized assets detracted. Overweight allocations to emerging markets sovereigns and corporates detracted, while security selection in emerging markets was positive.
Q. How did sector allocation and security selection each impact the Portfolio’s performance relative to its benchmark?
A. In the equity sleeves, security selection was the main driver to underperformance for the six-month period, specifically selection within Health Care and Materials were the largest laggards. Sector positioning also detracted from performance, led by an underweight to Energy and an overweight to Information Technology.
In the fixed income sleeve, an underweight to Treasuries, excluding derivatives, detracted. Off-benchmark exposure to collateralized loan obligations and credit risk transfers detracted, as risk assets underperformed. An underweight to agency mortgage backed-securities and the lack of exposure to developed market sovereign bonds were contributors. Security selection in investment grade corporates also detracted for the period. (1)
Q. How did the Risk Management Component impact the Portfolio’s performance during the period?
A. The Portfolio’s Risk Management Component is a sleeve of derivatives and cash equivalents that seeks to enhance the risk-adjusted return of the Portfolio. The Portfolio’s performance is enhanced on a risk-adjusted basis when the aggregate Portfolio achieves lower volatility with similar returns, or higher returns at similar volatility compared to a benchmark. For the period, the Portfolio’s return was 1.5% lower than the Balanced Component, while the Portfolio’s annualized volatility was lower than the Balanced Component by approximately 3%. The Risk Management Component did not enhance the risk-adjusted return after reflecting those offsetting impacts.
The Risk Management Component’s relative performance was attributable to losses in the Treasury futures position due to the significant rise in interest rates during the period and losses in options value associated with premium decay and lower implied volatilities. These losses were materially offset by the Portfolio having lower average equity exposure (when compared to the Balanced Component), as the equity markets declined significantly during the period. (1)
Q. Which securities contributed the most to, and detracted the most from, the Portfolio’s benchmark-relative performance?
A. Within the equity sleeves, an overweight to Health Care names Vertex Pharmaceuticals, Inc. and UnitedHealth Group, Inc. were the leading contributors to relative performance for the six-month period, while an underweight to Exxon Mobil Corp. and an overweight to Align Technology, Inc. were the largest detractors to performance for the period.
In the fixed income sleeve, selections in Carvana Co., Wells Fargo & Co. and The Boeing Co. were the main contributors to relative performance for period, while Charter Communications Operating LLC / LCharter Communications Operating Capital Corp., Echostar Dish Network and Comision Federal de Electricidad were the main detractors. (1)
Q. How did the Portfolio’s use of derivative instruments and initial public offerings (IPOs), if any, impact overall Portfolio performance?
A. The Risk Management Component detracted 1.5% to the absolute return of the aggregate Portfolio during the six-month period, primarily due to the use of derivative instruments. Long Treasury futures positions detracted from the aggregate Portfolio as interest rates rose significantly
| Ohio National Fund, Inc. | ON Risk Managed Balanced Portfolio (Unaudited) (Continued) |
during the period. Options positions also detracted due to premium decay and lower implied volatility rates. Those losses were materially offset by the Component’s short positions in equity index futures. (1)
| (1) | The Portfolio’s composition is subject to change. Holdings and weightings are as of June 30, 2022. |
Change in Value of $10,000 Investment
Hypothetical illustration based on past performance. Future performance will vary. The Portfolio’s returns reflect reinvested dividends. The Portfolio’s holdings may differ significantly from the securities in the index. The index is unmanaged and therefore does not reflect the cost of portfolio management and accounting.
The S&P 500® Index is a capitalization-weighted index designed to measure performance of the broad domestic economy through changes in the aggregate market value of 500 stocks representing all major industries. The index includes the effects of reinvested dividends.
The ICE BofA U.S. Broad Market Index measures the performance of U.S. dollar-denominated, investment grade debt securities, including U.S. Treasury notes and bonds, quasi-government securities, corporate securities, residential and commercial mortgage-backed securities and asset-backed securities. Securities are cap-weighted based on their amount outstanding times the market price plus accrued interest.
Past performance is no guarantee of future results. Redemption of fund shares could have tax implications unique to each shareholder.
| Portfolio Composition as of June 30, 2022 (1) |
| | % of Net Assets |
| Common Stocks (4) | 43.7 |
| U.S. Treasury Obligations | 17.0 |
| Corporate Bonds (4) | 14.5 |
| Purchased Options | 6.4 |
| Exchange Traded Funds | 5.0 |
| Asset-Backed / Mortgage-Backed Securities (4) | 4.8 |
| U.S. Government Agency Mortgage-Backed Securities | 4.4 |
| Preferred Securities (4) | 0.2 |
| Sovereign Debt Issues | 0.1 |
| Taxable Municipal Bonds | 0.0 |
Money Market Funds
Less Net Liabilities | 3.9 |
| | 100.0 |
| Top 10 Portfolio Holdings as of June 30, 2022 (1) (2) (3) |
| | | % of Net Assets |
| 1. | U.S. Treasury Note 1.875%, 02/15/2032 | 4.1 |
| 2. | U.S. Treasury Note 2.500%, 04/30/2024 | 4.1 |
| 3. | Microsoft Corp. | 3.1 |
| 4. | Vanguard S&P 500 ETF | 2.5 |
| 5. | SPDR S&P 500 ETF Trust | 2.5 |
| 6. | Alphabet, Inc. Class C | 2.3 |
| 7. | U.S. Treasury Note 2.750%, 04/30/2027 | 2.2 |
| 8. | U.S. Treasury Note 3.250%, 05/15/2042 | 1.8 |
| 9. | U.S. Treasury Inflation Indexed Bond 0.375%, 07/15/2027 | 1.8 |
| 10. | UnitedHealth Group, Inc. | 1.4 |
| | |
| (1) | Composition of Portfolio subject to change. |
| (2) | Short-term investments have been excluded from the list of Top 10 Portfolio Holdings. |
| (3) | Top 10 Portfolio Holdings is presented at an individual security level. Total investment exposure by issuer may be higher. |
| (4) | Sectors (Common Stocks, Corporate Bonds, Preferred Securities, Asset-Backed / Mortgage Backed Securities): |
| | % of Net Assets |
| Information Technology | 16.5 |
| Financials | 12.6 |
| Health Care | 9.1 |
| Consumer Discretionary | 5.4 |
| Consumer Staples | 4.9 |
| Communication Services | 4.9 |
| Industrials | 3.4 |
| Energy | 2.9 |
| Utilities | 1.9 |
| Real Estate | 0.9 |
| Materials | 0.7 |
| | 63.2 |
| Ohio National Fund, Inc. | ON Risk Managed Balanced Portfolio |
| Schedule of Investments | June 30, 2022 (Unaudited) |
| Common Stocks–43.7% | Shares | Value |
Communication Services–3.9%
| | | |
Alphabet, Inc. Class A (Interactive Media & Svs.)
| (a) | 191 | $ 416,239 |
Alphabet, Inc. Class C (Interactive Media & Svs.)
| (a) | 13,036 | 28,515,598 |
AT&T, Inc. (Diversified Telecom. Svs.)
| | 82,950 | 1,738,632 |
Comcast Corp. Class A (Media)
| | 59,423 | 2,331,758 |
Electronic Arts, Inc. (Entertainment)
| | 26,034 | 3,167,036 |
Lumen Technologies, Inc. (Diversified Telecom. Svs.)
| | 95,044 | 1,036,930 |
Meta Platforms, Inc. Class A (Interactive Media & Svs.)
| (a) | 29,274 | 4,720,432 |
Netflix, Inc. (Entertainment)
| (a) | 5,472 | 956,889 |
Paramount Global Class B (Media)
| | 33,961 | 838,157 |
Pinterest, Inc. Class A (Interactive Media & Svs.)
| (a) | 45,092 | 818,871 |
Verizon Communications, Inc. (Diversified Telecom. Svs.)
| | 47,932 | 2,432,549 |
Warner Bros Discovery, Inc. (Entertainment)
| (a) | 60,711 | 814,742 |
| | | | 47,787,833 |
Consumer Discretionary–3.9%
| | | |
Advance Auto Parts, Inc. (Specialty Retail)
| | 2,135 | 369,547 |
Amazon.com, Inc. (Internet & Direct Marketing Retail)
| (a) | 102,592 | 10,896,296 |
Aptiv PLC (Auto Components)
| (a) | 4,594 | 409,188 |
AutoZone, Inc. (Specialty Retail)
| (a) | 2,539 | 5,456,616 |
Best Buy Co., Inc. (Specialty Retail)
| | 5,059 | 329,796 |
Booking Holdings, Inc. (Internet & Direct Marketing Retail)
| (a) | 488 | 853,507 |
BorgWarner, Inc. (Auto Components)
| | 11,095 | 370,240 |
Burlington Stores, Inc. (Specialty Retail)
| (a) | 3,266 | 444,927 |
Chipotle Mexican Grill, Inc. (Hotels, Restaurants & Leisure)
| (a) | 1,715 | 2,241,951 |
D.R. Horton, Inc. (Household Durables)
| | 6,439 | 426,197 |
Darden Restaurants, Inc. (Hotels, Restaurants & Leisure)
| | 3,116 | 352,482 |
Domino's Pizza, Inc. (Hotels, Restaurants & Leisure)
| | 1,179 | 459,468 |
Etsy, Inc. (Internet & Direct Marketing Retail)
| (a) | 25,809 | 1,889,477 |
Home Depot, Inc. / The (Specialty Retail)
| | 30,973 | 8,494,965 |
Lennar Corp. Class A (Household Durables)
| | 6,035 | 425,890 |
LKQ Corp. (Distributors)
| | 8,694 | 426,788 |
NIKE, Inc. Class B (Textiles, Apparel & Luxury Goods)
| | 68,194 | 6,969,427 |
O'Reilly Automotive, Inc. (Specialty Retail)
| (a) | 5,539 | 3,499,319 |
PulteGroup, Inc. (Household Durables)
| | 9,730 | 385,600 |
Service Corp. International (Diversified Consumer Svs.)
| | 16,948 | 1,171,446 |
Tapestry, Inc. (Textiles, Apparel & Luxury Goods)
| | 12,309 | 375,671 |
Target Corp. (Multiline Retail)
| | 3,244 | 458,150 |
Whirlpool Corp. (Household Durables)
| | 2,294 | 355,272 |
Yum China Holdings, Inc. (Hotels, Restaurants & Leisure)
| | 10,729 | 520,356 |
| | | | 47,582,576 |
Consumer Staples–3.6%
| | | |
Altria Group, Inc. (Tobacco)
| | 50,694 | 2,117,488 |
Coca-Cola Co. / The (Beverages)
| | 69,635 | 4,380,738 |
Conagra Brands, Inc. (Food Products)
| | 30,019 | 1,027,851 |
Costco Wholesale Corp. (Food & Staples Retailing)
| | 19,878 | 9,527,128 |
General Mills, Inc. (Food Products)
| | 18,884 | 1,424,798 |
Keurig Dr Pepper, Inc. (Beverages)
| | 68,522 | 2,424,994 |
Koninklijke Ahold Delhaize N.V. – ADR (Food & Staples Retailing)
| | 81,210 | �� 2,122,829 |
Kroger Co. / The (Food & Staples Retailing)
| | 21,521 | 1,018,589 |
Molson Coors Beverage Co. Class B (Beverages)
| | 18,763 | 1,022,771 |
Monster Beverage Corp. (Beverages)
| (a) | 77,813 | 7,213,265 |
Philip Morris International, Inc. (Tobacco)
| | 29,844 | 2,946,797 |
Procter & Gamble Co. / The (Household Products)
| | 26,685 | 3,837,036 |
Tyson Foods, Inc. Class A (Food Products)
| | 11,800 | 1,015,508 |
U.S. Foods Holding Corp. (Food & Staples Retailing)
| (a) | 26,827 | 823,052 |
Walgreens Boots Alliance, Inc. (Food & Staples Retailing)
| | 26,350 | 998,665 |
Walmart, Inc. (Food & Staples Retailing)
| | 22,392 | 2,722,419 |
| | | | 44,623,928 |
Energy–1.1%
| | | |
APA Corp. (Oil, Gas & Consumable Fuels)
| | 22,683 | 791,637 |
Baker Hughes Co. (Energy Equip. & Svs.)
| | 31,193 | 900,542 |
Diamondback Energy, Inc. (Oil, Gas & Consumable Fuels)
| | 7,566 | 916,621 |
EOG Resources, Inc. (Oil, Gas & Consumable Fuels)
| | 9,956 | 1,099,541 |
Exxon Mobil Corp. (Oil, Gas & Consumable Fuels)
| | 30,737 | 2,632,317 |
Kinder Morgan, Inc. (Oil, Gas & Consumable Fuels)
| | 56,667 | 949,739 |
Marathon Petroleum Corp. (Oil, Gas & Consumable Fuels)
| | 12,812 | 1,053,274 |
Phillips 66 (Oil, Gas & Consumable Fuels)
| | 12,148 | 996,014 |
| Ohio National Fund, Inc. | ON Risk Managed Balanced Portfolio (Continued) |
| Schedule of Investments | June 30, 2022 (Unaudited) |
| Common Stocks (Continued) | Shares | Value |
| Energy (continued) | | | |
Pioneer Natural Resources Co. (Oil, Gas & Consumable Fuels)
| | 4,425 | $ 987,129 |
Schlumberger N.V. (Energy Equip. & Svs.)
| | 28,777 | 1,029,065 |
Shell PLC – ADR (Oil, Gas & Consumable Fuels)
| | 50,028 | 2,615,964 |
| | | | 13,971,843 |
Financials–3.8%
| | | |
Ally Financial, Inc. (Consumer Finance)
| | 21,821 | 731,222 |
American International Group, Inc. (Insurance)
| | 17,835 | 911,904 |
Annaly Capital Management, Inc. (Mortgage REIT)
| | 132,454 | 782,803 |
Aon PLC Class A (Insurance)
| | 3,450 | 930,396 |
Arthur J. Gallagher & Co. (Insurance)
| | 5,784 | 943,023 |
Bank of New York Mellon Corp. / The (Capital Markets)
| | 22,763 | 949,445 |
Berkshire Hathaway, Inc. Class B (Diversified Financial Svs.)
| (a) | 3,069 | 837,898 |
Brown & Brown, Inc. (Insurance)
| | 14,131 | 824,403 |
Capital One Financial Corp. (Consumer Finance)
| | 8,476 | 883,114 |
Chubb Ltd. (Insurance)
| | 6,000 | 1,179,480 |
Cincinnati Financial Corp. (Insurance)
| | 7,303 | 868,911 |
Citigroup, Inc. (Banks)
| | 26,416 | 1,214,872 |
Citizens Financial Group, Inc. (Banks)
| | 22,764 | 812,447 |
CME Group, Inc. (Capital Markets)
| | 7,574 | 1,550,398 |
Everest Re Group Ltd. (Insurance)
| | 6,464 | 1,811,730 |
Fidelity National Financial, Inc. (Insurance)
| | 21,575 | 797,412 |
Globe Life, Inc. (Insurance)
| | 8,707 | 848,671 |
Goldman Sachs Group, Inc. / The (Capital Markets)
| | 4,175 | 1,240,059 |
Houlihan Lokey, Inc. (Capital Markets)
| | 22,711 | 1,792,579 |
Intercontinental Exchange, Inc. (Capital Markets)
| | 20,574 | 1,934,779 |
JPMorgan Chase & Co. (Banks)
| | 46,627 | 5,250,667 |
KeyCorp (Banks)
| | 46,275 | 797,318 |
Markel Corp. (Insurance)
| (a) | 654 | 845,786 |
Marsh & McLennan Cos., Inc. (Insurance)
| | 20,557 | 3,191,474 |
Morgan Stanley (Capital Markets)
| | 16,464 | 1,252,252 |
Progressive Corp. / The (Insurance)
| | 32,457 | 3,773,775 |
S&P Global, Inc. (Capital Markets)
| | 2,848 | 959,947 |
Selective Insurance Group, Inc. (Insurance)
| | 12,714 | 1,105,355 |
Synchrony Financial (Consumer Finance)
| | 24,123 | 666,277 |
T. Rowe Price Group, Inc. (Capital Markets)
| | 7,419 | 842,873 |
Truist Financial Corp. (Banks)
| | 23,152 | 1,098,099 |
U.S. Bancorp (Banks)
| | 28,259 | 1,300,479 |
Willis Towers Watson PLC (Insurance)
| | 16,293 | 3,216,075 |
| | | | 46,145,923 |
Health Care–8.5%
| | | |
AbbVie, Inc. (Biotechnology)
| | 28,469 | 4,360,312 |
ABIOMED, Inc. (Health Care Equip. & Supplies)
| (a) | 4,767 | 1,179,880 |
Align Technology, Inc. (Health Care Equip. & Supplies)
| (a) | 7,025 | 1,662,607 |
AmerisourceBergen Corp. (Health Care Providers & Svs.)
| | 6,746 | 954,424 |
Avantor, Inc. (Life Sciences Tools & Svs.)
| (a) | 29,567 | 919,534 |
Biogen, Inc. (Biotechnology)
| (a) | 5,106 | 1,041,318 |
Centene Corp. (Health Care Providers & Svs.)
| (a) | 28,228 | 2,388,371 |
Cigna Corp. (Health Care Providers & Svs.)
| | 5,282 | 1,391,913 |
CVS Health Corp. (Health Care Providers & Svs.)
| | 39,955 | 3,702,230 |
Edwards Lifesciences Corp. (Health Care Equip. & Supplies)
| (a) | 61,645 | 5,861,823 |
Eli Lilly & Co. (Pharmaceuticals)
| | 7,950 | 2,577,628 |
Gilead Sciences, Inc. (Biotechnology)
| | 21,487 | 1,328,111 |
Hologic, Inc. (Health Care Equip. & Supplies)
| (a) | 13,862 | 960,637 |
IDEXX Laboratories, Inc. (Health Care Equip. & Supplies)
| (a) | 11,440 | 4,012,351 |
Illumina, Inc. (Life Sciences Tools & Svs.)
| (a) | 3,480 | 641,573 |
Incyte Corp. (Biotechnology)
| (a) | 12,543 | 952,892 |
Intuitive Surgical, Inc. (Health Care Equip. & Supplies)
| (a) | 29,316 | 5,884,014 |
Johnson & Johnson (Pharmaceuticals)
| | 17,967 | 3,189,322 |
Laboratory Corp. of America Holdings (Health Care Providers & Svs.)
| | 4,246 | 995,093 |
McKesson Corp. (Health Care Providers & Svs.)
| | 10,121 | 3,301,571 |
Merck & Co., Inc. (Pharmaceuticals)
| | 51,969 | 4,738,014 |
Mettler-Toledo International, Inc. (Life Sciences Tools & Svs.)
| (a) | 1,284 | 1,475,021 |
Moderna, Inc. (Biotechnology)
| (a) | 7,335 | 1,047,805 |
Molina Healthcare, Inc. (Health Care Providers & Svs.)
| (a) | 3,159 | 883,288 |
Organon & Co. (Pharmaceuticals)
| | 29,416 | 992,790 |
Quest Diagnostics, Inc. (Health Care Providers & Svs.)
| | 7,402 | 984,318 |
Roche Holding AG – ADR (Pharmaceuticals)
| | 63,927 | 2,666,395 |
Royalty Pharma PLC Class A (Pharmaceuticals)
| | 22,359 | 939,972 |
| Ohio National Fund, Inc. | ON Risk Managed Balanced Portfolio (Continued) |
| Schedule of Investments | June 30, 2022 (Unaudited) |
| Common Stocks (Continued) | Shares | Value |
Health Care (continued)
| | | |
Thermo Fisher Scientific, Inc. (Life Sciences Tools & Svs.)
| | 2,674 | $ 1,452,731 |
UnitedHealth Group, Inc. (Health Care Providers & Svs.)
| | 32,678 | 16,784,401 |
Universal Health Services, Inc. Class B (Health Care Providers & Svs.)
| | 7,782 | 783,725 |
Veeva Systems, Inc. Class A (Health Care Technology)
| (a) | 19,668 | 3,895,051 |
Vertex Pharmaceuticals, Inc. (Biotechnology)
| (a) | 33,786 | 9,520,557 |
Viatris, Inc. (Pharmaceuticals)
| | 94,089 | 985,112 |
Zoetis, Inc. (Pharmaceuticals)
| | 57,852 | 9,944,180 |
| | | | 104,398,964 |
Industrials–2.3%
| | | |
3M Co. (Industrial Conglomerates)
| | 5,368 | 694,673 |
AECOM (Construction & Engineering)
| | 18,383 | 1,198,939 |
Allegion PLC (Building Products)
| | 7,473 | 731,607 |
AMETEK, Inc. (Electrical Equip.)
| | 18,630 | 2,047,251 |
Builders FirstSource, Inc. (Building Products)
| (a) | 7,606 | 408,442 |
Carrier Global Corp. (Building Products)
| | 13,633 | 486,153 |
Copart, Inc. (Commercial Svs. & Supplies)
| (a) | 43,131 | 4,686,615 |
Cummins, Inc. (Machinery)
| | 2,875 | 556,399 |
Expeditors International of Washington, Inc. (Air Freight & Logistics)
| | 4,577 | 446,074 |
FedEx Corp. (Air Freight & Logistics)
| | 2,923 | 662,673 |
Fortune Brands Home & Security, Inc. (Building Products)
| | 6,323 | 378,621 |
General Dynamics Corp. (Aerospace & Defense)
| | 2,955 | 653,794 |
Huntington Ingalls Industries, Inc. (Aerospace & Defense)
| | 2,126 | 463,085 |
IDEX Corp. (Machinery)
| | 11,100 | 2,016,093 |
J.B. Hunt Transport Services, Inc. (Road & Rail)
| | 2,577 | 405,800 |
L3Harris Technologies, Inc. (Aerospace & Defense)
| | 2,727 | 659,116 |
Leidos Holdings, Inc. (Professional Svs.)
| | 4,664 | 469,712 |
Lockheed Martin Corp. (Aerospace & Defense)
| | 5,900 | 2,536,764 |
Masco Corp. (Building Products)
| | 8,975 | 454,135 |
Northrop Grumman Corp. (Aerospace & Defense)
| | 5,620 | 2,689,563 |
Oshkosh Corp. (Machinery)
| | 9,373 | 769,898 |
Otis Worldwide Corp. (Machinery)
| | 7,725 | 545,926 |
Owens Corning (Building Products)
| | 5,014 | 372,590 |
Pentair PLC (Machinery)
| | 8,913 | 407,948 |
RELX PLC – ADR (Professional Svs.)
| | 36,505 | 983,445 |
Robert Half International, Inc. (Professional Svs.)
| | 4,406 | 329,965 |
Stanley Black & Decker, Inc. (Machinery)
| | 4,212 | 441,670 |
Textron, Inc. (Aerospace & Defense)
| | 7,016 | 428,467 |
Trex Co., Inc. (Building Products)
| (a) | 20,843 | 1,134,276 |
Watsco, Inc. (Trading Companies & Distributors)
| | 1,701 | 406,233 |
| | | | 28,465,927 |
Information Technology–14.8%
| | | |
Adobe, Inc. (Software)
| (a) | 22,671 | 8,298,946 |
Advanced Micro Devices, Inc. (Semiconductors & Equip.)
| (a) | 47,132 | 3,604,184 |
Amdocs Ltd. (IT Svs.)
| | 24,485 | 2,039,845 |
Amphenol Corp. Class A (Electronic Equip., Instr. & Comp.)
| | 44,308 | 2,852,549 |
Analog Devices, Inc. (Semiconductors & Equip.)
| | 7,795 | 1,138,772 |
Apple, Inc. (Tech. Hardware, Storage & Periph.)
| | 60,001 | 8,203,337 |
Arista Networks, Inc. (Communications Equip.)
| (a) | 47,541 | 4,456,493 |
ASML Holding N.V. (Semiconductors & Equip.)
| | 3,610 | 1,717,927 |
Atlassian Corp. PLC Class A (Software)
| (a) | 5,433 | 1,018,144 |
Autodesk, Inc. (Software)
| (a) | 16,038 | 2,757,895 |
Automatic Data Processing, Inc. (IT Svs.)
| | 11,708 | 2,459,148 |
Booz Allen Hamilton Holding Corp. (IT Svs.)
| | 26,783 | 2,420,112 |
Broadcom, Inc. (Semiconductors & Equip.)
| | 7,968 | 3,870,934 |
CDW Corp. (Electronic Equip., Instr. & Comp.)
| | 9,066 | 1,428,439 |
Citrix Systems, Inc. (Software)
| | 4,721 | 458,740 |
Cognex Corp. (Electronic Equip., Instr. & Comp.)
| | 19,530 | 830,416 |
Corning, Inc. (Electronic Equip., Instr. & Comp.)
| | 14,998 | 472,587 |
Dell Technologies, Inc. Class C (Tech. Hardware, Storage & Periph.)
| | 9,965 | 460,483 |
DocuSign, Inc. (Software)
| (a) | 5,581 | 320,238 |
Entegris, Inc. (Semiconductors & Equip.)
| | 29,424 | 2,710,833 |
EPAM Systems, Inc. (IT Svs.)
| (a) | 11,953 | 3,523,505 |
Fair Isaac Corp. (Software)
| (a) | 1,183 | 474,265 |
Fidelity National Information Services, Inc. (IT Svs.)
| | 36,037 | 3,303,512 |
Fortinet, Inc. (Software)
| (a) | 84,300 | 4,769,694 |
Genpact Ltd. (IT Svs.)
| | 79,533 | 3,369,018 |
Global Payments, Inc. (IT Svs.)
| | 4,494 | 497,216 |
Hewlett Packard Enterprise Co. (Tech. Hardware, Storage & Periph.)
| | 34,012 | 450,999 |
| Ohio National Fund, Inc. | ON Risk Managed Balanced Portfolio (Continued) |
| Schedule of Investments | June 30, 2022 (Unaudited) |
| Common Stocks (Continued) | Shares | Value |
Information Technology (continued)
| | | |
HP, Inc. (Tech. Hardware, Storage & Periph.)
| | 15,712 | $ 515,039 |
Intel Corp. (Semiconductors & Equip.)
| | 29,776 | 1,113,920 |
KLA Corp. (Semiconductors & Equip.)
| | 5,984 | 1,909,375 |
Manhattan Associates, Inc. (Software)
| (a) | 8,773 | 1,005,386 |
Mastercard, Inc. Class A (IT Svs.)
| | 5,369 | 1,693,812 |
Micron Technology, Inc. (Semiconductors & Equip.)
| | 11,226 | 620,573 |
Microsoft Corp. (Software)
| | 150,047 | 38,536,571 |
Motorola Solutions, Inc. (Communications Equip.)
| | 14,137 | 2,963,115 |
NortonLifeLock, Inc. (Software)
| | 145,788 | 3,201,505 |
NVIDIA Corp. (Semiconductors & Equip.)
| | 36,034 | 5,462,394 |
Oracle Corp. (Software)
| | 61,251 | 4,279,607 |
Paychex, Inc. (IT Svs.)
| | 27,324 | 3,111,384 |
PayPal Holdings, Inc. (IT Svs.)
| (a) | 10,130 | 707,479 |
PTC, Inc. (Software)
| (a) | 26,145 | 2,780,259 |
Qorvo, Inc. (Semiconductors & Equip.)
| (a) | 4,275 | 403,218 |
QUALCOMM, Inc. (Semiconductors & Equip.)
| | 85,705 | 10,947,957 |
Roper Technologies, Inc. (Software)
| | 11,765 | 4,643,057 |
Salesforce, Inc. (Software)
| (a) | 6,412 | 1,058,237 |
ServiceNow, Inc. (Software)
| (a) | 6,585 | 3,131,299 |
Skyworks Solutions, Inc. (Semiconductors & Equip.)
| | 4,316 | 399,834 |
Texas Instruments, Inc. (Semiconductors & Equip.)
| | 4,673 | 718,006 |
Tyler Technologies, Inc. (Software)
| (a) | 6,548 | 2,177,079 |
VeriSign, Inc. (IT Svs.)
| (a) | 13,230 | 2,213,776 |
Visa, Inc. (IT Svs.)
| | 82,036 | 16,152,068 |
VMware, Inc. Class A (Software)
| | 10,966 | 1,249,905 |
Workday, Inc. Class A (Software)
| (a) | 2,378 | 331,921 |
Zebra Technologies Corp. Class A (Electronic Equip., Instr. & Comp.)
| (a) | 10,043 | 2,952,140 |
Zoom Video Communications, Inc. Class A (Software)
| (a) | 4,640 | 500,981 |
| | | | 182,688,128 |
Materials–0.4%
| | | |
Amcor PLC (Containers & Packaging)
| | 39,881 | 495,721 |
Celanese Corp. (Chemicals)
| | 3,026 | 355,888 |
Corteva, Inc. (Chemicals)
| | 10,244 | 554,610 |
Dow, Inc. (Chemicals)
| | 9,221 | 475,896 |
DuPont de Nemours, Inc. (Chemicals)
| | 8,354 | 464,315 |
International Paper Co. (Containers & Packaging)
| | 10,216 | 427,335 |
LyondellBasell Industries N.V. Class A (Chemicals)
| | 4,800 | 419,808 |
Sherwin-Williams Co. / The (Chemicals)
| | 8,160 | 1,827,106 |
Westrock Co. (Containers & Packaging)
| | 9,095 | 362,345 |
| | | | 5,383,024 |
Real Estate–0.4%
| | | |
American Tower Corp. (Equity REIT)
| | 2,498 | 638,464 |
Boston Properties, Inc. (Equity REIT)
| | 4,357 | 387,686 |
Digital Realty Trust, Inc. (Equity REIT)
| | 4,263 | 553,465 |
Gaming and Leisure Properties, Inc. (Equity REIT)
| | 10,662 | 488,959 |
Kilroy Realty Corp. (Equity REIT)
| | 6,605 | 345,640 |
Medical Properties Trust, Inc. (Equity REIT)
| | 25,871 | 395,050 |
Regency Centers Corp. (Equity REIT)
| | 6,966 | 413,153 |
Simon Property Group, Inc. (Equity REIT)
| | 4,258 | 404,169 |
Sun Communities, Inc. (Equity REIT)
| | 2,947 | 469,634 |
VICI Properties, Inc. (Equity REIT)
| | 18,292 | 544,919 |
Weyerhaeuser Co. (Equity REIT)
| | 13,913 | 460,799 |
| | | | 5,101,938 |
Utilities–1.0%
| | | |
Alliant Energy Corp. (Electric Utilities)
| | 13,598 | 796,979 |
Ameren Corp. (Multi-Utilities)
| | 28,238 | 2,551,586 |
American Electric Power Co., Inc. (Electric Utilities)
| | 27,067 | 2,596,808 |
CenterPoint Energy, Inc. (Multi-Utilities)
| | 35,096 | 1,038,140 |
Consolidated Edison, Inc. (Multi-Utilities)
| | 9,964 | 947,576 |
Constellation Energy Corp. (Electric Utilities)
| | 14,489 | 829,640 |
Evergy, Inc. (Electric Utilities)
| | 12,373 | 807,338 |
NiSource, Inc. (Multi-Utilities)
| | 28,140 | 829,849 |
NRG Energy, Inc. (Ind. Power & Renewable Elec.)
| | 22,105 | 843,748 |
PPL Corp. (Electric Utilities)
| | 30,650 | 831,534 |
| | | | 12,073,198 |
Total Common Stocks (Cost $532,682,466)
| | | $ 538,223,282 |
| Ohio National Fund, Inc. | ON Risk Managed Balanced Portfolio (Continued) |
| Schedule of Investments | June 30, 2022 (Unaudited) |
| U.S. Treasury Obligations–17.0% | Rate | Maturity | Face Amount | Value |
U.S. Treasury Inflation Indexed Bond
| | 0.375% | 07/15/2027 | $21,791,228 | $ 21,712,065 |
U.S. Treasury Note
| | 2.500% | 04/30/2024 | 50,726,000 | 50,284,129 |
U.S. Treasury Note
| (b) | 2.250% | 11/15/2024 | 1,865,000 | 1,833,382 |
U.S. Treasury Note
| (b) | 0.500% | 03/31/2025 | 6,986,200 | 6,520,089 |
U.S. Treasury Note
| | 1.625% | 05/15/2026 | 1,662,900 | 1,575,923 |
U.S. Treasury Note
| | 1.875% | 02/28/2027 | 300,700 | 285,430 |
U.S. Treasury Note
| (b) | 2.750% | 04/30/2027 | 27,279,100 | 26,910,406 |
U.S. Treasury Note
| | 1.500% | 11/30/2028 | 1,149,800 | 1,044,072 |
U.S. Treasury Note
| | 1.875% | 02/15/2032 | 56,236,100 | 50,946,392 |
U.S. Treasury Note
| | 1.750% | 08/15/2041 | 6,115,200 | 4,651,613 |
U.S. Treasury Note
| | 2.000% | 11/15/2041 | 656,500 | 521,405 |
U.S. Treasury Note
| | 2.375% | 02/15/2042 | 268,200 | 227,425 |
U.S. Treasury Note
| | 3.250% | 05/15/2042 | 23,351,600 | 22,789,702 |
U.S. Treasury Note
| | 2.750% | 08/15/2042 | 2,036,600 | 1,827,292 |
U.S. Treasury Note
| | 2.250% | 08/15/2049 | 1,246,800 | 1,023,009 |
U.S. Treasury Note
| | 2.375% | 11/15/2049 | 338,600 | 285,985 |
U.S. Treasury Note
| | 1.875% | 02/15/2051 | 1,425,500 | 1,069,292 |
U.S. Treasury Note
| | 2.375% | 05/15/2051 | 338,200 | 285,502 |
U.S. Treasury Note
| | 2.000% | 08/15/2051 | 866,300 | 669,521 |
U.S. Treasury Note
| | 1.875% | 11/15/2051 | 345,500 | 259,233 |
U.S. Treasury Note
| | 2.250% | 02/15/2052 | 16,994,700 | 13,986,107 |
U.S. Treasury Note
| | 2.875% | 05/15/2052 | 242,100 | 228,671 |
Total U.S. Treasury Obligations (Cost $215,426,197)
| | | | | $ 208,936,645 |
| Corporate Bonds–14.5% | Rate | Maturity | Face Amount | Value |
Communication Services–1.0%
| | | | | |
AT&T, Inc. (Diversified Telecom. Svs.)
| | 3.800% | 12/01/2057 | $ 949,000 | $ 732,934 |
AT&T, Inc. (Diversified Telecom. Svs.)
| | 3.650% | 09/15/2059 | 33,000 | 24,715 |
CCO Holdings LLC / CCO Holdings Capital Corp. (Media)
| (c) | 4.500% | 08/15/2030 | 59,000 | 48,986 |
CCO Holdings LLC / CCO Holdings Capital Corp. (Media)
| (c) | 4.750% | 02/01/2032 | 102,000 | 83,518 |
CCO Holdings LLC / CCO Holdings Capital Corp. (Media)
| (c) | 4.500% | 06/01/2033 | 209,000 | 164,696 |
Charter Communications Operating LLC / Charter Communications Operating Capital Corp. (Media)
| | 5.050% | 03/30/2029 | 519,000 | 499,517 |
Charter Communications Operating LLC / Charter Communications Operating Capital Corp. (Media)
| | 6.484% | 10/23/2045 | 62,000 | 60,275 |
Charter Communications Operating LLC / Charter Communications Operating Capital Corp. (Media)
| | 5.375% | 05/01/2047 | 49,000 | 41,722 |
Charter Communications Operating LLC / Charter Communications Operating Capital Corp. (Media)
| | 4.800% | 03/01/2050 | 762,000 | 603,778 |
Discovery Communications LLC (Media)
| | 5.200% | 09/20/2047 | 75,000 | 64,334 |
Discovery Communications LLC (Media)
| | 5.300% | 05/15/2049 | 35,000 | 29,967 |
Discovery Communications LLC (Media)
| | 4.650% | 05/15/2050 | 27,000 | 21,232 |
DISH DBS Corp. (Media)
| (c) | 5.250% | 12/01/2026 | 1,021,000 | 800,301 |
DISH DBS Corp. (Media)
| (c) | 5.750% | 12/01/2028 | 158,000 | 116,985 |
Entegris Escrow Corp. (Media)
| (c) | 4.750% | 04/15/2029 | 209,000 | 194,627 |
Fox Corp. (Media)
| | 5.576% | 01/25/2049 | 1,068,000 | 1,041,793 |
Globo Comunicacao e Participacoes SA (Media)
| | 4.875% | 01/22/2030 | 794,000 | 620,813 |
Level 3 Financing, Inc. (Diversified Telecom. Svs.)
| (c) | 3.875% | 11/15/2029 | 309,000 | 255,202 |
Magallanes, Inc. (Media)
| (c) | 4.279% | 03/15/2032 | 1,122,000 | 1,002,779 |
Netflix, Inc. (Entertainment)
| | 5.875% | 11/15/2028 | 310,000 | 303,090 |
Tencent Holdings Ltd. (Interactive Media & Svs.)
| (c) | 1.810% | 01/26/2026 | 201,000 | 185,800 |
Tencent Holdings Ltd. (Interactive Media & Svs.)
| | 2.390% | 06/03/2030 | 674,000 | 564,159 |
Tencent Holdings Ltd. (Interactive Media & Svs.)
| (c) | 3.240% | 06/03/2050 | 201,000 | 138,619 |
Time Warner Cable LLC (Media)
| | 7.300% | 07/01/2038 | 811,000 | 846,813 |
T-Mobile U.S.A., Inc. (Wireless Telecom. Svs.)
| | 2.625% | 04/15/2026 | 70,000 | 63,525 |
T-Mobile U.S.A., Inc. (Wireless Telecom. Svs.)
| | 2.625% | 02/15/2029 | 46,000 | 38,722 |
T-Mobile U.S.A., Inc. (Wireless Telecom. Svs.)
| | 3.375% | 04/15/2029 | 28,000 | 24,500 |
T-Mobile U.S.A., Inc. (Wireless Telecom. Svs.)
| | 3.875% | 04/15/2030 | 1,293,000 | 1,206,700 |
T-Mobile U.S.A., Inc. (Wireless Telecom. Svs.)
| | 2.550% | 02/15/2031 | 94,000 | 79,096 |
T-Mobile U.S.A., Inc. (Wireless Telecom. Svs.)
| | 2.875% | 02/15/2031 | 143,000 | 118,723 |
Verizon Communications, Inc. (Diversified Telecom. Svs.)
| | 3.150% | 03/22/2030 | 1,458,000 | 1,325,607 |
Weibo Corp. (Interactive Media & Svs.)
| | 3.375% | 07/08/2030 | 742,000 | 602,748 |
| | | | | | 11,906,276 |
Consumer Discretionary–1.4%
| | | | | |
1011778 B.C. ULC / New Red Finance, Inc. (Hotels, Restaurants & Leisure)
| (c) | 3.500% | 02/15/2029 | 1,088,000 | 921,014 |
Advance Auto Parts, Inc. (Specialty Retail)
| | 3.900% | 04/15/2030 | 1,335,000 | 1,213,883 |
Advance Auto Parts, Inc. (Specialty Retail)
| | 3.500% | 03/15/2032 | 3,000 | 2,573 |
AutoZone, Inc. (Specialty Retail)
| | 3.750% | 04/18/2029 | 303,000 | 286,257 |
AutoZone, Inc. (Specialty Retail)
| | 1.650% | 01/15/2031 | 1,010,000 | 791,953 |
| Ohio National Fund, Inc. | ON Risk Managed Balanced Portfolio (Continued) |
| Schedule of Investments | June 30, 2022 (Unaudited) |
| Corporate Bonds (Continued) | Rate | Maturity | Face Amount | Value |
Consumer Discretionary (continued)
| | | | | |
Bath & Body Works, Inc. (Specialty Retail)
| (c) | 6.625% | 10/01/2030 | $ 995,000 | $ 859,421 |
Booking Holdings, Inc. (Hotels, Restaurants & Leisure)
| | 4.625% | 04/13/2030 | 1,302,000 | 1,294,556 |
Carnival Corp. (Hotels, Restaurants & Leisure)
| (c) | 4.000% | 08/01/2028 | 237,000 | 194,340 |
Cedar Fair LP / Canada's Wonderland Co. / Magnum Management Corp. / Millennium Op (Hotels, Restaurants & Leisure)
| | 5.375% | 04/15/2027 | 1,000,000 | 947,680 |
Expedia Group, Inc. (Hotels, Restaurants & Leisure)
| | 4.625% | 08/01/2027 | 1,257,000 | 1,207,667 |
General Motors Co. (Automobiles)
| | 6.125% | 10/01/2025 | 79,000 | 81,665 |
General Motors Co. (Automobiles)
| | 4.200% | 10/01/2027 | 94,000 | 89,185 |
General Motors Co. (Automobiles)
| | 6.800% | 10/01/2027 | 107,000 | 112,656 |
General Motors Co. (Automobiles)
| | 5.000% | 10/01/2028 | 269,000 | 260,636 |
GLP Capital LP / GLP Financing II, Inc. (Hotels, Restaurants & Leisure)
| | 3.250% | 01/15/2032 | 2,123,000 | 1,701,521 |
Las Vegas Sands Corp. (Hotels, Restaurants & Leisure)
| | 3.900% | 08/08/2029 | 1,829,000 | 1,494,469 |
Marriott International, Inc. (Hotels, Restaurants & Leisure)
| | 5.750% | 05/01/2025 | 1,264,000 | 1,311,291 |
Mattel, Inc. (Leisure Products)
| (c) | 3.375% | 04/01/2026 | 128,000 | 117,430 |
McDonald's Corp. (Hotels, Restaurants & Leisure)
| | 3.500% | 07/01/2027 | 272,000 | 266,512 |
McDonald's Corp. (Hotels, Restaurants & Leisure)
| | 2.625% | 09/01/2029 | 1,700,000 | 1,523,356 |
McDonald's Corp. (Hotels, Restaurants & Leisure)
| | 3.625% | 09/01/2049 | 90,000 | 74,310 |
MDC Holdings, Inc. (Household Durables)
| | 6.000% | 01/15/2043 | 1,150,000 | 939,379 |
Nissan Motor Co. Ltd. (Automobiles)
| (c) | 4.345% | 09/17/2027 | 430,000 | 394,633 |
O'Reilly Automotive, Inc. (Specialty Retail)
| | 3.600% | 09/01/2027 | 6,000 | 5,794 |
O'Reilly Automotive, Inc. (Specialty Retail)
| | 4.350% | 06/01/2028 | 47,000 | 46,840 |
O'Reilly Automotive, Inc. (Specialty Retail)
| | 3.900% | 06/01/2029 | 232,000 | 219,690 |
Prosus N.V. (Internet & Direct Marketing Retail)
| (c) | 3.257% | 01/19/2027 | 629,000 | 546,651 |
Prosus N.V. (Internet & Direct Marketing Retail)
| (c) | 3.680% | 01/21/2030 | 216,000 | 172,084 |
Ross Stores, Inc. (Specialty Retail)
| | 4.700% | 04/15/2027 | 280,000 | 281,477 |
Royal Caribbean Cruises Ltd. (Hotels, Restaurants & Leisure)
| (c) | 10.875% | 06/01/2023 | 136,000 | 136,454 |
Royal Caribbean Cruises Ltd. (Hotels, Restaurants & Leisure)
| (c) | 11.500% | 06/01/2025 | 143,000 | 146,933 |
Wynn Macau Ltd. (Hotels, Restaurants & Leisure)
| (c) | 5.625% | 08/26/2028 | 292,000 | 179,872 |
| | | | | | 17,822,182 |
Consumer Staples–1.3%
| | | | | |
Albertsons Cos., Inc. / Safeway, Inc. / New Albertsons LP / Albertsons LLC (Food & Staples Retailing)
| (c) | 3.500% | 03/15/2029 | 156,000 | 126,253 |
Albertsons Cos., Inc. / Safeway, Inc. / New Albertsons LP / Albertsons LLC (Food & Staples Retailing)
| (c) | 4.875% | 02/15/2030 | 971,000 | 832,963 |
Alimentation Couche-Tard, Inc. (Food & Staples Retailing)
| (c) | 2.950% | 01/25/2030 | 77,000 | 66,337 |
Altria Group, Inc. (Tobacco)
| | 4.800% | 02/14/2029 | 106,000 | 100,718 |
Altria Group, Inc. (Tobacco)
| | 3.400% | 05/06/2030 | 1,934,000 | 1,640,541 |
B.A.T. Capital Corp. (Tobacco)
| | 4.700% | 04/02/2027 | 180,000 | 175,826 |
B.A.T. Capital Corp. (Tobacco)
| | 2.259% | 03/25/2028 | 1,460,000 | 1,223,095 |
Campbell Soup Co. (Food Products)
| | 3.950% | 03/15/2025 | 113,000 | 112,714 |
Cargill, Inc. (Food Products)
| (c) | 1.375% | 07/23/2023 | 77,000 | 75,477 |
Cargill, Inc. (Food Products)
| (c) | 2.125% | 04/23/2030 | 1,301,000 | 1,114,780 |
Coca-Cola Co. / The (Beverages)
| | 3.375% | 03/25/2027 | 1,376,000 | 1,364,290 |
Coca-Cola Co. / The (Beverages)
| | 3.450% | 03/25/2030 | 182,000 | 177,031 |
Estee Lauder Cos., Inc. / The (Personal Products)
| | 2.600% | 04/15/2030 | 412,000 | 369,860 |
Fomento Economico Mexicano S.A.B de C.V. (Beverages)
| | 3.500% | 01/16/2050 | 182,000 | 141,985 |
Indofood CBP Sukses Makmur Tbk PT (Food Products)
| | 3.398% | 06/09/2031 | 840,000 | 648,926 |
J.M. Smucker Co. / The (Food Products)
| | 2.375% | 03/15/2030 | 165,000 | 139,959 |
Lamb Weston Holdings, Inc. (Food Products)
| (c) | 4.875% | 05/15/2028 | 1,000,000 | 941,110 |
MARB BondCo PLC (Food Products)
| | 3.950% | 01/29/2031 | 1,483,000 | 1,138,603 |
Mars, Inc. (Food Products)
| (c) | 2.700% | 04/01/2025 | 113,000 | 110,383 |
Mars, Inc. (Food Products)
| (c) | 3.200% | 04/01/2030 | 28,000 | 26,001 |
Mondelez International Holdings Netherlands B.V. (Food Products)
| (c) | 2.250% | 09/19/2024 | 249,000 | 241,095 |
Mondelez International, Inc. (Food Products)
| | 2.750% | 04/13/2030 | 19,000 | 16,686 |
Natura Cosmeticos SA (Personal Products)
| | 4.125% | 05/03/2028 | 563,000 | 463,574 |
Natura Cosmeticos SA (Personal Products)
| (c) | 4.125% | 05/03/2028 | 230,000 | 189,382 |
PepsiCo, Inc. (Beverages)
| | 2.250% | 03/19/2025 | 1,412,000 | 1,375,168 |
PepsiCo, Inc. (Beverages)
| | 2.625% | 03/19/2027 | 58,000 | 55,654 |
Pilgrim's Pride Corp. (Food Products)
| (c) | 5.875% | 09/30/2027 | 347,000 | 332,253 |
Pilgrim's Pride Corp. (Food Products)
| (c) | 4.250% | 04/15/2031 | 1,000,000 | 834,480 |
Procter & Gamble Co. / The (Household Products)
| | 3.000% | 03/25/2030 | 68,000 | 64,157 |
Sysco Corp. (Food & Staples Retailing)
| | 2.400% | 02/15/2030 | 72,000 | 61,402 |
Sysco Corp. (Food & Staples Retailing)
| | 5.950% | 04/01/2030 | 1,279,000 | 1,363,619 |
| | | | | | 15,524,322 |
Energy–1.8%
| | | | | |
Apache Corp. (Oil, Gas & Consumable Fuels)
| | 4.250% | 01/15/2030 | 1,000,000 | 886,250 |
BP Capital Markets America, Inc. (Oil, Gas & Consumable Fuels)
| | 2.939% | 06/04/2051 | 2,874,000 | 2,054,909 |
Canadian Natural Resources Ltd. (Oil, Gas & Consumable Fuels)
| | 5.850% | 02/01/2035 | 860,000 | 872,417 |
| Ohio National Fund, Inc. | ON Risk Managed Balanced Portfolio (Continued) |
| Schedule of Investments | June 30, 2022 (Unaudited) |
| Corporate Bonds (Continued) | Rate | Maturity | Face Amount | Value |
| Energy (continued) | | | | | |
Cheniere Corpus Christi Holdings LLC (Oil, Gas & Consumable Fuels)
| | 3.700% | 11/15/2029 | $ 557,000 | $ 509,489 |
Continental Resources, Inc. (Oil, Gas & Consumable Fuels)
| (c) | 5.750% | 01/15/2031 | 1,582,000 | 1,529,699 |
Continental Resources, Inc. (Oil, Gas & Consumable Fuels)
| (c) | 2.875% | 04/01/2032 | 218,000 | 170,240 |
Devon Energy Corp. (Oil, Gas & Consumable Fuels)
| | 4.500% | 01/15/2030 | 1,733,000 | 1,636,993 |
Devon Energy Corp. (Oil, Gas & Consumable Fuels)
| | 5.600% | 07/15/2041 | 195,000 | 193,696 |
Enbridge Energy Partners LP (Oil, Gas & Consumable Fuels)
| | 7.375% | 10/15/2045 | 1,014,000 | 1,207,852 |
Energy Transfer LP (Oil, Gas & Consumable Fuels)
| | 6.250% | 04/15/2049 | 931,000 | 902,433 |
EQT Corp. (Oil, Gas & Consumable Fuels)
| | 7.500% | 02/01/2030 | 1,013,000 | 1,087,344 |
GNL Quintero SA (Oil, Gas & Consumable Fuels)
| | 4.634% | 07/31/2029 | 792,395 | 760,144 |
Hess Corp. (Oil, Gas & Consumable Fuels)
| | 4.300% | 04/01/2027 | 1,806,000 | 1,760,467 |
Kinder Morgan, Inc. (Oil, Gas & Consumable Fuels)
| | 4.300% | 03/01/2028 | 1,449,000 | 1,409,610 |
Marathon Oil Corp. (Oil, Gas & Consumable Fuels)
| | 6.800% | 03/15/2032 | 1,193,000 | 1,284,644 |
Marathon Petroleum Corp. (Oil, Gas & Consumable Fuels)
| | 6.500% | 03/01/2041 | 1,072,000 | 1,170,081 |
Oleoducto Central SA (Oil, Gas & Consumable Fuels)
| (c) | 4.000% | 07/14/2027 | 410,000 | 342,057 |
Oleoducto Central SA (Oil, Gas & Consumable Fuels)
| | 4.000% | 07/14/2027 | 356,000 | 297,006 |
ONEOK Partners LP (Oil, Gas & Consumable Fuels)
| | 6.125% | 02/01/2041 | 975,000 | 928,305 |
ONEOK, Inc. (Oil, Gas & Consumable Fuels)
| | 6.350% | 01/15/2031 | 127,000 | 132,664 |
Ovintiv, Inc. (Oil, Gas & Consumable Fuels)
| | 7.375% | 11/01/2031 | 985,000 | 1,082,841 |
Plains All American Pipeline LP / PAA Finance Corp. (Oil, Gas & Consumable Fuels)
| | 3.550% | 12/15/2029 | 136,000 | 119,824 |
Suncor Energy, Inc. (Oil, Gas & Consumable Fuels)
| | 6.800% | 05/15/2038 | 1,561,000 | 1,752,011 |
Tengizchevroil Finance Co. International Ltd. (Oil, Gas & Consumable Fuels)
| (c) | 3.250% | 08/15/2030 | 487,000 | 370,393 |
| | | | | | 22,461,369 |
Financials–4.0%
| | | | | |
AerCap Ireland Capital DAC / AerCap Global Aviation Trust (Diversified Financial Svs.)
| | 6.500% | 07/15/2025 | 271,000 | 277,281 |
Alleghany Corp. (Insurance)
| | 3.625% | 05/15/2030 | 291,000 | 272,278 |
Argentum Netherlands B.V. for Swiss Re Ltd. (Rate is fixed until 08/15/2025, at which point, the rate becomes QL + 359) (Insurance)
| (d) | 5.750% | 08/15/2050 | 1,500,000 | 1,449,945 |
Aviation Capital Group LLC (Diversified Financial Svs.)
| (c) | 4.375% | 01/30/2024 | 50,000 | 49,102 |
Aviation Capital Group LLC (Diversified Financial Svs.)
| (c) | 5.500% | 12/15/2024 | 148,000 | 146,699 |
Aviation Capital Group LLC (Diversified Financial Svs.)
| (c) | 4.125% | 08/01/2025 | 3,000 | 2,851 |
Aviation Capital Group LLC (Diversified Financial Svs.)
| (c) | 4.875% | 10/01/2025 | 57,000 | 55,247 |
Aviation Capital Group LLC (Diversified Financial Svs.)
| (c) | 1.950% | 01/30/2026 | 181,000 | 157,435 |
Aviation Capital Group LLC (Diversified Financial Svs.)
| (c) | 1.950% | 09/20/2026 | 2,008,000 | 1,706,185 |
Aviation Capital Group LLC (Diversified Financial Svs.)
| (c) | 3.500% | 11/01/2027 | 50,000 | 44,088 |
Banco de Credito del Peru SA (Rate is fixed until 07/01/2025, at which point, the rate becomes H15T5Y + 300) (Banks)
| (c)(d) | 3.125% | 07/01/2030 | 244,000 | 222,966 |
Banco Santander SA (Rate is fixed until 03/24/2027, at which point, the rate becomes H15T1Y + 200) (Banks)
| (d) | 4.175% | 03/24/2028 | 1,800,000 | 1,717,524 |
Bank of America Corp. (Rate is fixed until 04/24/2027, at which point, the rate becomes QL + 151) (Banks)
| (d) | 3.705% | 04/24/2028 | 501,000 | 477,579 |
Bank of America Corp. (Rate is fixed until 04/27/2027, at which point, the rate becomes SOFR + 158) (Banks)
| (d) | 4.376% | 04/27/2028 | 271,000 | 266,792 |
Bank of America Corp. (Rate is fixed until 03/05/2028, at which point, the rate becomes QL + 107) (Banks)
| (d) | 3.970% | 03/05/2029 | 177,000 | 168,777 |
Bank of America Corp. (Rate is fixed until 04/29/2030, at which point, the rate becomes SOFR + 215) (Banks)
| (d) | 2.592% | 04/29/2031 | 1,441,000 | 1,222,174 |
BNP Paribas SA (Rate is fixed until 11/19/2024, at which point, the rate becomes QL + 111) (Banks)
| (c)(d) | 2.819% | 11/19/2025 | 2,170,000 | 2,072,950 |
BNP Paribas SA (Rate is fixed until 01/13/2030, at which point, the rate becomes SOFR + 151) (Banks)
| (c)(d) | 3.052% | 01/13/2031 | 333,000 | 287,290 |
Capital One Financial Corp. (Rate is fixed until 05/10/2027, at which point, the rate becomes SOFR + 206) (Consumer Finance)
| (d) | 4.927% | 05/10/2028 | 197,000 | 195,105 |
Capital One Financial Corp. (Rate is fixed until 03/01/2029, at which point, the rate becomes SOFR + 179) (Consumer Finance)
| (d) | 3.273% | 03/01/2030 | 1,651,000 | 1,461,061 |
Citigroup, Inc. (Rate is fixed until 01/10/2027, at which point, the rate becomes QL + 156) (Banks)
| (d) | 3.887% | 01/10/2028 | 1,538,000 | 1,478,715 |
Citigroup, Inc. (Rate is fixed until 04/23/2028, at which point, the rate becomes QL + 119) (Banks)
| (d) | 4.075% | 04/23/2029 | 212,000 | 201,506 |
Citigroup, Inc. (Rate is fixed until 03/20/2029, at which point, the rate becomes QL + 134) (Banks)
| (d) | 3.980% | 03/20/2030 | 145,000 | 135,613 |
Citigroup, Inc. (Rate is fixed until 03/31/2030, at which point, the rate becomes SOFR + 391) (Banks)
| (d) | 4.412% | 03/31/2031 | 380,000 | 362,926 |
Cloverie PLC for Zurich Insurance Co. Ltd. (Rate is fixed until 06/24/2026, at which point, the rate becomes QL + 492) (Insurance)
| (d) | 5.625% | 06/24/2046 | 1,116,000 | 1,110,420 |
Cooperatieve Rabobank UA (Rate is fixed until 04/10/2024, at which point, the rate becomes USSW5 + 189) (Banks)
| (d) | 4.000% | 04/10/2029 | 1,000,000 | 978,652 |
Credit Suisse AG (Diversified Financial Svs.)
| (c) | 6.500% | 08/08/2023 | 346,000 | 346,000 |
Credit Suisse Group AG (Rate is fixed until 12/23/2027, at which point, the rate becomes H15T5Y + 638) (Capital Markets)
| (c)(d) | 9.750% | Perpetual | 641,000 | 654,621 |
Credit Suisse Group AG (Rate is fixed until 06/05/2025, at which point, the rate becomes SOFR + 204) (Capital Markets)
| (c)(d) | 2.193% | 06/05/2026 | 1,445,000 | 1,309,669 |
| Ohio National Fund, Inc. | ON Risk Managed Balanced Portfolio (Continued) |
| Schedule of Investments | June 30, 2022 (Unaudited) |
| Corporate Bonds (Continued) | Rate | Maturity | Face Amount | Value |
| Financials (continued) | | | | | |
Credit Suisse Group AG (Rate is fixed until 05/14/2031, at which point, the rate becomes SOFR + 173) (Capital Markets)
| (c)(d) | 3.091% | 05/14/2032 | $ 280,000 | $ 222,822 |
Danske Bank A/S (Rate is fixed until 04/01/2027, at which point, the rate becomes H15T1Y + 175) (Banks)
| (c)(d) | 4.298% | 04/01/2028 | 1,829,000 | 1,734,698 |
Deutsche Bank AG (Rate is fixed until 01/07/2027, at which point, the rate becomes SOFR + 132) (Banks)
| (d) | 2.552% | 01/07/2028 | 1,993,000 | 1,725,159 |
Ford Motor Credit Co. LLC (Consumer Finance)
| | 2.700% | 08/10/2026 | 862,000 | 734,553 |
Ford Motor Credit Co. LLC (Consumer Finance)
| | 4.950% | 05/28/2027 | 209,000 | 194,109 |
General Motors Financial Co., Inc. (Consumer Finance)
| | 4.350% | 01/17/2027 | 99,000 | 94,971 |
General Motors Financial Co., Inc. (Consumer Finance)
| | 2.400% | 10/15/2028 | 1,366,000 | 1,134,492 |
General Motors Financial Co., Inc. (Consumer Finance)
| | 4.300% | 04/06/2029 | 126,000 | 115,635 |
Goldman Sachs Group, Inc. / The (Rate is fixed until 04/22/2031, at which point, the rate becomes SOFR + 128) (Capital Markets)
| (d) | 2.615% | 04/22/2032 | 2,059,000 | 1,709,454 |
Goldman Sachs Group, Inc. / The (Rate is fixed until 07/21/2031, at which point, the rate becomes SOFR + 125) (Capital Markets)
| (d) | 2.383% | 07/21/2032 | 103,000 | 83,292 |
Harley-Davidson Financial Services, Inc. (Consumer Finance)
| (c) | 3.350% | 06/08/2025 | 187,000 | 179,674 |
Harley-Davidson Financial Services, Inc. (Consumer Finance)
| (c) | 3.050% | 02/14/2027 | 118,000 | 106,868 |
HSBC Holdings PLC (Rate is fixed until 03/30/2025, at which point, the rate becomes USISDA05 + 437) (Banks)
| (d) | 6.375% | Perpetual | 212,000 | 204,993 |
HSBC Holdings PLC (Rate is fixed until 03/10/2025, at which point, the rate becomes SOFR + 143) (Banks)
| (d) | 2.999% | 03/10/2026 | 289,000 | 275,082 |
HSBC Holdings PLC (Rate is fixed until 03/13/2027, at which point, the rate becomes QL + 155) (Banks)
| (d) | 4.041% | 03/13/2028 | 1,423,000 | 1,351,327 |
HSBC Holdings PLC (Rate is fixed until 03/29/2032, at which point, the rate becomes SOFR + 253) (Banks)
| (d) | 4.762% | 03/29/2033 | 280,000 | 258,263 |
ING Bank N.V. (Banks)
| (c) | 5.800% | 09/25/2023 | 1,306,000 | 1,327,919 |
ING Groep N.V. (Rate is fixed until 03/28/2027, at which point, the rate becomes SOFR + 183) (Banks)
| (d) | 4.017% | 03/28/2028 | 209,000 | 199,053 |
JPMorgan Chase & Co. (Rate is fixed until 12/05/2028, at which point, the rate becomes QL + 133) (Banks)
| (d) | 4.452% | 12/05/2029 | 1,465,000 | 1,426,773 |
JPMorgan Chase & Co. (Rate is fixed until 10/15/2029, at which point, the rate becomes SOFR + 151) (Banks)
| (d) | 2.739% | 10/15/2030 | 218,000 | 190,206 |
JPMorgan Chase & Co. (Rate is fixed until 03/24/2030, at which point, the rate becomes SOFR + 379) (Banks)
| (d) | 4.493% | 03/24/2031 | 171,000 | 167,001 |
JPMorgan Chase & Co. (Rate is fixed until 04/22/2031, at which point, the rate becomes SOFR + 125) (Banks)
| (d) | 2.580% | 04/22/2032 | 458,000 | 385,363 |
Mizuho Financial Group, Inc. (Rate is fixed until 09/13/2029, at which point, the rate becomes SOFR + 157) (Banks)
| (d) | 2.869% | 09/13/2030 | 1,261,000 | 1,095,115 |
Morgan Stanley (Rate is fixed until 04/20/2027, at which point, the rate becomes SOFR + 161) (Capital Markets)
| (d) | 4.210% | 04/20/2028 | 1,992,000 | 1,947,491 |
Nationwide Building Society (Thrifts & Mortgage Finance)
| (c) | 4.000% | 09/14/2026 | 1,299,000 | 1,251,100 |
Nationwide Building Society (Rate is fixed until 02/16/2027, at which point, the rate becomes SOFR + 129) (Thrifts & Mortgage Finance)
| (c)(d) | 2.972% | 02/16/2028 | 368,000 | 335,855 |
Nomura Holdings, Inc. (Capital Markets)
| | 2.999% | 01/22/2032 | 1,330,000 | 1,080,221 |
S&P Global, Inc. (Capital Markets)
| (c) | 4.750% | 08/01/2028 | 16,000 | 16,256 |
S&P Global, Inc. (Capital Markets)
| (c) | 4.250% | 05/01/2029 | 66,000 | 65,267 |
Santander Holdings U.S.A., Inc. (Rate is fixed until 01/06/2027, at which point, the rate becomes SOFR + 125) (Banks)
| (d) | 2.490% | 01/06/2028 | 1,365,000 | 1,204,736 |
Santander U.K. Group Holdings PLC (Rate is fixed until 01/11/2027, at which point, the rate becomes SOFR + 122) (Banks)
| (d) | 2.469% | 01/11/2028 | 1,374,000 | 1,214,040 |
Societe Generale SA (Rate is fixed until 12/14/2025, at which point, the rate becomes H15T1Y + 110) (Banks)
| (c)(d) | 1.488% | 12/14/2026 | 1,629,000 | 1,436,823 |
Societe Generale SA (Rate is fixed until 01/19/2027, at which point, the rate becomes H15T1Y + 130) (Banks)
| (c)(d) | 2.797% | 01/19/2028 | 380,000 | 339,328 |
Standard Chartered PLC (Rate is fixed until 03/30/2025, at which point, the rate becomes H15T1Y + 165) (Banks)
| (c)(d) | 3.971% | 03/30/2026 | 1,839,000 | 1,796,574 |
Swedbank AB (Rate is fixed until 09/17/2024, at which point, the rate becomes H15T5Y + 413) (Banks)
| (d) | 5.625% | Perpetual | 200,000 | 190,500 |
Swiss Re Finance Luxembourg SA (Rate is fixed until 04/02/2029, at which point, the rate becomes H15T5Y + 358) (Insurance)
| (d) | 5.000% | 04/02/2049 | 200,000 | 189,250 |
Synchrony Financial (Consumer Finance)
| | 4.875% | 06/13/2025 | 1,340,000 | 1,325,002 |
UBS Group AG (Rate is fixed until 05/12/2025, at which point, the rate becomes H15T1Y + 155) (Capital Markets)
| (c)(d) | 4.488% | 05/12/2026 | 267,000 | 265,980 |
UniCredit SpA (Rate is fixed until 06/03/2031, at which point, the rate becomes H15T1Y + 155) (Banks)
| (c)(d) | 3.127% | 06/03/2032 | 200,000 | 156,035 |
| Ohio National Fund, Inc. | ON Risk Managed Balanced Portfolio (Continued) |
| Schedule of Investments | June 30, 2022 (Unaudited) |
| Corporate Bonds (Continued) | Rate | Maturity | Face Amount | Value |
| Financials (continued) | | | | | |
Wells Fargo & Co. (Rate is fixed until 10/30/2029, at which point, the rate becomes SOFR + 143) (Banks)
| (d) | 2.879% | 10/30/2030 | $ 298,000 | $ 262,054 |
Wells Fargo & Co. (Rate is fixed until 04/04/2030, at which point, the rate becomes SOFR + 403) (Banks)
| (d) | 4.478% | 04/04/2031 | 2,033,000 | 1,988,176 |
| | | | | | 48,812,961 |
Health Care–0.6%
| | | | | |
AbbVie, Inc. (Biotechnology)
| | 3.250% | 10/01/2022 | 175,000 | 175,000 |
AbbVie, Inc. (Biotechnology)
| | 2.800% | 03/15/2023 | 14,000 | 13,959 |
AbbVie, Inc. (Biotechnology)
| | 2.600% | 11/21/2024 | 165,000 | 159,713 |
AbbVie, Inc. (Biotechnology)
| | 3.800% | 03/15/2025 | 1,235,000 | 1,225,114 |
Amgen, Inc. (Biotechnology)
| | 3.350% | 02/22/2032 | 159,000 | 145,551 |
Bayer U.S. Finance II LLC (Pharmaceuticals)
| (c) | 5.500% | 07/30/2035 | 879,000 | 875,437 |
Bristol-Myers Squibb Co. (Pharmaceuticals)
| | 3.400% | 07/26/2029 | 624,000 | 602,335 |
Centene Corp. (Health Care Providers & Svs.)
| | 4.625% | 12/15/2029 | 376,000 | 350,620 |
Centene Corp. (Health Care Providers & Svs.)
| | 3.375% | 02/15/2030 | 212,000 | 179,787 |
Cigna Corp. (Health Care Providers & Svs.)
| | 2.400% | 03/15/2030 | 1,334,000 | 1,148,766 |
Cigna Corp. (Health Care Providers & Svs.)
| | 3.200% | 03/15/2040 | 52,000 | 41,047 |
Cigna Corp. (Health Care Providers & Svs.)
| | 3.400% | 03/15/2050 | 78,000 | 59,534 |
CVS Health Corp. (Health Care Providers & Svs.)
| | 3.000% | 08/15/2026 | 33,000 | 31,561 |
CVS Health Corp. (Health Care Providers & Svs.)
| | 4.300% | 03/25/2028 | 682,000 | 674,784 |
CVS Health Corp. (Health Care Providers & Svs.)
| | 4.125% | 04/01/2040 | 141,000 | 123,072 |
DH Europe Finance II SARL (Health Care Equip. & Supplies)
| | 2.200% | 11/15/2024 | 129,000 | 123,745 |
DH Europe Finance II SARL (Health Care Equip. & Supplies)
| | 2.600% | 11/15/2029 | 71,000 | 63,665 |
Jaguar Land Rover Automotive PLC (Health Care Providers & Svs.)
| (c) | 5.500% | 07/15/2029 | 1,227,000 | 889,575 |
Medline Borrower LP (Health Care Equip. & Supplies)
| (c) | 3.875% | 04/01/2029 | 240,000 | 204,410 |
Pfizer, Inc. (Pharmaceuticals)
| | 2.625% | 04/01/2030 | 1,080,000 | 986,124 |
| | | | | | 8,073,799 |
Industrials–1.0%
| | | | | |
Air Lease Corp. (Trading Companies & Distributors)
| | 2.875% | 01/15/2026 | 28,000 | 25,701 |
Air Lease Corp. (Trading Companies & Distributors)
| | 3.625% | 04/01/2027 | 15,000 | 13,889 |
Air Lease Corp. (Trading Companies & Distributors)
| | 2.100% | 09/01/2028 | 107,000 | 85,778 |
Air Lease Corp. (Trading Companies & Distributors)
| | 4.625% | 10/01/2028 | 883,000 | 816,537 |
Aircastle Ltd. (Trading Companies & Distributors)
| | 4.125% | 05/01/2024 | 58,000 | 56,358 |
Aircastle Ltd. (Trading Companies & Distributors)
| (c) | 5.250% | 08/11/2025 | 1,269,000 | 1,225,208 |
Aircastle Ltd. (Trading Companies & Distributors)
| | 4.250% | 06/15/2026 | 21,000 | 19,428 |
Aircastle Ltd. (Trading Companies & Distributors)
| (c) | 2.850% | 01/26/2028 | 332,000 | 274,453 |
BAE Systems PLC (Aerospace & Defense)
| (c) | 3.400% | 04/15/2030 | 200,000 | 182,570 |
Carrier Global Corp. (Building Products)
| | 2.242% | 02/15/2025 | �� 21,000 | 19,955 |
Carrier Global Corp. (Building Products)
| | 2.493% | 02/15/2027 | 26,000 | 23,654 |
CITIC Ltd. (Industrial Conglomerates)
| | 2.850% | 02/25/2030 | 230,000 | 202,143 |
CNH Industrial Capital LLC (Machinery)
| | 3.950% | 05/23/2025 | 205,000 | 202,830 |
Delta Air Lines, Inc. / SkyMiles IP Ltd. (Airlines)
| (c) | 4.500% | 10/20/2025 | 859,058 | 834,715 |
Delta Air Lines, Inc. / SkyMiles IP Ltd. (Airlines)
| (c) | 4.750% | 10/20/2028 | 156,000 | 147,354 |
Embraer Netherlands Finance B.V. (Aerospace & Defense)
| (c) | 6.950% | 01/17/2028 | 647,000 | 626,296 |
ENA Master Trust
| (c) | 4.000% | 05/19/2048 | 203,000 | 157,585 |
Equifax, Inc. (Professional Svs.)
| | 2.600% | 12/01/2024 | 1,138,000 | 1,097,895 |
Equifax, Inc. (Professional Svs.)
| | 2.600% | 12/15/2025 | 147,000 | 138,572 |
Equifax, Inc. (Professional Svs.)
| | 3.100% | 05/15/2030 | 240,000 | 210,805 |
Flowserve Corp. (Machinery)
| | 2.800% | 01/15/2032 | 1,801,000 | 1,418,502 |
General Dynamics Corp. (Aerospace & Defense)
| | 3.625% | 04/01/2030 | 1,205,000 | 1,168,131 |
General Electric Co. (Industrial Conglomerates)
| | 6.750% | 03/15/2032 | 1,085,000 | 1,213,812 |
Huntington Ingalls Industries, Inc. (Aerospace & Defense)
| | 3.844% | 05/01/2025 | 205,000 | 201,845 |
Parker-Hannifin Corp. (Machinery)
| | 4.500% | 09/15/2029 | 868,000 | 863,701 |
RELX Capital, Inc. (Professional Svs.)
| | 4.750% | 05/20/2032 | 65,000 | 66,017 |
Westinghouse Air Brake Technologies Corp. (Machinery)
| | 4.400% | 03/15/2024 | 1,125,000 | 1,126,922 |
Westinghouse Air Brake Technologies Corp. (Machinery)
| | 3.200% | 06/15/2025 | 45,000 | 42,906 |
| | | | | | 12,463,562 |
Information Technology–1.7%
| | | | | |
Apple, Inc. (Tech. Hardware, Storage & Periph.)
| | 1.250% | 08/20/2030 | 1,070,000 | 877,626 |
Broadcom, Inc. (Semiconductors & Equip.)
| (c) | 4.000% | 04/15/2029 | 36,000 | 33,357 |
Broadcom, Inc. (Semiconductors & Equip.)
| | 4.150% | 11/15/2030 | 1,143,000 | 1,047,232 |
Broadcom, Inc. (Semiconductors & Equip.)
| (c) | 4.150% | 04/15/2032 | 123,000 | 111,045 |
Broadcom, Inc. (Semiconductors & Equip.)
| (c) | 4.926% | 05/15/2037 | 180,000 | 161,378 |
CDW LLC / CDW Finance Corp. (Electronic Equip., Instr. & Comp.)
| | 4.250% | 04/01/2028 | 1,196,000 | 1,079,390 |
Global Payments, Inc. (IT Svs.)
| | 4.800% | 04/01/2026 | 185,000 | 184,992 |
Global Payments, Inc. (IT Svs.)
| | 3.200% | 08/15/2029 | 75,000 | 65,541 |
HP, Inc. (Tech. Hardware, Storage & Periph.)
| | 5.500% | 01/15/2033 | 1,119,000 | 1,091,519 |
| Ohio National Fund, Inc. | ON Risk Managed Balanced Portfolio (Continued) |
| Schedule of Investments | June 30, 2022 (Unaudited) |
| Corporate Bonds (Continued) | Rate | Maturity | Face Amount | Value |
Information Technology (continued)
| | | | | |
Infor, Inc. (Software)
| (c) | 1.750% | 07/15/2025 | $ 1,696,000 | $ 1,568,697 |
Kyndryl Holdings, Inc. (IT Svs.)
| (c) | 2.050% | 10/15/2026 | 2,046,000 | 1,722,264 |
Lam Research Corp. (Semiconductors & Equip.)
| | 4.000% | 03/15/2029 | 816,000 | 801,694 |
Mastercard, Inc. (IT Svs.)
| | 3.350% | 03/26/2030 | 1,713,000 | 1,634,934 |
Micron Technology, Inc. (Semiconductors & Equip.)
| | 4.185% | 02/15/2027 | 207,000 | 202,039 |
NXP B.V. / NXP Funding LLC (Semiconductors & Equip.)
| | 5.550% | 12/01/2028 | 125,000 | 126,764 |
Oracle Corp. (Software)
| | 2.950% | 04/01/2030 | 1,796,000 | 1,533,780 |
Oracle Corp. (Software)
| | 2.875% | 03/25/2031 | 225,000 | 185,380 |
Oracle Corp. (Software)
| | 3.900% | 05/15/2035 | 1,039,000 | 856,898 |
Oracle Corp. (Software)
| | 3.600% | 04/01/2040 | 134,000 | 100,138 |
Oracle Corp. (Software)
| | 5.375% | 07/15/2040 | 43,000 | 39,163 |
Oracle Corp. (Software)
| | 3.650% | 03/25/2041 | 77,000 | 57,382 |
PayPal Holdings, Inc. (IT Svs.)
| | 2.850% | 10/01/2029 | 1,440,000 | 1,302,975 |
SK Hynix, Inc. (Semiconductors & Equip.)
| (c) | 2.375% | 01/19/2031 | 304,000 | 239,428 |
Skyworks Solutions, Inc. (Semiconductors & Equip.)
| | 3.000% | 06/01/2031 | 1,331,000 | 1,093,229 |
VeriSign, Inc. (IT Svs.)
| | 2.700% | 06/15/2031 | 1,408,000 | 1,133,077 |
Visa, Inc. (IT Svs.)
| | 1.900% | 04/15/2027 | 452,000 | 416,920 |
Visa, Inc. (IT Svs.)
| | 2.050% | 04/15/2030 | 220,000 | 192,988 |
VMware, Inc. (Software)
| | 4.500% | 05/15/2025 | 954,000 | 956,584 |
VMware, Inc. (Software)
| | 4.650% | 05/15/2027 | 293,000 | 291,486 |
Western Digital Corp. (Tech. Hardware, Storage & Periph.)
| | 2.850% | 02/01/2029 | 1,595,000 | 1,298,641 |
Workday, Inc. (Software)
| | 3.700% | 04/01/2029 | 42,000 | 39,286 |
Workday, Inc. (Software)
| | 3.800% | 04/01/2032 | 1,100,000 | 1,005,043 |
| | | | | | 21,450,870 |
Materials–0.3%
| | | | | |
Anglo American Capital PLC (Metals & Mining)
| (c) | 3.875% | 03/16/2029 | 355,000 | 326,487 |
Cemex S.A.B de C.V. (Construction Materials)
| (c) | 3.875% | 07/11/2031 | 380,000 | 285,000 |
CSN Resources SA (Metals & Mining)
| | 5.875% | 04/08/2032 | 787,000 | 598,120 |
Freeport Indonesia PT (Metals & Mining)
| (c) | 4.763% | 04/14/2027 | 749,000 | 716,793 |
Nucor Corp. (Metals & Mining)
| | 4.300% | 05/23/2027 | 685,000 | 682,404 |
Stillwater Mining Co. (Metals & Mining)
| (c) | 4.000% | 11/16/2026 | 300,000 | 249,600 |
Suzano Austria GmbH (Paper & Forest Products)
| | 2.500% | 09/15/2028 | 374,000 | 303,875 |
Suzano Austria GmbH (Paper & Forest Products)
| | 3.750% | 01/15/2031 | 56,000 | 45,220 |
Volcan Cia Minera S.A.A. (Metals & Mining)
| (c) | 4.375% | 02/11/2026 | 31,000 | 26,986 |
W.R. Grace Holdings LLC (Chemicals)
| (c) | 4.875% | 06/15/2027 | 551,000 | 479,502 |
| | | | | | 3,713,987 |
Real Estate–0.5%
| | | | | |
American Tower Corp. (Equity REIT)
| | 3.650% | 03/15/2027 | 138,000 | 131,049 |
American Tower Corp. (Equity REIT)
| | 3.800% | 08/15/2029 | 1,455,000 | 1,335,521 |
American Tower Corp. (Equity REIT)
| | 4.050% | 03/15/2032 | 70,000 | 63,791 |
Camden Property Trust (Equity REIT)
| | 2.800% | 05/15/2030 | 1,197,000 | 1,056,615 |
Crown Castle International Corp. (Equity REIT)
| | 3.650% | 09/01/2027 | 133,000 | 125,957 |
Crown Castle International Corp. (Equity REIT)
| | 4.300% | 02/15/2029 | 154,000 | 147,857 |
Crown Castle International Corp. (Equity REIT)
| | 3.100% | 11/15/2029 | 279,000 | 246,298 |
Crown Castle International Corp. (Equity REIT)
| | 3.300% | 07/01/2030 | 67,000 | 59,088 |
Equinix, Inc. (Equity REIT)
| | 3.200% | 11/18/2029 | 1,689,000 | 1,500,403 |
Vornado Realty LP (Equity REIT)
| | 3.400% | 06/01/2031 | 1,326,000 | 1,112,839 |
| | | | | | 5,779,418 |
Utilities–0.9%
| | | | | |
AES Panama Generation Holdings SRL (Electric Utilities)
| (c) | 4.375% | 05/31/2030 | 285,000 | 243,486 |
AES Panama Generation Holdings SRL (Electric Utilities)
| | 4.375% | 05/31/2030 | 241,000 | 205,895 |
Ameren Corp. (Multi-Utilities)
| | 3.500% | 01/15/2031 | 669,000 | 612,811 |
American Water Capital Corp. (Water Utilities)
| | 2.800% | 05/01/2030 | 1,002,000 | 898,389 |
Chile Electricity PEC SpA (Electric Utilities)
| (c) | 0.000% | 01/25/2028 | 460,000 | 337,308 |
Comision Federal de Electricidad (Electric Utilities)
| (c) | 4.688% | 05/15/2029 | 221,000 | 197,506 |
Comision Federal de Electricidad (Electric Utilities)
| | 3.348% | 02/09/2031 | 1,177,000 | 898,063 |
Comision Federal de Electricidad (Electric Utilities)
| (c) | 3.348% | 02/09/2031 | 236,000 | 180,070 |
Dominion Energy, Inc. (Multi-Utilities)
| | 3.375% | 04/01/2030 | 1,554,000 | 1,420,571 |
Duke Energy Carolinas NC Storm Funding LLC (Electric Utilities)
| | 2.617% | 07/01/2041 | 200,000 | 166,714 |
Enel Chile SA (Electric Utilities)
| | 4.875% | 06/12/2028 | 688,000 | 657,040 |
Engie Energia Chile SA (Electric Utilities)
| | 3.400% | 01/28/2030 | 673,000 | 571,209 |
NRG Energy, Inc. (Electric Utilities)
| (c) | 3.750% | 06/15/2024 | 308,000 | 302,142 |
Oncor Electric Delivery Co. LLC (Electric Utilities)
| | 3.700% | 11/15/2028 | 1,164,000 | 1,132,566 |
Pacific Gas and Electric Co. (Electric Utilities)
| | 4.400% | 03/01/2032 | 985,000 | 854,919 |
| Ohio National Fund, Inc. | ON Risk Managed Balanced Portfolio (Continued) |
| Schedule of Investments | June 30, 2022 (Unaudited) |
| Corporate Bonds (Continued) | Rate | Maturity | Face Amount | Value |
| Utilities (continued) | | | | | |
Southern Co. / The (Electric Utilities)
| | 3.700% | 04/30/2030 | $ 2,032,000 | $ 1,885,468 |
Vistra Operations Co. LLC (Ind. Power & Renewable Elec.)
| (c) | 4.375% | 05/01/2029 | 231,000 | 193,262 |
| | | | | | 10,757,419 |
Total Corporate Bonds (Cost $188,056,841)
| | | | | $178,766,165 |
| Purchased Options–6.4% | Notional
Amount | Expiration | Exercise Price | Contracts (e) | Value |
S&P 500 Index Call Option
| | $ 7,570,760 | December 2023 | $3,700 | 20 | $ 1,040,000 |
S&P 500 Index Call Option
| | 17,034,210 | December 2023 | 4,000 | 45 | 1,598,805 |
S&P 500 Index Call Option
| | 14,005,906 | December 2023 | 4,100 | 37 | 1,118,140 |
S&P 500 Index Call Option
| | 75,707,600 | December 2023 | 4,150 | 200 | 6,112,200 |
S&P 500 Index Call Option
| | 90,470,582 | December 2023 | 4,200 | 239 | 6,180,540 |
S&P 500 Index Call Option
| | 83,278,360 | December 2023 | 4,250 | 220 | 5,244,800 |
S&P 500 Index Call Option
| | 7,949,298 | December 2023 | 4,300 | 21 | 460,530 |
S&P 500 Index Call Option
| | 16,277,134 | December 2023 | 4,400 | 43 | 873,330 |
S&P 500 Index Call Option
| | 17,791,286 | December 2023 | 4,500 | 47 | 740,250 |
S&P 500 Index Call Option
| | 9,084,912 | December 2023 | 4,600 | 24 | 344,832 |
S&P 500 Index Call Option
| | 9,463,450 | December 2023 | 4,700 | 25 | 268,650 |
S&P 500 Index Call Option
| | 8,706,374 | December 2024 | 4,000 | 23 | 1,124,240 |
S&P 500 Index Put Option
| | 5,678,070 | December 2023 | 3,700 | 15 | 521,700 |
S&P 500 Index Put Option
| | 17,034,210 | December 2023 | 4,000 | 45 | 2,077,515 |
S&P 500 Index Put Option
| | 14,005,906 | December 2023 | 4,100 | 37 | 1,904,020 |
S&P 500 Index Put Option
| | 75,707,600 | December 2023 | 4,150 | 200 | 10,652,000 |
S&P 500 Index Put Option
| | 90,470,582 | December 2023 | 4,200 | 239 | 13,866,302 |
S&P 500 Index Put Option
| | 83,278,360 | December 2023 | 4,250 | 220 | 13,041,600 |
S&P 500 Index Put Option
| | 7,949,298 | December 2023 | 4,300 | 21 | 1,303,680 |
S&P 500 Index Put Option
| | 16,277,134 | December 2023 | 4,400 | 43 | 2,922,710 |
S&P 500 Index Put Option
| | 17,791,286 | December 2023 | 4,500 | 47 | 3,494,920 |
S&P 500 Index Put Option
| | 9,084,912 | December 2023 | 4,600 | 24 | 1,918,968 |
S&P 500 Index Put Option
| | 3,785,380 | December 2023 | 4,700 | 10 | 883,300 |
S&P 500 Index Put Option
| | 8,706,374 | December 2024 | 4,000 | 23 | 1,232,501 |
Total Purchased Options (Cost $86,283,584)
| | | | | | $ 78,925,533 |
| Exchange Traded Funds–5.0% | Shares | Value |
SPDR S&P 500 ETF Trust
| | 81,054 | $ 30,577,621 |
Vanguard S&P 500 ETF
| | 88,208 | 30,597,591 |
Total Exchange Traded Funds (Cost $63,437,890)
| | | $ 61,175,212 |
| Asset-Backed / Mortgage-Backed Securities–4.8% | Rate | Maturity | Face Amount | Value |
Consumer Discretionary–0.1%
| | | | | |
Domino's Pizza Master Issuer LLC 2021-1A A2I
| (c) | 2.662% | 04/25/2051 | $ 174,240 | $ 151,874 |
Great Wolf Trust 2019-WOLF C
| (c) | ML + 163 | 12/15/2036 | 79,000 | 76,020 |
Hardee's Funding LLC 2018-1A A23
| (c) | 5.710% | 06/20/2048 | 128,617 | 124,149 |
Hardee's Funding LLC 2020-1A A2
| (c) | 3.981% | 12/20/2050 | 133,015 | 120,793 |
| | | | | | 472,836 |
Financials–4.6%
| | | | | |
AB Issuer LLC 2021-1 A2
| (c) | 3.734% | 07/30/2051 | 317,600 | 281,868 |
ACM Auto Trust 2022-1A A
| (c) | 3.230% | 04/20/2029 | 323,994 | 322,898 |
Affirm Asset Securitization Trust 2021-A C
| (c) | 1.660% | 08/15/2025 | 200,000 | 191,258 |
Affirm Asset Securitization Trust 2021-Z1 A
| (c) | 1.070% | 08/15/2025 | 127,745 | 124,655 |
Affirm Asset Securitization Trust 2021-Z2 A
| (c) | 1.170% | 11/16/2026 | 79,701 | 77,602 |
AGL CLO 2021-12A D
| (c) | QL + 285 | 07/20/2034 | 250,000 | 227,790 |
AREIT 2022-CRE6 A
| (c) | SOFR30A + 125 | 01/16/2037 | 517,500 | 496,912 |
Atalaya Equipment Leasing Trust 2021-1A C
| (c) | 2.690% | 06/15/2028 | 300,000 | 282,643 |
Avant Loans Funding Trust 2021-REV1 A
| (c) | 1.210% | 07/15/2030 | 441,000 | 415,688 |
Bain Capital Credit CLO 2021-4A D
| (c) | QL + 310 | 10/20/2034 | 250,000 | 231,270 |
Balboa Bay Loan Funding 2020-1A AR
| (c) | QL + 112 | 01/20/2032 | 1,500,000 | 1,468,450 |
Balboa Bay Loan Funding 2021-1A D
| (c) | QL + 305 | 07/20/2034 | 307,948 | 284,236 |
Ballyrock CLO 15 Ltd. 2021-1A C
| (c) | QL + 310 | 04/15/2034 | 250,000 | 231,975 |
Ballyrock CLO 16 Ltd. 2021-16A C
| (c) | QL + 290 | 07/20/2034 | 250,000 | 228,298 |
Ballyrock CLO 17 Ltd. 2021-17A A1A
| (c) | QL + 115 | 10/20/2034 | 1,000,000 | 969,310 |
Ballyrock CLO 17 Ltd. 2021-17A C
| (c) | QL + 305 | 10/20/2034 | 250,000 | 232,680 |
BBCMS 2020-BID A
| (c) | ML + 214 | 10/15/2037 | 301,000 | 296,980 |
Bellemeade Re 2021-3A A2
| (c) | SOFR30A + 100 | 09/25/2031 | 286,223 | 278,788 |
Bellemeade Re 2022-1 M1C
| (c) | SOFR30A + 370 | 01/26/2032 | 327,948 | 313,345 |
| Ohio National Fund, Inc. | ON Risk Managed Balanced Portfolio (Continued) |
| Schedule of Investments | June 30, 2022 (Unaudited) |
| Asset-Backed / Mortgage-Backed Securities (Continued) | Rate | Maturity | Face Amount | Value |
| Financials (continued) | | | | | |
Bellemeade Re Ltd. 2021-1A M1C
| (c) | SOFR30A + 295 | 03/25/2031 | $ 167,482 | $ 164,409 |
BFLD Trust 2021-FPM A
| (c) | ML + 160 | 06/15/2038 | 462,000 | 445,616 |
Brex Commercial Charge Card Master Trust 2021-1 A
| (c) | 2.090% | 07/15/2024 | 167,000 | 163,780 |
BX Commercial Mortgage Trust 2019-IMC E
| (c) | ML + 215 | 04/15/2034 | 320,787 | 298,166 |
Cajun Global LLC 2021-1 A2
| (c) | 3.931% | 11/20/2051 | 61,535 | 55,742 |
Carvana Auto Receivables Trust 2021-N3 C
| | 1.020% | 06/12/2028 | 141,000 | 135,474 |
Carvana Auto Receivables Trust 2021-N4 D
| | 2.300% | 09/11/2028 | 128,000 | 119,509 |
Carvana Auto Receivables Trust 2021-P4 N
| (c) | 2.150% | 09/11/2028 | 521,650 | 518,831 |
College Ave Student Loans 2021-C C
| (c) | 3.060% | 07/26/2055 | 136,800 | 120,699 |
COMM 2015-LC23 C
| | 4.758% | 10/10/2048 | 100,000 | 95,227 |
Connecticut Avenue Securities Trust 2019-R02 1M2
| (c) | ML + 230 | 08/25/2031 | 9,569 | 9,569 |
Connecticut Avenue Securities Trust 2019-R03 1M2
| (c) | ML + 215 | 09/25/2031 | 26,252 | 26,205 |
Connecticut Avenue Securities Trust 2019-R04 2B1
| (c) | ML + 525 | 06/25/2039 | 937,518 | 949,958 |
Connecticut Avenue Securities Trust 2019-R06 2B1
| (c) | ML + 375 | 09/25/2039 | 1,000,000 | 945,727 |
Connecticut Avenue Securities Trust 2019-R07 1M2
| (c) | ML + 210 | 10/25/2039 | 36,220 | 35,955 |
Connecticut Avenue Securities Trust 2020-R02 2M2
| (c) | ML + 200 | 01/25/2040 | 128,043 | 126,122 |
Connecticut Avenue Securities Trust 2020-SBT1 1M2
| (c) | ML + 365 | 02/25/2040 | 255,000 | 243,994 |
Connecticut Avenue Securities Trust 2020-SBT1 2M2
| (c) | ML + 365 | 02/25/2040 | 270,000 | 257,586 |
Connecticut Avenue Securities Trust 2021-R01 1M2
| (c) | SOFR30A + 155 | 10/25/2041 | 462,831 | 429,287 |
Connecticut Avenue Securities Trust 2021-R03 1M2
| (c) | SOFR30A + 165 | 12/25/2041 | 117,550 | 104,675 |
Connecticut Avenue Securities Trust 2022-R01 1B1
| (c) | SOFR30A + 315 | 12/25/2041 | 305,277 | 260,444 |
Connecticut Avenue Securities Trust 2022-R02 2M1
| (c) | SOFR30A + 120 | 01/25/2042 | 354,790 | 345,346 |
Connecticut Avenue Securities Trust 2022-R02 2M2
| (c) | SOFR30A + 300 | 01/25/2042 | 960,000 | 884,954 |
Connecticut Avenue Securities Trust 2022-R03 1M1
| (c) | SOFR30A + 210 | 03/25/2042 | 1,380,688 | 1,356,303 |
Connecticut Avenue Securities Trust 2022-R03 1M2
| (c) | SOFR30A + 350 | 03/25/2042 | 253,631 | 241,292 |
Connecticut Avenue Securities Trust 2022-R04 1M2
| (c) | SOFR30A + 310 | 03/25/2042 | 63,262 | 59,156 |
Connecticut Avenue Securities Trust 2022-R05 2M2
| (c) | SOFR30A + 300 | 04/25/2042 | 599,367 | 569,668 |
Connecticut Avenue Securities Trust 2022-R06 1M1
| (c) | SOFR30A + 275 | 05/25/2042 | 1,528,785 | 1,524,933 |
Connecticut Avenue Securities Trust 2022-R07 1M1
| (c) | SOFR30A + 295 | 06/25/2042 | 1,298,674 | 1,301,718 |
CPS Auto Receivables Trust 2021-B C
| (c) | 1.230% | 03/15/2027 | 234,000 | 224,749 |
CPS Auto Receivables Trust 2021-C D
| (c) | 1.690% | 06/15/2027 | 210,000 | 193,930 |
Dext ABS 2021-1 C
| (c) | 2.290% | 09/15/2028 | 264,000 | 236,503 |
Dext ABS 2021-1 D
| (c) | 2.810% | 03/15/2029 | 133,000 | 117,514 |
Diamond Issuer 2021-1A B
| (c) | 2.701% | 11/20/2051 | 271,624 | 235,697 |
Donlen Fleet Lease Funding 2021-2 C
| (c) | 1.200% | 12/11/2034 | 460,000 | 432,976 |
Dryden 78 CLO Ltd. 2020-78A A
| (c) | QL + 118 | 04/17/2033 | 1,500,000 | 1,463,065 |
Eagle Re 2021-2 M1B
| (c) | SOFR30A + 205 | 04/25/2034 | 152,272 | 147,020 |
Elmwood CLO IX Ltd. 2021-2A D
| (c) | QL + 295 | 07/20/2034 | 250,000 | 228,995 |
Fannie Mae Connecticut Avenue Securities 2014-C04 1M2
| | ML + 490 | 11/25/2024 | 174,706 | 179,637 |
Fannie Mae Connecticut Avenue Securities 2015-C02 1M2
| | ML + 400 | 05/25/2025 | 18,403 | 18,496 |
Fannie Mae Connecticut Avenue Securities 2015-C03 1M2
| | ML + 500 | 07/25/2025 | 100,885 | 102,022 |
Fannie Mae Connecticut Avenue Securities 2015-C04 1M2
| | ML + 570 | 04/25/2028 | 59,358 | 61,969 |
Fannie Mae Connecticut Avenue Securities 2016-C01 1M2
| | ML + 675 | 08/25/2028 | 75,535 | 79,340 |
Fannie Mae Connecticut Avenue Securities 2016-C07 2M2
| | ML + 435 | 05/25/2029 | 87,358 | 90,326 |
Fannie Mae Connecticut Avenue Securities 2017-C01 1M2
| | ML + 355 | 07/25/2029 | 213,017 | 217,556 |
Fannie Mae Connecticut Avenue Securities 2017-C07 1B1
| | ML + 400 | 05/25/2030 | 300,000 | 302,636 |
Fannie Mae Connecticut Avenue Securities 2018-C05 1M2
| | ML + 235 | 01/25/2031 | 807,855 | 802,552 |
Fannie Mae Connecticut Avenue Securities 2018-C06 1M2
| | ML + 200 | 03/25/2031 | 182,850 | 180,831 |
Fannie Mae Connecticut Avenue Securities 2021-R02 2B1
| (c) | SOFR30A + 330 | 11/25/2041 | 211,036 | 180,495 |
Fannie Mae Connecticut Avenue Securities 2021-R02 2M2
| (c) | SOFR30A + 200 | 11/25/2041 | 1,000,000 | 892,481 |
FHF Trust 2021-2A A
| (c) | 0.830% | 12/15/2026 | 107,250 | 102,802 |
First Investors Auto Owner Trust 2018-1A E
| (c) | 5.350% | 07/15/2024 | 350,000 | 351,195 |
Flatiron CLO 2021-1A D
| (c) | QL + 290 | 07/19/2034 | 250,000 | 226,192 |
Ford Credit Auto Owner Trust 2021-1 D
| (c) | 2.310% | 10/17/2033 | 230,000 | 205,219 |
Freddie Mac Multifamily Structured Credit Risk 2021-MN1 M1
| (c) | SOFR30A + 200 | 01/25/2051 | 41,234 | 38,355 |
Freddie Mac REMICS FHR 4981 HS
| (f) | ML + 610 | 06/25/2050 | 802,403 | 99,897 |
Freddie Mac REMICS FHR 5015 BI
| (f) | 4.000% | 09/25/2050 | 558,088 | 104,529 |
Freddie Mac STACR REMIC Trust 2020-DNA1 M2
| (c) | ML + 170 | 01/25/2050 | 58,513 | 57,854 |
Freddie Mac STACR REMIC Trust 2020-DNA5 M2
| (c) | SOFR30A + 280 | 10/25/2050 | 118,212 | 118,396 |
Freddie Mac STACR REMIC Trust 2020-DNA6 M2
| (c) | SOFR30A + 200 | 12/25/2050 | 1,500,000 | 1,475,805 |
Freddie Mac STACR REMIC Trust 2021-DNA3 B1
| (c) | SOFR30A + 350 | 10/25/2033 | 278,276 | 239,700 |
Freddie Mac STACR REMIC Trust 2021-DNA5 B1
| (c) | SOFR30A + 305 | 01/25/2034 | 1,000,000 | 858,274 |
Freddie Mac STACR REMIC Trust 2021-DNA6 M2
| (c) | SOFR30A + 150 | 10/25/2041 | 393,665 | 359,377 |
Freddie Mac STACR REMIC Trust 2021-HQA2 M1
| (c) | SOFR30A + 70 | 12/25/2033 | 796,693 | 788,169 |
Freddie Mac STACR REMIC Trust 2021-HQA3 M2
| (c) | SOFR30A + 210 | 09/25/2041 | 1,000,000 | 874,021 |
Freddie Mac STACR REMIC Trust 2021-HQA4 M2
| (c) | SOFR30A + 235 | 12/25/2041 | 1,046,349 | 902,883 |
Freddie Mac STACR REMIC Trust 2022-DNA1 M1B
| (c) | SOFR30A + 185 | 01/25/2042 | 1,600,000 | 1,435,541 |
Freddie Mac STACR REMIC Trust 2022-DNA1 M2
| (c) | SOFR30A + 250 | 01/25/2042 | 394,327 | 333,868 |
| Ohio National Fund, Inc. | ON Risk Managed Balanced Portfolio (Continued) |
| Schedule of Investments | June 30, 2022 (Unaudited) |
| Asset-Backed / Mortgage-Backed Securities (Continued) | Rate | Maturity | Face Amount | Value |
| Financials (continued) | | | | | |
Freddie Mac STACR REMIC Trust 2022-DNA3 M1A
| (c) | SOFR30A + 200 | 04/25/2042 | $ 1,322,437 | $ 1,301,673 |
Freddie Mac STACR REMIC Trust 2022-DNA3 M1B
| (c) | SOFR30A + 290 | 04/25/2042 | 1,600,000 | 1,504,044 |
Freddie Mac STACR REMIC Trust 2022-DNA3 M2
| (c) | SOFR30A + 435 | 04/25/2042 | 200,000 | 181,610 |
Freddie Mac STACR REMIC Trust 2022-DNA4 M1B
| (c) | SOFR30A + 335 | 05/25/2042 | 1,621,038 | 1,541,112 |
Freddie Mac STACR REMIC Trust 2022-HQA1 M1B
| (c) | SOFR30A + 350 | 03/25/2042 | 65,368 | 62,422 |
Freddie Mac STACR Trust 2018-DNA2 B1
| (c) | ML + 370 | 12/25/2030 | 1,000,000 | 977,597 |
Freddie Mac STACR Trust 2019-DNA4 M2
| (c) | ML + 195 | 10/25/2049 | 13,808 | 13,685 |
Freddie Mac Structured Agency Credit Risk Debt Notes 2017-HQA2 M2B
| | ML + 265 | 12/25/2029 | 458,126 | 455,320 |
Freddie Mac Structured Agency Credit Risk Debt Notes 2021-DNA7 M2
| (c) | SOFR30A + 180 | 11/25/2041 | 986,480 | 888,410 |
Freddie Mac Structured Agency Credit Risk Debt Notes 2022-DNA2 M2
| (c) | SOFR30A + 375 | 02/25/2042 | 295,064 | 264,904 |
Freddie Mac Structured Agency Credit Risk Debt Notes 2022-DNA5 M1B
| (c) | SOFR30A + 450 | 06/25/2042 | 1,331,433 | 1,338,202 |
FREED ABS Trust 2021-2 C
| (c) | 1.940% | 06/19/2028 | 460,000 | 446,141 |
Galaxy 30 CLO Ltd. 2022-30A D
| (c) | TSFR3M + 335 | 04/15/2035 | 400,000 | 362,069 |
GCI Funding I LLC 2021-1 A
| (c) | 2.380% | 06/18/2046 | 152,395 | 134,756 |
Goldentree Loan Management U.S. CLO 7 Ltd. 2020-7A AR
| (c) | QL + 107 | 04/20/2034 | 250,000 | 241,751 |
Hertz Vehicle Financing III LLC 2022-1A C
| (c) | 2.630% | 06/25/2026 | 220,000 | 203,584 |
HFX Funding Issuer 2017-1
| | 3.622% | 03/15/2035 | 280,000 | 262,062 |
Home Re 2020-1 M1B
| (c) | ML + 325 | 10/25/2030 | 13,962 | 13,960 |
Home Re 2021-2 M1B
| (c) | SOFR30A + 160 | 01/25/2034 | 222,490 | 217,275 |
JP Morgan Chase Commercial Mortgage Securities Trust 2013-C10 B
| | 3.674% | 12/15/2047 | 300,000 | 296,941 |
JPMBB Commercial Mortgage Securities Trust 2013-C15 AS
| | 4.420% | 11/15/2045 | 250,000 | 249,581 |
JPMBB Commercial Mortgage Securities Trust 2014-C21 C
| | 4.797% | 08/15/2047 | 295,000 | 277,871 |
JPMBB Commercial Mortgage Securities Trust 2015-C27 AS
| | 3.634% | 02/15/2048 | 130,694 | 127,417 |
LAD Auto Receivables Trust 2021-1A C
| (c) | 2.350% | 04/15/2027 | 406,000 | 378,496 |
Morgan Stanley Capital I Trust 2018-H3 AS
| | 4.429% | 07/15/2051 | 270,000 | 265,707 |
MVW 2021-2A C
| (c) | 2.230% | 05/20/2039 | 386,875 | 352,973 |
Neighborly Issuer 2022-1A A2
| (c) | 3.695% | 01/30/2052 | 227,430 | 195,886 |
Neighborly Issuer LLC 2021-1A A2
| (c) | 3.584% | 04/30/2051 | 125,361 | 108,797 |
Nelnet Student Loan Trust 2021-BA B
| (c) | 2.680% | 04/20/2062 | 100,000 | 84,821 |
Nelnet Student Loan Trust 2021-DA C
| (c) | 3.500% | 04/20/2062 | 100,000 | 87,273 |
Neuberger Berman Loan Advisers CLO 2021-42A D
| (c) | QL + 280 | 07/16/2035 | 301,613 | 273,566 |
Neuberger Berman Loan Advisers CLO 43 Ltd. 2021-43A D
| (c) | QL + 310 | 07/17/2035 | 250,000 | 233,781 |
Oaktown Re VII Ltd. 2021-2 M1A
| (c) | SOFR30A + 160 | 04/25/2034 | 272,026 | 266,985 |
OCP CLO 2020-18A AR
| (c) | QL + 109 | 07/20/2032 | 322,000 | 314,497 |
Octane Receivables Trust 2021-2A C
| (c) | 2.530% | 05/21/2029 | 209,000 | 184,679 |
OneMain Direct Auto Receivables Trust 2022-1A C
| (c) | 5.310% | 06/14/2029 | 1,100,000 | 1,095,859 |
PMT Credit Risk Transfer Trust 2019-2R A
| (c) | ML + 275 | 05/27/2023 | 120,062 | 117,199 |
Rad CLO 11 Ltd. 2021-11A D
| (c) | QL + 290 | 04/15/2034 | 250,000 | 230,997 |
Regatta XX Funding Ltd. 2021-2A A
| (c) | QL + 116 | 10/15/2034 | 450,431 | 435,335 |
Regatta XXIV Funding Ltd. 2021-5A D
| (c) | QL + 310 | 01/20/2035 | 450,000 | 422,856 |
Rockford Tower CLO 2021-1A D
| (c) | QL + 300 | 07/20/2034 | 306,626 | 285,048 |
Rockford Tower CLO 2021-2A A1
| (c) | QL + 116 | 07/20/2034 | 250,000 | 241,956 |
Santander Bank Auto Credit-Linked Notes Series 2022-A B
| (c) | 5.281% | 05/15/2032 | 840,178 | 832,919 |
Santander Bank N.A. - SBCLN 2021-1A C
| (c) | 3.268% | 12/15/2031 | 548,932 | 533,571 |
Santander Consumer Auto Receivables Trust 2021-CA B
| (c) | 1.440% | 04/17/2028 | 55,749 | 55,468 |
SEB Funding LLC 2021-1A A2
| (c) | 4.969% | 01/30/2052 | 331,170 | 302,066 |
SG Commercial Mortgage Securities Trust 2016-C5 A4
| | 3.055% | 10/10/2048 | 250,000 | 237,964 |
Signal Peak CLO 2022-12A C
| (c) | TSFR3M + 345 | 07/18/2034 | 1,115,000 | 1,096,968 |
TICP CLO XV Ltd. 2020-15A A
| (c) | QL + 128 | 04/20/2033 | 1,600,000 | 1,568,199 |
Triangle Re 2021-3 M1B
| (c) | SOFR30A + 290 | 02/25/2034 | 240,000 | 228,669 |
UBS-Barclays Commercial Mortgage Trust 2012-C4 C
| (c) | 4.455% | 12/10/2045 | 390,000 | 384,425 |
Upstart Securitization Trust 2020-3 A
| (c) | 1.702% | 11/20/2030 | 19,532 | 19,474 |
Upstart Securitization Trust 2021-3 B
| (c) | 1.660% | 07/20/2031 | 210,000 | 193,484 |
VASA Trust 2021-VASA A
| (c) | ML + 90 | 07/15/2039 | 460,000 | 439,218 |
Wells Fargo Commercial Mortgage Trust 2016-C35 B
| | 3.438% | 07/15/2048 | 270,000 | 247,965 |
WFRBS Commercial Mortgage Trust 2014-C24 AS
| | 3.931% | 11/15/2047 | 270,000 | 264,486 |
| | | | | | 57,051,832 |
Industrials–0.1%
| | | | | |
Avis Budget Rental Car Funding AESOP LLC 2017-2A D
| (c) | 4.560% | 03/20/2024 | 1,185,000 | 1,184,999 |
Total Asset-Backed / Mortgage-Backed Securities (Cost $60,675,000)
| | | | | $ 58,709,667 |
| U.S. Government Agency Mortgage-Backed Securities–4.4% | Rate | Maturity | Face Amount | Value |
Fannie Mae or Freddie Mac UMBS TBA
| | 2.000% | 07/15/2052 | $ 1,523,097 | $ 1,321,525 |
Fannie Mae or Freddie Mac UMBS TBA
| | 2.500% | 07/15/2052 | 15,030,022 | 13,514,103 |
Fannie Mae or Freddie Mac UMBS TBA
| | 3.000% | 07/15/2052 | 4,172,412 | 3,885,233 |
Fannie Mae or Freddie Mac UMBS TBA
| | 3.500% | 07/15/2052 | 6,605,359 | 6,351,982 |
| Ohio National Fund, Inc. | ON Risk Managed Balanced Portfolio (Continued) |
| Schedule of Investments | June 30, 2022 (Unaudited) |
| U.S. Government Agency Mortgage-Backed Securities (Continued) | Rate | Maturity | Face Amount | Value |
Fannie Mae or Freddie Mac UMBS TBA
| | 4.000% | 07/15/2052 | $ 2,881,017 | $ 2,840,897 |
Fannie Mae or Freddie Mac UMBS TBA
| | 4.500% | 07/15/2052 | 2,854,498 | 2,865,314 |
Fannie Mae Pool FN AL5310
| | 3.500% | 04/01/2044 | 2,288 | 2,254 |
Fannie Mae Pool FN AL5887
| | 4.500% | 10/01/2044 | 14,396 | 14,824 |
Fannie Mae Pool FN AL6542
| | 4.500% | 03/01/2045 | 20,960 | 21,582 |
Fannie Mae Pool FN AL6620
| | 4.500% | 08/01/2042 | 130,262 | 133,166 |
Fannie Mae Pool FN AL6997
| | 4.500% | 11/01/2042 | 9,534 | 9,840 |
Fannie Mae Pool FN AL8855
| | 3.500% | 07/01/2046 | 8,229 | 8,047 |
Fannie Mae Pool FN AS7168
| | 3.500% | 05/01/2046 | 16,898 | 16,524 |
Fannie Mae Pool FN AS7587
| | 3.500% | 07/01/2046 | 96,131 | 93,997 |
Fannie Mae Pool FN AS7822
| | 3.500% | 08/01/2046 | 195,213 | 190,890 |
Fannie Mae Pool FN AZ9203
| | 3.000% | 10/01/2045 | 21,091 | 20,088 |
Fannie Mae Pool FN BA2885
| | 3.000% | 10/01/2045 | 39,862 | 37,630 |
Fannie Mae Pool FN BA4752
| | 3.000% | 01/01/2046 | 5,114 | 4,841 |
Fannie Mae Pool FN BC1520
| | 3.500% | 08/01/2046 | 149,121 | 145,816 |
Fannie Mae Pool FN BC2468
| | 3.000% | 03/01/2046 | 97,638 | 92,083 |
Fannie Mae Pool FN BC2488
| | 3.000% | 03/01/2046 | 109,786 | 103,617 |
Fannie Mae Pool FN BC9077
| | 3.500% | 12/01/2046 | 10,834 | 10,594 |
Fannie Mae Pool FN BH1902
| | 3.500% | 12/01/2047 | 9,769 | 9,575 |
Fannie Mae Pool FN BH3892
| | 3.500% | 08/01/2047 | 21,764 | 21,283 |
Fannie Mae Pool FN BH6940
| | 3.500% | 08/01/2047 | 19,279 | 18,852 |
Fannie Mae Pool FN BJ1692
| | 3.500% | 12/01/2047 | 48,479 | 47,404 |
Fannie Mae Pool FN BJ1695
| | 3.500% | 12/01/2047 | 6,907 | 6,754 |
Fannie Mae Pool FN BJ4558
| | 3.500% | 01/01/2048 | 35,685 | 34,894 |
Fannie Mae Pool FN BJ4559
| | 3.500% | 01/01/2048 | 13,031 | 12,739 |
Fannie Mae Pool FN BJ4566
| | 4.000% | 01/01/2048 | 113,872 | 114,392 |
Fannie Mae Pool FN BJ4567
| | 4.000% | 01/01/2048 | 164,487 | 164,965 |
Fannie Mae Pool FN BJ5170
| | 3.500% | 03/01/2048 | 8,727 | 8,554 |
Fannie Mae Pool FN BK1964
| | 4.000% | 03/01/2048 | 33,699 | 33,766 |
Fannie Mae Pool FN BK1975
| | 3.500% | 03/01/2048 | 20,312 | 19,862 |
Fannie Mae Pool FN BK3211
| | 4.500% | 03/01/2048 | 35,825 | 36,282 |
Fannie Mae Pool FN BK4157
| | 4.000% | 05/01/2048 | 46,578 | 46,733 |
Fannie Mae Pool FN BM3282
| | 3.500% | 12/01/2047 | 5,898 | 5,831 |
Fannie Mae Pool FN BM3511
| | 4.500% | 02/01/2046 | 75,388 | 77,802 |
Fannie Mae Pool FN BM3912
| | 3.000% | 03/01/2047 | 118,733 | 112,526 |
Fannie Mae Pool FN BM4427
| | 3.500% | 04/01/2048 | 68,343 | 66,831 |
Fannie Mae Pool FN BM4735
| | 3.500% | 04/01/2048 | 89,541 | 87,561 |
Fannie Mae Pool FN BM4896
| | 3.000% | 02/01/2047 | 775,878 | 741,296 |
Fannie Mae Pool FN BM5138
| | 3.500% | 11/01/2048 | 154,498 | 151,463 |
Fannie Mae Pool FN BM5334
| | 3.500% | 01/01/2049 | 38,165 | 37,324 |
Fannie Mae Pool FN BN0012
| | 4.500% | 08/01/2048 | 20,527 | 20,681 |
Fannie Mae Pool FN BO3223
| | 3.000% | 10/01/2034 | 31,967 | 31,585 |
Fannie Mae Pool FN BO4725
| | 2.500% | 11/01/2034 | 49,681 | 47,744 |
Fannie Mae Pool FN BO5957
| | 3.000% | 12/01/2034 | 5,949 | 5,873 |
Fannie Mae Pool FN BO7717
| | 3.000% | 11/01/2034 | 5,816 | 5,746 |
Fannie Mae Pool FN BU1240
| | 3.000% | 03/01/2052 | 1,080,365 | 1,011,166 |
Fannie Mae Pool FN BU1349
| | 3.000% | 02/01/2052 | 840,945 | 787,816 |
Fannie Mae Pool FN BU8919
| | 2.500% | 04/01/2052 | 693,325 | 625,880 |
Fannie Mae Pool FN BU8922
| | 2.500% | 04/01/2052 | 691,105 | 623,553 |
Fannie Mae Pool FN CA0108
| | 3.500% | 08/01/2047 | 20,410 | 20,181 |
Fannie Mae Pool FN CB1113
| | 2.000% | 07/01/2051 | 1,124,856 | 976,832 |
Fannie Mae Pool FN CB2538
| | 2.500% | 01/01/2052 | 725,862 | 655,514 |
Fannie Mae Pool FN CB3564
| | 2.500% | 05/01/2052 | 589,735 | 532,372 |
Fannie Mae Pool FN CB3565
| | 2.500% | 05/01/2052 | 474,231 | 427,515 |
Fannie Mae Pool FN FM0029
| | 3.000% | 09/01/2046 | 194,666 | 186,018 |
Fannie Mae Pool FN FM1036
| | 3.000% | 05/01/2043 | 98,662 | 94,071 |
Fannie Mae Pool FN FS0967
| | 2.500% | 03/01/2052 | 788,584 | 712,062 |
Fannie Mae Pool FN MA3211
| | 4.000% | 12/01/2047 | 46,542 | 46,740 |
Fannie Mae Pool FN MA3239
| | 4.000% | 01/01/2048 | 7,432 | 7,486 |
Freddie Mac Gold Pool FG G60658
| | 3.500% | 07/01/2046 | 193,365 | 190,693 |
Freddie Mac Gold Pool FG G61360
| | 3.500% | 03/01/2048 | 40,434 | 39,570 |
Freddie Mac Gold Pool FG G61737
| | 3.500% | 11/01/2048 | 165,768 | 162,234 |
Freddie Mac Gold Pool FG Q54793
| | 4.500% | 03/01/2048 | 31,653 | 32,038 |
Freddie Mac Gold Pool FG Q55394
| | 3.500% | 04/01/2048 | 13,238 | 12,956 |
Freddie Mac Pool FR QD8682
| | 3.000% | 03/01/2052 | 701,604 | 656,667 |
Freddie Mac Pool FR QE0805
| | 2.500% | 04/01/2052 | 645,937 | 582,800 |
Freddie Mac Pool FR QE0808
| | 2.500% | 04/01/2052 | 697,382 | 629,541 |
Freddie Mac Pool FR QN0783
| | 3.000% | 10/01/2034 | 31,523 | 31,146 |
Freddie Mac Pool FR QN0786
| | 3.000% | 10/01/2034 | 68,529 | 67,711 |
Freddie Mac Pool FR QN0951
| | 2.500% | 11/01/2034 | 47,839 | 45,974 |
| Ohio National Fund, Inc. | ON Risk Managed Balanced Portfolio (Continued) |
| Schedule of Investments | June 30, 2022 (Unaudited) |
| U.S. Government Agency Mortgage-Backed Securities (Continued) | Rate | Maturity | Face Amount | Value |
Freddie Mac Pool FR RA6963
| | 2.000% | 03/01/2052 | $ 1,087,030 | $ 947,614 |
Freddie Mac Pool FR SB0040
| | 2.500% | 12/01/2033 | 229,004 | 224,614 |
Freddie Mac Pool FR SB0116
| | 2.500% | 11/01/2034 | 59,453 | 57,107 |
Freddie Mac Pool FR SD0932
| | 2.500% | 04/01/2052 | 724,622 | 656,345 |
Freddie Mac Pool FR ZA4718
| | 3.000% | 10/01/2046 | 142,233 | 134,621 |
Freddie Mac Pool FR ZK8962
| | 3.000% | 09/01/2032 | 53,654 | 53,179 |
Freddie Mac Pool FR ZK9009
| | 3.000% | 10/01/2032 | 20,624 | 20,441 |
Freddie Mac Pool FR ZK9163
| | 3.000% | 01/01/2033 | 32,175 | 31,791 |
Freddie Mac Pool FR ZM1434
| | 3.500% | 07/01/2046 | 25,001 | 24,476 |
Freddie Mac Pool FR ZM4821
| | 3.500% | 11/01/2047 | 26,484 | 25,894 |
Freddie Mac Pool FR ZM4939
| | 3.500% | 11/01/2047 | 48,115 | 47,046 |
Freddie Mac Pool FR ZM5102
| | 3.500% | 12/01/2047 | 57,853 | 56,564 |
Freddie Mac Pool FR ZM5228
| | 3.500% | 12/01/2047 | 34,825 | 34,020 |
Freddie Mac Pool FR ZM5705
| | 3.500% | 02/01/2048 | 16,573 | 16,205 |
Freddie Mac Pool FR ZM5707
| | 3.500% | 02/01/2048 | 11,031 | 10,785 |
Freddie Mac Pool FR ZM5945
| | 4.000% | 03/01/2048 | 33,609 | 33,764 |
Freddie Mac Pool FR ZM6220
| | 4.000% | 04/01/2048 | 14,547 | 14,540 |
Freddie Mac Pool FR ZM6276
| | 4.000% | 04/01/2048 | 40,800 | 40,919 |
Freddie Mac Pool FR ZM6427
| | 4.000% | 05/01/2048 | 93,491 | 93,661 |
Freddie Mac Pool FR ZN2165
| | 4.500% | 12/01/2048 | 47,164 | 48,627 |
Freddie Mac Pool FR ZS4598
| | 3.000% | 01/01/2045 | 18,058 | 17,181 |
Freddie Mac Pool FR ZS7403
| | 3.000% | 05/01/2031 | 170,137 | 169,994 |
Freddie Mac Pool FR ZS9830
| | 3.500% | 10/01/2046 | 192,770 | 188,478 |
Freddie Mac Pool FR ZT0272
| | 3.500% | 02/01/2047 | 108,862 | 106,446 |
Freddie Mac Pool FR ZT0337
| | 3.500% | 12/01/2044 | 19,052 | 18,723 |
Freddie Mac Pool FR ZT0537
| | 3.500% | 03/01/2048 | 150,422 | 147,069 |
Freddie Mac Pool FR ZT1633
| | 4.000% | 03/01/2047 | 9,634 | 9,702 |
Ginnie Mae II Jumbo TBA
| | 3.000% | 07/15/2052 | 1,154,251 | 1,087,972 |
Ginnie Mae II Jumbo TBA
| | 4.000% | 07/15/2052 | 2,802,682 | 2,790,365 |
Ginnie Mae II Jumbo TBA
| | 4.500% | 09/15/2052 | 4,324,000 | 4,352,714 |
Total U.S. Government Agency Mortgage-Backed Securities (Cost $55,064,355)
| | | | | $ 54,272,558 |
| Preferred Securities–0.2% | Rate | Quantity | Value |
Financials–0.2%
| | | | |
Bank of America Corp. DR (Rate is fixed until 09/05/2024, at which point, the rate becomes QL + 371) (Banks)
| (d) | 6.250% | 286,000 | $ 277,992 |
Bank of America Corp. DR (Rate is fixed until 03/17/2025, at which point, the rate becomes QL + 390) (Banks)
| (d) | 6.100% | 124,000 | 122,100 |
Bank of New York Mellon Corp. / The DR (Rate is fixed until 09/20/2025, at which point, the rate becomes H15T5Y + 436) (Capital Markets)
| (d) | 4.700% | 61,000 | 59,597 |
Charles Schwab Corp. / The DR (Rate is fixed until 06/01/2026, at which point, the rate becomes H15T5Y + 317) (Capital Markets)
| (d) | 4.000% | 455,000 | 385,685 |
Citigroup, Inc. DR (Rate is fixed until 01/30/2023, at which point, the rate becomes QL + 407) (Banks)
| (d) | 5.950% | 217,000 | 212,617 |
Citigroup, Inc. DR (Rate is fixed until 05/15/2025, at which point, the rate becomes QL + 391) (Banks)
| (d) | 5.950% | 142,000 | 131,826 |
Citigroup, Inc. (Rate is fixed until 12/10/2025, at which point, the rate becomes H15T5Y + 360) (Banks)
| (d) | 4.000% | 101,000 | 87,365 |
Citigroup, Inc. DR (Rate is fixed until 02/15/2023, at which point, the rate becomes QL + 423) (Banks)
| (d) | 5.900% | 27,000 | 26,454 |
Discover Financial Services (Rate is fixed until 09/23/2025, at which point, the rate becomes H15T5Y + 578) (Consumer Finance)
| (d) | 6.125% | 404,000 | 403,959 |
Fifth Third Bancorp DR (Rate is fixed until 09/30/2025, at which point, the rate becomes H15T5Y + 422) (Banks)
| (d) | 4.500% | 76,000 | 70,773 |
Goldman Sachs Group, Inc. / The DR (Rate is fixed until 11/10/2026, at which point, the rate becomes H15T5Y + 295) (Capital Markets)
| (d) | 4.125% | 120,000 | 98,100 |
JPMorgan Chase & Co. DR (Banks)
| | QL + 347 | 131,000 | 124,188 |
JPMorgan Chase & Co. DR (Banks)
| | QL + 332 | 65,000 | 60,775 |
Truist Financial Corp. DR (Rate is fixed until 09/01/2030, at which point, the rate becomes H15T10Y + 435) (Banks)
| (d) | 5.100% | 256,000 | 231,680 |
Wells Fargo & Co. DR (Rate is fixed until 06/15/2025, at which point, the rate becomes QL + 399) (Banks)
| (d) | 5.875% | 292,000 | 284,671 |
| | | | | 2,577,782 |
Industrials–0.0%
| | | | |
General Electric Co. (Industrial Conglomerates)
| | QL + 333 | 336,000 | 294,403 |
Utilities–0.0%
| | | | |
Vistra Corp. (Rate is fixed until 12/15/2026, at which point, the rate becomes H15T5Y + 574) (Ind. Power & Renewable Elec.)
| (c)(d) | 7.000% | 107,000 | 97,103 |
Total Preferred Securities (Cost $3,286,024)
| | | | $ 2,969,288 |
| Sovereign Debt Issues–0.1% | Rate | Maturity | Face Amount | Value |
CDBL Funding 1
| | 3.500% | 10/24/2027 | $ 230,000 | $ 218,725 |
| Ohio National Fund, Inc. | ON Risk Managed Balanced Portfolio (Continued) |
| Schedule of Investments | June 30, 2022 (Unaudited) |
| Sovereign Debt Issues (Continued) | Rate | Maturity | Face Amount | Value |
Colombia Government International Bond
| | 3.125% | 04/15/2031 | $ 1,176,000 | $ 867,057 |
Dominican Republic International Bond
| (c) | 4.875% | 09/23/2032 | 250,000 | 192,359 |
Total Sovereign Debt Issues (Cost $1,533,203)
| | | | | $ 1,278,141 |
| Taxable Municipal Bonds–0.0% | Rate | Maturity | Face Amount | Value |
Ochsner LSU Health System of North Louisiana
| | 2.510% | 05/15/2031 | $ 230,000 | $ 186,097 |
Tobacco Settlement Finance Authority
| | 3.000% | 06/01/2035 | 73,548 | 70,191 |
University of California
| | 3.071% | 05/15/2051 | 310,000 | 234,090 |
Total Taxable Municipal Bonds (Cost $612,575)
| | | | | $ 490,378 |
| Money Market Funds–6.6% | Shares | Value |
State Street Institutional Liquid Reserves Fund Institutional Class, 1.494%
| (g) | 26,722,345 | $ 26,719,673 |
State Street Institutional U.S. Government Money Market Fund, 1.434%
| (g) | 53,828,706 | 53,828,706 |
Total Money Market Funds (Cost $80,549,457)
| | | $ 80,548,379 |
Total Investments – 102.7% (Cost $1,287,607,592)
| (h) | | $1,264,295,248 |
| Liabilities in Excess of Other Assets – (2.7)% | (b) | | (33,780,384) |
| Net Assets – 100.0% | | | $1,230,514,864 |
Percentages are stated as a percent of net assets. |
| Abbreviations: | |
| ADR: | American Depositary Receipts |
| CLO: | Collaterized Loan Obligation |
| DR: | Depositary Receipt |
| H15T10Y: | U.S. Treasury Yield Curve Rate T-Note Constant Maturity 10 Year, 2.980% at 06/30/2022 |
| H15T1Y: | U.S. Treasury Yield Curve Rate T-Note Constant Maturity 1 Year, 2.800% at 06/30/2022 |
| H15T5Y: | U.S. Treasury Yield Curve Rate T-Note Constant Maturity 5 Year, 3.010% at 06/30/2022 |
| ML: | Monthly U.S. LIBOR Rate, 1.787% at 06/30/2022 |
| QL: | Quarterly U.S. LIBOR Rate, 2.285% at 06/30/2022 |
| SOFR: | Secured Overnight Financing Rate, 1.500% at 06/30/2022 |
| SOFR30A: | 30 Day Average Secured Overnight Financing Rate, 1.089% at 06/30/2022 |
| TSFR3M: | Quarterly CME Term SOFR, 2.117% at 06/30/2022 |
| UMBS TBA: | Uniform Mortgage-Backed Security; the securities actually delivered on settlement of the To Be Announced ("TBA") could be issued by Fannie Mae, Freddie Mac, or any combination thereof |
| USISDA05: | USD ICE Swap Rate 11:00am NY 5 Year, 3.091% at 06/30/2022 |
| USSW5: | USD Swap Semi 30/360 5 Year, 3.075% at 06/30/2022 |
| Footnotes: | |
| (a) | Non-income producing security. |
| (b) | Security is partially pledged as collateral for the futures contracts outstanding at June 30, 2022. The market value pledged totaled $24,798,496. See also the following Schedule of Open Futures Contracts. |
| (c) | Security exempt from registration under Regulation D of the Securities Act of 1933. These securities may be resold in transactions exempt from registration, normally to qualified buyers under Rule 144A. At June 30, 2022, the value of these securities totaled $96,769,278, or 7.9% of the Portfolio’s net assets. |
| (d) | Security is a fixed-then-variable rate instrument in which the coupon or dividend rate is fixed until a later specified date, then is adjusted periodically. Rates stated, including interest rate caps and floors, if any, are those in effect at June 30, 2022. |
| (e) | 100 shares per contract. |
| (f) | Interest-only security |
| (g) | Rate represents the seven-day yield at June 30, 2022. |
| (h) | Represents cost for financial reporting purposes, which may differ from cost basis for federal income tax purposes. See also Note 7 of the Notes to Financial Statements. |
The accompanying notes are an integral part of these financial statements.
| Schedule of Open Futures Contracts | June 30, 2022 (Unaudited) |
Long Futures Contracts
| Description | | Number of
contracts | | Expiration Date | | Notional
Amount | | Value | | Unrealized
Appreciation
(Depreciation) | | Variation Margin
Receivable
(Payable) |
| CBT U.S. Ultra Bond - Long | | 17 | | September 21, 2022 | | $ 2,671,954 | | $ 2,623,844 | | $ (48,110) | | $ 39,843 |
| CBT 10-Year U.S. Ultra Bond - Long | | 20 | | September 21, 2022 | | 2,543,465 | | 2,547,500 | | 4,035 | | 4,062 |
| CBT U.S. Long Bond - Long | | 280 | | September 21, 2022 | | 39,137,638 | | 38,815,000 | | (322,638) | | 472,500 |
| CBT 10-Year U.S. Treasury Note - Long | | 3,109 | | September 21, 2022 | | 371,159,825 | | 368,513,656 | | (2,646,169) | | 3,157,578 |
| Ohio National Fund, Inc. | ON Risk Managed Balanced Portfolio (Continued) |
| Schedule of Open Futures Contracts | June 30, 2022 (Unaudited) |
Long Futures Contracts (Continued)
| Description | | Number of
contracts | | Expiration Date | | Notional
Amount | | Value | | Unrealized
Appreciation
(Depreciation) | | Variation Margin
Receivable
(Payable) |
| CBT 5-Year U.S. Treasury Note - Long | | 9 | | September 30, 2022 | | $ 1,015,887 | | $ 1,010,250 | | $ (5,637) | | $ 6,328 |
| CBT 2-Year U.S. Treasury Note - Long | | 31 | | September 30, 2022 | | 6,487,757 | | 6,510,484 | | 22,727 | | 17,438 |
| | | | | | | $423,016,526 | | $420,020,734 | | $(2,995,792) | | $3,697,749 |
Short Futures Contracts
| Description | | Number of
contracts | | Expiration Date | | Notional
Amount | | Value | | Unrealized
Appreciation
(Depreciation) | | Variation Margin
Receivable
(Payable) |
| CME E-mini S&P 500 Index - Short | | 1,117 | | September 16, 2022 | | $(217,310,024) | | (211,643,575) | | $5,666,449 | | $1,773,238 |
| Total Futures Contracts | | | | | | $ 205,706,502 | | $ 208,377,159 | | $2,670,657 | | $5,470,987 |
The accompanying notes are an integral part of these financial statements.
| Ohio National Fund, Inc. | ON Federated Core Plus Bond Portfolio (Unaudited) |
The ON Federated Core Plus Bond Portfolio seeks to provide total return by investing at least 80% of its net assets in fixed-income investments, primarily U.S. dollar denominated, investment-grade, fixed income securities. Investment-grade, fixed income securities are rated in one of the four highest categories (BBB- or higher) by a nationally recognized statistical rating organization (“NRSRO”).
Performance as of June 30, 2022
| Average Annual returns | |
| One year | -10.41% |
| Since inception (5/1/20) | -3.42% |
Past performance does not guarantee future results. The performance data quoted represents past performance and current returns may be lower or higher. Total return figures include change in share price and reinvestment of dividends and capital gains. The investment return and principal value will fluctuate so that an investor’s shares, when redeemed, may be worth more or less than the original cost. To obtain performance information up to the most recent month end, call toll-free 1-877-781-6392.
The Portfolio is not open to direct retail investment. Beneficial interest in the Portfolio’s shares is obtained either through an allocation to the Portfolio as an investment vehicle within variable life insurance policies or annuity contracts, or as an underlying investment by the ON Model Portfolios. Actual performance results for variable annuity and variable universal life contracts will be lower due to contract charges. Consult your contract for applicable charges.
Total expense ratio is 0.58% per the Fund’s prospectus dated April 29, 2022. Additional information pertaining to the Portfolio’s expense ratio as of June 30, 2022 can be found in the Portfolio’s Financial Highlights.
Comments from Sub-Adviser
Q. How did the Portfolio perform in comparison to its benchmark during the reporting period?
A. For the six-month period ended June 30, 2022, the Portfolio returned -10.29% versus -10.33% for its benchmark, the ICE BofA U.S. Broad Market Index.
Q. Were there specific market conditions, investment strategies, or techniques that materially affected the Portfolio’s benchmark-relative performance during the reporting period?
A. U.S. Treasury rates increased for all maturities of a month and longer. The magnitude of the rate increases was greatest in the front end of the yield curve with the one year rate up 236 basis points, while the thirty year rate was up 128 basis points during the period. This reshaping of the yield curve is known as a “bear flattener” and reflects the impact of the decision by the U.S. Federal Reserve (“Fed”) to increase the Federal Funds Rate by 150 basis points during the first six months of 2022. The Fed is raising the Fed Funds rate in an attempt to slow economic growth, in order to hopefully reduce inflation to the Fed’s inflation goal. Inflation has been running above the Fed’s goal due to continued strong consumer demand, supply chain disruptions, a tight labor market, and the Ukrainian war.
In anticipation of persistent inflation and a more aggressive Fed monetary policy, the Portfolio’s average duration position was less than that of the benchmark’s duration over the six-month period. In addition, the Portfolio was positioned for shorter term rates to increase more than longer term rates. As a result, the Portfolio generated positive returns relative to the benchmark from its duration and yield curve positioning in a rising interest rate environment. (1)
Q. How did sector allocation and security selection each impact the Portfolio’s performance relative to its benchmark?
A. The Portfolio was negatively affected by its sector allocation. During the six-month reporting period, credit spreads widened and the Portfolio’s allocation to the out of index emerging markets and bank loan sectors detracted from the Portfolio’s performance relative to the benchmark. In addition, the resulting underweight to U.S. Treasuries also detracted. These detractors more than offset the positive contribution from an underweight to the foreign sovereign sector.
The Portfolio’s security selection during the reporting period detracted from relative returns. Specifically, the Portfolio had negative security selection in U.S. Treasuries, consumer goods, and mortgage-backed securities. The Portfolio was positively impacted by security selection in energy, basic industries, and foreign sovereign securities. (1)
Q. Which securities contributed the most to, and detracted the most from, the Portfolio’s benchmark-relative performance?
A. The following holdings contributed the most to the Portfolio’s performance during the six-month period:
| • | The Portfolio held a short position in the June CBT U.S. Ultra Bond interest rate futures contract. This position was used to help manage the Portfolio’s interest rate risk and was a positive contributor in a rising rate environment. |
| • | The Portfolio held a short position in the March CBT U.S. Ultra Bond interest rate futures contract. This position was used to help manage the Portfolio’s interest rate risk and was a positive contributor in a rising rate environment. |
| • | The Portfolio held a short position in the June CBT 10-Year U.S. Treasury Note interest rate futures contract. This position was used to help manage the Portfolio’s interest rate risk and was a positive contributor in a rising rate environment. |
The following holdings detracted the most from the Portfolio’s performance during the period:
| • | U.S. Treasury Note 2.250% due 2/15/2052: This long U.S. Treasury Note was the worst contributor to performance due to the material increase in U.S. interest rates. |
| • | The Portfolio held an approximately 2.8% out of index position in the Federated Hermes Core Trust - Emerging Markets Core Fund. This exposure to credit sensitive emerging market bonds in a risk-off environment under-performed the higher quality benchmark. |
| • | U.S. Treasury Note 2.375% due 2/15/2042: This long U.S. Treasury Note was a negative contributor to performance due to the material increase in U.S. interest rates. (1) |
Q. How did the Portfolio’s use of derivative instruments and initial public offerings (IPOs), if any, impact performance?
A. U.S. interest rate futures were utilized to calibrate the Portfolio’s duration and yield curve positioning. The Portfolio’s average duration, which was less than the average duration of the benchmark, was a large positive contributor during the six-month period, while the Portfolio’s yield curve positioning was also a positive contributor. In aggregate, futures contracts contributed approximately 64 basis points to the Portfolio’s absolute return for the period. (1)
| (1) | The Portfolio’s composition is subject to change. Holdings and weightings are as of June 30, 2022. |
| Ohio National Fund, Inc. | ON Federated Core Plus Bond Portfolio (Unaudited) (Continued) |
Change in Value of $10,000 Investment
Hypothetical illustration based on past performance. Future performance will vary. The Portfolio’s returns reflect reinvested dividends. The Portfolio’s holdings may differ significantly from the securities in the index. The index is unmanaged and therefore does not reflect the cost of portfolio management and accounting.
The ICE BofA U.S. Broad Market Index measures the performance of U.S. dollar-denominated, investment grade debt securities, including U.S. Treasury notes and bonds, quasi-government securities, corporate securities, residential and commercial mortgage-backed securities and asset-backed securities. Securities are cap-weighted based on their amount outstanding times the market price plus accrued interest.
Past performance is no guarantee of future results. Redemption of fund shares could have tax implications unique to each shareholder.
| Portfolio Composition as of June 30, 2022 (1) |
| | % of Net Assets |
| U.S. Treasury Obligations | 38.6 |
| U.S. Government Agency Mortgage-Backed Securities | 27.2 |
| Corporate Bonds (4) | 23.0 |
| Investment Companies | 7.3 |
| Asset-Backed / Mortgage-Backed Securities (4) | 3.8 |
| Sovereign Debt Issues | 0.3 |
| Common Stocks (4) | 0.0 |
Money Market Funds
Less Net Liabilities | (0.2) |
| | 100.0 |
| Top 10 Portfolio Holdings as of June 30, 2022 (1) (2) (3) |
| | | % of Net Assets |
| 1. | U.S. Treasury Note 2.875%, 05/15/2052 | 5.9 |
| 2. | U.S. Treasury Note 0.125%, 06/30/2023 | 3.9 |
| 3. | Federated Hermes Core Trust III - Federated Project and Trade Finance Core Fund | 3.3 |
| 4. | U.S. Treasury Note 0.875%, 06/30/2026 | 2.9 |
| 5. | U.S. Treasury Note 2.500%, 03/31/2027 | 2.8 |
| 6. | U.S. Treasury Note 1.875%, 02/15/2032 | 2.4 |
| 7. | U.S. Treasury Note 2.250%, 03/31/2024 | 2.4 |
| 8. | Federated Hermes Core Trust - Emerging Markets Core Fund | 2.3 |
| 9. | U.S. Treasury Note 2.750%, 04/30/2027 | 2.2 |
| 10. | U.S. Treasury Note 2.375%, 02/15/2042 | 1.8 |
| | |
| (1) | Composition of Portfolio subject to change. |
| (2) | Short-term investments have been excluded from the list of Top 10 Portfolio Holdings. |
| (3) | Top 10 Portfolio Holdings is presented at an individual security level. Total investment exposure by issuer may be higher. |
| (4) | Sectors (Common Stocks, Corporate Bonds, Asset-Backed / Mortgage Backed Securities): |
| | % of Net Assets |
| Financials | 9.1 |
| Industrials | 2.9 |
| Communication Services | 2.5 |
| Utilities | 2.1 |
| Health Care | 2.0 |
| Energy | 1.8 |
| Information Technology | 1.5 |
| Consumer Staples | 1.5 |
| Consumer Discretionary | 1.2 |
| Real Estate | 1.1 |
| Materials | 1.1 |
| | 26.8 |
| Ohio National Fund, Inc. | ON Federated Core Plus Bond Portfolio |
| Schedule of Investments | June 30, 2022 (Unaudited) |
| U.S. Treasury Obligations–38.6% | Rate | Maturity | Face Amount | Value |
U.S. Treasury Note
| | 0.125% | 04/30/2023 | $ 3,000,000 | $ 2,932,500 |
U.S. Treasury Note
| | 0.125% | 06/30/2023 | 22,500,000 | 21,885,644 |
U.S. Treasury Note
| | 0.750% | 12/31/2023 | 7,250,000 | 7,013,809 |
U.S. Treasury Note
| | 2.250% | 03/31/2024 | 14,000,000 | 13,823,906 |
U.S. Treasury Note
| | 2.500% | 04/30/2024 | 8,400,000 | 8,326,828 |
U.S. Treasury Note
| | 0.250% | 05/15/2024 | 7,500,000 | 7,128,223 |
U.S. Treasury Note
| | 3.000% | 06/30/2024 | 5,000,000 | 5,002,539 |
U.S. Treasury Note
| | 0.375% | 09/15/2024 | 6,000,000 | 5,662,969 |
U.S. Treasury Note
| | 0.375% | 12/31/2025 | 3,000,000 | 2,734,101 |
U.S. Treasury Note
| | 0.875% | 06/30/2026 | 18,000,000 | 16,524,141 |
U.S. Treasury Note
| | 0.625% | 07/31/2026 | 2,400,000 | 2,176,500 |
U.S. Treasury Note
| | 1.500% | 01/31/2027 | 3,500,000 | 3,267,852 |
U.S. Treasury Note
| | 2.500% | 03/31/2027 | 16,400,000 | 16,000,891 |
U.S. Treasury Note
| (a) | 0.500% | 04/30/2027 | 3,200,000 | 2,832,250 |
U.S. Treasury Note
| | 2.750% | 04/30/2027 | 12,600,000 | 12,429,703 |
U.S. Treasury Note
| | 2.625% | 05/31/2027 | 3,000,000 | 2,943,281 |
U.S. Treasury Note
| | 1.250% | 03/31/2028 | 575,000 | 519,476 |
U.S. Treasury Note
| | 1.500% | 11/30/2028 | 4,200,000 | 3,813,797 |
U.S. Treasury Note
| | 1.375% | 12/31/2028 | 3,650,000 | 3,289,990 |
U.S. Treasury Note
| | 2.375% | 03/31/2029 | 6,500,000 | 6,221,973 |
U.S. Treasury Note
| | 2.875% | 04/30/2029 | 7,800,000 | 7,708,594 |
U.S. Treasury Note
| | 1.125% | 02/15/2031 | 405,000 | 348,015 |
U.S. Treasury Note
| | 1.875% | 02/15/2032 | 15,300,000 | 13,860,844 |
U.S. Treasury Note
| | 2.875% | 05/15/2032 | 2,500,000 | 2,471,875 |
U.S. Treasury Note
| | 1.375% | 11/15/2040 | 525,000 | 378,102 |
U.S. Treasury Note
| | 1.875% | 02/15/2041 | 180,000 | 141,166 |
U.S. Treasury Note
| | 2.375% | 02/15/2042 | 11,850,000 | 10,048,430 |
U.S. Treasury Note
| | 2.000% | 02/15/2050 | 3,750,000 | 2,905,957 |
U.S. Treasury Note
| | 1.875% | 02/15/2051 | 3,940,000 | 2,955,462 |
U.S. Treasury Note
| | 2.875% | 05/15/2052 | 35,300,000 | 33,341,953 |
Total U.S. Treasury Obligations (Cost $228,333,075)
| | | | | $218,690,771 |
| U.S. Government Agency Mortgage-Backed Securities–27.2% | Rate | Maturity | Face Amount | Value |
Fannie Mae Pool FN BM4333
| | 3.500% | 12/01/2047 | $ 1,078,745 | $ 1,052,469 |
Fannie Mae Pool FN BN6715
| | 4.000% | 06/01/2049 | 3,077,176 | 3,074,462 |
Fannie Mae Pool FN BP2797
| | 2.500% | 05/01/2050 | 1,586,169 | 1,432,322 |
Fannie Mae Pool FN BP6700
| | 2.500% | 09/01/2050 | 4,389,059 | 3,986,916 |
Fannie Mae Pool FN BP8188
| | 2.000% | 09/01/2050 | 6,278,936 | 5,477,063 |
Fannie Mae Pool FN BQ4558
| | 2.000% | 03/01/2051 | 2,193,698 | 1,912,411 |
Fannie Mae Pool FN BR1844
| | 2.500% | 01/01/2051 | 1,264,485 | 1,139,804 |
Fannie Mae Pool FN BR2231
| | 2.000% | 08/01/2051 | 1,882,964 | 1,641,634 |
Fannie Mae Pool FN BR4390
| | 2.000% | 03/01/2051 | 3,750,880 | 3,270,476 |
Fannie Mae Pool FN BR4694
| | 2.000% | 03/01/2051 | 5,892,785 | 5,136,732 |
Fannie Mae Pool FN BR9750
| | 2.000% | 04/01/2051 | 3,767,646 | 3,277,302 |
Fannie Mae Pool FN BT6901
| | 2.500% | 09/01/2051 | 2,577,968 | 2,323,626 |
Fannie Mae Pool FN BT7183
| | 2.500% | 08/01/2051 | 1,741,600 | 1,569,236 |
Fannie Mae Pool FN CA4574
| | 4.000% | 08/01/2049 | 1,743,039 | 1,737,888 |
Fannie Mae Pool FN CA4819
| | 4.000% | 12/01/2049 | 1,069,699 | 1,066,203 |
Fannie Mae Pool FN CA5348
| | 3.500% | 03/01/2050 | 1,667,595 | 1,617,049 |
Fannie Mae Pool FN CA5706
| | 2.500% | 05/01/2050 | 2,053,415 | 1,854,325 |
Fannie Mae Pool FN CA6998
| | 3.000% | 09/01/2050 | 3,170,971 | 2,963,696 |
Fannie Mae Pool FN CA7231
| | 2.500% | 10/01/2050 | 765,325 | 690,318 |
Fannie Mae Pool FN CA8118
| | 2.000% | 12/01/2050 | 1,880,759 | 1,639,665 |
Fannie Mae Pool FN CA9290
| | 2.500% | 02/01/2051 | 2,701,100 | 2,437,361 |
Fannie Mae Pool FN CA9293
| | 2.500% | 02/01/2051 | 2,529,295 | 2,279,868 |
Fannie Mae Pool FN CB1131
| | 2.500% | 07/01/2051 | 1,813,044 | 1,633,688 |
Fannie Mae Pool FN CB3335
| | 4.500% | 04/01/2052 | 4,865,564 | 5,001,372 |
Fannie Mae Pool FN FM2778
| | 3.000% | 03/01/2050 | 2,275,800 | 2,134,856 |
Fannie Mae Pool FN FM3734
| | 3.500% | 09/01/2049 | 1,230,784 | 1,203,676 |
Fannie Mae Pool FN FM3919
| | 4.000% | 05/01/2049 | 786,185 | 793,648 |
Fannie Mae Pool FN FM4122
| | 2.000% | 08/01/2050 | 6,445,096 | 5,619,481 |
Fannie Mae Pool FN FM4317
| | 3.000% | 09/01/2050 | 3,056,266 | 2,850,472 |
Fannie Mae Pool FN FM4532
| | 3.000% | 09/01/2050 | 3,443,424 | 3,218,284 |
Fannie Mae Pool FN FM5815
| | 2.500% | 12/01/2035 | 4,003,747 | 3,834,118 |
Fannie Mae Pool FN FM6708
| | 2.500% | 01/01/2051 | 3,823,576 | 3,446,838 |
Fannie Mae Pool FN FM7293
| | 2.500% | 05/01/2051 | 1,325,058 | 1,193,888 |
Fannie Mae Pool FN FM7502
| | 3.500% | 06/01/2050 | 2,849,135 | 2,760,380 |
Fannie Mae Pool FN FM7510
| | 3.000% | 06/01/2051 | 1,607,192 | 1,500,928 |
Fannie Mae Pool FN FM7706
| | 3.500% | 08/01/2050 | 3,419,460 | 3,322,003 |
| Ohio National Fund, Inc. | ON Federated Core Plus Bond Portfolio (Continued) |
| Schedule of Investments | June 30, 2022 (Unaudited) |
| U.S. Government Agency Mortgage-Backed Securities (Continued) | Rate | Maturity | Face Amount | Value |
Fannie Mae Pool FN FM8421
| | 2.500% | 08/01/2051 | $ 2,280,217 | $ 2,054,469 |
Fannie Mae Pool FN MA4119
| | 2.000% | 09/01/2050 | 934,888 | 815,141 |
Fannie Mae Pool FN MA4138
| | 1.500% | 09/01/2050 | 4,418,657 | 3,678,438 |
Fannie Mae Pool FN MA4255
| | 2.000% | 02/01/2051 | 1,702,487 | 1,484,654 |
Fannie Mae Pool FN MA4415
| | 3.000% | 09/01/2051 | 2,040,652 | 1,905,363 |
Fannie Mae Pool FN MA4593
| | 4.000% | 03/01/2052 | 969,989 | 957,650 |
Freddie Mac Pool FR QC8475
| | 2.000% | 10/01/2051 | 2,918,268 | 2,544,050 |
Freddie Mac Pool FR QC8887
| | 3.000% | 10/01/2051 | 2,304,295 | 2,150,805 |
Freddie Mac Pool FR QD7126
| | 2.500% | 02/01/2052 | 2,448,584 | 2,210,612 |
Freddie Mac Pool FR RA3357
| | 2.000% | 08/01/2050 | 1,234,151 | 1,075,253 |
Freddie Mac Pool FR RA3575
| | 2.000% | 09/01/2050 | 6,186,934 | 5,392,226 |
Freddie Mac Pool FR RA3611
| | 2.500% | 09/01/2050 | 4,215,198 | 3,803,328 |
Freddie Mac Pool FR RA5257
| | 2.000% | 05/01/2051 | 3,805,741 | 3,318,157 |
Freddie Mac Pool FR RA5258
| | 2.000% | 05/01/2051 | 7,389,500 | 6,441,905 |
Freddie Mac Pool FR RA5761
| | 2.000% | 06/01/2051 | 2,422,615 | 2,111,968 |
Freddie Mac Pool FR SB8122
| | 1.500% | 10/01/2036 | 1,848,542 | 1,683,394 |
Freddie Mac Pool FR SD0451
| | 3.000% | 10/01/2050 | 1,739,884 | 1,628,807 |
Freddie Mac Pool FR SD0625
| | 2.500% | 05/01/2051 | 2,211,689 | 1,992,737 |
Freddie Mac Pool FR SD0977
| | 3.500% | 02/01/2052 | 5,972,047 | 5,783,810 |
Freddie Mac Pool FR SD7505
| | 4.500% | 08/01/2049 | 832,699 | 850,931 |
Freddie Mac Pool FR SD8104
| | 1.500% | 11/01/2050 | 2,160,968 | 1,796,360 |
Freddie Mac Pool FR SD8121
| | 2.000% | 01/01/2051 | 1,682,087 | 1,466,026 |
Freddie Mac Pool FR SD8135
| | 2.500% | 03/01/2051 | 563,825 | 508,359 |
Freddie Mac Pool FR SD8148
| | 3.000% | 05/01/2051 | 3,244,776 | 3,028,418 |
Freddie Mac Pool FR SD8204
| | 2.000% | 04/01/2052 | 2,966,090 | 2,577,428 |
Freddie Mac Pool FR SD8210
| | 4.000% | 03/01/2052 | 950,639 | 939,715 |
Freddie Mac Pool FR ZT1257
| | 3.000% | 01/01/2046 | 793,938 | 758,700 |
Ginnie Mae II Pool G2 MA6866
| | 3.000% | 09/20/2050 | 1,529,443 | 1,448,346 |
Total U.S. Government Agency Mortgage-Backed Securities (Cost $171,565,696)
| | | | | $154,501,508 |
| Corporate Bonds–23.0% | Rate | Maturity | Face Amount | Value |
Communication Services–2.5%
| | | | | |
Alphabet, Inc. (Interactive Media & Svs.)
| | 1.900% | 08/15/2040 | $ 650,000 | $ 465,956 |
America Movil S.A.B de C.V. (Wireless Telecom. Svs.)
| | 2.875% | 05/07/2030 | 275,000 | 246,106 |
AT&T, Inc. (Diversified Telecom. Svs.)
| | 0.900% | 03/25/2024 | 550,000 | 524,403 |
AT&T, Inc. (Diversified Telecom. Svs.)
| | 1.700% | 03/25/2026 | 550,000 | 502,523 |
AT&T, Inc. (Diversified Telecom. Svs.)
| | 4.300% | 02/15/2030 | 175,000 | 170,783 |
AT&T, Inc. (Diversified Telecom. Svs.)
| | 3.500% | 06/01/2041 | 875,000 | 698,667 |
AT&T, Inc. (Diversified Telecom. Svs.)
| | 3.800% | 12/01/2057 | 1,870,000 | 1,444,244 |
Audacy Capital Corp. (Media)
| (b) | 6.500% | 05/01/2027 | 75,000 | 44,633 |
Audacy Capital Corp. (Media)
| (b) | 6.750% | 03/31/2029 | 75,000 | 39,938 |
Cars.com, Inc. (Interactive Media & Svs.)
| (b) | 6.375% | 11/01/2028 | 50,000 | 42,124 |
CCO Holdings LLC / CCO Holdings Capital Corp. (Media)
| (b) | 5.000% | 02/01/2028 | 100,000 | 92,270 |
CCO Holdings LLC / CCO Holdings Capital Corp. (Media)
| (b) | 4.500% | 08/15/2030 | 225,000 | 186,813 |
CCO Holdings LLC / CCO Holdings Capital Corp. (Media)
| (b) | 4.250% | 02/01/2031 | 125,000 | 101,875 |
CCO Holdings LLC / CCO Holdings Capital Corp. (Media)
| (b) | 4.500% | 06/01/2033 | 75,000 | 59,101 |
Charter Communications Operating LLC / Charter Communications Operating Capital Corp. (Media)
| | 6.484% | 10/23/2045 | 550,000 | 534,693 |
CMG Media Corp. (Media)
| (b) | 8.875% | 12/15/2027 | 125,000 | 98,751 |
Comcast Corp. (Media)
| | 3.450% | 02/01/2050 | 950,000 | 755,669 |
CSC Holdings LLC (Media)
| (b) | 5.500% | 04/15/2027 | 200,000 | 181,242 |
CSC Holdings LLC (Media)
| (b) | 7.500% | 04/01/2028 | 250,000 | 208,750 |
Cumulus Media New Holdings, Inc. (Media)
| (b) | 6.750% | 07/01/2026 | 73,000 | 67,251 |
DIRECTV Holdings LLC / DIRECTV Financing Co., Inc. (Media)
| (b) | 5.875% | 08/15/2027 | 75,000 | 63,980 |
DISH DBS Corp. (Media)
| (b) | 5.250% | 12/01/2026 | 50,000 | 39,192 |
DISH DBS Corp. (Media)
| | 7.375% | 07/01/2028 | 50,000 | 34,010 |
DISH DBS Corp. (Media)
| | 5.125% | 06/01/2029 | 75,000 | 45,573 |
Entegris Escrow Corp. (Media)
| (b) | 5.950% | 06/15/2030 | 25,000 | 23,784 |
Gray Escrow II, Inc. (Media)
| (b) | 5.375% | 11/15/2031 | 100,000 | 80,123 |
Gray Television, Inc. (Media)
| (b) | 4.750% | 10/15/2030 | 75,000 | 58,687 |
Grupo Televisa S.A.B. (Media)
| | 5.000% | 05/13/2045 | 350,000 | 325,071 |
iHeartCommunications, Inc. (Media)
| | 6.375% | 05/01/2026 | 25,000 | 23,156 |
iHeartCommunications, Inc. (Media)
| | 8.375% | 05/01/2027 | 100,000 | 79,468 |
iHeartCommunications, Inc. (Media)
| (b) | 5.250% | 08/15/2027 | 100,000 | 85,583 |
Lamar Media Corp. (Media)
| | 4.875% | 01/15/2029 | 50,000 | 45,006 |
Magallanes, Inc. (Media)
| (b) | 4.279% | 03/15/2032 | 450,000 | 402,184 |
Magallanes, Inc. (Media)
| (b) | 5.050% | 03/15/2042 | 470,000 | 399,871 |
Match Group Holdings II LLC (Interactive Media & Svs.)
| (b) | 5.000% | 12/15/2027 | 125,000 | 115,872 |
Midas OpCo Holdings LLC (Media)
| (b) | 5.625% | 08/15/2029 | 150,000 | 120,529 |
Millennium Escrow Corp. (Interactive Media & Svs.)
| (b) | 6.625% | 08/01/2026 | 50,000 | ��40,353 |
| Ohio National Fund, Inc. | ON Federated Core Plus Bond Portfolio (Continued) |
| Schedule of Investments | June 30, 2022 (Unaudited) |
| Corporate Bonds (Continued) | Rate | Maturity | Face Amount | Value |
Communication Services (continued)
| | | | | |
Netflix, Inc. (Entertainment)
| | 4.875% | 04/15/2028 | $ 325,000 | $ 305,841 |
News Corp. (Media)
| (b) | 5.125% | 02/15/2032 | 25,000 | 22,138 |
Nexstar Media, Inc. (Media)
| (b) | 5.625% | 07/15/2027 | 150,000 | 136,875 |
Paramount Global (Media)
| | 4.200% | 05/19/2032 | 525,000 | 463,057 |
Paramount Global (Media)
| | 4.900% | 08/15/2044 | 300,000 | 243,219 |
Rackspace Technology Global, Inc. (Interactive Media & Svs.)
| (b) | 3.500% | 02/15/2028 | 50,000 | 39,174 |
Rackspace Technology Global, Inc. (Interactive Media & Svs.)
| (b) | 5.375% | 12/01/2028 | 100,000 | 65,347 |
ROBLOX Corp. (Entertainment)
| (b) | 3.875% | 05/01/2030 | 50,000 | 40,526 |
Rogers Communications, Inc. (Wireless Telecom. Svs.)
| (b) | 4.500% | 03/15/2042 | 465,000 | 413,077 |
Scripps Escrow, Inc. (Media)
| (b) | 5.875% | 07/15/2027 | 100,000 | 87,546 |
Sinclair Television Group, Inc. (Media)
| (b) | 5.125% | 02/15/2027 | 25,000 | 21,078 |
Sinclair Television Group, Inc. (Media)
| (b) | 5.500% | 03/01/2030 | 50,000 | 36,816 |
Sirius XM Radio, Inc. (Media)
| (b) | 4.125% | 07/01/2030 | 50,000 | 41,760 |
Sirius XM Radio, Inc. (Media)
| (b) | 3.875% | 09/01/2031 | 200,000 | 159,250 |
Sky Ltd. (Media)
| (b) | 3.750% | 09/16/2024 | 375,000 | 373,776 |
Sprint Corp. (Wireless Telecom. Svs.)
| | 7.625% | 03/01/2026 | 50,000 | 52,681 |
TEGNA, Inc. (Media)
| (b) | 4.750% | 03/15/2026 | 75,000 | 71,982 |
TEGNA, Inc. (Media)
| | 4.625% | 03/15/2028 | 25,000 | 23,375 |
TEGNA, Inc. (Media)
| | 5.000% | 09/15/2029 | 25,000 | 23,646 |
T-Mobile U.S.A., Inc. (Wireless Telecom. Svs.)
| | 4.750% | 02/01/2028 | 100,000 | 96,921 |
T-Mobile U.S.A., Inc. (Wireless Telecom. Svs.)
| | 3.375% | 04/15/2029 | 125,000 | 109,375 |
T-Mobile U.S.A., Inc. (Wireless Telecom. Svs.)
| | 3.300% | 02/15/2051 | 500,000 | 364,092 |
Twitter, Inc. (Interactive Media & Svs.)
| (b) | 5.000% | 03/01/2030 | 50,000 | 47,437 |
Univision Communications, Inc. (Media)
| (b) | 4.500% | 05/01/2029 | 25,000 | 20,926 |
Univision Communications, Inc. (Media)
| (b) | 7.375% | 06/30/2030 | 25,000 | 24,438 |
UPC Broadband Finco B.V. (Media)
| (b) | 4.875% | 07/15/2031 | 200,000 | 163,000 |
Urban One, Inc. (Media)
| (b) | 7.375% | 02/01/2028 | 50,000 | 42,813 |
Verizon Communications, Inc. (Diversified Telecom. Svs.)
| | 4.000% | 03/22/2050 | 950,000 | 820,971 |
Virgin Media Finance PLC (Media)
| (b) | 5.000% | 07/15/2030 | 200,000 | 158,500 |
Vodafone Group PLC (Wireless Telecom. Svs.)
| | 4.125% | 05/30/2025 | 275,000 | 276,028 |
Vodafone Group PLC (Wireless Telecom. Svs.)
| | 5.250% | 05/30/2048 | 300,000 | 285,410 |
Walt Disney Co. / The (Entertainment)
| | 3.800% | 03/22/2030 | 125,000 | 120,857 |
Walt Disney Co. / The (Entertainment)
| | 4.700% | 03/23/2050 | 325,000 | 320,538 |
Walt Disney Co. / The (Entertainment)
| | 3.600% | 01/13/2051 | 350,000 | 292,125 |
| | | | | | 14,212,829 |
Consumer Discretionary–1.2%
| | | | | |
1011778 B.C. ULC / New Red Finance, Inc. (Hotels, Restaurants & Leisure)
| (b) | 4.000% | 10/15/2030 | 225,000 | 180,562 |
Advance Auto Parts, Inc. (Specialty Retail)
| | 3.900% | 04/15/2030 | 675,000 | 613,761 |
Affinity Gaming (Hotels, Restaurants & Leisure)
| (b) | 6.875% | 12/15/2027 | 125,000 | 105,005 |
Amazon.com, Inc. (Internet & Direct Marketing Retail)
| | 3.875% | 08/22/2037 | 425,000 | 402,864 |
Amazon.com, Inc. (Internet & Direct Marketing Retail)
| | 2.500% | 06/03/2050 | 725,000 | 510,974 |
Aramark Services, Inc. (Hotels, Restaurants & Leisure)
| (b) | 5.000% | 04/01/2025 | 50,000 | 47,907 |
Aramark Services, Inc. (Hotels, Restaurants & Leisure)
| (b) | 5.000% | 02/01/2028 | 50,000 | 45,311 |
Asbury Automotive Group, Inc. (Specialty Retail)
| (b) | 4.625% | 11/15/2029 | 25,000 | 20,656 |
Asbury Automotive Group, Inc. (Specialty Retail)
| (b) | 5.000% | 02/15/2032 | 50,000 | 40,875 |
Boyd Gaming Corp. (Hotels, Restaurants & Leisure)
| | 4.750% | 12/01/2027 | 50,000 | 45,250 |
Caesars Entertainment, Inc. (Hotels, Restaurants & Leisure)
| (b) | 8.125% | 07/01/2027 | 75,000 | 72,469 |
Caesars Entertainment, Inc. (Hotels, Restaurants & Leisure)
| (b) | 4.625% | 10/15/2029 | 100,000 | 77,750 |
Clarios Global LP (Automobiles)
| (b) | 6.750% | 05/15/2025 | 22,000 | 21,790 |
Clarios Global LP / Clarios U.S. Finance Co. (Auto Components)
| (b) | 8.500% | 05/15/2027 | 200,000 | 193,295 |
Daimler Finance North America LLC (Automobiles)
| (b) | 3.350% | 02/22/2023 | 700,000 | 700,907 |
Daimler Trucks Finance North America LLC (Automobiles)
| (b) | 2.000% | 12/14/2026 | 340,000 | 305,499 |
Daimler Trucks Finance North America LLC (Automobiles)
| (b) | 2.375% | 12/14/2028 | 180,000 | 154,961 |
Dana Financing Luxembourg SARL (Auto Components)
| (b) | 5.750% | 04/15/2025 | 50,000 | 47,742 |
Dana, Inc. (Auto Components)
| | 4.500% | 02/15/2032 | 50,000 | 36,939 |
Dollar General Corp. (Multiline Retail)
| | 3.875% | 04/15/2027 | 575,000 | 564,575 |
Dornoch Debt Merger Sub, Inc. (Auto Components)
| (b) | 6.625% | 10/15/2029 | 175,000 | 129,237 |
Gap, Inc. / The (Specialty Retail)
| (b) | 3.625% | 10/01/2029 | 25,000 | 17,555 |
Gap, Inc. / The (Specialty Retail)
| (b) | 3.875% | 10/01/2031 | 25,000 | 17,438 |
Garda World Security Corp. (Diversified Consumer Svs.)
| (b) | 9.500% | 11/01/2027 | 175,000 | 160,051 |
Gates Global LLC / Gates Corp. (Auto Components)
| (b) | 6.250% | 01/15/2026 | 150,000 | 139,125 |
General Motors Co. (Automobiles)
| | 6.125% | 10/01/2025 | 575,000 | 594,400 |
Hilton Domestic Operating Co., Inc. (Hotels, Restaurants & Leisure)
| (b) | 3.625% | 02/15/2032 | 50,000 | 39,719 |
Home Depot, Inc. / The (Specialty Retail)
| | 3.300% | 04/15/2040 | 950,000 | 806,500 |
MGM Resorts International (Hotels, Restaurants & Leisure)
| | 6.750% | 05/01/2025 | 50,000 | 49,062 |
Midwest Gaming Borrower LLC / Midwest Gaming Finance Corp. (Hotels, Restaurants & Leisure)
| (b) | 4.875% | 05/01/2029 | 50,000 | 40,750 |
Mohegan Gaming & Entertainment (Hotels, Restaurants & Leisure)
| (b) | 8.000% | 02/01/2026 | 150,000 | 127,500 |
| Ohio National Fund, Inc. | ON Federated Core Plus Bond Portfolio (Continued) |
| Schedule of Investments | June 30, 2022 (Unaudited) |
| Corporate Bonds (Continued) | Rate | Maturity | Face Amount | Value |
Consumer Discretionary (continued)
| | | | | |
Penn National Gaming, Inc. (Hotels, Restaurants & Leisure)
| (b) | 5.625% | 01/15/2027 | $ 25,000 | $ 21,938 |
Penn National Gaming, Inc. (Hotels, Restaurants & Leisure)
| (b) | 4.125% | 07/01/2029 | 25,000 | 18,970 |
Raptor Acquisition Corp. / Raptor Co-Issuer LLC (Hotels, Restaurants & Leisure)
| (b) | 4.875% | 11/01/2026 | 25,000 | 21,875 |
Real Hero Merger Sub 2, Inc. (Auto Components)
| (b) | 6.250% | 02/01/2029 | 175,000 | 132,718 |
Scientific Games Holdings LP / Scientific Games U.S. FinCo, Inc. (Hotels, Restaurants & Leisure)
| (b) | 6.625% | 03/01/2030 | 100,000 | 85,000 |
Scientific Games International, Inc. (Hotels, Restaurants & Leisure)
| (b) | 8.625% | 07/01/2025 | 50,000 | 51,255 |
Scientific Games International, Inc. (Hotels, Restaurants & Leisure)
| (b) | 7.250% | 11/15/2029 | 50,000 | 46,890 |
SeaWorld Parks & Entertainment, Inc. (Hotels, Restaurants & Leisure)
| (b) | 5.250% | 08/15/2029 | 50,000 | 42,310 |
Six Flags Entertainment Corp. (Hotels, Restaurants & Leisure)
| (b) | 5.500% | 04/15/2027 | 100,000 | 90,752 |
Station Casinos LLC (Hotels, Restaurants & Leisure)
| (b) | 4.500% | 02/15/2028 | 50,000 | 42,231 |
Station Casinos LLC (Hotels, Restaurants & Leisure)
| (b) | 4.625% | 12/01/2031 | 50,000 | 39,000 |
Yum! Brands, Inc. (Hotels, Restaurants & Leisure)
| | 4.625% | 01/31/2032 | 100,000 | 88,350 |
| | | | | | 6,991,718 |
Consumer Staples–1.5%
| | | | | |
Albertsons Cos., Inc. / Safeway, Inc. / New Albertsons LP / Albertsons LLC (Food & Staples Retailing)
| (b) | 5.875% | 02/15/2028 | 75,000 | 70,097 |
Alimentation Couche-Tard, Inc. (Food & Staples Retailing)
| (b) | 3.800% | 01/25/2050 | 625,000 | 471,583 |
Altria Group, Inc. (Tobacco)
| | 3.875% | 09/16/2046 | 800,000 | 538,174 |
Anheuser-Busch InBev Worldwide, Inc. (Beverages)
| | 4.350% | 06/01/2040 | 300,000 | 268,453 |
Anheuser-Busch InBev Worldwide, Inc. (Beverages)
| | 4.500% | 06/01/2050 | 1,050,000 | 943,925 |
B.A.T. Capital Corp. (Tobacco)
| | 4.540% | 08/15/2047 | 725,000 | 531,574 |
BellRing Brands, Inc. (Personal Products)
| (b) | 7.000% | 03/15/2030 | 100,000 | 94,250 |
Coca-Cola Europacific Partners PLC (Beverages)
| (b) | 1.500% | 01/15/2027 | 600,000 | 532,382 |
Coca-Cola Femsa S.A.B de C.V. (Beverages)
| | 2.750% | 01/22/2030 | 750,000 | 670,020 |
Constellation Brands, Inc. (Beverages)
| | 3.750% | 05/01/2050 | 400,000 | 319,505 |
Edgewell Personal Care Co. (Personal Products)
| (b) | 5.500% | 06/01/2028 | 50,000 | 45,495 |
Edgewell Personal Care Co. (Personal Products)
| (b) | 4.125% | 04/01/2029 | 25,000 | 20,634 |
Energizer Holdings, Inc. (Household Products)
| (b) | 6.500% | 12/31/2027 | 25,000 | 21,906 |
Energizer Holdings, Inc. (Household Products)
| (b) | 4.375% | 03/31/2029 | 100,000 | 76,773 |
Flowers Foods, Inc. (Food Products)
| | 3.500% | 10/01/2026 | 675,000 | 647,031 |
Flowers Foods, Inc. (Food Products)
| | 2.400% | 03/15/2031 | 185,000 | 152,587 |
Grupo Bimbo S.A.B de C.V. (Food Products)
| (b) | 4.875% | 06/27/2044 | 925,000 | 849,463 |
Keurig Dr Pepper, Inc. (Beverages)
| | 4.417% | 05/25/2025 | 36,000 | 36,282 |
Kraft Heinz Foods Co. (Food Products)
| | 4.375% | 06/01/2046 | 425,000 | 354,197 |
Kroger Co. / The (Food & Staples Retailing)
| | 3.950% | 01/15/2050 | 325,000 | 274,183 |
Performance Food Group, Inc. (Food & Staples Retailing)
| (b) | 5.500% | 10/15/2027 | 50,000 | 46,287 |
Performance Food Group, Inc. (Food & Staples Retailing)
| (b) | 4.250% | 08/01/2029 | 50,000 | 41,750 |
Philip Morris International, Inc. (Tobacco)
| | 3.875% | 08/21/2042 | 615,000 | 480,975 |
Post Holdings, Inc. (Food Products)
| (b) | 5.750% | 03/01/2027 | 150,000 | 145,312 |
Post Holdings, Inc. (Food Products)
| (b) | 4.625% | 04/15/2030 | 25,000 | 21,094 |
Sysco Corp. (Food & Staples Retailing)
| | 4.450% | 03/15/2048 | 525,000 | 460,855 |
U.S. Foods, Inc. (Food & Staples Retailing)
| (b) | 4.750% | 02/15/2029 | 75,000 | 65,564 |
U.S. Foods, Inc. (Food & Staples Retailing)
| (b) | 4.625% | 06/01/2030 | 75,000 | 63,228 |
Unilever Capital Corp. (Personal Products)
| | 0.375% | 09/14/2023 | 100,000 | 96,852 |
| | | | | | 8,340,431 |
Energy–1.8%
| | | | | |
Antero Midstream Partners LP / Antero Midstream Finance Corp. (Oil, Gas & Consumable Fuels)
| (b) | 7.875% | 05/15/2026 | 50,000 | 49,944 |
Antero Midstream Partners LP / Antero Midstream Finance Corp. (Oil, Gas & Consumable Fuels)
| (b) | 5.750% | 03/01/2027 | 75,000 | 69,750 |
Antero Midstream Partners LP / Antero Midstream Finance Corp. (Oil, Gas & Consumable Fuels)
| (b) | 5.750% | 01/15/2028 | 50,000 | 45,521 |
Antero Midstream Partners LP / Antero Midstream Finance Corp. (Oil, Gas & Consumable Fuels)
| (b) | 5.375% | 06/15/2029 | 75,000 | 67,167 |
Antero Resources Corp. (Oil, Gas & Consumable Fuels)
| (b) | 5.375% | 03/01/2030 | 50,000 | 45,591 |
Archrock Partners LP / Archrock Partners Finance Corp. (Oil, Gas & Consumable Fuels)
| (b) | 6.875% | 04/01/2027 | 75,000 | 68,390 |
Archrock Partners LP / Archrock Partners Finance Corp. (Oil, Gas & Consumable Fuels)
| (b) | 6.250% | 04/01/2028 | 50,000 | 44,265 |
Ascent Resources Utica Holdings LLC / ARU Finance Corp. (Oil, Gas & Consumable Fuels)
| (b) | 7.000% | 11/01/2026 | 25,000 | 23,250 |
Ascent Resources Utica Holdings LLC / ARU Finance Corp. (Oil, Gas & Consumable Fuels)
| (b) | 5.875% | 06/30/2029 | 100,000 | 88,000 |
Boardwalk Pipelines LP (Oil, Gas & Consumable Fuels)
| | 3.400% | 02/15/2031 | 450,000 | 383,683 |
BP Capital Markets America, Inc. (Oil, Gas & Consumable Fuels)
| | 3.194% | 04/06/2025 | 350,000 | 345,525 |
BP Capital Markets America, Inc. (Oil, Gas & Consumable Fuels)
| | 3.588% | 04/14/2027 | 725,000 | 706,650 |
Callon Petroleum Co. (Oil, Gas & Consumable Fuels)
| (b) | 7.500% | 06/15/2030 | 25,000 | 23,004 |
Canadian Natural Resources Ltd. (Oil, Gas & Consumable Fuels)
| | 2.050% | 07/15/2025 | 525,000 | 491,180 |
Centennial Resource Production LLC (Oil, Gas & Consumable Fuels)
| (b) | 6.875% | 04/01/2027 | 75,000 | 71,223 |
Cheniere Energy Partners LP (Oil, Gas & Consumable Fuels)
| | 4.500% | 10/01/2029 | 75,000 | 66,952 |
Cheniere Energy, Inc. (Oil, Gas & Consumable Fuels)
| | 4.625% | 10/15/2028 | 25,000 | 22,514 |
| Ohio National Fund, Inc. | ON Federated Core Plus Bond Portfolio (Continued) |
| Schedule of Investments | June 30, 2022 (Unaudited) |
| Corporate Bonds (Continued) | Rate | Maturity | Face Amount | Value |
| Energy (continued) | | | | | |
Chevron Corp. (Oil, Gas & Consumable Fuels)
| | 3.078% | 05/11/2050 | $ 475,000 | $ 377,700 |
CNX Midstream Partners LP (Oil, Gas & Consumable Fuels)
| (b) | 4.750% | 04/15/2030 | 50,000 | 42,000 |
Comstock Resources, Inc. (Oil, Gas & Consumable Fuels)
| (b) | 6.750% | 03/01/2029 | 100,000 | 89,543 |
Crestwood Midstream Partners LP / Crestwood Midstream Finance Corp. (Oil, Gas & Consumable Fuels)
| (b) | 8.000% | 04/01/2029 | 25,000 | 23,219 |
CrownRock LP / CrownRock Finance, Inc. (Oil, Gas & Consumable Fuels)
| (b) | 5.625% | 10/15/2025 | 75,000 | 70,500 |
DT Midstream, Inc. (Oil, Gas & Consumable Fuels)
| (b) | 4.375% | 06/15/2031 | 50,000 | 41,875 |
Eastern Gas Transmission & Storage, Inc. (Oil, Gas & Consumable Fuels)
| (b) | 3.900% | 11/15/2049 | 150,000 | 120,293 |
Enbridge Energy Partners LP (Oil, Gas & Consumable Fuels)
| | 5.500% | 09/15/2040 | 700,000 | 695,934 |
Endeavor Energy Resources LP / EER Finance, Inc. (Oil, Gas & Consumable Fuels)
| (b) | 5.750% | 01/30/2028 | 50,000 | 47,632 |
Energy Transfer LP (Oil, Gas & Consumable Fuels)
| | 3.750% | 05/15/2030 | 500,000 | 450,609 |
EQM Midstream Partners LP (Oil, Gas & Consumable Fuels)
| | 5.500% | 07/15/2028 | 125,000 | 107,921 |
EQM Midstream Partners LP (Oil, Gas & Consumable Fuels)
| (b) | 4.500% | 01/15/2029 | 75,000 | 60,891 |
EQM Midstream Partners LP (Oil, Gas & Consumable Fuels)
| (b) | 4.750% | 01/15/2031 | 50,000 | 39,875 |
EQM Midstream Partners LP (Oil, Gas & Consumable Fuels)
| | 6.500% | 07/15/2048 | 75,000 | 57,187 |
EQT Corp. (Oil, Gas & Consumable Fuels)
| (b) | 3.625% | 05/15/2031 | 25,000 | 21,602 |
Hess Corp. (Oil, Gas & Consumable Fuels)
| | 5.600% | 02/15/2041 | 580,000 | 565,090 |
Hess Midstream Operations LP (Oil, Gas & Consumable Fuels)
| (b) | 5.125% | 06/15/2028 | 25,000 | 22,438 |
Hess Midstream Operations LP (Oil, Gas & Consumable Fuels)
| (b) | 4.250% | 02/15/2030 | 25,000 | 20,937 |
Holly Energy Partners LP / Holly Energy Finance Corp. (Oil, Gas & Consumable Fuels)
| (b) | 5.000% | 02/01/2028 | 75,000 | 64,233 |
Kinder Morgan, Inc. (Oil, Gas & Consumable Fuels)
| | 3.250% | 08/01/2050 | 320,000 | 222,757 |
Marathon Petroleum Corp. (Oil, Gas & Consumable Fuels)
| | 4.750% | 09/15/2044 | 525,000 | 462,514 |
MPLX LP (Oil, Gas & Consumable Fuels)
| | 4.950% | 03/14/2052 | 525,000 | 453,683 |
Nabors Industries Ltd. (Energy Equip. & Svs.)
| (b) | 7.250% | 01/15/2026 | 50,000 | 44,343 |
Nabors Industries Ltd. (Energy Equip. & Svs.)
| (b) | 7.500% | 01/15/2028 | 25,000 | 21,500 |
NuStar Logistics LP (Oil, Gas & Consumable Fuels)
| | 6.000% | 06/01/2026 | 25,000 | 23,375 |
NuStar Logistics LP (Oil, Gas & Consumable Fuels)
| | 6.375% | 10/01/2030 | 25,000 | 21,721 |
Occidental Petroleum Corp. (Oil, Gas & Consumable Fuels)
| | 8.000% | 07/15/2025 | 75,000 | 78,937 |
Occidental Petroleum Corp. (Oil, Gas & Consumable Fuels)
| | 8.875% | 07/15/2030 | 25,000 | 28,702 |
Occidental Petroleum Corp. (Oil, Gas & Consumable Fuels)
| | 6.450% | 09/15/2036 | 125,000 | 128,125 |
ONEOK, Inc. (Oil, Gas & Consumable Fuels)
| | 2.200% | 09/15/2025 | 150,000 | 139,606 |
ONEOK, Inc. (Oil, Gas & Consumable Fuels)
| | 4.500% | 03/15/2050 | 625,000 | 500,580 |
PDC Energy, Inc. (Oil, Gas & Consumable Fuels)
| | 5.750% | 05/15/2026 | 50,000 | 46,641 |
Phillips 66 (Oil, Gas & Consumable Fuels)
| | 0.900% | 02/15/2024 | 150,000 | 142,835 |
Phillips 66 (Oil, Gas & Consumable Fuels)
| | 3.850% | 04/09/2025 | 300,000 | 298,144 |
Phillips 66 (Oil, Gas & Consumable Fuels)
| | 4.875% | 11/15/2044 | 375,000 | 363,696 |
Precision Drilling Corp. (Energy Equip. & Svs.)
| (b) | 6.875% | 01/15/2029 | 50,000 | 44,750 |
Range Resources Corp. (Oil, Gas & Consumable Fuels)
| | 8.250% | 01/15/2029 | 50,000 | 50,976 |
Rockcliff Energy II LLC (Oil, Gas & Consumable Fuels)
| (b) | 5.500% | 10/15/2029 | 50,000 | 45,499 |
Shell International Finance B.V. (Oil, Gas & Consumable Fuels)
| | 0.375% | 09/15/2023 | 480,000 | 464,701 |
SM Energy Co. (Oil, Gas & Consumable Fuels)
| | 6.750% | 09/15/2026 | 50,000 | 47,168 |
SM Energy Co. (Oil, Gas & Consumable Fuels)
| | 6.500% | 07/15/2028 | 50,000 | 45,985 |
Southwestern Energy Co. (Oil, Gas & Consumable Fuels)
| | 5.375% | 03/15/2030 | 25,000 | 23,000 |
Tap Rock Resources LLC (Oil, Gas & Consumable Fuels)
| (b) | 7.000% | 10/01/2026 | 50,000 | 47,211 |
Targa Resources Corp. (Oil, Gas & Consumable Fuels)
| | 4.200% | 02/01/2033 | 180,000 | 163,052 |
U.S.A. Compression Partners LP / U.S.A. Compression Finance Corp. (Energy Equip. & Svs.)
| | 6.875% | 04/01/2026 | 150,000 | 136,455 |
Valero Energy Corp. (Oil, Gas & Consumable Fuels)
| | 4.350% | 06/01/2028 | 350,000 | 340,347 |
Western Midstream Operating LP (Oil, Gas & Consumable Fuels)
| | 5.300% | 03/01/2048 | 75,000 | 60,461 |
Western Midstream Operating LP (Oil, Gas & Consumable Fuels)
| | 5.500% | 08/15/2048 | 25,000 | 20,375 |
Williams Cos., Inc. / The (Oil, Gas & Consumable Fuels)
| | 3.750% | 06/15/2027 | 525,000 | 501,322 |
| | | | | | 10,500,549 |
Financials–5.3%
| | | | | |
AerCap Ireland Capital DAC / AerCap Global Aviation Trust (Diversified Financial Svs.)
| | 3.000% | 10/29/2028 | 165,000 | 138,983 |
AerCap Ireland Capital DAC / AerCap Global Aviation Trust (Diversified Financial Svs.)
| | 3.400% | 10/29/2033 | 350,000 | 276,363 |
American Express Co. (Consumer Finance)
| | 3.300% | 05/03/2027 | 825,000 | 793,512 |
AmWINS Group, Inc. (Insurance)
| (b) | 4.875% | 06/30/2029 | 100,000 | 81,892 |
AssuredPartners, Inc. (Insurance)
| (b) | 7.000% | 08/15/2025 | 25,000 | 23,482 |
AssuredPartners, Inc. (Insurance)
| (b) | 5.625% | 01/15/2029 | 100,000 | 80,053 |
Bank of America Corp. (Rate is fixed until 02/13/2025, at which point, the rate becomes QL + 64) (Banks)
| (c) | 2.015% | 02/13/2026 | 2,475,000 | 2,319,645 |
Bank of America Corp. (Rate is fixed until 04/29/2030, at which point, the rate becomes SOFR + 215) (Banks)
| (c) | 2.592% | 04/29/2031 | 1,900,000 | 1,611,472 |
Bank of New York Mellon Corp. / The (Capital Markets)
| | 2.200% | 08/16/2023 | 1,350,000 | 1,335,750 |
Bank of New York Mellon Corp. / The (Rate is fixed until 06/13/2027, at which point, the rate becomes SOFR + 115) (Capital Markets)
| (c) | 3.992% | 06/13/2028 | 300,000 | 296,490 |
BlackRock, Inc. (Capital Markets)
| | 1.900% | 01/28/2031 | 425,000 | 352,523 |
BroadStreet Partners, Inc. (Insurance)
| (b) | 5.875% | 04/15/2029 | 175,000 | 136,922 |
Capital One Financial Corp. (Consumer Finance)
| | 3.900% | 01/29/2024 | 725,000 | 723,813 |
| Ohio National Fund, Inc. | ON Federated Core Plus Bond Portfolio (Continued) |
| Schedule of Investments | June 30, 2022 (Unaudited) |
| Corporate Bonds (Continued) | Rate | Maturity | Face Amount | Value |
| Financials (continued) | | | | | |
Chubb INA Holdings, Inc. (Insurance)
| | 3.350% | 05/03/2026 | $ 425,000 | $ 415,633 |
Citigroup, Inc. (Rate is fixed until 04/24/2024, at which point, the rate becomes QL + 90) (Banks)
| (c) | 3.352% | 04/24/2025 | 725,000 | 710,101 |
Citigroup, Inc. (Rate is fixed until 01/29/2030, at which point, the rate becomes SOFR + 115) (Banks)
| (c) | 2.666% | 01/29/2031 | 1,600,000 | 1,358,552 |
Citizens Bank N.A. (Banks)
| | 3.750% | 02/18/2026 | 475,000 | 466,437 |
Comerica, Inc. (Banks)
| | 3.800% | 07/22/2026 | 475,000 | 466,384 |
Ford Motor Credit Co. LLC (Consumer Finance)
| | 2.700% | 08/10/2026 | 225,000 | 191,734 |
Ford Motor Credit Co. LLC (Consumer Finance)
| | 5.113% | 05/03/2029 | 200,000 | 179,295 |
General Motors Financial Co., Inc. (Consumer Finance)
| | 2.900% | 02/26/2025 | 675,000 | 644,184 |
General Motors Financial Co., Inc. (Consumer Finance)
| | 5.000% | 04/09/2027 | 260,000 | 255,049 |
Goldman Sachs Group, Inc. / The (Capital Markets)
| | 3.500% | 04/01/2025 | 775,000 | 759,697 |
Goldman Sachs Group, Inc. / The (Capital Markets)
| | 3.800% | 03/15/2030 | 1,400,000 | 1,298,178 |
Goldman Sachs Group, Inc. / The (Rate is fixed until 01/27/2031, at which point, the rate becomes SOFR + 109) (Capital Markets)
| (c) | 1.992% | 01/27/2032 | 500,000 | 394,970 |
GTCR AP Finance, Inc. (Insurance)
| (b) | 8.000% | 05/15/2027 | 75,000 | 70,211 |
GYP Holdings III Corp. (Building Products)
| (b) | 4.625% | 05/01/2029 | 100,000 | 77,973 |
HSBC Holdings PLC (Banks)
| | 3.900% | 05/25/2026 | 975,000 | 952,915 |
HUB International Ltd. (Insurance)
| (b) | 7.000% | 05/01/2026 | 50,000 | 47,020 |
HUB International Ltd. (Insurance)
| (b) | 5.625% | 12/01/2029 | 525,000 | 433,678 |
Jefferies Group LLC (Diversified Financial Svs.)
| | 2.750% | 10/15/2032 | 305,000 | 231,581 |
John Deere Capital Corp. (Consumer Finance)
| | 3.450% | 03/07/2029 | 800,000 | 772,740 |
JPMorgan Chase & Co. (Banks)
| | 3.125% | 01/23/2025 | 525,000 | 517,303 |
JPMorgan Chase & Co. (Rate is fixed until 04/22/2030, at which point, the rate becomes SOFR + 204) (Banks)
| (c) | 2.522% | 04/22/2031 | 900,000 | 766,547 |
JPMorgan Chase & Co. (Rate is fixed until 11/19/2030, at which point, the rate becomes TSFR3M + 111) (Banks)
| (c) | 1.764% | 11/19/2031 | 100,000 | 79,076 |
JPMorgan Chase & Co. (Rate is fixed until 04/22/2031, at which point, the rate becomes SOFR + 125) (Banks)
| (c) | 2.580% | 04/22/2032 | 100,000 | 84,140 |
JPMorgan Chase & Co. (Rate is fixed until 01/25/2032, at which point, the rate becomes SOFR + 126) (Banks)
| (c) | 2.963% | 01/25/2033 | 1,200,000 | 1,030,033 |
Lincoln National Corp. (Insurance)
| | 4.000% | 09/01/2023 | 300,000 | 301,567 |
M&T Bank Corp. (Banks)
| | 3.550% | 07/26/2023 | 575,000 | 573,531 |
Morgan Stanley (Capital Markets)
| | 4.100% | 05/22/2023 | 325,000 | 326,267 |
Morgan Stanley (Capital Markets)
| | 6.250% | 08/09/2026 | 475,000 | 505,011 |
Morgan Stanley (Rate is fixed until 01/24/2028, at which point, the rate becomes QL + 114) (Capital Markets)
| (c) | 3.772% | 01/24/2029 | 750,000 | 711,634 |
Morgan Stanley (Rate is fixed until 02/13/2031, at which point, the rate becomes SOFR + 103) (Capital Markets)
| (c) | 1.794% | 02/13/2032 | 295,000 | 232,046 |
Morgan Stanley (Rate is fixed until 04/28/2031, at which point, the rate becomes SOFR + 102) (Capital Markets)
| (c) | 1.928% | 04/28/2032 | 250,000 | 198,242 |
Navient Corp. (Consumer Finance)
| | 4.875% | 03/15/2028 | 75,000 | 58,594 |
Navient Corp. (Consumer Finance)
| | 5.500% | 03/15/2029 | 50,000 | 38,546 |
NFP Corp. (Insurance)
| (b) | 6.875% | 08/15/2028 | 225,000 | 185,634 |
Outfront Media Capital LLC / Outfront Media Capital Corp. (Media)
| (b) | 4.250% | 01/15/2029 | 50,000 | 39,831 |
PNC Bank N.A. (Banks)
| | 3.875% | 04/10/2025 | 475,000 | 470,980 |
PNC Financial Services Group, Inc. / The (Rate is fixed until 06/06/2032, at which point, the rate becomes SOFRINDX + 185) (Banks)
| (c) | 4.626% | 06/06/2033 | 630,000 | 608,434 |
Prudential Financial, Inc. (Insurance)
| | 3.700% | 03/13/2051 | 575,000 | 480,057 |
Raymond James Financial, Inc. (Capital Markets)
| | 4.650% | 04/01/2030 | 100,000 | 98,917 |
Regions Financial Corp. (Banks)
| | 2.250% | 05/18/2025 | 345,000 | 329,135 |
Rocket Mortgage LLC / Rocket Mortgage Co-Issuer, Inc. (Thrifts & Mortgage Finance)
| (b) | 2.875% | 10/15/2026 | 50,000 | 41,320 |
Rocket Mortgage LLC / Rocket Mortgage Co-Issuer, Inc. (Thrifts & Mortgage Finance)
| (b) | 3.625% | 03/01/2029 | 75,000 | 58,974 |
Rocket Mortgage LLC / Rocket Mortgage Co-Issuer, Inc. (Thrifts & Mortgage Finance)
| (b) | 4.000% | 10/15/2033 | 50,000 | 35,500 |
Ryan Specialty Group LLC (Insurance)
| (b) | 4.375% | 02/01/2030 | 75,000 | 65,250 |
S&P Global, Inc. (Capital Markets)
| (b) | 2.900% | 03/01/2032 | 240,000 | 213,892 |
Stifel Financial Corp. (Capital Markets)
| | 4.000% | 05/15/2030 | 200,000 | 185,646 |
Toyota Motor Credit Corp. (Consumer Finance)
| | 3.950% | 06/30/2025 | 600,000 | 602,152 |
United Wholesale Mortgage LLC (Thrifts & Mortgage Finance)
| (b) | 5.500% | 11/15/2025 | 175,000 | 149,903 |
USI, Inc. (Insurance)
| (b) | 6.875% | 05/01/2025 | 200,000 | 193,000 |
Volkswagen Group of America Finance LLC (Consumer Finance)
| (b) | 4.250% | 11/13/2023 | 700,000 | 699,922 |
Wells Fargo & Co. (Banks)
| | 3.750% | 01/24/2024 | 750,000 | 751,776 |
Wells Fargo & Co. (Rate is fixed until 02/11/2030, at which point, the rate becomes SOFR + 126) (Banks)
| (c) | 2.572% | 02/11/2031 | 1,550,000 | 1,332,422 |
| | | | | | 29,862,514 |
Health Care–2.0%
| | | | | |
Abbott Laboratories (Health Care Equip. & Supplies)
| | 3.750% | 11/30/2026 | 475,000 | 477,468 |
Acadia Healthcare Co., Inc. (Health Care Providers & Svs.)
| (b) | 5.500% | 07/01/2028 | 25,000 | 23,357 |
| Ohio National Fund, Inc. | ON Federated Core Plus Bond Portfolio (Continued) |
| Schedule of Investments | June 30, 2022 (Unaudited) |
| Corporate Bonds (Continued) | Rate | Maturity | Face Amount | Value |
Health Care (continued)
| | | | | |
AdaptHealth LLC (Health Care Providers & Svs.)
| (b) | 4.625% | 08/01/2029 | $ 25,000 | $ 20,563 |
AdaptHealth LLC (Health Care Providers & Svs.)
| (b) | 5.125% | 03/01/2030 | 100,000 | 84,291 |
AHP Health Partners, Inc. (Health Care Providers & Svs.)
| (b) | 5.750% | 07/15/2029 | 75,000 | 55,102 |
Alcon Finance Corp. (Health Care Equip. & Supplies)
| (b) | 2.600% | 05/27/2030 | 400,000 | 340,111 |
Amgen, Inc. (Biotechnology)
| | 3.375% | 02/21/2050 | 500,000 | 382,051 |
Astrazeneca Finance LLC (Pharmaceuticals)
| | 2.250% | 05/28/2031 | 225,000 | 195,862 |
AstraZeneca PLC (Pharmaceuticals)
| | 3.125% | 06/12/2027 | 610,000 | 586,583 |
Avantor Funding, Inc. (Health Care Equip. & Supplies)
| (b) | 4.625% | 07/15/2028 | 100,000 | 91,670 |
Avantor Funding, Inc. (Health Care Equip. & Supplies)
| (b) | 3.875% | 11/01/2029 | 25,000 | 21,866 |
Bausch Health Americas, Inc. (Pharmaceuticals)
| (b) | 8.500% | 01/31/2027 | 75,000 | 52,594 |
Bausch Health Cos., Inc. (Pharmaceuticals)
| (b) | 6.125% | 02/01/2027 | 75,000 | 63,750 |
Bausch Health Cos., Inc. (Pharmaceuticals)
| (b) | 5.000% | 02/15/2029 | 100,000 | 52,000 |
Bausch Health Cos., Inc. (Pharmaceuticals)
| (b) | 6.250% | 02/15/2029 | 50,000 | 26,610 |
Bausch Health Cos., Inc. (Pharmaceuticals)
| (b) | 5.250% | 02/15/2031 | 100,000 | 51,177 |
Bayer U.S. Finance LLC (Pharmaceuticals)
| (b) | 3.375% | 10/08/2024 | 775,000 | 756,191 |
Becton Dickinson and Co. (Health Care Equip. & Supplies)
| | 4.685% | 12/15/2044 | 300,000 | 277,168 |
Becton Dickinson and Co. (Health Care Equip. & Supplies)
| | 3.794% | 05/20/2050 | 150,000 | 123,767 |
Biogen, Inc. (Biotechnology)
| | 3.150% | 05/01/2050 | 725,000 | 497,230 |
Bristol-Myers Squibb Co. (Pharmaceuticals)
| | 0.750% | 11/13/2025 | 245,000 | 223,288 |
Bristol-Myers Squibb Co. (Pharmaceuticals)
| | 3.900% | 02/20/2028 | 800,000 | 800,980 |
Bristol-Myers Squibb Co. (Pharmaceuticals)
| | 4.250% | 10/26/2049 | 200,000 | 187,817 |
Catalent Pharma Solutions, Inc. (Pharmaceuticals)
| (b) | 3.500% | 04/01/2030 | 25,000 | 20,398 |
Centene Corp. (Health Care Providers & Svs.)
| | 4.250% | 12/15/2027 | 200,000 | 186,694 |
Charles River Laboratories International, Inc. (Life Sciences Tools & Svs.)
| (b) | 3.750% | 03/15/2029 | 75,000 | 65,089 |
CHS / Community Health Systems, Inc. (Health Care Providers & Svs.)
| (b) | 5.625% | 03/15/2027 | 50,000 | 42,319 |
CHS / Community Health Systems, Inc. (Health Care Providers & Svs.)
| (b) | 6.125% | 04/01/2030 | 50,000 | 30,500 |
CHS / Community Health Systems, Inc. (Health Care Providers & Svs.)
| (b) | 5.250% | 05/15/2030 | 75,000 | 56,992 |
CVS Health Corp. (Health Care Providers & Svs.)
| | 2.875% | 06/01/2026 | 425,000 | 404,452 |
CVS Health Corp. (Health Care Providers & Svs.)
| | 4.250% | 04/01/2050 | 450,000 | 387,420 |
Danaher Corp. (Life Sciences Tools & Svs.)
| | 2.600% | 10/01/2050 | 645,000 | 454,132 |
DENTSPLY SIRONA, Inc. (Health Care Equip. & Supplies)
| | 3.250% | 06/01/2030 | 510,000 | 430,460 |
Embecta Corp. (Health Care Equip. & Supplies)
| (b) | 6.750% | 02/15/2030 | 50,000 | 45,016 |
Global Medical Response, Inc. (Health Care Providers & Svs.)
| (b) | 6.500% | 10/01/2025 | 100,000 | 89,098 |
HCA, Inc. (Health Care Providers & Svs.)
| | 5.375% | 09/01/2026 | 100,000 | 99,158 |
HCA, Inc. (Health Care Providers & Svs.)
| | 3.500% | 09/01/2030 | 25,000 | 21,268 |
HCA, Inc. (Health Care Providers & Svs.)
| | 3.500% | 07/15/2051 | 475,000 | 324,395 |
HealthEquity, Inc. (Health Care Providers & Svs.)
| (b) | 4.500% | 10/01/2029 | 75,000 | 65,625 |
Legacy LifePoint Health LLC (Health Care Providers & Svs.)
| (b) | 6.750% | 04/15/2025 | 50,000 | 48,330 |
LifePoint Health, Inc. (Health Care Providers & Svs.)
| (b) | 5.375% | 01/15/2029 | 75,000 | 55,125 |
Mallinckrodt International Finance SA / Mallinckrodt CB LLC (Pharmaceuticals)
| (b) | 10.000% | 06/15/2029 | 12,481 | 8,737 |
Medline Borrower LP (Health Care Equip. & Supplies)
| (b) | 3.875% | 04/01/2029 | 25,000 | 21,293 |
Medline Borrower LP (Health Care Equip. & Supplies)
| (b) | 5.250% | 10/01/2029 | 175,000 | 143,727 |
MEDNAX, Inc. (Health Care Providers & Svs.)
| (b) | 5.375% | 02/15/2030 | 50,000 | 42,838 |
MPH Acquisition Holdings LLC (Health Care Providers & Svs.)
| (b) | 5.500% | 09/01/2028 | 25,000 | 22,250 |
MPH Acquisition Holdings LLC (Health Care Providers & Svs.)
| (b) | 5.750% | 11/01/2028 | 150,000 | 124,305 |
Prestige Brands, Inc. (Pharmaceuticals)
| (b) | 5.125% | 01/15/2028 | 75,000 | 69,763 |
Regeneron Pharmaceuticals, Inc. (Biotechnology)
| | 2.800% | 09/15/2050 | 702,000 | 476,424 |
Stryker Corp. (Health Care Equip. & Supplies)
| | 3.500% | 03/15/2026 | 450,000 | 441,616 |
Syneos Health, Inc. (Life Sciences Tools & Svs.)
| (b) | 3.625% | 01/15/2029 | 75,000 | 63,512 |
Takeda Pharmaceutical Co. Ltd. (Pharmaceuticals)
| | 2.050% | 03/31/2030 | 350,000 | 292,745 |
Takeda Pharmaceutical Co. Ltd. (Pharmaceuticals)
| | 3.025% | 07/09/2040 | 400,000 | 307,857 |
Team Health Holdings, Inc. (Health Care Providers & Svs.)
| (b) | 6.375% | 02/01/2025 | 75,000 | 52,371 |
Tenet Healthcare Corp. (Health Care Providers & Svs.)
| | 4.625% | 07/15/2024 | 21,000 | 20,154 |
Tenet Healthcare Corp. (Health Care Providers & Svs.)
| (b) | 4.875% | 01/01/2026 | 75,000 | 69,000 |
Tenet Healthcare Corp. (Health Care Providers & Svs.)
| (b) | 6.125% | 10/01/2028 | 75,000 | 64,183 |
Tenet Healthcare Corp. (Health Care Providers & Svs.)
| (b) | 4.250% | 06/01/2029 | 75,000 | 63,166 |
Thermo Fisher Scientific, Inc. (Life Sciences Tools & Svs.)
| | 1.215% | 10/18/2024 | 350,000 | 331,586 |
Zoetis, Inc. (Pharmaceuticals)
| | 3.000% | 05/15/2050 | 625,000 | 462,018 |
| | | | | | 11,295,512 |
Industrials–2.9%
| | | | | |
Airbus SE (Aerospace & Defense)
| (b) | 3.150% | 04/10/2027 | 800,000 | 770,529 |
Allegion PLC (Building Products)
| | 3.500% | 10/01/2029 | 750,000 | 663,331 |
Allied Universal Holdco LLC / Allied Universal Finance Corp. (Commercial Svs. & Supplies)
| (b) | 6.625% | 07/15/2026 | 25,000 | 22,941 |
Allied Universal Holdco LLC / Allied Universal Finance Corp. (Commercial Svs. & Supplies)
| (b) | 6.000% | 06/01/2029 | 200,000 | 145,234 |
American Airlines, Inc. / AAdvantage Loyalty IP Ltd. (Airlines)
| (b) | 5.750% | 04/20/2029 | 75,000 | 64,032 |
BAE Systems PLC (Aerospace & Defense)
| (b) | 3.000% | 09/15/2050 | 500,000 | 355,079 |
BCPE Empire Holdings, Inc. (Commercial Svs. & Supplies)
| (b) | 7.625% | 05/01/2027 | 125,000 | 101,761 |
Boeing Co. / The (Aerospace & Defense)
| | 2.196% | 02/04/2026 | 1,025,000 | 923,900 |
| Ohio National Fund, Inc. | ON Federated Core Plus Bond Portfolio (Continued) |
| Schedule of Investments | June 30, 2022 (Unaudited) |
| Corporate Bonds (Continued) | Rate | Maturity | Face Amount | Value |
| Industrials (continued) | | | | | |
Boeing Co. / The (Aerospace & Defense)
| | 2.950% | 02/01/2030 | $ 225,000 | $ 187,224 |
Boeing Co. / The (Aerospace & Defense)
| | 5.805% | 05/01/2050 | 225,000 | 206,656 |
Burlington Northern Santa Fe LLC (Road & Rail)
| | 3.000% | 04/01/2025 | 475,000 | 467,944 |
Canadian Pacific Railway Co. (Road & Rail)
| | 1.750% | 12/02/2026 | 90,000 | 81,448 |
Canadian Pacific Railway Co. (Road & Rail)
| | 2.050% | 03/05/2030 | 175,000 | 148,090 |
Canadian Pacific Railway Co. (Road & Rail)
| | 3.000% | 12/02/2041 | 75,000 | 58,665 |
Clarivate Science Holdings Corp. (Professional Svs.)
| (b) | 4.875% | 07/01/2029 | 75,000 | 61,575 |
CNH Industrial N.V. (Machinery)
| | 3.850% | 11/15/2027 | 525,000 | 494,312 |
Cornerstone Building Brands, Inc. (Building Products)
| (b) | 6.125% | 01/15/2029 | 50,000 | 32,122 |
CP Atlas Buyer, Inc. (Building Products)
| (b) | 7.000% | 12/01/2028 | 125,000 | 90,272 |
Dun & Bradstreet Corp. / The (Professional Svs.)
| (b) | 5.000% | 12/15/2029 | 75,000 | 64,781 |
Equifax, Inc. (Professional Svs.)
| | 2.600% | 12/15/2025 | 750,000 | 707,002 |
ERAC U.S.A. Finance LLC (Road & Rail)
| (b) | 3.850% | 11/15/2024 | 650,000 | 641,141 |
Experian Finance PLC (Professional Svs.)
| (b) | 4.250% | 02/01/2029 | 350,000 | 343,299 |
Foundation Building Materials, Inc. (Trading Companies & Distributors)
| (b) | 6.000% | 03/01/2029 | 100,000 | 73,250 |
Garda World Security Corp. (Commercial Svs. & Supplies)
| (b) | 4.625% | 02/15/2027 | 50,000 | 43,000 |
Garda World Security Corp. (Commercial Svs. & Supplies)
| (b) | 6.000% | 06/01/2029 | 50,000 | 38,437 |
GE Capital International Funding Co. Unlimited Co. (Industrial Conglomerates)
| | 4.418% | 11/15/2035 | 287,000 | 268,057 |
General Dynamics Corp. (Aerospace & Defense)
| | 1.150% | 06/01/2026 | 670,000 | 608,098 |
GXO Logistics, Inc. (Air Freight & Logistics)
| | 1.650% | 07/15/2026 | 685,000 | 597,711 |
GXO Logistics, Inc. (Air Freight & Logistics)
| | 2.650% | 07/15/2031 | 670,000 | 528,572 |
H&E Equipment Services, Inc. (Trading Companies & Distributors)
| (b) | 3.875% | 12/15/2028 | 75,000 | 60,656 |
Honeywell International, Inc. (Industrial Conglomerates)
| | 1.350% | 06/01/2025 | 390,000 | 367,072 |
Honeywell International, Inc. (Industrial Conglomerates)
| | 2.800% | 06/01/2050 | 270,000 | 207,782 |
Huntington Ingalls Industries, Inc. (Aerospace & Defense)
| | 3.483% | 12/01/2027 | 775,000 | 724,649 |
Kansas City Southern (Road & Rail)
| | 3.500% | 05/01/2050 | 675,000 | 526,560 |
Madison IAQ LLC (Commercial Svs. & Supplies)
| (b) | 4.125% | 06/30/2028 | 25,000 | 20,649 |
Madison IAQ LLC (Commercial Svs. & Supplies)
| (b) | 5.875% | 06/30/2029 | 125,000 | 95,790 |
Masco Corp. (Building Products)
| | 3.500% | 11/15/2027 | 350,000 | 332,921 |
MIWD Holdco II LLC / MIWD Finance Corp. (Building Products)
| (b) | 5.500% | 02/01/2030 | 25,000 | 20,119 |
Nielsen Finance LLC / Nielsen Finance Co. (Professional Svs.)
| (b) | 5.875% | 10/01/2030 | 100,000 | 91,816 |
Northrop Grumman Corp. (Aerospace & Defense)
| | 3.250% | 01/15/2028 | 825,000 | 784,180 |
Penske Truck Leasing Co. LP / PTL Finance Corp (Road & Rail)
| (b) | 3.450% | 07/01/2024 | 500,000 | 489,395 |
Ryder System, Inc. (Road & Rail)
| | 3.400% | 03/01/2023 | 1,050,000 | 1,047,406 |
Solaris Midstream Holdings LLC (Commercial Svs. & Supplies)
| (b) | 7.625% | 04/01/2026 | 50,000 | 47,283 |
SPX FLOW, Inc. (Machinery)
| (b) | 8.750% | 04/01/2030 | 75,000 | 62,812 |
Textron, Inc. (Aerospace & Defense)
| | 3.650% | 03/15/2027 | 600,000 | 578,371 |
TransDigm, Inc. (Aerospace & Defense)
| (b) | 6.250% | 03/15/2026 | 125,000 | 120,469 |
TransDigm, Inc. (Aerospace & Defense)
| | 5.500% | 11/15/2027 | 200,000 | 169,676 |
Trident TPI Holdings, Inc. (Machinery)
| (b) | 9.250% | 08/01/2024 | 125,000 | 114,355 |
Union Pacific Corp. (Road & Rail)
| | 2.375% | 05/20/2031 | 385,000 | 332,668 |
United Rentals North America, Inc. (Trading Companies & Distributors)
| | 4.875% | 01/15/2028 | 75,000 | 70,911 |
United Rentals North America, Inc. (Trading Companies & Distributors)
| | 5.250% | 01/15/2030 | 25,000 | 23,187 |
United Rentals North America, Inc. (Trading Companies & Distributors)
| | 3.875% | 02/15/2031 | 25,000 | 21,090 |
Valmont Industries, Inc. (Construction & Engineering)
| | 5.000% | 10/01/2044 | 40,000 | 36,522 |
Verisk Analytics, Inc. (Professional Svs.)
| | 4.125% | 03/15/2029 | 600,000 | 578,123 |
Watco Cos. LLC / Watco Finance Corp. (Road & Rail)
| (b) | 6.500% | 06/15/2027 | 50,000 | 45,796 |
WESCO Distribution, Inc. (Trading Companies & Distributors)
| (b) | 7.250% | 06/15/2028 | 100,000 | 98,900 |
White Cap Buyer LLC (Building Products)
| (b) | 6.875% | 10/15/2028 | 75,000 | 60,000 |
White Cap Parent LLC (Building Products)
| (b)(d) | 8.250%, 9.000% PIK | 03/15/2026 | 50,000 | 41,625 |
Xylem, Inc. (Machinery)
| | 2.250% | 01/30/2031 | 455,000 | 379,097 |
| | | | | | 16,338,343 |
Information Technology–1.5%
| | | | | |
Apple, Inc. (Tech. Hardware, Storage & Periph.)
| | 2.900% | 09/12/2027 | 600,000 | 579,129 |
Apple, Inc. (Tech. Hardware, Storage & Periph.)
| | 2.375% | 02/08/2041 | 375,000 | 286,841 |
Broadcom, Inc. (Semiconductors & Equip.)
| | 4.150% | 11/15/2030 | 285,000 | 261,121 |
Broadcom, Inc. (Semiconductors & Equip.)
| (b) | 3.419% | 04/15/2033 | 160,000 | 132,279 |
Broadcom, Inc. (Semiconductors & Equip.)
| (b) | 3.187% | 11/15/2036 | 15,000 | 11,403 |
CDW LLC / CDW Finance Corp. (Electronic Equip., Instr. & Comp.)
| | 2.670% | 12/01/2026 | 480,000 | 427,648 |
Central Parent, Inc. / Central Merger Sub, Inc. (Software)
| (b) | 7.250% | 06/15/2029 | 75,000 | 72,187 |
Condor Merger Sub, Inc. (Software)
| (b) | 7.375% | 02/15/2030 | 150,000 | 121,915 |
Elastic N.V. (Software)
| (b) | 4.125% | 07/15/2029 | 50,000 | 41,739 |
Fidelity National Information Services, Inc. (IT Svs.)
| | 3.100% | 03/01/2041 | 305,000 | 222,559 |
Fiserv, Inc. (IT Svs.)
| | 3.800% | 10/01/2023 | 450,000 | 450,218 |
Fiserv, Inc. (IT Svs.)
| | 3.500% | 07/01/2029 | 425,000 | 387,680 |
Fortinet, Inc. (Software)
| | 1.000% | 03/15/2026 | 670,000 | 589,047 |
Go Daddy Operating Co. LLC / GD Finance Co., Inc. (IT Svs.)
| (b) | 5.250% | 12/01/2027 | 50,000 | 45,750 |
II-VI, Inc. (Electronic Equip., Instr. & Comp.)
| (b) | 5.000% | 12/15/2029 | 50,000 | 43,625 |
| Ohio National Fund, Inc. | ON Federated Core Plus Bond Portfolio (Continued) |
| Schedule of Investments | June 30, 2022 (Unaudited) |
| Corporate Bonds (Continued) | Rate | Maturity | Face Amount | Value |
Information Technology (continued)
| | | | | |
Leidos, Inc. (IT Svs.)
| | 3.625% | 05/15/2025 | $ 220,000 | $ 215,352 |
Leidos, Inc. (IT Svs.)
| | 4.375% | 05/15/2030 | 525,000 | 485,609 |
LogMeIn, Inc. (Software)
| (b) | 5.500% | 09/01/2027 | 100,000 | 69,627 |
Microsoft Corp. (Software)
| | 2.375% | 05/01/2023 | 1,200,000 | 1,196,087 |
Minerva Merger Sub, Inc. (Software)
| (b) | 6.500% | 02/15/2030 | 150,000 | 124,738 |
NCR Corp. (Tech. Hardware, Storage & Periph.)
| (b) | 5.000% | 10/01/2028 | 25,000 | 21,197 |
NCR Corp. (Tech. Hardware, Storage & Periph.)
| (b) | 5.125% | 04/15/2029 | 25,000 | 21,144 |
NCR Corp. (Tech. Hardware, Storage & Periph.)
| (b) | 5.250% | 10/01/2030 | 75,000 | 64,688 |
Open Text Corp. (Software)
| (b) | 3.875% | 12/01/2029 | 50,000 | 42,083 |
Oracle Corp. (Software)
| | 3.600% | 04/01/2050 | 500,000 | 347,329 |
Rocket Software, Inc. (Software)
| (b) | 6.500% | 02/15/2029 | 125,000 | 90,352 |
Roper Technologies, Inc. (Software)
| | 1.000% | 09/15/2025 | 525,000 | 474,662 |
Science Applications International Corp. (IT Svs.)
| (b) | 4.875% | 04/01/2028 | 25,000 | 23,313 |
Seagate HDD Cayman (Tech. Hardware, Storage & Periph.)
| | 3.125% | 07/15/2029 | 75,000 | 58,853 |
Skyworks Solutions, Inc. (Semiconductors & Equip.)
| | 1.800% | 06/01/2026 | 50,000 | 44,350 |
SS&C Technologies, Inc. (Software)
| (b) | 5.500% | 09/30/2027 | 125,000 | 116,570 |
TTM Technologies, Inc. (Electronic Equip., Instr. & Comp.)
| (b) | 4.000% | 03/01/2029 | 75,000 | 63,071 |
VeriSign, Inc. (IT Svs.)
| | 2.700% | 06/15/2031 | 660,000 | 531,130 |
Veritas U.S., Inc. / Veritas Bermuda Ltd. (Software)
| (b) | 7.500% | 09/01/2025 | 50,000 | 37,522 |
VMware, Inc. (Software)
| | 1.400% | 08/15/2026 | 240,000 | 212,331 |
VMware, Inc. (Software)
| | 2.200% | 08/15/2031 | 190,000 | 149,611 |
Vontier Corp. (Electronic Equip., Instr. & Comp.)
| | 1.800% | 04/01/2026 | 465,000 | 405,699 |
| | | | | | 8,468,459 |
Materials–1.1%
| | | | | |
Albemarle Corp. (Chemicals)
| | 5.450% | 12/01/2044 | 275,000 | 269,119 |
Anglo American Capital PLC (Metals & Mining)
| (b) | 2.875% | 03/17/2031 | 775,000 | 644,854 |
Ardagh Metal Packaging Finance U.S.A. LLC / Ardagh Metal Packaging Finance PLC (Containers & Packaging)
| (b) | 4.000% | 09/01/2029 | 250,000 | 200,625 |
Ardagh Packaging Finance PLC / Ardagh Holdings U.S.A., Inc. (Containers & Packaging)
| (b) | 5.250% | 08/15/2027 | 200,000 | 142,612 |
Ball Corp. (Containers & Packaging)
| | 3.125% | 09/15/2031 | 25,000 | 20,166 |
Berry Global, Inc. (Containers & Packaging)
| (b) | 5.625% | 07/15/2027 | 50,000 | 47,847 |
Clearwater Paper Corp. (Paper & Forest Products)
| (b) | 4.750% | 08/15/2028 | 125,000 | 107,792 |
Cleveland-Cliffs, Inc. (Metals & Mining)
| (b) | 4.625% | 03/01/2029 | 25,000 | 22,063 |
Cleveland-Cliffs, Inc. (Metals & Mining)
| (b) | 4.875% | 03/01/2031 | 50,000 | 44,083 |
Clydesdale Acquisition Holdings, Inc. (Containers & Packaging)
| (b) | 8.750% | 04/15/2030 | 275,000 | 237,207 |
Coeur Mining, Inc. (Metals & Mining)
| (b) | 5.125% | 02/15/2029 | 50,000 | 34,637 |
Compass Minerals International, Inc. (Metals & Mining)
| (b) | 4.875% | 07/15/2024 | 25,000 | 23,196 |
Compass Minerals International, Inc. (Metals & Mining)
| (b) | 6.750% | 12/01/2027 | 50,000 | 45,250 |
Diamond B.C. B.V. (Chemicals)
| (b) | 4.625% | 10/01/2029 | 125,000 | 99,962 |
Glencore Funding LLC (Metals & Mining)
| (b) | 1.625% | 04/27/2026 | 400,000 | 353,827 |
Glencore Funding LLC (Metals & Mining)
| (b) | 3.375% | 09/23/2051 | 200,000 | 136,346 |
Graphic Packaging International LLC (Containers & Packaging)
| (b) | 3.500% | 03/01/2029 | 75,000 | 62,977 |
Illuminate Buyer LLC / Illuminate Holdings IV, Inc. (Chemicals)
| (b) | 9.000% | 07/01/2028 | 50,000 | 39,500 |
International Flavors & Fragrances, Inc. (Chemicals)
| (b) | 1.832% | 10/15/2027 | 450,000 | 387,682 |
Koppers, Inc. (Chemicals)
| (b) | 6.000% | 02/15/2025 | 100,000 | 92,866 |
OI European Group B.V. (Containers & Packaging)
| (b) | 4.750% | 02/15/2030 | 50,000 | 41,875 |
Owens-Brockway Glass Container, Inc. (Containers & Packaging)
| (b) | 5.375% | 01/15/2025 | 50,000 | 47,000 |
Owens-Brockway Glass Container, Inc. (Containers & Packaging)
| (b) | 6.625% | 05/13/2027 | 38,000 | 35,465 |
Packaging Corp. of America (Containers & Packaging)
| | 3.650% | 09/15/2024 | 675,000 | 671,940 |
Polar U.S. Borrower LLC / Schenectady International Group, Inc. (Chemicals)
| (b) | 6.750% | 05/15/2026 | 100,000 | 69,826 |
Reliance Steel & Aluminum Co. (Metals & Mining)
| | 4.500% | 04/15/2023 | 760,000 | 762,335 |
RPM International, Inc. (Chemicals)
| | 4.550% | 03/01/2029 | 425,000 | 410,041 |
SRS Distribution, Inc. (Construction Materials)
| (b) | 6.125% | 07/01/2029 | 25,000 | 19,724 |
SRS Distribution, Inc. (Construction Materials)
| (b) | 6.000% | 12/01/2029 | 100,000 | 78,523 |
Standard Industries, Inc. (Construction Materials)
| (b) | 5.000% | 02/15/2027 | 200,000 | 178,511 |
Trivium Packaging Finance B.V. (Containers & Packaging)
| (b) | 8.500% | 08/15/2027 | 225,000 | 210,961 |
W.R. Grace Holdings LLC (Chemicals)
| (b) | 4.875% | 06/15/2027 | 25,000 | 21,756 |
W.R. Grace Holdings LLC (Chemicals)
| (b) | 5.625% | 08/15/2029 | 50,000 | 36,813 |
WRKCo, Inc. (Containers & Packaging)
| | 4.000% | 03/15/2028 | 525,000 | 512,148 |
| | | | | | 6,109,529 |
Real Estate–1.1%
| | | | | |
Alexandria Real Estate Equities, Inc. (Equity REIT)
| | 1.875% | 02/01/2033 | 930,000 | 699,266 |
AvalonBay Communities, Inc. (Equity REIT)
| | 3.350% | 05/15/2027 | 725,000 | 693,978 |
Boston Properties LP (Equity REIT)
| | 3.650% | 02/01/2026 | 650,000 | 631,035 |
Crown Castle International Corp. (Equity REIT)
| | 3.250% | 01/15/2051 | 450,000 | 322,800 |
Healthcare Trust of America Holdings LP (Equity REIT)
| | 2.000% | 03/15/2031 | 525,000 | 406,956 |
Kimco Realty Corp. (Equity REIT)
| | 2.700% | 10/01/2030 | 450,000 | 387,235 |
Mid-America Apartments LP (Equity REIT)
| | 4.000% | 11/15/2025 | 725,000 | 719,847 |
| Ohio National Fund, Inc. | ON Federated Core Plus Bond Portfolio (Continued) |
| Schedule of Investments | June 30, 2022 (Unaudited) |
| Corporate Bonds (Continued) | Rate | Maturity | Face Amount | Value |
Real Estate (continued)
| | | | | |
Piedmont Operating Partnership LP (Equity REIT)
| | 2.750% | 04/01/2032 | $ 300,000 | $ 231,763 |
Regency Centers LP (Equity REIT)
| | 2.950% | 09/15/2029 | 700,000 | 615,054 |
UDR, Inc. (Equity REIT)
| | 3.500% | 01/15/2028 | 725,000 | 684,823 |
VICI Properties LP / VICI Note Co., Inc. (Equity REIT)
| (b) | 4.625% | 06/15/2025 | 75,000 | 71,344 |
VICI Properties LP / VICI Note Co., Inc. (Equity REIT)
| (b) | 4.500% | 01/15/2028 | 75,000 | 68,347 |
W.P. Carey, Inc. (Equity REIT)
| | 3.850% | 07/15/2029 | 350,000 | 325,828 |
Welltower, Inc. (Equity REIT)
| | 4.250% | 04/01/2026 | 475,000 | 469,850 |
| | | | | | 6,328,126 |
Utilities–2.1%
| | | | | |
Ameren Corp. (Multi-Utilities)
| | 1.750% | 03/15/2028 | 1,000,000 | 861,572 |
American Electric Power Co., Inc. (Electric Utilities)
| | 2.031% | 03/15/2024 | 335,000 | 324,075 |
AmeriGas Partners LP / AmeriGas Finance Corp. (Gas Utilities)
| | 5.500% | 05/20/2025 | 50,000 | 47,059 |
Black Hills Corp. (Multi-Utilities)
| | 2.500% | 06/15/2030 | 370,000 | 309,036 |
Calpine Corp. (Ind. Power & Renewable Elec.)
| (b) | 5.000% | 02/01/2031 | 75,000 | 60,632 |
Calpine Corp. (Ind. Power & Renewable Elec.)
| (b) | 3.750% | 03/01/2031 | 25,000 | 20,335 |
Dominion Energy, Inc. (Multi-Utilities)
| | 1.450% | 04/15/2026 | 670,000 | 605,868 |
Duke Energy Corp. (Electric Utilities)
| | 3.750% | 09/01/2046 | 650,000 | 511,872 |
Duke Energy Corp. (Electric Utilities)
| | 4.200% | 06/15/2049 | 725,000 | 604,910 |
Emera U.S. Finance LP (Electric Utilities)
| | 3.550% | 06/15/2026 | 400,000 | 382,831 |
Emera U.S. Finance LP (Electric Utilities)
| | 4.750% | 06/15/2046 | 400,000 | 352,059 |
Enel Finance International N.V. (Electric Utilities)
| (b) | 2.250% | 07/12/2031 | 750,000 | 588,696 |
Eversource Energy (Electric Utilities)
| | 3.350% | 03/15/2026 | 670,000 | 650,601 |
Exelon Corp. (Electric Utilities)
| | 4.050% | 04/15/2030 | 1,175,000 | 1,127,513 |
Exelon Corp. (Electric Utilities)
| (b) | 4.100% | 03/15/2052 | 55,000 | 47,414 |
FirstEnergy Corp. (Electric Utilities)
| | 2.650% | 03/01/2030 | 250,000 | 206,250 |
National Fuel Gas Co. (Gas Utilities)
| | 5.500% | 01/15/2026 | 450,000 | 451,648 |
National Fuel Gas Co. (Gas Utilities)
| | 2.950% | 03/01/2031 | 270,000 | 219,149 |
NextEra Energy Capital Holdings, Inc. (Electric Utilities)
| | 3.550% | 05/01/2027 | 600,000 | 579,258 |
NextEra Energy Capital Holdings, Inc. (Electric Utilities)
| | 2.250% | 06/01/2030 | 600,000 | 503,840 |
NRG Energy, Inc. (Electric Utilities)
| | 5.750% | 01/15/2028 | 75,000 | 68,170 |
NRG Energy, Inc. (Electric Utilities)
| (b) | 3.875% | 02/15/2032 | 50,000 | 39,714 |
PPL Capital Funding, Inc. (Electric Utilities)
| | 3.100% | 05/15/2026 | 200,000 | 190,263 |
Puget Energy, Inc. (Electric Utilities)
| | 2.379% | 06/15/2028 | 685,000 | 598,854 |
Sempra Energy (Multi-Utilities)
| | 3.700% | 04/01/2029 | 590,000 | 554,068 |
Southern Co. / The (Rate is fixed until 01/15/2026, at which point, the rate becomes H15T5Y + 373) (Electric Utilities)
| (c) | 4.000% | 01/15/2051 | 1,350,000 | 1,210,248 |
Suburban Propane Partners LP / Suburban Energy Finance Corp. (Gas Utilities)
| | 5.875% | 03/01/2027 | 75,000 | 70,741 |
TerraForm Power Operating LLC (Ind. Power & Renewable Elec.)
| (b) | 5.000% | 01/31/2028 | 100,000 | 90,574 |
Vistra Operations Co. LLC (Ind. Power & Renewable Elec.)
| (b) | 5.500% | 09/01/2026 | 75,000 | 70,825 |
WEC Energy Group, Inc. (Multi-Utilities)
| | 0.800% | 03/15/2024 | 220,000 | 208,910 |
WEC Energy Group, Inc. (Multi-Utilities)
| | 2.200% | 12/15/2028 | 190,000 | 166,213 |
| | | | | | 11,723,198 |
Total Corporate Bonds (Cost $153,791,511)
| | | | | $130,171,208 |
| Investment Companies–7.3% | Shares | Value |
Federated Hermes Core Trust - Bank Loan Core Fund (Acquired 05/01/2020 through 06/28/2021, Cost $10,519,079)
| (e)(f) | 1,099,730 | $ 9,688,618 |
Federated Hermes Core Trust - Emerging Markets Core Fund (Acquired 05/01/2020 through 06/28/2021, Cost $17,267,059)
| (e)(f) | 1,684,692 | 13,191,139 |
Federated Hermes Core Trust III - Federated Project and Trade Finance Core Fund (Acquired 05/01/2020 through 06/28/2021, Cost $19,222,113)
| (f)(g) | 2,176,961 | 18,765,407 |
Total Investment Companies (Cost $47,008,251)
| | | $ 41,645,164 |
| Asset-Backed / Mortgage-Backed Securities–3.8% | Rate | Maturity | Face Amount | Value |
Financials–3.8%
| | | | | |
AmeriCredit Automobile Receivables Trust 2020-2 D
| | 2.130% | 03/18/2026 | $ 180,000 | $ 173,269 |
AmeriCredit Automobile Receivables Trust 2020-3 D
| | 1.490% | 09/18/2026 | 175,000 | 164,258 |
BANK 2022-BNK40 A4
| | 3.507% | 03/15/2064 | 660,000 | 615,050 |
Benchmark 2020-B19 A5
| | 1.850% | 09/15/2053 | 1,150,000 | 962,524 |
Benchmark 2021-B26 A2
| | 1.957% | 06/15/2054 | 520,000 | 479,658 |
Carmax Auto Owner Trust 2021-1 D
| | 1.280% | 07/15/2027 | 100,000 | 91,217 |
Chesapeake Funding II LLC 2020-1A D
| (b) | 2.830% | 08/15/2032 | 150,000 | 143,939 |
Ford Credit Auto Lease Trust 2020-B C
| | 1.700% | 02/15/2025 | 335,000 | 331,757 |
Ford Credit Floorplan Master Owner Trust A 2020-1 D
| | 2.120% | 09/15/2025 | 395,000 | 381,274 |
Freddie Mac Multifamily Structured Pass Through Certificates K108 A2
| | 1.517% | 03/25/2030 | 400,000 | 346,337 |
Freddie Mac Multifamily Structured Pass Through Certificates K109 A2
| | 1.558% | 04/25/2030 | 400,000 | 346,382 |
GM Financial Consumer Automobile Receivables Trust 2020-3 D
| | 1.910% | 09/16/2027 | 400,000 | 381,500 |
GS Mortgage-Backed Securities Trust 2022-PJ3 A4
| (b) | 2.500% | 08/25/2052 | 1,962,308 | 1,671,467 |
Home Partners of America 2022-1 B
| (b) | 4.330% | 04/17/2039 | 758,064 | 745,612 |
| Ohio National Fund, Inc. | ON Federated Core Plus Bond Portfolio (Continued) |
| Schedule of Investments | June 30, 2022 (Unaudited) |
| Asset-Backed / Mortgage-Backed Securities (Continued) | Rate | Maturity | Face Amount | Value |
| Financials (continued) | | | | | |
HPEFS Equipment Trust 2020-2A D
| (b) | 2.790% | 07/22/2030 | $ 750,000 | $ 738,631 |
Invitation Homes 2018-SFR4 B
| (b) | ML + 125 | 01/17/2038 | 2,999,862 | 2,969,630 |
J.P. Morgan Mortgage Trust 2022-1 A2
| (b) | 3.000% | 07/25/2052 | 1,443,433 | 1,284,035 |
JP Morgan Mortgage Trust 2022-2 A3
| (b) | 2.500% | 08/25/2052 | 1,940,356 | 1,652,768 |
JP Morgan Mortgage Trust 2022-3 A3
| (b) | 2.500% | 08/25/2052 | 1,956,529 | 1,688,653 |
MMAF Equipment Finance LLC 2020-A A5
| (b) | 1.560% | 10/09/2042 | 750,000 | 658,727 |
Navient Private Education Refi Loan Trust 2020-FA A
| (b) | 1.220% | 07/15/2069 | 186,059 | 177,614 |
Navistar Financial Dealer Note Master Trust 2020-1 D
| (b) | ML + 290 | 07/25/2025 | 275,000 | 275,007 |
PFS Financing Corp. 2020-G B
| (b) | 1.570% | 02/15/2026 | 310,000 | 294,748 |
Progress Residential 2022-SFR1 E1
| (b) | 3.930% | 02/17/2041 | 900,000 | 793,118 |
Progress Residential 2022-SFR2 D
| | 3.945% | 04/17/2027 | 1,000,000 | ��926,793 |
Progress Residential 2022-SFR4 B
| (b) | 4.788% | 05/17/2041 | 800,000 | 779,168 |
Santander Consumer Auto Receivables Trust 2020-BA D
| (b) | 2.140% | 12/15/2026 | 530,000 | 506,693 |
Santander Drive Auto Receivables Trust 2020-3 D
| | 1.640% | 11/16/2026 | 750,000 | 731,423 |
Sierra Timeshare 2020-2A A
| (b) | 1.330% | 07/20/2037 | 276,607 | 261,631 |
SMB Private Education Loan Trust 2020-B A1A
| (b) | 1.290% | 07/15/2053 | 470,984 | 426,899 |
Tesla Auto Lease Trust 2020-A C
| (b) | 1.680% | 02/20/2024 | 330,000 | 323,919 |
Tesla Auto Lease Trust 2020-A D
| (b) | 2.330% | 02/20/2024 | 100,000 | 97,689 |
World Omni Select Auto Trust 2020-A D
| | 1.700% | 10/15/2026 | 250,000 | 238,956 |
Total Asset-Backed / Mortgage-Backed Securities (Cost $23,284,570)
| | | | | $ 21,660,346 |
| Sovereign Debt Issues–0.3% | Rate | Maturity | Face Amount | Value |
Mexico Government International Bond
| | 3.750% | 01/11/2028 | $ 625,000 | $ 598,461 |
Mexico Government International Bond
| | 4.500% | 01/31/2050 | 775,000 | 603,286 |
Republic of Poland Government International Bond
| | 4.000% | 01/22/2024 | 600,000 | 599,393 |
Total Sovereign Debt Issues (Cost $2,123,492)
| | | | | $ 1,801,140 |
| Common Stocks–0.0% | Shares | Value |
Health Care–0.0%
| | | |
Mallinckrodt PLC (Pharmaceuticals)
| (h) | 438 | $ 10,878 |
Total Common Stocks (Cost $8,110)
| | | $ 10,878 |
| Money Market Funds–1.5% | Shares | Value |
State Street Institutional Liquid Reserves Fund Institutional Class, 1.494%
| (i) | 8,546,189 | $ 8,545,334 |
Total Money Market Funds (Cost $8,546,189)
| | | $ 8,545,334 |
Total Investments – 101.7% (Cost $634,660,894)
| (j) | | $577,026,349 |
Liabilities in Excess of Other Assets – (1.7)%
| | | (9,761,188) |
| Net Assets – 100.0% | | | $567,265,161 |
Percentages are stated as a percent of net assets. |
| Abbreviations: | |
| H15T5Y: | U.S. Treasury Yield Curve Rate T-Note Constant Maturity 5 Year, 3.010% at 06/30/2022 |
| ML: | Monthly U.S. LIBOR Rate, 1.787% at 06/30/2022 |
| PIK: | Payment-in-Kind |
| QL: | Quarterly U.S. LIBOR Rate, 2.285% at 06/30/2022 |
| SOFR: | Secured Overnight Financing Rate, 1.500% at 06/30/2022 |
| TSFR3M: | Quarterly CME Term SOFR, 2.117% at 06/30/2022 |
| Ohio National Fund, Inc. | ON Federated Core Plus Bond Portfolio (Continued) |
| Schedule of Investments | June 30, 2022 (Unaudited) |
| Footnotes: | |
| (a) | Security is partially pledged as collateral for the futures contracts outstanding at June 30, 2022. The market value of securities pledged totaled $669,119. See also the following Schedule of Open Futures Contracts. |
| (b) | Security exempt from registration under Regulation D of the Securities Act of 1933. These securities may be resold in transactions exempt from registration, normally to qualified buyers under Rule 144A. At June 30, 2022, the value of these securities totaled $42,737,978, or 7.5% of the Portfolio’s net assets. |
| (c) | Security is a fixed-then-variable rate instrument in which the coupon or dividend rate is fixed until a later specified date, then is adjusted periodically. Rates stated, including interest rate caps and floors, if any, are those in effect at June 30, 2022. |
| (d) | Issuer of the security has the option to make coupon payments in cash or in additional par value of this bond (Payment-in-Kind). |
| (e) | Shares of this fund have not been registered and are issued in reliance on Section 4(a)(2) and Regulation D of the Securities Act of 1933. Investments in this fund may only be made by investment companies, insurance company separate accounts, common or commingled trust funds or similar organizations or entities that are “accredited investors” within the meaning of Regulation D of the 1933 Act. |
| (f) | Represents a security deemed to be restricted. At June 30, 2022, the value of restricted securities in the Portfolio totaled $41,645,164, or 7.3% of the Portfolio’s net assets. |
| (g) | Open-end extended payment fund. Beneficial interests in this fund are issued solely in private placement transactions which do not involve any “public offering” within the meaning of Section 4(a)(2) and Regulation D of the Securities Act of 1933. Investments in this fund may only be made by organizations or entities that are “accredited investors” within the meaning of Regulation D of the 1933 Act and that are also “qualified purchasers” as defined in Section 2(a)(51) of the Investment Company Act of 1940, as amended (“Eligible Investors”). This fund has adopted policies to limit the transfer of its shares, which may occur only pursuant to authorization by this fund's Board of Directors, and only to Eligible Investors.When a redeeming shareholder of this fund presents shares to the fund's transfer agent in proper order for redemption, the fund will have up to 31 days to make payment to the redeeming shareholder. The price of redeemed shares will be determined as of the closing net asset value of the fund 24 days after receipt of a shareholder redemption request or, if such date is a weekend or holiday, on the preceding business day. The fund's NAV is calculated each day the NYSE is open. |
| (h) | Non-income producing security. |
| (i) | Rate represents the seven-day yield at June 30, 2022. |
| (j) | Represents cost for financial reporting purposes, which may differ from cost basis for federal income tax purposes. See also Note 7 of the Notes to Financial Statements. |
The accompanying notes are an integral part of these financial statements.
| Schedule of Open Futures Contracts | June 30, 2022 (Unaudited) |
Long Futures Contracts
| Description | | Number of
contracts | | Expiration Date | | Notional
Amount | | Value | | Unrealized
Appreciation
(Depreciation) | | Variation Margin
Receivable
(Payable) |
| CBT 10-Year U.S. Ultra Bond - Long | | 150 | | September 21, 2022 | | $19,184,869 | | $19,106,250 | | $ (78,619) | | $199,219 |
| CBT U.S. Long Bond - Long | | 20 | | September 21, 2022 | | 2,653,171 | | 2,772,500 | | 119,329 | | 33,750 |
| CBT 10-Year U.S. Treasury Note - Long | | 40 | | September 21, 2022 | | 4,628,685 | | 4,741,250 | | 112,565 | | 40,625 |
| CBT 5-Year U.S. Treasury Note - Long | | 60 | | September 30, 2022 | | 6,588,138 | | 6,735,000 | | 146,862 | | 42,188 |
| CBT 2-Year U.S. Treasury Note - Long | | 200 | | September 30, 2022 | | 42,270,281 | | 42,003,125 | | (267,156) | | 112,500 |
| | | | | | | $75,325,144 | | $75,358,125 | | $ 32,981 | | $428,282 |
Short Futures Contracts
| Description | | Number of
contracts | | Expiration Date | | Notional
Amount | | Value | | Unrealized
Appreciation
(Depreciation) | | Variation Margin
Receivable
(Payable) |
| CBT U.S. Ultra Bond - Short | | 144 | | September 21, 2022 | | $(22,507,123) | | (22,225,500) | | $281,623 | | $(337,501) |
| Total Futures Contracts | | | | | | $ 52,818,021 | | $ 53,132,625 | | $314,604 | | $ 90,781 |
The accompanying notes are an integral part of these financial statements.
| Ohio National Fund, Inc. | ON Janus Henderson U.S. Low Volatility Portfolio (Unaudited) |
The ON Janus Henderson U.S. Low Volatility Portfolio seeks capital appreciation by investing, under normal circumstances, at least 80% of its net assets in U.S. common stocks of companies included in the S&P 500® Index. Those stocks are selected by a mathematical investment process which seeks to achieve returns similar to those of the S&P 500® Index over the long-term with lower absolute volatility.
Performance as of June 30, 2022
| Average Annual returns | |
| One year | -0.30% |
| Since inception (6/25/21) | -0.10% |
Past performance does not guarantee future results. The performance data quoted represents past performance and current returns may be lower or higher. Total return figures include change in share price and reinvestment of dividends and capital gains. The investment return and principal value will fluctuate so that an investor’s shares, when redeemed, may be worth more or less than the original cost. To obtain performance information up to the most recent month end, call toll-free 1-877-781-6392.
The Portfolio is not open to direct retail investment. Beneficial interest in the Portfolio’s shares is obtained either through an allocation to the Portfolio as an investment vehicle within variable life insurance policies or annuity contracts, or as an underlying investment by the ON Model Portfolios. Actual performance results for variable annuity and variable universal life contracts will be lower due to contract charges. Consult your contract for applicable charges.
Total expense ratio is 0.62% per the Fund’s prospectus dated April 29, 2022. Additional information pertaining to the Portfolio’s expense ratio as of June 30, 2022 can be found in the Portfolio’s Financial Highlights.
Comments from Sub-Adviser
Q. How did the Portfolio perform in comparison to its benchmark during the reporting period?
A. For the six-month period ended June 30, 2022, the Portfolio returned -10.16% versus -19.96% for its benchmark, the S&P 500® Index.
Q. Were there specific market conditions, investment strategies, or techniques that materially affected the Portfolio’s benchmark-relative performance during the reporting period?
A. U.S. equity markets have been volatile amidst inflationary concerns and geopolitical tensions. The heightened volatility culminated in a sharp decline during the second quarter, as investors grew concerned that rising interest rates might not be enough to tamp down inflation without causing a recession. Many equity markets reached bear market territory (a loss of 20% of more from a recent high). The Portfolio benefited from its overall defensive positioning amidst the heightened volatility experienced during the period. Specifically, an overweight to lower beta stocks, which strongly outperformed during the period, contributed to relative performance. (1)
Q. How did sector allocation and security selection each impact the Portfolio’s performance relative to its benchmark?
A. For the six-month period, the benchmark was led by the strong performance of the Energy sector, which was the only benchmark sector to finish the period in positive territory. Defensive sectors, like Consumer Staples, Utilities and Health Care, were also significantly less negative than the overall market. While a lack of allocation to Energy was a headwind for the Portfolio during the period, the Portfolio outperformed and benefited from average overweights to Consumer Staples, Health Care and Utilities. While both allocation and security selection had meaningful impacts to relative returns, security selection led the Portfolio’s outperformance, especially within the Information Technology and Communication Services sectors. (1)
Q. Which securities contributed the most to, and detracted the most from, the Portfolio’s benchmark-relative performance?
A. The three biggest contributors to the Portfolio’s relative performance for the six-month period were overweight positions in T-Mobile U.S., Inc. (“T-Mobile”), Eli Lilly & Co. (“Eli Lilly”) and The Hershey Co. (“Hershey”). T-Mobile posted returns of 16% for the period, aided by improved demand for subscribers and cost savings from the combination with Sprint Corp. Eli Lilly posted returns of 18%, largely benefiting from Federal Drug Administration approvals of new drugs in its pipeline, as well as continued solid operating results. Hershey gained 12% during the period, continuing to benefit from favorable pricing increases and synergies from buyouts.
The three biggest detractors from the Portfolio’s relative performance for the period were not holding benchmark names Exxon Mobil Corp. (“Exxon Mobil”) and Chevron Corp.(“Chevron”), as well as an overweight to The Estee Lauder Cos., Inc. Class A (“Estee Lauder”). Exxon Mobil and Chevron posted returns of 43% and 26%, respectively, and outperformed the benchmark by a wide margin. Both companies continue to benefit from rising oil prices. Estee Lauder declined by 31% over concerns related to current valuations, despite strong earnings results. (1)
Q. Were there any significant changes to the Portfolio’s management team, investment strategy, or selection process during the reporting period?
A. In January 2022, Dr. Jian Tang was promoted to Portfolio Manager. He has full access to the Portfolio’s proprietary optimization methodology and is actively involved in identification and testing of ideas leading to enhancements, as well as new product development.
| (1) | The Portfolio’s composition is subject to change. Holdings and weightings are as of June 30, 2022. |
Change in Value of $10,000 Investment
Hypothetical illustration based on past performance. Future performance will vary. The Portfolio’s returns reflect reinvested dividends. The Portfolio’s holdings may differ significantly from the securities in the index. The index is unmanaged and therefore does not reflect the cost of portfolio management and accounting.
The S&P 500® Index is a capitalization-weighted index designed to measure performance of the broad domestic economy through changes in the aggregate market value of 500 stocks representing all major industries. The index presented includes the effects of reinvested dividends.
Past performance is no guarantee of future results. Redemption of fund shares could have tax implications unique to each shareholder.
| Ohio National Fund, Inc. | ON Janus Henderson U.S. Low Volatility Portfolio (Unaudited) (Continued) |
| Portfolio Composition as of June 30, 2022 (1) |
| | % of Net Assets |
| Common Stocks (4) | 99.4 |
Money Market Funds
Less Net Liabilities | 0.6 |
| | 100.0 |
| Top 10 Portfolio Holdings as of June 30, 2022 (1) (2) (3) |
| | | % of Net Assets |
| 1. | Apple, Inc. | 5.3 |
| 2. | Microsoft Corp. | 4.5 |
| 3. | Johnson & Johnson | 3.6 |
| 4. | Eli Lilly & Co. | 3.4 |
| 5. | Procter & Gamble Co. / The | 3.4 |
| 6. | T-Mobile U.S., Inc. | 3.0 |
| 7. | Gilead Sciences, Inc. | 2.9 |
| 8. | Oracle Corp. | 2.9 |
| 9. | Mondelez International, Inc. Class A | 2.8 |
| 10. | Costco Wholesale Corp. | 2.8 |
| | |
| (1) | Composition of Portfolio subject to change. |
| (2) | Short-term investments have been excluded from the list of Top 10 Portfolio Holdings. |
| (3) | Top 10 Portfolio Holdings is presented at an individual security level. Total investment exposure by issuer may be higher. |
| (4) | Sectors (Common Stocks): |
| | % of Net Assets |
| Consumer Staples | 26.2 |
| Health Care | 22.6 |
| Information Technology | 18.3 |
| Consumer Discretionary | 7.7 |
| Utilities | 7.6 |
| Financials | 6.7 |
| Communication Services | 6.4 |
| Industrials | 3.5 |
| Materials | 0.4 |
| | 99.4 |
| Ohio National Fund, Inc. | ON Janus Henderson U.S. Low Volatility Portfolio |
| Schedule of Investments | June 30, 2022 (Unaudited) |
| Common Stocks–99.4% | Shares | Value |
Communication Services–6.4%
| | | |
Alphabet, Inc. Class A (Interactive Media & Svs.)
| (a) | 2,835 | $ 6,178,202 |
Alphabet, Inc. Class C (Interactive Media & Svs.)
| (a) | 2,397 | 5,243,318 |
T-Mobile U.S., Inc. (Wireless Telecom. Svs.)
| (a) | 175,888 | 23,663,971 |
Verizon Communications, Inc. (Diversified Telecom. Svs.)
| | 285,532 | 14,490,749 |
| | | | 49,576,240 |
Consumer Discretionary–7.7%
| | | |
Amazon.com, Inc. (Internet & Direct Marketing Retail)
| (a) | 111,813 | 11,875,658 |
Dollar General Corp. (Multiline Retail)
| | 21,436 | 5,261,252 |
Domino's Pizza, Inc. (Hotels, Restaurants & Leisure)
| | 34,273 | 13,356,531 |
Garmin Ltd. (Household Durables)
| | 59,299 | 5,826,127 |
McDonald's Corp. (Hotels, Restaurants & Leisure)
| | 45,438 | 11,217,733 |
Target Corp. (Multiline Retail)
| | 72,799 | 10,281,403 |
Tesla, Inc. (Automobiles)
| (a) | 3,807 | 2,563,710 |
| | | | 60,382,414 |
Consumer Staples–26.2%
| | | |
Archer-Daniels-Midland Co. (Food Products)
| | 25,165 | 1,952,804 |
Campbell Soup Co. (Food Products)
| | 123,350 | 5,926,968 |
Church & Dwight Co., Inc. (Household Products)
| | 28,357 | 2,627,560 |
Colgate-Palmolive Co. (Household Products)
| | 270,645 | 21,689,490 |
Conagra Brands, Inc. (Food Products)
| | 179,392 | 6,142,382 |
Costco Wholesale Corp. (Food & Staples Retailing)
| | 45,458 | 21,787,110 |
Hershey Co. / The (Food Products)
| | 99,115 | 21,325,583 |
Hormel Foods Corp. (Food Products)
| | 275,300 | 13,038,208 |
J.M. Smucker Co. / The (Food Products)
| | 52,506 | 6,721,293 |
Kellogg Co. (Food Products)
| | 134,049 | 9,563,056 |
Kimberly-Clark Corp. (Household Products)
| | 6,652 | 899,018 |
Kroger Co. / The (Food & Staples Retailing)
| | 395,298 | 18,709,454 |
Mondelez International, Inc. Class A (Food Products)
| | 354,812 | 22,030,277 |
Procter & Gamble Co. / The (Household Products)
| | 185,539 | 26,678,653 |
Walgreens Boots Alliance, Inc. (Food & Staples Retailing)
| | 101,207 | 3,835,745 |
Walmart, Inc. (Food & Staples Retailing)
| | 175,874 | 21,382,761 |
| | | | 204,310,362 |
Financials–6.7%
| | | |
Aon PLC Class A (Insurance)
| | 26,009 | 7,014,107 |
Arthur J. Gallagher & Co. (Insurance)
| | 16,936 | 2,761,246 |
Assurant, Inc. (Insurance)
| | 52,852 | 9,135,468 |
Berkshire Hathaway, Inc. Class B (Diversified Financial Svs.)
| (a) | 4,942 | 1,349,265 |
Marsh & McLennan Cos., Inc. (Insurance)
| | 102,997 | 15,990,284 |
Progressive Corp. / The (Insurance)
| | 81,297 | 9,452,402 |
Willis Towers Watson PLC (Insurance)
| | 34,839 | 6,876,870 |
| | | | 52,579,642 |
Health Care–22.6%
| | | |
AbbVie, Inc. (Biotechnology)
| | 24,755 | 3,791,476 |
Amgen, Inc. (Biotechnology)
| | 26,048 | 6,337,478 |
Biogen, Inc. (Biotechnology)
| (a) | 88,774 | 18,104,569 |
Bristol-Myers Squibb Co. (Pharmaceuticals)
| | 65,382 | 5,034,414 |
Centene Corp. (Health Care Providers & Svs.)
| (a) | 8,719 | 737,715 |
CVS Health Corp. (Health Care Providers & Svs.)
| | 7,006 | 649,176 |
| Common Stocks (Continued) | Shares | Value |
Health Care (continued)
| | | |
Danaher Corp. (Life Sciences Tools & Svs.)
| | 46,051 | $ 11,674,849 |
Eli Lilly & Co. (Pharmaceuticals)
| | 82,599 | 26,781,074 |
Gilead Sciences, Inc. (Biotechnology)
| | 366,311 | 22,641,683 |
Johnson & Johnson (Pharmaceuticals)
| | 159,564 | 28,324,206 |
Organon & Co. (Pharmaceuticals)
| | 68,340 | 2,306,475 |
ResMed, Inc. (Health Care Equip. & Supplies)
| | 79,281 | 16,619,676 |
STERIS PLC (Health Care Equip. & Supplies)
| | 81,391 | 16,778,755 |
UnitedHealth Group, Inc. (Health Care Providers & Svs.)
| | 14,877 | 7,641,273 |
Waters Corp. (Life Sciences Tools & Svs.)
| (a) | 27,165 | 8,991,072 |
| | | | 176,413,891 |
Industrials–3.5%
| | | |
Jacobs Engineering Group, Inc. (Construction & Engineering)
| | 6,541 | 831,557 |
Leidos Holdings, Inc. (Professional Svs.)
| | 67,894 | 6,837,605 |
PACCAR, Inc. (Machinery)
| | 41,772 | 3,439,507 |
Republic Services, Inc. (Commercial Svs. & Supplies)
| | 118,185 | 15,466,871 |
United Parcel Service, Inc. Class B (Air Freight & Logistics)
| | 5,659 | 1,032,994 |
| | | | 27,608,534 |
Information Technology–18.3%
| | | |
Akamai Technologies, Inc. (IT Svs.)
| (a) | 79,585 | 7,268,498 |
Apple, Inc. (Tech. Hardware, Storage & Periph.)
| | 299,934 | 41,006,977 |
Automatic Data Processing, Inc. (IT Svs.)
| | 5,652 | 1,187,146 |
Citrix Systems, Inc. (Software)
| | 99,408 | 9,659,476 |
International Business Machines Corp. (IT Svs.)
| | 80,022 | 11,298,306 |
Microsoft Corp. (Software)
| | 137,141 | 35,221,923 |
Motorola Solutions, Inc. (Communications Equip.)
| | 13,142 | 2,754,563 |
NortonLifeLock, Inc. (Software)
| | 565,973 | 12,428,767 |
Oracle Corp. (Software)
| | 320,337 | 22,381,946 |
| | | | 143,207,602 |
Materials–0.4%
| | | |
Avery Dennison Corp. (Containers & Packaging)
| | 5,498 | 889,961 |
Ball Corp. (Containers & Packaging)
| | 33,957 | 2,335,223 |
| | | | 3,225,184 |
Utilities–7.6%
| | | |
Consolidated Edison, Inc. (Multi-Utilities)
| | 113,054 | 10,751,435 |
Dominion Energy, Inc. (Multi-Utilities)
| | 10,542 | 841,357 |
Duke Energy Corp. (Electric Utilities)
| | 177,629 | 19,043,605 |
Eversource Energy (Electric Utilities)
| | 49,767 | 4,203,819 |
FirstEnergy Corp. (Electric Utilities)
| | 495,182 | 19,010,037 |
WEC Energy Group, Inc. (Multi-Utilities)
| | 11,839 | 1,191,477 |
Xcel Energy, Inc. (Electric Utilities)
| | 54,350 | 3,845,806 |
| | | | 58,887,536 |
Total Common Stocks (Cost $807,752,993)
| | | $776,191,405 |
| Money Market Funds–0.7% | Shares | Value |
State Street Institutional Liquid Reserves Fund Institutional Class, 1.494%
| (b) | 5,373,313 | $ 5,372,776 |
Total Money Market Funds (Cost $5,372,922)
| | | $ 5,372,776 |
Total Investments – 100.1% (Cost $813,125,915)
| (c) | | $781,564,181 |
Liabilities in Excess of Other Assets – (0.1)%
| | | (715,877) |
| Net Assets – 100.0% | | | $780,848,304 |
Percentages are stated as a percent of net assets. |
| Ohio National Fund, Inc. | ON Janus Henderson U.S. Low Volatility Portfolio (Continued) |
| Schedule of Investments | June 30, 2022 (Unaudited) |
| Footnotes: | |
| (a) | Non-income producing security. |
| (b) | Rate represents the seven-day yield at June 30, 2022. |
| (c) | Represents cost for financial reporting purposes, which may differ from cost basis for federal income tax purposes. See also Note 7 of the Notes to Financial Statements. |
The accompanying notes are an integral part of these financial statements.
| Ohio National Fund, Inc. | ON iShares Managed Risk Balanced Portfolio (Unaudited) |
The ON iShares Managed Risk Balanced Portfolio seeks income and capital appreciation by investing in underlying exchange traded funds (“ETFs”) and futures. Under normal market conditions, through investments in the underlying funds and derivatives, the Portfolio invests a minimum of 25% of its assets in equity investments and a minimum of 25% of its assets in fixed income investments.
Performance as of June 30, 2022
| Average Annual returns | |
| One year | -12.71% |
| Since inception (6/25/21) | -12.61% |
Past performance does not guarantee future results. The performance data quoted represents past performance and current returns may be lower or higher. Total return figures include change in share price and reinvestment of dividends and capital gains. The investment return and principal value will fluctuate so that an investor’s shares, when redeemed, may be worth more or less than the original cost. To obtain performance information up to the most recent month end, call toll-free 1-877-781-6392.
The Portfolio is not open to direct retail investment. Beneficial interest in the Portfolio’s shares is obtained either through an allocation to the Portfolio as an investment vehicle within variable life insurance policies or annuity contracts, or as an underlying investment by the ON Model Portfolios. Actual performance results for variable annuity and variable universal life contracts will be lower due to contract charges. Consult your contract for applicable charges.
Total expense ratio is 0.72% per the Fund’s prospectus dated April 29, 2022. Additional information pertaining to the Portfolio’s expense ratio as of June 30, 2022 can be found in the Portfolio’s Financial Highlights.
Comments from Sub-Adviser
Q. How did the Portfolio perform in comparison to its benchmark during the reporting period?
A. For the six-month period ended June 30, 2022, the Portfolio returned -14.76% versus -19.96% for its benchmark, the S&P 500® Index. The Portfolio’s secondary benchmark, which is comprised of 50% MSCI All Country World Index/50% ICE BofA U.S. Broad Market Index, returned -15.28% for the period.
Q. Were there specific market conditions, investment strategies, or techniques that materially affected the Portfolio’s benchmark-relative performance during the reporting period?
A. The year began with uncertainty around global supply chains and worries about ongoing levels of inflation. China’s Zero COVID policies have caused issues in supply chains. In March, headlines were dominated by geopolitical tension in Europe. The Ukraine war exacerbated issues with global supply chains and drove up commodity prices, further supporting growing inflation. The Consumer Price Index (“CPI”) has continued to see increases over the period, not just on the commodity side, but widespread across the basket of goods. Measures of core inflation have increased month over month as CPI reads have failed to define a peak. Labor market strength and wage inflation has also had some impact on the CPI. Investors became concerned about increasing odds of a recession with elevated macro volatility throughout the second quarter and both bond yields and stocks around the world slumped. The Treasury curve rose across all maturities, most noticeably in the front end, leading to a flatter curve. Except for gold, commodity prices remained elevated, as Russia’s invasion of Ukraine and supply-chain disruptions continued but stumbled somewhat at the end of the period. Elevated commodity prices benefited the portfolio’s emerging market positioning, which outperformed relative to the benchmark.
Against this backdrop, several major central banks were forced to pursue the most aggressive series of policy rate hikes in decades. In the U.S., the Federal Reserve raised rates twice: first, in May with the first 50 basis point hike since 2000, and then in June with their biggest rate hike (75 basis points) since 1994. The Fed also signaled further increases could push the Federal Funds Rate above 3% before the end of 2022. The European Central Bank (“ECB”) ended a long-running stimulus scheme and is expected to deliver its first interest rate hike since 2011 in July and a potentially larger move in September if inflation warrants a tougher stance. In contrast, Japan maintained an accommodative policy, holding onto its ultra-loose stance to the detriment of its currency. In comparison to equities in other developed markets, Japanese companies derive substantial portions of their revenues from overseas and tend to outperform in periods of rising real rates. The Japanese equity position in the Portfolio added to performance in relative terms versus the benchmark. (1)
Q. How did asset class allocation impact the Portfolio’s performance relative to its benchmark?
A. The Portfolio follows a top-down asset allocation process and is highly diversified, investing across a wide opportunity set of global equities, bonds, and currencies. As such, the Portfolio takes positions across multiple geographies, asset classes and time horizons. Over the six-month period, the Portfolio was invested roughly 50% in equities and 50% in fixed income. Given the weak performance of equities in the first half of the year, the Portfolio’s fixed income exposure was a large contributor to relative performance. Other contributors included the Portfolio’s exposure to international developed equities and to emerging markets, as these markets outperformed relative to the U.S. (1)
Q. How did country selection impact the Portfolio’s performance relative to its benchmark?
A. The Portfolio seeks diversification by investing across equities in developed and emerging markets. During the six-month period, U.S. equities underperformed all other regions, with the primary benchmark declining 19.96%, while the MSCI EAFE declined 19.57% and MSCI Emerging Markets declining 17.63%. Some of the country exposures that contributed to relevant performance include Canada, U.K., and Japan while positioning in Sweden detracted over the period. (1)
Q. Which securities contributed the most to, and detracted the most from, the Portfolio’s benchmark-relative performance? ?
A. Relative to the primary benchmark, the best performing securities within the Portfolio for the six-month period were iShares Core U.S. Aggregate Bond ETF, CBT 5-year U.S. Treasury Note – Short expiring in June and the OSE TOPIX Index Future expiring in June. Both fixed income markets and Japanese equities delivered strong returns for the period, outpacing U.S. equities. An exposure to MSCI Emerging Markets Index – Long future expiring in March detracted from returns over the period. (1)
Q. How did the Portfolio’s use of derivative instruments and initial public offerings (IPOs), if any, impact performance?
A. During the six-month period, futures contracts detracted 91 basis points of absolute return for the Portfolio in aggregate. The Portfolio did not participate in any IPOs during the period. (1)
| (1) | The Portfolio’s composition is subject to change. Holdings and weightings are as of June 30, 2022. |
| Ohio National Fund, Inc. | ON iShares Managed Risk Balanced Portfolio (Unaudited) (Continued) |
Change in Value of $10,000 Investment
Hypothetical illustration based on past performance. Future performance will vary. The Portfolio’s returns reflect reinvested dividends. The Portfolio’s holdings may differ significantly from the securities in the index. The index is unmanaged and therefore does not reflect the cost of portfolio management and accounting.
The S&P 500® Index is a capitalization-weighted index designed to measure performance of the broad domestic economy through changes in the aggregate market value of 500 stocks representing all major industries. The index presented includes the effects of reinvested dividends.
The MSCI All Country World Index is a global free float-adjusted, market capitalization-weighted index that is designed to measure the equity market performance of large-cap and mid-cap stocks across many developed and emerging markets, and all eleven recognized GICS sectors. The index currently consists of 23 developed markets, including the United States, along with 27 emerging country markets. The returns presented for this index include the effects of reinvested dividends, net of taxes, and adjustment to U.S. Dollar denomination.
The ICE BofA U.S. Broad Market Index measures the performance of U.S. dollar-denominated, investment grade debt securities, including U.S. Treasury notes and bonds, quasi-government securities, corporate securities, residential and commercial mortgage-backed securities and asset-backed securities. Securities are cap-weighted based on their amount outstanding times the market price plus accrued interest.
Past performance is no guarantee of future results. Redemption of fund shares could have tax implications unique to each shareholder.
| Portfolio Composition as of June 30, 2022 (1) |
| | % of Net Assets |
| Exchange Traded Funds | 92.0 |
Money Market Funds and
Other Net Assets | 8.0 |
| | 100.0 |
| Top 10 Portfolio Holdings as of June 30, 2022 (1) (2) (3) |
| | | % of Net Assets |
| 1. | iShares Core U.S. Aggregate Bond ETF | 51.3 |
| 2. | iShares Core S&P 500 ETF | 15.3 |
| 3. | iShares Russell 1000 ETF | 10.9 |
| 4. | iShares Core MSCI EAFE ETF | 4.9 |
| 5. | iShares MSCI Canada ETF | 1.9 |
| 6. | iShares MSCI Japan ETF | 1.5 |
| 7. | iShares MSCI Sweden ETF | 1.0 |
| 8. | iShares MSCI Singapore ETF | 1.0 |
| 9. | iShares MSCI Taiwan ETF | 0.9 |
| 10. | iShares MSCI Germany ETF | 0.8 |
| | |
| (1) | Composition of Portfolio subject to change. |
| (2) | Short-term investments have been excluded from the list of Top 10 Portfolio Holdings. |
| (3) | Top 10 Portfolio Holdings is presented at an individual security level. Total investment exposure by issuer may be higher. |
| Ohio National Fund, Inc. | ON iShares Managed Risk Balanced Portfolio |
| Schedule of Investments | June 30, 2022 (Unaudited) |
| Exchange Traded Funds–92.0% | Shares | Value |
iShares Core MSCI EAFE ETF
| | 278,219 | $ 16,373,188 |
iShares Core S&P 500 ETF
| | 135,892 | 51,523,452 |
iShares Core U.S. Aggregate Bond ETF
| | 1,696,366 | 172,486,495 |
iShares MSCI Australia ETF
| | 125,481 | 2,662,707 |
iShares MSCI Canada ETF
| | 188,521 | 6,349,387 |
iShares MSCI China ETF
| | 29,484 | 1,645,502 |
iShares MSCI France ETF
| | 31,648 | 949,757 |
iShares MSCI Germany ETF
| | 122,084 | 2,809,153 |
iShares MSCI India ETF
| (a) | 3,357 | 132,165 |
iShares MSCI Japan ETF
| | 96,807 | 5,114,314 |
iShares MSCI Malaysia ETF
| | 27,138 | 595,679 |
iShares MSCI Netherlands ETF
| | 8,834 | 309,720 |
iShares MSCI Poland ETF
| | 48,037 | 702,781 |
iShares MSCI Singapore ETF
| | 180,484 | 3,190,957 |
iShares MSCI South Africa ETF
| | 27,690 | 1,176,548 |
iShares MSCI Sweden ETF
| | 109,428 | 3,332,083 |
iShares MSCI Taiwan ETF
| | 62,400 | 3,146,208 |
iShares MSCI United Kingdom ETF
| | 17,514 | 524,719 |
iShares Russell 1000 ETF
| | 175,563 | 36,474,969 |
Total Exchange Traded Funds (Cost $354,577,280)
| | | $309,499,784 |
| Money Market Funds–4.4% | Shares | Value |
State Street Institutional Liquid Reserves Fund Institutional Class, 1.494%
| (b) | 14,679,565 | $ 14,678,097 |
Total Money Market Funds (Cost $14,679,726)
| | | $ 14,678,097 |
Total Investments – 96.4% (Cost $369,257,006)
| (c) | | $324,177,881 |
Other Assets in Excess of Liabilities – 3.6%
| (d) | | 12,033,428 |
| Net Assets – 100.0% | | | $336,211,309 |
Percentages are stated as a percent of net assets. |
| Footnotes: | |
| (a) | Non-income producing security. |
| (b) | Rate represents the seven-day yield at June 30, 2022. |
| (c) | Represents cost for financial reporting purposes, which may differ from cost basis for federal income tax purposes. See also Note 7 of the Notes to Financial Statements. |
| (d) | Includes $3,529,236 of cash pledged as collateral for the futures contracts outstanding at June 30, 2022. See also the following Schedule of Open Futures Contracts. |
The accompanying notes are an integral part of these financial statements.
| Schedule of Open Futures Contracts | June 30, 2022 (Unaudited) |
Long Futures Contracts
| Description | | Number of
contracts | | Expiration Date | | Notional
Amount | | Value | | Unrealized
Appreciation
(Depreciation) | | Variation Margin
Receivable
(Payable) |
| MRV IBEX 35 Index - Long | | 21 | | July 15, 2022 | | $ 1,798,412 | | $ 1,769,271 | | $ (29,141) | | $ (18,679) |
| OSE TOPIX Index - Long | | 73 | | September 8, 2022 | | 10,473,309 | | 10,063,864 | | (409,445) | | (80,259) |
| MOD S&P TSX 60 Index - Long | | 16 | | September 15, 2022 | | 3,072,579 | | 2,840,273 | | (232,306) | | (34,458) |
| MSCI Emerging Markets Index - Long | | 182 | | September 16, 2022 | | 9,351,655 | | 9,124,570 | | (227,085) | | (42,770) |
| IFLL FTSE 100 Index - Long | | 44 | | September 16, 2022 | | 3,888,717 | | 3,814,094 | | (74,623) | | (74,184) |
| DMI FTSE MIB Index - Long | | 13 | | September 16, 2022 | | 1,489,662 | | 1,444,620 | | (45,042) | | (35,932) |
| | | | | | | $30,074,334 | | $29,056,692 | | $(1,017,642) | | $(286,282) |
Short Futures Contracts
| Description | | Number of
contracts | | Expiration Date | | Notional
Amount | | Value | | Unrealized
Appreciation
(Depreciation) | | Variation Margin
Receivable
(Payable) |
| MSCI EAFE Index - Short | | 251 | | September 16, 2022 | | $(23,388,727) | | (23,300,330) | | $88,397 | | $130,652 |
| CME E-mini S&P 500 Index - Short | | 95 | | September 16, 2022 | | (18,074,124) | | (18,000,125) | | 73,999 | | 181,956 |
| EUR Currency Future - Short | | 3 | | September 19, 2022 | | (403,661) | | (395,175) | | 8,486 | | (1,388) |
| JPY Currency Future - Short | | 13 | | September 19, 2022 | | (1,232,431) | | (1,205,019) | | 27,412 | | (8,206) |
| Ohio National Fund, Inc. | ON iShares Managed Risk Balanced Portfolio (Continued) |
| Schedule of Open Futures Contracts | June 30, 2022 (Unaudited) |
Short Futures Contracts (Continued)
| Description | | Number of
contracts | | Expiration Date | | Notional
Amount | | Value | | Unrealized
Appreciation
(Depreciation) | | Variation Margin
Receivable
(Payable) |
| CBT U.S. Ultra Bond - Short | | 41 | | September 21, 2022 | | $ (6,432,119) | | $ (6,328,094) | | $ 104,025 | | $ (96,092) |
| CBT 5-Year U.S. Treasury Note - Short | | 244 | | September 30, 2022 | | (27,586,386) | | (27,389,000) | | 197,386 | | (171,563) |
| | | | | | | $(77,117,448) | | $(76,617,743) | | $ 499,705 | | $ 35,359 |
| Total Futures Contracts | | | | | | $(47,043,114) | | $(47,561,051) | | $(517,937) | | $(250,923) |
The accompanying notes are an integral part of these financial statements.
| Ohio National Fund, Inc. | ON AB Relative Value Portfolio (Unaudited) |
The ON AB Relative Value Portfolio seeks long-term growth of capital by investing primarily in the equity securities of U.S. companies that the Portfolio's sub-adviser believes are trading at attractive valuations and that have strong or improving business models.
Performance as of June 30, 2022
| Average Annual returns | |
| Since inception (12/2/21) | -7.80% |
Past performance does not guarantee future results. The performance data quoted represents past performance and current returns may be lower or higher. Total return figures include change in share price and reinvestment of dividends and capital gains. The investment return and principal value will fluctuate so that an investor’s shares, when redeemed, may be worth more or less than the original cost. To obtain performance information up to the most recent month end, call toll-free 1-877-781-6392.
The Portfolio is not open to direct retail investment. Beneficial interest in the Portfolio’s shares is obtained either through an allocation to the Portfolio as an investment vehicle within variable life insurance policies or annuity contracts, or as an underlying investment by the ON Model Portfolios. Actual performance results for variable annuity and variable universal life contracts will be lower due to contract charges. Consult your contract for applicable charges.
Total expense ratio is 0.78% per the Fund’s prospectus dated April 29, 2022. Additional information pertaining to the Portfolio’s expense ratio as of June 30, 2022 can be found in the Portfolio’s Financial Highlights.
Comments from Sub-Adviser
Q. How did the Portfolio perform in comparison to its benchmark during the reporting period?
A. For the six-month period ended June 30, 2022, the Portfolio returned -12.36% versus -12.86% for its benchmark, the Russell 1000® Value Index.
Q. Were there specific market conditions, investment strategies, or techniques that materially affected the Portfolio’s benchmark-relative performance during the reporting period?
A. U.S. stocks declined during the six-month period. Equity markets experienced an increase in volatility early in the period, as persistent inflationary pressures prompted the U.S. Federal Reserve (“Fed”) to pivot towards more aggressive tightening of monetary policy, including balance-sheet reduction, which triggered periods of sharp volatility. Inflation worsened after Russia’s invasion of Ukraine caused energy and agricultural prices to surge and China’s pledge to enforce its zero-COVID policy prompted new supply-chain concerns. The Fed raised interest rates three times during the period, including a 0.75% increase in June - its largest since 1994. The growing fear of recession led to sharp declines and periods of widespread volatility across equity markets. Fed Chair Powell’s acknowledgement that the path to a soft landing had narrowed weighed on global equity market sentiment. Against a backdrop of rising rates, growth stocks came under pressure, triggering a rotation into value-oriented stocks. Within large-cap markets, both growth and value stocks declined in absolute terms, but value stocks outperformed growth stocks by a wide margin. Large-cap stocks outperformed small-cap stocks on a relative basis, but both declined in absolute terms.
During the period, the strategy’s overexposure to the earnings yield factor and underexposures to the idiosyncratic volatility and momentum factors contributed to relative performance, while the strategy’s overexposure to the beta factor and underexposures to dividend yield and leverage factors detracted from relative performance. (1)
Q. How did sector allocation and security selection each impact the Portfolio’s performance relative to its benchmark?
A. For the six-month period, security selection contributed to the Portfolio’s relative returns, while sector selection detracted. From a security selection perspective, selection within Industrials, Materials, and Consumer Discretionary were the largest contributors to relative returns, while selection within Health Care and Real Estate detracted. From a sector selection perspective, the Portfolio’s underweights to Financials, Materials, and Real Estate were the largest contributors to relative returns, but were more than offset by detraction resulting from an overweight to Consumer Discretionary and underweights to Energy and Utilities. (1)
Q. Which securities contributed the most to, and detracted the most from, the Portfolio’s benchmark-relative performance?
A. Philip Morris International, Inc., a leading international tobacco company, was the top relative contributor for the six-month period. The stock performed well due to its defensive business model, high profitability and low fundamental risk. Elevance Health, Inc. (formerly Anthem, Inc.), a managed care company, contributed to relative performance after delivering better-than-expected first-quarter sales, earnings, and medical loss ratio. Amgen, Inc., a biotechnology company, contributed to relative performance on the back of their lower fundamental business volatility, strong competitive position, and strong balance sheet.
ExxonMobil Corp., a leading integrated oil company which was not held in the Portfolio, detracted from relative performance for the six-month period. The stock benefitted from favorable supply and demand dynamics, which supported a sharp increase in commodity prices. Additionally, the Russian invasion of Ukraine and subsequent sanctions drove further commodity price increases. As a result, the Energy sector significantly outperformed the benchmark and was the only positively performing sector during the period. D.R. Horton, Inc., a homebuilder, detracted from relative performance as the stock underperformed amid concerns that rising interest rates may slow growth for home builders. Target Corp., a retailer, detracted from relative performance as the broader Consumer Discretionary sector continued to underperform due to higher costs. Target Corp. has had to cope with high inventory issues, forcing the company to sell products at considerable discounts. (1)
Q. Were there any significant changes to the Portfolio’s management team, investment strategy, or selection process during the reporting period?
A. During the performance period, there were four additions to the portfolio management team:
| • | Jerald Gooden joined the team as a generalist research associate. |
| • | Alex Pizzirani, CFA rejoined AllianceBernstein L.P. and the portfolio management team as a research analyst focused on research and development, leveraging machine learning and data science. |
| • | Ewa Przybylko, CFA joined the team as a research associate supporting co-CIO, Vinay Thapar, in covering the healthcare sector. |
| • | Pradeep Ramani joined the team as a research analyst covering the technology sector. He joined shortly after the close of the performance period, on July 11, 2022. |
| (1) | The Portfolio’s composition is subject to change. Holdings and weightings are as of June 30, 2022. |
| Ohio National Fund, Inc. | ON AB Relative Value Portfolio (Unaudited) (Continued) |
Change in Value of $10,000 Investment
Hypothetical illustration based on past performance. Future performance will vary. The Portfolio’s returns reflect reinvested dividends. The Portfolio’s holdings may differ significantly from the securities in the index. The index is unmanaged and therefore does not reflect the cost of portfolio management and accounting.
The Russell 1000® Value Index measures the performance of the large-cap value segment of the U.S. equity universe. It includes those Russell 1000® Index companies with lower price-to-book ratios and lower expected and historical growth rates.
Past performance is no guarantee of future results. Redemption of fund shares could have tax implications unique to each shareholder.
| Portfolio Composition as of June 30, 2022 (1) |
| | % of Net Assets |
| Common Stocks (4) | 96.0 |
Money Market Funds
Less Net Liabilities | 4.0 |
| | 100.0 |
| Top 10 Portfolio Holdings as of June 30, 2022 (1) (2) (3) |
| | | % of Net Assets |
| 1. | Elevance Health, Inc. | 4.4 |
| 2. | Wells Fargo & Co. | 4.2 |
| 3. | Philip Morris International, Inc. | 3.9 |
| 4. | Berkshire Hathaway, Inc. Class B | 3.7 |
| 5. | Roche Holding AG – ADR | 3.2 |
| 6. | Amgen, Inc. | 2.8 |
| 7. | Comcast Corp. Class A | 2.8 |
| 8. | JPMorgan Chase & Co. | 2.5 |
| 9. | Cigna Corp. | 2.4 |
| 10. | PerkinElmer, Inc. | 2.2 |
| | |
| (1) | Composition of Portfolio subject to change. |
| (2) | Short-term investments have been excluded from the list of Top 10 Portfolio Holdings. |
| (3) | Top 10 Portfolio Holdings is presented at an individual security level. Total investment exposure by issuer may be higher. |
| (4) | Sectors (Common Stocks): |
| | % of Net Assets |
| Health Care | 19.5 |
| Industrials | 18.4 |
| Financials | 17.4 |
| Consumer Discretionary | 10.7 |
| Information Technology | 9.3 |
| Energy | 5.0 |
| Consumer Staples | 4.8 |
| Communication Services | 4.7 |
| Real Estate | 3.7 |
| Materials | 1.6 |
| Utilities | 0.9 |
| | 96.0 |
| Ohio National Fund, Inc. | ON AB Relative Value Portfolio |
| Schedule of Investments | June 30, 2022 (Unaudited) |
| Common Stocks–96.0% | Shares | Value |
Communication Services–4.7%
| | | |
Comcast Corp. Class A (Media)
| | 61,481 | $ 2,412,514 |
Netflix, Inc. (Entertainment)
| (a) | 1,835 | 320,887 |
Verizon Communications, Inc. (Diversified Telecom. Svs.)
| | 25,788 | 1,308,741 |
| | | | 4,042,142 |
Consumer Discretionary–10.7%
| | | |
AutoZone, Inc. (Specialty Retail)
| (a) | 503 | 1,081,007 |
Booking Holdings, Inc. (Internet & Direct Marketing Retail)
| (a) | 261 | 456,486 |
BorgWarner, Inc. (Auto Components)
| | 9,423 | 314,445 |
D.R. Horton, Inc. (Household Durables)
| | 20,353 | 1,347,165 |
Deckers Outdoor Corp. (Textiles, Apparel & Luxury Goods)
| (a) | 1,242 | 317,145 |
LKQ Corp. (Distributors)
| | 36,474 | 1,790,509 |
Lowe's Cos., Inc. (Specialty Retail)
| | 8,743 | 1,527,140 |
Murphy U.S.A., Inc. (Specialty Retail)
| | 2,100 | 489,027 |
Target Corp. (Multiline Retail)
| | 9,403 | 1,327,986 |
Ulta Beauty, Inc. (Specialty Retail)
| (a) | 1,396 | 538,130 |
| | | | 9,189,040 |
Consumer Staples–4.8%
| | | |
Philip Morris International, Inc. (Tobacco)
| | 34,173 | 3,374,242 |
Walmart, Inc. (Food & Staples Retailing)
| | 6,220 | 756,228 |
| | | | 4,130,470 |
Energy–5.0%
| | | |
Chevron Corp. (Oil, Gas & Consumable Fuels)
| | 4,238 | 613,578 |
ConocoPhillips (Oil, Gas & Consumable Fuels)
| | 6,793 | 610,079 |
EOG Resources, Inc. (Oil, Gas & Consumable Fuels)
| | 10,271 | 1,134,329 |
Helmerich & Payne, Inc. (Energy Equip. & Svs.)
| | 15,945 | 686,592 |
Phillips 66 (Oil, Gas & Consumable Fuels)
| | 13,851 | 1,135,644 |
Woodside Energy Group Ltd. – ADR (Oil, Gas & Consumable Fuels)
| | 4,290 | 92,492 |
| | | | 4,272,714 |
Financials–17.4%
| | | |
Aflac, Inc. (Insurance)
| | 4,235 | 234,323 |
Allstate Corp. / The (Insurance)
| | 10,981 | 1,391,622 |
Bank OZK (Banks)
| | 18,110 | ��679,668 |
Berkshire Hathaway, Inc. Class B (Diversified Financial Svs.)
| (a) | 11,573 | 3,159,660 |
Capital One Financial Corp. (Consumer Finance)
| | 7,237 | 754,023 |
Goldman Sachs Group, Inc. / The (Capital Markets)
| | 6,216 | 1,846,276 |
JPMorgan Chase & Co. (Banks)
| | 19,185 | 2,160,423 |
Northern Trust Corp. (Capital Markets)
| | 12,685 | 1,223,849 |
Wells Fargo & Co. (Banks)
| | 91,041 | 3,566,076 |
| | | | 15,015,920 |
Health Care–19.5%
| | | |
Amgen, Inc. (Biotechnology)
| | 10,000 | 2,433,000 |
Bio-Rad Laboratories, Inc. Class A (Life Sciences Tools & Svs.)
| (a) | 1,584 | 784,080 |
Cigna Corp. (Health Care Providers & Svs.)
| | 7,938 | 2,091,822 |
Elevance Health, Inc. (Health Care Providers & Svs.)
| | 7,899 | 3,811,898 |
PerkinElmer, Inc. (Life Sciences Tools & Svs.)
| | 13,490 | 1,918,548 |
Pfizer, Inc. (Pharmaceuticals)
| | 12,466 | 653,592 |
Quest Diagnostics, Inc. (Health Care Providers & Svs.)
| | 6,861 | 912,376 |
Regeneron Pharmaceuticals, Inc. (Biotechnology)
| (a) | 2,519 | 1,489,057 |
Roche Holding AG – ADR (Pharmaceuticals)
| | 65,076 | 2,714,320 |
| | | | 16,808,693 |
Industrials–18.4%
| | | |
Acuity Brands, Inc. (Electrical Equip.)
| | 4,050 | 623,862 |
| Common Stocks (Continued) | Shares | Value |
| Industrials (continued) | | | |
Alaska Air Group, Inc. (Airlines)
| (a) | 18,705 | $ 749,135 |
Altra Industrial Motion Corp. (Machinery)
| | 11,206 | 395,012 |
Builders FirstSource, Inc. (Building Products)
| (a) | 12,133 | 651,542 |
Curtiss-Wright Corp. (Aerospace & Defense)
| | 5,046 | 666,375 |
EMCOR Group, Inc. (Construction & Engineering)
| | 7,593 | 781,775 |
Emerson Electric Co. (Electrical Equip.)
| | 19,507 | 1,551,587 |
Expeditors International of Washington, Inc. (Air Freight & Logistics)
| | 6,025 | 587,196 |
FedEx Corp. (Air Freight & Logistics)
| | 2,886 | 654,285 |
Hexcel Corp. (Aerospace & Defense)
| | 9,990 | 522,577 |
Knight-Swift Transportation Holdings, Inc. (Road & Rail)
| | 34,905 | 1,615,752 |
Middleby Corp. / The (Machinery)
| (a) | 2,500 | 313,400 |
MSC Industrial Direct Co., Inc. Class A (Trading Companies & Distributors)
| | 9,723 | 730,295 |
Raytheon Technologies Corp. (Aerospace & Defense)
| | 19,248 | 1,849,925 |
Robert Half International, Inc. (Professional Svs.)
| | 10,634 | 796,380 |
Southwest Airlines Co. (Airlines)
| (a) | 17,890 | 646,187 |
Textron, Inc. (Aerospace & Defense)
| | 22,816 | 1,393,373 |
Toro Co. / The (Machinery)
| | 8,161 | 618,522 |
Westinghouse Air Brake Technologies Corp. (Machinery)
| | 9,057 | 743,399 |
| | | | 15,890,579 |
Information Technology–9.3%
| | | |
Ciena Corp. (Communications Equip.)
| (a) | 7,096 | 324,287 |
Cisco Systems, Inc. (Communications Equip.)
| | 17,865 | 761,764 |
Cognizant Technology Solutions Corp. Class A (IT Svs.)
| | 12,210 | 824,053 |
FleetCor Technologies, Inc. (IT Svs.)
| (a) | 6,482 | 1,361,933 |
IPG Photonics Corp. (Electronic Equip., Instr. & Comp.)
| (a) | 8,696 | 818,555 |
Keysight Technologies, Inc. (Electronic Equip., Instr. & Comp.)
| (a) | 10,515 | 1,449,493 |
Mastercard, Inc. Class A (IT Svs.)
| | 4,565 | 1,440,166 |
MKS Instruments, Inc. (Semiconductors & Equip.)
| | 5,126 | 526,081 |
NXP Semiconductors N.V. (Semiconductors & Equip.)
| | 3,344 | 495,012 |
| | | | 8,001,344 |
Materials–1.6%
| | | |
BHP Group Ltd. – ADR (Metals & Mining)
| | 11,871 | 666,913 |
Mosaic Co. / The (Chemicals)
| | 8,785 | 414,915 |
Steel Dynamics, Inc. (Metals & Mining)
| | 4,593 | 303,827 |
| | | | 1,385,655 |
Real Estate–3.7%
| | | |
CBRE Group, Inc. Class A (Real Estate Mgmt. & Development)
| (a) | 21,569 | 1,587,694 |
Weyerhaeuser Co. (Equity REIT)
| | 47,585 | 1,576,015 |
| | | | 3,163,709 |
Utilities–0.9%
| | | |
IDACORP, Inc. (Electric Utilities)
| | 7,644 | 809,653 |
Total Common Stocks (Cost $92,262,109)
| | | $82,709,919 |
| Money Market Funds–4.9% | Shares | Value |
State Street Institutional Liquid Reserves Fund Institutional Class, 1.494%
| (b) | 4,269,457 | $ 4,269,030 |
Total Money Market Funds (Cost $4,269,314)
| | | $ 4,269,030 |
Total Investments – 100.9% (Cost $96,531,423)
| (c) | | $86,978,949 |
Liabilities in Excess of Other Assets – (0.9)%
| | | (811,678) |
| Net Assets – 100.0% | | | $86,167,271 |
| Ohio National Fund, Inc. | ON AB Relative Value Portfolio (Continued) |
| Schedule of Investments | June 30, 2022 (Unaudited) |
Percentages are stated as a percent of net assets. |
| Abbreviations: | |
| ADR: | American Depositary Receipts |
| Footnotes: | |
| (a) | Non-income producing security. |
| (b) | Rate represents the seven-day yield at June 30, 2022. |
| (c) | Represents cost for financial reporting purposes, which may differ from cost basis for federal income tax purposes. See also Note 7 of the Notes to Financial Statements. |
The accompanying notes are an integral part of these financial statements.
| Ohio National Fund, Inc. | ON Moderately Conservative Model Portfolio (Unaudited) |
The ON Moderately Conservative Model Portfolio is a fund of funds that seeks current income and moderate growth of capital with a greater emphasis on current income by investing in underlying mutual funds. Under normal circumstances, the Portfolio intends to have investment exposure to various asset classes within the following target asset allocation ranges: U.S. Equity 20-40%, International Equity 5-20%, and Fixed Income 30-70%.
Performance as of June 30, 2022
| Average Annual returns | |
| One year | -13.10% |
| Five years | 3.13% |
| Since inception (3/1/17) | 3.42% |
Past performance does not guarantee future results. The performance data quoted represents past performance and current returns may be lower or higher. Total return figures include change in share price and reinvestment of dividends and capital gains. The investment return and principal value will fluctuate so that an investor’s shares, when redeemed, may be worth more or less than the original cost. To obtain performance information up to the most recent month end, call toll-free 1-877-781-6392.
The Portfolio is not open to direct retail investment. Beneficial interest in the Portfolio’s shares is obtained either through an allocation to the Portfolio as an investment vehicle within variable life insurance policies or annuity contracts. Actual performance results for variable annuity and variable universal life contracts will be lower due to contract charges. Consult your contract for applicable charges.
Total gross expense ratio is estimated to be 1.02% per the Fund’s prospectus dated April 29, 2022. Additional information pertaining to the Portfolio’s expense ratio as of June 30, 2022 can be found in the Portfolio’s Financial Highlights. The Portfolio’s expense ratio included in the Financial Highlights does not include Acquired Fund Fees and Expenses (AFFE), which is a major component of the expense ratio that is required to be presented in the Fund’s prospectus. The Adviser has contractually agreed to make payments to the Fund to the extent necessary to maintain the Portfolio's expense ratio (including AFFE, but excluding certain other expenses) at 1.00% through April 30, 2023.
Q. How did the Portfolio perform in comparison to its benchmark during the reporting period?
A. For the six-month period ended June 30, 2022, the Portfolio returned -15.39% versus -13.96% for its benchmark, the Morningstar® Moderately Conservative Target Risk Index.
Q. Were there specific market conditions, investment strategies, or techniques that materially affected the Portfolio’s benchmark-relative performance during the reporting period?
A. During the first half of the year, equity markets declined substantially. Domestic indices generally underperformed international and emerging market indices. Within the domestic market, value stocks outperformed growth stocks by a wide margin, although both value and growth indices were negative for the period. The Portfolio’s exposure to international and emerging market funds enhanced relative performance, while its exposure to growth funds detracted from relative performance.
Fixed income markets also registered negative returns during the first half of 2022. The Federal Reserve has raised the Fed Funds rate aggressively in 2022 in an attempt to curb inflation, and has indicated that it will continue to raise the Fed Funds rate until inflation is under control. Interest rates increased across the entire yield curve, but short-term interest rates increased at a faster rate. Even so, shorter duration bonds outperformed longer duration bonds during the period. The yield curve has become inverted between the 2 year and 10 year Treasury rate,
which can be a harbinger of a recession. Credit spreads widened during the period, and lower quality bonds generally underperformed higher quality bonds. The Portfolio’s exposure to shorter duration bond funds enhanced relative performance, while its exposure to funds with credit exposure detracted from relative performance. (1)
Q. How did asset class allocation impact the Portfolio’s performance relative to its benchmark?
A. The Portfolio invests in affiliated and unaffiliated mutual funds, comprised mostly of fixed income funds, but also some equity funds. The asset allocation between fixed income funds and equity funds was roughly in-line with the benchmark. On the equity side, the exposure to value funds, international funds, and emerging market funds benefited relative performance. The exposure to growth funds detracted from performance. On the fixed income side, the overweight allocation to funds with credit exposure detracted from relative performance, while the allocation to shorter duration bond funds enhanced relative performance. (1)
Q. Which securities contributed the most to, and detracted the most from, the Portfolio’s benchmark-relative performance?
A. The top three performing funds in the Portfolio were PIMCO Low Duration Institutional, the ON Federated Core Plus Bond Portfolio, and PIMCO Total Return Institutional. Each of these funds benefited from exposure to shorter duration bonds. The top three funds that detracted from performance were ON Janus Henderson Forty Portfolio, Vanguard International Growth Fund Admiral Class, and ON AB Small Cap Portfolio. Each of these funds detracted from performance due to exposure to growth stocks. (1)
Q. Were there any significant changes to the Portfolio’s management team, investment strategy, or selection process during the reporting period?
A. The asset allocation team was disbanded after the departure of Tara York. The ON Model Portfolios are now being managed by Gary Rodmaker, who was previously the leader of the asset allocation team. There were no changes to the investment strategy or selection process during the period.
| (1) | The Portfolio’s composition is subject to change. Holdings and weightings are as of June 30, 2022. |
| Ohio National Fund, Inc. | ON Moderately Conservative Model Portfolio (Unaudited) (Continued) |
Change in Value of $10,000 Investment
Hypothetical illustration based on past performance. Future performance will vary. The Portfolio’s returns reflect reinvested dividends. The Portfolio’s holdings may differ significantly from the securities in the index. The index is unmanaged and therefore does not reflect the cost of portfolio management and accounting.
The Morningstar® Target Risk Index Family is a series of Morningstar Indexes that provide exposure to a broad array of asset classes using Morningstar asset allocation methodology. The index family provides global equity market risk levels that are scaled to fit five equity market risk profiles: aggressive, moderately aggressive, moderate, moderately conservative, and conservative. The five levels of global equity exposure are set at 95%, 80%, 60%, 40%, and 20%, respectively, and the Morningstar® Moderately Conservative Target Risk Index exposure is set at 40%.
Past performance is no guarantee of future results. Redemption of fund shares could have tax implications unique to each shareholder.
| Portfolio Composition as of June 30, 2022 |
| | % of Net Assets |
Open-End Mutual Funds
Less Net Liabilities | 100.0 |
| | 100.0 |
| Top 10 Portfolio Holdings as of June 30, 2022 |
| | | % of Net Assets |
| 1. | ON Federated Core Plus Bond Portfolio | 15.0 |
| 2. | ON S&P 500® Index Portfolio | 13.0 |
| 3. | Western Asset Core Plus Bond IS | 12.0 |
| 4. | PIMCO Total Return Institutional | 12.0 |
| 5. | PIMCO Low Duration Institutional | 8.0 |
| 6. | ON Bond Portfolio | 7.0 |
| 7. | ON Federated High Income Bond Portfolio | 5.0 |
| 8. | ON S&P MidCap 400® Index Portfolio | 5.0 |
| 9. | ON BlackRock Advantage International Equity Portfolio | 4.5 |
| 10. | ON BlackRock Advantage Large Cap Value Portfolio | 4.0 |
| Ohio National Fund, Inc. | ON Moderately Conservative Model Portfolio |
| Schedule of Investments in Unaffiliated Issuers | June 30, 2022 (Unaudited) |
| Open-End Mutual Funds–37.6% | Shares | Value |
DFA Emerging Markets Portfolio Institutional
| | 129,876 | $ 3,465,103 |
DFA International Core Equity Portfolio Institutional
| | 533,691 | 6,953,989 |
PIMCO Low Duration Institutional
| | 1,968,216 | 18,343,770 |
PIMCO Total Return Institutional
| | 3,059,548 | 27,535,929 |
Vanguard International Growth Fund Admiral Class
| | 24,029 | 2,289,485 |
Western Asset Core Plus Bond IS
| | 2,788,383 | 27,549,230 |
Total Open-End Mutual Funds
| | | $ 86,137,506 |
Total Investments in Securities of Unaffiliated Issuers – 37.6% (Cost $96,810,836)
| | | $ 86,137,506 |
| Total Investments in Affiliates – 62.4% (Cost $142,957,690) (see schedule below) | | | 143,092,836 |
| Liabilities in Excess of Other Assets – 0.0% | | | (99,990) |
| Net Assets – 100.0% | | | $229,130,352 |
Percentages are stated as a percent of net assets. |
The accompanying notes are an integral part of these financial statements.
| Schedule of Investments in Affiliates | June 30, 2022 (Unaudited) |
| Affiliate | | | Value at
January 1, 2022 | Cost of
Purchases | Proceeds
from Sales | Net Realized
Gain (Loss) | | Change in
Unrealized
Appreciation
(Depreciation) | Shares at
June 30,
2022 | Value at
June 30,
2022 |
| Open-End Mutual Funds – 62.4% | | | | | | | | | | |
Fidelity Advisor® Real Estate I
| | (a) | $ 2,815,609 | $ 323,176 | $ 294,579 | $ 20,175 | | $ (574,896) | 111,791 | $ 2,289,485 |
ON AB Mid Cap Core Portfolio
| | (a) | 2,815,609 | 402,275 | 172,367 | 44,520 | | (800,552) | 50,000 | 2,289,485 |
ON AB Relative Value Portfolio
| | (a) | 2,815,609 | 183,093 | 400,737 | 18,755 | | (327,235) | 248,317 | 2,289,485 |
ON AB Small Cap Portfolio
| | (a) | 2,815,609 | 494,285 | 158,873 | 445 | | (861,981) | 76,316 | 2,289,485 |
ON BlackRock Advantage International Equity Portfolio
| | (a) | 12,670,241 | 870,492 | 856,652 | 107,623 | | (2,489,020) | 692,385 | 10,302,684 |
ON BlackRock Advantage Large Cap Core Portfolio
| | (a) | 5,631,218 | 437,859 | 347,212 | 67,787 | | (1,210,681) | 128,804 | 4,578,971 |
ON BlackRock Advantage Large Cap Value Portfolio
| | (a) | 11,262,436 | 571,693 | 1,246,678 | 330,879 | | (1,760,388) | 448,919 | 9,157,942 |
ON Bond Portfolio
| | (a) | 19,709,263 | 623,943 | 1,556,955 | 12,694 | | (2,762,547) | 937,764 | 16,026,398 |
ON Federated Core Plus Bond Portfolio
| | (a) | 36,602,917 | 5,947,617 | 4,410,774 | (230,781) | | (3,566,698) | 3,716,697 | 34,342,281 |
ON Federated High Income Bond Portfolio
| | (a) | 14,078,045 | 267,598 | 1,051,629 | 93,494 | | (1,940,081) | 614,462 | 11,447,427 |
ON Janus Henderson Forty Portfolio
| | (a) | 2,815,609 | 583,116 | 76,280 | 21,014 | | (1,053,974) | 96,318 | 2,289,485 |
ON Nasdaq-100® Index Portfolio
| | (a) | 5,631,218 | 928,089 | 284,400 | 108,409 | | (1,804,345) | 226,794 | 4,578,971 |
ON S&P 500® Index Portfolio
| | (a) | 36,602,917 | 2,806,638 | 2,487,943 | 734,094 | | (7,892,396) | 806,375 | 29,763,310 |
ON S&P MidCap 400® Index Portfolio
| | (a) | 14,078,045 | 1,430,540 | 1,414,885 | 405,304 | | (3,051,577) | 543,821 | 11,447,427 |
Total Open-End Mutual Funds
| | | | | | $1,734,412 | | $(30,096,371) | | $143,092,836 |
Percentages are stated as a percent of net assets. |
| Footnotes: | |
| (a) | Pursuant to Section 2(a)(3) of the Investment Company Act of 1940, the investment meets the definition of “affiliated person”, as the Portfolio directly or indirectly owns, controls, or holds with power to vote 5 percent or more of the outstanding voting securities of the holding at June 30, 2022. |
The accompanying notes are an integral part of these financial statements.
| Ohio National Fund, Inc. | ON Balanced Model Portfolio (Unaudited) |
The ON Balanced Model Portfolio is a fund of funds that seeks a balance between growth of capital and current income with a greater emphasis on growth of capital by investing in underlying mutual funds. Under normal circumstances, the Portfolio intends to have investment exposure to various asset classes within the following target asset allocation ranges: U.S. Equity 25-50%, International Equity 10-25%, and Fixed Income 25-50%.
Performance as of June 30, 2022
| Average Annual returns | |
| One year | -14.51% |
| Five years | 3.95% |
| Since inception (3/1/17) | 4.21% |
Past performance does not guarantee future results. The performance data quoted represents past performance and current returns may be lower or higher. Total return figures include change in share price and reinvestment of dividends and capital gains. The investment return and principal value will fluctuate so that an investor’s shares, when redeemed, may be worth more or less than the original cost. To obtain performance information up to the most recent month end, call toll-free 1-877-781-6392.
The Portfolio is not open to direct retail investment. Beneficial interest in the Portfolio’s shares is obtained either through an allocation to the Portfolio as an investment vehicle within variable life insurance policies or annuity contracts. Actual performance results for variable annuity and variable universal life contracts will be lower due to contract charges. Consult your contract for applicable charges.
Total gross expense ratio is estimated to be 1.00% per the Fund’s prospectus dated April 29, 2022. Additional information pertaining to the Portfolio’s expense ratio as of June 30, 2022 can be found in the Portfolio’s Financial Highlights. The Portfolio’s expense ratio included in the Financial Highlights does not include Acquired Fund Fees and Expenses (AFFE), which is a major component of the expense ratio that is required to be presented in the Fund’s prospectus. The Adviser has contractually agreed to make payments to the Fund to the extent necessary to maintain the Portfolio's expense ratio (including AFFE, but excluding certain other expenses) at 1.00% through April 30, 2023.
Q. How did the Portfolio perform in comparison to its benchmark during the reporting period?
A. For the six-month period ended June 30, 2022, the Portfolio returned -17.16% versus -15.94% for its benchmark, the Morningstar® Moderate Target Risk Index.
Q. Were there specific market conditions, investment strategies, or techniques that materially affected the Portfolio’s benchmark-relative performance during the reporting period?
A. During the first half of the year, equity markets declined substantially. Domestic indices generally underperformed international and emerging market indices. Within the domestic market, value stocks outperformed growth stocks by a wide margin, although both value and growth indices were negative for the period. The Portfolio’s exposure to international and emerging market funds enhanced relative performance, while its exposure to growth funds detracted from relative performance.
Fixed income markets also registered negative returns during the first half of 2022. The Federal Reserve has raised the Fed Funds rate aggressively in 2022 in an attempt to curb inflation, and has indicated that it will continue to raise the Fed Funds rate until inflation is under control. Interest rates increased across the entire yield curve, but short-term interest rates increased at a faster rate. Even so, shorter duration bonds outperformed longer duration bonds during the period. The yield curve has become inverted between the 2 year and 10 year Treasury rate,
which can be a harbinger of a recession. Credit spreads widened during the period, and lower quality bonds generally underperformed higher quality bonds. The Portfolio’s exposure to shorter duration bond funds enhanced relative performance, while its exposure to funds with credit exposure detracted from relative performance. (1)
Q. How did asset class allocation impact the Portfolio’s performance relative to its benchmark?
A. The Portfolio invests in affiliated and unaffiliated mutual funds, comprised of fixed income and equity funds. The asset allocation between fixed income funds and equity funds was roughly in-line with the benchmark. On the equity side, the exposure to value funds, international funds, and emerging market funds benefited relative performance. The exposure to growth funds detracted from performance. On the fixed income side, the overweight allocation to funds with credit exposure detracted from relative performance, while the allocation to shorter duration bond funds enhanced relative performance. (1)
Q. Which securities contributed the most to, and detracted the most from, the Portfolio’s benchmark-relative performance?
A. The top three performing funds in the Portfolio were PIMCO Low Duration Institutional, the ON Federated Core Plus Bond Portfolio, and PIMCO Total Return Institutional. Each of these funds benefited from exposure to shorter duration bonds. The top three funds that detracted from performance were ON Janus Henderson Forty Portfolio, Vanguard International Growth Fund Admiral Class, and ON AB Small Cap Portfolio. Each of these funds detracted from performance due to exposure to growth stocks. (1)
Q. Were there any significant changes to the Portfolio’s management team, investment strategy, or selection process during the reporting period?
A. The asset allocation team was disbanded after the departure of Tara York. The ON Model Portfolios are now being managed by Gary Rodmaker, who was previously the leader of the asset allocation team. There were no changes to the investment strategy or selection process during the period.
| (1) | The Portfolio’s composition is subject to change. Holdings and weightings are as of June 30, 2022. |
| Ohio National Fund, Inc. | ON Balanced Model Portfolio (Unaudited) (Continued) |
Change in Value of $10,000 Investment
Hypothetical illustration based on past performance. Future performance will vary. The Portfolio’s returns reflect reinvested dividends. The Portfolio’s holdings may differ significantly from the securities in the index. The index is unmanaged and therefore does not reflect the cost of portfolio management and accounting.
The Morningstar® Target Risk Index Family is a series of Morningstar Indexes that provide exposure to a broad array of asset classes using Morningstar asset allocation methodology. The index family provides global equity market risk levels that are scaled to fit five equity market risk profiles: aggressive, moderately aggressive, moderate, moderately conservative, and conservative. The five levels of global equity exposure are set at 95%, 80%, 60%, 40%, and 20%, respectively, and the Morningstar® Moderate Target Risk Index exposure is set at 60%.
Past performance is no guarantee of future results. Redemption of fund shares could have tax implications unique to each shareholder.
| Portfolio Composition as of June 30, 2022 |
| | % of Net Assets |
Open-End Mutual Funds
Less Net Liabilities | 100.0 |
| | 100.0 |
| Top 10 Portfolio Holdings as of June 30, 2022 |
| | | % of Net Assets |
| 1. | ON S&P 500® Index Portfolio | 15.0 |
| 2. | ON Federated Core Plus Bond Portfolio | 9.0 |
| 3. | ON S&P MidCap 400® Index Portfolio | 9.0 |
| 4. | Western Asset Core Plus Bond IS | 8.0 |
| 5. | PIMCO Total Return Institutional | 8.0 |
| 6. | ON BlackRock Advantage International Equity Portfolio | 8.0 |
| 7. | PIMCO Low Duration Institutional | 6.0 |
| 8. | ON BlackRock Advantage Large Cap Value Portfolio | 5.0 |
| 9. | ON Bond Portfolio | 5.0 |
| 10. | DFA International Core Equity Portfolio Institutional | 4.0 |
| Ohio National Fund, Inc. | ON Balanced Model Portfolio |
| Schedule of Investments in Unaffiliated Issuers | June 30, 2022 (Unaudited) |
| Open-End Mutual Funds–33.1% | Shares | Value |
DFA Emerging Markets Portfolio Institutional
| | 1,267,628 | $ 33,820,323 |
DFA International Core Equity Portfolio Institutional
| | 2,604,860 | 33,941,332 |
PIMCO Low Duration Institutional
| | 5,402,273 | 50,349,179 |
PIMCO Total Return Institutional
| | 7,464,726 | 67,182,531 |
Vanguard International Growth Fund Admiral Class
| | 263,809 | 25,135,689 |
Western Asset Core Plus Bond IS
| | 6,803,206 | 67,215,677 |
Total Open-End Mutual Funds
| | | $277,644,731 |
Total Investments in Securities of Unaffiliated Issuers – 33.1% (Cost $307,587,713)
| | | $277,644,731 |
| Total Investments in Affiliates – 66.9% (Cost $543,899,743) (see schedule below) | | | 561,363,721 |
| Liabilities in Excess of Other Assets – 0.0% | | | (333,277) |
| Net Assets – 100.0% | | | $838,675,175 |
Percentages are stated as a percent of net assets. |
The accompanying notes are an integral part of these financial statements.
| Schedule of Investments in Affiliates | June 30, 2022 (Unaudited) |
| Affiliate | | | Value at
January 1, 2022 | Cost of
Purchases | Proceeds
from Sales | Net Realized
Gain (Loss) | | Change in
Unrealized
Appreciation
(Depreciation) | Shares at
June 30,
2022 | Value at
June 30,
2022 |
| Open-End Mutual Funds – 66.9% | | | | | | | | | | |
Fidelity Advisor® Real Estate I
| | (a) | $ 10,924,811 | $ 530,349 | $ 966,367 | $ 147,418 | | $ (2,257,648) | 409,110 | $ 8,378,563 |
ON AB Mid Cap Core Portfolio
| | (a) | 10,924,811 | 525,595 | 176,911 | 43,872 | | (2,938,804) | 182,978 | 8,378,563 |
ON AB Relative Value Portfolio
| | (a) | 21,849,621 | 9,487,971 | 2,536,880 | 99,745 | | (3,764,768) | 2,726,214 | 25,135,689 |
ON AB Small Cap Portfolio
| | (a) | 10,924,811 | 871,843 | 104,233 | 26,086 | | (3,339,944) | 279,285 | 8,378,563 |
ON BlackRock Advantage International Equity Portfolio
| | (a) | 87,398,485 | 774,032 | 4,891,727 | 539,318 | | (16,791,604) | 4,504,604 | 67,028,504 |
ON BlackRock Advantage Large Cap Core Portfolio
| | (a) | 21,849,621 | 404,202 | 1,139,962 | 296,381 | | (4,653,116) | 471,368 | 16,757,126 |
ON BlackRock Advantage Large Cap Growth Portfolio
| | (a) | 10,924,811 | 435,510 | 4,820,291 | 502,985 | | (2,853,733) | 174,263 | 4,189,282 |
ON BlackRock Advantage Large Cap Value Portfolio
| | (a) | 54,624,053 | 388,274 | 6,313,941 | 1,757,580 | | (8,563,151) | 2,053,569 | 41,892,815 |
ON BlackRock Advantage Small Cap Growth Portfolio
| | (a) | 21,849,621 | 1,546,080 | 228,054 | 44,242 | | (6,454,763) | 620,864 | 16,757,126 |
ON Bond Portfolio
| | (a) | 54,624,053 | 1,220,630 | 6,442,302 | 63,908 | | (7,573,474) | 2,451,306 | 41,892,815 |
ON Federated Core Plus Bond Portfolio
| | (a) | 87,398,485 | 10,628,936 | 13,725,768 | (740,910) | | (8,153,676) | 8,160,938 | 75,407,067 |
ON Federated High Income Bond Portfolio
| | (a) | 32,774,432 | 95,790 | 3,524,604 | 318,059 | | (4,527,988) | 1,349,205 | 25,135,689 |
ON Janus Henderson Forty Portfolio
| | (a) | 10,924,811 | 865,548 | 4,701,839 | 1,491,876 | | (4,391,115) | 176,242 | 4,189,281 |
ON Nasdaq-100® Index Portfolio
| | (a) | 21,849,621 | 1,675,733 | 295,812 | 92,227 | | (6,564,643) | 829,972 | 16,757,126 |
ON S&P 500® Index Portfolio
| | (a) | 163,872,158 | 3,113,701 | 9,885,641 | 3,101,074 | | (34,522,847) | 3,404,997 | 125,678,445 |
ON S&P MidCap 400® Index Portfolio
| | (a) | 98,323,295 | 2,534,044 | 7,168,106 | 2,293,675 | | (20,575,841) | 3,582,283 | 75,407,067 |
Total Open-End Mutual Funds
| | | | | | $10,077,536 | | $(137,927,115) | | $561,363,721 |
Percentages are stated as a percent of net assets. |
| Footnotes: | |
| (a) | Pursuant to Section 2(a)(3) of the Investment Company Act of 1940, the investment meets the definition of “affiliated person”, as the Portfolio directly or indirectly owns, controls, or holds with power to vote 5 percent or more of the outstanding voting securities of the holding at June 30, 2022. |
The accompanying notes are an integral part of these financial statements.
| Ohio National Fund, Inc. | ON Moderate Growth Model Portfolio (Unaudited) |
The ON Moderate Growth Model Portfolio is a fund of funds that seeks growth of capital and moderate current income with a greater emphasis on growth of capital by investing in underlying mutual funds. Under normal circumstances, the Portfolio intends to have investment exposure to various asset classes within the following target asset allocation ranges: U.S. Equity 40-60%, International Equity 15-35%, and Fixed Income 10-30%.
Performance as of June 30, 2022
| Average Annual returns | |
| One year | -15.87% |
| Five years | 4.95% |
| Since inception (3/1/17) | 5.31% |
Past performance does not guarantee future results. The performance data quoted represents past performance and current returns may be lower or higher. Total return figures include change in share price and reinvestment of dividends and capital gains. The investment return and principal value will fluctuate so that an investor’s shares, when redeemed, may be worth more or less than the original cost. To obtain performance information up to the most recent month end, call toll-free 1-877-781-6392.
The Portfolio is not open to direct retail investment. Beneficial interest in the Portfolio’s shares is obtained either through an allocation to the Portfolio as an investment vehicle within variable life insurance policies or annuity contracts. Actual performance results for variable annuity and variable universal life contracts will be lower due to contract charges. Consult your contract for applicable charges.
Total gross expense ratio is estimated to be 0.99% per the Fund’s prospectus dated April 29, 2022. Additional information pertaining to the Portfolio’s expense ratio as of June 30, 2022 can be found in the Portfolio’s Financial Highlights. The Portfolio’s expense ratio included in the Financial Highlights does not include Acquired Fund Fees and Expenses (AFFE), which is a major component of the expense ratio that is required to be presented in the Fund’s prospectus. The Adviser has contractually agreed to make payments to the Fund to the extent necessary to maintain the Portfolio's expense ratio (including AFFE, but excluding certain other expenses) at 1.07% through April 30, 2023.
Q. How did the Portfolio perform in comparison to its benchmark during the reporting period?
A. For the six-month period ended June 30, 2022, the Portfolio returned -19.33% versus -17.76% for its benchmark, the Morningstar® Moderately Aggressive Target Risk Index.
Q. Were there specific market conditions, investment strategies, or techniques that materially affected the Portfolio’s benchmark-relative performance during the reporting period?
A. During the first half of the year, equity markets declined substantially. Domestic indices generally underperformed international and emerging market indices. Within the domestic market, value stocks outperformed growth stocks by a wide margin, although both value and growth indices were negative for the period. The Portfolio’s exposure to international and emerging market funds enhanced relative performance, while its exposure to growth funds detracted from relative performance.
Fixed income markets also registered negative returns during the first half of 2022. The Federal Reserve has raised the Fed Funds rate aggressively in 2022 in an attempt to curb inflation, and has indicated that it will continue to raise the Fed Funds rate until inflation is under control. Interest rates increased across the entire yield curve, but short-term interest rates increased at a faster rate. Even so, shorter duration bonds outperformed longer duration bonds during the period. The yield curve has become inverted between the 2 year and 10 year Treasury rate,
which can be a harbinger of a recession. Credit spreads widened during the period, and lower quality bonds generally underperformed higher quality bonds. The Portfolio’s exposure to shorter duration bond funds enhanced relative performance, while its exposure to funds with credit exposure detracted from relative performance. (1)
Q. How did asset class allocation impact the Portfolio’s performance relative to its benchmark?
A. The Portfolio invests in affiliated and unaffiliated mutual funds, comprised mostly of equity funds, but also some fixed income funds. The asset allocation between fixed income funds and equity funds was roughly in-line with the benchmark. On the equity side, the exposure to value funds, international funds, and emerging market funds benefited relative performance. The exposure to growth funds detracted from performance. On the fixed income side, the overweight allocation to funds with credit exposure detracted from relative performance, while the allocation to shorter duration bond funds enhanced relative performance. (1)
Q. Which securities contributed the most to, and detracted the most from, the Portfolio’s benchmark-relative performance?
A. The top three performing funds in the Portfolio were PIMCO Low Duration Institutional, the ON Federated Core Plus Bond Portfolio, and PIMCO Total Return Institutional. Each of these funds benefited from exposure to shorter duration bonds. The top three funds that detracted from performance were ON Janus Henderson Forty Portfolio, Vanguard International Growth Fund Admiral Class, and ON AB Small Cap Portfolio. Each of these funds detracted from performance due to exposure to growth stocks. (1)
Q. Were there any significant changes to the Portfolio’s management team, investment strategy, or selection process during the reporting period?
A. The asset allocation team was disbanded after the departure of Tara York. The ON Model Portfolios are now being managed by Gary Rodmaker, who was previously the leader of the asset allocation team. There were no changes to the investment strategy or selection process during the period.
| (1) | The Portfolio’s composition is subject to change. Holdings and weightings are as of June 30, 2022. |
| Ohio National Fund, Inc. | ON Moderate Growth Model Portfolio (Unaudited) (Continued) |
Change in Value of $10,000 Investment
Hypothetical illustration based on past performance. Future performance will vary. The Portfolio’s returns reflect reinvested dividends. The Portfolio’s holdings may differ significantly from the securities in the index. The index is unmanaged and therefore does not reflect the cost of portfolio management and accounting.
The Morningstar® Target Risk Index Family is a series of Morningstar Indexes that provide exposure to a broad array of asset classes using Morningstar asset allocation methodology. The index family provides global equity market risk levels that are scaled to fit five equity market risk profiles: aggressive, moderately aggressive, moderate, moderately conservative, and conservative. The five levels of global equity exposure are set at 95%, 80%, 60%, 40%, and 20%, respectively, and the Morningstar® Moderately Aggressive Target Risk Index exposure is set at 80%.
Past performance is no guarantee of future results. Redemption of fund shares could have tax implications unique to each shareholder.
| Portfolio Composition as of June 30, 2022 |
| | % of Net Assets |
Open-End Mutual Funds
Less Net Liabilities | 100.0 |
| | 100.0 |
| Top 10 Portfolio Holdings as of June 30, 2022 |
| | | % of Net Assets |
| 1. | ON S&P 500® Index Portfolio | 18.0 |
| 2. | ON S&P MidCap 400® Index Portfolio | 10.0 |
| 3. | ON BlackRock Advantage International Equity Portfolio | 9.0 |
| 4. | ON BlackRock Advantage Large Cap Value Portfolio | 8.0 |
| 5. | DFA International Core Equity Portfolio Institutional | 6.1 |
| 6. | ON Federated Core Plus Bond Portfolio | 6.0 |
| 7. | DFA Emerging Markets Portfolio Institutional | 4.0 |
| 8. | Western Asset Core Plus Bond IS | 4.0 |
| 9. | PIMCO Total Return Institutional | 4.0 |
| 10. | ON BlackRock Advantage Large Cap Core Portfolio | 4.0 |
| Ohio National Fund, Inc. | ON Moderate Growth Model Portfolio |
| Schedule of Investments in Unaffiliated Issuers | June 30, 2022 (Unaudited) |
| Open-End Mutual Funds–23.6% | Shares | Value |
DFA Emerging Markets Portfolio Institutional
| | 2,286,593 | $ 61,006,303 |
DFA International Core Equity Portfolio Institutional
| | 7,048,630 | 91,843,646 |
PIMCO Low Duration Institutional
| | 2,435,921 | 22,702,783 |
PIMCO Total Return Institutional
| | 6,731,842 | 60,586,574 |
Vanguard International Growth Fund Admiral Class
| | 634,401 | 60,445,759 |
Western Asset Core Plus Bond IS
| | 6,135,301 | 60,616,778 |
Total Open-End Mutual Funds
| | | $ 357,201,843 |
Total Investments in Securities of Unaffiliated Issuers – 23.6% (Cost $391,925,147)
| | | $ 357,201,843 |
| Total Investments in Affiliates – 76.4% (Cost $1,121,580,608) (see schedule below) | | | 1,156,025,136 |
| Liabilities in Excess of Other Assets – 0.0% | | | (520,034) |
| Net Assets – 100.0% | | | $1,512,706,945 |
Percentages are stated as a percent of net assets. |
The accompanying notes are an integral part of these financial statements.
| Schedule of Investments in Affiliates | June 30, 2022 (Unaudited) |
| Affiliate | | | Value at
January 1, 2022 | Cost of
Purchases | Proceeds
from Sales | Net Realized
Gain (Loss) | | Change in
Unrealized
Appreciation
(Depreciation) | Shares at
June 30,
2022 | Value at
June 30,
2022 |
| Open-End Mutual Funds – 76.4% | | | | | | | | | | |
Fidelity Advisor® Real Estate I
| | (a) | $ 19,776,234 | $ 779,610 | $ 1,600,512 | $ 294,272 | | $ (4,138,164) | 737,863 | $ 15,111,440 |
ON AB Mid Cap Core Portfolio
| | (a) | 19,776,234 | 824,980 | 212,816 | 52,488 | | (5,329,446) | 330,016 | 15,111,440 |
ON AB Relative Value Portfolio
| | (a) | 39,552,467 | 16,479,178 | 3,995,211 | 137,363 | | (6,839,478) | 4,916,954 | 45,334,319 |
ON AB Small Cap Portfolio
| | (a) | 39,552,467 | 2,946,030 | 198,052 | 51,603 | | (12,129,169) | 1,007,429 | 30,222,879 |
ON BlackRock Advantage International Equity Portfolio
| | (a) | 177,986,103 | 957,652 | 9,549,441 | 917,201 | | (34,308,558) | 9,139,984 | 136,002,957 |
ON BlackRock Advantage Large Cap Core Portfolio
| | (a) | 79,104,935 | 540,209 | 3,292,531 | 1,272,204 | | (17,179,058) | 1,700,303 | 60,445,759 |
ON BlackRock Advantage Large Cap Growth Portfolio
| | (a) | 39,552,467 | 1,697,444 | 8,545,590 | 2,558,722 | | (12,595,883) | 942,893 | 22,667,160 |
ON BlackRock Advantage Large Cap Value Portfolio
| | (a) | 158,209,869 | 4,310 | 17,414,021 | 4,768,607 | | (24,677,248) | 5,926,055 | 120,891,517 |
ON BlackRock Advantage Small Cap Growth Portfolio
| | (a) | 59,328,701 | 4,004,229 | 480,326 | 96,127 | | (17,614,412) | 1,679,671 | 45,334,319 |
ON Bond Portfolio
| | (a) | 69,216,818 | 2,548,383 | 9,335,243 | 90,008 | | (9,629,927) | 3,094,795 | 52,890,039 |
ON Federated Core Plus Bond Portfolio
| | (a) | 118,657,402 | 2,717,820 | 18,901,530 | (999,059) | | (10,805,995) | 9,812,623 | 90,668,638 |
ON Federated High Income Bond Portfolio
| | (a) | 39,552,467 | 205,310 | 4,423,960 | 352,226 | | (5,463,164) | 1,622,269 | 30,222,879 |
ON Janus Henderson Forty Portfolio
| | (a) | 39,552,467 | 3,673,360 | 8,120,401 | 2,672,282 | | (15,110,548) | 953,604 | 22,667,160 |
ON Nasdaq-100® Index Portfolio
| | (a) | 59,328,701 | 4,291,559 | 578,699 | 180,368 | | (17,887,610) | 2,245,385 | 45,334,319 |
ON S&P 500® Index Portfolio
| | (a) | 355,972,206 | 2,422,147 | 17,484,285 | 5,868,803 | | (74,772,957) | 7,369,437 | 272,005,914 |
ON S&P MidCap 400® Index Portfolio
| | (a) | 197,762,337 | 3,345,583 | 12,916,285 | 3,892,514 | | (40,969,752) | 7,178,831 | 151,114,397 |
Total Open-End Mutual Funds
| | | | | | $22,205,729 | | $(309,451,369) | | $1,156,025,136 |
Percentages are stated as a percent of net assets. |
| Footnotes: | |
| (a) | Pursuant to Section 2(a)(3) of the Investment Company Act of 1940, the investment meets the definition of “affiliated person”, as the Portfolio directly or indirectly owns, controls, or holds with power to vote 5 percent or more of the outstanding voting securities of the holding at June 30, 2022. |
The accompanying notes are an integral part of these financial statements.
| Ohio National Fund, Inc. | ON Growth Model Portfolio (Unaudited) |
The ON Growth Model Portfolio is a fund of funds that seeks growth of capital and some current income by investing in underlying mutual funds. Under normal circumstances, the Portfolio intends to have investment exposure to various asset classes within the following target asset allocation ranges: U.S. Equity 50-80%, International Equity 15-45%, and Fixed Income 0-15%.
Performance as of June 30, 2022
| Average Annual returns | |
| One year | -17.24% |
| Five years | 5.80% |
| Since inception (3/1/17) | 6.13% |
Past performance does not guarantee future results. The performance data quoted represents past performance and current returns may be lower or higher. Total return figures include change in share price and reinvestment of dividends and capital gains. The investment return and principal value will fluctuate so that an investor’s shares, when redeemed, may be worth more or less than the original cost. To obtain performance information up to the most recent month end, call toll-free 1-877-781-6392.
The Portfolio is not open to direct retail investment. Beneficial interest in the Portfolio’s shares is obtained either through an allocation to the Portfolio as an investment vehicle within variable life insurance policies or annuity contracts. Actual performance results for variable annuity and variable universal life contracts will be lower due to contract charges. Consult your contract for applicable charges.
Total gross expense ratio is estimated to be 1.03% per the Fund’s prospectus dated April 29, 2022. Additional information pertaining to the Portfolio’s expense ratio as of June 30, 2022 can be found in the Portfolio’s Financial Highlights. The Portfolio’s expense ratio included in the Financial Highlights does not include Acquired Fund Fees and Expenses (AFFE), which is a major component of the expense ratio that is required to be presented in the Fund’s prospectus. The Adviser has contractually agreed to make payments to the Fund to the extent necessary to maintain the Portfolio's expense ratio (including AFFE, but excluding certain other expenses) at 1.14% through April 30, 2023.
Q. How did the Portfolio perform in comparison to its benchmark during the reporting period?
A. For the six-month period ended June 30, 2022, the Portfolio returned -21.07% versus -19.03% for its benchmark, the Morningstar® Aggressive Target Risk Index.
Q. Were there specific market conditions, investment strategies, or techniques that materially affected the Portfolio’s benchmark-relative performance during the reporting period?
A. During the first half of the year, equity markets declined substantially. Domestic indices generally underperformed international and emerging market indices. Within the domestic market, value stocks outperformed growth stocks by a wide margin, although both value and growth indices were negative for the period. The Portfolio’s exposure to international and emerging market funds enhanced relative performance, while its exposure to growth funds detracted from relative performance.
Fixed income markets also registered negative returns during the first half of 2022. The Federal Reserve has raised the Fed Funds rate aggressively in 2022 in an attempt to curb inflation, and has indicated that it will continue to raise the Fed Funds rate until inflation is under control. Interest rates increased across the entire yield curve, but short-term interest rates increased at a faster rate. Even so, shorter duration bonds outperformed longer duration bonds during the period. The yield curve has become inverted between the 2 year and 10 year Treasury rate, which can be a harbinger of a recession. Credit spreads widened during
the period, and lower quality bonds generally underperformed higher quality bonds. The Portfolio’s exposure to shorter duration bond funds enhanced relative performance, while its exposure to funds with credit exposure detracted from relative performance. (1)
Q. How did asset class allocation impact the Portfolio’s performance relative to its benchmark?
A. The Portfolio invests in affiliated and unaffiliated mutual funds, comprised mostly of equity funds, but also a small amount of fixed income funds. The asset allocation between fixed income funds and equity funds was roughly in-line with the benchmark. On the equity side, the exposure to value funds, international funds, and emerging market funds benefited relative performance. The exposure to growth funds detracted from performance. On the fixed income side, the overweight allocation to funds with credit exposure detracted from relative performance. (1)
Q. Which securities contributed the most to, and detracted the most from, the Portfolio’s benchmark-relative performance?
A. The top three performing funds in the Portfolio were PIMCO Total Return Institutional, ON AB Relative Value Portfolio, and ON Federated High Income Bond Portfolio. PIMCO Total Return Institutional and the ON Federated High Income Bond Portfolio benefited from exposure to shorter duration bonds, while the ON AB Relative Value Portfolio benefited from its exposure to value stocks. The top three funds that detracted from performance were ON Janus Henderson Forty Portfolio, Vanguard International Growth Fund Admiral Class, and ON AB Small Cap Portfolio. Each of these funds detracted from performance due to exposure to growth stocks. (1)
Q. Were there any significant changes to the Portfolio’s management team, investment strategy, or selection process during the reporting period?
A. The asset allocation team was disbanded after the departure of Tara York. The ON Model Portfolios are now being managed by Gary Rodmaker, who was previously the leader of the asset allocation team. There were no changes to the investment strategy or selection process during the period.
| (1) | The Portfolio’s composition is subject to change. Holdings and weightings are as of June 30, 2022. |
| Ohio National Fund, Inc. | ON Growth Model Portfolio (Unaudited) (Continued) |
Change in Value of $10,000 Investment
Hypothetical illustration based on past performance. Future performance will vary. The Portfolio’s returns reflect reinvested dividends. The Portfolio’s holdings may differ significantly from the securities in the index. The index is unmanaged and therefore does not reflect the cost of portfolio management and accounting.
The Morningstar® Target Risk Index Family is a series of Morningstar Indexes that provide exposure to a broad array of asset classes using Morningstar asset allocation methodology. The index family provides global equity market risk levels that are scaled to fit five equity market risk profiles: aggressive, moderately aggressive, moderate, moderately conservative, and conservative. The five levels of global equity exposure are set at 95%, 80%, 60%, 40%, and 20%, respectively, and the Morningstar® Aggressive Target Risk Index exposure is set at 95%.
Past performance is no guarantee of future results. Redemption of fund shares could have tax implications unique to each shareholder.
| Portfolio Composition as of June 30, 2022 |
| | % of Net Assets |
Open-End Mutual Funds
Less Net Liabilities | 100.0 |
| | 100.0 |
| Top 10 Portfolio Holdings as of June 30, 2022 |
| | | % of Net Assets |
| 1. | ON S&P 500® Index Portfolio | 18.0 |
| 2. | ON BlackRock Advantage International Equity Portfolio | 12.0 |
| 3. | ON S&P MidCap 400® Index Portfolio | 11.5 |
| 4. | ON BlackRock Advantage Large Cap Value Portfolio | 8.0 |
| 5. | DFA International Core Equity Portfolio Institutional | 7.1 |
| 6. | ON BlackRock Advantage Large Cap Core Portfolio | 6.0 |
| 7. | DFA Emerging Markets Portfolio Institutional | 5.0 |
| 8. | Vanguard International Growth Fund Admiral Class | 5.0 |
| 9. | ON BlackRock Advantage Small Cap Growth Portfolio | 4.5 |
| 10. | ON AB Small Cap Portfolio | 4.0 |
| Ohio National Fund, Inc. | ON Growth Model Portfolio |
| Schedule of Investments in Unaffiliated Issuers | June 30, 2022 (Unaudited) |
| Open-End Mutual Funds–20.1% | Shares | Value |
DFA Emerging Markets Portfolio Institutional
| | 635,851 | $ 16,964,488 |
DFA International Core Equity Portfolio Institutional
| | 1,829,562 | 23,839,196 |
PIMCO Total Return Institutional
| | 374,413 | 3,369,719 |
Vanguard International Growth Fund Admiral Class
| | 176,421 | 16,809,426 |
Western Asset Core Plus Bond IS
| | 682,472 | 6,742,819 |
Total Open-End Mutual Funds
| | | $ 67,725,648 |
Total Investments in Securities of Unaffiliated Issuers – 20.1% (Cost $75,087,931)
| | | $ 67,725,648 |
| Total Investments in Affiliates – 79.9% (Cost $263,093,626) (see schedule below) | | | 268,950,812 |
| Liabilities in Excess of Other Assets – 0.0% | | | (135,991) |
| Net Assets – 100.0% | | | $336,540,469 |
Percentages are stated as a percent of net assets. |
The accompanying notes are an integral part of these financial statements.
| Schedule of Investments in Affiliates | June 30, 2022 (Unaudited) |
| Affiliate | | | Value at
January 1, 2022 | Cost of
Purchases | Proceeds
from Sales | Net Realized
Gain (Loss) | | Change in
Unrealized
Appreciation
(Depreciation) | Shares at
June 30,
2022 | Value at
June 30,
2022 |
| Open-End Mutual Funds – 79.9% | | | | | | | | | | |
Fidelity Advisor® Real Estate I
| | (a) | $ 4,483,285 | $ 132,608 | $ 386,270 | $ 67,222 | | $ (934,960) | 164,155 | $ 3,361,885 |
ON AB Mid Cap Core Portfolio
| | (a) | 4,483,285 | 114,403 | 37,525 | 9,233 | | (1,207,511) | 73,420 | 3,361,885 |
ON AB Relative Value Portfolio
| | (a) | 13,449,855 | 3,617,487 | 1,615,094 | 28,086 | | (2,032,793) | 1,458,518 | 13,447,541 |
ON AB Small Cap Portfolio
| | (a) | 17,933,140 | 1,102,068 | 104,327 | 19,190 | | (5,502,530) | 448,251 | 13,447,541 |
ON BlackRock Advantage International Equity Portfolio
| | (a) | 53,799,420 | 273,501 | 3,648,482 | 270,501 | | (10,352,318) | 2,711,198 | 40,342,622 |
ON BlackRock Advantage Large Cap Core Portfolio
| | (a) | 26,899,710 | 31,565 | 1,355,818 | 496,223 | | (5,900,369) | 567,407 | 20,171,311 |
ON BlackRock Advantage Large Cap Growth Portfolio
| | (a) | 8,966,570 | 425,254 | 55,880 | 17,352 | | (2,629,526) | 279,691 | 6,723,770 |
ON BlackRock Advantage Large Cap Value Portfolio
| | (a) | 35,866,280 | — | 4,464,143 | 1,168,590 | | (5,675,646) | 1,318,386 | 26,895,081 |
ON BlackRock Advantage Small Cap Growth Portfolio
| | (a) | 20,174,782 | 1,060,984 | 133,609 | 26,036 | | (5,999,710) | 560,522 | 15,128,483 |
ON Bond Portfolio
| | (a) | 4,483,285 | 172,011 | 675,993 | 21,303 | | (638,721) | 196,716 | 3,361,885 |
ON Federated High Income Bond Portfolio
| | (a) | 4,483,285 | 27,774 | 573,133 | 19,318 | | (595,359) | 180,455 | 3,361,885 |
ON Janus Henderson Forty Portfolio
| | (a) | 13,449,855 | 1,000,324 | 3,702,352 | 1,216,646 | | (5,240,703) | 282,868 | 6,723,770 |
ON Nasdaq-100® Index Portfolio
| | (a) | 17,933,140 | 1,022,440 | 150,779 | 43,442 | | (5,400,702) | 666,050 | 13,447,541 |
ON S&P 500® Index Portfolio
| | (a) | 80,699,130 | 65,929 | 4,634,576 | 1,464,773 | | (17,081,323) | 1,639,500 | 60,513,933 |
ON S&P MidCap 400® Index Portfolio
| | (a) | 51,557,777 | 186,135 | 3,412,390 | 1,012,383 | | (10,682,226) | 1,836,659 | 38,661,679 |
Total Open-End Mutual Funds
| | | | | | $5,880,298 | | $(79,874,397) | | $268,950,812 |
Percentages are stated as a percent of net assets. |
| Footnotes: | |
| (a) | Pursuant to Section 2(a)(3) of the Investment Company Act of 1940, the investment meets the definition of “affiliated person”, as the Portfolio directly or indirectly owns, controls, or holds with power to vote 5 percent or more of the outstanding voting securities of the holding at June 30, 2022. |
The accompanying notes are an integral part of these financial statements.
| Statements of Assets and Liabilities | June 30, 2022 (Unaudited) |
| | ON Bond
Portfolio | | ON BlackRock
Balanced
Allocation
Portfolio | | ON BlackRock
Advantage
International
Equity Portfolio | | ON Janus
Henderson
Forty Portfolio | | ON AB
Small Cap
Portfolio | | ON AB Mid
Cap Core
Portfolio | | ON
S&P 500®
Index
Portfolio | | ON BlackRock
Advantage Large
Cap Value
Portfolio |
| Assets: | | | | | | | | | | | | | | | |
Investments in securities of unaffiliated issuers, at value*
| $218,037,595 | | $431,351,395 | | $386,917,268 | | $78,081,344 | | $118,618,644 | | $75,866,314 | | $1,005,441,597 | | $250,050,329 |
Cash
| — | | 14,603 | | 37,078 | | — | | 608 | | — | | — | | 2,430 |
Cash subject to usage restrictions
| — | | 273,000 | | 456,981 | | — | | — | | 13,500 | | 445,252 | | 242,550 |
Foreign currencies, at value
| — | | — | | 316,125 | | — | | — | | — | | — | | 435,284 |
Receivable for securities sold
| — | | 3,329,540 | | 11,166,016 | | 880,623 | | 674,602 | | 174,273 | | — | | 3,984,537 |
Receivable for fund shares sold
| 75,227 | | 1,587,885 | | 1,714,790 | | 3,026,373 | | 1,374,799 | | 1,348,388 | | 5,756,548 | | 662,859 |
Dividends and accrued interest receivable
| 2,174,040 | | 1,368,869 | | 503,864 | | 31,045 | | 78,150 | | 70,439 | | 793,821 | | 262,492 |
Foreign tax reclaim receivable
| — | | — | | 1,585,646 | | 4,261 | | — | | 2,335 | | — | | 121,522 |
Prepaid expenses and other assets
| 2,879 | | 5,765 | | 5,332 | | 1,308 | | 1,693 | | 1,081 | | 15,732 | | 3,540 |
Total assets
| 220,289,741 | | 437,931,057 | | 402,703,100 | | 82,024,954 | | 120,748,496 | | 77,476,330 | | 1,012,452,950 | | 255,765,543 |
| Liabilities: | | | | | | | | | | | | | | | |
Cash overdraft
| — | | — | | — | | — | | — | | 99,313 | | 79,877 | | — |
Payable for securities purchased
| — | | 3,681,118 | | 11,400,987 | | — | | 903,499 | | 551,257 | | — | | 3,347,565 |
Payable for fund shares redeemed
| 5,566,857 | | 150,257 | | 1,047,155 | | 16,896 | | 17,946 | | 18,488 | | 895,548 | | 754,029 |
Payable for investment management services
| 100,616 | | 180,710 | | 236,834 | | 49,681 | | 73,626 | | 46,202 | | 289,746 | | 143,492 |
Payable for variation margin on futures contracts
| — | | 41,275 | | 39,308 | | — | | — | | 1,080 | | 80,424 | | 33,338 |
Accrued custody expense
| 1,199 | | 6,557 | | 76,571 | | 3,571 | | 5,760 | | 6,104 | | 12,789 | | 6,054 |
Accrued professional fees
| 9,173 | | 9,297 | | 9,307 | | 9,613 | | 9,191 | | 9,028 | | 10,058 | | 9,443 |
Accrued accounting fees
| 7,969 | | 15,355 | | 28,632 | | 3,125 | | 4,877 | | 4,358 | | 25,055 | | 7,179 |
Accrued printing and filing fees
| 1,281 | | 915 | | 725 | | 1,151 | | 1,098 | | 1,309 | | 965 | | 877 |
Other liabilities
| 10,529 | | 9,937 | | 20,321 | | 9,815 | | 10,277 | | 10,316 | | 11,453 | | 10,980 |
Withholding tax payable
| — | | — | | 53,230 | | — | | — | | 137 | | 1,054 | | 61 |
Total liabilities
| 5,697,624 | | 4,095,421 | | 12,913,070 | | 93,852 | | 1,026,274 | | 747,592 | | 1,406,969 | | 4,313,018 |
Net assets
| $214,592,117 | | $433,835,636 | | $389,790,030 | | $81,931,102 | | $119,722,222 | | $76,728,738 | | $1,011,045,981 | | $251,452,525 |
| Net assets consist of: | | | | | | | | | | | | | | | |
Paid in capital
| 227,296,333 | | 371,771,591 | | 401,004,043 | | 15,312,742 | | 79,229,232 | | 57,596,338 | | 556,325,035 | | 207,073,612 |
Total distributable earnings
| (12,704,216) | | 62,064,045 | | (11,214,013) | | 66,618,360 | | 40,492,990 | | 19,132,400 | | 454,720,946 | | 44,378,913 |
Net assets
| $214,592,117 | | $433,835,636 | | $389,790,030 | | $81,931,102 | | $119,722,222 | | $76,728,738 | | $1,011,045,981 | | $251,452,525 |
*Investments in securities of unaffiliated issuers, at cost
| $242,622,323 | | $468,242,042 | | $442,089,529 | | $76,647,271 | | $148,278,012 | | $93,736,470 | | $ 721,547,005 | | $273,852,550 |
Foreign currencies, at cost
| $ — | | $ — | | $ 316,274 | | $ — | | $ — | | $ — | | $ — | | $ 463,792 |
Shares outstanding, par value, $1 per share
| 12,556,707 | | 12,606,901 | | 26,190,207 | | 3,446,523 | | 3,990,294 | | 1,675,538 | | 27,392,543 | | 12,327,065 |
Authorized Fund shares allocated to Portfolio
| 22,000,000 | | 22,000,000 | | 50,000,000 | | 9,000,000 | | 7,000,000 | | 4,000,000 | | 50,000,000 | | 26,000,000 |
Net asset value per share
| $ 17.09 | | $ 34.41 | | $ 14.88 | | $ 23.77 | | $ 30.00 | | $ 45.79 | | $ 36.91 | | $ 20.40 |
The accompanying notes are an integral part of these financial statements.
| Statements of Assets and Liabilities | June 30, 2022 (Unaudited) |
| | ON Federated
High Income
Bond
Portfolio | | ON
Nasdaq-100®
Index
Portfolio | | ON BlackRock
Advantage
Large Cap Core
Portfolio | | ON BlackRock
Advantage Small
Cap Growth
Portfolio | | ON S&P
MidCap 400®
Index
Portfolio | | ON BlackRock
Advantage Large
Cap Growth
Portfolio | | ON Risk Managed
Balanced
Portfolio | | ON Federated
Core Plus
Bond
Portfolio |
| Assets: | | | | | | | | | | | | | | | |
Investments in securities of unaffiliated issuers, at value*
| $130,764,858 | | $243,548,349 | | $325,305,655 | | $138,363,421 | | $325,061,347 | | $47,470,721 | | $1,264,295,248 | | $577,026,349 |
Cash
| — | | 2,536 | | 2,989 | | 3,385 | | 7 | | 966 | | 601,515 | | 47 |
Cash subject to usage restrictions
| — | | 37,377 | | 273,000 | | 605,000 | | 77,876 | | 45,000 | | — | | — |
Foreign currencies, at value
| — | | — | | — | | — | | — | | — | | — | | 7 |
Receivable for securities sold
| — | | — | | 4,452,932 | | — | | — | | 955,611 | | 8,966,314 | | — |
Receivable for fund shares sold
| 111,985 | | 4,450,114 | | 3,816,593 | | 3,517,650 | | 6,295,166 | | 1,074,812 | | 59,606 | | 28,359 |
Receivable for variation margin on futures contracts
| — | | — | | — | | — | | — | | — | | 5,470,987 | | 90,781 |
Dividends and accrued interest receivable
| 2,368,215 | | 46,095 | | 244,211 | | 44,826 | | 341,666 | | 22,332 | | 4,159,585 | | 2,866,719 |
Foreign tax reclaim receivable
| — | | — | | — | | — | | — | | — | | 7,178 | | — |
Prepaid expenses and other assets
| 1,829 | | 3,494 | | 4,555 | | 1,976 | | 4,553 | | 837 | | 4,553 | | 7,712 |
Total assets
| 133,246,887 | | 248,087,965 | | 334,099,935 | | 142,536,258 | | 331,780,615 | | 49,570,279 | | 1,283,564,986 | | 580,019,974 |
| Liabilities: | | | | | | | | | | | | | | | |
Payable for securities purchased
| — | | — | | 3,654,372 | | — | | — | | 967,316 | | 50,401,855 | | — |
Payable for fund shares redeemed
| 850,304 | | 135,424 | | 182,890 | | 58,947 | | 46,179 | | 1,081 | | 1,782,494 | | 12,454,755 |
Payable for investment management services
| 83,314 | | 77,071 | | 177,994 | | 90,313 | | 100,379 | | 26,666 | | 814,947 | | 243,530 |
Payable for variation margin on futures contracts
| — | | 29,070 | | 41,275 | | 73,700 | | 28,860 | | 9,690 | | — | | — |
Accrued custody expense
| 1,111 | | 4,485 | | 5,849 | | 3,504 | | 10,581 | | 3,678 | | 9,666 | | 5,774 |
Accrued professional fees
| 9,027 | | 9,578 | | 9,267 | | 9,231 | | 9,315 | | 9,248 | | 9,834 | | 13,596 |
Accrued accounting fees
| 13,106 | | 6,667 | | 8,648 | | 5,651 | | 9,795 | | 2,579 | | 18,960 | | 25,741 |
Accrued printing and filing fees
| 1,648 | | 735 | | 703 | | 1,129 | | 707 | | 1,265 | | 1,117 | | 795 |
Other liabilities
| 10,554 | | 10,035 | | 10,619 | | 10,000 | | 10,508 | | 9,672 | | 10,688 | | 10,622 |
Withholding tax payable
| — | | 761 | | — | | — | | — | | — | | 561 | | — |
Total liabilities
| 969,064 | | 273,826 | | 4,091,617 | | 252,475 | | 216,324 | | 1,031,195 | | 53,050,122 | | 12,754,813 |
Net assets
| $132,277,823 | | $247,814,139 | | $330,008,318 | | $142,283,783 | | $331,564,291 | | $48,539,084 | | $1,230,514,864 | | $567,265,161 |
| Net assets consist of: | | | | | | | | | | | | | | | |
Paid in capital
| 151,371,370 | | 98,235,198 | | 248,899,239 | | 135,234,109 | | 248,202,490 | | 19,507,278 | | 1,202,017,192 | | 633,760,813 |
Total distributable earnings
| (19,093,547) | | 149,578,941 | | 81,109,079 | | 7,049,674 | | 83,361,801 | | 29,031,806 | | 28,497,672 | | (66,495,652) |
Net assets
| $132,277,823 | | $247,814,139 | | $330,008,318 | | $142,283,783 | | $331,564,291 | | $48,539,084 | | $1,230,514,864 | | $567,265,161 |
*Investments in securities of unaffiliated issuers, at cost
| $152,935,333 | | $179,926,178 | | $346,348,006 | | $176,403,907 | | $301,151,572 | | $53,296,292 | | $1,287,607,592 | | $634,660,894 |
Foreign currencies, at cost
| $ — | | $ — | | $ — | | $ — | | $ — | | $ — | | $ — | | $ 7 |
Shares outstanding, par value, $1 per share
| 7,102,152 | | 12,274,966 | | 9,283,222 | | 5,271,276 | | 15,751,156 | | 2,019,362 | | 90,011,053 | | 61,380,949 |
Authorized Fund shares allocated to Portfolio
| 13,000,000 | | 22,000,000 | | 17,000,000 | | 8,000,000 | | 31,000,000 | | 42,000,000 | | 170,000,000 | | 115,000,000 |
Net asset value per share
| $ 18.63 | | $ 20.19 | | $ 35.55 | | $ 26.99 | | $ 21.05 | | $ 24.04 | | $ 13.67 | | $ 9.24 |
The accompanying notes are an integral part of these financial statements.
| Statements of Assets and Liabilities | June 30, 2022 (Unaudited) |
| | ON Janus
Henderson U.S.
Low Volatility
Portfolio | | ON iShares
Managed Risk
Balanced
Portfolio | | ON AB
Relative Value
Portfolio | | ON Moderately
Conservative
Model
Portfolio | | ON Balanced
Model
Portfolio | | ON Moderate
Growth Model
Portfolio | | ON
Growth Model
Portfolio |
| Assets: | | | | | | | | | | | | | |
Investments in securities of unaffiliated issuers, at value*
| $781,564,181 | | $324,177,881 | | $86,978,949 | | $ 86,137,506 | | $277,644,731 | | $ 357,201,843 | | $ 67,725,648 |
Investments in affiliates, at value**
| — | | — | | — | | 143,092,836 | | 561,363,721 | | 1,156,025,136 | | 268,950,812 |
Cash
| — | | — | | — | | 4,611 | | 4,655 | | 4,696 | | 4,577 |
Cash subject to usage restrictions
| — | | 3,529,236 | | — | | — | | — | | — | | — |
Foreign currencies, at value
| — | | 5,751,931 | | — | | — | | — | | — | | — |
Receivable for securities sold
| — | | 3,451,516 | | 603,131 | | 3,684,114 | | 12,276,630 | | 15,621,910 | | 1,890,600 |
Receivable for fund shares sold
| 27,167 | | 114,538 | | 378,184 | | 209 | | 6,600 | | 700 | | 2,769 |
Dividends and accrued interest receivable
| 311,985 | | 15,482 | | 74,928 | | 282,727 | | 1,158,068 | | 2,096,861 | | 491,629 |
Foreign tax reclaim receivable
| — | | — | | 9,599 | | — | | — | | — | | — |
Prepaid expenses and other assets
| 11,710 | | 4,302 | | 1,406 | | 2,964 | | 13,019 | | 23,936 | | 4,686 |
Total assets
| 781,915,043 | | 337,044,886 | | 88,046,197 | | 233,204,967 | | 852,467,424 | | 1,530,975,082 | | 339,070,721 |
| Liabilities: | | | | | | | | | | | | | |
Cash overdraft
| — | | 248,650 | | — | | — | | — | | — | | — |
Payable for securities purchased
| — | | — | | 1,662,108 | | 3,950,216 | | 13,250,140 | | 16,767,729 | | 2,326,000 |
Payable for fund shares redeemed
| 643,605 | | 143,878 | | 147,112 | | 21,446 | | 195,813 | | 956,438 | | 62,958 |
Payable for investment management services
| 381,979 | | 163,281 | | 47,431 | | 80,551 | | 318,055 | | 514,110 | | 114,861 |
Payable for variation margin on futures contracts
| — | | 250,923 | | — | | — | | — | | — | | — |
Accrued custody expense
| 3,650 | | 3,745 | | 1,679 | | 2,605 | | 2,850 | | 2,815 | | 2,558 |
Accrued professional fees
| 8,860 | | 8,422 | | 7,224 | | 4,296 | | 9,242 | | 9,926 | | 8,441 |
Accrued accounting fees
| 17,685 | | 4,213 | | 2,251 | | 3,852 | | 3,860 | | 3,860 | | 3,852 |
Accrued printing and filing fees
| 864 | | 892 | | 599 | | 897 | | 902 | | 1,161 | | 708 |
Other liabilities
| 10,096 | | 9,573 | | 10,522 | | 10,752 | | 11,387 | | 12,098 | | 10,874 |
Total liabilities
| 1,066,739 | | 833,577 | | 1,878,926 | | 4,074,615 | | 13,792,249 | | 18,268,137 | | 2,530,252 |
Net assets
| $780,848,304 | | $336,211,309 | | $86,167,271 | | $229,130,352 | | $838,675,175 | | $1,512,706,945 | | $336,540,469 |
| Net assets consist of: | | | | | | | | | | | | | |
Paid in capital
| 771,378,582 | | 386,302,211 | | 94,957,117 | | 224,346,197 | | 774,296,551 | | 1,359,445,710 | | 293,115,664 |
Total distributable earnings
| 9,469,722 | | (50,090,902) | | (8,789,846) | | 4,784,155 | | 64,378,624 | | 153,261,235 | | 43,424,805 |
Net assets
| $780,848,304 | | $336,211,309 | | $86,167,271 | | $229,130,352 | | $838,675,175 | | $1,512,706,945 | | $336,540,469 |
*Investments in securities of unaffiliated issuers, at cost
| $813,125,915 | | $369,257,006 | | $96,531,423 | | $ 96,810,836 | | $307,587,713 | | $ 391,925,147 | | $ 75,087,931 |
**Investments in affiliates, at cost
| $ — | | $ — | | $ — | | $142,957,690 | | $543,899,743 | | $1,121,580,608 | | $263,093,626 |
Foreign currencies, at cost
| $ — | | $ 5,915,172 | | $ — | | $ — | | $ — | | $ — | | $ — |
Shares outstanding, par value, $1 per share
| 78,143,232 | | 38,560,710 | | 9,350,104 | | 20,327,783 | | 71,216,725 | | 122,837,043 | | 25,897,689 |
Authorized Fund shares allocated to Portfolio
| 155,000,000 | | 133,000,000 | | 50,000,000 | | 36,000,000 | | 120,000,000 | | 210,000,000 | | 43,000,000 |
Net asset value per share
| $ 9.99 | | $ 8.72 | | $ 9.22 | | $ 11.27 | | $ 11.78 | | $ 12.31 | | $ 13.00 |
The accompanying notes are an integral part of these financial statements.
| Statements of Operations | For the Six-Month Period Ended June 30, 2022 (Unaudited) |
| | ON Bond
Portfolio | | ON BlackRock
Balanced
Allocation
Portfolio | | ON BlackRock
Advantage
International
Equity Portfolio | | ON Janus
Henderson
Forty Portfolio | | ON AB
Small Cap
Portfolio | | ON AB Mid
Cap Core
Portfolio | | ON
S&P 500®
Index
Portfolio | | ON BlackRock
Advantage Large
Cap Value
Portfolio |
| Investment income: | | | | | | | | | | | | | | | |
Interest
| $ 4,294,005 | | $ 2,116,125 | | $ 746 | | $ 363 | | $ — | | $ 8 | | $ 950 | | $ 116 |
Dividends from unaffiliated issuers, net of taxes withheld*
| 13,442 | | 2,686,592 | | 9,472,999 | | 304,518 | | 480,353 | | 570,900 | | 8,915,495 | | 3,113,606 |
Total investment income
| 4,307,447 | | 4,802,717 | | 9,473,745 | | 304,881 | | 480,353 | | 570,908 | | 8,916,445 | | 3,113,722 |
| Expenses: | | | | | | | | | | | | | | | |
Management fees
| 658,523 | | 1,189,323 | | 1,579,832 | | 388,922 | | 502,030 | | 313,699 | | 1,952,566 | | 970,980 |
Custodian fees
| 3,611 | | 19,508 | | 215,142 | | 11,338 | | 16,205 | | 17,774 | | 40,207 | | 18,234 |
Directors' fees
| 10,184 | | 20,750 | | 18,951 | | 5,167 | | 6,106 | | 3,867 | | 50,112 | | 12,444 |
Professional fees
| 11,734 | | 13,969 | | 13,647 | | 10,922 | | 10,813 | | 10,218 | | 20,584 | | 12,465 |
Accounting fees
| 24,461 | | 46,812 | | 78,811 | | 9,538 | | 14,765 | | 13,208 | | 76,736 | | 21,676 |
Administration fees
| 13,492 | | 15,392 | | 37,490 | | 10,986 | | 12,182 | | 12,166 | | 16,357 | | 13,009 |
Printing and filing fees
| 6,052 | | 7,878 | | 6,049 | | 4,419 | | 4,296 | | 4,270 | | 9,871 | | 5,253 |
Compliance expense
| 4,848 | | 4,848 | | 4,848 | | 4,848 | | 4,848 | | 4,848 | | 4,848 | | 4,848 |
Other
| 3,256 | | 7,808 | | 8,531 | | 2,434 | | 2,426 | | 1,509 | | 18,447 | | 5,540 |
Total expenses
| 736,161 | | 1,326,288 | | 1,963,301 | | 448,574 | | 573,671 | | 381,559 | | 2,189,728 | | 1,064,449 |
Net investment income (loss)
| 3,571,286 | | 3,476,429 | | 7,510,444 | | (143,693) | | (93,318) | | 189,349 | | 6,726,717 | | 2,049,273 |
| Realized/unrealized gain (loss) on investments, futures contracts, and foreign currency related transactions: | | | | | | | | | | | | | | | |
| Net realized gain (loss) on: | | | | | | | | | | | | | | | |
Investments in securities of unaffiliated issuers
| (240,363) | | 6,126,054 | | (20,883,263) | | 6,193,879 | | (6,471,344) | | (1,422,653) | | 35,628,007 | | 6,433,358 |
Futures contracts
| — | | (912,512) | | (1,491,598) | | — | | — | | (35,945) | | (1,507,866) | | (634,655) |
Foreign currency related transactions
| — | | 1 | | (157,690) | | (626) | | — | | — | | — | | 8 |
| Change in unrealized appreciation/depreciation on: | | | | | | | | | | | | | | | |
Investments in securities of unaffiliated issuers
| (41,179,483) | | (110,776,229) | | (79,913,684) | | (51,580,240) | | (43,439,480) | | (26,222,321) | | (297,679,988) | | (49,056,476) |
Futures contracts
| — | | (156,382) | | (144,894) | | — | | — | | (1,082) | | (156,380) | | (106,204) |
Foreign currency related transactions
| — | | — | | (116,160) | | (368) | | — | | (202) | | — | | (55,630) |
Net realized/unrealized loss on investments, futures contracts, and foreign currency related transactions
| (41,419,846) | | (105,719,068) | | (102,707,289) | | (45,387,355) | | (49,910,824) | | (27,682,203) | | (263,716,227) | | (43,419,599) |
Change in net assets from operations
| $(37,848,560) | | $(102,242,639) | | $ (95,196,845) | | $(45,531,048) | | $(50,004,142) | | $(27,492,854) | | $(256,989,510) | | $(41,370,326) |
*Taxes withheld
| $ — | | $ 200 | | $ 990,442 | | $ 5,938 | | $ 426 | | $ 565 | | $ 2,140 | | $ 311 |
The accompanying notes are an integral part of these financial statements.
| Statements of Operations | For the Six-Month Period Ended June 30, 2022 (Unaudited) |
| | ON Federated
High Income
Bond
Portfolio | | ON
Nasdaq-100®
Index
Portfolio | | ON BlackRock
Advantage
Large Cap Core
Portfolio | | ON BlackRock
Advantage Small
Cap Growth
Portfolio | | ON S&P
MidCap 400®
Index
Portfolio | | ON BlackRock
Advantage Large
Cap Growth
Portfolio | | ON Risk Managed
Balanced
Portfolio | | ON Federated
Core Plus
Bond
Portfolio |
| Investment income: | | | | | | | | | | | | | | | |
Interest
| $ 4,321,258 | | $ 452 | | $ 5 | | $ 4 | | $ 462 | | $ — | | $ 3,467,449 | | $ 6,802,493 |
Dividends from unaffiliated issuers, net of taxes withheld*
| 5,912 | | 1,205,171 | | 2,913,012 | | 559,187 | | 2,960,879 | | 283,025 | | 2,179,609 | | 1,369,751 |
Total investment income
| 4,327,170 | | 1,205,623 | | 2,913,017 | | 559,191 | | 2,961,341 | | 283,025 | | 5,647,058 | | 8,172,244 |
| Expenses: | | | | | | | | | | | | | | | |
Management fees
| 550,660 | | 530,031 | | 1,210,470 | | 616,411 | | 674,887 | | 209,213 | | 2,404,227 | | 1,595,699 |
Custodian fees
| 2,781 | | 9,663 | | 17,245 | | 9,686 | | 34,587 | | 10,866 | | 22,297 | | 17,997 |
Directors' fees
| 6,389 | | 13,184 | | 16,526 | | 7,156 | | 16,533 | | 3,016 | | 16,541 | | 26,559 |
Professional fees
| 10,791 | | 12,531 | | 13,004 | | 11,052 | | 13,062 | | 10,196 | | 16,154 | | 15,844 |
Accounting fees
| 40,177 | | 20,425 | | 26,570 | | 17,074 | | 29,819 | | 7,991 | | 57,984 | | 82,323 |
Administration fees
| 12,914 | | 11,724 | | 13,696 | | 11,551 | | 12,517 | | 10,506 | | 18,272 | | 16,536 |
Printing and filing fees
| 5,933 | | 5,260 | | 5,499 | | 4,645 | | 5,896 | | 3,902 | | 7,182 | | 8,365 |
Compliance expense
| 4,848 | | 4,848 | | 4,848 | | 4,848 | | 4,848 | | 4,848 | | 4,848 | | 4,848 |
Other
| 2,038 | | 5,106 | | 6,075 | | 2,869 | | 6,159 | | 1,337 | | 10,244 | | 7,429 |
Total expenses
| 636,531 | | 612,772 | | 1,313,933 | | 685,292 | | 798,308 | | 261,875 | | 2,557,749 | | 1,775,600 |
Net investment income (loss)
| 3,690,639 | | 592,851 | | 1,599,084 | | (126,101) | | 2,163,033 | | 21,150 | | 3,089,309 | | 6,396,644 |
| Realized/unrealized gain (loss) on investments and futures contracts: | | | | | | | | | | | | | | | |
| Net realized gain (loss) on: | | | | | | | | | | | | | | | |
Investments in securities of unaffiliated issuers
| (528,873) | | 6,318,687 | | 8,473,676 | | (3,327,814) | | 11,061,255 | | 515,644 | | 9,744,359 | | (27,682,308) |
Futures contracts
| — | | (1,076,240) | | (913,454) | | (785,156) | | (560,905) | | (247,318) | | (6,111,832) | | 3,845,684 |
| Change in unrealized appreciation/depreciation on: | | | | | | | | | | | | | | | |
Investments in securities of unaffiliated issuers
| (25,373,598) | | (108,771,639) | | (96,755,276) | | (52,260,640) | | (94,254,553) | | (21,424,031) | | (116,310,882) | | (54,417,421) |
Futures contracts
| — | | (64,786) | | (166,421) | | (416,126) | | (84,540) | | (18,738) | | 1,214,669 | | 586,382 |
Net realized/unrealized loss on investments and futures contracts
| (25,902,471) | | (103,593,978) | | (89,361,475) | | (56,789,736) | | (83,838,743) | | (21,174,443) | | (111,463,686) | | (77,667,663) |
Change in net assets from operations
| $(22,211,832) | | $(103,001,127) | | $(87,762,391) | | $(56,915,837) | | $(81,675,710) | | $(21,153,293) | | $(108,374,377) | | $(71,271,019) |
*Taxes withheld
| $ — | | $ 2,638 | | $ 212 | | $ 671 | | $ — | | $ 150 | | $ 9,703 | | $ — |
The accompanying notes are an integral part of these financial statements.
| Statements of Operations | For the Six-Month Period Ended June 30, 2022 (Unaudited) |
| | ON Janus
Henderson U.S.
Low Volatility
Portfolio | | ON iShares
Managed Risk
Balanced
Portfolio | | ON AB
Relative Value
Portfolio | | ON Moderately
Conservative
Model
Portfolio | | ON Balanced
Model
Portfolio | | ON Moderate
Growth Model
Portfolio | | ON
Growth Model
Portfolio |
| Investment income: | | | | | | | | | | | | | |
Interest
| $ — | | $ 1,274 | | $ — | | $ — | | $ — | | $ — | | $ — |
Dividends from unaffiliated issuers, net of taxes withheld*
| 7,022,522 | | 3,024,288 | | 902,057 | | 1,081,468 | | 3,248,946 | | 3,957,044 | | 674,546 |
Total investment income
| 7,022,522 | | 3,025,562 | | 902,057 | | 1,081,468 | | 3,248,946 | | 3,957,044 | | 674,546 |
| Expenses: | | | | | | | | | | | | | |
Management fees
| 2,562,693 | | 1,071,616 | | 258,891 | | 504,380 | | 1,910,016 | | 3,452,256 | | 777,776 |
Custodian fees
| 9,781 | | 11,104 | | 4,459 | | 7,679 | | 8,393 | | 8,393 | | 7,598 |
Directors' fees
| 37,178 | | 15,552 | | 2,922 | | 10,623 | | 40,784 | | 74,057 | | 16,782 |
Professional fees
| 20,233 | | 12,098 | | 12,696 | | 10,936 | | 18,026 | | 25,494 | | 12,271 |
Accounting fees
| 53,471 | | 12,519 | | 6,359 | | 11,527 | | 11,547 | | 11,547 | | 11,527 |
Administration fees
| 13,165 | | 10,948 | | 11,122 | | 9,689 | | 12,559 | | 15,454 | | 10,971 |
Printing and filing fees
| 7,797 | | 5,949 | | 3,734 | | 4,972 | | 8,589 | | 12,528 | | 5,671 |
Compliance expense
| 4,848 | | 4,848 | | 4,848 | | 4,848 | | 4,848 | | 4,848 | | 4,848 |
Recoupment of previously reimbursed expenses
| — | | — | | — | | 14,700 | | 86,500 | | — | | — |
Other
| 11,892 | | 11,193 | | 292 | | 3,383 | | 13,122 | | 23,335 | | 5,228 |
Total expenses
| 2,721,058 | | 1,155,827 | | 305,323 | | 582,737 | | 2,114,384 | | 3,627,912 | | 852,672 |
Net investment income (loss)
| 4,301,464 | | 1,869,735 | | 596,734 | | 498,731 | | 1,134,562 | | 329,132 | | (178,126) |
| Realized/unrealized gain (loss) on investments, futures contracts, foreign currency related transactions, and capital gain distributions received from underlying mutual funds: | | | | | | | | | | | | | |
| Net realized gain (loss) on: | | | | | | | | | | | | | |
Investments in securities of unaffiliated issuers
| 12,507,576 | | (6,416,246) | | 73,303 | | (879,770) | | (2,109,659) | | (7,294,447) | | 196,504 |
Investments in affiliates
| — | | — | | — | | 1,734,412 | | 10,077,536 | | 22,205,729 | | 5,880,298 |
Futures contracts
| — | | (2,808,612) | | — | | — | | — | | — | | — |
Foreign currency related transactions
| — | | (242,716) | | — | | — | | — | | — | | — |
| Change in unrealized appreciation/depreciation on: | | | | | | | | | | | | | |
Investments in securities of unaffiliated issuers
| (111,108,922) | | (50,975,774) | | (13,366,678) | | (13,801,847) | | (52,428,085) | | (78,143,878) | | (18,577,638) |
Investments in affiliates
| — | | — | | — | | (30,096,371) | | (137,927,115) | | (309,451,369) | | (79,874,397) |
Futures contracts
| — | | (846,756) | | — | | — | | — | | — | | — |
Foreign currency related transactions
| — | | (87,476) | | — | | — | | — | | — | | — |
Net realized/unrealized loss on investments, futures contracts, foreign currency related transactions, and capital gain distributions received from underlying mutual funds
| (98,601,346) | | (61,377,580) | | (13,293,375) | | (43,043,576) | | (182,387,323) | | (372,683,965) | | (92,375,233) |
Change in net assets from operations
| $ (94,299,882) | | $(59,507,845) | | $(12,696,641) | | $(42,544,845) | | $(181,252,761) | | $(372,354,833) | | $(92,553,359) |
*Taxes withheld
| $ — | | $ — | | $ 7,199 | | $ — | | $ — | | $ — | | $ — |
The accompanying notes are an integral part of these financial statements.
Statements of Changes in Net Assets
| | ON Bond
Portfolio | | ON BlackRock
Balanced Allocation
Portfolio | | ON BlackRock
Advantage International
Equity Portfolio | | ON Janus Henderson
Forty Portfolio |
| | Six-Month Period | | Year Ended | | Six-Month Period | | Year Ended | | Six-Month Period | | Year Ended | | Six-Month Period | | Year Ended |
| | Ended June 30,
2022 (Unaudited) | | December 31,
2021 | | Ended June 30,
2022 (Unaudited) | | December 31,
2021 | | Ended June 30,
2022 (Unaudited) | | December 31,
2021 | | Ended June 30,
2022 (Unaudited) | | December 31,
2021 |
| Increase (Decrease) in net assets: | | | | | | | | | | | | | | | |
| Operations: | | | | | | | | | | | | | | | |
Net investment income (loss)
| $ 3,571,286 | | $ 7,245,279 | | $ 3,476,429 | | $ 6,662,551 | | $ 7,510,444 | | $ 9,363,843 | | $ (143,693) | | $ (627,331) |
Net realized gain (loss) on investments, futures contracts, and foreign currency related transactions
| (240,363) | | 1,323,993 | | 5,213,543 | | 86,640,246 | | (22,532,551) | | 75,022,858 | | 6,193,253 | | 60,189,730 |
Change in unrealized appreciation/depreciation on investments, futures contracts, and foreign currency related transactions
| (41,179,483) | | (12,997,451) | | (110,932,611) | | 1,540,664 | | (80,174,738) | | (19,502,105) | | (51,580,608) | | (23,114,367) |
Change in net assets from operations
| (37,848,560) | | (4,428,179) | | (102,242,639) | | 94,843,461 | | (95,196,845) | | 64,884,596 | | (45,531,048) | | 36,448,032 |
| Distributions: | | | | | | | | | | | | | | | |
Distributions to shareholders
| — | | (8,269,842) | | — | | (51,715,211) | | — | | (6,864,821) | | — | | (22,460,454) |
| Capital transactions: | | | | | | | | | | | | | | | |
Received from shares sold
| 9,228,439 | | 32,994,619 | | 22,183,537 | | 29,168,030 | | 10,535,320 | | 26,665,740 | | 8,992,960 | | 8,289,653 |
Received from dividends reinvested
| — | | 8,269,842 | | — | | 51,715,211 | | — | | 6,864,821 | | — | | 22,460,454 |
Paid for shares redeemed
| (34,219,938) | | (46,195,857) | | (37,915,327) | | (105,891,073) | | (33,015,681) | | (88,499,287) | | (23,703,679) | | (106,202,973) |
Change in net assets from capital transactions
| (24,991,499) | | (4,931,396) | | (15,731,790) | | (25,007,832) | | (22,480,361) | | (54,968,726) | | (14,710,719) | | (75,452,866) |
Change in net assets
| (62,840,059) | | (17,629,417) | | (117,974,429) | | 18,120,418 | | (117,677,206) | | 3,051,049 | | (60,241,767) | | (61,465,288) |
| Net assets: | | | | | | | | | | | | | | | |
Beginning of period
| 277,432,176 | | 295,061,593 | | 551,810,065 | | 533,689,647 | | 507,467,236 | | 504,416,187 | | 142,172,869 | | 203,638,157 |
End of period
| $214,592,117 | | $277,432,176 | | $ 433,835,636 | | $ 551,810,065 | | $ 389,790,030 | | $507,467,236 | | $ 81,931,102 | | $ 142,172,869 |
The accompanying notes are an integral part of these financial statements.
Statements of Changes in Net Assets
| | ON AB Small Cap
Portfolio | | ON AB Mid Cap Core
Portfolio | | ON S&P 500® Index
Portfolio | | ON BlackRock
Advantage Large
Cap Value
Portfolio |
| | Six-Month Period | | Year Ended | | Six-Month Period | | Year Ended | | Six-Month Period | | Year Ended | | Six-Month Period | | Year Ended |
| | Ended June 30,
2022 (Unaudited) | | December 31,
2021 | | Ended June 30,
2022 (Unaudited) | | December 31,
2021 | | Ended June 30,
2022 (Unaudited) | | December 31,
2021 | | Ended June 30,
2022 (Unaudited) | | December 31,
2021 |
| Increase (Decrease) in net assets: | | | | | | | | | | | | | | | |
| Operations: | | | | | | | | | | | | | | | |
Net investment income (loss)
| $ (93,318) | | $ (47,782) | | $ 189,349 | | $ 321,060 | | $ 6,726,717 | | $ 13,473,248 | | $ 2,049,273 | | $ 4,273,372 |
Net realized gain (loss) on investments, futures contracts, and foreign currency related transactions
| (6,471,344) | | 76,999,076 | | (1,458,598) | | 38,338,872 | | 34,120,141 | | 127,464,857 | | 5,798,711 | | 71,892,256 |
Change in unrealized appreciation/depreciation on investments, futures contracts, and foreign currency related transactions
| (43,439,480) | | (62,498,852) | | (26,223,605) | | (21,875,140) | | (297,836,368) | | 178,003,338 | | (49,218,310) | | (2,635,835) |
Change in net assets from operations
| (50,004,142) | | 14,452,442 | | (27,492,854) | | 16,784,792 | | (256,989,510) | | 318,941,443 | | (41,370,326) | | 73,529,793 |
| Distributions: | | | | | | | | | | | | | | | |
Distributions to shareholders
| — | | (19,402,876) | | — | | (6,373,298) | | — | | (89,305,542) | | — | | (4,834,870) |
| Capital transactions: | | | | | | | | | | | | | | | |
Received from shares sold
| 9,174,729 | | 12,452,142 | | 4,995,874 | | 2,999,897 | | 43,498,875 | | 100,967,405 | | 3,589,587 | | 69,417,380 |
Received from dividends reinvested
| — | | 19,402,876 | | — | | 6,373,298 | | — | | 89,305,542 | | — | | 4,834,870 |
Paid for shares redeemed
| (8,744,723) | | (40,059,599) | | (5,425,756) | | (24,326,313) | | (100,497,200) | | (323,659,964) | | (36,671,657) | | (133,570,359) |
Change in net assets from capital transactions
| 430,006 | | (8,204,581) | | (429,882) | | (14,953,118) | | (56,998,325) | | (133,387,017) | | (33,082,070) | | (59,318,109) |
Change in net assets
| (49,574,136) | | (13,155,015) | | (27,922,736) | | (4,541,624) | | (313,987,835) | | 96,248,884 | | (74,452,396) | | 9,376,814 |
| Net assets: | | | | | | | | | | | | | | | |
Beginning of period
| 169,296,358 | | 182,451,373 | | 104,651,474 | | 109,193,098 | | 1,325,033,816 | | 1,228,784,932 | | 325,904,921 | | 316,528,107 |
End of period
| $119,722,222 | | $169,296,358 | | $ 76,728,738 | | $104,651,474 | | $1,011,045,981 | | $1,325,033,816 | | $251,452,525 | | $ 325,904,921 |
The accompanying notes are an integral part of these financial statements.
Statements of Changes in Net Assets
| | ON Federated
High Income Bond
Portfolio | | ON Nasdaq-100® Index
Portfolio | | ON BlackRock
Advantage
Large Cap Core
Portfolio | | ON BlackRock
Advantage Small
Cap Growth
Portfolio |
| | Six-Month Period | | Year Ended | | Six-Month Period | | Year Ended | | Six-Month Period | | Year Ended | | Six-Month Period | | Year Ended |
| | Ended June 30,
2022 (Unaudited) | | December 31,
2021 | | Ended June 30,
2022 (Unaudited) | | December 31,
2021 | | Ended June 30,
2022 (Unaudited) | | December 31,
2021 | | Ended June 30,
2022 (Unaudited) | | December 31,
2021 |
| Increase (Decrease) in net assets: | | | | | | | | | | | | | | | |
| Operations: | | | | | | | | | | | | | | | |
Net investment income (loss)
| $ 3,690,639 | | $ 7,809,473 | | $ 592,851 | | $ 1,057,844 | | $ 1,599,084 | | $ 2,854,069 | | $ (126,101) | | $ (681,084) |
Net realized gain (loss) on investments and futures contracts
| (528,873) | | 395,209 | | 5,242,447 | | 79,939,850 | | 7,560,222 | | 93,508,162 | | (4,112,970) | | 51,984,886 |
Change in unrealized appreciation/depreciation on investments and futures contracts
| (25,373,598) | | 215,689 | | (108,836,425) | | 10,383,620 | | (96,921,697) | | 11,678,282 | | (52,676,766) | | (41,385,911) |
Change in net assets from operations
| (22,211,832) | | 8,420,371 | | (103,001,127) | | 91,381,314 | | (87,762,391) | | 108,040,513 | | (56,915,837) | | 9,917,891 |
| Distributions: | | | | | | | | | | | | | | | |
Distributions to shareholders
| — | | (8,796,067) | | — | | (70,926,683) | | — | | (41,514,387) | | — | | (24,631,925) |
| Capital transactions: | | | | | | | | | | | | | | | |
Received from shares sold
| 2,882,118 | | 12,534,773 | | 20,820,519 | | 44,655,215 | | 9,683,455 | | 13,853,155 | | 12,888,067 | | 21,802,409 |
Received from dividends reinvested
| — | | 8,796,067 | | — | | 70,926,683 | | — | | 41,514,387 | | — | | 24,631,925 |
Paid for shares redeemed
| (18,578,334) | | (26,379,122) | | (26,538,007) | | (162,516,446) | | (29,167,121) | | (103,093,056) | | (9,917,690) | | (45,272,916) |
Change in net assets from capital transactions
| (15,696,216) | | (5,048,282) | | (5,717,488) | | (46,934,548) | | (19,483,666) | | (47,725,514) | | 2,970,377 | | 1,161,418 |
Change in net assets
| (37,908,048) | | (5,423,978) | | (108,718,615) | | (26,479,917) | | (107,246,057) | | 18,800,612 | | (53,945,460) | | (13,552,616) |
| Net assets: | | | | | | | | | | | | | | | |
Beginning of period
| 170,185,871 | | 175,609,849 | | 356,532,754 | | 383,012,671 | | 437,254,375 | | 418,453,763 | | 196,229,243 | | 209,781,859 |
End of period
| $132,277,823 | | $170,185,871 | | $ 247,814,139 | | $ 356,532,754 | | $ 330,008,318 | | $ 437,254,375 | | $142,283,783 | | $196,229,243 |
The accompanying notes are an integral part of these financial statements.
Statements of Changes in Net Assets
| | ON S&P
MidCap 400® Index
Portfolio | | ON BlackRock
Advantage Large
Cap Growth
Portfolio | | ON Risk Managed Balanced
Portfolio | | ON Federated
Core Plus Bond
Portfolio |
| | Six-Month Period | | Year Ended | | Six-Month Period | | Year Ended | | Six-Month Period | | Year Ended | | Six-Month Period | | Year Ended |
| | Ended June 30,
2022 (Unaudited) | | December 31,
2021 | | Ended June 30,
2022 (Unaudited) | | December 31,
2021 | | Ended June 30,
2022 (Unaudited) | | December 31,
2021 | | Ended June 30,
2022 (Unaudited) | | December 31,
2021 |
| Increase (Decrease) in net assets: | | | | | | | | | | | | | | | |
| Operations: | | | | | | | | | | | | | | | |
Net investment income (loss)
| $ 2,163,033 | | $ 4,345,697 | | $ 21,150 | | $ (92,248) | | $ 3,089,309 | | $ 2,153,197 | | $ 6,396,644 | | $ 8,936,477 |
Net realized gain (loss) on investments and futures contracts
| 10,500,350 | | 56,712,630 | | 268,326 | | 34,961,398 | | 3,632,527 | | 48,012,120 | | (23,836,624) | | (508,542) |
Change in unrealized appreciation/depreciation on investments and futures contracts
| (94,339,093) | | 34,882,504 | | (21,442,769) | | (9,425,747) | | (115,096,213) | | 12,672,602 | | (53,831,039) | | (11,035,630) |
Change in net assets from operations
| (81,675,710) | | 95,940,831 | | (21,153,293) | | 25,443,403 | | (108,374,377) | | 62,837,919 | | (71,271,019) | | (2,607,695) |
| Distributions: | | | | | | | | | | | | | | | |
Distributions to shareholders
| — | | (11,549,364) | | — | | (21,732,994) | | — | | (68,983,730) | | — | | (2,534,969) |
| Capital transactions: | | | | | | | | | | | | | | | |
Received from shares sold
| 9,963,370 | | 29,235,131 | | 3,576,735 | | 2,965,665 | | 944,408,910 | | 38,341,268 | | 28,869,735 | | 544,419,024 |
Received from dividends reinvested
| — | | 11,549,364 | | — | | 21,732,994 | | — | | 68,983,730 | | — | | 2,534,969 |
Paid for shares redeemed
| (34,276,206) | | (115,866,274) | | (15,344,535) | | (63,791,521) | | (52,478,508) | | (98,038,236) | | (106,823,629) | | (65,192,656) |
Change in net assets from capital transactions
| (24,312,836) | | (75,081,779) | | (11,767,800) | | (39,092,862) | | 891,930,402 | | 9,286,762 | | (77,953,894) | | 481,761,337 |
Change in net assets
| (105,988,546) | | 9,309,688 | | (32,921,093) | | (35,382,453) | | 783,556,025 | | 3,140,951 | | (149,224,913) | | 476,618,673 |
| Net assets: | | | | | | | | | | | | | | | |
Beginning of period
| 437,552,837 | | 428,243,149 | | 81,460,177 | | 116,842,630 | | 446,958,839 | | 443,817,888 | | 716,490,074 | | 239,871,401 |
End of period
| $ 331,564,291 | | $ 437,552,837 | | $ 48,539,084 | | $ 81,460,177 | | $1,230,514,864 | | $446,958,839 | | $ 567,265,161 | | $716,490,074 |
The accompanying notes are an integral part of these financial statements.
Statements of Changes in Net Assets
| | ON Janus Henderson
U.S. Low Volatility
Portfolio | | ON iShares Managed
Risk Balanced
Portfolio | | ON AB Relative Value
Portfolio | | ON Moderately
Conservative Model
Portfolio |
| | Six-Month Period | | Period from
June 25, 2021
(inception) to | | Six-Month Period | | Period from
June 25, 2021
(inception) to | | Six-Month Period | | Period from
December 2, 2021
(inception) to | | Six-Month Period | | Year Ended |
| | Ended June 30,
2022 (Unaudited) | | December 31,
2021 | | Ended June 30,
2022 (Unaudited) | | December 31,
2021 | | Ended June 30,
2022 (Unaudited) | | December 31,
2021 | | Ended June 30,
2022 (Unaudited) | | December 31,
2021 |
| Increase (Decrease) in net assets: | | | | | | | | | | | | | | | |
| Operations: | | | | | | | | | | | | | | | |
Net investment income
| $ 4,301,464 | | $ 4,437,604 | | $ 1,869,735 | | $ 2,599,006 | | $ 596,734 | | $ 22,424 | | $ 498,731 | | $ 3,783,470 |
Net realized gain (loss) on investments, futures contracts, foreign currency related transactions, and capital gain distributions received from underlying mutual funds
| 12,507,576 | | 19,784,812 | | (9,467,574) | | 668,234 | | 73,303 | | 70,167 | | 854,642 | | 18,920,001 |
Change in unrealized appreciation/depreciation on investments, futures contracts, and foreign currency related transactions
| (111,108,922) | | 79,547,188 | | (51,910,006) | | 6,149,703 | | (13,366,678) | | 3,814,204 | | (43,898,218) | | (506,059) |
Change in net assets from operations
| (94,299,882) | | 103,769,604 | | (59,507,845) | | 9,416,943 | | (12,696,641) | | 3,906,795 | | (42,544,845) | | 22,197,412 |
| Distributions: | | | | | | | | | | | | | | | |
Distributions to shareholders
| — | | — | | — | | — | | — | | — | | — | | (7,363,545) |
| Capital transactions: | | | | | | | | | | | | | | | |
Received from shares sold
| 5,711,716 | | 9,586,656 | | 11,763,923 | | 437,083,431 | | 29,767,729 | | 76,337,586 | | 12,947,673 | | 15,673,436 |
Received from in-kind transfer (see Note 3 of Notes to Financial Statements)
| — | | 983,714,079 | | — | | — | | — | | — | | — | | — |
Received from dividends reinvested
| — | | — | | — | | — | | — | | — | | — | | 7,363,545 |
Paid for shares redeemed
| (114,123,629) | | (113,510,240) | | (28,032,684) | | (34,512,459) | | (8,547,923) | | (2,600,275) | | (22,885,534) | | (59,739,637) |
Change in net assets from capital transactions
| (108,411,913) | | 879,790,495 | | (16,268,761) | | 402,570,972 | | 21,219,806 | | 73,737,311 | | (9,937,861) | | (36,702,656) |
Change in net assets
| (202,711,795) | | 983,560,099 | | (75,776,606) | | 411,987,915 | | 8,523,165 | | 77,644,106 | | (52,482,706) | | (21,868,789) |
| Net assets: | | | | | | | | | | | | | | | |
Beginning of period
| 983,560,099 | | — | | 411,987,915 | | — | | 77,644,106 | | — | | 281,613,058 | | 303,481,847 |
End of period
| $ 780,848,304 | | $ 983,560,099 | | $336,211,309 | | $411,987,915 | | $ 86,167,271 | | $77,644,106 | | $229,130,352 | | $281,613,058 |
The accompanying notes are an integral part of these financial statements.
Statements of Changes in Net Assets
| | ON Balanced
Model
Portfolio | | ON Moderate
Growth Model
Portfolio | | ON
Growth Model
Portfolio |
| | Six-Month Period | | Year Ended | | Six-Month Period | | Year Ended | | Six-Month Period | | Year Ended |
| | Ended June 30,
2022 (Unaudited) | | December 31,
2021 | | Ended June 30,
2022 (Unaudited) | | December 31,
2021 | | Ended June 30,
2022 (Unaudited) | | December 31,
2021 |
| Increase (Decrease) in net assets: | | | | | | | | | | | |
| Operations: | | | | | | | | | | | |
Net investment income (loss)
| $ 1,134,562 | | $ 12,794,426 | | $ 329,132 | | $ 19,494,611 | | $ (178,126) | | $ 3,524,848 |
Net realized gain on investments and capital gain distributions received from underlying mutual funds
| 7,967,877 | | 97,084,171 | | 14,911,282 | | 230,571,672 | | 6,076,802 | | 64,402,129 |
Change in unrealized appreciation/depreciation on investments
| (190,355,200) | | 7,337,016 | | (387,595,247) | | 26,359,312 | | (98,452,035) | | 4,869,139 |
Change in net assets from operations
| (181,252,761) | | 117,215,613 | | (372,354,833) | | 276,425,595 | | (92,553,359) | | 72,796,116 |
| Distributions: | | | | | | | | | | | |
Distributions to shareholders
| — | | (21,389,350) | | — | | (24,866,116) | | — | | (5,099,763) |
| Capital transactions: | | | | | | | | | | | |
Received from shares sold
| 11,395,571 | | 22,314,492 | | 23,808,279 | | 27,130,316 | | 2,390,453 | | 5,488,152 |
Received from dividends reinvested
| — | | 21,389,350 | | — | | 24,866,116 | | — | | 5,099,763 |
Paid for shares redeemed
| (83,991,698) | | (174,831,433) | | (116,070,924) | | (313,641,966) | | (21,483,600) | | (73,160,937) |
Change in net assets from capital transactions
| (72,596,127) | | (131,127,591) | | (92,262,645) | | (261,645,534) | | (19,093,147) | | (62,573,022) |
Change in net assets
| (253,848,888) | | (35,301,328) | | (464,617,478) | | (10,086,055) | | (111,646,506) | | 5,123,331 |
| Net assets: | | | | | | | | | | | |
Beginning of period
| 1,092,524,063 | | 1,127,825,391 | | 1,977,324,423 | | 1,987,410,478 | | 448,186,975 | | 443,063,644 |
End of period
| $ 838,675,175 | | $1,092,524,063 | | $1,512,706,945 | | $1,977,324,423 | | $ 336,540,469 | | $448,186,975 |
The accompanying notes are an integral part of these financial statements.
| | Selected per-share data | | | Ratios and supplemental data |
| | Operations | | Distributions | | | Ratios to average net assets | |
| | | | Ratios net of expenses reduced or
reimbursed by adviser | Ratios assuming no expenses reduced or reimbursed by adviser | |
| | Net asset value, beginning of year or period | Net investment income (loss) | Net realized and unrealized gain (loss) | Total from operations | | Distributions to shareholders | Net asset value, end of year or period | Total Return# | Expenses | Net investment income (loss) | Expenses | Net assets, end of year or period (millions) | Portfolio
turnover rate |
| ON Bond Portfolio | | | | | | | | | | | | | |
Six-Month Period Ended June 30, 2022+
| $19.88 | 0.34 | (3.13) | (2.79) | | — | $17.09 | (14.03)%* | 0.60%** | 2.93%** | 0.60%** | $214.6 | 5%* |
Year Ended December 31, 2021
| $20.79 | 0.54 | (0.85) | (0.31) | | (0.60) | $19.88 | (1.52)% | 0.59% | 2.56% | 0.59% | $277.4 | 13% |
Year Ended December 31, 2020
| $19.10 | 0.55 | 1.28 | 1.83 | | (0.14) | $20.79 | 9.59% | 0.60% | 2.72% | 0.60% | $295.1 | 69% |
Year Ended December 31, 2019
| $17.02 | 0.55 | 1.96 | 2.51 | | (0.43) | $19.10 | 14.73% | 0.60% | 3.19% | 0.60% | $290.5 | 60% |
Year Ended December 31, 2018
| $17.56 | 0.64 | (1.18) | (0.54) | | — | $17.02 | (3.08)% | 0.59% | 3.27% | 0.59% | $257.7 | 40% |
| ON BlackRock Balanced Allocation Portfolio | | | | | | | | | | | | | |
Six-Month Period Ended June 30, 2022+
| $42.43 | 0.29 | (8.31) | (8.02) | | — | $34.41 | (18.90)%* | 0.55%** | 1.44%** | 0.55%** | $433.8 | 41%* |
Year Ended December 31, 2021
| $39.40 | 0.58 | 6.66 | 7.24 | | (4.21) | $42.43 | 19.06% | 0.54% | 1.22% | 0.54% | $551.8 | 105% |
Year Ended December 31, 2020
| $34.30 | 0.60 | 4.75 | 5.35 | | (0.25) | $39.40 | 15.65% | 0.55% | 1.57% | 0.55% | $533.7 | 121% |
Year Ended December 31, 2019
| $27.85 | 0.26 | 7.85 | 8.11 | | (1.66) | $34.30 | 29.29% | 0.59% | 1.77% | 0.59% | $545.2 | 97% (a) |
Year Ended December 31, 2018
| $32.60 | 0.40 | (5.15) | (4.75) | | — | $27.85 | (14.57)% | 0.77% | 1.16% | 0.77% | $ 53.6 | 225% |
| ON BlackRock Advantage International Equity Portfolio | | | | | | | | | | | | | |
Six-Month Period Ended June 30, 2022+
| $18.44 | 0.31 | (3.87) | (3.56) | | — | $14.88 | (19.31)%* | 0.88%** | 3.37%** | 0.88%** | $389.8 | 67%* |
Year Ended December 31, 2021
| $16.47 | 0.36 | 1.86 | 2.22 | | (0.25) | $18.44 | 13.49% | 0.89% | 1.84% | 0.89% | $507.5 | 196% |
Year Ended December 31, 2020
| $15.52 | 0.20 | 0.83 | 1.03 | | (0.08) | $16.47 | 6.74% | 0.91% | 1.40% | 0.91% | $504.4 | 238% |
Year Ended December 31, 2019
| $13.07 | 0.34 | 2.37 | 2.71 | | (0.26) | $15.52 | 20.72% | 0.87% | 2.15% | 0.87% | $474.2 | 105% (b) |
Year Ended December 31, 2018
| $15.08 | 0.23 | (2.24) | (2.01) | | — | $13.07 | (13.33)% | 0.86% | 1.93% | 0.86% | $518.8 | 44% |
| ON Janus Henderson Forty Portfolio | | | | | | | | | | | | | |
Six-Month Period Ended June 30, 2022+
| $36.43 | (0.05) | (12.61) | (12.66) | | — | $23.77 | (34.75)%* | 0.83%** | (0.27)%** | 0.83%** | $ 81.9 | 21%* |
Year Ended December 31, 2021
| $35.13 | (0.17) | 7.07 | 6.90 | | (5.60) | $36.43 | 19.70% | 0.78% | (0.33)% | 0.78% | $142.2 | 31% |
Year Ended December 31, 2020
| $26.06 | (0.08) | 9.87 | 9.79 | | (0.72) | $35.13 | 37.87% | 0.79% | (0.24)% | 0.79% | $203.6 | 36% |
Year Ended December 31, 2019
| $20.97 | (—) (c) | 7.25 | 7.25 | | (2.16) | $26.06 | 34.89% | 0.81% | (—)% (c) | 0.81% | $196.9 | 53% |
Year Ended December 31, 2018
| $19.93 | (0.03) | 1.07 | 1.04 | | — | $20.97 | 5.22% | 0.87% | (0.15)% | 0.87% | $149.3 | 48% |
| | | | | | | | | | | | | | |
| + | Unaudited |
| * | Not annualized |
| ** | Annualized |
| (a) | The cost of purchases and proceeds from sales of Portfolio securities that were incurred to realign the Portfolio’s holdings subsequent to the August 23, 2019 reorganization are excluded from the portfolio turnover rate calculation. If such amounts had not been excluded, the portfolio turnover rate would have been 261%. Effective February 1, 2019, the sub-adviser for the equity portion of the ON BlackRock Balanced Allocation Portfolio changed from Suffolk Capital Management, LLC to BlackRock Investment Management, LLC. |
| (b) | Effective December 7, 2019, the sub-adviser to the ON BlackRock Advantage International Equity Portfolio changed from Lazard Asset Management LLC to BlackRock Investment Management, LLC. Costs of purchases and proceeds from sales of portfolio securities associated with the change in sub-advisers contributed to a higher portfolio turnover rate for the year ended December 31, 2019 as compared to prior years. |
| (c) | The absolute value of per share or ratio data is less than $0.005 per share, or 0.005%, respectively. |
# Performance does not include fees and expenses imposed by a variable annuity contract. Had those fees and expenses been included, performance would have been lower than the returns presented.
The accompanying notes are an integral part of these financial statements.
| | Selected per-share data | | | Ratios and supplemental data |
| | Operations | | Distributions | | | Ratios to average net assets | |
| | | | Ratios net of expenses reduced or
reimbursed by adviser | Ratios assuming no expenses reduced or reimbursed by adviser | |
| | Net asset value, beginning of year or period | Net investment income (loss) | Net realized and unrealized gain (loss) | Total from operations | | Distributions to shareholders | Net asset value, end of year or period | Total Return# | Expenses | Net investment income (loss) | Expenses | Net assets, end of year or period (millions) | Portfolio
turnover rate |
| ON AB Small Cap Portfolio | | | | | | | | | | | | | |
Six-Month Period Ended June 30, 2022+
| $42.63 | (0.02) | (12.61) | (12.63) | | — | $30.00 | (29.63)%* | 0.83%** | (0.14)%** | 0.83%** | $ 119.7 | 29%* |
Year Ended December 31, 2021
| $44.52 | (0.01) | 3.43 | 3.42 | | (5.31) | $42.63 | 8.17% | 0.85% | (0.03)% | 0.85% | $ 169.3 | 136% (a) |
Year Ended December 31, 2020
| $33.89 | (0.22) | 11.55 | 11.33 | | (0.70) | $44.52 | 34.04% | 0.89% | (0.48)% | 0.89% | $ 182.5 | 26% |
Year Ended December 31, 2019
| $30.89 | (0.15) | 8.87 | 8.72 | | (5.72) | $33.89 | 28.61% | 0.88% | (0.35)% | 0.88% | $ 170.7 | 17% |
Year Ended December 31, 2018
| $32.99 | (0.10) | (2.00) | (2.10) | | — | $30.89 | (6.37)% | 0.85% | (0.23)% | 0.85% | $ 207.4 | 33% |
| ON AB Mid Cap Core Portfolio | | | | | | | | | | | | | |
Six-Month Period Ended June 30, 2022+
| $62.45 | 0.11 | (16.77) | (16.66) | | — | $45.79 | (26.68)%* | 0.87%** | 0.43%** | 0.87%** | $ 76.7 | 22%* |
Year Ended December 31, 2021
| $56.98 | 0.18 | 9.18 | 9.36 | | (3.89) | $62.45 | 16.79% | 0.89% | 0.30% | 0.89% | $ 104.7 | 125% (a) |
Year Ended December 31, 2020
| $48.53 | (0.06) | 9.21 | 9.15 | | (0.70) | $56.98 | 19.15% | 0.98% | (0.12)% | 0.98% | $ 109.2 | 14% |
Year Ended December 31, 2019
| $37.36 | 0.05 | 13.54 | 13.59 | | (2.42) | $48.53 | 36.57% | 0.96% | 0.10% | 0.96% | $ 110.0 | 10% |
Year Ended December 31, 2018
| $38.60 | 0.02 | (1.26) | (1.24) | | — | $37.36 | (3.21)% | 0.96% | 0.06% | 0.96% | $ 102.6 | 103% (b) |
| ON S&P 500® Index Portfolio | | | | | | | | | | | | | |
Six-Month Period Ended June 30, 2022+
| $46.20 | 0.27 | (9.56) | (9.29) | | — | $36.91 | (20.11)%* | 0.38%** | 1.17%** | 0.38%** | $1,011.0 | 1%* |
Year Ended December 31, 2021
| $38.72 | 0.54 | 10.09 | 10.63 | | (3.15) | $46.20 | 28.25% | 0.37% | 1.05% | 0.37% | $1,325.0 | 5% |
Year Ended December 31, 2020
| $33.29 | 0.54 | 5.40 | 5.94 | | (0.51) | $38.72 | 17.99% | 0.39% | 1.49% | 0.39% | $1,228.8 | 6% |
Year Ended December 31, 2019
| $28.11 | 0.57 | 8.00 | 8.57 | | (3.39) | $33.29 | 30.97% | 0.39% | 1.64% | 0.39% | $1,202.6 | 7% |
Year Ended December 31, 2018
| $29.52 | 0.48 | (1.89) | (1.41) | | — | $28.11 | (4.78)% | 0.38% | 1.58% | 0.38% | $1,111.5 | 18% |
| ON BlackRock Advantage Large Cap Value Portfolio | | | | | | | | | | | | | |
Six-Month Period Ended June 30, 2022+
| $23.67 | 0.20 | (3.47) | (3.27) | | — | $20.40 | (13.81)%* | 0.73%** | 1.41%** | 0.73%** | $ 251.5 | 57%* |
Year Ended December 31, 2021
| $19.13 | 0.31 | 4.52 | 4.83 | | (0.29) | $23.67 | 25.39% | 0.73% | 1.25% | 0.73% | $ 325.9 | 153% |
Year Ended December 31, 2020
| $18.75 | 0.30 | 0.35 | 0.65 | | (0.27) | $19.13 | 3.66% | 0.74% | 1.70% | 0.74% | $ 316.5 | 150% |
Year Ended December 31, 2019
| $16.37 | 0.76 | 2.38 | 3.14 | | (0.76) | $18.75 | 19.21% | 0.77% | 3.94% | 0.77% | $ 320.7 | 127% (c) |
Year Ended December 31, 2018
| $17.88 | 0.87 | (2.38) | (1.51) | | — | $16.37 | (8.45)% | 0.76% | 3.88% | 0.76% | $ 321.8 | 18% |
| | | | | | | | | | | | | | |
| + | Unaudited |
| * | Not annualized |
| ** | Annualized |
| (a) | Effective May 1, 2021, the sub-adviser to the ON AB Small Cap Portfolio and ON AB Mid Cap Core Portfolio changed from Janus Capital Management LLC to AllianceBernstein, L.P. Costs of purchases and proceeds from sales of portfolio securities associated with the change in the sub-adviser contributed to a higher portfolio turnover rate for the year ended December 31, 2021 as compared to prior years. |
| (b) | Effective May 1, 2018, the sub-adviser changed from Goldman Sachs Asset Management, L.P. to Janus Capital Management LLC. Costs of purchases and proceeds from sales of portfolio securities associated with the change in the sub-adviser contributed to a higher portfolio turnover rate for the year ended December 31, 2018 as compared to prior years. |
| (c) | Effective December 7, 2019, the sub-adviser changed from Federated Equity Management Company of Pennsylvania to BlackRock Investment Management, LLC. Costs of purchases and proceeds from sales of portfolio securities associated with the change in the sub-adviser contributed to a higher portfolio turnover rate for the year ended December 31, 2019 as compared to prior years. |
# Performance does not include fees and expenses imposed by a variable annuity contract. Had those fees and expenses been included, performance would have been lower than the returns presented.
The accompanying notes are an integral part of these financial statements.
| | Selected per-share data | | | Ratios and supplemental data |
| | Operations | | Distributions | | | Ratios to average net assets | |
| | | | Ratios net of expenses reduced or
reimbursed by adviser | Ratios assuming no expenses reduced or reimbursed by adviser | |
| | Net asset value, beginning of year or period | Net investment income (loss) | Net realized and unrealized gain (loss) | Total from operations | | Distributions to shareholders | Net asset value, end of year or period | Total Return# | Expenses | Net investment income (loss) | Expenses | Net assets, end of year or period (millions) | Portfolio
turnover rate |
| ON Federated High Income Bond Portfolio | | | | | | | | | | | | | |
Six-Month Period Ended June 30, 2022+
| $21.58 | 0.63 | (3.58) | (2.95) | | — | $18.63 | (13.67)%* | 0.83%** | 4.84%** | 0.83%** | $132.3 | 8%* |
Year Ended December 31, 2021
| $21.65 | 1.05 | 0.02 | 1.07 | | (1.14) | $21.58 | 4.97% | 0.82% | 4.50% | 0.82% | $170.2 | 36% |
Year Ended December 31, 2020
| $20.69 | 1.12 | 0.16 | 1.28 | | (0.32) | $21.65 | 6.26% | 0.83% | 4.97% | 0.83% | $175.6 | 33% |
Year Ended December 31, 2019
| $18.73 | 1.14 | 1.70 | 2.84 | | (0.88) | $20.69 | 15.29% | 0.80% | 5.34% | 0.80% | $198.7 | 23% |
Year Ended December 31, 2018
| $19.36 | 1.41 | (2.04) | (0.63) | | — | $18.73 | (3.25)% | 0.75% | 5.39% | 0.75% | $202.1 | 14% |
| ON Nasdaq-100® Index Portfolio | | | | | | | | | | | | | |
Six-Month Period Ended June 30, 2022+
| $28.58 | 0.05 | (8.44) | (8.39) | | — | $20.19 | (29.36)%* | 0.42%** | 0.41%** | 0.42%** | $247.8 | 2%* |
Year Ended December 31, 2021
| $28.08 | 0.12 | 6.89 | 7.01 | | (6.51) | $28.58 | 26.99% | 0.41% | 0.28% | 0.41% | $356.5 | 7% |
Year Ended December 31, 2020
| $19.83 | 0.13 | 9.30 | 9.43 | | (1.18) | $28.08 | 48.32% | 0.42% | 0.49% | 0.42% | $383.0 | 10% |
Year Ended December 31, 2019
| $16.60 | 0.14 | 6.15 | 6.29 | | (3.06) | $19.83 | 38.86% | 0.42% | 0.66% | 0.42% | $353.0 | 8% |
Year Ended December 31, 2018
| $16.67 | 0.12 | (0.19) | (0.07) | | — | $16.60 | (0.42)% | 0.41% | 0.67% | 0.41% | $327.6 | 22% |
| ON BlackRock Advantage Large Cap Core Portfolio | | | | | | | | | | | | | |
Six-Month Period Ended June 30, 2022+
| $44.84 | 0.19 | (9.48) | (9.29) | | — | $35.55 | (20.72)%* | 0.69%** | 0.85%** | 0.69%** | $330.0 | 54%* |
Year Ended December 31, 2021
| $38.66 | 0.35 | 10.24 | 10.59 | | (4.41) | $44.84 | 28.49% | 0.69% | 0.66% | 0.69% | $437.3 | 135% |
Year Ended December 31, 2020
| $32.95 | 0.38 | 5.39 | 5.77 | | (0.06) | $38.66 | 17.55% | 0.70% | 1.04% | 0.70% | $418.5 | 137% |
Year Ended December 31, 2019
| $24.79 | 0.22 | 8.10 | 8.32 | | (0.16) | $32.95 | 33.60% | 0.74% | 1.28% | 0.74% | $430.6 | 152% (a) |
Year Ended December 31, 2018
| $30.22 | 0.20 | (5.63) | (5.43) | | — | $24.79 | (17.97)% | 0.82% | 0.63% | 0.82% | $155.3 | 272% |
| ON BlackRock Advantage Small Cap Growth Portfolio | | | | | | | | | | | | | |
Six-Month Period Ended June 30, 2022+
| $37.99 | (0.02) | (10.98) | (11.00) | | — | $26.99 | (28.95)%* | 0.85%** | (0.16)%** | 0.85%** | $142.3 | 31%* |
Year Ended December 31, 2021
| $41.69 | (0.13) | 1.88 | 1.75 | | (5.45) | $37.99 | 4.05% | 0.85% | (0.33)% | 0.85% | $196.2 | 87% |
Year Ended December 31, 2020
| $31.42 | (0.06) | 10.73 | 10.67 | | (0.40) | $41.69 | 34.34% | 0.86% | (0.17)% | 0.86% | $209.8 | 87% |
Year Ended December 31, 2019
| $23.62 | 0.02 | 8.02 | 8.04 | | (0.24) | $31.42 | 34.07% | 0.91% | 0.11% | 0.91% | $204.8 | 114% (a) |
Year Ended December 31, 2018
| $24.91 | (0.26) | (1.03) | (1.29) | | — | $23.62 | (5.18)% | 1.05% | (0.55)% | 1.05% | $ 25.5 | 201% |
| | | | | | | | | | | | | | |
| + | Unaudited |
| * | Not annualized |
| ** | Annualized |
| (a) | The cost of purchases and proceeds from sales of Portfolio securities that were incurred to realign the Portfolios holdings subsequent to the August 23, 2019 reorganization are excluded from the portfolio turnover rate calculation. If such amounts had not been excluded, the portfolio turnover rates would have been 211% for the ON BlackRock Advantage Large Cap Core Portfolio and and 177% for the ON BlackRock Advantage Small Cap Growth Portfolio. Effective February 1, 2019, the sub-adviser to the Portfolios changed from Suffolk Capital Management, LLC to BlackRock Investment Management, LLC. |
# Performance does not include fees and expenses imposed by a variable annuity contract. Had those fees and expenses been included, performance would have been lower than the returns presented.
The accompanying notes are an integral part of these financial statements.
| | Selected per-share data | | | Ratios and supplemental data |
| | Operations | | Distributions | | | Ratios to average net assets | |
| | | | Ratios net of expenses reduced or
reimbursed by adviser | Ratios assuming no expenses reduced or reimbursed by adviser | |
| | Net asset value, beginning of year or period | Net investment income (loss) | Net realized and unrealized gain (loss) | Total from operations | | Distributions to shareholders | Net asset value, end of year or period | Total Return# | Expenses | Net investment income (loss) | Expenses | Net assets, end of year or period (millions) | Portfolio
turnover rate |
| ON S&P MidCap 400® Index Portfolio | | | | | | | | | | | | | |
Six-Month Period Ended June 30, 2022+
| $26.22 | 0.15 | (5.32) | (5.17) | | — | $21.05 | (19.72)%* | 0.42%** | 1.14%** | 0.42%** | $ 331.6 | 4%* |
Year Ended December 31, 2021
| $21.70 | 0.29 | 4.90 | 5.19 | | (0.67) | $26.22 | 24.18% | 0.41% | 0.99% | 0.41% | $ 437.6 | 21% |
Year Ended December 31, 2020
| $19.25 | 0.27 | 2.27 | 2.54 | | (0.09) | $21.70 | 13.33% | 0.42% | 1.31% | 0.42% | $ 428.2 | 28% |
Year Ended December 31, 2019
| $15.46 | 0.21 | 3.74 | 3.95 | | (0.16) | $19.25 | 25.58% | 0.44% | 1.37% | 0.44% | $ 450.9 | 39% |
Year Ended December 31, 2018
| $17.46 | 0.10 | (2.10) | (2.00) | | — | $15.46 | (11.45)% | 0.51% | 1.32% | 0.51% | $ 306.6 | 28% |
| ON BlackRock Advantage Large Cap Growth Portfolio | | | | | | | | | | | | | |
Six-Month Period Ended June 30, 2022+
| $33.65 | 0.01 | (9.62) | (9.61) | | — | $24.04 | (28.56)%* | 0.83%** | 0.07%** | 0.83%** | $ 48.5 | 62%* |
Year Ended December 31, 2021
| $36.36 | 0.01 | 8.69 | 8.70 | | (11.41) | $33.65 | 26.69% | 0.78% | (0.09)% | 0.78% | $ 81.5 | 138% |
Year Ended December 31, 2020
| $27.54 | 0.08 | 9.22 | 9.30 | | (0.48) | $36.36 | 33.97% | 0.79% | 0.21% | 0.79% | $ 116.8 | 143% |
Year Ended December 31, 2019
| $20.59 | 0.16 | 7.77 | 7.93 | | (0.98) | $27.54 | 38.68% | 0.80% | 0.62% | 0.80% | $ 113.2 | 214% |
Year Ended December 31, 2018
| $24.19 | 0.12 | (3.72) | (3.60) | | — | $20.59 | (14.88)% | 0.88% | 0.43% | 0.88% | $ 87.5 | 269% |
| ON Risk Managed Balanced Portfolio | | | | | | | | | | | | | |
Six-Month Period Ended June 30, 2022+
| $17.16 | (0.03) | (3.46) | (3.49) | | — | $13.67 | (20.34)%* | 0.90%** | 1.08%** | 0.90%** | $1,230.5 | 37%* |
Year Ended December 31, 2021
| $17.63 | 0.09 | 2.43 | 2.52 | | (2.99) | $17.16 | 15.04% | 0.95% | 0.48% | 0.95% | $ 447.0 | 51% |
Year Ended December 31, 2020
| $14.81 | 0.13 | 3.12 | 3.25 | | (0.43) | $17.63 | 22.15% | 0.98% | 0.76% | 0.98% | $ 443.8 | 114% (a), (b) |
Year Ended December 31, 2019
| $12.91 | 0.21 | 3.01 | 3.22 | | (1.32) | $14.81 | 25.16% | 0.99% | 1.39% | 0.99% | $ 403.6 | 105% (b) |
Year Ended December 31, 2018
| $13.01 | 0.17 | (0.27) | (0.10) | | — | $12.91 | (0.77)% | 0.99% | 1.27% | 0.99% | $ 347.1 | 131% (b) |
| ON Federated Core Plus Bond Portfolio | | | | | | | | | | | | | |
Six-Month Period Ended June 30, 2022+
| $10.30 | 0.12 | (1.18) | (1.06) | | — | $ 9.24 | (10.29)%* | 0.56%** | 2.00%** | 0.56%** | $ 567.3 | 45%* |
Year Ended December 31, 2021
| $10.47 | 0.06 | (0.19) | (0.13) | | (0.04) | $10.30 | (1.27)% | 0.57% | 1.85% | 0.57% | $ 716.5 | 40% |
Period From May 1, 2020 (inception) to December 31, 2020
| $10.00 | 0.11 | 0.36 | 0.47 | | — | $10.47 | 4.70%* | 0.65%** | 1.65%** | 0.65%** | $ 239.9 | 30%* |
| | | | | | | | | | | | | | |
| + | Unaudited |
| * | Not annualized |
| ** | Annualized |
| (a) | Effective May 1, 2020, the sub-adviser(s) to the ON Risk Managed Balanced Portfolio changed from Janus Capital Management LLC and AnchorPath Financial, LLC to AllianceBernstein, L.P. Costs of purchases and proceeds from sales of portfolio securities associated with the change in the sub-adviser contributed to a higher portfolio turnover rate for the year ended December 31, 2020 as compared to prior years. |
| (b) | The portfolio turnover calculation in previous years includes purchases and sales from mortgage dollar roll transactions. Without the effect of mortgage dollar roll transactions, the portfolio turnover rate would have been 102% for the year ended December 31, 2020, 84% for the year ended December 31, 2019, 102% for the year ended December 31, 2018, and 63% for the year ended December 31, 2017 (see Note 2 of the Notes to Financial Statements). |
# Performance does not include fees and expenses imposed by a variable annuity contract. Had those fees and expenses been included, performance would have been lower than the returns presented.
The accompanying notes are an integral part of these financial statements.
| | Selected per-share data | | | Ratios and supplemental data |
| | Operations | | Distributions | | | Ratios to average net assets | |
| | | Ratios net of expenses reduced or
reimbursed by adviser | Ratios assuming no expenses reduced or reimbursed by adviser | |
| | Net asset value, beginning of year or period | Net investment income | Net realized and unrealized gain (loss) | Total from operations | | Distributions to shareholders | Return of capital | Total distributions | Net asset value, end of year or period | Total Return# | Expenses | Net investment income | Expenses | Net assets, end of year or period (millions) | Portfolio
turnover rate |
| ON Janus Henderson U.S. Low Volatility Portfolio | | | | | | | | | | | | | | | |
Six-Month Period Ended June 30, 2022+
| $11.12 | 0.06 | (1.19) | (1.13) | | — | — | — | $ 9.99 | (10.16)%* | 0.63%** | 0.99%** | 0.63%** | $780.8 | 15%* |
Period from June 25, 2021 (inception) to December 31, 2021
| $10.00 | 0.05 | 1.07 | 1.12 | | — | — | — | $11.12 | 11.20%* | 0.62%** | 0.89%** | 0.62%** | $983.6 | 32%* |
| ON iShares Managed Risk Balanced Portfolio | | | | | | | | | | | | | | | |
Six-Month Period Ended June 30, 2022+
| $10.23 | 0.05 | (1.56) | (1.51) | | — | — | — | $ 8.72 | (14.76)%* | 0.63%**** , † | 1.01%** , † | 0.63%** , † | $336.2 | 18%* |
Period from June 25, 2021 (inception) to December 31, 2021
| $10.00 | 0.06 | 0.17 | 0.23 | | — | — | — | $10.23 | 2.30%* | 0.62%** , † | 1.22%** , † | 0.62%** , † | $412.0 | 15%* |
| ON AB Relative Value Portfolio | | | | | | | | | | | | | | | |
Six-Month Period Ended June 30, 2022+
| $10.52 | 0.06 | (1.36) | (1.30) | | — | — | — | $ 9.22 | (12.36)%* | 0.77%** | 1.50%** | 0.77%** | $ 86.2 | 41%* |
Period from December 2, 2021 (inception) to December 31, 2021
| $10.00 | — (a) | 0.52 | 0.52 | | — | — | — | $10.52 | 5.20%* | 1.19%** | 0.38%** | 1.19%** | $ 77.6 | 5%* |
| ON Moderately Conservative Model Portfolio | | | | | | | | | | | | | | | |
Six-Month Period Ended June 30, 2022+
| $13.32 | 0.03 | (2.08) | (2.05) | | — | — | — | $11.27 | (15.39)%* | 0.46%**** , † | 0.40%** , † | 0.46%** , † | $229.1 | 8%* |
Year Ended December 31, 2021
| $12.67 | 0.20 | 0.79 | 0.99 | | (0.34) | — | (0.34) | $13.32 | 7.90% | 0.43% † | 1.29% † | 0.45% † | $281.6 | 13% |
Year Ended December 31, 2020
| $11.37 | 0.09 | 1.21 | 1.30 | | — | — | — | $12.67 | 11.43% | 0.40% † | 0.97% † | 0.47% † | $303.5 | 23% (b) |
Year Ended December 31, 2019
| $10.09 | 0.26 | 1.41 | 1.67 | | (0.37) | (0.02) | (0.39) | $11.37 | 16.58% | 0.35% † | 2.22% † | 0.46% † | $223.2 | 18% |
Year Ended December 31, 2018
| $10.69 | 0.15 | (0.75) | (0.60) | | — | — | — | $10.09 | (5.61)% | 0.28% † | 1.26% † | 0.45% † | $237.2 | 38% |
| | | | | | | | | | | | | | | | |
| + | Unaudited |
| * | Not annualized |
| ** | Annualized |
| † | The ratios presented only reflect the direct income and expenses for the Portfolio, and do not include the indirect expenses related to the underlying funds in which the Portfolio invests. |
| (a) | The absolute value of per share or ratio data is less than $0.005 per share, or 0.005%, respectively. |
| (b) | The cost of purchases and proceeds from sales of Portfolio securities that were incurred to realign the Portfolio’s holdings subsequent to the December 4, 2020 reorganization are excluded from the portfolio turnover rate calculation. If such amounts had not been excluded, the portfolio turnover rate would have been 28%. |
# Performance does not include fees and expenses imposed by a variable annuity contract. Had those fees and expenses been included, performance would have been lower than the returns presented.
The accompanying notes are an integral part of these financial statements.
| | Selected per-share data | | | Ratios and supplemental data |
| | Operations | | Distributions | | | Ratios to average net assets | |
| | | Ratios net of expenses reduced or
reimbursed by adviser | Ratios assuming no expenses reduced or reimbursed by adviser | |
| | Net asset value, beginning of year or period | Net investment income | Net realized and unrealized gain (loss) | Total from operations | | Distributions to shareholders | Return of capital | Total distributions | Net asset value, end of year or period | Total Return# | Expenses † | Net investment income (loss)† | Expenses † | Net assets, end of year or period (millions) | Portfolio
turnover rate |
| ON Balanced Model Portfolio | | | | | | | | | | | | | | | |
Six-Month Period Ended June 30, 2022+
| $14.22 | 0.04 | (2.48) | (2.44) | | — | — | — | $11.78 | (17.16)%* | 0.44%** | 0.24%** | 0.44%** | $ 838.7 | 5%* |
Year Ended December 31, 2021
| $13.06 | 0.18 | 1.25 | 1.43 | | (0.27) | — | (0.27) | $14.22 | 11.03% | 0.42% | 1.14% | 0.43% | $1,092.5 | 12% |
Year Ended December 31, 2020
| $11.48 | 0.08 | 1.50 | 1.58 | | — | — | — | $13.06 | 13.76% | 0.39% | 0.67% | 0.43% | $1,127.8 | 22% |
Year Ended December 31, 2019
| $ 9.97 | 0.21 | 1.73 | 1.94 | | (0.24) | (0.19) | (0.43) | $11.48 | 19.46% | 0.36% | 1.82% | 0.43% | $1,109.5 | 22% |
Year Ended December 31, 2018
| $10.81 | 0.09 | (0.93) | (0.84) | | — | — | — | $ 9.97 | (7.77)% | 0.31% | 0.77% | 0.42% | $1,146.9 | 37% |
| ON Moderate Growth Model Portfolio | | | | | | | | | | | | | | | |
Six-Month Period Ended June 30, 2022+
| $15.26 | 0.02 | (2.97) | (2.95) | | — | — | — | $12.31 | (19.33)%* | 0.42%** | 0.04%** | 0.42%** | $1,512.7 | 7%* |
Year Ended December 31, 2021
| $13.46 | 0.16 | 1.83 | 1.99 | | (0.19) | — | (0.19) | $15.26 | 14.83% | 0.42% | 0.98% | 0.42% | $1,977.3 | 15% |
Year Ended December 31, 2020
| $11.63 | 0.04 | 1.79 | 1.83 | | — | — | — | $13.46 | 15.74% | 0.44% | 0.35% | 0.45% | $1,987.4 | 16% |
Year Ended December 31, 2019
| $ 9.93 | 0.16 | 2.20 | 2.36 | | (0.30) | (0.36) | (0.66) | $11.63 | 23.81% | 0.43% | 1.31% | 0.44% | $1,961.4 | 20% |
Year Ended December 31, 2018
| $11.05 | 0.05 | (1.17) | (1.12) | | — | — | — | $ 9.93 | (10.14)% | 0.35% | 0.42% | 0.42% | $1,945.0 | 49% |
| ON Growth Model Portfolio | | | | | | | | | | | | | | | |
Six-Month Period Ended June 30, 2022+
| $16.47 | 0.01 | (3.48) | (3.47) | | — | — | — | $13.00 | (21.07)%* | 0.44%** | (0.09)%** | 0.44%** | $ 336.5 | 4%* |
Year Ended December 31, 2021
| $14.17 | 0.13 | 2.35 | 2.48 | | (0.18) | — | (0.18) | $16.47 | 17.58% | 0.49% | 0.78% | 0.49% | $ 448.2 | 18% |
Year Ended December 31, 2020
| $11.94 | 0.02 | 2.21 | 2.23 | | — | — | — | $14.17 | 18.68% | 0.46% | 0.16% | 0.47% | $ 443.1 | 11% |
Year Ended December 31, 2019
| $ 9.86 | 0.11 | 2.50 | 2.61 | | (0.35) | (0.18) | (0.53) | $11.94 | 26.47% | 0.45% | 0.92% | 0.47% | $ 433.6 | 18% |
Year Ended December 31, 2018
| $11.15 | 0.02 | (1.31) | (1.29) | | — | — | — | $ 9.86 | (11.57)% | 0.31% | 0.17% | 0.43% | $ 424.2 | 62% |
| | | | | | | | | | | | | | | | |
| + | Unaudited |
| * | Not annualized |
| ** | Annualized |
# Performance does not include fees and expenses imposed by a variable annuity contract. Had those fees and expenses been included, performance would have been lower than the returns presented.
† Ratios presented only reflect the direct income and expenses for the Portfolio, and do not include the indirect expenses related to the underlying funds in which the Portfolio invests.
The accompanying notes are an integral part of these financial statements.
| Notes to Financial Statements | June 30, 2022 (Unaudited) |
(1)Organization
Ohio National Fund, Inc. (the “Fund”) is a Maryland corporation registered under the Investment Company Act of 1940, as amended (the "40 Act"). The Fund is an open-end investment company and follows accounting and reporting guidance under Financial Accounting Standards Board (“FASB”) Accounting Standards Codification (“ASC”) Topic 946, “Financial Services-Investment Companies”. The Fund consists of twenty-three separate investment portfolios (the “Portfolios”) that seek the following objectives and strategies:
| ■ | ON Bond Portfolio – High level of income and opportunity for capital appreciation consistent with preservation of capital by investing, under normal circumstances, at least 80% of its net assets in corporate debt securities.
|
| ■ | ON BlackRock Balanced Allocation Portfolio – High level of long-term total return consistent with preservation of capital by investing in stocks, bonds, and money market instruments.
|
| ■ | ON BlackRock Advantage International Equity Portfolio – Long-term growth of capital by investing, under normal circumstances, at least 80% of its net assets in non-U.S. equity securities and equity-like instruments of companies that are components of, or have characteristics similar to, the companies included in the MSCI EAFE Index (Net - USD).
|
| ■ | ON Janus Henderson Forty Portfolio – Long-term capital growth by investing primarily in domestic and foreign equity securities selected for growth potential.
|
| ■ | ON AB Small Cap Portfolio – Long-term growth of capital by investing, under normal circumstances, at least 80% of its net assets in equity securities of smaller capitalization companies with market capitalizations at the time of investment that fall within the lowest 20% of the total U.S. equity market capitalization (excluding companies with market capitalizations of less than $10 million).
|
| ■ | ON AB Mid Cap Core Portfolio – Long-term growth of capital by investing, under normal circumstances, at least 80% of its net assets in equity securities of mid-capitalization companies with public stock market capitalization at the time of investment that are within the range of market capitalizations of the companies constituting the Russell Midcap® Index.
|
| ■ | ON S&P 500® Index Portfolio – Total return approximating that of the Standard & Poor's 500® Index (S&P 500® Index), at a risk level consistent with that of the S&P 500® Index by investing, under normal circumstances, more than 80% of its net assets in common stock and other securities of companies that are included in the S&P 500® Index.
|
| ■ | ON BlackRock Advantage Large Cap Value Portfolio – Growth of capital by investing, under normal circumstances, at least 80% of its net assets in stocks of large capitalization companies with market capitalizations at the time of investment that are within the range of market capitalizations of the companies in the Russell 1000® Value Index for the previous twelve months.
|
| ■ | ON Federated High Income Bond Portfolio – High current income by investing, under normal circumstances, at least 80% of its net assets in lower rated corporate debt obligations commonly referred to as "junk bonds". The Portfolio's investments are generally rated BB or lower by Standard & Poor’s or Fitch, or Ba or lower by Moody's.
|
| ■ | ON Nasdaq-100® Index Portfolio – Long-term growth of capital by investing, under normal circumstances, more than 80% of its net assets in the common stocks of companies that are included in the Nasdaq-100® Index. |
| ■ | ON BlackRock Advantage Large Cap Core Portfolio – Long-term growth of capital by investing, under normal circumstances, at least 80% of its net assets in common stocks of the 1,000 largest publicly traded U.S. companies in terms of market capitalization.
|
| ■ | ON BlackRock Advantage Small Cap Growth Portfolio – Long-term growth of capital by investing, under normal circumstances, at least 80% of its net assets in stocks of small capitalization companies with a market capitalization at the time of investment that is no greater than the largest market capitalization of a company in the Russell 2000® Index for the previous twelve months.
|
| ■ | ON S&P MidCap 400® Index Portfolio – Total return approximating that of the Standard & Poor’s MidCap 400® Index (S&P MidCap 400® Index), including reinvestment of dividends, at a risk level consistent with that of the S&P MidCap 400® Index by investing, under normal circumstances, more than 80% of its net assets in the common stock and other securities included in the S& P MidCap 400® Index.
|
| ■ | ON BlackRock Advantage Large Cap Growth Portfolio – Long-term growth of capital by investing, under normal circumstances, at least 80% of its net assets in stocks of large capitalization companies with market capitalizations at the time of investment that are within the range of market capitalizations of the companies in the Russell 1000® Growth Index for the previous twelve months. |
| Notes to Financial Statements (Continued) | June 30, 2022 (Unaudited) |
| ■ | ON Risk Managed Balanced Portfolio – Long-term capital growth, consistent with preservation of capital and balanced by current income. The Portfolio invests in a balanced portfolio of equity and fixed-income securities and a risk management portfolio intended to enhance the risk adjusted return of the Portfolio. |
| ■ | ON Federated Core Plus Bond Portfolio - Total return by investing, under normal circumstances, at least 80% of its net assets in fixed-income investments, primarily U.S. dollar denominated, investment-grade, fixed income securities. Investment-grade, fixed income securities are rated in one of the four highest categories (BBB- or higher) by a nationally recognized statistical rating organization (“NRSRO”).
|
| ■ | ON Janus Henderson U.S. Low Volatility Portfolio - Capital appreciation by investing, under normal circumstances, at least 80% of its net assets in U.S. common stocks of companies included in the S& P 500® Index. Those stocks are selected by a mathematical investment process which seeks to achieve returns similar to those of the S&P 500® Index over the long-term with lower absolute volatility. |
| ■ | ON iShares Managed Risk Balanced Portfolio - Income and capital appreciation by investing in underlying exchange traded funds ("ETFs") and futures. Under normal market conditions, through investments in the underlying funds and derivatives, the Portfolio invests a minimum of 25% of its assets in equity investments and a minimum of 25% of its assets in fixed income investments.
|
| ■ | ON AB Relative Value Portfolio - Long-term growth of capital by investing primarily in the equity securities of U.S. companies that the Portfolio's sub-adviser believes are trading at attractive valuations and that have strong or improving business models.
|
| ■ | ON Moderately Conservative Model Portfolio* – Current income and moderate growth of capital with a greater emphasis on current income by investing in underlying mutual funds. Under normal circumstances, the Portfolio intends to have investment exposure to various asset classes within the following target asset allocation ranges: U.S. Equity 20-40%, International Equity 5-20%, and Fixed Income 30-70%.
|
| ■ | ON Balanced Model Portfolio* – A balance between growth of capital and current income with a greater emphasis on growth of capital by investing in underlying mutual funds. Under normal circumstances, the Portfolio intends to have investment exposure to various asset classes within the following target asset allocation ranges: U.S. Equity 25-50%, International Equity 10-25%, and Fixed Income 25-50%.
|
| ■ | ON Moderate Growth Model Portfolio* – Growth of capital and moderate current income with a greater emphasis on growth of capital by investing in underlying mutual funds. Under normal circumstances, the Portfolio intends to have investment exposure to various asset classes within the following target asset allocation ranges: U.S. Equity 40-60%, International Equity 15-35%, and Fixed Income 10-30%.
|
| ■ | ON Growth Model Portfolio* – Growth of capital and some current income by investing in underlying mutual funds. Under normal circumstances, the Portfolio intends to have investment exposure to various asset classes within the following target asset allocation ranges: U.S. Equity 50-80%, International Equity 15-45%, and Fixed Income 0-15%. |
| * | Collectively, the "ON Model Portfolios". |
Additional detail regarding portfolio-specific objectives, policies, and investment strategies is provided in the Prospectuses and Statements of Additional Information of Ohio National Fund, Inc. There are no assurances that these objectives will be met. Each Portfolio, except the ON Nasdaq-100® Index Portfolio, is classified as diversified for purposes of Section 5(b) of the 40 Act.
At present, the Fund issues its shares to separate accounts of The Ohio National Life Insurance Company (“ONLIC”), Ohio National Life Assurance Corporation (“ONLAC”), and National Security Life and Annuity Company (“NSLA”) to support certain benefits under variable contracts issued by those entities, as well as for purchases by other Portfolios of the Fund. In the future, Fund shares may be used for other purposes but, unless there is a change in applicable law, they will not be sold directly to the public.
ONLIC and NSLA no longer market, nor issue, variable annuities. ONLIC and NSLA will continue to service the in-force variable annuity contracts, the variable separate accounts, and underlying subaccounts regardless of new sales.
Interest in each Portfolio is represented by a separate class of the Fund’s capital stock, par value $1. Each share of a Portfolio participates equally in the Portfolio’s dividends, distributions, net assets, and voting matters.
| Notes to Financial Statements (Continued) | June 30, 2022 (Unaudited) |
The Fund is authorized to issue 1.55 billion of its capital shares. Of this total, shares authorized have been allocated to specific Portfolios of the Fund as follows:
| Portfolio | | Authorized Shares | | Portfolio | | Authorized Shares |
| ON Bond | | 22,000,000 | | ON BlackRock Advantage Large Cap Growth | | 42,000,000 |
| ON BlackRock Balanced Allocation | | 22,000,000 | | ON Risk Managed Balanced | | 170,000,000 |
| ON BlackRock Advantage International Equity | | 50,000,000 | | ON Federated Core Plus Bond | | 115,000,000 |
| ON Janus Henderson Forty | | 9,000,000 | | ON Janus Henderson U.S. Low Volatility | | 155,000,000 |
| ON AB Small Cap | | 7,000,000 | | ON iShares Managed Risk Balanced | | 133,000,000 |
| ON AB Mid Cap Core | | 4,000,000 | | ON iShares Managed Risk Moderate Growth** | | 105,000,000 |
| ON S&P 500® Index | | 50,000,000 | | ON iShares Managed Risk Growth** | | 90,000,000 |
| ON BlackRock Advantage Large Cap Value | | 26,000,000 | | ON AB Relative Value | | 50,000,000 |
| ON Federated High Income Bond | | 13,000,000 | | ON Moderately Conservative Model | | 36,000,000 |
| ON Nasdaq-100® Index | | 22,000,000 | | ON Balanced Model | | 120,000,000 |
| ON BlackRock Advantage Large Cap Core | | 17,000,000 | | ON Moderate Growth Model | | 210,000,000 |
| ON BlackRock Advantage Small Cap Growth | | 8,000,000 | | ON Growth Model | | 43,000,000 |
| ON S&P MidCap 400® Index | | 31,000,000 | | | | |
| ** | These Portfolios and their respective authorized shares have been approved, although the Portfolios are not yet in operation. |
The Fund’s Board of Directors (the “Board”) periodically reallocates authorized shares among the Portfolios of the Fund and may authorize additional shares as deemed necessary.
Under the Fund’s organizational documents, its Officers and Directors are indemnified against certain liabilities arising out of the performance of their duties to the Fund. In addition, in the normal course of business, the Fund enters into contracts with its vendors and others that provide for general indemnifications. The Fund’s maximum exposure under these arrangements is unknown, as this would involve future claims that may be made against the Fund. However, based on experience, the risk of loss to the Fund is expected to be remote.
(2)Significant Accounting Policies
The following is a summary of significant accounting policies followed by the Fund in preparation of its financial statements:
Use of Estimates
The preparation of financial statements in conformity with U.S. generally accepted accounting principles (“U.S. GAAP”) requires management to make estimates and assumptions that affect the reported amounts of assets and liabilities and disclosure of contingent assets and liabilities at the date of the financial statements and the reported amounts of increases and decreases in net assets from operations during the reporting period. Actual results could differ from those estimates.
Security Valuation
Investments are valued using pricing procedures approved by the Board.
Fixed income instruments that mature in sixty days or less, and of sufficient credit quality, are valued at amortized cost. Amortized cost valuation involves valuing a security at its cost initially and thereafter amortizing to maturity any discounts or premiums on the level-yield method, regardless of the impact of fluctuating market interest rates on the value of the security. In these instances, amortized cost approximates fair value.
Investments, other than those securities aforementioned, are valued as follows:
Domestic equity securities that are traded on U.S. exchanges, other than the Nasdaq Stock Market, are valued at the last trade price reported by the primary exchange of each security (4:00 pm Eastern Time for normal trading sessions). Domestic equity securities that are listed on the Nasdaq Stock Market are valued at the Nasdaq Official Closing Price (“NOCP”). Over-the-counter domestic equity securities are valued at the last trade price reported daily as of 4:00 pm Eastern Time (normal trading sessions). If, on a particular day, a domestic equity security does not trade, or otherwise cannot be priced by independent pricing services, then a broker quotation as of the end of the current trading session, the evaluated mean between the bid and ask prices, as reported by an approved independent pricing source, or a previous last trade price may be used when appropriate.
| Notes to Financial Statements (Continued) | June 30, 2022 (Unaudited) |
Over-the-counter traded American Depositary Receipts ("ADRs") may also be valued at an evaluated price based on the value of the underlying securities. If a domestic equity security is not traded on a particular day, the mean between the bid and ask prices reported at 4:00 pm Eastern Time (normal trading sessions) by the primary exchange will generally be used for valuation purposes. The principal sources for market quotations are independent pricing services that have been approved by the Board.
Fixed income securities that have a remaining maturity exceeding sixty days are generally valued at the evaluated bid price reported at 4:00 pm Eastern Time (normal trading sessions), as provided by independent pricing services approved by the Board. Many fixed income securities, including investment grade and high-yield corporate bonds, U.S. Treasury and government agency obligations, and other asset-backed instruments are not actively traded on a daily basis. As such, the approved pricing services may use asset type-specific valuation models to provide good faith determinations that the holders of securities would receive in an orderly transaction under current market conditions. The valuation models may use observable market data such as recent transaction data, benchmark yields, broker/dealer inputs, valuations and yields of comparable instruments, relative credit information, observed market movements, and market research and news. Asset-backed securities and mortgage-backed securities may use valuation models that heavily consider predicted cash flows of each tranche of an issue, benchmark spreads, and unique attributes of the tranche. The last trade or last evaluated bid may be used if an evaluated bid price is not available.
U.S exchange-traded options are valued at the composite basis last sale price as reported to a Board-approved independent pricing service by the OPRA (Options Price Reporting Authority) at 4:00 pm Eastern Time (normal trading sessions). If there are no reported trades for a trading session, the evaluated composite-basis bid price, or other method will be used for valuation purposes.
Futures contracts are valued at the daily quoted settlement prices as reported by an approved independent pricing source.
Shares of open-end mutual funds are valued at each fund’s last calculated net asset value per share.
Shares of closed-end mutual funds that are traded on U.S. exchanges are valued similarly to other domestic equity securities, typically at the last trade price reported by the primary exchange of each fund (4:00 pm Eastern Time for normal trading sessions).
Foreign equity securities are initially priced at the reported close price of the exchange on which a security is primarily traded. Securities not traded on a particular day are valued at the mean between the last reported bid and ask quotes at daily close, or the last sale price when appropriate. The principal sources for market quotations are independent pricing services that have been approved by the Board.
Equity securities that are primarily traded on foreign exchanges, other than those with close times that are consistent with the normal 4:00 pm Eastern Time close of U.S. equity markets, are further subjected to fair valuation pricing procedures provided by an independent fair valuation service. The service provides data that can be used to estimate the price of a foreign issue that would prevail in a liquid market given market information available daily at 4:00 pm Eastern Time (normal trading sessions). Multiple factors may be considered in performing this valuation, including an issue’s local close price, relevant general and sector indices, currency fluctuations, and pricing of related depository receipts, exchange traded funds, and futures. The pricing procedures are performed for each individual security for which there is a fairly large degree of certainty that the local close price is not the liquid market price at the time of U.S. market close. The procedures are performed each day there is a change in a consistently used market index from the time of local close to the U.S. market close. Backtesting analysis is performed on a quarterly basis to monitor the effectiveness of these procedures. The testing is reviewed by management of the Fund and is reported to the Board. Prior results have indicated that these procedures have been effective in reaching valuation objectives.
Restricted securities, illiquid securities, or other investments for which market quotations or other observable market inputs are not readily available are valued at an estimate of value using methods determined in good faith by the Fund’s Pricing Committee under the supervision of the Board.
The differences between the aggregate cost and values of investments are reflected as unrealized appreciation or unrealized depreciation.
| Notes to Financial Statements (Continued) | June 30, 2022 (Unaudited) |
Pricing inputs used in the Fund’s determination of its investment values are categorized according to a three-tier hierarchy framework. The hierarchy is summarized in three broad levels:
| Level 1: | Quoted prices in active markets for identical securities. |
| Level 2: | Other significant observable inputs, including quoted prices for similar securities, interest rates, prepayment speeds, credit risk, etc. |
| Level 3: | Significant unobservable inputs, including the Fund’s own assumptions used to determine the value of securities. |
The following is a summary of the inputs used in valuing each of the Portfolio’s assets (liabilities) at value as of June 30, 2022:
| Portfolio | | Financial Instrument Type | | Level 1 | | Level 2 | | Level 3 |
ON Bond
| | Corporate Bonds*** | | $ — | | $206,980,253 | | $ — |
| | | Asset-Backed Securities*** | | — | | 6,161,518 | | — |
| | | Money Market Funds | | 4,895,824 | | — | | — |
| | | | | $ 4,895,824 | | $213,141,771 | | $ — |
ON BlackRock Balanced Allocation
| | Common Stocks*** | | $ 302,984,379 | | $ — | | $ — |
| | | Corporate Bonds*** | | — | | 117,044,792 | | — |
| | | Asset-Backed Securities*** | | — | | 2,491,424 | | — |
| | | U.S. Treasury Obligations | | — | | 905,937 | | — |
| | | Money Market Funds | | 7,924,863 | | — | | — |
| | | | | $ 310,909,242 | | $120,442,153 | | $ — |
| | | Long Futures Contracts | | $ (91,557) | | $ — | | $ — |
ON BlackRock Advantage International Equity
| | Common Stocks*** | | $ 327,137 | | $374,438,010 | | $ — |
| | | Preferred Securities*** | | — | | 4,133,053 | | — |
| | | Money Market Funds | | 8,019,068 | | — | | — |
| | | | | $ 8,346,205 | | $378,571,063 | | $ — |
| | | Long Futures Contracts | | $ (24,444) | | $ — | | $ — |
ON Janus Henderson Forty
| | Common Stocks*** | | $ 75,507,255 | | $ 1,575,708 | | $ — |
| | | Money Market Funds | | 998,381 | | — | | — |
| | | | | $ 76,505,636 | | $ 1,575,708 | | $ — |
ON AB Small Cap
| | Common Stocks*** | | $ 116,343,220 | | $ — | | $ — |
| | | Exchange Traded Funds | | 267,897 | | — | | — |
| | | Money Market Funds | | 2,007,527 | | — | | — |
| | | | | $ 118,618,644 | | $ — | | $ — |
ON AB Mid Cap Core
| | Common Stocks*** | | $ 74,739,194 | | $ — | | $ — |
| | | Money Market Funds | | 1,127,120 | | — | | — |
| | | | | $ 75,866,314 | | $ — | | $ — |
| | | Long Futures Contracts | | $ (1,082) | | $ — | | $ — |
ON S&P 500® Index
| | Common Stocks*** | | $ 994,488,033 | | $ — | | $ — |
| | | U.S. Treasury Obligations | | — | | 197,173 | | — |
| | | Money Market Funds | | 10,756,391 | | — | | — |
| | | | | $1,005,244,424 | | $ 197,173 | | $ — |
| | | Long Futures Contracts | | $ (227,945) | | $ — | | $ — |
| Notes to Financial Statements (Continued) | June 30, 2022 (Unaudited) |
| Portfolio | | Financial Instrument Type | | Level 1 | | Level 2 | | Level 3 |
ON BlackRock Advantage Large Cap Value
| | Common Stocks*** | | $ 247,602,316 | | $ — | | $ — |
| | | Money Market Funds | | 2,448,013 | | — | | — |
| | | | | $ 250,050,329 | | $ — | | $ — |
| | | Long Futures Contracts | | $ (50,233) | | $ — | | $ — |
ON Federated High Income Bond
| | Corporate Bonds*** | | $ — | | $129,172,614 | | $ — |
| | | Common Stocks*** | | 422,932 | | — | | — |
| | | Rights | | 2,216 | | — | | — |
| | | Money Market Funds | | 1,167,096 | | — | | — |
| | | | | $ 1,592,244 | | $129,172,614 | | $ — |
ON Nasdaq-100® Index
| | Common Stocks*** | | $ 241,426,185 | | $ — | | $ — |
| | | U.S. Treasury Obligations | | — | | 98,586 | | — |
| | | Money Market Funds | | 2,023,578 | | — | | — |
| | | | | $ 243,449,763 | | $ 98,586 | | $ — |
| | | Long Futures Contracts | | $ (91,721) | | $ — | | $ — |
ON BlackRock Advantage Large Cap Core
| | Common Stocks*** | | $ 321,598,053 | | $ — | | $ — |
| | | Money Market Funds | | 3,707,602 | | — | | — |
| | | | | $ 325,305,655 | | $ — | | $ — |
| | | Long Futures Contracts | | $ (89,492) | | $ — | | $ — |
ON BlackRock Advantage Small Cap Growth
| | Common Stocks*** | | $ 129,516,161 | | $ — | | $ — |
| | | Rights*** | | — | | 4,950 | | — |
| | | Money Market Funds | | 8,842,310 | | — | | — |
| | | | | $ 138,358,471 | | $ 4,950 | | $ — |
| | | Long Futures Contracts | | $ (362,174) | | $ — | | $ — |
ON S&P MidCap 400® Index
| | Common Stocks*** | | $ 322,250,276 | | $ — | | $ — |
| | | U.S. Treasury Obligations | | — | | 98,586 | | — |
| | | Money Market Funds | | 2,712,485 | | — | | — |
| | | | | $ 324,962,761 | | $ 98,586 | | $ — |
| | | Long Futures Contracts | | $ (46,605) | | $ — | | $ — |
ON BlackRock Advantage Large Cap Growth
| | Common Stocks*** | | $ 46,738,012 | | $ — | | $ — |
| | | Money Market Funds | | 732,709 | | — | | — |
| | | | | $ 47,470,721 | | $ — | | $ — |
| | | Long Futures Contracts | | $ (9,222) | | $ — | | $ — |
| Notes to Financial Statements (Continued) | June 30, 2022 (Unaudited) |
| Portfolio | | Financial Instrument Type | | Level 1 | | Level 2 | | Level 3 |
ON Risk Managed Balanced
| | Common Stocks*** | | $ 538,223,282 | | $ — | | $ — |
| | | U.S. Treasury Obligations | | — | | 208,936,645 | | — |
| | | Corporate Bonds*** | | — | | 178,766,165 | | — |
| | | Purchased Options | | 41,331,293 | | 37,594,240 | | — |
| | | Exchange Traded Funds | | 61,175,212 | | — | | — |
| | | Asset-Backed / Mortgage-Backed Securities*** | | — | | 58,709,667 | | — |
| | | U.S. Government Agency Mortgage-Backed Securities | | — | | 54,272,558 | | — |
| | | Preferred Securities*** | | — | | 2,969,288 | | — |
| | | Sovereign Debt Issues | | — | | 1,278,141 | | — |
| | | Taxable Municipal Bonds | | — | | 490,378 | | — |
| | | Money Market Funds | | 80,548,379 | | — | | — |
| | | | | $ 721,278,166 | | $543,017,082 | | $ — |
| | | Long Futures Contracts | | $ (2,995,792) | | $ — | | $ — |
| | | Short Futures Contracts | | $ 5,666,449 | | $ — | | $ — |
ON Federated Core Plus Bond
| | U.S. Treasury Obligations | | $ — | | $218,690,771 | | $ — |
| | | U.S. Government Agency Mortgage-Backed Securities | | — | | 154,501,508 | | — |
| | | Corporate Bonds*** | | — | | 130,171,208 | | — |
| | | Investment Companies | | 41,645,164 | | — | | — |
| | | Asset-Backed / Mortgage-Backed Securities*** | | — | | 21,660,346 | | — |
| | | Sovereign Debt Issues | | — | | 1,801,140 | | — |
| | | Common Stocks | | 10,878 | | — | | — |
| | | Money Market Funds | | 8,545,334 | | — | | — |
| | | | | $ 50,201,376 | | $526,824,973 | | $ — |
| | | Long Futures Contracts | | $ 32,981 | | $ — | | $ — |
| | | Short Futures Contracts | | $ 281,623 | | $ — | | $ — |
ON Janus Henderson U.S. Low Volatility
| | Common Stocks*** | | $ 776,191,405 | | $ — | | $ — |
| | | Money Market Funds | | 5,372,776 | | — | | — |
| | | | | $ 781,564,181 | | $ — | | $ — |
ON iShares Managed Risk Balanced
| | Exchange Traded Funds | | $ 309,499,784 | | $ — | | $ — |
| | | Money Market Funds | | 14,678,097 | | — | | — |
| | �� | | | $ 324,177,881 | | $ — | | $ — |
| | | Long Futures Contracts | | $ (1,017,642) | | $ — | | $ — |
| | | Short Futures Contracts | | $ 499,705 | | $ — | | $ — |
ON AB Relative Value
| | Common Stocks*** | | $ 82,709,919 | | $ — | | $ — |
| | | Money Market Funds | | 4,269,030 | | — | | — |
| | | | | $ 86,978,949 | | $ — | | $ — |
ON Moderately Conservative Model
| | Open-End Mutual Funds | | $ 229,230,342 | | $ — | | $ — |
ON Balanced Model
| | Open-End Mutual Funds | | $ 839,008,452 | | $ — | | $ — |
ON Moderate Growth Model
| | Open-End Mutual Funds | | $1,513,226,979 | | $ — | | $ — |
| Notes to Financial Statements (Continued) | June 30, 2022 (Unaudited) |
| Portfolio | | Financial Instrument Type | | Level 1 | | Level 2 | | Level 3 |
ON Growth Model
| | Open-End Mutual Funds | | $ 336,676,460 | | $ — | | $ — |
| *** | Each of the Portfolio's Schedules of Investments include detailed industry descriptions. |
Foreign Securities and Currency
The books and records of all the Portfolios are maintained in U.S. dollars. All investments and cash quoted in foreign currencies are valued daily in U.S. dollars on the basis of the foreign currency exchange rates provided by an independent source. These exchange rates are currently determined daily at 4:00 pm Eastern Time for normal trading sessions. Purchases and sales of foreign-denominated investments are recorded at rates of exchange prevailing on the respective dates of such transactions.
The Fund may not fully isolate that portion of the results of operations resulting from changes in foreign exchange rates from fluctuations arising from changes in market prices on foreign currency-denominated investments. For the portion that is isolated, amounts are reflected in the Statements of Operations as other foreign currency related transactions. However, for tax purposes, the Fund does fully isolate the effect of fluctuations in foreign exchange rates when determining the gain or loss upon sale or maturity of such investments to the extent required by federal income tax regulations.
All Portfolios of the Fund may invest in securities of foreign issuers. The ON BlackRock Advantage International Equity Portfolio may be invested entirely in foreign securities. Investments in securities of foreign issuers, including investments in foreign companies through the use of depositary receipts, carry certain risks not ordinarily associated with investments in securities of domestic issuers. Such risks include future political and economic developments, and the possible imposition of exchange controls or other foreign governmental laws and restrictions. In addition, with respect to certain countries, there is the possibility of expropriation of assets, confiscatory taxation, political or social instability, or diplomatic developments that could adversely affect capital investment within those countries.
Restricted Securities
Restricted securities are typically those securities purchased through a private offering and cannot be resold to the general public without prior registration under the Securities Act of 1933 (“the 1933 Act”) or pursuant to the resale limitations provided by Rule 144A under the 1933 Act, or an exemption from the registration requirements of the 1933 Act. 144A securities are issued by corporations without registration in reliance on 1933 Act provisions allowing for the private resale of unregistered securities to qualified institutional buyers. Section 4(a)(2) commercial paper is issued pursuant to Section 4(a)(2) of the 1933 Act which exempts an issue from registration. This paper may be used to finance non-current transactions, such as acquisitions, stock repurchase programs, and other long-term assets. Investments by a Portfolio in Rule 144A and Section 4(a)(2) securities could have the effect of decreasing the liquidity of a Portfolio during any period in which qualified institutional investors were no longer interested in purchasing these securities.
Investment Transactions and Related Income
For financial reporting purposes, investment transactions are accounted for on a trade date (T+0) basis. For purposes of executing separate account shareholder transactions in the normal course of business, however, the Fund’s investment transactions are recorded no later than the first calculation on the first business day following the trade date (T+1), in accordance with Rule 2a-4 of the 40 Act. Accordingly, differences between the net asset values for financial reporting and for executing separate account shareholder transactions may arise.
Dividend income is recognized on the ex-dividend date, except in the case of those Portfolios holding foreign securities, in which dividends are recorded as soon after the ex-dividend date as the Fund’s information agents become aware of such dividends.
Interest income is accrued daily as earned and includes the amortization of premium and accretion of discount using the interest method. The period of amortization or accretion extends from the purchase date to the maturity date, except for securities that are purchased at a premium and have explicit, noncontingent call features, whereby the securities are callable at fixed prices and on pre-determined dates. The premium amounts related to those securities are generally amortized to the earliest call date. Net realized gain or loss on investments and foreign exchange transactions are determined using the specific identification method. Payments received for interest-only mortgage-backed securities are included in interest income. Because no principal is received at the maturity of an interest-only security, adjustments are made to the cost of the security until maturity. These adjustments are also included in interest income on the Statements of Operations.
| Notes to Financial Statements (Continued) | June 30, 2022 (Unaudited) |
Distributions to Shareholders and Federal Taxes
The Fund satisfies its distribution requirements, as required for each of the Portfolios to qualify as a regulated investment company pursuant to Subchapter M of the Internal Revenue Code. The Fund has the intent to continue to comply with tax provisions pertaining to regulated investment companies and make distributions of taxable income sufficient to relieve it from substantially all federal income and excise taxes. As such, no provisions for federal income or excise taxes have been recorded. Also, no tax-related interest or penalties have been incurred or accrued. The Board's intent is that the Fund will not initiate any realized gain distributions until any applicable capital loss carryforwards have been offset.
The character of ordinary income distributions, realized capital gains distributions, and return of capital, if any, are determined in accordance with federal income tax regulations and may differ from net investment income and realized gains for financial reporting purposes. These “book/tax” differences are either considered temporary or permanent in nature. To the extent these differences are permanent in nature, they are reclassified within the composition of net assets; temporary differences do not require such reclassification. Distributions to shareholders that exceed taxable income and net taxable realized gains are reported as return of capital distributions.
The Fund’s management and its tax agent perform an affirmative evaluation of tax positions taken or expected to be taken in the course of preparing the Fund’s tax returns to determine whether it is more-likely-than-not (i.e. greater than 50-percent) that each tax position will be sustained upon examination by a taxing authority based on the technical merits of the position. Implementation of the evaluation included a review of tax positions taken in tax years that remain subject to examination by all major tax jurisdictions, including federal tax and the state of Maryland. The determination has been made that there are no uncertain tax positions that would require the Portfolios to record a tax liability or provision.
Expense Allocation
Expenses directly attributable to a Portfolio are charged to that Portfolio. Expenses that cannot be directly attributed to a Portfolio are allocated among all the benefited Portfolios on a basis of relative net assets or other appropriate method.
Foreign Withholding Taxes
Certain Portfolios in the Fund may be subject to taxes imposed by countries in which they invest with respect to their investments in issuers existing or operating in such countries. Such taxes are generally withheld based on income earned. These Portfolios accrue such taxes as the related income is earned.
TBA Commitments
To-Be-Announced (“TBA”) commitments are agreements for the purchase or sale of mortgage-backed securities for a fixed price, with payment and delivery on an agreed upon future settlement date beyond the customary settlement period for such securities. The specific securities to be delivered are not identified at the trade date. However, delivered securities must meet specified terms, including issuer, rate and term and be within industry-accepted “good delivery” standards. When entering into TBA commitments, a Portfolio may take possession of or deliver the underlying mortgage-backed securities but can extend the settlement or roll the transaction. TBA commitments involve a risk of loss if the value of the security to be purchased or sold declines or increases, respectively, prior to settlement date.
Mortgage Dollar Rolls
A Portfolio may enter into a mortgage dollar roll (“MDR”) transaction, in which the Portfolio agrees to both sell and purchase a similar, but not identical, TBA mortgage-backed security with the same issuer, rate, and term on a later date at a set price. MDRs are treated as purchases and sales, which may have the effect of increasing portfolio turnover rates, and result in realized gains and losses based on the agreed-upon fixed prices.
New Accounting Pronouncements and Regulations
In October 2020, the Securities and Exchange Commission (the “SEC”) adopted Rule 18f-4, which governs the use of derivatives by registered investment companies. Rule 18f-4 imposes limits on the amount of derivatives a fund can enter into, eliminates the asset segregation framework currently used by funds to comply with Section 18 of the 40 Act, and requires funds whose use of derivatives is greater than a limited specified amount to establish and maintain a comprehensive derivatives risk management program and appoint a derivatives risk manager. It is not currently clear what impact, if any, Rule 18f-4 will have on the availability, liquidity, or performance of derivatives. Rule 18f-4 may change how the Fund uses derivatives, affect performance of the Portfolios, and increase costs related to the Portfolios’ use of derivatives.
| Notes to Financial Statements (Continued) | June 30, 2022 (Unaudited) |
In December 2020, the SEC adopted Rules 2a-5 and 31a-4 (the "Rules") that clarify how investment companies may satisfy their valuation obligations under the 40 Act. The Rules permit an investment company’s board to designate the determination of fair value to a fund's investment adviser, subject to the board's oversight and certain other conditions. The Rules also create a framework for the determination of the fair value of an investment company’s investments to establish a standard baseline for valuation practices and recordkeeping. The Rules have a compliance date of September 8, 2022. Management of the Fund is evaluating the Rules to determine their potential impact on the Fund’s financial statements.
LIBOR Transition
The Portfolios may invest in certain fixed income securities that rely upon the London Interbank Offered Rate (“LIBOR”) for determination of variable interest rate terms. LIBOR is an average interest rate that banks charge one another for the use of short-term money. On March 5, 2021, the ICE Benchmark Administration, the administrator of LIBOR, stated that it will cease the publication of the overnight and one-, three-, six- and twelve-month USD LIBOR settings immediately following the LIBOR publication on Friday, June 30, 2023. The ICE Benchmark Administration ceased the publication of all other LIBOR settings, including the one-week and two-month USD LIBOR settings on December 31, 2021. There remains uncertainty regarding the impact of the transition from LIBOR on the Fund’s transactions and the financial markets generally. As such, the potential effect of a transition away from LIBOR on the Fund or the Fund’s investments cannot yet be determined.
Pandemic Risks
The COVID-19 virus pandemic has continued to significantly impact the global economy and market environment. Liquidity and performance of the Portfolios may be negatively impacted as a result of ongoing economic uncertainties caused by the pandemic. The values for the investments in future financial statements may differ significantly from those presented for this period end.
Subsequent Events
At a meeting held on May 13, 2022, the Board, including a majority of the Directors who are not “interested persons” of the Fund (the “Independent Directors”), approved an amendment to the Investment Advisory Agreement between ONI and the Fund, as well as a new sub-advisory agreement with Intech Investment Management LLC (“Intech”). Effective at the end of day August 19, 2022, Intech became the sub-adviser for the ON Janus Henderson U.S. Low Volatility Portfolio. In connection with this change in sub-adviser, on the effective date of the change, the name of the Portfolio became the ON U.S. Low Volatility Portfolio, although the Portfolio’s current objective, investment strategy, and benchmark were unchanged. The Board also approved the revision of the Portfolio’s annualized advisory and sub-advisory fee schedules, effective on the date of the sub-advisory change. The revised breakpoint schedules, based on the Portfolio’s daily net assets, are as follows:
| Advisory Fees |
| 0.575% of first $500 million |
| 0.555% over $500 million |
| Sub-advisory Fees |
| 0.10% of all net assets |
ONLIC, NSLA, and certain variable separate account entities affiliated with ONLIC and NSLA were parties to a correspondence letter filed with the SEC on July 22, 2022, which described the intent of those entities to execute a substitution of investment options pursuant to Commission Statement on Insurance Product Fund Substitution Applications, Release No. IC-34199. Those entities intend to substitute shares of four unaffiliated funds (the “Unaffiliated Funds”) currently available under certain variable contracts for shares of four affiliated fund options (the “Replacement Ohio National Fund Portfolios”). The substitution transactions are:
| Unaffiliated Funds | | Replacement Ohio National Fund Portfolios |
| Fidelity ® VIP Contrafund® Portfolio (Service Class 2) | | ON BlackRock Advantage Large Cap Growth Portfolio |
| TOPS ® Managed Risk Balanced ETF Portfolio (Class 2 and Class 3 Shares) | | ON iShares Managed Risk Balanced Portfolio |
| TOPS ® Managed Risk Moderate Growth ETF Portfolio (Class 2 and Class 3 Shares) | | ON iShares Managed Risk Moderate Growth Portfolio |
| TOPS ® Managed Risk Growth ETF Portfolio (Class 2 and Class 3 Shares) | | ON iShares Managed Risk Growth Portfolio |
| Notes to Financial Statements (Continued) | June 30, 2022 (Unaudited) |
The substitution transactions will occur as cash redemptions of each Unaffiliated Fund’s shares and cash subscriptions to each corresponding Replacement Ohio National Fund Portfolio’s shares. Those transactions are intended to take effect on or about September 9, 2022. Upon execution of those substitution transactions, the ON iShares Managed Risk Moderate Growth and ON iShares Managed Risk Growth Portfolios will commence operations and the fees and expenses related to certain of the Replacement Ohio National Fund Portfolios may be amended or limited.
Management has evaluated events and transactions through the date the financial statements were issued, for purposes of recognition or disclosure in these financial statements, and there are no other subsequent events to report.
(3)Related Party and Other Transactions
The Fund has an Investment Advisory Agreement with Ohio National Investments, Inc. ("ONI"), a wholly-owned subsidiary of ONLIC. Under the terms of this agreement, ONI provides portfolio management and investment advice to the Fund and administers its operations, subject to the supervision of the Board. This agreement is renewed annually upon the approval by the Board. As compensation for its services, ONI receives advisory fees from the Fund calculated on the basis of each Portfolio's average daily net assets and the following current schedule of Board-approved annualized fee breakpoints.
| ON Bond |
| 0.60% of first $100 million |
| 0.50% of next $150 million |
| 0.45% of next $250 million |
| 0.40% of next $500 million |
| 0.30% of next $1 billion |
| 0.25% over $2 billion |
| ON BlackRock Balanced Allocation |
| 0.58% of first $100 million |
| 0.50% of next $150 million |
| 0.45% of next $250 million |
| 0.40% of next $500 million |
| 0.30% of next $1 billion |
| 0.25% over $2 billion |
| ON BlackRock Advantage International Equity |
| 0.72% of first $200 million |
| 0.70% of next $800 million |
| 0.66% over $1 billion |
| ON Janus Henderson Forty |
| 0.73% of first $100 million |
| 0.68% of next $400 million |
| 0.63% over $500 million |
| ON AB Small Cap |
| 0.73% of first $400 million |
| 0.675% of next $200 million |
| 0.63% over $600 million |
| ON ON AB Mid Cap Core |
| 0.715% of first $100 million |
| 0.71% of next $200 million |
| 0.69% of next $200 million |
| 0.66% over $500 million |
| ON S&P 500® Index |
| 0.40% of first $100 million |
| 0.35% of next $150 million |
| 0.33% over $250 million |
| ON BlackRock Advantage Large Cap Value |
| 0.67% of first $500 million |
| 0.65% over $500 million |
| ON Federated High Income Bond |
| 0.75% of first $75 million |
| 0.70% of next $75 million |
| 0.65% of next $75 million |
| 0.60% over $225 million |
| ON Nasdaq-100® Index |
| 0.40% of first $100 million |
| 0.35% of next $150 million |
| 0.33% over $250 million |
| ON BlackRock Advantage Large Cap Core |
| 0.64% of first $500 million |
| 0.62% over $500 million |
| ON BlackRock Advantage Small Cap Growth |
| 0.78% of first $100 million |
| 0.75% of next $400 million |
| 0.70% over $500 million |
| ON S&P MidCap 400® Index |
| 0.40% of first $100 million |
| 0.35% of next $150 million |
| 0.33% over $250 million |
| ON BlackRock Advantage Large Cap Growth |
| 0.66% of first $500 million |
| 0.64% over $500 million |
| ON Risk Managed Balanced |
| 0.88% of first $500 million |
| 0.74% of next $1.3 billion |
| 0.72% over $1.8 billion |
| ON Federated Core Plus Bond |
| 0.56% of first $100 million |
| 0.54% of next $150 million |
| 0.50% of next $150 million |
| 0.45% of next $350 million |
| 0.43% over $750 million |
| ON Janus Henderson U.S. Low Volatility |
| 0.60% of first $500 million |
| 0.58% over $500 million |
| ON iShares Managed Risk Balanced |
| 0.58% of first $1.5 billion |
| 0.55% over $1.5 billion |
| ON AB Relative Value |
| 0.65% of first $100 million |
| 0.61% of next $200 million |
| 0.59% over $300 million |
| ON Model Portfolios |
| 0.40% of all net assets |
Under the Investment Advisory Agreement, the Fund authorizes ONI to retain sub-advisers for all Portfolios of the Fund, subject to the approval of the Board. ONI has entered into sub-advisory agreements with BlackRock Investment Management, LLC ("BlackRock"), Janus Capital Management LLC (“Janus”), Geode Capital Management, LLC (“Geode”), Federated Investment Management Company (“Federated”), and AllianceBernstein, L.P. (“AB”) to manage the investment of certain Portfolios’ assets, subject to the supervision of ONI.
The sub-advisers receive from ONI a sub-advisory fee calculated on the basis of each of the aforementioned Portfolios' average daily net assets and the following current Board-approved schedule of annualized fee breakpoints.
| Notes to Financial Statements (Continued) | June 30, 2022 (Unaudited) |
| ON BlackRock Advantage International Equity (BlackRock) |
| 0.32% of first $200 million |
| 0.30% over $200 million |
| ON Janus Henderson Forty (Janus) |
| 0.40% of first $100 million |
| 0.35% of next $400 million |
| 0.30% over $500 million |
| ON AB Small Cap (AB) |
| 0.32% of first $400 million |
| 0.29% of next $200 million |
| 0.255% over $600 million |
| ON AB Mid Cap Core (AB) |
| 0.28% of first $100 million |
| 0.27% of next $200 million |
| 0.265% of next $200 million |
| 0.26% over $500 million |
| ON S&P 500® Index (Geode)1 |
| 0.01% of all net assets |
| ON Federated High Income Bond (Federated) |
| 0.50% of first $30 million |
| 0.40% of next $20 million |
| 0.30% of next $25 million |
| 0.25% over $75 million |
| ON Nasdaq-100® Index (Geode)1 |
| 0.05% of first $100 million |
| 0.04% of next $150 million |
| 0.03% over $250 million |
| ON BlackRock Advantage Small Cap Growth (BlackRock) |
| 0.40% of first $250 million |
| 0.35% over $250 million |
| ON S&P MidCap 400® Index (Geode)1 |
| 0.039% of first $100 million |
| 0.038% of next $150 million |
| 0.037% of next $250 million |
| 0.036% of next $500 million |
| 0.035% over $1 billion |
| ON Risk Managed Balanced (AB) |
| 0.50% of first $400 million |
| 0.40% of next $800 million |
| 0.30% over $1.2 billion |
| ON Federated Core Plus Bond (Federated) |
| 0.18% of first $100 million |
| 0.15% of next $150 million |
| 0.12% of next $150 million |
| 0.10% of next $350 million |
| 0.08% over $750 million |
| ON Janus Henderson U.S. Low Volatility (Janus) |
| 0.15% of all net assets |
| ON iShares Managed Risk Balaced (BlackRock) |
| 0.20% of first $1.5 billion |
| 0.18% over $1.5 billion |
| ON AB Relative Value (AB) |
| 0.28% of first $100 million |
| 0.24% of next $200 million |
| 0.22% over $300 million |
| 1 | The sub-advisory fees for the three Portfolios sub-advised by Geode could be impacted by an agreed-upon minimum aggregate per annum fee of $150,000. For the six-month period ended June 30, 2022, the minimum aggregate fee had no impact on the sub-advisory fees that were calculated based on the breakpoint schedule indicated above. |
BlackRock receives from ONI a sub-advisory fee on the aggregate average daily net assets of the ON BlackRock Advantage Large Cap Core Portfolio, ON BlackRock Advantage Large Cap Growth Portfolio, ON BlackRock Advantage Large Cap Value Portfolio, and the equity sleeve of the ON BlackRock Balanced Allocation Portfolio that is sub-advised. The fee for the Portfolios is calculated based on 0.20% of the first $500 million in aggregate daily net assets, and 0.18% for aggregate daily net assets over $500 million.
In meetings held June 22, 2021 and November 11, 2021, the Board approved the adoption of a revised Investment Advisory Agreement between the Fund and ONI, and new sub-advisory agreements between ONI and each of the sub-advisers to the Fund Portfolios (together, the “new advisory agreements”). On August 30, 2021, the Fund’s shareholders, through a proxy solicitation and voting process involving the owners of ONLIC, ONLAC and NSLA variable contracts, also approved the adoption of the revised Investment Advisory Agreement. The approvals of the new advisory agreements were necessary due to the change in control of ONI upon the sponsored demutualization transaction involving Ohio National Mutual Holdings, Inc. (“ONMH”). ONMH is the 100% owner of Ohio National Financial Services, Inc., the parent company of ONLIC. The new investment advisory agreements were substantially identical in form and terms to the prior investment advisory agreements, other than the dates of execution and termination and certain non-material changes. Also, for certain of the Portfolios, the Fund’s shareholders approved a manager of managers structure, whereby ONI will be able, subject to approval of the Board, to enter into and materially amend, sub-advisory agreements pertaining to those Portfolios without obtaining further shareholder approval.
Pursuant to a service agreement among ONI, ONLIC, and the Fund, ONLIC has agreed to provide personnel and facilities to ONI on a cost-reimbursement basis. These personnel members include officers of the Fund. ONLIC also provides clerical and administrative services and such supplies and equipment as may be reasonably required in order for ONI to properly perform its advisory function pursuant to the Investment Advisory Agreement. ONLIC further performs duties to fulfill the transfer agent function on behalf of the Fund. Performance of these duties by ONLIC and availability of facilities, personnel, supplies, and equipment does not represent an expense to the Fund in excess of the advisory fees paid to ONI.
The Investment Advisory Agreement allows for a portion of the expenses related to ONLIC's compliance and legal staff to be incurred by the Fund and paid from the Fund to ONI. Pursuant to the service agreement among ONI, ONLIC, and the Fund, ONLIC has provided the personnel, services, and equipment necessary for the execution of the Fund’s regulation-mandated compliance functions and ONI has reimbursed ONLIC for those costs allocated to the Fund. For the six-month period ended June 30, 2022, the Fund incurred compliance expenses totaling $111,504, which are allocated to the Portfolios by equal dollar amounts on a daily basis. Expenses incurred by the Portfolios are reflected on the Statements of Operations as “Compliance expense”.
| Notes to Financial Statements (Continued) | June 30, 2022 (Unaudited) |
Pursuant to the Investment Advisory Agreement between ONI and the Fund, if the total expenses applicable to any Portfolio during any calendar quarter (excluding taxes, brokerage commissions, interest expense and management fees) exceed 1%, on an annualized basis, evaluated quarterly, of such Portfolio’s average daily net asset value, ONI will reimburse the Portfolio for such excess expenses. There were no expense reimbursements associated with this agreement during the six-month period ended June 30, 2022.
Through an Operating Expense Limitation Agreement, ONI has contractually agreed to reimburse the Fund to the extent that the annual ordinary operating expenses of the four ON Model Portfolios, excluding: portfolio transaction and other investment related costs (including brokerage fees and commissions); taxes; borrowing costs (such as interest and dividend expenses on securities sold short); fees and expenses associated with investments in derivative instruments (including for example option and swap fees and expenses); any amounts payable pursuant to a distribution or service plan adopted in accordance with Rule 12b-1 under the 40 Act; any administrative and/or shareholder servicing fees payable pursuant to a plan approved by the Board; expenses incurred in connection with any merger or reorganization; extraordinary expenses (such as litigation expenses, indemnification of Fund officers and Directors and contractual indemnification of Portfolio service providers); and other expenses that the Directors agree have not been incurred in the ordinary course of the Portfolio’s business, exceed certain percentages of the average daily net assets.
The applicable percentages of the average daily net assets of the four ON Model Portfolios are as follows:
| Portfolio | | May 1, 2022 to
April 30, 2023 | | May 1, 2021 to
April 30, 2022 | | May 1, 2020 to
April 30, 2021 |
ON Moderately Conservative Model
| | 1.00% | | 1.00% | | 1.00% |
ON Balanced Model
| | 1.00% | | 1.00% | | 1.00% |
ON Moderate Growth Model
| | 1.07% | | 1.07% | | 1.07% |
ON Growth Model
| | 1.14% | | 1.14% | | 1.14% |
For purposes of calculating the expenses subject to the Operating Expense Limitation Agreement, the annual operating expenses are those as presented pursuant to the Fund's prospectus requirements. The prospectus presentation of Fund expenses includes Acquired Fund Fees and Expenses, which is a calculation of the indirect costs associated with the Portfolios' underlying investments in other investment companies. The current Operating Expense Limitation Agreement will continue through April 30, 2023. The Operating Expense Limitation Agreement may only be terminated with the consent of the Board.
Pursuant to the current Operating Expense Limitation Agreement, as well as the prior agreements for the periods May 1, 2021 to April 30, 2022 and May 1, 2020 to April 30, 2021, ONI reimbursed the expenses of the ON Model Portfolios as follows:
| Portfolio | | Six-Month Period Ended June 30, 2022 | | Year Ended
December 31, 2021 |
ON Moderately Conservative Model
| | $— | | $ 64,732 |
ON Balanced Model
| | — | | 137,994 |
Under the terms of the current Operating Expense Limitation Agreement and prior operating expense limitation agreements, ONI is entitled to recover expenses waived or reimbursed for a period of up to three years from the date on which ONI reimbursed excess expenses. No recoupment will occur unless a Portfolio's operating expenses are below the expense limitation amount in effect at the time of the waiver or reimbursement and the Portfolio's current expense limitation. For the six-month period ended June 30, 2022, ONI recouped reimbursed expenses from the ON Moderately Conservative and ON Balanced Model Portfolios amounting to $14,700, $86,500, respectively. These recouped expenses were related to expenses reimbursed by ONI during the periods May 1, 2018 to April 30, 2019 and May 1, 2019 to April 30, 2020. For the year ended December 31, 2021, ONI recouped reimbursed expenses from the ON Moderately Conservative, ON Balanced, ON Moderate Growth and ON Growth Model Portfolios amounting to $6,011, $92,192, $34,233 and $218,062, respectively. These recouped expenses were related to expenses reimbursed by ONI during the periods May 1, 2018 to April 30, 2019 and May 1, 2019 to April 30, 2020.
Amounts of expenses, previously reimbursed by ONI under the Operating Expense Limitation Agreement and prior operating expense limitation agreements, that are available for future recoupments at June 30, 2022 are as follows:
| Portfolio | | Expires April
30, 2023 | | Expires April
30, 2024 | | Total |
ON Moderately Conservative Model
| | $177,296 | | $178,135 | | $ 355,431 |
ON Balanced Model
| | 622,006 | | 380,376 | | 1,002,382 |
| Notes to Financial Statements (Continued) | June 30, 2022 (Unaudited) |
The Fund, along with ONLIC, NSLA and certain variable separate account entities affiliated with ONLIC and NSLA, was a party to an application filed with the SEC for an order of approval pursuant to Section 26(c), and order of exemption pursuant to Section 17(b) of the 40 Act. In the application, those entities proposed to substitute shares of certain unaffiliated underlying funds currently available under certain variable contracts (the "Unaffiliated Funds") for shares of different underlying funds (the "Replacement Ohio National Fund Portfolios"). The entities also requested permission to carry out in-kind security transfers in order to execute certain of the proposed substitution transactions. The proposed substitution transactions that affected the Fund were:
| Unaffiliated Funds | | Replacement Ohio National Fund Portfolios |
| Federated Hermes Managed Volatility Fund II (Primary Shares and Service Shares) | | ON iShares Managed Risk Balanced Portfolio |
| Janus Henderson VIT U.S. Low Volatility Portfolio (Service Shares) | | ON Janus Henderson U.S. Low Volatility Portfolio |
| Morgan Stanley VIF Core Plus Fixed Income Portfolio (Class II) | | ON Federated Core Plus Bond Portfolio |
| PIMCO Total Return Portfolio (Administrative Share Class) | | ON Federated Core Plus Bond Portfolio |
On May 4, 2021, the application for the substitution transactions and in-kind transfers was approved by the SEC. The substitution transactions were effected on June 25, 2021 (the "Substitution Date") via cash redemptions of the Unaffiliated Funds and cash subscriptions to the Replacement Ohio National Fund Portfolios, with the exception of the transaction involving the ON Janus Henderson U.S. Low Volatility Portfolio. The substitution transaction involving that Portfolio was executed as an in-kind transfer of securities from the related Unaffiliated Fund. The cost basis of each security transferred in-kind to the ON Janus Henderson U.S. Low Volatility Portfolio was the fair value of that security, valued at the relevant active market exchange close price at the end of the Substitution Date. In conjunction with the substitution transactions, ONI entered into expense limitation agreements with certain of the affected Portfolios whereby, for a period of two years following the Substitution Date, the annual net operating expenses of the applicable Replacement Ohio National Fund Portfolios will not exceed the annual net operating expenses of the related Unaffiliated Fund for the fiscal year ended December 31, 2019. The net operating expense limitation for each applicable Replacement Ohio National Fund Portfolio, stated as a percent of average net assets, are as follows:
| Portfolio | | Expense Limitation |
ON Federated Core Plus Bond
| | 0.86% |
ON Janus Henderson U.S. Low Volatility
| | 0.82% |
ON iShares Managed Risk Balanced
| | 0.96% |
ONLIC, NSLA, and certain variable separate account entities affiliated with ONLIC and NSLA were parties to a correspondence letter filed with the SEC on March 28, 2022, which described the intent of those entities to execute a substitution of investment option pursuant to Commission Statement on Insurance Product Fund Substitution Applications, Release No. IC-34199. As outlined in the correspondence letter, those entities substituted shares of an unaffiliated fund available under certain variable contracts for shares of an affiliated fund option. In the substitution, each of ONLIC and NSLA exercised its contractual rights to substitute shares of Franklin Multi-Asset Dynamic Multi-Strategy VIT (Class I) (the "Existing Portfolio"), an external fund not affiliated with the Fund, with shares of ON Risk Managed Balanced Portfolio. The substitution transactions occurred as cash redemptions of the Existing Portfolio's shares and cash subscriptions to the ON Risk Managed Balanced Portfolio’s shares on May 20, 2022.
In conjunction with the substitution transactions, the Fund entered into an expense limitation agreement with ONI, whereby, for a period of two years following the date of the substitution, the annual net operating expenses of the ON Risk Managed Balanced Portfolio will not exceed 1.01% (the annual net operating expenses of the Existing Portfolio for the fiscal year ended December 31, 2021), stated as an annualized ratio of the ON Risk Managed Balanced Portfolio’s total fund expenses as a percent of its average net assets.
There were no recorded liabilities related to any of the expense limitation agreements at June 30, 2022.
Each director of the Board is compensated based on an annual retainer fee of $165,000, paid quarterly. The Board chair receives an additional quarterly retainer fee of $4,375, and the Audit Committee chair receives an additional quarterly retainer fee of $1,875; each paid quarterly. For the six-month period ended June 30, 2022, directors’ compensation and reimbursement of director expenses by the Portfolios of the Fund totaled $431,383.
The accounting agent and custodian for the Fund is State Street Bank (Kansas City, MO and Boston, MA). For assets held outside of the United States, State Street Bank utilizes a foreign sub-custodian network that is subject to oversight and periodic approval of the Board.
| Notes to Financial Statements (Continued) | June 30, 2022 (Unaudited) |
(4)Capital Share Transactions
Capital share transactions for the six-month period ended June 30, 2022, and the year ended December 31, 2021, respectively, were as follows:
| | ON Bond | | ON BlackRock Balanced Allocation | | ON BlackRock Advantage International Equity |
| | Six-Month
Period Ended | | Year Ended | | Six-Month
Period Ended | | Year Ended | | Six-Month
Period Ended | | Year Ended |
| | June 30,
2022 (Unaudited) | | December 31,
2021 | | June 30,
2022 (Unaudited) | | December 31,
2021 | | June 30,
2022 (Unaudited) | | December 31,
2021 |
Capital shares issued on sales
| 508,576 | | 1,638,958 | | 592,878 | | 695,502 | | 638,757 | | 1,472,906 |
Capital shares issued on reinvested distributions
| — | | 409,196 | | — | | 1,295,471 | | — | | 378,436 |
Capital shares redeemed
| (1,910,570) | | (2,280,423) | | (990,701) | | (2,530,622) | | (1,968,797) | | (4,962,157) |
Net increase (decrease)
| (1,401,994) | | (232,269) | | (397,823) | | (539,649) | | (1,330,040) | | (3,110,815) |
| | ON Janus Henderson Forty | | ON AB Small Cap | | ON AB Mid Cap Core |
| | Six-Month
Period Ended | | Year Ended | | Six-Month
Period Ended | | Year Ended | | Six-Month
Period Ended | | Year Ended |
| | June 30,
2022 (Unaudited) | | December 31,
2021 | | June 30,
2022 (Unaudited) | | December 31,
2021 | | June 30,
2022 (Unaudited) | | December 31,
2021 |
Capital shares issued on sales
| 326,610 | | 226,283 | | 264,572 | | 275,122 | | 100,045 | | 48,941 |
Capital shares issued on reinvested distributions
| — | | 618,916 | | — | | 473,472 | | — | | 107,512 |
Capital shares redeemed
| (782,671) | | (2,739,324) | | (245,517) | | (875,705) | | (100,220) | | (397,186) |
Net increase (decrease)
| (456,061) | | (1,894,125) | | 19,055 | | (127,111) | | (175) | | (240,733) |
| | ON S&P 500® Index | | ON BlackRock Advantage Large Cap Value | | ON Federated High Income Bond |
| | Six-Month
Period Ended | | Year Ended | | Six-Month
Period Ended | | Year Ended | | Six-Month
Period Ended | | Year Ended |
| | June 30,
2022 (Unaudited) | | December 31,
2021 | | June 30,
2022 (Unaudited) | | December 31,
2021 | | June 30,
2022 (Unaudited) | | December 31,
2021 |
Capital shares issued on sales
| 1,067,698 | | 2,304,647 | | 162,656 | | 3,078,143 | | 140,950 | | 572,042 |
Capital shares issued on reinvested distributions
| — | | 2,121,776 | | — | | 221,885 | | — | | 408,549 |
Capital shares redeemed
| (2,356,118) | | (7,477,008) | | (1,606,094) | | (6,076,719) | | (925,054) | | (1,204,705) |
Net increase (decrease)
| (1,288,420) | | (3,050,585) | | (1,443,438) | | (2,776,691) | | (784,104) | | (224,114) |
| | ON Nasdaq-100® Index | | ON BlackRock Advantage Large Cap Core | | ON BlackRock Advantage Small Cap Growth |
| | Six-Month
Period Ended | | Year Ended | | Six-Month
Period Ended | �� | Year Ended | | Six-Month
Period Ended | | Year Ended |
| | June 30,
2022 (Unaudited) | | December 31,
2021 | | June 30,
2022 (Unaudited) | | December 31,
2021 | | June 30,
2022 (Unaudited) | | December 31,
2021 |
Capital shares issued on sales
| 899,503 | | 1,529,196 | | 252,125 | | 315,562 | | 419,200 | | 526,740 |
Capital shares issued on reinvested distributions
| — | | 2,696,832 | | — | | 1,014,526 | | — | | 641,791 |
Capital shares redeemed
| (1,097,697) | | (5,390,952) | | (720,854) | | (2,402,926) | | (313,807) | | (1,034,313) |
Net increase (decrease)
| (198,194) | | (1,164,924) | | (468,729) | | (1,072,838) | | 105,393 | | 134,218 |
| Notes to Financial Statements (Continued) | June 30, 2022 (Unaudited) |
| | ON S&P MidCap 400® Index | | ON BlackRock Advantage Large Cap Growth | | ON Risk Managed Balanced |
| | Six-Month
Period Ended | | Year Ended | | Six-Month
Period Ended | | Year Ended | | Six-Month
Period Ended | | Year Ended |
| | June 30,
2022 (Unaudited) | | December 31,
2021 | | June 30,
2022 (Unaudited) | | December 31,
2021 | | June 30,
2022 (Unaudited) | | December 31,
2021 |
Capital shares issued on sales
| 455,030 | | 1,166,192 | | 130,744 | | 84,388 | | 67,569,522 | | 2,152,303 |
Capital shares issued on reinvested distributions
| — | | 477,050 | | — | | 702,651 | | — | | 4,198,645 |
Capital shares redeemed
| (1,391,745) | | (4,690,660) | | (532,114) | | (1,579,967) | | (3,606,861) | | (5,471,529) |
Net increase (decrease)
| (936,715) | | (3,047,418) | | (401,370) | | (792,928) | | 63,962,661 | | 879,419 |
| | ON Federated Core Plus Bond | | ON Janus Henderson U.S. Low Volatility | | ON iShares Managed Risk Balanced |
| | Six-Month
Period Ended | | Year Ended | | Six-Month
Period Ended | | Period from
June 25, 2021
(inception) to | | Six-Month
Period Ended | | Period from
June 25, 2021
(inception) to |
| | June 30,
2022 (Unaudited) | | December 31,
2021 | | June 30,
2022 (Unaudited) | | December 31,
2021 | | June 30,
2022 (Unaudited) | | December 31,
2021 |
Capital shares issued on sales
| 3,016,053 | | 52,677,628 | | 536,143 | | 913,773 | | 1,258,088 | | 43,695,081 |
Capital shares issued as a result of in-kind transfer (see Note 3 of Notes to Financial Statements)
| — | | — | | — | | 98,371,408 | | — | | — |
Capital shares issued on reinvested distributions
| — | | 243,513 | | — | | — | | — | | — |
Capital shares redeemed
| (11,182,347) | | (6,285,698) | | (10,861,268) | | (10,816,824) | | (2,979,829) | | (3,412,630) |
Net increase (decrease)
| (8,166,294) | | 46,635,443 | | (10,325,125) | | 88,468,357 | | (1,721,741) | | 40,282,451 |
| | ON AB Relative Value | | ON Moderately Conservative Model | | ON Balanced Model |
| | Six-Month
Period Ended | | Period from
December 2, 2021
(inception) to | | Six-Month
Period Ended | | Year Ended | | Six-Month
Period Ended | | Year Ended |
| | June 30,
2022 (Unaudited) | | December 31,
2021 | | June 30,
2022 (Unaudited) | | December 31,
2021 | | June 30,
2022 (Unaudited) | | December 31,
2021 |
Capital shares issued on sales
| 2,793,554 | | 7,633,724 | | 1,049,927 | | 1,206,062 | | 872,938 | | 1,617,055 |
Capital shares issued on reinvested distributions
| — | | — | | — | | 563,393 | | — | | 1,546,590 |
Capital shares redeemed
| (826,397) | | (250,777) | | (1,862,843) | | (4,572,097) | | (6,491,897) | | (12,691,753) |
Net increase (decrease)
| 1,967,157 | | 7,382,947 | | (812,916) | | (2,802,642) | | (5,618,959) | | (9,528,108) |
| | ON Moderate Growth Model | | ON Growth Model |
| | Six-Month
Period Ended | | Year Ended | | Six-Month
Period Ended | | Year Ended |
| | June 30,
2022 (Unaudited) | | December 31,
2021 | | June 30,
2022 (Unaudited) | | December 31,
2021 |
Capital shares issued on sales
| 1,699,152 | | 1,873,210 | | 156,405 | | 355,476 |
Capital shares issued on reinvested distributions
| — | | 1,693,877 | | — | | 324,206 |
Capital shares redeemed
| (8,427,896) | | (21,686,521) | | (1,466,247) | | (4,738,901) |
Net increase (decrease)
| (6,728,744) | | (18,119,434) | | (1,309,842) | | (4,059,219) |
| Notes to Financial Statements (Continued) | June 30, 2022 (Unaudited) |
(5)Investment Transactions
Cost of purchases and proceeds from sales of investments (excluding short-term and government securities) for the six-month period ended June 30, 2022 were as follows:
| | ON Bond | | ON BlackRock Balanced Allocation | | ON BlackRock Advantage International Equity | | ON Janus Henderson Forty | | ON AB Small Cap |
Cost of purchases
| $ 8,061,118 | | $198,023,483 | | $292,706,085 | | $23,122,958 | | $40,447,749 |
Proceeds from sales
| $19,611,657 | | $215,033,415 | | $310,303,360 | | $39,171,098 | | $42,239,192 |
| | ON AB Mid Cap Core | | ON S&P 500® Index | | ON BlackRock Advantage Large Cap Value | | ON Federated High Income Bond | | ON Nasdaq-100® Index |
Cost of purchases
| $19,106,596 | | $11,190,963 | | $165,904,907 | | $12,424,368 | | $ 4,828,551 |
Proceeds from sales
| $21,098,811 | | $75,424,257 | | $200,372,523 | | $19,732,316 | | $15,466,828 |
| | ON BlackRock Advantage Large Cap Core | | ON BlackRock Advantage Small Cap Growth | | ON S&P MidCap 400® Index | | ON BlackRock Advantage Large Cap Growth | | ON Risk Managed Balanced |
Cost of purchases
| $204,393,245 | | $48,591,542 | | $16,572,959 | | $39,388,588 | | $826,646,215 |
Proceeds from sales
| $231,007,509 | | $55,025,706 | | $48,468,101 | | $52,037,305 | | $142,279,481 |
| | ON Federated Core Plus Bond | | ON Janus Henderson U.S. Low Volatility | | ON iShares Managed Risk Balanced | | ON AB Relative Value | | ON Moderately Conservative Model |
Cost of purchases
| $ 95,520,251 | | $134,764,322 | | $60,773,261 | | $51,443,210 | | $21,019,328 |
Proceeds from sales
| $195,390,586 | | $237,976,264 | | $66,138,351 | | $32,412,421 | | $30,475,117 |
| | ON Balanced Model | | ON Moderate Growth Model | | ON Growth Model |
Cost of purchases
| $ 48,394,191 | | $122,700,561 | | $13,901,909 |
Proceeds from sales
| $119,914,411 | | $214,781,985 | | $33,206,765 |
Cost of purchases and proceeds from sales of government securities for the six-month period ended June 30, 2022 were as follows:
| | ON Bond | | ON BlackRock
Balanced Allocation | | ON Risk Managed
Balanced | | ON Federated
Core Plus Bond |
Cost of purchases
| $3,806,875 | | $951,719 | | $272,198,095 | | $188,105,969 |
Proceeds from sales
| $4,648,438 | | $ — | | $ 90,553,251 | | $127,597,507 |
(6)Financial Instruments
The Portfolios may trade in financial instruments with off-balance sheet risk for hedging purposes or, otherwise, in accordance with stated investment objectives. These financial instruments may include options, futures, and foreign currency contracts that may involve, to a varying degree, elements of risk in excess of the amounts recognized on financial statements.
Options
A Portfolio may buy call and put options. In purchasing call options, a Portfolio pays the seller of the call option a premium for the right of the Portfolio to buy the underlying securities from the seller at a specified exercise price prior to the expiration of the option. In purchasing put options, a Portfolio pays the seller of the put option a premium for the right of the Portfolio to sell the underlying securities to the seller at a specified exercise price prior to the expiration of the option. In order to terminate its position as the purchaser of an option, the Portfolio may enter into a “closing” transaction, which is the sale of an option on the same underlying securities and having the same exercise price and expiration date as the option previously purchased by the Portfolio.
When a Portfolio purchases a put or call option, an amount equal to the premium paid is included on the Portfolio’s Statement of Assets and Liabilities as an investment, and is subsequently marked-to-market to reflect the current market value of the option. If an option expires on the stipulated expiration date or if the Portfolio enters into a closing sale transaction, a gain or loss is realized. If a
| Notes to Financial Statements (Continued) | June 30, 2022 (Unaudited) |
Portfolio exercises a call option on an individual security, the cost of the security acquired is increased by the premium paid for the call. If the Portfolio exercises a put option on an individual security, a gain or loss is realized from the sale of the underlying security, and the proceeds from such a sale are decreased by the premium originally paid. If the Portfolio exercises a put option on a security index, a gain or loss is realized as determined by the premium originally paid, the exercise price and the market value of the index.
The ON Risk Managed Balanced Portfolio purchased call and put options associated with the S&P 500® Index or related exchange traded fund during the six-month period ended June 30, 2022. These instruments were used by the Risk Management Component of the Portfolio to provide for the Portfolio’s stated risk management strategy. Transactions involving purchased options by the ON Risk Managed Balanced Portfolio for the six-month period ended June 30, 2022 were: Cost of purchases: $57.6 million, Proceeds from sales: $1.3 million.
Purchased options are non-income producing securities.
Futures Contracts
A Portfolio may buy or sell futures contracts relating to stock indices, foreign currencies, or interest rates. Stock index futures contracts are contracts developed by and traded on national commodity exchanges whereby the buyer will, on a specified future date, pay or receive a final cash payment equal to the difference between the actual value of the stock index on the last day of the contract and the value of the stock index established by the contract multiplied by the specific dollar amount set by the exchange. Futures contracts may be based on broad-based stock indices such as the S&P 500® Index or on narrow-based stock indices. A particular index will be selected according to the Adviser’s investment strategy for the particular Portfolio. Foreign currency futures contracts are contracts traded on commodity exchanges whereby the buyer will, on a specified future date, pay or receive a final cash payment equal to the difference between the value of a stated foreign currency in relation to the U.S dollar, or other currency, on the last day of the contract and the relative value of those currencies on the date of executing the contract. Foreign currency futures may be valued by exchange rates that are based on the relative value of a variety of foreign currencies. An interest rate futures contract is an agreement whereby one party agrees to sell and another party agrees to purchase a specified amount of a specified financial instrument (debt security) at a specified price at a specified date, time and place. Although interest rate futures contracts typically require actual future delivery of and payment for financial instruments, the contracts are usually closed out before the delivery date. A public market exists in interest rate futures contracts covering primarily the following financial instruments: U.S. Treasury bonds; U.S. Treasury notes; Government National Mortgage Association ("GNMA") modified pass-through mortgage-backed securities; three-month U.S. Treasury bills; 90-day commercial paper; bank certificates of deposit; and Eurodollar certificates of deposit. U.S. futures contracts are traded on exchanges which have been designated “contract markets” by the Commodities Futures Trading Commission (“CFTC”) and must be executed through a futures commission merchant (“FCM”), or brokerage firm, which is a member of the relevant contract market.
The Fund, on behalf of each Portfolio, has filed with the National Futures Association, a notice claiming an exclusion from the definition of the term “commodity pool operator” under the Commodity Exchange Act, as amended, and the rules of the CFTC promulgated thereunder, with respect to each Portfolio's operation. Accordingly, the Portfolios are not subject to registration or regulation as a commodity pool operator.
The buyer or seller of a futures contract is not required to deliver or pay for the underlying instrument unless the contract is held until the delivery date. However, both the buyer and seller are required to deposit “initial margin” for the benefit of the broker when the contract is entered into. Initial margin deposits are equal to a percentage of the contract's value, as set by the exchange on which the contract is traded, and are similar to good faith deposits or performance bonds.
Unlike margin extended by a securities broker, initial margin payments do not constitute purchasing securities on margin for purposes of a Portfolio’s investment limitations. A Portfolio, its futures commission merchant and the Custodian retain control of the initial margin until the contract is liquidated. If the value of either party's position declines, the party on the side of the declining position will be required to make additional “variation margin” payments to settle the change in value on a daily basis. The party that has a gain may be entitled to receive all or a portion of this amount. Variation margin is recognized as a receivable and/or payable for variation margin on futures contracts on the Statement of Assets and Liabilities. In the event of a bankruptcy of the FCM that holds margin on behalf of a Portfolio, the Portfolio may be entitled to return of margin owed to the Portfolio only in proportion to the amount received by the FCM’s other customers. ONI and the sub-advisers will attempt to minimize this risk by carefully monitoring the creditworthiness of the FCMs with which the Portfolios do business. In addition to the margin restrictions discussed above, transactions in futures contracts and options on futures contracts may involve the segregation of funds pursuant to requirements imposed by the SEC. Under those requirements, where a Portfolio has a long position in a futures contract or sells a put option, it will be required to establish a segregated account (not with an FCM or broker) containing cash or certain liquid assets equal to the purchase price of the contract or the exercise price of the option (less any margin on deposit). For a short position in futures contacts held by a Portfolio or call options sold by a Portfolio, those requirements mandate the establishment of a segregated
| Notes to Financial Statements (Continued) | June 30, 2022 (Unaudited) |
account (not with a futures commission merchant or broker) containing cash or certain liquid assets that, when added to the amounts deposited as margin, equal the market value of the instruments underlying the futures contracts or call options. However, segregation of assets is not required if a Portfolio “covers” its position.
Portions of certain Portfolios’ securities and cash holdings, as noted on those Portfolios’ Schedules of Investments, were pledged at June 30, 2022 as collateral for the Portfolios’ futures contracts. The futures contracts, except those held by the ON Risk Managed Balanced, ON Federated Core Plus Bond, and ON iShares Managed Risk Balanced Portfolios, were used for the purpose of gaining equity exposure for cash and cash equivalents, thereby seeking to lessen a performance difference between the Portfolios and their respective benchmark indices. For the ON Risk Managed Balanced and ON iShares Managed Risk Balanced Portfolios, futures contracts were used to provide for the Portfolios' respective stated risk management strategies. For the ON Federated Core Plus Bond Portfolio, futures contracts were used by the Portfolio to manage total exposure to underlying investments, to manage interest rate risk, or to otherwise execute the Portfolio's stated investment strategy. There were other futures contracts executed and closed in the Portfolios during the six-month period ended June 30, 2022. Those contracts were executed for similar purposes as the contracts outstanding at June 30, 2022. For the six-month period ended June 30, 2022, the notional values of futures contracts opened and closed prior to contract settlement date by the Portfolios were as follows:
| Portfolio | | Collateral Pledged | | Futures Contracts
Opened (in millions) | | Futures Contracts
Closed (in millions) |
ON BlackRock Balanced Allocation
| | Portions of cash holdings | | $ 25.0 | | $ 25.9 |
ON BlackRock Advantage International Equity
| | Portions of cash holdings | | 44.1 | | 45.2 |
ON AB Mid Cap Core
| | Portions of cash holdings | | 2.3 | | 2.0 |
ON S&P 500® Index
| | Portions of cash holdings and securities | | 62.5 | | 61.0 |
ON BlackRock Advantage Large Cap Value
| | Portions of cash holdings | | 41.2 | | 42.1 |
ON Nasdaq-100® Index
| | Portions of cash holdings and securities | | 22.5 | | 22.6 |
ON BlackRock Advantage Large Cap Core
| | Portions of cash holdings | | 38.3 | | 39.6 |
ON BlackRock Advantage Small Cap Growth
| | Portions of cash holdings | | 30.5 | | 23.7 |
ON S&P MidCap 400® Index
| | Portions of cash holdings and securities | | 23.7 | | 24.6 |
ON BlackRock Advantage Large Cap Growth
| | Portions of cash holdings | | 6.2 | | 6.5 |
ON Risk Managed Balanced
| | Portions of securities | | 1,230.4 | | 831.0 |
ON Federated Core Plus Bond
| | Portions of securities | | 509.3 | | 519.1 |
ON iShares Managed Risk Balanced
| | Portions of cash holdings | | 346.3 | | 323.0 |
The values and financial statement effects of derivative instruments that were not accounted for as hedging instruments as of, and for, the six-month period ended June 30, 2022, were as follows:
| Portfolio | | Instrument | | Primary Risk Type | | Value-
Asset
Derivatives | | Value-
Liability
Derivatives | | Location on
Statements of
Assets and
Liabilities |
ON BlackRock Balanced Allocation
| | Futures contracts | | Equity price | | $ 4,926,350 | | $ 5,017,907 | | (1) |
ON BlackRock Advantage International Equity
| | Futures contracts | | Equity price | | 7,704,890 | | 7,729,334 | | (1) |
ON AB Mid Cap Core
| | Futures contracts | | Equity price | | 226,800 | | 227,882 | | (1) |
ON S&P 500® Index
| | Futures contracts | | Equity price | | 11,557,975 | | 11,785,920 | | (1) |
ON BlackRock Advantage Large Cap Value
| | Futures contracts | | Equity price | | 3,978,975 | | 4,029,208 | | (1) |
ON Nasdaq-100® Index
| | Futures contracts | | Equity price | | 2,075,310 | | 2,167,031 | | (1) |
ON BlackRock Advantage Large Cap Core
| | Futures contracts | | Equity price | | 4,926,350 | | 5,015,842 | | (1) |
ON BlackRock Advantage Small Cap Growth
| | Futures contracts | | Equity price | | 9,394,000 | | 9,756,174 | | (1) |
ON S&P MidCap 400® Index
| | Futures contracts | | Equity price | | 2,948,400 | | 2,995,005 | | (1) |
ON BlackRock Advantage Large Cap Growth
| | Futures contracts | | Equity price | | 691,770 | | 700,992 | | (1) |
ON Risk Managed Balanced
| | Futures contracts | | Equity price | | 217,310,024 | | 211,643,575 | | (1) |
| | | Futures contracts | | Interest rate | | 420,020,734 | | 423,016,526 | | (1) |
| | | Purchased options | | Equity price | | 78,925,533 | | — | | (2) |
| Notes to Financial Statements (Continued) | June 30, 2022 (Unaudited) |
| Portfolio | | Instrument | | Primary Risk Type | | Value-
Asset
Derivatives | | Value-
Liability
Derivatives | | Location on
Statements of
Assets and
Liabilities |
ON Federated Core Plus Bond
| | Futures contracts | | Interest rate | | $97,865,248 | | $97,550,644 | | (1) |
ON iShares Managed Risk Balanced
| | Futures contracts | | Equity price | | 70,519,543 | | 71,374,789 | | (1) |
| | | Futures contracts | | Interest rate | | 34,018,505 | | 33,717,094 | | (1) |
| | | Futures contracts | | Foreign currency | | 1,636,092 | | 1,600,194 | | (1) |
| (1) | Total distributable earnings. The amounts represent the cumulative appreciation (depreciation) of these futures contracts as reported in the Statements of Assets and Liabilities. Only the current day’s variation margin, if any, is reported within the Statements of Assets and Liabilities as receivable (payable) for variation margin on futures contracts. Each Portfolio's Schedule of Open Futures Contracts details the values by futures contract type. |
| (2) | Investments in securities of unaffiliated issuers, at value. |
| Portfolio | | Instrument | | Primary Risk Type | | Realized Gain
(Loss) on
Derivatives
Recognized in
Income | | Change in Unrealized
Appreciation/
Depreciation on
Derivatives
Recognized in
Income | | Location on
Statements
of Operations |
ON BlackRock Balanced Allocation
| | Futures contracts | | Equity price | | $ (912,512) | | $ (156,382) | | (1),(2) |
ON BlackRock Advantage International Equity
| | Futures contracts | | Equity price | | (1,491,598) | | (144,894) | | (1),(2) |
ON AB Mid Cap Core
| | Futures contracts | | Equity price | | (35,945) | | (1,082) | | (1),(2) |
ON S&P 500® Index
| | Futures contracts | | Equity price | | (1,507,866) | | (156,380) | | (1),(2) |
ON BlackRock Advantage Large Cap Value
| | Futures contracts | | Equity price | | (634,655) | | (106,204) | | (1),(2) |
ON Nasdaq-100® Index
| | Futures contracts | | Equity price | | (1,076,240) | | (64,786) | | (1),(2) |
ON BlackRock Advantage Large Cap Core
| | Futures contracts | | Equity price | | (913,454) | | (166,421) | | (1),(2) |
ON BlackRock Advantage Small Cap Growth
| | Futures contracts | | Equity price | | (785,156) | | (416,126) | | (1),(2) |
ON S&P MidCap 400® Index
| | Futures contracts | | Equity price | | (560,905) | | (84,540) | | (1),(2) |
ON BlackRock Advantage Large Cap Growth
| | Futures contracts | | Equity price | | (247,318) | | (18,738) | | (1),(2) |
ON Risk Managed Balanced
| | Futures contracts | | Equity price | | 10,549,150 | | 5,379,285 | | (1),(2) |
| | | Futures contracts | | Interest rate | | (16,660,982) | | (4,164,616) | | (1),(2) |
| | | Purchased options | | Equity price | | (403,831) | | (12,159,960) | | (3),(4) |
ON Federated Core Plus Bond
| | Futures contracts | | Interest rate | | 3,845,684 | | 586,382 | | (1),(2) |
ON iShares Managed Risk Balanced
| | Futures contracts | | Equity price | | (5,207,051) | | (1,277,069) | | (1),(2) |
| | | Futures contracts | | Interest rate | | 2,692,658 | | 453,842 | | (1),(2) |
| | | Futures contracts | | Foreign currency | | (294,219) | | (23,529) | | (1),(2) |
| (1) | Net realized gain (loss) on futures contracts. |
| (2) | Change in unrealized appreciation/depreciation on futures contracts. |
| (3) | Net realized gain (loss) on investments in securities of unaffiliated issuers. |
| (4) | Change in unrealized appreciation/depreciation on investments in securities of unaffiliated issuers. |
| Notes to Financial Statements (Continued) | June 30, 2022 (Unaudited) |
The Portfolios may enter into International Swaps and Derivatives Association, Inc. Master Agreements (“ISDA Master Agreement”) or similar agreements with their derivative contract counterparties whereby the Portfolios may, under certain circumstances, offset with the counterparty certain derivative financial instruments’ payables and/or receivables and create one single net payment. For financial reporting purposes, the Portfolios offset derivative assets and liabilities that are subject to netting arrangements in the Statements of Assets and Liabilities. At June 30, 2022, there were no outstanding derivative transactions subject to netting arrangements.
(7)Federal Income Tax Information
The following information is presented on a federal income tax basis. Differences between amounts for financial statements and federal income tax purposes are primarily due to timing and character differences in recognizing certain gains and losses on investment transactions. Permanent differences between financial statement and federal income tax reporting are reclassified within the capital accounts based on their federal income tax treatment. Temporary differences do not require reclassification. Reclassifications related to permanent differences relate principally to foreign currency gains and losses, net investment losses, and distributions from real estate investment trusts and closed end mutual funds.
The cost basis for federal income tax purposes may differ from the cost basis for financial reporting purposes. The table below details the unrealized appreciation (depreciation) and aggregate cost of investments at June 30, 2022 for federal income tax purposes.
| | ON Bond | | ON BlackRock Balanced Allocation | | ON BlackRock Advantage International Equity | | ON Janus Henderson Forty | | ON AB Small Cap | | ON AB Mid Cap Core |
| Gross unrealized: | | | | | | | | | | | |
Appreciation
| $ 87,680 | | $ 22,173,159 | | $ 16,260,894 | | $ 14,924,250 | | $ 4,193,259 | | $ 2,403,307 |
Depreciation
| (24,697,245) | | (59,942,106) | | (75,536,915) | | (13,674,054) | | (34,582,145) | | (20,518,924) |
Net unrealized appreciation (depreciation)
| $ (24,609,565) | | $ (37,768,947) | | $ (59,276,021) | | $ 1,250,196 | | $ (30,388,886) | | $(18,115,617) |
Aggregate cost of investments:
| $242,647,160 | | $469,028,785 | | $446,168,845 | | $ 76,831,148 | | $149,007,530 | | $ 93,980,849 |
| | ON S&P 500® Index | | ON BlackRock Advantage Large Cap Value | | ON Federated High Income Bond | | ON Nasdaq-100® Index | | ON BlackRock Advantage Large Cap Core | | ON BlackRock Advantage Small Cap Growth |
| Gross unrealized: | | | | | | | | | | | |
Appreciation
| $326,094,845 | | $ 8,455,207 | | $ 429,340 | | $ 82,621,421 | | $ 23,217,697 | | $ 7,603,023 |
Depreciation
| (53,429,863) | | (33,257,071) | | (22,670,522) | | (19,889,801) | | (45,287,534) | | (46,291,017) |
Net unrealized appreciation (depreciation)
| $272,664,982 | | $ (24,801,864) | | $ (22,241,182) | | $ 62,731,620 | | $ (22,069,837) | | $ (38,687,994) |
Aggregate cost of investments:
| $732,548,670 | | $274,801,960 | | $153,006,040 | | $180,725,007 | | $347,286,000 | | $176,689,241 |
| | ON S&P MidCap 400® Index | | ON BlackRock Advantage Large Cap Growth | | ON Risk Managed Balanced | | ON Federated Core Plus Bond | | ON Janus Henderson U.S. Low Volatility | | ON iShares Managed Risk Balanced |
| Gross unrealized: | | | | | | | | | | | |
Appreciation
| $ 51,500,448 | | $ 1,696,487 | | $ 43,606,833 | | $ 951,430 | | $ 33,870,008 | | $ 522,314 |
Depreciation
| (40,482,510) | | (7,693,616) | | (74,220,693) | | (59,472,458) | | (65,476,303) | | (46,282,200) |
Net unrealized appreciation (depreciation)
| $ 11,017,938 | | $ (5,997,129) | | $ (30,613,860) | | $ (58,521,028) | | $ (31,606,295) | | $ (45,759,886) |
Aggregate cost of investments:
| $313,996,804 | | $53,458,629 | | $1,297,579,765 | | $635,861,981 | | $813,170,476 | | $369,419,830 |
| Notes to Financial Statements (Continued) | June 30, 2022 (Unaudited) |
| | ON AB Relative Value | | ON Moderately Conservative Model | | ON Balanced Model | | ON Moderate Growth Model | | ON Growth Model |
| Gross unrealized: | | | | | | | | | |
Appreciation
| $ 1,698,363 | | $ 6,705,068 | | $ 35,546,857 | | $ 76,527,724 | | $ 16,472,381 |
Depreciation
| (11,250,837) | | (22,296,295) | | (75,725,905) | | (147,727,467) | | (36,557,792) |
Net unrealized appreciation (depreciation)
| $ (9,552,474) | | $ (15,591,227) | | $ (40,179,048) | | $ (71,199,743) | | $ (20,085,411) |
Aggregate cost of investments:
| $ 96,531,423 | | $244,821,569 | | $879,187,500 | | $1,584,426,722 | | $356,761,871 |
(8)Legal Matters
In December 2007, the ON S&P 500® Index Portfolio and the ON BlackRock Advantage Large Cap Value Portfolio (formerly known as "Strategic Value Portfolio"), shareholders of the Tribune Company, participated in a cash out merger in which shareholders received $34 per share of consideration. The value of the proceeds received by the ON S&P 500® Index Portfolio and ON BlackRock Advantage Large Cap Value Portfolio was $37,910 and $384,200, respectively. The company subsequently filed for bankruptcy and several legal complaints have been initiated by groups of Tribune Company creditors seeking to recover, or clawback, proceeds received by shareholders based on fraudulent transfer claims (the "Tribune Bankruptcy").
The first action, Official Committee of Unsecured Creditors of Tribune Company v. FitzSimons, et. al.(Creditor Actions) was initiated on November 1, 2010 in the U.S. Bankruptcy Court for the District of Delaware. As a result of these proceedings, the Court agreed to allow individual creditors to file similar complaints in U.S. district courts. The Fund is specifically named in a complaint in the U.S. District Court, Southern District of Ohio, Western Division, Deutsche Bank Trust Company Americas, et. al. v. American Electric Power, et. al., that was initiated in June of 2011. The Fund, along with the ON BlackRock Advantage Large Cap Value Portfolio is also named in a similar complaint in the U.S. District Court, Eastern District of Pennsylvania, Deutsche Bank Trust Company Americas, et. al. v. Ametek Inc. Employees Master Retirement Trust, et. al. (the “Trustee Action.”). These Tribune litigation actions have been consolidated into a single Multidistrict Litigation ("MDL") in the U.S. District Court, Southern District of New York ("District Court").
Thereafter, certain defendants in the MDL, including the Fund, filed various motions to dismiss. The District Court dismissed the Creditor Actions on September 23, 2013, holding that the plaintiffs could not pursue their claims so long as the Trustee pursued essentially the same claims in his action. On December 20, 2013, the plaintiffs appealed the dismissal to the Second Circuit Court of Appeals ("Second Circuit"). On March 29, 2016, the Second Circuit affirmed the dismissal and rejected the plaintiffs’ appeal. On September 9, 2016, plaintiffs filed a petition for writ of certiorari in the Supreme Court and the defendants opposed it. On April 3, 2018, the Supreme Court issued a “Statement” from two justices announcing that consideration of the petition for certiorari would be deferred for an undetermined period of time to “allow” the Second Circuit or the District Court to consider, among other things, whether the Second Circuit’s decision should be vacated as a result of the Supreme Court’s recent decision in Merit Management Group, LP v. FTI Consulting, Inc. On May 15, 2018, the Second Circuit recalled the mandate on its earlier decision for further panel review.
In December 2019, the Second Circuit reinstated its prior affirmance of dismissal, which safe-harbors all of the claims except the trustee’s actual intent claims (those claims are excepted from the safe harbor altogether). Those claims were earlier dismissed on traditional grounds, and that dismissal is now on appeal.
In January 2020, the Tribune creditors sought panel rehearing and rehearing en banc, asserting, among other arguments, that the Second Circuit improperly relied on extrinsic evidence to reach its decision regarding Computershare’s status as Tribune’s agent, that the question of Computershare’s agency was a new argument on appeal that should not have been considered, and that the Second Circuit’s findings regarding preemption go against the Supreme Court’s decision in Merit Management and other cases. On February 6, 2020 the Second Circuit denied this request.
In July 2020, the creditors filed a petition for writ of certiorari appealing the Second Circuit’s decision to the Supreme Court. The creditors dropped some of shareholder defendants, mostly unaffiliated funds, from the appeal to the Supreme Court. For those defendants only, this has the effect of accepting the adverse judgment and ending the case. Any non-listed defendant presumably is still a party to the appeal. On April 19, 2021 the Supreme Court denied the creditors' petition for writ of certiorari, meaning that the Second Circuit’s decision in our favor stands.
In the Trustee Action, in 2014, various shareholder defendants filed a motion to dismiss the intentional fraudulent transfer claims. On January 9, 2017, the Court granted the motion to dismiss the Trustee's actual fraudulent conveyance claim. On April 23, 2019, the District Court denied the Trustee’s motion to amend and add federal constructive fraudulent transfer claims. In June 2019, the Trustee appealed the dismissal of the intentional fraudulent transfer claims and the ruling that any constructive claims would be
| Notes to Financial Statements (Continued) | June 30, 2022 (Unaudited) |
barred by the safe harbor. On August 20, 2021, the Second Circuit affirmed those decisions and on October 7, 2021, the Second Circuit denied a request for a rehearing. On January 5, 2022, the Trustee filed a petition for a writ of certiorari, seeking review by the Supreme Court of the dismissal. On February 22, 2022, the Supreme Court denied the Trustee’s petition, The Litigation Trustee has exhausted all potential avenues for appeal, so the Second Circuit’s decision now stands as the final decision. The litigation is fully resolved. As such, the Fund has not recorded any expense or liability related to the resolution of this matter.
| Additional Information | June 30, 2022(Unaudited) |
(1)Review and Approval of Advisory and Sub-Advisory Agreement for ON U.S. Low Volatility Portfolio
At a meeting held on May 13, 2022, the Board of Directors of Ohio National Fund, Inc. (the “Fund) including a majority of the Directors who are not “interested persons” (the “Independent Directors”) of the Fund, approved an amendment to the Investment Advisory Agreement (“Advisory Agreement) between the Fund and Ohio National Investments, Inc. (the “Adviser”) and approved a new Sub-Advisory Agreement (the “Sub-Advisory Agreement”) between the Adviser and Intech Investment Management LLC (“Sub-Adviser”) for the ON U.S. Low Volatility Portfolio (the “Portfolio”). The Portfolio, formerly known as the ON Janus Henderson U.S. Low Volatility Portfolio, originally was sub-advised by Janus Henderson Investors US LLC (“Janus”) which utilized the services of the Sub-Adviser, a subsidiary of Janus, to manage the Portfolio. The Board, including a majority of the Independent Directors, originally approved a sub-advisory agreement with Janus and a sub-management agreement with the Sub-Adviser at a meeting held on February 12, 2020. The Portfolio commenced on June 23, 2021. At a meeting held on March 30, 2022, the Board approved a new sub-management agreement with the Sub-Adviser based on performance information as of December 31, 2021 and fee information as of September 30, 2021. This approval was required due to a pending change in control of the Sub-Adviser resulting from the sale of Janus’ controlling interest in the Sub-Adviser. At that meeting the Directors determined that the Portfolio performed well within its peer group and sub-advisory fees were below average versus the Portfolio’s peers. The new sub-management agreement became effective on March 31, 2022. Upon recommendation of the Adviser, the Board subsequently determined that it was in the best interest of the Portfolio and its shareholders to replace Janus as sub-adviser of the Portfolio with the Sub-Adviser, which it did at the meeting first noted above.
The Directors noted that the Adviser is responsible for monitoring the investment performance and other responsibilities of the Sub-Adviser, which has the responsibility for supervising and managing the assets in the Portfolio on a fully discretionary basis. They also noted that the Adviser will report to the Board on its analysis of the Sub-Adviser’s performance at the regular meetings of the Board, which are held at least quarterly. Finally, the Board noted that the Adviser provides the facilities and equipment utilized by the Fund; supplies business management services to the Fund, including monitoring expenses accruals and preparing the Portfolio’s financial statements; prepares and files Fund registration statements, proxies, shareholder reports and other regulatory filings; provides financial oversight; and ensures that proxies related to the Portfolio’s holdings are voted in compliance with policies approved by the Board.
In considering the amendment to the Advisory Agreement and the approval of the Sub-Advisory Agreement, the Board requested and reviewed a significant amount of information relating to the Portfolio, including the following: (1) proposed advisory and sub-advisory fee information; (2) comparative advisory fee and expense ratio information for a peer group of funds; (3) performance data for a fund employing a strategy similar to that of the Portfolio; and (4) other information regarding the nature, extent and quality of services anticipated to be provided by the Sub-Adviser.
The Board was assisted by experienced independent legal counsel throughout the contract review process. The Independent Directors discussed the proposed amendment to the Advisory Agreement and the new Sub-Advisory Agreement in a private session with such counsel at which no representatives of management, the Adviser or the Sub-Advisers were present. The Board relied upon the advice of independent legal counsel and their own business judgment in determining the material factors to be considered in evaluating whether to approve the amended Advisory Agreement and the Sub-Advisory Agreement and the weight to be given to each such factor. The conclusions reached by the Directors were based on a comprehensive evaluation of all the information provided and were not the result of any one factor. Moreover, each Director may have afforded different weight to the various factors in reaching his or her conclusions with respect to approving the amendment to the Advisory Agreement and the new Sub-Advisory Agreement.
Nature, Extent and Quality of Services
The Board evaluated the nature, extent and quality of the advisory services anticipated to be provided to the Portfolio by the Adviser. As part of its review, the Board reviewed information regarding the Adviser’s operations, procedures and personnel submitted by the Adviser at a meeting on November 11, 2021. The Directors took into account information they received during the previous year at Board meetings in connection with the Adviser’s service to other portfolios of the Fund and through periodic reports regarding the Adviser’s performance of its duties to the other portfolios. The Directors considered the capabilities and resources that the Adviser has dedicated to performing services on behalf of the Fund and its portfolios, as well as the quality of the Adviser’s administrative and other services, including the Adviser’s support to contract owners. The Directors also considered the quality of the compliance programs of the Adviser and its responsiveness to inquiries and requests from the Board. It was the Directors’ conclusion that overall, they were satisfied with the nature, extent and quality of services anticipated to be provided to the Portfolio by the Adviser.
The Board also evaluated the nature, extent and quality of the advisory services anticipated to be provided by the Sub-Adviser, noting that the Board has experience with the Sub-Adviser, as the Sub-Adviser currently is providing services to the Portfolio under a sub-management agreement. As part of its review, the Board reviewed information regarding the operations, procedures and personnel of the Sub-Adviser. The Directors considered the capabilities and resources that the Sub-Adviser is expected to dedicate
| Additional Information (Continued) | June 30, 2022(Unaudited) |
to performing services on behalf of the Portfolio, as well as the quality of its administrative and other services. The Directors also considered the quality of the compliance programs of the Sub-Adviser, and reviewed information on the Sub-Adviser’s portfolio management and brokerage practices. The Directors concluded that, overall, they were satisfied with the nature, extent and quality of services anticipated to be provided to the Portfolio by the Sub-Adviser.
Investment Performance
To assist the Board in its consideration of the Sub-Advisory Agreement, the Board reviewed updated Portfolio performance information for the period June 23, 2021 (the date of inception) to April 30, 2022. The Directors reviewed the performance of the Portfolio as compared to a comparable retail fund managed by the Sub-Adviser that utilizes a strategy similar to that of the Portfolio and to the S&P 500 Index, the Portfolio’s benchmark. The Directors noted that the Portfolio outperformed both the benchmark and the comparable fund for the month-to-date period and the benchmark for the 3-months and year-to-date periods ended April 30, 2022. Based on this performance, the Directors concluded that the Sub-Adviser has the ability to manage the Portfolio effectively going forward. The Board also considered the Adviser’s effectiveness in monitoring the performance of the Sub-Adviser, and the Adviser’s timeliness in responding to performance issues, with respect to the other portfolios of the Fund.
Fees and Expenses
The Board reviewed the Portfolio’s proposed advisory and sub-advisory fees compared to the advisory and sub-advisory fees of funds in its peer group, as well as a chart showing where the Portfolio’s proposed advisory fee and sub-advisory fee were located in the dispersion of its peer funds’ advisory fees and sub-advisory fees. The chart showed the number of funds in the peer group within each defined range of advisory fees or sub-advisory fees, and the range that included the Portfolio. The Directors reviewed the advisory fee paid to the Adviser for the Portfolio and noted the two-basis point reduction in the fee payable to the Adviser. The Directors also noted that the Adviser, and not the Portfolios, is responsible for paying sub-advisory fee to the Sub-Adviser. The Board evaluated whether the net advisory fee received by the Adviser for the Portfolio, after paying sub-advisory fees to the Sub-Adviser, was reasonable, given the level of the Adviser’s services to the Portfolio. The Directors took into account the fact that the Adviser had contractually agreed to limit Portfolio expenses and reimburse expenses to the extent necessary to keep total Portfolio expenses at or below a specified amount. The Board also considered the reasonableness of the proposed sub-advisory fees to be paid by the Adviser to the Sub-Adviser. The Directors relied on the ability of the Adviser to negotiate the terms of the Sub-Advisory Agreement, including the sub-advisory fee, at arm’s-length, noting that the Adviser is not affiliated with any Sub-Adviser. The Directors noted that the proposed amended advisory fee payable by the Portfolio was well within the range of fees payable by the Portfolio’s peer group and included fee breakpoints. The Directors acknowledged that, because the sub-advisory fees are paid by the Adviser and not by the Portfolio, the Adviser is incentivized to negotiate a favorable fee. Accordingly, as to the Sub-Adviser, the cost of services provided by the Sub-Adviser and the profitability of the Sub-Adviser in connection with its relationship with the Portfolio were not material factors in the Board’s deliberations. The Directors considered that the Portfolio’s proposed advisory fee was in the 30th percentile and below the peer group average and the Portfolio’s net expense ratio was below the peer group average and in the 12th percentile. Overall, the Directors concluded that the proposed advisory and sub-advisory fees were reasonable.
Profitability and Economies of Scale
The Directors noted that the advisory fee schedule contain breakpoints that would reduce the advisory fees on assets above a specified level as the Portfolio’s assets increase. After considering the Portfolio’s current size and potential for growth, the Board concluded that the Portfolio was likely to benefit from economies of scale as the Portfolio’s net assets increased, and that the existing breakpoints are appropriate. The Board concluded that the profitability and potential realization of economies of scale by the Portfolio from the sub-advisory arrangements with the unaffiliated Sub-Adviser is a matter more appropriately considered at the Advisory Agreement level should not be a material factor in its consideration of the Sub-Advisory Agreement.
After consideration of the foregoing, the Board reached the following conclusions regarding the Advisory Agreement and Sub-Advisory Agreement with respect to the Portfolio, in addition to the conclusions set forth above: (a) the Adviser and Sub-Adviser possess the capability and resources to perform the duties required of them under the Advisory Agreement and Sub-Advisory Agreement, respectively; (b) the investment philosophy, strategies and techniques of the Sub-Adviser are appropriate for pursuing the Portfolio’s investment objective; (c) the Sub-Adviser is likely to execute its investment philosophy, strategies and techniques consistently over time; and (d) the Adviser and Sub-Adviser maintain appropriate compliance programs. Based on the above-mentioned factors and their related conclusions, with no single factor or conclusion being determinative and with each Director not necessarily attributing the same weight to each factor, the Directors unanimously concluded that approval of the amendment to the Advisory Agreement and approval of the Sub-Advisory Agreement were in the best interests of the Portfolio and its shareholders. Accordingly, the Board, including all the Independent Directors, voted unanimously to approve the amendment to the Advisory Agreement and to approve the Sub-Advisory Agreement for the Portfolio.
| Additional Information (Continued) | June 30, 2022(Unaudited) |
(2)Expense Disclosure
An individual may not buy or own membership interests of the Fund directly. An individual acquires an indirect interest in the Fund by purchasing a variable annuity contract or variable insurance policy and allocating premiums or purchase payments to Fund Portfolios available through the separate accounts of ONLIC, ONLAC, and NSLA. Separate accounts of these entities are the shareholders of the Fund.
As a shareholder of the Fund, a separate account incurs ongoing costs, including management fees and other Fund expenses. This example is intended to help a policy/contract owner understand ongoing costs (in dollars) associated with the underlying investment in the Portfolios by the separate account shareholder and to compare these costs with the ongoing costs associated with investing in other mutual funds.
The example is based on an investment of $1,000 invested at January 1, 2022 and held through June 30, 2022.
Actual Expenses
The table below provides information about investment values and actual expenses associated with each Portfolio of the Fund. The information below, together with the amount of an underlying investment, can be used to estimate expenses paid over the period. An estimate can be obtained by simply dividing an underlying investment value by $1,000 (for example, an $8,600 investment value divided by $1,000 = 8.6), then multiplying the result by the number in the table under the heading entitled “Expenses Paid During Period”.
| Portfolio | | Beginning
Investment
Value
1/1/2022 | | Ending
Investment
Value
6/30/2022 | | Expenses Paid
During Period*
1/1/2022 – 6/30/2022 | | Expense Ratio
During Period
1/1/2022 – 6/30/2022
(Annualized) |
ON Bond
| | $1,000.00 | | $859.70 | | $2.77 | | 0.60% |
ON BlackRock Balanced Allocation
| | $1,000.00 | | $811.00 | | $2.47 | | 0.55% |
ON BlackRock Advantage International Equity
| | $1,000.00 | | $806.90 | | $3.94 | | 0.88% |
ON Janus Henderson Forty
| | $1,000.00 | | $652.50 | | $3.40 | | 0.83% |
ON AB Small Cap
| | $1,000.00 | | $703.70 | | $3.51 | | 0.83% |
ON AB Mid Cap Core
| | $1,000.00 | | $733.20 | | $3.74 | | 0.87% |
ON S&P 500® Index
| | $1,000.00 | | $798.90 | | $1.69 | | 0.38% |
ON BlackRock Advantage Large Cap Value
| | $1,000.00 | | $861.90 | | $3.37 | | 0.73% |
ON Federated High Income Bond
| | $1,000.00 | | $863.30 | | $3.83 | | 0.83% |
ON Nasdaq-100® Index
| | $1,000.00 | | $706.40 | | $1.78 | | 0.42% |
ON BlackRock Advantage Large Cap Core
| | $1,000.00 | | $792.80 | | $3.07 | | 0.69% |
ON BlackRock Advantage Small Cap Growth
| | $1,000.00 | | $710.50 | | $3.60 | | 0.85% |
ON S&P MidCap 400® Index
| | $1,000.00 | | $802.80 | | $1.88 | | 0.42% |
ON BlackRock Advantage Large Cap Growth
| | $1,000.00 | | $714.40 | | $3.53 | | 0.83% |
ON Risk Managed Balanced
| | $1,000.00 | | $796.60 | | $4.01 | | 0.90% |
ON Federated Core Plus Bond
| | $1,000.00 | | $897.10 | | $2.63 | | 0.56% |
ON Janus Henderson U.S. Low Volatility
| | $1,000.00 | | $898.40 | | $2.97 | | 0.63% |
ON iShares Managed Risk Balanced
| | $1,000.00 | | $852.40 | | $2.89 | | 0.63% |
ON AB Relative Value
| | $1,000.00 | | $876.40 | | $3.58 | | 0.77% |
ON Moderately Conservative Model
| | $1,000.00 | | $846.10 | | $2.11 | | 0.46% |
ON Balanced Model
| | $1,000.00 | | $828.40 | | $1.99 | | 0.44% |
ON Moderate Growth Model
| | $1,000.00 | | $806.70 | | $1.88 | | 0.42% |
ON Growth Model
| | $1,000.00 | | $789.30 | | $1.95 | | 0.44% |
| * | Expenses are equal to the average account value times the Portfolio’s annualized expense ratio multiplied by the number of days in the most recent fiscal half-year (181 days) divided by the number of days in the fiscal year (365 days). Please note that the expenses shown in these tables are meant to highlight ongoing Portfolio costs only and do not reflect any contract-level expenses or Portfolio transactional costs, such as sales charges (loads) or exchange fees (if any). Therefore, these tables are useful in comparing ongoing fund costs only, and will not fully assist a policy/contract owner in determining the relative total expenses of different funds. In addition, if transactional costs were included, costs may have been higher for these Portfolios as well as for a fund being compared. |
| Additional Information (Continued) | June 30, 2022(Unaudited) |
Hypothetical Example for Comparison Purposes
The table below provides information about hypothetical investment values and hypothetical expenses based on each respective Portfolio’s actual expense ratio and an assumed rate of return of 5% per year before expenses, which is not an actual return. The hypothetical investment values and expenses may not be used to estimate the actual ending investment balance or expenses actually paid for the period by the shareholders. A policy/contract holder may use this information to compare this 5% hypothetical example with the 5% hypothetical examples that appear in the shareholder reports of other funds.
| Portfolio | | Beginning
Investment
Value
1/1/2022 | | Ending
Investment
Value
6/30/2022 | | Expenses Paid
During Period*
1/1/2022 – 6/30/2022 | | Expense Ratio
During Period
1/1/2022 – 6/30/2022
(Annualized) |
ON Bond
| | $1,000.00 | | $1,021.82 | | $3.01 | | 0.60% |
ON BlackRock Balanced Allocation
| | $1,000.00 | | $1,022.07 | | $2.76 | | 0.55% |
ON BlackRock Advantage International Equity
| | $1,000.00 | | $1,020.43 | | $4.41 | | 0.88% |
ON Janus Henderson Forty
| | $1,000.00 | | $1,020.68 | | $4.16 | | 0.83% |
ON AB Small Cap
| | $1,000.00 | | $1,020.68 | | $4.16 | | 0.83% |
ON AB Mid Cap Core
| | $1,000.00 | | $1,020.48 | | $4.36 | | 0.87% |
ON S&P 500® Index
| | $1,000.00 | | $1,022.91 | | $1.91 | | 0.38% |
ON BlackRock Advantage Large Cap Value
| | $1,000.00 | | $1,021.17 | | $3.66 | | 0.73% |
ON Federated High Income Bond
| | $1,000.00 | | $1,020.68 | | $4.16 | | 0.83% |
ON Nasdaq-100® Index
| | $1,000.00 | | $1,022.71 | | $2.11 | | 0.42% |
ON BlackRock Advantage Large Cap Core
| | $1,000.00 | | $1,021.37 | | $3.46 | | 0.69% |
ON BlackRock Advantage Small Cap Growth
| | $1,000.00 | | $1,020.58 | | $4.26 | | 0.85% |
ON S&P MidCap 400® Index
| | $1,000.00 | | $1,022.71 | | $2.11 | | 0.42% |
ON BlackRock Advantage Large Cap Growth
| | $1,000.00 | | $1,020.68 | | $4.16 | | 0.83% |
ON Risk Managed Balanced
| | $1,000.00 | | $1,020.33 | | $4.51 | | 0.90% |
ON Federated Core Plus Bond
| | $1,000.00 | | $1,022.02 | | $2.81 | | 0.56% |
ON Janus Henderson U.S. Low Volatility
| | $1,000.00 | | $1,021.67 | | $3.16 | | 0.63% |
ON iShares Managed Risk Balanced
| | $1,000.00 | | $1,021.67 | | $3.16 | | 0.63% |
ON AB Relative Value
| | $1,000.00 | | $1,020.98 | | $3.86 | | 0.77% |
ON Moderately Conservative Model
| | $1,000.00 | | $1,022.51 | | $2.31 | | 0.46% |
ON Balanced Model
| | $1,000.00 | | $1,022.61 | | $2.21 | | 0.44% |
ON Moderate Growth Model
| | $1,000.00 | | $1,022.71 | | $2.11 | | 0.42% |
ON Growth Model
| | $1,000.00 | | $1,022.61 | | $2.21 | | 0.44% |
| * | Expenses are equal to the average account value times the Portfolio’s annualized expense ratio multiplied by the number of days in the most recent fiscal half-year (181 days) divided by the number of days in the fiscal year (365 days). Please note that the expenses shown in these tables are meant to highlight ongoing Portfolio costs only and do not reflect any contract-level expenses or Portfolio transactional costs, such as sales charges (loads) or exchange fees (if any). Therefore, these tables are useful in comparing ongoing fund costs only, and will not fully assist a policy/contract owner in determining the relative total expenses of different funds. In addition, if transactional costs were included, costs may have been higher for these Portfolios as well as for a fund being compared. |
(3)Other Disclosures
The Statement of Additional Information of the Fund includes additional information about the the Board and is available at http://www.ohionationalfund.com or upon request, without charge, by calling 877-781-6392 (toll-free).
A description of the policies and procedures that the Fund uses in voting proxies relating to Fund securities, as well as information regarding how the Fund voted proxies during the most recent twelve-month period ended June 30, is available without charge, upon request, by calling 877-781-6392 (toll-free) and on the SEC's website at http://www.sec.gov.
The Fund has filed its Schedules of Investments as of March 31 and September 30 with the SEC, as required, on Form N-PORT Part F. Form N-PORT Part F is required to be filed with the SEC for the first and third quarters of each fiscal year within sixty days after the end of each period and is available on the SEC website upon acceptance of each submission.
This report and the financial statements contained herein are submitted for the general information of the shareholders of the Fund. This report is not authorized for distribution to prospective investors in the Fund unless preceded or accompanied by an effective prospectus of the Fund. For a prospectus containing more complete information, including charges and expenses, please contact Ohio National Investments, Inc., One Financial Way, Cincinnati, OH 45242, telephone 877-781-6392 (toll-free).
| Information about Directors and Officers | June 30, 2022 (Unaudited) |
| Name and Address | | Age | | Position(s) with the Fund | | Term of Office
and Length of
Time Served | | Number of Portfolios
in the Fund to be
Overseen by Director | | Principal Occupation(s) During Past Five Years
and Other Directorships |
| Independent Directors | | | | | | | | | | |
Christopher A. Carlson
One Financial Way
Cincinnati, Ohio | | 63 | | Chairman and Director,
Member of Audit
and Independent
Directors Committees | | Indefinite;
Since
July
2020 | | 23 | | President/Vice Chairman and other positions: Ohio National Financial Services and subsidiaries (June 1993 - December 2018); President: Ohio National Fund, Inc. (March 2010 - May 2016). |
George M. Vredeveld
One Financial Way
Cincinnati, Ohio | | 79 | | Director, Member of
Audit and Independent
Directors Committees | | Indefinite;
Since
March
1996 | | 23 | | Professor Emeritus, Finance: University of Cincinnati (January 2014 - Present); Honorary Consul; Republic of Bulgaria (2019 - Present); Alpaugh Professor of Economics: Lindner College of Business, University of Cincinnati (2004 - 2013); Founder/President: Economics Center at the University of Cincinnati (1977 - 2012). |
Madeleine W. Ludlow
One Financial Way
Cincinnati, Ohio | | 67 | | Director, Chairman of
Audit Committee and
Member of Independent
Directors Committee | | Indefinite;
Since
April
2012 | | 23 | | Founder/Managing Director: West Capital Partners LLC (2010 - Present), General Partner: H Ventures LLC (2020 - 2021); Director: ALLETE, Inc. |
Geoffrey Keenan
One Financial Way
Cincinnati, Ohio | | 63 | | Director, Member of
Audit and Independent
Directors Committees | | Indefinite;
Since
January
2015 | | 23 | | Executive Vice President - Asset Management Operations: Acrisure LLC (May 2021 - December 2021); Executive Vice President and Chief Operating Officer: Gateway Investment Advisers, LLC (1995 - 2013). |
Lawrence L. Grypp
One Financial Way
Cincinnati, Ohio | | 73 | | Director, Member of
Audit and Independent
Directors Committees | | Indefinite;
Since
December
2016 | | 23 | | Senior Business Advisor and Board Member (January 2018 - Present); President: Goering Center for Family and Private Business (August 2008 - December 2017). |
| Officers | | | | | | | | | | |
Jeffery A. Bley Jr.
One Financial Way
Cincinnati, Ohio | | 50 | | President | | Indefinite;
Since
May
2022 | | | | Senior Vice President; Annuity Distribution and Sales: ONLIC (June 2022 - Present); Senior Vice President; Annuity Strategy and Sales: ONLIC (December 2021 - June 2022); Vice President; Annuity Strategy and Sales: ONLIC (May 2021 - December 2021); Vice President; National Sales, ONESCO: ONLIC (January 2015 - May 2021). |
Paul J. Gerard
One Financial Way
Cincinnati, Ohio | | 62 | | Vice President | | Indefinite;
Since
March
2016 | | | | Senior Vice President and Chief Investment Officer: ONLIC and NSLA (January 2016 - Present). |
R. Todd Brockman
One Financial Way
Cincinnati, Ohio | | 53 | | Treasurer | | Indefinite;
Since
August
2004 | | | | Vice President, Mutual Fund Operations: ONLIC and NSLA (February 2014 - Present); Treasurer: ONI. |
| Information about Directors and Officers (Continued) | June 30, 2022 (Unaudited) |
| Name and Address | | Age | | Position(s) with the Fund | | Term of Office
and Length of
Time Served | | Number of Portfolios
in the Fund to be
Overseen by Director | | Principal Occupation(s) During Past Five Years
and Other Directorships |
Kimberly A. Plante
One Financial Way
Cincinnati, Ohio | | 48 | | Secretary | | Indefinite;
Since
March
2005 | | | | Vice President and Counsel: ONLIC (November 2017 - Present); Second Vice President and Counsel: ONLIC (January 2016 - November 2017); Secretary: ONI; Officer of various other Ohio National-affiliated companies. |
Keith Dwyer
One Financial Way
Cincinnati, Ohio | | 49 | | Chief Compliance
Officer | | Indefinite;
Since
August
2016 | | | | Vice President, Fund Compliance: ONLIC (January 2022 - Present); Second Vice President, Fund Compliance: ONLIC (August 2016 - January 2022); Chief Compliance Officer: ONI and other Ohio National-affiliated companies (August 2016 - present); Chief Compliance Officer: Fiduciary Capital Management (a former Ohio National affiliate entity) (August 2016 - December 2017). |
Daniel P. Leming
One Financial Way
Cincinnati, Ohio | | 37 | | Assistant Treasurer | | Indefinite;
Since
March
2016 | | | | Assistant Vice President; Mutual Fund Operations: ONLIC (December 2020 - Present); Director, Fund Operations and Analysis: ONLIC (July 2018 - December 2020); Assistant Director, Fund Operations and Analysis: ONLIC (December 2016 - June 2018). |
[THIS PAGE LEFT INTENTIONALLY BLANK]
Ohio National Fund, Inc.
Post Office Box 371
Cincinnati, Ohio 45201
Form 1325 Rev. 8-22
PRSRT STD
U.S. POSTAGE
PAID
LANCASTER, PA
PERMIT NO. 1793
(b) Not applicable.
Item 2. Code Of Ethics.
Not applicable for semiannual reports.
Item 3. Audit Committee Financial Expert.
Not applicable for semiannual reports.
Item 4. Principal Accountant Fees And Services.
Not applicable for semiannual reports.
Item 5. Audit Committee Of Listed Registrants.
Not applicable for semiannual reports.
Item 6. Investments.
Not applicable, as the schedules are included as part of the report to shareholders filed under Item 1.
Item 7. Disclosure Of Proxy Voting Policies And Procedures For Closed-End Management Investment Companies.
Not applicable for open-end investment companies.
Item 8. Portfolio Managers of Closed-End Management Investment Companies.
Not applicable for open-end investment companies.
Item 9. Purchases of Equity Securities by Closed-End Management Investment Company and Affiliated Purchasers.
Not applicable for open-end investment companies.
Item 10. Submission of Matters to a Vote of Security Holders.
There were no material changes to the procedures by which shareholders may recommend nominees to the Fund’s Board of Directors.
Item 11. Controls and Procedures.
(a) The Fund’s principal executive officer and principal financial officer have concluded, based on their evaluation conducted as of a date within the most recent fiscal half-year of the filing of this report, that the Fund’s disclosure controls and procedures are adequately designed and are operating effectively to ensure (i) that material information relating to the Fund, including its consolidated subsidiaries, is made known to them by others within those entities, particularly during the period in which this report is being prepared; and (ii) that information required to be disclosed by the Fund on Form N-CSR is recorded, processed, summarized and reported within the time periods specified in the Securities and Exchange Commission’s rules and forms.
(b) There were no changes in the Fund’s internal control over financial reporting that occurred during the most recent fiscal half-year covered by this report that have materially affected, or are reasonably likely to materially affect, the Fund’s internal control over financial reporting.
Item 12. Disclosure of Securities Lending Activities for Closed-End Management Investment Companies.
Not Applicable.
Item 13. Exhibits.
(a)(1) Not applicable for semiannual reports.
(a)(2) A separate certification for each principal executive officer and principal financial officer of the Fund as required by Rule 30a-2(a) under the Investment Company Act of 1940 (17 CFR 270.30a-2(a)) is attached hereto as EX-99.CERT.
(a)(3) The certifications required by Section 906 of the Sarbanes-Oxley Act of 2002 are attached hereto as EX-99.906CERT.
SIGNATURES
Pursuant to the requirements of the Securities Exchange Act of 1934 and the Investment Company Act of 1940, the registrant has duly caused this report to be signed on its behalf by the undersigned, thereunto duly authorized.
| | |
| Ohio National Fund, Inc. |
| |
| By: | | /s/ Jeffery A. Bley, Jr. |
| | Jeffery A. Bley, Jr. |
| | President |
| | (Principal Executive Officer) |
| | August 30, 2022 |
Pursuant to the requirements of the Securities Exchange Act of 1934 and the Investment Company Act of 1940, this report has been signed below by the following persons on behalf of the registrant and in the capacities and on the dates indicated.
| | |
| Ohio National Fund, Inc. |
| |
| By | | /s/ Jeffery A. Bley, Jr. |
| | Jeffery A. Bley, Jr. |
| | President |
| | (Principal Executive Officer) |
| | August 30, 2022 |
| |
| By: | | /s/ R. Todd Brockman |
| | R. Todd Brockman |
| | Treasurer |
| | (Principal Financial Officer) |
| | August 30, 2022 |