UNITED STATES
SECURITIES AND EXCHANGE COMMISSION
Washington, D.C. 20549
FORMN-CSR
CERTIFIED SHAREHOLDER REPORT OF REGISTERED
MANAGEMENT INVESTMENT COMPANIES
Investment Company Act file number811-03015
Ohio National Fund, Inc.
(Exact name of registrant as specified in charter) | ||
One Financial Way, Cincinnati, Ohio
| 45242
| |
(Address of principal executive offices)
|
(Zip Code)
| |
CT Corporation 300 E. Lombard St., Suite 1400 Baltimore, MD 21202
| ||
(Name and address of agent for service) | ||
Registrant’s telephone number, including area code:513-794-6971
Date of fiscal year end: December 31
Date of reporting period: June 30, 2019
Item 1.Reports To Stockholders.

TABLE OF CONTENTS
| 1 | ||||
The following pages contain Performance, Comments fromAdviser/Sub-Adviser, Change in Value of $10,000 Investment, Portfolio Composition, Top Holdings and Schedule of Investments (all of which are unaudited) for each of the Fund’s Portfolios: | ||||
| 3 | ||||
| 9 | ||||
ON BlackRock Balanced Allocation Portfolio(formerly the ON Omni Portfolio) | 15 | |||
| 24 | ||||
| 28 | ||||
| 32 | ||||
| 37 | ||||
| 40 | ||||
| 44 | ||||
| 48 | ||||
| 56 | ||||
| 59 | ||||
| 70 | ||||
| 72 | ||||
ON BlackRock Advantage Large Cap Core Portfolio(formerly the ON Bristol Portfolio) | 76 | |||
ON BlackRock Advantage Small Cap Growth Portfolio(formerly the ON Bryton Growth Portfolio) | 82 | |||
| 90 | ||||
| 95 | ||||
ON BlackRock Advantage Large Cap Growth Portfolio(formerly the ON Bristol Growth Portfolio) | 102 | |||
| 108 | ||||
| 122 | ||||
| 125 | ||||
| 128 | ||||
| 131 | ||||
| 135 | ||||
| 138 | ||||
| 141 | ||||
| 144 | ||||
| 150 | ||||
| 156 | ||||
| 177 | ||||
| 182 | ||||
Message
Dear Investor:
Financial markets performed well during the first half of 2019 after struggling in the fourth quarter of 2018. Major domestic stock market indices posted double digit returns, while major domestic fixed income indices postedmid-single digit returns.
Entering the year, market participants had two major concerns. The first concern was that the Federal Reserve would make a policy error by continuing to raise the Fed Funds rate, which would temper economic expansion. This fear was mitigated during the first half of 2019, at which time the Federal Reserve changed course, stopped raising the Fed Funds rate, and laid the groundwork for interest rate cuts in the second half of 2019. Meanwhile, central banks around the world indicated their willingness to continue a more accommodative monetary policy, given the prospect of slower global growth. Equity and fixed income markets reacted favorably to this stance, as equity markets rose, and interest rates declined.
Secondly, market participants were concerned about an escalation of the trade war between the U.S. and China and its impact on global growth. While trade issues have not been resolved, talks between the U.S. and China continue, after a brief hiatus in the second quarter. To date, market participants have taken await-and-see approach to tariffs and the trade war, but the negative impacts have started to appear in the form of slower global growth. The outcome of these talks is still unclear, but when more certainty emerges it will have an impact on financial markets.
Domestically, the U.S. economy posted second quarter Gross Domestic Product (GDP) growth of 2.1% after strong 3.1% GDP growth in the first quarter of 2019. While GDP growth slowed, the unemployment rate remains low and job growth continues. The rate of inflation is relatively low, and interest rates have declined materially over the last
 |  | |
| Michael J. DeWeirdt, CFA, FRM | Gary R. Rodmaker, CFA, FLMI | |
| President, Ohio National Fund, Inc. | President, Ohio National Investments, Inc. |
few quarters. Lastly, corporate profits remain strong, but growth in corporate profits clearly slowed in the second quarter of 2019.
Equity Markets
Equity markets provided strong positive returns during the first half of 2019. Domestic indices outperformed international and emerging market indices by a wide margin. Within the domestic equity market, the S&P 500® Large Cap, S&P MidCap 400® and Russell 2000® Small Cap indices all posted positive returns, ranging from 17.0% to 18.5%. Large cap indices outperformed both mid cap and small cap indices during the quarter. Growth stocks continued to outperform value stocks during the period. The S&P 500® Growth Index provided a return of 20.2%, while the S&P 500® Value Index provided a return of 16.7%. Investors were clearly seeking growth stocks in an environment where growth may be more difficult to come by. Within the foreign equity market, international indices of developed countries outperformed emerging market indices. Slowing global growth and the potential for an escalation of the trade war disproportionally impacted emerging market indices.
A summary of returns for key equity benchmarks is presented below:
Index | 2019 U.S. Dollar Total Return (price and dividend) | |||
S&P 500® | 18.5 | % | ||
S&P 500®Growth | 20.2 | % | ||
S&P 500®Value | 16.7 | % | ||
S&P MidCap 400® | 18.0 | % | ||
| Russell 2000®Small Cap | 17.0 | % | ||
| MSCI All Country WorldEx-USA | ||||
(Net – USD) | 13.6 | % | ||
MSCI Emerging Markets | 10.7 | % | ||
1
Fixed Income Markets
Fixed income markets also provided strong positive returns during the first half of 2019. During 2018, the Federal Reserve raised the Fed Funds rate multiple times. In 2019, they changed course and stopped hiking rates. In July, they proceeded to cut the Fed Funds rate. The market’s expectation is for the Federal Reserve to continue to cut the Federal Funds rate one or more times over the next few quarters.
Interest rates declined across the curve during the period, in response to the Federal Reserve’s policy change and the prospect of slowing global growth. In addition, credit spreads tightened, producing higher total returns for corporate bonds but lower current yields.
The Bloomberg Barclays US Aggregate Bond Index posted a total return of 6.1% in the first half of 2019. Lower quality indices, like the Bloomberg Barclays Corporate Index and the Bloomberg Barclays US Corporate High Yield Index both provided higher total returns of 9.9%. Other higher quality indices, such as the Bloomberg Barclays US Treasury Index and the Bloomberg Barclays US Securitized Index, provided lower total returns of 5.2% and 4.3%, respectively.
The table below illustrates the returns of the various indices.
| 2019 U.S. Dollar Total | ||||
| Return | ||||
Index | (price and interest) | |||
| Bloomberg Barclays US Aggregate | 6.1% | |||
| Bloomberg Barclays US Treasury | 5.2% | |||
| Bloomberg Barclays Securitized | 4.3% | |||
| Bloomberg Barclays Corporate | 9.9% | |||
| Bloomberg Barclays US Corporate High Yield | 9.9% | |||
The Ohio National Fund, Inc.
During the first half of 2019, the Ohio National Fund, Inc. Portfolios delivered strong performance, with 18 of 22 actively managed Portfolios beating the performance of their respective peer groups. In addition, the returns of the three (3) index portfolios, before expenses, performed in line with their respective indices. The fund family continues to offer a wide array of investment options that can be used to build a diversified portfolio.
Looking Ahead
The consensus view is for the U.S. economy to grow at roughly 2% for the balance of 2019. The unemployment rate is expected to stay below 4% and the inflation rate is expected to be slightly below 2%, as measured by the Consumer Price Index (CPI). Wage growth is expected to be slightly higher than the rate of inflation, which would keep the consumer healthy. Corporate profits are expected to increase, albeit at a slower rate than in recent years. Lastly, the Federal Reserve is expected to remain accommodative, favoring an easy money bias to boost the economy. In short, the domestic economic backdrop is mildly favorable in the near term.
The global economic outlook is less positive than the domestic outlook. Growth is slowing worldwide, and Europe appears to be headed toward recession. Central banks around the world continue to embrace accommodative monetary policies, driving interest rates below zero in many cases, in an effort to spur growth. Geopolitical risks abound, and include the trade war with China, Brexit, and strained relationships with countries like Iran, North Korea, and Russia. None of these issues appears to be close to resolution, and all could have a negative impact in the future.
To date in 2019, equity markets around the world have shrugged off global risks and chosen to focus on the positives, such as accommodative monetary policies. Equity market valuations appear to be fairly high domestically, so there is little room for error, or a negative event. The outlook for interest rates will depend on the monetary policy of central banks worldwide, inflation rates, and global economic growth. Currently, these items point toward low rates for the balance of 2019. In this environment, we believe that staying the course in a well-diversified portfolio will serve one well over the long term.
Thank you for entrusting your assets to the Ohio National Fund, Inc. We look forward to continuing to serve your financial needs.
2
| Ohio National Fund, Inc. | ON Equity Portfolio (Unaudited) |
Objective/Strategy |
The ON Equity Portfolio seeks long-term growth of capital by investing, under normal circumstances, at least 80% of its net assets in common stocks of the 1,000 largest publicly traded U.S. companies in terms of market capitalization.
Performance as of June 30, 2019 |
Average Annual returns | ||
One year | 5.39% | |
Five years | 6.41% | |
Ten years | 11.66% |
Past performance does not guarantee future results. The performance data quoted represents past performance and current returns may be lower or higher. Total return figures include change in share price and reinvestment of dividends and capital gains. The investment return and principal value will fluctuate so that an investor’s shares, when redeemed, may be worth more or less than the original cost. To obtain performance information up to the most recent month end, call toll-free1-877-781-6392.
The Portfolio is not open to direct retail investment. Beneficial interest in shares is obtained solely by purchase of variable life insurance policies and variable annuity contracts. Actual performance results for variable annuity and variable universal life contracts will be lower due to contract charges. Consult your contract for applicable charges.
Total expense ratio is 0.69% per the Fund’s prospectus dated May 1, 2019. Additional information pertaining to the Portfolio’s expense ratio as of June 30, 2019 can be found in the Portfolio’s Financial Highlights.
Comments fromSub-Adviser |
Q. How did the Portfolio perform in comparison to its benchmark during the reporting period?
A.For thesix-month period ended June 30, 2019, the ON Equity Portfolio returned 19.99% versus 18.54% for its benchmark, the S&P 500 Index.
Effective May 1, 2019, BlackRock Investment Management, LLC (“BlackRock”) replaced the Portfolio’s previoussub-adviser, ClearBridge Investments, LLC. (“ClearBridge”). The Portfolio’s benchmark was unchanged.
For the period from January 1, 2019 to April 30, 2019 (the “first four-month period”), the Portfolio wassub-advised by ClearBridge. During the first four-month period, the Portfolio returned 19.97% versus 18.25% for the S&P 500 Index.
For the period from May 1, 2019 to June 30, 2019 (the “lattertwo-month period”), the Portfolio wassub-advised by BlackRock. During this period, the Portfolio returned 0.02% versus 0.24% for the S&P 500 Index.
Q. Were there specific market conditions, investment strategies, or techniques that materially affected the Portfolio’s benchmark-relative performance during the reporting period?
A. ClearBridge:The U.S. equities market had a strong recovery in the first quarter of 2019, as fears of a slowing economy and rising interest rates abated. Sentiment toward economic growth improved, driven by positive signs from U.S.-China trade negotiations and a more dovish stance from the Federal Reserve, positively impacting the Portfolio and the benchmark.
A. BlackRock:Relative performance over the lattertwo-month period was bifurcated, as the Portfolio outperformed its benchmark significantly in May, then gave back much of that outperformance in June. One of the core drivers of the outperformance in May was a sentiment-based insight that evaluates the sentiment of informed bond investors. The
signal also provides an alternative lens into company quality, and often exhibits defensive properties, which was particularly beneficial in May, as investors sought those characteristics. Gauging the sentiment of informed market participants was also beneficial, as investors tended to align themselves with these groups to identifybest-in-class companies during the market pullback.
In contrast, the Portfolio struggled in June amidst a strong market rally, driven largely by geopolitical developments and central bank policy. The market rally was sparked by a sharp reversal, as a constructive meeting between the United States and China at the G20 Osaka Summit led to a decrease in trade tensions, while the Federal Reserve’s dovish rhetoric increased expectations of more supportive central bank policy. The erratic nature of global trade discussions, combined with the divergence of central bank policy globally, led to an environment in which the Portfolio’s macro thematic signals struggled over the course of the month. Additionally, certain insights that exhibit more defensive properties hindered performance, as the market experienced a sharp rally following the reversal at the beginning of the month.
Q. How did sector allocation and security selection each impact the Portfolio’s performance relative to its benchmark? For sector allocation, were there any factors that impacted the benchmark’s performance more significantly than the Portfolio’s performance? For security selection, was there anything specific regarding the Portfolio’s strategy that caused deviation from the benchmark?
A. ClearBridge:Outperformance during the first four-month period was driven by security selection. In particular, security selection in the Health Care and Energy sectors contributed to outperformance, while security selection in the Industrials and Materials sectors detracted. Overall, sector allocation effects weighed on relative performance. An underweight to Information Technology and an overweight to Health Care also dampened relative results.
A. BlackRock:The portfolio management team targets a generally sector-neutral approach and seeks to derive the majority of its alpha from security selection. That being said, during the lattertwo-month period, a modest underweight to the Communication Services sector contributed slightly to performance over the period, as the sector underperformed the broader market. On the other hand, a modest underweight to Consumer Staples detracted slightly, as the sector outperformed in May, as investors sought out more defensive, higher-yielding names, amidst arisk-off, low interest rate environment. As expected, the majority of relative performance was driven by security selection decisions. Stock selection was particularly positive in the Industrials sector, especially among aerospace and defense companies, as well as road and rail holdings. Security selection was also positive in the Consumer Discretionary sector, particularly among multiline retailers, and in the Health Care sector. In contrast, selection within the Real Estate sector, most specifically in the equity real estate investment trust industry, was a notable detractor from relative performance. Stock selection in the Materials sector, especially among chemicals companies, and the Information Technology sector hindered relative returns as well.(1)
Q. Which holdings contributed the most to, and detracted the most from, the Portfolio’s benchmark-relative performance?
A. ClearBridge:Alexion Pharmaceuticals, Inc. (“Alexion”), the top relative contributor during the first four-month period, is a biotechnology company focused on developing treatments for severe and ultra-rare disorders. Its Solaris drug is abest-in-class treatment for life-threatening paroxysmal nocturnal hemoglobinuria (“PNH”). Alexion has been successful in the early stages of converting more than 70% of PNH patients taking Solaris to afollow-on drug, Ultomiris, which should extend the company’s dominant position in the area. Synchrony Financial, in the Financials sector, is a private label credit card issuer that
| 3 | (continued) |
| Ohio National Fund, Inc. | ON Equity Portfolio (Unaudited) (Continued) |
works with retailers and affinity groups, and was another top contributor. Synchrony Financial continued its bounce back after it reported profitable fourth and first quarters, announced the dismissal of a lawsuit from Walmart, Inc. and renewed retail card partnerships with Sam’s Club and Amazon.com, Inc.
Cisco Systems, Inc. (“Cisco”) and Facebook, Inc. Class A (“Facebook”) were relative detractors due to the Portfolio’s underweight to both stocks. Cisco reported a strong quarter, driven by the continued ramp out of Catalyst 9000, the company’s new switching platform. Facebook beat expected earnings in the first quarter, as the technology and momentum trade returned following the market’s drop in the fourth quarter of 2018. Its 36.1% revenue growth showed Facebook continuing to execute within its mobile platforms and was seen as evidence that Facebook Stories are playing a large factor.
A. BlackRock:For the lattertwo-month period, from a security standpoint, the top individual contributor was the Portfolio’s overweight to Target Corp. (“Target”). Target’s stock outperformed the broader market following a very strong first-quarter earnings report that included better than expected results for both revenue and earnings, as well as healthy same-store sales growth. More conveniente-commerce options, as well as improvements insame-day fulfillment services, supported by its Shipt business, drove digital sales growth and sparked investor confidence in the retailer’s ability to compete with other retail giants. Additionally, the Portfolio’s overweight position in Medtronic PLC added significantly to relative performance. The stock outperformed following the company’s first quarter earnings announcement, as company revenues beat expectations, and guidance wasin-line with expectations, easing investor concerns going into the announcement. Positive results from several research projects also helped support the share price towards the end of the quarter. The Portfolio’s overweight position in Lockheed Martin Corp. was also positive, as company shares gained over 10% for the period on news of increased product demand from the U.S. government and the passing of a defense authorization measure in the Senate.(1)
In contrast, the top individual detractor for the period was the Portfolio’s overweight position in Dell Technologies, Inc. Class C (“Dell”). Dell struggled over the lattertwo-month period, as first quarter revenues fell short of analyst projections and demand for its servers and networking gear fell almost 9% in the period, a sharp reversal from the trend seen in previous periods, and a point of concern for the business. Global trade tensions have also created a potential headwind, as the potential for higher input costs and lower revenue from the Chinese market have resulted in heightened investor concern and depressed share prices. An overweight position in The Charles Schwab Corp. was a further drag on relative returns. The company struggled over the period, amidst increased pricing pressure that some analysts believe could act as a headwind and stifle company revenue growth going forward. An overweight position in GoDaddy, Inc. Class A was the third largest individual detractor, as the company fell after announcing earnings that came in slightly below expectations. Slowing customer growth and concerns around company valuation also contributed to the company’s underperformance.(1)
Q. How did the Portfolio’s use of derivative instruments and initial public offerings (IPOs), if any, impact performance?
A. ClearBridge:The Portfolio did not hold any derivatives or participate in any IPOs during the first four-month period.
A. BlackRock:Pursuant to the Portfolio’s investment strategy, futures contracts were used in order to equitize cash and prevent a cash drag on performance during the lattertwo-month period. The futures did not meaningfully impact performance, however, due to their index characteristics and size in relation to the Portfolio’s net asset.(1)
| (1) | The Portfolio’s composition is subject to change. Holdings and weightings are as of June 30, 2019. |
Change in Value of $10,000 Investment |
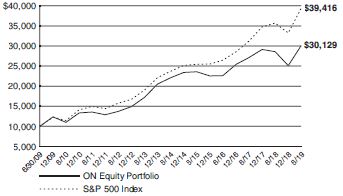
Hypothetical illustration based on past performance. Future performance will vary. The Portfolio’s returns reflect reinvested dividends. The Portfolio’s holdings may differ significantly from the securities in the index. The index is unmanaged and therefore does not reflect the cost of portfolio management and accounting.
The S&P 500 Index is a capitalization-weighted index designed to measure performance of the broad domestic economy through changes in the aggregate market value of 500 stocks representing all major industries. The index presented includes the effects of reinvested dividends.
Past performance is no guarantee of future results. Redemption of fund shares could have tax implications unique to each shareholder.
| 4 | (continued) |
| Ohio National Fund, Inc. | ON Equity Portfolio (Unaudited) (Continued) |
Portfolio Composition as of June 30, 2019(1) |
| % of Net Assets | ||||
Common Stocks(4) | 97.7 | |||
Money Market Funds and Other Net Assets | 2.3 | |||
|
| |||
| 100.0 | ||||
|
| |||
Top 10 Portfolio Holdings as of June 30, 2019(1)(2) (3) | ||||
| % of Net Assets | ||||||||
| 1. | Amazon.com, Inc. | 2.9 | ||||||
| 2. | Microsoft Corp. | 2.6 | ||||||
| 3. | Apple, Inc. | 2.5 | ||||||
| 4. | JPMorgan Chase & Co. | 2.3 | ||||||
| 5. | Facebook, Inc. Class A | 2.0 | ||||||
| 6. | Johnson & Johnson | 2.0 | ||||||
| 7. | Merck & Co., Inc. | 1.9 | ||||||
| 8. | Berkshire Hathaway, Inc. Class B | 1.8 | ||||||
| 9. | Verizon Communications, Inc. | 1.8 | ||||||
| 10. | Cisco Systems, Inc. | 1.7 | ||||||
| (1) | Composition of Portfolio subject to change. |
| (2) | Short-term investments have been excluded from the list of Top 10 Portfolio Holdings. |
| (3) | Top 10 Portfolio Holdings is presented at an individual security level. Total investment exposure by issuer may be higher. |
| (4) | Sectors (Common Stocks): |
| % of Net Assets | ||||
Information Technology | 21.5 | |||
Health Care | 13.7 | |||
Financials | 13.5 | |||
Industrials | 10.0 | |||
Consumer Discretionary | 9.7 | |||
Communication Services | 9.1 | |||
Consumer Staples | 6.1 | |||
Energy | 4.2 | |||
Real Estate | 3.7 | |||
Utilities | 3.6 | |||
Materials | 2.6 | |||
|
| |||
| 97.7 | ||||
|
| |||
5
| Ohio National Fund, Inc. | ON Equity Portfolio |
Schedule of Investments | June 30, 2019 (Unaudited) | |
| Common Stocks – 97.7% | Shares | Value | ||||||||
COMMUNICATION SERVICES – 9.1% |
| |||||||||
Activision Blizzard, Inc. (Entertainment) | 6,404 | $ | 302,269 | |||||||
Alphabet, Inc. Class A (Interactive Media & Svs.) | (a) | 871 | 943,119 | |||||||
Alphabet, Inc. Class C (Interactive Media & Svs.) | (a) | 2,597 | 2,807,123 | |||||||
Cargurus, Inc. (Interactive Media & Svs.) | (a) | 1,832 | 66,154 | |||||||
Comcast Corp. Class A (Media) | 67,698 | 2,862,271 | ||||||||
Facebook, Inc. Class A (Interactive Media & Svs.) | (a) | 25,100 | 4,844,300 | |||||||
Fox Corp. Class A (Media) | 6,747 | 247,210 | ||||||||
Fox Corp. Class B (Media) | 1,159 | 42,338 | ||||||||
Interpublic Group of Cos., Inc. /The (Media) | 118,971 | 2,687,555 | ||||||||
Liberty Media Corp. / Liberty Sirius XM (Media) | (a) | 730 | 27,601 | |||||||
Netflix, Inc. (Entertainment) | (a) | 1,766 | 648,687 | |||||||
Pinterest, Inc. Class A (Interactive Media & Svs.) | (a) | 16,139 | 439,304 | |||||||
Sinclair Broadcast Group, Inc. Class A (Media) | 5,528 | 296,467 | ||||||||
Sirius XM Holdings, Inc. (Media) | 28,024 | 156,374 | ||||||||
Take-Two Interactive Software, Inc. (Entertainment) | (a) | 1,586 | 180,059 | |||||||
Verizon Communications, Inc. (Diversified Telecom. Svs.) | 72,592 | 4,147,181 | ||||||||
Viacom, Inc. Class B (Entertainment) | 17,852 | 533,239 | ||||||||
Zynga, Inc. Class A (Entertainment) | (a) | 60,378 | 370,117 | |||||||
|
| |||||||||
| 21,601,368 | ||||||||||
|
| |||||||||
CONSUMER DISCRETIONARY – 9.7% |
| |||||||||
Advance Auto Parts, Inc. (Specialty Retail) | 5,034 | 775,941 | ||||||||
Amazon.com, Inc. (Internet & Direct Marketing Retail) | (a) | 3,681 | 6,970,452 | |||||||
AutoZone, Inc. (Specialty Retail) | (a) | 386 | 424,395 | |||||||
Chipotle Mexican Grill, Inc. (Hotels, Restaurants & Leisure) | (a) | 319 | 233,789 | |||||||
Dana, Inc. (Auto Components) | 17,524 | 349,429 | ||||||||
Darden Restaurants, Inc. (Hotels, Restaurants & Leisure) | 21,760 | 2,648,845 | ||||||||
Domino’s Pizza, Inc. (Hotels, Restaurants & Leisure) | 1,853 | 515,653 | ||||||||
Etsy, Inc. (Internet & Direct Marketing Retail) | (a) | 4,072 | 249,899 | |||||||
Extended Stay America, Inc. (Hotels, Restaurants & Leisure) | 86,157 | 1,455,192 | ||||||||
frontdoor, Inc. (Diversified Consumer Svs.) | (a) | 5,287 | 230,249 | |||||||
International Game Technology PLC (Hotels, Restaurants & Leisure) | 2,906 | 37,691 | ||||||||
Las Vegas Sands Corp. (Hotels, Restaurants & Leisure) | 24,506 | 1,448,059 | ||||||||
Lululemon Athletica, Inc. (Textiles, Apparel & Luxury Goods) | (a) | 5,286 | 952,590 | |||||||
McDonald’s Corp. (Hotels, Restaurants & Leisure) | 3,252 | 675,310 | ||||||||
Melco Resorts & Entertainment Ltd. – ADR (Hotels, Restaurants & Leisure) | 21,192 | 460,290 | ||||||||
NIKE, Inc. Class B (Textiles, Apparel & Luxury Goods) | 17,684 | 1,484,572 | ||||||||
Norwegian Cruise Line Holdings Ltd. (Hotels, Restaurants & Leisure) | (a) | 4,508 | 241,764 | |||||||
O’Reilly Automotive, Inc. (Specialty Retail) | (a) | 856 | 316,138 | |||||||
Royal Caribbean Cruises Ltd. (Hotels, Restaurants & Leisure) | 6,297 | 763,259 | ||||||||
Target Corp. (Multiline Retail) | 11,446 | 991,338 | ||||||||
Thor Industries, Inc. (Automobiles) | 1,082 | 63,243 | ||||||||
TJX Cos., Inc. / The (Specialty Retail) | 7,827 | 413,892 | ||||||||
Ulta Beauty, Inc. (Specialty Retail) | (a) | 198 | 68,684 | |||||||
Yum! Brands, Inc. (Hotels, Restaurants & Leisure) | 11,735 | 1,298,712 | ||||||||
|
| |||||||||
| 23,069,386 | ||||||||||
|
| |||||||||
| Common Stocks (Continued) | Shares | Value | ||||||||
CONSUMER STAPLES – 6.1% | ||||||||||
Anheuser-Busch InBev SA – ADR (Beverages) | 13,144 | $ | 1,163,375 | |||||||
Archer-Daniels-Midland Co. (Food Products) | 25,125 | 1,025,100 | ||||||||
Church & Dwight Co., Inc. (Household Products) | 15,256 | 1,114,603 | ||||||||
Colgate-Palmolive Co. (Household Products) | 10,277 | 736,553 | ||||||||
Costco Wholesale Corp. (Food & Staples Retailing) | 1,139 | 300,992 | ||||||||
Estee Lauder Cos., Inc. / The Class A (Personal Products) | 5,626 | 1,030,177 | ||||||||
General Mills, Inc. (Food Products) | 46,650 | 2,450,058 | ||||||||
Herbalife Nutrition Ltd. (Personal Products) | (a) | 5,643 | 241,295 | |||||||
Hershey Co. / The (Food Products) | 8,378 | 1,122,903 | ||||||||
J.M. Smucker Co. / The (Food Products) | 2,365 | 272,424 | ||||||||
Monster Beverage Corp. (Beverages) | (a) | 8,229 | 525,257 | |||||||
PepsiCo, Inc. (Beverages) | 14,177 | 1,859,030 | ||||||||
Performance Food Group Co. (Food & Staples Retailing) | (a) | 21,049 | 842,592 | |||||||
Philip Morris International, Inc. (Tobacco) | 6,350 | 498,666 | ||||||||
Procter & Gamble Co. / The (Household Products) | 2,723 | 298,577 | ||||||||
Walmart, Inc. (Food & Staples Retailing) | 9,163 | 1,012,420 | ||||||||
|
| |||||||||
| 14,494,022 | ||||||||||
|
| |||||||||
ENERGY – 4.2% | ||||||||||
Antero Midstream Corp. (Oil, Gas & Consumable Fuels) | 29,651 | 339,801 | ||||||||
Cabot Oil & Gas Corp. (Oil, Gas & Consumable Fuels) | 8,955 | 205,607 | ||||||||
Chevron Corp. (Oil, Gas & Consumable Fuels) | 19,944 | 2,481,831 | ||||||||
ConocoPhillips (Oil, Gas & Consumable Fuels) | 51,311 | 3,129,971 | ||||||||
Encana Corp. (Oil, Gas & Consumable Fuels) | 942 | 4,832 | ||||||||
EOG Resources, Inc. (Oil, Gas & Consumable Fuels) | 8,306 | 773,787 | ||||||||
Exxon Mobil Corp. (Oil, Gas & Consumable Fuels) | 3,799 | 291,117 | ||||||||
Halliburton Co. (Energy Equip. & Svs.) | 36,609 | 832,489 | ||||||||
Schlumberger Ltd. (Energy Equip. & Svs.) | 2,355 | 93,588 | ||||||||
Valero Energy Corp. (Oil, Gas & Consumable Fuels) | 1,160 | 99,308 | ||||||||
Williams Cos., Inc. / The (Oil, Gas & Consumable Fuels) | 57,833 | 1,621,637 | ||||||||
|
| |||||||||
| 9,873,968 | ||||||||||
|
| |||||||||
FINANCIALS – 13.5% | ||||||||||
Allstate Corp. / The (Insurance) | 15,512 | 1,577,415 | ||||||||
American Express Co. (Consumer Finance) | 12,466 | 1,538,803 | ||||||||
Berkshire Hathaway, Inc. Class B (Diversified Financial Svs.) | (a) | 20,040 | 4,271,927 | |||||||
Charles Schwab Corp. / The (Capital Markets) | 73,695 | 2,961,802 | ||||||||
Cincinnati Financial Corp. (Insurance) | 9,826 | 1,018,661 | ||||||||
Citizens Financial Group, Inc. (Banks) | 59,065 | 2,088,538 | ||||||||
Discover Financial Services (Consumer Finance) | 34,193 | 2,653,035 | ||||||||
Essent Group Ltd. (Thrifts & Mortgage Finance) | (a) | 3,465 | 162,820 | |||||||
Evercore, Inc. Class A (Capital Markets) | 4,014 | 355,520 | ||||||||
First American Financial Corp. (Insurance) | 8,855 | 475,514 | ||||||||
First Republic Bank (Banks) | 8,348 | 815,182 | ||||||||
JPMorgan Chase & Co. (Banks) | 48,986 | 5,476,635 | ||||||||
Loews Corp. (Insurance) | 24,964 | 1,364,782 | ||||||||
MetLife, Inc. (Insurance) | 27,575 | 1,369,650 | ||||||||
Morgan Stanley (Capital Markets) | 11,649 | 510,343 | ||||||||
Prudential Financial, Inc. (Insurance) | 25,799 | 2,605,699 | ||||||||
Synchrony Financial (Consumer Finance) | 9,053 | 313,868 | ||||||||
TD Ameritrade Holding Corp. (Capital Markets) | 12,269 | 612,469 | ||||||||
Wells Fargo & Co. (Banks) | 14,551 | 688,553 | ||||||||
Western Alliance Bancorp (Banks) | (a) | 23,681 | 1,059,014 | |||||||
|
| |||||||||
| 31,920,230 | ||||||||||
|
| |||||||||
| 6 | (continued) |
| Ohio National Fund, Inc. | ON Equity Portfolio (Continued) |
Schedule of Investments | June 30, 2019 (Unaudited) | |
| Common Stocks (Continued) | Shares | Value | ||||||||
HEALTH CARE – 13.7% | ||||||||||
AbbVie, Inc. (Biotechnology) | 27,637 | $ | 2,009,763 | |||||||
AmerisourceBergen Corp. (Health Care Providers & Svs.) | 4,067 | 346,752 | ||||||||
Amgen, Inc. (Biotechnology) | 16,038 | 2,955,483 | ||||||||
Anthem, Inc. (Health Care Providers & Svs.) | 8,770 | 2,474,982 | ||||||||
Bristol-Myers Squibb Co. (Pharmaceuticals) | 34,753 | 1,576,048 | ||||||||
Celgene Corp. (Biotechnology) | (a) | 6,074 | 561,481 | |||||||
Cigna Corp. (Health Care Providers & Svs.) | 1,292 | 203,555 | ||||||||
CVS Health Corp. (Health Care Providers & Svs.) | 13,664 | 744,551 | ||||||||
Danaher Corp. (Health Care Equip. & Supplies) | 1,722 | 246,108 | ||||||||
DexCom, Inc. (Health Care Equip. & Supplies) | (a) | 1,979 | 296,533 | |||||||
Gilead Sciences, Inc. (Biotechnology) | 47,756 | 3,226,395 | ||||||||
Hill-Rom Holdings, Inc. (Health Care Equip. & Supplies) | 4,391 | 459,386 | ||||||||
Johnson & Johnson (Pharmaceuticals) | 34,306 | 4,778,140 | ||||||||
McKesson Corp. (Health Care Providers & Svs.) | 1,651 | 221,878 | ||||||||
Medtronic PLC (Health Care Equip. & Supplies) | 30,544 | 2,974,680 | ||||||||
Merck & Co., Inc. (Pharmaceuticals) | 52,441 | 4,397,178 | ||||||||
Regeneron Pharmaceuticals, Inc. (Biotechnology) | (a) | 2,493 | 780,309 | |||||||
Stryker Corp. (Health Care Equip. & Supplies) | 7,610 | 1,564,464 | ||||||||
UnitedHealth Group, Inc. (Health Care Providers & Svs.) | 2,162 | 527,550 | ||||||||
Veeva Systems, Inc. Class A (Health Care Technology) | (a) | 9,192 | 1,490,115 | |||||||
Vertex Pharmaceuticals, Inc. (Biotechnology) | (a) | 2,991 | 548,490 | |||||||
|
| |||||||||
| 32,383,841 | ||||||||||
|
| |||||||||
INDUSTRIALS – 10.0% | ||||||||||
ABB Ltd. – ADR (Electrical Equip.) | 36,979 | 740,689 | ||||||||
ADT, Inc. (Commercial Svs. & Supplies) | 7,990 | 48,899 | ||||||||
Allegion PLC (Building Products) | 18,290 | 2,021,959 | ||||||||
CoStar Group, Inc. (Professional Svs.) | (a) | 3,261 | 1,806,790 | |||||||
Crane Co. (Machinery) | 15,404 | 1,285,310 | ||||||||
Cummins, Inc. (Machinery) | 4,247 | 727,681 | ||||||||
GATX Corp. (Trading Companies & Distributors) | 5,192 | 411,674 | ||||||||
Generac Holdings, Inc. (Electrical Equip.) | (a) | 1,052 | 73,019 | |||||||
Honeywell International, Inc. (Industrial Conglomerates) | 14,757 | 2,576,425 | ||||||||
Hubbell, Inc. (Electrical Equip.) | 8,600 | 1,121,440 | ||||||||
Insperity, Inc. (Professional Svs.) | 13,859 | 1,692,738 | ||||||||
L3Harris Technologies, Inc. (Aerospace & Defense) | 6,274 | 1,186,602 | ||||||||
Lockheed Martin Corp. (Aerospace & Defense) | 9,217 | 3,350,748 | ||||||||
Lyft, Inc. Class A (Road & Rail) | (a) | 9,643 | 633,641 | |||||||
MasTec, Inc. (Construction & Engineering) | (a) | 694 | 35,762 | |||||||
Oshkosh Corp. (Machinery) | 8,221 | 686,371 | ||||||||
PACCAR, Inc. (Machinery) | 38,643 | 2,769,157 | ||||||||
Rockwell Automation, Inc. (Electrical Equip.) | 4,890 | 801,129 | ||||||||
Ryder System, Inc. (Road & Rail) | 2,389 | 139,279 | ||||||||
Snap-on, Inc. (Machinery) | 5,606 | 928,578 | ||||||||
TriNet Group, Inc. (Professional Svs.) | (a) | 5,569 | 377,578 | |||||||
Uber Technologies, Inc. (Road & Rail) | (a) | 2,061 | 95,589 | |||||||
Waste Connections, Inc. (Commercial Svs. & Supplies) | 755 | 72,163 | ||||||||
|
| |||||||||
| 23,583,221 | ||||||||||
|
| |||||||||
INFORMATION TECHNOLOGY – 21.5% |
| |||||||||
Adobe, Inc. (Software) | (a) | 6,695 | 1,972,682 | |||||||
Amdocs Ltd. (IT Svs.) | 4,827 | 299,708 | ||||||||
Apple, Inc. (Tech. Hardware, Storage & Periph.) | 30,087 | 5,954,819 | ||||||||
Automatic Data Processing, Inc. (IT Svs.) | 18,604 | 3,075,799 | ||||||||
Broadcom, Inc. (Semiconductors & Equip.) | 907 | 261,089 | ||||||||
CDW Corp. (Electronic Equip., Instr. & Comp.) | 4,302 | 477,522 | ||||||||
Ciena Corp. (Communications Equip.) | (a) | 8,909 | 366,427 | |||||||
| Common Stocks (Continued) | Shares | Value | ||||||||
INFORMATION TECHNOLOGY (continued) |
| |||||||||
Cirrus Logic, Inc. (Semiconductors & Equip.) | (a) | 10,217 | $ | 446,483 | ||||||
Cisco Systems, Inc. (Communications Equip.) | 72,185 | 3,950,685 | ||||||||
Dell Technologies, Inc. Class C (Tech. Hardware, Storage & Periph.) | (a) | 14,586 | 740,969 | |||||||
Fidelity National Information Services, Inc. (IT Svs.) | 20,983 | 2,574,195 | ||||||||
GoDaddy, Inc. Class A (IT Svs.) | (a) | 26,297 | 1,844,735 | |||||||
HP, Inc. (Tech. Hardware, Storage & Periph.) | 46,495 | 966,631 | ||||||||
Intel Corp. (Semiconductors & Equip.) | 25,207 | 1,206,659 | ||||||||
International Business Machines Corp. (IT Svs.) | 6,462 | 891,110 | ||||||||
Intuit, Inc. (Software) | 4,411 | 1,152,727 | ||||||||
Microsoft Corp. (Software) | 45,880 | 6,146,085 | ||||||||
National Instruments Corp. (Electronic Equip., Instr. & Comp.) | 42,619 | 1,789,572 | ||||||||
NVIDIA Corp. (Semiconductors & Equip.) | 1,210 | 198,718 | ||||||||
NXP Semiconductors N.V. (Semiconductors & Equip.) | 403 | 39,337 | ||||||||
Paychex, Inc. (IT Svs.) | 28,701 | 2,361,805 | ||||||||
QUALCOMM, Inc. (Semiconductors & Equip.) | 451 | 34,308 | ||||||||
salesforce.com, Inc. (Software) | (a) | 22,803 | 3,459,899 | |||||||
ServiceNow, Inc. (Software) | (a) | 9,388 | 2,577,663 | |||||||
Square, Inc. Class A (IT Svs.) | (a) | 10,093 | 732,045 | |||||||
Tableau Software, Inc. Class A (Software) | (a) | 611 | 101,438 | |||||||
Tech Data Corp. (Electronic Equip., Instr. & Comp.) | (a) | 237 | 24,790 | |||||||
Texas Instruments, Inc. (Semiconductors & Equip.) | 19,179 | 2,200,982 | ||||||||
VeriSign, Inc. (IT Svs.) | (a) | 1,969 | 411,836 | |||||||
Visa, Inc. (IT Svs.) | 16,138 | 2,800,750 | ||||||||
Workday, Inc. Class A (Software) | (a) | 5,292 | 1,087,929 | |||||||
Xilinx, Inc. (Semiconductors & Equip.) | 7,625 | 899,140 | ||||||||
|
| |||||||||
| 51,048,537 | ||||||||||
|
| |||||||||
MATERIALS – 2.6% | ||||||||||
Air Products & Chemicals, Inc. (Chemicals) | 9,197 | 2,081,925 | ||||||||
Dow, Inc. (Chemicals) | 9,070 | 447,242 | ||||||||
DuPont de Nemours, Inc. (Chemicals) | 286 | 21,470 | ||||||||
Ecolab, Inc. (Chemicals) | 693 | 136,826 | ||||||||
LyondellBasell Industries N.V. Class A (Chemicals) | 16,434 | 1,415,460 | ||||||||
Westrock Co. (Containers & Packaging) | 54,324 | 1,981,196 | ||||||||
|
| |||||||||
| 6,084,119 | ||||||||||
|
| |||||||||
REAL ESTATE – 3.7% | ||||||||||
Equity LifeStyle Properties, Inc. (Equity REIT) | 21,479 | 2,606,262 | ||||||||
Park Hotels & Resorts, Inc. (Equity REIT) | 25,796 | 710,938 | ||||||||
Prologis, Inc. (Equity REIT) | 32,507 | 2,603,810 | ||||||||
Ryman Hospitality Properties, Inc. (Equity REIT) | 14,612 | 1,184,887 | ||||||||
Simon Property Group, Inc. (Equity REIT) | 9,938 | 1,587,695 | ||||||||
|
| |||||||||
| 8,693,592 | ||||||||||
|
| |||||||||
UTILITIES – 3.6% | ||||||||||
Alliant Energy Corp. (Electric Utilities) | 15,351 | 753,427 | ||||||||
American Water Works Co., Inc. (Water Utilities) | 23,602 | 2,737,832 | ||||||||
Black Hills Corp. (Multi-Utilities) | 15,172 | 1,185,995 | ||||||||
Consolidated Edison, Inc. (Multi-Utilities) | 21,338 | 1,870,916 | ||||||||
DTE Energy Co. (Multi-Utilities) | 460 | 58,825 | ||||||||
Evergy, Inc. (Electric Utilities) | 11,768 | 707,845 | ||||||||
IDACORP, Inc. (Electric Utilities) | 9,178 | 921,747 | ||||||||
Southwest Gas Holdings, Inc. (Gas Utilities) | 4,707 | 421,841 | ||||||||
|
| |||||||||
| 8,658,428 | ||||||||||
|
| |||||||||
Total Common Stocks (Cost $223,605,852) | $ | 231,410,712 | ||||||||
|
| |||||||||
| 7 | (continued) |
| Ohio National Fund, Inc. | ON Equity Portfolio (Continued) |
Schedule of Investments | June 30, 2019 (Unaudited) | |
| Money Market Funds –1.2% | Shares | Value | ||||||||
State Street Institutional Liquid Reserves Fund Institutional Class, 2.449% | (b) | 2,892,172 | $ | 2,892,750 | ||||||
State Street Institutional U.S. Government Money Market Fund Institutional Class, 2.310% | (b) | 13,650 | 13,650 | |||||||
|
| |||||||||
Total Money Market Funds | $ | 2,906,400 | ||||||||
|
| |||||||||
Total Investments – 98.9% | (c) | $ | 234,317,112 | |||||||
Other Assets in Excess of Liabilities – 1.1% | (d) | 2,527,077 | ||||||||
|
| |||||||||
Net Assets – 100.0% | $ | 236,844,189 | ||||||||
|
| |||||||||
Percentages are stated as a percent of net assets.
Abbreviations:
| ADR: | American Depositary Receipts |
Footnotes:
| (a) | Non-income producing security. |
| (b) | Rate represents theseven-day yield at June 30, 2019. |
| (c) | Represents cost for financial reporting purposes, which may differ from cost basis for federal income tax purposes. See also Note 7 of the Notes to Financial Statements. |
| (d) | Includes $233,100 of cash pledged as collateral for the futures contracts outstanding at June 30, 2019. See also the following Schedule of Open Futures Contracts. |
The accompanying notes are an integral part of these financial statements.
Schedule of Open Futures Contracts | June 30, 2019 (Unaudited) | |||||||||||
Description | Number of contracts | Expiration Date | Notional Amount | Value |
Unrealized |
Variation Margin | ||||||
CMEE-mini S&P 500 Index - Long | 37 | September 20, 2019 | $5,408,660 | $5,446,770 | $38,110 | $5,926 |
The accompanying notes are an integral part of these financial statements.
8
| Ohio National Fund, Inc. | ON Bond Portfolio (Unaudited) |
Objective/Strategy |
The ON Bond Portfolio seeks to obtain a high level of income and opportunity for capital appreciation consistent with the preservation of capital by investing, under normal circumstances, at least 80% of its net assets in corporate debt securities.
Performance as of June 30, 2019 | ||||
Average Annual returns | ||||
One year | 10.59 | % | ||
Five years | 4.01 | % | ||
Ten years | 5.23 | % |
Past performance does not guarantee future results. The performance data quoted represents past performance and current returns may be lower or higher. Total return figures include change in share price and reinvestment of dividends and capital gains. The investment return and principal value will fluctuate so that an investor’s shares, when redeemed, may be worth more or less than the original cost. To obtain performance information up to the most recent month end, call toll-free1-877-781-6392.
The Portfolio is not open to direct retail investment. Beneficial interest in shares is obtained solely by purchase of variable life insurance policies and variable annuity contracts. Actual performance results for variable annuity and variable universal life contracts will be lower due to contract charges. Consult your contract for applicable charges.
Total expense ratio is 0.59% per the Fund’s prospectus dated May 1, 2019. Additional information pertaining to the Portfolio’s expense ratio as of June 30, 2019 can be found in the Portfolio’s Financial Highlights.
Comments from Adviser |
Q. How did the Portfolio perform in comparison to its benchmark during the reporting period?
A.For thesix-month period ended June 30, 2019, the ON Bond Portfolio returned 10.40% versus 9.55% for its benchmark, the ICE BofA Merrill Lynch U.S. Corporate Master Index.
Q. Were there specific market conditions, investment strategies, or techniques that materially affected the Portfolio’s benchmark-relative performance during the reporting period?
A.Interest rates declined across the curve, as the Federal Reserve moved from a hawkish stance to a dovish stance during the first half of 2019. In this environment, longer duration bonds generally outperformed shorter duration bonds. Corporate credit spreads tightened during the period, with lower quality bonds generally outperforming higher quality bonds. From an investment strategy perspective, the Portfolio was positioned with a slightly lower duration and slightly lower credit quality than the benchmark.(1)
While neither of the above materially affected the Portfolio’s performance compared to the benchmark, the Portfolio’s lower credit quality contributed to relative performance, while its slightly shorter duration detracted from relative performance.(1)
Q. How did sector allocation and security selection each impact the Portfolio’s performance relative to its benchmark? For sector allocation, were there any factors that impacted the benchmark’s performance more significantly than the Portfolio’s performance? For security selection, was there anything specific regarding the Portfolio’s strategy that caused deviation from the benchmark?
A.The Portfolio’s overweight to Energy and Materials during the first half of 2019 positively contributed to performance relative to the benchmark. Other sector weightings compared to the benchmark did not materially affect relative performance. The Consumer Staples and Energy sectors
led performance, while the Consumer Discretionary and Financials sectors were the lowest performers during the period. Security selection within sectors accounted for the majority of the sector performance versus the benchmark, rather than the sector weighting.(1)
Q. Which holdings contributed the most to, and detracted the most from, the Portfolio’s benchmark-relative performance?
A.The top three contributors to the Portfolio’s performance relative to the benchmark were Anheuser-Busch InBevWorldwide, Inc. 4.600% due 2048, Canadian Natural Resources Ltd. 4.950% due 2047, and Anheuser-Busch Cos. LLC /Anheuser-Busch InBevWorldwide, Inc. 4.700% due 2036. Each of these bonds is a longer duration bond and experienced spread tightening during the period. The top three detractors to the Portfolio’s performance relative to the benchmark were Charter Communications Operating LLC / Charter Communications Operating Capital Corp. 5.050% due 2029, The Charles Schwab Corp. 3.200% due 2028, and Intercontinental Exchange, Inc. 2.750% due 2020. Each of these bonds was held for a short period of time during the period, which contributed to their lower performance vs. the benchmark.(1)
| (1) | The Portfolio’s composition is subject to change. Holdings and weightings are as of June 30, 2019. |
Change in Value of $10,000 Investment |
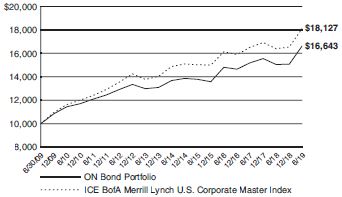
Hypothetical illustration based on past performance. Future performance will vary. The Portfolio’s returns reflect reinvested dividends. The Portfolio’s holdings may differ significantly from the securities in the index. The index is unmanaged and therefore does not reflect the cost of portfolio management and accounting.
The ICE BofA Merrill Lynch U.S. Corporate Master Index tracks the performance of all U.S. dollar-denominated, investment grade corporate public debt issued in the U.S. domestic bond market. Qualifying bonds must have an investment grade rating (based on an average of Moody’s, S&P, and Fitch). In addition, qualifying securities must have at least one year remaining term to maturity, a fixed coupon schedule, and a minimum amount outstanding of $250 million.
Past performance is no guarantee of future results. Redemption of fund shares could have tax implications unique to each shareholder.
| 9 | (continued) |
| Ohio National Fund, Inc. | ON Bond Portfolio (Unaudited) (Continued) |
Portfolio Composition as of June 30, 2019(1) |
| % of Net Assets | ||||
Corporate Bonds(4) | 94.7 | |||
Asset-Backed Securities(4) | 2.7 | |||
Sovereign Issues | 1.2 | |||
Money Market Funds and Other Net Assets | 1.4 | |||
|
| |||
| 100.0 | ||||
|
| |||
Top 10 Portfolio Holdings as of June 30, 2019(1)(2)(3) |
| % of Net Assets | ||||||
1. | Deutsche Bank AG | 1.9 | ||||
2.700%, 07/13/2020 | ||||||
2. | Aircastle Ltd. | 1.6 | ||||
4.125%, 05/01/2024 | ||||||
3. | Martin Marietta Materials, Inc. | 1.6 | ||||
3.500%, 12/15/2027 | ||||||
4. | Northrop Grumman Corp. | 1.5 | ||||
2.930%, 01/15/2025 | ||||||
5. | Lear Corp. | 1.5 | ||||
3.800%, 09/15/2027 | ||||||
6. | Canadian Natural Resources Ltd. | 1.3 | ||||
4.950%, 06/01/2047 | ||||||
7. | Expedia Group, Inc. | 1.3 | ||||
5.000%, 02/15/2026 | ||||||
8. | CVS Health Corp. | 1.2 | ||||
4.100%, 03/25/2025 | ||||||
9. | Mosaic Co. / The | 1.2 | ||||
4.050%, 11/15/2027 | ||||||
10. | American Airlines2015-1 Class B Pass Through Trust | 1.2 | ||||
3.700%, 05/01/2023 | ||||||
| (1) | Composition of Portfolio subject to change. |
| (2) | Short-term investments have been excluded from the list of Top 10 Portfolio Holdings. |
| (3) | Top 10 Portfolio Holdings is presented at an individual security level. Total investment exposure by issuer may be higher. |
| (4) | Sectors (Corporate Bonds, Asset-Backed Securities): |
| % of Net Assets | ||||
Financials | 26.5 | |||
Energy | 12.7 | |||
Industrials | 11.2 | |||
Materials | 10.7 | |||
Utilities | 8.0 | |||
Real Estate | 7.4 | |||
Consumer Staples | 6.1 | |||
Consumer Discretionary | 5.9 | |||
Health Care | 3.6 | |||
Communication Services | 3.4 | |||
Information Technology | 1.9 | |||
|
| |||
| 97.4 | ||||
|
|
10
| Ohio National Fund, Inc. | ON Bond Portfolio |
Schedule of Investments | June 30, 2019 (Unaudited) | |
| Corporate Bonds – 94.7% | Rate | Maturity | Face Amount | Value | ||||||||||||||||
COMMUNICATION SERVICES – 3.4% | ||||||||||||||||||||
AT&T, Inc. (Diversified Telecom. Svs.) | QL + 118 | 06/12/2024 | $2,000,000 | $ | 2,025,146 | |||||||||||||||
AT&T, Inc. (Diversified Telecom. Svs.) | 3.400% | 05/15/2025 | 1,000,000 | 1,027,448 | ||||||||||||||||
AT&T, Inc. (Diversified Telecom. Svs.) | 4.900% | 08/15/2037 | 1,000,000 | 1,080,109 | ||||||||||||||||
Discovery Communications LLC (Media) | 3.950% | 03/20/2028 | 900,000 | 927,549 | ||||||||||||||||
Lamar Media Corp. (Media) | 5.750% | 02/01/2026 | 500,000 | 525,625 | ||||||||||||||||
Sirius XM Radio, Inc. (Media) | (a | ) | 5.375% | 04/15/2025 | 1,000,000 | 1,031,250 | ||||||||||||||
Time Warner Cable LLC (Media) | 6.550% | 05/01/2037 | 850,000 | 981,324 | ||||||||||||||||
Verizon Communications, Inc. (Diversified Telecom. Svs.) | 4.500% | 08/10/2033 | 1,000,000 | 1,125,793 | ||||||||||||||||
|
| |||||||||||||||||||
| 8,724,244 | ||||||||||||||||||||
|
| |||||||||||||||||||
CONSUMER DISCRETIONARY – 5.9% | ||||||||||||||||||||
Amazon.com, Inc. (Internet & Direct Marketing Retail) | 3.875% | 08/22/2037 | 900,000 | 992,071 | ||||||||||||||||
Aptiv PLC (Auto Components) | 4.350% | 03/15/2029 | 1,000,000 | 1,053,398 | ||||||||||||||||
Dollar General Corp. (Multiline Retail) | 4.125% | 05/01/2028 | 2,000,000 | 2,127,576 | ||||||||||||||||
Expedia Group, Inc. (Internet & Direct Marketing Retail) | 5.000% | 02/15/2026 | 3,000,000 | 3,266,552 | ||||||||||||||||
General Motors Co. (Automobiles) | 5.000% | 04/01/2035 | 900,000 | 884,057 | ||||||||||||||||
Hasbro, Inc. (Leisure Products) | 3.500% | 09/15/2027 | 2,000,000 | 2,028,731 | ||||||||||||||||
Lear Corp. (Auto Components) | 3.800% | 09/15/2027 | 4,000,000 | 3,957,679 | ||||||||||||||||
Magna International, Inc. (Auto Components) | 3.625% | 06/15/2024 | 1,000,000 | 1,046,258 | ||||||||||||||||
|
| |||||||||||||||||||
| 15,356,322 | ||||||||||||||||||||
|
| |||||||||||||||||||
CONSUMER STAPLES – 6.1% | ||||||||||||||||||||
Anheuser-Busch Cos. LLC / Anheuser-Busch InBev Worldwide, Inc. (Beverages) | 4.700% | 02/01/2036 | 2,000,000 | 2,199,333 | ||||||||||||||||
Anheuser-Busch Cos. LLC / Anheuser-Busch InBev Worldwide, Inc. (Beverages) | 4.900% | 02/01/2046 | 1,000,000 | 1,111,466 | ||||||||||||||||
Anheuser-Busch InBev Worldwide, Inc. (Beverages) | 4.600% | 04/15/2048 | 2,000,000 | 2,147,717 | ||||||||||||||||
B.A.T. Capital Corp. (Tobacco) | 4.390% | 08/15/2037 | 3,000,000 | 2,851,613 | ||||||||||||||||
Campbell Soup Co. (Food Products) | 4.150% | 03/15/2028 | 2,000,000 | 2,087,008 | ||||||||||||||||
J.M. Smucker Co. / The (Food Products) | 3.375% | 12/15/2027 | 3,000,000 | 3,064,454 | ||||||||||||||||
Mead Johnson Nutrition Co. (Food Products) | 3.000% | 11/15/2020 | 900,000 | 907,955 | ||||||||||||||||
Philip Morris International, Inc. (Tobacco) | 4.125% | 05/17/2021 | 1,250,000 | 1,288,654 | ||||||||||||||||
|
| |||||||||||||||||||
| 15,658,200 | ||||||||||||||||||||
|
| |||||||||||||||||||
ENERGY – 12.7% | ||||||||||||||||||||
Apache Corp. (Oil, Gas & Consumable Fuels) | 4.375% | 10/15/2028 | 1,800,000 | 1,880,123 | ||||||||||||||||
Baker Hughes, a GE Co. LLC / Baker HughesCo-Obligor, Inc. (Energy Equip. & Svs.) | 4.080% | 12/15/2047 | 2,000,000 | 1,936,279 | ||||||||||||||||
BP Capital Markets America, Inc. (Oil, Gas & Consumable Fuels) | 3.017% | 01/16/2027 | 900,000 | 918,794 | ||||||||||||||||
Buckeye Partners LP (Oil, Gas & Consumable Fuels) | 4.875% | 02/01/2021 | 1,000,000 | 1,015,777 | ||||||||||||||||
Canadian Natural Resources Ltd. (Oil, Gas & Consumable Fuels) | 4.950% | 06/01/2047 | 3,000,000 | 3,416,114 | ||||||||||||||||
Chevron Corp. (Oil, Gas & Consumable Fuels) | 2.895% | 03/03/2024 | 900,000 | 929,264 | ||||||||||||||||
Columbia Pipeline Group, Inc. (Oil, Gas & Consumable Fuels) | 4.500% | 06/01/2025 | 1,000,000 | 1,074,591 | ||||||||||||||||
Concho Resources, Inc. (Oil, Gas & Consumable Fuels) | 3.750% | 10/01/2027 | 2,000,000 | 2,071,978 | ||||||||||||||||
Energy Transfer Operating LP (Oil, Gas & Consumable Fuels) | 4.950% | 06/15/2028 | 2,000,000 | 2,185,633 | ||||||||||||||||
EQM Midstream Partners LP (Oil, Gas & Consumable Fuels) | 4.750% | 07/15/2023 | 900,000 | 932,796 | ||||||||||||||||
Exxon Mobil Corp. (Oil, Gas & Consumable Fuels) | 4.114% | 03/01/2046 | 900,000 | 1,034,350 | ||||||||||||||||
Halliburton Co. (Energy Equip. & Svs.) | 4.850% | 11/15/2035 | 900,000 | 959,021 | ||||||||||||||||
Kinder Morgan Energy Partners LP (Oil, Gas & Consumable Fuels) | 4.150% | 03/01/2022 | 1,000,000 | 1,042,622 | ||||||||||||||||
Kinder Morgan, Inc. (Oil, Gas & Consumable Fuels) | 5.300% | 12/01/2034 | 1,000,000 | 1,130,179 | ||||||||||||||||
Marathon Oil Corp. (Oil, Gas & Consumable Fuels) | 3.850% | 06/01/2025 | 850,000 | 880,740 | ||||||||||||||||
Marathon Petroleum Corp. (Oil, Gas & Consumable Fuels) | 4.750% | 09/15/2044 | 1,000,000 | 1,030,367 | ||||||||||||||||
ONEOK, Inc. (Oil, Gas & Consumable Fuels) | 6.000% | 06/15/2035 | 1,000,000 | 1,137,011 | ||||||||||||||||
Patterson-UTI Energy, Inc. (Energy Equip. & Svs.) | 3.950% | 02/01/2028 | 1,000,000 | 982,863 | ||||||||||||||||
Peabody Energy Corp. (Oil, Gas & Consumable Fuels) | (a | ) | 6.000% | 03/31/2022 | 1,800,000 | 1,842,750 | ||||||||||||||
Shell International Finance BV (Oil, Gas & Consumable Fuels) | 4.000% | 05/10/2046 | 900,000 | 986,770 | ||||||||||||||||
Texas Eastern Transmission LP (Oil, Gas & Consumable Fuels) | (a | ) | 4.150% | 01/15/2048 | 1,000,000 | 1,019,380 | ||||||||||||||
Transocean Pontus Ltd. (Energy Equip. & Svs.) | (a | ) | 6.125% | 08/01/2025 | 1,181,250 | 1,216,688 | ||||||||||||||
Williams Cos., Inc. / The (Oil, Gas & Consumable Fuels) | 3.350% | 08/15/2022 | 1,000,000 | 1,018,859 | ||||||||||||||||
Williams Cos., Inc. / The (Oil, Gas & Consumable Fuels) | 3.750% | 06/15/2027 | 1,000,000 | 1,033,236 | ||||||||||||||||
Williams Cos., Inc. / The (Oil, Gas & Consumable Fuels) | 5.400% | 03/04/2044 | 1,000,000 | 1,102,913 | ||||||||||||||||
|
| |||||||||||||||||||
| 32,779,098 | ||||||||||||||||||||
|
| |||||||||||||||||||
FINANCIALS – 26.5% | ||||||||||||||||||||
AerCap Ireland Capital DAC /AerCap Global Aviation Trust (Diversified Financial Svs.) | 3.300% | 01/23/2023 | 3,000,000 | 3,025,553 | ||||||||||||||||
Aflac, Inc. (Insurance) | 3.625% | 06/15/2023 | 1,425,000 | 1,494,247 | ||||||||||||||||
American Express Co. (Consumer Finance) | QL + 75 | 08/03/2023 | 1,000,000 | 1,005,196 | ||||||||||||||||
American International Group, Inc. (Insurance) | 3.875% | 01/15/2035 | 2,500,000 | 2,489,501 | ||||||||||||||||
Bank of America Corp. (Banks) | 3.875% | 08/01/2025 | 850,000 | 909,200 | ||||||||||||||||
Bank of America Corp. (Rate is fixed until 01/23/2025, at which point, the rate becomes QL + 81) (Banks) | (b | ) | 3.366% | 01/23/2026 | 2,000,000 | 2,062,660 | ||||||||||||||
Bank of America Corp. (Rate is fixed until 04/24/2037, at which point, the rate becomes QL + 181) (Banks) | (b | ) | 4.244% | 04/24/2038 | 1,000,000 | 1,089,441 | ||||||||||||||
| 11 | (continued) |
| Ohio National Fund, Inc. | ON Bond Portfolio (Continued) |
Schedule of Investments | June 30, 2019 (Unaudited) | |
| Corporate Bonds (Continued) | Rate | Maturity | Face Amount | Value | ||||||||||||||
FINANCIALS (continued) | ||||||||||||||||||
Bank of Montreal (Rate is fixed until 12/15/2027, at which point, the rate becomes USSW5 + 143) (Banks) | (b) | 3.803% | 12/15/2032 | $2,800,000 | $ | 2,839,508 | ||||||||||||
Berkshire Hathaway, Inc. (Diversified Financial Svs.) | 3.125% | 03/15/2026 | 900,000 | 934,684 | ||||||||||||||
Branch Banking & Trust Co. (Banks) | 3.625% | 09/16/2025 | 1,180,000 | 1,240,510 | ||||||||||||||
Citigroup, Inc. (Banks) | 4.400% | 06/10/2025 | 2,000,000 | 2,134,421 | ||||||||||||||
Citigroup, Inc. (Banks) | 3.700% | 01/12/2026 | 1,000,000 | 1,052,306 | ||||||||||||||
Deutsche Bank AG (Capital Markets) | 2.700% | 07/13/2020 | 5,000,000 | 4,978,525 | ||||||||||||||
Discover Bank (Rate is fixed until 08/09/2023, at which point, the rate becomes USSW5 + 173) (Banks) | (b) | 4.682% | 08/09/2028 | 2,000,000 | 2,072,520 | |||||||||||||
E*TRADE Financial Corp. (Capital Markets) | 2.950% | 08/24/2022 | 1,800,000 | 1,817,126 | ||||||||||||||
Ford Motor Credit Co. LLC (Consumer Finance) | 3.157% | 08/04/2020 | 1,400,000 | 1,405,022 | ||||||||||||||
Ford Motor Credit Co. LLC (Consumer Finance) | QL + 88 | 10/12/2021 | 2,000,000 | 1,968,544 | ||||||||||||||
General Motors Financial Co., Inc. (Consumer Finance) | 3.200% | 07/06/2021 | 2,000,000 | 2,017,016 | ||||||||||||||
General Motors Financial Co., Inc. (Consumer Finance) | QL + 99 | 01/05/2023 | 2,000,000 | 1,970,976 | ||||||||||||||
General Motors Financial Co., Inc. (Consumer Finance) | 4.350% | 01/17/2027 | 1,000,000 | 1,018,224 | ||||||||||||||
Goldman Sachs Group, Inc. / The (Capital Markets) | 3.750% | 05/22/2025 | 2,000,000 | 2,090,807 | ||||||||||||||
Goldman Sachs Group, Inc. / The (Rate is fixed until 04/23/2028, at which point, the rate becomes QL + 116) (Capital Markets) | (b) | 3.814% | 04/23/2029 | 2,000,000 | 2,082,779 | |||||||||||||
Intercontinental Exchange, Inc. (Capital Markets) | 3.750% | 12/01/2025 | 1,000,000 | 1,068,416 | ||||||||||||||
Jefferies Group LLC / Jefferies Group Capital Finance, Inc. (Diversified Financial Svs.) | 4.850% | 01/15/2027 | 1,800,000 | 1,856,475 | ||||||||||||||
JPMorgan Chase & Co. (Banks) | 3.900% | 07/15/2025 | 2,023,000 | 2,159,079 | ||||||||||||||
JPMorgan Chase & Co. (Banks) | 3.625% | 12/01/2027 | 1,800,000 | 1,854,054 | ||||||||||||||
Marsh & McLennan Cos., Inc. (Insurance) | 3.500% | 06/03/2024 | 1,400,000 | 1,459,113 | ||||||||||||||
Morgan Stanley (Capital Markets) | QL + 140 | 10/24/2023 | 1,260,000 | 1,284,104 | ||||||||||||||
Morgan Stanley (Capital Markets) | 3.950% | 04/23/2027 | 1,000,000 | 1,045,521 | ||||||||||||||
Morgan Stanley (Rate is fixed until 05/06/2029, at which point, the rate becomes QL + 116) (Capital Markets) | (b) | 4.431% | 01/23/2030 | 2,000,000 | 2,214,180 | |||||||||||||
Nasdaq, Inc. (Capital Markets) | 3.850% | 06/30/2026 | 2,000,000 | 2,096,098 | ||||||||||||||
Progressive Corp. /The (Insurance) | 2.450% | 01/15/2027 | 900,000 | 890,394 | ||||||||||||||
Synchrony Financial (Consumer Finance) | 4.250% | 08/15/2024 | 1,000,000 | 1,041,428 | ||||||||||||||
TD Ameritrade Holding Corp. (Capital Markets) | 3.300% | 04/01/2027 | 1,900,000 | 1,959,515 | ||||||||||||||
Teachers Insurance & Annuity Association of America (Insurance) | (a) | 4.270% | 05/15/2047 | 900,000 | 973,361 | |||||||||||||
Wells Fargo & Co. (Banks) | 3.000% | 04/22/2026 | 900,000 | 910,089 | ||||||||||||||
Wells Fargo & Co. (Banks) | 4.650% | 11/04/2044 | 1,000,000 | 1,112,219 | ||||||||||||||
Wells Fargo Bank NA (Banks) | 3.550% | 08/14/2023 | 2,000,000 | 2,086,318 | ||||||||||||||
Westpac Banking Corp. (Banks) | QL + 57 | 01/11/2023 | 1,000,000 | 997,854 | ||||||||||||||
Westpac Banking Corp. (Rate is fixed until 11/23/2026, at which point, the rate becomes USISDA05 + 224) (Banks) | (b) | 4.322% | 11/23/2031 | 1,800,000 | 1,862,847 | |||||||||||||
|
| |||||||||||||||||
| 68,569,831 | ||||||||||||||||||
|
| |||||||||||||||||
HEALTH CARE – 3.6% | ||||||||||||||||||
AbbVie, Inc. (Biotechnology) | 2.900% | 11/06/2022 | 850,000 | 855,334 | ||||||||||||||
Bayer U.S. Finance II LLC (Pharmaceuticals) | (a) | 4.875% | 06/25/2048 | 2,000,000 | 2,051,452 | |||||||||||||
Celgene Corp. (Biotechnology) | 3.875% | 08/15/2025 | 2,000,000 | 2,142,453 | ||||||||||||||
CVS Health Corp. (Health Care Providers & Svs.) | 4.100% | 03/25/2025 | 3,000,000 | 3,162,378 | ||||||||||||||
UnitedHealth Group, Inc. (Health Care Providers & Svs.) | 3.875% | 12/15/2028 | 900,000 | 979,355 | ||||||||||||||
|
| |||||||||||||||||
| 9,190,972 | ||||||||||||||||||
|
| |||||||||||||||||
INDUSTRIALS – 8.5% | ||||||||||||||||||
Aircastle Ltd. (Trading Companies & Distributors) | 4.125% | 05/01/2024 | 4,000,000 | 4,094,999 | ||||||||||||||
Boeing Co. / The (Aerospace & Defense) | 3.200% | 03/01/2029 | 2,900,000 | 2,991,297 | ||||||||||||||
Burlington Northern Santa Fe LLC (Road & Rail) | 4.550% | 09/01/2044 | 900,000 | 1,041,535 | ||||||||||||||
FedEx Corp. (Air Freight & Logistics) | 4.900% | 01/15/2034 | 2,000,000 | 2,325,524 | ||||||||||||||
Lockheed Martin Corp. (Aerospace & Defense) | 3.600% | 03/01/2035 | 1,000,000 | 1,042,723 | ||||||||||||||
Northrop Grumman Corp. (Aerospace & Defense) | 2.930% | 01/15/2025 | 3,900,000 | 3,976,729 | ||||||||||||||
Parker-Hannifin Corp. (Machinery) | 4.200% | 11/21/2034 | 1,400,000 | 1,528,772 | ||||||||||||||
Union Pacific Corp. (Road &Rail) | 3.250% | 08/15/2025 | 1,000,000 | 1,039,649 | ||||||||||||||
United Rentals North America, Inc. (Trading Companies & Distributors) | 5.250% | 01/15/2030 | 2,000,000 | 2,055,000 | ||||||||||||||
Waste Connections, Inc. (Commercial Svs. & Supplies) | 4.250% | 12/01/2028 | 1,800,000 | 1,967,584 | ||||||||||||||
|
| |||||||||||||||||
| 22,063,812 | ||||||||||||||||||
|
| |||||||||||||||||
INFORMATION TECHNOLOGY – 1.9% | ||||||||||||||||||
Apple, Inc. (Tech. Hardware, Storage & Periph.) | 3.350% | 02/09/2027 | 900,000 | 945,233 | ||||||||||||||
Hewlett Packard Enterprise Co. (Tech. Hardware, Storage & Periph.) | 4.900% | 10/15/2025 | 850,000 | 928,742 | ||||||||||||||
Microsoft Corp. (Software) | 4.100% | 02/06/2037 | 900,000 | 1,026,403 | ||||||||||||||
Microsoft Corp. (Software) | 4.450% | 11/03/2045 | 900,000 | 1,078,081 | ||||||||||||||
Seagate HDD Cayman (Tech. Hardware, Storage & Periph.) | 4.875% | 03/01/2024 | 900,000 | 923,410 | ||||||||||||||
|
| |||||||||||||||||
| 4,901,869 | ||||||||||||||||||
|
| |||||||||||||||||
| 12 | (continued) |
| Ohio National Fund, Inc. | ON Bond Portfolio (Continued) |
Schedule of Investments | June 30, 2019 (Unaudited) | |
| Corporate Bonds (Continued) | Rate | Maturity | Face Amount | Value | ||||||||||||||
MATERIALS – 10.7% | ||||||||||||||||||
Anglo American Capital PLC (Metals & Mining) | (a) | 4.750% | 04/10/2027 | $1,000,000 | $ | 1,058,752 | ||||||||||||
Anglo American Capital PLC (Metals & Mining) | (a) | 4.000% | 09/11/2027 | 900,000 | 903,070 | |||||||||||||
Dow Chemical Co. / The (Chemicals) | 4.250% | 10/01/2034 | 1,900,000 | 1,972,541 | ||||||||||||||
FMC Corp. (Chemicals) | 3.950% | 02/01/2022 | 1,000,000 | 1,030,679 | ||||||||||||||
Kinross Gold Corp. (Metals & Mining) | 4.500% | 07/15/2027 | 2,900,000 | 2,929,000 | ||||||||||||||
Martin Marietta Materials, Inc. (Construction Materials) | 3.500% | 12/15/2027 | 4,000,000 | 3,991,409 | ||||||||||||||
Martin Marietta Materials, Inc. (Construction Materials) | 4.250% | 12/15/2047 | 1,000,000 | 934,793 | ||||||||||||||
Mosaic Co. / The (Chemicals) | 4.050% | 11/15/2027 | 3,000,000 | 3,099,295 | ||||||||||||||
Nutrien Ltd. (Chemicals) | 4.200% | 04/01/2029 | 1,900,000 | 2,050,321 | ||||||||||||||
Packaging Corp. of America (Containers & Packaging) | 3.400% | 12/15/2027 | 2,000,000 | 2,021,704 | ||||||||||||||
RPM International, Inc. (Chemicals) | 4.250% | 01/15/2048 | 3,000,000 | 2,733,332 | ||||||||||||||
Syngenta Finance N.V. (Chemicals) | (a) | 4.441% | 04/24/2023 | 1,000,000 | 1,039,147 | |||||||||||||
Syngenta Finance N.V. (Chemicals) | (a) | 5.182% | 04/24/2028 | 1,000,000 | 1,039,841 | |||||||||||||
Yamana Gold, Inc. (Metals & Mining) | 4.625% | 12/15/2027 | 2,800,000 | 2,861,079 | ||||||||||||||
|
| |||||||||||||||||
| 27,664,963 | ||||||||||||||||||
|
| |||||||||||||||||
REAL ESTATE – 7.4% | ||||||||||||||||||
Alexandria Real Estate Equities, Inc. (Equity REIT) | 3.950% | 01/15/2028 | 1,000,000 | 1,051,192 | ||||||||||||||
Boston Properties LP (Equity REIT) | 3.125% | 09/01/2023 | 925,000 | 948,340 | ||||||||||||||
Crown Castle International Corp. (Equity REIT) | 4.000% | 03/01/2027 | 1,800,000 | 1,888,436 | ||||||||||||||
Federal Realty Investment Trust (Equity REIT) | 3.000% | 08/01/2022 | 1,425,000 | 1,446,978 | ||||||||||||||
Federal Realty Investment Trust (Equity REIT) | 3.250% | 07/15/2027 | 2,000,000 | 2,040,738 | ||||||||||||||
HCP, Inc. (Equity REIT) | 4.000% | 06/01/2025 | 1,500,000 | 1,585,258 | ||||||||||||||
Healthcare Realty Trust, Inc. (Equity REIT) | 3.875% | 05/01/2025 | 1,400,000 | 1,445,053 | ||||||||||||||
Healthcare Realty Trust, Inc. (Equity REIT) | 3.625% | 01/15/2028 | 1,000,000 | 1,009,170 | ||||||||||||||
Highwoods Realty LP (Equity REIT) | 4.200% | 04/15/2029 | 1,850,000 | 1,934,571 | ||||||||||||||
Hospitality Properties Trust (Equity REIT) | 4.250% | 02/15/2021 | 1,000,000 | 1,010,933 | ||||||||||||||
Kilroy Realty LP (Equity REIT) | 3.450% | 12/15/2024 | 1,000,000 | 1,028,353 | ||||||||||||||
SITE Centers Corp. (Equity REIT) | 3.625% | 02/01/2025 | 1,721,000 | 1,740,596 | ||||||||||||||
Vornado Realty LP (Equity REIT) | 3.500% | 01/15/2025 | 1,000,000 | 1,020,162 | ||||||||||||||
Welltower, Inc. (Equity REIT) | 4.250% | 04/01/2026 | 1,000,000 | 1,065,304 | ||||||||||||||
|
| |||||||||||||||||
| 19,215,084 | ||||||||||||||||||
|
| |||||||||||||||||
UTILITIES – 8.0% | ||||||||||||||||||
AEP Transmission Co. LLC (Electric Utilities) | 4.000% | 12/01/2046 | 900,000 | 940,573 | ||||||||||||||
American Water Capital Corp. (Water Utilities) | 4.300% | 12/01/2042 | 1,400,000 | 1,518,675 | ||||||||||||||
Berkshire Hathaway Energy Co. (Multi-Utilities) | 3.250% | 04/15/2028 | 1,900,000 | 1,960,799 | ||||||||||||||
Commonwealth Edison Co. (Electric Utilities) | 4.350% | 11/15/2045 | 900,000 | 1,019,332 | ||||||||||||||
Connecticut Light & Power Co. / The (Electric Utilities) | 4.000% | 04/01/2048 | 900,000 | 982,727 | ||||||||||||||
DTE Electric Co. (Electric Utilities) | 3.375% | 03/01/2025 | 1,000,000 | 1,041,475 | ||||||||||||||
Duke Energy Corp. (Electric Utilities) | 3.750% | 09/01/2046 | 900,000 | 879,982 | ||||||||||||||
Duke Energy Florida LLC (Electric Utilities) | 2.100% | 12/15/2019 | 500,000 | 499,166 | ||||||||||||||
Eversource Energy (Electric Utilities) | 3.300% | 01/15/2028 | 1,000,000 | 1,020,050 | ||||||||||||||
FirstEnergy Transmission LLC (Electric Utilities) | (a) | 4.550% | 04/01/2049 | 1,800,000 | 1,966,220 | |||||||||||||
Jersey Central Power & Light Co. (Electric Utilities) | (a) | 4.300% | 01/15/2026 | 900,000 | 966,092 | |||||||||||||
LG&E & KU Energy LLC (Electric Utilities) | 4.375% | 10/01/2021 | 1,000,000 | 1,036,153 | ||||||||||||||
NextEra Energy Capital Holdings, Inc. (Electric Utilities) | 2.800% | 01/15/2023 | 3,000,000 | 3,019,947 | ||||||||||||||
Public Service Electric & Gas Co. (Multi-Utilities) | 3.600% | 12/01/2047 | 1,500,000 | 1,537,003 | ||||||||||||||
Southwest Gas Corp. (Gas Utilities) | 3.875% | 04/01/2022 | 1,000,000 | 1,023,273 | ||||||||||||||
Virginia Electric & Power Co. (Electric Utilities) | 3.450% | 02/15/2024 | 1,255,000 | 1,306,904 | ||||||||||||||
|
| |||||||||||||||||
| 20,718,371 | ||||||||||||||||||
|
| |||||||||||||||||
Total Corporate Bonds (Cost $235,839,745) | $ | 244,842,766 | ||||||||||||||||
|
| |||||||||||||||||
| Asset-Backed Securities – 2.7% | Rate | Maturity | Face Amount | Value | ||||||||||||||
INDUSTRIALS – 2.7% | ||||||||||||||||||
Air Canada2017-1 Class B Pass Through Trust | (a) | 3.700% | 01/15/2026 | $2,377,646 | $ | 2,369,324 | ||||||||||||
American Airlines2015-1 Class B Pass Through Trust | 3.700% | 05/01/2023 | 3,068,398 | 3,084,354 | ||||||||||||||
United Airlines2016-1 Class B Pass Through Trust | 3.650% | 01/07/2026 | 1,645,833 | 1,646,261 | ||||||||||||||
|
| |||||||||||||||||
Total Asset-Backed Securities (Cost $7,094,739) | $ | 7,099,939 | ||||||||||||||||
|
| |||||||||||||||||
| Sovereign Issues – 1.2% | Rate | Maturity | Face Amount | Value | ||||||||||||||
Mexico Government International Bond | 3.750% | 01/11/2028 | $3,000,000 | $ | 3,056,250 | |||||||||||||
|
| |||||||||||||||||
Total Sovereign Issues (Cost $2,988,734) | $ | 3,056,250 | ||||||||||||||||
|
| |||||||||||||||||
| 13 | (continued) |
| Ohio National Fund, Inc. | ON Bond Portfolio (Continued) |
Schedule of Investments | June 30, 2019 (Unaudited) | |
| Money Market Funds – 0.6% | Shares | Value | ||||||||||
State Street Institutional Liquid Reserves Fund Institutional Class, 2.449% | (c | ) | 1,468,904 | $ | 1,469,198 | |||||||
|
| |||||||||||
Total Money Market Funds (Cost $1,469,198) | $ | 1,469,198 | ||||||||||
|
| |||||||||||
Total Investments – 99.2% (Cost $247,392,416) | (d | ) | $ | 256,468,153 | ||||||||
Other Assets in Excess of Liabilities – 0.8% | 1,942,397 | |||||||||||
|
| |||||||||||
Net Assets – 100.0% | $ | 258,410,550 | ||||||||||
|
| |||||||||||
Percentages are stated as a percent of net assets.
Abbreviations:
| QL: | Quarterly U.S. LIBOR Rate, 2.320% at 06/30/2019 | |
| USISDA05: | USD ICE Swap Rate 11:00am NY 5 Year, 1.758% at 06/30/2019 | |
| USSW5: | USD Swap Semi 30/360 5 Year, 1.765% at 06/30/2019 |
Footnotes:
| (a) | Security exempt from registration under Regulation D of the Securities Act of 1933. These securities may be resold in transactions exempt from registration, normally to qualified buyers under Rule 144A. At June 30, 2019, the value of these securities totaled $17,477,327, or 6.8% of the Portfolio’s net assets. |
| (b) | Security is a fixed-then-variable rate instrument in which the coupon or dividend rate is fixed until a later specified date, then is adjusted periodically. Rates stated, including interest rate caps and floors, if any, are those in effect at June 30, 2019. |
| (c) | Rate represents theseven-day yield at June 30, 2019. |
| (d) | Represents cost for financial reporting purposes, which may differ from cost basis for federal income tax purposes. See also Note 7 of the Notes to Financial Statements. |
The accompanying notes are an integral part of these financial statements.
14
| Ohio National Fund, Inc. | ON BlackRock Balanced Allocation Portfolio (Unaudited) |
Objective/Strategy |
The ON BlackRock Balanced Allocation Portfolio(formerly the ON Omni Portfolio)seeks a high level of long-term total return consistent with preservation of capital by investing in stocks, bonds, and money market instruments.
Performance as of June 30, 2019 | ||||
Average Annual returns | ||||
One year | 2.98% | |||
Five years | 8.01% | |||
Ten years | 11.26% |
Past performance does not guarantee future results. The performance data quoted represents past performance and current returns may be lower or higher. Total return figures include change in share price and reinvestment of dividends and capital gains. The investment return and principal value will fluctuate so that an investor’s shares, when redeemed, may be worth more or less than the original cost. To obtain performance information up to the most recent month end, call toll-free1-877-781-6392.
The Portfolio is not open to direct retail investment. Beneficial interest in shares is obtained solely by purchase of variable life insurance policies and variable annuity contracts. Actual performance results for variable annuity and variable universal life contracts will be lower due to contract charges. Consult your contract for applicable charges.
Total expense ratio is 0.75% per the Fund’s prospectus dated May 1, 2019. Additional information pertaining to the Portfolio’s expense ratio as of June 30, 2019 can be found in the Portfolio’s Financial Highlights.
Comments fromSub-Adviser/Adviser |
Q. How did the Portfolio perform in comparison to its benchmark during the reporting period?
A.For thesix-month period ended June 30, 2019, the ON BlackRock Balanced Allocation Portfolio returned 20.32% versus 18.54% for its benchmark, the S&P 500 Index. The Portfolio’s secondary benchmark, which is comprised of 70% S&P 500 Index and 30% ICE BofA Merrill Lynch U.S. Corporate Master Index, returned 15.93% for the period.
Effective February 1, 2019, BlackRock Investment Management, LLC (“BlackRock”) replaced the Portfolio’s previoussub-adviser, Suffolk Capital Management, LLC (“Suffolk”). In conjunction with the change insub-adviser, the name of the Portfolio was changed from ON Omni Portfolio to ON BlackRock Balanced Allocation Portfolio. The Portfolio’s benchmarks were unchanged.
For the period from January 1, 2019 to January 31, 2019 (the “firstone-month period”), the Portfolio was known as the ON Omni Portfolio, and wassub-advised by Suffolk. During the firstone-month period, the Portfolio returned 10.84% versus 8.01% for the S&P 500 Index and 6.24% for the secondary benchmark, respectively.
For the period from February 1, 2019 to June 30, 2019 (the “latter five-month period”), the Portfolio wassub-advised by BlackRock. During this period, the Portfolio returned 8.55% versus 9.74% for the S&P 500 Index and 9.13% the secondary benchmark, respectively.
Q. Were there specific market conditions, investment strategies, or techniques that materially affected the Portfolio’s benchmark-relative performance during the reporting period?
A. Suffolk/ONI:For the firstone-month period, there were no market conditions, investment strategies, or techniques that materially affected the Portfolio’s benchmark relative performance.
A. BlackRock/ONI:For the latter five-month period, two select months were the primary drivers of relative returns for the equity portion of the Portfolio. The Portfolio outperformed its benchmark significantly in May, as the market declined, due to increased trade tensions and slowing global growth. One of the core drivers of the outperformance was a sentiment-based insight that evaluates the sentiment of informed bond investors. The signal provides an alternative lens into company quality and often exhibits defensive properties, which was particularly beneficial in May, as investors sought these characteristics. Several fundamental signals, particularly alternative quality measures, bolstered relative returns, as investors searched for sustainable businesses that had the potential for growth amidst ongoing economic uncertainty.
In contrast, the Portfolio struggled in June, amidst a strong market rally driven largely by geopolitical developments and central bank policy. The market rally was sparked by a sharp reversal, as a constructive meeting between the U.S. and China at the G20 Osaka Summit led to a decrease in trade tensions, while the Federal Reserve’s dovish rhetoric increased expectations of more supportive central bank policy. The erratic nature of global trade discussions, combined with the divergence of central bank policy globally, led to an environment in which the Portfolio’s macro thematic signals struggled over the course of the month. Additionally, certain insights that exhibit more defensive properties hindered performance, as the market experienced a sharp rally following the reversal at the beginning of the month.
As it relates to the fixed income, the Portfolio benefited from declining interest rates and tighter corporate bond spreads during the period. The Portfolio’s exposure to lower quality corporate bonds benefited relative performance.
Q. How did sector allocation and security selection each impact the Portfolio’s performance relative to its benchmark? For sector allocation, were there any factors that impacted the benchmark’s performance more significantly than the Portfolio’s performance? For security selection, was there anything specific regarding the Portfolio’s strategy that caused deviation from the benchmark?
A. Suffolk/ONI:For the firstone-month period, both sector allocation and security selection contributed to relative outperformance during the period. Stock selection in Health Care and Consumer Discretionary contributed to relative outperformance, while stock selection in Communication Services detracted from relative performance. Both security selection and sector allocation had positive contributions to relative performance. For the fixed income portion of the Portfolio, the Information Technology, Utilities and Energy sectors had positive contributions to performance, while the Consumer Discretionary sector detracted from performance. Security selection in the Energy, Information Technology and Financials sectors also contributed to performance.
A. BlackRock/ONI:The equity portfolio management team targets a generally sector-neutral approach and seeks to derive the majority of its alpha from security selection. That being said, a modest underweight to the Energy sector contributed slightly to performance, as the sector underperformed the broader market during the latter five-month period. On the other hand, a modest overweight to Health Care detracted slightly, as the sector underperformed, amidst arisk-on,pro-cyclical andpro-growth market environment. As expected, the majority of relative performance was driven by security selection decisions. Stock selection was positive in the Consumer Staples sector, particularly among food and staples retailers and food products companies. Security selection was also very positive in the Industrials sector, especially among industrial conglomerates, and in the Consumer Discretionary sector. In contrast, selection within the Energy sector, in both the oil, gas and consumable fuels industry and the energy equipment and services
| 15 | (continued) |
| Ohio National Fund, Inc. | ON BlackRock Balanced Allocation Portfolio (Unaudited) (Continued) |
industry, was a notable detractor from relative performance. Stock selection in the Financials sector, especially among capital markets companies, and in the Health Care sector, hindered relative returns as well.(1)
For the fixed income portion of the Portfolio, the Utilities, Materials, and Information Technology sectors had positive contributions to performance, while the Consumer Discretionary and Consumer Staples sectors detracted from performance. Security selection in the Utilities, Financials, and Energy sectors also contributed to performance.(1)
Q. Which holdings contributed the most to, and detracted the most from, the Portfolio’s benchmark-relative performance?
A. Suffolk/ONI:Top equity contributors for the firstone-month period included Sage Therapeutics, Inc., as it announced positive results for a Phase 3 trial in postpartum depression. Celgene Corp. contributed, as it was acquired by Bristol-Myers Squibb Co. Aerie Pharmaceuticals, Inc., another top contributor, expects to achieve its revenue target for Rhopressa, its new glaucoma drug, which is favorable compared to concerns of inventory buildup over the past several months. Additionally, the company announced positive pilot study results for Rhopressa in Japan, a significant new market opportunity. Top contributors on the fixed income portion of the Portfolio included Canadian Natural Resources Ltd. 4.950% due 2047, The Williams Cos., Inc. 5.400% due 2044, and Synchrony Financial 4.250% due 2024.
Alphabet, Inc. Class C detracted most from relative performance for the firstone-month period, as there were concerns Google would lose its share in online advertising to Amazon.com, Inc. (“Amazon”) and might withdraw its news service in Europe should a “snippet” tax be implemented. An underweight to Apple, Inc., due to expected phone pricing cuts, was another relative detractor. A third relative detractor was Amazon, as the Portfolio was underweight due to concerns of weaker U.S.e-commerce share gain and belief that increased regulation ofe-commerce in India would impact growth. For the fixed income portion of the Portfolio, the largest detractors were Charter Communications Operating LLC /Charter Communications Operating Capital Corp. 5.050% due 2029, Intercontinental Exchange, Inc. 2.750% due 2020, andKLA-Tencor Corp. 3.375% due 2019.
A. BlackRock/ONI:For the equity portion of the Portfolio, from a security standpoint, the top individual contributor for the latter five-month period was the Portfolio’s overweight in Target Corp. (“Target”). Target’s stock outperformed the broader market following a very strong first-quarter earnings report that included better than expected results on both revenue and earnings, as well as healthy same-store sales growth. More conveniente-commerce options, as well as improvements insame-day fulfillment services, supported by its Shipt business, drove digital sales growth and sparked investor confidence in the retailer’s ability to compete with other retail giants. The next largest contribution came from the Portfolio’s overweight in PepsiCo, Inc. The stock surged on news of the company’s first quarter earnings and revenue beats, along with the fact that the company experienced 5.2% organic revenue growth. Investors gained confidence, as the company has been increasingly diversifying its revenue drivers, including significant growth of its snack business, increased popularity of Bubly (its sparkling water) and healthy revenue growth internationally. The Portfolio’soff-benchmark position in CDW Corp. was beneficial as well. Largely due to company growth, as indicated in its first quarter earnings announcement, shares in the Information Technology company increased roughly 30% over the period. Company earnings and revenue both topped analyst expectations, as year-over-year earnings rose 18%, while revenue jumped 10%.(1)
Top contributors to the fixed income portion of the Portfolio included Canadian Natural Resources Ltd. 4.950% due 2047, Anheuser-Busch Cos. LLC /Anheuser-Busch InBevWorldwide, Inc. 4.700% due 2036, and Kinross Gold Corp. 4.500% due 2027.(1)
For the equity portion of the Portfolio, the top individual detractor for the period was the Portfolio’s overweight position in The Charles Schwab Corp. The company struggled amidst increased pricing pressure that some analysts believe could act as a headwind and stifle company revenue growth going forward. Furthermore, the Portfolio’s underweight in Microsoft Corp. was a drag on relative performance, as those shares outperformed the broader market. The company’s rapidly growing cloud computing business, Azure, was the primary driver of returns, as cloud-service revenue grew 73% year-over-year in the first quarter. This growth significantly topped analyst expectations and resulted in company revenues and earnings both beating estimates, with revenues growing 14% year-over-year. The Portfolio’s overweight position in UnitedHealth Group, Inc. was the third largest individual detractor, as the stock declined roughly 8% over the period. Despite fairly strong first quarter earnings, uncertainties around future policy changes caused investor concern, as certain policies, such asMedicare-for-All, could act as a significant headwind to Health Care providers and insurers. Analysts felt that the management team did little to address the potential risks and soothe investor concerns, causing a continuedsell-off throughout the latter five-month period.(1)
For the fixed income portion of the Portfolio, the largest detractors were Charter Communications Operating LLC /Charter Communications Operating Capital Corp. 5.050% due 2029, Intercontinental Exchange, Inc. 2.750% due 2020, andKLA-Tencor Corp. 3.375% due 2019.(1)
Q. How did the Portfolio’s use of derivative instruments and initial public offerings (IPOs), if any, impact performance?
A. Suffolk/ONI:The Portfolio did not hold any derivatives or participate in any IPOs during the firstone-month period.
A. BlackRock/ONI:Pursuant to the Portfolio’s investment strategy, futures contracts were used in order to equitize cash and prevent a cash drag on performance during the latter five-month period. The futures did not meaningfully impact performance, however, due to their index characteristics and size in relation to the Portfolio’s net assets.(1)
| (1) | The Portfolio’s composition is subject to change. Holdings and weightings are as of June 30, 2019. |
| 16 | (continued) |
| Ohio National Fund, Inc. | ON BlackRock Balanced Allocation Portfolio (Unaudited) (Continued) |
Change in Value of $10,000 Investment |
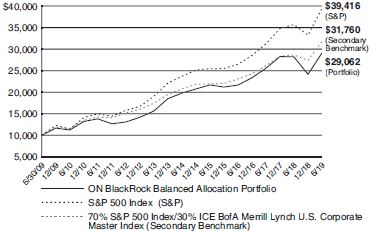
Hypothetical illustration based on past performance. Future performance will vary. The Portfolio’s returns reflect reinvested dividends. The Portfolio’s holdings may differ significantly from the securities in the index. The index is unmanaged and therefore does not reflect the cost of portfolio management and accounting.
The S&P 500 Index is a capitalization-weighted index designed to measure performance of the broad domestic market through changes in the aggregate market value of 500 stocks representing all major industries. The index presented includes the effects of reinvested dividends.
The ICE BofA Merrill Lynch U.S. Corporate Master Index tracks the performance of all U.S. dollar-denominated, investment grade corporate public debt issued in the U.S. domestic bond market. Qualifying bonds must have an investment grade rating (based on an average of Moody’s, S&P, and Fitch). In addition, qualifying securities must have at least one year remaining term to maturity, a fixed coupon schedule, and a minimum amount outstanding of $250 million.
Past performance is no guarantee of future results. Redemption of fund shares could have tax implications unique to each shareholder.
Portfolio Composition as of June 30, 2019(1) | ||
| % of Net Assets | ||||
Common Stocks(4) | 71.7 | |||
Corporate Bonds(4) | 25.6 | |||
Asset-Backed Securities(4) | 0.5 | |||
U.S. Treasury Obligations | 0.4 | |||
Money Market Funds and | 1.8 | |||
|
| |||
| 100.0 | ||||
|
| |||
Top 10 Portfolio Holdings as of June 30, 2019 (1) (2) (3) | ||||
| % of Net Assets | ||||||
1. | Amazon.com, Inc. | 2.8 | ||||
2. | Microsoft Corp. | 2.2 | ||||
3. | Apple, Inc. | 1.9 | ||||
4. | JPMorgan Chase & Co. | 1.9 | ||||
5. | Johnson & Johnson | 1.9 | ||||
6. | Facebook, Inc. Class A | 1.6 | ||||
7. | Berkshire Hathaway, Inc. Class B | 1.5 | ||||
8. | Merck & Co., Inc. | 1.4 | ||||
9. | Verizon Communications, Inc. | 1.3 | ||||
10. | Medtronic PLC | 1.1 | ||||
| (1) | Composition of Portfolio subject to change. |
| (2) | Short-term investments have been excluded from the list of Top 10 Portfolio Holdings. |
| (3) | Top 10 Portfolio Holdings is presented at an individual security level. Total investment exposure by issuer may be higher. |
| (4) | Sectors (Common Stocks, Corporate Bonds, Asset-Backed Securities): |
| % of Net Assets | ||||
Financials | 18.3 | |||
Information Technology | 16.8 | |||
Health Care | 11.6 | |||
Industrials | 9.5 | |||
Consumer Discretionary | 8.6 | |||
Communication Services | 8.3 | |||
Energy | 7.2 | |||
Consumer Staples | 5.4 | |||
Utilities | 4.5 | |||
Real Estate | 3.9 | |||
Materials | 3.7 | |||
|
| |||
| 97.8 | ||||
|
|
17
| Ohio National Fund, Inc. | ON BlackRock Balanced Allocation Portfolio |
Schedule of Investments | June 30, 2019 (Unaudited) | |
| Common Stocks – 71.7% | Shares | Value | ||||||||
COMMUNICATION SERVICES – 7.0% | ||||||||||
Activision Blizzard, Inc. (Entertainment) | 813 | $ | 38,374 | |||||||
Alphabet, Inc. Class A (Interactive Media & Svs.) | (a) | 222 | 240,381 | |||||||
Alphabet, Inc. Class C (Interactive Media & Svs.) | (a) | 531 | 573,963 | |||||||
AT&T, Inc. (Diversified Telecom. Svs.) | 4,176 | 139,938 | ||||||||
CBS Corp. Class B (Media) | 601 | 29,990 | ||||||||
Comcast Corp. Class A (Media) | 12,774 | 540,085 | ||||||||
Facebook, Inc. Class A (Interactive Media & Svs.) | (a) | 4,850 | 936,050 | |||||||
Fox Corp. Class A (Media) | 357 | 13,080 | ||||||||
Fox Corp. Class B (Media) | 685 | 25,023 | ||||||||
Interpublic Group of Cos., Inc. / The (Media) | 21,298 | 481,122 | ||||||||
Netflix, Inc. (Entertainment) | (a) | 419 | 153,907 | |||||||
Pinterest, Inc. Class A (Interactive Media & Svs.) | (a) | 927 | 25,233 | |||||||
Sinclair Broadcast Group, Inc. Class A (Media) | 406 | 21,774 | ||||||||
Verizon Communications, Inc. (Diversified Telecom. Svs.) | 13,696 | 782,452 | ||||||||
Viacom, Inc. Class B (Entertainment) | 2,878 | 85,966 | ||||||||
|
| |||||||||
| 4,087,338 | ||||||||||
|
| |||||||||
CONSUMER DISCRETIONARY – 6.9% | ||||||||||
Advance Auto Parts, Inc. (Specialty Retail) | 517 | 79,690 | ||||||||
Alibaba Group Holding Ltd. – ADR (Internet & Direct Marketing Retail) | (a) | 950 | 160,977 | |||||||
Amazon.com, Inc. (Internet & Direct Marketing Retail) | (a) | 868 | 1,643,672 | |||||||
AutoZone, Inc. (Specialty Retail) | (a) | 90 | 98,952 | |||||||
Chipotle Mexican Grill, Inc. (Hotels, Restaurants & Leisure) | (a) | 7 | 5,130 | |||||||
Darden Restaurants, Inc. (Hotels, Restaurants & Leisure) | 3,885 | 472,921 | ||||||||
Domino’s Pizza, Inc. (Hotels, Restaurants & Leisure) | 256 | 71,240 | ||||||||
Extended Stay America, Inc. (Hotels, Restaurants & Leisure) | 12,239 | 206,717 | ||||||||
frontdoor, Inc. (Diversified Consumer Svs.) | (a) | 558 | 24,301 | |||||||
Home Depot, Inc. / The (Specialty Retail) | 422 | 87,763 | ||||||||
Las Vegas Sands Corp. (Hotels, Restaurants & Leisure) | 3,497 | 206,638 | ||||||||
Lululemon Athletica, Inc. (Textiles, Apparel & Luxury Goods) | (a) | 708 | 127,589 | |||||||
McDonald’s Corp. (Hotels, Restaurants & Leisure) | 1,361 | 282,625 | ||||||||
NIKE, Inc. Class B (Textiles, Apparel & Luxury Goods) | 3,538 | 297,015 | ||||||||
O’Reilly Automotive, Inc. (Specialty Retail) | (a) | 104 | 38,409 | |||||||
Royal Caribbean Cruises Ltd. (Hotels, Restaurants & Leisure) | 698 | 84,605 | ||||||||
Target Corp. (Multiline Retail) | 2,070 | 179,283 | ||||||||
TJX Cos., Inc. / The (Specialty Retail) | 129 | 6,822 | ||||||||
Ulta Beauty, Inc. (Specialty Retail) | (a) | 27 | 9,366 | |||||||
|
| |||||||||
| 4,083,715 | ||||||||||
|
| |||||||||
CONSUMER STAPLES – 4.9% | ||||||||||
Archer-Daniels-Midland Co. (Food Products) | 4,046 | 165,077 | ||||||||
Church & Dwight Co., Inc. (Household Products) | 2,512 | 183,527 | ||||||||
Colgate-Palmolive Co. (Household Products) | 995 | 71,312 | ||||||||
Costco Wholesale Corp. (Food & Staples Retailing) | 890 | 235,191 | ||||||||
Estee Lauder Cos., Inc. / The Class A (Personal Products) | 526 | 96,316 | ||||||||
General Mills, Inc. (Food Products) | 6,462 | 339,384 | ||||||||
Hershey Co. / The (Food Products) | 1,844 | 247,151 | ||||||||
J.M. Smucker Co. / The (Food Products) | 477 | 54,945 | ||||||||
McCormick & Co., Inc. (Food Products) | 517 | 80,140 | ||||||||
Monster Beverage Corp. (Beverages) | (a) | 1,289 | 82,277 | |||||||
PepsiCo, Inc. (Beverages) | 3,676 | 482,034 | ||||||||
Performance Food Group Co. (Food & Staples Retailing) | (a) | 1,556 | 62,287 | |||||||
Philip Morris International, Inc. (Tobacco) | 2,746 | 215,643 | ||||||||
Procter & Gamble Co. / The (Household Products) | 3,201 | 350,990 | ||||||||
Walmart, Inc. (Food & Staples Retailing) | 1,930 | 213,246 | ||||||||
|
| |||||||||
| 2,879,520 | ||||||||||
|
| |||||||||
ENERGY – 3.2% | ||||||||||
Antero Midstream Corp. (Oil, Gas & Consumable Fuels) | 6,922 | 79,326 | ||||||||
Cabot Oil & Gas Corp. (Oil, Gas & Consumable Fuels) | 628 | 14,419 | ||||||||
Chevron Corp. (Oil, Gas & Consumable Fuels) | 4,005 | 498,382 | ||||||||
ConocoPhillips (Oil, Gas & Consumable Fuels) | 9,752 | 594,872 | ||||||||
EOG Resources, Inc. (Oil, Gas & Consumable Fuels) | 1,925 | 179,333 | ||||||||
Exxon Mobil Corp. (Oil, Gas & Consumable Fuels) | 1,524 | 116,784 | ||||||||
Halliburton Co. (Energy Equip. & Svs.) | 7,538 | 171,414 | ||||||||
Phillips 66 (Oil, Gas & Consumable Fuels) | 1,305 | 122,070 | ||||||||
Valero Energy Corp. (Oil, Gas & Consumable Fuels) | 1,174 | 100,506 | ||||||||
Williams Cos., Inc. / The (Oil, Gas & Consumable Fuels) | 314 | 8,805 | ||||||||
|
| |||||||||
| 1,885,911 | ||||||||||
|
| |||||||||
| 18 | (continued) |
| Ohio National Fund, Inc. | ON BlackRock Balanced Allocation Portfolio (Continued) |
Schedule of Investments | June 30, 2019 (Unaudited) | |
| Common Stocks (Continued) | Shares | Value | ||||||||
FINANCIALS – 9.8% | ||||||||||
Allstate Corp. / The (Insurance) | 2,354 | $ | 239,378 | |||||||
American Express Co. (Consumer Finance) | 3,550 | 438,212 | ||||||||
Bank of America Corp. (Banks) | 9,231 | 267,699 | ||||||||
Berkshire Hathaway, Inc. Class B (Diversified Financial Svs.) | (a) | 4,182 | 891,477 | |||||||
Charles Schwab Corp. / The (Capital Markets) | 13,477 | 541,641 | ||||||||
Cincinnati Financial Corp. (Insurance) | 448 | 46,444 | ||||||||
Citizens Financial Group, Inc. (Banks) | 10,906 | 385,636 | ||||||||
Discover Financial Services (Consumer Finance) | 5,251 | 407,425 | ||||||||
First American Financial Corp. (Insurance) | 2,117 | 113,683 | ||||||||
First Republic Bank (Banks) | 1,606 | 156,826 | ||||||||
JPMorgan Chase & Co. (Banks) | 9,782 | 1,093,628 | ||||||||
Lincoln National Corp. (Insurance) | 259 | 16,693 | ||||||||
Loews Corp. (Insurance) | 664 | 36,301 | ||||||||
MetLife, Inc. (Insurance) | 1,830 | 90,896 | ||||||||
Morgan Stanley (Capital Markets) | 1,127 | 49,374 | ||||||||
Prudential Financial, Inc. (Insurance) | 5,399 | 545,299 | ||||||||
TD Ameritrade Holding Corp. (Capital Markets) | 3,049 | 152,206 | ||||||||
Travelers Cos., Inc. / The (Insurance) | 416 | 62,200 | ||||||||
Wells Fargo & Co. (Banks) | 4,007 | 189,611 | ||||||||
Western Alliance Bancorp (Banks) | (a) | 478 | 21,376 | |||||||
|
| |||||||||
| 5,746,005 | ||||||||||
|
| |||||||||
HEALTH CARE – 10.3% | ||||||||||
AbbVie, Inc. (Biotechnology) | 5,277 | 383,743 | ||||||||
AmerisourceBergen Corp. (Health Care Providers & Svs.) | 909 | 77,501 | ||||||||
Amgen, Inc. (Biotechnology) | 2,956 | 544,732 | ||||||||
Anthem, Inc. (Health Care Providers & Svs.) | 500 | 141,105 | ||||||||
Bristol-Myers Squibb Co. (Pharmaceuticals) | 6,273 | 284,480 | ||||||||
Celgene Corp. (Biotechnology) | (a) | 1,222 | 112,962 | |||||||
Cigna Corp. (Health Care Providers & Svs.) | 261 | 41,121 | ||||||||
CVS Health Corp. (Health Care Providers & Svs.) | 2,230 | 121,513 | ||||||||
Danaher Corp. (Health Care Equip. & Supplies) | 90 | 12,863 | ||||||||
Genomic Health, Inc. (Biotechnology) | (a) | 17 | 989 | |||||||
Gilead Sciences, Inc. (Biotechnology) | 8,401 | 567,572 | ||||||||
Johnson & Johnson (Pharmaceuticals) | 7,798 | 1,086,105 | ||||||||
McKesson Corp. (Health Care Providers & Svs.) | 261 | 35,076 | ||||||||
Medtronic PLC (Health Care Equip. & Supplies) | 6,782 | 660,499 | ||||||||
Merck & Co., Inc. (Pharmaceuticals) | 9,870 | 827,599 | ||||||||
Regeneron Pharmaceuticals, Inc. (Biotechnology) | (a) | 323 | 101,099 | |||||||
Stryker Corp. (Health Care Equip. & Supplies) | 1,416 | 291,101 | ||||||||
UnitedHealth Group, Inc. (Health Care Providers & Svs.) | 2,308 | 563,175 | ||||||||
Veeva Systems, Inc. Class A (Health Care Technology) | (a) | 1,049 | 170,053 | |||||||
Vertex Pharmaceuticals, Inc. (Biotechnology) | (a) | 312 | 57,215 | |||||||
|
| |||||||||
| 6,080,503 | ||||||||||
|
| |||||||||
INDUSTRIALS – 7.1% | ||||||||||
ADT, Inc. (Commercial Svs. & Supplies) | 1,343 | 8,219 | ||||||||
Allegion PLC (Building Products) | 2,386 | 263,772 | ||||||||
CoStar Group, Inc. (Professional Svs.) | (a) | 191 | 105,825 | |||||||
Crane Co. (Machinery) | 5,274 | 440,063 | ||||||||
Curtiss-Wright Corp. (Aerospace & Defense) | 171 | 21,739 | ||||||||
Generac Holdings, Inc. (Electrical Equip.) | (a) | 437 | 30,332 | |||||||
Honeywell International, Inc. (Industrial Conglomerates) | 2,199 | 383,923 | ||||||||
Hubbell, Inc. (Electrical Equip.) | 652 | 85,021 | ||||||||
IDEX Corp. (Machinery) | 62 | 10,673 | ||||||||
Insperity, Inc. (Professional Svs.) | 2,822 | 344,679 | ||||||||
L3Harris Technologies, Inc. (Aerospace & Defense) | 1,449 | 274,049 | ||||||||
Landstar System, Inc. (Road & Rail) | 223 | 24,082 | ||||||||
Lockheed Martin Corp. (Aerospace & Defense) | 1,483 | 539,130 | ||||||||
Lyft, Inc. Class A (Road & Rail) | (a) | 1,298 | 85,292 | |||||||
Oshkosh Corp. (Machinery) | 888 | 74,139 | ||||||||
PACCAR, Inc. (Machinery) | 7,166 | 513,516 | ||||||||
Raytheon Co. (Aerospace & Defense) | 609 | 105,893 | ||||||||
Rockwell Automation, Inc. (Electrical Equip.) | 2,450 | 401,384 | ||||||||
Roper Technologies, Inc. (Industrial Conglomerates) | 93 | 34,062 | ||||||||
Snap-on, Inc. (Machinery) | 1,460 | 241,834 | ||||||||
TriNet Group, Inc. (Professional Svs.) | (a) | 172 | 11,662 | |||||||
| 19 | (continued) |
| Ohio National Fund, Inc. | ON BlackRock Balanced Allocation Portfolio (Continued) |
Schedule of Investments | June 30, 2019 (Unaudited) | |
| Common Stocks (Continued) | Shares | Value | ||||||||
INDUSTRIALS (continued) | ||||||||||
Uber Technologies, Inc. (Road & Rail) | (a) | 2,069 | $ | 95,960 | ||||||
Waste Management, Inc. (Commercial Svs. & Supplies) | 695 | 80,182 | ||||||||
|
| |||||||||
| 4,175,431 | ||||||||||
|
| |||||||||
INFORMATION TECHNOLOGY – 15.4% | ||||||||||
Adobe, Inc. (Software) | (a) | 1,626 | 479,101 | |||||||
Amdocs Ltd. (IT Svs.) | 280 | 17,385 | ||||||||
Analog Devices, Inc. (Semiconductors & Equip.) | 189 | 21,332 | ||||||||
Apple, Inc. (Tech. Hardware, Storage & Periph.) | 5,544 | 1,097,269 | ||||||||
Automatic Data Processing, Inc. (IT Svs.) | 3,137 | 518,640 | ||||||||
Broadcom, Inc. (Semiconductors & Equip.) | 471 | 135,582 | ||||||||
CDW Corp. (Electronic Equip., Instr. & Comp.) | 1,056 | 117,216 | ||||||||
Ciena Corp. (Communications Equip.) | (a) | 1,398 | 57,500 | |||||||
Cirrus Logic, Inc. (Semiconductors & Equip.) | (a) | 1,648 | 72,018 | |||||||
Cisco Systems, Inc. (Communications Equip.) | 11,695 | 640,067 | ||||||||
Dell Technologies, Inc. Class C (Tech. Hardware, Storage & Periph.) | (a) | 2,380 | 120,904 | |||||||
Fidelity National Information Services, Inc. (IT Svs.) | 3,155 | 387,055 | ||||||||
GoDaddy, Inc. Class A (IT Svs.) | (a) | 3,569 | 250,365 | |||||||
HP, Inc. (Tech. Hardware, Storage & Periph.) | 8,196 | 170,395 | ||||||||
Intel Corp. (Semiconductors & Equip.) | 6,232 | 298,326 | ||||||||
International Business Machines Corp. (IT Svs.) | 1,306 | 180,097 | ||||||||
Intuit, Inc. (Software) | 857 | 223,960 | ||||||||
Mastercard, Inc. Class A (IT Svs.) | 58 | 15,343 | ||||||||
Microsoft Corp. (Software) | 9,788 | 1,311,201 | ||||||||
National Instruments Corp. (Electronic Equip., Instr. & Comp.) | 5,181 | 217,550 | ||||||||
NVIDIA Corp. (Semiconductors & Equip.) | 304 | 49,926 | ||||||||
Oracle Corp. (Software) | 2,595 | 147,837 | ||||||||
Paychex, Inc. (IT Svs.) | 5,842 | 480,738 | ||||||||
PayPal Holdings, Inc. (IT Svs.) | (a) | 491 | 56,200 | |||||||
QUALCOMM, Inc. (Semiconductors & Equip.) | 68 | 5,173 | ||||||||
Red Hat, Inc. (Software) | (a) | 79 | 14,833 | |||||||
salesforce.com, Inc. (Software) | (a) | 4,294 | 651,529 | |||||||
ServiceNow, Inc. (Software) | (a) | 868 | 238,327 | |||||||
Square, Inc. Class A (IT Svs.) | (a) | 575 | 41,705 | |||||||
Texas Instruments, Inc. (Semiconductors & Equip.) | 1,873 | 214,945 | ||||||||
VeriSign, Inc. (IT Svs.) | (a) | 159 | 33,256 | |||||||
Visa, Inc. (IT Svs.) | 3,236 | 561,608 | ||||||||
Workday, Inc. Class A (Software) | (a) | 169 | 34,743 | |||||||
Xilinx, Inc. (Semiconductors & Equip.) | 1,614 | 190,323 | ||||||||
|
| |||||||||
| 9,052,449 | ||||||||||
|
| |||||||||
MATERIALS – 2.0% | ||||||||||
Air Products & Chemicals, Inc. (Chemicals) | 1,405 | 318,050 | ||||||||
Dow, Inc. (Chemicals) | 4,246 | 209,370 | ||||||||
Ecolab, Inc. (Chemicals) | 935 | 184,606 | ||||||||
LyondellBasell Industries N.V. Class A (Chemicals) | 1,776 | 152,967 | ||||||||
Westrock Co. (Containers & Packaging) | 8,714 | 317,800 | ||||||||
|
| |||||||||
| 1,182,793 | ||||||||||
|
| |||||||||
REAL ESTATE – 2.4% | ||||||||||
Equity LifeStyle Properties, Inc. (Equity REIT) | 3,637 | 441,314 | ||||||||
Outfront Media, Inc. (Equity REIT) | 1,760 | 45,390 | ||||||||
Park Hotels & Resorts, Inc. (Equity REIT) | 8,847 | 243,823 | ||||||||
Prologis, Inc. (Equity REIT) | 4,973 | 398,337 | ||||||||
Ryman Hospitality Properties, Inc. (Equity REIT) | 951 | 77,117 | ||||||||
Simon Property Group, Inc. (Equity REIT) | 1,328 | 212,161 | ||||||||
|
| |||||||||
| 1,418,142 | ||||||||||
|
| |||||||||
UTILITIES – 2.7% | ||||||||||
Alliant Energy Corp. (Electric Utilities) | 359 | 17,620 | ||||||||
American Water Works Co., Inc. (Water Utilities) | 4,067 | 471,772 | ||||||||
Avista Corp. (Multi-Utilities) | 1,104 | 49,238 | ||||||||
Black Hills Corp. (Multi-Utilities) | 1,011 | 79,030 | ||||||||
Consolidated Edison, Inc. (Multi-Utilities) | 2,039 | 178,780 | ||||||||
DTE Energy Co. (Multi-Utilities) | 2,671 | 341,567 | ||||||||
Evergy, Inc. (Electric Utilities) | 1,353 | 81,383 | ||||||||
IDACORP, Inc. (Electric Utilities) | 1,416 | 142,209 | ||||||||
Pinnacle West Capital Corp. (Electric Utilities) | 67 | 6,304 | ||||||||
| 20 | (continued) |
| Ohio National Fund, Inc. | ON BlackRock Balanced Allocation Portfolio (Continued) |
Schedule of Investments | June 30, 2019 (Unaudited) | |
| Common Stocks (Continued) | Shares | Value | ||||||
UTILITIES (continued) | ||||||||
Southwest Gas Holdings, Inc. (Gas Utilities) | 243 | $ | 21,778 | |||||
Xcel Energy, Inc. (Electric Utilities) | 3,582 | 213,093 | ||||||
|
| |||||||
| 1,602,774 | ||||||||
|
| |||||||
Total Common Stocks (Cost $39,737,306) | $ | 42,194,581 | ||||||
|
| |||||||
| Corporate Bonds – 25.6% | Rate | Maturity | Face Amount | Value | ||||||||||||||
COMMUNICATION SERVICES – 1.3% | ||||||||||||||||||
AT&T, Inc. (Diversified Telecom. Svs.) | 3.400% | 05/15/2025 | $150,000 | $ | 154,117 | |||||||||||||
Discovery Communications LLC (Media) | 3.950% | 03/20/2028 | 100,000 | 103,061 | ||||||||||||||
Time Warner Cable LLC (Media) | 6.550% | 05/01/2037 | 150,000 | 173,175 | ||||||||||||||
Verizon Communications, Inc. (Diversified Telecom. Svs.) | 4.500% | 08/10/2033 | 150,000 | 168,869 | ||||||||||||||
Viacom, Inc. (Entertainment) | 4.250% | 09/01/2023 | 150,000 | 158,624 | ||||||||||||||
|
| |||||||||||||||||
| 757,846 | ||||||||||||||||||
|
| |||||||||||||||||
CONSUMER DISCRETIONARY – 1.7% | ||||||||||||||||||
Amazon.com, Inc. (Internet & Direct Marketing Retail) | 3.875% | 08/22/2037 | 100,000 | 110,230 | ||||||||||||||
Aptiv PLC (Auto Components) | 4.350% | 03/15/2029 | 150,000 | 158,010 | ||||||||||||||
Booking Holdings, Inc. (Internet & Direct Marketing Retail) | 3.550% | 03/15/2028 | 200,000 | 208,358 | ||||||||||||||
General Motors Co. (Automobiles) | 5.000% | 04/01/2035 | 100,000 | 98,228 | ||||||||||||||
Lear Corp. (Auto Components) | 5.250% | 01/15/2025 | 222,000 | 230,332 | ||||||||||||||
Volkswagen Group of America Finance LLC (Automobiles) | (b) | 4.625% | 11/13/2025 | �� | 200,000 | 217,176 | ||||||||||||
|
| |||||||||||||||||
| 1,022,334 | ||||||||||||||||||
|
| |||||||||||||||||
CONSUMER STAPLES – 0.5% | ||||||||||||||||||
Anheuser-Busch Cos. LLC / Anheuser-Busch InBev Worldwide, Inc. (Beverages) | 4.700% | 02/01/2036 | 100,000 | 109,966 | ||||||||||||||
Mead Johnson Nutrition Co. (Food Products) | 3.000% | 11/15/2020 | 100,000 | 100,884 | ||||||||||||||
Philip Morris International, Inc. (Tobacco) | 3.375% | 08/11/2025 | 100,000 | 103,922 | ||||||||||||||
|
| |||||||||||||||||
| 314,772 | ||||||||||||||||||
|
| |||||||||||||||||
ENERGY – 4.0% | ||||||||||||||||||
Apache Corp. (Oil, Gas & Consumable Fuels) | 4.375% | 10/15/2028 | 200,000 | 208,903 | ||||||||||||||
BP Capital Markets America, Inc. (Oil, Gas & Consumable Fuels) | 3.017% | 01/16/2027 | 100,000 | 102,088 | ||||||||||||||
Canadian Natural Resources Ltd. (Oil, Gas & Consumable Fuels) | 4.950% | 06/01/2047 | 100,000 | 113,870 | ||||||||||||||
Chevron Corp. (Oil, Gas & Consumable Fuels) | 2.895% | 03/03/2024 | 100,000 | 103,251 | ||||||||||||||
Columbia Pipeline Group, Inc. (Oil, Gas & Consumable Fuels) | 4.500% | 06/01/2025 | 150,000 | 161,189 | ||||||||||||||
EOG Resources, Inc. (Oil, Gas & Consumable Fuels) | 3.150% | 04/01/2025 | 100,000 | 102,594 | ||||||||||||||
EQM Midstream Partners LP (Oil, Gas & Consumable Fuels) | 4.750% | 07/15/2023 | 100,000 | 103,644 | ||||||||||||||
Exxon Mobil Corp. (Oil, Gas & Consumable Fuels) | 4.114% | 03/01/2046 | 100,000 | 114,928 | ||||||||||||||
Halliburton Co. (Energy Equip. & Svs.) | 4.850% | 11/15/2035 | 100,000 | 106,558 | ||||||||||||||
Kinder Morgan Energy Partners LP (Oil, Gas & Consumable Fuels) | 4.150% | 03/01/2022 | 75,000 | 78,197 | ||||||||||||||
Marathon Oil Corp. (Oil, Gas & Consumable Fuels) | 3.850% | 06/01/2025 | 150,000 | 155,425 | ||||||||||||||
Marathon Petroleum Corp. (Oil, Gas & Consumable Fuels) | 3.800% | 04/01/2028 | 150,000 | 152,389 | ||||||||||||||
ONEOK, Inc. (Oil, Gas & Consumable Fuels) | 4.000% | 07/13/2027 | 150,000 | 155,832 | ||||||||||||||
Patterson-UTI Energy, Inc. (Energy Equip. & Svs.) | 3.950% | 02/01/2028 | 150,000 | 147,429 | ||||||||||||||
Peabody Energy Corp. (Oil, Gas & Consumable Fuels) | (b) | 6.000% | 03/31/2022 | 200,000 | 204,750 | |||||||||||||
Shell International Finance BV (Oil, Gas & Consumable Fuels) | 4.000% | 05/10/2046 | 100,000 | 109,641 | ||||||||||||||
Williams Cos., Inc. / The (Oil, Gas & Consumable Fuels) | 3.350% | 08/15/2022 | 109,000 | 111,056 | ||||||||||||||
Williams Cos., Inc. / The (Oil, Gas & Consumable Fuels) | 5.400% | 03/04/2044 | 100,000 | 110,291 | ||||||||||||||
|
| |||||||||||||||||
| 2,342,035 | ||||||||||||||||||
|
| |||||||||||||||||
FINANCIALS – 8.5% | ||||||||||||||||||
AerCap Ireland Capital DAC / AerCap Global Aviation Trust (Diversified Financial Svs.) | 3.300% | 01/23/2023 | 150,000 | 151,278 | ||||||||||||||
Aflac, Inc. (Insurance) | 3.625% | 06/15/2023 | 75,000 | 78,645 | ||||||||||||||
American Express Co. (Consumer Finance) | 3.000% | 10/30/2024 | 150,000 | 153,679 | ||||||||||||||
American International Group, Inc. (Insurance) | 3.875% | 01/15/2035 | 150,000 | 149,370 | ||||||||||||||
Bank of America Corp. (Banks) | 3.875% | 08/01/2025 | 150,000 | 160,447 | ||||||||||||||
Bank of Montreal (Rate is fixed until 12/15/2027, at which point, the rate becomes USSW5 + 143) (Banks) | (c) | 3.803% | 12/15/2032 | 200,000 | 202,822 | |||||||||||||
Bank of New York Mellon Corp. / The (Capital Markets) | 3.300% | 08/23/2029 | 200,000 | 207,265 | ||||||||||||||
Berkshire Hathaway, Inc. (Diversified Financial Svs.) | 3.125% | 03/15/2026 | 100,000 | 103,854 | ||||||||||||||
Branch Banking & Trust Co. (Banks) | 3.625% | 09/16/2025 | 100,000 | 105,128 | ||||||||||||||
Citigroup, Inc. (Banks) | 4.400% | 06/10/2025 | 100,000 | 106,721 | ||||||||||||||
Comerica, Inc. (Banks) | 3.800% | 07/22/2026 | 100,000 | 104,073 | ||||||||||||||
Deutsche Bank AG (Capital Markets) | 2.700% | 07/13/2020 | 200,000 | 199,141 | ||||||||||||||
Discover Bank (Rate is fixed until 08/09/2023, at which point, the rate becomes USSW5 + 173) (Banks) | (c) | 4.682% | 08/09/2028 | 250,000 | 259,065 | |||||||||||||
E*TRADE Financial Corp. (Capital Markets) | 2.950% | 08/24/2022 | 200,000 | 201,903 | ||||||||||||||
Ford Motor Credit Co. LLC (Consumer Finance) | 3.157% | 08/04/2020 | 100,000 | 100,359 | ||||||||||||||
General Motors Financial Co., Inc. (Consumer Finance) | 3.200% | 07/06/2021 | 100,000 | 100,851 | ||||||||||||||
Goldman Sachs Group, Inc. / The (Capital Markets) | 3.750% | 05/22/2025 | 150,000 | 156,811 | ||||||||||||||
| 21 | (continued) |
| Ohio National Fund, Inc. | ON BlackRock Balanced Allocation Portfolio (Continued) |
Schedule of Investments
|
June 30, 2019 (Unaudited)
|
| Corporate Bonds (Continued) | Rate | Maturity | Face Amount | Value | ||||||||||||
FINANCIALS (continued) | ||||||||||||||||
Jefferies Group LLC / Jefferies Group Capital Finance, Inc. (Diversified Financial Svs.) | 4.850% | 01/15/2027 | $200,000 | $ 206,275 | ||||||||||||
JPMorgan Chase & Co. (Banks) | 3.250% | 09/23/2022 | 100,000 | 102,695 | ||||||||||||
JPMorgan Chase & Co. (Banks) | 3.625% | 12/01/2027 | 200,000 | 206,006 | ||||||||||||
Marsh & McLennan Cos., Inc. (Insurance) | 3.500% | 06/03/2024 | 100,000 | 104,222 | ||||||||||||
Morgan Stanley (Capital Markets) | 3.950% | 04/23/2027 | 100,000 | 104,552 | ||||||||||||
Nasdaq, Inc. (Capital Markets) | 3.850% | 06/30/2026 | 100,000 | 104,805 | ||||||||||||
Northern Trust Corp. (Capital Markets) | 3.950% | 10/30/2025 | 200,000 | 215,785 | ||||||||||||
PNC Bank N.A. (Banks) | 3.250% | 06/01/2025 | 195,000 | 202,071 | ||||||||||||
Progressive Corp. / The (Insurance) | 2.450% | 01/15/2027 | 100,000 | 98,933 | ||||||||||||
Raymond James Financial, Inc. (Capital Markets) | 3.625% | 09/15/2026 | 150,000 | 154,195 | ||||||||||||
S&P Global, Inc. (Capital Markets) | 4.000% | 06/15/2025 | 150,000 | 162,784 | ||||||||||||
Synchrony Financial (Consumer Finance) | 4.250% | 08/15/2024 | 150,000 | 156,214 | ||||||||||||
TD Ameritrade Holding Corp. (Capital Markets) | 3.300% | 04/01/2027 | 150,000 | 154,698 | ||||||||||||
Teachers Insurance & Annuity Association of America (Insurance) | (b) | 4.270% | 05/15/2047 | 100,000 | 108,151 | |||||||||||
Wells Fargo & Co. (Banks) | 3.500% | 03/08/2022 | 75,000 | 77,143 | ||||||||||||
Wells Fargo & Co. (Banks) | 3.000% | 04/22/2026 | 100,000 | 101,121 | ||||||||||||
Westpac Banking Corp. (Rate is fixed until 11/23/2026, at which point, the rate becomes USISDA05 + 224) (Banks) | (c) | 4.322% | 11/23/2031 | 200,000 | 206,983 | |||||||||||
|
| |||||||||||||||
| 5,008,045 | ||||||||||||||||
|
| |||||||||||||||
HEALTH CARE – 1.3% | ||||||||||||||||
AbbVie, Inc. (Biotechnology) | 2.900% | 11/06/2022 | 150,000 | 150,942 | ||||||||||||
Celgene Corp. (Biotechnology) | 3.875% | 08/15/2025 | 150,000 | 160,684 | ||||||||||||
CVS Health Corp. (Health Care Providers & Svs.) | 4.100% | 03/25/2025 | 150,000 | 158,119 | ||||||||||||
HCA, Inc. (Health Care Providers & Svs.) | 5.250% | 06/15/2026 | 150,000 | 166,022 | ||||||||||||
UnitedHealth Group, Inc. (Health Care Providers & Svs.) | 3.875% | 12/15/2028 | 100,000 | 108,817 | ||||||||||||
|
| |||||||||||||||
| 744,584 | ||||||||||||||||
|
| |||||||||||||||
INDUSTRIALS – 1.9% | ||||||||||||||||
Boeing Co. / The (Aerospace & Defense) | 3.200% | 03/01/2029 | 100,000 | 103,148 | ||||||||||||
Burlington Northern Santa Fe LLC (Road & Rail) | 4.550% | 09/01/2044 | 100,000 | 115,726 | ||||||||||||
FedEx Corp. (Air Freight & Logistics) | 4.900% | 01/15/2034 | 150,000 | 174,414 | ||||||||||||
Lockheed Martin Corp. (Aerospace & Defense) | 3.600% | 03/01/2035 | 100,000 | 104,272 | ||||||||||||
Northrop Grumman Corp. (Aerospace & Defense) | 2.930% | 01/15/2025 | 100,000 | 101,968 | ||||||||||||
Parker-Hannifin Corp. (Machinery) | 4.200% | 11/21/2034 | 100,000 | 109,198 | ||||||||||||
Union Pacific Corp. (Road & Rail) | 3.250% | 08/15/2025 | 100,000 | 103,965 | ||||||||||||
United Rentals North America, Inc. (Trading Companies & Distributors) | 5.250% | 01/15/2030 | 100,000 | 102,750 | ||||||||||||
Waste Connections, Inc. (Commercial Svs. & Supplies) | 4.250% | 12/01/2028 | 200,000 | 218,621 | ||||||||||||
|
| |||||||||||||||
| 1,134,062 | ||||||||||||||||
|
| |||||||||||||||
INFORMATION TECHNOLOGY – 1.4% | ||||||||||||||||
Apple, Inc. (Tech. Hardware, Storage & Periph.) | 2.500% | 02/09/2025 | 100,000 | 100,974 | ||||||||||||
Apple, Inc. (Tech. Hardware, Storage & Periph.) | 3.350% | 02/09/2027 | 100,000 | 105,026 | ||||||||||||
Hewlett Packard Enterprise Co. (Tech. Hardware, Storage & Periph.) | 4.900% | 10/15/2025 | 150,000 | 163,895 | ||||||||||||
Microsoft Corp. (Software) | 4.100% | 02/06/2037 | 100,000 | 114,045 | ||||||||||||
Microsoft Corp. (Software) | 4.450% | 11/03/2045 | 100,000 | 119,787 | ||||||||||||
Oracle Corp. (Software) | 4.300% | 07/08/2034 | 100,000 | 113,836 | ||||||||||||
Seagate HDD Cayman (Tech. Hardware, Storage & Periph.) | 4.875% | 03/01/2024 | 100,000 | 102,601 | ||||||||||||
|
| |||||||||||||||
| 820,164 | ||||||||||||||||
|
| |||||||||||||||
MATERIALS – 1.7% | ||||||||||||||||
Anglo American Capital PLC (Metals & Mining) | (b) | 4.000% | 09/11/2027 | 100,000 | 100,341 | |||||||||||
CF Industries, Inc. (Chemicals) | (b) | 4.500% | 12/01/2026 | 150,000 | 155,902 | |||||||||||
Dow Chemical Co. / The (Chemicals) | 4.250% | 10/01/2034 | 100,000 | 103,818 | ||||||||||||
Kinross Gold Corp. (Metals & Mining) | 4.500% | 07/15/2027 | 100,000 | 101,000 | ||||||||||||
Mosaic Co. / The (Chemicals) | 4.050% | 11/15/2027 | 200,000 | 206,620 | ||||||||||||
Nutrien Ltd. (Chemicals) | 4.200% | 04/01/2029 | 100,000 | 107,911 | ||||||||||||
Yamana Gold, Inc. (Metals & Mining) | 4.625% | 12/15/2027 | 200,000 | 204,363 | ||||||||||||
|
| |||||||||||||||
| 979,955 | ||||||||||||||||
|
| |||||||||||||||
REAL ESTATE – 1.5% | ||||||||||||||||
Alexandria Real Estate Equities, Inc. (Equity REIT) | 3.950% | 01/15/2028 | 150,000 | 157,679 | ||||||||||||
Boston Properties LP (Equity REIT) | 3.125% | 09/01/2023 | 75,000 | 76,892 | ||||||||||||
Crown Castle International Corp. (Equity REIT) | 4.000% | 03/01/2027 | 200,000 | 209,826 | ||||||||||||
Federal Realty Investment Trust (Equity REIT) | 3.000% | 08/01/2022 | 75,000 | 76,157 | ||||||||||||
HCP, Inc. (Equity REIT) | 4.000% | 06/01/2025 | 100,000 | 105,684 | ||||||||||||
Healthcare Realty Trust, Inc. (Equity REIT) | 3.875% | 05/01/2025 | 100,000 | 103,218 | ||||||||||||
Highwoods Realty LP (Equity REIT) | 4.200% | 04/15/2029 | 150,000 | 156,857 | ||||||||||||
|
| |||||||||||||||
| 886,313 | ||||||||||||||||
|
| |||||||||||||||
| 22 | (continued) |
| Ohio National Fund, Inc. | ON BlackRock Balanced Allocation Portfolio (Continued) |
Schedule of Investments | June 30, 2019 (Unaudited) | |
| Corporate Bonds (Continued) | Rate | Maturity | Face Amount | Value | ||||||||||||||||
UTILITIES – 1.8% | ||||||||||||||||||||
AEP Transmission Co. LLC (Electric Utilities) | 4.000% | 12/01/2046 | $100,000 | $ | 104,508 | |||||||||||||||
American Water Capital Corp. (Water Utilities) | 4.300% | 12/01/2042 | 100,000 | 108,477 | ||||||||||||||||
Berkshire Hathaway Energy Co. (Multi-Utilities) | 3.250% | 04/15/2028 | 100,000 | 103,200 | ||||||||||||||||
Commonwealth Edison Co. (Electric Utilities) | 4.350% | 11/15/2045 | 100,000 | 113,259 | ||||||||||||||||
Connecticut Light & Power Co. / The (Electric Utilities) | 4.000% | 04/01/2048 | 100,000 | 109,192 | ||||||||||||||||
Duke Energy Corp. (Electric Utilities) | 3.750% | 09/01/2046 | 100,000 | 97,776 | ||||||||||||||||
FirstEnergy Transmission LLC (Electric Utilities) | (b | ) | 4.550% | 04/01/2049 | 200,000 | 218,469 | ||||||||||||||
Fortis, Inc. (Electric Utilities) | 3.055% | 10/04/2026 | 100,000 | 99,223 | ||||||||||||||||
Jersey Central Power & Light Co. (Electric Utilities) | (b | ) | 4.300% | 01/15/2026 | 100,000 | 107,343 | ||||||||||||||
|
| |||||||||||||||||||
| 1,061,447 | ||||||||||||||||||||
|
| |||||||||||||||||||
Total Corporate Bonds (Cost $14,327,292) | $ | 15,071,557 | ||||||||||||||||||
|
| |||||||||||||||||||
| Asset-Backed Securities – 0.5% | Rate | Maturity | Face Amount | Value | ||||||||||||||||
INDUSTRIALS – 0.5% | ||||||||||||||||||||
American Airlines2015-1 Class B Pass Through Trust | 3.700% | 05/01/2023 | $127,850 | $ | 128,515 | |||||||||||||||
United Airlines2016-1 Class B Pass Through Trust | 3.650% | 01/07/2026 | 182,870 | 182,918 | ||||||||||||||||
|
| |||||||||||||||||||
Total Asset-Backed Securities (Cost $310,746) | $ | 311,433 | ||||||||||||||||||
|
| |||||||||||||||||||
| U.S. Treasury Obligations – 0.4% | Rate | Maturity | Face Amount | Value | ||||||||||||||||
U.S. Treasury Note | 2.125% | 05/15/2025 | $200,000 | $ | 203,265 | |||||||||||||||
|
| |||||||||||||||||||
Total U.S. Treasury Obligations (Cost $195,856) | $ | 203,265 | ||||||||||||||||||
|
| |||||||||||||||||||
| Money Market Funds – 1.6% | Shares | Value | ||||||||||||||||||
State Street Institutional Liquid Reserves Fund Institutional Class, 2.449% | (d | ) | 949,424 | $ | 949,614 | |||||||||||||||
|
| |||||||||||||||||||
Total Money Market Funds (Cost $949,585) | $ | 949,614 | ||||||||||||||||||
|
| |||||||||||||||||||
Total Investments – 99.8% (Cost $55,520,785) | (e | ) | $ | 58,730,450 | ||||||||||||||||
Other Assets in Excess of Liabilities – 0.2% | (f | ) | 88,664 | |||||||||||||||||
|
| |||||||||||||||||||
Net Assets – 100.0% | $ | 58,819,114 | ||||||||||||||||||
|
| |||||||||||||||||||
Percentages are stated as a percent of net assets.
Abbreviations:
| ADR: | American Depositary Receipts | |||
| USISDA05: | USD ICE Swap Rate 11:00am NY 5 Year, 1.758% at 06/30/2019 | |||
| USSW5: | USD Swap Semi 30/360 5 Year, 1.765% at 06/30/2019 |
Footnotes:
| (a) | Non-income producing security. |
| (b) | Security exempt from registration under Regulation D of the Securities Act of 1933. These securities may be resold in transactions exempt from registration, normally to qualified buyers under Rule 144A. At June 30, 2019, the value of these securities totaled $1,112,132, or 1.9% of the Portfolio’s net assets. |
| (c) | Security is a fixed-then-variable rate instrument in which the coupon or dividend rate is fixed until a later specified date, then is adjusted periodically. Rates stated, including interest rate caps and floors, if any, are those in effect at June 30, 2019. |
| (d) | Rate represents theseven-day yield at June 30, 2019. |
| (e) | Represents cost for financial reporting purposes, which may differ from cost basis for federal income tax purposes. See also Note 7 of the Notes to Financial Statements. |
| (f) | Includes $25,200 of cash pledged as collateral for the futures contracts outstanding at June 30, 2019. See also the following Schedule of Open Futures Contracts. |
The accompanying notes are an integral part of these financial statements.
Schedule of Open Futures Contracts | June 30, 2019 (Unaudited) | |||||||||||
Description | Number of contracts | Expiration Date | Notional Amount | Value | Unrealized Appreciation (Depreciation) | Variation Margin Receivable (Payable) | ||||||||||
CMEE-mini S&P 500 Index - Long | 4 | September 20, 2019 | $ | 585,594 | $ | 588,840 | $3,246 | $2,660 | ||||||||
The accompanying notes are an integral part of these financial statements.
23
| Ohio National Fund, Inc. | ON Capital Appreciation Portfolio (Unaudited) |
Objective/Strategy |
The ON Capital Appreciation Portfolio seeks long-term growth of capital by investing primarily in equity and equity related securities of established companies with either current or emerging earnings growth not fully appreciated or recognized by the market.
Performance as of June 30, 2019 | ||
Average Annual returns | ||||
One year | -2.49% | |||
Five years | 4.88% | |||
Ten years | 12.04% |
Past performance does not guarantee future results. The performance data quoted represents past performance and current returns may be lower or higher. Total return figures include change in share price and reinvestment of dividends and capital gains. The investment return and principal value will fluctuate so that an investor’s shares, when redeemed, may be worth more or less than the original cost. To obtain performance information up to the most recent month end, call toll-free1-877-781-6392.
The Portfolio is not open to direct retail investment. Beneficial interest in shares is obtained solely by purchase of variable life insurance policies and variable annuity contracts. Actual performance results for variable annuity and variable universal life contracts will be lower due to contract charges. Consult your contract for applicable charges.
Total expense ratio is 0.89% per the Fund’s prospectus dated May 1, 2019. Additional information pertaining to the Portfolio’s expense ratio as of June 30, 2019 can be found in the Portfolio’s Financial Highlights.
Comments fromSub-Adviser |
Q. How did the Portfolio perform in comparison to its benchmark during the reporting period?
A.For thesix-month period ended June 30, 2019, the ON Capital Appreciation Portfolio returned 14.37% versus 18.54% for its benchmark, the S&P 500 Index.
Q. Were there specific market conditions, investment strategies, or techniques that materially affected the Portfolio’s benchmark-relative performance during the reporting period?
A.Across Russell’s U.S. Equity Indices, growth significantly outperformed value throughout the capitalization spectrum. Mid cap and large cap growth stocks performed the best, while mid cap and small cap value positions lagged. The market’s tilt toward growth hindered Portfolio results, and the Portfolio underperformed relative to the S&P 500 Index.
Q. How did sector allocation and security selection each impact the Portfolio’s performance relative to its benchmark? For sector allocation, were there any factors that impacted the benchmark’s performance more significantly than the Portfolio’s performance? For security selection, was there anything specific regarding the Portfolio’s strategy that caused deviation from the benchmark?
A.Selection within growth-oriented sectors like Consumer Discretionary and Information Technology detracted the most from relative results, as the Portfolio’s holdings did not keep pace with the strong returns of the benchmark. An underweight in Information Technology was also a source of relative weakness.(1)
On the positive side, stock selection in Consumer Staples, Financials, and Materials aided relative performance.(1)
Q. Which holdings contributed the most to, and detracted the most from, the Portfolio’s benchmark-relative performance?
A.YETI Holdings, Inc., a designer, marketer, distributor, and retailer of premium products within the outdoor recreation market, was the top contributor. The company’s fourth quarter results and 2019 guidance were better than expected. We eliminated the position during the period, as we found it fully valued after very strong share price performance. Summit Materials, Inc. Class A (“Summit”), a manufacturer of cement,ready-mix concrete, asphalt paving mix, and other construction-related material had the next largest relative impact. Its shares were up as the result of a potential merger with Grupo Argos SA, a vertically integrated cement andready-mix-concrete producer. While a deal is far from confirmed, we believe Summit would benefit from the merger. Mondelez International, Inc. Class A, another top performer, manufactures and sells snack food and beverage products worldwide. Its shares benefited from organic sales growth, cost-saving divestments, and innovative initiatives, such as expansions into emerging markets and partnerships with Google and China’s Alibaba Group Holding Ltd. In our view, the company’s management has demonstrated its ability to continually expand the company’s customer base.(1)
Houghton Mifflin Harcourt Co. is a provider of content, services, and technology solutions for educational institutions and consumers and was the top detractor. Its financial results were lackluster and 2019 guidance fell short of expectations, due mostly to underperformance in the core textbook business, as Florida decided to defer purchases on new math and reading materials. We still view the industry environment as healthy and the reward to risk ratio for the company as very attractive. New curriculum adoptions in California and Texas could be tailwinds to better growth. Qurate Retail, Inc., another top detractor, is a media conglomerate comprised of seven leading retail brands, all dedicated to providing a shopping experience beyond transactionale-commerce or traditional brick and mortar stores. Its earnings were mixed, with solid revenue and customer performance offset by weaker margins. Cigna Corp. also weighed on relative returns, as its fourth-quarter earnings were essentially in line with expectations, while 2019 earnings guidance was modestly short of our projection. The stock’s decline also may have reflected uncertainty about the effects of a Centers for Medicare and Medicaid Services (CMS) Medicare rebate proposal.(1)
Q. How did the Portfolio’s use of derivative instruments and initial public offerings (IPOs), if any, impact performance?
A.Derivatives were not used during the period. The Portfolio participated in several IPO’s, but Parsons Corp. was the only IPO that significantly impacted performance. Parsons contributed 24 bps to total return during the period.(1)
| (1) | The Portfolio’s composition is subject to change. Holdings and weightings are as of June 30, 2019. |
| 24 | (continued) |
| Ohio National Fund, Inc. | ON Capital Appreciation Portfolio (Unaudited) (Continued) |
Change in Value of $10,000 Investment |
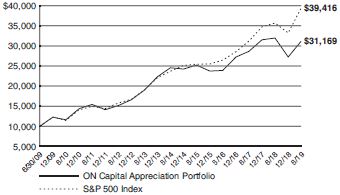
Hypothetical illustration based on past performance. Future performance will vary. The Portfolio’s returns reflect reinvested dividends. The Portfolio’s holdings may differ significantly from the securities in the index. The index is unmanaged and therefore does not reflect the cost of portfolio management and accounting.
The S&P 500 Index is a capitalization-weighted index designed to measure performance of the broad domestic economy through changes in the aggregate market value of 500 stocks representing all major industries. The index presented includes the effects of reinvested dividends.
Past performance is no guarantee of future results. Redemption of fund shares could have tax implications unique to each shareholder.
Portfolio Composition as of June 30, 2019(1) | ||||
| % of Net Assets | ||||
Common Stocks(4) | 97.4 | |||
Money Market Funds and | 2.6 | |||
|
| |||
| 100.0 | ||||
|
|
Top 10 Portfolio Holdings as of June 30, 2019(1) (2) (3) | ||||
| % of Net Assets | ||||||
| 1. | Alphabet, Inc. Class C | 2.4 | ||||
| 2. | Microsoft Corp. | 2.4 | ||||
| 3. | Walmart, Inc. | 2.0 | ||||
| 4. | Summit Materials, Inc. Class A | 1.9 | ||||
| 5. | Mondelez International, Inc. Class A | 1.9 | ||||
| 6. | Barrick Gold Corp. | 1.9 | ||||
| 7. | Liberty Global PLC Class C | 1.9 | ||||
| 8. | Facebook, Inc. Class A | 1.8 | ||||
| 9. | Delta Air Lines, Inc. | 1.8 | ||||
| 10. | Morgan Stanley | 1.7 |
| (1) | Composition of Portfolio subject to change. |
| (2) | Short-term investments have been excluded from the list of Top 10 Portfolio Holdings. |
| (3) | Top 10 Portfolio Holdings is presented at an individual security level. Total investment exposure by issuer may be higher. |
| (4) | Sectors (Common Stocks): |
| % of Net Assets | ||||
Industrials | 15.5 | |||
Information Technology | 12.7 | |||
Communication Services | 12.5 | |||
Financials | 12.4 | |||
Consumer Discretionary | 11.1 | |||
Health Care | 9.4 | |||
Materials | 8.2 | |||
Energy | 7.1 | |||
Consumer Staples | 5.5 | |||
Real Estate | 3.0 | |||
|
| |||
| 97.4 | ||||
|
|
25
| Ohio National Fund, Inc. | ON Capital Appreciation Portfolio |
Schedule of Investments | June 30, 2019 (Unaudited) | |
| Common Stocks – 97.4% | Shares | Value | ||||||||
COMMUNICATION SERVICES – 12.5% |
| |||||||||
Alphabet, Inc. Class C (Interactive Media & Svs.) | (a) | 2,158 | $ | 2,332,604 | ||||||
Comcast Corp. Class A (Media) | 35,743 | 1,511,214 | ||||||||
Facebook, Inc. Class A (Interactive Media & Svs.) | (a) | 9,017 | 1,740,281 | |||||||
Inmarsat PLC (Diversified Telecom. Svs.) | (b) | 129,228 | 895,102 | |||||||
Liberty Global PLC Class C (Media) | (a) | 67,403 | 1,788,202 | |||||||
Spotify Technology SA (Entertainment) | (a) | 7,177 | 1,049,421 | |||||||
Viacom, Inc. Class B (Entertainment) | 51,277 | 1,531,644 | ||||||||
Walt Disney Co. / The (Entertainment) | 8,707 | 1,215,845 | ||||||||
|
| |||||||||
| 12,064,313 | ||||||||||
|
| |||||||||
CONSUMER DISCRETIONARY – 11.1% |
| |||||||||
Extended Stay America, Inc. (Hotels, Restaurants & Leisure) | 71,019 | 1,199,511 | ||||||||
Houghton Mifflin Harcourt Co. (Diversified Consumer Svs.) | (a) | 158,652 | 913,836 | |||||||
International Game Technology PLC (Hotels, Restaurants & Leisure) | 107,271 | 1,391,305 | ||||||||
Laureate Education, Inc. Class A (Diversified Consumer Svs.) | (a) | 85,114 | 1,337,141 | |||||||
MGM Resorts International (Hotels, Restaurants & Leisure) | 52,555 | 1,501,496 | ||||||||
Playa Hotels & Resorts N.V. (Hotels, Restaurants & Leisure) | (a) | 131,731 | 1,015,646 | |||||||
Qurate Retail, Inc. (Internet & Direct Marketing Retail) | (a) | 49,550 | 613,924 | |||||||
SeaWorld Entertainment, Inc. (Hotels, Restaurants & Leisure) | (a) | 42,256 | 1,309,936 | |||||||
Tapestry, Inc. (Textiles, Apparel & Luxury Goods) | 43,548 | 1,381,778 | ||||||||
|
| |||||||||
| 10,664,573 | ||||||||||
|
| |||||||||
CONSUMER STAPLES – 5.5% |
| |||||||||
Mondelez International, Inc. Class A (Food Products) | 34,059 | 1,835,780 | ||||||||
Philip Morris International, Inc. (Tobacco) | 19,591 | 1,538,481 | ||||||||
Walmart, Inc. (Food & Staples Retailing) | 17,526 | 1,936,448 | ||||||||
|
| |||||||||
| 5,310,709 | ||||||||||
|
| |||||||||
ENERGY – 7.1% |
| |||||||||
Concho Resources, Inc. (Oil, Gas & Consumable Fuels) | 13,902 | 1,434,408 | ||||||||
Diamondback Energy, Inc. (Oil, Gas & Consumable Fuels) | 6,395 | 696,863 | ||||||||
Noble Energy, Inc. (Oil, Gas & Consumable Fuels) | 53,057 | 1,188,477 | ||||||||
TechnipFMC PLC (Energy Equip. & Svs.) | 50,746 | 1,316,351 | ||||||||
Valero Energy Corp. (Oil, Gas & Consumable Fuels) | 17,824 | 1,525,913 | ||||||||
WPX Energy, Inc. (Oil, Gas & Consumable Fuels) | (a) | 56,060 | 645,251 | |||||||
|
| |||||||||
| 6,807,263 | ||||||||||
|
| |||||||||
FINANCIALS – 12.4% |
| |||||||||
Brighthouse Financial, Inc. (Insurance) | (a) | 19,913 | 730,608 | |||||||
Chubb Ltd. (Insurance) | 9,050 | 1,332,974 | ||||||||
Citigroup, Inc. (Banks) | 21,705 | 1,520,001 | ||||||||
Goldman Sachs Group, Inc. /The (Capital Markets) | 6,975 | 1,427,085 | ||||||||
MetLife, Inc. (Insurance) | 32,074 | 1,593,116 | ||||||||
Moelis & Co. Class A (Capital Markets) | 36,144 | 1,263,233 | ||||||||
Morgan Stanley (Capital Markets) | 38,390 | 1,681,866 | ||||||||
Pinnacle Financial Partners, Inc. (Banks) | 18,249 | 1,048,953 | ||||||||
RenaissanceRe Holdings Ltd. (Insurance) | 3,143 | 559,485 | ||||||||
Wells Fargo & Co. (Banks) | 16,610 | 785,985 | ||||||||
|
| |||||||||
| 11,943,306 | ||||||||||
|
| |||||||||
HEALTH CARE – 9.4% | ||||||||||
Alexion Pharmaceuticals, Inc. (Biotechnology) | (a) | 10,326 | 1,352,499 | |||||||
| Common Stocks (Continued) | Shares | Value | ||||||||
HEALTH CARE (continued) | ||||||||||
Allergan PLC (Pharmaceuticals) | 6,888 | $ | 1,153,258 | |||||||
AstraZeneca PLC – ADR (Pharmaceuticals) | 30,690 | 1,266,883 | ||||||||
BioMarin Pharmaceutical, Inc. (Biotechnology) | (a) | 12,481 | 1,068,998 | |||||||
Bristol-Myers Squibb Co. (Pharmaceuticals) | 31,157 | 1,412,970 | ||||||||
Celgene Corp. (Biotechnology) | (a) | 7,343 | 678,787 | |||||||
Cigna Corp. (Health Care Providers & Svs.) | 7,980 | 1,257,249 | ||||||||
Pfizer, Inc. (Pharmaceuticals) | 19,610 | 849,505 | ||||||||
|
| |||||||||
| 9,040,149 | ||||||||||
|
| |||||||||
INDUSTRIALS – 15.5% |
| |||||||||
Airbus SE (Aerospace & Defense) | (b) | 7,498 | 1,061,129 | |||||||
Arcosa, Inc. (Construction & Engineering) | 13,186 | 496,189 | ||||||||
Beacon Roofing Supply, Inc. (Trading Companies & Distributors) | (a) | 31,512 | 1,157,121 | |||||||
Boeing Co. /The (Aerospace & Defense) | 4,408 | 1,604,556 | ||||||||
Delta Air Lines, Inc. (Airlines) | 29,718 | 1,686,496 | ||||||||
Emerson Electric Co. (Electrical Equip.) | 17,549 | 1,170,869 | ||||||||
GrafTech International Ltd. (Electrical Equip.) | 45,683 | 525,354 | ||||||||
Nielsen Holdings PLC (Professional Svs.) | 55,958 | 1,264,651 | ||||||||
Parsons Corp. (Aerospace & Defense) | (a) | 33,901 | 1,249,591 | |||||||
Trinity Industries, Inc. (Machinery) | 71,186 | 1,477,109 | ||||||||
Union Pacific Corp. (Road & Rail) | 9,498 | 1,606,207 | ||||||||
United Technologies Corp. (Aerospace & Defense) | 12,143 | 1,581,019 | ||||||||
|
| |||||||||
| 14,880,291 | ||||||||||
|
| |||||||||
INFORMATION TECHNOLOGY – 12.7% |
| |||||||||
BlackBerry Ltd. (Software) | (a) | 135,054 | 1,007,503 | |||||||
FLIR Systems, Inc. (Electronic Equip., Instr. & Comp.) | 21,047 | 1,138,643 | ||||||||
Microsoft Corp. (Software) | 17,279 | 2,314,695 | ||||||||
Nokia OYJ – ADR (Communications Equip.) | 188,139 | 942,577 | ||||||||
NVIDIA Corp. (Semiconductors & Equip.) | 6,023 | 989,157 | ||||||||
QUALCOMM, Inc. (Semiconductors & Equip.) | 21,562 | 1,640,221 | ||||||||
Silicon Laboratories, Inc. (Semiconductors & Equip.) | (a) | 9,393 | 971,236 | |||||||
Teradata Corp. (Software) | (a) | 36,112 | 1,294,615 | |||||||
Verint Systems, Inc. (Software) | (a) | 22,528 | 1,211,556 | |||||||
Verra Mobility Corp. (IT Svs.) | (a) | 58,534 | 766,210 | |||||||
|
| |||||||||
| 12,276,413 | ||||||||||
|
| |||||||||
MATERIALS – 8.2% |
| |||||||||
Agnico Eagle Mines Ltd. (Metals & Mining) | 11,466 | 587,518 | ||||||||
Barrick Gold Corp. (Metals & Mining) | 114,888 | 1,811,784 | ||||||||
Graphic Packaging Holding Co. (Containers & Packaging) | 108,683 | 1,519,388 | ||||||||
Lundin Mining Corp. (Metals & Mining) | 165,439 | 910,859 | ||||||||
Summit Materials, Inc. Class A (Construction Materials) | (a) | 96,954 | 1,866,365 | |||||||
Teck Resources Ltd. (Metals & Mining) | 51,856 | 1,195,799 | ||||||||
|
| |||||||||
| 7,891,713 | ||||||||||
|
| |||||||||
REAL ESTATE – 3.0% |
| |||||||||
CoreCivic, Inc. (Equity REIT) | 66,602 | 1,382,657 | ||||||||
Weyerhaeuser Co. (Equity REIT) | 55,853 | 1,471,168 | ||||||||
|
| |||||||||
| 2,853,825 | ||||||||||
|
| |||||||||
Total Common Stocks | $ | 93,732,555 | ||||||||
|
| |||||||||
| Money Market Funds – 1.4% | Shares | Value | ||||||||
State Street Institutional Liquid Reserves Fund Institutional Class, 2.449% | (c) | 1,380,533 | $ | 1,380,809 | ||||||
|
| |||||||||
Total Money Market Funds | $ | 1,380,809 | ||||||||
|
| |||||||||
Total Investments – 98.8% | (d) | $ | 95,113,364 | |||||||
Other Assets in Excess of | 1,155,816 | |||||||||
|
| |||||||||
Net Assets – 100.0% | $ | 96,269,180 | ||||||||
|
| |||||||||
| 26 | (continued) |
| Ohio National Fund, Inc. | ON Capital Appreciation Portfolio (Continued) |
Schedule of Investments | June 30, 2019 (Unaudited) | |
Percentages are stated as a percent of net assets.
Abbreviations:
| ADR: | American Depositary Receipts |
Footnotes:
| (a) | Non-income producing security. |
| (b) | Security traded on a foreign exchange has been valued at an estimate of fair value that is different than the local market close price. These fair value estimates are determined by an independent fair valuation service that has been approved by the Board. These securities represent $1,956,231 or 2.0% of the Portfolio’s net assets. |
| (c) | Rate represents theseven-day yield at June 30, 2019. |
| (d) | Represents cost for financial reporting purposes, which may differ from cost basis for federal income tax purposes. See also Note 7 of the Notes to Financial Statements. |
The accompanying notes are an integral part of these financial statements.
27
| Ohio National Fund, Inc. | ON International Equity Portfolio (Unaudited) |
Objective/Strategy |
The ON International Equity Portfolio seeks long-term growth of capital by investing, under normal circumstances, at least 80% of its net assets in equity securities of foreign companies.
Performance as of June 30, 2019 | ||
Average Annual returns | ||||
One year | 2.79 | % | ||
Five years | 1.39 | % | ||
Ten years | 6.43 | % |
Past performance does not guarantee future results. The performance data quoted represents past performance and current returns may be lower or higher. Total return figures include change in share price and reinvestment of dividends and capital gains. The investment return and principal value will fluctuate so that an investor’s shares, when redeemed, may be worth more or less than the original cost. To obtain performance information up to the most recent month end, call toll-free1-877-781-6392.
The Portfolio is not open to direct retail investment. Beneficial interest in shares is obtained solely by purchase of variable life insurance policies and variable annuity contracts. Actual performance results for variable annuity and variable universal life contracts will be lower due to contract charges. Consult your contract for applicable charges.
Total expense ratio is 0.86% per the Fund’s prospectus dated May 1, 2019. Additional information pertaining to the Portfolio’s expense ratio as of June 30, 2019 can be found in the Portfolio’s Financial Highlights.
Comments fromSub-Adviser |
Q. How did the Portfolio perform in comparison to its benchmark during the reporting period?
A.For thesix-month period ended June 30, 2019, the ON International Equity Portfolio returned 15.53% versus 14.03% for its benchmark, the MSCI EAFE Index (Net – USD).
Q. Were there specific market conditions, investment strategies, or techniques that materially affected the Portfolio’s benchmark-relative performance during the reporting period?
A.Historically, the strategy has added more value versus the benchmark when markets are fundamentally driven in both down markets and moderately rising markets, as opposed tolow-quality-led, rapidly rising markets.
International equities posted moderate gains in the second quarter after rising significantly in the first three months of 2019. Equity markets were volatile in the second quarter, as investors, concerned about deteriorating trade relations between China and the United States, sold stocks in May. Markets recovered in June, as investors expected looser monetary policy from the Federal Reserve, which was followed by looser policies from the European Central Bank and some emerging markets central banks. In addition, investors were encouraged by ongoing stimulus implemented by the Chinese government.
While high quality and growth stocks continued to lead the market, higher volatility in the second quarter helped performance because the strategy defended well when the market declined.
Q. How did country selection impact the Portfolio’s performance relative to its benchmark?
A.Lazard’s relative value investment philosophy is based on value creation through the process ofbottom-up stock selection. This philosophy is implemented by assessing thetrade-off between valuation and financial productivity for an individual security. As such, sector and
country/regional weightings are a residual of our bottom up stock selection process. During the period, the Portfolio’s overall country allocation effect was mostly neutral, while stock selection was positive.(1)
Q. How did sector allocation and security selection each impact the Portfolio’s performance relative to its benchmark? For sector allocation, were there any factors that impacted the benchmark’s performance more significantly than the Portfolio’s performance? For stock selection, was there anything specific regarding the Portfolio’s strategy that caused deviation from the benchmark?
A.As discussed above, sector and country/regional weightings are a residual of our bottom up stock selection process. Attribution has historically been primarily driven by stock selection.(1)
Relative returns were helped by stock selection in the Financials, Consumer Staples, and Materials sectors. Relative returns were hurt by stock selection in the Real Estate, Consumer Discretionary, and Industrials sectors.(1)
Q. Which holdings contributed the most to, and detracted the most from, the Portfolio’s benchmark-relative performance?
A.SAP SE, the top contributor, is a relatively defensive German enterprise software company with high margin licensing fees and maintenance contracts. With a new product cycle underway, and a large recurring revenue base, SAP SE represents an attractive relative value investment opportunity. Aon PLC, a global insurance broker domiciled in the United Kingdom, continued to drive positive performance during the period, as it did throughout the past year. This long-term holding has demonstrated the ability to generate strong free cash flow from operating leverage, derived from continued strong, organic revenue growth and disciplined spending and capital allocation. During the quarter, the company grew revenues ahead of peers, while leveraging its cost structure to drive margins 190 basis points higher. We continue to own the stock, given the compounding nature of high performing financial productivity. Anheuser-Busch InBev SA/NV rebounded from a challenging fourth quarter and full-year 2018. Operational issues in Brazil and South Africa, which hurt the stock in the fourth quarter, were addressed in the first quarter of 2019. These temporary issues gave us an opportunity to add to the Portfolio’s position. Early in the first quarter, Bloomberg reported that its management was considering an IPO of the company’s Asian operations. The IPO valuation would substantially increase the pace of deleveraging, which is currently running at$7-8 billion per year. The company posted better-than-expected revenue and earnings before interest, taxes, depreciation, and amortization (“EBITDA”) growth, driving stock returns of 27% in the first quarter, and 36% for the period.(1)
Daiwa House Industry Co. Ltd., a Japanese real estate developer and one of the largest developers of residential real estate, was the top detractor. The stock lagged during the period, as some houses and rental apartment units were found to not conform to current building regulations. We believe these issues are transitory. Additionally, the supply of rental apartments has increased and banks have scaled back lending on fears of rising vacancies. Ryanair Holdings PLC, the second largest detractor, is the leader in the intra-Europe discount airline market with a highly competitive cost base and a record of profitable value creation and cash generation. The stock lagged in the quarter due to the continued slowdown in European Union economic activity and air traffic demand, leading to further summer 2019 fare downgrades. Profitability per passenger is at its lowest since 2011 – implying significant margin and valuation upside. Not holding Nestle SA was the third largest relative detractor, as the stock performed well within the benchmark.(1)
| (1) | The Portfolio’s composition is subject to change. Holdings and weightings are as of June 30, 2019. |
| 28 | (continued) |
| Ohio National Fund, Inc. | ON International Equity Portfolio (Unaudited) (Continued) |
Change in Value of $10,000 Investment |
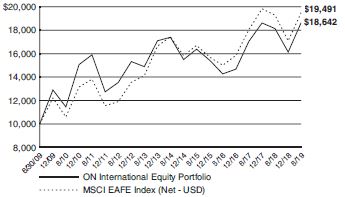
Hypothetical illustration based on past performance. Future performance will vary. The Portfolio’s returns reflect reinvested dividends. The Portfolio’s holdings may differ significantly from the securities in the index. The index is unmanaged and therefore does not reflect the cost of portfolio management and accounting.
The MSCI EAFE Index(Net-USD) is a free-float-adjusted market-capitalization weighted index that is designed to measure the equity market performance of 21 developed markets, including countries in Europe, Australasia and the Far East, excluding the U.S. and Canada. The returns for this index include the effects of reinvested dividends, net of taxes, and adjustment to U.S. Dollar denomination.
Past performance is no guarantee of future results. Redemption of fund shares could have tax implications unique to each shareholder.
Portfolio Composition as of June 30, 2019(1) |
| % of Net Assets | ||||
Common Stocks(4) (5) | 95.4 | |||
Preferred Securities(4) (5) | 1.8 | |||
Money Market Funds Less Net Liabilities | 2.8 | |||
|
| |||
| 100.0 | ||||
|
| |||
Top 10 Portfolio Holdings as of June 30, 2019(1)(2) (3) | ||||
| % of Net Assets | ||||||||
| 1. | Novartis AG | 4.0 | ||||||
| 2. | SAP SE | 3.6 | ||||||
| 3. | Royal Dutch Shell PLC | 3.4 | ||||||
| 4. | Aon PLC | 3.1 | ||||||
| 5. | Medtronic PLC | 2.7 | ||||||
| 6. | Anheuser-Busch InBev SA /N.V. | 2.7 | ||||||
| 7. | RELX PLC | 2.6 | ||||||
| 8. | Sanofi | 2.4 | ||||||
| 9. | Unilever PLC | 2.4 | ||||||
| 10. | Prudential PLC | 2.4 | ||||||
| (1) | Composition of Portfolio subject to change. |
| (2) | Short-term investments have been excluded from the list of Top 10 Portfolio Holdings. |
| (3) | Top 10 Portfolio Holdings is presented at an individual security level. Total investment exposure by issuer may be higher. |
| (4) | Top 10 Country Weightings (Common Stocks, Preferred Securities): |
| % of Net Assets | ||||
United Kingdom | 18.9 | |||
France | 13.1 | |||
Japan | 13.0 | |||
Netherlands | 7.5 | |||
Germany | 6.8 | |||
Canada | 5.4 | |||
Switzerland | 4.8 | |||
Ireland | 3.8 | |||
Sweden | 3.6 | |||
Singapore | 2.7 | |||
| (5) | Sectors (Common Stocks, Preferred Securities): |
| % of Net Assets | ||||
Financials | 18.6 | |||
Industrials | 18.1 | |||
Health Care | 9.8 | |||
Consumer Staples | 9.2 | |||
Communication Services | 7.8 | |||
Materials | 7.5 | |||
Information Technology | 7.3 | |||
Consumer Discretionary | 7.1 | |||
Energy | 6.3 | |||
Real Estate | 2.8 | |||
Utilities | 2.7 | |||
|
| |||
| 97.2 | ||||
|
| |||
29
| Ohio National Fund, Inc. | ON International Equity Portfolio |
Schedule of Investments | June 30, 2019 (Unaudited) | |
| Common Stocks – 95.4% | Shares | Value | ||||||||||
UNITED KINGDOM – 18.9% | ||||||||||||
Amcor PLC (Materials) | (a) | 503,064 | $ | 5,724,101 | ||||||||
Aon PLC (Financials) | 76,800 | 14,820,864 | ||||||||||
Compass Group PLC (Consumer Discretionary) | (a) | 292,470 | 7,011,019 | |||||||||
Diageo PLC (Consumer Staples) | (a) | 145,490 | 6,261,924 | |||||||||
Ferguson PLC (Industrials) | (a) | 66,542 | 4,737,119 | |||||||||
Howden Joinery Group PLC (Industrials) | (a) | 340,171 | 2,189,252 | |||||||||
Informa PLC (Communication Services) | (a) | 606,804 | 6,435,065 | |||||||||
Prudential PLC (Financials) | (a) | 517,117 | 11,289,164 | |||||||||
RELX PLC (Industrials) | (a) | 514,198 | 12,471,582 | |||||||||
RSA Insurance Group PLC (Financials) | (a) | 647,105 | 4,742,344 | |||||||||
Unilever PLC (Consumer Staples) | (a) | 182,542 | 11,331,340 | |||||||||
Weir Group PLC / The (Industrials) | (a) | 156,629 | 3,081,885 | |||||||||
|
| |||||||||||
| 90,095,659 | ||||||||||||
|
| |||||||||||
FRANCE – 13.1% | ||||||||||||
Air Liquide SA (Materials) | (a) | 52,984 | 7,410,787 | |||||||||
Atos SE (Information Technology) | (a) | 63,670 | 5,319,439 | |||||||||
Cie Generale des Etablissements Michelin SCA (Consumer Discretionary) | (a) | 38,941 | 4,923,756 | |||||||||
Engie SA (Utilities) | (a) | 411,528 | 6,240,199 | |||||||||
Safran SA (Industrials) | (a) | 76,271 | 11,157,820 | |||||||||
Sanofi (Health Care) | (a) | 134,377 | 11,613,172 | |||||||||
Vinci SA (Industrials) | (a) | 67,555 | 6,899,096 | |||||||||
Vivendi SA (Communication Services) | (a) | 316,625 | 8,689,035 | |||||||||
|
| |||||||||||
| 62,253,304 | ||||||||||||
|
| |||||||||||
JAPAN – 13.0% | ||||||||||||
Daiwa House Industry Co. Ltd. (Real Estate) | (a) | 356,819 | 10,426,499 | |||||||||
Hitachi Ltd. (Information Technology) | (a) | 99,200 | 3,649,837 | |||||||||
Kao Corp. (Consumer Staples) | (a) | 80,210 | 6,120,368 | |||||||||
Makita Corp. (Industrials) | (a) | 162,400 | 5,544,737 | |||||||||
Nexon Co. Ltd. (Communication Services) | (a)(b) | 452,900 | 6,616,705 | |||||||||
Pan Pacific International Holdings Corp. (Consumer Discretionary) | (a) | 69,007 | 4,387,430 | |||||||||
Shin-Etsu Chemical Co. Ltd. (Materials) | (a) | 90,700 | 8,486,061 | |||||||||
Sumitomo Mitsui Financial Group, Inc. (Financials) | (a) | 208,500 | 7,390,421 | |||||||||
Suzuki Motor Corp. (Consumer Discretionary) | (a) | 105,400 | 4,958,658 | |||||||||
Yamaha Corp. (Consumer Discretionary) | (a) | 91,200 | 4,340,884 | |||||||||
|
| |||||||||||
| 61,921,600 | ||||||||||||
|
| |||||||||||
NETHERLANDS – 7.5% | ||||||||||||
ABN AMRO Bank N.V. (Financials) | (a) | 210,838 | 4,511,404 | |||||||||
Koninklijke DSM N.V. (Materials) | (a) | 54,791 | 6,760,354 | |||||||||
Royal Dutch Shell PLC (Energy) | (a) | 493,506 | 16,106,832 | |||||||||
Wolters Kluwer N.V. (Industrials) | (a) | 113,432 | 8,252,324 | |||||||||
|
| |||||||||||
| 35,630,914 | ||||||||||||
|
| |||||||||||
CANADA – 5.4% | ||||||||||||
Canadian National Railway Co. (Industrials) | 58,900 | 5,451,247 | ||||||||||
National Bank of Canada (Financials) | 120,844 | 5,740,678 | ||||||||||
Rogers Communications, Inc. Class B (Communication Services) | 94,800 | 5,074,629 | ||||||||||
Suncor Energy, Inc. (Energy) | 301,800 | 9,414,325 | ||||||||||
|
| |||||||||||
| 25,680,879 | ||||||||||||
|
| |||||||||||
GERMANY – 5.0% | ||||||||||||
Fresenius SE & Co. KGaA (Health Care) | (a) | 63,389 | 3,442,022 | |||||||||
SAP SE (Information Technology) | (a) | 126,693 | 17,368,577 | |||||||||
Vonovia SE (Real Estate) | (a) | 63,758 | 3,045,708 | |||||||||
|
| |||||||||||
| 23,856,307 | ||||||||||||
|
| |||||||||||
SWITZERLAND – 4.8% | ||||||||||||
ABB Ltd. (Industrials) | (a) | 199,133 | 3,992,251 | |||||||||
Novartis AG (Health Care) | (a) | 208,735 | 19,055,783 | |||||||||
|
| |||||||||||
| 23,048,034 | ||||||||||||
|
| |||||||||||
| Common Stocks (Continued) | Shares | Value | ||||||||||
IRELAND – 3.8% | ||||||||||||
Medtronic PLC (Health Care) | 134,270 | $ | 13,076,555 | |||||||||
Ryanair Holdings PLC – ADR (Industrials) | (b) | 81,320 | 5,215,865 | |||||||||
|
| |||||||||||
| 18,292,420 | ||||||||||||
|
| |||||||||||
SWEDEN – 3.6% | ||||||||||||
Assa Abloy AB Class B (Industrials) | (a) | 468,607 | 10,573,033 | |||||||||
Epiroc AB Class A (Industrials) | (a) | 618,120 | 6,440,393 | |||||||||
|
| |||||||||||
| 17,013,426 | ||||||||||||
|
| |||||||||||
SINGAPORE – 2.7% | ||||||||||||
DBS Group Holdings Ltd. (Financials) | (a) | 459,520 | 8,827,404 | |||||||||
NetLink NBN Trust (Communication Services) | (c) | 6,011,700 | 3,954,481 | |||||||||
|
| |||||||||||
| 12,781,885 | ||||||||||||
|
| |||||||||||
BELGIUM – 2.6% | ||||||||||||
Anheuser-Busch InBev SA / N.V. (Consumer Staples) | (a) | 142,633 | 12,621,647 | |||||||||
|
| |||||||||||
FINLAND – 2.5% | ||||||||||||
Nordea Bank Abp (Financials) | (a) | 712,364 | 5,172,610 | |||||||||
Sampo Oyj (Financials) | (a) | 143,756 | 6,785,920 | |||||||||
|
| |||||||||||
| 11,958,530 | ||||||||||||
|
| |||||||||||
NORWAY – 2.3% | ||||||||||||
Equinor ASA (Energy) | (a) | 231,590 | 4,594,136 | |||||||||
Telenor ASA (Communication Services) | (a) | 309,949 | 6,585,238 | |||||||||
|
| |||||||||||
| 11,179,374 | ||||||||||||
|
| |||||||||||
CHINA – 1.7% | ||||||||||||
Ping An Insurance Group Co. of China Ltd. (Financials) | (a) | 667,000 | 8,020,590 | |||||||||
|
| |||||||||||
DENMARK – 1.6% | ||||||||||||
Carlsberg A/S Class B (Consumer Staples) | (a) | 56,575 | 7,507,342 | |||||||||
|
| |||||||||||
AUSTRALIA – 1.5% | ||||||||||||
BHP Group PLC (Materials) | (a) | 274,162 | 7,011,516 | |||||||||
|
| |||||||||||
SPAIN – 1.4% | ||||||||||||
Red Electrica Corp. SA (Utilities) | (a) | 332,107 | 6,917,162 | |||||||||
|
| |||||||||||
SOUTH KOREA – 1.2% | ||||||||||||
Samsung Electronics Co. Ltd. (Information Technology) | (a) | 143,197 | 5,831,028 | |||||||||
|
| |||||||||||
ISRAEL – 1.2% | ||||||||||||
Bank LeumiLe-Israel BM (Financials) | (a) | 776,091 | 5,609,620 | |||||||||
|
| |||||||||||
INDIA – 1.1% | ||||||||||||
ICICI Bank Ltd. – ADR (Financials) | 425,910 | 5,362,207 | ||||||||||
|
| |||||||||||
UNITED ARAB EMIRATES – 0.5% | ||||||||||||
Network International Holdings PLC (Information Technology) | (b)(c) | 327,070 | 2,463,099 | |||||||||
|
| |||||||||||
Total Common Stocks (Cost $442,049,380) | $ | 455,056,543 | ||||||||||
|
| |||||||||||
| Preferred Securities – 1.8% | Rate | Quantity | Value | |||||||||
GERMANY – 1.8% | ||||||||||||
Volkswagen AG (Consumer Discretionary) | (a) (d) | 49,506 | $ | 8,338,675 | ||||||||
|
| |||||||||||
Total Preferred Securities (Cost $9,005,984) | $ | 8,338,675 | ||||||||||
|
| |||||||||||
| 30 | (continued) |
| Ohio National Fund, Inc. | ON International Equity Portfolio (Continued) |
Schedule of Investments | June 30, 2019 (Unaudited) | |
| Money Market Funds –3.1% | Shares | Value | ||||||||||
State Street Institutional Liquid Reserves Fund Institutional Class, 2.449% | (e) | 14,677,453 | $ | 14,680,388 | ||||||||
|
| |||||||||||
Total Money Market Funds | $ | 14,680,388 | ||||||||||
|
| |||||||||||
Total Investments – 100.3% | (f) | $ | 478,075,606 | |||||||||
Liabilities in Excess of Other Assets – (0.3)% | (1,227,796 | ) | ||||||||||
|
| |||||||||||
Net Assets – 100.0% | $ | 476,847,810 | ||||||||||
|
| |||||||||||
Percentages are stated as a percent of net assets.
Abbreviations:
ADR: American Depositary Receipts |
Footnotes:
| (a) | Security traded on a foreign exchange has been valued at an estimate of fair value that is different than the local market close price. These fair value estimates are determined by an independent fair valuation service that has been approved by the Board. These securities represent $392,821,268 or 82.4% of the Portfolio’s net assets. |
| (b) | Non-income producing security. |
| (c) | As discussed in Note 2 of the Notes to Financial Statements, not all investments that are traded on a foreign exchange are valued at an estimate that is different from the local close price. In some instances, the independent fair valuation service uses a stock’s local close price because the service’s measure of predictability related to their valuation model of a stock is below a chosen threshold. These securities represent $6,417,580 or 1.3% of the Portfolio’s net assets. Other Portfolio securities are not subjected to fair valuation procedures because they are traded on domestic or foreign exchanges that have close times that are consistent with the U.S. market close, normally 4:00 pm Eastern Time. |
| (d) | Payout is the rate of the company’s ordinary common stock dividend per share + 6 cents per share. |
| (e) | Rate represents theseven-day yield at June 30, 2019. |
| (f) | Represents cost for financial reporting purposes, which may differ from cost basis for federal income tax purposes. See also Note 7 of the Notes to Financial Statements. |
The accompanying notes are an integral part of these financial statements.
31
| Ohio National Fund, Inc. | ON Foreign Portfolio (Unaudited) |
Objective/Strategy |
The ON Foreign Portfolio seeks long-term growth of capital by investing, under normal circumstances, at least 80% of its net assets in foreign securities.
Performance as of June 30, 2019 |
Average Annual returns | ||||
One year | -6.11 | % | ||
Five years | 0.26 | % | ||
Ten years | 7.09 | % |
Past performance does not guarantee future results. The performance data quoted represents past performance and current returns may be lower or higher. Total return figures include change in share price and reinvestment of dividends and capital gains. The investment return and principal value will fluctuate so that an investor’s shares, when redeemed, may be worth more or less than the original cost. To obtain performance information up to the most recent month end, call toll-free1-877-781-6392.
The Portfolio is not open to direct retail investment. Beneficial interest in shares is obtained solely by purchase of variable life insurance policies and variable annuity contracts. Actual performance results for variable annuity and variable universal life contracts will be lower due to contract charges. Consult your contract for applicable charges.
Total expense ratio is 1.17% per the Fund’s prospectus dated May 1, 2019. Additional information pertaining to the Portfolio’s expense ratio as of June 30, 2019 can be found in the Portfolio’s Financial Highlights.
Comments fromSub-Adviser |
Q. How did the Portfolio perform in comparison to its benchmark during the reporting period?
A.For thesix-month period ended June 30, 2019, the ON Foreign Portfolio returned 6.99% versus 13.60% for its benchmark, the MSCI All Country WorldEx-USA Index (Net – USD).
Q. Were there specific market conditions, investment strategies, or techniques that materially affected the Portfolio’s benchmark-relative performance during the reporting period?
A.The continued underperformance of value stocks significantly detracted from relative performance. Thissix-month period was the worst six months for international value stocks relative to growth stocks since thedot-com bubble nearly two decades ago. The market’s sustained preference for growth companies amplified the impact of single-stock relative detractors, limited single-stock relative contributors and muted the positive impact of diversification across a value-focused Portfolio. While some investors have moved away from value, we remain confident those stocks will eventually recover. In short, we believe the forces negatively impacting value—the macroeconomic and policy environment, technological innovation, and a changing market structure—are either overstated or temporary in nature.
Q. How did country selection impact the Portfolio’s performance relative to the benchmark?
A.North America was the only region that contributed to relative performance. In particular, an overweight in the U.S. and stock selection in Canada helped relative results. Asia was the largest relative detractor, with stock selection in China and Japan and an overweight in South Korea hurting relative returns the most. Europe also detracted from relative performance, with stock selection in Germany and Switzerland being the largest detractors. Stock selection in Israel and New Zealand further detracted from relative results.(1)
Q. How did sector allocation and security selection each impact the Portfolio’s performance relative to its benchmark? For sector allocation, were there any factors that impacted the benchmark’s performance more significantly than the Portfolio’s performance? For security selection, was there anything specific regarding the Portfolio’s strategy that caused deviation from the benchmark?
A.Stock selection in the Materials and Information Technology sectors contributed to relative performance. In contrast, stock selection and an overweighted allocation in Communication Services detracted from relative results. Stock selection in Health Care and Financials also detracted from relative results.(1)
Q. Which holdings contributed the most to, and detracted the most from, the Portfolio’s benchmark-relative performance?
A.Top Contributors:
Alamos Gold, Inc. Class A – Shares of the Canadian gold miner rallied as the price of gold rose to asix-year high. As the mining sector’s economic cycle matures, we have been taking profits on industrial metals miners that benefit from global, centralbank-led reflation, and bought into a handful of select precious metals firms with strong balance sheets, high-quality assets and attractive business models. We continue to see long-term upside potential and attractive counter-cyclical characteristics in the depressed precious metals sector, particularly in light of record central bank gold buying, rising geopolitical instability, and low real interest rates.(1)
SBM Offshore NV – Shares of the Dutch floating oilrig platform manufacturer rallied, as the price of oil recovered and the firm reported rising sales and confirmed prior earnings guidance. While the stock has moved closer to what we view as fair value, it remains a core holding given its defensive business model, improved competitive position and resolution of legacy issues that have plagued the stock in the past. (1)
China Life Insurance Co. Ltd. (“China Life”) – China’s largest life insurer benefited from multiple analyst upgrades during the period. While China Life has a leading position in a structurally attractive market, we have become increasingly concerned about rising competition, long-term interest rate trends, a suboptimal business mix and regulatory uncertainty. As a result, we liquidated our position during the period. (1)
Top Detractors:
Teva Pharmaceutical Industries Ltd. – ADR (“Teva”) - Shares of the Israeli generic drug-maker slumped after a surprising settlement in a U.S. opioid lawsuit increased existing litigation risk surrounding an industry-wide price-fixing scandal. While these situations are unlikely to materially impact near-term cash flow—which we believe should improve amid ongoing cost cutting—they do raise the company’s risk profile given Teva’s high financial and operational leverage in the competitive, commodity-like, generic drug industry.(1)
Baidu, Inc. – ADR (“Baidu”) - Shares of the Chinese internet search firm came under pressure amid a cyclical slowdown in China’s economy, which we believe exposes two structural issues impacting the firm going forward. First, excess advertising capacity and increasing competition suggest deteriorating cost-benefit dynamics in the digital advertising space. Second, Baidu’s core search product is proving not to be as scalable as traditional search platforms. While the firm’s search business remains at a cheap valuation and Baidu enjoys strong growth in active daily users and a high cash position, the capital required to maintain leadership and innovation is significant.(1)
Telefonica Deutschland Holding AG - Shares of the German telecommunications operator declined amid ongoing concerns about an upcoming spectrum auction that could raise costs and increase competition. While such near-term concerns may be justified, we are
| 32 | (continued) |
| Ohio National Fund, Inc. | ON Foreign Portfolio (Unaudited) (Continued) |
optimistic about the longer-term growth potential fromhigh-margin wholesale revenue, driven by structurally rising mobile data consumption. With ample scope for cost reduction and self-help, as well as an underleveraged balance sheet and shareholder-friendly management team, we believe the company is well positioned to grow free cash flow and dividends over our long-term investment horizon.(1)
Q. Were there any significant changes to the Portfolio’s management team, investment strategy, or security selection process during the reporting period?
A.We are implementing a number of enhancements to our core fundamental value process to optimize Portfolio positioning in a challenging environment. Many of these changes began at the end of last year, during a volatile market, and negatively impacted short-term performance.
Changes in strategy include shifting the Portfolio to own more defensive, dividend-paying holdings in the current late-cycle,low-rate environment, as well as allocating additional resources to uncover what we believe to be the best long-term investment opportunities in overlooked market segments. We have also enhanced our research database, developed a new system to quantify economic exposures at the portfolio level, made targeted changes to research coverage and investment personnel, and begun to reduce the number of companies in our portfolios, in an attempt to ensure that only the highest quality stocks are represented.
| (1) | The Portfolio’s composition is subject to change. Holdings and weightings are as of June 30, 2019. |
Change in Value of $10,000 Investment |
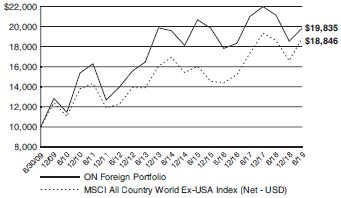
Hypothetical illustration based on past performance. Future performance will vary. The Portfolio’s returns reflect reinvested dividends. The Portfolio’s holdings may differ significantly from the securities in the index. The index is unmanaged and therefore does not reflect the cost of portfolio management and accounting.
The MSCI All Country WorldEx-USA Index(Net-USD) is a free float adjusted market capitalization weighted index that is designed to measure the equity market performance of developed and emerging markets. The MSCI All Country World Index (ACWI) consists of 23 developed and 24 emerging market country indices, while the MSCI All Country WorldEx-USA Index specifically excludes the impact of the United States. The returns presented for this index include the effects of reinvested dividends, net of taxes, and adjustment to U.S. Dollar denomination.
Past performance is no guarantee of future results. Redemption of fund shares could have tax implications unique to each shareholder.
| 33 | (continued) |
| Ohio National Fund, Inc. | ON Foreign Portfolio (Unaudited) (Continued) |
Portfolio Composition as of June 30, 2019(1) | ||
% of Net Assets | ||||
Common Stocks(4)(5) | 96.6 | |||
Money Market Funds and Other Net Assets | 3.4 | |||
|
| |||
| 100.0 | ||||
|
| |||
Top 10 Portfolio Holdings as of June 30, 2019 (1) (2) (3) | ||||
% of Net Assets | ||||||||
| 1. | Samsung Electronics Co. Ltd. | 3.8 | ||||||
| 2. | BP PLC | 3.4 | ||||||
| 3. | Roche Holding AG | 3.3 | ||||||
| 4. | Standard Chartered PLC | 3.1 | ||||||
| 5. | BNP Paribas SA | 3.0 | ||||||
| 6. | KB Financial Group, Inc. | 2.6 | ||||||
| 7. | TOTAL SA | 2.6 | ||||||
| 8. | Royal Dutch Shell PLC | 2.5 | ||||||
| 9. | Sanofi | 2.4 | ||||||
| 10. | Eni SpA | 2.3 | ||||||
| (1) | Composition of Portfolio subject to change. |
| (2) | Short-term investments have been excluded from the list of Top 10 Portfolio Holdings. |
| (3) | Top 10 Portfolio Holdings is presented at an individual security level. Total investment exposure by issuer may be higher. |
| (4) | Top 10 Country Weightings (Common Stocks): |
| % of Net Assets | ||||
United Kingdom | 15.2 | |||
Japan | 12.6 | |||
France | 11.5 | |||
South Korea | 10.9 | |||
Netherlands | 8.7 | |||
Germany | 5.5 | |||
Switzerland | 4.7 | |||
Canada | 4.3 | |||
Hong Kong | 4.3 | |||
China | 4.2 | |||
| (5) | Sectors (Common Stocks): |
| % of Net Assets | ||||
Financials | 22.3 | |||
Energy | 13.9 | |||
Health Care | 13.7 | |||
Communication Services | 10.4 | |||
Materials | 9.0 | |||
Information Technology | 7.9 | |||
Industrials | 6.7 | |||
Consumer Discretionary | 4.6 | |||
Utilities | 3.4 | |||
Consumer Staples | 2.5 | |||
Real Estate | 2.2 | |||
|
| |||
| 96.6 | ||||
|
| |||
| 34 |
Ohio National Fund, Inc.
| ON Foreign Portfolio
| |
Schedule of Investments | June 30, 2019 (Unaudited) | |
| Common Stocks – 96.6% | Shares | Value | ||||||||||
UNITED KINGDOM – 15.2% | ||||||||||||
BAE Systems PLC (Industrials) | (a) | 89,022 | $ | 559,493 | ||||||||
Barclays PLC (Financials) | (a) | 254,711 | 484,473 | |||||||||
BP PLC (Energy) | (a) | 253,813 | 1,768,254 | |||||||||
HSBC Holdings PLC (Financials) | (a) | 122,577 | 1,023,059 | |||||||||
Johnson Matthey PLC (Materials) | (a) | 21,642 | 914,970 | |||||||||
Kingfisher PLC (Consumer Discretionary) | (a) | 236,478 | 644,563 | |||||||||
Standard Chartered PLC (Financials) | (a) | 178,468 | 1,619,036 | |||||||||
Vodafone Group PLC (Communication Services) | (a) | 606,062 | 993,373 | |||||||||
|
| |||||||||||
| 8,007,221 | ||||||||||||
|
| |||||||||||
JAPAN – 12.6% | ||||||||||||
Astellas Pharma, Inc. (Health Care) | (a) | 39,100 | 557,205 | |||||||||
Ezaki Glico Co. Ltd. (Consumer Staples) | (a) | 3,600 | 160,491 | |||||||||
Kirin Holdings Co. Ltd. (Consumer Staples) | (a) | 7,200 | 155,466 | |||||||||
Mitsui Fudosan Co. Ltd. (Real Estate) | (a) | 27,600 | 670,795 | |||||||||
Panasonic Corp. (Consumer Discretionary) | (a) | 96,100 | 802,738 | |||||||||
Seven & I Holdings Co. Ltd. (Consumer Staples) | (a) | 14,500 | 491,280 | |||||||||
Sumitomo Metal Mining Co. Ltd. (Materials) | (a) | 22,400 | 671,475 | |||||||||
Sumitomo Mitsui Financial Group, Inc. (Financials) | (a) | 23,800 | 843,607 | |||||||||
Sumitomo Rubber Industries Ltd. (Consumer Discretionary) | (a) | 39,500 | 457,499 | |||||||||
Suntory Beverage & Food Ltd. (Consumer Staples) | (a) | 11,900 | 517,435 | |||||||||
Taiheiyo Cement Corp. (Materials) | (a) | 12,900 | 391,653 | |||||||||
Takeda Pharmaceutical Co. Ltd. (Health Care) | (a) | 25,302 | 900,063 | |||||||||
|
| |||||||||||
| 6,619,707 | ||||||||||||
|
| |||||||||||
FRANCE – 11.5% | ||||||||||||
BNP Paribas SA (Financials) | (a) | 33,682 | 1,596,704 | |||||||||
Cie de Saint-Gobain (Industrials) | (a) | 15,148 | 591,526 | |||||||||
Cie Generale des Etablissements Michelin SCA (Consumer Discretionary) | (a) | 4,190 | 529,790 | |||||||||
Sanofi (Health Care) | (a) | 14,777 | 1,277,063 | |||||||||
TOTAL SA (Energy) | (a) | 24,279 | 1,361,900 | |||||||||
Veolia Environnement SA (Utilities) | (a) | 28,410 | 691,794 | |||||||||
|
| |||||||||||
| 6,048,777 | ||||||||||||
|
| |||||||||||
SOUTH KOREA – 10.9% | ||||||||||||
Hana Financial Group, Inc. (Financials) | (a) | 26,784 | 868,131 | |||||||||
KB Financial Group, Inc. (Financials) | (a) | 35,307 | 1,399,541 | |||||||||
Korea Electric Power Corp. (Utilities) | (a)(b) | 18,139 | 401,532 | |||||||||
Lotte Chemical Corp. (Materials) | (a) | 2,637 | 577,609 | |||||||||
Samsung Electronics Co. Ltd. (Information Technology) | (a) | 49,163 | 2,001,933 | |||||||||
Shinhan Financial Group Co. Ltd. (Financials) | (a) | 13,160 | 511,846 | |||||||||
|
| |||||||||||
| 5,760,592 | ||||||||||||
| �� | |||||||||||
NETHERLANDS – 8.7% | ||||||||||||
Flow Traders (Financials) | (a) | 17,936 | 523,473 | |||||||||
ING Groep N.V. (Financials) | (a) | 101,930 | 1,180,730 | |||||||||
NXP Semiconductors N.V. (Information Technology) | 9,000 | 878,490 | ||||||||||
Royal Dutch Shell PLC (Energy) | (a) | 40,322 | 1,321,218 | |||||||||
SBM Offshore N.V. (Energy) | (a) | 36,078 | 696,468 | |||||||||
|
| |||||||||||
| 4,600,379 | ||||||||||||
|
| |||||||||||
GERMANY – 5.5% | ||||||||||||
Bayer AG (Health Care) | (a) | 15,389 | 1,067,386 | |||||||||
E.ON SE (Utilities) | (a) | 62,109 | 673,890 | |||||||||
Merck KGaA (Health Care) | (a) | 6,268 | 654,700 | |||||||||
Telefonica Deutschland Holding AG (Communication Services) | (c) | 172,636 | 482,320 | |||||||||
|
| |||||||||||
| 2,878,296 | ||||||||||||
|
| |||||||||||
| Common Stocks (Continued) | Shares | Value | ||||||||
SWITZERLAND – 4.7% | ||||||||||
Roche Holding AG (Health Care) | (a) | 6,113 | $ | 1,718,900 | ||||||
UBS Group AG (Financials) | (a) | 64,269 | 763,852 | |||||||
|
| |||||||||
| 2,482,752 | ||||||||||
|
| |||||||||
CANADA – 4.3% | ||||||||||
Alamos Gold, Inc. Class A (Materials) | 158,700 | 960,135 | ||||||||
Husky Energy, Inc. (Energy) | 47,800 | 452,978 | ||||||||
Wheaton Precious Metals Corp. (Materials) | 35,500 | 858,528 | ||||||||
|
| |||||||||
| 2,271,641 | ||||||||||
|
| |||||||||
HONG KONG – 4.3% | ||||||||||
China Mobile Ltd. (Communication Services) | (a) | 81,000 | 737,396 | |||||||
CK Asset Holdings Ltd. (Real Estate) | (a) | 59,800 | 468,478 | |||||||
CK Hutchison Holdings Ltd. (Industrials) | (a) | 106,000 | 1,045,557 | |||||||
|
| |||||||||
| 2,251,431 | ||||||||||
|
| |||||||||
CHINA – 4.2% | ||||||||||
Baidu, Inc. – ADR (Communication Services) | (b) | 5,010 | 587,973 | |||||||
China Telecom Corp. Ltd. (Communication Services) | (a) | 1,596,000 | 803,662 | |||||||
Sinopec Engineering Group Co. Ltd. (Industrials) | (a) | 463,900 | 393,174 | |||||||
Sinopharm Group Co. Ltd. (Health Care) | (a) | 112,400 | 395,771 | |||||||
|
| |||||||||
| 2,180,580 | ||||||||||
|
| |||||||||
ITALY – 2.3% | ||||||||||
Eni SpA (Energy) | (a) | 73,117 | 1,215,740 | |||||||
|
| |||||||||
LUXEMBOURG – 2.0% | ||||||||||
SES SA (Communication Services) | (a) | 40,086 | 626,001 | |||||||
Tenaris SA (Energy) | (a) | 32,056 | 420,440 | |||||||
|
| |||||||||
| 1,046,441 | ||||||||||
|
| |||||||||
SINGAPORE – 2.0% | ||||||||||
Singapore Telecommunications Ltd. (Communication Services) | (a) | 398,800 | 1,032,220 | |||||||
|
| |||||||||
IRELAND – 1.8% | ||||||||||
Bank of Ireland Group PLC (Financials) | (a) | 104,821 | 548,384 | |||||||
CRH PLC (Materials) | (a) | 12,375 | 404,504 | |||||||
|
| |||||||||
| 952,888 | ||||||||||
|
| |||||||||
DENMARK – 1.8% | ||||||||||
AP Moller – Maersk A/S Class B (Industrials) | (a) | 465 | 578,607 | |||||||
Drilling Co. of 1972 A/S / The (Energy) | (b)(c) | 931 | 72,334 | |||||||
Vestas Wind Systems A/S (Industrials) | (a) | 3,481 | 301,572 | |||||||
|
| |||||||||
| 952,513 | ||||||||||
|
| |||||||||
TAIWAN – 1.5% | ||||||||||
Taiwan Semiconductor Manufacturing Co. Ltd. (Information Technology) | (a) | 105,000 | 803,080 | |||||||
|
| |||||||||
ISRAEL – 1.1% | ||||||||||
Teva Pharmaceutical Industries Ltd. – ADR (Health Care) | (b) | 64,943 | 599,424 | |||||||
|
| |||||||||
THAILAND – 0.9% | ||||||||||
Bangkok Bank PCL (Financials) | (a) | 18,400 | 119,471 | |||||||
Kasikornbank PCL – Foreign Shares (Financials) | (a) | 16,500 | 102,020 | |||||||
Kasikornbank PCL – NVDR (Financials) | (a) | 44,400 | 272,326 | |||||||
|
| |||||||||
| 493,817 | ||||||||||
|
| |||||||||
UNITED STATES – 0.9% | ||||||||||
Oracle Corp. (Information Technology) | 8,060 | 459,178 | ||||||||
|
| |||||||||
NEW ZEALAND – 0.4% | ||||||||||
SKY Network Television Ltd. (Communication Services) | (a) | 292,337 | 231,796 | |||||||
|
| |||||||||
Total Common Stocks | $ | 50,888,473 | ||||||||
|
| |||||||||
| 35 | (continued) |
| Ohio National Fund, Inc. | ON Foreign Portfolio (Continued) |
Schedule of Investments | June 30, 2019 (Unaudited) | |
| Money Market Funds – 3.3% | Shares | Value | ||||||||||
State Street Institutional Liquid Reserves Fund Institutional Class, 2.449% | (d | ) | 1,719,273 | $ | 1,719,617 | |||||||
|
| |||||||||||
Total Money Market Funds | $ | 1,719,617 | ||||||||||
|
| |||||||||||
Total Investments – 99.9% | (e | ) | $ | 52,608,090 | ||||||||
Other Assets in Excess of | 61,394 | |||||||||||
|
| |||||||||||
Net Assets – 100.0% | $ | 52,669,484 | ||||||||||
|
| |||||||||||
Percentages are stated as a percent of net assets.
Abbreviations:
| ADR: | American Depositary Receipts |
| NVDR: | Non-Voting Depository Receipts |
Footnotes:
| (a) | Security traded on a foreign exchange has been valued at an estimate of fair value that is different than the local market close price. These fair value estimates are determined by an independent fair valuation service that has been approved by the Board. These securities represent $45,537,113 or 86.5% of the Portfolio’s net assets. |
| (b) | Non-income producing security. |
| (c) | As discussed in Note 2 of the Notes to Financial Statements, not all investments that are traded on a foreign exchange are valued at an estimate that is different from the local close price. In some instances, the independent fair valuation service uses a stock’s local close price because the service’s measure of predictability related to their valuation model of a stock is below a chosen threshold. These securities represent $554,654 or 1.1% of the Portfolio’s net assets. Other Portfolio securities are not subjected to fair valuation procedures because they are traded on domestic or foreign exchanges that have close times that are consistent with the U.S. market close, normally 4:00 pm Eastern Time. |
| (d) | Rate represents theseven-day yield at June 30, 2019. |
| (e) | Represents cost for financial reporting purposes, which may differ from cost basis for federal income tax purposes. See also Note 7 of the Notes to Financial Statements. |
The accompanying notes are an integral part of these financial statements.
| 36 |
| Ohio National Fund, Inc. | ON Janus Henderson Forty Portfolio (Unaudited) |
Objective/Strategy |
The ON Janus Henderson Forty Portfolio seeks long-term capital growth by investing primarily in domestic and foreign equity securities selected for growth potential.
Performance as of June 30, 2019 | ||
Average Annual returns | ||
One year | 13.83% | |
Five years | 15.50% | |
Ten years | 15.44% |
Past performance does not guarantee future results. The performance data quoted represents past performance and current returns may be lower or higher. Total return figures include change in share price and reinvestment of dividends and capital gains. The investment return and principal value will fluctuate so that an investor’s shares, when redeemed, may be worth more or less than the original cost. To obtain performance information up to the most recent month end, call toll-free1-877-781-6392.
The Portfolio is not open to direct retail investment. Beneficial interest in shares is obtained solely by purchase of variable life insurance policies and variable annuity contracts. Actual performance results for variable annuity and variable universal life contracts will be lower due to contract charges. Consult your contract for applicable charges.
Total expense ratio is 0.87% per the Fund’s prospectus dated May 1, 2019. Additional information pertaining to the Portfolio’s expense ratio as of June 30, 2019 can be found in the Portfolio’s Financial Highlights.
Comments fromSub-Adviser |
Q. How did the Portfolio perform in comparison to its benchmark during the reporting period?
A.For thesix-month period ended June 30, 2019, the ON Janus Henderson Forty Portfolio returned 22.89% versus 21.49% for its benchmark, the Russell 1000 Growth Index.
Q. Were there specific market conditions, investment strategies, or techniques that materially affected the Portfolio’s benchmark-relative performance during the reporting period?
A.Due to the concentrated nature of the Portfolio, relative outperformance was due largely to the individual stocks in the Portfolio, rather than a market condition or investment strategy that worked in its favor. However, the Portfolio holds fewer economically-sensitive companies than the benchmark, which helped relative performance in the second quarter, as concerns about the global economy grew.(1)
Q. How did sector allocation and security selection each impact the Portfolio’s performance relative to its benchmark? For sector allocation, were there any factors that impacted the benchmark’s performance more significantly than the Portfolio’s performance? For security selection, was there anything specific regarding the Portfolio’s strategy that caused deviation from the benchmark?
A.Relative outperformance was due largely to stock selection. Due to the concentrated nature of the Portfolio, sector holdings are significantly different from the benchmark. Stock selection was strongest in the Information Technology and Industrials sectors. Several companies within those sectors put up impressive earnings results that helped drive the stocks higher.(1)
Sector allocation modestly detracted from performance. An overweight to the Health Care sector detracted from relative results, though stock selection within that sector was a contributor to relative results.(1)
Q. Which holdings contributed the most to, and detracted the most from, the Portfolio’s benchmark-relative performance?
A.Mastercard, Inc. Class A was a top contributor to the Portfolio’s relative performance. Strong earnings results and anticipation of how the company’s business model can addressbusiness-to-business payment solutions played a role in driving the stock higher. Ball Corp. (“Ball”) was another top contributor, as the market gained appreciation for how industry consolidation has improved Ball’s competitive dynamics. A greater appreciation for the sustainability of aluminum cans and future demand for such environmentally-friendly packaging also played a role in the stock’s gains. L3 Harris Technologies, Inc. was a third relative contributor. Strong earnings for both Harris Corp. and L3 Technologies, Inc., which Harris merged with at the end of the period, improved the outlook for the combined company, and drove the stock higher.(1)
Apple, Inc. (“Apple”) was the top relative detractor, due to the Portfolio’s underweight relative to its benchmark. While the Portfolio has maintained some exposure to Apple, it is underweight because the portfolio managers are less optimistic about Apple’s long-term earnings potential after the iPhone 8 and iPhone X product cycle. Not holding Facebook, Inc. Class A and Visa, Inc., high-performing positions held in the benchmark, were the other two top relative detractors.(1)
Q. How did the Portfolio’s use of derivative instruments and initial public offerings (IPOs), if any, impact performance?
A.The Portfolio did not use derivatives during the period. The Portfolio’s participation in the Luckin Coffee, Inc. IPO contributed 5 basis points to total return.(1)
| (1) | The Portfolio’s composition is subject to change. Holdings and weightings are as of June 30, 2019. |
Change in Value of $10,000 Investment |
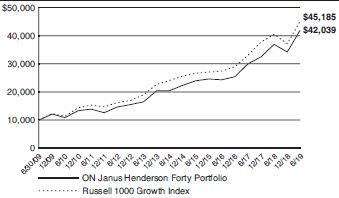
Hypothetical illustration based on past performance. Future performance will vary. The Portfolio’s returns reflect reinvested dividends. The Portfolio’s holdings may differ significantly from the securities in the index. The index is unmanaged and therefore does not reflect the cost of portfolio management and accounting.
The Russell 1000 Growth Index is a market-capitalization weighted index of those firms in the Russell 1000 Index with higherprice-to-book ratios and higher forecasted growth values. The Russell 1000 Index measures the performance of thelarge-cap segment of the U.S. equity universe. The index presented includes the effects of reinvested dividends.
Past performance is no guarantee of future results. Redemption of fund shares could have tax implications unique to each shareholder.
| 37 | (continued) |
| Ohio National Fund, Inc. | ON Janus Henderson Forty Portfolio (Unaudited) (Continued) |
Portfolio Composition as of June 30, 2019(1) | ||||
% of Net Assets | ||||
Common Stocks(4) | 99.1 | |||
Money Market Funds Less Net Liabilities | 0.9 | |||
|
| |||
| 100.0 | ||||
|
| |||
Top 10 Portfolio Holdings as of June 30, 2019(1)(2)(3) | ||||
% of Net Assets | ||||||||
| 1. | Microsoft Corp. | 7.4 | ||||||
| 2. | Mastercard, Inc. Class A | 6.8 | ||||||
| 3. | Amazon.com, Inc. | 4.4 | ||||||
| 4. | Walt Disney Co. / The | 4.2 | ||||||
| 5. | Alphabet, Inc. Class C | 4.2 | ||||||
| 6. | salesforce.com, Inc. | 3.9 | ||||||
| 7. | L3Harris Technologies, Inc. | 3.5 | ||||||
| 8. | Intercontinental Exchange, Inc. | 3.4 | ||||||
| 9. | Texas Instruments, Inc. | 3.3 | ||||||
| 10. | Boston Scientific Corp. | 3.1 | ||||||
| (1) | Composition of Portfolio subject to change. |
| (2) | Short-term investments have been excluded from the list of Top 10 Portfolio Holdings. |
| (3) | Top 10 Portfolio Holdings is presented at an individual security level. Total investment exposure by issuer may be higher. |
| (4) | Sectors (Common Stocks): |
| % of Net Assets | ||||
Information Technology | 33.1 | |||
Health Care | 15.4 | |||
Communication Services | 13.7 | |||
Industrials | 10.9 | |||
Financials | 9.4 | |||
Consumer Discretionary | 9.4 | |||
Materials | 4.3 | |||
Real Estate | 2.9 | |||
|
| |||
| 99.1 | ||||
|
| |||
38
| Ohio National Fund, Inc. | ON Janus Henderson Forty Portfolio |
Schedule of Investments | June 30, 2019 (Unaudited) | |
| Common Stocks – 99.1% | Shares | Value | ||||||||||
COMMUNICATION SERVICES – 13.7% |
| |||||||||||
Alphabet, Inc. Class C (Interactive Media & Svs.) | (a | ) | 7,475 | $ | 8,079,802 | |||||||
GCI Liberty, Inc. Class A (Diversified Telecom. Svs.) | (a | ) | 47,631 | 2,927,401 | ||||||||
Live Nation Entertainment, Inc. (Entertainment) | (a | ) | 38,679 | 2,562,484 | ||||||||
Netflix, Inc. (Entertainment) | (a | ) | 12,412 | 4,559,176 | ||||||||
Walt Disney Co. / The (Entertainment) | 58,656 | 8,190,724 | ||||||||||
|
| |||||||||||
| �� | 26,319,587 | |||||||||||
|
| |||||||||||
CONSUMER DISCRETIONARY – 9.4% |
| |||||||||||
Amazon.com, Inc. (Internet & Direct Marketing Retail) | (a | ) | 4,430 | 8,388,781 | ||||||||
Home Depot, Inc. / The (Specialty Retail) | 27,521 | 5,723,542 | ||||||||||
NIKE, Inc. Class B (Textiles, Apparel & Luxury Goods) | 46,428 | 3,897,631 | ||||||||||
|
| |||||||||||
| 18,009,954 | ||||||||||||
|
| |||||||||||
FINANCIALS – 9.4% | ||||||||||||
Intercontinental Exchange, Inc. | 76,130 | 6,542,612 | ||||||||||
Markel Corp. (Insurance) | (a | ) | 4,523 | 4,928,261 | ||||||||
SVB Financial Group (Banks) | (a | ) | 10,589 | 2,378,183 | ||||||||
TD Ameritrade Holding Corp. (Capital Markets) | 86,988 | 4,342,441 | ||||||||||
|
| |||||||||||
| 18,191,497 | ||||||||||||
|
| |||||||||||
HEALTH CARE – 15.4% |
| |||||||||||
Boston Scientific Corp. (Health Care Equip. & Supplies) | (a | ) | 138,447 | 5,950,452 | ||||||||
Cooper Cos., Inc. / The (Health Care Equip. & Supplies) | 13,301 | 4,480,974 | ||||||||||
Danaher Corp. (Health Care Equip. & Supplies) | 20,924 | 2,990,458 | ||||||||||
Edwards Lifesciences Corp. (Health Care Equip. & Supplies) | (a | ) | 12,725 | 2,350,816 | ||||||||
ICU Medical, Inc. (Health Care Equip. & Supplies) | (a | ) | 14,125 | 3,558,229 | ||||||||
Insmed, Inc. (Biotechnology) | (a | ) | 124,576 | 3,189,146 | ||||||||
Intuitive Surgical, Inc. (Health Care Equip. & Supplies) | (a | ) | 8,751 | 4,590,337 | ||||||||
Neurocrine Biosciences, Inc. (Biotechnology) | (a | ) | 29,410 | 2,483,086 | ||||||||
|
| |||||||||||
| 29,593,498 | ||||||||||||
|
| |||||||||||
INDUSTRIALS – 10.9% | ||||||||||||
Boeing Co. / The (Aerospace & Defense) | 14,508 | 5,281,057 | ||||||||||
CoStar Group, Inc. (Professional Svs.) | (a | ) | 5,918 | 3,278,927 | ||||||||
| Common Stocks (Continued) | Shares | Value | ||||||||||
INDUSTRIALS (continued) |
| |||||||||||
L3Harris Technologies, Inc. (Aerospace & Defense) | 35,316 | $ | 6,679,315 | |||||||||
Wabtec Corp. (Machinery) | 79,430 | 5,699,897 | ||||||||||
|
| |||||||||||
| 20,939,196 | ||||||||||||
|
| |||||||||||
INFORMATION TECHNOLOGY – 33.1% |
| |||||||||||
Adobe, Inc. (Software) | (a | ) | 14,904 | 4,391,464 | ||||||||
Apple, Inc. (Tech. Hardware, Storage & Periph.) | 13,628 | 2,697,254 | ||||||||||
ASML Holding N.V. (Semiconductors & Equip.) | 19,097 | 3,970,839 | ||||||||||
Atlassian Corp. PLC Class A (Software) | (a | ) | 16,285 | 2,130,729 | ||||||||
Avalara, Inc. (Software) | (a | ) | 22,318 | 1,611,360 | ||||||||
Cognex Corp. (Electronic Equip., Instr. & Comp.) | 25,982 | 1,246,616 | ||||||||||
Mastercard, Inc. Class A (IT Svs.) | 49,225 | 13,021,489 | ||||||||||
Microsoft Corp. (Software) | 106,499 | 14,266,606 | ||||||||||
NVIDIA Corp. (Semiconductors & Equip.) | 6,112 | 1,003,774 | ||||||||||
Pagseguro Digital Ltd. Class A (IT Svs.) | (a | ) | 77,444 | 3,017,993 | ||||||||
salesforce.com, Inc. (Software) | (a | ) | 49,185 | 7,462,840 | ||||||||
Texas Instruments, Inc. (Semiconductors & Equip.) | 55,606 | 6,381,344 | ||||||||||
Trade Desk, Inc. / The Class A (Software) | (a | ) | 10,592 | 2,412,646 | ||||||||
|
| |||||||||||
| 63,614,954 | ||||||||||||
|
| |||||||||||
MATERIALS – 4.3% |
| |||||||||||
Ball Corp. (Containers & Packaging) | 58,928 | 4,124,371 | ||||||||||
Sherwin-Williams Co. / The (Chemicals) | 9,051 | 4,147,983 | ||||||||||
|
| |||||||||||
| 8,272,354 | ||||||||||||
|
| |||||||||||
REAL ESTATE – 2.9% | ||||||||||||
American Tower Corp. (Equity REIT) |
| 27,396 | 5,601,112 | |||||||||
|
| |||||||||||
Total Common Stocks | $ | 190,542,152 | ||||||||||
|
| |||||||||||
| Money Market Funds – 1.0% | Shares | Value | ||||||||||
State Street Institutional Liquid Reserves Fund Institutional | (b | ) | 1,921,187 | $ | 1,921,572 | |||||||
|
| |||||||||||
Total Money Market Funds | $ | 1,921,572 | ||||||||||
|
| |||||||||||
Total Investments – 100.1% | (c | ) | $ | 192,463,724 | ||||||||
Liabilities in Excess of Other | (221,487 | ) | ||||||||||
|
| |||||||||||
Net Assets – 100.0% |
| $ | 192,242,237 | |||||||||
|
| |||||||||||
Percentages are stated as a percent of net assets.
Footnotes:
| (a) | Non-income producing security. |
| (b) | Rate represents theseven-day yield at June 30, 2019. |
| (c) | Represents cost for financial reporting purposes, which may differ from cost basis for federal income tax purposes. See also Note 7 of the Notes to Financial Statements. |
The accompanying notes are an integral part of these financial statements.
39
| Ohio National Fund, Inc. |
Objective/Strategy |
The ON Janus Henderson Venture Portfolio seeks long-term capital appreciation by investing, under normal circumstances, at least 80% of its net assets in stocks of small capitalization companies.
Performance as of June 30, 2019 |
Average Annual returns | ||||
One year | 4.16 | % | ||
Five years | 10.51 | % | ||
Ten years | 16.87 | % |
Past performance does not guarantee future results. The performance data quoted represents past performance and current returns may be lower or higher. Total return figures include change in share price and reinvestment of dividends and capital gains. The investment return and principal value will fluctuate so that an investor’s shares, when redeemed, may be worth more or less than the original cost. To obtain performance information up to the most recent month end, call toll-free1-877-781-6392.
The Portfolio is not open to direct retail investment. Beneficial interest in shares is obtained solely by purchase of variable life insurance policies and variable annuity contracts. Actual performance results for variable annuity and variable universal life contracts will be lower due to contract charges. Consult your contract for applicable charges.
Total expense ratio is 0.85% per the Fund’s prospectus dated May 1, 2019. Additional information pertaining to the Portfolio’s expense ratio as of June 30, 2019 can be found in the Portfolio’s Financial Highlights.
Comments fromSub-Adviser |
Q. How did the Portfolio perform in comparison to its benchmark during the reporting period?
A.For thesix-month period ended June 30, 2019, the ON Janus Henderson Venture Portfolio returned 24.15% versus 20.36% for its benchmark, the Russell 2000 Growth Index.
Q. Were there specific market conditions, investment strategies, or techniques that materially affected the Portfolio’s benchmark-relative performance during the reporting period?
A.The Portfolio significantly outperformed its benchmark when volatility returned to markets in May. The portfolio managers take a high-quality approach to investing in small caps, focusing on companies that have more predictable, growing revenue streams. The investment team favors companies that generate a high return on invested capital, or demonstrate a proven ability to expand profit margins. Many times, these companies are defined by sustainable competitive advantages that give them pricing power, and help the company grow in a variety of market and economic environments. Historically, the bulk of relative outperformance has come in weak or uncertain market environments, when the stability of these businesses is more appreciated.
Q. How did sector allocation and security selection each impact the Portfolio’s performance relative to its benchmark? For sector allocation, were there any factors that impacted the benchmark’s performance more significantly than the Portfolio’s performance? For security selection, was there anything specific regarding the Portfolio’s strategy that caused deviation from the benchmark?
A.An overweight to the Information Technology sector was a large contributor to relative outperformance. The overweight position was driven by changes in the benchmark, as many of the larger Information Technology companies graduated out of the index due to increased market capitalization. Stock selection in the Information Technology and Financials sectors was also a large driver of relative outperformance.(1)
Stock selection in the Health Care sector detracted from relative results during the period. The Portfolio is underweight biotechnology companies, and that hurt relative performance. Biotechnology stocks now comprise more than 10% of the benchmark, and many of those companies do not have products on the market yet, or are not yet profitable. While the Portfolio selectively includes a few biotech companies with promising treatments, the portfolio managers have avoided many of the unprofitable companies due to the uncertainty of their future earnings streams.(1)
Q. Which holdings contributed the most to, and detracted the most from, the Portfolio’s benchmark-relative performance?
A.None of the Portfolio’s top three relative contributors was included in the benchmark. Catalent, Inc. contributed to the Portfolio’s performance in the first quarter, when it sourced an alternative supplier of ibuprofen to resolve a shortage issue. In addition, the company reported another strong quarter in its biologics business, which is a key driver of current and future growth. HEICO Corp. Class A, an aerospace parts supplier, also contributed to the Portfolio’s performance after the stock rose following the company beating earnings expectations and raising guidance for 2019. The portfolio managers continue to like HEICO’s aftermarket business, which provides a resilient, recurring revenue stream for the company, and also believe the technical expertise required to make its mission-critical parts, as well as the FAA approval process required for each part, present a high barrier to entry forwould-be competitors. Another significant contributor to Portfolio performance was Euronet Worldwide, Inc. (“Euronet”), as a final draft of an European Union regulation around fee structures for ATM withdrawals was not as onerous as the market feared, removing an overhang for the stock during the period. Long term, the portfolio managers continue to like the company for its distinct growth platforms in money transfer, prepaid and mobile, and believe Euronet has an attractive ATM outsourcing business, with market-leading positions in Europe.(1)
The bottom three detractors for the Portfolio’s benchmark relative performance were due to not holding benchmark names Array Biopharma, Inc., Coupa Software, Inc., and Roku, Inc., all of which had triple digit returns in the benchmark during the period. An overweight to Arlo Technologies, Inc., which provides security cameras and home automation services, detracted from Portfolio performance after the company stumbled with the launch of one of its security cameras.(1)
Q. How did the Portfolio’s use of derivative instruments and initial public offerings (IPOs), if any, impact performance?
A.The Portfolio did not use any derivatives during the period. The Portfolio invested in three IPOs during the period, which contributed a modest 18 basis points (“bps”) to total return. Fastly, Inc. contributed 7 bps, Grocery Outlet Holding Corp. contributed 6 bps, and Beyond Meat, Inc. contributed 5 bps.(1)
| (1) | The Portfolio’s composition is subject to change. Holdings and weightings are as of June 30, 2019. |
| 40 | (continued) |
| Ohio National Fund, Inc. | ON Janus Henderson Venture Portfolio (Unaudited) (Continued) |
Change in Value of $10,000 Investment |
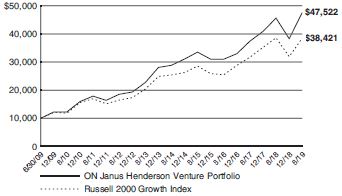
Hypothetical illustration based on past performance. Future performance will vary. The Portfolio’s returns reflect reinvested dividends. The Portfolio’s holdings may differ significantly from the securities in the index. The index is unmanaged and therefore does not reflect the cost of portfolio management and accounting.
The Russell 2000 Growth Index measures the performance of thesmall-cap growth segment of the U.S. equity universe. It includes the Russell 2000 Index companies with higherprice-to-value ratios and higher forecasted growth values. The Russell 2000 Index includes the 2000 firms from the Russell 3000 Index with the smallest market capitalizations. The Russell 3000 Index represents 98% of the investable U.S. equity markets. The index presented includes the effects of reinvested dividends.
Past performance is no guarantee of future results. Redemption of fund shares could have tax implications unique to each shareholder.
Portfolio Composition as of June 30, 2019(1) | ||||
% of Net Assets | ||||||
Common Stocks(4) | 97.4 | |||||
Master Limited Partnerships(4) | 1.8 | |||||
Money Market Funds Less Net Liabilities | 0.8 | |||||
|
| |||||
| 100.0 | ||||||
|
| |||||
Top 10 Portfolio Holdings as of June 30, 2019 (1) (2) (3) | ||||
% of Net Assets | ||||||||
| 1. | HEICO Corp. Class A | 2.7 | ||||||
| 2. | Catalent, Inc. | 2.5 | ||||||
| 3. | Euronet Worldwide, Inc. | 2.3 | ||||||
| 4. | Nice Ltd. – ADR | 2.2 | ||||||
| 5. | ServiceMaster Global Holdings, Inc. | 2.0 | ||||||
| 6. | LPL Financial Holdings, Inc. | 1.9 | ||||||
| 7. | STERIS PLC | 1.9 | ||||||
| 8. | SS&C Technologies Holdings, Inc. | 1.8 | ||||||
| 9. | j2 Global, Inc. | 1.7 | ||||||
| 10. | Blackbaud, Inc. | 1.7 | ||||||
| (1) | Composition of Portfolio subject to change. |
| (2) | Short-term investments have been excluded from the list of Top 10 Portfolio Holdings. |
| (3) | Top 10 Portfolio Holdings is presented at an individual security level. Total investment exposure by issuer may be higher. |
| (4) | Sectors (Common Stocks, Master Limited Partnerships): |
| % of Net Assets | ||||
Information Technology | 34.1 | |||
Health Care | 19.9 | |||
Industrials | 18.3 | |||
Consumer Discretionary | 10.2 | |||
Financials | 6.2 | |||
Materials | 4.5 | |||
Real Estate | 2.1 | |||
Energy | 1.7 | |||
Consumer Staples | 1.3 | |||
Communication Services | 0.9 | |||
|
| |||
| 99.2 | ||||
|
| |||
41
Ohio National Fund, Inc.
| ON Janus Henderson Venture Portfolio
| |
Schedule of Investments | June 30, 2019 (Unaudited) | |
| Common Stocks – 97.4% | Shares | Value | ||||||||
COMMUNICATION SERVICES – 0.9% |
| |||||||||
Bandwidth, Inc. Class A (Diversified Telecom. Svs.) | (a) | 7,589 | $ | 569,327 | ||||||
Manchester United PLC Class A (Entertainment) | 48,665 | 879,863 | ||||||||
|
| |||||||||
| 1,449,190 | ||||||||||
|
| |||||||||
CONSUMER DISCRETIONARY – 9.0% |
| |||||||||
Carter’s, Inc. (Textiles, Apparel & Luxury Goods) | 8,964 | 874,349 | ||||||||
Dunkin’ Brands Group, Inc. (Hotels, Restaurants & Leisure) | 17,646 | 1,405,680 | ||||||||
Farfetch Ltd. Class A (Internet & Direct Marketing Retail) | (a) | 34,198 | 711,318 | |||||||
frontdoor, Inc. (Diversified Consumer Svs.) | (a) | 32,984 | 1,436,453 | |||||||
K12, Inc. (Diversified Consumer Svs.) | (a) | 42,768 | 1,300,575 | |||||||
Lovesac Co. / The (Household Durables) | (a) | 38,822 | 1,206,199 | |||||||
MakeMyTrip Ltd. (Internet & Direct Marketing Retail) | (a) | 23,607 | 585,454 | |||||||
Monarch Casino & Resort, Inc. (Hotels, Restaurants & Leisure) | (a) | 19,870 | 849,244 | |||||||
RealReal, Inc. / The (Internet & Direct Marketing Retail) | (a) | 13,169 | 380,584 | |||||||
ServiceMaster Global Holdings, Inc. (Diversified Consumer Svs.) | (a) | 65,967 | 3,436,221 | |||||||
Thor Industries, Inc. (Automobiles) | 14,634 | 855,357 | ||||||||
Visteon Corp. (Auto Components) | (a) | 15,174 | 888,893 | |||||||
Waitr Holdings, Inc. (Internet & Direct Marketing Retail) | (a) | 94,030 | 591,449 | |||||||
Williams-Sonoma, Inc. (Specialty Retail) | 14,983 | 973,895 | ||||||||
|
| |||||||||
| 15,495,671 | ||||||||||
|
| |||||||||
CONSUMER STAPLES – 1.3% | ||||||||||
Casey’s General Stores, Inc. (Food & Staples Retailing) | 5,691 | 887,739 | ||||||||
Hain Celestial Group, Inc. / The (Food Products) | (a) | 23,750 | 520,125 | |||||||
Ontex Group N.V. (Personal Products) | (b) | 52,442 | 846,441 | |||||||
|
| |||||||||
| 2,254,305 | ||||||||||
|
| |||||||||
ENERGY – 1.1% | ||||||||||
Magnolia Oil & Gas Corp. Class A (Oil, Gas & Consumable Fuels) | (a) | 82,041 | 950,035 | |||||||
Solaris Oilfield Infrastructure, Inc. Class A (Energy Equip. & Svs.) | 65,437 | 980,246 | ||||||||
|
| |||||||||
| 1,930,281 | ||||||||||
|
| |||||||||
FINANCIALS – 6.2% | ||||||||||
Kearny Financial Corp. (Thrifts & Mortgage Finance) | 61,313 | 814,850 | ||||||||
LendingTree, Inc. (Thrifts & Mortgage Finance) | (a) | 3,677 | 1,544,450 | |||||||
LPL Financial Holdings, Inc. (Capital Markets) | 40,330 | 3,289,718 | ||||||||
MSCI, Inc. (Capital Markets) | 4,725 | 1,128,283 | ||||||||
RLI Corp. (Insurance) | 21,247 | 1,821,080 | ||||||||
SLM Corp. (Consumer Finance) | 99,488 | 967,023 | ||||||||
UMB Financial Corp. (Banks) | 15,390 | 1,012,970 | ||||||||
|
| |||||||||
| 10,578,374 | ||||||||||
|
| |||||||||
HEALTH CARE –19.9% | ||||||||||
Acceleron Pharma, Inc. (Biotechnology) | (a) | 11,458 | 470,695 | |||||||
AnaptysBio, Inc. (Biotechnology) | (a) | 11,582 | 653,457 | |||||||
AngioDynamics, Inc. (Health Care Equip. & Supplies) | (a) | 52,564 | 1,034,985 | |||||||
BeiGene Ltd. – ADR (Biotechnology) | (a) | 4,679 | 579,962 | |||||||
Bio-Techne Corp. (Life Sciences Tools & Svs.) | 8,772 | 1,828,874 | ||||||||
Bridgebio Pharma, Inc. (Biotechnology) | (a) | 19,241 | 518,930 | |||||||
Catalent, Inc. (Pharmaceuticals) | (a) | 80,240 | 4,349,810 | |||||||
Codexis, Inc. (Life Sciences Tools & Svs.) | (a) | 44,790 | 825,480 | |||||||
Deciphera Pharmaceuticals, Inc. (Biotechnology) | (a) | 12,535 | 282,664 | |||||||
Eagle Pharmaceuticals, Inc. (Biotechnology) | (a) | 23,031 | 1,282,366 | |||||||
| Common Stocks (Continued) | Shares | Value | ||||||||||
HEALTH CARE (continued) | ||||||||||||
Enanta Pharmaceuticals, Inc. (Biotechnology) | (a) | 10,949 | $ | 923,877 | ||||||||
FibroGen, Inc. (Biotechnology) | (a) | 20,135 | 909,699 | |||||||||
Globus Medical, Inc. Class A (Health Care Equip. & Supplies) | (a) | 35,497 | 1,501,523 | |||||||||
GW Pharmaceuticals PLC – ADR (Pharmaceuticals) | (a) | 6,236 | 1,075,024 | |||||||||
HealthEquity, Inc. (Health Care Providers & Svs.) | (a) | 11,386 | 744,644 | |||||||||
Heron Therapeutics, Inc. (Biotechnology) | (a) | 36,054 | 670,244 | |||||||||
Heska Corp. (Health Care Equip. & Supplies) | (a) | 7,849 | 668,499 | |||||||||
ICU Medical, Inc. (Health Care Equip. & Supplies) | (a) | 6,376 | 1,606,178 | |||||||||
Immunomedics, Inc. (Biotechnology) | (a) | 33,304 | 461,927 | |||||||||
Insmed, Inc. (Biotechnology) | (a) | 50,239 | 1,286,118 | |||||||||
Knight Therapeutics, Inc. (Pharmaceuticals) | (a) | 130,290 | 768,080 | |||||||||
Ligand Pharmaceuticals, Inc. (Biotechnology) | (a) | 12,389 | 1,414,204 | |||||||||
Mirati Therapeutics, Inc. (Biotechnology) | (a) | 7,564 | 779,092 | |||||||||
Myovant Sciences Ltd. (Biotechnology) | (a) | 21,993 | 199,037 | |||||||||
NeoGenomics, Inc. (Life Sciences Tools & Svs.) | (a) | 90,365 | 1,982,608 | |||||||||
Neurocrine Biosciences, Inc. (Biotechnology) | (a) | 13,944 | 1,177,292 | |||||||||
Prestige Consumer Healthcare, Inc. (Pharmaceuticals) | (a) | 28,975 | 917,928 | |||||||||
Rhythm Pharmaceuticals, Inc. (Biotechnology) | (a) | 26,020 | 572,440 | |||||||||
STERIS PLC (Health Care Equip. & Supplies) | 21,854 | 3,253,624 | ||||||||||
Surmodics, Inc. (Health Care Equip. & Supplies) | (a) | 14,422 | 622,598 | |||||||||
WaVe Life Sciences Ltd. (Pharmaceuticals) | (a) | 25,435 | 663,599 | |||||||||
|
| |||||||||||
| 34,025,458 | ||||||||||||
|
| |||||||||||
INDUSTRIALS – 18.3% | ||||||||||||
AMERCO (Road & Rail) | 3,781 | 1,431,298 | ||||||||||
Brady Corp. Class A (Commercial Svs. & Supplies) | 32,821 | 1,618,732 | ||||||||||
Cimpress N.V. (Commercial Svs. & Supplies) | (a) | 10,746 | 976,704 | |||||||||
Clarivate Analytics PLC (Professional Svs.) | (a) | 140,898 | 2,167,011 | |||||||||
CSW Industrials, Inc. (Building Products) | 35,523 | 2,420,892 | ||||||||||
EnerSys (Electrical Equip.) | 12,494 | 855,839 | ||||||||||
Gates Industrial Corp. PLC (Machinery) | (a) | 124,018 | 1,415,045 | |||||||||
HEICO Corp. Class A (Aerospace & Defense) | 44,122 | 4,560,891 | ||||||||||
ITT, Inc. (Machinery) | 34,441 | 2,255,197 | ||||||||||
Kennametal, Inc. (Machinery) | 31,662 | 1,171,177 | ||||||||||
Kornit Digital Ltd. (Machinery) | (a) | 54,899 | 1,738,102 | |||||||||
Nordson Corp. (Machinery) | 12,749 | 1,801,561 | ||||||||||
Old Dominion Freight Line, Inc. (Road & Rail) | 7,292 | 1,088,404 | ||||||||||
Proto Labs, Inc. (Machinery) | (a) | 7,249 | 841,029 | |||||||||
Rexnord Corp. (Machinery) | (a) | 72,603 | 2,194,063 | |||||||||
Standex International Corp. (Machinery) | 24,654 | 1,803,194 | ||||||||||
TrueBlue, Inc. (Professional Svs.) | (a) | 47,689 | 1,052,019 | |||||||||
WABCO Holdings, Inc. (Machinery) | (a) | 7,618 | 1,010,147 | |||||||||
Wabtec Corp. (Machinery) | 12,127 | 870,234 | ||||||||||
|
| |||||||||||
| 31,271,539 | ||||||||||||
|
| |||||||||||
INFORMATION TECHNOLOGY – 34.1% |
| |||||||||||
Altair Engineering, Inc. Class A (Software) | (a) | 28,866 | 1,165,898 | |||||||||
Arlo Technologies, Inc. (Electronic Equip., Instr. & Comp.) | (a) | 41,152 | 165,019 | |||||||||
Belden, Inc. (Electronic Equip., Instr. & Comp.) | 34,752 | 2,070,177 | ||||||||||
Blackbaud, Inc. (Software) | 34,808 | 2,906,468 | ||||||||||
Broadridge Financial Solutions, Inc. (IT Svs.) | 19,788 | 2,526,532 | ||||||||||
Cadence Design Systems, Inc. (Software) | (a) | 28,747 | 2,035,575 | |||||||||
ChannelAdvisor Corp. (Software) | (a) | 80,155 | 702,158 | |||||||||
Cision Ltd. (Software) | (a) | 109,125 | 1,280,036 | |||||||||
CTS Corp. (Electronic Equip., Instr. & Comp.) | 25,170 | 694,189 | ||||||||||
Descartes Systems Group, Inc. / The (Software) | (a) | 58,785 | 2,174,895 | |||||||||
Envestnet, Inc. (Software) | (a) | 28,723 | 1,963,791 | |||||||||
Euronet Worldwide, Inc. (IT Svs.) | (a) | 23,080 | 3,882,979 | |||||||||
Everbridge, Inc. (Software) | (a) | 13,870 | 1,240,255 | |||||||||
| 42 | (continued) |
| Ohio National Fund, Inc. | ON Janus Henderson Venture Portfolio (Continued) |
Schedule of Investments | June 30, 2019 (Unaudited) | |
| Common Stocks (Continued) | Shares | Value | ||||||||||
INFORMATION TECHNOLOGY (continued) |
| |||||||||||
GTY Technology Holdings, Inc. (Software) | (a | ) | 105,470 | $ | 722,469 | |||||||
Guidewire Software, Inc. (Software) | (a | ) | 11,501 | 1,165,971 | ||||||||
Instructure, Inc. (Software) | (a | ) | 30,218 | 1,284,265 | ||||||||
j2 Global, Inc. (Software) | 33,120 | 2,944,037 | ||||||||||
LivePerson, Inc. (Software) | (a | ) | 44,617 | 1,251,061 | ||||||||
National Instruments Corp. (Electronic Equip., Instr. & Comp.) | 16,542 | 694,599 | ||||||||||
Nice Ltd. – ADR (Software) | (a | ) | 27,945 | 3,828,465 | ||||||||
Novanta, Inc. (Electronic Equip., Instr. & Comp.) | (a | ) | 13,106 | 1,235,896 | ||||||||
ON Semiconductor Corp. (Semiconductors & Equip.) | (a | ) | 126,990 | 2,566,468 | ||||||||
OSI Systems, Inc. (Electronic Equip., Instr. & Comp.) | (a | ) | 16,570 | 1,866,279 | ||||||||
Paylocity Holding Corp. (Software) | (a | ) | 19,404 | 1,820,483 | ||||||||
RealPage, Inc. (Software) | (a | ) | 28,499 | 1,677,166 | ||||||||
Rogers Corp. (Electronic Equip., Instr. & Comp.) | (a | ) | 10,358 | 1,787,584 | ||||||||
SailPoint Technologies Holding, Inc. (Software) | (a | ) | 53,975 | 1,081,659 | ||||||||
SS&C Technologies Holdings, Inc. (Software) | 52,508 | 3,024,986 | ||||||||||
Trade Desk, Inc. / The Class A (Software) | (a | ) | 7,991 | 1,820,190 | ||||||||
Tyler Technologies, Inc. (Software) | (a | ) | 6,828 | 1,474,985 | ||||||||
WEX, Inc. (IT Svs.) | (a | ) | 9,534 | 1,984,025 | ||||||||
WNS Holdings Ltd. – ADR (IT Svs.) | (a | ) | 34,235 | 2,026,712 | ||||||||
Yext, Inc. (Software) | (a | ) | 66,031 | 1,326,563 | ||||||||
|
| |||||||||||
| 58,391,835 | ||||||||||||
|
| |||||||||||
MATERIALS – 4.5% | ||||||||||||
Chase Corp. (Chemicals) | 6,675 | 718,497 | ||||||||||
H.B. Fuller Co. (Chemicals) | 27,979 | 1,298,225 | ||||||||||
Neenah, Inc. (Paper & Forest Products) | 14,738 | 995,552 | ||||||||||
Sensient Technologies Corp. (Chemicals) | 39,466 | 2,899,962 | ||||||||||
Valvoline, Inc. (Chemicals) | 95,451 | 1,864,158 | ||||||||||
|
| |||||||||||
| 7,776,394 | ||||||||||||
|
| |||||||||||
| Common Stocks (Continued) | Shares | Value | ||||||||||
REAL ESTATE – 2.1% | ||||||||||||
Condor Hospitality Trust, Inc. (Equity REIT) | 59,008 | $ | 535,202 | |||||||||
Easterly Government Properties, Inc. (Equity REIT) | 46,522 | 842,513 | ||||||||||
FirstService Corp. (Real Estate Mgmt. & Development) | 13,016 | 1,248,495 | ||||||||||
Redfin Corp. (Real Estate Mgmt. & Development) | (a | ) | 56,663 | 1,018,801 | ||||||||
|
| |||||||||||
| 3,645,011 | ||||||||||||
|
| |||||||||||
Total Common Stocks | $ | 166,818,058 | ||||||||||
|
| |||||||||||
| Master Limited Partnerships – 1.8% | Shares | Value | ||||||||||
CONSUMER DISCRETIONARY – 1.2% | ||||||||||||
Cedar Fair LP (Hotels, Restaurants & Leisure) | 44,091 | $ | 2,102,700 | |||||||||
|
| |||||||||||
ENERGY – 0.6% | ||||||||||||
DCP Midstream LP (Oil, Gas & Consumable Fuels) | 33,600 | 984,480 | ||||||||||
|
| |||||||||||
Total Master Limited Partnerships (Cost $2,902,036) | $ | 3,087,180 | ||||||||||
|
| |||||||||||
| Money Market Funds –1.3% | Shares | Value | ||||||||||
State Street Institutional Liquid Reserves Fund Institutional Class, 2.449% | (c | ) | 2,282,646 | $ | 2,283,102 | |||||||
|
| |||||||||||
Total Money Market Funds (Cost $2,283,000) | $ | 2,283,102 | ||||||||||
|
| |||||||||||
Total Investments – 100.5% | (d | ) | $ | 172,188,340 | ||||||||
Liabilities in Excess of Other | (809,010 | ) | ||||||||||
|
| |||||||||||
Net Assets – 100.0% | $ | 171,379,330 | ||||||||||
|
| |||||||||||
Percentages are stated as a percent of net assets.
Abbreviations:
| ADR: | American Depositary Receipts |
Footnotes:
| (a) | Non-income producing security. |
| (b) | Security traded on a foreign exchange has been valued at an estimate of fair value that is different than the local market close price. These fair value estimates are determined by an independent fair valuation service that has been approved by the Board. These securities represent $846,441 or 0.5% of the Portfolio’s net assets. |
Other Portfolio securities are not subjected to fair value procedures because they are traded on domestic or foreign exchanges that have close times that are consistent with the U.S. market close, normally 4:00 pm Eastern Time. |
| (c) | Rate represents theseven-day yield at June 30, 2019. |
| (d) | Represents cost for financial reporting purposes, which may differ from cost basis for federal income tax purposes. See also Note 7 of the Notes to Financial Statements. |
The accompanying notes are an integral part of these financial statements.
43
| Ohio National Fund, Inc. | ON Janus Henderson Enterprise Portfolio (Unaudited) |
Objective/Strategy |
The ON Janus Henderson Enterprise Portfolio seeks long-term total return by investing, under normal circumstances, at least 50% of its net assets in equity securities ofmid-cap companies, primarily those that are strategically positioned for long-term growth.
Performance as of June 30, 2019 | ||||
| Average Annual returns | ||||
One year | 16.63% | |||
Five years | 9.85% | |||
Ten years | 14.68% |
Past performance does not guarantee future results. The performance data quoted represents past performance and current returns may be lower or higher. Total return figures include change in share price and reinvestment of dividends and capital gains. The investment return and principal value will fluctuate so that an investor’s shares, when redeemed, may be worth more or less than the original cost. To obtain performance information up to the most recent month end, call toll-free1-877-781-6392.
The Portfolio is not open to direct retail investment. Beneficial interest in shares is obtained solely by purchase of variable life insurance policies and variable annuity contracts. Actual performance results for variable annuity and variable universal life contracts will be lower due to contract charges. Consult your contract for applicable charges.
Total expense ratio is 0.96% per the Fund’s prospectus dated May 1, 2019. Additional information pertaining to the Portfolio’s expense ratio as of June 30, 2019 can be found in the Portfolio’s Financial Highlights.
Comments fromSub-Adviser |
Q. How did the Portfolio perform in comparison to its benchmark during the reporting period?
A.For thesix-month period ended June 30, 2019, the ON Janus Henderson Enterprise Portfolio returned 26.90% versus 26.08% for its benchmark, the Russell Midcap Growth Index.
Q. Were there specific market conditions, investment strategies, or techniques that materially affected the Portfolio’s benchmark-relative performance during the reporting period?
A.The Portfolio lagged the benchmark in the first quarter, as markets surged. However, the Portfolio slightly outperformed for thesix-month period. The Portfolio made up significant ground on the benchmark when markets were volatile in May. This is largely how one would expect the Portfolio to perform. The Portfolio tends to emphasize “durable growth” companies that have more predictable business models, recurring revenue streams, and strong competitive positioning that can allow the companies to take market share and experience sustainable, long-term growth. This focus on higher-quality growth companies has historically helped the Portfolio outperform when markets are volatile.
Q. How did sector allocation and security selection each impact the Portfolio’s performance relative to its benchmark? For sector allocation, were there any factors that impacted the benchmark’s performance more significantly than the Portfolio’s performance? For stock selection, was there anything specific regarding the Portfolio’s strategy that caused deviation from the benchmark?
A.From a sector allocation perspective, the Portfolio was helped most by an underweight to the Consumer Staples sector. In arisk-on environment, defensive sectors, such as Consumer Staples, lagged the broader benchmark.(1)
Stock selection in the Consumer Discretionary and Health Care sectors also helped drive relative outperformance. Within the Consumer Discretionary sector, the Portfolio did not hold the stocks of many retailers that generally lagged during the period. Stock selection in the Real Estate and Financials sectors detracted from relative performance.(1)
Q. Which holdings contributed the most to, and detracted the most from, the Portfolio’s benchmark-relative performance?
A.Constellation Software, Inc. (“Constellation”), a position not in the benchmark, was the top relative contributor to the Portfolio’s performance, as strong organic revenue growth helped drive the stock of the diversified software company. Constellation also deployed a lot of capital toward acquisitions, which the market has viewed favorably due to Constellation’s history of creating value with the companies it acquires. WEX, Inc. was another top contributor. The company provides payment processing and information management services to vehicle fleets, and rising oil prices helped lift the stock during the period. CoStar Group, Inc. also contributed to the Portfolio’s performance, as the stock rose after the company reported a strong fourth quarter and offered upbeat guidance for the year ahead. The portfolio managers like the recurring revenue streams associated with its subscription-based commercial real estate database and its new business in the apartment rental market.(1)
The top three relative detractors were top performers in the benchmark, but not held by the Portfolio: ServiceNow, Inc., Advanced Mirco Devices, Inc., and Moody’s Corp. Cimpress NV, anon-benchmark holding which largely focuses on producing marketing collateral for small businesses, but also has a smallbusiness-to-consumer segment, detracted from the Portfolio’s performance. Growth for that segment has been slow and the company made a decision to pull back and reassess advertising spending for that business, but the portfolio managers believe the changes will help improve long-term profitability. An overweight to National Instruments Corp. detracted from the Portfolio’s performance after the company reported first-quarter revenue that was below consensus expectations. However, the portfolio managers continue to like the company, which provides automated test equipment and virtual instrumentation software, because they believe the flexibility of its software-based measurement solutions is poised to take market share.(1)
Q. How did the Portfolio’s use of derivative instruments and initial public offerings (IPOs), if any, impact performance?
A.The Portfolio did not use derivatives during the period. The Portfolio participated in one IPO, CrowdStrike Holdings, Inc., which modestly contributed 2 basis points to total return.(1)
| (1) | The Portfolio’s composition is subject to change. Holdings and weightings are as of June 30, 2019. |
| 44 | (continued) |
| Ohio National Fund, Inc. | ON Janus Henderson Enterprise Portfolio (Unaudited) (Continued) |
Change in Value of $10,000 Investment |
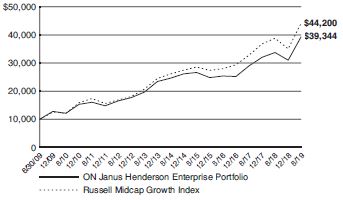
Hypothetical illustration based on past performance. Future performance will vary. The Portfolio’s returns reflect reinvested dividends. The Portfolio’s holdings may differ significantly from the securities in the index. The index is unmanaged and therefore does not reflect the cost of portfolio management and accounting.
The Russell Midcap Growth Index is a subset of the Russell Midcap Index, which measures the performance of the 800 smallest companies in the Russell 1000 Index. The Russell Midcap Growth Index measures the performance of those stocks of the Russell Midcap Index with higherprice-to-book ratios and higher relative forecasted growth rates. The index presented includes the effects of reinvested dividends.
Past performance is no guarantee of future results. Redemption of fund shares could have tax implications unique to each shareholder.
Portfolio Composition as of June 30, 2019(1) | ||||
% of Net Assets | ||||
Common Stocks(4) | 97.7 | |||
Money Market Funds Less Net Liabilities | 2.3 | |||
|
| |||
| 100.0 | ||||
|
| |||
Top 10 Portfolio Holdings as of June 30, 2019(1)(2)(3) | ||||
% of Net Assets | ||||||||
| 1. | Nice Ltd. – ADR | 2.7 | ||||||
| 2. | Constellation Software, Inc. | 2.7 | ||||||
| 3. | Global Payments, Inc. | 2.5 | ||||||
| 4. | Aon PLC | 2.4 | ||||||
| 5. | Microchip Technology, Inc. | 2.3 | ||||||
| 6. | WEX, Inc. | 2.3 | ||||||
| 7. | Sensata Technologies Holding PLC | 2.3 | ||||||
| 8. | Crown Castle International Corp. | 2.3 | ||||||
| 9. | LPL Financial Holdings, Inc. | 2.2 | ||||||
| 10. | Cooper Cos., Inc. / The | 2.2 | ||||||
| (1) | Composition of Portfolio subject to change. |
| (2) | Short-term investments have been excluded from the list of Top 10 Portfolio Holdings. |
| (3) | Top 10 Portfolio Holdings is presented at an individual security level. Total investment exposure by issuer may be higher. |
| (4) | Sectors (Common Stocks): |
| % of Net Assets | ||||
Information Technology | 35.6 | |||
Industrials | 20.3 | |||
Health Care | 14.5 | |||
Financials | 12.3 | |||
Consumer Discretionary | 8.1 | |||
Real Estate | 4.3 | |||
Communication Services | 1.3 | |||
Materials | 1.3 | |||
|
| |||
| 97.7 | ||||
|
| |||
45
Ohio National Fund, Inc.
| ON Janus Henderson Enterprise Portfolio
| |
Schedule of Investments | June 30, 2019 (Unaudited) | |
| Common Stocks – 97.7% | Shares | Value | ||||||||||
COMMUNICATION SERVICES – 1.3% |
| |||||||||||
Liberty Media Corp. - Liberty Formula One Class C (Entertainment) | (a | ) | 13,128 | $ | 491,119 | |||||||
Omnicom Group, Inc. (Media) | 11,820 | 968,649 | ||||||||||
|
| |||||||||||
| 1,459,768 | ||||||||||||
|
| |||||||||||
CONSUMER DISCRETIONARY – 8.1% |
| |||||||||||
Aramark (Hotels, Restaurants & Leisure) | 25,423 | 916,753 | ||||||||||
Dunkin’ Brands Group, Inc. (Hotels, Restaurants & Leisure) | 19,836 | 1,580,136 | ||||||||||
frontdoor, Inc. (Diversified Consumer Svs.) | (a | ) | 12,567 | 547,293 | ||||||||
Gildan Activewear, Inc. (Textiles, Apparel & Luxury Goods) | 45,394 | 1,755,840 | ||||||||||
Norwegian Cruise Line Holdings Ltd. (Hotels, Restaurants & Leisure) | (a | ) | 19,512 | 1,046,429 | ||||||||
ServiceMaster Global Holdings, Inc. (Diversified Consumer Svs.) | (a | ) | 25,139 | 1,309,490 | ||||||||
Visteon Corp. (Auto Components) | (a | ) | 6,788 | 397,641 | ||||||||
Wayfair, Inc. Class A (Internet & Direct Marketing Retail) | (a | ) | 4,102 | 598,892 | ||||||||
Williams-Sonoma, Inc. (Specialty Retail) | 9,854 | 640,510 | ||||||||||
|
| |||||||||||
| 8,792,984 | ||||||||||||
|
| |||||||||||
FINANCIALS – 12.3% | ||||||||||||
Aon PLC (Insurance) | 13,355 | 2,577,248 | ||||||||||
CBOE Global Markets, Inc. (Capital Markets) | 6,643 | 688,414 | ||||||||||
Intact Financial Corp. (Insurance) | 16,040 | 1,482,311 | ||||||||||
LPL Financial Holdings, Inc. (Capital Markets) | 29,645 | 2,418,143 | ||||||||||
MSCI, Inc. (Capital Markets) | 3,448 | 823,348 | ||||||||||
SVB Financial Group (Banks) | (a | ) | 2,650 | 595,164 | ||||||||
Synchrony Financial (Consumer Finance) | 20,537 | 712,018 | ||||||||||
TD Ameritrade Holding Corp. (Capital Markets) | 46,297 | 2,311,146 | ||||||||||
W.R. Berkley Corp. (Insurance) | 26,699 | 1,760,265 | ||||||||||
|
| |||||||||||
| 13,368,057 | ||||||||||||
|
| |||||||||||
HEALTH CARE – 14.5% | ||||||||||||
Alkermes PLC (Biotechnology) | (a | ) | 331 | 7,461 | ||||||||
Boston Scientific Corp. (Health Care Equip. & Supplies) | (a | ) | 53,466 | 2,297,969 | ||||||||
Catalent, Inc. (Pharmaceuticals) | (a | ) | 24,121 | 1,307,599 | ||||||||
Cooper Cos., Inc. / The (Health Care Equip. & Supplies) | 7,003 | 2,359,241 | ||||||||||
Elanco Animal Health, Inc. (Pharmaceuticals) | (a | ) | 8,176 | 276,349 | ||||||||
ICU Medical, Inc. (Health Care Equip. & Supplies) | (a | ) | 3,532 | 889,746 | ||||||||
IQVIA Holdings, Inc. (Life Sciences Tools & Svs.) | (a | ) | 10,417 | 1,676,095 | ||||||||
Neurocrine Biosciences, Inc. (Biotechnology) | (a | ) | 10,802 | 912,013 | ||||||||
PerkinElmer, Inc. (Life Sciences Tools & Svs.) | 23,781 | 2,291,061 | ||||||||||
Sage Therapeutics, Inc. (Biotechnology) | (a | ) | 1,764 | 322,971 | ||||||||
Sarepta Therapeutics, Inc. (Biotechnology) | (a | ) | 3,364 | 511,160 | ||||||||
Teleflex, Inc. (Health Care Equip. & Supplies) | 2,960 | 980,204 | ||||||||||
Varian Medical Systems, Inc. (Health Care Equip. & Supplies) | (a | ) | 5,338 | 726,662 | ||||||||
Waters Corp. (Life Sciences Tools & Svs.) | (a | ) | 6,086 | 1,309,950 | ||||||||
|
| |||||||||||
| 15,868,481 | ||||||||||||
|
| |||||||||||
INDUSTRIALS – 20.3% | ||||||||||||
Carlisle Cos., Inc. (Industrial Conglomerates) | 11,345 | 1,592,951 | ||||||||||
Cimpress N.V. (Commercial Svs. & Supplies) | (a | ) | 11,907 | 1,082,227 | ||||||||
CoStar Group, Inc. (Professional Svs.) | (a | ) | 4,065 | 2,252,254 | ||||||||
Edenred (Commercial Svs. & Supplies) | (b | ) | 17,272 | 880,259 | ||||||||
Ferguson PLC (Trading Companies & Distributors) | (b | ) | 9,090 | 647,116 | ||||||||
HEICO Corp. Class A (Aerospace & Defense) | 2,632 | 272,070 | ||||||||||
IHS Markit Ltd. (Professional Svs.) | (a | ) | 17,956 | 1,144,156 | ||||||||
L3Harris Technologies, Inc. (Aerospace & Defense) | 7,837 | 1,482,212 | ||||||||||
| Common Stocks (Continued) | Shares | Value | ||||||||||
INDUSTRIALS (continued) | ||||||||||||
Middleby Corp. / The (Machinery) | (a | ) | 6,165 | $ | 836,591 | |||||||
Old Dominion Freight Line, Inc. (Road & Rail) | 6,137 | 916,009 | ||||||||||
Rexnord Corp. (Machinery) | (a | ) | 47,443 | 1,433,728 | ||||||||
Ritchie Bros Auctioneers, Inc. (Commercial Svs. & Supplies) | 33,001 | 1,096,293 | ||||||||||
Ryanair Holdings PLC – ADR (Airlines) | (a | ) | 11,204 | 718,625 | ||||||||
Sensata Technologies Holding PLC (Electrical Equip.) | (a | ) | 51,608 | 2,528,792 | ||||||||
Teledyne Technologies, Inc. (Aerospace & Defense) | (a | ) | 7,345 | 2,011,575 | ||||||||
Verisk Analytics, Inc. (Professional Svs.) | 13,222 | 1,936,494 | ||||||||||
Wabtec Corp. (Machinery) | 17,694 | 1,269,721 | ||||||||||
|
| |||||||||||
| 22,101,073 | ||||||||||||
|
| |||||||||||
INFORMATION TECHNOLOGY – 35.6% |
| |||||||||||
Amdocs Ltd. (IT Svs.) | 29,416 | 1,826,439 | ||||||||||
Atlassian Corp. PLC Class A (Software) | (a | ) | 11,914 | 1,558,828 | ||||||||
Belden, Inc. (Electronic Equip., Instr. & Comp.) | 12,556 | 747,961 | ||||||||||
Broadridge Financial Solutions, Inc. (IT Svs.) | 14,326 | 1,829,144 | ||||||||||
Constellation Software, Inc. (Software) | 3,072 | 2,895,358 | ||||||||||
Dolby Laboratories, Inc. Class A (Electronic Equip., Instr. & Comp.) | 16,093 | 1,039,608 | ||||||||||
Euronet Worldwide, Inc. (IT Svs.) | (a | ) | 4,046 | 680,699 | ||||||||
Fidelity National Information Services, Inc. (IT Svs.) | 12,986 | 1,593,122 | ||||||||||
Flex Ltd. (Electronic Equip., Instr. & Comp.) | (a | ) | 84,343 | 807,162 | ||||||||
Gartner, Inc. (IT Svs.) | (a | ) | 5,721 | 920,738 | ||||||||
Global Payments, Inc. (IT Svs.) | 16,816 | 2,692,746 | ||||||||||
GoDaddy, Inc. Class A (IT Svs.) | (a | ) | 21,678 | 1,520,712 | ||||||||
Intuit, Inc. (Software) | 2,966 | 775,105 | ||||||||||
KLA-Tencor Corp. (Semiconductors & Equip.) | 15,907 | 1,880,207 | ||||||||||
Lam Research Corp. (Semiconductors & Equip.) | 6,952 | 1,305,864 | ||||||||||
Microchip Technology, Inc. (Semiconductors & Equip.) | �� | 29,550 | 2,561,985 | |||||||||
National Instruments Corp. (Electronic Equip., Instr. & Comp.) | 37,974 | 1,594,528 | ||||||||||
Nice Ltd. – ADR (Software) | (a | ) | 21,806 | 2,987,422 | ||||||||
ON Semiconductor Corp. (Semiconductors & Equip.) | (a | ) | 84,801 | 1,713,828 | ||||||||
SS&C Technologies Holdings, Inc. (Software) | 39,765 | 2,290,862 | ||||||||||
TE Connectivity Ltd. (Electronic Equip., Instr. & Comp.) | 23,673 | 2,267,400 | ||||||||||
WEX, Inc. (IT Svs.) | (a | ) | 12,258 | 2,550,890 | ||||||||
Xilinx, Inc. (Semiconductors & Equip.) | 6,081 | 717,071 | ||||||||||
|
| |||||||||||
| 38,757,679 | ||||||||||||
|
| |||||||||||
MATERIALS – 1.3% | ||||||||||||
Sealed Air Corp. (Containers & Packaging) | 32,695 | 1,398,692 | ||||||||||
|
| |||||||||||
REAL ESTATE – 4.3% | ||||||||||||
Crown Castle International Corp. (Equity REIT) | 19,071 | 2,485,905 | ||||||||||
Lamar Advertising Co. Class A (Equity REIT) | 27,523 | 2,221,381 | ||||||||||
|
| |||||||||||
| 4,707,286 | ||||||||||||
|
| |||||||||||
Total Common Stocks | $ | 106,454,020 | ||||||||||
|
| |||||||||||
| Money Market Funds – 2.7% | Shares | Value | ||||||||||
State Street Institutional Liquid Reserves Fund Institutional Class, 2.449% | (c | ) | 2,955,643 | $ | 2,956,234 | |||||||
|
| |||||||||||
Total Money Market Funds | $ | 2,956,234 | ||||||||||
|
| |||||||||||
Total Investments – 100.4% | (d | ) | $ | 109,410,254 | ||||||||
Liabilities in Excess of Other Assets – (0.4)% | (466,435 | ) | ||||||||||
|
| |||||||||||
Net Assets – 100.0% | $ | 108,943,819 | ||||||||||
|
| |||||||||||
| 46 | (continued) |
| Ohio National Fund, Inc. | ON Janus Henderson Enterprise Portfolio (Continued) |
Schedule of Investments | June 30, 2019 (Unaudited) | |
Percentages are stated as a percent of net assets.
Abbreviations:
| ADR: | American Depositary Receipts |
Footnotes:
| (a) | Non-income producing security. |
| (b) | Security traded on a foreign exchange has been valued at an estimate of fair value that is different than the local market close price. These fair value estimates are determined by an independent fair valuation service that has been approved by the Board. These securities represent $1,527,375 or 1.4% of the Portfolio’s net assets. |
| (c) | Rate represents theseven-day yield at June 30, 2019. |
| (d) | Represents cost for financial reporting purposes, which may differ from cost basis for federal income tax purposes. See also Note 7 of the Notes to Financial Statements. |
The accompanying notes are an integral part of these financial statements.
47
| Ohio National Fund, Inc. | ON S&P 500® Index Portfolio (Unaudited) |
Objective/Strategy |
The ON S&P 500® Index Portfolio seeks total return approximating that of the Standard & Poor’s 500® Index (S&P 500® Index), at a risk level consistent with that of the S&P 500® Index by investing, under normal circumstances, more than 80% of its net assets in the securities included in the S&P 500® Index.
Performance as of June 30, 2019 | ||
| Average Annual returns | ||||
One year | 9.95% | |||
Five years | 10.24% | |||
Ten years | 14.17% | |||
Past performance does not guarantee future results. The performance data quoted represents past performance and current returns may be lower or higher. Total return figures include change in share price and reinvestment of dividends and capital gains. The investment return and principal value will fluctuate so that an investor’s shares, when redeemed, may be worth more or less than the original cost. To obtain performance information up to the most recent month end, call toll-free1-877-781-6392.
The Portfolio is not open to direct retail investment. Beneficial interest in shares is obtained solely by purchase of variable life insurance policies and variable annuity contracts. Actual performance results for variable annuity and variable universal life contracts will be lower due to contract charges. Consult your contract for applicable charges.
Total expense ratio is 0.38% per the Fund’s prospectus dated May 1, 2019. Additional information pertaining to the Portfolio’s expense ratio as of June 30, 2019 can be found in the Portfolio’s Financial Highlights.
Comments fromSub-Adviser |
Q. How did the Portfolio perform in comparison to its benchmark during the reporting period?
A.For thesix-month period June 30, 2019, the ON S&P 500® Index Portfolio returned 18.29% versus 18.54% for its benchmark, the S&P 500® Index.
Q. Were there specific market conditions, investment strategies, or techniques that materially affected the Portfolio’s benchmark-relative performance during the reporting period?
A.The Portfolio intends to track the underlying return of the S&P 500® Index. There were no material market events or changes in strategy during the year that materially impacted the Portfolio’s relative return. Sources of return variance were related to the cumulative impact of investing theday-to-day cash flows in the Portfolio.
Q. How did sector allocation and security selection each impact the Portfolio’s performance relative to its benchmark? For sector allocation, were there any factors that impacted the benchmark’s performance more significantly than the Portfolio’s performance? For security selection, was there anything specific regarding the Portfolio’s strategy that caused deviation from the benchmark?
A.There was no impact from either sector or stock selection that caused any significant performance variance between the Portfolio and its benchmark.(1)
Information Technology, which is the largest sector in the index, contributed the most for thesix-month period. Financials and Consumer Discretionary also contributed to the return. Materials and Utilities were laggards for the period.(1)
Q. Which holdings contributed the most to, and detracted the most from, the Portfolio’s benchmark-relative performance?
A.The largest contributors to the Portfolio and benchmark returns for the period were Microsoft Corp., Apple Inc., and Amazon.com, Inc. The largest detractors from the Portfolio and benchmark returns for the period were Abbvie, Inc., Biogen, Inc., and CVS Health Corp.(1)
Q. How did the Portfolio’s use of derivative instruments and initial public offerings (IPOs), if any, impact performance?
A.The Portfolio uses S&P 500® Index futures contracts primarily to equitize open dividend receivables, as well as to manageday-to-day cash flows, to ensure the Portfolio is fully invested. The futures did not meaningfully impact performance, however, due to their index characteristics and size in relation to the Portfolio’s net assets.(1)
Q. Were there any significant changes to the Portfolio’s management team, investment strategy, or security selection process during the reporting period?
A.The portfolio management team, consisting of Portfolio Managers and Associate Portfolio Managers, added one new member over the period, while four members of the team departed for varying reasons. The team is currently staffed at seven. There were no material changes to the investment strategy or stock selection process during the period.
| (1) | The Portfolio’s composition is subject to change. Holdings and weightings are as of June 30, 2019. |
Change in Value of $10,000 Investment |
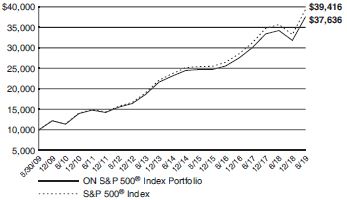
Hypothetical illustration based on past performance. Future performance will vary. The Portfolio’s returns reflect reinvested dividends. The Portfolio’s holdings may differ significantly from the securities in the index. The index is unmanaged and therefore does not reflect the cost of portfolio management and accounting. Investors cannot invest directly in an index, although they can invest in its underlying securities or funds.
The S&P 500® Index is a capitalization-weighted index designed to measure performance of the broad domestic economy through changes in the aggregate market value of 500 stocks representing all major industries. The index presented includes the effects of reinvested dividends.
Past performance is no guarantee of future results. Redemption of fund shares could have tax implications unique to each shareholder.
The S&P 500® Index is a product of S&P Dow Jones Indices LLC or its affiliates (“SPDJI”), and has been licensed for use by Ohio National Investments, Inc. (“ONI”). Standard & Poor’s® and S&P® are registered trademarks of Standard & Poor’s Financial Services LLC (“S&P”); Dow Jones® is a registered trademark of Dow Jones Trademark Holdings LLC (“Dow Jones”); and these trademarks have been licensed for use by SPDJI and sublicensed for certain purposes by ONI. The S&P 500® Index Portfolio of Ohio National Fund, Inc. is not sponsored, endorsed, sold or promoted by SPDJI, Dow Jones, S&P, their respective affiliates, and none of such parties make any representation regarding the advisability of investing in such product(s) nor do they have any liability for any errors, omissions, or interruptions of the S&P 500® Index.
| 48 | (continued) |
| Ohio National Fund, Inc. | ON S&P 500®Index Portfolio (Unaudited) (Continued) |
Portfolio Composition as of June 30, 2019(1) | ||
% of Net Assets | ||||
Common Stocks(4) | 99.9 | |||
Other Net Assets | 0.1 | |||
|
| |||
| 100.0 | ||||
|
| |||
Top 10 Portfolio Holdings as of June 30, 2019 (1) (2) (3) | ||||
% of Net Assets | ||||||
1. | Microsoft Corp. | 4.2 | ||||
2. | Apple, Inc. | 3.5 | ||||
3. | Amazon.com, Inc. | 3.2 | ||||
4. | Facebook, Inc. Class A | 1.9 | ||||
5. | Berkshire Hathaway, Inc. Class B | 1.7 | ||||
6. | Johnson & Johnson | 1.5 | ||||
7. | JPMorgan Chase & Co. | 1.5 | ||||
8. | Alphabet, Inc. Class C | 1.4 | ||||
9. | Alphabet, Inc. Class A | 1.3 | ||||
10. | Exxon Mobil Corp. | 1.3 | ||||
| (1) | Composition of Portfolio subject to change. |
| (2) | Short-term investments have been excluded from the list of Top 10 Portfolio Holdings. |
| (3) | Top 10 Portfolio Holdings is presented at an individual security level. Total investment exposure by issuer may be higher. |
| (4) | Sectors (Common Stocks): |
| % of Net Assets | ||||
Information Technology | 21.4 | |||
Health Care | 14.2 | |||
Financials | 13.1 | |||
Consumer Discretionary | 10.2 | |||
Communication Services | 10.2 | |||
Industrials | 9.4 | |||
Consumer Staples | 7.3 | |||
Energy | 5.0 | |||
Utilities | 3.3 | |||
Real Estate | 3.0 | |||
Materials | 2.8 | |||
|
| |||
| 99.9 | ||||
|
| |||
49
Ohio National Fund, Inc.
| ON S&P 500®Index Portfolio
| |
Schedule of Investments | June 30, 2019 (Unaudited) | |
| Common Stocks – 99.9% | Shares | Value | ||||||||
COMMUNICATION SERVICES – 10.2% |
| |||||||||
Activision Blizzard, Inc. (Entertainment) | 36,559 | $ | 1,725,585 | |||||||
Alphabet, Inc. Class A (Interactive Media & Svs.) | (a) | 14,307 | 15,491,620 | |||||||
Alphabet, Inc. Class C (Interactive Media & Svs.) | (a) | 14,612 | 15,794,257 | |||||||
AT&T, Inc. (Diversified Telecom. Svs.) | 348,336 | 11,672,739 | ||||||||
CBS Corp. Class B (Media) | 16,775 | 837,072 | ||||||||
CenturyLink, Inc. (Diversified Telecom. Svs.) | 45,555 | 535,727 | ||||||||
Charter Communications, Inc. Class A (Media) | (a) | 8,211 | 3,244,823 | |||||||
Comcast Corp. Class A (Media) | 216,172 | 9,139,752 | ||||||||
Discovery, Inc. Class A (Media) | (a) | 7,574 | 232,522 | |||||||
Discovery, Inc. Class C (Media) | (a) | 17,104 | 486,609 | |||||||
DISH Network Corp. Class A (Media) | (a) | 11,065 | 425,007 | |||||||
Electronic Arts, Inc. (Entertainment) | (a) | 14,158 | 1,433,639 | |||||||
Facebook, Inc. Class A (Interactive Media & Svs.) | (a) | 114,672 | 22,131,696 | |||||||
Fox Corp. Class A (Media) | 16,836 | 616,871 | ||||||||
Fox Corp. Class B (Media) | 7,803 | 285,044 | ||||||||
Interpublic Group of Cos., Inc. / The (Media) | 18,561 | 419,293 | ||||||||
Netflix, Inc. (Entertainment) | (a) | 20,868 | 7,665,234 | |||||||
News Corp. Class A (Media) | 18,466 | 249,106 | ||||||||
News Corp. Class B (Media) | 5,957 | 83,160 | ||||||||
Omnicom Group, Inc. (Media) | 10,496 | 860,147 | ||||||||
Take-Two Interactive Software, Inc. (Entertainment) | (a) | 5,350 | 607,385 | |||||||
TripAdvisor, Inc. (Interactive Media & Svs.) | (a) | 4,964 | 229,784 | |||||||
Twitter, Inc. (Interactive Media & Svs.) | (a) | 34,851 | 1,216,300 | |||||||
Verizon Communications, Inc. (Diversified Telecom. Svs.) | 197,402 | 11,277,576 | ||||||||
Viacom, Inc. Class B (Entertainment) | 16,959 | 506,565 | ||||||||
Walt Disney Co. / The (Entertainment) | 83,318 | 11,634,525 | ||||||||
|
| |||||||||
| 118,802,038 | ||||||||||
|
| |||||||||
CONSUMER DISCRETIONARY – 10.2% |
| |||||||||
Advance Auto Parts, Inc. (Specialty Retail) | 3,440 | 530,242 | ||||||||
Amazon.com, Inc. (Internet & Direct Marketing Retail) | (a) | 19,739 | 37,378,363 | |||||||
Aptiv PLC (Auto Components) | 12,291 | 993,482 | ||||||||
AutoZone, Inc. (Specialty Retail) | (a) | 1,171 | 1,287,479 | |||||||
Best Buy Co., Inc. (Specialty Retail) | 11,069 | 771,841 | ||||||||
Booking Holdings, Inc. (Internet & Direct Marketing Retail) | (a) | 2,066 | 3,873,151 | |||||||
BorgWarner, Inc. (Auto Components) | 9,943 | 417,407 | ||||||||
Capri Holdings Ltd. (Textiles, Apparel & Luxury Goods) | (a) | 7,238 | 251,014 | |||||||
CarMax, Inc. (Specialty Retail) | (a) | 7,911 | 686,912 | |||||||
Carnival Corp. (Hotels, Restaurants & Leisure) | 19,092 | 888,733 | ||||||||
Chipotle Mexican Grill, Inc. (Hotels, Restaurants & Leisure) | (a) | 1,163 | 852,339 | |||||||
D.R. Horton, Inc. (Household Durables) | 16,156 | 696,808 | ||||||||
Darden Restaurants, Inc. (Hotels, Restaurants & Leisure) | 5,856 | 712,851 | ||||||||
Dollar General Corp. (Multiline Retail) | 12,326 | 1,665,982 | ||||||||
Dollar Tree, Inc. (Multiline Retail) | (a) | 11,337 | 1,217,480 | |||||||
eBay, Inc. (Internet & Direct Marketing Retail) | 39,100 | 1,544,450 | ||||||||
Expedia Group, Inc. (Internet & Direct Marketing Retail) | 5,636 | 749,757 | ||||||||
Foot Locker, Inc. (Specialty Retail) | 5,391 | 225,991 | ||||||||
Ford Motor Co. (Automobiles) | 186,974 | 1,912,744 | ||||||||
Gap, Inc. / The (Specialty Retail) | 10,146 | 182,324 | ||||||||
Garmin Ltd. (Household Durables) | 5,815 | 464,037 | ||||||||
General Motors Co. (Automobiles) | 62,931 | 2,424,731 | ||||||||
Genuine Parts Co. (Distributors) | 6,956 | 720,502 | ||||||||
H&R Block, Inc. (Diversified Consumer Svs.) | 9,749 | 285,646 | ||||||||
Hanesbrands, Inc. (Textiles, Apparel & Luxury Goods) | 17,334 | 298,491 | ||||||||
Harley-Davidson, Inc. (Automobiles) | 7,619 | 272,989 | ||||||||
Hasbro, Inc. (Leisure Products) | 5,506 | 581,874 | ||||||||
Hilton Worldwide Holdings, Inc. (Hotels, Restaurants & Leisure) | 13,893 | 1,357,902 | ||||||||
Home Depot, Inc. / The (Specialty Retail) | 52,513 | 10,921,129 | ||||||||
| Common Stocks (Continued) | Shares | Value | ||||||||||
CONSUMER DISCRETIONARY (continued) |
| |||||||||||
Kohl’s Corp. (Multiline Retail) | 7,770 | $ | 369,463 | |||||||||
L Brands, Inc. (Specialty Retail) | 10,999 | 287,074 | ||||||||||
Leggett & Platt, Inc. (Household Durables) | 6,295 | 241,539 | ||||||||||
Lennar Corp. Class A (Household Durables) | 13,576 | 657,893 | ||||||||||
LKQ Corp. (Distributors) | (a) | 14,878 | 395,904 | |||||||||
Lowe’s Cos., Inc. (Specialty Retail) | 37,363 | 3,770,300 | ||||||||||
Macy’s, Inc. (Multiline Retail) | 14,812 | 317,866 | ||||||||||
Marriott International, Inc. Class A (Hotels, Restaurants & Leisure) | 13,193 | 1,850,846 | ||||||||||
McDonald’s Corp. (Hotels, Restaurants & Leisure) | 36,446 | 7,568,376 | ||||||||||
MGM Resorts International (Hotels, Restaurants & Leisure) | 24,295 | 694,108 | ||||||||||
Mohawk Industries, Inc. (Household Durables) | (a) | 2,952 | 435,331 | |||||||||
Newell Brands, Inc. (Household Durables) | 18,667 | 287,845 | ||||||||||
NIKE, Inc. Class B (Textiles, Apparel & Luxury Goods) | 59,964 | 5,033,978 | ||||||||||
Nordstrom, Inc. (Multiline Retail) | 5,043 | 160,670 | ||||||||||
Norwegian Cruise Line Holdings Ltd. (Hotels, Restaurants & Leisure) | (a) | 10,329 | 553,944 | |||||||||
O’Reilly Automotive, Inc. (Specialty Retail) | (a) | 3,736 | 1,379,780 | |||||||||
PulteGroup, Inc. (Household Durables) | 12,227 | 386,618 | ||||||||||
PVH Corp. (Textiles, Apparel & Luxury Goods) | 3,592 | 339,947 | ||||||||||
Ralph Lauren Corp. (Textiles, Apparel & Luxury Goods) | 2,503 | 284,316 | ||||||||||
Ross Stores, Inc. (Specialty Retail) | 17,535 | 1,738,069 | ||||||||||
Royal Caribbean Cruises Ltd. (Hotels, Restaurants & Leisure) | 8,201 | 994,043 | ||||||||||
Starbucks Corp. (Hotels, Restaurants & Leisure) | 57,821 | 4,847,134 | ||||||||||
Tapestry, Inc. (Textiles, Apparel & Luxury Goods) | 13,914 | 441,491 | ||||||||||
Target Corp. (Multiline Retail) | 24,447 | 2,117,355 | ||||||||||
Tiffany & Co. (Specialty Retail) | 5,181 | 485,149 | ||||||||||
TJX Cos., Inc. / The (Specialty Retail) | 57,871 | 3,060,218 | ||||||||||
Tractor Supply Co. (Specialty Retail) | 5,736 | 624,077 | ||||||||||
Ulta Beauty, Inc. (Specialty Retail) | (a) | 2,648 | 918,565 | |||||||||
Under Armour, Inc. Class A (Textiles, Apparel & Luxury Goods) | (a) | 8,827 | 223,764 | |||||||||
Under Armour, Inc. Class C (Textiles, Apparel & Luxury Goods) | (a) | 9,305 | 206,571 | |||||||||
V.F. Corp. (Textiles, Apparel & Luxury Goods) | 15,526 | 1,356,196 | ||||||||||
Whirlpool Corp. (Household Durables) | 3,038 | 432,490 | ||||||||||
Wynn Resorts Ltd. (Hotels, Restaurants & Leisure) | 4,647 | 576,182 | ||||||||||
Yum! Brands, Inc. (Hotels, Restaurants & Leisure) | 14,609 | 1,616,778 | ||||||||||
|
| |||||||||||
| 118,820,531 | ||||||||||||
|
| |||||||||||
CONSUMER STAPLES – 7.3% | ||||||||||||
Altria Group, Inc. (Tobacco) | 89,293 | 4,228,024 | ||||||||||
Archer-Daniels-Midland Co. (Food Products) | 26,725 | 1,090,380 | ||||||||||
Brown-Forman Corp. Class B (Beverages) | 7,977 | 442,165 | ||||||||||
Campbell Soup Co. (Food Products) | 9,243 | 370,367 | ||||||||||
Church & Dwight Co., Inc. (Household Products) | 11,739 | 857,651 | ||||||||||
Clorox Co. / The (Household Products) | 6,075 | 930,143 | ||||||||||
Coca-Cola Co. / The (Beverages) | 183,240 | 9,330,581 | ||||||||||
Colgate-Palmolive Co. (Household Products) | 40,972 | 2,936,463 | ||||||||||
Conagra Brands, Inc. (Food Products) | 23,130 | 613,408 | ||||||||||
Constellation Brands, Inc. Class A (Beverages) | 7,978 | 1,571,187 | ||||||||||
Costco Wholesale Corp. (Food & Staples Retailing) | 20,993 | 5,547,610 | ||||||||||
Coty, Inc. Class A (Personal Products) | 14,425 | 193,295 | ||||||||||
Estee Lauder Cos., Inc. / The Class A (Personal Products) | 10,465 | 1,916,246 | ||||||||||
General Mills, Inc. (Food Products) | 28,577 | 1,500,864 | ||||||||||
Hershey Co. / The (Food Products) | 6,643 | 890,361 | ||||||||||
Hormel Foods Corp. (Food Products) | 13,057 | 529,331 | ||||||||||
J.M. Smucker Co. / The (Food Products) | 5,412 | 623,408 | ||||||||||
Kellogg Co. (Food Products) | 11,826 | 633,519 | ||||||||||
| 50 | (continued) |
| Ohio National Fund, Inc. | ON S&P 500® Index Portfolio (Continued) |
Schedule of Investments | June 30, 2019 (Unaudited) | |
| Common Stocks (Continued) | Shares | Value | ||||||||||
CONSUMER STAPLES (continued) |
| |||||||||||
Kimberly-Clark Corp. (Household Products) | 16,409 | $ | 2,186,992 | |||||||||
Kraft Heinz Co. / The (Food Products) | 29,674 | 921,081 | ||||||||||
Kroger Co. / The (Food & Staples Retailing) | 38,452 | 834,793 | ||||||||||
Lamb Weston Holdings, Inc. (Food Products) | 7,015 | 444,470 | ||||||||||
McCormick & Co., Inc. (Food Products) | 5,840 | 905,259 | ||||||||||
Molson Coors Brewing Co. Class B (Beverages) | 9,005 | 504,280 | ||||||||||
Mondelez International, Inc. Class A (Food Products) | 68,753 | 3,705,787 | ||||||||||
Monster Beverage Corp. (Beverages) | (a | ) | 18,677 | 1,192,153 | ||||||||
PepsiCo, Inc. (Beverages) | 66,903 | 8,772,990 | ||||||||||
Philip Morris International, Inc. (Tobacco) | 74,255 | 5,831,245 | ||||||||||
Procter & Gamble Co. / The (Household Products) | 119,723 | 13,127,627 | ||||||||||
Sysco Corp. (Food & Staples Retailing) | 22,574 | 1,596,433 | ||||||||||
Tyson Foods, Inc. Class A (Food Products) | 14,070 | 1,136,012 | ||||||||||
Walgreens Boots Alliance, Inc. (Food & Staples Retailing) | 37,089 | 2,027,656 | ||||||||||
Walmart, Inc. (Food & Staples Retailing) | 66,773 | 7,377,749 | ||||||||||
|
| |||||||||||
| 84,769,530 | ||||||||||||
|
| |||||||||||
ENERGY – 5.0% |
| |||||||||||
Anadarko Petroleum Corp. (Oil, Gas & Consumable Fuels) | 23,965 | 1,690,970 | ||||||||||
Apache Corp. (Oil, Gas & Consumable Fuels) | 18,027 | 522,242 | ||||||||||
Baker Hughes, a GE Co. (Energy Equip. & Svs.) | 24,491 | 603,213 | ||||||||||
Cabot Oil & Gas Corp. (Oil, Gas & Consumable Fuels) | 20,299 | 466,065 | ||||||||||
Chevron Corp. (Oil, Gas & Consumable Fuels) | 90,922 | 11,314,334 | ||||||||||
Cimarex Energy Co. (Oil, Gas & Consumable Fuels) | 4,864 | 288,581 | ||||||||||
Concho Resources, Inc. (Oil, Gas & Consumable Fuels) | 9,571 | 987,536 | ||||||||||
ConocoPhillips (Oil, Gas & Consumable Fuels) | 53,944 | 3,290,584 | ||||||||||
Devon Energy Corp. (Oil, Gas & Consumable Fuels) | 19,737 | 562,899 | ||||||||||
Diamondback Energy, Inc. (Oil, Gas & Consumable Fuels) | 7,376 | 803,763 | ||||||||||
EOG Resources, Inc. (Oil, Gas & Consumable Fuels) | 27,698 | 2,580,346 | ||||||||||
Exxon Mobil Corp. (Oil, Gas & Consumable Fuels) | 201,951 | 15,475,505 | ||||||||||
Halliburton Co. (Energy Equip. & Svs.) | 41,696 | 948,167 | ||||||||||
Helmerich & Payne, Inc. (Energy Equip. & Svs.) | 5,300 | 268,286 | ||||||||||
Hess Corp. (Oil, Gas & Consumable Fuels) | 12,147 | 772,185 | ||||||||||
HollyFrontier Corp. (Oil, Gas & Consumable Fuels) | 7,534 | 348,673 | ||||||||||
Kinder Morgan, Inc. (Oil, Gas & Consumable Fuels) | 92,946 | 1,940,712 | ||||||||||
Marathon Oil Corp. (Oil, Gas & Consumable Fuels) | 38,876 | 552,428 | ||||||||||
Marathon Petroleum Corp. (Oil, Gas & Consumable Fuels) | 31,623 | 1,767,093 | ||||||||||
National Oilwell Varco, Inc. (Energy Equip. & Svs.) | 18,507 | 411,411 | ||||||||||
Noble Energy, Inc. (Oil, Gas & Consumable Fuels) | 22,934 | 513,722 | ||||||||||
Occidental Petroleum Corp. (Oil, Gas & Consumable Fuels) | 35,697 | 1,794,845 | ||||||||||
ONEOK, Inc. (Oil, Gas & Consumable Fuels) | 19,706 | 1,355,970 | ||||||||||
Phillips 66 (Oil, Gas & Consumable Fuels) | 19,935 | 1,864,720 | ||||||||||
Pioneer Natural Resources Co. (Oil, Gas & Consumable Fuels) | 8,039 | 1,236,881 | ||||||||||
Schlumberger Ltd. (Energy Equip. & Svs.) | 66,120 | 2,627,609 | ||||||||||
TechnipFMC PLC (Energy Equip. & Svs.) | 20,000 | 518,800 | ||||||||||
Valero Energy Corp. (Oil, Gas & Consumable Fuels) | 19,913 | 1,704,752 | ||||||||||
Williams Cos., Inc. / The (Oil, Gas & Consumable Fuels) | 57,846 | 1,622,002 | ||||||||||
|
| |||||||||||
| 58,834,294 | ||||||||||||
|
| |||||||||||
| Common Stocks (Continued) | Shares | Value | ||||||||||
FINANCIALS – 13.1% |
| |||||||||||
Affiliated Managers Group, Inc. (Capital Markets) | 2,455 | $ | 226,204 | |||||||||
Aflac, Inc. (Insurance) | 35,591 | 1,950,743 | ||||||||||
Allstate Corp. / The (Insurance) | 15,897 | 1,616,566 | ||||||||||
American Express Co. (Consumer Finance) | 32,688 | 4,035,007 | ||||||||||
American International Group, Inc. (Insurance) | 41,508 | 2,211,546 | ||||||||||
Ameriprise Financial, Inc. (Capital Markets) | 6,387 | 927,137 | ||||||||||
Aon PLC (Insurance) | 11,482 | 2,215,796 | ||||||||||
Arthur J. Gallagher & Co. (Insurance) | 8,825 | 772,982 | ||||||||||
Assurant, Inc. (Insurance) | 2,946 | 313,395 | ||||||||||
Bank of America Corp. (Banks) | 422,027 | 12,238,783 | ||||||||||
Bank of New York Mellon Corp. / The (Capital Markets) | 42,036 | 1,855,889 | ||||||||||
BB&T Corp. (Banks) | 36,552 | 1,795,800 | ||||||||||
Berkshire Hathaway, Inc. Class B (Diversified Financial Svs.) | (a | ) | 92,493 | 19,716,733 | ||||||||
BlackRock, Inc. (Capital Markets) | 5,679 | 2,665,155 | ||||||||||
Capital One Financial Corp. (Consumer Finance) | 22,411 | 2,033,574 | ||||||||||
CBOE Global Markets, Inc. (Capital Markets) | 5,311 | 550,379 | ||||||||||
Charles Schwab Corp. / The (Capital Markets) | 56,704 | 2,278,934 | ||||||||||
Chubb Ltd. (Insurance) | 21,856 | 3,219,170 | ||||||||||
Cincinnati Financial Corp. (Insurance) | 7,226 | 749,119 | ||||||||||
Citigroup, Inc. (Banks) | 110,363 | 7,728,721 | ||||||||||
Citizens Financial Group, Inc. (Banks) | 21,841 | 772,298 | ||||||||||
CME Group, Inc. (Capital Markets) | 17,088 | 3,316,952 | ||||||||||
Comerica, Inc. (Banks) | 7,393 | 537,027 | ||||||||||
Discover Financial Services (Consumer Finance) | 15,452 | 1,198,921 | ||||||||||
E*TRADE Financial Corp. (Capital Markets) | 11,620 | 518,252 | ||||||||||
Everest Re Group Ltd. (Insurance) | 1,953 | 482,743 | ||||||||||
Fifth Third Bancorp (Banks) | 34,684 | 967,684 | ||||||||||
First Republic Bank (Banks) | 7,850 | 766,552 | ||||||||||
Franklin Resources, Inc. (Capital Markets) | 14,113 | 491,132 | ||||||||||
Goldman Sachs Group, Inc. / The (Capital Markets) | 16,235 | 3,321,681 | ||||||||||
Hartford Financial Services Group, Inc. / The (Insurance) | 17,245 | 960,891 | ||||||||||
Huntington Bancshares, Inc. (Banks) | 49,811 | 688,388 | ||||||||||
Intercontinental Exchange, Inc. (Capital Markets) | 26,919 | 2,313,419 | ||||||||||
Invesco Ltd. (Capital Markets) | 19,210 | 393,037 | ||||||||||
Jefferies Financial Group, Inc. (Diversified Financial Svs.) | 12,150 | 233,644 | ||||||||||
JPMorgan Chase & Co. (Banks) | 154,828 | 17,309,770 | ||||||||||
KeyCorp (Banks) | 48,062 | 853,100 | ||||||||||
Lincoln National Corp. (Insurance) | 9,623 | 620,202 | ||||||||||
Loews Corp. (Insurance) | 12,772 | 698,245 | ||||||||||
M&T Bank Corp. (Banks) | 6,521 | 1,109,026 | ||||||||||
MarketAxess Holdings, Inc. (Capital Markets) | 1,799 | 578,235 | ||||||||||
Marsh & McLennan Cos., Inc. (Insurance) | 24,408 | 2,434,698 | ||||||||||
MetLife, Inc. (Insurance) | 45,352 | 2,252,634 | ||||||||||
Moody’s Corp. (Capital Markets) | 7,872 | 1,537,480 | ||||||||||
Morgan Stanley (Capital Markets) | 61,001 | 2,672,454 | ||||||||||
MSCI, Inc. (Capital Markets) | 4,039 | 964,473 | ||||||||||
Nasdaq, Inc. (Capital Markets) | 5,563 | 534,994 | ||||||||||
Northern Trust Corp. (Capital Markets) | 10,384 | 934,560 | ||||||||||
People’s United Financial, Inc. (Banks) | 18,911 | 317,327 | ||||||||||
PNC Financial Services Group, Inc. / The (Banks) | 21,546 | 2,957,835 | ||||||||||
Principal Financial Group, Inc. (Insurance) | 12,334 | 714,385 | ||||||||||
Progressive Corp. / The (Insurance) | 27,877 | 2,228,209 | ||||||||||
Prudential Financial, Inc. (Insurance) | 19,373 | 1,956,673 | ||||||||||
Raymond James Financial, Inc. (Capital Markets) | 6,000 | 507,300 | ||||||||||
Regions Financial Corp. (Banks) | 48,255 | 720,930 | ||||||||||
S&P Global, Inc. (Capital Markets) | 11,746 | 2,675,621 | ||||||||||
State Street Corp. (Capital Markets) | 17,801 | 997,924 | ||||||||||
SunTrust Banks, Inc. (Banks) | 21,180 | 1,331,163 | ||||||||||
SVB Financial Group (Banks) | (a | ) | 2,508 | 563,272 | ||||||||
Synchrony Financial (Consumer Finance) | 30,265 | 1,049,288 | ||||||||||
| 51 | (continued) |
| Ohio National Fund, Inc. | ON S&P 500® Index Portfolio (Continued) |
Schedule of Investments | June 30, 2019 (Unaudited) | |
| Common Stocks (Continued) | Shares | Value | ||||||||||
FINANCIALS (continued) |
| |||||||||||
T. Rowe Price Group, Inc. (Capital Markets) | 11,285 | $ | 1,238,077 | |||||||||
Torchmark Corp. (Insurance) | 4,854 | 434,239 | ||||||||||
Travelers Cos., Inc. / The (Insurance) | 12,501 | 1,869,149 | ||||||||||
U.S. Bancorp (Banks) | 71,434 | 3,743,142 | ||||||||||
Unum Group (Insurance) | 10,161 | 340,902 | ||||||||||
Wells Fargo & Co. (Banks) | 193,048 | 9,135,031 | ||||||||||
Willis Towers Watson PLC (Insurance) | 6,170 | 1,181,802 | ||||||||||
Zions Bancorp N.A. (Banks) | 8,755 | 402,555 | ||||||||||
|
| |||||||||||
| 152,928,949 | ||||||||||||
|
| |||||||||||
HEALTH CARE – 14.2% |
| |||||||||||
Abbott Laboratories (Health Care Equip. & Supplies) | 84,224 | 7,083,238 | ||||||||||
AbbVie, Inc. (Biotechnology) | 70,559 | 5,131,050 | ||||||||||
ABIOMED, Inc. (Health Care Equip. & Supplies) | (a | ) | 2,164 | 563,700 | ||||||||
Agilent Technologies, Inc. (Life Sciences Tools & Svs.) | 15,085 | 1,126,397 | ||||||||||
Alexion Pharmaceuticals, Inc. (Biotechnology) | (a | ) | 10,703 | 1,401,879 | ||||||||
Align Technology, Inc. (Health Care Equip. & Supplies) | (a | ) | 3,472 | 950,286 | ||||||||
Allergan PLC (Pharmaceuticals) | 14,706 | 2,462,226 | ||||||||||
AmerisourceBergen Corp. (Health Care Providers & Svs.) | 7,400 | 630,924 | ||||||||||
Amgen, Inc. (Biotechnology) | 29,112 | 5,364,759 | ||||||||||
Anthem, Inc. (Health Care Providers & Svs.) | 12,279 | 3,465,257 | ||||||||||
Baxter International, Inc. (Health Care Equip. & Supplies) | 22,658 | 1,855,690 | ||||||||||
Becton Dickinson and Co. (Health Care Equip. & Supplies) | 12,877 | 3,245,133 | ||||||||||
Biogen, Inc. (Biotechnology) | (a | ) | 9,253 | 2,163,999 | ||||||||
Boston Scientific Corp. (Health Care Equip. & Supplies) | (a | ) | 66,397 | 2,853,743 | ||||||||
Bristol-Myers Squibb Co. (Pharmaceuticals) | 78,065 | 3,540,248 | ||||||||||
Cardinal Health, Inc. (Health Care Providers & Svs.) | 14,184 | 668,066 | ||||||||||
Celgene Corp. (Biotechnology) | (a | ) | 33,662 | 3,111,715 | ||||||||
Centene Corp. (Health Care Providers & Svs.) | (a | ) | 19,728 | 1,034,536 | ||||||||
Cerner Corp. (Health Care Technology) | 15,536 | 1,138,789 | ||||||||||
Cigna Corp. (Health Care Providers & Svs.) | 18,116 | 2,854,176 | ||||||||||
Cooper Cos., Inc. / The (Health Care Equip. & Supplies) | 2,358 | 794,387 | ||||||||||
CVS Health Corp. (Health Care Providers & Svs.) | 62,011 | 3,378,979 | ||||||||||
Danaher Corp. (Health Care Equip. & Supplies) | 30,081 | 4,299,177 | ||||||||||
DaVita, Inc. (Health Care Providers & Svs.) | (a | ) | 6,065 | 341,217 | ||||||||
DENTSPLY SIRONA, Inc. (Health Care Equip. & Supplies) | 11,134 | 649,780 | ||||||||||
Edwards Lifesciences Corp. (Health Care Equip. & Supplies) | (a | ) | 9,954 | 1,838,902 | ||||||||
Eli Lilly & Co. (Pharmaceuticals) | 41,241 | 4,569,090 | ||||||||||
Gilead Sciences, Inc. (Biotechnology) | 60,689 | 4,100,149 | ||||||||||
HCA Healthcare, Inc. (Health Care Providers & Svs.) | 12,749 | 1,723,282 | ||||||||||
Henry Schein, Inc. (Health Care Providers & Svs.) | (a | ) | 7,149 | 499,715 | ||||||||
Hologic, Inc. (Health Care Equip. & Supplies) | (a | ) | 12,750 | 612,255 | ||||||||
Humana, Inc. (Health Care Providers &Svs.) | 6,447 | 1,710,389 | ||||||||||
IDEXX Laboratories, Inc. (Health Care Equip. & Supplies) | (a | ) | 4,106 | 1,130,505 | ||||||||
Illumina, Inc. (Life Sciences Tools & Svs.) | (a | ) | 7,017 | 2,583,309 | ||||||||
Incyte Corp. (Biotechnology) | (a | ) | 8,477 | 720,206 | ||||||||
Intuitive Surgical, Inc. (Health Care Equip. & Supplies) | (a | ) | 5,511 | 2,890,795 | ||||||||
IQVIA Holdings, Inc. (Life Sciences Tools & Svs.) | (a | ) | 7,535 | 1,212,382 | ||||||||
Johnson & Johnson (Pharmaceuticals) | 126,723 | 17,649,979 | ||||||||||
Laboratory Corp. of America Holdings (Health Care Providers & Svs.) | (a | ) | 4,694 | 811,593 | ||||||||
McKesson Corp. (Health Care Providers & Svs.) | 9,071 | 1,219,052 | ||||||||||
| Common Stocks (Continued) | Shares | Value | ||||||||||
HEALTH CARE (continued) |
| |||||||||||
Medtronic PLC (Health Care Equip. & Supplies) | 64,001 | $ | 6,233,057 | |||||||||
Merck & Co., Inc. (Pharmaceuticals) | 122,888 | 10,304,159 | ||||||||||
Mettler-Toledo International, Inc. (Life Sciences Tools & Svs.) | (a | ) | 1,183 | 993,720 | ||||||||
Mylan N.V. (Pharmaceuticals) | (a | ) | 24,719 | 470,650 | ||||||||
Nektar Therapeutics (Pharmaceuticals) | (a | ) | 8,359 | 297,413 | ||||||||
PerkinElmer, Inc. (Life Sciences Tools & Svs.) | 5,266 | 507,326 | ||||||||||
Perrigo Co. PLC (Pharmaceuticals) | 6,000 | 285,720 | ||||||||||
Pfizer, Inc. (Pharmaceuticals) | 264,981 | 11,478,977 | ||||||||||
Quest Diagnostics, Inc. (Health Care Providers & Svs.) | 6,394 | 650,973 | ||||||||||
Regeneron Pharmaceuticals, Inc. (Biotechnology) | (a | ) | 3,753 | 1,174,689 | ||||||||
ResMed, Inc. (Health Care Equip. & Supplies) | 6,835 | 834,075 | ||||||||||
Stryker Corp. (Health Care Equip. & Supplies) | 14,787 | 3,039,911 | ||||||||||
Teleflex, Inc. (Health Care Equip. & Supplies) | 2,198 | 727,868 | ||||||||||
Thermo Fisher Scientific, Inc. (Life Sciences Tools & Svs.) | 19,095 | 5,607,820 | ||||||||||
UnitedHealth Group, Inc. (Health Care Providers & Svs.) | 45,363 | 11,069,026 | ||||||||||
Universal Health Services, Inc. Class B (Health Care Providers & Svs.) | 3,936 | 513,215 | ||||||||||
Varian Medical Systems, Inc. (Health Care Equip. & Supplies) | (a | ) | 4,323 | 588,490 | ||||||||
Vertex Pharmaceuticals, Inc. (Biotechnology) | (a | ) | 12,226 | 2,242,004 | ||||||||
Waters Corp. (Life Sciences Tools & Svs.) | (a | ) | 3,308 | 712,014 | ||||||||
WellCare Health Plans, Inc. (Health Care Providers & Svs.) | (a | ) | 2,395 | 682,743 | ||||||||
Zimmer Biomet Holdings, Inc. (Health Care Equip. & Supplies) | 9,777 | 1,151,144 | ||||||||||
Zoetis, Inc. (Pharmaceuticals) | 22,848 | 2,593,020 | ||||||||||
|
| |||||||||||
| 165,538,968 | ||||||||||||
|
| |||||||||||
INDUSTRIALS – 9.4% |
| |||||||||||
3M Co. (Industrial Conglomerates) | 27,510 | 4,768,583 | ||||||||||
A.O. Smith Corp. (Building Products) | 6,772 | 319,368 | ||||||||||
Alaska Air Group, Inc. (Airlines) | 5,923 | 378,539 | ||||||||||
Allegion PLC (Building Products) | 4,502 | 497,696 | ||||||||||
American Airlines Group, Inc. (Airlines) | 18,827 | 613,948 | ||||||||||
AMETEK, Inc. (Electrical Equip.) | 10,870 | 987,431 | ||||||||||
Arconic, Inc. (Aerospace & Defense) | 19,148 | 494,401 | ||||||||||
Boeing Co. / The (Aerospace & Defense) | 24,974 | 9,090,786 | ||||||||||
C.H. Robinson Worldwide, Inc. (Air Freight & Logistics) | 6,489 | 547,347 | ||||||||||
Caterpillar, Inc. (Machinery) | 27,293 | 3,719,763 | ||||||||||
Cintas Corp. (Commercial Svs. & Supplies) | 4,041 | 958,889 | ||||||||||
Copart, Inc. (Commercial Svs. & Supplies) | (a | ) | 9,601 | 717,579 | ||||||||
CSX Corp. (Road & Rail) | 36,701 | 2,839,556 | ||||||||||
Cummins, Inc. (Machinery) | 6,918 | 1,185,330 | ||||||||||
Deere & Co. (Machinery) | 15,130 | 2,507,192 | ||||||||||
Delta Air Lines, Inc. (Airlines) | 28,435 | 1,613,686 | ||||||||||
Dover Corp. (Machinery) | 6,919 | 693,284 | ||||||||||
Eaton Corp. PLC (Electrical Equip.) | 20,203 | 1,682,506 | ||||||||||
Emerson Electric Co. (Electrical Equip.) | 29,341 | 1,957,631 | ||||||||||
Equifax, Inc. (Professional Svs.) | 5,756 | 778,441 | ||||||||||
Expeditors International of Washington, Inc. (Air Freight & Logistics) | 8,181 | 620,611 | ||||||||||
Fastenal Co. (Trading Companies & Distributors) | 27,290 | 889,381 | ||||||||||
FedEx Corp. (Air Freight & Logistics) | 11,442 | 1,878,662 | ||||||||||
Flowserve Corp. (Machinery) | 6,289 | 331,367 | ||||||||||
Fortive Corp. (Machinery) | 14,079 | 1,147,720 | ||||||||||
Fortune Brands Home & Security, Inc. (Building Products) | 6,621 | 378,258 | ||||||||||
General Dynamics Corp. (Aerospace & Defense) | 12,959 | 2,356,205 | ||||||||||
General Electric Co. (Industrial Conglomerates) | 416,232 | 4,370,436 | ||||||||||
Honeywell International, Inc. (Industrial Conglomerates) | 34,742 | 6,065,606 | ||||||||||
| 52 | (continued) |
| Ohio National Fund, Inc. | ON S&P 500® Index Portfolio (Continued) |
Schedule of Investments | June 30, 2019 (Unaudited) | |
| Common Stocks (Continued) | Shares | Value | ||||||||||
INDUSTRIALS (continued) |
| |||||||||||
Huntington Ingalls Industries, Inc. (Aerospace & Defense) | 1,993 | $ | 447,907 | |||||||||
IHS Markit Ltd. (Professional Svs.) | (a | ) | 17,364 | 1,106,434 | ||||||||
Illinois Tool Works, Inc. (Machinery) | 14,308 | 2,157,789 | ||||||||||
Ingersoll-Rand PLC (Machinery) | 11,515 | 1,458,605 | ||||||||||
J.B. Hunt Transport Services, Inc. (Road & Rail) | 4,172 | 381,363 | ||||||||||
Jacobs Engineering Group, Inc. (Construction & Engineering) | 5,443 | 459,335 | ||||||||||
Johnson Controls International PLC (Building Products) | 37,977 | 1,568,830 | ||||||||||
Kansas City Southern (Road & Rail) | 4,779 | 582,178 | ||||||||||
L3 Technologies, Inc. (Aerospace & Defense) | 3,790 | 929,194 | ||||||||||
L3Harris Technologies, Inc. (Aerospace & Defense) | 5,639 | 1,066,504 | ||||||||||
Lockheed Martin Corp. (Aerospace & Defense) | 11,732 | 4,265,051 | ||||||||||
Masco Corp. (Building Products) | 13,961 | 547,830 | ||||||||||
Nielsen Holdings PLC (Professional Svs.) | 17,048 | 385,285 | ||||||||||
Norfolk Southern Corp. (Road & Rail) | 12,700 | 2,531,491 | ||||||||||
Northrop Grumman Corp. (Aerospace & Defense) | 8,104 | 2,618,483 | ||||||||||
PACCAR, Inc. (Machinery) | 16,542 | 1,185,400 | ||||||||||
Parker-Hannifin Corp. (Machinery) | 6,122 | 1,040,801 | ||||||||||
Pentair PLC (Machinery) | 7,584 | 282,125 | ||||||||||
Quanta Services, Inc. (Construction & Engineering) | 6,814 | 260,227 | ||||||||||
Raytheon Co. (Aerospace & Defense) | 13,293 | 2,311,387 | ||||||||||
Republic Services, Inc. (Commercial Svs. & Supplies) | 10,275 | 890,226 | ||||||||||
Robert Half International, Inc. (Professional Svs.) | 5,687 | 324,216 | ||||||||||
Rockwell Automation, Inc. (Electrical Equip.) | 5,645 | 924,820 | ||||||||||
Rollins, Inc. (Commercial Svs. & Supplies) | 7,068 | 253,529 | ||||||||||
Roper Technologies, Inc. (Industrial Conglomerates) | 4,960 | 1,816,650 | ||||||||||
Snap-on, Inc. (Machinery) | 2,656 | 439,940 | ||||||||||
Southwest Airlines Co. (Airlines) | 23,329 | 1,184,647 | ||||||||||
Stanley Black & Decker, Inc. (Machinery) | 7,232 | 1,045,819 | ||||||||||
Textron, Inc. (Aerospace & Defense) | 11,065 | 586,888 | ||||||||||
TransDigm Group, Inc. (Aerospace & Defense) | (a | ) | 2,336 | 1,130,157 | ||||||||
Union Pacific Corp. (Road & Rail) | 33,789 | 5,714,058 | ||||||||||
United Continental Holdings, Inc. (Airlines) | (a | ) | 10,541 | 922,865 | ||||||||
United Parcel Service, Inc. Class B (Air Freight & Logistics) | 33,299 | 3,438,788 | ||||||||||
United Rentals, Inc. (Trading Companies & Distributors) | (a | ) | 3,732 | 494,975 | ||||||||
United Technologies Corp. (Aerospace & Defense) | 38,714 | 5,040,563 | ||||||||||
Verisk Analytics, Inc. (Professional Svs.) | 7,814 | 1,144,438 | ||||||||||
W.W. Grainger, Inc. (Trading Companies & Distributors) | 2,135 | 572,671 | ||||||||||
Wabtec Corp. (Machinery) | 7,758 | 556,714 | ||||||||||
Waste Management, Inc. (Commercial Svs. & Supplies) | 18,657 | 2,152,458 | ||||||||||
Xylem, Inc. (Machinery) | 8,568 | 716,627 | ||||||||||
|
| |||||||||||
| 109,327,470 | ||||||||||||
|
| |||||||||||
INFORMATION TECHNOLOGY – 21.4% |
| |||||||||||
Accenture PLC Class A (IT Svs.) | 30,448 | 5,625,877 | ||||||||||
Adobe, Inc. (Software) | (a | ) | 23,291 | 6,862,693 | ||||||||
Advanced Micro Devices, Inc. (Semiconductors & Equip.) | (a | ) | 42,334 | 1,285,684 | ||||||||
Akamai Technologies, Inc. (IT Svs.) | (a | ) | 7,805 | 625,493 | ||||||||
Alliance Data Systems Corp. (IT Svs.) | 2,160 | 302,681 | ||||||||||
Amphenol Corp. Class A (Electronic Equip., Instr. & Comp.) | 14,260 | 1,368,104 | ||||||||||
Analog Devices, Inc. (Semiconductors & Equip.) | 17,655 | 1,992,720 | ||||||||||
ANSYS, Inc. (Software) | (a | ) | 4,000 | 819,280 | ||||||||
| Common Stocks (Continued) | Shares | Value | ||||||||||
INFORMATION TECHNOLOGY (continued) |
| |||||||||||
Apple, Inc. (Tech. Hardware, Storage & Periph.) | 208,628 | $ | 41,291,654 | |||||||||
Applied Materials, Inc. (Semiconductors & Equip.) | 44,682 | 2,006,669 | ||||||||||
Arista Networks, Inc. (Communications Equip.) | (a | ) | 2,515 | 652,944 | ||||||||
Autodesk, Inc. (Software) | (a | ) | 10,484 | 1,707,844 | ||||||||
Automatic Data Processing, Inc. (IT Svs.) | 20,780 | 3,435,557 | ||||||||||
Broadcom, Inc. (Semiconductors & Equip.) | 18,894 | 5,438,827 | ||||||||||
Broadridge Financial Solutions, Inc. (IT Svs.) | 5,531 | 706,198 | ||||||||||
Cadence Design Systems, Inc. (Software) | (a | ) | 13,405 | 949,208 | ||||||||
Cisco Systems, Inc. (Communications Equip.) | 204,314 | 11,182,105 | ||||||||||
Citrix Systems, Inc. (Software) | 5,998 | 588,644 | ||||||||||
Cognizant Technology Solutions Corp. Class A (IT Svs.) | 27,169 | 1,722,243 | ||||||||||
Corning, Inc. (Electronic Equip., Instr. & Comp.) | 37,455 | 1,244,630 | ||||||||||
DXC Technology Co. (IT Svs.) | 12,772 | 704,376 | ||||||||||
F5 Networks, Inc. (Communications Equip.) | (a | ) | 2,863 | 416,939 | ||||||||
Fidelity National Information Services, Inc. (IT Svs.) | 15,459 | 1,896,510 | ||||||||||
Fiserv, Inc. (IT Svs.) | (a | ) | 18,733 | 1,707,700 | ||||||||
FleetCor Technologies, Inc. (IT Svs.) | (a | ) | 4,115 | 1,155,698 | ||||||||
FLIR Systems, Inc. (Electronic Equip., Instr. & Comp.) | 6,494 | 351,325 | ||||||||||
Fortinet, Inc. (Software) | (a | ) | 6,961 | 534,814 | ||||||||
Gartner, Inc. (IT Svs.) | (a | ) | 4,288 | 690,111 | ||||||||
Global Payments, Inc. (IT Svs.) | 7,482 | 1,198,093 | ||||||||||
Hewlett Packard Enterprise Co. (Tech. Hardware, Storage & Periph.) | 63,887 | 955,111 | ||||||||||
HP, Inc. (Tech. Hardware, Storage & Periph.) | 71,943 | 1,495,695 | ||||||||||
Intel Corp. (Semiconductors & Equip.) | 213,686 | 10,229,149 | ||||||||||
International Business Machines Corp. (IT Svs.) | 42,318 | 5,835,652 | ||||||||||
Intuit, Inc. (Software) | 12,376 | 3,234,220 | ||||||||||
IPG Photonics Corp. (Electronic Equip., Instr. & Comp.) | (a | ) | 1,708 | 263,459 | ||||||||
Jack Henry & Associates, Inc. (IT Svs.) | 3,665 | 490,817 | ||||||||||
Juniper Networks, Inc. (Communications Equip.) | 16,513 | 439,741 | ||||||||||
Keysight Technologies, Inc. (Electronic Equip., Instr. & Comp.) | (a | ) | 8,967 | 805,326 | ||||||||
KLA-Tencor Corp. (Semiconductors & Equip.) | 7,708 | 911,086 | ||||||||||
Lam Research Corp. (Semiconductors & Equip.) | 7,157 | 1,344,371 | ||||||||||
Mastercard, Inc. Class A (IT Svs.) | 42,901 | 11,348,601 | ||||||||||
Maxim Integrated Products, Inc. (Semiconductors & Equip.) | 12,971 | 775,925 | ||||||||||
Microchip Technology, Inc. (Semiconductors & Equip.) | 11,353 | 984,305 | ||||||||||
Micron Technology, Inc. (Semiconductors & Equip.) | (a | ) | 52,814 | 2,038,092 | ||||||||
Microsoft Corp. (Software) | 365,744 | 48,995,066 | ||||||||||
Motorola Solutions, Inc. (Communications Equip.) | 7,866 | 1,311,498 | ||||||||||
NetApp, Inc. (Tech. Hardware, Storage & Periph.) | 11,762 | 725,715 | ||||||||||
NVIDIA Corp. (Semiconductors & Equip.) | 29,066 | 4,773,509 | ||||||||||
Oracle Corp. (Software) | 115,822 | 6,598,379 | ||||||||||
Paychex, Inc. (IT Svs.) | 15,278 | 1,257,227 | ||||||||||
PayPal Holdings, Inc. (IT Svs.) | (a | ) | 56,083 | 6,419,260 | ||||||||
Qorvo, Inc. (Semiconductors & Equip.) | (a | ) | 5,714 | 380,609 | ||||||||
QUALCOMM, Inc. (Semiconductors & Equip.) | 58,025 | 4,413,962 | ||||||||||
Red Hat, Inc. (Software) | (a | ) | 8,487 | 1,593,519 | ||||||||
salesforce.com, Inc. (Software) | (a | ) | 37,066 | 5,624,024 | ||||||||
Seagate Technology PLC (Tech. Hardware, Storage & Periph.) | 11,975 | 564,262 | ||||||||||
Skyworks Solutions, Inc. (Semiconductors & Equip.) | 8,216 | 634,850 | ||||||||||
Symantec Corp. (Software) | 29,406 | 639,874 | ||||||||||
Synopsys, Inc. (Software) | (a | ) | 7,149 | 920,005 | ||||||||
TE Connectivity Ltd. (Electronic Equip., Instr. & Comp.) | 16,079 | 1,540,047 | ||||||||||
| 53 | (continued) |
| Ohio National Fund, Inc. | ON S&P 500® Index Portfolio (Continued) |
Schedule of Investments | June 30, 2019 (Unaudited) | |
| Common Stocks (Continued) | Shares | Value | ||||||||||
INFORMATION TECHNOLOGY (continued) |
| |||||||||||
Texas Instruments, Inc. (Semiconductors & Equip.) | 44,788 | $ | 5,139,871 | |||||||||
Total System Services, Inc. (IT Svs.) | 7,769 | 996,530 | ||||||||||
VeriSign, Inc. (IT Svs.) | (a) | 5,007 | 1,047,264 | |||||||||
Visa, Inc. (IT Svs.) | 83,007 | 14,405,865 | ||||||||||
Western Digital Corp. (Tech. Hardware, Storage & Periph.) | 13,938 | 662,752 | ||||||||||
Western Union Co. / The (IT Svs.) | 20,655 | 410,828 | ||||||||||
Xerox Corp. (Tech. Hardware, Storage & Periph.) | 9,372 | 331,862 | ||||||||||
Xilinx, Inc. (Semiconductors & Equip.) | 12,123 | 1,429,544 | ||||||||||
|
| |||||||||||
| 250,432,493 | ||||||||||||
|
| |||||||||||
MATERIALS – 2.8% | ||||||||||||
Air Products & Chemicals, Inc. (Chemicals) | 10,511 | 2,379,375 | ||||||||||
Albemarle Corp. (Chemicals) | 5,081 | 357,753 | ||||||||||
Amcor PLC (Containers & Packaging) | (a) | 77,403 | 889,361 | |||||||||
Avery Dennison Corp. (Containers & Packaging) | 4,048 | 468,273 | ||||||||||
Ball Corp. (Containers & Packaging) | 15,979 | 1,118,370 | ||||||||||
Celanese Corp. (Chemicals) | 6,025 | 649,495 | ||||||||||
CF Industries Holdings, Inc. (Chemicals) | 10,602 | 495,219 | ||||||||||
Corteva, Inc. (Chemicals) | (a) | 35,721 | 1,056,270 | |||||||||
Dow, Inc. (Chemicals) | 35,738 | 1,762,241 | ||||||||||
DuPont de Nemours, Inc. (Chemicals) | 35,735 | 2,682,627 | ||||||||||
Eastman Chemical Co. (Chemicals) | 6,581 | 512,199 | ||||||||||
Ecolab, Inc. (Chemicals) | 12,112 | 2,391,393 | ||||||||||
FMC Corp. (Chemicals) | 6,254 | 518,769 | ||||||||||
Freeport-McMoRan, Inc. (Metals & Mining) | 69,132 | 802,623 | ||||||||||
International Flavors & Fragrances, Inc. (Chemicals) | 4,827 | 700,349 | ||||||||||
International Paper Co. (Containers & Packaging) | 18,937 | 820,351 | ||||||||||
Linde PLC (Chemicals) | 25,908 | 5,202,326 | ||||||||||
LyondellBasell Industries N.V. Class A (Chemicals) | 14,488 | 1,247,851 | ||||||||||
Martin Marietta Materials, Inc. (Construction Materials) | 2,974 | 684,347 | ||||||||||
Mosaic Co. / The (Chemicals) | 17,021 | 426,036 | ||||||||||
Newmont Goldcorp Corp. (Metals & Mining) | 39,140 | 1,505,716 | ||||||||||
Nucor Corp. (Metals & Mining) | 14,525 | 800,328 | ||||||||||
Packaging Corp. of America (Containers & Packaging) | 4,478 | 426,843 | ||||||||||
PPG Industries, Inc. (Chemicals) | 11,271 | 1,315,438 | ||||||||||
Sealed Air Corp. (Containers & Packaging) | 7,467 | 319,438 | ||||||||||
Sherwin-Williams Co. / The (Chemicals) | 3,878 | 1,777,249 | ||||||||||
Vulcan Materials Co. (Construction Materials) | 6,298 | 864,778 | ||||||||||
Westrock Co. (Containers & Packaging) | 12,327 | 449,566 | ||||||||||
|
| |||||||||||
| 32,624,584 | ||||||||||||
|
| |||||||||||
REAL ESTATE – 3.0% | ||||||||||||
Alexandria Real Estate Equities, Inc. (Equity REIT) | 5,380 | 759,064 | ||||||||||
American Tower Corp. (Equity REIT) | 21,101 | 4,314,099 | ||||||||||
Apartment Investment & Management Co. Class A (Equity REIT) | 7,137 | 357,706 | ||||||||||
AvalonBay Communities, Inc. (Equity REIT) | 6,659 | 1,352,976 | ||||||||||
Boston Properties, Inc. (Equity REIT) | 7,371 | 950,859 | ||||||||||
CBRE Group, Inc. Class A (Real Estate Mgmt. & Development) | (a) | 14,894 | 764,062 | |||||||||
Crown Castle International Corp. (Equity REIT) | 19,845 | 2,586,796 | ||||||||||
Digital Realty Trust, Inc. (Equity REIT) | 9,941 | 1,170,950 | ||||||||||
Duke Realty Corp. (Equity REIT) | 17,236 | 544,830 | ||||||||||
Equinix, Inc. (Equity REIT) | 4,013 | 2,023,716 | ||||||||||
Equity Residential (Equity REIT) | 17,696 | 1,343,480 | ||||||||||
| Common Stocks (Continued) | Shares | Value | ||||||||||
REAL ESTATE (continued) | ||||||||||||
Essex Property Trust, Inc. (Equity REIT) | 3,135 | $ | 915,201 | |||||||||
Extra Space Storage, Inc. (Equity REIT) | 6,064 | 643,390 | ||||||||||
Federal Realty Investment Trust (Equity REIT) | 3,592 | 462,506 | ||||||||||
HCP, Inc. (Equity REIT) | 22,764 | 727,993 | ||||||||||
Host Hotels & Resorts, Inc. (Equity REIT) | 35,249 | 642,237 | ||||||||||
Iron Mountain, Inc. (Equity REIT) | 13,757 | 430,594 | ||||||||||
Kimco Realty Corp. (Equity REIT) | 20,239 | 374,017 | ||||||||||
Macerich Co. / The (Equity REIT) | 5,085 | 170,297 | ||||||||||
Mid-America Apartment Communities, Inc. (Equity REIT) | 5,424 | 638,730 | ||||||||||
Prologis, Inc. (Equity REIT) | 30,113 | 2,412,051 | ||||||||||
Public Storage (Equity REIT) | 7,164 | 1,706,250 | ||||||||||
Realty Income Corp. (Equity REIT) | 15,025 | 1,036,274 | ||||||||||
Regency Centers Corp. (Equity REIT) | 7,938 | 529,782 | ||||||||||
SBA Communications Corp. (Equity REIT) | (a) | 5,407 | 1,215,710 | |||||||||
Simon Property Group, Inc. (Equity REIT) | 14,743 | 2,355,342 | ||||||||||
SL Green Realty Corp. (Equity REIT) | 4,044 | 325,016 | ||||||||||
UDR, Inc. (Equity REIT) | 13,401 | 601,571 | ||||||||||
Ventas, Inc. (Equity REIT) | 17,631 | 1,205,079 | ||||||||||
Vornado Realty Trust (Equity REIT) | 8,246 | 528,569 | ||||||||||
Welltower, Inc. (Equity REIT) | 19,335 | 1,576,383 | ||||||||||
Weyerhaeuser Co. (Equity REIT) | 35,521 | 935,623 | ||||||||||
|
| |||||||||||
| 35,601,153 | ||||||||||||
|
| |||||||||||
UTILITIES – 3.3% | ||||||||||||
AES Corp. (Ind. Power & Renewable Elec.) | 31,523 | 528,326 | ||||||||||
Alliant Energy Corp. (Electric Utilities) | 11,225 | 550,923 | ||||||||||
Ameren Corp. (Multi-Utilities) | 11,711 | 879,613 | ||||||||||
American Electric Power Co., Inc. (Electric Utilities) | 23,572 | 2,074,572 | ||||||||||
American Water Works Co., Inc. (Water Utilities) | 8,614 | 999,224 | ||||||||||
Atmos Energy Corp. (Gas Utilities) | 5,562 | 587,125 | ||||||||||
CenterPoint Energy, Inc. (Multi-Utilities) | 23,907 | 684,457 | ||||||||||
CMS Energy Corp. (Multi-Utilities) | 13,521 | 783,001 | ||||||||||
Consolidated Edison, Inc. (Multi-Utilities) | 15,615 | 1,369,123 | ||||||||||
Dominion Energy, Inc. (Multi-Utilities) | 38,299 | 2,961,279 | ||||||||||
DTE Energy Co. (Multi-Utilities) | 8,747 | 1,118,566 | ||||||||||
Duke Energy Corp. (Electric Utilities) | 34,749 | 3,066,252 | ||||||||||
Edison International (Electric Utilities) | 15,547 | 1,048,023 | ||||||||||
Entergy Corp. (Electric Utilities) | 9,059 | 932,443 | ||||||||||
Evergy, Inc. (Electric Utilities) | 11,622 | 699,063 | ||||||||||
Eversource Energy (Electric Utilities) | 15,333 | 1,161,628 | ||||||||||
Exelon Corp. (Electric Utilities) | 46,351 | 2,222,067 | ||||||||||
FirstEnergy Corp. (Electric Utilities) | 24,094 | 1,031,464 | ||||||||||
NextEra Energy, Inc. (Electric Utilities) | 22,864 | 4,683,919 | ||||||||||
NiSource, Inc. (Multi-Utilities) | 17,892 | 515,290 | ||||||||||
NRG Energy, Inc. (Ind. Power & Renewable Elec.) | 12,812 | 449,957 | ||||||||||
Pinnacle West Capital Corp. (Electric Utilities) | 5,384 | 506,581 | ||||||||||
PPL Corp. (Electric Utilities) | 34,439 | 1,067,953 | ||||||||||
Public Service Enterprise Group, Inc. (Multi-Utilities) | 24,132 | 1,419,444 | ||||||||||
Sempra Energy (Multi-Utilities) | 13,098 | 1,800,189 | ||||||||||
Southern Co. / The (Electric Utilities) | 49,685 | 2,746,587 | ||||||||||
WEC Energy Group, Inc. (Multi-Utilities) | 15,068 | 1,256,219 | ||||||||||
Xcel Energy, Inc. (Electric Utilities) | 24,587 | 1,462,681 | ||||||||||
|
| |||||||||||
| 38,605,969 | ||||||||||||
|
| |||||||||||
Total Common Stocks | $ | 1,166,285,979 | ||||||||||
|
| |||||||||||
Total Investments – 99.9% | (b) | $ | 1,166,285,979 | |||||||||
Other Assets in Excess of | (c) | 1,356,492 | ||||||||||
|
| |||||||||||
Net Assets – 100.0% | $ | 1,167,642,471 | ||||||||||
|
| |||||||||||
| 54 | (continued) |
| Ohio National Fund, Inc. | ON S&P 500® Index Portfolio (Continued) |
Schedule of Investments | June 30, 2019 (Unaudited) | |
Percentages are stated as a percent of net assets.
Footnotes:
| (a) | Non-income producing security. |
| (b) | Represents cost for financial reporting purposes, which may differ from cost basis for federal income tax purposes. See also Note 7 of the Notes to Financial Statements. |
| (c) | Includes $119,700 of cash pledged as collateral for the futures contracts outstanding at June 30, 2019. See also the following Schedule of Open Futures Contracts. |
The accompanying notes are an integral part of these financial statements.
Schedule of Open Futures Contracts | June 30, 2019 (Unaudited) | |||||
Description | Number of contracts | Expiration Date | Notional Amount | Value |
Unrealized | Variation Margin Receivable (Payable) | ||||||
CMEE-mini S&P 500 Index - Long | 19 | September 20, 2019 | $2,782,820 | $2,796,990 | $14,170 | $5,570 |
The accompanying notes are an integral part of these financial statements.
| 55 |
| Ohio National Fund, Inc. | ON Federated Strategic Value Dividend Portfolio (Unaudited) |
Objective/Strategy |
The ON Federated Strategic Value Dividend Portfolio seeks growth of capital and income by investing primarily in high dividend paying common stocks with dividend growth potential.
Performance as of June 30, 2019 | ||||
Average Annual returns | ||||
One year | 5.92 | % | ||
Five years | 5.86 | % | ||
Ten years | 11.54 | % |
Past performance does not guarantee future results. The performance data quoted represents past performance and current returns may be lower or higher. Total return figures include change in share price and reinvestment of dividends and capital gains. The investment return and principal value will fluctuate so that an investor’s shares, when redeemed, may be worth more or less than the original cost. To obtain performance information up to the most recent month end, call toll-free1-877-781-6392.
The Portfolio is not open to direct retail investment. Beneficial interest in shares is obtained solely by purchase of variable life insurance policies and variable annuity contracts. Actual performance results for variable annuity and variable universal life contracts will be lower due to contract charges. Consult your contract for applicable charges.
Total expense ratio is 0.76% per the Fund’s prospectus dated May 1, 2019. Additional information pertaining to the Portfolio’s expense ratio as of June 30, 2019 can be found in the Portfolio’s Financial Highlights.
Comments fromSub-Adviser |
Q. How did the Portfolio perform in comparison to its benchmark during the reporting period?
A.For thesix-month period ended June 30, 2019, the ON Federated Strategic Value Dividend Portfolio returned 10.32% versus 13.64% for its benchmark, the Dow Jones U.S. Select Dividend Index (“DJSDI”).
Q. Were there specific market conditions, investment strategies, or techniques that materially affected the Portfolio’s benchmark-relative performance during the reporting period?
A.The market reached new highs during the period, as investor optimism increased amid talks of the Federal Reserve lowering rates and of a potential truce in the ongoing U.S.-China trade war, propelling a“Risk-On” trade for the period. As a result, the market environment was not conducive to a high quality, defensive, dividend strategy, as higher yielding equities were a notable laggard. An area of weakness versus the benchmark was the Portfolio’s 24% average international exposure, which posted a collective 8.21% return in the Portfolio, which lagged the U.S. market. Thenon-U.S. exposure of the Portfolio is employed to pursue yield, while injecting diversification into the strategy.(1)
The Portfolio’s core goal of providing investors with a stable, high and rising income stream from high quality investments has remained the strategy’s focus, evidenced by the gross weighted average dividend yield of 4.70%. This yield exceeded not only the broad market represented by the S&P 500 Index with its 1.96% yield, but also surpassed the 4.07% yield of the benchmark. For thesix-month period, the Portfolio had 20 of its 43 holdings increase their dividend distributions.(1)
Q. How did sector allocation and security selection each impact the Portfolio’s performance relative to its benchmark? For sector allocation, were there any factors that impacted the benchmark’s performance more significantly than the Portfolio’s performance? For stock selection, was there anything specific regarding the Portfolio’s strategy that caused deviation from the benchmark?
A.The strategy focuses on the dividend-rich segments of the economy, such as Consumer Staples, Health Care, Telecommunication Services and Utilities. Therefore, the strategy maintains a structural underweight in cyclical sectors that afford little to no dividend growth opportunities. The Portfolio has limited to no exposure to the Industrials, Information Technology, Materials, and Consumer Discretionary sectors. Further, the benchmark has a large weight in the Utilities sector, which creates notable dispersion in periods when the sector greatly underperforms or outperforms.(1)
During the period, the primary driver of relative weakness was stock selection in Health Care, driven bynon-benchmark holding, Abbvie, Inc. Abbvie fell 16% in one day, after announcing its merger with Allergan PLC. Although the acquisition initially surprised investors, we expect the deal to lead to significant cash flow accretion, thus providing an opportunity for higher dividend growth, deleveraging, and investment in its business.(1)
Relative performance was further hampered by stock selection and an underweight in Industrials, as the Portfolio’s sole holding, United Parcel Services, Inc. Class B posted a return of 7.8%, which underperformed the benchmark’s Industrials sector return of 25.5%.An underweight in Information Technology, which returned 23.2% for the benchmark, also detracted from relative performance. (1)
On a positive note, the Portfolio’s underweight in Consumer Discretionary added to performance, as Consumer Discretionary was a laggard in the benchmark, generating an 8.8% return. Furthermore, the Portfolio’s overweight to Real Estate Investment Trusts (“REITs”) was a positive contributor, appreciating 17.1% in the period. (1)
Q. Which holdings contributed the most to, and detracted the most from, the Portfolio’s benchmark-relative performance?
A.The Southern Co., returning over 28% and not included in the benchmark, was the top relative contributor. The Southern Co. benefited from strong fourth quarter earnings, due to favorable regulatory results andin-line first quarter results due to cost control. Also contributing was an overweight to Phillip Morris International, Inc., returning almost 21%, buoyed by strong fourth quarter earnings and investor optimism surrounding the company’s next generation ofI-Quit-Ordinary-Smoking (“IQOS”) devices. Crown Castle International Corp., returning over 22% and not included in the benchmark, was the third top contributor, reporting solid first quarter results, in line with expectations.(1)
Abbvie, Inc., discussed above, was the top relative detractor. Not holding Ford Motor Company, which returned over 38% in the benchmark, was the second largest relative detractor. The Portfolio has little to no exposure to Consumer Discretionary due to the lack of reliable dividend growth and yield opportunities. Not holding ONEOK, Inc., in the Energy sector, which returned over 30% in the benchmark, also detracted from relative returns.(1)
| (1) | The Portfolio’s composition is subject to change. Holdings and weightings are as of June 30, 2019. |
| 56 | (continued) |
| Ohio National Fund, Inc. | ON Federated Strategic Value Dividend Portfolio (Unaudited) (Continued) |
Change in Value of $10,000 Investment |
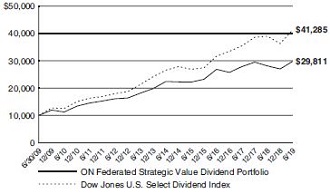
Hypothetical illustration based on past performance. Future performance will vary. The Portfolio’s returns reflect reinvested dividends. The Portfolio’s holdings may differ significantly from the securities in the index. The index is unmanaged and therefore does not reflect the cost of portfolio management and accounting.
The Dow Jones U.S. Select Dividend Index is comprised of all dividend-paying companies in the Dow Jones U.S. Index that have a non-negative historical five-yeardividend-per-share growth rate, a five-year average dividend toearnings-per-share ratio of less than or equal to 60%, paid dividends in each of the previous five years, and a three-month average daily trading volume of 200,000 shares. Current index components are included in the universe regardless of their dividend payout ratio or trading volume. The Dow Jones U.S. Index aims to consistently represent the top 95% of U.S. companies based on float-adjusted market capitalization, excluding non common issues and illiquid stocks. The index presented includes the effects of reinvested dividends.
Past performance is no guarantee of future results. Redemption of fund shares could have tax implications unique to each shareholder.
Portfolio Composition as of June 30, 2019(1) | ||
% of Net Assets | ||||
Common Stocks(4) | 97.1 | |||
Money Market Funds and Other Net Assets | 2.9 | |||
|
| |||
| 100.0 | ||||
|
| |||
Top 10 Portfolio Holdings as of June 30, 2019(1) (2) (3) | ||||
% of Net Assets | ||||||
| 1. | AT&T, Inc. | 5.8 | ||||
| 2. | Philip Morris International, Inc. | 4.7 | ||||
| 3. | Dominion Energy, Inc. | 4.1 | ||||
| 4. | BP PLC | 4.1 | ||||
| 5. | AbbVie, Inc. | 4.1 | ||||
| 6. | Exxon Mobil Corp. | 3.9 | ||||
| 7. | Coca-Cola Co. / The | 3.9 | ||||
| 8. | Southern Co. / The | 3.7 | ||||
| 9. | National Grid PLC | 3.5 | ||||
| 10. | Verizon Communications, Inc. | 3.4 | ||||
| (1) | Composition of Portfolio subject to change. |
| (2) | Short-term investments have been excluded from the list of Top 10 Portfolio Holdings. |
| (3) | Top 10 Portfolio Holdings is presented at an individual security level. Total investment exposure by issuer may be higher. |
| (4) | Sectors (Common Stocks): |
| % of Net Assets | ||||
Consumer Staples | 20.7 | |||
Utilities | 17.1 | |||
Energy | 16.1 | |||
Communication Services | 13.9 | |||
Real Estate | 10.3 | |||
Health Care | 8.4 | |||
Financials | 7.1 | |||
Industrials | 2.3 | |||
Information Technology | 0.5 | |||
Materials | 0.4 | |||
Consumer Discretionary | 0.3 | |||
|
| |||
| 97.1 | ||||
|
| |||
57
| Ohio National Fund, Inc. | ON Federated Strategic Value Dividend Portfolio |
Schedule of Investments | June 30, 2019 (Unaudited) | |
| Common Stocks – 97.1% | Shares | Value | ||||||||||
COMMUNICATION SERVICES – 13.9% |
| |||||||||||
AT&T, Inc. (Diversified Telecom. Svs.) | 554,173 | $ | 18,570,337 | |||||||||
BCE, Inc. (Diversified Telecom. Svs.) | 213,630 | 9,719,427 | ||||||||||
Verizon Communications, Inc. (Diversified Telecom. Svs.) | 191,001 | 10,911,887 | ||||||||||
Vodafone Group PLC – ADR (Wireless Telecom. Svs.) | 318,268 | 5,197,317 | ||||||||||
|
| |||||||||||
| 44,398,968 | ||||||||||||
|
| |||||||||||
CONSUMER DISCRETIONARY – 0.3% |
| |||||||||||
Cracker Barrel Old Country Store, Inc. (Hotels, Restaurants & Leisure) | 5,750 | 981,697 | ||||||||||
|
| |||||||||||
CONSUMER STAPLES – 20.7% |
| |||||||||||
Altria Group, Inc. (Tobacco) | 166,320 | 7,875,252 | ||||||||||
British American Tobacco PLC (Tobacco) | (a | ) | 118,675 | 4,143,644 | ||||||||
Coca-Cola Co. / The (Beverages) | 242,400 | 12,343,008 | ||||||||||
General Mills, Inc. (Food Products) | 60,225 | 3,163,017 | ||||||||||
Kimberly-Clark Corp. (Household Products) | 78,675 | 10,485,804 | ||||||||||
PepsiCo, Inc. (Beverages) | 75,675 | 9,923,263 | ||||||||||
Philip Morris International, Inc. (Tobacco) | 189,120 | 14,851,594 | ||||||||||
Procter & Gamble Co. / The (Household Products) | 29,165 | 3,197,942 | ||||||||||
|
| |||||||||||
| 65,983,524 | ||||||||||||
|
| |||||||||||
ENERGY – 16.1% | ||||||||||||
BP PLC (Oil, Gas & Consumable Fuels) | (a | ) | 1,881,000 | 13,104,476 | ||||||||
Chevron Corp. (Oil, Gas & Consumable Fuels) | 84,930 | 10,568,689 | ||||||||||
Enbridge, Inc. (Oil, Gas & Consumable Fuels) | 108,675 | 3,925,262 | ||||||||||
Exxon Mobil Corp. (Oil, Gas & Consumable Fuels) | 163,950 | 12,563,489 | ||||||||||
Occidental Petroleum Corp. (Oil, Gas & Consumable Fuels) | 105,225 | 5,290,713 | ||||||||||
TOTAL SA (Oil, Gas & Consumable Fuels) | (a | ) | 104,150 | 5,842,165 | ||||||||
|
| |||||||||||
| 51,294,794 | ||||||||||||
|
| |||||||||||
FINANCIALS – 7.1% | ||||||||||||
Canadian Imperial Bank of Commerce (Banks) | 46,675 | 3,670,415 | ||||||||||
Invesco Ltd. (Capital Markets) | 171,125 | 3,501,217 | ||||||||||
KeyCorp (Banks) | 160,425 | 2,847,544 | ||||||||||
Muenchener Rueckversicherungs-Gesellschaft AG in Muenchen (Insurance) | (a | ) | 18,725 | 4,693,564 | ||||||||
PNC Financial Services Group, Inc. / The (Banks) | 32,900 | 4,516,512 | ||||||||||
Regions Financial Corp. (Banks) | 222,925 | 3,330,499 | ||||||||||
|
| |||||||||||
| 22,559,751 | ||||||||||||
|
| |||||||||||
| Common Stocks (Continued) | Shares | Value | ||||||||||
HEALTH CARE – 8.4% | ||||||||||||
AbbVie, Inc. (Biotechnology) | 177,925 | $ | 12,938,706 | |||||||||
GlaxoSmithKline PLC (Pharmaceuticals) | (a | ) | 509,506 | 10,212,959 | ||||||||
Pfizer, Inc. (Pharmaceuticals) | 79,875 | 3,460,185 | ||||||||||
|
| |||||||||||
| 26,611,850 | ||||||||||||
|
| |||||||||||
INDUSTRIALS – 2.3% | ||||||||||||
United Parcel Service, Inc. Class B (Air Freight & Logistics) | 71,700 | 7,404,459 | ||||||||||
|
| |||||||||||
INFORMATION TECHNOLOGY – 0.5% |
| |||||||||||
Paychex, Inc. (IT Svs.) | 17,975 | 1,479,163 | ||||||||||
|
| |||||||||||
MATERIALS – 0.4% | ||||||||||||
Amcor PLC (Containers & Packaging) | (b | ) | 116,275 | 1,336,000 | ||||||||
|
| |||||||||||
REAL ESTATE – 10.3% | ||||||||||||
Crown Castle International Corp. (Equity REIT) | 56,675 | 7,387,586 | ||||||||||
Digital Realty Trust, Inc. (Equity REIT) | 26,720 | 3,147,349 | ||||||||||
National Retail Properties, Inc. (Equity REIT) | 66,200 | 3,509,262 | ||||||||||
Omega Healthcare Investors, Inc. (Equity REIT) | 94,150 | 3,460,012 | ||||||||||
Realty Income Corp. (Equity REIT) | 37,075 | 2,557,063 | ||||||||||
Ventas, Inc. (Equity REIT) | 136,805 | 9,350,622 | ||||||||||
Welltower, Inc. (Equity REIT) | 41,450 | 3,379,418 | ||||||||||
|
| |||||||||||
| 32,791,312 | ||||||||||||
|
| |||||||||||
UTILITIES – 17.1% | ||||||||||||
Dominion Energy, Inc. (Multi-Utilities) | 171,300 | 13,244,916 | ||||||||||
Duke Energy Corp. (Electric Utilities) | 121,756 | 10,743,749 | ||||||||||
National Grid PLC (Multi-Utilities) | (a | ) | 1,041,100 | 11,071,952 | ||||||||
PPL Corp. (Electric Utilities) | 250,275 | 7,761,028 | ||||||||||
Southern Co. / The (Electric Utilities) | 212,460 | 11,744,789 | ||||||||||
|
| |||||||||||
| 54,566,434 | ||||||||||||
|
| |||||||||||
Total Common Stocks | $ | 309,407,952 | ||||||||||
|
| |||||||||||
| Money Market Funds – 1.8% | Shares | Value | ||||||||||
State Street Institutional Liquid Reserves Fund Institutional Class, 2.449% | (c | ) | 5,567,038 | $ | 5,568,151 | |||||||
|
| |||||||||||
Total Money Market Funds | $ | 5,568,151 | ||||||||||
|
| |||||||||||
Total Investments – 98.9% | (d | ) | $ | 314,976,103 | ||||||||
Other Assets in Excess of | 3,586,715 | |||||||||||
|
| |||||||||||
Net Assets – 100.0% | $ | 318,562,818 | ||||||||||
|
| |||||||||||
Percentages are stated as a percent of net assets.
Abbreviations:
| ADR: | American Depositary Receipts |
Footnotes:
| (a) | Security traded on a foreign exchange has been valued at an estimate of fair value that is different than the local market close price. These fair value estimates are determined by an independent fair valuation service that has been approved by the Board. These securities represent $49,068,760 or 15.4% of the Portfolio’s net assets. |
Other Portfolio securities are not subjected to fair value procedures because they are traded on domestic or foreign exchanges that have close times that are consistent with the U.S. market close, normally 4:00 pm Eastern Time. |
| (b) | Non-income producing security. |
| (c) | Rate represents theseven-day yield at June 30, 2019. |
| (d) | Represents cost for financial reporting purposes, which may differ from cost basis for federal income tax purposes. See also Note 7 of the Notes to Financial Statements. |
The accompanying notes are an integral part of these financial statements.
58
Ohio National Fund, Inc. | ON Federated High Income Bond Portfolio (Unaudited) |
Objective/Strategy |
The ON Federated High Income Bond Portfolio seeks high current income by investing, under normal circumstances, at least 80% of its net assets in lower rated corporate debt obligations commonly referred to as “junk bonds”. The Portfolio’s investments are generally rated BB or lower by Standard & Poor’s or Fitch, or Ba or lower by Moody’s.
Performance as of June 30, 2019 |
Average Annual returns
One year | 7.43 | % | ||
Five years | 4.47 | % | ||
Ten years | 8.53 | % |
Past performance does not guarantee future results. The performance data quoted represents past performance and current returns may be lower or higher. Total return figures include change in share price and reinvestment of dividends and capital gains. The investment return and principal value will fluctuate so that an investor’s shares, when redeemed, may be worth more or less than the original cost. To obtain performance information up to the most recent month end, call toll-free1-877-781-6392.
The Portfolio is not open to direct retail investment. Beneficial interest in shares is obtained solely by purchase of variable life insurance policies and variable annuity contracts. Actual performance results for variable annuity and variable universal life contracts will be lower due to contract charges. Consult your contract for applicable charges.
Total expense ratio is 0.75% per the Fund’s prospectus dated May 1, 2019. Additional information pertaining to the Portfolio’s expense ratio as of June 30, 2019 can be found in the Portfolio’s Financial Highlights.
Comments fromSub-Adviser |
Q. How did the Portfolio perform in comparison to its benchmark during the reporting period?
A.For thesix-month period ended June 30, 2019, the ON Federated High Income Bond Portfolio returned 10.41% versus 9.94% for its benchmark, the Bloomberg Barclays U.S. Corporate High Yield 2% Issuer Capped Index.
Q. Were there specific market conditions, investment strategies, or techniques that materially affected the Portfolio’s benchmark-relative performance during the reporting period?
A.The total return for the high yield market for the period significantly outperformed most other fixed income asset classes. For example, the benchmark returned 9.94% versus the 6.11% return for the Bloomberg Barclays U.S. Aggregate Bond Index, a measure of high quality bond performance. The main driver of the high yield market’s strong performance was the attractive valuations that existed at the beginning of the period. After the high yield market’s difficult close to 2018, the Federal Reserve turned dovish in the first half of 2019, leading market participants to go from expecting further rate hikes to expecting rate eases to counteract potential economic weakness. The benefit can be seen in the yield spread between the Credit Suisse High Yield Bond Index and Treasury securities with comparable maturities, which declined from 575 basis points at the beginning of the period to 452 basis points at period end.
Within the high-yield market, major industry sectors that substantially outperformed the overall benchmark included finance companies, retailers, banking, construction machinery and home construction. Major industry sectors that substantially underperformed the benchmark included independent energy, oil field services, chemicals, consumer cyclical services and automotive. Reflecting the move to lower interest rates, the more interest rate-sensitiveBB-rated sector led the way with a return of 10.5%, followed by theB-rated sector, which returned 10.1%.
The more economically-sensitiveCCC-rated sector trailed the other two sectors with a return of 7.5%, as economic concerns and credit specific issues offset the positive interest rate impact.
Q. How did sector allocation and security selection each impact the Portfolio’s performance relative to its benchmark? For sector allocation, were there any factors that impacted the benchmark’s performance more significantly than the Portfolio’s performance? For security selection, was there anything specific regarding the Portfolio’s strategy that caused deviation from the benchmark?
A.Sector allocation did not have a major impact during the period. The main negative from a sector standpoint was the Portfolio’s modest cash holding, which negatively impacted performance given the market’s strong positive total return. This was partially offset by the Portfolio’s overweight to the property & casualty sector.(1)
Security selection was a substantial positive for the Portfolio during the period. This was especially true in the independent energy, cable & satellite, finance company, metals & mining, technology, automotive, packaging and wireless industry sectors. The Portfolio was negatively impacted by security selection in the healthcare and refining industry sectors.(1)
Q. Which holdings contributed the most to, and detracted the most from, the Portfolio’s benchmark-relative performance?
A.Specific holdings of the Portfolio that positively impacted performance relative to the benchmark included Bausch Health Cos., Inc., which was the top relative contributor, as the company stabilized operations, refinanced near term maturities and continued to generate substantial free cash flow from operations. The company also continues to focus on repaying debt to reduce leverage, positively impacting overall credit quality. Navient Corp., another top contributor, is one of the largest student loan servicing companies. The company continues to effectively service a large portfolio of student loans, while fighting several high profile legal cases. HCA, Inc., the largest for profit hospital company in the U.S., was a third relative contributor. Itsbest-in-class operating performance continues to benefit stakeholders. The company’s secured bonds were upgraded to investment grade during the period, while its unsecured obligation remains in high yield. (1)
Specific holdings that negatively impacted performance relative to the benchmark included SESI LLC, an oil field service company that provides drilling, completion and production related services. Low oil prices and overcapacity in the pressure pumping business continues to weigh on company results. Team Health Holdings, Inc. and Envision Healthcare Corp, providers of outsourced physician management services, detracted, as proposed regulatory reform and difficult operating conditions have ramped up concern about future operating results.(1)
| (1) | The Portfolio’s composition is subject to change. Holdings and weightings are as of June 30, 2019. |
| 59 | (continued) |
| Ohio National Fund, Inc. | ON Federated High Income Bond Portfolio (Unaudited) (Continued) |
Change in Value of $10,000 Investment |
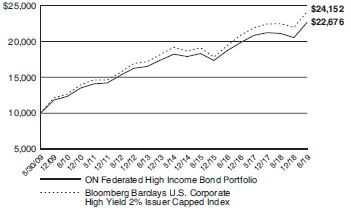
Hypothetical illustration based on past performance. Future performance will vary. All returns reflect reinvested dividends. The Portfolio’s holdings may differ significantly from the securities in the index. The index is unmanaged and therefore does not reflect the cost of portfolio management and accounting.
The Bloomberg Barclays U.S. Corporate High Yield 2% Issuer Capped Index is the 2% Issuer Cap component of the Bloomberg Barclays U.S. Corporate High Yield Bond Index. The Bloomberg Barclays U.S. Corporate High Yield Bond Index is an unmanaged index that includes all fixed income securities having a maximum quality rating of Ba1/BB+/BB+, a minimum amount outstanding of $150 million, and a least 1 year to maturity. The 2% Issuer Cap component limits the exposure of each issuer to 2% of the total market value and distributes any excess market value index–wide on a pro–rata basis. The index is presented on a total return basis.
Past performance is no guarantee of future results. Redemption of fund shares could have tax implications unique to each shareholder.
Portfolio Composition as of June 30, 2019(1) |
% of Net Assets | ||||
Corporate Bonds(4) | 95.4 | |||
Common Stocks(4) | 0.0 | |||
Money Market Funds and Other Net Assets | 4.6 | |||
|
| |||
| 100.0 | ||||
|
| |||
Top 10 Portfolio Holdings as of June 30, 2019 (1) (2) (3) |
% of Net Assets | ||||||
1. | CCO Holdings LLC / CCO Holdings Capital Corp. | 1.2 | ||||
| 5.750%, 01/15/2024 | ||||||
2. | HUB International Ltd. | 1.0 | ||||
| 7.000%, 05/01/2026 | ||||||
3. | Park Aerospace Holdings Ltd. | 1.0 | ||||
| 5.500%, 02/15/2024 | ||||||
4. | Jaguar Holding Co. II / Pharmaceutical Product Development LLC | 1.0 | ||||
| 6.375%, 08/01/2023 | ||||||
5. | Sprint Corp. | 0.9 | ||||
| 7.625%, 02/15/2025 | ||||||
6. | BWAY Holding Co. | 0.8 | ||||
| 7.250%, 04/15/2025 | ||||||
7. | Altice France SA | 0.8 | ||||
| 7.375%, 05/01/2026 | ||||||
8. | Post Holdings, Inc. | 0.8 | ||||
| 5.000%, 08/15/2026 | ||||||
9. | 1011778 B.C. ULC / New Red Finance, Inc. | 0.8 | ||||
| 5.000%, 10/15/2025 | ||||||
10. | Ortho-Clinical Diagnostics, Inc. / Ortho-Clinical Diagnostics SA | 0.7 | ||||
| 6.625%, 05/15/2022 | ||||||
| (1) | Composition of Portfolio subject to change. |
| (2) | Short-term investments have been excluded from the list of Top 10 Portfolio Holdings. |
| (3) | Top 10 Portfolio Holdings is presented at an individual security level. Total investment exposure by issuer may be higher. |
| (4) | Sectors (Common Stocks, Corporate Bonds): |
| % of Net Assets | ||||
Communication Services | 18.0 | |||
Health Care | 15.8 | |||
Energy | 12.9 | |||
Consumer Discretionary | 11.1 | |||
Materials | 9.6 | |||
Industrials | 9.5 | |||
Financials | 6.3 | |||
Information Technology | 5.4 | |||
Utilities | 3.6 | |||
Consumer Staples | 3.2 | |||
|
| |||
| 95.4 | ||||
|
| |||
60
Ohio National Fund, Inc.
| ON Federated High Income Bond Portfolio
| |
Schedule of Investments | June 30, 2019 (Unaudited) | |
| Corporate Bonds – 95.4% | Rate | Maturity | Face Amount | Value | ||||||||||||||
COMMUNICATION SERVICES – 18.0% | ||||||||||||||||||
Acosta, Inc. (Media) | (a) | 7.750% | 10/01/2022 | $1,075,000 | $ | 172,000 | ||||||||||||
Altice France SA (Diversified Telecom. Svs.) | (a) | 7.375% | 05/01/2026 | 1,625,000 | 1,665,625 | |||||||||||||
Altice France SA (Diversified Telecom. Svs.) | (a) | 8.125% | 02/01/2027 | 200,000 | 210,000 | |||||||||||||
Altice Luxembourg SA (Wireless Telecom. Svs.) | (a) | 7.625% | 02/15/2025 | 825,000 | 776,016 | |||||||||||||
AMC Networks, Inc. (Media) | 5.000% | 04/01/2024 | 600,000 | 615,750 | ||||||||||||||
AMC Networks, Inc. (Media) | 4.750% | 08/01/2025 | 225,000 | 228,375 | ||||||||||||||
CCO Holdings LLC / CCO Holdings Capital Corp. (Media) | 5.125% | 02/15/2023 | 150,000 | 152,370 | ||||||||||||||
CCO Holdings LLC / CCO Holdings Capital Corp. (Media) | 5.750% | 09/01/2023 | 225,000 | 229,991 | ||||||||||||||
CCO Holdings LLC / CCO Holdings Capital Corp. (Media) | 5.750% | 01/15/2024 | 2,325,000 | 2,377,022 | ||||||||||||||
CCO Holdings LLC / CCO Holdings Capital Corp. (Media) | (a) | 5.875% | 05/01/2027 | 400,000 | 422,000 | |||||||||||||
CCO Holdings LLC / CCO Holdings Capital Corp. (Media) | (a) | 5.000% | 02/01/2028 | 650,000 | 663,780 | |||||||||||||
CCO Holdings LLC / CCO Holdings Capital Corp. (Media) | (a) | 5.375% | 06/01/2029 | 175,000 | 180,688 | |||||||||||||
Clear Channel Worldwide Holdings, Inc. (Media) | 6.500% | 11/15/2022 | 275,000 | 281,187 | ||||||||||||||
Clear Channel Worldwide Holdings, Inc. (Media) | 6.500% | 11/15/2022 | 175,000 | 178,063 | ||||||||||||||
CSC Holdings LLC (Media) | (a) | 5.125% | 12/15/2021 | 525,000 | 525,000 | |||||||||||||
CSC Holdings LLC (Media) | (a) | 5.375% | 07/15/2023 | 375,000 | 385,312 | |||||||||||||
CSC Holdings LLC (Media) | 5.250% | 06/01/2024 | 825,000 | 856,969 | ||||||||||||||
CSC Holdings LLC (Media) | (a) | 7.750% | 07/15/2025 | 525,000 | 567,997 | |||||||||||||
CSC Holdings LLC (Media) | (a) | 6.625% | 10/15/2025 | 300,000 | 321,000 | |||||||||||||
CSC Holdings LLC (Media) | (a) | 5.500% | 04/15/2027 | 1,100,000 | 1,155,000 | |||||||||||||
CSC Holdings LLC (Media) | (a) | 7.500% | 04/01/2028 | 550,000 | 603,790 | |||||||||||||
Cumulus Media New Holdings, Inc. (Media) | (a) | 6.750% | 07/01/2026 | 75,000 | 74,813 | |||||||||||||
Digicel Group One Ltd. (Wireless Telecom. Svs.) | (a) | 8.250% | 12/30/2022 | 102,000 | 56,100 | |||||||||||||
DISH DBS Corp. (Media) | 5.875% | 11/15/2024 | 675,000 | 638,719 | ||||||||||||||
DISH DBS Corp. (Media) | 7.750% | 07/01/2026 | 825,000 | 808,500 | ||||||||||||||
Entercom Media Corp. (Media) | (a) | 7.250% | 11/01/2024 | 575,000 | 605,906 | |||||||||||||
Entercom Media Corp. (Media) | (a) | 6.500% | 05/01/2027 | 225,000 | 234,000 | |||||||||||||
Gray Television, Inc. (Media) | (a) | 5.125% | 10/15/2024 | 250,000 | 254,687 | |||||||||||||
Gray Television,Inc. (Media) | (a) | 5.875% | 07/15/2026 | 825,000 | 855,937 | |||||||||||||
iHeartCommunications, Inc. (Media) | 6.375% | 05/01/2026 | 41,769 | 44,327 | ||||||||||||||
iHeartCommunications, Inc. (Media) | 8.375% | 05/01/2027 | 825,707 | 864,945 | ||||||||||||||
Intelsat Jackson Holdings SA (Diversified Telecom. Svs.) | 5.500% | 08/01/2023 | 500,000 | 456,250 | ||||||||||||||
Intelsat Jackson Holdings SA (Diversified Telecom. Svs.) | (a) | 8.500% | 10/15/2024 | 375,000 | 371,250 | |||||||||||||
Intelsat Jackson Holdings SA (Diversified Telecom. Svs.) | (a) | 9.750% | 07/15/2025 | 350,000 | 358,750 | |||||||||||||
Match Group, Inc. (Interactive Media & Svs.) | (a) | 5.000% | 12/15/2027 | 675,000 | 706,995 | |||||||||||||
Nexstar Broadcasting, Inc. (Media) | 5.875% | 11/15/2022 | 350,000 | 357,875 | ||||||||||||||
Nexstar Broadcasting, Inc. (Media) | (a) | 5.625% | 08/01/2024 | 1,025,000 | 1,061,859 | |||||||||||||
Nexstar Escrow, Inc. (Media) | (a) | 5.625% | 07/15/2027 | 200,000 | 205,000 | |||||||||||||
Rackspace Hosting, Inc. (Interactive Media & Svs.) | (a) | 8.625% | 11/15/2024 | 900,000 | 825,750 | |||||||||||||
Sinclair Television Group, Inc. (Media) | (a) | 5.625% | 08/01/2024 | 700,000 | 715,750 | |||||||||||||
Sinclair Television Group, Inc. (Media) | (a) | 5.875% | 03/15/2026 | 400,000 | 408,880 | |||||||||||||
Sinclair Television Group, Inc. (Media) | (a) | 5.125% | 02/15/2027 | 250,000 | 245,000 | |||||||||||||
Sirius XM Radio, Inc. (Media) | (a) | 4.625% | 05/15/2023 | 425,000 | 429,250 | |||||||||||||
Sirius XM Radio, Inc. (Media) | (a) | 4.625% | 07/15/2024 | 225,000 | 230,238 | |||||||||||||
Sirius XM Radio, Inc. (Media) | (a) | 6.000% | 07/15/2024 | 200,000 | 205,550 | |||||||||||||
Sirius XM Radio, Inc. (Media) | (a) | 5.375% | 04/15/2025 | 75,000 | 77,344 | |||||||||||||
Sirius XM Radio, Inc. (Media) | (a) | 5.375% | 07/15/2026 | 725,000 | 751,281 | |||||||||||||
Sirius XM Radio, Inc. (Media) | (a) | 5.000% | 08/01/2027 | 250,000 | 254,350 | |||||||||||||
Sprint Capital Corp. (Wireless Telecom. Svs.) | 6.875% | 11/15/2028 | 825,000 | 853,875 | ||||||||||||||
Sprint Corp. (Wireless Telecom. Svs.) | 7.125% | 06/15/2024 | 200,000 | 212,060 | ||||||||||||||
Sprint Corp. (Wireless Telecom. Svs.) | 7.625% | 02/15/2025 | 1,725,000 | 1,834,969 | ||||||||||||||
Sprint Corp. (Wireless Telecom. Svs.) | 7.625% | 03/01/2026 | 325,000 | 346,450 | ||||||||||||||
TEGNA, Inc. (Media) | 6.375% | 10/15/2023 | 475,000 | 489,250 | ||||||||||||||
Telenet Finance Luxembourg Notes SARL (Media) | (a) | 5.500% | 03/01/2028 | 1,000,000 | 1,015,000 | |||||||||||||
T-Mobile U.S.A., Inc. (Wireless Telecom. Svs.) | 6.500% | 01/15/2024 | 325,000 | 336,375 | ||||||||||||||
T-Mobile U.S.A., Inc. (Wireless Telecom. Svs.) | 6.375% | 03/01/2025 | 125,000 | 129,813 | ||||||||||||||
T-Mobile U.S.A., Inc. (Wireless Telecom. Svs.) | 5.125% | 04/15/2025 | 675,000 | 702,526 | ||||||||||||||
T-Mobile U.S.A., Inc. (Wireless Telecom. Svs.) | 6.500% | 01/15/2026 | 325,000 | 351,344 | ||||||||||||||
T-Mobile U.S.A., Inc. (Wireless Telecom. Svs.) | 5.375% | 04/15/2027 | 200,000 | 214,000 | ||||||||||||||
Tribune Media Co. (Media) | 5.875% | 07/15/2022 | 750,000 | 763,050 | ||||||||||||||
Unitymedia GmbH (Media) | (a) | 6.125% | 01/15/2025 | 775,000 | 806,194 | |||||||||||||
Unitymedia Hessen GmbH & Co. KG / Unitymedia NRW GmbH (Media) | (a) | 5.000% | 01/15/2025 | 200,000 | 206,000 | |||||||||||||
Urban One, Inc. (Media) | (a) | 7.375% | 04/15/2022 | 175,000 | 174,563 | |||||||||||||
Virgin Media Finance PLC (Media) | (a) | 6.000% | 10/15/2024 | 800,000 | 829,000 | |||||||||||||
Virgin Media Finance PLC (Media) | (a) | 5.750% | 01/15/2025 | 600,000 | 620,994 | |||||||||||||
Virgin Media Secured Finance PLC (Media) | (a) | 5.250% | 01/15/2026 | 425,000 | 435,502 | |||||||||||||
Ziggo B.V. (Diversified Telecom. Svs.) | (a) | 5.500% | 01/15/2027 | 600,000 | 610,326 | |||||||||||||
Ziggo Bond Co. B.V. (Diversified Telecom. Svs.) | (a) | 6.000% | 01/15/2027 | 775,000 | 776,937 | |||||||||||||
|
| |||||||||||||||||
| 36,375,469 | ||||||||||||||||||
|
| |||||||||||||||||
| 61 | (continued) |
| Ohio National Fund, Inc. | ON Federated High Income Bond Portfolio (Continued) |
Schedule of Investments | June 30, 2019 (Unaudited) | |
| Corporate Bonds (Continued) | Rate | Maturity | Face Amount | Value | ||||||||||||||
CONSUMER DISCRETIONARY – 11.1% | ||||||||||||||||||
1011778 B.C. ULC /New Red Finance, Inc. (Hotels, Restaurants & Leisure) | (a) | 5.000% | 10/15/2025 | $1,550,000 | $ | 1,562,090 | ||||||||||||
Adient Global Holdings Ltd. (Auto Components) | (a) | 4.875% | 08/15/2026 | 900,000 | 713,250 | |||||||||||||
American Axle & Manufacturing, Inc. (Auto Components) | 6.500% | 04/01/2027 | 1,025,000 | 1,022,437 | ||||||||||||||
Aramark Services, Inc. (Hotels, Restaurants & Leisure) | 5.125% | 01/15/2024 | 175,000 | 179,813 | ||||||||||||||
Aramark Services, Inc. (Hotels, Restaurants & Leisure) | (a) | 5.000% | 04/01/2025 | 175,000 | 177,625 | |||||||||||||
Aramark Services, Inc. (Hotels, Restaurants & Leisure) | 4.750% | 06/01/2026 | 375,000 | 381,562 | ||||||||||||||
Aramark Services, Inc. (Hotels, Restaurants & Leisure) | (a) | 5.000% | 02/01/2028 | 575,000 | 591,531 | |||||||||||||
Boyd Gaming Corp. (Hotels, Restaurants & Leisure) | 6.375% | 04/01/2026 | 525,000 | 555,387 | ||||||||||||||
Boyd Gaming Corp. (Hotels, Restaurants & Leisure) | 6.000% | 08/15/2026 | 100,000 | 105,125 | ||||||||||||||
Caesars Resort Collection LLC / CRC Finco, Inc. (Hotels, Restaurants & Leisure) | (a) | 5.250% | 10/15/2025 | 1,025,000 | 1,025,000 | |||||||||||||
Dana Financing Luxembourg Sarl (Auto Components) | (a) | 6.500% | 06/01/2026 | 875,000 | 919,844 | |||||||||||||
Eldorado Resorts, Inc. (Hotels, Restaurants & Leisure) | 6.000% | 04/01/2025 | 500,000 | 525,625 | ||||||||||||||
Eldorado Resorts, Inc. (Hotels, Restaurants & Leisure) | 6.000% | 09/15/2026 | 200,000 | 218,500 | ||||||||||||||
Gates Global LLC / Gates Global Co. (Auto Components) | (a) | 6.000% | 07/15/2022 | 789,000 | 789,493 | |||||||||||||
Goodyear Tire & Rubber Co. / The (Auto Components) | 5.125% | 11/15/2023 | 50,000 | 50,625 | ||||||||||||||
Goodyear Tire & Rubber Co. / The (Auto Components) | 5.000% | 05/31/2026 | 375,000 | 369,375 | ||||||||||||||
Goodyear Tire & Rubber Co. / The (Auto Components) | 4.875% | 03/15/2027 | 300,000 | 285,000 | ||||||||||||||
Hanesbrands, Inc. (Textiles, Apparel & Luxury Goods) | (a) | 4.875% | 05/15/2026 | 325,000 | 337,152 | |||||||||||||
Hilton Domestic Operating Co., Inc. (Hotels, Restaurants & Leisure) | 5.125% | 05/01/2026 | 525,000 | 547,969 | ||||||||||||||
Hilton Domestic Operating Co., Inc. (Hotels, Restaurants & Leisure) | (a) | 4.875% | 01/15/2030 | 150,000 | 154,750 | |||||||||||||
IHO Verwaltungs GmbH (Auto Components) | (a)(b) | 4.750%, 5.500% PIK | 09/15/2026 | 900,000 | 876,375 | |||||||||||||
IHO Verwaltungs GmbH (Auto Components) | (a)(b) | 6.000%, 6.750% PIK | 05/15/2027 | 200,000 | 201,000 | |||||||||||||
J.B. Poindexter & Co., Inc. (Auto Components) | (a) | 7.125% | 04/15/2026 | 375,000 | 382,500 | |||||||||||||
KFC Holding Co. / Pizza Hut Holdings LLC / Taco Bell of America LLC (Hotels, Restaurants & Leisure) | (a) | 5.250% | 06/01/2026 | 300,000 | 314,622 | |||||||||||||
KFC Holding Co. / Pizza Hut Holdings LLC / Taco Bell of America LLC (Hotels, Restaurants & Leisure) | (a) | 4.750% | 06/01/2027 | 525,000 | 538,125 | |||||||||||||
MGM Growth Properties Operating Partnership LP / MGP FinanceCo-Issuer, Inc. (Hotels, Restaurants & Leisure) | 5.625% | 05/01/2024 | 50,000 | 53,875 | ||||||||||||||
MGM Resorts International (Hotels, Restaurants & Leisure) | 5.750% | 06/15/2025 | 500,000 | 543,740 | ||||||||||||||
MGM Resorts International (Hotels, Restaurants & Leisure) | 4.625% | 09/01/2026 | 1,075,000 | 1,080,375 | ||||||||||||||
Michaels Stores, Inc. (Specialty Retail) | (a) | 8.000% | 07/15/2027 | 400,000 | 398,156 | |||||||||||||
Mohegan Gaming & Entertainment (Hotels, Restaurants & Leisure) | (a) | 7.875% | 10/15/2024 | 700,000 | 685,125 | |||||||||||||
Panther BF Aggregator 2 LP / Panther Finance Co., Inc. (Auto Components) | (a) | 6.250% | 05/15/2026 | 125,000 | 129,844 | |||||||||||||
Panther BF Aggregator 2 LP / Panther Finance Co., Inc. (Auto Components) | (a) | 8.500% | 05/15/2027 | 1,100,000 | 1,133,000 | |||||||||||||
Party City Holdings, Inc. (Specialty Retail) | (a) | 6.125% | 08/15/2023 | 700,000 | 705,250 | |||||||||||||
Party City Holdings, Inc. (Specialty Retail) | (a) | 6.625% | 08/01/2026 | 400,000 | 388,000 | |||||||||||||
Rivers Pittsburgh Borrower LP / Rivers Pittsburgh Finance Corp. (Hotels, Restaurants & Leisure) | (a) | 6.125% | 08/15/2021 | 825,000 | 837,375 | |||||||||||||
Six Flags Entertainment Corp. (Hotels, Restaurants & Leisure) | (a) | 5.500% | 04/15/2027 | 875,000 | 910,000 | |||||||||||||
Stars Group Holdings B.V. / Stars Group U.S.Co-Borrower LLC (Hotels, Restaurants & Leisure) | (a) | 7.000% | 07/15/2026 | 775,000 | 819,562 | |||||||||||||
Station Casinos LLC (Hotels, Restaurants & Leisure) | (a) | 5.000% | 10/01/2025 | 725,000 | 726,812 | |||||||||||||
Sugarhouse HSP Gaming Prop. Mezz. LP / Sugarhouse HSP Gaming Finance Corp. (Hotels, Restaurants & Leisure) | (a) | 5.875% | 05/15/2025 | 375,000 | 369,375 | |||||||||||||
VOC Escrow Ltd. (Hotels, Restaurants & Leisure) | (a) | 5.000% | 02/15/2028 | 325,000 | 329,469 | |||||||||||||
William Carter Co. / The (Textiles, Apparel & Luxury Goods) | (a) | 5.625% | 03/15/2027 | 75,000 | 78,563 | |||||||||||||
Wyndham Hotels & Resorts, Inc. (Hotels, Restaurants & Leisure) | (a) | 5.375% | 04/15/2026 | 325,000 | 340,031 | |||||||||||||
|
| |||||||||||||||||
| 22,353,327 | ||||||||||||||||||
|
| |||||||||||||||||
CONSUMER STAPLES – 3.2% | ||||||||||||||||||
Albertson’s Cos. LLC / Safeway, Inc. / New Albertson’s LP / Albertson’s LLC (Food & Staples Retailing) | 6.625% | 06/15/2024 | 875,000 | 906,719 | ||||||||||||||
Albertson’s Cos. LLC / Safeway, Inc. / New Albertson’s LP / Albertson’s LLC (Food & Staples Retailing) | 5.750% | 03/15/2025 | 825,000 | 831,187 | ||||||||||||||
B&G Foods, Inc. (Food Products) | 5.250% | 04/01/2025 | 775,000 | 782,750 | ||||||||||||||
Energizer Holdings, Inc. (Household Products) | (a) | 5.500% | 06/15/2025 | 125,000 | 126,563 | |||||||||||||
Energizer Holdings, Inc. (Household Products) | (a) | 6.375% | 07/15/2026 | 100,000 | 102,750 | |||||||||||||
Energizer Holdings, Inc. (Household Products) | (a) | 7.750% | 01/15/2027 | 450,000 | 487,049 | |||||||||||||
First Quality Finance Co., Inc. (Personal Products) | (a) | 5.000% | 07/01/2025 | 100,000 | 100,750 | |||||||||||||
Performance Food Group, Inc. (Food & Staples Retailing) | (a) | 5.500% | 06/01/2024 | 75,000 | 76,594 | |||||||||||||
Post Holdings, Inc. (Food Products) | (a) | 5.000% | 08/15/2026 | 1,550,000 | 1,571,312 | |||||||||||||
Post Holdings, Inc. (Food Products) | (a) | 5.750% | 03/01/2027 | 550,000 | 567,875 | |||||||||||||
U.S. Foods, Inc. (Food & Staples Retailing) | (a) | 5.875% | 06/15/2024 | 825,000 | 847,687 | |||||||||||||
|
| |||||||||||||||||
| 6,401,236 | ||||||||||||||||||
|
| |||||||||||||||||
ENERGY – 12.9% | ||||||||||||||||||
Andeavor Logistics LP / Tesoro Logistics Finance Corp. (Oil, Gas & Consumable Fuels) | 6.250% | 10/15/2022 | 28,000 | 28,700 | ||||||||||||||
Antero Midstream Partners LP / Antero Midstream Finance Corp. (Oil, Gas & Consumable Fuels) | 5.375% | 09/15/2024 | 675,000 | 670,781 | ||||||||||||||
Antero Midstream Partners LP / Antero Midstream Finance Corp. (Oil, Gas & Consumable Fuels) | (a) | 5.750% | 03/01/2027 | 75,000 | 75,000 | |||||||||||||
| 62 | (continued) |
| Ohio National Fund, Inc. | ON Federated High Income Bond Portfolio (Continued) |
Schedule of Investments | June 30, 2019 (Unaudited) | |
| Corporate Bonds (Continued) | Rate | Maturity | Face Amount | Value | ||||||||||||||
ENERGY (continued) | ||||||||||||||||||
Antero Midstream Partners LP / Antero Midstream Finance Corp. (Oil, Gas & Consumable Fuels) | (a) | 5.750% | 01/15/2028 | $ | 450,000 | $ | 445,500 | |||||||||||
Apergy Corp. (Energy Equip. & Svs.) | 6.375% | 05/01/2026 | 100,000 | 100,750 | ||||||||||||||
Archrock Partners LP / Archrock Partners Finance Corp. (Oil, Gas & Consumable Fuels) | (a) | 6.875% | 04/01/2027 | 450,000 | 470,295 | |||||||||||||
Ascent Resources Utica Holdings LLC / ARU Finance Corp. (Oil, Gas & Consumable Fuels) | (a) | 7.000% | 11/01/2026 | 200,000 | 182,500 | |||||||||||||
Berry Petroleum Co. LLC (Oil, Gas & Consumable Fuels) | (a) | 7.000% | 02/15/2026 | 325,000 | 315,250 | |||||||||||||
Callon Petroleum Co. (Oil, Gas & Consumable Fuels) | 6.125% | 10/01/2024 | 539,000 | 544,390 | ||||||||||||||
Callon Petroleum Co. (Oil, Gas & Consumable Fuels) | 6.375% | 07/01/2026 | 225,000 | 226,406 | ||||||||||||||
Carrizo Oil & Gas, Inc. (Oil, Gas & Consumable Fuels) | 6.250% | 04/15/2023 | 100,000 | 96,375 | ||||||||||||||
Carrizo Oil & Gas, Inc. (Oil, Gas & Consumable Fuels) | 8.250% | 07/15/2025 | 450,000 | 443,250 | ||||||||||||||
Centennial Resource Production LLC (Oil, Gas & Consumable Fuels) | (a) | 6.875% | 04/01/2027 | 350,000 | 353,500 | |||||||||||||
Cheniere Corpus Christi Holdings LLC (Oil, Gas & Consumable Fuels) | 7.000% | 06/30/2024 | 325,000 | 373,782 | ||||||||||||||
Cheniere Corpus Christi Holdings LLC (Oil, Gas & Consumable Fuels) | 5.875% | 03/31/2025 | 350,000 | 389,812 | ||||||||||||||
Cheniere Energy Partners LP (Oil, Gas & Consumable Fuels) | 5.250% | 10/01/2025 | 900,000 | 930,375 | ||||||||||||||
Chesapeake Energy Corp. (Oil, Gas & Consumable Fuels) | 8.000% | 01/15/2025 | 50,000 | 46,125 | ||||||||||||||
Chesapeake Energy Corp. (Oil, Gas & Consumable Fuels) | 8.000% | 06/15/2027 | 1,025,000 | 896,239 | ||||||||||||||
CNX Midstream Partners LP /CNX Midstream Finance Corp. (Oil, Gas & Consumable Fuels) | (a) | 6.500% | 03/15/2026 | 725,000 | 688,750 | |||||||||||||
CrownRock LP / CrownRock Finance, Inc. (Oil, Gas & Consumable Fuels) | (a) | 5.625% | 10/15/2025 | 875,000 | 875,000 | |||||||||||||
CVR Refining LLC / Coffeyville Finance, Inc. (Oil, Gas & Consumable Fuels) | 6.500% | 11/01/2022 | 1,250,000 | 1,274,375 | ||||||||||||||
Endeavor Energy Resources LP /EER Finance, Inc. (Oil, Gas & Consumable Fuels) | (a) | 5.750% | 01/30/2028 | 250,000 | 263,125 | |||||||||||||
Enviva Partners LP / Enviva Partners Finance Corp. (Oil, Gas & Consumable Fuels) | 8.500% | 11/01/2021 | 1,025,000 | 1,066,000 | ||||||||||||||
EP Energy LLC / Everest Acquisition Finance, Inc. (Oil, Gas & Consumable Fuels) | 6.375% | 06/15/2023 | 150,000 | 3,000 | ||||||||||||||
EP Energy LLC / Everest Acquisition Finance, Inc. (Oil, Gas & Consumable Fuels) | (a) | 8.000% | 11/29/2024 | 550,000 | 374,000 | |||||||||||||
Gulfport Energy Corp. (Oil, Gas & Consumable Fuels) | 6.000% | 10/15/2024 | 250,000 | 193,125 | ||||||||||||||
Gulfport Energy Corp. (Oil, Gas & Consumable Fuels) | 6.375% | 05/15/2025 | 275,000 | 212,781 | ||||||||||||||
Gulfport Energy Corp. (Oil, Gas & Consumable Fuels) | 6.375% | 01/15/2026 | 125,000 | 94,688 | ||||||||||||||
Holly Energy Partners LP / Holly Energy Finance Corp. (Oil, Gas & Consumable Fuels) | (a) | 6.000% | 08/01/2024 | 1,075,000 | 1,118,000 | |||||||||||||
Jagged Peak Energy LLC (Oil, Gas & Consumable Fuels) | 5.875% | 05/01/2026 | 350,000 | 344,750 | ||||||||||||||
Laredo Petroleum, Inc. (Oil, Gas & Consumable Fuels) | 5.625% | 01/15/2022 | 150,000 | 139,125 | ||||||||||||||
Laredo Petroleum, Inc. (Oil, Gas & Consumable Fuels) | 6.250% | 03/15/2023 | 475,000 | 441,892 | ||||||||||||||
NuStar Logistics LP (Oil, Gas & Consumable Fuels) | 5.625% | 04/28/2027 | 875,000 | 881,562 | ||||||||||||||
Oasis Petroleum, Inc. (Oil, Gas & Consumable Fuels) | 6.875% | 03/15/2022 | 625,000 | 621,484 | ||||||||||||||
Oasis Petroleum, Inc. (Oil, Gas & Consumable Fuels) | (a) | 6.250% | 05/01/2026 | 75,000 | 72,563 | |||||||||||||
Parsley Energy LLC / Parsley Finance Corp. (Oil, Gas & Consumable Fuels) | (a) | 5.250% | 08/15/2025 | 175,000 | 177,625 | |||||||||||||
Parsley Energy LLC / Parsley Finance Corp. (Oil, Gas & Consumable Fuels) | (a) | 5.625% | 10/15/2027 | 475,000 | 496,375 | |||||||||||||
PDC Energy, Inc. (Oil, Gas & Consumable Fuels) | 6.125% | 09/15/2024 | 350,000 | 350,000 | ||||||||||||||
PDC Energy, Inc. (Oil, Gas & Consumable Fuels) | 5.750% | 05/15/2026 | 225,000 | 221,063 | ||||||||||||||
Precision Drilling Corp. (Energy Equip. & Svs.) | 6.500% | 12/15/2021 | 16,054 | 16,095 | ||||||||||||||
Precision Drilling Corp. (Energy Equip. & Svs.) | 7.750% | 12/15/2023 | 425,000 | 433,372 | ||||||||||||||
Precision Drilling Corp. (Energy Equip. & Svs.) | (a) | 7.125% | 01/15/2026 | 100,000 | 96,750 | |||||||||||||
QEP Resources, Inc. (Oil, Gas & Consumable Fuels) | 5.250% | 05/01/2023 | 75,000 | 72,188 | ||||||||||||||
QEP Resources, Inc. (Oil, Gas & Consumable Fuels) | 5.625% | 03/01/2026 | 400,000 | 376,000 | ||||||||||||||
Range Resources Corp. (Oil, Gas & Consumable Fuels) | 4.875% | 05/15/2025 | 600,000 | 526,500 | ||||||||||||||
SESI LLC (Energy Equip. & Svs.) | 7.125% | 12/15/2021 | 375,000 | 261,563 | ||||||||||||||
SESI LLC (Energy Equip. & Svs.) | 7.750% | 09/15/2024 | 1,000,000 | 642,500 | ||||||||||||||
Shelf Drilling Holdings Ltd. (Oil, Gas & Consumable Fuels) | (a) | 8.250% | 02/15/2025 | 575,000 | 530,725 | |||||||||||||
SM Energy Co. (Oil, Gas & Consumable Fuels) | 5.000% | 01/15/2024 | 175,000 | 160,563 | ||||||||||||||
SM Energy Co. (Oil, Gas & Consumable Fuels) | 5.625% | 06/01/2025 | 100,000 | 91,000 | ||||||||||||||
SM Energy Co. (Oil, Gas & Consumable Fuels) | 6.750% | 09/15/2026 | 350,000 | 328,125 | ||||||||||||||
SM Energy Co. (Oil, Gas & Consumable Fuels) | 6.625% | 01/15/2027 | 25,000 | 23,125 | ||||||||||||||
SRC Energy, Inc. (Oil, Gas & Consumable Fuels) | 6.250% | 12/01/2025 | 500,000 | 455,000 | ||||||||||||||
Summit Midstream Holdings LLC / Summit Midstream Finance Corp. (Oil, Gas & Consumable Fuels) | 5.500% | 08/15/2022 | 950,000 | 912,000 | ||||||||||||||
Summit Midstream Holdings LLC / Summit Midstream Finance Corp. (Oil, Gas & Consumable Fuels) | 5.750% | 04/15/2025 | 350,000 | 306,250 | ||||||||||||||
Sunoco LP / Sunoco Finance Corp. (Oil, Gas & Consumable Fuels) | 4.875% | 01/15/2023 | 50,000 | 51,063 | ||||||||||||||
Sunoco LP / Sunoco Finance Corp. (Oil, Gas & Consumable Fuels) | 5.500% | 02/15/2026 | 225,000 | 234,281 | ||||||||||||||
Sunoco LP / Sunoco Finance Corp. (Oil, Gas & Consumable Fuels) | 5.875% | 03/15/2028 | 350,000 | 362,687 | ||||||||||||||
Targa Resources Partners LP / Targa Resources Partners Finance Corp. (Oil, Gas & Consumable Fuels) | 5.250% | 05/01/2023 | 150,000 | 152,078 | ||||||||||||||
Targa Resources Partners LP / Targa Resources Partners Finance Corp. (Oil, Gas & Consumable Fuels) | 5.875% | 04/15/2026 | 150,000 | 159,000 | ||||||||||||||
Targa Resources Partners LP / Targa Resources Partners Finance Corp. (Oil, Gas & Consumable Fuels) | 5.375% | 02/01/2027 | 700,000 | 724,500 | ||||||||||||||
Targa Resources Partners LP / Targa Resources Partners Finance Corp. (Oil, Gas & Consumable Fuels) | (a) | 6.500% | 07/15/2027 | 25,000 | 27,250 | |||||||||||||
Targa Resources Partners LP / Targa Resources Partners Finance Corp. (Oil, Gas & Consumable Fuels) | 5.000% | 01/15/2028 | 600,000 | 601,500 | ||||||||||||||
TransMontaigne Partners LP / TLP Finance Corp. (Oil, Gas & Consumable Fuels) | 6.125% | 02/15/2026 | 125,000 | 120,313 | ||||||||||||||
U.S.A. Compression Partners LP / U.S.A. Compression Finance Corp. (Energy Equip. & Svs.) | 6.875% | 04/01/2026 | 850,000 | 898,790 | ||||||||||||||
U.S.A. Compression Partners LP / U.S.A. Compression Finance Corp. (Energy Equip. & Svs.) | (a) | 6.875% | 09/01/2027 | 100,000 | 105,011 | |||||||||||||
| 63 | (continued) |
| Ohio National Fund, Inc. | ON Federated High Income Bond Portfolio (Continued) |
Schedule of Investments | June 30, 2019 (Unaudited) | |
| Corporate Bonds (Continued) | Rate | Maturity | Face Amount | Value | ||||||||||||||
ENERGY (continued) | ||||||||||||||||||
Ultra Resources, Inc. (Oil, Gas & Consumable Fuels) | (a) | 6.875% | 04/15/2022 | $ | 150,000 | $ | 18,000 | |||||||||||
Ultra Resources, Inc. (Oil, Gas & Consumable Fuels) | (a) | 7.125% | 04/15/2025 | 400,000 | 34,000 | |||||||||||||
Whiting Petroleum Corp. (Oil, Gas & Consumable Fuels) | 6.250% | 04/01/2023 | 425,000 | 423,937 | ||||||||||||||
Whiting Petroleum Corp. (Oil, Gas & Consumable Fuels) | 6.625% | 01/15/2026 | 325,000 | 313,422 | ||||||||||||||
|
| |||||||||||||||||
| 25,955,901 | ||||||||||||||||||
|
| |||||||||||||||||
FINANCIALS – 6.3% | ||||||||||||||||||
Acrisure LLC / Acrisure Finance, Inc. (Insurance) | (a) | 8.125% | 02/15/2024 | 100,000 | 103,250 | |||||||||||||
Acrisure LLC / Acrisure Finance, Inc. (Insurance) | (a) | 7.000% | 11/15/2025 | 875,000 | 789,687 | |||||||||||||
Ally Financial, Inc. (Consumer Finance) | 5.750% | 11/20/2025 | 475,000 | 525,421 | ||||||||||||||
Alpha 2 BV (Diversified Financial Svs.) | (a)(b) | 8.750%, 9.500% PIK | 06/01/2023 | 325,000 | 319,313 | |||||||||||||
Alpha 3 BV / Alpha U.S. Bidco, Inc. (Diversified Financial Svs.) | (a) | 6.250% | 02/01/2025 | 900,000 | 886,500 | |||||||||||||
AmWINS Group, Inc. (Insurance) | (a) | 7.750% | 07/01/2026 | 675,000 | 698,625 | |||||||||||||
Ardonagh Midco 3 PLC (Insurance) | (a) | 8.625% | 07/15/2023 | 500,000 | 470,000 | |||||||||||||
AssuredPartners, Inc. (Insurance) | (a) | 7.000% | 08/15/2025 | 775,000 | 770,156 | |||||||||||||
Avolon Holdings Funding Ltd. (Diversified Financial Svs.) | (a) | 5.500% | 01/15/2023 | 75,000 | 79,958 | |||||||||||||
GTCR AP Finance, Inc. (Insurance) | (a) | 8.000% | 05/15/2027 | 125,000 | 125,625 | |||||||||||||
HUB International Ltd. (Insurance) | (a) | 7.000% | 05/01/2026 | 2,000,000 | 2,027,500 | |||||||||||||
Navient Corp. (Consumer Finance) | 6.125% | 03/25/2024 | 350,000 | 358,750 | ||||||||||||||
Navient Corp. (Consumer Finance) | 5.875% | 10/25/2024 | 875,000 | 884,844 | ||||||||||||||
Navient Corp. (Consumer Finance) | 6.750% | 06/15/2026 | 125,000 | 129,688 | ||||||||||||||
NFP Corp. (Insurance) | (a) | 6.875% | 07/15/2025 | 950,000 | 940,215 | |||||||||||||
Quicken Loans, Inc. (Thrifts & Mortgage Finance) | (a) | 5.750% | 05/01/2025 | 1,075,000 | 1,106,906 | |||||||||||||
Quicken Loans, Inc. (Thrifts & Mortgage Finance) | (a) | 5.250% | 01/15/2028 | 375,000 | 373,125 | |||||||||||||
Refinitiv U.S. Holdings, Inc. (Capital Markets) | (a) | 6.250% | 05/15/2026 | 200,000 | 205,700 | |||||||||||||
Refinitiv U.S. Holdings, Inc. (Capital Markets) | (a) | 8.250% | 11/15/2026 | 925,000 | 951,362 | |||||||||||||
USI Inc. / NY (Insurance) | (a) | 6.875% | 05/01/2025 | 950,000 | 940,500 | |||||||||||||
|
| |||||||||||||||||
| 12,687,125 | ||||||||||||||||||
|
| |||||||||||||||||
HEALTH CARE – 15.8% | ||||||||||||||||||
Acadia Healthcare Co., Inc. (Health Care Providers & Svs.) | 5.625% | 02/15/2023 | 750,000 | 762,187 | ||||||||||||||
Acadia Healthcare Co., Inc. (Health Care Providers & Svs.) | 6.500% | 03/01/2024 | 400,000 | 417,000 | ||||||||||||||
Air Medical Group Holdings, Inc. (Health Care Providers & Svs.) | (a) | 6.375% | 05/15/2023 | 900,000 | 805,500 | |||||||||||||
Avantor, Inc. (Health Care Equip. & Supplies) | (a) | 6.000% | 10/01/2024 | 125,000 | 133,000 | |||||||||||||
Avantor, Inc. (Health Care Equip. & Supplies) | (a) | 9.000% | 10/01/2025 | 975,000 | 1,087,125 | |||||||||||||
Bausch Health Americas, Inc. (Pharmaceuticals) | (a) | 8.500% | 01/31/2027 | 625,000 | 687,200 | |||||||||||||
Bausch Health Cos., Inc. (Pharmaceuticals) | (a) | 5.500% | 03/01/2023 | 70,000 | 70,560 | |||||||||||||
Bausch Health Cos., Inc. (Pharmaceuticals) | (a) | 7.000% | 03/15/2024 | 225,000 | 239,085 | |||||||||||||
Bausch Health Cos., Inc. (Pharmaceuticals) | (a) | 6.125% | 04/15/2025 | 1,175,000 | 1,198,500 | |||||||||||||
Bausch Health Cos., Inc. (Pharmaceuticals) | (a) | 5.500% | 11/01/2025 | 200,000 | 208,500 | |||||||||||||
Bausch Health Cos., Inc. (Pharmaceuticals) | (a) | 9.000% | 12/15/2025 | 525,000 | 586,582 | |||||||||||||
Bausch Health Cos., Inc. (Pharmaceuticals) | (a) | 5.750% | 08/15/2027 | 175,000 | 183,922 | |||||||||||||
Bausch Health Cos., Inc. (Pharmaceuticals) | (a) | 7.250% | 05/30/2029 | 650,000 | 676,000 | |||||||||||||
Centene Corp. (Health Care Providers & Svs.) | (a) | 5.375% | 06/01/2026 | 425,000 | 446,781 | |||||||||||||
Charles River Laboratories International, Inc. (Life Sciences Tools & Svs.) | (a) | 5.500% | 04/01/2026 | 225,000 | 236,768 | |||||||||||||
CHS / Community Health Systems, Inc. (Health Care Providers & Svs.). | 6.875% | 02/01/2022 | 500,000 | 337,500 | ||||||||||||||
CHS / Community Health Systems, Inc. (Health Care Providers & Svs.) | 6.250% | 03/31/2023 | 600,000 | 577,500 | ||||||||||||||
CHS / Community Health Systems, Inc. (Health Care Providers & Svs.) | (a) | 8.625% | 01/15/2024 | 50,000 | 50,156 | |||||||||||||
CHS / Community Health Systems, Inc. (Health Care Providers & Svs.) | (a) | 8.000% | 03/15/2026 | 200,000 | 192,206 | |||||||||||||
Eagle Holding Co. II LLC (Health Care Providers & Svs.) | (a)(b) | 7.625%, 8.375% PIK | 05/15/2022 | 50,000 | 50,250 | |||||||||||||
Eagle Holding Co. II LLC (Health Care Providers & Svs.) | (a)(b) | 7.750%, 8.500% PIK | 05/15/2022 | 350,000 | 352,625 | |||||||||||||
Endo Dac / Endo Finance LLC / Endo Finco, Inc. (Pharmaceuticals) | (a) | 6.000% | 07/15/2023 | 200,000 | 144,000 | |||||||||||||
Endo Dac / Endo Finance LLC / Endo Finco, Inc. (Pharmaceuticals) | (a) | 6.000% | 02/01/2025 | 1,225,000 | 820,750 | |||||||||||||
Envision Healthcare Corp. (Health Care Providers & Svs.) | (a) | 8.750% | 10/15/2026 | 750,000 | 519,375 | |||||||||||||
HCA, Inc. (Health Care Providers & Svs.) | 5.875% | 05/01/2023 | 275,000 | 299,030 | ||||||||||||||
HCA, Inc. (Health Care Providers & Svs.) | 5.000% | 03/15/2024 | 375,000 | 408,354 | ||||||||||||||
HCA, Inc. (Health Care Providers & Svs.) | 5.375% | 02/01/2025 | 900,000 | 971,437 | ||||||||||||||
HCA, Inc. (Health Care Providers & Svs.) | 5.875% | 02/15/2026 | 650,000 | 718,250 | ||||||||||||||
HCA, Inc. (Health Care Providers & Svs.) | 5.375% | 09/01/2026 | 100,000 | 107,750 | ||||||||||||||
HCA, Inc. (Health Care Providers & Svs.) | 5.625% | 09/01/2028 | 425,000 | 460,062 | ||||||||||||||
HCA, Inc. (Health Care Providers & Svs.) | 5.875% | 02/01/2029 | 375,000 | 411,094 | ||||||||||||||
IQVIA, Inc. (Health Care Technology) | (a) | 5.000% | 10/15/2026 | 300,000 | 310,875 | |||||||||||||
IQVIA, Inc. (Life Sciences Tools & Svs.) | (a) | 5.000% | 05/15/2027 | 300,000 | 309,750 | |||||||||||||
Jaguar Holding Co. II / Pharmaceutical Product Development LLC (Health Care Providers & Svs.). | (a) | 6.375% | 08/01/2023 | 1,875,000 | 1,940,625 | |||||||||||||
Mallinckrodt International Finance SA / Mallinckrodt CB LLC (Pharmaceuticals) | (a) | 5.625% | 10/15/2023 | 1,275,000 | 962,625 | |||||||||||||
Mallinckrodt International Finance SA / Mallinckrodt CB LLC (Pharmaceuticals) | (a) | 5.500% | 04/15/2025 | 400,000 | 268,000 | |||||||||||||
MEDNAX, Inc. (Health Care Providers & Svs.) | (a) | 6.250% | 01/15/2027 | 325,000 | 319,719 | |||||||||||||
MPH Acquisition Holdings LLC (Health Care Providers & Svs.) | (a) | 7.125% | 06/01/2024 | 1,550,000 | 1,453,435 | |||||||||||||
Ortho-Clinical Diagnostics, Inc. / Ortho-Clinical Diagnostics SA (Health Care Equip. & Supplies) | (a) | 6.625% | 05/15/2022 | 1,525,000 | 1,456,375 | |||||||||||||
Polaris Intermediate Corp. (Health Care Providers & Svs.) | (a)(b) | 8.500%, 9.250% PIK | 12/01/2022 | 375,000 | 330,938 | |||||||||||||
| 64 | (continued) |
| Ohio National Fund, Inc. | ON Federated High Income Bond Portfolio (Continued) |
Schedule of Investments | June 30, 2019 (Unaudited) | |
| Corporate Bonds (Continued) | Rate | Maturity | Face Amount | Value | ||||||||||||||
HEALTH CARE (continued) | ||||||||||||||||||
Prestige Brands, Inc. (Pharmaceuticals) | (a) | 5.375% | 12/15/2021 | $ | 600,000 | $ | 603,000 | |||||||||||
Prestige Brands, Inc. (Pharmaceuticals) | (a) | 6.375% | 03/01/2024 | 1,300,000 | 1,360,125 | |||||||||||||
RegionalCare Hospital Partners Holdings, Inc. / LifePoint Health, Inc. (Health Care Providers & Svs.) | (a) | 9.750% | 12/01/2026 | 675,000 | 707,062 | |||||||||||||
Sotera Health Holdings LLC (Health Care Equip. & Supplies) | (a) | 6.500% | 05/15/2023 | 725,000 | 734,062 | |||||||||||||
Sotera Health Topco, Inc. (Health Care Equip. & Supplies) | (a)(b) | 8.125%, 8.875% PIK | 11/01/2021 | 1,175,000 | 1,172,062 | |||||||||||||
Surgery Center Holdings, Inc. (Health Care Providers & Svs.) | (a) | 6.750% | 07/01/2025 | 625,000 | 540,625 | |||||||||||||
Team Health Holdings, Inc. (Health Care Providers & Svs.) | (a) | 6.375% | 02/01/2025 | 1,725,000 | 1,319,625 | |||||||||||||
Teleflex, Inc. (Health Care Equip. & Supplies) | 5.250% | 06/15/2024 | 275,000 | 282,477 | ||||||||||||||
Teleflex, Inc. (Health Care Equip. & Supplies) | 4.625% | 11/15/2027 | 175,000 | 180,031 | ||||||||||||||
Tenet Healthcare Corp. (Health Care Providers & Svs.) | 4.500% | 04/01/2021 | 275,000 | 278,781 | ||||||||||||||
Tenet Healthcare Corp. (Health Care Providers & Svs.) | 6.750% | 06/15/2023 | 925,000 | 928,469 | ||||||||||||||
Tenet Healthcare Corp. (Health Care Providers & Svs.) | 4.625% | 07/15/2024 | 125,000 | 126,563 | ||||||||||||||
Tenet Healthcare Corp. (Health Care Providers & Svs.) | 5.125% | 05/01/2025 | 650,000 | 653,250 | ||||||||||||||
Tenet Healthcare Corp. (Health Care Providers & Svs.) | 7.000% | 08/01/2025 | 125,000 | 124,531 | ||||||||||||||
Vizient, Inc. (Health Care Providers & Svs.) | (a) | 6.250% | 05/15/2027 | 125,000 | 132,038 | |||||||||||||
WellCare Health Plans, Inc. (Health Care Providers & Svs.) | (a) | 5.375% | 08/15/2026 | 225,000 | 238,500 | |||||||||||||
West Street Merger Sub, Inc. (Life Sciences Tools & Svs.) | (a) | 6.375% | 09/01/2025 | 1,075,000 | 994,375 | |||||||||||||
|
| |||||||||||||||||
| 31,886,967 | ||||||||||||||||||
|
| |||||||||||||||||
INDUSTRIALS – 9.5% | ||||||||||||||||||
Allied Universal Holdco LLC (Commercial Svs. & Supplies) | (a) | 6.625% | 07/15/2026 | 150,000 | 152,438 | |||||||||||||
Allied Universal Holdco LLC (Commercial Svs. & Supplies) | (a) | 9.750% | 07/15/2027 | 775,000 | 775,000 | |||||||||||||
American Builders & Contractors Supply Co., Inc. (Trading Companies & Distributors) | (a) | 5.750% | 12/15/2023 | 50,000 | 51,813 | |||||||||||||
American Builders & Contractors Supply Co., Inc. (Trading Companies & Distributors) | (a) | 5.875% | 05/15/2026 | 975,000 | 1,016,437 | |||||||||||||
Amsted Industries, Inc. (Machinery) | (a) | 5.625% | 07/01/2027 | 175,000 | 182,437 | |||||||||||||
Colfax Corp. (Machinery) | (a) | 6.000% | 02/15/2024 | 150,000 | 158,625 | |||||||||||||
Colfax Corp. (Machinery) | (a) | 6.375% | 02/15/2026 | 125,000 | 134,063 | |||||||||||||
Core & Main LP (Commercial Svs. & Supplies) | (a) | 6.125% | 08/15/2025 | 675,000 | 681,750 | |||||||||||||
Cornerstone Building Brands, Inc. (Building Products) | (a) | 8.000% | 04/15/2026 | 750,000 | 730,312 | |||||||||||||
Dun & Bradstreet Corp. / The (Professional Svs.) | (a) | 6.875% | 08/15/2026 | 225,000 | 238,078 | |||||||||||||
Dun & Bradstreet Corp. / The (Professional Svs.) | (a) | 10.250% | 02/15/2027 | 975,000 | 1,034,719 | |||||||||||||
Garda World Security Corp. (Commercial Svs. & Supplies) | (a) | 8.750% | 05/15/2025 | 750,000 | 740,625 | |||||||||||||
Hillman Group, Inc. / The (Building Products) | (a) | 6.375% | 07/15/2022 | 625,000 | 554,687 | |||||||||||||
IAA, Inc. (Commercial Svs. & Supplies) | (a) | 5.500% | 06/15/2027 | 100,000 | 104,000 | |||||||||||||
Masonite International Corp. (Building Products) | (a) | 5.625% | 03/15/2023 | 175,000 | 180,250 | |||||||||||||
Multi-Color Corp. (Commercial Svs. & Supplies) | (a) | 6.125% | 12/01/2022 | 750,000 | 773,437 | |||||||||||||
Multi-Color Corp. (Commercial Svs. & Supplies) | (a) | 4.875% | 11/01/2025 | 450,000 | 473,062 | |||||||||||||
Nielsen Co. Luxembourg SARL / The (Professional Svs.) | (a) | 5.000% | 02/01/2025 | 125,000 | 122,813 | |||||||||||||
Nielsen Finance LLC / Nielsen Finance Co. (Professional Svs.) | (a) | 5.000% | 04/15/2022 | 575,000 | 574,281 | |||||||||||||
Park Aerospace Holdings Ltd. (Trading Companies & Distributors) | (a) | 5.500% | 02/15/2024 | 1,850,000 | 1,994,263 | |||||||||||||
Resideo Funding, Inc. (Building Products) | (a) | 6.125% | 11/01/2026 | 250,000 | 260,000 | |||||||||||||
Standard Industries, Inc. / NJ (Building Products). | (a) | 6.000% | 10/15/2025 | 150,000 | 159,188 | |||||||||||||
Tempo Acquisition LLC / Tempo Acquisition Finance Corp. (Professional Svs.) | (a) | 6.750% | 06/01/2025 | 1,325,000 | 1,364,750 | |||||||||||||
Tervita Escrow Corp. (Commercial Svs. & Supplies) | (a) | 7.625% | 12/01/2021 | 475,000 | 483,175 | |||||||||||||
Titan Acquisition Ltd. / TitanCo-Borrower LLC (Machinery) | (a) | 7.750% | 04/15/2026 | 525,000 | 472,500 | |||||||||||||
TransDigm U.K. Holdings PLC (Aerospace & Defense) | 6.875% | 05/15/2026 | 275,000 | 278,266 | ||||||||||||||
TransDigm, Inc. (Aerospace & Defense) | 6.500% | 07/15/2024 | 600,000 | 607,500 | ||||||||||||||
TransDigm, Inc. (Aerospace & Defense) | 6.500% | 05/15/2025 | 350,000 | 353,937 | ||||||||||||||
TransDigm, Inc. (Aerospace & Defense) | (a) | 6.250% | 03/15/2026 | 575,000 | 601,594 | |||||||||||||
TransDigm, Inc. (Aerospace & Defense) | 6.375% | 06/15/2026 | 850,000 | 860,625 | ||||||||||||||
Trident Merger Sub, Inc. (Machinery) | (a) | 6.625% | 11/01/2025 | 700,000 | 652,750 | |||||||||||||
United Rentals North America, Inc. (Trading Companies & Distributors) | 5.875% | 09/15/2026 | 100,000 | 106,500 | ||||||||||||||
United Rentals North America, Inc. (Trading Companies & Distributors) | 6.500% | 12/15/2026 | 250,000 | 270,625 | ||||||||||||||
United Rentals North America, Inc. (Trading Companies & Distributors) | 5.500% | 05/15/2027 | 350,000 | 368,375 | ||||||||||||||
United Rentals North America, Inc. (Trading Companies & Distributors) | 4.875% | 01/15/2028 | 525,000 | 535,500 | ||||||||||||||
United Rentals North America, Inc. (Trading Companies & Distributors) | 5.250% | 01/15/2030 | 100,000 | 102,750 | ||||||||||||||
WESCO Distribution, Inc. (Trading Companies & Distributors) | 5.375% | 12/15/2021 | 350,000 | 352,625 | ||||||||||||||
WESCO Distribution, Inc. (Trading Companies & Distributors) | 5.375% | 06/15/2024 | 600,000 | 615,000 | ||||||||||||||
|
| |||||||||||||||||
| 19,118,750 | ||||||||||||||||||
|
| |||||||||||||||||
INFORMATION TECHNOLOGY – 5.4% | ||||||||||||||||||
Anixter, Inc. (Electronic Equip., Instr. & Comp.) | (a) | 6.000% | 12/01/2025 | 175,000 | 189,875 | |||||||||||||
Banff Merger Sub, Inc. (IT Svs.) | (a) | 9.750% | 09/01/2026 | 850,000 | 737,375 | |||||||||||||
CDW LLC / CDW Finance Corp. (Electronic Equip., Instr. & Comp.) | 5.500% | 12/01/2024 | 475,000 | 507,775 | ||||||||||||||
Dell International LLC / EMC Corp. (Computers & Peripherals) | (a) | 7.125% | 06/15/2024 | 950,000 | 1,002,938 | |||||||||||||
First Data Corp. (IT Svs.) | (a) | 5.000% | 01/15/2024 | 550,000 | 563,475 | |||||||||||||
First Data Corp. (IT Svs.) | (a) | 5.750% | 01/15/2024 | 1,025,000 | 1,053,828 | |||||||||||||
Gartner, Inc. (IT Svs.) | (a) | 5.125% | 04/01/2025 | 200,000 | 206,282 | |||||||||||||
Go Daddy Operating Co. LLC / GD Finance Co., Inc. (IT Svs.) | (a) | 5.250% | 12/01/2027 | 150,000 | 155,250 | |||||||||||||
Infor U.S., Inc. (Software) | 6.500% | 05/15/2022 | 1,375,000 | 1,399,200 | ||||||||||||||
| 65 | (continued) |
| Ohio National Fund, Inc. | ON Federated High Income Bond Portfolio (Continued) |
Schedule of Investments | June 30, 2019 (Unaudited) | |
| Corporate Bonds (Continued) | Rate | Maturity | Face Amount | Value | ||||||||||||||
INFORMATION TECHNOLOGY (continued) | ||||||||||||||||||
Informatica LLC (Software) | (a) | 7.125% | 07/15/2023 | $ | 1,100,000 | $ | 1,119,437 | |||||||||||
NCR Corp. (Tech. Hardware, Storage & Periph.) | 6.375% | 12/15/2023 | 225,000 | 232,031 | ||||||||||||||
Nuance Communications, Inc. (Software) | 6.000% | 07/01/2024 | 125,000 | 129,375 | ||||||||||||||
Nuance Communications, Inc. (Software) | 5.625% | 12/15/2026 | 550,000 | 573,540 | ||||||||||||||
Riverbed Technology, Inc. (Communications Equip.) | (a) | 8.875% | 03/01/2023 | 450,000 | 300,375 | |||||||||||||
RP Crown Parent LLC (Software) | (a) | 7.375% | 10/15/2024 | 1,075,000 | 1,120,688 | |||||||||||||
Sophia LP / Sophia Finance, Inc. (Software) | (a) | 9.000% | 09/30/2023 | 325,000 | 335,156 | |||||||||||||
SS&C Technologies, Inc. (Software) | (a) | 5.500% | 09/30/2027 | 550,000 | 570,625 | |||||||||||||
TTM Technologies, Inc. (Electronic Equip., Instr. & Comp.) | (a) | 5.625% | 10/01/2025 | 400,000 | 391,104 | |||||||||||||
Western Digital Corp. (Tech. Hardware, Storage & Periph.) | 4.750% | 02/15/2026 | 300,000 | 294,315 | ||||||||||||||
|
| |||||||||||||||||
| 10,882,644 | ||||||||||||||||||
|
| |||||||||||||||||
MATERIALS – 9.6% | ||||||||||||||||||
ARD Finance SA (Containers & Packaging) | (b) | 7.125%, 7.875% PIK | 09/15/2023 | 1,250,000 | 1,278,125 | |||||||||||||
Ardagh Packaging Finance PLC / Ardagh Holdings U.S.A., Inc. (Containers & Packaging) | (a) | 7.250% | 05/15/2024 | 675,000 | 711,281 | |||||||||||||
Ardagh Packaging Finance PLC / Ardagh Holdings U.S.A., Inc. (Containers & Packaging) | (a) | 6.000% | 02/15/2025 | 200,000 | 207,000 | |||||||||||||
Berry Global Escrow Corp. (Containers & Packaging) | (a) | 4.875% | 07/15/2026 | 475,000 | 485,094 | |||||||||||||
Berry Global Escrow Corp. (Containers & Packaging) | (a) | 5.625% | 07/15/2027 | 275,000 | 286,000 | |||||||||||||
Berry Global, Inc. (Containers & Packaging) | 5.500% | 05/15/2022 | 850,000 | 859,562 | ||||||||||||||
Berry Global, Inc. (Containers & Packaging) | 6.000% | 10/15/2022 | 75,000 | 76,500 | ||||||||||||||
BWAY Holding Co. (Containers & Packaging) | (a) | 5.500% | 04/15/2024 | 300,000 | 300,188 | |||||||||||||
BWAY Holding Co. (Containers & Packaging) | (a) | 7.250% | 04/15/2025 | 1,750,000 | 1,686,562 | |||||||||||||
Clearwater Paper Corp. (Paper & Forest Products) | 4.500% | 02/01/2023 | 650,000 | 617,500 | ||||||||||||||
Clearwater Paper Corp. (Paper & Forest Products) | (a) | 5.375% | 02/01/2025 | 625,000 | 567,188 | |||||||||||||
Coeur Mining, Inc. (Metals & Mining) | 5.875% | 06/01/2024 | 500,000 | 486,875 | ||||||||||||||
Compass Minerals International, Inc. (Metals & Mining) | (a) | 4.875% | 07/15/2024 | 900,000 | 858,375 | |||||||||||||
Crown Americas LLC / Crown Americas Capital Corp. VI (Containers & Packaging) | 4.750% | 02/01/2026 | 450,000 | 462,375 | ||||||||||||||
Element Solutions, Inc. (Chemicals) | (a) | 5.875% | 12/01/2025 | 325,000 | 338,406 | |||||||||||||
Flex Acquisition Co., Inc. (Containers & Packaging) | (a) | 6.875% | 01/15/2025 | 1,400,000 | 1,267,000 | |||||||||||||
Flex Acquisition Co., Inc. (Containers & Packaging) | (a) | 7.875% | 07/15/2026 | 675,000 | 622,687 | |||||||||||||
Freeport-McMoRan, Inc. (Metals & Mining) | 3.875% | 03/15/2023 | 750,000 | 750,000 | ||||||||||||||
Freeport-McMoRan, Inc. (Metals & Mining) | 5.400% | 11/14/2034 | 700,000 | 666,750 | ||||||||||||||
Graphic Packaging International LLC (Containers & Packaging) | (a) | 4.750% | 07/15/2027 | 150,000 | 153,938 | |||||||||||||
Hexion, Inc. (Acquired 01/16/2013 through 01/18/2018, Cost $730,181) (Chemicals) | (c) | 6.625% | 04/15/2020 | 800,000 | 620,000 | |||||||||||||
Hexion, Inc. (Chemicals) | (a) | 7.875% | 07/15/2027 | 200,000 | 201,000 | |||||||||||||
Hudbay Minerals, Inc. (Metals & Mining) | (a) | 7.250% | 01/15/2023 | 225,000 | 231,750 | |||||||||||||
Hudbay Minerals, Inc. (Metals & Mining) | (a) | 7.625% | 01/15/2025 | 425,000 | 438,813 | |||||||||||||
Koppers, Inc. (Chemicals) | (a) | 6.000% | 02/15/2025 | 775,000 | 726,562 | |||||||||||||
Owens-Brockway Glass Container, Inc. (Containers & Packaging) | (a) | 5.875% | 08/15/2023 | 225,000 | 242,674 | |||||||||||||
Owens-Brockway Glass Container, Inc. (Containers & Packaging) | (a) | 5.375% | 01/15/2025 | 175,000 | 182,438 | |||||||||||||
Owens-Brockway Glass Container, Inc. (Containers & Packaging) | (a) | 6.375% | 08/15/2025 | 600,000 | 654,000 | |||||||||||||
PQ Corp. (Chemicals) | (a) | 5.750% | 12/15/2025 | 125,000 | 126,406 | |||||||||||||
Reynolds Group Issuer, Inc. / Reynolds Group Issuer LLC / Reynolds Group Issuer (Containers & Packaging) | (a) | 7.000% | 07/15/2024 | 900,000 | 930,618 | |||||||||||||
Standard Industries Inc. (Construction Materials) | (a) | 5.000% | 02/15/2027 | 1,200,000 | 1,215,000 | |||||||||||||
Starfruit Finco B.V. / Starfruit U.S. Holdco LLC (Chemicals) | (a) | 8.000% | 10/01/2026 | 750,000 | 770,625 | |||||||||||||
Teck Resources Ltd. (Metals & Mining) | 6.125% | 10/01/2035 | 225,000 | 256,118 | ||||||||||||||
|
| |||||||||||||||||
| 19,277,410 | ||||||||||||||||||
|
| |||||||||||||||||
UTILITIES – 3.6% | ||||||||||||||||||
AmeriGas Partners LP / AmeriGas Finance Corp. (Gas Utilities) | 5.875% | 08/20/2026 | 850,000 | 901,000 | ||||||||||||||
AmeriGas Partners LP / AmeriGas Finance Corp. (Gas Utilities) | 5.750% | 05/20/2027 | 100,000 | 105,000 | ||||||||||||||
Calpine Corp. (Ind. Power & Renewable Elec.) | 5.750% | 01/15/2025 | 675,000 | 669,937 | ||||||||||||||
Calpine Corp. (Ind. Power & Renewable Elec.) | (a) | 5.250% | 06/01/2026 | 150,000 | 152,625 | |||||||||||||
Ferrellgas LP / Ferrellgas Finance Corp. (Gas Utilities) | 6.500% | 05/01/2021 | 200,000 | 181,500 | ||||||||||||||
Ferrellgas LP / Ferrellgas Finance Corp. (Gas Utilities) | 6.750% | 01/15/2022 | 425,000 | 376,125 | ||||||||||||||
Ferrellgas LP / Ferrellgas Finance Corp. (Gas Utilities) | 6.750% | 06/15/2023 | 375,000 | 329,063 | ||||||||||||||
NRG Energy, Inc. (Ind. Power & Renewable Elec.) | 7.250% | 05/15/2026 | 750,000 | 825,937 | ||||||||||||||
NRG Energy, Inc. (Ind. Power & Renewable Elec.) | 6.625% | 01/15/2027 | 250,000 | 271,563 | ||||||||||||||
NRG Energy, Inc. (Ind. Power & Renewable Elec.) | (a) | 5.250% | 06/15/2029 | 125,000 | 133,281 | |||||||||||||
Suburban Propane Partners LP / Suburban Energy Finance Corp. (Gas Utilities) | 5.500% | 06/01/2024 | 425,000 | 427,125 | ||||||||||||||
Suburban Propane Partners LP / Suburban Energy Finance Corp. (Gas Utilities) | 5.875% | 03/01/2027 | 600,000 | 601,500 | ||||||||||||||
TerraForm Power Operating LLC (Ind. Power & Renewable Elec.) | (a) | 4.250% | 01/31/2023 | 75,000 | 75,094 | |||||||||||||
TerraForm Power Operating LLC (Ind. Power & Renewable Elec.) | (a) | 6.625% | 06/15/2025 | 150,000 | 157,500 | |||||||||||||
TerraForm Power Operating LLC (Ind. Power & Renewable Elec.) | (a) | 5.000% | 01/31/2028 | 1,125,000 | 1,129,219 | |||||||||||||
Vistra Operations Co. LLC (Ind. Power & Renewable Elec.) | (a) | 5.500% | 09/01/2026 | 225,000 | 237,656 | |||||||||||||
Vistra Operations Co. LLC (Ind. Power & Renewable Elec.) | (a) | 5.625% | 02/15/2027 | 350,000 | 370,563 | |||||||||||||
Vistra Operations Co. LLC (Ind. Power & Renewable Elec.) | (a) | 5.000% | 07/31/2027 | 375,000 | 387,879 | |||||||||||||
|
| |||||||||||||||||
| 7,332,567 | ||||||||||||||||||
|
| |||||||||||||||||
Total Corporate Bonds (Cost $194,751,121) | $ | 192,271,396 | ||||||||||||||||
|
| |||||||||||||||||
| 66 | (continued) |
| Ohio National Fund, Inc. | ON Federated High Income Bond Portfolio (Continued) |
Schedule of Investments | June 30, 2019 (Unaudited) | |
| Common Stocks – 0.0% | Shares | Value | ||||||||
COMMUNICATION SERVICES – 0.0% | ||||||||||
iHeartMedia, Inc. Class A (Media) | (d) | 7,387 | $ | 111,174 | ||||||
|
| |||||||||
Total Common Stocks (Cost $178,496) | $ | 111,174 | ||||||||
|
| |||||||||
| Money Market Funds – 3.5% | Shares | Value | ||||||||
State Street Institutional Liquid Reserves Fund Institutional Class, 2.449% | (e) | 7,059,835 | $ | 7,061,247 | ||||||
|
| |||||||||
Total Money Market Funds (Cost $7,060,790) | $ | 7,061,247 | ||||||||
|
| |||||||||
Total Investments – 98.9% (Cost $201,990,407) | (f) | $ | 199,443,817 | |||||||
Other Assets in Excess of Liabilities – 1.1% | 2,137,630 | |||||||||
|
| |||||||||
Net Assets – 100.0% | $ | 201,581,447 | ||||||||
|
| |||||||||
Percentages are stated as a percent of net assets.
Abbreviations:
| PIK: | Payment-in-Kind |
Footnotes:
| (a) | Security exempt from registration under Regulation D of the Securities Act of 1933. These securities may be resold in transactions exempt from registration, normally to qualified buyers under Rule 144A. At June 30, 2019, the value of these securities totaled $121,977,132, or 60.5% of the Portfolio’s net assets. |
| (b) | Issuer of the security has the option to make coupon payments in cash or in additional par value of this bond(Payment-in-Kind). |
| (c) | Represents a security that is in default. These securities were deemed liquid pursuant to procedures approved by the Board of Directors. |
| (d) | Non-income producing security. |
| (e) | Rate represents theseven-day yield at June 30, 2019. |
| (f) | Represents cost for financial reporting purposes, which may differ from cost basis for federal income tax purposes. See also Note 7 of the Notes to Financial Statements. |
The accompanying notes are an integral part of these financial statements.
| 67 |
| Ohio National Fund, Inc. | ON ClearBridge Small Cap Portfolio (Unaudited) |
Objective/Strategy |
The ON ClearBridge Small Cap Portfolio seeks long-term capital appreciation by investing, under normal circumstances, at least 80% of its net assets in common stocks and other equity securities of small capitalization companies or in other investments that the portfolio managers believe have similar economic characteristics.
Performance as of June 30, 2019 |
Average Annual returns | ||||
One year | 3.79% | |||
Five years | 9.13% | |||
Ten years | 14.49% |
Past performance does not guarantee future results. The performance data quoted represents past performance and current returns may be lower or higher. Total return figures include change in share price and reinvestment of dividends and capital gains. The investment return and principal value will fluctuate so that an investor’s shares, when redeemed, may be worth more or less than the original cost. To obtain performance information up to the most recent month end, call toll-free1-877-781-6392.
The Portfolio is not open to direct retail investment. Beneficial interest in shares is obtained solely by purchase of variable life insurance policies and variable annuity contracts. Actual performance results for variable annuity and variable universal life contracts will be lower due to contract charges. Consult your contract for applicable charges.
Total expense ratio is 0.90% per the Fund’s prospectus dated May 1, 2019. Additional information pertaining to the Portfolio’s expense ratio as of June 30, 2019 can be found in the Portfolio’s Financial Highlights.
Comments fromSub-Adviser |
Q. How did the Portfolio perform in comparison to its benchmark during the reporting period?
A.For thesix-month period ended June 30, 2019, the ON ClearBridge Small Cap Portfolio returned 20.65% versus 16.98% for its benchmark, the Russell 2000 Index.
Q. How did sector allocation and security selection each impact the Portfolio’s performance relative to its benchmark? For sector allocation, were there any factors that impacted the benchmark’s performance more significantly than the Portfolio’s performance? For security selection, was there anything specific regarding the Portfolio’s strategy that caused deviation from the benchmark?
A.Outperformance was driven by security selection. In particular, selection in the Financials, Health Care and Consumer Discretionary sectors added to relative performance, while stock selection in the Industrials sector detracted. Sector allocation detracted somewhat from relative results, particularly with the Portfolio’s cash position.
Q. Which holdings contributed the most to, and detracted the most from, the Portfolio’s benchmark-relative performance?
A.Amarin Corp. PLC – ADR (“Amarin”), a biopharmaceutical company and the Portfolio’s largest holding, rose more than 50% in the first quarter. Amarin released full data from its post-approval drug trial that showed a 25% reduction in major, adverse cardiovascular events, and no adverse side effects, for high-risk patients already on statin therapy. This result is similar to the effectiveness of statins, which 40 million Americans take, giving Amarin’s drug blockbuster prospects.(1)
Aaron’s, Inc., a retailer in the Consumer Discretionary sector, is alease-to-own retailer that was the second largest relative contributor. Aaron’s Inc. reported strong revenue growth, driven primarily by its progressive segment in the first quarter, and kept up the momentum with a strong earnings beat in the second quarter.(1)
Rapid7, Inc. (“Rapid7”), the third relative contributor, bounced back in the first quarter, after a small slump to close out 2018, and has been on a steady course since. Rapid7’s fundamental results were very strong in 2018. The company reported a stellar final quarter and outlook for 2019 that drove Wall Street estimates higher.(1)
Dynavax Technologies Corp. was the top relative detractor, and has been achieving underwhelming results with its hepatitis B vaccine,Heplisav-B. That vaccine had been championed as a successor to GlaxoSmithKline PLC’s aging hepatitis B vaccine,Engerix-B, thanks to its pronounced dosing and potency advantages over the current market share leader.(1)
Hudson Ltd. Class A, a retailer in the Consumer Discretionary sector and the Portfolio’s second largest detractor, slumped almost 20% in the first quarter for two main reasons. First, its CEO abruptly resigned on January 9 without explanation or transition time. Second, its guidance for revenue growth in 2019 was weaker than expected, thanks largely to slowing Chinese duty-free spending in the U.S. This slowing growth outlook came after reports in December that Amazon.com, Inc. may want to open Amazon Go stores in airports, so investors may have sensed greater headwinds. These factors continued to weigh on the stock, although we do not think Amazon.com, Inc. is a threat — airport concessions are not granted on astore-by-store basis generally — and think that Hudson remains well positioned in its core airport retail business.(1)
| (1) | The Portfolio’s composition is subject to change. Holdings and weightings are as of June 30, 2019. |
Change in Value of $10,000 Investment |
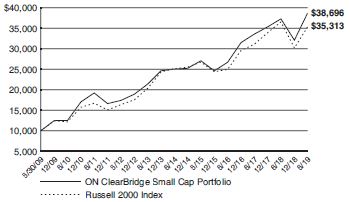
Hypothetical illustration based on past performance. Future performance will vary. The Portfolio’s returns reflect reinvested dividends. The Portfolio’s holdings may differ significantly from the securities in the index. The index is unmanaged and therefore does not reflect the cost of portfolio management and accounting.
The Russell 2000 Index measures the performance of thesmall-cap segment of the U.S equity universe. The Russell 2000 Index includes the 2000 firms from the Russell 3000 Index with the smallest market capitalizations. The Russell 3000 Index represents 98% of the investable U.S. equity market. The index presented includes the effects of reinvested dividends.
Past performance is no guarantee of future results. Redemption of fund shares could have tax implications unique to each shareholder.
| 68 | (continued) |
| Ohio National Fund, Inc. | ON ClearBridge Small Cap Portfolio (Unaudited) (Continued) |
Portfolio Composition as of June 30, 2019(1) |
| % of Net Assets | ||||
Common Stocks(4) | 98.5 | |||
Money Market Funds and Other Net Assets | 1.5 | |||
|
| |||
| 100.0 | ||||
|
| |||
Top 10 Portfolio Holdings as of June 30, 2019 (1) (2) (3) | ||||
| % of Net Assets | ||||||||
| 1. | Amarin Corp. PLC – ADR | 4.1 | ||||||
| 2. | Black Hills Corp. | 2.1 | ||||||
| 3. | Aaron’s, Inc. | 1.9 | ||||||
| 4. | Cadence Bancorp | 1.9 | ||||||
| 5. | Quotient Ltd. | 1.7 | ||||||
| 6. | Advanced Energy Industries, Inc. | 1.7 | ||||||
| 7. | Murphy U.S.A., Inc. | 1.7 | ||||||
| 8. | SkyWest, Inc. | 1.6 | ||||||
| 9. | WNS Holdings Ltd. – ADR | 1.6 | ||||||
| 10. | Service Corp. International | 1.6 | ||||||
| (1) | Composition of Portfolio subject to change. |
| (2) | Short-term investments have been excluded from the list of Top 10 Portfolio Holdings. |
| (3) | Top 10 Portfolio Holdings is presented at an individual security level. Total investment exposure by issuer may be higher. |
| (4) | Sectors (Common Stocks): |
| % of Net Assets | ||||
Financials | 19.9 | |||
Industrials | 14.6 | |||
Information Technology | 13.1 | |||
Consumer Discretionary | 12.7 | |||
Health Care | 12.5 | |||
Real Estate | 6.6 | |||
Materials | 4.8 | |||
Utilities | 4.1 | |||
Communication Services | 3.7 | |||
Energy | 3.4 | |||
Consumer Staples | 3.1 | |||
|
| |||
| 98.5 | ||||
|
| |||
69
| Ohio National Fund, Inc. | ON ClearBridge Small Cap Portfolio |
Schedule of Investments | June 30, 2019 (Unaudited) | |
| Common Stocks – 98.5% | Shares | Value | ||||||||||
COMMUNICATION SERVICES – 3.7% |
| |||||||||||
Gray Television, Inc. (Media) | (a | ) | 111,910 | $ | 1,834,205 | |||||||
ORBCOMM, Inc. (Diversified Telecom. Svs.) | (a | ) | 171,720 | 1,244,970 | ||||||||
QuinStreet, Inc. (Interactive Media & Svs.) | (a | ) | 96,500 | 1,529,525 | ||||||||
|
| |||||||||||
| 4,608,700 | ||||||||||||
|
| |||||||||||
CONSUMER DISCRETIONARY – 12.7% |
| |||||||||||
Aaron’s, Inc. (Specialty Retail) | 38,710 | 2,377,181 | ||||||||||
Chuy’s Holdings, Inc. (Hotels, Restaurants & Leisure) | (a | ) | 57,760 | 1,323,860 | ||||||||
Cooper-Standard Holdings, Inc. (Auto Components) | (a | ) | 26,210 | 1,200,942 | ||||||||
Hudson Ltd. Class A (Specialty Retail) | (a | ) | 107,123 | 1,477,226 | ||||||||
Lithia Motors, Inc. Class A (Specialty Retail) | 16,260 | 1,931,363 | ||||||||||
Monro, Inc. (Specialty Retail) | 17,007 | 1,450,697 | ||||||||||
Murphy U.S.A., Inc. (Specialty Retail) | (a | ) | 24,670 | 2,073,020 | ||||||||
OneSpaWorld Holdings Ltd. (Diversified Consumer Svs.) | (a | ) | 60,330 | 935,115 | ||||||||
Service Corp. International (Diversified Consumer Svs.) | 41,600 | 1,946,048 | ||||||||||
Twin River Worldwide Holdings, Inc. (Hotels, | ||||||||||||
Restaurants & Leisure) | (a | ) | 32,500 | 966,875 | ||||||||
|
| |||||||||||
| 15,682,327 | ||||||||||||
|
| |||||||||||
CONSUMER STAPLES – 3.1% | ||||||||||||
Inter Parfums, Inc. (Personal Products) | 13,220 | 878,998 | ||||||||||
Sanderson Farms, Inc. (Food Products) | 10,110 | 1,380,621 | ||||||||||
Sprouts Farmers Market, Inc. (Food & Staples Retailing) | (a | ) | 85,500 | 1,615,095 | ||||||||
|
| |||||||||||
| 3,874,714 | ||||||||||||
|
| |||||||||||
ENERGY – 3.4% | ||||||||||||
Carrizo Oil & Gas, Inc. (Oil, Gas & Consumable Fuels) | (a | ) | 108,480 | 1,086,969 | ||||||||
Liberty Oilfield Services, Inc. Class A (Energy | ||||||||||||
Equip. & Svs.) | 97,170 | 1,572,210 | ||||||||||
Smart Sand, Inc. (Energy Equip. & Svs.) | (a | ) | 265,990 | 649,016 | ||||||||
U.S. Silica Holdings, Inc. (Energy Equip. & Svs.) | 73,730 | 943,007 | ||||||||||
|
| |||||||||||
| 4,251,202 | ||||||||||||
|
| |||||||||||
FINANCIALS – 19.9% | ||||||||||||
Assured Guaranty Ltd. (Insurance) | 35,060 | 1,475,325 | ||||||||||
Bank OZK (Banks) | 43,130 | 1,297,782 | ||||||||||
Cadence Bancorp (Banks) | 111,440 | 2,317,952 | ||||||||||
Encore Capital Group, Inc. (Consumer Finance) | (a | ) | 44,990 | 1,523,811 | ||||||||
Essent Group Ltd. (Thrifts & Mortgage Finance) | (a | ) | 24,160 | 1,135,278 | ||||||||
First Interstate BancSystem, Inc. Class A (Banks) | 44,890 | 1,778,093 | ||||||||||
Great Western Bancorp, Inc. (Banks) | 50,270 | 1,795,644 | ||||||||||
Kinsale Capital Group, Inc. (Insurance) | 11,900 | 1,088,612 | ||||||||||
Main Street Capital Corp. (Capital Markets) | 23,212 | 954,478 | ||||||||||
OneMain Holdings, Inc. (Consumer Finance) | 45,620 | 1,542,412 | ||||||||||
Origin Bancorp, Inc. (Banks) | 7,412 | 244,596 | ||||||||||
Palomar Holdings, Inc. (Insurance) | (a | ) | 28,560 | 686,582 | ||||||||
PennantPark Investment Corp. (Capital Markets) | 183,774 | 1,161,452 | ||||||||||
ProAssurance Corp. (Insurance) | 39,240 | 1,416,956 | ||||||||||
Radian Group, Inc. (Thrifts & Mortgage Finance) | 35,270 | 805,920 | ||||||||||
TriState Capital Holdings, Inc. (Banks) | (a | ) | 67,438 | 1,439,127 | ||||||||
Washington Federal, Inc. (Thrifts & Mortgage Finance) | 45,040 | 1,573,247 | ||||||||||
WesBanco, Inc. (Banks) | 29,310 | 1,129,901 | ||||||||||
Wintrust Financial Corp. (Banks) | 16,700 | 1,221,772 | ||||||||||
|
| |||||||||||
| 24,588,940 | ||||||||||||
|
| |||||||||||
HEALTH CARE – 12.5% | ||||||||||||
Acadia Healthcare Co., Inc. (Health Care Providers & Svs.) | (a | ) | 44,810 | 1,566,110 | ||||||||
Akebia Therapeutics, Inc. (Biotechnology) | (a | ) | 123,880 | 599,579 | ||||||||
Amarin Corp. PLC – ADR (Biotechnology) | (a | ) | 259,510 | 5,031,899 | ||||||||
Dynavax Technologies Corp. (Biotechnology) | (a | ) | 114,400 | 456,456 | ||||||||
Encompass Health Corp. (Health Care Providers & Svs.) | 25,330 | 1,604,909 | ||||||||||
| Common Stocks (Continued) | Shares | Value | ||||||||||
HEALTH CARE (continued) | ||||||||||||
HealthEquity, Inc. (Health Care Providers & Svs.) | (a | ) | 24,920 | $ | 1,629,768 | |||||||
Lexicon Pharmaceuticals, Inc. (Biotechnology) | (a | ) | 128,190 | 806,315 | ||||||||
Quotient Ltd. (Health Care Equip. & Supplies) | (a | ) | 227,460 | 2,126,751 | ||||||||
Syneos Health, Inc. (Life Sciences Tools & Svs.) | (a | ) | 31,390 | 1,603,715 | ||||||||
|
| |||||||||||
| 15,425,502 | ||||||||||||
|
| |||||||||||
INDUSTRIALS – 14.6% | ||||||||||||
Continental Building Products, Inc. (Building Products) | (a | ) | 47,080 | 1,250,916 | ||||||||
Dycom Industries, Inc. (Construction & Engineering) | (a | ) | 17,440 | 1,026,693 | ||||||||
EnPro Industries, Inc. (Machinery) | 22,760 | 1,452,998 | ||||||||||
Foundation Building Materials, Inc. (Trading Companies & Distributors) | (a | ) | 75,220 | 1,337,412 | ||||||||
GATX Corp. (Trading Companies & Distributors) | 18,240 | 1,446,249 | ||||||||||
ICF International, Inc. (Professional Svs.) | 18,696 | 1,361,069 | ||||||||||
Landstar System, Inc. (Road & Rail) | 13,451 | 1,452,573 | ||||||||||
Marten Transport Ltd. (Road & Rail) | 67,796 | 1,230,497 | ||||||||||
MRC Global, Inc. (Trading Companies & Distributors) | (a | ) | 91,850 | 1,572,472 | ||||||||
Rush Enterprises, Inc. Class A (Trading Companies & Distributors) | 41,470 | 1,514,484 | ||||||||||
SkyWest, Inc. (Airlines) | 33,500 | 2,032,445 | ||||||||||
Textainer Group Holdings Ltd. (Trading Companies & Distributors) | (a | ) | 81,070 | 817,186 | ||||||||
Triton International Ltd. (Trading Companies & Distributors) | 49,080 | 1,607,861 | ||||||||||
|
| |||||||||||
| 18,102,855 | ||||||||||||
|
| |||||||||||
INFORMATION TECHNOLOGY – 13.1% |
| |||||||||||
2U, Inc. (Software) | (a | ) | 31,167 | 1,173,126 | ||||||||
Advanced Energy Industries, Inc. (Semiconductors & Equip.) | (a | ) | 37,470 | 2,108,437 | ||||||||
CommVault Systems, Inc. (Software) | (a | ) | 5,560 | 275,887 | ||||||||
EVERTEC, Inc. (IT Svs.) | 40,550 | 1,325,985 | ||||||||||
Itron, Inc. (Electronic Equip., Instr. & Comp.) | (a | ) | 30,900 | 1,933,413 | ||||||||
nLight, Inc. (Electronic Equip., Instr. & Comp.) | (a | ) | 71,145 | 1,365,984 | ||||||||
Q2 Holdings, Inc. (Software) | (a | ) | 13,810 | 1,054,532 | ||||||||
Rapid7, Inc. (Software) | (a | ) | 22,130 | 1,279,999 | ||||||||
RingCentral, Inc. Class A (Software) | (a | ) | 7,840 | 900,973 | ||||||||
Semtech Corp. (Semiconductors & Equip.) | (a | ) | 19,670 | 945,143 | ||||||||
Tower Semiconductor Ltd. (Semiconductors & Equip.) | (a | ) | 117,180 | 1,847,929 | ||||||||
WNS Holdings Ltd. – ADR (IT Svs.) | (a | ) | 33,430 | 1,979,056 | ||||||||
|
| |||||||||||
| 16,190,464 | ||||||||||||
|
| |||||||||||
MATERIALS – 4.8% | ||||||||||||
Commercial Metals Co. (Metals & Mining) | 79,720 | 1,423,002 | ||||||||||
Silgan Holdings, Inc. (Containers & Packaging). | 52,330 | 1,601,298 | ||||||||||
U.S. Concrete, Inc. (Construction Materials) | (a | ) | 26,550 | 1,319,270 | ||||||||
Venator Materials PLC (Chemicals) | (a | ) | 294,590 | 1,558,381 | ||||||||
|
| |||||||||||
| 5,901,951 | ||||||||||||
|
| |||||||||||
REAL ESTATE –6.6% | ||||||||||||
Brandywine Realty Trust (Equity REIT) | 84,760 | 1,213,763 | ||||||||||
Lexington Realty Trust (Equity REIT) | 184,060 | 1,732,005 | ||||||||||
Outfront Media, Inc. (Equity REIT) | 42,450 | 1,094,785 | ||||||||||
PotlatchDeltic Corp. (Equity REIT) | 34,150 | 1,331,167 | ||||||||||
STORE Capital Corp. (Equity REIT) | 27,840 | 924,010 | ||||||||||
Summit Hotel Properties, Inc. (Equity REIT) | 162,720 | 1,866,398 | ||||||||||
|
| |||||||||||
| 8,162,128 | ||||||||||||
|
| |||||||||||
UTILITIES – 4.1% | ||||||||||||
Black Hills Corp. (Multi-Utilities) | 33,540 | 2,621,822 | ||||||||||
NextEra Energy Partners LP (Ind. Power & | ||||||||||||
Renewable Elec.) | 27,591 | 1,331,266 | ||||||||||
PNM Resources, Inc. (Electric Utilities) | 20,940 | 1,066,055 | ||||||||||
|
| |||||||||||
| 5,019,143 | ||||||||||||
|
| |||||||||||
Total Common Stocks | $ | 121,807,926 | ||||||||||
|
| |||||||||||
| 70 | (continued) |
| Ohio National Fund, Inc. | ON ClearBridge Small Cap Portfolio (Continued) |
Schedule of Investments | June 30, 2019 (Unaudited) | |
| Money Market Funds – 1.1% | Shares | Value | ||||||||||
State Street Institutional Liquid Reserves Fund Institutional Class, 2.449% | (b | ) | 1,296,249 | $ | 1,296,508 | |||||||
|
| |||||||||||
Total Money Market Funds | $ | 1,296,508 | ||||||||||
|
| |||||||||||
Total Investments – 99.6% | (c | ) | $ | 123,104,434 | ||||||||
Other Assets in Excess of Liabilities – 0.4% | 504,762 | |||||||||||
|
| |||||||||||
Net Assets – 100.0% | $ | 123,609,196 | ||||||||||
|
| |||||||||||
Percentages are stated as a percent of net assets.
Abbreviations:
| ADR: | American Depositary Receipts |
Footnotes:
| (a) | Non-income producing security. |
| (b) | Rate represents theseven-day yield at June 30, 2019. |
| (c) | Represents cost for financial reporting purposes, which may differ from cost basis for federal income tax purposes. See also Note 7 of the Notes to Financial Statements. |
The accompanying notes are an integral part of these financial statements.
| 71 |
| Ohio National Fund, Inc. | ON Nasdaq-100® Index Portfolio (Unaudited) |
Objective/Strategy |
The ONNasdaq-100® Index Portfolio seeks long-term growth of capital by investing, under normal circumstances, more than 80% of its net assets in the common stocks of companies that are included in theNasdaq-100® Index.
Performance as of June 30, 2019 | ||||
Average Annual returns | ||||
One year | 9.67 | % | ||
Five years | 15.57 | % | ||
Ten years | 18.61 | % |
Past performance does not guarantee future results. The performance data quoted represents past performance and current returns may be lower or higher. Total return figures include change in share price and reinvestment of dividends and capital gains. The investment return and principal value will fluctuate so that an investor’s shares, when redeemed, may be worth more or less than the original cost. To obtain performance information up to the most recent month end, call toll-free1-877-781-6392.
The Portfolio is not open to direct retail investment. Beneficial interest in shares is obtained solely by purchase of variable life insurance policies and variable annuity contracts. Actual performance results for variable annuity and variable universal life contracts will be lower due to contract charges. Consult your contract for applicable charges.
Total expense ratio is 0.41% per the Fund’s prospectus dated May 1, 2019. Additional information pertaining to the Portfolio’s expense ratio as of June 30, 2019 can be found in the Portfolio’s Financial Highlights.
Comments fromSub-Adviser |
Q. How did the Portfolio perform in comparison to its benchmark during the reporting period?
A.For thesix-month period ended June 30, 2019, the ONNasdaq-100® Index Portfolio returned 21.63% versus 21.85% for its benchmark, theNasdaq-100® Index.
Q. Were there specific market conditions, investment strategies, or techniques that materially affected the Portfolio’s benchmark-relative performance during the reporting period?
A.The Portfolio intends to track the underlying return of theNasdaq-100® Index. There were no material market events or changes in strategy during the year that materially impacted the Portfolio’s relative return. Sources of return variance were related to the cumulative impact of investing theday-to-day cash flows in the Portfolio.
Q. How did sector allocation and security selection each impact the Portfolio’s performance relative to its benchmark? For sector allocation, were there any factors that impacted the benchmark’s performance more significantly than the Portfolio’s performance? For security selection, was there anything specific regarding the Portfolio’s strategy that caused deviation from the benchmark?
A.There was no impact from either sector or stock selection that caused any significant performance variance between the Portfolio and its benchmark.(1)
Information Technology, which is the largest sector in the index, contributed the most for the period. Communication Services and Consumer Discretionary also contributed to the return. Financials and Utilities were laggards for the period.(1)
Q. Which holdings contributed the most to, and detracted the most from, the Portfolio’s benchmark-relative performance?
A.The largest contributors to the Portfolio and benchmark returns for the period were Microsoft Corp., Apple, Inc., and Amazon.com, Inc. The largest detractors from the Portfolio and benchmark returns for the period were Tesla, Inc., The Kraft Heinz Co., and Biogen, Inc.(1)
Q. How did the Portfolio’s use of derivative instruments and initial public offerings (IPOs), if any, impact performance?
A.The Portfolio usesNasdaq-100® Index futures contracts primarily to equitize open dividend receivables, as well as to manageday-to-day cash flows, to ensure the Portfolio is fully invested. The futures did not meaningfully impact performance, however, due to their index characteristics and size in relation to the Portfolio’s net assets.(1)
Q. Were there any significant changes to the Portfolio’s management team, investment strategy, or security selection process during the reporting period?
A.The portfolio management team, consisting of Portfolio Managers and Associate Portfolio Managers, added one new member over the period, while four members of the team departed for varying reasons. The team is currently staffed at seven. There were no material changes to the investment strategy or stock selection process during the period.
| (1) | The Portfolio’s composition is subject to change. Holdings and weightings are as of June 30, 2019. |
Change in Value of $10,000 Investment |
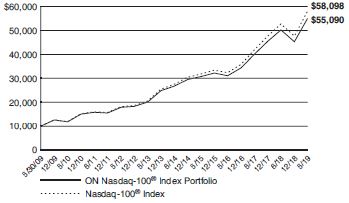
Hypothetical illustration based on past performance. Future performance will vary. The Portfolio’s returns reflect reinvested dividends. The Portfolio’s holdings may differ significantly from the securities in the index. The index is unmanaged and therefore does not reflect the cost of portfolio management and accounting.
TheNasdaq-100® Index is a modified capitalization-weighted index of the 100 largest domestic and internationalnon-financial companies listed on the NASDAQ® Stock Market. The index presented includes the effects of reinvested dividends.
Past performance is no guarantee of future results. Redemption of fund shares could have tax implications unique to each shareholder.
TheNasdaq-100®,Nasdaq-100 Index®, and Nasdaq® are registered trademarks of The NASDAQ OMX Group, Inc. (which with its affiliates is referred to as “NASDAQ OMX”). Ohio National Investments, Inc. has licensed these marks for the Portfolio’s use. NASDAQ OMX has not passed on the Portfolio’s legality or suitability. NASDAQ OMX does not sponsor, endorse, sell or promote the Portfolio. NASDAQ OMX MAKES NO WARRANTIES AND BEARS NO LIABILITY WITH RESPECT TO THE PORTFOLIO.
| 72 | (continued) |
| Ohio National Fund, Inc. | ON Nasdaq-100® Index Portfolio (Unaudited) (Continued) |
Portfolio Composition as of June 30, 2019(1) | ||||
| % of Net Assets | ||||
Common Stocks(4) | 99.5 | |||
U.S. Treasury Obligations | 0.1 | |||
Money Market Funds and Other Net Assets | 0.4 | |||
|
| |||
| 100.0 | ||||
|
| |||
Top 10 Portfolio Holdings as of June 30, 2019 (1) (2) (3) | ||||
| % of Net Assets | ||||||
1. | Microsoft Corp. | 11.2 | ||||
2. | Amazon.com, Inc. | 10.2 | ||||
3. | Apple, Inc. | 9.9 | ||||
4. | Facebook, Inc. Class A | 5.1 | ||||
5. | Alphabet, Inc. Class C | 4.1 | ||||
6. | Alphabet, Inc. Class A | 3.6 | ||||
7. | Cisco Systems, Inc. | 2.8 | ||||
8. | Intel Corp. | 2.6 | ||||
9. | Comcast Corp. Class A | 2.3 | ||||
10. | PepsiCo, Inc. | 2.2 | ||||
| (1) | Composition of Portfolio subject to change. |
| (2) | Short-term investments have been excluded from the list of Top 10 Portfolio Holdings. |
| (3) | Top 10 Portfolio Holdings is presented at an individual security level. Total investment exposure by issuer may be higher. |
| (4) | Sectors (Common Stocks): |
| % of Net Assets | ||||
Information Technology | 44.3 | |||
Communication Services | 21.3 | |||
Consumer Discretionary | 16.9 | |||
Health Care | 7.9 | |||
Consumer Staples | 6.0 | |||
Industrials | 2.4 | |||
Utilities | 0.4 | |||
Financials | 0.3 | |||
|
| |||
| 99.5 | ||||
|
| |||
73
| Ohio National Fund, Inc. | ONNasdaq-100®Index Portfolio |
Schedule of Investments | June 30, 2019 (Unaudited) | |
| Common Stocks – 99.5% | Shares | Value | ||||||||
COMMUNICATION SERVICES – 21.3% | ||||||||||
Activision Blizzard, Inc. (Entertainment) | 31,284 | $ | 1,476,605 | |||||||
Alphabet, Inc. Class A (Interactive Media & Svs.) | (a) | 11,327 | 12,264,875 | |||||||
Alphabet, Inc. Class C (Interactive Media & Svs.) | (a) | 12,914 | 13,958,872 | |||||||
Baidu, Inc. –ADR (Interactive Media & Svs.) | (a) | 11,381 | 1,335,674 | |||||||
Charter Communications, Inc. Class A (Media) | (a) | 9,124 | 3,605,622 | |||||||
Comcast Corp. Class A (Media) | 184,982 | 7,821,039 | ||||||||
Electronic Arts, Inc. (Entertainment) | (a) | 12,140 | 1,229,296 | |||||||
Facebook, Inc. Class A (Interactive Media & Svs.) | (a) | 89,250 | 17,225,250 | |||||||
Fox Corp. Class A (Media) | 14,092 | 516,331 | ||||||||
Fox Corp. Class B (Media) | 10,721 | 391,638 | ||||||||
Liberty Global PLC Class A (Media) | (a) | 8,382 | 226,230 | |||||||
Liberty Global PLC Class C (Media) | (a) | 21,275 | 564,426 | |||||||
NetEase, Inc. – ADR (Entertainment) | 2,980 | 762,195 | ||||||||
Netflix, Inc. (Entertainment) | (a) | 17,856 | 6,558,866 | |||||||
Sirius XM Holdings, Inc. (Media) | 188,166 | 1,049,966 | ||||||||
Take-Two Interactive Software, Inc. (Entertainment) | (a) | 4,596 | 521,784 | |||||||
T-Mobile U.S., Inc. (Wireless Telecom. Svs.) | (a) | 34,891 | 2,586,819 | |||||||
|
| |||||||||
| 72,095,488 | ||||||||||
|
| |||||||||
CONSUMER DISCRETIONARY – 16.9% | ||||||||||
Amazon.com, Inc. (Internet & Direct Marketing Retail) | (a) | 18,121 | 34,314,469 | |||||||
Booking Holdings, Inc. (Internet & Direct Marketing Retail) | (a) | 1,768 | 3,314,487 | |||||||
Ctrip.com International Ltd. – ADR (Internet & Direct Marketing Retail) | (a) | 19,889 | 734,103 | |||||||
Dollar Tree, Inc. (Multiline Retail) | (a) | 9,703 | 1,042,005 | |||||||
eBay, Inc. (Internet & Direct Marketing Retail) | 35,594 | 1,405,963 | ||||||||
Expedia Group, Inc. (Internet & Direct Marketing Retail) | 5,555 | 738,982 | ||||||||
Hasbro, Inc. (Leisure Products) | 5,140 | 543,195 | ||||||||
JD.com, Inc. – ADR (Internet & Direct Marketing Retail) | (a) | 37,787 | 1,144,568 | |||||||
Lululemon Athletica, Inc. (Textiles, Apparel & Luxury Goods) | (a) | 5,019 | 904,474 | |||||||
Marriott International, Inc. Class A (Hotels, Restaurants & Leisure) | 13,600 | 1,907,944 | ||||||||
MercadoLibre, Inc. (Internet & Direct Marketing Retail) | (a) | 2,014 | 1,232,105 | |||||||
O’Reilly Automotive, Inc. (Specialty Retail) | (a) | 3,197 | 1,180,716 | |||||||
Ross Stores, Inc. (Specialty Retail) | 15,007 | 1,487,494 | ||||||||
Starbucks Corp. (Hotels, Restaurants & Leisure) | 49,466 | 4,146,735 | ||||||||
Tesla, Inc. (Automobiles) | (a) | 7,240 | 1,617,850 | |||||||
Ulta Beauty, Inc. (Specialty Retail) | (a) | 2,387 | 828,027 | |||||||
Wynn Resorts Ltd. (Hotels, Restaurants & Leisure) | 4,397 | 545,184 | ||||||||
|
| |||||||||
| 57,088,301 | ||||||||||
|
| |||||||||
CONSUMER STAPLES – 6.0% | ||||||||||
Costco Wholesale Corp. (Food & Staples Retailing) | 17,965 | 4,747,431 | ||||||||
Kraft Heinz Co. / The (Food Products) | 49,803 | 1,545,885 | ||||||||
Mondelez International, Inc. Class A (Food Products) | 58,829 | 3,170,883 | ||||||||
Monster Beverage Corp. (Beverages) | (a) | 22,200 | 1,417,026 | |||||||
PepsiCo, Inc. (Beverages) | 57,252 | 7,507,455 | ||||||||
Walgreens Boots Alliance, Inc. (Food & Staples Retailing) | 37,341 | 2,041,433 | ||||||||
|
| |||||||||
| 20,430,113 | ||||||||||
|
| |||||||||
FINANCIALS – 0.3% | ||||||||||
Willis Towers Watson PLC (Insurance) | 5,278 | 1,010,948 | ||||||||
|
| |||||||||
HEALTH CARE – 7.9% | ||||||||||
Alexion Pharmaceuticals, Inc. (Biotechnology) | (a) | 9,158 | 1,199,515 | |||||||
| Common Stocks (Continued) | Shares | Value | ||||||||
HEALTH CARE (continued) | ||||||||||
Align Technology, Inc. (Health Care Equip. & Supplies) | (a) | 3,267 | $ | 894,178 | ||||||
Amgen, Inc. (Biotechnology) | 24,910 | 4,590,415 | ||||||||
Biogen, Inc. (Biotechnology) | (a) | 7,919 | 1,852,017 | |||||||
BioMarin Pharmaceutical, Inc. (Biotechnology) | (a) | 7,313 | 626,358 | |||||||
Celgene Corp. (Biotechnology) | (a) | 28,803 | 2,662,549 | |||||||
Cerner Corp. (Health Care Technology) | 13,290 | 974,157 | ||||||||
Gilead Sciences, Inc. (Biotechnology) | 51,931 | 3,508,458 | ||||||||
Henry Schein, Inc. (Health Care Providers & Svs.) | (a) | 6,088 | 425,551 | |||||||
IDEXX Laboratories, Inc. (Health Care Equip. & Supplies) | (a) | 3,513 | 967,234 | |||||||
Illumina, Inc. (Life Sciences Tools & Svs.) | (a) | 6,004 | 2,210,373 | |||||||
Incyte Corp. (Biotechnology) | (a) | 8,758 | 744,080 | |||||||
Intuitive Surgical, Inc. (Health Care Equip. & Supplies) | (a) | 4,715 | 2,473,253 | |||||||
Mylan N.V. (Pharmaceuticals) | (a) | 21,052 | 400,830 | |||||||
Regeneron Pharmaceuticals, Inc. (Biotechnology) | (a) | 4,400 | 1,377,200 | |||||||
Vertex Pharmaceuticals, Inc. (Biotechnology) | (a) | 10,460 | 1,918,155 | |||||||
|
| |||||||||
| 26,824,323 | ||||||||||
|
| |||||||||
INDUSTRIALS – 2.4% | ||||||||||
American Airlines Group, Inc. (Airlines) | 18,167 | 592,426 | ||||||||
Cintas Corp. (Commercial Svs. & Supplies) | 4,271 | 1,013,466 | ||||||||
CSX Corp. (Road & Rail) | 33,047 | 2,556,846 | ||||||||
Fastenal Co. (Trading Companies & Distributors) | 23,387 | 762,182 | ||||||||
J.B. Hunt Transport Services, Inc. (Road & Rail) | 4,441 | 405,952 | ||||||||
PACCAR, Inc. (Machinery) | 14,149 | 1,013,917 | ||||||||
United Continental Holdings, Inc. (Airlines) | (a) | 10,746 | 940,812 | |||||||
Verisk Analytics, Inc. (Professional Svs.) | 6,684 | 978,939 | ||||||||
|
| |||||||||
| 8,264,540 | ||||||||||
|
| |||||||||
INFORMATION TECHNOLOGY – 44.3% | ||||||||||
Adobe, Inc. (Software) | (a) | 19,928 | 5,871,785 | |||||||
Advanced Micro Devices, Inc. (Semiconductors & Equip.) | (a) | 44,174 | 1,341,564 | |||||||
Analog Devices, Inc. (Semiconductors & Equip.) | 15,101 | 1,704,450 | ||||||||
Apple, Inc. (Tech. Hardware, Storage & Periph.) | 169,327 | 33,513,200 | ||||||||
Applied Materials, Inc. (Semiconductors & Equip.) | 38,231 | 1,716,954 | ||||||||
ASML Holding N.V. (Semiconductors & Equip.) | 2,989 | 621,503 | ||||||||
Autodesk, Inc. (Software) | (a) | 8,992 | 1,464,797 | |||||||
Automatic Data Processing, Inc. (IT Svs.) | 17,775 | 2,938,741 | ||||||||
Broadcom, Inc. (Semiconductors & Equip.) | 16,167 | 4,653,833 | ||||||||
Cadence Design Systems, Inc. (Software) | (a) | 11,478 | 812,757 | |||||||
Check Point Software Technologies Ltd. (Software) | (a) | 6,218 | 718,863 | |||||||
Cisco Systems, Inc. (Communications Equip.) | 174,829 | 9,568,391 | ||||||||
Citrix Systems, Inc. (Software) | 5,377 | 527,699 | ||||||||
Cognizant Technology Solutions Corp. Class A (IT Svs.) | 23,250 | 1,473,818 | ||||||||
Fiserv, Inc. (IT Svs.) | (a) | 16,028 | 1,461,113 | |||||||
Intel Corp. (Semiconductors & Equip.) | 182,845 | 8,752,790 | ||||||||
Intuit, Inc. (Software) | 10,588 | 2,766,962 | ||||||||
KLA-Tencor Corp. (Semiconductors & Equip.) | 6,601 | 780,238 | ||||||||
Lam Research Corp. (Semiconductors & Equip.) | 6,123 | 1,150,144 | ||||||||
Maxim Integrated Products, Inc. (Semiconductors & Equip.) | 11,126 | 665,557 | ||||||||
Microchip Technology, Inc. (Semiconductors & Equip.) | 9,717 | 842,464 | ||||||||
Micron Technology, Inc. (Semiconductors & Equip.) | (a) | 45,198 | 1,744,191 | |||||||
| 74 | (continued) |
| Ohio National Fund, Inc. | ON Nasdaq-100® Index Portfolio (Continued) |
Schedule of Investments | June 30, 2019 (Unaudited) | |
Common Stocks (Continued) | Shares | Value | ||||||||
INFORMATION TECHNOLOGY (continued) |
| |||||||||
Microsoft Corp. (Software) | 281,996 | $ | 37,776,185 | |||||||
NetApp, Inc. (Tech. Hardware, Storage & Periph.) | 10,087 | 622,368 | ||||||||
NVIDIA Corp. (Semiconductors & Equip.) | 24,872 | 4,084,729 | ||||||||
NXP Semiconductors N.V. (Semiconductors & Equip.) | 13,425 | 1,310,414 | ||||||||
Paychex, Inc. (IT Svs.) | 14,678 | 1,207,853 | ||||||||
PayPal Holdings, Inc. (IT Svs.) | (a) | 47,985 | 5,492,363 | |||||||
QUALCOMM, Inc. (Semiconductors & Equip.). | 49,650 | 3,776,876 | ||||||||
Skyworks Solutions, Inc. (Semiconductors & Equip.) | 7,053 | 544,985 | ||||||||
Symantec Corp. (Software) | 25,248 | 549,396 | ||||||||
Synopsys, Inc. (Software) | (a) | 6,122 | 787,840 | |||||||
Texas Instruments, Inc. (Semiconductors & Equip.) | 38,317 | 4,397,259 | ||||||||
VeriSign, Inc. (IT Svs.) | (a) | 4,868 | 1,018,191 | |||||||
Western Digital Corp. (Tech. Hardware, Storage & Periph.) | 11,966 | 568,983 | ||||||||
Workday, Inc. Class A (Software) | (a) | 6,616 | 1,360,117 | |||||||
Xilinx, Inc. (Semiconductors & Equip.) | 10,370 | 1,222,830 | ||||||||
|
| |||||||||
| 149,812,203 | ||||||||||
|
| |||||||||
UTILITIES – 0.4% | ||||||||||
Xcel Energy, Inc. (Electric Utilities) | 21,020 | 1,250,480 | ||||||||
|
| |||||||||
Total Common Stocks | $ | 336,776,396 | ||||||||
|
| |||||||||
| U.S. Treasury Obligations – 0.1% | Rate | Maturity | Face Amount | Value | ||||||||||||
U.S. Treasury Bill | 0.000% | 09/12/2019 | $200,000 | $ | 199,162 | |||||||||||
|
| |||||||||||||||
| Total U.S. Treasury Obligations (Cost $199,013) |
| $ | 199,162 | |||||||||||||
|
| |||||||||||||||
| Money Market Funds – 0.2% | Shares | Value | ||||||||||||||
State Street Institutional Liquid Reserves Fund Institutional Class, 2.449% | (b) | 640,942 | $ | 641,070 | ||||||||||||
|
| |||||||||||||||
Total Money Market Funds |
| $ | 641,070 | |||||||||||||
|
| |||||||||||||||
Total Investments – 99.8% |
| (c) | $ | 337,616,628 | ||||||||||||
Other Assets in Excess of |
| (d) | 748,574 | |||||||||||||
|
| |||||||||||||||
Net Assets – 100.0% |
| $ | 338,365,202 | |||||||||||||
|
| |||||||||||||||
Percentages are stated as a percent of net assets.
Abbreviations:
| ADR: | American Depositary Receipts |
Footnotes:
| (a) | Non-income producing security. |
| (b) | Rate represents theseven-day yield at June 30, 2019. |
| (c) | Represents cost for financial reporting purposes, which may differ from cost basis for federal income tax purposes. See also Note 7 of the Notes to Financial Statements. |
| (d) | Includes $60,800 of cash pledged as collateral for the futures contracts outstanding at June 30, 2019. See also the following Schedule of Open Futures Contracts. |
The accompanying notes are an integral part of these financial statements.
Schedule of Open Futures Contracts | June 30, 2019 (Unaudited) | |||||||||||
Description | Number of contracts | Expiration Date | Notional Amount | Value | Unrealized Appreciation (Depreciation) | Variation Margin Receivable (Payable) | ||||||||||
CMEE-miniNasdaq-100 Index - Long | 8 | September 20, 2019 | $1,213,284 | $1,231,000 | $17,716 | $(2,306) | ||||||||||
The accompanying notes are an integral part of these financial statements.
75
| Ohio National Fund, Inc. | ON BlackRock Advantage Large Cap Core Portfolio (Unaudited) |
Objective/Strategy |
The ON BlackRock Advantage Large Cap Core Portfolio(formerly the ON Bristol Portfolio)seeks long-term growth of capital by investing, under normal circumstances, at least 80% of its net assets in common stocks of the 1,000 largest publicly traded U.S. companies in terms of market capitalization.
Performance as of June 30, 2019 | ||||
Average Annual returns | ||||
One year | 0.36 | % | ||
Five years | 9.38 | % | ||
Ten years | 12.98 | % |
Past performance does not guarantee future results. The performance data quoted represents past performance and current returns may be lower or higher. Total return figures include change in share price and reinvestment of dividends and capital gains. The investment return and principal value will fluctuate so that an investor’s shares, when redeemed, may be worth more or less than the original cost. To obtain performance information up to the most recent month end, call toll-free1-877-781-6392.
The Portfolio is not open to direct retail investment. Beneficial interest in shares is obtained solely by purchase of variable life insurance policies and variable annuity contracts. Actual performance results for variable annuity and variable universal life contracts will be lower due to contract charges. Consult your contract for applicable charges.
Total expense ratio is 0.71% per the Fund’s prospectus dated May 1, 2019. Additional information pertaining to the Portfolio’s expense ratio as of June 30, 2019 can be found in the Portfolio’s Financial Highlights.
Comments fromSub-Adviser |
Q. How did the Portfolio perform in comparison to its benchmark during the reporting period?
A.For thesix-month period ended June 30, 2019, the ON BlackRock Advantage Large Cap Core Portfolio returned 22.99% versus 18.54% for its benchmark, the S&P 500 Index.
Effective February 1, 2019, BlackRock Investment Management, LLC (“BlackRock”) replaced the Portfolio’s previoussub-adviser, Suffolk Capital Management, LLC (“Suffolk”). In conjunction with the change insub-adviser, the name of the Portfolio was changed from ON Bristol Portfolio to ON BlackRock Advantage Large Cap Core Portfolio. The Portfolio’s benchmark was unchanged.
For the period from January 1, 2019 to January 31, 2019 (the “firstone-month period”), the Portfolio was known as the ON Bristol Portfolio, and wassub-advised by Suffolk. During the firstone-month period, the Portfolio returned 13.51% versus 8.01% for the S&P 500 Index.
For the period from February 1, 2019 to June 30, 2019 (the “latter five-month period”), the Portfolio wassub-advised by BlackRock. During this period, the Portfolio returned 8.35% versus 9.74% for the S&P 500 Index.
Q. Were there specific market conditions, investment strategies, or techniques that materially affected the Portfolio’s benchmark-relative performance during the reporting period?
A. Suffolk:For the firstone-month period, there were no market conditions, investment strategies, or techniques that materially affected the Portfolio’s benchmark relative performance.
A. BlackRock:For the latter five-month period, two select months were the primary drivers of relative returns. The Portfolio outperformed its benchmark significantly in May, as the market declined, due to increased
trade tensions and slowing global growth. One of the core drivers of the outperformance was a sentiment-based insight that evaluates the sentiment of informed bond investors. The signal provides an alternative lens into company quality and often exhibits defensive properties, which was particularly beneficial in May, as investors sought these characteristics. Several fundamental signals, particularly alternative quality measures, bolstered relative returns, as investors searched for sustainable businesses that had the potential for growth amidst ongoing economic uncertainty.
In contrast, the Portfolio struggled in June, amidst a strong market rally driven largely by geopolitical developments and central bank policy. The market rally was sparked by a sharp reversal, as a constructive meeting between the U.S. and China at the G20 Osaka Summit led to a decrease in trade tensions, while the Federal Reserve’s dovish rhetoric increased expectations of more supportive central bank policy. The erratic nature of global trade discussions, combined with the divergence of central bank policy globally, led to an environment in which the Portfolio’s macro thematic signals struggled over the course of the month. Additionally, certain insights that exhibit more defensive properties hindered performance, as the market experienced a sharp rally following the reversal at the beginning of the month.
Q. How did sector allocation and security selection each impact the Portfolio’s performance relative to its benchmark? For sector allocation, were there any factors that impacted the benchmark’s performance more significantly than the Portfolio’s performance? For security selection, was there anything specific regarding the Portfolio’s strategy that caused deviation from the benchmark?
A. Suffolk:For the firstone-month period, both sector allocation and stock selection contributed to relative outperformance. Stock selection in Health Care and Consumer Discretionary contributed to relative outperformance, while stock selection in Communication Services detracted from relative performance.
A. BlackRock:The portfolio management team targets a generally sector-neutral approach and seeks to derive the majority of its alpha from security selection. That being said, a modest underweight to the Energy sector contributed slightly to performance during the latter five-month period, as the sector underperformed the broader market. On the other hand, a modest underweight to Communication Services companies detracted slightly. As expected though, the majority of relative performance was driven by security selection decisions. Stock selection was particularly positive in the Health Care sector, especially among pharmaceuticals companies, as well as health care providers and services companies. Selection was also positive in the Consumer Staples sector, particularly among food and staples retailers, and in the Utilities sector. In contrast, selection within the Energy sector, in both the oil, gas and consumable fuels industry and the energy equipment and services industry, was a notable detractor from relative performance. Stock selection in the Information Technology sector, especially among software companies, and in the Communication Services sector hindered relative returns as well.(1)
Q. Which holdings contributed the most to, and detracted the most from, the Portfolio’s benchmark-relative performance?
A. Suffolk:Top contributors for the firstone-month period included Sage Therapeutics, Inc., as it announced positive results for a Phase 3 trial in postpartum depression. Celgene Corp. contributed, as it was acquired by Bristol-Myers Squibb Co. Aerie Pharmaceuticals, Inc., another top contributor, expects to achieve its revenue target for Rhopressa, its new glaucoma drug, which is favorable compared to concerns of inventory buildup over the past several months. Additionally, the company announced positive pilot study results for Rhopressa in Japan, a significant new market opportunity.
| 76 | (continued) |
| Ohio National Fund, Inc. | ON BlackRock Advantage Large Cap Core Portfolio (Unaudited) (Continued) |
Alphabet, Inc. Class C detracted most from relative performance for the firstone-month period, as there were concerns Google would lose its share in online advertising to Amazon.com, Inc. (“Amazon”) and might withdraw its news service in Europe should a “snippet” tax be implemented. An underweight to Apple, Inc., due to expected phone pricing cuts, was another relative detractor. A third relative detractor was Amazon, as the Portfolio was underweight due to concerns of weaker U.S.e-commerce share gain and belief that increased regulation ofe-commerce in India would impact growth.
A. BlackRock:From a security standpoint, the top individual contributor for the latter five-month period was the Portfolio’s overweight in Target Corp. (“Target”). Target’s stock outperformed the broader market following a very strong first-quarter earnings report that included better than expected results for both revenue and earnings, as well as healthy same-store sales growth. More conveniente-commerce options, as well as improvements insame-day fulfillment services, supported by its Shipt business, drove digital sales growth and sparked investor confidence in the retailer’s ability to compete with other retail giants. The Portfolio’s underweight position in 3M Co. was also positive, especially in April, as the share price tumbled. During this time, the company’s management slashed its profit outlook and announced that operating income decreased across all five of its major business units. High raw material prices, weak electronics and automotive markets, and headwinds from China caused the company to miss on earnings and forced it to cut 2,000 jobs. The next largest contribution came from the Portfolio’s overweight in PepsiCo, Inc. The stock surged on news of the company’s first quarter earnings and revenue beats, along with the fact that the company experienced 5.2% organic revenue growth. Investors gained confidence, as the company has been increasingly diversifying its revenue drivers, including significant growth of its snack business, increased popularity of Bubly (its sparkling water) and healthy revenue growth internationally.(1)
In contrast, the top individual detractor was the Portfolio’s overweight position in The Charles Schwab Corp. The company struggled amidst increased pricing pressure that some analysts believe could act as a headwind and stifle company revenue growth going forward. The Portfolio’s overweight to Halliburton Co. was also a top detractor from performance, as there was significant downward pricing pressure on oilfield servicing and fracking throughout the latter five-month period, due to depressed oil prices and exploration and production activity. This pricing pressure and reduced activity caused company share prices to slump, despite some encouraging data points emerging from the company’s first quarter earnings. Lastly, the Portfolio’s underweight in Microsoft Corp. was a drag on relative performance, as those shares outperformed the broader market. The Company’s rapidly growing cloud computing business, Azure, was the primary driver of returns, as cloud-service revenue grew 73% year-over-year in the first quarter. This growth significantly topped analyst expectations, and resulted in actual company revenues and earnings in excess of estimates, with revenues growing 14% year-over-year.(1)
Q. How did the Portfolio’s use of derivative instruments and initial public offerings (IPOs), if any, impact performance?
A. Suffolk:The Portfolio did not hold any derivatives or participate in any IPOs during the firstone-month period.
A. BlackRock:Pursuant to the Portfolio’s investment strategy, futures contracts were used in order to equitize cash and prevent a cash drag on performance during the latter five-month period. The futures did not meaningfully impact performance, however, due to their index characteristics and size in relation to the Portfolio’s net assets.(1)
| (1) | The Portfolio’s composition is subject to change. Holdings and weightings are as of June 30, 2019. |
Change in Value of $10,000 Investment |
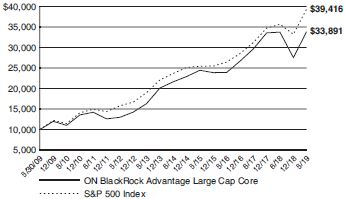
Hypothetical illustration based on past performance. Future performance will vary. The Portfolio’s returns reflect reinvested dividends. The Portfolio’s holdings may differ significantly from the securities in the index. The index is unmanaged and therefore does not reflect the cost of portfolio management and accounting.
The S&P 500 Index is a capitalization-weighted index designed to measure performance of the broad domestic economy through changes in the aggregate market value of 500 stocks representing all major industries. The index presented includes the effects of reinvested dividends.
Past performance is no guarantee of future results. Redemption of fund shares could have tax implications unique to each shareholder.
| 77 | (continued) |
| Ohio National Fund, Inc. | ON BlackRock Advantage Large Cap Core Portfolio (Unaudited) (Continued) |
Portfolio Composition as of June 30, 2019(1) |
| % of Net Assets | ||||
Common Stocks(4) | 98.5 | |||
Money Market Funds and Other Net Assets | 1.5 | |||
|
| |||
| 100.0 | ||||
|
| |||
Top 10 Portfolio Holdings as of June 30, 2019 (1) (2) (3) | ||||
| % of Net Assets | ||||||
1. | Amazon.com, Inc. | 3.7 | ||||
2. | Microsoft Corp. | 3.1 | ||||
3. | JPMorgan Chase & Co. | 2.6 | ||||
4. | Apple, Inc. | 2.5 | ||||
5. | Johnson & Johnson | 2.5 | ||||
6. | Facebook, Inc. Class A | 2.4 | ||||
7. | Berkshire Hathaway, Inc. Class B | 2.3 | ||||
8. | Merck & Co., Inc. | 1.9 | ||||
9. | Verizon Communications, Inc. | 1.9 | ||||
10. | Medtronic PLC | 1.6 | ||||
| (1) | Composition of Portfolio subject to change. |
| (2) | Short-term investments have been excluded from the list of Top 10 Portfolio Holdings. |
| (3) | Top 10 Portfolio Holdings is presented at an individual security level. Total investment exposure by issuer may be higher. |
| (4) | Sectors (Common Stocks): |
| % of Net Assets | ||||
Information Technology | 21.2 | |||
Health Care | 14.1 | |||
Financials | 13.4 | |||
Industrials | 9.8 | |||
Consumer Discretionary | 9.6 | |||
Communication Services | 9.5 | |||
Consumer Staples | 6.7 | |||
Energy | 4.4 | |||
Utilities | 3.8 | |||
Real Estate | 3.3 | |||
Materials | 2.7 | |||
|
| |||
| 98.5 | ||||
|
| |||
78
| Ohio National Fund, Inc. | ON BlackRock Advantage Large Cap Core Portfolio |
Schedule of Investments | June 30, 2019 (Unaudited) | |
| Common Stocks – 98.5% | Shares | Value | ||||||||
COMMUNICATION SERVICES – 9.5% | ||||||||||
Activision Blizzard, Inc. (Entertainment) | 1,505 | $ | 71,036 | |||||||
Alphabet, Inc. Class A (Interactive Media & Svs.) | (a) | 497 | 538,152 | |||||||
Alphabet, Inc. Class C (Interactive Media & Svs.) | (a) | 1,243 | 1,343,571 | |||||||
CBS Corp. Class B (Media) | 848 | 42,315 | ||||||||
Comcast Corp. Class A (Media) | 28,358 | 1,198,976 | ||||||||
Facebook, Inc. Class A (Interactive Media & Svs.) | (a) | 12,597 | 2,431,221 | |||||||
Fox Corp. Class A (Media) | 1,879 | 68,847 | ||||||||
Fox Corp. Class B (Media) | 2,924 | 106,814 | ||||||||
Interpublic Group of Cos., Inc. /The (Media) | 49,834 | 1,125,750 | ||||||||
Netflix, Inc. (Entertainment) | (a) | 978 | 359,239 | |||||||
Omnicom Group, Inc. (Media) | 114 | 9,342 | ||||||||
Pinterest, Inc. Class A (Interactive Media & Svs.) | (a) | 2,685 | 73,086 | |||||||
Sinclair Broadcast Group, Inc. Class A (Media) | 1,423 | 76,315 | ||||||||
Take-Two Interactive Software, Inc. (Entertainment) | (a) | 101 | 11,467 | |||||||
Verizon Communications, Inc. (Diversified Telecom. Svs.) | 33,154 | 1,894,088 | ||||||||
Viacom, Inc. Class B (Entertainment) | 7,113 | 212,465 | ||||||||
|
| |||||||||
| 9,562,684 | ||||||||||
|
| |||||||||
CONSUMER DISCRETIONARY – 9.6% | ||||||||||
Advance Auto Parts, Inc. (Specialty Retail) | 1,582 | 243,849 | ||||||||
Alibaba Group Holding Ltd. – ADR (Internet & Direct Marketing Retail) | (a) | 2,811 | 476,324 | |||||||
Amazon.com, Inc. (Internet & Direct Marketing Retail) | (a) | 1,931 | 3,656,599 | |||||||
AutoZone, Inc. (Specialty Retail) | (a) | 252 | 277,066 | |||||||
Chipotle Mexican Grill, Inc. (Hotels, Restaurants & Leisure) | (a) | 37 | 27,117 | |||||||
Dana, Inc. (Auto Components) | 665 | 13,260 | ||||||||
Darden Restaurants, Inc. (Hotels, Restaurants & Leisure) | 9,195 | 1,119,307 | ||||||||
Domino’s Pizza, Inc. (Hotels, Restaurants & Leisure) | 622 | 173,090 | ||||||||
Extended Stay America, Inc. (Hotels, Restaurants & Leisure) | 30,840 | 520,888 | ||||||||
frontdoor, Inc. (Diversified Consumer Svs.) | (a) | 1,438 | 62,625 | |||||||
Home Depot, Inc. / The (Specialty Retail) | 372 | 77,365 | ||||||||
Las Vegas Sands Corp. (Hotels, Restaurants & Leisure) | 10,363 | 612,350 | ||||||||
Lululemon Athletica, Inc. (Textiles, Apparel & Luxury Goods) | .(a) | 1,851 | 333,569 | |||||||
McDonald’s Corp. (Hotels, Restaurants & Leisure) | 2,578 | 535,347 | ||||||||
NIKE, Inc. Class B (Textiles, Apparel & Luxury Goods) | 7,463 | 626,519 | ||||||||
O’Reilly Automotive, Inc. (Specialty Retail) | (a) | 305 | 112,643 | |||||||
Royal Caribbean Cruises Ltd. (Hotels, Restaurants & Leisure) | 1,862 | 225,693 | ||||||||
Target Corp. (Multiline Retail) | 4,712 | 408,106 | ||||||||
TJX Cos., Inc. /The (Specialty Retail) | 375 | 19,830 | ||||||||
Ulta Beauty, Inc. (Specialty Retail) | (a) | 175 | 60,706 | |||||||
|
| |||||||||
| 9,582,253 | ||||||||||
|
| |||||||||
CONSUMER STAPLES – 6.7% | ||||||||||
Archer-Daniels-Midland Co. (Food Products) | 9,510 | 388,008 | ||||||||
Church & Dwight Co., Inc. (Household Products) | 5,951 | 434,780 | ||||||||
Colgate-Palmolive Co. (Household Products) | 2,138 | 153,230 | ||||||||
Costco Wholesale Corp. (Food & Staples Retailing) | 1,316 | 347,766 | ||||||||
Estee Lauder Cos., Inc. / The Class A (Personal Products) | 1,154 | 211,309 | ||||||||
General Mills, Inc. (Food Products) | 17,206 | 903,659 | ||||||||
Hershey Co. / The (Food Products) | 3,962 | 531,027 | ||||||||
| Common Stocks (Continued) | Shares | Value | ||||||||
CONSUMER STAPLES (continued) | ||||||||||
J.M. Smucker Co. / The (Food Products) | 1,482 | $ | 170,712 | |||||||
McCormick & Co., Inc. (Food Products) | 491 | 76,110 | ||||||||
Monster Beverage Corp. (Beverages) | (a) | 3,048 | 194,554 | |||||||
PepsiCo, Inc. (Beverages) | 8,686 | 1,138,995 | ||||||||
Performance Food Group Co. (Food & Staples Retailing) | (a) | 5,189 | 207,716 | |||||||
Philip Morris International, Inc. (Tobacco) | 6,056 | 475,578 | ||||||||
Procter & Gamble Co. / The (Household Products) | 6,950 | 762,067 | ||||||||
Walmart, Inc. (Food & Staples Retailing) | 6,559 | 724,704 | ||||||||
|
| |||||||||
| 6,720,215 | ||||||||||
|
| |||||||||
ENERGY – 4.4% | ||||||||||
Antero Midstream Corp. (Oil, Gas & Consumable Fuels) | 15,702 | 179,945 | ||||||||
Cabot Oil & Gas Corp. (Oil, Gas & Consumable Fuels) | 2,601 | 59,719 | ||||||||
Chevron Corp. (Oil, Gas & Consumable Fuels) | 9,344 | 1,162,767 | ||||||||
ConocoPhillips (Oil, Gas & Consumable Fuels) | 22,970 | 1,401,170 | ||||||||
EOG Resources, Inc. (Oil, Gas & Consumable Fuels) | 4,234 | 394,440 | ||||||||
Exxon Mobil Corp. (Oil, Gas & Consumable Fuels) | 3,608 | 276,481 | ||||||||
Halliburton Co. (Energy Equip. & Svs.) | 20,261 | 460,735 | ||||||||
Phillips 66 (Oil, Gas & Consumable Fuels) | 2,032 | 190,073 | ||||||||
Valero Energy Corp. (Oil, Gas & Consumable Fuels) | 2,585 | 221,302 | ||||||||
Williams Cos., Inc. / The (Oil, Gas & Consumable Fuels) | 3,517 | 98,617 | ||||||||
|
| |||||||||
| 4,445,249 | ||||||||||
|
| |||||||||
FINANCIALS – 13.4% | ||||||||||
Allstate Corp. / The (Insurance) | 5,577 | 567,125 | ||||||||
American Express Co. (Consumer Finance) | 10,171 | 1,255,508 | ||||||||
Arthur J. Gallagher & Co. (Insurance) | 2,942 | 257,690 | ||||||||
Bank of America Corp. (Banks) | 16,643 | 482,647 | ||||||||
Berkshire Hathaway, Inc. Class B (Diversified Financial Svs.) | (a) | 10,644 | 2,268,982 | |||||||
Charles Schwab Corp. / The (Capital Markets) | 32,338 | 1,299,664 | ||||||||
Cincinnati Financial Corp. (Insurance) | 1,350 | 139,955 | ||||||||
Citizens Financial Group, Inc. (Banks) | 25,692 | 908,469 | ||||||||
Discover Financial Services (Consumer Finance) | 2,996 | 232,460 | ||||||||
First American Financial Corp. (Insurance) | 4,381 | 235,260 | ||||||||
First Republic Bank (Banks) | 2,348 | 229,282 | ||||||||
Franklin Resources, Inc. (Capital Markets) | 473 | 16,460 | ||||||||
JPMorgan Chase & Co. (Banks) | 23,015 | 2,573,077 | ||||||||
Loews Corp. (Insurance) | 4,573 | 250,006 | ||||||||
MetLife, Inc. (Insurance) | 3,667 | 182,140 | ||||||||
Morgan Stanley (Capital Markets) | 7,125 | 312,146 | ||||||||
Prudential Financial, Inc. (Insurance) | 12,633 | 1,275,933 | ||||||||
TD Ameritrade Holding Corp. (Capital Markets). | 5,274 | 263,278 | ||||||||
Travelers Cos., Inc. / The (Insurance) | 466 | 69,676 | ||||||||
Wells Fargo & Co. (Banks) | 12,520 | 592,446 | ||||||||
Western Alliance Bancorp (Banks) | (a) | 735 | 32,869 | |||||||
|
| |||||||||
| 13,445,073 | ||||||||||
|
| |||||||||
HEALTH CARE – 14.1% | ||||||||||
AbbVie, Inc. (Biotechnology) | 12,468 | 906,673 | ||||||||
AmerisourceBergen Corp. (Health Care Providers & Svs.) | 2,393 | 204,027 | ||||||||
Amgen, Inc. (Biotechnology) | 5,944 | 1,095,360 | ||||||||
Anthem, Inc. (Health Care Providers & Svs.) | 1,269 | 358,124 | ||||||||
Bristol-Myers Squibb Co. (Pharmaceuticals) | 13,312 | 603,699 | ||||||||
Celgene Corp. (Biotechnology) | (a) | 2,877 | 265,950 | |||||||
Cigna Corp. (Health Care Providers & Svs.) | 422 | 66,486 | ||||||||
CVS Health Corp. (Health Care Providers & Svs.) | 4,906 | 267,328 | ||||||||
Danaher Corp. (Health Care Equip. & Supplies) | 998 | 142,634 | ||||||||
Genomic Health, Inc. (Biotechnology) | (a) | 46 | 2,676 | |||||||
| 79 | (continued) |
| Ohio National Fund, Inc. | ON BlackRock Advantage Large Cap Core Portfolio (Continued) |
Schedule of Investments | June 30, 2019 (Unaudited) | |
| Common Stocks (Continued) | Shares | Value | ||||||||
HEALTH CARE (continued) | ||||||||||
Gilead Sciences, Inc. (Biotechnology) | 20,617 | $ | 1,392,885 | |||||||
Johnson & Johnson (Pharmaceuticals) | 18,245 | 2,541,164 | ||||||||
McKesson Corp. (Health Care Providers & Svs.) | 657 | 88,294 | ||||||||
Medtronic PLC (Health Care Equip. & Supplies) | 16,351 | 1,592,424 | ||||||||
Merck & Co., Inc. (Pharmaceuticals) | 23,101 | 1,937,019 | ||||||||
Pfizer, Inc. (Pharmaceuticals) | 419 | 18,151 | ||||||||
Regeneron Pharmaceuticals, Inc. (Biotechnology) | (a) | 752 | 235,376 | |||||||
Stryker Corp. (Health Care Equip. & Supplies) | 3,136 | 644,699 | ||||||||
UnitedHealth Group, Inc. (Health Care Providers & Svs.) | 5,294 | 1,291,789 | ||||||||
Veeva Systems, Inc. Class A (Health Care Technology) | (a) | 2,599 | 421,324 | |||||||
Vertex Pharmaceuticals, Inc. (Biotechnology) | (a) | 501 | 91,873 | |||||||
|
| |||||||||
| 14,167,955 | ||||||||||
|
| |||||||||
INDUSTRIALS – 9.8% | ||||||||||
ADT, Inc. (Commercial Svs. & Supplies) | 3,177 | 19,443 | ||||||||
Allegion PLC (Building Products) | 5,755 | 636,215 | ||||||||
CoStar Group, Inc. (Professional Svs.) | (a) | 422 | 233,813 | |||||||
Crane Co. (Machinery) | 12,858 | 1,072,872 | ||||||||
Cummins, Inc. (Machinery) | 54 | 9,252 | ||||||||
Curtiss-Wright Corp. (Aerospace & Defense) | 867 | 110,222 | ||||||||
Generac Holdings, Inc. (Electrical Equip.) | (a) | 1,063 | 73,783 | |||||||
Honeywell International, Inc. (Industrial Conglomerates) | 5,822 | 1,016,463 | ||||||||
Hubbell, Inc. (Electrical Equip.) | 1,415 | 184,516 | ||||||||
IDEX Corp. (Machinery) | 150 | 25,821 | ||||||||
Insperity, Inc. (Professional Svs.) | 6,909 | 843,865 | ||||||||
L3Harris Technologies, Inc. (Aerospace & Defense) | 3,428 | 648,338 | ||||||||
Landstar System, Inc. (Road & Rail) | 582 | 62,850 | ||||||||
Lockheed Martin Corp. (Aerospace & Defense) | 3,248 | 1,180,778 | ||||||||
Lyft, Inc. Class A (Road & Rail) | (a) | 2,923 | 192,070 | |||||||
Oshkosh Corp. (Machinery) | 2,074 | 173,158 | ||||||||
PACCAR, Inc. (Machinery) | 16,690 | 1,196,006 | ||||||||
Raytheon Co. (Aerospace & Defense) | 1,175 | 204,309 | ||||||||
Rockwell Automation, Inc. (Electrical Equip.) | 5,271 | 863,548 | ||||||||
Roper Technologies, Inc. (Industrial Conglomerates) | 80 | 29,301 | ||||||||
Ryder System, Inc. (Road & Rail) | 493 | 28,742 | ||||||||
Snap-on, Inc. (Machinery) | 3,144 | 520,772 | ||||||||
TriNet Group, Inc. (Professional Svs.) | (a) | 1,066 | 72,275 | |||||||
Uber Technologies, Inc. (Road & Rail) | (a) | 5,123 | 237,605 | |||||||
Waste Connections, Inc. (Commercial Svs. & Supplies) | 726 | 69,391 | ||||||||
Waste Management, Inc. (Commercial Svs. & Supplies) | 643 | 74,183 | ||||||||
|
| |||||||||
| 9,779,591 | ||||||||||
|
| |||||||||
INFORMATION TECHNOLOGY – 21.2% | ||||||||||
Adobe, Inc. (Software) | (a) | 4,414 | 1,300,585 | |||||||
Amdocs Ltd. (IT Svs.) | 1,286 | 79,848 | ||||||||
Analog Devices, Inc. (Semiconductors & Equip.) | 932 | 105,195 | ||||||||
Apple, Inc. (Tech. Hardware, Storage & Periph.) | 12,856 | 2,544,459 | ||||||||
Automatic Data Processing, Inc. (IT Svs.) | 7,138 | 1,180,126 | ||||||||
Broadcom, Inc. (Semiconductors & Equip.) | 1,144 | 329,312 | ||||||||
CDW Corp. (Electronic Equip., Instr. & Comp.) | 2,560 | 284,160 | ||||||||
Ciena Corp. (Communications Equip.) | (a) | 1,824 | 75,021 | |||||||
Cirrus Logic, Inc. (Semiconductors & Equip.) | (a) | 2,441 | 106,672 | |||||||
Cisco Systems, Inc. (Communications Equip.) | 27,002 | 1,477,819 | ||||||||
Dell Technologies, Inc. Class C (Tech. Hardware, Storage & Periph.) | (a) | 5,769 | 293,065 | |||||||
Fidelity National Information Services, Inc. (IT Svs.) | 7,047 | 864,526 | ||||||||
GoDaddy, Inc. Class A (IT Svs.) | (a) | 8,871 | 622,301 | |||||||
| Common Stocks (Continued) | Shares | Value | ||||||||
INFORMATION TECHNOLOGY (continued) |
| |||||||||
HP, Inc. (Tech. Hardware, Storage & Periph.) | 21,425 | $ | 445,426 | |||||||
Intel Corp. (Semiconductors & Equip.) | 15,168 | 726,092 | ||||||||
International Business Machines Corp. (IT Svs.) | 2,780 | 383,362 | ||||||||
Intuit, Inc. (Software) | 2,009 | 525,012 | ||||||||
Mastercard, Inc. Class A (IT Svs.) | 396 | 104,754 | ||||||||
Microsoft Corp. (Software) | 22,962 | 3,075,989 | ||||||||
National Instruments Corp. (Electronic Equip., Instr. & Comp.) | 13,195 | 554,058 | ||||||||
NVIDIA Corp. (Semiconductors & Equip.) | 396 | 65,035 | ||||||||
Oracle Corp. (Software) | 3,975 | 226,456 | ||||||||
Paychex, Inc. (IT Svs.) | 13,645 | 1,122,847 | ||||||||
QUALCOMM, Inc. (Semiconductors & Equip.) | 179 | 13,617 | ||||||||
salesforce.com, Inc. (Software) | (a) | 10,129 | 1,536,873 | |||||||
ServiceNow, Inc. (Software) | (a) | 2,116 | 580,990 | |||||||
Square, Inc. Class A (IT Svs.) | (a) | 1,144 | 82,974 | |||||||
Texas Instruments, Inc. (Semiconductors & Equip.) | 4,723 | 542,011 | ||||||||
VeriSign, Inc. (IT Svs.) | (a) | 239 | 49,989 | |||||||
Visa, Inc. (IT Svs.) | 8,472 | 1,470,316 | ||||||||
Workday, Inc. Class A (Software) | (a) | 244 | 50,162 | |||||||
Xilinx, Inc. (Semiconductors & Equip.) | 3,534 | 416,729 | ||||||||
|
| |||||||||
| 21,235,781 | ||||||||||
|
| |||||||||
MATERIALS – 2.7% | ||||||||||
Air Products & Chemicals, Inc. (Chemicals) | 3,404 | 770,564 | ||||||||
Dow, Inc. (Chemicals) | 9,889 | 487,627 | ||||||||
Ecolab, Inc. (Chemicals) | 928 | 183,224 | ||||||||
LyondellBasell Industries N.V. Class A (Chemicals) | 4,111 | 354,080 | ||||||||
Westrock Co. (Containers & Packaging) | 25,106 | 915,616 | ||||||||
|
| |||||||||
| 2,711,111 | ||||||||||
|
| |||||||||
REAL ESTATE – 3.3% | ||||||||||
Equity LifeStyle Properties, Inc. (Equity REIT) | 6,375 | 773,542 | ||||||||
Park Hotels & Resorts, Inc. (Equity REIT) | 17,892 | 493,104 | ||||||||
Prologis, Inc. (Equity REIT) | 11,729 | 939,493 | ||||||||
Ryman Hospitality Properties, Inc. (Equity REIT) | 1,538 | 124,716 | ||||||||
Simon Property Group, Inc. (Equity REIT) | 6,430 | 1,027,257 | ||||||||
|
| |||||||||
| 3,358,112 | ||||||||||
|
| |||||||||
UTILITIES – 3.8% | ||||||||||
Alliant Energy Corp. (Electric Utilities) | 671 | 32,933 | ||||||||
American Water Works Co., Inc. (Water Utilities) | 9,992 | 1,159,072 | ||||||||
Avista Corp. (Multi-Utilities) | 2,725 | 121,535 | ||||||||
Black Hills Corp. (Multi-Utilities) | 3,501 | 273,673 | ||||||||
Consolidated Edison, Inc. (Multi-Utilities) | 4,071 | 356,945 | ||||||||
DTE Energy Co. (Multi-Utilities) | 7,069 | 903,984 | ||||||||
Evergy, Inc. (Electric Utilities) | 7,665 | 461,050 | ||||||||
IDACORP, Inc. (Electric Utilities) | 1,096 | 110,071 | ||||||||
Southwest Gas Holdings, Inc. (Gas Utilities) | 861 | 77,163 | ||||||||
Xcel Energy, Inc. (Electric Utilities) | 4,485 | 266,812 | ||||||||
|
| |||||||||
| 3,763,238 | ||||||||||
|
| |||||||||
Total Common Stocks | $ | 98,771,262 | ||||||||
|
| |||||||||
| Money Market Funds – 1.4% | Shares | Value | ||||||||
State Street Institutional Liquid Reserves Fund Institutional Class, 2.449% | (b) | 1,406,065 | $ | 1,406,346 | ||||||
State Street Institutional U.S. Government Money Market Fund Institutional Class, 2.310% | (b) | 6,500 | 6,500 | |||||||
|
| |||||||||
Total Money Market Funds | $ | 1,412,846 | ||||||||
|
| |||||||||
Total Investments – 99.9% | (c) | $ | 100,184,108 | |||||||
Other Assets in Excess of | (d) | 68,685 | ||||||||
|
| |||||||||
Net Assets – 100.0% | $ | 100,252,793 | ||||||||
|
| |||||||||
| 80 | (continued) |
| Ohio National Fund, Inc. | ON BlackRock Advantage Large Cap Core Portfolio (Continued) |
Schedule of Investments | June 30, 2019 (Unaudited) | |
Percentages are stated as a percent of net assets.
Abbreviations:
| ADR: | American Depositary Receipts |
Footnotes:
| (a) | Non-income producing security. |
| (b) | Rate represents theseven-day yield at June 30, 2019. |
| (c) | Represents cost for financial reporting purposes, which may differ from cost basis for federal income tax purposes. See also Note 7 of the Notes to Financial Statements. |
| (d) | Includes $63,000 of cash pledged as collateral for the futures contracts outstanding at June 30, 2019. See also the following Schedule of Open Futures Contracts. |
The accompanying notes are an integral part of these financial statements.
Schedule of Open Futures Contracts | June 30, 2019 (Unaudited) | |||||||||||
Description | Number of contracts | Expiration Date | Notional Amount | Value | Unrealized Appreciation (Depreciation) | Variation Margin Receivable (Payable) | ||||||||||
CMEE-mini S&P 500 Index - Long | 10 | September 20, 2019 | $ | 1,452,224 | $ | 1,472,100 | $19,876 | $6,650 | ||||||||
The accompanying notes are an integral part of these financial statements.
81
| Ohio National Fund, Inc. | ON BlackRock Advantage Small Cap Growth Portfolio (Unaudited) |
Objective/Strategy |
The ON BlackRock Advantage Small Cap Growth Portfolio(formerly the ON Bryton Growth Portfolio)seeks long-term growth of capital by investing, under normal circumstances, at least 80% of its net assets in stocks of companies with a market capitalization at the time of investment that is no greater than the largest market capitalization of a company in the Russell 2000 Index for the previous 12 months.
Performance as of June 30, 2019 | ||||
Average Annual returns | ||||
One year | 1.15 | % | ||
Five years | 7.30 | % | ||
Ten years | 12.10 | % |
Past performance does not guarantee future results. The performance data quoted represents past performance and current returns may be lower or higher. Total return figures include change in share price and reinvestment of dividends and capital gains. The investment return and principal value will fluctuate so that an investor’s shares, when redeemed, may be worth more or less than the original cost. To obtain performance information up to the most recent month end, call toll-free1-877-781-6392.
The Portfolio is not open to direct retail investment. Beneficial interest in shares is obtained solely by purchase of variable life insurance policies and variable annuity contracts. Actual performance results for variable annuity and variable universal life contracts will be lower due to contract charges. Consult your contract for applicable charges.
Total expense ratio is 0.98% per the Fund’s prospectus dated May 1, 2019. Additional information pertaining to the Portfolio’s expense ratio as of June 30, 2019 can be found in the Portfolio’s Financial Highlights.
Comments fromSub-Adviser |
Q. How did the Portfolio perform in comparison to its benchmark during the reporting period?
A.For thesix-month period ended June 30, 2019, the ON BlackRock Advantage Small Cap Growth Portfolio returned 22.95% versus 20.36% for its benchmark, the Russell 2000 Growth Index.
Effective February 1, 2019, BlackRock Investment Management, LLC (“BlackRock”) replaced the Portfolio’s previoussub-adviser, Suffolk Capital Management, LLC (“Suffolk”). In conjunction with the change insub-adviser, the name of the Portfolio was changed from ON Bryton Growth Portfolio to ON BlackRock Advantage Small Cap Growth Portfolio. The Portfolio’s benchmark was unchanged.
For the period from January 1, 2019 to January 31, 2019 (the “firstone-month period”), the Portfolio was known as the ON Bryton Growth Portfolio, and wassub-advised by Suffolk. During the firstone-month period, the Portfolio returned 12.96% versus 11.55% for the Russell 2000 Growth Index
For the period from February 1, 2019 to June 30, 2019 (the “latter five-month period”), the Portfolio wassub-advised by BlackRock. During this period, the Portfolio returned 8.85% versus 7.90% for the Russell 2000 Growth Index.
Q. Were there specific market conditions, investment strategies, or techniques that materially affected the Portfolio’s benchmark-relative performance during the reporting period?
A. Suffolk:For the firstone-month period, there were no market conditions, investment strategies, or techniques that materially affected the Portfolio’s benchmark relative performance.
A. BlackRock:For the latter five-month period, two select months were the primary drivers of relative returns. The Portfolio outperformed its benchmark significantly in May, as the market declined, due to increased trade concerns and slowing global growth. One of the core drivers of the outperformance was a quality and risk management signal preferring companies with lower risk profiles, which was unsurprising, given the uncertainty and weakness in the market. The signal often exhibits defensive properties, which was particularly beneficial in May, as investors sought those characteristics. Also positive was an insight that uses alternative data sources to better predict consumer transactions. Though it is a trend-based signal, it provides an alternative lens into company quality, which was beneficial, as investors increasingly searched for quality businesses with strong consumer demand, amidst increasing uncertainty. In this vein, a machine-learned signal, analyzing company fundamentals to predict future sales growth, an additional measure of quality, also contributed.
In contrast, the Portfolio struggled in March, as it gave back the outperformance generated in February. Despite an easing of trade tensions, the Fed’s overly dovish comments during the month sparked growth and broad economic concerns, causing U.S. small cap stocks to retreat. From a relative return standpoint, the Portfolio’s more traditional fundamental insights that seek attractively priced stocks struggled, as investors favored growth companies over value companies, amidst increased economic concerns. Rewarding companies with increases in online job postings, an indication of company expansion and future growth potential, was also detrimental to relative performance, as people became increasingly uncertain about the country’s overall economic health.
Q. How did sector allocation and security selection each impact the Portfolio’s performance relative to its benchmark? For sector allocation, were there any factors that impacted the benchmark’s performance more significantly than the Portfolio’s performance? For security selection, was there anything specific regarding the Portfolio’s strategy that caused deviation from the benchmark?
A. Suffolk:For the firstone-month period, sector allocation and stock selection both contributed positively to relative performance. Stock selection in Information Technology and Materials contributed to relative outperformance, while stock selection in Industrials detracted from relative performance.
A. BlackRock:The portfolio management team targets a generally sector-neutral approach and seeks to derive the majority of its alpha from security selection. That being said, a modest overweight to the Industrials sector contributed slightly to performance for the latter five-month period, as the sector outperformed the broader market. On the other hand, a modest overweight to Consumer Discretionary companies detracted slightly, as the sector underperformed. As expected, the majority of relative performance was driven by security selection decisions. Stock selection was particularly positive in the Consumer Discretionary sector, especially among specialty retailers and internet and direct marketing retailers. Security selection was also very positive in the Industrials sector, particularly among commercial services and supplies companies, and in the Materials sector. In contrast, selection within the Communication Services sector, in both the media and the interactive media and services industries, was a notable detractor from relative performance. Stock selection in the Consumer Staples sector, especially among personal products companies, and in the Real Estate sector, hindered relative returns as well.(1)
Q. Which holdings contributed the most to, and detracted the most from, the Portfolio’s benchmark-relative performance?
A. Suffolk:Top contributors for the firstone-month period included Sage Therapeutics, Inc., as the company announced positive results for a Phase 3 trial in postpartum depression. Ultra Clean Holdings, Inc.,
| 82 | (continued) |
| Ohio National Fund, Inc. | ON BlackRock Advantage Small Cap Growth Portfolio (Unaudited) (Continued) |
another relative contributor, recovered after the sharp selloff in the fourth quarter of last year, as demand for semiconductor equipment and concerns about correction in the cycle were far worse than expectations, as supported by earnings reports from large cap peers, Lam Research Corp. andKLA-Tencor Corp. Aerie Pharmaceuticals, Inc., another top contributor, expects to achieve its revenue target for Rhopressa, its new glaucoma drug, which is favorable compared to concerns of inventory buildup over the past several months. Additionally, the company announced positive pilot study results for Rhopressa in Japan, a significant new market opportunity.
Top detractors for the firstone-month period included AxoGen, Inc., as it experienced a weak earnings report for fourth quarter, as revenue fell slightly short, expenses remained high, and management turnover continued. Ligland Pharmaceuticals, Inc. faced questions regarding the value of current licensing relationships and pipeline value, causing a sharp selloff in the stock inmid-January, making it another top detractor. Lindsay Corp., another detractor from performance, had a first quarter earnings miss for both revenue and earnings per share, driven by weaker irrigation demand internationally.
A. BlackRock:From a security standpoint, the top individual contributor for the latter five-month period was the Portfolio’s overweight to software company eGain Corp. The stock surged almost 20% on first quarter earnings, after the company reported an unexpected profit and raised guidance for bothsoftware-as-a-service revenue growth and subscription revenue growth. Having no exposure to benchmark holding Stamps.com, Inc. was also beneficial, as the stock plunged, following news that the company was ending its exclusive partnership with the U.S. postal service, a crucial revenue driver for the business. A declining profit outlook, combined with concerns around margins and threats from Amazon.com, Inc.’s push into shipping services, continued to dampen the stock price throughout the latter five-month period. Lastly, an overweight position in insurance company Kinsale Capital Group, Inc. further bolstered relative performance. The stock advanced more than 50% over the latter five-month period, largely due to strong first quarter earnings. The company experienced substantial top line growth across almost all of its major businesses and came in well above analyst earnings expectations for the quarter.(1)
On the other hand, the top individual detractor for the period was an overweight to Health Care company Inogen, Inc. Share prices sank, following the publication of several sell-side reports and announcements that the company was significantly overvalued, and that several investment shops had large short positions. These reports were seemingly validated when the company significantly cut 2019 revenue guidance, causing shares to tumble as much as 30%. The Portfolio’s overweight position in USANA Health Sciences, Inc. was also a notable drag on performance, as the company’s shares underperformed after it lowered 2019 earnings per share and revenue guidance. The company cited limited promotional activity in many of its regions, and the negative effects of China’s review of the health product industry as key factors in the downward revision. Lastly, an overweight position in software company Benefitfocus, Inc. detracted from relative returns, as shares in the company were down almost 50% for the latter five-month period. The primary catalyst of thesell-off was the resignation of the company’s Chief Financial Officer (“CFO”), as he was the third CFO to leave the company in the last three years. This sparked an immediatesell-off, due to increased investor concern around the health of the company.(1)
Q. How did the Portfolio’s use of derivative instruments and initial public offerings (IPOs), if any, impact performance?
A. Suffolk:The Portfolio did not hold any derivatives or participate in any IPOs during the firstone-month period.
A. BlackRock:Pursuant to the Portfolio’s investment strategy, futures contracts were used in order to equitize cash and prevent a cash drag on performance during the latter five-month period. The futures did not meaningfully impact performance, however, due to their index characteristics and size in relation to the Portfolio’s net assets. The Portfolio was active in small cap IPOs during the period, which contributed slightly on an absolute basis. The Portfolio participated in 10 IPOs, adding approximately 0.40% of return.(1)
| (1) | The Portfolio’s composition is subject to change. Holdings and weightings are as of June 30, 2019. |
Change in Value of $10,000 Investment |
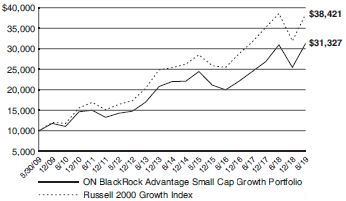
Hypothetical illustration based on past performance. Future performance will vary. The Portfolio’s returns reflect reinvested dividends. The Portfolio’s holdings may differ significantly from the securities in the index. The index is unmanaged and therefore does not reflect the cost of portfolio management and accounting.
The Russell 2000 Growth Index measures the performance of thesmall-cap growth segment of the U.S. equity universe. It includes the Russell 2000 Index companies with higherprice-to-value ratios and higher forecasted growth values. The Russell 2000 Index includes the 2000 firms from the Russell 3000 Index with the smallest market capitalizations. The Russell 3000 Index represents 98% of the investable U.S. equity market. The index presented includes the effects of reinvested dividends.
Past performance is no guarantee of future results. Redemption of fund shares could have tax implications unique to each shareholder.
| 83 | (continued) |
| Ohio National Fund, Inc. | ON BlackRock Advantage Small Cap Growth Portfolio (Unaudited) (Continued) |
Portfolio Composition as of June 30, 2019(1) | ||||
| % of Net Assets | ||||
Common Stocks(4) | 98.0 | |||
Money Market Funds and Other Net Assets | 2.0 | |||
|
| |||
| 100.0 | ||||
|
| |||
Top 10 Portfolio Holdings as of June 30, 2019 (1) (2) (3) | ||||
| % of Net Assets | ||||||
1. | Insperity, Inc. | 1.7 | ||||
2. | Woodward, Inc. | 1.2 | ||||
3. | Paylocity Holding Corp. | 1.2 | ||||
4. | Applied Industrial Technologies, Inc. | 1.2 | ||||
5. | U.S. Physical Therapy, Inc. | 1.2 | ||||
6. | Cornerstone OnDemand, Inc. | 1.1 | ||||
7. | EastGroup Properties, Inc. | 1.1 | ||||
8. | Texas Roadhouse, Inc. | 1.1 | ||||
9. | MasTec, Inc. | 1.0 | ||||
10. | Innospec, Inc. | 1.0 | ||||
| (1) | Composition of Portfolio subject to change. |
| (2) | Short-term investments have been excluded from the list of Top 10 Portfolio Holdings. |
| (3) | Top 10 Portfolio Holdings is presented at an individual security level. Total investment exposure by issuer may be higher. |
| (4) | Sectors (Common Stocks): |
| % of Net Assets | ||||
Health Care | 28.8 | |||
Industrials | 18.8 | |||
Information Technology | 17.2 | |||
Consumer Discretionary | 12.9 | |||
Financials | 5.4 | |||
Real Estate | 4.5 | |||
Communication Services | 3.5 | |||
Consumer Staples | 3.0 | |||
Materials | 2.5 | |||
Energy | 1.1 | |||
Utilities | 0.3 | |||
|
| |||
| 98.0 | ||||
|
| |||
84
| Ohio National Fund, Inc. | ON BlackRock Advantage Small Cap Growth Portfolio |
Schedule of Investments | June 30, 2019 (Unaudited) | |
| Common Stocks – 98.0% | Shares | Value | ||||||||
COMMUNICATION SERVICES – 3.5% | ||||||||||
Bandwidth, Inc. Class A (Diversified Telecom. Svs.) | (a) | 1,355 | $ | 101,652 | ||||||
Care.com, Inc. (Interactive Media & Svs.) | (a) | 9,866 | 108,329 | |||||||
Cargurus, Inc. (Interactive Media & Svs.) | (a) | 12,734 | 459,825 | |||||||
Cogent Communications Holdings, Inc. (Diversified Telecom. Svs.) | 9,510 | 564,514 | ||||||||
EverQuote, Inc. Class A (Interactive Media & Svs.) | (a) | 6,450 | 83,850 | |||||||
Gogo, Inc. (Wireless Telecom. Svs.) | (a) | 12,254 | 48,771 | |||||||
IDT Corp. Class B (Diversified Telecom. Svs.) | (a) | 6,073 | 57,511 | |||||||
MSG Networks, Inc. Class A (Media) | (a) | 24,967 | 517,816 | |||||||
Ooma, Inc. (Diversified Telecom. Svs.) | (a) | 7,140 | 74,827 | |||||||
QuinStreet, Inc. (Interactive Media & Svs.) | (a) | 9,758 | 154,664 | |||||||
TechTarget, Inc. (Media) | (a) | 3,534 | 75,097 | |||||||
Travelzoo (Interactive Media & Svs.) | (a) | 1,141 | 17,617 | |||||||
TrueCar, Inc. (Interactive Media & Svs.) | (a) | 22,630 | 123,560 | |||||||
Vonage Holdings Corp. (Diversified Telecom. Svs.) | (a) | 5,758 | 65,238 | |||||||
Yelp, Inc. (Interactive Media & Svs.) | (a) | 14,364 | 490,961 | |||||||
|
| |||||||||
| 2,944,232 | ||||||||||
|
| |||||||||
CONSUMER DISCRETIONARY – 12.9% | ||||||||||
1-800-Flowers.com, Inc. Class A (Internet & Direct Marketing Retail) | (a) | 9,867 | 186,289 | |||||||
American Eagle Outfitters, Inc. (Specialty Retail) | 16,894 | 285,509 | ||||||||
America’sCar-Mart, Inc. (Specialty Retail) | (a) | 1,848 | 159,076 | |||||||
Asbury Automotive Group, Inc. (Specialty Retail) | (a) | 8,552 | 721,276 | |||||||
BJ’s Restaurants, Inc. (Hotels, Restaurants & Leisure) | 5,924 | 260,301 | ||||||||
Bloomin’ Brands, Inc. (Hotels, Restaurants & Leisure) | 14,534 | 274,838 | ||||||||
Boyd Gaming Corp. (Hotels, Restaurants & Leisure) | 10,516 | 283,301 | ||||||||
Brinker International, Inc. (Hotels, Restaurants & Leisure) | 9,503 | 373,943 | ||||||||
Chegg, Inc. (Diversified Consumer Svs.) | (a) | 11,467 | 442,512 | |||||||
Churchill Downs, Inc. (Hotels, Restaurants & Leisure) | 4,046 | 465,573 | ||||||||
Collectors Universe, Inc. (Diversified Consumer Svs.) | 1,568 | 33,461 | ||||||||
Core-Mark Holding Co., Inc. (Distributors) | 4,738 | 188,193 | ||||||||
Crocs, Inc. (Textiles, Apparel & Luxury Goods) | (a) | 10,556 | 208,481 | |||||||
Dana, Inc. (Auto Components) | 5,578 | 111,225 | ||||||||
Deckers Outdoor Corp. (Textiles, Apparel & Luxury Goods) | (a) | 1,757 | 309,179 | |||||||
Eldorado Resorts, Inc. (Hotels, Restaurants & Leisure) | (a) | 1,733 | 79,839 | |||||||
Etsy, Inc. (Internet & Direct Marketing Retail) | (a) | 10,299 | 632,050 | |||||||
Five Below, Inc. (Specialty Retail) | (a) | 489 | 58,690 | |||||||
Fox Factory Holding Corp. (Auto Components) | (a) | 2,301 | 189,856 | |||||||
G-III Apparel Group Ltd. (Textiles, Apparel & Luxury Goods) | (a) | 1,335 | 39,276 | |||||||
GoPro, Inc. Class A (Household Durables) | (a) | 28,147 | 153,683 | |||||||
iRobot Corp. (Household Durables) | (a) | 2,421 | 221,860 | |||||||
La-Z-Boy, Inc. (Household Durables) | 2,444 | 74,933 | ||||||||
Lithia Motors, Inc. Class A (Specialty Retail) | 3,159 | 375,226 | ||||||||
Malibu Boats, Inc. Class A (Leisure Products) | (a) | 2,383 | 92,580 | |||||||
MarineMax, Inc. (Specialty Retail) | (a) | 715 | 11,755 | |||||||
MasterCraft Boat Holdings, Inc. (Leisure Products) | (a) | 141 | 2,762 | |||||||
MDC Holdings, Inc. (Household Durables) | 6,399 | 209,759 | ||||||||
Meritage Homes Corp. (Household Durables) | (a) | 6,518 | 334,634 | |||||||
Murphy U.S.A., Inc. (Specialty Retail) | (a) | 2,409 | 202,428 | |||||||
Ollie’s Bargain Outlet Holdings, Inc. (Multiline Retail) | (a) | 385 | 33,537 | |||||||
Oxford Industries, Inc. (Textiles, Apparel & Luxury Goods) | 6,333 | 480,041 | ||||||||
| Common Stocks (Continued) | Shares | Value | ||||||||
CONSUMER DISCRETIONARY (continued) |
| |||||||||
Planet Fitness, Inc. Class A (Hotels, Restaurants & Leisure) | (a) | 6,213 | $ | 450,070 | ||||||
RealReal, Inc. / The (Internet & Direct Marketing Retail) | (a) | 2,309 | 66,730 | |||||||
Rocky Brands, Inc. (Textiles, Apparel & Luxury Goods) | 2,682 | 73,165 | ||||||||
Rubicon Project, Inc. / The (Internet & Direct Marketing Retail) | (a) | 9,559 | 60,795 | |||||||
Ruth’s Hospitality Group, Inc. (Hotels, Restaurants & Leisure) | 1,694 | 38,471 | ||||||||
SeaWorld Entertainment, Inc. (Hotels, Restaurants & Leisure) | (a) | 4,886 | 151,466 | |||||||
Shake Shack, Inc. Class A (Hotels, Restaurants & Leisure) | (a) | 1,389 | 100,286 | |||||||
Sleep Number Corp. (Specialty Retail) | (a) | 1,214 | 49,033 | |||||||
Sonic Automotive, Inc. Class A (Specialty Retail) | 2,322 | 54,219 | ||||||||
Sonos, Inc. (Household Durables) | (a) | 4,175 | 47,345 | |||||||
Steven Madden Ltd. (Textiles, Apparel & Luxury Goods) | 6,652 | 225,835 | ||||||||
Strategic Education, Inc. (Diversified Consumer Svs.) | 1,987 | 353,686 | ||||||||
Target Hospitality Corp. (Hotels, Restaurants & Leisure) | (a) | 16,390 | 149,149 | |||||||
Texas Roadhouse, Inc. (Hotels, Restaurants & Leisure) | 16,627 | 892,371 | ||||||||
Tilly’s, Inc. (Specialty Retail) | 5,969 | 45,543 | ||||||||
TopBuild Corp. (Household Durables) | (a) | 3,114 | 257,715 | |||||||
Tower International, Inc. (Auto Components) | 3,109 | 60,625 | ||||||||
Wolverine World Wide, Inc. (Textiles, Apparel & Luxury Goods) | 10,492 | 288,950 | ||||||||
Zumiez, Inc. (Specialty Retail) | (a) | 2,104 | 54,914 | |||||||
|
| |||||||||
| 10,916,434 | ||||||||||
|
| |||||||||
CONSUMER STAPLES – 3.0% | ||||||||||
BJ’s Wholesale Club Holdings, Inc. (Food & Staples Retailing) | (a) | 5,248 | 138,547 | |||||||
Boston Beer Co., Inc. / The Class A (Beverages) | (a) | 882 | 333,184 | |||||||
Calavo Growers, Inc. (Food Products) | 1,950 | 188,643 | ||||||||
Freshpet, Inc. (Food Products) | (a) | 7,351 | 334,544 | |||||||
J&J Snack Foods Corp. (Food Products) | 1,662 | 267,499 | ||||||||
John B. Sanfilippo & Son, Inc. (Food Products) | 2,085 | 166,154 | ||||||||
Medifast, Inc. (Personal Products) | 419 | 53,758 | ||||||||
Natural Health Trends Corp. (Personal Products) | 4,066 | 32,731 | ||||||||
Nomad Foods Ltd. (Food Products) | (a) | 2,035 | 43,468 | |||||||
Performance Food Group Co. (Food & Staples Retailing) | (a) | 6,907 | 276,487 | |||||||
Turning Point Brands, Inc. (Tobacco) | 1,913 | 93,699 | ||||||||
USANA Health Sciences, Inc. (Personal Products) | (a) | 3,710 | 294,685 | |||||||
Vector Group Ltd. (Tobacco) | 33,602 | 327,619 | ||||||||
|
| |||||||||
| 2,551,018 | ||||||||||
|
| |||||||||
ENERGY– 1.1% | ||||||||||
Archrock, Inc. (Energy Equip. & Svs.) | 7,698 | 81,599 | ||||||||
Cactus, Inc. Class A (Energy Equip. & Svs.) | (a) | 2,050 | 67,896 | |||||||
CVR Energy, Inc. (Oil, Gas & Consumable Fuels) | 1,624 | 81,184 | ||||||||
Evolution Petroleum Corp. (Oil, Gas & Consumable Fuels) | 31,209 | 223,144 | ||||||||
Matrix Service Co. (Energy Equip. & Svs.) | (a) | 1,310 | 26,541 | |||||||
ProPetro Holding Corp. (Energy Equip. & Svs.) | (a) | 16,706 | 345,814 | |||||||
Superior Energy Services, Inc. (Energy Equip. & Svs.) | (a) | 48,651 | 63,246 | |||||||
Talos Energy, Inc. (Oil, Gas & Consumable Fuels) | (a) | 1,949 | 46,874 | |||||||
|
| |||||||||
| 936,298 | ||||||||||
|
| |||||||||
| 85 | (continued) |
| Ohio National Fund, Inc. | ON BlackRock Advantage Small Cap Growth Portfolio (Continued) |
Schedule of Investments | June 30, 2019 (Unaudited) | |
| Common Stocks (Continued) | Shares | Value | ||||||||
FINANCIALS – 5.4% | ||||||||||
Ares Management Corp. Class A (Capital Markets) | 5,656 | $ | 148,018 | |||||||
Artisan Partners Asset Management, Inc. Class A (Capital Markets) | 8,030 | 220,986 | ||||||||
BankFinancial Corp. (Banks) | 5,622 | 78,652 | ||||||||
Banner Corp. (Banks) | 874 | 47,327 | ||||||||
Cadence Bancorp (Banks) | 21,248 | 441,958 | ||||||||
Cathay General Bancorp (Banks) | 6,045 | 217,076 | ||||||||
Chemical Financial Corp. (Banks) | 3,062 | 125,879 | ||||||||
Cohen & Steers, Inc. (Capital Markets) | 1,707 | 87,808 | ||||||||
Enova International, Inc. (Consumer Finance) | (a) | 1,706 | 39,323 | |||||||
Essent Group Ltd. (Thrifts & Mortgage Finance) | (a) | 8,885 | 417,506 | |||||||
First Financial Corp. (Banks) | 1,207 | 48,473 | ||||||||
First Savings Financial Group, Inc. (Banks) | 2,371 | 142,260 | ||||||||
FirstCash, Inc. (Consumer Finance) | 3,514 | 351,470 | ||||||||
Green Dot Corp. Class A (Consumer Finance) | (a) | 2,127 | 104,010 | |||||||
Home BancShares, Inc. (Banks) | 13,110 | 252,499 | ||||||||
Kinsale Capital Group, Inc. (Insurance) | 7,328 | 670,365 | ||||||||
LendingTree, Inc. (Thrifts & Mortgage Finance) | (a) | 184 | 77,286 | |||||||
Moelis & Co. Class A (Capital Markets) | 8,451 | 295,362 | ||||||||
People’s Utah Bancorp (Banks) | 184 | 5,410 | ||||||||
Riverview Bancorp, Inc. (Thrifts & Mortgage Finance) | 1,100 | 9,394 | ||||||||
Sandy Spring Bancorp, Inc. (Banks) | 2,703 | 94,281 | ||||||||
TriState Capital Holdings, Inc. (Banks) | (a) | 27,460 | 585,996 | |||||||
West Bancorporation, Inc. (Banks) | 3,649 | 77,432 | ||||||||
|
| |||||||||
| 4,538,771 | ||||||||||
|
| |||||||||
HEALTH CARE – 28.8% | ||||||||||
ACADIA Pharmaceuticals, Inc. (Biotechnology) | (a) | 9,991 | 267,059 | |||||||
Accuray, Inc. (Health Care Equip. & Supplies) | (a) | 4,004 | 15,495 | |||||||
Acer Therapeutics, Inc. (Pharmaceuticals) | (a) | 12,940 | 50,466 | |||||||
Adamas Pharmaceuticals, Inc. (Biotechnology) | (a) | 2,186 | 13,553 | |||||||
Adaptive Biotechnologies Corp. (Life Sciences Tools & Svs.) | (a) | 821 | 39,654 | |||||||
Agenus, Inc. (Biotechnology) | (a) | 62,746 | 188,238 | |||||||
Aimmune Therapeutics, Inc. (Biotechnology) | (a) | 5,844 | 121,672 | |||||||
Akcea Therapeutics, Inc. (Biotechnology) | (a) | 2,274 | 53,325 | |||||||
Akebia Therapeutics, Inc. (Biotechnology) | (a) | 23,338 | 112,956 | |||||||
Alder Biopharmaceuticals, Inc. (Biotechnology) | (a) | 14,366 | 169,088 | |||||||
Allogene Therapeutics, Inc. (Biotechnology) | (a) | 6,519 | 175,035 | |||||||
Amedisys, Inc. (Health Care Providers & Svs.) | (a) | 2,041 | 247,798 | |||||||
Amicus Therapeutics, Inc. (Biotechnology) | (a) | 9,045 | 112,882 | |||||||
AMN Healthcare Services, Inc. (Health Care Providers & Svs.) | (a) | 2,236 | 121,303 | |||||||
Amneal Pharmaceuticals, Inc. (Pharmaceuticals) | (a) | 9,017 | 64,652 | |||||||
Amphastar Pharmaceuticals, Inc. (Pharmaceuticals) | (a) | 2,966 | 62,612 | |||||||
AnaptysBio, Inc. (Biotechnology) | (a) | 867 | 48,916 | |||||||
Apellis Pharmaceuticals, Inc. (Biotechnology) | (a) | 6,871 | 174,111 | |||||||
Arcus Biosciences, Inc. (Biotechnology) | (a) | 8,261 | 65,675 | |||||||
Arena Pharmaceuticals, Inc. (Biotechnology) | (a) | 906 | 53,119 | |||||||
Array BioPharma, Inc. (Biotechnology) | (a) | 15,952 | 739,056 | |||||||
Arrowhead Pharmaceuticals, Inc. (Biotechnology) | (a) | 6,141 | 162,736 | |||||||
Arvinas, Inc. (Pharmaceuticals) | (a) | 2,154 | 47,366 | |||||||
Atara Biotherapeutics, Inc. (Biotechnology) | (a) | 5,726 | 115,150 | |||||||
Athersys, Inc. (Biotechnology) | (a) | 60,257 | 101,232 | |||||||
AtriCure, Inc. (Health Care Equip. & Supplies) | (a) | 2,589 | 77,256 | |||||||
Audentes Therapeutics, Inc. (Biotechnology) | (a) | 4,614 | 174,686 | |||||||
Biohaven Pharmaceutical Holding Co. Ltd. (Biotechnology) | (a) | 2,869 | 125,634 | |||||||
Blueprint Medicines Corp. (Biotechnology) | (a) | 2,756 | 259,973 | |||||||
Calithera Biosciences, Inc. (Biotechnology) | (a) | 9,213 | 35,931 | |||||||
Cara Therapeutics, Inc. (Biotechnology) | (a) | 1,155 | 24,833 | |||||||
Cardiovascular Systems, Inc. (Health Care Equip. & Supplies) | (a) | 9,091 | 390,277 | |||||||
| Common Stocks (Continued) | Shares | Value | ||||||||
HEALTH CARE (continued) | ||||||||||
Castlight Health, Inc. Class B (Health Care Technology) | (a) | 39,467 | $ | 127,478 | ||||||
ChemoCentryx, Inc. (Biotechnology) | (a) | 13,142 | 122,221 | |||||||
Clovis Oncology, Inc. (Biotechnology) | (a) | 5,633 | 83,763 | |||||||
Coherus Biosciences, Inc. (Biotechnology) | (a) | 4,168 | 92,113 | |||||||
CONMED Corp. (Health Care Equip. & Supplies) | 4,421 | 378,305 | ||||||||
Corcept Therapeutics, Inc. (Pharmaceuticals) | (a) | 15,043 | 167,729 | |||||||
CorVel Corp. (Health Care Providers & Svs.) | (a) | 1,602 | 139,390 | |||||||
Corvus Pharmaceuticals, Inc. (Biotechnology) | (a) | 3,100 | 11,594 | |||||||
Crinetics Pharmaceuticals, Inc. (Biotechnology) | (a) | 2,601 | 65,025 | |||||||
Deciphera Pharmaceuticals, Inc. (Biotechnology) | (a) | 4,933 | 111,239 | |||||||
Denali Therapeutics, Inc. (Biotechnology) | (a) | 8,753 | 181,712 | |||||||
Editas Medicine, Inc. (Biotechnology) | (a) | 4,462 | 110,390 | |||||||
Emergent BioSolutions, Inc. (Biotechnology) | (a) | 3,695 | 178,505 | |||||||
Enanta Pharmaceuticals, Inc. (Biotechnology) | (a) | 404 | 34,090 | |||||||
Ensign Group, Inc. / The (Health Care Providers & Svs.) | 3,865 | 219,996 | ||||||||
Epizyme, Inc. (Biotechnology) | (a) | 5,308 | 66,615 | |||||||
Esperion Therapeutics, Inc. (Biotechnology) | (a) | 4,046 | 188,220 | |||||||
Evolent Health, Inc. Class A (Health Care Technology) | (a) | 5,821 | 46,277 | |||||||
Fate Therapeutics, Inc. (Biotechnology) | (a) | 10,851 | 220,275 | |||||||
FibroGen, Inc. (Biotechnology) | (a) | 6,013 | 271,667 | |||||||
Fluidigm Corp. (Life Sciences Tools & Svs.) | (a) | 6,678 | 82,273 | |||||||
GenMark Diagnostics, Inc. (Health Care Equip. & Supplies) | (a) | 7,590 | 49,259 | |||||||
Genomic Health, Inc. (Biotechnology) | (a) | 5,171 | 300,797 | |||||||
Glaukos Corp. (Health Care Equip. & Supplies) | (a) | 1,278 | 96,361 | |||||||
Global Blood Therapeutics, Inc. (Biotechnology) | (a) | 5,879 | 309,235 | |||||||
Globus Medical, Inc. Class A (Health Care Equip. & Supplies) | (a) | 10,542 | 445,927 | |||||||
Gossamer Bio, Inc. (Biotechnology) | (a) | 4,355 | 96,594 | |||||||
Haemonetics Corp. (Health Care Equip. & Supplies) | (a) | 3,709 | 446,341 | |||||||
Halozyme Therapeutics, Inc. (Biotechnology) | (a) | 12,834 | 220,488 | |||||||
HealthEquity, Inc. (Health Care Providers & Svs.) | (a) | 8,955 | 585,657 | |||||||
HealthStream, Inc. (Health Care Technology) | (a) | 8,056 | 208,328 | |||||||
HMS Holdings Corp. (Health Care Technology) | (a) | 9,094 | 294,555 | |||||||
Horizon Therapeutics PLC (Pharmaceuticals) | (a) | 13,252 | 318,843 | |||||||
ImmunoGen, Inc. (Biotechnology) | (a) | 6,035 | 13,096 | |||||||
Immunomedics, Inc. (Biotechnology) | (a) | 2,928 | 40,611 | |||||||
Innoviva, Inc. (Pharmaceuticals) | (a) | 12,873 | 187,431 | |||||||
Inogen, Inc. (Health Care Equip. & Supplies) | (a) | 2,851 | 190,333 | |||||||
Insmed, Inc. (Biotechnology) | (a) | 1,239 | 31,718 | |||||||
Inspire Medical Systems, Inc. (Health Care Technology) | (a) | 807 | 48,945 | |||||||
Integer Holdings Corp. (Health Care Equip. & Supplies) | (a) | 3,512 | 294,727 | |||||||
Intellia Therapeutics, Inc. (Biotechnology) | (a) | 13,937 | 228,149 | |||||||
Intercept Pharmaceuticals, Inc. (Biotechnology) | (a) | 2,920 | 232,344 | |||||||
Intersect ENT, Inc. (Pharmaceuticals). | (a) | 5,606 | 127,593 | |||||||
Intra-Cellular Therapies, Inc. (Pharmaceuticals) | (a) | 5,412 | 70,248 | |||||||
Intrexon Corp. (Biotechnology) | (a) | 15,818 | 121,166 | |||||||
Invitae Corp. (Biotechnology) | (a) | 12,316 | 289,426 | |||||||
Iovance Biotherapeutics, Inc. (Biotechnology). | (a) | 3,046 | 74,688 | |||||||
iRadimed Corp. (Health Care Equip. & Supplies) | (a) | 4,808 | 98,324 | |||||||
iRhythm Technologies, Inc. (Health Care Equip. & Supplies) | (a) | 5,191 | 410,504 | |||||||
Ironwood Pharmaceuticals, Inc. (Biotechnology) | (a) | 15,413 | 168,618 | |||||||
KalVista Pharmaceuticals, Inc. (Biotechnology). | (a) | 3,078 | 68,178 | |||||||
LHC Group, Inc. (Health Care Providers & Svs.) | (a) | 903 | 107,981 | |||||||
Ligand Pharmaceuticals, Inc. (Biotechnology) | (a) | 806 | 92,005 | |||||||
| 86 | (continued) |
| Ohio National Fund, Inc. | ON BlackRock Advantage Small Cap Growth Portfolio (Continued) |
Schedule of Investments | June 30, 2019 (Unaudited) | |
| Common Stocks (Continued) | Shares | Value | ||||||||
HEALTH CARE (continued) | ||||||||||
MacroGenics, Inc. (Biotechnology) | (a) | 8,789 | $ | 149,149 | ||||||
Madrigal Pharmaceuticals, Inc. (Biotechnology) | (a) | 569 | 59,637 | |||||||
Medicines Co. / The (Biotechnology) | (a) | 3,887 | 141,759 | |||||||
Medidata Solutions, Inc. (Health Care Technology) | (a) | 361 | 32,674 | |||||||
Medpace Holdings, Inc. (Life Sciences Tools & Svs.) | (a) | 4,951 | 323,894 | |||||||
MeiraGTx Holdings PLC (Biotechnology) | (a) | 1,192 | 32,041 | |||||||
Merit Medical Systems, Inc. (Health Care Equip. & Supplies) | (a) | 12,685 | 755,519 | |||||||
Mirati Therapeutics, Inc. (Biotechnology) | (a) | 2,085 | 214,755 | |||||||
Myriad Genetics, Inc. (Biotechnology) | (a) | 6,884 | 191,238 | |||||||
NanoString Technologies, Inc. (Life Sciences Tools & Svs.) | (a) | 7,675 | 232,936 | |||||||
Natera, Inc. (Biotechnology) | (a) | 9,273 | 255,749 | |||||||
Neogen Corp. (Health Care Equip. & Supplies) | (a) | 5,014 | 311,420 | |||||||
NeoGenomics, Inc. (Life Sciences Tools & Svs.) | (a) | 10,144 | 222,559 | |||||||
Neon Therapeutics, Inc. (Biotechnology) | (a) | 3,526 | 16,713 | |||||||
NextGen Healthcare, Inc. (Health Care Technology) | (a) | 4,851 | 96,535 | |||||||
NGM Biopharmaceuticals, Inc. (Pharmaceuticals) | (a) | 3,545 | 51,899 | |||||||
Novocure Ltd. (Health Care Equip. & Supplies) | (a) | 10,614 | 671,123 | |||||||
NuVasive, Inc. (Health Care Equip. & Supplies) | (a) | 920 | 53,857 | |||||||
Omeros Corp. (Pharmaceuticals) | (a) | 3,442 | 54,005 | |||||||
Omnicell, Inc. (Health Care Technology) | (a) | 8,278 | 712,156 | |||||||
Pacira BioSciences, Inc. (Pharmaceuticals) | (a) | 4,037 | 175,569 | |||||||
PetIQ, Inc. (Health Care Providers & Svs.) | (a) | 1,867 | 61,536 | |||||||
Phibro Animal Health Corp. Class A (Pharmaceuticals) | 4,888 | 155,292 | ||||||||
Portola Pharmaceuticals, Inc. (Biotechnology) | (a) | 5,503 | 149,296 | |||||||
Precision BioSciences, Inc. (Biotechnology) | (a) | 4,571 | 60,566 | |||||||
Principia Biopharma, Inc. (Biotechnology) | (a) | 1,515 | 50,283 | |||||||
PTC Therapeutics, Inc. (Biotechnology) | (a) | 1,271 | 57,195 | |||||||
Puma Biotechnology, Inc. (Biotechnology) | (a) | 2,375 | 30,186 | |||||||
Ra Pharmaceuticals, Inc. (Biotechnology) | (a) | 3,144 | 94,540 | |||||||
Radius Health, Inc. (Biotechnology) | (a) | 4,975 | 121,191 | |||||||
Reata Pharmaceuticals, Inc. Class A (Pharmaceuticals) | (a) | 2,000 | 188,700 | |||||||
Recro Pharma, Inc. (Biotechnology) | (a) | 3,321 | 33,775 | |||||||
REGENXBIO, Inc. (Biotechnology) | (a) | 1,826 | 93,802 | |||||||
Repligen Corp. (Biotechnology) | (a) | 2,496 | 214,531 | |||||||
Retrophin, Inc. (Biotechnology) | (a) | 10,392 | 208,775 | |||||||
Rigel Pharmaceuticals, Inc. (Biotechnology) | (a) | 24,042 | 62,750 | |||||||
RTI Surgical Holdings, Inc. (Health Care Equip. & Supplies) | (a) | 21,514 | 91,435 | |||||||
Sage Therapeutics, Inc. (Biotechnology) | (a) | 361 | 66,095 | |||||||
Sangamo Therapeutics, Inc. (Biotechnology) | (a) | 5,737 | 61,787 | |||||||
Select Medical Holdings Corp. (Health Care Providers & Svs.) | (a) | 14,947 | 237,209 | |||||||
Seres Therapeutics, Inc. (Biotechnology) | (a) | 22,788 | 73,377 | |||||||
Spark Therapeutics, Inc. (Biotechnology) | (a) | 2,450 | 250,831 | |||||||
Spectrum Pharmaceuticals, Inc. (Biotechnology) | (a) | 13,585 | 116,967 | |||||||
Stemline Therapeutics, Inc. (Biotechnology) | (a) | 6,478 | 99,243 | |||||||
Supernus Pharmaceuticals, Inc. (Pharmaceuticals) | (a) | 5,812 | 192,319 | |||||||
Tandem Diabetes Care, Inc. (Health Care Equip. & Supplies) | (a) | 2,991 | 192,979 | |||||||
Teladoc Health, Inc. (Health Care Technology) | (a) | 2,977 | 197,703 | |||||||
Tenet Healthcare Corp. (Health Care Providers & Svs.) | (a) | 5,502 | 113,671 | |||||||
Theravance Biopharma, Inc. (Pharmaceuticals) | (a) | 10,861 | 177,360 | |||||||
Tivity Health, Inc. (Health Care Providers & Svs.) | (a) | 829 | 13,629 | |||||||
Tocagen, Inc. (Biotechnology) | (a) | 5,869 | 39,205 | |||||||
Twist Bioscience Corp. (Biotechnology) | (a) | 4,664 | 135,303 | |||||||
| Common Stocks (Continued) | Shares | Value | ||||||||
HEALTH CARE (continued) | ||||||||||
U.S. Physical Therapy, Inc. (Health Care Providers & Svs.) | 7,990 | $ | 979,334 | |||||||
Ultragenyx Pharmaceutical, Inc. (Biotechnology) | (a) | 3,867 | 245,554 | |||||||
UNITY Biotechnology, Inc. (Biotechnology) | (a) | 7,381 | 70,120 | |||||||
Vanda Pharmaceuticals, Inc. (Biotechnology) | (a) | 4,097 | 57,727 | |||||||
Veracyte, Inc. (Biotechnology) | (a) | 8,949 | 255,136 | |||||||
Vericel Corp. (Biotechnology) | (a) | 1,418 | 26,786 | |||||||
Vocera Communications, Inc. (Health Care Technology) | (a) | 2,842 | 90,717 | |||||||
Wright Medical Group N.V. (Health Care Equip. & Supplies) | (a) | 6,448 | 192,279 | |||||||
Xencor, Inc. (Biotechnology) | (a) | 8,807 | 360,471 | |||||||
Xeris Pharmaceuticals, Inc. (Pharmaceuticals) | (a) | 6,297 | 72,038 | |||||||
Zogenix, Inc. (Pharmaceuticals) | (a) | 1,582 | 75,588 | |||||||
|
| |||||||||
| 24,401,554 | ||||||||||
|
| |||||||||
INDUSTRIALS – 18.8% | ||||||||||
Albany International Corp. Class A (Machinery) | 8,031 | 665,850 | ||||||||
Applied Industrial Technologies, Inc. (Trading Companies & Distributors) | 16,923 | 1,041,272 | ||||||||
ASGN, Inc. (Professional Svs.) | (a) | 2,126 | 128,836 | |||||||
Astronics Corp. (Aerospace & Defense) | (a) | 1,492 | 60,008 | |||||||
Atkore International Group, Inc. (Electrical Equip.) | (a) | 7,274 | 188,178 | |||||||
Axon Enterprise, Inc. (Aerospace & Defense) | (a) | 2,124 | 136,382 | |||||||
BMC Stock Holdings, Inc. (Trading Companies & Distributors) | (a) | 11,825 | 250,690 | |||||||
Builders FirstSource, Inc. (Building Products) | (a) | 21,832 | 368,088 | |||||||
Comfort Systems, U.S.A., Inc. (Construction & Engineering) | 9,752 | 497,254 | ||||||||
Continental Building Products, Inc. (Building Products) | (a) | 14,746 | 391,801 | |||||||
Covenant Transportation Group, Inc. Class A (Road & Rail) | (a) | 6,504 | 95,674 | |||||||
CRA International, Inc. (Professional Svs.) | 4,691 | 179,806 | ||||||||
CSW Industrials, Inc. (Building Products) | 4,474 | 304,903 | ||||||||
DXP Enterprises, Inc. (Trading Companies & Distributors) | (a) | 2,136 | 80,933 | |||||||
Encore Wire Corp. (Electrical Equip.) | 1,005 | 58,873 | ||||||||
Ennis, Inc. (Commercial Svs. & Supplies) | 2,897 | 59,446 | ||||||||
ESCO Technologies, Inc. (Machinery) | 988 | 81,629 | ||||||||
Forrester Research, Inc. (Professional Svs.) | 6,905 | 324,742 | ||||||||
Forward Air Corp. (Air Freight & Logistics) | 920 | 54,418 | ||||||||
Foundation Building Materials, Inc. (Trading Companies & Distributors) | (a) | 5,737 | 102,004 | |||||||
Franklin Covey Co. (Professional Svs.) | (a) | 297 | 10,098 | |||||||
Generac Holdings, Inc. (Electrical Equip.) | (a) | 10,441 | 724,710 | |||||||
H&E Equipment Services, Inc. (Trading Companies & Distributors) | 8,101 | 235,658 | ||||||||
Harsco Corp. (Machinery) | (a) | 7,526 | 206,513 | |||||||
Herc Holdings, Inc. (Trading Companies & Distributors) | (a) | 1,775 | 81,348 | |||||||
Hub Group, Inc. Class A (Air Freight & Logistics) | (a) | 4,661 | 195,669 | |||||||
ICF International, Inc. (Professional Svs.) | 1,977 | 143,926 | ||||||||
Insperity, Inc. (Professional Svs.) | 11,673 | 1,425,740 | ||||||||
John Bean Technologies Corp. (Machinery) | 2,213 | 268,061 | ||||||||
Kforce, Inc. (Professional Svs.) | 8,102 | 284,299 | ||||||||
MasTec, Inc. (Construction & Engineering) | (a) | 17,071 | 879,669 | |||||||
McGrath RentCorp (Commercial Svs. & Supplies) | 6,805 | 422,931 | ||||||||
Meritor, Inc. (Machinery) | (a) | 8,643 | 209,593 | |||||||
Miller Industries, Inc. (Machinery) | 4,975 | 152,981 | ||||||||
Mobile Mini, Inc. (Commercial Svs. & Supplies) | 9,461 | 287,898 | ||||||||
Moog, Inc. Class A (Aerospace & Defense) | 1,526 | 142,849 | ||||||||
MYR Group, Inc. (Construction & Engineering) | (a) | 3,819 | 142,640 | |||||||
PGT Innovations, Inc. (Building Products) | (a) | 5,277 | 88,231 | |||||||
Proto Labs, Inc. (Machinery) | (a) | 963 | 111,727 | |||||||
| 87 | (continued) |
| Ohio National Fund, Inc. | ON BlackRock Advantage Small Cap Growth Portfolio (Continued) |
Schedule of Investments | June 30, 2019 (Unaudited) | |
| Common Stocks (Continued) | Shares | Value | ||||||||
INDUSTRIALS (continued) | ||||||||||
Radiant Logistics, Inc. (Air Freight & Logistics) | (a) | 10,231 | $ | 62,818 | ||||||
RBC Bearings, Inc. (Machinery) | (a) | 202 | 33,696 | |||||||
Rexnord Corp. (Machinery) | (a) | 9,238 | 279,172 | |||||||
Steelcase, Inc. Class A (Commercial Svs. & Supplies) | 13,375 | 228,713 | ||||||||
Tetra Tech, Inc. (Commercial Svs. & Supplies) | 6,963 | 546,944 | ||||||||
Trex Co., Inc. (Building Products) | (a) | 11,763 | 843,407 | |||||||
TriMas Corp. (Machinery) | (a) | 1,645 | 50,946 | |||||||
TriNet Group, Inc. (Professional Svs.) | (a) | 7,989 | 541,654 | |||||||
Universal Forest Products, Inc. (Building Products) | 1,448 | 55,111 | ||||||||
Universal Logistics Holdings, Inc. (Road & Rail) | 1,593 | 35,795 | ||||||||
Viad Corp. (Commercial Svs. & Supplies) | 3,866 | 256,084 | ||||||||
Watts Water Technologies, Inc. Class A (Machinery) | 7,850 | 731,463 | ||||||||
Werner Enterprises, Inc. (Road & Rail) | 5,056 | 157,140 | ||||||||
Woodward, Inc. (Machinery) | 9,355 | 1,058,612 | ||||||||
|
| |||||||||
| 15,966,883 | ||||||||||
|
| |||||||||
INFORMATION TECHNOLOGY – 17.2% | ||||||||||
A10 Networks, Inc. (Software) | (a) | 9,222 | 62,894 | |||||||
ACI Worldwide, Inc. (Software) | (a) | 3,750 | 128,775 | |||||||
Alarm.com Holdings, Inc. (Software) | (a) | 5,581 | 298,584 | |||||||
Amkor Technology, Inc. (Semiconductors & Equip.) | (a) | 60,478 | 451,166 | |||||||
Anixter International, Inc. (Electronic Equip., Instr. & Comp.) | (a) | 2,637 | 157,455 | |||||||
Aquantia Corp. (Semiconductors & Equip.) | (a) | 1,702 | 22,177 | |||||||
Avalara, Inc. (Software) | (a) | 2,924 | 211,113 | |||||||
Benefitfocus, Inc. (Software) | (a) | 13,971 | 379,313 | |||||||
Blackline, Inc. (Software) | (a) | 5,568 | 297,944 | |||||||
Box, Inc. Class A (Software) | (a) | 27,812 | 489,769 | |||||||
Brooks Automation, Inc. (Semiconductors & Equip.) | 2,035 | 78,856 | ||||||||
Calix, Inc. (Communications Equip.) | (a) | 6,233 | 40,888 | |||||||
Ciena Corp. (Communications Equip.) | (a) | 12,439 | 511,616 | |||||||
Cirrus Logic, Inc. (Semiconductors & Equip.) | (a) | 15,969 | 697,845 | |||||||
Cloudera, Inc. (Software) | (a) | 33,947 | 178,561 | |||||||
Control4 Corp. (Electronic Equip., Instr. & Comp.) | (a) | 859 | 20,401 | |||||||
Cornerstone OnDemand, Inc. (Software) | (a) | 16,120 | 933,832 | |||||||
Coupa Software, Inc. (Software) | (a) | 494 | 62,545 | |||||||
CSG Systems International, Inc. (IT Svs.) | 10,548 | 515,059 | ||||||||
Domo, Inc. Class B (Software) | (a) | 7,208 | 196,923 | |||||||
eGain Corp. (Software) | (a) | 4,029 | 32,796 | |||||||
Envestnet, Inc. (Software) | (a) | 1,065 | 72,814 | |||||||
Everbridge, Inc. (Software) | (a) | 841 | 75,202 | |||||||
Extreme Networks, Inc. (Communications Equip.) | (a) | 2,100 | 13,587 | |||||||
Fitbit, Inc. Class A (Electronic Equip., Instr. & Comp.) | (a) | 74,989 | 329,952 | |||||||
Five9, Inc. (Software) | (a) | 4,902 | 251,424 | |||||||
Hackett Group, Inc. / The (IT Svs.) | 8,456 | 141,976 | ||||||||
Impinj, Inc. (Semiconductors & Equip.) | (a) | 3,000 | 85,860 | |||||||
Inphi Corp. (Semiconductors & Equip.) | (a) | 2,421 | 121,292 | |||||||
Insight Enterprises, Inc. (Electronic Equip., Instr & Comp.) | (a) | 3,547 | 206,435 | |||||||
International Money Express, Inc. (IT Svs.) | (a) | 18,136 | 255,718 | |||||||
j2 Global, Inc. (Software) | 1,237 | 109,957 | ||||||||
Lattice Semiconductor Corp. (Semiconductors & Equip.) | (a) | 7,054 | 102,918 | |||||||
LivePerson, Inc. (Software) | (a) | 9,652 | 270,642 | |||||||
LiveRamp Holdings, Inc. (IT Svs.) | (a) | 751 | 36,408 | |||||||
ManTech International Corp. Class A (IT Svs.) | 5,215 | 343,408 | ||||||||
MaxLinear, Inc. (Semiconductors & Equip.) | (a) | 2,715 | 63,640 | |||||||
MobileIron, Inc. (Software) | (a) | 5,010 | 31,062 | |||||||
New Relic, Inc. (Software) | (a) | 3,692 | 319,395 | |||||||
NIC, Inc. (IT Svs.) | 20,944 | 335,942 | ||||||||
| Common Stocks (Continued) | Shares | Value | ||||||||||
INFORMATION TECHNOLOGY (continued) |
| |||||||||||
OSI Systems, Inc. (Electronic Equip., Instr. & Comp.) | (a) | 7,514 | $ | 846,302 | ||||||||
Paylocity Holding Corp. (Software) | (a) | 11,118 | 1,043,091 | |||||||||
Perficient, Inc. (IT Svs.) | (a) | 1,773 | 60,849 | |||||||||
Progress Software Corp. (Software) | 1,685 | 73,500 | ||||||||||
PROS Holdings, Inc. (Software) | (a) | 2,620 | 165,741 | |||||||||
Qualys, Inc. (Software) | (a) | 3,308 | 288,061 | |||||||||
Radware Ltd. (Communications Equip.) | (a) | 5,120 | 126,618 | |||||||||
Rapid7, Inc. (Software) | (a) | 7,483 | 432,817 | |||||||||
Sanmina Corp. (Electronic Equip., Instr. & Comp.) | (a) | 10,703 | 324,087 | |||||||||
ScanSource, Inc. (Electronic Equip., Instr. & Comp.) | (a) | 8,072 | 262,824 | |||||||||
Semtech Corp. (Semiconductors & Equip.) | (a) | 2,417 | 116,137 | |||||||||
Silicon Motion Technology Corp. – ADR (Semiconductors & Equip.) | 1,921 | 85,254 | ||||||||||
SPS Commerce, Inc. (Software) | (a) | 1,825 | 186,533 | |||||||||
SunPower Corp. (Semiconductors & Equip.) | (a) | 4,357 | 46,576 | |||||||||
SVMK, Inc. (Software) | (a) | 6,317 | 104,294 | |||||||||
Synaptics, Inc. (Semiconductors & Equip.) | (a) | 672 | 19,582 | |||||||||
Tech Data Corp. (Electronic Equip., Instr. & Comp.) | (a) | 200 | 20,920 | |||||||||
Telenav, Inc. (Software) | (a) | 20,780 | 166,240 | |||||||||
TESSCO Technologies, Inc. (Communications Equip.) | 2,784 | 49,722 | ||||||||||
Virtusa Corp. (IT Svs.) | (a) | 1,561 | 69,355 | |||||||||
Workiva, Inc. (Software) | (a) | 8,365 | 485,923 | |||||||||
Yext, Inc. (Software) | (a) | 21,605 | 434,044 | |||||||||
Zscaler, Inc. (Software) | (a) | 2,891 | 221,566 | |||||||||
|
| |||||||||||
| 14,566,180 | ||||||||||||
|
| |||||||||||
MATERIALS – 2.5% | ||||||||||||
Boise Cascade Co. (Paper & Forest Products) | 5,307 | 149,180 | ||||||||||
Hawkins, Inc. (Chemicals) | 646 | 28,043 | ||||||||||
Innospec, Inc. (Chemicals) | 9,408 | 858,386 | ||||||||||
Kaiser Aluminum Corp. (Metals & Mining) | 4,018 | 392,197 | ||||||||||
Materion Corp. (Metals & Mining) | 2,890 | 195,971 | ||||||||||
PolyOne Corp. (Chemicals) | 16,109 | 505,661 | ||||||||||
|
| |||||||||||
| 2,129,438 | ||||||||||||
|
| |||||||||||
REAL ESTATE – 4.5% | ||||||||||||
EastGroup Properties, Inc. (Equity REIT) | 7,770 | 901,165 | ||||||||||
First Industrial Realty Trust, Inc. (Equity REIT) | 19,905 | 731,310 | ||||||||||
Four Corners Property Trust, Inc. (Equity REIT) | 5,230 | 142,936 | ||||||||||
Getty Realty Corp. (Equity REIT) | 1,852 | 56,967 | ||||||||||
Hersha Hospitality Trust (Equity REIT) | 18,547 | 306,767 | ||||||||||
Marcus & Millichap, Inc. (Real Estate Mgmt. & Development) | (a) | 6,100 | 188,185 | |||||||||
National Storage Affiliates Trust (Equity REIT) | 1,563 | 45,233 | ||||||||||
NexPoint Residential Trust, Inc. (Equity REIT) | 2,262 | 93,647 | ||||||||||
PS Business Parks, Inc. (Equity REIT) | 1,698 | 286,164 | ||||||||||
RLJ Lodging Trust (Equity REIT) | 20,841 | 369,719 | ||||||||||
Ryman Hospitality Properties, Inc. (Equity REIT) |
| 6,568 | 532,599 | |||||||||
Sunstone Hotel Investors, Inc. (Equity REIT) | 10,735 | 147,177 | ||||||||||
|
| |||||||||||
| 3,801,869 | ||||||||||||
|
| |||||||||||
UTILITIES – 0.3% | ||||||||||||
American States Water Co. (Water Utilities) | 1,084 | 81,560 | ||||||||||
California Water Service Group (Water Utilities) | 1,408 | 71,287 | ||||||||||
Chesapeake Utilities Corp. (Gas Utilities) | 688 | 65,374 | ||||||||||
Global Water Resources, Inc. (Water Utilities) | 622 | 6,494 | ||||||||||
Northwest Natural Holding Co. (Gas Utilities) | 683 | 47,468 | ||||||||||
|
| |||||||||||
| 272,183 | ||||||||||||
|
| |||||||||||
Total Common Stocks (Cost $81,391,695) | $ | 83,024,860 | ||||||||||
|
| |||||||||||
| 88 | (continued) |
| Ohio National Fund, Inc. | ON BlackRock Advantage Small Cap Growth Portfolio (Continued) |
Schedule of Investments | June 30, 2019 (Unaudited) | |
| Money Market Funds – 1.5% | Shares | Value | ||||||||
State Street Institutional Liquid Reserves Fund Institutional Class, 2.449% | (b) | 1,273,438 | $ | 1,273,693 | ||||||
State Street Institutional U.S. Government Money Market Fund Institutional Class, 2.310% | (b) | 25,659 | 25,659 | |||||||
|
| |||||||||
Total Money Market Funds | $ | 1,299,352 | ||||||||
|
| |||||||||
Total Investments – 99.5% | (c) | $ | 84,324,212 | |||||||
Other Assets in Excess of Liabilities – 0.5% | (d) | 407,020 | ||||||||
|
| |||||||||
Net Assets – 100.0% | $ | 84,731,232 | ||||||||
|
| |||||||||
Percentages are stated as a percent of net assets.
Abbreviations:
| ADR: | American Depositary Receipts |
Footnotes:
| (a) | Non-income producing security. |
| (b) | Rate represents theseven-day yield at June 30, 2019. |
| (c) | Represents cost for financial reporting purposes, which may differ from cost basis for federal income tax purposes. See also Note 7 of the Notes to Financial Statements. |
| (d) | Includes $102,950 of cash pledged as collateral for the futures contracts outstanding at June 30, 2019. See also the following Schedule of Open Futures Contracts. |
The accompanying notes are an integral part of these financial statements.
Schedule of Open Futures Contracts | June 30, 2019 (Unaudited) | |||||||||||
Description | Number of contracts | Expiration Date | Notional Amount | Value | Unrealized Appreciation (Depreciation) | Variation Margin Receivable (Payable) | ||||||||||
CMEE-mini Russell 2000 Index - Long | 29 | September 20, 2019 | $ | 2,238,702 | $ | 2,272,295 | $33,593 | $14,184 | ||||||||
The accompanying notes are an integral part of these financial statements.
89
| Ohio National Fund, Inc. | ON ICON Balanced Portfolio (Unaudited) |
Objective/Strategy |
The ON ICON Balanced Portfolio seeks capital appreciation and income by investing, under normal circumstances, up to 75% of its assets in equity securities of domestic companies of any market capitalization while maintaining a minimum of 25% of its assets in fixed income securities.
Performance as of June 30, 2019 | ||||
Average Annual returns | ||||
One year | 1.85 | % | ||
Five years | 4.04 | % | ||
Ten years | 8.04 | % |
Past performance does not guarantee future results. The performance data quoted represents past performance and current returns may be lower or higher. Total return figures include change in share price and reinvestment of dividends and capital gains. The investment return and principal value will fluctuate so that an investor’s shares, when redeemed, may be worth more or less than the original cost. To obtain performance information up to the most recent month end, call toll-free1-877-781-6392.
The Portfolio is not open to direct retail investment. Beneficial interest in shares is obtained solely by purchase of variable life insurance policies and variable annuity contracts. Actual performance results for variable annuity and variable universal life contracts will be lower due to contract charges. Consult your contract for applicable charges.
Total expense ratio is 0.72% per the Fund’s prospectus dated May 1, 2019. Additional information pertaining to the Portfolio’s expense ratio as of June 30, 2019 can be found in the Portfolio’s Financial Highlights.
Comments fromSub-Adviser |
Q. How did the Portfolio perform in comparison to its benchmark during the reporting period?
A.For thesix-month period ended June 30, 2019, the ON ICON Balanced Portfolio returned 14.57% versus 18.37% for its benchmark, the S&P Composite 1500 Index. The Portfolio’s secondary benchmark, which is comprised of 60% S&P Composite 1500 Index and 40% Bloomberg Barclays U.S. Universal Index, returned 13.71% for the period.
Q. Were there specific market conditions, investment strategies, or techniques that materially affected the Portfolio’s benchmark-relative performance during the reporting period?
A.The last year had two distinctly different halves. The second half of calendar year 2018 featured what we call a volatility event, which was very similar in depth and duration to ones seen in 1990, 1998, 2010 and 2011. We believe such events are irrational and unpredictable, as investors focus on and worry about a situation that never comes to be. Expecting a quick recovery like in those previous volatility events, we maintained Portfolio positioning.
During thesix-month period ended June 30, 2019, the market has quickly recovered back toall-time highs and the long term industry and sector leadership has resumed. The Portfolio has fully participated in this recovery.
The Portfolio’s fixed income volatility remained relatively low. The Portfolio’s use of closed end funds continued to be rewarded, as several of the positions had tender offers or were liquidated, generally capturing the discount to net asset value at which they had been acquired. The Portfolio’s continued underweight position in U.S. Treasuries hurt performance, as interest rates fell.(1)
Q. How did sector allocation and security selection each impact the Portfolio’s performance relative to its benchmark? For sector allocation, were there any factors that impacted the bench mark’s performance more significantly than the Portfolio’s performance? For security selection, was there anything specific regarding the Portfolio’s strategy that caused deviation from the benchmark?
A.Sector tilts in Industrials, Information Technology, and Consumer Discretionary all contributed favorably to Portfolio performance. As the market rebounded after the declines in the fourth quarter of 2018, market-wide growth was led by the traditionally cyclical industries. At the beginning of the year, ICON’s valuation system identified these sectors as the most oversold during the downturn and the Portfolio increased exposure to these sectors. The Portfolio also began the year increasing the equity exposure in the fund to a 70% equity, 30% fixed income balance to capitalize on the rebound from the oversold market.(1)
Security selection did not have a positive impact on the Portfolio’s performance. In the equity market, investors generally favored growth stocks over value stocks, the latter being the focus of ICON’s management strategy. It was the sector and equity weightings that heavily impacted the Portfolio’s performance.(1)
Q. Which holdings contributed the most to, and detracted the most from, the Portfolio’s benchmark-relative performance?
A.The top three contributors to performance were Mastercard, Inc. Class A (“Mastercard”), eBay, Inc. (“eBay”), and Visa, Inc. (“Visa”). Mastercard has had strong growth due to market expansion and new contracts with companies in the U.S., as well as continued expansion through partnerships in Asia. eBay has consistently performed well, pushing analyst targets up. Visa saw strong growth, being one of the best performing stocks so far in 2019. As with Mastercard, they have continued aggressive expansion via partnerships in Asian markets.(1)
On the other end, Cigna Corp. was the biggest detractor from performance, followed by AbbVie, Inc. and the Portfolio’s U.S. Treasury Note exposure. Cigna Corp. has been hurt by White House drug plans and the failed merger with Anthem, Inc. AbbVie, Inc. has been hurt by a $4 Billion lawsuit over Humira, as well as facing Congressional pressure over drug pricing. As rates fell, U.S. Treasuries underperformed the broader S&P 500 index.(1)
Q. How did the Portfolio’s use of derivative instruments and initial public offerings (IPOs), if any, impact performance?
A.The Portfolio held put options on the S&P 500 Index throughout the period. Because of the upward movement of the market over the period, there was not an opportunity to exercise the options. This resulted in a 0.30% detraction from Portfolio performance.(1)
| (1) | The Portfolio’s composition is subject to change. Holdings and weightings are as of June 30, 2019. |
| 90 | (continued) |
| Ohio National Fund, Inc. | ON ICON Balanced Portfolio (Unaudited) (Continued) |
Change in Value of $10,000 Investment |
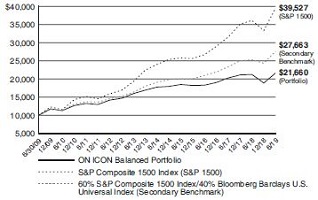
Hypothetical illustration based on past performance. Future performance will vary. The Portfolio’s returns reflect reinvested dividends. The Portfolio’s holdings may differ significantly from the securities in the index. The index is unmanaged and therefore does not reflect the cost of portfolio management and accounting.
The S&P Composite 1500 Index is a broad-based capitalization-weighted index of 1500 U.S. companies and is comprised of the S&P MidCap 400, S&P 500, and the S&P SmallCap 600. It is designed for investors seeking to replicate to the performance of the U.S. equity market or benchmark against a representative universe of tradable stocks. The index presented includes the effects of reinvested dividends.
The Bloomberg Barclays U.S. Universal Index represents the union of the U.S. Aggregate Index, U.S. Corporate High Yield Index. Investment Grade 144A Index, Eurodollar Index, U.S. Emerging Markets Index, and thenon-ERISA portion of the Commercial Mortgage-Backed Securities (CMBS) Index. The index coversUSD-denominated, taxable bonds that are rated either investment grade or high-yield.
Past performance is no guarantee of future results. Redemption of fund shares could have tax implications unique to each shareholder.
Portfolio Composition as of June 30, 2019(1) | ||||
| % of Net Assets | ||||
Common Stocks(4) | 71.0 | |||
Corporate Bonds(4) | 16.9 | |||
U.S. Treasury Obligations | 2.9 | |||
Closed-End Mutual Funds | 2.4 | |||
Asset-Backed Securities(4) | 1.4 | |||
Preferred Securities(4) | 0.5 | |||
Purchased Options | 0.0 | |||
Money Market Funds and Other Net Assets | 4.9 | |||
|
| |||
| 100.0 | ||||
|
| |||
Top 10 Portfolio Holdings as of June 30, 2019 (1) (2) (3) |
| % of Net Assets | ||||||
1. | Mastercard, Inc. Class A | 4.1 | ||||
2. | Visa, Inc. | 3.3 | ||||
3. | Lincoln National Corp. | 3.0 | ||||
4. | U.S. Treasury Note 2.500%, 12/31/2020 | 2.9 | ||||
5. | JPMorgan Chase & Co. | 2.7 | ||||
6. | eBay, Inc. | 2.6 | ||||
7. | Bank of America Corp. | 2.6 | ||||
8. | �� | Northrop Grumman Corp. | 2.4 | |||
9. | Fortune Brands Home & Security, Inc. | 2.4 | ||||
10. | NIKE, Inc. Class B | 2.2 | ||||
| (1) | Composition of Portfolio subject to change. |
| (2) | Short-term investments have been excluded from the list of Top 10 Portfolio Holdings. |
| (3) | Top 10 Portfolio Holdings is presented at an individual security level. Total investment exposure by issuer may be higher. |
| (4) | Sectors (Common Stocks, Corporate Bonds, Preferred Securities, Asset-Backed Securities): |
| % of Net Assets | ||||
Financials | 20.2 | |||
Industrials | 18.1 | |||
Consumer Discretionary | 15.3 | |||
Health Care | 8.4 | |||
Information Technology | 7.6 | |||
Materials | 7.1 | |||
Energy | 6.6 | |||
Communication Services | 5.6 | |||
Consumer Staples | 0.5 | |||
Utilities | 0.3 | |||
Real Estate | 0.1 | |||
|
| |||
| 89.8 | ||||
|
| |||
91
| Ohio National Fund, Inc. | ON ICON Balanced Portfolio |
Schedule of Investments | June 30, 2019 (Unaudited) | |
| Common Stocks – 71.0% | Shares | Value | ||||||||
COMMUNICATION SERVICES – 2.3% | ||||||||||
Alphabet, Inc. Class C (Interactive Media & Svs.) | (a) | 4,386 | $ | 4,740,871 | ||||||
Facebook, Inc. Class A (Interactive Media & Svs.) | (a) | 33,254 | 6,418,022 | |||||||
|
| |||||||||
| 11,158,893 | ||||||||||
|
| |||||||||
CONSUMER DISCRETIONARY – 12.0% | ||||||||||
AutoZone, Inc. (Specialty Retail) | (a) | 5,302 | 5,829,390 | |||||||
Brunswick Corp. (Leisure Products) | 147,713 | 6,778,550 | ||||||||
D.R. Horton, Inc. (Household Durables) | 138,020 | 5,952,803 | ||||||||
eBay, Inc. (Internet & Direct Marketing Retail) | 325,000 | 12,837,500 | ||||||||
Marriott Vacations Worldwide Corp. (Hotels, Restaurants & Leisure) | 74,000 | 7,133,600 | ||||||||
NIKE, Inc. Class B (Textiles, Apparel & Luxury Goods) | 130,000 | 10,913,500 | ||||||||
Royal Caribbean Cruises Ltd. (Hotels, Restaurants & Leisure) | 74,464 | 9,025,781 | ||||||||
|
| |||||||||
| 58,471,124 | ||||||||||
|
| |||||||||
ENERGY– 3.1% | ||||||||||
Diamondback Energy, Inc. (Oil, Gas & Consumable Fuels) | 61,404 | 6,691,194 | ||||||||
Marathon Petroleum Corp. (Oil, Gas & Consumable Fuels) | 85,352 | 4,769,470 | ||||||||
SRC Energy, Inc. (Oil, Gas & Consumable Fuels) | (a) | 772,526 | 3,831,729 | |||||||
|
| |||||||||
| 15,292,393 | ||||||||||
|
| |||||||||
FINANCIALS – 15.3% | ||||||||||
Bank of America Corp. (Banks) | 431,610 | 12,516,690 | ||||||||
JPMorgan Chase & Co. (Banks) | 117,804 | 13,170,487 | ||||||||
KeyCorp (Banks) | 297,895 | 5,287,636 | ||||||||
Lincoln National Corp. (Insurance) | 223,052 | 14,375,701 | ||||||||
Prudential Financial, Inc. (Insurance) | 98,000 | 9,898,000 | ||||||||
Signature Bank (Banks) | 76,139 | �� | 9,200,637 | |||||||
SVB Financial Group (Banks) | (a) | 43,537 | 9,777,975 | |||||||
|
| |||||||||
| 74,227,126 | ||||||||||
|
| |||||||||
HEALTH CARE – 7.0% | ||||||||||
AbbVie, Inc. (Biotechnology) | 63,768 | 4,637,209 | ||||||||
Cigna Corp. (Health Care Providers & Svs.) | 45,891 | 7,230,127 | ||||||||
PerkinElmer, Inc. (Life Sciences Tools & Svs.) | 90,266 | 8,696,226 | ||||||||
PRA Health Sciences, Inc. (Life Sciences Tools & Svs.) | (a) | 47,705 | 4,729,951 | |||||||
Thermo Fisher Scientific, Inc. (Life Sciences Tools & Svs.) | 28,951 | 8,502,330 | ||||||||
|
| |||||||||
| 33,795,843 | ||||||||||
|
| |||||||||
INDUSTRIALS – 17.2% | ||||||||||
A.O. Smith Corp. (Building Products) | 193,121 | 9,107,587 | ||||||||
Air Lease Corp. (Trading Companies & Distributors) | 202,848 | 8,385,736 | ||||||||
Canadian Pacific Railway Ltd. (Road & Rail) | 35,264 | 8,295,503 | ||||||||
Fortune Brands Home & Security, Inc. (Building Products) | 200,200 | 11,437,426 | ||||||||
L3Harris Technologies, Inc. (Aerospace & Defense) | 41,200 | 7,792,156 | ||||||||
Masco Corp. (Building Products) | 160,779 | 6,308,968 | ||||||||
Northrop Grumman Corp. (Aerospace & Defense) | 36,200 | 11,696,582 | ||||||||
Raytheon Co. (Aerospace & Defense) | 56,200 | 9,772,056 | ||||||||
Union Pacific Corp. (Road & Rail) | 63,320 | 10,708,045 | ||||||||
|
| |||||||||
| 83,504,059 | ||||||||||
|
| |||||||||
INFORMATION TECHNOLOGY – 7.4% | ||||||||||
Mastercard, Inc. Class A (IT Svs.) | 76,152 | 20,144,489 | ||||||||
Visa, Inc. (IT Svs.) | 92,613 | 16,072,986 | ||||||||
|
| |||||||||
| 36,217,475 | ||||||||||
|
| |||||||||
MATERIALS – 6.7% | ||||||||||
Eagle Materials, Inc. (Construction Materials) | 62,138 | 5,760,193 | ||||||||
Graphic Packaging Holding Co. (Containers & Packaging) | 577,777 | 8,077,322 | ||||||||
International Paper Co. (Containers & Packaging) | 215,900 | 9,352,788 | ||||||||
Packaging Corp. of America (Containers & Packaging) | 100,700 | 9,598,724 | ||||||||
|
| |||||||||
| 32,789,027 | ||||||||||
|
| |||||||||
Total Common Stocks (Cost $298,025,709) | $ | 345,455,940 | ||||||||
|
| |||||||||
| Corporate Bonds – 16.9% | Rate | Maturity | Face Amount | Value | ||||||||||||||
COMMUNICATION SERVICES – 2.9% | ||||||||||||||||||
Clear Channel International BV (Media) | (b) | 8.750% | 12/15/2020 | $ 4,000,000 | $ | 4,090,000 | ||||||||||||
CSC Holdings LLC (Media) | (b) | 10.875% | 10/15/2025 | 4,100,000 | 4,702,208 | |||||||||||||
Level 3 Parent LLC (Diversified Telecom. Svs.) | 5.750% | 12/01/2022 | 5,400,000 | 5,447,250 | ||||||||||||||
|
| |||||||||||||||||
| 14,239,458 | ||||||||||||||||||
|
| |||||||||||||||||
CONSUMER DISCRETIONARY – 3.3% | ||||||||||||||||||
Brookfield Residential Properties, Inc. (Household Durables) | (b) | 6.500% | 12/15/2020 | 2,400,000 | 2,403,000 | |||||||||||||
Lear Corp. (Auto Components) | 5.250% | 01/15/2025 | 2,950,000 | 3,060,717 | ||||||||||||||
Penske Automotive Group, Inc. (Specialty Retail) | 5.750% | 10/01/2022 | 1,090,000 | 1,104,988 | ||||||||||||||
| 92 | (continued) |
| Ohio National Fund, Inc. | ON ICON Balanced Portfolio (Continued) |
Schedule of Investments | June 30, 2019 (Unaudited) | |
| Corporate Bonds (Continued) | Rate | Maturity | Face Amount | Value | ||||||||||||||||
CONSUMER DISCRETIONARY (continued) | ||||||||||||||||||||
Silversea Cruise Finance Ltd. (Hotels, Restaurants & Leisure) | (b) | 7.250% | 02/01/2025 | $ 5,863,000 | $ | 6,300,966 | ||||||||||||||
William Lyon Homes, Inc. (Textiles, Apparel & Luxury Goods) | 7.000% | 08/15/2022 | 3,250,000 | 3,262,187 | ||||||||||||||||
|
| |||||||||||||||||||
| 16,131,858 | ||||||||||||||||||||
|
| |||||||||||||||||||
CONSUMER STAPLES – 0.5% | ||||||||||||||||||||
Central Garden & Pet Co. (Household Products) | 6.125% | 11/15/2023 | 2,229,000 | 2,312,587 | ||||||||||||||||
|
| |||||||||||||||||||
ENERGY – 3.5% | ||||||||||||||||||||
Andeavor Logistics LP /Tesoro Logistics Finance Corp. (Oil, Gas & Consumable Fuels) | 6.250% | 10/15/2022 | 3,608,000 | 3,698,200 | ||||||||||||||||
Andeavor Logistics LP /Tesoro Logistics Finance Corp. (Oil, Gas & Consumable Fuels) | 6.375% | 05/01/2024 | 7,470,000 | 7,824,825 | ||||||||||||||||
Antero Resources Corp. (Oil, Gas & Consumable Fuels) | 5.375% | 11/01/2021 | 1,300,000 | 1,283,750 | ||||||||||||||||
Continental Resources, Inc. (Oil, Gas & Consumable Fuels) | 5.000% | 09/15/2022 | 3,954,000 | 3,985,016 | ||||||||||||||||
|
| |||||||||||||||||||
| 16,791,791 | ||||||||||||||||||||
|
| |||||||||||||||||||
FINANCIALS – 3.7% | ||||||||||||||||||||
Delphi Financial Group, Inc. (Insurance) | 7.875% | 01/31/2020 | 6,140,000 | 6,315,239 | ||||||||||||||||
Principal Financial Group, Inc. (Rate is fixed until 05/15/2020, at which point, the rate becomes QL + 304) (Insurance) | (c) | 4.700% | 05/15/2055 | 4,250,000 | 4,209,328 | |||||||||||||||
Prudential Financial, Inc. (Rate is fixed until 09/15/2022, at which point, the rate becomes QL + 418) (Insurance) | (c) | 5.875% | 09/15/2042 | 4,000,000 | 4,233,960 | |||||||||||||||
Willis North America, Inc. (Insurance) | 7.000% | 09/29/2019 | 3,000,000 | 3,029,536 | ||||||||||||||||
|
| |||||||||||||||||||
| 17,788,063 | ||||||||||||||||||||
|
| |||||||||||||||||||
HEALTH CARE – 1.4% | ||||||||||||||||||||
Bausch Health Cos., Inc. (Pharmaceuticals) | (b) | 7.000% | 03/15/2024 | 3,400,000 | 3,612,840 | |||||||||||||||
Becton Dickinson and Co. (Health Care Equip. & Supplies) | 3.875% | 05/15/2024 | 3,000,000 | 3,107,221 | ||||||||||||||||
|
| |||||||||||||||||||
| 6,720,061 | ||||||||||||||||||||
|
| |||||||||||||||||||
INDUSTRIALS – 0.7% | ||||||||||||||||||||
Air Canada (Airlines) | (b) | 7.750% | 04/15/2021 | 109,000 | 117,502 | |||||||||||||||
R.R. Donnelley & Sons Co. (Commercial Svs. & Supplies) | 7.875% | 03/15/2021 | 618,000 | 630,360 | ||||||||||||||||
USG Corp. (Building Products) | (b) | 5.500% | 03/01/2025 | 2,700,000 | 2,727,000 | |||||||||||||||
|
| |||||||||||||||||||
| 3,474,862 | ||||||||||||||||||||
|
| |||||||||||||||||||
INFORMATION TECHNOLOGY– 0.2% | ||||||||||||||||||||
Dell International LLC /EMC Corp. (Computers & Peripherals) | (b) | 7.125% | 06/15/2024 | 1,000,000 | 1,055,724 | |||||||||||||||
|
| |||||||||||||||||||
MATERIALS – 0.4% | ||||||||||||||||||||
First Quantum Minerals Ltd. (Metals & Mining) | (b) | 7.000% | 02/15/2021 | 535,000 | 545,700 | |||||||||||||||
Standard Industries, Inc. (Construction Materials) | (b) | 5.500% | 02/15/2023 | 1,185,000 | 1,217,587 | |||||||||||||||
|
| |||||||||||||||||||
| 1,763,287 | ||||||||||||||||||||
|
| |||||||||||||||||||
UTILITIES – 0.3% | ||||||||||||||||||||
Vistra Energy Corp. (Ind. Power & Renewable Elec.) | (b) | 8.125% | 01/30/2026 | 1,500,000 | 1,616,250 | |||||||||||||||
|
| |||||||||||||||||||
Total Corporate Bonds (Cost $82,222,599) | $ | 81,893,941 | ||||||||||||||||||
|
| |||||||||||||||||||
| U.S. Treasury Obligations – 2.9% | Rate | Maturity | Face Amount | Value | ||||||||||||||||
U.S. Treasury Note | 2.500% | 12/31/2020 | $ 14,000,000 | $ | 14,133,437 | |||||||||||||||
|
| |||||||||||||||||||
Total U.S. Treasury Obligations (Cost $13,990,406) | $ | 14,133,437 | ||||||||||||||||||
|
| |||||||||||||||||||
| Closed-End Mutual Funds – 2.4% | Shares | Value | ||||||||||||||||||
BlackRock Enhanced Government Fund, Inc. | 27,355 | $ | 357,256 | |||||||||||||||||
BlackRock Income Trust, Inc. | 313,115 | 1,894,346 | ||||||||||||||||||
Duff & Phelps Utility and Corporate Bond Trust, Inc. | 111,059 | 971,766 | ||||||||||||||||||
Eaton Vance California Municipal Income Trust | 41,448 | 513,126 | ||||||||||||||||||
Nuveen Mortgage Opportunity Term Fund | 299,080 | 6,944,638 | ||||||||||||||||||
Nuveen Mortgage Opportunity Term Fund 2 | 23,412 | 526,536 | ||||||||||||||||||
Pioneer Diversified High Income Trust | 37,505 | 536,322 | ||||||||||||||||||
|
| |||||||||||||||||||
TotalClosed-End Mutual Funds (Cost $11,594,053) | . | $ | 11,743,990 | |||||||||||||||||
|
| |||||||||||||||||||
| Asset-Backed Securities – 1.4% | Rate | Maturity | Face Amount | Value | ||||||||||||||||
FINANCIALS – 1.2% | ||||||||||||||||||||
SMB Private Education Loan Trust2014-A C | (b) | 4.500 | % | 09/15/2045 | $ 6,250,000 | $ | 6,064,721 | |||||||||||||
|
| |||||||||||||||||||
INDUSTRIALS – 0.2% | ||||||||||||||||||||
United Airlines2007-1 Class B Pass Through Trust | 7.336 | % | 07/02/2019 | 718,357 | 720,153 | |||||||||||||||
|
| |||||||||||||||||||
Total Asset-Backed Securities (Cost $6,768,176) | $ | 6,784,874 | ||||||||||||||||||
|
| |||||||||||||||||||
| 93 | (continued) |
| Ohio National Fund, Inc. | ON ICON Balanced Portfolio (Continued) |
Schedule of Investments | June 30, 2019 (Unaudited) | |
| Preferred Securities – 0.5% | Rate | Quantity | Value | |||||||||||
COMMUNICATION SERVICES – 0.4% | ||||||||||||||
Centaur Funding Corp. (Media) | (b) | 9.080% | 1,800 | $ | 1,899,000 | |||||||||
|
| |||||||||||||
FINANCIALS – 0.0% | ||||||||||||||
Argo Group U.S., Inc. (Insurance) | 6.500% | 1,131 | 28,976 | |||||||||||
|
| |||||||||||||
REAL ESTATE – 0.1% | ||||||||||||||
Equity Commonwealth (Equity REIT) | 6.500% | 12,866 | 354,845 | |||||||||||
|
| |||||||||||||
Total Preferred Securities (Cost $2,270,719) | $ | 2,282,821 | ||||||||||||
|
| |||||||||||||
| Purchased Options – 0.0% | Notional Amount | Expiration | Exercise Price | Contracts (d) | Value | |||||||||||||||||
S&P 500 Index Put Option | 13,237,920 | August 2019 | $2,675 | 45 | $ | 45,225 | ||||||||||||||||
|
| |||||||||||||||||||||
Total Purchased Options (Cost $232,714) | $ | 45,225 | ||||||||||||||||||||
|
| |||||||||||||||||||||
| Money Market Funds – 2.6% | Shares | Value | ||||||||||||||||||||
State Street Institutional Liquid Reserves Fund Institutional Class, 2.449% | (e) | 12,790,790 | $ | 12,793,348 | ||||||||||||||||||
|
| |||||||||||||||||||||
Total Money Market Funds (Cost $12,793,289) | $ | 12,793,348 | ||||||||||||||||||||
|
| |||||||||||||||||||||
Total Investments – 97.7% (Cost $427,897,665) | (f) | $ | 475,133,576 | |||||||||||||||||||
Other Assets in Excess of Liabilities – 2.3% | 11,314,149 | |||||||||||||||||||||
|
| |||||||||||||||||||||
Net Assets – 100.0% | $ | 486,447,725 | ||||||||||||||||||||
|
| |||||||||||||||||||||
Percentages are stated as a percent of net assets.
Abbreviations:
| QL: | Quarterly U.S. LIBOR Rate, 2.320% at 06/30/2019 |
Footnotes:
| (a) | Non-income producing security. |
| (b) | Security exempt from registration under Regulation D of the Securities Act of 1933. These securities may be resold in transactions exempt from registration, normally to qualified buyers under Rule 144A. At June 30, 2019, the value of these securities totaled $36,352,498, or 7.5% of the Portfolio’s net assets. |
| (c) | Security is a fixed-then-variable rate instrument in which the coupon or dividend rate is fixed until a later specified date, then is adjusted periodically. Rates stated, including interest rate caps and floors, if any, are those in effect at June 30, 2019. |
| (d) | 100 shares per contract. |
| (e) | Rate represents theseven-day yield at June 30, 2019. |
| (f) | Represents cost for financial reporting purposes, which may differ from cost basis for federal income tax purposes. See also Note 7 of the Notes to Financial Statements. |
The accompanying notes are an integral part of these financial statements.
94
| Ohio National Fund, Inc. | ON S&P MidpCap 400® Index Portfolio (Unaudited) |
Objective/Strategy |
The ON S&P MidCap 400® Index Portfolio seeks total return approximating that of the Standard & Poor’s MidCap 400® Index (S&P MidCap 400® Index), including reinvestment of dividends, at a risk level consistent with that of the S&P MidCap 400® Index by investing, under normal circumstances, more than 80% of its net assets in the securities included in the S&P MidCap 400® Index.
Performance as of June 30, 2019 | ||
Average Annual returns | ||||
One year | 0.94 | % | ||
Five years | 5.10 | % | ||
Ten years | 11.71 | % |
Past performance does not guarantee future results. The performance data quoted represents past performance and current returns may be lower or higher. Total return figures include change in share price and reinvestment of dividends and capital gains. The investment return and principal value will fluctuate so that an investor’s shares, when redeemed, may be worth more or less than the original cost. To obtain performance information up to the most recent month end, call toll-free1-877-781-6392.
The Portfolio is not open to direct retail investment. Beneficial interest in shares is obtained solely by purchase of variable life insurance policies and variable annuity contracts. Actual performance results for variable annuity and variable universal life contracts will be lower due to contract charges. Consult your contract for applicable charges.
Total expense ratio is 0.51% per the Fund’s prospectus dated May 1, 2019. Additional information pertaining to the Portfolio’s expense ratio as of June 30, 2019 can be found in the Portfolio’s Financial Highlights.
Comments fromSub-Adviser |
Q. How did the Portfolio perform in comparison to its benchmark during the reporting period?
A.For thesix-month period ended June 30, 2019, the ON S&P MidCap 400® Index Portfolio returned 17.66% versus 17.97% for the benchmark, the S&P MidCap 400® Index.
Q. Were there specific market conditions, investment strategies, or techniques that materially affected the Portfolio’s benchmark-relative performance during the reporting period?
A.The Portfolio intends to track the underlying return of the S&P MidCap 400® Index. There were no material market events or changes in strategy during the year that materially impacted the Portfolio’s relative return. Sources of return variance were related to the cumulative impact of investing theday-to-day cash flows in the Portfolio.
Q. How did sector allocation and security selection each impact the Portfolio’s performance relative to its benchmark? For sector allocation, were there any factors that impacted the benchmark’s performance more significantly than the Portfolio’s performance? For security selection, was there anything specific regarding the Portfolio’s strategy that caused deviation from the benchmark?
A.There was no impact from either sector or stock selection that caused any significant performance variance between the Portfolio and its benchmark.(1)
Information Technology, which is the largest sector in the index, contributed the most for the period. Industrials and Financials also contributed to the return. Energy and Consumer Staples were laggards for the period.(1)
Q. Which holdings contributed the most to, and detracted the most from, the Portfolio’s benchmark-relative performance?
A.The largest contributors to the Portfolio and benchmark returns for the period were MarketAxess Holdings, Inc., Leidos Holdings, Inc., and Universal Display Corp. The largest detractors from the Portfolio and benchmark returns for the period were Covetrus, Inc., Green Dot Corp. Class A, and United Therapeutics Corp.
Q. How did the Portfolio’s use of derivative instruments and initial public offerings (IPOs), if any, impact performance?
A.The Portfolio uses S&P MidCap 400® Index futures contracts primarily to equitize open dividend receivables, as well as to manageday-to-day cash flows, to ensure the Portfolio is fully invested. The futures did not meaningfully impact performance, however, due to their index characteristics and size in relation to the Portfolio’s net assets.(1)
Q. Were there any significant changes to the Portfolio’s management team, investment strategy, or security selection process during the reporting period?
A.The portfolio management team, consisting of Portfolio Managers and Associate Portfolio Managers, added one new member over the period, while four members of the team departed for varying reasons. The team is currently staffed at seven. There were no material changes to the investment strategy or stock selection process during the period.
| (1) | The Portfolio’s composition is subject to change. Holdings and weightings are as of June 30, 2019. |
| 95 | (continued) |
| Ohio National Fund, Inc. | ON S&P MidCap 400® Index Portfolio (Unaudited) (Continued) |
Change in Value of $10,000 Investment |
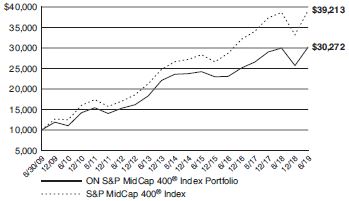
Hypothetical illustration based on past performance. Future performance will vary. The Portfolio’s returns reflect reinvested dividends. The Portfolio’s holdings may differ significantly from the securities in the index. The index is unmanaged and therefore does not reflect the cost of portfolio management and accounting.
The S&P MidCap 400® Index is a capitalization-weighted index of 400 common stocks representing all major industries in themid-range of the U.S. stock market. The index presented includes the effects of reinvested dividends.
Past performance is no guarantee of future results. Redemption of fund shares could have tax implications unique to each shareholder.
Prior to December 16, 2016, the Portfolio was known as the Target VIP Portfolio. The strategy of the Target VIP Portfolio was to seek above average total return by investing in common stocks of companies which were identified by a model that applied separate uniquely specialized strategies.
The S&P MidCap 400® Index is a product of S&P Dow Jones Indices LLC or its affiliates (“SPDJI”), and has been licensed for use by Ohio National Investments, Inc. (“ONI”). Standard & Poor’s® and S&P® are registered trademarks of Standard & Poor’s Financial Services LLC (“S&P”); Dow Jones® is a registered trademark of Dow Jones Trademark Holdings LLC (“Dow Jones”); and these trademarks have been licensed for use by SPDJI and sublicensed for certain purposes by ONI. The S&P MidCap 400® Index Portfolio of Ohio National Fund, Inc. is not sponsored, endorsed, sold or promoted by SPDJI, Dow Jones, S&P, their respective affiliates, and none of such parties make any representation regarding the advisability of investing in such product(s) nor do they have any liability for any errors, omissions, or interruptions of the S&P MidCap 400® Index.
Portfolio Composition as of June 30, 2019(1) | ||||
| % of Net Assets | ||||||||
Common Stocks(4) |
| 99.7 | ||||||
Money Market Funds Less Net Liabilities |
| 0.3 | ||||||
|
| |||||||
| 100.0 | ||||||||
|
| |||||||
Top 10 Portfolio Holdings as of June 30, 2019(1)(2) (3) | ||||
| % of Net Assets | ||||||||
| 1. | IDEX Corp. | 0.7 | ||||||
| 2. | STERIS PLC | 0.7 | ||||||
| 3. | Leidos Holdings, Inc. | 0.7 | ||||||
| 4. | Domino’s Pizza, Inc. | 0.7 | ||||||
| 5. | NVR, Inc. | 0.7 | ||||||
| 6. | Trimble, Inc. | 0.7 | ||||||
| 7. | Zebra Technologies Corp. Class A | 0.6 | ||||||
| 8. | FactSet Research Systems, Inc. | 0.6 | ||||||
| 9. | Camden Property Trust | 0.6 | ||||||
| 10. | Teledyne Technologies, Inc. | 0.6 | ||||||
| (1) | Composition of Portfolio subject to change. |
| (2) | Short-term investments have been excluded from the list of Top 10 Portfolio Holdings. |
| (3) | Top 10 Portfolio Holdings is presented at an individual security level. Total investment exposure by issuer may be higher. |
| (4) | Sectors (Common Stocks): |
| % of Net Assets | ||||
Financials | 16.2 | |||
Industrials | 16.2 | |||
Information Technology | 15.7 | |||
Consumer Discretionary | 12.3 | |||
Real Estate | 10.2 | |||
Health Care | 9.7 | |||
Materials | 6.4 | |||
Utilities | 4.7 | |||
Energy | 3.1 | |||
Consumer Staples | 2.7 | |||
Communication Services | 2.5 | |||
|
| |||
| 99.7 | ||||
|
| |||
96
| Ohio National Fund, Inc. | ON S&P MidCap 400®Index Portfolio |
Schedule of Investments | June 30, 2019 (Unaudited) | |
| Common Stocks – 99.7% | Shares | Value | ||||||||
COMMUNICATION SERVICES – 2.5% | ||||||||||
AMC Networks, Inc. Class A (Media) | (a) | 8,297 | $ | 452,104 | ||||||
Cable One, Inc. (Media) | 908 | 1,063,259 | ||||||||
Cars.com, Inc. (Interactive Media & Svs.) | (a) | 11,222 | 221,298 | |||||||
Cinemark Holdings, Inc. (Entertainment) | 19,509 | 704,275 | ||||||||
John Wiley & Sons, Inc. Class A (Media) | 8,247 | 378,207 | ||||||||
Live Nation Entertainment, Inc. (Entertainment) | (a) | 25,572 | 1,694,145 | |||||||
Meredith Corp. (Media) | 7,335 | 403,865 | ||||||||
New York Times Co. / The Class A (Media) | 26,011 | 848,479 | ||||||||
TEGNA, Inc. (Media) | 39,610 | 600,091 | ||||||||
Telephone & Data Systems, Inc. (Wireless Telecom. Svs.) | 17,198 | 522,819 | ||||||||
World Wrestling Entertainment, Inc. Class A (Entertainment) | 7,993 | 577,174 | ||||||||
Yelp, Inc. (Interactive Media & Svs.) | (a) | 13,015 | 444,853 | |||||||
|
| |||||||||
| 7,910,569 | ||||||||||
|
| |||||||||
CONSUMER DISCRETIONARY – 12.3% |
| |||||||||
Aaron’s, Inc. (Specialty Retail) | 12,390 | 760,870 | ||||||||
Adient PLC (Auto Components) | 15,925 | 386,500 | ||||||||
Adtalem Global Education, Inc. (Diversified Consumer Svs.) | (a) | 10,358 | 466,628 | |||||||
American Eagle Outfitters, Inc. (Specialty Retail) | 29,953 | 506,206 | ||||||||
AutoNation, Inc. (Specialty Retail) | (a) | 10,453 | 438,399 | |||||||
Bed Bath & Beyond, Inc. (Specialty Retail) | 24,181 | 280,983 | ||||||||
Boyd Gaming Corp. (Hotels, Restaurants & Leisure) | 14,627 | 394,051 | ||||||||
Brinker International, Inc. (Hotels, Restaurants & Leisure) | 6,869 | 270,295 | ||||||||
Brunswick Corp. (Leisure Products) | 15,941 | 731,533 | ||||||||
Caesars Entertainment Corp. (Hotels, Restaurants & Leisure) | (a) | 107,147 | 1,266,478 | |||||||
Carter’s, Inc. (Textiles, Apparel & Luxury Goods) | 8,277 | 807,339 | ||||||||
Cheesecake Factory, Inc. /The (Hotels, Restaurants & Leisure) | 7,614 | 332,884 | ||||||||
Churchill Downs, Inc. (Hotels, Restaurants & Leisure) | 6,477 | 745,308 | ||||||||
Cracker Barrel Old Country Store, Inc. (Hotels, Restaurants & Leisure) | 4,402 | 751,553 | ||||||||
Dana, Inc. (Auto Components) | 26,345 | 525,319 | ||||||||
Deckers Outdoor Corp. (Textiles, Apparel & Luxury Goods) | (a) | 5,336 | 938,976 | |||||||
Delphi Technologies PLC (Auto Components) | 16,101 | 322,020 | ||||||||
Dick’s Sporting Goods, Inc. (Specialty Retail) | 12,365 | 428,200 | ||||||||
Dillard’s, Inc. Class A (Multiline Retail) | 3,262 | 203,157 | ||||||||
Domino’s Pizza, Inc. (Hotels, Restaurants & Leisure) | 7,525 | 2,094,057 | ||||||||
Dunkin’ Brands Group, Inc. (Hotels, Restaurants & Leisure) | 15,131 | 1,205,335 | ||||||||
Eldorado Resorts, Inc. (Hotels, Restaurants & Leisure) | (a) | 11,914 | 548,878 | |||||||
Five Below, Inc. (Specialty Retail) | (a) | 10,245 | 1,229,605 | |||||||
Gentex Corp. (Auto Components) | 46,793 | 1,151,576 | ||||||||
Goodyear Tire & Rubber Co. / The (Auto Components) | 42,556 | 651,107 | ||||||||
Graham Holdings Co. Class B (Diversified Consumer Svs.) | 797 | 549,954 | ||||||||
Helen of Troy Ltd. (Household Durables) | (a) | 4,579 | 597,972 | |||||||
International Speedway Corp. Class A (Hotels, Restaurants & Leisure) | 4,374 | 196,349 | ||||||||
Jack in the Box, Inc. (Hotels, Restaurants & Leisure) | 4,726 | 384,649 | ||||||||
KB Home (Household Durables) | 15,477 | 398,223 | ||||||||
Marriott Vacations Worldwide Corp. (Hotels, Restaurants & Leisure) | 7,139 | 688,200 | ||||||||
Mattel, Inc. (Leisure Products) | (a) | 63,239 | 708,909 | |||||||
Michaels Cos., Inc./ The (Specialty Retail) | (a) | 16,467 | 143,263 | |||||||
Murphy U.S.A., Inc. (Specialty Retail) | (a) | 5,478 | 460,316 | |||||||
| Common Stocks (Continued) | Shares | Value | ||||||||
CONSUMER DISCRETIONARY (continued) |
| |||||||||
NVR, Inc. (Household Durables) | (a) | 618 | $ | 2,082,815 | ||||||
Ollie’s Bargain Outlet Holdings, Inc. (Multiline Retail) | (a) | 9,531 | 830,245 | |||||||
Papa John’s International, Inc. (Hotels, Restaurants & Leisure) | 4,123 | 184,381 | ||||||||
Penn National Gaming, Inc. (Hotels, Restaurants & Leisure) | (a) | 19,513 | 375,820 | |||||||
Polaris Industries, Inc. (Leisure Products) | 10,510 | 958,827 | ||||||||
Pool Corp. (Distributors) | 7,282 | 1,390,862 | ||||||||
Sally Beauty Holdings, Inc. (Specialty Retail) | (a) | 22,075 | 294,481 | |||||||
Scientific Games Corp. (Hotels, Restaurants & Leisure) | (a) | 10,211 | 202,382 | |||||||
Service Corp. International (Diversified Consumer Svs.) | 33,367 | 1,560,908 | ||||||||
Signet Jewelers Ltd. (Specialty Retail) | 9,555 | 170,843 | ||||||||
Six Flags Entertainment Corp. (Hotels, Restaurants & Leisure) | 13,111 | 651,355 | ||||||||
Skechers U.S.A., Inc. Class A (Textiles, Apparel & Luxury Goods) | (a) | 24,603 | 774,748 | |||||||
Sotheby’s (Diversified Consumer Svs.) | (a) | 6,059 | 352,210 | |||||||
Tempur Sealy International, Inc. (Household Durables) | (a) | 8,417 | 617,555 | |||||||
Texas Roadhouse, Inc. (Hotels, Restaurants & Leisure) | 12,230 | 656,384 | ||||||||
Thor Industries, Inc. (Automobiles) | 9,576 | 559,717 | ||||||||
Toll Brothers, Inc. (Household Durables) | 24,231 | 887,339 | ||||||||
TRI Pointe Group, Inc. (Household Durables) | (a) | 26,026 | 311,531 | |||||||
Tupperware Brands Corp. (Household Durables) | 8,930 | 169,938 | ||||||||
Urban Outfitters, Inc. (Specialty Retail) | (a) | 12,554 | 285,604 | |||||||
Visteon Corp. (Auto Components) | (a) | 5,176 | 303,210 | |||||||
Weight Watchers International, Inc. (Diversified Consumer Svs.) | (a) | 7,114 | 135,877 | |||||||
Wendy’s Co. / The (Hotels, Restaurants & Leisure) | 33,369 | 653,365 | ||||||||
Williams-Sonoma, Inc. (Specialty Retail) | 14,428 | 937,820 | ||||||||
Wyndham Destinations, Inc. (Hotels, Restaurants & Leisure) | 17,138 | 752,358 | ||||||||
Wyndham Hotels & Resorts, Inc. (Hotels, Restaurants & Leisure) | 17,812 | 992,841 | ||||||||
|
| |||||||||
| 38,658,508 | ||||||||||
|
| |||||||||
CONSUMER STAPLES – 2.7% | ||||||||||
Boston Beer Co., Inc. / The Class A (Beverages) | (a) | 1,602 | 605,171 | |||||||
Casey’s General Stores, Inc. (Food & Staples Retailing) | 6,707 | 1,046,225 | ||||||||
Edgewell Personal Care Co. (Personal Products) | (a) | 9,908 | 267,021 | |||||||
Energizer Holdings, Inc. (Household Products) | 11,640 | 449,770 | ||||||||
Flowers Foods, Inc. (Food Products) | 33,679 | 783,710 | ||||||||
Hain Celestial Group, Inc. / The (Food Products) | (a) | 16,396 | 359,072 | |||||||
Ingredion, Inc. (Food Products) | 12,208 | 1,007,038 | ||||||||
Lancaster Colony Corp. (Food Products) | 3,575 | 531,245 | ||||||||
Nu Skin Enterprises, Inc. Class A (Personal Products) | 10,158 | 500,993 | ||||||||
Post Holdings, Inc. (Food Products) | (a) | 12,213 | 1,269,786 | |||||||
Sanderson Farms, Inc. (Food Products) | 3,570 | 487,519 | ||||||||
Sprouts Farmers Market, Inc. (Food & Staples Retailing) | (a) | 21,597 | 407,967 | |||||||
Tootsie Roll Industries, Inc. (Food Products) | 3,473 | 128,258 | ||||||||
TreeHouse Foods, Inc. (Food Products) | (a) | 10,277 | 555,986 | |||||||
|
| |||||||||
| 8,399,761 | ||||||||||
|
| |||||||||
ENERGY – 3.1% | ||||||||||
Apergy Corp. (Energy Equip. & Svs.) | (a) | 14,169 | 475,228 | |||||||
Callon Petroleum Co. (Oil, Gas & Consumable Fuels) | (a) | 41,753 | 275,152 | |||||||
| 97 | (continued) |
| Ohio National Fund, Inc. | ON S&P MidCap 400® Index Portfolio (Continued) |
Schedule of Investments | June 30, 2019 (Unaudited) | |
| Common Stocks (Continued) | Shares | Value | ||||||||
ENERGY (continued) | ||||||||||
Chesapeake Energy Corp. (Oil, Gas & Consumable Fuels) | (a) | 191,409 | $ | 373,248 | ||||||
CNX Resources Corp. (Oil, Gas & Consumable Fuels) | (a) | 35,782 | 261,566 | |||||||
Core Laboratories N.V. (Energy Equip. & Svs.) | 8,119 | 424,461 | ||||||||
Ensco Rowan PLC Class A (Energy Equip. & Svs.) | 36,038 | 307,404 | ||||||||
EQT Corp. (Oil, Gas & Consumable Fuels) | 46,777 | 739,544 | ||||||||
Equitrans Midstream Corp. (Oil, Gas & Consumable Fuels) | 37,352 | 736,208 | ||||||||
Matador Resources Co. (Oil, Gas & Consumable Fuels) | (a) | 18,997 | 377,660 | |||||||
McDermott International, Inc. (Energy Equip. & Svs.) | (a) | 33,257 | 321,263 | |||||||
Murphy Oil Corp. (Oil, Gas & Consumable Fuels) | 29,880 | 736,542 | ||||||||
Oasis Petroleum, Inc. (Oil, Gas & Consumable Fuels) | (a) | 49,518 | 281,262 | |||||||
Oceaneering International, Inc. (Energy Equip. & Svs.) | (a) | 18,110 | 369,263 | |||||||
Patterson-UTI Energy, Inc. (Energy Equip. & Svs.) | 38,178 | 439,429 | ||||||||
PBF Energy, Inc. Class A (Oil, Gas & Consumable Fuels) | 21,941 | 686,753 | ||||||||
QEP Resources, Inc. (Oil, Gas & Consumable Fuels) | (a) | 43,578 | 315,069 | |||||||
Range Resources Corp. (Oil, Gas & Consumable Fuels) | 38,162 | 266,371 | ||||||||
SM Energy Co. (Oil, Gas & Consumable Fuels) | 18,903 | 236,666 | ||||||||
Southwestern Energy Co. (Oil, Gas & Consumable Fuels) | (a) | 99,071 | 313,064 | |||||||
Transocean Ltd. (Energy Equip. & Svs.) | (a) | 92,934 | 595,707 | |||||||
World Fuel Services Corp. (Oil, Gas & Consumable Fuels) | 12,314 | 442,812 | ||||||||
WPX Energy, Inc. (Oil, Gas & Consumable Fuels) | (a) | 72,668 | 836,409 | |||||||
|
| |||||||||
| 9,811,081 | ||||||||||
|
| |||||||||
FINANCIALS – 16.2% | ||||||||||
Alleghany Corp. (Insurance) | (a) | 2,644 | 1,800,855 | |||||||
American Financial Group, Inc. (Insurance) | 12,972 | 1,329,241 | ||||||||
Associated Banc-Corp. (Banks) | 30,004 | 634,284 | ||||||||
BancorpSouth Bank (Banks) | 16,836 | 488,917 | ||||||||
Bank of Hawaii Corp. (Banks) | 7,505 | 622,239 | ||||||||
Bank OZK (Banks) | 22,130 | 665,892 | ||||||||
Brighthouse Financial, Inc. (Insurance) | (a) | 21,201 | 777,865 | |||||||
Brown & Brown, Inc. (Insurance) | 42,863 | 1,435,910 | ||||||||
Cathay General Bancorp (Banks) | 13,980 | 502,022 | ||||||||
Chemical Financial Corp. (Banks) | 13,098 | 538,459 | ||||||||
CNO Financial Group, Inc. (Insurance) | 29,285 | 488,474 | ||||||||
Commerce Bancshares, Inc. (Banks) | 18,009 | 1,074,417 | ||||||||
Cullen /Frost Bankers, Inc. (Banks) | 11,551 | 1,081,867 | ||||||||
East West Bancorp, Inc. (Banks) | 26,645 | 1,246,187 | ||||||||
Eaton Vance Corp. (Capital Markets) | 20,891 | 901,029 | ||||||||
Evercore, Inc. Class A (Capital Markets) | 7,521 | 666,135 | ||||||||
FactSet Research Systems, Inc. (Capital Markets) | 7,004 | 2,007,066 | ||||||||
Federated Investors, Inc. Class B (Capital Markets) | 17,613 | 572,422 | ||||||||
First American Financial Corp. (Insurance) | 20,523 | 1,102,085 | ||||||||
First Financial Bankshares, Inc. (Banks) | 24,848 | 765,070 | ||||||||
First Horizon National Corp. (Banks) | 57,736 | 861,998 | ||||||||
FNB Corp. (Banks) | 59,451 | 699,738 | ||||||||
Fulton Financial Corp. (Banks) | 30,906 | 505,931 | ||||||||
Genworth Financial, Inc. Class A (Insurance) | (a) | 92,137 | 341,828 | |||||||
Green Dot Corp. Class A (Consumer Finance) | (a) | 8,758 | 428,266 | |||||||
Hancock Whitney Corp. (Banks) | 15,693 | 628,662 | ||||||||
Hanover Insurance Group, Inc./ The (Insurance) | 7,452 | 956,092 | ||||||||
| Common Stocks (Continued) | Shares | Value | ||||||||
FINANCIALS (continued) | ||||||||||
Home BancShares, Inc. (Banks) | 28,296 | $ | 544,981 | |||||||
Interactive Brokers Group, Inc. Class A (Capital Markets) | 13,750 | 745,250 | ||||||||
International Bancshares Corp. (Banks) | 9,973 | 376,082 | ||||||||
Janus Henderson Group PLC (Capital Markets) | 30,018 | 642,385 | ||||||||
Kemper Corp. (Insurance) | 11,442 | 987,330 | ||||||||
Legg Mason, Inc. (Capital Markets) | 15,862 | 607,197 | ||||||||
LendingTree, Inc. (Thrifts & Mortgage Finance) | (a) | 1,368 | 574,601 | |||||||
Mercury General Corp. (Insurance) | 4,967 | 310,437 | ||||||||
Navient Corp. (Consumer Finance) | 38,991 | 532,227 | ||||||||
New York Community Bancorp, Inc. (Thrifts & Mortgage Finance) | 85,560 | 853,889 | ||||||||
Old Republic International Corp. (Insurance) | 52,139 | 1,166,871 | ||||||||
PacWest Bancorp (Banks) | 21,753 | 844,669 | ||||||||
Pinnacle Financial Partners, Inc. (Banks) | 13,245 | 761,323 | ||||||||
Primerica, Inc. (Insurance) | 7,752 | 929,852 | ||||||||
Prosperity Bancshares, Inc. (Banks) | 12,152 | 802,640 | ||||||||
Reinsurance Group of America, Inc. (Insurance) | 11,454 | 1,787,168 | ||||||||
RenaissanceRe Holdings Ltd. (Insurance) | 8,086 | 1,439,389 | ||||||||
SEI Investments Co. (Capital Markets) | 23,465 | 1,316,386 | ||||||||
Signature Bank (Banks) | 10,087 | 1,218,913 | ||||||||
SLM Corp. (Consumer Finance) | 79,144 | 769,280 | ||||||||
Sterling Bancorp (Banks) | 38,368 | 816,471 | ||||||||
Stifel Financial Corp. (Capital Markets) | 12,962 | 765,536 | ||||||||
Synovus Financial Corp. (Banks) | 28,834 | 1,009,190 | ||||||||
TCF Financial Corp. (Banks) | 30,059 | 624,927 | ||||||||
Texas Capital Bancshares, Inc. (Banks) | (a) | 9,204 | 564,849 | |||||||
Trustmark Corp. (Banks) | 11,852 | 394,079 | ||||||||
UMB Financial Corp. (Banks) | 8,085 | 532,155 | ||||||||
Umpqua Holdings Corp. (Banks) | 40,361 | 669,589 | ||||||||
United Bankshares, Inc. (Banks) | 18,697 | 693,472 | ||||||||
Valley National Bancorp (Banks) | 60,732 | 654,691 | ||||||||
W.R. Berkley Corp. (Insurance) | 26,490 | 1,746,486 | ||||||||
Washington Federal, Inc. (Thrifts & Mortgage Finance) | 14,728 | 514,449 | ||||||||
Webster Financial Corp. (Banks) | 16,869 | 805,832 | ||||||||
Wintrust Financial Corp. (Banks) | 10,374 | 758,962 | ||||||||
|
| |||||||||
| 50,884,509 | ||||||||||
|
| |||||||||
HEALTH CARE – 9.7% | ||||||||||
Acadia Healthcare Co., Inc. (Health Care Providers & Svs.) | (a) | 16,238 | 567,518 | |||||||
Allscripts Healthcare Solutions, Inc. (Health Care Technology) | (a) | 30,466 | 354,320 | |||||||
Amedisys, Inc. (Health Care Providers & Svs.) | (a) | 5,339 | 648,208 | |||||||
Avanos Medical, Inc. (Health Care Equip. & Supplies) | �� | (a) | 8,696 | 379,233 | ||||||
Bio-Rad Laboratories, Inc. Class A (Life Sciences Tools & Svs.) | (a) | 3,667 | 1,146,268 | |||||||
Bio-Techne Corp. (Life Sciences Tools & Svs.) | 6,934 | 1,445,670 | ||||||||
Cantel Medical Corp. (Health Care Equip. & Supplies) | 6,652 | 536,417 | ||||||||
Catalent, Inc. (Pharmaceuticals) | (a) | 26,677 | 1,446,160 | |||||||
Charles River Laboratories International, Inc. (Life Sciences Tools & Svs.) | (a) | 8,926 | 1,266,599 | |||||||
Chemed Corp. (Health Care Providers & Svs.) | 2,918 | 1,052,931 | ||||||||
Covetrus, Inc. (Health Care Providers & Svs.) | (a) | 17,586 | 430,154 | |||||||
Encompass Health Corp. (Health Care Providers & Svs.) | 18,097 | 1,146,626 | ||||||||
Exelixis, Inc. (Biotechnology) | (a) | 55,246 | 1,180,607 | |||||||
Globus Medical, Inc. Class A (Health Care Equip. & Supplies) | (a) | 14,014 | 592,792 | |||||||
Haemonetics Corp. (Health Care Equip. & Supplies) | (a) | 9,375 | 1,128,188 | |||||||
HealthEquity, Inc. (Health Care Providers & Svs.) | (a) | 9,990 | 653,346 | |||||||
Hill-Rom Holdings, Inc. (Health Care Equip. & Supplies) | 12,225 | 1,278,979 | ||||||||
| 98 | (continued) |
| Ohio National Fund, Inc. | ON S&P MidCap 400® Index Portfolio (Continued) |
Schedule of Investments | June 30, 2019 (Unaudited) | |
| Common Stocks (Continued) | Shares | Value | ||||||||||
HEALTH CARE (continued) | ||||||||||||
ICU Medical, Inc. (Health Care Equip. & Supplies) | (a | ) | 3,057 | $ | 770,089 | |||||||
Inogen, Inc. (Health Care Equip. & Supplies) | (a | ) | 3,292 | 219,774 | ||||||||
Integra LifeSciences Holdings Corp. (Health Care Equip. & Supplies) | (a | ) | 12,988 | 725,380 | ||||||||
Ligand Pharmaceuticals, Inc. (Biotechnology) | (a | ) | 3,588 | 409,570 | ||||||||
LivaNova PLC (Health Care Equip. & Supplies) | (a | ) | 8,846 | 636,558 | ||||||||
Mallinckrodt PLC (Pharmaceuticals) | (a | ) | 15,381 | 141,198 | ||||||||
Masimo Corp. (Health Care Equip. & Supplies) | (a | ) | 8,988 | 1,337,594 | ||||||||
Medidata Solutions, Inc. (Health Care Technology) | (a | ) | 11,399 | 1,031,723 | ||||||||
MEDNAX, Inc. (Health Care Providers & Svs.) | (a | ) | 15,840 | 399,643 | ||||||||
Molina Healthcare, Inc. (Health Care Providers & Svs.) | (a | ) | 11,464 | 1,640,957 | ||||||||
NuVasive, Inc. (Health Care Equip. & Supplies) | (a | ) | 9,499 | 556,071 | ||||||||
Patterson Cos., Inc. (Health Care Providers & Svs.) | 15,156 | 347,072 | ||||||||||
PRA Health Sciences, Inc. (Life Sciences Tools & Svs.) | (a | ) | 10,819 | 1,072,704 | ||||||||
Prestige Consumer Healthcare, Inc. (Pharmaceuticals) | (a | ) | 9,481 | 300,358 | ||||||||
STERIS PLC (Health Care Equip. & Supplies) | 15,480 | 2,304,662 | ||||||||||
Syneos Health, Inc. (Life Sciences Tools & Svs.) | (a | ) | 11,206 | 572,515 | ||||||||
Tenet Healthcare Corp. (Health Care Providers & Svs.) | (a | ) | 15,292 | 315,933 | ||||||||
United Therapeutics Corp. (Biotechnology) | (a | ) | 8,021 | 626,119 | ||||||||
West Pharmaceutical Services, Inc. (Health Care Equip. & Supplies) | 13,453 | 1,683,643 | ||||||||||
|
| |||||||||||
| 30,345,579 | ||||||||||||
|
| |||||||||||
INDUSTRIALS – 16.2% | ||||||||||||
Acuity Brands, Inc. (Electrical Equip.) | 7,306 | 1,007,570 | ||||||||||
AECOM (Construction & Engineering) | (a | ) | 28,806 | 1,090,307 | ||||||||
AGCO Corp. (Machinery) | 11,809 | 916,024 | ||||||||||
ASGN, Inc. (Professional Svs.) | (a | ) | 9,665 | 585,699 | ||||||||
Avis Budget Group, Inc. (Road & Rail) | (a | ) | 11,673 | 410,423 | ||||||||
Axon Enterprise, Inc. (Aerospace & Defense) | (a | ) | 10,782 | 692,312 | ||||||||
Brink’s Co. / The (Commercial Svs. & Supplies) |
| 9,129 | 741,092 | |||||||||
Carlisle Cos., Inc. (Industrial Conglomerates) | 10,446 | 1,466,723 | ||||||||||
Clean Harbors, Inc. (Commercial Svs. & Supplies) | (a | ) | 9,308 | 661,799 | ||||||||
Colfax Corp. (Machinery) | (a | ) | 17,431 | 488,591 | ||||||||
Crane Co. (Machinery) | 9,319 | 777,577 | ||||||||||
Curtiss-Wright Corp. (Aerospace & Defense) | 7,830 | 995,428 | ||||||||||
Deluxe Corp. (Commercial Svs. & Supplies) | 7,986 | 324,711 | ||||||||||
Donaldson Co., Inc. (Machinery) | 23,347 | 1,187,428 | ||||||||||
Dycom Industries, Inc. (Construction & Engineering) | (a | ) | 5,763 | 339,268 | ||||||||
EMCOR Group, Inc. (Construction & Engineering) | 10,270 | 904,787 | ||||||||||
EnerSys (Electrical Equip.) | 7,845 | 537,382 | ||||||||||
Fluor Corp. (Construction & Engineering) | 25,615 | 862,969 | ||||||||||
GATX Corp. (Trading Companies & Distributors) | 6,627 | 525,455 | ||||||||||
Genesee & Wyoming, Inc. Class A (Road & Rail) | (a | ) | 10,347 | 1,034,700 | ||||||||
Graco, Inc. (Machinery) | 30,486 | 1,529,787 | ||||||||||
Granite Construction, Inc. (Construction & Engineering) | 8,570 | 412,903 | ||||||||||
Healthcare Services Group, Inc. (Commercial Svs. & Supplies) | 13,560 | 411,139 | ||||||||||
Herman Miller, Inc. (Commercial Svs. & Supplies) | 10,765 | 481,196 | ||||||||||
HNI Corp. (Commercial Svs. & Supplies) | 7,937 | 280,811 | ||||||||||
Hubbell, Inc. (Electrical Equip.) | 9,979 | 1,301,262 | ||||||||||
IDEX Corp. (Machinery) | 13,861 | 2,386,033 | ||||||||||
Insperity, Inc. (Professional Svs.) | 6,873 | 839,468 | ||||||||||
ITT, Inc. (Machinery) | 16,075 | 1,052,591 | ||||||||||
| Common Stocks (Continued) | Shares | Value | ||||||||||
INDUSTRIALS (continued) | ||||||||||||
JetBlue Airways Corp. (Airlines) | (a | ) | 55,096 | $ | 1,018,725 | |||||||
Kennametal, Inc. (Machinery) | 15,082 | 557,883 | ||||||||||
Kirby Corp. (Marine) | (a | ) | 9,871 | 779,809 | ||||||||
Knight-Swift Transportation Holdings, Inc. (Road & Rail) | 22,820 | 749,409 | ||||||||||
Landstar System, Inc. (Road & Rail) | 7,353 | 794,050 | ||||||||||
Lennox International, Inc. (Building Products) | 6,462 | 1,777,050 | ||||||||||
Lincoln Electric Holdings, Inc. (Machinery) | 11,496 | 946,351 | ||||||||||
ManpowerGroup, Inc. (Professional Svs.) | 10,952 | 1,057,963 | ||||||||||
MasTec, Inc. (Construction & Engineering) | (a | ) | 11,312 | 582,907 | ||||||||
MSA Safety, Inc. (Commercial Svs. & Supplies) | 6,445 | 679,239 | ||||||||||
MSC Industrial Direct Co., Inc. Class A (Trading Companies & Distributors) | 8,234 | 611,457 | ||||||||||
Nordson Corp. (Machinery) | 9,466 | 1,337,640 | ||||||||||
NOW, Inc. (Trading Companies & Distributors) | (a | ) | 19,903 | 293,768 | ||||||||
nVent Electric PLC (Electrical Equip.) | 29,097 | 721,315 | ||||||||||
Old Dominion Freight Line, Inc. (Road & Rail) | 11,856 | 1,769,627 | ||||||||||
Oshkosh Corp. (Machinery) | 12,800 | 1,068,672 | ||||||||||
Regal Beloit Corp. (Electrical Equip.) | 7,838 | 640,443 | ||||||||||
Resideo Technologies, Inc. (Building Products) | (a | ) | 22,462 | 492,367 | ||||||||
Ryder System, Inc. (Road & Rail) | 9,756 | 568,775 | ||||||||||
Stericycle, Inc. (Commercial Svs. & Supplies) | (a | ) | 15,666 | 748,051 | ||||||||
Teledyne Technologies, Inc. (Aerospace & Defense) | (a | ) | 6,634 | 1,816,854 | ||||||||
Terex Corp. (Machinery) | 11,468 | 360,095 | ||||||||||
Timken Co. / The (Machinery) | 12,542 | 643,906 | ||||||||||
Toro Co. / The (Machinery) | 19,486 | 1,303,613 | ||||||||||
Trex Co., Inc. (Building Products) | (a | ) | 10,710 | 767,907 | ||||||||
Trinity Industries, Inc. (Machinery) | 23,766 | 493,144 | ||||||||||
Valmont Industries, Inc. (Construction & Engineering) | 4,001 | 507,367 | ||||||||||
Watsco, Inc. (Trading Companies & Distributors) | 5,901 | 964,991 | ||||||||||
Werner Enterprises, Inc. (Road & Rail) | 7,933 | 246,558 | ||||||||||
Woodward, Inc. (Machinery) | 10,236 | 1,158,306 | ||||||||||
XPO Logistics, Inc. (Air Freight & Logistics) | (a | ) | 16,834 | 973,174 | ||||||||
|
| |||||||||||
| 50,676,851 | ||||||||||||
|
| |||||||||||
INFORMATION TECHNOLOGY – 15.7% |
| |||||||||||
ACI Worldwide, Inc. (Software) | (a | ) | 20,243 | 695,145 | ||||||||
Arrow Electronics, Inc. (Electronic Equip., Instr. & Comp.) | (a | ) | 15,510 | 1,105,398 | ||||||||
Avnet, Inc. (Electronic Equip., Instr. & Comp.) | 19,459 | 880,909 | ||||||||||
Belden, Inc. (Electronic Equip., Instr. & Comp.) | 7,223 | 430,274 | ||||||||||
Blackbaud, Inc. (Software) | 9,004 | 751,834 | ||||||||||
CACI International, Inc. Class A (IT Svs.) | (a | ) | 4,554 | 931,703 | ||||||||
CDK Global, Inc. (Software) | 22,268 | 1,100,930 | ||||||||||
Ciena Corp. (Communications Equip.) | (a | ) | 26,205 | 1,077,812 | ||||||||
Cirrus Logic, Inc. (Semiconductors & Equip.) | (a | ) | 10,639 | 464,924 | ||||||||
Cognex Corp. (Electronic Equip., Instr. & Comp.) | 31,372 | 1,505,229 | ||||||||||
Coherent, Inc. (Electronic Equip., Instr. & Comp.) | (a | ) | 4,429 | 603,983 | ||||||||
CommVault Systems, Inc. (Software) | (a | ) | 7,024 | 348,531 | ||||||||
CoreLogic, Inc. (IT Svs.) | (a | ) | 14,771 | 617,871 | ||||||||
Cree, Inc. (Semiconductors & Equip.) | (a | ) | 19,269 | 1,082,532 | ||||||||
Cypress Semiconductor Corp. (Semiconductors & Equip.) | 66,996 | 1,489,991 | ||||||||||
Fair Isaac Corp. (Software) | (a | ) | 5,308 | 1,666,818 | ||||||||
First Solar, Inc. (Semiconductors & Equip.) | (a | ) | 13,887 | 912,098 | ||||||||
InterDigital, Inc. (Communications Equip.) | 5,808 | 374,035 | ||||||||||
j2 Global, Inc. (Software) | 8,511 | 756,543 | ||||||||||
Jabil, Inc. (Electronic Equip., Instr. & Comp.) | 25,470 | 804,852 | ||||||||||
KBR, Inc. (IT Svs.) | 25,900 | 645,946 | ||||||||||
Leidos Holdings, Inc. (IT Svs.) | 26,403 | 2,108,279 | ||||||||||
Littelfuse, Inc. (Electronic Equip., Instr. & Comp.) | 4,527 | 800,872 | ||||||||||
LiveRamp Holdings, Inc. (IT Svs.) | (a | ) | 12,628 | 612,205 | ||||||||
| 99 | (continued) |
| Ohio National Fund, Inc. | ON S&P MidCap 400®Index Portfolio (Continued) |
Schedule of Investments | June 30, 2019 (Unaudited) | |
| Common Stocks (Continued) | Shares | Value | ||||||||
INFORMATION TECHNOLOGY (continued) | ||||||||||
LogMeIn, Inc. (Software) | 9,121 | $ | 672,035 | |||||||
Lumentum Holdings, Inc. (Communications Equip.) | (a) | 13,987 | 747,046 | |||||||
Manhattan Associates, Inc. (Software) | (a) | 11,827 | 819,966 | |||||||
MAXIMUS, Inc. (IT Svs.) | 11,684 | 847,557 | ||||||||
MKS Instruments, Inc. (Semiconductors & Equip.) | 9,951 | 775,083 | ||||||||
Monolithic Power Systems, Inc. (Semiconductors & Equip.) | 7,252 | 984,677 | ||||||||
National Instruments Corp. (Electronic Equip., Instr. & Comp.) | 20,520 | 861,635 | ||||||||
NCR Corp. (Tech. Hardware, Storage & Periph.) | (a) | 21,988 | 683,827 | |||||||
NetScout Systems, Inc. (Communications Equip.) | (a) | 12,762 | 324,027 | |||||||
Perspecta, Inc. (IT Svs.) | 25,622 | 599,811 | ||||||||
Plantronics, Inc. (Communications Equip.) | 6,011 | 222,647 | ||||||||
PTC, Inc. (Software) | (a) | 18,956 | 1,701,491 | |||||||
Sabre Corp. (IT Svs.) | 50,293 | 1,116,505 | ||||||||
Science Applications International Corp. (IT Svs.) | 9,318 | 806,566 | ||||||||
Semtech Corp. (Semiconductors & Equip.) | (a) | 12,206 | 586,498 | |||||||
Silicon Laboratories, Inc. (Semiconductors & Equip.) | (a) | 7,934 | 820,376 | |||||||
Synaptics, Inc. (Semiconductors & Equip.) | (a) | 6,318 | 184,106 | |||||||
SYNNEX Corp. (Electronic Equip., Instr. & Comp.) | 7,595 | 747,348 | ||||||||
Tech Data Corp. (Electronic Equip., Instr. & Comp.) | (a) | 6,680 | 698,728 | |||||||
Teradata Corp. (Software) | (a) | 21,439 | 768,588 | |||||||
Teradyne, Inc. (Semiconductors & Equip.) | 31,379 | 1,503,368 | ||||||||
Trimble, Inc. (Electronic Equip., Instr. & Comp.) | (a) | 46,068 | 2,078,127 | |||||||
Tyler Technologies, Inc. (Software) | (a) | 7,020 | 1,516,460 | |||||||
Universal Display Corp. (Semiconductors & Equip.) | 7,779 | 1,462,919 | ||||||||
Versum Materials, Inc. (Semiconductors & Equip.) | 19,999 | 1,031,548 | ||||||||
ViaSat, Inc. (Communications Equip.) | (a) | 10,429 | 842,872 | |||||||
Vishay Intertechnology, Inc. (Electronic Equip., Instr. & Comp.) | 24,223 | 400,164 | ||||||||
WEX, Inc. (IT Svs.) | (a) | 7,919 | 1,647,944 | |||||||
Zebra Technologies Corp. Class A (Electronic Equip., Instr. & Comp.) | (a) | 9,882 | 2,070,180 | |||||||
| 49,290,813 | ||||||||||
MATERIALS –6.4% | ||||||||||
Allegheny Technologies, Inc. (Metals & Mining) | (a) | 23,074 | 581,465 | |||||||
AptarGroup, Inc. (Containers & Packaging) | 11,570 | 1,438,614 | ||||||||
Ashland Global Holdings, Inc. (Chemicals) | 11,484 | 918,375 | ||||||||
Cabot Corp. (Chemicals) | 10,702 | 510,592 | ||||||||
Carpenter Technology Corp. (Metals & Mining) | 8,674 | 416,179 | ||||||||
Chemours Co. / The (Chemicals) | 30,017 | 720,408 | ||||||||
Commercial Metals Co. (Metals & Mining) | 21,586 | 385,310 | ||||||||
Compass Minerals International, Inc. (Metals & Mining) | 6,203 | 340,855 | ||||||||
Domtar Corp. (Paper & Forest Products) | 11,550 | 514,321 | ||||||||
Eagle Materials, Inc. (Construction Materials) | 8,077 | 748,738 | ||||||||
Greif, Inc. Class A (Containers & Packaging) | 4,807 | 156,468 | ||||||||
Ingevity Corp. (Chemicals) | (a) | 7,661 | 805,707 | |||||||
Louisiana-Pacific Corp. (Paper & Forest Products) | 22,600 | 592,572 | ||||||||
Minerals Technologies, Inc. (Chemicals) | 6,450 | 345,139 | ||||||||
NewMarket Corp. (Chemicals) | 1,598 | 640,702 | ||||||||
Olin Corp. (Chemicals) | 30,181 | 661,266 | ||||||||
Owens-Illinois, Inc. (Containers & Packaging) | 28,418 | 490,779 | ||||||||
PolyOne Corp. (Chemicals) | 14,243 | 447,088 | ||||||||
Reliance Steel & Aluminum Co. (Metals & Mining) | 12,309 | 1,164,678 | ||||||||
| Common Stocks (Continued) | Shares | Value | ||||||||
MATERIALS (continued) | ||||||||||
Royal Gold, Inc. (Metals & Mining) | 11,996 | $ | 1,229,470 | |||||||
RPM International, Inc. (Chemicals) | 23,997 | 1,466,457 | ||||||||
Scotts Miracle-Gro Co. / The (Chemicals) | 7,211 | 710,283 | ||||||||
Sensient Technologies Corp. (Chemicals) | 7,747 | 569,250 | ||||||||
Silgan Holdings, Inc. (Containers & Packaging) | 14,243 | 435,836 | ||||||||
Sonoco Products Co. (Containers & Packaging) | 18,317 | 1,196,833 | ||||||||
Steel Dynamics, Inc. (Metals & Mining) | 40,687 | 1,228,747 | ||||||||
United States Steel Corp. (Metals &Mining) | 31,558 | 483,153 | ||||||||
Valvoline, Inc. (Chemicals) | 34,455 | 672,906 | ||||||||
Worthington Industries, Inc. (Metals & Mining) | 7,133 | 287,175 | ||||||||
| 20,159,366 | ||||||||||
REAL ESTATE – 10.2% | ||||||||||
Alexander & Baldwin, Inc. (Equity REIT) | 12,412 | 286,717 | ||||||||
American Campus Communities, Inc. (Equity REIT) | 25,131 | 1,160,047 | ||||||||
Brixmor Property Group, Inc. (Equity REIT) | 54,550 | 975,354 | ||||||||
Camden Property Trust (Equity REIT) | 17,702 | 1,847,912 | ||||||||
CoreCivic, Inc. (Equity REIT) | 21,796 | 452,485 | ||||||||
CoreSite Realty Corp. (Equity REIT) | 6,755 | 777,973 | ||||||||
Corporate Office Properties Trust (Equity REIT) | 20,486 | 540,216 | ||||||||
Cousins Properties, Inc. (Equity REIT) | 26,604 | 962,267 | ||||||||
CyrusOne, Inc. (Equity REIT) | 20,719 | 1,195,901 | ||||||||
Douglas Emmett, Inc. (Equity REIT) | 29,616 | 1,179,901 | ||||||||
EastGroup Properties, Inc. (Equity REIT) | 6,730 | 780,545 | ||||||||
EPR Properties (Equity REIT) | 13,823 | 1,031,058 | ||||||||
First Industrial Realty Trust, Inc. (Equity REIT) | 23,157 | 850,788 | ||||||||
GEO Group, Inc. / The (Equity REIT) | 22,187 | 466,149 | ||||||||
Healthcare Realty Trust, Inc. (Equity REIT) | 23,658 | 740,968 | ||||||||
Highwoods Properties, Inc. (Equity REIT) | 18,980 | 783,874 | ||||||||
Hospitality Properties Trust (Equity REIT) | 30,095 | 752,375 | ||||||||
JBG SMITH Properties (Equity REIT) | 22,095 | 869,217 | ||||||||
Jones Lang LaSalle, Inc. (Real Estate Mgmt. & Development) | 8,374 | 1,178,138 | ||||||||
Kilroy Realty Corp. (Equity REIT) | 18,485 | 1,364,378 | ||||||||
Lamar Advertising Co. Class A (Equity REIT) | 15,665 | 1,264,322 | ||||||||
Liberty Property Trust (Equity REIT) | 27,146 | 1,358,386 | ||||||||
Life Storage, Inc. (Equity REIT) | 8,537 | 811,698 | ||||||||
Mack-Cali Realty Corp. (Equity REIT) | 16,537 | 385,147 | ||||||||
Medical Properties Trust, Inc. (Equity REIT) | 72,215 | 1,259,430 | ||||||||
National Retail Properties, Inc. (Equity REIT) | 29,787 | 1,579,009 | ||||||||
Omega Healthcare Investors, Inc. (Equity REIT) | 39,277 | 1,443,430 | ||||||||
Pebblebrook Hotel Trust (Equity REIT) | 23,912 | 673,840 | ||||||||
PotlatchDeltic Corp. (Equity REIT) | 12,372 | 482,260 | ||||||||
PS Business Parks, Inc. (Equity REIT) | 3,665 | 617,662 | ||||||||
Rayonier, Inc. (Equity REIT) | 23,730 | 719,019 | ||||||||
Sabra Health Care REIT, Inc. (Equity REIT) | 32,856 | 646,935 | ||||||||
Senior Housing Properties Trust (Equity REIT) | 43,510 | 359,828 | ||||||||
Tanger Factory Outlet Centers, Inc. (Equity REIT) | 17,223 | 279,185 | ||||||||
Taubman Centers, Inc. (Equity REIT) | 11,196 | 457,133 | ||||||||
Uniti Group, Inc. (Equity REIT) | 33,712 | 320,264 | ||||||||
Urban Edge Properties (Equity REIT) | 22,032 | 381,814 | ||||||||
Weingarten Realty Investors (Equity REIT) | 21,899 | 600,471 | ||||||||
| 31,836,096 | ||||||||||
UTILITIES – 4.7% | ||||||||||
ALLETE, Inc. (Electric Utilities) | 9,450 | 786,335 | ||||||||
Aqua America, Inc. (Water Utilities) | 39,501 | 1,634,156 | ||||||||
Black Hills Corp. (Multi-Utilities) | 9,948 | 777,635 | ||||||||
Hawaiian Electric Industries, Inc. (Electric Utilities) | 19,942 | 868,474 | ||||||||
IDACORP, Inc. (Electric Utilities) | 9,224 | 926,366 | ||||||||
MDU Resources Group, Inc. (Multi-Utilities) | 36,257 | 935,431 | ||||||||
National Fuel Gas Co. (Gas Utilities) | 15,799 | 833,397 | ||||||||
New Jersey Resources Corp. (Gas Utilities) | 16,333 | 812,893 | ||||||||
NorthWestern Corp. (Multi-Utilities) | 9,234 | 666,233 | ||||||||
OGE Energy Corp. (Electric Utilities) | 36,650 | 1,559,824 | ||||||||
ONE Gas, Inc. (Gas Utilities) | 9,646 | 871,034 | ||||||||
| 100 | (continued) |
| Ohio National Fund, Inc. | ON S&P MidCap 400®Index Portfolio (Continued) |
Schedule of Investments | June 30, 2019 (Unaudited) | |
| Common Stocks (Continued) | Shares | Value | ||||||||
UTILITIES (continued) | ||||||||||
PNM Resources, Inc. (Electric Utilities) | 14,583 | $ | 742,421 | |||||||
Southwest Gas Holdings, Inc. (Gas Utilities) | 9,776 | 876,125 | ||||||||
Spire, Inc. (Gas Utilities) | 9,289 | 779,533 | ||||||||
UGI Corp. (Gas Utilities) | 31,889 | 1,703,192 | ||||||||
|
| |||||||||
| 14,773,049 | ||||||||||
|
| |||||||||
Total Common Stocks | $ | 312,746,182 | ||||||||
|
| |||||||||
| Money Market Funds – 0.4% | Shares | Value | ||||||||
State Street Institutional Liquid Reserves Fund Institutional Class, 2.449% | (b) | 1,372,088 | $ | 1,372,362 | ||||||
|
| |||||||||
Total Money Market Funds | $ | 1,372,362 | ||||||||
|
| |||||||||
Total Investments – 100.1% | (c) | $ | 314,118,544 | |||||||
Liabilities in Excess of Other Assets – (0.1)% | (d) | (426,096 | ) | |||||||
|
| |||||||||
Net Assets – 100.0% | $ | 313,692,448 | ||||||||
|
| |||||||||
Percentages are stated as a percent of net assets.
Footnotes:
| (a) | Non-income producing security. |
| (b) | Rate represents theseven-day yield at June 30, 2019. |
| (c) | Represents cost for financial reporting purposes, which may differ from cost basis for federal income tax purposes. See also Note 7 of the Notes to Financial Statements. |
| (d) | Includes $85,000 of cash pledged as collateral for the futures contracts outstanding at June 30, 2019. See also the following Schedule of Open Futures Contracts. |
The accompanying notes are an integral part of these financial statements.
Schedule of Open Futures Contracts | June 30, 2019 (Unaudited) | |||||||||||
Description | Number of contracts | Expiration Date | Notional Amount | Value | Unrealized Appreciation (Depreciation) | Variation Margin Receivable (Payable) | ||||||
CMEE-mini S&P MidCap 400 Index - Long | 10 | September 20, 2019 | $1,914,358 | $1,950,000 | $35,642 | $22,800 |
The accompanying notes are an integral part of these financial statements.
101
| Ohio National Fund, Inc. | ON BlackRock Advantage Large Cap Growth Portfolio (Unaudited) |
Objective/Strategy |
The ON BlackRock Advantage Large Cap Growth Portfolio(formerly the ON Bristol Growth Portfolio)seeks long-term growth of capital by investing, under normal circumstances, at least 80% of its net assets in stocks of companies with market capitalizations at the time of investment that are within the range of market capitalizations of the companies in the Russell 1000 Growth Index for the previous 12 months.
Performance as of June 30, 2019 | ||||
Average Annual returns | ||||
One year | 3.18 | % | ||
Five years | 10.80 | % | ||
Ten years | 13.96 | % |
Past performance does not guarantee future results. The performance data quoted represents past performance and current returns may be lower or higher. Total return figures include change in share price and reinvestment of dividends and capital gains. The investment return and principal value will fluctuate so that an investor’s shares, when redeemed, may be worth more or less than the original cost. To obtain performance information up to the most recent month end, call toll-free1-877-781-6392.
The Portfolio is not open to direct retail investment. Beneficial interest in shares is obtained solely by purchase of variable life insurance policies and variable annuity contracts. Actual performance results for variable annuity and variable universal life contracts will be lower due to contract charges. Consult your contract for applicable charges.
Total expense ratio is 0.76% per the Fund’s prospectus dated May 1, 2019. Additional information pertaining to the Portfolio’s expense ratio as of June 30, 2019 can be found in the Portfolio’s Financial Highlights.
Comments fromSub-Adviser |
Q. How did the Portfolio perform in comparison to its benchmark during the reporting period?
A.For thesix-month period ended June 30, 2019, the ON BlackRock Advantage Large Cap Growth Portfolio returned 25.89% versus 21.49% for its benchmark, the Russell 1000 Growth Index.
Effective February 1, 2019, BlackRock Investment Management, LLC (“BlackRock”) replaced the Portfolio’s previoussub-adviser, Suffolk Capital Management, LLC (“Suffolk”). In conjunction with the change insub-adviser, the name of the Portfolio was changed from ON Bristol Growth Portfolio to ON BlackRock Advantage Large Cap Growth Portfolio. The Portfolio’s benchmark was unchanged.
For the period from January 1, 2019 to January 31, 2019 (the “firstone-month period”), the Portfolio was known as the ON Bristol Growth Portfolio, and wassub-advised by Suffolk. During the firstone-month period, the Portfolio returned 13.31% versus 8.99% for the Russell 1000 Growth Index.
For the period from February 1, 2019 to June 30, 2019 (the “latter five-month period”), the Portfolio wassub-advised by BlackRock. During this period, the Portfolio returned 11.10% versus 11.47% for the Russell 1000 Growth Index.
Q. Were there specific market conditions, investment strategies, or techniques that materially affected the Portfolio’s benchmark-relative performance during the reporting period?
A. Suffolk:For the firstone-month period, there were no market conditions, investment strategies, or techniques that materially affected the Portfolio’s benchmark relative performance.
A. BlackRock:For the latter five-month period, two select months were the primary drivers of relative returns. The Portfolio outperformed its benchmark significantly in May, as the market declined, due to increased trade tensions and slowing global growth. One of the core drivers of the outperformance was a sentiment-based insight that evaluates the sentiment of informed bond investors. The signal provides an alternative lens into company quality and often exhibits defensive properties, which was particularly beneficial in May, as investors sought those characteristics. Machine-learned signals analyzing management conference calls were also beneficial, both to determine shorter-term management sentiment as well as longer term company fundamentals. These insights supported performance, as investors seemingly looked to management teams in order to help identify companies with strong, sustainable growth prospects during the market turmoil.
In contrast, the Portfolio struggled in June, amidst a strong market rally driven largely by geopolitical developments and central bank policy. The market rally was sparked by a sharp reversal, as a constructive meeting between the U.S. and China at the G20 Osaka Summit led to a decrease in trade tensions, while the Federal Reserve’s dovish rhetoric increased expectations of more supportive central bank policy. The erratic nature of global trade discussions, combined with the divergence of central bank policy globally, led to an environment in which the Portfolio’s macro thematic signals struggled over the course of the month. Additionally, certain insights that exhibit more defensive properties hindered performance, as the market experienced a sharp rally following the reversal at the beginning of the month.
Q. How did sector allocation and security selection each impact the Portfolio’s performance relative to its benchmark? For sector allocation, were there any factors that impacted the benchmark’s performance more significantly than the Portfolio’s performance? For security selection, was there anything specific regarding the Portfolio’s strategy that caused deviation from the benchmark?
A. Suffolk:For the firstone-month period, both sector allocation and stock selection contributed positively to relative performance. Stock selection in Consumer Discretionary and Health Care contributed to relative outperformance, while stock selection in Communication Services detracted from relative performance.
A. BlackRock:The portfolio management team targets a generally sector-neutral approach and seeks to derive the majority of its alpha from security selection. That being said, a modest underweight to the Communication Services sector contributed slightly to performance during the latter five-month period, as the sector underperformed the broader market. On the other hand, a modest overweight to Health Care companies detracted slightly, as the sector underperformed, amidst arisk-on,pro-cyclical andpro-growth market environment. As expected though, the majority of relative performance was driven by security selection decisions. Stock selection was particularly positive in the Health Care sector, especially among pharmaceuticals companies, as well as health care equipment and supplies companies. Security selection was also positive in the Industrials sector, particularly among industrial conglomerates, and in the Consumer Discretionary sector. In contrast, selection within the Financials sector, specifically in the capital markets industry, was a notable detractor from relative performance. Stock selection in the Real Estate sector, especially among real estate investment trust companies, and in the Communication Services sector, hindered relative returns as well.(1)
Q. Which holdings contributed the most to, and detracted the most from, the Portfolio’s benchmark-relative performance?
A. Suffolk:Top contributors for the firstone-month period included Sage Therapeutics, Inc., as it announced positive results for a Phase 3 trial in postpartum depression. Celgene Corp. contributed, as it was acquired by Bristol-Myers Squibb Co. Aerie Pharmaceuticals, Inc., another top
| 102 | (continued) |
| Ohio National Fund, Inc. | ON BlackRock Advantage Large Cap Growth Portfolio (Unaudited) (Continued) |
Contributor, expects to achieve its revenue target for Rhopressa, its new glaucoma drug, which is favorable compared to concerns of inventory buildup over the past several months. Additionally, the company announced positive pilot study results for Rhopressa in Japan, a significant new market opportunity.
The top detractor for the firstone-month period was Facebook, Inc. Class A (“Facebook”). The Portfolio was underweight Facebook due to concerns of weaker growth for ad impressions and pricing. An underweight to Amazon.com, Inc. (“Amazon”), due to concerns of weaker U.S.e-commerce share gain and belief that increased regulation ofe-commerce in India would impact Amazon’s growth, was another detractor. Alphabet, Inc. Class C detracted from relative performance, due to concerns Google would lose its share in online advertising to Amazon and might withdraw its news service in Europe should a “snippet” tax be implemented.
A. BlackRock:From a security standpoint, the top individual contributor for the latter five-month period was an underweight position in 3M Co., especially within April, as the share price tumbled. During this time, company management slashed the company’s profit outlook and announced that operating income decreased in all five of its major business units. High raw material prices, weak electronics and automotive markets, and headwinds from China caused the company to miss on earnings and forced it to cut 2,000 jobs. The Portfolio’soff-benchmark position in Target Corp. (“Target”) also contributed. Target’s stock outperformed the broader market following a very strong first-quarter earnings report that included better than expected results for both revenue and earnings, as well as healthy same-store sales growth. More conveniente-commerce options, as well as improvements insame-day fulfillment services, supported by its Shipt business, drove digital sales growth and sparked investor confidence in the retailer’s ability to compete with other retail giants. Lastly, the Portfolio’s overweight position in CDW Corp. was beneficial. Largely due to company growth indicated in its first quarter earnings announcement, shares in the Information Technology company increased roughly 30% over the latter five-month period. Company earnings and revenue both topped analyst expectations, as year-over-year earnings rose 18%, while revenue jumped 10%.(1)
In contrast, the top individual detractor for the period was the Portfolio’s overweight position in The Charles Schwab Corp. The company struggled amidst increased pricing pressure that some analysts believe could act as a headwind and stifle company revenue growth going forward. An overweight position in UnitedHealth Group, Inc. was the next largest individual detractor, as the stock declined roughly 8% during the latter five-month period. Despite fairly strong first quarter earnings, uncertainties around future policy changes caused investor concern, as certain policies, such asMedicare-for-All, could act as a significant headwind to health care providers and insurers. Analysts felt that the management team did little to address the potential risks and soothe investor concerns, causing a continuedsell-off. Finally, the Portfolio’s underweight in Microsoft Corp. was a drag on relative performance, as those shares outperformed the broader market. The company’s rapidly growing cloud computing business, Azure, was the primary driver of returns, as cloud-service revenue grew 73% year-over-year in the first quarter. This growth significantly topped analyst expectations and resulted in company revenues and earnings both beating estimates, with revenues growing 14% year-over-year.(1)
Q. How did the Portfolio’s use of derivative instruments and initial public offerings (IPOs), if any, impact performance?
A. Suffolk:The Portfolio did not hold any derivatives or participate in any IPOs during the firstone-month period.
A. BlackRock:Pursuant to the Portfolio’s investment strategy, futures contracts were used in order to equitize cash and prevent a cash drag on performance during the latter five-month period. The futures did not meaningfully impact performance, however, due to their index characteristics and size in relation to the Portfolio’s net assets.(1)
| (1) | The Portfolio’s composition is subject to change. Holdings and weightings are as of June 30, 2019. |
Change in Value of $10,000 Investment |
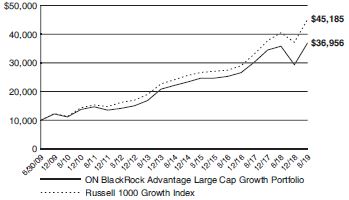
Hypothetical illustration based on past performance. Future performance will vary. The Portfolio’s returns reflect reinvested dividends. The Portfolio’s holdings may differ significantly from the securities in the index. The index is unmanaged and therefore does not reflect the cost of portfolio management and accounting.
The Russell 1000 Growth Index is a market-capitalization weighted index of those firms in the Russell 1000 Index with higherprice-to-book ratios and higher forecasted growth values. The Russell 1000 Index measures the performance of thelarge-cap segment of the U.S. equity universe. The index presented includes the effects of reinvested dividends.
Past performance is no guarantee of future results. Redemption of fund shares could have tax implications unique to each shareholder.
| 103 | (continued) |
| Ohio National Fund, Inc. | ON BlackRock Advantage Large Cap Growth Portfolio (Unaudited) (Continued) |
Portfolio Composition as of June 30, 2019(1) | ||
| % of Net Assets | ||||
Common Stocks(4) | 98.2 | |||
Money Market Funds and Other Net Assets | 1.8 | |||
|
| |||
| 100.0 | ||||
|
| |||
Top 10 Portfolio Holdings as of June 30, 2019(1)(2) (3) | ||||
| % of Net Assets | ||||
1. Microsoft Corp. | 6.1 | |||
2. Amazon.com, Inc. | 6.0 | |||
3. Apple, Inc. | 5.7 | |||
4. Facebook, Inc. Class A | 3.6 | |||
5. Visa, Inc. | 2.8 | |||
6. Merck & Co., Inc. | 2.5 | |||
7. Alphabet, Inc. Class C | 2.3 | |||
8. salesforce.com, Inc. | 1.9 | |||
9. UnitedHealth Group, Inc. | 1.7 | |||
10. Adobe, Inc. | 1.7 | |||
| (1) | Composition of Portfolio subject to change. |
| (2) | Short-term investments have been excluded from the list of Top 10 Portfolio Holdings. |
| (3) | Top 10 Portfolio Holdings is presented at an individual security level. Total investment exposure by issuer may be higher. |
| (4) | Sectors (Common Stocks): |
| % of Net Assets | ||||
Information Technology | 36.2 | |||
Health Care | 14.2 | |||
Consumer Discretionary | 14.0 | |||
Communication Services | 11.1 | |||
Industrials | 10.0 | |||
Consumer Staples | 4.8 | |||
Financials | 3.6 | |||
Real Estate | 2.4 | |||
Materials | 1.2 | |||
Utilities | 0.5 | |||
Energy | 0.2 | |||
|
| |||
| 98.2 | ||||
|
| |||
104
| Ohio National Fund, Inc. | ON BlackRock Advantage Large Cap Growth Portfolio |
Schedule of Investments | June 30, 2019 (Unaudited) | |
| Common Stocks – 98.2% | Shares | Value | ||||||||
COMMUNICATION SERVICES – 11.1% | ||||||||||
Activision Blizzard, Inc. (Entertainment) | 6,650 | $ | 313,880 | |||||||
Alphabet, Inc. Class A (Interactive Media & Svs.) | (a) | 1,447 | 1,566,812 | |||||||
Alphabet, Inc. Class C (Interactive Media & Svs.) | (a) | 2,417 | 2,612,559 | |||||||
Cargurus, Inc. (Interactive Media & Svs.) | (a) | 1,680 | 60,665 | |||||||
CBS Corp. Class B (Media) | 1,812 | 90,419 | ||||||||
Comcast Corp. Class A (Media) | 7,000 | 295,960 | ||||||||
Electronic Arts, Inc. (Entertainment) | (a) | 517 | 52,351 | |||||||
Facebook, Inc. Class A (Interactive Media & Svs.) | (a) | 20,933 | 4,040,069 | |||||||
Interpublic Group of Cos., Inc. /The (Media) | 55,003 | 1,242,518 | ||||||||
Netflix, Inc. (Entertainment) | (a) | 2,752 | 1,010,865 | |||||||
Omnicom Group, Inc. (Media) | 1,820 | 149,149 | ||||||||
Pinterest, Inc. Class A (Interactive Media & Svs.) | (a) | 1,973 | 53,705 | |||||||
Sinclair Broadcast Group, Inc. Class A (Media) | 1,468 | 78,729 | ||||||||
Sirius XM Holdings, Inc. (Media) | 2,748 | 15,334 | ||||||||
Take-Two Interactive Software, Inc. (Entertainment) | (a) | 1,412 | 160,304 | |||||||
Twitter, Inc. (Interactive Media & Svs.) | (a) | 4,661 | 162,669 | |||||||
United States Cellular Corp. (Wireless Telecom. Svs.) | (a) | 450 | 20,101 | |||||||
Verizon Communications, Inc. (Diversified Telecom. Svs.) | 4,985 | 284,793 | ||||||||
Zynga, Inc. Class A (Entertainment) | (a) | 32,647 | 200,126 | |||||||
|
| |||||||||
| 12,411,008 | ||||||||||
|
| |||||||||
CONSUMER DISCRETIONARY – 14.0% | ||||||||||
Advance Auto Parts, Inc. (Specialty Retail) | 2,681 | 413,249 | ||||||||
Alibaba Group Holding Ltd. – ADR (Internet & Direct Marketing Retail) | (a) | 1,907 | 323,141 | |||||||
Amazon.com, Inc. (Internet & Direct Marketing Retail) | (a) | 3,522 | 6,669,365 | |||||||
AutoZone, Inc. (Specialty Retail) | (a) | 410 | 450,783 | |||||||
Chipotle Mexican Grill, Inc. (Hotels, Restaurants & Leisure) | (a) | 300 | 219,864 | |||||||
Choice Hotels International, Inc. (Hotels, Restaurants & Leisure) | 1,705 | 148,352 | ||||||||
Darden Restaurants, Inc. (Hotels, Restaurants & Leisure) | 10,258 | 1,248,706 | ||||||||
Domino’s Pizza, Inc. (Hotels, Restaurants & Leisure) | 1,496 | 416,307 | ||||||||
Etsy, Inc. (Internet & Direct Marketing Retail) | (a) | 1,061 | 65,114 | |||||||
Extended Stay America, Inc. (Hotels, Restaurants & Leisure) | 43,256 | 730,594 | ||||||||
frontdoor, Inc. (Diversified Consumer Svs.) | (a) | 4,345 | 189,225 | |||||||
H&R Block, Inc. (Diversified Consumer Svs.) | 1,049 | 30,736 | ||||||||
Home Depot, Inc. / The (Specialty Retail) | 1,384 | 287,830 | ||||||||
Las Vegas Sands Corp. (Hotels, Restaurants & Leisure) | 15,003 | 886,527 | ||||||||
Lululemon Athletica, Inc. (Textiles, Apparel & Luxury Goods) | (a) | 3,548 | 639,385 | |||||||
McDonald’s Corp. (Hotels, Restaurants & Leisure) | 169 | 35,094 | ||||||||
NIKE, Inc. Class B (Textiles, Apparel & Luxury Goods) | 11,226 | 942,423 | ||||||||
Norwegian Cruise Line Holdings Ltd. (Hotels, Restaurants & Leisure) | (a) | 766 | 41,081 | |||||||
O’Reilly Automotive, Inc. (Specialty Retail) | (a) | 981 | 362,303 | |||||||
Royal Caribbean Cruises Ltd. (Hotels, Restaurants & Leisure) | 858 | 103,998 | ||||||||
Six Flags Entertainment Corp. (Hotels, Restaurants & Leisure) | 449 | 22,306 | ||||||||
Target Corp. (Multiline Retail) | 1,555 | 134,679 | ||||||||
TJX Cos., Inc. / The (Specialty Retail) | 9,748 | 515,474 | ||||||||
| Common Stocks (Continued) | Shares | Value | ||||||||
CONSUMER DISCRETIONARY (continued) |
| |||||||||
Ulta Beauty, Inc. (Specialty Retail) | (a) | 652 | $ | 226,172 | ||||||
Yum! Brands, Inc. (Hotels, Restaurants & Leisure) | 4,799 | 531,105 | ||||||||
|
| |||||||||
| 15,633,813 | ||||||||||
|
| |||||||||
CONSUMER STAPLES – 4.8% | ||||||||||
Brown-Forman Corp. Class A (Beverages) | 1,178 | 64,790 | ||||||||
Church & Dwight Co., Inc. (Household Products) | 6,689 | 488,698 | ||||||||
Costco Wholesale Corp. (Food & Staples Retailing) | 2,015 | 532,484 | ||||||||
Estee Lauder Cos., Inc. / The Class A (Personal Products) | 2,091 | 382,883 | ||||||||
General Mills, Inc. (Food Products) | 13,092 | 687,592 | ||||||||
Hershey Co. / The (Food Products) | 4,418 | 592,144 | ||||||||
Monster Beverage Corp. (Beverages) | (a) | 10,336 | 659,747 | |||||||
PepsiCo, Inc. (Beverages) | 13,051 | 1,711,378 | ||||||||
Performance Food Group Co. (Food & Staples Retailing) | (a) | 7,534 | 301,586 | |||||||
|
| |||||||||
| 5,421,302 | ||||||||||
|
| |||||||||
ENERGY – 0.2% | ||||||||||
ConocoPhillips (Oil, Gas & Consumable Fuels) | 4,299 | 262,239 | ||||||||
|
| |||||||||
FINANCIALS – 3.6% | ||||||||||
American Express Co. (Consumer Finance) | 4,081 | 503,759 | ||||||||
Berkshire Hathaway, Inc. Class B (Diversified Financial Svs.) | (a) | 2,039 | 434,654 | |||||||
Charles Schwab Corp. / The (Capital Markets) | 34,818 | 1,399,335 | ||||||||
Discover Financial Services (Consumer Finance) | 1,037 | 80,461 | ||||||||
First American Financial Corp. (Insurance) | 6,080 | 326,496 | ||||||||
Prudential Financial, Inc. (Insurance) | 7,005 | 707,505 | ||||||||
S&P Global, Inc. (Capital Markets) | 890 | 202,733 | ||||||||
TD Ameritrade Holding Corp. (Capital Markets) | 8,261 | 412,389 | ||||||||
|
| |||||||||
| 4,067,332 | ||||||||||
|
| |||||||||
HEALTH CARE – 14.2% | ||||||||||
AbbVie, Inc. (Biotechnology) | 18,629 | 1,354,701 | ||||||||
AmerisourceBergen Corp. (Health Care Providers & Svs.) | 1,943 | 165,660 | ||||||||
Amgen, Inc. (Biotechnology) | 9,160 | 1,688,005 | ||||||||
Anthem, Inc. (Health Care Providers & Svs.) | 682 | 192,467 | ||||||||
Bristol-Myers Squibb Co. (Pharmaceuticals) | 13,399 | 607,645 | ||||||||
Bruker Corp. (Life Sciences Tools & Svs.) | 340 | 16,983 | ||||||||
Celgene Corp. (Biotechnology) | (a) | 5,627 | 520,160 | |||||||
DexCom, Inc. (Health Care Equip. & Supplies) | (a) | 1,750 | 262,220 | |||||||
Gilead Sciences, Inc. (Biotechnology) | 19,438 | 1,313,231 | ||||||||
Hill-Rom Holdings, Inc. (Health Care Equip. & Supplies) | 3,645 | 381,340 | ||||||||
IDEXX Laboratories, Inc. (Health Care Equip. & Supplies) | (a) | 981 | 270,099 | |||||||
Incyte Corp. (Biotechnology) | (a) | 777 | 66,014 | |||||||
Johnson & Johnson (Pharmaceuticals) | 7,669 | 1,068,138 | ||||||||
Medtronic PLC (Health Care Equip. & Supplies) | 1,712 | 166,732 | ||||||||
Merck & Co., Inc. (Pharmaceuticals) | 33,843 | 2,837,735 | ||||||||
Regeneron Pharmaceuticals, Inc. (Biotechnology) | (a) | 1,558 | 487,654 | |||||||
Stryker Corp. (Health Care Equip. & Supplies) | 5,055 | 1,039,207 | ||||||||
UnitedHealth Group, Inc. (Health Care Providers & Svs.) | 7,896 | 1,926,703 | ||||||||
Veeva Systems, Inc. Class A (Health Care Technology) | (a) | 6,220 | 1,008,324 | |||||||
Vertex Pharmaceuticals, Inc. (Biotechnology) | (a) | 2,103 | 385,648 | |||||||
WellCare Health Plans, Inc. (Health Care Providers & Svs.) | (a) | 369 | 105,191 | |||||||
|
| |||||||||
| 15,863,857 | ||||||||||
|
| |||||||||
INDUSTRIALS – 10.0% | ||||||||||
Allegion PLC (Building Products) | 8,111 | 896,671 | ||||||||
| 105 | (continued) |
| Ohio National Fund, Inc. | ON BlackRock Advantage Large Cap Growth Portfolio (Continued) |
Schedule of Investments | June 30, 2019 (Unaudited) | |
| Common Stocks (Continued) | Shares | Value | ||||||||
INDUSTRIALS (continued) | ||||||||||
Boeing Co. / The (Aerospace & Defense) | 895 | $ | 325,789 | |||||||
CoStar Group, Inc. (Professional Svs.) | (a) | 1,678 | 929,713 | |||||||
Crane Co. (Machinery) | 10,085 | 841,492 | ||||||||
Cummins, Inc. (Machinery) | 1,028 | 176,138 | ||||||||
Generac Holdings, Inc. (Electrical Equip.) | (a) | 1,712 | 118,830 | |||||||
Honeywell International, Inc. (Industrial Conglomerates) | 3,680 | 642,491 | ||||||||
Hubbell, Inc. (Electrical Equip.) | 3,152 | 411,021 | ||||||||
Insperity, Inc. (Professional Svs.) | 7,210 | 880,629 | ||||||||
L3Harris Technologies, Inc. (Aerospace & Defense) | 3,931 | 743,470 | ||||||||
Landstar System, Inc. (Road & Rail) | 296 | 31,965 | ||||||||
Lockheed Martin Corp. (Aerospace & Defense) | 3,566 | 1,296,384 | ||||||||
Lyft, Inc. Class A (Road & Rail) | (a) | 2,743 | 180,243 | |||||||
Oshkosh Corp. (Machinery) | 3,983 | 332,541 | ||||||||
PACCAR, Inc. (Machinery) | 16,470 | 1,180,240 | ||||||||
Raytheon Co. (Aerospace & Defense) | 2,280 | 396,446 | ||||||||
Rockwell Automation, Inc. (Electrical Equip.) | 4,857 | 795,722 | ||||||||
Roper Technologies, Inc. (Industrial Conglomerates) | 71 | 26,004 | ||||||||
Snap-on, Inc. (Machinery) | 1,940 | 321,342 | ||||||||
TriNet Group, Inc. (Professional Svs.) | (a) | 5,177 | 351,001 | |||||||
Uber Technologies, Inc. (Road & Rail) | (a) | 2,879 | 133,528 | |||||||
Waste Management, Inc. (Commercial Svs. & Supplies) | 1,166 | 134,521 | ||||||||
|
| |||||||||
| 11,146,181 | ||||||||||
|
| |||||||||
INFORMATION TECHNOLOGY – 36.2% |
| |||||||||
Accenture PLC Class A (IT Svs.) | 791 | 146,153 | ||||||||
Adobe, Inc. (Software) | (a) | 6,350 | 1,871,028 | |||||||
Apple, Inc. (Tech. Hardware, Storage & Periph.) | 32,348 | 6,402,316 | ||||||||
Applied Materials, Inc. (Semiconductors & Equip.) | 6,808 | 305,747 | ||||||||
Automatic Data Processing, Inc. (IT Svs.) | 10,785 | 1,783,084 | ||||||||
Booz Allen Hamilton Holding Corp. (IT Svs.) | 6,853 | 453,737 | ||||||||
Broadcom, Inc. (Semiconductors & Equip.) | 715 | 205,820 | ||||||||
CDW Corp. (Electronic Equip., Instr. & Comp.) | 6,836 | 758,796 | ||||||||
Ciena Corp. (Communications Equip.) | (a) | 3,656 | 150,371 | |||||||
Cirrus Logic, Inc. (Semiconductors & Equip.) | (a) | 4,862 | 212,470 | |||||||
Cisco Systems, Inc. (Communications Equip.) | 17,608 | 963,686 | ||||||||
Dell Technologies, Inc. Class C (Tech. Hardware, Storage & Periph.) | (a) | 6,974 | 354,279 | |||||||
Fidelity National Information Services, Inc. (IT Svs.) | 8,577 | 1,052,226 | ||||||||
First Data Corp. Class A (IT Svs.) | (a) | 1,105 | 29,912 | |||||||
GoDaddy, Inc. Class A (IT Svs.) | (a) | 15,896 | 1,115,105 | |||||||
HP, Inc. (Tech. Hardware, Storage & Periph.) | 2,360 | 49,065 | ||||||||
International Business Machines Corp. (IT Svs.) | 3,548 | 489,269 | ||||||||
Intuit, Inc. (Software) | 3,046 | 796,011 | ||||||||
Master card, Inc. Class A (IT Svs.) | 3,169 | 838,296 | ||||||||
Microsoft Corp. (Software) | 51,196 | 6,858,216 | ||||||||
National Instruments Corp. (Electronic Equip., Instr. & Comp.) | 22,476 | 943,767 | ||||||||
NVIDIA Corp. (Semiconductors & Equip.) | 2,157 | 354,244 | ||||||||
Palo Alto Networks, Inc. (Software) | (a) | 861 | 175,437 | |||||||
| Common Stocks (Continued) | Shares | Value | ||||||||
INFORMATION TECHNOLOGY (continued) |
| |||||||||
Paychex, Inc. (IT Svs.) | 16,268 | $ | 1,338,694 | |||||||
Paycom Software, Inc. (Software) | (a) | 736 | 166,866 | |||||||
Paylocity Holding Corp. (Software) | (a) | 4,956 | 464,972 | |||||||
PayPal Holdings, Inc. (IT Svs.) | (a) | 5,524 | 632,277 | |||||||
QUALCOMM, Inc. (Semiconductors & Equip.) | 2,139 | 162,714 | ||||||||
Red Hat, Inc. (Software) | (a) | 1,408 | 264,366 | |||||||
RingCentral, Inc. Class A (Software) | (a) | 2,843 | 326,718 | |||||||
salesforce.com, Inc. (Software) | (a) | 13,734 | 2,083,860 | |||||||
ServiceNow, Inc. (Software) | (a) | 5,797 | 1,591,682 | |||||||
Square, Inc. Class A (IT Svs.) | (a) | 6,632 | 481,019 | |||||||
Tableau Software, Inc. Class A (Software) | (a) | 566 | 93,967 | |||||||
Texas Instruments, Inc. (Semiconductors & Equip.) | 9,638 | 1,106,057 | ||||||||
VeriSign, Inc. (IT Svs.) | (a) | 4,061 | 849,399 | |||||||
Visa, Inc. (IT Svs.) | 18,004 | 3,124,594 | ||||||||
Workday, Inc. Class A (Software) | (a) | 4,045 | 831,571 | |||||||
Xilinx, Inc. (Semiconductors & Equip.) | 5,434 | 640,777 | ||||||||
Zendesk, Inc. (Software) | (a) | 510 | 45,405 | |||||||
|
| |||||||||
| 40,513,973 | ||||||||||
|
| |||||||||
MATERIALS – 1.2% | ||||||||||
Air Products & Chemicals, Inc. (Chemicals) | 2,347 | 531,291 | ||||||||
Dow, Inc. (Chemicals) | 58 | 2,860 | ||||||||
Ecolab, Inc. (Chemicals) | 2,291 | 452,335 | ||||||||
Westrock Co. (Containers & Packaging) | 9,992 | 364,408 | ||||||||
|
| |||||||||
| 1,350,894 | ||||||||||
|
| |||||||||
REAL ESTATE – 2.4% | ||||||||||
Equity LifeStyle Properties, Inc. (Equity REIT) | 10,427 | 1,265,212 | ||||||||
Park Hotels & Resorts, Inc. (Equity REIT) | 4,297 | 118,425 | ||||||||
Prologis, Inc. (Equity REIT) | 5,056 | 404,986 | ||||||||
Ryman Hospitality Properties, Inc. (Equity REIT) | 2,488 | 201,752 | ||||||||
Simon Property Group, Inc. (Equity REIT) | 4,177 | 667,317 | ||||||||
|
| |||||||||
| 2,657,692 | ||||||||||
|
| |||||||||
UTILITIES – 0.5% | ||||||||||
American Water Works Co., Inc. (Water Utilities) | 4,378 | 507,848 | ||||||||
Black Hills Corp. (Multi-Utilities) | 274 | 21,418 | ||||||||
IDACORP, Inc. (Electric Utilities) | 67 | 6,729 | ||||||||
Southwest Gas Holdings, Inc. (Gas Utilities) | 132 | 11,830 | ||||||||
|
| |||||||||
| 547,825 | ||||||||||
|
| |||||||||
Total Common Stocks | $ | 109,876,116 | ||||||||
|
| |||||||||
| Money Market Funds – 1.4% | Shares | Value | ||||||||
State Street Institutional Liquid Reserves Fund Institutional Class, 2.449% | (b) | 1,581,274 | $ | 1,581,591 | ||||||
State Street Institutional U.S. Government Money Market Fund Institutional Class, 2.310% | (b) | 7,030 | 7,030 | |||||||
|
| |||||||||
Total Money Market Funds | $ | 1,588,621 | ||||||||
|
| |||||||||
Total Investments – 99.6% | (c) | $ | 111,464,737 | |||||||
Other Assets in Excess of Liabilities – 0.4% | (d) | 494,313 | ||||||||
|
| |||||||||
Net Assets – 100.0% | $ | 111,959,050 | ||||||||
|
| |||||||||
| 106 | (continued) |
| Ohio National Fund, Inc. | ON BlackRock Advantage Large Cap Growth Portfolio (Continued) |
Schedule of Investments | June 30, 2019 (Unaudited) | |
Percentages are stated as a percent of net assets.
Abbreviations:
| ADR: | American Depositary Receipts |
Footnotes:
| (a) | Non-income producing security. |
| (b) | Rate represents theseven-day yield at June 30, 2019. |
| (c) | Represents cost for financial reporting purposes, which may differ from cost basis for federal income tax purposes. See also Note 7 of the Notes to Financial Statements. |
| (d) | Includes $88,200 of cash pledged as collateral for the futures contracts outstanding at June 30, 2019. See also the following Schedule of Open Futures Contracts. |
The accompanying notes are an integral part of these financial statements.
Schedule of Open Futures Contracts | June 30, 2019 (Unaudited) | |||||||||
Description | Number of contracts | Expiration Date | Notional Amount | Value | Unrealized Appreciation (Depreciation) | Variation Margin Receivable (Payable) | ||||||||||
CMEE-mini S&P 500 Index - Long | 14 | September 20, 2019 | $ | 2,038,267 | $ | 2,060,940 | $22,673 | $6,975 | ||||||||
The accompanying notes are an integral part of these financial statements.
107
| Ohio National Fund, Inc. | ON Risk Managed Balanced Portfolio (Unaudited) |
Objective/Strategy |
The ON Risk Managed Balanced Portfolio seeks long-term capital growth, consistent with preservation of capital and balanced by current income. The Portfolio invests in a balanced portfolio of equity and fixed-income securities (the “Balanced Component”) and a risk management portfolio intended to enhance the risk adjusted return of the Portfolio (the “Risk Management Component”).
Performance as of June 30, 2019 |
Average Annual returns | ||||
One year | 12.60% | |||
Five years | 7.62% | |||
Since inception (5/1/14) | 7.98% |
Past performance does not guarantee future results. The performance data quoted represents past performance and current returns may be lower or higher. Total return figures include change in share price and reinvestment of dividends and capital gains. The investment return and principal value will fluctuate so that an investor’s shares, when redeemed, may be worth more or less than the original cost. To obtain performance information up to the most recent month end, call toll-free1-877-781-6392.
The Portfolio is not open to direct retail investment. Beneficial interest in shares is obtained solely by purchase of variable life insurance policies and variable annuity contracts. Actual performance results for variable annuity and variable universal life contracts will be lower due to contract charges. Consult your contract for applicable charges.
Total expense ratio is 1.01% per the Fund’s prospectus dated May 1, 2019. Additional information pertaining to the Portfolio’s expense ratio as of June 30, 2019 can be found in the Portfolio’s Financial Highlights.
Comments fromSub-Advisers |
Q. How did the Portfolio perform in comparison to its benchmark during the reporting period?
A.For thesix-month period ended June 30, 2019, the ON Risk Managed Balanced Portfolio returned 14.87% versus 18.54% for its benchmark, the S&P 500 Index. The Portfolio’s secondary benchmark, which is comprised of 55% S&P 500 Index and 45% Bloomberg Barclays U.S. Aggregate Bond Index, returned 13.01% for the period.
Q. Were there specific market conditions, investment strategies, or techniques that materially affected the Portfolio’s benchmark-relative performance during the reporting period?
A.The Portfolio underperformed the S&P 500 Index during the period. Equities outperformed fixed income, and the Portfolio’s allocation to fixed income securities held back relative results. The Portfolio ended June with approximately 40% allocated to fixed income, 60% allocated to equities, and a small portion in cash. The asset allocations may vary based on market conditions, and positioning reflected the portfolio managers’ belief that equities offered greater risk-adjusted opportunities versus fixed income throughout the period. The equity sleeve also modestly underperformed its S&P 500 Index benchmark, largely due to stock selection.
The fixed income sleeve outperformed the Bloomberg Barclays U.S. Aggregate Bond Index. The Portfolio’s Treasury allocation contributed to relative outperformance. The fixed income portion of the Portfolio was positioned with a bias to longer-dated Treasuries, and the duration overweight performed well as rates rallied. Security selection in investment-grade corporates, the strongest-performing benchmark sector, also supported relative results. Anout-of-index allocation to high-yield corporate bonds was another contributor to relative performance, as spreads tightened.Front-end and floating rate collateralized mortgage obligations, asset-backed securities and
collateralized loan obligations allocations detracted from relative performance, largely due to their lack of duration. A modest cash balance detracted from relative performance during the period’s“risk-on” sentiment.
Q. How did sector allocation and security selection each impact the Portfolio’s performance relative to its benchmark? For sector allocation, were there any factors that impacted the benchmark’s performance more significantly than the Portfolio’s performance? For security selection, was there anything specific regarding the Portfolio’s strategy that caused deviation from the benchmark?
A.In the equity sleeve, stock selection in Health Care, Industrials and Consumer Staples weighed on performance relative to the S&P 500 Index. Stock selection in the Financials, Information Technology and Energy sectors contributed to relative results. In terms of sector allocation, an underweight to the poor-performing Health Care sector proved beneficial, amid drug pricing rhetoric and Democratic candidate proposals for health care for all. The Energy sector also lagged, as oil prices declined late in the period, and the Portfolio’s underweight there further aided relative returns. An overweight to the strongest-performing sector, Information Technology, proved beneficial, while an overweight to Consumer Staples detracted from relative performance.(1)
In the fixed income sleeve, holdings in midstream energy, wireline communications and food and beverage contributed to relative results, largely due to overweight allocations. Holdings in independent energy, life insurance and railroads modestly detracted from relative results.(1)
Q. How did the Risk Management Component impact the Portfolio’s performance during the period?
A.The Portfolio’s Risk Management Component,sub-advised by AnchorPath Financial LLC, is a sleeve of derivatives and cash equivalents that seeks to enhance the risk-adjusted return of the Portfolio. Under normal circumstances, the Risk Management Component will represent approximately 20% of the Portfolio. During thesix-month period, this allocation ranged between 18.4% and 22.0%.(1)
The Portfolio’s performance is enhanced on a risk-adjusted basis when the aggregate Portfolio achieves lower volatility with similar returns, or higher returns at similar volatility compared to a benchmark. For thesix-month period, compared to the Balanced Component, the Risk Managed Balanced Portfolio’s realized volatility was lower by 0.6% and the cumulative return was higher by 2.1%. Due to the higher return and lower volatility over the period, the risk-adjusted return of the Risk Managed Balanced Portfolio was materially enhanced compared to the Balanced Component. For the period, the Risk Management Component experienced a loss on index-based options associated with the time decay of premium value. This loss, however, was more than offset by gains on the Treasury futures positions.(1)
Q. Which holdings contributed the most to, and detracted the most from, the Portfolio’s benchmark-relative performance?
A.Largest Equity Contributors:
| • | Multinational financial services corporation Mastercard, Inc. Class A was the strongest individual contributor to relative performance. The company is growing faster than its competition and benefiting from smart acquisitions and its fixed-cost business model, which is resulting in high incremental margins. Payments companies continue to benefit as credit cards and electronic payments grow in popularity among consumers and businesses globally. (1) |
| 108 | (continued) |
| Ohio National Fund, Inc. | ON Risk Managed Balanced Portfolio (Unaudited) (Continued) |
| • | Membership-only warehouse club Costco Wholesale Corp. also performed well. The company has been growing its grocery business and expanding its organics line, and the retailer is well positioned to take market share.(1) |
Largest Fixed Income Contributor:
| • | A position in Campbell Soup Co. was a top relative contributor. The company executed a small asset sale and is benefiting from its plans to sell additional assets, the proceeds of which are expected to be used for deleveraging.(1) |
Largest Equity Detractors:
| • | Not holding Facebook, Inc. Class A, which gained 47% in the benchmark during the period, was the top relative detractor. (1) |
| • | Online retailer Amazon.com, Inc. was the largest owned detractor on a relative basis. The stock performed well during the period, but the portfolio managers were building a position and did not capture all of the stock’s upside.(1) |
Largest Fixed Income Detractor:
| • | Novelis Corp., an industrial aluminum company, was a modest detractor from relative returns. The company, among others in the metals and mining sector, was disproportionately affected by U.S.-China trade tensions.(1) |
Q. How did the Portfolio’s use of derivative instruments and initial public offerings (IPOs), if any, impact overall Portfolio performance?
A.The Risk Management Component contributed 4.7% to the absolute return of the aggregate Portfolio during the period, primarily due to the use of derivative instruments. This was driven mainly by gains on both treasury and equity futures, slightly offset by the time decay of premium value of the Portfolio’s options.(1)
| (1) | The Portfolio’s composition is subject to change. Holdings and weightings are as of June 30, 2019. |
Change in Value of $10,000 Investment |
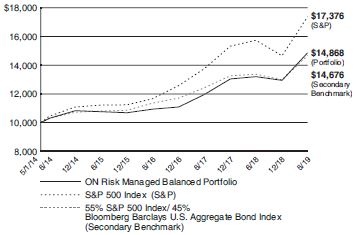
Hypothetical illustration based on past performance. Future performance will vary. The Portfolio’s returns reflect reinvested dividends. The Portfolio’s holdings may differ significantly from the securities in the index. The index is unmanaged and therefore does not reflect the cost of portfolio management and accounting.
The S&P 500 Index is a capitalization-weighted index designed to measure performance of the broad domestic economy through changes in the aggregate market value of 500 stocks representing all major industries. The index includes the effects of reinvested dividends.
The Bloomberg Barclays U.S. Aggregate Bond Index measures returns of U.S. investment grade bonds market, which includes investment grade U.S. Government bonds, high quality corporate bonds, mortgage pass-through securities, and asset-backed securities publicly offered for sale in the U.S. The index’s securities must have at least one year remaining to maturity; they must also be denominated in U.S. dollars and must be fixed rate, nonconvertible, and taxable.
Past performance is no guarantee of future results. Redemption of fund shares could have tax implications unique to each shareholder.
| 109 | (continued) |
| Ohio National Fund, Inc. | ON Risk Managed Balanced Portfolio (Unaudited) (Continued) |
Portfolio Composition as of June 30, 2019(1) | ||
| % of Net Assets | ||||
Common Stocks(4) | 46.7 | |||
Corporate Bonds(4) | 14.0 | |||
U.S. Government Agency Mortgage-Backed Securities | 8.1 | |||
U.S. Treasury Obligations | 7.5 | |||
Purchased Options | 5.9 | |||
Asset-Backed / Mortgage-Backed Securities(4) | 1.6 | |||
Preferred Securities(4) | 0.3 | |||
Money Market Funds Less Net Liabilities | 15.9 | |||
|
| |||
| 100.0 | ||||
|
| |||
Top 10 Portfolio Holdings as of June 30, 2019(1)(2) (3) | ||||
| % of Net Assets | ||||
1. Microsoft Corp. | 2.9 | |||
2. Mastercard, Inc. Class A | 2.2 | |||
3. Boeing Co. / The | 1.6 | |||
4. Alphabet, Inc. Class C | 1.6 | |||
5. McDonald’s Corp. | 1.5 | |||
6. Apple, Inc. | 1.4 | |||
7. U.S. Bancorp | 1.4 | |||
8. Costco Wholesale Corp. | 1.3 | |||
9. UnitedHealth Group, Inc. | 1.3 | |||
10. Home Depot, Inc. / The | 1.3 | |||
| (1) | Composition of Portfolio subject to change. |
| (2) | Short-term investments have been excluded from the list of Top 10 Portfolio Holdings. |
| (3) | Top 10 Portfolio Holdings is presented at an individual security level. Total investment exposure by issuer may be higher. |
| (4) | Sectors (Common Stocks, Corporate Bonds, Preferred Securities, Asset-Backed / Mortgage Backed Securities): |
| % of Net Assets | ||||
Information Technology | 13.0 | |||
Financials | 10.0 | |||
Health Care | 7.4 | |||
Industrials | 7.2 | |||
Consumer Discretionary | 7.0 | |||
Consumer Staples | 5.8 | |||
Communication Services | 5.2 | |||
Energy | 2.2 | |||
Materials | 2.1 | |||
Real Estate | 1.6 | |||
Utilities | 1.1 | |||
|
| |||
| 62.6 | ||||
|
| |||
| 110 | (continued) |
| Ohio National Fund, Inc. | ON Risk Managed Balanced Portfolio |
Schedule of Investments | June 30, 2019 (Unaudited) | |
| Common Stocks – 46.7% | Shares | Value | ||||||||
COMMUNICATION SERVICES – 3.3% | ||||||||||
Alphabet, Inc. Class C (Interactive Media & Svs.) | (a) | 5,584 | $ | 6,035,802 | ||||||
Comcast Corp. Class A (Media) | 98,889 | 4,181,027 | ||||||||
Walt Disney Co. / The (Entertainment) | 18,927 | 2,642,966 | ||||||||
|
| |||||||||
| 12,859,795 | ||||||||||
|
| |||||||||
CONSUMER DISCRETIONARY – 5.9% | ||||||||||
Amazon.com, Inc. (Internet & Direct Marketing Retail) | (a) | 1,370 | 2,594,273 | |||||||
General Motors Co. (Automobiles) | 36,642 | 1,411,816 | ||||||||
Hasbro, Inc. (Leisure Products) | 16,639 | 1,758,410 | ||||||||
Hilton Worldwide Holdings, Inc. (Hotels, Restaurants &Leisure) | 23,691 | 2,315,558 | ||||||||
Home Depot, Inc. / The (Specialty Retail) | 23,867 | 4,963,620 | ||||||||
McDonald’s Corp. (Hotels, Restaurants & Leisure) | 28,403 | 5,898,167 | ||||||||
NIKE, Inc. Class B (Textiles, Apparel & Luxury Goods) | 28,242 | 2,370,916 | ||||||||
Norwegian Cruise Line Holdings Ltd. (Hotels, Restaurants & Leisure) | (a) | 16,870 | 904,738 | |||||||
Six Flags Entertainment Corp. (Hotels, Restaurants & Leisure) | 12,599 | 625,918 | ||||||||
|
| |||||||||
| 22,843,416 | ||||||||||
|
| |||||||||
CONSUMER STAPLES – 4.6% | ||||||||||
Altria Group, Inc. (Tobacco) | 88,715 | 4,200,655 | ||||||||
Clorox Co. / The (Household Products) | 8,477 | 1,297,914 | ||||||||
Costco Wholesale Corp. (Food & Staples Retailing) | 19,697 | 5,205,129 | ||||||||
Estee Lauder Cos., Inc. / The Class A (Personal Products) | 7,180 | 1,314,730 | ||||||||
Hershey Co. / The (Food Products) | 12,889 | 1,727,513 | ||||||||
Kroger Co. / The (Food & Staples Retailing) | 42,414 | 920,808 | ||||||||
Sysco Corp. (Food & Staples Retailing) | 42,238 | 2,987,071 | ||||||||
|
| |||||||||
| 17,653,820 | ||||||||||
|
| |||||||||
ENERGY – 0.9% | ||||||||||
EOG Resources, Inc. (Oil, Gas & Consumable Fuels) | 14,255 | 1,327,996 | ||||||||
Suncor Energy, Inc. (Oil, Gas & Consumable Fuels) | 65,990 | 2,056,248 | ||||||||
|
| |||||||||
| 3,384,244 | ||||||||||
|
| |||||||||
FINANCIALS – 6.0% | ||||||||||
American Express Co. (Consumer Finance) | 14,979 | 1,849,008 | ||||||||
Bank of America Corp. (Banks) | 70,253 | 2,037,337 | ||||||||
Blackstone Group, Inc. / The Class A (Capital Markets) | 48,014 | 2,132,782 | ||||||||
CME Group, Inc. (Capital Markets) | 13,863 | 2,690,947 | ||||||||
Morgan Stanley (Capital Markets) | 43,729 | 1,915,767 | ||||||||
Progressive Corp. / The (Insurance) | 24,024 | 1,920,238 | ||||||||
Synchrony Financial (Consumer Finance) | 80,207 | 2,780,777 | ||||||||
TD Ameritrade Holding Corp. (Capital Markets) | 49,127 | 2,452,420 | ||||||||
U.S. Bancorp (Banks) | 100,806 | 5,282,234 | ||||||||
|
| |||||||||
| 23,061,510 | ||||||||||
|
| |||||||||
HEALTH CARE – 5.8% | ||||||||||
Abbott Laboratories (Health Care Equip. & Supplies) | 35,117 | 2,953,340 | ||||||||
AbbVie, Inc. (Biotechnology) | 17,160 | 1,247,875 | ||||||||
Bristol-Myers Squibb Co. (Pharmaceuticals) | 52,922 | 2,400,013 | ||||||||
Eli Lilly & Co. (Pharmaceuticals) | 24,063 | 2,665,940 | ||||||||
Medtronic PLC (Health Care Equip. & Supplies) | 23,188 | 2,258,279 | ||||||||
Merck & Co., Inc. (Pharmaceuticals) | 53,594 | 4,493,857 | ||||||||
Thermo Fisher Scientific, Inc. (Life Sciences Tools & Svs.) | 4,151 | 1,219,065 | ||||||||
UnitedHealth Group, Inc. (Health Care Providers & Svs.) | 20,686 | 5,047,591 | ||||||||
|
| |||||||||
| 22,285,960 | ||||||||||
|
| |||||||||
INDUSTRIALS – 6.2% | ||||||||||
Boeing Co. / The (Aerospace & Defense) | 16,862 | 6,137,937 | ||||||||
CSX Corp. (Road & Rail) | 55,767 | 4,314,693 | ||||||||
Deere & Co. (Machinery) | 11,938 | 1,978,246 | ||||||||
Delta Air Lines, Inc. (Airlines) | 32,044 | 1,818,497 | ||||||||
General Dynamics Corp. (Aerospace & Defense) | 22,773 | 4,140,587 | ||||||||
Honeywell International, Inc. (Industrial Conglomerates) | 11,107 | 1,939,171 | ||||||||
Parker-Hannifin Corp. (Machinery) | 5,245 | 891,702 | ||||||||
Stanley Black & Decker, Inc. (Machinery) | 8,655 | 1,251,600 | ||||||||
United Parcel Service, Inc. Class B (Air Freight & Logistics) | 13,590 | 1,403,439 | ||||||||
|
| |||||||||
| 23,875,872 | ||||||||||
|
| |||||||||
INFORMATION TECHNOLOGY – 11.7% | ||||||||||
Accenture PLC Class A (IT Svs.) | 20,472 | 3,782,611 | ||||||||
Adobe, Inc. (Software) | (a) | 14,425 | 4,250,326 | |||||||
| 111 | (continued) |
| Ohio National Fund, Inc. | ON Risk Managed Balanced Portfolio (Continued) |
Schedule of Investments | June 30, 2019 (Unaudited) | |
| Common Stocks (Continued) | Shares | Value | ||||||||
INFORMATION TECHNOLOGY (continued) | ||||||||||
Apple, Inc. (Tech. Hardware, Storage & Periph.) | 26,958 | $ | 5,335,527 | |||||||
Corning, Inc. (Electronic Equip., Instr. & Comp.) | 58,355 | 1,939,137 | ||||||||
Intel Corp. (Semiconductors &Equip.) | 57,116 | 2,734,143 | ||||||||
Lam Research Corp. (Semiconductors & Equip.) | 11,471 | 2,154,713 | ||||||||
Mastercard, Inc. Class A (IT Svs.) | 31,991 | 8,462,579 | ||||||||
Microsoft Corp. (Software) | 84,809 | 11,361,014 | ||||||||
NVIDIA Corp. (Semiconductors & Equip.) | 8,095 | 1,329,442 | ||||||||
salesforce.com, Inc. (Software) | (a) | 8,890 | 1,348,880 | |||||||
Texas Instruments, Inc. (Semiconductors & Equip.) | 20,636 | 2,368,187 | ||||||||
|
| |||||||||
| 45,066,559 | ||||||||||
|
| |||||||||
MATERIALS – 0.9% | ||||||||||
LyondellBasell Industries N.V. Class A (Chemicals) | 42,817 | 3,687,828 | ||||||||
|
| |||||||||
REAL ESTATE – 1.4% | ||||||||||
CBRE Group, Inc. Class A (Real Estate Mgmt. & Development) | (a) | 35,099 | 1,800,579 | |||||||
Crown Castle International Corp. (Equity REIT) | 12,800 | 1,668,480 | ||||||||
MGM Growth Properties LLC Class A (Equity REIT) | 38,530 | 1,180,944 | ||||||||
Outfront Media, Inc. (Equity REIT) | 35,001 | 902,676 | ||||||||
|
| |||||||||
| 5,552,679 | ||||||||||
|
| |||||||||
Total Common Stocks (Cost $134,377,092) | $ | 180,271,683 | ||||||||
|
| |||||||||
| Corporate Bonds – 14.0% | Rate | Maturity | Face Amount | Value | ||||||||||
COMMUNICATION SERVICES – 1.9% | ||||||||||||||
AT&T, Inc. (Diversified Telecom. Svs.) | 3.600% | 07/15/2025 | $ | 170,000 | $ | 176,184 | ||||||||
AT&T, Inc. (Diversified Telecom. Svs.) | 4.350% | 03/01/2029 | 528,000 | 566,431 | ||||||||||
AT&T, Inc. (Diversified Telecom. Svs.) | 5.250% | 03/01/2037 | 74,000 | 82,982 | ||||||||||
AT&T, Inc. (Diversified Telecom. Svs.) | 4.850% | 03/01/2039 | 180,000 | 193,063 | ||||||||||
AT&T, Inc. (Diversified Telecom. Svs.) | 4.750% | 05/15/2046 | 208,000 | 218,681 | ||||||||||
AT&T, Inc. (Diversified Telecom. Svs.) | 5.150% | 11/15/2046 | 165,000 | 182,253 | ||||||||||
AT&T, Inc. (Diversified Telecom. Svs.) | 4.500% | 03/09/2048 | 199,000 | 203,878 | ||||||||||
CCO Holdings LLC /CCO Holdings Capital Corp. (Media) | 5.250% | 03/15/2021 | 173,000 | 173,757 | ||||||||||
CenturyLink, Inc. (Diversified Telecom. Svs.) | 6.450% | 06/15/2021 | 182,000 | 192,465 | ||||||||||
CenturyLink, Inc. (Diversified Telecom. Svs.) | 5.800% | 03/15/2022 | 102,000 | 106,335 | ||||||||||
Charter Communications Operating LLC / Charter Communications Operating Capital (Media) | 4.908% | 07/23/2025 | 201,000 | 218,095 | ||||||||||
Charter Communications Operating LLC / Charter Communications Operating Capital (Media) | 5.050% | 03/30/2029 | 1,018,000 | 1,121,512 | ||||||||||
Comcast Corp. (Media) | 3.150% | 03/01/2026 | 146,000 | 150,820 | ||||||||||
Comcast Corp. (Media) | 4.150% | 10/15/2028 | 167,000 | 184,069 | ||||||||||
Comcast Corp. (Media) | 4.250% | 10/15/2030 | 189,000 | 210,511 | ||||||||||
Comcast Corp. (Media) | 4.600% | 10/15/2038 | 153,000 | 175,031 | ||||||||||
Comcast Corp. (Media) | 4.950% | 10/15/2058 | 158,000 | 192,567 | ||||||||||
CSC Holdings LLC (Media) | (b) | 6.500% | 02/01/2029 | 395,000 | 431,044 | |||||||||
Fox Corp. (Media) | (b) | 4.030% | 01/25/2024 | 105,000 | 111,634 | |||||||||
Sirius XM Radio, Inc. (Media) | (b) | 5.500% | 07/01/2029 | 238,000 | 243,998 | |||||||||
T-Mobile U.S.A., Inc. (Wireless Telecom. Svs.) | 6.375% | 03/01/2025 | 370,000 | �� | 384,245 | |||||||||
UBM PLC (Media) | (b) | 5.750% | 11/03/2020 | 108,000 | 111,832 | |||||||||
Verizon Communications, Inc. (Diversified Telecom. Svs.) | 2.625% | 08/15/2026 | 268,000 | 266,150 | ||||||||||
Verizon Communications, Inc. (Diversified Telecom. Svs.) | 4.329% | 09/21/2028 | 576,000 | 636,961 | ||||||||||
Verizon Communications, Inc. (Diversified Telecom. Svs.) | 3.875% | 02/08/2029 | 93,000 | 99,703 | ||||||||||
Verizon Communications, Inc. (Diversified Telecom. Svs.) | 4.862% | 08/21/2046 | 93,000 | 108,236 | ||||||||||
Verizon Communications, Inc. (Diversified Telecom. Svs.) | 4.522% | 09/15/2048 | 69,000 | 77,066 | ||||||||||
Verizon Communications, Inc. (Diversified Telecom. Svs.) | 5.012% | 08/21/2054 | 140,000 | 167,366 | ||||||||||
Viacom, Inc. (Entertainment) | 5.850% | 09/01/2043 | 291,000 | 343,330 | ||||||||||
|
| |||||||||||||
| 7,330,199 | ||||||||||||||
|
| |||||||||||||
CONSUMER DISCRETIONARY – 0.7% | ||||||||||||||
AutoZone, Inc. (Specialty Retail) | 3.750% | 04/18/2029 | 238,000 | 247,362 | ||||||||||
General Motors Co. (Automobiles) | 5.000% | 10/01/2028 | 235,000 | 246,804 | ||||||||||
GLP Capital LP / GLP Financing II, Inc. (Hotels, Restaurants & Leisure) | 5.250% | 06/01/2025 | 88,000 | 94,283 | ||||||||||
GLP Capital LP / GLP Financing II, Inc. (Hotels, Restaurants & Leisure) | 5.375% | 04/15/2026 | 102,000 | 110,291 | ||||||||||
Lowe’s Cos., Inc. (Specialty Retail) | 3.650% | 04/05/2029 | 187,000 | 195,353 | ||||||||||
MDC Holdings, Inc. (Household Durables) | 5.500% | 01/15/2024 | 53,000 | 56,445 | ||||||||||
MGM Resorts International (Hotels, Restaurants & Leisure) | 6.625% | 12/15/2021 | 123,000 | 132,840 | ||||||||||
MGM Resorts International (Hotels, Restaurants & Leisure) | 7.750% | 03/15/2022 | 44,000 | 49,060 | ||||||||||
Newell Brands, Inc. (Household Durables) | 4.200% | 04/01/2026 | 315,000 | 312,940 | ||||||||||
Newell Brands, Inc. (Household Durables) | 5.375% | 04/01/2036 | 360,000 | 355,306 | ||||||||||
O’Reilly Automotive, Inc. (Specialty Retail) | 3.600% | 09/01/2027 | 6,000 | 6,166 | ||||||||||
O’Reilly Automotive, Inc. (Specialty Retail) | 4.350% | 06/01/2028 | 47,000 | 50,794 | ||||||||||
O’Reilly Automotive, Inc. (Specialty Retail) | 3.900% | 06/01/2029 | 275,000 | 288,240 | ||||||||||
| 112 | (continued) |
| Ohio National Fund, Inc. | ON Risk Managed Balanced Portfolio (Continued) |
Schedule of Investments | June 30, 2019 (Unaudited) | |
| Corporate Bonds (Continued) | Rate | Maturity | Face Amount | Value | ||||||||||
CONSUMER DISCRETIONARY (continued) | ||||||||||||||
Service Corp. International (Diversified Consumer Svs.) | 5.125% | 06/01/2029 | $ | 298,000 | $ | 313,645 | ||||||||
Starbucks Corp. (Hotels, Restaurants & Leisure) | 4.450% | 08/15/2049 | 180,000 | 196,867 | ||||||||||
|
| |||||||||||||
| 2,656,396 | ||||||||||||||
|
| |||||||||||||
CONSUMER STAPLES – 1.2% | ||||||||||||||
Anheuser-Busch InBev Worldwide, Inc. (Beverages) | 4.150% | 01/23/2025 | 568,000 | 614,688 | ||||||||||
Anheuser-Busch InBev Worldwide, Inc. (Beverages) | 4.750% | 01/23/2029 | 274,000 | 310,377 | ||||||||||
Campbell Soup Co. (Food Products) | 3.950% | 03/15/2025 | 148,000 | 153,874 | ||||||||||
Campbell Soup Co. (Food Products) | 4.150% | 03/15/2028 | 221,000 | 230,614 | ||||||||||
Campbell Soup Co. (Food Products) | 4.800% | 03/15/2048 | 238,000 | 240,573 | ||||||||||
General Mills, Inc. (Food Products) | 4.200% | 04/17/2028 | 314,000 | 338,204 | ||||||||||
JBS U.S.A. LUX SA / JBS U.S.A. Finance, Inc. (Food Products) | (b) | 5.875% | 07/15/2024 | 70,000 | 72,013 | |||||||||
JBS U.S.A. LUX SA / JBS U.S.A. Finance, Inc. (Food Products) | (b) | 5.750% | 06/15/2025 | 124,000 | 128,960 | |||||||||
JBS U.S.A. LUX SA / JBS U.S.A. Finance, Inc. (Food Products) | (b) | 6.750% | 02/15/2028 | 38,000 | 41,278 | |||||||||
JBS U.S.A. LUX SA / JBS U.S.A. Food Co. / JBS U.S.A. Finance, Inc. (Food Products) | (b) | 6.500% | 04/15/2029 | 55,000 | 59,744 | |||||||||
Keurig Dr Pepper, Inc. (Beverages) | 4.597% | 05/25/2028 | 277,000 | 303,057 | ||||||||||
Keurig Dr Pepper, Inc. (Beverages) | 5.085% | 05/25/2048 | 111,000 | 123,453 | ||||||||||
Kraft Heinz Foods Co. (Food Products) | 4.000% | 06/15/2023 | 79,000 | 82,626 | ||||||||||
Kraft Heinz Foods Co. (Food Products) | 3.000% | 06/01/2026 | 518,000 | 503,858 | ||||||||||
Kraft Heinz Foods Co. (Food Products) | 4.625% | 01/30/2029 | 98,000 | 105,397 | ||||||||||
Kraft Heinz Foods Co. (Food Products) | 5.000% | 06/04/2042 | 82,000 | 84,160 | ||||||||||
Kraft Heinz Foods Co. (Food Products) | 4.375% | 06/01/2046 | 217,000 | 205,951 | ||||||||||
Mars, Inc. (Food Products) | (b) | 2.700% | 04/01/2025 | 113,000 | 115,234 | |||||||||
Mars, Inc. (Food Products) | (b) | 3.200% | 04/01/2030 | 139,000 | 144,347 | |||||||||
Mars, Inc. (Food Products) | (b) | 3.950% | 04/01/2049 | 186,000 | 199,874 | |||||||||
Mars, Inc. (Food Products) | (b) | 4.200% | 04/01/2059 | 118,000 | 128,084 | |||||||||
Reckson Operating Partnership LP (Household Products) | 7.750% | 03/15/2020 | 237,000 | 245,390 | ||||||||||
Sysco Corp. (Food & Staples Retailing) | 2.500% | 07/15/2021 | 73,000 | 73,295 | ||||||||||
|
| |||||||||||||
| 4,505,051 | ||||||||||||||
|
| |||||||||||||
ENERGY – 1.3% | ||||||||||||||
Cenovus Energy, Inc. (Oil, Gas & Consumable Fuels) | 4.250% | 04/15/2027 | 98,000 | 101,343 | ||||||||||
Cheniere Energy Partners LP (Oil, Gas & Consumable Fuels) | (b) | 5.625% | 10/01/2026 | 163,000 | 171,965 | |||||||||
Continental Resources, Inc. (Oil, Gas & Consumable Fuels) | 5.000% | 09/15/2022 | 357,000 | 359,800 | ||||||||||
Continental Resources, Inc. (Oil, Gas & Consumable Fuels) | 4.500% | 04/15/2023 | 295,000 | 309,842 | ||||||||||
Energy Transfer Operating LP (Oil, Gas & Consumable Fuels) | 4.250% | 03/15/2023 | 146,000 | 152,359 | ||||||||||
Energy Transfer Operating LP (Oil, Gas & Consumable Fuels) | 5.875% | 01/15/2024 | 127,000 | 141,145 | ||||||||||
Energy Transfer Operating LP (Oil, Gas & Consumable Fuels) | 5.500% | 06/01/2027 | 98,000 | 109,502 | ||||||||||
Energy Transfer Operating LP (Oil, Gas & Consumable Fuels) | 4.950% | 06/15/2028 | 25,000 | 27,320 | ||||||||||
Energy Transfer Operating LP (Oil, Gas & Consumable Fuels) | 6.125% | 12/15/2045 | 77,000 | 88,151 | ||||||||||
Energy Transfer Operating LP (Oil, Gas & Consumable Fuels) | 6.000% | 06/15/2048 | 252,000 | 287,343 | ||||||||||
EnLink Midstream Partners LP (Oil, Gas & Consumable Fuels) | 4.150% | 06/01/2025 | 278,000 | 272,440 | ||||||||||
EQM Midstream Partners LP (Oil, Gas & Consumable Fuels) | 5.500% | 07/15/2028 | 294,000 | 309,905 | ||||||||||
Hess Corp. (Oil, Gas & Consumable Fuels) | 4.300% | 04/01/2027 | 605,000 | 627,295 | ||||||||||
HollyFrontier Corp. (Oil, Gas & Consumable Fuels) | 5.875% | 04/01/2026 | 242,000 | 265,911 | ||||||||||
Kinder Morgan Energy Partners LP (Oil, Gas & Consumable Fuels) | 5.000% | 10/01/2021 | 304,000 | 318,682 | ||||||||||
Kinder Morgan, Inc. (Oil, Gas & Consumable Fuels) | 4.300% | 03/01/2028 | 69,000 | 73,878 | ||||||||||
Kinder Morgan, Inc. (Oil, Gas & Consumable Fuels) | 5.550% | 06/01/2045 | 66,000 | 76,318 | ||||||||||
Kinder Morgan, Inc. (Oil, Gas & Consumable Fuels) | 5.200% | 03/01/2048 | 44,000 | 49,666 | ||||||||||
NGPL PipeCo LLC (Oil, Gas & Consumable Fuels) | (b) | 4.375% | 08/15/2022 | 248,000 | 255,440 | |||||||||
NGPL PipeCo LLC (Oil, Gas & Consumable Fuels) | (b) | 4.875% | 08/15/2027 | 136,000 | 143,990 | |||||||||
NuStar Logistics LP (Oil, Gas & Consumable Fuels) | 5.625% | 04/28/2027 | 147,000 | 148,103 | ||||||||||
Plains All American Pipeline LP (Oil, Gas & Consumable Fuels) | 4.650% | 10/15/2025 | 322,000 | 342,775 | ||||||||||
Tallgrass Energy Partners LP / Tallgrass Energy Finance Corp. (Oil, Gas & Consumable Fuels) | (b) | 4.750% | 10/01/2023 | 242,000 | 245,332 | |||||||||
Tallgrass Energy Partners LP / Tallgrass Energy Finance Corp. (Oil, Gas & Consumable Fuels) | (b) | 5.500% | 09/15/2024 | 90,000 | 92,925 | |||||||||
|
| |||||||||||||
| 4,971,430 | ||||||||||||||
|
| |||||||||||||
FINANCIALS – 2.6% | ||||||||||||||
Bank of America Corp. (Rate is fixed until 04/24/2027, at which point, the rate becomes QL +151) (Banks) | (c) | 3.705% | 04/24/2028 | 951,000 | 998,780 | |||||||||
Bank of America Corp. (Rate is fixed until 03/05/2028, at which point, the rate becomes QL +107) (Banks) | (c) | 3.970% | 03/05/2029 | 232,000 | 248,004 | |||||||||
Bank of America Corp. (Rate is fixed until 02/07/2029, at which point, the rate becomes QL + 121) (Banks) | (c) | 3.974% | 02/07/2030 | 317,000 | 339,500 | |||||||||
Bank of Montreal (Banks) | 3.300% | 02/05/2024 | 312,000 | 323,469 | ||||||||||
Brown & Brown, Inc. (Insurance) | 4.500% | 03/15/2029 | 140,000 | 146,994 | ||||||||||
Cboe Global Markets, Inc. (Capital Markets) | 3.650% | 01/12/2027 | 267,000 | 280,182 | ||||||||||
Citigroup, Inc. (Rate is fixed until 01/10/2027, at which point, the rate becomes QL + 156) (Banks) | (c) | 3.887% | 01/10/2028 | 1,168,000 | 1,235,185 | |||||||||
Citizens Financial Group, Inc. (Banks) | 3.750% | 07/01/2024 | 47,000 | 47,729 | ||||||||||
Citizens Financial Group, Inc. (Banks) | 4.350% | 08/01/2025 | 41,000 | 43,014 | ||||||||||
| 113 | (continued) |
| Ohio National Fund, Inc. | ON Risk Managed Balanced Portfolio (Continued) |
Schedule of Investments | June 30, 2019 (Unaudited) | |
| Corporate Bonds (Continued) | Rate | Maturity | Face Amount | Value | ||||||||||||
FINANCIALS (continued) | ||||||||||||||||
Citizens Financial Group, Inc. (Banks) | 4.300% | 12/03/2025 | $ | 229,000 | $ | 242,147 | ||||||||||
E*TRADE Financial Corp. (Capital Markets) | 3.800% | 08/24/2027 | 214,000 | 215,383 | ||||||||||||
E*TRADE Financial Corp. (Capital Markets) | 4.500% | 06/20/2028 | 79,000 | 83,032 | ||||||||||||
First Republic Bank (Banks) | 4.625% | 02/13/2047 | 100,000 | 107,528 | ||||||||||||
Ford Motor Credit Co. LLC (Consumer Finance) | 3.815% | 11/02/2027 | 648,000 | 620,567 | ||||||||||||
Ford Motor Credit Co. LLC (Consumer Finance) | 5.113% | 05/03/2029 | 302,000 | 308,689 | ||||||||||||
General Motors Financial Co., Inc. (Consumer Finance) | 4.350% | 04/09/2025 | 177,000 | 182,591 | ||||||||||||
General Motors Financial Co., Inc. (Consumer Finance) | 4.300% | 07/13/2025 | 54,000 | 55,660 | ||||||||||||
General Motors Financial Co., Inc. (Consumer Finance) | 4.350% | 01/17/2027 | 107,000 | 108,950 | ||||||||||||
JPMorgan Chase & Co. (Rate is fixed until 12/05/2028, at which point, the rate becomes QL+ 133) (Banks) | (c) | 3.960% | 01/29/2027 | 508,000 | 543,085 | |||||||||||
JPMorgan Chase & Co. (Rate is fixed until 01/21/2021, at which point, the rate becomes QL + 333) (Banks) | (c) | 3.782% | 02/01/2028 | 348,000 | 368,761 | |||||||||||
JPMorgan Chase & Co. (Rate is fixed until 02/01/2027, at which point, the rate becomes QL + 134) (Banks) | (c) | 4.452% | 12/05/2029 | 935,000 | 1,039,875 | |||||||||||
JPMorgan Chase & Co. (Rate is fixed until 01/29/2026, at which point, the rate becomes QL + 125) (Banks) | (c) | 3.702% | 05/06/2030 | 298,000 | 314,071 | |||||||||||
Morgan Stanley (Capital Markets) | 4.350% | 09/08/2026 | 274,000 | 293,700 | ||||||||||||
Morgan Stanley (Capital Markets) | 3.950% | 04/23/2027 | 464,000 | 485,122 | ||||||||||||
Morgan Stanley (Rate is fixed until 05/06/2029, at which point, the rate becomes QL + 116) (Capital Markets) | (c) | 4.431% | 01/23/2030 | 534,000 | 591,186 | |||||||||||
Raymond James Financial, Inc. (Capital Markets) | 4.950% | 07/15/2046 | 236,000 | 265,935 | ||||||||||||
Synchrony Financial (Consumer Finance) | 4.375% | 03/19/2024 | 61,000 | 63,847 | ||||||||||||
Synchrony Financial (Consumer Finance) | 3.950% | 12/01/2027 | 254,000 | 253,591 | ||||||||||||
Synchrony Financial (Consumer Finance) | 5.150% | 03/19/2029 | 236,000 | 254,183 | ||||||||||||
|
| |||||||||||||||
| 10,060,760 | ||||||||||||||||
|
| |||||||||||||||
HEALTH CARE – 1.6% | ||||||||||||||||
Allergan Finance LLC (Pharmaceuticals) | 3.250% | 10/01/2022 | 175,000 | 177,852 | ||||||||||||
Allergan Funding SCS (Pharmaceuticals) | 3.450% | 03/15/2022 | 327,000 | 333,773 | ||||||||||||
Allergan Funding SCS (Pharmaceuticals) | 3.800% | 03/15/2025 | 210,000 | 217,827 | ||||||||||||
Allergan, Inc. (Pharmaceuticals) | 2.800% | 03/15/2023 | 14,000 | 13,957 | ||||||||||||
Bausch Health Cos., Inc. (Pharmaceuticals) | (b) | 7.000% | 03/15/2024 | 221,000 | 234,835 | |||||||||||
Boston Scientific Corp. (Health Care Equip. & Supplies) | 3.750% | 03/01/2026 | 137,000 | 145,628 | ||||||||||||
Boston Scientific Corp. (Health Care Equip. & Supplies) | 4.000% | 03/01/2029 | 71,000 | 76,757 | ||||||||||||
Boston Scientific Corp. (Health Care Equip. & Supplies) | 4.700% | 03/01/2049 | 114,000 | 130,679 | ||||||||||||
Bristol-Myers Squibb Co. (Pharmaceuticals) | (b) | 3.400% | 07/26/2029 | 125,000 | 130,734 | |||||||||||
Bristol-Myers Squibb Co. (Pharmaceuticals) | (b) | 4.125% | 06/15/2039 | 90,000 | 97,488 | |||||||||||
Bristol-Myers Squibb Co. (Pharmaceuticals) | (b) | 4.250% | 10/26/2049 | 155,000 | 170,606 | |||||||||||
Centene Corp. (Health Care Providers & Svs.) | 4.750% | 05/15/2022 | 15,000 | 15,319 | ||||||||||||
Centene Corp. (Health Care Providers & Svs.) | 6.125% | 02/15/2024 | 171,000 | 179,122 | ||||||||||||
Centene Corp. (Health Care Providers & Svs.) | (b) | 5.375% | 06/01/2026 | 428,000 | 449,935 | |||||||||||
Cigna Corp. (Health Care Providers & Svs.) | (b) | 3.400% | 09/17/2021 | 47,000 | 47,902 | |||||||||||
Cigna Corp. (Health Care Providers & Svs.) | (b) | 3.750% | 07/15/2023 | 189,000 | 196,669 | |||||||||||
CVS Health Corp. (Health Care Providers & Svs.) | 4.750% | 12/01/2022 | 120,000 | 127,389 | ||||||||||||
CVS Health Corp. (Health Care Providers & Svs.) | 4.100% | 03/25/2025 | 332,000 | 349,970 | ||||||||||||
CVS Health Corp. (Health Care Providers & Svs.) | 4.300% | 03/25/2028 | 172,000 | 181,276 | ||||||||||||
CVS Health Corp. (Health Care Providers & Svs.) | 5.050% | 03/25/2048 | 183,000 | 194,632 | ||||||||||||
Elanco Animal Health, Inc. (Pharmaceuticals) | 4.272% | 08/28/2023 | 112,000 | 117,504 | ||||||||||||
Elanco Animal Health, Inc. (Pharmaceuticals) | 4.900% | 08/28/2028 | 104,000 | 116,094 | ||||||||||||
Eli Lilly & Co. (Pharmaceuticals) | 3.375% | 03/15/2029 | 594,000 | 632,343 | ||||||||||||
GlaxoSmithKline Capital PLC (Pharmaceuticals) | 3.375% | 06/01/2029 | 334,000 | 353,007 | ||||||||||||
HCA, Inc. (Health Care Providers & Svs.) | 4.500% | 02/15/2027 | 285,000 | 303,936 | ||||||||||||
HCA, Inc. (Health Care Providers & Svs.) | 4.125% | 06/15/2029 | 697,000 | 713,203 | ||||||||||||
HCA, Inc. (Health Care Providers & Svs.) | 5.125% | 06/15/2039 | 124,000 | 128,800 | ||||||||||||
HCA, Inc. (Health Care Providers & Svs.) | 5.250% | 06/15/2049 | 180,000 | 187,148 | ||||||||||||
IQVIA, Inc. (Life Sciences Tools & Svs.) | (b) | 5.000% | 05/15/2027 | 300,000 | 309,750 | |||||||||||
Teva Pharmaceutical Finance Co. BV (Pharmaceuticals) | 3.650% | 11/10/2021 | 88,000 | 84,700 | ||||||||||||
|
| |||||||||||||||
| 6,418,835 | ||||||||||||||||
|
| |||||||||||||||
INDUSTRIALS – 0.9% | ||||||||||||||||
Boeing Co. / The (Aerospace & Defense) | 2.250% | 06/15/2026 | 35,000 | 34,068 | ||||||||||||
Boeing Co. / The (Aerospace & Defense) | 3.250% | 03/01/2028 | 44,000 | 45,623 | ||||||||||||
Boeing Co. / The (Aerospace & Defense) | 3.200% | 03/01/2029 | 250,000 | 257,870 | ||||||||||||
Boeing Co. / The (Aerospace & Defense) | 3.600% | 05/01/2034 | 290,000 | 302,505 | ||||||||||||
GE Capital International Funding Co. Unlimited Co. (Industrial Conglomerates) | 4.418% | 11/15/2035 | 316,000 | 311,627 | ||||||||||||
Huntington Ingalls Industries, Inc. (Aerospace & Defense) | (b) | 5.000% | 11/15/2025 | 429,000 | 444,015 | |||||||||||
IHS Markit Ltd. (Professional Svs.) | (b) | 5.000% | 11/01/2022 | 26,000 | 27,547 | |||||||||||
IHS Markit Ltd. (Professional Svs.) | (b) | 4.750% | 02/15/2025 | 215,000 | 230,609 | |||||||||||
Masonite International Corp. (Building Products) | (b) | 5.625% | 03/15/2023 | 66,000 | 67,980 | |||||||||||
| 114 | (continued) |
| Ohio National Fund, Inc. | ON Risk Managed Balanced Portfolio (Continued) |
Schedule of Investments | June 30, 2019 (Unaudited) | |
| Corporate Bonds (Continued) | Rate | Maturity | Face Amount | Value | ||||||||||||
INDUSTRIALS (continued) | ||||||||||||||||
Verisk Analytics, Inc. (Professional Svs.) | 5.800% | 05/01/2021 | $ | 211,000 | $ | 223,732 | ||||||||||
Verisk Analytics, Inc. (Professional Svs.) | 4.125% | 09/12/2022 | 67,000 | 70,355 | ||||||||||||
Verisk Analytics, Inc. (Professional Svs.) | 5.500% | 06/15/2045 | 199,000 | 233,218 | ||||||||||||
Wabtec Corp. (Machinery) | 4.400% | 03/15/2024 | 247,000 | 261,385 | ||||||||||||
Wabtec Corp. (Machinery) | 3.450% | 11/15/2026 | 66,000 | 64,466 | ||||||||||||
Wabtec Corp. (Machinery) | 4.950% | 09/15/2028 | 735,000 | 787,712 | ||||||||||||
|
| |||||||||||||||
| 3,362,712 | ||||||||||||||||
|
| |||||||||||||||
INFORMATION TECHNOLOGY – 1.3% | ||||||||||||||||
Broadcom Corp. / Broadcom Cayman Finance Ltd. (Semiconductors & Equip.) | 3.875% | 01/15/2027 | 134,000 | 131,370 | ||||||||||||
Broadcom, Inc. (Semiconductors & Equip.) | (b) | 4.250% | 04/15/2026 | 177,000 | 179,315 | |||||||||||
Broadcom, Inc. (Semiconductors & Equip.) | (b) | 4.750% | 04/15/2029 | 240,000 | 245,922 | |||||||||||
CommScope, Inc. (Communications Equip.) | (b) | 5.500% | 03/01/2024 | 197,000 | 202,171 | |||||||||||
CommScope, Inc. (Communications Equip.) | (b) | 6.000% | 03/01/2026 | 324,000 | 332,100 | |||||||||||
Dell International LLC / EMC Corp. (Tech. Hardware, Storage & Periph.) | (b) | 5.300% | 10/01/2029 | 148,000 | 155,757 | |||||||||||
Entegris, Inc. (Semiconductors & Equip.) | (b) | 4.625% | 02/10/2026 | 173,000 | 174,297 | |||||||||||
Fidelity National Information Services, Inc. (IT Svs.) | 3.750% | 05/21/2029 | 83,000 | 88,123 | ||||||||||||
Lam Research Corp. (Semiconductors & Equip.) | 4.000% | 03/15/2029 | 51,000 | 54,287 | ||||||||||||
Marvell Technology Group Ltd. (Semiconductors & Equip.) | 4.200% | 06/22/2023 | 108,000 | 112,426 | ||||||||||||
Marvell Technology Group Ltd. (Semiconductors & Equip.) | 4.875% | 06/22/2028 | 402,000 | 425,972 | ||||||||||||
Micron Technology, Inc. (Semiconductors & Equip.) | 5.500% | 02/01/2025 | 88,000 | 90,530 | ||||||||||||
Micron Technology, Inc. (Semiconductors & Equip.) | 4.975% | 02/06/2026 | 114,000 | 120,239 | ||||||||||||
Micron Technology, Inc. (Semiconductors & Equip.) | 5.327% | 02/06/2029 | 293,000 | 310,037 | ||||||||||||
Oracle Corp. (Software) | 3.900% | 05/15/2035 | 124,000 | 134,134 | ||||||||||||
Qorvo, Inc. (Semiconductors & Equip.) | 5.500% | 07/15/2026 | 194,000 | 205,310 | ||||||||||||
Total System Services, Inc. (IT Svs.) | 4.800% | 04/01/2026 | 369,000 | 405,290 | ||||||||||||
Trimble, Inc. (Electronic Equip., Instr. & Comp.) | 4.750% | 12/01/2024 | 270,000 | 283,738 | ||||||||||||
Trimble, Inc. (Electronic Equip., Instr. & Comp.) | 4.900% | 06/15/2028 | 544,000 | 582,577 | ||||||||||||
Western Digital Corp. (Tech. Hardware, Storage & Periph.) | 4.750% | 02/15/2026 | 772,000 | 757,371 | ||||||||||||
|
| |||||||||||||||
| 4,990,966 | ||||||||||||||||
|
| |||||||||||||||
MATERIALS – 1.2% | ||||||||||||||||
Allegheny Technologies, Inc. (Metals & Mining) | 5.950% | 01/15/2021 | 223,000 | 229,133 | ||||||||||||
Ball Corp. (Containers & Packaging) | 4.375% | 12/15/2020 | 227,000 | 231,994 | ||||||||||||
CF Industries, Inc. (Chemicals) | (b) | 4.500% | 12/01/2026 | 116,000 | 120,564 | |||||||||||
Constellium SE (Metals & Mining) | (b) | 5.750% | 05/15/2024 | 281,000 | 287,323 | |||||||||||
Freeport-McMoRan, Inc. (Metals & Mining) | 3.550% | 03/01/2022 | 351,000 | 351,439 | ||||||||||||
Freeport-McMoRan, Inc. (Metals & Mining) | 3.875% | 03/15/2023 | 341,000 | 341,000 | ||||||||||||
Georgia-Pacific LLC (Paper & Forest Products) | (b) | 3.163% | 11/15/2021 | 99,000 | 100,399 | |||||||||||
Georgia-Pacific LLC (Paper & Forest Products) | (b) | 3.600% | 03/01/2025 | 386,000 | 405,129 | |||||||||||
Hudbay Minerals, Inc. (Metals & Mining) | (b) | 7.250% | 01/15/2023 | 307,000 | 316,210 | |||||||||||
Novelis Corp. (Metals & Mining) | (b) | 5.875% | 09/30/2026 | 558,000 | 564,975 | |||||||||||
Nutrien Ltd. (Chemicals) | 4.200% | 04/01/2029 | 55,000 | 59,351 | ||||||||||||
Nutrien Ltd. (Chemicals) | 5.000% | 04/01/2049 | 67,000 | 75,973 | ||||||||||||
Reliance Steel & Aluminum Co. (Metals & Mining) | 4.500% | 04/15/2023 | 116,000 | 121,753 | ||||||||||||
Steel Dynamics, Inc. (Metals & Mining) | 5.500% | 10/01/2024 | 286,000 | 296,368 | ||||||||||||
Valvoline, Inc. (Chemicals) | 5.500% | 07/15/2024 | 90,000 | 93,060 | ||||||||||||
Valvoline, Inc. (Chemicals) | 4.375% | 08/15/2025 | 202,000 | 201,495 | ||||||||||||
WRKCo, Inc. (Containers & Packaging) | 3.750% | 03/15/2025 | 18,000 | 18,720 | ||||||||||||
WRKCo, Inc. (Containers & Packaging) | 4.650% | 03/15/2026 | 110,000 | 119,581 | ||||||||||||
WRKCo, Inc. (Containers & Packaging) | 3.375% | 09/15/2027 | 20,000 | 20,023 | ||||||||||||
WRKCo, Inc. (Containers & Packaging) | 4.000% | 03/15/2028 | 66,000 | 68,501 | ||||||||||||
WRKCo, Inc. (Containers & Packaging) | 4.900% | 03/15/2029 | 460,000 | 502,653 | ||||||||||||
|
| |||||||||||||||
| 4,525,644 | ||||||||||||||||
|
| |||||||||||||||
REAL ESTATE – 0.2% | ||||||||||||||||
Crown Castle International Corp. (Equity REIT) | 3.650% | 09/01/2027 | 133,000 | 136,902 | ||||||||||||
Crown Castle International Corp. (Equity REIT) | 4.300% | 02/15/2029 | 154,000 | 165,571 | ||||||||||||
Crown Castle International Corp. (Equity REIT) | 5.200% | 02/15/2049 | 172,000 | 197,643 | ||||||||||||
Jones Lang LaSalle, Inc. (Real Estate Mgmt. & Development) | 4.400% | 11/15/2022 | 197,000 | 204,780 | ||||||||||||
Ventas Realty LP (Equity REIT) | 3.500% | 04/15/2024 | 282,000 | 292,433 | ||||||||||||
|
| |||||||||||||||
| 997,329 | ||||||||||||||||
|
| |||||||||||||||
UTILITIES – 1.1% | ||||||||||||||||
AmeriGas Partners LP / AmeriGas Finance Corp. (Gas Utilities) | 5.625% | 05/20/2024 | 10,000 | 10,650 | ||||||||||||
AmeriGas Partners LP / AmeriGas Finance Corp. (Gas Utilities) | 5.500% | 05/20/2025 | 393,000 | 413,632 | ||||||||||||
NRG Energy, Inc. (Ind. Power & Renewable Elec.) | (b) | 3.750% | 06/15/2024 | 308,000 | 316,275 | |||||||||||
NRG Energy, Inc. (Ind. Power & Renewable Elec.) | 7.250% | 05/15/2026 | 273,000 | 300,641 | ||||||||||||
NRG Energy, Inc. (Ind. Power & Renewable Elec.) | 6.625% | 01/15/2027 | 329,000 | 357,376 | ||||||||||||
NRG Energy, Inc. (Ind. Power & Renewable Elec.) | 5.750% | 01/15/2028 | 60,000 | 64,350 | ||||||||||||
| 115 | (continued) |
| Ohio National Fund, Inc. | ON Risk Managed Balanced Portfolio (Continued) |
Schedule of Investments | June 30, 2019 (Unaudited) | |
| Corporate Bonds (Continued) | Rate | Maturity | Face Amount | Value | ||||||||||||
UTILITIES (continued) | ||||||||||||||||
NRG Energy, Inc. (Ind. Power & Renewable Elec.) | (b) | 4.450% | 06/15/2029 | $ | 297,000 | $ | 308,867 | |||||||||
NRG Energy, Inc. (Ind. Power & Renewable Elec.) | (b) | 5.250% | 06/15/2029 | 118,000 | 125,818 | |||||||||||
Oncor Electric Delivery Co. LLC (Electric Utilities) | (b) | 2.750% | 06/01/2024 | 242,000 | 246,404 | |||||||||||
Oncor Electric Delivery Co. LLC (Electric Utilities) | (b) | 3.700% | 11/15/2028 | 194,000 | 208,814 | |||||||||||
Oncor Electric Delivery Co. LLC (Electric Utilities) | (b) | 3.800% | 06/01/2049 | 297,000 | 313,062 | |||||||||||
PPL WEM Ltd. / Western Power Distribution Ltd. (Electric Utilities) | (b) | 5.375% | 05/01/2021 | 203,000 | 210,053 | |||||||||||
Southern Co. / The (Electric Utilities) | 2.950% | 07/01/2023 | 192,000 | 194,702 | ||||||||||||
Vistra Operations Co. LLC (Ind. Power & Renewable Elec.) | (b) | 5.500% | 09/01/2026 | 114,000 | 120,413 | |||||||||||
Vistra Operations Co. LLC (Ind. Power & Renewable Elec.) | (b) | 5.625% | 02/15/2027 | 610,000 | 645,837 | |||||||||||
Vistra Operations Co. LLC (Ind. Power & Renewable Elec.) | (b) | 5.000% | 07/31/2027 | 398,000 | 411,669 | |||||||||||
|
| |||||||||||||||
| 4,248,563 | ||||||||||||||||
|
| |||||||||||||||
Total Corporate Bonds (Cost $51,716,815) | $ | 54,067,885 | ||||||||||||||
|
| |||||||||||||||
| U.S. Government Agency Mortgage-Backed Securities – 8.1% | Rate | Maturity | Face Amount | Value | ||||||||||||
Fannie Mae or Freddie Mac UMBS TBA | 4.000% | 07/15/2049 | $ | 2,950,000 | $ | 3,048,237 | ||||||||||
Fannie Mae or Freddie Mac UMBS TBA | 4.500% | 07/15/2049 | 766,000 | 800,365 | ||||||||||||
Fannie Mae Pool FN AB6548 | 3.500% | 10/01/2042 | 101,559 | 104,785 | ||||||||||||
Fannie Mae Pool FN AB8407 | 3.500% | 02/01/2043 | 25,052 | 25,945 | ||||||||||||
Fannie Mae Pool FN AL3083 | 3.500% | 12/01/2042 | 233,124 | 241,427 | ||||||||||||
Fannie Mae Pool FN AL5310 | 3.500% | 04/01/2044 | 4,365 | 4,555 | ||||||||||||
Fannie Mae Pool FN AL5439 | 3.500% | 11/01/2043 | 24,024 | 24,881 | ||||||||||||
Fannie Mae Pool FN AL5887 | 4.500% | 10/01/2044 | 26,586 | 28,861 | ||||||||||||
Fannie Mae Pool FN AL5942 | 5.000% | 07/01/2044 | 146,863 | 158,812 | ||||||||||||
Fannie Mae Pool FN AL6348 | 3.500% | 02/01/2045 | 34,605 | 35,843 | ||||||||||||
Fannie Mae Pool FN AL6535 | 3.500% | 02/01/2045 | 6,350 | 6,577 | ||||||||||||
Fannie Mae Pool FN AL6542 | 4.500% | 03/01/2045 | 42,240 | 45,857 | ||||||||||||
Fannie Mae Pool FN AL6620 | 4.500% | 08/01/2042 | 277,150 | 299,695 | ||||||||||||
Fannie Mae Pool FN AL6997 | 4.500% | 11/01/2042 | 20,762 | 22,353 | ||||||||||||
Fannie Mae Pool FN AL7381 | 4.500% | 06/01/2045 | 114,651 | 122,995 | ||||||||||||
Fannie Mae Pool FN AL8855 | 3.500% | 07/01/2046 | 18,330 | 18,983 | ||||||||||||
Fannie Mae Pool FN AR2624 | 3.500% | 02/01/2043 | 40,004 | 41,435 | ||||||||||||
Fannie Mae Pool FN AS7168 | 3.500% | 05/01/2046 | 47,511 | 49,097 | ||||||||||||
Fannie Mae Pool FN AS7587 | 3.500% | 07/01/2046 | 203,161 | 211,391 | ||||||||||||
Fannie Mae Pool FN AS7822 | 3.500% | 08/01/2046 | 585,201 | 604,629 | ||||||||||||
Fannie Mae Pool FN AS9751 | 4.000% | 05/01/2047 | 50,304 | 52,578 | ||||||||||||
Fannie Mae Pool FN AT2957 | 3.000% | 05/01/2043 | 30,716 | 31,138 | ||||||||||||
Fannie Mae Pool FN AZ9203 | 3.000% | 10/01/2045 | 77,144 | 77,923 | ||||||||||||
Fannie Mae Pool FN BA2885 | 3.000% | 10/01/2045 | 119,996 | 121,212 | ||||||||||||
Fannie Mae Pool FN BA4752 | 3.000% | 01/01/2046 | 15,975 | 16,187 | ||||||||||||
Fannie Mae Pool FN BC1520 | 3.500% | 08/01/2046 | 362,683 | 374,745 | ||||||||||||
Fannie Mae Pool FN BC2468 | 3.000% | 03/01/2046 | 330,902 | 335,259 | ||||||||||||
Fannie Mae Pool FN BC2488 | 3.000% | 03/01/2046 | 482,931 | 489,241 | ||||||||||||
Fannie Mae Pool FN BC9077 | 3.500% | 12/01/2046 | 24,150 | 24,952 | ||||||||||||
Fannie Mae Pool FN BD0667 | 4.500% | 06/01/2047 | 18,734 | 19,918 | ||||||||||||
Fannie Mae Pool FN BD6435 | 4.000% | 10/01/2046 | 7,519 | 7,822 | ||||||||||||
Fannie Mae Pool FN BD8952 | 3.000% | 11/01/2046 | 38,912 | 39,531 | ||||||||||||
Fannie Mae Pool FN BD8980 | 3.000% | 11/01/2046 | 38,075 | 38,681 | ||||||||||||
Fannie Mae Pool FN BE0637 | 4.000% | 07/01/2047 | 7,281 | 7,589 | ||||||||||||
Fannie Mae Pool FN BE0640 | 4.500% | 08/01/2047 | 16,038 | 16,983 | ||||||||||||
Fannie Mae Pool FN BE2717 | 4.500% | 07/01/2047 | 11,471 | 12,195 | ||||||||||||
Fannie Mae Pool FN BE2732 | 4.000% | 07/01/2047 | 25,118 | 26,344 | ||||||||||||
Fannie Mae Pool FN BE2733 | 4.500% | 07/01/2047 | 13,555 | 14,411 | ||||||||||||
Fannie Mae Pool FN BE2774 | 4.000% | 10/01/2047 | 57,246 | 59,633 | ||||||||||||
Fannie Mae Pool FN BE2784 | 4.000% | 11/01/2047 | 74,606 | 77,717 | ||||||||||||
Fannie Mae Pool FN BE2786 | 4.500% | 11/01/2047 | 64,003 | 67,775 | ||||||||||||
Fannie Mae Pool FN BF0130 | 3.500% | 08/01/2056 | 341,310 | 350,537 | ||||||||||||
Fannie Mae Pool FN BF0167 | 3.000% | 02/01/2057 | 303,562 | 306,028 | ||||||||||||
Fannie Mae Pool FN BF0168 | 3.500% | 02/01/2057 | 488,622 | 501,830 | ||||||||||||
Fannie Mae Pool FN BH1596 | 4.000% | 01/01/2048 | 37,889 | 40,189 | ||||||||||||
Fannie Mae Pool FN BH1902 | 3.500% | 12/01/2047 | 20,534 | 21,393 | ||||||||||||
Fannie Mae Pool FN BH3305 | 4.500% | 05/01/2047 | 28,467 | 30,606 | ||||||||||||
Fannie Mae Pool FN BH3306 | 4.500% | 05/01/2047 | 22,437 | 23,965 | ||||||||||||
Fannie Mae Pool FN BH3307 | 4.500% | 05/01/2047 | 23,899 | 25,387 | ||||||||||||
Fannie Mae Pool FN BH3336 | 4.500% | 05/01/2047 | 16,780 | 18,041 | ||||||||||||
Fannie Mae Pool FN BH3337 | 4.500% | 05/01/2047 | 13,493 | 14,412 | ||||||||||||
Fannie Mae Pool FN BH3338 | 4.500% | 05/01/2047 | 16,764 | 17,808 | ||||||||||||
Fannie Mae Pool FN BH3540 | 4.000% | 06/01/2047 | 6,836 | 7,128 | ||||||||||||
Fannie Mae Pool FN BH3892 | 3.500% | 08/01/2047 | 74,596 | 76,772 | ||||||||||||
| 116 | (continued) |
| Ohio National Fund, Inc. | ON Risk Managed Balanced Portfolio (Continued) |
Schedule of Investments | June 30, 2019 (Unaudited) | |
| U.S. Government Agency Mortgage-Backed Securities (Continued) | Rate | Maturity | Face Amount | Value | ||||||||||
Fannie Mae Pool FN BH4380 | 4.000% | 06/01/2047 | $ | 14,195 | $ | 14,789 | ||||||||
Fannie Mae Pool FN BH4639 | 4.500% | 06/01/2047 | 9,912 | 10,657 | ||||||||||
Fannie Mae Pool FN BH4640 | 4.500% | 05/01/2047 | 8,221 | 8,781 | ||||||||||
Fannie Mae Pool FN BH4667 | 4.500% | 05/01/2047 | 5,408 | 5,814 | ||||||||||
Fannie Mae Pool FN BH4706 | 4.500% | 05/01/2047 | 5,543 | 5,959 | ||||||||||
Fannie Mae Pool FN BH5672 | 4.000% | 06/01/2047 | 13,550 | 14,124 | ||||||||||
Fannie Mae Pool FN BH5673 | 4.000% | 07/01/2047 | 10,422 | 10,855 | ||||||||||
Fannie Mae Pool FN BH5725 | 4.000% | 11/01/2047 | 85,481 | 89,045 | ||||||||||
Fannie Mae Pool FN BH6165 | 4.000% | 07/01/2047 | 22,306 | 23,269 | ||||||||||
Fannie Mae Pool FN BH6168 | 4.000% | 06/01/2047 | 28,065 | 29,265 | ||||||||||
Fannie Mae Pool FN BH6170 | 4.500% | 07/01/2047 | 61,271 | 64,881 | ||||||||||
Fannie Mae Pool FN BH6940 | 3.500% | 08/01/2047 | 49,652 | 51,269 | ||||||||||
Fannie Mae Pool FN BH7029 | 4.000% | 12/01/2047 | 170,388 | 177,448 | ||||||||||
Fannie Mae Pool FN BH7108 | 4.000% | 01/01/2048 | 324,433 | 337,618 | ||||||||||
Fannie Mae Pool FN BH8168 | 4.000% | 08/01/2047 | 27,579 | 28,747 | ||||||||||
Fannie Mae Pool FN BH8170 | 4.000% | 08/01/2047 | 44,437 | 46,356 | ||||||||||
Fannie Mae Pool FN BH8171 | 4.500% | 08/01/2047 | 86,761 | 91,873 | ||||||||||
Fannie Mae Pool FN BH8224 | 4.000% | 08/01/2047 | 127,841 | 133,255 | ||||||||||
Fannie Mae Pool FN BH8655 | 4.000% | 08/01/2047 | 12,008 | 12,501 | ||||||||||
Fannie Mae Pool FN BJ0241 | 4.000% | 09/01/2047 | 11,653 | 12,147 | ||||||||||
Fannie Mae Pool FN BJ1588 | 4.000% | 10/01/2047 | 25,660 | 26,730 | ||||||||||
Fannie Mae Pool FN BJ1692 | 3.500% | 12/01/2047 | 121,854 | 125,945 | ||||||||||
Fannie Mae Pool FN BJ1695 | 3.500% | 12/01/2047 | 22,796 | 23,476 | ||||||||||
Fannie Mae Pool FN BJ1735 | 4.000% | 10/01/2047 | 52,087 | 54,251 | ||||||||||
Fannie Mae Pool FN BJ1747 | 4.000% | 10/01/2047 | 31,935 | 33,301 | ||||||||||
Fannie Mae Pool FN BJ1758 | 4.000% | 10/01/2047 | 49,450 | 51,464 | ||||||||||
Fannie Mae Pool FN BJ3260 | 4.500% | 10/01/2047 | 5,697 | 6,025 | ||||||||||
Fannie Mae Pool FN BJ3265 | 4.000% | 11/01/2047 | 22,187 | 23,107 | ||||||||||
Fannie Mae Pool FN BJ3443 | 4.000% | 03/01/2048 | 32,933 | 34,918 | ||||||||||
Fannie Mae Pool FN BJ4558 | 3.500% | 01/01/2048 | 88,384 | 91,399 | ||||||||||
Fannie Mae Pool FN BJ4559 | 3.500% | 01/01/2048 | 32,309 | 33,383 | ||||||||||
Fannie Mae Pool FN BJ4566 | 4.000% | 01/01/2048 | 295,634 | 309,105 | ||||||||||
Fannie Mae Pool FN BJ4567 | 4.000% | 01/01/2048 | 518,039 | 540,505 | ||||||||||
Fannie Mae Pool FN BJ5170 | 3.500% | 03/01/2048 | 17,679 | 18,417 | ||||||||||
Fannie Mae Pool FN BJ5796 | 4.500% | 03/01/2048 | 108,324 | 115,002 | ||||||||||
Fannie Mae Pool FN BJ5834 | 4.500% | 05/01/2048 | 58,879 | 62,420 | ||||||||||
Fannie Mae Pool FN BJ5844 | 4.500% | 04/01/2048 | 84,401 | 89,694 | ||||||||||
Fannie Mae Pool FN BJ7349 | 4.000% | 10/01/2048 | 24,044 | 25,171 | ||||||||||
Fannie Mae Pool FN BK1964 | 4.000% | 03/01/2048 | 125,761 | 131,492 | ||||||||||
Fannie Mae Pool FN BK1975 | 3.500% | 03/01/2048 | 53,891 | 55,730 | ||||||||||
Fannie Mae Pool FN BK3211 | 4.500% | 03/01/2048 | 130,636 | 137,261 | ||||||||||
Fannie Mae Pool FN BK3986 | 4.500% | 05/01/2048 | 66,370 | 70,406 | ||||||||||
Fannie Mae Pool FN BK4039 | 4.500% | 06/01/2048 | 67,407 | 71,337 | ||||||||||
Fannie Mae Pool FN BK4157 | 4.000% | 05/01/2048 | 333,006 | 346,132 | ||||||||||
Fannie Mae Pool FN BK5358 | 4.000% | 05/01/2048 | 85,685 | 88,977 | ||||||||||
Fannie Mae Pool FN BK5378 | 4.000% | 06/01/2048 | 137,101 | 142,331 | ||||||||||
Fannie Mae Pool FN BM1660 | 4.000% | 08/01/2047 | 248,396 | 260,113 | ||||||||||
Fannie Mae Pool FN BM3032 | 3.000% | 02/01/2047 | 630,707 | 642,965 | ||||||||||
Fannie Mae Pool FN BM3144 | 4.000% | 11/01/2047 | 142,235 | 148,669 | ||||||||||
Fannie Mae Pool FN BM3282 | 3.500% | 12/01/2047 | 10,285 | 10,756 | ||||||||||
Fannie Mae Pool FN BM3511 | 4.500% | 02/01/2046 | 188,973 | 202,764 | ||||||||||
Fannie Mae Pool FN BM3557 | 4.000% | 09/01/2047 | 289,207 | 307,787 | ||||||||||
Fannie Mae Pool FN BM3878 | 4.000% | 04/01/2048 | 70,391 | 74,634 | ||||||||||
Fannie Mae Pool FN BM3912 | 3.000% | 03/01/2047 | 249,589 | 253,626 | ||||||||||
Fannie Mae Pool FN BM4427 | 3.500% | 04/01/2048 | 181,538 | 187,221 | ||||||||||
Fannie Mae Pool FN BM4735 | 3.500% | 04/01/2048 | 177,963 | 184,814 | ||||||||||
Fannie Mae Pool FN BM5058 | 4.000% | 01/01/2048 | 25,884 | 27,444 | ||||||||||
Fannie Mae Pool FN BM5138 | 3.500% | 11/01/2048 | 291,675 | 304,060 | ||||||||||
Fannie Mae Pool FN BM5334 | 3.500% | 01/01/2049 | 108,622 | 112,203 | ||||||||||
Fannie Mae Pool FN BN0012 | 4.500% | 08/01/2048 | 134,511 | 141,229 | ||||||||||
Fannie Mae Pool FN BN4541 | 4.000% | 02/01/2049 | 53,263 | 55,229 | ||||||||||
Fannie Mae Pool FN CA0108 | 3.500% | 08/01/2047 | 37,516 | 39,214 | ||||||||||
Fannie Mae Pool FN MA1363 | 3.000% | 02/01/2043 | 8,219 | 8,332 | ||||||||||
Fannie Mae Pool FN MA1404 | 3.500% | 04/01/2043 | 132,216 | 136,927 | ||||||||||
Fannie Mae Pool FN MA3239 | 4.000% | 01/01/2048 | 33,708 | 35,063 | ||||||||||
Fannie Mae Pool FN MA3525 | 4.500% | 11/01/2038 | 152,141 | 160,208 | ||||||||||
Freddie Mac Gold Pool FG C92007 | 4.500% | 05/01/2038 | 221,500 | 233,310 | ||||||||||
Freddie Mac Gold Pool FG C92015 | 4.500% | 07/01/2038 | 170,866 | 180,034 | ||||||||||
Freddie Mac Gold Pool FG C92020 | 4.500% | 09/01/2038 | 112,458 | 118,492 | ||||||||||
Freddie Mac Gold Pool FG G08622 | 3.000% | 01/01/2045 | 59,078 | 60,008 | ||||||||||
Freddie Mac Gold Pool FG G08831 | 4.000% | 08/01/2048 | 1,940,810 | 2,010,222 | ||||||||||
| 117 | (continued) |
| Ohio National Fund, Inc. | ON Risk Managed Balanced Portfolio (Continued) |
Schedule of Investments | June 30, 2019 (Unaudited) | |
| U.S. Government Agency Mortgage-Backed Securities (Continued) | Rate | Maturity | Face Amount | Value | ||||||||||
Freddie Mac Gold Pool FG G60658 | 3.500% | 07/01/2046 | $ | 389,226 | $ | 405,831 | ||||||||
Freddie Mac Gold Pool FG G60726 | 3.500% | 10/01/2046 | 488,648 | 505,269 | ||||||||||
Freddie Mac Gold Pool FG G60989 | 3.000% | 12/01/2046 | 653,278 | 663,029 | ||||||||||
Freddie Mac Gold Pool FG G61315 | 3.500% | 02/01/2047 | 302,417 | 312,663 | ||||||||||
Freddie Mac Gold Pool FG G61338 | 3.000% | 08/01/2047 | 1,699,192 | 1,727,651 | ||||||||||
Freddie Mac Gold Pool FG G61360 | 3.500% | 03/01/2048 | 87,212 | 90,157 | ||||||||||
Freddie Mac Gold Pool FG G61392 | 3.500% | 12/01/2044 | 47,714 | 49,530 | ||||||||||
Freddie Mac Gold Pool FG G61596 | 3.500% | 08/01/2048 | 336,759 | 348,132 | ||||||||||
Freddie Mac Gold Pool FG G61737 | 3.500% | 11/01/2048 | 432,782 | 447,390 | ||||||||||
Freddie Mac Gold Pool FG G61810 | 4.000% | 03/01/2047 | 25,890 | 27,120 | ||||||||||
Freddie Mac Gold Pool FG G67709 | 3.500% | 03/01/2048 | 334,838 | 347,485 | ||||||||||
Freddie Mac Gold Pool FG Q40332 | 4.000% | 05/01/2046 | 60,507 | 63,419 | ||||||||||
Freddie Mac Gold Pool FG Q41917 | 3.500% | 07/01/2046 | 77,386 | 80,119 | ||||||||||
Freddie Mac Gold Pool FG Q52307 | 3.500% | 11/01/2047 | 57,934 | 60,126 | ||||||||||
Freddie Mac Gold Pool FG Q52419 | 3.500% | 11/01/2047 | 103,112 | 106,473 | ||||||||||
Freddie Mac Gold Pool FG Q52875 | 3.500% | 12/01/2047 | 133,515 | 138,566 | ||||||||||
Freddie Mac Gold Pool FG Q53205 | 3.500% | 12/01/2047 | 71,545 | 74,039 | ||||||||||
Freddie Mac Gold Pool FG Q54450 | 3.500% | 02/01/2048 | 31,519 | 32,579 | ||||||||||
Freddie Mac Gold Pool FG Q54453 | 3.500% | 02/01/2048 | 30,632 | 31,620 | ||||||||||
Freddie Mac Gold Pool FG Q54737 | 4.500% | 03/01/2048 | 77,529 | 81,573 | ||||||||||
Freddie Mac Gold Pool FG Q54793 | 4.500% | 03/01/2048 | 125,621 | 132,000 | ||||||||||
Freddie Mac Gold Pool FG Q54952 | 4.000% | 03/01/2048 | 85,232 | 89,176 | ||||||||||
Freddie Mac Gold Pool FG Q55394 | 3.500% | 04/01/2048 | 30,324 | 31,348 | ||||||||||
Freddie Mac Gold Pool FG Q55522 | 4.000% | 04/01/2048 | 126,326 | 131,282 | ||||||||||
Freddie Mac Gold Pool FG Q55628 | 4.000% | 04/01/2048 | 138,476 | 144,578 | ||||||||||
Freddie Mac Gold Pool FG Q55894 | 4.000% | 05/01/2048 | 62,900 | 65,400 | ||||||||||
Freddie Mac Gold Pool FG Q55913 | 4.000% | 05/01/2048 | 376,623 | 391,623 | ||||||||||
Freddie Mac Gold Pool FG Q56524 | 4.000% | 06/01/2048 | 98,967 | 102,857 | ||||||||||
Freddie Mac Gold Pool FG Q57835 | 4.000% | 08/01/2048 | 438,775 | 465,520 | ||||||||||
Freddie Mac Gold Pool FG Q58012 | 4.500% | 08/01/2048 | 99,081 | 104,149 | ||||||||||
Freddie Mac Gold Pool FG Q58159 | 5.000% | 09/01/2048 | 27,027 | 28,675 | ||||||||||
Freddie Mac Gold Pool FG Q58441 | 4.500% | 09/01/2048 | 376,328 | 395,387 | ||||||||||
Freddie Mac Gold Pool FG Q60519 | 4.500% | 12/01/2048 | 130,980 | 139,573 | ||||||||||
Freddie Mac Gold Pool FG Q60839 | 4.000% | 01/01/2049 | 125,846 | 133,714 | ||||||||||
Freddie Mac Gold Pool FG U91030 | 3.500% | 02/01/2043 | 91,756 | 95,109 | ||||||||||
Freddie Mac Gold Pool FG U99096 | 4.500% | 05/01/2044 | 112,869 | 121,112 | ||||||||||
Freddie Mac Gold Pool FG U99114 | 3.500% | 02/01/2044 | 12,355 | 12,804 | ||||||||||
Freddie Mac Gold Pool FG V82645 | 3.000% | 10/01/2046 | 323,369 | 328,195 | ||||||||||
Ginnie Mae I Pool GN 784059 | 4.000% | 01/15/2045 | 255,297 | 271,214 | ||||||||||
Ginnie Mae I Pool GN 784182 | 4.500% | 08/15/2046 | 416,727 | 449,032 | ||||||||||
Ginnie Mae I Pool GN BB4357 | 4.000% | 07/15/2047 | 337,284 | 357,744 | ||||||||||
Ginnie Mae I Pool GN BC7161 | 4.000% | 08/15/2047 | 66,276 | 70,289 | ||||||||||
Ginnie Mae I Pool GN BD7109 | 4.000% | 11/15/2047 | 67,767 | 71,108 | ||||||||||
Ginnie Mae I Pool GN BD7135 | 4.000% | 12/15/2047 | 88,285 | 92,633 | ||||||||||
Ginnie Mae II Pool G2 BB9817 | 4.000% | 08/20/2047 | 29,174 | 30,423 | ||||||||||
Ginnie Mae II Pool G2 BH3672 | 4.500% | 05/20/2048 | 46,231 | 48,872 | ||||||||||
Ginnie Mae II Pool G2 BH3673 | 4.500% | 05/20/2048 | 193,208 | 204,218 | ||||||||||
Ginnie Mae II Pool G2 MA5921 | 3.500% | 05/20/2049 | 399,397 | 408,097 | ||||||||||
Ginnie Mae II Pool G2 MA5976 | 3.500% | 06/20/2049 | 155,632 | 159,022 | ||||||||||
Ginnie Mae TBA | 4.500% | 07/15/2049 | 302,000 | 314,782 | ||||||||||
Ginnie Mae TBA | 5.000% | 07/15/2049 | 1,284,768 | 1,342,951 | ||||||||||
|
| |||||||||||||
Total U.S. Government Agency Mortgage-Backed Securities (Cost $30,856,873) | $ | 31,340,267 | ||||||||||||
|
| |||||||||||||
U.S. Treasury Obligations – 7.5%
| Rate | Maturity | Face Amount | Value | ||||||||||
U.S. Treasury Bill | (d) | 0.000% | 12/05/2019 | $ | 300,000 | $ | 297,354 | |||||||
U.S. Treasury Bill | (d) | 0.000% | 02/27/2020 | 250,000 | 246,755 | |||||||||
U.S. Treasury Note | 2.375% | 04/30/2020 | 2,954,000 | 2,962,539 | ||||||||||
U.S. Treasury Note | 2.750% | 05/31/2023 | 1,220,100 | 1,266,283 | ||||||||||
U.S. Treasury Note | 2.875% | 09/30/2023 | 1,800,000 | 1,882,336 | ||||||||||
U.S. Treasury Note | 2.875% | 10/31/2023 | 1,370,700 | 1,434,416 | ||||||||||
U.S. Treasury Note | 2.875% | 11/30/2023 | 234,000 | 245,133 | ||||||||||
U.S. Treasury Note | 2.625% | 12/31/2023 | 618,000 | 640,982 | ||||||||||
U.S. Treasury Note | 2.125% | 03/31/2024 | 28,000 | 28,454 | ||||||||||
U.S. Treasury Note | 2.250% | 04/30/2024 | 246,000 | 251,468 | ||||||||||
U.S. Treasury Note | 2.000% | 05/31/2024 | 2,021,000 | 2,043,736 | ||||||||||
U.S. Treasury Note | (d) | 2.250% | 11/15/2024 | 1,865,000 | 1,907,545 | |||||||||
U.S. Treasury Note | 2.875% | 11/30/2025 | 2,000 | 2,123 | ||||||||||
U.S. Treasury Note | 2.375% | 04/30/2026 | 113,000 | 116,628 | ||||||||||
U.S. Treasury Note | 2.875% | 08/15/2028 | 472,000 | 506,958 | ||||||||||
U.S. Treasury Note | 3.125% | 11/15/2028 | 2,742,000 | 3,005,917 | ||||||||||
| 118 | (continued) |
| Ohio National Fund, Inc. | ON Risk Managed Balanced Portfolio (Continued) |
Schedule of Investments | June 30, 2019 (Unaudited) | |
U.S. Treasury Obligations (Continued)
| Rate | Maturity | Face Amount | Value | ||||||||||
U.S. Treasury Note | 2.625% | 02/15/2029 | $ | 1,131,000 | $ | 1,192,012 | ||||||||
U.S. Treasury Note | 2.375% | 05/15/2029 | 1,426,000 | 1,472,791 | ||||||||||
U.S. Treasury Note | 2.250% | 08/15/2046 | 384,000 | 362,295 | ||||||||||
U.S. Treasury Note |
| 2.750% | 08/15/2047 | 46,000 | 47,939 | |||||||||
U.S. Treasury Note | 2.750% | 11/15/2047 | 1,287,000 | 1,341,396 | ||||||||||
U.S. Treasury Note | 3.000% | 02/15/2048 | 934,000 | 1,021,672 | ||||||||||
U.S. Treasury Note | 3.000% | 08/15/2048 | 157,000 | 171,927 | ||||||||||
U.S. Treasury Note | 3.375% | 11/15/2048 | 858,300 | 1,008,905 | ||||||||||
U.S. Treasury Note | 3.000% | 02/15/2049 | 1,136,000 | 1,245,872 | ||||||||||
U.S. Treasury Note | 2.875% | 05/15/2049 | 4,199,000 | 4,497,523 | ||||||||||
|
| |||||||||||||
Total U.S. Treasury Obligations (Cost $28,173,105) | $ | 29,200,959 | ||||||||||||
|
| |||||||||||||
| Purchased Options – 5.9% | Notional Amount | Expiration | Exercise Price | Contracts (e) | Value | |||||||||||||||
S&P 500 Index Call Option | 8,825,280 | December 2020 | $2,850 | 30 | $ | 816,600 | ||||||||||||||
S&P 500 Index Call Option | 10,296,160 | December 2020 | $2,900 | 35 | 844,550 | |||||||||||||||
S&P 500 Index Call Option | 5,883,520 | December 2020 | $3,000 | 20 | 380,700 | |||||||||||||||
S&P 500 Index Call Option | 1,470,880 | December 2020 | $3,050 | 5 | 79,435 | |||||||||||||||
S&P 500 Index Call Option | 29,417,600 | December 2021 | $2,800 | 100 | 3,665,700 | |||||||||||||||
S&P 500 Index Call Option | 13,237,920 | December 2021 | $2,850 | 45 | 1,513,350 | |||||||||||||||
S&P 500 Index Call Option | 25,004,960 | December 2021 | $2,900 | 85 | 2,621,400 | |||||||||||||||
S&P 500 Index Call Option | 4,412,640 | December 2021 | $3,000 | 15 | 384,150 | |||||||||||||||
S&P 500 Index Put Option | 8,825,280 | December 2020 | $2,850 | 30 | 567,390 | |||||||||||||||
S&P 500 Index Put Option | 10,296,160 | December 2020 | $2,900 | 35 | 704,200 | |||||||||||||||
S&P 500 Index Put Option | 5,883,520 | December 2020 | $3,000 | 20 | 481,400 | |||||||||||||||
S&P 500 Index Put Option | 1,470,880 | December 2020 | $3,050 | 5 | 131,500 | |||||||||||||||
S&P 500 Index Put Option | 29,417,600 | December 2021 | $2,800 | 100 | 2,381,000 | |||||||||||||||
S&P 500 Index Put Option | 13,237,920 | December 2021 | $2,850 | 45 | 1,155,150 | |||||||||||||||
S&P 500 Index Put Option | 25,004,960 | December 2021 | $2,900 | 85 | 2,348,550 | |||||||||||||||
S&P 500 Index Put Option | 4,412,640 | December 2021 | $3,000 | 15 | 478,650 | |||||||||||||||
SPDR S&P 500 ETF Trust Call Option | 4,043,400 | December 2020 | $275 | 138 | 463,956 | |||||||||||||||
SPDR S&P 500 ETF Trust Call Option | 3,047,200 | December 2020 | $280 | 104 | 312,520 | |||||||||||||||
SPDR S&P 500 ETF Trust Call Option | 2,490,500 | December2020 | $285 | 85 | 230,265 | |||||||||||||||
SPDR S&P 500 ETF Trust Call Option | 4,834,500 | December 2020 | $290 | 165 | 404,910 | |||||||||||||||
SPDR S&P 500 ETF Trust Call Option | 6,153,000 | December 2020 | $300 | 210 | 393,540 | |||||||||||||||
SPDR S&P 500 ETF Trust Call Option | 3,105,800 | December 2020 | $305 | 106 | 171,190 | |||||||||||||||
SPDR S&P 500 ETF Trust Call Option | 3,223,000 | December 2020 | $310 | 110 | 150,260 | |||||||||||||||
SPDR S&P 500 ETF Trust Put Option | 4,043,400 | December 2020 | $275 | 138 | 207,276 | |||||||||||||||
SPDR S&P 500 ETF Trust Put Option | 3,047,200 | December 2020 | $280 | 104 | 179,608 | |||||||||||||||
SPDR S&P 500 ETF Trust Put Option | 2,490,500 | December 2020 | $285 | 85 | 161,585 | |||||||||||||||
SPDR S&P 500 ETF Trust Put Option | 4,834,500 | December 2020 | $290 | 165 | 332,640 | |||||||||||||||
SPDR S&P 500 ETF Trust Put Option | 6,153,000 | December 2020 | $300 | 210 | 501,060 | |||||||||||||||
SPDR S&P 500 ETF Trust Put Option | 3,105,800 | December 2020 | $305 | 106 | 276,236 | |||||||||||||||
SPDR S&P 500 ETF Trust Put Option | 3,223,000 | December 2020 | $310 | 110 | 307,230 | |||||||||||||||
|
| |||||||||||||||||||
Total Purchased Options (Cost $24,094,943) | $ | 22,646,001 | ||||||||||||||||||
|
| |||||||||||||||||||
| Asset-Backed / Mortgage-Backed Securities – 1.6% | Rate | Maturity | Face Amount | Value | ||||||||||||||||
CONSUMER DISCRETIONARY – 0.4% | ||||||||||||||||||||
Applebee’s Funding LLC | (b) | 4.194% | 06/07/2049 | $ | 195,000 | $ | 197,052 | |||||||||||||
Applebee’s Funding LLC | (b) | 4.723% | 06/07/2049 | 99,000 | 100,341 | |||||||||||||||
DB Master Finance LLC2019-1A A23 | (b) | 4.352% | 05/20/2049 | 91,000 | 94,078 | |||||||||||||||
DB Master Finance LLC2019-1A A2I | (b) | 3.787% | 05/20/2049 | 114,000 | 116,431 | |||||||||||||||
DB Master Finance LLC2019-1A A2II | (b) | 4.021% | 05/20/2049 | 50,000 | 51,465 | |||||||||||||||
Domino’s Pizza Master Issuer LLC2017-1A A2II | (b) | 3.082% | 07/25/2047 | 49,125 | 49,199 | |||||||||||||||
Domino’s Pizza Master Issuer LLC2018-1A A2I | (b) | 4.116% | 07/25/2048 | 59,400 | 61,171 | |||||||||||||||
Jack In The Box Funding LLC2019-1A A23 | (b) | 4.970% | 08/25/2049 | 240,000 | 240,000 | |||||||||||||||
Jack In The Box Funding LLC2019-1A A2I | (b) | 3.982% | 08/25/2049 | 240,000 | 240,000 | |||||||||||||||
Jack In The Box Funding LLC2019-1A A2II | (b) | 4.476% | 08/25/2049 | 240,000 | 240,000 | |||||||||||||||
Wendy’s Funding LLC2018-1A A2I | (b) | 3.573% | 03/15/2048 | 73,875 | 74,299 | |||||||||||||||
|
| |||||||||||||||||||
| 1,464,036 | ||||||||||||||||||||
|
| |||||||||||||||||||
FINANCIALS – 1.2% | ||||||||||||||||||||
AmeriCredit Automobile Receivables Trust2015-3 D | 3.340% | 08/08/2021 | 383,000 | 384,747 | ||||||||||||||||
Angel Oak Mortgage Trust I LLC2018-2 A1 | (b) | 3.674% | 07/27/2048 | 50,735 | 51,533 | |||||||||||||||
Arroyo Mortgage Trust2018-1 A1 | (b) | 3.763% | 04/25/2048 | 86,653 | 88,719 | |||||||||||||||
BAMLL Commercial Mortgage Securities Trust 2018-DSNY A | (b) | ML + 85 | 09/15/2034 | 144,000 | 144,038 | |||||||||||||||
BBCMS Mortgage Trust 2018-TALL A | (b) | ML + 72 | 03/15/2037 | 355,000 | 353,665 | |||||||||||||||
BBCMS Trust 2015-SRCH A2 | (b) | 4.197% | 08/10/2035 | 210,000 | 230,879 | |||||||||||||||
| 119 | (continued) |
| Ohio National Fund, Inc. | ON Risk Managed Balanced Portfolio (Continued) |
Schedule of Investments | June 30, 2019 (Unaudited) | |
| Asset-Backed / Mortgage-Backed Securities (Continued) | Rate | Maturity | Face Amount | Value | ||||||||||||||
FINANCIALS (continued) | ||||||||||||||||||
BX Commercial Mortgage Trust2018-IND A | (b) | ML + 75 | 11/15/2035 | $ | 315,104 | $ | 315,363 | |||||||||||
BXP Trust2017-GM A | (b) | 3.379% | 06/13/2039 | 96,000 | 100,458 | |||||||||||||
CSMLT2015-2 A6 | (b) | 3.500% | 08/25/2045 | 102,260 | 103,462 | |||||||||||||
Drive Auto Receivables Trust2017-AA D | (b) | 4.160% | 05/15/2024 | 101,000 | 102,730 | |||||||||||||
Drive Auto Receivables Trust2019-1 D | 4.090% | 06/15/2026 | 42,000 | 43,457 | ||||||||||||||
Fannie Mae Connecticut Avenue Securities2014-C03 1M2 | ML + 300 | 07/25/2024 | 270,724 | 283,877 | ||||||||||||||
Fannie Mae Connecticut Avenue Securities2017-C02 2M1 | ML + 115 | 09/25/2029 | 27,023 | 27,102 | ||||||||||||||
Fannie Mae Connecticut Avenue Securities2017-C03 1M1 | ML + 95 | 10/25/2029 | 19,160 | 19,210 | ||||||||||||||
Fannie Mae Connecticut Avenue Securities2017-C06 1M1 | ML + 75 | 02/25/2030 | 19,653 | 19,653 | ||||||||||||||
Fannie Mae Connecticut Avenue Securities2017-C06 2M1 | ML + 75 | 02/25/2030 | 15,989 | 15,997 | ||||||||||||||
Fannie Mae Connecticut Avenue Securities2018-C01 1M1 | ML + 60 | 07/25/2030 | 44,444 | 44,420 | ||||||||||||||
Fannie Mae Connecticut Avenue Securities2018-C05 1M1 | ML + 72 | 01/25/2031 | 13,684 | 13,689 | ||||||||||||||
Fannie Mae REMICS FNR2018-27 EA | 3.000% | 05/25/2048 | 303,561 | 307,759 | ||||||||||||||
Government National Mortgage Association GNR2019-18 FQ | ML + 45 | 02/20/2049 | 255,186 | 255,610 | ||||||||||||||
Government National Mortgage Association GNR2019-18 QF | ML + 45 | 02/20/2049 | 225,142 | 225,558 | ||||||||||||||
JP Morgan Mortgage Trust2019-5 A11 | (b) | ML + 90 | 11/25/2049 | 42,000 | 42,027 | |||||||||||||
Mello Warehouse Securitization Trust2018-W1 A | (b) | ML + 85 | 11/25/2051 | 500,000 | 498,884 | |||||||||||||
New Residential Mortgage Loan Trust2018-2A A1 | (b) | 4.500% | 02/25/2058 | 99,824 | 104,764 | |||||||||||||
OneMain Direct Auto Receivables Trust2018-1A C | (b) | 3.850% | 10/14/2025 | 100,000 | 102,260 | |||||||||||||
OneMain Direct Auto Receivables Trust2018-1A D | (b) | 4.400% | 01/14/2028 | 100,000 | 103,066 | |||||||||||||
Towd Point HE Trust2019-HE1 A1 | (b) | ML + 90 | 04/25/2048 | 240,000 | 239,237 | |||||||||||||
Wachovia Bank Commercial Mortgage Trust Series2007-C34 AJ | 6.308% | 05/15/2046 | 8,490 | 8,541 | ||||||||||||||
Wells Fargo Mortgage Backed Securities2018-1 A17 | (b) | 3.500% | 07/25/2047 | 94,365 | 94,560 | |||||||||||||
Wells Fargo Mortgage Backed Securities2019-1 A3 | (b) | 4.000% | 11/25/2048 | 100,390 | 102,080 | |||||||||||||
Wells Fargo Mortgage Backed Securities2019-2 A17 | (b) | 4.000% | 04/25/2049 | 104,283 | 106,033 | |||||||||||||
WinWater Mortgage Loan Trust2015-5 A5 | (b) | 3.500% | 08/20/2045 | 320,689 | 322,355 | |||||||||||||
|
| |||||||||||||||||
| 4,855,733 | ||||||||||||||||||
|
| |||||||||||||||||
Total Asset-Backed / Mortgage-Backed Securities (Cost $6,275,531) | $ | 6,319,769 | ||||||||||||||||
|
| |||||||||||||||||
| Preferred Securities – 0.3% | Rate | Quantity | Value | |||||||||||||||
FINANCIALS – 0.2% | ||||||||||||||||||
Goldman Sachs Capital I (Capital Markets) | 6.345% | 497,000 | $ | 624,336 | ||||||||||||||
|
| |||||||||||||||||
INDUSTRIALS –0.1% | ||||||||||||||||||
General Electric Co. (Rate is fixed until 01/23/2029, at which point, the rate becomes QL + 163) (Industrial Conglomerates) | (c) | 5.000% | 402,000 | 385,623 | ||||||||||||||
|
| |||||||||||||||||
Total Preferred Securities (Cost $960,981) | $ | 1,009,959 | ||||||||||||||||
|
| |||||||||||||||||
| Money Market Funds – 16.8% | Shares | Value | ||||||||||||||||
State Street Institutional Liquid Reserves Fund Institutional Class, 2.449% | (f) | 64,789,983 | $ | 64,802,941 | ||||||||||||||
State Street Institutional U.S. Government Money Market Fund Institutional Class, 2.310% | (f) | 238,460 | 238,460 | |||||||||||||||
|
| |||||||||||||||||
Total Money Market Funds (Cost $65,034,265) | $ | 65,041,401 | ||||||||||||||||
|
| |||||||||||||||||
Total Investments – 100.9% (Cost $341,489,605) | (g) | $ | 389,897,924 | |||||||||||||||
Liabilities in Excess of Other Assets – (0.9)% | (d) | (3,588,151 | ) | |||||||||||||||
|
| |||||||||||||||||
Net Assets – 100.0% | $ | 386,309,773 | ||||||||||||||||
|
| |||||||||||||||||
| 120 | (continued) |
| Ohio National Fund, Inc. | ON Risk Managed Balanced Portfolio (Continued) |
Schedule of Investments | June 30, 2019 (Unaudited) | |
Percentages are stated as a percent of net assets.
Abbreviations:
| ML: | Monthly U.S. LIBOR Rate, 2.398% at 06/30/2019 |
| QL: | Quarterly U.S. LIBOR Rate, 2.320% at 06/30/2019 |
| TBA: | To Be Announced |
| UMBS: | Uniform Mortgage-Backed Security; the securities actually delivered on settlement of the TBA could be issued by Fannie Mae, Freddie Mac, or any combination thereof |
Footnotes:
| (a) | Non-income producing security. |
| (b) | Security exempt from registration under Regulation D of the Securities Act of 1933. These securities may be resold in transactions exempt from registration, normally to qualified buyers under Rule 144A. At June 30, 2019, the value of these securities totaled $15,767,287, or 4.1% of the Portfolio’s net assets. |
| (c) | Security is a fixed-then-variable rate instrument in which the coupon or dividend rate is fixed until a later specified date, then is adjusted periodically. Rates stated, including interest rate caps and floors, if any, are those in effect at June 30, 2019. |
| (d) | Security is fully or partially pledged, in addition to $700,469 of the Portfolio’s cash holdings, as collateral for the futures contracts outstanding at June 30, 2019. See also the following Schedule of Open Futures Contracts. |
| (e) | 100 shares per contract. |
| (f) | Rate represents theseven-day yield at June 30, 2019. |
| (g) | Represents cost for financial reporting purposes, which may differ from cost basis for federal income tax purposes. See also Note 7 of the Notes to Financial Statements. |
The accompanying notes are an integral part of these financial statements.
Schedule of Open Futures Contracts | June 30, 2019 (Unaudited) | |
Description | Number of contracts | Expiration Date | Notional Amount | Value | Unrealized Appreciation (Depreciation) | Variation Margin Receivable (Payable) | ||||||||||||||||||||||||||||||||||
10-Year U.S. Treasury Note - Long | 1,569 | September 19, 2019 | $196,221,357 | $200,782,969 | $4,561,612 | $ | 49,031 | |||||||||||||||||||||||||||||||||
U.S. Treasury Long Bond - Long | 53 | September 19, 2019 | 8,038,337 | 8,246,469 | 208,132 | (6,625 | ) | |||||||||||||||||||||||||||||||||
CMEE-mini S&P 500 Index - Long | 370 | September 20, 2019 | 53,722,214 | 54,467,700 | 745,486 | 246,050 | ||||||||||||||||||||||||||||||||||
|
|
|
|
|
|
|
| |||||||||||||||||||||||||||||||||
| $257,981,908 | $263,497,138 | $5,515,230 | $ | 288,456 | ||||||||||||||||||||||||||||||||||||
|
|
|
|
|
|
|
| |||||||||||||||||||||||||||||||||
The accompanying notes are an integral part of these financial statements.
| 121 |
| Ohio National Fund, Inc. | ON Conservative Model Portfolio (Unaudited) |
Objective/Strategy |
The ON Conservative Model Portfolio is a fund of funds that seeks current income and preservation of capital by investing in underlying mutual funds. Under normal circumstances, the Portfolio intends to have investment exposure to various asset classes within the following target asset allocation ranges: U.S. Equity0-25%, International Equity0-10%, and Fixed Income65-90%.
Performance as of June 30, 2019 | ||||
Average Annual returns | ||||
One year | 7.13 | % | ||
Since inception (3/1/17) | 4.65 | % |
Past performance does not guarantee future results. The performance data quoted represents past performance and current returns may be lower or higher. Total return figures include change in share price and reinvestment of dividends and capital gains. The investment return and principal value will fluctuate so that an investor’s shares, when redeemed, may be worth more or less than the original cost. To obtain performance information up to the most recent month end, call toll-free1-877-781-6392.
The Portfolio is not open to direct retail investment. Beneficial interest in shares is obtained solely by purchase of variable life insurance policies and variable annuity contracts. Actual performance results for variable annuity and variable universal life contracts will be lower due to contract charges. Consult your contract for applicable charges.
Total gross expense ratio is estimated to be 1.13% per the Fund’s prospectus dated May 1, 2019. Additional information pertaining to the Portfolio’s expense ratio as of June 30, 2019 can be found in the Portfolio’s Financial Highlights. The Portfolio’s expense ratio included in the Financial Highlights does not include Acquired Fund Fees and Expenses (AFFE), which is a major component of the expense ratio that is required to be presented in the Fund’s prospectus. The Adviser has contractually agreed to make payments to the Fund to the extent necessary to maintain the Portfolio’s expense ratio (including AFFE, but excluding certain other expenses) at 0.92% through April 30, 2020.
Comments from Adviser |
Q. How did the Portfolio perform in comparison to its benchmark during the reporting period?
A.For thesix-month period ended June 30, 2019, the ON Conservative Model Portfolio returned 8.91% versus 7.55% for its benchmark, the Morningstar® Conservative Target Risk Index.
Q. Were there specific market conditions, investment strategies, or techniques that materially affected the Portfolio’s benchmark-relative performance during the reporting period?
A.During the first half of 2019, domestic and foreign equity markets provided positive returns. Domestic stocks generally outperformed foreign stocks, and large cap stocks generally outperformed mid cap and small cap stocks. Growth stocks materially outperformed value stocks during the period. The Portfolio’s large cap and domestic stock holdings benefited relative performance.(1)
Fixed income markets also provided positive returns for the period. Interest rates declined across the curve, as the Federal Reserve signaled a more dovish policy. In this environment, longer duration bonds outperformed shorter duration bonds. Corporate credit spreads tightened, and lower quality bonds outperformed higher quality bonds. The Portfolio is overweight to corporate bonds benefited performance, while its exposure to short term bonds detracted.(1)
Q. How did asset class allocation impact the Portfolio’s performance relative to its benchmark?
A. The Portfolio invests in affiliated and unaffiliatedopen-end mutual funds, comprised mostly of fixed income funds, but also some equity funds. The asset allocation between fixed income funds and equity funds was roughlyin-line with the benchmark. On the equity side, the overweight allocation to large cap domestic equity funds benefited performance. On the fixed income side, the overweight allocation to corporate bonds aided performance, while the allocation to shorter bonds detracted from performance.(1)
Q. Which holdings contributed the most to, and detracted the most from, the Portfolio’s benchmark-relative performance?
A.The top three performing funds were the Ohio National Fund, Inc.- ON Janus Henderson Venture Portfolio (“ON JHV”), the Ohio National Fund, Inc.- ON S&P 500® Index Portfolio (“ON S&P 500”), and the Ohio National Fund, Inc.- ON S&P MidCap 400® Index Portfolio (“ON S&P MidCap 400”). ON JHV benefited from its exposure to growth stocks, which outperformed during the period. ON S&P 500 is comprised of stocks that represent a large percentage of the U.S. domestic equity market, which performed well. Likewise, the ON S&P MidCap 400 benefited from its exposure to domestic stocks, which outperformed foreign stocks during the period.(1)
The top three detractors from performance were PIMCO Low Duration Institutional, PIMCO Total Return Institutional, and PIMCO Real Return Institutional. PIMCO Low Duration Institutional underperformed due to its shorter duration and exposure to higher quality bonds. PIMCO Total Return Institutional underperformed due to its lower weighting in corporate bonds. PIMCO Real Return Institutional focuses on inflation protected securities. It underperformed in an environment of low inflation.(1)
| (1) | The Portfolio’s composition is subject to change. Holdings and weightings are as of June 30, 2019. |
Change in Value of $10,000 Investment |
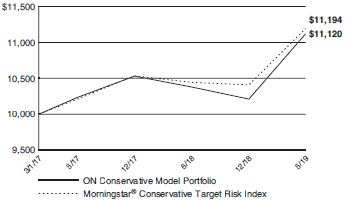
Hypothetical illustration based on past performance. Future performance will vary. The Portfolio’s returns reflect reinvested dividends. The Portfolio’s holdings may differ significantly from the securities in the index. The index is unmanaged and therefore does not reflect the cost of portfolio management and accounting.
The Morningstar® Target Risk Index Family is a series of Morningstar Indexes that provide exposure to a broad array of asset classes using Morningstar asset allocation methodology. The index family provides global equity market risk levels that are scaled to fit five equity market risk profiles: aggressive, moderately aggressive, moderate, moderately conservative, and conservative. The five levels of global equity exposure are set at 95%, 80%, 60%, 40%, and 20%, respectively, and the Morningstar® Conservative Target Risk Index exposure is set at 20%.
Past performance is no guarantee of future results. Redemption of fund shares could have tax implications unique to each shareholder.
| 122 | (continued) |
| Ohio National Fund, Inc. | ON Conservative Model Portfolio (Unaudited) (Continued) |
Portfolio Composition as of June 30, 2019(1) | ||||
| % of Net Assets | ||||
Open-End Mutual Funds Less Net Liabilities | 100.0 | |||
|
| |||
| 100.0 | ||||
|
| |||
Top 10 Portfolio Holdings as of June 30, 2019(1) (2) (3) | ||||
| % of Net Assets | ||||||
1. | Western Asset Core Plus Bond IS | 22.0 | ||||
2. | PIMCO Total Return Institutional | 17.0 | ||||
3. | PIMCO Real Return Institutional | 15.0 | ||||
4. | PIMCO Low Duration Institutional | 11.0 | ||||
5. | Ohio National Fund, Inc.- ON S&P 500®Index Portfolio | 11.0 | ||||
6. | Ohio National Fund, Inc.- ON Bond Portfolio | 7.0 | ||||
7. | Ohio National Fund, Inc.- ON Federated High Income Bond Portfolio | 7.0 | ||||
8. | Ohio National Fund, Inc. - ON Federated Strategic Value Dividend Portfolio | 3.0 | ||||
9. | DFA International Core Equity Portfolio Institutional | 2.0 | ||||
10. | Ohio National Fund, Inc.- ON S&P MidCap 400®Index Portfolio | 2.0 | ||||
| (1) | Composition of Portfolio subject to change. |
| (2) | Short-term investments have been excluded from the list of Top 10 Portfolio Holdings. |
| (3) | Top 10 Portfolio Holdings is presented at an individual security level. Total investment exposure by issuer may be higher. |
| 123 |
| Ohio National Fund, Inc. | ON Conservative Model Portfolio |
Schedule of Investments in Unaffiliated Issuers | June 30, 2019 (Unaudited) | |||
| Open-End Mutual Funds – 67.1% | Shares | Value | ||||||||
DFA International Core Equity Portfolio Institutional | 119,874 | $ | 1,554,768 | |||||||
PIMCO Low Duration Institutional | 860,875 | 8,453,788 | ||||||||
PIMCO Real Return Institutional | 1,038,864 | 11,541,779 | ||||||||
PIMCO Total Return Institutional | 1,261,970 | 13,061,385 | ||||||||
Western Asset Core Plus Bond IS | 1,420,383 | 16,902,563 | ||||||||
|
| |||||||||
TotalOpen-End Mutual Funds | $ | 51,514,283 | ||||||||
|
| |||||||||
Total Investments in Securities of Unaffiliated Issuers – 67.1% (Cost $50,614,810) | (a) | $ | 51,514,283 | |||||||
Total Investments in Affiliates – 32.9% (Cost $23,622,873) (see schedule below) | (a) | 25,279,835 | ||||||||
Liabilities in Excess of Other Assets – 0.0% | (22,782 | ) | ||||||||
|
| |||||||||
Net Assets – 100.0% | $ | 76,771,336 | ||||||||
|
| |||||||||
Percentages are stated as a percent of net assets.
Footnotes:
| (a) | Represents cost for financial reporting purposes, which may differ from cost basis for federal income tax purposes. See also Note 7 of the Notes to Financial Statements. |
The accompanying notes are an integral part of these financial statements.
Schedule of Investments in Affiliates | June 30, 2019 (Unaudited) | |
| Affiliate | Value at January 1, 2019 | Cost of Purchases | Proceeds from Sales | Net Realized Gain (Loss) | Change in Unrealized Appreciation (Depreciation) | Income Distributions | Capital Gain Distributions | Shares at June 30, 2019 | Value at June 30, 2019 | |||||||||||||||||||||||||||||||||||||||||
Open-End Mutual Funds – 32.9% | ||||||||||||||||||||||||||||||||||||||||||||||||||
Ohio National Fund, Inc.- ON Bond Portfolio | (a | )(b) | $ | 5,557,747 | $ | 311,411 | $ | 1,032,903 | $ | 8,706 | $ | 517,428 | $ | — | $ | — | 285,385 | $ | 5,362,389 | |||||||||||||||||||||||||||||||
Ohio National Fund, Inc.- ON Federated High Income Bond Portfolio | (a | )(b) | 5,470,926 | 445,447 | 1,090,824 | 331,426 | 205,414 | — | — | 259,303 | 5,362,389 | |||||||||||||||||||||||||||||||||||||||
Ohio National Fund, Inc.- ON Federated Strategic Value Dividend Portfolio | (a | )(b) | 2,307,819 | 316,032 | 556,457 | 32,149 | 198,624 | — | — | 127,252 | 2,298,167 | |||||||||||||||||||||||||||||||||||||||
Ohio National Fund, Inc.- ON International Equity Portfolio | (a | )(b) | 1,572,159 | 164,511 | 429,635 | (33,493 | ) | 258,569 | — | — | 101,465 | 1,532,111 | ||||||||||||||||||||||||||||||||||||||
Ohio National Fund, Inc. - ON Janus Henderson Venture Portfolio | (a | )(b) | 767,825 | 128,462 | 302,388 | 3,387 | 168,770 | — | — | 19,991 | 766,056 | |||||||||||||||||||||||||||||||||||||||
Ohio National Fund, Inc.- ON S&P 500®Index Portfolio | (a | )(b) | 8,441,448 | 1,269,375 | 2,738,972 | 231,577 | 1,223,184 | — | — | 253,432 | 8,426,612 | |||||||||||||||||||||||||||||||||||||||
Ohio National Fund, Inc. - ON S&P MidCap 400®Index Portfolio | (a | )(b) | 1,525,495 | 273,634 | 528,535 | (3,185 | ) | 264,702 | — | — | 84,228 | 1,532,111 | ||||||||||||||||||||||||||||||||||||||
|
|
|
|
|
|
|
|
|
| |||||||||||||||||||||||||||||||||||||||||
TotalOpen-End Mutual Funds | $ | 570,567 | $ | 2,836,691 | $ | — | $ | — | $ | 25,279,835 | ||||||||||||||||||||||||||||||||||||||||
|
|
|
|
|
|
|
|
|
| |||||||||||||||||||||||||||||||||||||||||
Percentages are stated as a percent of net assets.
Footnotes:
| (a) | Pursuant to Section 2(a)(3) of the Investment Company Act of 1940, the investment meets the definition of “affiliated person”, as the Portfolio directly or indirectly owns, controls, or holds with power to vote 5 percent or more of the outstanding voting securities of the holding at June 30, 2019. |
| (b) | Non-income producing security. |
The accompanying notes are an integral part of these financial statements.
| 124 |
| Ohio National Fund, Inc. | ON Moderately Conservative Model Portfolio (Unaudited) |
Objective/Strategy |
The ON Moderately Conservative Model Portfolio is a fund of funds that seeks current income and moderate growth of capital with a greater emphasis on current income by investing in underlying mutual funds. Under normal circumstances, the Portfolio intends to have investment exposure to various asset classes within the following target asset allocation ranges: U.S. Equity20-40%, International Equity5-20%, and Fixed Income30-70%.
Performance as of June 30, 2019 |
Average Annual returns | ||||
One year | 6.56% | |||
Since inception (3/1/17) | 5.01% |
Past performance does not guarantee future results. The performance data quoted represents past performance and current returns may be lower or higher. Total return figures include change in share price and reinvestment of dividends and capital gains. The investment return and principal value will fluctuate so that an investor’s shares, when redeemed, may be worth more or less than the original cost. To obtain performance information up to the most recent month end, call toll-free1-877-781-6392.
The Portfolio is not open to direct retail investment. Beneficial interest in shares is obtained solely by purchase of variable life insurance policies and variable annuity contracts. Actual performance results for variable annuity and variable universal life contracts will be lower due to contract charges. Consult your contract for applicable charges.
Total gross expense ratio is estimated to be 1.06% per the Fund’s prospectus dated May 1, 2019. Additional information pertaining to the Portfolio’s expense ratio as of June 30, 2019 can be found in the Portfolio’s Financial Highlights. The Portfolio’s expense ratio included in the Financial Highlights does not include Acquired Fund Fees and Expenses (AFFE), which is a major component of the expense ratio that is required to be presented in the Fund’s prospectus. The Adviser has contractually agreed to make payments to the Fund to the extent necessary to maintain the Portfolio’s expense ratio (including AFFE, but excluding certain other expenses) at 1.00% through April 30, 2020.
Comments from Adviser |
Q. How did the Portfolio perform in comparison to its benchmark during the reporting period?
A.For thesix-month period ended June 30, 2019, the ON Moderately Conservative Model Portfolio returned 11.10% versus 9.85% for its benchmark, the Morningstar® Moderately Conservative Target Risk Index.
Q. Were there specific market conditions, investment strategies, or techniques that materially affected the Portfolio’s benchmark-relative performance during the reporting period?
A.During the first half of 2019, domestic and foreign equity markets provided positive returns. Domestic stocks generally outperformed foreign stocks, and large cap stocks generally outperformed mid cap and small cap stocks. Growth stocks materially outperformed value stocks during the period. The Portfolio’s holdings of large cap, domestic, and growth stocks benefited relative performance.(1)
Fixed income markets also provided positive returns for the period. Interest rates declined across the curve, as the Federal Reserve signaled a more dovish policy. In this environment, longer duration bonds outperformed shorter duration bonds. Corporate credit spreads tightened, and lower quality bonds outperformed higher quality bonds. The Portfolio is overweight to corporate bonds benefited performance, while its exposure to short term bonds detracted from performance.(1)
Q. How did asset class allocation impact the Portfolio’s performance relative to its benchmark?
A.The Portfolio invests in affiliated and unaffiliatedopen-end mutual funds, comprised mostly of fixed income funds, but also some equity funds. The asset allocation between fixed income funds and equity funds was roughlyin-line with the benchmark. On the equity side, the overweight allocation to large cap, domestic, and growth equity funds benefited performance versus the benchmark. On the fixed income side, the overweight allocation to corporate bonds aided performance versus the benchmark, while the allocation to shorter bonds detracted from performance relative to the benchmark during the period.(1)
Q. Which holdings contributed the most to, and detracted the most from, the Portfolio’s benchmark-relative performance?
A.The top three performing funds were the Ohio National Fund, Inc.- ON Janus Henderson Enterprise Portfolio, the Ohio National Fund, Inc.- ON Janus Henderson Venture Portfolio, the Ohio National Fund, Inc.- ON Janus Henderson Forty Portfolio. Each of the funds benefited from its exposure to domestic growth stocks in the mid cap, small cap, and large cap sectors, respectively.(1)
The top three detractors from performance were PIMCO Low Duration Institutional, PIMCO Total Return Institutional, and PIMCO Real Return Institutional. PIMCO Low Duration Institutional underperformed due to its shorter duration and exposure to higher quality bonds. PIMCO Total Return fund underperformed due to its lower weighting in corporate bonds. PIMCO Real Return Institutional focuses on inflation protected securities. It underperformed in an environment of low inflation.(1)
| (1) | The Portfolio’s composition is subject to change. Holdings and weightings are as of June 30, 2019. |
Change in Value of $10,000 Investment
|
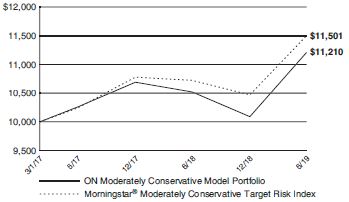
Hypothetical illustration based on past performance. Future performance will vary. The Portfolio’s returns reflect reinvested dividends. The Portfolio’s holdings may differ significantly from the securities in the index. The index is unmanaged and therefore does not reflect the cost of portfolio management and accounting.
The Morningstar® Target Risk Index Family is a series of Morningstar Indexes that provide exposure to a broad array of asset classes using Morningstar asset allocation methodology. The index family provides global equity market risk levels that are scaled to fit five equity market risk profiles: aggressive, moderately aggressive, moderate, moderately conservative, and conservative. The five levels of global equity exposure are set at 95%, 80%, 60%, 40%, and 20%, respectively, and the Morningstar® Moderately Conservative Target Risk Index exposure is set at 40%.
Past performance is no guarantee of future results. Redemption of fund shares could have tax implications unique to each shareholder
| 125 | (continued) |
| Ohio National Fund, Inc. | ON Moderately Conservative Model Portfolio (Unaudited) (Continued) |
Portfolio Composition as of June 30, 2019(1) | ||||
| % of Net Assets | ||||
Open-End Mutual Funds Less Net Liabilities | 100.0 | |||
|
| |||
| 100.0 | ||||
|
| |||
Top 10 Portfolio Holdings as of June 30, 2019 (1) (2) (3) | ||||
| % of Net Assets | ||||||
1. | Western Asset Core Plus Bond IS | 17.0 | ||||
2. | PIMCO Total Return Institutional | 13.0 | ||||
3. | Ohio National Fund, Inc.- ON S&P 500® Index Portfolio | 13.0 | ||||
4. | PIMCO Real Return Institutional | 9.0 | ||||
5. | PIMCO Low Duration Institutional | 8.0 | ||||
6. | Ohio National Fund, Inc.- ON Bond Portfolio | 6.0 | ||||
7. | Ohio National Fund, Inc.- ON Federated High Income Bond Portfolio | 6.0 | ||||
8. | Ohio National Fund, Inc.- ON Federated Strategic Value Dividend Portfolio | 5.0 | ||||
9. | Ohio National Fund, Inc. - ON International Equity Portfolio | 4.5 | ||||
10. | DFA International Core Equity Portfolio Institutional | 3.0 | ||||
| (1) | Composition of Portfolio subject to change. |
| (2) | Short-term investments have been excluded from the list of Top 10 Portfolio Holdings. |
| (3) | Top 10 Portfolio Holdings is presented at an individual security level. Total investment exposure by issuer may be higher. |
| 126 |
| Ohio National Fund, Inc. | ON Moderately Conservative Model Portfolio |
Schedule of Investments in Unaffiliated Issuers | June 30, 2019 (Unaudited) |
| Open-End Mutual Funds – 52.6% | Shares | Value | ||||||||||
DFA Emerging Markets Portfolio Institutional | 122,069 | $ | 3,417,937 | |||||||||
DFA International Core Equity Portfolio Institutional | 532,240 | 6,903,153 | ||||||||||
PIMCO Low Duration Institutional | 1,853,249 | 18,198,901 | ||||||||||
PIMCO Real Return Institutional | 1,845,093 | 20,498,978 | ||||||||||
PIMCO Total Return Institutional | 2,856,531 | 29,565,102 | ||||||||||
Vanguard International Growth Fund Admiral Class | 24,127 | 2,267,415 | ||||||||||
Western Asset Core Plus Bond IS | 3,248,831 | 38,661,089 | ||||||||||
|
| |||||||||||
TotalOpen-End Mutual Funds | $ | 119,512,575 | ||||||||||
|
| |||||||||||
Total Investments in Securities of Unaffiliated Issuers – 52.6% (Cost $117,594,447) | (a) | $ | 119,512,575 | |||||||||
Total Investments in Affiliates – 47.4% (Cost $103,414,417) (see schedule below) | (a) | 107,702,205 | ||||||||||
Liabilities in Excess of Other Assets – 0.0% | (32,730 | ) | ||||||||||
|
| |||||||||||
Net Assets – 100.0% | $ | 227,182,050 | ||||||||||
|
| |||||||||||
Percentages are stated as a percent of net assets.
Footnotes:
| (a) | Represents cost for financial reporting purposes, which may differ from cost basis for federal income tax purposes. See also Note 7 of the Notes to Financial Statements. |
The accompanying notes are an integral part of these financial statements.
Schedule of Investments in Affiliates | June 30, 2019 (Unaudited) | |
| Affiliate | Value at January 1, 2019 | Cost of Purchases | Proceeds from Sales | Net Realized Gain (Loss) | Change in Unrealized | Income Distributions | Capital Gain Distributions | Shares at June 30, 2019 | Value at June 30, 2019 | ||||||||||||||||||||||||||||||||||||||
Open-End Mutual Funds – 47.4% | |||||||||||||||||||||||||||||||||||||||||||||||
Fidelity Advisor®Mid Cap II Class I | (a) | $ | 4,511,453 | $ | 490,692 | $ | 1,123,875 | $(105,522 | ) | $ | 762,082 | $ | — | $ | 136,771 | 236,929 | $ | 4,534,830 | |||||||||||||||||||||||||||||
Fidelity Advisor®Real Estate I | (a) | 2,260,163 | 304,132 | 678,585 | (32,145 | ) | 413,850 | 6,920 | — | 99,666 | 2,267,415 | ||||||||||||||||||||||||||||||||||||
Ohio National Fund, Inc. - ON Bond Portfolio | (a)(b) | 14,429,925 | 168,109 | 2,367,218 | 57,062 | 1,316,611 | — | — | 724,028 | 13,604,489 | |||||||||||||||||||||||||||||||||||||
Ohio National Fund, Inc.- ON Equity Portfolio | (a)(b) | 6,856,092 | 97,453 | 3,285,311 | 793,803 | 72,793 | — | — | 105,979 | 4,534,830 | |||||||||||||||||||||||||||||||||||||
Ohio National Fund, Inc. - ON Federated High Income Bond Portfolio | (a)(b) | 14,266,409 | 131,158 | 2,188,922 | 1,007,773 | 388,071 | — | — | 657,857 | 13,604,489 | |||||||||||||||||||||||||||||||||||||
Ohio National Fund, Inc. - ON Federated Strategic Value Dividend Portfolio | (a)(b) | 11,658,209 | 528,801 | 2,014,004 | 1,966,728 | (802,660 | ) | — | — | 627,745 | 11,337,074 | ||||||||||||||||||||||||||||||||||||
Ohio National Fund, Inc. - ON International Equity Portfolio | (a)(b) | 14,354,319 | 171,990 | 5,793,468 | (806,773 | ) | 2,277,299 | — | — | 675,720 | 10,203,367 | ||||||||||||||||||||||||||||||||||||
Ohio National Fund, Inc. - ON Janus Henderson Enterprise Portfolio | (a)(b) | 2,315,876 | 139,606 | 759,503 | 8,191 | 563,245 | — | — | 47,826 | 2,267,415 | |||||||||||||||||||||||||||||||||||||
Ohio National Fund, Inc.- ON Janus Henderson Forty Portfolio | (a)(b) | 2,315,481 | 143,074 | 687,385 | 9,949 | 486,296 | — | — | 87,987 | 2,267,415 | |||||||||||||||||||||||||||||||||||||
Ohio National Fund, Inc. - ON Janus Henderson Venture Portfolio | (a)(b) | 2,264,567 | 188,224 | 709,284 | 5,871 | 518,037 | — | — | 59,170 | 2,267,415 | |||||||||||||||||||||||||||||||||||||
Ohio National Fund, Inc. - ONNasdaq-100®Index Portfolio | (a)(b) | 4,605,428 | 299,403 | 1,311,515 | (14,557 | ) | 956,071 | — | — | 224,608 | 4,534,830 | ||||||||||||||||||||||||||||||||||||
Ohio National Fund, Inc. - ON S&P 500®Index Portfolio | (a)(b) | 27,742,673 | 3,682,240 | 7,219,218 | 1,099,389 | 4,171,308 | — | — | 886,508 | 29,476,392 | |||||||||||||||||||||||||||||||||||||
Ohio National Fund, Inc. - ON S&P MidCap 400®Index Portfolio | (a)(b) | 6,777,920 | 568,202 | 1,732,711 | (163,309 | ) | 1,352,142 | — | — | 373,955 | 6,802,244 | ||||||||||||||||||||||||||||||||||||
|
|
|
|
|
|
|
|
|
| ||||||||||||||||||||||||||||||||||||||
TotalOpen-End Mutual Funds | $ | 3,826,460 | $ | 12,475,145 | $ | 6,920 | $ | 136,771 | $ | 107,702,205 | |||||||||||||||||||||||||||||||||||||
|
|
|
|
|
|
|
|
|
| ||||||||||||||||||||||||||||||||||||||
Percentages are stated as a percent of net assets.
Footnotes:
| (a) | Pursuant to Section 2(a)(3) of the Investment Company Act of 1940, the investment meets the definition of “affiliated person”, as the Portfolio directly or indirectly owns, controls, or holds with power to vote 5 percent or more of the outstanding voting securities of the holding at June 30, 2019. |
| (b) | Non-income producing security. |
The accompanying notes are an integral part of these financial statements.
| 127 |
| Ohio National Fund, Inc. | ON Balanced Model Portfolio (Unaudited) |
Objective/Strategy |
The ON Balanced Model Portfolio is a fund of funds that seeks a balance between growth of capital and current income with a greater emphasis on growth of capital by investing in underlying mutual funds. Under normal circumstances, the Portfolio intends to have investment exposure to various asset classes within the following target asset allocation ranges: U.S. Equity25-50%, International Equity10-25%, and Fixed Income25-50%.
Performance as of June 30, 2019 |
Average Annual returns | ||||
One year | 5.34 | % | ||
Since inception (3/1/17) | 5.14 | % |
Past performance does not guarantee future results. The performance data quoted represents past performance and current returns may be lower or higher. Total return figures include change in share price and reinvestment of dividends and capital gains. The investment return and principal value will fluctuate so that an investor’s shares, when redeemed, may be worth more or less than the original cost. To obtain performance information up to the most recent month end, call toll-free1-877-781-6392.
The Portfolio is not open to direct retail investment. Beneficial interest in shares is obtained solely by purchase of variable life insurance policies and variable annuity contracts. Actual performance results for variable annuity and variable universal life contracts will be lower due to contract charges. Consult your contract for applicable charges.
Total gross expense ratio is estimated to be 1.07% per the Fund’s prospectus dated May 1, 2019. Additional information pertaining to the Portfolio’s expense ratio as of June 30, 2019 can be found in the Portfolio’s Financial Highlights. The Portfolio’s expense ratio included in the Financial Highlights does not include Acquired Fund Fees and Expenses (AFFE), which is a major component of the expense ratio that is required to be presented in the Fund’s prospectus. The Adviser has contractually agreed to make payments to the Fund to the extent necessary to maintain the Portfolio’s expense ratio (including AFFE, but excluding certain other expenses) at 1.00% through April 30, 2020.
Comments from Adviser |
Q. How did the Portfolio perform in comparison to its benchmark during the reporting period?
A.For thesix-month period ended June 30, 2019, the ON Balanced Model Portfolio returned 12.74% versus 12.08% for its benchmark, the Morningstar® Moderate Target Risk Index.
Q. Were there specific market conditions, investment strategies, or techniques that materially affected the Portfolio’s benchmark-relative performance during the reporting period?
A.During the first half of 2019 domestic and foreign equity markets provided positive returns. Domestic stocks generally outperformed foreign stocks, and large cap stocks generally outperformed mid cap and small cap stocks. Growth stocks materially outperformed value stocks during the period. The Portfolio’s holdings of large cap, domestic, and growth stocks benefited performance, while its exposure to value stocks and emerging market stocks detracted from performance.(1)
Fixed income markets also provided positive returns for the period. Interest rates declined across the curve, as the Federal Reserve signaled a more dovish policy. In this environment, longer duration bonds outperformed shorter duration bonds. Corporate credit spreads tightened, and lower quality bonds outperformed higher quality bonds. The Portfolio’s overweight to corporate bonds benefited performance, while its exposure to short term bonds detracted.(1)
Q. How did asset class allocation impact the Portfolio’s performance relative to its benchmark?
A.The Portfolio invests in affiliated and unaffiliatedopen-end mutual funds, comprised of fixed income and equity funds. The asset allocation between fixed income funds and equity funds was roughlyin-line with the benchmark. On the equity side, the overweight allocation to large cap, domestic, and growth equity funds benefited performance, while exposure to emerging market funds detracted. On the fixed income side, the overweight allocation to corporate bonds aided performance, while the allocation to shorter bonds detracted.(1)
Q. Which holdings contributed the most to, and detracted the most from, the Portfolio’s benchmark-relative performance?
A.The top three performing funds were the Ohio National Fund, Inc.- ON Janus Henderson Enterprise Portfolio, the Ohio National Fund, Inc.- ON BlackRock Advantage Large Cap Growth Portfolio, and the Ohio National Fund, Inc.- ON BlackRock Advantage Small Cap Growth Portfolio. Each of the funds benefited from its exposure to domestic growth stocks in the mid cap, large cap, and small cap sectors, respectively.(1)
The top three detractors from performance were PIMCO Low Duration Institutional, PIMCO Total Return Institutional, and PIMCO Real Return Institutional. PIMCO Low Duration Institutional underperformed due to its shorter duration and exposure to higher quality bonds. PIMCO Total Return Institutional underperformed due to its lower weighting in corporate bonds. PIMCO Real Return Institutional focuses on inflation protected securities. It underperformed in an environment of low inflation.(1)
| (1) | The Portfolio’s composition is subject to change. Holdings and weightings are as of June 30, 2019. |
Change in Value of $10,000 Investment |
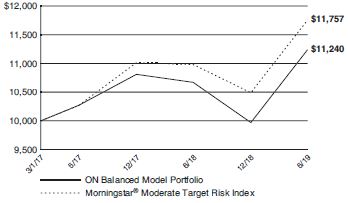
Hypothetical illustration based on past performance. Future performance will vary. The Portfolio’s returns reflect reinvested dividends. The Portfolio’s holdings may differ significantly from the securities in the index. The index is unmanaged and therefore does not reflect the cost of portfolio management and accounting.
The Morningstar® Target Risk Index Family is a series of Morningstar Indexes that provide exposure to a broad array of asset classes using Morningstar asset allocation methodology. The index family provides global equity market risk levels that are scaled to fit five equity market risk profiles: aggressive, moderately aggressive, moderate, moderately conservative, and conservative. The five levels of global equity exposure are set at 95%, 80%, 60%, 40%, and 20%, respectively, and the Morningstar® Moderate Target Risk Index exposure is set at 60%.
Past performance is no guarantee of future results. Redemption of fund shares could have tax implications unique to each shareholder.
| 128 | (continued) |
| Ohio National Fund, Inc. | ON Balanced Model Portfolio (Unaudited) (Continued) |
Portfolio Composition as of June 30, 2019(1) |
| % of Net Assets | ||||
Open-End Mutual Funds Less Net Liabilities | 100.0 | |||
|
| |||
| 100.0 | ||||
|
| |||
Top 10 Portfolio Holdings as of June 30, 2019 (1) (2) (3) |
| % of Net Assets | ||||
1. | Ohio National Fund, Inc.- ON S&P 500® Index Portfolio | 14.0 | ||
2. | PIMCO Total Return Institutional | 10.0 | ||
3. | Ohio National Fund, Inc.- ON International Equity Portfolio | 7.5 | ||
4. | PIMCO Real Return Institutional | 7.0 | ||
5. | PIMCO Low Duration Institutional | 7.0 | ||
6. | Western Asset Core Plus Bond IS | 7.0 | ||
7. | Ohio National Fund, Inc.- ON S&P MidCap 400®Index Portfolio | 7.0 | ||
8. | Ohio National Fund, Inc. - ON Federated Strategic Value Dividend Portfolio | 6.0 | ||
9. | DFA International Core Equity Portfolio Institutional | 4.0 | ||
10. | Ohio National Fund, Inc. - ON Federated High Income Bond Portfolio | 4.0 |
| (1) | Composition of Portfolio subject to change. |
| (2) | Short-term investments have been excluded from the list of Top 10 Portfolio Holdings. |
| (3) | Top 10 Portfolio Holdings is presented at an individual security level. Total investment exposure by issuer may be higher. |
| 129 |
| Ohio National Fund, Inc. | ON Balanced Model Portfolio |
Schedule of Investments in Unaffiliated Issuers | June 30, 2019 (Unaudited) | |
| Open-End Mutual Funds – 42.6% | Shares | Value | ||||||||
DFA Emerging Markets Portfolio Institutional | 1,200,433 | $ | 33,612,125 | |||||||
DFA International Core Equity Portfolio Institutional | 3,489,369 | 45,257,114 | ||||||||
Lazard Emerging Markets Equity Class R6 | 943,234 | 16,723,541 | ||||||||
PIMCO Low Duration Institutional | 7,973,405 | 78,298,838 | ||||||||
PIMCO Real Return Institutional | 7,056,340 | 78,395,938 | ||||||||
PIMCO Total Return Institutional | 10,804,429 | 111,825,835 | ||||||||
Vanguard International Growth Fund Admiral Class | 355,896 | 33,447,081 | ||||||||
Western Asset Core Plus Bond IS | 6,577,846 | 78,276,373 | ||||||||
|
| |||||||||
TotalOpen-End Mutual Funds | $ | 475,836,845 | ||||||||
|
| |||||||||
Total Investments in Securities of Unaffiliated Issuers – 42.6% (Cost $471,866,620) | (a) | $ | 475,836,845 | |||||||
Total Investments in Affiliates – 57.4% (Cost $613,575,755) (see schedule below) | (a) | 641,069,051 | ||||||||
Liabilities in Excess of Other Assets – 0.0% | (143,375 | ) | ||||||||
|
| |||||||||
Net Assets – 100.0% | $ | 1,116,762,521 | ||||||||
|
| |||||||||
Percentages are stated as a percent of net assets.
Footnotes:
| (a) | Represents cost for financial reporting purposes, which may differ from cost basis for federal income tax purposes. See also Note 7 of the Notes to Financial Statements. |
The accompanying notes are an integral part of these financial statements.
Schedule of Investments in Affiliates | June 30, 2019 (Unaudited) | |
| Affiliate | Value at January 1, 2019 | Cost of Purchases | Proceeds from Sales | Net Realized Gain (Loss) | Change in Unrealized Appreciation (Depreciation) | Income Distributions | Capital Gain Distributions | Shares at June 30, 2019 | Value at June 30, 2019 | ||||||||||||||||||||||||||||||||||||||
Open-End Mutual Funds – 57.4% | |||||||||||||||||||||||||||||||||||||||||||||||
Fidelity Advisor®Mid Cap II Class I | (a) | $ | 33,130,964 | $ | 2,332,408 | $ | 6,767,716 | $ | (576,291 | ) | $ | 5,327,716 | $ | — | $ | 996,841 | 1,747,496 | $ | 33,447,081 | ||||||||||||||||||||||||||||
Fidelity Advisor®Real Estate I | (a) | 11,117,605 | 999,597 | 2,813,178 | (36,503 | ) | 1,881,506 | 34,056 | — | 490,067 | 11,149,027 | ||||||||||||||||||||||||||||||||||||
Ohio National Fund, Inc. - ON BlackRock Advantage Large Cap Core Portfolio | (a)(b) | 32,873,140 | 0 | 37,575,674 | 3,051,068 | 1,651,466 | — | — | — | — | |||||||||||||||||||||||||||||||||||||
Ohio National Fund, Inc. - ON BlackRock Advantage Large Cap Growth Portfolio | (a)(b) | — | 22,592,783 | 320,249 | (320 | ) | 25,840 | — | — | 860,264 | 22,298,054 | ||||||||||||||||||||||||||||||||||||
Ohio National Fund, Inc. - ON BlackRock Advantage Small Cap Growth Portfolio | (a)(b) | — | 11,543,959 | 546,408 | 3,699 | 147,777 | — | — | 384,052 | 11,149,027 | |||||||||||||||||||||||||||||||||||||
Ohio National Fund, Inc. - ON Bond Portfolio | (a)(b) | 46,653,347 | 303,769 | 6,844,226 | 500,460 | 3,982,758 | — | — | 2,373,396 | 44,596,108 | |||||||||||||||||||||||||||||||||||||
Ohio National Fund, Inc. - ON ClearBridge Small Cap Portfolio | (a)(b) | 21,582,749 | 1,658,601 | 16,458,758 | 3,616,090 | 750,345 | — | — | 177,194 | 11,149,027 | |||||||||||||||||||||||||||||||||||||
Ohio National Fund, Inc. - ON Equity Portfolio | (a)(b) | 33,632,658 | 38,805 | 15,578,052 | 6,234,836 | (2,030,193 | ) | — | — | 521,104 | 22,298,054 | ||||||||||||||||||||||||||||||||||||
Ohio National Fund, Inc. - ON Federated High Income Bond Portfolio | (a)(b) | 46,073,588 | 56,110 | 6,061,721 | 4,091,431 | 436,700 | — | — | 2,156,485 | 44,596,108 | |||||||||||||||||||||||||||||||||||||
Ohio National Fund, Inc. - ON Federated Strategic Value Dividend Portfolio | (a)(b) | 68,460,865 | 1,544,367 | 9,907,541 | 6,876,550 | (80,079 | ) | — | — | 3,703,996 | 66,894,162 | ||||||||||||||||||||||||||||||||||||
Ohio National Fund, Inc. - ON International Equity Portfolio | (a)(b) | 104,680,132 | 202,380 | 33,399,370 | (4,357,733 | ) | 16,492,293 | — | — | 5,537,596 | 83,617,702 | ||||||||||||||||||||||||||||||||||||
Ohio National Fund, Inc. - ON Janus Henderson Enterprise Portfolio | (a)(b) | 11,370,364 | 351,014 | 3,349,074 | 39,663 | 2,737,060 | — | — | 235,162 | 11,149,027 | |||||||||||||||||||||||||||||||||||||
Ohio National Fund, Inc. - ON Janus Henderson Forty Portfolio | (a)(b) | 11,381,204 | 11,774,732 | 6,031,053 | 89,952 | 5,083,219 | — | — | 865,272 | 22,298,054 | |||||||||||||||||||||||||||||||||||||
Ohio National Fund, Inc. - ONNasdaq-100®Index Portfolio | (a)(b) | 22,571,601 | 931,658 | 5,783,893 | 367,095 | 4,211,593 | — | — | 1,104,411 | 22,298,054 | |||||||||||||||||||||||||||||||||||||
Ohio National Fund, Inc. - ON S&P 500®Index Portfolio | (a)(b) | 147,536,690 | 14,776,073 | 33,764,527 | 5,518,265 | 22,019,876 | — | — | 4,694,327 | 156,086,377 | |||||||||||||||||||||||||||||||||||||
Ohio National Fund, Inc. - ON S&P MidCap 400® Index Portfolio | (a)(b) | 77,497,515 | 4,060,496 | 16,907,936 | (771,229 | ) | 14,164,343 | — | — | 4,290,445 | 78,043,189 | ||||||||||||||||||||||||||||||||||||
|
|
|
|
|
|
|
|
|
| ||||||||||||||||||||||||||||||||||||||
Total Open-End Mutual Funds | $ | 24,647,033 | $ | 76,802,220 | $ | 34,056 | $ | 996,841 | $ | 641,069,051 | |||||||||||||||||||||||||||||||||||||
|
|
|
|
|
|
|
|
|
| ||||||||||||||||||||||||||||||||||||||
Percentages are stated as a percent of net assets.
Footnotes:
| (a) | Pursuant to Section 2(a)(3) of the Investment Company Act of 1940, the investment meets the definition of “affiliated person”, as the Portfolio directly or indirectly owns, controls, or holds with power to vote 5 percent or more of the outstanding voting securities of the holding at June 30, 2019. |
| (b) | Non-income producing security. |
The accompanying notes are an integral part of these financial statements.
| 130 |
| Ohio National Fund, Inc. | ON Moderate Growth Model Portfolio (Unaudited) |
Objective/Strategy |
The ON Moderate Growth Model Portfolio is a fund of funds that seeks growth of capital and moderate current income with a greater emphasis on growth of capital by investing in underlying mutual funds. Under normal circumstances, the Portfolio intends to have investment exposure to various asset classes within the following target asset allocation ranges: U.S. Equity40-60%, International Equity15-35%, and Fixed Income10-30%.
Performance as of June 30, 2019 |
Average Annual returns | ||||
One year | 4.84 | % | ||
Since inception (3/1/17) | 6.05 | % |
Past performance does not guarantee future results. The performance data quoted represents past performance and current returns may be lower or higher. Total return figures include change in share price and reinvestment of dividends and capital gains. The investment return and principal value will fluctuate so that an investor’s shares, when redeemed, may be worth more or less than the original cost. To obtain performance information up to the most recent month end, call toll-free1-877-781-6392.
The Portfolio is not open to direct retail investment. Beneficial interest in shares is obtained solely by purchase of variable life insurance policies and variable annuity contracts. Actual performance results for variable annuity and variable universal life contracts will be lower due to contract charges. Consult your contract for applicable charges.
Total gross expense ratio is estimated to be 1.07% per the Fund’s prospectus dated May 1, 2019. Additional information pertaining to the Portfolio’s expense ratio as of June 30, 2019 can be found in the Portfolio’s Financial Highlights. The Portfolio’s expense ratio included in the Financial Highlights does not include Acquired Fund Fees and Expenses (AFFE), which is a major component of the expense ratio that is required to be presented in the Fund’s prospectus. The Adviser has contractually agreed to make payments to the Fund to the extent necessary to maintain the Portfolio’s expense ratio (including AFFE, but excluding certain other expenses) at 1.07% through April 30, 2020.
Comments from Adviser |
Q. How did the Portfolio perform in comparison to its benchmark during the reporting period?
A.For thesix-month period ended June 30, 2019, the ON Moderate Growth Model Portfolio returned 15.51% versus 14.36% for its benchmark, the Morningstar® Moderately Aggressive Target Risk Index.
Q. Were there specific market conditions, investment strategies, or techniques that materially affected the Portfolio’s benchmark-relative performance during the reporting period?
A.During the first half of 2019 domestic and foreign equity markets provided positive returns. Domestic stocks generally outperformed foreign stocks, and large cap stocks generally outperformed mid cap and small cap stocks. Growth stocks materially outperformed value stocks during the period. The Portfolio’s holdings of large cap, domestic, and growth stocks benefited performance, while its exposure to value stocks and emerging market stocks detracted from performance.(1)
Fixed income markets also provided positive returns for the period. Interest rates declined across the curve, as the Federal Reserve signaled a more dovish policy. In this environment, longer duration bonds outperformed shorter duration bonds. Corporate credit spreads tightened, and lower quality bonds outperformed higher quality bonds. The Portfolio’s overweight to corporate bonds benefited performance, while its exposure to short term bonds detracted from performance.(1)
Q. How did asset class allocation impact the Portfolio’s performance relative to its benchmark?
A.The Portfolio invests in affiliated and unaffiliatedopen-end mutual funds, comprised mostly of equity funds, but also some fixed income funds. The asset allocation between fixed income funds and equity funds was roughlyin-line with the benchmark. On the equity side, the overweight allocation to large cap, domestic, and growth equity funds benefited performance, while exposure to emerging market funds detracted. On the fixed income side, the overweight allocation to corporate bonds aided performance, while the allocation to shorter bonds detracted.(1)
Q. Which holdings contributed the most to, and detracted the most from, the Portfolio’s benchmark-relative performance?
A.The top three performing funds were the Ohio National Fund, Inc.- ON Janus Henderson Enterprise Portfolio, the Ohio National Fund, Inc.- ON BlackRock Advantage Large Cap Growth Portfolio, and the Ohio National Fund, Inc.- ON Janus Henderson Venture Portfolio. Each of the funds benefited from its exposure to domestic growth stocks in the mid cap, large cap, and small cap sectors, respectively.(1)
The top three detractors from performance were PIMCO Low Duration Institutional, PIMCO Real Return Institutional, and Western Asset Core Plus Bond IS. PIMCO Low Duration Institutional underperformed due to its shorter duration and exposure to higher quality bonds. PIMCO Real Return Institutional focuses on inflation protected securities. It underperformed in an environment of low inflation. Lastly, while Western Asset Core Plus Bond IS performed well, its exposure to fixed income assets made it one of the three lowest returning Portfolios, as equity funds outperformed bond funds during the first half of 2019.(1)
| (1) | The Portfolio’s composition is subject to change. Holdings and weightings are as of June 30, 2019. |
Change in Value of $10,000 Investment |
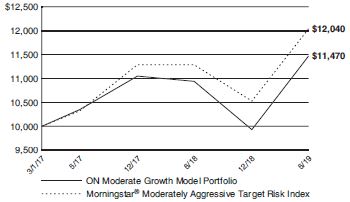
Hypothetical illustration based on past performance. Future performance will vary. The Portfolio’s returns reflect reinvested dividends. The Portfolio’s holdings may differ significantly from the securities in the index. The index is unmanaged and therefore does not reflect the cost of portfolio management and accounting.
The Morningstar® Target Risk Index Family is a series of Morningstar Indexes that provide exposure to a broad array of asset classes using Morningstar asset allocation methodology. The index family provides global equity market risk levels that are scaled to fit five equity market risk profiles: aggressive, moderately aggressive, moderate, moderately conservative, and conservative. The five levels of global equity exposure are set at 95%, 80%, 60%, 40%, and 20%, respectively, and the Morningstar® Moderately Aggressive Target Risk Index exposure is set at 80%.
Past performance is no guarantee of future results. Redemption of fund shares could have tax implications unique to each shareholder.
| 131 | (continued) |
| Ohio National Fund, Inc. | ON Moderate Growth Model Portfolio (Unaudited) (Continued) |
Portfolio Composition as of June 30, 2019(1) |
| % of Net Assets | ||||
Open-End Mutual Funds Less Net Liabilities | 100.0 | |||
|
| |||
| 100.0 | ||||
|
| |||
Top 10 Portfolio Holdings as of June 30, 2019 (1) (2) (3) |
| % of Net Assets | ||||||||
| 1. | Ohio National Fund, Inc.- ON S&P 500® Index Portfolio | 16.9 | ||||||
| 2. | Western Asset Core Plus Bond IS | 10.0 | ||||||
| 3. | Ohio National Fund, Inc.- ON International Equity Portfolio | 10.0 | ||||||
| 4. | Ohio National Fund, Inc.- ON Federated Strategic Value Dividend Portfolio | 7.0 | ||||||
| 5. | Ohio National Fund, Inc.- ON S&P MidCap 400®Index Portfolio | 7.0 | ||||||
| 6. | DFA International Core Equity Portfolio Institutional | 6.1 | ||||||
| 7. | Fidelity Advisor®Mid Cap II Class I | 4.0 | ||||||
| 8. | Ohio National Fund, Inc.- ON Janus Henderson Forty Portfolio | 4.0 | ||||||
| 9. | Ohio National Fund, Inc.- ONNasdaq-100®Index Portfolio | 4.0 | ||||||
| 10. | Vanguard International Growth Fund Admiral Class | 4.0 | ||||||
| (1) | Composition of Portfolio subject to change. |
| (2) | Short-term investments have been excluded from the list of Top 10 Portfolio Holdings. |
| (3) | Top 10 Portfolio Holdings is presented at an individual security level. Total investment exposure by issuer may be higher. |
| 132 |
| Ohio National Fund, Inc. | ON Moderate Growth Model Portfolio |
Schedule of Investments in Unaffiliated Issuers | June 30, 2019 (Unaudited) | |
| Open-End Mutual Funds – 28.4% | Shares | Value | ||||||||
DFA Emerging Markets Portfolio Institutional | 2,091,839 | $ | 58,571,501 | |||||||
DFA International Core Equity Portfolio Institutional | 9,120,984 | 118,299,165 | ||||||||
Lazard Emerging Markets Equity Class R6 | 2,191,506 | 38,855,403 | ||||||||
PIMCO Low Duration Institutional | 4,565,023 | 44,828,523 | ||||||||
PIMCO Real Return Institutional | 1,756,474 | 19,514,427 | ||||||||
Vanguard International Growth Fund Admiral Class | 826,887 | 77,710,805 | ||||||||
Western Asset Core Plus Bond IS | 16,374,082 | 194,851,574 | ||||||||
|
| |||||||||
TotalOpen-End Mutual Funds | $ | 552,631,398 | ||||||||
|
| |||||||||
Total Investments in Securities of Unaffiliated Issuers – 28.4% (Cost $560,860,271) | (a) | $ | 552,631,398 | |||||||
Total Investments in Affiliates – 71.6% (Cost $1,350,744,263) (see schedule below) | (a) | 1,392,966,183 | ||||||||
Liabilities in Excess of Other Assets – 0.0% | (653,970 | ) | ||||||||
|
| |||||||||
Net Assets – 100.0% | $ | 1,944,943,611 | ||||||||
|
| |||||||||
Percentages are stated as a percent of net assets.
Footnotes:
| (a) | Represents cost for financial reporting purposes, which may differ from cost basis for federal income tax purposes. See also Note 7 of the Notes to Financial Statements. |
The accompanying notes are an integral part of these financial statements.
Schedule of Investments in Affiliates | June 30, 2019 (Unaudited) | |
| Affiliate | Value at January 1, 2019 | Cost of Purchases | Proceeds from Sales | Net Realized Gain (Loss) | Change in Unrealized Appreciation (Depreciation) | Income Distributions | Capital Gain Distributions | Shares at June 30, 2019 | Value at 2019 | |||||||||||||||||||||||||||||||||||||||||
Open-End Mutual Funds – 71.6% | ||||||||||||||||||||||||||||||||||||||||||||||||||
Fidelity Advisor®Mid Cap II Class I | (a) | $ | 76,368,521 | $ | 3,353,646 | $ | 12,819,474 | $ (1,144,684 | ) | $ | 11,952,796 | $ | — | $ | 2,308,521 | 4,060,126 | $ | 77,710,805 | ||||||||||||||||||||||||||||||||
Fidelity Advisor®Real Estate I | (a) | 19,006,606 | 1,663,446 | 4,399,615 | (123,727 | ) | 3,280,991 | 58,892 | — | 853,965 | 19,427,701 | |||||||||||||||||||||||||||||||||||||||
Ohio National Fund, Inc. - ON BlackRock Advantage Large Cap Core Portfolio | (a)(b) | 56,954,349 | 11,906 | 26,093,251 | 11,603,711 | (3,621,312 | ) | — | — | 1,274,365 | 38,855,403 | |||||||||||||||||||||||||||||||||||||||
Ohio National Fund, Inc.- ON BlackRock Advantage Large Cap Growth Portfolio | (a)(b) | 57,212,499 | 1,276,012 | 14,049,960 | 14,352,023 | (507,470 | ) | — | — | 2,248,576 | 58,283,104 | |||||||||||||||||||||||||||||||||||||||
Ohio National Fund, Inc.- ON BlackRock Advantage Small Cap Growth Portfolio | (a)(b) | — | 40,288,810 | 1,964,475 | 14,002 | 517,066 | — | — | 1,338,457 | 38,855,403 | ||||||||||||||||||||||||||||||||||||||||
Ohio National Fund, Inc.- ON Bond Portfolio | (a)(b) | 49,026,543 | 1,391,666 | 6,669,961 | 435,174 | 4,385,831 | — | — | 2,584,846 | 48,569,253 | ||||||||||||||||||||||||||||||||||||||||
Ohio National Fund, Inc.- ON ClearBridge Small Cap Portfolio | (a)(b) | 18,657,039 | 1,182,716 | 4,205,608 | 6,266,238 | (2,472,684 | ) | — | — | 308,768 | 19,427,701 | |||||||||||||||||||||||||||||||||||||||
Ohio National Fund, Inc.- ON Equity Portfolio | (a)(b) | 58,042,295 | 19,962 | 26,414,033 | 14,834,481 | (7,627,302 | ) | — | — | 908,049 | 38,855,403 | |||||||||||||||||||||||||||||||||||||||
Ohio National Fund, Inc. - ON Federated High Income Bond Portfolio | (a)(b) | 38,972,697 | 366,803 | 4,360,683 | 3,962,393 | (85,807 | ) | — | — | 1,878,888 | 38,855,403 | |||||||||||||||||||||||||||||||||||||||
Ohio National Fund, Inc. - ON Federated Strategic Value Dividend Portfolio | (a)(b) | 136,023,700 | 4,916,396 | 18,529,093 | 15,499,678 | (1,916,772 | ) | — | — | 7,530,117 | 135,993,909 | |||||||||||||||||||||||||||||||||||||||
Ohio National Fund, Inc. - ON International Equity Portfolio | (a)(b) | 216,202,907 | 91,834 | 50,197,286 | (5,736,477 | ) | 33,916,035 | — | — | 12,866,027 | 194,277,013 | |||||||||||||||||||||||||||||||||||||||
Ohio National Fund, Inc. - ON Janus Henderson Enterprise Portfolio | (a)(b) | 19,601,630 | 180,735 | 5,122,013 | 90,321 | 4,677,028 | — | — | 409,781 | 19,427,701 | ||||||||||||||||||||||||||||||||||||||||
Ohio National Fund, Inc. - ON Janus Henderson Forty Portfolio | (a)(b) | 58,733,759 | 19,733,817 | 17,900,553 | 355,047 | 16,788,735 | — | — | 3,015,553 | 77,710,805 | ||||||||||||||||||||||||||||||||||||||||
Ohio National Fund, Inc.- ON Janus Henderson Venture Portfolio | (a)(b) | 80,707,688 | 1,994,750 | 56,838,089 | 13,628,656 | 3,247,938 | — | — | 1,115,369 | 42,740,943 | ||||||||||||||||||||||||||||||||||||||||
Ohio National Fund, Inc.- ONNasdaq-100®Index Portfolio | (a)(b) | 77,556,500 | 1,403,342 | 16,981,790 | 1,407,692 | 14,325,061 | — | — | 3,848,975 | 77,710,805 | ||||||||||||||||||||||||||||||||||||||||
Ohio National Fund, Inc.- ON S&P 500®Index Portfolio | (a)(b) | 312,123,952 | 20,866,733 | 60,032,428 | 14,927,513 | 42,385,152 | — | — | 9,932,960 | 330,270,922 | ||||||||||||||||||||||||||||||||||||||||
Ohio National Fund, Inc.- ON S&P MidCap 400® Index Portfolio | (a)(b) | 134,046,140 | 3,080,029 | 24,033,171 | (2,202,226 | ) | 25,103,137 | — | — | 7,476,301 | 135,993,909 | |||||||||||||||||||||||||||||||||||||||
|
|
|
|
|
|
|
|
|
| |||||||||||||||||||||||||||||||||||||||||
Total Open-End Mutual Funds | $ | 88,169,815 | $ | 144,348,423 | $ | 58,892 | $ | 2,308,521 | $ | 1,392,966,183 | ||||||||||||||||||||||||||||||||||||||||
|
|
|
|
|
|
|
|
|
| |||||||||||||||||||||||||||||||||||||||||
| 133 |
| Ohio National Fund, Inc. | ON Moderate Growth Model Portfolio (Continued) |
Schedule of Investments in Affiliates | June 30, 2019 (Unaudited) | |
Percentages are stated as a percent of net assets.
Footnotes:
| (a) | Pursuant to Section 2(a)(3) of the Investment Company Act of 1940, the investment meets the definition of “affiliated person”, as the Portfolio directly or indirectly owns, controls, or holds with power to vote 5 percent or more of the outstanding voting securities of the holding at June 30, 2019. |
| (b) | Non-income producing security. |
The accompanying notes are an integral part of these financial statements.
| 134 |
| Ohio National Fund, Inc. | ON Growth Model Portfolio (Unaudited) |
Objective/Strategy |
The ON Growth Model Portfolio is a fund of funds that seeks growth of capital and some current income by investing in underlying mutual funds. Under normal circumstances, the Portfolio intends to have investment exposure to various asset classes within the following target asset allocation ranges: U.S. Equity50-80%, International Equity15-45%, and Fixed Income0-15%.
Performance as of June 30, 2019 |
Average Annual returns | ||||
One year | 4.33% | |||
Since inception (3/1/17) | 6.41% |
Past performance does not guarantee future results. The performance data quoted represents past performance and current returns may be lower or higher. Total return figures include change in share price and reinvestment of dividends and capital gains. The investment return and principal value will fluctuate so that an investor’s shares, when redeemed, may be worth more or less than the original cost. To obtain performance information up to the most recent month end, call toll-free1-877-781-6392.
The Portfolio is not open to direct retail investment. Beneficial interest in shares is obtained solely by purchase of variable life insurance policies and variable annuity contracts. Actual performance results for variable annuity and variable universal life contracts will be lower due to contract charges. Consult your contract for applicable charges.
Total gross expense ratio is estimated to be 1.12% per the Fund’s prospectus dated May 1, 2019. Additional information pertaining to the Portfolio’s expense ratio as of June 30, 2019 can be found in the Portfolio’s Financial Highlights. The Portfolio’s expense ratio included in the Financial Highlights does not include Acquired Fund Fees and Expenses (AFFE), which is a major component of the expense ratio that is required to be presented in the Fund’s prospectus. The Adviser has contractually agreed to make payments to the Fund to the extent necessary to maintain the Portfolio’s expense ratio (including AFFE, but excluding certain other expenses) at 1.12% through April 30, 2020.
Comments from Adviser |
Q. How did the Portfolio perform in comparison to its benchmark during the reporting period?
A.For thesix-month period ended June 30, 2019, the ON Growth Model Portfolio returned 17.24% versus 16.05% for its benchmark, the Morningstar® Aggressive Target Risk Index.
Q. Were there specific market conditions, investment strategies, or techniques that materially affected the Portfolio’s benchmark-relative performance during the reporting period?
A.During the first half of 2019 domestic and foreign equity markets provided positive returns. Domestic stocks generally outperformed foreign stocks, and large cap stocks generally outperformed mid cap and small cap stocks. Growth stocks materially outperformed value stocks during the period. The Portfolio’s holdings of large cap, domestic, and growth stocks benefited performance, while its exposure to value stocks and emerging market stocks detracted from performance.(1)
Fixed income markets also provided positive returns for the period. Interest rates declined across the curve, as the Federal Reserve signaled a more dovish policy. In this environment, longer duration bonds outperformed shorter duration bonds. Corporate credit spreads tightened, and lower quality bonds outperformed higher quality bonds. The Portfolio’s overweight to corporate bonds benefited performance.(1)
Q. How did asset class allocation impact the Portfolio’s performance relative to its benchmark?
A.The Portfolio invests in affiliated and unaffiliatedopen-end mutual funds, comprised mostly of equity funds, but also some fixed income funds. The asset allocation between fixed income funds and equity funds was roughlyin-line with the benchmark. On the equity side, the overweight allocation to large cap, domestic, and growth equity funds benefited performance, while exposure to emerging market funds detracted from performance. On the fixed income side, the overweight allocation to corporate bonds aided performance.(1)
Q. Which holdings contributed the most to, and detracted the most from, the Portfolio’s benchmark-relative performance?
A.The top three performing funds were the Ohio National Fund, Inc.- ON Janus Henderson Enterprise Portfolio, the Ohio National Fund, Inc.- ON BlackRock Advantage Large Cap Growth Portfolio, and the Ohio National Fund, Inc.- ON Janus Henderson Venture Portfolio. Each of the funds benefited from its exposure to domestic growth stocks in the mid cap, large cap, and small cap sectors, respectively.(1)
The top three detractors from performance were Western Asset Core Plus Bond IS, DFA Emerging Markets Portfolio Institutional (“DFA”), Lazard Emerging Markets Equity Class R6 (“Lazard”). Western Asset Core Plus Bond IS’s exposure to fixed income securities made it one of the three lowest returning Portfolios, as equity funds outperformed bond funds during the first half of 2019. DFA and Lazard both underperformed due to their exposure to emerging market stocks, which underperformed domestic stocks during the period.(1)
| (1) | The Portfolio’s composition is subject to change. Holdings and weightings are as of June 30, 2019. |
Change in Value of $10,000 Investment |
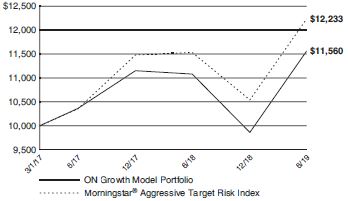
Hypothetical illustration based on past performance. Future performance will vary. The Portfolio’s returns reflect reinvested dividends. The Portfolio’s holdings may differ significantly from the securities in the index. The index is unmanaged and therefore does not reflect the cost of portfolio management and accounting.
The Morningstar® Target Risk Index Family is a series of Morningstar Indexes that provide exposure to a broad array of asset classes using Morningstar asset allocation methodology. The index family provides global equity market risk levels that are scaled to fit five equity market risk profiles: aggressive, moderately aggressive, moderate, moderately conservative, and conservative. The five levels of global equity exposure are set at 95%, 80%, 60%, 40%, and 20%, respectively, and the Morningstar® Aggressive Target Risk Index exposure is set at 95%.
Past performance is no guarantee of future results. Redemption of fund shares could have tax implications unique to each shareholder.
| 135 | (continued) |
| Ohio National Fund, Inc. | ON Growth Model Portfolio (Unaudited) (Continued) |
Portfolio Composition as of June 30, 2019(1) |
| % of Net Assets | ||||
Open-End Mutual Funds Less Net Liabilities | 100.0 | |||
|
| |||
| 100.0 | ||||
|
| |||
Top 10 Portfolio Holdings as of June 30, 2019 (1) (2) (3) |
| % of Net Assets | ||||
| 1. | Ohio National Fund, Inc.- ON S&P 500® Index Portfolio | 16.9 | ||
| 2. | Ohio National Fund, Inc.- ON International Equity Portfolio | 12.0 | ||
| 3. | Ohio National Fund, Inc. - ON S&P MidCap 400®Index Portfolio | 8.0 | ||
| 4. | DFA International Core Equity Portfolio Institutional | 7.1 | ||
| 5. | Ohio National Fund, Inc. - ON Federated Strategic Value Dividend Portfolio | 7.0 | ||
| 6. | Ohio National Fund, Inc. - ONNasdaq-100®Index Portfolio | 7.0 | ||
| 7. | Ohio National Fund, Inc. - ON Janus Henderson Forty Portfolio | 5.0 | ||
| 8. | Vanguard International Growth Fund Admiral Class | 5.0 | ||
| 9. | Fidelity Advisor®Mid Cap II Class I | 4.0 | ||
| 10. | Ohio National Fund, Inc. - ON Janus Henderson Venture Portfolio | 4.0 |
| (1) | Composition of Portfolio subject to change. |
| (2) | Short-term investments have been excluded from the list of Top 10 Portfolio Holdings. |
| (3) | Top 10 Portfolio Holdings is presented at an individual security level. Total investment exposure by issuer may be higher. |
| 136 |
| Ohio National Fund, Inc. | ON Growth Model Portfolio |
Schedule of Investments in Unaffiliated Issuers | June 30, 2019 (Unaudited) | |
| Open-End Mutual Funds – 19.6% | Shares | Value | ||||||||||
DFA Emerging Markets Portfolio Institutional | 541,370 | $ | 15,158,354 | |||||||||
DFA International Core Equity Portfolio Institutional | 2,360,451 | 30,615,050 | ||||||||||
Lazard Emerging Markets Equity Class R6 | 607,684 | 10,774,233 | ||||||||||
Vanguard International Growth Fund Admiral Class | 229,288 | 21,548,466 | ||||||||||
Western Asset Core Plus Bond IS | 544,851 | 6,483,733 | ||||||||||
|
| |||||||||||
TotalOpen-End Mutual Funds | $ | 84,579,836 | ||||||||||
|
| |||||||||||
Total Investments in Securities of Unaffiliated Issuers – 19.6% (Cost $88,613,996) | (a) | $ | 84,579,836 | |||||||||
Total Investments in Affiliates – 80.4% (Cost $332,464,296) (see schedule below) | (a) | 346,930,305 | ||||||||||
Liabilities in Excess of Other Assets – 0.0% | (162,658 | ) | ||||||||||
|
| |||||||||||
Net Assets – 100.0% | $ | 431,347,483 | ||||||||||
|
| |||||||||||
Percentages are stated as a percent of net assets.
Footnotes:
| (a) | Represents cost for financial reporting purposes, which may differ from cost basis for federal income tax purposes. See also Note 7 of the Notes to Financial Statements. |
The accompanying notes are an integral part of these financial statements.
Schedule of Investments in Affiliates | June 30, 2019 (Unaudited) | |
| Affiliate | Value at January 1, 2019 | Cost of Purchases | Proceeds from Sales | Net Realized Gain (Loss) | Change in Unrealized Appreciation (Depreciation) | Income Distributions | Capital Gain Distributions | Shares at June 30, 2019 | Value at 2019 | |||||||||||||||||||||||||||||||||||||||||
Open-End Mutual Funds – 80.4% | ||||||||||||||||||||||||||||||||||||||||||||||||||
Fidelity Advisor®Mid Cap II Class I | (a) | $ | 16,756,248 | $ | 574,075 | $ | 2,443,637 | $ | (230,844 | ) | $ | 2,582,931 | $ | — | $ | 511,082 | 900,667 | $ | 17,238,773 | |||||||||||||||||||||||||||||||
Fidelity Advisor®Real Estate I | (a) | 4,171,062 | 360,890 | 912,720 | (27,624 | ) | 718,085 | 13,066 | — | 189,437 | 4,309,693 | |||||||||||||||||||||||||||||||||||||||
Ohio National Fund, Inc. - ON BlackRock Advantage Large Cap Core Portfolio | (a)(b) | 16,684,342 | 9,848 | 6,416,263 | 3,148,837 | (497,684 | ) | — | — | 424,043 | 12,929,080 | |||||||||||||||||||||||||||||||||||||||
Ohio National Fund, Inc. - ON BlackRock Advantage Large Cap Growth Portfolio | (a)(b) | 12,570,572 | 154,770 | 2,827,529 | 2,877,680 | 153,587 | — | — | 498,807 | 12,929,080 | ||||||||||||||||||||||||||||||||||||||||
Ohio National Fund, Inc. - ON BlackRock Advantage Small Cap Growth Portfolio | (a)(b) | — | 8,882,340 | 379,258 | 2,570 | 113,734 | — | — | 296,913 | 8,619,386 | ||||||||||||||||||||||||||||||||||||||||
Ohio National Fund, Inc. - ON Bond Portfolio | (a)(b) | 4,275,363 | 254,608 | 645,140 | 10,965 | 413,897 | — | — | 229,361 | 4,309,693 | ||||||||||||||||||||||||||||||||||||||||
Ohio National Fund, Inc. - ON ClearBridge Small Cap Portfolio | (a)(b) | 10,226,333 | 536,462 | 2,059,191 | 2,109,938 | (39,309 | ) | — | — | 171,237 | 10,774,233 | |||||||||||||||||||||||||||||||||||||||
Ohio National Fund, Inc. - ON Equity Portfolio | (a)(b) | 8,457,091 | 25,988 | 1,450,282 | 2,596,055 | (1,009,466 | ) | — | — | 201,435 | 8,619,386 | |||||||||||||||||||||||||||||||||||||||
Ohio National Fund, Inc. - ON Federated High Income Bond Portfolio | (a)(b) | 4,246,399 | 99,698 | 460,764 | 498,014 | (73,654 | ) | — | — | 208,399 | 4,309,693 | |||||||||||||||||||||||||||||||||||||||
Ohio National Fund, Inc. - ON Federated Strategic Value Dividend Portfolio | (a)(b) | 29,630,978 | 1,480,035 | 3,910,388 | 2,878,652 | 88,576 | — | — | 1,670,424 | 30,167,853 | ||||||||||||||||||||||||||||||||||||||||
Ohio National Fund, Inc.- ON International Equity Portfolio | (a)(b) | 55,656,074 | 43,337 | 11,422,332 | (1,284,036 | ) | 8,723,276 | — | — | 3,424,922 | 51,716,319 | |||||||||||||||||||||||||||||||||||||||
Ohio National Fund, Inc. - ON Janus Henderson Enterprise Portfolio | (a)(b) | 4,289,634 | 13,587 | 1,039,091 | 20,436 | 1,025,127 | — | — | 90,903 | 4,309,693 | ||||||||||||||||||||||||||||||||||||||||
Ohio National Fund, Inc. - ON Janus Henderson Forty Portfolio | (a)(b) | 17,129,289 | 4,234,923 | 4,480,924 | 100,114 | 4,565,064 | — | — | 836,184 | 21,548,466 | ||||||||||||||||||||||||||||||||||||||||
Ohio National Fund, Inc. - ON Janus Henderson Venture Portfolio | (a)(b) | 25,305,964 | 387,846 | 13,857,414 | 3,414,998 | 1,987,379 | — | — | 449,863 | 17,238,773 | ||||||||||||||||||||||||||||||||||||||||
Ohio National Fund, Inc. - ONNasdaq-100®Index Portfolio | (a)(b) | 29,738,185 | 340,993 | 5,949,841 | 227,293 | 5,811,223 | — | — | 1,494,198 | 30,167,853 | ||||||||||||||||||||||||||||||||||||||||
Ohio National Fund, Inc.- ON S&P 500®Index Portfolio | (a)(b) | 72,479,169 | 674 | 11,683,667 | 2,852,439 | 9,616,170 | — | — | 2,203,452 | 73,264,785 | ||||||||||||||||||||||||||||||||||||||||
Ohio National Fund, Inc.- ON S&P MidCap 400®Index Portfolio | (a)(b) | 33,609,521 | 507,191 | 5,353,777 | 89,452 | 5,625,159 | — | — | 1,895,412 | 34,477,546 | ||||||||||||||||||||||||||||||||||||||||
|
|
|
|
|
|
|
|
|
|
| ||||||||||||||||||||||||||||||||||||||||
Total Open-End Mutual Funds | $ | 19,284,939 | $ | 39,804,095 | $ | 13,066 | $ | 511,082 | $ | 346,930,305 | ||||||||||||||||||||||||||||||||||||||||
|
|
|
|
|
|
|
|
|
|
| ||||||||||||||||||||||||||||||||||||||||
Percentages are stated as a percent of net assets.
Footnotes:
| (a) | Pursuant to Section 2(a)(3) of the Investment Company Act of 1940, the investment meets the definition of “affiliated person”, as the Portfolio directly or indirectly owns, controls, or holds with power to vote 5 percent or more of the outstanding voting securities of the holding at June 30, 2019. |
| (b) | Non-income producing security. |
The accompanying notes are an integral part of these financial statements.
| 137 |
| Ohio National Fund, Inc. |
June 30, 2019 (Unaudited) | ||
ON Equity Portfolio | ON Bond Portfolio | ON BlackRock Balanced Allocation Portfolio | ON Capital Appreciation Portfolio | ON International Equity Portfolio | ON Foreign Portfolio | ON Janus Henderson Forty Portfolio | ON Janus Henderson Venture Portfolio | ON Janus Henderson Enterprise Portfolio | |||||||||||||||||||||||||||||||||||||
Assets: | |||||||||||||||||||||||||||||||||||||||||||||
Investments in securities of unaffiliated issuers, at value* | $ | 234,317,112 | $ | 256,468,153 | $ | 58,730,450 | $ | 95,113,364 | $ | 478,075,606 | $ | 52,608,090 | $ | 192,463,724 | $ | 172,188,340 | $ | 109,410,254 | |||||||||||||||||||||||||||
Cash | — | — | 3,930 | — | — | — | — | 7,879 | — | ||||||||||||||||||||||||||||||||||||
Cash subject to usage restrictions | 233,100 | — | 25,200 | — | — | — | — | — | — | ||||||||||||||||||||||||||||||||||||
Foreign currencies, at value** | — | — | — | — | 406,466 | 38,329 | — | — | 7,910 | ||||||||||||||||||||||||||||||||||||
Receivable for securities sold | 7,065,848 | — | — | 1,326,574 | 1,625,637 | 161,701 | 767,062 | 1,074,463 | 37,038 | ||||||||||||||||||||||||||||||||||||
Receivable for fund shares sold | . 122,544 | 43,904 | 20,267 | 15,206 | 23,073 | 14,092 | 12,209 | 28,770 | 13,140 | ||||||||||||||||||||||||||||||||||||
Receivable for variation margin on futures contracts | 5,926 | — | 2,660 | — | — | — | — | — | — | ||||||||||||||||||||||||||||||||||||
Dividends and accrued interest receivable | 163,035 | 2,609,039 | 190,552 | 104,967 | 510,118 | 173,999 | 45,660 | 48,268 | 57,399 | ||||||||||||||||||||||||||||||||||||
Foreign tax reclaim receivable | — | 10,551 | — | 17,207 | 546,330 | 82,988 | 2,224 | 18,715 | 2,534 | ||||||||||||||||||||||||||||||||||||
Prepaid expenses and other assets | 3,909 | 2,694 | 2,581 | 1,052 | 5,581 | 596 | 1,907 | 2,020 | 1,132 | ||||||||||||||||||||||||||||||||||||
|
|
|
|
|
|
|
|
|
|
|
|
|
|
|
|
|
| ||||||||||||||||||||||||||||
Total assets | 241,911,474 | 259,134,341 | 58,975,640 | 96,578,370 | 481,192,811 | 53,079,795 | 193,292,786 | 173,368,455 | 109,529,407 | ||||||||||||||||||||||||||||||||||||
|
|
|
|
|
|
|
|
|
|
|
|
|
|
|
|
|
| ||||||||||||||||||||||||||||
Liabilities: | |||||||||||||||||||||||||||||||||||||||||||||
Cash overdraft | 96,892 | 87 | — | 554 | 164 | 18 | 66 | — | 37 | ||||||||||||||||||||||||||||||||||||
Payable for securities purchased | 4,650,707 | — | — | 172,237 | 1,970,779 | 303,955 | 451,054 | 1,389,828 | — | ||||||||||||||||||||||||||||||||||||
Payable for fund shares redeemed | 165,126 | 577,176 | 105,066 | 53,573 | 1,891,104 | 6,098 | 463,751 | 455,126 | 484,099 | ||||||||||||||||||||||||||||||||||||
Payable for investment management services | 123,389 | 113,469 | 27,669 | 61,760 | 293,001 | 36,019 | 110,596 | 109,693 | 74,809 | ||||||||||||||||||||||||||||||||||||
Accrued custody expense | 5,925 | 2,748 | 4,566 | 2,424 | 86,554 | 32,264 | 3,485 | 10,644 | 4,861 | ||||||||||||||||||||||||||||||||||||
Accrued professional fees | 5,582 | 5,589 | 5,490 | 5,511 | 5,701 | 5,487 | 5,558 | 5,548 | 5,515 | ||||||||||||||||||||||||||||||||||||
Accrued accounting fees | 9,750 | 14,280 | 6,606 | 4,857 | 21,100 | 7,249 | 6,721 | 8,740 | 5,151 | ||||||||||||||||||||||||||||||||||||
Accrued printing and filing fees | . 2,462 | 3,014 | 215 | 1,202 | 5,554 | 579 | 2,113 | 1,937 | 3,570 | ||||||||||||||||||||||||||||||||||||
Other liabilities | 7,437 | 7,428 | 6,914 | 7,072 | 7,935 | 6,972 | 7,205 | 7,316 | 7,085 | ||||||||||||||||||||||||||||||||||||
Withholding tax payable | 15 | — | — | — | 63,109 | 11,670 | — | 293 | 461 | ||||||||||||||||||||||||||||||||||||
|
|
|
|
|
|
|
|
|
|
|
|
|
|
|
|
|
| ||||||||||||||||||||||||||||
Total liabilities | 5,067,285 | 723,791 | 156,526 | 309,190 | 4,345,001 | 410,311 | 1,050,549 | 1,989,125 | 585,588 | ||||||||||||||||||||||||||||||||||||
|
|
|
|
|
|
|
|
|
|
|
|
|
|
|
|
|
| ||||||||||||||||||||||||||||
Net assets | $ | 236,844,189 | $ | 258,410,550 | $ | 58,819,114 | $ | 96,269,180 | $ | 476,847,810 | $ | 52,669,484 | $ | 192,242,237 | $ | 171,379,330 | $ | 108,943,819 | |||||||||||||||||||||||||||
|
|
|
|
|
|
|
|
|
|
|
|
|
|
|
|
|
| ||||||||||||||||||||||||||||
Net assets consist of: | |||||||||||||||||||||||||||||||||||||||||||||
Paid in capital | 200,535,514 | 247,070,794 | 55,773,012 | 91,820,855 | 485,905,080 | 57,787,889 | 153,940,073 | 105,593,676 | 92,239,682 | ||||||||||||||||||||||||||||||||||||
Total distributable earnings | 36,308,675 | 11,339,756 | 3,046,102 | 4,448,325 | (9,057,270 | ) | (5,118,405 | ) | 38,302,164 | 65,785,654 | 16,704,137 | ||||||||||||||||||||||||||||||||||
|
|
|
|
|
|
|
|
|
|
|
|
|
|
|
|
|
| ||||||||||||||||||||||||||||
Net assets | $ | 236,844,189 | $ | 258,410,550 | $ | 58,819,114 | $ | 96,269,180 | $ | 476,847,810 | $ | 52,669,484 | $ | 192,242,237 | $ | 171,379,330 | $ | 108,943,819 | |||||||||||||||||||||||||||
|
|
|
|
|
|
|
|
|
|
|
|
|
|
|
|
|
| ||||||||||||||||||||||||||||
*Investments in securities of unaffiliated issuers, at cost | . $ | 226,512,003 | $ | 247,392,416 | $ | 55,520,785 | $ | 93,370,143 | $ | 465,734,778 | $ | 58,132,827 | $ | 162,248,111 | $ | 128,142,049 | $ | 95,688,599 | |||||||||||||||||||||||||||
|
|
|
|
|
|
|
|
|
|
|
|
|
|
|
|
|
| ||||||||||||||||||||||||||||
**Foreign currencies, at cost | $ | — | $ | — | $ | — | $ | — | $ | 407,079 | $ | 38,585 | $ | — | $ | — | $ | 7,908 | |||||||||||||||||||||||||||
|
|
|
|
|
|
|
|
|
|
|
|
|
|
|
|
|
| ||||||||||||||||||||||||||||
Shares outstanding, par value, $1 per share | 5,535,439 | 13,750,540 | 1,755,364 | 2,231,294 | 31,571,952 | 1,756,151 | 7,461,108 | 4,469,210 | 2,297,749 | ||||||||||||||||||||||||||||||||||||
|
|
|
|
|
|
|
|
|
|
|
|
|
|
|
|
|
| ||||||||||||||||||||||||||||
Authorized Fund shares allocated to Portfolio | 35,000,000 | 30,000,000 | 15,000,000 | 25,000,000 | 90,000,000 | 32,000,000 | 24,000,000 | 30,000,000 | 21,000,000 | ||||||||||||||||||||||||||||||||||||
|
|
|
|
|
|
|
|
|
|
|
|
|
|
|
|
|
| ||||||||||||||||||||||||||||
Net asset value per share | $ | 42.79 | $ | 18.79 | $ | 33.51 | $ | 43.15 | $ | 15.10 | $ | 29.99 | $ | 25.77 | $ | 38.35 | $ | 47.41 | |||||||||||||||||||||||||||
|
|
|
|
|
|
|
|
|
|
|
|
|
|
|
|
|
| ||||||||||||||||||||||||||||
The accompanying notes are an integral part of these financial statements.
| 138 |
| Ohio National Fund, Inc. |
Statements of Assets and Liabilities | June 30, 2019 (Unaudited) | |
ON S&P 500® Index Portfolio | ON Federated Strategic Value Dividend Portfolio | ON Federated High Income Bond Portfolio | ON ClearBridge Small Cap Portfolio | ON Nasdaq-100® Index Portfolio | ON BlackRock Advantage Large Cap Core Portfolio | ON BlackRock Advantage Small Cap Growth Portfolio | ON ICON Balanced Portfolio | ON S&P MidCap 400® Index Portfolio | |||||||||||||||||||||||||||||||||||||
Assets: | |||||||||||||||||||||||||||||||||||||||||||||
Investments in securities of unaffiliated issuers, at value* | $ | 1,166,285,979 | $ | 314,976,103 | $ | 199,443,817 | $ | 123,104,434 | $ | 337,616,628 | $ | 100,184,108 | $ | 84,324,212 | $ | 475,133,576 | $ | 314,118,544 | |||||||||||||||||||||||||||
Cash | — | — | — | — | 343,173 | 3,320 | — | — | 160,044 | ||||||||||||||||||||||||||||||||||||
Cash subject to usage restrictions | 119,700 | — | — | — | 60,800 | 63,000 | 102,950 | — | 85,000 | ||||||||||||||||||||||||||||||||||||
Foreign currencies, at value** | — | 50,472 | — | — | — | — | — | — | — | ||||||||||||||||||||||||||||||||||||
Receivable for securities sold | 5,520,636 | 2,964,930 | 617,573 | 848,733 | — | — | 7,178,908 | 9,777,748 | 2,209,717 | ||||||||||||||||||||||||||||||||||||
Receivable for fund shares sold | 1,155,919 | 1,812,660 | 358,556 | 400,474 | 430,760 | 23,468 | 388 | 20,145 | 102,687 | ||||||||||||||||||||||||||||||||||||
Receivable for variation margin on futures contracts | 5,570 | — | — | — | — | 6,650 | 14,184 | — | 22,800 | ||||||||||||||||||||||||||||||||||||
Dividends and accrued interest receivable | 976,330 | 1,809,369 | 3,294,607 | 113,513 | 105,956 | 75,121 | 45,674 | 2,044,966 | 317,014 | ||||||||||||||||||||||||||||||||||||
Foreign tax reclaim receivable | — | 385,915 | — | — | — | — | — | 27,160 | 7,152 | ||||||||||||||||||||||||||||||||||||
Prepaid expenses and other assets | 14,954 | 3,483 | 2,305 | 1,635 | 4,078 | 3,542 | 2,767 | 7,983 | 3,501 | ||||||||||||||||||||||||||||||||||||
|
|
|
|
|
|
|
|
|
|
|
|
|
|
|
|
|
| ||||||||||||||||||||||||||||
Total assets | 1,174,079,088 | 322,002,932 | 203,716,858 | 124,468,789 | 338,561,395 | 100,359,209 | 91,669,083 | 487,011,578 | 317,026,459 | ||||||||||||||||||||||||||||||||||||
|
|
|
|
|
|
|
|
|
|
|
|
|
|
|
|
|
| ||||||||||||||||||||||||||||
Liabilities: | |||||||||||||||||||||||||||||||||||||||||||||
Cash overdraft | 2,943,193 | 108 | 68 | 41 | — | — | 34,000 | 165 | — | ||||||||||||||||||||||||||||||||||||
Payable for securities purchased | . 578,234 | 3,179,800 | 1,939,468 | 724,879 | — | — | 6,299,338 | — | 1,907,382 | ||||||||||||||||||||||||||||||||||||
Payable for fund shares redeemed | 2,479,736 | 11,144 | 41,095 | 28,163 | 52,333 | 26,693 | 529,048 | 273,170 | 1,276,146 | ||||||||||||||||||||||||||||||||||||
Payable for investment management services | 320,937 | 185,611 | 115,851 | 83,806 | 97,885 | 52,187 | 52,937 | 245,253 | 91,380 | ||||||||||||||||||||||||||||||||||||
Payable for variation margin on futures contracts | — | — | — | — | 2,306 | — | — | — | — | ||||||||||||||||||||||||||||||||||||
Accrued custody expense | 44,385 | 7,657 | 4,626 | 2,377 | 13,692 | 7,733 | 5,824 | 5,026 | 29,420 | ||||||||||||||||||||||||||||||||||||
Accrued professional fees | 6,052 | 5,623 | 5,562 | 5,524 | 5,633 | 5,512 | 5,503 | 5,710 | 5,619 | ||||||||||||||||||||||||||||||||||||
Accrued accounting fees | 40,647 | 12,222 | 18,849 | 5,910 | 12,508 | 6,392 | 3,713 | 17,740 | 13,343 | ||||||||||||||||||||||||||||||||||||
Accrued printing and filing fees | 14,281 | 3,491 | 2,509 | 1,629 | 3,761 | 737 | 523 | 5,597 | 3,390 | ||||||||||||||||||||||||||||||||||||
Other liabilities | 9,152 | 7,580 | 7,383 | 7,264 | 7,573 | 7,162 | 6,965 | 7,840 | 7,331 | ||||||||||||||||||||||||||||||||||||
Withholding tax payable | — | 26,878 | — | — | 502 | — | — | 3,352 | — | ||||||||||||||||||||||||||||||||||||
|
|
|
|
|
|
|
|
|
|
|
|
|
|
|
|
|
| ||||||||||||||||||||||||||||
Total liabilities | 6,436,617 | 3,440,114 | 2,135,411 | 859,593 | 196,193 | 106,416 | 6,937,851 | 563,853 | 3,334,011 | ||||||||||||||||||||||||||||||||||||
|
|
|
|
|
|
|
|
|
|
|
|
|
|
|
|
|
| ||||||||||||||||||||||||||||
Commitments and contingent liabilities (see Note 8 of Notes to Financial Statements) | |||||||||||||||||||||||||||||||||||||||||||||
Net assets | $ | 1,167,642,471 | $ | 318,562,818 | $ | 201,581,447 | $ | 123,609,196 | $ | 338,365,202 | $ | 100,252,793 | $ | 84,731,232 | $ | 486,447,725 | $ | 313,692,448 | |||||||||||||||||||||||||||
|
|
|
|
|
|
|
|
|
|
|
|
|
|
|
|
|
| ||||||||||||||||||||||||||||
Net assets consist of: | |||||||||||||||||||||||||||||||||||||||||||||
Paid in capital | 868,788,297 | 321,807,106 | 204,399,822 | 109,070,719 | 228,501,924 | 100,312,489 | 83,168,303 | 437,751,027 | 312,203,077 | ||||||||||||||||||||||||||||||||||||
Total distributable earnings | 298,854,174 | (3,244,288 | ) | (2,818,375 | ) | 14,538,477 | 109,863,278 | (59,696 | ) | 1,562,929 | 48,696,698 | 1,489,371 | |||||||||||||||||||||||||||||||||
|
|
|
|
|
|
|
|
|
|
|
|
|
|
|
|
|
| ||||||||||||||||||||||||||||
Net assets | $ | 1,167,642,471 | $ | 318,562,818 | $ | 201,581,447 | $ | 123,609,196 | $ | 338,365,202 | $ | 100,252,793 | $ | 84,731,232 | $ | 486,447,725 | $ | 313,692,448 | |||||||||||||||||||||||||||
|
|
|
|
|
|
|
|
|
|
|
|
|
|
|
|
|
| ||||||||||||||||||||||||||||
*Investments in securities of unaffiliated issuers, at cost | $ | 946,986,756 | $ | 322,402,098 | $ | 201,990,407 | $ | 112,502,929 | $ | 264,094,082 | $ | 94,832,705 | $ | 82,690,923 | $ | 427,897,665 | $ | 314,401,595 | |||||||||||||||||||||||||||
|
|
|
|
|
|
|
|
|
|
|
|
|
|
|
| �� |
|
| |||||||||||||||||||||||||||
**Foreign currencies, at cost | $ | — | $ | 53,493 | $ | — | $ | — | $ | — | $ | — | $ | — | $ | — | $ | — | |||||||||||||||||||||||||||
|
|
|
|
|
|
|
|
|
|
|
|
|
|
|
|
|
| ||||||||||||||||||||||||||||
Shares outstanding, par value, $1 per share | 35,112,026 | 17,642,156 | 9,746,427 | 1,964,693 | 16,761,175 | 3,288,523 | 2,917,631 | 21,552,590 | 17,245,660 | ||||||||||||||||||||||||||||||||||||
|
|
|
|
|
|
|
|
|
|
|
|
|
|
|
|
|
| ||||||||||||||||||||||||||||
Authorized Fund shares allocated to Portfolio | 90,000,000 | 75,000,000 | 45,000,000 | 15,000,000 | 50,000,000 | 23,000,000 | 15,000,000 | 90,000,000 | 30,000,000 | ||||||||||||||||||||||||||||||||||||
|
|
|
|
|
|
|
|
|
|
|
|
|
|
|
|
|
| ||||||||||||||||||||||||||||
Net asset value per share | $ | 33.25 | $ | 18.06 | $ | 20.68 | $ | 62.92 | $ | 20.19 | $ | 30.49 | $ | 29.04 | $ | 22.57 | $ | 18.19 | |||||||||||||||||||||||||||
|
|
|
|
|
|
|
|
|
|
|
|
|
|
|
|
|
| ||||||||||||||||||||||||||||
The accompanying notes are an integral part of these financial statements.
| 139 |
| Ohio National Fund, Inc. |
Statements of Assets and Liabilities | June 30, 2019 (Unaudited) | |
| ON BlackRock Advantage Large Cap Growth Portfolio | ON Risk Managed Balanced Portfolio | ON Conservative Portfolio | ON Moderately Model Portfolio | ON Balanced Model Portfolio | ON Moderate Portfolio | ON Growth Model | |||||||||||||||||||||||||||||
Assets: | |||||||||||||||||||||||||||||||||||
Investments in securities of unaffiliated issuers, at value* | $ | 111,464,737 | $ | 389,897,924 | $ | 51,514,283 | $ | 119,512,575 | $ | 475,836,845 | $ | 552,631,398 | $ | 84,579,836 | |||||||||||||||||||||
Investments in affiliates, at value** | — | — | 25,279,835 | 107,702,205 | 641,069,051 | 1,392,966,183 | 346,930,305 | ||||||||||||||||||||||||||||
Cash | — | 119,602 | 16,166 | — | — | — | — | ||||||||||||||||||||||||||||
Cash subject to usage restrictions | 88,200 | 700,469 | — | — | — | — | — | ||||||||||||||||||||||||||||
Receivable for securities sold | 5,519,314 | 565,678 | 8,962 | 360,626 | 3,208,095 | 4,913,879 | 951,312 | ||||||||||||||||||||||||||||
Receivable for fund shares sold | 59,351 | 534,759 | 446,743 | 21,571 | 1,328 | 143,920 | — | ||||||||||||||||||||||||||||
Receivable for variation margin on futures contracts | 6,975 | 288,456 | — | — | — | — | — | ||||||||||||||||||||||||||||
Dividends and accrued interest receivable | 49,555 | 1,182,827 | 188,417 | 472,685 | 1,999,182 | 2,816,867 | 538,085 | ||||||||||||||||||||||||||||
Prepaid expenses and other assets | 3,098 | 3,739 | 804 | 2,475 | 14,480 | 25,773 | 4,982 | ||||||||||||||||||||||||||||
|
|
|
|
|
|
|
|
|
|
|
|
|
| ||||||||||||||||||||||
Total assets | 117,191,230 | 393,293,454 | 77,455,210 | 228,072,137 | 1,122,128,981 | 1,953,498,020 | 433,004,520 | ||||||||||||||||||||||||||||
|
|
|
|
|
|
|
|
|
|
|
|
|
| ||||||||||||||||||||||
Liabilities: | |||||||||||||||||||||||||||||||||||
Cash overdraft | 8,218 | — | — | 77 | 380 | 662 | 147 | ||||||||||||||||||||||||||||
Payable for securities purchased | 5,080,688 | 6,284,443 | 645,480 | 817,654 | 4,116,013 | 7,349,569 | 1,437,288 | ||||||||||||||||||||||||||||
Payable for fund shares redeemed | 60,511 | 341,620 | 14,809 | 37,151 | 1,092,212 | 524,435 | 51,962 | ||||||||||||||||||||||||||||
Payable for investment management services | 60,096 | 282,009 | 835 | 10,083 | 120,182 | 630,270 | 139,728 | ||||||||||||||||||||||||||||
Accrued custody expense | 4,611 | 17,233 | 612 | 644 | 786 | 953 | 684 | ||||||||||||||||||||||||||||
Accrued professional fees | 5,518 | 5,649 | 3,237 | 3,315 | 3,764 | 4,190 | 3,420 | ||||||||||||||||||||||||||||
Accrued accounting fees | 4,590 | 40,792 | 6,219 | 6,359 | 6,419 | 6,439 | 6,379 | ||||||||||||||||||||||||||||
Accrued printing and filing fees | 884 | 4,359 | 1,199 | 2,636 | 13,623 | 24,052 | 4,917 | ||||||||||||||||||||||||||||
Other liabilities | 7,064 | 7,576 | 11,483 | 12,168 | 13,081 | 13,839 | 12,512 | ||||||||||||||||||||||||||||
|
|
|
|
|
|
|
|
|
|
|
|
|
| ||||||||||||||||||||||
Total liabilities | 5,232,180 | 6,983,681 | 683,874 | 890,087 | 5,366,460 | 8,554,409 | 1,657,037 | ||||||||||||||||||||||||||||
|
|
|
|
|
|
|
|
|
|
|
|
|
| ||||||||||||||||||||||
Net assets | $ | 111,959,050 | $ | 386,309,773 | $ | 76,771,336 | $ | 227,182,050 | $ | 1,116,762,521 | $ | 1,944,943,611 | $ | 431,347,483 | |||||||||||||||||||||
|
|
|
|
|
|
|
|
|
|
|
|
|
| ||||||||||||||||||||||
Net assets consist of: | |||||||||||||||||||||||||||||||||||
Paid in capital | 102,168,108 | 314,169,819 | 75,901,507 | 228,677,040 | 1,144,344,926 | 2,021,828,526 | 452,779,139 | ||||||||||||||||||||||||||||
Total distributable earnings | 9,790,942 | 72,139,954 | 869,829 | (1,494,990 | ) | (27,582,405 | ) | (76,884,915 | ) | (21,431,656 | ) | ||||||||||||||||||||||||
|
|
|
|
|
|
|
|
|
|
|
|
|
| ||||||||||||||||||||||
Net assets | $ | 111,959,050 | $ | 386,309,773 | $ | 76,771,336 | $ | 227,182,050 | $ | 1,116,762,521 | $ | 1,944,943,611 | $ | 431,347,483 | |||||||||||||||||||||
|
|
|
|
|
|
|
|
|
|
|
|
|
| ||||||||||||||||||||||
*Investments in securities of unaffiliated issuers, at cost | $ | 103,154,947 | $ | 341,489,605 | $ | 50,492,529 | $ | 117,251,386 | $ | 470,349,498 | $ | 557,610,124 | $ | 87,797,078 | |||||||||||||||||||||
|
|
|
|
|
|
|
|
|
|
|
|
|
| ||||||||||||||||||||||
**Investments in affiliates, at cost | $ | — | $ | — | $ | 23,745,154 | $ | 103,757,478 | $ | 615,092,877 | $ | 1,353,994,410 | $ | 333,281,214 | |||||||||||||||||||||
|
|
|
|
|
|
|
|
|
|
|
|
|
| ||||||||||||||||||||||
Shares outstanding, par value, $1 per share | 4,318,733 | 26,041,596 | 6,902,172 | 20,271,519 | 99,327,836 | 169,545,229 | 37,321,082 | ||||||||||||||||||||||||||||
|
|
|
|
|
|
|
|
|
|
|
|
|
| ||||||||||||||||||||||
Authorized Fund shares allocated to Portfolio | 30,000,000 | 85,000,000 | 30,000,000 | 70,000,000 | 200,000,000 | 300,000,000 | 100,000,000 | ||||||||||||||||||||||||||||
|
|
|
|
|
|
|
|
|
|
|
|
|
| ||||||||||||||||||||||
Net asset value per share | $ | 25.92 | $ | 14.83 | $ | 11.12 | $ | 11.21 | $ | 11.24 | $ | 11.47 | $ | 11.56 | |||||||||||||||||||||
|
|
|
|
|
|
|
|
|
|
|
|
|
| ||||||||||||||||||||||
The accompanying notes are an integral part of these financial statements.
| 140 |
| Ohio National Fund, Inc. |
| For the Six-Month Period Ended June 30, 2019 (Unaudited) | ||
| ON Equity Portfolio | ON Bond Portfolio | ON BlackRock Allocation Portfolio | ON Capital Portfolio | ON International Equity Portfolio | ON Foreign Portfolio | ON Janus Henderson Forty Portfolio | ON Janus Henderson Venture Portfolio | ON Janus Henderson Enterprise Portfolio | |||||||||||||||||||||||||||||||||||||
Investment income: | |||||||||||||||||||||||||||||||||||||||||||||
Interest | $ | 2,651 | $ | 4,993,959 | $ | 285,155 | $ | — | $ | — | $ | 1 | $ | 7,678 | $ | 4,210 | $ | — | |||||||||||||||||||||||||||
Dividends from unaffiliated issuers, net of taxes withheld* | 2,475,465 | 30,481 | 415,172 | 1,027,435 | 10,139,689 | 1,222,954 | 801,207 | 513,648 | 606,511 | ||||||||||||||||||||||||||||||||||||
|
|
|
|
|
|
|
|
|
|
|
|
|
|
|
|
|
| ||||||||||||||||||||||||||||
Total investment income | 2,478,116 | 5,024,440 | 700,327 | 1,027,435 | 10,139,689 | 1,222,955 | 808,885 | 517,858 | 606,511 | ||||||||||||||||||||||||||||||||||||
|
|
|
|
|
|
|
|
|
|
|
|
|
|
|
|
|
| ||||||||||||||||||||||||||||
Expenses: | |||||||||||||||||||||||||||||||||||||||||||||
Management fees | 873,305 | 681,394 | 166,921 | 389,933 | 1,788,004 | 231,342 | 729,012 | 734,602 | 453,530 | ||||||||||||||||||||||||||||||||||||
Custodian fees | 10,157 | 7,184 | 4,795 | 4,506 | 175,761 | 70,878 | 8,298 | 29,997 | 7,097 | ||||||||||||||||||||||||||||||||||||
Directors’ fees | 10,806 | 11,581 | 2,762 | 4,590 | 21,407 | 2,617 | 8,726 | 8,907 | 4,979 | ||||||||||||||||||||||||||||||||||||
Professional fees | 12,115 | 12,259 | 10,436 | 10,816 | 14,323 | 10,406 | 11,687 | 11,594 | 14,406 | ||||||||||||||||||||||||||||||||||||
Accounting fees | 18,461 | 27,486 | 14,559 | 9,517 | 40,269 | 14,310 | 13,951 | 16,807 | 10,226 | ||||||||||||||||||||||||||||||||||||
Administration fees | 12,849 | 12,753 | 11,531 | 11,859 | 13,997 | 11,534 | 12,293 | 12,482 | 11,884 | ||||||||||||||||||||||||||||||||||||
Printing and filing fees | 7,221 | 8,383 | 5,850 | 4,934 | 10,012 | 4,362 | 6,624 | 5,770 | 7,483 | ||||||||||||||||||||||||||||||||||||
Compliance expense | 7,540 | 7,540 | 7,540 | 7,540 | 7,540 | 7,540 | 7,540 | 7,540 | 7,540 | ||||||||||||||||||||||||||||||||||||
Other | 4,392 | 3,193 | 888 | 1,623 | 7,332 | 873 | 2,224 | 3,250 | 786 | ||||||||||||||||||||||||||||||||||||
|
|
|
|
|
|
|
|
|
|
|
|
|
|
|
|
|
| ||||||||||||||||||||||||||||
Total expenses | 956,846 | 771,773 | 225,282 | 445,318 | 2,078,645 | 353,862 | 800,355 | 830,949 | 517,931 | ||||||||||||||||||||||||||||||||||||
|
|
|
|
|
|
|
|
|
|
|
|
|
|
|
|
|
| ||||||||||||||||||||||||||||
Net investment income (loss) | 1,521,270 | 4,252,667 | 475,045 | 582,117 | 8,061,044 | 869,093 | 8,530 | (313,091 | ) | 88,580 | |||||||||||||||||||||||||||||||||||
|
|
|
|
|
|
|
|
|
|
|
|
|
|
|
|
|
| ||||||||||||||||||||||||||||
Realized/unrealized gain (loss) on investments, futures contracts, and foreign currency related transactions: | |||||||||||||||||||||||||||||||||||||||||||||
Net realized gain (loss) on: | |||||||||||||||||||||||||||||||||||||||||||||
Investments in securities of unaffiliated issuers, net of foreign capital gain taxes** | 28,707,403 | (634,576 | ) | (266,510 | ) | 2,415,126 | (15,918,767 | ) | (409,162 | ) | 8,079,634 | 22,794,516 | 2,983,415 | ||||||||||||||||||||||||||||||||
Futures contracts | (86,130 | ) | — | 13,410 | — | — | — | — | — | — | |||||||||||||||||||||||||||||||||||
Foreign currency related transactions | (1,867 | ) | — | — | (2,358 | ) | (51,748 | ) | (8,880 | ) | — | (448 | ) | (140 | ) | ||||||||||||||||||||||||||||||
Change in unrealized appreciation/depreciation on: | |||||||||||||||||||||||||||||||||||||||||||||
Investments in securities of unaffiliated issuers | 12,969,883 | 21,653,996 | 10,241,286 | 10,127,412 | 76,337,908 | 3,401,481 | 32,981,932 | 23,344,654 | 22,603,062 | ||||||||||||||||||||||||||||||||||||
Futures contracts | 38,110 | — | 3,246 | — | — | — | — | — | — | ||||||||||||||||||||||||||||||||||||
Foreign currency related transactions | (419 | ) | — | — | (154 | ) | 4,660 | 737 | (170 | ) | (59 | ) | 42 | ||||||||||||||||||||||||||||||||
|
|
|
|
|
|
|
|
|
|
|
|
|
|
|
|
|
| ||||||||||||||||||||||||||||
Net realized/unrealized gain on investments, futures contracts, and foreign currency related transactions | 41,626,980 | 21,019,420 | 9,991,432 | 12,540,026 | 60,372,053 | 2,984,176 | 41,061,396 | 46,138,663 | 25,586,379 | ||||||||||||||||||||||||||||||||||||
|
|
|
|
|
|
|
|
|
|
|
|
|
|
|
|
|
| ||||||||||||||||||||||||||||
Change in net assets from operations | $ | 43,148,250 | $ | 25,272,087 | $ | 10,466,477 | $ | 13,122,143 | $ | 68,433,097 | $ | 3,853,269 | $ | 41,069,926 | $ | 45,825,572 | $ | 25,674,959 | |||||||||||||||||||||||||||
|
|
|
|
|
|
|
|
|
|
|
|
|
|
|
|
|
| ||||||||||||||||||||||||||||
*Taxes withheld | $ | 9,888 | $ | — | $ | — | $ | 2,119 | $ | 1,160,719 | $ | 140,597 | $ | 4,377 | $ | 4,216 | $ | 19,427 | |||||||||||||||||||||||||||
|
|
|
|
|
|
|
|
|
|
|
|
|
|
|
|
|
| ||||||||||||||||||||||||||||
**Foreign capital gain taxes | $ | — | $ | — | $ | — | $ | — | $ | — | $ | 152 | $ | — | $ | — | $ | — | |||||||||||||||||||||||||||
|
|
|
|
|
|
|
|
|
|
|
|
|
|
|
|
|
| ||||||||||||||||||||||||||||
The accompanying notes are an integral part of these financial statements.
| 141 |
| Ohio National Fund, Inc. |
Statements of Operations | For the Six-Month Period Ended June 30, 2019 (Unaudited) | |
ON S&P 500® | ON Federated Strategic Value Dividend Portfolio | ON Federated High Income Bond Portfolio | ON ClearBridge Small Cap Portfolio | ON Nasdaq-100® Index | ON BlackRock Advantage Large Cap Core | ON BlackRock Advantage Small Cap Growth Portfolio | ON ICON Balanced | ON S&P MidCap 400® Portfolio | |||||||||||||||||||||||||||||||||||||
Investment income: | |||||||||||||||||||||||||||||||||||||||||||||
Interest | $ | 7,879 | $ | — | $ | 6,335,667 | $ | — | $ | 6,465 | $ | 15 | $ | 42 | $ | 2,784,626 | $ | 2,489 | |||||||||||||||||||||||||||
Dividends from unaffiliated issuers, net of taxes withheld* | 11,954,184 | 7,807,042 | 63,173 | 858,659 | 1,846,144 | 1,160,882 | 334,999 | 3,116,686 | 2,724,661 | ||||||||||||||||||||||||||||||||||||
|
|
|
|
|
|
|
|
|
|
|
|
|
|
|
|
|
| ||||||||||||||||||||||||||||
Total investment income | 11,962,063 | 7,807,042 | 6,398,840 | 858,659 | 1,852,609 | 1,160,897 | 335,041 | 5,901,312 | 2,727,150 | ||||||||||||||||||||||||||||||||||||
|
|
|
|
|
|
|
|
|
|
|
|
|
|
|
|
|
| ||||||||||||||||||||||||||||
Expenses: | |||||||||||||||||||||||||||||||||||||||||||||
Management fees | 1,961,126 | 1,145,911 | 708,569 | 540,793 | 603,386 | 393,305 | 257,670 | 1,514,301 | 566,978 | ||||||||||||||||||||||||||||||||||||
Custodian fees | 116,240 | 14,010 | 9,350 | 5,100 | 37,272 | 10,962 | 14,053 | 8,020 | 90,596 | ||||||||||||||||||||||||||||||||||||
Directors’ fees | 51,952 | 14,670 | 9,218 | 6,047 | 15,027 | 5,258 | 2,694 | 22,288 | 14,201 | ||||||||||||||||||||||||||||||||||||
Professional fees | 20,678 | 12,894 | 11,769 | 11,082 | 13,013 | 10,958 | 10,582 | 14,482 | 12,806 | ||||||||||||||||||||||||||||||||||||
Accounting fees | 80,998 | 23,560 | 34,537 | 9,834 | 24,109 | 12,127 | 7,781 | 34,927 | 28,613 | ||||||||||||||||||||||||||||||||||||
Administration fees | 17,600 | 13,141 | 12,557 | 12,194 | 13,147 | 11,976 | 11,534 | 13,908 | 12,715 | ||||||||||||||||||||||||||||||||||||
Printing and filing fees | 22,186 | 8,215 | 8,427 | 5,544 | 8,732 | 4,877 | 5,272 | 13,031 | 8,312 | ||||||||||||||||||||||||||||||||||||
Compliance expense | 7,540 | 7,540 | 7,540 | 7,540 | 7,540 | 7,540 | 7,540 | 7,540 | 7,540 | ||||||||||||||||||||||||||||||||||||
Other | 16,807 | 5,212 | 2,957 | 2,941 | 5,035 | 2,409 | 834 | 8,535 | 2,727 | ||||||||||||||||||||||||||||||||||||
|
|
|
|
|
|
|
|
|
|
|
|
|
|
|
|
|
| ||||||||||||||||||||||||||||
Total expenses | 2,295,127 | 1,245,153 | 804,924 | 601,075 | 727,261 | 459,412 | 317,960 | 1,637,032 | 744,488 | ||||||||||||||||||||||||||||||||||||
|
|
|
|
|
|
|
|
|
|
|
|
|
|
|
|
|
| ||||||||||||||||||||||||||||
Net investment income | 9,666,936 | 6,561,889 | 5,593,916 | 257,584 | 1,125,348 | 701,485 | 17,081 | 4,264,280 | 1,982,662 | ||||||||||||||||||||||||||||||||||||
|
|
|
|
|
|
|
|
|
|
|
|
|
|
|
|
|
| ||||||||||||||||||||||||||||
Realized/unrealized gain (loss) on investments, futures contracts, and foreign currency related transactions: | |||||||||||||||||||||||||||||||||||||||||||||
Net realized gain (loss) on: | |||||||||||||||||||||||||||||||||||||||||||||
Investments in securities of unaffiliated issuers | 77,022,156 | (2,253,093 | ) | (1,050,263 | ) | 7,626,241 | 35,340,933 | (4,840,802 | ) | 696,513 | (2,822,249 | ) | 1,156,821 | ||||||||||||||||||||||||||||||||
Futures contracts | 1,255,967 | — | — | — | 460,278 | 76,759 | 5 | — | 115,339 | ||||||||||||||||||||||||||||||||||||
Foreign currency related transactions | — | (44,710 | ) | — | — | — | — | — | 377 | — | |||||||||||||||||||||||||||||||||||
Change in unrealized appreciation/depreciation on: | |||||||||||||||||||||||||||||||||||||||||||||
Investments in securities of unaffiliated issuers | 110,374,699 | 27,837,116 | 15,572,998 | 17,618,905 | 29,757,938 | 29,703,981 | 5,634,425 | 64,933,219 | 49,398,526 | ||||||||||||||||||||||||||||||||||||
Futures contracts | (25,930 | ) | — | — | — | 11,065 | 19,876 | 33,593 | — | 37,558 | |||||||||||||||||||||||||||||||||||
Foreign currency related transactions | — | 2,227 | — | — | — | — | — | 45 | — | ||||||||||||||||||||||||||||||||||||
|
|
|
|
|
|
|
|
|
|
|
|
|
|
|
|
|
| ||||||||||||||||||||||||||||
Net realized/unrealized gain on investments, futures contracts, and foreign currency related transactions | 188,626,892 | 25,541,540 | 14,522,735 | 25,245,146 | 65,570,214 | 24,959,814 | 6,364,536 | 62,111,392 | 50,708,244 | ||||||||||||||||||||||||||||||||||||
|
|
|
|
|
|
|
|
|
|
|
|
|
|
|
|
|
| ||||||||||||||||||||||||||||
Change in net assets from operations | $ | 198,293,828 | $ | 32,103,429 | $ | 20,116,651 | $ | 25,502,730 | $ | 66,695,562 | $ | 25,661,299 | $ | 6,381,617 | $ | 66,375,672 | $ | 52,690,906 | |||||||||||||||||||||||||||
|
|
|
|
|
|
|
|
|
|
|
|
|
|
|
|
|
| ||||||||||||||||||||||||||||
*Taxes withheld | $ | — | $ | 134,828 | $ | — | $ | — | $ | 2,074 | $ | — | $ | — | $ | 5,908 | $ | 1,414 | |||||||||||||||||||||||||||
|
|
|
|
|
|
|
|
|
|
|
|
|
|
|
|
|
| ||||||||||||||||||||||||||||
The accompanying notes are an integral part of these financial statements.
| 142 |
| Ohio National Fund, Inc. |
Statements of Operations | For the Six-Month Period Ended June 30, 2019 (Unaudited) | |
| ON BlackRock Advantage Large Cap Growth Portfolio | ON Risk Managed Balanced Portfolio | ON Conservative Portfolio | ON Moderately Conservative Model Portfolio | ON Balanced Model Portfolio | ON Moderate Growth Model Portfolio | ON Growth Model | |||||||||||||||||||||||||||||
Investment income: | |||||||||||||||||||||||||||||||||||
Interest | $ | 6 | $ | 2,115,687 | $ | — | $ | — | $ | — | $ | — | $ | — | |||||||||||||||||||||
Dividends from unaffiliated issuers, net of taxes withheld* | 738,231 | 2,492,059 | 834,547 | 1,946,740 | 6,647,194 | 6,870,007 | 694,369 | ||||||||||||||||||||||||||||
Dividends from affililiates | — | — | — | 6,920 | 34,056 | 58,892 | 13,066 | ||||||||||||||||||||||||||||
|
|
|
|
|
|
|
|
|
|
|
|
|
| ||||||||||||||||||||||
Total investment income | 738,237 | 4,607,746 | 834,547 | 1,953,660 | 6,681,250 | 6,928,899 | 707,435 | ||||||||||||||||||||||||||||
|
|
|
|
|
|
|
|
|
|
|
|
|
| ||||||||||||||||||||||
Expenses: | |||||||||||||||||||||||||||||||||||
Management fees | 335,981 | 1,645,437 | 150,226 | 458,326 | 2,241,481 | 3,892,196 | 859,680 | ||||||||||||||||||||||||||||
Custodian fees | 10,649 | 30,978 | 1,382 | 1,467 | 1,715 | 2,058 | 1,564 | ||||||||||||||||||||||||||||
Directors’ fees | 4,747 | 16,600 | 3,544 | 10,417 | 50,211 | 87,240 | 19,419 | ||||||||||||||||||||||||||||
Professional fees | 10,850 | 13,325 | 11,549 | 12,980 | 21,258 | 28,995 | 14,877 | ||||||||||||||||||||||||||||
Accounting fees | 9,162 | 82,465 | 12,480 | 12,752 | 12,831 | 12,881 | 12,738 | ||||||||||||||||||||||||||||
Administration fees | 11,777 | 13,202 | 20,072 | 21,825 | 25,408 | 28,479 | 23,266 | ||||||||||||||||||||||||||||
Printing and filing fees | 5,212 | 11,126 | 4,644 | 6,719 | 19,705 | 32,509 | 9,989 | ||||||||||||||||||||||||||||
Compliance expense | 7,540 | 7,540 | 7,540 | 7,540 | 7,540 | 7,540 | 7,540 | ||||||||||||||||||||||||||||
Other | 1,496 | 4,448 | 972 | 3,053 | 15,327 | 26,596 | 5,774 | ||||||||||||||||||||||||||||
|
|
|
|
|
|
|
|
|
|
|
|
|
| ||||||||||||||||||||||
Total expenses | 397,414 | 1,825,121 | 212,409 | 535,079 | 2,395,476 | 4,118,494 | 954,847 | ||||||||||||||||||||||||||||
|
|
|
|
|
|
|
|
|
|
|
|
|
| ||||||||||||||||||||||
Less expenses reduced or reimbursed by advisor | — | — | (121,189 | ) | (170,799 | ) | (433,882 | ) | — | — | |||||||||||||||||||||||||
|
|
|
|
|
|
|
|
|
|
|
|
|
| ||||||||||||||||||||||
Net expenses | 397,414 | 1,825,121 | 91,220 | 364,280 | 1,961,594 | 4,118,494 | 954,847 | ||||||||||||||||||||||||||||
|
|
|
|
|
|
|
|
|
|
|
|
|
| ||||||||||||||||||||||
Net investment income (loss) | 340,823 | 2,782,625 | 743,327 | 1,589,380 | 4,719,656 | 2,810,405 | (247,412 | ) | |||||||||||||||||||||||||||
|
|
|
|
|
|
|
|
|
|
|
|
|
| ||||||||||||||||||||||
Realized/unrealized gain on investments, capital gain distributions received from underlying mutual funds, futures contracts, and foreign currency related transactions: | |||||||||||||||||||||||||||||||||||
Net realized gain (loss) on: | |||||||||||||||||||||||||||||||||||
Investments in securities of unaffiliated issuers | 2,133,949 | 3,172,448 | (153,230 | ) | (398,317 | ) | (2,995,245 | ) | (6,560,556 | ) | (1,609,441 | ) | |||||||||||||||||||||||
Investments in affiliates | — | — | 570,567 | 3,826,460 | 24,647,033 | 88,169,815 | 19,284,939 | ||||||||||||||||||||||||||||
Capital gain distributions received from underlying affiliated mutual funds | — | — | — | 136,771 | 996,841 | 2,308,520 | 511,082 | ||||||||||||||||||||||||||||
Futures contracts | 44,359 | 16,511,039 | — | — | — | — | — | ||||||||||||||||||||||||||||
Foreign currency related transactions | — | 169 | — | — | — | — | — | ||||||||||||||||||||||||||||
Change in unrealized appreciation/depreciation on: | |||||||||||||||||||||||||||||||||||
Investments in securities of unaffiliated issuers | 18,783,038 | 25,675,974 | 2,521,587 | 6,749,550 | 32,843,106 | 54,484,424 | 11,151,999 | ||||||||||||||||||||||||||||
Investments in affiliates | — | — | 2,836,691 | 12,475,145 | 76,802,220 | 144,348,423 | 39,804,095 | ||||||||||||||||||||||||||||
Futures contracts | 22,673 | 2,758,467 | — | — | — | — | — | ||||||||||||||||||||||||||||
|
|
|
|
|
|
|
|
|
|
|
|
|
| ||||||||||||||||||||||
Net realized/unrealized gain on investments, capital gain distributions received from underlying mutual funds, futures contracts, and foreign currency related transactions | 20,984,019 | 48,118,097 | 5,775,615 | 22,789,609 | 132,293,955 | 282,750,626 | 69,142,674 | ||||||||||||||||||||||||||||
|
|
|
|
|
|
|
|
|
|
|
|
|
| ||||||||||||||||||||||
Change in net assets from operations | $ | 21,324,842 | $ | 50,900,722 | $ | 6,518,942 | $ | 24,378,989 | $ | 137,013,611 | $ | 285,561,031 | $ | 68,895,262 | |||||||||||||||||||||
|
|
|
|
|
|
|
|
|
|
|
|
|
| ||||||||||||||||||||||
*Taxes withheld | $ | — | $ | 6,327 | $ | — | $ | — | $ | — | $ | — | $ | — | |||||||||||||||||||||
|
|
|
|
|
|
|
|
|
|
|
|
|
| ||||||||||||||||||||||
The accompanying notes are an integral part of these financial statements.
| 143 |
| Ohio National Fund, Inc. |
| ON BlackRock Balanced Allocation Portfolio | ON Capital Appreciation Portfolio | |||||||||||||||||||||||||||||||||||||||
| ON Equity Portfolio | ON Bond Portfolio | |||||||||||||||||||||||||||||||||||||||
| Six-Month Period Ended June 30, 2019 (Unaudited) | Year Ended December 31, 2018 | Six-Month Period Ended June 30, 2019 (Unaudited) | Year Ended December 31, 2018 | Six-Month Period Ended June 30, 2019 (Unaudited) | Year Ended December 31, 2018 | Six-Month Period Ended June 30, 2019 (Unaudited) | Year Ended December 31, 2018 | |||||||||||||||||||||||||||||||||
Increase (Decrease) in net assets: | ||||||||||||||||||||||||||||||||||||||||
Operations: | ||||||||||||||||||||||||||||||||||||||||
Net investment income | $ | 1,521,270 | $ | 3,678,023 | $ | 4,252,667 | $ | 9,665,588 | $ | 475,045 | $ | 774,383 | $ | 582,117 | $ | 998,726 | ||||||||||||||||||||||||
Net realized gain (loss) on investments, futures contracts, and foreign currency related transactions | 28,619,406 | 34,126,131 | (634,576 | ) | (1,332,707 | ) | (253,100 | ) | 4,734,973 | 2,412,768 | 12,868,329 | |||||||||||||||||||||||||||||
Change in unrealized appreciation/depreciation on investments, futures contracts, and foreign currency related transactions | 13,007,574 | (79,717,330 | ) | 21,653,996 | (18,121,945 | ) | 10,244,532 | (15,186,311 | ) | 10,127,258 | (27,867,547 | ) | ||||||||||||||||||||||||||||
|
|
|
|
|
|
|
|
|
|
|
|
|
|
|
| |||||||||||||||||||||||||
Change in net assets from operations | 43,148,250 | (41,913,176 | ) | 25,272,087 | (9,789,064 | ) | 10,466,477 | (9,676,955 | ) | 13,122,143 | (14,000,492 | ) | ||||||||||||||||||||||||||||
|
|
|
|
|
|
|
|
|
|
|
|
|
|
|
| |||||||||||||||||||||||||
Capital transactions: | ||||||||||||||||||||||||||||||||||||||||
Received from shares sold | 2,570,761 | 21,760,700 | 13,157,955 | 38,682,232 | 1,921,209 | 10,920,667 | 1,753,411 | 10,441,625 | ||||||||||||||||||||||||||||||||
Paid for shares redeemed | (66,828,810 | ) | (296,773,433 | ) | (37,710,176 | ) | (88,523,835 | ) | (7,132,120 | ) | (16,074,459 | ) | (11,836,728 | ) | (28,800,944 | ) | ||||||||||||||||||||||||
|
|
|
|
|
|
|
|
|
|
|
|
|
|
|
| |||||||||||||||||||||||||
Change in net assets from capital transactions | (64,258,049 | ) | (275,012,733 | ) | (24,552,221 | ) | (49,841,603 | ) | (5,210,911 | ) | (5,153,792 | ) | (10,083,317 | ) | (18,359,319 | ) | ||||||||||||||||||||||||
|
|
|
|
|
|
|
|
|
|
|
|
|
|
|
| |||||||||||||||||||||||||
Change in net assets | (21,109,799 | ) | (316,925,909 | ) | 719,866 | (59,630,667 | ) | 5,255,566 | (14,830,747 | ) | 3,038,826 | (32,359,811 | ) | |||||||||||||||||||||||||||
Net assets: | ||||||||||||||||||||||||||||||||||||||||
Beginning of period | 257,953,988 | 574,879,897 | 257,690,684 | 317,321,351 | 53,563,548 | 68,394,295 | 93,230,354 | 125,590,165 | ||||||||||||||||||||||||||||||||
|
|
|
|
|
|
|
|
|
|
|
|
|
|
|
| |||||||||||||||||||||||||
End of period | $ | 236,844,189 | $ | 257,953,988 | $ | 258,410,550 | $ | 257,690,684 | $ | 58,819,114 | $ | 53,563,548 | $ | 96,269,180 | $ | 93,230,354 | ||||||||||||||||||||||||
|
|
|
|
|
|
|
|
|
|
|
|
|
|
|
| |||||||||||||||||||||||||
The accompanying notes are an integral part of these financial statements.
| 144 |
| Ohio National Fund, Inc. |
Statements of Changes in Net Assets |
| ON International Equity Portfolio | ON Foreign Portfolio | ON Janus Henderson Forty Portfolio | ON Janus Henderson Venture Portfolio | |||||||||||||||||||||||||||||||||||||
| Six-Month Period Ended June 30, 2019 (Unaudited) | Year Ended December 31, 2018 | Six-Month Period Ended June 30, 2019 (Unaudited) | Year Ended December 31, 2018 | Six-Month Period Ended June 30, 2019 (Unaudited) | Year Ended December 31, 2018 | Six-Month Period Ended June 30, 2019 (Unaudited) | Year Ended December 31, 2018 | |||||||||||||||||||||||||||||||||
Increase (Decrease) in net assets: | ||||||||||||||||||||||||||||||||||||||||
Operations: | ||||||||||||||||||||||||||||||||||||||||
Net investment income (loss) | $ | 8,061,044 | $ | 9,203,118 | $ | 869,093 | $ | 1,198,783 | $ | 8,530 | $ | (181,828 | ) | $ | (313,091 | ) | $ | (597,775 | ) | |||||||||||||||||||||
Net realized gain (loss) on investments and foreign currency related transactions | (15,970,515 | ) | (13,437,629 | ) | (418,042 | ) | 920,353 | 8,079,634 | 9,044,086 | 22,794,068 | 36,513,561 | |||||||||||||||||||||||||||||
Change in unrealized appreciation/depreciation on investments and foreign currency related transactions | 76,342,568 | (81,640,074 | ) | 3,402,218 | (12,858,643 | ) | 32,981,762 | (14,617,276 | ) | 23,344,595 | (46,188,021 | ) | ||||||||||||||||||||||||||||
|
|
|
|
|
|
|
|
|
|
|
|
|
|
|
| |||||||||||||||||||||||||
Change in net assets from operations | 68,433,097 | (85,874,585 | ) | 3,853,269 | (10,739,507 | ) | 41,069,926 | (5,755,018 | ) | 45,825,572 | (10,272,235 | ) | ||||||||||||||||||||||||||||
|
|
|
|
|
|
|
|
|
|
|
|
|
|
|
| |||||||||||||||||||||||||
Capital transactions: | ||||||||||||||||||||||||||||||||||||||||
Received from shares sold | 4,723,426 | 522,211,794 | 1,942,958 | 7,071,488 | 42,134,920 | 131,184,789 | 5,267,518 | 28,648,853 | ||||||||||||||||||||||||||||||||
Paid for shares redeemed | (115,065,707 | ) | (75,666,960 | ) | (8,213,370 | ) | (20,936,084 | ) | (40,299,892 | ) | (36,734,844 | ) | (87,161,187 | ) | (87,143,672 | ) | ||||||||||||||||||||||||
|
|
|
|
|
|
|
|
|
|
|
|
|
|
|
| |||||||||||||||||||||||||
Change in net assets from capital transactions | (110,342,281 | ) | 446,544,834 | (6,270,412 | ) | (13,864,596 | ) | 1,835,028 | 94,449,945 | (81,893,669 | ) | (58,494,819 | ) | |||||||||||||||||||||||||||
|
|
|
|
|
|
|
|
|
|
|
|
|
|
|
| |||||||||||||||||||||||||
Change in net assets | (41,909,184 | ) | 360,670,249 | (2,417,143 | ) | (24,604,103 | ) | 42,904,954 | 88,694,927 | (36,068,097 | ) | (68,767,054 | ) | |||||||||||||||||||||||||||
Net assets: | ||||||||||||||||||||||||||||||||||||||||
Beginning of period | 518,756,994 | 158,086,745 | 55,086,627 | 79,690,730 | 149,337,283 | 60,642,356 | 207,447,427 | 276,214,481 | ||||||||||||||||||||||||||||||||
|
|
|
|
|
|
|
|
|
|
|
|
|
|
|
| |||||||||||||||||||||||||
End of period | $ | 476,847,810 | $ | 518,756,994 | $ | 52,669,484 | $ | 55,086,627 | $ | 192,242,237 | $ | 149,337,283 | $ | 171,379,330 | $ | 207,447,427 | ||||||||||||||||||||||||
|
|
|
|
|
|
|
|
|
|
|
|
|
|
|
| |||||||||||||||||||||||||
The accompanying notes are an integral part of these financial statements.
| 145 |
| Ohio National Fund, Inc. |
Statements of Changes in Net Assets |
| ON Janus Henderson Enterprise Portfolio | ON S&P 500®Index Portfolio | ON Federated Strategic Value Dividend Portfolio | ON Federated High Income Bond Portfolio | |||||||||||||||||||||||||||||||||||||
| Six-Month Period Ended June 30, 2019 (Unaudited) | Year Ended December 31, 2018 | Six-Month Period Ended June 30, 2019 (Unaudited) | Year Ended December 31, 2018 | Six-Month Period Ended June 30, 2019 (Unaudited) | Year Ended December 31, 2018 | Six-Month Period Ended June 30, 2019 (Unaudited) | Year Ended December 31, 2018 | |||||||||||||||||||||||||||||||||
Increase (Decrease) in net assets: | ||||||||||||||||||||||||||||||||||||||||
Operations: | ||||||||||||||||||||||||||||||||||||||||
Net investment income | $ | 88,580 | $ | 59,084 | $ | 9,666,936 | $ | 19,156,628 | $ | 6,561,889 | $ | 17,166,976 | $ | 5,593,916 | $ | 15,221,264 | ||||||||||||||||||||||||
Net realized gain (loss) on investments, futures contracts, and foreign currency related transactions | 2,983,275 | 19,972,986 | 78,278,123 | 123,480,167 | (2,297,803 | ) | 15,250,075 | (1,050,263 | ) | (539,202 | ) | |||||||||||||||||||||||||||||
Change in unrealized appreciation/depreciation on investments, futures contracts, and foreign currency related transactions | 22,603,104 | (26,217,301 | ) | 110,348,769 | (196,611,132 | ) | 27,839,343 | (75,279,284 | ) | 15,572,998 | (21,613,364 | ) | ||||||||||||||||||||||||||||
|
|
|
|
|
|
|
|
|
|
|
|
|
|
|
| |||||||||||||||||||||||||
Change in net assets from operations | 25,674,959 | (6,185,231 | ) | 198,293,828 | (53,974,337 | ) | 32,103,429 | (42,862,233 | ) | 20,116,651 | (6,931,302 | ) | ||||||||||||||||||||||||||||
|
|
|
|
|
|
|
|
|
|
|
|
|
|
|
| |||||||||||||||||||||||||
Capital transactions: | ||||||||||||||||||||||||||||||||||||||||
Received from shares sold | 2,257,390 | 57,214,680 | 70,256,064 | 347,702,650 | 12,034,759 | 32,510,016 | 8,059,545 | 22,584,954 | ||||||||||||||||||||||||||||||||
Paid for shares redeemed | (21,579,592 | ) | (26,241,838 | ) | (212,445,956 | ) | (326,345,158 | ) | (47,414,403 | ) | (264,473,671 | ) | (28,677,039 | ) | (132,623,908 | ) | ||||||||||||||||||||||||
|
|
|
|
|
|
|
|
|
|
|
|
|
|
|
| |||||||||||||||||||||||||
Change in net assets from capital transactions | (19,322,202 | ) | 30,972,842 | (142,189,892 | ) | 21,357,492 | (35,379,644 | ) | (231,963,655 | ) | (20,617,494 | ) | (110,038,954 | ) | ||||||||||||||||||||||||||
|
|
|
|
|
|
|
|
|
|
|
|
|
|
|
| |||||||||||||||||||||||||
Change in net assets | 6,352,757 | 24,787,611 | 56,103,936 | (32,616,845 | ) | (3,276,215 | ) | (274,825,888 | ) | (500,843 | ) | (116,970,256 | ) | |||||||||||||||||||||||||||
Net assets: | ||||||||||||||||||||||||||||||||||||||||
Beginning of period | 102,591,062 | 77,803,451 | 1,111,538,535 | 1,144,155,380 | 321,839,033 | 596,664,921 | 202,082,290 | 319,052,546 | ||||||||||||||||||||||||||||||||
|
|
|
|
|
|
|
|
|
|
|
|
|
|
|
| |||||||||||||||||||||||||
End of period | $ | 108,943,819 | $ | 102,591,062 | $ | 1,167,642,471 | $ | 1,111,538,535 | $ | 318,562,818 | $ | 321,839,033 | $ | 201,581,447 | $ | 202,082,290 | ||||||||||||||||||||||||
|
|
|
|
|
|
|
|
|
|
|
|
|
|
|
| |||||||||||||||||||||||||
The accompanying notes are an integral part of these financial statements.
| 146 |
| Ohio National Fund, Inc. |
Statements of Changes in Net Assets |
| ON ClearBridge Small Cap Portfolio | ONNasdaq-100®Index Portfolio | ON BlackRock Advantage Large Cap Core Portfolio | ON BlackRock Advantage Small Cap Growth Portfolio | |||||||||||||||||||||||||||||||||||||
| Six-Month Period Ended June 30, 2019 (Unaudited) | Year Ended December 31, 2018 | Six-Month Period Ended June 30, 2019 (Unaudited) | Year Ended December 31, 2018 | Six-Month Period Ended June 30, 2019 (Unaudited) | Year Ended December 31, 2018 | Six-Month Period Ended June 30, 2019 (Unaudited) | Year Ended December 31, 2018 | |||||||||||||||||||||||||||||||||
Increase (Decrease) in net assets: | ||||||||||||||||||||||||||||||||||||||||
Operations: | ||||||||||||||||||||||||||||||||||||||||
Net investment income (loss) | $ | 257,584 | $ | 444,410 | $ | 1,125,348 | $ | 2,359,160 | $ | 701,485 | $ | 1,258,378 | $ | 17,081 | $ | (278,025 | ) | |||||||||||||||||||||||
Net realized gain (loss) on investments and futures contracts | 7,626,241 | 34,009,076 | 35,801,211 | 47,305,884 | (4,764,043 | ) | 21,820,877 | 696,518 | 8,841,303 | |||||||||||||||||||||||||||||||
Change in unrealized appreciation/depreciation on investments and futures contracts | 17,618,905 | (40,203,319 | ) | 29,769,003 | (58,771,178 | ) | 29,723,857 | (55,659,595 | ) | 5,668,018 | (7,430,497 | ) | ||||||||||||||||||||||||||||
|
|
|
|
|
|
|
|
|
|
|
|
|
|
|
| |||||||||||||||||||||||||
Change in net assets from operations | 25,502,730 | (5,749,833 | ) | 66,695,562 | (9,106,134 | ) | 25,661,299 | (32,580,340 | ) | 6,381,617 | 1,132,781 | |||||||||||||||||||||||||||||
|
|
|
|
|
|
|
|
|
|
|
|
|
|
|
| |||||||||||||||||||||||||
Capital transactions: | ||||||||||||||||||||||||||||||||||||||||
Received from shares sold | 6,099,859 | 13,705,484 | 19,548,976 | 203,694,976 | 1,818,152 | 24,292,885 | 61,210,665 | 6,244,393 | ||||||||||||||||||||||||||||||||
Paid for shares redeemed | (34,182,104 | ) | (156,864,507 | ) | (75,461,518 | ) | (124,224,169 | ) | (82,571,274 | ) | (60,069,872 | ) | (8,323,015 | ) | (38,689,793 | ) | ||||||||||||||||||||||||
|
|
|
|
|
|
|
|
|
|
|
|
|
|
|
| |||||||||||||||||||||||||
Change in net assets from capital transactions | (28,082,245 | ) | (143,159,023 | ) | (55,912,542 | ) | 79,470,807 | (80,753,122 | ) | (35,776,987 | ) | 52,887,650 | (32,445,400 | ) | ||||||||||||||||||||||||||
|
|
|
|
|
|
|
|
|
|
|
|
|
|
|
| |||||||||||||||||||||||||
Change in net assets | (2,579,515 | ) | (148,908,856 | ) | 10,783,020 | 70,364,673 | (55,091,823 | ) | (68,357,327 | ) | 59,269,267 | (31,312,619 | ) | |||||||||||||||||||||||||||
Net assets: | ||||||||||||||||||||||||||||||||||||||||
Beginning of period | 126,188,711 | 275,097,567 | 327,582,182 | 257,217,509 | 155,344,616 | 223,701,943 | 25,461,965 | 56,774,584 | ||||||||||||||||||||||||||||||||
|
|
|
|
|
|
|
|
|
|
|
|
|
|
|
| |||||||||||||||||||||||||
End of period | $ | 123,609,196 | $ | 126,188,711 | $ | 338,365,202 | $ | 327,582,182 | $ | 100,252,793 | $ | 155,344,616 | $ | 84,731,232 | $ | 25,461,965 | ||||||||||||||||||||||||
|
|
|
|
|
|
|
|
|
|
|
|
|
|
|
| |||||||||||||||||||||||||
The accompanying notes are an integral part of these financial statements.
| 147 |
| Ohio National Fund, Inc. |
Statements of Changes in Net Assets |
| ON ICON Balanced Portfolio | ON S&P MidCap 400®Index Portfolio | ON BlackRock Advantage Large Cap Growth Portfolio | ON Risk Managed Balanced Portfolio | |||||||||||||||||||||||||||||||||||||
| Six-Month Period Ended June 30, 2019 (Unaudited) | Year Ended December 31, 2018 | Six-Month Period Ended June 30, 2019 (Unaudited) | Year Ended December 31, 2018 | Six-Month Period Ended June 30, 2019 (Unaudited) | Year Ended December 31, 2018 | Six-Month Period Ended June 30, 2019 (Unaudited) | Year Ended December 31, 2018 | |||||||||||||||||||||||||||||||||
Increase (Decrease) in net assets: | ||||||||||||||||||||||||||||||||||||||||
Operations: | ||||||||||||||||||||||||||||||||||||||||
Net investment income | $ | 4,264,280 | $ | 11,589,899 | $ | 1,982,662 | $ | 1,928,886 | $ | 340,823 | $ | 501,750 | $ | 2,782,625 | $ | 4,499,219 | ||||||||||||||||||||||||
Net realized gain (loss) on investments, futures contracts, foreign currency related transactions, and capital gain distributions received from underlying mutual funds | (2,821,872 | ) | 28,046,590 | 1,272,160 | 3,662,528 | 2,178,308 | 15,780,396 | 19,683,656 | 7,276,307 | |||||||||||||||||||||||||||||||
Change in unrealized appreciation/depreciation on investments, futures contracts, and foreign currency related transactions | 64,933,264 | (85,113,701 | ) | 49,436,084 | (55,549,977 | ) | 18,805,711 | (31,162,980 | ) | 28,434,441 | (14,874,374 | ) | ||||||||||||||||||||||||||||
|
|
|
|
|
|
|
|
|
|
|
|
|
|
|
| |||||||||||||||||||||||||
Change in net assets from operations | 66,375,672 | (45,477,212 | ) | 52,690,906 | (49,958,563 | ) | 21,324,842 | (14,880,834 | ) | 50,900,722 | (3,098,848 | ) | ||||||||||||||||||||||||||||
|
|
|
|
|
|
|
|
|
|
|
|
|
|
|
| |||||||||||||||||||||||||
Capital transactions: | ||||||||||||||||||||||||||||||||||||||||
Received from shares sold | 9,070,295 | 51,811,471 | 11,991,660 | 294,163,638 | 25,529,732 | 16,790,977 | 24,773,867 | 67,212,455 | ||||||||||||||||||||||||||||||||
Paid for shares redeemed | (55,683,133 | ) | (494,749,369 | ) | (57,627,975 | ) | (26,349,955 | ) | (22,370,232 | ) | (42,484,491 | ) | (36,432,512 | ) | (61,216,514 | ) | ||||||||||||||||||||||||
|
|
|
|
|
|
|
|
|
|
|
|
|
|
|
| |||||||||||||||||||||||||
Change in net assets from capital transactions | (46,612,838 | ) | (442,937,898 | ) | (45,636,315 | ) | 267,813,683 | 3,159,500 | (25,693,514 | ) | (11,658,645 | ) | 5,995,941 | |||||||||||||||||||||||||||
|
|
|
|
|
|
|
|
|
|
|
|
|
|
|
| |||||||||||||||||||||||||
Change in net assets | 19,762,834 | (488,415,110 | ) | 7,054,591 | 217,855,120 | 24,484,342 | (40,574,348 | ) | 39,242,077 | 2,897,093 | ||||||||||||||||||||||||||||||
Net assets: | ||||||||||||||||||||||||||||||||||||||||
Beginning of period | 466,684,891 | 955,100,001 | 306,637,857 | 88,782,737 | 87,474,708 | 128,049,056 | 347,067,696 | 344,170,603 | ||||||||||||||||||||||||||||||||
|
|
|
|
|
|
|
|
|
|
|
|
|
|
|
| |||||||||||||||||||||||||
End of period | $ | 486,447,725 | $ | 466,684,891 | $ | 313,692,448 | $ | 306,637,857 | $ | 111,959,050 | $ | 87,474,708 | $ | 386,309,773 | $ | 347,067,696 | ||||||||||||||||||||||||
|
|
|
|
|
|
|
|
|
|
|
|
|
|
|
| |||||||||||||||||||||||||
The accompanying notes are an integral part of these financial statements.
| 148 |
| Ohio National Fund, Inc. |
Statements of Changes in Net Assets |
| ON Conservative Model Portfolio | ON Moderately Conservative Model Portfolio | ON Balanced Model Portfolio | ON Moderate Growth Model Portfolio | ON Growth Model Portfolio | ||||||||||||||||||||||||||||||||||||||||||||||
| Six-Month Period Ended June 30, 2019 (Unaudited) | Year Ended December 31, 2018 | Six-Month Period Ended June 30, 2019 (Unaudited) | Year Ended December 31, 2018 | Six-Month Period Ended June 30, 2019 (Unaudited) | Year Ended December 31, 2018 | Six-Month Period Ended June 30, 2019 (Unaudited) | Year Ended December 31, 2018 | Six-Month Period Ended June 30, 2019 (Unaudited) | Year Ended December 31, 2018 | |||||||||||||||||||||||||||||||||||||||||
Increase (Decrease) in net assets: | ||||||||||||||||||||||||||||||||||||||||||||||||||
Operations: | ||||||||||||||||||||||||||||||||||||||||||||||||||
Net investment income (loss) | $ | 743,327 | $ | 1,510,170 | $ | 1,589,380 | $ | 3,575,597 | $ | 4,719,656 | $ | 10,526,530 | $ | 2,810,405 | $ | 10,080,252 | $ | (247,412 | ) | $ | 845,686 | |||||||||||||||||||||||||||||
Net realized gain on investments and capital gain distributions received from underlying mutual funds | 417,337 | 1,817,278 | 3,564,914 | 9,612,832 | 22,648,629 | 67,642,977 | 83,917,779 | 127,657,022 | 18,186,580 | 31,124,553 | ||||||||||||||||||||||||||||||||||||||||
Change in unrealized appreciation/depreciation on investments | 5,358,278 | (6,039,704 | ) | 19,224,695 | (28,270,231 | ) | 109,645,326 | (180,255,198 | ) | 198,832,847 | (366,502,824 | ) | 50,956,094 | (88,888,976 | ) | |||||||||||||||||||||||||||||||||||
|
|
|
|
|
|
|
|
|
|
|
|
|
|
|
|
|
|
|
| |||||||||||||||||||||||||||||||
Change in net assets from operations | 6,518,942 | (2,712,256 | ) | 24,378,989 | (15,081,802 | ) | 137,013,611 | (102,085,691 | ) | 285,561,031 | (228,765,550 | ) | 68,895,262 | (56,918,737 | ) | |||||||||||||||||||||||||||||||||||
|
|
|
|
|
|
|
|
|
|
|
|
|
|
|
|
|
|
|
| |||||||||||||||||||||||||||||||
Capital transactions: | ||||||||||||||||||||||||||||||||||||||||||||||||||
Received from shares sold | 7,064,367 | 16,321,184 | 7,187,454 | 17,226,213 | 12,486,684 | 32,601,532 | 12,604,877 | 62,284,294 | 4,942,022 | 37,982,945 | ||||||||||||||||||||||||||||||||||||||||
Paid for shares redeemed | (15,812,039 | ) | (34,326,169 | ) | (41,602,343 | ) | (90,882,373 | ) | (179,628,654 | ) | (346,200,979 | ) | (298,211,142 | ) | (535,321,797 | ) | (66,641,528 | ) | (100,690,231 | ) | ||||||||||||||||||||||||||||||
|
|
|
|
|
|
|
|
|
|
|
|
|
|
|
|
|
|
|
| |||||||||||||||||||||||||||||||
Change in net assets from capital transactions | (8,747,672 | ) | (18,004,985 | ) | (34,414,889 | ) | (73,656,160 | ) | (167,141,970 | ) | (313,599,447 | ) | (285,606,265 | ) | (473,037,503 | ) | (61,699,506 | ) | (62,707,286 | ) | ||||||||||||||||||||||||||||||
|
|
|
|
|
|
|
|
|
|
|
|
|
|
|
|
|
|
|
| |||||||||||||||||||||||||||||||
Change in net assets | (2,228,730 | ) | (20,717,241 | ) | (10,035,900 | ) | (88,737,962 | ) | (30,128,359 | ) | (415,685,138 | ) | (45,234 | ) | (701,803,053 | ) | 7,195,756 | (119,626,023 | ) | |||||||||||||||||||||||||||||||
Net assets: | ||||||||||||||||||||||||||||||||||||||||||||||||||
Beginning of period | 79,000,066 | 99,717,307 | 237,217,950 | 325,955,912 | 1,146,890,880 | 1,562,576,018 | 1,944,988,845 | 2,646,791,898 | 424,151,727 | 543,777,750 | ||||||||||||||||||||||||||||||||||||||||
|
|
|
|
|
|
|
|
|
|
|
|
|
|
|
|
|
|
|
| |||||||||||||||||||||||||||||||
End of period | $ | 76,771,336 | $ | 79,000,066 | $ | 227,182,050 | $ | 237,217,950 | $ | 1,116,762,521 | $ | 1,146,890,880 | $ | 1,944,943,611 | $ | 1,944,988,845 | $ | 431,347,483 | $ | 424,151,727 | ||||||||||||||||||||||||||||||
|
|
|
|
|
|
|
|
|
|
|
|
|
|
|
|
|
|
|
| |||||||||||||||||||||||||||||||
The accompanying notes are an integral part of these financial statements.
| 149 |
| Ohio National Fund, Inc. |
| Selectedper-share data | Ratios and supplemental data | |||||||||||||||||||||||||||||||||||||||||||||||||||||||||||
| Operations | Distributions | Ratios to average net assets | ||||||||||||||||||||||||||||||||||||||||||||||||||||||||||
| Ratios net of expenses reduced or reimbursed by adviser | Ratios assuming no expenses reduced or reimbursed by adviser | |||||||||||||||||||||||||||||||||||||||||||||||||||||||||||
Net asset value, or period | Net investment income | Net realized and unrealized gain on investments, futures contracts, and foreign currency related transactions | Total from operations | Distributions from net investment income | Net asset value, end of year or period | Total Return# | Net assets at end of year or period (in millions) | Expenses | Net investment income | Expenses | Portfolio turnover rate | |||||||||||||||||||||||||||||||||||||||||||||||||
ON Equity Portfolio | ||||||||||||||||||||||||||||||||||||||||||||||||||||||||||||
Six-Month Period Ended June 30, 2019+ | $ | 35.66 | 0.27 | 6.86 | 7.13 | — | $ | 42.79 | 19.99% | * | $ | 236.8 | 0.80% | ** | 1.28% | ** | 0.80% | ** | 119% | *,(a) | ||||||||||||||||||||||||||||||||||||||||
Year Ended December 31, 2018 | $ | 41.38 | 0.51 | (6.23 | ) | (5.72 | ) | — | $ | 35.66 | -13.82% | $ | 258.0 | 0.81% | 0.90% | 0.81% | 28% | |||||||||||||||||||||||||||||||||||||||||||
Year Ended December 31, 2017 | $ | 36.09 | 0.35 | 4.94 | 5.29 | — | $ | 41.38 | 14.66% | $ | 574.9 | 0.80% | 0.71% | 0.80% | 41% | |||||||||||||||||||||||||||||||||||||||||||||
Year Ended December 31, 2016 | $ | 32.02 | 0.35 | 3.72 | 4.07 | — | $ | 36.09 | 12.71% | $ | 581.8 | 0.82% | 1.05% | 0.82% | 47% | |||||||||||||||||||||||||||||||||||||||||||||
Year Ended December 31, 2015 | $ | 33.44 | 0.21 | (1.44 | ) | (1.23 | ) | (0.19 | ) | $ | 32.02 | -3.69% | $ | 535.3 | 0.81% | 0.69% | 0.81% | 47% | ||||||||||||||||||||||||||||||||||||||||||
ON Bond Portfolio | ||||||||||||||||||||||||||||||||||||||||||||||||||||||||||||
Six-Month Period Ended June 30, 2019+ | $ | 17.02 | 0.31 | 1.46 | 1.77 | — | $ | 18.79 | 10.40% | * | $ | 258.4 | 0.61% | ** | 3.36% | ** | 0.61% | ** | 19% | * | ||||||||||||||||||||||||||||||||||||||||
Year Ended December 31, 2018 | $ | 17.56 | 0.64 | (1.18 | ) | (0.54 | ) | — | $ | 17.02 | -3.08% | $ | 257.7 | 0.59% | 3.27% | 0.59% | 40% | |||||||||||||||||||||||||||||||||||||||||||
Year Ended December 31, 2017 | $ | 16.54 | 0.04 | 0.98 | 1.02 | — | $ | 17.56 | 6.17% | $ | 317.3 | 0.63% | 3.16% | 0.63% | 114% | |||||||||||||||||||||||||||||||||||||||||||||
Year Ended December 31, 2016 | $ | 15.33 | 0.59 | 0.62 | 1.21 | — | $ | 16.54 | 7.89% | $ | 158.7 | 0.65% | 3.33% | 0.65% | 88% | |||||||||||||||||||||||||||||||||||||||||||||
Year Ended December 31, 2015 | $ | 15.65 | 0.56 | (0.88 | ) | (0.32 | ) | — | $ | 15.33 | -2.04% | $ | 154.0 | 0.64% | 3.46% | 0.64% | 93% | |||||||||||||||||||||||||||||||||||||||||||
ON BlackRock Balanced Allocation Portfolio | ||||||||||||||||||||||||||||||||||||||||||||||||||||||||||||
Six-Month Period Ended June 30, 2019+ | $ | 27.85 | 0.27 | 5.39 | 5.66 | — | $ | 33.51 | 20.32% | * | $ | 58.8 | 0.79% | ** | 1.66% | ** | 0.79% | ** | 189% | *,(a) | ||||||||||||||||||||||||||||||||||||||||
Year Ended December 31, 2018 | $ | 32.60 | 0.40 | (5.15 | ) | (4.75 | ) | — | $ | 27.85 | -14.57% | $ | 53.6 | 0.77% | 1.16% | 0.77% | 225% | |||||||||||||||||||||||||||||||||||||||||||
Year Ended December 31, 2017 | $ | 26.93 | 0.31 | 5.36 | 5.67 | — | $ | 32.60 | 21.05% | $ | 68.4 | 0.78% | 1.02% | 0.78% | 187% | |||||||||||||||||||||||||||||||||||||||||||||
Year Ended December 31, 2016 | $ | 24.43 | 0.25 | 2.25 | 2.50 | — | $ | 26.93 | 10.23% | $ | 57.9 | 0.80% | 1.09% | 0.80% | 194% | |||||||||||||||||||||||||||||||||||||||||||||
Year Ended December 31, 2015 | $ | 24.15 | 0.28 | 0.24 | 0.52 | (0.24 | ) | $ | 24.43 | 2.15% | $ | 48.7 | 0.77% | 1.23% | 0.77% | 186% | ||||||||||||||||||||||||||||||||||||||||||||
ON Capital Appreciation Portfolio | ||||||||||||||||||||||||||||||||||||||||||||||||||||||||||||
Six-Month Period Ended June 30, 2019+ | $ | 37.73 | 0.26 | 5.16 | 5.42 | — | $ | 43.15 | 14.37% | * | $ | 96.3 | 0.91% | ** | 1.19% | ** | 0.91% | ** | 29% | * | ||||||||||||||||||||||||||||||||||||||||
Year Ended December 31, 2018 | $ | 43.66 | 0.40 | (6.33 | ) | (5.93 | ) | — | $ | 37.73 | -13.58% | $ | 93.2 | 0.89% | 0.86% | 0.89% | 55% | |||||||||||||||||||||||||||||||||||||||||||
Year Ended December 31, 2017 | $ | 37.70 | 1.28 | 4.68 | 5.96 | — | $ | 43.66 | 15.81% | $ | 125.6 | 0.86% | 1.00% | 0.86% | 51% | |||||||||||||||||||||||||||||||||||||||||||||
Year Ended December 31, 2016 | $ | 32.88 | 0.91 | 3.91 | 4.82 | — | $ | 37.70 | 14.66% | $ | 195.7 | 0.82% | 1.21% | 0.82% | 55% | |||||||||||||||||||||||||||||||||||||||||||||
Year Ended December 31, 2015 | $ | 33.82 | 0.29 | (0.98 | ) | (0.69 | ) | (0.25 | ) | $ | 32.88 | -2.05% | $ | 430.4 | 0.80% | 0.86% | 0.80% | 69% | ||||||||||||||||||||||||||||||||||||||||||
| + | Unaudited |
| * | Not annualized |
| ** | Annualized |
| (a) | Effective February 1, 2019, thesub-adviser for the equity portion of the ON BlackRock Balanced Allocation Portfolio changed from Suffolk Capital Management, LLC to BlackRock Investment Management, LLC (“BlackRock”). Effective May 1, 2019, thesub-adviser to the ON Equity Portfolio changed from ClearBridge Investments, LLC to BlackRock. Costs of purchases and proceeds from sales of portfolio securities associated with the changes in thesub-advisers contributed to higher portfolio turnover rates for thesix-month period ended June 30, 2019 as compared to prior periods. |
| # | Performance does not include fees and expenses imposed by a variable annuity contract. Had those fees and expenses been included, performance would have been lower than the returns presented. |
The accompanying notes are an integral part of these financial statements.
150 | ||||
| Ohio National Fund, Inc. |
Financial Highlights |
| Selectedper-share data | Ratios and supplemental data | ||||||||||||||||||||||||||||||||||||||||||||||||||||||
| Operations | Ratios to average net assets | ||||||||||||||||||||||||||||||||||||||||||||||||||||||
| Ratios net of expenses reduced or reimbursed by adviser | Ratios assuming no expenses reduced or reimbursed by adviser | ||||||||||||||||||||||||||||||||||||||||||||||||||||||
| Net asset value, beginning of year or period | Net investment income (loss) | Net realized and unrealized gain on investments, futures contracts, foreign currency contracts, and other foreign currency related transactions | Total from operations | Net asset value, end of year or period | Total Return# | Net assets at end of year or period (in millions) | Expenses | Net investment income (loss) | Expenses | Portfolio turnover rate | |||||||||||||||||||||||||||||||||||||||||||||
ON International Equity Portfolio | |||||||||||||||||||||||||||||||||||||||||||||||||||||||
Six-Month Period Ended June 30, 2019+ | $ | 13.07 | 0.26 | 1.77 | 2.03 | $ | 15.10 | 15.53% | * | $ | 476.8 | 0.87% | ** | 3.39% | ** | 0.87% | ** | 15% | * | ||||||||||||||||||||||||||||||||||||
Year Ended December 31, 2018 | $ | 15.08 | 0.23 | (2.24 | ) | (2.01 | ) | $ | 13.07 | -13.33% | $ | 518.8 | 0.86% | 1.93% | 0.86% | 44% | |||||||||||||||||||||||||||||||||||||||
Year Ended December 31, 2017 | $ | 11.89 | 0.18 | 3.01 | 3.19 | $ | 15.08 | 26.83% | $ | 158.1 | 1.06% | 1.25% | 1.06% | 132% | (a) | ||||||||||||||||||||||||||||||||||||||||
Year Ended December 31, 2016 | $ | 12.50 | 0.22 | (0.83 | ) | (0.61 | ) | $ | 11.89 | -4.88% | $ | 141.5 | 1.02% | 1.57% | 1.02% | 69% | |||||||||||||||||||||||||||||||||||||||
Year Ended December 31, 2015 | $ | 12.55 | 0.19 | (0.24 | ) | (0.05 | ) | $ | 12.50 | -0.40% | (b) | $ | 159.0 | 1.00% | 1.21% | 1.00% | 72% | ||||||||||||||||||||||||||||||||||||||
ON Foreign Portfolio | |||||||||||||||||||||||||||||||||||||||||||||||||||||||
Six-Month Period Ended June 30, 2019+ | $ | 28.03 | 0.49 | 1.47 | 1.96 | $ | 29.99 | 6.99% | * | $ | 52.7 | 1.30% | ** | 3.19% | ** | 1.30% | ** | 16% | * | ||||||||||||||||||||||||||||||||||||
Year Ended December 31, 2018 | $ | 33.22 | 0.57 | (5.76 | ) | (5.19 | ) | $ | 28.03 | -15.62% | $ | 55.1 | 1.17% | 1.72% | 1.17% | 22% | |||||||||||||||||||||||||||||||||||||||
Year Ended December 31, 2017 | $ | 27.72 | 0.32 | 5.18 | 5.50 | $ | 33.22 | 19.84% | $ | 79.7 | 1.22% | 1.01% | 1.22% | 126% | (a) | ||||||||||||||||||||||||||||||||||||||||
Year Ended December 31, 2016 | $ | 29.98 | 0.26 | (2.52 | ) | (2.26 | ) | $ | 27.72 | -7.54% | $ | 66.7 | 1.24% | 0.89% | 1.24% | 51% | |||||||||||||||||||||||||||||||||||||||
Year Ended December 31, 2015 | $ | 27.39 | 0.03 | 2.56 | 2.59 | $ | 29.98 | 9.46% | (b) | $ | 78.3 | 1.23% | 0.12% | 1.23% | 58% | ||||||||||||||||||||||||||||||||||||||||
ON Janus Henderson Forty Portfolio | |||||||||||||||||||||||||||||||||||||||||||||||||||||||
Six-Month Period Ended June 30, 2019+ | $ | 20.97 | — | 4.80 | 4.80 | $ | 25.77 | 22.89% | * | $ | 192.2 | 0.84% | ** | 0.01% | ** | 0.84% | ** | 33% | * | ||||||||||||||||||||||||||||||||||||
Year Ended December 31, 2018 | $ | 19.93 | (0.03 | ) | 1.07 | 1.04 | $ | 20.97 | 5.22% | $ | 149.3 | 0.87% | -0.15% | 0.87% | 48% | ||||||||||||||||||||||||||||||||||||||||
Year Ended December 31, 2017 | $ | 15.61 | (0.03 | ) | 4.35 | 4.32 | $ | 19.93 | 27.67% | $ | 60.6 | 0.96% | -0.15% | 0.96% | 57% | ||||||||||||||||||||||||||||||||||||||||
Year Ended December 31, 2016 | $ | 15.09 | (0.02 | ) | 0.54 | 0.52 | $ | 15.61 | 3.45% | $ | 49.9 | 0.95% | -0.09% | 0.95% | 63% | ||||||||||||||||||||||||||||||||||||||||
Year Ended December 31, 2015 | $ | 13.70 | (0.01 | ) | 1.40 | 1.39 | $ | 15.09 | 10.15% | $ | 51.4 | 0.93% | -0.10% | 0.93% | 60% | ||||||||||||||||||||||||||||||||||||||||
ON Janus Henderson Venture Portfolio | |||||||||||||||||||||||||||||||||||||||||||||||||||||||
Six-Month Period Ended June 30, 2019+ | $ | 30.89 | (0.11 | ) | 7.57 | 7.46 | $ | 38.35 | 24.15% | * | $ | 171.4 | 0.89% | ** | -0.34% | ** | 0.89% | ** | 8% | * | |||||||||||||||||||||||||||||||||||
Year Ended December 31, 2018 | $ | 32.99 | (0.10 | ) | (2.00 | ) | (2.10 | ) | $ | 30.89 | -6.37% | $ | 207.4 | 0.85% | -0.23% | 0.85% | 33% | ||||||||||||||||||||||||||||||||||||||
Year Ended December 31, 2017 | $ | 26.61 | (0.06 | ) | 6.44 | 6.38 | $ | 32.99 | 23.98% | $ | 276.2 | 0.85% | -0.19% | 0.85% | 26% | ||||||||||||||||||||||||||||||||||||||||
Year Ended December 31, 2016 | $ | 25.01 | 0.01 | 1.59 | 1.60 | $ | 26.61 | 6.40% | $ | 232.3 | 0.86% | 0.04% | 0.86% | 25% | |||||||||||||||||||||||||||||||||||||||||
Year Ended December 31, 2015 | $ | 25.07 | (0.03 | ) | (0.03 | ) | (0.06 | ) | $ | 25.01 | -0.24% | (b) | $ | 238.2 | 0.85% | -0.12% | 0.85% | 37% | |||||||||||||||||||||||||||||||||||||
| + | Unaudited |
| * | Not annualized |
| ** | Annualized |
| (a) | Effective May 1, 2017, thesub-adviser to the ON International Equity Portfolio changed from Federated Global Investment Management Corp. to Lazard Asset Management LLC, and thesub-adviser to the ON Foreign Portfolio changed from Federated Global Investment Management Corp. to Templeton Global Advisors Limited. Costs of purchases and proceeds from sales of portfolio securities associated with the changes in thesub-advisers contributed to higher portfolio turnover rates for the year ended December 31, 2017 as compared to prior years. |
| (b) | Initial Public Offering (IPO) investments had a significant impact on the total return in this period and such performance may be difficult to repeat. |
| # | Performance does not include fees and expenses imposed by a variable annuity contract. Had those fees and expenses been included, performance would have been lower than the returns presented. |
The accompanying notes are an integral part of these financial statements.
151 | ||||
| Ohio National Fund, Inc. |
Financial Highlights |
| Selectedper-share data | Ratios and supplemental data | |||||||||||||||||||||||||||||||||||||||||||||||||||||||||||
Operations | Distributions | Ratios to average net assets | ||||||||||||||||||||||||||||||||||||||||||||||||||||||||||
Ratios net of expenses | Ratios assuming no expenses reduced or reimbursed by adviser | |||||||||||||||||||||||||||||||||||||||||||||||||||||||||||
Net asset value, beginning of year or period | Net investment income (loss) | Net realized and unrealized gain on investments, futures contracts, and foreign currency related transactions | Total from operations | Distributions from net investment | Net asset value, period | Total Return# | Net assets at end of year or period (in millions) | Expenses | Net investment income (loss) | Expenses | Portfolio turnover rate | |||||||||||||||||||||||||||||||||||||||||||||||||
ON Janus Henderson Enterprise Portfolio | ||||||||||||||||||||||||||||||||||||||||||||||||||||||||||||
Six-Month Period Ended June 30, 2019+ | $ | 37.36 | 0.04 | 10.01 | 10.05 | — | $ | 47.41 | 26.90 | %* | $ | 108.9 | 0.97 | %** | 0.17 | %** | 0.97 | %** | 5 | %* | ||||||||||||||||||||||||||||||||||||||||
Year Ended December 31, 2018 | $ | 38.60 | 0.02 | (1.26 | ) | (1.24 | ) | — | $ | 37.36 | -3.21 | % | $ | 102.6 | 0.96 | % | 0.06 | % | 0.96 | % | 103 | %(a) | ||||||||||||||||||||||||||||||||||||||
Year Ended December 31, 2017 | $ | 30.37 | (0.09 | ) | 8.32 | 8.23 | — | $ | 38.60 | 27.10 | % | $ | 77.8 | 0.98 | % | -0.24 | % | 0.98 | % | 57 | % | |||||||||||||||||||||||||||||||||||||||
Year Ended December 31, 2016 | $ | 29.90 | (0.09 | ) | 0.56 | 0.47 | — | $ | 30.37 | 1.57 | % | $ | 70.2 | 0.98 | % | -0.29 | % | 0.98 | % | 61 | % | |||||||||||||||||||||||||||||||||||||||
Year Ended December 31, 2015 | $ | 31.49 | (0.07 | ) | (1.52 | ) | (1.59 | ) | — | $ | 29.90 | -5.05 | %(b) | $ | 78.7 | 0.94 | % | -0.21 | % | 0.94 | % | 59 | % | |||||||||||||||||||||||||||||||||||||
ON S&P 500®Index Portfolio | ||||||||||||||||||||||||||||||||||||||||||||||||||||||||||||
Six-Month Period Ended June 30, 2019+ | $ | 28.11 | 0.28 | 4.86 | 5.14 | — | $ | 33.25 | 18.29 | %* | $ | 1,167.6 | 0.40 | %** | 1.67 | %** | 0.40 | %** | 4 | %* | ||||||||||||||||||||||||||||||||||||||||
Year Ended December 31, 2018 | $ | 29.52 | 0.48 | (1.89 | ) | (1.41 | ) | — | $ | 28.11 | -4.78 | % | $ | 1,111.5 | 0.38 | % | 1.58 | % | 0.38 | % | 18 | % | ||||||||||||||||||||||||||||||||||||||
Year Ended December 31, 2017 | $ | 24.32 | 0.37 | 4.83 | 5.20 | — | $ | 29.52 | 21.38 | % | $ | 1,144.2 | 0.38 | % | 1.65 | % | 0.38 | % | 8 | % | ||||||||||||||||||||||||||||||||||||||||
Year Ended December 31, 2016 | $ | 21.82 | 0.25 | 2.25 | 2.50 | — | $ | 24.32 | 11.46 | % | $ | 842.6 | 0.42 | % | 1.84 | % | 0.42 | % | 8 | % | ||||||||||||||||||||||||||||||||||||||||
Year Ended December 31, 2015 | $ | 21.93 | 0.37 | (0.17 | ) | 0.20 | (0.31 | ) | $ | 21.82 | 0.91 | % | $ | 410.7 | 0.41 | % | 1.72 | % | 0.41 | % | 14 | % | ||||||||||||||||||||||||||||||||||||||
ON Federated Strategic Value Dividend Portfolio | ||||||||||||||||||||||||||||||||||||||||||||||||||||||||||||
Six-Month Period Ended June 30, 2019+ | $ | 16.37 | 0.37 | 1.32 | 1.69 | — | $ | 18.06 | 10.32 | %* | $ | 318.6 | 0.78 | %** | 4.10 | %** | 0.78 | %** | 11 | %* | ||||||||||||||||||||||||||||||||||||||||
Year Ended December 31, 2018 | $ | 17.88 | 0.87 | (2.38 | ) | (1.51 | ) | — | $ | 16.37 | -8.45 | % | $ | 321.8 | 0.76 | % | 3.88 | % | 0.76 | % | 18 | % | ||||||||||||||||||||||||||||||||||||||
Year Ended December 31, 2017 | $ | 15.60 | 0.59 | 1.69 | 2.28 | — | $ | 17.88 | 14.62 | % | $ | 596.7 | 0.75 | % | 3.77 | % | 0.75 | % | 27 | % | ||||||||||||||||||||||||||||||||||||||||
Year Ended December 31, 2016 | $ | 14.07 | 0.36 | 1.17 | 1.53 | — | $ | 15.60 | 10.87 | % | $ | 475.5 | 0.78 | % | 3.19 | % | 0.78 | % | 32 | % | ||||||||||||||||||||||||||||||||||||||||
Year Ended December 31, 2015 | $ | 13.92 | 0.53 | 0.06 | 0.59 | (0.44 | ) | $ | 14.07 | 4.26 | % | $ | 309.8 | 0.78 | % | 3.47 | % | 0.78 | % | 13 | % | |||||||||||||||||||||||||||||||||||||||
ON Federated High Income Bond Portfolio | ||||||||||||||||||||||||||||||||||||||||||||||||||||||||||||
Six-Month Period Ended June 30, 2019+ | $ | 18.73 | 0.57 | 1.38 | 1.95 | — | $ | 20.68 | 10.41 | %* | $ | 201.6 | 0.80 | %** | 5.57 | %** | 0.80 | %** | 10 | %* | ||||||||||||||||||||||||||||||||||||||||
Year Ended December 31, 2018 | $ | 19.36 | 1.41 | (2.04 | ) | (0.63 | ) | — | $ | 18.73 | -3.25 | % | $ | 202.1 | 0.75 | % | 5.39 | % | 0.75 | % | 14 | % | ||||||||||||||||||||||||||||||||||||||
Year Ended December 31, 2017 | $ | 18.10 | 1.04 | 0.22 | 1.26 | — | $ | 19.36 | 6.96 | % | $ | 319.1 | 0.74 | % | 5.21 | % | 0.74 | % | 30 | % | ||||||||||||||||||||||||||||||||||||||||
Year Ended December 31, 2016 | $ | 15.82 | 0.43 | 1.85 | 2.28 | — | $ | 18.10 | 14.41 | % | $ | 313.8 | 0.80 | % | 5.56 | % | 0.80 | % | 30 | % | ||||||||||||||||||||||||||||||||||||||||
Year Ended December 31, 2015 | $ | 16.32 | 1.18 | (1.68 | ) | (0.50 | ) | — | $ | 15.82 | -3.06 | % | $ | 194.2 | 0.80 | % | 5.65 | % | 0.80 | % | 29 | % | ||||||||||||||||||||||||||||||||||||||
| + | Unaudited |
| * | Not annualized |
| ** | Annualized |
| (a) | Effective May 1, 2018, thesub-adviser changed from Goldman Sachs Asset Management, L.P.to Janus Capital Management LLC. Costs of purchases and proceeds from sales of portfolio securities associated with the change in thesub-adviser contributed to a higher portfolio turnover rate for the year ended December 31, 2018 as compared to prior years. |
| (b) | Initial Public Offering (IPO) investments had a significant impact on the total return in this period and such performance may be difficult to repeat. |
| # | Performance does not include fees and expenses imposed by a variable annuity contract. Had those fees and expenses been included, performance would have been lower than the returns presented. |
The accompanying notes are an integral part of these financial statements.
152 | ||||
| Ohio National Fund, Inc. |
Financial Highlights |
| Selectedper-share data | Ratios and supplemental data | |||||||||||||||||||||||||||||||||||||||||||||||||||||||||||
Operations | Distributions | Ratios to average net assets | ||||||||||||||||||||||||||||||||||||||||||||||||||||||||||
Ratios net of expenses | Ratios assuming no expenses reduced or reimbursed by adviser | |||||||||||||||||||||||||||||||||||||||||||||||||||||||||||
Net asset value, beginning of year or period | Net investment income (loss) | Net realized and unrealized gain on investments and futures contracts | Total from operations | Distributions from net investment income | Net asset value, end of year or period | Total Return# | Net assets at end of year or period (in millions) | Expenses | Net investment income (loss) | Expenses | Portfolio turnover rate | |||||||||||||||||||||||||||||||||||||||||||||||||
ON ClearBridge Small Cap Portfolio | ||||||||||||||||||||||||||||||||||||||||||||||||||||||||||||
Six-Month Period Ended June 30, 2019+ | $ | 52.15 | 0.13 | 10.64 | 10.77 | — | $ | 62.92 | 20.65 | %* | $ | 123.6 | 0.94 | %** | 0.40 | %** | 0.94 | %** | 16 | %* | ||||||||||||||||||||||||||||||||||||||||
Year Ended December 31, 2018 | $ | 57.46 | 0.19 | (5.50 | ) | (5.31 | ) | — | $ | 52.15 | -9.24 | % | $ | 126.2 | 0.90 | % | 0.19 | % | 0.90 | % | 41 | % | ||||||||||||||||||||||||||||||||||||||
Year Ended December 31, 2017 | $ | 51.21 | 0.20 | 6.05 | 6.25 | — | $ | 57.46 | 12.20 | % | $ | 275.1 | 0.89 | % | 0.30 | % | 0.89 | % | 46 | % | ||||||||||||||||||||||||||||||||||||||||
Year Ended December 31, 2016 | $ | 40.00 | 0.22 | 10.99 | 11.21 | — | $ | 51.21 | 28.03 | % | $ | 275.7 | 0.93 | % | 0.92 | % | 0.93 | % | 51 | % | ||||||||||||||||||||||||||||||||||||||||
Year Ended December 31, 2015 | $ | 41.01 | (0.10 | ) | (0.91 | ) | (1.01 | ) | — | $ | 40.00 | -2.46 | % | $ | 94.0 | 1.01 | % | -0.29 | % | 1.01 | % | 126 | %(a) | |||||||||||||||||||||||||||||||||||||
ONNasdaq-100®Index Portfolio | ||||||||||||||||||||||||||||||||||||||||||||||||||||||||||||
Six-Month Period Ended June 30, 2019+ | $ | 16.60 | 0.07 | 3.52 | 3.59 | — | $ | 20.19 | 21.63 | %* | $ | 338.4 | 0.43 | %** | 0.67 | %** | 0.43 | %** | 2 | %* | ||||||||||||||||||||||||||||||||||||||||
Year Ended December 31, 2018 | $ | 16.67 | 0.12 | (0.19 | ) | (0.07 | ) | — | $ | 16.60 | -0.42 | % | $ | 327.6 | 0.41 | % | 0.67 | % | 0.41 | % | 22 | % | ||||||||||||||||||||||||||||||||||||||
Year Ended December 31, 2017 | $ | 12.59 | 0.07 | 4.01 | 4.08 | — | $ | 16.67 | 32.41 | % | $ | 257.2 | 0.45 | % | 0.71 | % | 0.45 | % | 9 | % | ||||||||||||||||||||||||||||||||||||||||
Year Ended December 31, 2016 | $ | 11.80 | 0.09 | 0.70 | 0.79 | — | $ | 12.59 | 6.69 | % | $ | 156.1 | 0.48 | % | 0.84 | % | 0.48 | % | 13 | % | ||||||||||||||||||||||||||||||||||||||||
Year Ended December 31, 2015 | $ | 10.88 | 0.09 | 0.91 | 1.00 | (0.08 | ) | $ | 11.80 | 9.14 | % | $ | 138.6 | 0.46 | % | 0.79 | % | 0.46 | % | 19 | % | |||||||||||||||||||||||||||||||||||||||
ON BlackRock Advantage Large Cap Core Portfolio | ||||||||||||||||||||||||||||||||||||||||||||||||||||||||||||
Six-Month Period Ended June 30, 2019+ | $ | 24.79 | 0.21 | 5.49 | 5.70 | — | $ | 30.49 | 22.99 | %* | $ | 100.3 | 0.78 | %** | 1.19 | %** | 0.78 | %** | 142 | %*,(b) | ||||||||||||||||||||||||||||||||||||||||
Year Ended December 31, 2018 | $ | 30.22 | 0.20 | (5.63 | ) | (5.43 | ) | — | $ | 24.79 | -17.97 | % | $ | 155.3 | 0.82 | % | 0.63 | % | 0.82 | % | 272 | % | ||||||||||||||||||||||||||||||||||||||
Year Ended December 31, 2017 | $ | 24.02 | 0.16 | 6.04 | 6.20 | — | $ | 30.22 | 25.81 | % | $ | 223.7 | 0.82 | % | 0.47 | % | 0.82 | % | 220 | % | ||||||||||||||||||||||||||||||||||||||||
Year Ended December 31, 2016 | $ | 21.49 | 0.12 | 2.41 | 2.53 | — | $ | 24.02 | 11.77 | % | $ | 207.9 | 0.83 | % | 0.49 | % | 0.83 | % | 223 | % | ||||||||||||||||||||||||||||||||||||||||
Year Ended December 31, 2015 | $ | 20.75 | 0.12 | 0.73 | 0.85 | (0.11 | ) | $ | 21.49 | 4.08 | % | $ | 218.7 | 0.81 | % | 0.55 | % | 0.81 | % | 228 | % | |||||||||||||||||||||||||||||||||||||||
ON BlackRock Advantage Small Cap Growth Portfolio | ||||||||||||||||||||||||||||||||||||||||||||||||||||||||||||
Six-Month Period Ended June 30, 2019+ | $ | 23.62 | 0.01 | 5.41 | 5.42 | — | $ | 29.04 | 22.95 | %* | $ | 84.7 | 0.97 | %** | 0.05 | %** | 0.97 | %** | 91 | %*,(b) | ||||||||||||||||||||||||||||||||||||||||
Year Ended December 31, 2018 | $ | 24.91 | (0.26 | ) | (1.03 | ) | (1.29 | ) | — | $ | 23.62 | -5.18 | % | $ | 25.5 | 1.05 | % | -0.55 | % | 1.05 | % | 201 | % | |||||||||||||||||||||||||||||||||||||
Year Ended December 31, 2017 | $ | 20.49 | (0.21 | ) | 4.63 | 4.42 | — | $ | 24.91 | 21.57 | % | $ | 56.8 | 0.98 | % | -0.55 | % | 0.98 | % | 196 | % | |||||||||||||||||||||||||||||||||||||||
Year Ended December 31, 2016 | $ | 19.60 | (0.19 | ) | 1.08 | 0.89 | — | $ | 20.49 | 4.54 | % | $ | 94.6 | 0.92 | % | -0.62 | % | 0.92 | % | 188 | % | |||||||||||||||||||||||||||||||||||||||
Year Ended December 31, 2015 | $ | 20.47 | (0.11 | ) | (0.76 | ) | (0.87 | ) | — | $ | 19.60 | -4.25 | % | $ | 162.2 | 0.88 | % | -0.53 | % | 0.88 | % | 169 | % | |||||||||||||||||||||||||||||||||||||
| + | Unaudited |
| * | Not annualized |
| ** | Annualized |
| (a) | Effective September 25, 2015, thesub-adviser changed from Eagle Asset Management, Inc. to ClearBridge Investments, LLC. Costs of purchases and proceeds from sales of portfolio securities associated with the change in thesub-adviser contributed to a higher portfolio turnover rate for the year ended December 31, 2015 as compared to prior years. |
| (b) | Effective February 1, 2019, thesub-adviser to the ON BlackRock Advantage Large Cap Core Portfolio and ON BlackRock Advantage Small Cap Growth Portfolio changed from Suffolk Capital Management, LLC to BlackRock Investment Management, LLC. Costs of purchases and proceeds from sales of portfolio securities associated with the changes in thesub-adviser contributed to higher portfolio turnover rates for thesix-month period ended June 30, 2019 as compared to prior periods. |
| # | Performance does not include fees and expenses imposed by a variable annuity contract. Had those fees and expenses been included, performance would have been lower than the returns presented. |
The accompanying notes are an integral part of these financial statements.
153 | ||||
| Ohio National Fund, Inc. |
Financial Highlights |
| Selectedper-share data | Ratios and supplemental data | |||||||||||||||||||||||||||||||||||||||||||||||||||||||||||
Operations | Distributions | Ratios to average net assets | ||||||||||||||||||||||||||||||||||||||||||||||||||||||||||
Net realized and unrealized gain on investments, futures contracts, foreign currency related | Ratios net of expenses reduced or reimbursed by adviser | Ratios assuming no expenses reduced or reimbursed by adviser | ||||||||||||||||||||||||||||||||||||||||||||||||||||||||||
Net asset value, beginning of year | Net investment income | transactions, written options, and capital distributions received from underlying mutual funds | Total from operations | Distributions from net investment income | Net asset value, end of year or period | Total Return# | Net assets at end of year or period (in millions) | Expenses | Net investment income | Expenses | Portfolio turnover rate | |||||||||||||||||||||||||||||||||||||||||||||||||
ON ICON Balanced Portfolio | ||||||||||||||||||||||||||||||||||||||||||||||||||||||||||||
Six-Month Period Ended June 30, 2019+ | $ | 19.70 | 0.20 | 2.67 | 2.87 | — | $ | 22.57 | 14.57 | %* | $ | 486.4 | 0.67 | %** | 1.75 | %** | 0.67 | %** | 51 | %* | ||||||||||||||||||||||||||||||||||||||||
Year Ended December 31, 2018 | $ | 22.03 | 0.49 | (2.82 | ) | (2.33 | ) | — | $ | 19.70 | -10.58 | % | $ | 466.7 | 0.64 | % | 1.58 | % | 0.64 | % | 47 | % | ||||||||||||||||||||||||||||||||||||||
Year Ended December 31, 2017 | $ | 19.86 | 0.47 | 1.70 | 2.17 | — | $ | 22.03 | 10.93 | % | $ | 955.1 | 0.62 | % | 1.93 | % | 0.62 | % | 106 | % | ||||||||||||||||||||||||||||||||||||||||
Year Ended December 31, 2016 | $ | 18.99 | 0.39 | 0.48 | 0.87 | — | $ | 19.86 | 4.58 | % | $ | 952.1 | 0.64 | % | 2.05 | % | 0.64 | % | 99 | % | ||||||||||||||||||||||||||||||||||||||||
Year Ended December 31, 2015 | $ | 18.96 | 0.30 | (0.02 | ) | 0.28 | (0.25 | ) | $ | 18.99 | 1.47 | % | $ | 864.9 | 0.64 | % | 1.58 | % | 0.64 | % | 92 | % | ||||||||||||||||||||||||||||||||||||||
ON S&P MidCap 400®Index Portfolio | ||||||||||||||||||||||||||||||||||||||||||||||||||||||||||||
Six-Month Period Ended June 30, 2019+ | $ | 15.46 | 0.11 | 2.62 | 2.73 | — | $ | 18.19 | 17.66 | %* | $ | 313.7 | 0.47 | %** | 1.26 | %** | 0.47 | %** | 8 | %* | ||||||||||||||||||||||||||||||||||||||||
Year Ended December 31, 2018 | $ | 17.46 | 0.10 | (2.10 | ) | (2.00 | ) | — | $ | 15.46 | -11.45 | % | $ | 306.6 | 0.51 | % | 1.32 | % | 0.51 | % | 28 | % | ||||||||||||||||||||||||||||||||||||||
Year Ended December 31, 2017 | $ | 15.12 | 0.04 | 2.30 | 2.34 | — | $ | 17.46 | 15.48 | % | $ | 88.8 | 0.71 | % | 0.92 | % | 0.71 | % | 41 | % | ||||||||||||||||||||||||||||||||||||||||
Year Ended December 31, 2016 | $ | 13.81 | 0.17 | 1.14 | 1.31 | — | $ | 15.12 | 9.49 | % | $ | 47.9 | 0.79 | % | 1.24 | % | 0.79 | % | 179 | %(a) | ||||||||||||||||||||||||||||||||||||||||
Year Ended December 31, 2015 | $ | 14.49 | 0.25 | (0.72 | ) | (0.47 | ) | (0.21 | ) | $ | 13.81 | -3.24 | % | $ | 46.3 | 0.77 | % | 1.54 | % | 0.77 | % | 72 | % | |||||||||||||||||||||||||||||||||||||
ON BlackRock Advantage Large Cap Growth Portfolio | ||||||||||||||||||||||||||||||||||||||||||||||||||||||||||||
Six-Month Period Ended June 30, 2019+ | $ | 20.59 | 0.08 | 5.25 | 5.33 | — | $ | 25.92 | 25.89 | %* | $ | 112.0 | 0.81 | %** | 0.69 | %** | 0.81 | %** | 152 | %*,(b) | ||||||||||||||||||||||||||||||||||||||||
Year Ended December 31, 2018 | $ | 24.19 | 0.12 | (3.72 | ) | (3.60 | ) | — | $ | 20.59 | -14.88 | % | $ | 87.5 | 0.88 | % | 0.43 | % | 0.88 | % | 269 | % | ||||||||||||||||||||||||||||||||||||||
Year Ended December 31, 2017 | $ | 18.65 | 0.07 | 5.47 | 5.54 | — | $ | 24.19 | 29.71 | % | $ | 128.0 | 0.88 | % | 0.24 | % | 0.88 | % | 218 | % | ||||||||||||||||||||||||||||||||||||||||
Year Ended December 31, 2016 | $ | 17.31 | 0.07 | 1.27 | 1.34 | — | $ | 18.65 | 7.74 | % | $ | 117.6 | 0.89 | % | 0.36 | % | 0.89 | % | 162 | % | ||||||||||||||||||||||||||||||||||||||||
Year Ended December 31, 2015 | $ | 16.44 | 0.08 | 0.86 | 0.94 | (0.07 | ) | $ | 17.31 | 5.72 | % | $ | 116.2 | 0.86 | % | 0.43 | % | 0.86 | % | 168 | % | |||||||||||||||||||||||||||||||||||||||
ON Risk Managed Balanced Portfolio | ||||||||||||||||||||||||||||||||||||||||||||||||||||||||||||
Six-Month Period Ended June 30, 2019+ | $ | 12.91 | 0.11 | 1.81 | 1.92 | — | $ | 14.83 | 14.87 | %* | $ | 386.3 | 1.00 | %** | 1.52 | %** | 1.00 | %** | 50 | %*,(c) | ||||||||||||||||||||||||||||||||||||||||
Year Ended December 31, 2018 | $ | 13.01 | 0.17 | (0.27 | ) | (0.10 | ) | — | $ | 12.91 | -0.77 | % | $ | 347.1 | 0.99 | % | 1.27 | % | 0.99 | % | 131 | %(c) | ||||||||||||||||||||||||||||||||||||||
Year Ended December 31, 2017 | $ | 11.06 | 0.14 | 1.81 | 1.95 | — | $ | 13.01 | 17.63 | % | $ | 344.2 | 1.00 | % | 1.22 | % | 1.00 | % | 72 | %(c) | ||||||||||||||||||||||||||||||||||||||||
Year Ended December 31, 2016 | $ | 10.66 | 0.09 | 0.31 | 0.40 | — | $ | 11.06 | 3.75 | % | $ | 272.1 | 1.03 | % | 1.09 | % | 1.03 | % | 78 | % | ||||||||||||||||||||||||||||||||||||||||
Year Ended December 31, 2015 | $ | 10.83 | 0.03 | (0.17 | ) | (0.14 | ) | (0.03 | ) | $ | 10.66 | -1.32 | % | $ | 154.3 | 1.11 | % | 0.81 | % | 1.11 | % | 71 | % | |||||||||||||||||||||||||||||||||||||
| + | Unaudited |
| * | Not annualized |
| ** | Annualized |
| (a) | Effective December 16, 2016, thesub-adviser to the Portfolio changed from First Trust Advisors L.P. to Geode Capital Management, LLC. Costs of purchases and proceeds from sales of portfolio securities associated with the change in thesub-adviser contributed to a higher portfolio turnover rate for the year ended December 31, 2016 as compared to prior years. |
| (b) | Effective February 1, 2019, thesub-adviser to the ON BlackRock Advantage Large Cap Growth Portfolio changed from Suffolk Capital Management, LLC to BlackRock Investment Management, LLC. Costs of purchases and proceeds from sales of portfolio securities associated with the changes in thesub-adviser contributed to a higher portfolio turnover rate for thesix-month period ended June 30, 2019 as compared to prior periods. |
| (c) | The portfolio turnover calculation includes purchases and sales from mortgage dollar roll transactions. Without the effect of mortgage dollar roll transactions, the portfolio turnover rate would have been 42% for thesix-month period ended June 30, 2019, 102% for the year ended December 31, 2018, and 63% for the year ended December 31, 2017 (see Note 2 of the Notes to Financial Statements). |
| # | Performance does not include fees and expenses imposed by a variable annuity contract. Had those fees and expenses been included, performance would have been lower than the returns presented. |
The accompanying notes are an integral part of these financial statements.
154 | ||||
| Ohio National Fund, Inc. |
Financial Highlights |
| Selectedper-share data | Ratios and supplemental data | ||||||||||||||||||||||||||||||||||||||||||||||||||||||
Operations | Ratios to average net assets | ||||||||||||||||||||||||||||||||||||||||||||||||||||||
Ratios net of expenses reduced | Ratios assuming no expenses reduced or reimbursed by adviser | ||||||||||||||||||||||||||||||||||||||||||||||||||||||
Net asset value, beginning of year or period | Net investment income (loss) | Net realized and unrealized gain on investments and capital gain distributions received from underlying mutual funds | Total from operations | Net asset value, end of year or period | Total Return# | Net assets at end of year or period (in millions) | Expenses† | Net investment income (loss)† | Expenses† | Portfolio turnover rate | |||||||||||||||||||||||||||||||||||||||||||||
ON Conservative Model Portfolio | |||||||||||||||||||||||||||||||||||||||||||||||||||||||
Six-Month Period Ended June 30, 2019+ | $ | 10.21 | 0.11 | 0.80 | 0.91 | $ | 11.12 | 8.91 | %* | $ | 76.8 | 0.24 | %** | 1.98 | %** | 0.57 | %** | 11 | %* | ||||||||||||||||||||||||||||||||||||
Year Ended December 31, 2018 | $ | 10.53 | 0.20 | (0.52 | ) | (0.32 | ) | $ | 10.21 | -3.04 | % | $ | 79.0 | 0.27 | % | 1.70 | % | 0.52 | % | 35 | % | ||||||||||||||||||||||||||||||||||
Period From March 1, 2017 (inception) to December 31, 2017 | $ | 10.00 | 0.16 | 0.37 | 0.53 | $ | 10.53 | 5.30 | %* | $ | 99.7 | 0.25 | %** | 1.71 | %** | 0.51 | %** | 29 | %* | ||||||||||||||||||||||||||||||||||||
ON Moderately Conservative Model Portfolio | |||||||||||||||||||||||||||||||||||||||||||||||||||||||
Six-Month Period Ended June 30, 2019+ | $ | 10.09 | 0.08 | 1.04 | 1.12 | $ | 11.21 | 11.10 | %* | $ | 227.2 | 0.32 | %** | 1.39 | %** | 0.47 | %** | 7 | %* | ||||||||||||||||||||||||||||||||||||
Year Ended December 31, 2018 | $ | 10.69 | 0.15 | (0.75 | ) | (0.60 | ) | $ | 10.09 | -5.61 | % | $ | 237.2 | 0.28 | % | 1.26 | % | 0.45 | % | 38 | % | ||||||||||||||||||||||||||||||||||
Period From March 1, 2017 (inception) to December 31, 2017 | $ | 10.00 | 0.13 | 0.56 | 0.69 | $ | 10.69 | 6.90 | %* | $ | 326.0 | 0.25 | %** | 1.40 | %** | 0.45 | %** | 22 | %* | ||||||||||||||||||||||||||||||||||||
ON Balanced Model Portfolio | |||||||||||||||||||||||||||||||||||||||||||||||||||||||
Six-Month Period Ended June 30, 2019+ | $ | 9.97 | 0.05 | 1.22 | 1.27 | $ | 11.24 | 12.74 | %* | $ | 1,116.8 | 0.35 | %** | 0.84 | %** | 0.43 | %** | 10 | %* | ||||||||||||||||||||||||||||||||||||
Year Ended December 31, 2018 | $ | 10.81 | 0.09 | (0.93 | ) | (0.84 | ) | $ | 9.97 | -7.77 | % | $ | 1,146.9 | 0.31 | % | 0.77 | % | 0.42 | % | 37 | % | ||||||||||||||||||||||||||||||||||
Period From March 1, 2017 (inception) to December 31, 2017 | $ | 10.00 | 0.09 | 0.72 | 0.81 | $ | 10.81 | 8.10 | %* | $ | 1,562.6 | 0.25 | %** | 1.01 | %** | 0.42 | %** | 25 | %* | ||||||||||||||||||||||||||||||||||||
ON Moderate Growth Model Portfolio | |||||||||||||||||||||||||||||||||||||||||||||||||||||||
Six-Month Period Ended June 30, 2019+ | $ | 9.93 | 0.02 | 1.52 | 1.54 | $ | 11.47 | 15.51 | %* | $ | 1,944.9 | 0.42 | %** | 0.29 | %** | 0.42 | %** | 9 | %* | ||||||||||||||||||||||||||||||||||||
Year Ended December 31, 2018 | $ | 11.05 | 0.05 | (1.17 | ) | (1.12 | ) | $ | 9.93 | -10.14 | % | $ | 1,945.0 | 0.35 | % | 0.42 | % | 0.42 | % | 49 | % | ||||||||||||||||||||||||||||||||||
Period From March 1, 2017 (inception) to December 31, 2017 | $ | 10.00 | 0.07 | 0.98 | 1.05 | $ | 11.05 | 10.50 | %* | $ | 2,646.8 | 0.26 | %** | 0.80 | %** | 0.42 | %** | 23 | %* | ||||||||||||||||||||||||||||||||||||
ON Growth Model Portfolio | |||||||||||||||||||||||||||||||||||||||||||||||||||||||
Six-Month Period Ended June 30, 2019+ | $ | 9.86 | (0.01 | ) | 1.71 | 1.70 | $ | 11.56 | 17.24 | %* | $ | 431.3 | 0.44 | %** | -0.12 | %** | 0.44 | %** | 7 | %* | |||||||||||||||||||||||||||||||||||
Year Ended December 31, 2018 | $ | 11.15 | 0.02 | (1.31 | ) | (1.29 | ) | $ | 9.86 | -11.57 | % | $ | 424.2 | 0.31 | % | 0.17 | % | 0.43 | % | 62 | % | ||||||||||||||||||||||||||||||||||
Period From March 1, 2017 (inception) to December 31, 2017 | $ | 10.00 | 0.05 | 1.10 | 1.15 | $ | 11.15 | 11.50 | %* | $ | 543.8 | 0.25 | %** | 0.51 | %** | 0.43 | %** | 24 | %* | ||||||||||||||||||||||||||||||||||||
| + | Unaudited |
| * | Not annualized |
| ** | Annualized |
| # | Performance does not include fees and expenses imposed by a variable annuity contract. Had those fees and expenses been included, performance would have been lower than the returns presented. |
| † | Ratios presented only reflect the direct income and expenses for the Portfolio, and do not include the indirect expenses related to the underlying funds in which the Portfolio invests. |
The accompanying notes are an integral part of these financial statements.
155 | ||||
| Ohio National Fund, Inc. |
June 30, 2019 (Unaudited) | ||
| (1) | Organization |
Ohio National Fund, Inc. (the “Fund”) is a Maryland corporation registered under the Investment Company Act of 1940, as amended (the “40 Act”). The Fund is anopen-end investment company and follows accounting and reporting guidance under Financial Accounting Standards Board (“FASB”) Accounting Standards Codification (“ASC”) Topic 946, “Financial Services-Investment Companies”. The Fund consists of twenty-five separate investment portfolios (the “Portfolios”) that seek the following objectives and strategies:
| ∎ | ON Equity Portfolio – Long-term growth of capital by investing, under normal circumstances, at least 80% of its net assets in common stocks of the 1,000 largest publicly traded U.S. companies in terms of market capitalization. |
| ∎ | ON Bond Portfolio – High level of income and opportunity for capital appreciation consistent with preservation of capital by investing, under normal circumstances, at least 80% of its net assets in corporate debt securities. |
| ∎ | ON BlackRock Balanced Allocation Portfolio – High level of long-term total return consistent with preservation of capital by investing in stocks, bonds, and money market instruments. |
| ∎ | ON Capital Appreciation Portfolio –Long-term growth of capital by investing primarily in equity and equity related securities of established companies with either current or emerging earnings growth not fully appreciated or recognized by the market. |
| ∎ | ON International Equity Portfolio – Long-term growth of capital by investing, under normal circumstances, at least 80% of its net assets in equity securities of foreign companies. |
| ∎ | ON Foreign Portfolio –Long-term growth of capital by investing, under normal circumstances, at least 80% of its net assets in foreign securities. |
| ∎ | ON Janus Henderson Forty Portfolio – Long-term capital growth by investing primarily in domestic and foreign equity securities selected for growth potential. |
| ∎ | ON Janus Henderson Venture Portfolio – Long-term capital appreciation by investing, under normal circumstances, at least 80% of its net assets in stocks of small capitalization companies. |
| ∎ | ON Janus Henderson Enterprise Portfolio – Long-term total return by investing, under normal circumstances, at least 50% of its net assets in equity securities ofmid-cap companies, primarily those that are strategically positioned for long-term growth. |
| ∎ | ON S&P 500® Index Portfolio –Total return approximating that of the Standard & Poor’s 500® Index (S&P 500® Index), at a risk level consistent with that of the S&P 500® Index by investing, under normal circumstances, more than 80% of its net assets in securities included in the S&P 500® Index. |
| ∎ | ON Federated Strategic Value Dividend Portfolio – Growth of capital and income by investing primarily in high dividend paying common stocks with dividend growth potential. |
| ∎ | ON Federated High Income Bond Portfolio – High current income by investing, under normal circumstances, at least 80% of its net assets in lower rated corporate debt obligations commonly referred to as “junk bonds”. The Portfolio’s investments are generally rated BB or lower by Standard & Poor’s or Fitch, or Ba or lower by Moody’s. |
| ∎ | ON ClearBridge Small Cap Portfolio – Long-term capital appreciation by investing, under normal circumstances, at least 80% of its net assets in common stocks and other equity securities of small capitalization companies or in other investments that the portfolio managers believe have similar economic characteristics. |
| ∎ | ONNasdaq-100® Index Portfolio – Long-term growth of capital by investing, under normal circumstances, more than 80% of its net assets in the common stocks of companies that are included in theNasdaq-100® Index. |
| ∎ | ON BlackRock Advantage Large Cap Core Portfolio– Long-term growth of capital by investing, under normal circumstances, at least 80% of its net assets in common stocks of the 1,000 largest publicly traded U.S. companies in terms of market capitalization. |
| ∎ | ON BlackRock Advantage Small Cap Growth Portfolio – Long-term growth of capital by investing, under normal circumstances, at least 80% of its net assets in stocks of companies with a market capitalization at the time of investment that is no greater than the largest market capitalization of a company in the Russell 2000 Index for the previous 12 months. |
| ∎ | ON ICON Balanced Portfolio – Capital appreciation and income by investing, under normal circumstances, up to 75% of its assets in equity securities of domestic companies of any market capitalization while maintaining a minimum of 25% of its assets in fixed income securities. |
| 156 | (continued) |
| Ohio National Fund, Inc. |
Notes to Financial Statements (Continued) | June 30, 2019 (Unaudited) | |
| ∎ | ON S&P MidCap 400® Index Portfolio – Total return approximating that of the Standard & Poor’s MidCap 400® Index (S&P MidCap 400® Index), including reinvestment of dividends, at a risk level consistent with that of the S&P MidCap 400® Index by investing, under normal circumstances, more than 80% of its net assets in the securities included in the S&P MidCap 400® Index. |
| ∎ | ON BlackRock Advantage Large Cap Growth Portfolio – Long-term growth of capital by investing, under normal circumstances, at least 80% of its net assets in stocks of companies with market capitalizations at the time of investment that are within the range of market capitalizations of the companies in the Russell 1000 Growth Index for the previous 12 months. |
| ∎ | ON Risk Managed Balanced Portfolio – Long-term capital growth, consistent with preservation of capital and balanced by current income. The Portfolio invests in a balanced portfolio of equity and fixed-income securities and a risk management portfolio intended to enhance the risk adjusted return of the Portfolio. |
| ∎ | ON Conservative Model Portfolio* – Current income and preservation of capital by investing in underlying mutual funds. Under normal circumstances, the Portfolio intends to have investment exposure to various asset classes within the following target asset allocation ranges: U.S. Equity0-25%, International Equity0-10%, and Fixed Income65-90%. |
| ∎ | ON Moderately Conservative Model Portfolio* – Current income and moderate growth of capital with a greater emphasis on current income by investing in underlying mutual funds. Under normal circumstances, the Portfolio intends to have investment exposure to various asset classes within the following target asset allocation ranges: U.S. Equity20-40%, International Equity5-20%, and Fixed Income30-70%. |
| ∎ | ON Balanced Model Portfolio* – A balance between growth of capital and current income with a greater emphasis on growth of capital by investing in underlying mutual funds. Under normal circumstances, the Portfolio intends to have investment exposure to various asset classes within the following target asset allocation ranges: U.S. Equity25-50%, International Equity10-25%, and Fixed Income25-50%. |
| ∎ | ON Moderate Growth Model Portfolio* – Growth of capital and moderate current income with a greater emphasis on growth of capital by investing in underlying mutual funds. Under normal circumstances, the Portfolio intends to have investment exposure to various asset classes within the following target asset allocation ranges: U.S. Equity40-60%, International Equity15-35%, and Fixed Income10-30%. |
| ∎ | ON Growth Model Portfolio* – Growth of capital and some current income by investing in underlying mutual funds. Under normal circumstances, the Portfolio intends to have investment exposure to various asset classes within the following target asset allocation ranges: U.S. Equity50-80%, International Equity15-45%, and Fixed Income0-15%. |
| * | Collectively, the “ON Model Portfolios”. |
The names presented above reflect the current Portfolio names. Effective May 1, 2019, several Portfolios of the Fund underwent name changes. The changes, approved by the Fund’s Board of Directors (the “Board”), are detailed below:
Portfolio Name Prior to May 1, 2019 | Current Portfolio Name | |||
ON Omni Portfolio | ON BlackRock Balanced Allocation Portfolio | |||
ON Bristol Portfolio | ON BlackRock Advantage Large Cap Core Portfolio | |||
ON Bryton Growth Portfolio | ON BlackRock Advantage Small Cap Growth Portfolio | |||
ON Bristol Growth Portfolio | ON BlackRock Advantage Large Cap Growth Portfolio | |||
Additional detail regarding portfolio-specific objectives, policies, and investment strategies is provided in the prospectus and Statement of Additional Information of Ohio National Fund, Inc. There are no assurances that these objectives will be met. Each Portfolio, except the ONNasdaq-100® Index Portfolio, is classified as diversified for purposes of Section 5(b) of the 40 Act.
At present, the Fund issues its shares to separate accounts of The Ohio National Life Insurance Company (“ONLIC”), Ohio National Life Assurance Corporation (“ONLAC”), and National Security Life and Annuity Company (“NSLA”) to support certain benefits under variable contracts issued by those entities, as well as for purchases by other Portfolios of the Fund. In the future, Fund shares may be used for other purposes but, unless there is a change in applicable law, they will not be sold directly to the public.
Effective September 15, 2018 and March 16, 2018, respectively, ONLIC and NSLA no longer market, nor issue, variable annuities. ONLIC and NSLA will continue to service thein-force variable annuity contracts, the variable separate accounts, and underlying subaccounts regardless of new sales.
Interest in each Portfolio is represented by a separate class of the Fund’s capital stock, par value $1. Each share of a Portfolio participates equally in the Portfolio’s dividends, distributions, net assets, and voting matters.
| 157 | (continued) |
| Ohio National Fund, Inc. |
Notes to Financial Statements (Continued) | June 30, 2019 (Unaudited) | |
The Fund is authorized to issue 1.55 billion of its capital shares. These authorized shares have been allocated to specific Portfolios of the Fund as follows:
Portfolio | Authorized Shares | ||||
ON Equity | 35,000,000 | ||||
ON Bond | 30,000,000 | ||||
ON BlackRock Balanced Allocation | 15,000,000 | ||||
ON Capital Appreciation | 25,000,000 | ||||
ON International Equity | 90,000,000 | ||||
ON Foreign | 32,000,000 | ||||
ON Janus Henderson Forty | 24,000,000 | ||||
ON Janus Henderson Venture | 30,000,000 | ||||
ON Janus Henderson Enterprise | 21,000,000 | ||||
ON S&P 500®Index | 90,000,000 | ||||
ON Federated Strategic Value Dividend | 75,000,000 | ||||
ON Federated High Income Bond | 45,000,000 | ||||
ON ClearBridge Small Cap | 15,000,000 | ||||
ONNasdaq-100®Index | 50,000,000 | ||||
Portfolio | Authorized Shares | ||||
ON BlackRock Advantage Large Cap Core | 23,000,000 | ||||
ON BlackRock Advantage Small Cap Growth | 15,000,000 | ||||
ON ICON Balanced | 90,000,000 | ||||
ON S&P MidCap 400® Index | 30,000,000 | ||||
ON BlackRock Advantage Large Cap Growth | 30,000,000 | ||||
ON Risk Managed Balanced | 85,000,000 | ||||
ON Conservative Model | 30,000,000 | ||||
ON Moderately Conservative Model | 70,000,000 | ||||
ON Balanced Model | 200,000,000 | ||||
ON Moderate Growth Model | 300,000,000 | ||||
ON Growth Model | 100,000,000 | ||||
The Board periodically reallocates authorized shares among the Portfolios of the Fund and may authorize additional shares as deemed necessary.
Under the Fund’s organizational documents, its Officers and Directors are indemnified against certain liabilities arising out of the performance of their duties to the Fund. In addition, in the normal course of business, the Fund enters into contracts with its vendors and others that provide for general indemnifications. The Fund’s maximum exposure under these arrangements is unknown as this would involve future claims that may be made against the Fund. However, based on experience, the risk of loss to the Fund is expected to be remote.
| (2) | Significant Accounting Policies |
The following is a summary of significant accounting policies followed by the Fund in preparation of its financial statements:
Use of Estimates
The preparation of financial statements in conformity with U.S. generally accepted accounting principles (“U.S. GAAP”) requires management to make estimates and assumptions that affect the reported amounts of assets and liabilities and disclosure of contingent assets and liabilities at the date of the financial statements and the reported amounts of increases and decreases in net assets from operations during the reporting period. Actual results could differ from those estimates.
Security Valuation
Investments are valued using pricing procedures approved by the Board.
Fixed income instruments that mature in sixty days or less, and of sufficient credit quality, are valued at amortized cost. Amortized cost valuation involves valuing a security at its cost initially and thereafter amortizing to maturity any discounts or premiums on the level-yield method, regardless of the impact of fluctuating market interest rates on the value of the security. In these instances, amortized cost approximates fair value.
Investments, other than those securities aforementioned, are valued as follows:
Domestic equity securities that are traded on U.S. exchanges, other than the Nasdaq Stock Market, are valued at the last trade price reported by the primary exchange of each security (4:00 pm Eastern Time for normal trading sessions). Domestic equity securities that are listed on the Nasdaq Stock Market are valued at the Nasdaq Official Closing Price (“NOCP”).Over-the-counter domestic equity securities are valued at the last trade price reported daily as of 4:00 pm Eastern Time (normal trading sessions).
Over-the-counter traded American Depositary Receipts ( “ADRs”) may also be valued at an evaluated price based on the value of the underlying securities. If a domestic equity security is not traded on a particular day, the mean between the bid and ask prices reported at 4:00 pm Eastern Time (normal trading sessions) by the primary exchange will generally be used for valuation purposes. The principal sources for market quotations are independent pricing services that have been approved by the Board.
| 158 | (continued) |
| Ohio National Fund, Inc. |
Notes to Financial Statements (Continued) | June 30, 2019 (Unaudited) | |
Fixed income securities that have a remaining maturity exceeding sixty days are generally valued at the evaluated bid price reported at 4:00 pm Eastern Time (normal trading sessions), as provided by independent pricing services approved by the Board. Many fixed income securities, including investment grade and high-yield corporate bonds, U.S. Treasury and government agency obligations, bank loans, and other asset-backed instruments are not actively traded on a daily basis. As such, the approved pricing services may use asset type-specific valuation models to provide good faith determinations that the holders of securities would receive in an orderly transaction under current market conditions. The valuation models may use observable market data such as recent transaction data, benchmark yields, broker/dealer inputs, valuations and yields of comparable instruments, relative credit information, observed market movements, and market research and news. Asset-backed securities and mortgage-backed securities may use valuation models that heavily consider predicted cash flows of each tranche of an issue, benchmark spreads, and unique attributes of the tranche. The last trade or last evaluated bid may be used if an evaluated bid price is not available.
U.S exchange-traded options are valued at the composite basis last sale price as reported to a Board-approved independent pricing service by the OPRA (Options Price Reporting Authority) at 4:15 pm Eastern Time (normal trading sessions). If there are no reported trades for a trading session, the evaluated composite-basis bid price will generally be used for valuation purposes.
Futures contracts are valued at the daily quoted settlement prices as reported by an approved independent pricing source.
Shares ofopen-end mutual funds are valued at each fund’s last calculated net asset value per share.
Shares ofclosed-end mutual funds that are traded on U.S. exchanges are valued similarly to other domestic equity securities, typically at the last trade price reported by the primary exchange of each fund (4:00 pm Eastern Time for normal trading sessions).
Foreign equity securities are initially priced at the reported close price of the exchange on which a security is primarily traded. Securities not traded on a particular day are valued at the mean between the last reported bid and ask quotes at daily close, or the last sale price when appropriate. The principal sources for market quotations are independent pricing services that have been approved by the Board.
Equity securities that are primarily traded on foreign exchanges, other than those with close times that are consistent with the normal 4:00 pm Eastern Time close of U.S. equity markets, are further subjected to fair valuation pricing procedures provided by an independent fair valuation service. The service provides data that can be used to estimate the price of a foreign issue that would prevail in a liquid market given market information available daily at 4:00 pm Eastern Time (normal trading sessions). Multiple factors may be considered in performing this valuation, including an issue’s local close price, relevant general and sector indices, currency fluctuations, and pricing of related depository receipts, exchange traded funds, and futures. The pricing procedures are performed for each individual security for which there is a fairly large degree of certainty that the local close price is not the liquid market price at the time of U.S. market close. The procedures are performed each day there is a change in a consistently used market index from the time of local close to the U.S. market close. Backtesting analysis is performed on a quarterly basis to monitor the effectiveness of these procedures. The testing is reviewed by management of the Fund as well as the Board. Prior results have indicated that these procedures have been effective in reaching valuation objectives.
Restricted securities, illiquid securities, or other investments for which market quotations or other observable market inputs are not readily available are valued at an estimate of value using methods determined in good faith by the Fund’s Pricing Committee under the supervision of the Board.
The differences between the aggregate cost and values of investments are reflected as unrealized appreciation or unrealized depreciation.
Pricing inputs used in the Fund’s determination of its investment values are categorized according to a three-tier hierarchy framework. The hierarchy is summarized in three broad levels:
Level 1: Quoted prices in active markets for identical securities.
Level 2: Other significant observable inputs, including quoted prices for similar securities, interest rates, prepayment speeds, credit risk, etc.
Level 3: Significant unobservable inputs, including the Fund’s own assumptions used to determine the value of securities.
The following is a summary of the inputs used in valuing each of the Portfolio’s assets (liabilities) at value as of June 30, 2019:
| 159 | (continued) |
| Ohio National Fund, Inc. |
Notes to Financial Statements (Continued) | June 30, 2019 (Unaudited) | |
Portfolio | Financial Instrument Type | Level 1 | Level 2 | Level 3 | ||||||||||
ON Equity | Common Stocks** | $ | 231,410,712 | $ | — | $ | — | |||||||
| Money Market Funds | 2,906,400 | — | — | |||||||||||
|
|
|
|
|
| |||||||||
| $ | 234,317,112 | $ | — | $ | — | |||||||||
|
|
|
|
|
| |||||||||
| Futures Contracts | $ | 38,110 | $ | — | $ | — | ||||||||
|
|
|
|
|
| |||||||||
ON Bond | Corporate Bonds** | $ | — | $ | 244,842,766 | $ | — | |||||||
| Asset-Backed Securities** | — | 7,099,939 | — | |||||||||||
| Sovereign Issues | — | 3,056,250 | — | |||||||||||
| Money Market Funds | 1,469,198 | — | — | |||||||||||
|
|
|
|
|
| |||||||||
| $ | 1,469,198 | $ | 254,998,955 | $ | — | |||||||||
|
|
|
|
|
| |||||||||
| ON BlackRock Balanced Allocation | Common Stocks** | $ | 42,194,581 | $ | — | $ | — | |||||||
| Corporate Bonds** | — | 15,071,557 | — | |||||||||||
| Asset-Backed Securities** | — | 311,433 | — | |||||||||||
| U.S. Treasury Obligations | — | 203,265 | — | |||||||||||
| Money Market Funds | 949,614 | — | — | |||||||||||
|
|
|
|
|
| |||||||||
| $ | 43,144,195 | $ | 15,586,255 | $ | — | |||||||||
|
|
|
|
|
| |||||||||
| Futures Contracts | $ | 3,246 | $ | — | $ | — | ||||||||
|
|
|
|
|
| |||||||||
ON Capital Appreciation | Common Stocks** | $ | 91,776,324 | $ | 1,956,231 | $ | — | |||||||
| Money Market Funds | 1,380,809 | — | — | |||||||||||
|
|
|
|
|
| |||||||||
| $ | 93,157,133 | $ | 1,956,231 | $ | — | |||||||||
|
|
|
|
|
| |||||||||
ON International Equity | Common Stocks** | $ | 70,573,950 | $ | 384,482,593 | $ | — | |||||||
| Preferred Securities** | — | 8,338,675 | — | |||||||||||
| Money Market Funds | 14,680,388 | — | — | |||||||||||
|
|
|
|
|
| |||||||||
| $ | 85,254,338 | $ | 392,821,268 | $ | — | |||||||||
|
|
|
|
|
| |||||||||
ON Foreign | Common Stocks** | $ | 5,351,360 | $ | 45,537,113 | $ | — | |||||||
| Money Market Funds | 1,719,617 | — | — | |||||||||||
|
|
|
|
|
| |||||||||
| $ | 7,070,977 | $ | 45,537,113 | $ | — | |||||||||
|
|
|
|
|
| |||||||||
ON Janus Henderson Forty | Common Stocks** | $ | 190,542,152 | $ | — | $ | — | |||||||
| Money Market Funds | 1,921,572 | — | — | |||||||||||
|
|
|
|
|
| |||||||||
| $ | 192,463,724 | $ | — | $ | — | |||||||||
|
|
|
|
|
| |||||||||
ON Janus Henderson Venture | Common Stocks** | $ | 165,971,617 | $ | 846,441 | $ | — | |||||||
| Master Limited Partnerships** | 3,087,180 | — | — | |||||||||||
| Money Market Funds | 2,283,102 | — | — | |||||||||||
|
|
|
|
|
| |||||||||
| $ | 171,341,899 | $ | 846,441 | $ | — | |||||||||
|
|
|
|
|
| |||||||||
| ON Janus Henderson Enterprise | Common Stocks** | $ | 104,926,645 | $ | 1,527,375 | $ | — | |||||||
| Money Market Funds | 2,956,234 | — | — | |||||||||||
|
|
|
|
|
| |||||||||
| $ | 107,882,879 | $ | 1,527,375 | $ | — | |||||||||
|
|
|
|
|
| |||||||||
ON S&P 500®Index | Common Stocks** | $ | 1,166,285,979 | $ | — | $ | — | |||||||
|
|
|
|
|
| |||||||||
| Futures Contracts | $ | 14,170 | $ | — | $ | — | ||||||||
|
|
|
|
|
| |||||||||
| ON Federated Strategic Value Dividend | Common Stocks** | $ | 260,339,192 | $ | 49,068,760 | $ | — | |||||||
| Money Market Funds | 5,568,151 | — | — | |||||||||||
|
|
|
|
|
| |||||||||
| $ | 265,907,343 | $ | 49,068,760 | $ | — | |||||||||
|
|
|
|
|
| |||||||||
ON Federated High Income Bond | Corporate Bonds** | $ | — | $ | 192,271,396 | $ | — | |||||||
| Common Stocks** | 111,174 | — | — | |||||||||||
| Money Market Funds | 7,061,247 | — | — | |||||||||||
|
|
|
|
|
| |||||||||
| $ | 7,172,421 | $ | 192,271,396 | $ | — | |||||||||
|
|
|
|
|
| |||||||||
| 160 | (continued) |
| Ohio National Fund, Inc. |
Notes to Financial Statements (Continued) | June 30, 2019 (Unaudited) | |
Portfolio | Financial Instrument Type | Level 1 | Level 2 | Level 3 | ||||||||||
ON ClearBridge Small Cap | Common Stocks** | $ | 121,807,926 | $ | — | $ | — | |||||||
| Money Market Funds | 1,296,508 | — | — | |||||||||||
|
|
|
|
|
| |||||||||
| $ | 123,104,434 | $ | — | $ | — | |||||||||
|
|
|
|
|
| |||||||||
ONNasdaq-100®Index | Common Stocks** | $ | 336,776,396 | $ | — | $ | — | |||||||
| U.S. Treasury Obligations | — | 199,162 | — | |||||||||||
| Money Market Funds | 641,070 | — | — | |||||||||||
|
|
|
|
|
| |||||||||
| $ | 337,417,466 | $ | 199,162 | $ | — | |||||||||
|
|
|
|
|
| |||||||||
| Futures Contracts | $ | 17,716 | $ | — | $ | — | ||||||||
|
|
|
|
|
| |||||||||
| ON BlackRock Advantage Large Cap Core | Common Stocks** | $ | 98,771,262 | $ | — | $ | — | |||||||
| Money Market Funds | 1,412,846 | — | — | |||||||||||
|
|
|
|
|
| |||||||||
| $ | 100,184,108 | $ | — | $ | — | |||||||||
|
|
|
|
|
| |||||||||
| Futures Contracts | $ | 19,876 | $ | — | $ | — | ||||||||
|
|
|
|
|
| |||||||||
| ON BlackRock Advantage Small Cap Growth | Common Stocks** | $ | 83,024,860 | $ | — | $ | — | |||||||
| Money Market Funds | 1,299,352 | — | — | |||||||||||
|
|
|
|
|
| |||||||||
| $ | 84,324,212 | $ | — | $ | — | |||||||||
|
|
|
|
|
| |||||||||
| Futures Contracts | $ | 33,593 | $ | — | $ | — | ||||||||
|
|
|
|
|
| |||||||||
ON ICON Balanced | Common Stocks** | $ | 345,455,940 | $ | — | $ | — | |||||||
| Corporate Bonds** | — | 81,893,941 | — | |||||||||||
| U.S. Treasury Obligations | — | 14,133,437 | — | |||||||||||
| Closed-End Mutual Funds | 11,743,990 | — | — | |||||||||||
| Asset-Backed Securities** | — | 6,784,874 | — | |||||||||||
| Preferred Securities** | 2,282,821 | — | — | |||||||||||
| Purchased Options | 45,225 | — | — | |||||||||||
| Money Market Funds | 12,793,348 | — | — | |||||||||||
|
|
|
|
|
| |||||||||
| $ | 372,321,324 | $ | 102,812,252 | $ | — | |||||||||
|
|
|
|
|
| |||||||||
ON S&P MidCap 400®Index | Common Stocks** | $ | 312,746,182 | $ | — | $ | — | |||||||
| Money Market Funds | 1,372,362 | — | — | |||||||||||
|
|
|
|
|
| |||||||||
| $ | 314,118,544 | $ | — | $ | — | |||||||||
|
|
|
|
|
| |||||||||
| Futures Contracts | $ | 35,642 | $ | — | $ | — | ||||||||
|
|
|
|
|
| |||||||||
| ON BlackRock Advantage Large Cap Growth | Common Stocks** | $ | 109,876,116 | $ | — | $ | — | |||||||
| Money Market Funds | 1,588,621 | — | — | |||||||||||
|
|
|
|
|
| |||||||||
| $ | 111,464,737 | $ | — | $ | — | |||||||||
|
|
|
|
|
| |||||||||
| Futures Contracts | $ | 22,673 | $ | — | $ | — | ||||||||
|
|
|
|
|
| |||||||||
ON Risk Managed Balanced | Common Stocks** | $ | 180,271,683 | $ | — | $ | — | |||||||
| Corporate Bonds** | — | 54,067,885 | — | |||||||||||
| U.S. Government Agency Mortgage-Backed Securities | — | 31,340,267 | — | |||||||||||
| U.S. Treasury Obligations | — | 29,200,959 | — | |||||||||||
| Purchased Options | 6,061,279 | 16,584,722 | — | |||||||||||
| Asset-Backed /Mortgage-Backed Securities** | — | 6,319,769 | — | |||||||||||
| Preferred Securities** | — | 1,009,959 | — | |||||||||||
| Money Market Funds | 65,041,401 | — | — | |||||||||||
|
|
|
|
|
| |||||||||
| $ | 251,374,363 | $ | 138,523,561 | $ | — | |||||||||
|
|
|
|
|
| |||||||||
| Futures Contracts | $ | 5,515,230 | $ | — | $ | — | ||||||||
|
|
|
|
|
| |||||||||
| 161 | (continued) |
| Ohio National Fund, Inc. |
Notes to Financial Statements (Continued) | June 30, 2019 (Unaudited) | |
Portfolio | Financial Instrument Type | Level 1 | Level 2 | Level 3 | ||||||||||
ON Conservative Model | Open-End Mutual Funds | $ | 76,794,118 | $ | — | $ | — | |||||||
|
|
|
|
|
| |||||||||
ON Moderately Conservative Model | Open-End Mutual Funds | $ | 227,214,780 | $ | — | $ | — | |||||||
|
|
|
|
|
| |||||||||
ON Balanced Model | Open-End Mutual Funds | $ | 1,116,905,896 | $ | — | $ | — | |||||||
|
|
|
|
|
| |||||||||
ON Moderate Growth Model | Open-End Mutual Funds | $ | 1,945,597,581 | $ | — | $ | — | |||||||
|
|
|
|
|
| |||||||||
ON Growth Model | Open-End Mutual Funds | $ | 431,510,141 | $ | — | $ | — | |||||||
|
|
|
|
|
| |||||||||
| ** | For detailed industry descriptions, see the accompanying Schedules of Investments. |
Foreign Securities and Currency
The books and records of all the Portfolios are maintained in U.S. dollars. All investments and cash quoted in foreign currencies are valued daily in U.S. dollars on the basis of the foreign currency exchange rates provided by an independent source. These exchange rates are currently determined daily at 4:00 pm Eastern Time for normal trading sessions. Purchases and sales of foreign-denominated investments are recorded at rates of exchange prevailing on the respective dates of such transactions.
The Fund may not fully isolate that portion of the results of operations resulting from changes in foreign exchange rates from fluctuations arising from changes in market prices on foreign currency-denominated investments. For the portion that is isolated, amounts are reflected in the Statements of Operations as other foreign currency related transactions. However, for tax purposes, the Fund does fully isolate the effect of fluctuations in foreign exchange rates when determining the gain or loss upon sale or maturity of such investments to the extent required by federal income tax regulations.
All Portfolios of the Fund may invest in securities of foreign issuers. The ON International Equity and ON Foreign Portfolios may be invested entirely in foreign securities. Investments in securities of foreign issuers, including investments in foreign companies through the use of depositary receipts, carry certain risks not ordinarily associated with investments in securities of domestic issuers. Such risks include future political and economic developments, and the possible imposition of exchange controls or other foreign governmental laws and restrictions. In addition, with respect to certain countries, there is the possibility of expropriation of assets, confiscatory taxation, political or social instability, or diplomatic developments that could adversely affect capital investment within those countries.
Restricted Securities
Restricted securities are those securities purchased through a private offering and cannot be resold to the general public without prior registration under the Securities Act of 1933 (“the 1933 Act”) or pursuant to the resale limitations provided by Rule 144A under the 1933 Act, or an exemption from the registration requirements of the 1933 Act. 144A securities are issued by corporations without registration in reliance on 1933 Act provisions allowing for the private resale of unregistered securities to qualified institutional buyers. Section 4(a)(2) commercial paper is issued pursuant to Section 4(a)(2) of the 1933 Act which exempts an issue from registration. This paper may be used to financenon-current transactions, such as acquisitions, stock repurchase programs, and other long-term assets. Investments by a portfolio in Rule 144A and Section 4(a)(2) securities could have the effect of decreasing the liquidity of a Portfolio during any period in which qualified institutional investors were no longer interested in purchasing these securities.
Investment Transactions and Related Income
For financial reporting purposes, investment transactions are accounted for on a trade date basis. For purposes of executing separate account shareholder transactions in the normal course of business, however, the Fund’s investment transactions are recorded no later than the first calculation on the first business day following the trade date in accordance with Rule2a-4 of the 40 Act. Accordingly, differences between the net asset values for financial reporting and for executing separate account shareholder transactions may arise.
Dividend income is recognized on theex-dividend date, except in the case of those Portfolios holding foreign securities, in which dividends are recorded as soon after theex-dividend date as the Fund’s information agents become aware of such dividends. Interest income is accrued daily as earned and includes the amortization of premium and accretion of discount. Net realized gain or loss on investments and foreign exchange transactions are determined using the specific identification method.
| 162 | (continued) |
| Ohio National Fund, Inc. |
Notes to Financial Statements (Continued) | June 30, 2019 (Unaudited) | |
Distributions to Shareholders and Federal Taxes
The Fund satisfies its distribution requirements, as required for each of the Portfolios to continue to qualify as a regulated investment company pursuant to Subchapter M of the Internal Revenue Code, by using consent dividends rather than cash distributions. The consent dividends, when authorized, become taxable to the Fund’s shareholders as if they were paid in cash. The Fund has the intent to continue to comply with tax provisions pertaining to regulated investment companies and make distributions of taxable income, whether by cash or consent dividends, sufficient to relieve it from substantially all federal income and excise taxes. As such, no provisions for federal income or excise taxes have been recorded. Also, notax-related interest or penalties have been incurred or recognized. The Board’s intent is that the Fund will not distribute any realized gain distributions (consent or otherwise) until any applicable capital loss carryforwards have been offset or expired.
The character of income and realized capital gains distributions are determined in accordance with federal income tax regulations and may differ from net investment income and realized gains for financial reporting purposes. These “book/tax” differences are either considered temporary or permanent in nature. To the extent these differences are permanent in nature they are reclassified within the composition of net assets; temporary differences do not require such reclassification. Distributions to shareholders that exceed taxable income and net taxable realized gains are reported as return of capital distributions.
The Fund’s management and its tax agent perform an affirmative evaluation of tax positions taken or expected to be taken in the course of preparing the Fund’s tax returns to determine whether it ismore-likely-than-not (i.e. greater than50-percent) that each tax position will be sustained upon examination by a taxing authority based on the technical merits of the position. Implementation of the evaluation included a review of tax positions taken in tax years that remain subject to examination by all major tax jurisdictions, including federal tax and the state of Maryland. The determination has been made that there are no uncertain tax positions that would require the Portfolios to record a tax liability or provision.
Expense Allocation
Expenses directly attributable to a Portfolio are charged to that Portfolio. Expenses that cannot be directly attributed to a Portfolio are allocated among all the benefited Portfolios on a basis of relative net assets or other appropriate method.
Foreign Withholding Taxes
Certain Portfolios in the Fund may be subject to taxes imposed by countries in which they invest with respect to their investments in issuers existing or operating in such countries. Such taxes are generally withheld based on income earned. These Portfolios accrue such taxes as the related income is earned.
TBA Commitments
To-Be-Announced (“TBA”) commitments are agreements for the purchase or sale of mortgage-backed securities for a fixed price, with payment and delivery on an agreed upon future settlement date beyond the customary settlement period for such securities. The specific securities to be delivered are not identified at the trade date. However, delivered securities must meet specified terms, including issuer, rate and term and be within industry-accepted “good delivery” standards. When entering into TBA commitments, a Portfolio may take possession of or deliver the underlying mortgage-backed securities but can extend the settlement or roll the transaction. TBA commitments involve a risk of loss if the value of the security to be purchased or sold declines or increases, respectively, prior to settlement date.
Mortgage Dollar Rolls
A Portfolio may enter into a mortgage dollar roll (“MDR”) transaction, in which the Portfolio agrees to both sell and purchase a similar, but not identical, TBA mortgage-backed security with the same issuer, rate, and term on a later date at a set price. MDRs are treated as purchases and sales, which may have the effect of increasing portfolio turnover rates, and result in realized gains and losses based on the agreed-upon fixed prices.
Bank Loans
A Portfolio may invest in bank loans, which represent an interest in amounts owned by a borrower to a syndicate of lenders. Bank loans are generallynon-investment grade and often involve borrowers whose financial condition is highly leveraged. Transactions in bank loans may settle on a delayed basis, which could result in proceeds from the sale not being readily available for a Portfolio to make additional investments or meet its redemption obligations. Bank loans are typically senior in the corporate capital structure of the borrower. Bank loans generally pay interest at variable rates that are periodically determined by reference to a base lending rate plus a premium. The base lending rates are generally the lending rate offered by one or more European banks, such as the
| 163 | (continued) |
| Ohio National Fund, Inc. |
Notes to Financial Statements (Continued) | June 30, 2019 (Unaudited) | |
London Interbank Offered Rate (“LIBOR”). Bank loans may involve foreign borrowers, and investments may be denominated in foreign currencies. While the Portfolios expect to invest in fully funded term loans, certain of the loans in which the Portfolios invest may include revolving loans, bridge loans, and delayed draw term loans. These investments are treated as fixed income securities for valuation purposes.
Bank loans may be acquired through either an assignment or a participation. In a participation, a Portfolio would have a contractual relationship with the lender, not with the borrower, and the lender would remain the official holder of the loan, with the participant owning the rights to the amount purchased. As such, the Portfolio would not only assume the credit risk of the borrower, but also that of the selling participant or other persons interpositioned between the Portfolio and the borrower. In contrast, in an assignment, a Portfolio would become a direct signatory to the loan and receive interest and principal payments directly from the administrative agent. The ON Risk Managed Balanced Portfolio and the ON Federated High Income Bond Portfolio were the only Portfolios to hold bank loans during thesix-month period ended June 30, 2019, and all bank loans were held via assignment.
New Accounting Pronouncements and Regulations
In March 2017, the Financial Accounting Standards Board (the “FASB”) issued ASU2017-08, “Premium Amortization on Purchased Callable Debt Securities”, which provides guidance related to the amortization period for certain purchased callable debt securities held at a premium. This ASU is effective for annual periods beginning after December 15, 2018, and interim periods within those annual periods. The Fund’s management has evaluated the impact of the amendment and has concluded that there is no significant impact on the Fund’s financial statements.
In August 2018, the FASB issued ASU2018-13 “Disclosure Framework –Changes to the Disclosure Requirements for Fair Value Measurement“, which modifies the disclosure requirements on fair value measurements included in Topic 820, Fair Value Measurement. This ASU is effective for annual periods beginning after December 15, 2019, and interim periods within those annual periods. The Fund has early-adopted the removal of the disclosure of the amount and reasons for transfers between Level 1 and Level 2 of the fair value hierarchy, as well as the policy for timing of transfers between levels. The Fund’s management is currently evaluating the impact of the other modifications of this ASU on the Fund’s financial statements.
Subsequent Events
At meetings held on May 16, 2019 and June 19, 2019, the Board approved reorganizations pursuant to which the assets of each of the ON Equity and ON Capital Appreciation Portfolios, ON ICON Balanced Portfolio, and ON ClearBridge Small Cap Portfolio (the “Target Portfolios”) assets would be acquired, and each of the Portfolio’s liabilities would be assumed, by the Portfolio (the “Survivor Portfolio”) listed opposite the Target Portfolio(s) in the chart below in exchange for shares of the Survivor Portfolio. The reorganizations were consummated effective as of the end of business on August 23, 2019.
Target Portfolios | To be reorganized into | Survivor Portfolios | ||||
ON Equity, ON Capital Appreciation | -> | ON BlackRock Advantage Large Cap Core | ||||
ON ICON Balanced | -> | ON BlackRock Balanced Allocation | ||||
ON ClearBridge Small Cap | -> | ON BlackRock Advantage Small Cap Growth |
The combination of assets for each reorganization presented opportunities for operational efficiencies, which should translate to a decrease in the rate of future expenses borne by the shareholders of the Survivor Portfolios. It is anticipated that no gain or loss for federal income tax purposes will be recognized by Portfolio shareholders as a result of the reorganizations. All fees and expenses incurred directly as a result of the reorganizations were borne by ONI.
Pursuant to the reorganizations, the shares of each Target Portfolio were liquidated, and shares of each Survivor Portfolio were distributed to the Target Portfolio shareholders at the same aggregate dollar value as those of the Target Portfolio. The liquidation of Target Portfolio shares and distribution of Survivor Portfolio shares resulting from the reorganizations are summarized below:
Target Portfolios prior to the reorganizations:
| ON Equity | ON Capital Appreciation | ON ICON Balanced | ON ClearBridge Small Cap | |||||||||||||
Investment portfolio fair value | $ | 223,035,288 | $ | 89,148,174 | $ | 460,592,643 | $ | 113,322,189 | ||||||||
Investment portfolio cost | $ | 224,887,233 | $ | 91,889,534 | $ | 431,725,518 | $ | 112,226,496 | ||||||||
Net assets | $ | 223,245,270 | $ | 89,333,028 | $ | 462,055,756 | $ | 113,327,536 | ||||||||
Net asset value (per share, extended) | $ | 35.7255 | $ | 39.8373 | $ | 21.4979 | $ | 54.6402 | ||||||||
Shares | 6,248,906 | 2,242,446 | 21,493,028 | 2,074,069 | ||||||||||||
| 164 | (continued) |
| Ohio National Fund, Inc. |
Notes to Financial Statements (Continued) | June 30, 2019 (Unaudited) | |
Survivor Portfolios prior to the reorganizations:
| ON BlackRock Advantage Large Cap Core | ON BlackRock Balanced Allocation | ON BlackRock Advantage Small Cap Growth | ||||||||||
Investment portfolio fair value | $ | 94,021,654 | $ | 55,607,905 | $ | 78,723,068 | ||||||
Investment portfolio cost | $ | 92,769,119 | $ | 53,682,160 | $ | 81,346,417 | ||||||
Net assets | $ | 94,156,983 | $ | 55,776,643 | $ | 78,924,045 | ||||||
Net asset value (per share, extended) | $ | 29.3958 | $ | 32.9692 | $ | 27.6742 | ||||||
Shares | 3,203,074 | 1,691,779 | 2,851,900 | |||||||||
Survivor Portfolios subsequent to the reorganizations:
| ON BlackRock Advantage Large Cap Core | ON BlackRock Balanced Allocation | ON BlackRock Advantage Small Cap Growth | ||||||||||
Investment portfolio fair value | $ | 406,205,116 | $ | 516,200,548 | $ | 192,045,257 | ||||||
Investment portfolio cost | $ | 409,545,886 | $ | 485,407,678 | $ | 193,572,913 | ||||||
Net assets | $ | 406,735,281 | $ | 517,832,399 | $ | 192,251,581 | ||||||
Net asset value (per share, extended) | $ | 29.3958 | $ | 32.9692 | $ | 27.6742 | ||||||
Shares | 13,836,508 | 15,706,525 | 6,946,962 | |||||||||
| (3) | Related Party and Other Transactions |
The Fund has an Investment Advisory Agreement with Ohio National Investments, Inc. (“ONI”), a wholly-owned subsidiary of ONLIC. Under the terms of this agreement, ONI provides portfolio management and investment advice to the Fund and administers its operations, subject to the supervision of the Board. This agreement is renewed annually upon the approval by the Board. As compensation for its services, ONI receives advisory fees from the Fund calculated on the basis of each Portfolio’s average daily net assets and the following current schedule of Board-approved annualized fee breakpoints.
ON Equity2 | ON Foreign | ON Federated High Income Bond | ||
| 0.64% of first $500 million | 0.85% of first $100 million | 0.75% of first $75 million | ||
| 0.62% over $500 million | 0.80% of next $100 million | 0.70% of next $75 million | ||
| ON Bond | 0.70% of next $800 million | 0.65% of next $75 million | ||
| 0.60% of first $100 million | 0.67% over $1 billion | 0.60% over $225 million | ||
| 0.50% of next $150 million | ON Janus Henderson Forty | ON ClearBridge Small Cap | ||
| 0.45% of next $250 million | 0.80% of first $100 million | 0.85% of first $200 million | ||
| 0.40% of next $500 million | 0.75% of next $400 million | 0.80% of next $300 million | ||
| 0.30% of next $1 billion | 0.70% over $500 million | 0.75% over $500 million | ||
| 0.25% over $2 billion | ON Janus Henderson Venture | ONNasdaq-100®Index | ||
| ON BlackRock Balanced Allocation1 | 0.80% of first $150 million | 0.40% of first $100 million | ||
| 0.58% of first $100 million | 0.75% of next $150 million | 0.35% of next $150 million | ||
| 0.50% of next $150 million | 0.70% of next $300 million | 0.33% over $250 million | ||
| 0.45% of next $250 million | 0.65% over $600 million | ON BlackRock Advantage Large Cap Core1 | ||
| 0.40% of next $500 million | ON Janus Henderson Enterprise | 0.64% of first $500 million | ||
| 0.30% of next $1 billion | 0.85% of first $100 million | 0.62% over $500 million | ||
| 0.25% over $2 billion | 0.80% of next $100 million | ON BlackRock Advantage Small Cap Growth1 | ||
| ON Capital Appreciation | 0.75% of next $300 million | 0.78% of first $100 million | ||
| 0.80% of first $100 million | 0.70% over $500 million | 0.75% of next $400 million | ||
| 0.75% of next $300 million | ON S&P 500®Index | 0.70% over $500 million | ||
| 0.65% of next $600 million | 0.40% of first $100 million | ON ICON Balanced | ||
| 0.60% over $1 billion | 0.35% of next $150 million | 0.65% of first $200 million | ||
| ON International Equity | 0.33% over $250 million | 0.60% of next $300 million | ||
| 0.85% of first $100 million | ON Federated Strategic Value Dividend | 0.55% over $500 million | ||
| 0.80% of next $100 million | 0.75% of first $100 million | ON S&P MidCap 400®Index | ||
| 0.70% of next $800 million | 0.70% of next $400 million | 0.40% of first $100 million | ||
| 0.67% over $1 billion | 0.65% over $500 million | 0.35% of next $150 million | ||
| 0.33% over $250 million |
| 165 | (continued) |
| Ohio National Fund, Inc. |
Notes to Financial Statements (Continued) | June 30, 2019 (Unaudited) | |
| ON BlackRock Advantage Large Cap Growth1 | ON Conservative Model | ON Moderate Growth Model | ||
| 0.66% of first $500 million | 0.40% of all net assets | 0.40% of all net assets | ||
| 0.64% over $500 million | ON Moderately Conservative Model | ON Growth Model | ||
| ON Risk Managed Balanced | 0.40% of all net assets | 0.40% of all net assets | ||
| 0.90% of first $500 million | ON Balanced Model | |||
| 0.75% over $500 million | 0.40% of all net assets |
| 1 | At a meeting held on January 25, 2019, the Board, including a majority of the Directors who are not “interested persons” of the Fund, approved the replacement of thesub-adviser to the Portfolio. |
Effective February 1, 2019, BlackRock Investment Management, LLC (”BlackRock“) replaced the Portfolios’ previoussub-adviser, Suffolk Capital Management, LLC . In conjunction with the change insub-adviser, the names of the Portfolios were changed. Also, the Board approved a revision to the Portfolios’ advisory fee schedule shown above, also effective February 1, 2019. Previously, the advisory fee breakpoints, based on the Portfolios’ daily net assets, respectively, were as follows:
ON BlackRock Balanced Allocation | ON BlackRock Advantage Large Cap Core | ON BlackRock Advantage Small Cap Growth | ON BlackRock Advantage Large Cap Growth | |||
| 0.60% of first $100 million | 0.80% of first $100 million | 0.85% of first $100 million | 0.80% of first $100 million | |||
| 0.50% of next $150 million | 0.70% of next $400 million | 0.75% of next $400 million | 0.70% of next $400 million | |||
| 0.45% of next $250 million | 0.65% over $500 million | 0.70% over $500 million | 0.65% over $500 million | |||
| 0.40% of next $500 million | ||||||
| 0.30% of next $1 billion | ||||||
| 0.25% over $2 billion |
| 2 | At a meeting held on February 21, 2019, the Board, including a majority of the Directors who are not “interested persons” of the Fund, approved the replacement of thesub-adviser to the Portfolio. |
Effective May 1, 2019, BlackRock replaced the Portfolio’s previoussub-adviser, ClearBridge Investments, LLC. In conjunction with the change insub-adviser, the Board approved a revision to the Portfolio’s advisory fee schedule shown above. Previously, the advisory fee breakpoints, based on the Portfolio’s daily net assets, were:
0.79% of first $200 million 0.74% of next $800 million 0.70% over $1 billion |
Under the Investment Advisory Agreement, the Fund authorizes ONI to retainsub-advisers (“theSub-Advisers”) for all Portfolios of the Fund, subject to the approval of the Board. ONI has entered intosub-advisory agreements with ClearBridge Investments, LLC (“ClearBridge”), BlackRock Investment Management, LLC (“BlackRock”), Lazard Asset Management, LLC (“Lazard”), Templeton Global Advisors Limited (“Templeton”), Jennison Associates LLC (“Jennison”), Janus Capital Management LLC (“Janus”), Geode Capital Management, LLC (“Geode”), Federated Equity Management Company of Pennsylvania (“Federated Equity”), Federated Investment Management Company (“Federated Investment”), ICON Advisers, Inc. (“ICON”), and AnchorPath Financial, LLC (“AnchorPath”) to manage the investment of certain Portfolios’ assets, subject to the supervision of ONI.
As compensation for their services, theSub-Advisers receive from ONI asub-advisory fee calculated on the basis of each of the aforementioned Portfolio’s average daily net assets and the following current Board-approved schedule of annualized fee breakpoints.
| ON Equity (ClearBridge)4 | ON International Equity (Lazard) | ON Janus Henderson Enterprise (Janus) | ||
| 0.20% of first $500 million | 0.40% on first $500 Million | 0.60% of first $100 million | ||
| 0.18% over $500 million | 0.35% on next $500 Million | 0.55% of next $100 million | ||
| ON BlackRock Balanced Allocation Portfolio (BlackRock)3 | 0.32% over $1 Billion | 0.50% over $200 million | ||
| 0.20% of first $500 million | ON Foreign (Templeton) | ON S&P 500®Index (Geode)5 | ||
| 0.18% over $500 million | 0.43% on first $500 Million | 0.025% of first $100 million | ||
| ON Capital Appreciation (Jennison) | 0.38% on next $500 Million | 0.020% of next $150 million | ||
| 0.75% of first $10 million | 0.35% over $1 Billion | 0.015% over $250 million | ||
| 0.50% of next $30 million | ON Janus Henderson Forty (Janus) | ON Federated Strategic Dividend Value (Federated Equity) | ||
| 0.35% of next $25 million | 0.55% of first $100 million | 0.50% of first $35 million | ||
| 0.25% of next $335 million | 0.50% of next $400 million | 0.35% of next $65 million | ||
| 0.22% of next $600 million | 0.45% over $500 million | 0.25% over $100 million | ||
| 0.20% over $1 billion | ON Janus Henderson Venture (Janus) | |||
| 0.55% of first $150 million | ||||
| 0.45% over $150 million |
| 166 | (continued) |
| Ohio National Fund, Inc. |
Notes to Financial Statements (Continued) | June 30, 2019 (Unaudited) | |
| ON Federated High Income Bond (Federated Investment) | ON BlackRock Advantage Small Cap Growth (BlackRock)3 | ON Risk Managed Balanced (Janus) | ||
| 0.50% of first $30 million | 0.45% of all net assets | 0.35% of first $500 million | ||
| 0.40% of next $20 million | ON ICON Balanced (ICON) | 0.25% over $500 million | ||
| 0.30% of next $25 million | 0.40% of first $200 million | ON Risk Managed Balanced (Anchor Path) | ||
| 0.25% over $75 million | 0.35% of next $300 million | 0.20% of first $500 million | ||
| ON ClearBridge Small Cap (ClearBridge) | 0.30% over $500 million | 0.15% over $500 million | ||
| 0.55% of first $200 million | ON S&P MidCap 400®Index (Geode)5 | |||
| 0.50% over $200 million | 0.039% of first $100 million | |||
| ONNasdaq-100®Index (Geode)5 | 0.038% of next $150 million | |||
| 0.05% of first $100 million | 0.037% of next $250 million | |||
| 0.04% of next $150 million | 0.036% of next $500 million | |||
| 0.03% over $250 million | 0.035% over $1 billion | |||
| ON BlackRock Large Cap Core (BlackRock)3 | ON BlackRock Advantage Large Cap Growth (BlackRock)3 | |||
| 0.20% of first $500 million | 0.20% of first $500 million | |||
| 0.18% over $500 million | 0.18% over $500 million | |||
| 3 | At a meeting held on January 25, 2019, the Board, including a majority of the Directors who are not “interested persons” of the Fund, approved the replacement of thesub-adviser to the Portfolio. |
Effective May 1, 2019, BlackRock Investment Management, LLC replaced the Portfolios’ previoussub-adviser, Suffolk Capital Management, LLC. In conjunction with the change insub-adviser, the names of the Portfolios were changed. Previously, thesub-advisory fee breakpoints, based on the Portfolios’ daily net assets, respectively, were:
ON BlackRock Balanced Allocation | ON BlackRock Advantage Large Cap Core | ON BlackRock Advantage Small Cap Growth | ON BlackRock Advantage Large Cap Growth | |||
0.30% of first $100 million | 0.45% of first $100 million | 0.50% of first $100 million | 0.45% of first $100 million | |||
0.25% of next $150 million | 0.40% of next $400 million | 0.45% of next $400 million | 0.40% of next $400 million | |||
0.225% of next $250 million | 0.35% over $500 million | 0.40% over $500 million | 0.35% over $500 million | |||
0.20% of next $500 million | ||||||
0.15% of next $1 billion | ||||||
0.125% over $2 billion |
| 4 | At a meeting held on February 21, 2019, the Board, including a majority of the Directors who are not “interested persons” of the Fund, approved the replacement of thesub-adviser to the Portfolio. |
Effective May 1, 2019, BlackRock Investment Management, LLC replaced the Portfolio’s previoussub-adviser, ClearBridge Investments, LLC. In conjunction with the change insub-adviser, the Board approved a revision to the Portfolio’ssub-advisory fee schedule shown above. Previously, thesub-advisory fee breakpoints, based on the Portfolio’s daily net assets, were:
0.40% of first $200 Million 0.38% over $200 Million |
| 5 | Thesub-advisory fees for the three Portfoliossub-advised by Geode could be impacted by an agreed-upon minimum aggregate per annum fee of $150,000. For thesix-month period ended June 30, 2019, the minimum aggregate fee had no impact on thesub-advisory fees that were calculated based on the breakpoint schedule indicated above. |
Pursuant to a service agreement among ONI, ONLIC, and the Fund, ONLIC has agreed to provide personnel and facilities to ONI on a cost-reimbursement basis. These personnel members include officers of the Fund. ONLIC also provides clerical and administrative services and such supplies and equipment as may be reasonably required in order for ONI to properly perform its advisory function pursuant to the Investment Advisory Agreement. ONLIC further performs duties to fulfill the transfer agent function on behalf of the Fund. Performance of these duties by ONLIC and availability of facilities, personnel, supplies, and equipment does not represent an expense to the Fund in excess of the advisory fees paid to ONI.
Pursuant to the Investment Advisory Agreement between ONI and the Fund, if the total expenses applicable to any Portfolio during any calendar quarter (excluding taxes, brokerage commissions, interest expense and management fees) exceed 1%, on an annualized basis, evaluated quarterly, of such Portfolio’s average daily net asset value, ONI will reimburse the Portfolio for such excess expenses. There were no expense reimbursements associated with this agreement during thesix-month period ended June 30, 2019.
ONI has contractually agreed to reimburse the Fund to the extent that the annual ordinary operating expenses of the five ON Model Portfolios, excluding: portfolio transaction and other investment related costs (including brokerage fees and commissions); taxes; borrowing costs (such as interest and dividend expenses on securities sold short); fees and expenses associated with investments in derivative instruments (including for example option and swap fees and expenses); any amounts payable pursuant to a distribution or service plan adopted in accordance with Rule12b-1 under the 40 Act; any administrative and/or shareholder servicing
| 167 | (continued) |
Ohio National Fund, Inc. |
Notes to Financial Statements (Continued) | June 30, 2019 (Unaudited) | |
fees payable pursuant to a plan approved by the Board; expenses incurred in connection with any merger or reorganization; extraordinary expenses (such as litigation expenses, indemnification of Fund officers and Directors and contractual indemnification of Portfolio service providers); and other expenses that the Directors agree have not been incurred in the ordinary course of the Portfolio’s business, exceed certain percentages of the average daily net assets (the “Expense Limitation Agreement”.).
For the period from May 1, 2019 to April 30, 2020, the applicable percentages of the average daily net assets of the five ON Model Portfolios are as follow:
Portfolio | ||||||
ON Conservative Model | 0.92 | % | ||||
ON Moderately Conservative Model | 1.00 | % | ||||
ON Balanced Model | 1.00 | % | ||||
ON Moderate Growth Model | 1.07 | % | ||||
ON Growth Model | 1.12 | % | ||||
For the period from May 1, 2018 to April 30, 2019, the applicable percentages of the average daily net assets of the five ON Model Portfolios were as follows:
Portfolio | ||||||
ON Conservative Model | 0.87 | % | ||||
ON Moderately Conservative Model | 0.92 | % | ||||
ON Balanced Model | 0.99 | % | ||||
ON Moderate Growth Model | 1.04 | % | ||||
ON Growth Model | 1.08 | % | ||||
For purposes of calculating the expenses subject to the Expense Limitation Agreement, the annual operating expenses are those as presented pursuant to the Fund’s prospectus requirements. The prospectus presentation of Fund expenses includes Acquired Fund Fees and Expenses (”AFFE“), which is a calculation of the indirect costs associated with the Portfolios’ underlying investments in other investment companies. The current Expense Limitation Agreement will continue through April 30, 2020. The Expense Limitation Agreement may only be terminated with the consent of the Board. Under the Expense Limitation Agreement, ONI is entitled to a reimbursement of the excess expense payments paid by it in the three years following the date the particular expense payment occurred, but only if such reimbursement can be achieved without exceeding the lesser of the applicable annual expense limitation in effect at the time of the expense payment or the reimbursement. There were no recorded liabilities related to this agreement at June 30, 2019.
Pursuant to the current Expense Limitation Agreement, as well as the prior agreements for the period May 1, 2018 to April 30, 2019 and March 1, 2017 to April 30, 2018, ONI reimbursed the expenses of the ON Model Portfolios as follows:
Portfolio | Six-Month Period Ended June 30, 2019 (Unaudited) | Year Ended December 31, 2018 | Period From March 1, 2017 (inception) to December 31, 2017 | |||||||||
ON Conservative Model | $ 121,189 | $ 226,418 | $ 225,670 | |||||||||
ON Moderately Conservative Model | 170,799 | 470,818 | 546,454 | |||||||||
ON Balanced Model | 433,882 | 1,505,609 | 2,175,981 | |||||||||
ON Moderate Growth Model | 0 | 1,692,796 | 3,208,708 | |||||||||
ON Growth Model | 0 | 638,268 | 787,420 | |||||||||
The Investment Advisory Agreement allows for a portion of the expenses related to the Fund’s Chief Compliance Officer and staff to be incurred by the Fund and paid from the Fund to the Fund’s adviser, ONI. Pursuant to the service agreement among ONI, ONLIC, and the Fund, ONLIC has provided the personnel, services, and equipment necessary for the execution of the Fund’s regulation-mandated compliance function and ONI has reimbursed ONLIC for costs allocated to the Fund. For thesix-month period ended June 30, 2019, the Fund incurred compliance expenses totaling $188,500, which are allocated to the Portfolios by equal dollar amounts. Expenses incurred by the Portfolios are reflected on the Statements of Operations as “Compliance expense”.
Each director of the Board is compensated based on an annual retainer fee of $155,000, paid quarterly. The Board chair receives an additional quarterly retainer fee of $3,750, the lead independent director of the Board receives an additional quarterly retainer fee of $3,125, and the Audit Committee chair receives an additional quarterly retainer fee of $1,250; each paid quarterly. For thesix-month period ended June 30, 2019, directors’ compensation and reimbursement of director expenses by the Portfolios of the Fund totaled $409,908.
| 168 | (continued) |
| Ohio National Fund, Inc. |
Notes to Financial Statements (Continued) | June 30, 2019 (Unaudited) | |
The accounting agent and custodian for the Fund is State Street Bank (Kansas City, MO and Boston, MA). For assets held outside of the United States, State Street Bank utilizes a foreignsub-custodian network that is subject to oversight and periodic approval of the Board.
| (4) | Capital Share Transactions |
Capital share transactions for thesix-month period ended June 30, 2019, and the year ended December 31, 2018, respectively, were as follows:
| ON Equity | ON Bond | ON BlackRock Balanced Allocation | ||||||||||||||||||||||||||||
| Six-Month Period Ended June 30, 2019 (Unaudited) | Year Ended December 31, 2018 | Six-Month Period Ended June 30, 2019 (Unaudited) | Year Ended December 31, 2018 | Six-Month Period Ended June 30, 2019 (Unaudited) | Year Ended December 31, 2018 | |||||||||||||||||||||||||
Capital shares issued on sales | 63,919 | 543,340 | 737,021 | 2,259,416 | 59,523 | 333,499 | ||||||||||||||||||||||||
Capital shares redeemed | (1,762,088 | ) | (7,201,001 | ) | (2,125,026 | ) | (5,188,262 | ) | (227,535 | ) | (508,020 | ) | ||||||||||||||||||
|
|
|
|
|
|
|
|
|
|
|
| |||||||||||||||||||
Net increase/(decrease) | (1,698,169 | ) | (6,657,661 | ) | (1,388,005 | ) | (2,928,846 | ) | (168,012 | ) | (174,521 | ) | ||||||||||||||||||
|
|
|
|
|
|
|
|
|
|
|
| |||||||||||||||||||
| ON Capital Appreciation | ON International Equity | ON Foreign | ||||||||||||||||||||||||||||
| Six-Month Period Ended June 30, 2019 (Unaudited) | Year Ended December 31, 2018 | Six-Month Period Ended June 30, 2019 (Unaudited) | Year Ended December 31, 2018 | Six-Month Period Ended June 30, 2019 (Unaudited) | Year Ended December 31, 2018 | |||||||||||||||||||||||||
Capital shares issued on sales | 41,869 | 244,891 | 329,137 | 34,482,673 | 65,100 | 218,991 | ||||||||||||||||||||||||
Capital shares redeemed | (281,558 | ) | (650,640 | ) | (8,444,013 | ) | (5,279,130 | ) | (274,107 | ) | (653,067 | ) | ||||||||||||||||||
|
|
|
|
|
|
|
|
|
|
|
| |||||||||||||||||||
Net increase/(decrease) | (239,689 | ) | (405,749 | ) | (8,114,876 | ) | 29,203,543 | (209,007 | ) | (434,076 | ) | |||||||||||||||||||
|
|
|
|
|
|
|
|
|
|
|
| |||||||||||||||||||
| ON Janus Henderson Forty | ON Janus Henderson Venture | ON Janus Henderson Enterprise | ||||||||||||||||||||||||||||
| Six-Month Period Ended June 30, 2019 (Unaudited) | Year Ended December 31, 2018 | Six-Month Period Ended June 30, 2019 (Unaudited) | Year Ended December 31, 2018 | Six-Month Period Ended June 30, 2019 (Unaudited) | Year Ended December 31, 2018 | |||||||||||||||||||||||||
Capital shares issued on sales | 2,037,282 | 5,693,993 | 159,900 | 807,578 | 55,200 | 1,370,764 | ||||||||||||||||||||||||
Capital shares redeemed | (1,697,821 | ) | (1,615,798 | ) | (2,405,625 | ) | (2,464,805 | ) | (503,097 | ) | (640,902 | ) | ||||||||||||||||||
|
|
|
|
|
|
|
|
|
|
|
| |||||||||||||||||||
Net increase/(decrease) | 339,461 | 4,078,195 | (2,245,725 | ) | (1,657,227 | ) | (447,897 | ) | 729,862 | |||||||||||||||||||||
|
|
|
|
|
|
|
|
|
|
|
| |||||||||||||||||||
| ON S&P 500®Index | ON Federated Strategic Value Dividend | ON Federated High Income Bond | ||||||||||||||||||||||||||||
| Six-Month Period Ended June 30, 2019 (Unaudited) | Year Ended December 31, 2018 | Six-Month Period Ended June 30, 2019 (Unaudited) | Year Ended December 31, 2018 | Six-Month Period Ended June 30, 2019 (Unaudited) | Year Ended December 31, 2018 | |||||||||||||||||||||||||
Capital shares issued on sales | 2,426,421 | 11,443,848 | 677,407 | 1,908,206 | 398,933 | 1,170,318 | ||||||||||||||||||||||||
Capital shares redeemed | (6,858,808 | ) | (10,664,652 | ) | (2,699,009 | ) | (15,617,523 | ) | (1,440,906 | ) | (6,860,078 | ) | ||||||||||||||||||
|
|
|
|
|
|
|
|
|
|
|
| |||||||||||||||||||
Net increase/(decrease) | (4,432,387 | ) | 779,196 | (2,021,602 | ) | (13,709,317 | ) | (1,041,973 | ) | (5,689,760 | ) | |||||||||||||||||||
|
|
|
|
|
|
|
|
|
|
|
| |||||||||||||||||||
| ON ClearBridge Small Cap | ONNasdaq-100®Index | ON BlackRock Advantage Large Cap Core | ||||||||||||||||||||||||||||
| Six-Month Period Ended June 30, 2019 (Unaudited) | Year Ended December 31, 2018 | Six-Month Period Ended June 30, 2019 (Unaudited) | Year Ended December 31, 2018 | Six-Month Period Ended June 30, 2019 (Unaudited) | Year Ended December 31, 2018 | |||||||||||||||||||||||||
Capital shares issued on sales | 107,494 | 230,406 | 1,068,036 | 11,099,181 | 67,168 | 829,082 | ||||||||||||||||||||||||
Capital shares redeemed | (562,332 | ) | (2,598,696 | ) | (4,040,630 | ) | (6,796,455 | ) | (3,044,355 | ) | (1,966,097 | ) | ||||||||||||||||||
|
|
|
|
|
|
|
|
|
|
|
| |||||||||||||||||||
Net increase/(decrease) | (454,838 | ) | (2,368,290 | ) | (2,972,594 | ) | 4,302,726 | (2,977,187 | ) | (1,137,015 | ) | |||||||||||||||||||
|
|
|
|
|
|
|
|
|
|
|
| |||||||||||||||||||
| 169 | (continued) |
| Ohio National Fund, Inc. |
Notes to Financial Statements (Continued) | June 30, 2019 (Unaudited) | |
| ON BlackRock Advantage Small Cap Growth | ON ICON Balanced | ON S&P MidCap 400®Index | ||||||||||||||||||||||||||||
| Six-Month Period Ended June 30, 2019 (Unaudited) | Year Ended December 31, 2018 | Six-Month Period Ended June 30, 2019 (Unaudited) | Year Ended December 31, 2018 | Six-Month Period Ended June 30, 2019 (Unaudited) | Year Ended December 31, 2018 | |||||||||||||||||||||||||
Capital shares issued on sales | 2,137,642 | 232,264 | 420,703 | 2,389,470 | 742,927 | 16,253,134 | ||||||||||||||||||||||||
Capital shares redeemed | (298,114 | ) | (1,433,520 | ) | (2,554,976 | ) | (22,056,812 | ) | (3,336,215 | ) | (1,498,050 | ) | ||||||||||||||||||
|
|
|
|
|
|
|
|
|
|
|
| |||||||||||||||||||
Net increase/(decrease) | 1,839,528 | (1,201,256 | ) | (2,134,273 | ) | (19,667,342 | ) | (2,593,288 | ) | 14,755,084 | ||||||||||||||||||||
|
|
|
|
|
|
|
|
|
|
|
| |||||||||||||||||||
| ON BlackRock Advantage Large Cap Growth | ON Risk Managed Balanced | ON Conservative Model | ||||||||||||||||||||||||||||
| Six-Month Period Ended June 30, 2019 (Unaudited) | Year Ended December 31, 2018 | Six-Month Period Ended June 30, 2019 (Unaudited) | Year Ended December 31, 2018 | Six-Month Period Ended June 30, 2019 (Unaudited) | Year Ended December 31, 2018 | |||||||||||||||||||||||||
Capital shares issued on sales | 1,009,283 | 682,377 | 1,773,786 | 5,049,116 | 653,009 | 1,569,020 | ||||||||||||||||||||||||
Capital shares redeemed | (938,563 | ) | (1,728,342 | ) | (2,615,310 | ) | (4,626,549 | ) | (1,486,302 | ) | (3,300,032 | ) | ||||||||||||||||||
|
|
|
|
|
|
|
|
|
|
|
| |||||||||||||||||||
Net increase/(decrease) | 70,720 | (1,045,965 | ) | (841,524 | ) | 422,567 | (833,293 | ) | (1,731,012 | ) | ||||||||||||||||||||
|
|
|
|
|
|
|
|
|
|
|
| |||||||||||||||||||
| ON Moderately Conservative Model | ON Balanced Model | ON Moderate Growth Model | ||||||||||||||||||||||||||||
| Six-Month Period Ended June 30, 2019 (Unaudited) | Year Ended December 31, 2018 | Six-Month Period Ended June 30, 2019 (Unaudited) | Year Ended December 31, 2018 | Six-Month Period Ended June 30, 2019 (Unaudited) | Year Ended December 31, 2018 | |||||||||||||||||||||||||
Capital shares issued on sales | 670,331 | 1,634,214 | 1,153,832 | 3,043,170 | 1,156,599 | 5,659,528 | ||||||||||||||||||||||||
Capital shares redeemed | (3,897,534 | ) | (8,637,861 | ) | (16,833,170 | ) | (32,518,291 | ) | (27,562,753 | ) | (49,240,271 | ) | ||||||||||||||||||
|
|
|
|
|
|
|
|
|
|
|
| |||||||||||||||||||
Net increase/(decrease) | (3,227,203 | ) | (7,003,647 | ) | (15,679,338 | ) | (29,475,121 | ) | (26,406,154 | ) | (43,580,743 | ) | ||||||||||||||||||
|
|
|
|
|
|
|
|
|
|
|
| |||||||||||||||||||
| ON Growth Model | ||||||||||||||||||||||||||||||
| Six-Month Period Ended June 30, 2019 (Unaudited) | Year Ended December 31, 2018 | |||||||||||||||||||||||||||||
Capital shares issued on sales | 458,686 | 3,385,893 | ||||||||||||||||||||||||||||
Capital shares redeemed | (6,133,891 | ) | (9,165,822 | ) | ||||||||||||||||||||||||||
|
|
|
| |||||||||||||||||||||||||||
Net increase/(decrease) | (5,675,205 | ) | (5,779,929 | ) | ||||||||||||||||||||||||||
|
|
|
| |||||||||||||||||||||||||||
| 170 | (continued) |
| Ohio National Fund, Inc. |
Notes to Financial Statements (Continued) | June 30, 2019 (Unaudited) | |
| (5) | Investment Transactions |
Cost of purchases and proceeds from sales of investments (excluding short-term and government securities) for thesix-month period ended June 30, 2019 were as follows:
| ON Equity | ON Bond | ON BlackRock Balanced Allocation | ON Capital Appreciation | ON International Equity | ||||||
Cost of purchases | $274,819,853 | $44,934,135 | $102,566,200 | $27,244,404 | $ 68,008,319 | |||||
Proceeds from sales | $304,135,070 | $66,927,515 | $107,750,131 | $35,135,074 | $168,382,080 | |||||
| ON Foreign | ON Janus Henderson Forty | ON Janus Henderson Venture | ON Janus Henderson Enterprise | ON S&P 500® Index | ||||||
Cost of purchases | $ 8,252,302 | $64,952,271 | $13,913,359 | $ 5,415,149 | $ 51,014,440 | |||||
Proceeds from sales | $13,259,163 | $59,843,855 | $96,862,143 | $25,464,669 | $173,529,216 | |||||
| ON Federated Strategic Value Dividend | ON Federated High Income Bond | ON ClearBridge Small Cap | ONNasdaq-100® Index | ON BlackRock Advantage Large Cap Core | ||||||
Cost of purchases | $35,633,782 | $18,946,767 | $19,196,720 | $ 6,201,468 | $167,083,911 | |||||
Proceeds from sales | $66,349,557 | $35,801,707 | $46,015,531 | $57,485,621 | $245,141,352 | |||||
| ON BlackRock Advantage Small Cap Growth | ON ICON Balanced | ON S&P MidCap 400® Index | ON BlackRock Advantage Large Cap Growth | ON Risk Managed Balanced | ||||||
Cost of purchases | $110,843,651 | $200,609,207 | $25,444,243 | $151,751,368 | $91,502,980 | |||||
Proceeds from sales | $ 56,983,508 | $246,564,207 | $69,621,425 | $149,430,490 | $85,105,591 | |||||
| ON Conservative Model | ON Moderately Conservative Model | ON Balanced Model | ON Moderate Growth Model | ON Growth Model | ||||||
Cost of purchases | $ 8,249,611 | $16,766,885 | $116,108,663 | $166,599,792 | $29,316,331 | |||||
Proceeds from sales | $16,406,738 | $50,004,801 | $285,458,381 | $459,689,147 | $94,756,757 | |||||
| Cost of purchases and proceeds from sales of government securities for thesix-month period ended June 30, 2019 were as follows: | ||||||||||
| ON Bond | ON BlackRock Balanced Allocation | ON ICON Balanced | ON Risk Managed Balanced | |||||||
Cost of purchases | $2,900,977 | $4,121,180 | $36,639,433 | $66,070,405 | ||||||
Proceeds from sales | $2,912,813 | $4,148,596 | $34,195,254 | $87,820,383 | ||||||
| (6) | Financial Instruments |
The Portfolios may trade in financial instruments withoff-balance sheet risk for hedging purposes or, otherwise, in accordance with stated investing objectives. These financial instruments may include options, futures, and foreign currency contracts that may involve, to a varying degree, elements of risk in excess of the amounts recognized on financial statements.
Options
A Portfolio may buy and write (i.e., sell) call and put options. In writing call options, the Portfolio gives the purchaser of the call option the right to purchase the underlying securities from the Portfolio at a specified “exercise” price at any time prior to the expiration of the option, normally within nine months. A Portfolio writes a covered call option when it owns the underlying securities and an uncovered call option when it does not. In purchasing put options, a Portfolio pays the seller of the put option a premium for the right of the Portfolio to sell the underlying securities to the seller at a specified exercise price prior to the expiration of the option. When a Portfolio sells a put option, it has the obligation to buy, and the purchaser of the put the right to sell, the underlying security at the exercise price during the option period. Whenever a Portfolio has a written covered call option outstanding, the underlying securities will be segregated by the Custodian and held in an escrow account to assure that such securities will be delivered to the option holder if the option is exercised. While the underlying securities are subject to the option, the Portfolio remains the record owner of the securities, entitling it to receive dividends and to exercise any voting rights. Whenever a Portfolio has a written
| 171 | (continued) |
| Ohio National Fund, Inc. |
Notes to Financial Statements (Continued) | June 30, 2019 (Unaudited) | |
uncovered call option outstanding, it will segregate with the Custodian cash or liquid assets that, when added to the amounts deposited with the broker as margin, equal to the market value of the securities underlying the call option (but not less than the exercise price of the call option). To cover a written put option, the Portfolio writing the option deposits cash or liquid securities in a segregated account at the Custodian. In order to terminate its position as the writer or the purchaser of an option, the Portfolio may enter into a “closing” transaction, which is the purchase (if the Portfolio has written the option) or sale (if the Portfolio is the purchaser of the option) of an option on the same underlying securities and having the same exercise price and expiration date as the option previously written or purchased by the Portfolio.
When a Portfolio writes a put or call option, an amount equal to the premium received is included on the Statement of Assets and Liabilities as a liability. The amount of the liability is subsequentlymarked-to-market to reflect the current market value of the option. Such liability is subject to off balance sheet risks to the extent of any future increases in market value of the written options. If an option expires on its stipulated expiration date or if the Portfolio enters into a closing purchase transaction, a gain or loss is realized. If a written call option on an individual security is exercised, a gain or loss is realized for the sale of the underlying security, and the proceeds from the sale are increased by the premium originally received. If a written call option on a securities index is exercised, a gain or loss is realized as determined by the premium originally received, the exercise price and the market value of the index. If a written put option on an individual security is exercised, the cost of the security acquired is decreased by the premium originally received. When a Portfolio purchases a put or call option, an amount equal to the premium paid is included on the Portfolio’s Statement of Assets and Liabilities as an investment, and is subsequentlymarked-to-market to reflect the current market value of the option. If an option expires on the stipulated expiration date or if the Portfolio enters into a closing sale transaction, a gain or loss is realized. If a Portfolio exercises a call option on an individual security, the cost of the security acquired is increased by the premium paid for the call. If the Portfolio exercises a put option on an individual security, a gain or loss is realized from the sale of the underlying security, and the proceeds from such a sale are decreased by the premium originally paid. If the Portfolio exercises a put option on a security index, a gain or loss is realized as determined by the premium originally paid, the exercise price and the market value of the index.
The ON ICON Balanced Portfolio held and purchased put options during thesix-month period ended June 30, 2019. These instruments were used by the Portfolio to provide a hedge against equity price risk. During a period in which the prices of the Portfolio’s common stocks may decline, these instruments are designed to increase in value, thus providing price accumulation gains that partially offset the price accumulation losses of the common stocks in the Portfolio. Transactions involving purchased options by the ON ICON Balanced Portfolio for thesix-month period ended June 30, 2019 were: Cost of purchases: $1.5 million, Expirations: $1.2 million.
The ON Risk Managed Balanced Portfolio also purchased call and put options associated with the S&P 500 Index or related exchange traded fund during thesix-month period ended June 30, 2019. These instruments were used by the Risk Management Component of the Portfolio to provide for the Portfolio’s stated risk management strategy. Transactions involving purchased options by the ON Risk Managed Balanced Portfolio for thesix-month period ended June 30, 2019 were: Cost of purchases: $14.7 million, Proceeds from sales: $13.9 million.
Written and purchased options arenon-income producing securities.
Futures Contracts
A Portfolio may buy or sell two kinds of financial futures contracts: stock index futures contracts and interest rate futures contracts. Stock index futures contracts are contracts developed by and traded on national commodity exchanges whereby the buyer will, on a specified future date, pay or receive a final cash payment equal to the difference between the actual value of the stock index on the last day of the contract and the value of the stock index established by the contract multiplied by the specific dollar amount set by the exchange. Futures contracts may be based on broad-based stock indices such as the S&P 500 Index or on narrow-based stock indices. A particular index will be selected according to the Adviser’s investment strategy for the particular Portfolio. An interest rate futures contract is an agreement whereby one party agrees to sell and another party agrees to purchase a specified amount of a specified financial instrument (debt security) at a specified price at a specified date, time and place. Although interest rate futures contracts typically require actual future delivery of and payment for financial instruments, the contracts are usually closed out before the delivery date. A public market exists in interest rate futures contracts covering primarily the following financial instruments: U.S. Treasury bonds; U.S. Treasury notes; Government National Mortgage Association (“GNMA”) modified pass-through mortgage-backed securities; three-month U.S. Treasury bills;90-day commercial paper; bank certificates of deposit; and Eurodollar certificates of deposit. U.S. futures contracts are traded on exchanges which have been designated “contract markets” by the Commodities Futures Trading Commission (“CFTC”) and must be executed through a futures commission merchant (“FCM”), or brokerage firm, which is a member of the relevant contract market. It is expected that futures contracts trading in additional financial instruments will be authorized.
| 172 | (continued) |
| Ohio National Fund, Inc. |
Notes to Financial Statements (Continued) | June 30, 2019 (Unaudited) | |
The Fund, on behalf of each Portfolio, has filed with the National Futures Association, a notice claiming an exclusion from the definition of the term “commodity pool operator” under the Commodity Exchange Act, as amended, and the rules of the CFTC promulgated thereunder, with respect to each Portfolio’s operation. Accordingly, the Portfolios are not subject to registration or regulation as a commodity pool operator.
The buyer or seller of a futures contract is not required to deliver or pay for the underlying instrument unless the contract is held until the delivery date. However, both the buyer and seller are required to deposit “initial margin” for the benefit of the broker when the contract is entered into. Initial margin deposits are equal to a percentage of the contract’s value, as set by the exchange on which the contract is traded, and are similar to good faith deposits or performance bonds.
Unlike margin extended by a securities broker, initial margin payments do not constitute purchasing securities on margin for purposes of a Portfolio’s investment limitations. A Portfolio, its futures commission merchant and the Custodian retain control of the initial margin until the contract is liquidated. If the value of either party’s position declines, the party on the side of the declining position will be required to make additional “variation margin” payments to settle the change in value on a daily basis. The party that has a gain may be entitled to receive all or a portion of this amount. Variation margin is recognized as a receivable and/or payable for variation margin on futures contracts on the Statement of Assets and Liabilities. In the event of the bankruptcy of the FCM that holds margin on behalf of a Portfolio, the Portfolio may be entitled to return of margin owed to the Portfolio only in proportion to the amount received by the FCM’s other customers. ONI and theSub-Advisers will attempt to minimize this risk by carefully monitoring the creditworthiness of the FCMs with which the Portfolios do business. In addition to the margin restrictions discussed above, transactions in futures contracts and options on futures contracts may involve the segregation of funds pursuant to requirements imposed by the SEC. Under those requirements, where a Portfolio has a long position in a futures contract or sells a put option, it will be required to establish a segregated account (not with an FCM or broker) containing cash or certain liquid assets equal to the purchase price of the contract or the exercise price of the option (less any margin on deposit). For a short position in futures contacts held by a Portfolio or call options sold by a Portfolio, those requirements mandate the establishment of a segregated account (not with a futures commission merchant or broker) containing cash or certain liquid assets that, when added to the amounts deposited as margin, equal the market value of the instruments underlying the futures contracts or call options. However, segregation of assets is not required if a Portfolio “covers” its position.
Portions of certain Portfolios’ cash holdings, as noted on those Portfolios’ Schedules of Investments, were pledged at June 30, 2019 as collateral for the Portfolios’ futures contracts. The futures contracts, except those held by the ON Risk Managed Balanced Portfolio, were used for the purpose of gaining equity exposure for cash and cash equivalents, thereby seeking to lessen a performance difference between the Portfolios and their respective benchmark indices. For the ON Risk Managed Balanced Portfolio, these futures contracts were used by the Portfolio to provide for the Portfolio’s stated risk management strategy. There were other futures contracts executed and closed in the Portfolios during thesix-month period ended June 30, 2019. Those contracts were executed for similar purposes as the contracts outstanding at June 30, 2019. For thesix-month period ended June 30, 2019, the notional values of futures contracts opened and closed prior to contract settlement date by the Portfolios were as follows:
Portfolio | Collateral Pledged | Futures Contracts Opened (in millions) | Futures Contracts Closed (in millions) | |||||||||
ON Equity | Portions of cash holdings | $ | 22.9 | $ | 17.5 | |||||||
ON BlackRock Balanced Allocation | Portions of cash holdings | 3.9 | 3.3 | |||||||||
ON S&P 500®Index | Portions of cash holdings | 158.6 | 164.9 | |||||||||
ONNasdaq-100®Index | Portions of cash holdings | 40.8 | 40.6 | |||||||||
ON BlackRock Advantage Large Cap Core | Portions of cash holdings | 15.2 | 13.8 | |||||||||
ON BlackRock Advantage Small Cap Growth | Portions of cash holdings | 10.2 | 7.9 | |||||||||
ON S&P MidCap 400®Index | Portions of cash holdings | 32.1 | 30.5 | |||||||||
ON BlackRock Advantage Large Cap Growth | Portions of cash holdings | 14.7 | 12.7 | |||||||||
ON Risk Managed Balanced | Portions of securities and cash holdings | 714.0 | 696.4 | |||||||||
| 173 | (continued) |
| Ohio National Fund, Inc. |
Notes to Financial Statements (Continued) | June 30, 2019 (Unaudited) | |
The values and financial statement effects of derivative instruments that were not accounted for as hedging instruments as of, and for, thesix-month period ended June 30, 2019, were as follows:
Portfolio | Instrument | Primary Risk Type | Value- Asset Derivatives | Value- Liability Derivatives | Location on Statements of Assets and Liabilities | |||||||||
ON Equity | Futures contracts | Equity price | $ | 5,446,770 | $ | 5,408,660 | (1) | |||||||
|
|
|
| |||||||||||
ON BlackRock Balanced Allocation | Futures contracts | Equity price | 588,840 | 585,594 | (1) | |||||||||
|
|
|
| |||||||||||
ON S&P 500®Index | Futures contracts | Equity price | 2,796,990 | 2,782,820 | (1) | |||||||||
|
|
|
| |||||||||||
ONNasdaq-100®Index | Futures contracts | Equity price | 1,231,000 | 1,213,284 | (1) | |||||||||
|
|
|
| |||||||||||
ON BlackRock Advantage Large Cap Core | Futures contracts | Equity price | 1,472,100 | 1,452,224 | (1) | |||||||||
|
|
|
| |||||||||||
ON BlackRock Advantage Small Cap Growth | Futures contracts | Equity price | 2,272,295 | 2,238,702 | (1) | |||||||||
|
|
|
| |||||||||||
ON ICON Balanced | Purchased options | Equity price | 45,225 | — | (2) | |||||||||
|
|
|
| |||||||||||
ON S&P MidCap 400®Index | Futures contracts | Equity price | 1,950,000 | 1,914,358 | (1) | |||||||||
|
|
|
| |||||||||||
ON BlackRock Advantage Large Cap Growth | Futures contracts | Equity price | 2,060,940 | 2,038,267 | (1) | |||||||||
|
|
|
| |||||||||||
ON Risk Managed Balanced | Futures contracts | Equity price | 263,497,138 | 257,981,908 | (1) | |||||||||
|
|
|
| |||||||||||
| Purchased options | Equity price | 22,646,001 | — | (2) | ||||||||||
|
|
|
| |||||||||||
| (1) | Total distributable earnings. The amounts represent the cumulative appreciation (depreciation) of these futures contracts as reported in the Statements of Assets and Liabilities. Only the current day’s variation margin, if any, is reported within the Statements of Assets and Liabilities as receivable (payable) for variation margin on futures contracts. |
| (2) | Investments in securities of unaffiliated issuers, at value. |
Portfolio | Instrument | Primary Risk Type | Realized Gain (Loss) on Derivatives Recognized in Income | Change in Unrealized Appreciation/ Depreciation on Derivatives Recognized in Income | Location on Statements of Operations | ||||||||||||||||||||||||
ON Equity | Futures contracts | Equity price | $ | (86,130 | ) | $ | 38,110 | (1),(2) | |||||||||||||||||||||
|
|
|
| ||||||||||||||||||||||||||
ON BlackRock Balanced Allocation | Futures contracts | Equity price | 13,410 | 3,246 | (1),(2) | ||||||||||||||||||||||||
|
|
|
| ||||||||||||||||||||||||||
ON S&P 500®Index | Futures contracts | Equity price | 1,255,967 | (25,930 | ) | (1),(2) | |||||||||||||||||||||||
|
|
|
| ||||||||||||||||||||||||||
ONNasdaq-100®Index | Futures contracts | Equity price | 460,278 | 11,065 | (1),(2) | ||||||||||||||||||||||||
|
|
|
| ||||||||||||||||||||||||||
ON BlackRock Advantage Large Cap Core | Futures contracts | Equity price | 76,759 | 19,876 | (1),(2) | ||||||||||||||||||||||||
|
|
|
| ||||||||||||||||||||||||||
ON BlackRock Advantage Small Cap Growth | Futures contracts | Equity price | 5 | 33,593 | (1),(2) | ||||||||||||||||||||||||
|
|
|
| ||||||||||||||||||||||||||
ON ICON Balanced | Purchased options | Equity price | (1,230,756 | ) | (187,489 | ) | (3),(4) | ||||||||||||||||||||||
|
|
|
| ||||||||||||||||||||||||||
ON S&P MidCap 400®Index | Futures contracts | Equity price | 115,339 | 37,558 | (1),(2) | ||||||||||||||||||||||||
|
|
|
| ||||||||||||||||||||||||||
ON BlackRock Advantage Large Cap Growth | Futures contracts | Equity price | 44,359 | 22,673 | (1),(2) | ||||||||||||||||||||||||
|
|
|
| ||||||||||||||||||||||||||
ON Risk Managed Balanced | Futures contracts | Equity price | 16,511,039 | 2,758,467 | (1),(2) | ||||||||||||||||||||||||
|
|
|
| ||||||||||||||||||||||||||
| Purchased options | Equity price | (2,021,979 | ) | (1,622,891 | ) | (3),(4) | |||||||||||||||||||||||
|
|
|
| ||||||||||||||||||||||||||
| (1) | Net realized gain (loss) on futures contracts. |
| (2) | Change in unrealized appreciation/depreciation on futures contracts. |
| (3) | Net realized gain (loss) on investments in securities of unaffiliated issuers. |
| (4) | Change in unrealized appreciation/depreciation on investments in securities of unaffiliated issuers. |
| 174 | (continued) |
| Ohio National Fund, Inc. |
Notes to Financial Statements (Continued) | June 30, 2019 (Unaudited) | |
The Portfolios may enter into International Swaps and Derivatives Association, Inc. Master Agreements (“ISDA Master Agreement”) or similar agreements with their derivative contract counterparties whereby the Portfolios may, under certain circumstances, offset with the counterparty certain derivative financial instruments’ payables and/or receivables and create one single net payment. For financial reporting purposes, the Portfolios offset derivative assets and liabilities that are subject to netting arrangements in the Statements of Assets and Liabilities. At June 30, 2019, there were no outstanding derivative transactions subject to netting arrangements.
| (7) | Federal Income Tax Information |
The following information is presented on a federal income tax basis. Differences between amounts for financial statements and federal income tax purposes are primarily due to timing and character differences in recognizing certain gains and losses on investment transactions. Permanent differences between financial statement and federal income tax reporting are reclassified within the capital accounts based on their federal income tax treatment. Temporary differences do not require reclassification. Reclassifications related to permanent differences relate principally to consent dividends, foreign currency gains and losses, net investment losses, and distributions from real estate investment trusts and closed end mutual funds.
The cost basis for federal income tax purposes may differ from the cost basis for financial reporting purposes. The table below details the unrealized appreciation (depreciation) and aggregate cost of investments at June 30, 2019 for federal income tax purposes.
| ON Equity | ON Bond | ON BlackRock Balanced Allocation | ON Capital Appreciation | ON International Equity | ON Foreign | |||||||||||||||||||||||||
Gross unrealized: | ||||||||||||||||||||||||||||||
Appreciation | $ | 12,416,585 | $ | 9,839,585 | $ | 3,852,362 | $ | 10,008,111 | $ | 49,953,102 | $ | 2,491,031 | ||||||||||||||||||
Depreciation | (6,248,586 | ) | (765,824 | ) | (1,028,204 | ) | (8,554,658 | ) | (38,611,349 | ) | (8,060,889 | ) | ||||||||||||||||||
|
|
|
|
|
|
|
|
|
|
|
| |||||||||||||||||||
Net unrealized appreciation (depreciation) | $ | 6,167,999 | $ | 9,073,761 | $ | 2,824,158 | $ | 1,453,453 | $ | 11,341,753 | $ | (5,569,858) | ||||||||||||||||||
|
|
|
|
|
|
|
|
|
|
|
| |||||||||||||||||||
Aggregate cost of investments: | $ | 228,187,223 | $ | 247,394,392 | $ | 55,909,538 | $ | 93,659,911 | $ | 466,733,853 | $ | 58,177,948 | ||||||||||||||||||
|
|
|
|
|
|
|
|
|
|
|
| |||||||||||||||||||
| ON Janus Henderson Forty | ON Janus Henderson Venture | ON Janus Henderson Enterprise | ON S&P 500® Index | ON Federated Strategic Value Dividend | ON Federated High Income Bond | |||||||||||||||||||||||||
Gross unrealized: | ||||||||||||||||||||||||||||||
Appreciation | $ | 32,122,541 | $ | 52,167,761 | $ | 17,419,598 | $ | 260,371,901 | $ | 20,182,921 | $ | 4,367,414 | ||||||||||||||||||
Depreciation | (1,908,371 | ) | (8,863,348 | ) | (3,787,365 | ) | (49,422,686 | ) | (27,700,194 | ) | (6,957,787 | ) | ||||||||||||||||||
|
|
|
|
|
|
|
|
|
|
|
| |||||||||||||||||||
Net unrealized appreciation (depreciation) | $ | 30,214,170 | $ | 43,304,413 | $ | 13,632,233 | $ | 210,949,215 | $ | (7,517,273) | $ | (2,590,373) | ||||||||||||||||||
|
|
|
|
|
|
|
|
|
|
|
| |||||||||||||||||||
Aggregate cost of investments: | $ | 162,249,554 | $ | 128,883,927 | $ | 95,778,021 | $ | 955,350,934 | $ | 322,493,376 | $ | 202,034,190 | ||||||||||||||||||
|
|
|
|
|
|
|
|
|
|
|
| |||||||||||||||||||
| ON ClearBridge Small Cap | ON Nasdaq-100® Index | ON BlackRock Advantage Large Cap Core | ON BlackRock Advantage Small Cap Growth | ON ICON Balanced | ON S&P MidCap 400®Index | |||||||||||||||||||||||||
Gross unrealized: | ||||||||||||||||||||||||||||||
Appreciation | $ | 23,020,310 | $ | 81,423,431 | $ | 6,879,411 | $ | 6,278,972 | $ | 58,420,112 | $ | 25,577,156 | ||||||||||||||||||
Depreciation | (16,365,657 | ) | (8,480,061 | ) | (2,876,548 | ) | (5,429,642 | ) | (11,165,851 | ) | (27,344,523 | ) | ||||||||||||||||||
|
|
|
|
|
|
|
|
|
|
|
| |||||||||||||||||||
Net unrealized appreciation (depreciation) | $ | 6,654,653 | $ | 72,943,370 | $ | 4,002,863 | $ | 849,330 | $ | 47,254,261 | $ | (1,767,367) | ||||||||||||||||||
|
|
|
|
|
|
|
|
|
|
|
| |||||||||||||||||||
Aggregate cost of investments: | $ | 116,449,781 | $ | 264,690,974 | $ | 96,201,121 | $ | 83,508,475 | $ | 427,879,315 | $ | 315,921,553 | ||||||||||||||||||
|
|
|
|
|
|
|
|
|
|
|
| |||||||||||||||||||
| 175 | (continued) |
| Ohio National Fund, Inc. |
Notes to Financial Statements (Continued) | June 30, 2019 (Unaudited) | |
| ON BlackRock Advantage Large Cap Growth | ON Risk Managed Balanced | ON Conservative Model | ON Moderately Conservative Model | ON Balanced Model | ON Moderate Growth Model | |||||||||||||||||||||||||
Gross unrealized: | ||||||||||||||||||||||||||||||
Appreciation | $ | 9,737,334 | $ | 59,185,135 | $ | 2,630,091 | $ | 8,558,303 | $ | 43,527,728 | $ | 80,896,103 | ||||||||||||||||||
Depreciation | (2,465,523 | ) | (6,754,699 | ) | (2,920,926 | ) | (15,207,587 | ) | (98,478,418 | ) | (244,509,202 | ) | ||||||||||||||||||
|
|
|
|
|
|
|
|
|
|
|
| |||||||||||||||||||
Net unrealized appreciation (depreciation) | $ | 7,271,811 | $ | 52,430,436 | $ | (290,835 | ) | $ | (6,649,284 | ) | $ | (54,950,690 | ) | $ | (163,613,099 | ) | ||||||||||||||
|
|
|
|
|
|
|
|
|
|
|
| |||||||||||||||||||
Aggregate cost of investments: | $ | 104,215,599 | $ | 342,982,533 | $ | 77,084,953 | $ | 233,864,064 | $ | 1,171,856,586 | $ | 2,109,210,680 | ||||||||||||||||||
|
|
|
|
|
|
|
|
|
|
|
| |||||||||||||||||||
| ON Growth Model | ||||||||||||||||||||||||||||||
Gross unrealized: | ||||||||||||||||||||||||||||||
Appreciation | $ | 20,818,484 | ||||||||||||||||||||||||||||
Depreciation | (60,189,308 | ) | ||||||||||||||||||||||||||||
|
| |||||||||||||||||||||||||||||
Net unrealized appreciation (depreciation) | $ | (39,370,824 | ) | |||||||||||||||||||||||||||
|
| |||||||||||||||||||||||||||||
Aggregate cost of investments: | $ | 470,880,965 | ||||||||||||||||||||||||||||
|
| |||||||||||||||||||||||||||||
| (8) | Legal Matters |
In December 2007, the S&P 500® Index and Strategic Value Portfolios, shareholders of the Tribune Company, participated in a cash out merger in which shareholders received $34 per share of consideration. The value of the proceeds received by the S&P 500® Index and Strategic Value Portfolios was $37,910 and $384,200, respectively. The company subsequently filed for bankruptcy, and several legal complaints have been initiated by groups of Tribune Company creditors seeking to recover, or claw back, proceeds received by shareholders based on fraudulent transfer claims (the “Tribune Bankruptcy”).
The first action, Official Committee of Unsecured Creditors of Tribune Company v. FitzSimons, et. al. (“FitzSimons”) was initiated on November 1, 2010 in the U.S. Bankruptcy Court for the District of Delaware. As a result of these proceedings, the Court agreed to allow individual creditors to file similar complaints in U.S. district courts. The Fund is specifically named in a complaint in the U.S. District Court, Southern District of Ohio, Western Division, Deutsche Bank Trust Company Americas, et. al. v. American Electric Power, et. al., that was initiated in June of 2011. The Fund, along with the Strategic Value Portfolio, is also named in a similar complaint in the U.S. District Court, Eastern District of Pennsylvania, Deutsche Bank Trust Company Americas, et. al. v. Ametek Inc. Employees Master Retirement Trust, et. al. These Tribune litigation actions have been consolidated into a single Multidistrict Litigation (“MDL”)in the U.S. District Court, Southern District of New York (“District Court”).
Thereafter, certain defendants in the MDL, including the Fund, filed various motions to dismiss. The District Court dismissed the creditor actions on September 23, 2013, holding that the plaintiffs could not pursue their claims so long as the Trustee pursued essentially the same claims in his action. On December 20, 2013, the plaintiffs appealed the dismissal to the Second Circuit Court of Appeals. On March 29, 2016, the Court of Appeals affirmed the dismissal and rejected the plaintiffs’ appeal. On September 9, 2016, plaintiffs filed a petition for writ of certiorari in the Supreme Court and the defendants opposed it. The Supreme Court has not yet decided whether to grant certiorari. On April 3, 2018, the Supreme Court issued a “Statement” from two justices announcing that consideration of the petition for certiorari would be deferred for an undetermined period of time to “allow” the Court of Appeals or the District Court to consider, among other things, whether the Court of Appeals’s decision should be vacated as a result of the Supreme Court’s recent decision in Merit Management Group, LP v. FTI Consulting, Inc. On May 15, 2018, the Second Circuit recalled the mandate on its earlier decision for further panel review. The Second Circuit has not yet provided any specific timing for, or guidance on, next steps.
In 2014, various shareholder defendants filed a motion to dismiss the intentional fraudulent transfer claims. On January 9, 2017, the District Court granted the motion to dismiss the Trustee’s actual fraudulent conveyance claim. The plaintiff will almost certainly appeal to the Second Circuit Court of Appeals. Because of a procedural issue, however, the plaintiff cannot automatically appeal the decision, but must first obtain permission from the District Court. On January 14, 2019, the District Court held a status conference during which it indicated that the plaintiff would be allowed to file a motion seeking reconsideration of the prior dismissal of the intentional fraudulent transfer claims. On April 23, 2019, the District Court denied the Trustee’s motion to amend and add federal constructive fraudulent transfer claims. The judge accepted the defendants’ “alternative safe harbor” argument. Procedurally, this cuts off any chance of discovery in the short term. We will now almost certainly see an appeal of both the Trustee’s intentional claims and this new issue.
The outcome of these proceedings cannot be predicted. Management of the Fund continues to assess litigation matters and any offers of settlement.
| 176 |
| Ohio National Fund, Inc. |
| June 30, 2019 (Unaudited) | ||
| (1) | Review and Approval of Advisory andSub-Advisory Agreements |
At a meeting held on January 25, 2019, the Board of Directors, including a majority of the Directors who are not “interested persons” of the Fund (the “Independent Directors”), approvedsub-advisory agreements between Ohio National Investments, Inc. (the “Adviser”) and BlackRock Investment Management, LLC (“BlackRock” or the“Sub-Adviser”) with respect to the ON Omni Portfolio (only the equity portion), the ON Bristol Portfolio, the ON Bristol Growth Portfolio and the ON Bryton Growth Portfolio (collectively, the “Portfolios”) (the“Sub-Advisory Agreements”).
A representative of the Adviser reported that the previoussub-adviser to the Portfolios had notified the Adviser that it was ceasing operations and would no longer be able to manage the Portfolios, and stated that the Adviser is recommending that BlackRock become thesub-adviser for the Portfolios. The Directors then met with representatives of BlackRock to discuss how it intends to manage the Portfolios. The Directors had the opportunity to ask questions that the representatives answered to the Directors satisfaction.
In considering the approval of theSub-Advisory Agreements, the Board requested and reviewed a significant amount of information relating to each Portfolio, including the following: (1) proposed advisory andsub-advisory fee information, including a comparison to existing fees for the Portfolio; (2) comparative advisory fee and expense ratio information for a peer group of funds, as well as advisory fee andsub-advisory fee peer comparison charts showing where each Portfolio’s proposed advisory fee andsub-advisory fee were located in the dispersion of its peer funds’ advisory fees andsub-advisory fees; (3) performance data for a BlackRock fund, or a composite of BlackRock accounts, employing similar strategies to that of the respective Portfolio; (4) estimated Adviser profitability information; and (5) other information regarding the nature, extent and quality of services anticipated to be provided by BlackRock.
The Directors, including all of the Independent Directors, were assisted by experienced independent legal counsel throughout the contract review process. The Independent Directors discussed the proposedSub-Advisory Agreements in private session with such counsel at which no representatives of management, the Adviser or theSub-Adviser were present. The Directors, including all of the Independent Directors, relied upon the advice of independent legal counsel and their own business judgment in determining the material factors to be considered in evaluating eachSub-Advisory Agreement and the weight to be given to each such factor The conclusions reached by the Directors were based on a comprehensive evaluation of all of the information provided and were not the result of any one factor. Moreover, each Director may have afforded different weight to the various factors in reaching his or her conclusions with respect to eachSub-Advisory Agreement.
Nature, Extent and Quality of Services
The Board evaluated the nature, extent and quality of the advisory services anticipated to be provided by theSub-Adviser. As part of its review, the Board reviewed information regarding theSub-Adviser’s operations, procedures and personnel. The Directors considered the capabilities and resources that theSub-Adviser is expected to dedicate to performing services on behalf of the Portfolio, as well as the quality of its administrative and other services. The Directors also considered the quality of the compliance programs of theSub-Adviser, and reviewed information on theSub-Adviser’s portfolio management and brokerage practices, including any soft dollar benefits received. It was the Directors’ conclusion that overall they were satisfied with the nature, extent and quality of services anticipated to be provided to each Portfolio by theSub-Adviser.
Investment Performance
With respect to the ON Bristol Portfolio and the equity portion of the ON Omni Portfolio, the Board considered the performance of a composite of large cap core accounts following a strategy similar to that which BlackRock will use for each Portfolio, relative to that of the Portfolio’s benchmark and Morningstar peer group. The Directors noted that the composite outperformed the benchmark and peer group for the1-,3- and5-year periods ended December 31, 2018 and was in the 4th percentile of its peer group for the5-year period. Based on this performance, the Directors concluded that BlackRock has the ability to manage the ON Bristol Portfolio and the equity portion of the ON OMNI Portfolio effectively going forward.
With respect to the ON Bristol Growth Portfolio, the Board considered the performance of the BlackRock Advantage Large Cap Growth Fund, which utilizes a strategy similar to that of the Portfolio, relative to that of its benchmark and Morningstar peer group. The Directors noted that the only performance information available was for the1-year period ended December 31, 2018, and that the BlackRock Fund had underperformed its benchmark and peer group. They noted, however, that the BlackRock Fund performance was in the 54th percentile of its peer group. Based on this performance, the Directors concluded that BlackRock has the ability to manage the ON Bristol Growth Portfolio effectively going forward.
| 177 | (continued) |
| Ohio National Fund, Inc. |
Additional Information (Continued) | June 30, 2019 (Unaudited) | |
With respect to the ON Bryton Growth Portfolio, the Board considered the performance of the BlackRock Advantage Small Cap Growth Fund, which utilizes a strategy similar to that of the Portfolio, relative to that of its benchmark and Morningstar peer group. The Directors noted that it had outperformed its benchmark and peer group for the1- and3-year periods ended December 31, 2018, but underperformed for the5-year period. The Directors remarked that the BlackRock Fund was in the 45th percentile of its peer group for the1-year period. Based on this performance, the Directors concluded that BlackRock has the ability to manage the ON Bryton Growth Portfolio effectively going forward.
Fees and Expenses, Profitability, & Economies of Scale
The Board reviewed charts showing, for each Portfolio, how the Portfolio’s proposed advisory andsub-advisory fees compared to the advisory andsub-advisory fees of the funds in its peer group. The charts showed the number of funds in the peer group within each defined range of advisory fees orsub-advisory fees, and the range that included the Portfolio. The Directors also noted that the Adviser, and not the Portfolios, is responsible for paying sub advisory fees to theSub-Advisers. The Board also considered the reasonableness of the proposedsub-advisory fees to be paid by the Adviser to theSub-Adviser for each Portfolio. The Directors relied on the ability of the Adviser to negotiate the terms of eachsub-advisory agreement, including thesub-advisory fee, atarm’s-length, noting that the Adviser is not affiliated with theSub-Adviser.
With respect to each Portfolio, the Directors noted that the proposed advisory and subadvisory fees were lower than the current fees. They also noted that the advisory fees payable by each Portfolio were well within the range of fees payable by the Portfolio’s peer group. The Directors remarked that, because thesub-advisory fees were paid by the Adviser and not by a Portfolio, the Adviser was incentivized to negotiate a favorable fee. Accordingly, the cost of services provided by eachSub-Adviser and the profitability of theSub-Adviser in connection with its relationship with the applicable Portfolio were not material factors in the Board’s deliberations. For similar reasons, the Board concluded that the potential realization of economies of scale by the Portfolios from thesub-advisory arrangements with theSub-Advisers should not be a material factor in its deliberations.
After consideration of the foregoing, the Board reached the following conclusions regarding the proposedSub-Advisory Agreements, in addition to the conclusions set forth above: (a) theSub-Adviser possesses the capability and resources to perform the duties required of it under theSub-Advisory Agreements; (b) the investment philosophy, strategies and techniques of the Adviser are appropriate for pursuing the applicable Portfolio’s investment objective; (c) theSub-Adviser is likely to execute its investment philosophy, strategies and techniques consistently over time; and (d) theSub-Adviser maintains appropriate compliance programs. Based on all of the above-mentioned factors and their related conclusions, with no single factor or conclusion being determinative and with each Director not necessarily attributing the same weight to each factor, the Directors unanimously approved theSub-Advisory Agreements.
At a meeting held on February 21, 2019, the Board of Directors (the “Board” or “Directors”), including a majority of the Directors who are not “interested persons” of the Fund (the “Independent Directors”), approved theSub-Advisory Agreement between the Adviser andSub-Adviser, with respect to the ON Equity Portfolio (the “Portfolio”). A representative of the Adviser stated the Adviser was recommending that BlackRock become thesub-adviser for the Portfolio and that the Portfolio’s investment strategy be changed to the strategy BlackRock is using for the Fund’s ON BlackRock Advantage Large Cap Core Portfolio (formerly the Fund’s ON Bristol Portfolio). The representative reminded the Directors that they had met with representatives of BlackRock to discuss how it intended to manage the ON BlackRock Advantage Large Cap Core Portfolio at the January 25, 2019 meeting and that they had the opportunity to ask questions that the representatives answered to the Directors’ satisfaction.
In considering the approval of theSub-Advisory Agreement, the Board requested and reviewed a significant amount of information relating to the Portfolio, including the following: (1) proposed advisory andsub-advisory fee information, including a comparison to existing fees for the Portfolio; (2) comparative advisory fee and expense ratio information for a peer group of funds, as well as advisory fee andsub-advisory fee peer comparison charts showing where the Portfolio’s proposed advisory fee andsub-advisory fee were located in the dispersion of its peer funds’ advisory fees andsub-advisory fees; (3) performance data for a composite of BlackRock accounts employing similar strategies to that of the Portfolio; (4) other information regarding the nature, extent and quality of services anticipated to be provided by BlackRock.
The Directors, including all of the Independent Directors, were assisted by experienced independent legal counsel throughout the contract review process. The Independent Directors discussed the proposedSub-Advisory Agreement in private session with such counsel at which no representatives of management, the Adviser or theSub-Adviser were present. The Directors, including all of the Independent Directors, relied upon the advice of independent legal counsel and their own business judgment in determining the material factors to be considered in evaluating theSub-Advisory Agreement and the weight to be given to each such factor. The conclusions reached by the Directors were based on a comprehensive evaluation of all of the information provided and were not the result of any one factor. Moreover, each Director may have afforded different weight to the various factors in reaching his or her conclusions with respect to theSub-Advisory Agreement.
| 178 | (continued) |
| Ohio National Fund, Inc. |
Additional Information (Continued) | June 30, 2019 (Unaudited) | |
Nature, Extent and Quality of Services
The Board evaluated the nature, extent and quality of the advisory services anticipated to be provided by theSub-Adviser. As part of its review, the Board reviewed information regarding theSub-Adviser’s operations, procedures and personnel. The Directors considered the capabilities and resources that theSub-Adviser is expected to dedicate to performing services on behalf of the Portfolio, as well as the quality of its administrative and other services. The Directors also considered the quality of the compliance programs of theSub-Adviser, and reviewed information on theSub-Adviser’s portfolio management and brokerage practices, including any soft dollar benefits received. It was the Directors’ conclusion that overall they were satisfied with the nature, extent and quality of services anticipated to be provided to the Portfolio by theSub-Adviser
Investment Performance
The Board considered the performance of a composite of large cap core accounts following a strategy similar to that which BlackRock will use for the Portfolio, relative to that of the Portfolio’s benchmark and Morningstar peer group. The Directors noted that the composite outperformed the benchmark and peer group for the1-,3- and5-year periods ended December 31, 2018 and was in the 4th percentile of its peer group for the5-year period. Based on this performance, the Directors concluded that BlackRock has the ability to manage the Portfolio effectively going forward
Fees and Expenses, Profitability, & Economies of Scale
The Board reviewed charts showing how the Portfolio’s proposed advisory andsub-advisory fees compared to the advisory andsub-advisory fees of the funds in its peer group. The charts showed the number of funds in the peer group within each defined range of advisory fees orsub-advisory fees, and the range that included the Portfolio. The Directors also noted that the Adviser, and not the Portfolio, is responsible for payingsub-advisory fees to theSub-Adviser. The Board also considered the reasonableness of the proposedsub-advisory fees to be paid by the Adviser to theSub-Adviser for the Portfolio. The Directors relied on the ability of the Adviser to negotiate the terms of theSub-Advisory Agreement, including thesub-advisory fee, atarm’s-length, noting that the Adviser is not affiliated with theSub-Adviser.
The Directors noted that the proposed advisory andsub-advisory fees were lower than the current fees. They also noted that the advisory fees payable by the Portfolio were well within the range of fees payable by the Portfolio’s peer group.
The Directors remarked that, because thesub-advisory fees were paid by the Adviser and not by the Portfolio, the Adviser was incentivized to negotiate a favorable fee. Accordingly, the cost of services provided by theSub-Adviser and the profitability of theSub-Adviser in connection with its relationship with the Portfolio were not material factors in the Board’s deliberations. For similar reasons, the Board concluded that the potential realization of economies of scale by the Portfolio from thesub-advisory arrangements with theSub-Adviser should not be a material factor in its deliberations.
After consideration of the foregoing, the Board reached the following conclusions regarding the proposedSub-Advisory Agreement, in addition to the conclusions set forth above: (a) theSub-Adviser possesses the capability and resources to perform the duties required of it under theSub-Advisory Agreement; (b) the investment philosophy, strategies and techniques of the Adviser are appropriate for pursuing the Portfolio’s investment objective; (c) theSub-Adviser is likely to execute its investment philosophy strategies and techniques consistently over time; and (d) theSub-Adviser maintains appropriate compliance programs. Based on all of the above-mentioned factors and their related conclusions, with no single factor or conclusion being determinative and with each Director not necessarily attributing the same weight to each factor, the Directors unanimously approved theSub-Advisory Agreement.
| (2) | Expense Disclosure |
An individual may not buy or own membership interests of the Fund directly. An individual acquires an indirect interest in the Fund by purchasing a variable annuity contract or variable insurance policy and allocating premiums or purchase payments to Fund Portfolios available through the separate accounts of ONLIC, ONLAC, and NSLA. Separate accounts of these entities are the shareholders of the Fund.
As a shareholder of the Fund, a separate account incurs ongoing costs, including management fees and other Fund expenses. This example is intended to help a policy/contract owner understand ongoing costs (in dollars) associated with the underlying investment in the Portfolios by the separate account shareholder and to compare these costs with the ongoing costs associated with investing in other mutual funds.
The example is based on an investment of $1,000 invested at January 1, 2019 and held through June 30, 2019.
| 179 | (continued) |
| Ohio National Fund, Inc. |
Additional Information (Continued) | June 30, 2019 (Unaudited) | |
Actual Expenses
The table below provides information about investment values and actual expenses associated with each Portfolio of the Fund. The information below, together with the amount of an underlying investment, can be used to estimate expenses paid over the period. An estimate can be obtained by simply dividing an underlying investment value by $1,000 (for example, an $8,600 investment value divided by $1,000 = 8.6), then multiplying the result by the number in the table under the heading entitled “Expenses Paid During Period”.
Portfolio | Beginning Investment Value 1/1/2019 | Ending Investment Value 6/30/2019 | Expenses Paid During Period* 1/1/2019 – 6/30/2019 | Expense Ratio During Period 1/1/2019 – 6/30/2019 (Annualized) | ||||||||||||||||
ON Equity | $ | 1,000.00 | $ | 1,199.90 | $ | 4.36 | 0.80 | % | ||||||||||||
ON Bond | $ | 1,000.00 | $ | 1,104.00 | $ | 3.18 | 0.61 | % | ||||||||||||
ON BlackRock Balanced Allocation | $ | 1,000.00 | $ | 1,203.20 | $ | 4.32 | 0.79 | % | ||||||||||||
ON Capital Appreciation | $ | 1,000.00 | $ | 1,143.70 | $ | 4.84 | 0.91 | % | ||||||||||||
ON International Equity | $ | 1,000.00 | $ | 1,155.30 | $ | 4.65 | 0.87 | % | ||||||||||||
ON Foreign | $ | 1,000.00 | $ | 1,069.90 | $ | 6.67 | 1.30 | % | ||||||||||||
ON Janus Henderson Forty | $ | 1,000.00 | $ | 1,228.90 | $ | 4.64 | 0.84 | % | ||||||||||||
ON Janus Henderson Venture | $ | 1,000.00 | $ | 1,241.50 | $ | 4.95 | 0.89 | % | ||||||||||||
ON Janus Henderson Enterprise | $ | 1,000.00 | $ | 1,269.00 | $ | 5.46 | 0.97 | % | ||||||||||||
ON S&P 500®Index | $ | 1,000.00 | $ | 1,182.90 | $ | 2.16 | 0.40 | % | ||||||||||||
ON Federated Strategic Value Dividend | $ | 1,000.00 | $ | 1,103.20 | $ | 4.07 | 0.78 | % | ||||||||||||
ON Federated High Income Bond | $ | 1,000.00 | $ | 1,104.10 | $ | 4.17 | 0.80 | % | ||||||||||||
ON ClearBridge Small Cap | $ | 1,000.00 | $ | 1,206.50 | $ | 5.14 | 0.94 | % | ||||||||||||
ONNasdaq-100®Index | $ | 1,000.00 | $ | 1,216.30 | $ | 2.36 | 0.43 | % | ||||||||||||
ON BlackRock Advantage Large Cap Core | $ | 1,000.00 | $ | 1,229.90 | $ | 4.31 | 0.78 | % | ||||||||||||
ON BlackRock Advantage Small Cap Growth | $ | 1,000.00 | $ | 1,229.50 | $ | 5.36 | 0.97 | % | ||||||||||||
ON ICON Balanced | $ | 1,000.00 | $ | 1,145.70 | $ | 3.56 | 0.67 | % | ||||||||||||
ON S&P MidCap 400®Index | $ | 1,000.00 | $ | 1,176.60 | $ | 2.54 | 0.47 | % | ||||||||||||
ON BlackRock Advantage Large Cap Growth | $ | 1,000.00 | $ | 1,258.90 | $ | 4.54 | 0.81 | % | ||||||||||||
ON Risk Managed Balanced | $ | 1,000.00 | $ | 1,148.70 | $ | 5.33 | 1.00 | % | ||||||||||||
ON Conservative Model | $ | 1,000.00 | $ | 1,089.10 | $ | 1.24 | 0.24 | % | ||||||||||||
ON Moderately Conservative Model | $ | 1,000.00 | $ | 1,111.00 | $ | 1.67 | 0.32 | % | ||||||||||||
ON Balanced Model | $ | 1,000.00 | $ | 1,127.40 | $ | 1.85 | 0.35 | % | ||||||||||||
ON Moderate Growth Model | $ | 1,000.00 | $ | 1,155.10 | $ | 2.24 | 0.42 | % | ||||||||||||
ON Growth Model | $ | 1,000.00 | $ | 1,172.40 | $ | 2.37 | 0.44 | % | ||||||||||||
Hypothetical Example for Comparison Purposes |
| |||||||||||||||||||
The table below provides information about hypothetical investment values and hypothetical expenses based on each respective Portfolio’s actual expense ratio and an assumed rate of return of 5% per year before expenses, which is not an actual return. The hypothetical investment values and expenses may not be used to estimate the actual ending investment balance or expenses actually paid for the period by the shareholders. A policy/contract holder may use this information to compare this 5% hypothetical example with the 5% hypothetical examples that appear in the shareholder reports of other funds. |
| |||||||||||||||||||
Portfolio | Beginning Investment Value 1/1/2019 | Ending Investment Value 6/30/2019 | Expenses Paid During Period* 1/1/2019 – 6/30/2019 | Expense Ratio During Period 1/1/2019 – 6/30/2019 (Annualized) | ||||||||||||||||
ON Equity | $ | 1,000.00 | $ | 1,020.83 | $ | 4.01 | 0.80 | % | ||||||||||||
ON Bond | $ | 1,000.00 | $ | 1,021.77 | $ | 3.06 | 0.61 | % | ||||||||||||
ON BlackRock Balanced Allocation | $ | 1,000.00 | $ | 1,020.88 | $ | 3.96 | 0.79 | % | ||||||||||||
ON Capital Appreciation | $ | 1,000.00 | $ | 1,020.28 | $ | 4.56 | 0.91 | % | ||||||||||||
ON International Equity | $ | 1,000.00 | $ | 1,020.48 | $ | 4.36 | 0.87 | % | ||||||||||||
ON Foreign | $ | 1,000.00 | $ | 1,018.35 | $ | 6.51 | 1.30 | % | ||||||||||||
ON Janus Henderson Forty | $ | 1,000.00 | $ | 1,020.63 | $ | 4.21 | 0.84 | % | ||||||||||||
ON Janus Henderson Venture | $ | 1,000.00 | $ | 1,020.38 | $ | 4.46 | 0.89 | % | ||||||||||||
ON Janus Henderson Enterprise | $ | 1,000.00 | $ | 1,019.98 | $ | 4.86 | 0.97 | % | ||||||||||||
| 180 | (continued) |
| Ohio National Fund, Inc. |
Additional Information (Continued) | June 30, 2019 (Unaudited) | |
Portfolio | Beginning Investment Value 1/1/2019 | Ending Investment Value 6/30/2019 | Expenses Paid During Period* 1/1/2019 – 6/30/2019 | Expense Ratio During Period 1/1/2019 – 6/30/2019 (Annualized) | ||||||||||||||||||
ON S&P 500®Index | $ | 1,000.00 | $ | 1,022.81 | $ | 2.01 | 0.40 | % | ||||||||||||||
ON Federated Strategic Value Dividend | $ | 1,000.00 | $ | 1,020.93 | $ | 3.91 | 0.78 | % | ||||||||||||||
ON Federated High Income Bond | $ | 1,000.00 | $ | 1,020.83 | $ | 4.01 | 0.80 | % | ||||||||||||||
ON ClearBridge Small Cap | $ | 1,000.00 | $ | 1,020.13 | $ | 4.71 | 0.94 | % | ||||||||||||||
ONNasdaq-100®Index | $ | 1,000.00 | $ | 1,022.66 | $ | 2.16 | 0.43 | % | ||||||||||||||
ON BlackRock Advantage Large Cap Core | $ | 1,000.00 | $ | 1,020.93 | $ | 3.91 | 0.78 | % | ||||||||||||||
ON BlackRock Advantage Small Cap Growth | $ | 1,000.00 | $ | 1,019.98 | $ | 4.86 | 0.97 | % | ||||||||||||||
ON ICON Balanced | $ | 1,000.00 | $ | 1,021.47 | $ | 3.36 | 0.67 | % | ||||||||||||||
ON S&P MidCap 400®Index | $ | 1,000.00 | $ | 1,022.46 | $ | 2.36 | 0.47 | % | ||||||||||||||
ON BlackRock Advantage Large Cap Growth | $ | 1,000.00 | $ | 1,020.78 | $ | 4.06 | 0.81 | % | ||||||||||||||
ON Risk Managed Balanced | $ | 1,000.00 | $ | 1,019.84 | $ | 5.01 | 1.00 | % | ||||||||||||||
ON Conservative Model | $ | 1,000.00 | $ | 1,023.60 | $ | 1.20 | 0.24 | % | ||||||||||||||
ON Moderately Conservative Model | $ | 1,000.00 | $ | 1,023.21 | $ | 1.61 | 0.32 | % | ||||||||||||||
ON Balanced Model | $ | 1,000.00 | $ | 1,023.06 | $ | 1.76 | 0.35 | % | ||||||||||||||
ON Moderate Growth Model | $ | 1,000.00 | $ | 1,022.71 | $ | 2.11 | 0.42 | % | ||||||||||||||
ON Growth Model | $ | 1,000.00 | $ | 1,022.61 | $ | 2.21 | 0.44 | % | ||||||||||||||
| * | Expenses are equal to the average account value times the Fund’s annualized expense ratio multiplied by the number of days in the most recent fiscal half-year (181 days) divided by the number of days in the fiscal year (365 days). Please note that the expenses shown in these tables are meant to highlight ongoing Fund costs only and do not reflect any contract-level expenses or Fund transactional costs, such as sales charges (loads) or exchange fees (if any). Therefore, these tables are useful in comparing ongoing fund costs only, and will not fully assist a policy/contract owner in determining the relative total expenses of different funds. In addition, if transactional costs were included, costs may have been higher for these Portfolios as well as for a fund being compared. |
| (3) | Other Disclosures |
The Statement of Additional Information of the Fund includes additional information about the the Board and is available athttp://www.ohionationalfund.com or upon request, without charge, by calling877-781-6392 (toll-free).
A description of the policies and procedures that the Fund uses in voting proxies relating to Fund securities, as well as information regarding how the Fund voted proxies during the most recent twelve-month period ended June 30, is available without charge, upon request, by calling877-781-6392 (toll-free) and on the SEC’s website athttp://www.sec.gov.
The Fund has filed its Schedules of Investments as of March 31 and September 30 with the SEC, as required, on FormN-Port Part F. FormN-Port Part F is required to be filed with the SEC for the first and third quarters of each fiscal year with in sixty days after the end of each period and is available on the SEC website upon acceptance of each submission. The Fund’s FormsN-Port Part Fs may be reviewed and copied at the SEC’s Public Reference Room in Washington, DC. Information about the Public Reference Room is available by calling1-800-SEC-0330 (toll-free).
This report and the financial statements contained herein are submitted for the general information of the shareholders of the Fund. This report is not authorized for distribution to prospective investors in the Fund unless preceded or accompanied by an effective prospectus of the Fund. For a prospectus containing more complete information, including charges and expenses, please contact Ohio National Investments, Inc., One Financial Way, Cincinnati, OH 45242, telephone877-781-6392 (toll-free).
| 181 |
| Ohio National Fund, Inc. |
| June 30, 2019 (Unaudited) | ||
| Name and Address | Age | Position(s) with the Fund | Term of Office and Length of Time Served | Number of Portfolios in the Fund to be Overseen by Director | Principal Occupation(s) During Past Five Years and Other Directorships | |||||
| Independent Directors | ||||||||||
George M. Vredeveld One Financial Way Cincinnati, Ohio | 76 | Director, Member of Audit and Independent Directors Committees | Indefinite; Since March 1996 | 25 | Professor Emeritus, Finance: University of Cincinnati (January 2014 - present); Research Fellow and Member of Academic Council: Varna Free University, Varna, Bulgaria (2012 - present); Alpaugh Professor of Economics: Lindner College of Business, University of Cincinnati (2004 - 2013); Founder/President: Economics Center at the University of Cincinnati (1977 - 2012). | |||||
Madeleine W. Ludlow One Financial Way Cincinnati, Ohio | 64 | Director, Chairman of Audit Committee and Member of Independent Directors Committee | Indefinite; Since April 2012 | 25 | Founder/Managing Director: West Capital Partners LLC (2010 - present), Ludlow Ward Capital Advisors LLC (2005 - 2009); Director: ALLETE, Inc. | |||||
Geoffrey Keenan One Financial Way Cincinnati, Ohio | 60 | Lead Independent Director, Member of Audit and Independent Directors Committees | Indefinite; Since January 2015 | 25 | Executive Vice President and Chief Operating Officer: Gateway Investment Advisers, LLC (1995 - 2013). | |||||
Lawrence L. Grypp One Financial Way Cincinnati, Ohio | 70 | Director, Member of Audit and Independent Directors Committees | Indefinite; Since December 2016 | 25 | Senior Business Advisor and Board Member: Goering Center for Family and Private Business (January 2018 - Present); President: Goering Center for Family and Private Business (August 2008 - December 2017). | |||||
| Interested Director | ||||||||||
John J. Palmer One Financial Way Cincinnati, Ohio | 79 | Chairman and Director | Indefinite; Since July 1997 | 25 | Insurance industry consultant (April 2010 - present), President: Ohio National Fund, Inc. (1997 - 2010); Director and Vice Chairman: ONLIC (1997 - 2010); President and CEO: NSLA (2002 - 2010); Director: NSLA. | |||||
| Officers | ||||||||||
Michael J. DeWeirdt One Financial Way Cincinnati, Ohio | 60 | President | Indefinite; Since March 2017 | Senior Vice President and Chief Product Officer: ONLIC (September 2018 -Present); President: NSLAC (May 2016 - Present); Senior Vice President and Head of Annuities SBU: ONLIC (January 2016 - September 2018); Senior Vice President, Chief Risk Officer: ONLIC (September 2015 - December 2015); Senior Vice President, Capital and Financial Risk Management: ONLIC (December 2012 - September 2015) | ||||||
Paul J. Gerard One Financial Way Cincinnati, Ohio | 59 | Vice President | Indefinite; Since March 2016 | �� | Senior Vice President and Chief Investment Officer: ONLIC and NSLA (January 2016 - present); Senior Vice President, Investments: ONLIC (July 2012 - December 2015) | |||||
| 182 |
| Ohio National Fund, Inc. |
Information about Directors and Officers (Continued) | June 30, 2019 (Unaudited) | |
| Name and Address | Age | Position(s) with the Fund | Term of Office and Length of Time Served | Number of Portfolios in the Fund to be Overseen by Director | Principal Occupation(s) During Past Five Years and Other Directorships | |||||
R. Todd Brockman One Financial Way Cincinnati, Ohio | 50 | Treasurer | Indefinite; Since August 2004 | Vice President, Mutual Funds: ONLIC and NSLA (February 2014 - present); Treasurer: ONI. | ||||||
Kimberly A. Plante One Financial Way Cincinnati, Ohio | 45 | Secretary | Indefinite; Since March 2005 | Vice President and Counsel: ONLIC (November 2017 - present); Second Vice President and Counsel: ONLIC (January 2016 - November 2017); Senior Associate Counsel: ONLIC (January 2011 - January 2016); Secretary: ONI; Officer of various other Ohio National-affiliated companies. | ||||||
Keith Dwyer One Financial Way Cincinnati, Ohio | 46 | Chief Compliance Officer | Indefinite; Since August 2016 | Second Vice President, Fund Compliance: ONLIC (August 2016 -present); Director, Fund Compliance: ONLIC (January 2015 - August 2016); Administrator, Fund Compliance: ONLIC (January 2014 - January 2015); Chief Compliance Officer: ONI and other Ohio National-affiliated companies (August 2016 - present); Chief Compliance Officer: Fiduciary Capital Management (“FCM”) (August 2016 - December 2017); Chief Compliance Officer: Suffolk (August 2016 - December 2016); Interim Chief Compliance Officer: ONI, Suffolk, FCM and other Ohio National-affiliated companies (November 2015 - August 2016). | ||||||
Daniel P. Leming One Financial Way Cincinnati, Ohio | 34 | Assistant Treasurer | Indefinite; Since March 2016 | Director, Fund Operations and Analysis: ONLIC (July 2018 -present); Assistant Director, Fund Operations and Analysis: ONLIC (December 2016 - June 2018); Manager, Fund Operations and Analysis: ONLIC (February 2016 - December 2016); Sr. Mutual Fund Reporting & Operations Analyst: ONLIC (May 2012 - February 2016). | ||||||
| 183 |
Ohio National Fund, Inc.
Post Office Box 371
Cincinnati, Ohio 45201
Form 1325 Rev.8-19
| Item 2. | Code Of Ethics. |
Not applicable for semiannual reports.
| Item 3. | Audit Committee Financial Expert. |
Not applicable for semiannual reports.
| Item 4. | Principal Accountant Fees And Services. |
Not applicable for semiannual reports.
| Item 5. | Audit Committee Of Listed Registrants. |
Not applicable for semiannual reports.
| Item 6. | Investments. |
Not applicable, as the schedules are included as part of the report to shareholders filed under Item 1.
| Item 7. | Disclosure Of Proxy Voting Policies And Procedures ForClosed-End Management Investment Companies. |
Not applicable foropen-end investment companies.
| Item 8. | Portfolio Managers ofClosed-End Management Investment Companies. |
Not applicable foropen-end investment companies.
| Item 9. | Purchases of Equity Securities byClosed-End Management Investment Company and Affiliated Purchasers. |
Not applicable foropen-end investment companies.
| Item 10. | Submission of Matters to a Vote of Security Holders. |
There were no material changes to the procedures by which shareholders may recommend nominees to the Fund’s Board of Directors.
| Item 11. | Controls and Procedures. |
| (a) | The Fund’s principal executive officer and principal financial officer have concluded, based on their evaluation conducted as of a date within the most recent fiscal half-year of the filing of this report, that the Fund’s disclosure controls and procedures are adequately designed and are operating effectively to ensure (i) that material information relating to the Fund, including its consolidated subsidiaries, is made known to them by others within those entities, particularly during the period in which this report is being prepared; and (ii) that information required to be disclosed by the Fund on FormN-CSR is recorded, processed, summarized and reported within the time periods specified in the Securities and Exchange Commission’s rules and forms. |
| (b) | There were no changes in the Fund’s internal control over financial reporting that occurred during the most recent fiscal half-year covered by this report that have materially affected, or are reasonably likely to materially affect, the Fund’s internal control over financial reporting. |
| Item 12. | Disclosure of Securities Lending Activities forClosed-End Management Investment Companies. |
Not Applicable.
| Item 13. | Exhibits. |
| (a)(1) | Not applicable for semiannual reports. |
| (a)(2) | A separate certification for each principal executive officer and principal financial officer of the Fund as required by Rule30a-2(a) under the Investment Company Act of 1940 (17 CFR270.30a-2(a)) is attached hereto asEX-99.CERT. |
SIGNATURES
Pursuant to the requirements of the Securities Exchange Act of 1934 and the Investment Company Act of 1940, the registrant has duly caused this report to be signed on its behalf by the undersigned, thereunto duly authorized.
| Ohio National Fund, Inc. | ||
| By: | /s/ Michael J. DeWeirdt | |
| Michael J. DeWeirdt | ||
| President | ||
| (Principal Executive Officer) | ||
| September 3, 2019 | ||
Pursuant to the requirements of the Securities Exchange Act of 1934 and the Investment Company Act of 1940, this report has been signed below by the following persons on behalf of the registrant and in the capacities and on the dates indicated.
| Ohio National Fund, Inc. | ||
| By: | /s/ Michael J. DeWeirdt | |
| Michael J. DeWeirdt | ||
| President | ||
| (Principal Executive Officer) | ||
| September 3, 2019 | ||
| By: | /s/ R. Todd Brockman | |
| R. Todd Brockman | ||
| Treasurer | ||
| (Principal Financial Officer) | ||
| September 3, 2019 | ||