UNITED STATES
SECURITIES AND EXCHANGE COMMISSION
Washington, D.C. 20549
FORM N-CSR
CERTIFIED SHAREHOLDER REPORT OF REGISTERED
MANAGEMENT INVESTMENT COMPANIES
Investment Company Act file number 811-03015
Ohio National Fund, Inc.
(Exact name of registrant as specified in charter)
| One Financial Way, Cincinnati, Ohio | 45242 | |
| ||
| (Address of principal executive offices) | (Zip code) | |
CT Corporation 300 E. Lombard St. Suite 1400 Baltimore, MD 21202
(Name and address of agent for service)
Registrant’s telephone number, including area code: 513-794-6971
Date of fiscal year end: December 31
Date of reporting period: June 30, 2016
Form N-CSR is to be used by management investment companies to file reports with the Commission not later than 10 days after the transmission to stockholders of any report that is required to be transmitted to stockholders under Rule 30e-1 under the Investment Company Act of 1940 (17 CFR 270.30e-1). The Commission may use the information provided on Form N-CSR in its regulatory, disclosure review, inspection, and policymaking roles.
A registrant is required to disclose the information specified by Form N-CSR, and the Commission will make this information public. A registrant is not required to respond to the collection of information contained in Form N-CSR unless the Form displays a currently valid Office of Management and Budget (“OMB”) control number. Please direct comments concerning the accuracy of the information collection burden estimate and any suggestions for reducing the burden to Secretary, Securities and Exchange Commission, 450 Fifth Street, NW, Washington, DC 20549-0609. The OMB has reviewed this collection of information under the clearance requirements of 44 U.S.C. § 3507.
| Item 1. | Reports To Stockholders. |

Ohio National Fund, Inc.
SEMIANNUAL REPORT JUNE 30, 2016
OHIO NATIONAL FUND, INC.
| 1 | ||||
| 3 | ||||
The following pages contain Performance, Management’s Comments, Change in Value of $10,000 Investment, Portfolio Composition, Top Holdings, and Schedule of Investments (Unaudited) for each of the Fund’s Portfolios: | ||||
| 4 | ||||
| 8 | ||||
| 13 | ||||
| 19 | ||||
| 23 | ||||
| 29 | ||||
| 35 | ||||
| 40 | ||||
| 45 | ||||
| 49 | ||||
| 56 | ||||
| 59 | ||||
| 69 | ||||
| 74 | ||||
| 78 | ||||
| 81 | ||||
| 84 | ||||
| 91 | ||||
| 95 | ||||
| 98 | ||||
| 110 | ||||
| 113 | ||||
| 116 | ||||
| 121 | ||||
| 131 | ||||
| 154 | ||||
| 157 | ||||
Message |  |
Dear Investor:
The first half of 2016 proved to be a good period for the performance of financial assets. Domestic equities generally posted positive returns, while the fixed income market produced excellent returns. With the exception of a sell-off early in the first quarter on weak commodity prices, and a brief negative reaction to the Brexit vote, domestic equity markets have performed well. Dividend stocks outperformed growth stocks, as the search for yield impacted the equity markets, as well as the fixed income markets. Foreign equity markets did not perform as well, as sluggish growth and the lack of inflation continue to plague many of those markets.
The U.S. economy remained sluggish during the first half of 2016, with 0.8 percent Gross Domestic Product (GDP) growth in the first quarter and 1.2 percent GDP growth during the second quarter. Labor markets have tightened, with the unemployment rate dropping below 5.0 percent for the first time since 2008. Commodity prices stabilized and rallied during the second quarter of the year, which provides some anecdotal evidence that the slowdown in worldwide growth may be ebbing. Central banks in Europe and Asia continue to provide monetary stimulus, which has caused interest rates to decline around the world. The secondary effects of central bank intervention are driving interest rates, corporate bond spreads, foreign exchange rates and the equity markets. These forces do not seem to be diminishing, notwithstanding the Federal Reserve’s desire to normalize short-term interest rates.
On the negative side, corporate profits have declined and equity valuations are somewhat high. Interest rates are near all-time lows, which won’t last forever if central bankers ultimately achieve their objectives. The Federal Reserve has indicated that it would like to raise interest
rates, but economic data has been below expectations, forcing the Fed to defer rate hikes.
Equity Markets
During the first two quarters of 2016, returns varied significantly among different sectors of the equity market. For example, large cap stocks, as measured by the Standard & Poor’s 500® Index, provided a total return of 3.84 percent, while midcap stocks, as measured by the Standard & Poor’s Midcap 400® Index, provided a total return of 7.93 percent. However, large cap growth stocks, as measured by the Dow Jones U.S. Large-Cap Growth Total Stock Market Index, provided a negative total return of 0.72 percent and international equities, as measured by the MSCI All Country World ex-U.S. Index, provided a negative total return of 0.68 percent in U.S. dollar terms. These varied results illustrate the need for a well-diversified portfolio, as not all stocks perform similarly during a given period.
Fixed Income Markets
Fixed income markets performed well during the first half of 2016. Interest rates declined worldwide, and the U.S. was no exception. The yield on the 10-year U.S. Treasury note dropped from 2.27 percent to 1.47 percent during the period. Lower rates, combined with the continued stretch for yield, provided the ingredients for very strong returns in the fixed income market. The Barclays Capital U.S. Aggregate Bond Index provided a return of 5.31 percent for the period. Within the various sectors of the index, corporate bonds performed the best, with a return of 7.68 percent, as spreads tightened. Securitized bonds performed the worst with a return of 3.26 percent, primarily due to their shorter duration and prepayment characteristics.
| 1 |
Worldwide growth remains sluggish, and inflation has not returned to most developed economies. Central bankers worldwide continue to pursue accommodative monetary policies in an attempt to increase economic growth and spur inflation. To date, these policies have been largely ineffective in countries like Japan, and collectively, in Europe. In the U.S., success has been moderate, at best. The combination of these factors has led to lower interest rates globally, with 10-year government bond yields moving into negative territory in Japan, Germany, and Switzerland. Given the relative stability and growth in the U.S., it is not surprising that capital is flowing into the U.S. fixed income market, driving interest rates and spreads lower.
Ohio National Fund, Inc.
With the financial markets generally performing well during the first half of 2016, the collective funds offered through the Ohio National Fund, Inc. performed in line with the market. Both index funds tracked their respective indexes very closely. Of the Fund’s 18 remaining Portfolios, which are all actively managed, nine either beat their benchmark or placed in the top half of their peer group, while five of the 18 did both.
Looking Ahead
As we enter the second half of 2016, domestic equities are near all-time highs and interest rates are near all-time lows. The domestic economy is moving forward at a slow pace, but Europe and Asia continue to have difficulty achieving their growth objectives. China’s growth rate remains unclear, and there is uncertainty around the long-term impact of Britain leaving the European Union.
Corporate profits have declined for the last four quarters, led by energy-related companies, and meaningful top-line growth remains a challenge for many companies. Recent strength in the U.S. dollar will provide further challenges for companies with international sales, and tighter labor markets may cause margin pressure as the U.S. economic recovery continues. However, domestic equity markets should continue to benefit from equity-friendly activities,
which include share buybacks, increased dividends, and mergers and acquisitions (M&A).
In terms of stock valuation, the current S&P 500® price-to-earnings multiple of 19.6 is higher than its 16.4 historical average over the last 60 years. While the current price-to-earnings multiple cannot predict the future direction of the equity markets, it can be a useful guide to current valuation.
The markets will face many uncertainties in the second half of 2016, not the least of which is the U.S. presidential election in November. The policy differences between the two candidates are stark and will have implications for the economy in 2017 and beyond.
U.S. economic growth is expected to increase in the second half of the year, while interest rates are expected to remain relatively low. Janet Yellen has indicated that the Federal Reserve wants to raise short-term interest rates in the future, an action that could create a headwind to the financial markets when it occurs. However, without a material increase in domestic economic activity and inflation, it is hard to imagine anything more than a small increase in interest rates for the balance of 2016. Meanwhile, we remain in a low-yield, low-return environment.
In times like these, it is important to maintain a long-term view, set realistic financial goals and support those goals with a diversified asset allocation strategy that meets your individual, long-term risk/return objectives.
Thank you for entrusting your assets to the Ohio National Fund, Inc. We look forward to continuing to serve your financial needs.
Sincerely,

Paul J. Gerard
President
| 2 |
Directors and Officers of Ohio National Fund, Inc.
John J. Palmer, Director
Madeleine W. Ludlow, Director
George M. Vredeveld, Director
John I. Von Lehman, Director
Geoffrey Keenan, Director
Paul J. Gerard, President
Thomas A. Barefield, Vice President
R. Todd Brockman, Treasurer
Kimberly A. Plante, Secretary
Keith Dwyer, Interim Chief Compliance Officer
Emily Bae, Assistant Secretary
Daniel P. Leming, Assistant Treasurer
The Statement of Additional Information of Ohio National Fund, Inc. (the “Fund”) includes additional information about the Fund’s Board of Directors (the “Board”) and is available at http://www.ohionationalfund.com or upon request, without charge, by calling 877-781-6392 (toll-free).
A description of the policies and procedures that the Fund uses in voting proxies relating to Fund securities, as well as information regarding how the Fund voted proxies during the most recent twelve-month period ended June 30, is available without charge, upon request, by calling 877-781-6392 (toll-free) and on the Securities and Exchange Commission (the “Commission”) website at http://www.sec.gov.
The Fund has filed its Schedules of Investments as of March 31 and September 30 with the Commission, as required, on Form N-Q. Form N-Q is required to be filed with the Commission for the first and third quarters of each fiscal year within sixty days after the end of each period and is available on the Commission website upon acceptance of each submission. The Fund’s Forms N-Q may be reviewed and copied at the Commission’s Public Reference Room in Washington, DC. Information about the Public Reference Room is available by calling 1-800-SEC-0330 (toll-free).
This report and the financial statements contained herein are submitted for the general information of the shareholders of the Fund. This report is not authorized for distribution to prospective investors in the Fund unless preceded or accompanied by an effective prospectus of Ohio National Fund, Inc. For a prospectus containing more complete information, including charges and expenses, please contact Ohio National Investments, Inc., One Financial Way, Cincinnati, OH 45242, telephone 877-781-6392 (toll-free).
| 3 |
| Ohio National Fund, Inc. | Equity Portfolio |
Objective/Strategy
The Equity Portfolio seeks long-term growth of capital by investing at least 80% of its assets in equity securities.
Performance as of June 30, 2016
Average Annual Returns: | ||||
One year | -4.07% | |||
Five years | 10.80% | |||
Ten years | 1.96% |
Past performance does not guarantee future results. The performance data quoted represents past performance and current returns may be lower or higher. Total return figures include change in share price and reinvestment of dividends and capital gains. The investment return and principal value will fluctuate so that an investor’s shares, when redeemed, may be worth more or less than the original cost. To obtain performance information up to the most recent month end, call toll-free 1-877-781-6392.
The Portfolio is not open to direct retail investment. Beneficial interest in shares is obtained solely by purchase of variable life insurance policies and variable annuity contracts. Actual performance results for variable annuity and variable universal life contracts will be lower due to contract charges. Consult your contract for applicable charges.
Comments
For the six-month period ended June 30, 2016, the Equity Portfolio returned 0.34% versus 3.84% for its benchmark, the S&P 500 Index.
Major indices opened the year with losses between 5% and 8% in January amid weak fourth quarter earnings announcements and downward pressure on oil prices. Stocks rallied in late February, and into March, then traded roughly flat for the majority of the second quarter. Investors looked past a terrorist attack in Belgium and largely focused on the recovery in oil, a relatively weaker dollar, generally positive economic reports and dovish indications from the Federal Reserve (“Fed”). Stocks continued to show resiliency in the final weeks of the period despite the United Kingdom’s vote to leave the European Union (“EU”), commonly referred to as “Brexit.” While the market was hit hard by Brexit, major indices rebounded in the final trading days of the quarter to finish with modest gains, as the heads of the United Kingdom and EU central banks stressed that they were prepared to act to mitigate Brexit-related economic stress.
Minutes from the Fed’s December 2015 meeting showed that the decision to raise short-term rates was unanimous, but committee members expressed concern over low inflation, sluggish global growth and the U.S. dollar’s strength against foreign currencies. The committee held rates steady after the January meeting, but several officials indicated hopes for another rate hike sooner rather than later this year. Fed Chair Janet Yellen acknowledged that market turmoil has significantly tightened financial conditions and quashed these hawkish views when she offered a dovish tone several weeks later. The run-up to Brexit, and the vote itself, induced volatility and broader concern about the state of the global markets. Just prior to the vote, the implied probability of a Fed rate hike by the December Federal Open Market Committee (“FOMC”) meeting was a coin toss, but the Brexit results and more recent cautious comments from Federal Reserve leaders has futures markets pushing back the likely timeline for a rate hike far into 2017. The 10-year U.S. Treasury yield fluctuated dramatically during the first half, falling as low as 1.66% and climbing to nearly 2% in early March, before falling below 1.5% for the first time in four years after the Brexit vote. The U.S. dollar eased against a basket of foreign currencies in the first quarter to
provide some relief for U.S. exporters, and closed June nearly 4% below its November high.
U.S. economic indicators were mixed-to-positive during the first half of the year. Annualized U.S. GDP growth from the first quarter was 1.1%, slightly softer than the 1.4% registered during the fourth quarter of 2015. Employment growth was robust, other than weak reports in April and May, and the 287,000 jobs added in June marked the strongest month since October. Meanwhile, the unemployment rate oscillated between 4.7% and 5.0% and wage growth continued to improve, with June’s wages 2.6% above their levels last year. Finally, retail sales increased in back-to-back months in April and May, for the first time since late-2015, to shrug off a weak first quarter.
Oil prices recovered from their sub-$30 per barrel February lows, rising to stabilize between $45 and $50 per barrel in May and June, as supply tempered in non-OPEC countries. This recovery and stabilization supported energy stocks in the first half of 2016 and helped reduce volatility across the market for most of May and June. Meanwhile, market expectations of “lower rates for longer” and margin concerns led to a pullback in financial stocks, particularly banks, which were hit hard after Brexit. The S&P 500 Financials Index fell 3% in the first half of the year. However, banks received good news at the end of June when the Fed announced the results of its Comprehensive Capital Analysis and Review, more commonly known as CCAR, in which 30 of 33 bank holding companies (BHCs) passed, and which showed the overall Common Equity Tier 1 Ratio for all 33 BHCs had more than doubled from 5.5% in the first quarter of 2009 to 12.2% for this year. Information Technology was the only other sector with a negative return in the first half of the year. Stocks in defensive sectors with higher yields performed well in the first half, with the S&P 500 Telecommunications Services, Utilities and Consumer Staples indices up 24.8%, 23.4% and 10.5%, respectively. Materials and Industrials stocks also performed well in the first half. The S&P 500 Health Care and Consumer Discretionary indices posted small gains of 0.4% and 0.7%, respectively.
Relative underperformance was driven by both security selection and sector allocation effects, although stock selections in Financials, Health Care and Industrials were the primary factors. Stock selection in Energy and Information Technology contributed to relative performance. An overweight position in Utilities generated the largest contribution to allocation effects, while an underweight to Consumer Staples and an overweight to Financials both detracted from performance. The Portfolio’s lack of position in Telecommunication Services also detracted from performance, as the sector was the leading performer in the benchmark.(1)
AES Corp., CONSOL Energy Inc., Albemarle Corp., Steel Dynamics Inc. and Apache Corp. were the largest contributors to performance, while the largest detractors included Citigroup Inc., Perrigo Co. PLC, United Continental Holdings Inc., Alexion Pharmaceuticals Inc. and Genworth Financial, Inc.(1)
Citigroup Inc. was a leading detractor in the first half of the year, as broad economic weakness and Brexit concerns pushed the 10-Year Treasury yield below 1.5% and flattened the yield curve further, creating an earnings headwind for the company and other banks. While some recovery in rates is necessary for the stock to rebound, the company’s management has shored up its balance sheet and shed some of its worst-performing divisions in an effort to de-risk its portfolio and focus on better-performing and core business divisions. The company also passed its most recent CCAR test and will be expanding stock buybacks and more than tripling its dividend payout. So, while low rates for longer is a concern, Citigroup Inc.
| 4 | (continued) |
| Ohio National Fund, Inc. | Equity Portfolio (Continued) |
has actively made positive operational improvements and capital allocation decisions that have enhanced shareholder value. These factors, however, are clearly not appreciated in a stock price that is trading well below book value.(1)
Perrigo Co. PLC shares tumbled roughly 30% in the final trading days of April after CEO Joseph Papa abruptly left the company for a CEO position with Valeant Pharmaceuticals. John Hendrickson, the former head of consumer health, was promoted to take over the helm and immediately lowered the company’s earnings guidance, pointing to weaker generic drug pricing. As a reminder, the Portfolio owned the stock last year when Mylan offered a $26B hostile bid for the company, and the Portfolio sold the stock before the deal fell through. We subsequently initiated a position once the stock had retreated back below our estimate of fair value. While the recent events have been disappointing, our investment case remains intact. We have met with Mr. Hendrickson since the management change, and have several positive takeaways. Management is confident that it can reach the $190M in incremental generic sales to reach its new guidance targets, and it is addressing the underperformance of the recently acquired Omega business. However, we are monitoring Perrigo Co. PLC’s quarterly operational performance closely given the number of moving parts.(1)
United Continental Holdings, Inc. declined more than 28% in the first half of the year on broader industry concerns and declining business travel. Consolidation over the past decade has largely improved the airline industry but, recently, management teams have failed to act as rationally as investors would expect. Margins have expanded as jet fuel costs declined with oil prices, leading several airlines to add capacity and offer competitive discounts. This is disappointing on the one hand, given softening demand trends in the U.S. and a stagnant economy in Europe, but partially justifiable given the decrease in fuel prices. United Continental Holdings, Inc. also has experienced mid-to-high single digit declines in passenger revenue per available seat mile (“PRASM”), as it has ceded market share to competitors and as its most profitable sales in business travel have weakened with the pullback in corporate spending. However, we believe that the company is taking steps to recover market share and close its margin gap to peers by investing in its labor force to improve operations and service while cutting costs. At 5.3x current year earnings estimates, United Continental Holdings, Inc. is significantly undervalued and is expected to outperform over the long term.(1)
AES Corp. and CONSOL Energy, Inc. were top contributors that benefitted from commodities finding a bottom in February and recovering throughout the first half of the year. However, each management team has been very proactive in deleveraging and de-risking its business to survive the downturn rather than simply waiting for commodity markets to rebound. CONSOL Energy, Inc. continues to sell its coal assets and focus on its natural gas business. Similarly, AES Corp. has delivered on its strategy to simplify its global footprint by shedding non-core assets. CONSOL Energy, Inc. is well-capitalized and the coal overhang on the stock continues to undervalue its quality gas assets. AES Corp. continues to generate very strong free-cash-flow streams and will benefit from any improvements in power pricing.(1)
Albemarle Corp. was a top contributor during the period and we exited the position on valuation. Positive estimate revisions, due to lithium price gains and decent trends in Albermarle Corp.’s core business, caused the market to bid the stock up above our estimate of fair value. While momentum could continue to drive the stock’s upward trajectory, this is a high beta stock that has experienced
substantial crowding. Thus, the stock is vulnerable to any earnings disappointment or broader market shock, and our analysis indicates a negative risk/reward skew. Therefore, we harvested gains and redeployed the capital to opportunities with greater risk-adjusted return potential.(1)
We put odds of a U.S. recession at less than 20%. U.S. growth will likely slow some due to Brexit, but not materially. In addition, lower rates would act as a direct tailwind to our consumer-led economy, manifested most directly in lower mortgage rates. This would continue to support a steadily improving housing market, while commodity prices remain subdued, and employment continues to improve. What would change these odds? If credit spreads in the U.S. started to increase, similar to what we saw in early 2016, they would act like shadow market-driven monetary tightening. So far, there is little evidence of that, post-Brexit, and our recession probability is essentially unchanged. We put a 60% probability that the U.S. economy continues to muddle through, with slow but positive real growth of roughly 2%, and modest margin compression from higher unit labor costs. The combination would still allow many U.S. companies to generate ample free cash flow, which would support the market if share buybacks and deal activity would offset a continued liquidation of equities by private investors. U.S. equity risk premiums and valuation spreads will probably stay elevated under this scenario, but these will likely not spike. Multiple expansion is unlikely, in our opinion, but with continued stability in oil prices and no major post-Brexit spike in the U.S. dollar, we could see an end to the current earnings recession. This could support mid-single digit earnings growth and a commensurate return in equities over the next few quarters.
We think a rise in rates is the real risk to be concerned about and our subjective probability is somewhere between 10% and 20%. We realize this view is different from the current market narrative, but the potential for a significant surprise is what makes this scenario so dangerous. This outcome would likely trigger a spike in credit and valuation spreads, as the magnitude of risky investing resulting from an extremely low cost of capital could trigger forced selling. The silver lining in this scenario is that if it comes with fiscal policies that help reflate the U.S. economy, deep value assets that are tied to reflation could do well. This possibility will make this scenario even harder for people to stomach, but the major risk comes from the challenge of selling crowded assets against limiting market liquidity.
So where does this leave us on portfolio positioning? As always, our valuation-driven investment process is focused on buying stocks where a price-to-value gap suggests absolute value potential. Most importantly, we are focused on equities where absolute value is not driven by an artificially low cost of capital or unsustainably high cash flows and earnings. Broadly, we are finding absolute value opportunities where the stock price is volatile, and thus shunned by most investors, but where the underlying business model and cash flow is much less volatile than the price. The vast majority of the time, price is much more volatile than underlying business value, but these volatility-driven opportunities are even more prevalent in the current market environment where low volatility is prized.
| (1) | The Portfolio’s composition is subject to change. Holdings and weightings are as of June 30, 2016. |
| 5 | (continued) |
| Ohio National Fund, Inc. | Equity Portfolio (Continued) |
Change in Value of $10,000 Investment
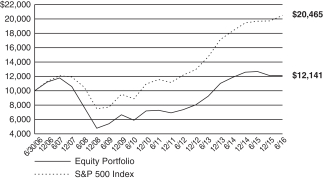
Hypothetical illustration based on past performance. Future performance will vary. The Portfolio’s returns reflect reinvested dividends. The Portfolio’s holdings may differ significantly from the securities in the index. The index is unmanaged and therefore does not reflect the cost of portfolio management and accounting.
The S&P 500 Index is a capitalization-weighted index designed to measure performance of the broad domestic economy through changes in the aggregate market value of 500 stocks representing all major industries. The index presented herein includes the effects of reinvested dividends.
Portfolio Composition as of June 30, 2016 (1)
| % of Net Assets | ||||
Common Stocks (4) | 97.3 | |||
Master Limited Partnerships (4) | 0.9 | |||
Money Market Funds and | 1.8 | |||
|
| |||
| 100.0 | ||||
|
|
Top 10 Portfolio Holdings as of June 30, 2016 (1) (2) (3)
| % of Net Assets | ||||||
| 1. | Microsoft Corp. | 3.7 | ||||
| 2. | AES Corp. | 3.7 | ||||
| 3. | Oracle Corp. | 3.5 | ||||
| 4. | Merck & Co., Inc. | 3.5 | ||||
| 5. | Cisco Systems, Inc. | 3.3 | ||||
| 6. | Citigroup, Inc. | 3.3 | ||||
| 7. | Calpine Corp. | 3.2 | ||||
| 8. | Amazon.com, Inc. | 3.1 | ||||
| 9. | Synchrony Financial | 3.0 | ||||
| 10. | Wells Fargo & Co. | 2.8 |
| (1) | Composition of Portfolio subject to change. |
| (2) | Short-term investments have been excluded from the list of Top 10 Portfolio Holdings. |
| (3) | Top 10 Portfolio Holdings is presented at an individual security level. Total investment exposure by issuer may be higher. |
| (4) | Sectors (Common Stocks, Master Limited Partnerships): |
| % of Net Assets | ||||
Financials | 21.2 | |||
Information Technology | 20.0 | |||
Health Care | 16.3 | |||
Consumer Discretionary | 10.9 | |||
Industrials | 9.5 | |||
Utilities | 8.8 | |||
Energy | 5.7 | |||
Materials | 3.9 | |||
Consumer Staples | 1.9 | |||
|
| |||
| 98.2 | ||||
|
|
| 6 |
| Ohio National Fund, Inc. | Equity Portfolio |
Schedule of Investments | June 30, 2016 (Unaudited) |
| Common Stocks – 97.3% | Shares | Value | ||||||||
CONSUMER DISCRETIONARY – 10.9% |
| |||||||||
PulteGroup, Inc. (Household Durables) | 691,617 | $ | 13,479,615 | |||||||
Amazon.com, Inc. (Internet & Catalog Retail) | (a) | 22,400 | 16,029,888 | |||||||
CBS Corp. Class B (Media) | 112,111 | 6,103,323 | ||||||||
Lowe’s Cos., Inc. (Specialty Retail) | 146,690 | 11,613,447 | ||||||||
Ralph Lauren Corp. (Textiles, Apparel & Luxury Goods) | 100,840 | 9,037,281 | ||||||||
|
| |||||||||
| 56,263,554 | ||||||||||
|
| |||||||||
CONSUMER STAPLES – 1.9% | ||||||||||
Colgate-Palmolive Co. (Household Products) | 137,230 | 10,045,236 | ||||||||
|
| |||||||||
ENERGY – 5.7% | ||||||||||
Apache Corp. (Oil, Gas & Consumable Fuels) | 160,181 | 8,917,276 | ||||||||
CONSOL Energy, Inc. (Oil, Gas & Consumable Fuels) | 529,570 | 8,520,781 | ||||||||
Devon Energy Corp. (Oil, Gas & Consumable Fuels) | 338,400 | 12,267,000 | ||||||||
|
| |||||||||
| 29,705,057 | ||||||||||
|
| |||||||||
FINANCIALS – 20.3% | ||||||||||
Citigroup, Inc. (Banks) | 398,002 | 16,871,305 | ||||||||
Wells Fargo & Co. (Banks) | 308,320 | 14,592,786 | ||||||||
Ameriprise Financial, Inc. (Capital Markets) | 89,974 | 8,084,164 | ||||||||
Discover Financial Services (Consumer Finance) | 170,830 | 9,154,780 | ||||||||
Synchrony Financial (Consumer Finance) | (a) | 611,760 | 15,465,293 | |||||||
American International Group, Inc. (Insurance) | 159,320 | 8,426,435 | ||||||||
MetLife, Inc. (Insurance) | 205,085 | 8,168,536 | ||||||||
American Homes 4 Rent (Real Estate Investment Trusts) | 696,610 | 14,266,573 | ||||||||
Realogy Holdings Corp. (Real Estate Mgmt. & Development) | (a) | 347,480 | 10,083,870 | |||||||
|
| |||||||||
| 105,113,742 | ||||||||||
|
| |||||||||
HEALTH CARE – 16.3% | ||||||||||
Alexion Pharmaceuticals, Inc. (Biotechnology) | (a) | 70,651 | 8,249,211 | |||||||
Biogen, Inc. (Biotechnology) | (a) | 50,400 | 12,187,728 | |||||||
Express Scripts Holding Co. (Health Care Providers & Svs.) | (a) | 153,850 | 11,661,830 | |||||||
UnitedHealth Group, Inc. (Health Care Providers & Svs.) | 96,474 | 13,622,129 | ||||||||
Jazz Pharmaceuticals PLC (Pharmaceuticals) | (a) | 44,330 | 6,264,272 | |||||||
Merck & Co., Inc. (Pharmaceuticals) | 310,840 | 17,907,492 | ||||||||
Mylan NV (Pharmaceuticals) | (a) | 139,699 | 6,040,585 | |||||||
Perrigo Co. PLC (Pharmaceuticals) | 92,037 | 8,344,995 | ||||||||
|
| |||||||||
| 84,278,242 | ||||||||||
|
| |||||||||
INDUSTRIALS – 9.5% | ||||||||||
Boeing Co. / The (Aerospace & Defense) | 65,920 | 8,561,030 | ||||||||
C.H. Robinson Worldwide, Inc. (Air Freight & Logistics) | 113,190 | 8,404,358 | ||||||||
| Common Stocks (Continued) | Shares | Value | ||||||||
INDUSTRIALS (continued) | ||||||||||
United Continental Holdings, Inc. (Airlines) | (a) | 201,030 | $ | 8,250,271 | ||||||
Rockwell Automation, Inc. (Electrical Equip.) | 92,060 | 10,570,329 | ||||||||
PACCAR, Inc. (Machinery) | 134,295 | 6,965,882 | ||||||||
United Rentals, Inc. (Trading Companies & Distributors) | (a) | 98,730 | 6,624,783 | |||||||
|
| |||||||||
| 49,376,653 | ||||||||||
|
| |||||||||
INFORMATION TECHNOLOGY – 20.0% | ||||||||||
Cisco Systems, Inc. (Communications Equip.) | 597,760 | 17,149,734 | ||||||||
Alphabet, Inc. Class C (Internet Software & Svs.) | (a) | 16,894 | 11,692,337 | |||||||
Yahoo!, Inc. (Internet Software & Svs.) | (a) | 356,400 | 13,386,384 | |||||||
NXP Semiconductors NV (Semiconductors & Equip.) | (a) | 179,047 | 14,026,542 | |||||||
QUALCOMM, Inc. (Semiconductors & Equip.) | 180,620 | 9,675,813 | ||||||||
Microsoft Corp. (Software) | 376,190 | 19,249,642 | ||||||||
Oracle Corp. (Software) | 447,209 | 18,304,264 | ||||||||
|
| |||||||||
| 103,484,716 | ||||||||||
|
| |||||||||
MATERIALS – 3.9% | ||||||||||
LyondellBasell Industries NV Class A (Chemicals) | 92,279 | 6,867,403 | ||||||||
Mosaic Co. / The (Chemicals) | 195,283 | 5,112,509 | ||||||||
Steel Dynamics, Inc. (Metals & Mining) | 343,986 | 8,427,657 | ||||||||
|
| |||||||||
| 20,407,569 | ||||||||||
|
| |||||||||
UTILITIES – 8.8% | ||||||||||
Exelon Corp. (Electric Utilities) | 272,990 | 9,925,916 | ||||||||
AES Corp. (Ind. Power & Renewable Elec.) | 1,526,467 | 19,050,308 | ||||||||
Calpine Corp. (Ind. Power & Renewable Elec.) | (a) | 1,134,030 | 16,726,943 | |||||||
|
| |||||||||
| 45,703,167 | ||||||||||
|
| |||||||||
Total Common Stocks (Cost $495,463,809) | $ | 504,377,936 | ||||||||
|
| |||||||||
| Master Limited Partnerships – 0.9% | Shares | Value | ||||||||
FINANCIALS – 0.9% | ||||||||||
KKR & Co. LP (Capital Markets) | 386,610 | $ | 4,770,767 | |||||||
|
| |||||||||
Total Master Limited Partnerships (Cost $7,618,680) | $ | 4,770,767 | ||||||||
|
| |||||||||
| Money Market Funds – 0.7% | Shares | Value | ||||||||
State Street Institutional Liquid Reserves Fund Institutional Class | 776,397 | $ | 776,397 | |||||||
State Street Institutional U.S. Government Money Market Fund Institutional Class | 2,683,854 | 2,683,854 | ||||||||
|
| |||||||||
Total Money Market Funds (Cost $3,460,251) | $ | 3,460,251 | ||||||||
|
| |||||||||
Total Investments – 98.9% (Cost $506,542,740) | (b) | $ | 512,608,954 | |||||||
Other Assets in Excess of Liabilities – 1.1% | 5,809,340 | |||||||||
|
| |||||||||
Net Assets – 100.0% | $ | 518,418,294 | ||||||||
|
| |||||||||
Percentages are stated as a percent of net assets.
Footnotes:
| (a) | Non-income producing security. |
| (b) | Represents cost for financial reporting purposes, which may differ from cost basis for federal income tax purposes. See also Note 7 of the Notes to Financial Statements. |
The accompanying notes are an integral part of these financial statements.
| 7 |
| Ohio National Fund, Inc. | Bond Portfolio |
Objective/Strategy
The Bond Portfolio seeks to obtain a high level of income and opportunity for capital appreciation consistent with the preservation of capital by investing primarily in intermediate-term and long-term fixed income securities.
Performance as of June 30, 2016
Average Annual Returns: | ||||
One year | 7.46% | |||
Five years | 4.14% | |||
Ten years | 4.75% |
Past performance does not guarantee future results. The performance data quoted represents past performance and current returns may be lower or higher. Total return figures include change in share price and reinvestment of dividends and capital gains. The investment return and principal value will fluctuate so that an investor’s shares, when redeemed, may be worth more or less than the original cost. To obtain performance information up to the most recent month end, call toll-free 1-877-781-6392.
The Portfolio is not open to direct retail investment. Beneficial interest in shares is obtained solely by purchase of variable life insurance policies and variable annuity contracts. Actual performance results for variable annuity and variable universal life contracts will be lower due to contract charges. Consult your contract for applicable charges.
Comments
For the six month period ended June 30, 2016, the Bond Portfolio returned 9.07% versus 7.56% for its benchmark, the BofA Merrill Lynch U.S. Corporate Master Index (the “Index”).
Both the Portfolio and the Index had large positive returns for the period, as U.S. Treasury yields decreased across the yield curve and credit spreads tightened. For the period, the 10-year Treasury yield decreased 80 basis points and the 30-year Treasury yield decreased 73 basis points. Interest rates moved lower globally, due to slow growth, accommodative central banks, and the lack of meaningful inflation. As measured by the Index, credit spreads tightened 11 basis points during the period. While credit spreads tightened across most industry sectors, the tightening was most pronounced in the energy and metals/mining sectors due to the rebound in commodities prices.
The Portfolio outperformed the Index by 1.51% for the six-month period ended June 30, 2016. The Portfolio’s relative performance was the outcome of a combination of factors, including the Portfolio’s allocation to several industry sectors, the overall credit quality of the Portfolio, and certain holdings in the Portfolio. The average credit quality of the Portfolio was Baa1 versus A3 for the Index, and this difference in credit quality contributed to the relative performance because lower quality bonds outperformed higher quality bonds during the period. The Portfolio’s duration positioning detracted from relative performance slightly. The Portfolio’s duration was approximately 0.27 years shorter than the duration of the Index during a period in which Treasury yields declined and credit spreads tightened.(1)
With the exception of the Energy and Financial sectors, differences in industry weightings between the Portfolio and the Index had little impact on relative performance. The Portfolio was over-weighted in the Energy sector by approximately 5% during the first half of 2016, and this helped relative performance because the Energy sector performed well, as oil prices recovered. The Portfolio was also approximately 7% under-weighted in the Financials sector, which also added to relative performance, because the Financials sector was one of the worst performing sectors during the period.(1)
Interest rates declined materially during the period, so securities with short durations underperformed. The five securities in the Portfolio that performed the worst during the first half of 2016 all had short durations and included Broadcom Corp., GE Capital International Funding Co., Comerica Bank, Equity One Inc., and Discover Financial Services. The five best performing securities during the period were energy or mining-related and included Chesapeake Energy Corp., Teck Resources Ltd., The Williams Companies, Inc., Freeport-McMoRan Inc., and Southwestern Energy Co.(1)
Despite many headwinds, the U.S. economy is expected to grow moderately in 2016. Corporate profits have declined slightly in recent quarters and may continue to do so, given the strong U.S. dollar and emerging wage pressure that may negatively impact margins. While the Federal Reserve would like to increase short-term rates, it appears increasingly likely that there will be little, if any, change in 2016. Inflation remains low and growth remains sluggish globally, making it difficult for most central banks to justify increasing rates. Corporate credit continues to deteriorate in 2016, as companies pursue equity-friendly policies such as increased dividends, debt-financed stock buybacks, and debt-financed merger and acquisition activity. All of these activities decrease corporate credit quality and should lead to spread widening eventually. However, the overwhelming demand for U.S. dollar denominated debt, and the stretch for yield in the current low interest rate environment will likely keep spreads tight for the short term. Spreads are expected to widen over the intermediate to long term, as the credit cycle matures. Given this outlook, we expect to maintain our overweight to BBB investment grade bonds for the balance of the year. We also plan to maintain the small exposure to BB high yield bonds in the Portfolio. Lastly, we plan to maintain the Portfolio’s duration slightly below that of the Index. We prefer to take slightly more credit risk than interest rate risk, given the low level of interest rates and the current economic environment.
| (1) | The Portfolio’s composition is subject to change. Holdings and weightings are as of June 30, 2016. |
Change in Value of $10,000 Investment
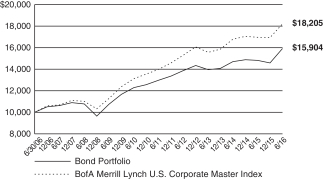
Hypothetical illustration based on past performance. Future performance will vary. The Portfolio’s returns reflect reinvested dividends. The Portfolio’s holdings may differ significantly from the securities in the index. The index is unmanaged and therefore does not reflect the cost of portfolio management and accounting.
The BofA Merrill Lynch U.S. Corporate Master Index tracks the performance of all U.S. dollar-denominated, investment grade corporate public debt issued in the U.S. domestic bond market. Qualifying bonds must have an investment grade rating (based on an average of Moody’s, S&P, and Fitch). In addition, qualifying securities must have at least one year remaining term to maturity, a fixed coupon schedule, and a minimum amount outstanding of $250 million.
| 8 | (continued) |
| Ohio National Fund, Inc. | Bond Portfolio (Continued) |
Portfolio Composition as of June 30, 2016 (1)
| % of Net Assets | ||||
Corporate Bonds (4) | 98.1 | |||
Asset-Backed Securities (4) | 0.5 | |||
U.S. Treasury Obligations | 0.3 | |||
Money Market Funds | 1.1 | |||
|
| |||
| 100.0 | ||||
|
|
Top 10 Portfolio Holdings as of June 30, 2016 (1) (2) (3)
| % of Net Assets | ||||
1. Masco Corp. | 1.3 | |||
2. Fifth Third Bancorp | 1.1 | |||
3. Intel Corp. | 1.0 | |||
4. FedEx Corp. | 1.0 | |||
5. Simon Property Group LP | 1.0 | |||
6. Oracle Corp. | 1.0 | |||
7. American Water Capital Corp. | 1.0 | |||
8. Union Electric Co. | 1.0 | |||
9. Parker-Hannifin Corp. | 1.0 | |||
10. Kansas City Power & Light Co. | 1.0 |
| (1) | Composition of Portfolio subject to change. |
| (2) | Short-term investments have been excluded from the list of Top 10 Portfolio Holdings. |
| (3) | Top 10 Portfolio Holdings is presented at an individual security level. Total investment exposure by issuer may be higher. |
| (4) | Sectors (Corporate Bonds, Asset-Backed Securities): |
| % of Net Assets | ||||
Financials | 26.3 | |||
Energy | 16.2 | |||
Industrials | 10.6 | |||
Utilities | 9.8 | |||
Consumer Discretionary | 9.0 | |||
Health Care | 7.7 | |||
Information Technology | 7.3 | |||
Consumer Staples | 4.7 | |||
Materials | 4.2 | |||
Telecommunication Services | 2.8 | |||
|
| |||
| 98.6 | ||||
|
|
| 9 |
| Ohio National Fund, Inc. | Bond Portfolio |
Schedule of Investments | June 30, 2016 (Unaudited) |
| Corporate Bonds – 98.1% | Rate | Maturity | Face Amount | Value | ||||||||||||
CONSUMER DISCRETIONARY – 9.0% | ||||||||||||||||
Magna International, Inc. (Auto Components) | 3.625% | 06/15/2024 | $ | 1,000,000 | $ | 1,055,231 | ||||||||||
General Motors Co. (Automobiles) | 5.000% | 04/01/2035 | 900,000 | 896,830 | ||||||||||||
General Motors Financial Co., Inc. (Automobiles) | 3.200% | 07/06/2021 | 900,000 | 902,606 | ||||||||||||
Newell Rubbermaid, Inc. (Household Durables) | �� | (b) | 3.150% | 04/01/2021 | 900,000 | 937,702 | ||||||||||
Expedia, Inc. (Internet & Catalog Retail) | (a) | 5.000% | 02/15/2026 | 1,000,000 | 1,037,216 | |||||||||||
21st Century Fox America, Inc. (Media) | 4.500% | 02/15/2021 | 1,250,000 | 1,395,771 | ||||||||||||
Charter Communications Operating LLC / Charter Communications Operating Capital (Media) | (a) | 3.579% | 07/23/2020 | 1,000,000 | 1,045,537 | |||||||||||
Comcast Corp. (Media) | 4.250% | 01/15/2033 | 750,000 | 828,150 | ||||||||||||
Discovery Communications, LLC (Media) | 4.375% | 06/15/2021 | 1,000,000 | 1,073,879 | ||||||||||||
Discovery Communications, LLC (Media) | 3.300% | 05/15/2022 | 275,000 | 277,911 | ||||||||||||
Time Warner Cable, Inc. (Media) | 6.550% | 05/01/2037 | 850,000 | 991,763 | ||||||||||||
Time Warner, Inc. (Media) | 2.950% | 07/15/2026 | 900,000 | 907,276 | ||||||||||||
Viacom, Inc. (Media) | 4.850% | 12/15/2034 | 1,500,000 | 1,399,146 | ||||||||||||
Kohl’s Corp. (Multiline Retail) | 4.000% | 11/01/2021 | 925,000 | 967,651 | ||||||||||||
Bed Bath & Beyond, Inc. (Specialty Retail) | 5.165% | 08/01/2044 | 900,000 | 793,448 | ||||||||||||
|
| |||||||||||||||
| 14,510,117 | ||||||||||||||||
|
| |||||||||||||||
CONSUMER STAPLES – 4.7% | ||||||||||||||||
Anheuser-Busch InBev Finance, Inc. (Beverages) | 4.700% | 02/01/2036 | 900,000 | 1,012,557 | ||||||||||||
Anheuser-Busch InBev Finance, Inc. (Beverages) | 4.900% | 02/01/2046 | 1,000,000 | 1,171,368 | ||||||||||||
Bunge NA Finance LP (Food Products) | 5.900% | 04/01/2017 | 1,500,000 | 1,548,126 | ||||||||||||
Mead Johnson Nutrition Co. (Food Products) | 3.000% | 11/15/2020 | 900,000 | 940,305 | ||||||||||||
Imperial Tobacco Finance PLC (Tobacco) | (a) | 3.750% | 07/21/2022 | 1,400,000 | 1,477,603 | |||||||||||
Philip Morris International, Inc. (Tobacco) | 4.125% | 05/17/2021 | 1,250,000 | 1,392,920 | ||||||||||||
|
| |||||||||||||||
| 7,542,879 | ||||||||||||||||
|
| |||||||||||||||
ENERGY – 16.2% | ||||||||||||||||
Ensco PLC (Energy Equip. & Svs.) | 5.200% | 03/15/2025 | 900,000 | 625,500 | ||||||||||||
Halliburton Co. (Energy Equip. & Svs.) | 4.850% | 11/15/2035 | 900,000 | 975,091 | ||||||||||||
Noble Holding International Ltd. (Energy Equip. & Svs.) | (b) | 5.000% | 03/16/2018 | 900,000 | 886,500 | |||||||||||
Noble Holding International Ltd. (Energy Equip. & Svs.) | (b) | 6.950% | 04/01/2025 | 1,000,000 | 797,500 | |||||||||||
Buckeye Partners LP (Oil, Gas & Consumable Fuels) | 4.875% | 02/01/2021 | 1,000,000 | 1,050,644 | ||||||||||||
Chesapeake Energy Corp. (Oil, Gas & Consumable Fuels) | (a) | 8.000% | 12/15/2022 | 565,000 | 480,956 | |||||||||||
Columbia Pipeline Group, Inc. (Oil, Gas & Consumable Fuels) | 4.500% | 06/01/2025 | 900,000 | 967,871 | ||||||||||||
ConocoPhillips Co. (Oil, Gas & Consumable Fuels) | 3.350% | 05/15/2025 | 350,000 | 361,970 | ||||||||||||
Devon Energy Corp. (Oil, Gas & Consumable Fuels) | 3.250% | 05/15/2022 | 900,000 | 872,926 | ||||||||||||
Energy Transfer Partners LP (Oil, Gas & Consumable Fuels) | 4.750% | 01/15/2026 | 400,000 | 412,880 | ||||||||||||
Enterprise Products Operating, LLC (Oil, Gas & Consumable Fuels) | 3.900% | 02/15/2024 | 1,000,000 | 1,058,788 | ||||||||||||
Exxon Mobil Corp. (Oil, Gas & Consumable Fuels) | 4.114% | 03/01/2046 | 900,000 | 1,012,946 | ||||||||||||
Kinder Morgan Energy Partners LP (Oil, Gas & Consumable Fuels) | 4.150% | 03/01/2022 | 1,000,000 | 1,011,772 | ||||||||||||
Kinder Morgan, Inc. (Oil, Gas & Consumable Fuels) | 5.300% | 12/01/2034 | 1,000,000 | 977,883 | ||||||||||||
Magellan Midstream Partners LP (Oil, Gas & Consumable Fuels) | 4.250% | 02/01/2021 | 1,000,000 | 1,082,299 | ||||||||||||
Marathon Oil Corp. (Oil, Gas & Consumable Fuels) | 3.850% | 06/01/2025 | 850,000 | 781,287 | ||||||||||||
Marathon Petroleum Corp. (Oil, Gas & Consumable Fuels) | 4.750% | 09/15/2044 | 1,000,000 | 853,529 | ||||||||||||
MPLX LP (Oil, Gas & Consumable Fuels) | (a) | 4.875% | 12/01/2024 | 1,000,000 | 974,583 | |||||||||||
Murphy Oil Corp. (Oil, Gas & Consumable Fuels) | (b) | 4.700% | 12/01/2022 | 1,400,000 | 1,280,986 | |||||||||||
Occidental Petroleum Corp. (Oil, Gas & Consumable Fuels) | 3.125% | 02/15/2022 | 1,000,000 | 1,048,177 | ||||||||||||
Phillips 66 (Oil, Gas & Consumable Fuels) | 4.300% | 04/01/2022 | 1,300,000 | 1,420,026 | ||||||||||||
Plains All American Pipeline LP / PAA Finance Corp. (Oil, Gas & Consumable Fuels) | 2.850% | 01/31/2023 | 1,000,000 | 920,790 | ||||||||||||
Plains All American Pipeline LP / PAA Finance Corp. (Oil, Gas & Consumable Fuels) | 4.650% | 10/15/2025 | 900,000 | 909,105 | ||||||||||||
Shell International Finance BV (Oil, Gas & Consumable Fuels) | 2.875% | 05/10/2026 | 900,000 | 914,880 | ||||||||||||
Southwestern Energy Co. (Oil, Gas & Consumable Fuels) | (b) | 4.050% | 01/23/2020 | 900,000 | 879,750 | |||||||||||
Spectra Energy Capital, LLC (Oil, Gas & Consumable Fuels) | 3.300% | 03/15/2023 | 1,425,000 | 1,369,697 | ||||||||||||
TransCanada PipeLines Ltd. (Oil, Gas & Consumable Fuels) | 2.500% | 08/01/2022 | 1,425,000 | 1,415,700 | ||||||||||||
Williams Cos., Inc. / The (Oil, Gas & Consumable Fuels) | 5.750% | 06/24/2044 | 1,000,000 | 852,500 | ||||||||||||
|
| |||||||||||||||
| 26,196,536 | ||||||||||||||||
|
| |||||||||||||||
FINANCIALS – 26.3% | ||||||||||||||||
Bank of America Corp. (Banks) | 4.200% | 08/26/2024 | 500,000 | 517,085 | ||||||||||||
Bank of America Corp. (Banks) | 3.875% | 08/01/2025 | 850,000 | 904,696 | ||||||||||||
Branch Banking & Trust Co. (Banks) | 3.625% | 09/16/2025 | 900,000 | 969,370 | ||||||||||||
Citigroup, Inc. (Banks) | 4.400% | 06/10/2025 | 900,000 | 939,410 | ||||||||||||
Citigroup, Inc. (Banks) | 3.700% | 01/12/2026 | 1,000,000 | 1,053,225 | ||||||||||||
Fifth Third Bancorp (Banks) | 4.500% | 06/01/2018 | 1,750,000 | 1,841,943 | ||||||||||||
KeyCorp (Banks) | 5.100% | 03/24/2021 | 500,000 | 562,519 | ||||||||||||
PNC Bank NA (Banks) | 3.250% | 06/01/2025 | 850,000 | 903,534 | ||||||||||||
SunTrust Banks, Inc. (Banks) | 2.500% | 05/01/2019 | 1,400,000 | 1,430,374 | ||||||||||||
Wells Fargo & Co. (Banks) | 3.000% | 04/22/2026 | 900,000 | 917,390 | ||||||||||||
Wells Fargo & Co. (Banks) | 4.650% | 11/04/2044 | 1,000,000 | 1,050,760 | ||||||||||||
Goldman Sachs Group, Inc. / The (Capital Markets) | 3.750% | 05/22/2025 | 1,400,000 | 1,462,804 | ||||||||||||
Morgan Stanley (Capital Markets) | 3.750% | 02/25/2023 | 1,250,000 | 1,324,151 | ||||||||||||
Morgan Stanley (Capital Markets) | 3.950% | 04/23/2027 | 1,000,000 | 1,008,677 | ||||||||||||
| 10 | (continued) |
| Ohio National Fund, Inc. | Bond Portfolio (Continued) |
Schedule of Investments | June 30, 2016 (Unaudited) |
| Corporate Bonds (Continued) | Rate | Maturity | Face Amount | Value | ||||||||||||
FINANCIALS (continued) |
| |||||||||||||||
Northern Trust Corp. (Capital Markets) | 3.450% | 11/04/2020 | $ | 1,000,000 | $ | 1,076,255 | ||||||||||
State Street Corp. (Capital Markets) | 4.375% | 03/07/2021 | 1,250,000 | 1,391,066 | ||||||||||||
Capital One Financial Corp. (Consumer Finance) | 2.450% | 04/24/2019 | 925,000 | 941,398 | ||||||||||||
Ford Motor Credit Co., LLC (Consumer Finance) | 3.157% | 08/04/2020 | 1,400,000 | 1,451,674 | ||||||||||||
Synchrony Financial (Consumer Finance) | 4.250% | 08/15/2024 | 900,000 | 931,831 | ||||||||||||
Berkshire Hathaway, Inc. (Diversified Financial Svs.) | 3.125% | 03/15/2026 | 900,000 | 944,181 | ||||||||||||
Intercontinental Exchange, Inc. (Diversified Financial Svs.) | 2.750% | 12/01/2020 | 900,000 | 942,408 | ||||||||||||
Intercontinental Exchange, Inc. (Diversified Financial Svs.) | 3.750% | 12/01/2025 | 1,000,000 | 1,079,332 | ||||||||||||
Moody’s Corp. (Diversified Financial Svs.) | 5.250% | 07/15/2044 | 1,000,000 | 1,216,901 | ||||||||||||
Nasdaq, Inc. (Diversified Financial Svs.) | (b) | 3.850% | 06/30/2026 | 900,000 | 914,886 | |||||||||||
Aflac, Inc. (Insurance) | 3.625% | 06/15/2023 | 1,425,000 | 1,530,548 | ||||||||||||
Allstate Corp. / The (Insurance) | 5.200% | 01/15/2042 | 500,000 | 590,727 | ||||||||||||
American International Group, Inc. (Insurance) | 3.875% | 01/15/2035 | 1,400,000 | 1,341,194 | ||||||||||||
Hartford Financial Services Group, Inc. / The (Insurance) | 5.375% | 03/15/2017 | 1,500,000 | 1,542,699 | ||||||||||||
Loews Corp. (Insurance) | 3.750% | 04/01/2026 | 1,000,000 | 1,060,592 | ||||||||||||
Marsh & McLennan Cos., Inc. (Insurance) | 3.500% | 06/03/2024 | 1,400,000 | 1,454,499 | ||||||||||||
American Tower Corp. (Real Estate Investment Trusts) | 3.375% | 10/15/2026 | 900,000 | 905,168 | ||||||||||||
Boston Properties LP (Real Estate Investment Trusts) | 3.125% | 09/01/2023 | 925,000 | 951,191 | ||||||||||||
Camden Property Trust (Real Estate Investment Trusts) | 4.250% | 01/15/2024 | 500,000 | 541,782 | ||||||||||||
Federal Realty Investment Trust (Real Estate Investment Trusts) | 3.000% | 08/01/2022 | 1,425,000 | 1,477,085 | ||||||||||||
HCP, Inc. (Real Estate Investment Trusts) | 4.000% | 06/01/2025 | 1,500,000 | 1,512,962 | ||||||||||||
Hospitality Properties Trust (Real Estate Investment Trusts) | 4.250% | 02/15/2021 | 1,000,000 | 1,042,194 | ||||||||||||
Simon Property Group LP (Real Estate Investment Trusts) | 3.750% | 02/01/2024 | 1,475,000 | 1,609,511 | ||||||||||||
Welltower, Inc. (Real Estate Investment Trusts) | 4.250% | 04/01/2026 | 1,000,000 | 1,075,566 | ||||||||||||
|
| |||||||||||||||
| 42,411,588 | ||||||||||||||||
|
| |||||||||||||||
HEALTH CARE – 7.7% | ||||||||||||||||
AbbVie, Inc. (Biotechnology) | 2.900% | 11/06/2022 | 1,425,000 | 1,453,154 | ||||||||||||
Amgen, Inc. (Biotechnology) | 4.100% | 06/15/2021 | 1,000,000 | 1,096,966 | ||||||||||||
Baxalta, Inc. (Biotechnology) | 4.000% | 06/23/2025 | 1,400,000 | 1,459,304 | ||||||||||||
Celgene Corp. (Biotechnology) | 3.875% | 08/15/2025 | 1,350,000 | 1,440,685 | ||||||||||||
Becton Dickinson and Co. (Health Care Equip. & Supplies) | 5.000% | 05/15/2019 | 500,000 | 545,647 | ||||||||||||
Aetna, Inc. (Health Care Providers & Svs.) | 4.250% | 06/15/2036 | 900,000 | 929,947 | ||||||||||||
Express Scripts Holding Co. (Health Care Providers & Svs.) | 2.250% | 06/15/2019 | 900,000 | 915,292 | ||||||||||||
Laboratory Corp. of America Holdings (Health Care Providers & Svs.) | 3.750% | 08/23/2022 | 425,000 | 447,554 | ||||||||||||
Quest Diagnostics, Inc. (Health Care Providers & Svs.) | 2.700% | 04/01/2019 | 1,000,000 | 1,025,604 | ||||||||||||
Johnson & Johnson (Pharmaceuticals) | 2.450% | 03/01/2026 | 1,000,000 | 1,034,144 | ||||||||||||
Merck Sharp & Dohme Corp. (Pharmaceuticals) | 5.000% | 06/30/2019 | 1,000,000 | 1,110,947 | ||||||||||||
Mylan NV (Pharmaceuticals) | (a) | 3.000% | 12/15/2018 | 900,000 | 921,423 | |||||||||||
|
| |||||||||||||||
| 12,380,667 | ||||||||||||||||
|
| |||||||||||||||
INDUSTRIALS – 10.1% | ||||||||||||||||
BAE Systems Holdings, Inc. (Aerospace & Defense) | (a) | 6.375% | 06/01/2019 | 750,000 | 843,085 | |||||||||||
Lockheed Martin Corp. (Aerospace & Defense) | 3.350% | 09/15/2021 | 1,000,000 | 1,066,238 | ||||||||||||
Lockheed Martin Corp. (Aerospace & Defense) | 3.600% | 03/01/2035 | 1,000,000 | 1,014,328 | ||||||||||||
Raytheon Co. (Aerospace & Defense) | 4.400% | 02/15/2020 | 1,250,000 | 1,384,495 | ||||||||||||
FedEx Corp. (Air Freight & Logistics) | 4.900% | 01/15/2034 | 1,425,000 | 1,618,278 | ||||||||||||
Masco Corp. (Building Products) | 4.375% | 04/01/2026 | 2,000,000 | 2,062,980 | ||||||||||||
Illinois Tool Works, Inc. (Machinery) | 3.375% | 09/15/2021 | 500,000 | 539,277 | ||||||||||||
Parker-Hannifin Corp. (Machinery) | 4.200% | 11/21/2034 | 1,400,000 | 1,572,011 | ||||||||||||
Burlington Northern Santa Fe, LLC (Road & Rail) | 4.550% | 09/01/2044 | 900,000 | 1,035,882 | ||||||||||||
CSX Corp. (Road & Rail) | 5.600% | 05/01/2017 | 1,500,000 | 1,554,935 | ||||||||||||
Norfolk Southern Corp. (Road & Rail) | 3.000% | 04/01/2022 | 600,000 | 626,394 | ||||||||||||
Penske Truck Leasing Co. LP / PTL Finance Corp. (Road & Rail) | (a) | 3.300% | 04/01/2021 | 900,000 | 925,272 | |||||||||||
Union Pacific Corp. (Road & Rail) | 3.250% | 08/15/2025 | 1,000,000 | 1,091,131 | ||||||||||||
Sydney Airport Finance Co. Pty. Ltd. (Transportation Infrastructure) | (a) | 3.625% | 04/28/2026 | 900,000 | 929,241 | |||||||||||
|
| |||||||||||||||
| 16,263,547 | ||||||||||||||||
|
| |||||||||||||||
INFORMATION TECHNOLOGY – 7.3% | ||||||||||||||||
Harris Corp. (Communications Equip.) | 2.700% | 04/27/2020 | 900,000 | 912,783 | ||||||||||||
Denali Borrower, LLC / Denali Finance Corp. (Computers & Peripherals) | (a) | 5.625% | 10/15/2020 | 900,000 | 944,100 | |||||||||||
Diamond 1 Finance Corp. / Diamond 2 Finance Corp. (Computers & Peripherals) | (a)(b) | 5.450% | 06/15/2023 | 900,000 | 933,233 | |||||||||||
Diamond 1 Finance Corp. / Diamond 2 Finance Corp. (Computers & Peripherals) | (a) | 5.875% | 06/15/2021 | 500,000 | 512,443 | |||||||||||
Diamond 1 Finance Corp. / Diamond 2 Finance Corp. (Computers & Peripherals) | (a) | 7.125% | 06/15/2024 | 500,000 | 522,371 | |||||||||||
Fidelity National Information Services, Inc. (IT Svs.) | 2.850% | 10/15/2018 | 900,000 | 923,658 | ||||||||||||
Intel Corp. (Semiconductors & Equip.) | 4.000% | 12/15/2032 | 1,500,000 | 1,623,624 | ||||||||||||
KLA-Tencor Corp. (Semiconductors & Equip.) | (b) | 3.375% | 11/01/2019 | 900,000 | 930,706 | |||||||||||
Microsoft Corp. (Software) | 4.450% | 11/03/2045 | 900,000 | 1,012,246 | ||||||||||||
Oracle Corp. (Software) | 4.300% | 07/08/2034 | 1,500,000 | 1,598,213 | ||||||||||||
Apple, Inc. (Tech. Hardware, Storage & Periph.) | 2.500% | 02/09/2025 | 1,000,000 | 1,016,212 | ||||||||||||
Hewlett Packard Enterprise Co. (Tech. Hardware, Storage & Periph.) | (a) | 4.900% | 10/15/2025 | 850,000 | 888,511 | |||||||||||
|
| |||||||||||||||
| 11,818,100 | ||||||||||||||||
|
| |||||||||||||||
| 11 | (continued) |
| Ohio National Fund, Inc. | Bond Portfolio (Continued) |
Schedule of Investments | June 30, 2016 (Unaudited) |
| Corporate Bonds (Continued) | Rate | Maturity | Face Amount | Value | ||||||||||||
MATERIALS – 4.2% | ||||||||||||||||
Airgas, Inc. (Chemicals) | 3.050% | 08/01/2020 | $ | 900,000 | $ | 936,834 | ||||||||||
Dow Chemical Co. / The (Chemicals) | 4.250% | 10/01/2034 | 1,400,000 | 1,445,812 | ||||||||||||
Eastman Chemical Co. (Chemicals) | 3.600% | 08/15/2022 | 1,000,000 | 1,051,558 | ||||||||||||
FMC Corp. (Chemicals) | 3.950% | 02/01/2022 | 1,000,000 | 1,045,845 | ||||||||||||
Packaging Corp. of America (Containers & Packaging) | 4.500% | 11/01/2023 | 675,000 | 733,464 | ||||||||||||
Newmont Mining Corp. (Metals & Mining) | 3.500% | 03/15/2022 | 1,425,000 | 1,479,870 | ||||||||||||
|
| |||||||||||||||
| 6,693,383 | ||||||||||||||||
|
| |||||||||||||||
TELECOMMUNICATION SERVICES – 2.8% | ||||||||||||||||
AT&T, Inc. (Diversified Telecom. Svs.) | 3.400% | 05/15/2025 | 900,000 | 921,052 | ||||||||||||
AT&T, Inc. (Diversified Telecom. Svs.) | 4.125% | 02/17/2026 | 1,000,000 | 1,074,242 | ||||||||||||
Verizon Communications, Inc. (Diversified Telecom. Svs.) | 4.600% | 04/01/2021 | 1,250,000 | 1,401,506 | ||||||||||||
Verizon Communications, Inc. (Diversified Telecom. Svs.) | 3.850% | 11/01/2042 | 425,000 | 400,615 | ||||||||||||
Rogers Communications, Inc. (Wireless Telecom. Svs.) | 3.000% | 03/15/2023 | 700,000 | 730,679 | ||||||||||||
|
| |||||||||||||||
| 4,528,094 | ||||||||||||||||
|
| |||||||||||||||
UTILITIES – 9.8% | ||||||||||||||||
Appalachian Power Co. (Electric Utilities) | 4.600% | 03/30/2021 | 1,000,000 | 1,101,164 | ||||||||||||
Commonwealth Edison Co. (Electric Utilities) | 4.350% | 11/15/2045 | 900,000 | 1,023,309 | ||||||||||||
DTE Electric Co. (Electric Utilities) | 3.375% | 03/01/2025 | 1,000,000 | 1,087,944 | ||||||||||||
Duke Energy Florida, LLC (Electric Utilities) | 4.550% | 04/01/2020 | 500,000 | 551,201 | ||||||||||||
ITC Holdings Corp. (Electric Utilities) | 3.650% | 06/15/2024 | 500,000 | 520,614 | ||||||||||||
Kansas City Power & Light Co. (Electric Utilities) | 5.850% | 06/15/2017 | 1,500,000 | 1,555,590 | ||||||||||||
LG&E & KU Energy, LLC (Electric Utilities) | 4.375% | 10/01/2021 | 1,000,000 | 1,103,664 | ||||||||||||
South Carolina Electric & Gas Co. (Electric Utilities) | 4.350% | 02/01/2042 | 1,000,000 | 1,088,005 | ||||||||||||
Union Electric Co. (Electric Utilities) | 6.400% | 06/15/2017 | 1,500,000 | 1,572,617 | ||||||||||||
Xcel Energy, Inc. (Electric Utilities) | 4.700% | 05/15/2020 | 1,000,000 | 1,105,323 | ||||||||||||
AGL Capital Corp. (Gas Utilities) | 5.250% | 08/15/2019 | 1,000,000 | 1,094,112 | ||||||||||||
Southwest Gas Corp. (Gas Utilities) | 3.875% | 04/01/2022 | 1,250,000 | 1,302,479 | ||||||||||||
Avista Corp. (Multi-Utilities) | 5.950% | 06/01/2018 | 1,000,000 | 1,081,286 | ||||||||||||
American Water Capital Corp. (Water Utilities) | 4.300% | 12/01/2042 | 1,400,000 | 1,574,880 | ||||||||||||
|
| |||||||||||||||
| 15,762,188 | ||||||||||||||||
|
| |||||||||||||||
Total Corporate Bonds (Cost $151,650,799) | $ | 158,107,099 | ||||||||||||||
|
| |||||||||||||||
| Asset-Backed Securities – 0.5% | Rate | Maturity | Face Amount | Value | ||||||||||||
INDUSTRIALS – 0.5% | ||||||||||||||||
American Airlines 2015-1 Class B Pass Through Trust (Airlines) | 3.700% | 11/01/2024 | $ | 817,436 | $ | 801,087 | ||||||||||
|
| |||||||||||||||
Total Asset-Backed Securities (Cost $817,436) | $ | 801,087 | ||||||||||||||
|
| |||||||||||||||
| U.S. Treasury Obligations – 0.3% | Rate | Maturity | Face Amount | Value | ||||||||||||
U.S. Treasury Note | 2.250% | 11/15/2024 | $ | 500,000 | $ | 533,574 | ||||||||||
|
| |||||||||||||||
Total U.S. Treasury Obligations (Cost $525,866) | $ | 533,574 | ||||||||||||||
|
| |||||||||||||||
| Warrants – 0.0% | Quantity | Value | ||||||||||||||
CONSUMER DISCRETIONARY – 0.0% | ||||||||||||||||
HealthSouth Corp. (Health Care Providers & Svs.) | 656 | $ | 1,109 | |||||||||||||
|
| |||||||||||||||
Total Warrants (Cost $0) | $ | 1,109 | ||||||||||||||
|
| |||||||||||||||
| Money Market Funds – 1.7% | Shares | Value | ||||||||||||||
State Street Institutional Liquid Reserves Fund Institutional Class | 1,054,355 | $ | 1,054,355 | |||||||||||||
State Street Institutional U.S. Government Money Market Fund Institutional Class | 1,681,159 | 1,681,159 | ||||||||||||||
|
| |||||||||||||||
Total Money Market Funds (Cost $2,735,514) | $ | 2,735,514 | ||||||||||||||
|
| |||||||||||||||
Total Investments – 100.6% (Cost $155,729,615) | (c) | $ | 162,178,383 | |||||||||||||
Liabilities in Excess of Other Assets – (0.6)% | (1,053,937) | |||||||||||||||
|
| |||||||||||||||
Net Assets – 100.0% | $ | 161,124,446 | ||||||||||||||
|
| |||||||||||||||
Percentages are stated as a percent of net assets.
Footnotes:
| (a) | Security exempt from registration under Regulation D of the Securities Act of 1933. These securities may be resold in transactions exempt from registration, normally to qualified buyers under Rule 144A. At June 30, 2016, the value of these securities totaled $12,435,574, or 7.7% of the Portfolio’s net assets. These securities were deemed liquid pursuant to procedures approved by the Board of Directors. |
| (b) | Represents bonds that are credit sensitive. The coupon rates for these bonds are subject to adjustment based on changes in national credit rating agency ratings. |
| (c) | Represents cost for financial reporting purposes, which may differ from cost basis for federal income tax purposes. See also Note 7 of the Notes to Financial Statements. |
The accompanying notes are an integral part of these financial statements.
| 12 |
| Ohio National Fund, Inc. | Omni Portfolio |
Objective/Strategy
The Omni Portfolio seeks a high level of long-term total return consistent with preservation of capital by investing in stocks, bonds, and money market instruments.
Performance as of June 30, 2016
Average Annual Returns: | ||||
One year | -0.18% | |||
Five years | 9.42% | |||
Ten years | 7.23% |
Past performance does not guarantee future results. The performance data quoted represents past performance and current returns may be lower or higher. Total return figures include change in share price and reinvestment of dividends and capital gains. The investment return and principal value will fluctuate so that an investor’s shares, when redeemed, may be worth more or less than the original cost. To obtain performance information up to the most recent month end, call toll-free 1-877-781-6392.
The Portfolio is not open to direct retail investment. Beneficial interest in shares is obtained solely by purchase of variable life insurance policies and variable annuity contracts. Actual performance results for variable annuity and variable universal life contracts will be lower due to contract charges. Consult your contract for applicable charges.
Comments
For the six-month period ended June 30, 2016, the Omni Portfolio returned 2.17% versus 5.00% for its benchmark, which is comprised of 70% S&P 500 Index and 30% BofA Merrill Lynch U.S. Corporate Master Index (the “Merrill Lynch Index”).
The underperformance for the Portfolio versus the blended benchmark is the result of underperformance by the equity portion of the Portfolio versus the S&P 500 Index, somewhat offset by the outperformance of the bond portion of the Portfolio versus the Merrill Lynch Index. The asset allocation decision to overweight stocks and underweight bonds versus the blended benchmark also detracted from relative performance because bonds outperformed stocks during the six-month period.(1)
For the period, the equity portion of the Portfolio returned 0.48% versus 3.84% for the S&P 500 Index, for underperformance of 278 basis points. The Portfolio’s equity underperformance resulted primarily from sector allocations. In all but the Financials sector, overweights or underweights worked against the Portfolio in terms of performance relative to the benchmark. Overall, stock selection was positive, as Health Care led all sectors. Stock selection in Financials, however, was a key detractor from relative performance.(1)
The Portfolio’s top performing stocks for the first half of the year were Tesaro Inc., Pioneer Natural Resources Co., PHV Corp., Anacor Pharmaceuticals Inc., and Xylem Inc. The Portfolio’s worst performing stocks were Delphi Automotive PLC, Bank of America Corp., Allergan PLC, Harman International Industries Inc., and Anadarko Petroleum Corp. The top contributors to stock performance were Tesaro Inc., Anacor Pharmaceuticals Inc., PVH Corp., Xylem Inc., and HCA Holdings Inc. The top detractors from stock performance were Delphi Automotive PLC, Intel Corp., Allergan PLC, Mylan NV, and Valient Pharmaceuticals International Inc.(1)
The top equity contributor to the Portfolio’s performance through the first half of the year was Tesaro, Inc., which generated 223 basis points. The company reported positive Phase 3 data for its ovarian cancer drug. Anacor Pharmaceuticals, Inc. added 77 points, as the
stock benefited from Pfizer’s announcement to acquire the company. The deal, valued at $5.2 billion, provided Pfizer with access to Anacor’s non-steroidal topical gel to treat eczema. PVH Corp. added 56 basis points, as it reported an earnings “beat and raise” for the first quarter and trends for the subsequent quarter have remained positive to in-line with guidance. Xylem, Inc. added 43 basis points, as it benefited from stronger growth in municipal water project activity and positive sentiment regarding the water crisis in Flint, Michigan. Finally, HCA Holdings, Inc. gained 36 basis points, as the market is moving back to fundamentally sound companies in the uncertain environment.(1)
Detractors from performance during the first half of the year included Delphi Automotive PLC, as concerns over Brexit and the U.S. auto cycle pressured the stock and impacted the Portfolio negatively by 76 basis points. Intel Corp. cost the Portfolio 50 basis points due to a reduced PC sales forecast. Valeant Pharmaceuticals International, Inc. cost the portfolio 45 basis points as it faced several issues during the first quarter, starting with a leave of absence taken by the CEO early in the year due to a severe case of pneumonia. We sold the position following news of a decline in reimbursement by CVS Health Corp. for a key drug, Jublia, which is used to treat toenail fungal infections, and the company’s announcement that its 10-K would be delayed due to a restatement of its financials after an internal review of the company’s accounting of sales through its specialty pharmacy subsidiary. Fortunately, we avoided another significant decline in the stock after the company lowered its profit outlook sharply later in the quarter due to weaker pricing and demand, as well as higher taxes, which led to heightened investors’ concerns about its ability to repay its significant level of debt. Specialty pharmaceutical companies, such as Allergan PLC and Mylan NV had some unforeseen issues. Allergan PLC’s proposed merger with Pfizer, Inc. was terminated, and concerns of weaker pricing in generic drugs outweighed Mylan NV’s strong growth prospects, costing the Portfolio 94 basis points in aggregate.(1)
For the period, the bond portion of the Portfolio returned 8.95% versus 7.56% for the Merrill Lynch Index, for outperformance of 139 basis points. Both the bond portion of the Portfolio and the Merrill Lynch Index had strong positive results primarily because Treasury yields declined over the period (the 10-year Treasury yield declined 80 basis points). The bond portion of the Portfolio outperformed the Merrill Lynch Index primarily because of its approximate 6% overweighting in the Energy sector. This sector performed poorly in the fourth quarter of 2015, and it made a strong recovery in 2016, as oil prices increased from very depressed levels at the start of the year. The approximate 9% underweighting in the Financials sector also benefited relative performance, as this sector underperformed. The approximate 5% overweighting in the Information Technology sector detracted from relative performance because this sector also underperformed. The average credit quality of the bond portion of the Portfolio was Baa1 versus A3 for the Merrill Lynch Index, and this difference in credit quality benefited relative performance because lower quality bonds outperformed higher quality bonds during the period. Having a bond duration that was approximately 0.2 years shorter than the Merrill Lynch Index had a marginally negative impact on relative bond performance because Treasury yields declined and credit spreads tightened over the six-month period. (1)
The five bonds in the Portfolio that performed the best during the first half of 2016 came from the mining and energy sectors, which recovered in price in 2016 after the large price declines suffered by them late in 2015. These five best performing bonds were Teck Resources Ltd., Freeport-McMoRan, Inc., Southwestern Energy Corp., Energy Transfer Partners, L.P., and Murphy Oil Corporation. The five worst performing bonds that were held for the entire period were Citigroup Inc., Kansas
| 13 | (continued) |
| Ohio National Fund, Inc. | Omni Portfolio (Continued) |
City Power & Light Company, Union Electric Company, Pennsylvania Electric Company, and Comcast Corporation. These “worst” performing bonds have short maturities and did not appreciate in value as Treasury yields declined, and their credit quality is sound.(1)
The month of June will certainly go down in history as being eventful. To the shock of many, the United Kingdom voted to exit the European Union. Volatility increased and “contagion” and “risk off” came back into our daily vocabulary. Despite that, the market was roughly flat for the month, and up slightly for the quarter, led by defensive-oriented groups. While it is quite unclear what lies ahead for European, and global, economic growth, we feel that the U.S. markets will be a safe haven to investors, as multiples are reasonable and companies will continue to grow, though at a slightly slower pace. Our continued focus on company and industry specific fundamentals should be a contributor to outperformance of stocks going forward. Corporate credit may continue to deteriorate in 2016, as companies pursue equity-friendly policies such as increased dividends, debt-financed stock buybacks and debt-financed merger and acquisition activity. All of these activities should lead to credit spread widening eventually. However, the overwhelming demand for U.S. dollar denominated debt, and the stretch for yield in the current low interest rate environment will likely keep credit spreads from widening for the short term. Given this outlook, we expect to maintain our overweight to BBB investment grade bonds, and maintain a small exposure to BB high yield bonds. Lastly, in the bond portion of Omni, we plan to maintain the Portfolio’s duration slightly short of that of the Merrill Lynch Index. We prefer to take slightly more credit risk than interest rate risk, given the low level of interest rates and the current economic environment.
| (1) | The Portfolio’s composition is subject to change. Holdings and weightings are as of June 30, 2016. |
Change in Value of $10,000 Investment
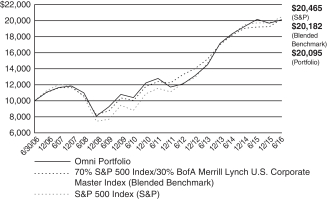
Hypothetical illustration based on past performance. Future performance will vary. The Portfolio’s returns reflect reinvested dividends. The Portfolio’s holdings may differ significantly from the securities in the index. The index is unmanaged and therefore does not reflect the cost of portfolio management and accounting.
The S&P 500 Index is a capitalization-weighted index designed to measure performance of the broad domestic market through changes in the aggregate market value of 500 stocks representing all major industries. The index presented herein includes the effects of reinvested dividends.
The BofA Merrill Lynch U.S. Corporate Master Index tracks the performance of all U.S. dollar-denominated, investment grade corporate public debt issued in the U.S. domestic bond market. Qualifying bonds must have an investment grade rating (based on an average of Moody’s, S&P, and Fitch). In addition, qualifying securities must have at least one year remaining term to maturity, a fixed coupon schedule, and a minimum amount outstanding of $250 million.
Portfolio Composition as of June 30, 2016 (1)
| % of Net Assets | ||||
Common Stocks (4) | 72.2 | |||
Corporate Bonds (4) | 21.9 | |||
Asset-Backed Securities (4) | 0.2 | |||
U.S. Treasury Obligations | 0.8 | |||
Money Market Funds | 4.9 | |||
|
| |||
| 100.0 | ||||
|
|
Top 10 Portfolio Holdings as of June 30, 2016 (1) (2) (3)
| % of Net Assets | ||||
1. Amazon.com, Inc. | 2.1 | |||
2. TESARO, Inc. | 1.9 | |||
3. NXP Semiconductors NV | 1.8 | |||
4. Newell Brands, Inc. | 1.8 | |||
5. Allergan PLC | 1.8 | |||
6. Facebook, Inc. Class A | 1.8 | |||
7. Time Warner, Inc. | 1.7 | |||
8. Alibaba Group Holding Ltd. – ADR | 1.7 | |||
9. Humana, Inc. | 1.6 | |||
10. PVH Corp. | 1.6 |
| (1) | Composition of Portfolio subject to change. |
| (2) | Short-term investments have been excluded from the list of Top 10 Portfolio Holdings. |
| (3) | Top 10 Portfolio Holdings is presented at an individual security level. Total investment exposure by issuer may be higher. |
| (4) | Sectors (Common Stocks, Corporate Bonds, Asset-Backed Securities): |
| % of Net Assets | ||||
Information Technology | 24.4 | |||
Financials | 15.2 | |||
Consumer Discretionary | 14.8 | |||
Health Care | 13.7 | |||
Industrials | 13.2 | |||
Energy | 6.6 | |||
Consumer Staples | 2.9 | |||
Utilities | 1.7 | |||
Materials | 1.3 | |||
Telecommunication Services | 0.5 | |||
|
| |||
| 94.3 | ||||
|
|
| 14 |
| Ohio National Fund, Inc. | Omni Portfolio |
Schedule of Investments | June 30, 2016 (Unaudited) |
| Common Stocks – 72.2% | Shares | Value | ||||||||
CONSUMER DISCRETIONARY – 12.7% | ||||||||||
Delphi Automotive PLC (Auto Components) | 10,837 | $ | 678,396 | |||||||
MGM Resorts International (Hotels, Restaurants & Leisure) | (a) | 30,571 | 691,822 | |||||||
Newell Brands, Inc. (Household Durables) | 18,691 | 907,822 | ||||||||
Amazon.com, Inc. (Internet & Catalog Retail) | (a) | 1,525 | 1,091,320 | |||||||
Time Warner, Inc. (Media) | 12,079 | 888,290 | ||||||||
Lowe’s Cos., Inc. (Specialty Retail) | 9,329 | 738,577 | ||||||||
Deckers Outdoor Corp. (Textiles, Apparel & Luxury Goods) | (a) | 11,391 | 655,210 | |||||||
PVH Corp. (Textiles, Apparel & Luxury Goods) | 8,591 | 809,530 | ||||||||
|
| |||||||||
| 6,460,967 | ||||||||||
|
| |||||||||
CONSUMER STAPLES – 1.5% | ||||||||||
Kellogg Co. (Food Products) | 4,808 | 392,573 | ||||||||
Pinnacle Foods, Inc. (Food Products) | 8,203 | 379,717 | ||||||||
|
| |||||||||
| 772,290 | ||||||||||
|
| |||||||||
ENERGY – 2.3% | ||||||||||
Schlumberger Ltd. (Energy Equip. & Svs.) | 6,003 | 474,717 | ||||||||
Pioneer Natural Resources Co. (Oil, Gas & Consumable Fuels) | 4,654 | 703,732 | ||||||||
|
| |||||||||
| 1,178,449 | ||||||||||
|
| |||||||||
FINANCIALS – 9.2% | ||||||||||
BankUnited, Inc. (Banks) | 12,809 | 393,492 | ||||||||
Citigroup, Inc. (Banks) | 16,481 | 698,630 | ||||||||
KeyCorp (Banks) | 57,121 | 631,187 | ||||||||
Regions Financial Corp. (Banks) | 75,294 | 640,752 | ||||||||
Bank of New York Mellon Corp. / The (Capital Markets) | 17,556 | 682,051 | ||||||||
Capital One Financial Corp. (Consumer Finance) | 5,400 | 342,954 | ||||||||
MetLife, Inc. (Insurance) | 16,460 | 655,602 | ||||||||
Prudential Financial, Inc. (Insurance) | 9,221 | 657,826 | ||||||||
|
| |||||||||
| 4,702,494 | ||||||||||
|
| |||||||||
HEALTH CARE – 12.5% | ||||||||||
TESARO, Inc. (Biotechnology) | (a) | 11,283 | 948,336 | |||||||
Aetna, Inc. (Health Care Providers & Svs.) | 5,921 | 723,132 | ||||||||
HCA Holdings, Inc. (Health Care Providers & Svs.) | (a) | 9,673 | 744,918 | |||||||
Humana, Inc. (Health Care Providers & Svs.) | 4,502 | 809,819 | ||||||||
UnitedHealth Group, Inc. (Health Care Providers & Svs.) | 5,280 | 745,536 | ||||||||
Thermo Fisher Scientific, Inc. (Life Sciences Tools & Svs.) | 4,920 | 726,979 | ||||||||
Allergan PLC (Pharmaceuticals) | (a) | 3,909 | 903,331 | |||||||
Mylan NV (Pharmaceuticals) | (a) | 16,787 | 725,870 | |||||||
|
| |||||||||
| 6,327,921 | ||||||||||
|
| |||||||||
INDUSTRIALS – 11.1% | ||||||||||
Hexcel Corp. (Aerospace & Defense) | 6,999 | 291,438 | ||||||||
Huntington Ingalls Industries, Inc. (Aerospace & Defense) | 3,410 | 572,982 | ||||||||
Raytheon Co. (Aerospace & Defense) | 5,486 | 745,822 | ||||||||
FedEx Corp. (Air Freight & Logistics) | 4,691 | 712,000 | ||||||||
AECOM (Construction & Engineering) | (a) | 23,441 | 744,721 | |||||||
Rockwell Automation, Inc. (Electrical Equip.) | 6,390 | 733,700 | ||||||||
General Electric Co. (Industrial Conglomerates) | 12,878 | 405,400 | ||||||||
Xylem, Inc. (Machinery) | 15,636 | 698,147 | ||||||||
Union Pacific Corp. (Road & Rail) | 8,412 | 733,947 | ||||||||
|
| |||||||||
| 5,638,157 | ||||||||||
|
| |||||||||
INFORMATION TECHNOLOGY – 22.5% | ||||||||||
Cisco Systems, Inc. (Communications Equip.) | 26,678 | 765,392 | ||||||||
Harris Corp. (Communications Equip.) | 9,236 | 770,652 | ||||||||
Alibaba Group Holding Ltd. – ADR (Internet Software & Svs.) | (a) | 10,847 | 862,662 | |||||||
Alphabet, Inc. Class A (Internet Software & Svs.) | (a) | 371 | 261,010 | |||||||
Alphabet, Inc. Class C (Internet Software & Svs.) | (a) | 1,073 | 742,623 | |||||||
Facebook, Inc. Class A (Internet Software & Svs.) | (a) | 7,841 | 896,069 | |||||||
Computer Sciences Corp. (IT Svs.) | 10,313 | 512,040 | ||||||||
International Business Machines Corp. (IT Svs.) | 4,879 | 740,535 | ||||||||
MasterCard, Inc. Class A (IT Svs.) | 7,973 | 702,102 | ||||||||
Broadcom Ltd. (Semiconductors & Equip.) | 4,882 | 758,663 | ||||||||
NXP Semiconductors NV (Semiconductors & Equip.) | (a) | 11,963 | 937,181 | |||||||
Adobe Systems, Inc. (Software) | (a) | 7,485 | 716,988 | |||||||
Electronic Arts, Inc. (Software) | (a) | 9,829 | 744,645 | |||||||
Microsoft Corp. (Software) | 12,359 | 632,410 | ||||||||
Oracle Corp. (Software) | 16,967 | 694,459 | ||||||||
Hewlett Packard Enterprise Co. (Tech. Hardware, Storage & Periph.) | 37,532 | 685,710 | ||||||||
|
| |||||||||
| 11,423,141 | ||||||||||
|
| |||||||||
| 15 | (continued) |
| Ohio National Fund, Inc. | Omni Portfolio (Continued) |
Schedule of Investments | June 30, 2016 (Unaudited) |
| Common Stocks (Continued) | Shares | Value | ||||||||
MATERIALS – 0.4% | ||||||||||
Monsanto Co. (Chemicals) | 1,725 | $ | 178,382 | |||||||
|
| |||||||||
Total Common Stocks (Cost $34,917,250) | $ | 36,681,801 | ||||||||
|
| |||||||||
| Corporate Bonds – 21.9% | Rate | Maturity | Face Amount | Value | ||||||||||||
CONSUMER DISCRETIONARY – 2.1% | ||||||||||||||||
General Motors Co. (Automobiles) | 5.000% | 04/01/2035 | $ | 100,000 | $ | 99,648 | ||||||||||
General Motors Financial Co., Inc. (Automobiles) | 3.200% | 07/06/2021 | 100,000 | 100,290 | ||||||||||||
Newell Rubbermaid, Inc. (Household Durables) | (c) | 3.150% | 04/01/2021 | 100,000 | 104,189 | |||||||||||
21st Century Fox America, Inc. (Media) | 4.500% | 02/15/2021 | 100,000 | 111,662 | ||||||||||||
Comcast Corp. (Media) | 5.875% | 02/15/2018 | 75,000 | 80,774 | ||||||||||||
Discovery Communications, LLC (Media) | 3.300% | 05/15/2022 | 75,000 | 75,794 | ||||||||||||
Time Warner Cable, Inc. (Media) | 6.550% | 05/01/2037 | 150,000 | 175,017 | ||||||||||||
Time Warner, Inc. (Media) | 2.950% | 07/15/2026 | 100,000 | 100,808 | ||||||||||||
Viacom, Inc. (Media) | 4.250% | 09/01/2023 | 75,000 | 77,949 | ||||||||||||
Kohl’s Corp. (Multiline Retail) | 4.000% | 11/01/2021 | 75,000 | 78,458 | ||||||||||||
Bed Bath & Beyond, Inc. (Specialty Retail) | 5.165% | 08/01/2044 | 100,000 | 88,161 | ||||||||||||
|
| |||||||||||||||
| 1,092,750 | ||||||||||||||||
|
| |||||||||||||||
CONSUMER STAPLES – 1.4% | ||||||||||||||||
Anheuser-Busch InBev Finance, Inc. (Beverages) | 4.700% | 02/01/2036 | 100,000 | 112,506 | ||||||||||||
Bunge NA Finance LP (Food Products) | 5.900% | 04/01/2017 | 150,000 | 154,813 | ||||||||||||
Mead Johnson Nutrition Co. (Food Products) | 3.000% | 11/15/2020 | 100,000 | 104,478 | ||||||||||||
Procter & Gamble Co. / The (Household Products) | 4.700% | 02/15/2019 | 100,000 | 109,609 | ||||||||||||
Imperial Tobacco Finance PLC (Tobacco) | (b) | 3.750% | 07/21/2022 | 100,000 | 105,543 | |||||||||||
Philip Morris International, Inc. (Tobacco) | 3.375% | 08/11/2025 | 100,000 | 108,197 | ||||||||||||
|
| |||||||||||||||
| 695,146 | ||||||||||||||||
|
| |||||||||||||||
ENERGY – 4.3% | ||||||||||||||||
Ensco PLC (Energy Equip. & Svs.) | 5.200% | 03/15/2025 | 100,000 | 69,500 | ||||||||||||
Halliburton Co. (Energy Equip. & Svs.) | 4.850% | 11/15/2035 | 100,000 | 108,343 | ||||||||||||
Noble Holding International Ltd. (Energy Equip. & Svs.) | (c) | 5.000% | 03/16/2018 | 100,000 | 98,500 | |||||||||||
Boardwalk Pipelines LP (Oil, Gas & Consumable Fuels) | 5.500% | 02/01/2017 | 100,000 | 101,516 | ||||||||||||
Columbia Pipeline Group, Inc. (Oil, Gas & Consumable Fuels) | 4.500% | 06/01/2025 | 100,000 | 107,541 | ||||||||||||
ConocoPhillips Co. (Oil, Gas & Consumable Fuels) | 3.350% | 05/15/2025 | 150,000 | 155,130 | ||||||||||||
Devon Energy Corp. (Oil, Gas & Consumable Fuels) | 3.250% | 05/15/2022 | 100,000 | 96,992 | ||||||||||||
Energy Transfer Partners LP (Oil, Gas & Consumable Fuels) | 4.750% | 01/15/2026 | 100,000 | 103,220 | ||||||||||||
Enterprise Products Operating, LLC (Oil, Gas & Consumable Fuels) | 3.900% | 02/15/2024 | 100,000 | 105,879 | ||||||||||||
EOG Resources, Inc. (Oil, Gas & Consumable Fuels) | 3.150% | 04/01/2025 | 100,000 | 101,531 | ||||||||||||
Exxon Mobil Corp. (Oil, Gas & Consumable Fuels) | 4.114% | 03/01/2046 | 100,000 | 112,549 | ||||||||||||
Kinder Morgan Energy Partners LP (Oil, Gas & Consumable Fuels) | 4.150% | 03/01/2022 | 75,000 | 75,883 | ||||||||||||
Magellan Midstream Partners LP (Oil, Gas & Consumable Fuels) | 6.400% | 07/15/2018 | 150,000 | 162,978 | ||||||||||||
Marathon Oil Corp. (Oil, Gas & Consumable Fuels) | 3.850% | 06/01/2025 | 150,000 | 137,874 | ||||||||||||
Murphy Oil Corp. (Oil, Gas & Consumable Fuels) | (c) | 4.700% | 12/01/2022 | 100,000 | 91,499 | |||||||||||
Phillips 66 (Oil, Gas & Consumable Fuels) | 4.300% | 04/01/2022 | 100,000 | 109,233 | ||||||||||||
Plains All American Pipeline LP / PAA Finance Corp. (Oil, Gas & Consumable Fuels) | 4.650% | 10/15/2025 | 100,000 | 101,012 | ||||||||||||
Shell International Finance BV (Oil, Gas & Consumable Fuels) | 2.875% | 05/10/2026 | 100,000 | 101,653 | ||||||||||||
Southwestern Energy Co. (Oil, Gas & Consumable Fuels) | (c) | 4.050% | 01/23/2020 | 100,000 | 97,750 | |||||||||||
Spectra Energy Capital, LLC (Oil, Gas & Consumable Fuels) | 3.300% | 03/15/2023 | 75,000 | 72,089 | ||||||||||||
TransCanada PipeLines Ltd. (Oil, Gas & Consumable Fuels) | 2.500% | 08/01/2022 | 75,000 | 74,511 | ||||||||||||
|
| |||||||||||||||
| 2,185,183 | ||||||||||||||||
|
| |||||||||||||||
FINANCIALS – 6.0% | ||||||||||||||||
Bank of America Corp. (Banks) | 3.875% | 08/01/2025 | 150,000 | 159,652 | ||||||||||||
Branch Banking & Trust Co. (Banks) | 3.625% | 09/16/2025 | 100,000 | 107,708 | ||||||||||||
Citigroup, Inc. (Banks) | 5.850% | 08/02/2016 | 75,000 | 75,268 | ||||||||||||
Citigroup, Inc. (Banks) | 4.400% | 06/10/2025 | 100,000 | 104,379 | ||||||||||||
Comerica, Inc. (Banks) | 3.800% | 07/22/2026 | 100,000 | 101,799 | ||||||||||||
JPMorgan Chase & Co. (Banks) | 3.250% | 09/23/2022 | 100,000 | 104,557 | ||||||||||||
KeyBank NA (Banks) | 5.700% | 11/01/2017 | 150,000 | 158,116 | ||||||||||||
PNC Bank NA (Banks) | 3.250% | 06/01/2025 | 150,000 | 159,447 | ||||||||||||
SunTrust Banks, Inc. (Banks) | 2.500% | 05/01/2019 | 100,000 | 102,170 | ||||||||||||
Wells Fargo & Co. (Banks) | 3.000% | 04/22/2026 | 100,000 | 101,932 | ||||||||||||
Wells Fargo & Co. (Banks) | 3.500% | 03/08/2022 | 75,000 | 80,459 | ||||||||||||
Goldman Sachs Group, Inc. / The (Capital Markets) | 3.750% | 05/22/2025 | 100,000 | 104,486 | ||||||||||||
Mellon Funding Corp. (Capital Markets) | 5.500% | 11/15/2018 | 100,000 | 109,168 | ||||||||||||
Morgan Stanley (Capital Markets) | 3.750% | 02/25/2023 | 75,000 | 79,449 | ||||||||||||
Morgan Stanley (Capital Markets) | 3.950% | 04/23/2027 | 100,000 | 100,868 | ||||||||||||
Northern Trust Corp. (Capital Markets) | 3.950% | 10/30/2025 | 75,000 | 83,774 | ||||||||||||
Capital One Financial Corp. (Consumer Finance) | 2.450% | 04/24/2019 | 75,000 | 76,330 | ||||||||||||
| 16 | (continued) |
| Ohio National Fund, Inc. | Omni Portfolio (Continued) |
Schedule of Investments | June 30, 2016 (Unaudited) |
| Corporate Bonds (Continued) | Rate | Maturity | Face Amount | Value | ||||||||||||
FINANCIALS (continued) | ||||||||||||||||
Ford Motor Credit Co., LLC (Consumer Finance) | 3.157% | 08/04/2020 | $ | 100,000 | $ | 103,691 | ||||||||||
Synchrony Financial (Consumer Finance) | 4.250% | 08/15/2024 | 100,000 | 103,537 | ||||||||||||
Berkshire Hathaway, Inc. (Diversified Financial Svs.) | 3.125% | 03/15/2026 | 100,000 | 104,909 | ||||||||||||
Intercontinental Exchange, Inc. (Diversified Financial Svs.) | 2.750% | 12/01/2020 | 100,000 | 104,712 | ||||||||||||
Nasdaq, Inc. (Diversified Financial Svs.) | (c) | 3.850% | 06/30/2026 | 100,000 | 101,654 | |||||||||||
Aflac, Inc. (Insurance) | 3.625% | 06/15/2023 | 75,000 | 80,555 | ||||||||||||
American International Group, Inc. (Insurance) | 3.875% | 01/15/2035 | 100,000 | 95,800 | ||||||||||||
Marsh & McLennan Cos., Inc. (Insurance) | 3.500% | 06/03/2024 | 100,000 | 103,893 | ||||||||||||
American Tower Corp. (Real Estate Investment Trusts) | 3.375% | 10/15/2026 | 100,000 | 100,574 | ||||||||||||
Boston Properties LP (Real Estate Investment Trusts) | 3.125% | 09/01/2023 | 75,000 | 77,124 | ||||||||||||
Federal Realty Investment Trust (Real Estate Investment Trusts) | 3.000% | 08/01/2022 | 75,000 | 77,741 | ||||||||||||
HCP, Inc. (Real Estate Investment Trusts) | 4.000% | 06/01/2025 | 100,000 | 100,864 | ||||||||||||
Simon Property Group LP (Real Estate Investment Trusts) | 3.750% | 02/01/2024 | 75,000 | 81,839 | ||||||||||||
|
| |||||||||||||||
| 3,046,455 | ||||||||||||||||
|
| |||||||||||||||
HEALTH CARE – 1.2% | ||||||||||||||||
AbbVie, Inc. (Biotechnology) | 2.900% | 11/06/2022 | 75,000 | 76,482 | ||||||||||||
Baxalta, Inc. (Biotechnology) | 4.000% | 06/23/2025 | 100,000 | 104,236 | ||||||||||||
Celgene Corp. (Biotechnology) | 3.875% | 08/15/2025 | 150,000 | 160,076 | ||||||||||||
Aetna, Inc. (Health Care Providers & Svs.) | 4.250% | 06/15/2036 | 100,000 | 103,327 | ||||||||||||
Laboratory Corp. of America Holdings (Health Care Providers & Svs.) | 3.750% | 08/23/2022 | 75,000 | 78,980 | ||||||||||||
Mylan NV (Pharmaceuticals) | (b) | 3.000% | 12/15/2018 | 100,000 | 102,380 | |||||||||||
|
| |||||||||||||||
| 625,481 | ||||||||||||||||
|
| |||||||||||||||
INDUSTRIALS – 1.9% | ||||||||||||||||
Lockheed Martin Corp. (Aerospace & Defense) | 3.600% | 03/01/2035 | 100,000 | 101,433 | ||||||||||||
FedEx Corp. (Air Freight & Logistics) | 4.900% | 01/15/2034 | 75,000 | 85,173 | ||||||||||||
Parker-Hannifin Corp. (Machinery) | 4.200% | 11/21/2034 | 100,000 | 112,287 | ||||||||||||
Burlington Northern Santa Fe, LLC (Road & Rail) | 4.550% | 09/01/2044 | 100,000 | 115,098 | ||||||||||||
ERAC U.S.A. Finance, LLC (Road & Rail) | (b)(c) | 6.375% | 10/15/2017 | 150,000 | 159,000 | |||||||||||
Norfolk Southern Corp. (Road & Rail) | 3.000% | 04/01/2022 | 75,000 | 78,299 | ||||||||||||
Penske Truck Leasing Co. LP / PTL Finance Corp. (Road & Rail) | (b) | 3.300% | 04/01/2021 | 100,000 | 102,808 | |||||||||||
Union Pacific Corp. (Road & Rail) | 3.250% | 08/15/2025 | 100,000 | 109,113 | ||||||||||||
Sydney Airport Finance Co. Pty. Ltd. (Transportation Infrastructure) | (b) | 3.625% | 04/28/2026 | 100,000 | 103,249 | |||||||||||
|
| |||||||||||||||
| 966,460 | ||||||||||||||||
|
| |||||||||||||||
INFORMATION TECHNOLOGY – 1.9% | ||||||||||||||||
Harris Corp. (Communications Equip.) | 2.700% | 04/27/2020 | 100,000 | 101,420 | ||||||||||||
Denali Borrower, LLC / Denali Finance Corp. (Computers & Peripherals) | (b) | 5.625% | 10/15/2020 | 100,000 | 104,900 | |||||||||||
Diamond 1 Finance Corp. / Diamond 2 Finance Corp. (Computers & Peripherals) | (b)(c) | 5.450% | 06/15/2023 | 100,000 | 103,693 | |||||||||||
Fidelity National Information Services, Inc. (IT Svs.) | 2.850% | 10/15/2018 | 100,000 | 102,629 | ||||||||||||
KLA-Tencor Corp. (Semiconductors & Equip.) | (c) | 3.375% | 11/01/2019 | 100,000 | 103,412 | |||||||||||
Microsoft Corp. (Software) | 4.450% | 11/03/2045 | 100,000 | 112,472 | ||||||||||||
Oracle Corp. (Software) | 4.300% | 07/08/2034 | 100,000 | 106,547 | ||||||||||||
Apple, Inc. (Tech. Hardware, Storage & Periph.) | 2.500% | 02/09/2025 | 100,000 | 101,621 | ||||||||||||
Hewlett Packard Enterprise Co. (Tech. Hardware, Storage & Periph.) | (b) | 4.900% | 10/15/2025 | 150,000 | 156,796 | |||||||||||
|
| |||||||||||||||
| 993,490 | ||||||||||||||||
|
| |||||||||||||||
MATERIALS – 0.9% | ||||||||||||||||
Airgas, Inc. (Chemicals) | 3.050% | 08/01/2020 | 100,000 | 104,093 | ||||||||||||
CF Industries, Inc. (Chemicals) | 3.450% | 06/01/2023 | 75,000 | 74,944 | ||||||||||||
Dow Chemical Co. / The (Chemicals) | 4.250% | 10/01/2034 | 100,000 | 103,272 | ||||||||||||
Packaging Corp. of America (Containers & Packaging) | 4.500% | 11/01/2023 | 75,000 | 81,496 | ||||||||||||
Newmont Mining Corp. (Metals & Mining) | 3.500% | 03/15/2022 | 75,000 | 77,888 | ||||||||||||
|
| |||||||||||||||
| 441,693 | ||||||||||||||||
|
| |||||||||||||||
TELECOMMUNICATION SERVICES – 0.5% | ||||||||||||||||
AT&T, Inc. (Diversified Telecom. Svs.) | 3.400% | 05/15/2025 | 100,000 | 102,339 | ||||||||||||
Verizon Communications, Inc. (Diversified Telecom. Svs.) | 3.850% | 11/01/2042 | 75,000 | 70,697 | ||||||||||||
Rogers Communications, Inc. (Wireless Telecom. Svs.) | 3.000% | 03/15/2023 | 75,000 | 78,287 | ||||||||||||
|
| |||||||||||||||
| 251,323 | ||||||||||||||||
|
| |||||||||||||||
UTILITIES – 1.7% | ||||||||||||||||
Commonwealth Edison Co. (Electric Utilities) | 4.350% | 11/15/2045 | 100,000 | 113,701 | ||||||||||||
Kansas City Power & Light Co. (Electric Utilities) | 5.850% | 06/15/2017 | 150,000 | 155,559 | ||||||||||||
Pennsylvania Electric Co. (Electric Utilities) | 6.050% | 09/01/2017 | 150,000 | 157,560 | ||||||||||||
South Carolina Electric & Gas Co. (Electric Utilities) | 4.350% | 02/01/2042 | 75,000 | 81,600 | ||||||||||||
Union Electric Co. (Electric Utilities) | 6.400% | 06/15/2017 | 150,000 | 157,262 | ||||||||||||
Southwest Gas Corp. (Gas Utilities) | 3.875% | 04/01/2022 | 75,000 | 78,149 | ||||||||||||
American Water Capital Corp. (Water Utilities) | 4.300% | 12/01/2042 | 100,000 | 112,491 | ||||||||||||
|
| |||||||||||||||
| 856,322 | ||||||||||||||||
|
| |||||||||||||||
Total Corporate Bonds (Cost $10,721,139) | $ | 11,154,303 | ||||||||||||||
|
| |||||||||||||||
| 17 | (continued) |
| Ohio National Fund, Inc. | Omni Portfolio (Continued) |
Schedule of Investments | June 30, 2016 (Unaudited) |
| Asset-Backed Securities – 0.2% | Rate | Maturity | Face Amount | Value | ||||||||||||
INDUSTRIALS – 0.2% | ||||||||||||||||
American Airlines 2015-1 Class B Pass Through Trust (Airlines) | 3.700% | 11/01/2024 | $ | 90,826 | $ | 89,009 | ||||||||||
|
| |||||||||||||||
Total Asset-Backed Securities (Cost $90,826) | $ | 89,009 | ||||||||||||||
|
| |||||||||||||||
| U.S. Treasury Obligations – 0.8% | Rate | Maturity | Face Amount | Value | ||||||||||||
U.S. Treasury Note | 1.500% | 03/31/2023 | $ | 200,000 | $ | 202,922 | ||||||||||
U.S. Treasury Note | 1.750% | 05/15/2022 | 200,000 | 206,711 | ||||||||||||
|
| |||||||||||||||
Total U.S. Treasury Obligations (Cost $403,822) | $ | 409,633 | ||||||||||||||
|
| |||||||||||||||
| Warrants – 0.0% | Quantity | Value | ||||||||||||||
CONSUMER DISCRETIONARY – 0.0% | ||||||||||||||||
HealthSouth Corp. (Health Care Providers & Svs.) | 1,900 | $ | 3,211 | |||||||||||||
|
| |||||||||||||||
Total Warrants (Cost $0) | $ | 3,211 | ||||||||||||||
|
| |||||||||||||||
| Money Market Funds – 5.0% | Shares | Value | ||||||||||||||
State Street Institutional Liquid Reserves Fund Institutional Class | 706,691 | $ | 706,691 | |||||||||||||
State Street Institutional U.S. Government Money Market Fund Institutional Class | 1,816,488 | 1,816,488 | ||||||||||||||
|
| |||||||||||||||
Total Money Market Funds (Cost $2,523,179) | $ | 2,523,179 | ||||||||||||||
|
| |||||||||||||||
Total Investments – 100.1% (Cost $48,656,216) | (d) | $ | 50,861,136 | |||||||||||||
Liabilities in Excess of Other Assets – (0.1)% | (57,424) | |||||||||||||||
|
| |||||||||||||||
Net Assets – 100.0% | $ | 50,803,712 | ||||||||||||||
|
| |||||||||||||||
Percentages are stated as a percent of net assets.
Abbreviations:
ADR: American Depositary Receipts
Footnotes:
| (a) | Non-income producing security. |
| (b) | Security exempt from registration under Regulation D of the Securities Act of 1933. These securities may be resold in transactions exempt from registration, normally to qualified buyers under Rule 144A. At June 30, 2016, the value of these securities totaled $938,369, or 1.8% of the Portfolio’s net assets. These securities were deemed liquid pursuant to procedures approved by the Board of Directors. |
| (c) | Represents bonds that are credit sensitive. The coupon rates for these bonds are subject to adjustment based on changes in national credit rating agency ratings. |
| (d) | Represents cost for financial reporting purposes, which may differ from cost basis for federal income tax purposes. See also Note 7 of the Notes to Financial Statements. |
The accompanying notes are an integral part of these financial statements.
| 18 |
| Ohio National Fund, Inc. | Capital Appreciation Portfolio |
Objective/Strategy
The Capital Appreciation Portfolio seeks long-term capital growth by investing primarily in equity and equity related securities of established companies with either current or emerging earnings growth not fully appreciated or recognized by the market.
Performance as of June 30, 2016
Average Annual Returns: | ||||
One year | -5.30% | |||
Five years | 9.12% | |||
Ten years | 6.83% |
Past performance does not guarantee future results. The performance data quoted represents past performance and current returns may be lower or higher. Total return figures include change in share price and reinvestment of dividends and capital gains. The investment return and principal value will fluctuate so that an investor’s shares, when redeemed, may be worth more or less than the original cost. To obtain performance information up to the most recent month end, call toll-free 1-877-781-6392.
The Portfolio is not open to direct retail investment. Beneficial interest in shares is obtained solely by purchase of variable life insurance policies and variable annuity contracts. Actual performance results for variable annuity and variable universal life contracts will be lower due to contract charges. Consult your contract for applicable charges.
Comments
For the six-month period ended June 30, 2016, the Capital Appreciation Portfolio returned 0.61% versus 3.84% for its benchmark, the S&P 500 Index.
Investor risk aversion in a volatile global market had a major impact on equity returns in the six-month period ended June 30, 2016. Contributing to market volatility were: decelerating economic growth in China; concerns that emerging economies might face balance sheet risks, how the United Kingdom’s decision to leave the European Union will unfold, reduced energy sector activity due to sharply lower prices, fears of slowing economic growth in the U.S., and uncertainty about the course of future Federal Reserve monetary tightening.
The S&P 500 Index’s 3.84% return for the period masks the significant volatility that was present in the period. The broad market fell nearly 11% through mid-February before rallying in the remainder of the first quarter. There was continued volatility in the second quarter, especially toward the end of June, with the index falling sharply after the Brexit vote but recovering by June 30th. From a sector perspective, Telecommunication Services, Utilities, and Energy generated solid double digit gains within the index, while Financials and Information Technology returns were negative.
The Portfolio generated a positive return but underperformed the benchmark. Investment selections in Financials were disappointing overall and responsible for much of the shortfall. Voya Financial, Inc., Citigroup, Inc., and Bank of America Corp. drove the weak results. Concerns that a slowdown in the U.S. economy would put future Fed rate hikes on hold, as well as the potential for higher credit losses weighed on the shares of most large banks. The sector received another large setback amid the United Kingdom’s decision to exit the European Union, which added additional uncertainty around the path of higher rates, capital market activity, and credit conditions. Bank of America Corp.’s valuation is extremely attractive, in our view, as it trades at a significant discount to book value and discounts very little future earnings growth as the turnaround progresses. In our view, Citigroup, Inc. has been meeting financial
and strategic goals and we believe it will continue to make progress on both fronts. Voya Financial, Inc., in the insurance industry, was hurt by near-term headwinds for product spreads and re-investment rates given the risk of lower rates in this economic environment. We like its focus on strong future capital deployment and delivering long-term growth in a solid set of business lines following its restructuring. All three of these financial stocks sell for single digit P/E multiples and significant discounts to tangible book value, which gives them favorable reward to risk profiles according to our analysis.(1)
Mylan NV and Express Scripts Holding Co., both in the Health Care sector, were other notable detractors. Shares of Mylan NV fell on its proposed acquisition of Meda AB, as many investors struggled to justify the high price offered. While Mylan NV has a solid and diverse base business (especially its EpiPen product), we think the poorly-received Meda AB deal could be an overhang to its share price performance. Controversy over drug pricing is also an added risk and, as such, we eliminated the position. Express Scripts Holding Co. was hurt by contract re-pricing discussions with Anthem, Inc., its largest customer. We eliminated the position due to a narrowing reward to risk ratio.(1)
Our Energy positions were the largest contributor to returns. Newfield Exploration Co., Patterson–UTI Energy, Inc., and Halliburton Co. were standouts. As the crude oil market has rebounded due to falling U.S. shale production, the market has rewarded what we view are the stronger energy companies. Newfield Exploration Co. benefited from higher than expected production, as well as the acquisition of 42,000 acres in the STACK play in the Anadarko Basin. We believe this is a highly strategic deal and we like the company’s consistent operational execution. Patterson-UTI Energy, Inc., a land driller with a highly specialized fleet, is executing very well in a difficult environment and we expect for it to remain free cash flow positive through the trough of the drilling cycle. We also like the unique strengths of its pressure pumping franchise as competitors exit the business. Halliburton Co., a relatively new position in the Portfolio, benefited from anticipation that its merger with Baker Hughes, Inc. would be terminated (this ultimately occurred on May 1, 2016). We think this will allow Halliburton Co. to focus on its strong position in a production led cyclical recovery.(1)
Consumer Discretionary also added value, led by solid gains in lululemon athletica, Inc. and Coach, Inc. Shares of lululemon athletica, Inc. benefited from current sales, which we believe sets the company up for better growth and gross margins going forward. We think multi-year margin improvement plans and better inventory management will continue to reward our investment. Coach, Inc. is in the early stages of a turnaround and that brand improvement is setting the stage for sales and profit acceleration, in our view.(1)
We continue to see opportunity in finding attractively valued companies with underappreciated earnings growth profiles. Additionally, there has been a notable uptick in the dispersion of fundamentals and valuations of companies within the same industry. Near-term trends are also quite mixed as growth expectations shift toward the second-half of 2016. Our view is that these factors, along with the continued uncertainty around China’s economic growth trajectory and Brexit, should contribute to heightened volatility for the remainder of the year. Against this backdrop, we think it is still premature to buy many companies based on valuations without a significant catalyst to realize that value; however, we are well prepared to take advantage of irrational market behavior and near term volatility to capture opportunistic buys.
| 19 | (continued) |
| Ohio National Fund, Inc. | Capital Appreciation Portfolio (Continued) |
In this environment, bottom-up research and understanding individual business risk drivers are critical. To be successful, we believe that a wide net in looking for stock candidates must be cast, while avoiding areas that have bubble-like valuations due to low interest rate expectations. We believe this bodes well for our investment process, long-term approach, and the performance expectations of our clients.
| (1) | The Portfolio’s composition is subject to change. Holdings and weightings are as of June 30, 2016. |
Change in Value of $10,000 Investment
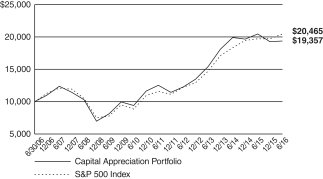
Hypothetical illustration based on past performance. Future performance will vary. The Portfolio’s returns reflect reinvested dividends. The Portfolio’s holdings may differ significantly from the securities in the index. The index is unmanaged and therefore does not reflect the cost of portfolio management and accounting.
The S&P 500 Index is a capitalization-weighted index designed to measure performance of the broad domestic economy through changes in the aggregate market value of 500 stocks representing all major industries. The index presented herein includes the effects of reinvested dividends.
Portfolio Composition as of June 30, 2016 (1)
| % of Net Assets | ||||
Common Stocks (4) | 95.4 | |||
Money Market Funds | 4.6 | |||
|
| |||
| 100.0 | ||||
|
|
Top 10 Portfolio Holdings as of June 30, 2016 (1) (2) (3)
| % of Net Assets |
1. Bristol-Myers Squibb Co. | 2.6 | |||
2. Comcast Corp. Class A | 2.1 | |||
3. Microsoft Corp. | 2.1 | |||
4. Viacom, Inc. Class B | 2.1 | |||
5. ConAgra Foods, Inc. | 2.1 | |||
6. Pfizer, Inc. | 2.0 | |||
7. Patterson-UTI Energy, Inc. | 2.0 | |||
8. General Electric Co. | 2.0 | |||
9. Shire PLC – ADR | 1.9 | |||
10. MetLife, Inc. | 1.9 |
| (1) | Composition of Portfolio subject to change. |
| (2) | Short-term investments have been excluded from the list of Top 10 Portfolio Holdings. |
| (3) | Top 10 Portfolio Holdings is presented at an individual security level. Total investment exposure by issuer may be higher. |
| (4) | Sectors (Common Stocks): |
| % of Net Assets | ||||
Consumer Discretionary | 21.3 | |||
Information Technology | 15.8 | |||
Health Care | 14.4 | |||
Financials | 13.1 | |||
Energy | 10.1 | |||
Industrials | 8.9 | |||
Consumer Staples | 4.1 | |||
Utilities | 3.7 | |||
Materials | 2.8 | |||
Telecommunication Services | 1.2 | |||
|
| |||
| 95.4 | ||||
|
|
| 20 |
| Ohio National Fund, Inc. | Capital Appreciation Portfolio |
Schedule of Investments | June 30, 2016 (Unaudited) |
| Common Stocks – 95.4% | Shares | Value | ||||||||
CONSUMER DISCRETIONARY – 21.3% |
| |||||||||
Carnival Corp. (Hotels, Restaurants & Leisure) | 120,501 | $ | 5,326,144 | |||||||
Hyatt Hotels Corp. Class A (Hotels, Restaurants & Leisure) | (a) | 146,097 | 7,179,207 | |||||||
MGM Resorts International (Hotels, Restaurants & Leisure) | (a) | 311,883 | 7,057,912 | |||||||
SeaWorld Entertainment, Inc. (Hotels, Restaurants & Leisure) | 213,846 | 3,064,413 | ||||||||
Wendy’s Co. / The (Hotels, Restaurants & Leisure) | 452,170 | 4,349,875 | ||||||||
CalAtlantic Group, Inc. (Household Durables) | 195,707 | 7,184,404 | ||||||||
Comcast Corp. Class A (Media) | 134,161 | 8,745,956 | ||||||||
Live Nation Entertainment, Inc. (Media) | (a) | 287,277 | 6,751,010 | |||||||
Twenty-First Century Fox, Inc. Class A (Media) | 243,481 | 6,586,161 | ||||||||
Viacom, Inc. Class B (Media) | 209,796 | 8,700,240 | ||||||||
Vivendi SA (Media) | (b) | 155,175 | 2,903,124 | |||||||
Target Corp. (Multiline Retail) | 97,140 | 6,782,315 | ||||||||
Coach, Inc. (Textiles, Apparel & Luxury Goods) | 179,483 | 7,312,137 | ||||||||
lululemon athletica, Inc. (Textiles, Apparel & Luxury Goods) | (a) | 89,214 | 6,589,346 | |||||||
|
| |||||||||
| 88,532,244 | ||||||||||
|
| |||||||||
CONSUMER STAPLES – 4.1% | ||||||||||
ConAgra Foods, Inc. (Food Products) | 181,271 | 8,666,567 | ||||||||
Mondelez International, Inc. Class A (Food Products) | 150,695 | 6,858,129 | ||||||||
Turning Point Brands, Inc. (Tobacco) | (a) | 160,195 | 1,645,203 | |||||||
|
| |||||||||
| 17,169,899 | ||||||||||
|
| |||||||||
ENERGY – 10.1% | ||||||||||
Halliburton Co. (Energy Equip. & Svs.) | 169,552 | 7,679,010 | ||||||||
Patterson-UTI Energy, Inc. (Energy Equip. & Svs.) | 388,275 | 8,278,023 | ||||||||
Cobalt International Energy, Inc. (Oil, Gas & Consumable Fuels) | (a) | 280,960 | 376,486 | |||||||
Newfield Exploration Co. (Oil, Gas & Consumable Fuels) | (a) | 173,493 | 7,664,921 | |||||||
Noble Energy, Inc. (Oil, Gas & Consumable Fuels) | 216,471 | 7,764,815 | ||||||||
Occidental Petroleum Corp. (Oil, Gas & Consumable Fuels) | 79,288 | 5,991,001 | ||||||||
Royal Dutch Shell PLC Class A – ADR (Oil, Gas & Consumable Fuels) | 77,668 | 4,288,827 | ||||||||
|
| |||||||||
| 42,043,083 | ||||||||||
|
| |||||||||
FINANCIALS – 13.1% | ||||||||||
Bank of America Corp. (Banks) | 395,088 | 5,242,818 | ||||||||
Citigroup, Inc. (Banks) | 146,746 | 6,220,563 | ||||||||
JPMorgan Chase & Co. (Banks) | 93,634 | 5,818,417 | ||||||||
PNC Financial Services Group, Inc. / The (Banks) | 82,511 | 6,715,570 | ||||||||
Evercore Partners, Inc. Class A (Capital Markets) | 9,904 | 437,658 | ||||||||
Goldman Sachs Group, Inc. / The (Capital Markets) | 48,422 | 7,194,541 | ||||||||
Morgan Stanley (Capital Markets) | 235,456 | 6,117,147 | ||||||||
Synchrony Financial (Consumer Finance) | (a) | 178,235 | 4,505,781 | |||||||
Voya Financial, Inc. (Diversified Financial Svs.) | 181,439 | 4,492,429 | ||||||||
MetLife, Inc. (Insurance) | 197,442 | 7,864,115 | ||||||||
|
| |||||||||
| 54,609,039 | ||||||||||
|
| |||||||||
HEALTH CARE – 14.4% | ||||||||||
AbbVie, Inc. (Biotechnology) | 89,660 | 5,550,850 | ||||||||
Biogen, Inc. (Biotechnology) | (a) | 13,861 | 3,351,867 | |||||||
BioMarin Pharmaceutical, Inc. (Biotechnology) | (a) | 52,765 | 4,105,117 | |||||||
Shire PLC – ADR (Biotechnology) | 43,173 | 7,947,286 | ||||||||
Cigna Corp. (Health Care Providers & Svs.) | 33,444 | 4,280,497 | ||||||||
Veeva Systems, Inc. Class A (Health Care Technology) | (a) | 137,304 | 4,684,812 | |||||||
Allergan plc (Pharmaceuticals) | (a) | 23,306 | 5,385,784 | |||||||
Bristol-Myers Squibb Co. (Pharmaceuticals) | 146,720 | 10,791,256 | ||||||||
Merck & Co., Inc. (Pharmaceuticals) | 93,537 | 5,388,667 | ||||||||
| Common Stocks (Continued) | Shares | Value | ||||||||
HEALTH CARE (continued) | ||||||||||
Pfizer, Inc. (Pharmaceuticals) | 240,265 | $ | 8,459,731 | |||||||
|
| |||||||||
| 59,945,867 | ||||||||||
|
| |||||||||
INDUSTRIALS – 8.9% | ||||||||||
DigitalGlobe, Inc. (Aerospace & Defense) | (a) | 203,834 | 4,360,009 | |||||||
United Technologies Corp. (Aerospace & Defense) | 53,914 | 5,528,881 | ||||||||
Eaton Corp. PLC (Electrical Equip.) | 48,504 | 2,897,144 | ||||||||
General Electric Co. (Industrial Conglomerates) | 260,730 | 8,207,780 | ||||||||
Mueller Water Products, Inc. Class A (Machinery) | 272,139 | 3,107,827 | ||||||||
Ryder System, Inc. (Road & Rail) | 45,945 | 2,809,077 | ||||||||
Union Pacific Corp. (Road & Rail) | 75,103 | 6,552,737 | ||||||||
Univar, Inc. (Trading Companies & Distributors) | (a) | 175,810 | 3,324,567 | |||||||
|
| |||||||||
| 36,788,022 | ||||||||||
|
| |||||||||
INFORMATION TECHNOLOGY – 15.8% | ||||||||||
Brocade Communications Systems, Inc. (Communications Equip.) | 439,388 | 4,033,582 | ||||||||
Juniper Networks, Inc. (Communications Equip.) | 160,623 | 3,612,411 | ||||||||
Benchmark Electronics, Inc. (Electronic Equip., Instr. & Comp.) | (a) | 172,598 | 3,650,448 | |||||||
Alphabet, Inc. Class C (Internet Software & Svs.) | (a) | 9,896 | 6,849,022 | |||||||
Cadence Design Systems, Inc. (Software) | (a) | 136,628 | 3,320,060 | |||||||
Fortinet, Inc. (Software) | (a) | 138,995 | 4,390,852 | |||||||
Guidewire Software, Inc. (Software) | (a) | 88,905 | 5,490,773 | |||||||
Microsoft Corp. (Software) | 170,116 | 8,704,836 | ||||||||
PTC, Inc. (Software) | (a) | 188,609 | 7,087,926 | |||||||
Qlik Technologies, Inc. (Software) | (a) | 132,009 | 3,904,826 | |||||||
Rovi Corp. (Software) | (a) | 135,613 | 2,120,987 | |||||||
Verint Systems, Inc. (Software) | (a) | 93,176 | 3,086,921 | |||||||
Apple, Inc. (Tech. Hardware, Storage & Periph.) | 40,056 | 3,829,354 | ||||||||
Diebold, Inc. (Tech. Hardware, Storage & Periph.) | 217,538 | 5,401,468 | ||||||||
|
| |||||||||
| 65,483,466 | ||||||||||
|
| |||||||||
MATERIALS – 2.8% | ||||||||||
Monsanto Co. (Chemicals) | 47,095 | 4,870,094 | ||||||||
Constellium NV Class A (Metals & Mining) | (a) | 253,511 | 1,188,967 | |||||||
Louisiana-Pacific Corp. (Paper & Forest Products) | (a) | 318,172 | 5,520,284 | |||||||
|
| |||||||||
| 11,579,345 | ||||||||||
|
| |||||||||
TELECOMMUNICATION SERVICES – 1.2% | ||||||||||
Frontier Communications Corp. (Diversified Telecom. Svs.) | 1,007,536 | 4,977,228 | ||||||||
|
| |||||||||
UTILITIES – 3.7% | ||||||||||
FirstEnergy Corp. (Electric Utilities) | 188,988 | 6,597,571 | ||||||||
PG&E Corp. (Electric Utilities) | 75,479 | 4,824,618 | ||||||||
Calpine Corp. (Ind. Power & Renewable Elec.) | (a) | 257,228 | 3,794,113 | |||||||
|
| |||||||||
| 15,216,302 | ||||||||||
|
| |||||||||
Total Common Stocks (Cost $395,397,505) | $ | 396,344,495 | ||||||||
|
| |||||||||
| Money Market Funds – 5.4% | Shares | Value | ||||||||
State Street Institutional Liquid Reserves Fund Institutional Class | 10,482,315 | $ | 10,482,315 | |||||||
|
| |||||||||
State Street Institutional U.S. Government Money Market Fund Institutional Class | 11,955,460 | 11,955,460 | ||||||||
|
| |||||||||
Total Money Market Funds (Cost $22,437,775) | $ | 22,437,775 | ||||||||
|
| |||||||||
Total Investments – 100.8% (Cost $417,835,280) | (c) | $ | 418,782,270 | |||||||
Liabilities in Excess of Other Assets – (0.8)% |
| (3,429,253) | ||||||||
|
| |||||||||
Net Assets – 100.0% | $ | 415,353,017 | ||||||||
|
| |||||||||
| 21 | (continued) |
| Ohio National Fund, Inc. | Capital Appreciation Portfolio (Continued) |
Schedule of Investments | June 30, 2016 (Unaudited) |
Percentages are stated as a percent of net assets.
Abbreviations:
ADR: American Depositary Receipts
Footnotes:
| (a) | Non-income producing security. |
| (b) | Security traded on a foreign exchange has been valued at an estimate of fair value that is different than the local market close price. These fair value estimates are determined by an independent fair valuation service that has been approved by the Board. These securities represent $2,903,124, or 0.7% of the Portfolio’s net assets. |
Other Portfolio securities are not subjected to fair value procedures because they are traded on domestic or foreign exchanges that have close times that are consistent with the U.S. market close, normally 4:00 pm Eastern Time.
| (c) | Represents cost for financial reporting purposes, which may differ from cost basis for federal income tax purposes. See also Note 7 of the Notes to Financial Statements. |
The accompanying notes are an integral part of these financial statements.
| 22 |
| Ohio National Fund, Inc. | International Portfolio |
Objective/Strategy
The International Portfolio seeks long-term growth of capital by investing at least 80% of its assets in securities of foreign companies.
Performance as of June 30, 2016
Average Annual Returns: | ||||
One year | -12.89% | |||
Five years | -2.14% | |||
Ten years | -0.13% |
Past performance does not guarantee future results. The performance data quoted represents past performance and current returns may be lower or higher. Total return figures include change in share price and reinvestment of dividends and capital gains. The investment return and principal value will fluctuate so that an investor’s shares, when redeemed, may be worth more or less than the original cost. To obtain performance information up to the most recent month end, call toll-free 1-877-781-6392.
The Portfolio is not open to direct retail investment. Beneficial interest in shares is obtained solely by purchase of variable life insurance policies and variable annuity contracts. Actual performance results for variable annuity and variable universal life contracts will be lower due to contract charges. Consult your contract for applicable charges.
Comments
For the six-month period ended June 30, 2016, the International Portfolio returned -7.52% versus -1.02% for its benchmark, the MSCI All Country World ex-USA Index (Net-USD).
International equity markets initially declined as fears of a financial crisis in emerging markets and continued turmoil in the Middle East, which contributed to the refugee crisis in Europe, coincided with the ongoing commodity correction. Markets troughed in mid-February as a rebound in oil prices and better than expected economic data eased the fears of investors. Additional policy action by major central banks in March lowered investors’ risk aversion and drove a market rally. As we moved into the second quarter, equity markets shifted focus to the United Kingdom (UK) referendum and the consequences of a decision to leave the European Union (EU). Following the unexpected vote to leave the EU, equity volatility spiked. Global equity markets fell, and the U.S. dollar strengthened, as uncertainty rose over the future of the EU and how the negative surprise would impact the European and global economies. Given the low level of interest rates globally and the continuation of quantitative easing, investors are concerned that the major central banks lack the traditional firepower required to stimulate their economies in the event of a potential downturn. Despite central bank concerns, emerging markets, as measured by the MSCI Emerging Markets Index, led international benchmarks, rising 6.41% for the six-month period ended June 30, 2016. Developed foreign markets, as measured by the MSCI EAFE Index, declined 4.42%, while MSCI USA Index was up 3.24%.
During the period, equity markets were supported by accommodative monetary policy, as major central banks recommitted to price stability with new rate cuts and additional quantitative easing. Japan joined Sweden, Denmark, Switzerland and the European Central Bank (ECB) when it cut its benchmark rate to below zero. Central banks are following a Negative Interest Rate Policy (NIRP) in a continued effort to fight deflation and encourage economic growth. Given the muted outlook for global growth and prices, the Federal Reserve (Fed) held rates steady at its March and June meetings. The dovish Federal Open Market Committee (FOMC) policy statements indicated that the Fed would follow a slower path of interest rate increases and would be less aggressive in normalizing interest
rates. Overall, the monetary policies in place are supportive of price appreciation and improving economic activity.
European economic outlook remains on a gradual upward trajectory. Despite geopolitical turmoil (tragic acts of terrorism and massive influx of refugees), the euro area aggregate purchasing managers’ index (PMI) remained in expansionary territory throughout the six-month period. While exports to emerging markets fell, domestic demand in Europe continues to recover, helped by record low interest rates, lower energy costs, and a relatively weaker currency. Furthermore, as government budgets have improved and bond yields declined, the effects of austerity on growth have diminished. In March, the ECB recommitted to its 1.1 trillion euro asset purchase program and to begin buying corporate bonds, extending the scope of asset purchases in their effort to counter deflationary forces. However, geopolitical events remained influential throughout the second quarter. The UK voted in favor of a referendum to leave the European Union, the so called ‘Brexit.’ Growing populism spurred by an anti-immigration movement, persistent austerity, and lackluster domestic growth drove much of the negative sentiment towards the EU. While the referendum race tightened in recent months, polls immediately taken before the vote suggested the UK would reject leaving the EU. Consequently, the final result of the vote surprised the markets. Brexit and the potential for future referendums by other EU member states will likely continue to have a negative impact on consumer and business sentiment. It is unclear what will be the future relationship of the UK to the EU and this uncertainty may overhang the economy and markets.
In Japan, despite double digit positive returns from February’s low, the MSCI Japan Index declined 5.58% and was the worst performing among the Asian equity markets. Investors grew increasingly concerned that the yen, which strengthened 15.3% versus the U.S. dollar as turmoil drove risk-off sentiment in the market, would hurt corporate profits and undermine corporate confidence. Economic data was softer than anticipated, reflecting a drop in personal consumption and weaker than expected wage growth. As discussed, the Bank of Japan (BoJ) lowered its benchmark rate into negative territory in an attempt to encourage economic activity and raise inflation expectations. However, the change in policy was negatively received, as worries about undermining the banking sector led to a sell-off in Financials. Japanese structural reforms under the “three arrows” of Abenomics are slowly changing the economic landscape; however, persistent zero to low real economic growth continues to trouble policy makers. In an effort to boost confidence, Abe announced a two and half year delay of the long awaited consumption tax hike that was previously slated for April 2017.
After an uncertain start to the year, China’s equity markets stabilized and its economy appears to be growing modestly as domestic consumption, reflected by the new economy companies and real estate, showed strength. The old economy stocks, such as cement and steel companies, are effectively in a long term secular decline as the country continues its economic transformation from one dependent on high fixed asset investment to one reliant on consumption and services. Poor policy decisions by the central government spooked investors at the start of the year, but appear to have abated with officials learning from their mistakes. The Renminbi continued to depreciate, but in a more measured and orderly fashion than last year’s sudden devaluation. The impact from earlier stimulus measures appears to slowly be taking effect. Concern about the high level of corporate debt will continue to overhang the market; however, the Chinese government has demonstrated that rising non-performing loan issues will be managed orderly. As a result, economic and social stability should be maintained.
| 23 | (continued) |
| Ohio National Fund, Inc. | International Portfolio (Continued) |
In Latin America, the outlook for Brazil and Mexico remain divergent. Brazil continues to be mired in a political scandal and in an environment of stagflation, where growth is declining and inflation is rising. President Rousseff was temporarily removed from office as the process to impeach her for fiscal irregularities moved forward. The interim head of state, former Vice President Temer, quickly replaced the cabinet and central bank chief and put into place policies that are expected to stabilize the budget deficit. Expectations for real GDP growth for Brazil in 2016 have declined from 0.9%, a year ago, to -3.4%, currently. Additional reforms and a weak currency are expected to help pull the nation’s economy out of recession by 2017. The prospect of a brighter economic future, following an extended period of underperformance, caused Brazilian equities to be among the top performing markets in the period, with MSCI Brazil Index appreciating 46.34%. In contrast, the Mexican economy continued to expand, with GDP growth driven by strong personal consumption. Mexico’s economy remains stable with an improving domestic economy bolstered by foreign direct investment (FDI) and solid exports to the U.S. Mexican real GDP is expected to be 2.4% for 2016. Job creation and above trend wage growth, coupled with strength in remittances from the US, drove retail sales up 10.6% year over year in May. Despite that, the Mexican stock market, as measured by MSCI Mexico Index, rose 0.88% primarily as a result of the sell-off in the peso vs. the U.S. dollar.
The primary drivers of international equity markets during the first half of 2016 included the following: (1) the Brexit referendum, (2) currency and commodity volatility coupled with U.S. dollar strength, (3) the trajectory for U.S. growth and debate over the timing and size of Fed tightening, (4) concerns about China’s economy and signs of a downturn in global growth outlook, and (5) geopolitical risk events emanating from the Middle East.
Country allocation remained a key driver of performance for the reporting period, as it has been in the past. The Portfolio maintained exposure to select healthy, high sovereign quality, developed and emerging markets, although country allocation was the most significant factor in relative underperformance. (1)
In Asia, the Portfolio’s overweight allocation to Japan detracted from relative performance. The combination of yen strengthening and weak corporate guidance hurt the outlook for earnings. Investments in exporters, such as electrical components manufacturer Murata Manufacturing Co. Ltd. (-23.9%) and auto maker Honda Motor Co. Ltd. (-15.8%), hurt performance. Furthermore, investor concerns about how the BoJ’s negative interest rate policy would affect stability in the banking sector dragged on performance. While exporters dragged on performance, the Portfolio’s overweight to the leisure & hotel industry helped performance, as Japan Hotel REIT Investment Corp. (+13.3%) and Hoshino Resorts REIT Inc. (+22.3%) benefitted from both the declining interest rate environment and strong tourism. The tourism industry in Japan was among the top performing decisions in the Portfolio during the period along with an overweight in Japanese pharmaceuticals.(1)
Overall contributions from the Portfolio’s allocations to European equities were also negative for the period, as European equity markets retreated following Brexit. Developed Europe country overweights, including Germany, Austria, and Sweden, were a drag on performance which was only partly balanced by our underweight to United Kingdom equities. Financials and cyclical names led these markets lower as investors sought to reduce risk and cyclicality. Auto company Daimler AG (-26.4%) and retailer Hennes & Mauritz AB (-16.7%) detracted from performance. European financials negatively impacted performance, including Nordea Bank AB (-20.6%),
ING Groep NV (-21.8%), and Erste Group Bank AG (-27.0%) which declined due to interest rate uncertainty in the region. However, European energy companies contributed positively to performance. Portfolio performance also benefited from the decision to remain underweight in France, Spain and Switzerland.(1)
The Portfolio’s underweight to several resource markets such as Australia, Canada, Brazil and South Africa also significantly detracted from performance relative to the benchmark. The Portfolio had zero weight in these countries at the beginning of the period, as the economic prospects of those countries looked subpar; however, the equities markets and currencies in those countries rebounded on a reversal in sentiment in metals (gold, copper and iron ore) following a long period of underperformance. The exception in the Portfolio was an overweight to Norway, which is a large oil and gas producing country. Some companies in that country had a positive impact on performance, especially Statoil ASA (+26.8%), which was one of the top performers for the period. Statoil ASA’s revenue’s improved in the first half of 2016 as oil prices moved higher and were coupled with efficiency improvements and lower input prices. In the Netherlands, Royal Dutch Shell PLC (+24.7%) was also a top performer, favorably impacting performance in the period.(1)
In Latin America, the Portfolio’s weight in Mexico aided performance as companies benefit from external demand from the U.S., where roughly 80% of Mexico’s exports are destined. A cheaper peso, stable labor costs, and membership in the North American Free Trade Agreement (NAFTA) make the country an attractive destination for investments.(1)
The Portfolio used foreign exchange (FX) currency forward contracts to reduce currency exchange rate risk relative to the benchmark. In the period, the overall net returns of the FX forward positions contributed negatively to performance. The Portfolio’s short position in the yen and long position to the British Pound both detracted from performance.(1)
We continue to monitor our investment universe for signs of countries and companies with poor credit quality (or unmanageable debt levels), preferring to focus on countries and companies with healthy balance sheets and strategic expansion opportunities. As developed economies continue to adjust to new debt levels, and investors continue to fear a reoccurrence of a global financial crisis, markets may see periods of volatility. However, as long-term investors, we feel that fundamentals are supportive of global growth in the mid to long term. We expect the winners to maintain higher profitability and gain market share, while the weaker players, who continue to struggle to gain footing, may underperform. We also continue to expect global financial conditions to remain accommodative for some time to come.
| (1) | The Portfolio’s composition is subject to change. Holdings and weightings are as of June 30, 2016. |
| 24 | (continued) |
| Ohio National Fund, Inc. | International Portfolio (Continued) |
Change in Value of $10,000 Investment
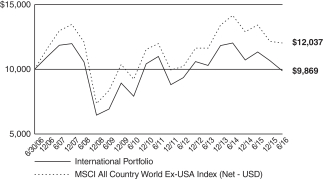
Hypothetical illustration based on past performance. Future performance will vary. The Portfolio’s returns reflect reinvested dividends. The Portfolio’s holdings may differ significantly from the securities in the index. The index is unmanaged and therefore does not reflect the cost of portfolio management and accounting.
The MSCI All Country World Ex-USA Index (Net-USD) is a free float-adjusted market capitalization weighted index that is designed to measure the equity market performance of the developed and emerging markets. The MSCI All Country World Index consists of 23 developed and 23 emerging market country indices. The MSCI All Country World Ex-USA Index (Net-USD) excludes the impact of the United States from the MSCI All Country World Index. The returns for the MSCI All Country World Ex-USA Index (Net-USD) include the effects of reinvested dividends, net of taxes, and adjustment to U.S. Dollar denomination.
Portfolio Composition as of June 30, 2016 (1)
| % of Net Assets | ||||
Common Stocks (4) | 89.3 | |||
Preferred Stocks (4) | 0.6 | |||
Money Market Funds and | 10.1 | |||
|
| |||
| 100.0 | ||||
|
|
Top 10 Portfolio Holdings as of June 30, 2016 (1) (2) (3)
| % of Net Assets | ||||
1. Samsung Electronics Co. Ltd. | 2.7 | |||
2. Statoil ASA | 2.3 | |||
3. Chugai Pharmaceutical Co. Ltd. | 2.2 | |||
4. Novo Nordisk A/S – ADR | 2.0 | |||
5. Danske Bank A/S | 2.0 | |||
6. Grupo Financiero Banorte SAB de CV | 1.9 | |||
7. Royal Caribbean Cruises Ltd. | 1.6 | |||
8. Heineken NV | 1.6 | |||
9. Royal Dutch Shell PLC – ADR | 1.5 | |||
10. Taiwan Semiconductor Manufacturing Co. Ltd. | 1.5 |
| (1) | Composition of Portfolio subject to change. |
| (2) | Short-term investments have been excluded from the list of Top 10 Portfolio Holdings. |
| (3) | Top 10 Portfolio Holdings is presented at an individual security level. Total investment exposure by issuer may be higher. |
| (4) | Top 10 Country Weightings (Common Stocks, Preferred Stocks): |
| % of Net Assets | ||||
Japan | 13.9 | |||
Germany | 11.2 | |||
Denmark | 8.5 | |||
Mexico | 8.5 | |||
Netherlands | 8.5 | |||
South Korea | 8.1 | |||
Sweden | 7.5 | |||
Taiwan | 5.0 | |||
Norway | 4.5 | |||
Austria | 3.0 |
| 25 |
| Ohio National Fund, Inc. | International Portfolio |
Schedule of Investments | June 30, 2016 (Unaudited) |
| Common Stocks – 89.3% | Shares | Value | ||||||||
Japan – 13.9% | ||||||||||
Aisin Seiki Co. Ltd. | (c) | 38,100 | $ | 1,551,937 | ||||||
Alps Electric Co. Ltd. | (c) | 34,600 | 657,341 | |||||||
ANA Holdings, Inc. | (c) | 338,000 | 963,167 | |||||||
Chugai Pharmaceutical Co. Ltd. | (c) | 91,800 | 3,271,587 | |||||||
Disco Corp. | (c) | 9,800 | 886,310 | |||||||
Don Quijote Holdings Co. Ltd. | (c) | 24,300 | 903,054 | |||||||
Doutor Nichires Holdings Co. Ltd. | (c) | 29,900 | 520,494 | |||||||
Fuji Heavy Industries Ltd. | (c) | 21,900 | 752,777 | |||||||
Hoshino Resorts REIT, Inc. | (c) | 108 | 1,360,063 | |||||||
Japan Hotel REIT Investment Corp. | (c) | 1,850 | 1,559,996 | |||||||
Kubota Corp. | (c) | 27,700 | 374,651 | |||||||
Kyowa Hakko Kirin Co. Ltd. | (c) | 46,000 | 784,565 | |||||||
Oriental Land Co. Ltd. | (c) | 14,200 | 919,441 | |||||||
Osaka Gas Co. Ltd. | (c) | 234,000 | 899,611 | |||||||
Resorttrust, Inc. | (c) | 55,400 | 1,196,750 | |||||||
Sekisui House Ltd. | (c) | 97,300 | 1,703,925 | |||||||
Sumitomo Mitsui Financial Group, Inc. | (c) | 36,700 | 1,059,714 | |||||||
Yamaha Motor Co. Ltd. | (c) | 61,900 | 944,266 | |||||||
|
| |||||||||
| 20,309,649 | ||||||||||
|
| |||||||||
Germany – 10.6% | ||||||||||
Allianz SE | (c) | 11,300 | 1,612,029 | |||||||
BASF SE | (c) | 22,000 | 1,686,932 | |||||||
Bayer AG | (c) | 8,000 | 803,478 | |||||||
Daimler AG | (c) | 25,700 | 1,537,845 | |||||||
Deutsche Pfandbriefbank AG | (b)(c) | 47,923 | 472,578 | |||||||
Deutsche Telekom AG | (c) | 117,000 | 1,995,114 | |||||||
HeidelbergCement AG | (c) | 7,000 | 527,324 | |||||||
ProSiebenSat.1 Media SE | (c) | 41,600 | 1,819,669 | |||||||
SAP SE | (c) | 28,600 | 2,148,007 | |||||||
Siemens AG | (c) | 10,700 | 1,098,046 | |||||||
Symrise AG | (c) | 26,300 | 1,793,952 | |||||||
|
| |||||||||
| 15,494,974 | ||||||||||
|
| |||||||||
Denmark – 8.5% | ||||||||||
Carlsberg A/S | (c) | 4,000 | 381,632 | |||||||
Danske Bank A/S | (c) | 109,000 | 2,868,921 | |||||||
DSV A/S | (c) | 34,300 | 1,442,251 | |||||||
ISS A/S | (c) | 38,000 | 1,429,191 | |||||||
NKT Holding A/S | (c) | 18,071 | 913,912 | |||||||
Novo Nordisk A/S – ADR | 55,800 | 3,000,924 | ||||||||
Sydbank A/S | (c) | 20,050 | 503,482 | |||||||
Vestas Wind Systems A/S | (c) | 28,700 | 1,950,722 | |||||||
|
| |||||||||
| 12,491,035 | ||||||||||
|
| |||||||||
Mexico – 8.5% | ||||||||||
Alpek SAB de CV | 740,700 | 1,215,016 | ||||||||
Alsea SAB de CV | 389,600 | 1,483,172 | ||||||||
Cemex SAB de CV – ADR | (a) | 88,700 | 547,279 | |||||||
Fomento Economico Mexicano SAB de CV – ADR | 8,700 | 804,663 | ||||||||
Gruma SAB de CV | 53,200 | 765,298 | ||||||||
Grupo Aeroportuario del Sureste SAB de CV – ADR | 5,700 | 909,435 | ||||||||
Grupo Financiero Banorte SAB de CV | 495,200 | 2,767,641 | ||||||||
Grupo Financiero Santander Mexico SAB de CV – ADR | 109,800 | 998,082 | ||||||||
Grupo Lala SAB de CV | 463,500 | 1,021,941 | ||||||||
Infraestructura Energetica Nova SAB de CV | 126,500 | 533,122 | ||||||||
Nemak SAB de CV | (b) | 242,000 | 283,397 | |||||||
Wal-Mart de Mexico SAB de CV | 478,000 | 1,149,864 | ||||||||
|
| |||||||||
| 12,478,910 | ||||||||||
|
| |||||||||
Netherlands – 8.5% | ||||||||||
ABN AMRO Group NV | (b)(c) | 74,558 | 1,225,782 | |||||||
Akzo Nobel NV | (c) | 9,019 | 560,267 | |||||||
ASML Holding NV | 7,700 | 763,917 | ||||||||
GrandVision NV | (b)(c) | 15,000 | 387,997 | |||||||
Heineken NV | (c) | 25,199 | 2,311,298 | |||||||
ING Groep NV | (c) | 150,800 | 1,560,162 | |||||||
| Common Stocks (Continued) | Shares | Value | ||||||||
Netherlands (continued) | ||||||||||
Intertrust NV | (a)(b)(c) | 41,652 | $ | 929,567 | ||||||
Koninklijke Philips NV | (c) | 49,000 | 1,216,977 | |||||||
NN Group NV | (c) | 32,774 | 902,216 | |||||||
Randstad Holding NV | (c) | 8,000 | 319,928 | |||||||
Royal Dutch Shell PLC | (c) | 406 | 11,151 | |||||||
Royal Dutch Shell PLC – ADR | 40,824 | 2,254,301 | ||||||||
|
| |||||||||
| 12,443,563 | ||||||||||
|
| |||||||||
South Korea – 8.1% | ||||||||||
GS Holdings Corp. | (c) | 17,500 | 726,744 | |||||||
Hana Financial Group, Inc. | (c) | 29,000 | 589,595 | |||||||
Hanwha Chemical Corp. | (c) | 16,800 | 351,025 | |||||||
Hyundai Motor Co. | (a)(c) | 3,100 | 366,703 | |||||||
Kia Motors Corp. | (c) | 7,800 | 293,899 | |||||||
Korea Electric Power Corp. | (c) | 26,300 | 1,380,539 | |||||||
KT Corp. | (c) | 4 | 103 | |||||||
LG Uplus Corp. | (c) | 52,800 | 501,477 | |||||||
Lotte Chemical Corp. | (c) | 1,300 | 323,554 | |||||||
Poongsan Corp. | (c) | 14,000 | 356,906 | |||||||
Samsung Card Co. Ltd. | (c) | 17,600 | 637,788 | |||||||
Samsung Electronics Co. Ltd. | (c) | 3,160 | 3,935,310 | |||||||
Shinhan Financial Group Co. Ltd. – ADR | 14,700 | 481,278 | ||||||||
SK Hynix, Inc. | (c) | 9,500 | 270,341 | |||||||
SK Telecom Co. Ltd. – ADR | 39,500 | 826,340 | ||||||||
Woori Bank | (c) | 91,300 | 759,102 | |||||||
|
| |||||||||
| 11,800,704 | ||||||||||
|
| |||||||||
Sweden – 7.5% | ||||||||||
Hennes & Mauritz AB | (c) | 74,500 | 2,191,850 | |||||||
Husqvarna AB | (c) | 199,900 | 1,488,550 | |||||||
Nordax Group AB | (b)(d) | 128,790 | 551,042 | |||||||
Nordea Bank AB | (c) | 93,800 | 795,765 | |||||||
Peab AB | (c) | 147,400 | 1,118,337 | |||||||
Skandinaviska Enskilda Banken AB | (c) | 125,900 | 1,099,822 | |||||||
SKF AB | (c) | 36,700 | 588,043 | |||||||
Swedbank AB | (c) | 55,700 | 1,169,871 | |||||||
Telefonaktiebolaget LM Ericsson | (c) | 92,100 | 707,563 | |||||||
Volvo AB | (c) | 134,400 | 1,335,171 | |||||||
|
| |||||||||
| 11,046,014 | ||||||||||
|
| |||||||||
Taiwan – 5.0% | ||||||||||
Chang Hwa Commercial Bank Ltd. | (c) | 1,290,000 | 673,569 | |||||||
China Life Insurance Co. Ltd. | (c) | 590,000 | 459,301 | |||||||
Chunghwa Telecom Co. Ltd. | (c) | 208,000 | 752,266 | |||||||
First Financial Holding Co. Ltd. | (c) | 750,000 | 394,387 | |||||||
Hon Hai Precision Industry Co. Ltd. | (c) | 192,150 | 495,033 | |||||||
Lite-On Technology Corp. | (c) | 432,000 | 594,989 | |||||||
Pegatron Corp. | (c) | 191,000 | 405,670 | |||||||
Pou Chen Corp. | (c) | 272,000 | 366,115 | |||||||
President Chain Store Corp. | (c) | 65,000 | 507,868 | |||||||
Taiwan Semiconductor Manufacturing Co. Ltd. | (c) | 435,000 | 2,192,268 | |||||||
Uni-President Enterprises Corp. | (c) | 248,000 | 489,810 | |||||||
|
| |||||||||
| 7,331,276 | ||||||||||
|
| |||||||||
Norway – 4.5% | ||||||||||
DNB ASA | (c) | 92,885 | 1,111,814 | |||||||
Marine Harvest ASA | (c) | 36,000 | 607,221 | |||||||
Statoil ASA | (c) | 192,600 | 3,327,829 | |||||||
Tomra Systems ASA | (c) | 40,000 | 426,101 | |||||||
Yara International ASA | (c) | 35,898 | 1,140,365 | |||||||
|
| |||||||||
| 6,613,330 | ||||||||||
|
| |||||||||
Austria – 3.0% | ||||||||||
Erste Group Bank AG | (c) | 61,500 | 1,400,230 | |||||||
OMV AG | (c) | 19,500 | 548,158 | |||||||
UNIQA Insurance Group AG | (c) | 89,700 | 538,724 | |||||||
voestalpine AG | (c) | 32,600 | 1,097,161 | |||||||
Wienerberger AG | (c) | 59,500 | 833,774 | |||||||
|
| |||||||||
| 4,418,047 | ||||||||||
|
| |||||||||
| 26 | (continued) |
| Ohio National Fund, Inc. | International Portfolio (Continued) |
Schedule of Investments | June 30, 2016 (Unaudited) |
| Common Stocks (Continued) | Shares | Value | ||||||||
Thailand – 2.5% | ||||||||||
Advanced Info Service PCL | (c) | 62,400 | $ | 281,080 | ||||||
Airports of Thailand PCL | (c) | 60,000 | 667,166 | |||||||
Bangkok Dusit Medical Services PCL | (c) | 333,800 | 227,529 | |||||||
Central Pattana PCL | (c) | 109,200 | 186,071 | |||||||
CP ALL PCL | (c) | 269,300 | 386,277 | |||||||
Kasikornbank PCL | (c) | 69,800 | 338,942 | |||||||
Minor International PCL | (c) | 340,900 | 391,835 | |||||||
PTT PCL | (c) | 53,900 | 483,404 | |||||||
Siam Cement PCL / The | (c) | 33,000 | 448,319 | |||||||
Siam Commercial Bank PCL / The | (c) | 60,500 | 240,517 | |||||||
|
| |||||||||
| 3,651,140 | ||||||||||
|
| |||||||||
United Kingdom – 2.4% | ||||||||||
Dialog Semiconductor PLC | (a)(c) | 41,600 | 1,246,479 | |||||||
Fiat Chrysler Automobiles NV | (c) | 62,535 | 384,932 | |||||||
Unilever NV | (d) | 41,232 | 1,917,684 | |||||||
|
| |||||||||
| 3,549,095 | ||||||||||
|
| |||||||||
Italy – 1.8% | ||||||||||
Azimut Holding SpA | (c) | 20,800 | 339,370 | |||||||
Cerved Information Solutions SpA | (c) | 129,100 | 1,017,095 | |||||||
Ferrari NV | (c) | 6,253 | 256,700 | |||||||
Luxottica Group SpA | (c) | 11,300 | 550,735 | |||||||
Rizzoli Corriere Della Sera Mediagroup SpA | (a)(c) | 4,236 | 3,795 | |||||||
Yoox Net-A-Porter Group SpA | (a)(c) | 22,000 | 510,589 | |||||||
|
| |||||||||
| 2,678,284 | ||||||||||
|
| |||||||||
United States – 1.6% | ||||||||||
Royal Caribbean Cruises Ltd. | 35,650 | 2,393,897 | ||||||||
|
| |||||||||
| Common Stocks (Continued) | Shares | Value | ||||||||
Czech Republic – 1.1% | ||||||||||
CEZ AS | (c) | 39,800 | $ | 678,989 | ||||||
Komercni banka as | (c) | 25,500 | 956,098 | |||||||
|
| |||||||||
| 1,635,087 | ||||||||||
|
| |||||||||
Hungary – 1.1% | ||||||||||
MOL Hungarian Oil & Gas PLC | (c) | 9,900 | 573,120 | |||||||
OTP Bank PLC | (c) | 45,500 | 1,018,170 | |||||||
|
| |||||||||
| 1,591,290 | ||||||||||
|
| |||||||||
Portugal – 0.4% | ||||||||||
Jeronimo Martins SGPS SA | (c) | 35,000 | 552,011 | |||||||
|
| |||||||||
Belgium – 0.3% | ||||||||||
Anheuser-Busch InBev SA/NV | (c) | 3,800 | 502,498 | |||||||
|
| |||||||||
Total Common Stocks (Cost $133,996,442) | $ | 130,980,804 | ||||||||
|
| |||||||||
| Preferred Stocks – 0.6% | Shares | Value | ||||||||
Germany – 0.6% | ||||||||||
Henkel AG & Co. KGaA | (c) | 7,500 | $ | 916,579 | ||||||
|
| |||||||||
Total Preferred Stocks (Cost $904,221) | $ | 916,579 | ||||||||
|
| |||||||||
| Money Market Funds – 7.4% | Shares | Value | ||||||||
State Street Institutional Liquid Reserves Fund Institutional Class | 10,780,500 | $ | 10,780,500 | |||||||
|
| |||||||||
Total Money Market Funds (Cost $10,780,500) | $ | 10,780,500 | ||||||||
|
| |||||||||
Total Investments – 97.3% (Cost $145,681,163) | (e) | $ | 142,677,883 | |||||||
Other Assets in Excess of Liabilities – 2.7% | (f) | 3,985,353 | ||||||||
|
| |||||||||
Net Assets – 100.0% | $ | 146,663,236 | ||||||||
|
| |||||||||
Percentages are stated as a percent of net assets.
Abbreviations:
ADR: American Depositary Receipts
Footnotes:
| (a) | Non-income producing security. |
| (b) | Security exempt from registration under Regulation D of the Securities Act of 1933. These securities may be resold in transactions exempt from registration, normally to qualified buyers under Rule 144A. At June 30, 2016, the value of these securities totaled $3,850,363, or 2.6% of the Portfolio’s net assets. These securities were deemed liquid pursuant to procedures approved by the Board of Directors. |
| (c) | Security traded on a foreign exchange has been valued at an estimate of fair value that is different than the local market close price. These fair value estimates are determined by an independent fair valuation service that has been approved by the Board. These securities represent $107,229,090, or 73.1% of the Portfolio’s net assets. |
| (d) | As discussed in Note 2 of the Notes to Financial Statements, not all investments that are traded on a foreign exchange are valued at an estimate that is different from the local close price. In some instances, the independent fair valuation service uses a stock’s local close price because the service’s measure of predictability related to their valuation model of a stock is below a chosen threshold. These securities represent $2,468,726, or 1.7% of the Portfolio’s net assets. |
Other Portfolio securities are not subjected to fair valuation procedures because they are traded on domestic or foreign exchanges that have close times that are consistent with the U.S. market close, normally 4:00 pm Eastern Time.
| (e) | Represents cost for financial reporting purposes, which may differ from cost basis for federal income tax purposes. See also Note 7 of the Notes to Financial Statements. |
| (f) | Includes $178,669 of cash pledged as collateral for the following futures contracts outstanding at June 30, 2016: |
Type | Description | Expiration | Number of Contracts | Contract | Initial Contract Amount | Unrealized Appreciation (Depreciation) | Variation Margin Receivable (Payable) | |||||||||||||||
Long | Borsa Istanbul BIST 30 Index Contracts (Turkey) | August 31, 2016 | 538 | $1,791,775 | $ | 1,816,783 | $ | (25,008 | ) | $ | (1,863 | ) | ||||||||||
|
|
|
|
|
|
| ||||||||||||||||
| 27 | (continued) |
| Ohio National Fund, Inc. | International Portfolio (Continued) |
Schedule of Investments | June 30, 2016 (Unaudited) |
Details of the foreign currency contracts outstanding in the International Portfolio at June 30, 2016 are as follows:
Contracts to buy foreign currency:
Date of contract | Exchange date | Counterparty | Currency to receive | Currency to deliver | Contract at value | Unrealized Appreciation (Depreciation) | ||||||||||||||
April 26, 2016 | July 28, 2016 | GS | 5,247,921 GBP | $ | 7,650,000 | $ | 6,987,622 | $ | (662,378 | ) | ||||||||||
April 26, 2016 | July 28, 2016 | GS | 9,652,000 CHF | $ | 9,942,316 | $ | 9,898,980 | $ | (43,336 | ) | ||||||||||
April 26, 2016 | July 28, 2016 | GS | 5,158,128 AUD | $ | 3,978,000 | $ | 3,843,665 | $ | (134,335 | ) | ||||||||||
June 2, 2016 | July 28, 2016 | GS | 5,015,148 GBP | $ | 7,242,500 | $ | 6,677,683 | $ | (564,817 | ) | ||||||||||
June 14, 2016 | September 16, 2016 | JPM | 75,000 EUR | $ | 84,348 | $ | 83,450 | $ | (898 | ) | ||||||||||
|
|
|
|
|
| |||||||||||||||
| $ | 28,897,164 | $ | 27,491,400 | $ | (1,405,764 | ) | ||||||||||||||
|
|
|
|
|
| |||||||||||||||
Contracts to sell foreign currency:
Date of contract | Exchange date | Counterparty | Currency to receive | Currency to deliver | Contract at value | Unrealized Appreciation (Depreciation) | ||||||||||||||
June 27, 2016 | July 28, 2016 | GS | $ | 7,242,500 | 5,492,068 GBP | $ | 7,312,705 | $ | (70,205 | ) | ||||||||||
June 27, 2016 | July 28, 2016 | JPM | $ | 700,000 | 530,302 GBP | $ | 706,100 | $ | (6,100 | ) | ||||||||||
June 27, 2016 | July 28, 2016 | GS | $ | 3,978,000 | 5,428,538 AUD | $ | 4,045,166 | $ | (67,166 | ) | ||||||||||
June 27, 2016 | July 28, 2016 | GS | $ | 6,950,000 | 5,265,870 GBP | $ | 7,011,521 | $ | (61,521 | ) | ||||||||||
June 14, 2016 | September 16, 2016 | CITI | $ | 14,703,822 | 13,076,000 EUR | $ | 14,511,090 | $ | 192,732 | |||||||||||
|
|
|
|
|
| |||||||||||||||
| $ | 33,574,322 | $ | 33,586,582 | $ | (12,260 | ) | ||||||||||||||
|
|
|
|
|
| |||||||||||||||
Counterparties | Currencies | |
CITI – Citigroup Global Markets, Inc. | AUD – Australian Dollar | |
GS – Goldman Sachs Bank USA | CHF – Swiss Franc | |
JPM – JPMorgan Chase Bank, N.A. | EUR – Euro | |
GBP – British Pound |
Sector Classifications (Common Stocks & Preferred Stocks): (Percent of net assets)
Financials | 22.2% | |||
Consumer Discretionary | 15.8% | |||
Industrials | 10.1% | |||
Information Technology | 9.7% | |||
Consumer Staples | 8.4% | |||
Materials | 7.4% | |||
Health Care | 5.5% | |||
Energy | 5.4% | |||
Telecommunication Services | 3.0% | |||
Utilities | 2.4% | |||
|
| |||
| 89.9% | ||||
|
|
The accompanying notes are an integral part of these financial statements.
| 28 |
| Ohio National Fund, Inc. | International Small-Mid Company Portfolio |
Objective/Strategy
The International Small-Mid Company Portfolio seeks long-term growth of capital by investing at least 80% of its assets in equity securities of non-U.S. small and mid-cap companies.
Performance as of June 30, 2016
Average Annual Returns: | ||||
One year | -13.82% | |||
Five years | 1.81% | |||
Ten years | 2.90% |
Past performance does not guarantee future results. The performance data quoted represents past performance and current returns may be lower or higher. Total return figures include change in share price and reinvestment of dividends and capital gains. The investment return and principal value will fluctuate so that an investor’s shares, when redeemed, may be worth more or less than the original cost. To obtain performance information up to the most recent month end, call toll-free 1-877-781-6392.
The Portfolio is not open to direct retail investment. Beneficial interest in shares is obtained solely by purchase of variable life insurance policies and variable annuity contracts. Actual performance results for variable annuity and variable universal life contracts will be lower due to contract charges. Consult your contract for applicable charges.
Comments
For the six-month period ended June 30, 2016, the International Small-Mid Company Portfolio returned -10.17% versus -0.31% for its benchmark, the MSCI ACWI ex USA SMID Cap Index (Net-USD).
International equity markets initially declined as fears of a financial crisis in emerging markets and continued turmoil in the Middle East, which contributed to the refugee crisis in Europe, coincided with the ongoing commodity correction. Markets troughed in mid-February as a rebound in oil prices and better than expected economic data eased the fears of investors. Additional policy action by major central banks in March lowered investors’ risk aversion and drove a market rally. As we moved into the second quarter, equity markets shifted focus to the United Kingdom (UK) referendum and the consequences of a decision to leave the European Union (EU). Following the unexpected vote to leave the EU, equity volatility spiked. Global equity markets fell and the U.S. dollar strengthened as uncertainty rose over the future of the EU and how the negative surprise would impact the European and global economies. Given the low level of interest rates globally and the continuation of quantitative easing, investors are concerned that the major central banks lack the traditional firepower required to stimulate their economies in event of a potential downturn. Despite central bank concerns, emerging markets, as measured by the MSCI Emerging Markets Index, led international benchmarks, rising 6.41% for the six-month period ended June 30, 2016. Developed foreign markets, as measured by the MSCI EAFE Index, declined 4.42%, while MSCI USA Index was up 3.24%.
During the period, equity markets were supported by accommodative monetary policy, as major central banks recommitted to price stability with new rate cuts and additional quantitative easing. Japan joined Sweden, Denmark, Switzerland and the European Central Bank (ECB) when it cut its benchmark rate to below zero. Central banks are following a Negative Interest Rate Policy (NIRP) in a continued effort to fight deflation and encourage economic growth. Given the muted outlook for global growth and prices, the U.S. Federal Reserve (Fed) held rates steady at its March and June meetings. The dovish FOMC policy statements indicated that the Fed would follow a slower path of interest rate increases and would be less aggressive in normalizing interest rates. Overall, the monetary
policies in place are supportive of price appreciation and improving economic activity.
European economic outlook remains on a gradual upward trajectory. Despite geopolitical turmoil (tragic acts of terrorism and massive influx of refugees), the euro area aggregate purchasing managers’ index (PMI) remained in expansionary territory during the first quarter. While exports to emerging markets fell, domestic demand in Europe continues to recover, helped by record low interest rates, lower energy costs, and a relatively weaker currency. Furthermore, as government budgets have improved and bond yields declined, the effects of austerity on growth have diminished. In March, the ECB recommitted to its 1.1 trillion euro asset purchase program and to begin buying corporate bonds, extending the scope of asset purchases in their effort to counter deflationary forces. However, geopolitical events remained influential throughout the second quarter. The UK voted in favor of a referendum to leave the European Union, the so called ‘Brexit.’ Growing populism spurred by an anti-immigration movement, persistent austerity, and lackluster domestic growth drove much of the negative sentiment towards the EU. While the referendum race tightened in recent months, polls immediately taken before the vote suggested the UK would reject leaving the EU. Consequently, the final result of the vote surprised the markets. Brexit and the potential for future referendums by other EU member states will likely continue to have a negative impact on consumer and business sentiment. It is unclear what will be the future relationship of the UK to the EU and this uncertainty may overhang the economy and markets.
In Japan, despite double digit positive returns from February’s low, the MSCI Japan Index declined 5.58% and was the worst performing among the Asian equity markets. Investors grew increasingly concerned that the yen, which strengthened 15.3% versus the U.S. dollar as turmoil drove risk-off sentiment in the market, would hurt corporate profits and undermine corporate confidence. Economic data was softer than anticipated, reflecting a drop in personal consumption and weaker than expected wage growth. As discussed, the Bank of Japan (BoJ) lowered its benchmark rate into negative territory in an attempt to encourage economic activity and raise inflation expectations. However, the change in policy was negatively received, as worries about undermining the banking sector led to a sell-off in Financials. Japanese structural reforms under the “three arrows” of Abenomics are slowly changing the economic landscape; however, persistent zero to low real economic growth continues to trouble policy makers. In an effort to boost confidence, Abe announced a two and half year delay of the long awaited consumption tax hike that was previously slated for April 2017.
After an uncertain start to the year, China’s equity markets stabilized and its economy appears to be growing modestly as domestic consumption, reflected by the new economy companies and real estate, showed strength. The old economy stocks, such as cement and steel companies, are effectively in a long term secular decline as the country continues its economic transformation from one dependent on high fixed asset investment to one reliant on consumption and services. Poor policy decisions by the central government spooked investors at the start of the year, but appear to have abated with officials learning from their mistakes. The Renminbi continued to depreciate, but in a more measured and orderly fashion than last year’s sudden devaluation. The impact from earlier stimulus measures appears to slowly be taking effect. Concern about the high level of corporate debt will continue to overhang the market; however the Chinese government has demonstrated that rising non-performing loan issues will be managed in an orderly fashion. As a result, economic and social stability should be maintained.
| 29 | (continued) |
| Ohio National Fund, Inc. | International Small-Mid Company Portfolio (Continued) |
In Latin America, the outlook for Brazil and Mexico remain divergent. Brazil continues to be mired in a political scandal and in an environment of stagflation, where growth is declining and inflation is rising. President Rousseff was temporarily removed from office as the process to impeach her for fiscal irregularities moved forward. The interim head of state, former Vice President Temer, quickly replaced the cabinet and central bank chief and put into place policies that are expected to stabilize the budget deficit. Expectations for real GDP growth for Brazil in 2016 have declined from 0.9% a year ago to -3.4% currently. Additional reforms and a weak currency are expected to help pull the nation’s economy out of recession by 2017. The prospect of a brighter economic future, following an extended period of underperformance, caused Brazilian equities to be among the top performing markets in the period, with MSCI Brazil Index appreciating 46.34%. In contrast, the Mexican economy continued to expand with GDP growth driven by strong personal consumption. Mexico’s economy remains stable with an improving domestic economy bolstered by foreign direct investment (FDI) and solid exports to the U.S. Mexican real GDP is expected to be 2.4% for 2016. Job creation and above trend wage growth, coupled with strength in remittances from the US, drove retail sales up 10.6% year over year in May. Despite that, the Mexican stock market, as measured by MSCI Mexico Index, rose 0.88% driven almost entirely by a sell-off in the peso vs. the U.S. dollar.
The primary drivers of international equity markets during the first half of 2016 included the following: (1) the Brexit referendum, (2) currency and commodity volatility coupled with U.S. dollar strength, (3) the trajectory for U.S. growth and debate over the timing and size of Fed tightening, (4) concerns about China’s economy and signs of a downturn in global growth outlook, and (5) geopolitical risk events emanating from the Middle East.
It was a very challenging half in which we saw the UK unexpectedly vote to leave the EU, subsequently causing a widespread sell-off in global equities on fears of contagion. Unfortunately, the Portfolio was not immune from the “Brexit” impact, which has triggered a significant de-risking across UK and European equity markets.
The Portfolio’s significant underperformance during the six-month period was primarily due to stock selection, which was amplified by negative sector allocation and country exposure. The largest detractor was the Portfolio’s exposure to the Financials sector. The Portfolio maintained its overweight exposure to European Financials throughout the period, based on a combination of attractive fundamentals and the assumption that the sector would rebound if the UK voted to remain in the EU, as the majority of polls suggested. The surprising outcome of the vote triggered a sharp sector dislocation, with many of our holdings experiencing declines ranging from 20% to almost 50%. Among the most impacted holdings were UK challenger bank Shawbrook Group PLC, UK wealth manager St. James’s Place PLC and Italian asset managers Azimut Holding SpA and Anima Holding SpA(1)
The Portfolio’s underweight in the Materials sector, including a lack of exposure to mining stocks, also detracted from the Portfolio’s performance. The sudden rally in mining stocks helped unwind five years of underperformance. The massive re-rating of mining stocks has pushed the sector to become one of the most expensive in terms of valuation in both relative and absolute terms. In our opinion, the materials rally was inversely correlated with the weakening U.S. dollar and the real test for sustainability of valuations will come in the form of the future trajectory of global growth. The best performing stocks in the benchmark were gold and silver miners, which benefited significantly from the elevated risk levels and uncertainty created by Brexit.(1)
Industrial companies were under pressure in the six-month period, reflecting investors’ concerns about slowing global growth. One of the key detractors was Rheinmetall AG, as concerns grew over its exposure to the decelerating auto market, which is half of its sales. The other half of its business is exposed to defense contracts, and the high order backlog should help offset any weakness in auto going forward. Our cyclically-exposed Japanese companies also detracted from performance in the period, as the surging yen put pressure on international orders and profits.(1)
The Portfolio maintained its overweight exposure to the Health Care sector, which was one of the best performing sectors in the six-month period. Two of our Japanese pharmaceutical companies, Shionogi & Co. Ltd. and Ono Pharmaceutical Co. Ltd. were among the top overall contributors to the Portfolio in the first half. Both companies reported better than expected earnings as Ono Pharmaceutical Co. Ltd. is experiencing a high level of success with its cancer treatment drug Opdivo. Shionogi & Co. Ltd. announced an international licensing deal for its anti-influenza drug with Roche Holding AG. The company also continued to benefit from the strong uptake of its partnered HIV drugs.(1)
Retailers were a source of mixed performance, as the bifurcated trends of the sector continued. The Portfolio’s top contributor in the first half was Vancouver based athleisure retailer lululemon athletica Inc. The company continues to defy the slowdown in mall traffic with innovative and fashionable product launches. The company also made progress on reducing inventory levels and rebuilding margins that were impacted by the West Coast port strikes last year. Nitori Holdings Co. Ltd., a Japanese furniture retailer, was another top contributor in the six-month period. Nitori Holdings Co. Ltd. has been gaining market share in its domestic market through the introduction of middle-range price products in its stores and several successful promotions. Bermuda based Signet Jewelers Ltd. contrasted the positive contribution from lululemon athletica Inc. and Nitori Holdings Co. Ltd. Signet Jewelers Ltd. is the market leading jewelry retailer in the United States and the UK. Signet Jewelers Ltd.’s lending standards have recently come under scrutiny from short sellers who waged a vocal campaign against the company that impacted the share price. The collapse of the British Pound, post-Brexit, also weighed on Signet Jewelers Ltd., as the company gets 10% of its sales in the UK.(1)
Criteo SA and Kloeckner & Co. SE round out the list of the Portfolio’s top contributors in the period. Criteo SA is a French digital media company and reported better than expected digital advertising revenues. The company continues to expand into the mid-market and recently launched a new email product. Kloceckner & Co. SE is a European based steel distributor with 40% of its sales coming from the United States. Klockner & Co. SE has benefited from rising steel prices on both continents supported by government introduction of anti-dumping policies designed to protect domestic producers. Kloeckner & Co. SE is also a leader in digitalizing the steel trade, the largest structural change in the last hundred years to impact a steel industry.(1)
The Portfolio’s positioning reflects our best long-term investment ideas combined with a portion of the portfolio dedicated to more tactical holdings. During the first quarter, prior to the ECB’s expansion of its monetary stimulus program, we re-established a short position in the euro. We also initiated a short position in the British pound to offset expected volatility from the European referendum. We increased these short positions in the second quarter and in an effort to further hedge the Portfolio, we established a position in a Canadian gold trust. These decisions reduced our exposure to the respective currencies relative to our benchmark and are used
| 30 | (continued) |
| Ohio National Fund, Inc. | International Small-Mid Company Portfolio (Continued) |
to manage risk. We also monetized a small portion of our cash position through Japanese index futures to reduce our underweight to that market.(1)
The UK’s decision to exit the Eurozone is expected to have an adverse impact on global growth and is an additional drag on the global economy. The majority of central banks remain on hold, including the Federal Reserve following a disappointing May jobs report. The Bank of Japan, European Central Bank and the Bank of England (BOE) have all pledged to remain accommodative in regards to monetary policy and the BOE has already provided fresh stimulus money to UK financial institutions to support loan growth. In light of these developments, we are reviewing the Portfolio’s positioning and plan to act accordingly.
Despite a volatile start to the year, we continue to position the Portfolio towards businesses that exhibit structural growth characteristics and trade at valuations that we deem to be attractive relative to fair value. By geography, we are overweight to companies that derive the bulk of their profits in the eurozone and the United States. The Portfolio remains underweight to emerging markets, with the majority of our exposure to Asia. In terms of sector positioning, we continue to have an overweight to the Consumer Discretionary and Health Care sectors, while we remain underweight to the Materials sector. Our sector positioning stems from our belief that the economic recovery will be driven by advancements in technology and continued strength in consumer spending. Looking forward, we are starting to see resurgence in the initial public offering (IPO) pipeline and will participate in deals that fit our investment strategy and philosophy.
| (1) | The Portfolio’s composition is subject to change. Holdings and weightings are as of June 30, 2016. |
Change in Value of $10,000 Investment
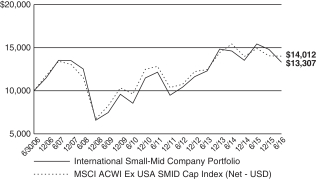
Hypothetical illustration based on past performance. Future performance will vary. The Portfolios returns reflect reinvested dividends. The Portfolios holdings may differ significantly from the securities in the index. The index is unmanaged and therefore does not reflect the cost of portfolio management and accounting.
The MSCI ACWI ex USA SMID Cap Index captures mid and small cap representation across 22 of 23 developed market countries (excluding the U.S.) and 23 emerging markets countries. With over 5,000 constituents, the index covers approximately 28% of the free float-adjusted market capitalization in each country. The returns presented for this index include the effects of reinvested dividends, net of taxes, and adjustment to U.S Dollar denomination.
Portfolio Composition as of June 30, 2016 (1)
| % of Net Assets | ||||
Common Stocks (4) | 94.0 | |||
Closed-End Mutual Funds | 2.1 | |||
Money Market Funds and | 3.9 | |||
|
| |||
| 100.0 | ||||
|
|
Top 10 Portfolio Holdings as of June 30, 2016 (1) (2) (3)
| % of Net Assets | ||||
1. Sprott Physical Gold Trust | 2.1 | |||
2. Ipsen SA | 1.9 | |||
3. Chugai Pharmaceutical Co. Ltd. | 1.8 | |||
4. ASOS PLC | 1.7 | |||
5. Shire PLC | 1.6 | |||
6. Kakaku.com, Inc. | 1.6 | |||
7. St. James’s Place PLC | 1.6 | |||
8. Techtronic Industries Co. Ltd. | 1.6 | |||
9. Yoox Net-A-Porter Group SpA | 1.5 | |||
10. London Stock Exchange Group PLC | 1.5 |
| (1) | Composition of Portfolio subject to change. |
| (2) | Short-term investments have been excluded from the list of Top 10 Portfolio Holdings. |
| (3) | Top 10 Portfolio Holdings is presented at an individual security level. Total investment exposure by issuer may be higher. |
| (4) | Top 10 Country Weightings (Common Stocks): |
| % of Net Assets | ||||
Japan | 19.2 | |||
United Kingdom | 18.4 | |||
France | 10.4 | |||
Germany | 8.1 | |||
Italy | 5.2 | |||
Netherlands | 5.0 | |||
Hong Kong | 5.0 | |||
United States | 3.3 | |||
Spain | 2.1 | |||
China | 1.8 |
| 31 |
| Ohio National Fund, Inc. | International Small-Mid Company Portfolio |
Schedule of Investments | June 30, 2016 (Unaudited) |
| Common Stocks – 94.0% | Shares | Value | ||||||||
Japan – 19.2% | ||||||||||
Aisin Seiki Co. Ltd. | (c) | 20,600 | $ | 839,105 | ||||||
Alps Electric Co. Ltd. | (c) | 13,700 | 260,277 | |||||||
Chugai Pharmaceutical Co. Ltd. | (c) | 33,000 | 1,176,061 | |||||||
Daifuku Co. Ltd. | (c) | 51,600 | 924,145 | |||||||
Disco Corp. | (c) | 4,400 | 397,935 | |||||||
Don Quijote Holdings Co. Ltd. | (c) | 21,500 | 798,998 | |||||||
Doutor Nichires Holdings Co. Ltd. | (c) | 24,900 | 433,455 | |||||||
Horiba Ltd. | (c) | 17,900 | 787,578 | |||||||
Japan Hotel REIT Investment Corp. | (c) | 690 | 581,836 | |||||||
Kakaku.com, Inc. | (c) | 51,901 | 1,031,256 | |||||||
Kanamoto Co. Ltd. | (c) | 19,400 | 378,037 | |||||||
K’s Holdings Corp. | (c) | 25,800 | 481,473 | |||||||
Kyowa Hakko Kirin Co. Ltd. | (c) | 26,000 | 443,450 | |||||||
Matsumotokiyoshi Holdings Co. Ltd. | (c) | 5,900 | 288,436 | |||||||
Nidec Corp. | (c) | 5,300 | 403,452 | |||||||
Nitori Holdings Co. Ltd. | (c) | 5,000 | 606,420 | |||||||
NSK Ltd. | (c) | 38,600 | 282,549 | |||||||
Ono Pharmaceutical Co. Ltd. | (c) | 8,300 | 361,557 | |||||||
Shionogi & Co. Ltd. | (c) | 11,400 | 623,193 | |||||||
Sompo Japan Nipponkoa Holdings, Inc. | (c) | 18,000 | 479,019 | |||||||
Tadano Ltd. | (c) | 29,000 | 242,138 | |||||||
United Arrows Ltd. | (c) | 15,000 | 436,784 | |||||||
|
| |||||||||
| 12,257,154 | ||||||||||
|
| |||||||||
United Kingdom – 18.4% | ||||||||||
Ashtead Group PLC | (c) | 57,732 | 824,639 | |||||||
ASOS PLC | (a)(c) | 20,340 | 1,086,545 | |||||||
Babcock International Group PLC | (c) | 58,587 | 708,330 | |||||||
Booker Group PLC | (c) | 142,000 | 328,841 | |||||||
Croda International PLC | (c) | 12,680 | 532,291 | |||||||
Dialog Semiconductor PLC | (a)(c) | 19,700 | 590,279 | |||||||
Essentra PLC | (c) | 47,570 | 326,377 | |||||||
Howden Joinery Group PLC | (c) | 69,589 | 357,413 | |||||||
ICAP PLC | (c) | 65,000 | 365,735 | |||||||
InterContinental Hotels Group PLC | (c) | 1 | 12 | |||||||
John Wood Group PLC | (c) | 61,045 | 561,928 | |||||||
LivaNova PLC | (a) | 15,096 | 758,272 | |||||||
London Stock Exchange Group PLC | (c) | 27,279 | 926,898 | |||||||
Man Group PLC | (c) | 191,000 | 296,754 | |||||||
Pagegroup PLC | (c) | 71,659 | 284,529 | |||||||
Rightmove PLC | (c) | 9,088 | 443,866 | |||||||
Schroders PLC | (c) | 14,589 | 461,022 | |||||||
Shawbrook Group PLC | (a)(b)(c) | 233,545 | 531,405 | |||||||
St. James’s Place PLC | (c) | 96,611 | 1,018,837 | |||||||
Stock Spirits Group PLC | (c) | 245,343 | 523,258 | |||||||
Vectura Group PLC | (a)(d) | 216,833 | 466,184 | |||||||
Worldpay Group PLC | (a)(b)(c) | 87,930 | 320,038 | |||||||
|
| |||||||||
| 11,713,453 | ||||||||||
|
| |||||||||
France – 10.4% | ||||||||||
Accor SA | (c) | 23,617 | 904,912 | |||||||
Advanced Accelerator Applications SA – ADR | (a) | 16,367 | 494,856 | |||||||
Criteo SA – ADR | (a) | 9,740 | 447,261 | |||||||
Edenred | (c) | 26,687 | 546,445 | |||||||
Ingenico Group SA | (c) | 3,610 | 418,417 | |||||||
Ipsen SA | (c) | 19,547 | 1,197,661 | |||||||
Publicis Groupe SA | (c) | 11,835 | 791,790 | |||||||
Teleperformance | (c) | 9,432 | 803,437 | |||||||
Television Francaise 1 | (c) | 49,100 | 519,985 | |||||||
Zodiac Aerospace | (c) | 20,800 | 485,232 | |||||||
|
| |||||||||
| 6,609,996 | ||||||||||
|
| |||||||||
Germany – 8.1% | ||||||||||
Deutsche Pfandbriefbank AG | (b)(c) | 70,246 | 692,709 | |||||||
Deutz AG | (c) | 128,096 | 529,145 | |||||||
GEA Group AG | (c) | 10,189 | 480,934 | |||||||
HeidelbergCement AG | (c) | 10,195 | 768,010 | |||||||
Kloeckner & Co. SE | (a)(c) | 68,749 | 759,996 | |||||||
OSRAM Licht AG | (c) | 9,837 | 511,099 | |||||||
Rheinmetall AG | (c) | 12,044 | 716,362 | |||||||
| Common Stocks (Continued) | Shares | Value | ||||||||
Germany (continued) | ||||||||||
SAF-Holland SA | (c) | 36,465 | $ | 404,021 | ||||||
Siltronic AG | (a)(c) | 17,050 | 275,923 | |||||||
|
| |||||||||
| 5,138,199 | ||||||||||
|
| |||||||||
Italy – 5.2% | ||||||||||
Anima Holding SpA | (b)(c) | 88,836 | 418,821 | |||||||
Azimut Holding SpA | (c) | 22,408 | 365,606 | |||||||
Infrastrutture Wireless Italiane SpA | (b)(c) | 172,319 | 760,956 | |||||||
Massimo Zanetti Beverage Group SpA | (b)(d) | 60,835 | 495,535 | |||||||
Prada SpA | (c) | 98,800 | 305,966 | |||||||
Yoox Net-A-Porter Group SpA | (a)(c) | 41,235 | 957,006 | |||||||
|
| |||||||||
| 3,303,890 | ||||||||||
|
| |||||||||
Netherlands – 5.0% | ||||||||||
ABN AMRO Group NV | (b)(c) | 36,100 | 593,507 | |||||||
ASR Nederland NV | (a)(d) | 13,035 | 281,356 | |||||||
GrandVision NV | (b)(c) | 21,758 | 562,802 | |||||||
Intertrust NV | (a)(b)(c) | 25,173 | 561,798 | |||||||
Koninklijke DSM NV | (c) | 8,864 | 511,368 | |||||||
NN Group NV | (c) | 25,587 | 704,369 | |||||||
|
| |||||||||
| 3,215,200 | ||||||||||
|
| |||||||||
Hong Kong – 5.0% | ||||||||||
Beijing Enterprises Water Group Ltd. | (c) | 900,000 | 546,201 | |||||||
China Everbright International Ltd. | (c) | 589,000 | 658,589 | |||||||
Haier Electronics Group Co. Ltd. | (c) | 246,000 | 376,504 | |||||||
PAX Global Technology Ltd. | (c) | 241,000 | 212,146 | |||||||
Regina Miracle International Holdings Ltd. | (a)(b)(c) | 291,000 | 386,910 | |||||||
Techtronic Industries Co. Ltd. | (c) | 239,500 | 1,000,151 | |||||||
|
| |||||||||
| 3,180,501 | ||||||||||
|
| |||||||||
United States – 3.3% | ||||||||||
Nexteer Automotive Group Ltd. | (c) | 836,000 | 765,066 | |||||||
Shire PLC | (c) | 16,910 | 1,045,079 | |||||||
Signet Jewelers Ltd. | 3,800 | 313,158 | ||||||||
|
| |||||||||
| 2,123,303 | ||||||||||
|
| |||||||||
Spain – 2.1% | ||||||||||
Cellnex Telecom SAU | (b)(c) | 47,673 | 748,111 | |||||||
Telepizza Group SA | (a)(b)(d) | 97,832 | 607,987 | |||||||
|
| |||||||||
| 1,356,098 | ||||||||||
|
| |||||||||
China – 1.8% | ||||||||||
CT Environmental Group Ltd. | (c) | 2,434,000 | 711,302 | |||||||
SouFun Holdings Ltd. – ADR | (a) | 81,995 | 412,435 | |||||||
|
| |||||||||
| 1,123,737 | ||||||||||
|
| |||||||||
Canada – 1.5% | ||||||||||
Canadian Western Bank | 33,000 | 629,630 | ||||||||
Hudson’s Bay Co. | 29,671 | 358,041 | ||||||||
|
| |||||||||
| 987,671 | ||||||||||
|
| |||||||||
Israel – 1.5% | ||||||||||
Caesarstone Ltd. | (a) | 8,614 | 299,423 | |||||||
Nice Ltd. – ADR | 10,300 | 657,655 | ||||||||
|
| |||||||||
| 957,078 | ||||||||||
|
| |||||||||
Ireland – 1.4% | ||||||||||
Grafton Group PLC | (c) | 53,983 | 356,926 | |||||||
Smurfit Kappa Group PLC | (c) | 24,098 | 530,598 | |||||||
|
| |||||||||
| 887,524 | ||||||||||
|
| |||||||||
Taiwan – 1.3% | ||||||||||
Eclat Textile Co. Ltd. | (c) | 46,034 | 446,430 | |||||||
Makalot Industrial Co. Ltd. | (c) | 83,000 | 390,687 | |||||||
|
| |||||||||
| 837,117 | ||||||||||
|
| |||||||||
Switzerland – 1.3% | ||||||||||
Julius Baer Group Ltd. | (c) | 20,769 | 835,917 | |||||||
|
| |||||||||
Bermuda – 1.2% | ||||||||||
Arch Capital Group Ltd. | (a) | 10,200 | 734,400 | |||||||
|
| |||||||||
| 32 | (continued) |
| Ohio National Fund, Inc. | International Small-Mid Company Portfolio (Continued) |
Schedule of Investments | June 30, 2016 (Unaudited) |
| Common Stocks (Continued) | Shares | Value | ||||||||
Sweden – 1.0% | ||||||||||
Hoist Finance AB | (b)(c) | 75,059 | $ | 662,889 | ||||||
|
| |||||||||
South Korea – 1.0% | ||||||||||
Hotel Shilla Co. Ltd. | (c) | 11,118 | 659,643 | |||||||
|
| |||||||||
Denmark – 1.0% | ||||||||||
Pandora A/S | (c) | 4,773 | 650,079 | |||||||
|
| |||||||||
Mexico – 1.0% | ||||||||||
Grupo Aeroportuario del Sureste SAB de CV – ADR | 4,020 | 641,391 | ||||||||
|
| |||||||||
Thailand – 1.0% | ||||||||||
Minor International PCL | (c) | 553,000 | 635,624 | |||||||
|
| |||||||||
Australia – 0.9% | ||||||||||
Link Administration Holdings Ltd. | (a)(c) | 96,586 | 591,760 | |||||||
|
| |||||||||
Austria – 0.9% | ||||||||||
Erste Group Bank AG | (c) | 24,500 | 557,815 | |||||||
|
| |||||||||
Belgium – 0.5% | ||||||||||
UCB SA | (c) | 4,591 | 344,726 | |||||||
|
| |||||||||
Total Common Stocks (Cost $57,354,706) | $ | 60,005,165 | ||||||||
|
| |||||||||
| Closed-End Mutual Funds – 2.1% | Shares | Value | ||||||||
Sprott Physical Gold Trust | (a) | 121,000 | $ | 1,328,580 | ||||||
|
| |||||||||
Total Closed-End Mutual Funds (Cost $1,314,290) | $ | 1,328,580 | ||||||||
|
| |||||||||
| Money Market Funds – 4.7% | Shares | Value | ||||||||
State Street Institutional Liquid Reserves Fund Institutional Class | 555,528 | $ | 555,528 | |||||||
State Street Institutional U.S. Government Money Market Fund Institutional Class | 2,418,588 | 2,418,588 | ||||||||
|
| |||||||||
Total Money Market Funds (Cost $2,974,116) | $ | 2,974,116 | ||||||||
|
| |||||||||
Total Investments – 100.8% (Cost $61,643,112) | (e) | $ | 64,307,861 | |||||||
Liabilities in Excess of Other Assets – (0.8)% | (508,871) | |||||||||
|
| |||||||||
Net Assets – 100.0% | $ | 63,798,990 | ||||||||
|
| |||||||||
Percentages are stated as a percent of net assets.
Abbreviations:
ADR: American Depositary Receipts
Footnotes:
| (a) | Non-income producing security. |
| (b) | Security exempt from registration under Regulation D of the Securities Act of 1933. These securities may be resold in transactions exempt from registration, normally to qualified buyers under Rule 144A. At June 30, 2016, the value of these securities totaled $7,343,468, or 11.5% of the Portfolio’s net assets. These securities were deemed liquid pursuant to procedures approved by the Board of Directors. |
| (c) | Security traded on a foreign exchange has been valued at an estimate of fair value that is different than the local market close price. These fair value estimates are determined by an independent fair valuation service that has been approved by the Board. These securities represent $52,407,581, or 82.1% of the Portfolio’s net assets. |
| (d) | As discussed in Note 2 of the Notes to Financial Statements, not all investments that are traded on a foreign exchange are valued at an estimate that is different from the local close price. In some instances, the independent fair valuation service uses a stock’s local close price because the service’s measure of predictability related to their valuation model of a stock is below a chosen threshold. These securities represent $1,851,062, or 2.9% of the Portfolio’s net assets. |
| (e) | Represents cost for financial reporting purposes, which may differ from cost basis for federal income tax purposes. See also Note 7 of the Notes to Financial Statements. |
Details of the foreign currency contracts outstanding in the International Small-Mid Company Portfolio at June 30, 2016 are as follows:
Contracts to buy foreign currency:
Date of contract | Exchange date | Counterparty | Currency to receive | Currency to deliver | Contract at value | Unrealized Appreciation (Depreciation) | ||||||||||||||
June 16, 2016 | September 15, 2016 | JPM | 3,280,000 GBP | $ | 4,652,125 | $ | 4,369,414 | $ | (282,711 | ) | ||||||||||
June 24, 2016 | September 15, 2016 | BARC | 1,158,000 EUR | $ | 1,323,409 | $ | 1,288,413 | $ | (34,996 | ) | ||||||||||
June 24, 2016 | September 15, 2016 | BARC | 1,800,000 GBP | $ | 2,688,768 | $ | 2,397,849 | $ | (290,919 | ) | ||||||||||
|
|
|
|
|
| |||||||||||||||
| $ | 8,664,302 | $ | 8,055,676 | $ | (608,626 | ) | ||||||||||||||
|
|
|
|
|
| |||||||||||||||
Contracts to sell foreign currency:
Date of contract | Exchange date | Counterparty | Currency to receive | Currency to deliver | Contract at value | Unrealized Appreciation (Depreciation) | ||||||||||||||
June 13, 2016 | September 15, 2016 | JPM | $ | 2,684,991 | 1,888,000 GBP | $ | 2,515,077 | $ | 169,914 | |||||||||||
June 14, 2016 | September 15, 2016 | BARC | $ | 4,046,544 | 3,600,000 EUR | $ | 4,005,429 | $ | 41,115 | |||||||||||
June 14, 2016 | September 15, 2016 | BARC | $ | 2,664,685 | 1,888,000 GBP | $ | 2,515,077 | $ | 149,608 | |||||||||||
June 16, 2016 | September 15, 2016 | JPM | $ | 2,555,938 | 1,820,000 GBP | $ | 2,424,492 | $ | 131,446 | |||||||||||
June 24, 2016 | September 15, 2016 | JPM | $ | 3,243,868 | 2,900,000 EUR | $ | 3,226,596 | $ | 17,272 | |||||||||||
June 24, 2016 | July 28, 2016 | JPM | $ | 395,320 | 290,000 GBP | $ | 386,136 | $ | 9,184 | |||||||||||
June 24, 2016 | September 15, 2016 | JPM | $ | 2,444,225 | 1,740,000 GBP | $ | 2,317,921 | $ | 126,304 | |||||||||||
|
|
|
|
|
| |||||||||||||||
| $ | 18,035,571 | $ | 17,390,728 | $ | 644,843 | |||||||||||||||
|
|
|
|
|
| |||||||||||||||
| 33 | (continued) |
| Ohio National Fund, Inc. | International Small-Mid Company Portfolio (Continued) |
Schedule of Investments | June 30, 2016 (Unaudited) |
Counterparties | Currencies | |
JPM – JPMorgan Chase Bank, N.A. | EUR – Euro | |
BARC – Barclays Bank PLC | GBP – British Pound |
Sector Classifications (Common Stocks): (Percent of net assets)
Consumer Discretionary | 24.6% | |||
Financials | 18.3% | |||
Industrials | 17.5% | |||
Health Care | 10.8% | |||
Information Technology | 10.7% | |||
Materials | 4.2% | |||
Consumer Staples | 2.6% | |||
Telecommunication Services | 2.4% | |||
Utilities | 2.0% | |||
Energy | 0.9% | |||
|
| |||
| 94.0% | ||||
|
|
The accompanying notes are an integral part of these financial statements.
| 34 |
| Ohio National Fund, Inc. | Aggressive Growth Portfolio |
Objective/Strategy
The Aggressive Growth Portfolio seeks long-term capital growth by investing primarily in domestic and foreign equity securities selected for growth potential.
Performance as of June 30, 2016
Average Annual Returns: | ||||
One year | 1.43% | |||
Five years | 11.84% | |||
Ten years | 8.49% |
Past performance does not guarantee future results. The performance data quoted represents past performance and current returns may be lower or higher. Total return figures include change in share price and reinvestment of dividends and capital gains. The investment return and principal value will fluctuate so that an investor’s shares, when redeemed, may be worth more or less than the original cost. To obtain performance information up to the most recent month end, call toll-free 1-877-781-6392.
The Portfolio is not open to direct retail investment. Beneficial interest in shares is obtained solely by purchase of variable life insurance policies and variable annuity contracts. Actual performance results for variable annuity and variable universal life contracts will be lower due to contract charges. Consult your contract for applicable charges.
Comments
For the six-month period ended June 30, 2016, the Aggressive Growth Portfolio returned -1.19% versus 1.36% for its benchmark, the Russell 1000 Growth Index; and 3.84% for its former benchmark, the S&P 500 Index.
Relative underperformance was primarily due to stock selections in the Financial and Consumer Discretionary sectors. An underweight in the out-performing Consumer Staples sector was also a key detractor. Stock selection in Health Care and Materials, however, were relative contributors during the period.
The largest detractors from the Portfolio returns for the six-month period were Norwegian Cruise Line Holdings Ltd., Regeneron Pharmaceuticals, Inc., Alphabet, Inc., Celgene Corp. and E*Trade Financial Corp.(1)
Consumer Discretionary holding Norwegian Cruise Line Holdings Ltd. was the leading absolute detractor during the period. The stock declined as geopolitical concerns in Europe weighed on the willingness of North American tourists to book cruises to the region. Over the long term, however, we remain encouraged by Norwegian’s potential. We appreciate the company’s position in a three-player market, and believe industry dynamics are setting up an environment for improving returns on invested capital for cruise lines. Increased cruise demand from China and new routes, such as Cuba, also offer growth potential. We like the company’s CEO, an industry veteran, who we believe will be able to increase return on invested capital for the company. Norwegian, also, has the youngest fleet and what we believe to be the highest capacity for growth in the cruise industry.(1)
Another key detractor during the period, Regeneron Pharmaceuticals, Inc., was impacted by the broad downturn in biotechnology stocks during the first quarter. Slower-than-expected adoption of the drugs that the company recently launched was also a headwind. Moreover, the company communicated during the first quarter that it is planning for the coming year to be an investment year, which weighed on estimates. We view Regeneron Pharmaceuticals, Inc.’s Eylea drug as an advance for the treatment of wet age-related
macular degeneration (AMD), a leading cause of blindness in the elderly. We believe Eylea has potency, cost and convenience advantages over the current standard of care, which has led to a strong uptake in the market. We feel Regeneron Pharmaceuticals, Inc. has a strong technology platform and an underappreciated pipeline of novel antibody drug candidates, including a potentially leading therapy for a new class of cholesterol-lowering agents.(1)
Alphabet, Inc., the Internet search engine leader formerly known as Google, is benefiting from strong growth in mobile search through its Android software for mobile devices. We think Android’s rapidly growing installed base will provide the company significant control over its mobile search and display advertising destiny. We also believe the company’s mobile and tablet search business will more than neutralize the impact of its declining desktop computer search business in developed markets. We also believe its YouTube unit is well positioned to benefit from secular growth in online video.(1)
Celgene Corp., a global biotechnology company, seeks to deliver truly innovative and life-changing drugs for the treatment of cancer and other severe immune, inflammatory conditions. We see the potential for continued strong growth ahead for Celgene Corp.’s blood-cancer-fighting Revlimid drug franchise and believe its additional pipeline products could further supplement this growth. Some of the new drugs that could become meaningful contributors include Abraxane for pancreatic cancer, Pomalyst for refractory multiple myeloma and a recently licensed drug to treat Crohn’s disease. We also appreciate its management’s willingness to utilize free cash flow for share repurchases and product acquisitions.(1)
E*Trade Financial Corp. is a financial services company that offers online brokerage services and related products for investors. We believe the core brokerage business is attractive, and we like the recent restructuring of the balance sheet. However, we have questions about its capital allocation. We trimmed our position during the period.(1)
While some stocks negatively impacted performance, we are pleased with the performance of a number of our positions. Medical device maker Boston Scientific Corp. aided performance. During the second quarter, the company reported stronger-than-expected earnings per share, and the pace of organic sales growth was the highest reported in over a decade. Results were especially strong in the company’s interventional cardiology unit, as well as in urology and neuromodulation. Margin performance was also impressive. Earlier in the month, at the American College of Cardiology conference, strong data for transcatheter aortic valve replacement (TAVR) devices in intermediate risk patients led many analysts to raise their estimates of the long term market potential. Boston Scientific is the number three player in the TAVR market and stands to benefit from wider acceptance of these devices. Boston Scientific Corp., the medical device maker, offers a range of products in applications including cardiovascular, pulmonary, digestive, urological and women’s health. We are encouraged by management’s initiatives to boost its product pipeline, revenues and operating margins. New product launches, especially in the cardiovascular field, have been encouraging. We also view the company as a potential target as the market consolidates, or as an acquirer of smaller companies that would be identified as synergistic to its existing operations.(1)
Construction aggregate company Vulcan Materials Co. also contributed to performance. The company performed well during the period, as residential and nonresidential aggregate markets continued to recover. Improvements in highway infrastructure spending also aided the stock’s performance. We believe the macroeconomic environment is favorable for continued performance by Vulcan
| 35 | (continued) |
| Ohio National Fund, Inc. | Aggressive Growth Portfolio (Continued) |
Materials Co., which we believe enjoys strong competitive advantages around its business model and quarries. We like that there are very high barriers to entry around its business as the high weight and low value of the company’s product has necessitated operating in local markets. Additionally, the company’s geographic footprint is stronger than those of its competitors, and an arduous permitting process makes it difficult for competitors to open new mines.(1)
Crown Castle International Corp., owner of wireless communication towers, maintains a predictable, long-term contract-driven revenue base which remains attractive to us. The firm has benefited from growing numbers of tenants on its towers. We think this could continue as wireless service providers work to upgrade their networks to meet the growing demand for data transmission.(1)
Amazon.com, Inc., the online retailer, offers a wide range of products, including books, music, computers, electronics, home and garden, and numerous other products. Amazon.com, Inc. offers personalized shopping services, Web-based credit card payment and direct shipping to customers. We believe the company’s competitive advantages of a low overhead cost structure, allowing an aggressive pricing structure, and faster shipping will cause consumers to shift an increasing amount of their general merchandise spending toward it. Given that over 90% of retail sales are still sold offline, we believe Amazon.com, Inc. has significant opportunities ahead, particularly as it expands into new business lines and geographies.(1)
Nielsen Holdings PLC, a global information and measurement company, measures and monitors what consumers watch (programming, advertising) and what consumers buy (categories, brands, products) on both a global and local basis. We think the company will benefit from the fragmentation of media, as it provides measurement data on how much video content is viewed through different mediums. We also think Nielsen Holdings PLC is a beneficiary of the growth of the developing market consumer. As consumer spending power in emerging markets grows, we expect companies will seek more data on consumers’ purchasing patterns.(1)
As part of our investment strategy, we seek companies that have clear, sustainable competitive moats around their businesses that should help them grow market share within their respective industries over time. Important competitive advantages could include a strong brand, network effects from a product or service that would be hard for a competitor to replicate, a lower cost structure than competitors in the industry, a distribution advantage or patent protection over valuable intellectual property. We think emphasizing such sustainable competitive advantages can be a meaningful driver of outperformance over time because the market often underestimates the duration of growth for these companies and the long-term potential return to shareholders.
Moving into the second half of 2016, markets are still faced with a slow-growing global economy and geopolitical pressures that are, to some degree, a reaction to slow global growth. Given the outcome of the June referendum in the United Kingdom (“UK”), we expect increased geopolitical uncertainty in Europe, as well as moderately lower growth in Europe and globally as the UK navigates its exit from the European Union.
While there are concerns about the global economy, we think it underscores the importance of finding those select companies with truly sustainable competitive advantages that can take market share and continue to grow earnings, even without the backdrop of a strong global economy. Such companies are more appreciated in a
world where growth is harder to come by, as they can create their own path to creating value.
| (1) | The Portfolio’s composition is subject to change. Holdings and weightings are as of June 30, 2016. |
Change in Value of $10,000 Investment
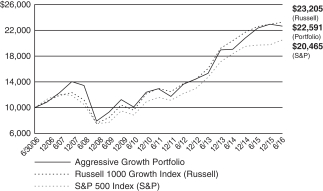
Hypothetical illustration based on past performance. Future performance will vary. The Portfolio’s returns reflect reinvested dividends. The Portfolio’s holdings may differ significantly from the securities in the index. The index is unmanaged and therefore does not reflect the cost of portfolio management and accounting.
The Portfolio’s investment adviser and sub-adviser elected to change the Portfolio’s broad-based securities market index from the S&P 500® Index to the Russell 1000 Growth Index effective May 1, 2016. The change in the benchmark was made because the Russell 1000 Growth Index better reflects the style of the strategy.
The Russell 1000 Growth Index is a market-capitalization weighted index of those firms in the Russell 1000 Index with higher price-to-book ratios and higher forecasted growth values. The Russell 1000 Index measures the performance of the large-cap segment of the U.S. equity universe.
The S&P 500 Index is a capitalization-weighted index designed to measure performance of the broad domestic economy through changes in the aggregate market value of 500 stocks representing all major industries. The index presented herein includes the effects of reinvested dividends.
| 36 | (continued) |
| Ohio National Fund, Inc. | Aggressive Growth Portfolio (Continued) |
Portfolio Composition as of June 30, 2016 (1)
| % of Net Assets | ||||
Common Stocks (4) | 96.3 | |||
Commercial Paper | 3.8 | |||
Money Market Funds | (0.1 | ) | ||
|
| |||
| 100.0 | ||||
|
|
Top 10 Portfolio Holdings as of June 30, 2016 (1) (2) (3)
| % of Net Assets | ||||
1. General Electric Co. | 5.1 | |||
2. Alphabet, Inc. Class C | 5.1 | |||
3. Lowe’s Cos., Inc. | 4.9 | |||
4. Amazon.com, Inc. | 4.9 | |||
5. Zoetis, Inc. | 4.6 | |||
6. MasterCard, Inc. Class A | 4.0 | |||
7. Celgene Corp. | 3.6 | |||
8. Intercontinental Exchange, Inc. | 3.1 | |||
9. Adobe Systems, Inc. | 3.1 | |||
10. Crown Castle International Corp. | 3.1 |
| (1) | Composition of Portfolio subject to change. |
| (2) | Short-term investments have been excluded from the list of Top 10 Portfolio Holdings. |
| (3) | Top 10 Portfolio Holdings is presented at an individual security level. Total investment exposure by issuer may be higher. |
| (4) | Sectors (Common Stocks): |
| % of Net Assets | ||||
Information Technology | 31.1 | |||
Consumer Discretionary | 24.6 | |||
Health Care | 16.4 | |||
Financials | 10.5 | |||
Industrials | 9.1 | |||
Materials | 2.7 | |||
Consumer Staples | 1.9 | |||
|
| |||
| 96.3 | ||||
|
|
| 37 |
| Ohio National Fund, Inc. | Aggressive Growth Portfolio |
Schedule of Investments | June 30, 2016 (Unaudited) |
| Common Stocks – 96.3% | Shares | Value | ||||||||||||||
CONSUMER DISCRETIONARY – 24.6% | ||||||||||||||||
Tesla Motors, Inc. (Automobiles) | (a) | 1,970 | $ | 418,192 | ||||||||||||
Chipotle Mexican Grill, Inc. (Hotels, Restaurants & Leisure) | (a) | 1,418 | 571,114 | |||||||||||||
Norwegian Cruise Line Holdings Ltd. (Hotels, Restaurants & Leisure) | (a) | 15,350 | 611,544 | |||||||||||||
Starbucks Corp. (Hotels, Restaurants & Leisure) | 15,265 | 871,937 | ||||||||||||||
Amazon.com, Inc. (Internet & Catalog Retail) | (a) | 3,639 | 2,604,141 | |||||||||||||
Ctrip.com International Ltd. – ADR (Internet & Catalog Retail) | (a) | 12,658 | 521,510 | |||||||||||||
Priceline Group, Inc. / The (Internet & Catalog Retail) | (a) | 579 | 722,829 | |||||||||||||
Time Warner, Inc. (Media) | 14,474 | 1,064,418 | ||||||||||||||
Advance Auto Parts, Inc. (Specialty Retail) | 5,352 | 865,044 | ||||||||||||||
Lowe’s Cos., Inc. (Specialty Retail) | 33,034 | 2,615,302 | ||||||||||||||
Gildan Activewear, Inc. (Textiles, Apparel & Luxury Goods) | 29,204 | 856,553 | ||||||||||||||
NIKE, Inc. Class B (Textiles, Apparel & Luxury Goods) | 24,156 | 1,333,411 | ||||||||||||||
|
| |||||||||||||||
| 13,055,995 | ||||||||||||||||
|
| |||||||||||||||
CONSUMER STAPLES – 1.9% | ||||||||||||||||
Costco Wholesale Corp. (Food & Staples Retailing) | 6,580 | 1,033,323 | ||||||||||||||
|
| |||||||||||||||
FINANCIALS – 10.5% | ||||||||||||||||
PacWest Bancorp (Banks) | 12,951 | 515,191 | ||||||||||||||
TD Ameritrade Holding Corp. (Capital Markets) | 34,477 | 981,733 | ||||||||||||||
Synchrony Financial (Consumer Finance) | (a) | 30,872 | 780,444 | |||||||||||||
Intercontinental Exchange, Inc. (Diversified Financial Svs.) | 6,416 | 1,642,239 | ||||||||||||||
Crown Castle International Corp. (Real Estate Investment Trusts) | 16,017 | 1,624,604 | ||||||||||||||
|
| |||||||||||||||
| 5,544,211 | ||||||||||||||||
|
| |||||||||||||||
HEALTH CARE – 16.4% | ||||||||||||||||
Celgene Corp. (Biotechnology) | (a) | 19,144 | 1,888,173 | |||||||||||||
DBV Technologies SA – ADR (Biotechnology) | (a) | 8,731 | 284,805 | |||||||||||||
Regeneron Pharmaceuticals, Inc. (Biotechnology) | (a) | 1,692 | 590,897 | |||||||||||||
Boston Scientific Corp. (Health Care Equip. & Supplies) | (a) | 52,228 | 1,220,568 | |||||||||||||
DexCom, Inc. (Health Care Equip. & Supplies) | (a) | 6,212 | 492,798 | |||||||||||||
Teleflex, Inc. (Health Care Equip. & Supplies) | 3,878 | 687,608 | ||||||||||||||
Quintiles Transnational Holdings, Inc. (Life Sciences Tools & Svs.) | (a) | 16,442 | 1,073,992 | |||||||||||||
Zoetis, Inc. (Pharmaceuticals) | 51,559 | 2,446,990 | ||||||||||||||
|
| |||||||||||||||
| 8,685,831 | ||||||||||||||||
|
| |||||||||||||||
INDUSTRIALS – 9.1% | ||||||||||||||||
General Electric Co. (Industrial Conglomerates) | 86,325 | 2,717,511 | ||||||||||||||
Nielsen Holdings PLC (Professional Svs.) | 16,628 | 864,157 | ||||||||||||||
Verisk Analytics, Inc. (Professional Svs.) | (a) | 6,947 | 563,263 | |||||||||||||
Canadian Pacific Railway Ltd. (Road & Rail) | 5,166 | 665,329 | ||||||||||||||
|
| |||||||||||||||
| 4,810,260 | ||||||||||||||||
|
| |||||||||||||||
INFORMATION TECHNOLOGY – 31.1% | ||||||||||||||||
Alphabet, Inc. Class C (Internet Software & Svs.) | (a) | 3,897 | 2,697,114 | |||||||||||||
CoStar Group, Inc. (Internet Software & Svs.) | (a) | 6,927 | 1,514,658 | |||||||||||||
Facebook, Inc. Class A (Internet Software & Svs.) | (a) | 11,894 | 1,359,246 | |||||||||||||
SPS Commerce, Inc. (Internet Software & Svs.) | (a) | 13,618 | 825,251 | |||||||||||||
MasterCard, Inc. Class A (IT Svs.) | 23,921 | 2,106,483 | ||||||||||||||
WEX, Inc. (IT Svs.) | (a) | 11,186 | 991,863 | |||||||||||||
NXP Semiconductors NV (Semiconductors & Equip.) | (a) | 9,343 | 731,931 | |||||||||||||
Activision Blizzard, Inc. (Software) | 29,643 | 1,174,752 | ||||||||||||||
Adobe Systems, Inc. (Software) | (a) | 17,108 | 1,638,775 | |||||||||||||
Atlassian Corp. PLC Class A (Software) | (a) | 2,207 | 57,161 | |||||||||||||
salesforce.com, Inc. (Software) | (a) | 17,431 | 1,384,196 | |||||||||||||
Workday, Inc. Class A (Software) | (a) | 11,483 | 857,436 | |||||||||||||
Apple, Inc. (Tech. Hardware, Storage & Periph.) | 12,032 | 1,150,259 | ||||||||||||||
|
| |||||||||||||||
| 16,489,125 | ||||||||||||||||
|
| |||||||||||||||
MATERIALS – 2.7% | ||||||||||||||||
Vulcan Materials Co. (Construction Materials) | 12,070 | 1,452,745 | ||||||||||||||
|
| |||||||||||||||
Total Common Stocks (Cost $44,573,493) | $ | 51,071,490 | ||||||||||||||
|
| |||||||||||||||
| Commercial Paper – 3.8% | Rate | Maturity | Face Amount | Value | ||||||||||||
BNP Paribas SA | 0.000% | 07/01/2016 | $ | 2,000,000 | $ | 2,000,000 | ||||||||||
|
| |||||||||||||||
Total Commercial Paper (Cost $2,000,000) | $ | 2,000,000 | ||||||||||||||
|
| |||||||||||||||
| 38 | (continued) |
| Ohio National Fund, Inc. | Aggressive Growth Portfolio (Continued) |
Schedule of Investments | June 30, 2016 (Unaudited) |
| Money Market Funds – 4.0% | Shares | Value | ||||||||||||||
State Street Institutional Liquid Reserves Fund Institutional Class | 2,124,550 | $ | 2,124,550 | |||||||||||||
|
| |||||||||||||||
Total Money Market Funds (Cost $2,124,550) | $ | 2,124,550 | ||||||||||||||
|
| |||||||||||||||
Total Investments – 104.1% (Cost $48,698,043) | (b) | $ | 55,196,040 | |||||||||||||
Liabilities in Excess of Other Assets – (4.1)% | (2,192,892) | |||||||||||||||
|
| |||||||||||||||
Net Assets – 100.0% | $ | 53,003,148 | ||||||||||||||
|
| |||||||||||||||
Percentages are stated as a percent of net assets.
Abbreviations:
ADR: American Depositary Receipts
Footnotes:
| (a) | Non-income producing security. |
| (b) | Represents cost for financial reporting purposes, which may differ from cost basis for federal income tax purposes. See also Note 7 of the Notes to Financial Statements. |
The accompanying notes are an integral part of these financial statements.
| 39 |
| Ohio National Fund, Inc. | Small Cap Growth Portfolio |
Objective/Strategy
The Small Cap Growth Portfolio seeks long-term capital appreciation by investing at least 80% of its net assets in stocks of small companies.
Performance as of June 30, 2016
Average Annual Returns: | ||||
One year | -7.50% | |||
Five years | 11.65% | |||
Ten years | 10.32% |
Past performance does not guarantee future results. The performance data quoted represents past performance and current returns may be lower or higher. Total return figures include change in share price and reinvestment of dividends and capital gains. The investment return and principal value will fluctuate so that an investor’s shares, when redeemed, may be worth more or less than the original cost. To obtain performance information up to the most recent month end, call toll-free 1-877-781-6392.
The Portfolio is not open to direct retail investment. Beneficial interest in shares is obtained solely by purchase of variable life insurance policies and variable annuity contracts. Actual performance results for variable annuity and variable universal life contracts will be lower due to contract charges. Consult your contract for applicable charges.
Comments
For the six–month period ended June 30, 2016, the Small Cap Growth Portfolio returned 0.04% versus -1.59% for its benchmark, the Russell 2000 Growth Index.
U.S. equities were volatile, and small cap stocks sold off particularly hard during the first half of the period. Once again, a chief concern was the fear of slower-than-expected growth in China, the world’s second largest economy. The negative sentiment was also reflected in weakness in energy markets, with the U.S. benchmark for crude oil dipping to levels not seen in over a decade.
After recovering from their winter correction, U.S. stocks traded narrowly for much of the April-to-June period. Investors gleaned enough positive news from economic data to keep stocks buoyant. Expectations of an interest rate hike in the near term by the Federal Reserve (Fed) were quashed by the weak May employment report. This sent the value of the dollar downward, providing additional support to U.S. stocks. Markets were jolted late in the quarter by the United Kingdom electorate’s surprise decision to leave the European Union. Stocks sold off sharply and the dollar surged, as capital flowed into safe-haven government bonds, thereby pushing yields lower. In the final days of the quarter, however, U.S. shares recaptured much of their post-Brexit slide.
We have taken a high-quality approach to investing in small caps. Many of the companies in our Portfolio have predictable, recurring revenue streams. Our companies also typically generate a high return on invested capital and have demonstrated a proven ability to expand profit margins. We also put a great emphasis on identifying companies with sustainable competitive advantages that should help them gain market share and grow in a variety of market environments. Given our high-quality focus, we expect our Portfolio to produce positive results during market rallies and to outperform the benchmark in weak or uncertain market environments, creating a smoother path to investing in small caps and a better opportunity to generate higher compounded returns over full market cycles.
When markets are up sharply, as they were for much of the six-month period, it is not our ideal backdrop for relative outperformance. The Portfolio, however, did outperform its benchmark for the period. At the sector level, our positive stock selection and underweight to the Health Care sector were the primary drivers of relative results. Stock selections in Consumer Discretionary and Information
Technology were also positive, while our selections in Financials and Consumer Staples weighed on relative performance.(1)
The largest contributors to the Portfolio returns for the six-month period were Broadridge Financial Solutions, Inc., LDR Holding Corp., DCP Midstream Partners LP, FEI Co. and Tumi Holdings, Inc.(1)
Broadridge Financial Solutions, Inc. provides investor communications and technology-driven solutions to banks, broker-dealers, mutual funds and corporations globally. We think the company’s wide network of broker-dealers and banks is a competitive advantage that makes the company the preferable choice for corporations to use in distributing proxy information.(1)
LDR Holding Corp. sells spinal implants for use in lumbar and cervical spinal disorders. We believe LDR Holding Corp. has differentiated technology that will allow it to take share from competitors, particularly in the faster-growing cervical spine market. The company was acquired during the period.(1)
DCP Midstream Partners LP owns assets associated with the shipping, processing and storage of natural gas and natural gas liquids (“NGLs”). We like the company for the stable, fee-based revenue it receives from exploration and production companies that depend on DCP Midstream Partners LP to transport and process natural gas and natural gas liquids.(1)
FEI Co. manufactures electron microscopes for the semiconductor and health care industries. We like the company’s strong balance sheet. We also believe that new forms of semiconductor architecture that call for decreasing the space between nodes on a microchip will create increased demand for FEI Co.’s microscopes. It was acquired during the period.(1)
Tumi Holdings, Inc. is a global travel and accessories company. We think the company has a strong global footprint and like its strong multi-channel footprint across digital and in-store channels. It was announced during the quarter that Samsonite will acquire Tumi Holdings, Inc., and we sold the position on gains after the announcement.(1)
The largest detractors from the Portfolio returns for the six-month period were Eagle Pharmaceuticals, Inc., SS&C Technologies Holdings, Inc., LPL Financial Holdings, Inc., j2 Global, Inc. and OSI Systems, Inc.(1)
Eagle Pharmaceuticals, Inc. is a specialty pharmaceutical company that focuses on improving formulations of existing hospital administered drugs. We believe the value of the company’s product pipeline remains underappreciated, particularly the potential of a licensing agreement with Teva Pharmaceutical Industries Ltd. for a new formulation to treat chronic lymphocytic leukemia (“CLL”) and non-Hodgkin lymphoma (“NHL”).(1)
LPL Financial Holdings, Inc. provides an integrated platform of brokerage and investment advisory services to independent financial advisors and financial advisors at financial institutions. Through its custody and clearing platform, the company provides access to diversified financial products and services enabling its advisors to offer independent financial advice and brokerage services to retail investors. We are currently reviewing the stock in light of recent headwinds facing the company.(1)
OSI Systems, Inc. is a maker of security systems, health care monitoring systems, and optoelectronics. The company is evolving from a manufacturing company into a turnkey provider of security solutions. This stands to increase the recurring revenue component of its business.(1)
SS&C Technologies Holdings, Inc. is a global provider of investment and financial software-enabled services and is focused exclusively on the global financial services industry. We like SS&C Tech-
| 40 | (continued) |
| Ohio National Fund, Inc. | Small Cap Growth Portfolio (Continued) |
nologies Holdings, Inc. because the majority of its revenue comes from recurring sources such as subscription services or software maintenance, where client retention has remained high. We believe the most significant opportunity for the company is in fund administration, where hedge funds are looking for independent providers with a high level of transparency and accountability.(1)
j2 Global, Inc. is an Internet services company providing a range of communications services for businesses. We like that the company is moving beyond its traditional business of converting faxes to emails and into other high margin businesses. We also like the company’s history of making good acquisitions and improving the operations of those purchases.(1)
For much of the past quarter, we were concerned that equity valuations did not appropriately discount the level of risk that we believed was present in the market. Earlier in the year, we witnessed what we had considered another detachment from fundamentals when global stocks, in our view, overcorrected. The subsequent rebound propelled valuations to levels that we thought failed to account not only for the possibility of the Brexit campaign succeeding, but also other factors that could impair the outlook for stocks. Chief among these were economic policies that have not only failed to lead to broad-based growth, but also may prove difficult to unwind without significant unforeseen consequences. At present, we see opportunities in pockets of the market, but also recognize that many risks remain.
When such exogenous factors abound, we believe that maintaining our investment discipline of focusing on high-quality companies that can control their own destiny will serve us well. While we choose companies that can deliver solid growth over the long term and return capital to shareholders, we also recognize that these same attributes may make them attractive targets for acquisition. We do not invest in smaller capitalization companies with the expectation
of a sale, but we believe the mergers and acquisitions environment remains fertile as large-cap companies seek to buy growth, and borrowing rates remain extraordinarily low.
| (1) | The Portfolio’s composition is subject to change. Holdings and weightings are as of June 30, 2016. |
Change in Value of $10,000 Investment
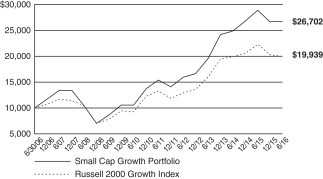
Hypothetical illustration based on past performance. Future performance will vary. The Portfolio’s returns reflect reinvested dividends. The Portfolio’s holdings may differ significantly from the securities in the index. The index is unmanaged and therefore does not reflect the cost of portfolio management and accounting.
The Russell 2000 Growth Index measures the performance of the small-cap growth segment of the U.S. equity universe. It includes the Russell 2000 Index companies with higher price-to-value ratios and higher forecasted growth values. The Russell 2000 Index includes the 2000 firms from the Russell 3000 Index with the smallest market capitalizations. The Russell 3000 Index represents 98% of the investable U.S. equity markets. The index presented herein includes the effects of reinvested dividends.
Portfolio Composition as of June 30, 2016 (1)
| % of Net Assets | ||||
Common Stocks (4) | 94.7 | |||
Master Limited Partnerships (4) | 2.2 | |||
Commercial Paper | 0.5 | |||
Money Market Funds | 2.6 | |||
|
| |||
| 100.0 | ||||
|
|
Top 10 Portfolio Holdings as of June 30, 2016 (1) (2) (3)
| % of Net Assets | ||||
1. Broadridge Financial Solutions, Inc. | 2.4 | |||
2. Sensient Technologies Corp. | 2.4 | |||
3. Cadence Design Systems, Inc. | 2.1 | |||
4. SS&C Technologies Holdings, Inc. | 2.1 | |||
5. Blackbaud, Inc. | 2.0 | |||
6. Nice Ltd. – ADR | 2.0 | |||
7. Sally Beauty Holdings, Inc. | 1.9 | |||
8. ServiceMaster Global Holdings, Inc. | 1.9 | |||
9. Carter’s, Inc. | 1.7 | |||
10. Biglari Holdings, Inc. | 1.6 |
| (1) | Composition of Portfolio subject to change. |
| (2) | Short-term investments have been excluded from the list of Top 10 Portfolio Holdings. |
| (3) | Top 10 Portfolio Holdings is presented at an individual security level. Total investment exposure by issuer may be higher. |
| (4) | Sectors (Common Stocks, Master Limited Partnership): |
| % of Net Assets | ||||
Information Technology | 32.1 | |||
Health Care | 20.6 | |||
Consumer Discretionary | 15.3 | |||
Industrials | 12.5 | |||
Financials | 8.6 | |||
Consumer Staples | 3.6 | |||
Materials | 2.4 | |||
Energy | 1.8 | |||
|
| |||
| 96.9 | ||||
|
|
| 41 |
| Ohio National Fund, Inc. | Small Cap Growth Portfolio |
Schedule of Investments | June 30, 2016 (Unaudited) |
| Common Stocks – 94.7% | Shares | Value | ||||||||||||||
CONSUMER DISCRETIONARY – 14.3% | ||||||||||||||||
Gentherm, Inc. (Auto Components) | (a) | 30,796 | $ | 1,054,763 | ||||||||||||
ServiceMaster Global Holdings, Inc. (Diversified Consumer Svs.) | (a) | 109,912 | 4,374,498 | |||||||||||||
Biglari Holdings, Inc. (Hotels, Restaurants & Leisure) | (a) | 9,449 | 3,811,160 | |||||||||||||
Diamond Resorts International, Inc. (Hotels, Restaurants & Leisure) | (a) | 78,648 | 2,356,294 | |||||||||||||
Domino’s Pizza Group PLC (Hotels, Restaurants & Leisure) | (b) | 351,624 | 1,562,227 | |||||||||||||
Dunkin’ Brands Group, Inc. (Hotels, Restaurants & Leisure) | 46,408 | 2,024,317 | ||||||||||||||
Manchester United PLC Class A (Media) | 75,977 | 1,210,314 | ||||||||||||||
National CineMedia, Inc. (Media) | 149,546 | 2,314,972 | ||||||||||||||
Monro Muffler Brake, Inc. (Specialty Retail) | 20,123 | 1,279,018 | ||||||||||||||
Party City Holdco, Inc. (Specialty Retail) | (a) | 53,117 | 738,857 | |||||||||||||
Sally Beauty Holdings, Inc. (Specialty Retail) | (a) | 152,944 | 4,498,083 | |||||||||||||
Williams-Sonoma, Inc. (Specialty Retail) | 22,420 | 1,168,755 | ||||||||||||||
Carter’s, Inc. (Textiles, Apparel & Luxury Goods) | 36,803 | 3,918,415 | ||||||||||||||
Wolverine World Wide, Inc. (Textiles, Apparel & Luxury Goods) | 136,390 | 2,771,445 | ||||||||||||||
|
| |||||||||||||||
| 33,083,118 | ||||||||||||||||
|
| |||||||||||||||
CONSUMER STAPLES – 3.6% | ||||||||||||||||
Britvic PLC (Beverages) | (b) | 90,198 | 705,820 | |||||||||||||
Casey’s General Stores, Inc. (Food & Staples Retailing) | 18,333 | 2,410,973 | ||||||||||||||
Amplify Snack Brands, Inc. (Food Products) | (a) | 130,079 | 1,918,665 | |||||||||||||
Ontex Group NV (Personal Products) | (b) | 105,993 | 3,341,840 | |||||||||||||
|
| |||||||||||||||
| 8,377,298 | ||||||||||||||||
|
| |||||||||||||||
ENERGY – 0.6% | ||||||||||||||||
Dril-Quip, Inc. (Energy Equip. & Svs.) | (a) | 22,202 | 1,297,263 | |||||||||||||
|
| |||||||||||||||
FINANCIALS – 8.6% | ||||||||||||||||
Bank of the Ozarks, Inc. (Banks) | 40,206 | 1,508,529 | ||||||||||||||
Artisan Partners Asset Management, Inc. Class A (Capital Markets) | 43,933 | 1,216,065 | ||||||||||||||
Financial Engines, Inc. (Capital Markets) | 46,341 | 1,198,842 | ||||||||||||||
LPL Financial Holdings, Inc. (Capital Markets) | 79,930 | 1,800,823 | ||||||||||||||
Pace Holdings Corp. (Capital Markets) | (a) | 84,896 | 848,960 | |||||||||||||
WisdomTree Investments, Inc. (Capital Markets) | 112,919 | 1,105,477 | ||||||||||||||
MSCI, Inc. (Diversified Financial Svs.) | 44,502 | 3,431,994 | ||||||||||||||
RLI Corp. (Insurance) | 32,681 | 2,247,799 | ||||||||||||||
Easterly Government Properties, Inc. (Real Estate Investment Trusts) | 76,645 | 1,512,206 | ||||||||||||||
Physicians Realty Trust (Real Estate Investment Trusts) | 61,802 | 1,298,460 | ||||||||||||||
Jones Lang LaSalle, Inc. (Real Estate Mgmt. & Development) | 11,198 | 1,091,245 | ||||||||||||||
St. Joe Co. / The (Real Estate Mgmt. & Development) | (a) | 61,731 | 1,093,873 | |||||||||||||
LendingTree, Inc. (Thrifts & Mortgage Finance) | (a) | 18,419 | 1,626,950 | |||||||||||||
|
| |||||||||||||||
| 19,981,223 | ||||||||||||||||
|
| |||||||||||||||
HEALTH CARE – 20.6% | ||||||||||||||||
ACADIA Pharmaceuticals, Inc. (Biotechnology) | (a) | 45,569 | 1,479,170 | |||||||||||||
Alder Biopharmaceuticals, Inc. (Biotechnology) | (a) | 30,967 | 773,246 | |||||||||||||
DBV Technologies SA – ADR (Biotechnology) | (a) | 37,345 | 1,218,194 | |||||||||||||
Eagle Pharmaceuticals, Inc. (Biotechnology) | (a) | 34,317 | 1,331,156 | |||||||||||||
Ironwood Pharmaceuticals, Inc. (Biotechnology) | (a) | 110,298 | 1,442,146 | |||||||||||||
Ligand Pharmaceuticals, Inc. (Biotechnology) | (a) | 14,945 | 1,782,490 | |||||||||||||
Novavax, Inc. (Biotechnology) | (a) | 86,222 | 626,834 | |||||||||||||
Puma Biotechnology, Inc. (Biotechnology) | (a) | 26,249 | 781,958 | |||||||||||||
Atrion Corp. (Health Care Equip. & Supplies) | 2,092 | 895,083 | ||||||||||||||
Endologix, Inc. (Health Care Equip. & Supplies) | (a) | 149,403 | 1,861,561 | |||||||||||||
Globus Medical, Inc. (Health Care Equip. & Supplies) | (a) | 73,597 | 1,753,817 | |||||||||||||
Insulet Corp. (Health Care Equip. & Supplies) | (a) | 7,049 | 213,162 | |||||||||||||
LDR Holding Corp. (Health Care Equip. & Supplies) | (a) | 62,686 | 2,316,248 | |||||||||||||
Masimo Corp. (Health Care Equip. & Supplies) | (a) | 32,499 | 1,706,685 | |||||||||||||
Novadaq Technologies, Inc. (Health Care Equip. & Supplies) | (a) | 137,559 | 1,353,581 | |||||||||||||
Quidel Corp. (Health Care Equip. & Supplies) | (a) | 58,942 | 1,052,704 | |||||||||||||
STERIS PLC (Health Care Equip. & Supplies) | 42,616 | 2,929,850 | ||||||||||||||
Trinity Biotech PLC – ADR (Health Care Equip. & Supplies) | (a) | 104,778 | 1,188,183 | |||||||||||||
Wright Medical Group NV (Health Care Equip. & Supplies) | (a) | 67,513 | 1,172,701 | |||||||||||||
Capital Senior Living Corp. (Health Care Providers & Svs.) | (a) | 59,086 | 1,044,050 | |||||||||||||
ExamWorks Group, Inc. (Health Care Providers & Svs.) | (a) | 36,338 | 1,266,379 | |||||||||||||
HealthEquity, Inc. (Health Care Providers & Svs.) | (a) | 59,240 | 1,800,007 | |||||||||||||
athenahealth, Inc. (Health Care Technology) | (a) | 16,148 | 2,228,585 | |||||||||||||
HealthStream, Inc. (Health Care Technology) | (a) | 5,760 | 152,755 | |||||||||||||
Medidata Solutions, Inc. (Health Care Technology) | (a) | 38,779 | 1,817,572 | |||||||||||||
Bio-Techne Corp. (Life Sciences Tools & Svs.) | 23,625 | 2,664,191 | ||||||||||||||
Aralez Pharmaceuticals, Inc. (Pharmaceuticals) | (a) | 114,924 | 379,249 | |||||||||||||
| 42 | (continued) |
| Ohio National Fund, Inc. | Small Cap Growth Portfolio (Continued) |
Schedule of Investments | June 30, 2016 (Unaudited) |
| Common Stocks (Continued) | Shares | Value | ||||||||||||||
HEALTH CARE (Continued) | ||||||||||||||||
Catalent, Inc. (Pharmaceuticals) | (a) | 107,503 | $ | 2,471,494 | ||||||||||||
GW Pharmaceuticals PLC – ADR (Pharmaceuticals) | (a) | 9,720 | 890,060 | |||||||||||||
Phibro Animal Health Corp. Class A (Pharmaceuticals) | 55,235 | 1,030,685 | ||||||||||||||
Prestige Brands Holdings, Inc. (Pharmaceuticals) | (a) | 44,415 | 2,460,591 | |||||||||||||
Relypsa, Inc. (Pharmaceuticals) | (a) | 63,429 | 1,173,437 | |||||||||||||
Teligent, Inc. (Pharmaceuticals) | (a) | 122,398 | 873,922 | |||||||||||||
XenoPort, Inc. (Pharmaceuticals) | (a) | 206,453 | 1,453,429 | |||||||||||||
|
| |||||||||||||||
| 47,585,175 | ||||||||||||||||
|
| |||||||||||||||
INDUSTRIALS – 12.5% | ||||||||||||||||
HEICO Corp. Class A (Aerospace & Defense) | 66,539 | 3,569,817 | ||||||||||||||
Sparton Corp. (Aerospace & Defense) | (a) | 38,896 | 846,766 | |||||||||||||
A.O. Smith Corp. (Building Products) | 29,095 | 2,563,560 | ||||||||||||||
SP Plus Corp. (Commercial Svs. & Supplies) | (a) | 32,972 | 744,508 | |||||||||||||
EnerSys (Electrical Equip.) | 47,879 | 2,847,364 | ||||||||||||||
Raven Industries, Inc. (Industrial Conglomerates) | 77,370 | 1,465,388 | ||||||||||||||
Kennametal, Inc. (Machinery) | 67,417 | 1,490,590 | ||||||||||||||
Nordson Corp. (Machinery) | 37,313 | 3,119,740 | ||||||||||||||
Proto Labs, Inc. (Machinery) | (a) | 24,842 | 1,429,906 | |||||||||||||
Rexnord Corp. (Machinery) | (a) | 154,843 | 3,039,568 | |||||||||||||
Wabtec Corp. (Machinery) | 16,302 | 1,144,889 | ||||||||||||||
Advisory Board Co. / The (Professional Svs.) | (a) | 53,109 | 1,879,528 | |||||||||||||
CEB, Inc. (Professional Svs.) | 38,688 | 2,386,276 | ||||||||||||||
Old Dominion Freight Line, Inc. (Road & Rail) | (a) | 25,034 | 1,509,801 | |||||||||||||
SiteOne Landscape Supply, Inc. (Trading Companies & Distributors) | (a) | 22,961 | 780,444 | |||||||||||||
|
| |||||||||||||||
| 28,818,145 | ||||||||||||||||
|
| |||||||||||||||
INFORMATION TECHNOLOGY – 32.1% | ||||||||||||||||
Belden, Inc. (Electronic Equip., Instr. & Comp.) | 56,641 | 3,419,417 | ||||||||||||||
CTS Corp. (Electronic Equip., Instr. & Comp.) | 134,103 | 2,403,126 | ||||||||||||||
FEI Co. (Electronic Equip., Instr. & Comp.) | 30,833 | 3,295,431 | ||||||||||||||
National Instruments Corp. (Electronic Equip., Instr. & Comp.) | 50,265 | 1,377,261 | ||||||||||||||
OSI Systems, Inc. (Electronic Equip., Instr. & Comp.) | (a) | 33,555 | 1,950,552 | |||||||||||||
Alarm.com Holdings, Inc. (Internet Software & Svs.) | (a) | 44,180 | 1,132,333 | |||||||||||||
ChannelAdvisor Corp. (Internet Software & Svs.) | (a) | 98,409 | 1,425,946 | |||||||||||||
Cimpress NV (Internet Software & Svs.) | (a) | 18,411 | 1,702,649 | |||||||||||||
CoStar Group, Inc. (Internet Software & Svs.) | (a) | 9,083 | 1,986,089 | |||||||||||||
Envestnet, Inc. (Internet Software & Svs.) | (a) | 66,665 | 2,220,611 | |||||||||||||
j2 Global, Inc. (Internet Software & Svs.) | 38,602 | 2,438,488 | ||||||||||||||
Zillow Group, Inc. (Internet Software & Svs.) | (a) | 44,564 | 1,633,271 | |||||||||||||
Broadridge Financial Solutions, Inc. (IT Svs.) | 85,581 | 5,579,881 | ||||||||||||||
Euronet Worldwide, Inc. (IT Svs.) | (a) | 49,942 | 3,455,487 | |||||||||||||
MAXIMUS, Inc. (IT Svs.) | 41,733 | 2,310,756 | ||||||||||||||
WEX, Inc. (IT Svs.) | (a) | 32,882 | 2,915,647 | |||||||||||||
ON Semiconductor Corp. (Semiconductors & Equip.) | (a) | 278,651 | 2,457,702 | |||||||||||||
SolarEdge Technologies, Inc. (Semiconductors & Equip.) | (a) | 48,715 | 954,814 | |||||||||||||
ACI Worldwide, Inc. (Software) | (a) | 67,322 | 1,313,452 | |||||||||||||
Blackbaud, Inc. (Software) | 69,044 | 4,688,088 | ||||||||||||||
Cadence Design Systems, Inc. (Software) | (a) | 198,662 | 4,827,487 | |||||||||||||
Descartes Systems Group, Inc. / The (Software) | (a) | 77,780 | 1,487,630 | |||||||||||||
Fleetmatics Group PLC (Software) | (a) | 49,641 | 2,150,945 | |||||||||||||
Guidewire Software, Inc. (Software) | (a) | 28,957 | 1,788,384 | |||||||||||||
Nice Ltd. – ADR (Software) | 73,389 | 4,685,888 | ||||||||||||||
Paylocity Holding Corp. (Software) | (a) | 50,753 | 2,192,530 | |||||||||||||
RealPage, Inc. (Software) | (a) | 76,370 | 1,705,342 | |||||||||||||
SS&C Technologies Holdings, Inc. (Software) | 171,486 | 4,815,327 | ||||||||||||||
Tyler Technologies, Inc. (Software) | (a) | 11,721 | 1,954,008 | |||||||||||||
|
| |||||||||||||||
| 74,268,542 | ||||||||||||||||
|
| |||||||||||||||
MATERIALS – 2.4% | ||||||||||||||||
Sensient Technologies Corp. (Chemicals) | 77,936 | 5,536,573 | ||||||||||||||
|
| |||||||||||||||
Total Common Stocks (Cost $199,573,229) | $ | 218,947,337 | ||||||||||||||
|
| |||||||||||||||
| Master Limited Partnerships – 2.2% | Shares | Value | ||||||||||||||
CONSUMER DISCRETIONARY – 1.0% | ||||||||||||||||
Cedar Fair LP (Hotels, Restaurants & Leisure) | 37,809 | $ | 2,186,117 | |||||||||||||
|
| |||||||||||||||
ENERGY – 1.2% | ||||||||||||||||
DCP Midstream Partners LP (Oil, Gas & Consumable Fuels) | 82,772 | 2,854,806 | ||||||||||||||
|
| |||||||||||||||
Total Master Limited Partnerships (Cost $5,126,461) | $ | 5,040,923 | ||||||||||||||
|
| |||||||||||||||
| 43 | (continued) |
| Ohio National Fund, Inc. | Small Cap Growth Portfolio (Continued) |
Schedule of Investments | June 30, 2016 (Unaudited) |
| Commercial Paper – 0.5% | Rate | Maturity | Face Amount | Value | ||||||||||||
BNP Paribas SA | 0.000% | 07/01/2016 | $ | 1,200,000 | $ | 1,200,000 | ||||||||||
|
| |||||||||||||||
Total Commercial Paper (Cost $1,200,000) | $ | 1,200,000 | ||||||||||||||
|
| |||||||||||||||
| Money Market Funds – 3.9% | Shares | Value | ||||||||||||||
State Street Institutional Liquid Reserves Fund Institutional Class | 1,277,566 | $ | 1,277,566 | |||||||||||||
State Street Institutional U.S. Government Money Market Fund Institutional Class | 7,668,937 | 7,668,937 | ||||||||||||||
|
| |||||||||||||||
Total Money Market Funds (Cost $8,946,503) | $ | 8,946,503 | ||||||||||||||
|
| |||||||||||||||
Total Investments – 101.3% (Cost $214,846,193) | (c) | $ | 234,134,763 | |||||||||||||
Liabilities in Excess of Other Assets – (1.3)% | (2,938,448) | |||||||||||||||
|
| |||||||||||||||
Net Assets – 100.0% | $ | 231,196,315 | ||||||||||||||
|
| |||||||||||||||
Percentages are stated as a percent of net assets.
Abbreviations:
ADR: American Depositary Receipts
Footnotes:
| (a) | Non-income producing security. |
| (b) | Security traded on a foreign exchange has been valued at an estimate of fair value that is different than the local market close price. These fair value estimates are determined by an independent fair valuation service that has been approved by the Board. These securities represent $5,609,887, or 2.4% of the Portfolio’s net assets. |
| Other Portfolio securities are not subjected to fair value procedures because they are traded on domestic or foreign exchanges that have close times that are consistent with the U.S. market close, normally 4:00 pm Eastern Time. |
| (c) | Represents cost for financial reporting purposes, which may differ from cost basis for federal income tax purposes. See also Note 7 of the Notes to Financial Statements. |
The accompanying notes are an integral part of these financial statements.
| 44 |
| Ohio National Fund, Inc. | Mid Cap Opportunity Portfolio |
Objective/Strategy
The Mid Cap Opportunity Portfolio seeks long-term total return by investing at least 80% of its net assets in equity securities of mid-cap companies, primarily those that are strategically positioned for long-term growth.
Performance as of June 30, 2016
Average Annual Returns: | ||||
One year | -4.77% | |||
Five years | 9.59% | |||
Ten years | 5.27% |
Past performance does not guarantee future results. The performance data quoted represents past performance and current returns may be lower or higher. Total return figures include change in share price and reinvestment of dividends and capital gains. The investment return and principal value will fluctuate so that an investor’s shares, when redeemed, may be worth more or less than the original cost. To obtain performance information up to the most recent month end, call toll-free 1-877-781-6392.
The Portfolio is not open to direct retail investment. Beneficial interest in shares is obtained solely by purchase of variable life insurance policies and variable annuity contracts. Actual performance results for variable annuity and variable universal life contracts will be lower due to contract charges. Consult your contract for applicable charges.
Comments
For the six-month period ended June 30, 2016, the Mid Cap Opportunity Portfolio returned 2.24% versus 2.15% for its benchmark, the Russell Midcap Growth Index.
On a sector level, stock selection within Consumer Staples, Financials and Health Care contributed the most to relative performance, while stock selection within Information Technology detracted from relative performance. Sector selection did not significantly impact relative performance during the period. (1)
The Portfolio’s top performers for the first half of the year were Five Below, Inc., Concho Resources, Inc., Teleflex, Inc. Ulta Salon, Cosmetics & Fragrance, Inc. and TreeHouse Foods, Inc. The worst performers for the first half of the year were Restoration Hardware Holdings, Inc., Alkermes PLC, BioMarin Pharmaceutical, Inc., L Brands, Inc. and Vertex Pharmaceuticals, Inc.
The Portfolio’s top contributors to returns were McCormick & Company, Inc., Ulta Salon, Cosmetics & Fragrance, Inc., Equinix, Inc., TreeHouse Foods, Inc., and Kate Spade & Co. The top detractors from returns were LinkedIn Corp. Class A, Restoration Hardware Holdings, Inc., Sensata Technologies Holdings NV, L Brands, Inc. and ServiceNow, Inc. (1)
We continue to believe that equities are more attractive than other asset classes in a low-return and modest growth environments. While the market has been focused on a variety of issues recently, including Brexit, oil prices, weaker economic activity and monetary policy, we believe fundamentals are reasonably solid in many sectors. Economic data has been mixed, with areas of improving activity and the labor market appearing healthy. Risks to the market remain, as volatility is likely to persist, and as the U.S. economy continues through the later stage of the cycle. As earnings quality gains more attention and top line growth becomes harder to find, selectivity will likely become increasingly important.
While the lost art of active management has been tested in recent years, we remain committed to our core philosophy and process. We will maintain a long term time horizon, rather than forecast the next quarter. We will continue to favor high quality growth businesses over breathtaking concepts. We intend to invest when valuations are attractive, rather than following the trend. These core beliefs have guided our team over the past thirty years and we believe they hold the answer for the next thirty.
| (1) | The Portfolio’s composition is subject to change. Holdings and weightings are as of June 30, 2016. |
Change in Value of $10,000 Investment
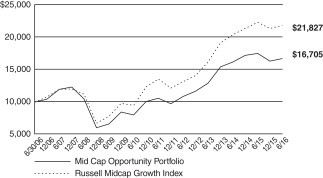
Hypothetical illustration based on past performance. Future performance will vary. The Portfolio’s returns reflect reinvested dividends. The Portfolio’s holdings may differ significantly from the securities in the index. The index is unmanaged and therefore does not reflect the cost of portfolio management and accounting.
The Russell Midcap Growth Index is a subset of the Russell Midcap Index, which measures the performance of the 800 smallest companies in the Russell 1000 Index. The Russell Midcap Growth Index measures the performance of those stocks of the Russell Midcap Index with higher price-to-book ratios and higher relative forecasted growth rates. The index presented herein includes the effects of reinvested dividends.
| 45 | (continued) |
| Ohio National Fund, Inc. | Mid Cap Opportunity Portfolio (Continued) |
Portfolio Composition as of June 30, 2016 (1)
| % of Net Assets | ||||
Common Stocks (4) | 96.7 | |||
Money Market Funds | 3.3 | |||
|
| |||
| 100.0 | ||||
|
|
Top 10 Portfolio Holdings as of June 30, 2016 (1) (2) (3)
| % of Net Assets | ||||
1. Amphenol Corp. Class A | 2.6 | |||
2. Ross Stores, Inc. | 2.5 | |||
3. Equinix, Inc. | 2.5 | |||
4. McCormick & Co., Inc. | 2.5 | |||
5. SBA Communications Corp. Class A | 2.5 | |||
6. Panera Bread Co. Class A | 2.4 | |||
7. Tractor Supply Co. | 2.3 | |||
8. Ulta Salon Cosmetics & Fragrance, Inc. | 2.3 | |||
9. Fidelity National Information Services, Inc. | 2.3 | |||
10. Intuit, Inc. | 2.3 |
| (1) | Composition of Portfolio subject to change. |
| (2) | Short-term investments have been excluded from the list of Top 10 Portfolio Holdings. |
| (3) | Top 10 Portfolio Holdings is presented at an individual security level. Total investment exposure by issuer may be higher. |
| (4) | Sectors (Common Stocks): |
| % of Net Assets | ||||
Consumer Discretionary | 20.3 | |||
Information Technology | 18.3 | |||
Health Care | 15.7 | |||
Industrials | 14.1 | |||
Consumer Staples | 9.8 | |||
Financials | 8.2 | |||
Materials | 5.8 | |||
Telecommunication Services | 3.8 | |||
Energy | 0.7 | |||
|
| |||
| 96.7 | ||||
|
|
| 46 |
| Ohio National Fund, Inc. | Mid Cap Opportunity Portfolio |
Schedule of Investments | June 30, 2016 (Unaudited) |
| Common Stocks – 96.7% | Shares | Value | ||||||
CONSUMER DISCRETIONARY – 20.3% | ||||||||
BorgWarner, Inc. (Auto Components) | 7,501 | $ 221,430 | ||||||
Chipotle Mexican Grill, Inc. (Hotels, Restaurants & Leisure) | (a) | 2,924 | 1,177,670 | |||||
Panera Bread Co. Class A (Hotels, Restaurants & Leisure) | (a) | 8,328 | 1,765,036 | |||||
Newell Brands, Inc. (Household Durables) | 23,657 | 1,149,021 | ||||||
Expedia, Inc. (Internet & Catalog Retail) | 11,363 | 1,207,887 | ||||||
Advance Auto Parts, Inc. (Specialty Retail) | 6,019 | 972,851 | ||||||
Five Below, Inc. (Specialty Retail) | (a) | 11,645 | 540,444 | |||||
O’Reilly Automotive, Inc. (Specialty Retail) | (a) | 2,640 | 715,704 | |||||
Ross Stores, Inc. (Specialty Retail) | 32,906 | 1,865,441 | ||||||
Tractor Supply Co. (Specialty Retail) | 18,889 | 1,722,299 | ||||||
Ulta Salon Cosmetics & Fragrance, Inc. (Specialty Retail) | (a) | 7,066 | 1,721,560 | |||||
Kate Spade & Co. (Textiles, Apparel & Luxury Goods) | (a) | 50,268 | 1,036,024 | |||||
PVH Corp. (Textiles, Apparel & Luxury Goods) | 4,923 | 463,894 | ||||||
Under Armour, Inc. Class A (Textiles, Apparel & Luxury Goods) | (a) | 12,905 | 517,878 | |||||
| ||||||||
| 15,077,139 | ||||||||
| ||||||||
CONSUMER STAPLES – 9.8% | ||||||||
Brown-Forman Corp. Class B (Beverages) | 3,805 | 379,587 | ||||||
Monster Beverage Corp. (Beverages) | (a) | 4,884 | 784,908 | |||||
Whole Foods Market, Inc. (Food & Staples Retailing) | 29,713 | 951,410 | ||||||
Blue Buffalo Pet Products, Inc. (Food Products) | (a) | 39,062 | 911,707 | |||||
McCormick & Co., Inc. (Food Products) | 17,307 | 1,846,138 | ||||||
Mead Johnson Nutrition Co. (Food Products) | 11,114 | 1,008,595 | ||||||
TreeHouse Foods, Inc. (Food Products) | (a) | 13,357 | 1,371,096 | |||||
| ||||||||
| 7,253,441 | ||||||||
| ||||||||
ENERGY – 0.7% | ||||||||
Dril-Quip, Inc. (Energy Equip. & Svs.) | (a) | 4,798 | 280,347 | |||||
Concho Resources, Inc. (Oil, Gas & Consumable Fuels) | (a) | 2,019 | 240,806 | |||||
| ||||||||
| 521,153 | ||||||||
| ||||||||
FINANCIALS – 8.2% | ||||||||
Eagle Bancorp, Inc. (Banks) | (a) | 17,548 | 844,234 | |||||
First Republic Bank (Banks) | 10,632 | 744,134 | ||||||
Affiliated Managers Group, Inc. (Capital Markets) | (a) | 8,768 | 1,234,271 | |||||
Intercontinental Exchange, Inc. (Diversified Financial Svs.) | 5,540 | 1,418,019 | ||||||
Equinix, Inc. (Real Estate Investment Trusts) | 4,762 | 1,846,370 | ||||||
| ||||||||
| 6,087,028 | ||||||||
| ||||||||
HEALTH CARE – 15.7% | ||||||||
Alexion Pharmaceuticals, Inc. (Biotechnology) | (a) | 1,583 | 184,831 | |||||
Alkermes PLC (Biotechnology) | (a) | 10,632 | 459,515 | |||||
Cepheid (Biotechnology) | (a) | 10,488 | 322,506 | |||||
Medivation, Inc. (Biotechnology) | (a) | 5,091 | 306,987 | |||||
Vertex Pharmaceuticals, Inc. (Biotechnology) | (a) | 5,832 | 501,669 | |||||
C.R. Bard, Inc. (Health Care Equip. & Supplies) | 6,339 | 1,490,679 | ||||||
DexCom, Inc. (Health Care Equip. & Supplies) | (a) | 3,190 | 253,063 | |||||
Teleflex, Inc. (Health Care Equip. & Supplies) | 4,312 | 764,561 | ||||||
Adeptus Health, Inc. Class A (Health Care Providers & Svs.) | (a) | 4,505 | 232,728 | |||||
Cardinal Health, Inc. (Health Care Providers & Svs.) | 9,261 | 722,451 | ||||||
Henry Schein, Inc. (Health Care Providers & Svs.) | (a) | 8,893 | 1,572,282 | |||||
Cerner Corp. (Health Care Technology) | (a) | 17,346 | 1,016,476 | |||||
Agilent Technologies, Inc. (Life Sciences Tools & Svs.) | 23,630 | 1,048,227 | ||||||
Mettler-Toledo International, Inc. (Life Sciences Tools & Svs.) | (a) | 3,813 | 1,391,440 | |||||
Zoetis, Inc. (Pharmaceuticals) | 28,229 | 1,339,748 | ||||||
| ||||||||
| 11,607,163 | ||||||||
| ||||||||
| Common Stocks (Continued) | Shares | Value | ||||||
INDUSTRIALS – 14.1% | ||||||||
Fortune Brands Home & Security, Inc. (Building Products) | 17,897 | $ 1,037,489 | ||||||
AMETEK, Inc. (Electrical Equip.) | 28,205 | 1,303,917 | ||||||
Hubbell, Inc. (Electrical Equip.) | 6,130 | 646,531 | ||||||
Sensata Technologies Holding NV (Electrical Equip.) | (a) | 31,022 | 1,082,358 | |||||
Roper Technologies, Inc. (Industrial Conglomerates) | 6,472 | 1,103,864 | ||||||
Graco, Inc. (Machinery) | 9,374 | 740,452 | ||||||
Middleby Corp. / The (Machinery) | (a) | 14,016 | 1,615,344 | |||||
Xylem, Inc. (Machinery) | 32,858 | 1,467,110 | ||||||
Kansas City Southern (Road & Rail) | 6,393 | 575,945 | ||||||
W.W. Grainger, Inc. (Trading Companies & Distributors) | 3,954 | 898,547 | ||||||
| ||||||||
| 10,471,557 | ||||||||
| ||||||||
INFORMATION TECHNOLOGY – 18.3% | ||||||||
Amphenol Corp. Class A (Electronic Equip., Instr. & Comp.) | 33,248 | 1,906,108 | ||||||
LinkedIn Corp. (Internet Software & Svs.) | (a) | 1,983 | 375,283 | |||||
Match Group, Inc. (Internet Software & Svs.) | (a) | 20,649 | 311,284 | |||||
Black Knight Financial Services, Inc. Class A (IT Svs.) | (a) | 35,407 | 1,331,303 | |||||
Fidelity National Information Services, Inc. (IT Svs.) | 22,886 | 1,686,241 | ||||||
FleetCor Technologies, Inc. (IT Svs.) | (a) | 8,118 | 1,161,929 | |||||
Global Payments, Inc. (IT Svs.) | 9,727 | 694,313 | ||||||
Sabre Corp. (IT Svs.) | 33,662 | 901,805 | ||||||
Qorvo, Inc. (Semiconductors & Equip.) | (a) | 12,168 | 672,404 | |||||
Electronic Arts, Inc. (Software) | (a) | 17,753 | 1,344,967 | |||||
Intuit, Inc. (Software) | 15,084 | 1,683,525 | ||||||
Mobileye NV (Software) | (a) | 9,928 | 458,078 | |||||
ServiceNow, Inc. (Software) | (a) | 6,875 | 456,500 | |||||
Splunk, Inc. (Software) | (a) | 9,035 | 489,516 | |||||
Pure Storage, Inc. Class A (Tech. Hardware, Storage & Periph.) | (a) | 11,039 | 120,325 | |||||
| ||||||||
| 13,593,581 | ||||||||
| ||||||||
MATERIALS – 5.8% | ||||||||
Ashland, Inc. (Chemicals) | 11,036 | 1,266,602 | ||||||
Axalta Coating Systems Ltd. (Chemicals) | (a) | 14,951 | 396,650 | |||||
RPM International, Inc. (Chemicals) | 20,499 | 1,023,925 | ||||||
Sherwin-Williams Co. / The (Chemicals) | 5,388 | 1,582,294 | ||||||
| ||||||||
| 4,269,471 | ||||||||
| ||||||||
TELECOMMUNICATION SERVICES – 3.8% | ||||||||
Level 3 Communications, Inc. (Diversified Telecom. Svs.) | (a) | 19,275 | 992,470 | |||||
SBA Communications Corp. Class A (Diversified Telecom. Svs.) | (a) | 16,877 | 1,821,703 | |||||
| 2,814,173 | ||||||||
| ||||||||
Total Common Stocks (Cost $62,742,265) | $71,694,706 | |||||||
| ||||||||
| Warrants – 0.0% | Quantity | Value | ||||||
CONSUMER DISCRETIONARY – 0.0% | ||||||||
HealthSouth Corp. (Health Care Providers & Svs.) | 2,083 | $3,520 | ||||||
| ||||||||
Total Warrants (Cost $0) | $3,520 | |||||||
| ||||||||
| Money Market Funds – 3.6% | Shares | Value | ||||||
State Street Institutional Liquid Reserves Fund Institutional Class | 134,561 | $ 134,561 | ||||||
State Street Institutional U.S. Government Money Market Fund Institutional Class | 2,571,939 | 2,571,939 | ||||||
| ||||||||
Total Money Market Funds (Cost $2,706,500) | $ 2,706,500 | |||||||
| ||||||||
Total Investments – 100.3% (Cost $65,448,765) | (b) | $74,404,726 | ||||||
Liabilities in Excess of Other Assets – (0.3)% | (255,635) | |||||||
| ||||||||
Net Assets – 100.0% | $74,149,091 | |||||||
| ||||||||
| 47 | (continued) |
| Ohio National Fund, Inc. | Mid Cap Opportunity Portfolio (Continued) |
Schedule of Investments | June 30, 2016 (Unaudited) |
Percentages are stated as a percent of net assets.
Footnotes:
| (a) | Non-income producing security. |
| (b) | Represents cost for financial reporting purposes, which may differ from cost basis for federal income tax purposes. See also Note 7 of the Notes to Financial Statements. |
The accompanying notes are an integral part of these financial statements.
| 48 |
| Ohio National Fund, Inc. | S&P 500® Index Portfolio |
Objective/Strategy
The S&P 500® Index Portfolio seeks total return that approximates the total return of the Standard & Poor’s 500® Index (S&P 500® Index), at a risk level consistent with that of the Standard & Poor’s 500® Index.
Performance as of June 30, 2016
Average Annual Returns: | ||||
One year | 3.48% | |||
Five years | 11.56% | |||
Ten years | 6.91% |
Past performance does not guarantee future results. The performance data quoted represents past performance and current returns may be lower or higher. Total return figures include change in share price and reinvestment of dividends and capital gains. The investment return and principal value will fluctuate so that an investor’s shares, when redeemed, may be worth more or less than the original cost. To obtain performance information up to the most recent month end, call toll-free 1-877-781-6392.
The Portfolio is not open to direct retail investment. Beneficial interest in shares is obtained solely by purchase of variable life insurance policies and variable annuity contracts. Actual performance results for variable annuity and variable universal life contracts will be lower due to contract charges. Consult your contract for applicable charges.
Comments
For the six-month period ended June 30, 2016, the S&P 500® Index Portfolio returned 3.57% versus 3.84% for its benchmark, the S&P 500® Index.
The largest contributors to the Portfolio and benchmark returns for the six-month period were Exxon Mobil Corp., AT&T, Inc., Johnson & Johnson, Verizon Communications, Inc., and Chevron Corp. The largest detractors from the Portfolio and benchmark returns for the six-month period were Apple, Inc., Bank of America Corp., Allergan PLC, Wells Fargo & Co., and Microsoft Corp. (1)
Eight of ten sectors represented in the benchmark produced a positive return over the six-month period, with Telecommunication Services and Utilities leading the way. The two laggard sectors were Financials and Information Technology. (1)
The Portfolio is managed on a risk-controlled basis and is constructed to closely replicate its benchmark index. The expected sources of performance variance include the impact of trading daily cash flows, including trading commissions, and the operating expenses of the Portfolio.
Effective May 2, 2016, the Portfolio has been sub-advised by Geode Capital Management, LLC (“Geode”). Prior to that date, the management of the Portfolio’s securities was performed by Ohio National Investments, Inc. (“ONI”), the adviser to the Portfolio.
Since May 2, 2016, the Portfolio has held E-mini S&P 500 Index futures contracts for the purposes of efficiently managing daily cash flows and gaining market exposure for dividend receivables. The futures position did not have a material impact on performance (less than 1 basis point) during the period in which Geode was the sub-adviser to the Portfolio, nor for the entire six-month period ended June 30, 2016.(1)
| (1) | The Portfolio’s composition is subject to change. Holdings and weightings are as of June 30, 2016. |
Change in Value of $10,000 Investment
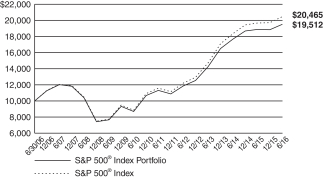
Hypothetical illustration based on past performance. Future performance will vary. The Portfolio’s returns reflect reinvested dividends. The Portfolio’s holdings may differ significantly from the securities in the index. The index is unmanaged and therefore does not reflect the cost of portfolio management and accounting. Investors cannot invest directly in an index, although they can invest in its underlying securities or funds.
The S&P 500® Index is a capitalization-weighted index designed to measure performance of the broad domestic economy through changes in the aggregate market value of 500 stocks representing all major industries. The index presented herein includes the effects of reinvested dividends.
“Standard & Poor’s®”, “S&P®”, “S&P 500®” and “Standard & Poor’s 500” are trademarks of The McGraw-Hill Companies, Inc. and have been licensed for use by Ohio National Investments, Inc. (ONI). The S&P 500® Index Portfolio is not sponsored, endorsed, sold or promoted by Standard & Poor’s (“S&P”) and S&P makes no representation regarding the advisability of investing in the S&P 500® Index Portfolio. S&P makes no representation or warranty, express or implied, to the owners of the Portfolio or any member of the public regarding the advisability of investing in securities generally or in the Portfolio particularly or the ability of the S&P 500® Index to track general stock market performance. S&P’s only relationship to ONI is the licensing of certain trademarks and trade names of S&P® and of the S&P 500® Index which is determined, composed and calculated by S&P® without regard to ONI or the S&P 500® Index Portfolio. S&P® has no obligation to take the needs of ONI or the owners of the Portfolio into consideration in determining, composing or calculating the S&P 500® Index. S&P® is not responsible for and has not participated in the determination of the prices and amount of the Portfolio or the timing of the issuance or sale of the Portfolio or in the determination or calculation of the equation by which the Portfolio is to be converted into cash. S&P® has no obligation or liability in connection with the administration, marketing or trading of the Portfolio.
| 49 | (continued) |
| Ohio National Fund, Inc. | S&P 500® Index Portfolio (Continued) |
Portfolio Composition as of June 30, 2016 (1)
| % of Net Assets | ||||
Common Stocks (4) | 98.6 | |||
Money Market Funds and | 1.4 | |||
|
| |||
| 100.0 | ||||
|
|
Top 10 Portfolio Holdings as of June 30, 2016 (1) (2) (3)
| % of Net Assets | ||||
1. Apple, Inc. | 2.8 | |||
2. Microsoft Corp. | 2.2 | |||
3. Exxon Mobil Corp. | 2.1 | |||
4. Johnson & Johnson | 1.8 | |||
5. General Electric Co. | 1.6 | |||
6. Amazon.com, Inc. | 1.5 | |||
7. Berkshire Hathaway, Inc. Class B | 1.5 | |||
8. AT&T, Inc. | 1.4 | |||
9. Facebook, Inc. Class A | 1.4 | |||
10. Verizon Communications, Inc. | 1.2 |
| (1) | Composition of Portfolio subject to change. |
| (2) | Short-term investments have been excluded from the list of Top 10 Portfolio Holdings. |
| (3) | Top 10 Portfolio Holdings is presented at an individual security level. Total investment exposure by issuer may be higher. |
| (4) | Sectors (Common Stocks): |
| % of Net Assets | ||||
Information Technology | 19.5 | |||
Financials | 15.5 | |||
Health Care | 14.8 | |||
Consumer Discretionary | 12.1 | |||
Consumer Staples | 10.4 | |||
Industrials | 9.7 | |||
Energy | 7.3 | |||
Utilities | 3.6 | |||
Telecommunication Services | 2.9 | |||
Materials | 2.8 | |||
|
| |||
| 98.6 | ||||
|
|
| 50 |
| Ohio National Fund, Inc. | S&P 500® Index Portfolio |
Schedule of Investments | June 30, 2016 (Unaudited |
| Common Stocks – 98.6% | Shares | Value | ||||||||
CONSUMER DISCRETIONARY – 12.1% | ||||||||||
BorgWarner, Inc. (Auto Components) | 5,093 | $ | 150,345 | |||||||
Delphi Automotive PLC (Auto Components) | 6,432 | 402,643 | ||||||||
Goodyear Tire & Rubber Co. / The (Auto Components) | 6,221 | 159,631 | ||||||||
Johnson Controls, Inc. (Auto Components) | 15,275 | 676,071 | ||||||||
Ford Motor Co. (Automobiles) | 91,932 | 1,155,585 | ||||||||
General Motors Co. (Automobiles) | 33,011 | 934,211 | ||||||||
Harley-Davidson, Inc. (Automobiles) | 4,300 | 194,790 | ||||||||
Genuine Parts Co. (Distributors) | 3,530 | 357,413 | ||||||||
LKQ Corp. (Distributors) | (a) | 7,264 | 230,269 | |||||||
H&R Block, Inc. (Diversified Consumer Svs.) | 5,249 | 120,727 | ||||||||
Carnival Corp. (Hotels, Restaurants & Leisure) | 10,334 | 456,763 | ||||||||
Chipotle Mexican Grill, Inc. (Hotels, Restaurants & Leisure) | (a) | 691 | 278,307 | |||||||
Darden Restaurants, Inc. (Hotels, Restaurants & Leisure) | 2,668 | 168,991 | ||||||||
Marriott International, Inc. Class A (Hotels, Restaurants & Leisure) | 4,504 | 299,336 | ||||||||
McDonald’s Corp. (Hotels, Restaurants & Leisure) | 20,678 | 2,488,391 | ||||||||
Royal Caribbean Cruises Ltd. (Hotels, Restaurants & Leisure) | 3,966 | 266,317 | ||||||||
Starbucks Corp. (Hotels, Restaurants & Leisure) | 34,513 | 1,971,383 | ||||||||
Starwood Hotels & Resorts Worldwide, Inc. (Hotels, Restaurants & Leisure) | 3,982 | 294,469 | ||||||||
Wyndham Worldwide Corp. (Hotels, Restaurants & Leisure) | 2,621 | 186,694 | ||||||||
Wynn Resorts Ltd. (Hotels, Restaurants & Leisure) | 1,905 | 172,669 | ||||||||
Yum! Brands, Inc. (Hotels, Restaurants & Leisure) | 9,599 | 795,949 | ||||||||
D.R. Horton, Inc. (Household Durables) | 7,818 | 246,111 | ||||||||
Garmin Ltd. (Household Durables) | 2,740 | 116,231 | ||||||||
Harman International Industries, Inc. (Household Durables) | 1,650 | 118,503 | ||||||||
Leggett & Platt, Inc. (Household Durables) | 3,142 | 160,588 | ||||||||
Lennar Corp. Class A (Household Durables) | 4,290 | 197,769 | ||||||||
Mohawk Industries, Inc. (Household Durables) | (a) | 1,507 | 285,968 | |||||||
Newell Brands, Inc. (Household Durables) | 10,766 | 522,905 | ||||||||
PulteGroup, Inc. (Household Durables) | 7,365 | 143,544 | ||||||||
Whirlpool Corp. (Household Durables) | 1,794 | 298,952 | ||||||||
Amazon.com, Inc. (Internet & Catalog Retail) | (a) | 9,115 | 6,522,876 | |||||||
Expedia, Inc. (Internet & Catalog Retail) | 2,770 | 294,451 | ||||||||
Netflix, Inc. (Internet & Catalog Retail) | (a) | 10,091 | 923,125 | |||||||
Priceline Group, Inc. / The (Internet & Catalog Retail) | (a) | 1,170 | 1,460,640 | |||||||
TripAdvisor, Inc. (Internet & Catalog Retail) | (a) | 2,673 | 171,874 | |||||||
Hasbro, Inc. (Leisure Products) | 2,660 | 223,413 | ||||||||
Mattel, Inc. (Leisure Products) | 8,056 | 252,072 | ||||||||
CBS Corp. Class B (Media) | 9,789 | 532,913 | ||||||||
Comcast Corp. Class A (Media) | 56,961 | 3,713,288 | ||||||||
Discovery Communications, Inc. Class A (Media) | (a) | 3,511 | 88,583 | |||||||
Discovery Communications, Inc. Class C (Media) | (a) | 5,714 | 136,279 | |||||||
Interpublic Group of Cos., Inc. / The (Media) | 9,537 | 220,305 | ||||||||
News Corp. Class A (Media) | 8,971 | 101,821 | ||||||||
News Corp. Class B (Media) | 2,453 | 28,627 | ||||||||
Omnicom Group, Inc. (Media) | 5,601 | 456,425 | ||||||||
Scripps Networks Interactive, Inc. Class A (Media) | 2,223 | 138,426 | ||||||||
TEGNA, Inc. (Media) | 5,089 | 117,912 | ||||||||
Time Warner, Inc. (Media) | 18,530 | 1,362,696 | ||||||||
Twenty-First Century Fox, Inc. Class A (Media) | 25,832 | 698,756 | ||||||||
Twenty-First Century Fox, Inc. Class B (Media) | 10,161 | 276,887 | ||||||||
Viacom, Inc. Class B (Media) | 8,174 | 338,976 | ||||||||
Walt Disney Co. / The (Media) | 35,168 | 3,440,134 | ||||||||
Dollar General Corp. (Multiline Retail) | 6,689 | 628,766 | ||||||||
Dollar Tree, Inc. (Multiline Retail) | (a) | 5,553 | 523,315 | |||||||
Kohl’s Corp. (Multiline Retail) | 4,297 | 162,942 | ||||||||
Macy’s, Inc. (Multiline Retail) | 7,302 | 245,420 | ||||||||
Nordstrom, Inc. (Multiline Retail) | 3,004 | 114,302 | ||||||||
Target Corp. (Multiline Retail) | 13,892 | 969,939 | ||||||||
Advance Auto Parts, Inc. (Specialty Retail) | 1,739 | 281,074 | ||||||||
AutoNation, Inc. (Specialty Retail) | (a) | 1,664 | 78,175 | |||||||
AutoZone, Inc. (Specialty Retail) | (a) | 704 | 558,863 | |||||||
Bed Bath & Beyond, Inc. (Specialty Retail) | 3,610 | 156,024 | ||||||||
| Common Stocks (Continued) | Shares | Value | ||||||||
CONSUMER DISCRETIONARY (continued) | ||||||||||
Best Buy Co., Inc. (Specialty Retail) | 6,693 | $ | 204,806 | |||||||
CarMax, Inc. (Specialty Retail) | (a) | 4,592 | 225,146 | |||||||
Foot Locker, Inc. (Specialty Retail) | 3,183 | 174,619 | ||||||||
Gap, Inc. / The (Specialty Retail) | 5,315 | 112,784 | ||||||||
Home Depot, Inc. / The (Specialty Retail) | 29,307 | 3,742,211 | ||||||||
L Brands, Inc. (Specialty Retail) | 5,964 | 400,363 | ||||||||
Lowe’s Cos., Inc. (Specialty Retail) | 20,876 | 1,652,753 | ||||||||
O’Reilly Automotive, Inc. (Specialty Retail) | (a) | 2,273 | 616,210 | |||||||
Ross Stores, Inc. (Specialty Retail) | 9,470 | 536,854 | ||||||||
Signet Jewelers Ltd. (Specialty Retail) | 1,824 | 150,316 | ||||||||
Staples, Inc. (Specialty Retail) | 15,116 | 130,300 | ||||||||
Tiffany & Co. (Specialty Retail) | 2,564 | 155,481 | ||||||||
TJX Cos., Inc. / The (Specialty Retail) | 15,575 | 1,202,857 | ||||||||
Tractor Supply Co. (Specialty Retail) | 3,153 | 287,491 | ||||||||
Ulta Salon Cosmetics & Fragrance, Inc. (Specialty Retail) | (a) | 1,473 | 358,882 | |||||||
Urban Outfitters, Inc. (Specialty Retail) | (a) | 2,027 | 55,743 | |||||||
Coach, Inc. (Textiles, Apparel & Luxury Goods) | 6,579 | 268,028 | ||||||||
Hanesbrands, Inc. (Textiles, Apparel & Luxury Goods) | 8,942 | 224,712 | ||||||||
Michael Kors Holdings Ltd. (Textiles, Apparel & Luxury Goods) | (a) | 4,128 | 204,253 | |||||||
NIKE, Inc. Class B (Textiles, Apparel & Luxury Goods) | 31,379 | 1,732,121 | ||||||||
PVH Corp. (Textiles, Apparel & Luxury Goods) | 1,895 | 178,566 | ||||||||
Ralph Lauren Corp. (Textiles, Apparel & Luxury Goods) | 1,334 | 119,553 | ||||||||
Under Armour, Inc. Class A (Textiles, Apparel & Luxury Goods) | (a) | 4,283 | 171,877 | |||||||
Under Armour, Inc. Class C (Textiles, Apparel & Luxury Goods) | (a) | 4,306 | 156,743 | |||||||
V.F. Corp. (Textiles, Apparel & Luxury Goods) | 7,886 | 484,910 | ||||||||
|
| |||||||||
| 52,618,403 | ||||||||||
|
| |||||||||
CONSUMER STAPLES – 10.4% | ||||||||||
Brown-Forman Corp. Class B (Beverages) | 2,382 | 237,628 | ||||||||
Coca-Cola Co. / The (Beverages) | 91,726 | 4,157,940 | ||||||||
Constellation Brands, Inc. Class A (Beverages) | 4,155 | 687,237 | ||||||||
Dr Pepper Snapple Group, Inc. (Beverages) | 4,379 | 423,143 | ||||||||
Molson Coors Brewing Co. Class B (Beverages) | 4,338 | 438,702 | ||||||||
Monster Beverage Corp. (Beverages) | (a) | 3,317 | 533,075 | |||||||
PepsiCo, Inc. (Beverages) | 34,028 | 3,604,926 | ||||||||
Costco Wholesale Corp. (Food & Staples Retailing) | 10,320 | 1,620,653 | ||||||||
CVS Health Corp. (Food & Staples Retailing) | 25,302 | 2,422,413 | ||||||||
Kroger Co. / The (Food & Staples Retailing) | 22,469 | 826,635 | ||||||||
Sysco Corp. (Food & Staples Retailing) | 12,342 | 626,233 | ||||||||
Walgreens Boots Alliance, Inc. (Food & Staples Retailing) | 20,361 | 1,695,460 | ||||||||
Wal-Mart Stores, Inc. (Food & Staples Retailing) | 35,977 | 2,627,040 | ||||||||
Whole Foods Market, Inc. (Food & Staples Retailing) | 7,607 | 243,576 | ||||||||
Archer-Daniels-Midland Co. (Food Products) | 13,846 | 593,855 | ||||||||
Campbell Soup Co. (Food Products) | 4,239 | 282,021 | ||||||||
ConAgra Foods, Inc. (Food Products) | 10,276 | 491,296 | ||||||||
General Mills, Inc. (Food Products) | 13,987 | 997,553 | ||||||||
Hershey Co. / The (Food Products) | 3,318 | 376,560 | ||||||||
Hormel Foods Corp. (Food Products) | 6,407 | 234,496 | ||||||||
J.M. Smucker Co. / The (Food Products) | 2,820 | 429,796 | ||||||||
Kellogg Co. (Food Products) | 5,934 | 484,511 | ||||||||
Kraft Heinz Co. / The (Food Products) | 14,032 | 1,241,551 | ||||||||
McCormick & Co., Inc. (Food Products) | 2,726 | 290,782 | ||||||||
Mead Johnson Nutrition Co. (Food Products) | 4,400 | 399,300 | ||||||||
Mondelez International, Inc. Class A (Food Products) | 36,557 | 1,663,709 | ||||||||
Tyson Foods, Inc. Class A (Food Products) | 7,078 | 472,740 | ||||||||
Church & Dwight Co., Inc. (Household Products) | 3,031 | 311,860 | ||||||||
Clorox Co. / The (Household Products) | 3,048 | 421,813 | ||||||||
Colgate-Palmolive Co. (Household Products) | 21,033 | 1,539,616 | ||||||||
Kimberly-Clark Corp. (Household Products) | 8,483 | 1,166,243 | ||||||||
Procter & Gamble Co. / The (Household Products) | 62,706 | 5,309,317 | ||||||||
Estee Lauder Cos., Inc. / The Class A (Personal Products) | 5,246 | 477,491 | ||||||||
Altria Group, Inc. (Tobacco) | 46,070 | 3,176,987 | ||||||||
| 51 | (continued) |
| Ohio National Fund, Inc. | S&P 500® Index Portfolio (Continued) |
Schedule of Investments | June 30, 2016 (Unaudited |
| Common Stocks (Continued) | Shares | Value | ||||||||
CONSUMER STAPLES (continued) | ||||||||||
Philip Morris International, Inc. (Tobacco) | 36,544 | $ | 3,717,256 | |||||||
Reynolds American, Inc. (Tobacco) | 19,494 | 1,051,311 | ||||||||
|
| |||||||||
| 45,274,725 | ||||||||||
|
| |||||||||
ENERGY – 7.3% | ||||||||||
Baker Hughes, Inc. (Energy Equip. & Svs.) | 10,324 | 465,922 | ||||||||
Diamond Offshore Drilling, Inc. (Energy Equip. & Svs.) | 1,500 | 36,495 | ||||||||
FMC Technologies, Inc. (Energy Equip. & Svs.) | (a) | 5,304 | 141,458 | |||||||
Halliburton Co. (Energy Equip. & Svs.) | 20,258 | 917,485 | ||||||||
Helmerich & Payne, Inc. (Energy Equip. & Svs.) | 2,527 | 169,637 | ||||||||
National Oilwell Varco, Inc. (Energy Equip. & Svs.) | 8,904 | 299,620 | ||||||||
Schlumberger Ltd. (Energy Equip. & Svs.) | 32,744 | 2,589,395 | ||||||||
Transocean Ltd. (Energy Equip. & Svs.) | 8,029 | 95,465 | ||||||||
Anadarko Petroleum Corp. (Oil, Gas & Consumable Fuels) | 12,026 | 640,384 | ||||||||
Apache Corp. (Oil, Gas & Consumable Fuels) | 8,916 | 496,354 | ||||||||
Cabot Oil & Gas Corp. (Oil, Gas & Consumable Fuels) | 10,995 | 283,011 | ||||||||
Chesapeake Energy Corp. (Oil, Gas & Consumable Fuels) | (a) | 13,679 | 58,546 | |||||||
Chevron Corp. (Oil, Gas & Consumable Fuels) | 44,398 | 4,654,242 | ||||||||
Cimarex Energy Co. (Oil, Gas & Consumable Fuels) | 2,244 | 267,754 | ||||||||
Columbia Pipeline Group, Inc. (Oil, Gas & Consumable Fuels) | 9,469 | 241,365 | ||||||||
Concho Resources, Inc. (Oil, Gas & Consumable Fuels) | (a) | 3,073 | 366,517 | |||||||
ConocoPhillips (Oil, Gas & Consumable Fuels) | 29,175 | 1,272,030 | ||||||||
Devon Energy Corp. (Oil, Gas & Consumable Fuels) | 12,347 | 447,579 | ||||||||
EOG Resources, Inc. (Oil, Gas & Consumable Fuels) | 12,962 | 1,081,290 | ||||||||
EQT Corp. (Oil, Gas & Consumable Fuels) | 4,079 | 315,837 | ||||||||
Exxon Mobil Corp. (Oil, Gas & Consumable Fuels) | 97,688 | 9,157,273 | ||||||||
Hess Corp. (Oil, Gas & Consumable Fuels) | 6,221 | 373,882 | ||||||||
Kinder Morgan, Inc. (Oil, Gas & Consumable Fuels) | 43,111 | 807,038 | ||||||||
Marathon Oil Corp. (Oil, Gas & Consumable Fuels) | 20,032 | 300,680 | ||||||||
Marathon Petroleum Corp. (Oil, Gas & Consumable Fuels) | 12,481 | 473,779 | ||||||||
Murphy Oil Corp. (Oil, Gas & Consumable Fuels) | 3,786 | 120,206 | ||||||||
Newfield Exploration Co. (Oil, Gas & Consumable Fuels) | (a) | 4,600 | 203,228 | |||||||
Noble Energy, Inc. (Oil, Gas & Consumable Fuels) | 10,105 | 362,466 | ||||||||
Occidental Petroleum Corp. (Oil, Gas & Consumable Fuels) | 17,988 | 1,359,173 | ||||||||
ONEOK, Inc. (Oil, Gas & Consumable Fuels) | 4,979 | 236,254 | ||||||||
Phillips 66 (Oil, Gas & Consumable Fuels) | 11,016 | 874,009 | ||||||||
Pioneer Natural Resources Co. (Oil, Gas & Consumable Fuels) | 3,852 | 582,461 | ||||||||
Range Resources Corp. (Oil, Gas & Consumable Fuels) | 3,970 | 171,266 | ||||||||
Southwestern Energy Co. (Oil, Gas & Consumable Fuels) | (a) | 11,151 | 140,280 | |||||||
Spectra Energy Corp. (Oil, Gas & Consumable Fuels) | 16,116 | 590,329 | ||||||||
Tesoro Corp. (Oil, Gas & Consumable Fuels) | 2,846 | 213,222 | ||||||||
Valero Energy Corp. (Oil, Gas & Consumable Fuels) | 11,066 | 564,366 | ||||||||
Williams Cos., Inc. / The (Oil, Gas & Consumable Fuels) | 16,109 | 348,438 | ||||||||
|
| |||||||||
| 31,718,736 | ||||||||||
|
| |||||||||
FINANCIALS – 15.5% | ||||||||||
Bank of America Corp. (Banks) | 242,015 | 3,211,539 | ||||||||
BB&T Corp. (Banks) | 19,351 | 689,089 | ||||||||
Citigroup, Inc. (Banks) | 69,151 | 2,931,311 | ||||||||
Citizens Financial Group, Inc. (Banks) | 12,513 | 250,010 | ||||||||
Comerica, Inc. (Banks) | 4,096 | 168,468 | ||||||||
Fifth Third Bancorp (Banks) | 18,118 | 318,696 | ||||||||
Huntington Bancshares, Inc. (Banks) | 18,684 | 167,035 | ||||||||
JPMorgan Chase & Co. (Banks) | 86,148 | 5,353,237 | ||||||||
KeyCorp (Banks) | 19,960 | 220,558 | ||||||||
M&T Bank Corp. (Banks) | 3,747 | 443,008 | ||||||||
| Common Stocks (Continued) | Shares | Value | ||||||||
FINANCIALS (continued) | ||||||||||
People’s United Financial, Inc. (Banks) | 7,270 | $ | 106,578 | |||||||
PNC Financial Services Group, Inc. / The (Banks) | 11,766 | 957,635 | ||||||||
Regions Financial Corp. (Banks) | 29,952 | 254,891 | ||||||||
SunTrust Banks, Inc. (Banks) | 11,807 | 485,031 | ||||||||
U.S. Bancorp (Banks) | 38,225 | 1,541,614 | ||||||||
Wells Fargo & Co. (Banks) | 108,846 | 5,151,681 | ||||||||
Zions Bancorporation (Banks) | 4,785 | 120,247 | ||||||||
Affiliated Managers Group, Inc. (Capital Markets) | (a) | 1,278 | 179,904 | |||||||
Ameriprise Financial, Inc. (Capital Markets) | 3,909 | 351,224 | ||||||||
Bank of New York Mellon Corp. / The (Capital Markets) | 25,368 | 985,547 | ||||||||
BlackRock, Inc. (Capital Markets) | 2,962 | 1,014,574 | ||||||||
Charles Schwab Corp. / The (Capital Markets) | 28,331 | 717,058 | ||||||||
E*TRADE Financial Corp. (Capital Markets) | (a) | 6,519 | 153,131 | |||||||
Franklin Resources, Inc. (Capital Markets) | 8,708 | 290,586 | ||||||||
Goldman Sachs Group, Inc. / The (Capital Markets) | 9,104 | 1,352,672 | ||||||||
Invesco Ltd. (Capital Markets) | 9,864 | 251,927 | ||||||||
Legg Mason, Inc. (Capital Markets) | 2,465 | 72,693 | ||||||||
Morgan Stanley (Capital Markets) | 35,609 | 925,122 | ||||||||
Northern Trust Corp. (Capital Markets) | 5,058 | 335,143 | ||||||||
State Street Corp. (Capital Markets) | 9,328 | 502,966 | ||||||||
T. Rowe Price Group, Inc. (Capital Markets) | 5,847 | 426,656 | ||||||||
American Express Co. (Consumer Finance) | 19,048 | 1,157,356 | ||||||||
Capital One Financial Corp. (Consumer Finance) | 12,070 | 766,566 | ||||||||
Discover Financial Services (Consumer Finance) | 9,716 | 520,680 | ||||||||
Navient Corp. (Consumer Finance) | 7,731 | 92,385 | ||||||||
Synchrony Financial (Consumer Finance) | (a) | 19,651 | 496,777 | |||||||
Berkshire Hathaway, Inc. Class B (Diversified Financial Svs.) | (a) | 44,145 | 6,391,755 | |||||||
CME Group, Inc. (Diversified Financial Svs.) | 7,977 | 776,960 | ||||||||
Intercontinental Exchange, Inc. (Diversified Financial Svs.) | 2,804 | 717,712 | ||||||||
Leucadia National Corp. (Diversified Financial Svs.) | 7,796 | 135,105 | ||||||||
Moody’s Corp. (Diversified Financial Svs.) | 3,987 | 373,622 | ||||||||
Nasdaq, Inc. (Diversified Financial Svs.) | 2,693 | 174,156 | ||||||||
S&P Global, Inc. (Diversified Financial Svs.) | 6,232 | 668,444 | ||||||||
Aflac, Inc. (Insurance) | 9,748 | 703,416 | ||||||||
Allstate Corp. / The (Insurance) | 8,818 | 616,819 | ||||||||
American International Group, Inc. (Insurance) | 26,364 | 1,394,392 | ||||||||
Aon PLC (Insurance) | 6,241 | 681,704 | ||||||||
Arthur J. Gallagher & Co. (Insurance) | 4,143 | 197,207 | ||||||||
Assurant, Inc. (Insurance) | 1,449 | 125,063 | ||||||||
Chubb Ltd. (Insurance) | 10,938 | 1,429,706 | ||||||||
Cincinnati Financial Corp. (Insurance) | 3,502 | 262,265 | ||||||||
Hartford Financial Services Group, Inc. / The (Insurance) | 9,268 | 411,314 | ||||||||
Lincoln National Corp. (Insurance) | 5,660 | 219,438 | ||||||||
Loews Corp. (Insurance) | 6,339 | 260,470 | ||||||||
Marsh & McLennan Cos., Inc. (Insurance) | 12,273 | 840,210 | ||||||||
MetLife, Inc. (Insurance) | 25,887 | 1,031,079 | ||||||||
Principal Financial Group, Inc. (Insurance) | 6,374 | 262,035 | ||||||||
Progressive Corp. / The (Insurance) | 13,730 | 459,955 | ||||||||
Prudential Financial, Inc. (Insurance) | 10,415 | 743,006 | ||||||||
Torchmark Corp. (Insurance) | 2,626 | 162,339 | ||||||||
Travelers Cos., Inc. / The (Insurance) | 6,885 | 819,590 | ||||||||
Unum Group (Insurance) | 5,563 | 176,848 | ||||||||
Willis Towers Watson PLC (Insurance) | 3,262 | 405,499 | ||||||||
XL Group PLC (Insurance) | 6,751 | 224,876 | ||||||||
American Tower Corp. (Real Estate Investment Trusts) | 9,996 | 1,135,646 | ||||||||
Apartment Investment & Management Co. Class A (Real Estate Investment Trusts) | 3,663 | 161,758 | ||||||||
AvalonBay Communities, Inc. (Real Estate Investment Trusts) | 3,228 | 582,299 | ||||||||
Boston Properties, Inc. (Real Estate Investment Trusts) | 3,617 | 477,082 | ||||||||
Crown Castle International Corp. (Real Estate Investment Trusts) | 7,932 | 804,543 | ||||||||
Digital Realty Trust, Inc. (Real Estate Investment Trusts) | 3,463 | 377,432 | ||||||||
| 52 | (continued) |
| Ohio National Fund, Inc. | S&P 500® Index Portfolio (Continued) |
Schedule of Investments | June 30, 2016 (Unaudited |
| Common Stocks (Continued) | Shares | Value | ||||||||
FINANCIALS (continued) | ||||||||||
Equinix, Inc. (Real Estate Investment Trusts) | 1,635 | $ | 633,939 | |||||||
Equity Residential (Real Estate Investment Trusts) | 8,607 | 592,850 | ||||||||
Essex Property Trust, Inc. (Real Estate Investment Trusts) | 1,544 | 352,171 | ||||||||
Extra Space Storage, Inc. (Real Estate Investment Trusts) | 2,962 | 274,103 | ||||||||
Federal Realty Investment Trust (Real Estate Investment Trusts) | 1,677 | 277,627 | ||||||||
General Growth Properties, Inc. (Real Estate Investment Trusts) | 13,739 | 409,697 | ||||||||
HCP, Inc. (Real Estate Investment Trusts) | 11,011 | 389,569 | ||||||||
Host Hotels & Resorts, Inc. (Real Estate Investment Trusts) | 17,660 | 286,269 | ||||||||
Iron Mountain, Inc. (Real Estate Investment Trusts) | 5,669 | 225,796 | ||||||||
Kimco Realty Corp. (Real Estate Investment Trusts) | 9,917 | 311,195 | ||||||||
Macerich Co. / The (Real Estate Investment Trusts) | 2,952 | 252,071 | ||||||||
Prologis, Inc. (Real Estate Investment Trusts) | 12,363 | 606,282 | ||||||||
Public Storage (Real Estate Investment Trusts) | 3,469 | 886,642 | ||||||||
Realty Income Corp. (Real Estate Investment Trusts) | 6,073 | 421,223 | ||||||||
Simon Property Group, Inc. (Real Estate Investment Trusts) | 7,287 | 1,580,550 | ||||||||
SL Green Realty Corp. (Real Estate Investment Trusts) | 2,373 | 252,653 | ||||||||
UDR, Inc. (Real Estate Investment Trusts) | 6,334 | 233,851 | ||||||||
Ventas, Inc. (Real Estate Investment Trusts) | 7,962 | 579,793 | ||||||||
Vornado Realty Trust (Real Estate Investment Trusts) | 4,181 | 418,602 | ||||||||
Welltower, Inc. (Real Estate Investment Trusts) | 8,409 | 640,514 | ||||||||
Weyerhaeuser Co. (Real Estate Investment Trusts) | 17,597 | 523,863 | ||||||||
CBRE Group, Inc. (Real Estate Mgmt. & Development) | (a) | 6,825 | 180,726 | |||||||
|
| |||||||||
| 67,497,326 | ||||||||||
|
| |||||||||
HEALTH CARE – 14.8% | ||||||||||
AbbVie, Inc. (Biotechnology) | 38,105 | 2,359,080 | ||||||||
Alexion Pharmaceuticals, Inc. (Biotechnology) | (a) | 5,279 | 616,376 | |||||||
Amgen, Inc. (Biotechnology) | 17,699 | 2,692,903 | ||||||||
Biogen, Inc. (Biotechnology) | (a) | 5,161 | 1,248,033 | |||||||
Celgene Corp. (Biotechnology) | (a) | 18,250 | 1,799,997 | |||||||
Gilead Sciences, Inc. (Biotechnology) | 31,378 | 2,617,553 | ||||||||
Regeneron Pharmaceuticals, Inc. (Biotechnology) | (a) | 1,838 | 641,885 | |||||||
Vertex Pharmaceuticals, Inc. (Biotechnology) | (a) | 5,830 | 501,497 | |||||||
Abbott Laboratories (Health Care Equip. & Supplies) | 34,618 | 1,360,834 | ||||||||
Baxter International, Inc. (Health Care Equip. & Supplies) | 13,013 | 588,448 | ||||||||
Becton Dickinson and Co. (Health Care Equip. & Supplies) | 4,999 | 847,780 | ||||||||
Boston Scientific Corp. (Health Care Equip. & Supplies) | (a) | 31,968 | 747,092 | |||||||
C.R. Bard, Inc. (Health Care Equip. & Supplies) | 1,728 | 406,356 | ||||||||
Danaher Corp. (Health Care Equip. & Supplies) | 14,106 | 1,424,706 | ||||||||
DENTSPLY SIRONA, Inc. (Health Care Equip. & Supplies) | 5,525 | 342,771 | ||||||||
Edwards Lifesciences Corp. (Health Care Equip. & Supplies) | (a) | 4,989 | 497,553 | |||||||
Hologic, Inc. (Health Care Equip. & Supplies) | (a) | 5,674 | 196,320 | |||||||
Intuitive Surgical, Inc. (Health Care Equip. & Supplies) | (a) | 896 | 592,623 | |||||||
Medtronic PLC (Health Care Equip. & Supplies) | 33,129 | 2,874,603 | ||||||||
St. Jude Medical, Inc. (Health Care Equip. & Supplies) | 6,699 | 522,522 | ||||||||
Stryker Corp. (Health Care Equip. & Supplies) | 7,401 | 886,862 | ||||||||
Varian Medical Systems, Inc. (Health Care Equip. & Supplies) | (a) | 2,228 | 183,208 | |||||||
Zimmer Biomet Holdings, Inc. (Health Care Equip. & Supplies) | 4,694 | 565,064 | ||||||||
Aetna, Inc. (Health Care Providers & Svs.) | 8,258 | 1,008,550 | ||||||||
AmerisourceBergen Corp. (Health Care Providers & Svs.) | 4,330 | 343,456 | ||||||||
Anthem, Inc. (Health Care Providers & Svs.) | 6,194 | 813,520 | ||||||||
Cardinal Health, Inc. (Health Care Providers & Svs.) | 7,673 | 598,571 | ||||||||
Centene Corp. (Health Care Providers & Svs.) | (a) | 4,030 | 287,621 | |||||||
| Common Stocks (Continued) | Shares | Value | ||||||||
HEALTH CARE (continued) | ||||||||||
Cigna Corp. (Health Care Providers & Svs.) | 6,042 | $ | 773,315 | |||||||
DaVita HealthCare Partners, Inc. (Health Care Providers & Svs.) | (a) | 3,856 | 298,146 | |||||||
Express Scripts Holding Co. (Health Care Providers & Svs.) | (a) | 14,906 | 1,129,875 | |||||||
HCA Holdings, Inc. (Health Care Providers & Svs.) | (a) | 7,092 | 546,155 | |||||||
Henry Schein, Inc. (Health Care Providers & Svs.) | (a) | 1,936 | 342,285 | |||||||
Humana, Inc. (Health Care Providers & Svs.) | 3,511 | 631,559 | ||||||||
Laboratory Corp. of America Holdings (Health Care Providers & Svs.) | (a) | 2,419 | 315,123 | |||||||
McKesson Corp. (Health Care Providers & Svs.) | 5,301 | 989,432 | ||||||||
Patterson Cos., Inc. (Health Care Providers & Svs.) | 1,947 | 93,242 | ||||||||
Quest Diagnostics, Inc. (Health Care Providers & Svs.) | 3,348 | 272,561 | ||||||||
UnitedHealth Group, Inc. (Health Care Providers & Svs.) | 22,393 | 3,161,892 | ||||||||
Universal Health Services, Inc. Class B (Health Care Providers & Svs.) | 2,122 | 284,560 | ||||||||
Cerner Corp. (Health Care Technology) | (a) | 7,093 | 415,650 | |||||||
Agilent Technologies, Inc. (Life Sciences Tools & Svs.) | 7,731 | 342,947 | ||||||||
Illumina, Inc. (Life Sciences Tools & Svs.) | (a) | 3,469 | 486,978 | |||||||
PerkinElmer, Inc. (Life Sciences Tools & Svs.) | 2,547 | 133,514 | ||||||||
Thermo Fisher Scientific, Inc. (Life Sciences Tools & Svs.) | 9,271 | 1,369,883 | ||||||||
Waters Corp. (Life Sciences Tools & Svs.) | (a) | 1,895 | 266,532 | |||||||
Allergan PLC (Pharmaceuticals) | (a) | 9,320 | 2,153,759 | |||||||
Bristol-Myers Squibb Co. (Pharmaceuticals) | 39,328 | 2,892,574 | ||||||||
Eli Lilly & Co. (Pharmaceuticals) | 22,886 | 1,802,272 | ||||||||
Endo International PLC (Pharmaceuticals) | (a) | 4,798 | 74,801 | |||||||
Johnson & Johnson (Pharmaceuticals) | 64,803 | 7,860,604 | ||||||||
Mallinckrodt PLC (Pharmaceuticals) | (a) | 2,557 | 155,414 | |||||||
Merck & Co., Inc. (Pharmaceuticals) | 65,215 | 3,757,036 | ||||||||
Mylan NV (Pharmaceuticals) | (a) | 10,063 | 435,124 | |||||||
Perrigo Co. PLC (Pharmaceuticals) | 3,381 | 306,555 | ||||||||
Pfizer, Inc. (Pharmaceuticals) | 142,887 | 5,031,051 | ||||||||
Zoetis, Inc. (Pharmaceuticals) | 10,763 | 510,812 | ||||||||
|
| |||||||||
| 64,399,435 | ||||||||||
|
| |||||||||
INDUSTRIALS – 9.7% | ||||||||||
Boeing Co. / The (Aerospace & Defense) | 14,107 | 1,832,076 | ||||||||
General Dynamics Corp. (Aerospace & Defense) | 6,766 | 942,098 | ||||||||
Honeywell International, Inc. (Aerospace & Defense) | 17,950 | 2,087,944 | ||||||||
L-3 Communications Holdings, Inc. (Aerospace & Defense) | 1,821 | 267,123 | ||||||||
Lockheed Martin Corp. (Aerospace & Defense) | 6,161 | 1,528,975 | ||||||||
Northrop Grumman Corp. (Aerospace & Defense) | 4,247 | 944,023 | ||||||||
Raytheon Co. (Aerospace & Defense) | 6,992 | 950,562 | ||||||||
Rockwell Collins, Inc. (Aerospace & Defense) | 3,080 | 262,231 | ||||||||
Textron, Inc. (Aerospace & Defense) | 6,365 | 232,704 | ||||||||
TransDigm Group, Inc. (Aerospace & Defense) | (a) | 1,250 | 329,613 | |||||||
United Technologies Corp. (Aerospace & Defense) | 18,336 | 1,880,357 | ||||||||
C.H. Robinson Worldwide, Inc. (Air Freight & Logistics) | 3,379 | 250,891 | ||||||||
Expeditors International of Washington, Inc. (Air Freight & Logistics) | 4,258 | 208,812 | ||||||||
FedEx Corp. (Air Freight & Logistics) | 5,883 | 892,922 | ||||||||
United Parcel Service, Inc. Class B (Air Freight & Logistics) | 16,263 | 1,751,850 | ||||||||
Alaska Air Group, Inc. (Airlines) | 2,883 | 168,050 | ||||||||
American Airlines Group, Inc. (Airlines) | 13,640 | 386,148 | ||||||||
Delta Air Lines, Inc. (Airlines) | 18,180 | 662,297 | ||||||||
Southwest Airlines Co. (Airlines) | 15,045 | 589,914 | ||||||||
United Continental Holdings, Inc. (Airlines) | (a) | 7,916 | 324,873 | |||||||
Allegion PLC (Building Products) | 2,240 | 155,523 | ||||||||
Fortune Brands Home & Security, Inc. (Building Products) | 3,611 | 209,330 | ||||||||
Masco Corp. (Building Products) | 7,882 | 243,869 | ||||||||
Cintas Corp. (Commercial Svs. & Supplies) | 2,027 | 198,910 | ||||||||
Pitney Bowes, Inc. (Commercial Svs. & Supplies) | 4,411 | 78,516 | ||||||||
| 53 | (continued) |
| Ohio National Fund, Inc. | S&P 500® Index Portfolio (Continued) |
Schedule of Investments | June 30, 2016 (Unaudited |
| Common Stocks (Continued) | Shares | Value | ||||||||
INDUSTRIALS (continued) | ||||||||||
Republic Services, Inc. (Commercial Svs. & Supplies) | 5,613 | $ | 288,003 | |||||||
Stericycle, Inc. (Commercial Svs. & Supplies) | (a) | 2,015 | 209,802 | |||||||
Tyco International Plc (Commercial Svs. & Supplies) | 10,024 | 427,022 | ||||||||
Waste Management, Inc. (Commercial Svs. & Supplies) | 9,723 | 644,343 | ||||||||
Fluor Corp. (Construction & Engineering) | 3,255 | 160,406 | ||||||||
Jacobs Engineering Group, Inc. (Construction & Engineering) | (a) | 2,854 | 142,158 | |||||||
Quanta Services, Inc. (Construction & Engineering) | (a) | 3,538 | 81,799 | |||||||
Acuity Brands, Inc. (Electrical Equip.) | 1,037 | 257,135 | ||||||||
AMETEK, Inc. (Electrical Equip.) | 5,523 | 255,328 | ||||||||
Eaton Corp. PLC (Electrical Equip.) | 10,791 | 644,546 | ||||||||
Emerson Electric Co. (Electrical Equip.) | 15,156 | 790,537 | ||||||||
Rockwell Automation, Inc. (Electrical Equip.) | 3,071 | 352,612 | ||||||||
3M Co. (Industrial Conglomerates) | 14,287 | 2,501,939 | ||||||||
General Electric Co. (Industrial Conglomerates) | 216,634 | 6,819,638 | ||||||||
Roper Technologies, Inc. (Industrial Conglomerates) | 2,385 | 406,786 | ||||||||
Caterpillar, Inc. (Machinery) | 13,759 | 1,043,070 | ||||||||
Cummins, Inc. (Machinery) | 3,733 | 419,739 | ||||||||
Deere & Co. (Machinery) | 7,035 | 570,116 | ||||||||
Dover Corp. (Machinery) | 3,671 | 254,474 | ||||||||
Flowserve Corp. (Machinery) | 3,049 | 137,723 | ||||||||
Illinois Tool Works, Inc. (Machinery) | 7,611 | 792,762 | ||||||||
Ingersoll-Rand PLC (Machinery) | 6,067 | 386,347 | ||||||||
PACCAR, Inc. (Machinery) | 8,257 | 428,291 | ||||||||
Parker-Hannifin Corp. (Machinery) | 3,178 | 343,383 | ||||||||
Pentair PLC (Machinery) | 4,275 | 249,190 | ||||||||
Snap-on, Inc. (Machinery) | 1,379 | 217,634 | ||||||||
Stanley Black & Decker, Inc. (Machinery) | 3,537 | 393,385 | ||||||||
Xylem, Inc. (Machinery) | 4,184 | 186,816 | ||||||||
Dun & Bradstreet Corp. / The (Professional Svs.) | 848 | 103,320 | ||||||||
Equifax, Inc. (Professional Svs.) | 2,807 | 360,419 | ||||||||
Nielsen Holdings PLC (Professional Svs.) | 8,499 | 441,693 | ||||||||
Robert Half International, Inc. (Professional Svs.) | 3,071 | 117,189 | ||||||||
Verisk Analytics, Inc. (Professional Svs.) | (a) | 3,656 | 296,428 | |||||||
CSX Corp. (Road & Rail) | 22,530 | 587,582 | ||||||||
J.B. Hunt Transport Services, Inc. (Road & Rail) | 2,082 | 168,496 | ||||||||
Kansas City Southern (Road & Rail) | 2,562 | 230,811 | ||||||||
Norfolk Southern Corp. (Road & Rail) | 6,968 | 593,186 | ||||||||
Ryder System, Inc. (Road & Rail) | 1,256 | 76,792 | ||||||||
Union Pacific Corp. (Road & Rail) | 19,815 | 1,728,859 | ||||||||
Fastenal Co. (Trading Companies & Distributors) | 6,824 | 302,917 | ||||||||
United Rentals, Inc. (Trading Companies & Distributors) | (a) | 2,070 | 138,897 | |||||||
W.W. Grainger, Inc. (Trading Companies & Distributors) | 1,332 | 302,697 | ||||||||
|
| |||||||||
| 42,233,881 | ||||||||||
|
| |||||||||
INFORMATION TECHNOLOGY – 19.5% | ||||||||||
Cisco Systems, Inc. (Communications Equip.) | 118,494 | 3,399,593 | ||||||||
F5 Networks, Inc. (Communications Equip.) | (a) | 1,567 | 178,387 | |||||||
Harris Corp. (Communications Equip.) | 2,953 | 246,398 | ||||||||
Juniper Networks, Inc. (Communications Equip.) | 8,262 | 185,812 | ||||||||
Motorola Solutions, Inc. (Communications Equip.) | 3,760 | 248,047 | ||||||||
Amphenol Corp. Class A (Electronic Equip., Instr. & Comp.) | 7,253 | 415,814 | ||||||||
Corning, Inc. (Electronic Equip., Instr. & Comp.) | 25,336 | 518,881 | ||||||||
FLIR Systems, Inc. (Electronic Equip., Instr. & Comp.) | 3,221 | 99,690 | ||||||||
TE Connectivity Ltd. (Electronic Equip., Instr. & Comp.) | 8,426 | 481,209 | ||||||||
Akamai Technologies, Inc. (Internet Software & Svs.) | (a) | 4,162 | 232,781 | |||||||
Alphabet, Inc. Class A (Internet Software & Svs.) | (a) | 6,921 | 4,869,131 | |||||||
Alphabet, Inc. Class C (Internet Software & Svs.) | (a) | 6,956 | 4,814,248 | |||||||
eBay, Inc. (Internet Software & Svs.) | (a) | 24,905 | 583,026 | |||||||
Facebook, Inc. Class A (Internet Software & Svs.) | (a) | 54,465 | 6,224,260 | |||||||
VeriSign, Inc. (Internet Software & Svs.) | (a) | 2,233 | 193,065 | |||||||
Yahoo!, Inc. (Internet Software & Svs.) | (a) | 20,592 | 773,436 | |||||||
Accenture PLC Class A (IT Svs.) | 14,690 | 1,664,230 | ||||||||
Alliance Data Systems Corp. (IT Svs.) | (a) | 1,394 | 273,112 | |||||||
Automatic Data Processing, Inc. (IT Svs.) | 10,727 | 985,489 | ||||||||
| Common Stocks (Continued) | Shares | Value | ||||||||
INFORMATION TECHNOLOGY (continued) | ||||||||||
Cognizant Technology Solutions Corp. Class A (IT Svs.) | (a) | 14,271 | $ | 816,872 | ||||||
CSRA, Inc. (IT Svs.) | 3,203 | 75,046 | ||||||||
Fidelity National Information Services, Inc. (IT Svs.) | 6,536 | 481,572 | ||||||||
Fiserv, Inc. (IT Svs.) | (a) | 5,231 | 568,767 | |||||||
Global Payments, Inc. (IT Svs.) | 3,642 | 259,966 | ||||||||
International Business Machines Corp. (IT Svs.) | 20,806 | 3,157,935 | ||||||||
MasterCard, Inc. Class A (IT Svs.) | 22,863 | 2,013,316 | ||||||||
Paychex, Inc. (IT Svs.) | 7,550 | 449,225 | ||||||||
PayPal Holdings, Inc. (IT Svs.) | (a) | 25,984 | 948,676 | |||||||
Teradata Corp. (IT Svs.) | (a) | 3,041 | 76,238 | |||||||
Total System Services, Inc. (IT Svs.) | 4,008 | 212,865 | ||||||||
Visa, Inc. (IT Svs.) | 44,866 | 3,327,711 | ||||||||
Western Union Co. / The (IT Svs.) | 11,645 | 223,351 | ||||||||
Xerox Corp. (IT Svs.) | 22,577 | 214,256 | ||||||||
Analog Devices, Inc. (Semiconductors & Equip.) | 7,241 | 410,130 | ||||||||
Applied Materials, Inc. (Semiconductors & Equip.) | 25,649 | 614,807 | ||||||||
Broadcom Ltd. (Semiconductors & Equip.) | 8,737 | 1,357,730 | ||||||||
First Solar, Inc. (Semiconductors & Equip.) | (a) | 1,794 | 86,973 | |||||||
Intel Corp. (Semiconductors & Equip.) | 111,225 | 3,648,180 | ||||||||
KLA-Tencor Corp. (Semiconductors & Equip.) | 3,683 | 269,780 | ||||||||
Lam Research Corp. (Semiconductors & Equip.) | 3,769 | 316,822 | ||||||||
Linear Technology Corp. (Semiconductors & Equip.) | 5,656 | 263,174 | ||||||||
Microchip Technology, Inc. (Semiconductors & Equip.) | 5,082 | 257,962 | ||||||||
Micron Technology, Inc. (Semiconductors & Equip.) | (a) | 24,499 | 337,106 | |||||||
NVIDIA Corp. (Semiconductors & Equip.) | 11,945 | 561,534 | ||||||||
Qorvo, Inc. (Semiconductors & Equip.) | (a) | 2,983 | 164,841 | |||||||
QUALCOMM, Inc. (Semiconductors & Equip.) | 34,600 | 1,853,522 | ||||||||
Skyworks Solutions, Inc. (Semiconductors & Equip.) | 4,494 | 284,380 | ||||||||
Texas Instruments, Inc. (Semiconductors & Equip.) | 23,637 | 1,480,858 | ||||||||
Xilinx, Inc. (Semiconductors & Equip.) | 5,999 | 276,734 | ||||||||
Activision Blizzard, Inc. (Software) | 11,994 | 475,322 | ||||||||
Adobe Systems, Inc. (Software) | (a) | 11,777 | 1,128,119 | |||||||
Autodesk, Inc. (Software) | (a) | 5,307 | 287,321 | |||||||
CA, Inc. (Software) | 7,012 | 230,204 | ||||||||
Citrix Systems, Inc. (Software) | (a) | 3,663 | 293,370 | |||||||
Electronic Arts, Inc. (Software) | (a) | 7,105 | 538,275 | |||||||
Intuit, Inc. (Software) | 6,026 | 672,562 | ||||||||
Microsoft Corp. (Software) | 185,180 | 9,475,661 | ||||||||
Oracle Corp. (Software) | 73,319 | 3,000,947 | ||||||||
Red Hat, Inc. (Software) | (a) | 4,281 | 310,801 | |||||||
salesforce.com, Inc. (Software) | (a) | 15,002 | 1,191,309 | |||||||
Symantec Corp. (Software) | 14,468 | 297,173 | ||||||||
Apple, Inc. (Tech. Hardware, Storage & Periph.) | 129,047 | 12,336,893 | ||||||||
EMC Corp. (Tech. Hardware, Storage & Periph.) | 46,026 | 1,250,526 | ||||||||
Hewlett Packard Enterprise Co. (Tech. Hardware, Storage & Periph.) | 39,158 | 715,417 | ||||||||
HP, Inc. (Tech. Hardware, Storage & Periph.) | 40,316 | 505,966 | ||||||||
NetApp, Inc. (Tech. Hardware, Storage & Periph.) | 6,761 | 166,253 | ||||||||
Seagate Technology PLC (Tech. Hardware, Storage & Periph.) | 6,981 | 170,057 | ||||||||
Western Digital Corp. (Tech. Hardware, Storage & Periph.) | 6,646 | 314,090 | ||||||||
|
| |||||||||
| 84,757,204 | ||||||||||
|
| |||||||||
MATERIALS – 2.8% | ||||||||||
Air Products & Chemicals, Inc. (Chemicals) | 4,578 | 650,259 | ||||||||
Albemarle Corp. (Chemicals) | 2,645 | 209,775 | ||||||||
CF Industries Holdings, Inc. (Chemicals) | 5,452 | 131,393 | ||||||||
Dow Chemical Co. / The (Chemicals) | 26,449 | 1,314,780 | ||||||||
Eastman Chemical Co. (Chemicals) | 3,519 | 238,940 | ||||||||
Ecolab, Inc. (Chemicals) | 6,214 | 736,980 | ||||||||
E.I. du Pont de Nemours & Co. (Chemicals) | 20,577 | 1,333,390 | ||||||||
FMC Corp. (Chemicals) | 3,128 | 144,858 | ||||||||
International Flavors & Fragrances, Inc. (Chemicals) | 1,889 | 238,146 | ||||||||
LyondellBasell Industries NV Class A (Chemicals) | 8,041 | 598,411 | ||||||||
Monsanto Co. (Chemicals) | 10,292 | 1,064,296 | ||||||||
Mosaic Co. / The (Chemicals) | 8,294 | 217,137 | ||||||||
PPG Industries, Inc. (Chemicals) | 6,264 | 652,396 | ||||||||
| 54 | (continued) |
| Ohio National Fund, Inc. | S&P 500® Index Portfolio (Continued) |
Schedule of Investments | June 30, 2016 (Unaudited |
| Common Stocks (Continued) | Shares | Value | ||||||||
MATERIALS (continued) | ||||||||||
Praxair, Inc. (Chemicals) | 6,718 | $ | 755,036 | |||||||
Sherwin-Williams Co. / The (Chemicals) | 1,850 | 543,289 | ||||||||
Martin Marietta Materials, Inc. (Construction Materials) | 1,502 | 288,384 | ||||||||
Vulcan Materials Co. (Construction Materials) | 3,141 | 378,051 | ||||||||
Avery Dennison Corp. (Containers & Packaging) | 2,084 | 155,779 | ||||||||
Ball Corp. (Containers & Packaging) | 4,098 | 296,244 | ||||||||
International Paper Co. (Containers & Packaging) | 9,687 | 410,535 | ||||||||
Owens-Illinois, Inc. (Containers & Packaging) | (a) | 3,791 | 68,276 | |||||||
Sealed Air Corp. (Containers & Packaging) | 4,675 | 214,910 | ||||||||
WestRock Co. (Containers & Packaging) | 5,987 | 232,715 | ||||||||
Alcoa, Inc. (Metals & Mining) | 31,066 | 287,982 | ||||||||
Freeport-McMoRan, Inc. (Metals & Mining) | 29,546 | 329,142 | ||||||||
Newmont Mining Corp. (Metals & Mining) | 12,494 | 488,765 | ||||||||
Nucor Corp. (Metals & Mining) | 7,494 | 370,279 | ||||||||
|
| |||||||||
| 12,350,148 | ||||||||||
|
| |||||||||
TELECOMMUNICATION SERVICES – 2.9% | ||||||||||
AT&T, Inc. (Diversified Telecom. Svs.) | 145,026 | 6,266,574 | ||||||||
CenturyLink, Inc. (Diversified Telecom. Svs.) | 12,881 | 373,678 | ||||||||
Frontier Communications Corp. (Diversified Telecom. Svs.) | 27,437 | 135,539 | ||||||||
Level 3 Communications, Inc. (Diversified Telecom. Svs.) | (a) | 6,839 | 352,140 | |||||||
Verizon Communications, Inc. (Diversified Telecom. Svs.) | 96,029 | 5,362,259 | ||||||||
|
| |||||||||
| 12,490,190 | ||||||||||
|
| |||||||||
UTILITIES – 3.6% | ||||||||||
Alliant Energy Corp. (Electric Utilities) | 5,349 | 212,355 | ||||||||
American Electric Power Co., Inc. (Electric Utilities) | 11,569 | 810,871 | ||||||||
Duke Energy Corp. (Electric Utilities) | 16,236 | 1,392,887 | ||||||||
Edison International (Electric Utilities) | 7,675 | 596,117 | ||||||||
Entergy Corp. (Electric Utilities) | 4,221 | 343,378 | ||||||||
Eversource Energy (Electric Utilities) | 7,473 | 447,633 | ||||||||
Exelon Corp. (Electric Utilities) | 21,724 | 789,885 | ||||||||
FirstEnergy Corp. (Electric Utilities) | 10,023 | 349,903 | ||||||||
NextEra Energy, Inc. (Electric Utilities) | 10,866 | 1,416,926 | ||||||||
PG&E Corp. (Electric Utilities) | 11,688 | 747,097 | ||||||||
Pinnacle West Capital Corp. (Electric Utilities) | 2,638 | 213,836 | ||||||||
PPL Corp. (Electric Utilities) | 15,945 | 601,924 | ||||||||
| Common Stocks (Continued) | Shares | Value | ||||||||
UTILITIES (continued) | ||||||||||
Southern Co. / The (Electric Utilities) | 22,108 | $ | 1,185,652 | |||||||
Xcel Energy, Inc. (Electric Utilities) | 11,963 | 535,703 | ||||||||
AGL Resources, Inc. (Gas Utilities) | 2,822 | 186,167 | ||||||||
AES Corp. (Ind. Power & Renewable Elec.) | 15,411 | 192,329 | ||||||||
NRG Energy, Inc. (Ind. Power & Renewable Elec.) | 7,371 | 110,491 | ||||||||
Ameren Corp. (Multi-Utilities) | 5,733 | 307,174 | ||||||||
CenterPoint Energy, Inc. (Multi-Utilities) | 10,072 | 241,728 | ||||||||
CMS Energy Corp. (Multi-Utilities) | 6,598 | 302,584 | ||||||||
Consolidated Edison, Inc. (Multi-Utilities) | 7,168 | 576,594 | ||||||||
Dominion Resources, Inc. (Multi-Utilities) | 14,523 | 1,131,777 | ||||||||
DTE Energy Co. (Multi-Utilities) | 4,231 | 419,377 | ||||||||
NiSource, Inc. (Multi-Utilities) | 7,521 | 199,457 | ||||||||
Public Service Enterprise Group, Inc. (Multi-Utilities) | 11,922 | 555,685 | ||||||||
SCANA Corp. (Multi-Utilities) | 3,384 | 256,034 | ||||||||
Sempra Energy (Multi-Utilities) | 5,587 | 637,030 | ||||||||
TECO Energy, Inc. (Multi-Utilities) | 5,509 | 152,269 | ||||||||
WEC Energy Group, Inc. (Multi-Utilities) | 7,431 | 485,244 | ||||||||
American Water Works Co., Inc. (Water Utilities) | 4,196 | 354,604 | ||||||||
|
| |||||||||
| 15,752,711 | ||||||||||
|
| |||||||||
Total Common Stocks (Cost $290,396,126) | $ | 429,092,759 | ||||||||
|
| |||||||||
| Warrants – 0.0% | Quantity | Value | ||||||||
CONSUMER DISCRETIONARY – 0.0% | ||||||||||
HealthSouth Corp. (Health Care Providers & Svs.) | 46 | $ | 78 | |||||||
|
| |||||||||
Total Warrants (Cost $0) | $ | 78 | ||||||||
|
| |||||||||
| Money Market Funds – 1.2% | Shares | Value | ||||||||
State Street Institutional Liquid Reserves Fund Institutional Class | 468,570 | $ | 468,570 | |||||||
State Street Institutional U.S. Government Money Market Fund Institutional Class | 4,451,189 | 4,451,189 | ||||||||
|
| |||||||||
Total Money Market Funds (Cost $4,919,759) | $ | 4,919,759 | ||||||||
|
| |||||||||
Total Investments – 99.8% (Cost $295,315,885) | (b) | $ | 434,012,596 | |||||||
Other Assets in Excess of Liabilities – 0.2% | (c) | 1,043,452 | ||||||||
|
| |||||||||
Net Assets – 100.0% | $ | 435,056,048 | ||||||||
|
| |||||||||
Percentages are stated as a percent of net assets.
Footnotes:
| (a) | Non-income producing security. |
| (b) | Represents cost for financial reporting purposes, which may differ from cost basis for federal income tax purposes. See also Note 7 of the Notes to Financial Statements. |
| (c) | Includes $457,926 of cash pledged as collateral for the following futures contracts outstanding at June 30, 2016: |
Type | Description | Expiration | Number of Contracts | Contract | Initial Contract Amount | Unrealized Appreciation (Depreciation) | Variation Margin Receivable (Payable) | |||||||||||||||
Long | CME E-mini S&P 500 Contracts (United States) | September 16, 2016 | 53 | $5,539,030 | $ | 5,514,294 | $ | 24,736 | $ | 24,835 | ||||||||||||
|
|
|
|
|
|
| ||||||||||||||||
The accompanying notes are an integral part of these financial statements.
| 55 |
| Ohio National Fund, Inc. | Strategic Value Portfolio |
Objective/Strategy
The Strategic Value Portfolio seeks growth of capital and income by investing primarily in securities of high dividend yielding, undervalued stocks with dividend growth potential.
Performance as of June 30, 2016
Average Annual Returns: | ||||
One year | 21.07% | |||
Five years | 13.07% | |||
Ten years | 6.56% |
Past performance does not guarantee future results. The performance data quoted represents past performance and current returns may be lower or higher. Total return figures include change in share price and reinvestment of dividends and capital gains. The investment return and principal value will fluctuate so that an investor’s shares, when redeemed, may be worth more or less than the original cost. To obtain performance information up to the most recent month end, call toll-free 1-877-781-6392.
The Portfolio is not open to direct retail investment. Beneficial interest in shares is obtained solely by purchase of variable life insurance policies and variable annuity contracts. Actual performance results for variable annuity and variable universal life contracts will be lower due to contract charges. Consult your contract for applicable charges.
Comments
For the six-month period ended June 30, 2016, the Strategic Value Portfolio returned 15.71% versus 15.55% for its benchmark, the Dow Jones U.S. Select Dividend Index (“DJSDI”).
Notwithstanding the heightened volatility surrounding the market over the United Kingdom’s decision to leave the European Union, the upcoming U.S. election, and the Federal Reserve’s future decision on rate hikes, the Portfolio remained focused on its objectives of obtaining a high and rising income stream, and ended the period with a gross weighted average yield of 3.73%. The Portfolio’s yield exceeded that of the broad market, represented by the S&P 500 Index (2.17% yield), the 10-year U.S. Treasury Note (1.49% yield) and the DJSDI (3.37% yield).
The Portfolio experienced robust organic growth, as 16 holdings raised their dividend, which enhanced overall yield. The most notable increases came courtesy of Reynolds American, Inc., General Mills, Inc., and Johnson & Johnson, which raised dividend payments by 16.7%, 9.1%, and 6.7%, respectively. Additionally, GlaxoSmithKline PLC declared a special cash distribution, valued at 20 GBp/share, or approximately $0.58/share, which was paid to shareholders on May 15th. (1)
From an absolute perspective, the Portfolio posted positive returns across all of the sectors that it was invested in, with the highest benchmark-relative contributions derived from stock selections in Financials and sector weightings in Information Technology, Consumer Staples and Telecommunication Services. (1)
The outperformance in Consumer Staples was driven by important exposures to The Kraft Heinz Co., Altria Group, Inc. and Philip Morris International, Inc. The Kraft Heinz Co. continues to outperform, posting a total return of 23.3%, following the completion of its recent merger. Altria Group, Inc. and Philip Morris International, Inc. posted total returns of 20.6% and 18.1%, respectively. Both tobacco investments benefitted from stronger pricing in the tobacco industry. The Portfolio’s total return was further enhanced by significant exposure and strong performance in Telecommunications Services and Utilities, as well as the more modest representation in high-returning Real Estate Investment Trusts (“REITs”), as heightened market
volatility culminated with an unexpected Brexit vote causing a stampede into safe, defensive havens such as high yield and low beta investments. (1)
The Portfolio’s five best performing securities were Digital Realty Trust, Inc. (46.9%), Realty Income Corp. (37.0%), Ventas, Inc. (32.2%), National Retail Properties, Inc. (31.8%) and AT&T, Inc. (28.9%). (1)
While the Portfolio did not post negative returns at the sector level, the lowest contribution to sector returns came from Consumer Discretionary (3.4%) and Health Care (10.7%). McDonalds Corp., the sole Consumer Discretionary holding, gave back modestly on previous gains associated with promotional activity. The weakest performance in Health Care came from Sanofi, a new investment, which posted a rather flat 0.9% return.
From a country perspective, in association with Brexit, the British Pound declined 9.3%, creating some currency headwind for the Portfolio. However, the strategy’s United Kingdom investments are large, defensive, multi-national companies, such as Unilever PLC and GlaxoSmithKline PLC, that derive their revenue streams from around the globe. As a result, the non-U.S. investments also benefitted from the flight to safety, and finished the period with an average positive return of 8.3%. (1)
The Portfolio’s five worst performing securities were Royal Dutch Shell PLC (-13.4%), HCP, Inc. (-3.3%), Vodafone Group PLC (-1.0%), Sanofi (+0.9%) and Kellogg Co. (+2.3%). (1)
On a relative basis, the Portfolio’s highest positive net total return difference came from the Financials sector. Within Financials, the Portfolio’s investments in REITs posted a total return of 31.1%, considerably outperforming the bank, diversified financials, and insurance investments in the DJSDI. The Portfolio further benefited from avoiding Information Technology, which was the benchmark’s worst performing sector for the period. (1)
Areas of relative weakness were Utilities and Energy. The Portfolio’s underperformance in Utilities resulted from both an underweight position and stock selection within the DJSDI’s leading sector performer. The Portfolio’s exposure focuses on regulated utilities, where we have better visibility into the expectations of future dividends and dividend growth, but which returned a more muted 16.2% return in the same period. The Portfolio’s regulated utilities tend to have lower standard deviations, indicating that they typically go down less during periods of declining commodity pricing or periods of market distress but may also go up less during periods of broad market advances. Underperformance in Energy relative to the DJSDI resulted from the Portfolio’s lack of exposure to Oneok, Inc., a midstream energy company that recovered 100.8% after prior steep declines. (1)
The Portfolio has not changed its basic positioning, as it continues to invest in companies that exhibit both the ability and the inclination to pay and increase their dividends. That being said, the holdings of the Portfolio have changed modestly. Notable changes to sector exposures included an 8.0% increase in Health Care, a -6.6% decrease in Consumer Staples, a -2.2% decrease in Consumer Discretionary and a -2.0% decrease in Energy. Health Care increased, a result of adding a new position, Abbvie, Inc. Abbvie, Inc. is committed to returning cash to shareholders through a strong and growing dividend as well as possesses the best selling biologic therapy in the world, Humira. We have also added to existing positions in Merck & Co., Inc. and Sanofi. (1)
Consumer Staples exposure was decreased by trimming some names to lock in gains, such as The Kraft Heinz Co., Reynolds American, Inc., and Altria Group, Inc., which had posted strong
| 56 | (continued) |
| Ohio National Fund, Inc. | Strategic Value Portfolio (Continued) |
performance, putting some modest pressure on the yield. Further, Kellogg Co. was eliminated in the Portfolio, as the stock had advanced roughly 14% on an annualized basis since the Portfolio’s purchase in March 2009. Additionally, a position was started in a name currently held in our international strategy, Diageo PLC, which has a diversified portfolio of leading spirit brands across categories and price points. Diageo PLC is a reliable dividend grower that has increased its dividend every year since its formation in 1997. (1)
Consumer Discretionary was reduced, as the sector’s sole holding, McDonalds Corp., was trimmed to lock in gains due to the stock’s strong performance. Proceeds were distributed across yield accretive holdings. (1)
Lastly, Energy exposure was reduced, as Royal Dutch Shell PLC was eliminated from the Portfolio during the period on concerns that its acquisition of BG PLC could impede its ability to continue to pay a rising dividend. BP PLC was also trimmed to take advantage of the rally in oil prices that occurred in February. (1)
Looking forward, we believe policy uncertainty will continue to weigh on business confidence and spending, not just because of Brexit, but also because of a presidential campaign between two polarizing candidates with high unfavorable ratings, Democrat Hillary Clinton and Republican Donald Trump, that’s set to shift into high gear with this summer’s nominating party conventions. On the plus side, the futures markets now think the combination of uncertainty, a slowing labor market, and Brexit will keep the Federal Reserve at bay through the end of the year and into 2017, likely continuing a low-rate/low-yield environment that’s generally favorable for stocks.
| (1) | The Portfolio’s composition is subject to change. Holdings and weightings are as of June 30, 2016. |
Change in Value of $10,000 Investment
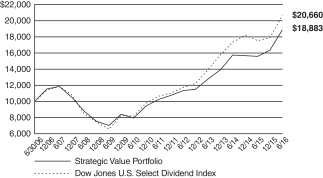
Hypothetical illustration based on past performance. Future performance will vary. The Portfolio’s returns reflect reinvested dividends. The Portfolio’s holdings may differ significantly from the securities in the index. The index is unmanaged and therefore does not reflect the cost of portfolio management and accounting.
The Dow Jones U.S. Select Dividend Index is comprised of all dividend-paying companies in the Dow Jones U.S. Index that have a non-negative historical five-year dividend-per-share growth rate, a five-year average dividend to earnings-per-share ratio of less than or equal to 60%, paid dividends in each of the previous five years, and a three-month average daily trading volume of 200,000 shares. Current index components are included in the universe regardless of their dividend payout ratio or trading volume. The Dow Jones U.S. Index aims to consistently represent the top 95% of U.S. companies based on float-adjusted market capitalization, excluding non common issues and illiquid stocks. The index presented includes the effects of reinvested dividends.
Portfolio Composition as of June 30, 2016 (1)
| % of Net Assets | ||||
Common Stocks (4) | 98.0 | |||
Money Market Funds | 2.0 | |||
|
| |||
| 100.0 | ||||
|
|
Top 10 Portfolio Holdings as of June 30, 2016 (1) (2) (3)
| % of Net Assets | ||||
1. Verizon Communications, Inc. | 4.8 | |||
2. AT&T, Inc. | 4.7 | |||
3. Philip Morris International, Inc. | 4.4 | |||
4. GlaxoSmithKline PLC | 4.1 | |||
5. Merck & Co., Inc. | 4.1 | |||
6. Vodafone Group PLC – ADR | 4.1 | |||
7. Duke Energy Corp. | 4.0 | |||
8. National Grid PLC | 4.0 | |||
9. Altria Group, Inc. | 4.0 | |||
10. Southern Co. / The | 3.7 |
| (1) | Composition of Portfolio subject to change. |
| (2) | Short-term investments have been excluded from the list of Top 10 Portfolio Holdings. |
| (3) | Top 10 Portfolio Holdings is presented at an individual security level. Total investment exposure by issuer may be higher. |
| (4) | Sectors (Common Stocks): |
| % of Net Assets | ||||
Consumer Staples | 27.1 | |||
Utilities | 17.6 | |||
Health Care | 17.3 | |||
Telecommunication Services | 16.8 | |||
Energy | 8.6 | |||
Financials | 8.0 | |||
Consumer Discretionary | 2.6 | |||
|
| |||
| 98.0 | ||||
|
|
| 57 |
| Ohio National Fund, Inc. | Strategic Value Portfolio |
Schedule of Investments | June 30, 2016 (Unaudited) |
| Common Stocks – 98.0% | Shares | Value | ||||||||
CONSUMER DISCRETIONARY – 2.6% | ||||||||||
McDonald’s Corp. (Hotels, Restaurants & Leisure) | 76,145 | $ | 9,163,289 | |||||||
|
| |||||||||
CONSUMER STAPLES – 27.1% | ||||||||||
Coca-Cola Co. / The (Beverages) | 83,450 | 3,782,789 | ||||||||
Diageo PLC (Beverages) | (a) | 156,000 | 4,357,962 | |||||||
PepsiCo, Inc. (Beverages) | 36,700 | 3,887,998 | ||||||||
General Mills, Inc. (Food Products) | 85,100 | 6,069,332 | ||||||||
Kraft Heinz Co. / The (Food Products) | 97,930 | 8,664,846 | ||||||||
Kimberly-Clark Corp. (Household Products) | 53,475 | 7,351,743 | ||||||||
Procter & Gamble Co. / The (Household Products) | 140,350 | 11,883,435 | ||||||||
Unilever PLC (Personal Products) | (a) | 158,600 | 7,599,341 | |||||||
Altria Group, Inc. (Tobacco) | 198,195 | 13,667,527 | ||||||||
Philip Morris International, Inc. (Tobacco) | 147,045 | 14,957,417 | ||||||||
Reynolds American, Inc. (Tobacco) | 199,340 | 10,750,406 | ||||||||
|
| |||||||||
| 92,972,796 | ||||||||||
|
| |||||||||
ENERGY – 8.6% | ||||||||||
BP PLC (Oil, Gas & Consumable Fuels) | (a) | 1,281,300 | 7,500,105 | |||||||
Chevron Corp. (Oil, Gas & Consumable Fuels) | 110,980 | 11,634,033 | ||||||||
Exxon Mobil Corp. (Oil, Gas & Consumable Fuels) | 110,000 | 10,311,400 | ||||||||
|
| |||||||||
| 29,445,538 | ||||||||||
|
| |||||||||
FINANCIALS – 8.0% | ||||||||||
Crown Castle International Corp. (Real Estate Investment Trusts) | 55,500 | 5,629,365 | ||||||||
Digital Realty Trust, Inc. (Real Estate Investment Trusts) | 36,900 | 4,021,731 | ||||||||
National Retail Properties, Inc. (Real Estate Investment Trusts) | 83,000 | 4,292,760 | ||||||||
Realty Income Corp. (Real Estate Investment Trusts) | 52,800 | 3,662,208 | ||||||||
Ventas, Inc. (Real Estate Investment Trusts) | 74,530 | 5,427,275 | ||||||||
Welltower, Inc. (Real Estate Investment Trusts) | 56,800 | 4,326,456 | ||||||||
|
| |||||||||
| 27,359,795 | ||||||||||
|
| |||||||||
HEALTH CARE – 17.3% | ||||||||||
AbbVie, Inc. (Biotechnology) | 200,000 | 12,382,000 | ||||||||
GlaxoSmithKline PLC (Pharmaceuticals) | (a) | 659,156 | 14,155,365 | |||||||
Johnson & Johnson (Pharmaceuticals) | 51,860 | 6,290,618 | ||||||||
Merck & Co., Inc. (Pharmaceuticals) | 244,300 | 14,074,123 | ||||||||
| Common Stocks (Continued) | Shares | Value | ||||||||
HEALTH CARE (continued) | ||||||||||
Sanofi (Pharmaceuticals) | (a) | 149,036 | $ | 12,382,310 | ||||||
|
| |||||||||
| 59,284,416 | ||||||||||
|
| |||||||||
TELECOMMUNICATION SERVICES – 16.8% | ||||||||||
AT&T, Inc. (Diversified Telecom. Svs.) | 373,223 | 16,126,966 | ||||||||
BCE, Inc. (Diversified Telecom. Svs.) | 233,780 | 11,063,361 | ||||||||
Verizon Communications, Inc. (Diversified Telecom. Svs.) | 294,101 | 16,422,600 | ||||||||
Vodafone Group PLC – ADR (Wireless Telecom. Svs.) | 455,393 | 14,067,089 | ||||||||
|
| |||||||||
| 57,680,016 | ||||||||||
|
| |||||||||
UTILITIES – 17.6% | ||||||||||
American Electric Power Co., Inc. (Electric Utilities) | 50,600 | 3,546,554 | ||||||||
Duke Energy Corp. (Electric Utilities) | 159,906 | 13,718,336 | ||||||||
PPL Corp. (Electric Utilities) | 221,900 | 8,376,725 | ||||||||
Southern Co. / The (Electric Utilities) | 234,860 | 12,595,542 | ||||||||
Consolidated Edison, Inc. (Multi-Utilities) | 47,000 | 3,780,680 | ||||||||
Dominion Resources, Inc. (Multi-Utilities) | 61,225 | 4,771,264 | ||||||||
National Grid PLC (Multi-Utilities) | (a) | 929,800 | 13,673,008 | |||||||
|
| |||||||||
| 60,462,109 | ||||||||||
|
| |||||||||
Total Common Stocks (Cost $281,684,527) | $ | 336,367,959 | ||||||||
|
| |||||||||
| Money Market Funds – 2.3% | Shares | Value | ||||||||
State Street Institutional Liquid Reserves Fund Institutional Class | 2,841,794 | $ | 2,841,794 | |||||||
State Street Institutional U.S. Government Money Market Fund Institutional Class | 5,131,436 | 5,131,436 | ||||||||
|
| |||||||||
Total Money Market Funds (Cost $7,973,230) | $ | 7,973,230 | ||||||||
|
| |||||||||
Total Investments – 100.3% (Cost $289,657,757) | (b) | $ | 344,341,189 | |||||||
Liabilities in Excess of Other Assets – (0.3)% | (1,197,516) | |||||||||
|
| |||||||||
Net Assets – 100.0% | $ | 343,143,673 | ||||||||
|
| |||||||||
Percentages are stated as a percent of net assets.
Abbreviations:
ADR: American Depositary Receipts
Footnotes:
| (a) | Security traded on a foreign exchange has been valued at an estimate of fair value that is different than the local market close price. These fair value estimates are determined by an independent fair valuation service that has been approved by the Board. These securities represent $59,668,091, or 17.4% of the Portfolio’s net assets. Other Portfolio securities are not subjected to fair value procedures because they are traded on domestic or foreign exchanges that have close times that are consistent with the U.S. market close, normally 4:00 pm Eastern Time. |
| (b) | Represents cost for financial reporting purposes, which may differ from cost basis for federal income tax purposes. See also Note 7 of the Notes to Financial Statements. |
The accompanying notes are an integral part of these financial statements.
| 58 |
| Ohio National Fund, Inc. | High Income Bond Portfolio |
Objective/Strategy
The High Income Bond Portfolio seeks high current income by investing at least 80% of its net assets in lower rated corporate debt obligations commonly referred to as “junk bonds”. The Portfolio’s investments are generally rated Ba or lower by Moody’s, or BB or lower by Standard & Poor’s or Fitch.
Performance as of June 30, 2016
Average Annual Returns: | ||||
One year | 2.22% | |||
Five years | 5.86% | |||
Ten years | 6.98% |
Past performance does not guarantee future results. The performance data quoted represents past performance and current returns may be lower or higher. Total return figures include change in share price and reinvestment of dividends and capital gains. The investment return and principal value will fluctuate so that an investor’s shares, when redeemed, may be worth more or less than the original cost. To obtain performance information up to the most recent month end, call toll-free 1-877-781-6392.
The Portfolio is not open to direct retail investment. Beneficial interest in shares is obtained solely by purchase of variable life insurance policies and variable annuity contracts. Actual performance results for variable annuity and variable universal life contracts will be lower due to contract charges. Consult your contract for applicable charges.
Comments
For the six-month period ended June 30, 2016, the High Income Bond Portfolio returned 7.90% versus 9.06% for its benchmark, the Barclays Capital U.S. Corporate High Yield 2% Issuer Capped Index (“BCHY2%ICI”).
The high yield market generated attractive relative and absolute returns during the six-month reporting period. For comparison, the Barclays U.S. Aggregate Index, a measure of high quality bond performance, returned 5.31% versus 9.06% for the BHY2%ICI. The main factor driving performance during the period was the rebound in commodity prices and, along with it, the performance of commodity sectors within the BHY2%ICI. While these sectors underperformed (along with falling commodity prices) in the first six weeks of 2016, a major reversal began in mid-February and continued through the end of the period. For example, the metals sector had a total return for the period of 29.70%, the independent energy sector returned 25.70% and the oil field services sector returned 18.53%. The strong performance of these three commodity-based sectors set a positive tone for the overall market and helping pull the overall market higher. A substantial move lower in the yield on U.S. Treasury securities also provided a positive backdrop for the high yield market. On the economic front, the U.S. economy continues its slow but steady advance, contributing to stable credit quality away from the commodity sectors. The market’s strength is illustrated by the narrowing of yield spreads between the Credit Suisse High Yield Bond Index and U.S. Treasury securities with comparable maturities, which began the period at 753 basis points and ended the period at 674 basis points.
Within the high-yield market, major industry sectors that substantially outperformed the overall BHY2%ICI included: metals, independent energy, oil field services, midstream and industrial other. Major industry sectors that substantially underperformed the overall BHY2%ICI included: pharmaceuticals, financial institutions, cable satellite, transportation and home construction. From a ratings quality perspective, the CCC-rated sector generated the best returns
at 16.03% given the “risk on” environment, while the BB and B-rated sector returned 7.60% and 7.41%, respectively.
The Portfolio’s relative underperformance was driven by its underweight to the strong performing metals, independent energy, oil field services sectors. The Portfolio was also negatively impacted by its overweight to the underperforming media entertainment sector. The Portfolio was positively impacted by its underweight to the underperforming financial institutions and home construction sectors as well as its overweight to the strong performing midstream (oil) sector. (1)
The Portfolio benefitted from particularly strong security selection in the healthcare and technology sectors, which was somewhat offset by negative security selection in the industrial-other sector. Specific holdings that substantially outperformed the BHY2%ICI included: Chesapeake Energy Corp., Legacy Reserves LP/Legacy Reserves Finance Corp., Approach Resources, Inc., California Resources Corp. and Jo-Ann Stores Holdings, Inc. Specific holdings that substantially underperformed the BHY2%ICI included: Intelsat Luxembourg SA, W & T Offshore, Inc., Endo Finance LLC/Endo Ltd./Endo Finco, Inc., Valeant Pharmaceuticals International, Inc. and UCI International, Inc. (1)
Despite strong returns to date in 2016, the high yield market appears attractive based on a number of factors. Yield spreads remain well above their long term medians, credit conditions are stable and, perhaps, the worst is over in the commodity sectors. Economic conditions, while not booming, are also stable with a strong U.S. consumer leading the way. Certainly, risks exist including Brexit, a reversal in recent commodity price increases, uncharted negative interest rate regimes throughout the world and what promises to be an interesting U.S. election season. However, the high yield market tends to correlate with the U.S. economy and, for now, slow and steady seems to be winning the race.
| (1) | The Portfolio’s composition is subject to change. Holdings and weightings are as of June 30, 2016. |
Change in Value of $10,000 Investment
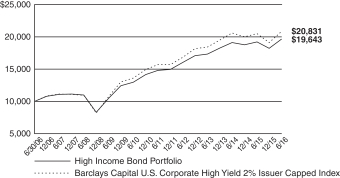
Hypothetical illustration based on past performance. Future performance will vary. All returns reflect reinvested dividends. The Portfolio’s holdings may differ significantly from the securities in the index. The index is unmanaged and therefore does not reflect the cost of Portfolio management or trading. Neither the Portfolio nor the index is open to direct investment.
The Barclays Capital U.S. Corporate High Yield 2% Issuer Capped Index is the 2% Issuer Cap component of the Barclays Capital U.S. Corporate High Yield Bond Index. The Barclays Capital U.S. Corporate High Yield Bond Index is an unmanaged index that includes all fixed income securities having a maximum quality rating of Ba1/BB+/BB+, a minimum amount outstanding of $150 million, and a least 1 year to maturity. The 2% Issuer Cap component limits the exposure of each issuer to 2% of the total market value and distributes any excess market value index–wide on a pro–rata basis. The index is presented on a total return basis.
| 59 | (continued) |
| Ohio National Fund, Inc. | High Income Bond Portfolio (Continued) |
Portfolio Composition as of June 30, 2016 (1)
| % of Net Assets | ||||
Corporate Bonds (4) | 96.7 | |||
Money Market Funds and | 3.3 | |||
|
| |||
| 100.0 | ||||
|
|
Top 10 Portfolio Holdings as of June 30, 2016 (1) (2) (3)
| % of Net Assets | ||||
1. HCA, Inc. | 1.1 | |||
2. First Data Corp. | 1.0 | |||
3. Infor Software Parent LLC / Infor Software Parent, Inc. | 0.8 | |||
4. International Lease Finance Corp. 5.875%, 08/15/2022 | 0.8 | |||
5. DISH DBS Corp. | 0.8 | |||
6. Crimson Merger Sub., Inc. | 0.8 | |||
7. Jaguar Holding Co. II / Pharmaceutical Product Development LLC | 0.7 | |||
8. Berry Plastics Corp. | 0.7 | |||
9. CCO Holdings LLC / CCO Holdings Capital Corp. | 0.7 | |||
10. Nielsen Finance LLC / Nielsen Finance Co. | 0.6 |
| (1) | Composition of Portfolio subject to change. |
| (2) | Short-term investments have been excluded from the list of Top 10 Portfolio Holdings. |
| (3) | Top 10 Portfolio Holdings is presented at an individual security level. Total investment exposure by issuer may be higher. |
| (4) | Sectors (Corporate Bonds): |
| % of Net Assets | ||||
Consumer Discretionary | 27.0 | |||
Health Care | 13.3 | |||
Information Technology | 11.1 | |||
Materials | 10.4 | |||
Energy | 10.2 | |||
Industrials | 9.8 | |||
Telecommunication Services | 5.7 | |||
Utilities | 3.2 | |||
Financials | 3.1 | |||
Consumer Staples | 2.9 | |||
|
| |||
| 96.7 | ||||
|
|
| 60 |
| Ohio National Fund, Inc. | High Income Bond Portfolio |
Schedule of Investments | June 30, 2016 (Unaudited) |
| Corporate Bonds – 96.7% | Rate | Maturity | Face Amount | Value | ||||||||||||
CONSUMER DISCRETIONARY – 27.0% | ||||||||||||||||
American Axle & Manufacturing, Inc. (Auto Components) | 6.625% | 10/15/2022 | $ | 625,000 | $ | 668,750 | ||||||||||
American Axle & Manufacturing, Inc. (Auto Components) | 6.250% | 03/15/2021 | 400,000 | 415,000 | ||||||||||||
Dana Financing Luxembourg Sarl (Auto Components) | (b) | 6.500% | 06/01/2026 | 425,000 | 413,844 | |||||||||||
Gates Global LLC / Gates Global Co. (Auto Components) | (b) | 6.000% | 07/15/2022 | 925,000 | 809,375 | |||||||||||
Goodyear Tire & Rubber Co. / The (Auto Components) | 5.125% | 11/15/2023 | 300,000 | 309,750 | ||||||||||||
Goodyear Tire & Rubber Co. / The (Auto Components) | 5.000% | 05/31/2026 | 250,000 | 254,687 | ||||||||||||
International Automotive Components Group SL (Auto Components) | (b) | 9.125% | 06/01/2018 | 550,000 | 550,000 | |||||||||||
J.B. Poindexter & Co., Inc. (Auto Components) | (b) | 9.000% | 04/01/2022 | 725,000 | 754,000 | |||||||||||
Lear Corp. (Auto Components) | 4.750% | 01/15/2023 | 350,000 | 359,625 | ||||||||||||
Lear Corp. (Auto Components) | 5.375% | 03/15/2024 | 225,000 | 236,812 | ||||||||||||
Lear Corp. (Auto Components) | 5.250% | 01/15/2025 | 100,000 | 104,875 | ||||||||||||
MPG Holdco I, Inc. (Auto Components) | 7.375% | 10/15/2022 | 625,000 | 615,625 | ||||||||||||
Omega U.S. Sub, LLC (Auto Components) | (b) | 8.750% | 07/15/2023 | 325,000 | 318,500 | |||||||||||
Tenneco, Inc. (Auto Components) | 5.000% | 07/15/2026 | 100,000 | 101,437 | ||||||||||||
ZF North America Capital, Inc. (Auto Components) | (b) | 4.750% | 04/29/2025 | 325,000 | 329,264 | |||||||||||
ServiceMaster Co. LLC / The (Diversified Consumer Svs.) | 7.450% | 08/15/2027 | 300,000 | 308,250 | ||||||||||||
ServiceMaster Co. LLC / The (Diversified Consumer Svs.) | 7.100% | 03/01/2018 | 450,000 | 465,750 | ||||||||||||
1011778 B.C. ULC / New Red Finance, Inc. (Hotels, Restaurants & Leisure) | (b) | 6.000% | 04/01/2022 | 1,175,000 | 1,218,698 | |||||||||||
1011778 B.C. ULC / New Red Finance, Inc. (Hotels, Restaurants & Leisure) | (b) | 4.625% | 01/15/2022 | 275,000 | 279,125 | |||||||||||
Affinity Gaming LLC / Affinity Gaming Finance Corp. (Hotels, Restaurants & Leisure) | 9.000% | 05/15/2018 | 250,000 | 255,625 | ||||||||||||
Aramark Services, Inc. (Hotels, Restaurants & Leisure) | 5.125% | 01/15/2024 | 350,000 | 357,000 | ||||||||||||
Aramark Services, Inc. (Hotels, Restaurants & Leisure) | (b) | 5.125% | 01/15/2024 | 200,000 | 204,000 | |||||||||||
Boyd Gaming Corp. (Hotels, Restaurants & Leisure) | 6.875% | 05/15/2023 | 525,000 | 559,125 | ||||||||||||
Boyd Gaming Corp. (Hotels, Restaurants & Leisure) | (b) | 6.375% | 04/01/2026 | 100,000 | 104,500 | |||||||||||
Cedar Fair LP / Canada’s Wonderland Co. / Magnum Management Corp. (Hotels, Restaurants & Leisure) | 5.375% | 06/01/2024 | 375,000 | 386,250 | ||||||||||||
Chester Downs & Marina LLC (Hotels, Restaurants & Leisure) | (b) | 9.250% | 02/01/2020 | 450,000 | 397,125 | |||||||||||
GLP Capital LP / GLP Financing II, Inc. (Hotels, Restaurants & Leisure) | 5.375% | 11/01/2023 | 375,000 | 391,406 | ||||||||||||
GLP Capital LP / GLP Financing II, Inc. (Hotels, Restaurants & Leisure) | 5.375% | 04/15/2026 | 125,000 | 129,375 | ||||||||||||
KFC Holding Co. / Pizza Hut Holdings LLC / Taco Bell of America LLC (Hotels, Restaurants & Leisure) | (b) | 5.000% | 06/01/2024 | 150,000 | 153,750 | |||||||||||
KFC Holding Co. / Pizza Hut Holdings LLC / Taco Bell of America LLC (Hotels, Restaurants & Leisure) | (b) | 5.250% | 06/01/2026 | 300,000 | 307,500 | |||||||||||
MGM Growth Properties Operating Partnership LP / MGP Escrow Co-Issuer, Inc. (Hotels, Restaurants & Leisure) | (b) | 5.625% | 05/01/2024 | 50,000 | 52,875 | |||||||||||
MGM Resorts International (Hotels, Restaurants & Leisure) | 7.750% | 03/15/2022 | 1,125,000 | 1,271,250 | ||||||||||||
MGM Resorts International (Hotels, Restaurants & Leisure) | 6.750% | 10/01/2020 | 250,000 | 273,125 | ||||||||||||
Mohegan Tribal Gaming Authority (Hotels, Restaurants & Leisure) | 9.750% | 09/01/2021 | 525,000 | 559,125 | ||||||||||||
NPC International, Inc. / NPC Operating Co. A, Inc. / NPC Operating Co. B, Inc. (Hotels, Restaurants & Leisure) | 10.500% | 01/15/2020 | 450,000 | 473,625 | ||||||||||||
Penn National Gaming, Inc. (Hotels, Restaurants & Leisure) | 5.875% | 11/01/2021 | 1,075,000 | 1,093,812 | ||||||||||||
Pinnacle Entertainment, Inc. (Hotels, Restaurants & Leisure) | (b) | 5.625% | 05/01/2024 | 300,000 | 299,250 | |||||||||||
Rivers Pittsburgh Borrower LP / Rivers Pittsburgh Finance Corp. (Hotels, Restaurants & Leisure) | (b) | 9.500% | 06/15/2019 | 473,000 | 484,825 | |||||||||||
Seminole Hard Rock Entertainment, Inc. / Seminole Hard Rock International LLC (Hotels, Restaurants & Leisure) | (b) | 5.875% | 05/15/2021 | 1,225,000 | 1,228,062 | |||||||||||
Seminole Indian Tribe of Florida (Hotels, Restaurants & Leisure) | (b) | 7.804% | 10/01/2020 | 630,000 | 620,550 | |||||||||||
Station Casinos LLC (Hotels, Restaurants & Leisure) | 7.500% | 03/01/2021 | 625,000 | 661,719 | ||||||||||||
Yum! Brands, Inc. (Hotels, Restaurants & Leisure) | 3.875% | 11/01/2023 | 325,000 | 306,719 | ||||||||||||
RSI Home Products, Inc. (Household Durables) | (b) | 6.500% | 03/15/2023 | 775,000 | 796,312 | |||||||||||
Serta Simmons Holdings LLC (Household Durables) | (b) | 8.125% | 10/01/2020 | 1,175,000 | 1,201,437 | |||||||||||
Tempur Sealy International, Inc. (Household Durables) | (b) | 5.500% | 06/15/2026 | 150,000 | 147,375 | |||||||||||
FGI Operating Co. LLC / FGI Finance, Inc. (Leisure Products) | 7.875% | 05/01/2020 | 800,000 | 580,000 | ||||||||||||
Vista Outdoor, Inc. (Leisure Products) | (b) | 5.875% | 10/01/2023 | 275,000 | 286,687 | |||||||||||
Acosta, Inc. (Media) | (b) | 7.750% | 10/01/2022 | 1,325,000 | 1,162,687 | |||||||||||
Altice Financing SA (Media) | (b) | 6.625% | 02/15/2023 | 100,000 | 98,187 | |||||||||||
Altice SA (Media) | (b) | 7.750% | 05/15/2022 | 975,000 | 984,750 | |||||||||||
Altice SA (Media) | (b) | 7.625% | 02/15/2025 | 250,000 | 244,063 | |||||||||||
Altice U.S. Finance I Corp. (Media) | (b) | 5.375% | 07/15/2023 | 375,000 | 376,406 | |||||||||||
Altice U.S. Finance II Corp. (Media) | (b) | 7.750% | 07/15/2025 | 325,000 | 338,812 | |||||||||||
AMC Networks, Inc. (Media) | 5.000% | 04/01/2024 | 375,000 | 371,203 | ||||||||||||
CCO Holdings LLC / CCO Holdings Capital Corp. (Media) | 6.625% | 01/31/2022 | 400,000 | 422,000 | ||||||||||||
CCO Holdings LLC / CCO Holdings Capital Corp. (Media) | 5.125% | 02/15/2023 | 150,000 | 151,875 | ||||||||||||
CCO Holdings LLC / CCO Holdings Capital Corp. (Media) | 5.750% | 09/01/2023 | 325,000 | 334,750 | ||||||||||||
CCO Holdings LLC / CCO Holdings Capital Corp. (Media) | 5.750% | 01/15/2024 | 1,275,000 | 1,341,810 | ||||||||||||
CCO Holdings LLC / CCO Holdings Capital Corp. (Media) | (b) | 5.375% | 05/01/2025 | 175,000 | 177,625 | |||||||||||
CCO Holdings LLC / CCO Holdings Capital Corp. (Media) | (b) | 5.875% | 05/01/2027 | 150,000 | 154,875 | |||||||||||
Cequel Communications Holdings I LLC / Cequel Capital Corp. (Media) | (b) | 5.125% | 12/15/2021 | 750,000 | 714,375 | |||||||||||
Cequel Communications Holdings I LLC / Cequel Capital Corp. (Media) | (b) | 5.125% | 12/15/2021 | 100,000 | 95,000 | |||||||||||
| 61 | (continued) |
| Ohio National Fund, Inc. | High Income Bond Portfolio (Continued) |
Schedule of Investments | June 30, 2016 (Unaudited) |
| Corporate Bonds (Continued) | Rate | Maturity | Face Amount | Value | ||||||||||||
CONSUMER DISCRETIONARY (continued) | ||||||||||||||||
Clear Channel International BV (Media) | (b) | 8.750% | 12/15/2020 | $ | 50,000 | $ | 52,000 | |||||||||
Clear Channel Worldwide Holdings, Inc. (Media) | 6.500% | 11/15/2022 | 275,000 | 264,687 | ||||||||||||
Clear Channel Worldwide Holdings, Inc. (Media) | 6.500% | 11/15/2022 | 825,000 | 825,000 | ||||||||||||
Cumulus Media Holdings, Inc. (Media) | 7.750% | 05/01/2019 | 275,000 | 112,750 | ||||||||||||
DISH DBS Corp. (Media) | 5.875% | 07/15/2022 | 1,525,000 | 1,483,062 | ||||||||||||
DISH DBS Corp. (Media) | (b) | 7.750% | 07/01/2026 | 50,000 | 51,625 | |||||||||||
EMI Music Publishing Group North America Holdings, Inc. (Media) | (b) | 7.625% | 06/15/2024 | 275,000 | 282,562 | |||||||||||
Entercom Radio LLC (Media) | 10.500% | 12/01/2019 | 500,000 | 527,500 | ||||||||||||
Expo Event Transco, Inc. (Media) | (b) | 9.000% | 06/15/2021 | 800,000 | 807,000 | |||||||||||
Gannett Co., Inc. (Media) | (b) | 5.500% | 09/15/2024 | 75,000 | 77,250 | |||||||||||
Gray Television, Inc. (Media) | 7.500% | 10/01/2020 | 700,000 | 729,750 | ||||||||||||
Gray Television, Inc. (Media) | (b) | 5.875% | 07/15/2026 | 225,000 | 226,687 | |||||||||||
iHeartCommunications, Inc. (Media) | 9.000% | 03/01/2021 | 700,000 | 493,500 | ||||||||||||
Intelsat Jackson Holdings SA (Media) | 7.500% | 04/01/2021 | 375,000 | 258,750 | ||||||||||||
Intelsat Jackson Holdings SA (Media) | 6.625% | 12/15/2022 | 825,000 | 556,875 | ||||||||||||
Intelsat Jackson Holdings SA (Media) | 5.500% | 08/01/2023 | 550,000 | 347,875 | ||||||||||||
Intelsat Jackson Holdings SA (Media) | (b) | 8.000% | 02/15/2024 | 300,000 | 295,500 | |||||||||||
Intelsat Luxembourg SA (Media) | 7.750% | 06/01/2021 | 325,000 | 79,625 | ||||||||||||
Intelsat Luxembourg SA (Media) | 8.125% | 06/01/2023 | 750,000 | 185,625 | ||||||||||||
Lamar Media Corp. (Media) | 5.000% | 05/01/2023 | 450,000 | 463,500 | ||||||||||||
Lamar Media Corp. (Media) | 5.375% | 01/15/2024 | 275,000 | 286,687 | ||||||||||||
LIN Television Corp. (Media) | 5.875% | 11/15/2022 | 350,000 | 351,750 | ||||||||||||
Lynx II Corp. (Media) | (b) | 6.375% | 04/15/2023 | 475,000 | 475,000 | |||||||||||
McGraw-Hill Global Education Holdings LLC / McGraw-Hill Global Education Finance (Media) | (b) | 7.875% | 05/15/2024 | 200,000 | 207,000 | |||||||||||
Nexstar Broadcasting, Inc. (Media) | (b) | 6.125% | 02/15/2022 | 475,000 | 479,750 | |||||||||||
Nielsen Finance LLC / Nielsen Finance Co. (Media) | (b) | 5.000% | 04/15/2022 | 1,250,000 | 1,275,000 | |||||||||||
Outfront Media Capital LLC / Outfront Media Capital Corp. (Media) | 5.250% | 02/15/2022 | 300,000 | 304,500 | ||||||||||||
Outfront Media Capital LLC / Outfront Media Capital Corp. (Media) | 5.625% | 02/15/2024 | 300,000 | 309,000 | ||||||||||||
Radio One, Inc. (Media) | (b) | 9.250% | 02/15/2020 | 650,000 | 575,250 | |||||||||||
Radio One, Inc. (Media) | (b) | 7.375% | 04/15/2022 | 425,000 | 405,875 | |||||||||||
Regal Entertainment Group (Media) | 5.750% | 02/01/2025 | 550,000 | 541,750 | ||||||||||||
Regal Entertainment Group (Media) | 5.750% | 03/15/2022 | 100,000 | 102,500 | ||||||||||||
Sinclair Television Group, Inc. (Media) | (b) | 5.625% | 08/01/2024 | 875,000 | 894,687 | |||||||||||
Sinclair Television Group, Inc. (Media) | (b) | 5.875% | 03/15/2026 | 50,000 | 51,000 | |||||||||||
Sirius XM Radio, Inc. (Media) | (b) | 4.625% | 05/15/2023 | 1,175,000 | 1,139,844 | |||||||||||
Sirius XM Radio, Inc. (Media) | (b) | 6.000% | 07/15/2024 | 275,000 | 284,281 | |||||||||||
Sirius XM Radio, Inc. (Media) | (b) | 5.375% | 04/15/2025 | 150,000 | 149,344 | |||||||||||
Sirius XM Radio, Inc. (Media) | (b) | 5.375% | 07/15/2026 | 100,000 | 98,500 | |||||||||||
TEGNA, Inc. (Media) | 6.375% | 10/15/2023 | 700,000 | 743,750 | ||||||||||||
Townsquare Media, Inc. (Media) | (b) | 6.500% | 04/01/2023 | 500,000 | 494,375 | |||||||||||
Tribune Media Co. (Media) | 5.875% | 07/15/2022 | 675,000 | 671,625 | ||||||||||||
Unitymedia Hessen GmbH & Co. KG / Unitymedia NRW GmbH (Media) | (b) | 5.500% | 01/15/2023 | 475,000 | 477,375 | |||||||||||
Unitymedia Hessen GmbH & Co. KG / Unitymedia NRW GmbH (Media) | (b) | 5.000% | 01/15/2025 | 200,000 | 196,000 | |||||||||||
Unitymedia KabelBW GmbH (Media) | (b) | 6.125% | 01/15/2025 | 425,000 | 435,582 | |||||||||||
Virgin Media Finance PLC (Media) | (b) | 5.750% | 01/15/2025 | 200,000 | 193,750 | |||||||||||
Virgin Media Secured Finance PLC (Media) | (b) | 5.250% | 01/15/2026 | 425,000 | 411,719 | |||||||||||
Virgin Media Secured Finance PLC (Media) | (b) | 5.500% | 08/15/2026 | 200,000 | 194,500 | |||||||||||
JC Penney Corp., Inc. (Multiline Retail) | (b) | 5.875% | 07/01/2023 | 75,000 | 75,562 | |||||||||||
Argos Merger Sub, Inc. (Specialty Retail) | (b) | 7.125% | 03/15/2023 | 1,050,000 | 1,080,187 | |||||||||||
Jo-Ann Stores Holdings, Inc. (Specialty Retail) | (b)(d) | 9.750%, 10.500% PIK | 10/15/2019 | 100,000 | 87,500 | |||||||||||
L Brands, Inc. (Specialty Retail) | 5.625% | 02/15/2022 | 350,000 | 376,600 | ||||||||||||
Michaels Stores, Inc. (Specialty Retail) | (b) | 5.875% | 12/15/2020 | 575,000 | 598,719 | |||||||||||
Neiman Marcus Group Ltd., Inc. (Specialty Retail) | (b)(d) | 8.750%, 9.500% PIK | 10/15/2021 | 450,000 | 342,000 | |||||||||||
Party City Holdings, Inc. (Specialty Retail) | (b) | 6.125% | 08/15/2023 | 675,000 | 698,625 | |||||||||||
Sally Holdings LLC / Sally Capital, Inc. (Specialty Retail) | 5.625% | 12/01/2025 | 100,000 | 104,750 | ||||||||||||
Hanesbrands, Inc. (Textiles, Apparel & Luxury Goods) | (b) | 4.875% | 05/15/2026 | 125,000 | 125,450 | |||||||||||
Springs Industries, Inc. (Textiles, Apparel & Luxury Goods) | 6.250% | 06/01/2021 | 625,000 | 631,250 | ||||||||||||
|
| |||||||||||||||
| 53,056,349 | ||||||||||||||||
|
| |||||||||||||||
CONSUMER STAPLES – 2.9% | ||||||||||||||||
Albertsons Cos., LLC / Safeway, Inc. / New Albertson’s, Inc. / Albertson’s, LLC (Food & Staples Retailing) | (b) | 6.625% | 06/15/2024 | 350,000 | 361,375 | |||||||||||
Performance Food Group, Inc. (Food & Staples Retailing) | (b) | 5.500% | 06/01/2024 | 75,000 | 76,312 | |||||||||||
Rite Aid Corp. (Food & Staples Retailing) | (b) | 6.125% | 04/01/2023 | 550,000 | 588,445 | |||||||||||
U.S. Foods, Inc. (Food & Staples Retailing) | (b) | 5.875% | 06/15/2024 | 550,000 | 563,750 | |||||||||||
Hearthside Group Holdings LLC / Hearthside Finance Co. (Food Products) | (b) | 6.500% | 05/01/2022 | 1,100,000 | 932,250 | |||||||||||
Pinnacle Foods Finance LLC / Pinnacle Foods Finance Corp. (Food Products) | 4.875% | 05/01/2021 | 550,000 | 557,562 | ||||||||||||
Post Holdings, Inc. (Food Products) | (b) | 6.000% | 12/15/2022 | 100,000 | 102,500 | |||||||||||
| 62 | (continued) |
| Ohio National Fund, Inc. | High Income Bond Portfolio (Continued) |
Schedule of Investments | June 30, 2016 (Unaudited) |
| Corporate Bonds (Continued) | Rate | Maturity | Face Amount | Value | ||||||||||||
CONSUMER STAPLES (continued) | ||||||||||||||||
Post Holdings, Inc. (Food Products) | (b) | 7.750% | 03/15/2024 | $ | 225,000 | $ | 246,656 | |||||||||
Post Holdings, Inc. (Food Products) | (b) | 8.000% | 07/15/2025 | 700,000 | 776,125 | |||||||||||
Sun Merger Sub., Inc. (Food Products) | (b) | 5.875% | 08/01/2021 | 100,000 | 104,250 | |||||||||||
TreeHouse Foods, Inc. (Food Products) | (b) | 6.000% | 02/15/2024 | 125,000 | 133,350 | |||||||||||
Spectrum Brands, Inc. (Household Products) | 6.125% | 12/15/2024 | 175,000 | 184,625 | ||||||||||||
Spectrum Brands, Inc. (Household Products) | 5.750% | 07/15/2025 | 400,000 | 416,500 | ||||||||||||
First Quality Finance Co., Inc. (Personal Products) | (b) | 4.625% | 05/15/2021 | 700,000 | 661,500 | |||||||||||
|
| |||||||||||||||
| 5,705,200 | ||||||||||||||||
|
| |||||||||||||||
ENERGY – 10.2% | ||||||||||||||||
CGG SA (Energy Equip. & Svs.) | 6.875% | 01/15/2022 | 300,000 | 130,500 | ||||||||||||
Weatherford International Ltd. (Energy Equip. & Svs.) | 7.000% | 03/15/2038 | 250,000 | 185,000 | ||||||||||||
Weatherford International Ltd. (Energy Equip. & Svs.) | 8.250% | 06/15/2023 | 375,000 | 356,250 | ||||||||||||
Antero Resources Corp. (Oil, Gas & Consumable Fuels) | 6.000% | 12/01/2020 | 725,000 | 732,859 | ||||||||||||
Antero Resources Corp. (Oil, Gas & Consumable Fuels) | 5.125% | 12/01/2022 | 200,000 | 192,000 | ||||||||||||
Approach Resources, Inc. (Oil, Gas & Consumable Fuels) | 7.000% | 06/15/2021 | 100,000 | 59,000 | ||||||||||||
California Resources Corp. (Oil, Gas & Consumable Fuels) | 6.000% | 11/15/2024 | 475,000 | 232,750 | ||||||||||||
Carrizo Oil & Gas, Inc. (Oil, Gas & Consumable Fuels) | 7.500% | 09/15/2020 | 575,000 | 582,187 | ||||||||||||
Carrizo Oil & Gas, Inc. (Oil, Gas & Consumable Fuels) | 6.250% | 04/15/2023 | 100,000 | 96,250 | ||||||||||||
Cheniere Corpus Christi Holdings, LLC (Oil, Gas & Consumable Fuels) | (b) | 7.000% | 06/30/2024 | 150,000 | 154,032 | |||||||||||
Chesapeake Energy Corp. (Oil, Gas & Consumable Fuels) | 5.375% | 06/15/2021 | 525,000 | 338,625 | ||||||||||||
Chesapeake Energy Corp. (Oil, Gas & Consumable Fuels) | (b) | 8.000% | 12/15/2022 | 125,000 | 106,406 | |||||||||||
Continental Resources, Inc. (Oil, Gas & Consumable Fuels) | 4.500% | 04/15/2023 | 350,000 | 326,375 | ||||||||||||
Crestwood Midstream Partners LP / Crestwood Midstream Finance Corp. (Oil, Gas & Consumable Fuels) | 6.125% | 03/01/2022 | 154,000 | 141,430 | ||||||||||||
Crestwood Midstream Partners LP / Crestwood Midstream Finance Corp. (Oil, Gas & Consumable Fuels) | (b) | 6.250% | 04/01/2023 | 700,000 | 644,000 | |||||||||||
CrownRock LP / CrownRock Finance, Inc. (Oil, Gas & Consumable Fuels) | (b) | 7.750% | 02/15/2023 | 175,000 | 182,875 | |||||||||||
CVR Refining LLC / Coffeyville Finance, Inc. (Oil, Gas & Consumable Fuels) | 6.500% | 11/01/2022 | 500,000 | 430,000 | ||||||||||||
Energy Transfer Equity LP (Oil, Gas & Consumable Fuels) | 5.875% | 01/15/2024 | 1,025,000 | 996,812 | ||||||||||||
EP Energy LLC / Everest Acquisition Finance, Inc. (Oil, Gas & Consumable Fuels) | 7.750% | 09/01/2022 | 100,000 | 61,000 | ||||||||||||
EP Energy LLC / Everest Acquisition Finance, Inc. (Oil, Gas & Consumable Fuels) | 6.375% | 06/15/2023 | 250,000 | 150,000 | ||||||||||||
EP Energy LLC / Everest Acquisition Finance, Inc. (Oil, Gas & Consumable Fuels) | 9.375% | 05/01/2020 | 50,000 | 35,375 | ||||||||||||
Gulfport Energy Corp. (Oil, Gas & Consumable Fuels) | 7.750% | 11/01/2020 | 350,000 | 359,625 | ||||||||||||
Gulfport Energy Corp. (Oil, Gas & Consumable Fuels) | 6.625% | 05/01/2023 | 225,000 | 221,625 | ||||||||||||
Halcon Resources Corp. (Oil, Gas & Consumable Fuels) | (b) | 8.625% | 02/01/2020 | 300,000 | 282,936 | |||||||||||
Hiland Partners LP / Hiland Partners Finance Corp. (Oil, Gas & Consumable Fuels) | (b) | 5.500% | 05/15/2022 | 250,000 | 250,593 | |||||||||||
Holly Energy Partners LP / Holly Energy Finance Corp. (Oil, Gas & Consumable Fuels) | 6.500% | 03/01/2020 | 475,000 | 477,375 | ||||||||||||
Laredo Petroleum, Inc. (Oil, Gas & Consumable Fuels) | 7.375% | 05/01/2022 | 150,000 | 150,375 | ||||||||||||
Laredo Petroleum, Inc. (Oil, Gas & Consumable Fuels) | 5.625% | 01/15/2022 | 275,000 | 257,125 | ||||||||||||
Laredo Petroleum, Inc. (Oil, Gas & Consumable Fuels) | 6.250% | 03/15/2023 | 125,000 | 118,750 | ||||||||||||
Legacy Reserves LP / Legacy Reserves Finance Corp. (Oil, Gas & Consumable Fuels) | 6.625% | 12/01/2021 | 350,000 | 147,000 | ||||||||||||
MPLX LP (Oil, Gas & Consumable Fuels) | (b) | 5.500% | 02/15/2023 | 600,000 | 609,650 | |||||||||||
MPLX LP (Oil, Gas & Consumable Fuels) | (b) | 4.500% | 07/15/2023 | 325,000 | 315,119 | |||||||||||
MPLX LP (Oil, Gas & Consumable Fuels) | (b) | 4.875% | 12/01/2024 | 75,000 | 73,094 | |||||||||||
Northern Oil and Gas, Inc. (Oil, Gas & Consumable Fuels) | 8.000% | 06/01/2020 | 700,000 | 528,500 | ||||||||||||
Northern Tier Energy LLC / Northern Tier Finance Corp. (Oil, Gas & Consumable Fuels) | 7.125% | 11/15/2020 | 300,000 | 305,250 | ||||||||||||
Oasis Petroleum, Inc. (Oil, Gas & Consumable Fuels) | 6.875% | 03/15/2022 | 750,000 | 693,750 | ||||||||||||
Parsley Energy LLC / Parsley Finance Corp. (Oil, Gas & Consumable Fuels) | (b) | 6.250% | 06/01/2024 | 50,000 | 50,875 | |||||||||||
PDC Energy, Inc. (Oil, Gas & Consumable Fuels) | 7.750% | 10/15/2022 | 100,000 | 104,000 | ||||||||||||
QEP Resources, Inc. (Oil, Gas & Consumable Fuels) | 6.875% | 03/01/2021 | 175,000 | 176,750 | ||||||||||||
QEP Resources, Inc. (Oil, Gas & Consumable Fuels) | 5.250% | 05/01/2023 | 125,000 | 115,000 | ||||||||||||
Range Resources Corp. (Oil, Gas & Consumable Fuels) | 4.875% | 05/15/2025 | 600,000 | 571,500 | ||||||||||||
Regency Energy Partners LP / Regency Energy Finance Corp. (Oil, Gas & Consumable Fuels) | 5.500% | 04/15/2023 | 175,000 | 176,572 | ||||||||||||
Regency Energy Partners LP / Regency Energy Finance Corp. (Oil, Gas & Consumable Fuels) | 4.500% | 11/01/2023 | 225,000 | 219,733 | ||||||||||||
Regency Energy Partners LP / Regency Energy Finance Corp. (Oil, Gas & Consumable Fuels) | 5.000% | 10/01/2022 | 200,000 | 205,245 | ||||||||||||
Rice Energy, Inc. (Oil, Gas & Consumable Fuels) | 6.250% | 05/01/2022 | 500,000 | 496,250 | ||||||||||||
Rice Energy, Inc. (Oil, Gas & Consumable Fuels) | 7.250% | 05/01/2023 | 75,000 | 76,125 | ||||||||||||
Rose Rock Midstream LP / Rose Rock Finance Corp. (Oil, Gas & Consumable Fuels) | 5.625% | 07/15/2022 | 225,000 | 198,000 | ||||||||||||
Rose Rock Midstream LP / Rose Rock Finance Corp. (Oil, Gas & Consumable Fuels) | 5.625% | 11/15/2023 | 200,000 | 174,000 | ||||||||||||
RSP Permian, Inc. (Oil, Gas & Consumable Fuels) | 6.625% | 10/01/2022 | 350,000 | 360,500 | ||||||||||||
Sabine Pass Liquefaction, LLC (Oil, Gas & Consumable Fuels) | 5.625% | 04/15/2023 | 225,000 | 225,844 | ||||||||||||
Sabine Pass Liquefaction, LLC (Oil, Gas & Consumable Fuels) | 5.625% | 02/01/2021 | 625,000 | 631,250 | ||||||||||||
Sabine Pass Liquefaction, LLC (Oil, Gas & Consumable Fuels) | 6.250% | 03/15/2022 | 300,000 | 307,500 | ||||||||||||
Sabine Pass Liquefaction, LLC (Oil, Gas & Consumable Fuels) | 5.625% | 03/01/2025 | 225,000 | 224,156 | ||||||||||||
SM Energy Co. (Oil, Gas & Consumable Fuels) | 6.500% | 11/15/2021 | 50,000 | 47,125 | ||||||||||||
| 63 | (continued) |
| Ohio National Fund, Inc. | High Income Bond Portfolio (Continued) |
Schedule of Investments | June 30, 2016 (Unaudited) |
| Corporate Bonds (Continued) | Rate | Maturity | Face Amount | Value | ||||||||||||
ENERGY (continued) | ||||||||||||||||
SM Energy Co. (Oil, Gas & Consumable Fuels) | 6.500% | 01/01/2023 | $ | 100,000 | $ | 93,000 | ||||||||||
SM Energy Co. (Oil, Gas & Consumable Fuels) | 5.000% | 01/15/2024 | 375,000 | 320,625 | ||||||||||||
SM Energy Co. (Oil, Gas & Consumable Fuels) | 5.625% | 06/01/2025 | 175,000 | 150,500 | ||||||||||||
Summit Midstream Holdings LLC / Summit Midstream Finance Corp. (Oil, Gas & Consumable Fuels) | 5.500% | 08/15/2022 | 700,000 | 602,000 | ||||||||||||
Targa Resources Partners LP / Targa Resources Partners Finance Corp. (Oil, Gas & Consumable Fuels) | 5.250% | 05/01/2023 | 225,000 | 212,625 | ||||||||||||
Tesoro Corp. (Oil, Gas & Consumable Fuels) | 5.125% | 04/01/2024 | 425,000 | 427,125 | ||||||||||||
Tesoro Logistics LP / Tesoro Logistics Finance Corp. (Oil, Gas & Consumable Fuels) | 5.875% | 10/01/2020 | 500,000 | 512,500 | ||||||||||||
Tesoro Logistics LP / Tesoro Logistics Finance Corp. (Oil, Gas & Consumable Fuels) | 6.125% | 10/15/2021 | 325,000 | 336,375 | ||||||||||||
Tesoro Logistics LP / Tesoro Logistics Finance Corp. (Oil, Gas & Consumable Fuels) | 5.500% | 10/15/2019 | 50,000 | 52,250 | ||||||||||||
Tesoro Logistics LP / Tesoro Logistics Finance Corp. (Oil, Gas & Consumable Fuels) | 6.250% | 10/15/2022 | 75,000 | 78,187 | ||||||||||||
Tesoro Logistics LP / Tesoro Logistics Finance Corp. (Oil, Gas & Consumable Fuels) | 6.375% | 05/01/2024 | 150,000 | 157,125 | ||||||||||||
Western Refining Logistics LP / WNRL Finance Corp. (Oil, Gas & Consumable Fuels) | 7.500% | 02/15/2023 | 400,000 | 392,000 | ||||||||||||
Whiting Petroleum Corp. (Oil, Gas & Consumable Fuels) | 5.000% | 03/15/2019 | 75,000 | 69,000 | ||||||||||||
Whiting Petroleum Corp. (Oil, Gas & Consumable Fuels) | 6.250% | 04/01/2023 | 800,000 | 716,000 | ||||||||||||
Williams Cos., Inc. / The (Oil, Gas & Consumable Fuels) | 4.550% | 06/24/2024 | 100,000 | 91,850 | ||||||||||||
Williams Partners LP / ACMP Finance Corp. (Oil, Gas & Consumable Fuels) | 4.875% | 03/15/2024 | 225,000 | 215,890 | ||||||||||||
Williams Partners LP / ACMP Finance Corp. (Oil, Gas & Consumable Fuels) | 6.125% | 07/15/2022 | 225,000 | 230,845 | ||||||||||||
|
| |||||||||||||||
| 19,942,815 | ||||||||||||||||
|
| |||||||||||||||
FINANCIALS – 3.2% | ||||||||||||||||
CIT Group, Inc. (Banks) | 5.375% | 05/15/2020 | 225,000 | 234,562 | ||||||||||||
CIT Group, Inc. (Banks) | 5.000% | 08/01/2023 | 350,000 | 352,625 | ||||||||||||
Ally Financial, Inc. (Consumer Finance) | 4.125% | 02/13/2022 | 475,000 | 471,437 | ||||||||||||
Ally Financial, Inc. (Consumer Finance) | 4.125% | 03/30/2020 | 125,000 | 125,312 | ||||||||||||
Ally Financial, Inc. (Consumer Finance) | 4.625% | 03/30/2025 | 400,000 | 393,500 | ||||||||||||
Ally Financial, Inc. (Consumer Finance) | 4.625% | 05/19/2022 | 250,000 | 251,875 | ||||||||||||
Ally Financial, Inc. (Consumer Finance) | 5.750% | 11/20/2025 | 750,000 | 751,875 | ||||||||||||
Navient Corp. (Consumer Finance) | 5.875% | 10/25/2024 | 450,000 | 384,750 | ||||||||||||
Navient Corp. (Consumer Finance) | 5.500% | 01/25/2023 | 50,000 | 43,875 | ||||||||||||
MSCI, Inc. (Diversified Financial Svs.) | (b) | 5.250% | 11/15/2024 | 150,000 | 153,375 | |||||||||||
MSCI, Inc. (Diversified Financial Svs.) | (b) | 5.750% | 08/15/2025 | 325,000 | 337,187 | |||||||||||
Hockey Merger Sub 2, Inc. (Insurance) | (b) | 7.875% | 10/01/2021 | 1,025,000 | 984,000 | |||||||||||
RHP Hotel Properties LP / RHP Finance Corp. (Real Estate Investment Trusts) | 5.000% | 04/15/2023 | 100,000 | 99,250 | ||||||||||||
Hub Holdings, LLC / Hub Holdings Finance, Inc. (Real Estate Mgmt. & Development) | (b)(d) | 8.125%, 8.875% PIK | 07/15/2019 | 600,000 | 576,000 | |||||||||||
HUB International Ltd. (Real Estate Mgmt. & Development) | (b) | 9.250% | 02/15/2021 | 50,000 | 52,250 | |||||||||||
Quicken Loans, Inc. (Thrifts & Mortgage Finance) | (b) | 5.750% | 05/01/2025 | 1,000,000 | 965,000 | |||||||||||
|
| |||||||||||||||
| 6,176,873 | ||||||||||||||||
|
| |||||||||||||||
HEALTH CARE – 13.3% | ||||||||||||||||
Grifols Worldwide Operations Ltd. (Biotechnology) | 5.250% | 04/01/2022 | 675,000 | 686,812 | ||||||||||||
Crimson Merger Sub., Inc. (Health Care Equip. & Supplies) | (b) | 6.625% | 05/15/2022 | 1,775,000 | 1,473,250 | |||||||||||
Hill-Rom Holdings, Inc. (Health Care Equip. & Supplies) | (b) | 5.750% | 09/01/2023 | 100,000 | 102,250 | |||||||||||
Sterigenics-Nordion Holdings LLC (Health Care Equip. & Supplies) | (b) | 6.500% | 05/15/2023 | 850,000 | 860,625 | |||||||||||
Teleflex, Inc. (Health Care Equip. & Supplies) | 5.250% | 06/15/2024 | 275,000 | 277,750 | ||||||||||||
Teleflex, Inc. (Health Care Equip. & Supplies) | 4.875% | 06/01/2026 | 100,000 | 100,750 | ||||||||||||
Acadia Healthcare Co., Inc. (Health Care Providers & Svs.) | (b) | 6.500% | 03/01/2024 | 400,000 | 406,000 | |||||||||||
Air Medical Merger Sub Corp. (Health Care Providers & Svs.) | (b) | 6.375% | 05/15/2023 | 625,000 | 593,750 | |||||||||||
Amsurg Corp. (Health Care Providers & Svs.) | 5.625% | 07/15/2022 | 675,000 | 693,562 | ||||||||||||
CHS / Community Health Systems, Inc. (Health Care Providers & Svs.) | 5.125% | 08/01/2021 | 300,000 | 297,750 | ||||||||||||
CHS / Community Health Systems, Inc. (Health Care Providers & Svs.) | 6.875% | 02/01/2022 | 1,400,000 | 1,225,000 | ||||||||||||
DaVita HealthCare Partners, Inc. (Health Care Providers & Svs.) | 5.125% | 07/15/2024 | 450,000 | 454,995 | ||||||||||||
Envision Healthcare Corp. (Health Care Providers & Svs.) | (b) | 5.125% | 07/01/2022 | 875,000 | 887,950 | |||||||||||
HCA, Inc. (Health Care Providers & Svs.) | 5.000% | 03/15/2024 | 2,175,000 | 2,251,125 | ||||||||||||
HCA, Inc. (Health Care Providers & Svs.) | 5.250% | 04/15/2025 | 450,000 | 470,250 | ||||||||||||
HCA, Inc. (Health Care Providers & Svs.) | 5.375% | 02/01/2025 | 1,200,000 | 1,230,000 | ||||||||||||
HCA, Inc. (Health Care Providers & Svs.) | 5.875% | 02/15/2026 | 225,000 | 233,437 | ||||||||||||
HCA, Inc. (Health Care Providers & Svs.) | 5.875% | 05/01/2023 | 275,000 | 293,219 | ||||||||||||
IASIS Healthcare LLC / IASIS Capital Corp. (Health Care Providers & Svs.) | 8.375% | 05/15/2019 | 700,000 | 672,433 | ||||||||||||
Jaguar Holding Co. II / Pharmaceutical Product Development LLC (Health Care Providers & Svs.) | (b) | 6.375% | 08/01/2023 | 1,375,000 | 1,405,937 | |||||||||||
LifePoint Health, Inc. (Health Care Providers & Svs.) | 5.500% | 12/01/2021 | 750,000 | 781,875 | ||||||||||||
LifePoint Health, Inc. (Health Care Providers & Svs.) | 5.875% | 12/01/2023 | 75,000 | 78,000 | ||||||||||||
LifePoint Health, Inc. (Health Care Providers & Svs.) | (b) | 5.375% | 05/01/2024 | 75,000 | 75,188 | |||||||||||
MEDNAX, Inc. (Health Care Providers & Svs.) | (b) | 5.250% | 12/01/2023 | 125,000 | 126,563 | |||||||||||
MPH Acquisition Holdings LLC (Health Care Providers & Svs.) | (b) | 7.125% | 06/01/2024 | 600,000 | 630,000 | |||||||||||
Surgical Care Affiliates, Inc. (Health Care Providers & Svs.) | (b) | 6.000% | 04/01/2023 | 600,000 | 612,000 | |||||||||||
Team Health, Inc. (Health Care Providers & Svs.) | (b) | 7.250% | 12/15/2023 | 475,000 | 508,307 | |||||||||||
Tenet Healthcare Corp. (Health Care Providers & Svs.) | 4.500% | 04/01/2021 | 350,000 | 351,750 | ||||||||||||
| 64 | (continued) |
| Ohio National Fund, Inc. | High Income Bond Portfolio (Continued) |
Schedule of Investments | June 30, 2016 (Unaudited) |
| Corporate Bonds (Continued) | Rate | Maturity | Face Amount | Value | ||||||||||||
HEALTH CARE (continued) | ||||||||||||||||
Tenet Healthcare Corp. (Health Care Providers & Svs.) | 4.375% | 10/01/2021 | $ | 475,000 | $ | 472,625 | ||||||||||
Tenet Healthcare Corp. (Health Care Providers & Svs.) | 8.125% | 04/01/2022 | 900,000 | 922,320 | ||||||||||||
Tenet Healthcare Corp. (Health Care Providers & Svs.) | 6.750% | 06/15/2023 | 575,000 | 550,563 | ||||||||||||
Vizient, Inc. (Health Care Providers & Svs.) | (b) | 10.375% | 03/01/2024 | 600,000 | 643,500 | |||||||||||
Change Healthcare Holdings, Inc. (Health Care Technology) | 11.000% | 12/31/2019 | 475,000 | 505,281 | ||||||||||||
Change Healthcare Holdings, Inc. (Health Care Technology) | (b) | 6.000% | 02/15/2021 | 150,000 | 159,000 | |||||||||||
Endo Finance LLC / Endo Ltd. / Endo Finco, Inc. (Pharmaceuticals) | (b) | 6.000% | 02/01/2025 | 625,000 | 542,188 | |||||||||||
Endo Finance LLC / Endo Ltd. / Endo Finco, Inc. (Pharmaceuticals) | (b) | 6.000% | 07/15/2023 | 475,000 | 418,000 | |||||||||||
Mallinckrodt International Finance SA (Pharmaceuticals) | 4.750% | 04/15/2023 | 475,000 | 387,125 | ||||||||||||
Mallinckrodt International Finance SA / Mallinckrodt CB LLC (Pharmaceuticals) | (b) | 4.875% | 04/15/2020 | 100,000 | 96,500 | |||||||||||
Mallinckrodt International Finance SA / Mallinckrodt CB LLC (Pharmaceuticals) | (b) | 5.500% | 04/15/2025 | 550,000 | 490,666 | |||||||||||
Mallinckrodt International Finance SA / Mallinckrodt CB LLC (Pharmaceuticals) | (b) | 5.625% | 10/15/2023 | 250,000 | 232,813 | |||||||||||
Prestige Brands, Inc. (Pharmaceuticals) | (b) | 5.375% | 12/15/2021 | 925,000 | 938,875 | |||||||||||
Prestige Brands, Inc. (Pharmaceuticals) | (b) | 6.375% | 03/01/2024 | 75,000 | 77,813 | |||||||||||
Valeant Pharmaceuticals International, Inc. (Pharmaceuticals) | (b) | 5.625% | 12/01/2021 | 100,000 | 82,500 | |||||||||||
Valeant Pharmaceuticals International, Inc. (Pharmaceuticals) | (b) | 7.250% | 07/15/2022 | 75,000 | 64,703 | |||||||||||
Valeant Pharmaceuticals International, Inc. (Pharmaceuticals) | (b) | 5.500% | 03/01/2023 | 175,000 | 140,547 | |||||||||||
VPII Escrow Corp. (Pharmaceuticals) | (b) | 7.500% | 07/15/2021 | 750,000 | 661,406 | |||||||||||
VRX Escrow Corp. (Pharmaceuticals) | (b) | 5.875% | 05/15/2023 | 650,000 | 524,875 | |||||||||||
VRX Escrow Corp. (Pharmaceuticals) | (b) | 6.125% | 04/15/2025 | 500,000 | 401,250 | |||||||||||
|
| |||||||||||||||
| 26,093,078 | ||||||||||||||||
|
| |||||||||||||||
INDUSTRIALS – 9.8% | ||||||||||||||||
Silver II Borrower / Silver II U.S. Holdings LLC (Aerospace & Defense) | (b) | 7.750% | 12/15/2020 | 550,000 | 485,375 | |||||||||||
TransDigm, Inc. (Aerospace & Defense) | 5.500% | 10/15/2020 | 275,000 | 279,813 | ||||||||||||
TransDigm, Inc. (Aerospace & Defense) | 7.500% | 07/15/2021 | 300,000 | 316,875 | ||||||||||||
TransDigm, Inc. (Aerospace & Defense) | 6.000% | 07/15/2022 | 550,000 | 552,849 | ||||||||||||
TransDigm, Inc. (Aerospace & Defense) | 6.500% | 07/15/2024 | 475,000 | 477,375 | ||||||||||||
TransDigm, Inc. (Aerospace & Defense) | 6.500% | 05/15/2025 | 50,000 | 50,125 | ||||||||||||
TransDigm, Inc. (Aerospace & Defense) | (b) | 6.375% | 06/15/2026 | 100,000 | 99,750 | |||||||||||
Allegion PLC (Building Products) | 5.875% | 09/15/2023 | 125,000 | 132,500 | ||||||||||||
Allegion U.S. Holding Co., Inc. (Building Products) | 5.750% | 10/01/2021 | 325,000 | 339,625 | ||||||||||||
Building Materials Corp. of America (Building Products) | (b) | 6.000% | 10/15/2025 | 225,000 | 235,125 | |||||||||||
Hillman Group, Inc. / The (Building Products) | (b) | 6.375% | 07/15/2022 | 775,000 | 689,750 | |||||||||||
Masonite International Corp. (Building Products) | (b) | 5.625% | 03/15/2023 | 150,000 | 155,625 | |||||||||||
NCI Building Systems, Inc. (Building Products) | (b) | 8.250% | 01/15/2023 | 450,000 | 483,656 | |||||||||||
Nortek, Inc. (Building Products) | 8.500% | 04/15/2021 | 550,000 | 570,625 | ||||||||||||
Unifrax I LLC / Unifrax Holding Co. (Building Products) | (b) | 7.500% | 02/15/2019 | 775,000 | 670,375 | |||||||||||
Garda World Security Corp. (Commercial Svs. & Supplies) | (b) | 7.250% | 11/15/2021 | 600,000 | 484,500 | |||||||||||
Garda World Security Corp. (Commercial Svs. & Supplies) | (b) | 7.250% | 11/15/2021 | 650,000 | 524,875 | |||||||||||
Multi-Color Corp. (Commercial Svs. & Supplies) | (b) | 6.125% | 12/01/2022 | 650,000 | 664,625 | |||||||||||
Mustang Merger Corp. (Commercial Svs. & Supplies) | (b) | 8.500% | 08/15/2021 | 775,000 | 809,875 | |||||||||||
Southern Graphics, Inc. (Commercial Svs. & Supplies) | (b) | 8.375% | 10/15/2020 | 1,025,000 | 1,025,000 | |||||||||||
EnerSys (Electrical Equip.) | (b) | 5.000% | 04/30/2023 | 225,000 | 222,188 | |||||||||||
Sensata Technologies BV (Electrical Equip.) | (b) | 5.625% | 11/01/2024 | 225,000 | 233,577 | |||||||||||
Sensata Technologies BV (Electrical Equip.) | (b) | 5.000% | 10/01/2025 | 150,000 | 150,659 | |||||||||||
Sensata Technologies UK Financing Co. PLC (Electrical Equip.) | (b) | 6.250% | 02/15/2026 | 225,000 | 232,875 | |||||||||||
Dematic SA / DH Services Luxembourg Sarl (Machinery) | (b) | 7.750% | 12/15/2020 | 750,000 | 785,625 | |||||||||||
Gardner Denver, Inc. (Machinery) | (b) | 6.875% | 08/15/2021 | 475,000 | 431,063 | |||||||||||
Manitowoc Foodservice, Inc. (Machinery) | (b) | 9.500% | 02/15/2024 | 75,000 | 83,625 | |||||||||||
Milacron LLC / Mcron Finance Corp. (Machinery) | (b) | 7.750% | 02/15/2021 | 375,000 | 386,250 | |||||||||||
Schaeffler Finance BV (Machinery) | (b) | 4.750% | 05/15/2021 | 375,000 | 382,969 | |||||||||||
Schaeffler Finance BV (Machinery) | (b) | 4.750% | 05/15/2023 | 375,000 | 380,625 | |||||||||||
Schaeffler Holding Finance BV (Machinery) | (b)(d) | 6.750%, 7.500% PIK | 11/15/2022 | 239,358 | 263,294 | |||||||||||
IHS, Inc. (Professional Svs.) | 5.000% | 11/01/2022 | 175,000 | 180,688 | ||||||||||||
Avis Budget Car Rental, LLC / Avis Budget Finance, Inc. (Road & Rail) | 5.500% | 04/01/2023 | 125,000 | 123,125 | ||||||||||||
Avis Budget Car Rental, LLC / Avis Budget Finance, Inc. (Road & Rail) | (b) | 5.250% | 03/15/2025 | 200,000 | 181,000 | |||||||||||
Avis Budget Car Rental, LLC / Avis Budget Finance, Inc. (Road & Rail) | (b) | 6.375% | 04/01/2024 | 525,000 | 519,750 | |||||||||||
Hertz Corp. / The (Road & Rail) | 6.750% | 04/15/2019 | 625,000 | 638,066 | ||||||||||||
Hertz Corp. / The (Road & Rail) | 6.250% | 10/15/2022 | 375,000 | 386,250 | ||||||||||||
AerCap Ireland Capital Ltd. / AerCap Global Aviation Trust (Trading Companies & Distributors) | 4.625% | 07/01/2022 | 150,000 | 153,612 | ||||||||||||
AerCap Ireland Capital Ltd. / AerCap Global Aviation Trust (Trading Companies & Distributors) | 4.625% | 10/30/2020 | 200,000 | 207,350 | ||||||||||||
American Builders & Contractors Supply Co., Inc. (Trading Companies & Distributors) | (b) | 5.625% | 04/15/2021 | 550,000 | 567,875 | |||||||||||
American Builders & Contractors Supply Co., Inc. (Trading Companies & Distributors) | (b) | 5.750% | 12/15/2023 | 50,000 | 51,750 | |||||||||||
Beacon Roofing Supply, Inc. (Trading Companies & Distributors) | 6.375% | 10/01/2023 | 175,000 | 183,313 | ||||||||||||
HD Supply, Inc. (Trading Companies & Distributors) | 7.500% | 07/15/2020 | 100,000 | 104,740 | ||||||||||||
HD Supply, Inc. (Trading Companies & Distributors) | (b) | 5.250% | 12/15/2021 | 225,000 | 235,899 | |||||||||||
| 65 | (continued) |
| Ohio National Fund, Inc. | High Income Bond Portfolio (Continued) |
Schedule of Investments | June 30, 2016 (Unaudited) |
| Corporate Bonds (Continued) | Rate | Maturity | Face Amount | Value | ||||||||||||
INDUSTRIALS (continued) | ||||||||||||||||
HD Supply, Inc. (Trading Companies & Distributors) | (b) | 5.750% | 04/15/2024 | $ | 200,000 | $ | 208,000 | |||||||||
International Lease Finance Corp. (Trading Companies & Distributors) | 5.875% | 08/15/2022 | 1,375,000 | 1,488,438 | ||||||||||||
United Rentals North America, Inc. (Trading Companies & Distributors) | 7.375% | 05/15/2020 | 26,000 | 27,040 | ||||||||||||
United Rentals North America, Inc. (Trading Companies & Distributors) | 4.625% | 07/15/2023 | 225,000 | 227,250 | ||||||||||||
United Rentals North America, Inc. (Trading Companies & Distributors) | 5.500% | 07/15/2025 | 400,000 | 394,000 | ||||||||||||
WESCO Distribution, Inc. (Trading Companies & Distributors) | 5.375% | 12/15/2021 | 425,000 | 428,188 | ||||||||||||
WESCO Distribution, Inc. (Trading Companies & Distributors) | (b) | 5.375% | 06/15/2024 | 350,000 | 350,000 | |||||||||||
|
| |||||||||||||||
| 19,257,402 | ||||||||||||||||
|
| |||||||||||||||
INFORMATION TECHNOLOGY – 11.1% | ||||||||||||||||
CommScope Technologies Finance LLC (Communications Equip.) | (b) | 6.000% | 06/15/2025 | 325,000 | 333,125 | |||||||||||
CommScope, Inc. (Communications Equip.) | (b) | 5.500% | 06/15/2024 | 525,000 | 532,875 | |||||||||||
Diamond 1 Finance Corp. / Diamond 2 Finance Corp. (Computers & Peripherals) | (b) | 5.875% | 06/15/2021 | 150,000 | 153,733 | |||||||||||
Diamond 1 Finance Corp. / Diamond 2 Finance Corp. (Computers & Peripherals) | (b) | 7.125% | 06/15/2024 | 500,000 | 522,371 | |||||||||||
Anixter, Inc. (Electronic Equip., Instr. & Comp.) | 5.500% | 03/01/2023 | 325,000 | 330,688 | ||||||||||||
Belden, Inc. (Electronic Equip., Instr. & Comp.) | (b) | 5.500% | 09/01/2022 | 725,000 | 730,438 | |||||||||||
Belden, Inc. (Electronic Equip., Instr. & Comp.) | (b) | 5.250% | 07/15/2024 | 375,000 | 362,813 | |||||||||||
CDW LLC / CDW Finance Corp. (Electronic Equip., Instr. & Comp.) | 5.500% | 12/01/2024 | 650,000 | 671,125 | ||||||||||||
CDW LLC / CDW Finance Corp. (Electronic Equip., Instr. & Comp.) | 5.000% | 09/01/2023 | 550,000 | 553,845 | ||||||||||||
Cleaver-Brooks, Inc. (Electronic Equip., Instr. & Comp.) | (b) | 8.750% | 12/15/2019 | 475,000 | 471,438 | |||||||||||
Zebra Technologies Corp. (Electronic Equip., Instr. & Comp.) | 7.250% | 10/15/2022 | 825,000 | 874,500 | ||||||||||||
Blackboard, Inc. (Acquired 12/10/2013 through 02/03/2014, Cost $401,201)(Internet Software & Svs.) | (b)(e) | 7.750% | 11/15/2019 | 400,000 | 336,000 | |||||||||||
Match Group, Inc. (Internet Software & Svs.) | (b) | 6.750% | 12/15/2022 | 1,100,000 | 1,144,000 | |||||||||||
Match Group, Inc. (Internet Software & Svs.) | (b) | 6.375% | 06/01/2024 | 50,000 | 52,125 | |||||||||||
VeriSign, Inc. (Internet Software & Svs.) | 4.625% | 05/01/2023 | 300,000 | 303,750 | ||||||||||||
VeriSign, Inc. (Internet Software & Svs.) | 5.250% | 04/01/2025 | 125,000 | 128,125 | ||||||||||||
First Data Corp. (IT Svs.) | (b) | 5.375% | 08/15/2023 | 550,000 | 558,531 | |||||||||||
First Data Corp. (IT Svs.) | (b) | 7.000% | 12/01/2023 | 250,000 | 253,750 | |||||||||||
First Data Corp. (IT Svs.) | (b) | 5.750% | 01/15/2024 | 1,925,000 | 1,908,156 | |||||||||||
Sabre GLBL, Inc. (IT Svs.) | (b) | 5.375% | 04/15/2023 | 450,000 | 460,125 | |||||||||||
Sabre GLBL, Inc. (IT Svs.) | (b) | 5.250% | 11/15/2023 | 75,000 | 76,313 | |||||||||||
Advanced Micro Devices, Inc. (Semiconductors & Equip.) | 7.500% | 08/15/2022 | 75,000 | 66,750 | ||||||||||||
Advanced Micro Devices, Inc. (Semiconductors & Equip.) | 7.000% | 07/01/2024 | 225,000 | 190,125 | ||||||||||||
Entegris, Inc. (Semiconductors & Equip.) | (b) | 6.000% | 04/01/2022 | 925,000 | 946,969 | |||||||||||
Micron Technology, Inc. (Semiconductors & Equip.) | (b) | 5.250% | 08/01/2023 | 400,000 | 341,000 | |||||||||||
Micron Technology, Inc. (Semiconductors & Equip.) | (b) | 5.250% | 01/15/2024 | 175,000 | 148,313 | |||||||||||
Microsemi Corp. (Semiconductors & Equip.) | (b) | 9.125% | 04/15/2023 | 375,000 | 412,500 | |||||||||||
Qorvo, Inc. (Semiconductors & Equip.) | (b) | 7.000% | 12/01/2025 | 500,000 | 527,500 | |||||||||||
Blue Coat Holdings, Inc. (Software) | (b) | 8.375% | 06/01/2023 | 450,000 | 508,500 | |||||||||||
BMC Software Finance, Inc. (Software) | (b) | 8.125% | 07/15/2021 | 1,150,000 | 862,500 | |||||||||||
Ensemble S Merger Sub, Inc. (Software) | (b) | 9.000% | 09/30/2023 | 675,000 | 666,563 | |||||||||||
Infor Software Parent LLC / Infor Software Parent, Inc. (Software) | (b)(d) | 7.125%, 7.875% PIK | 05/01/2021 | 1,725,000 | 1,535,250 | |||||||||||
Infor U.S., Inc. (Software) | 6.500% | 05/15/2022 | 775,000 | 731,895 | ||||||||||||
Italics Merger Sub, Inc. (Software) | (b) | 7.125% | 07/15/2023 | 825,000 | 781,688 | |||||||||||
Nuance Communications, Inc. (Software) | (b) | 5.375% | 08/15/2020 | 850,000 | 864,875 | |||||||||||
Nuance Communications, Inc. (Software) | (b) | 6.000% | 07/01/2024 | 100,000 | 100,500 | |||||||||||
PTC, Inc. (Software) | 6.000% | 05/15/2024 | 125,000 | 129,375 | ||||||||||||
Solera LLC / Solera Finance, Inc. (Software) | (b) | 10.500% | 03/01/2024 | 600,000 | 629,625 | |||||||||||
SS&C Technologies Holdings, Inc. (Software) | 5.875% | 07/15/2023 | 400,000 | 407,000 | ||||||||||||
NCR Corp. (Tech. Hardware, Storage & Periph.) | 4.625% | 02/15/2021 | 475,000 | 470,250 | ||||||||||||
NCR Corp. (Tech. Hardware, Storage & Periph.) | 5.000% | 07/15/2022 | 450,000 | 441,000 | ||||||||||||
NCR Corp. (Tech. Hardware, Storage & Periph.) | 6.375% | 12/15/2023 | 225,000 | 229,500 | ||||||||||||
|
| |||||||||||||||
| 21,749,504 | ||||||||||||||||
|
| |||||||||||||||
MATERIALS – 10.4% | ||||||||||||||||
Ashland, Inc. (Chemicals) | 4.750% | 08/15/2022 | 600,000 | 601,500 | ||||||||||||
Eco Services Operations LLC / Eco Finance Corp. (Chemicals) | (b) | 8.500% | 11/01/2022 | 325,000 | 325,000 | |||||||||||
Hexion, Inc. (Chemicals) | 6.625% | 04/15/2020 | 425,000 | 355,428 | ||||||||||||
Hexion, Inc. (Chemicals) | 8.875% | 02/01/2018 | 725,000 | 628,938 | ||||||||||||
Huntsman International LLC (Chemicals) | 4.875% | 11/15/2020 | 525,000 | 527,625 | ||||||||||||
Huntsman International LLC (Chemicals) | 5.125% | 11/15/2022 | 325,000 | 321,750 | ||||||||||||
Platform Specialty Products Corp. (Chemicals) | (b) | 6.500% | 02/01/2022 | 1,175,000 | 1,034,000 | |||||||||||
Platform Specialty Products Corp. (Chemicals) | (b) | 10.375% | 05/01/2021 | 150,000 | 151,125 | |||||||||||
PQ Corp. (Chemicals) | (b) | 6.750% | 11/15/2022 | 125,000 | 130,000 | |||||||||||
U.S. Coatings Acquisition, Inc. / Flash Dutch 2 BV (Chemicals) | (b) | 7.375% | 05/01/2021 | 675,000 | 711,281 | |||||||||||
W.R. Grace & Co. (Chemicals) | (b) | 5.125% | 10/01/2021 | 150,000 | 154,125 | |||||||||||
W.R. Grace & Co. (Chemicals) | (b) | 5.625% | 10/01/2024 | 200,000 | 205,000 | |||||||||||
Ardagh Packaging Finance PLC / Ardagh Holdings U.S.A., Inc. (Containers & Packaging) | (b) | 7.000% | 11/15/2020 | 48,529 | 47,559 | |||||||||||
| 66 | (continued) |
| Ohio National Fund, Inc. | High Income Bond Portfolio (Continued) |
Schedule of Investments | June 30, 2016 (Unaudited) |
| Corporate Bonds (Continued) | Rate | Maturity | Face Amount | Value | |||||||||||||||
MATERIALS (continued) | |||||||||||||||||||
Ardagh Packaging Finance PLC / Ardagh Holdings U.S.A., Inc. (Containers & Packaging) | (b) | 6.750% | 01/31/2021 | $ | 200,000 | $ | 202,000 | ||||||||||||
Ardagh Packaging Finance PLC / Ardagh Holdings U.S.A., Inc. (Containers & Packaging) | (b) | 6.000% | 06/30/2021 | 200,000 | 198,500 | ||||||||||||||
Ardagh Packaging Finance PLC / Ardagh Holdings U.S.A., Inc. (Containers & Packaging) | (b) | 4.625% | 05/15/2023 | 200,000 | 197,000 | ||||||||||||||
Ardagh Packaging Finance PLC / Ardagh Holdings U.S.A., Inc. (Containers & Packaging) | (b) | 7.250% | 05/15/2024 | 975,000 | 995,109 | ||||||||||||||
Ball Corp. (Containers & Packaging) | 4.000% | 11/15/2023 | 400,000 | 394,000 | |||||||||||||||
Ball Corp. (Containers & Packaging) | 5.250% | 07/01/2025 | 325,000 | 338,813 | |||||||||||||||
Berry Plastics Corp. (Containers & Packaging) | 5.500% | 05/15/2022 | 1,325,000 | 1,356,469 | |||||||||||||||
Berry Plastics Corp. (Containers & Packaging) | 5.125% | 07/15/2023 | 250,000 | 250,000 | |||||||||||||||
Berry Plastics Corp. (Containers & Packaging) | 6.000% | 10/15/2022 | 75,000 | 77,531 | |||||||||||||||
BWAY Holding Co. (Containers & Packaging) | (b) | 9.125% | 08/15/2021 | 1,050,000 | 1,005,375 | ||||||||||||||
Crown Americas LLC / Crown Americas Capital Corp. IV (Containers & Packaging) | 4.500% | 01/15/2023 | 725,000 | 739,500 | |||||||||||||||
Graphic Packaging International, Inc. (Containers & Packaging) | 4.875% | 11/15/2022 | 275,000 | 286,000 | |||||||||||||||
Owens-Brockway Glass Container, Inc. (Containers & Packaging) | (b) | 5.875% | 08/15/2023 | 225,000 | 236,345 | ||||||||||||||
Owens-Brockway Glass Container, Inc. (Containers & Packaging) | (b) | 6.375% | 08/15/2025 | 250,000 | 261,250 | ||||||||||||||
Owens-Brockway Glass Container, Inc. (Containers & Packaging) | (b) | 5.000% | 01/15/2022 | 100,000 | 100,125 | ||||||||||||||
Owens-Brockway Glass Container, Inc. (Containers & Packaging) | (b) | 5.375% | 01/15/2025 | 325,000 | 322,563 | ||||||||||||||
Pactiv LLC (Containers & Packaging) | 7.950% | 12/15/2025 | 225,000 | 233,438 | |||||||||||||||
Reynolds Group Issuer, Inc. / Reynolds Group Issuer LLC (Containers & Packaging) | 8.250% | 02/15/2021 | 650,000 | 679,978 | |||||||||||||||
Reynolds Group Issuer, Inc. / Reynolds Group Issuer LLC (Containers & Packaging) | 5.750% | 10/15/2020 | 1,025,000 | 1,058,743 | |||||||||||||||
Reynolds Group Issuer, Inc. / Reynolds Group Issuer LLC (Containers & Packaging) | (b) | 7.000% | 07/15/2024 | 50,000 | 51,475 | ||||||||||||||
Sealed Air Corp. (Containers & Packaging) | (b) | 5.250% | 04/01/2023 | 100,000 | 103,500 | ||||||||||||||
Sealed Air Corp. (Containers & Packaging) | (b) | 4.875% | 12/01/2022 | 225,000 | 231,469 | ||||||||||||||
Sealed Air Corp. (Containers & Packaging) | (b) | 5.125% | 12/01/2024 | 350,000 | 359,188 | ||||||||||||||
Sealed Air Corp. (Containers & Packaging) | (b) | 5.500% | 09/15/2025 | 400,000 | 416,500 | ||||||||||||||
Signode Industrial Group Lux SA / Signode Industrial Group U.S., Inc. (Containers & Packaging) | (b) | 6.375% | 05/01/2022 | 1,100,000 | 1,051,875 | ||||||||||||||
ArcelorMittal (Metals & Mining) | 6.125% | 06/01/2025 | 750,000 | 746,250 | |||||||||||||||
Freeport-McMoRan, Inc. (Metals & Mining) | 3.875% | 03/15/2023 | 500,000 | 437,500 | |||||||||||||||
Freeport-McMoRan, Inc. (Metals & Mining) | 5.400% | 11/14/2034 | 675,000 | 536,625 | |||||||||||||||
Steel Dynamics, Inc. (Metals & Mining) | 5.250% | 04/15/2023 | 125,000 | 127,500 | |||||||||||||||
Steel Dynamics, Inc. (Metals & Mining) | 5.125% | 10/01/2021 | 200,000 | 204,250 | |||||||||||||||
Steel Dynamics, Inc. (Metals & Mining) | 5.500% | 10/01/2024 | 350,000 | 357,875 | |||||||||||||||
Teck Resources Ltd. (Metals & Mining) | 6.125% | 10/01/2035 | 300,000 | 214,500 | |||||||||||||||
Teck Resources Ltd. (Metals & Mining) | (b) | 8.000% | 06/01/2021 | 75,000 | 77,250 | ||||||||||||||
Teck Resources Ltd. (Metals & Mining) | (b) | 8.500% | 06/01/2024 | 300,000 | 311,250 | ||||||||||||||
Wise Metals Intermediate Holdings LLC / Wise Holdings Finance Corp. (Metals & Mining) | (b)(d) | 9.750%, 10.500% PIK | 06/15/2019 | 342,062 | 184,713 | ||||||||||||||
Clearwater Paper Corp. (Paper & Forest Products) | 4.500% | 02/01/2023 | 650,000 | 631,313 | |||||||||||||||
Clearwater Paper Corp. (Paper & Forest Products) | (b) | 5.375% | 02/01/2025 | 275,000 | 275,000 | ||||||||||||||
|
| ||||||||||||||||||
| 20,444,103 | |||||||||||||||||||
|
| ||||||||||||||||||
TELECOMMUNICATION SERVICES – 5.7% | |||||||||||||||||||
Level 3 Communications, Inc. (Diversified Telecom. Svs.) | 5.750% | 12/01/2022 | 475,000 | 480,938 | |||||||||||||||
Level 3 Financing, Inc. (Diversified Telecom. Svs.) | 5.375% | 05/01/2025 | 775,000 | 769,188 | |||||||||||||||
Level 3 Financing, Inc. (Diversified Telecom. Svs.) | 5.375% | 01/15/2024 | 100,000 | 100,625 | |||||||||||||||
Neptune Finco Corp. (Diversified Telecom. Svs.) | (b) | 10.875% | 10/15/2025 | 750,000 | 858,750 | ||||||||||||||
Neptune Finco Corp. (Diversified Telecom. Svs.) | (b) | 6.625% | 10/15/2025 | 300,000 | 315,750 | ||||||||||||||
Neptune Finco Corp. (Diversified Telecom. Svs.) | (b) | 10.125% | 01/15/2023 | 300,000 | 336,000 | ||||||||||||||
Numericable-SFR SA (Diversified Telecom. Svs.) | (b) | 7.375% | 05/01/2026 | 300,000 | 296,625 | ||||||||||||||
Numericable Group SA (Diversified Telecom. Svs.) | (b) | 6.000% | 05/15/2022 | 575,000 | 559,188 | ||||||||||||||
Numericable Group SA (Diversified Telecom. Svs.) | (b) | 6.250% | 05/15/2024 | 400,000 | 382,500 | ||||||||||||||
Digicel Group Ltd. (Wireless Telecom. Svs.) | (b) | 8.250% | 09/30/2020 | 975,000 | 814,125 | ||||||||||||||
Sprint Capital Corp. (Wireless Telecom. Svs.) | 6.875% | 11/15/2028 | 825,000 | 647,625 | |||||||||||||||
Sprint Communications, Inc. (Wireless Telecom. Svs.) | 6.000% | 11/15/2022 | 875,000 | 688,538 | |||||||||||||||
Sprint Corp. (Wireless Telecom. Svs.) | 7.875% | 09/15/2023 | 900,000 | 735,750 | |||||||||||||||
Sprint Corp. (Wireless Telecom. Svs.) | 7.125% | 06/15/2024 | 325,000 | 257,156 | |||||||||||||||
Sprint Corp. (Wireless Telecom. Svs.) | 7.625% | 02/15/2025 | 250,000 | 197,813 | |||||||||||||||
Sprint Nextel Corp. (Wireless Telecom. Svs.) | (b) | 7.000% | 03/01/2020 | 350,000 | 366,447 | ||||||||||||||
Syniverse Holdings, Inc. (Wireless Telecom. Svs.) | 9.125% | 01/15/2019 | 725,000 | 355,250 | |||||||||||||||
T-Mobile U.S.A., Inc. (Wireless Telecom. Svs.) | 6.625% | 11/15/2020 | 875,000 | 902,344 | |||||||||||||||
T-Mobile U.S.A., Inc. (Wireless Telecom. Svs.) | 6.731% | 04/28/2022 | 75,000 | 78,866 | |||||||||||||||
T-Mobile U.S.A., Inc. (Wireless Telecom. Svs.) | 6.125% | 01/15/2022 | 200,000 | 209,750 | |||||||||||||||
T-Mobile U.S.A., Inc. (Wireless Telecom. Svs.) | 6.500% | 01/15/2024 | 625,000 | 657,813 | |||||||||||||||
T-Mobile U.S.A., Inc. (Wireless Telecom. Svs.) | 6.625% | 04/01/2023 | 450,000 | 475,704 | |||||||||||||||
T-Mobile U.S.A., Inc. (Wireless Telecom. Svs.) | 6.000% | 03/01/2023 | 150,000 | 155,250 | |||||||||||||||
T-Mobile U.S.A., Inc. (Wireless Telecom. Svs.) | 6.375% | 03/01/2025 | 225,000 | 235,125 | |||||||||||||||
T-Mobile U.S.A., Inc. (Wireless Telecom. Svs.) | 6.500% | 01/15/2026 | 325,000 | 342,875 | |||||||||||||||
|
| ||||||||||||||||||
| 11,219,995 | |||||||||||||||||||
|
| ||||||||||||||||||
| 67 | (continued) |
| Ohio National Fund, Inc. | High Income Bond Portfolio (Continued) |
Schedule of Investments | June 30, 2016 (Unaudited) |
| Corporate Bonds (Continued) | Rate | Maturity | Face Amount | Value | ||||||||||||
UTILITIES – 3.1% | ||||||||||||||||
AmeriGas Partners LP / AmeriGas Finance Corp. (Gas Utilities) | 5.625% | 05/20/2024 | $ | 250,000 | $ | 251,875 | ||||||||||
AmeriGas Partners LP / AmeriGas Finance Corp. (Gas Utilities) | 5.875% | 08/20/2026 | 700,000 | 701,750 | ||||||||||||
Ferrellgas LP / Ferrellgas Finance Corp. (Gas Utilities) | 6.500% | 05/01/2021 | 450,000 | 412,875 | ||||||||||||
Ferrellgas LP / Ferrellgas Finance Corp. (Gas Utilities) | 6.750% | 01/15/2022 | 500,000 | 455,000 | ||||||||||||
Ferrellgas LP / Ferrellgas Finance Corp. (Gas Utilities) | (b) | 6.750% | 06/15/2023 | 200,000 | 175,500 | |||||||||||
Suburban Propane Partners LP / Suburban Energy Finance Corp. (Gas Utilities) | 7.375% | 08/01/2021 | 372,000 | 387,113 | ||||||||||||
Suburban Propane Partners LP / Suburban Energy Finance Corp. (Gas Utilities) | 5.500% | 06/01/2024 | 825,000 | 810,563 | ||||||||||||
Calpine Corp. (Ind. Power & Renewable Elec.) | 5.750% | 01/15/2025 | 1,275,000 | 1,239,938 | ||||||||||||
NRG Energy, Inc. (Ind. Power & Renewable Elec.) | 6.625% | 03/15/2023 | 75,000 | 73,875 | ||||||||||||
NRG Energy, Inc. (Ind. Power & Renewable Elec.) | 6.250% | 05/01/2024 | 975,000 | 928,083 | ||||||||||||
NRG Energy, Inc. (Ind. Power & Renewable Elec.) | (b) | 7.250% | 05/15/2026 | 250,000 | 248,750 | |||||||||||
TerraForm Power Operating, LLC (Ind. Power & Renewable Elec.) | (b) | 5.875% | 02/01/2023 | 375,000 | 356,925 | |||||||||||
TerraForm Power Operating, LLC (Ind. Power & Renewable Elec.) | (b) | 6.125% | 06/15/2025 | 150,000 | 141,750 | |||||||||||
FPL Energy National Wind Portfolio LLC (Acquired 05/27/2009, Cost $10,393) (Multi-Utilities) | (b)(e) | 6.125% | 03/25/2019 | 11,130 | 11,130 | |||||||||||
|
| |||||||||||||||
| 6,195,127 | ||||||||||||||||
|
| |||||||||||||||
Total Corporate Bonds (Cost $195,128,365) | $ | 189,840,446 | ||||||||||||||
|
| |||||||||||||||
| Common Stocks – 0.0% | Shares | Value | ||||||||||||||
ENERGY – 0.0% | ||||||||||||||||
Lone Pine Resources Canada Ltd. (Acquired 07/10/2012, Cost $48,613)(Oil, Gas & Consumable Fuels) | (a)(c)(e) | 6,236 | $ | 10,788 | ||||||||||||
|
| |||||||||||||||
Total Common Stocks (Cost $48,613) | $ | 10,788 | ||||||||||||||
|
| |||||||||||||||
| Money Market Funds – 2.2% | Shares | Value | ||||||||||||||
State Street Institutional Liquid Reserves Fund | 1,410,458 | $ | 1,410,458 | |||||||||||||
State Street Institutional U.S. Government Money Market Fund | 2,963,065 | 2,963,065 | ||||||||||||||
|
| |||||||||||||||
Total Money Market Funds (Cost $4,373,523) | $ | 4,373,523 | ||||||||||||||
|
| |||||||||||||||
Total Investments – 98.9% (Cost $199,550,501) | (f) | $ | 194,224,757 | |||||||||||||
Other Assets in Excess of Liabilities – 1.1% | 2,158,978 | |||||||||||||||
|
| |||||||||||||||
Net Assets – 100.0% | $ | 196,383,735 | ||||||||||||||
|
| |||||||||||||||
Percentages are stated as a percent of net assets.
Abbreviations:
PIK: Payment-in-Kind
QL: Quarterly U.S. LIBOR Rate, 0.654% on 06/30/2016
Footnotes:
| (a) | Non-income producing security. |
| (b) | Security exempt from registration under Regulation D of the Securities Act of 1933. These securities may be resold in transactions exempt from registration, normally to qualified buyers under Rule 144A. At June 30, 2016, the value of these securities totaled $94,402,842, or 48.1% of the Portfolio’s net assets. Unless also noted with (e), as defined below, these securities were deemed liquid pursuant to procedures approved by the Board of Directors. |
| (c) | A market quotation for this investment was not readily available at June 30, 2016. As discussed in Note 2 of the Notes to Financial Statements, the price for this issue was derived from an estimate of fair market value using methods determined in good faith by the Fund’s Pricing Committee under supervision of the Board. This security represents $10,788 or 0.0% of the Portfolio’s net assets. |
| (d) | Issuer of the security has the option to make coupon payments in cash or in additional par value of this bond (Payment-in-Kind). |
| (e) | Represents a security deemed to be illiquid. At June 30, 2016, the value of illiquid securities in the Portfolio totaled $357,918, or 0.2% of the Portfolio’s net assets. |
| (f) | Represents cost for financial reporting purposes, which may differ from cost basis for federal income tax purposes. See also Note 7 of the Notes to Financial Statements. |
The accompanying notes are an integral part of these financial statements.
| 68 |
| Ohio National Fund, Inc. | ClearBridge Small Cap Portfolio |
Objective/Strategy
The ClearBridge Small Cap Portfolio seeks long-term capital appreciation by investing at least 80% of its net assets in common stocks and other equity securities of small capitalization companies or in other investments that the portfolio managers believe have similar economic characteristics.
Performance as of June 30, 2016
Average Annual returns: | ||||
One year | -1.36% | |||
Five years | 6.80% | |||
Ten years | 8.55% |
Past performance does not guarantee future results. The performance data quoted represents past performance and current returns may be lower or higher. Total return figures include change in share price and reinvestment of dividends and capital gains. The investment return and principal value will fluctuate so that an investor’s shares, when redeemed, may be worth more or less than the original cost. To obtain performance information up to the most recent month end, call toll-free 1-877-781-6392.
The Portfolio is not open to direct retail investment. Beneficial interest in shares is obtained solely by purchase of variable life insurance policies and variable annuity contracts. Actual performance results for variable annuity and variable universal life contracts will be lower due to contract charges. Consult your contract for applicable charges.
Comments
For the six-month period ended June 30, 2016, the ClearBridge Small Cap Portfolio returned 8.50% versus 2.22% for its benchmark, the Russell 2000 Index.
Major indices opened the year with losses between 5% and 8% in January amid weak fourth quarter earnings announcements and downward pressure on oil prices. However, stocks rallied in late February and into March and traded roughly flat for the majority of the second quarter. Investors looked past a terrorist attack in Belgium and largely focused on the recovery in oil, a relatively weaker dollar, generally positive economic reports and dovish indications from the Federal Reserve (“Fed”). Stocks continued to show resiliency in the final weeks of the period despite the United Kingdom’s vote to leave the European Union (���EU”), commonly referred to as “Brexit.” While the market was hit hard by Brexit, major indices rebounded in the final trading days of the quarter to finish with modest gains, as the heads of the United Kingdom and EU central banks stressed that they were prepared to act to mitigate Brexit-related economic stress.
Minutes from the Fed’s December 2015 meeting showed that the decision to raise short-term rates was unanimous, but committee members expressed concern over low inflation, sluggish global growth and the U.S. dollar’s strength against foreign currencies. The committee held rates steady after the January meeting, but several officials indicated hopes for another rate hike sooner rather than later this year. Fed Chair Janet Yellen acknowledged that market turmoil has significantly tightened financial conditions and quashed these hawkish views when she offered a dovish tone several weeks later. The run-up to Brexit, and the vote itself, induced volatility and broader concern about the state of the global markets. Just prior to the vote, the implied probability of a Fed rate hike by the December Federal Open Market Committee (“FOMC”) meeting was a coin toss, but the Brexit results and more recent cautious comments from Federal Reserve leaders has futures markets pushing back the likely timeline for a rate hike far into 2017. The 10-year U.S. Treasury yield
fluctuated dramatically during the first half, falling as low as 1.66% and climbing to nearly 2% in early March, before falling below 1.5% for the first time in four years after the Brexit vote. The U.S. dollar eased against a basket of foreign currencies in the first quarter to provide some relief for U.S. exporters, and closed June nearly 4% below its November high.
U.S. economic indicators were mixed-to-positive during the first half of the year. Annualized U.S. Gross Domestic Product (GDP) growth from the first quarter was 1.1%, slightly softer than the 1.4% registered during the fourth quarter of 2015. Employment growth was robust, other than weak reports in April and May, and the 287,000 jobs added in June marked the strongest month since October. Meanwhile, the unemployment rate oscillated between 4.7% and 5.0% and wage growth continued to improve, with June’s wages 2.6% above their levels last year. Finally, retail sales increased in back-to-back months in April and May, for the first time since late-2015, to shrug off a weak first quarter.
Oil prices recovered from their sub-$30 per barrel February lows, rising to stabilize between $45 and $50 per barrel in May and June, as supply tempered in non-OPEC countries. This recovery and stabilization supported energy stocks in the first half of 2016 and helped reduce volatility across the market for most of May and June. Meanwhile, market expectations of “lower rates for longer” and margin concerns led to a pullback in financial stocks, particularly banks, which were hit hard after Brexit. The S&P 500 Financials Index fell 3% in the first half of the year. However, banks received good news at the end of June when the Fed announced the results of its Comprehensive Capital Analysis and Review, more commonly known as CCAR, in which 30 of 33 bank holding companies (BHCs) passed, and which showed the overall Common Equity Tier 1 Ratio for all 33 BHCs had more than doubled from 5.5% in the first quarter of 2009 to 12.2% for this year. Information Technology was the only other sector with a negative return in the first half of the year. Stocks in defensive sectors with higher yields performed well in the first half, with the S&P 500 Telecommunications Services, Utilities and Consumer Staples indices up 24.8%, 23.4% and 10.5%, respectively. Materials and Industrials stocks also performed well in the first half. The S&P 500 Health Care and Consumer Discretionary indices posted small gains of 0.4% and 0.7%, respectively.
Relative Portfolio outperformance was primarily driven by security selection in Health Care and Materials. Stock selection in other sectors, and sector allocation effects overall, also contributed to outperformance during the period. (1)
U.S. Silica Holdings, Inc., Steel Dynamics, Inc., TreeHouse Foods, Inc., HealthEquity, Inc. and Hi-Crush Partners LP were the largest contributors to performance, while the largest detractors included OneMain Holdings, Inc., Quotient Ltd., DHI Group, Inc., PRA Group, Inc. and ePlus, Inc. (1)
U.S. Silica Holdings, Inc., a provider of silica sand for shale oil extraction, was a top contributor, advancing 83.1% in the first half of the year on oil price stability and a rebound in energy stocks. Given that the stock appreciated nicely since the doldrums of January and February this year, we trimmed our position to invest in Hi-Crush Partners LP, another name in the sand proppant space with what we see as upside potential. (1)
Steel Dynamics, Inc. shares surged nearly 40% in the first half of 2016 to its highest level since 2008. The stock had sold off in 2015, as weak demand in China and exposure to the flagging U.S. energy industry resulted in weak steel prices. Steel prices and the margin between scrap and finished steel products have improved, as China
| 69 | (continued) |
| Ohio National Fund, Inc. | ClearBridge Small Cap Portfolio (Continued) |
has cut back on production and as U.S. demand has improved, particularly in the non-residential construction and automotive industries. We trimmed our position in Steel Dynamics, Inc., as the market began to appreciate the scrap price arbitrage, and the gap between stock price and our estimate of intrinsic value narrowed. (1)
TreeHouse Foods, Inc. was a top contributor in the first half of 2016, gaining 30% after beating earnings estimates. The company continues to send encouraging signs from its recent $2.7 billion acquisition of ConAgra Foods, Inc.’s private-label business, despite overall weakness in the packaged food industry. Revenue jumped 62% year-over-year in the most recent quarter, and management announced that it expects net sales to double this year as a result of the deal. We believe TreeHouse Foods, Inc. has opportunity to consolidate further in a fragmented, low-margin industry. (1)
OneMain Holdings, Inc. shares sold off sharply in the early part of the year as investors appeared concerned about liquidity and temporarily higher leverage following the Springleaf Finance Corp./OneMain Holdings, Inc. merger. The company has forcefully addressed its liquidity position, yet the market has not adequately rewarded the stock. In addition to broader unease about the U.S. economy, fresh concerns surrounding OneMain Holdings, Inc.’s subprime credit exposure, particularly in autos, now weighs on the share price. In reality, OneMain Holdings, Inc. has minimal auto purchase exposure. Instead, the company engages in well-underwritten auto refinance lending where interest rates are higher, loss content is lower, and thus returns superior to the subprime auto lending market broadly. We believe that the current valuation, which is embedding high odds of a material consumer recession, is overly pessimistic. Finally, while the market is embedding negative consumer receivables growth, we expect the company to deliver mid-teens growth, though this could prove conservative given strong loan demand. We recently added to our position, given that our analysis of OneMain Holdings, Inc. points to a favorable risk/reward skew. (1)
After closing 2015 as a top contributor, Quotient Ltd. detracted from performance in the first quarter on little incremental information. In general, it was a tough quarter for money-losing, small-cap companies, particularly those within the Health Care sector. The fundamentals driving our investment case for the company’s flagship MosaiQ platform, an automation platform for blood grouping and serological disease screening, remain intact. We maintain our confidence that the company will deliver on its plans for a commercial launch in Europe by the end of 2016 and in the U.S. early in 2018, and we believe the platform will dominate the market. (1)
DHI Group, Inc. shares have underperformed this year, as revenues have come under pressure and investors have grown concerned over increased competition from LinkedIn Corp. and other smaller talent recruitment companies. DHI Group, Inc.’s energy product, Rigzone, faces the challenges of a depressed commodity price environment. Additionally, the company recently faced negative headlines surrounding Rigzone’s former CEO’s alleged attempt to steal customer data. DHI Group, Inc.’s issues are real, but management is investing heavily in delivering new products to market to grow its revenue base and diversify its product portfolio from macro risk. At less than 6x EBITDA, shares do not adequately reflect the potential business value, and thus we maintain our position. (1)
It should come as no surprise that the most significant and remarked upon market event of the quarter was the United Kingdom’s unexpected vote to leave the European Union on June 23rd. This outcome was startling, as most put long odds on it (approximately 25% prior to voting at PredictWise.com and an 11/4 payoff at
Britain’s William Hill) and the ramifications are potentially far reaching. It is tempting to craft a narrative about what the vote may mean for the future, but this is a complex, uncertain situation, as market volatility over the five days to close the quarter suggests. We offer no such narrative. We are not macro economists or political scientists, and will thus leave it to the pundits to prognosticate the future of the global economy. Instead, these uncertain times emphasize the importance of our research process that focuses on evaluating investment options under a variety of scenarios, and investing only when the probability-weighted value of the security in these scenarios produces upside to the current price with a margin of safety.
Our approach to stock selection and portfolio construction reduces the importance of correctly predicting the future, which we do not believe is critical to success as an investor. In fact, we see it as a fool’s errand with little chance for repeatable success. Instead, we believe greater odds of success over time come from understanding how both individual stock values and the overall portfolio value change under different conditions, combined with gauging and updating probabilities of these conditions coming to bear. Surprising events occur all the time and none of us holds perfect knowledge of the future. We endeavor to offset this fundamental reality and build a resilient portfolio that can withstand the risk of low-probability, high-impact events through probabilistic analysis and portfolio construction.
| (1) | The Portfolio’s composition is subject to change. Holdings and weightings are as of June 30, 2016. |
Change in Value of $10,000 Investment
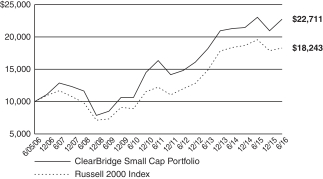
Hypothetical illustration based on past performance. Future performance will vary. The Portfolio’s returns reflect reinvested dividends. The Portfolio’s holdings may differ significantly from the securities in the index. The index is unmanaged and therefore does not reflect the cost of portfolio management and accounting.
The Russell 2000 Index measures the performance of the small-cap segment of the U.S equity universe. The Russell 2000 Index includes the 2000 firms from the Russell 3000 Index with the smallest market capitalizations. The Russell 3000 Index represents 98% of the investable U.S. equity market. The index presented herein includes the effects of reinvested dividends.
| 70 | (continued) |
| Ohio National Fund, Inc. | ClearBridge Small Cap Portfolio (Continued) |
Portfolio Composition as of June 30, 2016 (1)
| % of Net Assets | ||||
Common Stocks (4) | 98.0 | |||
Master Limited Partnerships (4) | 1.1 | |||
Money Market Funds | 0.9 | |||
|
| |||
| 100.0 | ||||
|
|
Top 10 Portfolio Holdings as of June 30, 2016 (1) (2) (3)
| % of Net Assets | ||||
1. Service Corp. International | 2.2 | |||
2. TreeHouse Foods, Inc. | 2.2 | |||
3. HealthEquity, Inc. | 2.2 | |||
4. Murphy U.S.A., Inc. | 2.1 | |||
5. Gentex Corp. | 1.9 | |||
6. American Homes 4 Rent | 1.8 | |||
7. ProAssurance Corp. | 1.8 | |||
8. Press Ganey Holdings, Inc. | 1.7 | |||
9. Landstar System, Inc. | 1.7 | |||
10. Q2 Holdings, Inc. | 1.7 |
| (1) | Composition of Portfolio subject to change. |
| (2) | Short-term investments have been excluded from the list of Top 10 Portfolio Holdings. |
| (3) | Top 10 Portfolio Holdings is presented at an individual security level. Total investment exposure by issuer may be higher. |
| (4) | Sectors (Common Stocks, Master Limited Partnerships): |
| % of Net Assets | ||||
Financials | 23.7 | |||
Information Technology | 18.9 | |||
Consumer Discretionary | 14.6 | |||
Industrials | 14.6 | |||
Health Care | 12.8 | |||
Consumer Staples | 4.1 | |||
Utilities | 3.7 | |||
Materials | 3.7 | |||
Energy | 3.0 | |||
|
| |||
| 99.1 | ||||
|
|
| 71 |
| Ohio National Fund, Inc. | ClearBridge Small Cap Portfolio |
Schedule of Investments | June 30, 2016 (Unaudited) |
| Common Stocks – 98.0% | Shares | Value | ||||||||
CONSUMER DISCRETIONARY – 14.6% |
| |||||||||
Gentex Corp. (Auto Components) | 115,960 | $ | 1,791,582 | |||||||
Service Corp. International (Diversified Consumer Svs.) | 76,240 | 2,061,530 | ||||||||
Chuy’s Holdings, Inc. (Hotels, Restaurants & Leisure) | (a) | 32,850 | 1,136,938 | |||||||
Fogo De Chao, Inc. (Hotels, Restaurants & Leisure) | (a) | 45,250 | 590,965 | |||||||
Planet Fitness, Inc. Class A (Hotels, Restaurants & Leisure) | (a) | 58,290 | 1,100,515 | |||||||
Potbelly Corp. (Hotels, Restaurants & Leisure) | (a) | 79,920 | 1,002,197 | |||||||
Red Robin Gourmet Burgers, Inc. (Hotels, Restaurants & Leisure) | (a) | 18,480 | 876,506 | |||||||
Taylor Morrison Home Corp. Class A (Household Durables) | (a) | 55,150 | 818,426 | |||||||
Gray Television, Inc. (Media) | (a) | 74,160 | 804,636 | |||||||
Monro Muffler Brake, Inc. (Specialty Retail) | 24,230 | 1,540,059 | ||||||||
Murphy U.S.A., Inc. (Specialty Retail) | (a) | 25,850 | 1,917,036 | |||||||
|
| |||||||||
| 13,640,390 | ||||||||||
|
| |||||||||
CONSUMER STAPLES – 4.1% | ||||||||||
United Natural Foods, Inc. (Food & Staples Retailing) | (a) | 28,240 | 1,321,632 | |||||||
TreeHouse Foods, Inc. (Food Products) | (a) | 19,897 | 2,042,427 | |||||||
Inter Parfums, Inc. (Personal Products) | 17,160 | 490,261 | ||||||||
|
| |||||||||
| 3,854,320 | ||||||||||
|
| |||||||||
ENERGY – 3.0% | ||||||||||
Frank’s International NV (Energy Equip. & Svs.) | 60,990 | 891,064 | ||||||||
U.S. Silica Holdings, Inc. (Energy Equip. & Svs.) | 35,484 | 1,223,134 | ||||||||
Sanchez Energy Corp. (Oil, Gas & Consumable Fuels) | (a) | 92,390 | 652,273 | |||||||
|
| |||||||||
| 2,766,471 | ||||||||||
|
| |||||||||
FINANCIALS – 23.7% | ||||||||||
First Interstate BancSystem, Inc. Class A (Banks) | 55,420 | 1,557,302 | ||||||||
Hancock Holding Co. (Banks) | 42,500 | 1,109,675 | ||||||||
LegacyTexas Financial Group, Inc. (Banks) | 58,480 | 1,573,697 | ||||||||
Popular, Inc. (Banks) | 35,230 | 1,032,239 | ||||||||
Talmer Bancorp, Inc. Class A (Banks) | 53,630 | 1,028,087 | ||||||||
Main Street Capital Corp. (Capital Markets) | 43,142 | 1,417,215 | ||||||||
PennantPark Investment Corp. (Capital Markets) | 126,909 | 866,789 | ||||||||
Triangle Capital Corp. (Capital Markets) | 50,637 | 981,345 | ||||||||
OneMain Holdings, Inc. (Consumer Finance) | (a) | 61,730 | 1,408,679 | |||||||
PRA Group, Inc. (Consumer Finance) | (a) | 25,847 | 623,946 | |||||||
MarketAxess Holdings, Inc. (Diversified Financial Svs.) | 8,610 | 1,251,894 | ||||||||
Assured Guaranty Ltd. (Insurance) | 40,240 | 1,020,889 | ||||||||
ProAssurance Corp. (Insurance) | 30,540 | 1,635,417 | ||||||||
American Homes 4 Rent (Real Estate Investment Trusts) | 80,180 | 1,642,086 | ||||||||
Lexington Realty Trust (Real Estate Investment Trusts) | 92,440 | 934,568 | ||||||||
Potlatch Corp. (Real Estate Investment Trusts) | 36,350 | 1,239,535 | ||||||||
Summit Hotel Properties, Inc. (Real Estate Investment Trusts) | 92,420 | 1,223,641 | ||||||||
Washington Federal, Inc. (Thrifts & Mortgage Finance) | 64,260 | 1,558,948 | ||||||||
|
| |||||||||
| 22,105,952 | ||||||||||
|
| |||||||||
HEALTH CARE – 12.8% | ||||||||||
Amarin Corp. PLC – ADR (Biotechnology) | (a) | 360,000 | 777,600 | |||||||
Ironwood Pharmaceuticals, Inc. (Biotechnology) | (a) | 52,240 | 683,038 | |||||||
Ligand Pharmaceuticals, Inc. (Biotechnology) | (a) | 8,730 | 1,041,227 | |||||||
Endologix, Inc. (Health Care Equip. & Supplies) | (a) | 98,210 | 1,223,697 | |||||||
LivaNova PLC (Health Care Equip. & Supplies) | (a) | 13,718 | 689,055 | |||||||
Quotient Ltd. (Health Care Equip. & Supplies) | (a) | 119,900 | 929,225 | |||||||
Brookdale Senior Living, Inc. (Health Care Providers & Svs.) | (a) | 33,610 | 518,938 | |||||||
HealthEquity, Inc. (Health Care Providers & Svs.) | (a) | 66,160 | 2,010,272 | |||||||
Molina Healthcare, Inc. (Health Care Providers & Svs.) | (a) | 16,890 | 842,811 | |||||||
| Common Stocks (Continued) | Shares | Value | ||||||||
HEALTH CARE (continued) | ||||||||||
Surgical Care Affiliates, Inc. (Health Care Providers & Svs.) | (a) | 21,846 | $ | 1,041,399 | ||||||
Press Ganey Holdings, Inc. (Health Care Technology) | (a) | 41,070 | 1,616,104 | |||||||
INC Research Holdings, Inc. Class A (Life Sciences Tools & Svs.) | (a) | 15,790 | 602,073 | |||||||
|
| |||||||||
| 11,975,439 | ||||||||||
|
| |||||||||
INDUSTRIALS – 14.6% | ||||||||||
HEICO Corp. (Aerospace & Defense) | 19,900 | 1,329,519 | ||||||||
Allegiant Travel Co. (Airlines) | 5,650 | 855,975 | ||||||||
Continental Building Products, Inc. (Building Products) | (a) | 59,610 | 1,325,130 | |||||||
Copart, Inc. (Commercial Svs. & Supplies) | (a) | 24,960 | 1,223,290 | |||||||
CIRCOR International, Inc. (Machinery) | 16,530 | 942,045 | ||||||||
Matson, Inc. (Marine) | 30,800 | 994,532 | ||||||||
ICF International, Inc. (Professional Svs.) | (a) | 32,120 | 1,313,708 | |||||||
Landstar System, Inc. (Road & Rail) | 23,111 | 1,586,801 | ||||||||
Marten Transport Ltd. (Road & Rail) | 41,480 | 821,304 | ||||||||
GATX Corp. (Trading Companies & Distributors) | 29,470 | 1,295,796 | ||||||||
Rush Enterprises, Inc. Class A (Trading Companies & Distributors) | (a) | 48,470 | 1,044,528 | |||||||
TAL International Group, Inc. (Trading Companies & Distributors) | 66,770 | 895,386 | ||||||||
|
| |||||||||
| 13,628,014 | ||||||||||
|
| |||||||||
INFORMATION TECHNOLOGY – 18.9% | ||||||||||
ePlus, Inc. (Electronic Equip., Instr. & Comp.) | (a) | 13,930 | 1,139,335 | |||||||
Methode Electronics, Inc. (Electronic Equip., Instr. & Comp.) | 44,430 | 1,520,839 | ||||||||
2U, Inc. (Internet Software & Svs.) | (a) | 45,950 | 1,351,389 | |||||||
Criteo SA – ADR (Internet Software & Svs.) | (a) | 23,240 | 1,067,181 | |||||||
DHI Group, Inc. (Internet Software & Svs.) | (a) | 117,950 | 734,829 | |||||||
Q2 Holdings, Inc. (Internet Software & Svs.) | (a) | 56,550 | 1,584,531 | |||||||
WebMD Health Corp. (Internet Software & Svs.) | (a) | 18,340 | 1,065,737 | |||||||
CSG Systems International, Inc. (IT Svs.) | 36,480 | 1,470,509 | ||||||||
EVERTEC, Inc. (IT Svs.) | 77,010 | 1,196,735 | ||||||||
Applied Micro Circuits Corp. (Semiconductors & Equip.) | (a) | 166,140 | 1,066,619 | |||||||
Power Integrations, Inc. (Semiconductors & Equip.) | 19,390 | 970,857 | ||||||||
Semtech Corp. (Semiconductors & Equip.) | (a) | 51,620 | 1,231,653 | |||||||
Veeco Instruments, Inc. (Semiconductors & Equip.) | (a) | 59,610 | 987,142 | |||||||
AVG Technologies NV (Software) | (a) | 63,010 | 1,196,560 | |||||||
Manhattan Associates, Inc. (Software) | (a) | 16,588 | 1,063,788 | |||||||
|
| |||||||||
| 17,647,704 | ||||||||||
|
| |||||||||
MATERIALS – 2.6% | ||||||||||
Balchem Corp. (Chemicals) | 25,850 | 1,541,953 | ||||||||
Steel Dynamics, Inc. (Metals & Mining) | 36,098 | 884,401 | ||||||||
|
| |||||||||
| 2,426,354 | ||||||||||
|
| |||||||||
UTILITIES – 3.7% | ||||||||||
PNM Resources, Inc. (Electric Utilities) | 36,490 | 1,293,206 | ||||||||
Portland General Electric Co. (Electric Utilities) | 28,950 | 1,277,274 | ||||||||
Dynegy, Inc. (Ind. Power & Renewable Elec.) | (a) | 54,330 | 936,649 | |||||||
|
| |||||||||
| 3,507,129 | ||||||||||
|
| |||||||||
Total Common Stocks (Cost $86,343,248) | $ | 91,551,773 | ||||||||
|
| |||||||||
| Master Limited Partnerships – 1.1% | Shares | Value | ||||||||
MATERIALS – 1.1% | ||||||||||
Hi-Crush Partners LP (Metals & Mining) | 76,463 | $ | 999,371 | |||||||
|
| |||||||||
Total Master Limited Partnerships (Cost $585,217) | $ | 999,371 | ||||||||
|
| |||||||||
| 72 | (continued) |
| Ohio National Fund, Inc. | ClearBridge Small Cap Portfolio (Continued) |
Schedule of Investments | June 30, 2016 (Unaudited) |
| Money Market Funds – 2.1% | Shares | Value | ||||||||
State Street Institutional Liquid Reserves Fund Institutional Class | 686,079 | $ | 686,079 | |||||||
State Street Institutional U.S. Government Money Market Fund Institutional Class | 1,271,893 | 1,271,893 | ||||||||
|
| |||||||||
Total Money Market Funds (Cost $1,957,972) | $ | 1,957,972 | ||||||||
|
| |||||||||
Total Investments – 101.2% (Cost $88,886,437) | (b) | $ | 94,509,116 | |||||||
Liabilities in Excess of Other Assets – (1.2)% | (1,079,534) | |||||||||
|
| |||||||||
Net Assets – 100.0% | $ | 93,429,582 | ||||||||
|
| |||||||||
Percentages are stated as a percent of net assets.
Abbreviations:
ADR: American Depositary Receipts
Footnotes:
| (a) | Non-income producing security. |
| (b) | Represents cost for financial reporting purposes, which may differ from cost basis for federal income tax purposes. See also Note 7 of the Notes to Financial Statements. |
The accompanying notes are an integral part of these financial statements.
| 73 |
| Ohio National Fund, Inc. | Nasdaq-100® Index Portfolio |
Objective/Strategy
The Nasdaq-100® Index Portfolio seeks long-term growth of capital by investing primarily in stocks that are included in the Nasdaq-100® Index. Unlike the other Portfolios of the Fund, the Nasdaq-100® Index Portfolio is a non-diversified portfolio for purposes of Section 5(b) of the Investment Company Act of 1940, as amended.
Performance as of June 30, 2016
Average Annual returns: | ||||
One year | 1.17% | |||
Five years | 14.51% | |||
Ten years | 11.27% |
Past performance does not guarantee future results. The performance data quoted represents past performance and current returns may be lower or higher. Total return figures include change in share price and reinvestment of dividends and capital gains. The investment return and principal value will fluctuate so that an investor’s shares, when redeemed, may be worth more or less than the original cost. To obtain performance information up to the most recent month end, call toll-free 1-877-781-6392.
The Portfolio is not open to direct retail investment. Beneficial interest in shares is obtained solely by purchase of variable life insurance policies and variable annuity contracts. Actual performance results for variable annuity and variable universal life contracts will be lower due to contract charges. Consult your contract for applicable charges.
Comments
For the six-month period ended June 30, 2016, the Nasdaq-100® Index Portfolio returned -3.47% versus -3.17% for its benchmark, the Nasdaq-100® Index.
The largest contributors to the Portfolio and benchmark returns for the six-month period were Comcast Corp. Class A, Facebook, Inc., The Kraft Heinz Co., Amazon.com, Inc., and Cisco Systems, Inc. The largest detractors from the Portfolio and benchmark returns for the six-month period were Apple, Inc., Microsoft Corp., Gilead Sciences, Inc., Alphabet, Inc. Class C, and Alphabet, Inc. Class A. (1)
The Portfolio is managed on a risk-controlled basis and is constructed to closely replicate its benchmark index. The expected sources of performance variance include the impact of trading daily cash flows, including trading commissions, and the operating expenses of the Portfolio.
Effective May 2, 2016, the Portfolio has been sub-advised by Geode Capital Management, LLC (“Geode”). Prior to that date, the portfolio management of the Portfolio was performed by Ohio National Investment, Inc. (ONI), the adviser to the Portfolio.
Since May 2, 2016, the Portfolio has held E-mini Nasdaq-100 futures contracts for the purposes of efficiently managing daily cash flows and gaining market exposure for dividend receivables. The futures position did not have a material impact on performance (less than 1 basis point) during the period in which Geode was the sub-adviser to the Portfolio, nor the six-month period ended June 30, 2016. (1)
| (1) | The Portfolio’s composition is subject to change. Holdings and weightings are as of June 30, 2016. |
Change in Value of $10,000 Investment
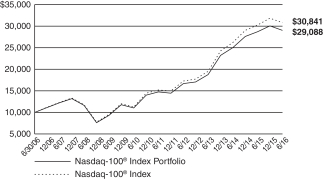
Hypothetical illustration based on past performance. Future performance will vary. The Portfolio’s returns reflect reinvested dividends. The Portfolio’s holdings may differ significantly from the securities in the index. The index is unmanaged and therefore does not reflect the cost of portfolio management and accounting. Investors cannot invest in an index. Although they can invest in its underlying securities or funds.
The Nasdaq-100® Index is a modified capitalization-weighted index of the 100 largest domestic and international non-financial companies listed on the NASDAQ Stock Market. The index presented herein includes the effects of reinvested dividends.
The Nasdaq-100®, Nasdaq-100 Index®, and Nasdaq® are registered trademarks of The NASDAQ OMX Group, Inc. (which with its affiliates is referred to as “NASDAQ OMX”). Ohio National Investments, Inc. has licensed these marks for the Portfolio’s use. NASDAQ OMX has not passed on the Portfolio’s legality or suitability. NASDAQ OMX does not sponsor, endorse, sell or promote the Portfolio. NASDAQ OMX MAKES NO WARRANTIES AND BEARS NO LIABILITY WITH RESPECT TO THE PORTFOLIO.
| 74 | (continued) |
| Ohio National Fund, Inc. | Nasdaq-100® Index Portfolio (Continued) |
Portfolio Composition as of June 30, 2016 (1)
| % of Net Assets | ||||
Common Stocks (4) | 96.6 | |||
Money Market Funds and | 3.4 | |||
|
| |||
| 100.0 | ||||
|
|
Top 10 Portfolio Holdings as of June 30, 2016 (1) (2) (3)
| % of Net Assets | ||||
1. Apple, Inc. | 9.9 | |||
2. Microsoft Corp. | 7.6 | |||
3. Amazon.com, Inc. | 6.4 | |||
4. Facebook, Inc. Class A | 5.0 | |||
5. Alphabet, Inc. Class C | 4.5 | |||
6. Alphabet, Inc. Class A | 3.9 | |||
7. Comcast Corp. Class A | 3.0 | |||
8. Intel Corp. | 2.9 | |||
9. Cisco Systems, Inc. | 2.7 | |||
10. Amgen, Inc. | 2.2 |
| (1) | Composition of Portfolio subject to change. |
| (2) | Short-term investments have been excluded from the list of Top 10 Portfolio Holdings. |
| (3) | Top 10 Portfolio Holdings is presented at an individual security level. Total investment exposure by issuer may be higher. |
| (4) | Sectors (Common Stocks): |
| % of Net Assets | ||||
Information Technology | 53.3 | |||
Consumer Discretionary | 21.2 | |||
Health Care | 12.0 | |||
Consumer Staples | 7.2 | |||
Industrials | 1.8 | |||
Telecommunication Services | 1.1 | |||
|
| |||
| 96.6 | ||||
|
|
| 75 |
| Ohio National Fund, Inc. | Nasdaq-100® Index Portfolio |
Schedule of Investments | June 30, 2016 (Unaudited) |
| Common Stocks – 96.6% | Shares | Value | ||||||||
CONSUMER DISCRETIONARY – 21.2% |
| |||||||||
Tesla Motors, Inc. (Automobiles) | (a) | 3,764 | $ | 799,022 | ||||||
Marriott International, Inc. Class A (Hotels, Restaurants & Leisure) | 6,486 | 431,060 | ||||||||
Norwegian Cruise Line Holdings Ltd. (Hotels, Restaurants & Leisure) | (a) | 5,791 | 230,714 | |||||||
Starbucks Corp. (Hotels, Restaurants & Leisure) | 37,372 | 2,134,689 | ||||||||
Amazon.com, Inc. (Internet & Catalog Retail) | (a) | 12,037 | 8,613,918 | |||||||
Ctrip.com International Ltd. – ADR (Internet & Catalog Retail) | (a) | 9,506 | 391,648 | |||||||
Expedia, Inc. (Internet & Catalog Retail) | 3,469 | 368,755 | ||||||||
JD.com, Inc. – ADR (Internet & Catalog Retail) | (a) | 23,178 | 492,069 | |||||||
Liberty Interactive Corp. QVC Group Class A (Internet & Catalog Retail) | (a) | 11,520 | 292,263 | |||||||
Liberty Ventures (Internet & Catalog Retail) | (a) | 3,446 | 127,744 | |||||||
Netflix, Inc. (Internet & Catalog Retail) | (a) | 10,927 | 999,602 | |||||||
Priceline Group, Inc. / The (Internet & Catalog Retail) | (a) | 1,266 | 1,580,488 | |||||||
TripAdvisor, Inc. (Internet & Catalog Retail) | (a) | 3,391 | 218,042 | |||||||
Mattel, Inc. (Leisure Products) | 8,685 | 271,754 | ||||||||
Charter Communications, Inc. Class A (Media) | (a) | 6,898 | 1,577,159 | |||||||
Comcast Corp. Class A (Media) | 61,681 | 4,020,985 | ||||||||
Discovery Communications, Inc. Class A (Media) | (a) | 3,839 | 96,858 | |||||||
Discovery Communications, Inc. Class C (Media) | (a) | 6,345 | 151,329 | |||||||
DISH Network Corp. Class A (Media) | (a) | 5,773 | 302,506 | |||||||
Liberty Global PLC Class A (Media) | (a) | 7,267 | 211,179 | |||||||
Liberty Global PLC Class C (Media) | (a) | 16,704 | 478,570 | |||||||
Sirius XM Holdings, Inc. (Media) | (a) | 126,490 | 499,636 | |||||||
Twenty-First Century Fox, Inc. Class A (Media) | 27,954 | 756,156 | ||||||||
Twenty-First Century Fox, Inc. Class B (Media) | 20,372 | 555,137 | ||||||||
Viacom, Inc. Class B (Media) | 8,843 | 366,720 | ||||||||
Dollar Tree, Inc. (Multiline Retail) | (a) | 6,010 | 566,383 | |||||||
Bed Bath & Beyond, Inc. (Specialty Retail) | 3,938 | 170,201 | ||||||||
O’Reilly Automotive, Inc. (Specialty Retail) | (a) | 2,461 | 667,178 | |||||||
Ross Stores, Inc. (Specialty Retail) | 10,251 | 581,130 | ||||||||
Tractor Supply Co. (Specialty Retail) | 3,404 | 310,377 | ||||||||
Ulta Salon Cosmetics & Fragrance, Inc. (Specialty Retail) | (a) | 1,598 | 389,337 | |||||||
|
| |||||||||
| 28,652,609 | ||||||||||
|
| |||||||||
CONSUMER STAPLES – 7.2% | ||||||||||
Monster Beverage Corp. (Beverages) | (a) | 5,180 | 832,478 | |||||||
Costco Wholesale Corp. (Food & Staples Retailing) | 11,200 | 1,758,848 | ||||||||
Walgreens Boots Alliance, Inc. (Food & Staples Retailing) | 27,559 | 2,294,838 | ||||||||
Whole Foods Market, Inc. (Food & Staples Retailing) | 8,190 | 262,244 | ||||||||
Kraft Heinz Co. / The (Food Products) | 31,021 | 2,744,739 | ||||||||
Mondelez International, Inc. Class A (Food Products) | 39,595 | 1,801,969 | ||||||||
|
| |||||||||
| 9,695,116 | ||||||||||
|
| |||||||||
HEALTH CARE – 12.0% | ||||||||||
Alexion Pharmaceuticals, Inc. (Biotechnology) | (a) | 5,715 | 667,284 | |||||||
Amgen, Inc. (Biotechnology) | 19,165 | 2,915,955 | ||||||||
Biogen, Inc. (Biotechnology) | (a) | 5,588 | 1,351,291 | |||||||
BioMarin Pharmaceutical, Inc. (Biotechnology) | (a) | 4,141 | 322,170 | |||||||
Celgene Corp. (Biotechnology) | (a) | 19,761 | 1,949,028 | |||||||
Gilead Sciences, Inc. (Biotechnology) | 33,977 | 2,834,362 | ||||||||
Incyte Corp. (Biotechnology) | (a) | 4,786 | 382,784 | |||||||
Regeneron Pharmaceuticals, Inc. (Biotechnology) | (a) | 2,632 | 919,174 | |||||||
Vertex Pharmaceuticals, Inc. (Biotechnology) | (a) | 6,310 | 542,786 | |||||||
DENTSPLY SIRONA, Inc. (Health Care Equip. & Supplies) | 5,976 | 370,751 | ||||||||
Intuitive Surgical, Inc. (Health Care Equip. & Supplies) | (a) | 971 | 642,229 | |||||||
Express Scripts Holding Co. (Health Care Providers & Svs.) | (a) | 16,137 | 1,223,185 | |||||||
Henry Schein, Inc. (Health Care Providers & Svs.) | (a) | 2,094 | 370,219 | |||||||
Cerner Corp. (Health Care Technology) | (a) | 8,625 | 505,425 | |||||||
| Common Stocks (Continued) | Shares | Value | ||||||||
HEALTH CARE (continued) | ||||||||||
Illumina, Inc. (Life Sciences Tools & Svs.) | (a) | 3,755 | $ | 527,127 | ||||||
Endo International PLC (Pharmaceuticals) | (a) | 5,680 | 88,551 | |||||||
Mylan NV (Pharmaceuticals) | (a) | 12,969 | 560,780 | |||||||
|
| |||||||||
| 16,173,101 | ||||||||||
|
| |||||||||
INDUSTRIALS – 1.8% | ||||||||||
American Airlines Group, Inc. (Airlines) | 14,750 | 417,573 | ||||||||
Stericycle, Inc. (Commercial Svs. & Supplies) | (a) | 2,166 | 225,524 | |||||||
PACCAR, Inc. (Machinery) | 8,941 | 463,770 | ||||||||
Verisk Analytics, Inc. (Professional Svs.) | (a) | 4,290 | 347,833 | |||||||
CSX Corp. (Road & Rail) | 24,386 | 635,987 | ||||||||
Fastenal Co. (Trading Companies & Distributors) | 7,370 | 327,154 | ||||||||
|
| |||||||||
| 2,417,841 | ||||||||||
|
| |||||||||
INFORMATION TECHNOLOGY – 53.3% | ||||||||||
Cisco Systems, Inc. (Communications Equip.) | 128,316 | 3,681,386 | ||||||||
Akamai Technologies, Inc. (Internet Software & Svs.) | (a) | 4,480 | 250,567 | |||||||
Alphabet, Inc. Class A (Internet Software & Svs.) | (a) | 7,492 | 5,270,847 | |||||||
Alphabet, Inc. Class C (Internet Software & Svs.) | (a) | 8,762 | 6,064,180 | |||||||
Baidu, Inc. – ADR (Internet Software & Svs.) | (a) | 6,991 | 1,154,564 | |||||||
eBay, Inc. (Internet Software & Svs.) | (a) | 29,310 | 686,147 | |||||||
Facebook, Inc. Class A (Internet Software & Svs.) | (a) | 58,979 | 6,740,120 | |||||||
NetEase, Inc. – ADR (Internet Software & Svs.) | 1,948 | 376,393 | ||||||||
Yahoo!, Inc. (Internet Software & Svs.) | (a) | 24,234 | 910,229 | |||||||
Automatic Data Processing, Inc. (IT Svs.) | 11,621 | 1,067,621 | ||||||||
Cognizant Technology Solutions Corp. Class A (IT Svs.) | (a) | 15,457 | 884,759 | |||||||
Fiserv, Inc. (IT Svs.) | (a) | 5,672 | 616,717 | |||||||
Paychex, Inc. (IT Svs.) | 9,187 | 546,627 | ||||||||
PayPal Holdings, Inc. (IT Svs.) | (a) | 30,921 | 1,128,926 | |||||||
Analog Devices, Inc. (Semiconductors & Equip.) | 7,841 | 444,114 | ||||||||
Applied Materials, Inc. (Semiconductors & Equip.) | 27,786 | 666,031 | ||||||||
Broadcom Ltd. (Semiconductors & Equip.) | 9,961 | 1,547,940 | ||||||||
Intel Corp. (Semiconductors & Equip.) | 120,466 | 3,951,285 | ||||||||
Lam Research Corp. (Semiconductors & Equip.) | 4,072 | 342,293 | ||||||||
Linear Technology Corp. (Semiconductors & Equip.) | 6,100 | 283,833 | ||||||||
Maxim Integrated Products, Inc. (Semiconductors & Equip.) | 7,253 | 258,860 | ||||||||
Micron Technology, Inc. (Semiconductors & Equip.) | (a) | 26,457 | 364,049 | |||||||
NVIDIA Corp. (Semiconductors & Equip.) | 13,623 | 640,417 | ||||||||
NXP Semiconductors NV (Semiconductors & Equip.) | (a) | 8,739 | 684,613 | |||||||
QUALCOMM, Inc. (Semiconductors & Equip.) | 37,474 | 2,007,482 | ||||||||
Skyworks Solutions, Inc. (Semiconductors & Equip.) | 4,853 | 307,098 | ||||||||
Texas Instruments, Inc. (Semiconductors & Equip.) | 25,619 | 1,605,031 | ||||||||
Xilinx, Inc. (Semiconductors & Equip.) | 6,473 | 298,600 | ||||||||
Activision Blizzard, Inc. (Software) | 18,833 | 746,352 | ||||||||
Adobe Systems, Inc. (Software) | (a) | 12,761 | 1,222,376 | |||||||
Autodesk, Inc. (Software) | (a) | 5,730 | 310,222 | |||||||
CA, Inc. (Software) | 10,633 | 349,082 | ||||||||
Check Point Software Technologies Ltd. (Software) | (a) | 4,375 | 348,600 | |||||||
Citrix Systems, Inc. (Software) | (a) | 3,957 | 316,917 | |||||||
Electronic Arts, Inc. (Software) | (a) | 7,695 | 582,974 | |||||||
Intuit, Inc. (Software) | 6,528 | 728,591 | ||||||||
Microsoft Corp. (Software) | 200,533 | 10,261,274 | ||||||||
Symantec Corp. (Software) | 15,621 | 320,856 | ||||||||
Apple, Inc. (Tech. Hardware, Storage & Periph.) | 139,738 | 13,358,953 | ||||||||
NetApp, Inc. (Tech. Hardware, Storage & Periph.) | 7,375 | 181,352 | ||||||||
Seagate Technology PLC (Tech. Hardware, Storage & Periph.) | 7,615 | 185,502 | ||||||||
Western Digital Corp. (Tech. Hardware, Storage & Periph.) | 7,182 | 339,422 | ||||||||
|
| |||||||||
| 72,033,202 | ||||||||||
|
| |||||||||
| 76 | (continued) |
| Ohio National Fund, Inc. | Nasdaq-100® Index Portfolio (Continued) |
Schedule of Investments | June 30, 2016 (Unaudited) |
| Common Stocks (Continued) | Shares | Value | ||||||||
TELECOMMUNICATION SERVICES – 1.1% | ||||||||||
SBA Communications Corp. Class A (Diversified Telecom. Svs.) | (a) | 3,202 | $ | 345,624 | ||||||
T-Mobile U.S., Inc. (Wireless Telecom. Svs.) | (a) | 20,975 | 907,589 | |||||||
Vodafone Group PLC – ADR (Wireless Telecom. Svs.) | 9,895 | 305,657 | ||||||||
|
| |||||||||
| 1,558,870 | ||||||||||
|
| |||||||||
Total Common Stocks (Cost $82,585,767) | $ | 130,530,739 | ||||||||
|
| |||||||||
| Rights – 0.0% | Quantity | Value | ||||||||
CONSUMER DISCRETIONARY – 0.0% | ||||||||||
Liberty Braves Group (Media) | (a) | 392 | $ | 730 | ||||||
|
| |||||||||
Total Rights (Cost $0) | $ | 730 | ||||||||
|
| |||||||||
| Money Market Funds – 2.9% | Shares | Value | ||||||||
State Street Institutional Liquid Reserves Fund Institutional Class | 934,557 | $ | 934,557 | |||||||
State Street Institutional U.S. Government Money Market Fund Institutional Class | 2,956,560 | 2,956,560 | ||||||||
|
| |||||||||
Total Money Market Funds (Cost $3,891,117) | $ | 3,891,117 | ||||||||
|
| |||||||||
Total Investments – 99.5% (Cost $86,476,884) | (b) | $ | 134,422,586 | |||||||
Other Assets in Excess of Liabilities – 0.5% | (c) | 750,583 | ||||||||
|
| |||||||||
Net Assets – 100.0% | $ | 135,173,169 | ||||||||
|
| |||||||||
Percentages are stated as a percent of net assets.
Abbreviations:
ADR: American Depositary Receipts
Footnotes:
| (a) | Non-income producing security. |
| (b) | Represents cost for financial reporting purposes, which may differ from cost basis for federal income tax purposes. See also Note 7 of the Notes to Financial Statements. |
| (c) | Includes $328,638 of cash pledged as collateral for the following futures contracts outstanding at June 30, 2016: |
Type | Description | Expiration | Number of Contracts | Contract at Value | Initial Contract Amount | Unrealized Appreciation (Depreciation) | Variation Margin Receivable (Payable) | ||||||||||||||||||||||
Long | CME E-mini Nasdaq-100 Contracts (United States) | September 16, 2016 | 52 | $ | 4,583,280 | $ | 4,579,478 | $ | 3,802 | $ | 3,885 | ||||||||||||||||||
|
|
|
|
|
|
|
| ||||||||||||||||||||||
The accompanying notes are an integral part of these financial statements.
| 77 |
| Ohio National Fund, Inc. | Bristol Portfolio |
Objective/Strategy
The Bristol Portfolio seeks long-term growth of capital by investing primarily in common stocks of the 1,000 largest publicly traded U.S. companies in terms of market capitalization.
Performance as of June 30, 2016
Average Annual returns: | ||||
One year | -2.23% | |||
Five years | 10.96% | |||
Ten years | 6.91% |
Past performance does not guarantee future results. The performance data quoted represents past performance and current returns may be lower or higher. Total return figures include change in share price and reinvestment of dividends and capital gains. The investment return and principal value will fluctuate so that an investor’s shares, when redeemed, may be worth more or less than the original cost. To obtain performance information up to the most recent month end, call toll-free 1-877-781-6392.
The Portfolio is not open to direct retail investment. Beneficial interest in shares is obtained solely by purchase of variable life insurance policies and variable annuity contracts. Actual performance results for variable annuity and variable universal life contracts will be lower due to contract charges. Consult your contract for applicable charges.
Comments
For the six-month period ended June 30, 2016, the Bristol Portfolio returned 0.14% versus 3.84% for its benchmark, the S&P 500 Index.
The Portfolio’s underperformance resulted primarily from sector allocations. In all but the Financials sector, sector overweights or underweights worked against the Portfolio in terms of performance relative to the benchmark. Overall, stock selection was positive, as Health Care led all sectors. Stock selection in Financials, however, was a key detractor from relative performance. (1)
The Portfolio’s top performers for the first half of the year were Tesaro, Inc., Pioneer Natural Resources Co., PVH Corp., Anacor Pharmaceuticals, Inc., and Xylem, Inc. The worst performers were Delphi Automotive PLC., Bank of America Corp., Allergan PLC, Harman International Industries, Inc., and Anadarko Petroleum Corp. (1)
The top contributor to the Portfolio’s performance through the first half of the year was Tesaro, Inc., which generated 221 basis points. The company reported positive Phase 3 data for its ovarian cancer drug. Anacor Pharmaceuticals, Inc. added 76 points, as the stock benefitted from Pfizer, Inc.’s announcement to acquire the company in a deal valued at $5.2B for access to Anacor’s non-steroidal topical gel to treat eczema. PVH Corp. added 53 basis points, as it reported an earnings “beat and raise” for first quarter and trends for this quarter have remained positive to in-line with guidance. Many analysts made some very positive comments at the Piper Jaffray Consumer Conference in June. Xylem, Inc. added 43 basis points as it benefited from stronger growth in municipal water project activity and positive sentiment regarding the water crisis in Flint, Michigan. Finally, HCA Holdings, Inc. gained 34 basis points as the market is moving back to fundamentally sound companies in the uncertain environment. (1)
Detractors from performance during the first half of the year included Delphi Automotive PLC. Concerns over Brexit and the U.S. auto cycle have pressured the stock, which impacted the Portfolio negatively by 76 basis points. Intel Corp. cost the Portfolio 50 basis points due to a reduced PC sales forecast. Valeant Pharmaceuticals International, Inc. cost the Portfolio 45 basis points as it faced
several issues during the first quarter, starting with a leave of absence taken by the CEO early in the year due to a severe case of pneumonia. We sold the position following news of a cut in reimbursement by CVS Health Corp. for a key drug, Jublia, which is used to treat toenail fungal infections, and the company’s announcement that its 10-K would be delayed due to a restatement of its financials after an internal review of the company’s accounting of sales through its specialty pharmacy subsidiary. Fortunately, we avoided another significant decline in the stock after the company lowered its profit outlook sharply later in the quarter due to weaker pricing and demand, as well as higher taxes, which led to heightened investors’ concerns about its ability to repay its significant level of debt. Specialty pharmaceutical companies such as Allergan PLC and Mylan NV had some unforeseen issues. Allergan PLC’s proposed merger with Pfizer, Inc. was terminated, and concerns of weaker pricing in generic drugs outweighed Mylan NV’s strong growth prospects, costing the Portfolio 94 basis points in aggregate. (1)
The month of June will certainly go down in history as being eventful. To the shock of many, the United Kingdom voted to exit the European Union. Volatility increased, contagion and “risk off” came back into our daily vocabulary. Despite that, the market was roughly flat for the month and up slightly for the quarter, led by defensive-oriented groups. While it is quite unclear what lies ahead for European, and global, economic growth, we feel that the U.S. markets will be a safe haven to investors as multiples are reasonable and companies will continue to grow, though at a slightly slower pace. Our continued focus on company and industry specific fundamentals should hopefully be a contributor to outperformance going forward.
| (1) | The Portfolio’s composition is subject to change. Holdings and weightings are as of June 30, 2016. |
Change in Value of $10,000 Investment
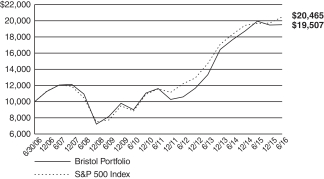
Hypothetical illustration based on past performance. Future performance will vary. The Portfolio’s returns reflect reinvested dividends. The Portfolio’s holdings may differ significantly from the securities in the index. The index is unmanaged and therefore does not reflect the cost of portfolio management and accounting.
The S&P 500 Index is a capitalization-weighted index designed to measure performance of the broad domestic economy through changes in the aggregate market value of 500 stocks representing all major industries. The index presented herein includes the effects of reinvested dividends.
| 78 | (continued) |
| Ohio National Fund, Inc. | Bristol Portfolio (Continued) |
Portfolio Composition as of June 30, 2016 (1)
| % of Net Assets | ||||
Common Stocks (4) | 100.6 | |||
Money Market Funds | (0.6 | ) | ||
|
| |||
| 100.0 | ||||
|
|
Top 10 Portfolio Holdings as of June 30, 2016 (1) (2) (3)
| % of Net Assets | ||||
1. Amazon.com, Inc. | 3.0 | |||
2. Newell Brands, Inc. | 2.6 | |||
3. Time Warner, Inc. | 2.5 | |||
4. Facebook, Inc. Class A | 2.5 | |||
5. TESARO, Inc. | 2.5 | |||
6. NXP Semiconductors NV | 2.5 | |||
7. Allergan PLC | 2.4 | |||
8. Alibaba Group Holding Ltd. – ADR | 2.3 | |||
9. Alphabet, Inc. Class C | 2.3 | |||
10. Microsoft Corp. | 2.3 |
| (1) | Composition of Portfolio subject to change. |
| (2) | Short-term investments have been excluded from the list of Top 10 Portfolio Holdings. |
| (3) | Top 10 Portfolio Holdings is presented at an individual security level. Total investment exposure by issuer may be higher. |
| (4) | Sectors (Common Stocks): |
| % of Net Assets | ||||
Information Technology | 32.7 | |||
Consumer Discretionary | 17.6 | |||
Health Care | 16.5 | |||
Industrials | 15.7 | |||
Financials | 12.6 | |||
Energy | 3.1 | |||
Consumer Staples | 1.9 | |||
Materials | 0.5 | |||
|
| |||
| 100.6 | ||||
|
|
| 79 |
| Ohio National Fund, Inc. | Bristol Portfolio |
Schedule of Investments | June 30, 2016 (Unaudited) |
| Common Stocks – 100.6% | Shares | Value | ||||||||
CONSUMER DISCRETIONARY – 17.6% | ||||||||||
Delphi Automotive PLC (Auto Components) | 62,440 | $ | 3,908,744 | |||||||
MGM Resorts International (Hotels, Restaurants & Leisure) | (a) | 175,800 | 3,978,354 | |||||||
Newell Brands, Inc. (Household Durables) | 112,311 | 5,454,945 | ||||||||
Amazon.com, Inc. (Internet & Catalog Retail) | (a) | 8,943 | 6,399,790 | |||||||
Time Warner, Inc. (Media) | 73,753 | 5,423,796 | ||||||||
Lowe’s Cos., Inc. (Specialty Retail) | 53,784 | 4,258,079 | ||||||||
Deckers Outdoor Corp. (Textiles, Apparel & Luxury Goods) | (a) | 58,134 | 3,343,868 | |||||||
PVH Corp. (Textiles, Apparel & Luxury Goods) | 49,080 | 4,624,808 | ||||||||
|
| |||||||||
| 37,392,384 | ||||||||||
|
| |||||||||
CONSUMER STAPLES – 1.9% | ||||||||||
Kellogg Co. (Food Products) | 25,622 | 2,092,036 | ||||||||
Pinnacle Foods, Inc. (Food Products) | 45,054 | 2,085,550 | ||||||||
|
| |||||||||
| 4,177,586 | ||||||||||
|
| |||||||||
ENERGY – 3.1% | ||||||||||
Schlumberger Ltd. (Energy Equip. & Svs.) | 32,028 | 2,532,774 | ||||||||
Pioneer Natural Resources Co. (Oil, Gas & Consumable Fuels) | 26,620 | 4,025,210 | ||||||||
|
| |||||||||
| 6,557,984 | ||||||||||
|
| |||||||||
FINANCIALS – 12.6% | ||||||||||
BankUnited, Inc. (Banks) | 77,494 | 2,380,616 | ||||||||
Citigroup, Inc. (Banks) | 96,061 | 4,072,026 | ||||||||
KeyCorp (Banks) | 333,879 | 3,689,363 | ||||||||
Regions Financial Corp. (Banks) | 440,098 | 3,745,234 | ||||||||
Bank of New York Mellon Corp. / The (Capital Markets) | 102,617 | 3,986,670 | ||||||||
Capital One Financial Corp. (Consumer Finance) | 31,168 | 1,979,480 | ||||||||
MetLife, Inc. (Insurance) | 78,939 | 3,144,140 | ||||||||
Prudential Financial, Inc. (Insurance) | 52,681 | 3,758,263 | ||||||||
|
| |||||||||
| 26,755,792 | ||||||||||
|
| |||||||||
HEALTH CARE – 16.5% | ||||||||||
TESARO, Inc. (Biotechnology) | (a) | 64,388 | 5,411,811 | |||||||
Aetna, Inc. (Health Care Providers & Svs.) | 33,803 | 4,128,360 | ||||||||
HCA Holdings, Inc. (Health Care Providers & Svs.) | (a) | 34,751 | 2,676,175 | |||||||
Humana, Inc. (Health Care Providers & Svs.) | 25,898 | 4,658,532 | ||||||||
UnitedHealth Group, Inc. (Health Care Providers & Svs.) | 30,404 | 4,293,045 | ||||||||
Thermo Fisher Scientific, Inc. (Life Sciences Tools & Svs.) | 30,614 | 4,523,525 | ||||||||
Allergan PLC (Pharmaceuticals) | (a) | 22,513 | 5,202,529 | |||||||
Mylan NV (Pharmaceuticals) | (a) | 96,720 | 4,182,173 | |||||||
|
| |||||||||
| 35,076,150 | ||||||||||
|
| |||||||||
INDUSTRIALS – 15.7% | ||||||||||
Hexcel Corp. (Aerospace & Defense) | 51,542 | 2,146,209 | ||||||||
Huntington Ingalls Industries, Inc. (Aerospace & Defense) | 20,212 | 3,396,222 | ||||||||
| Common Stocks (Continued) | Shares | Value | ||||||||
INDUSTRIALS (continued) | ||||||||||
Raytheon Co. (Aerospace & Defense) | 32,299 | $ | 4,391,049 | |||||||
FedEx Corp. (Air Freight & Logistics) | 28,104 | 4,265,625 | ||||||||
AECOM (Construction & Engineering) | (a) | 130,831 | 4,156,501 | |||||||
Rockwell Automation, Inc. (Electrical Equip.) | 36,820 | 4,227,673 | ||||||||
General Electric Co. (Industrial Conglomerates) | 75,287 | 2,370,035 | ||||||||
Xylem, Inc. (Machinery) | 93,588 | 4,178,704 | ||||||||
Union Pacific Corp. (Road & Rail) | 48,464 | 4,228,484 | ||||||||
|
| |||||||||
| 33,360,502 | ||||||||||
|
| |||||||||
INFORMATION TECHNOLOGY – 32.7% | ||||||||||
Cisco Systems, Inc. (Communications Equip.) | 156,447 | 4,488,464 | ||||||||
Harris Corp. (Communications Equip.) | 53,207 | 4,439,592 | ||||||||
Alibaba Group Holding Ltd. – ADR (Internet Software & Svs.) | (a) | 62,490 | 4,969,830 | |||||||
Alphabet, Inc. Class A (Internet Software & Svs.) | (a) | 3,469 | 2,440,546 | |||||||
Alphabet, Inc. Class C (Internet Software & Svs.) | (a) | 7,077 | 4,897,992 | |||||||
Facebook, Inc. Class A (Internet Software & Svs.) | (a) | 47,408 | 5,417,786 | |||||||
Computer Sciences Corp. (IT Svs.) | 57,679 | 2,863,762 | ||||||||
International Business Machines Corp. (IT Svs.) | 29,636 | 4,498,152 | ||||||||
MasterCard, Inc. Class A (IT Svs.) | 45,916 | 4,043,363 | ||||||||
Broadcom Ltd. (Semiconductors & Equip.) | 28,534 | 4,434,184 | ||||||||
NXP Semiconductors NV (Semiconductors & Equip.) | (a) | 68,348 | 5,354,382 | |||||||
Adobe Systems, Inc. (Software) | (a) | 44,004 | 4,215,143 | |||||||
Electronic Arts, Inc. (Software) | (a) | 57,053 | 4,322,335 | |||||||
Microsoft Corp. (Software) | 94,369 | 4,828,862 | ||||||||
Oracle Corp. (Software) | 107,632 | 4,405,378 | ||||||||
Hewlett Packard Enterprise Co. (Tech. Hardware, Storage & Periph.) | 221,415 | 4,045,252 | ||||||||
|
| |||||||||
| 69,665,023 | ||||||||||
|
| |||||||||
MATERIALS – 0.5% | ||||||||||
Monsanto Co. (Chemicals) | 10,090 | 1,043,407 | ||||||||
|
| |||||||||
Total Common Stocks (Cost $201,496,704) | $ | 214,028,828 | ||||||||
|
| |||||||||
| Money Market Funds – 0.2% | Shares | Value | ||||||||
State Street Institutional U.S. Government Money Market Fund Institutional Class | 447,420 | $ | 447,420 | |||||||
|
| |||||||||
Total Money Market Funds (Cost $447,420) | $ | 447,420 | ||||||||
|
| |||||||||
Total Investments – 100.8% (Cost $201,944,124) | (b) | $ | 214,476,248 | |||||||
Liabilities in Excess of Other Assets – (0.8)% | (1,674,560) | |||||||||
|
| |||||||||
Net Assets – 100.0% | $ | 212,801,688 | ||||||||
|
| |||||||||
Percentages are stated as a percent of net assets.
Abbreviations:
ADR: American Depositary Receipts
Footnotes:
| (a) | Non-income producing security. |
| (b) | Represents cost for financial reporting purposes, which may differ from cost basis for federal income tax purposes. See also Note 7 of the Notes to Financial Statements. |
The accompanying notes are an integral part of these financial statements.
| 80 |
| Ohio National Fund, Inc. | Bryton Growth Portfolio |
Objective/Strategy
The Bryton Growth Portfolio seeks long-term growth of capital by investing primarily in common stocks of growth-oriented U.S. companies smaller than the 500 largest publicly traded U.S. companies in terms of market capitalization.
Performance as of June 30, 2016
Average Annual returns: | ||||
One year | -18.22% | |||
Five years | 5.91% | |||
Ten years | 5.53% |
Past performance does not guarantee future results. The performance data quoted represents past performance and current returns may be lower or higher. Total return figures include change in share price and reinvestment of dividends and capital gains. The investment return and principal value will fluctuate so that an investor’s shares, when redeemed, may be worth more, or less than the original cost. To obtain performance information up to the most recent month end, call toll-free 1-877-781-6392.
The Portfolio is not open to direct retail investment. Beneficial interest in shares is obtained solely by purchase of variable life insurance policies and variable annuity contracts. Actual performance results for variable annuity and variable universal life contracts will be lower due to contract charges. Consult your contract for applicable charges.
Comments
For the six-month period ended June 30, 2016, the Bryton Growth Portfolio returned -5.41% versus -1.59% for its benchmark, the Russell 2000 Growth Index.
The Portfolio’s underperformance resulted from both sector allocation and stock selection. Stock selection was particularly weak in Information Technology during the period, while stock selection in Consumer Discretionary and Financials also detracted from relative returns. Overall, sector allocation was a drag on relative results, as several sector underweights or overweights worked against the Portfolio in benchmark-relative terms. (1)
The Portfolio’s top performers for the first half of the year were Tesaro, Inc., Burlington Stores, Inc., LDR Holding Corp., Fabrinet, and Carrizo Oil & Gas, Inc. The worst performers were Celldex Therapeutics, Inc., Performance Sports Group Ltd., Revance Therapeutics Inc., Biodelivery Sciences International, Inc., and Quantum Corp. (1)
The top contributor to the Portfolio’s performance for the first half of the year was Tesaro, Inc., which generated 121 basis points. The company reported positive Phase 3 data for its ovarian cancer drug. Burlington Stores, Inc. added 76 points as the stock benefitted from strong off-price trends as full-price retailers struggled through the spring season. LDR Holding Corp. contributed 68 basis points after being acquired by Zimmer Biomet Holdings, Inc. for its strong position in spinal devices. Chef’s Warehouse, Inc., a specialty foodservice distributor, added 64 basis points after demonstrating an improving earnings trajectory thanks to both operational efficiencies as it consolidated recent acquisitions and as a result of declining protein price inflation that relieved margin pressure. Finally, PowerSecure International, Inc. gained 52 basis points with the company’s impressive leadership in the data center backup-power generation market leading to an acquisition by The Southern Co. (1)
Detractors from performance during for the first half of the year included Celldex Therapeutics, Inc., which was forced to stop its final-stage study for a brain-tumor vaccine due to poor results and,
thus, impacted the Portfolio negatively by 148 basis points. Performance Sports Group Ltd., lost 136 basis points because of write-downs associated with The Sports Authority, Inc. bankruptcy, a decline in baseball orders and bad debt reserves for some U.S. hockey customers. Revance Therapeutics, Inc. struggled after producing poor results for its topical Botox substitute, subtracting 117 basis points. Quantum Corp. underperformed because of a continued decline in its core tape storage business that has yet to be lapped by growth in newer products. Biodelivery Sciences International Inc.’s Bunvail drug has underperformed during its launch. (1)
We believe the Portfolio is well-positioned for the second half of 2016. Our Health Care positions maintain strong pipelines, with catalysts through the rest of the year, and several large pharmaceutical companies have returned to the M&A markets, increasing the chances of a takeout. We plan to avoid a significant position in the Financials sector, as we remain unsure of potential Federal Reserve actions, highlighted by mixed economic news and Fed commentary. Lastly, our Information Technology exposures are typically skewed towards growth segments where companies continue to invest aggressively. We believe these companies are seen as marquee assets and could be takeover targets as larger software companies look to acquire growth. (1)
| (1) | The Portfolio’s composition is subject to change. Holdings and weightings are as of June 30, 2016. |
Change in Value of $10,000 Investment

Hypothetical illustration based on past performance. Future performance will vary. The Portfolio’s returns reflect reinvested dividends. The Portfolio’s holdings may differ significantly from the securities in the index. The index is unmanaged and therefore does not reflect the cost of portfolio management and accounting.
The Russell 2000 Growth Index measures the performance of the small-cap growth segment of the U.S. equity universe. It includes the Russell 2000 Index companies with higher price-to-value ratios and higher forecasted growth values. The Russell 2000 Index includes the 2000 firms from the Russell 3000 Index with the smallest market capitalizations. The Russell 3000 Index represents 98% of the investable U.S. equity market. The index presented herein includes the effects of reinvested dividends.
| 81 | (continued) |
| Ohio National Fund, Inc. | Bryton Growth Portfolio (Continued) |
Portfolio Composition as of June 30, 2016 (1)
| % of Net Assets | ||||
Common Stocks (4) | 101.0 | |||
Money Market Funds | (1.0 | ) | ||
|
| |||
| 100.0 | ||||
|
|
Top 10 Portfolio Holdings as of June 30, 2016 (1) (2) (3)
| % of Net Assets | ||||
1. J&J Snack Foods Corp. | 2.3 | |||
2. Healthcare Services Group, Inc. | 2.0 | |||
3. G-III Apparel Group Ltd. | 2.0 | |||
4. Neogen Corp. | 2.0 | |||
5. Teligent, Inc. | 2.0 | |||
6. Mueller Water Products, Inc. Class A | 2.0 | |||
7. PolyOne Corp. | 1.9 | |||
8. Radware Ltd. | 1.9 | |||
9. Ollie’s Bargain Outlet Holdings, Inc. | 1.9 | |||
10. Electronics For Imaging, Inc. | 1.8 |
| (1) | Composition of Portfolio subject to change. |
| (2) | Short-term investments have been excluded from the list of Top 10 Portfolio Holdings. |
| (3) | Top 10 Portfolio Holdings is presented at an individual security level. Total investment exposure by issuer may be higher. |
| (4) | Sectors (Common Stocks): |
| % of Net Assets | ||||
Information Technology | 30.4 | |||
Health Care | 24.7 | |||
Industrials | 16.3 | |||
Consumer Discretionary | 15.8 | |||
Consumer Staples | 5.5 | |||
Materials | 3.5 | |||
Financials | 3.1 | |||
Energy | 1.7 | |||
|
| |||
| 101.0 | ||||
|
|
| 82 |
| Ohio National Fund, Inc. | Bryton Growth Portfolio |
Schedule of Investments | June 30, 2016 (Unaudited) |
| Common Stocks – 101.0% | Shares | Value | ||||||||
CONSUMER DISCRETIONARY – 15.8% | ||||||||||
Gentherm, Inc. (Auto Components) | (a) | 77,648 | $ | 2,659,444 | ||||||
Buffalo Wild Wings, Inc. (Hotels, Restaurants & Leisure) | (a) | 16,645 | 2,312,823 | |||||||
ClubCorp Holdings, Inc. (Hotels, Restaurants & Leisure) | 184,432 | 2,397,616 | ||||||||
Jack in the Box, Inc. (Hotels, Restaurants & Leisure) | 26,078 | 2,240,622 | ||||||||
Planet Fitness, Inc. Class A (Hotels, Restaurants & Leisure) | (a) | 117,117 | 2,211,169 | |||||||
1-800-Flowers.com, Inc. Class A (Internet & Catalog Retail) | (a) | 311,851 | 2,812,896 | |||||||
Ollie’s Bargain Outlet Holdings, Inc. (Multiline Retail) | (a) | 116,755 | 2,906,032 | |||||||
Burlington Stores, Inc. (Specialty Retail) | (a) | 24,017 | 1,602,174 | |||||||
Deckers Outdoor Corp. (Textiles, Apparel & Luxury Goods) | (a) | 40,002 | 2,300,915 | |||||||
G-III Apparel Group Ltd. (Textiles, Apparel & Luxury Goods) | (a) | 69,900 | 3,195,828 | |||||||
|
| |||||||||
| 24,639,519 | ||||||||||
|
| |||||||||
CONSUMER STAPLES – 5.5% | ||||||||||
MGP Ingredients, Inc. (Beverages) | 63,627 | 2,432,460 | ||||||||
J&J Snack Foods Corp. (Food Products) | 29,543 | 3,523,594 | ||||||||
Snyder’s-Lance, Inc. (Food Products) | 76,478 | 2,591,839 | ||||||||
|
| |||||||||
| 8,547,893 | ||||||||||
|
| |||||||||
ENERGY – 1.7% | ||||||||||
RSP Permian, Inc. (Oil, Gas & Consumable Fuels) | (a) | 75,446 | 2,632,311 | |||||||
|
| |||||||||
FINANCIALS – 3.1% | ||||||||||
Ameris Bancorp (Banks) | 84,129 | 2,498,631 | ||||||||
Bank of the Ozarks, Inc. (Banks) | 64,783 | 2,430,658 | ||||||||
|
| |||||||||
| 4,929,289 | ||||||||||
|
| |||||||||
HEALTH CARE – 24.7% | ||||||||||
Arbutus Biopharma Corp. (Biotechnology) | (a) | 441,915 | 1,537,864 | |||||||
Celldex Therapeutics, Inc. (Biotechnology) | (a) | 474,799 | 2,084,368 | |||||||
Cepheid (Biotechnology) | (a) | 74,156 | 2,280,297 | |||||||
Ligand Pharmaceuticals, Inc. (Biotechnology) | (a) | 20,457 | 2,439,906 | |||||||
MacroGenics, Inc. (Biotechnology) | (a) | 58,010 | 1,565,690 | |||||||
Sangamo BioSciences, Inc. (Biotechnology) | (a) | 246,047 | 1,424,612 | |||||||
TESARO, Inc. (Biotechnology) | (a) | 27,673 | 2,325,916 | |||||||
Alliqua BioMedical, Inc. (Health Care Equip. & Supplies) | (a) | 1,206,127 | 1,350,862 | |||||||
K2M Group Holdings, Inc. (Health Care Equip. & Supplies) | (a) | 126,881 | 1,969,193 | |||||||
Neogen Corp. (Health Care Equip. & Supplies) | (a) | 56,759 | 3,192,694 | |||||||
Zeltiq Aesthetics, Inc. (Health Care Equip. & Supplies) | (a) | 81,335 | 2,222,886 | |||||||
Team Health Holdings, Inc. (Health Care Providers & Svs.) | (a) | 57,058 | 2,320,549 | |||||||
Aerie Pharmaceuticals, Inc. (Pharmaceuticals) | (a) | 119,005 | 2,094,488 | |||||||
Intra-Cellular Therapies, Inc. (Pharmaceuticals) | (a) | 60,754 | 2,358,470 | |||||||
Phibro Animal Health Corp. Class A (Pharmaceuticals) | 80,979 | 1,511,068 | ||||||||
Prestige Brands Holdings, Inc. (Pharmaceuticals) | (a) | 46,838 | 2,594,825 | |||||||
Revance Therapeutics, Inc. (Pharmaceuticals) | (a) | 158,812 | 2,159,843 | |||||||
Teligent, Inc. (Pharmaceuticals) | (a) | 433,387 | 3,094,383 | |||||||
|
| |||||||||
| 38,527,914 | ||||||||||
|
| |||||||||
INDUSTRIALS – 16.3% | ||||||||||
Aerojet Rocketdyne Holdings, Inc. (Aerospace & Defense) | (a) | 153,848 | 2,812,341 | |||||||
Aerovironment, Inc. (Aerospace & Defense) | (a) | 90,574 | 2,517,957 | |||||||
| Common Stocks (continued) | Shares | Value | ||||||||
INDUSTRIALS (continued) | ||||||||||
Astronics Corp. (Aerospace & Defense) | (a) | 59,406 | $ | 1,975,844 | ||||||
Echo Global Logistics, Inc. (Air Freight & Logistics) | (a) | 75,112 | 1,684,011 | |||||||
XPO Logistics, Inc. (Air Freight & Logistics) | (a) | 93,290 | 2,449,795 | |||||||
Healthcare Services Group, Inc. (Commercial Svs. & Supplies) | 77,365 | 3,201,364 | ||||||||
Mueller Water Products, Inc. Class A (Machinery) | 268,399 | 3,065,117 | ||||||||
Proto Labs, Inc. (Machinery) | (a) | 41,541 | 2,391,100 | |||||||
Rexnord Corp. (Machinery) | (a) | 136,560 | 2,680,673 | |||||||
Univar, Inc. (Trading Companies & Distributors) | (a) | 139,416 | 2,636,356 | |||||||
|
| |||||||||
| 25,414,558 | ||||||||||
|
| |||||||||
INFORMATION TECHNOLOGY – 30.4% | ||||||||||
Ciena Corp. (Communications Equip.) | (a) | 105,329 | 1,974,919 | |||||||
Infinera Corp. (Communications Equip.) | (a) | 175,023 | 1,974,259 | |||||||
Radware Ltd. (Communications Equip.) | (a) | 260,692 | 2,935,392 | |||||||
FARO Technologies, Inc. (Electronic Equip., Instr. & Comp.) | (a) | 45,712 | 1,546,437 | |||||||
Cornerstone OnDemand, Inc. (Internet Software & Svs.) | (a) | 60,986 | 2,321,127 | |||||||
Euronet Worldwide, Inc. (IT Svs.) | (a) | 20,824 | 1,440,813 | |||||||
Cavium, Inc. (Semiconductors & Equip.) | (a) | 59,881 | 2,311,407 | |||||||
Inphi Corp. (Semiconductors & Equip.) | (a) | 86,213 | 2,761,402 | |||||||
Integrated Device Technology, Inc. (Semiconductors & Equip.) | (a) | 115,773 | 2,330,511 | |||||||
Lattice Semiconductor Corp. (Semiconductors & Equip.) | (a) | 443,653 | 2,373,544 | |||||||
Microsemi Corp. (Semiconductors & Equip.) | (a) | 85,521 | 2,794,826 | |||||||
NeoPhotonics Corp. (Semiconductors & Equip.) | (a) | 252,357 | 2,404,962 | |||||||
Power Integrations, Inc. (Semiconductors & Equip.) | 53,289 | 2,668,180 | ||||||||
CommVault Systems, Inc. (Software) | (a) | 64,108 | 2,768,825 | |||||||
Digimarc Corp. (Software) | (a) | 37,412 | 1,195,688 | |||||||
Guidewire Software, Inc. (Software) | (a) | 25,226 | 1,557,958 | |||||||
Imperva, Inc. (Software) | (a) | 65,693 | 2,825,456 | |||||||
Proofpoint, Inc. (Software) | (a) | 38,784 | 2,446,883 | |||||||
Tyler Technologies, Inc. (Software) | (a) | 9,906 | 1,651,429 | |||||||
Zendesk, Inc. (Software) | (a) | 87,614 | 2,311,257 | |||||||
Electronics For Imaging, Inc. (Tech. Hardware, Storage & Periph.) | (a) | 66,506 | 2,862,418 | |||||||
|
| |||||||||
| 47,457,693 | ||||||||||
|
| |||||||||
MATERIALS – 3.5% | ||||||||||
PolyOne Corp. (Chemicals) | 83,884 | 2,956,072 | ||||||||
Berry Plastics Group, Inc. (Containers & Packaging) | (a) | 67,173 | 2,609,671 | |||||||
|
| |||||||||
| 5,565,743 | ||||||||||
|
| |||||||||
Total Common Stocks (Cost $166,181,929) | $ | 157,714,920 | ||||||||
|
| |||||||||
| Money Market Funds – 2.5% | Shares | Value | ||||||||
State Street Institutional Liquid Reserves Fund | 2,019,607 | $ | 2,019,606 | |||||||
State Street Institutional U.S. Government Money Market Fund Institutional Class | 1,952,981 | 1,952,981 | ||||||||
|
| |||||||||
Total Money Market Funds (Cost $3,972,587) | $ | 3,972,587 | ||||||||
|
| |||||||||
Total Investments – 103.5% (Cost $170,154,516) | (b) | $ | 161,687,507 | |||||||
Liabilities in Excess of Other Assets – (3.5)% | (5,495,172) | |||||||||
|
| |||||||||
Net Assets – 100.0% | $ | 156,192,335 | ||||||||
|
| |||||||||
Percentages are stated as a percent of net assets.
Footnotes:
| (a) | Non-income producing security. |
| (b) | Represents cost for financial reporting purposes, which may differ from cost basis for federal income tax purposes. See also Note 7 of the Notes to Financial Statements. |
The accompanying notes are an integral part of these financial statements.
| 83 |
| Ohio National Fund, Inc. | Balanced Portfolio |
Objective/Strategy
The Balanced Portfolio seeks capital appreciation and income by investing normally up to 75% of its assets in equity securities within under-priced sectors and industries while maintaining a minimum of 25% of its assets in fixed income securities.
Performance as of June 30, 2016
Average Annual returns: | ||||
One year | -0.98% | |||
Five years | 6.66% | |||
Ten years | 5.36% |
Past performance does not guarantee future results. The performance data quoted represents past performance and current returns may be lower or higher. Total return figures include change in share price and reinvestment of dividends and capital gains. The investment return and principal value will fluctuate so that an investor’s shares, when redeemed, may be worth more or less than the original cost. To obtain performance information up to the most recent month end, call toll-free 1-877-781-6392.
The Portfolio is not open to direct retail investment. Beneficial interest in shares is obtained solely by purchase of variable life insurance policies and variable annuity contracts. Actual performance results for variable annuity and variable universal life contracts will be lower due to contract charges. Consult your contract for applicable charges.
Comments
For the six-month period ended June 30, 2016, the Balanced Portfolio returned 0.42% versus 4.89% for its benchmark, which is comprised of 60% S&P 1500 Composite Index and 40% Barclays Capital U.S. Universal Index.
Entering 2016, our equity valuation model viewed the overall broad domestic market as approximately 5% below our estimate of fair value. While our return expectations were relatively low for the overall market, our system saw distinct valuation differences at both a sector and industry level. While the Portfolio was slightly underweight in equities relative to the blended benchmark to begin the year, the Portfolio had overweight positions relative to the blended benchmark in the Financials, Utilities, and Materials sectors in an attempt to take advantage of what we believed to be attractive segments of the market. Additionally, given our relatively muted overall market value readings, the Portfolio bought out-of-the-money S&P 500 put options and wrote out-of-the-money S&P 500 call options in an attempt to reduce the effects of market-based volatility on the Portfolio. Relative to the fixed income portion of the benchmark, the Portfolio began the year with an overweight position in the corporate debt segment of the market and had a lower overall duration and less Treasury exposure than the benchmark. We continued to look for specific “event-driven” opportunities in both credit risk and closed end fund arbitrage throughout the period. (1)
The equity market began the year with a rather aggressive sell-off, as investors appeared focused on both macro-economic concerns and the continuation of lower overall interest rates. The combination of these two factors pulled down the broad equity market, hitting the Financials sector particularly hard. Unfortunately, given our overweight position in this sector, our downside participation during the sell-off had a negative impact on the Portfolio’s relative performance. Additionally, our lack of exposure to U.S. Treasuries, generally lower duration, and an aggressive widening of credit spreads resulted in underperformance relative to the fixed income portion of the blended benchmark as the yield on the 10-year U.S. Treasury Note fell. (1)
In mid-February, the market began to stabilize and our equity valuation model indicated that many segments of the market had become substantially more attractive. As a result, we increased exposure to both common stocks and equity-based closed end funds. Both of these moves proved to be beneficial to Portfolio performance, as the market rebounded throughout the remainder of the time period.
The equity portion of the Portfolio underperformed the S&P 1500 Composite Index. Negative stock selection in Financials was the key detractor for the equity portion, although stock selections in Information Technology and Energy also weighed on relative performance. Overall, sector allocation in equities did not have a significant impact on performance relative to the equity index.
With regard to individual stock performance within the Portfolio, the five best benchmark-relative contributors to Portfolio performance were CMS Energy Corp., St. Jude Medical, Inc., Martin Marietta Materials, Inc., Hertz Global Holdings, Inc., and Eagle Materials, Inc. The five stocks that had the most negative benchmark-relative contribution were CBRE Group, Inc., Signature Bank, Royal Caribbean Cruises Ltd., Allergan PLC, and SVB Financial Group. (1)
In the fixed income portion of the Portfolio, we had positive overall performance over the time period despite a shorter overall duration. Our general use of credit risk was rewarded with spread tightening in both investment grade and high yield corporate bonds. In addition, our use of closed end fund arbitrage was rewarded as a number of these closed end funds either converted to an open-end fund or liquidated, capitalizing on the original discount to net asset prices at which they had been acquired. Performance was negatively impacted by our relatively shorter duration and underweight exposure to U.S. Treasury securities. Given this positioning, we tend to expect underperformance when rates fall aggressively and relative outperformance when rates rise. (1)
The option hedging strategy that utilizes out-of-the-money S&P 500 options also detracted from the Portfolio’s return. The S&P 500 Index held onto its gains and equity volatility remained relatively low during the period, leading to general valuation declines in the prices of the options.
At the conclusion of the time period, our overall average value-to-price (V/P) ratio was at 1.09; giving us confidence there is room for the market to rise in the coming year. Currently, our system indicates attractive opportunities within the Financial, Consumer Discretionary, and Information Technology sectors. The Portfolio continues to remain slightly underweight in equities relative to the blended benchmark with approximately 56% allocated to equities, 39% to fixed income (which includes preferred stocks and closed-end funds), and about 5% to cash. Additionally, the Portfolio’s options positions have been reduced recently, targeting an equity beta at the upper end of our historical range. We will continue to adjust the Portfolio’s positioning based on our value readings. (1)
| (1) | The Portfolio’s composition is subject to change. Holdings and weightings are as of June 30, 2016. |
| 84 | (continued) |
| Ohio National Fund, Inc. | Balanced Portfolio (Continued) |
Change in Value of $10,000 Investment
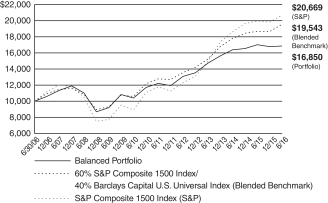
Hypothetical illustration based on past performance. Future performance will vary. The Portfolio’s returns reflect reinvested dividends. The Portfolio’s holdings may differ significantly from the securities in the index. The index is unmanaged and therefore does not reflect the cost of portfolio management and accounting.
The S&P Composite 1500 Index is a broad-based capitalization-weighted index of 1500 U.S. companies and is comprised of the S&P MidCap 400, S&P 500, and the S&P SmallCap 600. It is designed for investors seeking to replicate to the performance of the U.S. equity market or benchmark against a representative universe of tradable stocks. The index presented herein includes the effects of reinvested dividends.
The Barclays Capital U.S. Universal Index represents the union of the U.S. Aggregate Index, U.S. Corporate High Yield Index. Investment Grade 144A Index, Eurodollar Index, U.S. Emerging Markets Index, and the non-ERISA portion of the Commercial Mortgage-Backed Securities (CMBS) Index. The index covers USD-denominated, taxable bonds that are rated either investment grade or high-yield.
Portfolio Composition as of June 30, 2016 (1)
| % of Net Assets | ||||
Common Stocks (4) | 52.0 | |||
Corporate Bonds (4) | 18.3 | |||
Preferred Stocks (4) | 2.2 | |||
Trust Preferred Securities (4) | 3.7 | |||
Asset-Backed / Mortgage-Backed Securities (4) | 4.8 | |||
U.S. Treasury Obligations | 3.4 | |||
Closed-End Mutual Funds | 5.1 | |||
Open-End Mutual Funds | 0.4 | |||
Exchange Traded Funds | 3.0 | |||
Purchased Options | 0.5 | |||
Money Market Funds and | 6.6 | |||
|
| |||
| 100.0 | ||||
|
|
Top 10 Portfolio Holdings as of June 30, 2016 (1) (2) (3)
| % of Net Assets |
1. SPDR S&P 500 ETF Trust | 1.4 | |||
2. CVS Health Corp. | 1.4 | |||
3. Visa, Inc. | 1.2 | |||
4. MasterCard, Inc. Class A | 1.2 | |||
5. Berkshire Hathaway, Inc. Class B | 1.2 | |||
6. U.S. Treasury Note | 1.1 | |||
7. U.S. Treasury Note | 1.1 | |||
8. U.S. Treasury Note | 1.1 | |||
9. Facebook, Inc. Class A | 1.1 | |||
10. Lender Processing Services, Inc. / Black Knight Lending Solutions, Inc. | 1.1 |
| (1) | Composition of Portfolio subject to change. |
| (2) | Short-term investments have been excluded from the list of Top 10 Portfolio Holdings. |
| (3) | Top 10 Portfolio Holdings is presented at an individual security level. Total investment exposure by issuer may be higher. |
| (4) | Sectors (Common Stocks, Corporate Bonds, Preferred Stocks, Trust Preferred Securities, Asset-Backed Securities / Mortgage-Backed Securities): |
| % of Net Assets | ||||
Financials | 24.3 | |||
Health Care | 11.4 | |||
Consumer Discretionary | 10.8 | |||
Information Technology | 10.7 | |||
Industrials | 10.3 | |||
Consumer Staples | 5.6 | |||
Materials | 2.3 | |||
Telecommunication Services | 2.1 | |||
Utilities | 2.0 | |||
Energy | 1.5 | |||
|
| |||
| 81.0 | ||||
|
|
| 85 |
| Ohio National Fund, Inc. | Balanced Portfolio |
Schedule of Investments | June 30, 2016 (Unaudited) |
| Common Stocks – 52.0% | Shares | Value | ||||||||||||||||
CONSUMER DISCRETIONARY – 9.6% | ||||||||||||||||||
Gentherm, Inc. (Auto Components) | (a) | 50,000 | $ | 1,712,500 | ||||||||||||||
Magna International, Inc. (Auto Components) | 120,000 | 4,208,400 | ||||||||||||||||
Royal Caribbean Cruises Ltd. (Hotels, Restaurants & Leisure) | 60,000 | 4,029,000 | ||||||||||||||||
Starbucks Corp. (Hotels, Restaurants & Leisure) | 85,000 | 4,855,200 | ||||||||||||||||
Wyndham Worldwide Corp. (Hotels, Restaurants & Leisure) | 90,000 | 6,410,700 | ||||||||||||||||
Newell Brands, Inc. (Household Durables) | 70,000 | 3,399,900 | ||||||||||||||||
Tempur Sealy International, Inc. (Household Durables) | (a) | 30,000 | 1,659,600 | |||||||||||||||
Whirlpool Corp. (Household Durables) | 30,000 | 4,999,200 | ||||||||||||||||
Brunswick Corp. (Leisure Products) | 62,000 | 2,809,840 | ||||||||||||||||
CBS Corp. Class B (Media) | 149,704 | 8,149,886 | ||||||||||||||||
Comcast Corp. Class A (Media) | 114,044 | 7,434,528 | ||||||||||||||||
Time Warner, Inc. (Media) | 36,000 | 2,647,440 | ||||||||||||||||
Twenty-First Century Fox, Inc. Class A (Media) | 165,000 | 4,463,250 | ||||||||||||||||
Advance Auto Parts, Inc. (Specialty Retail) | 20,000 | 3,232,600 | ||||||||||||||||
Home Depot, Inc. / The (Specialty Retail) | 40,000 | 5,107,600 | ||||||||||||||||
Lowe’s Cos., Inc. (Specialty Retail) | 85,000 | 6,729,450 | ||||||||||||||||
Hanesbrands, Inc. (Textiles, Apparel & Luxury Goods) | 170,000 | 4,272,100 | ||||||||||||||||
NIKE, Inc. Class B (Textiles, Apparel & Luxury Goods) | 115,000 | 6,348,000 | ||||||||||||||||
Skechers U.S.A., Inc. Class A (Textiles, Apparel & Luxury Goods) | (a) | 155,000 | 4,606,600 | |||||||||||||||
|
| |||||||||||||||||
| 87,075,794 | ||||||||||||||||||
|
| |||||||||||||||||
CONSUMER STAPLES – 1.5% | ||||||||||||||||||
CVS Health Corp. (Food & Staples Retailing) | 80,000 | 7,659,200 | ||||||||||||||||
Walgreens Boots Alliance, Inc. (Food & Staples Retailing) | 75,000 | 6,245,250 | ||||||||||||||||
|
| |||||||||||||||||
| 13,904,450 | ||||||||||||||||||
|
| |||||||||||||||||
ENERGY – 1.2% | ||||||||||||||||||
Schlumberger Ltd. (Energy Equip. & Svs.) | 45,000 | 3,558,600 | ||||||||||||||||
Marathon Petroleum Corp. (Oil, Gas & Consumable Fuels) | 40,000 | 1,518,400 | ||||||||||||||||
PBF Energy, Inc. Class A (Oil, Gas & Consumable Fuels) | 132,643 | 3,154,250 | ||||||||||||||||
Synergy Resources Corp. (Oil, Gas & Consumable Fuels) | (a) | 300,000 | 1,998,000 | |||||||||||||||
Valero Energy Corp. (Oil, Gas & Consumable Fuels) | 20,000 | 1,020,000 | ||||||||||||||||
|
| |||||||||||||||||
| 11,249,250 | ||||||||||||||||||
|
| |||||||||||||||||
FINANCIALS – 9.6% | ||||||||||||||||||
Bank of America Corp. (Banks) | 490,000 | 6,502,300 | ||||||||||||||||
JPMorgan Chase & Co. (Banks) | 35,000 | 2,174,900 | ||||||||||||||||
Signature Bank (Banks) | (a) | 63,270 | 7,903,689 | |||||||||||||||
SVB Financial Group (Banks) | (a) | 55,000 | 5,233,800 | |||||||||||||||
U.S. Bancorp (Banks) | 50,000 | 2,016,500 | ||||||||||||||||
Wells Fargo & Co. (Banks) | 79,000 | 3,739,070 | ||||||||||||||||
Invesco Ltd. (Capital Markets) | 132,900 | 3,394,266 | ||||||||||||||||
Ally Financial, Inc. (Consumer Finance) | (a) | 525,000 | 8,961,750 | |||||||||||||||
Discover Financial Services (Consumer Finance) | 172,080 | 9,221,767 | ||||||||||||||||
Berkshire Hathaway, Inc. Class B (Diversified Financial Svs.) | (a) | 73,000 | 10,569,670 | |||||||||||||||
American International Group, Inc. (Insurance) | 70,000 | 3,702,300 | ||||||||||||||||
Lincoln National Corp. (Insurance) | 75,000 | 2,907,750 | ||||||||||||||||
XL Group PLC (Insurance) | 200,000 | 6,662,000 | ||||||||||||||||
Winthrop Realty Trust (Real Estate Investment Trusts) | 259,661 | 2,282,420 | ||||||||||||||||
CBRE Group, Inc. (Real Estate Mgmt. & Development) | (a) | 355,000 | 9,400,400 | |||||||||||||||
Jones Lang LaSalle, Inc. (Real Estate Mgmt. & Development) | 19,029 | 1,854,376 | ||||||||||||||||
|
| |||||||||||||||||
| 86,526,958 | ||||||||||||||||||
|
| |||||||||||||||||
HEALTH CARE – 9.0% | ||||||||||||||||||
AbbVie, Inc. (Biotechnology) | 100,000 | 6,191,000 | ||||||||||||||||
Amgen, Inc. (Biotechnology) | 20,000 | 3,043,000 | ||||||||||||||||
Celgene Corp. (Biotechnology) | (a) | 20,000 | 1,972,600 | |||||||||||||||
St. Jude Medical, Inc. (Health Care Equip. & Supplies) | 25,000 | 1,950,000 | ||||||||||||||||
Zimmer Biomet Holdings, Inc. (Health Care Equip. & Supplies) | 25,000 | 3,009,500 | ||||||||||||||||
Aetna, Inc. (Health Care Providers & Svs.) | 65,000 | 7,938,450 | ||||||||||||||||
Cardinal Health, Inc. (Health Care Providers & Svs.) | 25,000 | 1,950,250 | ||||||||||||||||
Cigna Corp. (Health Care Providers & Svs.) | 38,000 | 4,863,620 | ||||||||||||||||
HCA Holdings, Inc. (Health Care Providers & Svs.) | (a) | 110,000 | 8,471,100 | |||||||||||||||
McKesson Corp. (Health Care Providers & Svs.) | 45,000 | 8,399,250 | ||||||||||||||||
MEDNAX, Inc. (Health Care Providers & Svs.) | (a) | 30,000 | 2,172,900 | |||||||||||||||
Allscripts Healthcare Solutions, Inc. (Health Care Technology) | (a) | 215,000 | 2,730,500 | |||||||||||||||
Cerner Corp. (Health Care Technology) | (a) | 65,000 | 3,809,000 | |||||||||||||||
Allergan plc (Pharmaceuticals) | (a) | 28,700 | 6,632,283 | |||||||||||||||
Bristol-Myers Squibb Co. (Pharmaceuticals) | 95,000 | 6,987,250 | ||||||||||||||||
Eli Lilly & Co. (Pharmaceuticals) | 60,000 | 4,725,000 | ||||||||||||||||
Jazz Pharmaceuticals PLC (Pharmaceuticals) | (a) | 45,000 | 6,358,950 | |||||||||||||||
|
| |||||||||||||||||
| 81,204,653 | ||||||||||||||||||
|
| |||||||||||||||||
| 86 | (continued) |
| Ohio National Fund, Inc. | Balanced Portfolio (Continued) |
Schedule of Investments | June 30, 2016 (Unaudited) |
| Common Stocks (Continued) | Shares | Value | ||||||||||||||||
INDUSTRIALS – 7.5% | ||||||||||||||||||
B/E Aerospace, Inc. (Aerospace & Defense) | 95,000 | $ | 4,386,625 | |||||||||||||||
General Dynamics Corp. (Aerospace & Defense) | 50,000 | 6,962,000 | ||||||||||||||||
Honeywell International, Inc. (Aerospace & Defense) | 73,840 | 8,589,069 | ||||||||||||||||
Orbital ATK, Inc. (Aerospace & Defense) | 69,915 | 5,952,563 | ||||||||||||||||
Delta Air Lines, Inc. (Airlines) | 90,000 | 3,278,700 | ||||||||||||||||
Southwest Airlines Co. (Airlines) | 60,000 | 2,352,600 | ||||||||||||||||
United Continental Holdings, Inc. (Airlines) | (a) | 40,000 | 1,641,600 | |||||||||||||||
Fortune Brands Home & Security, Inc. (Building Products) | 45,000 | 2,608,650 | ||||||||||||||||
Masco Corp. (Building Products) | 225,000 | 6,961,500 | ||||||||||||||||
PGT, Inc. (Building Products) | (a) | 265,000 | 2,729,500 | |||||||||||||||
Comfort Systems U.S.A., Inc. (Construction & Engineering) | 19,396 | 631,728 | ||||||||||||||||
Dycom Industries, Inc. (Construction & Engineering) | (a) | 35,000 | 3,141,600 | |||||||||||||||
Herc Holdings, Inc. (Road & Rail) | (a) | 500,000 | 5,535,000 | |||||||||||||||
Old Dominion Freight Line, Inc. (Road & Rail) | (a) | 65,000 | 3,920,150 | |||||||||||||||
Ryder System, Inc. (Road & Rail) | 30,000 | 1,834,200 | ||||||||||||||||
Union Pacific Corp. (Road & Rail) | 88,160 | 7,691,960 | ||||||||||||||||
|
| |||||||||||||||||
| 68,217,445 | ||||||||||||||||||
|
| |||||||||||||||||
INFORMATION TECHNOLOGY – 9.1% | ||||||||||||||||||
IPG Photonics Corp. (Electronic Equip., Instr. & Comp.) | (a) | 77,172 | 6,173,760 | |||||||||||||||
TE Connectivity Ltd. (Electronic Equip., Instr. & Comp.) | 135,000 | 7,709,850 | ||||||||||||||||
Akamai Technologies, Inc. (Internet Software & Svs.) | (a) | 40,000 | 2,237,200 | |||||||||||||||
Alphabet, Inc. Class C (Internet Software & Svs.) | (a) | 7,776 | 5,381,770 | |||||||||||||||
Facebook, Inc. Class A (Internet Software & Svs.) | (a) | 85,000 | 9,713,800 | |||||||||||||||
LinkedIn Corp. (Internet Software & Svs.) | (a)(d) | 25,000 | 4,731,250 | |||||||||||||||
DST Systems, Inc. (IT Svs.) | 30,000 | 3,492,900 | ||||||||||||||||
MasterCard, Inc. Class A (IT Svs.) | 121,600 | 10,708,096 | ||||||||||||||||
Visa, Inc. (IT Svs.) | 151,400 | 11,229,338 | ||||||||||||||||
Xerox Corp. (IT Svs.) | 150,000 | 1,423,500 | ||||||||||||||||
Broadcom Ltd. (Semiconductors & Equip.) | 25,000 | 3,885,000 | ||||||||||||||||
Microsemi Corp. (Semiconductors & Equip.) | (a) | 130,000 | 4,248,400 | |||||||||||||||
Skyworks Solutions, Inc. (Semiconductors & Equip.) | 30,000 | 1,898,400 | ||||||||||||||||
Synaptics, Inc. (Semiconductors & Equip.) | (a) | 27,000 | 1,451,250 | |||||||||||||||
Synchronoss Technologies, Inc. (Software) | (a) | 23,821 | 758,937 | |||||||||||||||
Apple, Inc. (Tech. Hardware, Storage & Periph.) | 78,910 | 7,543,796 | ||||||||||||||||
|
| |||||||||||||||||
| 82,587,247 | ||||||||||||||||||
|
| |||||||||||||||||
MATERIALS – 2.3% | ||||||||||||||||||
Ashland, Inc. (Chemicals) | 20,000 | 2,295,400 | ||||||||||||||||
Sherwin-Williams Co. / The (Chemicals) | 15,000 | 4,405,050 | ||||||||||||||||
Eagle Materials, Inc. (Construction Materials) | 35,000 | 2,700,250 | ||||||||||||||||
Martin Marietta Materials, Inc. (Construction Materials) | 23,000 | 4,416,000 | ||||||||||||||||
Graphic Packaging Holding Co. (Containers & Packaging) | 250,000 | 3,135,000 | ||||||||||||||||
International Paper Co. (Containers & Packaging) | 100,000 | 4,238,000 | ||||||||||||||||
|
| |||||||||||||||||
| 21,189,700 | ||||||||||||||||||
|
| |||||||||||||||||
TELECOMMUNICATION SERVICES – 1.0% | ||||||||||||||||||
BCE, Inc. (Diversified Telecom. Svs.) | 30,000 | 1,419,300 | ||||||||||||||||
T-Mobile U.S., Inc. (Wireless Telecom. Svs.) | (a) | 170,000 | 7,355,900 | |||||||||||||||
|
| |||||||||||||||||
| 8,775,200 | ||||||||||||||||||
|
| |||||||||||||||||
UTILITIES – 1.2% | ||||||||||||||||||
ALLETE, Inc. (Electric Utilities) | 40,000 | 2,585,200 | ||||||||||||||||
OGE Energy Corp. (Electric Utilities) | 60,190 | 1,971,222 | ||||||||||||||||
CMS Energy Corp. (Multi-Utilities) | 51,300 | 2,352,618 | ||||||||||||||||
Sempra Energy (Multi-Utilities) | 35,000 | 3,990,700 | ||||||||||||||||
|
| |||||||||||||||||
| 10,899,740 | ||||||||||||||||||
|
| |||||||||||||||||
Total Common Stocks (Cost $463,898,049) | $ | 471,630,437 | ||||||||||||||||
|
| |||||||||||||||||
| Corporate Bonds – 18.3% | Rate | Maturity | Face Amount | Value | ||||||||||||||
CONSUMER DISCRETIONARY – 1.2% | ||||||||||||||||||
International Game Technology (Hotels, Restaurants & Leisure) | 5.350% | 10/15/2023 | $ | 2,000,000 | $ | 1,950,000 | ||||||||||||
Lee Enterprises, Inc. (Media) | (b) | 9.500% | 03/15/2022 | 3,600,000 | 3,546,000 | |||||||||||||
TCI Communications, Inc. (Media) | 7.125% | 02/15/2028 | 4,000,000 | 5,563,092 | ||||||||||||||
|
| |||||||||||||||||
| 11,059,092 | ||||||||||||||||||
|
| |||||||||||||||||
CONSUMER STAPLES – 4.1% | ||||||||||||||||||
CVS Health Corp. (Food & Staples Retailing) | 4.750% | 12/01/2022 | 10,726,000 | 12,252,964 | ||||||||||||||
Innovation Ventures LLC / Innovation Ventures Finance Corp. (Food & Staples Retailing) | (b) | 9.500% | 08/15/2019 | 2,500,000 | 2,609,375 | |||||||||||||
Rite Aid Corp. (Food & Staples Retailing) | (b) | 6.125% | 04/01/2023 | 4,250,000 | 4,547,075 | |||||||||||||
| 87 | (continued) |
| Ohio National Fund, Inc. | Balanced Portfolio (Continued) |
Schedule of Investments | June 30, 2016 (Unaudited) |
| Corporate Bonds (Continued) | Rate | Maturity | Face Amount | Value | ||||||||||||||
CONSUMER STAPLES (continued) | ||||||||||||||||||
Walgreens Boots Alliance, Inc. (Food & Staples Retailing) | 3.100% | 06/01/2023 | $ | 3,250,000 | $ | 3,304,152 | ||||||||||||
Kraft Heinz Foods Co. (Food Products) | (b) | 4.875% | 02/15/2025 | 7,714,000 | 8,461,749 | |||||||||||||
Altria Group, Inc. (Tobacco) | (h) | 9.250% | 08/06/2019 | 4,567,000 | 5,630,325 | |||||||||||||
|
| |||||||||||||||||
| 36,805,640 | ||||||||||||||||||
|
| |||||||||||||||||
ENERGY – 0.3% | ||||||||||||||||||
Alliance Pipeline LP / United States (Oil, Gas & Consumable Fuels) | (b) | 7.877% | 12/31/2025 | 2,000,000 | 2,456,576 | |||||||||||||
|
| |||||||||||||||||
FINANCIALS – 5.3% | ||||||||||||||||||
Citigroup, Inc. (Banks) | 6.875% | 06/01/2025 | 2,250,000 | 2,809,868 | ||||||||||||||
RBC U.S.A. Holdco Corp. (Banks) | 5.250% | 09/15/2020 | 1,500,000 | 1,692,777 | ||||||||||||||
E*TRADE Financial Corp. (Capital Markets) | 5.375% | 11/15/2022 | 6,890,000 | 7,268,950 | ||||||||||||||
Neuberger Berman Group LLC / Neuberger Berman Finance Corp. (Capital Markets) | (b) | 5.875% | 03/15/2022 | 5,800,000 | 6,053,750 | |||||||||||||
Ally Financial, Inc. (Consumer Finance) | 8.000% | 03/15/2020 | 4,400,000 | 4,950,000 | ||||||||||||||
Berkshire Hathaway, Inc. (Diversified Financial Svs.) | 2.750% | 03/15/2023 | 2,250,000 | 2,325,654 | ||||||||||||||
Alleghany Corp. (Insurance) | 5.625% | 09/15/2020 | 1,000,000 | 1,119,800 | ||||||||||||||
American Equity Investment Life Holding Co. (Insurance) | 6.625% | 07/15/2021 | 2,000,000 | 2,030,000 | ||||||||||||||
Chubb INA Holdings, Inc. (Insurance) | 8.875% | 08/15/2029 | 1,700,000 | 2,601,833 | ||||||||||||||
MBIA, Inc. (Insurance) | 6.625% | 10/01/2028 | 2,810,000 | 2,781,900 | ||||||||||||||
Old Republic International Corp. (Insurance) | 4.875% | 10/01/2024 | 5,000,000 | 5,342,925 | ||||||||||||||
ProAssurance Corp. (Insurance) | 5.300% | 11/15/2023 | 5,063,000 | 5,453,656 | ||||||||||||||
Prudential Financial, Inc. (Insurance) | (e) | 8.875% | 06/15/2038 | 2,610,000 | 2,871,000 | |||||||||||||
CBRE Services, Inc. (Real Estate Mgmt. & Development) | 5.250% | 03/15/2025 | 800,000 | 838,594 | ||||||||||||||
|
| |||||||||||||||||
| 48,140,707 | ||||||||||||||||||
|
| |||||||||||||||||
HEALTH CARE – 2.4% | ||||||||||||||||||
CHS / Community Health Systems, Inc. (Health Care Providers & Svs.) | 8.000% | 11/15/2019 | 1,750,000 | 1,708,438 | ||||||||||||||
HCA, Inc. (Health Care Providers & Svs.) | 5.250% | 04/15/2025 | 6,200,000 | 6,479,000 | ||||||||||||||
Highmark, Inc. (Acquired 12/11/2014 through 03/31/2015, Cost $2,228,860)(Health Care Providers & Svs.) | (b)(i) | 6.125% | 05/15/2041 | 2,100,000 | 2,119,215 | |||||||||||||
Prospect Medical Holdings, Inc. (Health Care Providers & Svs.) | (b) | 8.375% | 05/01/2019 | 6,482,000 | 6,741,280 | |||||||||||||
inVentiv Health, Inc. (Health Care Providers & Svs.) | (b) | 9.000% | 01/15/2018 | 5,020,000 | 5,158,050 | |||||||||||||
|
| |||||||||||||||||
| 22,205,983 | ||||||||||||||||||
|
| |||||||||||||||||
INDUSTRIALS – 2.1% | ||||||||||||||||||
Air Canada (Airlines) | (b) | 8.750% | 04/01/2020 | 5,715,000 | 6,043,612 | |||||||||||||
Nortek, Inc. (Building Products) | 8.500% | 04/15/2021 | 3,518,000 | 3,649,925 | ||||||||||||||
Ingersoll-Rand Co. (Machinery) | 6.391% | 11/15/2027 | 2,215,000 | 2,686,618 | ||||||||||||||
Ingersoll-Rand Co. (Machinery) | 6.443% | 11/15/2027 | 1,800,000 | 2,247,754 | ||||||||||||||
International Lease Finance Corp. (Trading Companies & Distributors) | 5.875% | 08/15/2022 | 4,256,000 | 4,607,120 | ||||||||||||||
|
| |||||||||||||||||
| 19,235,029 | ||||||||||||||||||
|
| |||||||||||||||||
INFORMATION TECHNOLOGY – 1.6% | ||||||||||||||||||
Corning, Inc. (Electronic Equip., Instr. & Comp.) | 7.250% | 08/15/2036 | 2,180,000 | 2,634,593 | ||||||||||||||
EarthLink Holdings Corp. (Internet Software & Svs.) | 7.375% | 06/01/2020 | 2,400,000 | 2,496,000 | ||||||||||||||
Lender Processing Services, Inc. / Black Knight Lending Solutions, Inc. (IT Svs.) | 5.750% | 04/15/2023 | 9,188,000 | 9,624,430 | ||||||||||||||
|
| |||||||||||||||||
| 14,755,023 | ||||||||||||||||||
|
| |||||||||||||||||
TELECOMMUNICATION SERVICES – 1.1% | ||||||||||||||||||
Cincinnati Bell, Inc. (Diversified Telecom. Svs.) | 8.375% | 10/15/2020 | 3,281,000 | 3,421,787 | ||||||||||||||
Clearwire Communications LLC / Clearwire Finance, Inc. (Wireless Telecom. Svs.) | (b) | 8.250% | 12/01/2040 | 6,600,000 | 6,682,500 | |||||||||||||
|
| |||||||||||||||||
| 10,104,287 | ||||||||||||||||||
|
| |||||||||||||||||
UTILITIES – 0.2% | ||||||||||||||||||
Tenaska Georgia Partners LP (Electric Utilities) | 9.500% | 02/01/2030 | 1,273,086 | 1,502,716 | ||||||||||||||
|
| |||||||||||||||||
Total Corporate Bonds (Cost $165,174,558) | $ | 166,265,053 | ||||||||||||||||
|
| |||||||||||||||||
| Preferred Stocks – 2.2% | Rate | Quantity | Value | |||||||||||||||
FINANCIALS – 1.5% | ||||||||||||||||||
Charles Schwab Corp. Series A / The (Capital Markets) | (f) | 7.000% | 4,000,000 | $ | 4,555,000 | |||||||||||||
Gramercy Property Trust (Acquired 08/26/2014 through 01/22/2016, Cost $4,009,020) (Real Estate Investment Trusts) | (i) | 7.125% | 156,854 | 4,179,375 | ||||||||||||||
Hatteras Financial Corp. (Real Estate Investment Trusts) | 7.625% | 176,098 | 4,374,274 | |||||||||||||||
|
| |||||||||||||||||
| 13,108,649 | ||||||||||||||||||
|
| |||||||||||||||||
INDUSTRIALS – 0.7% | ||||||||||||||||||
General Electric Co. (Industrial Conglomerates) | (f) | 5.000% | 5,760,000 | $ | 6,120,000 | |||||||||||||
|
| |||||||||||||||||
Total Preferred Stocks (Cost $18,438,221) | $ | 19,228,649 | ||||||||||||||||
|
| |||||||||||||||||
| 88 | (continued) |
| Ohio National Fund, Inc. | Balanced Portfolio (Continued) |
Schedule of Investments | June 30, 2016 (Unaudited) |
| Trust Preferred Securities – 3.7% | Rate | Quantity | Value | |||||||||||||||
FINANCIALS – 3.1% | ||||||||||||||||||
GMAC Capital Trust I (Consumer Finance) | (f) | QL + 579 | 353,690 | $ | 8,778,586 | |||||||||||||
ILFC E-Capital Trust II (Diversified Financial Svs.) | (b)(g) | | QL/10T/30T + 180, 14.5% Max | | 2,900,000 | 2,291,000 | ||||||||||||
MetLife Capital Trust IV (Insurance) | (b) | 7.875% | 1,000,000 | 1,192,500 | ||||||||||||||
NTC Capital I (Capital Markets) | (f) | QL + 52 | 3,300,000 | 2,871,000 | ||||||||||||||
PNC Preferred Funding Trust II (Banks) | (b)(f) | QL + 122 | 4,000,000 | 3,520,000 | ||||||||||||||
State Street Capital Trust I (Capital Markets) | (f) | QL + 56 | 5,123,000 | 4,367,357 | ||||||||||||||
USB Capital IX (Banks) | (f) | QL + 102 | 1,500,000 | 1,226,250 | ||||||||||||||
USB Realty Corp. (Banks) | (b)(f) | QL + 115 | 5,000,000 | 3,993,750 | ||||||||||||||
|
| |||||||||||||||||
| 28,240,443 | ||||||||||||||||||
|
| |||||||||||||||||
UTILITIES – 0.6% | ||||||||||||||||||
PECO Energy Capital Trust IV (Electric Utilities) | 5.750% | 5,000,000 | 5,437,010 | |||||||||||||||
|
| |||||||||||||||||
Total Trust Preferred Securities (Cost $35,127,181) | $ | 33,677,453 | ||||||||||||||||
|
| |||||||||||||||||
| Asset-Backed / Mortgage-Backed Securities – 4.8% | Rate | Maturity | Face Amount | Value | ||||||||||||||
FINANCIALS – 4.8% | ||||||||||||||||||
Citigroup Mortgage Loan Trust 2013-J1 Class B2 (Acquired 05/21/2015, Cost $1,932,683) | (b)(i) | 3.542% | 10/25/2043 | $ | 1,937,472 | $ | 1,930,069 | |||||||||||
Green Tree 2008-HE1 Class A (Acquired 05/05/2016, Cost $3,214,605) | (b)(i) | 9.500% | 03/25/2038 | 2,990,786 | 3,179,040 | |||||||||||||
MASTR Seasoned Securitization Trust 2005-1 Class 1A1 | 6.445% | 09/25/2032 | 1,774,360 | 1,906,285 | ||||||||||||||
New Residential Mortgage Loan Trust 2016-1 Class B3 (Acquired 04/11/2016 through 04/26/2016, Cost $5,532,771) | (b)(i) | 5.547% | 03/25/2056 | 5,294,952 | 5,556,549 | |||||||||||||
Sequoia Mortgage Trust 2013-12 Class B3 (Acquired 10/07/2015, Cost $2,281,741) | (b)(i) | 4.250% | 12/25/2043 | 2,244,398 | 2,279,936 | |||||||||||||
Towd Point Mortgage Trust 2015-1 Class A4 (Acquired 05/17/2016, Cost $6,715,351) | (b)(i) | 4.250% | 10/25/2053 | 6,600,000 | 6,715,035 | |||||||||||||
Towd Point Mortgage Trust 2015-2 Class 2M1 (Acquired 02/16/2016 through 05/09/2016, Cost $5,699,360) | (b)(i) | 3.750% | 11/25/2057 | 5,687,000 | 5,964,402 | |||||||||||||
Towd Point Mortgage Trust 2015-3 Class M2 (Acquired 05/12/2016 through 06/13/2016, Cost $6,982,524) | (b)(i) | 4.000% | 03/25/2054 | 7,000,000 | 7,124,625 | |||||||||||||
Towd Point Mortgage Trust 2015-4 Class M2 (Acquired 10/29/2015 through 11/30/2015, Cost $3,901,524) | (b)(i) | 3.750% | 04/25/2055 | 4,000,000 | 3,897,128 | |||||||||||||
Velocity Commercial Capital Loan Trust 2014-1 Class M3 (Acquired 02/17/2016, Cost $1,989,165) | (b)(i) | 6.888% | 09/25/2044 | 1,900,000 | 2,009,250 | |||||||||||||
Velocity Commercial Capital Loan Trust 2014-1 Class M4 (Acquired 03/16/2016, Cost $2,441,130) | (b)(i) | 7.051% | 09/25/2044 | 2,397,000 | 2,462,918 | |||||||||||||
|
| |||||||||||||||||
Total Asset-Backed / Mortgage-Backed Securities (Cost $42,605,470) | $ | 43,025,237 | ||||||||||||||||
|
| |||||||||||||||||
| U.S. Treasury Obligations – 3.4% | Rate | Maturity | Face Amount | Value | ||||||||||||||
U.S. Treasury Note | 1.000% | 09/15/2017 | $ | 10,000,000 | $ | 10,053,520 | ||||||||||||
U.S. Treasury Note | 1.875% | 05/31/2022 | 10,000,000 | 10,403,520 | ||||||||||||||
U.S. Treasury Note | 1.625% | 02/15/2026 | 10,000,000 | 10,118,750 | ||||||||||||||
|
| |||||||||||||||||
Total U.S. Treasury Obligations (Cost $29,507,826) | $ | 30,575,790 | ||||||||||||||||
|
| |||||||||||||||||
| Closed-End Mutual Funds – 5.1% | Shares | Value | ||||||||||||||||
Advent/Claymore Enhanced Growth & Income Fund | 328,530 | $ | 2,690,661 | |||||||||||||||
BlackRock Income Trust, Inc. | 410,819 | 2,723,730 | ||||||||||||||||
Delaware Investments Dividend & Income Fund, Inc. | 158,351 | 1,577,176 | ||||||||||||||||
Deutsche Global High Income Fund, Inc. | 27,439 | 223,353 | ||||||||||||||||
Deutsche High Income Opportunities Fund, Inc. | 76,528 | 1,040,781 | ||||||||||||||||
Deutsche High Income Trust | 69,688 | 611,861 | ||||||||||||||||
Deutsche Multi-Market Income Trust | 483,506 | 3,940,574 | ||||||||||||||||
Deutsche Strategic Income Trust | 94,282 | 1,081,414 | ||||||||||||||||
Diversified Real Asset Income Fund | 148,807 | 2,462,756 | ||||||||||||||||
First Trust Dividend and Income Fund | 153,683 | 1,381,610 | ||||||||||||||||
First Trust Enhanced Equity Income Fund | 111,807 | 1,466,908 | ||||||||||||||||
First Trust Mortgage Income Fund | 123,249 | 1,778,483 | ||||||||||||||||
Firsthand Technology Value Fund, Inc. | (a) | 36,800 | 272,872 | |||||||||||||||
Franklin Limited Duration Income Trust | 377,818 | 4,382,689 | ||||||||||||||||
Madison Strategic Sector Premium Fund | 6,539 | 75,133 | ||||||||||||||||
Morgan Stanley Income Securities, Inc. | 141,529 | 2,597,057 | ||||||||||||||||
Neuberger Berman Real Estate Securities Income Fund, Inc. | 292,723 | 1,662,667 | ||||||||||||||||
Nuveen Global Equity Income Fund | 554,118 | 6,466,557 | ||||||||||||||||
Pacholder High Yield Fund, Inc. | 54,014 | 384,580 | ||||||||||||||||
Virtus Total Return Fund | 573,532 | 2,649,718 | ||||||||||||||||
Wells Fargo Multi-Sector Income Fund | 134,755 | 1,704,651 | ||||||||||||||||
Zweig Fund, Inc. | 185,804 | 2,339,272 | ||||||||||||||||
Zweig Total Return Fund, Inc. / The | 250,578 | 3,014,453 | ||||||||||||||||
|
| |||||||||||||||||
Total Closed-End Mutual Funds (Cost $45,386,051) | $ | 46,528,956 | ||||||||||||||||
|
| |||||||||||||||||
| 89 | (continued) |
| Ohio National Fund, Inc. | Balanced Portfolio (Continued) |
Schedule of Investments | June 30, 2016 (Unaudited) |
| Open-End Mutual Funds – 0.4% | Shares | Value | ||||||||||||||||
UBS Total Return Bond Fund | 257,057 | $ | 3,891,843 | |||||||||||||||
|
| |||||||||||||||||
Total Open-End Mutual Funds (Cost $3,651,020) | $ | 3,891,843 | ||||||||||||||||
|
| |||||||||||||||||
| Exchange Traded Funds – 3.0% | Shares | Value | ||||||||||||||||
iShares Currency Hedged MSCI Eurozone ETF | 345,000 | $ | 8,304,150 | |||||||||||||||
iShares Europe ETF | 170,000 | 6,424,300 | ||||||||||||||||
SPDR S&P 500 ETF Trust | 59,152 | 12,394,119 | ||||||||||||||||
|
| |||||||||||||||||
Total Exchange Traded Funds (Cost $28,489,546) | $ | 27,122,569 | ||||||||||||||||
|
| |||||||||||||||||
| Purchased Options – 0.5% | Expiration | Exercise Price | Contracts (c) | Value | ||||||||||||||
S&P 500 Index Call Option | September 2016 | $ | 2,300.00 | 3,000 | $ | 105,000 | ||||||||||||
S&P 500 Index Put Option | December 2016 | $ | 1,800.00 | 700 | 2,023,000 | |||||||||||||
S&P 500 Index Put Option | January 2017 | $ | 1,800.00 | 700 | 2,555,000 | |||||||||||||
|
| |||||||||||||||||
Total Purchased Options (Cost $5,741,399) | $ | 4,683,000 | ||||||||||||||||
|
| |||||||||||||||||
| Money Market Funds – 6.0% | Shares | Value | ||||||||||||||||
State Street Institutional Liquid Reserves Fund Institutional Class | 7,989,892 | $ | 7,989,892 | |||||||||||||||
State Street Institutional U.S. Government Money Market Fund Institutional Class | 46,684,032 | 46,684,032 | ||||||||||||||||
|
| |||||||||||||||||
Total Money Market Funds (Cost $54,673,924) | $ | 54,673,924 | ||||||||||||||||
|
| |||||||||||||||||
Total Investments – 99.4% (Cost $892,693,245) | (j) | $ | 901,302,911 | |||||||||||||||
Total Written Options Outstanding – (0.0)% (see following schedule) | (37,500) | |||||||||||||||||
Other Assets in Excess of Liabilities – 0.6% | 5,654,142 | |||||||||||||||||
|
| |||||||||||||||||
Net Assets – 100.0% | $ | 906,919,553 | ||||||||||||||||
|
| |||||||||||||||||
Percentages are stated as a percent of net assets.
Abbreviations:
QL: Quarterly U.S. LIBOR Rate, 0.654% on 06/30/2016
10T: 10 Year Constant Maturity Treasury Rate, 1.475% on 06/30/2016
30T: 30 Year Constant Maturity Treasury Rate, 2.285% on 06/30/2016
Footnotes:
| (a) | Non-income producing security. |
| (b) | Security exempt from registration under Regulation D of the Securities Act of 1933. These securities may be resold in transactions exempt from registration, normally to qualified buyers under Rule 144A. At June 30, 2016, the value of these securities totaled $106,535,384, or 11.7% of the Portfolio’s net assets. Unless also noted with (i), as defined below, these securities were deemed liquid pursuant to procedures approved by the Board of Directors. |
| (c) | 100 shares per contract. |
| (d) | Security is fully or partially pledged as collateral for written call options outstanding. Outstanding written call options are presented in the following schedule. |
| (e) | Security is a variable rate instrument in which the coupon rate is fixed until a later specified date, then is adjusted quarterly in concert with U.S. LIBOR. Interest rates stated are those in effect at June 30, 2016. |
| (f) | Security is a variable rate preferred stock or trust preferred security in which the dividend rate is fixed until a later specified date, then is adjusted quarterly in concert with U.S. LIBOR. Dividend rates stated are those in effect at June 30, 2016. |
| (g) | Security is a variable rate trust preferred security in which the dividend rate is fixed until a later specified date, then is adjusted quarterly in concert with U.S. LIBOR, 10 Year Constant Maturity Treasury Rate, or 30 Year Constant Maturity Treasury Rate up to a maximum of 14.5%. Dividend rates stated are those in effect at June 30, 2016. |
| (h) | Represents bonds that are credit sensitive. The coupon rates for these bonds are subject to adjustment based on changes in national credit rating agency ratings. |
| (i) | Represents a security deemed to be illiquid. At June 30, 2016, the value of illiquid securities in the Portfolio totaled $47,417,542, or 5.2% of the Portfolio’s net assets. |
| (j) | Represents cost for financial reporting purposes, which may differ from cost basis for federal income tax purposes. See also Note 7 of the Notes to Financial Statements. |
The accompanying notes are an integral part of these financial statements.
Schedule of Written Options Outstanding | June 30, 2016 (Unaudited) |
| Expiration | Exercise Price | Contracts* | Value | |||||||
LinkedIn Corp. Call Option | August 2016 | $190 | 250 | $ | 37,500 | |||||
|
|
| ||||||||
Total Written Options Outstanding (Premiums received $69,670) | 250 | $ | 37,500 | |||||||
|
|
| ||||||||
| * | 100 shares per contract. |
The accompanying notes are an integral part of these financial statements.
| 90 |
| Ohio National Fund, Inc. | Target VIP Portfolio |
Objective/Strategy
The Target VIP Portfolio seeks an above average total return by investing in the common stocks of companies which are identified by a model which applies separate uniquely specialized strategies.
Performance as of June 30, 2016
Average Annual returns: | ||||
One year | -4.72% | |||
Five years | 8.40% | |||
Ten years | 4.36% |
Past performance does not guarantee future results. The performance data quoted represents past performance and current returns may be lower or higher. Total return figures include change in share price and reinvestment of dividends and capital gains. The investment return and principal value will fluctuate so that an investor’s shares, when redeemed, may be worth more or less than the original cost. To obtain performance information up to the most recent month end, call toll-free 1-877-781-6392.
The Portfolio is not open to direct retail investment. Beneficial interest in shares is obtained solely by purchase of variable life insurance policies and variable annuity contracts. Actual performance results for variable annuity and variable universal life contracts will be lower due to contract charges. Consult your contract for applicable charges.
Comments
For the six-month period ended June 30, 2016, the Target VIP Portfolio returned 0.51% versus 3.62% for its benchmark, the Russell 3000 Index.
U.S. equities posted decent gains over the first six months of 2016, though the journey was anything but boring. The year started with a sharp selloff that saw the Russell 3000 Index fall over 11% by early February. Global growth concerns, mixed domestic economic data and plunging oil prices were among the factors driving the market slide. Stocks rebounded sharply through early June, as Federal Reserve rate hikes expectations were pushed out and economic data showed the economy remain resilient. Just prior to the end of the period, the surprise vote by the United Kingdom to leave the European Union renewed market volatility.
The Portfolio had its annual rebalance in early January 2016. Though the selection process for the underlying strategies did not change, there were changes in the sector exposure of the Portfolio as a result of the rebalance. The rebalance resulted in additional exposure to the Financials and Information Technology sectors. Information Technology is now overweight, while the additional Financials exposure brought that sector to roughly in-line with the benchmark. The sectors losing notable weight as a result of the rebalance were Health Care, Telecommunications Services and Consumer Discretionary. Health Care is now underweight, while Consumer Discretionary remains overweight and Telecommunication Services is in-line with the benchmark. (1)
Stock selection in Utilities led the Portfolio’s underperformance relative to the benchmark. Foreign utilities picked up by the Target European 20 strategy within the Portfolio were responsible for the underperformance from the sector. Stock selection in the Consumer Discretionary, Financials, and Telecommunications Services sectors was also a drag on relative performance. (1)
The Industrials sector was the biggest positive contributor to relative performance, as stock selection drove performance in the sector. 3M Co. and Insperity, Inc. were among the top five contributors
in the Portfolio for the period while Universal Forest Products, Inc. was also a top performer. Positive stock selection, along with positive allocation due to an underweight in Health Care names, also contributed positively to Portfolio performance. Small cap names Supernus Pharmaceuticals, Inc. and AMN Healthcare Services, Inc. were among the top performers in the Health Care sector. (1)
The Portfolio’s best performers were Insperity, Inc., Supernus Pharmaceuticals, Inc., National Beverage Corp., NVIDIA Corp. and Patrick Industries, Inc. The worst performers were Conn’s, Inc., Zagg, Inc., Sucampo Pharmaceuticals, Inc. Class A, Applied Optoelectronics, Inc. and Legal & General Group PLC (ADR). The Portfolio’s top contributors to performance were 3M Co., Reynolds American, Inc., NVIDIA Corp., Insperity, Inc. and Travelers Cos., Inc. The top detractors from performance were Alphabet, Inc. Class A, Gilead Sciences, Inc., The Boeing Co., American Express Co. and Nike, Inc. (1)
As we look to the second half of 2016, we believe equities look attractive relative to other asset classes and offer a compelling risk/reward opportunity. With interest rates set to likely stay lower for longer, economic growth proving resilient and equities reasonably valued, conditions remain favorable for the asset class. As always, we remain consistent in the application of the six strategies underlying the Portfolio. The result is a Portfolio with broad exposures across the size and sector spectrum, which provides diversification along with upside potential.
| (1) | The Portfolio’s composition is subject to change. Holdings and weightings are as of June 30, 2016. |
Change in Value of $10,000 Investment
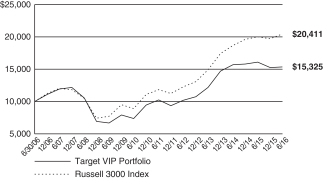
Hypothetical illustration based on past performance. Future performance will vary. The Portfolio’s returns reflect reinvested dividends. The Portfolio’s holdings may differ significantly from the securities in the index. The index is unmanaged and therefore does not reflect the cost of portfolio management and accounting.
The Russell 3000 Index measures the performance of the largest 3000 U.S. companies representing approximately 98% of the investable U.S. equity market. The Russell 3000 Index is constructed to provide a comprehensive, unbiased, and stable barometer of the broad market and is completely reconstituted annually to ensure new and growing equities are reflected. The index presented includes the effects of reinvested dividends.
| 91 | (continued) |
| Ohio National Fund, Inc. | Target VIP Portfolio (Continued) |
Portfolio Composition as of June 30, 2016 (1)
| % of Net Assets | ||||
Common Stocks (4) | 97.8 | |||
Money Market Funds and | 2.2 | |||
|
| |||
| 100.0 | ||||
|
|
Top 10 Portfolio Holdings as of June 30, 2016 (1) (2) (3)
| % of Net Assets | ||||
1. Alphabet, Inc. Class A | 7.4 | |||
2. Starbucks Corp. | 4.1 | |||
3. 3M Co. | 3.8 | |||
4. Travelers Cos., Inc. / The | 3.4 | |||
5. Intel Corp. | 3.0 | |||
6. Apple, Inc. | 2.9 | |||
7. Boeing Co. / The | 2.9 | |||
8. American Express Co. | 2.9 | |||
9. Accenture PLC Class A | 2.4 | |||
10. Reynolds American, Inc. | 2.3 |
| (1) | Composition of Portfolio subject to change. |
| (2) | Short-term investments have been excluded from the list of Top 10 Portfolio Holdings. |
| (3) | Top 10 Portfolio Holdings is presented at an individual security level. Total investment exposure by issuer may be higher. |
| (4) | Sectors (Common Stocks): |
| % of Net Assets | ||||
Information Technology | 25.2 | |||
Financials | 15.5 | |||
Consumer Discretionary | 14.8 | |||
Industrials | 13.4 | |||
Health Care | 8.5 | |||
Consumer Staples | 7.1 | |||
Energy | 5.6 | |||
Utilities | 3.7 | |||
Telecommunication Services | 2.2 | |||
Materials | 1.8 | |||
|
| |||
| 97.8 | ||||
|
|
| 92 |
| Ohio National Fund, Inc. | Target VIP Portfolio |
Schedule of Investments | June 30, 2016 (Unaudited) |
| Common Stocks – 97.8% | Shares | Value | ||||||||
CONSUMER DISCRETIONARY – 14.8% | ||||||||||
H&R Block, Inc. (Diversified Consumer Svs.) | 4,214 | $ | 96,922 | |||||||
Chuy’s Holdings, Inc. (Hotels, Restaurants & Leisure) | (a) | 3,397 | 117,570 | |||||||
Isle of Capri Casinos, Inc. (Hotels, Restaurants & Leisure) | (a) | 8,510 | 155,903 | |||||||
Starbucks Corp. (Hotels, Restaurants & Leisure) | 31,351 | 1,790,769 | ||||||||
LGI Homes, Inc. (Household Durables) | (a) | 3,978 | 127,057 | |||||||
NVR, Inc. (Household Durables) | (a) | 49 | 87,237 | |||||||
ZAGG, Inc. (Household Durables) | (a) | 5,539 | 29,080 | |||||||
Expedia, Inc. (Internet & Catalog Retail) | 1,135 | 120,650 | ||||||||
Priceline Group, Inc. / The (Internet & Catalog Retail) | (a) | 414 | 516,842 | |||||||
Gray Television, Inc. (Media) | (a) | 13,919 | 151,021 | |||||||
Vivendi SA – ADR (Media) | 16,659 | 313,356 | ||||||||
World Wrestling Entertainment, Inc. Class A (Media) | 7,081 | 130,361 | ||||||||
AutoZone, Inc. (Specialty Retail) | (a) | 922 | 731,920 | |||||||
Conn’s, Inc. (Specialty Retail) | (a) | 6,679 | 50,226 | |||||||
O’Reilly Automotive, Inc. (Specialty Retail) | (a) | 2,579 | 699,167 | |||||||
Ross Stores, Inc. (Specialty Retail) | 3,362 | 190,592 | ||||||||
Ulta Salon Cosmetics & Fragrance, Inc. (Specialty Retail) | (a) | 524 | 127,667 | |||||||
NIKE, Inc. Class B (Textiles, Apparel & Luxury Goods) | 17,589 | 970,913 | ||||||||
|
| |||||||||
| 6,407,253 | ||||||||||
|
| |||||||||
CONSUMER STAPLES – 7.1% | ||||||||||
Brown-Forman Corp. Class B (Beverages) | 2,049 | 204,408 | ||||||||
Coca-Cola Bottling Co. Consolidated (Beverages) | 390 | 57,513 | ||||||||
National Beverage Corp. (Beverages) | (a) | 1,530 | 96,099 | |||||||
Casey’s General Stores, Inc. (Food & Staples Retailing) | 582 | 76,539 | ||||||||
Cal-Maine Foods, Inc. (Food Products) | 1,507 | 66,790 | ||||||||
Hormel Foods Corp. (Food Products) | 6,819 | 249,575 | ||||||||
Lancaster Colony Corp. (Food Products) | 610 | 77,842 | ||||||||
Mondelez International, Inc. Class A (Food Products) | 13,165 | 599,139 | ||||||||
Clorox Co. / The (Household Products) | 2,265 | 313,453 | ||||||||
Estee Lauder Cos., Inc. / The Class A (Personal Products) | 3,897 | 354,705 | ||||||||
Reynolds American, Inc. (Tobacco) | 18,187 | 980,825 | ||||||||
|
| |||||||||
| 3,076,888 | ||||||||||
|
| |||||||||
ENERGY – 5.6% | ||||||||||
BP PLC – ADR (Oil, Gas & Consumable Fuels) | 11,443 | 406,341 | ||||||||
Eni SpA – ADR (Oil, Gas & Consumable Fuels) | 11,936 | 386,130 | ||||||||
Marathon Petroleum Corp. (Oil, Gas & Consumable Fuels) | 3,466 | 131,569 | ||||||||
Royal Dutch Shell PLC Class B – ADR (Oil, Gas & Consumable Fuels) | 7,737 | 433,272 | ||||||||
Statoil ASA – ADR (Oil, Gas & Consumable Fuels) | 25,816 | 446,875 | ||||||||
Tesoro Corp. (Oil, Gas & Consumable Fuels) | 775 | 58,063 | ||||||||
TOTAL SA – ADR (Oil, Gas & Consumable Fuels) | 7,935 | 381,674 | ||||||||
Valero Energy Corp. (Oil, Gas & Consumable Fuels) | 3,118 | 159,018 | ||||||||
|
| |||||||||
| 2,402,942 | ||||||||||
|
| |||||||||
FINANCIALS – 15.5% | ||||||||||
Ameris Bancorp (Banks) | 6,660 | 197,802 | ||||||||
Customers Bancorp, Inc. (Banks) | (a) | 5,438 | 136,657 | |||||||
FCB Financial Holdings, Inc. Class A (Banks) | (a) | 7,521 | 255,714 | |||||||
HSBC Holdings PLC – ADR (Banks) | 9,025 | 282,573 | ||||||||
Nordea Bank AB – ADR (Banks) | 32,483 | 275,618 | ||||||||
Skandinaviska Enskilda Banken AB – ADR (Banks) | 33,175 | 282,319 | ||||||||
Swedbank AB – ADR (Banks) | 16,152 | 339,030 | ||||||||
Talmer Bancorp, Inc. Class A (Banks) | 13,568 | 260,099 | ||||||||
INTL FCStone, Inc. (Capital Markets) | (a) | 3,889 | 106,131 | |||||||
American Express Co. (Consumer Finance) | 20,428 | 1,241,205 | ||||||||
Moody’s Corp. (Diversified Financial Svs.) | 6,618 | 620,173 | ||||||||
Nasdaq, Inc. (Diversified Financial Svs.) | 5,506 | 356,073 | ||||||||
Legal & General Group PLC – ADR (Insurance) | 17,563 | 230,602 | ||||||||
Torchmark Corp. (Insurance) | 4,128 | 255,193 | ||||||||
Travelers Cos., Inc. / The (Insurance) | 12,540 | 1,492,762 | ||||||||
Kearny Financial Corp. (Thrifts & Mortgage Finance) | 19,225 | 241,851 | ||||||||
Walker & Dunlop, Inc. (Thrifts & Mortgage Finance) | (a) | 6,270 | 142,831 | |||||||
|
| |||||||||
| 6,716,633 | ||||||||||
|
| |||||||||
| Common Stocks (Continued) | Shares | Value | ||||||||
HEALTH CARE – 8.5% | ||||||||||
Gilead Sciences, Inc. (Biotechnology) | 9,389 | $ | 783,230 | |||||||
Repligen Corp. (Biotechnology) | (a) | 7,003 | 191,602 | |||||||
Cynosure, Inc. Class A (Health Care Equip. & Supplies) | (a) | 4,588 | 223,183 | |||||||
Edwards Lifesciences Corp. (Health Care Equip. & Supplies) | (a) | 1,399 | 139,522 | |||||||
Inogen, Inc. (Health Care Equip. & Supplies) | (a) | 4,064 | 203,647 | |||||||
Vascular Solutions, Inc. (Health Care Equip. & Supplies) | (a) | 3,540 | 147,476 | |||||||
Adeptus Health, Inc. Class A (Health Care Providers & Svs.) | (a) | 2,918 | 150,744 | |||||||
Almost Family, Inc. (Health Care Providers & Svs.) | (a) | 2,059 | 87,734 | |||||||
AMN Healthcare Services, Inc. (Health Care Providers & Svs.) | (a) | 9,749 | 389,668 | |||||||
Chemed Corp. (Health Care Providers & Svs.) | 471 | 64,202 | ||||||||
LHC Group, Inc. (Health Care Providers & Svs.) | (a) | 3,721 | 161,045 | |||||||
PharMerica Corp. (Health Care Providers & Svs.) | (a) | 6,173 | 152,226 | |||||||
Providence Service Corp. / The (Health Care Providers & Svs.) | (a) | 3,193 | 143,302 | |||||||
Cambrex Corp. (Life Sciences Tools & Svs.) | (a) | 1,508 | 78,009 | |||||||
Waters Corp. (Life Sciences Tools & Svs.) | (a) | 528 | 74,263 | |||||||
GlaxoSmithKline PLC – ADR (Pharmaceuticals) | 8,730 | 378,358 | ||||||||
Sucampo Pharmaceuticals, Inc. Class A (Pharmaceuticals) | (a) | 9,356 | 102,635 | |||||||
Supernus Pharmaceuticals, Inc. (Pharmaceuticals) | (a) | 9,875 | 201,154 | |||||||
|
| |||||||||
| 3,672,000 | ||||||||||
|
| |||||||||
INDUSTRIALS – 13.4% | ||||||||||
Boeing Co. / The (Aerospace & Defense) | 9,789 | 1,271,297 | ||||||||
Northrop Grumman Corp. (Aerospace & Defense) | 2,618 | 581,929 | ||||||||
Expeditors International of Washington, Inc. (Air Freight & Logistics) | 2,663 | 130,594 | ||||||||
Hawaiian Holdings, Inc. (Airlines) | (a) | 1,965 | 74,591 | |||||||
JetBlue Airways Corp. (Airlines) | (a) | 4,094 | 67,797 | |||||||
American Woodmark Corp. (Building Products) | (a) | 886 | 58,813 | |||||||
Lennox International, Inc. (Building Products) | 566 | 80,712 | ||||||||
Patrick Industries, Inc. (Building Products) | (a) | 3,190 | 192,325 | |||||||
Universal Forest Products, Inc. (Building Products) | 4,198 | 389,113 | ||||||||
Cintas Corp. (Commercial Svs. & Supplies) | 1,549 | 152,003 | ||||||||
Comfort Systems U.S.A., Inc. (Construction & Engineering) | 7,851 | 255,707 | ||||||||
Dycom Industries, Inc. (Construction & Engineering) | (a) | 1,024 | 91,914 | |||||||
3M Co. (Industrial Conglomerates) | 9,434 | 1,652,082 | ||||||||
John Bean Technologies Corp. (Machinery) | 5,985 | 366,402 | ||||||||
Barrett Business Services, Inc. (Professional Svs.) | 1,479 | 61,112 | ||||||||
Insperity, Inc. (Professional Svs.) | 5,030 | 388,467 | ||||||||
|
| |||||||||
| 5,814,858 | ||||||||||
|
| |||||||||
INFORMATION TECHNOLOGY – 25.2% | ||||||||||
Applied Optoelectronics, Inc. (Communications Equip.) | (a) | 3,499 | 39,014 | |||||||
ePlus, Inc. (Electronic Equip., Instr. & Comp.) | (a) | 1,530 | 125,139 | |||||||
II-VI, Inc. (Electronic Equip., Instr. & Comp.) | (a) | 12,485 | 234,219 | |||||||
Alphabet, Inc. Class A (Internet Software & Svs.) | (a) | 4,526 | 3,184,177 | |||||||
Angie’s List, Inc. (Internet Software & Svs.) | (a) | 11,912 | 77,547 | |||||||
VeriSign, Inc. (Internet Software & Svs.) | (a) | 3,062 | 264,741 | |||||||
Accenture PLC Class A (IT Svs.) | 9,061 | 1,026,521 | ||||||||
Global Payments, Inc. (IT Svs.) | 1,682 | 120,061 | ||||||||
Sykes Enterprises, Inc. (IT Svs.) | (a) | 8,868 | 256,817 | |||||||
Total System Services, Inc. (IT Svs.) | 2,389 | 126,880 | ||||||||
Broadcom Ltd. (Semiconductors & Equip.) | 2,287 | 355,400 | ||||||||
Integrated Device Technology, Inc. (Semiconductors & Equip.) | (a) | 2,661 | 53,566 | |||||||
Intel Corp. (Semiconductors & Equip.) | 39,389 | 1,291,959 | ||||||||
NVIDIA Corp. (Semiconductors & Equip.) | 11,401 | 535,961 | ||||||||
Photronics, Inc. (Semiconductors & Equip.) | (a) | 13,985 | 124,606 | |||||||
Texas Instruments, Inc. (Semiconductors & Equip.) | 8,487 | 531,711 | ||||||||
Xilinx, Inc. (Semiconductors & Equip.) | 2,133 | 98,395 | ||||||||
Activision Blizzard, Inc. (Software) | 6,049 | 239,722 | ||||||||
Electronic Arts, Inc. (Software) | (a) | 2,569 | 194,627 | |||||||
Gigamon, Inc. (Software) | (a) | 7,003 | 261,842 | |||||||
| 93 | (continued) |
| Ohio National Fund, Inc. | Target VIP Portfolio (Continued) |
Schedule of Investments | June 30, 2016 (Unaudited) |
| Common Stocks (Continued) | Shares | Value | ||||||||
INFORMATION TECHNOLOGY (continued) | ||||||||||
Intuit, Inc. (Software) | 3,871 | $ | 432,042 | |||||||
Manhattan Associates, Inc. (Software) | (a) | 1,053 | 67,529 | |||||||
Apple, Inc. (Tech. Hardware, Storage & Periph.) | 13,354 | 1,276,642 | ||||||||
|
| |||||||||
| 10,919,118 | ||||||||||
|
| |||||||||
MATERIALS – 1.8% | ||||||||||
BHP Billiton Ltd. – ADR (Metals & Mining) | 13,780 | 393,557 | ||||||||
Rio Tinto PLC – ADR (Metals & Mining) | 12,316 | 385,491 | ||||||||
|
| |||||||||
| 779,048 | ||||||||||
|
| |||||||||
TELECOMMUNICATION SERVICES – 2.2% | ||||||||||
Telenor ASA – ADR (Diversified Telecom. Svs.) | 21,335 | 353,308 | ||||||||
Vonage Holdings Corp. (Diversified Telecom. Svs.) | (a) | 44,320 | 270,352 | |||||||
Vodafone Group PLC – ADR (Wireless Telecom. Svs.) | 11,156 | 344,609 | ||||||||
|
| |||||||||
| 968,269 | ||||||||||
|
| |||||||||
UTILITIES – 3.7% | ||||||||||
Electricite de France SA – ADR (Electric Utilities) | 123,123 | 294,264 | ||||||||
Eversource Energy (Electric Utilities) | 952 | 57,025 | ||||||||
NextEra Energy, Inc. (Electric Utilities) | 1,378 | 179,691 | ||||||||
| Common Stocks (Continued) | Shares | Value | ||||||||
UTILITIES (continued) | ||||||||||
SSE PLC – ADR (Electric Utilities) | 15,756 | $ | 325,677 | |||||||
Engie SA – ADR (Multi-Utilities) | 20,049 | 324,994 | ||||||||
National Grid PLC – ADR (Multi-Utilities) | 5,068 | 376,704 | ||||||||
SCANA Corp. (Multi-Utilities) | 430 | 32,534 | ||||||||
|
| |||||||||
| 1,590,889 | ||||||||||
|
| |||||||||
Total Common Stocks (Cost $42,559,484) | $ | 42,347,898 | ||||||||
|
| |||||||||
| Money Market Funds – 2.1% | Shares | Value | ||||||||
State Street Institutional Liquid Reserves Fund Institutional Class | 260,404 | $ | 260,404 | |||||||
State Street Institutional U.S. Government Money Market Fund Institutional Class | 663,960 | 663,960 | ||||||||
|
| |||||||||
Total Money Market Funds (Cost $924,364) | $ | 924,364 | ||||||||
|
| |||||||||
Total Investments – 99.9% (Cost $43,483,848) | (b) | $ | 43,272,262 | |||||||
Other Assets in Excess of Liabilities – 0.1% | 42,815 | |||||||||
|
| |||||||||
Net Assets – 100.0% | $ | 43,315,077 | ||||||||
|
| |||||||||
Percentages are stated as a percent of net assets.
Abbreviations:
ADR: American Depositary Receipts
Footnotes:
| (a) | Non-income producing security. |
| (b) | Represents cost for financial reporting purposes, which may differ from cost basis for federal income tax purposes. See also Note 7 of the Notes to Financial Statements. |
The accompanying notes are an integral part of these financial statements.
| 94 |
| Ohio National Fund, Inc. | Bristol Growth Portfolio |
Objective/Strategy
The Bristol Growth Portfolio seeks long-term growth of capital by investing primarily in common stocks of the 1,000 largest publicly traded U.S. companies in terms of market capitalization.
Performance as of June 30, 2016
Average Annual returns: | ||||
One year | 2.43% | |||
Five years | 11.47% | |||
Since inception (5/1/07) | 6.69% |
Past performance does not guarantee future results. The performance data quoted represents past performance and current returns may be lower or higher. Total return figures include change in share price and reinvestment of dividends and capital gains. The investment return and principal value will fluctuate so that an investor’s shares, when redeemed, may be worth more or less than the original cost. To obtain performance information up to the most recent month end, call toll-free 1-877-781-6392.
The Portfolio is not open to direct retail investment. Beneficial interest in shares is obtained solely by purchase of variable life insurance policies and variable annuity contracts. Actual performance results for variable annuity and variable universal life contracts will be lower due to contract charges. Consult your contract for applicable charges.
Comments
For the six-month period ended June 30, 2016, the Bristol Growth Portfolio returned 2.43% versus 1.36% for its benchmark, the Russell 1000 Growth Index.
The Portfolio’s relative out-performance resulted primarily from stock selection in Health Care, although selection in other sectors, such as Information Technology and Telecommunications Services, was also positive. Overall, sector allocation detracted from relative performance, as overweights or underweights in several sectors worked against the Portfolio in benchmark-relative terms. (1)
The Portfolio’s top performers for the first half of the year were Tesaro, Inc., AT&T, Inc., PVH Corp., Anacor Pharmaceuticals, Inc., and Pioneer Natural Resources Co. The worst performers were Delphi Automotive PLC., Bank of America Corp., Allergan PLC, Harman International Industries, Inc., and Anadarko Petroleum Corp. (1)
The top contributor to the Portfolio’s performance through the first half of the year was Tesaro, Inc., which generated 224 basis points. The company reported positive Phase 3 data for its ovarian cancer drug. Anacor Pharmaceuticals, Inc. added 83 points as the stock benefitted from Pfizer, Inc.’s announcement to acquire the company in a deal valued at $5.2B for access to Anacor’s non-steroidal topical gel to treat eczema. AT&T, Inc. contributed 50 basis points as it reiterated expectations for full year video net ads to grow and is on track to meet or exceed estimated DTV deal synergies. Xylem, Inc. added 43 basis points as it benefited from stronger growth in municipal water project activity and positive sentiment regarding the water crisis in Flint, Michigan. Finally, HCA Holdings, Inc. gained 35 basis points as the market is moving back to fundamentally sound companies in the uncertain environment. (1)
Detractors form performance during the first half of the year included Delphi Automotive PLC, as concerns over Brexit and the U.S. auto cycle have pressured the stock which impacted the Portfolio negatively by 78 basis points. Specialty pharmaceutical companies such as Allergan PLC and Mylan NV, had some unforeseen issues. Allergan PLC’s proposed merger with Pfizer, Inc. was terminated, and concerns of weaker pricing in generic drugs
outweighed Mylan NV’s strong growth prospects, costing the Portfolio 95 basis points in aggregate. Among our biotechnology investments, Celgene Corp. underperformed due to weaker adoption of a new cancer drug, and Biogen, Inc. experienced a major setback in its development of a drug to repair nerve cell damage in patients suffering from multiple sclerosis, costing the Portfolio 75 basis points in aggregate. (1)
The month of June will certainly go down in history as being eventful. To the shock of many, the United Kingdom voted to exit the European Union. Volatility increased, and “contagion” and “risk off” came back into our daily vocabulary. Despite that, the market was roughly flat for the month. While the complexion of stocks that outperformed the market certainly changed from growth to more defensive names, we managed to outperform the market slightly as stock selection (Tesaro, Inc., Anacor Pharmaceuticals, Inc.) helped performance significantly. While recession concerns have crept back into people’s minds due to the “Brexit” and the contagion that may ensue in Europe, we feel that the U.S. markets will be a safe haven to investors, as multiples are reasonable and companies will continue to grow, though at a slightly slower pace. The Federal Reserve will continue to act as necessary depending upon the economic data, which should provide some support for equities as rates stay low. With the markets fairly valued and the “Brexit” vote now behind us, our focus on company and industry specific fundamentals should hopefully be a contributor to outperformance going forward.
| (1) | The Portfolio’s composition is subject to change. Holdings and weightings are as of June 30, 2016. |
Change in Value of $10,000 Investment
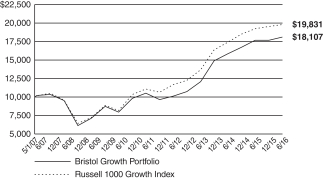
Hypothetical illustration based on past performance. Future performance will vary. The Portfolio’s returns reflect reinvested dividends. The Portfolio’s holdings may differ significantly from the securities in the index. The index is unmanaged and therefore does not reflect the cost of portfolio management and accounting.
The Russell 1000 Growth Index is a market-capitalization weighted index of those firms in the Russell 1000 Index with higher price-to-book ratios and higher forecasted growth values. The Russell 1000 Index measures the performance of the large-cap segment of the U.S. equity universe. The index presented herein includes the effects of requested dividends.
| 95 | (continued) |
| Ohio National Fund, Inc. | Bristol Growth Portfolio (Continued) |
Portfolio Composition as of June 30, 2016 (1)
| % of Net Assets | ||||
Common Stocks (4) | 100.1 | |||
Money Market Funds | (0.1 | ) | ||
|
| |||
| 100.0 | ||||
|
|
Top 10 Portfolio Holdings as of June 30, 2016 (1) (2) (3)
| % of Net Assets | ||||
1. Amazon.com, Inc. | 3.7 | |||
2. Apple, Inc. | 3.1 | |||
3. Microsoft Corp. | 2.7 | |||
4. Alphabet, Inc. Class C | 2.6 | |||
5. TESARO, Inc. | 2.5 | |||
6. Facebook, Inc. Class A | 2.5 | |||
7. Newell Brands, Inc. | 2.5 | |||
8. Allergan PLC | 2.2 | |||
9. Humana, Inc. | 2.2 | |||
10. Thermo Fisher Scientific, Inc. | 2.1 |
| (1) | Composition of Portfolio subject to change. |
| (2) | Short-term investments have been excluded from the list of Top 10 Portfolio Holdings. |
| (3) | Top 10 Portfolio Holdings is presented at an individual security level. Total investment exposure by issuer may be higher. |
| (4) | Sectors (Common Stocks): |
| % of Net Assets | ||||
Information Technology | 33.9 | |||
Health Care | 19.8 | |||
Consumer Discretionary | 18.2 | |||
Industrials | 13.8 | |||
Consumer Staples | 6.2 | |||
Financials | 3.5 | |||
Energy | 2.5 | |||
Telecommunication Services | 1.7 | |||
Materials | 0.5 | |||
|
| |||
| 100.1 | ||||
|
|
| 96 |
| Ohio National Fund, Inc. | Bristol Growth Portfolio |
Schedule of Investments | June 30, 2016 (Unaudited) |
| Common Stocks – 100.1% | Shares | Value | ||||||||
CONSUMER DISCRETIONARY – 18.2% | ||||||||||
Delphi Automotive PLC (Auto Components) | 33,695 | $ | 2,109,307 | |||||||
MGM Resorts International (Hotels, Restaurants & Leisure) | (a) | 94,899 | 2,147,564 | |||||||
Newell Brands, Inc. (Household Durables) | 58,635 | 2,847,902 | ||||||||
Amazon.com, Inc. (Internet & Catalog Retail) | (a) | 6,026 | 4,312,326 | |||||||
Time Warner, Inc. (Media) | 32,447 | 2,386,152 | ||||||||
Twenty-First Century Fox, Inc. Class A (Media) | 18,043 | 488,063 | ||||||||
Lowe’s Cos., Inc. (Specialty Retail) | 29,056 | 2,300,363 | ||||||||
Deckers Outdoor Corp. (Textiles, Apparel & Luxury Goods) | (a) | 31,211 | 1,795,257 | |||||||
Hanesbrands, Inc. (Textiles, Apparel & Luxury Goods) | 59,627 | 1,498,427 | ||||||||
PVH Corp. (Textiles, Apparel & Luxury Goods) | 13,312 | 1,254,390 | ||||||||
|
| |||||||||
| 21,139,751 | ||||||||||
|
| |||||||||
CONSUMER STAPLES – 6.2% | ||||||||||
Coca-Cola Co. / The (Beverages) | 35,658 | 1,616,377 | ||||||||
Kellogg Co. (Food Products) | 27,348 | 2,232,964 | ||||||||
Pinnacle Foods, Inc. (Food Products) | 25,053 | 1,159,704 | ||||||||
Colgate-Palmolive Co. (Household Products) | 28,969 | 2,120,531 | ||||||||
|
| |||||||||
| 7,129,576 | ||||||||||
|
| |||||||||
ENERGY – 2.5% | ||||||||||
Schlumberger Ltd. (Energy Equip. & Svs.) | 16,519 | 1,306,322 | ||||||||
Pioneer Natural Resources Co. (Oil, Gas & Consumable Fuels) | 10,812 | 1,634,883 | ||||||||
|
| |||||||||
| 2,941,205 | ||||||||||
|
| |||||||||
FINANCIALS – 3.5% | ||||||||||
Bank of New York Mellon Corp. / The (Capital Markets) | 54,996 | 2,136,595 | ||||||||
Prudential Financial, Inc. (Insurance) | 27,442 | 1,957,712 | ||||||||
|
| |||||||||
| 4,094,307 | ||||||||||
|
| |||||||||
HEALTH CARE – 19.8% | ||||||||||
AbbVie, Inc. (Biotechnology) | 10,447 | 646,774 | ||||||||
Celgene Corp. (Biotechnology) | (a) | 17,940 | 1,769,422 | |||||||
Juno Therapeutics, Inc. (Biotechnology) | (a) | 25,421 | 977,183 | |||||||
TESARO, Inc. (Biotechnology) | (a) | 35,006 | 2,942,254 | |||||||
Danaher Corp. (Health Care Equip. & Supplies) | 21,013 | 2,122,313 | ||||||||
Aetna, Inc. (Health Care Providers & Svs.) | 18,452 | 2,253,543 | ||||||||
HCA Holdings, Inc. (Health Care Providers & Svs.) | (a) | 23,549 | 1,813,509 | |||||||
Humana, Inc. (Health Care Providers & Svs.) | 14,007 | 2,519,579 | ||||||||
UnitedHealth Group, Inc. (Health Care Providers & Svs.) | 4,907 | 692,868 | ||||||||
Thermo Fisher Scientific, Inc. (Life Sciences Tools & Svs.) | 16,392 | 2,422,082 | ||||||||
Allergan PLC (Pharmaceuticals) | (a) | 11,010 | 2,544,301 | |||||||
Mylan NV (Pharmaceuticals) | (a) | 52,295 | 2,261,236 | |||||||
|
| |||||||||
| 22,965,064 | ||||||||||
|
| |||||||||
INDUSTRIALS – 13.8% | ||||||||||
Hexcel Corp. (Aerospace & Defense) | 41,943 | 1,746,507 | ||||||||
Huntington Ingalls Industries, Inc. (Aerospace & Defense) | 10,863 | 1,825,310 | ||||||||
| Common Stocks (Continued) | Shares | Value | ||||||||
INDUSTRIALS (continued) | ||||||||||
FedEx Corp. (Air Freight & Logistics) | 15,013 | $ | 2,278,673 | |||||||
AECOM (Construction & Engineering) | (a) | 73,039 | 2,320,449 | |||||||
Rockwell Automation, Inc. (Electrical Equip.) | 19,870 | 2,281,473 | ||||||||
Stanley Black & Decker, Inc. (Machinery) | 11,332 | 1,260,345 | ||||||||
Xylem, Inc. (Machinery) | 52,991 | 2,366,048 | ||||||||
Union Pacific Corp. (Road & Rail) | 22,291 | 1,944,890 | ||||||||
|
| |||||||||
| 16,023,695 | ||||||||||
|
| |||||||||
INFORMATION TECHNOLOGY – 33.9% | ||||||||||
Harris Corp. (Communications Equip.) | 28,770 | 2,400,569 | ||||||||
Alibaba Group Holding Ltd. – ADR (Internet Software & Svs.) | (a) | 20,684 | 1,644,999 | |||||||
Alphabet, Inc. Class A (Internet Software & Svs.) | (a) | 3,368 | 2,369,489 | |||||||
Alphabet, Inc. Class C (Internet Software & Svs.) | (a) | 4,315 | 2,986,411 | |||||||
Facebook, Inc. Class A (Internet Software & Svs.) | (a) | 25,644 | 2,930,596 | |||||||
International Business Machines Corp. (IT Svs.) | 15,915 | 2,415,579 | ||||||||
MasterCard, Inc. Class A (IT Svs.) | 11,957 | 1,052,933 | ||||||||
Visa, Inc. (IT Svs.) | 25,144 | 1,864,931 | ||||||||
Broadcom Ltd. (Semiconductors & Equip.) | 15,293 | 2,376,532 | ||||||||
Intel Corp. (Semiconductors & Equip.) | 36,760 | 1,205,728 | ||||||||
NXP Semiconductors NV (Semiconductors & Equip.) | (a) | 27,146 | 2,126,618 | |||||||
Adobe Systems, Inc. (Software) | (a) | 23,666 | 2,266,966 | |||||||
Electronic Arts, Inc. (Software) | (a) | 31,179 | 2,362,121 | |||||||
Microsoft Corp. (Software) | 61,797 | 3,162,152 | ||||||||
Oracle Corp. (Software) | 58,697 | 2,402,468 | ||||||||
Apple, Inc. (Tech. Hardware, Storage & Periph.) | 37,607 | 3,595,229 | ||||||||
Hewlett Packard Enterprise Co. (Tech. Hardware, Storage & Periph.) | 116,842 | 2,134,703 | ||||||||
|
| |||||||||
| 39,298,024 | ||||||||||
|
| |||||||||
MATERIALS – 0.5% | ||||||||||
Monsanto Co. (Chemicals) | 5,407 | 559,138 | ||||||||
|
| |||||||||
TELECOMMUNICATION SERVICES – 1.7% | ||||||||||
AT&T, Inc. (Diversified Telecom. Svs.) | 18,298 | 790,657 | ||||||||
Verizon Communications, Inc. (Diversified Telecom. Svs.) | 21,574 | 1,204,692 | ||||||||
|
| |||||||||
| 1,995,349 | ||||||||||
|
| |||||||||
Total Common Stocks (Cost $106,031,149) | $ | 116,146,109 | ||||||||
|
| |||||||||
| Money Market Funds – 0.7% | Shares | Value | ||||||||
State Street Institutional Liquid Reserves Fund Institutional Class | 356,278 | $ | 356,278 | |||||||
State Street Institutional U.S. Government Money Market Fund Institutional Class | 412,876 | 412,876 | ||||||||
|
| |||||||||
Total Money Market Funds (Cost $769,154) | $ | 769,154 | ||||||||
|
| |||||||||
Total Investments – 100.8% (Cost $106,800,303) | (b) | $ | 116,915,263 | |||||||
Liabilities in Excess of Other Assets – (0.8)% | (973,847) | |||||||||
|
| |||||||||
Net Assets – 100.0% | $ | 115,941,416 | ||||||||
|
| |||||||||
Percentages are stated as a percent of net assets.
Abbreviations:
ADR: American Depositary Receipts
Footnotes:
| (a) | Non-income producing security. |
| (b) | Represents cost for financial reporting purposes, which may differ from cost basis for federal income tax purposes. See also Note 7 of the Notes to Financial Statements. |
The accompanying notes are an integral part of these financial statements.
| 97 |
| Ohio National Fund, Inc. | Risk Managed Balanced Portfolio |
Objective/Strategy
The Risk Managed Balanced Portfolio seeks long-term capital growth, consistent with preservation of capital and balanced by current income. The Portfolio invests in a balanced portfolio of equity and fixed-income securities (the “Balanced Component”) and a risk management portfolio intended to enhance the risk adjusted return of the Portfolio (the “Risk Management Component”).
Performance as of June 30, 2016
Average Annual returns: | ||||
One year | 1.65% | |||
Since inception (5/1/14) | 4.22% |
Comments
For the six-month period ended June 30, 2016, the Risk Managed Balanced Portfolio returned 2.35% versus 4.60% for its benchmark, which is comprised of 55% S&P 500 Index and 45% Barclays Capital U.S. Aggregate Bond Index.
The period began with concerns over sluggish economic growth and the possibility of recession weighing heavily on global markets. Slower-than-expected growth in China, the implications of negative interest rates and weakness in commodities-related sectors also dragged markets down through early February. In a sharp reversal, risk assets rallied and crude oil prices reset within a higher trading band for much of the remaining period. By early April, a more optimistic outlook was in favor. Late in June, market participants met with a few surprises. First, June’s probable interest rate hike by the Federal Reserve (Fed) was derailed by a weak employment report from May. Questions about the health of the U.S. economy resurfaced, and the Fed lowered its projection for future interest rate hikes. June’s second surprise came from Europe, when voters in the United Kingdom (UK) opted to leave the European Union (EU). Risk assets tumbled immediately after the unexpected news, the dollar rose and yields on safe-haven government bonds fell. In the final days of the period, however, credit spreads and U.S. equities recaptured much of their post-Brexit slide.
The U.S. Treasury curve flattened over the last six months, as yields fell significantly across most tenors. The combination of Brexit concerns, slowing global growth and negative interest rate policies abroad triggered a rotation into U.S. Treasuries during the period.
The Balanced Component, sub-advised by Janus Capital Management LLC, seeks to provide consistent returns over time by allocating across the spectrum of fixed income and equity securities.
The Balanced Component’s equity sleeve underperformed its benchmark, the S&P 500 Index. Value equities, particularly more defensive names, outperformed growth during the period, which created a headwind for our growth tilt. On a sector basis, our Health Care exposure weighed on relative performance. Negative sentiment surrounded the Health Care sector early in the year, due in large part to political rhetoric about controlling drug prices. Questionable accounting and drug pricing tactics at a well-known specialty pharmaceutical company also spurred a sell-off in specialty pharmaceutical and biotechnology stocks in the first half of the period. Our Financials sector holdings also detracted on a relative basis, as they were negatively impacted by the large decline in rates over the six month period. Security selection in Consumer Staples was a relative contributor to the Portfolio’s performance. (1)
Allergan PLC was our largest detractor. Stock for the specialty pharmaceutical company traded down when the proposed merger between Allergan PLC and Pfizer, Inc. fell apart. We believe the sale of the company’s generics business to Teva Pharmaceutical Industries Ltd. will take place and think the move will strengthen Allergan PLC’s balance sheet and increase capital return potential. We also like the company’s product mix, as many of its products are not subject to government reimbursement. (1)
Regeneron Pharmaceuticals, Inc. also detracted from results. In addition to the general headwinds impacting biotech companies, slower than expected sales for one of the company’s drugs controlling cholesterol weighed on the stock, as did news that the company lost a court case with a competitor over patent infringement. We exited our position during the period. (1)
Norwegian Cruise Line Holdings Ltd. was another detractor. The stock traded down as geopolitical and macroeconomic concerns dampened expectations on demand for future discretionary spending, such as cruising. Strengthening oil prices also contributed to negative sentiment around future margins, although we believe the fuel environment is still very favorable. We remain encouraged by Norwegian Cruise Line Holdings Ltd.’s newer fleet and innovative portfolio of on-board offerings that we believe should increase customer spending over time. Additionally, our outlook for the industry remains positive. Increasing global demand in a number of markets has improved the overall supply/demand relationship, helping to enhance the industry’s outlook for higher returns on capital. (1)
While the aforementioned stocks detracted from performance, we were pleased by the results of other companies in the Portfolio. Dollar Tree, Inc. was a top contributor. The stock was up after the company reported strong earnings and continued to show progress in integrating Family Dollar Stores, Inc. We continue to be encouraged by the opportunity for Dollar Tree, Inc.’s management team to improve margins for the former Family Dollar Stores, Inc. franchise. Additionally, we believe dollar stores that offer consumers low price points remain well positioned in a relatively weak economic environment. (1)
Altria Group, Inc. also performed well. Volume growth for the tobacco company has continued to hold up relatively well for the industry, and the company has continued to maintain pricing discipline and grow profits. We like the holding for the high level of free cash flow returned to shareholders. (1)
The Hershey Co. was another leading contributor to performance. The stock advanced late in the period on news that Mondelez International, Inc., a confectionery, food, and beverage conglomerate, had sent Hershey Co. a takeover bid during the month. Although Hershey Co. rejected the bid, we believe that this action highlights the value of its brand and position in the U.S. market. (1)
The Balanced Component’s fixed income sleeve also underperformed its benchmark, the Barclays U.S. Aggregate Bond Index. We held our defensive stance for the period, seeking higher quality companies with solid balance sheets and strong fundamentals. We reduced U.S. dollar denominated global exposure and added shorter duration, more defensive U.S. focused names. Avoidance of security “pitfalls” continued to be a central theme, as we focused on preserving capital in this challenging market environment. (1)
Positioning in investment-grade corporate credit detracted from relative performance, primarily due to the shorter to intermediate duration of our exposure. Our out-of-index allocation to high-yield corporate credit also weighed on relative results. The more
| 98 | (continued) |
| Ohio National Fund, Inc. | Risk Managed Balanced Portfolio (Continued) |
defensive nature of our high-yield security selection has not kept up with the lower quality rally since credit spreads peaked near mid-February.
On a credit sector basis, relative detractors included security selection in banking and midstream energy, as well as our underweight allocation to electric utilities. Macro-economic challenges, including slower gross domestic product (GDP) growth globally and shifting monetary policy, weighed on the banking sector in several regions, as evidenced by the early 2016 sell-off in banking-related securities. Banking credits managed to retrace much of their losses by June’s end; however, Royal Bank of Scotland Group PLC, an individual detractor from relative performance, faced additional challenges mainly in the form of the UK’s vote to leave the EU. While we are mindful of the uncertainties around the future of the UK and the EU, we continue to like the company’s improving asset quality, capital building and plans for restructuring. The key points of our thesis will likely take longer to play out in the face of slower GDP growth and generally weaker capital markets. (1)
Hard disk manufacturer Seagate HDD Cayman also detracted from relative performance. Hard disk year-over-year demand has continued to weaken due to limited personal computer growth. Elevated issuance in the investment-grade segment of technology also weighed on spreads. While we have reduced the position, we remain constructive on an improving earnings outlook and a management team focused on deleveraging. (1)
Relative credit sector contributors included security selection and an overweight allocation in independent energy. Holdings in consumer products and building materials also contributed on a relative basis. Given recent dislocations in the Energy sector, we added energy exposure where we were able to identify strong risk-adjusted return potential in low-risk energy issuers with solid balance sheets. Energy performed well on the back of higher crude oil prices later in the period, and our overweight to independent energy contributed to relative results. ConocoPhillips Co. was one of our top relative contributors. We believe the multinational energy corporation can succeed in a sustained low oil price environment with its diversified production mix and broad geographic footprint. We like the company’s high-quality exploration and production assets and strong management team. (1)
Due to the visibility of their cash flows, defensive industriess, including consumer products, tend to outperform in periods of uncertain economic growth and market volatility. Newell Rubbermaid, Inc., an individual contributor to relative results, fits our focus of seeking corporate credit with stable free cash flows and a management team focused on balance sheet strength. The company, which manufactures and markets branded consumer products, recently purchased Jarden Corporation and has expressed commitment to delivering in the near-term. (1)
On an asset class basis, our cash position weighed on relative results. Cash is not used as a strategy within the Portfolio but is a frictional component of day-to-day investing. Our overweight to longer-dated Treasuries, which we utilize to hedge our corporate credit exposure, benefited from curve flattening and aided relative performance. The decline in rates aided our positioning in U.S. mortgage-backed securities (MBS) as well. The prepayment resistant nature of our positions proved beneficial in a falling rate environment. We focus on higher quality specified pools with higher coupons and less negative convexity than the positions in the index, making them less vulnerable to declining rates. (1)
The Portfolio’s Risk Management Component, sub-advised by AnchorPath Financial LLC, is a sleeve of derivatives and cash
equivalents that seeks to enhance the risk-adjusted return of the Portfolio. Under normal circumstances, the Risk Management Component will represent approximately 20% of the Portfolio. Over the first half of 2016 this allocation ranged between 19.0% and 21.9%, and ended the period representing approximately 21.3% of the Portfolio. (1)
The Portfolio’s performance is enhanced on a risk-adjusted basis when the aggregate Portfolio achieves lower volatility with similar returns, or higher returns at similar volatility compared to a benchmark. Over the period, compared to the Balanced Component, the Risk Managed Balanced Portfolio’s risk adjusted returns were enhanced. The aggregate Portfolio achieved a 3.0% higher cumulative return and 1.9% lower annualized volatility than the Balanced Component over the six month period. The out-performance of the Risk Management Component was mainly attributable to gains on 10-year Treasury Note futures. (1)
We believe global growth will be under pressure following the UK’s unexpected decision to split from Brussels; the short-term outlook for Europe and the UK looks particularly grim. The vote has also increased the likelihood of additional central bank stimulus from the Bank of England and the European Central Bank, in our view. The Fed, which just a few months ago was signaling the possibility of a summer rate hike, likely won’t raise rates again in 2016; the question is now whether we will see additional easing in the U.S. Moreover, we anticipate continued volatility in the market given the upcoming U.S. election.
Although the U.S. economy has shown some recent signs of weakness – most notably the much weaker-than-expected May nonfarm payrolls number – the U.S. consumer appears to have remained resilient. Therefore, we plan to position the equity sleeve to capitalize on this strength and to avoid the more economically sensitive sectors. In general, we are looking for defensive areas with decent demand and the ability to grow regardless of global macro events. Our outlook for the energy sector remains cautious, given the persistent oversupply and the likelihood of a stronger dollar in the wake of the Brexit vote. Given the consistent growth in Health Care, we intend to maintain our modest overweight allocation to the sector. Overall, we favor innovative companies with products and services that enable them to take market share regardless of overall macroeconomic trends. (1)
Within the fixed income sleeve, we agree that domestic opportunities continue to look more favorable than those abroad. U.S. yields may be low, but they are comparatively higher than most developed countries – and positive, whereas a large percentage of the world’s sovereign debt now has negative yields. Yet, we believe caution in credit is warranted. Asset values in the U.S. are stretched, in our opinion, and we anticipate some weakness in second quarter revenue and earnings growth which will make current valuations more difficult to justify. Aggressive re-leveraging of corporate balance sheets, 2015’s record mergers and acquisitions activity and multiple large leveraged buyout announcements this year suggest the end of the credit cycle is drawing near. It is feasible that further stimulus from the world’s major central banks – to help markets cope with Brexit – may support credit in the short term; however, we are mindful that markets can go only so far on accommodative monetary policy and little in the way of accelerated fundamentals.
We foresee range bound to higher spreads in the latter half of 2016. Spread widening can be extremely violent, and break-evens are tight, making security avoidance, in our opinion, all the more important in the months to come. Our Treasury positioning is con-
| 99 | (continued) |
| Ohio National Fund, Inc. | Risk Managed Balanced Portfolio (Continued) |
centrated further out on the curve to hedge our credit exposure, while in corporate credit we continue to favor shorter- to intermediate-term issuance in which we believe we have a clearer insight on the issuers’ fundamentals and ability to pay down debt. Our defensive posture in the fixed income sleeve remains intact as we seek to deliver on our central tenet of capital preservation and strong risk-adjusted returns.
| (1) | The Portfolio’s composition is subject to change. Holdings and weightings are as of June 30, 2016. |
Change in Value of $10,000 Investment
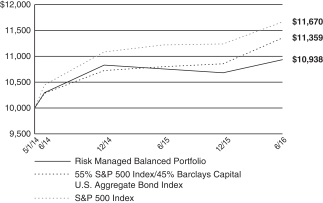
The S&P 500 index is a capitalization-weighted index designed to measure performance of the broad domestic economy through changes in the aggregate market value of 500 stocks representing all major industries. The index includes the effects of reinvested dividends.
The Barclays Capital U.S. Aggregate Bond Index measures returns of U.S. investment grade bonds market, which includes investment grade U.S. Government bonds, high quality corporate bonds, mortgage pass-through securities, and asset-backed securities publicly offered for sale in the U.S. The index’s securities must have at least one year remaining to maturity; they must also be denominated in U.S. dollars and must be fixed rate, nonconvertible, and taxable.
Portfolio Composition as of June 30, 2016 (1)
| % of Net Assets | ||||
Common Stocks (4) | 46.1 | |||
Corporate Bonds (4) | 11.7 | |||
Preferred Stocks (4) | 0.3 | |||
Trust Preferred Securities (4) | 0.3 | |||
Preferred Stock Depository Receipts (4) | 0.3 | |||
Master Limited Partnerships (4) | 0.9 | |||
Asset-Backed / Mortgage-Backed Securities (4) | 1.8 | |||
U.S. Treasury Obligations | 10.2 | |||
U.S. Government Agency Mortgage-Backed Securities | 7.5 | |||
Purchased Options | 6.5 | |||
Money Market Funds | 14.4 | |||
|
| |||
| 100.0 | ||||
|
|
Top 10 Portfolio Holdings as of June 30, 2016 (1) (2) (3)
| % of Net Assets | ||||
1. Microsoft Corp. | 2.2 | |||
2. Bristol-Myers Squibb Co. | 2.0 | |||
3. Amgen, Inc. | 2.0 | |||
4. MasterCard, Inc. Class A | 1.9 | |||
5. Boeing Co. / The | 1.9 | |||
6. Altria Group, Inc. | 1.8 | |||
7. Alphabet, Inc. Class C | 1.8 | |||
8. NIKE, Inc. Class B | 1.7 | |||
9. AbbVie, Inc. | 1.6 | |||
10. LyondellBasell Industries NV Class A | 1.4 |
| (1) | Composition of Portfolio subject to change. |
| (2) | Short-term investments have been excluded from the list of Top 10 Portfolio Holdings. |
| (3) | Top 10 Portfolio Holdings is presented at an individual security level. Total investment exposure by issuer may be higher. |
| (4) | Sectors (Common Stocks, Corporate Bonds, Preferred Stocks, Trust Preferred Securities, Preferred Stock Depository Receipts, Master Limited Partnerships, Asset-Backed Securities / Mortgage-Backed Securities): |
| % of Net Assets | ||||
Financials | 12.9 | |||
Consumer Discretionary | 11.4 | |||
Information Technology | 10.4 | |||
Health Care | 8.8 | |||
Industrials | 7.2 | |||
Consumer Staples | 6.7 | |||
Materials | 2.5 | |||
Energy | 1.0 | |||
Utilities | 0.3 | |||
Telecommunication Services | 0.2 | |||
|
| |||
| 61.4 | ||||
|
|
| 100 |
| Ohio National Fund, Inc. | Risk Managed Balanced Portfolio |
Schedule of Investments | June 30, 2016 (Unaudited) |
| Common Stocks – 46.1% | Shares | Value | ||||||||||||||||
CONSUMER DISCRETIONARY – 9.6% |
| |||||||||||||||||
General Motors Co. (Automobiles) | 72,606 | $ | 2,054,750 | |||||||||||||||
Norwegian Cruise Line Holdings Ltd. (Hotels, Restaurants & Leisure) | (a) | 27,873 | 1,110,460 | |||||||||||||||
Six Flags Entertainment Corp. (Hotels, Restaurants & Leisure) | 9,003 | 521,724 | ||||||||||||||||
Starbucks Corp. (Hotels, Restaurants & Leisure) | 26,735 | 1,527,103 | ||||||||||||||||
Priceline Group, Inc. / The (Internet & Catalog Retail) | (a) | 1,868 | 2,332,030 | |||||||||||||||
Mattel, Inc. (Leisure Products) | 31,139 | 974,339 | ||||||||||||||||
Comcast Corp. Class A (Media) | 32,121 | 2,093,968 | ||||||||||||||||
Time Warner, Inc. (Media) | 18,029 | 1,325,853 | ||||||||||||||||
Dollar Tree, Inc. (Multiline Retail) | (a) | 21,542 | 2,030,118 | |||||||||||||||
Home Depot, Inc. / The (Specialty Retail) | 20,677 | 2,640,246 | ||||||||||||||||
NIKE, Inc. Class B (Textiles, Apparel & Luxury Goods) | 65,921 | 3,638,839 | ||||||||||||||||
|
| |||||||||||||||||
| 20,249,430 | ||||||||||||||||||
|
| |||||||||||||||||
CONSUMER STAPLES – 5.6% | ||||||||||||||||||
Costco Wholesale Corp. (Food & Staples Retailing) | 17,649 | 2,771,599 | ||||||||||||||||
Kroger Co. / The (Food & Staples Retailing) | 35,383 | 1,301,741 | ||||||||||||||||
Hershey Co. / The (Food Products) | 18,666 | 2,118,404 | ||||||||||||||||
Kimberly-Clark Corp. (Household Products) | 12,541 | 1,724,137 | ||||||||||||||||
Altria Group, Inc. (Tobacco) | 55,640 | 3,836,934 | ||||||||||||||||
|
| |||||||||||||||||
| 11,752,815 | ||||||||||||||||||
|
| |||||||||||||||||
FINANCIALS – 5.6% | ||||||||||||||||||
U.S. Bancorp (Banks) | 41,956 | 1,692,085 | ||||||||||||||||
Morgan Stanley (Capital Markets) | 37,980 | 986,720 | ||||||||||||||||
TD Ameritrade Holding Corp. (Capital Markets) | 40,528 | 1,154,035 | ||||||||||||||||
American Express Co. (Consumer Finance) | 18,080 | 1,098,541 | ||||||||||||||||
Synchrony Financial (Consumer Finance) | (a) | 69,363 | 1,753,497 | |||||||||||||||
CME Group, Inc. (Diversified Financial Svs.) | 20,669 | 2,013,161 | ||||||||||||||||
Colony Capital, Inc. (Real Estate Investment Trusts) | 55,886 | 857,850 | ||||||||||||||||
MGM Growth Properties, LLC Class A (Real Estate Investment Trusts) | 16,139 | 430,588 | ||||||||||||||||
Outfront Media, Inc. (Real Estate Investment Trusts) | 24,835 | 600,262 | ||||||||||||||||
CBRE Group, Inc. (Real Estate Mgmt. & Development) | (a) | 48,308 | 1,279,196 | |||||||||||||||
|
| |||||||||||||||||
| 11,865,935 | ||||||||||||||||||
|
| |||||||||||||||||
HEALTH CARE – 7.9% | ||||||||||||||||||
AbbVie, Inc. (Biotechnology) | 52,999 | 3,281,168 | ||||||||||||||||
Amgen, Inc. (Biotechnology) | 27,295 | 4,152,934 | ||||||||||||||||
Celgene Corp. (Biotechnology) | (a) | 4,278 | 421,939 | |||||||||||||||
Medtronic PLC (Health Care Equip. & Supplies) | 15,944 | 1,383,461 | ||||||||||||||||
Aetna, Inc. (Health Care Providers & Svs.) | 8,976 | 1,096,239 | ||||||||||||||||
Allergan plc (Pharmaceuticals) | (a) | 7,016 | 1,621,328 | |||||||||||||||
Bristol-Myers Squibb Co. (Pharmaceuticals) | 56,708 | 4,170,873 | ||||||||||||||||
Eli Lilly & Co. (Pharmaceuticals) | 6,817 | 536,839 | ||||||||||||||||
|
| |||||||||||||||||
| 16,664,781 | ||||||||||||||||||
|
| |||||||||||||||||
INDUSTRIALS – 6.4% | ||||||||||||||||||
Boeing Co. / The (Aerospace & Defense) | 30,385 | 3,946,100 | ||||||||||||||||
General Dynamics Corp. (Aerospace & Defense) | 5,931 | 825,833 | ||||||||||||||||
Honeywell International, Inc. (Aerospace & Defense) | 23,678 | 2,754,225 | ||||||||||||||||
Northrop Grumman Corp. (Aerospace & Defense) | 8,185 | 1,819,362 | ||||||||||||||||
United Parcel Service, Inc. Class B (Air Freight & Logistics) | 8,286 | 892,568 | ||||||||||||||||
General Electric Co. (Industrial Conglomerates) | 65,561 | 2,063,860 | ||||||||||||||||
CSX Corp. (Road & Rail) | 47,502 | 1,238,852 | ||||||||||||||||
|
| |||||||||||||||||
| 13,540,800 | ||||||||||||||||||
|
| |||||||||||||||||
INFORMATION TECHNOLOGY – 9.3% | ||||||||||||||||||
Alphabet, Inc. Class C (Internet Software & Svs.) | (a) | 5,395 | 3,733,880 | |||||||||||||||
Accenture PLC Class A (IT Svs.) | 9,767 | 1,106,503 | ||||||||||||||||
Automatic Data Processing, Inc. (IT Svs.) | 9,835 | 903,541 | ||||||||||||||||
MasterCard, Inc. Class A (IT Svs.) | 45,793 | 4,032,532 | ||||||||||||||||
Adobe Systems, Inc. (Software) | (a) | 25,866 | 2,477,704 | |||||||||||||||
Microsoft Corp. (Software) | 88,936 | 4,550,855 | ||||||||||||||||
Apple, Inc. (Tech. Hardware, Storage & Periph.) | 29,814 | 2,850,218 | ||||||||||||||||
|
| |||||||||||||||||
| 19,655,233 | ||||||||||||||||||
|
| |||||||||||||||||
MATERIALS – 1.7% | ||||||||||||||||||
E.I. du Pont de Nemours & Co. (Chemicals) | 12,200 | 790,560 | ||||||||||||||||
LyondellBasell Industries NV Class A (Chemicals) | 39,114 | 2,910,864 | ||||||||||||||||
|
| |||||||||||||||||
| 3,701,424 | ||||||||||||||||||
|
| |||||||||||||||||
Total Common Stocks (Cost $96,203,165) | $ | 97,430,418 | ||||||||||||||||
|
| |||||||||||||||||
| 101 | (continued) |
| Ohio National Fund, Inc. | Risk Managed Balanced Portfolio (Continued) |
Schedule of Investments | June 30, 2016 (Unaudited) |
| Corporate Bonds – 11.7% | Rate | Maturity | Face Amount | Value | ||||||||||||
CONSUMER DISCRETIONARY – 1.1% | ||||||||||||||||
ZF North America Capital, Inc. (Auto Components) | (b) | 4.000% | 04/29/2020 | $ | 200,000 | $ | 205,124 | |||||||||
ZF North America Capital, Inc. (Auto Components) | (b) | 4.750% | 04/29/2025 | 234,000 | 237,070 | |||||||||||
General Motors Co. (Automobiles) | 4.875% | 10/02/2023 | 205,000 | 217,899 | ||||||||||||
General Motors Financial Co., Inc. (Automobiles) | 3.700% | 05/09/2023 | 67,000 | 67,436 | ||||||||||||
1011778 B.C. ULC / New Red Finance, Inc. (Hotels, Restaurants & Leisure) | (b) | 4.625% | 01/15/2022 | 179,000 | 181,685 | |||||||||||
Aramark Services, Inc. (Hotels, Restaurants & Leisure) | (b) | 5.125% | 01/15/2024 | 21,000 | 21,420 | |||||||||||
Brinker International, Inc. (Hotels, Restaurants & Leisure) | 3.875% | 05/15/2023 | 120,000 | 121,778 | ||||||||||||
D.R. Horton, Inc. (Household Durables) | 4.750% | 05/15/2017 | 64,000 | 65,320 | ||||||||||||
D.R. Horton, Inc. (Household Durables) | 3.750% | 03/01/2019 | 128,000 | 129,920 | ||||||||||||
MDC Holdings, Inc. (Household Durables) | 5.500% | 01/15/2024 | 46,000 | 45,540 | ||||||||||||
Newell Rubbermaid, Inc. (Household Durables) | (f) | 3.150% | 04/01/2021 | 48,000 | 50,011 | |||||||||||
Newell Rubbermaid, Inc. (Household Durables) | (f) | 3.850% | 04/01/2023 | 45,000 | 47,737 | |||||||||||
Newell Rubbermaid, Inc. (Household Durables) | (f) | 4.200% | 04/01/2026 | 241,000 | 261,387 | |||||||||||
Toll Brothers Finance Corp. (Household Durables) | 5.875% | 02/15/2022 | 74,000 | 79,624 | ||||||||||||
Toll Brothers Finance Corp. (Household Durables) | 4.375% | 04/15/2023 | 37,000 | 36,445 | ||||||||||||
Charter Communications Operating LLC / Charter Communications Operating Capital (Media) | (b) | 4.464% | 07/23/2022 | 150,000 | 161,501 | |||||||||||
Time Warner Cable, Inc. (Media) | 5.850% | 05/01/2017 | 102,000 | 105,589 | ||||||||||||
UBM PLC (Media) | (b)(f) | 5.750% | 11/03/2020 | 50,000 | 54,109 | |||||||||||
Hanesbrands, Inc. (Textiles, Apparel & Luxury Goods) | (b) | 4.625% | 05/15/2024 | 196,000 | 196,490 | |||||||||||
|
| |||||||||||||||
| 2,286,085 | ||||||||||||||||
|
| |||||||||||||||
CONSUMER STAPLES – 1.1% | ||||||||||||||||
Anheuser-Busch InBev Finance, Inc. (Beverages) | 2.650% | 02/01/2021 | 109,000 | 112,952 | ||||||||||||
Anheuser-Busch InBev Finance, Inc. (Beverages) | 3.300% | 02/01/2023 | 287,000 | 301,946 | ||||||||||||
Anheuser-Busch InBev Finance, Inc. (Beverages) | 3.650% | 02/01/2026 | 184,000 | 196,937 | ||||||||||||
Molson Coors Brewing Co. (Beverages) | 3.000% | 07/15/2026 | 124,000 | 123,945 | ||||||||||||
Molson Coors Brewing Co. (Beverages) | 4.200% | 07/15/2046 | 49,000 | 49,245 | ||||||||||||
CVS Health Corp. (Food & Staples Retailing) | 2.800% | 07/20/2020 | 290,000 | 301,854 | ||||||||||||
CVS Health Corp. (Food & Staples Retailing) | 4.750% | 12/01/2022 | 69,000 | 78,823 | ||||||||||||
CVS Health Corp. (Food & Staples Retailing) | 5.000% | 12/01/2024 | 87,000 | 101,869 | ||||||||||||
Sysco Corp. (Food & Staples Retailing) | 2.500% | 07/15/2021 | 37,000 | 37,813 | ||||||||||||
Sysco Corp. (Food & Staples Retailing) | 3.300% | 07/15/2026 | 93,000 | 96,536 | ||||||||||||
Walgreens Boots Alliance, Inc. (Food & Staples Retailing) | 2.600% | 06/01/2021 | 42,000 | 42,692 | ||||||||||||
Walgreens Boots Alliance, Inc. (Food & Staples Retailing) | 3.100% | 06/01/2023 | 26,000 | 26,433 | ||||||||||||
Walgreens Boots Alliance, Inc. (Food & Staples Retailing) | 3.450% | 06/01/2026 | 107,000 | 110,007 | ||||||||||||
Walgreens Boots Alliance, Inc. (Food & Staples Retailing) | 4.650% | 06/01/2046 | 18,000 | 19,211 | ||||||||||||
Kraft Heinz Foods Co. (Food Products) | (b) | 2.800% | 07/02/2020 | 102,000 | 105,930 | |||||||||||
Kraft Heinz Foods Co. (Food Products) | (b) | 3.500% | 07/15/2022 | 98,000 | 104,095 | |||||||||||
Kraft Heinz Foods Co. (Food Products) | (b) | 3.000% | 06/01/2026 | 104,000 | 105,113 | |||||||||||
Smithfield Foods, Inc. (Food Products) | (b) | 5.250% | 08/01/2018 | 36,000 | 36,360 | |||||||||||
Wm. Wrigley Jr. Co. (Food Products) | (b) | 2.400% | 10/21/2018 | 338,000 | 344,708 | |||||||||||
|
| |||||||||||||||
| 2,296,469 | ||||||||||||||||
|
| |||||||||||||||
ENERGY – 1.0% | ||||||||||||||||
Helmerich & Payne International Drilling Co. (Energy Equip. & Svs.) | 4.650% | 03/15/2025 | 153,000 | 163,322 | ||||||||||||
Oceaneering International, Inc. (Energy Equip. & Svs.) | 4.650% | 11/15/2024 | 52,000 | 50,301 | ||||||||||||
Anadarko Petroleum Corp. (Oil, Gas & Consumable Fuels) | 6.375% | 09/15/2017 | 6,000 | 6,315 | ||||||||||||
Anadarko Petroleum Corp. (Oil, Gas & Consumable Fuels) | 4.850% | 03/15/2021 | 25,000 | 26,518 | ||||||||||||
Anadarko Petroleum Corp. (Oil, Gas & Consumable Fuels) | 5.550% | 03/15/2026 | 87,000 | 96,118 | ||||||||||||
Anadarko Petroleum Corp. (Oil, Gas & Consumable Fuels) | 6.600% | 03/15/2046 | 65,000 | 78,536 | ||||||||||||
Canadian Natural Resources Ltd. (Oil, Gas & Consumable Fuels) | 5.700% | 05/15/2017 | 31,000 | 31,892 | ||||||||||||
Canadian Natural Resources Ltd. (Oil, Gas & Consumable Fuels) | 5.900% | 02/01/2018 | 58,000 | 61,275 | ||||||||||||
Cenovus Energy, Inc. (Oil, Gas & Consumable Fuels) | 5.700% | 10/15/2019 | 4,000 | 4,231 | ||||||||||||
Cimarex Energy Co. (Oil, Gas & Consumable Fuels) | 5.875% | 05/01/2022 | 88,000 | 92,184 | ||||||||||||
Cimarex Energy Co. (Oil, Gas & Consumable Fuels) | 4.375% | 06/01/2024 | 37,000 | 38,709 | ||||||||||||
ConocoPhillips Co. (Oil, Gas & Consumable Fuels) | 4.950% | 03/15/2026 | 173,000 | 196,103 | ||||||||||||
ConocoPhillips Co. (Oil, Gas & Consumable Fuels) | 4.200% | 03/15/2021 | 104,000 | 112,329 | ||||||||||||
Devon Energy Corp. (Oil, Gas & Consumable Fuels) | 6.300% | 01/15/2019 | 43,000 | 46,584 | ||||||||||||
Devon Energy Corp. (Oil, Gas & Consumable Fuels) | 2.250% | 12/15/2018 | 206,000 | 204,547 | ||||||||||||
Energy Transfer Partners LP (Oil, Gas & Consumable Fuels) | 4.150% | 10/01/2020 | 81,000 | 82,218 | ||||||||||||
Hess Corp. (Oil, Gas & Consumable Fuels) | 8.125% | 02/15/2019 | 44,000 | 49,034 | ||||||||||||
Kinder Morgan Energy Partners LP (Oil, Gas & Consumable Fuels) | 5.000% | 10/01/2021 | 156,000 | 165,221 | ||||||||||||
Kinder Morgan Energy Partners LP (Oil, Gas & Consumable Fuels) | 4.300% | 05/01/2024 | 121,000 | 122,089 | ||||||||||||
Kinder Morgan Energy Partners LP (Oil, Gas & Consumable Fuels) | 3.950% | 09/01/2022 | 82,000 | 83,463 | ||||||||||||
Kinder Morgan Energy Partners LP (Oil, Gas & Consumable Fuels) | 4.150% | 02/01/2024 | 29,000 | 29,160 | ||||||||||||
Motiva Enterprises LLC (Oil, Gas & Consumable Fuels) | (b) | 5.750% | 01/15/2020 | 27,000 | 29,541 | |||||||||||
Phillips 66 Partners LP (Oil, Gas & Consumable Fuels) | 3.605% | 02/15/2025 | 40,000 | 39,325 | ||||||||||||
Spectra Energy Partners LP (Oil, Gas & Consumable Fuels) | 4.750% | 03/15/2024 | 128,000 | 140,734 | ||||||||||||
Western Gas Partners LP (Oil, Gas & Consumable Fuels) | 5.375% | 06/01/2021 | 224,000 | 236,196 | ||||||||||||
|
| |||||||||||||||
| 2,185,945 | ||||||||||||||||
|
| |||||||||||||||
| 102 | (continued) |
| Ohio National Fund, Inc. | Risk Managed Balanced Portfolio (Continued) |
Schedule of Investments | June 30, 2016 (Unaudited) |
| Corporate Bonds (Continued) | Rate | Maturity | Face Amount | Value | ||||||||||||
FINANCIALS – 4.5% | ||||||||||||||||
Bank of America Corp. (Banks) | 5.750% | 08/15/2016 | $ | 65,000 | $ | 65,309 | ||||||||||
Bank of America Corp. (Banks) | 4.450% | 03/03/2026 | 243,000 | 254,289 | ||||||||||||
Bank of America Corp. (Banks) | 5.700% | 05/02/2017 | 107,000 | 110,765 | ||||||||||||
CIT Group, Inc. (Banks) | (b) | 5.500% | 02/15/2019 | 92,000 | 96,255 | |||||||||||
CIT Group, Inc. (Banks) | 4.250% | 08/15/2017 | 346,000 | 352,401 | ||||||||||||
Citigroup, Inc. (Banks) | 4.450% | 09/29/2027 | 123,000 | 126,455 | ||||||||||||
Citizens Financial Group, Inc. (Banks) | 4.300% | 12/03/2025 | 183,000 | 192,711 | ||||||||||||
JPMorgan Chase & Co. (Banks) | 4.250% | 10/01/2027 | 210,000 | 223,115 | ||||||||||||
Royal Bank of Scotland Group PLC (Banks) | 6.100% | 06/10/2023 | 132,000 | 135,050 | ||||||||||||
Santander UK PLC (Banks) | (b) | 5.000% | 11/07/2023 | 488,000 | 500,932 | |||||||||||
SVB Financial Group (Banks) | 5.375% | 09/15/2020 | 126,000 | 140,665 | ||||||||||||
Wells Fargo & Co. (Banks) | 3.000% | 04/22/2026 | 62,000 | 63,198 | ||||||||||||
Carlyle Holdings Finance LLC (Capital Markets) | (b) | 3.875% | 02/01/2023 | 72,000 | 75,054 | |||||||||||
Charles Schwab Corp. / The (Capital Markets) | 3.000% | 03/10/2025 | 82,000 | 85,660 | ||||||||||||
E*TRADE Financial Corp. (Capital Markets) | 5.375% | 11/15/2022 | 173,000 | 182,515 | ||||||||||||
E*TRADE Financial Corp. (Capital Markets) | 4.625% | 09/15/2023 | 239,000 | 241,988 | ||||||||||||
Goldman Sachs Group, Inc. / The (Capital Markets) | 5.625% | 01/15/2017 | 93,000 | 95,051 | ||||||||||||
Goldman Sachs Group, Inc. / The (Capital Markets) | 3.750% | 02/25/2026 | 182,000 | 190,960 | ||||||||||||
Lazard Group LLC (Capital Markets) | 6.850% | 06/15/2017 | 29,000 | 30,327 | ||||||||||||
Lazard Group LLC (Capital Markets) | 4.250% | 11/14/2020 | 153,000 | 162,870 | ||||||||||||
Lazard Group LLC (Capital Markets) | 3.750% | 02/13/2025 | 33,000 | 32,820 | ||||||||||||
Morgan Stanley (Capital Markets) | 2.450% | 02/01/2019 | 193,000 | 196,624 | ||||||||||||
Morgan Stanley (Capital Markets) | 4.875% | 11/01/2022 | 59,000 | 64,617 | ||||||||||||
Morgan Stanley (Capital Markets) | 3.950% | 04/23/2027 | 132,000 | 133,145 | ||||||||||||
Murray Street Investment Trust I (Capital Markets) | 4.647% | 03/09/2017 | 82,000 | 83,842 | ||||||||||||
Neuberger Berman Group LLC / Neuberger Berman Finance Corp. (Capital Markets) | (b) | 5.875% | 03/15/2022 | 355,000 | 370,531 | |||||||||||
Neuberger Berman Group LLC / Neuberger Berman Finance Corp. (Capital Markets) | (b) | 4.875% | 04/15/2045 | 153,000 | 135,325 | |||||||||||
Raymond James Financial, Inc. (Capital Markets) | 5.625% | 04/01/2024 | 335,000 | 383,229 | ||||||||||||
Scottrade Financial Services, Inc. (Acquired 05/03/2016 through 05/05/2016, Cost $43,625)(Capital Markets) | (b)(f)(g) | 6.125% | 07/11/2021 | 41,000 | 44,117 | |||||||||||
Stifel Financial Corp. (Capital Markets) | 4.250% | 07/18/2024 | 64,000 | 65,667 | ||||||||||||
TD Ameritrade Holding Corp. (Capital Markets) | 3.625% | 04/01/2025 | 286,000 | 306,515 | ||||||||||||
TD Ameritrade Holding Corp. (Capital Markets) | 2.950% | 04/01/2022 | 161,000 | 167,769 | ||||||||||||
Ally Financial, Inc. (Consumer Finance) | 8.000% | 12/31/2018 | 41,000 | 44,793 | ||||||||||||
American Express Co. (Consumer Finance) | (c) | 6.800% | 9/1/2066 | 204,000 | 203,745 | |||||||||||
American Express Credit Corp. (Consumer Finance) | 2.250% | 05/05/2021 | 164,000 | 166,963 | ||||||||||||
Discover Financial Services (Consumer Finance) | 3.950% | 11/06/2024 | 123,000 | 126,122 | ||||||||||||
Discover Financial Services (Consumer Finance) | 3.750% | 03/04/2025 | 142,000 | 143,121 | ||||||||||||
Synchrony Financial (Consumer Finance) | 3.000% | 08/15/2019 | 115,000 | 117,269 | ||||||||||||
Synchrony Financial (Consumer Finance) | 2.600% | 01/15/2019 | 7,000 | 7,074 | ||||||||||||
Berkshire Hathaway, Inc. (Diversified Financial Svs.) | 3.125% | 03/15/2026 | 76,000 | 79,731 | ||||||||||||
Intercontinental Exchange, Inc. (Diversified Financial Svs.) | 3.750% | 12/01/2025 | 163,000 | 175,931 | ||||||||||||
International Lease Finance Corp. (Diversified Financial Svs.) | (b) | 6.750% | 09/01/2016 | 106,000 | 106,530 | |||||||||||
International Lease Finance Corp. (Diversified Financial Svs.) | 8.750% | 03/15/2017 | 74,000 | 77,256 | ||||||||||||
LeasePlan Corp. NV (Diversified Financial Svs.) | (b) | 2.500% | 05/16/2018 | 293,000 | 293,115 | |||||||||||
Voya Financial, Inc. (Diversified Financial Svs.) | (c) | 5.650% | 5/15/2053 | 102,000 | 96,135 | |||||||||||
CNO Financial Group, Inc. (Insurance) | 4.500% | 05/30/2020 | 39,000 | 40,365 | ||||||||||||
CNO Financial Group, Inc. (Insurance) | 5.250% | 05/30/2025 | 114,000 | 117,420 | ||||||||||||
Primerica, Inc. (Insurance) | 4.750% | 07/15/2022 | 265,000 | 291,742 | ||||||||||||
Alexandria Real Estate Equities, Inc. (Real Estate Investment Trusts) | 4.600% | 04/01/2022 | 208,000 | 225,041 | ||||||||||||
Alexandria Real Estate Equities, Inc. (Real Estate Investment Trusts) | 2.750% | 01/15/2020 | 132,000 | 133,168 | ||||||||||||
Alexandria Real Estate Equities, Inc. (Real Estate Investment Trusts) | 4.500% | 07/30/2029 | 118,000 | 122,731 | ||||||||||||
American Tower Corp. (Real Estate Investment Trusts) | 3.500% | 01/31/2023 | 25,000 | 25,872 | ||||||||||||
American Tower Corp. (Real Estate Investment Trusts) | 3.450% | 09/15/2021 | 14,000 | 14,574 | ||||||||||||
American Tower Corp. (Real Estate Investment Trusts) | 3.300% | 02/15/2021 | 155,000 | 161,713 | ||||||||||||
American Tower Corp. (Real Estate Investment Trusts) | 4.400% | 02/15/2026 | 87,000 | 94,502 | ||||||||||||
American Tower Corp. (Real Estate Investment Trusts) | 3.375% | 10/15/2026 | 223,000 | 224,280 | ||||||||||||
Crown Castle International Corp. (Real Estate Investment Trusts) | 5.250% | 01/15/2023 | 115,000 | 129,065 | ||||||||||||
Crown Castle International Corp. (Real Estate Investment Trusts) | 4.875% | 04/15/2022 | 198,000 | 217,444 | ||||||||||||
Post Apartment Homes LP (Real Estate Investment Trusts) | 4.750% | 10/15/2017 | 46,000 | 47,487 | ||||||||||||
Senior Housing Properties Trust (Real Estate Investment Trusts) | 6.750% | 12/15/2021 | 55,000 | 62,297 | ||||||||||||
SL Green Realty Corp. (Real Estate Investment Trusts) | 7.750% | 03/15/2020 | 111,000 | 129,774 | ||||||||||||
SL Green Realty Corp. (Real Estate Investment Trusts) | 5.000% | 08/15/2018 | 77,000 | 80,756 | ||||||||||||
Jones Lang LaSalle, Inc. (Real Estate Mgmt. & Development) | 4.400% | 11/15/2022 | 154,000 | 160,807 | ||||||||||||
Kennedy-Wilson, Inc. (Real Estate Mgmt. & Development) | 5.875% | 04/01/2024 | 245,000 | 238,875 | ||||||||||||
|
| |||||||||||||||
| 9,465,469 | ||||||||||||||||
|
| |||||||||||||||
| 103 | (continued) |
| Ohio National Fund, Inc. | Risk Managed Balanced Portfolio (Continued) |
Schedule of Investments | June 30, 2016 (Unaudited) |
| Corporate Bonds (Continued) | Rate | Maturity | Face Amount | Value | ||||||||||||
HEALTH CARE – 0.9% | ||||||||||||||||
AbbVie, Inc. (Biotechnology) | 3.200% | 05/14/2026 | $ | 215,000 | $ | 217,386 | ||||||||||
Becton Dickinson and Co. (Health Care Equip. & Supplies) | 1.800% | 12/15/2017 | 160,000 | 161,317 | ||||||||||||
Aetna, Inc. (Health Care Providers & Svs.) | 2.400% | 06/15/2021 | 89,000 | 90,953 | ||||||||||||
Aetna, Inc. (Health Care Providers & Svs.) | 2.800% | 06/15/2023 | 65,000 | 66,449 | ||||||||||||
Aetna, Inc. (Health Care Providers & Svs.) | 3.200% | 06/15/2026 | 154,000 | 158,607 | ||||||||||||
Express Scripts Holding Co. (Health Care Providers & Svs.) | 4.500% | 02/25/2026 | 232,000 | 255,011 | ||||||||||||
Express Scripts Holding Co. (Health Care Providers & Svs.) | 3.400% | 03/01/2027 | 125,000 | 125,137 | ||||||||||||
Express Scripts Holding Co. (Health Care Providers & Svs.) | 4.800% | 07/15/2046 | 76,000 | 75,950 | ||||||||||||
Fresenius Medical Care U.S. Finance II, Inc. (Health Care Providers & Svs.) | (b) | 5.875% | 01/31/2022 | 61,000 | 66,871 | |||||||||||
HCA, Inc. (Health Care Providers & Svs.) | 3.750% | 03/15/2019 | 93,000 | 96,255 | ||||||||||||
Universal Health Services, Inc. (Health Care Providers & Svs.) | (b) | 4.750% | 08/01/2022 | 79,000 | 80,352 | |||||||||||
Universal Health Services, Inc. (Health Care Providers & Svs.) | (b) | 5.000% | 06/01/2026 | 73,000 | 73,183 | |||||||||||
Life Technologies Corp. (Life Sciences Tools & Svs.) | 6.000% | 03/01/2020 | 112,000 | 126,406 | ||||||||||||
Thermo Fisher Scientific, Inc. (Life Sciences Tools & Svs.) | 3.300% | 02/15/2022 | 86,000 | 89,526 | ||||||||||||
Actavis Funding SCS (Pharmaceuticals) | 3.000% | 03/12/2020 | 263,000 | 270,991 | ||||||||||||
|
| |||||||||||||||
| 1,954,394 | ||||||||||||||||
|
| |||||||||||||||
INDUSTRIALS – 0.7% | ||||||||||||||||
Southwest Airlines Co. (Airlines) | 5.125% | 03/01/2017 | 79,000 | 81,149 | ||||||||||||
Masco Corp. (Building Products) | 3.500% | 04/01/2021 | 80,000 | 81,624 | ||||||||||||
Owens Corning (Building Products) | 4.200% | 12/01/2024 | 65,000 | 68,045 | ||||||||||||
CNH Industrial Capital LLC (Machinery) | 3.625% | 04/15/2018 | 103,000 | 103,000 | ||||||||||||
Verisk Analytics, Inc. (Professional Svs.) | 5.800% | 05/01/2021 | 192,000 | 220,237 | ||||||||||||
Verisk Analytics, Inc. (Professional Svs.) | 4.875% | 01/15/2019 | 55,000 | 58,642 | ||||||||||||
Verisk Analytics, Inc. (Professional Svs.) | 4.125% | 09/12/2022 | 102,000 | 108,623 | ||||||||||||
Verisk Analytics, Inc. (Professional Svs.) | 5.500% | 06/15/2045 | 166,000 | 170,813 | ||||||||||||
Penske Truck Leasing Co. LP / PTL Finance Corp. (Road & Rail) | (b) | 3.375% | 03/15/2018 | 87,000 | 89,308 | |||||||||||
Penske Truck Leasing Co. LP / PTL Finance Corp. (Road & Rail) | (b) | 4.250% | 01/17/2023 | 135,000 | 141,410 | |||||||||||
Penske Truck Leasing Co. LP / PTL Finance Corp. (Road & Rail) | (b) | 2.500% | 06/15/2019 | 53,000 | 53,577 | |||||||||||
AerCap Ireland Capital Ltd. / AerCap Global Aviation Trust (Trading Companies & Distributors) | 4.625% | 10/30/2020 | 242,000 | 250,894 | ||||||||||||
|
| |||||||||||||||
| 1,427,322 | ||||||||||||||||
|
| |||||||||||||||
INFORMATION TECHNOLOGY – 1.1% | ||||||||||||||||
Harris Corp. (Communications Equip.) | 4.250% | 10/01/2016 | 82,000 | 82,497 | ||||||||||||
FLIR Systems, Inc. (Electronic Equip., Instr. & Comp.) | 3.750% | 09/01/2016 | 101,000 | 101,453 | ||||||||||||
Trimble Navigation Ltd. (Electronic Equip., Instr. & Comp.) | 4.750% | 12/01/2024 | 249,000 | 259,683 | ||||||||||||
Fidelity National Information Services, Inc. (IT Svs.) | 5.000% | 03/15/2022 | 14,000 | 14,587 | ||||||||||||
Fidelity National Information Services, Inc. (IT Svs.) | 3.625% | 10/15/2020 | 81,000 | 85,614 | ||||||||||||
Fidelity National Information Services, Inc. (IT Svs.) | 4.500% | 10/15/2022 | 100,000 | 110,767 | ||||||||||||
Fidelity National Information Services, Inc. (IT Svs.) | 5.000% | 10/15/2025 | 246,000 | 279,397 | ||||||||||||
Total System Services, Inc. (IT Svs.) | 4.800% | 04/01/2026 | 251,000 | 272,313 | ||||||||||||
Total System Services, Inc. (IT Svs.) | 3.800% | 04/01/2021 | 82,000 | 86,840 | ||||||||||||
TSMC Global Ltd. (Semiconductors & Equip.) | (b) | 1.625% | 04/03/2018 | 348,000 | 348,465 | |||||||||||
Cadence Design Systems, Inc. (Software) | 4.375% | 10/15/2024 | 224,000 | 231,550 | ||||||||||||
Seagate HDD Cayman (Tech. Hardware, Storage & Periph.) | 4.750% | 01/01/2025 | 339,000 | 268,234 | ||||||||||||
Seagate HDD Cayman (Tech. Hardware, Storage & Periph.) | 5.750% | 12/01/2034 | 84,000 | 59,010 | ||||||||||||
Seagate HDD Cayman (Tech. Hardware, Storage & Periph.) | 4.875% | 06/01/2027 | 76,000 | 54,910 | ||||||||||||
|
| |||||||||||||||
| 2,255,320 | ||||||||||||||||
|
| |||||||||||||||
MATERIALS – 0.8% | ||||||||||||||||
Albemarle Corp. (Chemicals) | 4.150% | 12/01/2024 | 109,000 | 114,186 | ||||||||||||
Albemarle Corp. (Chemicals) | 5.450% | 12/01/2044 | 146,000 | 155,762 | ||||||||||||
Ashland, Inc. (Chemicals) | 3.875% | 04/15/2018 | 90,000 | 91,800 | ||||||||||||
Hanson Ltd. (Construction Materials) | 6.125% | 08/15/2016 | 150,000 | 150,188 | ||||||||||||
Martin Marietta Materials, Inc. (Construction Materials) | 4.250% | 07/02/2024 | 86,000 | 91,640 | ||||||||||||
Vulcan Materials Co. (Construction Materials) | 7.000% | 06/15/2018 | 106,000 | 116,070 | ||||||||||||
Vulcan Materials Co. (Construction Materials) | 7.500% | 06/15/2021 | 64,000 | 76,883 | ||||||||||||
Vulcan Materials Co. (Construction Materials) | 4.500% | 04/01/2025 | 146,000 | 155,855 | ||||||||||||
Ball Corp. (Containers & Packaging) | 4.375% | 12/15/2020 | 96,000 | 100,980 | ||||||||||||
Alcoa, Inc. (Metals & Mining) | 5.125% | 10/01/2024 | 167,000 | 166,583 | ||||||||||||
Reliance Steel & Aluminum Co. (Metals & Mining) | 4.500% | 04/15/2023 | 105,000 | 107,359 | ||||||||||||
Georgia-Pacific LLC (Paper & Forest Products) | (b) | 3.163% | 11/15/2021 | 74,000 | 77,875 | |||||||||||
Georgia-Pacific LLC (Paper & Forest Products) | (b) | 3.600% | 03/01/2025 | 207,000 | 221,503 | |||||||||||
|
| |||||||||||||||
| 1,626,684 | ||||||||||||||||
|
| |||||||||||||||
TELECOMMUNICATION SERVICES – 0.2% | ||||||||||||||||
BellSouth, LLC (Diversified Telecom. Svs.) | (b) | 4.400% | 04/26/2017 | 358,000 | 366,950 | |||||||||||
|
| |||||||||||||||
UTILITIES – 0.3% | ||||||||||||||||
IPALCO Enterprises, Inc. (Electric Utilities) | 5.000% | 05/01/2018 | 76,000 | 79,420 | ||||||||||||
PPL WEM Holdings Ltd. (Electric Utilities) | (b) | 5.375% | 05/01/2021 | 151,000 | 168,153 | |||||||||||
| 104 | (continued) |
| Ohio National Fund, Inc. | Risk Managed Balanced Portfolio (Continued) |
Schedule of Investments | June 30, 2016 (Unaudited) |
| Corporate Bonds (Continued) | Rate | Maturity | Face Amount | Value | ||||||||||||
UTILITIES (continued) | ||||||||||||||||
Southern Co. / The (Electric Utilities) | 2.350% | 07/01/2021 | $ | 203,000 | $ | 206,992 | ||||||||||
Southern Co. / The (Electric Utilities) | 2.950% | 07/01/2023 | 108,000 | 111,969 | ||||||||||||
Southern Co. / The (Electric Utilities) | 3.250% | 07/01/2026 | 203,000 | 211,036 | ||||||||||||
|
| |||||||||||||||
| 777,570 | ||||||||||||||||
|
| |||||||||||||||
Total Corporate Bonds (Cost $24,226,625) | $ | 24,642,208 | ||||||||||||||
|
| |||||||||||||||
| Preferred Stocks – 0.3% | Rate | Quantity | Value | |||||||||||||
FINANCIALS – 0.2% | ||||||||||||||||
Charles Schwab Corp. Series A / The (Capital Markets) | (d) | 7.000% | 168,000 | $ | 191,310 | |||||||||||
Discover Financial Services (Consumer Finance) | 6.500% | 7,550 | 199,622 | |||||||||||||
|
| |||||||||||||||
| 390,932 | ||||||||||||||||
|
| |||||||||||||||
INDUSTRIALS – 0.1% | ||||||||||||||||
General Electric Co. (Industrial Conglomerates) | (d) | 5.000% | 177,000 | 188,062 | ||||||||||||
General Electric Co. (Industrial Conglomerates) | 4.700% | 364 | 9,650 | |||||||||||||
|
| |||||||||||||||
| 197,712 | ||||||||||||||||
|
| |||||||||||||||
Total Preferred Stocks (Cost $570,911) | $ | 588,644 | ||||||||||||||
|
| |||||||||||||||
| Trust Preferred Securities – 0.3% | Rate | Quantity | Value | |||||||||||||
FINANCIALS – 0.3% | ||||||||||||||||
Citigroup Capital XIII (Banks) | (d) | QL + 637 | 8,275 | $ | 269,825 | |||||||||||
JPMorgan Chase Capital XXI (Banks) | (d) | QL + 95 | 18,000 | 13,725 | ||||||||||||
Goldman Sachs Capital I (Capital Markets) | 6.345% | 255,000 | 300,013 | |||||||||||||
|
| |||||||||||||||
Total Trust Preferred Securities (Cost $575,775) | $ | 583,563 | ||||||||||||||
|
| |||||||||||||||
| Preferred Stock Depository Receipts – 0.3% | Rate | Quantity | Value | |||||||||||||
FINANCIALS – 0.3% | ||||||||||||||||
Bank of America Corp. (Banks) | (e) | 8.000% | 56,000 | $ | 55,650 | |||||||||||
Bank of America Corp. (Banks) | (e) | 6.300% | 102,000 | 107,992 | ||||||||||||
Wells Fargo & Co. (Banks) | (e) | 5.875% | 92,000 | 98,095 | ||||||||||||
Wells Fargo & Co. (Banks) | (e) | 6.625% | 1,800 | 53,568 | ||||||||||||
Morgan Stanley (Capital Markets) | (e) | 7.125% | 2,750 | 81,593 | ||||||||||||
Morgan Stanley (Capital Markets) | (e) | 5.550% | 172,000 | 170,383 | ||||||||||||
Morgan Stanley (Capital Markets) | (e) | 6.875% | 5,150 | 148,011 | ||||||||||||
|
| |||||||||||||||
Total Preferred Stock Depository Receipts (Cost $697,453) | $ | 715,292 | ||||||||||||||
|
| |||||||||||||||
| Master Limited Partnerships – 0.9% | Shares | Value | ||||||||||||||
FINANCIALS – 0.9% | ||||||||||||||||
Blackstone Group LP / The (Capital Markets) | 77,345 | $ | 1,898,046 | |||||||||||||
|
| |||||||||||||||
Total Master Limited Partnerships (Cost $2,380,698) | $ | 1,898,046 | ||||||||||||||
|
| |||||||||||||||
| Asset-Backed / Mortgage-Backed Securities – 1.8% | Rate | Maturity | Face Amount | Value | ||||||||||||
CONSUMER DISCRETIONARY – 0.7% | ||||||||||||||||
Applebee’s Funding LLC / IHOP Funding LLC 2014-1 A2 | (b) | 4.277% | 09/05/2044 | $ | 7,000 | $ | 7,125 | |||||||||
CKE Restaurant Holdings, Inc. 2013-1A A2 | (b) | 4.474% | 03/20/2043 | 428,063 | 428,413 | |||||||||||
Domino’s Pizza Master Issuer LLC 2012-1A A2 | (b) | 5.216% | 01/25/2042 | 168,186 | 173,097 | |||||||||||
Domino’s Pizza Master Issuer LLC 2015-1A A2I | (b) | 3.484% | 10/25/2045 | 123,380 | 125,332 | |||||||||||
Hilton U.S.A. Trust 2013-HLT DFX | (b) | 4.407% | 11/05/2030 | 254,000 | 255,507 | |||||||||||
Hilton U.S.A. Trust 2013-HLT EFX | (b) | 4.602% | 11/05/2030 | 150,000 | 150,942 | |||||||||||
Taco Bell Funding, LLC 2016-1A A2I | (b) | 3.832% | 05/25/2046 | 133,000 | 134,623 | |||||||||||
Wendys Funding LLC 2015-1A A2I | (b) | 3.371% | 06/15/2045 | 84,363 | 84,827 | |||||||||||
|
| |||||||||||||||
| 1,359,866 | ||||||||||||||||
|
| |||||||||||||||
FINANCIALS – 1.1% | ||||||||||||||||
American Tower Trust I 13 1A | (b) | 1.551% | 03/15/2018 | 60,000 | 60,128 | |||||||||||
AmeriCredit Automobile Receivables 2016-1 D | 3.590% | 02/08/2022 | 81,000 | 83,159 | ||||||||||||
AmeriCredit Automobile Receivables Trust 2012-4 E | (b) | 3.820% | 02/10/2020 | 145,000 | 146,232 | |||||||||||
AmeriCredit Automobile Receivables Trust 2015-2 D | 3.000% | 06/08/2021 | 20,000 | 20,233 | ||||||||||||
AmeriCredit Automobile Receivables Trust 2016-2 D | 3.650% | 05/09/2022 | 63,000 | 64,624 | ||||||||||||
Banc of America Commercial Mortgage Trust 2006-6 AJ | 5.421% | 10/10/2045 | 320,000 | 319,006 | ||||||||||||
Banc of America Commercial Mortgage Trust 2007-3 AJ | 5.723% | 06/10/2049 | 45,303 | 45,532 | ||||||||||||
COBALT CMBS Commercial Mortgage Trust 2007-C2 | 5.568% | 04/15/2047 | 26,539 | 26,339 | ||||||||||||
COMM 2007-C9 Mortgage Trust AJ | 5.650% | 12/10/2049 | 10,000 | 10,137 | ||||||||||||
Commercial Mortgage Trust 2007-GG11 AM | 5.867% | 12/10/2049 | 25,000 | 25,862 | ||||||||||||
| 105 | (continued) |
| Ohio National Fund, Inc. | Risk Managed Balanced Portfolio (Continued) |
Schedule of Investments | June 30, 2016 (Unaudited) |
| Asset-Backed / Mortgage-Backed Securities (Continued) | Rate | Maturity | Face Amount | Value | ||||||||||||
FINANCIALS (continued) | ||||||||||||||||
Core Industrial Trust 2015-TEXW E | (b) | 3.977% | 02/10/2034 | $ | 100,000 | $ | 95,136 | |||||||||
GAHR Commericial Mortgage Trust 2015-NRF DFX | (b) | 3.495% | 12/15/2034 | 10,000 | 9,954 | |||||||||||
JP Morgan Chase Commercial Mortgage Securities Trust 2015-COSMO D | (b) | 3.742% | 01/15/2032 | 287,000 | 284,659 | |||||||||||
JP Morgan Chase Commercial Mortgage Securities Trust 2015-SGP B | (b) | 3.192% | 07/15/2036 | 150,000 | 149,906 | |||||||||||
JP Morgan Chase Commercial Mortgage Securities Trust 2015-SGP D | (b) | 4.942% | 07/15/2036 | 100,000 | 99,124 | |||||||||||
JP Morgan Chase Commercial Mortgage Securities Trust 2015-UES E | (b) | 3.742% | 09/05/2032 | 44,000 | 42,362 | |||||||||||
LB-UBS Commercial Mortgage Trust 2006-C1 AJ | 5.276% | 02/15/2041 | 162,527 | 160,908 | ||||||||||||
LB-UBS Commercial Mortgage Trust 2007-C1 AJ | 5.484% | 02/15/2040 | 23,685 | 23,815 | ||||||||||||
LB-UBS Commercial Mortgage Trust 2007-C7 AJ | 6.449% | 09/15/2045 | 43,782 | 43,797 | ||||||||||||
Santander Drive Auto Receivables Trust 2015-1 D | 3.240% | 04/15/2021 | 341,000 | 346,132 | ||||||||||||
Santander Drive Auto Receivables Trust 2015-4 D | 3.530% | 08/16/2021 | 53,000 | 54,710 | ||||||||||||
Wachovia Bank Commercial Mortgage Trust Series 2007-C30 AM | 5.383% | 12/15/2043 | 46,628 | 47,434 | ||||||||||||
Wachovia Bank Commercial Mortgage Trust Series 2007-C31 AJ | 5.660% | 04/15/2047 | 121,647 | 121,918 | ||||||||||||
Wachovia Bank Commercial Mortgage Trust Series 2007-C33 AJ | 6.147% | 02/15/2051 | 81,969 | 81,292 | ||||||||||||
Wachovia Bank Commercial Mortgage Trust Series 2007-C34 AJ | 6.141% | 05/15/2046 | 33,843 | 33,505 | ||||||||||||
|
| |||||||||||||||
| 2,395,904 | ||||||||||||||||
|
| |||||||||||||||
Total Asset-Backed / Mortgage-Backed Securities (Cost $3,778,173) | $ | 3,755,770 | ||||||||||||||
|
| |||||||||||||||
| U.S. Treasury Obligations – 10.2% | Rate | Maturity | Face Amount | Value | ||||||||||||
U.S. Treasury Note | 0.625% | 05/31/2017 | $ | 827,000 | $ | 827,776 | ||||||||||
U.S. Treasury Note | 0.875% | 04/15/2019 | 1,406,000 | 1,412,866 | ||||||||||||
U.S. Treasury Note | 0.875% | 06/15/2019 | 82,000 | 82,410 | ||||||||||||
U.S. Treasury Note | 1.625% | 12/31/2019 | 583,000 | 599,169 | ||||||||||||
U.S. Treasury Note | 1.750% | 12/31/2020 | 533,000 | 551,426 | ||||||||||||
U.S. Treasury Note | 1.375% | 01/31/2021 | 659,000 | 670,790 | ||||||||||||
U.S. Treasury Note | 1.125% | 02/28/2021 | 1,871,000 | 1,884,301 | ||||||||||||
U.S. Treasury Note | 1.250% | 03/31/2021 | 2,121,000 | 2,146,104 | ||||||||||||
U.S. Treasury Note | 1.125% | 06/30/2021 | 591,000 | 594,001 | ||||||||||||
U.S. Treasury Note | 2.125% | 09/30/2021 | 416,000 | 438,490 | ||||||||||||
U.S. Treasury Note | 2.125% | 12/31/2021 | 583,000 | 614,814 | ||||||||||||
U.S. Treasury Note | 1.750% | 05/15/2023 | 174,000 | 179,539 | ||||||||||||
U.S. Treasury Note | 1.375% | 06/30/2023 | 108,000 | 108,582 | ||||||||||||
U.S. Treasury Note | 2.500% | 08/15/2023 | 638,000 | 691,283 | ||||||||||||
U.S. Treasury Note | 2.750% | 11/15/2023 | 813,000 | 896,459 | ||||||||||||
U.S. Treasury Note | 2.500% | 05/15/2024 | 468,000 | 508,475 | ||||||||||||
U.S. Treasury Note | (j) | 2.250% | 11/15/2024 | 1,865,000 | 1,990,231 | |||||||||||
U.S. Treasury Note | 2.000% | 02/15/2025 | 81,000 | 84,768 | ||||||||||||
U.S. Treasury Note | 2.000% | 08/15/2025 | 690,000 | 721,697 | ||||||||||||
U.S. Treasury Note | 2.250% | 11/15/2025 | 1,559,000 | 1,664,172 | ||||||||||||
U.S. Treasury Note | 1.625% | 02/15/2026 | 177,000 | 179,102 | ||||||||||||
U.S. Treasury Note | 1.625% | 05/15/2026 | 1,592,000 | 1,612,397 | ||||||||||||
U.S. Treasury Note | 3.750% | 11/15/2043 | 502,000 | 662,856 | ||||||||||||
U.S. Treasury Note | 3.625% | 02/15/2044 | 127,000 | 163,865 | ||||||||||||
U.S. Treasury Note | 3.375% | 05/15/2044 | 112,000 | 138,149 | ||||||||||||
U.S. Treasury Note | 2.500% | 02/15/2045 | 90,000 | 93,790 | ||||||||||||
U.S. Treasury Note | 3.000% | 05/15/2045 | 131,000 | 150,706 | ||||||||||||
U.S. Treasury Note | 2.875% | 08/15/2045 | 235,000 | 263,953 | ||||||||||||
U.S. Treasury Note | 3.000% | 11/15/2045 | 910,000 | 1,047,246 | ||||||||||||
U.S. Treasury Note | 2.500% | 02/15/2046 | 208,000 | 216,783 | ||||||||||||
U.S. Treasury Note | 2.500% | 05/15/2046 | 323,000 | 336,967 | ||||||||||||
|
| |||||||||||||||
Total U.S. Treasury Obligations (Cost $20,943,409) | $ | 21,533,167 | ||||||||||||||
|
| |||||||||||||||
| U.S. Government Agency Mortgage-Backed Securities – 7.5% | Rate | Maturity | Face Amount | Value | ||||||||||||
Fannie Mae Pool | 6.000% | 08/01/2022 | $ | 36,761 | $ | 40,019 | ||||||||||
Fannie Mae Pool | 4.000% | 03/01/2029 | 53,841 | 57,628 | ||||||||||||
Fannie Mae Pool | 4.000% | 06/01/2029 | 6,193 | 6,614 | ||||||||||||
Fannie Mae Pool | 4.000% | 07/01/2029 | 50,584 | 53,902 | ||||||||||||
Fannie Mae Pool | 4.000% | 09/01/2029 | 231,394 | 245,899 | ||||||||||||
Fannie Mae Pool | 3.500% | 10/01/2029 | 25,698 | 27,255 | ||||||||||||
Fannie Mae Pool | 3.500% | 05/01/2033 | 379,599 | 404,153 | ||||||||||||
Fannie Mae Pool | 4.000% | 04/01/2034 | 21,743 | 23,634 | ||||||||||||
Fannie Mae Pool | 5.500% | 04/01/2040 | 264,119 | 298,602 | ||||||||||||
Fannie Mae Pool | 4.500% | 01/01/2041 | 99,309 | 110,862 | ||||||||||||
Fannie Mae Pool | 5.500% | 05/01/2041 | 6,379 | 7,212 | ||||||||||||
Fannie Mae Pool | 5.500% | 06/01/2041 | 35,058 | 40,185 | ||||||||||||
Fannie Mae Pool | 5.500% | 07/01/2041 | 35,925 | 40,617 | ||||||||||||
Fannie Mae Pool | 4.500% | 11/01/2041 | 288,680 | 322,180 | ||||||||||||
Fannie Mae Pool | 5.500% | 02/01/2042 | 148,758 | 168,038 | ||||||||||||
| 106 | (continued) |
| Ohio National Fund, Inc. | Risk Managed Balanced Portfolio (Continued) |
Schedule of Investments | June 30, 2016 (Unaudited) |
| U.S. Government Agency Mortgage-Backed Securities (Continued) | Rate | Maturity | Face Amount | Value | ||||||||||
Fannie Mae Pool | 4.000% | 06/01/2042 | $ | 15,036 | $ | 16,307 | ||||||||
Fannie Mae Pool | 3.500% | 07/01/2042 | 34,706 | 37,148 | ||||||||||
Fannie Mae Pool | 4.000% | 07/01/2042 | 112,699 | 122,156 | ||||||||||
Fannie Mae Pool | 4.000% | 08/01/2042 | 6,810 | 7,383 | ||||||||||
Fannie Mae Pool | 4.000% | 09/01/2042 | 8,972 | 9,730 | ||||||||||
Fannie Mae Pool | 4.500% | 11/01/2042 | 35,776 | 39,608 | ||||||||||
Fannie Mae Pool | 4.000% | 12/01/2042 | 5,512 | 6,030 | ||||||||||
Fannie Mae Pool | 3.500% | 01/01/2043 | 39,999 | 42,627 | ||||||||||
Fannie Mae Pool | 3.500% | 02/01/2043 | 60,730 | 64,719 | ||||||||||
Fannie Mae Pool | 3.500% | 02/01/2043 | 39,952 | 42,564 | ||||||||||
Fannie Mae Pool | 4.500% | 03/01/2043 | 192,112 | 215,241 | ||||||||||
Fannie Mae Pool | 4.000% | 07/01/2043 | 706,425 | 766,106 | ||||||||||
Fannie Mae Pool | 4.000% | 08/01/2043 | 21,637 | 23,461 | ||||||||||
Fannie Mae Pool | 3.500% | 04/01/2044 | 6,538 | 6,996 | ||||||||||
Fannie Mae Pool | 3.500% | 05/01/2044 | 46,746 | 50,160 | ||||||||||
Fannie Mae Pool | 4.500% | 05/01/2044 | 294,546 | 330,412 | ||||||||||
Fannie Mae Pool | 5.500% | 05/01/2044 | 97,906 | 110,584 | ||||||||||
Fannie Mae Pool | 4.000% | 06/01/2044 | 164,697 | 178,614 | ||||||||||
Fannie Mae Pool | 5.000% | 07/01/2044 | 231,031 | 262,258 | ||||||||||
Fannie Mae Pool | 4.000% | 07/01/2044 | 47,788 | 52,492 | ||||||||||
Fannie Mae Pool | 4.500% | 08/01/2044 | 70,013 | 78,572 | ||||||||||
Fannie Mae Pool | 4.000% | 08/01/2044 | 29,883 | 32,828 | ||||||||||
Fannie Mae Pool | 4.500% | 10/01/2044 | 44,512 | 49,859 | ||||||||||
Fannie Mae Pool | 4.500% | 10/01/2044 | 53,773 | 60,449 | ||||||||||
Fannie Mae Pool | 3.500% | 02/01/2045 | 50,158 | 53,458 | ||||||||||
Fannie Mae Pool | 4.500% | 03/01/2045 | 80,141 | 89,804 | ||||||||||
Fannie Mae Pool | 4.500% | 05/01/2045 | 30,206 | 33,970 | ||||||||||
Fannie Mae Pool | 4.500% | 05/01/2045 | 157,936 | 177,616 | ||||||||||
Fannie Mae Pool | 4.000% | 05/01/2045 | 70,083 | 77,081 | ||||||||||
Fannie Mae Pool | 4.500% | 06/01/2045 | 166,120 | 185,542 | ||||||||||
Fannie Mae Pool | 4.000% | 09/01/2045 | 198,014 | 216,243 | ||||||||||
Fannie Mae Pool | 4.000% | 10/01/2045 | 504,344 | 551,420 | ||||||||||
Fannie Mae Pool | 4.500% | 10/01/2045 | 330,617 | 370,582 | ||||||||||
Fannie Mae Pool | 4.500% | 10/01/2045 | 237,982 | 267,637 | ||||||||||
Fannie Mae Pool | 4.000% | 12/01/2045 | 88,386 | 97,289 | ||||||||||
Fannie Mae Pool | 3.500% | 01/01/2046 | 232,331 | 248,732 | ||||||||||
Fannie Mae Pool | 3.500% | 01/01/2046 | 227,963 | 244,144 | ||||||||||
Fannie Mae Pool | 4.500% | 02/01/2046 | 185,345 | 208,377 | ||||||||||
Fannie Mae Pool | 4.500% | 02/01/2046 | 77,618 | 87,122 | ||||||||||
Fannie Mae Pool | 4.000% | 04/01/2046 | 122,663 | 135,314 | ||||||||||
Fannie Mae Pool | 4.500% | 04/01/2046 | 118,520 | 134,241 | ||||||||||
Fannie Mae Pool | 4.000% | 05/01/2046 | 152,049 | 167,187 | ||||||||||
Freddie Mac Gold Pool | 3.500% | 07/01/2029 | 80,752 | 85,642 | ||||||||||
Freddie Mac Gold Pool | 3.500% | 09/01/2029 | 358,672 | 380,472 | ||||||||||
Freddie Mac Gold Pool | 5.500% | 08/01/2041 | 127,989 | 147,707 | ||||||||||
Freddie Mac Gold Pool | 5.500% | 08/01/2041 | 349,182 | 398,883 | ||||||||||
Freddie Mac Gold Pool | 5.000% | 03/01/2042 | 244,816 | 275,323 | ||||||||||
Freddie Mac Gold Pool | 3.500% | 02/01/2044 | 18,317 | 19,516 | ||||||||||
Freddie Mac Gold Pool | 4.500% | 05/01/2044 | 184,510 | 204,963 | ||||||||||
Freddie Mac Gold Pool | 5.000% | 07/01/2044 | 559,366 | 628,278 | ||||||||||
Freddie Mac Gold Pool | 4.000% | 08/01/2044 | 81,591 | 89,374 | ||||||||||
Freddie Mac Gold Pool | 4.500% | 06/01/2045 | 111,379 | 125,274 | ||||||||||
Freddie Mac Gold Pool | 4.500% | 10/01/2045 | 1,055,692 | 1,182,727 | ||||||||||
Freddie Mac Gold Pool | 4.500% | 02/01/2046 | 952,417 | 1,071,242 | ||||||||||
Freddie Mac Gold Pool | 4.500% | 02/01/2046 | 87,338 | 97,876 | ||||||||||
Ginnie Mae I Pool | 7.500% | 08/15/2033 | 50,766 | 61,044 | ||||||||||
Ginnie Mae I Pool | 5.500% | 02/15/2039 | 38,580 | 44,416 | ||||||||||
Ginnie Mae I Pool | 5.000% | 01/15/2040 | 230,929 | 258,678 | ||||||||||
Ginnie Mae I Pool | 5.000% | 05/15/2040 | 120,773 | 136,924 | ||||||||||
Ginnie Mae I Pool | 4.500% | 05/15/2041 | 86,177 | 98,905 | ||||||||||
Ginnie Mae I Pool | 4.500% | 05/15/2044 | 25,446 | 28,413 | ||||||||||
Ginnie Mae I Pool | 5.000% | 06/15/2044 | 77,103 | 87,600 | ||||||||||
Ginnie Mae I Pool | 5.000% | 06/15/2044 | 39,585 | 45,024 | ||||||||||
Ginnie Mae I Pool | 5.000% | 07/15/2044 | 31,611 | 35,884 | ||||||||||
Ginnie Mae I Pool | 4.000% | 01/15/2045 | 418,601 | 454,577 | ||||||||||
Ginnie Mae I Pool | 4.000% | 03/15/2045 | 1,017,660 | 1,102,573 | ||||||||||
Ginnie Mae I Pool | 4.000% | 04/15/2045 | 157,283 | 172,180 | ||||||||||
Ginnie Mae II Pool | 5.500% | 11/20/2037 | 5,346 | 6,085 | ||||||||||
Ginnie Mae II Pool | 5.500% | 05/20/2042 | 7,444 | 8,263 | ||||||||||
Ginnie Mae II Pool | 5.000% | 12/20/2044 | 389,173 | 443,184 | ||||||||||
Ginnie Mae II Pool | 5.000% | 09/20/2045 | 90,585 | 103,025 | ||||||||||
Ginnie Mae II Pool | 4.000% | 10/20/2045 | 225,923 | 245,178 | ||||||||||
|
| |||||||||||||
Total U.S. Government Agency Mortgage-Backed Securities (Cost $15,679,024) | $ | 15,838,093 | ||||||||||||
|
| |||||||||||||
| 107 | (continued) |
| Ohio National Fund, Inc. | Risk Managed Balanced Portfolio (Continued) |
Schedule of Investments | June 30, 2016 (Unaudited) |
| Purchased Options – 6.5% | Expiration | Exercise Price | Contracts (h) | Value | ||||||||||||
S&P 500 Index Call Option | December 2017 | $ 1,950.00 | 17 | $ | 405,960 | |||||||||||
S&P 500 Index Call Option | December 2017 | 2,000.00 | 9 | 185,940 | ||||||||||||
S&P 500 Index Call Option | December 2017 | 2,050.00 | 4 | 66,160 | ||||||||||||
S&P 500 Index Call Option | December 2017 | 2,100.00 | 9 | 135,000 | ||||||||||||
S&P 500 Index Call Option | December 2018 | 2,050.00 | 10 | 215,000 | ||||||||||||
S&P 500 Index Call Option | December 2018 | 2,100.00 | 32 | 639,712 | ||||||||||||
S&P 500 Index Put Option | December 2017 | 1,950.00 | 17 | 244,324 | ||||||||||||
S&P 500 Index Put Option | December 2017 | 2,000.00 | 9 | 144,000 | ||||||||||||
S&P 500 Index Put Option | December 2017 | 2,050.00 | 4 | 67,320 | ||||||||||||
S&P 500 Index Put Option | December 2017 | 2,100.00 | 9 | 180,000 | ||||||||||||
S&P 500 Index Put Option | December 2018 | 2,050.00 | 10 | 236,300 | ||||||||||||
S&P 500 Index Put Option | December 2018 | 2,100.00 | 32 | 877,152 | ||||||||||||
SPDR S&P 500 ETF Trust Call Option | December 2017 | 195.00 | 42 | 102,480 | ||||||||||||
SPDR S&P 500 ETF Trust Call Option | December 2017 | 200.00 | 465 | 978,360 | ||||||||||||
SPDR S&P 500 ETF Trust Call Option | December 2017 | 205.00 | 420 | 756,000 | ||||||||||||
SPDR S&P 500 ETF Trust Call Option | December 2017 | 210.00 | 425 | 646,000 | ||||||||||||
SPDR S&P 500 ETF Trust Call Option | December 2017 | 215.00 | 137 | 166,592 | ||||||||||||
SPDR S&P 500 ETF Trust Call Option | December 2017 | 220.00 | 99 | 96,228 | ||||||||||||
SPDR S&P 500 ETF Trust Call Option | December 2018 | 200.00 | 94 | 237,068 | ||||||||||||
SPDR S&P 500 ETF Trust Call Option | December 2018 | 205.00 | 244 | 536,312 | ||||||||||||
SPDR S&P 500 ETF Trust Call Option | December 2018 | 210.00 | 569 | 1,138,000 | ||||||||||||
SPDR S&P 500 ETF Trust Call Option | December 2018 | 215.00 | 35 | 60,025 | ||||||||||||
SPDR S&P 500 ETF Trust Put Option | December 2017 | 195.00 | 42 | 60,018 | ||||||||||||
SPDR S&P 500 ETF Trust Put Option | December 2017 | 200.00 | 465 | 757,485 | ||||||||||||
SPDR S&P 500 ETF Trust Put Option | December 2017 | 205.00 | 420 | 766,920 | ||||||||||||
SPDR S&P 500 ETF Trust Put Option | December 2017 | 210.00 | 425 | 865,725 | ||||||||||||
SPDR S&P 500 ETF Trust Put Option | December 2017 | 215.00 | 137 | 306,332 | ||||||||||||
SPDR S&P 500 ETF Trust Put Option | December 2017 | 220.00 | 99 | 251,460 | ||||||||||||
SPDR S&P 500 ETF Trust Put Option | December 2018 | 200.00 | 94 | 220,618 | ||||||||||||
SPDR S&P 500 ETF Trust Put Option | December 2018 | 205.00 | 244 | 618,540 | ||||||||||||
SPDR S&P 500 ETF Trust Put Option | December 2018 | 210.00 | 569 | 1,603,442 | ||||||||||||
SPDR S&P 500 ETF Trust Put Option | December 2018 | 215.00 | 35 | 106,400 | ||||||||||||
|
| |||||||||||||||
Total Purchased Options (Cost $15,381,742) | $ | 13,670,873 | ||||||||||||||
|
| |||||||||||||||
| Money Market Funds – 14.9% | Shares | Value | ||||||||||||||
State Street Institutional Liquid Reserves Fund Institutional Class | 18,619,799 | $ | 18,619,799 | |||||||||||||
State Street Institutional U.S. Government Money Market Fund Institutional Class | 12,842,437 | 12,842,437 | ||||||||||||||
|
| |||||||||||||||
Total Money Market Funds (Cost $31,462,236) | $ | 31,462,236 | ||||||||||||||
|
| |||||||||||||||
Total Investments – 100.5% (Cost $211,899,216) | (i) | $ | 212,118,310 | |||||||||||||
Liabilities in Excess of Other Assets – (0.5)% | (987,048) | |||||||||||||||
|
| |||||||||||||||
Net Assets – 100.0% | $ | 211,131,262 | ||||||||||||||
|
| |||||||||||||||
Percentages are stated as a percent of net assets.
Abbreviations:
QL: Quarterly U.S. LIBOR Rate, 0.654% on June 30, 2016
Footnotes:
| (a) | Non-income producing security. |
| (b) | Security exempt from registration under Regulation D of the Securities Act of 1933. These securities may be resold in transactions exempt from registration, normally to qualified buyers under Rule 144A. At June 30, 2016, the value of these securities totaled $7,340,019, or 3.5% of the Portfolio’s net assets. These securities were deemed liquid pursuant to procedures approved by the Board of Directors. |
| (c) | Security is a variable rate instrument in which the coupon rate is fixed until a later specified date, then is adjusted quarterly in concert with U.S. LIBOR. Interest rates stated are those in effect at June 30, 2016. |
| (d) | Security is a variable rate preferred stock or trust preferred security in which the dividend rate is fixed until a later specified date, then is adjusted quarterly in concert with U.S. LIBOR. Dividend rates stated are those in effect at June 30, 2016. |
| (e) | Security is a variable rate preferred stock depository receipt in which the dividend rate is fixed until a later specified date, then is adjusted quarterly in concert with U.S. LIBOR. Dividend rates stated are those in effect at June 30, 2016. |
| (f) | Represents bonds that are credit sensitive. The coupon rates for these bonds are subject to adjustment based on changes in national credit rating agency ratings. |
| (g) | Represents a security deemed to be illiquid. At June 30, 2016, the value of illiquid securities in the Portfolio totaled $44,117, or 0.0% of the Portfolio’s net assets. |
| (h) | 100 shares per contract. |
| (i) | Represents cost for financial reporting purposes, which may differ from cost basis for federal income tax purposes. See also Note 7 of the Notes to Financial Statements. |
| 108 | (continued) |
| Ohio National Fund, Inc. | Risk Managed Balanced Portfolio (Continued) |
Schedule of Investments | June 30, 2016 (Unaudited) |
| (j) | Security is fully or partially pledged, in addition to $827,330 of cash, as collateral for the following futures contracts outstanding at June 30, 2016: |
Type | Description | Expiration | Number of contracts | Contract at value | Initial contract amount | Unrealized Appreciation (Depreciation) | Variation Margin Receivable (Payable) | |||||||||||||||
Long | CME E-mini S&P 500 Contracts (United States) | September 16, 2016 | 281 | $ | 29,367,310 | $ | 28,352,694 | $ | 1,014,616 | |||||||||||||
Long | 10-Year U.S. Treasury Note Contracts (United States) | September 21, 2016 | 876 | $ | 116,494,313 | $ | 115,962,106 | $ | 532,207 | |||||||||||||
|
|
|
|
|
| |||||||||||||||||
| $ | 145,861,623 | $ | 144,314,800 | $ | 1,546,823 | $ | 297,887 | |||||||||||||||
|
|
|
|
|
|
|
| |||||||||||||||
The accompanying notes are an integral part of these financial statements.
| 109 |
| Ohio National Fund, Inc. |
| June 30, 2016 (Unaudited) |
| Equity Portfolio | Bond Portfolio | Omni Portfolio | Capital Appreciation Portfolio | International Portfolio | International Small-Mid Company Portfolio | Aggressive Growth Portfolio | Small Cap Growth Portfolio | |||||||||||||||||||||||||
Assets: | ||||||||||||||||||||||||||||||||
Investments in securities, at value* | $ | 512,608,954 | $ | 162,178,383 | $ | 50,861,136 | $ | 418,782,270 | $ | 142,677,883 | $ | 64,307,861 | $ | 55,196,040 | $ | 234,134,763 | ||||||||||||||||
Cash | — | — | — | — | 15,226 | — | — | — | ||||||||||||||||||||||||
Cash subject to usage restrictions | — | — | — | — | 176,806 | — | — | — | ||||||||||||||||||||||||
Foreign currencies, at value** | — | — | — | — | 88,671 | 1,201 | — | — | ||||||||||||||||||||||||
Receivable for securities sold | 10,016,000 | 2,710,204 | 1,477,967 | 133,247 | — | 72,659 | 305,774 | — | ||||||||||||||||||||||||
Receivable for fund shares sold | 1,222,218 | 210,572 | 25,088 | 201,481 | 5,097,118 | 76,234 | 22,192 | 100,518 | ||||||||||||||||||||||||
Dividends and accrued interest receivable | 356,353 | 1,471,726 | 124,681 | 492,568 | 228,143 | 83,709 | 27,340 | 72,935 | ||||||||||||||||||||||||
Foreign tax reclaim receivable | — | — | — | 4,986 | 226,694 | 29,746 | 2,223 | 8,393 | ||||||||||||||||||||||||
Prepaid expenses and other assets | 5,403 | 1,674 | 482 | 4,340 | 1,530 | 721 | 527 | 2,345 | ||||||||||||||||||||||||
Unrealized apppreciation on foreign currency contracts | — | — | — | — | 192,732 | 177,528 | — | — | ||||||||||||||||||||||||
|
|
|
|
|
|
|
|
|
|
|
|
|
|
|
| |||||||||||||||||
Total assets | 524,208,928 | 166,572,559 | 52,489,354 | 419,618,892 | 148,704,803 | 64,749,659 | 55,554,096 | 234,318,954 | ||||||||||||||||||||||||
|
|
|
|
|
|
|
|
|
|
|
|
|
|
|
| |||||||||||||||||
Liabilities: | ||||||||||||||||||||||||||||||||
Cash overdraft | — | — | — | — | — | — | 1,117,650 | — | ||||||||||||||||||||||||
Payable for securities purchased | 5,002,510 | 3,589,272 | 1,539,539 | 3,062,943 | — | 672,342 | 1,369,907 | — | ||||||||||||||||||||||||
Payable for fund shares redeemed | 396,796 | 1,749,578 | 98,026 | 885,894 | 230,324 | 14,610 | 11,387 | 2,932,701 | ||||||||||||||||||||||||
Payable for investment management services | 325,423 | 75,142 | 24,788 | 260,504 | 99,371 | 54,465 | 34,054 | 150,470 | ||||||||||||||||||||||||
Accrued custody expense | 2,160 | 1,021 | 1,955 | 2,371 | 29,773 | 10,836 | 1,033 | 3,633 | ||||||||||||||||||||||||
Accrued professional fees | 7,011 | 5,712 | 5,308 | 6,652 | 5,676 | 5,391 | 5,320 | 5,959 | ||||||||||||||||||||||||
Accrued accounting fees | 26,876 | 14,883 | 8,123 | 22,148 | 8,422 | 4,279 | 3,401 | 13,364 | ||||||||||||||||||||||||
Accrued printing and filing fees | 18,498 | 5,399 | 1,997 | 14,949 | 5,541 | 3,046 | 1,918 | 8,388 | ||||||||||||||||||||||||
Variation margin payable on futures contracts | — | — | — | — | 1,863 | — | — | — | ||||||||||||||||||||||||
Other fees payable | 11,360 | 7,106 | 5,906 | 10,414 | 7,214 | 6,714 | 5,940 | 8,124 | ||||||||||||||||||||||||
Withholding tax payable | — | — | — | — | 42,627 | 37,675 | 338 | — | ||||||||||||||||||||||||
Unrealized depreciation on foreign currency contracts | — | — | — | — | 1,610,756 | 141,311 | — | — | ||||||||||||||||||||||||
|
|
|
|
|
|
|
|
|
|
|
|
|
|
|
| |||||||||||||||||
Total liabilities | 5,790,634 | �� | 5,448,113 | 1,685,642 | 4,265,875 | 2,041,567 | 950,669 | 2,550,948 | 3,122,639 | |||||||||||||||||||||||
|
|
|
|
|
|
|
|
|
|
|
|
|
|
|
| |||||||||||||||||
Net assets | $ | 518,418,294 | $ | 161,124,446 | $ | 50,803,712 | $ | 415,353,017 | $ | 146,663,236 | $ | 63,798,990 | $ | 53,003,148 | $ | 231,196,315 | ||||||||||||||||
|
|
|
|
|
|
|
|
|
|
|
|
|
|
|
| |||||||||||||||||
Net assets consist of: | ||||||||||||||||||||||||||||||||
Par value, $1 per share | $ | 16,137,277 | $ | 9,636,938 | $ | 2,035,748 | $ | 12,556,068 | $ | 12,687,188 | $ | 2,369,405 | $ | 3,554,485 | $ | 9,241,553 | ||||||||||||||||
Paid-in capital in excess of par value | 499,782,770 | 143,639,867 | 45,205,859 | 374,467,918 | 208,060,818 | 51,526,236 | 38,636,356 | 199,166,292 | ||||||||||||||||||||||||
Accumulated net realized gain (loss) on investments | (6,169,321 | ) | (6,930,724 | ) | 1,001,307 | 24,497,303 | (75,661,025 | ) | 6,687,603 | 4,322,215 | 3,634,150 | |||||||||||||||||||||
Net unrealized appreciation (depreciation) on: | ||||||||||||||||||||||||||||||||
Investments | 6,066,214 | 6,448,768 | 2,204,920 | 946,990 | (3,003,280 | ) | 2,664,749 | 6,497,997 | 19,288,570 | |||||||||||||||||||||||
Foreign currency contracts | — | — | — | — | (1,418,024 | ) | 36,217 | — | ||||||||||||||||||||||||
Futures contracts | — | — | — | — | (25,008 | ) | — | — | — | |||||||||||||||||||||||
Other foreign currency related transactions | — | — | — | (1,776 | ) | (15,273 | ) | (35,604 | ) | (128 | ) | (873 | ) | |||||||||||||||||||
Undistributed net investment income (loss) | 2,601,354 | 8,329,597 | 355,878 | 2,886,514 | 6,037,840 | 550,384 | (7,777 | ) | (133,377 | ) | ||||||||||||||||||||||
|
|
|
|
|
|
|
|
|
|
|
|
|
|
|
| |||||||||||||||||
Net assets | $ | 518,418,294 | $ | 161,124,446 | $ | 50,803,712 | $ | 415,353,017 | $ | 146,663,236 | $ | 63,798,990 | $ | 53,003,148 | $ | 231,196,315 | ||||||||||||||||
|
|
|
|
|
|
|
|
|
|
|
|
|
|
|
| |||||||||||||||||
* Investments in securities, at cost | $ | 506,542,740 | $ | 155,729,615 | $ | 48,656,216 | $ | 417,835,280 | $ | 145,681,163 | $ | 61,643,112 | $ | 48,698,043 | $ | 214,846,193 | ||||||||||||||||
|
|
|
|
|
|
|
|
|
|
|
|
|
|
|
| |||||||||||||||||
** Foreign currencies, at cost | $ | — | $ | — | $ | — | $ | — | $ | 109,936 | $ | 1,386 | $ | — | $ | — | ||||||||||||||||
|
|
|
|
|
|
|
|
|
|
|
|
|
|
|
| |||||||||||||||||
Shares outstanding | 16,137,277 | 9,636,938 | 2,035,748 | 12,556,068 | 12,687,188 | 2,369,405 | 3,554,485 | 9,241,553 | ||||||||||||||||||||||||
|
|
|
|
|
|
|
|
|
|
|
|
|
|
|
| |||||||||||||||||
Authorized Fund shares allocated to Portfolio | 35,000,000 | 30,000,000 | 10,000,000 | 25,000,000 | 30,000,000 | 7,000,000 | 9,000,000 | 20,000,000 | ||||||||||||||||||||||||
|
|
|
|
|
|
|
|
|
|
|
|
|
|
|
| |||||||||||||||||
Net asset value per share | $ | 32.13 | $ | 16.72 | $ | 24.96 | $ | 33.08 | $ | 11.56 | $ | 26.93 | $ | 14.91 | $ | 25.02 | ||||||||||||||||
|
|
|
|
|
|
|
|
|
|
|
|
|
|
|
| |||||||||||||||||
The accompanying notes are an integral part of these financial statements.
| 110 |
| Ohio National Fund, Inc. |
Statements of Assets and Liabilities | June 30, 2016 (Unaudited) |
| Mid Cap Opportunity Portfolio | S&P 500® Index | Strategic Value | High Income Bond Portfolio | ClearBridge Small Cap Portfolio | Nasdaq-100® Index Portfolio | Bristol Portfolio | Bryton Growth Portfolio | |||||||||||||||||||||||||
Assets: | ||||||||||||||||||||||||||||||||
Investments in securities, at value* | $ | 74,404,726 | $ | 434,012,596 | $ | 344,341,189 | $ | 194,224,757 | $ | 94,509,116 | $ | 134,422,586 | $ | 214,476,248 | $ | 161,687,507 | ||||||||||||||||
Cash | — | 3,058 | — | 234,911 | — | 84 | — | — | ||||||||||||||||||||||||
Cash subject to usage restrictions | — | 457,926 | — | — | — | 328,638 | — | — | ||||||||||||||||||||||||
Receivable for securities sold | 763,983 | — | 10,298,038 | 1,860,869 | 377,009 | 97,427 | 6,896,020 | 4,702,565 | ||||||||||||||||||||||||
Receivable for fund shares sold | 43,682 | 1,858,635 | 569,286 | 48,440 | 69,321 | 575,782 | 49,993 | 31,180 | ||||||||||||||||||||||||
Dividends and accrued interest receivable | 26,793 | 488,253 | 1,859,300 | 3,332,325 | 107,744 | 51,465 | 93,564 | 49,069 | ||||||||||||||||||||||||
Foreign tax reclaim receivable | — | 279 | 111,948 | — | — | — | — | — | ||||||||||||||||||||||||
Variation margin receivable on futures contracts | — | 24,835 | — | — | — | 3,885 | — | — | ||||||||||||||||||||||||
Prepaid expenses and other assets | 785 | 4,356 | 3,448 | 2,053 | 926 | 1,393 | 2,212 | 1,548 | ||||||||||||||||||||||||
|
|
|
|
|
|
|
|
|
|
|
|
|
|
|
| |||||||||||||||||
Total assets | 75,239,969 | 436,849,938 | 357,183,209 | 199,703,355 | 95,064,116 | 135,481,260 | 221,518,037 | 166,471,869 | ||||||||||||||||||||||||
|
|
|
|
|
|
|
|
|
|
|
|
|
|
|
| |||||||||||||||||
Liabilities: | ||||||||||||||||||||||||||||||||
Payable for securities purchased | 668,242 | 503,123 | — | 314,038 | 184,379 | — | 6,275,459 | 3,802,086 | ||||||||||||||||||||||||
Payable for fund shares redeemed | 349,213 | 1,103,538 | 13,772,871 | 2,833,463 | 1,357,746 | 238,668 | 2,272,647 | 6,338,302 | ||||||||||||||||||||||||
Payable for investment management services | 51,837 | 124,012 | 199,660 | 114,748 | 65,405 | 42,360 | 131,781 | 107,385 | ||||||||||||||||||||||||
Accrued custody expense | 1,912 | 5,699 | 4,676 | 1,958 | 2,135 | 1,484 | 2,295 | 3,402 | ||||||||||||||||||||||||
Accrued professional fees | 5,406 | 6,634 | 6,212 | 5,838 | 5,463 | 5,605 | 5,896 | 5,695 | ||||||||||||||||||||||||
Accrued accounting fees | 4,983 | 27,934 | 17,420 | 34,914 | 5,866 | 8,391 | 11,568 | 8,743 | ||||||||||||||||||||||||
Accrued printing and filing fees | 3,034 | 12,851 | 11,171 | 7,122 | 6,567 | 4,642 | 8,762 | 6,710 | ||||||||||||||||||||||||
Other fees payable | 6,251 | 10,099 | 9,001 | 7,539 | 6,419 | 6,941 | 7,941 | 7,211 | ||||||||||||||||||||||||
Withholding tax payable | — | — | 18,525 | — | 554 | — | — | — | ||||||||||||||||||||||||
|
|
|
|
|
|
|
|
|
|
|
|
|
|
|
| |||||||||||||||||
Total liabilities | 1,090,878 | 1,793,890 | 14,039,536 | 3,319,620 | 1,634,534 | 308,091 | 8,716,349 | 10,279,534 | ||||||||||||||||||||||||
|
|
|
|
|
|
|
|
|
|
|
|
|
|
|
| |||||||||||||||||
Net assets | $ | 74,149,091 | $ | 435,056,048 | $ | 343,143,673 | $ | 196,383,735 | $ | 93,429,582 | $ | 135,173,169 | $ | 212,801,688 | $ | 156,192,335 | ||||||||||||||||
|
|
|
|
|
|
|
|
|
|
|
|
|
|
|
| |||||||||||||||||
Net assets consist of: | ||||||||||||||||||||||||||||||||
Par value, $1 per share | $ | 2,425,662 | $ | 19,248,738 | $ | 21,074,103 | $ | 11,506,805 | $ | 2,152,797 | $ | 11,867,501 | $ | 9,887,739 | $ | 8,424,032 | ||||||||||||||||
Paid-in capital in excess of par value | 59,080,014 | 263,139,230 | 240,960,065 | 178,312,939 | 70,272,544 | 70,006,655 | 173,878,006 | 151,180,188 | ||||||||||||||||||||||||
Accumulated net realized gain (loss) on investments | 3,764,268 | 9,098,107 | 19,154,452 | (6,170,182 | ) | 15,137,999 | 4,587,263 | 15,814,485 | 5,533,747 | |||||||||||||||||||||||
Net unrealized appreciation (depreciation) on: |
| |||||||||||||||||||||||||||||||
Investments | 8,955,961 | 138,696,711 | 54,683,432 | (5,325,744 | ) | 5,622,679 | 47,945,702 | 12,532,124 | (8,467,009 | ) | ||||||||||||||||||||||
Futures contracts | — | 24,736 | — | — | — | 3,802 | — | — | ||||||||||||||||||||||||
Foreign currency related transactions | — | — | (47,578 | ) | — | — | — | — | — | |||||||||||||||||||||||
Undistributed net investment income (loss) | (76,814 | ) | 4,848,526 | 7,319,199 | 18,059,917 | 243,563 | 762,246 | 689,334 | (478,623 | ) | ||||||||||||||||||||||
|
|
|
|
|
|
|
|
|
|
|
|
|
|
|
| |||||||||||||||||
Net assets | $ | 74,149,091 | $ | 435,056,048 | $ | 343,143,673 | $ | 196,383,735 | $ | 93,429,582 | $ | 135,173,169 | $ | 212,801,688 | $ | 156,192,335 | ||||||||||||||||
|
|
|
|
|
|
|
|
|
|
|
|
|
|
|
| |||||||||||||||||
* Investments in securities, at cost | $ | 65,448,765 | $ | 295,315,885 | $ | 289,657,757 | $ | 199,550,501 | $ | 88,886,437 | $ | 86,476,884 | $ | 201,944,124 | $ | 170,154,516 | ||||||||||||||||
|
|
|
|
|
|
|
|
|
|
|
|
|
|
|
| |||||||||||||||||
Shares outstanding | 2,425,662 | 19,248,738 | 21,074,103 | 11,506,805 | 2,152,797 | 11,867,501 | 9,887,739 | 8,424,032 | ||||||||||||||||||||||||
|
|
|
|
|
|
|
|
|
|
|
|
|
|
|
| |||||||||||||||||
Authorized Fund shares allocated to Portfolio | 6,000,000 | 40,000,000 | 65,000,000 | 35,000,000 | 5,000,000 | 30,000,000 | 33,000,000 | 25,000,000 | ||||||||||||||||||||||||
|
|
|
|
|
|
|
|
|
|
|
|
|
|
|
| |||||||||||||||||
Net asset value per share | $ | 30.57 | $ | 22.60 | $ | 16.28 | $ | 17.07 | $ | 43.40 | $ | 11.39 | $ | 21.52 | $ | 18.54 | ||||||||||||||||
|
|
|
|
|
|
|
|
|
|
|
|
|
|
|
| |||||||||||||||||
The accompanying notes are an integral part of these financial statements.
| 111 |
| Ohio National Fund, Inc. |
Statements of Assets and Liabilities | June 30, 2016 (Unaudited) |
| Balanced Portfolio | Target VIP Portfolio | Bristol Growth Portfolio | Risk Managed Balanced Portfolio | |||||||||||||
Assets: | ||||||||||||||||
Investments in securities, at value* | $ | 901,302,911 | $ | 43,272,262 | $ | 116,915,263 | $ | 212,118,310 | ||||||||
Cash | 28,618 | — | — | — | ||||||||||||
Cash subject to usage restrictions | — | — | — | 827,330 | ||||||||||||
Receivable for securities sold | 822,875 | — | 2,036,746 | 4,629,215 | ||||||||||||
Receivable for fund shares sold | 6,308,196 | 6,299 | 23,935 | 631,413 | ||||||||||||
Dividends and accrued interest receivable | 3,353,572 | 77,710 | 45,818 | 543,261 | ||||||||||||
Foreign tax reclaim receivable | — | 10,278 | — | — | ||||||||||||
Variation margin receivable on futures contracts | — | — | — | 297,887 | ||||||||||||
Prepaid expenses and other assets | 9,247 | 455 | 1,201 | 1,885 | ||||||||||||
|
|
|
|
|
|
|
| |||||||||
Total assets | 911,825,419 | 43,367,004 | 119,022,963 | 219,049,301 | ||||||||||||
|
|
|
|
|
|
|
| |||||||||
Liabilities: | ||||||||||||||||
Cash overdraft | — | 4,181 | — | 966,623 | ||||||||||||
Options written, at value** | 37,500 | — | — | — | ||||||||||||
Payable for securities purchased | 4,111,509 | — | 1,985,095 | 6,468,352 | ||||||||||||
Payable for fund shares redeemed | 215,201 | 5,047 | 996,560 | 262,294 | ||||||||||||
Payable for investment management services | 435,770 | 21,139 | 75,073 | 151,040 | ||||||||||||
Accrued custody expense | 5,689 | 548 | 615 | 19,485 | ||||||||||||
Accrued professional fees | 5,730 | 5,290 | 5,544 | 5,823 | ||||||||||||
Accrued accounting fees | 49,371 | 4,100 | 6,753 | 33,568 | ||||||||||||
Accrued printing and filing fees | 25,819 | 1,817 | 5,186 | 4,548 | ||||||||||||
Other fees payable | 14,523 | 5,864 | 6,721 | 6,306 | ||||||||||||
Withholding tax payable | 4,754 | 3,941 | — | — | ||||||||||||
|
|
|
|
|
|
|
| |||||||||
Total liabilities | 4,905,866 | 51,927 | 3,081,547 | 7,918,039 | ||||||||||||
|
|
|
|
|
|
|
| |||||||||
Net assets | $ | 906,919,553 | $ | 43,315,077 | $ | 115,941,416 | $ | 211,131,262 | ||||||||
|
|
|
|
|
|
|
| |||||||||
Net assets consist of: | ||||||||||||||||
Par value, $1 per share | $ | 47,551,166 | $ | 3,120,522 | $ | 6,538,955 | $ | 19,350,097 | ||||||||
Paid-in capital in excess of par value | 827,524,413 | 43,996,594 | 87,685,061 | 187,328,115 | ||||||||||||
Accumulated net realized gain (loss) on investments | 11,725,528 | (4,021,036 | ) | 11,321,606 | 1,576,517 | |||||||||||
Net unrealized appreciation (depreciation) on: |
| |||||||||||||||
Investments | 8,609,666 | (211,586 | ) | 10,114,960 | 219,094 | |||||||||||
Futures contracts | — | — | — | 1,546,823 | ||||||||||||
Other foreign currency related transactions | (338 | ) | — | — | 4 | |||||||||||
Written options | 32,170 | — | — | — | ||||||||||||
Undistributed net investment income | 11,476,948 | 430,583 | 280,834 | 1,110,612 | ||||||||||||
|
|
|
|
|
|
|
| |||||||||
Net assets | $ | 906,919,553 | $ | 43,315,077 | $ | 115,941,416 | $ | 211,131,262 | ||||||||
|
|
|
|
|
|
|
| |||||||||
* Investments in securities, at cost | $ | 892,693,245 | $ | 43,483,848 | $ | 106,800,303 | $ | 211,899,216 | ||||||||
|
|
|
|
|
|
|
| |||||||||
** Premiums received on options written | $ | 69,670 | $ | — | $ | — | $ | — | ||||||||
|
|
|
|
|
|
|
| |||||||||
Shares outstanding | 47,551,166 | 3,120,522 | 6,538,955 | 19,350,097 | ||||||||||||
|
|
|
|
|
|
|
| |||||||||
Authorized Fund shares allocated to Portfolio | 80,000,000 | 10,000,000 | 20,000,000 | 35,000,000 | ||||||||||||
|
|
|
|
|
|
|
| |||||||||
Net asset value per share | $ | 19.07 | $ | 13.88 | $ | 17.73 | $ | 10.91 | ||||||||
|
|
|
|
|
|
|
| |||||||||
The accompanying notes are an integral part of these financial statements.
| 112 |
| Ohio National Fund, Inc. |
| For the Six-Month Period Ended June 30, 2016 (Unaudited) |
| Equity Portfolio | Bond Portfolio | Omni Portfolio | Capital Appreciation Portfolio | International Portfolio | International Small-Mid Company Portfolio | Aggressive Growth Portfolio | Small Cap Growth | |||||||||||||||||||||||||
Investment income: | ||||||||||||||||||||||||||||||||
Interest | $ | — | $ | 3,233,581 | $ | 220,292 | $ | — | $ | 1,808 | $ | — | $ | 757 | $ | 3,733 | ||||||||||||||||
Dividends, net of taxes withheld* | 4,415,172 | 4,580 | 226,196 | 4,006,787 | 2,672,788 | 917,446 | 226,414 | 1,000,937 | ||||||||||||||||||||||||
|
|
|
|
|
|
|
|
|
|
|
|
|
|
|
| |||||||||||||||||
Total investment income | 4,415,172 | 3,238,161 | 446,488 | 4,006,787 | 2,674,596 | 917,446 | 227,171 | 1,004,670 | ||||||||||||||||||||||||
|
|
|
|
|
|
|
|
|
|
|
|
|
|
|
| |||||||||||||||||
Expenses: | ||||||||||||||||||||||||||||||||
Management fees | 1,918,921 | 447,611 | 134,409 | 1,545,860 | 610,155 | 348,487 | 198,961 | 869,845 | ||||||||||||||||||||||||
Custodian fees | 8,686 | 3,527 | 6,766 | 8,370 | 57,082 | 26,848 | 2,525 | 9,832 | ||||||||||||||||||||||||
Directors’ fees | 33,073 | 10,343 | 2,936 | 26,505 | 9,266 | 4,403 | 3,247 | 14,267 | ||||||||||||||||||||||||
Professional fees | 33,196 | 16,306 | 10,774 | 28,454 | 15,720 | 12,006 | 11,033 | 19,382 | ||||||||||||||||||||||||
Accounting fees | 41,544 | 23,322 | 12,401 | 34,550 | 22,084 | 10,990 | 5,480 | 20,963 | ||||||||||||||||||||||||
Administration fees | 6,599 | 5,932 | 5,797 | 6,306 | 7,307 | 7,228 | 5,816 | 6,083 | ||||||||||||||||||||||||
Printing and filing fees | 17,914 | 5,265 | 1,939 | 14,419 | 5,448 | 2,845 | 1,869 | 8,106 | ||||||||||||||||||||||||
Compliance expense | 5,000 | 5,000 | 5,000 | 5,000 | 5,000 | 5,000 | 5,000 | 5,000 | ||||||||||||||||||||||||
Other | 10,992 | 2,658 | 974 | 8,924 | 8,255 | 1,790 | 1,017 | 5,129 | ||||||||||||||||||||||||
|
|
|
|
|
|
|
|
|
|
|
|
|
|
|
| |||||||||||||||||
Total expenses | 2,075,925 | 519,964 | 180,996 | 1,678,388 | 740,317 | 419,597 | 234,948 | 958,607 | ||||||||||||||||||||||||
|
|
|
|
|
|
|
|
|
|
|
|
|
|
|
| |||||||||||||||||
Net investment income (loss) | 2,339,247 | 2,718,197 | 265,492 | 2,328,399 | 1,934,279 | 497,849 | (7,777 | ) | 46,063 | |||||||||||||||||||||||
|
|
|
|
|
|
|
|
|
|
|
|
|
|
|
| |||||||||||||||||
Realized/unrealized gain (loss) on investments, futures contracts, foreign currency contracts, and other foreign currency related transactions: | ||||||||||||||||||||||||||||||||
Net realized gain (loss) on: | ||||||||||||||||||||||||||||||||
Investments | (3,899,480 | ) | 939,361 | (1,025,519 | ) | (10,860,473 | ) | 3,328,208 | 394,342 | 389,421 | (2,860,170 | ) | ||||||||||||||||||||
Futures contracts | — | — | — | — | (357,875 | ) | (135,475 | ) | — | — | ||||||||||||||||||||||
Foreign currency contracts | — | — | — | — | (2,479,869 | ) | 391,048 | — | — | |||||||||||||||||||||||
Other foreign currency related transactions | — | — | — | 6,823 | 123,279 | (10,790 | ) | (38 | ) | 1,479 | ||||||||||||||||||||||
Change in unrealized appreciation/depreciation on: | ||||||||||||||||||||||||||||||||
Investments | 2,514,533 | 10,374,778 | 1,497,606 | 10,545,146 | (13,285,620 | ) | (8,438,629 | ) | (919,268 | ) | 2,474,373 | |||||||||||||||||||||
Futures contracts | — | — | �� | — | — | 99,307 | 20,803 | — | — | |||||||||||||||||||||||
Foreign currency contracts | — | — | — | — | (1,271,497 | ) | (426,893 | ) | — | — | ||||||||||||||||||||||
Other foreign currency related transactions | — | — | — | 1,007 | (4,833 | ) | (7,756 | ) | 67 | (682 | ) | |||||||||||||||||||||
|
|
|
|
|
|
|
|
|
|
|
|
|
|
|
| |||||||||||||||||
Net realized/unrealized gain (loss) on investments, futures contracts, foreign currency contracts, and other foreign currency related transactions | (1,384,947 | ) | 11,314,139 | 472,087 | (307,497 | ) | (13,848,900 | ) | (8,213,350 | ) | (529,818 | ) | (385,000 | ) | ||||||||||||||||||
|
|
|
|
|
|
|
|
|
|
|
|
|
|
|
| |||||||||||||||||
Change in net assets from operations | $ | 954,300 | $ | 14,032,336 | $ | 737,579 | $ | 2,020,902 | $ | (11,914,621 | ) | $ | (7,715,501 | ) | $ | (537,595 | ) | $ | (338,937 | ) | ||||||||||||
|
|
|
|
|
|
|
|
|
|
|
|
|
|
|
| |||||||||||||||||
* Taxes withheld | $ | — | $ | — | $ | 108 | $ | 109,281 | $ | 385,715 | $ | 80,263 | $ | 1,415 | $ | 11,449 | ||||||||||||||||
|
|
|
|
|
|
|
|
|
|
|
|
|
|
|
| |||||||||||||||||
The accompanying notes are an integral part of these financial statements.
| 113 |
| Ohio National Fund, Inc. |
Statements of Operations | For the Six-Month Period Ended June 30, 2016 (Unaudited) |
| Mid Cap Opportunity Portfolio | S&P 500® Index Portfolio | Strategic Value Portfolio | High Income Bond Portfolio | ClearBridge Small Cap Portfolio | Nasdaq-100® Index Portfolio | Bristol Portfolio | Bryton Growth Portfolio | |||||||||||||||||||||||||
Investment income: | ||||||||||||||||||||||||||||||||
Interest | $ | — | $ | — | $ | — | $ | 6,433,076 | $ | — | $ | — | $ | — | $ | — | ||||||||||||||||
Dividends, net of taxes withheld* | 279,765 | 4,644,880 | 7,073,450 | 4,859 | 669,062 | 931,127 | 1,402,064 | 189,686 | ||||||||||||||||||||||||
|
|
|
|
|
|
|
|
|
|
|
|
|
|
|
| |||||||||||||||||
Total investment income | 279,765 | 4,644,880 | 7,073,450 | 6,437,935 | 669,062 | 931,127 | 1,402,064 | 189,686 | ||||||||||||||||||||||||
|
|
|
|
|
|
|
|
|
|
|
|
|
|
|
| |||||||||||||||||
Expenses: | ||||||||||||||||||||||||||||||||
Management fees | 311,055 | 725,257 | 1,153,514 | 681,283 | 373,979 | 254,816 | 773,043 | 600,145 | ||||||||||||||||||||||||
Custodian fees | 5,193 | 17,761 | 11,903 | 6,540 | 4,114 | 4,610 | 8,094 | 9,043 | ||||||||||||||||||||||||
Directors’ fees | 4,786 | 26,815 | 21,136 | 12,597 | 5,684 | 8,499 | 13,487 | 9,267 | ||||||||||||||||||||||||
Professional fees | 12,167 | 28,532 | 24,245 | 17,899 | 12,891 | 14,992 | 18,611 | 15,685 | ||||||||||||||||||||||||
Accounting fees | 7,975 | 44,171 | 27,624 | 56,100 | 9,275 | 13,432 | 18,031 | 13,470 | ||||||||||||||||||||||||
Administration fees | 5,826 | 6,287 | 6,136 | 5,975 | 5,830 | 5,857 | 5,936 | 5,852 | ||||||||||||||||||||||||
Printing and filing fees | 2,932 | 12,372 | 10,793 | 6,925 | 6,474 | 4,506 | 8,475 | 6,498 | ||||||||||||||||||||||||
Compliance expense | 5,000 | 5,000 | 5,000 | 5,000 | 5,000 | 5,000 | 5,000 | 5,000 | ||||||||||||||||||||||||
Other | 1,645 | 8,379 | 10,799 | 3,374 | 2,252 | 2,894 | 4,595 | 3,349 | ||||||||||||||||||||||||
|
|
|
|
|
|
|
|
|
|
|
|
|
|
|
| |||||||||||||||||
Total expenses | 356,579 | 874,574 | 1,271,150 | 795,693 | 425,499 | 314,606 | 855,272 | 668,309 | ||||||||||||||||||||||||
|
|
|
|
|
|
|
|
|
|
|
|
|
|
|
| |||||||||||||||||
Net investment income (loss) | (76,814 | ) | 3,770,306 | 5,802,300 | 5,642,242 | 243,563 | 616,521 | 546,792 | (478,623 | ) | ||||||||||||||||||||||
|
|
|
|
|
|
|
|
|
|
|
|
|
|
|
| |||||||||||||||||
Realized/unrealized gain (loss) on investments, futures contracts, and foreign currency related transactions: | ||||||||||||||||||||||||||||||||
Net realized gain (loss) on: | ||||||||||||||||||||||||||||||||
Investments | (1,357,619 | ) | 4,196,056 | 12,176,549 | (5,194,633 | ) | 1,928,618 | 1,073,250 | (5,219,789 | ) | (13,237,456 | ) | ||||||||||||||||||||
Futures contracts | — | 90,746 | — | — | — | 58,276 | — | — | ||||||||||||||||||||||||
Foreign currency related transactions | — | — | (79,348 | ) | — | — | — | — | — | |||||||||||||||||||||||
Change in unrealized appreciation/depreciation on: | ||||||||||||||||||||||||||||||||
Investments | 2,967,960 | 7,270,303 | 30,464,289 | 14,288,993 | 4,876,040 | (6,526,771 | ) | 4,793,960 | 5,476,951 | |||||||||||||||||||||||
Futures contracts | — | 24,736 | — | — | — | 3,802 | — | — | ||||||||||||||||||||||||
Foreign currency related transactions | — | — | (29,220 | ) | — | — | — | — | — | |||||||||||||||||||||||
|
|
|
|
|
|
|
|
|
|
|
|
|
|
|
| |||||||||||||||||
Net realized/unrealized gain (loss) on investments, futures contracts, and foreign currency related transactions | 1,610,341 | 11,581,841 | 42,532,270 | 9,094,360 | 6,804,658 | (5,391,443 | ) | (425,829 | ) | (7,760,505 | ) | |||||||||||||||||||||
|
|
|
|
|
|
|
|
|
|
|
|
|
|
|
| |||||||||||||||||
Change in net assets from operations | $ | 1,533,527 | $ | 15,352,147 | $ | 48,334,570 | $ | 14,736,602 | $ | 7,048,221 | $ | (4,774,922 | ) | $ | 120,963 | $ | (8,239,128 | ) | ||||||||||||||
|
|
|
|
|
|
|
|
|
|
|
|
|
|
|
| |||||||||||||||||
* Taxes withheld | $ | — | $ | — | $ | 165,875 | $ | — | $ | 4,242 | $ | — | $ | 609 | $ | — | ||||||||||||||||
|
|
|
|
|
|
|
|
|
|
|
|
|
|
|
| |||||||||||||||||
The accompanying notes are an integral part of these financial statements.
| 114 |
| Ohio National Fund, Inc. |
Statements of Operations | For the Six-Month Period Ended June 30, 2016 (Unaudited) |
| Balanced Portfolio | Target VIP Portfolio | Bristol Growth Portfolio | Risk Managed Balanced Portfolio | |||||||||||||
Investment income: | ||||||||||||||||
Interest | $ | 5,528,269 | $ | — | $ | — | $ | 863,742 | ||||||||
Dividends, net of taxes withheld** | 6,330,496 | 510,886 | 736,934 | 921,628 | ||||||||||||
|
|
|
|
|
|
|
| |||||||||
Total investment income | 11,858,765 | 510,886 | 736,934 | 1,785,370 | ||||||||||||
|
|
|
|
|
|
|
| |||||||||
Expenses: | ||||||||||||||||
Management fees | 2,566,692 | 128,109 | 441,613 | 805,855 | ||||||||||||
Custodian fees | 19,244 | 3,437 | 4,750 | 33,225 | ||||||||||||
Directors’ fees | 56,848 | 2,771 | 7,308 | 11,750 | ||||||||||||
Professional fees | 51,022 | 11,639 | 14,045 | 17,380 | ||||||||||||
Accounting fees | 82,559 | 6,760 | 10,640 | 50,684 | ||||||||||||
Administration fees | 7,501 | 5,713 | 5,807 | 5,888 | ||||||||||||
Printing and filing fees | 27,024 | 1,749 | 5,048 | 4,632 | ||||||||||||
Compliance expense | 5,000 | 5,000 | 5,000 | 5,000 | ||||||||||||
Other | 17,694 | 6,329 | 2,451 | 5,275 | ||||||||||||
|
|
|
|
|
|
|
| |||||||||
Total expenses | 2,833,584 | 171,507 | 496,662 | 939,689 | ||||||||||||
|
|
|
|
|
|
|
| |||||||||
Net investment income | 9,025,181 | 339,379 | 240,272 | 845,681 | ||||||||||||
|
|
|
|
|
|
|
| |||||||||
Realized/unrealized gain (loss) on investments, foreign currency related transactions, and written options: | ||||||||||||||||
Net realized gain (loss) on: | ||||||||||||||||
Investments | (15,039,116 | ) | (384,987 | ) | 1,834,379 | 2,681,939 | ||||||||||
Futures contracts | — | — | — | 1,416,196 | ||||||||||||
Foreign currency related transactions | (382 | ) | — | — | 1,334 | |||||||||||
Written options | (2,084,331 | ) | — | — | — | |||||||||||
Change in unrealized appreciation/depreciation on: | ||||||||||||||||
Investments | 13,110,226 | 153,356 | 627,640 | (1,428,930 | ) | |||||||||||
Futures contracts | — | — | — | 1,455,396 | ||||||||||||
Foreign currency related transactions | 477 | — | — | 4 | ||||||||||||
Written options | (140,515 | ) | — | — | — | |||||||||||
|
|
|
|
|
|
|
| |||||||||
Net realized/unrealized gain (loss) on investments, foreign currency related transactions, and written options | (4,153,641 | ) | (231,631 | ) | 2,462,019 | 4,125,939 | ||||||||||
|
|
|
|
|
|
|
| |||||||||
Change in net assets from operations | $ | 4,871,540 | $ | 107,748 | $ | 2,702,291 | $ | 4,971,620 | ||||||||
|
|
|
|
|
|
|
| |||||||||
* Taxes withheld | $ | 22,325 | $ | 27,250 | $ | 213 | $ | — | ||||||||
|
|
|
|
|
|
|
| |||||||||
The accompanying notes are an integral part of these financial statements.
| 115 |
| Ohio National Fund, Inc. |
| Equity Portfolio | Bond Portfolio | Omni Portfolio | Capital Appreciation Portfolio | |||||||||||||||||||||||||||||
| Six-Month Period Ended June 30, 2016 (Unaudited) | Year Ended December 31, 2015 | Six-Month Period Ended June 30, 2016 (Unaudited) | Year Ended December 31, 2015 | Six-Month Period Ended June 30, 2016 (Unaudited) | Year Ended December 31, 2015 | Six-Month Period Ended June 30, 2016 (Unaudited) | Year Ended December 31, 2015 | |||||||||||||||||||||||||
Increase (Decrease) in net assets: | ||||||||||||||||||||||||||||||||
Operations: | ||||||||||||||||||||||||||||||||
Net investment income | $ | 2,339,247 | $ | 3,617,256 | $ | 2,718,197 | $ | 5,610,400 | $ | 265,492 | $ | 569,257 | $ | 2,328,399 | $ | 3,834,325 | ||||||||||||||||
Net realized gain (loss) on investments and foreign currency related transactions | (3,899,480 | ) | 45,846,599 | 939,361 | 2,188,579 | (1,025,519 | ) | 2,180,458 | (10,853,650 | ) | 36,847,325 | |||||||||||||||||||||
Change in unrealized appreciation/depreciation on investments | 2,514,533 | (62,046,849 | ) | 10,374,778 | (11,088,723 | ) | 1,497,606 | (2,270,120 | ) | 10,546,153 | (46,512,351 | ) | ||||||||||||||||||||
|
|
|
|
|
|
|
|
|
|
|
|
|
|
|
| |||||||||||||||||
Change in net assets from operations | 954,300 | (12,582,994 | ) | 14,032,336 | (3,289,744 | ) | 737,579 | 479,595 | 2,020,902 | (5,830,701 | ) | |||||||||||||||||||||
|
|
|
|
|
|
|
|
|
|
|
|
|
|
|
| |||||||||||||||||
Distributions to shareholders: | ||||||||||||||||||||||||||||||||
Distributions from net investment income | — | (3,223,171 | ) | — | — | — | (478,871 | ) | — | (3,261,845 | ) | |||||||||||||||||||||
|
|
|
|
|
|
|
|
|
|
|
|
|
|
|
| |||||||||||||||||
Capital transactions: | ||||||||||||||||||||||||||||||||
Received from shares sold | 23,617,343 | 130,000,804 | 23,802,408 | 45,521,831 | 15,036,673 | 22,103,189 | 18,659,341 | 63,158,311 | ||||||||||||||||||||||||
Received from dividends reinvested | — | 3,223,171 | — | — | — | 478,871 | — | 3,261,845 | ||||||||||||||||||||||||
Paid for shares redeemed | (41,442,309 | ) | (100,864,266 | ) | (30,750,709 | ) | (46,855,502 | ) | (13,669,672 | ) | (11,080,234 | ) | (35,755,385 | ) | (76,313,498 | ) | ||||||||||||||||
|
|
|
|
|
|
|
|
|
|
|
|
|
|
|
| |||||||||||||||||
Change in net assets from capital transactions | (17,824,966 | ) | 32,359,709 | (6,948,301 | ) | (1,333,671 | ) | 1,367,001 | 11,501,826 | (17,096,044 | ) | (9,893,342 | ) | |||||||||||||||||||
|
|
|
|
|
|
|
|
|
|
|
|
|
|
|
| |||||||||||||||||
Change in net assets | (16,870,666 | ) | 16,553,544 | 7,084,035 | (4,623,415 | ) | 2,104,580 | 11,502,550 | (15,075,142 | ) | (18,985,888 | ) | ||||||||||||||||||||
Net assets: | ||||||||||||||||||||||||||||||||
Beginning of period | 535,288,960 | 518,735,416 | 154,040,411 | 158,663,826 | 48,699,132 | 37,196,582 | 430,428,159 | 449,414,047 | ||||||||||||||||||||||||
|
|
|
|
|
|
|
|
|
|
|
|
|
|
|
| |||||||||||||||||
End of period | $ | 518,418,294 | $ | 535,288,960 | $ | 161,124,446 | $ | 154,040,411 | $ | 50,803,712 | $ | 48,699,132 | $ | 415,353,017 | $ | 430,428,159 | ||||||||||||||||
|
|
|
|
|
|
|
|
|
|
|
|
|
|
|
| |||||||||||||||||
Undistributed net investment income | $ | 2,601,354 | $ | 262,107 | $ | 8,329,597 | $ | 5,611,400 | $ | 355,878 | $ | 90,386 | $ | 2,886,514 | $ | 558,115 | ||||||||||||||||
|
|
|
|
|
|
|
|
|
|
|
|
|
|
|
| |||||||||||||||||
The accompanying notes are an integral part of these financial statements.
| 116 |
| Ohio National Fund, Inc. |
Statements of Changes in Net Assets |
| International Portfolio | International Small-Mid Company Portfolio | Aggressive Growth Portfolio | Small Cap Growth Portfolio | |||||||||||||||||||||||||||||
| Six-Month Period Ended June 30, 2016 (Unaudited) | Year Ended December 31, 2015 | Six-Month Period Ended June 30, 2016 (Unaudited) | Year Ended December 31, 2015 | Six-Month Period Ended June 30, 2016 (Unaudited) | Year Ended December 31, 2015 | Six-Month Period Ended June 30, 2016 (Unaudited) | Year Ended December 31, 2015 | |||||||||||||||||||||||||
Increase (Decrease) in net assets: | ||||||||||||||||||||||||||||||||
Operations: | ||||||||||||||||||||||||||||||||
Net investment income (loss) | $ | 1,934,279 | $ | 2,095,825 | $ | 497,849 | $ | 93,533 | $ | (7,777 | ) | $ | (43,862 | ) | $ | 46,063 | $ | (275,332 | ) | |||||||||||||
Net realized gain (loss) on investments, futures contracts, foreign currency contracts, and other foreign currency related transactions | 613,743 | (6,614,913 | ) | 639,125 | 6,012,979 | 389,383 | 4,256,416 | (2,858,691 | ) | 6,834,479 | ||||||||||||||||||||||
Change in unrealized appreciation/depreciation on investments, futures contracts, foreign currency contracts, and other foreign currency related transactions | (14,462,643 | ) | 4,449,966 | (8,852,475 | ) | (46,294 | ) | (919,201 | ) | (157,349 | ) | 2,473,691 | (5,327,297 | ) | ||||||||||||||||||
|
|
|
|
|
|
|
|
|
|
|
|
|
|
|
| |||||||||||||||||
Change in net assets from operations | (11,914,621 | ) | (69,122 | ) | (7,715,501 | ) | 6,060,218 | (537,595 | ) | 4,055,205 | (338,937 | ) | 1,231,850 | |||||||||||||||||||
|
|
|
|
|
|
|
|
|
|
|
|
|
|
|
| |||||||||||||||||
Capital transactions: | ||||||||||||||||||||||||||||||||
Received from shares sold | 14,716,059 | 18,999,736 | 6,590,204 | 27,350,020 | 11,192,840 | 19,273,663 | 22,245,813 | 80,445,971 | ||||||||||||||||||||||||
Received from dividends reinvested | — | — | — | — | — | — | — | — | ||||||||||||||||||||||||
Paid for shares redeemed | (15,115,761 | ) | (34,323,447 | ) | (13,402,636 | ) | (22,637,681 | ) | (9,003,894 | ) | (11,902,340 | ) | (28,945,567 | ) | (55,586,735 | ) | ||||||||||||||||
|
|
|
|
|
|
|
|
|
|
|
|
|
|
|
| |||||||||||||||||
Change in net assets from capital transactions | (399,702 | ) | (15,323,711 | ) | (6,812,432 | ) | 4,712,339 | 2,188,946 | 7,371,323 | (6,699,754 | ) | 24,859,236 | ||||||||||||||||||||
|
|
|
|
|
|
|
|
|
|
|
|
|
|
|
| |||||||||||||||||
Change in net assets | (12,314,323 | ) | (15,392,833 | ) | (14,527,933 | ) | 10,772,557 | 1,651,351 | 11,426,528 | (7,038,691 | ) | 26,091,086 | ||||||||||||||||||||
Net assets: | ||||||||||||||||||||||||||||||||
Beginning of period | 158,977,559 | 174,370,392 | 78,326,923 | 67,554,366 | 51,351,797 | 39,925,269 | 238,235,006 | 212,143,920 | ||||||||||||||||||||||||
|
|
|
|
|
|
|
|
|
|
|
|
|
|
|
| |||||||||||||||||
End of period | $ | 146,663,236 | $ | 158,977,559 | $ | 63,798,990 | $ | 78,326,923 | $ | 53,003,148 | $ | 51,351,797 | $ | 231,196,315 | $ | 238,235,006 | ||||||||||||||||
|
|
|
|
|
|
|
|
|
|
|
|
|
|
|
| |||||||||||||||||
Undistributed net investment income (loss) | $ | 6,037,840 | $ | 4,103,561 | $ | 550,384 | $ | 52,535 | $ | (7,777 | ) | $ | — | $ | (133,377 | ) | $ | (179,440 | ) | |||||||||||||
|
|
|
|
|
|
|
|
|
|
|
|
|
|
|
| |||||||||||||||||
The accompanying notes are an integral part of these financial statements.
| 117 |
| Ohio National Fund, Inc. |
Statements of Changes in Net Assets |
| Mid Cap Opportunity Portfolio | S&P 500® Index Portfolio | Strategic Value Portfolio | High Income Bond Portfolio | |||||||||||||||||||||||||||||
| Six-Month Period Ended June 30, 2016 (Unaudited) | Year Ended December 31, 2015 | Six-Month Period Ended June 30, 2016 (Unaudited) | Year Ended December 31, 2015 | Six-Month Period Ended June 30, 2016 (Unaudited) | Year Ended December 31, 2015 | Six-Month Period Ended June 30, 2016 (Unaudited) | Year Ended December 31, 2015 | |||||||||||||||||||||||||
Increase (Decrease) in net assets: | ||||||||||||||||||||||||||||||||
Operations: | ||||||||||||||||||||||||||||||||
Net investment income (loss) | $ | (76,814 | ) | $ | (181,194 | ) | $ | 3,770,306 | $ | 6,969,435 | $ | 5,802,300 | $ | 11,456,581 | $ | 5,642,242 | $ | 12,384,157 | ||||||||||||||
Net realized gain on investments, futures contracts, and foreign currency related transactions | (1,357,619 | ) | 6,123,950 | 4,286,802 | 7,650,057 | 12,097,201 | 6,865,294 | (5,194,633 | ) | (949,435 | ) | |||||||||||||||||||||
Change in unrealized appreciation/depreciation on investments, futures contracts, and foreign currency related transactions | 2,967,960 | (10,394,162 | ) | 7,295,039 | (9,995,310 | ) | 30,435,069 | (5,120,840 | ) | 14,288,993 | (17,429,312 | ) | ||||||||||||||||||||
|
|
|
|
|
|
|
|
|
|
|
|
|
|
|
| |||||||||||||||||
Change in net assets from operations | 1,533,527 | (4,451,406 | ) | 15,352,147 | 4,624,182 | 48,334,570 | 13,201,035 | 14,736,602 | (5,994,590 | ) | ||||||||||||||||||||||
|
|
|
|
|
|
|
|
|
|
|
|
|
|
|
| |||||||||||||||||
Distributions to shareholders: | ||||||||||||||||||||||||||||||||
Distributions from net investment income . | — | — | — | (5,803,104 | ) | — | (9,545,259 | ) | — | — | ||||||||||||||||||||||
|
|
|
|
|
|
|
|
|
|
|
|
|
|
|
| |||||||||||||||||
Capital transactions: | ||||||||||||||||||||||||||||||||
Received from shares sold | 6,275,951 | 15,062,479 | 68,472,810 | 121,420,565 | 44,324,990 | 40,593,584 | 12,948,573 | 30,680,501 | ||||||||||||||||||||||||
Received from dividends reinvested | — | — | — | 5,803,104 | — | 9,545,259 | — | — | ||||||||||||||||||||||||
Paid for shares redeemed | (12,363,758 | ) | (18,579,706 | ) | (59,492,550 | ) | (103,525,243 | ) | (59,324,653 | ) | (76,596,758 | ) | (25,522,453 | ) | (60,565,349 | ) | ||||||||||||||||
|
|
|
|
|
|
|
|
|
|
|
|
|
|
|
| |||||||||||||||||
Change in net assets from capital transactions | (6,087,807 | ) | (3,517,227 | ) | 8,980,260 | 23,698,426 | (14,999,663 | ) | (26,457,915 | ) | (12,573,880 | ) | (29,884,848 | ) | ||||||||||||||||||
|
|
|
|
|
|
|
|
|
|
|
|
|
|
|
| |||||||||||||||||
Change in net assets | (4,554,280 | ) | (7,968,633 | ) | 24,332,407 | 22,519,504 | 33,334,907 | (22,802,139 | ) | 2,162,722 | (35,879,438 | ) | ||||||||||||||||||||
Net assets: | ||||||||||||||||||||||||||||||||
Beginning of period | 78,703,371 | 86,672,004 | 410,723,641 | 388,204,137 | 309,808,766 | 332,610,905 | 194,221,013 | 230,100,451 | ||||||||||||||||||||||||
|
|
|
|
|
|
|
|
|
|
|
|
|
|
|
| |||||||||||||||||
End of period | $ | 74,149,091 | $ | 78,703,371 | $ | 435,056,048 | $ | 410,723,641 | $ | 343,143,673 | $ | 309,808,766 | $ | 196,383,735 | $ | 194,221,013 | ||||||||||||||||
|
|
|
|
|
|
|
|
|
|
|
|
|
|
|
| |||||||||||||||||
Undistributed net investment income (loss) | $ | (76,814 | ) | $ | — | $ | 4,848,526 | $ | 1,078,220 | $ | 7,319,199 | $ | 1,516,899 | $ | 18,059,917 | $ | 12,417,675 | |||||||||||||||
|
|
|
|
|
|
|
|
|
|
|
|
|
|
|
| |||||||||||||||||
The accompanying notes are an integral part of these financial statements.
| 118 |
| Ohio National Fund, Inc. |
Statements of Changes in Net Assets |
| ClearBridge Small Cap Portfolio | Nasdaq-100® Index Portfolio | Bristol Portfolio | Bryton Growth Portfolio | |||||||||||||||||||||||||||||
| Six-Month Period Ended June 30, 2016 (Unaudited) | Year Ended December 31, 2015 | Six-Month Period Ended June 30, 2016 (Unaudited) | Year Ended December 31, 2015 | Six-Month Period Ended June 30, 2016 (Unaudited) | Year Ended December 31, 2015 | Six-Month Period Ended June 30, 2016 (Unaudited) | Year Ended December 31, 2015 | |||||||||||||||||||||||||
Increase (Decrease) in net assets: | ||||||||||||||||||||||||||||||||
Operations: | ||||||||||||||||||||||||||||||||
Net investment income (loss) | $ | 243,563 | $ | (234,376 | ) | $ | 616,521 | $ | 1,035,803 | $ | 546,792 | $ | 1,286,447 | $ | (478,623 | ) | $ | (928,394 | ) | |||||||||||||
Net realized gain (loss) on investments, futures contracts, and foreign currency related transactions | 1,928,618 | 13,222,203 | 1,131,526 | 3,980,078 | (5,219,789 | ) | 22,223,785 | (13,237,456 | ) | 20,443,670 | ||||||||||||||||||||||
Change in unrealized appreciation/depreciation on investments, futures contracts, and foreign currency related transactions | 4,876,040 | (14,029,088 | ) | (6,522,969 | ) | 6,340,633 | 4,793,960 | (13,681,233 | ) | 5,476,951 | (24,955,849 | ) | ||||||||||||||||||||
|
|
|
|
|
|
|
|
|
|
|
|
|
|
|
| |||||||||||||||||
Change in net assets from operations | 7,048,221 | (1,041,261 | ) | (4,774,922 | ) | 11,356,514 | 120,963 | 9,828,999 | (8,239,128 | ) | (5,440,573 | ) | ||||||||||||||||||||
|
|
|
|
|
|
|
|
|
|
|
|
|
|
|
| |||||||||||||||||
Distributions to shareholders: | ||||||||||||||||||||||||||||||||
Distributions from net investment income | — | — | — | (890,078 | ) | — | (1,143,905 | ) | — | — | ||||||||||||||||||||||
|
|
|
|
|
|
|
|
|
|
|
|
|
|
|
| |||||||||||||||||
Capital transactions: | ||||||||||||||||||||||||||||||||
Received from shares sold | 6,928,895 | 40,142,976 | 28,383,919 | 45,816,486 | 12,682,121 | 24,394,898 | 20,177,593 | 33,757,924 | ||||||||||||||||||||||||
Received from dividends reinvested | — | — | — | 890,078 | — | 1,143,905 | — | — | ||||||||||||||||||||||||
Paid for shares redeemed | (14,551,001 | ) | (20,589,393 | ) | (27,002,733 | ) | (40,292,164 | ) | (18,684,113 | ) | (47,557,762 | ) | (17,914,725 | ) | (45,234,692 | ) | ||||||||||||||||
|
|
|
|
|
|
|
|
|
|
|
|
|
|
|
| |||||||||||||||||
Change in net assets from capital transactions | (7,622,106 | ) | 19,553,583 | 1,381,186 | 6,414,400 | (6,001,992 | ) | (22,018,959 | ) | 2,262,868 | (11,476,768 | ) | ||||||||||||||||||||
|
|
|
|
|
|
|
|
|
|
|
|
|
|
|
| |||||||||||||||||
Change in net assets | (573,885 | ) | 18,512,322 | (3,393,736 | ) | 16,880,836 | (5,881,029 | ) | (13,333,865 | ) | (5,976,260 | ) | (16,917,341 | ) | ||||||||||||||||||
Net assets: | ||||||||||||||||||||||||||||||||
Beginning of period | 94,003,467 | 75,491,145 | 138,566,905 | 121,686,069 | 218,682,717 | 232,016,582 | 162,168,595 | 179,085,936 | ||||||||||||||||||||||||
|
|
|
|
|
|
|
|
|
|
|
|
|
|
|
| |||||||||||||||||
End of period | $ | 93,429,582 | $ | 94,003,467 | $ | 135,173,169 | $ | 138,566,905 | $ | 212,801,688 | $ | 218,682,717 | $ | 156,192,335 | $ | 162,168,595 | ||||||||||||||||
|
|
|
|
|
|
|
|
|
|
|
|
|
|
|
| |||||||||||||||||
Undistributed net investment income (loss) | $ | 243,563 | $ | — | $ | 762,246 | $ | 145,725 | $ | 689,334 | $ | 142,542 | $ | (478,623 | ) | $ | — | |||||||||||||||
|
|
|
|
|
|
|
|
|
|
|
|
|
|
|
| |||||||||||||||||
The accompanying notes are an integral part of these financial statements.
| 119 |
| Ohio National Fund, Inc. |
Statements of Changes in Net Assets |
| Balanced Portfolio | Target VIP Portfolio | Bristol Growth Portfolio | Risk Managed Balanced Portfolio | |||||||||||||||||||||||||||||
| Six-Month Period Ended June 30, 2016 (Unaudited) | Year Ended December 31, 2015 | Six-Month Period Ended June 30, 2016 (Unaudited) | Year Ended December 31, 2015 | Six-Month Period Ended June 30, 2016 (Unaudited) | Year Ended December 31, 2015 | Six-Month Period Ended June 30, 2016 (Unaudited) | Year Ended December 31, 2015 | |||||||||||||||||||||||||
Increase (Decrease) in net assets: | ||||||||||||||||||||||||||||||||
Operations: | ||||||||||||||||||||||||||||||||
Net investment income | $ | 9,025,181 | $ | 13,669,039 | $ | 339,379 | $ | 802,799 | $ | 240,272 | $ | 536,338 | $ | 845,681 | $ | 669,425 | ||||||||||||||||
Net realized gain (loss) on investments, futures contracts, foreign currency related transactions, and written options | (17,123,829 | ) | 29,262,363 | (384,987 | ) | 2,814,877 | 1,834,379 | 10,012,228 | 4,099,469 | (2,218,021 | ) | |||||||||||||||||||||
Change in unrealized appreciation/depreciation on investments, futures contracts, foreign currency related transactions, and written options | 12,970,188 | (32,385,091 | ) | 153,356 | (5,122,274 | ) | 627,640 | (3,703,251 | ) | 26,470 | 799,826 | |||||||||||||||||||||
|
|
|
|
|
|
|
|
|
|
|
|
|
|
|
| |||||||||||||||||
Change in net assets from operations | 4,871,540 | 10,546,311 | 107,748 | (1,504,598 | ) | 2,702,291 | 6,845,315 | 4,971,620 | (748,770 | ) | ||||||||||||||||||||||
|
|
|
|
|
|
|
|
|
|
|
|
|
|
|
| |||||||||||||||||
Distributions to shareholders: | ||||||||||||||||||||||||||||||||
Distributions from net investment income | — | (11,143,284 | ) | — | (711,595 | ) | — | (495,776 | ) | — | (376,684 | ) | ||||||||||||||||||||
|
|
|
|
|
|
|
|
|
|
|
|
|
|
|
| |||||||||||||||||
Capital transactions: | ||||||||||||||||||||||||||||||||
Received from shares sold | 94,221,004 | 192,294,038 | 1,122,320 | 3,534,416 | 6,197,133 | 40,862,885 | 64,963,250 | 140,396,888 | ||||||||||||||||||||||||
Received from dividends reinvested | — | 11,143,284 | — | 711,595 | — | 495,776 | — | 376,684 | ||||||||||||||||||||||||
Paid for shares redeemed | (57,095,028 | ) | (171,051,951 | ) | (4,187,247 | ) | (10,899,471 | ) | (9,183,149 | ) | (55,536,366 | ) | (13,127,628 | ) | (19,130,791 | ) | ||||||||||||||||
|
|
|
|
|
|
|
|
|
|
|
|
|
|
|
| |||||||||||||||||
Change in net assets from capital transactions | 37,125,976 | 32,385,371 | (3,064,927 | ) | (6,653,460 | ) | (2,986,016 | ) | (14,177,705 | ) | 51,835,622 | 121,642,781 | ||||||||||||||||||||
|
|
|
|
|
|
|
|
|
|
|
|
|
|
|
| |||||||||||||||||
Change in net assets | 41,997,516 | 31,788,398 | (2,957,179 | ) | (8,869,653 | ) | (283,725 | ) | (7,828,166 | ) | 56,807,242 | 120,517,327 | ||||||||||||||||||||
Net assets: | ||||||||||||||||||||||||||||||||
Beginning of period | 864,922,037 | 833,133,639 | 46,272,256 | 55,141,909 | 116,225,141 | 124,053,307 | 154,324,020 | 33,806,693 | ||||||||||||||||||||||||
|
|
|
|
|
|
|
|
|
|
|
|
|
|
|
| |||||||||||||||||
End of period | $ | 906,919,553 | $ | 864,922,037 | $ | 43,315,077 | $ | 46,272,256 | $ | 115,941,416 | $ | 116,225,141 | $ | 211,131,262 | $ | 154,324,020 | ||||||||||||||||
|
|
|
|
|
|
|
|
|
|
|
|
|
|
|
| |||||||||||||||||
Undistributed net investment income | $ | 11,476,948 | $ | 2,451,767 | $ | 430,583 | $ | 91,204 | $ | 280,834 | $ | 40,562 | $ | 1,110,612 | $ | 264,931 | ||||||||||||||||
|
|
|
|
|
|
|
|
|
|
|
|
|
|
|
| |||||||||||||||||
The accompanying notes are an integral part of these financial statements.
| 120 |
| Ohio National Fund, Inc. |
| Equity Portfolio | Bond Portfolio | |||||||||||||||||||||||||||||||||||||||
| Six-Month Period Ended June 30, 2016 (Unaudited) | Years Ended December 31, | Six-Month Period Ended June 30, 2016 (Unaudited) | Years Ended December 31, | |||||||||||||||||||||||||||||||||||||
| 2015 | 2014 | 2013 | 2012 | 2015 | 2014 | 2013 | 2012 | |||||||||||||||||||||||||||||||||
Selected per-share data: | ||||||||||||||||||||||||||||||||||||||||
Net asset value, beginning of period | $ | 32.02 | $ | 33.44 | $ | 29.41 | $ | 21.54 | $ | 18.88 | $ | 15.33 | $ | 15.65 | $ | 14.78 | $ | 15.07 | $ | 14.05 | ||||||||||||||||||||
Operations: | ||||||||||||||||||||||||||||||||||||||||
Net investment income | 0.15 | 0.21 | 0.12 | 0.27 | 0.35 | 0.31 | 0.56 | 0.50 | 0.56 | 0.51 | ||||||||||||||||||||||||||||||
Net realized and unrealized gain (loss) on investments and foreign currency related transactions | (0.04 | ) | (1.44 | ) | 4.02 | 7.84 | 2.61 | 1.08 | (0.88 | ) | 0.37 | (0.85 | ) | 0.51 | ||||||||||||||||||||||||||
|
|
|
|
|
|
|
|
|
|
|
|
|
|
|
|
|
|
|
| |||||||||||||||||||||
Total from operations | 0.11 | (1.23 | ) | 4.14 | 8.11 | 2.96 | 1.39 | (0.32 | ) | 0.87 | (0.29 | ) | 1.02 | |||||||||||||||||||||||||||
|
|
|
|
|
|
|
|
|
|
|
|
|
|
|
|
|
|
|
| |||||||||||||||||||||
Distributions: | ||||||||||||||||||||||||||||||||||||||||
Distributions from net investment income | — | (0.19 | ) | (0.11 | ) | (0.24 | ) | (0.30 | ) | — | — | — | — | — | ||||||||||||||||||||||||||
|
|
|
|
|
|
|
|
|
|
|
|
|
|
|
|
|
|
|
| |||||||||||||||||||||
Net asset value, end of period | $ | 32.13 | $ | 32.02 | $ | 33.44 | $ | 29.41 | $ | 21.54 | $ | 16.72 | $ | 15.33 | $ | 15.65 | $ | 14.78 | $ | 15.07 | ||||||||||||||||||||
|
|
|
|
|
|
|
|
|
|
|
|
|
|
|
|
|
|
|
| |||||||||||||||||||||
Total return | 0.34 | %* | –3.69 | % | 14.07 | % | 37.69 | % | 15.69 | % | 9.07 | %* | –2.04 | % | 5.89 | % | –1.92 | % | 7.26 | % | ||||||||||||||||||||
Ratios and supplemental data: | ||||||||||||||||||||||||||||||||||||||||
Net assets at end of period (in millions) | $ | 518.4 | $ | 535.3 | $ | 518.7 | $ | 221.4 | $ | 186.5 | $ | 161.1 | $ | 154.0 | $ | 158.7 | $ | 151.6 | $ | 172.2 | ||||||||||||||||||||
Ratios to average net assets: | ||||||||||||||||||||||||||||||||||||||||
Expenses | 0.82 | %** | 0.81 | % | 0.83 | % | 0.87 | % | 0.89 | % | 0.65 | %** | 0.64 | % | 0.64 | % | 0.66 | % | 0.66 | % | ||||||||||||||||||||
Net investment income | 0.93 | %** | 0.69 | % | 0.69 | % | 0.98 | % | 1.55 | % | 3.42 | %** | 3.46 | % | 3.34 | % | 3.34 | % | 3.41 | % | ||||||||||||||||||||
Portfolio turnover rate | 23 | %* | 47 | % | 46 | % | 43 | % | 48 | % | 44 | %* | 93 | % | 35 | % | 15 | % | 18 | % | ||||||||||||||||||||
| * | Not annualized |
| ** | Annualized |
The accompanying notes are an integral part of these financial statements.
| 121 |
| Ohio National Fund, Inc. |
Financial Highlights |
| Omni Portfolio | Capital Appreciation Portfolio | |||||||||||||||||||||||||||||||||||||||
| Six-Month Period Ended June 30, 2016 (Unaudited) | Years Ended December 31, | Six-Month Period Ended June 30, 2016 (Unaudited) | Years Ended December 31, | |||||||||||||||||||||||||||||||||||||
| 2015 | 2014 | 2013 | 2012 | 2015 | 2014 | 2013 | 2012 | |||||||||||||||||||||||||||||||||
Selected per-share data: | ||||||||||||||||||||||||||||||||||||||||
Net asset value, beginning of period | $ | 24.43 | $ | 24.15 | $ | 21.74 | $ | 16.82 | $ | 15.21 | $ | 32.88 | $ | 33.82 | $ | 31.24 | $ | 23.32 | $ | 19.95 | ||||||||||||||||||||
Operations: | ||||||||||||||||||||||||||||||||||||||||
Net investment income | 0.13 | 0.28 | 0.26 | 0.24 | 0.26 | 0.19 | 0.29 | 0.08 | 0.13 | 0.15 | ||||||||||||||||||||||||||||||
Net realized and unrealized gain (loss) on investments and foreign currency related transactions | 0.40 | 0.24 | 2.37 | 4.89 | 1.57 | 0.01 | (0.98 | ) | 2.59 | 7.91 | 3.36 | |||||||||||||||||||||||||||||
|
|
|
|
|
|
|
|
|
|
|
|
|
|
|
|
|
|
|
| |||||||||||||||||||||
Total from operations | 0.53 | 0.52 | 2.63 | 5.13 | 1.83 | 0.20 | (0.69 | ) | 2.67 | 8.04 | 3.51 | |||||||||||||||||||||||||||||
|
|
|
|
|
|
|
|
|
|
|
|
|
|
|
|
|
|
|
| |||||||||||||||||||||
Distributions: | ||||||||||||||||||||||||||||||||||||||||
Distributions from net investment income | — | (0.24 | ) | (0.22 | ) | (0.21 | ) | (0.22 | ) | — | (0.25 | ) | (0.09 | ) | (0.12 | ) | (0.14 | ) | ||||||||||||||||||||||
|
|
|
|
|
|
|
|
|
|
|
|
|
|
|
|
|
|
|
| |||||||||||||||||||||
Net asset value, end of period | $ | 24.96 | $ | 24.43 | $ | 24.15 | $ | 21.74 | $ | 16.82 | $ | 33.08 | $ | 32.88 | $ | 33.82 | $ | 31.24 | $ | 23.32 | ||||||||||||||||||||
|
|
|
|
|
|
|
|
|
|
|
|
|
|
|
|
|
|
|
| |||||||||||||||||||||
Total return | 2.17 | %* | 2.15 | % | 12.12 | % | 30.53 | % | 12.04 | % | 0.61 | %* | –2.05 | % | 8.54 | % | 34.51 | % | 17.59 | % | ||||||||||||||||||||
Ratios and supplemental data: | ||||||||||||||||||||||||||||||||||||||||
Net assets at end of period (in millions) | $ | 50.8 | $ | 48.7 | $ | 37.2 | $ | 37.9 | $ | 33.2 | $ | 415.4 | $ | 430.4 | $ | 449.4 | $ | 138.0 | $ | 115.7 | ||||||||||||||||||||
Ratios to average net assets: | ||||||||||||||||||||||||||||||||||||||||
Expenses | 0.81 | %** | 0.77 | % | 0.77 | % | 0.79 | % | 0.81 | % | 0.82 | %** | 0.80 | % | 0.83 | % | 0.88 | % | 0.90 | % | ||||||||||||||||||||
Net investment income | 1.19 | %** | 1.23 | % | 1.06 | % | 1.17 | % | 1.49 | % | 1.14 | %** | 0.86 | % | 0.56 | % | 0.45 | % | 0.66 | % | ||||||||||||||||||||
Portfolio turnover rate | 106 | %* | 186 | % | 198 | % | 210 | % | 179 | % | 29 | %* | 69 | % | 67 | % | 49 | % | 39 | % | ||||||||||||||||||||
| * | Not annualized |
| ** | Annualized |
The accompanying notes are an integral part of these financial statements.
| 122 |
| Ohio National Fund, Inc. |
Financial Highlights |
| International Portfolio | International Small-Mid Company Portfolio | |||||||||||||||||||||||||||||||||||||||
| Six-Month Period Ended June 30, 2016 (Unaudited) | Years Ended December 31, | Six-Month Period Ended June 30, 2016 (Unaudited) | Years Ended December 31, | |||||||||||||||||||||||||||||||||||||
| 2015 | 2014 | 2013 | 2012 | 2015 | 2014 | 2013 | 2012 | |||||||||||||||||||||||||||||||||
Selected per-share data: | ||||||||||||||||||||||||||||||||||||||||
Net asset value, beginning of period | $ | 12.50 | $ | 12.55 | $ | 13.85 | $ | 12.41 | $ | 10.32 | $ | 29.98 | $ | 27.39 | $ | 30.03 | $ | 23.52 | $ | 19.17 | ||||||||||||||||||||
Operations: | ||||||||||||||||||||||||||||||||||||||||
Net investment income | 0.15 | 0.19 | 0.18 | 0.23 | 0.20 | 0.21 | 0.03 | 0.12 | 0.12 | 0.17 | ||||||||||||||||||||||||||||||
Net realized and unrealized gain (loss) on investments, futures contracts, foreign currency contracts, and other foreign currency related transactions | (1.09 | ) | (0.24 | ) | (1.48 | ) | 1.21 | 1.89 | (3.26 | ) | 2.56 | (2.76 | ) | 6.39 | 4.18 | |||||||||||||||||||||||||
|
|
|
|
|
|
|
|
|
|
|
|
|
|
|
|
|
|
|
| |||||||||||||||||||||
Total from operations | (0.94 | ) | (0.05 | ) | (1.30 | ) | 1.44 | 2.09 | (3.05 | ) | 2.59 | (2.64 | ) | 6.51 | 4.35 | |||||||||||||||||||||||||
|
|
|
|
|
|
|
|
|
|
|
|
|
|
|
|
|
|
|
| |||||||||||||||||||||
Net asset value, end of period | $ | 11.56 | $ | 12.50 | $ | 12.55 | $ | 13.85 | $ | 12.41 | $ | 26.93 | $ | 29.98 | $ | 27.39 | $ | 30.03 | $ | 23.52 | ||||||||||||||||||||
|
|
|
|
|
|
|
|
|
|
|
|
|
|
|
|
|
|
|
| |||||||||||||||||||||
Total return | –7.52 | %* | –0.40 | % (a) | –9.39 | % | 11.60 | % | 20.25 | % | –10.17 | %* | 9.46 | % (a) | –8.79 | % | 27.68 | % | 22.69 | % | ||||||||||||||||||||
Ratios and supplemental data: | ||||||||||||||||||||||||||||||||||||||||
Net assets at end of period (in millions) | $ | 146.7 | $ | 159.0 | $ | 174.4 | $ | 189.4 | $ | 180.3 | $ | 63.8 | $ | 78.3 | $ | 67.6 | $ | 77.0 | $ | 64.5 | ||||||||||||||||||||
Ratios to average net assets: | ||||||||||||||||||||||||||||||||||||||||
Ratios net of expenses reduced or reimbursed by adviser: | ||||||||||||||||||||||||||||||||||||||||
Expenses | 1.01 | %** | 1.00 | % | 0.84 | % | 0.75 | % | 1.02 | % | 1.20 | %** | 1.23 | % | 1.18 | % | 1.19 | % | 1.21 | % | ||||||||||||||||||||
Net investment income | 2.64 | %** | 1.21 | % | 1.43 | % | 1.52 | % | 1.65 | % | 1.43 | %** | 0.12 | % | 0.38 | % | 0.40 | % | 0.64 | % | ||||||||||||||||||||
Ratios assuming no expenses reduced or reimbursed by adviser: | ||||||||||||||||||||||||||||||||||||||||
Expenses | 1.01 | %** | 1.00 | % | 1.00 | % | 1.01 | % | 1.02 | % | 1.43 | %** | 1.23 | % | 1.18 | % | 1.19 | % | 1.21 | % | ||||||||||||||||||||
Portfolio turnover rate | 25 | %* | 72 | % | 95 | % | 53 | % | 61 | % | 13 | %* | 58 | % | 65 | % | 51 | % | 55 | % | ||||||||||||||||||||
| * | Not annualized |
| ** | Annualized |
| (a) | Initial Public Offering (IPO) investments had a significant impact on the total return in the period and such performance may be difficult to repeat. |
The accompanying notes are an integral part of these financial statements.
| 123 |
| Ohio National Fund, Inc. |
Financial Highlights |
| Aggressive Growth Portfolio | Small Cap Growth Portfolio | |||||||||||||||||||||||||||||||||||||||
| Six-Month Period Ended June 30, 2016 (Unaudited) | Years Ended December 31, | Six-Month Period Ended June 30, 2016 (Unaudited) | Years Ended December 31, | |||||||||||||||||||||||||||||||||||||
| 2015 | 2014 | 2013 | 2012 | 2015 | 2014 | 2013 | 2012 | |||||||||||||||||||||||||||||||||
Selected per-share data: | ||||||||||||||||||||||||||||||||||||||||
Net asset value, beginning of period | $ | 15.09 | $ | 13.70 | $ | 12.50 | $ | 9.51 | $ | 7.74 | $ | 25.01 | $ | 25.07 | $ | 22.65 | $ | 15.59 | $ | 13.21 | ||||||||||||||||||||
Operations: | ||||||||||||||||||||||||||||||||||||||||
Net investment income (loss) | — | (0.01 | ) | (0.03 | ) | (0.02 | ) | 0.03 | — | (0.03 | ) | (0.05 | ) | (0.03 | ) | (0.03 | ) | |||||||||||||||||||||||
Net realized and unrealized gain (loss) on investments and foreign currency related transactions | (0.18 | ) | 1.40 | 1.23 | 3.01 | 1.74 | 0.01 | (0.03 | ) | 2.47 | 7.09 | 2.41 | ||||||||||||||||||||||||||||
|
|
|
|
|
|
|
|
|
|
|
|
|
|
|
|
|
|
|
| |||||||||||||||||||||
Total from operations | (0.18 | ) | 1.39 | 1.20 | 2.99 | 1.77 | 0.01 | (0.06 | ) | 2.42 | 7.06 | 2.38 | ||||||||||||||||||||||||||||
|
|
|
|
|
|
|
|
|
|
|
|
|
|
|
|
|
|
|
| |||||||||||||||||||||
Net asset value, end of period | $ | 14.91 | $ | 15.09 | $ | 13.70 | $ | 12.50 | $ | 9.51 | $ | 25.02 | $ | 25.01 | $ | 25.07 | $ | 22.65 | $ | 15.59 | ||||||||||||||||||||
|
|
|
|
|
|
|
|
|
|
|
|
|
|
|
|
|
|
|
| |||||||||||||||||||||
Total return | –1.19 | %* | 10.15 | % | 9.60 | % | 31.44 | % | 22.87 | % | 0.04 | %* | –0.24 | % (a) | 10.64 | % | 45.29 | % | 18.02 | % | ||||||||||||||||||||
Ratios and supplemental data: | ||||||||||||||||||||||||||||||||||||||||
Net assets at end of period (in millions) | $ | 53.0 | $ | 51.4 | $ | 39.9 | $ | 39.4 | $ | 33.1 | $ | 231.2 | $ | 238.2 | $ | 212.1 | $ | 109.5 | $ | 35.0 | ||||||||||||||||||||
Ratios to average net assets: | ||||||||||||||||||||||||||||||||||||||||
Expenses | 0.94 | %** | 0.93 | % | 0.94 | % | 0.97 | % | 0.99 | % | 0.86 | %** | 0.85 | % | 0.89 | % | 1.04 | % | 1.10 | % | ||||||||||||||||||||
Net investment income (loss) | –0.03 | %** | –0.10 | % | –0.23 | % | –0.25 | % | 0.34 | % | 0.04 | %** | –0.12 | % | –0.31 | % | –0.29 | % | –0.20 | % | ||||||||||||||||||||
Portfolio turnover rate | 26 | % | 60 | % | 55 | % | 60 | % | 17 | % | 8 | %* | 37 | % | 58 | % | 69 | %(b) | 65 | % | ||||||||||||||||||||
| * | Not annualized |
| ** | Annualized |
| (a) | Initial Public Offering (IPO) investments had a significant impact on the total return in the period and such performance may be difficult to repeat. |
| (b) | The cost of purchases and proceeds from sales of securities that were incurred to realign the Portfolio’s holdings subsequent to the December 20, 2013 reorganization are excluded from the 2013 portfolio turnover rate calculation. If such amounts had not been excluded, the portfolio turnover rate would have been 146%. |
The accompanying notes are an integral part of these financial statements.
| 124 |
| Ohio National Fund, Inc. |
Financial Highlights |
| Mid Cap Opportunity Portfolio | S&P 500® Index Portfolio | �� | ||||||||||||||||||||||||||||||||||||||
| Six-Month Period Ended June 30, 2016 (Unaudited) | Years Ended December 31, | Six-Month Period Ended June 30, 2016 (Unaudited) | Years Ended December 31, | |||||||||||||||||||||||||||||||||||||
| 2015 | 2014 | 2013 | 2012 | 2015 | 2014 | 2013 | 2012 | |||||||||||||||||||||||||||||||||
Selected per-share data: | ||||||||||||||||||||||||||||||||||||||||
Net asset value, beginning of period | $ | 29.90 | $ | 31.49 | $ | 28.24 | $ | 21.32 | $ | 17.81 | $ | 21.82 | $ | 21.93 | $ | 19.63 | $ | 15.08 | $ | 13.25 | ||||||||||||||||||||
Operations: | ||||||||||||||||||||||||||||||||||||||||
Net investment income (loss) | (0.03 | ) | (0.07 | ) | (0.05 | ) | (0.07 | ) | (0.02 | ) | 0.19 | 0.37 | 0.32 | 0.26 | 0.26 | |||||||||||||||||||||||||
Net realized and unrealized gain (loss) on investments, futures contracts, and foreign currency related transactions | 0.70 | (1.52 | ) | 3.30 | 6.99 | 3.53 | 0.59 | (0.17 | ) | 2.25 | 4.52 | 1.78 | ||||||||||||||||||||||||||||
|
|
|
|
|
|
|
|
|
|
|
|
|
|
|
|
|
|
|
| |||||||||||||||||||||
Total from operations | 0.67 | (1.59 | ) | 3.25 | 6.92 | 3.51 | 0.78 | 0.20 | 2.57 | 4.78 | 2.04 | |||||||||||||||||||||||||||||
|
|
|
|
|
|
|
|
|
|
|
|
|
|
|
|
|
|
|
| |||||||||||||||||||||
Distributions: | ||||||||||||||||||||||||||||||||||||||||
Distributions from net investment income | — | — | — | — | — | — | (0.31 | ) | (0.27 | ) | (0.23 | ) | (0.21 | ) | ||||||||||||||||||||||||||
|
|
|
|
|
|
|
|
|
|
|
|
|
|
|
|
|
|
|
| |||||||||||||||||||||
Net asset value, end of period | $ | 30.57 | $ | 29.90 | $ | 31.49 | $ | 28.24 | $ | 21.32 | $ | 22.60 | $ | 21.82 | $ | 21.93 | $ | 19.63 | $ | 15.08 | ||||||||||||||||||||
|
|
|
|
|
|
|
|
|
|
|
|
|
|
|
|
|
|
|
| |||||||||||||||||||||
Total return | 2.24 | %* | –5.05 | % (a) | 11.51 | % | 32.46 | % | 19.71 | % | 3.57 | %* | 0.91 | % | 13.11 | % | 31.74 | % | 15.40 | % | ||||||||||||||||||||
Ratios and supplemental data: | ||||||||||||||||||||||||||||||||||||||||
Net assets at end of period (in millions) | $ | 74.1 | $ | 78.7 | $ | 86.7 | $ | 83.0 | $ | 67.1 | $ | 435.1 | $ | 410.7 | $ | 388.2 | $ | 314.9 | $ | 207.8 | ||||||||||||||||||||
Ratios to average net assets: | ||||||||||||||||||||||||||||||||||||||||
Expenses | 0.97 | %** | 0.94 | % | 0.94 | % | 0.96 | % | 0.98 | % | 0.43 | %** | 0.41 | % | 0.43 | % | 0.45 | % | 0.48 | % | ||||||||||||||||||||
Net investment income (loss) | –0.21 | %** | –0.21 | % | –0.18 | % | –0.28 | % | –0.09 | % | 1.84 | %** | 1.72 | % | 1.64 | % | 1.68 | % | 1.87 | % | ||||||||||||||||||||
Portfolio turnover rate | 30 | %* | 59 | % | 61 | % | 44 | % | 45 | % | 9 | %* | 14 | % | 11 | % | 15 | % | 7 | % | ||||||||||||||||||||
| * | Not annualized |
| ** | Annualized |
| (a) | Initial Public Offering (IPO) investments had a significant impact on the total return in the period and such performance may be difficult to repeat. |
The accompanying notes are an integral part of these financial statements.
| 125 |
| Ohio National Fund, Inc. |
Financial Highlights |
| Strategic Value Portfolio | High Income Bond Portfolio | |||||||||||||||||||||||||||||||||||||||
| Six-Month Period Ended June 30, 2016 (Unaudited) | Years Ended December 31, | Six-Month Period Ended June 30, 2016 (Unaudited) | Years Ended December 31, | |||||||||||||||||||||||||||||||||||||
| 2015 | 2014 | 2013 | 2012 | 2015 | 2014 | 2013 | 2012 | |||||||||||||||||||||||||||||||||
Selected per-share data: | ||||||||||||||||||||||||||||||||||||||||
Net asset value, beginning of period | $ | 14.07 | $ | 13.92 | $ | 13.09 | $ | 11.09 | $ | 10.50 | $ | 15.82 | $ | 16.32 | $ | 15.88 | $ | 14.83 | $ | 12.97 | ||||||||||||||||||||
Operations: | ||||||||||||||||||||||||||||||||||||||||
Net investment income | 0.28 | 0.53 | 0.93 | 0.35 | 0.13 | 0.56 | 1.18 | 1.57 | 1.10 | 0.99 | ||||||||||||||||||||||||||||||
Net realized and unrealized gain (loss) on investments and foreign currency related transactions | 1.93 | 0.06 | 0.68 | 1.97 | 0.63 | 0.69 | (1.68 | ) | (1.13 | ) | (0.05 | ) | 0.87 | |||||||||||||||||||||||||||
|
|
|
|
|
|
|
|
|
|
|
|
|
|
|
|
|
|
|
| |||||||||||||||||||||
Total from operations | 2.21 | 0.59 | 1.61 | 2.32 | 0.76 | 1.25 | (0.50 | ) | 0.44 | 1.05 | 1.86 | |||||||||||||||||||||||||||||
|
|
|
|
|
|
|
|
|
|
|
|
|
|
|
|
|
|
|
| |||||||||||||||||||||
Distributions: | ||||||||||||||||||||||||||||||||||||||||
Distributions from net investment income | — | (0.44 | ) | (0.78 | ) | (0.32 | ) | (0.17 | ) | — | — | — | — | — | ||||||||||||||||||||||||||
|
|
|
|
|
|
|
|
|
|
|
|
|
|
|
|
|
|
|
| |||||||||||||||||||||
Net asset value, end of period | $ | 16.28 | $ | 14.07 | $ | 13.92 | $ | 13.09 | $ | 11.09 | $ | 17.07 | $ | 15.82 | $ | 16.32 | $ | 15.88 | $ | 14.83 | ||||||||||||||||||||
|
|
|
|
|
|
|
|
|
|
|
|
|
|
|
|
|
|
|
| |||||||||||||||||||||
Total return | 15.71 | %* | 4.26 | % | 12.41 | % | 21.00 | % | 7.21 | % | 7.90 | %* | –3.06 | % | 2.77 | % | 7.08 | % | 14.34 | % | ||||||||||||||||||||
Ratios and supplemental data: | ||||||||||||||||||||||||||||||||||||||||
Net assets at end of period (in millions) | $ | 343.1 | $ | 309.8 | $ | 332.6 | $ | 397.7 | $ | 268.2 | $ | 196.4 | $ | 194.2 | $ | 230.1 | $ | 307.9 | $ | 311.9 | ||||||||||||||||||||
Ratios to average net assets: | ||||||||||||||||||||||||||||||||||||||||
Expenses | 0.79 | %** | 0.78 | % | 0.78 | % | 0.79 | % | 0.82 | % | 0.83 | %** | 0.80 | % | 0.77 | % | 0.77 | % | 0.79 | % | ||||||||||||||||||||
Net investment income | 3.60 | %** | 3.47 | % | 5.37 | % | 3.58 | % | 3.84 | % | 5.86 | %** | 5.65 | % | 5.73 | % | 6.36 | % | 7.17 | % | ||||||||||||||||||||
Portfolio turnover rate | 16 | %* | 13 | % | 22 | % | 22 | % | 30 | % | 14 | %* | 29 | % | 33 | % | 29 | % | 35 | % | ||||||||||||||||||||
| * | Not annualized |
| ** | Annualized |
The accompanying notes are an integral part of these financial statements.
| 126 |
| Ohio National Fund, Inc. |
Financial Highlights |
| ClearBridge Small Cap Portfolio | Nasdaq-100® Index Portfolio | |||||||||||||||||||||||||||||||||||||||
| Six-Month Period Ended June 30, 2016 (Unaudited) | Years Ended December 31, | Six-Month Period Ended June 30, 2016 (Unaudited) | Years Ended December 31, | |||||||||||||||||||||||||||||||||||||
| 2015 | 2014 | 2013 | 2012 | 2015 | 2014 | 2013 | 2012 | |||||||||||||||||||||||||||||||||
Selected per-share data: | ||||||||||||||||||||||||||||||||||||||||
Net asset value, beginning of period | $ | 40.00 | $ | 41.01 | $ | 40.03 | $ | 30.73 | $ | 27.00 | $ | 11.80 | $ | 10.88 | $ | 9.25 | $ | 6.85 | $ | 5.85 | ||||||||||||||||||||
Operations: | ||||||||||||||||||||||||||||||||||||||||
Net investment income (loss) | 0.11 | (0.10 | ) | (0.19 | ) | (0.15 | ) | (0.03 | ) | 0.05 | 0.09 | 0.12 | 0.07 | 0.06 | ||||||||||||||||||||||||||
Net realized and unrealized gain (loss) on investments, futures contracts, and foreign currency related transactions | 3.29 | (0.91 | ) | 1.17 | 9.45 | 3.76 | (0.46 | ) | 0.91 | 1.62 | 2.39 | 0.99 | ||||||||||||||||||||||||||||
|
|
|
|
|
|
|
|
|
|
|
|
|
|
|
|
|
|
|
| |||||||||||||||||||||
Total from operations | 3.40 | (1.01 | ) | 0.98 | 9.30 | 3.73 | (0.41 | ) | 1.00 | 1.74 | 2.46 | 1.05 | ||||||||||||||||||||||||||||
|
|
|
|
|
|
|
|
|
|
|
|
|
|
|
|
|
|
|
| |||||||||||||||||||||
Distributions: | ||||||||||||||||||||||||||||||||||||||||
Distributions from investment income | — | — | — | — | — | ��� | (0.08 | ) | (0.11 | ) | (0.06 | ) | (0.05 | ) | ||||||||||||||||||||||||||
|
|
|
|
|
|
|
|
|
|
|
|
|
|
|
|
|
|
|
| |||||||||||||||||||||
Net asset value, end of period | $ | 43.40 | $ | 40.00 | $ | 41.01 | $ | 40.03 | $ | 30.73 | $ | 11.39 | $ | 11.80 | $ | 10.88 | $ | 9.25 | $ | 6.85 | ||||||||||||||||||||
|
|
|
|
|
|
|
|
|
|
|
|
|
|
|
|
|
|
|
| |||||||||||||||||||||
Total return | 8.50 | %* | –2.46 | % | 2.45 | % | 30.26 | % | 13.81 | % | –3.47 | %* | 9.14 | % | 18.77 | % | 35.98 | % | 17.88 | % | ||||||||||||||||||||
Ratios and supplemental data: | ||||||||||||||||||||||||||||||||||||||||
Net assets at end of period (in millions) | $ | 93.4 | $ | 94.0 | $ | 75.5 | $ | 80.4 | $ | 55.1 | $ | 135.2 | $ | 138.6 | $ | 121.7 | $ | 95.8 | $ | 68.5 | ||||||||||||||||||||
Ratios to average net assets: | ||||||||||||||||||||||||||||||||||||||||
Expenses | 0.97 | %** | 1.01 | % | 1.00 | % | 1.01 | % | 1.04 | % | 0.48 | %** | 0.46 | % | 0.48 | % | 0.51 | % | 0.53 | % | ||||||||||||||||||||
Net investment income (loss) | 0.55 | %** | –0.29 | % | –0.45 | % | –0.44 | % | –0.10 | % | 0.94 | %** | 0.79 | % | 1.23 | % | 0.94 | % | 0.98 | % | ||||||||||||||||||||
Portfolio turnover rate | 14 | %* | 126 | % (a) | 44 | % | 42 | % | 42 | % | 7 | %* | 19 | % | 23 | % | 43 | % | 25 | % | ||||||||||||||||||||
| * | Not annualized |
| ** | Annualized |
| (a) | Effective September 25, 2015, the sub-adviser changed from Eagle Asset Managment, Inc. to ClearBridge, LLC. Costs of purchases and proceeds from sales of portfolio securities associated with the change in the sub-adviser contributed to a higher portfolio turnover rate for the year ended December 31, 2015 as compared to prior years or the current period. |
The accompanying notes are an integral part of these financial statements.
| 127 |
| Ohio National Fund, Inc. |
Financial Highlights |
| Bristol Portfolio | Bryton Growth Portfolio | |||||||||||||||||||||||||||||||||||||||
| Six-Month Period Ended June 30, 2016 (Unaudited) | Years Ended December 31, | Six-Month Period Ended June 30, 2016 (Unaudited) | Years Ended December 31, | |||||||||||||||||||||||||||||||||||||
| 2015 | 2014 | 2013 | 2012 | 2015 | 2014 | 2013 | 2012 | |||||||||||||||||||||||||||||||||
Selected per-share data: | ||||||||||||||||||||||||||||||||||||||||
Net asset value, beginning of period | $ | 21.49 | $ | 20.75 | $ | 18.29 | $ | 13.01 | $ | 11.56 | $ | 19.60 | $ | 20.47 | $ | 19.28 | $ | 13.70 | $ | 12.31 | ||||||||||||||||||||
Operations: | ||||||||||||||||||||||||||||||||||||||||
Net investment income (loss) | 0.06 | 0.12 | 0.09 | 0.09 | 0.09 | (0.06 | ) | (0.11 | ) | (0.09 | ) | (0.11 | ) | (0.07 | ) | |||||||||||||||||||||||||
Net realized and unrealized gain (loss) on investments | (0.03 | ) | 0.73 | 2.45 | 5.27 | 1.43 | (1.00 | ) | (0.76 | ) | 1.28 | 5.69 | 1.46 | |||||||||||||||||||||||||||
|
|
|
|
|
|
|
|
|
|
|
|
|
|
|
|
|
|
|
| |||||||||||||||||||||
Total from operations | 0.03 | 0.85 | 2.54 | 5.36 | 1.52 | (1.06 | ) | (0.87 | ) | 1.19 | 5.58 | 1.39 | ||||||||||||||||||||||||||||
|
|
|
|
|
|
|
|
|
|
|
|
|
|
|
|
|
|
|
| |||||||||||||||||||||
Distributions: | ||||||||||||||||||||||||||||||||||||||||
Distributions from net investment income | — | (0.11 | ) | (0.08 | ) | (0.08 | ) | (0.07 | ) | — | — | — | — | — | ||||||||||||||||||||||||||
|
|
|
|
|
|
|
|
|
|
|
|
|
|
|
|
|
|
|
| |||||||||||||||||||||
Net asset value, end of period | $ | 21.52 | $ | 21.49 | $ | 20.75 | $ | 18.29 | $ | 13.01 | $ | 18.54 | $ | 19.60 | $ | 20.47 | $ | 19.28 | $ | 13.70 | ||||||||||||||||||||
|
|
|
|
|
|
|
|
|
|
|
|
|
|
|
|
|
|
|
| |||||||||||||||||||||
Total return | 0.14 | %* | 4.08 | % | 13.88 | % | 41.21 | % | 13.19 | % | –5.41 | %* | –4.25 | % | 6.17 | % | 40.73 | % | 11.29 | % | ||||||||||||||||||||
Ratios and supplemental data: | ||||||||||||||||||||||||||||||||||||||||
Net assets at end of period (in millions) | $ | 212.8 | $ | 218.7 | $ | 232.0 | $ | 231.5 | $ | 204.9 | $ | 156.2 | $ | 162.2 | $ | 179.1 | $ | 180.8 | $ | 157.7 | ||||||||||||||||||||
Ratios to average net assets: | ||||||||||||||||||||||||||||||||||||||||
Expenses | 0.83 | %** | 0.81 | % | 0.81 | % | 0.82 | % | 0.85 | % | 0.91 | %** | 0.88 | % | 0.88 | % | 0.89 | % | 0.93 | % | ||||||||||||||||||||
Net investment income (loss) | 0.53 | %** | 0.55 | % | 0.42 | % | 0.51 | % | 0.68 | % | –0.65 | %** | –0.53 | % | –0.45 | % | –0.59 | % | –0.57 | % | ||||||||||||||||||||
Portfolio turnover rate | 122 | %* | 228 | % | 239 | % | 269 | % | 244 | % | 87 | %* | 169 | % | 178 | % | 185 | % | 152 | % | ||||||||||||||||||||
| * | Not annualized |
| ** | Annualized |
The accompanying notes are an integral part of these financial statements.
| 128 |
| Ohio National Fund, Inc. |
Financial Highlights |
| Balanced Portfolio | Target VIP Portfolio | |||||||||||||||||||||||||||||||||||||||
| Six-Month Period Ended June 30, 2016 (Unaudited) | Years Ended December 31, | Six-Month Period Ended June 30, 2016 (Unaudited) | Years Ended December 31, | |||||||||||||||||||||||||||||||||||||
| 2015 | 2014 | 2013 | 2012 | 2015 | 2014 | 2013 | 2012 | |||||||||||||||||||||||||||||||||
Selected per-share data: | ||||||||||||||||||||||||||||||||||||||||
Net asset value, beginning of period | $ | 18.99 | $ | 18.96 | $ | 18.02 | $ | 15.76 | $ | 13.91 | $ | 13.81 | $ | 14.49 | $ | 13.70 | $ | 10.10 | $ | 8.89 | ||||||||||||||||||||
Operations: | ||||||||||||||||||||||||||||||||||||||||
Net investment income | 0.19 | 0.30 | 0.16 | 0.08 | 0.10 | 0.11 | 0.25 | 0.25 | 0.09 | 0.18 | ||||||||||||||||||||||||||||||
Net realized and unrealized gain (loss) on investments, foreign currency related transactions, and written options | (0.11 | ) | (0.02 | ) | 0.92 | 2.32 | 1.75 | (0.04 | ) | (0.72 | ) | 0.77 | 3.61 | 1.17 | ||||||||||||||||||||||||||
|
|
|
|
|
|
|
|
|
|
|
|
|
|
|
|
|
|
|
| |||||||||||||||||||||
Total from operations | 0.08 | 0.28 | 1.08 | 2.40 | 1.85 | 0.07 | (0.47 | ) | 1.02 | 3.70 | 1.35 | |||||||||||||||||||||||||||||
|
|
|
|
|
|
|
|
|
|
|
|
|
|
|
|
|
|
|
| |||||||||||||||||||||
Distributions: | ||||||||||||||||||||||||||||||||||||||||
Distributions from net investment income | — | (0.25 | ) | (0.14 | ) | (0.14 | ) | — | — | (0.21 | ) | (0.23 | ) | (0.10 | ) | (0.14 | ) | |||||||||||||||||||||||
|
|
|
|
|
|
|
|
|
|
|
|
|
|
|
|
|
|
|
| |||||||||||||||||||||
Net asset value, end of period | $ | 19.07 | $ | 18.99 | $ | 18.96 | $ | 18.02 | $ | 15.76 | $ | 13.88 | $ | 13.81 | $ | 14.49 | $ | 13.70 | $ | 10.10 | ||||||||||||||||||||
|
|
|
|
|
|
|
|
|
|
|
|
|
|
|
|
|
|
|
| |||||||||||||||||||||
Total return | 0.42 | %* | 1.47 | % | 5.99 | % | 15.26 | % | 13.30 | % | 0.51 | %* | –3.24 | % | 7.44 | % | 36.71 | % | 15.24 | % | ||||||||||||||||||||
Ratios and supplemental data: | ||||||||||||||||||||||||||||||||||||||||
Net assets at end of period (in millions) | $ | 906.9 | $ | 864.9 | $ | 833.1 | $ | 249.1 | $ | 77.1 | $ | 43.3 | $ | 46.3 | $ | 55.1 | $ | 53.7 | $ | 21.2 | ||||||||||||||||||||
Ratios to average net assets: | ||||||||||||||||||||||||||||||||||||||||
Ratios net of expenses reduced or reimbursed by adviser: | ||||||||||||||||||||||||||||||||||||||||
Expenses | 0.65 | %** | 0.64 | % | 0.64 | % | 0.75 | % | 0.86 | % | 0.80 | %** | 0.77 | % | 0.77 | % | 0.82 | % | 0.87 | % | ||||||||||||||||||||
Net investment income | 2.07 | %** | 1.58 | % | 1.80 | % | 1.45 | % | 1.90 | % | 1.59 | %** | 1.54 | % | 1.77 | % | 0.92 | % | 1.73 | % | ||||||||||||||||||||
Ratios assuming no expenses reduced or reimbursed by adviser: | ||||||||||||||||||||||||||||||||||||||||
Expenses | 0.65 | %** | 0.64 | % | 0.68 | % | 0.75 | % | 0.86 | % | 0.80 | %** | 0.77 | % | 0.77 | % | 0.82 | % | 0.87 | % | ||||||||||||||||||||
Portfolio turnover rate | 49 | %* | 92 | % | 94 | % | 82 | % (a) | 60 | % | 71 | %* | 72 | % | 79 | % | 57 | % (b) | 70 | % | ||||||||||||||||||||
| * | Not annualized |
| ** | Annualized |
| (a) | The cost of purchases and proceeds from sales of securities that were incurred to realign the Portfolio’s holdings subsequent to the December 20, 2013 reorganization are excluded from the 2013 portfolio turnover rate calculation. If such amounts had not been excluded, the portfolio turnover rate would have been 89%. |
| (b) | The cost of purchases and proceeds from sales of securities that were incurred to realign the Portfolio’s holdings subsequent to the December 20, 2013 reorganization are excluded from the 2013 portfolio turnover rate calculation. If such amounts had not been excluded, the portfolio turnover rate would have been 138%. |
The accompanying notes are an integral part of these financial statements.
| 129 |
| Ohio National Fund, Inc. |
Financial Highlights |
| Bristol Growth Portfolio | Risk Managed Balanced Portfolio | |||||||||||||||||||||||||||||||
| Six-Month Period Ended June 30, 2016 (Unaudited) | Years Ended December 31, | Six-Month Period Ended June 30, 2016 (Unaudited) | Year ended December 31, 2015 | Period from May 1, 2014*** to December 31, 2014 | ||||||||||||||||||||||||||||
| 2015 | 2014 | 2013 | 2012 | |||||||||||||||||||||||||||||
Selected per-share data: | ||||||||||||||||||||||||||||||||
Net asset value, beginning of period | $ | 17.31 | $ | 16.44 | $ | 14.72 | $ | 10.66 | $ | 9.63 | $ | 10.66 | $ | 10.83 | $ | 10.00 | ||||||||||||||||
Operations: | ||||||||||||||||||||||||||||||||
Net investment income | 0.04 | 0.08 | 0.06 | 0.06 | 0.06 | 0.04 | 0.03 | 0.03 | ||||||||||||||||||||||||
Net realized and unrealized gain (loss) on investments, futures contracts, and foreign currency related transactions | 0.38 | 0.86 | 1.71 | 4.05 | 1.02 | 0.21 | (0.17 | ) | 0.80 | |||||||||||||||||||||||
|
|
|
|
|
|
|
|
|
|
|
|
|
|
|
| |||||||||||||||||
Total from operations | 0.42 | 0.94 | 1.77 | 4.11 | 1.08 | 0.25 | (0.14 | ) | 0.83 | |||||||||||||||||||||||
|
|
|
|
|
|
|
|
|
|
|
|
|
|
|
| |||||||||||||||||
Distributions: | ||||||||||||||||||||||||||||||||
Distributions from net investment income | — | (0.07 | ) | (0.05 | ) | (0.05 | ) | (0.05 | ) | — | (0.03 | ) | — | |||||||||||||||||||
|
|
|
|
|
|
|
|
|
|
|
|
|
|
|
| |||||||||||||||||
Net asset value, end of period | $ | 17.73 | $ | 17.31 | $ | 16.44 | $ | 14.72 | $ | 10.66 | $ | 10.91 | $ | 10.66 | $ | 10.83 | ||||||||||||||||
|
|
|
|
|
|
|
|
|
|
|
|
|
|
|
| |||||||||||||||||
Total return | 2.43 | %* | 5.72 | % | 12.01 | % | 38.62 | % | 11.20 | % | 2.35 | %* | –1.32 | % | 8.30 | %* | ||||||||||||||||
Ratios and supplemental data: | ||||||||||||||||||||||||||||||||
Net assets at end of period (in millions) | $ | 115.9 | $ | 116.2 | $ | 124.1 | $ | 122.3 | $ | 108.0 | $ | 211.1 | $ | 154.3 | $ | 33.8 | ||||||||||||||||
Ratios to average net assets: | ||||||||||||||||||||||||||||||||
Expenses | 0.89 | %** | 0.86 | % | 0.86 | % | 0.88 | % | 0.92 | % | 1.05 | %** | 1.11 | % | 1.43 | %** | ||||||||||||||||
Net investment income | 0.43 | %** | 0.43 | % | 0.34 | % | 0.42 | % | 0.57 | % | 0.95 | %** | 0.81 | % | 0.43 | %** | ||||||||||||||||
Portfolio turnover rate | 89 | %* | 168 | % | 192 | % | 237 | % | 229 | % | 43 | %* | 71 | % | 94 | %* | ||||||||||||||||
| * | Not annualized |
| ** | Annualized |
| *** | Represents date of inception and commencement of operations. |
The accompanying notes are an integral part of these financial statements.
| 130 |
| Ohio National Fund, Inc. |
| June 30, 2016 (Unaudited) |
| (1) | Organization |
Ohio National Fund, Inc. (the “Fund”) is a Maryland corporation registered under the Investment Company Act of 1940, as amended (the “40 Act”). The fund is an open-end investment company and follows accounting and reporting guidance under Financial Accounting Standards Board (“FASB”) Accounting Standards Codification (“ASC”) Topic 946, “Financial Services-Investment Companies”. The Fund consists of twenty separate investment portfolios (the “Portfolios”) that seek the following objectives and strategies:
| ¢ | Equity Portfolio — Long-term growth of capital by investing at least 80% of its assets in equity securities. |
| ¢ | Bond Portfolio — High level of income and opportunity for capital appreciation consistent with preservation of capital by investing primarily in intermediate-term and long-term fixed income securities. |
| ¢ | Omni Portfolio — High level of long-term total return consistent with preservation of capital by investing in stocks, bonds, and money market instruments. |
| ¢ | International Portfolio — Long term growth of capital by investing at least 80% of its assets in securities of foreign companies. |
| ¢ | International Small-Mid Company Portfolio — Long-term growth of capital by investing at least 80% of its assets in equity securities of non-U.S. small and mid-cap companies. |
| ¢ | Capital Appreciation Portfolio — Long-term capital growth by investing primarily in equity and equity related securities of established companies with either current or emerging earnings growth not fully appreciated or recognized by the market. |
| ¢ | Aggressive Growth Portfolio — Long-term capital growth by investing primarily in domestic and foreign equity securities selected for growth potential. |
| ¢ | Small Cap Growth Portfolio — Long-term capital appreciation by investing at least 80% of its net assets in stocks of small capitalization companies. |
| ¢ | Mid Cap Opportunity Portfolio — Long-term total return by investing at least 80% of its net assets in equity securities of mid-cap companies, primarily those that are strategically positioned for long-term growth. |
| ¢ | S&P 500® Index Portfolio — Total return that approximates the total return of the Standard & Poor’s 500® Index, at a risk level consistent with that of the Standard & Poor’s 500® Index. |
| ¢ | Strategic Value Portfolio — Growth of capital and income by investing primarily in high dividend yielding common stocks with dividend growth potential. |
| ¢ | High Income Bond Portfolio — High current income by investing at least 80% of its net assets in lower rated corporate debt obligations commonly referred to as “junk bonds”. The Portfolio’s investments are generally rated Ba or lower by Moody’s, or BB or lower by Standard & Poor’s or Fitch. |
| ¢ | ClearBridge Small Cap Portfolio — Long-term capital appreciation by investing at least 80% of its net assets in common stocks and other equity securities of small capitalization companies or in other investments that the portfolio managers believe have similar economic characteristics. |
| ¢ | Nasdaq-100® Index Portfolio — Long-term growth of capital by investing primarily in stocks that are included in the Nasdaq-100® Index. Unlike the other Portfolios of the Fund, the Nasdaq-100® Index Portfolio is a non-diversified portfolio for purposes of Section 5(b) of the 40 Act. |
| ¢ | Bristol Portfolio — Long-term growth of capital by investing primarily in common stocks of the 1,000 largest publicly traded U.S. companies in terms of market capitalization. |
| ¢ | Bryton Growth Portfolio — Long-term growth of capital by investing primarily in common stocks of growth-oriented U.S. companies smaller than the 500 largest publicly traded U.S. companies in terms of market capitalization. |
| ¢ | Balanced Portfolio — Capital appreciation and income by investing normally up to 75% of its total assets in equity securities of domestic and foreign companies of any market capitalization while maintaining a minimum of 25% of its total assets in fixed income securities. |
| ¢ | Target VIP Portfolio — Above average total return by investing in the common stocks of companies which are identified by a model that applies separate uniquely specialized strategies. |
| 131 | (continued) |
| Ohio National Fund, Inc. |
Notes to Financial Statements (Continued) | June 30, 2016 (Unaudited) |
| ¢ | Bristol Growth Portfolio — Long-term growth of capital by investing primarily in common stocks of the 1,000 largest publicly traded U.S. companies in terms of market capitalization. |
| ¢ | Risk Managed Balanced Portfolio — Long-term capital growth, consistent with preservation of capital and balanced by current income. The Portfolio invests in a balanced portfolio of equity and fixed-income securities and a risk management portfolio intended to enhance the risk adjusted return of the Portfolio. |
Additional detail regarding portfolio-specific objectives, policies, and investment strategies is provided in the prospectus and Statement of Additional Information of Ohio National Fund, Inc. There are no assurances that these objectives will be met. Each Portfolio, except the Nasdaq-100® Index Portfolio, is classified as diversified for purposes of Section 5(b) of the 40 Act.
At present, the Fund sells its shares only to separate accounts of The Ohio National Life Insurance Company (“ONLIC”), Ohio National Life Assurance Corporation (“ONLAC”), and National Security Life and Annuity Company (“NSLA”) to support certain benefits under variable contracts issued by those entities. In the future, Fund shares may be used for other purposes but, unless there is a change in applicable law, they will not be sold directly to the public.
Interest in each Portfolio is represented by a separate class of the Fund’s capital stock, par value $1. Each share of a Portfolio participates equally in the Portfolio’s dividends, distributions, net assets, and voting matters.
The Fund is authorized to issue 550 million of its capital shares. These authorized shares have been allocated to specific Portfolios of the Fund as follows:
Portfolio | Authorized Shares | |||
Equity | 35,000,000 | |||
Bond | 30,000,000 | |||
Omni | 10,000,000 | |||
Capital Appreciation | 25,000,000 | |||
International | 30,000,000 | |||
International Small-Mid Company | 7,000,000 | |||
Aggressive Growth | 9,000,000 | |||
Small Cap Growth | 20,000,000 | |||
Mid Cap Opportunity | 6,000,000 | |||
S&P 500® Index | 40,000,000 | |||
Portfolio | Authorized Shares | |||
Strategic Value | 65,000,000 | |||
High Income Bond | 35,000,000 | |||
ClearBridge Small Cap | 5,000,000 | |||
Nasdaq-100® Index | 30,000,000 | |||
Bristol | 33,000,000 | |||
Bryton Growth | 25,000,000 | |||
Balanced | 80,000,000 | |||
Target VIP | 10,000,000 | |||
Bristol Growth | 20,000,000 | |||
Risk Managed Balanced | 35,000,000 | |||
The Fund’s Board of Directors (the “Board”) periodically reallocates authorized shares among the Portfolios of the Fund and may authorize additional shares as deemed necessary. In its March 17, 2016 meeting, the Board approved a reallocation of authorized shares to the amounts shown above. This reallocation was necessary due to the shareholder-approved liquidation of the Money Market Portfolio on February 26, 2016.
Under the Fund’s organizational documents, its Officers and Directors are indemnified against certain liabilities arising out of the performance of their duties to the Fund. In addition, in the normal course of business, the Fund enters into contracts with its vendors and others that provide for general indemnifications. The Fund’s maximum exposure under these arrangements is unknown as this would involve future claims that may be made against the Fund. However, based on experience, the risk of loss to the Fund is expected to be remote.
| (2) | Significant Accounting Policies |
The following is a summary of significant accounting policies followed by the Fund in preparation of its Schedules of Investments:
Use of Estimates
The preparation of Schedules of Investments in conformity with U.S. generally accepted accounting principles (“U.S. GAAP”) requires management to make estimates and assumptions that affect the reported amounts of assets and liabilities and disclosure of contingent assets and liabilities at the date of the financial statements and the reported amounts of increases and decreases in net assets from operations during the reporting period. Actual results could differ from those estimates.
| 132 | (continued) |
| Ohio National Fund, Inc. |
Notes to Financial Statements (Continued) | June 30, 2016 (Unaudited) |
Security Valuation
Investments are valued using pricing procedures approved by the Board.
Fixed income instruments that mature in sixty days or less, and of sufficient credit quality, are valued at amortized cost. Amortized cost valuation involves valuing a security at its cost initially and thereafter amortizing to maturity any discounts or premiums on the level-yield method, regardless of the impact of fluctuating market interest rates on the value of the security. In these instances, amortized cost approximates fair value.
Investments, other than those securities aforementioned, are valued as follows:
Domestic equity securities that are traded on U.S. exchanges, other than Nasdaq Stock Market, are valued at the last trade price reported by the primary exchange of each security (4:00 pm Eastern Time for normal trading sessions). Domestic equity securities that are listed on the Nasdaq Stock Market are valued at the Nasdaq Official Closing Price (“NOCP”). Over-the-counter domestic equity securities are valued at the last trade price reported daily as of 4:00 pm Eastern Time (normal trading sessions). Over-the-counter traded ADRs may also be valued at an evaluated price based on the value of the underlying securities. If a domestic equity security is not traded on a particular day, the mean between the bid and ask prices reported at 4:00 pm Eastern Time (normal trading sessions) by the primary exchange will generally be used for valuation purposes. The principal sources for market quotations are independent pricing services that have been approved by the Board.
Fixed income securities that have a remaining maturity exceeding sixty days are generally valued at the bid price reported at 4:00 pm Eastern Time (normal trading sessions), as provided by independent pricing services approved by the Board. The last trade or last evaluated bid may be used if an evaluated bid price is not available.
U.S exchange-traded options are valued at the composite basis last sale price as reported to a Board-approved independent pricing service by the OPRA (Options Price Reporting Authority) at 4:15 pm Eastern Time (normal trading sessions). If there are no reported trades for a trading session, the evaluated composite basis bid price will generally be used for valuation purposes.
Shares of open-end mutual funds are valued at each fund’s last calculated net asset value per share.
Restricted securities, illiquid securities, or other investments for which market quotations or other observable market inputs are not readily available are valued at an estimate of value using methods determined in good faith by the Fund’s Pricing Committee under the supervision of the Board.
Foreign equity securities are initially priced at the reported close price of the exchange on which a security is primarily traded. Securities not traded on a particular day are valued at the mean between the last reported bid and ask quotes at daily close, or the last sale price when appropriate. The principal sources for market quotations are independent pricing services that have been approved by the Board.
Equity securities that are primarily traded on foreign exchanges, other than those with close times that are consistent with the normal 4:00 pm Eastern Time close of U.S. equity markets, are further subjected to fair valuation pricing procedures provided by an independent fair valuation service. The service provides data that can be used to estimate the price of a foreign issue that would prevail in a liquid market given market information available daily at 4:00 pm Eastern Time (normal trading sessions). Multiple factors may be considered in performing this valuation, including an issue’s local close price, relevant general and sector indices, currency fluctuations, and pricing of related depository receipts, exchange traded funds, and futures. The pricing procedures are performed for each individual security for which there is a fairly large degree of certainty that the local close price is not the liquid market price at the time of U.S. market close. The procedures are performed each day there is a change in a consistently used market index from the time of local close to the U.S. market close. Backtesting analysis is performed on a quarterly basis to monitor the effectiveness of these procedures. The testing is reviewed by management of the Fund as well as the Fund’s Board. Prior results have indicated that these procedures have been effective in reaching valuation objectives.
The differences between the aggregate cost and values of investments are reflected as unrealized appreciation or unrealized depreciation.
| 133 | (continued) |
| Ohio National Fund, Inc. |
Notes to Financial Statements (Continued) | June 30, 2016 (Unaudited) |
Pricing inputs used in the Fund’s determination of its investment values are categorized according to a three-tier hierarchy framework. The hierarchy is summarized in three broad levels:
| Level 1: | Quoted prices in active markets for identical securities. |
| Level 2: | Other significant observable inputs, including quoted prices for similar securities, interest rates, prepayment speeds, credit risk, etc. |
| Level 3: | Significant unobservable inputs, including the Fund’s own assumptions used to determine the value of securities. |
The following is a summary of the inputs used in valuing each of the Portfolio’s assets (liabilities) at value as of June 30, 2016:
Portfolio | Financial Instrument Type | Level 1 | Level 2 | Level 3 | ||||||||||
Equity | Common Stocks** | $ | 504,377,936 | $ | — | $ | — | |||||||
| Master Limited Partnerships** | 4,770,767 | — | — | |||||||||||
| Money Market Funds | 3,460,251 | — | — | |||||||||||
|
|
|
|
|
| |||||||||
| $ | 512,608,954 | $ | — | $ | — | |||||||||
|
|
|
|
|
| |||||||||
Bond | Corporate Bonds** | $ | — | $ | 158,107,099 | $ | — | |||||||
| Asset-Backed Securities** | — | 801,087 | — | |||||||||||
| U.S. Treasury Obligations | — | 533,574 | — | |||||||||||
| Warrants** | 1,109 | — | — | |||||||||||
| Money Market Funds | 2,735,514 | — | — | |||||||||||
|
|
|
|
|
| |||||||||
| $ | 2,736,623 | $ | 159,441,760 | $ | — | |||||||||
|
|
|
|
|
| |||||||||
Omni | Common Stocks** | $ | 36,681,801 | $ | — | $ | — | |||||||
| Corporate Bonds** | — | 11,154,303 | — | |||||||||||
| Asset-Backed Securities** | — | 89,009 | — | |||||||||||
| U.S. Treasury Obligations | — | 409,633 | — | |||||||||||
| Warrants** | 3,211 | — | — | |||||||||||
| Money Market Funds | 2,523,179 | — | — | |||||||||||
|
|
|
|
|
| |||||||||
| $ | 39,208,191 | $ | 11,652,945 | $ | — | |||||||||
|
|
|
|
|
| |||||||||
Capital Appreciation | Common Stocks** | $ | 393,441,371 | $ | 2,903,124 | $ | — | |||||||
| Money Market Funds | 22,437,775 | — | — | |||||||||||
|
|
|
|
|
| |||||||||
| $ | 415,879,146 | $ | 2,903,124 | $ | — | |||||||||
|
|
|
|
|
| |||||||||
International | Common Stocks** | $ | 24,668,293 | $ | 106,312,511 | $ | — | |||||||
| Preferred Stocks** | — | 916,579 | — | |||||||||||
| Money Market Funds | 10,780,500 | — | — | |||||||||||
|
|
|
|
|
| |||||||||
| $ | 35,448,793 | $ | 107,229,090 | $ | — | |||||||||
|
|
|
|
|
| |||||||||
| Foreign currency contracts | $ | (1,418,024 | ) | $ | — | $ | — | |||||||
|
|
|
|
|
| |||||||||
| Futures contracts | $ | (25,008 | ) | $ | — | $ | — | |||||||
|
|
|
|
|
| |||||||||
International Small-Mid Company | Common Stocks** | $ | 7,597,584 | $ | 52,407,581 | $ | — | |||||||
| Closed-End Mutual Funds | 1,328,580 | — | — | |||||||||||
| Money Market Funds | 2,974,116 | — | — | |||||||||||
|
|
|
|
|
| |||||||||
| $ | 11,900,280 | $ | 52,407,581 | $ | — | |||||||||
|
|
|
|
|
| |||||||||
| Foreign currency contracts | $ | 36,217 | $ | — | $ | — | ||||||||
|
|
|
|
|
| |||||||||
Aggressive Growth | Common Stocks** | $ | 51,071,490 | $ | — | $ | — | |||||||
| Commercial Paper** | — | 2,000,000 | — | |||||||||||
| Money Market Funds | 2,124,550 | — | — | |||||||||||
|
|
|
|
|
| |||||||||
| $ | 53,196,040 | $ | 2,000,000 | $ | — | |||||||||
|
|
|
|
|
| |||||||||
Small Cap Growth | Common Stocks** | $ | 213,337,450 | $ | 5,609,887 | $ | — | |||||||
| Master Limited Partnerships** | 5,040,923 | — | — | |||||||||||
| Commercial Paper** | — | 1,200,000 | — | |||||||||||
| Money Market Funds | 8,946,503 | — | — | |||||||||||
|
|
|
|
|
| |||||||||
| $ | 227,324,876 | $ | 6,809,887 | $ | — | |||||||||
|
|
|
|
|
| |||||||||
| 134 | (continued) |
| Ohio National Fund, Inc. |
Notes to Financial Statements (Continued) | June 30, 2016 (Unaudited) |
Portfolio | Financial Instrument Type | Level 1 | Level 2 | Level 3 | ||||||||||
Mid Cap Opportunity | Common Stocks** | $ | 71,694,706 | $ | — | $ | — | |||||||
| Warrants** | 3,520 | — | — | |||||||||||
| Money Market Funds | 2,706,500 | — | — | |||||||||||
|
|
|
|
|
| |||||||||
| $ | 74,404,726 | $ | — | $ | — | |||||||||
|
|
|
|
|
| |||||||||
S&P 500® Index | Common Stocks** | $ | 429,092,759 | $ | — | $ | — | |||||||
| Warrants** | 78 | — | — | |||||||||||
| Money Market Funds | 4,919,759 | — | — | |||||||||||
|
|
|
|
|
| |||||||||
| $ | 434,012,596 | $ | — | $ | — | |||||||||
|
|
|
|
|
| |||||||||
| Futures contracts | $ | 24,736 | $ | — | $ | — | ||||||||
|
|
|
|
|
| |||||||||
Strategic Value | Common Stocks** | $ | 276,699,868 | $ | 59,668,091 | $ | — | |||||||
| Money Market Funds | 7,973,230 | — | — | |||||||||||
|
|
|
|
|
| |||||||||
| $ | 289,031,060 | $ | 55,310,129 | $ | — | |||||||||
|
|
|
|
|
| |||||||||
High Income Bond | Corporate Bonds** | $ | — | $ | 189,840,446 | $ | — | |||||||
| Common Stocks** | — | — | 10,788 | |||||||||||
| Money Market Funds | 4,373,523 | — | — | |||||||||||
|
|
|
|
|
| |||||||||
| $ | 4,373,523 | $ | 189,840,446 | $ | 10,788 | |||||||||
|
|
|
|
|
| |||||||||
ClearBridge Small Cap | Common Stocks** | $ | 91,551,773 | $ | — | $ | — | |||||||
| Master Limited Partnerships** | 999,371 | — | — | |||||||||||
| Money Market Funds | 1,957,972 | — | — | |||||||||||
|
|
|
|
|
| |||||||||
| $ | 94,509,116 | $ | — | $ | — | |||||||||
|
|
|
|
|
| |||||||||
Nasdaq-100® Index | Common Stocks** | $ | 130,530,739 | $ | — | $ | — | |||||||
| Rights** | 730 | — | — | |||||||||||
| Money Market Funds | 3,891,117 | — | — | |||||||||||
|
|
|
|
|
| |||||||||
| $ | 134,422,586 | $ | — | $ | — | |||||||||
|
|
|
|
|
| |||||||||
| Futures contracts | $ | 3,802 | $ | — | $ | — | ||||||||
|
|
|
|
|
| |||||||||
Bristol | Common Stocks** | $ | 214,028,828 | $ | — | $ | — | |||||||
| Money Market Funds | 447,420 | — | — | |||||||||||
|
|
|
|
|
| |||||||||
| $ | 214,476,248 | $ | — | $ | — | |||||||||
|
|
|
|
|
| |||||||||
Bryton Growth | Common Stocks** | $ | 157,714,920 | $ | — | $ | — | |||||||
| Money Market Funds | 3,972,587 | — | — | |||||||||||
|
|
|
|
|
| |||||||||
| $ | 161,687,507 | $ | — | $ | — | |||||||||
|
|
|
|
|
| |||||||||
Balanced | Common Stocks** | $ | 471,630,437 | $ | — | $ | — | |||||||
| Corporate Bonds** | — | 166,265,053 | — | |||||||||||
| Preferred Stocks** | 8,553,649 | 10,675,000 | — | |||||||||||
| Trust Preferred Securities** | 8,778,586 | 24,898,867 | — | |||||||||||
| Asset-Backed / Mortgage-Backed Securities** | — | 43,025,237 | — | |||||||||||
| U.S. Treasury Obligations | — | 30,575,790 | — | |||||||||||
| Closed-End Mutual Funds | 46,528,956 | — | — | |||||||||||
| Open-End Mutual Funds | 3,891,843 | — | — | |||||||||||
| Exchange Traded Funds | 27,122,569 | — | — | |||||||||||
| Purchased Options | 4,683,000 | — | — | |||||||||||
| Money Market Funds | 54,673,924 | — | — | |||||||||||
|
|
|
|
|
| |||||||||
| $ | 625,862,964 | $ | 275,439,947 | $ | — | |||||||||
|
|
|
|
|
| |||||||||
| Written Options Outstanding | $ | (37,500 | ) | $ | — | $ | — | |||||||
|
|
|
|
|
| |||||||||
| 135 | (continued) |
| Ohio National Fund, Inc. |
Notes to Financial Statements (Continued) | June 30, 2016 (Unaudited) |
Portfolio | Financial Instrument Type | Level 1 | Level 2 | Level 3 | ||||||||||
Target VIP | Common Stocks** | $ | 42,347,898 | $ | — | $ | — | |||||||
| Money Market Funds | 924,364 | — | — | |||||||||||
|
|
|
|
|
| |||||||||
| $ | 43,272,262 | $ | — | $ | — | |||||||||
|
|
|
|
|
| |||||||||
Bristol Growth | Common Stocks** | $ | 116,146,109 | $ | — | $ | — | |||||||
| Money Market Funds | 769,154 | — | — | |||||||||||
|
|
|
|
|
| |||||||||
| $ | 116,915,263 | $ | — | $ | — | |||||||||
|
|
|
|
|
| |||||||||
Risk Managed Balanced | Common Stocks** | $ | 97,430,418 | $ | — | $ | — | |||||||
| Corporate Bonds** | — | 24,642,208 | — | |||||||||||
| Preferred Stocks** | 209,272 | 379,372 | — | |||||||||||
| Trust Preferred Securities** | 269,825 | 313,738 | — | |||||||||||
| Preferred Stock Depository Receipts** | 283,172 | 432,120 | — | |||||||||||
| Master Limited Partnerships** | 1,898,046 | — | — | |||||||||||
| Asset-Backed / Mortgage-Backed Securities** | — | 3,755,770 | — | |||||||||||
| U.S. Treasury Obligations | — | 21,533,167 | — | |||||||||||
| U.S. Government Agency Mortgage-Backed Securities | — | 15,838,093 | — | |||||||||||
| Purchased Options | 12,548,835 | 1,122,038 | — | |||||||||||
| Money Market Funds | 31,462,236 | — | — | |||||||||||
|
|
|
|
|
| |||||||||
| $ | 144,101,804 | $ | 68,016,506 | $ | — | |||||||||
|
|
|
|
|
| |||||||||
| Futures contracts | $ | 1,546,823 | $ | — | $ | — | ||||||||
|
|
|
|
|
| |||||||||
| ** | For detailed industry descriptions, see the accompanying Schedules of Investments. |
As stated above, the value assigned to the Fund’s foreign securities will, in most cases, not be the quoted or published prices of the investments on their respective primary markets or exchanges. Securities that are priced using fair value estimates are categorized as Level 2 in the fair value hierarchy, whereas securities that do not meet the established criteria are categorized as Level 1. The valuation of a foreign security from one valuation period to the next may result in a transfer between Levels 1 and 2 if the degree of certainty that the local close price is not the liquid market price at the time of U.S. market close is not similar for both periods. The Fund’s policy is to recognize transfers between fair value hierarchy levels at the reporting period end.
In the International Portfolio, there were four transfers of common stocks from Level 1 pricing at December 31, 2015 to Level 2 at June 30, 2016. The fair valuation service provider reported that those securities did not meet the minimum predictability threshold to be fair valued at December 31, 2015, whereas in the current period, the securities met the threshold to be fair valued. These securities are detailed in the table below.
Security Name | Value at December 31, 2015 | Value at June 30, 2016 | ||||||
Deutsche Pfandbriefbank AG | $ | 583,300 | $ | 472,578 | ||||
ABN AMRO Group NV | 512,159 | 1,225,782 | ||||||
ING Groep NV | 2,040,329 | 1,560,162 | ||||||
Intertrust NV | 917,075 | 929,567 | ||||||
| 136 | (continued) |
| Ohio National Fund, Inc. |
Notes to Financial Statements (Continued) | June 30, 2016 (Unaudited) |
In the International Small-Mid Company Portfolio, there were nine transfers of common stocks from Level 1 pricing at December 31, 2015 to Level 2 at June 30, 2016. The fair valuation service provider reported that those securities did not meet the minimum predictability threshold to be fair valued at December 31, 2015, whereas in the current period, the securities met the threshold to be fair valued. These securities are detailed in the table below.
Security Name | Value at December 31, 2015 | Value at June 30, 2016 | ||||||
Shawbrook Group PLC | $ | 1,205,366 | $ | 531,405 | ||||
Stock Spirits Group PLC | 504,550 | 523,258 | ||||||
Worldpay Group PLC | 457,235 | 320,038 | ||||||
Deutsche Pfandbriefbank AG | 648,089 | 692,709 | ||||||
Link Administration Holdings Ltd. | 524,347 | 591,760 | ||||||
Prada SpA | 531,751 | 305,966 | ||||||
ABN AMRO Group NV | 810,919 | 593,507 | ||||||
Intertrust NV | 433,151 | 561,798 | ||||||
Regina Miracle Intl Holdings Ltd. | 425,796 | 386,910 | ||||||
Also, in the International Small-Mid Company Portfolio, there was a transfer of a common stock from Level 2 pricing at December 31, 2015 to Level 1 pricing at June 30, 2016. This security was that Portfolio’s holding of Massimo Zanetti Beverage Group SpA common stock. The fair value service provider reported that particular security met the minimum predictability threshold to be fair valued at December 31, 2015, whereas in the current period, the security did not meet the threshold to be fair valued. The value of this holding was $627,542 and $495,535 at December 31, 2015 and June 30, 2016, respectively.
Below is a reconciliation that details the activity of securities in Level 3 during the six-month period ended June 30, 2016.
| High Income Bond | ||||
Beginning Balance – January 1, 2016 | $ | 8,419 | ||
Total gains or losses (realized/unrealized): | ||||
Included in earnings (or changes in net assets) | 2,369 | |||
Issuances | — | |||
Settlements | — | |||
Transfers out of Level 3 (due to availability of active market quotations or significant observable market inputs) | — | |||
Transfers into Level 3 (due to lack of active market quotations or significant observable inputs) | — | |||
|
| |||
Ending Balance – June 30, 2016 | $ | 10,788 | ||
|
| |||
The amount of total gains or losses for the period included in earnings (or changes in net assets) attributable to the change in unrealized gains or losses relating to assets still held at the reporting date | $ | 2,369 | ||
|
| |||
The following table presents additional information about valuation techniques and inputs used for investments that are measured at fair value and categorized within Level 3 at June 30, 2016:
Instrument | Valuation Technique Used | Unobservable inputs | Input Values | |||||
Lone Pine Resources Canada Ltd. (Common Stock) | Value of claim on the enterprise value of underlying company | Net enterprise value (in thousands) | $ | 172,860 | ||||
Share class claim on value | 25 | % | ||||||
| # of share class total shares (in thousands) | 24,990 | |||||||
Foreign Securities and Currency
The books and records of all the Portfolios are maintained in U.S. dollars. All investments and cash quoted in foreign currencies are valued daily in U.S. dollars on the basis of the foreign currency exchange rates provided by an independent source. These exchange rates are currently determined daily, at 4:00 pm Eastern Time for normal trading sessions. Purchases and sales of foreign-denominated investments are recorded at rates of exchange prevailing on the respective dates of such transactions.
| 137 | (continued) |
| Ohio National Fund, Inc. |
Notes to Financial Statements (Continued) | June 30, 2016 (Unaudited) |
The Fund may not fully isolate that portion of the results of operations resulting from changes in foreign exchange rates from fluctuations arising from changes in market prices on foreign currency-denominated investments. For the portion that is isolated, amounts are reflected in the Statements of Operations as other foreign currency related transactions. However, for tax purposes, the Fund does fully isolate the effect of fluctuations in foreign exchange rates when determining the gain or loss upon sale or maturity of such investments to the extent required by federal income tax regulations.
All Portfolios of the Fund may invest in securities of foreign issuers. The International and International Small-Mid Company Portfolios may be invested entirely in foreign securities. Investments in securities of foreign issuers, including investments in foreign companies through the use of depositary receipts, carry certain risks not ordinarily associated with investments in securities of domestic issuers. Such risks include future political and economic developments, and the possible imposition of exchange controls or other foreign governmental laws and restrictions. In addition, with respect to certain countries, there is the possibility of expropriation of assets, confiscatory taxation, political or social instability, or diplomatic developments that could adversely affect capital investment within those countries.
Restricted and Illiquid Securities
Restricted securities are those securities purchased through a private offering and cannot be resold to the general public without prior registration under the Securities Act of 1933 (“the 1933 Act”) or pursuant to the resale limitations provided by Rule 144A under the 1933 Act, or an exemption from the registration requirements of the 1933 Act. 144A securities are issued by corporations without registration in reliance on 1933 Act provisions allowing for the private resale of unregistered securities to qualified institutional buyers. Section 4(a)(2) commercial paper is issued pursuant to Section 4(a)(2) of the 1933 Act which exempts an issue from registration. This paper may be used to finance non-current transactions, such as acquisitions, stock repurchase programs, and other long-term assets. Investments by a portfolio in Rule 144A and Section 4(a)(2) securities could have the effect of decreasing the liquidity of a Portfolio during any period in which qualified institutional investors were no longer interested in purchasing these securities.
Typically, the restricted securities noted above are not considered illiquid. The criteria used to determine if a restricted security is illiquid includes frequency of trades and quotes, available dealers willing to make transactions, availability of market makers in the security, and the nature of the security and its trades. The Bond and Omni Portfolios may invest up to 10% of their respective assets in illiquid securities. Each of the other Portfolios of the Fund may invest up to 15% of its net assets in illiquid securities.
Investment Transactions and Related Income
For financial reporting purposes, investment transactions are accounted for on a trade date basis. For purposes of executing separate account shareholder transactions in the normal course of business, however, the Fund’s investment transactions are recorded no later than the first calculation on the first business day following the trade date in accordance with Rule 2a-4 of the 40 Act. Accordingly, differences between the net asset values for financial reporting and for executing separate account shareholder transactions may arise.
Dividend income is recognized on the ex-dividend date, except in the case of those Portfolios holding foreign securities, in which dividends are recorded as soon after the ex-dividend date as the Fund’s information agents become aware of such dividends. Interest income is accrued daily as earned and includes the amortization of premium and accretion of discount. Net realized gain or loss on investments and foreign exchange transactions are determined using the specific identification method.
Distributions to Shareholders and Federal Taxes
Distributions arising from net investment income and net capital gains from the Portfolios are declared and paid to shareholders periodically, as required for each of the Portfolios to continue to qualify as a regulated investment company pursuant to Subchapter M of the Internal Revenue Code. The Fund also fully or partially satisfies its distribution requirements by using consent dividends rather than cash distributions. The consent dividends, when authorized, become taxable to the shareholders as if they were paid in cash. The Fund has the intent to continue to comply with tax provisions pertaining to regulated investment companies and make distributions of taxable income, whether by cash or consent dividends, sufficient to relieve it from substantially all federal income and excise taxes. As such, no provisions for federal income or excise taxes have been recorded.
The character of income and realized capital gains distributions are determined in accordance with federal income tax regulations and may differ from net investment income and realized gains for financial reporting purposes. These “book/tax”
| 138 | (continued) |
| Ohio National Fund, Inc. |
Notes to Financial Statements (Continued) | June 30, 2016 (Unaudited) |
differences are either considered temporary or permanent in nature. To the extent these differences are permanent in nature they are reclassified within the composition of net assets; temporary differences do not require such reclassification. Distributions to shareholders that exceed taxable income and net taxable realized gains are reported as return of capital distributions.
The Fund’s management and its tax agent perform an affirmative evaluation of tax positions taken or expected to be taken in the course of preparing the Fund’s tax returns to determine whether it is more-likely-than-not (i.e. greater than 50-percent) that each tax position will be sustained upon examination by a taxing authority based on the technical merits of the position. A tax position that meets the more-likely-than-not recognition threshold is measured to determine the amount of benefit to recognize in the Schedules of Investments. Differences between tax positions taken in a tax return and amounts recognized in the Schedules of Investments will generally result in an increase in a liability for taxes payable (or a reduction of a tax refund receivable), including the recognition of any related interest and penalties as an operating expense. Implementation of the evaluation included a review of tax positions taken in tax years that remain subject to examination by all major tax jurisdictions, including federal tax and the state of Maryland (i.e., the last four tax year ends and the interim tax period since then). The determination has been made that there are no uncertain tax positions that would require the Portfolios to record a tax liability and, therefore, there is no impact to the Portfolios’ Schedules of Investments.
Expense Allocation
Expenses directly attributable to a Portfolio are charged to that Portfolio. Expenses that cannot be directly attributed to a Portfolio are allocated among all the benefited Portfolios on a basis of relative net assets or other appropriate method.
Foreign Withholding Taxes
Certain Portfolios in the Fund may be subject to taxes imposed by countries in which they invest with respect to their investments in issuers existing or operating in such countries. Such taxes are generally withheld based on income earned. These Portfolios accrue such taxes as the related income is earned.
Subsequent Events
Management has evaluated events and transactions through the date the financial statements were issued, for purposes of recognition or disclosure in these financial statements, and there are no subsequent events to report.
| (3) | Related Party and Other Transactions |
The Fund has an Investment Advisory Agreement with Ohio National Investments, Inc. (“ONI”), a wholly-owned subsidiary of ONLIC. Under the terms of this agreement, ONI provides portfolio management and investment advice to the Fund and administers its operations, subject to the supervision of the Fund’s Board. This agreement is renewed annually upon the approval by the Board. As compensation for its services, ONI receives advisory fees from the Fund calculated on the basis of each Portfolio’s average daily net assets and the following current schedule of Board-approved annualized fee breakpoints.
Equity |
| 0.79% of first $200 million |
| 0.74% of next $800 million |
| 0.70% over $1 billion |
Omni |
| 0.60% of first $100 million |
| 0.50% of next $150 million |
| 0.45% of next $250 million |
| 0.40% of next $500 million |
| 0.30% of next $1 billion |
| 0.25% over $2 billion |
International |
| 0.85% of first $100 million |
| 0.80% of next $100 million |
| 0.70% over $200 million |
Bond |
| 0.60% of first $100 million |
| 0.50% of next $150 million |
| 0.45% of next $250 million |
| 0.40% of next $500 million |
| 0.30% of next $1 billion |
| 0.25% over $2 billion |
Capital Appreciation |
| 0.80% of first $100 million |
| 0.75% of next $300 million |
| 0.65% of next $600 million |
| 0.60% over $1 billion |
International Small-Mid Company |
| 1.00% of first $100 million |
| 0.90% of next $100 million |
| 0.85% over $200 million |
| 139 | (continued) |
| Ohio National Fund, Inc. |
Notes to Financial Statements (Continued) | June 30, 2016 (Unaudited) |
Aggressive Growth |
| 0.80% of first $100 million |
| 0.75% of next $400 million |
| 0.70% over $500 million |
Mid Cap Opportunity |
| 0.85% of first $100 million |
| 0.80% of next $100 million |
| 0.75% of next $300 million |
| 0.70% over $500 million |
Strategic Value |
| 0.75% of first $100 million |
| 0.70% of next $400 million |
| 0.65% over $500 million |
ClearBridge Small Cap |
| 0.85% of first $200 million |
| 0.80% of next $300 million |
| 0.75% over $500 million |
Bristol |
| 0.80% of first $100 million |
| 0.70% of next $400 million |
| 0.65% over $500 million |
Balanced |
| 0.65% of first $200 million |
| 0.60% of next $300 million |
| 0.55% over $500 million |
Bristol Growth |
| 0.80% of first $100 million |
| 0.70% of next $400 million |
| 0.65% over $500 million |
Small Cap Growth |
| 0.80% of first $150 million |
| 0.75% of next $150 million |
| 0.70% of next $300 million |
| 0.65% over $600 million |
S&P 500® Index |
| 0.40% of first $100 million |
| 0.35% of next $150 million |
| 0.33% over $250 million |
High Income Bond |
| 0.75% of first $75 million |
| 0.70% of next $75 million |
| 0.65% of next $75 million |
| 0.60% over $225 million |
Nasdaq-100® Index |
| 0.40% of first $100 million |
| 0.35% of next $150 million |
| 0.33% over $250 million |
Bryton Growth |
| 0.85% of first $100 million |
| 0.75% of next $400 million |
| 0.70% over $500 million |
Target VIP |
| 0.60% of first $100 million |
| 0.55% of next $400 million |
| 0.50% over $500 million |
Risk Managed Balanced |
| 0.90% of first $500 million |
| 0.75% over $500 million |
Under the Investment Advisory Agreement, the Fund authorizes ONI to retain sub-advisers (“the Sub-Advisers”) for the Equity, Omni, International, Capital Appreciation, International Small-Mid Company, Aggressive Growth, Small Cap Growth, Mid Cap Opportunity, Strategic Value, High Income Bond, ClearBridge Small Cap, Bristol, Bryton Growth, Balanced, Target VIP, Bristol Growth, and Risk Managed Balanced Portfolios subject to the approval of the Board. ONI has entered into sub-advisory agreements with ClearBridge, LLC (“ClearBridge”), Suffolk Capital Management, LLC (“Suffolk”), Federated Global Investment Management Corp. (“Federated Global”), Jennison Associates LLC (“Jennison”), Janus Capital Management LLC (“Janus”), Goldman Sachs Asset Management, L.P. (“Goldman Sachs”), Federated Equity Management Company of Pennsylvania (“Federated Equity”), Federated Investment Management Company (“Federated Investment”), ICON Advisers, Inc. (“ICON”), First Trust Advisors L.P. (“First Trust”), and AnchorPath Financial, LLC (“AnchorPath”) to manage the investment of those Portfolios’ assets, subject to the supervision of ONI.
At a meeting held on March 17, 2016, the Board of Directors, including a majority of the Directors who are not “interested persons” of the Fund, approved sub-advisory agreements between ONI and Geode Capital Management, LLC (“Geode”) for the S&P 500® Index Portfolio and the Nasdaq-100® Index Portfolio. Effective May 2, 2016, the S&P 500® Index and Nasdaq-100® Index Portfolios were sub-advised by Geode. Prior to that date, the portfolio management of these two Portfolios was performed by ONI.
| 140 | (continued) |
| Ohio National Fund, Inc. |
Notes to Financial Statements (Continued) | June 30, 2016 (Unaudited) |
As compensation for their services, the Sub-Advisers receive from ONI a sub-advisory fee calculated on the basis of each of the aforementioned Portfolio’s average daily net assets and the following current Board-approved schedule of annualized fee breakpoints.
Equity (ClearBridge) |
| 0.40% of first $200 million |
| 0.38% over $200 million |
Capital Appreciation (Jennison) |
| 0.75% of first $10 million |
| 0.50% of next $30 million |
| 0.35% of next $25 million |
| 0.25% of next $335 million |
| 0.22% of next $600 million |
| 0.20% over $1 billion |
International Small-Mid Company (Federated Global) |
| 0.75% of first $100 million |
| 0.65% over $100 million |
Small Cap Growth (Janus) |
| 0.55% of first $150 million |
| 0.45% over $150 million |
S&P 500® Index (Geode)1 |
| 0.025% of first $100 million |
| 0.02% of next $150 million |
| 0.015% over $250 million |
High Income Bond (Federated Investment) |
| 0.50% of first $30 million |
| 0.40% of next $20 million |
| 0.30% of next $25 million |
| 0.25% over $75 million |
Nasdaq-100® Index (Geode)1 |
| 0.05% of first $100 million |
| 0.04% of next $150 million |
| 0.03% over $250 million |
Bryton Growth (Suffolk) |
| 0.50% of first $100 million |
| 0.45% of next $400 million |
| 0.40% over $500 million |
Target VIP (First Trust) |
| 0.35% of first $500 million |
| 0.25% over $500 million |
Risk Managed Balanced (Janus) |
| 0.35% of first $500 million |
| 0.25% over $500 million |
Risk Managed Balanced (AnchorPath) |
| 0.20% of first $500 million |
| 0.15% over $500 million |
Omni (Suffolk) |
| 0.30% of first $100 million |
| 0.25% of next $150 million |
| 0.225% of next $250 million |
| 0.20% of next $500 million |
| 0.15% of next $1 billion |
| 0.125% over $2 billion |
International (Federated Global) |
| 0.40% of first $200 million |
| 0.35% over $200 million |
Aggressive Growth (Janus) |
| 0.55% of first $100 million |
| 0.50% of next $400 million |
| 0.45% over $500 million |
Mid Cap Opportunity (Goldman Sachs) |
| 0.60% of first $100 million |
| 0.55% of next $100 million |
| 0.50% over $200 million |
Strategic Value (Federated Equity) |
| 0.50% of first $35 million |
| 0.35% of next $65 million |
| 0.25% over $100 million |
ClearBridge Small Cap (ClearBridge) |
| 0.55% of first $200 million |
| 0.50% over $200 million |
Bristol (Suffolk) |
| 0.45% of first $100 million |
| 0.40% of next $400 million |
| 0.35% over $500 million |
Balanced (ICON) |
| 0.40% of first $200 million |
| 0.35% of next $300 million |
| 0.30% over $500 million |
Bristol Growth (Suffolk) |
| 0.45% of first $100 million |
| 0.40% of next $400 million |
| 0.35% over $500 million |
| 1 | As noted above, the sub-advisory relationship for this Portfolio was effective May 2, 2016. |
Suffolk, the sub-adviser for the Omni, Bristol, Bryton Growth, and Bristol Growth Portfolios has an affiliation with ONI. Ohio National Financial Services, Inc. (ONFS) owns 100% of ONLIC, the parent company of ONI, and also owns 84.7% of the voting securities of Suffolk. There were no Fund liabilities payable to Suffolk at June 30, 2016 and fees paid to Suffolk are an expense of ONI, not of the Fund.
Pursuant to a service agreement among ONI, ONLIC, and the Fund, ONLIC has agreed to provide personnel and facilities to ONI on a cost-reimbursement basis. These personnel members include officers of the Fund. ONLIC also provides clerical and administrative services and such supplies and equipment as may be reasonably required in order for ONI to properly perform its advisory function pursuant to the Investment Advisory Agreement. ONLIC further performs duties to fulfill the transfer agent
| 141 | (continued) |
| Ohio National Fund, Inc. |
Notes to Financial Statements (Continued) | June 30, 2016 (Unaudited) |
function on behalf of the Fund. Performance of these duties by ONLIC and availability of facilities, personnel, supplies, and equipment does not represent an expense to the Fund in excess of the advisory fees paid to ONI.
Pursuant to the Investment Advisory Agreement between ONI and the Fund, if the total expenses applicable to any Portfolio during any calendar quarter (excluding taxes, brokerage commissions, interest expense and management fees) exceed 1%, on an annualized basis, evaluated quarterly, of such Portfolio’s average daily net asset value, ONI will reimburse the Portfolio for such excess expenses. There were no expense reimbursements associated with this agreement during the six-month period ended June 30, 2016.
The Investment Advisory Agreement allows for a portion of the expenses related to the Fund’s Chief Compliance Officer and staff to be incurred by the Fund and paid from the Fund to the Fund’s adviser, ONI. Pursuant to the service agreement among ONI, ONLIC, and the Fund, ONLIC has provided the personnel, services, and equipment necessary for the execution of the Fund’s regulation-mandated compliance function and ONI has reimbursed ONLIC for costs allocated to the Fund. For the six-month period ended June 30, 2016, the Fund incurred compliance expenses totaling $100,000, which is allocated to the Portfolios by equal dollar amounts. Expenses incurred by the Portfolios are reflected on the Statements of Operations as “Compliance expense”.
Each director of the Board is compensated based on an annual retainer fee of $105,000, paid quarterly. The Board chair receives an additional quarterly retainer fee of $3,750, the lead independent director of the Board receives an additional quarterly retainer fee of $3,125, and the Audit Committee chair receives an additional quarterly retainer fee of $1,250; each paid quarterly. For the six-month period ended June 30, 2016, directors’ compensation and reimbursement of director expenses by the Portfolios of the Fund totaled $284,988.
The accounting agent and custodian for the Fund is State Street Bank (Kansas City, MO and Boston, MA). For assets held outside of the U.S., State Street utilizes a foreign sub-custodian network that is subject to oversight and periodic approval of the Board.
| (4) | Capital Share Transactions |
Capital share transactions for the six-month period ended June 30, 2016, and the year ended December 31, 2015, respectively, were as follows:
| Equity | Bond | Omni | ||||||||||||||||||||||
| Six-Month Period Ended 6/30/16 | Year Ended 12/31/2015 | Six-Month Period Ended 6/30/16 | Year Ended 12/31/2015 | Six-Month Period Ended 6/30/16 | Year Ended 12/31/2015 | |||||||||||||||||||
Capital shares issued on sales | 751,283 | 4,185,136 | 1,500,810 | 2,899,766 | 621,627 | 881,341 | ||||||||||||||||||
Capital shares issued on reinvested dividends | — | 100,661 | — | — | — | 19,348 | ||||||||||||||||||
Capital shares redeemed | (1,331,348 | ) | (3,082,399 | ) | (1,914,368 | ) | (2,989,043 | ) | (578,935 | ) | (447,556 | ) | ||||||||||||
|
|
|
|
|
|
|
|
|
|
|
| |||||||||||||
Net increase/(decrease) | (580,065 | ) | 1,203,398 | (413,558 | ) | (89,277 | ) | 42,692 | 453,133 | |||||||||||||||
|
|
|
|
|
|
|
|
|
|
|
| |||||||||||||
| Capital Appreciation | International | International Small-Mid Company | ||||||||||||||||||||||
| Six-Month Period Ended 6/30/16 | Year Ended 12/31/2015 | Six-Month Period Ended 6/30/16 | Year Ended 12/31/2015 | Six-Month Period Ended 6/30/16 | Year Ended 12/31/2015 | |||||||||||||||||||
Capital shares issued on sales | 579,195 | 1,931,947 | 1,249,744 | 1,470,570 | 234,694 | 902,741 | ||||||||||||||||||
Capital shares issued on reinvested dividends | — | 99,144 | — | — | — | — | ||||||||||||||||||
Capital shares redeemed | (1,115,815 | ) | (2,228,176 | ) | (1,278,961 | ) | (2,644,069 | ) | (477,784 | ) | (756,199 | ) | ||||||||||||
|
|
|
|
|
|
|
|
|
|
|
| |||||||||||||
Net increase/(decrease) | (536,620 | ) | (197,085 | ) | (29,217 | ) | (1,173,499 | ) | (243,090 | ) | 146,542 | |||||||||||||
|
|
|
|
|
|
|
|
|
|
|
| |||||||||||||
| Aggressive Growth | Small Cap Growth | Mid Cap Opportunity | ||||||||||||||||||||||
| Six-Month Period Ended 6/30/16 | Year Ended 12/31/2015 | Six-Month Period Ended 6/30/16 | Year Ended 12/31/2015 | Six-Month Period Ended 6/30/16 | Year Ended 12/31/2015 | |||||||||||||||||||
Capital shares issued on sales | 771,060 | 1,299,408 | 924,733 | 3,225,048 | 213,898 | 476,708 | ||||||||||||||||||
Capital shares issued on reinvested dividends | — | — | — | — | — | — | ||||||||||||||||||
Capital shares redeemed | (619,525 | ) | (810,197 | ) | (1,208,325 | ) | (2,161,674 | ) | (420,379 | ) | (597,287 | ) | ||||||||||||
|
|
|
|
|
|
|
|
|
|
|
| |||||||||||||
Net increase/(decrease) | 151,535 | 489,211 | (283,592 | ) | 1,063,374 | (206,481 | ) | (120,579 | ) | |||||||||||||||
|
|
|
|
|
|
|
|
|
|
|
| |||||||||||||
| 142 | (continued) |
| Ohio National Fund, Inc. |
Notes to Financial Statements (Continued) | June 30, 2016 (Unaudited) |
| S&P 500® Index | Strategic Value | High Income Bond | ||||||||||||||||||||||
| Six-Month Period Ended 6/30/16 | Year Ended 12/31/2015 | Six-Month Period Ended 6/30/16 | Year Ended 12/31/2015 | Six-Month Period Ended 6/30/16 | Year Ended 12/31/2015 | |||||||||||||||||||
Capital shares issued on sales | 3,158,080 | 5,538,430 | 2,935,326 | 2,875,366 | 790,867 | 1,866,173 | ||||||||||||||||||
Capital shares issued on reinvested dividends | — | 263,658 | — | 689,188 | — | — | ||||||||||||||||||
Capital shares redeemed | (2,729,786 | ) | (4,681,641 | ) | (3,873,692 | ) | (5,446,104 | ) | (1,563,611 | ) | (3,682,767 | ) | ||||||||||||
|
|
|
|
|
|
|
|
|
|
|
| |||||||||||||
Net increase/(decrease) | 428,294 | 1,120,447 | (938,366 | ) | (1,881,550 | ) | (772,744 | ) | (1,816,594 | ) | ||||||||||||||
|
|
|
|
|
|
|
|
|
|
|
| |||||||||||||
| ClearBridge Small Cap | Nasdaq-100® Index | Bristol | ||||||||||||||||||||||
| Six-Month Period Ended 6/30/16 | Year Ended 12/31/2015 | Six-Month Period Ended 6/30/16 | Year Ended 12/31/2015 | Six-Month Period Ended 6/30/16 | Year Ended 12/31/2015 | |||||||||||||||||||
Capital shares issued on sales | 170,496 | 999,894 | 2,530,424 | 4,028,917 | 608,961 | 1,140,805 | ||||||||||||||||||
Capital shares issued on reinvested dividends | — | — | — | 73,804 | — | 52,545 | ||||||||||||||||||
Capital shares redeemed | (367,688 | ) | (490,656 | ) | (2,405,526 | ) | (3,548,870 | ) | (897,811 | ) | (2,197,197 | ) | ||||||||||||
|
|
|
|
|
|
|
|
|
|
|
| |||||||||||||
Net increase/(decrease) | (197,192 | ) | 509,238 | 124,898 | 553,851 | (288,850 | ) | (1,003,847 | ) | |||||||||||||||
|
|
|
|
|
|
|
|
|
|
|
| |||||||||||||
| Bryton Groth | Balanced | Target VIP | ||||||||||||||||||||||
| Six-Month Period Ended 6/30/16 | Year Ended 12/31/2015 | Six-Month Period Ended 6/30/16 | Year Ended 12/31/2015 | Six-Month Period Ended 6/30/16 | Year Ended 12/31/2015 | |||||||||||||||||||
Capital shares issued on sales | 1,159,418 | 1,667,540 | 5,053,352 | 9,929,846 | 84,780 | 241,439 | ||||||||||||||||||
Capital shares issued on reinvested dividends | — | — | — | 583,724 | — | 50,539 | ||||||||||||||||||
Capital shares redeemed | (1,011,176 | ) | (2,139,839 | ) | (3,040,328 | ) | (8,911,105 | ) | (315,347 | ) | (747,298 | ) | ||||||||||||
|
|
|
|
|
|
|
|
|
|
|
| |||||||||||||
Net increase/(decrease) | 148,242 | (472,299 | ) | 2,013,024 | 1,602,465 | (230,567 | ) | (455,320 | ) | |||||||||||||||
|
|
|
|
|
|
|
|
|
|
|
| |||||||||||||
| Bristol Growth | Risk Managed Balanced | |||||||||||||||||||||||
| Six-Month Period Ended 6/30/16 | Year Ended 12/31/2015 | Six-Month Period Ended 6/30/16 | Year Ended 12/31/2015 | |||||||||||||||||||||
Capital shares issued on sales | 366,048 | 2,488,528 | 6,113,012 | 13,089,618 | ||||||||||||||||||||
Capital shares issued on reinvested dividends | — | 28,330 | — | 34,878 | ||||||||||||||||||||
Capital shares redeemed | (539,838 | ) | (3,350,039 | ) | (1,236,597 | ) | (1,771,547 | ) | ||||||||||||||||
|
|
|
|
|
|
|
| |||||||||||||||||
Net increase/(decrease) | (173,790 | ) | (833,181 | ) | 4,876,415 | 11,352,949 | ||||||||||||||||||
|
|
|
|
|
|
|
| |||||||||||||||||
| (5) | Investment Transactions |
Cost of purchases and proceeds from sales of investments (excluding short-term and government securities) for the six-month period ended June 30, 2016 were as follows:
| Equity | Bond | Omni | Capital Appreciation | International | ||||||||||||||||
Cost of purchases | $ | 115,352,424 | $ | 48,703,253 | $ | 46,834,647 | $ | 114,262,974 | $ | 35,457,650 | ||||||||||
Proceeds from sales | $ | 138,916,827 | $ | 51,580,085 | $ | 47,663,973 | $ | 129,744,467 | $ | 47,440,387 | ||||||||||
| International Small-Mid Company | Aggressive Growth | Small Cap Growth | Mid Cap Opportunity | S&P 500® Index | ||||||||||||||||
Cost of purchases | $ | 8,603,195 | $ | 14,315,504 | $ | 16,993,462 | $ | 21,794,064 | $ | 43,719,644 | ||||||||||
Proceeds from sales | $ | 13,367,787 | $ | 12,921,770 | $ | 24,196,750 | $ | 28,729,995 | $ | 35,714,503 | ||||||||||
| Strategic Value | High Income Bond | ClearBridge Small Cap | Nasdaq-100® Index | Bristol | ||||||||||||||||
Cost of purchases | $ | 50,282,212 | $ | 27,022,761 | $ | 12,372,539 | $ | 9,775,670 | $ | 257,010,436 | ||||||||||
Proceeds from sales | $ | 61,590,809 | $ | 30,924,718 | $ | 17,509,881 | $ | 12,645,434 | $ | 260,323,605 | ||||||||||
| 143 | (continued) |
| Ohio National Fund, Inc. |
Notes to Financial Statements (Continued) | June 30, 2016 (Unaudited) |
| Bryton Growth | Balanced | Target VIP | Bristol Growth | Risk Managed Balanced | ||||||||||||||
Cost of purchases | $134,256,927 | $ | 401,797,357 | $ | 30,489,936 | $ | 100,955,776 | $ | 80,613,081 | |||||||||
Proceeds from sales | $128,056,656 | $ | 385,309,483 | $ | 33,690,278 | $ | 102,849,662 | $ | 38,573,801 | |||||||||
Cost of purchases and proceeds from sales of government securities for the six-month period ended June 30, 2016 were as follows:
| Bond | Omni | Balanced | Risk Managed Balanced | |||||||||||||
Cost of purchases | $ | 19,483,438 | $ | 403,953 | $ | 9,684,375 | $ | 35,908,950 | ||||||||
Proceeds from sales | $ | 20,125,449 | $ | 350,355 | $ | 20,134,673 | $ | 27,668,950 | ||||||||
| (6) | Financial Instruments |
The Fund’s Portfolios may trade in financial instruments with off-balance sheet risk for hedging purposes or, otherwise, in accordance with stated investing objectives. These financial instruments may include options, futures, and foreign currency contracts that may involve, to a varying degree, elements of risk in excess of the amounts recognized on financial statements.
Options
A Portfolio may buy and write (i.e., sell) call and put options. In writing call options, the Portfolio gives the purchaser of the call option the right to purchase the underlying securities from the Portfolio at a specified “exercise” price at any time prior to the expiration of the option, normally within nine months. A Portfolio writes a covered call option when it owns the underlying securities and an uncovered call option when it does not. In purchasing put options, a Portfolio pays the seller of the put option a premium for the right of the Portfolio to sell the underlying securities to the seller at a specified exercise price prior to the expiration of the option. When a Portfolio sells a put option, it has the obligation to buy, and the purchaser of the put the right to sell, the underlying security at the exercise price during the option period. Whenever a Portfolio has a written covered call option outstanding, the underlying securities will be segregated by the Custodian and held in an escrow account to assure that such securities will be delivered to the option holder if the option is exercised. While the underlying securities are subject to the option, the Portfolio remains the record owner of the securities, entitling it to receive dividends and to exercise any voting rights. Whenever a Portfolio has a written uncovered call option outstanding, it will segregate with the Custodian cash or liquid assets that, when added to the amounts deposited with the broker as margin, equal to the market value of the securities underlying the call option (but not less than the exercise price of the call option). To cover a written put option, the Portfolio writing the option deposits cash or liquid securities in a segregated account at the Custodian. In order to terminate its position as the writer or the purchaser of an option, the Portfolio may enter into a “closing” transaction, which is the purchase (if the Portfolio has written the option) or sale (if the Portfolio is the purchaser of the option) of an option on the same underlying securities and having the same exercise price and expiration date as the option previously written or purchased by the Portfolio.
When a Portfolio writes a put or call option, an amount equal to the premium received is included on the Statement of Assets and Liabilities as a liability. The amount of the liability is subsequently marked-to-market to reflect the current market value of the option. Such liability is subject to off balance sheet risks to the extent of any future increases in market value of the written options. If an option expires on its stipulated expiration date or if the Portfolio enters into a closing purchase transaction, a gain or loss is realized. If a written call option on an individual security is exercised, a gain or loss is realized for the sale of the underlying security, and the proceeds from the sale are increased by the premium originally received. If a written call option on a securities index is exercised, a gain or loss is realized as determined by the premium originally received, the exercise price and the market value of the index. If a written put option on an individual security is exercised, the cost of the security acquired is decreased by the premium originally received. When a Portfolio purchases a put or call option, an amount equal to the premium paid is included on the Portfolio’s Statement of Assets and Liabilities as an investment, and is subsequently marked-to-market to reflect the current market value of the option. If an option expires on the stipulated expiration date or if the Portfolio enters into a closing sale transaction, a gain or loss is realized. If a Portfolio exercises a call option on an individual security, the cost of the security acquired is increased by the premium paid for the call. If the Portfolio exercises a put option on an individual security, a gain or loss is realized from the sale of the underlying security, and the proceeds from such a sale are decreased by the premium originally paid. If the Portfolio exercises a put option on a security index, a gain or loss is realized as determined by the premium originally paid, the exercise price and the market value of the index.
| 144 | (continued) |
| Ohio National Fund, Inc. |
Notes to Financial Statements (Continued) | June 30, 2016 (Unaudited) |
The Balanced Portfolio wrote call options and purchased put options during the six-month period ended June 30, 2016. These instruments were used by the Portfolio to provide a hedge against equity price risk. During a period in which the prices of the Portfolio’s common stocks may decline, these instruments are designed to increase in value, thus providing price accumulation gains that partially offset the price accumulation losses of the common stocks in the Portfolio.
The Balanced Portfolio’s written call options are collateralized by cash and/or securities held by the Portfolio’s custodian under an Escrow Deposit Agreement between the custodian and the Options Clearing Corporation (“OCC”). Such collateral holdings are restricted from trading. The cash collateral or borrowings, if necessary, are included on the Statement of Assets and Liabilities. The securities pledged as collateral under the Escrow Deposit Agreement are noted as such on the Portfolio’s Schedule of Investments. Written and purchased options are non-income producing securities.
The number of option contracts written and the premiums received by the Balanced Portfolio for the six-month period ended June 30, 2016 were as follows:
| Number of Contracts | Premiums Received | |||||||
Options outstanding, beginning of period | 400 | $ | 544,685 | |||||
Options written | 1,650 | 2,273,999 | ||||||
Options exercised | — | — | ||||||
Options expired | — | — | ||||||
Options closed | (1,800 | ) | (2,749,014 | ) | ||||
|
|
|
| |||||
Options outstanding, end of period | 250 | $ | 69,670 | |||||
|
|
|
| |||||
Transactions involving purchased options by the Balanced Portfolio for the six-month period ended June 30, 2016 were: Cost of purchases: $14.3 million, Proceeds from sales: $5.9 million.
The Risk Managed Balanced Portfolio also purchased call and put options associated with the S&P 500 Index during the six-month period ended June 30, 2016. These instruments were used by the Risk Management Component of the Portfolio to provide for the Portfolio’s stated risk management strategy. Transactions involving purchased options by the Risk Managed Balanced Portfolio for the six-month period ended June 30, 2016 were: Cost of purchases: $9.5 million, Proceeds from sales: $4.6 million.
Futures Contracts
A Portfolio may buy or sell two kinds of financial futures contracts: stock index futures contracts and interest rate futures contracts. Stock index futures contracts are contracts developed by and traded on national commodity exchanges whereby the buyer will, on a specified future date, pay or receive a final cash payment equal to the difference between the actual value of the stock index on the last day of the contract and the value of the stock index established by the contract multiplied by the specific dollar amount set by the exchange. Futures contracts may be based on broad-based stock indexes such as the S&P 500 Index or on narrow-based stock indices. A particular index will be selected according to the Adviser’s investment strategy for the particular Portfolio. An interest rate futures contract is an agreement whereby one party agrees to sell and another party agrees to purchase a specified amount of a specified financial instrument (debt security) at a specified price at a specified date, time and place. Although interest rate futures contracts typically require actual future delivery of and payment for financial instruments, the contracts are usually closed out before the delivery date. A public market exists in interest rate futures contracts covering primarily the following financial instruments: U.S. Treasury bonds; U.S. Treasury notes; Government National Mortgage Association (GNMA) modified pass-through mortgage-backed securities; three-month U.S. Treasury bills; 90-day commercial paper; bank certificates of deposit; and Eurodollar certificates of deposit. U.S. futures contracts are traded on exchanges which have been designated “contract markets” by the Commodities Futures Trading Commission (“CFTC”) and must be executed through a futures commission merchant (“FCM”), or brokerage firm, which is a member of the relevant contract market. It is expected that futures contracts trading in additional financial instruments will be authorized.
The Fund, on behalf of each Portfolio, has filed with the National Futures Association, a notice claiming an exclusion from the definition of the term “commodity pool operator” under the Commodity Exchange Act, as amended, and the rules of the CFTC promulgated thereunder, with respect to each Portfolio’s operation. Accordingly, the Portfolios are not subject to registration or regulation as a commodity pool operator.
| 145 | (continued) |
| Ohio National Fund, Inc. |
Notes to Financial Statements (Continued) | June 30, 2016 (Unaudited) |
The buyer or seller of a futures contract is not required to deliver or pay for the underlying instrument unless the contract is held until the delivery date. However, both the buyer and seller are required to deposit “initial margin” for the benefit of the broker when the contract is entered into. Initial margin deposits are equal to a percentage of the contract’s value, as set by the exchange on which the contract is traded, and are similar to good faith deposits or performance bonds.
Unlike margin extended by a securities broker, initial margin payments do not constitute purchasing securities on margin for purposes of a Portfolio’s investment limitations. A Portfolio, its futures commission merchant and the Custodian retain control of the initial margin until the contract is liquidated. If the value of either party’s position declines, the party on the side of the declining position will be required to make additional “variation margin” payments to settle the change in value on a daily basis. The party that has a gain may be entitled to receive all or a portion of this amount. In the event of the bankruptcy of the FCM that holds margin on behalf of a Portfolio, the Portfolio may be entitled to return of margin owed to the Portfolio only in proportion to the amount received by the FCM’s other customers. ONI and the Sub-Advisers will attempt to minimize this risk by carefully monitoring the creditworthiness of the FCMs with which the Portfolios do business. In addition to the margin restrictions discussed above, transactions in futures contracts and options on futures contracts may involve the segregation of funds pursuant to requirements imposed by the SEC. Under those requirements, where a Portfolio has a long position in a futures contract or sells a put option, it will be required to establish a segregated account (not with an FCM or broker) containing cash or certain liquid assets equal to the purchase price of the contract or the exercise price of the option (less any margin on deposit). For a short position in futures contacts held by a Portfolio or call options sold by a Portfolio, those requirements mandate the establishment of a segregated account (not with a futures commission merchant or broker) containing cash or certain liquid assets that, when added to the amounts deposited as margin, equal the market value of the instruments underlying the futures contracts or call options. However, segregation of assets is not required if a Portfolio “covers” its position.
At June 30, 2016, there were outstanding futures contracts in the Fund’s Portfolios. Details of these contracts are as follows:
International
Type | Description | Expiration | Number of Contracts | Contract at Value | Initial Contract Amount | Unrealized Appreciation (Depreciation) | Variation Margin Receivable (Payable) | |||||||||||||||
Long | Borsa Istanbul BIST 30 Index Contracts (Turkey) | August 31, 2016 | 538 | $ | 1,791,775 | $ | 1,816,783 | $ | (25,008 | ) | $ | (1,863 | ) | |||||||||
|
|
|
|
|
|
|
| |||||||||||||||
S&P 500® Index
Type | Description | Expiration | Number of Contracts | Contract at Value | Initial Contract Amount | Unrealized Appreciation (Depreciation) | Variation Margin Receivable (Payable) | |||||||||||||||
Long | CME E-mini S&P 500 Contracts (United States) | September 16, 2016 | 53 | $ | 5,539,030 | $ | 5,514,294 | $ | 24,736 | $ | 24,835 | |||||||||||
|
|
|
|
|
|
|
| |||||||||||||||
Nasdaq-100® Index
Type | Description | Expiration | Number of Contracts | Contract at Value | Initial Contract Amount | Unrealized Appreciation (Depreciation) | Variation Margin Receivable (Payable) | |||||||||||||||
Long | CME E-mini Nasdaq-100 Contracts (United States) | September 16, 2016 | 52 | $ | 4,583,280 | $ | 4,579,478 | $ | 3,802 | $ | 3,885 | |||||||||||
|
|
|
|
|
|
|
| |||||||||||||||
| 146 | (continued) |
| Ohio National Fund, Inc. |
Notes to Financial Statements (Continued) | June 30, 2016 (Unaudited) |
Risk Managed Balanced
Type | Description | Expiration | Number of Contracts | Contract at Value | Initial Contract Amount | Unrealized Appreciation (Depreciation) | Variation Margin Receivable (Payable) | |||||||||||||
Long | CME E-mini S&P 500 Contracts (United States) | September 16, 2016 | 281 | $ 29,367,310 | $ | 28,352,694 | $ | 1,014,616 | ||||||||||||
Long | 10-Year U.S. Treasury Note Contracts (United States) | September 21, 2016 | 876 | 116,494,313 | 115,962,106 | 532,207 | ||||||||||||||
|
|
|
|
| ||||||||||||||||
| $145,861,623 | $ | 144,314,800 | $ | 1,546,823 | $ | 297,887 | ||||||||||||||
|
|
|
|
|
|
| ||||||||||||||
A portion of the International Portfolio’s cash holdings, as noted on the Portfolio’s Schedule of Investments, was pledged at June 30, 2016 as collateral for the Portfolio’s contracts. These futures contracts were executed for the purpose of increasing exposure to an attractive equities market, beyond that evidenced by the Portfolio’s investment in common stocks, while maintaining a significant cash balance that could be used for potentially higher-than-average shareholder transactions. There were other index futures contracts that were executed and closed in the International Portfolio during the six-month period ended June 30, 2016. Those contracts were executed for similar purposes as the contracts outstanding at June 30, 2016. For the six-month period ended June 30, 2016, the notional values of futures contracts opened and closed prior to contract settlement date by the Portfolio were $13.8 million and $16.0 million, respectively.
Although there were no outstanding futures contracts in the International Small-Mid Company Portfolio at June 30, 2016, there were futures contracts that were executed in that Portfolio during the six-month period ended June 30, 2016. Those contracts were also executed for the purpose of increasing exposure to an attractive equities market, beyond that evidenced by the Portfolio’s investment in common stocks, while maintaining a significant cash balance that could be used for potentially higher-than-average shareholder transactions. For the six-month period ended June 30, 2016, the notional values of futures contracts opened and closed prior to contract settlement date by the Portfolio were $0.7 million and $1.5 million, respectively.
Portions of the S&P 500® Index Portfolio’s cash holdings, as noted on the Portfolio’s Schedule of Investments, were pledged at June 30, 2016 as collateral for the Portfolio’s contracts. These futures contracts were used by the Portfolio for the purpose of gaining equity exposure for cash and cash equivalents, thereby seeking to lessen a performance difference between the Portfolio and the benchmark index. There were other index futures contracts that were executed and closed in the S&P 500® Index during the six-month period ended June 30, 2016. Those contracts were executed for similar purposes as the contracts outstanding at June 30, 2016. For the six-month period ended June 30, 2016, the notional values of futures contracts opened and closed prior to contract settlement date by the Portfolio were $13.5 million and $8.0 million, respectively.
Portions of the Nasdaq-100® Index Portfolio’s cash holdings, as noted on the Portfolio’s Schedule of Investments, were pledged at June 30, 2016 as collateral for the Portfolio’s contracts. These futures contracts were used by the Portfolio for the purpose of gaining equity exposure for cash and cash equivalents, thereby seeking to lessen a performance difference between the Portfolio and the benchmark index. There were other index futures contracts that were executed and closed in the Nasdaq-100® Index Portfolio during the six-month period ended June 30, 2016. Those contracts were executed for similar purposes as the contracts outstanding at June 30, 2016. For the six-month period ended June 30, 2016, the notional values of futures contracts opened and closed prior to contract settlement date by the Portfolio were $9.9 million and $5.3 million, respectively.
Portions of the Risk Managed Balanced Portfolio’s securities and cash holdings, as noted on the Portfolio’s Schedule of Investments, were pledged at June 30, 2016 as collateral for the Portfolio’s contracts. These futures contracts were used by the Portfolio to provide for the Portfolio’s stated risk management strategy. There were other index futures contracts that were executed and closed in the Risk Managed Balanced Portfolio during the six-month period ended June 30, 2016. Those contracts were executed for similar purposes as the contracts outstanding at June 30, 2016. For the six-month period ended June 30, 2016, the notional values of futures contracts opened and closed prior to contract settlement date by the Portfolio were $446.1 million and $411.1 million, respectively.
| 147 | (continued) |
| Ohio National Fund, Inc. |
Notes to Financial Statements (Continued) | June 30, 2016 (Unaudited) |
Foreign Currency Contracts
In order to hedge against changes in the exchange rates of foreign currencies in relation to the U.S. dollar, each Portfolio may engage in forward foreign currency contracts, foreign currency options and foreign currency futures contracts in connection with the purchase, sale or ownership of a specific security. The International Portfolio, International Small-Mid Company Portfolio, Strategic Value Portfolio and High Income Bond Portfolio may engage in non-hedging related transactions to implement their investment strategies.
The Portfolios generally conduct their foreign currency exchange transactions on a spot (i.e., cash) basis at the spot rate prevailing in the foreign exchange currency market. When a Portfolio purchases or sells a security denominated in or exposed to a foreign currency, it may enter into a forward foreign currency contract (“forward contract”) for the purchase or sale, for a fixed amount of dollars, of the amount of currency involved in the underlying security transaction. A forward contract involves an obligation to purchase or sell a specific currency at a future date, which may be any fixed number of days from the date of the contract agreed upon by the parties, at a price set at the time of the contract. In this manner, a Portfolio may obtain protection against a possible loss resulting from an adverse change in the relationship between the U.S. dollar and the foreign currency during the period between the date the security is purchased or sold and the date upon which payment is made or received. Although such contracts tend to minimize the risk of loss due to the decline in the value of the hedged currency, at the same time they tend to limit any potential gain which might result should the value of such currency increase.
Forward contracts are traded in the interbank market conducted directly between currency traders (usually large commercial banks) and their customers. Generally a forward contract has no deposit requirement, and no commissions are charged. Although foreign exchange dealers do not charge a fee for conversion, they do realize a profit based on the difference between the prices at which they buy and sell various currencies. When the Portfolio manager believes that the currency of a particular foreign country may suffer a substantial decline against the U.S. dollar, a Portfolio may enter into a forward contract to sell, for a fixed amount of dollars, the amount of foreign currency approximating the value of some or all of that Portfolio’s securities denominated in or exposed to such foreign currency. No Portfolio will enter into such forward contracts or maintain a net exposure to such contracts where the consummation of the contracts would obligate the Portfolio to deliver an amount of foreign currency in excess of the value of its assets denominated in or exposed to that currency. At the consummation of a forward contract for delivery by a Portfolio of a foreign currency, the Portfolio may either make delivery of the foreign currency or terminate its contractual obligation to deliver the foreign currency by purchasing an offsetting contract obligating it to purchase, at the same maturity date, the same amount of the foreign currency. If the Portfolio chooses to make delivery of the foreign currency, it may be required to obtain such currency through the sale of its securities denominated in such currency or through conversion of other Portfolio assets into such currency. It is impossible to forecast the market value of Portfolio securities at the expiration of the forward contract. Accordingly, it may be necessary for the Portfolio to purchase additional foreign currency on the spot market (and bear the expense of such purchase) if the market value of the security is less than the amount of foreign currency the Portfolio is obligated to deliver, and if a decision is made to sell the security and make delivery of the foreign currency. Conversely, it may be necessary for the Portfolio to sell on the spot market some of the foreign currency received on the sale of its hedged security if the security’s market value exceeds the amount of foreign currency the Portfolio is obligated to deliver.
If the Portfolio retains the hedged security and engages in an offsetting transaction, it will incur a gain or loss to the extent that there has been movement in spot or forward contract prices. If a Portfolio engages in an offsetting transaction, it may subsequently enter into a new forward contract to sell the foreign currency. Should forward prices decline during the period between the Portfolio’s entering into a forward contract for the sale of a foreign currency and the date it enters into an offsetting contract for the purchase of the foreign currency, the Portfolio will realize a gain to the extent the price of the currency it has agreed to sell exceeds the price of the currency it has agreed to purchase. Should forward prices increase, the Portfolio will suffer a loss to the extent the price of the currency it has agreed to purchase exceeds the price of the currency it has agreed to sell.
Buyers and sellers of foreign currency options and futures contracts are subject to the same risks previously described with respect to options and futures generally. In addition, settlement of currency options and futures contracts with respect to most currencies must occur at a bank located in the issuing nation. The ability to establish and close out positions on such options is subject to the maintenance of a liquid market that may not always be available. Currency rates may fluctuate based on political considerations and governmental actions as opposed to purely economic factors.
| 148 | (continued) |
| Ohio National Fund, Inc. |
Notes to Financial Statements (Continued) | June 30, 2016 (Unaudited) |
Predicting the movements of foreign currency in relation to the U.S. dollar is difficult and requires different skills than those necessary to predict movements in the securities market. There is no assurance that the use of foreign currency hedging transactions can successfully protect a Portfolio against loss resulting from the movements of foreign currency in relation to the U.S. dollar. In addition, it must be remembered that these methods of protecting the value of a Portfolio’s securities against a decline in the value of a currency does not eliminate fluctuations in the underlying prices of the securities. It simply establishes a rate of exchange which can be achieved at some future point in time. Additionally, although such contracts tend to minimize the risk of loss due to the decline in the value of the hedged currency, at the same time they tend to limit any potential gain which might result should the value of such currency increase.
Foreign currency contracts were executed in the International and International Small-Mid Company Portfolios in order to mitigate the effect that exchange rate volatility had on the valuation of the Portfolios’ investments that were either significantly under-weighted or over-weighted in relation to the Portfolios’ respective benchmark indices. The International Portfolio was under-weighted in equity investments within the United Kingdom, Switzerland and Australia and, therefore, executed contracts to buy the British Pound, Swiss Franc and Australian Dollar in order to mitigate the effect that volatility in those exchange rates (in relation to the U.S. dollar) might otherwise have on relative performance. Likewise, the International Portfolio was over-weighted in equity investments within the member states of the European Union and, therefore, executed contracts to sell the Euro in order to mitigate the effect that volatility in that exchange rate might otherwise have on relative performance. The International Small-Mid Company Portfolio was over-weighted in equity investments within the United Kingdom and the member states of the European Union and, therefore, executed contracts to sell the British Pound and the Euro in order to mitigate the effect that volatility in those exchange rates might otherwise have on relative performance. The Portfolios later entered into contracts to effectively exit the entire amount, or portions, of the original contracts prior to stated delivery dates. These contracts were executed to lock in gains that resulted from original transactions, to mitigate losses when economic conditions were perceived to become undesirable for the original contracts, or as investment over-weights or under-weights were reduced in the Portfolios.
The Portfolios entered into other foreign currency contracts during the period for similar benchmark performance hedging purposes. For the six-month period ended June 30, 2016, the notional value of foreign currency contracts executed by the International Portfolio were approximately $71.0 million for currencies bought and approximately $97.0 million for currencies sold. For the six-month period ended June 30, 2016, the notional value of foreign currency contracts executed by the International Small-Mid Company Portfolio were approximately $14.4 million for currencies bought and approximately $14.8 million for currencies sold.
The values and financial statement effects of derivative instruments that were not accounted for as hedging instruments as of, and for the six-month period ended June 30, 2016, were as follows:
Portfolio | Instrument | Primary Risk Type | Value-Asset Derivatives | Value-Liability Derivatives | Location on Statements of Assets and Liabilities | |||||||||||
International | Contracts to buy foreign currencies | Currency exchange rate | $ | 27,491,400 | $ | (28,897,164 | ) | (1 | ) | |||||||
|
|
|
| |||||||||||||
Contracts to sell foreign currencies | Currency exchange rate | $ | 33,574,322 | $ | (33,586,582 | ) | (1 | ) | ||||||||
|
|
|
| |||||||||||||
Futures contracts | Equity price | $ | 1,791,775 | $ | (1,816,783 | ) | (2 | ) | ||||||||
|
|
|
| |||||||||||||
International Small-Mid Company | Contracts to buy foreign currencies | Currency exchange rate | $ | 8,055,676 | $ | (8,664,302 | ) | (1 | ) | |||||||
|
|
|
| |||||||||||||
Contracts to sell foreign currencies | Currency exchange rate | $ | 18,035,571 | $ | (17,390,728 | ) | (1 | ) | ||||||||
|
|
|
| |||||||||||||
S&P 500® Index | Futures contracts | Equity price | $ | 5,539,030 | $ | (5,514,294 | ) | (2 | ) | |||||||
|
|
|
| |||||||||||||
Nasdaq-100® Index | Futures contracts | Equity price | $ | 4,583,280 | $ | (4,579,478 | ) | (2 | ) | |||||||
|
|
|
| |||||||||||||
| 149 | (continued) |
| Ohio National Fund, Inc. |
Notes to Financial Statements (Continued) | June 30, 2016 (Unaudited) |
Portfolio | Instrument | Primary Risk Type | Value-Asset Derivatives | Value-Liability Derivatives | Location on Statements of Assets and Liabilities | |||||||||||
Balanced | Purchased options | Equity price | $ | 4,683,000 | $ | — | (3 | ) | ||||||||
|
|
|
| |||||||||||||
Written options | Equity price | $ | — | $ | (37,500 | ) | (4 | ) | ||||||||
|
|
|
| |||||||||||||
Risk Managed Balanced | Purchased options | Equity price | $ | 13,670,873 | $ | — | (3 | ) | ||||||||
|
|
|
| |||||||||||||
Futures contracts | Equity price | $ | 145,861,623 | $ | (144,314,800 | ) | (2 | ) | ||||||||
|
|
|
| |||||||||||||
| (1) | Net unrealized appreciation/(depreciation) on foreign currency contacts. |
| (2) | Net unrealized appreciation/(depreciation) on futures contracts. The amounts represent the cumulative appreciation/(depreciation) of these futures contracts as reported in the Schedules of Investments. Only the current day’s variation margin is reported within the Statements of Assets and Liabilities as Variation margin receivable or payable on futures contracts. |
| (3) | Investments in securities, at value. |
| (4) | Options written, at value. |
Portfolio | Instrument | Risk Type | Realized Gain (Loss) on Derivatives Recognized in Income | Change in Unrealized Appreciation/ Depreciation on Derivatives Recognized in Income | Location on Statements of Operations | |||||||||||
International | Foreign currency contracts | Currency exchange rate | $ | (2,479,869 | ) | $ | (1,271,497 | ) | (1 | ),(2) | ||||||
|
|
|
| |||||||||||||
Futures contracts | Equity price | $ | (357,875 | ) | $ | 99,307 | (3 | ),(4) | ||||||||
|
|
|
| |||||||||||||
International Small-Mid Company | Foreign currency contracts | Currency exchange rate | $ | 391,048 | $ | (426,893 | ) | (1 | ),(2) | |||||||
|
|
|
| |||||||||||||
Futures contracts | Equity price | $ | (135,475 | ) | $ | 20,803 | (3 | ),(4) | ||||||||
|
|
|
| |||||||||||||
S&P 500® Index | Futures contracts | Equity price | $ | 90,746 | $ | 24,736 | (3 | ),(4) | ||||||||
|
|
|
| |||||||||||||
Nasdaq-100® Index | Futures contracts | Equity price | $ | 58,276 | $ | 3,802 | (3 | ),(4) | ||||||||
|
|
|
| |||||||||||||
Balanced | Purchased options | Equity price | $ | (5,689,570 | ) | $ | (161,501 | ) | (5 | ), (6) | ||||||
|
|
|
| |||||||||||||
Written options | Equity price | $ | (2,084,331 | ) | $ | (140,515 | ) | (7 | ),(8) | |||||||
|
|
|
| |||||||||||||
Risk Managed Balanced | Futures contracts | Equity price | $ | 1,416,196 | $ | 1,455,396 | (3 | ),(4) | ||||||||
|
|
|
| |||||||||||||
Purchased options | Equity price | $ | (416,041 | ) | $ | 1,047,148 | (5 | ),(6) | ||||||||
|
|
|
| |||||||||||||
| (1) | Net realized gain (loss) on foreign currency contracts. |
| (2) | Change in unrealized appreciation/(depreciation) on foreign currency contracts. |
| (3) | Net realized gain (loss) on futures contracts. |
| (4) | Change in unrealized appreciation/(depreciation) on futures contracts. |
| (5) | Net realized gain (loss) on investments. |
| (6) | Change in unrealized appreciation/(depreciation) on investments. |
| (7) | Net realized gain (loss) on written options. |
| (8) | Change in unrealized appreciation/(depreciation) on written options. |
| 150 | (continued) |
| Ohio National Fund, Inc. |
Notes to Financial Statements (Continued) | June 30, 2016 (Unaudited) |
The Portfolios may enter into International Swaps and Derivatives Association, Inc. Master Agreements (“ISDA Master Agreement”) or similar agreements with their derivative contract counterparties whereby the Portfolios may, under certain circumstances, offset with the counterparty certain derivative financial instruments’ payables and/or receivables and create one single net payment. Under certain of the ISDA Master Agreements in place at June 30, 2016, the Portfolios are subject to master netting agreements (“MNA”) that allows for amounts owed between each Portfolio and the counterparty to their transactions to be netted. The party that has the larger payable pays the excess of the larger amount over the smaller amount to the other party. The MNAs do not apply to amounts owed to or from different counterparties; further, certain of the MNAs limit offsetting for forward foreign currency contracts to amounts owed in the same currency and on the same exchange date.
For financial reporting purposes, the Portfolios offset derivative assets and liabilities that are subject to netting arrangements in the Statement of Assets and Liabilities.
Contracts Subject to Master Netting Agreements:
International
Counterparty | Currency | Exchange Date | Derivative Liability Subject to a MNA by Counterparty | Derivative Asset Available for Offset | Net Liability presented in the Statement of Assets and Liabilities | |||||||||||
Goldman Sachs Bank USA | Australian Dollar | July 28, 2016 | $ | (134,335 | ) | $ | — | $ | (134,335 | ) | ||||||
Goldman Sachs Bank USA | Australian Dollar | July 28, 2016 | (67,166 | ) | — | (67,166 | ) | |||||||||
Goldman Sachs Bank USA | British Pound | July 28, 2016 | (662,378 | ) | — | (662,378 | ) | |||||||||
Goldman Sachs Bank USA | British Pound | July 28, 2016 | (564,817 | ) | — | (564,817 | ) | |||||||||
Goldman Sachs Bank USA | British Pound | July 28, 2016 | (70,205 | ) | — | (70,205 | ) | |||||||||
Goldman Sachs Bank USA | British Pound | July 28, 2016 | (61,521 | ) | — | (61,521 | ) | |||||||||
International Small-Mid Company
Counterparty | Currency | Exchange Date | Derivative Asset Subject to a MNA by Counterparty | Derivative Liability Available for Offset | Net Asset presented in the Statement of Assets and Liabilities | |||||||||||
Barclays Bank PLC Wholesale | Euro | September 15, 2016 | $ | 41,115 | $ | (34,996 | ) | $ | 6,119 | |||||||
Barclays Bank PLC Wholesale | British Pound | September 15, 2016 | 149,608 | (149,608 | ) | — | ||||||||||
JPMorgan Chase Bank, N.A. | British Pound | September 15, 2016 | 169,914 | (169,914 | ) | — | ||||||||||
JPMorgan Chase Bank, N.A. | British Pound | September 15, 2016 | 131,446 | (112,797 | ) | 18,649 | ||||||||||
JPMorgan Chase Bank, N.A. | British Pound | July 28, 2016 | 9,184 | — | 9,184 | |||||||||||
JPMorgan Chase Bank, N.A. | British Pound | September 15, 2016 | 126,304 | — | 126,304 | |||||||||||
Counterparty | Currency | Exchange Date | Derivative Liability Subject to a MNA by Counterparty | Derivative Asset Available for Offset | Net Liability presented in the Statement of Assets and Liabilities | |||||||||||
Barclays Bank PLC Wholesale | Euro | September 15, 2016 | $ | (34,996 | ) | $ | 34,996 | $ | — | |||||||
Barclays Bank PLC Wholesale | British Pound | September 15, 2016 | (290,919 | ) | 149,608 | (141,311 | ) | |||||||||
JPMorgan Chase Bank, N.A. | British Pound | September 15, 2016 | (282,711 | ) | 282,711 | — | ||||||||||
| 151 | (continued) |
| Ohio National Fund, Inc. |
Notes to Financial Statements (Continued) | June 30, 2016 (Unaudited) |
| (7) | Federal Income Tax Information |
The cost basis for Federal income tax purposes may differ from the cost basis for financial reporting purposes. The table below details the unrealized appreciation (depreciation) and aggregate cost of securities at June 30, 2016 for Federal income tax purposes.
| Equity | Bond | Omni | Capital Appreciation | International | International Small-Mid Company | |||||||||||||||||||
Gross unrealized: | ||||||||||||||||||||||||
Appreciation | $ | 44,305,660 | $ | 8,334,056 | $ | 3,062,317 | $ | 33,530,976 | $ | 11,851,878 | $ | 11,835,649 | ||||||||||||
Depreciation | (38,941,216 | ) | (1,885,288 | ) | (1,476,573 | ) | (34,081,265 | ) | (15,347,260 | ) | (9,310,417 | ) | ||||||||||||
|
|
|
|
|
|
|
|
|
|
|
| |||||||||||||
Net unrealized: | ||||||||||||||||||||||||
Appreciation (Depreciation) | $ | 5,364,444 | $ | 6,448,768 | $ | 1,585,744 | $ | (550,289 | ) | $ | (3,495,382 | ) | $ | 2,525,232 | ||||||||||
|
|
|
|
|
|
|
|
|
|
|
| |||||||||||||
Aggregate cost of securities: | $ | 507,244,510 | $ | 155,729,615 | $ | 49,275,392 | $ | 419,332,559 | $ | 146,148,258 | $ | 61,782,629 | ||||||||||||
|
|
|
|
|
|
|
|
|
|
|
| |||||||||||||
| Aggressive Growth | Small Cap Growth | Mid Cap Opportunity | S&P 500® Index | Strategic Value | High Income Bond | |||||||||||||||||||
Gross unrealized: | ||||||||||||||||||||||||
Appreciation | $ | 8,001,536 | $ | 35,890,048 | $ | 11,593,862 | $ | 149,423,277 | $ | 67,552,245 | $ | 3,684,735 | ||||||||||||
Depreciation | (1,503,344 | ) | (16,984,638 | ) | (2,830,574 | ) | (14,203,723 | ) | (12,946,950 | ) | (9,003,075 | ) | ||||||||||||
|
|
|
|
|
|
|
|
|
|
|
| |||||||||||||
Net unrealized: | ||||||||||||||||||||||||
Appreciation (Depreciation) | $ | 6,498,192 | $ | 18,905,410 | $ | 8,763,288 | $ | 135,219,554 | $ | 54,605,295 | $ | (5,318,340 | ) | |||||||||||
|
|
|
|
|
|
|
|
|
|
|
| |||||||||||||
Aggregate cost of securities: | $ | 48,697,848 | $ | 215,229,352 | $ | 65,641,439 | $ | 298,817,779 | $ | 289,735,894 | $ | 199,543,097 | ||||||||||||
|
|
|
|
|
|
|
|
|
|
|
| |||||||||||||
| ClearBridge Small Cap | Nasdaq-100® Index | Bristol | Bryton Growth | Balanced | Target VIP | |||||||||||||||||||
Gross unrealized: | ||||||||||||||||||||||||
Appreciation | $ | 11,591,442 | $ | 51,130,358 | $ | 16,848,774 | $ | 9,778,370 | $ | 40,956,150 | $ | 3,056,596 | ||||||||||||
Depreciation | (5,971,408 | ) | (3,700,045 | ) | (8,364,993 | ) | (20,401,186 | ) | (31,692,291 | ) | (3,325,369 | ) | ||||||||||||
|
|
|
|
|
|
|
|
|
|
|
| |||||||||||||
Net unrealized: | ||||||||||||||||||||||||
Appreciation (Depreciation) | $ | 5,620,034 | $ | 47,430,313 | $ | 8,483,781 | $ | (10,622,816 | ) | $ | 9,263,859 | $ | (268,773 | ) | ||||||||||
|
|
|
|
|
|
|
|
|
|
|
| |||||||||||||
Aggregate cost of securities: | $ | 88,889,082 | $ | 86,996,075 | $ | 205,992,467 | $ | 172,310,323 | $ | 892,039,052 | $ | 43,541,035 | ||||||||||||
|
|
|
|
|
|
|
|
|
|
|
| |||||||||||||
| Bristol Growth | Risk Managed Balanced | |||||||||||||||||||||||
Gross unrealized: | ||||||||||||||||||||||||
Appreciation | $ | 12,602,256 | $ | 7,855,245 | ||||||||||||||||||||
Depreciation | (3,893,350 | ) | (6,553,032 | ) | ||||||||||||||||||||
|
|
|
| |||||||||||||||||||||
Net unrealized: | ||||||||||||||||||||||||
Appreciation (Depreciation) | $ | 8,708,906 | $ | 1,302,213 | ||||||||||||||||||||
|
|
|
| |||||||||||||||||||||
Aggregate cost of securities: | $ | 108,206,357 | $ | 212,362,920 | ||||||||||||||||||||
|
|
|
| |||||||||||||||||||||
| 152 | (continued) |
| Ohio National Fund, Inc. |
Notes to Financial Statements (Continued) | June 30, 2016 (Unaudited) |
| (8) | Legal Matters |
Effective December 20, 2013, the assets and liabilities of the Target Equity/Income Portfolio were acquired and assumed by the Target VIP Portfolio in exchange for shares of the Target VIP Portfolio (“the reorganization”).
In December 2007, prior to the reorganization, the Target Equity/Income Portfolio, as a shareholder of Lyondell Chemical Company (“Lyondell”), participated in a cash out merger of Lyondell in which it received $48 per share of consideration (the “Merger”). Lyondell later filed for bankruptcy and two entities created by the Lyondell bankruptcy plan of reorganization have initiated lawsuits seeking to recover, or clawback, proceeds received by shareholders in the December 2007 merger based on fraudulent transfer claims.
The first action, Edward S. Weisfelner, as Trustee of the LB Creditor Trust v. Morgan Stanley & Co., Inc., et. al., was initiated on October 22, 2010 (the “Creditor Trust Action”), in the Supreme Court of the State of New York in the County of New York but has subsequently been removed to the U.S. Bankruptcy Court for the Southern District of New York. The second action, Edward S. Weisfelner, as Trustee of the LB Litigation Trust v. Holmes TTEE, et. al., was initiated on December 23, 2010 (the “Litigation Trust Action”), in the U.S. Bankruptcy Court for the Southern District of New York. Both actions attempt to recover the proceeds paid out to the holders of Lyondell shares at the time of the 2007 merger. The value of the proceeds to the fund totaled $1,772,400.
On January 4, 2012, the Fund was named in a second amended complaint in the Creditor Trust Action. On April 9, 2014, plaintiffs filed a third amended complaint. In response, on July 30, 2014, the defendant group, including the Fund, filed an omnibus motion to dismiss. The outcome of these proceedings on the Portfolio cannot be predicted.
As a result of the aforementioned reorganization involving the Target Equity/Income Portfolio, any future claims that may result from these complaints will be assumed by the Target VIP Portfolio as the Survivor Portfolio. Management of the Fund continues to assess the cases and has not yet determined the potential effect, if any, on the net asset value of the Target VIP Portfolio.
Also, in December 2007, the S&P 500® Index and Strategic Value Portfolios, shareholders of the Tribune Company, participated in a similar cash out merger in which shareholders received $34 per share of consideration. The value of the proceeds received by the S&P 500® Index and Strategic Value Portfolios was $37,910 and $384,200, respectively. The company subsequently filed for bankruptcy and several legal complaints have been initiated by groups of Tribune Company creditors seeking to recover, or clawback, proceeds received by shareholders based on fraudulent transfer claims (the “Tribune Bankruptcy”).
The first action, Official Committee of Unsecured Creditors of Tribune Company v. FitzSimons, et. al. (“FitzSimons”) was initiated on November 1, 2010 in the U.S. Bankruptcy Court for the District of Delaware. As a result of these proceedings, the Court agreed to allow individual creditors to file similar complaints in U.S. state courts. The Fund is specifically named in a complaint in the U.S. District Court, Southern District of Ohio, Western Division, Deutsche Bank Trust Company Americas, et. al. v. American Electric Power, et. al., that was initiated in June of 2011. The Fund, along with the Strategic Value Portfolio, is also named in a similar complaint in the U.S. District Court, Eastern District of Pennsylvania, Deutsche Bank Trust Company Americas, et. al. v. Ametek Inc. Employees Master Retirement Trust, et. al. These Tribune litigation actions have been consolidated into a single Multidistrict Litigation (“MDL”) in the U.S. District Court, Southern District of New York. Pursuant to a Court order dated September 7, 2012, certain defendants in the MDL, including the Fund, filed a motion to dismiss on November 6, 2012. The Court granted the motion to dismiss on September 23, 2013. Pending an appeal, only the actual fraudulent transfer claims as alleged in FitzSimons remain. The outcome of these proceedings on the two Portfolios of the Fund cannot be predicted. Management of the Fund continues to assess litigation matters and any offers of settlement.
| 153 |
| Ohio National Fund, Inc. |
| June 30, 2016 (Unaudited) |
| (1) | Review and Approval of Advisory and Sub-advisory Agreements |
At a meeting held on March 17, 2016, the Board of Directors, including a majority of the Directors who are not “interested persons” of the Fund (the “Independent Directors”), approved respective sub-advisory agreements (the “Sub-Advisory Agreements”) between Ohio National Investments, Inc. (the “Adviser”) and Geode Capital Management, LLC (the “Sub-Adviser”) for the S&P 500® Index Portfolio (the “S&P Portfolio”) and the Nasdaq-100® Index Portfolio (the “Nasdaq Portfolio;” collectively, the “Portfolios”). The Directors reviewed the form of proposed Sub-Advisory Agreement for each Portfolio and the proposed sub-advisory fees. They noted that the Sub-Adviser would have day-to-day responsibility for the management of each Portfolio, and that the Adviser would be responsible for monitoring the investment performance and other responsibilities of the Sub-Adviser.
In considering the Sub-Advisory Agreements, the Board requested and reviewed a significant amount of information relating to each Portfolio and the Sub-Adviser, including the following: (1) performance data for each Portfolio for various time periods, including year-to-date through February 29, 2016; (2) comparative performance, advisory fee and expense ratio information for a peer group of funds in the respective Portfolio’s Morningstar category (a “Morningstar Peer Group” or “ peer group”), as well as management fee peer comparison charts showing where each Portfolio’s sub-advisory fee was located in the dispersion of its peer funds’ sub-advisory fees; (3) comparable performance information for each Portfolio’s relevant benchmark index; (4) comparative performance data, including gross returns and a tracking error analysis relative to the applicable index, for each Portfolio and for institutional funds (the “Geode Funds”) managed by the Sub-Adviser designed to track the same index (for the S&P Portfolio) or a similar index (the NASDAQ Composite Index, as opposed to the NASDAQ-100® Index, for the Nasdaq Portfolio), for various time periods through February 29, 2016; (5) comparative data regarding sub-advisory fees, including data regarding the fees charged by the Sub-Adviser for managing representative Geode Funds; (6) comparative data regarding the expense ratio of each Portfolio as compared to its Morningstar Peer Group; (7) profitability analyses for the Adviser with respect to each Portfolio; and (8) other information regarding the nature, extent and quality of services anticipated to be provided by the Sub-Adviser.
The Directors, including all of the Independent Directors, were assisted by experienced independent legal counsel throughout the contract review process. The Independent Directors discussed approval of the proposed Sub-Advisory Agreements with such counsel at which no representatives of management, the Adviser or the Sub-Adviser were present. The Directors, including all of the Independent Directors, relied upon the advice of independent legal counsel and their own business judgment in determining the material factors to be considered in evaluating the Sub-Advisory Agreements and the weight to be given to each such factor. The conclusions reached by the Directors were based on a comprehensive evaluation of all of the information provided and were not the result of any one factor. Moreover, each Director may have afforded different weight to the various factors in reaching his or her conclusions with respect to the Sub-Advisory Agreements.
Nature, Extent and Quality of Services
The Board evaluated the nature, extent and quality of the sub-advisory services anticipated to be provided to the Portfolios by the Sub-Adviser. As part of its review, the Board reviewed information regarding the Sub-Adviser’s operations, procedures and personnel. The Directors considered a summary of the Sub-Adviser’s portfolio management team, investment selection process and risk management program, as well as a summary of the Sub-Adviser’s compliance policies and procedures. The Directors also considered the capabilities and resources that the Sub-Adviser has dedicated to performing services on behalf of the Geode Funds. In addition, the Directors reviewed information on the Sub-Adviser’s portfolio management and brokerage practices, including any soft dollar benefits received. The Directors also reviewed performance information regarding the applicable Geode Fund(s) for each Portfolio. It was the Directors’ conclusion that overall, they were satisfied with the nature, extent and quality of services anticipated to be provided to each of the Portfolios by the Sub-Adviser.
Investment Performance
Representatives of the Adviser reviewed with the Directors each Portfolio’s gross returns year-to-date and for the 1-, 3-, 5- and 10- year periods ended February 29, 2016, as compared to the applicable Geode Fund(s), as well as comparative tracking error information for the Portfolio and applicable Geode Fund(s). The Directors considered that each Portfolio attempts to track its benchmark index and that for all periods the applicable Geode Funds had less tracking error than the S&P Portfolio and the applicable Geode Fund had less tracking error with respect to the NASDAQ Composite Index than the Nasdaq Portfolio had with respect to the NASDAQ-100® Index. A representative of the Adviser pointed out that the Sub-Adviser would be expected to be able to more closely track an index because it has the advantage of larger scale, which allows the Sub-Adviser to rebalance more frequently and pass on lower commission rates to the Portfolios. The Directors also noted that the Sub-Adviser’s anticipated use of, and experience with using, index futures, index swaps and exchange traded funds should enable it to more closely track the applicable index. It was the Directors’ conclusion that the Sub-Adviser would be able to enhance each Portfolio’s tracking of its benchmark index.
Fees and Expenses.
A representative of the Adviser reminded the Directors that they had approved the advisory fee for each Portfolio at their November 19, 2015 meeting. He noted that the Adviser would pay the sub-advisory fees if the Board approves the proposed Sub-Advisory Agreements, and that therefore the expenses of each Portfolio would not be affected.
| 154 | (continued) |
| Ohio National Fund, Inc. |
Additional Information (Continued) | June 30, 2016 (Unaudited) |
The Board reviewed the proposed sub-advisory fee for each Portfolio, as well as the difference of each Portfolio’s fee from the average advisory fee for the Portfolio’s Morningstar Peer Group and the fee’s percentile ranking within the peer group. The Board also considered charts showing, for each Portfolio, how the Portfolio’s sub-advisory fee compared to the sub-advisory fees of the funds in its peer group. The charts showed the number of funds in the peer group within each defined range of advisory fees, and the range that included the Portfolio. The Board noted that the proposed sub-advisory fee for the S&P Portfolio was slightly above the average of its peer group and that the proposed fee for the Nasdaq Portfolio was below the average of its peer group. The Board also reviewed a comparison of the sub-advisory fees paid by representative Geode Fund(s) having an unaffiliated investment adviser to the proposed fee for each Portfolio.
In their consideration of the proposed sub-advisory fees, the Board relied to a degree on the Adviser’s negotiation of each Sub-Advisory Agreement on an arm’s-length basis, noting that in the past the Adviser has negotiated decreases in the sub-advisory fee for certain Portfolios and that the Adviser has always passed on the decrease by reducing its advisory fee by the same amount. Overall, the Board concluded that the proposed sub-advisory fees were reasonable.
Profitability and Economies of Scale
The Directors noted that, in their consideration of the reasonableness of the sub-advisory fees to be paid by the Adviser to the Sub-Adviser, they had in part relied on the ability of the Adviser to negotiate the terms of each Sub-Advisory Agreement, including the sub-advisory fee, at arm’s-length, noting that the Adviser is not affiliated with the Sub-Adviser. Accordingly, the cost of services provided by the Sub-Adviser and the profitability to the Sub-Adviser of its relationship with the applicable Portfolio were not material factors in the Board’s deliberations. For similar reasons, the Board concluded that the potential realization of economies of scale by the Portfolios from the sub-advisory arrangements with the Sub-Adviser should not be a material factor in the Board’s deliberations.
The Directors also noted that all of the advisory and sub-advisory fee schedules contain breakpoints that would reduce the applicable advisory or sub-advisory fees on assets above a specified level as the applicable Portfolio’s assets increase. The Directors also recognized that a Portfolio would realize additional economies of scale if the Portfolio’s net assets increase over time proportionately more than certain other expenses. The Directors concluded that each Portfolio is likely to benefit from economies of scale as the Portfolio’s net assets increase.
After consideration of the foregoing, the Board reached the following conclusions regarding the proposed Sub-Advisory Agreements with respect to each Portfolio, in addition to the conclusions set forth above: (a) the Sub-Adviser possesses the capability and resources to perform the duties required of it under the Sub-Advisory Agreement; (b) the investment philosophy, strategies and techniques of the Sub-Adviser are appropriate for pursuing the applicable Portfolio’s investment objective; (c) the Sub-Adviser is likely to execute its investment philosophy, strategies and techniques consistently over time; and (d) the Sub-Adviser maintains appropriate compliance programs. Based on all of the above-mentioned factors and their related conclusions, the Directors unanimously determined that approval of the proposed Sub-Advisory Agreement was in the best interests of each Portfolio and its shareholders. Accordingly, the Board voted unanimously to approve the Sub-Advisory Agreement for each Portfolio.
| (2) | Expense Disclosure |
An individual may not buy or own membership interests of the Fund directly. An individual acquires an indirect interest in the Fund by purchasing a variable annuity contract or variable insurance policy and allocating premiums or purchase payments to Fund Portfolios available through the separate accounts of ONLIC, ONLAC, and NSLA. Separate accounts of these entities are the shareholders of the Fund.
As a shareholder of the Fund, a separate account incurs ongoing costs, including management fees and other Fund expenses. This example is intended to help a policy/contract owner understand ongoing costs (in dollars) associated with the underlying investment in the Fund’s Portfolios by the separate account shareholder and to compare these costs with the ongoing costs associated with investing in other mutual funds.
The example is based on an investment of $1,000 invested at January 1, 2016 and held through June 30, 2016.
Actual Expenses
The table below provides information about investment values and actual expenses associated with each Portfolio of the Fund. The information below, together with the amount of an underlying investment, can be used to estimate expenses paid over the period. An estimate can be
| 155 | (continued) |
| Ohio National Fund, Inc. |
Additional Information (Continued) | June 30, 2016 (Unaudited) |
obtained by simply dividing an underlying investment value by $1,000 (for example, an $8,600 investment value divided by $1,000 = 8.6), then multiplying the result by the number in the table under the heading entitled “Expenses Paid During Period”.
Portfolio | Beginning Investment Value 1/1/2016 | Ending Investment Value 6/30/2016 | Expense Paid During Period* 1/1/2016 – 6/30/2016 | Expense Ratio During Period 1/1/2016 – 6/30/2016 (Annualized) | ||||||||||||
Equity | $ | 1,000.00 | $ | 1,003.40 | $ | 4.08 | 0.82 | % | ||||||||
Bond | 1,000.00 | $ | 1,090.70 | $ | 3.38 | 0.65 | % | |||||||||
Omni | 1,000.00 | $ | 1,021.70 | $ | 4.07 | 0.81 | % | |||||||||
Capital Appreciation | 1,000.00 | $ | 1,006.10 | $ | 4.09 | 0.82 | % | |||||||||
International | 1,000.00 | $ | 924.80 | $ | 4.83 | 1.01 | % | |||||||||
International Small-Mid Company | 1,000.00 | $ | 898.30 | $ | 5.66 | 1.20 | % | |||||||||
Aggressive Growth | 1,000.00 | $ | 988.10 | $ | 4.65 | 0.94 | % | |||||||||
Small Cap Growth | 1,000.00 | $ | 1,000.40 | $ | 4.28 | 0.86 | % | |||||||||
Mid Cap Opportunity | 1,000.00 | $ | 1,022.40 | $ | 4.88 | 0.97 | % | |||||||||
S&P 500® Index | 1,000.00 | $ | 1,035.70 | $ | 2.18 | 0.43 | % | |||||||||
Strategic Value | 1,000.00 | $ | 1,157.10 | $ | 4.24 | 0.79 | % | |||||||||
High Income Bond | 1,000.00 | $ | 1,079.00 | $ | 4.29 | 0.83 | % | |||||||||
ClearBridge Small Cap | 1,000.00 | $ | 1,085.00 | $ | 5.03 | 0.97 | % | |||||||||
Nasdaq-100® Index | 1,000.00 | $ | 965.30 | $ | 2.35 | 0.48 | % | |||||||||
Bristol | 1,000.00 | $ | 1,001.40 | $ | 4.13 | 0.83 | % | |||||||||
Bryton Growth | 1,000.00 | $ | 945.90 | $ | 4.40 | 0.91 | % | |||||||||
Balanced | 1,000.00 | $ | 1,004.20 | $ | 3.24 | 0.65 | % | |||||||||
Target VIP | 1,000.00 | $ | 1,005.10 | $ | 3.99 | 0.80 | % | |||||||||
Bristol Growth | 1,000.00 | $ | 1,024.30 | $ | 4.48 | 0.89 | % | |||||||||
Risk Managed Balanced | 1,000.00 | $ | 1,023.50 | $ | 5.28 | 1.05 | % | |||||||||
Hypothetical Example for Comparison Purposes
The table below provides information about hypothetical investment values and hypothetical expenses based on each respective Portfolio’s actual expense ratio and an assumed rate of return of 5% per year before expenses, which is not an actual return. The hypothetical investment values and expenses may not be used to estimate the actual ending investment balance or expenses actually paid for the period by the shareholders. A policy/contract holder may use this information to compare this 5% hypothetical example with the 5% hypothetical examples that appear in the shareholder reports of other funds.
Portfolio | Beginning Investment Value 1/1/2016 | Ending Investment Value 6/30/2016 | Expense Paid During Period* 1/1/2016 – 6/30/2016 | Expense Ratio During Period 1/1/2016 – 6/30/2016 (Annualized) | ||||||||||||
Equity | $ | 1,000.00 | $ | 1,020.79 | $ | 4.12 | 0.82 | % | ||||||||
Bond | 1,000.00 | $ | 1,021.63 | $ | 3.27 | 0.65 | % | |||||||||
Omni | 1,000.00 | $ | 1,020.84 | $ | 4.07 | 0.81 | % | |||||||||
Capital Appreciation | 1,000.00 | $ | 1,020.79 | $ | 4.12 | 0.82 | % | |||||||||
International | 1,000.00 | $ | 1,019.84 | $ | 5.07 | 1.01 | % | |||||||||
International Small-Mid Company | 1,000.00 | $ | 1,018.90 | $ | 6.02 | 1.20 | % | |||||||||
Aggressive Growth | 1,000.00 | $ | 1,020.19 | $ | 4.72 | 0.94 | % | |||||||||
Small Cap Growth | 1,000.00 | $ | 1,020.59 | $ | 4.32 | 0.86 | % | |||||||||
Mid Cap Opportunity | 1,000.00 | $ | 1,020.04 | $ | 4.87 | 0.97 | % | |||||||||
S&P 500® Index | 1,000.00 | $ | 1,022.73 | $ | 2.16 | 0.43 | % | |||||||||
Strategic Value | 1,000.00 | $ | 1,020.93 | $ | 3.97 | 0.79 | % | |||||||||
High Income Bond | 1,000.00 | $ | 1,020.74 | $ | 4.17 | 0.83 | % | |||||||||
ClearBridge Small Cap | 1,000.00 | $ | 1,020.04 | $ | 4.87 | 0.97 | % | |||||||||
Nasdaq-100® Index | 1,000.00 | $ | 1,022.48 | $ | 2.41 | 0.48 | % | |||||||||
Bristol | 1,000.00 | $ | 1,020.74 | $ | 4.17 | 0.83 | % | |||||||||
Bryton Growth | 1,000.00 | $ | 1,020.34 | $ | 4.57 | 0.91 | % | |||||||||
Balanced | 1,000.00 | $ | 1,021.63 | $ | 3.27 | 0.65 | % | |||||||||
Target VIP | 1,000.00 | $ | 1,020.89 | $ | 4.02 | 0.80 | % | |||||||||
Bristol Growth | 1,000.00 | $ | 1,020.44 | $ | 4.47 | 0.89 | % | |||||||||
Risk Managed Balanced | 1,000.00 | $ | 1,019.64 | $ | 5.27 | 1.05 | % | |||||||||
| * | Expenses are equal to the average account value times the Fund’s annualized expense ratio multiplied by the number of days in the most recent fiscal half-year (182 days) divided by the number of days in the fiscal year (366 days). Please note that the expenses shown in these tables are meant to highlight ongoing Fund costs only and do not reflect any contract-level expenses or Fund transactional costs, such as sales charges (loads) or exchange fees (if any). Therefore, these tables are useful in comparing ongoing fund costs only, and will not fully assist a policy/contract owner in determining the relative total expenses of different funds. In addition, if transactional costs were included, costs may have been higher for these Portfolios as well as for a fund being compared. |
| 156 | (continued) |
| Ohio National Fund, Inc. |
| June 30, 2016 (Unaudited) |
Name and Address | Age | Position(s) with the Fund | Term of | Number of Portfolios in the Fund to be Overseen by Director | Principal Occupation(s) During Past Five Years | |||||||||
Independent Directors | ||||||||||||||
George M. Vredeveld One Financial Way Cincinnati, Ohio | 73 | Lead Independent Director, Member of Audit and Independent Directors Committees | Indefinite; Since March 1996 | 20 | Professor Emeritus, Finance: University of Cincinnati (January 2014-present); Research Fellow and Member of Academic Council: Varna Free University, Varna, Bulgaria (2012-present); Alpaugh Professor of Economics: Lindner College of Business, University of Cincinnati (2004-2013); Founder/President: Economics Center at the University of Cincinnati (1977-2012). | |||||||||
John I. Von Lehman One Financial Way Cincinnati, Ohio | 63 | Director, Member of Audit and Independent Directors Committees | Indefinite; Since August 2007 | 20 | Executive Vice President, CFO, Secretary, and Director: The Midland Company (1988-2007); Director, Audit Committee and Corporate Governance Committee Member: American Financial Group, Inc.; Finance Committee and Investment Committee member: Life Enriching Communities; Investment Committee: Xavier University Foundation. | |||||||||
Madeleine W. Ludlow One Financial Way Cincinnati, Ohio | 61 | Director, Chairman of Audit Committee and Member of Independent Directors Committee | Indefinite; Since April 2012 | 20 | Founder/Managing Director: West Capital Partners LLC (2010-present), Ludlow Ward Capital Advisors LLC (2005-2009); Director: ALLETE, Inc. | |||||||||
Geoffrey Keenan One Financial Way Cincinnati, Ohio | 57 | Director, Member of Audit and Independent Directors Committees | Indefinite; Since January 2015 | 20 | Executive Vice President and Chief Operating Officer of Gateway Investments Advisers, LLC (1995-2013). | |||||||||
Interested Director | ||||||||||||||
John J. Palmer One Financial Way Cincinnati, Ohio | 76 | Chairman and Director | Indefinite; Since July 1997 | 20 | Insurance industry consultant (April 2010 to present), President: Ohio National Fund, Inc. (1997-2010); Director and Vice Chairman: ONLIC (1997-2010); President and CEO: NSLA (2002-2010); Director: NSLA, Tucson Symphony Orchestra, and Pima Canyon Estates Homeowners’ Association. | |||||||||
Officers | ||||||||||||||
Paul J. Gerard One Financial Way Cincinnati, Ohio | 56 | President | Indefinite; Since March 2016 | Senior Vice President and Chief Investment Officer: ONLIC and NSLA (January 2016-present); Senior Vice President, Investments: ONLIC (July 2012-December 2015); Vice President, Investments: ONLIC (February 2009-June 2012). | ||||||||||
Thomas A. Barefield One Financial Way Cincinnati, Ohio | 63 | Vice President | Indefinite; Since February 1998 | Vice Chairman and Chief Distribution Officer: ONLIC (January 2014-present); Executive Vice President and Chief Marketing Officer — Institutional: ONLIC (January 2008-January 2014); Director and Vice President — Marketing: NSLA; Director: ONI; Senior Vice President: Ohio National Equities, Inc. | ||||||||||
R. Todd Brockman One Financial Way Cincinnati, Ohio | 47 | Treasurer | Indefinite; Since August 2004 | Vice President, Mutual Funds: ONLIC and NSLA (February 2014-present); Second Vice President, Mutual Fund Operations: ONLIC and NSLA (January 2007-February 2014); Treasurer: ONI. | ||||||||||
Kimberly A. Plante One Financial Way Cincinnati, Ohio | 42 | Secretary | Indefinite; Since March 2005 | Second Vice President and Counsel: ONLIC (January 2016-present); Senior Associate Counsel: ONLIC (January 2011-January 2016); Associate Counsel: ONLIC (July 2007-January 2011); Secretary: ONI; Officer of various other Ohio National-affiliated companies. | ||||||||||
| 157 | (continued) |
| Ohio National Fund, Inc. |
Information about Directors and Officers (Continued) | June 30, 2016 (Unaudited) |
Name and Address | Age | Position(s) with the Fund | Term of | Number of Portfolios in the Fund to be Overseen by Director | Principal Occupation(s) During Past Five Years | |||||||
Keith Dwyer One Financial Way Cincinnati, Ohio | 43 | Interim Chief Compliance Officer | Indefinite; Since November 2015 | Director, Fund Compliance: ONLIC (January 2015-present); Administrator, Fund Compliance: ONLIC (January 2014-January 2015); Compliance Analyst (September 2009-September 2011 and April 2013-January 2014); Interim Chief Compliance Officer: ONI, Suffolk, and other Ohio National-affiliated companies (November 2015 to present). | ||||||||
Emily Bae One Financial Way Cincinnati, Ohio | 31 | Assistant Secretary | Indefinite; Since May 2013 | Assistant Counsel: ONLIC (April 2013-present); Assistant Secretary: ONI (April 2013-present); Counsel: Goodyear Tire & Rubber Company (January 2012-April 2013). | ||||||||
Daniel P. Leming One Financial Way Cincinnati, Ohio | 31 | Assistant Treasurer | Indefinite; Since March 2016 | Manager, Fund Operations and Analysis: ONLIC (February 2016-present); Sr. Mutual Fund Reporting & Operations Analyst: ONLIC (May 2012-Februrary 2016); Mutual Fund Reporting & Operations Analyst: ONLIC (September 2008-May 2012). | ||||||||
| 158 |
Ohio National Fund, Inc.
Post Office Box 371
Cincinnati, Ohio 45201
Form 1325 Rev. 8-16
| Item 2. | Code Of Ethics. |
As of the end of the period covered by this report, Ohio National Fund, Inc. (the “Fund”) has adopted a code of ethics that applies to the Fund’s principal executive officer and principal financial officer. There were no substantive amendments or waivers to the Code of Ethics during the period covered by this report.
A copy of this Code of Ethics is filed as Exhibit EX-99.CODE to this Form N-CSR and is also available, without charge, upon request, by calling 877-781-6392 toll free.
| Item 3. | Audit Committee Financial Expert. |
The Fund’s Board of Directors has determined that the Fund has an audit committee financial expert serving on its Audit Committee. The Audit Committee financial expert is Madeleine W. Ludlow, who is independent for purposes of Item 3 of Form N-CSR.
| Item 4. | Principal Accountant Fees And Services. |
The aggregate fees for each of the last two fiscal years for professional services rendered by the principal accountant for the audit of the Fund’s annual financial statements or services that are normally provided by the accountant in connection with statutory and regulatory filings or engagements for those fiscal years are listed below.
| (a) | Audit Fees. |
Audits of the Portfolios:
Fiscal year ended December 31, 2015: $275,500
Fiscal year ended December 31, 2014: $267,750
| (b) | Audit-Related Fees. |
Consent(s) on N-1A Annual Registration Statement filed with the SEC:
Fiscal year ended December 31, 2015: $10,000
Fiscal year ended December 31, 2014: $5,000
Professional services rendered in connection with the consent on the Fund’s N-14 merger filing (paid by the Fund’s adviser (ONI)
| (c) | Tax Fees. |
Fiscal year ended December 31, 2015: $81,480
Fiscal year ended December 31, 2014: $0
| (d) | All Other Fees. None. |
| (e)(1) | Audit Committee Pre-Approval Policies and Procedures: |
The Fund’s Audit Committee has adopted an Audit Committee Charter that requires that the Audit Committee oversee the quality and appropriateness of the accounting methods used in the preparation of the Fund’s financial statements, and the independent audit thereof; approve the selection and compensation of the independent auditors; and pre-approve the performance, by the independent auditors, of non-audit services for the Fund, its investment adviser, or any affiliated entity controlling, controlled by or under common control with the investment adviser that provides ongoing services to the Fund.
| (e)(2) | Services Approved Pursuant to Paragraph (c)(7)(i)(C) of Rule 2-01 of Regulation S-X: |
During the fiscal years ended December 31, 2015 and 2014, there were no non-audit services provided by the Fund’s principal accountant that would have required pre-approval by the Fund’s Audit Committee. The audit related fees aforementioned were pre-approved by the Fund’s Audit Committee, although not required by paragraph (c) (7) (ii) of Regulation S-X as the audit-related fees were less than five percent of the total amount of revenues paid to the Fund’s principal accountant.
| (f) | Not applicable. |
| (g) | There were no non-audit services provided by the Fund’s principal accountant, other than items disclosed in item (b) above, in which a fee was billed to the Fund, the Fund’s adviser, and any entity controlling, controlled by, or under common control with the adviser that provides ongoing services to the registrant for the last two fiscal years. |
| (h) | Not applicable, as there were no non-audit services performed by the Fund’s principal accountant that were rendered to the Fund, the Fund’s adviser, or any entity controlling, controlled by, or under common control with the adviser that provided ongoing services to the registrant that were not pre-approved for the last two fiscal years. |
| Item 5. | Audit Committee Of Listed Registrants. |
Not applicable.
| Item 6. | Schedule of Investments. |
Not applicable.
| Item 7. | Disclosure Of Proxy Voting Policies And Procedures For Closed-End Management Investment Companies. |
Not Applicable.
| Item 8. | Portfolio Managers of Closed-End Management Investment Companies. |
Not Applicable.
| Item 9. | Purchases of Equity Securities by Closed-End Management Investment Company and Affiliated Purchasers. |
Not Applicable.
| Item 10. | Submission of Matters to a Vote of Security Holders. |
There were no material changes to the procedures by which shareholders may recommend nominees to the Fund’s Board of Directors.
| Item 11. | Controls and Procedures. |
| (a) | The Fund’s principal executive officer and principal financial officer have concluded, based on their evaluation conducted as of a date within 90 days of the filing of this report, that the Fund’s disclosure controls and procedures are adequately designed and are operating effectively to ensure (i) that material information relating to the Fund, including its consolidated subsidiaries, is made known to them by others within those entities, particularly during the period in which this report is being prepared; and (ii) that information required to be disclosed by the Fund on Form N-CSR is recorded, processed, summarized and reported within the time periods specified in the Securities and Exchange Commission’s rules and forms. |
| (b) | There were no changes in the Fund’s internal control over financial reporting that occurred during the second fiscal quarter of the period covered by this report that have materially affected, or are reasonably likely to materially affect, the Fund’s internal control over financial reporting. |
| Item 12. | Exhibits. |
| (a)(1) | The Fund’s Code of Ethics pursuant to Item 2 of Form N-CSR is filed and attached hereto as EX-99.CODE. |
| (a)(2) | A separate certification for each principal executive officer and principal financial officer of the Fund as required by Rule 30a-2(a) under the Investment Company Act of 1940 (17 CFR 270.30a-2(a)) is attached hereto as EX-99.CERT. |
The certifications required by Section 906 of the Sarbanes-Oxley Act of 2002 are attached hereto as EX-99.906CERT. |
SIGNATURES
Pursuant to the requirements of the Securities Exchange Act of 1934 and the Investment Company Act of 1940, the registrant has duly caused this report to be signed on its behalf by the undersigned, thereunto duly authorized.
Ohio National Fund, Inc.
By: | /s/ Paul J. Gerard | |
Paul J. Gerard | ||
President (Principal Executive Officer) September 7, 2016 |
Pursuant to the requirements of the Securities Exchange Act of 1934 and the Investment Company Act of 1940, this report has been signed below by the following persons on behalf of the registrant and in the capacities and on the dates indicated.
Ohio National Fund, Inc.
By: | /s/ Paul J. Gerard | |
Paul J. Gerard | ||
President (Principal Executive Officer) September 7, 2016 |
By: | /s/ R. Todd Brockman | |
R. Todd Brockman | ||
Treasurer (Principal Financial Officer) September 7, 2016 |