UNITED STATES
SECURITIES AND EXCHANGE COMMISSION
Washington, D.C. 20549
FORM N-CSR
CERTIFIED SHAREHOLDER REPORT OF REGISTERED
MANAGEMENT INVESTMENT COMPANIES
Investment Company Act file number 811-03015
Ohio National Fund, Inc.
(Exact name of registrant as specified in charter)
| One Financial Way, Cincinnati, Ohio | 45242 |
| (Address of principal executive offices) | (Zip code) |
CT Corporation 300 E. Lombard St. Suite 1400 Baltimore, MD 21202
(Name and address of agent for service)
Registrant’s telephone number, including area code: 513-794-6971
Date of fiscal year end: December 31
Date of reporting period: June 30, 2013
Form N-CSR is to be used by management investment companies to file reports with the Commission not later than 10 days after the transmission to stockholders of any report that is required to be transmitted to stockholders under Rule 30e-1 under the Investment Company Act of 1940 (17 CFR 270.30e-1). The Commission may use the information provided on Form N-CSR in its regulatory, disclosure review, inspection, and policymaking roles.
A registrant is required to disclose the information specified by Form N-CSR, and the Commission will make this information public. A registrant is not required to respond to the collection of information contained in Form N-CSR unless the Form displays a currently valid Office of Management and Budget (“OMB”) control number. Please direct comments concerning the accuracy of the information collection burden estimate and any suggestions for reducing the burden to Secretary, Securities and Exchange Commission, 450 Fifth Street, NW, Washington, DC 20549-0609. The OMB has reviewed this collection of information under the clearance requirements of 44 U.S.C. § 3507.
| Item 1. | Reports To Stockholders. |
WEALTH BUILDING OPPORTUNITY
Ohio National Fund, Inc.
Semiannual Report
JUNE 30, 2013
Ohio National Fund, Inc.
OHIO NATIONAL FUND, INC.
| 1 | ||||
| 2 | ||||
The following pages contain Performance, Management’s Comments, Change in Value of $10,000 Investment, Portfolio Composition, Top Holdings, and Schedule of Investments for each of the Fund’s Portfolios (Unaudited): | ||||
| 3 | ||||
| 7 | ||||
| 9 | ||||
| 14 | ||||
| 19 | ||||
| 24 | ||||
| 29 | ||||
| 33 | ||||
| 38 | ||||
| 41 | ||||
| 45 | ||||
| 49 | ||||
| 56 | ||||
| 59 | ||||
| 69 | ||||
| 74 | ||||
| 78 | ||||
| 81 | ||||
| 84 | ||||
| 87 | ||||
| 93 | ||||
| 97 | ||||
| 101 | ||||
| 104 | ||||
| 107 | ||||
| 110 | ||||
| 113 | ||||
| 119 | ||||
| 131 | ||||
| 156 | ||||
| 160 | ||||
Message |  |
Dear Investor:
In the first half of 2013, the equity markets behaved much as they did in 2012, except even better. The first quarter of both years produced higher returns. While both second quarters produced smaller or even negative returns, the latter portion of those quarters was strong. In 2012, this continued into the third quarter. Let’s hope for a continuation of that pattern. Fortunately, there are no signs of concern.
In many ways, the first half of 2013 was better than the first half of 2012. Returns were higher (the S&P 500® Index was up 13.81 percent on June 30, 2013 compared to 9.5 percent at this same time in 2012) and volatility was 25 percent lower. So, what has fueled this equity market run-up that has left the S&P 500® Index 180 points higher than the pre-financial crisis high, and 930 points above the financial crisis low (a 160 percent return)? The answer: a combination of good fundamentals and some unusual circumstances.
As I said in my last President’s Message, earnings strength is the backbone of equity market support. This year, earnings have been reasonably good. Additionally, reports from some companies with lower than expected second quarter earnings (e.g., Google, Microsoft, Intel, Phillip Morris and Samsung), as well as an unusually high number of negative revisions, were quickly forgotten by the marketplace. Good fundamentals have helped fuel the market rise.
Meanwhile, a number of unusual circumstances have had a more interesting effect on the market. The first is our political situation. There was concern last year that the U.S. government would become unable to pay its current obligations, resulting in another debate around raising the debt ceiling. While the market generally does not like uncertainty surrounding political and fiscal issues, this could have led to negotiations and a grand bargain to avoid the fiscal cliff. What resulted was sequestration – designed
to be the most unfavorable outcome – and accompanying concerns of economic calamity.
However, with increasing tax revenue from a growing economy and reduced expenditures from sequestration, there is more talk now about budget surpluses than budget deficits. In fact, the budget surplus in June was $117 billion, the biggest June surplus on record. Government receipts were up 10 percent, including payments from Fannie Mae and Freddie Mac, both of which received government support during the financial crisis. Both are now returning billions to the U.S. Treasury, indicating that the rescue of Fannie Mae and Freddie Mac may turn out to have been a good investment after all. While positive, this was more an accident than good economic planning, and it has allowed the market to focus on the fundamentals.
Additionally, sequestration has been more benign than was originally predicted. The only widely reported problem was a widespread delay in air traffic, caused by furloughing air traffic controllers. This problem was fixed within a few days primarily by reversing that decision. As we move forward, however, more people will become affected by the cuts. It is unclear whether this situation will lead to a rollback of the sequestration. Rolling back all, or a portion of, sequestration without other spending reductions may lead to greater deficits and put us back on the path to another fiscal cliff. This kind of uncertainty is never well received by the market.
The Federal Reserve’s activity to stimulate the economy is another interesting and unusual circumstance. Since the financial crisis, the Fed has been introducing liquidity into the financial system to keep interest rates low and to stimulate the economy. As the economy continues to grow modestly, the question now becomes: when will this stimulus end? The short answer: it will end when it is no longer needed.
| 1 |
The impact of the stimulus on the market is what I call the “bad news is good news and good news is bad news” effect. When there is positive economic news, the market reacts negatively, because investors fear the Fed’s stimulus is nearing its end. When there is negative economic news, the market reacts positively because the “easy money days” will continue. While counter-intuitive, this behavior makes sense. However, ongoing stimulus is not sustainable.
Fortunately, with the reduction in market volatility, it has become easier for equity managers to find good performance and outperform their benchmarks. Some of the strong Ohio National Fund, Inc. performers in the first half of 2013 include the Equity Portfolio, managed by Legg Mason Capital Management, LLC, and the Omni and Bristol Portfolios, managed by Suffolk Capital Management, LLC.
Fixed income managers have not had as easy a time because rising interest rates, which began to occur in the second quarter, make positive fixed income returns more difficult to achieve. This is expected to continue as we get closer to the time when the Fed announces an easing of its easy money policy, and interest rates will almost certainly rise further.
While the economy is improving, volatility is lessening and interest rates are slowly rising, unusual circumstances such as the ones I described will continue to evolve. How they will affect the market is uncertain, but there is no indication of concern as we look ahead to the second half of 2013. As always, it is important to consult your financial adviser to make sure your assets are appropriately positioned.
Thank you for entrusting your assets to the Ohio National Fund, Inc. We look forward to continuing to serve your investment needs.
Sincerely,

Christopher A. Carlson
President
Directors and Officers of Ohio National Fund, Inc.
John J. Palmer, Director
Madeleine W. Ludlow, Director
George M. Vredeveld, Director
John I. Von Lehman, Director
Christopher A. Carlson, President
Thomas A. Barefield, Vice President
R. Todd Brockman, Treasurer
Kimberly A. Plante, Secretary
Julie T. Thomas, Chief Compliance Officer
Catherine E. Gehr, Assistant Treasurer
Emily Bae, Assistant Secretary
The Statement of Additional Information of Ohio National Fund, Inc. (the “Fund”) includes additional information about the Fund’s Board of Directors (the “Board”) and is available at http://www.ohionationalfund.com or upon request, without charge, by calling 877-781-6392 (toll-free).
A description of the policies and procedures that the Fund uses in voting proxies relating to Fund securities, as well as information regarding how the Fund voted proxies during the most recent twelve-month period ended June 30, is available without charge, upon request, by calling 877-781-6392 (toll-free) and on the Securities and Exchange Commission (the “Commission”) website at http://www.sec.gov.
The Fund has filed its Schedules of Investments as of March 31 and September 30 with the Commission, as required, on Form N-Q. Form N-Q is required to be filed with the Commission for the first and third quarters of each fiscal year within sixty days after the end of each period and is available on the Commission website upon acceptance of each submission. The Fund’s Forms N-Q may be reviewed and copied at the Commission’s Public Reference Room in Washington, DC. Information about the Public Reference Room is available by calling 1-800-SEC-0330 (toll-free).
This report and the financial statements contained herein are submitted for the general information of the shareholders of the Fund. This report is not authorized for distribution to prospective investors in the Fund unless preceded or accompanied by an effective prospectus of Ohio National Fund, Inc. For a prospectus containing more complete information, including charges and expenses, please contact Ohio National Investments, Inc., One Financial Way, Cincinnati, OH 45242, telephone 877-781-6392 (toll-free).
| 2 |
| Ohio National Fund, Inc. | Equity Portfolio |
Objective/Strategy
The Equity Portfolio seeks long-term growth of capital by investing at least 80% of its assets in equity securities.
Performance as of June 30, 2013
Average Annual Returns: | ||||
One year | 25.32% | |||
Five years | 3.81% | |||
Ten years | 2.16% |
Past performance does not guarantee future results. The performance data quoted represents past performance and current returns may be lower or higher. Total return figures include change in share price and reinvestment of dividends and capital gains. The investment return and principal value will fluctuate so that an investor’s shares, when redeemed, may be worth more or less than the original cost. To obtain performance information up to the most recent month end, call toll-free 1-877-781-6392.
The Portfolio is not open to direct retail investment. Beneficial interest in shares is obtained solely by purchase of variable life insurance policies and variable annuity contracts. Actual performance results for variable annuity and variable universal life contracts will be lower due to contract charges. Consult your contract for applicable charges.
Comments
For the six-month period ended June 30, 2013, the Equity Portfolio returned 15.32% versus 13.82% for the current benchmark, the S&P 500 Index.
Relative out-performance was primarily driven by security selection and sector allocation, with overweight positions in Financials, Consumer Discretionary and Health Care generating the largest contributions. At the security level, Celgene Corp., MetLife, Inc., Marvell Technology Group Ltd., JPMorgan & Chase Co. and United Continental Holdings, Inc. were the largest contributors to performance, while the biggest detractors included Apple, Inc., Cognizant Technology Solutions Corp., F5 Networks, Inc., Teradata Corp. and CONSOL Energy, Inc. (1)
The start of 2013 echoed the beginning of 2012 as stocks again posted double-digit returns. This pushed the S&P 500 Index and the Dow Jones Industrials Average to all-time highs despite concerns of low growth, the European debt crisis, and tightening government budgets. Just as calendars flipped the page to January 2013, Congress passed a bill to avoid the “Fiscal Cliff.” Included were a slew of new tax amendments, including a boost to capital gains taxes, estate taxes and dividend taxes on the wealthy. Meanwhile, a provision in the bill delayed the across-the-board spending cuts by two months, a sequestration that would last through the majority of the quarter.
As the year progressed, companies posted strong earnings and economic indicators pointed to the continuing recovery. For the quarter, 65% of S&P 500 companies beat consensus earnings estimates, while 25% missed, and 10% met expectations. Information Technology, Consumer Discretionary and Consumer Staples boasted the highest “beat rates”, while Telecommunication Services, Materials and Utilities missed more often. The economy added 219,000 jobs in December, followed by increases of 148,000 in January, 268,000 in February and 88,000 in March, which collectively drove the unemployment rate down to a four-year low of 7.6%. Housing starts were above 900,000 for all three monthly reports during the quarter, the first time in nearly five years. Building permits were similarly strong, supporting the robust recovery in the housing market.
In response to the low-rate environment and broad recovery, merger & acquisition activity picked up in the quarter. Berkshire Hathaway joined a partnership to purchase Heinz for $23 billion, Dell announced an agreement to go private in a $24.4 billion leveraged buyout, led by founder Michael Dell, and General Electric sold NBC Universal to Comcast for $16.7 billion.
Despite increased volatility, concerns about the Federal Reserve “tapering” easing programs and spiking U.S. Treasury yields, stocks advanced again during the second quarter of 2013, ultimately setting new all-time highs. Strong economic data led stocks higher early in the quarter. Notably, the economy added roughly 600,000 jobs, housing starts achieved an annualized rate over one million, and consumer confidence reached its highest level since summer 2007. Additionally, the European Central Bank (ECB) President Mario Draghi decided to cut the main lending rate from 0.75% to 0.50% as nearly every European Union country, including Germany, struggled to find economic growth. After stocks hit all-time highs on May 21, equity volatility increased, U.S. Treasury yields surged, and 30-year mortgage rates soared as the Federal Reserve indicated that quantitative easing programs may be tapered.
Although the Federal Reserve’s monetary policy-setting committee left the target short-term interest rate unchanged at 0% to 0.25% and maintained the $85 billion per month bond buying program, Chairman Ben Bernanke said the central bank may start reducing asset purchases later this year, and end them in mid-2014, if the economy continues to improve in line with the Federal Reserve’s projection. Equities subsequently sold off, the VIX index jumped from 12 to 20, the benchmark 10-year Treasury rate jumped 98 bps to a two-year high of 2.61%, and 30-year mortgage rates surged 118 bps to a high of 4.58%. Elsewhere in capital markets, gold plunged 23% in the second quarter and a late jump in oil markets moved the price of a barrel to nearly $100.
Apple, Inc.’s fourth-quarter slide persisted into the first quarter of 2013 as investors continued to worry about the sustainability of the technology giant’s margins and recent meteoric growth. In January, management issued top- and bottom-line guidance well short of expectations, which is not uncommon for the normally conservative management team. However, management disclosed that guidance going forward would reflect targets “likely to be achieved” rather than its typical conservative numbers, causing the stock to sell off. Apple, Inc. reported better-than-expected revenue and earnings for its fiscal second quarter ending in March and announced a $100 billion dividend and share repurchase program to run through 2015. However, underperformance continued in the second quarter due to the lack of new blockbuster devices and shrinking profitability from its current product suite. Customer loyalty remains very high among iPhone owners but Apple, Inc. is failing to grab its historically high share of new smart phone buyers due to the lack of any new products for several years. Apple, Inc. indicated that new products will be unveiled in the fall, which disappointed some investors looking for new products this summer. Concerns about Apple, Inc.’s profitability in the absence of a product refresh are real, but the embedded expectations of single-digit revenue growth and sharp margin declines overstate the business risk, creating an opportunity for patient investors to buy shares of a great consumer-electronic franchise at attractive prices. (1)
After recording modest gains in the first quarter, shares of Cognizant Technology Solutions Corp. lost ground throughout April due to a comprehensive immigration bill that, if passed by Congress, would prohibit companies from hiring immigrants with H-1B visas unless 50% of employees are U.S. citizens. Cognizant Technology Solutions
| 3 | (continued) |
| Ohio National Fund, Inc. | Equity Portfolio (Continued) |
Corp.’s stock sold off on the news as the company would experience labor shortages, wage increases and business flow disruption. We reduced the position to appropriately reflect the heightened regulatory risk, and plan to monitor the situation as it plays out. At present, we are maintaining exposure to Cognizant Technology Solutions Corp. as we are seeing the beginning of a cyclical recovery evidenced by more than 20% year-over-year growth in several key segments as well as substantial improvement in Europe. (1)
Shares of network equipment provider F5 Networks, Inc. detracted from relative performance after pre-announcing quarterly results well below consensus estimates. Quarterly sales were below the low end of management’s earlier guidance and earnings came in 13% under the company’s forecast. The company’s management blamed the poor results on weak federal and telecommunication spending and the lumpiness of high-dollar capital purchases. Additionally, customers likely delayed purchases in the face of F5 Network, Inc.’s rollout of new product lines. Positively, the enterprise side of the business performed to expectations. We continue to believe the company’s shares are undervalued as fundamentals are showing signs of bottoming, the upcoming product cycle presents a top-line opportunity, and the operating leverage in the business should significantly help grow earnings. (1)
Shares of Celgene Corp. surged nearly 50% in the first quarter of 2013 after management reported positive phase III test results for two key pipeline drugs and issued bullish long-term earnings guidance. Psoriasis treatment Apremilast is expected to receive approval in the second half of the year after proving statistically significant in phase III testing, while pancreatic cancer drug Abraxane recently received approval. Each drug is projected to drive over $1 billion in sales. These announcements coincided with subsiding concerns over label expansion opportunities for the company’s flagship drug, Revlimid. With these updates, company management issued forecasts for earnings per share between $13 and $14 in 2017, outpacing street estimates and implying a 20% compound annual growth rate for earnings. Despite the recent rally, we believe the company’s shares have more room to run if management can meet these projections, as they trade at only 9 times these 2017 figures. (1)
MetLife, Inc. shares contributed to the Portfolio’s out-performance during the first half of the year thanks to an unexpected 50% increase in its quarterly dividend in April, consensus-beating results for both the fourth and first quarter, and rising interest rates. The dividend increase indicates management’s expectation that regulators may take a more nuanced approach to evaluating MetLife, Inc. as a systematically important financial institution (SIFI). This is important because subjecting MetLife, Inc., an insurer, to the same capital standards as a bank would reduce its ability to return capital to shareholders. MetLife, Inc. shares advanced further after the company posted better-than-expected first-quarter results thanks to strong performance across all business units. Rising interest rates during May and June also boosted shares because higher rates reduce the present value of the company’s outstanding liabilities. Although shares of MetLife, Inc.’s have climbed to nearly a five-year high, they still trade at a discount to their peers in terms of price-to-earnings and price-to-book multiples, which we believe is unwarranted given MetLife, Inc.’s strong fundamentals and a favorable macro environment. (1)
Marvell Technology Group Ltd. stock has returned more than 60% so far this year after trumping washed-out earning expectations two quarters in a row. Most recently, management guided for a robust 8% sequential increase in revenue that was better than many expected. Our investment case is playing out in that the storage
business is now stable with share gains in hard disc drives and strong momentum in its emerging solid state drive business, and management continues to return more than 100% of free cash flow to shareholders. Additionally, we believe ruling updates on the potential payout in the Carnegie Mellon patent litigation have set the stage for a reduction in damages. The improving business fundamentals and updated litigation outlook should provide more upside to the stock from current levels, in our opinion. (1)
In this past quarter, the risk-free rate surged as bonds were punished with outflows, major indices hit all-time highs, the equity risk premium subsided, and the valuation multiples expanded after several straight quarters of strong corporate earnings. Despite these factors and several years of strong realized equity returns, we continue to find very attractive price-to-value gaps within the equity market. Financials stocks highlight this group, as they will benefit from the higher rates that should accompany an improving economy and relaxing Federal Reserve. Information Technology has also been a major return laggard since last year, as investors grapple with the major structural shift from PC- to cloud-based architectures. The lowered expectations in Information Technology are creating attractive opportunities to buy inexpensive growth options. Beyond cyclical areas, Health Care remains the most attractively valued group in our view, and we continue to find good long-term expectations gaps. Conversely, we remain underweight within the most bond-like equity areas such as Utilities, Telecommunication Services and selected Consumer Staples. (1)
| (1) | The Portfolio’s composition is subject to change. Holdings and weightings are as of June 30, 2013. |
Change in Value of $10,000 Investment
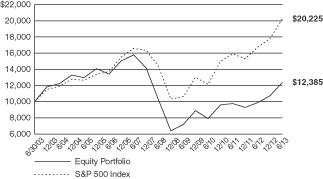
Hypothetical illustration based on past performance. Future performance will vary. The Portfolio’s returns reflect reinvested dividends. The Portfolio’s holdings may differ significantly from the securities in the index. The index is unmanaged and therefore does not reflect the cost of portfolio management and accounting.
The S&P 500 Index is a capitalization-weighted index designed to measure performance of the broad domestic economy through changes in the aggregate market value of 500 stocks representing all major industries. The index presented herein includes the effects of reinvested dividends.
| 4 | (continued) |
| Ohio National Fund, Inc. | Equity Portfolio (Continued) |
Portfolio Composition as of June 30, 2013 (1)
| % of Net Assets | ||||
Common Stocks (3) | 97.9 | |||
Money Market Funds and | 2.1 | |||
|
| |||
| 100.0 | ||||
|
|
Top 10 Portfolio Holdings as of June 30, 2013 (1) (2)
| % of Net Assets | ||||
1. JPMorgan Chase & Co. | 4.1 | |||
2. Apple, Inc. | 3.9 | |||
3. Chevron Corp. | 3.1 | |||
4. MetLife, Inc. | 3.0 | |||
5. McDonald’s Corp. | 3.0 | |||
6. Citigroup, Inc. | 2.9 | |||
7. UnitedHealth Group, Inc. | 2.8 | |||
8. Ford Motor Co. | 2.7 | |||
9. Medtronic, Inc. | 2.7 | |||
10. Microsoft Corp. | 2.7 |
| (1) | Composition of Portfolio subject to change. |
| (2) | Short-term investments have been excluded from the list of Top 10 Portfolio Holdings. |
| (3) | Sectors: |
| % of Net Assets | ||||
Financials | 20.6 | |||
Health Care | 18.9 | |||
Information Technology | 18.9 | |||
Consumer Discretionary | 13.4 | |||
Industrials | 11.1 | |||
Energy | 9.4 | |||
Consumer Staples | 3.6 | |||
Materials | 2.0 | |||
|
| |||
| 97.9 | ||||
|
|
| 5 |
| Ohio National Fund, Inc. | Equity Portfolio |
Schedule of Investments | June 30, 2013 (Unaudited) |
| Common Stocks – 97.9% | Shares | Value | ||||||||
CONSUMER DISCRETIONARY – 13.4% |
| |||||||||
Ford Motor Co. (Automobiles) | 352,320 | $ | 5,450,390 | |||||||
McDonald’s Corp. (Hotels, Restaurants & Leisure) | 61,200 | 6,058,800 | ||||||||
Amazon.com, Inc. (Internet & Catalog Retail) | (a) | 15,650 | 4,345,848 | |||||||
Groupon, Inc. (Internet & Catalog Retail) | (a) | 287,000 | 2,439,500 | |||||||
Viacom, Inc. Class B (Media) | 62,210 | 4,233,390 | ||||||||
Target Corp. (Multiline Retail) | 62,900 | 4,331,294 | ||||||||
|
| |||||||||
| 26,859,222 | ||||||||||
|
| |||||||||
CONSUMER STAPLES – 3.6% |
| |||||||||
Dr Pepper Snapple Group, Inc. (Beverages) | 61,200 | 2,810,916 | ||||||||
Colgate-Palmolive Co. (Household Products) | 78,000 | 4,468,620 | ||||||||
|
| |||||||||
| 7,279,536 | ||||||||||
|
| |||||||||
ENERGY – 9.4% |
| |||||||||
Halliburton Co. (Energy Equip. & Svs.) | 81,370 | 3,394,756 | ||||||||
Chevron Corp. (Oil, Gas & Consumable Fuels) | 52,200 | 6,177,348 | ||||||||
CONSOL Energy, Inc. (Oil, Gas & Consumable Fuels) | 76,980 | 2,086,158 | ||||||||
Phillips 66 (Oil, Gas & Consumable Fuels) | 53,490 | 3,151,096 | ||||||||
Southwestern Energy Co. (Oil, Gas & Consumable Fuels) | (a) | 108,310 | 3,956,564 | |||||||
|
| |||||||||
| 18,765,922 | ||||||||||
|
| |||||||||
FINANCIALS – 20.6% |
| |||||||||
Fifth Third Bancorp (Commercial Banks) | 244,200 | 4,407,810 | ||||||||
Wells Fargo & Co. (Commercial Banks) | 121,800 | 5,026,686 | ||||||||
Capital One Financial Corp. (Consumer Finance) | 70,000 | 4,396,700 | ||||||||
Citigroup, Inc. (Diversified Financial Svs.) | 121,600 | 5,833,152 | ||||||||
JPMorgan Chase & Co. (Diversified Financial Svs.) | 155,400 | 8,203,566 | ||||||||
Genworth Financial, Inc. Class A (Insurance) | (a) | 349,800 | 3,991,218 | |||||||
Hartford Financial Services Group, Inc. (Insurance) | 108,500 | 3,354,820 | ||||||||
MetLife, Inc. (Insurance) | 132,690 | 6,071,894 | ||||||||
|
| |||||||||
| 41,285,846 | ||||||||||
|
| |||||||||
HEALTH CARE – 18.9% |
| |||||||||
Ariad Pharmaceuticals, Inc. (Biotechnology) | (a) | 78,530 | 1,373,490 | |||||||
Celgene Corp. (Biotechnology) | (a) | 34,900 | 4,080,159 | |||||||
Medtronic, Inc. (Health Care Equip. & Supplies) | 104,100 | 5,358,027 | ||||||||
Express Scripts Holding Co. (Health Care Providers & Svs.) | (a) | 60,710 | 3,745,200 | |||||||
UnitedHealth Group, Inc. (Health Care Providers & Svs.) | 86,700 | 5,677,116 | ||||||||
Forest Laboratories, Inc. (Pharmaceuticals) | (a) | 85,230 | 3,494,430 | |||||||
GlaxoSmithKline PLC – ADR (Pharmaceuticals) | 100,500 | 5,021,985 | ||||||||
Merck & Co., Inc. (Pharmaceuticals) | 88,710 | 4,120,579 | ||||||||
Pfizer, Inc. (Pharmaceuticals) | 181,500 | 5,083,815 | ||||||||
|
| |||||||||
| 37,954,801 | ||||||||||
|
| |||||||||
| Common Stocks (Continued) | Shares | Value | ||||||||
INDUSTRIALS – 11.1% |
| |||||||||
United Technologies Corp. (Aerospace & Defense) | 53,400 | $ | 4,962,996 | |||||||
United Continental Holdings, Inc. (Airlines) | (a) | 132,840 | 4,156,564 | |||||||
Emerson Electric Co. (Electrical Equip.) | 43,570 | 2,376,308 | ||||||||
PACCAR, Inc. (Machinery) | 60,725 | 3,258,504 | ||||||||
Parker Hannifin Corp. (Machinery) | 39,300 | 3,749,220 | ||||||||
Norfolk Southern Corp. (Road & Rail) | 52,000 | 3,777,800 | ||||||||
|
| |||||||||
| 22,281,392 | ||||||||||
|
| |||||||||
INFORMATION TECHNOLOGY – 18.9% |
| |||||||||
F5 Networks, Inc. (Communications Equip.) | (a) | 44,600 | 3,068,480 | |||||||
Apple, Inc. (Computers & Peripherals) | 19,995 | 7,919,620 | ||||||||
EMC Corp. (Computers & Peripherals) | 166,500 | 3,932,730 | ||||||||
eBay, Inc. (Internet Software & Svs.) | (a) | 70,000 | 3,620,400 | |||||||
Facebook, Inc. Class A (Internet Software & Svs.) | (a) | 87,300 | 2,170,278 | |||||||
Cognizant Technology Solutions Corp. Class A (IT Svs.) | (a) | 57,320 | 3,588,805 | |||||||
Teradata Corp. (IT Svs.) | (a) | 79,550 | 3,995,797 | |||||||
Marvell Technology Group Ltd. (Semiconductors & Equip.) | 142,690 | 1,670,900 | ||||||||
Texas Instruments, Inc. (Semiconductors & Equip.) | 71,650 | 2,498,436 | ||||||||
Microsoft Corp. (Software) | 154,200 | 5,324,526 | ||||||||
|
| |||||||||
| 37,789,972 | ||||||||||
|
| |||||||||
MATERIALS – 2.0% |
| |||||||||
LyondellBasell Industries NV Class A (Chemicals) | 60,900 | 4,035,234 | ||||||||
|
| |||||||||
Total Common Stocks (Cost $158,314,514) | $ | 196,251,925 | ||||||||
|
| |||||||||
| Money Market Funds – 2.1% | Shares | Value | ||||||||
| Fidelity Institutional Money Market Funds | ||||||||||
| Money Market Portfolio – Class I | 4,289,000 | $ | 4,289,000 | |||||||
|
| |||||||||
Total Money Market Funds (Cost $4,289,000) | $ | 4,289,000 | ||||||||
|
| |||||||||
Total Investments – 100.0% (Cost $162,603,514) | (b) | $ | 200,540,925 | |||||||
Other Assets in Excess of Liabilities – 0.0% | 8,947 | |||||||||
|
| |||||||||
Net Assets – 100.0% | $ | 200,549,872 | ||||||||
|
| |||||||||
Percentages are stated as a percent of net assets.
Abbreviations:
ADR: American Depositary Receipts
Footnotes:
| (a) | Non-income producing security. |
| (b) | Represents cost for financial reporting purposes, which may differ from cost basis for federal income tax purposes. See also Note 7 of the Notes to Financial Statements. |
The accompanying notes are an integral part of these financial statements.
| 6 |
| Ohio National Fund, Inc. | Money Market Portfolio |
Portfolio Composition as of June 30, 2013 (1)
| % of Net Assets | ||||
Commercial Paper (2) | 63.7 | |||
U.S. Government Agency Issues | 3.7 | |||
U.S. Treasury Obligations | 4.5 | |||
Money Market Funds and | 28.1 | |||
|
| |||
| 100.0 | ||||
|
|
Top 10 Portfolio Holdings as of June 30, 2013 (1)
| % of Net Assets | ||||
1. U.S. Bank | 4.5 | |||
2. Prudential Funding LLC | 4.5 | |||
3. Nestle Capital Corp. | 4.5 | |||
4. Exxon Mobil Corp. | 4.5 | |||
5. Pfizer, Inc. | 4.5 | |||
6. Praxair, Inc. | 4.5 | |||
7. Wal-Mart Stores, Inc. | 4.5 | |||
8. Chevron Corp. | 4.5 | |||
9. E.I. du Pont de Nemours & Co. | 4.5 | |||
10. Toyota Motor Credit Corp. | 4.5 |
| (1) | Composition of Portfolio subject to change. |
| (2) | Sectors: |
| % of Net Assets | ||||
Financials | 21.0 | |||
Consumer Staples | 16.5 | |||
Energy | 9.0 | |||
Materials | 9.0 | |||
Health Care | 8.2 | |||
|
| |||
| 63.7 | ||||
|
|
| 7 |
| Ohio National Fund, Inc. | Money Market Portfolio |
Schedule of Investments | June 30, 2013 (Unaudited) |
| Commercial Paper – 63.7% | (b) Rate | Maturity | Face Amount | Amortized Cost | ||||||||||||
CONSUMER STAPLES – 16.5% | ||||||||||||||||
Coca-Cola Co. / The (Beverages) | (a) | 0.060% | 07/26/2013 | $ | 5,000,000 | $ | 4,999,791 | |||||||||
Coca-Cola Co. / The (Beverages) | (a) | 0.100% | 08/22/2013 | 5,000,000 | 4,999,278 | |||||||||||
Wal-Mart Stores, Inc. (Food & Staples Retailing) | (a) | 0.060% | 07/09/2013 | 12,000,000 | 11,999,840 | |||||||||||
Nestle Capital Corp. (Food Products) | (a) | 0.005% | 07/03/2013 | 12,000,000 | 11,999,997 | |||||||||||
Procter & Gamble Co. / The (Household Products) | (a) | 0.060% | 07/08/2013 | 7,000,000 | 6,999,918 | |||||||||||
Procter & Gamble Co. / The (Household Products) | (a) | 0.070% | 07/31/2013 | 3,000,000 | 2,999,825 | |||||||||||
|
| |||||||||||||||
| 43,998,649 | ||||||||||||||||
|
| |||||||||||||||
ENERGY – 9.0% | ||||||||||||||||
Exxon Mobil Corp. (Oil, Gas & Consumable Fuels) | 0.070% | 07/02/2013 | 12,000,000 | 11,999,977 | ||||||||||||
Chevron Corp. (Oil, Gas & Consumable Fuels) | (a) | 0.060% | 07/10/2013 | 12,000,000 | 11,999,820 | |||||||||||
|
| |||||||||||||||
| 23,999,797 | ||||||||||||||||
|
| |||||||||||||||
FINANCIALS – 21.0% | ||||||||||||||||
U.S. Bank (Commercial Banks) | 0.050% | 07/01/2013 | 12,000,000 | 12,000,000 | ||||||||||||
Toyota Motor Credit Corp. (Consumer Finance) | 0.070% | 07/12/2013 | 12,000,000 | 11,999,743 | ||||||||||||
American Honda Finance Corp. (Consumer Finance) | 0.070% | 07/23/2013 | 10,000,000 | 9,999,572 | ||||||||||||
General Electric Capital Corp. (Diversified Financial Services) | 0.050% | 07/05/2013 | 10,000,000 | 9,999,944 | ||||||||||||
Prudential Funding LLC (Insurance) | 0.040% | 07/01/2013 | 12,000,000 | 12,000,000 | ||||||||||||
|
| |||||||||||||||
| 55,999,259 | ||||||||||||||||
|
| |||||||||||||||
HEALTH CARE – 8.2% | ||||||||||||||||
Pfizer, Inc. (Pharmaceuticals) | (a) | 0.040% | 07/05/2013 | 12,000,000 | 11,999,947 | |||||||||||
Johnson & Johnson (Pharmaceuticals) | (a) | 0.050% | 07/09/2013 | 10,000,000 | 9,999,889 | |||||||||||
|
| |||||||||||||||
| 21,999,836 | ||||||||||||||||
|
| |||||||||||||||
MATERIALS – 9.0% | ||||||||||||||||
Praxair, Inc. (Chemicals) | 0.060% | 07/08/2013 | 12,000,000 | 11,999,860 | ||||||||||||
E.I. du Pont de Nemours & Co. (Chemicals) | (a) | 0.070% | 07/11/2013 | 12,000,000 | 11,999,767 | |||||||||||
| 23,999,627 | ||||||||||||||||
|
| |||||||||||||||
Total Commercial Paper (Cost $169,997,168) | $ | 169,997,168 | ||||||||||||||
|
| |||||||||||||||
| U.S. Government Agency Issues – 3.7% | Rate | Maturity | Face Amount | Amortized Cost | ||||||||||||
Federal Home Loan Bank | 0.045% | 07/26/2013 | $ | 10,000,000 | $ | 9,999,688 | ||||||||||
|
| |||||||||||||||
Total U.S. Government Agency Issues (Cost $9,999,688) | $ | 9,999,688 | ||||||||||||||
|
| |||||||||||||||
| U.S. Treasury Obligations – 4.5% | Rate | Maturity | Face Amount | Amortized Cost | ||||||||||||
U.S. Treasury Bill | 0.030% | 08/01/2013 | $ | 12,000,000 | $ | 11,999,690 | ||||||||||
|
| |||||||||||||||
Total U.S. Treasury Obligations (Cost $11,999,690) | $ | 11,999,690 | ||||||||||||||
|
| |||||||||||||||
| Money Market Funds – 11.2% | �� | Shares | Value | |||||||||||||
Federated Prime Cash Obligations Fund – Institutional Class | 10,000,000 | $ | 10,000,000 | |||||||||||||
Fidelity Institutional Money Market Funds Money Market Portfolio – Class I | 10,000,000 | 10,000,000 | ||||||||||||||
First American Prime Obligations Fund – Class Z | 10,000,000 | 10,000,000 | ||||||||||||||
|
| |||||||||||||||
Total Money Market Funds (Cost $30,000,000) | $ | 30,000,000 | ||||||||||||||
|
| |||||||||||||||
Total Investments – 83.1% (Cost $221,996,546) | (c) | $ | 221,996,546 | |||||||||||||
Other Assets in Excess of Liabilities – 16.9% | 44,993,838 | |||||||||||||||
|
| |||||||||||||||
Net Assets – 100.0% | $ | 266,990,384 | ||||||||||||||
|
| |||||||||||||||
Percentages are stated as a percent of net assets.
Footnotes:
| (a) | Security exempt from registration under Section 4 (2) of the Securities Act of 1933. These securities may be resold in transactions exempt from registration, normally to qualified buyers under Rule 144A. At June 30, 2013, the value of these securities totaled $89,998,072, or 33.7% of the Portfolio’s net assets. These securities were deemed liquid pursuant to procedures approved by the Board of Directors. |
| (b) | Rate represented is the effective yield at the time of purchase. |
| (c) | Represents cost for federal income tax and financial reporting purposes. See also Note 2 regarding the use of amortized cost for valuation of instruments in this Portfolio. |
The accompanying notes are an integral part of these financial statements.
| 8 |
| Ohio National Fund, Inc. | Bond Portfolio |
Objective/Strategy
The Bond Portfolio seeks to obtain a high level of income and opportunity for capital appreciation consistent with the preservation of capital by investing primarily in intermediate-term and long-term fixed income securities.
Performance as of June 30, 2013
Average Annual Returns: | ||||
One year | 0.55% | |||
Five years | 5.29% | |||
Ten years | 4.13% |
Past performance does not guarantee future results. The performance data quoted represents past performance and current returns may be lower or higher. Total return figures include change in share price and reinvestment of dividends and capital gains. The investment return and principal value will fluctuate so that an investor’s shares, when redeemed, may be worth more or less than the original cost. To obtain performance information up to the most recent month end, call toll-free 1-877-781-6392.
The Portfolio is not open to direct retail investment. Beneficial interest in shares is obtained solely by purchase of variable life insurance policies and variable annuity contracts. Actual performance results for variable annuity and variable universal life contracts will be lower due to contract charges. Consult your contract for applicable charges.
Comments
For the six-month period ended June 30, 2013, the Bond Portfolio returned -2.72% versus -3.34% for the current benchmark, the BofA Merrill Lynch U.S. Corporate Master Index (the “Index”).
Both the Portfolio and the Index had negative returns because U.S. Treasury yields increased and credit spreads widened during the six-month period. The ten-year Treasury yield increased 73 basis points and the credit spread of the Index widened 13 basis points. Treasury yields increased because the Federal Reserve hinted that it may begin to reduce its monthly purchases of mortgage-backed and Treasury securities. Credit spreads widened because investors feared that a reduction in the Federal Reserve’s bond buying program would result in a weakening of the U.S. economy.
The Portfolio outperformed the Index by 62 basis points for the six-month period primarily because the duration of the Portfolio was approximately 1.5 years shorter than the Index during a time when Treasury yields rose and credit spreads widened. Having a shorter duration resulted in less bond price depreciation than the Index as Treasury yields increased.(1)
Several industry weightings had an impact on relative performance versus the Index but this impact was less than the impact from differences in duration between the Portfolio and the Index. The Portfolio was over-weighted in electric utilities by approximately 6% and this benefited performance because electric utilities outperformed during the period. The slight over-weightings in brokerage, insurance, REITs and consumer cyclicals similarly benefited performance because these industries also performed well. The approximate 10% under-weighting in banks had a minor negative impact on relative performance because banks slightly outperformed during the six-month period. The under-weighting in Telecommunication Services benefited performance because Telecommunication Services under-performed, while the under-weighting in Information Technology detracted from performance because Information Technology outperformed. The overall credit quality of the Portfolio was Baa1 and this detracted from relative
performance because the average credit quality of the Index was A3, and bonds rated Baa suffered more spread widening than did bonds rated A and above.(1)
Because the U.S. economy continued to grow, albeit at a slow rate, the credit quality of the holdings in the Portfolio was maintained. There were not any real credit problems during the period with any of the holdings in the Portfolio. The five bonds that performed the worst were Time Warner Cable, Inc., Newmont Mining Corp., Verizon Communications, Inc., The Walt Disney Co., and Teck Resources Ltd. Time Warner Cable, Inc., Verizon Communications, Inc., and The Walt Disney Co. performed poorly solely because they are long maturing bonds that were held during a period of rising interest rates. Newmont Mining Corp. and Teck Resources Ltd. performed poorly because they are mining companies, and mining companies have been negatively impacted by weak commodity prices. The five best performing bonds were Tenaska Georgia Partners LP, Deutsche Bank Capital Funding Trust VII, Newell Rubbermaid, Inc., Ryder System, Inc. and Axis Capital Holdings Ltd.(1)
We expect that the growth rate of the U.S. economy will continue to be tepid in 2013. We also expect that the Federal Reserve will begin to reduce its purchases of mortgage-backed and Treasury securities at some point in the next year. Should this happen, or if the credit market discounts this action, Treasury yields should rise, and could rise sharply. For this reason, the duration of the Portfolio will be maintained short of the Index duration. Because of low Treasury yields, demand for corporate bonds will be high, keeping a lid on corporate spreads. We will continue to purchase what we consider to be solid Baa investment grade bonds, which are slightly lower in quality than the average for the Index.
| (1) | The Portfolio’s composition is subject to change. Holdings and weightings are as of June 30, 2013. |
Change in Value of $10,000 Investment
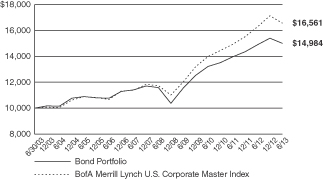
Hypothetical illustration based on past performance. Future performance will vary. The Portfolio’s returns reflect reinvested dividends. The Portfolio’s holdings may differ significantly from the securities in the index. The index is unmanaged and therefore does not reflect the cost of portfolio management and accounting.
The BofA Merrill Lynch U.S. Corporate Master Index tracks the performance of all U.S. dollar-denominated, investment grade corporate public debt issued in the U.S. domestic bond market. Qualifying bonds must have an investment grade rating (based on an average of Moody’s, S&P, and Fitch). In addition, qualifying securities must have at least one year remaining term to maturity, a fixed coupon schedule, and a minimum amount outstanding of $250 million.
| 9 | (continued) |
| Ohio National Fund, Inc. | Bond Portfolio (Continued) |
Portfolio Composition as of June 30, 2013 (1)
| % of Net Assets | ||||
Corporate Bonds (3) | 96.7 | |||
Money Market Funds and | 3.3 | |||
|
| |||
| 100.0 | ||||
|
|
Top 10 Portfolio Holdings as of June 30, 2013 (1) (2)
| % of Net Assets | ||||
1. Fifth Third Bancorp | 1.3 | |||
2. Union Electric Co. | 1.2 | |||
3. Mondelez International, Inc. | 1.2 | |||
4. Prudential Financial, Inc. | 1.2 | |||
5. Commonwealth Edison Co. | 1.2 | |||
6. Comerica Bank | 1.2 | |||
7. CSX Corp. | 1.2 | |||
8. Weatherford International Ltd. | 1.2 | |||
9. Computer Sciences Corp. | 1.1 | |||
10. Kansas City Power & Light Co. | 1.1 |
| (1) | Composition of Portfolio subject to change. |
| (2) | Short-term investments have been excluded from the list of Top 10 Portfolio Holdings. |
| (3) | Sectors: |
| % of Net Assets | ||||
Financials | 25.6 | |||
Utilities | 15.7 | |||
Energy | 11.5 | |||
Consumer Discretionary | 10.6 | |||
Industrials | 9.5 | |||
Consumer Staples | 9.0 | |||
Health Care | 5.8 | |||
Materials | 4.3 | |||
Telecommunication Services | 3.4 | |||
Information Technology | 1.3 | |||
|
| |||
| 96.7 | ||||
|
|
| 10 |
| Ohio National Fund, Inc. | Bond Portfolio |
Schedule of Investments | June 30, 2013 (Unaudited) |
Corporate Bonds – 96.7% | Rate | Maturity | Face Amount | Value | ||||||||||||
CONSUMER DISCRETIONARY – 10.6% | ||||||||||||||||
Darden Restaurants, Inc. (Hotels, Restaurants & Leisure) | 3.350% | 11/01/2022 | $ | 1,425,000 | $ | 1,314,498 | ||||||||||
Newell Rubbermaid, Inc. (Household Durables) | 6.250% | 04/15/2018 | 500,000 | 578,979 | ||||||||||||
Mattel, Inc. (Leisure Equip. & Products) | 3.150% | 03/15/2023 | 625,000 | 592,726 | ||||||||||||
Comcast Corp. (Media) | 4.250% | 01/15/2033 | 750,000 | 720,613 | ||||||||||||
Discovery Communications LLC (Media) | 4.375% | 06/15/2021 | 1,000,000 | 1,050,984 | ||||||||||||
Discovery Communications LLC (Media) | 3.300% | 05/15/2022 | 275,000 | 263,308 | ||||||||||||
News America, Inc. (Media) | 4.500% | 02/15/2021 | 1,250,000 | 1,340,619 | ||||||||||||
Time Warner Cable, Inc. (Media) | 5.850% | 05/01/2017 | 1,000,000 | 1,102,442 | ||||||||||||
Time Warner Cable, Inc. (Media) | 4.500% | 09/15/2042 | 425,000 | 331,105 | ||||||||||||
Time Warner, Inc. (Media) | 3.150% | 07/15/2015 | 1,250,000 | 1,306,195 | ||||||||||||
Viacom, Inc. (Media) | 4.375% | 09/15/2014 | 1,000,000 | 1,042,805 | ||||||||||||
Walt Disney Co. / The (Media) | 3.700% | 12/01/2042 | 925,000 | 818,043 | ||||||||||||
Kohl’s Corp. (Multiline Retail) | 4.000% | 11/01/2021 | 1,250,000 | 1,252,522 | ||||||||||||
Macy’s Retail Holdings, Inc. (Multiline Retail) | 5.900% | 12/01/2016 | 425,000 | 483,078 | ||||||||||||
Target Corp. (Multiline Retail) | 2.900% | 01/15/2022 | 1,500,000 | 1,469,842 | ||||||||||||
AutoZone, Inc. (Specialty Retail) | 3.125% | 07/15/2023 | 925,000 | 865,049 | ||||||||||||
Lowe’s Cos., Inc. (Specialty Retail) | 3.800% | 11/15/2021 | 1,000,000 | 1,039,639 | ||||||||||||
|
| |||||||||||||||
| 15,572,447 | ||||||||||||||||
|
| |||||||||||||||
CONSUMER STAPLES – 9.0% | ||||||||||||||||
Anheuser-Busch Cos. LLC (Beverages) | 5.500% | 01/15/2018 | 750,000 | 856,365 | ||||||||||||
Anheuser-Busch InBev Finance, Inc. (Beverages) | 4.000% | 01/17/2043 | 750,000 | 682,774 | ||||||||||||
CVS Caremark Corp. (Food & Staples Retailing) | 5.750% | 06/01/2017 | 487,000 | 559,804 | ||||||||||||
Kroger Co. / The (Food & Staples Retailing) | 2.200% | 01/15/2017 | 1,500,000 | 1,506,811 | ||||||||||||
Wal-Mart Stores, Inc. (Food & Staples Retailing) | 1.500% | 10/25/2015 | 1,250,000 | 1,274,814 | ||||||||||||
Bunge NA Finance LP (Food Products) | 5.900% | 04/01/2017 | 1,500,000 | 1,653,129 | ||||||||||||
Hillshire Brands Co. (Food Products) | 2.750% | 09/15/2015 | 1,250,000 | 1,284,955 | ||||||||||||
Mead Johnson Nutrition Co. (Food Products) | 3.500% | 11/01/2014 | 800,000 | 822,942 | ||||||||||||
Mondelez International, Inc. (Food Products) | 6.125% | 02/01/2018 | 1,500,000 | 1,734,772 | ||||||||||||
Tyson Foods, Inc. (Food Products) | (b) | 6.600% | 04/01/2016 | 1,000,000 | 1,130,102 | |||||||||||
Procter & Gamble Co. / The (Household Products) | 4.700% | 02/15/2019 | 250,000 | 282,198 | ||||||||||||
Philip Morris International, Inc. (Tobacco) | 4.125% | 05/17/2021 | 1,250,000 | 1,322,661 | ||||||||||||
|
| |||||||||||||||
| 13,111,327 | ||||||||||||||||
|
| |||||||||||||||
ENERGY – 11.5% | ||||||||||||||||
Weatherford International Ltd. (Energy Equip. & Svs.) | 6.000% | 03/15/2018 | 1,500,000 | 1,685,604 | ||||||||||||
Anadarko Petroleum Corp. (Oil, Gas & Consumable Fuels) | 5.950% | 09/15/2016 | 1,000,000 | 1,122,324 | ||||||||||||
Apache Corp. (Oil, Gas & Consumable Fuels) | 2.625% | 01/15/2023 | 1,000,000 | 923,378 | ||||||||||||
Buckeye Partners LP (Oil, Gas & Consumable Fuels) | 4.875% | 02/01/2021 | 1,000,000 | 1,025,066 | ||||||||||||
Devon Energy Corp. (Oil, Gas & Consumable Fuels) | 3.250% | 05/15/2022 | 500,000 | 484,927 | ||||||||||||
EOG Resources, Inc. (Oil, Gas & Consumable Fuels) | 2.950% | 06/01/2015 | 1,250,000 | 1,302,241 | ||||||||||||
Kinder Morgan Energy Partners LP (Oil, Gas & Consumable Fuels) | 4.150% | 03/01/2022 | 1,000,000 | 1,006,423 | ||||||||||||
Magellan Midstream Partners LP (Oil, Gas & Consumable Fuels) | 4.250% | 02/01/2021 | 1,000,000 | 1,052,196 | ||||||||||||
Murphy Oil Corp. (Oil, Gas & Consumable Fuels) | 4.000% | 06/01/2022 | 1,250,000 | 1,195,572 | ||||||||||||
Occidental Petroleum Corp. (Oil, Gas & Consumable Fuels) | 3.125% | 02/15/2022 | 1,000,000 | 970,062 | ||||||||||||
ONEOK Partners LP (Oil, Gas & Consumable Fuels) | 3.250% | 02/01/2016 | 1,000,000 | 1,043,443 | ||||||||||||
Phillips 66 (Oil, Gas & Consumable Fuels) | 4.300% | 04/01/2022 | 1,300,000 | 1,344,908 | ||||||||||||
Plains All American Pipeline LP / PAA Finance Corp. (Oil, Gas & Consumable Fuels) | 2.850% | 01/31/2023 | 1,000,000 | 919,710 | ||||||||||||
Shell International Finance BV (Oil, Gas & Consumable Fuels) | 4.375% | 03/25/2020 | 1,250,000 | 1,390,936 | ||||||||||||
TransCanada PipeLines Ltd. (Oil, Gas & Consumable Fuels) | 2.500% | 08/01/2022 | 1,425,000 | 1,315,953 | ||||||||||||
|
| |||||||||||||||
| 16,782,743 | ||||||||||||||||
|
| |||||||||||||||
FINANCIALS – 25.6% | ||||||||||||||||
Credit Suisse (Capital Markets) | 3.500% | 03/23/2015 | 1,250,000 | 1,304,455 | ||||||||||||
Franklin Resources, Inc. (Capital Markets) | 3.125% | 05/20/2015 | 1,000,000 | 1,041,711 | ||||||||||||
Goldman Sachs Group, Inc. / The (Capital Markets) | 6.150% | 04/01/2018 | 1,250,000 | 1,409,527 | ||||||||||||
Janus Capital Group, Inc. (Capital Markets) | (b) | 6.700% | 06/15/2017 | 1,500,000 | 1,675,845 | |||||||||||
Morgan Stanley (Capital Markets) | 3.750% | 02/25/2023 | 1,250,000 | 1,197,029 | ||||||||||||
Northern Trust Corp. (Capital Markets) | 3.450% | 11/04/2020 | 1,000,000 | 1,030,694 | ||||||||||||
State Street Corp. (Capital Markets) | 4.375% | 03/07/2021 | 1,250,000 | 1,354,487 | ||||||||||||
TD Ameritrade Holding Corp. (Capital Markets) | 4.150% | 12/01/2014 | 1,000,000 | 1,047,293 | ||||||||||||
BB&T Corp. (Commercial Banks) | 5.200% | 12/23/2015 | 1,000,000 | 1,092,699 | ||||||||||||
Comerica Bank (Commercial Banks) | 5.750% | 11/21/2016 | 1,500,000 | 1,707,133 | ||||||||||||
Fifth Third Bancorp (Commercial Banks) | 4.500% | 06/01/2018 | 1,750,000 | 1,885,917 | ||||||||||||
KeyCorp (Commercial Banks) | 5.100% | 03/24/2021 | 500,000 | 556,913 | ||||||||||||
PNC Funding Corp. (Commercial Banks) | 5.250% | 11/15/2015 | 1,500,000 | 1,633,093 | ||||||||||||
SunTrust Bank (Commercial Banks) | 5.000% | 09/01/2015 | 229,000 | 245,604 | ||||||||||||
Wells Fargo & Co. (Commercial Banks) | 4.600% | 04/01/2021 | 1,250,000 | 1,363,709 | ||||||||||||
Discover Financial Services (Consumer Finance) | 6.450% | 06/12/2017 | 750,000 | 852,496 | ||||||||||||
| 11 | (continued) |
| Ohio National Fund, Inc. | Bond Portfolio (Continued) |
Schedule of Investments | June 30, 2013 (Unaudited) |
Corporate Bonds (Continued) | Rate | Maturity | Face Amount | Value | ||||||||||||
FINANCIALS (continued) | ||||||||||||||||
Bank of America Corp. (Diversified Financial Svs.) | 5.650% | 05/01/2018 | $ | 1,000,000 | $ | 1,111,771 | ||||||||||
Citigroup, Inc. (Diversified Financial Svs.) | 6.125% | 05/15/2018 | 1,250,000 | 1,431,940 | ||||||||||||
General Electric Capital Corp. (Diversified Financial Svs.) | 5.625% | 05/01/2018 | 1,000,000 | 1,147,824 | ||||||||||||
JPMorgan Chase & Co. (Diversified Financial Svs.) | 5.150% | 10/01/2015 | 1,500,000 | 1,621,284 | ||||||||||||
National Rural Utilities Cooperative Finance Corp. (Diversified Financial Svs.) | 1.900% | 11/01/2015 | 1,000,000 | 1,024,770 | ||||||||||||
Allstate Corp. / The (Insurance) | 5.200% | 01/15/2042 | 500,000 | 538,647 | ||||||||||||
Axis Capital Holdings Ltd. (Insurance) | 5.750% | 12/01/2014 | 1,000,000 | 1,060,219 | ||||||||||||
Berkshire Hathaway, Inc. (Insurance) | 3.200% | 02/11/2015 | 1,250,000 | 1,300,551 | ||||||||||||
Hartford Financial Services Group, Inc. (Insurance) | 5.375% | 03/15/2017 | 1,500,000 | 1,648,880 | ||||||||||||
Loews Corp. (Insurance) | 5.250% | 03/15/2016 | 750,000 | 822,777 | ||||||||||||
Prudential Financial, Inc. (Insurance) | 6.100% | 06/15/2017 | 1,500,000 | 1,711,227 | ||||||||||||
Boston Properties LP (Real Estate Investment Trusts) | 3.125% | 09/01/2023 | 925,000 | 855,705 | ||||||||||||
Equity One, Inc. (Real Estate Investment Trusts) | 6.250% | 01/15/2017 | 1,250,000 | 1,389,833 | ||||||||||||
Federal Realty Investment Trust (Real Estate Investment Trusts) | 3.000% | 08/01/2022 | 1,425,000 | 1,340,163 | ||||||||||||
HCP, Inc. (Real Estate Investment Trusts) | 5.375% | 02/01/2021 | 1,000,000 | 1,085,900 | ||||||||||||
|
| |||||||||||||||
| 37,490,096 | ||||||||||||||||
|
| |||||||||||||||
HEALTH CARE – 5.8% | ||||||||||||||||
Amgen, Inc. (Biotechnology) | 4.100% | 06/15/2021 | 1,000,000 | 1,049,811 | ||||||||||||
Celgene Corp. (Biotechnology) | 2.450% | 10/15/2015 | 1,250,000 | 1,287,844 | ||||||||||||
Becton Dickinson and Co. (Health Care Equip. & Supplies) | 5.000% | 05/15/2019 | 500,000 | 564,135 | ||||||||||||
Covidien International Finance SA (Health Care Equip. & Supplies) | 2.800% | 06/15/2015 | 1,250,000 | 1,294,243 | ||||||||||||
AmerisourceBergen Corp. (Health Care Providers & Svs.) | 4.875% | 11/15/2019 | 500,000 | 559,607 | ||||||||||||
Laboratory Corp. of America Holdings (Health Care Providers & Svs.) | 3.750% | 08/23/2022 | 425,000 | 406,520 | ||||||||||||
Thermo Fisher Scientific, Inc. (Life Sciences Tools & Svs.) | 3.250% | 11/20/2014 | 300,000 | 308,504 | ||||||||||||
AbbVie, Inc. (Pharmaceuticals) | (a) | 2.900% | 11/06/2022 | 1,425,000 | 1,334,461 | |||||||||||
Merck Sharp & Dohme Corp. (Pharmaceuticals) | 5.000% | 06/30/2019 | 1,000,000 | 1,142,737 | ||||||||||||
Teva Pharmaceutical Finance II BV / Teva Pharmaceutical Finance III LLC (Pharmaceuticals) | 3.000% | 06/15/2015 | 500,000 | 519,723 | ||||||||||||
|
| |||||||||||||||
| 8,467,585 | ||||||||||||||||
|
| |||||||||||||||
INDUSTRIALS – 9.5% | ||||||||||||||||
BAE Systems Holdings, Inc. (Aerospace & Defense) | (a) | 6.375% | 06/01/2019 | 750,000 | 869,156 | |||||||||||
Lockheed Martin Corp. (Aerospace & Defense) | 3.350% | 09/15/2021 | 1,000,000 | 996,367 | ||||||||||||
Raytheon Co. (Aerospace & Defense) | 4.400% | 02/15/2020 | 1,250,000 | 1,361,276 | ||||||||||||
Republic Services, Inc. (Commercial Svs. & Supplies) | 3.800% | 05/15/2018 | 1,000,000 | 1,057,036 | ||||||||||||
Waste Management, Inc. (Commercial Svs. & Supplies) | 6.100% | 03/15/2018 | 500,000 | 578,705 | ||||||||||||
Emerson Electric Co. (Electrical Equip.) | 4.250% | 11/15/2020 | 1,250,000 | 1,347,348 | ||||||||||||
Caterpillar, Inc. (Machinery) | 5.700% | 08/15/2016 | 1,000,000 | 1,138,407 | ||||||||||||
Deere & Co. (Machinery) | 4.375% | 10/16/2019 | 1,250,000 | 1,393,525 | ||||||||||||
Illinois Tool Works, Inc. (Machinery) | 3.375% | 09/15/2021 | 500,000 | 512,080 | ||||||||||||
CSX Corp. (Road & Rail) | 5.600% | 05/01/2017 | 1,500,000 | 1,691,724 | ||||||||||||
Norfolk Southern Corp. (Road & Rail) | 3.000% | 04/01/2022 | 600,000 | 580,160 | ||||||||||||
Ryder System, Inc. (Road & Rail) | 3.600% | 03/01/2016 | 1,000,000 | 1,051,762 | ||||||||||||
Union Pacific Corp. (Road & Rail) | 4.000% | 02/01/2021 | 1,250,000 | 1,341,096 | ||||||||||||
|
| |||||||||||||||
| 13,918,642 | ||||||||||||||||
|
| |||||||||||||||
INFORMATION TECHNOLOGY – 1.3% | ||||||||||||||||
Cisco Systems, Inc. (Communications Equip.) | 2.900% | 11/17/2014 | 300,000 | 309,903 | ||||||||||||
Computer Sciences Corp. (IT Svs.) | 6.500% | 03/15/2018 | 1,500,000 | 1,676,411 | ||||||||||||
|
| |||||||||||||||
| 1,986,314 | ||||||||||||||||
|
| |||||||||||||||
MATERIALS – 4.3% | ||||||||||||||||
Eastman Chemical Co. (Chemicals) | 3.600% | 08/15/2022 | 1,000,000 | 965,158 | ||||||||||||
FMC Corp. (Chemicals) | 3.950% | 02/01/2022 | 1,000,000 | 1,007,739 | ||||||||||||
Freeport-McMoRan Copper & Gold, Inc. (Metals & Mining) | 3.550% | 03/01/2022 | 1,250,000 | 1,136,900 | ||||||||||||
Newmont Mining Corp. (Metals & Mining) | 3.500% | 03/15/2022 | 1,425,000 | 1,220,978 | ||||||||||||
Rio Tinto Finance U.S.A. Ltd. (Metals & Mining) | 1.875% | 11/02/2015 | 1,000,000 | 1,014,922 | ||||||||||||
Teck Resources Ltd. (Metals & Mining) | 3.750% | 02/01/2023 | 1,000,000 | 920,054 | ||||||||||||
|
| |||||||||||||||
| 6,265,751 | ||||||||||||||||
|
| |||||||||||||||
TELECOMMUNICATION SERVICES – 3.4% | ||||||||||||||||
AT&T, Inc. (Diversified Telecom. Svs.) | 3.875% | 08/15/2021 | 1,000,000 | 1,032,651 | ||||||||||||
AT&T, Inc. (Diversified Telecom. Svs.) | 3.000% | 02/15/2022 | 500,000 | 481,145 | ||||||||||||
Verizon Communications, Inc. (Diversified Telecom. Svs.) | 4.600% | 04/01/2021 | 1,250,000 | 1,356,579 | ||||||||||||
Verizon Communications, Inc. (Diversified Telecom. Svs.) | 3.850% | 11/01/2042 | 425,000 | 354,485 | ||||||||||||
America Movil SAB de CV (Wireless Telecom. Svs.) | 5.750% | 01/15/2015 | 1,000,000 | 1,067,500 | ||||||||||||
Rogers Communications, Inc. (Wireless Telecom. Svs.) | 3.000% | 03/15/2023 | 700,000 | 654,314 | ||||||||||||
|
| |||||||||||||||
| 4,946,674 | ||||||||||||||||
|
| |||||||||||||||
| 12 | (continued) |
| Ohio National Fund, Inc. | Bond Portfolio (Continued) |
Schedule of Investments | June 30, 2013 (Unaudited) |
Corporate Bonds (Continued) | Rate | Maturity | Face Amount | Value | ||||||||||||
UTILITIES – 15.7% | ||||||||||||||||
Appalachian Power Co. (Electric Utilities) | 4.600% | 03/30/2021 | $ | 1,000,000 | $ | 1,078,158 | ||||||||||
Commonwealth Edison Co. (Electric Utilities) | 5.950% | 08/15/2016 | 1,500,000 | 1,708,653 | ||||||||||||
Duke Energy Corp. (Electric Utilities) | 3.350% | 04/01/2015 | 1,250,000 | 1,302,360 | ||||||||||||
Duke Energy Florida, Inc. (Electric Utilities) | 4.550% | 04/01/2020 | 500,000 | 553,072 | ||||||||||||
Kansas City Power & Light Co. (Electric Utilities) | 5.850% | 06/15/2017 | 1,500,000 | 1,676,121 | ||||||||||||
Pepco Holdings, Inc. (Electric Utilities) | 2.700% | 10/01/2015 | 750,000 | 771,910 | ||||||||||||
South Carolina Electric & Gas Co. (Electric Utilities) | 4.350% | 02/01/2042 | 1,000,000 | 947,512 | ||||||||||||
Tenaska Georgia Partners LP (Electric Utilities) | 9.500% | 02/01/2030 | 465,614 | 573,108 | ||||||||||||
Union Electric Co. (Electric Utilities) | 6.400% | 06/15/2017 | 1,500,000 | 1,759,679 | ||||||||||||
Virginia Electric and Power Co. (Electric Utilities) | 5.400% | 01/15/2016 | 1,500,000 | 1,665,701 | ||||||||||||
Westar Energy, Inc. (Electric Utilities) | 4.125% | 03/01/2042 | 500,000 | 477,317 | ||||||||||||
Xcel Energy, Inc. (Electric Utilities) | 4.700% | 05/15/2020 | 1,000,000 | 1,110,609 | ||||||||||||
AGL Capital Corp. (Gas Utilities) | 5.250% | 08/15/2019 | 1,000,000 | 1,135,256 | ||||||||||||
Southwest Gas Corp. (Gas Utilities) | 3.875% | 04/01/2022 | 1,250,000 | 1,297,155 | ||||||||||||
Spectra Energy Capital LLC (Gas Utilities) | 3.300% | 03/15/2023 | 1,425,000 | 1,287,445 | ||||||||||||
Energy Future Competitive Holdings Co. LLC (Ind. Power Prod. & Energy Traders) | 7.480% | 01/01/2017 | 387,520 | 333,993 | ||||||||||||
Alliant Energy Corp. (Multi-Utilities) | 4.000% | 10/15/2014 | 1,000,000 | 1,037,843 | ||||||||||||
Avista Corp. (Multi-Utilities) | 5.950% | 06/01/2018 | 1,000,000 | 1,168,767 | ||||||||||||
LG&E and KU Energy LLC (Multi-Utilities) | 4.375% | 10/01/2021 | 1,000,000 | 1,043,152 | ||||||||||||
NextEra Energy Capital Holdings, Inc. (Multi-Utilities) | 2.600% | 09/01/2015 | 1,250,000 | 1,287,936 | ||||||||||||
Public Service Electric & Gas Co. (Multi-Utilities) | 3.950% | 05/01/2042 | 750,000 | 700,371 | ||||||||||||
|
| |||||||||||||||
| 22,916,118 | ||||||||||||||||
|
| |||||||||||||||
Total Corporate Bonds (Cost $134,652,233) | $ | 141,457,697 | ||||||||||||||
|
| |||||||||||||||
| Money Market Funds – 3.2% | Shares | Value | ||||||||||||||
Fidelity Institutional Money Market Funds Money Market Portfolio – Class I | 4,656,000 | $ | 4,656,000 | |||||||||||||
|
| |||||||||||||||
Total Money Market Funds (Cost $4,656,000) | $ | 4,656,000 | ||||||||||||||
|
| |||||||||||||||
Total Investments – 99.9% (Cost $139,308,233) | (c) | $ | 146,113,697 | |||||||||||||
Other Assets in Excess of Liabilities – 0.1% | 185,542 | |||||||||||||||
|
| |||||||||||||||
Net Assets – 100.0% | $ | 146,299,239 | ||||||||||||||
|
| |||||||||||||||
Percentages are stated as a percent of net assets.
Footnotes:
| (a) | Security exempt from registration under Regulation D of the Securities Act of 1933. These securities may be resold in transactions exempt from registration, normally to qualified buyers under Rule 144A. At June 30, 2013, the value of these securities totaled $2,203,617, or 1.5% of the Portfolio’s net assets. These securities were deemed liquid pursuant to procedures approved by the Board of Directors. |
| (b) | These securities are credit sensitive bonds. The coupon rates are variable rates subject to adjustment based on changes in national credit rating agency ratings. |
| (c) | Represents cost for financial reporting purposes, which may differ from cost basis for federal income tax purposes. See also Note 7 of the Notes to Financial Statements. |
The accompanying notes are an integral part of these financial statements.
| 13 |
| Ohio National Fund, Inc. | Omni Portfolio |
Objective/Strategy
The Omni Portfolio seeks a high level of long-term total return consistent with preservation of capital by investing in stocks, bonds, and money market instruments.
Performance as of June 30, 2013
Average Annual Returns: | ||||
One year | 19.43% | |||
Five years | 5.64% | |||
Ten years | 7.08% |
Past performance does not guarantee future results. The performance data quoted represents past performance and current returns may be lower or higher. Total return figures include change in share price and reinvestment of dividends and capital gains. The investment return and principal value will fluctuate so that an investor’s shares, when redeemed, may be worth more or less than the original cost. To obtain performance information up to the most recent month end, call toll-free 1-877-781-6392.
The Portfolio is not open to direct retail investment. Beneficial interest in shares is obtained solely by purchase of variable life insurance policies and variable annuity contracts. Actual performance results for variable annuity and variable universal life contracts will be lower due to contract charges. Consult your contract for applicable charges.
Comments
For the six-month period ended June 30, 2013, the Omni Portfolio returned 10.17% versus 8.46% for the current benchmark, which is composed of 70% S&P 500 Index and 30% BofA Merrill Lynch U.S. Corporate Master Index (the “Merrill Lynch Index”).
The outperformance of the Portfolio versus the benchmark is the result of several factors, including outperformance by both the equity portion of the Portfolio versus the S&P 500 Index and outperformance of the bond portion of the Portfolio versus the Merrill Lynch Index. The asset allocation decision to overweight stocks and underweight bonds versus the benchmark also benefited relative performance because stocks outperformed bonds for the six-month period.(1)
The equity portion of the Portfolio returned 15.39% versus 13.82% for the S&P 500 Index. The Portfolio’s best performing stocks for the six-month period were Vertex Pharmaceuticals, Inc., Delta Airlines, Inc., Hertz Global Holdings, Inc., Hanesbrands, Inc. and Prudential Financial, Inc. The Portfolio’s worst performers were Infinity Pharmaceuticals, Inc., Apple, Inc., Amarin Corp. PLC, Terex Corp. and Abercrombie & Fitch Co. The top contributors to performance were Vertex Pharmaceuticals, Inc., Delta Airlines, Inc., Hertz Global Holdings, Inc., Lincoln National Corp. and Hartford Financial Services Group, Inc. The top detractors from performance were Infinity Pharmaceuticals, Inc., Apple, Inc., Terex Corp., Abercrombie & Fitch Co. and Amarin Corp.(1)
During the six-month period, the equity portion of the Portfolio was over-weighted in Consumer Discretionary stocks which added 38 basis points in relative performance. The underweighting in the Materials sector generated an additional 25 basis points. The overweighting in the Information Technology sector cost 45 basis points of performance, and this overweighting has subsequently been reduced. Strong stock selection in Financials generated 118 basis points, but was partially offset by stock selection in Information Technology that cost the Portfolio 108 basis points.(1)
The bond portion of the Portfolio had a return of -2.44% versus -3.34% for the Merrill Lynch Index. Both the bond portion of the Portfolio and the Merrill Lynch Index had negative returns because U.S. Treasury yields increased and credit spreads widened during the
six-month period. The bond portion of the Portfolio outperformed the Merrill Lynch Index primarily because the bonds held by the Portfolio had a duration that was approximately 1.6 years shorter than that of the Merrill Lynch Index. Having a shorter duration resulted in less bond price depreciation than the Merrill Lynch Index as Treasury yields rose and credit spreads widened. The only difference in industry weightings to have a significant impact on relative bond performance was the approximate 6% over-weighting in electric utility bonds, which benefited performance because electric utility bonds outperformed. The overall credit quality of the bond portion of the Portfolio was Baa1 and this detracted from relative performance because the average credit quality of the Merrill Lynch Index was A3, and bonds rated Baa suffered more spread widening than did bonds rated A and above.(1)
Because the U.S. economy continued to grow, albeit at a slow rate, the credit quality of the bond holdings in the Portfolio was maintained. That being said, the five bonds that performed the worst were Time Warner Cable, Inc., Newmont Mining Corp., Verizon Communications, Inc., The Walt Disney Co. and Teck Resources Ltd. These bonds underperformed because they were either long maturity bonds that were hurt as interest rates climbed or in the mining industry, which has been negatively impacted by weak commodity prices. The five best performing bonds were Deutsche Bank Capital Funding Trust VII, Boardwalk Pipelines LP, Bank of America Corp., Key Bank NA and Morgan Stanley.(1)
Looking ahead to the remainder of 2013 and into 2014, it appears that the benefits of quantitative easing will likely continue. Quantitative easing has benefited investors for the past four years and will continue to provide strong support for equities for the balance of the year. We are committed to the idea that economic growth will be driven by consumer spending, which generates 70% of economic activity, and thus we remain over-weighted in Consumer Discretionary stocks. We will also continue to be over-weighted in stocks versus bonds because bonds may be negatively impacted by our expectation for higher Treasury yields. Because we expect higher interest rates, the bond portion of the Portfolio is well positioned because its duration is shorter than the Merrill Lynch Index.
| (1) | The Portfolio’s composition is subject to change. Holdings and weightings are as of June 30, 2013. |
| 14 | (continued) |
| Ohio National Fund, Inc. | Omni Portfolio (Continued) |
Change in Value of $10,000 Investment
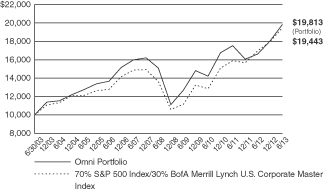
Hypothetical illustration based on past performance. Future performance will vary. The Portfolio’s returns reflect reinvested dividends. The Portfolio’s holdings may differ significantly from the securities in the index. The index is unmanaged and therefore does not reflect the cost of portfolio management and accounting.
The BofA Merrill Lynch U.S. Corporate Master Index tracks the performance of all U.S. dollar-denominated, investment grade corporate public debt issued in the U.S. domestic bond market. Qualifying bonds must have an investment grade rating (based on an average of Moody’s, S&P, and Fitch). In addition, qualifying securities must have at least one year remaining term to maturity, a fixed coupon schedule, and a minimum amount outstanding of $250 million.
The S&P 500 Index is a capitalization-weighted index designed to measure performance of the broad domestic market through changes in the aggregate market value of 500 stocks representing all major industries. The index presented herein includes the effects of reinvested dividends.
Portfolio Composition as of June 30, 2013 (1)
| % of Net Assets | ||||
Common Stocks (3) | 76.3 | |||
Corporate Bonds (3) | 19.3 | |||
U.S. Treasury Obligations | 0.9 | |||
Money Market Funds and | 3.5 | |||
|
| |||
| 100.0 | ||||
|
|
Top 10 Portfolio Holdings as of June 30, 2013 (1) (2)
| % of Net Assets | ||||
1. Apple, Inc. | 2.1 | |||
2. Facebook, Inc. Class A | 2.0 | |||
3. Adobe Systems, Inc. | 2.0 | |||
4. Valeant Pharmaceuticals International, Inc. | 2.0 | |||
5. Vertex Pharmaceuticals, Inc. | 1.9 | |||
6. Delta Air Lines, Inc. | 1.6 | |||
7. Hartford Financial Services Group, Inc. | 1.6 | |||
8. Eaton Corp PLC | 1.6 | |||
9. American International Group, Inc. | 1.6 | |||
10. Lincoln National Corp. | 1.6 |
| (1) | Composition of Portfolio subject to change. |
| (2) | Short-term investments have been excluded from the list of Top 10 Portfolio Holdings. |
| (3) | Sectors (combined): |
| % of Net Assets | ||||
Information Technology | 21.2 | |||
Industrials | 18.0 | |||
Financials | 15.4 | |||
Consumer Discretionary | 14.2 | |||
Health Care | 11.0 | |||
Energy | 7.6 | |||
Utilities | 3.7 | |||
Consumer Staples | 2.8 | |||
Telecommunication Services | 0.9 | |||
Materials | 0.8 | |||
|
| |||
| 95.6 | ||||
|
|
| 15 |
| Ohio National Fund, Inc. | Omni Portfolio |
Schedule of Investments | June 30, 2013 (Unaudited) |
| Common Stocks – 76.3% | Shares | Value | ||||||||
CONSUMER DISCRETIONARY – 12.4% | ||||||||||
Sotheby’s (Diversified Consumer Svs.) | 13,700 | $ | 519,367 | |||||||
Las Vegas Sands Corp. (Hotels, Restaurants & Leisure) | 9,000 | 476,370 | ||||||||
CBS Corp. Class B (Media) | 10,500 | 513,135 | ||||||||
Time Warner, Inc. (Media) | 8,900 | 514,598 | ||||||||
Walt Disney Co. / The (Media) | 8,000 | 505,200 | ||||||||
Abercrombie & Fitch Co. Class A (Specialty Retail) | 10,400 | 470,600 | ||||||||
Deckers Outdoor Corp. (Textiles, Apparel & Luxury Goods) | (a) | 3,800 | 191,938 | |||||||
Hanesbrands, Inc. (Textiles, Apparel & Luxury Goods) | 10,100 | 519,342 | ||||||||
V.F. Corp. (Textiles, Apparel & Luxury Goods) | 2,690 | 519,331 | ||||||||
|
| |||||||||
| 4,229,881 | ||||||||||
|
| |||||||||
CONSUMER STAPLES – 1.2% | ||||||||||
ConAgra Foods, Inc. (Food Products) | 11,200 | 391,216 | ||||||||
|
| |||||||||
ENERGY – 5.1% | ||||||||||
Anadarko Petroleum Corp. (Oil, Gas & Consumable Fuels) | 5,900 | 506,987 | ||||||||
Apache Corp. (Oil, Gas & Consumable Fuels) | 4,600 | 385,618 | ||||||||
Pioneer Natural Resources Co. (Oil, Gas & Consumable Fuels) | 3,470 | 502,283 | ||||||||
Whiting Petroleum Corp. (Oil, Gas & Consumable Fuels) | (a) | 7,700 | 354,893 | |||||||
|
| |||||||||
| 1,749,781 | ||||||||||
|
| |||||||||
FINANCIALS – 10.8% | ||||||||||
Capital One Financial Corp. (Consumer Finance) | 8,300 | 521,323 | ||||||||
Bank of America Corp. (Diversified Financial Svs.) | 39,700 | 510,542 | ||||||||
American International Group, Inc. (Insurance) | (a) | 12,000 | 536,400 | |||||||
Hartford Financial Services Group, Inc. (Insurance) | 17,900 | 553,468 | ||||||||
Lincoln National Corp. (Insurance) | 14,600 | 532,462 | ||||||||
MetLife, Inc. (Insurance) | 11,403 | 521,801 | ||||||||
Prudential Financial, Inc. (Insurance) | 7,000 | 511,210 | ||||||||
|
| |||||||||
| 3,687,206 | ||||||||||
|
| |||||||||
HEALTH CARE – 9.6% | ||||||||||
Amarin Corp PLC – ADR (Biotechnology) | (a) | 16,200 | 93,960 | |||||||
Celgene Corp. (Biotechnology) | (a) | 4,250 | 496,868 | |||||||
Pharmacyclics, Inc. (Biotechnology) | (a) | 5,100 | 405,297 | |||||||
Vertex Pharmaceuticals, Inc. (Biotechnology) | (a) | 8,100 | 646,947 | |||||||
Thermo Fisher Scientific, Inc. (Life Sciences Tools & Svs.) | 5,300 | 448,539 | ||||||||
Merck & Co., Inc. (Pharmaceuticals) | 11,000 | 510,950 | ||||||||
Valeant Pharmaceuticals International, Inc. (Pharmaceuticals) | (a) | 7,730 | 665,398 | |||||||
|
| |||||||||
| 3,267,959 | ||||||||||
|
| |||||||||
INDUSTRIALS – 16.5% | ||||||||||
Boeing Co. / The (Aerospace & Defense) | 5,060 | 518,346 | ||||||||
FedEx Corp. (Air Freight & Logistics) | 5,370 | 529,375 | ||||||||
Delta Air Lines, Inc. (Airlines) | (a) | 29,600 | 553,816 | |||||||
Tyco International Ltd. (Commercial Svs. & Supplies) | 15,300 | 504,135 | ||||||||
Eaton Corp. PLC (Electrical Equip.) | 8,300 | 546,223 | ||||||||
Pentair Ltd. (Machinery) | 9,000 | 519,210 | ||||||||
Snap-On, Inc. (Machinery) | 5,100 | 455,838 | ||||||||
Stanley Black & Decker, Inc. (Machinery) | 6,400 | 494,720 | ||||||||
Terex Corp. (Machinery) | (a) | 17,700 | 465,510 | |||||||
Xylem, Inc. (Machinery) | 19,000 | 511,860 | ||||||||
Hertz Global Holdings, Inc. (Road & Rail) | (a) | 20,500 | 508,400 | |||||||
|
| |||||||||
| 5,607,433 | ||||||||||
|
| |||||||||
INFORMATION TECHNOLOGY – 20.7% | ||||||||||
Cisco Systems, Inc. (Communications Equip.) | 21,000 | 510,510 | ||||||||
Apple, Inc. (Computers & Peripherals) | 1,800 | 712,944 | ||||||||
EMC Corp. (Computers & Peripherals) | 21,300 | 503,106 | ||||||||
Hewlett-Packard Co. (Computers & Peripherals) | 21,200 | 525,760 | ||||||||
eBay, Inc. (Internet Software & Svs.) | (a) | 6,900 | 356,868 | |||||||
Facebook, Inc. Class A (Internet Software & Svs.) | (a) | 27,300 | 678,678 | |||||||
Google, Inc. Class A (Internet Software & Svs.) | (a) | 600 | 528,222 | |||||||
International Business Machines Corp. (IT Svs.) | 2,590 | 494,975 | ||||||||
Mastercard, Inc. Class A (IT Svs.) | 920 | 528,540 | ||||||||
Avago Technologies Ltd. (Semiconductors & Equip.) | 13,800 | 515,844 | ||||||||
Intel Corp. (Semiconductors & Equip.) | 21,400 | 518,308 | ||||||||
Adobe Systems, Inc. (Software) | (a) | 14,700 | 669,732 | |||||||
Microsoft Corp. (Software) | 14,900 | 514,497 | ||||||||
|
| |||||||||
| 7,057,984 | ||||||||||
|
| |||||||||
Total Common Stocks (Cost $23,704,657) | $ | 25,991,460 | ||||||||
|
| |||||||||
| 16 | (continued) |
| Ohio National Fund, Inc. | Omni Portfolio (Continued) |
Schedule of Investments | June 30, 2013 (Unaudited) |
| Corporate Bonds – 19.3% | Rate | Maturity | Face Amount | Value | ||||||||||||||
CONSUMER DISCRETIONARY – 1.8% | ||||||||||||||||||
Darden Restaurants, Inc. (Hotels, Restaurants & Leisure) | 3.350 | % | 11/01/2022 | $ | 75,000 | $ | 69,184 | |||||||||||
Mattel, Inc. (Leisure Equip. & Products) | 3.150 | % | 03/15/2023 | 75,000 | 71,127 | |||||||||||||
Comcast Corp. (Media) | 5.875 | % | 02/15/2018 | 75,000 | 87,624 | |||||||||||||
Discovery Communications LLC (Media) | 3.300 | % | 05/15/2022 | 75,000 | 71,811 | |||||||||||||
Time Warner Cable, Inc. (Media) | 4.500 | % | 09/15/2042 | 75,000 | 58,430 | |||||||||||||
Walt Disney Co. / The (Media) | 3.700 | % | 12/01/2042 | 75,000 | 66,328 | |||||||||||||
Kohl’s Corp. (Multiline Retail) | 4.000 | % | 11/01/2021 | 75,000 | 75,151 | |||||||||||||
Macy’s Retail Holdings, Inc. (Multiline Retail) | 5.900 | % | 12/01/2016 | 42,000 | 47,739 | |||||||||||||
AutoZone, Inc. (Specialty Retail) | 3.125 | % | 07/15/2023 | 75,000 | 70,139 | |||||||||||||
|
| |||||||||||||||||
| 617,533 | ||||||||||||||||||
|
| |||||||||||||||||
CONSUMER STAPLES – 1.6% | ||||||||||||||||||
Anheuser-Busch Cos. LLC (Beverages) | 5.500 | % | 01/15/2018 | 150,000 | 171,273 | |||||||||||||
CVS Caremark Corp. (Food & Staples Retailing) | 5.750 | % | 06/01/2017 | 73,000 | 83,913 | |||||||||||||
Bunge NA Finance LP (Food Products) | 5.900 | % | 04/01/2017 | 150,000 | 165,313 | |||||||||||||
Procter & Gamble Co. / The (Household Products) | 4.700 | % | 02/15/2019 | 100,000 | 112,879 | |||||||||||||
|
| |||||||||||||||||
| 533,378 | ||||||||||||||||||
|
| |||||||||||||||||
ENERGY – 2.5% | ||||||||||||||||||
Weatherford International Ltd. (Energy Equip. & Svs.) | 6.000 | % | 03/15/2018 | 150,000 | 168,560 | |||||||||||||
Anadarko Petroleum Corp. (Oil, Gas & Consumable Fuels) | 5.950 | % | 09/15/2016 | 100,000 | 112,232 | |||||||||||||
Boardwalk Pipelines LP (Oil, Gas & Consumable Fuels) | 5.500 | % | 02/01/2017 | 100,000 | 110,399 | |||||||||||||
Enterprise Products Operating LLC (Oil, Gas & Consumable Fuels) | 5.000 | % | 03/01/2015 | 75,000 | 79,925 | |||||||||||||
Kinder Morgan Energy Partners LP (Oil, Gas & Consumable Fuels) | 4.150 | % | 03/01/2022 | 75,000 | 75,482 | |||||||||||||
Magellan Midstream Partners LP (Oil, Gas & Consumable Fuels) | 6.400 | % | 07/15/2018 | 150,000 | 177,926 | |||||||||||||
Murphy Oil Corp. (Oil, Gas & Consumable Fuels) | 4.000 | % | 06/01/2022 | 75,000 | 71,734 | |||||||||||||
TransCanada PipeLines Ltd. (Oil, Gas & Consumable Fuels) | 2.500 | % | 08/01/2022 | 75,000 | 69,261 | |||||||||||||
|
| |||||||||||||||||
| 865,519 | ||||||||||||||||||
|
| |||||||||||||||||
FINANCIALS – 4.6% | ||||||||||||||||||
Mellon Funding Corp. (Capital Markets) | 5.500 | % | 11/15/2018 | 100,000 | 115,324 | |||||||||||||
Morgan Stanley (Capital Markets) | 3.750 | % | 02/25/2023 | 75,000 | 71,822 | |||||||||||||
BB&T Corp. (Commercial Banks) | 5.200 | % | 12/23/2015 | 100,000 | 109,270 | |||||||||||||
KeyBank NA (Commercial Banks) | 5.700 | % | 11/01/2017 | 150,000 | 167,958 | |||||||||||||
PNC Funding Corp. (Commercial Banks) | 5.250 | % | 11/15/2015 | 75,000 | 81,655 | |||||||||||||
Wells Fargo & Co. (Commercial Banks) | 3.500 | % | 03/08/2022 | 75,000 | 75,948 | |||||||||||||
Discover Financial Services (Consumer Finance) | 6.450 | % | 06/12/2017 | 150,000 | 170,499 | |||||||||||||
Bank of America Corp. (Diversified Financial Svs.) | 5.750 | % | 08/15/2016 | 75,000 | 81,546 | |||||||||||||
Citigroup, Inc. (Diversified Financial Svs.) | 5.850 | % | 08/02/2016 | 75,000 | 83,931 | |||||||||||||
General Electric Capital Corp. (Diversified Financial Svs.) | 5.000 | % | 01/08/2016 | 100,000 | 109,110 | |||||||||||||
JPMorgan Chase & Co. (Diversified Financial Svs.) | 5.150 | % | 10/01/2015 | 100,000 | 108,086 | |||||||||||||
Allstate Corp. / The (Insurance) | 3.150 | % | 06/15/2023 | 75,000 | 72,928 | |||||||||||||
Boston Properties LP (Real Estate Investment Trusts) | 3.125 | % | 09/01/2023 | 75,000 | 69,381 | |||||||||||||
Federal Realty Investment Trust (Real Estate Investment Trusts) | 3.000 | % | 08/01/2022 | 75,000 | 70,535 | |||||||||||||
HCP, Inc. (Real Estate Investment Trusts) | 6.000 | % | 01/30/2017 | 150,000 | 168,358 | |||||||||||||
|
| |||||||||||||||||
| 1,556,351 | ||||||||||||||||||
|
| |||||||||||||||||
HEALTH CARE – 1.4% | ||||||||||||||||||
Laboratory Corp. of America Holdings (Health Care Providers & Svs.) | 3.750 | % | 08/23/2022 | 75,000 | 71,739 | |||||||||||||
WellPoint, Inc. (Health Care Providers & Svs.) | 5.875 | % | 06/15/2017 | 150,000 | 170,525 | |||||||||||||
AbbVie, Inc. (Pharmaceuticals) | (b) | 2.900 | % | 11/06/2022 | 75,000 | 70,235 | ||||||||||||
Hospira, Inc. (Pharmaceuticals) | 6.050 | % | 03/30/2017 | 150,000 | 160,599 | |||||||||||||
|
| |||||||||||||||||
| 473,098 | ||||||||||||||||||
|
| |||||||||||||||||
INDUSTRIALS – 1.5% | ||||||||||||||||||
Waste Management, Inc. (Commercial Svs. & Supplies) | 6.100 | % | 03/15/2018 | 75,000 | 86,806 | |||||||||||||
CSX Corp. (Road & Rail) | 5.600 | % | 05/01/2017 | 150,000 | 169,172 | |||||||||||||
ERAC U.S.A. Finance LLC (Road & Rail) | (b) | 6.375 | % | 10/15/2017 | 150,000 | 174,286 | ||||||||||||
Norfolk Southern Corp. (Road & Rail) | 3.000 | % | 04/01/2022 | 75,000 | 72,520 | |||||||||||||
|
| |||||||||||||||||
| 502,784 | ||||||||||||||||||
|
| |||||||||||||||||
INFORMATION TECHNOLOGY – 0.5% | ||||||||||||||||||
Computer Sciences Corp. (IT Svs.) | 6.500 | % | 03/15/2018 | 150,000 | 167,641 | |||||||||||||
|
| |||||||||||||||||
MATERIALS – 0.8% | ||||||||||||||||||
CF Industries, Inc. (Chemicals) | 3.450 | % | 06/01/2023 | 75,000 | 72,181 | |||||||||||||
Freeport-McMoRan Copper & Gold, Inc. (Metals & Mining) | 3.550 | % | 03/01/2022 | 75,000 | 68,214 | |||||||||||||
Newmont Mining Corp. (Metals & Mining) | 3.500 | % | 03/15/2022 | 75,000 | 64,262 | |||||||||||||
Teck Resources Ltd. (Metals & Mining) | 3.750 | % | 02/01/2023 | 75,000 | 69,004 | |||||||||||||
|
| |||||||||||||||||
| 273,661 | ||||||||||||||||||
|
| |||||||||||||||||
| 17 | (continued) |
| Ohio National Fund, Inc. | Omni Portfolio (Continued) |
Schedule of Investments | June 30, 2013 (Unaudited) |
| Corporate Bonds (Continued) | Rate | Maturity | Face Amount | Value | ||||||||||||||
TELECOMMUNICATION SERVICES – 0.9% | ||||||||||||||||||
AT&T, Inc. (Diversified Telecom. Svs.) | 3.000 | % | 02/15/2022 | $ | 75,000 | $ | 72,172 | |||||||||||
Verizon Communications, Inc. (Diversified Telecom. Svs.) | 3.850 | % | 11/01/2042 | 75,000 | 62,556 | |||||||||||||
America Movil SAB de CV (Wireless Telecom. Svs.) | 5.750 | % | 01/15/2015 | 100,000 | 106,750 | |||||||||||||
Rogers Communications, Inc. (Wireless Telecom. Svs.) | 3.000 | % | 03/15/2023 | 75,000 | 70,105 | |||||||||||||
|
| |||||||||||||||||
| 311,583 | ||||||||||||||||||
|
| |||||||||||||||||
UTILITIES – 3.7% | ||||||||||||||||||
Commonwealth Edison Co. (Electric Utilities) | 5.950 | % | 08/15/2016 | 75,000 | 85,433 | |||||||||||||
Kansas City Power & Light Co. (Electric Utilities) | 5.850 | % | 06/15/2017 | 150,000 | 167,612 | |||||||||||||
Nevada Power Co. (Electric Utilities) | 5.950 | % | 03/15/2016 | 75,000 | 83,555 | |||||||||||||
Pennsylvania Electric Co. (Electric Utilities) | 6.050 | % | 09/01/2017 | 150,000 | 170,622 | |||||||||||||
South Carolina Electric & Gas Co. (Electric Utilities) | 4.350 | % | 02/01/2042 | 75,000 | 71,063 | |||||||||||||
Union Electric Co. (Electric Utilities) | 6.400 | % | 06/15/2017 | 150,000 | 175,968 | |||||||||||||
Westar Energy, Inc. (Electric Utilities) | 4.125 | % | 03/01/2042 | 75,000 | 71,598 | |||||||||||||
Southwest Gas Corp. (Gas Utilities) | 3.875 | % | 04/01/2022 | 75,000 | 77,829 | |||||||||||||
Spectra Energy Capital LLC (Gas Utilities) | 3.300 | % | 03/15/2023 | 75,000 | 67,760 | |||||||||||||
Southern Power Co. (Ind. Power Prod. & Energy Traders) | 4.875 | % | 07/15/2015 | 100,000 | 107,206 | |||||||||||||
American Water Capital Corp. (Water Utilities) | 6.085 | % | 10/15/2017 | 150,000 | 173,120 | |||||||||||||
|
| |||||||||||||||||
| 1,251,766 | ||||||||||||||||||
|
| |||||||||||||||||
Total Corporate Bonds (Cost $6,182,788) | $ | 6,553,314 | ||||||||||||||||
|
| |||||||||||||||||
| U.S. Treasury Obligations – 0.9% | Rate | Maturity | Face Amount | Value | ||||||||||||||
United States Treasury Note | 3.375 | % | 11/15/2019 | $ | 200,000 | $ | 219,992 | |||||||||||
United States Treasury Note | 1.625 | % | 08/15/2022 | 100,000 | 93,773 | |||||||||||||
|
| |||||||||||||||||
Total U.S. Treasury Obligations (Cost $302,443) | $ | 313,765 | ||||||||||||||||
|
| |||||||||||||||||
| Money Market Funds – 3.3% | Shares | Value | ||||||||||||||||
Fidelity Institutional Money Market Funds Money Market Portfolio – Class I | 1,131,000 | $ | 1,131,000 | |||||||||||||||
|
| |||||||||||||||||
Total Money Market Funds (Cost $1,131,000) | $ | 1,131,000 | ||||||||||||||||
|
| |||||||||||||||||
Total Investments – 99.8% (Cost $31,320,888) | (c) | $ | 33,989,539 | |||||||||||||||
Other Assets in Excess of Liabilities – 0.2% | 56,909 | |||||||||||||||||
|
| |||||||||||||||||
Net Assets – 100.0% | $ | 34,046,448 | ||||||||||||||||
|
| |||||||||||||||||
Percentages are stated as a percent of net assets.
Abbreviations:
ADR: American Depositary Receipts
Footnotes:
| (a) | Non-income producing security. |
| (b) | Security exempt from registration under Regulation D of the Securities Act of 1933. These securities may be resold in transactions exempt from registration, normally to qualified buyers under Rule 144A. At June 30, 2013, the value of these securities totaled $244,521, or 0.7% of the Portfolio’s net assets. These securities were deemed liquid pursuant to procedures approved by the Board of Directors. |
| (c) | Represents cost for financial reporting purposes, which may differ from cost basis for federal income tax purposes. See also Note 7 of the Notes to Financial Statements. |
The accompanying notes are an integral part of these financial statements.
| 18 |
| Ohio National Fund, Inc. | International Portfolio |
Objective/Strategy
The International Portfolio seeks long-term growth of capital by investing at least 80% of its assets in securities of foreign companies.
Performance as of June 30, 2013
Average Annual Returns: | ||||
One year | 10.04% | |||
Five years | -0.54% | |||
Ten years | 5.51% |
Past performance does not guarantee future results. The performance data quoted represents past performance and current returns may be lower or higher. Total return figures include change in share price and reinvestment of dividends and capital gains. The investment return and principal value will fluctuate so that an investor’s shares, when redeemed, may be worth more or less than the original cost. To obtain performance information up to the most recent month end, call toll-free 1-877-781-6392.
The Portfolio is not open to direct retail investment. Beneficial interest in shares is obtained solely by purchase of variable life insurance policies and variable annuity contracts. Actual performance results for variable annuity and variable universal life contracts will be lower due to contract charges. Consult your contract for applicable charges.
Comments
For the six-month period ended June 30, 2013, the International Portfolio returned -2.82% versus -0.04% for the current benchmark, the MSCI All Country World ex-USA Index (Net-USD).
In the first half of the year, global equity markets reacted to positive U.S. economic data, Japan’s plan for structural growth, and the decreased risk of a Eurozone meltdown. The first half began with global equity markets continuing their upward march, as global confidence improved and tail-risk subsided with several major markets hitting all-time highs. However, as we moved into the second quarter, investors grew increasingly concerned about the economic growth of emerging markets, particularly China, and rotated into developed markets. During the first half of the year, developed markets, as measured by the MSCI EAFE Index, returned 4.10%, as compared to the MSCI Emerging Market Index, which returned -9.57%. Notably, the MSCI Japan Index returned 16.55% while the MSCI USA Index returned 13.34%.
In Japan, economic data has improved consistently throughout the year. Important surveys such as the Tankan and the Manufacturing PMI reflected an accelerating growth trend. Since the Liberal Democratic Party’s return to power in December, Prime Minister Shinzo Abe has acted aggressively to revitalize Japanese growth. The latest component of “Growth Strategy” was unveiled in late June. The broad plan for economic revitalization included creation of three new business councils directing economic and fiscal policy, industrial competitiveness, and regulatory reforms. Collectively, the reform strategy represents the “Third Arrow” of Japan’s makeover under “Abenomics.” The growth plan, coupled with massive quantitative easing undertaken by the Bank of Japan, led to a positive outlook for Japan. Despite a selloff late in the first half, Japanese stocks, as measured by the MSCI Japan Index, appreciated 33.90% in local terms. The weakening Yen was a headwind for U.S. dollar based returns.
Elsewhere in Asia, China, Asia’s largest economy, showed mixed signs of economic growth and stability. China’s new government, which took office in March, attempted to reset market expectations by hinting at a new plan, which will be unveiled later. The Chinese government suggests a growth plan that is more focused on
modernization and urbanization, with a moderate 7.5% gross domestic product growth target. Chinese import and export data was flat, and the manufacturing surveys came in weaker than expected. Furthermore, in June, heightened volatility in the Chinese overnight interbank rates caused fear that the credit system was freezing up. While the People’s Bank Of China intervened to provide relief, it was clearly sending a signal that credit growth would slow. Meanwhile in South Korea, three major stories dominated: the inauguration of the first female president in South Korean history, the rapid Japanese yen depreciation, and increased tensions with North Korea. In April, the South Korean government announced its third largest supplementary budget of 17.3 trillion Won, aimed at covering a tax revenue shortfall and stimulating the economy. Heightened instability on the Korean peninsula occurred as North Korea was reported to have tested a nuclear device in February. However, by the end of the first half, amid pressures from the international community, North Korea began to open the door to possible peace talks and markets were calmed.
European markets began the year sluggishly, as banking problems in Cyprus and Italy’s political instability weighed on investors’ expectations. Amid the uncertainty, the European Central Bank (ECB) left key interest rates unchanged during the first quarter as policy makers continued to signal that they would “do whatever it takes to preserve the Euro”. Spanish and Italian bond yields remained below “crisis” levels. At its May meeting, the ECB decided to cut its key rate to an all-time low of 0.50%, the first cut since July of 2012. Overall, European markets were quiet with respect to the rest of the world and began to show signs of stabilization as the pace of contraction slowed across much of the continent. With the meltdown scenarios becoming less likely as time goes on, confidence is building, as sovereign borrowing costs remain subdued and balance sheet repair moves forward. While still in recessionary territory, core European countries, such as Italy and France, showed better than expected forward looking economic indicators. Germany also continues to plod along with modest economic growth and favorable low inflation while growth prospects are expected to be above trend by 2014.
Developed market performance was led by Japan, up 16.55%, Switzerland, up 10.92%, and Ireland, up 8.52%. Emerging markets had a difficult quarter, relative to the broader markets. Top performing emerging economies included the Philippines, up 8.17%, Indonesia, up 5.65%, and Malaysia, up 5.30%. As measured by the Trade Weighted Dollar Index, the U.S. Dollar strengthened 4.22% during the six-month period on the continued strength in the U.S. economy and the weaker Japanese Yen.
Country allocation remained the primary driver of performance for the six-month period. Our country ranking process seeks to identify strong economies trading at reasonable valuation levels and favorable macroeconomic outlooks. During the period, the Portfolio maintained exposure to select healthy, high sovereign quality, developed and emerging markets. We continue to find country and stock holdings attractive for the long-term.(1)
In Asia, our exposure to Japan contributed positively to Portfolio performance. Japan, a key overweight for the Portfolio, benefitted from recently announced stimulus measures designed to encourage economic growth. Exporters contributed positively to Portfolio performance as the Yen weakened. Companies such as industrial equipment manufacturers Kubota Corp, Murata Manufacturing Co. Ltd., and bathroom fixture maker TOTO Ltd. led in gains. South Korea contributed negatively to Portfolio performance as the Won strengthened against the Yen. Despite a June rally in Korean stocks, companies such as Samsung Electronics Co. Ltd. negatively impacted performance.(1)
| 19 | (continued) |
| Ohio National Fund, Inc. | International Portfolio (Continued) |
In Europe, our German shares, which represented the Portfolio’s largest overweight allocation, positively impacted the Portfolio’s performance as a rebound in consumer spending, along with record low unemployment levels, contributed positively to economic growth. Companies such as Daimler AG benefitted from its strong global position while Kabel Deutschland Holding AG rose as talks advanced for the firm to be acquired by Vodafone.(1)
In Latin America, the Portfolio’s exposures to Mexico and Brazil had a negative impact on Portfolio performance, as domestic demand for goods and services and industrial production softened. With the U.S. being Mexico’s largest trading partner, uncertainty over the “fiscal cliff” earlier in the first half of the year led to lower levels of exports from Mexico to the U.S. Recently announced reforms of telecommunications and energy regulations are expected to boost economic growth. However, in April, a manufacturing decline, coupled with weaker than expected first quarter gross domestic product growth and rising inflation, led to weakness in the equity market. Companies such as America Movil SAB de CV were weaker during the period.(1)
In Brazil, despite efforts promoting growth, rising inflation along with slower than expected gross domestic product growth, created a headwind as the market underperformed. A lack of a sustainable recovery led investors to sell Brazilian companies such as Vale SA, which contributed negatively to Portfolio performance.(1)
The Portfolio used foreign exchange (FX) currency contracts to reduce currency risk. In the period, the overall net returns of the FX forward positions contributed negatively to performance. Positive contribution from our short Yen (vs. U.S. dollar) position was offset by long exposure to United Kingdom Pounds.(1)
The latest research shows that country effects have become even more influential in a well-diversified international portfolio. Relative country trades have increased. Portfolio management believes the greater importance of country divergences is likely to persist given the increasing fundamental divergences between countries (even within the Euro- zone), increased macro instability related to sovereign indebtedness, and low trend growth.
The Portfolio maintained exposure to select healthy, high quality developed markets. Our highest conviction country overweights included Germany, Denmark, and Norway, while we underweighted European peripheral debt-laden economies such as Spain, Italy, and Portugal. The Portfolio maintained its overweight in Germany on the belief that strong long-term fundamentals will be the key driver of stock returns and that German shares will benefit from continued low European Central Bank rates, a competitive currency, and low unemployment. The Portfolio has been overweighted in Norway as the country has strong public finances and is benefiting from the boom in off-shore oil and gas exploration and production.(1)
At the end of the period, Japan represented 25.3% of the Portfolio, on the belief that economic conditions in Japan are improving, and will continue to remain on an upward trajectory. Prime Minister Shinzo Abe has acted aggressively to revitalize the economy under his “Three Arrows” strategy, which is expected to boost the labor market and provide relief from years of deflation.(1)
The Portfolio maintained its overweight in emerging markets, where we find countries that are healthier in terms of economic conditions. Provided that credit conditions do not deteriorate meaningfully, developing economies have better long-term growth prospects supported by both structural demand and strong demographics. Many advanced economies are, however, constrained by weak demographics and government debt burdens that may constrain
growth in the long-term. The Portfolio’s overweight in emerging markets has been spread among several attractive countries: South Korea, China and Brazil. At the end of the quarter, our emerging markets weight stood at 32.6%. Excluding South Korea, which some key benchmark providers consider a developed market, our emerging market weight was 20.4%.(1)
During the first half, the Portfolio maintained a position in China, primarily by owning companies that focus on China’s growing domestic consumption economy rather than on Chinese exporters or financial stocks. While pockets of China’s economy may be slowing, the Portfolio’s managers expect China’s domestic economy to continue to grow due to a rapidly expanding middle class and anticipated new urbanization and renewal policies.(1)
We continue to monitor our investment universe for signs of countries and companies with poor credit quality (or unmanageable debt levels), preferring to focus on countries and companies with healthy balance sheets and strategic expansion opportunities. As developed economies continue to adjust to new debt levels, and investors continue to fear a reoccurrence of a global financial crisis, markets may continue to be volatile. However, as long-term investors, we feel that fundamentals are supportive of global growth. The Portfolio’s managers expect the winners to maintain higher profitability and gain market share, while the weaker players, who continue to struggle to gain footing, may underperform. Globally, despite talk of ‘Fed tapering,’ we expect financial conditions to remain accommodative for some time to come.
| (1) | The Portfolio’s composition is subject to change. Holdings and weightings are as of June 30, 2013. |
Change in Value of $10,000 Investment
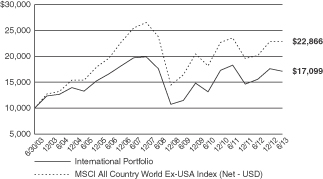
Hypothetical illustration based on past performance. Future performance will vary. The Portfolio’s returns reflect reinvested dividends. The Portfolio’s holdings may differ significantly from the securities in the index. The index is unmanaged and therefore does not reflect the cost of portfolio management and accounting.
The MSCI All Country World Ex-USA Index (Net-USD) is a free float-adjusted market capitalization weighted index that is designed to measure the equity market performance of the developed and emerging markets. The MSCI All Country World Index consists of 24 developed and 21 emerging market country indices.
| 20 | (continued) |
| Ohio National Fund, Inc. | International Portfolio (Continued) |
Portfolio Composition as of June 30, 2013 (1)
| % of Net Assets | ||||
Common Stocks (3) | 95.3 | |||
Preferred Stocks (3) | 0.6 | |||
U.S. Treasury Obligations | 0.2 | |||
Money Market Funds | 3.9 | |||
|
| |||
| 100.0 | ||||
|
|
Top 10 Portfolio Holdings as of June 30, 2013 (1) (2)
| % of Net Assets | ||||
1. Samsung Electronics Co. Ltd. | 3.0 | |||
2. Siemens AG | 2.8 | |||
3. Daimler AG | 2.6 | |||
4. Statoil ASA | 2.5 | |||
5. Novo Nordisk A/S – ADR | 2.5 | |||
6. Kubota Corp. | 2.1 | |||
7. TOTO Ltd. | 2.0 | |||
8. Yara International ASA | 2.0 | |||
9. Hyundai Motor Co. | 1.9 | |||
10. Allianz SE | 1.9 |
| (1) | Composition of Portfolio subject to change. |
| (2) | Short-term investments have been excluded from the list of Top 10 Portfolio Holdings. |
| (3) | Top 10 Country Weightings (combined): |
| % of Net Assets | ||||
Japan | 25.3 | |||
Germany | 18.3 | |||
South Korea | 12.1 | |||
Norway | 9.8 | |||
Brazil | 7.1 | |||
Denmark | 7.0 | |||
China | 6.4 | |||
Indonesia | 2.7 | |||
United Kingdom | 1.6 | |||
Bermuda | 1.5 |
| 21 |
| Ohio National Fund, Inc. | International Portfolio |
Schedule of Investments | June 30, 2013 (Unaudited) |
| Common Stocks – 95.3% | Shares | Value | ||||||||
Japan – 25.3% | ||||||||||
Aisin Seiki Co. Ltd. | (b) | 83,700 | $ | 3,195,868 | ||||||
Asahi Kasei Corp. | (b) | 384,000 | 2,533,680 | |||||||
Astellas Pharma, Inc. | (b) | 14,000 | 760,537 | |||||||
Chugai Pharmaceutical Co. Ltd. | (b) | 35,000 | 724,476 | |||||||
Disco Corp. | (b) | 18,000 | 1,241,511 | |||||||
Fuji Heavy Industries Ltd. | (b) | 77,000 | 1,901,456 | |||||||
Hitachi Ltd. | (b) | 220,000 | 1,409,649 | |||||||
Honda Motor Co. Ltd. | (b) | 64,400 | 2,392,423 | |||||||
Japan Tobacco, Inc. | (b) | 87,100 | 3,074,414 | |||||||
Kaneka Corp. | (b) | 240,000 | 1,582,464 | |||||||
Kubota Corp. | (b) | 246,000 | 3,580,127 | |||||||
Kuraray Co. Ltd. | (b) | 64,600 | 905,382 | |||||||
Mitsubishi Chemical Holdings Corp. | (b) | 186,500 | 874,071 | |||||||
Mitsui & Co. Ltd. | (b) | 167,000 | 2,094,214 | |||||||
Murata Manufacturing Co. Ltd. | (b) | 36,700 | 2,791,582 | |||||||
ORIX Corp. | (b) | 103,000 | 1,405,611 | |||||||
Sekisui House Ltd. | (b) | 190,000 | 2,745,212 | |||||||
Shionogi & Co. Ltd. | (b) | 101,600 | 2,118,706 | |||||||
Shiseido Co. Ltd. | (b) | 122,300 | 1,819,679 | |||||||
TOTO Ltd. | (b) | 337,408 | 3,430,778 | |||||||
United Arrows Ltd. | (b) | 68,300 | 2,853,511 | |||||||
|
| |||||||||
| 43,435,351 | ||||||||||
|
| |||||||||
Germany – 18.3% | ||||||||||
Allianz SE | (b) | 22,310 | 3,256,396 | |||||||
BASF SE | (b) | 34,600 | 3,086,094 | |||||||
Bayer AG | (b) | 10,400 | 1,107,293 | |||||||
Bayerische Motoren Werke AG | (b) | 30,300 | 2,644,469 | |||||||
Continental AG | (b) | 6,718 | 895,570 | |||||||
Daimler AG | (b) | 72,900 | 4,400,889 | |||||||
Deutsche Post AG | (b) | 66,800 | 1,657,843 | |||||||
Deutsche Wohnen AG | (b) | 39,250 | 665,387 | |||||||
Gerresheimer AG | (b) | 17,400 | 1,004,756 | |||||||
HeidelbergCement AG | (b) | 11,900 | 797,310 | |||||||
Kabel Deutschland Holding AG | (b) | 8,200 | 900,370 | |||||||
Muenchener Rueckversicherungs AG | (b) | 14,110 | 2,592,184 | |||||||
Rheinmetall AG | (b) | 32,300 | 1,502,389 | |||||||
Siemens AG | (b) | 48,114 | 4,872,192 | |||||||
Suedzucker AG | (b) | 41,400 | 1,281,717 | |||||||
TAG Immobilien AG | (b) | 57,100 | 622,350 | |||||||
|
| |||||||||
| 31,287,209 | ||||||||||
|
| |||||||||
South Korea – 12.1% | ||||||||||
Amorepacific Corp. | (b) | 1,000 | 801,137 | |||||||
Binggrae Co. Ltd. | (b) | 8,600 | 810,687 | |||||||
Cheil Worldwide, Inc. | (a)(b) | 41,500 | 890,869 | |||||||
Coway Co. Ltd. | (b) | 16,973 | 824,790 | |||||||
Hyundai Motor Co. | (b) | 16,800 | 3,294,994 | |||||||
Kia Motors Corp. | (b) | 48,600 | 2,624,508 | |||||||
Korea Electric Power Corp. | (a)(b) | 31,800 | 731,432 | |||||||
LG Display Co. Ltd. | (a)(b) | 42,500 | 1,014,043 | |||||||
Samsung Electronics Co. Ltd. | (b) | 4,393 | 5,134,643 | |||||||
Samsung Heavy Industries Co. Ltd. | (b) | 61,500 | 1,913,674 | |||||||
Samsung SDI Co. Ltd. | (b) | 15,900 | 1,887,409 | |||||||
SK Innovation Co. Ltd. | (b) | 6,900 | 812,850 | |||||||
|
| |||||||||
| 20,741,036 | ||||||||||
|
| |||||||||
Norway – 9.8% | ||||||||||
DNB ASA | (b) | 212,985 | 3,089,700 | |||||||
Fred Olsen Energy ASA | (b) | 49,966 | 1,978,642 | |||||||
Norwegian Air Shuttle AS | (a)(b) | 29,697 | 1,298,256 | |||||||
Statoil ASA | (b) | 210,800 | 4,354,720 | |||||||
Telenor ASA | (b) | 51,000 | 1,013,014 | |||||||
TGS Nopec Geophysical Co. ASA | (b) | 57,100 | 1,659,305 | |||||||
Yara International ASA | (b) | 84,500 | 3,369,779 | |||||||
|
| |||||||||
| 16,763,416 | ||||||||||
|
| |||||||||
Denmark – 7.0% | ||||||||||
AP Moeller – Maersk A/S | (b) | 136 | 972,891 | |||||||
Carlsberg A/S | (b) | 18,200 | 1,627,372 | |||||||
| Common Stocks (Continued) | Shares | Value | ||||||||
Denmark (continued) | ||||||||||
Chr Hansen Holding A/S | (b) | 45,200 | $ | 1,546,376 | ||||||
Danske Bank A/S | (a)(b) | 104,300 | 1,779,247 | |||||||
DSV A/S | (b) | 70,500 | 1,717,388 | |||||||
Novo Nordisk A/S – ADR | 28,100 | 4,354,657 | ||||||||
|
| |||||||||
| 11,997,931 | ||||||||||
|
| |||||||||
Brazil – 6.5% | ||||||||||
Banco do Brasil SA | 109,600 | 1,086,987 | ||||||||
BB Seguridade Participacoes SA | (a) | 133,333 | 1,051,678 | |||||||
BM&FBovespa SA | 118,000 | 653,631 | ||||||||
Cia Brasileira de Distribuicao Grupo Pao de Acucar – ADR | 19,600 | 891,016 | ||||||||
Cia de Bebidas das Americas – ADR | 34,900 | 1,303,515 | ||||||||
Cielo SA | 60,480 | 1,517,861 | ||||||||
Itau Unibanco Holding SA – ADR | 58,190 | 751,815 | ||||||||
Localiza Rent a Car SA | 59,115 | 837,177 | ||||||||
Mills Estruturas e Servicos de Engenharia SA | 52,000 | 704,022 | ||||||||
Porto Seguro SA | 51,500 | 547,001 | ||||||||
Tim Participacoes SA – ADR | 42,600 | 792,360 | ||||||||
Tractebel Energia SA | 60,000 | 932,261 | ||||||||
|
| |||||||||
| 11,069,324 | ||||||||||
|
| |||||||||
China – 6.4% | ||||||||||
Air China Ltd. | (b) | 3,048,000 | 2,174,197 | |||||||
Baidu, Inc. – ADR | (a) | 4,700 | 444,291 | |||||||
Bank of China Ltd. | (b) | 2,790,000 | 1,142,965 | |||||||
CNOOC Ltd. – ADR | 10,800 | 1,808,784 | ||||||||
Ctrip.com International Ltd. – ADR | (a) | 56,400 | 1,840,332 | |||||||
Datang International Power Generation Co. Ltd. | (b) | 2,500,000 | 1,015,286 | |||||||
Great Wall Motor Co. Ltd. | (b) | 260,000 | 1,107,729 | |||||||
Tencent Holdings Ltd. | (b) | 35,000 | 1,366,652 | |||||||
|
| |||||||||
| 10,900,236 | ||||||||||
|
| |||||||||
Indonesia – 2.7% | ||||||||||
Bank Mandiri Persero Tbk PT | (b) | 790,000 | 712,529 | |||||||
Bank Negara Indonesia Persero Tbk PT | (b) | 2,450,000 | 1,054,515 | |||||||
Bumi Serpong Damai PT | (b) | 3,940,000 | 710,308 | |||||||
Indocement Tunggal Prakarsa Tbk PT | (b) | 466,000 | 1,144,260 | |||||||
Media Nusantara Citra Tbk PT | (b) | 3,400,000 | 1,068,323 | |||||||
|
| |||||||||
| 4,689,935 | ||||||||||
|
| |||||||||
United Kingdom – 1.6% | ||||||||||
Burberry Group PLC | (b) | 54,127 | 1,113,527 | |||||||
Subsea 7 SA | (a)(b) | 91,530 | 1,610,299 | |||||||
|
| |||||||||
| 2,723,826 | ||||||||||
|
| |||||||||
Bermuda – 1.5% | ||||||||||
Seadrill Ltd. | (b) | 62,966 | 2,536,041 | |||||||
|
| |||||||||
Hong Kong – 1.4% | ||||||||||
China Overseas Land & Investment Ltd. | (b) | 632,000 | 1,637,295 | |||||||
Guangdong Investment Ltd. | (b) | 812,000 | 705,686 | |||||||
|
| |||||||||
| 2,342,981 | ||||||||||
|
| |||||||||
Italy – 1.3% | ||||||||||
Prada SpA | (b) | 243,000 | 2,194,428 | |||||||
|
| |||||||||
Turkey – 0.8% | ||||||||||
BIM Birlesik Magazalar AS | (b) | 20,800 | 451,145 | |||||||
Turkiye Halk Bankasi AS | (b) | 52,000 | 440,595 | |||||||
Turkiye Vakiflar Bankasi Tao | (b) | 175,000 | 435,762 | |||||||
|
| |||||||||
| 1,327,502 | ||||||||||
|
| |||||||||
Sweden – 0.6% | ||||||||||
Nordea Bank AB | (b) | 100,800 | 1,125,660 | |||||||
|
| |||||||||
Total Common Stocks (Cost $140,098,326) | $ | 163,134,876 | ||||||||
|
| |||||||||
| 22 | (continued) |
| Ohio National Fund, Inc. | International Portfolio (Continued) |
Schedule of Investments | June 30, 2013 (Unaudited) |
| Preferred Stocks – 0.6% | Shares | Value | ||||||||
Brazil – 0.6% | ||||||||||
Marcopolo SA | 103,000 | $ | 587,622 | |||||||
Randon Participacoes SA | 95,000 | 513,456 | ||||||||
|
| |||||||||
Total Preferred Stocks (Cost $1,061,388) | $ | 1,101,078 | ||||||||
|
| |||||||||
| U.S. Treasury Obligations – 0.2% | Face Amount | Value | ||||||||
U.S. Treasury Bill | (c) | $ | 335,000 | $ | 334,990 | |||||
|
| |||||||||
Total U.S. Treasury Obligations (Cost $334,962) | $ | 334,990 | ||||||||
|
| |||||||||
| Money Market Funds – 4.8% | Shares | Value | ||||||||
State Street Institutional Liquid Reserves Fund Institutional Class | 8,300,182 | $ | 8,300,182 | |||||||
|
| |||||||||
Total Money Market Funds (Cost $8,300,182) | $ | 8,300,182 | ||||||||
|
| |||||||||
Total Investments – 100.9% (Cost $149,794,858) | (d) | $ | 172,871,126 | |||||||
Liabilities in Excess of Other Assets – (0.9)% | (1,615,852) | |||||||||
|
| |||||||||
Net Assets – 100.0% | $ | 171,255,274 | ||||||||
|
| |||||||||
Percentages are stated as a percent of net assets.
Abbreviations:
ADR: American Depositary Receipts
Footnotes:
| (a) | Non-income producing security. |
| (b) | Security traded on a foreign exchange has been valued at an estimate of fair value that is different than the local market close price. These fair value estimates are determined by an independent fair valuation service that has been approved by the Board. These securities represent $143,617,488, or 83.9% of the Portfolio’s net assets. |
Other Portfolio securities are not subjected to fair valuation procedures because they are traded on domestic or foreign exchanges that have close times that are consistent with the U.S. market close, normally 4:00 pm Eastern Time.
| (c) | Security is fully or partially pledged as collateral for the Portfolio’s futures contracts outstanding at June 30, 2013. See also Note 6 of the Notes to Financial Statements. |
| (d) | Represents cost for financial reporting purposes, which may differ from cost basis for federal income tax purposes. See also Note 7 of the Notes to Financial Statements. |
Sector Classifications (Common and preferred stocks): (Percent of net assets)
Consumer Discretionary | 21.5% | |||
Industrials | 16.3% | |||
Financials | 14.5% | |||
Information Technology | 9.8% | |||
Materials | 9.2% | |||
Energy | 8.6% | |||
Consumer Staples | 7.0% | |||
Health Care | 5.9% | |||
Utilities | 2.0% | |||
Telecommunication Services | 1.1% | |||
|
| |||
| 95.9% | ||||
|
|
The accompanying notes are an integral part of these financial statements.
| 23 |
| Ohio National Fund, Inc. | Capital Appreciation Portfolio |
Objective/Strategy
The Capital Appreciation Portfolio seeks long-term capital growth by investing primarily in common stocks of established companies with either current or emerging earnings growth not fully appreciated or recognized by the market.
Performance as of June 30, 2013
Average Annual Returns: | ||||
One year | 25.40% | |||
Five years | 8.42% | |||
Ten years | 8.75% |
Past performance does not guarantee future results. The performance data quoted represents past performance and current returns may be lower or higher. Total return figures include change in share price and reinvestment of dividends and capital gains. The investment return and principal value will fluctuate so that an investor’s shares, when redeemed, may be worth more or less than the original cost. To obtain performance information up to the most recent month end, call toll-free 1-877-781-6392.
The Portfolio is not open to direct retail investment. Beneficial interest in shares is obtained solely by purchase of variable life insurance policies and variable annuity contracts. Actual performance results for variable annuity and variable universal life contracts will be lower due to contract charges. Consult your contract for applicable charges.
Comments
For the six-month period ended June 30, 2013, the Capital Appreciation Portfolio returned 14.28% versus 13.82% for the current benchmark, the S&P 500 Index.
Buoyed particularly by a robust first quarter, the broad markets, as represented by the S&P 500 Index and the Russell 3000 Index, finished the first half of 2013 with strong gains. The S&P 500 Index advanced 13.82% while the Russell 3000 Index was up 14.06%. Most sectors had double-digit gains, with Health Care, Consumer Discretionary, and Financials showing the greatest strength. Materials and Information Technology were the weakest performing sectors. In the larger capitalizations, value stocks outperformed growth stocks, while in the smaller capitalizations, growth stocks had the edge. The Portfolio outperformed both indexes.
Stock selection in the standout Financials and Consumer Discretionary sectors had a particularly positive impact on relative performance. An underweight in Financials, however, tempered those returns, while an overweight in Consumer Discretionary further contributed. Stock selection in Information Technology and Industrials, in combination with an underweight in Information Technology, also were key to the Portfolio’s outperformance. Stock selection in Energy, Health Care, Materials, and Telecommunication Services, along with an overweight in Materials, detracted from relative performance.(1)
The five largest contributors during the six-month period were Vertex Pharmaceuticals, Inc., Live Nation Entertainment, Inc., GameStop Corp., MetLife, Inc., and The Charles Schwab Corp.(1)
The largest individual contributor during the period, Vertex Pharmaceuticals, Inc., announced that its Phase 2 trial data for its second cystic fibrosis drug, VX-661, in combination with Kalydeco, indicated that the drug was significantly more effective than anticipated. The results are a very favorable indicator for Vertex Pharmaceuticals, Inc.’s pipeline of cystic fibrosis drugs. It now appears likely that Vertex Pharmaceuticals, Inc. will be able to bring to market a drug combination for homozygous cystic fibrosis patients with what is
known as the delta F508 mutation. To that end, Vertex Pharmaceuticals, Inc.’s VX-661 combination will progress to the next stage of trials and there is a good chance that Phase 3 trials of Vertex Pharmaceuticals, Inc.’s 809 drug, also for homozygous cystic fibrosis patients in combination with Kalydeco, will be successful. The results further raise the likelihood that Vertex Pharmaceuticals, Inc. will be able to develop a potent drug combination for the harder-to-treat heterozygous cystic fibrosis population.(1)
Another major contributor, Live Nation Entertainment, Inc., a producer of live music concerts worldwide, reported two successive strong quarters, driven particularly by its sponsorship business and concert revenue. First quarter results were particularly auspicious for the rest of 2013 since the first quarter is traditionally slow. Live Nation Entertainment, Inc.’s recent announcement that it had prevailed in an arbitration case with CTS Eventim produced an additional surge in the stock. Earlier in the period, the market responded favorably after Liberty Media increased its investment in Live Nation Entertainment, Inc. and Liberty Media’s CEO was named non-executive chairman of Live Nation Entertainment, Inc.’s Board of Directors. We believe that Live Nation Entertainment, Inc. is making astute investments to build its business, including the technology used in its ticketing business, expanding its promotions and ticketing businesses internationally, and increasing its sponsorships and e-commerce activities. Though we have slightly trimmed the position due to the rise in the share price, we believe the reward to risk ratio remains above 2:1 over the medium term.(1)
GameStop Corp., the leading video game retailer, reported earnings and revenue for its January quarter which exceeded expectations. Since then, shares have advanced in anticipation of a new console cycle. GameStop Corp. continues to take significant market share in both the new and used software categories, and we believe that sales growth will improve with the release of new games in the next few quarters and increased traction from multiple digital initiatives. We continue to believe that GameStop Corp. is the best positioned retailer for the transition of the video game industry from a pure console driven model to a combination of both console and digital options.(1)
MetLife, Inc. reported what we consider a solid first quarter, with earnings well above expectations. We believe that the company has protected itself against potential risks while positioning itself to benefit from positive scenarios. MetLife, Inc. appears committed to returning capital to shareholders and we continue to believe that its shares are undervalued.(1)
The Charles Schwab Corp., a provider of securities brokerage, banking, and related financial services, reported solid growth in assets in April. Although The Charles Schwab Corp. has faced headwinds from low interest rates, it is benefitting from investor trends toward obtaining advisory services. The market has rewarded The Charles Schwab Corp.’s shares in response to the recent uptick in long-term Treasury rates, which is a reflection of an improving economy and seen as a precursor to higher short rates, which in turn should benefit the company’s money market business.(1)
Energy and Materials companies dominated the individual detractors during the period. The five largest detractors were Peabody Energy Corp., United States Steel Corp., CONSOL Energy, Inc., Goldcorp, Inc., and Newfield Exploration Co.(1)
Peabody Energy Corp. shares fell on continuing forecasts of declining metallurgical coal prices on rising global supply and weak demand. The recent weakness in China and other emerging market economies has accentuated the risk to the secular demand growth
| 24 | (continued) |
| Ohio National Fund, Inc. | Capital Appreciation Portfolio (Continued) |
outlook for metallurgical coal and thus Peabody Energy Corp.’s Australian operations. We believe the company has done a solid job of restructuring those operations but cannot easily deflect the negative perception of having bought the metallurgical assets at peak prices. Given the negative macroeconomic backdrop for the coal market and the lack of flow through of positive developments to Peabody Energy Corp.’s share price, we decided to exit the position in the company as the risk-reward narrowed.(1)
United States Steel Corp. announced fourth quarter earnings losses that were less than anticipated due to improved costs. However, the company projected flat earnings growth for the first quarter of 2013, below prior expectations. Growth in steel imports has prevented our expected steel pricing cycle and we exited our position in the company.(1)
Shares of CONSOL Energy, Inc., a low-cost coal and natural gas producer, have been hurt by volatility in the coal and natural gas markets. President Obama’s announcement that power plants would have to meet stricter emissions standards in the future may also have contributed to their decline. CONSOL Energy, Inc. remains an undervalued company, in our view, with some of the lowest cost and most profitable thermal coal assets in the East, paired with a growing natural gas and liquids play in the Marcellus Shale region of Southwest Pennsylvania and Ohio.(1)
Goldcorp Inc. shares declined along with those of other gold mining stocks as the price of gold continued to slide. We have exited our position in the stock.(1)
Newfield Exploration Co., an oil and gas exploration and production (E&P) company with operations in the U.S., Malaysia, and China, suffered from lower crude oil prices in the period. Newfield Exploration Co. also announced that it planned to sell its international assets and focus on developing its existing assets in its four core areas of the U.S. The company’s stock fell following the announcement and we believe the company will have to execute a sale before the positive impact is reflected in the shares. We continue to believe the company’s exposure to the new South Central Oklahoma Oil Province (SCOOP) play in the Cana Woodford area of Oklahoma offers solid upside potential.(1)
The five best performing holdings were Vertex Pharmaceuticals, Inc., GameStop Corp., Live Nation Entertainment, Inc., Delta Air Lines, Inc., and Splunk, Inc. The five worst performing holdings were Peabody Energy Corp., Amarin Corp., United States Steel Corp., Impax Laboratories, Inc., and Goldcorp, Inc.(1)
With the end of the second quarter, the slow recovery in the U.S. continues, but at a somewhat more uneven pace, and amid new global volatility. The following three currents remain critical: the fragile recovery in the U.S., the emerging market contraction, and the possibility of Federal Reserve Chairman Ben Bernanke cutting back on quantitative easing.
As they have in the past several months, private non-farm payrolls continue to expand at a moderate pace; June’s tally was 202,000 and May’s number was revised upward to 207,000. The Institute for Supply Management’s purchasing managers’ index, a key manufacturing data point, also remains above fifty, which is considered a sign of an expanding economy. The strength of the housing market continues to be an important source of growth, contributing to many areas of the economy. The duration and magnitude of the housing recovery remains to be seen as the initial stage of recovery seems to be driven by investment funds rather than new household formation. All in all, our assessment of the U.S. has not changed – slow
recovery with one step back for every two steps forward. The markets seem to be a bit fickle as they try to decide whether Bernanke’s possible ending of quantitative easing is a well-timed response to a healthy economy or a premature move that will lead to higher rates and a stifled recovery. Another unknown is the extent of the contraction in emerging markets, led by China and Brazil, and its effect on the already fragile growth trajectory of the U.S. economy.
The markets have delivered a solid year-to-date performance as they climb the wall of worry. While company-specific, microeconomic drivers are the most important factors for our investment process, we also monitor the macroeconomic variable for its effect on our individual investments. For the Portfolio, we continue to selectively pursue new opportunities and harvest stock price gains as our targets are met and risk/rewards narrow. The upcoming earnings season will provide a key reading on the effect these cross currents have on the earnings prospects for the companies in the Portfolio.
| (1) | The Portfolio’s composition is subject to change. Holdings and weightings are as of June 30, 2013. |
Change in Value of $10,000 Investment
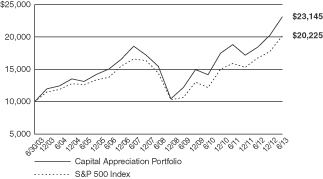
Hypothetical illustration based on past performance. Future performance will vary. The Portfolio’s returns reflect reinvested dividends. The Portfolio’s holdings may differ significantly from the securities in the index. The index is unmanaged and therefore does not reflect the cost of portfolio management and accounting.
The S&P 500 Index is a capitalization-weighted index designed to measure performance of the broad domestic economy through changes in the aggregate market value of 500 stocks representing all major industries. The index presented herein includes the effects of reinvested dividends.
| 25 | (continued) |
| Ohio National Fund, Inc. | Capital Appreciation Portfolio (Continued) |
Portfolio Composition as of June 30, 2013 (1)
| % of Net Assets | ||||
Common Stocks (3) | 96.8 | |||
Money Market Funds and | 3.2 | |||
|
| |||
| 100.0 | ||||
|
|
Top 10 Portfolio Holdings as of June 30, 2013 (1) (2)
| % of Net Assets | ||||
1. Google, Inc. Class A | 2.1 | |||
2. Pfizer, Inc. | 2.1 | |||
3. MetLife, Inc. | 2.1 | |||
4. Live Nation Entertainment, Inc. | 2.1 | |||
5. Pinnacle Entertainment, Inc. | 2.0 | |||
6. PNC Financial Services Group, Inc. / The | 1.9 | |||
7. Microsoft Corp. | 1.9 | |||
8. Cameron International Corp. | 1.9 | |||
9. Calpine Corp. | 1.9 | |||
10. Monsanto Co. | 1.8 |
| (1) | Composition of Portfolio subject to change. |
| (2) | Short-term investments have been excluded from the list of Top 10 Portfolio Holdings. |
| (3) | Sectors: |
| % of Net Assets | ||||
Consumer Discretionary | 20.3 | |||
Information Technology | 18.2 | |||
Financials | 14.0 | |||
Health Care | 11.3 | |||
Energy | 10.8 | |||
Industrials | 8.7 | |||
Consumer Staples | 6.5 | |||
Materials | 3.8 | |||
Utilities | 1.9 | |||
Telecommunication Services | 1.3 | |||
|
| |||
| 96.8 | ||||
|
|
| 26 |
| Ohio National Fund, Inc. | Capital Appreciation Portfolio |
Schedule of Investments | June 30, 2013 (Unaudited) |
| Common Stocks – 96.8% | Shares | Value | ||||||||
CONSUMER DISCRETIONARY – 20.3% | ||||||||||
Lear Corp. (Auto Components) | 30,111 | $ | 1,820,511 | |||||||
Toyota Motor Corp. – ADR (Automobiles) | 18,771 | 2,264,909 | ||||||||
Accor SA (Hotels, Restaurants & Leisure) | (b) | 28,594 | 1,005,095 | |||||||
Hyatt Hotels Corp. Class A (Hotels, Restaurants & Leisure) | (a) | 43,503 | 1,755,781 | |||||||
International Game Technology (Hotels, Restaurants & Leisure) | 131,211 | 2,192,536 | ||||||||
Pinnacle Entertainment, Inc. (Hotels, Restaurants & Leisure) | (a) | 129,859 | 2,554,327 | |||||||
Wendy’s Co. / The (Hotels, Restaurants & Leisure) | 338,557 | 1,973,787 | ||||||||
Comcast Corp. Class A (Media) | 35,534 | 1,409,634 | ||||||||
Live Nation Entertainment, Inc. (Media) | (a) | 168,198 | 2,607,069 | |||||||
RTL Group SA (Media) | (b) | 20,593 | 1,693,603 | |||||||
Thomson Reuters Corp. (Media) | 39,439 | 1,284,528 | ||||||||
Twenty-First Century Fox, Inc. (Media) | 34,981 | 1,014,099 | ||||||||
Viacom, Inc. Class B (Media) | 23,250 | 1,582,162 | ||||||||
GameStop Corp. Class A (Specialty Retail) | 53,239 | 2,237,635 | ||||||||
|
| |||||||||
| 25,395,676 | ||||||||||
|
| |||||||||
CONSUMER STAPLES – 6.5% | ||||||||||
CVS Caremark Corp. (Food & Staples Retailing) | 34,422 | 1,968,250 | ||||||||
Wal-Mart Stores, Inc. (Food & Staples Retailing) | 24,987 | 1,861,282 | ||||||||
Bunge Ltd. (Food Products) | 16,570 | 1,172,659 | ||||||||
Mondelez International, Inc. Class A (Food Products) | 70,315 | 2,006,087 | ||||||||
Tyson Foods, Inc. Class A (Food Products) | 42,856 | 1,100,542 | ||||||||
|
| |||||||||
| 8,108,820 | ||||||||||
|
| |||||||||
ENERGY – 10.8% | ||||||||||
Cameron International Corp. (Energy Equip. & Svs.) | (a) | 38,851 | 2,376,127 | |||||||
Schlumberger Ltd. (Energy Equip. & Svs.) | 31,539 | 2,260,085 | ||||||||
Superior Energy Services, Inc. (Energy Equip. & Svs.) | (a) | 69,612 | 1,805,735 | |||||||
Cobalt International Energy, Inc. (Oil, Gas & Consumable Fuels) | (a) | 57,599 | 1,530,405 | |||||||
CONSOL Energy, Inc. (Oil, Gas & Consumable Fuels) | 59,721 | 1,618,439 | ||||||||
EOG Resources, Inc. (Oil, Gas & Consumable Fuels) | 11,097 | 1,461,253 | ||||||||
Newfield Exploration Co. (Oil, Gas & Consumable Fuels) | (a) | 51,817 | 1,237,908 | |||||||
Southwestern Energy Co. (Oil, Gas & Consumable Fuels) | (a) | 33,343 | 1,218,020 | |||||||
|
| |||||||||
| 13,507,972 | ||||||||||
|
| |||||||||
FINANCIALS – 14.0% | ||||||||||
Charles Schwab Corp. / The (Capital Markets) | 97,726 | 2,074,723 | ||||||||
Evercore Partners, Inc. Class A (Capital Markets) | 21,722 | 853,240 | ||||||||
Goldman Sachs Group, Inc. / The (Capital Markets) | 9,551 | 1,444,589 | ||||||||
PNC Financial Services Group, Inc. / The (Commercial Banks) | 33,288 | 2,427,361 | ||||||||
Wells Fargo & Co. (Commercial Banks) | 50,210 | 2,072,167 | ||||||||
Citigroup, Inc. (Diversified Financial Svs.) | 26,514 | 1,271,877 | ||||||||
ING U.S., Inc. (Diversified Financial Svs.) | (a) | 68,462 | 1,852,582 | |||||||
JPMorgan Chase & Co. (Diversified Financial Svs.) | 25,806 | 1,362,299 | ||||||||
MetLife, Inc. (Insurance) | 57,783 | 2,644,150 | ||||||||
Symetra Financial Corp. (Insurance) | 98,183 | 1,569,946 | ||||||||
|
| |||||||||
| 17,572,934 | ||||||||||
|
| |||||||||
HEALTH CARE – 11.3% | ||||||||||
Amarin Corp. PLC – ADR (Biotechnology) | (a) | 82,830 | 480,414 | |||||||
Vertex Pharmaceuticals, Inc. (Biotechnology) | (a) | 15,492 | 1,237,346 | |||||||
Hologic, Inc. (Health Care Equip. & Supplies) | (a) | 67,254 | 1,298,002 | |||||||
Express Scripts Holding Co. (Health Care | (a) | 28,453 | 1,755,266 | |||||||
Universal Health Services, Inc. Class B (Health Care Providers & Svs.) | 29,201 | 1,955,299 | ||||||||
Agilent Technologies, Inc. (Life Sciences Tools & Svs.) | 37,993 | 1,624,581 | ||||||||
| Common Stocks (Continued) | Shares | Value | ||||||||
HEALTH CARE (continued) | ||||||||||
Impax Laboratories, Inc. (Pharmaceuticals) | (a) | 47,772 | $ | 953,051 | ||||||
Merck & Co., Inc. (Pharmaceuticals) | 47,959 | 2,227,696 | ||||||||
Pfizer, Inc. (Pharmaceuticals) | 95,174 | 2,665,824 | ||||||||
|
| |||||||||
| 14,197,479 | ||||||||||
|
| |||||||||
INDUSTRIALS – 8.7% | ||||||||||
Boeing Co. / The (Aerospace & Defense) | 18,052 | 1,849,247 | ||||||||
United Technologies Corp. (Aerospace & Defense) | 20,759 | 1,929,341 | ||||||||
FedEx Corp. (Air Freight & Logistics) | 10,466 | 1,031,738 | ||||||||
Delta Air Lines, Inc. (Airlines) | (a) | 63,245 | 1,183,314 | |||||||
Brink’s Co. / The (Commercial Svs. & Supplies) | 43,672 | 1,114,073 | ||||||||
Dover Corp. (Machinery) | 16,159 | 1,254,908 | ||||||||
Rexnord Corp. (Machinery) | (a) | 16,845 | 283,838 | |||||||
Xylem, Inc. (Machinery) | 35,937 | 968,143 | ||||||||
Kirby Corp. (Marine) | (a) | 15,732 | 1,251,323 | |||||||
|
| |||||||||
| 10,865,925 | ||||||||||
|
| |||||||||
INFORMATION TECHNOLOGY – 18.2% | ||||||||||
Brocade Communications Systems, Inc. (Communications Equip.) | (a) | 210,040 | 1,209,830 | |||||||
Juniper Networks, Inc. (Communications Equip.) | (a) | 78,895 | 1,523,462 | |||||||
Apple, Inc. (Computers & Peripherals) | 4,504 | 1,783,944 | ||||||||
Diebold, Inc. (Computers & Peripherals) | 27,508 | 926,744 | ||||||||
Google, Inc. Class A (Internet Software & Svs.) | (a) | 3,059 | 2,693,052 | |||||||
Monster Worldwide, Inc. (Internet Software & Svs.) | (a) | 88,258 | 433,347 | |||||||
Broadcom Corp. Class A (Semiconductors & Equip.) | 63,172 | 2,132,687 | ||||||||
International Rectifier Corp. (Semiconductors & Equip.) | (a) | 67,425 | 1,411,879 | |||||||
Maxim Integrated Products, Inc. (Semiconductors & Equip.) | 24,128 | 670,276 | ||||||||
Xilinx, Inc. (Semiconductors & Equip.) | 46,614 | 1,846,381 | ||||||||
Activision Blizzard, Inc. (Software) | 83,695 | 1,193,491 | ||||||||
BroadSoft, Inc. (Software) | (a) | 17,689 | 488,216 | |||||||
Cadence Design Systems, Inc. (Software) | (a) | 138,123 | 2,000,021 | |||||||
Fortinet, Inc. (Software) | (a) | 61,373 | 1,074,027 | |||||||
Microsoft Corp. (Software) | 69,786 | 2,409,711 | ||||||||
Silver Spring Networks, Inc. (Software) | (a) | 41,640 | 1,038,502 | |||||||
|
| |||||||||
| 22,835,570 | ||||||||||
|
| |||||||||
MATERIALS – 3.8% | ||||||||||
Monsanto Co. (Chemicals) | 23,109 | 2,283,169 | ||||||||
PPG Industries, Inc. (Chemicals) | 8,447 | 1,236,725 | ||||||||
Constellium NV Class A (Metals & Mining) | (a) | 79,383 | 1,282,035 | |||||||
|
| |||||||||
| 4,801,929 | ||||||||||
|
| |||||||||
TELECOMMUNICATION SERVICES – 1.3% | ||||||||||
Vivendi SA (Diversified Telecom. Svs.) | (b) | 88,841 | 1,683,672 | |||||||
|
| |||||||||
UTILITIES – 1.9% | ||||||||||
Calpine Corp. (Ind. Power Prod. & Energy Traders) | (a) | 111,116 | 2,358,993 | |||||||
|
| |||||||||
Total Common Stocks (Cost $98,201,406) | $ | 121,328,970 | ||||||||
|
| |||||||||
| Money Market Funds – 2.5% | Shares | Value | ||||||||
Fidelity Institutional Money Market Funds | 3,126,000 | $ | 3,126,000 | |||||||
|
| |||||||||
Total Money Market Funds (Cost $3,126,000) | $ | 3,126,000 | ||||||||
|
| |||||||||
Total Investments – 99.3% (Cost $101,327,406) | (c) | $ | 124,454,970 | |||||||
Other Assets in Excess of Liabilities – 0.7% | 875,803 | |||||||||
|
| |||||||||
Net Assets – 100.0% | $ | 125,330,773 | ||||||||
|
| |||||||||
| 27 | (continued) |
| Ohio National Fund, Inc. | Capital Appreciation Portfolio (Continued) |
Schedule of Investments | June 30, 2013 (Unaudited) |
Percentages are stated as a percent of net assets.
Abbreviations:
ADR: American Depositary Receipts
Footnotes:
| (a) | Non-income producing security. |
| (b) | Security traded on a foreign exchange has been valued at an estimate of fair value that is different than the local market close price. These fair value estimates are determined by an independent fair valuation service that has been approved by the Board. These securities represent $4,382,370, or 3.5% of the Portfolio’s net assets. Other Portfolio securities are not subjected to fair valuation procedures because they are traded on domestic or foreign exchanges that have close times that are consistent with the U.S. market close, normally 4:00 pm Eastern Time. |
| (c) | Represents cost for financial reporting purposes, which may differ from cost basis for federal income tax purposes. See also Note 7 of the Notes to Financial Statements. |
The accompanying notes are an integral part of these financial statements.
| 28 |
| Ohio National Fund, Inc. | Millennium Portfolio |
Objective/Strategy
The Millennium Portfolio seeks capital growth by investing primarily in common stocks of small sized companies.
Performance as of June 30, 2013
Average Annual Returns: | ||||
One year | 18.35% | |||
Five years | 4.59% | |||
Ten years | 7.31% |
Past performance does not guarantee future results. The performance data quoted represents past performance and current returns may be lower or higher. Total return figures include change in share price and reinvestment of dividends and capital gains. The investment return and principal value will fluctuate so that an investor’s shares, when redeemed, may be worth more or less than the original cost. To obtain performance information up to the most recent month end, call toll-free 1-877-781-6392.
The Portfolio is not open to direct retail investment. Beneficial interest in shares is obtained solely by purchase of variable life insurance policies and variable annuity contracts. Actual performance results for variable annuity and variable universal life contracts will be lower due to contract charges. Consult your contract for applicable charges.
Comments
For the six-month period ended June 30, 2013, the Millennium Portfolio returned 17.59% versus 17.44% for the current benchmark, the Russell 2000 Growth Index.
As the first half of the year concluded, equities continued their ascent in a market defined by an overabundance of liquidity, the result of which has fostered an unusual mix of investment emotions and behavior from the usual suspects. In the face of a resilient, albeit stealthy, bull market, the average person on the street still likely finds it hard to believe that we are essentially in year four of a mostly upwardly mobile market. A near zero-rate environment continues to cultivate dependency among yield obsessed investors and a significant number of corporations are happy to provide escalating dividend programs over direct capital reinvestment into their franchises. The broad effect has been a suppression of balance sheet differentiation and a continued stylistic rotation away from higher growth and higher expectation companies. While the level of macro-economic news moderated, the road out of recovery, fueled by positive trends in housing and steady gross domestic product growth, occasionally encountered turbulence related to ongoing concerns around the eventual impact of sequester-driven budget cuts, the true health of China’s economy, political unrest in various emerging and developing countries, and the direction of Federal Reserve policy.
During the six-month period, the Portfolio was overweight Consumer Discretionary, Information Technology and Energy and underweight Industrials, Health Care, Consumer Staples and Materials. In what has been a positive period for the strategy, strong stock selection was the key as our Consumer Discretionary, Consumer Staples and Energy holdings more than compensated for weakness in the Portfolio’s Industrials names, which continue to feel the weight of ongoing global macro concerns, as well as the initial impact of the sequester budget cuts. For the trailing six months, Fifth & Pacific Cos. Inc., Tile Shop Holdings, Inc., Lions Gate Entertainment Corp., Cabela’s, Inc. and Alkermes PLC were the top contributors to performance, while InnerWorkings, Inc., American Vanguard Corp., Boulder Brands, Inc., Orient-Express Hotels Ltd. and Stratasys Ltd. were the leading detractors.(1)
Fifth & Pacific Cos., Inc., formally known as Liz Claiborne, is a designer and marketer of retail-based premium brands, including Juicy Couture, Kate Spade and Lucky Brand. The company operates over 300 retail stores under its various brands. The Kate Spade brand continued to perform well and the market also continued to react well to signs that the company will divest its Juicy and Lucky brands to focus solely on growing Kate Spade, a key component of our original buy thesis.(1)
Tile Shop Holdings, Inc. is a specialty retailer of manufactured and natural stone tiles, setting and maintenance materials, and related accessories in the United States. The company, through its stores and website, sells over 4,000 manufactured and natural products. Tile Shop Holdings, Inc. continues to execute at a high level and, by benefiting from a sustainable and positive trend in housing new construction and remodeling, has been able to maintain robust growth targets.(1)
Lions Gate Entertainment Corp. is an entertainment production and distribution company. The company’s results were boosted by the success in the film group, especially the first installment of the “Hunger Games” franchise.(1)
Cabela’s, Inc. is a specialty retailer focused on the outdoor lifestyle, with an emphasis on hunting, fishing, camping, and related merchandise. The Company operates 34 retail stores and a direct business segment via its catalogs and internet website. Cabela’s, Inc. delivered strong unit and same-store sales growth, in part driven by a surge in gun and ammunition sales. Its continued reinvestment into advertising, new stores and internet initiatives should be beneficial to future results, regardless of any future gun control legislation.(1)
Alkermes PLC is engaged in the business of developing, manufacturing and commercializing medicines for the treatment of prevalent, chronic diseases, such as schizophrenia, bipolar I, addiction, diabetes and autoimmune disorders. The company continues to beat expectations and raise future estimates. In addition, the market has recognized the potential positive risk/reward of these drugs, both in the market and in the company’s pipeline.(1)
InnerWorkings, Inc. is a provider of global print management and promotional solutions. Utilizing its proprietary technology and broad databases, the company offers a range of print, fulfillment and logistics services to corporate clients. Shortly after reaffirming its guidance, management unexpectedly announced the loss of a major client, resulting in a material downward earnings revision. Given our loss of confidence following management’s poor communication around the health of the business and the expected high retention of clients, we sold our position in favor of other opportunities.(1)
American Vanguard Corp. is primarily a chemical manufacturer that develops and markets products for agricultural and commercial uses. A wet and cold planting season caused demand to be lower than expected. With lower usage comes higher inventories, which will likely result in pricing pressure into next season. Given those concerns, we sold our position.(1)
Boulder Brands, Inc. is a marketer of functional food products, under the Smart Balance, Earth Balance and Bestlife brands, and a wide range of gluten-free product offerings. Boulder Brands, Inc. pulled back over concerns that its brands outside of the fast growing gluten-free segment are showing signs of deceleration. We subsequently sold our position in favor of more attractive opportunities.(1)
| 29 | (continued) |
| Ohio National Fund, Inc. | Millennium Portfolio (Continued) |
Orient-Express Hotels Ltd. is a hotel and travel company with 50 properties located in 24 countries. The company’s management and board have long rebuffed takeover overtures in lieu of going it alone and, despite the recent appointment of a new CEO, investors have become frustrated with the board’s lack of interest in selling and/or pursuing more aggressively strategic transactions. Given the unsettled direction of the company and the macro headwinds it continues to face in Europe, we sold our position.(1)
Stratasys Ltd. is a manufacturer, marketer and distributor of professional 3D printing systems and solutions for rapid prototyping and manufacturing applications. Stratasys Ltd.’s products create precise 3D models and parts directly from computer aided design software throughout a new product design, development and production process. Concerns over price competition and the risk of products being commoditized hurt the stock and led us to exit our position in favor of better ideas.(1)
The question remains, has the market come too far too fast, and it’s hard not to lean towards an answer of likely, yes. While we remain cautiously optimistic and stout believers in the resiliency of our economy and the market over the last 3 plus years, neither current earnings growth, future guidance nor management’s tone, despite various positive economic growth trends, match the current market’s overall upward momentum. In reality, perhaps taking some air out of a market via a “tapering” of Federal Reserve driven liquidity might not be such a bad thing, as it should more clearly illustrate whether we have truly moved beyond basic recovery to an economy that is on solid footing to continue its slow and steady upward march. Looking ahead to the balance of 2013, we believe valuations remain attractive across traditional small cap growth sectors, particularly for the higher growth and higher expectation stories we typically covet. We remain optimistic that it will continue to be a positive year for small cap equities.
| (1) | The Portfolio’s composition is subject to change. Holdings and weightings are as of June 30, 2013. |
Change in Value of $10,000 Investment
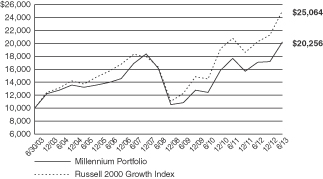
Hypothetical illustration based on past performance. Future performance will vary. The Portfolio’s returns reflect reinvested dividends. The Portfolio’s holdings may differ significantly from the securities in the index. The index is unmanaged and therefore does not reflect the cost of portfolio management and accounting.
The Russell 2000 Growth Index measures the performance of the small-cap growth segment of the U.S. equity universe. It includes those Russell 2000 Index companies with higher price-to-value ratios and higher forecasted growth values. The Russell 2000 Index includes the 2000 firms from the Russell 3000 Index with the smallest market capitalizations. The Russell 3000 Index represents 98% of the investable U.S. equity markets. The index presented herein includes the effects of reinvested dividends.
| 30 | (continued) |
| Ohio National Fund, Inc. | Millennium Portfolio (Continued) |
Portfolio Composition as of June 30, 2013 (1)
| % of Net Assets | ||||
Common Stocks (3) | 97.0 | |||
Money Market Funds and | 3.0 | |||
|
| |||
| 100.0 | ||||
|
|
Top 10 Portfolio Holdings as of June 30, 2013 (1) (2)
| % of Net Assets | ||||
1. Fifth & Pacific Cos., Inc. | 3.9 | |||
2. DigitalGlobe, Inc. | 2.9 | |||
3. Novadaq Technologies, Inc. | 2.3 | |||
4. Ultimate Software Group, Inc. | 2.1 | |||
5. Home BancShares, Inc. | 1.7 | |||
6. Globus Medical, Inc. | 1.7 | |||
7. Oasis Petroleum, Inc. | 1.6 | |||
8. HEICO Corp. | 1.6 | |||
9. NetSuite, Inc. | 1.6 | |||
10. Tractor Supply Co. | 1.5 |
| (1) | Composition of Portfolio subject to change. |
| (2) | Short-term investments have been excluded from the list of Top 10 Portfolio Holdings. |
| (3) | Sectors: |
| % of Net Assets | ||||
Information Technology | 25.9 | |||
Consumer Discretionary | 20.2 | |||
Health Care | 17.8 | |||
Industrials | 13.7 | |||
Financials | 8.1 | |||
Energy | 5.2 | |||
Consumer Staples | 4.8 | |||
Materials | 1.3 | |||
|
| |||
| 97.0 | ||||
|
|
| 31 |
| Ohio National Fund, Inc. | Millennium Portfolio |
Schedule of Investments | June 30, 2013 (Unaudited) |
| Common Stocks – 97.0% | Shares | Value | ||||||||
CONSUMER DISCRETIONARY – 20.2% | ||||||||||
Gentherm, Inc. (Auto Components) | (a) | 21,800 | $ | 404,826 | ||||||
Bally Technologies, Inc. (Hotels, Restaurants & Leisure) | (a) | 7,300 | 411,866 | |||||||
Blue Nile, Inc. (Internet & Catalog Retail) | (a) | 11,100 | 419,358 | |||||||
Brunswick Corp. (Leisure Equip. & Products) | 13,800 | 440,910 | ||||||||
Sinclair Broadcast Group, Inc. Class A (Media) | 16,000 | 470,080 | ||||||||
Big 5 Sporting Goods Corp. (Specialty Retail) | 24,800 | 544,360 | ||||||||
MarineMax, Inc. (Specialty Retail) | (a) | 39,700 | 449,801 | |||||||
Pier 1 Imports, Inc. (Specialty Retail) | 20,800 | 488,592 | ||||||||
Restoration Hardware Holdings, Inc. | (a) | 6,000 | 450,000 | |||||||
Tile Shop Holdings, Inc. (Specialty Retail) | (a) | 19,000 | 550,240 | |||||||
Tractor Supply Co. (Specialty Retail) | 4,900 | 576,289 | ||||||||
Zale Corp. (Specialty Retail) | (a) | 43,100 | 392,210 | |||||||
Fifth & Pacific Cos., Inc. (Textiles, Apparel & Luxury Goods) | (a) | 64,500 | 1,440,930 | |||||||
G-III Apparel Group Ltd. (Textiles, Apparel & Luxury Goods) | (a) | 9,700 | 466,764 | |||||||
|
| |||||||||
| 7,506,226 | ||||||||||
|
| |||||||||
CONSUMER STAPLES – 4.8% | ||||||||||
Natural Grocers by Vitamin Cottage, Inc. (Food & Staples Retailing) | (a) | 15,300 | 474,300 | |||||||
Pricesmart, Inc. (Food & Staples Retailing) | 4,600 | 403,098 | ||||||||
Rite Aid Corp. (Food & Staples Retailing) | (a) | 169,200 | 483,912 | |||||||
WhiteWave Foods Co. Class A (Food Products) | (a) | 25,200 | 409,500 | |||||||
|
| |||||||||
| 1,770,810 | ||||||||||
|
| |||||||||
ENERGY – 5.2% | ||||||||||
Dawson Geophysical Co. (Energy Equip. & Svs.) | (a) | 9,900 | 364,914 | |||||||
Forum Energy Technologies, Inc. | (a) | 16,400 | 499,052 | |||||||
Bonanza Creek Energy, Inc. (Oil, Gas & Consumable Fuels) | (a) | 13,300 | 471,618 | |||||||
Oasis Petroleum, Inc. (Oil, Gas & Consumable Fuels) | (a) | 15,700 | 610,259 | |||||||
|
| |||||||||
| 1,945,843 | ||||||||||
|
| |||||||||
FINANCIALS – 8.1% | ||||||||||
WisdomTree Investments, Inc. (Capital Markets) | (a) | 30,600 | 354,042 | |||||||
Cathay General Bancorp (Commercial Banks) | 20,300 | 413,105 | ||||||||
Home BancShares, Inc. (Commercial Banks) | 24,000 | 623,280 | ||||||||
OFG Bancorp (Commercial Banks) | 29,100 | 527,001 | ||||||||
Renasant Corp. (Commercial Banks) | 9,900 | 240,966 | ||||||||
SCBT Financial Corp. (Commercial Banks) | 7,900 | 398,081 | ||||||||
Marlin Business Services Corp. (Diversified | 20,400 | 464,712 | ||||||||
|
| |||||||||
| 3,021,187 | ||||||||||
|
| |||||||||
HEALTH CARE – 17.8% | ||||||||||
Alkermes PLC (Biotechnology) | (a) | 17,400 | 499,032 | |||||||
Cyberonics, Inc. (Health Care Equip. & Supplies) | (a) | 7,100 | 368,916 | |||||||
DexCom, Inc. (Health Care Equip. & Supplies) | (a) | 22,600 | 507,370 | |||||||
Globus Medical, Inc. (Health Care Equip. & Supplies) | (a) | 36,400 | 613,704 | |||||||
ICU Medical, Inc. (Health Care Equip. & Supplies) | (a) | 6,500 | 468,390 | |||||||
Insulet Corp. (Health Care Equip. & Supplies) | (a) | 16,600 | 521,406 | |||||||
Novadaq Technologies, Inc. (Health Care Equip. & Supplies) | (a) | 63,200 | 850,672 | |||||||
Spectranetics Corp. (Health Care Equip. & Supplies) | (a) | 28,700 | 536,116 | |||||||
Acadia Healthcare Co., Inc. (Health Care | (a) | 14,800 | 489,436 | |||||||
Omnicell, Inc. (Health Care Technology) | (a) | 22,600 | 464,430 | |||||||
ICON PLC (Life Sciences Tools & Svs.) | (a) | 12,600 | 446,418 | |||||||
Medicines Co. / The (Pharmaceuticals) | (a) | 13,700 | 421,412 | |||||||
Pacira Pharmaceuticals, Inc. (Pharmaceuticals) | (a) | 15,500 | 449,500 | |||||||
|
| |||||||||
| 6,636,802 | ||||||||||
|
| |||||||||
| Common Stocks (Continued) | Shares | Value | ||||||||
INDUSTRIALS – 13.7% | ||||||||||
Astronics Corp. (Aerospace & Defense) | (a) | 9,400 | $ | 384,178 | ||||||
DigitalGlobe, Inc. (Aerospace & Defense) | (a) | 34,300 | 1,063,643 | |||||||
HEICO Corp. (Aerospace & Defense) | 11,900 | 599,403 | ||||||||
PGT, Inc. (Building Products) | (a) | 62,700 | 543,609 | |||||||
Generac Holdings, Inc. (Electrical Equip.) | 10,800 | 399,708 | ||||||||
PowerSecure International, Inc. (Electrical Equip.) | (a) | 34,400 | 517,032 | |||||||
Trimas Corp. (Machinery) | (a) | 15,200 | 566,656 | |||||||
Old Dominion Freight Line, Inc. (Road & Rail) | (a) | 12,400 | 516,088 | |||||||
H&E Equipment Services, Inc. (Trading Companies & Distributors) | 1,000 | 21,070 | ||||||||
Watsco, Inc. (Trading Companies & Distributors) | 5,900 | 495,364 | ||||||||
|
| |||||||||
| 5,106,751 | ||||||||||
|
| |||||||||
INFORMATION TECHNOLOGY – 25.9% | ||||||||||
Calix, Inc. (Communications Equip.) | (a) | 41,400 | 418,140 | |||||||
Cornerstone OnDemand, Inc. (Internet Software & Svs.) | (a) | 12,400 | 536,796 | |||||||
CoStar Group, Inc. (Internet Software & Svs.) | (a) | 4,200 | 542,094 | |||||||
Demandware, Inc. (Internet Software & Svs.) | (a) | 12,400 | 525,884 | |||||||
SPS Commerce, Inc. (Internet Software & Svs.) | (a) | 8,200 | 451,000 | |||||||
EPAM Systems, Inc. (IT Svs.) | (a) | 19,100 | 519,138 | |||||||
EVERTEC, Inc. (IT Svs.) | (a) | 21,100 | 463,567 | |||||||
InterXion Holding NV (IT Svs.) | (a) | 18,100 | 472,953 | |||||||
Semtech Corp. (Semiconductors & Equip.) | (a) | 10,300 | 360,809 | |||||||
Aspen Technology, Inc. (Software) | (a) | 15,700 | 452,003 | |||||||
CommVault Systems, Inc. (Software) | (a) | 7,100 | 538,819 | |||||||
Concur Technologies, Inc. (Software) | (a) | 6,500 | 528,970 | |||||||
FleetMatics Group PLC (Software) | (a) | 16,900 | 561,587 | |||||||
Guidewire Software, Inc. (Software) | (a) | 13,600 | 571,880 | |||||||
NetSuite, Inc. (Software) | (a) | 6,300 | 577,962 | |||||||
QLIK Technologies, Inc. (Software) | (a) | 15,900 | 449,493 | |||||||
Take-Two Interactive Software, Inc. (Software) | (a) | 24,300 | 363,771 | |||||||
Tyler Technologies, Inc. (Software) | (a) | 7,200 | 493,560 | |||||||
Ultimate Software Group, Inc. (Software) | (a) | 6,700 | 785,843 | |||||||
|
| |||||||||
| 9,614,269 | ||||||||||
|
| |||||||||
MATERIALS – 1.3% | ||||||||||
Caesarstone Sdot-Yam Ltd. | (a) | 17,400 | 473,802 | |||||||
|
| |||||||||
Total Common Stocks (Cost $31,844,557) | $ | 36,075,690 | ||||||||
|
| |||||||||
| Money Market Funds – 2.7% | Shares | Value | ||||||||
Fidelity Institutional Money Market Funds | 992,000 | $ | 992,000 | |||||||
|
| |||||||||
Total Money Market Funds (Cost $992,000) | $ | 992,000 | ||||||||
|
| |||||||||
Total Investments – 99.7% (Cost $32,836,557) | (b) | $ | 37,067,690 | |||||||
Other Assets in Excess of Liabilities – 0.3% | 113,210 | |||||||||
|
| |||||||||
Net Assets – 100.0% | $ | 37,180,900 | ||||||||
|
| |||||||||
Percentages are stated as a percent of net assets.
Footnotes:
| (a) | Non-income producing security. |
| (b) | Represents cost for financial reporting purposes, which may differ from cost basis for federal income tax purposes. See also Note 7 of the Notes to Financial Statements. |
The accompanying notes are an integral part of these financial statements.
| 32 |
| Ohio National Fund, Inc. | International Small-Mid Company Portfolio |
Objective/Strategy
The International Small-Mid Company Portfolio seeks long-term growth of capital by investing at least 80% of its assets in equity securities of foreign small and mid-cap companies.
Performance as of June 30, 2013
Average Annual Returns: | ||||
One year | 18.12% | |||
Five years | -0.36% | |||
Ten years | 10.47% |
Past performance does not guarantee future results. The performance data quoted represents past performance and current returns may be lower or higher. Total return figures include change in share price and reinvestment of dividends and capital gains. The investment return and principal value will fluctuate so that an investor’s shares, when redeemed, may be worth more or less than the original cost. To obtain performance information up to the most recent month end, call toll-free 1-877-781-6392.
The Portfolio is not open to direct retail investment. Beneficial interest in shares is obtained solely by purchase of variable life insurance policies and variable annuity contracts. Actual performance results for variable annuity and variable universal life contracts will be lower due to contract charges. Consult your contract for applicable charges.
Comments
For the six-month period ended June 30, 2013, the International Small-Mid Company Portfolio returned 5.87% versus 3.94% for the current benchmark, the S&P Developed Small Cap Ex-U.S. Growth Index.
International equity markets rallied into 2013, with renewed optimism for a global economic recovery supported by new governments, accommodative central banks, and overcoming seemingly insignificant events. Global equity markets reacted negatively to concerns over China’s moderating economy, positively towards Japan’s monetary and fiscal stimulus policies, and cautiously to the decreased risk of a Eurozone implosion. China’s new leadership continued to focus on its domestic issues (i.e. pollution, wages, social unrest, urbanization, infrastructure, corruption, etc). China’s new government, which took over in March, attempted to reset market expectations by guiding for a 7.5% growth rate going forward. The National People’s Congress shows a clear preference for the quality of growth over the pace of growth. China’s policy for moderating growth has had reverberations throughout the world, most noticeably in emerging markets and in commodity prices.
In Japan, Prime Minister Shinzo Abe announced a stimulus plan to reignite Japan’s economic growth. After more than a decade of deflation, Japan’s parties and central banks collaborated to stimulate growth in the economy through coordinated fiscal and monetary policies. The Yen fell to multi-year lows, helping Japanese equities to their best quarterly performance in the first quarter since 2005. Exports are recovering and the 10.1% year-over-year rise in May’s merchandise exports is the fastest pace since December 2010. However, investors grew increasingly impatient with the lack of additional details in the plans mid-way through the second quarter, leading to a sell-off in the Japanese market. This sell-off happened to coincide with the U.S. Federal Reserve’s announcement that it may curb quantitative easing sooner rather than later, which weighed on all markets negatively.
European markets began the year with major markets like France, Italy, and Spain still in a recession. In Germany, news was mixed, as services expanded and unemployment remained at historically low
levels despite weaker factory orders. Overall, the markets remained sluggish during the first quarter, as banking problems in Cyprus and Italy’s political instability worried investors. Amid the uncertainty, the European Central Bank (ECB) left key interest rates unchanged during the first quarter, as policy makers continued to signal that they would “do whatever it takes”. However, at its May meeting, the ECB decided to cut its key rate to an all-time low of 0.50%, the first cut since July 2012. European markets began to show some signs of stabilization as the pace of contraction slowed across much of the continent. Northern European economies, such as Norway, Sweden, and Switzerland, showed signs of economic life. Greece was downgraded to emerging market status by MSCI. Late in the first-half, Portugal began showing signs of political tensions and instability with the resignation of its foreign minister and finance minister. In the U.K., the service sector showed signs of growth, while its PMI moved further into expansionary territory. However, the U.K.’s recovery is weak with low inflation indicating that low interest rates could continue for some time.
For the first half of 2013, emerging markets were the worst performing region for small- and mid-size companies, as the S&P Emerging Small Cap Growth Index posted a gross loss of 4.1% while the S&P Asia Pacific Ex-Japan Small Cap Growth Index had negative returns of 8.8%. European small caps posted the best returns for the period, where the S&P Europe Small Cap Growth Index gained 6.9% on a gross return basis. The S&P Japan Small Cap Growth Index posted one of the best country returns, as it rose 14.3% on a U.S. dollar gross return basis. The largest absolute returns were delivered by smaller companies in Greece, up 24.0%, Denmark, up 30.0%, Italy, up 13.1%, and Mexico, up 11.9%, as measured by their respective S&P small cap growth country indices in U.S. dollars, all on a gross return basis.
On the currency front, the U.S. dollar appreciated against most major currencies during the first half of the year, as investors flocked to the safety of the dollar over weakening economies and depreciating currencies. Depreciating currencies included: the Japanese Yen, down 14.3%, British sterling, down 6.4%, and the Canadian dollar, down 6.0%. The Portfolio generally does not hedge against currency fluctuations, making gains or losses in line with currency movements.
The Portfolio benefited from being relatively overweight Europe versus Asia. This regional overweight benefitted relative performance, as the Euro weakened less than other major currency exposures in an unhedged currency portfolio. However, in light of the supportive country-specific macro environment and depreciating Yen that had evolved during the period, the Portfolio increased its investment exposure to Japan over the first half of the year appreciably, which was funded by a decrease in investments within the emerging markets. Excellent stock selection in Japan helped the Portfolio, as our returns were greater than the Japan small cap benchmark.(1)
Australia was the best relative performing country, as the Portfolio had no investments there while the country index sank nearly 19% in the period. Strong relative investment performance came from investments in Canada, the United Kingdom, and Italy. Weaker relative performance came from out-of-benchmark investments in Mexico, and relatively weaker stock selections in Norway, Sweden, and Austria.(1)
Relative outperforming sectors came from investments within Consumer Discretionary, Materials, and Industrials. A few individual stocks that contributed to the Portfolio’s performance included ASOS PLC and China Everbright International Ltd. ASOS PLC is a
| 33 | (continued) |
| Ohio National Fund, Inc. | International Small-Mid Company Portfolio (Continued) |
U.K.-based company that is a global online fashion and beauty retailer with branded and own label product lines. ASOS PLC successfully caters to the fashion forward twenty-somethings in 160 countries. The company reported a 19% increase in first-half profits with sixty-one percent of sales coming from international markets. ASOS PLC reached a record six million active customers during the first-half of its fiscal year. The company expects to expand it business into China by October this year. China Everbright International Ltd. is a Hong Kong-listed environmental energy company. The company provides environmental protection project management including construction and operation of waste water treatment and waste-to-energy facilities. The company has successfully added to its order book by winning contracts with various Chinese municipalities. The company reported that 2012 net profit increased 40% year-over-year. China Everbright International Ltd. is the market leader and we think its sustainable earnings growth will be driven by sequential project wins in the coming decade.(1)
On a relative basis, weaker performance came from investments within Energy, Financials, and Consumer Staples. Mexichem SAB de CV is a Mexican producer of petrochemical products including PVC products. The company has had difficulty and delays integrating its most recent and largest ever acquisition of Wavin NV, a Dutch-listed PVC manufacturer. Mexichem SAB de CV reported first quarter operating profits declined 8% on 18% revenue growth compared to the same period last year. The inconsistent U.S. homebuilding market also weighed on the stock, as construction is the third largest chemicals end market globally. Europe and the general macro environment were not supportive for its businesses. Petroleum Geo-Services ASA is a Norwegian-listed company focused on providing seismic services of underwater oil and gas fields to its customers in the energy industry. First quarter results were good and the company’s management maintained its guidance for the year, citing market strength and price increases. Later, Petroleum Geo-Services ASA lowered its pricing expectations an average price increase of 10-15% in 2013 versus its previous expectation of 15%. This moderation of price expectations appeared to be a response to a quarter in which Petroleum Geo-Services ASA’s backlog declined (10% year-over-year). Generally, however, the weaker oil price has weighed heavily on Energy sector participants.(1)
Monthly economic statistics have oscillated between signaling good and poor economic conditions. We look behind the numbers to give us a sense of policy direction that would support small companies’ growth performances. Similar to last year, there is a disconnect between the markets’ performance and economic results. Investors do not learn how economically good a quarter is until after it has happened, thereby missing an investment opportunity during the period. While volatility will likely continue, we remain positive for the long term. Japan looks poised to break out onto a new future course. While Abenomics has many moving parts requiring structural reform, corporate tax changes, expanded labor pools, etc., we feel that the forthcoming changes will finally move Japan out of its historical downward spiral. For the first time, Japan has all political parties and the central bank on the same page. A key parliamentary election is due in July with Abe’s party expected to win. With the ruling party firmly in place in the lower and upper houses, policy implementation should begin shortly and Japanese citizens and corporates will benefit. A government budget highlighting the economic areas of growth will be presented around September. Europe continues to work out its problems and will continue to do “whatever it takes”. Again, the European Union today is in a better position than it was last summer.
We believe our bottom-up process is precisely what is called for to identify those individual investment opportunities that provide future growth and participation in a global economic recovery. Central banks and governments “will do whatever it takes” to provide a supportive economic environment and head off any threat of deep recession. Monetary and fiscal policies will continue towards more accommodative stances as inflation remains manageable. Germany continues to lead Europe with its strong export industries. Most emerging markets have struggled so far this year and depend on China’s growth. Our emerging market exposure remains small with selectivity towards those in Southeast Asia versus Latin America.(1)
| (1) | The Portfolio’s composition is subject to change. Holdings and weightings are as of June 30, 2013. |
Change in Value of $10,000 Investment
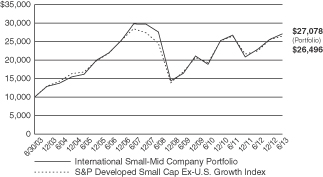
Hypothetical illustration based on past performance. Future performance will vary. The Portfolios returns reflect reinvested dividends. The Portfolios holdings may differ significantly from the securities in the index. The index is unmanaged and therefore does not reflect the cost of portfolio management and accounting.
The S&P Developed Small Cap Ex-U.S. Growth Index is a subset of the S&P Global Broad Market Index (BMI), a broad index including all publicly listed equities with float-adjusted market values of US$ 100 million or more and annual dollar value traded of at least US$ 50 million in all included countries. The Developed Small Cap component of the BMI includes the equities in the bottom 15% of the market capitalization within each “developed” local market. Ex-U.S. denotes the use of all developed markets excluding the United States. The “Growth” subset includes those companies in each local market that exhibit the characteristics of growth. The index presented includes the effects of reinvested dividends.
| 34 | (continued) |
| Ohio National Fund, Inc. | International Small-Mid Company Portfolio (Continued) |
Portfolio Composition as of June 30, 2013 (1)
| % of Net Assets | ||||
Common Stocks (3) | 91.6 | |||
Exchange Traded Funds | 1.4 | |||
Money Market Funds | 7.0 | |||
|
| |||
| 100.0 | ||||
|
|
Top 10 Portfolio Holdings as of June 30, 2013 (1) (2)
| % of Net Assets | ||||
1. Ashtead Group PLC | 2.0 | |||
2. Publicis Groupe SA | 1.9 | |||
3. Telecity Group PLC | 1.9 | |||
4. Dollarama, Inc. | 1.7 | |||
5. ASOS PLC | 1.7 | |||
6. InterContinental Hotels Group PLC | 1.7 | |||
7. John Wood Group PLC | 1.7 | |||
8. Bangkok Dusit Medical Services PCL | 1.6 | |||
9. Signet Jewelers Ltd. | 1.6 | |||
10. Rightmove PLC | 1.6 |
| (1) | Composition of Portfolio subject to change. |
| (2) | Short-term investments have been excluded from the list of Top 10 Portfolio Holdings. |
| (3) | Top 10 Country Weightings: |
| % of Net Assets | ||||
United Kingdom | 21.9 | |||
Japan | 16.8 | |||
France | 8.9 | |||
Germany | 5.5 | |||
Canada | 4.4 | |||
Thailand | 3.8 | |||
Hong Kong | 3.6 | |||
Italy | 3.0 | |||
Switzerland | 2.4 | |||
Singapore | 2.4 |
| 35 |
| Ohio National Fund, Inc. | International Small-Mid Company Portfolio |
Schedule of Investments | June 30, 2013 (Unaudited) |
| Common Stocks – 91.6% | Shares | Value | ||||||||
United Kingdom – 21.9% | ||||||||||
Aberdeen Asset Management PLC | (b) | 105,374 | $ | 613,239 | ||||||
Aggreko PLC | (b) | 12,792 | 319,729 | |||||||
AMEC PLC | (b) | 20,951 | 320,429 | |||||||
Ashtead Group PLC | (b) | 131,834 | 1,297,566 | |||||||
ASOS PLC | (a)(b) | 18,196 | 1,116,699 | |||||||
Babcock International Group PLC | (b) | 22,000 | 369,400 | |||||||
Burberry Group PLC | (b) | 37,629 | 774,122 | |||||||
Croda International PLC | (b) | 22,054 | 831,658 | |||||||
Delphi Automotive PLC | 11,355 | 575,585 | ||||||||
Essentra PLC | (b) | 77,000 | 823,391 | |||||||
InterContinental Hotels Group PLC | (b) | 40,245 | 1,106,022 | |||||||
Intertek Group PLC | (b) | 6,000 | 266,709 | |||||||
John Wood Group PLC | (b) | 88,702 | 1,093,976 | |||||||
Jupiter Fund Management PLC | (b) | 165,000 | 726,619 | |||||||
Rightmove PLC | (b) | 32,807 | 1,040,081 | |||||||
Schroders PLC | (b) | 20,000 | 663,938 | |||||||
Soco International PLC | (a)(b) | 139,373 | 740,969 | |||||||
Subsea 7 SA | (a)(b) | 23,000 | 404,642 | |||||||
Telecity Group PLC | (b) | 80,738 | 1,244,177 | |||||||
Vectura Group PLC | (a)(c) | 74,000 | 91,166 | |||||||
|
| |||||||||
| 14,420,117 | ||||||||||
|
| |||||||||
Japan – 16.8% | ||||||||||
Aisin Seiki Co. Ltd. | (b) | 17,400 | 664,374 | |||||||
Avex Group Holdings, Inc. | (b) | 18,100 | 571,294 | |||||||
Daihatsu Motor Co. Ltd. | (b) | 32,000 | 606,104 | |||||||
Don Quijote Co. Ltd. | (b) | 12,900 | 626,224 | |||||||
Ebara Corp. | (b) | 84,000 | 448,397 | |||||||
Fuji Heavy Industries Ltd. | (b) | 23,000 | 567,967 | |||||||
Hino Motors Ltd. | (b) | 29,000 | 425,544 | |||||||
Japan Exchange Group, Inc. | (b) | 3,400 | 343,424 | |||||||
JGC Corp. | (b) | 18,000 | 648,224 | |||||||
JSR Corp. | (b) | 22,000 | 445,140 | |||||||
Kakaku.com, Inc. | (b) | 20,500 | 626,010 | |||||||
Livesense, Inc. | (a)(b) | 8,600 | 441,264 | |||||||
Matsui Securities Co. Ltd. | (a)(b) | 33,000 | 292,057 | |||||||
NGK Spark Plug Co. Ltd. | (b) | 21,000 | 420,312 | |||||||
Park24 Co. Ltd. | (b) | 34,800 | 631,342 | |||||||
Shionogi & Co. Ltd. | (b) | 40,200 | 838,307 | |||||||
Ship Healthcare Holdings, Inc. | (b) | 28,000 | 1,029,309 | |||||||
Toyo Suisan Kaisha Ltd. | (b) | 11,000 | 366,000 | |||||||
United Arrows Ltd. | (b) | 13,200 | 551,484 | |||||||
Yaskawa Electric Corp. | (b) | 41,000 | 497,601 | |||||||
|
| |||||||||
| 11,040,378 | ||||||||||
|
| |||||||||
France – 8.9% | ||||||||||
Accor SA | (b) | 16,283 | 572,359 | |||||||
Bureau Veritas SA | (b) | 31,748 | 822,126 | |||||||
Edenred | (b) | 15,965 | 488,843 | |||||||
JCDecaux SA | (b) | 14,436 | 392,947 | |||||||
Publicis Groupe SA | (b) | 17,881 | 1,273,469 | |||||||
Technip SA | (b) | 9,173 | 932,273 | |||||||
Teleperformance | (b) | 11,500 | 553,826 | |||||||
Zodiac Aerospace | (b) | 6,162 | 815,922 | |||||||
|
| |||||||||
| 5,851,765 | ||||||||||
|
| |||||||||
Germany – 5.5% | ||||||||||
GEA Group AG | (b) | 20,022 | 708,924 | |||||||
Gerresheimer AG | (b) | 14,393 | 831,118 | |||||||
HeidelbergCement AG | (b) | 8,249 | 552,690 | |||||||
SAF-Holland SA | (a)(b) | 58,032 | 552,798 | |||||||
Wirecard AG | (b) | 35,587 | 968,320 | |||||||
|
| |||||||||
| 3,613,850 | ||||||||||
|
| |||||||||
Canada – 4.4% | ||||||||||
Ainsworth Lumber Co. Ltd. | (a) | 109,000 | 331,653 | |||||||
Bombardier, Inc. | 150,700 | 670,606 | ||||||||
Dollarama, Inc. | 16,444 | 1,150,939 | ||||||||
Norbord, Inc. | 12,400 | 358,783 | ||||||||
West Fraser Timber Co. Ltd. | 5,000 | 377,959 | ||||||||
|
| |||||||||
| 2,889,940 | ||||||||||
|
| |||||||||
| Common Stocks (Continued) | Shares | Value | ||||||||
Thailand – 3.8% | ||||||||||
Amata Corp. PCL | (b) | 835,100 | $ | 487,968 | ||||||
Bangkok Dusit Medical Services PCL | (b) | 208,600 | 1,053,833 | |||||||
Minor International PCL | (b) | 860,000 | 682,974 | |||||||
Sansiri PCL | (b) | 3,000,000 | 299,553 | |||||||
|
| |||||||||
| 2,524,328 | ||||||||||
|
| |||||||||
Hong Kong – 3.6% | ||||||||||
Brilliance China Automotive Holdings Ltd. | (a)(b) | 510,000 | 568,142 | |||||||
China Everbright International Ltd. | (b) | 1,143,000 | 880,985 | |||||||
Haier Electronics Group Co. Ltd. | (b) | 300,000 | 477,333 | |||||||
Techtronic Industries Co. | (b) | 189,000 | 450,624 | |||||||
|
| |||||||||
| 2,377,084 | ||||||||||
|
| |||||||||
Italy – 3.0% | ||||||||||
Azimut Holding SpA | (b) | 57,066 | 1,038,978 | |||||||
Yoox SpA | (a)(b) | 43,200 | 927,308 | |||||||
|
| |||||||||
| 1,966,286 | ||||||||||
|
| |||||||||
Switzerland – 2.4% | ||||||||||
Adecco SA | (b) | 12,424 | 707,571 | |||||||
GAM Holding AG | (b) | 32,000 | 489,993 | |||||||
Partners Group Holding AG | (b) | 1,500 | 406,018 | |||||||
|
| |||||||||
| 1,603,582 | ||||||||||
|
| |||||||||
Singapore – 2.4% | ||||||||||
City Developments Ltd. | (b) | 76,000 | 639,366 | |||||||
Ezion Holdings Ltd. | (b) | 569,000 | 948,794 | |||||||
|
| |||||||||
| 1,588,160 | ||||||||||
|
| |||||||||
Mexico – 2.1% | ||||||||||
Genomma Lab Internacional SAB de CV | (a) | 170,000 | 335,737 | |||||||
Grupo Aeroportuario del Sureste SAB de CV – ADR | 4,500 | 500,580 | ||||||||
Mexichem SAB de CV | 133,268 | 552,616 | ||||||||
|
| |||||||||
| 1,388,933 | ||||||||||
|
| |||||||||
Norway – 1.8% | ||||||||||
Fred Olsen Energy ASA | (b) | 10,836 | 429,103 | |||||||
Petroleum Geo-Services ASA | (b) | 61,895 | 755,738 | |||||||
|
| |||||||||
| 1,184,841 | ||||||||||
|
| |||||||||
Denmark – 1.7% | ||||||||||
Pandora A/S | (b) | 20,700 | 699,710 | |||||||
Rockwool International A/S | (b) | 3,000 | 419,067 | |||||||
|
| |||||||||
| 1,118,777 | ||||||||||
|
| |||||||||
United States – 1.7% | ||||||||||
Catamaran Corp. | (a) | 7,800 | 380,016 | |||||||
Invesco Ltd. | 22,533 | 716,549 | ||||||||
|
| |||||||||
| 1,096,565 | ||||||||||
|
| |||||||||
Bermuda – 1.6% | ||||||||||
Signet Jewelers Ltd. | 15,500 | 1,045,165 | ||||||||
|
| |||||||||
Netherlands – 1.6% | ||||||||||
Koninklijke DSM NV | (b) | 15,723 | 1,025,035 | |||||||
|
| |||||||||
Panama – 1.5% | ||||||||||
Copa Holdings SA | 7,700 | 1,009,624 | ||||||||
|
| |||||||||
Brazil – 1.3% | ||||||||||
Cia Brasileira de Distribuicao Grupo Pao de | 18,899 | 859,149 | ||||||||
|
| |||||||||
Israel – 1.1% | ||||||||||
NICE Systems Ltd. – ADR | 19,600 | 723,044 | ||||||||
|
| |||||||||
South Korea – 1.0% | ||||||||||
Hotel Shilla Co. Ltd. | (b) | 11,960 | 636,713 | |||||||
|
| |||||||||
Austria – 0.8% | ||||||||||
Andritz AG | (b) | 10,695 | 548,733 | |||||||
|
| |||||||||
Luxembourg – 0.8% | ||||||||||
Eurofins Scientific | (a)(b) | 2,587 | 545,915 | |||||||
|
| |||||||||
| 36 | (continued) |
| Ohio National Fund, Inc. | International Small-Mid Company Portfolio (Continued) |
Schedule of Investments | June 30, 2013 (Unaudited) |
| Common Stocks (Continued) | Shares | Value | ||||||||
Cayman Islands – 0.8% | ||||||||||
Fabrinet | (a) | 36,000 | $ | 504,000 | ||||||
|
| |||||||||
Ireland – 0.6% | ||||||||||
Grafton Group PLC | (b) | 55,000 | 384,263 | |||||||
|
| |||||||||
Sweden – 0.5% | ||||||||||
Getinge AB | (b) | 10,339 | 313,902 | |||||||
|
| |||||||||
Total Common Stocks (Cost $47,182,190) | $ | 60,260,149 | ||||||||
|
| |||||||||
| Exchange Traded Funds – 1.4% | Shares | Value | ||||||||
iShares MSCI Japan ETF | 82,000 | $ | 920,040 | |||||||
|
| |||||||||
Total Exchange Traded Funds (Cost $896,662) | $ | 920,040 | ||||||||
|
| |||||||||
| Money Market Funds – 10.0% | Shares | Value | ||||||||
State Street Institutional Liquid Reserves Fund | 3,290,621 | $ | 3,290,621 | |||||||
State Street Institutional U.S. Government | 3,286,853 | 3,286,853 | ||||||||
|
| |||||||||
Total Money Market Funds (Cost $6,577,474) | $ | 6,577,474 | ||||||||
|
| |||||||||
Total Investments – 103.0% | (d) | $ | 67,757,663 | |||||||
Liabilities in Excess of Other Assets – (3.0)% | (1,972,716) | |||||||||
|
| |||||||||
Net Assets – 100.0% | $ | 65,784,947 | ||||||||
|
| |||||||||
Percentages are stated as a percent of net assets.
Abbreviations:
ADR: American Depositary Receipts
Footnotes:
| (a) | Non-income producing security. |
| (b) | Security traded on a foreign exchange has been valued at an estimate of fair value that is different than the local market close price. These fair value estimates are determined by an independent fair valuation service that has been approved by the Board. These securities represent $50,076,978, or 76.1% of the Portfolio’s net assets. |
| (c) | As discussed in Note 2 of the Notes to Schedules of Investments, not all investments that are traded on a foreign exchange are valued at an estimate that is different from the local close price. In some instances, the independent fair valuation service uses a stock’s local close price because the service’s measure of predictability related to their valuation model of a stock is below a chosen threshold. These securities represent $91,166, or 0.1% of the Portfolio’s net assets. |
Other Portfolio securities are not subjected to fair valuation procedures because they are traded on domestic or foreign exchanges that have close times that are consistent with the U.S. market close, normally 4:00 pm Eastern Time.
| (d) | Represents cost for financial reporting purposes, which may differ from cost basis for federal income tax purposes. See also Note 7 of the Notes to Financial Statements. |
Sector Classifications (Common stocks): (Percent of net assets)
Consumer Discretionary | 27.4% | |||
Industrials | 19.6% | |||
Financials | 10.2% | |||
Energy | 8.6% | |||
Health Care | 8.2% | |||
Materials | 8.1% | |||
Information Technology | 7.6% | |||
Consumer Staples | 1.9% | |||
|
| |||
| 91.6% | ||||
|
|
The accompanying notes are an integral part of these financial statements.
| 37 |
| Ohio National Fund, Inc. | Aggressive Growth Portfolio |
Objective/Strategy
The Aggressive Growth Portfolio seeks long-term capital growth by investing primarily in domestic and foreign equity securities selected for growth potential.
Performance as of June 30, 2013
Average Annual Returns: | ||||
One year | 12.35% | |||
Five years | 2.68% | |||
Ten years | 7.91% |
Past performance does not guarantee future results. The performance data quoted represents past performance and current returns may be lower or higher. Total return figures include change in share price and reinvestment of dividends and capital gains. The investment return and principal value will fluctuate so that an investor’s shares, when redeemed, may be worth more or less than the original cost. To obtain performance information up to the most recent month end, call toll-free 1-877-781-6392.
The Portfolio is not open to direct retail investment. Beneficial interest in shares is obtained solely by purchase of variable life insurance policies and variable annuity contracts. Actual performance results for variable annuity and variable universal life contracts will be lower due to contract charges. Consult your contract for applicable charges.
Comments
For the six-month period ended June 30, 2013, the Aggressive Growth Portfolio returned 6.20% versus 13.82% for the current benchmark, the S&P 500 Index.
Stocks posted strong gains for much of the first half of 2013 and the U.S. economic recovery continued due to a stronger housing market and improving jobs data. However, in June, economic improvement also stoked concerns the Federal Reserve might ease off its loose monetary policies that had helped fuel a broad market rally earlier in the year. These fears led to increased volatility toward the end of the six-month period.
Much of the Portfolio’s underperformance came during the first three months of the period. The Portfolio’s selections in the Information Technology and Industrials sectors were the largest detractors from relative performance. Stock selection in the Health Care sector and an underweight in the Energy sector contributed to relative results. The companies with the lowest returns for the period included Turquoise Hill Resources Ltd., Apple, Inc., FANUC Corp., VMware, Inc. and Trimble Navigation Ltd. Stocks with the highest returns during the period included Vertex Pharmaceuticals, Inc., Yelp, Inc., Celgene Corp., CoStar Group, Inc. and Gilead Sciences, Inc.(1)
The Portfolio’s top five contributors included several health care companies. Celgene Corp. was the top contributor to performance. This global biotechnology company seeks to deliver truly innovative and life-changing drugs for the treatment of cancer and other severe immune, inflammatory conditions. We see the potential for continued strong growth ahead for Celgene Corp.’s blood-cancer-fighting Revlimid drug franchise and believe its additional pipeline products could further supplement this growth. Some of the new drugs that could become meaningful contributors include Apremilast, an oral drug to treat psoriatic arthritis and psoriasis, Abraxane for pancreatic cancer, and Pomalyst for refractory multiple myeloma. We also appreciate the company management’s willingness to utilize free cash flow for share repurchases and acquisitions.(1)
Vertex Pharmaceuticals, Inc. was the Portfolio’s second largest contributor. The biotechnology company has been a favorite for our health care research analysts because of its new treatments for cystic fibrosis, which are the first drugs to address the underlying cause of the disease, as opposed to just treating its symptoms. The stock was up more than 40% during the quarter after new data pointed to the drugs’ ability to treat a wider subset of patients suffering from the disease.(1)
Another Portfolio contributor was News Corp. The diversified media company’s plans to split the company into two separate businesses, one for its more profitable entertainment business and the other for publishing businesses, is evidence, along with share buybacks and accretive acquisitions, that company management is focused on increasing shareholder value. We feel the fundamental growth rates for the company’s global entertainment businesses continue to be strong and are well positioned to gain market share. We also like the company’s role as a provider of content, which we think will increase in value going forward.(1)
CoStar Group, Inc. was another large contributor. We like the potential recurring revenue streams associated with CoStar Group, Inc.’s subscription-based commercial real estate database. In our view, building a network among real estate brokers across the country is a wide competitive moat business that would be difficult for any competitor to replicate.(1)
Express Scripts Holdings Co. was the fifth largest contributor. Toward the end of last year, the company had issued unclear guidance about future growth potential, which concerned investors. After earnings and revenue beat estimates in the most recent quarterly earnings and the company raised guidance, the market became more clear on what we believe is its strong long-term growth potential. Express Scripts Holdings Co. is seeing the benefit of its merger with Medco Health Solutions, which made the company the largest pharmacy benefit manager in the market. We believe this scale is an important competitive advantage for the company. As a pharmacy benefit manager, Express Scripts Holdings Co. gains when it saves employers money by helping drive greater utilization of generic drugs. With greater scale, Express Scripts Holdings Co. can negotiate better pricing for drugs, driving further savings for its customers.(1)
Two Information Technology companies were among the Portfolio’s largest detractors. Apple, Inc. was the Portfolio’s top detractor. In an effort to more accurately reflect the long-term competitive advantages of the company, we trimmed the position during the latest quarter. However, at current valuation levels we think the market is overlooking some of the positive attributes of the company. Apple, Inc. is undoubtedly being challenged by Google, Inc., a new holding in the Portfolio, to win market share among first-time and lower-end smartphone users. Many of these consumers have shown a preference for low-cost devices that use Google, Inc.’s Android operating system. However, Apple, Inc. still has a very sticky customer base of high-end consumers, and we believe there is optionality from a product upgrade cycle or potential innovation.(1)
FANUC Corp., from the Industrials sector, was the Portfolio’s next largest detractor. The provider of industrial automation equipment has benefited from higher penetration of computer numeric control (CNC) systems in machine tools and increased automation, particularly in China, as wage inflation becomes a bigger concern. These trends have led to high returns on invested capital. We trimmed the position during the quarter to more accurately reflect its risk/reward profile.(1)
| 38 | (continued) |
| Ohio National Fund, Inc. | Aggressive Growth Portfolio (Continued) |
The Portfolio’s third largest detractor was Turquoise Hill Resources Ltd. The company owns a Mongolian Copper Mine. Geopolitical risk and lower copper prices have weighed on the stock. We sold the position during the period.(1)
Trimble Navigation Ltd. was the Portfolio’s next detractor. Trimble Navigation Ltd. makes global positioning services (GPS) navigation and surveying devices. We think Trimble Navigation Ltd.’s products are cost-saving, productivity enhancing tools offering demonstrable returns to its customers in agriculture and construction. We also like the company’s potential to gain market share.(1)
The Portfolio’s fifth largest detractor was VMware, Inc. A provider of virtualization and virtualization-based cloud infrastructure solutions, VMware, Inc.’s products facilitate access to cloud computing capacity, business continuity, software lifecycle management and corporate end-user computing device management. We are monitoring the stock closely due to concerns about the potential size of the software virtualization market and VMware, Inc.’s ability to gain share in that market.(1)
The U.S. economy continues to grow at a slow but steady pace, but we believe this is a favorable environment for concentrated growth portfolios. We believe companies with competitive advantages and secular tailwinds that allow them to grow even in a slow-growth economic environment should be more appreciated by the market when growth is harder to come by for many companies.
As part of our change in Portfolio managers, we expect to make a few changes in how the Portfolio is constructed going forward. We will, however, continue to focus on finding wide-moat businesses with clear competitive advantages. We still believe concentrated portfolios represent a strong way to generate alpha, but we are reducing the sizes of the largest positions in the Portfolio. Ideally, we do not expect any of the holdings to comprise more than 8% of the Portfolio. By distributing position sizes more evenly, we believe it
creates a more meaningful opportunity for all the positions in the Portfolio to contribute to performance. Another change is that we expect to identify more emerging large-cap companies with innovative products or services that could be disruptive to the current competitive landscape in which they do business. If we can identify these companies earlier than the rest of the market, they can potentially create some of the greatest growth opportunities.
| (1) | The Portfolio’s composition is subject to change. Holdings and weightings are as of June 30, 2013. |
Change in Value of $10,000 Investment
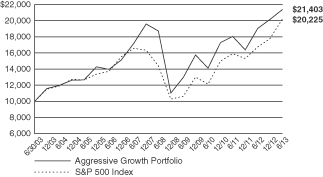
Hypothetical illustration based on past performance. Future performance will vary. The Portfolio’s returns reflect reinvested dividends. The Portfolio’s holdings may differ significantly from the securities in the index. The index is unmanaged and therefore does not reflect the cost of portfolio management and accounting.
The S&P 500 Index is a capitalization-weighted index designed to measure performance of the broad domestic economy through changes in the aggregate market value of 500 stocks representing all major industries. The index presented herein includes the effects of reinvested dividends.
Portfolio Composition as of June 30, 2013 (1)
| % of Net Assets | ||||
Common Stocks (3) | 99.8 | |||
Other Net Assets | 0.2 | |||
|
| |||
| 100.0 | ||||
|
|
Top 10 Portfolio Holdings as of June 30, 2013 (1) (2)
| % of Net Assets | ||||
1. Twenty-First Century Fox, Inc. Class A | 5.7 | |||
2. Express Scripts Holding Co. | 5.5 | |||
3. Celgene Corp. | 4.9 | |||
4. Apple, Inc. | 4.4 | |||
5. Google, Inc. Class A | 4.1 | |||
6. Zoetis, Inc. | 3.7 | |||
7. FANUC Corp. | 3.3 | |||
8. Monster Beverage Corp. | 3.2 | |||
9. U.S. Bancorp | 3.2 | |||
10. Vertex Pharmaceuticals, Inc. | 3.1 |
| (1) | Composition of Portfolio subject to change. |
| (2) | Short-term investments have been excluded from the list of Top 10 Portfolio Holdings. |
| (3) | Sectors: |
| % of Net Assets | ||||
Health Care | 27.4 | |||
Information Technology | 26.4 | |||
Consumer Discretionary | 22.1 | |||
Consumer Staples | 7.0 | |||
Financials | 6.8 | |||
Industrials | 4.1 | |||
Telecommunication Services | 3.7 | |||
Materials | 2.3 | |||
|
| |||
| 99.8 | ||||
|
|
| 39 |
| Ohio National Fund, Inc. | Aggressive Growth Portfolio |
Schedule of Investments | June 30, 2013 (Unaudited) |
| Common Stocks – 99.8% | Shares | Value | ||||||||
CONSUMER DISCRETIONARY – 22.1% | ||||||||||
Delphi Automotive PLC (Auto Components) | 12,537 | $ | 635,501 | |||||||
MGM Resorts International (Hotels, Restaurants & Leisure) | (a) | 53,914 | 796,849 | |||||||
Amazon.com, Inc. (Internet & Catalog Retail) | (a) | 1,144 | 317,677 | |||||||
priceline.com, Inc. (Internet & Catalog Retail) | (a) | 817 | 675,765 | |||||||
Twenty-First Century Fox, Inc. Class A (Media) | (a) | 56,782 | 1,851,093 | |||||||
L Brands, Inc. (Specialty Retail) | 19,290 | 950,033 | ||||||||
TJX Cos., Inc. (Specialty Retail) | 13,426 | 672,106 | ||||||||
Cie Financiere Richemont SA (Textiles, Apparel & Luxury Goods) | (b) | 10,856 | 957,372 | |||||||
Prada SpA (Textiles, Apparel & Luxury Goods) | (b) | 36,900 | 332,755 | |||||||
|
| |||||||||
| 7,189,151 | ||||||||||
|
| |||||||||
CONSUMER STAPLES – 7.0% | ||||||||||
Davide Campari-Milano SpA (Beverages) | (b) | 128,976 | 934,411 | |||||||
Monster Beverage Corp. (Beverages) | (a) | 17,034 | 1,035,156 | |||||||
Pernod-Ricard SA (Beverages) | (b) | 2,898 | 321,659 | |||||||
|
| |||||||||
| 2,291,226 | ||||||||||
|
| |||||||||
FINANCIALS – 6.8% | ||||||||||
U.S. Bancorp (Commercial Banks) | 28,399 | 1,026,624 | ||||||||
AIA Group Ltd. (Insurance) | (b) | 118,000 | 497,134 | |||||||
Prudential PLC (Insurance) | (b) | 41,630 | 679,521 | |||||||
|
| |||||||||
| 2,203,279 | ||||||||||
|
| |||||||||
HEALTH CARE – 27.4% | ||||||||||
Celgene Corp. (Biotechnology) | (a) | 13,588 | 1,588,573 | |||||||
Gilead Sciences, Inc. (Biotechnology) | (a) | 13,429 | 687,699 | |||||||
Medivation, Inc. (Biotechnology) | (a) | 20,347 | 1,001,072 | |||||||
Vertex Pharmaceuticals, Inc. (Biotechnology) | (a) | 12,716 | 1,015,627 | |||||||
Intuitive Surgical, Inc. (Health Care Equip. & Supplies) | (a) | 653 | 330,797 | |||||||
DaVita HealthCare Partners, Inc. (Health Care | (a) | 5,250 | 634,200 | |||||||
Express Scripts Holding Co. (Health Care | (a) | 29,028 | 1,790,737 | |||||||
Valeant Pharmaceuticals International, Inc. (Pharmaceuticals) | (a) | 7,761 | 668,067 | |||||||
Zoetis, Inc. (Pharmaceuticals) | 38,476 | 1,188,524 | ||||||||
|
| |||||||||
| 8,905,296 | ||||||||||
|
| |||||||||
| Common Stocks (Continued) | Shares | Value | ||||||||
INDUSTRIALS – 4.1% | ||||||||||
Precision Castparts Corp. (Aerospace & Defense) | 1,219 | $ | 275,506 | |||||||
FANUC Corp. (Machinery) | (b) | 7,400 | 1,070,979 | |||||||
|
| |||||||||
| 1,346,485 | ||||||||||
|
| |||||||||
INFORMATION TECHNOLOGY – 26.4% | ||||||||||
Apple, Inc. (Computers & Peripherals) | 3,628 | 1,436,978 | ||||||||
EMC Corp. (Computers & Peripherals) | 42,510 | 1,004,086 | ||||||||
Amphenol Corp. Class A (Electronic Equip., Instr. & Comp.) | 4,853 | 378,243 | ||||||||
TE Connectivity Ltd. (Electronic Equip., Instr. & Comp.) | 16,417 | 747,630 | ||||||||
Trimble Navigation Ltd. (Electronic Equip., Instr. & Comp.) | (a) | 31,568 | 821,084 | |||||||
CoStar Group, Inc. (Internet Software & Svs.) | (a) | 5,656 | 730,020 | |||||||
eBay, Inc. (Internet Software & Svs.) | (a) | 19,174 | 991,679 | |||||||
Google, Inc. Class A (Internet Software & Svs.) | (a) | 1,529 | 1,346,086 | |||||||
Mastercard, Inc. Class A (IT Svs.) | 1,193 | 685,379 | ||||||||
VMware, Inc. Class A (Software) | (a) | 6,649 | 445,417 | |||||||
|
| |||||||||
| 8,586,602 | ||||||||||
|
| |||||||||
MATERIALS – 2.3% | ||||||||||
Monsanto Co. (Chemicals) | 6,494 | 641,607 | ||||||||
Turquoise Hill Resources Ltd. (Metals & Mining) | (a) | 19,326 | 114,603 | |||||||
|
| |||||||||
| 756,210 | ||||||||||
|
| |||||||||
TELECOMMUNICATION SERVICES – 3.7% | ||||||||||
Iliad SA (Diversified Telecom. Svs.) | (b) | 2,310 | 499,068 | |||||||
Crown Castle International Corp. (Wireless | (a) | 9,687 | 701,242 | |||||||
|
| |||||||||
| 1,200,310 | ||||||||||
|
| |||||||||
Total Common Stocks (Cost $25,105,646) | $ | 32,478,559 | ||||||||
|
| |||||||||
Total Investments – 99.8% (Cost $25,105,646) | (c) | $ | 32,478,559 | |||||||
Other Assets in Excess of Liabilities – 0.2% | 69,476 | |||||||||
|
| |||||||||
Net Assets – 100.0% | $ | 32,548,035 | ||||||||
|
| |||||||||
Percentages are stated as a percent of net assets.
Footnotes:
| (a) | Non-income producing security. |
| (b) | Security traded on a foreign exchange has been valued at an estimate of fair value that is different than the local market close price. These fair value estimates are determined by an independent fair valuation service that has been approved by the Board. These securities represent $5,292,899, or 16.3% of the Portfolio’s net assets. |
Other Portfolio securities are not subjected to fair value procedures because they are traded on domestic or foreign exchanges that have close times that are consistent with the U.S. market close, normally 4:00 pm Eastern Time.
| (c) | Represents cost for financial reporting purposes, which may differ from cost basis for federal income tax purposes. See also Note 7 of the Notes to Financial Statements. |
The accompanying notes are an integral part of these financial statements.
| 40 |
| Ohio National Fund, Inc. | Small Cap Growth Portfolio |
Objective/Strategy
The Small Cap Growth Portfolio seeks long-term capital appreciation by investing at least 80% of its net assets in stocks of small companies.
Performance as of June 30, 2013
Average Annual Returns: | ||||
One year | 22.61% | |||
Five years | 13.34% | |||
Ten years | 12.10% |
Past performance does not guarantee future results. The performance data quoted represents past performance and current returns may be lower or higher. Total return figures include change in share price and reinvestment of dividends and capital gains. The investment return and principal value will fluctuate so that an investor’s shares, when redeemed, may be worth more or less than the original cost. To obtain performance information up to the most recent month end, call toll-free 1-877-781-6392.
The Portfolio is not open to direct retail investment. Beneficial interest in shares is obtained solely by purchase of variable life insurance policies and variable annuity contracts. Actual performance results for variable annuity and variable universal life contracts will be lower due to contract charges. Consult your contract for applicable charges.
Comments
For the six-month period ended June 30, 2013, the Small Cap Growth Portfolio returned 17.58% versus 17.44% for the current benchmark, the Russell 2000 Growth Index.
Stock selection in Information Technology and Financials were the largest contributors to relative performance during the period. The Portfolio’s Industrials and Health Care holdings detracted from relative results. The Portfolio’s five top performing stocks during the period were WisdomTree Investments, Inc., Yelp, Inc., Envestnet, Inc., Financial Engines, Inc. and Exact Sciences Corp. The Portfolio’s five stocks with the worst returns included Ironwood Pharmaceuticals, Inc., Marin Software, Inc., LivePerson, Inc., Volcano Corp. and GrafTech International, Ltd.(1)
Envestnet, Inc. was the Portfolio’s top contributor. A number of the Portfolio’s Information Technology holdings have predictable or recurring revenue streams from diverse end markets outside the Information Technology sector. Envestnet, Inc. is a good example. The company provides a range of practice management and reporting solutions to financial advisors. Financial advisors depend on Envestnet, Inc.’s services to run their practices more efficiently. Since Envestnet, Inc.’s revenue is based on the asset bases of the advisors it serves, we think this creates a predictable revenue stream for the company.(1)
SS&C Technologies Holdings, Inc. was the Portfolio’s second largest contributor. The company provides software services to the financial services industry. SS&C Technologies Holdings, Inc. is another example of the type of stable recurring-revenue business models we seek in the Portfolio, as most of its revenue comes from subscription services or software maintenance. Last year, the company acquired another company that provides back-office services to hedge funds. This year we have seen early signs that SS&C Technologies Holdings, Inc. is having success in cross-selling the products of the company it acquired. We also think increased scrutiny of the hedge fund industry plays into the hands of SS&C Technologies Holdings, Inc., as hedge funds seek independent providers of fund administration services with a high level of transparency and accountability.(1)
Another contributor was Blackbaud, Inc. Blackbaud, Inc. provides software solutions to the nonprofit industry. The company acquired
one of its competitors last year, which was disruptive to the business over the short term. Now, we believe the market has gained clarity on how the two companies will work together and has come to appreciate Blackbaud, Inc.’s competitive positioning. The company’s main competitors have not invested enough in their technology platforms, in our view, which should allow Blackbaud, Inc. to gain market share. We also like the company because the majority of its revenue comes from maintenance and subscription services, which is a steadier, more predictable revenue stream.(1)
Quicksilver, Inc. was the Portfolio’s fourth largest contributor. The company designs, develops and distributes branded apparel, footwear, accessories, and related products, catering to the casual, youth lifestyle associated with surfing, skateboarding and snowboarding. Quiksilver, Inc. is in the middle of a turnaround, which we believe it can successfully execute as it better monetizes the value of its underlying brands.(1)
The Portfolio’s fifth largest contributor was Wolverine World Wide, Inc. The company designs, manufactures and markets a range of casual footwear and apparel, performance outdoor footwear and apparel, industrial work shoes, boots and apparel, and uniform shoes and boots. We think the company will create value by pushing some of its newly acquired shoe brands through its global distribution network. We also think Wolverine World Wide, Inc. can improve the brands, some of which had been undermanaged.(1)
LivePerson, Inc. was the Portfolio’s largest detractor during the period. The company has made large investments to try to move from being a customer service center for its retailers to a company that helps retailers generate additional revenue from the customers who visit their web sites. The investments LivePerson, Inc. has made in trying to develop these new services have played a role in compressing profit margins, which weighed on the stock. We are closely monitoring how the company executes on new strategies designed to help retailers generate additional revenue from the customers who visit their web sites.(1)
The Portfolio’s second largest detractor was GrafTech International Ltd. GrafTech International Ltd. produces graphite electrodes, which go into the electric arc furnaces used for steel production. Destocking among steel producers has weighed on the stock in recent months. Our long-term view of the company remains unchanged. Electric arc furnaces are a more environmentally friendly way to make steel than blast furnaces, but still have a low penetration rate outside the U.S. We think GrafTech International Ltd.’s global footprint gives the company an opportunity to serve this large addressable market. We also think GrafTech International Ltd. has a competitive advantage in being the only vertically integrated graphite electrode producer.(1)
Volcano Corp. was the Portfolio’s third largest detractor. The company makes intravascular ultrasound and heart diagnostic tools. We believe the company is well positioned because its tools save costs in the system, often eliminating the need for retreatment of patients. However, the growth trajectory of some of Volcano Corp.’s products has been slower than expected. Volcano Corp. has also raised debt to fund future acquisitions. The market has questioned the acquisition strategy, which has weighed on the stock. We continue to monitor the position closely as these issues play out at the company.(1)
Another Portfolio detractor was Intrepid Potash, Inc. The company produces potash, a key ingredient in fertilizer. We believe demand for potash will continue to grow as farmers seek to improve crop yields to take advantage of higher agricultural commodity prices and to keep up with growing food demand. We also think that potash is an attractive industry, due to a tightly controlled supply profile and the low penetration level of potash use in farming in emerging markets.(1)
| 41 | (continued) |
| Ohio National Fund, Inc. | Small Cap Growth Portfolio (Continued) |
Ironwood Pharmaceuticals, Inc. was the Portfolio’s fifth largest detractor. Ironwood Pharmaceuticals, Inc. is a small-cap biotechnology company that has developed Linzess, a potential best-in-class drug for IBS-C (irritable bowel syndrome) and chronic constipation. These are diseases that affect over 30 million people in the U.S., with over 10 million doctor visits. Despite the large market, there have been no available therapies that address the key symptoms for these patients (constipation and abdominal pain). Ironwood Pharmaceuticals, Inc. and its partner, Forest Laboratories, launched Linzess in December of 2012 and the initial adoption has been strong, with positive feedback from physicians. We continue to believe the drug has significant sales potential.(1)
We believe the U.S. economy is continuing to improve. Cheap natural gas and oil are creating a U.S. manufacturing renaissance. A stronger housing market is boosting a number of industries, and consumer spending has been surprisingly resilient over the past year. But much of the positive economic news has been factored into stock valuations. The Russell 2000 Growth Index hit an all-time high during the quarter and after such a strong climb, valuations for a number of small-cap companies more fully reflect their growth potential. When the risk/reward profile of stocks is more balanced, however, it makes good stock selection more important. Even though many stocks are more fully valued, our analysts continue to find several new and exciting growth opportunities, and we hope to use the potential of market volatility in the coming months to add those positions to the Portfolio.
| (1) | The Portfolio’s composition is subject to change. Holdings and weightings are as of June 30, 2013. |
Change in Value of $10,000 Investment
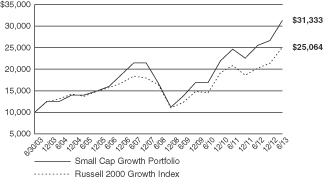
Hypothetical illustration based on past performance. Future performance will vary. The Portfolio’s returns reflect reinvested dividends. The Portfolio’s holdings may differ significantly from the securities in the index. The index is unmanaged and therefore does not reflect the cost of portfolio management and accounting.
The Russell 2000 Growth Index measures the performance of the small-cap growth segment of the U.S. equity universe. It includes the Russell 2000 Index companies with higher price-to-value ratios and higher forecasted growth values. The Russell 2000 Index includes the 2000 firms from the Russell 3000 Index with the smallest market capitalizations. The Russell 3000 Index represents 98% of the investable U.S. equity markets. The index presented herein includes the effects of reinvested dividends.
Portfolio Composition as of June 30, 2013 (1)
| % of Net Assets | ||||
Common Stocks (3) | 91.2 | |||
Money Market Funds and | 8.8 | |||
|
| |||
| 100.0 | ||||
|
|
Top 10 Portfolio Holdings as of June 30, 2013 (1) (2)
| % of Net Assets | ||||
1. SS&C Technologies Holdings, Inc. | 3.0 | |||
2. Wolverine World Wide, Inc. | 2.6 | |||
3. Carter’s, Inc. | 2.5 | |||
4. Blackbaud, Inc. | 2.3 | |||
5. Dresser-Rand Group, Inc. | 2.2 | |||
6. Measurement Specialties, Inc. | 2.2 | |||
7. HEICO Corp. Class A | 2.0 | |||
8. WESCO International, Inc. | 1.9 | |||
9. Quidel Corp. | 1.8 | |||
10. Broadridge Financial Solutions, Inc. | 1.8 |
| (1) | Composition of Portfolio subject to change. |
| (2) | Short-term investments have been excluded from the list of Top 10 Portfolio Holdings. |
| (3) | Sectors: |
| % of Net Assets | ||||
Information Technology | 26.4 | |||
Industrials | 21.3 | |||
Health Care | 14.9 | |||
Consumer Discretionary | 14.5 | |||
Energy | 6.2 | |||
Financials | 5.5 | |||
Consumer Staples | 1.2 | |||
Materials | 1.2 | |||
|
| |||
| 91.2 | ||||
|
|
| 42 |
| Ohio National Fund, Inc. | Small Cap Growth Portfolio |
Schedule of Investments | June 30, 2013 (Unaudited) |
| Common Stocks – 91.2% | Shares | Value | ||||||||
CONSUMER DISCRETIONARY – 14.5% | ||||||||||
Ascent Capital Group, Inc. Class A (Diversified | (a) | 2,014 | $ | 157,233 | ||||||
K12, Inc. (Diversified Consumer Svs.) | (a) | 548 | 14,396 | |||||||
Biglari Holdings, Inc. (Hotels, Restaurants & Leisure) | (a) | 116 | 47,606 | |||||||
Noodles & Co. (Hotels, Restaurants & Leisure) | (a) | 1,242 | 45,644 | |||||||
SodaStream International Ltd. (Household Durables) | (a) | 9,079 | 659,589 | |||||||
Arctic Cat, Inc. (Leisure Equip. & Products) | 9,358 | 420,923 | ||||||||
National CineMedia, Inc. (Media) | 37,956 | 641,077 | ||||||||
Gordmans Stores, Inc. (Multiline Retail) | (a) | 22,138 | 301,298 | |||||||
Hibbett Sports, Inc. (Specialty Retail) | (a) | 14,210 | 788,655 | |||||||
Monro Muffler Brake, Inc. (Specialty Retail) | 12,672 | 608,890 | ||||||||
Carter’s, Inc. (Textiles, Apparel & Luxury Goods) | 15,509 | 1,148,752 | ||||||||
Deckers Outdoor Corp. (Textiles, Apparel & Luxury Goods) | (a) | 3,614 | 182,543 | |||||||
Maidenform Brands, Inc. (Textiles, Apparel & Luxury Goods) | (a) | 12,120 | 210,040 | |||||||
Quiksilver, Inc. (Textiles, Apparel & Luxury Goods) | (a) | 31,901 | 205,442 | |||||||
Wolverine World Wide, Inc. (Textiles, Apparel & Luxury Goods) | 21,707 | 1,185,419 | ||||||||
|
| |||||||||
| 6,617,507 | ||||||||||
|
| |||||||||
CONSUMER STAPLES – 1.2% | ||||||||||
Casey’s General Stores, Inc. (Food & Staples Retailing) | 5,416 | 325,827 | ||||||||
Prestige Brands Holdings, Inc. (Personal Products) | (a) | 7,838 | 228,399 | |||||||
|
| |||||||||
| 554,226 | ||||||||||
|
| |||||||||
ENERGY – 6.2% | ||||||||||
Dresser-Rand Group, Inc. (Energy Equip. & Svs.) | (a) | 16,487 | 988,890 | |||||||
Dril-Quip, Inc. (Energy Equip. & Svs.) | (a) | 6,370 | 575,147 | |||||||
DCP Midstream Partners LP (Oil, Gas & Consumable Fuels) | 14,010 | 757,941 | ||||||||
Kinder Morgan Energy Partners LP (Oil, Gas & Consumable Fuels) | 1 | 71 | ||||||||
Targa Resources Corp. (Oil, Gas & Consumable Fuels) | 4,289 | 275,911 | ||||||||
World Fuel Services Corp. (Oil, Gas & Consumable Fuels) | 5,235 | 209,295 | ||||||||
|
| |||||||||
| 2,807,255 | ||||||||||
|
| |||||||||
FINANCIALS – 5.5% | ||||||||||
Artisan Partners Asset Management, Inc. (Capital Markets) | (a) | 3,001 | 149,780 | |||||||
Financial Engines, Inc. (Capital Markets) | 7,358 | 335,451 | ||||||||
LPL Financial Holdings, Inc. (Capital Markets) | 10,697 | 403,919 | ||||||||
WisdomTree Investments, Inc. (Capital Markets) | (a) | 43,305 | 501,039 | |||||||
Bank of the Ozarks, Inc. (Commercial Banks) | 5,099 | 220,940 | ||||||||
MarketAxess Holdings, Inc. (Diversified Financial Svs.) | 10,031 | 468,949 | ||||||||
MSCI, Inc. (Diversified Financial Svs.) | (a) | 12,870 | 428,185 | |||||||
|
| |||||||||
| 2,508,263 | ||||||||||
|
| |||||||||
HEALTH CARE – 14.9% | ||||||||||
Achillion Pharmaceuticals, Inc. (Biotechnology) | (a) | 28,546 | 233,506 | |||||||
Ariad Pharmaceuticals, Inc. (Biotechnology) | (a) | 15,815 | 276,604 | |||||||
Exact Sciences Corp. (Biotechnology) | (a) | 30,755 | 427,802 | |||||||
Incyte Corp Ltd. (Biotechnology) | (a) | 17,915 | 394,130 | |||||||
Ironwood Pharmaceuticals, Inc. (Biotechnology) | (a) | 19,818 | 197,189 | |||||||
Medivation, Inc. (Biotechnology) | (a) | 6,481 | 318,865 | |||||||
Seattle Genetics, Inc. (Biotechnology) | (a) | 5,584 | 175,673 | |||||||
Synageva BioPharma Corp. (Biotechnology) | (a) | 7,005 | 294,210 | |||||||
Endologix, Inc. (Health Care Equip. & Supplies) | (a) | 43,551 | 578,357 | |||||||
Masimo Corp. (Health Care Equip. & Supplies) | 24,886 | 527,583 | ||||||||
Novadaq Technologies, Inc. (Health Care Equip. & Supplies) | (a) | 31,317 | 421,527 | |||||||
Quidel Corp. (Health Care Equip. & Supplies) | (a) | 32,350 | 825,896 | |||||||
Volcano Corp. (Health Care Equip. & Supplies) | (a) | 10,130 | 183,657 | |||||||
| Common Stocks (Continued) | Shares | Value | ||||||||
HEALTH CARE (continued) | ||||||||||
ExamWorks Group, Inc. (Health Care Providers & Svs.) | (a) | 30,404 | $ | 645,477 | ||||||
athenahealth, Inc. (Health Care Technology) | (a) | 6,052 | 512,725 | |||||||
Techne Corp. (Life Sciences Tools & Svs.) | 10,964 | 757,393 | ||||||||
|
| |||||||||
| 6,770,594 | ||||||||||
|
| |||||||||
INDUSTRIALS – 21.3% | ||||||||||
HEICO Corp. Class A (Aerospace & Defense) | 24,547 | 906,030 | ||||||||
Hub Group, Inc. Class A (Air Freight & Logistics) | (a) | 21,180 | 771,376 | |||||||
Clean Harbors, Inc. (Commercial Svs. & Supplies) | (a) | 4,061 | 205,202 | |||||||
Heritage-Crystal Clean, Inc. (Commercial Svs. & Supplies) | (a) | 24,153 | 352,875 | |||||||
Ritchie Bros Auctioneers, Inc. (Commercial Svs. & Supplies) | 34,925 | 671,258 | ||||||||
Standard Parking Corp. (Commercial Svs. & Supplies) | (a) | 25,374 | 544,526 | |||||||
GrafTech International Ltd. (Electrical Equip.) | (a) | 103,664 | 754,674 | |||||||
Polypore International, Inc. (Electrical Equip.) | (a) | 18,741 | 755,262 | |||||||
Kennametal, Inc. (Machinery) | 8,470 | 328,890 | ||||||||
Nordson Corp. (Machinery) | 10,799 | 748,479 | ||||||||
Tennant Co. (Machinery) | 11,397 | 550,133 | ||||||||
Wabtec Corp. (Machinery) | 14,694 | 785,100 | ||||||||
Landstar System, Inc. (Road & Rail) | 11,766 | 605,949 | ||||||||
Old Dominion Freight Line, Inc. (Road & Rail) | (a) | 11,630 | 484,041 | |||||||
Saia, Inc. (Road & Rail) | (a) | 12,545 | 375,959 | |||||||
WESCO International, Inc. (Trading Companies & Distributors) | (a) | 12,653 | 859,898 | |||||||
|
| |||||||||
| 9,699,652 | ||||||||||
|
| |||||||||
INFORMATION TECHNOLOGY – 26.4% | ||||||||||
Stratasys Ltd. (Computers & Peripherals) | (a) | 3,890 | 325,749 | |||||||
DTS, Inc. (Electronic Equip., Instr. & Comp.) | (a) | 24,181 | 497,645 | |||||||
Measurement Specialties, Inc. (Electronic Equip., Instr. & Comp.) | (a) | 21,117 | 982,574 | |||||||
National Instruments Corp. (Electronic Equip., Instr. & Comp.) | 3,888 | 108,631 | ||||||||
RealD, Inc. (Electronic Equip., Instr. & Comp.) | (a) | 28,489 | 395,997 | |||||||
ChannelAdvisor Corp. (Internet Software & Svs.) | (a) | 4,556 | 71,666 | |||||||
Cornerstone OnDemand, Inc. (Internet Software & Svs.) | (a) | 8,183 | 354,242 | |||||||
CoStar Group, Inc. (Internet Software & Svs.) | (a) | 2,269 | 292,860 | |||||||
Envestnet, Inc. (Internet Software & Svs.) | (a) | 17,732 | 436,207 | |||||||
j2 Global, Inc. (Internet Software & Svs.) | 5,514 | 234,400 | ||||||||
LivePerson, Inc. (Internet Software & Svs.) | (a) | 57,491 | 514,832 | |||||||
Marin Software, Inc. (Internet Software & Svs.) | (a) | 5,253 | 53,791 | |||||||
Textura Corp. (Internet Software & Svs.) | (a) | 1,313 | 34,151 | |||||||
VistaPrint NV (Internet Software & Svs.) | (a) | 12,630 | 623,543 | |||||||
Yelp, Inc. (Internet Software & Svs.) | (a) | 6,622 | 230,247 | |||||||
Zillow, Inc. Class A (Internet Software & Svs.) | (a) | 1,882 | 105,957 | |||||||
Broadridge Financial Solutions, Inc. (IT Svs.) | 30,221 | 803,274 | ||||||||
Euronet Worldwide, Inc. (IT Svs.) | (a) | 15,315 | 487,936 | |||||||
International Rectifier Corp. (Semiconductors & Equip.) | (a) | 14,186 | 297,055 | |||||||
Advent Software, Inc. (Software) | (a) | 7,045 | 246,998 | |||||||
Blackbaud, Inc. (Software) | 32,520 | 1,059,176 | ||||||||
Cadence Design Systems, Inc. (Software) | (a) | 39,926 | 578,128 | |||||||
Guidewire Software, Inc. (Software) | (a) | 7,073 | 297,420 | |||||||
Model N, Inc. (Software) | (a) | 2,619 | 61,180 | |||||||
NICE Systems Ltd. – ADR (Software) | 6,103 | 225,140 | ||||||||
Rally Software Development Corp. (Software) | (a) | 2,727 | 67,684 | |||||||
RealPage, Inc. (Software) | (a) | 39,511 | 724,632 | |||||||
Solera Holdings, Inc. (Software) | 3,945 | 219,539 | ||||||||
SS&C Technologies Holdings, Inc. (Software) | (a) | 41,570 | 1,367,653 | |||||||
Tyler Technologies, Inc. (Software) | (a) | 4,710 | 322,871 | |||||||
|
| |||||||||
| 12,021,178 | ||||||||||
|
| |||||||||
| 43 | (continued) |
| Ohio National Fund, Inc. | Small Cap Growth Portfolio (Continued) |
Schedule of Investments | June 30, 2013 (Unaudited) |
| Common Stocks (Continued) | Shares | Value | ||||||||
MATERIALS – 1.2% | ||||||||||
Intrepid Potash, Inc. (Chemicals) | 27,987 | $ | 533,152 | |||||||
|
| |||||||||
Total Common Stocks (Cost $36,995,551) | $ | 41,511,827 | ||||||||
|
| |||||||||
| Money Market Funds – 8.0% | Shares | Value | ||||||||
Fidelity Institutional Money Market Funds | 3,628,000 | $ | 3,628,000 | |||||||
|
| |||||||||
Total Money Market Funds (Cost $3,628,000) | $ | 3,628,000 | ||||||||
|
| |||||||||
Total Investments – 99.2% (Cost $40,623,551) | (b) | $ | 45,139,827 | |||||||
Other Assets in Excess of Liabilities – 0.8% | 384,224 | |||||||||
|
| |||||||||
Net Assets – 100.0% | $ | 45,524,051 | ||||||||
|
| |||||||||
Percentages are stated as a percent of net assets.
Footnotes:
| (a) | Non-income producing security. |
| (b) | Represents cost for financial reporting purposes, which may differ from cost basis for federal income tax purposes. See also Note 7 of the Notes to Financial Statements. |
The accompanying notes are an integral part of these financial statements.
| 44 |
| Ohio National Fund, Inc. | Mid Cap Opportunity Portfolio |
Objective/Strategy
The Mid Cap Opportunity Portfolio seeks long-term total return by investing at least 80% of its net assets in equity securities of mid-cap companies, primarily those that are strategically positioned for long-term growth.
Performance as of June 30, 2013
Average Annual Returns: | ||||
One year | 18.89% | |||
Five years | 4.34% | |||
Ten years | 7.63% |
Past performance does not guarantee future results. The performance data quoted represents past performance and current returns may be lower or higher. Total return figures include change in share price and reinvestment of dividends and capital gains. The investment return and principal value will fluctuate so that an investor’s shares, when redeemed, may be worth more or less than the original cost. To obtain performance information up to the most recent month end, call toll-free 1-877-781-6392.
The Portfolio is not open to direct retail investment. Beneficial interest in shares is obtained solely by purchase of variable life insurance policies and variable annuity contracts. Actual performance results for variable annuity and variable universal life contracts will be lower due to contract charges. Consult your contract for applicable charges.
Comments
For the six-month period ended June 30, 2013, the Mid Cap Opportunity Portfolio returned 10.98% versus 14.70% for the current benchmark, the Russell Midcap Growth Index.
As we enter the third quarter, we continue to be optimistic regarding the U.S. equity market. Despite a strong first half of 2013, we believe the case for investing in U.S. equities remains compelling. In our view, valuations are reasonable, as the S&P 500 Index is trading below its historical average price-to-earnings (P/E) multiple and offers an attractive dividend yield of approximately 2%. The strength of corporate balance sheets provides companies with a number of options to enhance shareholder value going forward. Signs of improving U.S. economic growth remain intact, supported by a continued recovery in the housing market and consumer confidence. However, some headwinds remain, given market concerns about the Federal Reserve tapering asset purchases and rising rates, fiscal policy’s drag on growth, and global weakness. We believe it is important to recognize that rising rates and advancing equity markets are not mutually exclusive. Equities have the potential to continue to rise in an increasing rate environment, driven by improving U.S. economic growth and given that the absolute level of rates remains low by historical standards. Additional catalysts could also be improved sentiment and increased flows into equities.
Weakness in Consumer Discretionary, Information Technology, and Industrials stock selection detracted from relative returns, while positive stock selection in the Financials and Materials sectors contributed to performance.(1)
Rackspace Hosting, Inc., a leading provider of managed hosting and cloud computing services, detracted from performance, as it reported disappointing fiscal first quarter results. The slowdown in sales growth highlights the challenges the company is experiencing gaining traction with its new cloud offering and, more specifically, transitioning large enterprise customers to the new offering. The company also indicated that it would have to spend more to acquire new customers. The secular growth trends driving Rackspace Hosting, Inc. remain intact, as the architecture of computing and
enterprise information technology spending continue to shift towards the cloud. However, we are being thoughtful about position sizing in order to reflect changes in the overall risk/reward profile.(1)
Equinix, Inc., a leading data center solutions company, also detracted from returns. Its shares declined in the second quarter of 2013, as the potential for rising interest rates weighed broadly on yield-sensitive securities such as bonds and real estate investment trusts (REITs). In addition, the U.S. Internal Revenue Service (IRS) announced that it will more closely evaluate how it defines a REIT and, therefore, applies REIT status to particular companies. In 2012, Equinix, Inc. announced its planned conversion to a REIT. In our view, this is a short-term headwind for the stock, as similar companies in the data center industry have already converted to a REIT structure. We believe that, despite the recent weakness, company fundamentals remain strong and Equinix, Inc. continues to benefit from several secular growth drivers, including cloud computing, growth in internet traffic and enterprise outsourcing, and rising demand for optimized network performance. We believe that Equinix, Inc.’s pricing power remains strong in all regions in which it operates and its global focus continues to be a significant differentiator versus peers.(1)
Vertex Pharmaceuticals, Inc. was a top performer during the second quarter of 2013. Supportive trial data was released on one of its cystic fibrosis drugs that is in development, causing its shares to move higher now that regulatory approval of the treatment seems more likely. We believe Vertex Pharmaceuticals, Inc. has an attractive risk/reward profile and is well positioned to grow its addressable market through its Cystic Fibrosis franchise. In addition, we believe the value of Vertex Pharmaceuticals, Inc.’s Hepatitis-C franchise is underestimated by the market, which could lead to significant upside in the stock. In our view, the company has a robust pipeline of new treatments and maintains a healthy balance sheet that should help fund research on additional therapies.(1)
Pandora Media, Inc., a leading Internet radio service provider, was another top contributor to performance. Pandora Media, Inc. reported record results for the first quarter of its 2014 fiscal year and raised its full year guidance. The stock was also bolstered by the news that the company estimates that one third of all new cars sold in 2013 in the U.S. will have Pandora Media installed, including over 100 vehicle models. This announcement highlights Pandora Media gaining share of radio listening in the car, which should drive up listening hours per user. We believe the company is well positioned to gain market share within the terrestrial radio market and should continue to grow its active user base as it builds out its advertising sales force. Pandora Media, Inc.’s differentiated business model, first-mover advantage, and strong brand recognition also support sustainable growth.(1)
The Portfolio’s best performers were Pandora Media, Inc., Vertex Pharmaceuticals, Inc., FleetCor Technologies, Inc., Intercontinental Exchange, Inc. and Core Laboratories NV. The Portfolio’s worst performers were Rackspace Hosting, Inc., VeriFone Systems, Inc., Cognizant Technology Solutions Corp., Lululemon Athletica, Inc. and Medivation, Inc. The Portfolio’s largest contributors were Vertex Pharmaceuticals, Inc., Pandora Media, Inc., FleetCor Technologies, Inc., Activision Blizzard, Inc. and IntercontinentalExchange, Inc. The Portfolio’s largest detractors were Rackspace Hosting, Inc., Equinix, Inc., SBA Communications Corp., Salesforce.com, Inc. and Ritchie Bros Auctioneers, Inc.(1)
| (1) | The Portfolio’s composition is subject to change. Holdings and weightings are as of June 30, 2013. |
| 45 |
| Ohio National Fund, Inc. | Mid Cap Opportunity Portfolio (Continued) |
Change in Value of $10,000 Investment
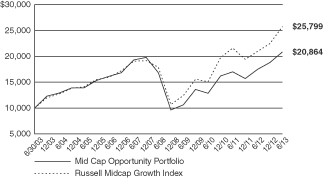
Hypothetical illustration based on past performance. Future performance will vary. The Portfolio’s returns reflect reinvested dividends. The Portfolio’s holdings may differ significantly from the securities in the index. The index is unmanaged and therefore does not reflect the cost of portfolio management and accounting.
The Russell Midcap Growth Index is a subset of the Russell Midcap Index, which measures the performance of the 800 smallest companies in the Russell 1000 Index. The Russell Midcap Growth Index measures the performance of those stocks of the Russell Midcap Index with higher price-to-book ratios and higher relative forecasted growth rates. The index presented herein includes the effects of reinvested dividends.
Portfolio Composition as of June 30, 2013 (1)
| % of Net Assets | ||||
Common Stocks (3) | 99.4 | |||
Money Market Funds | 0.6 | |||
|
| |||
| 100.0 | ||||
|
|
Top 10 Portfolio Holdings as of June 30, 2013 (1) (2)
| % of Net Assets | ||||
1. SBA Communications Corp. Class A | 3.3 | |||
2. Equinix, Inc. | 2.7 | |||
3. CBRE Group, Inc. | 2.7 | |||
4. IntercontinentalExchange, Inc. | 2.5 | |||
5. Agilent Technologies, Inc. | 2.5 | |||
6. PVH Corp. | 2.4 | |||
7. Xilinx, Inc. | 2.3 | |||
8. MSCI, Inc. | 2.2 | |||
9. Amphenol Corp. Class A | 2.2 | |||
10. Dollar General Corp. | 2.1 |
| (1) | Composition of Portfolio subject to change. |
| (2) | Short-term investments have been excluded from the list of Top 10 Portfolio Holdings. |
| (3) | Sectors: |
| % of Net Assets | ||||
Consumer Discretionary | 19.9 | |||
Information Technology | 16.6 | |||
Health Care | 16.5 | |||
Financials | 14.2 | |||
Industrials | 11.5 | |||
Consumer Staples | 5.9 | |||
Energy | 5.5 | |||
Telecommunication Services | 4.7 | |||
Materials | 4.6 | |||
|
| |||
| 99.4 | ||||
|
|
| 46 |
| Ohio National Fund, Inc. | Mid Cap Opportunity Portfolio |
Schedule of Investments | June 30, 2013 (Unaudited) |
| Common Stocks – 99.4% | Shares | Value | ||||||||
CONSUMER DISCRETIONARY – 19.9% | ||||||||||
Coinstar, Inc. (Diversified Consumer Svs.) | (a) | 15,915 | $ | 933,733 | ||||||
Chipotle Mexican Grill, Inc. (Hotels, Restaurants & Leisure) | (a) | 2,082 | 758,577 | |||||||
Dunkin’ Brands Group, Inc. (Hotels, Restaurants & Leisure) | 13,943 | 597,039 | ||||||||
Marriott International, Inc. Class A (Hotels, Restaurants & Leisure) | 19,956 | 805,624 | ||||||||
Discovery Communications, Inc. Class A (Media) | (a) | 10,121 | 781,442 | |||||||
Scripps Networks Interactive, Inc. Class A (Media) | 13,542 | 904,064 | ||||||||
Dollar General Corp. (Multiline Retail) | (a) | 30,214 | 1,523,692 | |||||||
Dick’s Sporting Goods, Inc. (Specialty Retail) | 13,347 | 668,151 | ||||||||
L Brands, Inc. (Specialty Retail) | 26,218 | 1,291,236 | ||||||||
PetSmart, Inc. (Specialty Retail) | 19,939 | 1,335,714 | ||||||||
Tiffany & Co. (Specialty Retail) | 8,542 | 622,199 | ||||||||
Ulta Salon Cosmetics & Fragrance, Inc. (Specialty Retail) | (a) | 3,805 | 381,109 | |||||||
Deckers Outdoor Corp. (Textiles, Apparel & Luxury Goods) | (a) | 19,130 | 966,256 | |||||||
Fifth & Pacific Cos., Inc. (Textiles, Apparel & Luxury Goods) | (a) | 35,837 | 800,599 | |||||||
Lululemon Athletica, Inc. (Textiles, Apparel & Luxury Goods) | (a) | 7,767 | 508,894 | |||||||
PVH Corp. (Textiles, Apparel & Luxury Goods) | 14,053 | 1,757,328 | ||||||||
|
| |||||||||
| 14,635,657 | ||||||||||
|
| |||||||||
CONSUMER STAPLES – 5.9% | ||||||||||
Beam, Inc. (Beverages) | 13,861 | 874,768 | ||||||||
Monster Beverage Corp. (Beverages) | (a) | 6,446 | 391,723 | |||||||
Hain Celestial Group, Inc. / The (Food Products) | (a) | 13,884 | 902,043 | |||||||
TreeHouse Foods, Inc. (Food Products) | (a) | 8,264 | 541,623 | |||||||
Church & Dwight Co., Inc. (Household Products) | 16,209 | 1,000,257 | ||||||||
Estee Lauder Cos., Inc. / The Class A (Personal Products) | 9,757 | 641,718 | ||||||||
|
| |||||||||
| 4,352,132 | ||||||||||
|
| |||||||||
ENERGY – 5.5% | ||||||||||
Cameron International Corp. (Energy Equip. & Svs.) | (a) | 19,669 | 1,202,956 | |||||||
Core Laboratories NV (Energy Equip. & Svs.) | 4,193 | 635,910 | ||||||||
Dril-Quip, Inc. (Energy Equip. & Svs.) | (a) | 7,383 | 666,611 | |||||||
Pioneer Natural Resources Co. (Oil, Gas & Consumable Fuels) | 6,577 | 952,021 | ||||||||
Whiting Petroleum Corp. (Oil, Gas & Consumable Fuels) | (a) | 11,842 | 545,798 | |||||||
|
| |||||||||
| 4,003,296 | ||||||||||
|
| |||||||||
FINANCIALS – 14.2% | ||||||||||
Lazard Ltd. Class A (Capital Markets) | 28,105 | 903,576 | ||||||||
Northern Trust Corp. (Capital Markets) | 17,951 | 1,039,363 | ||||||||
T. Rowe Price Group, Inc. (Capital Markets) | 12,972 | 948,902 | ||||||||
First Republic Bank (Commercial Banks) | 32,798 | 1,262,067 | ||||||||
SLM Corp. (Consumer Finance) | 40,585 | 927,773 | ||||||||
IntercontinentalExchange, Inc. (Diversified Financial Svs.) | (a) | 10,202 | 1,813,507 | |||||||
MSCI, Inc. (Diversified Financial Svs.) | (a) | 47,766 | 1,589,175 | |||||||
CBRE Group, Inc. (Real Estate Mgmt. & Development) | (a) | 83,631 | 1,953,620 | |||||||
|
| |||||||||
| 10,437,983 | ||||||||||
|
| |||||||||
HEALTH CARE – 16.5% | ||||||||||
Alexion Pharmaceuticals, Inc. (Biotechnology) | (a) | 4,132 | 381,136 | |||||||
Ariad Pharmaceuticals, Inc. (Biotechnology) | (a) | 13,918 | 243,426 | |||||||
BioMarin Pharmaceutical, Inc. (Biotechnology) | (a) | 10,196 | 568,835 | |||||||
Cepheid, Inc. (Biotechnology) | (a) | 23,668 | 814,653 | |||||||
| Common Stocks (Continued) | Shares | Value | ||||||||
HEALTH CARE (continued) | ||||||||||
Medivation, Inc. (Biotechnology) | (a) | 10,046 | $ | 494,263 | ||||||
Pharmacyclics, Inc. (Biotechnology) | (a) | 3,600 | 286,092 | |||||||
Regeneron Pharmaceuticals, Inc. (Biotechnology) | (a) | 2,304 | 518,123 | |||||||
Vertex Pharmaceuticals, Inc. (Biotechnology) | (a) | 12,979 | 1,036,633 | |||||||
CareFusion Corp. (Health Care Equip. & Supplies) | (a) | 25,702 | 947,119 | |||||||
C.R. Bard, Inc. (Health Care Equip. & Supplies) | 13,926 | 1,513,478 | ||||||||
Teleflex, Inc. (Health Care Equip. & Supplies) | 3,346 | 259,281 | ||||||||
Henry Schein, Inc. (Health Care Providers & Svs.) | (a) | 10,173 | 974,065 | |||||||
MEDNAX, Inc. (Health Care Providers & Svs.) | (a) | 4,099 | 375,386 | |||||||
HMS Holdings Corp. (Health Care Technology) | (a) | 26,820 | 624,906 | |||||||
Agilent Technologies, Inc. (Life Sciences Tools & Svs.) | 42,152 | 1,802,419 | ||||||||
Mettler-Toledo International, Inc. (Life Sciences Tools & Svs.) | (a) | 2,512 | 505,414 | |||||||
Shire PLC – ADR (Pharmaceuticals) | 8,006 | 761,451 | ||||||||
|
| |||||||||
| 12,106,680 | ||||||||||
|
| |||||||||
INDUSTRIALS – 11.5% | ||||||||||
Healthcare Services Group, Inc. (Commercial Svs. & Supplies) | 10,080 | 247,162 | ||||||||
Ritchie Bros Auctioneers, Inc. (Commercial Svs. & Supplies) | 36,129 | 694,399 | ||||||||
Quanta Services, Inc. (Construction & Engineering) | (a) | 24,431 | 646,444 | |||||||
Hubbell, Inc. Class B (Electrical Equip.) | 10,443 | 1,033,857 | ||||||||
Rockwell Automation, Inc. (Electrical Equip.) | 7,921 | 658,552 | ||||||||
Roper Industries, Inc. (Electrical Equip.) | 6,717 | 834,386 | ||||||||
Sensata Technologies Holding NV (Electrical Equip.) | (a) | 36,700 | 1,280,830 | |||||||
Graco, Inc. (Machinery) | 19,663 | 1,242,898 | ||||||||
Kennametal, Inc. (Machinery) | 27,647 | 1,073,533 | ||||||||
W.W. Grainger, Inc. (Trading Companies & Distributors) | 2,930 | 738,887 | ||||||||
|
| |||||||||
| 8,450,948 | ||||||||||
|
| |||||||||
INFORMATION TECHNOLOGY – 16.6% | ||||||||||
Juniper Networks, Inc. (Communications Equip.) | (a) | 18,576 | 358,702 | |||||||
Amphenol Corp. Class A (Electronic Equip., Instr. & Comp.) | 20,314 | 1,583,273 | ||||||||
Equinix, Inc. (Internet Software & Svs.) | (a) | 10,761 | 1,987,772 | |||||||
Pandora Media, Inc. (Internet Software & Svs.) | (a) | 34,870 | 641,608 | |||||||
Rackspace Hosting, Inc. (Internet Software & Svs.) | (a) | 23,038 | 872,910 | |||||||
Cognizant Technology Solutions Corp. Class A (IT Svs.) | (a) | 8,353 | 522,981 | |||||||
FleetCor Technologies, Inc. (IT Svs.) | (a) | 7,697 | 625,766 | |||||||
Genpact Ltd. (IT Svs.) | 31,287 | 601,962 | ||||||||
Altera Corp. (Semiconductors & Equip.) | 31,240 | 1,030,608 | ||||||||
Linear Technology Corp. (Semiconductors & Equip.) | 17,420 | 641,753 | ||||||||
Xilinx, Inc. (Semiconductors & Equip.) | 42,028 | 1,664,729 | ||||||||
MICROS Systems, Inc. (Software) | (a) | 20,105 | 867,531 | |||||||
Salesforce.com, Inc. (Software) | (a) | 20,672 | 789,257 | |||||||
|
| |||||||||
| 12,188,852 | ||||||||||
|
| |||||||||
MATERIALS – 4.6% | ||||||||||
Airgas, Inc. (Chemicals) | 12,904 | 1,231,816 | ||||||||
Ecolab, Inc. (Chemicals) | 13,757 | 1,171,959 | ||||||||
International Flavors & Fragrances, Inc. (Chemicals) | 13,449 | 1,010,827 | ||||||||
|
| |||||||||
| 3,414,602 | ||||||||||
|
| |||||||||
TELECOMMUNICATION SERVICES – 4.7% | ||||||||||
tw telecom, Inc. (Diversified Telecom. Svs.) | (a) | 36,137 | 1,016,895 | |||||||
SBA Communications Corp. Class A (Wireless | (a) | 33,175 | 2,458,931 | |||||||
|
| |||||||||
| 3,475,826 | ||||||||||
|
| |||||||||
Total Common Stocks (Cost $59,097,285) | $ | 73,065,976 | ||||||||
|
| |||||||||
| 47 | (continued) |
| Ohio National Fund, Inc. | Mid Cap Opportunity Portfolio (Continued) |
Schedule of Investments | June 30, 2013 (Unaudited) |
| Money Market Funds – 1.1% | Shares | Value | ||||||||
Fidelity Institutional Money Market Funds | 828,000 | $ | 828,000 | |||||||
|
| |||||||||
Total Money Market Funds (Cost $828,000) | $ | 828,000 | ||||||||
|
| |||||||||
Total Investments – 100.5% (Cost $59,925,285) | (b) | $ | 73,893,976 | |||||||
Liabilities in Excess of Other Assets – (0.5)% | (380,765) | |||||||||
|
| |||||||||
Net Assets – 100.0% | $ | 73,513,211 | ||||||||
|
| |||||||||
Percentages are stated as a percent of net assets.
Abbreviations:
ADR: American Depositary Receipts
Footnotes:
| (a) | Non-income producing security. |
| (b) | Represents cost for financial reporting purposes, which may differ from cost basis for federal income tax purposes. See also Note 7 of the Notes to Financial Statements. |
The accompanying notes are an integral part of these financial statements.
| 48 |
| Ohio National Fund, Inc. | S&P 500® Index Portfolio |
Objective/Strategy
The S&P 500® Index Portfolio seeks total return that approximates the total return of the Standard & Poor’s 500® Index (S&P 500® Index), at a risk level consistent with that of the Standard & Poor’s 500® Index.
Performance as of June 30, 2013
Average Annual Returns: | ||||
One year | 19.96% | |||
Five years | 6.48% | |||
Ten years | 6.78% |
Past performance does not guarantee future results. The performance data quoted represents past performance and current returns may be lower or higher. Total return figures include change in share price and reinvestment of dividends and capital gains. The investment return and principal value will fluctuate so that an investor’s shares, when redeemed, may be worth more or less than the original cost. To obtain performance information up to the most recent month end, call toll-free 1-877-781-6392.
The Portfolio is not open to direct retail investment. Beneficial interest in shares is obtained solely by purchase of variable life insurance policies and variable annuity contracts. Actual performance results for variable annuity and variable universal life contracts will be lower due to contract charges. Consult your contract for applicable charges.
Comments
For the six-month period ended June 30, 2013, the S&P 500® Index Portfolio returned 13.53% versus 13.82% for the current benchmark, the S&P 500® Index.
The Portfolio’s correlation with the S&P 500® Index was 99.9%. The high correlation is due to the fact that the Portfolio invests in each of the 500 stocks in the index. The Portfolio also invests in the SPDR S&P 500 ETF Trust, an exchange traded fund that mimics the holdings and returns of the S&P 500® Index.(1)
The largest contributors to the index return for the six-month period were Microsoft Corp., Google, Inc., Johnson & Johnson, Berkshire Hathaway, Inc. and JPMorgan Chase & Co. The largest detractors for the six-month period were Apple, Inc., Oracle Corp., Newmont Mining Corp., Freeport-McMoRan Copper & Gold Co. and Cognizant Technology Solutions Corp.(1)
Stocks had a decent first half of 2013. However, in mid-June, Federal Reserve Chairman Bernanke signaled that the central bank would likely begin tapering bond purchases in the latter part of 2013. With the end of quantitative easing in sight, stocks lost some steam.
Stocks could pick up their momentum if economic data does not meet the Federal Reserve’s expectation and quantitative easing continues. The Federal Reserve’s latest comments are relatively dovish, trying to calm investors by saying the central bank’s asset purchases “are by no means on a preset course”, and the Federal Reserve is responding to the data it receives. Stocks may finish out the year relatively strong, with the Federal Reserve still ready to assist the economy if the recovery is not as strong as its expectation.
| (1) | The Portfolio’s composition is subject to change. Holdings and weightings are as of June 30, 2013. |
“Standard & Poor’s®”, “S&P®”, “S&P 500®” and “Standard & Poor’s 500” are trademarks of The McGraw-Hill Companies, Inc. and have been licensed for use by Ohio National Investments, Inc. (ONI). The S&P 500® Index Portfolio is not sponsored, endorsed, sold or promoted by Standard & Poor’s (“S&P”) and S&P makes no representation regarding the advisability of investing in the S&P 500®
Index Portfolio. S&P makes no representation or warranty, express or implied, to the owners of the Portfolio or any member of the public regarding the advisability of investing in securities generally or in the Portfolio particularly or the ability of the S&P 500® Index to track general stock market performance. S&P’s only relationship to ONI is the licensing of certain trademarks and trade names of S&P® and of the S&P 500® Index which is determined, composed and calculated by S&P® without regard to ONI or the S&P 500® Index Portfolio. S&P® has no obligation to take the needs of ONI or the owners of the Portfolio into consideration in determining, composing or calculating the S&P 500® Index. S&P® is not responsible for and has not participated in the determination of the prices and amount of the Portfolio or the timing of the issuance or sale of the Portfolio or in the determination or calculation of the equation by which the Portfolio is to be converted into cash. S&P® has no obligation or liability in connection with the administration, marketing or trading of the Portfolio.
Change in Value of $10,000 Investment
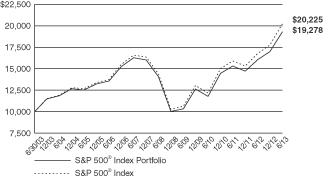
Hypothetical illustration based on past performance. Future performance will vary. The Portfolio’s returns reflect reinvested dividends. The Portfolio’s holdings may differ significantly from the securities in the index. The index is unmanaged and therefore does not reflect the cost of portfolio management and accounting. Investors cannot invest directly in an index, although they can invest in its underlying securities or funds.
The S&P 500® Index is a capitalization-weighted index designed to measure performance of the broad domestic economy through changes in the aggregate market value of 500 stocks representing all major industries. The index presented herein includes the effects of reinvested dividends.
| 49 | (continued) |
| Ohio National Fund, Inc. | S&P 500® Index Portfolio (Continued) |
Portfolio Composition as of June 30, 2013 (1)
| % of Net Assets | ||||
Common Stocks (3) | 94.7 | |||
Exchange Traded Funds and | 5.3 | |||
|
| |||
| 100.0 | ||||
|
| |||
Top 10 Portfolio Holdings as of June 30, 2013 (1) (2)
| % of Net Assets | ||||
1. SPDR S&P 500 ETF Trust | 4.8 | |||
2. Exxon Mobil Corp. | 2.7 | |||
3. Apple, Inc. | 2.5 | |||
4. Microsoft Corp. | 1.7 | |||
5. Johnson & Johnson | 1.6 | |||
6. General Electric Co. | 1.6 | |||
7. Google, Inc. Class A | 1.6 | |||
8. Chevron Corp. | 1.5 | |||
9. Procter & Gamble Co. / The | 1.4 | |||
10. Berkshire Hathaway, Inc. Class B | 1.3 |
| (1) | Composition of Portfolio subject to change. |
| (2) | Short-term investments have been excluded from the list of Top 10 Portfolio Holdings. |
| (3) | Sectors: |
| % of Net Assets | ||||
Information Technology | 16.8 | |||
Financials | 15.8 | |||
Health Care | 12.0 | |||
Consumer Discretionary | 11.6 | |||
Energy | 10.0 | |||
Consumer Staples | 9.9 | |||
Industrials | 9.6 | |||
Utilities | 3.2 | |||
Materials | 3.1 | |||
Telecommunication Services | 2.7 | |||
|
| |||
| 94.7 | ||||
|
|
| 50 |
| Ohio National Fund, Inc. | S&P 500® Index Portfolio |
Schedule of Investments | June 30, 2013 (Unaudited) |
| Common Stocks – 94.7% | Shares | Value | ||||||||
CONSUMER DISCRETIONARY – 11.6% | ||||||||||
BorgWarner, Inc. (Auto Components) | (a) | 1,900 | $ | 163,685 | ||||||
Delphi Automotive PLC (Auto Components) | 4,700 | 238,243 | ||||||||
Goodyear Tire & Rubber Co. / The (Auto Components) | (a) | 3,900 | 59,631 | |||||||
Johnson Controls, Inc. (Auto Components) | 11,000 | 393,690 | ||||||||
Ford Motor Co. (Automobiles) | 62,987 | 974,409 | ||||||||
General Motors Co. (Automobiles) | (a) | 12,300 | 409,713 | |||||||
Harley-Davidson, Inc. (Automobiles) | 3,600 | 197,352 | ||||||||
Genuine Parts Co. (Distributors) | 2,500 | 195,175 | ||||||||
H&R Block, Inc. (Diversified Consumer Svs.) | 4,400 | 122,100 | ||||||||
Carnival Corp. (Hotels, Restaurants & Leisure) | 7,100 | 243,459 | ||||||||
Chipotle Mexican Grill, Inc. (Hotels, Restaurants & Leisure) | (a) | 500 | 182,175 | |||||||
Darden Restaurants, Inc. (Hotels, Restaurants & Leisure) | 2,100 | 106,008 | ||||||||
International Game Technology (Hotels, Restaurants & Leisure) | 4,200 | 70,182 | ||||||||
Marriott International, Inc. Class A (Hotels, Restaurants & Leisure) | 3,846 | 155,263 | ||||||||
McDonald’s Corp. (Hotels, Restaurants & Leisure) | 16,100 | 1,593,900 | ||||||||
Starbucks Corp. (Hotels, Restaurants & Leisure) | 12,000 | 785,880 | ||||||||
Starwood Hotels & Resorts Worldwide, Inc. (Hotels, Restaurants & Leisure) | 3,100 | 195,889 | ||||||||
Wyndham Worldwide Corp. (Hotels, Restaurants & Leisure) | 2,160 | 123,617 | ||||||||
Wynn Resorts Ltd. (Hotels, Restaurants & Leisure) | 1,300 | 166,400 | ||||||||
Yum! Brands, Inc. (Hotels, Restaurants & Leisure) | 7,200 | 499,248 | ||||||||
D.R. Horton, Inc. (Household Durables) | 4,500 | 95,760 | ||||||||
Garmin Ltd. (Household Durables) | 1,800 | 65,088 | ||||||||
Harman International Industries, Inc. (Household Durables) | 1,100 | 59,620 | ||||||||
Leggett & Platt, Inc. (Household Durables) | 2,300 | 71,507 | ||||||||
Lennar Corp. Class A (Household Durables) | 2,700 | 97,308 | ||||||||
Newell Rubbermaid, Inc. (Household Durables) | 4,600 | 120,750 | ||||||||
PulteGroup, Inc. (Household Durables) | (a) | 5,450 | 103,387 | |||||||
Whirlpool Corp. (Household Durables) | 1,255 | 143,522 | ||||||||
Amazon.com, Inc. (Internet & Catalog Retail) | (a) | 5,850 | 1,624,486 | |||||||
Expedia, Inc. (Internet & Catalog Retail) | 1,500 | 90,225 | ||||||||
Netflix, Inc. (Internet & Catalog Retail) | (a) | 850 | 179,426 | |||||||
priceline.com, Inc. (Internet & Catalog Retail) | (a) | 800 | 661,704 | |||||||
TripAdvisor, Inc. (Internet & Catalog Retail) | (a) | 1,800 | 109,566 | |||||||
Hasbro, Inc. (Leisure Equip. & Products) | 1,800 | 80,694 | ||||||||
Mattel, Inc. (Leisure Equip. & Products) | 5,500 | 249,205 | ||||||||
Cablevision Systems Corp. Class A (Media) | 3,500 | 58,870 | ||||||||
CBS Corp. Class B (Media) | 9,150 | 447,160 | ||||||||
Comcast Corp. Class A (Media) | 42,253 | 1,769,556 | ||||||||
DIRECTV (Media) | (a) | 9,000 | 554,580 | |||||||
Discovery Communications, Inc. Class A (Media) | (a) | 3,900 | 301,119 | |||||||
Gannett Co., Inc. (Media) | 3,700 | 90,502 | ||||||||
Interpublic Group of Cos., Inc. / The (Media) | 6,823 | 99,275 | ||||||||
Omnicom Group, Inc. (Media) | 4,100 | 257,767 | ||||||||
Scripps Networks Interactive, Inc. Class A (Media) | 1,400 | 93,464 | ||||||||
Time Warner Cable, Inc. (Media) | 4,632 | 521,007 | ||||||||
Time Warner, Inc. (Media) | 14,966 | 865,334 | ||||||||
Twenty-First Century Fox, Inc. Class A (Media) | (a) | 31,900 | 1,039,940 | |||||||
Viacom, Inc. Class B (Media) | 7,150 | 486,558 | ||||||||
Walt Disney Co. / The (Media) | 28,900 | 1,825,035 | ||||||||
Washington Post Co. / The Class B (Media) | 75 | 36,283 | ||||||||
Dollar General Corp. (Multiline Retail) | (a) | 4,800 | 242,064 | |||||||
Dollar Tree, Inc. (Multiline Retail) | (a) | 3,600 | 183,024 | |||||||
Family Dollar Stores, Inc. (Multiline Retail) | 1,500 | 93,465 | ||||||||
J.C. Penney Co., Inc. (Multiline Retail) | (a) | 2,300 | 39,284 | |||||||
Kohl’s Corp. (Multiline Retail) | 3,300 | 166,683 | ||||||||
Macy’s, Inc. (Multiline Retail) | 6,176 | 296,448 | ||||||||
Nordstrom, Inc. (Multiline Retail) | 2,400 | 143,856 | ||||||||
Target Corp. (Multiline Retail) | 10,300 | 709,258 | ||||||||
Abercrombie & Fitch Co. Class A (Specialty Retail) | 1,300 | 58,825 | ||||||||
AutoNation, Inc. (Specialty Retail) | (a) | 600 | 26,034 | |||||||
AutoZone, Inc. (Specialty Retail) | (a) | 600 | 254,214 | |||||||
| Common Stocks (Continued) | Shares | Value | ||||||||
CONSUMER DISCRETIONARY (continued) | ||||||||||
Bed Bath & Beyond, Inc. (Specialty Retail) | (a) | 3,500 | $ | 248,150 | ||||||
Best Buy Co., Inc. (Specialty Retail) | 4,275 | 116,836 | ||||||||
CarMax, Inc. (Specialty Retail) | (a) | 3,600 | 166,176 | |||||||
GameStop Corp. Class A (Specialty Retail) | 1,900 | 79,857 | ||||||||
Gap, Inc. / The (Specialty Retail) | 4,650 | 194,045 | ||||||||
Home Depot, Inc. / The (Specialty Retail) | 23,400 | 1,812,798 | ||||||||
L Brands, Inc. (Specialty Retail) | 3,800 | 187,150 | ||||||||
Lowe’s Cos., Inc. (Specialty Retail) | 17,200 | 703,480 | ||||||||
O’Reilly Automotive, Inc. (Specialty Retail) | (a) | 1,800 | 202,716 | |||||||
PetSmart, Inc. (Specialty Retail) | 1,700 | 113,883 | ||||||||
Ross Stores, Inc. (Specialty Retail) | 3,500 | 226,835 | ||||||||
Staples, Inc. (Specialty Retail) | 10,600 | 168,116 | ||||||||
Tiffany & Co. (Specialty Retail) | 1,900 | 138,396 | ||||||||
TJX Cos., Inc. (Specialty Retail) | 11,500 | 575,690 | ||||||||
Urban Outfitters, Inc. (Specialty Retail) | (a) | 1,800 | 72,396 | |||||||
Coach, Inc. (Textiles, Apparel & Luxury Goods) | 4,500 | 256,905 | ||||||||
Fossil Group, Inc. (Textiles, Apparel & Luxury Goods) | (a) | 800 | 82,648 | |||||||
NIKE, Inc. Class B (Textiles, Apparel & Luxury Goods) | 11,600 | 738,688 | ||||||||
PVH Corp. (Textiles, Apparel & Luxury Goods) | 1,300 | 162,565 | ||||||||
Ralph Lauren Corp. (Textiles, Apparel & Luxury Goods) | 1,000 | 173,740 | ||||||||
V.F. Corp. (Textiles, Apparel & Luxury Goods) | 1,400 | 270,284 | ||||||||
|
| |||||||||
| 27,979,226 | ||||||||||
|
| |||||||||
CONSUMER STAPLES – 9.9% | ||||||||||
Beam, Inc. (Beverages) | 2,600 | 164,086 | ||||||||
Brown-Forman Corp. Class B (Beverages) | 2,475 | 167,186 | ||||||||
Coca-Cola Co. / The (Beverages) | 61,400 | 2,462,754 | ||||||||
Coca-Cola Enterprises, Inc. (Beverages) | 4,100 | 144,156 | ||||||||
Constellation Brands, Inc. Class A (Beverages) | (a) | 2,500 | 130,300 | |||||||
Dr Pepper Snapple Group, Inc. (Beverages) | 3,300 | 151,569 | ||||||||
Molson Coors Brewing Co. Class B (Beverages) | 2,500 | 119,650 | ||||||||
Monster Beverage Corp. (Beverages) | (a) | 2,300 | 139,771 | |||||||
PepsiCo, Inc. (Beverages) | 24,747 | 2,024,057 | ||||||||
Costco Wholesale Corp. (Food & Staples Retailing) | 7,000 | 773,990 | ||||||||
CVS Caremark Corp. (Food & Staples Retailing) | 19,620 | 1,121,872 | ||||||||
Kroger Co. / The (Food & Staples Retailing) | 8,300 | 286,682 | ||||||||
Safeway, Inc. (Food & Staples Retailing) | 3,900 | 92,274 | ||||||||
Sysco Corp. (Food & Staples Retailing) | 9,500 | 324,520 | ||||||||
Walgreen Co. (Food & Staples Retailing) | 13,800 | 609,960 | ||||||||
Wal-Mart Stores, Inc. (Food & Staples Retailing) | 26,300 | 1,959,087 | ||||||||
Whole Foods Market, Inc. (Food & Staples Retailing) | 5,500 | 283,140 | ||||||||
Archer-Daniels-Midland Co. (Food Products) | 10,550 | 357,750 | ||||||||
Campbell Soup Co. (Food Products) | 2,900 | 129,891 | ||||||||
ConAgra Foods, Inc. (Food Products) | 6,700 | 234,031 | ||||||||
General Mills, Inc. (Food Products) | 10,300 | 499,859 | ||||||||
Hershey Co. / The (Food Products) | 2,400 | 214,272 | ||||||||
Hormel Foods Corp. (Food Products) | 2,200 | 84,876 | ||||||||
J.M. Smucker Co. / The (Food Products) | 1,700 | 175,355 | ||||||||
Kellogg Co. (Food Products) | 4,100 | 263,343 | ||||||||
Kraft Foods Group, Inc. (Food Products) | 9,525 | 532,162 | ||||||||
McCormick & Co., Inc. (Food Products) | 2,100 | 147,756 | ||||||||
Mead Johnson Nutrition Co. (Food Products) | 3,251 | 257,577 | ||||||||
Mondelez International, Inc. Class A (Food Products) | 28,576 | 815,273 | ||||||||
Tyson Foods, Inc. Class A (Food Products) | 4,600 | 118,128 | ||||||||
Clorox Co. / The (Household Products) | 2,100 | 174,594 | ||||||||
Colgate-Palmolive Co. (Household Products) | 14,100 | 807,789 | ||||||||
Kimberly-Clark Corp. (Household Products) | 6,200 | 602,268 | ||||||||
Procter & Gamble Co. / The (Household Products) | 43,922 | 3,381,555 | ||||||||
Avon Products, Inc. (Personal Products) | 6,900 | 145,107 | ||||||||
Estee Lauder Cos., Inc. / The Class A (Personal Products) | 3,900 | 256,503 | ||||||||
Altria Group, Inc. (Tobacco) | 32,200 | 1,126,678 | ||||||||
Lorillard, Inc. (Tobacco) | 6,091 | 266,055 | ||||||||
Philip Morris International, Inc. (Tobacco) | 26,200 | 2,269,444 | ||||||||
Reynolds American, Inc. (Tobacco) | 5,100 | 246,687 | ||||||||
|
| |||||||||
| 24,062,007 | ||||||||||
|
| |||||||||
| 51 | (continued) |
| Ohio National Fund, Inc. | S&P 500® Index Portfolio (Continued) |
Schedule of Investments | June 30, 2013 (Unaudited) |
| Common Stocks (Continued) | Shares | Value | ||||||||
ENERGY – 10.0% | ||||||||||
Baker Hughes, Inc. (Energy Equip. & Svs.) | 7,041 | $ | 324,801 | |||||||
Cameron International Corp. (Energy Equip. & Svs.) | (a) | 4,000 | 244,640 | |||||||
Diamond Offshore Drilling, Inc. (Energy Equip. | 1,100 | 75,669 | ||||||||
Ensco PLC Class A (Energy Equip. & Svs.) | 3,700 | 215,044 | ||||||||
FMC Technologies, Inc. (Energy Equip. & Svs.) | (a) | 3,800 | 211,584 | |||||||
Halliburton Co. (Energy Equip. & Svs.) | 14,900 | 621,628 | ||||||||
Helmerich & Payne, Inc. (Energy Equip. & Svs.) | 1,700 | 106,165 | ||||||||
Nabors Industries Ltd. (Energy Equip. & Svs.) | 4,700 | 71,957 | ||||||||
National Oilwell Varco, Inc. (Energy Equip. & Svs.) | 6,800 | 468,520 | ||||||||
Noble Corp. (Energy Equip. & Svs.) | 4,100 | 154,078 | ||||||||
Rowan Cos. Plc Class A (Energy Equip. & Svs.) | (a) | 2,000 | 68,140 | |||||||
Schlumberger Ltd. (Energy Equip. & Svs.) | 21,347 | 1,529,726 | ||||||||
Anadarko Petroleum Corp. (Oil, Gas & Consumable Fuels) | 8,000 | 687,440 | ||||||||
Apache Corp. (Oil, Gas & Consumable Fuels) | 6,272 | 525,782 | ||||||||
Cabot Oil & Gas Corp. (Oil, Gas & Consumable Fuels) | 3,400 | 241,468 | ||||||||
Chesapeake Energy Corp. (Oil, Gas & Consumable Fuels) | 8,300 | 169,154 | ||||||||
Chevron Corp. (Oil, Gas & Consumable Fuels) | 31,038 | 3,673,037 | ||||||||
ConocoPhillips (Oil, Gas & Consumable Fuels) | 19,600 | 1,185,800 | ||||||||
CONSOL Energy, Inc. (Oil, Gas & Consumable Fuels) | 3,700 | 100,270 | ||||||||
Denbury Resources, Inc. (Oil, Gas & Consumable Fuels) | (a) | 6,000 | 103,920 | |||||||
Devon Energy Corp. (Oil, Gas & Consumable Fuels) | 6,100 | 316,468 | ||||||||
EOG Resources, Inc. (Oil, Gas & Consumable Fuels) | 4,350 | 572,808 | ||||||||
EQT Corp. (Oil, Gas & Consumable Fuels) | 2,400 | 190,488 | ||||||||
Exxon Mobil Corp. (Oil, Gas & Consumable Fuels) | 71,264 | 6,438,702 | ||||||||
Hess Corp. (Oil, Gas & Consumable Fuels) | 4,800 | 319,152 | ||||||||
Kinder Morgan, Inc. (Oil, Gas & Consumable Fuels) | 10,173 | 388,100 | ||||||||
Marathon Oil Corp. (Oil, Gas & Consumable Fuels) | 11,320 | 391,446 | ||||||||
Marathon Petroleum Corp. (Oil, Gas & Consumable Fuels) | 5,160 | 366,670 | ||||||||
Murphy Oil Corp. (Oil, Gas & Consumable Fuels) | 2,900 | 176,581 | ||||||||
Newfield Exploration Co. (Oil, Gas & Consumable Fuels) | (a) | 2,200 | 52,558 | |||||||
Noble Energy, Inc. (Oil, Gas & Consumable Fuels) | 5,800 | 348,232 | ||||||||
Occidental Petroleum Corp. (Oil, Gas & Consumable Fuels) | 12,900 | 1,151,067 | ||||||||
Peabody Energy Corp. (Oil, Gas & Consumable Fuels) | 4,300 | 62,952 | ||||||||
Phillips 66 (Oil, Gas & Consumable Fuels) | 9,950 | 586,154 | ||||||||
Pioneer Natural Resources Co. (Oil, Gas & Consumable Fuels) | 2,200 | 318,450 | ||||||||
QEP Resources, Inc. (Oil, Gas & Consumable Fuels) | 2,900 | 80,562 | ||||||||
Range Resources Corp. (Oil, Gas & Consumable Fuels) | 2,600 | 201,032 | ||||||||
Southwestern Energy Co. (Oil, Gas & Consumable Fuels) | (a) | 5,600 | 204,568 | |||||||
Spectra Energy Corp. (Oil, Gas & Consumable Fuels) | 10,718 | 369,342 | ||||||||
Tesoro Corp. (Oil, Gas & Consumable Fuels) | 2,200 | 115,104 | ||||||||
Valero Energy Corp. (Oil, Gas & Consumable Fuels) | 8,700 | 302,499 | ||||||||
Williams Cos., Inc. / The (Oil, Gas & Consumable Fuels) | 10,900 | 353,923 | ||||||||
WPX Energy, Inc. (Oil, Gas & Consumable Fuels) | (a) | 3,200 | 60,608 | |||||||
|
| |||||||||
| 24,146,289 | ||||||||||
|
| |||||||||
FINANCIALS – 15.8% | ||||||||||
Ameriprise Financial, Inc. (Capital Markets) | 3,280 | 265,286 | ||||||||
Bank of New York Mellon Corp. / The (Capital Markets) | 18,611 | 522,039 | ||||||||
BlackRock, Inc. (Capital Markets) | 2,000 | 513,700 | ||||||||
Charles Schwab Corp. / The (Capital Markets) | 17,600 | 373,648 | ||||||||
E*TRADE Financial Corp. (Capital Markets) | (a) | 4,590 | 58,109 | |||||||
Franklin Resources, Inc. (Capital Markets) | 2,200 | 299,244 | ||||||||
Goldman Sachs Group, Inc. / The (Capital Markets) | 6,950 | 1,051,187 | ||||||||
Invesco Ltd. (Capital Markets) | 7,100 | 225,780 | ||||||||
Legg Mason, Inc. (Capital Markets) | 1,800 | 55,818 | ||||||||
Morgan Stanley (Capital Markets) | 22,000 | 537,460 | ||||||||
| Common Stocks (Continued) | Shares | Value | ||||||||
FINANCIALS (continued) | ||||||||||
Northern Trust Corp. (Capital Markets) | 3,500 | $ | 202,650 | |||||||
State Street Corp. (Capital Markets) | 7,300 | 476,033 | ||||||||
T. Rowe Price Group, Inc. (Capital Markets) | 4,200 | 307,230 | ||||||||
BB&T Corp. (Commercial Banks) | 11,200 | 379,456 | ||||||||
Comerica, Inc. (Commercial Banks) | 3,000 | 119,490 | ||||||||
Fifth Third Bancorp (Commercial Banks) | 14,050 | 253,602 | ||||||||
Huntington Bancshares, Inc. (Commercial Banks) | 13,400 | 105,592 | ||||||||
KeyCorp (Commercial Banks) | 14,800 | 163,392 | ||||||||
M&T Bank Corp. (Commercial Banks) | 2,000 | 223,500 | ||||||||
PNC Financial Services Group, Inc. / The (Commercial Banks) | 8,442 | 615,591 | ||||||||
Regions Financial Corp. (Commercial Banks) | 22,675 | 216,093 | ||||||||
SunTrust Banks, Inc. (Commercial Banks) | 8,600 | 271,502 | ||||||||
U.S. Bancorp (Commercial Banks) | 29,690 | 1,073,293 | ||||||||
Wells Fargo & Co. (Commercial Banks) | 78,913 | 3,256,740 | ||||||||
Zions Bancorporation (Commercial Banks) | 3,000 | 86,640 | ||||||||
American Express Co. (Consumer Finance) | 15,300 | 1,143,828 | ||||||||
Capital One Financial Corp. (Consumer Finance) | 9,373 | 588,718 | ||||||||
Discover Financial Services (Consumer Finance) | 7,850 | 373,974 | ||||||||
SLM Corp. (Consumer Finance) | 7,100 | 162,306 | ||||||||
Bank of America Corp. (Diversified Financial Svs.) | 172,827 | 2,222,555 | ||||||||
Citigroup, Inc. (Diversified Financial Svs.) | 48,736 | 2,337,866 | ||||||||
CME Group, Inc. (Diversified Financial Svs.) | 4,875 | 370,403 | ||||||||
IntercontinentalExchange, Inc. (Diversified Financial Svs.) | (a) | 1,200 | 213,312 | |||||||
JPMorgan Chase & Co. (Diversified Financial Svs.) | 60,543 | 3,196,065 | ||||||||
Leucadia National Corp. (Diversified Financial Svs.) | 4,700 | 123,234 | ||||||||
McGraw Hill Financial, Inc. (Diversified Financial Svs.) | 4,400 | 234,036 | ||||||||
Moody’s Corp. (Diversified Financial Svs.) | 3,100 | 188,883 | ||||||||
NASDAQ OMX Group, Inc. / The (Diversified Financial Svs.) | 1,900 | 62,301 | ||||||||
NYSE Euronext (Diversified Financial Svs.) | 3,900 | 161,460 | ||||||||
ACE Ltd. (Insurance) | 5,500 | 492,140 | ||||||||
Aflac, Inc. (Insurance) | 7,500 | 435,900 | ||||||||
Allstate Corp. / The (Insurance) | 7,500 | 360,900 | ||||||||
American International Group, Inc. (Insurance) | (a) | 23,695 | 1,059,167 | |||||||
Aon PLC (Insurance) | 5,000 | 321,750 | ||||||||
Assurant, Inc. (Insurance) | 1,200 | 61,092 | ||||||||
Berkshire Hathaway, Inc. Class B (Insurance) | (a) | 29,191 | 3,267,057 | |||||||
Chubb Corp. / The (Insurance) | 4,200 | 355,530 | ||||||||
Cincinnati Financial Corp. (Insurance) | 2,366 | 108,599 | ||||||||
Genworth Financial, Inc. Class A (Insurance) | (a) | 7,900 | 90,139 | |||||||
Hartford Financial Services Group, Inc. (Insurance) | 7,300 | 225,716 | ||||||||
Lincoln National Corp. (Insurance) | 4,286 | 156,310 | ||||||||
Loews Corp. (Insurance) | 4,961 | 220,268 | ||||||||
Marsh & McLennan Cos., Inc. (Insurance) | 8,800 | 351,296 | ||||||||
MetLife, Inc. (Insurance) | 17,600 | 805,376 | ||||||||
Principal Financial Group, Inc. (Insurance) | 4,400 | 164,780 | ||||||||
Progressive Corp. / The (Insurance) | 8,900 | 226,238 | ||||||||
Prudential Financial, Inc. (Insurance) | 7,500 | 547,725 | ||||||||
Torchmark Corp. (Insurance) | 1,450 | 94,453 | ||||||||
Travelers Cos., Inc. / The (Insurance) | 6,059 | 484,235 | ||||||||
Unum Group (Insurance) | 4,300 | 126,291 | ||||||||
XL Group PLC (Insurance) | 4,600 | 139,472 | ||||||||
American Tower Corp. (Real Estate Investment Trusts) | 6,300 | 460,971 | ||||||||
Apartment Investment & Management Co. Class A (Real Estate Investment Trusts) | 2,373 | 71,285 | ||||||||
AvalonBay Communities, Inc. (Real Estate Investment Trusts) | 1,931 | 260,511 | ||||||||
Boston Properties, Inc. (Real Estate Investment Trusts) | 2,400 | 253,128 | ||||||||
Equity Residential (Real Estate Investment Trusts) | 5,100 | 296,106 | ||||||||
HCP, Inc. (Real Estate Investment Trusts) | 7,300 | 331,712 | ||||||||
Health Care REIT, Inc. (Real Estate Investment Trusts) | 4,600 | 308,338 | ||||||||
Host Hotels & Resorts, Inc. (Real Estate Investment Trusts) | 11,902 | 200,787 | ||||||||
Kimco Realty Corp. (Real Estate Investment Trusts) | 6,600 | 141,438 | ||||||||
| 52 | (continued) |
| Ohio National Fund, Inc. | S&P 500® Index Portfolio (Continued) |
Schedule of Investments | June 30, 2013 (Unaudited) |
| Common Stocks (Continued) | Shares | Value | ||||||||
FINANCIALS (continued) | ||||||||||
Macerich Co. / The (Real Estate Investment Trusts) | 2,200 | $ | 134,134 | |||||||
Plum Creek Timber Co., Inc. (Real Estate Investment Trusts) | 2,600 | 121,342 | ||||||||
Prologis, Inc. (Real Estate Investment Trusts) | 7,939 | 299,459 | ||||||||
Public Storage (Real Estate Investment Trusts) | 2,300 | 352,659 | ||||||||
Simon Property Group, Inc. (Real Estate Investment Trusts) | 4,962 | 783,599 | ||||||||
Ventas, Inc. (Real Estate Investment Trusts) | 4,700 | 326,462 | ||||||||
Vornado Realty Trust (Real Estate Investment Trusts) | 2,693 | 223,115 | ||||||||
Weyerhaeuser Co. (Real Estate Investment Trusts) | 8,763 | 249,658 | ||||||||
CBRE Group, Inc. (Real Estate Mgmt. & Development) | (a) | 4,900 | 114,464 | |||||||
Hudson City Bancorp, Inc. (Thrifts & Mortgage Finance) | 7,600 | 69,616 | ||||||||
People’s United Financial, Inc. (Thrifts & Mortgage Finance) | 5,400 | 80,460 | ||||||||
|
| |||||||||
| 38,205,694 | ||||||||||
|
| |||||||||
HEALTH CARE – 12.0% | ||||||||||
Alexion Pharmaceuticals, Inc. (Biotechnology) | (a) | 3,100 | 285,944 | |||||||
Amgen, Inc. (Biotechnology) | 12,006 | 1,184,512 | ||||||||
Biogen Idec, Inc. (Biotechnology) | (a) | 3,845 | 827,444 | |||||||
Celgene Corp. (Biotechnology) | (a) | 6,700 | 783,297 | |||||||
Gilead Sciences, Inc. (Biotechnology) | (a) | 24,400 | 1,249,524 | |||||||
Regeneron Pharmaceuticals, Inc. (Biotechnology) | (a) | 1,200 | 269,856 | |||||||
Abbott Laboratories (Health Care Equip. & Supplies) | 25,000 | 872,000 | ||||||||
Baxter International, Inc. (Health Care Equip. & Supplies) | 8,700 | 602,649 | ||||||||
Becton Dickinson and Co. (Health Care Equip. & Supplies) | 3,100 | 306,373 | ||||||||
Boston Scientific Corp. (Health Care Equip. & Supplies) | (a) | 21,603 | 200,260 | |||||||
CareFusion Corp. (Health Care Equip. & Supplies) | (a) | 3,550 | 130,818 | |||||||
Covidien PLC (Health Care Equip. & Supplies) | 7,500 | 471,300 | ||||||||
C.R. Bard, Inc. (Health Care Equip. & Supplies) | 1,200 | 130,416 | ||||||||
DENTSPLY International, Inc. (Health Care Equip. & Supplies) | 2,300 | 94,208 | ||||||||
Edwards Lifesciences Corp. (Health Care Equip. & Supplies) | (a) | 1,800 | 120,960 | |||||||
Intuitive Surgical, Inc. (Health Care Equip. & Supplies) | (a) | 625 | 316,612 | |||||||
Medtronic, Inc. (Health Care Equip. & Supplies) | 16,200 | 833,814 | ||||||||
St. Jude Medical, Inc. (Health Care Equip. & Supplies) | 4,500 | 205,335 | ||||||||
Stryker Corp. (Health Care Equip. & Supplies) | 4,600 | 297,528 | ||||||||
Varian Medical Systems, Inc. (Health Care Equip. & Supplies) | (a) | 1,700 | 114,665 | |||||||
Zimmer Holdings, Inc. (Health Care Equip. & Supplies) | 2,670 | 200,090 | ||||||||
Aetna, Inc. (Health Care Providers & Svs.) | 6,054 | 384,671 | ||||||||
AmerisourceBergen Corp. (Health Care Providers & Svs.) | 3,700 | 206,571 | ||||||||
Cardinal Health, Inc. (Health Care Providers & Svs.) | 5,500 | 259,600 | ||||||||
Cigna Corp. (Health Care Providers & Svs.) | 4,600 | 333,454 | ||||||||
DaVita HealthCare Partners, Inc. (Health Care Providers & Svs.) | (a) | 1,400 | 169,120 | |||||||
Express Scripts Holding Co. (Health Care Providers & Svs.) | (a) | 13,078 | 806,782 | |||||||
Humana, Inc. (Health Care Providers & Svs.) | 2,500 | 210,950 | ||||||||
Laboratory Corp. of America Holdings (Health Care Providers & Svs.) | (a) | 1,500 | 150,150 | |||||||
McKesson Corp. (Health Care Providers & Svs.) | 3,600 | 412,200 | ||||||||
Patterson Cos., Inc. (Health Care Providers & Svs.) | 1,300 | 48,880 | ||||||||
Quest Diagnostics, Inc. (Health Care Providers & Svs.) | 2,500 | 151,575 | ||||||||
Tenet Healthcare Corp. (Health Care Providers & Svs.) | (a) | 1,612 | 74,313 | |||||||
UnitedHealth Group, Inc. (Health Care Providers & Svs.) | 16,300 | 1,067,324 | ||||||||
| Common Stocks (Continued) | Shares | Value | ||||||||
HEALTH CARE (continued) | ||||||||||
WellPoint, Inc. (Health Care Providers & Svs.) | 4,800 | $ | 392,832 | |||||||
Cerner Corp. (Health Care Technology) | (a) | 2,300 | 221,007 | |||||||
Agilent Technologies, Inc. (Life Sciences Tools & Svs.) | 5,500 | 235,180 | ||||||||
Life Technologies Corp. (Life Sciences Tools & Svs.) | (a) | 2,717 | 201,085 | |||||||
PerkinElmer, Inc. (Life Sciences Tools & Svs.) | 1,800 | 58,500 | ||||||||
Thermo Fisher Scientific, Inc. (Life Sciences Tools & Svs.) | 5,800 | 490,854 | ||||||||
Waters Corp. (Life Sciences Tools & Svs.) | (a) | 1,400 | 140,070 | |||||||
AbbVie, Inc. (Pharmaceuticals) | 25,400 | 1,050,036 | ||||||||
Actavis, Inc. (Pharmaceuticals) | (a) | 2,000 | 252,440 | |||||||
Allergan, Inc. (Pharmaceuticals) | 4,800 | 404,352 | ||||||||
Bristol-Myers Squibb Co. (Pharmaceuticals) | 26,369 | 1,178,431 | ||||||||
Eli Lilly & Co. (Pharmaceuticals) | 15,900 | 781,008 | ||||||||
Forest Laboratories, Inc. (Pharmaceuticals) | (a) | 3,800 | 155,800 | |||||||
Hospira, Inc. (Pharmaceuticals) | (a) | 2,610 | 99,989 | |||||||
Johnson & Johnson (Pharmaceuticals) | 45,000 | 3,863,700 | ||||||||
Merck & Co., Inc. (Pharmaceuticals) | 48,394 | 2,247,901 | ||||||||
Mylan, Inc. (Pharmaceuticals) | (a) | 6,100 | 189,283 | |||||||
Perrigo Co. (Pharmaceuticals) | 1,400 | 169,400 | ||||||||
Pfizer, Inc. (Pharmaceuticals) | 107,010 | 2,997,350 | ||||||||
Zoetis, Inc. (Pharmaceuticals) | 8,000 | 247,120 | ||||||||
|
| |||||||||
| 29,149,533 | ||||||||||
|
| |||||||||
INDUSTRIALS – 9.6% | ||||||||||
Boeing Co. / The (Aerospace & Defense) | 10,900 | 1,116,596 | ||||||||
General Dynamics Corp. (Aerospace & Defense) | 5,300 | 415,149 | ||||||||
Honeywell International, Inc. (Aerospace & Defense) | 12,600 | 999,684 | ||||||||
L-3 Communications Holdings, Inc. (Aerospace & Defense) | 1,400 | 120,036 | ||||||||
Lockheed Martin Corp. (Aerospace & Defense) | 4,300 | 466,378 | ||||||||
Northrop Grumman Corp. (Aerospace & Defense) | 3,800 | 314,640 | ||||||||
Precision Castparts Corp. (Aerospace & Defense) | 2,300 | 519,823 | ||||||||
Raytheon Co. (Aerospace & Defense) | 5,200 | 343,824 | ||||||||
Rockwell Collins, Inc. (Aerospace & Defense) | 2,200 | 139,502 | ||||||||
Textron, Inc. (Aerospace & Defense) | 4,500 | 117,225 | ||||||||
United Technologies Corp. (Aerospace & Defense) | 13,600 | 1,263,984 | ||||||||
C.H. Robinson Worldwide, Inc. (Air Freight & Logistics) | 2,600 | 146,406 | ||||||||
Expeditors International of Washington, Inc. (Air Freight & Logistics) | 3,300 | 125,433 | ||||||||
FedEx Corp. (Air Freight & Logistics) | 4,700 | 463,326 | ||||||||
United Parcel Service, Inc. Class B (Air Freight & Logistics) | 11,400 | 985,872 | ||||||||
Southwest Airlines Co. (Airlines) | 11,600 | 149,524 | ||||||||
Masco Corp. (Building Products) | 5,700 | 111,093 | ||||||||
ADT Corp. / The (Commercial Svs. & Supplies) | 3,550 | 141,468 | ||||||||
Avery Dennison Corp. (Commercial Svs. & Supplies) | 1,600 | 68,416 | ||||||||
Cintas Corp. (Commercial Svs. & Supplies) | 1,700 | 77,418 | ||||||||
Iron Mountain, Inc. (Commercial Svs. & Supplies) | 2,684 | 71,421 | ||||||||
Pitney Bowes, Inc. (Commercial Svs. & Supplies) | 3,200 | 46,976 | ||||||||
Republic Services, Inc. (Commercial Svs. & Supplies) | 4,780 | 162,233 | ||||||||
Stericycle, Inc. (Commercial Svs. & Supplies) | (a) | 1,400 | 154,602 | |||||||
Tyco International Ltd. (Commercial Svs. & Supplies) | 7,400 | 243,830 | ||||||||
Waste Management, Inc. (Commercial Svs. & Supplies) | 7,000 | 282,310 | ||||||||
Fluor Corp. (Construction & Engineering) | 2,600 | 154,206 | ||||||||
Jacobs Engineering Group, Inc. (Construction & Engineering) | (a) | 2,100 | 115,773 | |||||||
Quanta Services, Inc. (Construction & Engineering) | (a) | 3,400 | 89,964 | |||||||
Eaton Corp. PLC (Electrical Equip.) | 7,536 | 495,944 | ||||||||
Emerson Electric Co. (Electrical Equip.) | 11,500 | 627,210 | ||||||||
Rockwell Automation, Inc. (Electrical Equip.) | 2,200 | 182,908 | ||||||||
Roper Industries, Inc. (Electrical Equip.) | 1,600 | 198,752 | ||||||||
3M Co. (Industrial Conglomerates) | 10,200 | 1,115,370 | ||||||||
Danaher Corp. (Industrial Conglomerates) | 9,300 | 588,690 | ||||||||
General Electric Co. (Industrial Conglomerates) | 165,700 | 3,842,583 | ||||||||
Caterpillar, Inc. (Machinery) | 10,500 | 866,145 | ||||||||
Cummins, Inc. (Machinery) | 2,800 | 303,688 | ||||||||
| 53 | (continued) |
| Ohio National Fund, Inc. | S&P 500® Index Portfolio (Continued) |
Schedule of Investments | June 30, 2013 (Unaudited) |
| Common Stocks (Continued) | Shares | Value | ||||||||
INDUSTRIALS (continued) | ||||||||||
Deere & Co. (Machinery) | 6,200 | $ | 503,750 | |||||||
Dover Corp. (Machinery) | 2,700 | 209,682 | ||||||||
Flowserve Corp. (Machinery) | 2,400 | 129,624 | ||||||||
Illinois Tool Works, Inc. (Machinery) | 6,600 | 456,522 | ||||||||
Ingersoll-Rand PLC (Machinery) | 4,500 | 249,840 | ||||||||
Joy Global, Inc. (Machinery) | 1,700 | 82,501 | ||||||||
PACCAR, Inc. (Machinery) | 5,712 | 306,506 | ||||||||
Pall Corp. (Machinery) | 1,800 | 119,574 | ||||||||
Parker Hannifin Corp. (Machinery) | 2,400 | 228,960 | ||||||||
Pentair Ltd. (Machinery) | 3,303 | 190,550 | ||||||||
Snap-On, Inc. (Machinery) | 900 | 80,442 | ||||||||
Stanley Black & Decker, Inc. (Machinery) | 2,547 | 196,883 | ||||||||
Xylem, Inc. (Machinery) | 3,000 | 80,820 | ||||||||
Dun & Bradstreet Corp. / The (Professional Svs.) | 600 | 58,470 | ||||||||
Equifax, Inc. (Professional Svs.) | 1,900 | 111,967 | ||||||||
Robert Half International, Inc. (Professional Svs.) | 2,200 | 73,106 | ||||||||
CSX Corp. (Road & Rail) | 16,400 | 380,316 | ||||||||
Kansas City Southern (Road & Rail) | 1,800 | 190,728 | ||||||||
Norfolk Southern Corp. (Road & Rail) | 5,100 | 370,515 | ||||||||
Ryder System, Inc. (Road & Rail) | 800 | 48,632 | ||||||||
Union Pacific Corp. (Road & Rail) | 7,500 | 1,157,100 | ||||||||
Fastenal Co. (Trading Companies & Distributors) | 4,300 | 197,155 | ||||||||
W.W. Grainger, Inc. (Trading Companies & Distributors) | 1,000 | 252,180 | ||||||||
|
| |||||||||
| 23,304,225 | ||||||||||
|
| |||||||||
INFORMATION TECHNOLOGY – 16.8% | ||||||||||
Cisco Systems, Inc. (Communications Equip.) | 85,700 | 2,083,367 | ||||||||
F5 Networks, Inc. (Communications Equip.) | (a) | 1,300 | 89,440 | |||||||
Harris Corp. (Communications Equip.) | 1,800 | 88,650 | ||||||||
JDS Uniphase Corp. (Communications Equip.) | (a) | 3,775 | 54,285 | |||||||
Juniper Networks, Inc. (Communications Equip.) | (a) | 8,100 | 156,411 | |||||||
Motorola Solutions, Inc. (Communications Equip.) | 4,314 | 249,047 | ||||||||
QUALCOMM, Inc. (Communications Equip.) | 27,700 | 1,691,916 | ||||||||
Apple, Inc. (Computers & Peripherals) | 15,025 | 5,951,102 | ||||||||
Dell, Inc. (Computers & Peripherals) | 23,500 | 313,725 | ||||||||
EMC Corp. (Computers & Peripherals) | 33,700 | 795,994 | ||||||||
Hewlett-Packard Co. (Computers & Peripherals) | 30,900 | 766,320 | ||||||||
NetApp, Inc. (Computers & Peripherals) | (a) | 5,800 | 219,124 | |||||||
SanDisk Corp. (Computers & Peripherals) | (a) | 3,900 | 238,290 | |||||||
Seagate Technology PLC (Computers & Peripherals) | 5,100 | 228,633 | ||||||||
Western Digital Corp. (Computers & Peripherals) | 3,400 | 211,106 | ||||||||
Amphenol Corp. Class A (Electronic Equip., Instr. & Comp.) | 2,600 | 202,644 | ||||||||
Corning, Inc. (Electronic Equip., Instr. & Comp.) | 23,600 | 335,828 | ||||||||
FLIR Systems, Inc. (Electronic Equip., Instr. & Comp.) | 2,300 | 62,031 | ||||||||
Jabil Circuit, Inc. (Electronic Equip., Instr. & Comp.) | 3,000 | 61,140 | ||||||||
Molex, Inc. (Electronic Equip., Instr. & Comp.) | 2,200 | 64,548 | ||||||||
TE Connectivity Ltd. (Electronic Equip., Instr. & Comp.) | 6,700 | 305,118 | ||||||||
Akamai Technologies, Inc. (Internet Software & Svs.) | (a) | 2,800 | 119,140 | |||||||
eBay, Inc. (Internet Software & Svs.) | (a) | 18,700 | 967,164 | |||||||
Google, Inc. Class A (Internet Software & Svs.) | (a) | 4,275 | 3,763,582 | |||||||
VeriSign, Inc. (Internet Software & Svs.) | (a) | 2,400 | 107,184 | |||||||
Yahoo!, Inc. (Internet Software & Svs.) | (a) | 15,300 | 384,183 | |||||||
Accenture PLC Class A (IT Svs.) | 10,400 | 748,384 | ||||||||
Automatic Data Processing, Inc. (IT Svs.) | 7,800 | 537,108 | ||||||||
Cognizant Technology Solutions Corp. Class A (IT Svs.) | (a) | 4,800 | 300,528 | |||||||
Computer Sciences Corp. (IT Svs.) | 2,400 | 105,048 | ||||||||
Fidelity National Information Services, Inc. (IT Svs.) | 4,700 | 201,348 | ||||||||
Fiserv, Inc. (IT Svs.) | (a) | 2,100 | 183,561 | |||||||
International Business Machines Corp. (IT Svs.) | 16,750 | 3,201,092 | ||||||||
Mastercard, Inc. Class A (IT Svs.) | 1,675 | 962,287 | ||||||||
Paychex, Inc. (IT Svs.) | 5,200 | 189,904 | ||||||||
SAIC, Inc. (IT Svs.) | 4,600 | 64,078 | ||||||||
Teradata Corp. (IT Svs.) | (a) | 2,600 | 130,598 | |||||||
Total System Services, Inc. (IT Svs.) | 2,577 | 63,085 | ||||||||
Visa, Inc. (IT Svs.) | 8,100 | 1,480,275 | ||||||||
Western Union Co. / The (IT Svs.) | 8,947 | 153,083 | ||||||||
| Common Stocks (Continued) | Shares | Value | ||||||||
INFORMATION TECHNOLOGY (continued) | ||||||||||
Xerox Corp. (Office Electronics) | 19,702 | $ | 178,697 | |||||||
Advanced Micro Devices, Inc. (Semiconductors & Equip.) | (a) | 9,700 | 39,576 | |||||||
Altera Corp. (Semiconductors & Equip.) | 5,100 | 168,249 | ||||||||
Analog Devices, Inc. (Semiconductors & Equip.) | 4,900 | 220,794 | ||||||||
Applied Materials, Inc. (Semiconductors & Equip.) | 19,300 | 287,763 | ||||||||
Broadcom Corp. Class A (Semiconductors & Equip.) | 8,450 | 285,272 | ||||||||
First Solar, Inc. (Semiconductors & Equip.) | (a) | 1,050 | 46,967 | |||||||
Intel Corp. (Semiconductors & Equip.) | 79,700 | 1,930,334 | ||||||||
KLA-Tencor Corp. (Semiconductors & Equip.) | 2,700 | 150,471 | ||||||||
Lam Research Corp. (Semiconductors & Equip.) | (a) | 2,625 | 116,393 | |||||||
Linear Technology Corp. (Semiconductors & Equip.) | 3,700 | 136,308 | ||||||||
LSI Corp. (Semiconductors & Equip.) | (a) | 8,800 | 62,832 | |||||||
Microchip Technology, Inc. (Semiconductors & Equip.) | 3,200 | 119,200 | ||||||||
Micron Technology, Inc. (Semiconductors & Equip.) | (a) | 16,500 | 236,445 | |||||||
NVIDIA Corp. (Semiconductors & Equip.) | 9,300 | 130,479 | ||||||||
Teradyne, Inc. (Semiconductors & Equip.) | (a) | 3,100 | 54,467 | |||||||
Texas Instruments, Inc. (Semiconductors & Equip.) | 17,800 | 620,686 | ||||||||
Xilinx, Inc. (Semiconductors & Equip.) | 4,200 | 166,362 | ||||||||
Adobe Systems, Inc. (Software) | (a) | 8,000 | 364,480 | |||||||
Autodesk, Inc. (Software) | (a) | 3,600 | 122,184 | |||||||
BMC Software, Inc. (Software) | (a) | 2,100 | 94,794 | |||||||
CA, Inc. (Software) | 5,300 | 151,739 | ||||||||
Citrix Systems, Inc. (Software) | (a) | 3,000 | 180,990 | |||||||
Electronic Arts, Inc. (Software) | (a) | 4,900 | 112,553 | |||||||
Intuit, Inc. (Software) | 4,500 | 274,635 | ||||||||
Microsoft Corp. (Software) | 120,500 | 4,160,865 | ||||||||
Oracle Corp. (Software) | 58,900 | 1,809,408 | ||||||||
Red Hat, Inc. (Software) | (a) | 3,000 | 143,460 | |||||||
Salesforce.com, Inc. (Software) | (a) | 8,700 | 332,166 | |||||||
Symantec Corp. (Software) | 11,194 | 251,529 | ||||||||
|
| |||||||||
| 40,780,449 | ||||||||||
|
| |||||||||
MATERIALS – 3.1% | ||||||||||
Air Products & Chemicals, Inc. (Chemicals) | 3,300 | 302,181 | ||||||||
Airgas, Inc. (Chemicals) | 1,100 | 105,006 | ||||||||
CF Industries Holdings, Inc. (Chemicals) | 1,000 | 171,500 | ||||||||
Dow Chemical Co. / The (Chemicals) | 19,400 | 624,098 | ||||||||
Eastman Chemical Co. (Chemicals) | 2,500 | 175,025 | ||||||||
Ecolab, Inc. (Chemicals) | 4,300 | 366,317 | ||||||||
E.I. du Pont de Nemours & Co. (Chemicals) | 14,800 | 777,000 | ||||||||
FMC Corp. (Chemicals) | 2,200 | 134,332 | ||||||||
International Flavors & Fragrances, Inc. (Chemicals) | 1,300 | 97,708 | ||||||||
LyondellBasell Industries NV Class A (Chemicals) | 6,100 | 404,186 | ||||||||
Monsanto Co. (Chemicals) | 8,586 | 848,297 | ||||||||
Mosaic Co. / The (Chemicals) | 4,400 | 236,764 | ||||||||
PPG Industries, Inc. (Chemicals) | 2,300 | 336,743 | ||||||||
Praxair, Inc. (Chemicals) | 4,700 | 541,252 | ||||||||
Sherwin-Williams Co. / The (Chemicals) | 1,400 | 247,240 | ||||||||
Sigma-Aldrich Corp. (Chemicals) | 1,900 | 152,684 | ||||||||
Vulcan Materials Co. (Construction Materials) | 2,100 | 101,661 | ||||||||
Ball Corp. (Containers & Packaging) | 2,400 | 99,696 | ||||||||
Bemis Co., Inc. (Containers & Packaging) | 1,600 | 62,624 | ||||||||
MeadWestvaco Corp. (Containers & Packaging) | 2,800 | 95,508 | ||||||||
Owens-Illinois, Inc. (Containers & Packaging) | (a) | 2,600 | 72,254 | |||||||
Sealed Air Corp. (Containers & Packaging) | 3,100 | 74,245 | ||||||||
Alcoa, Inc. (Metals & Mining) | 17,100 | 133,722 | ||||||||
Allegheny Technologies, Inc. (Metals & Mining) | 1,700 | 44,727 | ||||||||
Cliffs Natural Resources, Inc. (Metals & Mining) | 2,500 | 40,625 | ||||||||
Freeport-McMoRan Copper & Gold, Inc. (Metals & Mining) | 16,652 | 459,762 | ||||||||
Newmont Mining Corp. (Metals & Mining) | 8,000 | 239,600 | ||||||||
Nucor Corp. (Metals & Mining) | 5,100 | 220,932 | ||||||||
United States Steel Corp. (Metals & Mining) | 2,300 | 40,319 | ||||||||
International Paper Co. (Paper & Forest Products) | 7,100 | 314,601 | ||||||||
|
| |||||||||
| 7,520,609 | ||||||||||
|
| |||||||||
TELECOMMUNICATION SERVICES – 2.7% | ||||||||||
AT&T, Inc. (Diversified Telecom. Svs.) | 86,278 | 3,054,241 | ||||||||
CenturyLink, Inc. (Diversified Telecom. Svs.) | 9,772 | 345,440 | ||||||||
| 54 | (continued) |
| Ohio National Fund, Inc. | S&P 500® Index Portfolio (Continued) |
Schedule of Investments | June 30, 2013 (Unaudited) |
| Common Stocks (Continued) | Shares | Value | ||||||||
TELECOMMUNICATION SERVICES (continued) | ||||||||||
Frontier Communications Corp. (Diversified Telecom. Svs.) | 16,041 | $ | 64,966 | |||||||
Verizon Communications, Inc. (Diversified Telecom. Svs.) | 45,900 | 2,310,606 | ||||||||
Windstream Corp. (Diversified Telecom. Svs.) | 9,496 | 73,214 | ||||||||
Crown Castle International Corp. (Wireless Telecom. Svs.) | (a) | 4,700 | 340,233 | |||||||
Sprint Nextel Corp. (Wireless Telecom. Svs.) | (a) | 48,332 | 339,291 | |||||||
|
| |||||||||
| 6,527,991 | ||||||||||
|
| |||||||||
UTILITIES – 3.2% | ||||||||||
American Electric Power Co., Inc. (Electric Utilities) | 7,800 | 349,284 | ||||||||
Duke Energy Corp. (Electric Utilities) | 11,343 | 765,652 | ||||||||
Edison International (Electric Utilities) | 5,200 | 250,432 | ||||||||
Entergy Corp. (Electric Utilities) | 2,900 | 202,072 | ||||||||
Exelon Corp. (Electric Utilities) | 13,690 | 422,747 | ||||||||
FirstEnergy Corp. (Electric Utilities) | 6,734 | 251,448 | ||||||||
NextEra Energy, Inc. (Electric Utilities) | 6,800 | 554,064 | ||||||||
Northeast Utilities (Electric Utilities) | 5,000 | 210,100 | ||||||||
Pepco Holdings, Inc. (Electric Utilities) | 4,000 | 80,640 | ||||||||
Pinnacle West Capital Corp. (Electric Utilities) | 1,800 | 99,846 | ||||||||
PPL Corp. (Electric Utilities) | 9,500 | 287,470 | ||||||||
Southern Co. / The (Electric Utilities) | 14,000 | 617,820 | ||||||||
Xcel Energy, Inc. (Electric Utilities) | 8,000 | 226,720 | ||||||||
AGL Resources, Inc. (Gas Utilities) | 1,886 | 80,834 | ||||||||
ONEOK, Inc. (Gas Utilities) | 3,300 | 136,323 | ||||||||
AES Corp. (Ind. Power Prod. & Energy Traders) | 9,900 | 118,701 | ||||||||
| Common Stocks (Continued) | Shares | Value | ||||||||
UTILITIES (continued) | ||||||||||
NRG Energy, Inc. (Ind. Power Prod. & Energy Traders) | 5,200 | $ | 138,840 | |||||||
Ameren Corp. (Multi-Utilities) | 3,900 | 134,316 | ||||||||
CenterPoint Energy, Inc. (Multi-Utilities) | 6,900 | 162,081 | ||||||||
CMS Energy Corp. (Multi-Utilities) | 4,300 | 116,831 | ||||||||
Consolidated Edison, Inc. (Multi-Utilities) | 4,700 | 274,057 | ||||||||
Dominion Resources, Inc. (Multi-Utilities) | 9,300 | 528,426 | ||||||||
DTE Energy Co. (Multi-Utilities) | 2,800 | 187,628 | ||||||||
Integrys Energy Group, Inc. (Multi-Utilities) | 1,312 | 76,791 | ||||||||
NiSource, Inc. (Multi-Utilities) | 5,000 | 143,200 | ||||||||
PG&E Corp. (Multi-Utilities) | 7,100 | 324,683 | ||||||||
Public Service Enterprise Group, Inc. (Multi-Utilities) | 8,100 | 264,546 | ||||||||
SCANA Corp. (Multi-Utilities) | 2,200 | 108,020 | ||||||||
Sempra Energy (Multi-Utilities) | 3,600 | 294,336 | ||||||||
TECO Energy, Inc. (Multi-Utilities) | 3,300 | 56,727 | ||||||||
Wisconsin Energy Corp. (Multi-Utilities) | 3,700 | 151,663 | ||||||||
|
| |||||||||
| 7,616,298 | ||||||||||
|
| |||||||||
Total Common Stocks (Cost $158,388,395) | $ | 229,292,321 | ||||||||
|
| |||||||||
| Exchange Traded Funds – 4.8% | Shares | Value | ||||||||
SPDR S&P 500 ETF Trust | 72,675 | $ | 11,628,727 | |||||||
|
| |||||||||
Total Exchange Traded Funds (Cost $11,115,315) | $ | 11,628,727 | ||||||||
|
| |||||||||
Total Investments – 99.5% (Cost $169,503,710) | (b) | $ | 240,921,048 | |||||||
Other Assets in Excess of Liabilities – 0.5% | 1,271,361 | |||||||||
|
| |||||||||
Net Assets – 100.0% | $ | 242,192,409 | ||||||||
|
| |||||||||
Percentages are stated as a percent of net assets.
Footnotes:
| (a) | Non-income producing security. |
| (b) | Represents cost for financial reporting purposes, which may differ from cost basis for federal income tax purposes. See also Note 7 of the Notes to Financial Statements. |
The accompanying notes are an integral part of these financial statements.
| 55 |
| Ohio National Fund, Inc. | Strategic Value Portfolio |
Objective/Strategy
The Strategic Value Portfolio seeks growth of capital and income by investing primarily in securities of high dividend yielding, undervalued stocks with dividend growth potential.
Performance as of June 30, 2013
Average Annual Returns; | ||||
One year | 12.79% | |||
Five years | 7.77% | |||
Ten years | 5.50% |
Past performance does not guarantee future results. The performance data quoted represents past performance and current returns may be lower or higher. Total return figures include change in share price and reinvestment of dividends and capital gains. The investment return and principal value will fluctuate so that an investor’s shares, when redeemed, may be worth more or less than the original cost. To obtain performance information up to the most recent month end, call toll-free 1-877-781-6392.
The Portfolio is not open to direct retail investment. Beneficial interest in shares is obtained solely by purchase of variable life insurance policies and variable annuity contracts. Actual performance results for variable annuity and variable universal life contracts will be lower due to contract charges. Consult your contract for applicable charges.
Comments
For the six-month period ended June 30, 2013, the Strategic Value Portfolio returned 10.91% versus 13.85% for the current benchmark, the Dow Jones U.S. Select Dividend Index (DJSDI).
The stocks that embody the characteristics sought by the Portfolio were within the sectors that turned out to be some of the largest positive contributors to performance. These sectors included Consumer Staples and Health Care, which provided Portfolio returns of 19.2% and 18.8%, respectively. Accordingly, three of the Portfolio’s top five best performing securities were found in Consumer Staples and the remaining two in Health Care.(1)
The Portfolio’s five best performing securities were Bristol-Myers Squibb Co., H.J. Heinz Co., Kraft Foods Group, Inc., Johnson & Johnson, and General Mills, Inc. Of note, H.J. Heinz Co., the best performer within Consumer Staples, following the buyout offer from Warren Buffett and 3G Capital, was subsequently sold.(1)
Due to important position sizes in each, the following five stocks, predominantly investments in Consumer Staples and Health Care, were the leading contributors to Portfolio total return: Bristol-Myers Squibb Co., Kraft Foods Group, Inc., GlaxoSmithKline PLC, Johnson & Johnson and Verizon Communications, Inc.(1)
The Portfolio further benefited from avoiding the cyclical sector, Materials, which was the worst performer in the Index. As a result of the avoidance of Materials, the Portfolio had positive returns across all sectors for the first half of the year.(1)
The key factor of the relative under-performance of the Portfolio was having no exposure to Industrials, which advanced 20.7% within the benchmark during the first half of the year. The DJSDI has a notable weight in this sector, but due to lack of reliable dividend growth and yield opportunities in the sector, the Portfolio had no exposure. While the Portfolio was invested in the DJSDI’s domestic Energy constituents, Chevron Corp. and ConocoPhillips, negative returns in its non-U.S. holdings, BP PLC, Total, and Royal Dutch Shell were the drivers of the Portfolio’s relative underperformance in Energy. The Portfolio’s non-U.S. Energy holdings accounted for three of the Portfolio’s five worst performing securities: CenturyLink, Inc., Royal Dutch Shell PLC, BP PLC, Total SA, and BCE, Inc. Due to the combina-
tion of notable position size and negative performance, the following five stocks, investments in Energy and Telecommunication Services, were the leading detractors from Portfolio total return: CenturyLink, Inc., Royal Dutch Shell PLC, Total SA, BCE, Inc., and Windstream Corp.(1)
Within Telecommunication Services, the Portfolio experienced a dividend cut from CenturyLink, Inc. when the company’s management team unexpectedly chose to pursue a different capital allocation strategy. Following the announcement of the dividend cut, CenturyLink, Inc. was sold out of the Portfolio, since it was no longer supportive of a dividend-based investment strategy.(1)
The Portfolio continues to stay focused on its main objectives of providing a generous and consistent income stream and capital appreciation while also providing a hedge against market risk and inflation. As a result, the Portfolio was still able to provide a 10.91% return coupled with an attractively higher-than-market dividend yield, regardless of the volatility in the market for the period. At the end of June, the Portfolio’s gross weighted average dividend yield measured 4.5%, higher than that of the DJSDI, which aims to reflect the domestic dividend-paying universe, and eclipsing the 10-Year U.S. Treasury Bond and the broad market, represented by the S&P 500 Index. There was also concurrent dividend growth in the period. This dividend growth, which propels long-term capital appreciation and provides investors with a hedge against inflation, came courtesy of eighteen dividend increases announced by holdings within the Portfolio. The most notable of these increases came from Chevron Corp. and Unilever PLC, as they raised dividends by 11.1% and 10.7%, respectively.(1)
Entering the second half of 2013, there are several issues that will most likely continue to spur volatility in the markets. Globally, the International Monetary Fund has forecasted slower global growth for 2013 and 2014 due to new risks emerging such as a slowdown in developing country economies, with the severity of China’s slowdown looming as a worry, and the ongoing flair-ups in the euro zone that may be worse than expected. Domestically, equity markets continue to vacillate between generally improving economic data and the Federal Reserve sending somewhat mixed messages about when it will start to take some of the punch out of the punch bowl. Recent statements by Chairman Ben Bernanke have caused a sizeable sell-off in Treasuries on expectations that the Federal Reserve’s purchases of Treasuries and agency mortgage backed securities will be coming to an end over the next year or so. While the Federal Reserve continues to form its language around an organized dismantling of quantitative easing (QE), high-quality, defensive dividend investments may experience some near-term volatility, as investors weigh the tapering of QE and the probable rise in interest rates. In that environment, and all other environments, the Portfolio intends to remain grounded in its steadfast belief that investing in high and rising income streams generates excellent total return over time. By selecting well-established companies that generate reliable cash flows and pay high and rising dividends, we believe investors can be reassured that the Portfolio will work toward its objectives regardless of the market outlook. So, whether an investor is looking simply for an income stream that rises, or a way to achieve superior long-term returns, we believe that the Portfolio is well positioned to meet the investor’s needs.
| (1) | The Portfolio’s composition is subject to change. Holdings and weightings are as of June 30, 2013. |
| 56 | (continued) |
| Ohio National Fund, Inc. | Strategic Value Portfolio (Continued) |
Change in Value of $10,000 Investment
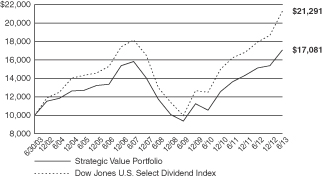
Hypothetical illustration based on past performance. Future performance will vary. The Portfolio’s returns reflect reinvested dividends. The Portfolio’s holdings may differ significantly from the securities in the index. The index is unmanaged and therefore does not reflect the cost of portfolio management and accounting.
The Dow Jones U.S. Select Dividend Index is comprised of all dividend-paying companies in the Dow Jones U.S. Index that have a non-negative historical five-year dividend-per-share growth rate, a five-year average dividend to earnings-per-share ratio of less than or equal to 60%, paid dividends in each of the previous five years, and a three-month average daily trading volume of 200,000 shares. Current index components are included in the universe regardless of their dividend payout ratio or trading volume. The Dow Jones U.S. Index aims to consistently represent the top 95% of U.S. companies based on float-adjusted market capitalization, excluding non common issues and illiquid stocks. The index presented includes the effects of reinvested dividends.
Top 10 Portfolio Holdings as of June 30, 2013 (1) (2)
| % of Net Assets | ||||
Common Stocks (3) | 96.4 | |||
Money Market Funds and | 3.6 | |||
|
| |||
| 100.0 | ||||
|
|
Top 10 Portfolio Holdings as of June 30, 2013 (1) (2)
| % of Net Assets | ||||
1. Kraft Foods Group, Inc. | 4.7 | |||
2. ConocoPhillips | 4.4 | |||
3. AT&T, Inc. | 4.4 | |||
4. Verizon Communications, Inc. | 4.2 | |||
5. AstraZeneca PLC | 4.1 | |||
6. Vodafone Group PLC – ADR | 4.1 | |||
7. National Grid PLC | 4.0 | |||
8. GlaxoSmithKline PLC | 4.0 | |||
9. Altria Group, Inc. | 3.9 | |||
10. Reynolds American, Inc. | 3.8 |
| (1) | Composition of Portfolio subject to change. |
| (2) | Short-term investments have been excluded from the list of Top 10 Portfolio Holdings. |
| (3) | Sectors: |
| % of Net Assets | ||||
Consumer Staples | 25.4 | |||
Utilities | 21.1 | |||
Health Care | 20.3 | |||
Telecommunication Services | 13.7 | |||
Energy | 13.3 | |||
Consumer Discretionary | 2.6 | |||
|
| |||
| 96.4 | ||||
|
|
| 57 |
| Ohio National Fund, Inc. | Strategic Value Portfolio |
Schedule of Investments | June 30, 2013 (Unaudited) |
| Common Stocks – 96.4% | Shares | Value | ||||||||
CONSUMER DISCRETIONARY – 2.6% | ||||||||||
McDonald’s Corp. (Hotels, Restaurants & Leisure) | 75,125 | $ | 7,437,375 | |||||||
|
| |||||||||
CONSUMER STAPLES – 25.4% | ||||||||||
Coca-Cola Co. / The (Beverages) | 47,630 | 1,910,439 | ||||||||
PepsiCo, Inc. (Beverages) | 34,500 | 2,821,755 | ||||||||
General Mills, Inc. (Food Products) | 57,700 | 2,800,181 | ||||||||
Kellogg Co. (Food Products) | 46,075 | 2,959,397 | ||||||||
Kraft Foods Group, Inc. (Food Products) | 236,830 | 13,231,692 | ||||||||
Unilever PLC (Food Products) | (a) | 75,160 | 3,042,659 | |||||||
Kimberly-Clark Corp. (Household Products) | 71,875 | 6,981,937 | ||||||||
Procter & Gamble Co. / The (Household Products) | 36,660 | 2,822,453 | ||||||||
Altria Group, Inc. (Tobacco) | 316,200 | 11,063,838 | ||||||||
Lorillard, Inc. (Tobacco) | 172,200 | 7,521,696 | ||||||||
Philip Morris International, Inc. (Tobacco) | 65,435 | 5,667,980 | ||||||||
Reynolds American, Inc. (Tobacco) | 224,220 | 10,845,521 | ||||||||
|
| |||||||||
| 71,669,548 | ||||||||||
|
| |||||||||
ENERGY – 13.3% | ||||||||||
BP PLC (Oil, Gas & Consumable Fuels) | (a) | 397,000 | 2,755,175 | |||||||
Chevron Corp. (Oil, Gas & Consumable Fuels) | 40,150 | 4,751,351 | ||||||||
ConocoPhillips (Oil, Gas & Consumable Fuels) | 205,905 | 12,457,253 | ||||||||
Royal Dutch Shell PLC (Oil, Gas & Consumable Fuels) | (a) | 301,720 | 9,992,708 | |||||||
Total SA (Oil, Gas & Consumable Fuels) | (a) | 154,220 | 7,532,556 | |||||||
|
| |||||||||
| 37,489,043 | ||||||||||
|
| |||||||||
HEALTH CARE – 20.3% | ||||||||||
AbbVie, Inc. (Pharmaceuticals) | 197,000 | 8,143,980 | ||||||||
AstraZeneca PLC (Pharmaceuticals) | (a) | 244,500 | 11,559,746 | |||||||
Bristol-Myers Squibb Co. (Pharmaceuticals) | 121,775 | 5,442,125 | ||||||||
Eli Lilly & Co. (Pharmaceuticals) | 61,690 | 3,030,213 | ||||||||
GlaxoSmithKline PLC (Pharmaceuticals) | (a) | 452,816 | 11,318,762 | |||||||
Johnson & Johnson (Pharmaceuticals) | 103,660 | 8,900,248 | ||||||||
Merck & Co., Inc. (Pharmaceuticals) | 190,100 | 8,830,145 | ||||||||
|
| |||||||||
| 57,225,219 | ||||||||||
|
| |||||||||
| Common Stocks (Continued) | Shares | Value | ||||||||
TELECOMMUNICATION SERVICES – 13.7% | ||||||||||
AT&T, Inc. (Diversified Telecom. Svs.) | 350,500 | $ | 12,407,700 | |||||||
BCE, Inc. (Diversified Telecom. Svs.) | 75,580 | 3,098,802 | ||||||||
Verizon Communications, Inc. (Diversified Telecom. Svs.) | 234,120 | 11,785,601 | ||||||||
Vodafone Group PLC – ADR (Wireless Telecom. Svs.) | 401,170 | 11,529,626 | ||||||||
|
| |||||||||
| 38,821,729 | ||||||||||
|
| |||||||||
UTILITIES – 21.1% | ||||||||||
American Electric Power Co., Inc. (Electric Utilities) | 97,100 | 4,348,138 | ||||||||
Duke Energy Corp. (Electric Utilities) | 153,206 | 10,341,405 | ||||||||
Pepco Holdings, Inc. (Electric Utilities) | 150,000 | 3,024,000 | ||||||||
PPL Corp. (Electric Utilities) | 328,400 | 9,937,384 | ||||||||
Southern Co. / The (Electric Utilities) | 163,360 | 7,209,077 | ||||||||
SSE PLC (Electric Utilities) | (a) | 387,100 | 8,964,351 | |||||||
Dominion Resources, Inc. (Multi-Utilities) | 79,825 | 4,535,657 | ||||||||
National Grid PLC (Multi-Utilities) | (a) | 1,002,100 | 11,359,497 | |||||||
|
| |||||||||
| 59,719,509 | ||||||||||
|
| |||||||||
Total Common Stocks (Cost $253,308,006) | $ | 272,362,423 | ||||||||
|
| |||||||||
| Money Market Funds – 0.9% | Shares | Value | ||||||||
Fidelity Institutional Money Market Funds | 2,579,000 | $ | 2,579,000 | |||||||
|
| |||||||||
Total Money Market Funds (Cost $2,579,000) | $ | 2,579,000 | ||||||||
|
| |||||||||
Total Investments – 97.3% (Cost $255,887,006) | (b) | $ | 274,941,423 | |||||||
Other Assets in Excess of Liabilities – 2.7% | 7,649,505 | |||||||||
|
| |||||||||
Net Assets – 100.0% | $ | 282,590,928 | ||||||||
|
| |||||||||
Percentages are stated as a percent of net assets.
Abbreviations:
ADR: American Depositary Receipts
Footnotes:
| (a) | Security traded on a foreign exchange has been valued at an estimate of fair value that is different than the local market close price. These fair value estimates are determined by an independent fair valuation service that has been approved by the Board. These securities represent $66,525,454, or 23.5% of the Portfolio’s net assets. Other Portfolio securities are not subjected to fair value procedures because they are traded on domestic or foreign exchanges that have close times that are consistent with the U.S. market close, normally 4:00 pm Eastern Time. |
| (b) | Represents cost for financial reporting purposes, which may differ from cost basis for federal income tax purposes. See also Note 7 of the Notes to Financial Statements. |
The accompanying notes are an integral part of these financial statements.
| 58 |
| Ohio National Fund, Inc. | High Income Bond Portfolio |
Objective/Strategy
The High Income Bond Portfolio seeks high current income by investing at least 80% of its net assets in lower rated corporate debt obligations commonly referred to as “junk bonds”. The Portfolio’s investments are generally rated Ba or lower by Moody’s, or BB or lower by Standard & Poor’s or Fitch.
Performance as of June 30, 2013
Average Annual Returns: | ||||
One year | 8.03% | |||
Five years | 9.61% | |||
Ten years | 8.14% |
Past performance does not guarantee future results. The performance data quoted represents past performance and current returns may be lower or higher. Total return figures include change in share price and reinvestment of dividends and capital gains. The investment return and principal value will fluctuate so that an investor’s shares, when redeemed, may be worth more or less than the original cost. To obtain performance information up to the most recent month end, call toll-free 1-877-781-6392.
The Portfolio is not open to direct retail investment. Beneficial interest in shares is obtained solely by purchase of variable life insurance policies and variable annuity contracts. Actual performance results for variable annuity and variable universal life contracts will be lower due to contract charges. Consult your contract for applicable charges.
Comments
For the six-month period ended June 30, 2013, the High Income Bond Portfolio returned 1.55% versus 1.42% for the current benchmark, the Barclays Capital U.S. Corporate High-Yield 2% Issuer Capped Index (“BCHY2%”).
The high yield market generated attractive relative returns compared to most fixed income asset classes during the period. However, absolute returns were somewhat modest given the substantial rise in the general level of interest rates late in the period. The rise in rates was a result of the Federal Reserve’s discussion of “tapering” its aggressive quantitative easing program later in 2013 if, as the Federal Reserve expects, the U.S. economy continues on its path of modest growth. Given good economic growth, strong corporate credit measures for high yield issuers, and low default rates, credit spreads should have tightened in the rising rate environment helping to offset some of the rise in U.S. Treasury rates. For the period as a whole, credit spreads were modestly tighter, but they actually widened in May and June as technical selling pressure brought on by outflows from high yield mutual funds offset the benefit of good credit fundamentals. During June 2013, high yield mutual funds experienced three of the largest five weekly outflows on record. For example, the yield spread between the Credit Suisse High Yield Bond Index and Treasury securities with comparable maturities began the period at 554 basis points (bp), hit a low point in early May at roughly 430 bp, before rising to 541 bp at June 30, 2013. The BCHY2%’s ability to outperform the aggregate bond index reflects its somewhat shorter duration, higher level of income and the modest tightening of credit spreads.
Within the high yield market, the strongest performing major industries relative to the BCHY2% were retailers, technology, industrial other, paper and chemicals. The weakest performing major industries relative the BCHY2% were the natural gas utilities, media cable, wireless telecommunications, wireline telecommunication and metals. From a quality perspective, the lowest quality CCC-rated sector of the BCHY2% led the way, returning 5.29%, followed by the B-rated and BB-rated sectors, which returned 1.20% and 0.06%, respectively.
The Portfolio benefitted from strong security selection in the automotive, chemicals, gaming and health care sectors. The Portfolio also benefitted by being overweight the strong performing retailers and technology sectors and by being underweight the poor performing metals sector. The Portfolio’s shorter duration relative to the BCHY2% also aided performance due to the increase in interest rates. The Portfolio also benefited by being overweight in the higher quality portion of the CCC-rated quality sector. Specific high yield issuers held by the Portfolio that substantially outperformed the BCHY2% included: Advanced Micro Devices, Inc., DJO Finance LLC/DJO Finance Corp., Forbes Energy Services Ltd., Aspect Software, Inc. and Viasystems, Inc.(1)
The Portfolio was negatively impacted by poor security selection in the food & beverage, financial institutions and wireless telecommunication sectors. Specific high yield issuers held by the Portfolio that substantially underperformed the BCHY2% included: Exide Technologies, Lone Pine Resources Canada Ltd., Mmodal, Inc., Newfield Exploration Co. and Allen Systems Group, Inc.(1)
Late second quarter credit spread widening was a function of mutual fund selling to meet redemptions in the midst of a substantial increase in interest rates. We believe the less liquid nature of the high yield market, coupled with selling pressure, caused an overreaction on the valuation front. Credit spreads, after moving below long term medians in May, finished the quarter above median levels as selling pressure drove prices lower. Spreads typically tighten when U.S. Treasury interest rates increase, given stable credit conditions. We expect credit spreads to tighten once stabilization comes to the U.S. Treasury market.
| (1) | The Portfolio’s composition is subject to change. Holdings and weightings are as of June 30, 2013. |
Change in Value of $10,000 Investment
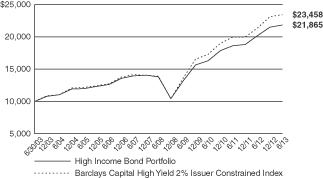
Hypothetical illustration based on past performance. Future performance will vary. All returns reflect reinvested dividends. The Portfolio’s holdings may differ significantly from the securities in the index. The index is unmanaged and therefore does not reflect the cost of Portfolio management or trading. Neither the Portfolio nor the index is open to direct investment.
The Barclays Capital U.S. Corporate High Yield 2% Issuer Capped Index is the 2% Issuer Cap component of the Barclays Capital U.S. Corporate High Yield Bond Index. The Barclays Capital U.S. Corporate High Yield Bond Index is an unmanaged index that includes all fixed income securities having a maximum quality rating of Ba1/BB+/BB+, a minimum amount outstanding of $150 million, and a least 1 year to maturity. The 2% Issuer Cap component limits the exposure of each issuer to 2% of the total market value and distributes any excess market value index–wide on a pro–rata basis. The index is presented on a total return basis.
| 59 | (continued) |
| Ohio National Fund, Inc. | High Income Bond Portfolio (Continued) |
Portfolio Composition as of June 30, 2013 (1)
| % of Net Assets | ||||
Corporate Bonds (3) | 97.7 | |||
Preferred Stocks (3) | 0.1 | |||
Warrants (3) | 0.1 | |||
Money Market Funds and | 2.1 | |||
|
| |||
| 100.0 | ||||
|
|
Top 10 Portfolio Holdings as of June 30, 2013 (1) (2)
| % of Net Assets | ||||
1. U.S. Foods, Inc. | 1.0 | |||
2. First Data Corp. | 1.0 | |||
3. HCA, Inc. | 0.9 | |||
4. Michael Foods Group, Inc. | 0.7 | |||
5. Del Monte Corp. | 0.7 | |||
6. Ally Financial, Inc. | 0.7 | |||
7. International Lease Finance Corp. | 0.7 | |||
8. CDW LLC / CDW Finance Corp. | 0.7 | |||
9. Sprint Capital Corp. | 0.7 | |||
10. Energy Transfer Equity LP | 0.6 |
| (1) | Composition of Portfolio subject to change. |
| (2) | Short-term investments have been excluded from the list of Top 10 Portfolio Holdings. |
| (3) | Sectors (combined): |
| % of Net Assets | ||||
Consumer Discretionary | 28.2 | |||
Industrials | 11.8 | |||
Energy | 11.2 | |||
Health Care | 10.5 | |||
Information Technology | 10.5 | |||
Materials | 8.1 | |||
Consumer Staples | 6.2 | |||
Telecommunication Services | 4.9 | |||
Financials | 4.6 | |||
Utilities | 1.9 | |||
|
| |||
| 97.9 | ||||
|
|
| 60 |
| Ohio National Fund, Inc. | High Income Bond Portfolio |
Schedule of Investments | June 30, 2013 (Unaudited) |
| Corporate Bonds – 97.7% | Rate | Maturity | Face Amount | Value | ||||||||||||
CONSUMER DISCRETIONARY – 28.1% | ||||||||||||||||
Allison Transmission, Inc. (Auto Components) | (b) | 7.125% | 05/15/2019 | $ | 600,000 | $ | 637,500 | |||||||||
American Axle & Manufacturing, Inc. (Auto Components) | 7.750% | 11/15/2019 | 625,000 | 690,625 | ||||||||||||
American Axle & Manufacturing, Inc. (Auto Components) | 6.625% | 10/15/2022 | 700,000 | 714,000 | ||||||||||||
American Axle & Manufacturing, Inc. (Auto Components) | 6.250% | 03/15/2021 | 400,000 | 408,500 | ||||||||||||
Cooper-Standard Automotive, Inc. (Auto Components) | 8.500% | 05/01/2018 | 775,000 | 825,375 | ||||||||||||
Exide Technologies (Acquired 06/03/2011 through 01/05/2012, Cost $637,665)(Auto Components) | (a)(d) | 8.625% | 02/01/2018 | 650,000 | 403,000 | |||||||||||
IDQ Holdings, Inc. (Auto Components) | (b) | 11.500% | 04/01/2017 | 600,000 | 660,000 | |||||||||||
International Automotive Components Group SL (Auto Components) | (b) | 9.125% | 06/01/2018 | 950,000 | 954,750 | |||||||||||
J.B. Poindexter & Co., Inc. (Auto Components) | (b) | 9.000% | 04/01/2022 | 825,000 | 870,375 | |||||||||||
Lear Corp. (Auto Components) | (b) | 4.750% | 01/15/2023 | 325,000 | 310,375 | |||||||||||
Pittsburgh Glass Works LLC (Auto Components) | (b) | 8.500% | 04/15/2016 | 775,000 | 771,125 | |||||||||||
Stoneridge, Inc. (Auto Components) | (b) | 9.500% | 10/15/2017 | 500,000 | 537,500 | |||||||||||
Tenneco, Inc. (Auto Components) | 7.750% | 08/15/2018 | 325,000 | 349,375 | ||||||||||||
Tenneco, Inc. (Auto Components) | 6.875% | 12/15/2020 | 450,000 | 483,750 | ||||||||||||
Tomkins LLC (Auto Components) | 9.000% | 10/01/2018 | 576,000 | 630,720 | ||||||||||||
Tower Automotive Holdings U.S.A. LLC / T.A. Holdings Finance, Inc. (Auto Components) | (b) | 10.625% | 09/01/2017 | 74,000 | 78,810 | |||||||||||
UCI International, Inc. (Auto Components) | 8.625% | 02/15/2019 | 1,675,000 | 1,716,875 | ||||||||||||
Chrysler Group LLC / CG Co-Issuer, Inc. (Automobiles) | 8.250% | 06/15/2021 | 750,000 | 831,562 | ||||||||||||
General Motors Financial Co., Inc. (Automobiles) | (b) | 3.250% | 05/15/2018 | 100,000 | 97,500 | |||||||||||
General Motors Financial Co., Inc. (Automobiles) | (b) | 4.250% | 05/15/2023 | 100,000 | 93,375 | |||||||||||
General Motors Financial Co., Inc. (Automobiles) | (b) | 2.750% | 05/15/2016 | 150,000 | 147,844 | |||||||||||
Jaguar Land Rover PLC (Automobiles) | (b) | 8.125% | 05/15/2021 | 1,050,000 | 1,160,250 | |||||||||||
Jaguar Land Rover Automotive PLC (Automobiles) | (b) | 5.625% | 02/01/2023 | 200,000 | 195,000 | |||||||||||
Affinia Group, Inc. (Distributors) | (b) | 7.750% | 05/01/2021 | 400,000 | 405,000 | |||||||||||
Knowledge Learning Corp. (Diversified Consumer Svs.) | (b) | 7.750% | 02/01/2015 | 325,000 | 315,250 | |||||||||||
Monitronics International, Inc. (Diversified Consumer Svs.) | 9.125% | 04/01/2020 | 650,000 | 676,000 | ||||||||||||
ServiceMaster Co. (Diversified Consumer Svs.) | 7.100% | 03/01/2018 | 450,000 | 436,500 | ||||||||||||
ServiceMaster Co. (Diversified Consumer Svs.) | 7.450% | 08/15/2027 | 300,000 | 256,500 | ||||||||||||
ServiceMaster Co. (Diversified Consumer Svs.) | 8.000% | 02/15/2020 | 750,000 | 751,875 | ||||||||||||
ServiceMaster Co. (Diversified Consumer Svs.) | 7.000% | 08/15/2020 | 1,000,000 | 953,750 | ||||||||||||
Affinity Gaming LLC / Affinity Gaming Finance Corp. (Hotels, Restaurants & Leisure) | 9.000% | 05/15/2018 | 975,000 | 1,011,562 | ||||||||||||
Ameristar Casinos, Inc. (Hotels, Restaurants & Leisure) | 7.500% | 04/15/2021 | 550,000 | 574,750 | ||||||||||||
Caesars Entertainment Operating Co., Inc. (Hotels, Restaurants & Leisure) | 11.250% | 06/01/2017 | 725,000 | 756,719 | ||||||||||||
Cedar Fair LP / Canada’s Wonderland Co. / Magnum Management Corp. (Hotels, Restaurants & Leisure) | 9.125% | 08/01/2018 | 775,000 | 848,625 | ||||||||||||
Cedar Fair LP / Canada’s Wonderland Co. / Magnum Management Corp. (Hotels, Restaurants & Leisure) | (b) | 5.250% | 03/15/2021 | 125,000 | 120,469 | |||||||||||
Chester Downs & Marina LLC (Hotels, Restaurants & Leisure) | (b) | 9.250% | 02/01/2020 | 550,000 | 533,500 | |||||||||||
Choice Hotels International, Inc. (Hotels, Restaurants & Leisure) | 5.750% | 07/01/2022 | 275,000 | 292,875 | ||||||||||||
DineEquity, Inc. (Hotels, Restaurants & Leisure) | 9.500% | 10/30/2018 | 1,575,000 | 1,756,125 | ||||||||||||
MGM Resorts International (Hotels, Restaurants & Leisure) | 7.500% | 06/01/2016 | 575,000 | 629,625 | ||||||||||||
MGM Resorts International (Hotels, Restaurants & Leisure) | 7.750% | 03/15/2022 | 550,000 | 600,187 | ||||||||||||
MGM Resorts International (Hotels, Restaurants & Leisure) | 8.625% | 02/01/2019 | 600,000 | 681,000 | ||||||||||||
MGM Resorts International (Hotels, Restaurants & Leisure) | 6.750% | 10/01/2020 | 250,000 | 259,375 | ||||||||||||
NPC International, Inc. / NPC Operating Co. A, Inc. / NPC Operating Co. B, Inc. (Hotels, Restaurants & Leisure) | 10.500% | 01/15/2020 | 1,200,000 | 1,381,500 | ||||||||||||
Rivers Pittsburgh Borrower LP / Rivers Pittsburgh Finance Corp. (Hotels, Restaurants & Leisure) | (b) | 9.500% | 06/15/2019 | 693,000 | 751,905 | |||||||||||
Royal Caribbean Cruises Ltd. (Hotels, Restaurants & Leisure) | 5.250% | 11/15/2022 | 475,000 | 467,875 | ||||||||||||
Seminole Hard Rock Entertainment, Inc. / Seminole Hard Rock International LLC (Hotels, Restaurants & Leisure) | (b) | 5.875% | 05/15/2021 | 500,000 | 485,937 | |||||||||||
Seminole Indian Tribe of Florida (Hotels, Restaurants & Leisure) | (b) | 7.804% | 10/01/2020 | 950,000 | 1,011,750 | |||||||||||
Seminole Indian Tribe of Florida (Hotels, Restaurants & Leisure) | (b) | 7.750% | 10/01/2017 | 150,000 | 159,937 | |||||||||||
Six Flags Entertainment Corp. (Hotels, Restaurants & Leisure) | (b) | 5.250% | 01/15/2021 | 800,000 | 774,000 | |||||||||||
Station Casinos LLC (Hotels, Restaurants & Leisure) | (b) | 7.500% | 03/01/2021 | 750,000 | 761,250 | |||||||||||
B.C. Mountain LLC / B.C. Mountain Finance, Inc. (Household Durables) | (b) | 7.000% | 02/01/2021 | 275,000 | 281,187 | |||||||||||
Hillman Group, Inc. / The (Household Durables) | 10.875% | 06/01/2018 | 975,000 | 1,060,312 | ||||||||||||
Hillman Group, Inc. / The (Household Durables) | (b) | 10.875% | 06/01/2018 | 250,000 | 271,875 | |||||||||||
Jarden Corp. (Household Durables) | 7.500% | 05/01/2017 | 600,000 | 664,500 | ||||||||||||
Libbey Glass, Inc. (Household Durables) | 6.875% | 05/15/2020 | 810,000 | 851,512 | ||||||||||||
Norcraft Cos. LP / Norcraft Finance Corp. (Household Durables) | 10.500% | 12/15/2015 | 1,275,000 | 1,324,406 | ||||||||||||
RSI Home Products, Inc. (Household Durables) | (b) | 6.875% | 03/01/2018 | 425,000 | 436,687 | |||||||||||
Serta Simmons Holdings LLC (Household Durables) | (b) | 8.125% | 10/01/2020 | 1,275,000 | 1,303,687 | |||||||||||
Yankee Candle Co., Inc. / The (Household Durables) | 9.750% | 02/15/2017 | 1,725,000 | 1,791,844 | ||||||||||||
YCC Holdings LLC / Yankee Finance, Inc. (Household Durables) | (c) | 10.250% | 02/15/2016 | 700,000 | 721,000 | |||||||||||
CDW LLC / CDW Finance Corp. (Internet & Catalog Retail) | 12.535% | 10/12/2017 | 317,000 | 336,020 | ||||||||||||
CDW LLC / CDW Finance Corp. (Internet & Catalog Retail) | 8.500% | 04/01/2019 | 1,850,000 | 1,998,000 | ||||||||||||
FGI Operating Co. LLC / FGI Finance, Inc. (Leisure Equip. & Products) | (b) | 7.875% | 05/01/2020 | 1,000,000 | 1,040,000 | |||||||||||
AMC Networks, Inc. (Media) | 7.750% | 07/15/2021 | 575,000 | 631,062 | ||||||||||||
AMC Networks, Inc. (Media) | 4.750% | 12/15/2022 | 350,000 | 339,500 | ||||||||||||
| 61 | (continued) |
| Ohio National Fund, Inc. | High Income Bond Portfolio (Continued) |
Schedule of Investments | June 30, 2013 (Unaudited) |
| Corporate Bonds (Continued) | Rate | Maturity | Face Amount | Value | ||||||||||||
CONSUMER DISCRETIONARY (continued) | ||||||||||||||||
CCO Holdings LLC / CCO Holdings Capital Corp. (Media) | 8.125% | 04/30/2020 | $ | 75,000 | $ | 82,312 | ||||||||||
CCO Holdings LLC / CCO Holdings Capital Corp. (Media) | 7.000% | 01/15/2019 | 425,000 | 452,625 | ||||||||||||
CCO Holdings LLC / CCO Holdings Capital Corp. (Media) | 6.625% | 01/31/2022 | 500,000 | 523,750 | ||||||||||||
CCO Holdings LLC / CCO Holdings Capital Corp. (Media) | 5.125% | 02/15/2023 | 150,000 | 141,375 | ||||||||||||
CCO Holdings LLC / CCO Holdings Capital Corp. (Media) | (b) | 5.750% | 09/01/2023 | 325,000 | 316,062 | |||||||||||
CCO Holdings LLC / CCO Holdings Capital Corp. (Media) | 5.750% | 01/15/2024 | 1,125,000 | 1,088,437 | ||||||||||||
Cequel Communications Holdings I LLC / Cequel Capital Corp. (Media) | (b) | 6.375% | 09/15/2020 | 350,000 | 357,875 | |||||||||||
Cequel Communications Holdings I LLC / Cequel Capital Corp. (Media) | (b) | 5.125% | 12/15/2021 | 400,000 | 378,000 | |||||||||||
Cinemark U.S.A., Inc. (Media) | 7.375% | 06/15/2021 | 500,000 | 545,000 | ||||||||||||
Clear Channel Communications, Inc. (Media) | 9.000% | 03/01/2021 | 1,550,000 | 1,480,250 | ||||||||||||
Clear Channel Communications, Inc. (Media) | (b) | 11.250% | 03/01/2021 | 250,000 | 261,875 | |||||||||||
Clear Channel Worldwide Holdings, Inc. (Media) | 7.625% | 03/15/2020 | 175,000 | 181,125 | ||||||||||||
Clear Channel Worldwide Holdings, Inc. (Media) | 7.625% | 03/15/2020 | 1,200,000 | 1,248,000 | ||||||||||||
Clear Channel Worldwide Holdings, Inc. (Media) | (b) | 6.500% | 11/15/2022 | 275,000 | 283,250 | |||||||||||
Clear Channel Worldwide Holdings, Inc. (Media) | (b) | 6.500% | 11/15/2022 | 750,000 | 776,250 | |||||||||||
Crown Media Holdings, Inc. (Media) | 10.500% | 07/15/2019 | 1,525,000 | 1,700,375 | ||||||||||||
Cumulus Media Holdings, Inc. (Media) | 7.750% | 05/01/2019 | 1,025,000 | 1,007,062 | ||||||||||||
DISH DBS Corp. (Media) | 5.875% | 07/15/2022 | 1,525,000 | 1,555,500 | ||||||||||||
DISH DBS Corp. (Media) | 4.625% | 07/15/2017 | 200,000 | 202,000 | ||||||||||||
Entercom Radio LLC (Media) | 10.500% | 12/01/2019 | 825,000 | 930,187 | ||||||||||||
Entravision Communications Corp. (Media) | 8.750% | 08/01/2017 | 717,000 | 766,294 | ||||||||||||
Expo Event Transco, Inc. (Media) | (b) | 9.000% | 06/15/2021 | 950,000 | 942,875 | |||||||||||
Igloo Holdings Corp. (Media) | (b)(c) | 8.250% | 12/15/2017 | 1,000,000 | 1,025,000 | |||||||||||
Intelsat Jackson Holdings, S.A. (Media) | 8.500% | 11/01/2019 | 675,000 | 730,687 | ||||||||||||
Intelsat Jackson Holdings, S.A. (Media) | 7.500% | 04/01/2021 | 450,000 | 474,750 | ||||||||||||
Intelsat Jackson Holdings, S.A. (Media) | 7.250% | 04/01/2019 | 550,000 | 578,187 | ||||||||||||
Intelsat Jackson Holdings, S.A. (Media) | 7.250% | 10/15/2020 | 150,000 | 158,250 | ||||||||||||
Intelsat Jackson Holdings, S.A. (Media) | (b) | 6.625% | 12/15/2022 | 175,000 | 170,625 | |||||||||||
Intelsat Jackson Holdings, S.A. (Media) | (b) | 5.500% | 08/01/2023 | 550,000 | 519,750 | |||||||||||
Intelsat Luxembourg S.A. (Media) | (b) | 7.750% | 06/01/2021 | 650,000 | 658,937 | |||||||||||
Intelsat Luxembourg S.A. (Media) | (b) | 8.125% | 06/01/2023 | 750,000 | 777,187 | |||||||||||
Lamar Media Corp. (Media) | 5.875% | 02/01/2022 | 250,000 | 258,125 | ||||||||||||
Lamar Media Corp. (Media) | 5.000% | 05/01/2023 | 725,000 | 699,625 | ||||||||||||
Lynx II Corp. (Media) | (b) | 6.375% | 04/15/2023 | 200,000 | 202,500 | |||||||||||
Nexstar Broadcasting, Inc. / Mission Broadcasting, Inc. (Media) | 8.875% | 04/15/2017 | 275,000 | 295,625 | ||||||||||||
Nielsen Finance LLC / Nielsen Finance Co. (Media) | 7.750% | 10/15/2018 | 550,000 | 594,000 | ||||||||||||
Nielsen Finance LLC / Nielsen Finance Co. (Media) | (b) | 4.500% | 10/01/2020 | 450,000 | 434,250 | |||||||||||
Regal Entertainment Group (Media) | 5.750% | 02/01/2025 | 325,000 | 310,375 | ||||||||||||
Sirius XM Radio, Inc. (Media) | (b) | 5.250% | 08/15/2022 | 1,025,000 | 999,375 | |||||||||||
Sirius XM Radio, Inc. (Media) | (b) | 4.250% | 05/15/2020 | 275,000 | 259,187 | |||||||||||
Sirius XM Radio, Inc. (Media) | (b) | 4.625% | 05/15/2023 | 475,000 | 440,562 | |||||||||||
SIWF Merger Sub, Inc. / Springs Industries, Inc. (Media) | (b) | 6.250% | 06/01/2021 | 150,000 | 147,375 | |||||||||||
Townsquare Radio LLC / Townsquare Radio, Inc. (Media) | (b) | 9.000% | 04/01/2019 | 825,000 | 882,750 | |||||||||||
Visant Corp. (Media) | 10.000% | 10/01/2017 | 1,400,000 | 1,298,500 | ||||||||||||
XM Satellite Radio, Inc. (Media) | (b) | 7.625% | 11/01/2018 | 475,000 | 520,125 | |||||||||||
Academy Ltd. / Academy Finance Corp. (Specialty Retail) | (b) | 9.250% | 08/01/2019 | 1,025,000 | 1,140,312 | |||||||||||
Claire’s Stores, Inc. (Specialty Retail) | (b) | 6.125% | 03/15/2020 | 275,000 | 271,562 | |||||||||||
CST Brands, Inc. (Specialty Retail) | (b) | 5.000% | 05/01/2023 | 125,000 | 122,500 | |||||||||||
Gymboree Corp. / The (Specialty Retail) | 9.125% | 12/01/2018 | 425,000 | 401,625 | ||||||||||||
Jo-Ann Stores Holdings, Inc. (Specialty Retail) | (b)(c) | 9.750% | 10/15/2019 | 850,000 | 877,625 | |||||||||||
Jo-Ann Stores, Inc. (Specialty Retail) | (b) | 8.125% | 03/15/2019 | 1,625,000 | 1,665,625 | |||||||||||
L Brands, Inc. (Specialty Retail) | 5.625% | 02/15/2022 | 725,000 | 739,500 | ||||||||||||
Michaels Stores, Inc. (Specialty Retail) | 7.750% | 11/01/2018 | 1,275,000 | 1,370,625 | ||||||||||||
New Academy Finance Co. LLC / New Academy Finance Corp. (Specialty Retail) | (b)(c) | 8.000% | 06/15/2018 | 775,000 | 798,250 | |||||||||||
Party City Holdings, Inc. (Specialty Retail) | (b) | 8.875% | 08/01/2020 | 550,000 | 592,625 | |||||||||||
Penske Automotive Group, Inc. (Specialty Retail) | 5.750% | 10/01/2022 | 300,000 | 307,500 | ||||||||||||
Petco Animal Supplies, Inc. (Specialty Retail) | (b) | 9.250% | 12/01/2018 | 1,350,000 | 1,461,375 | |||||||||||
Petco Holdings, Inc. (Specialty Retail) | (b)(c) | 8.500% | 10/15/2017 | 1,225,000 | 1,255,625 | |||||||||||
Sally Holdings LLC , Inc. (Specialty Retail) | 5.750% | 06/01/2022 | 125,000 | 127,500 | ||||||||||||
Sally Holdings LLC , Inc. (Specialty Retail) | 6.875% | 11/15/2019 | 700,000 | 754,250 | ||||||||||||
PVH Corp. (Textiles, Apparel & Luxury Goods) | 4.500% | 12/15/2022 | 200,000 | 193,000 | ||||||||||||
Wolverine World Wide, Inc. (Textiles, Apparel & Luxury Goods) | (b) | 6.125% | 10/15/2020 | 250,000 | 259,375 | |||||||||||
|
| |||||||||||||||
| 84,268,719 | ||||||||||||||||
|
| |||||||||||||||
CONSUMER STAPLES – 6.2% | ||||||||||||||||
Constellation Brands, Inc. (Beverages) | 6.000% | 05/01/2022 | 725,000 | 781,187 | ||||||||||||
U.S. Foods, Inc. (Food & Staples Retailing) | 8.500% | 06/30/2019 | 2,800,000 | 2,940,000 | ||||||||||||
B&G Foods, Inc. (Food Products) | 4.625% | 06/01/2021 | 525,000 | 502,687 | ||||||||||||
Dean Foods Co. (Food Products) | 7.000% | 06/01/2016 | 550,000 | 600,875 | ||||||||||||
| 62 | (continued) |
| Ohio National Fund, Inc. | High Income Bond Portfolio (Continued) |
Schedule of Investments | June 30, 2013 (Unaudited) |
| Corporate Bonds (Continued) | Rate | Maturity | Face Amount | Value | ||||||||||||
CONSUMER STAPLES (continued) | ||||||||||||||||
Dean Foods Co. (Food Products) | 9.750% | 12/15/2018 | $ | 550,000 | $ | 624,250 | ||||||||||
Del Monte Corp. (Food Products) | 7.625% | 02/15/2019 | 2,100,000 | 2,168,250 | ||||||||||||
Hawk Acquisition Sub, Inc. (Food Products) | (b) | 4.250% | 10/15/2020 | 1,875,000 | 1,797,656 | |||||||||||
Michael Foods Group, Inc. (Food Products) | 9.750% | 07/15/2018 | 1,975,000 | 2,172,500 | ||||||||||||
Michael Foods Holding, Inc. (Food Products) | (b)(c) | 8.500% | 07/15/2018 | 1,175,000 | 1,213,187 | |||||||||||
Pinnacle Foods Finance LLC / Pinnacle Foods Finance Corp. (Food Products) | (b) | 4.875% | 05/01/2021 | 1,300,000 | 1,244,750 | |||||||||||
Shearer’s Foods LLC / Chip Finance Corp. (Food Products) | (b) | 9.000% | 11/01/2019 | 550,000 | 584,375 | |||||||||||
Smithfield Foods, Inc. (Food Products) | 6.625% | 08/15/2022 | 1,275,000 | 1,373,812 | ||||||||||||
Spectrum Brands, Inc. (Household Products) | 9.500% | 06/15/2018 | 150,000 | 165,000 | ||||||||||||
Spectrum Brands, Inc. (Household Products) | 6.750% | 03/15/2020 | 1,150,000 | 1,217,562 | ||||||||||||
First Quality Finance Co., Inc. (Personal Products) | (b) | 4.625% | 05/15/2021 | 375,000 | 358,125 | |||||||||||
Prestige Brands, Inc. (Personal Products) | 8.250% | 04/01/2018 | 750,000 | 802,500 | ||||||||||||
Prestige Brands, Inc. (Personal Products) | 8.125% | 02/01/2020 | 175,000 | 192,062 | ||||||||||||
|
| |||||||||||||||
| 18,738,778 | ||||||||||||||||
|
| |||||||||||||||
ENERGY – 11.2% | ||||||||||||||||
Basic Energy Services, Inc. (Energy Equip. & Svs.) | 7.750% | 02/15/2019 | 425,000 | 421,812 | ||||||||||||
Basic Energy Services, Inc. (Energy Equip. & Svs.) | 7.750% | 10/15/2022 | 300,000 | 297,750 | ||||||||||||
CGG (Energy Equip. & Svs.) | 7.750% | 05/15/2017 | 1,100,000 | 1,122,000 | ||||||||||||
CGG (Energy Equip. & Svs.) | 9.500% | 05/15/2016 | 400,000 | 419,500 | ||||||||||||
Chaparral Energy, Inc. (Energy Equip. & Svs.) | 9.875% | 10/01/2020 | 1,075,000 | 1,198,625 | ||||||||||||
Chaparral Energy, Inc. (Energy Equip. & Svs.) | 7.625% | 11/15/2022 | 125,000 | 128,125 | ||||||||||||
Drill Rigs Holdings, Inc. (Energy Equip. & Svs.) | (b) | 6.500% | 10/01/2017 | 350,000 | 350,875 | |||||||||||
Forbes Energy Services Ltd. (Energy Equip. & Svs.) | 9.000% | 06/15/2019 | 650,000 | 643,500 | ||||||||||||
PHI, Inc. (Energy Equip. & Svs.) | 8.625% | 10/15/2018 | 850,000 | 905,250 | ||||||||||||
SESI LLC (Energy Equip. & Svs.) | 6.375% | 05/01/2019 | 275,000 | 285,312 | ||||||||||||
SESI LLC (Energy Equip. & Svs.) | 7.125% | 12/15/2021 | 250,000 | 271,250 | ||||||||||||
Access Midstream Partners LP / ACMP Finance Corp. (Oil, Gas & Consumable Fuels) | 6.125% | 07/15/2022 | 525,000 | 534,187 | ||||||||||||
Access Midstream Partners LP / ACMP Finance Corp. (Oil, Gas & Consumable Fuels) | 4.875% | 05/15/2023 | 900,000 | 839,250 | ||||||||||||
Antero Resources Finance Corp. (Oil, Gas & Consumable Fuels) | 6.000% | 12/01/2020 | 1,200,000 | 1,188,000 | ||||||||||||
Approach Resources, Inc. (Oil, Gas & Consumable Fuels) | 7.000% | 06/15/2021 | 250,000 | 253,125 | ||||||||||||
Athlon Holdings LP / Athlon Finance Corp. (Oil, Gas & Consumable Fuels) | (b) | 7.375% | 04/15/2021 | 350,000 | 346,500 | |||||||||||
ATP Oil & Gas Corp. (Acquired 04/19/2010 through 02/11/2011, Cost $727,229)(Oil, Gas & Consumable Fuels) | (a)(d) | 11.875% | 05/01/2015 | 775,000 | 11,625 | |||||||||||
Carrizo Oil & Gas, Inc. (Oil, Gas & Consumable Fuels) | 7.500% | 09/15/2020 | 575,000 | 600,875 | ||||||||||||
Chesapeake Energy Corp. (Oil, Gas & Consumable Fuels) | 6.875% | 11/15/2020 | 675,000 | 735,750 | ||||||||||||
Chesapeake Energy Corp. (Oil, Gas & Consumable Fuels) | 5.750% | 03/15/2023 | 450,000 | 456,750 | ||||||||||||
Chesapeake Energy Corp. (Oil, Gas & Consumable Fuels) | 5.375% | 06/15/2021 | 525,000 | 523,687 | ||||||||||||
Chesapeake Oilfield Operating LLC / Chesapeake Oilfield Finance, Inc. (Oil, Gas & Consumable Fuels) | (b) | 6.625% | 11/15/2019 | 800,000 | 796,000 | |||||||||||
Comstock Resources, Inc. (Oil, Gas & Consumable Fuels) | 7.750% | 04/01/2019 | 300,000 | 307,500 | ||||||||||||
Comstock Resources, Inc. (Oil, Gas & Consumable Fuels) | 9.500% | 06/15/2020 | 375,000 | 406,875 | ||||||||||||
Concho Resources, Inc. (Oil, Gas & Consumable Fuels) | 7.000% | 01/15/2021 | 525,000 | 567,000 | ||||||||||||
Concho Resources, Inc. (Oil, Gas & Consumable Fuels) | 5.500% | 04/01/2023 | 600,000 | 594,000 | ||||||||||||
Continental Resources, Inc. (Oil, Gas & Consumable Fuels) | (b) | 4.500% | 04/15/2023 | 375,000 | 365,156 | |||||||||||
El Paso LLC (Oil, Gas & Consumable Fuels) | 7.250% | 06/01/2018 | 225,000 | 250,277 | ||||||||||||
El Paso LLC (Oil, Gas & Consumable Fuels) | 6.500% | 09/15/2020 | 900,000 | 963,612 | ||||||||||||
Energy Transfer Equity LP (Oil, Gas & Consumable Fuels) | 7.500% | 10/15/2020 | 1,750,000 | 1,920,625 | ||||||||||||
Energy XXI Gulf Coast, Inc. (Oil, Gas & Consumable Fuels) | 7.750% | 06/15/2019 | 200,000 | 207,000 | ||||||||||||
EP Energy LLC / EP Energy Finance, Inc. (Oil, Gas & Consumable Fuels) | 9.375% | 05/01/2020 | 1,150,000 | 1,305,250 | ||||||||||||
EP Energy LLC / Everest Acquisition Finance, Inc. (Oil, Gas & Consumable Fuels) | 6.875% | 05/01/2019 | 250,000 | 268,750 | ||||||||||||
EPE Holdings LLC / EP Energy Bond Co., Inc. (Oil, Gas & Consumable Fuels) | (b)(c) | 8.125% | 12/15/2017 | 417,158 | 427,587 | |||||||||||
Forest Oil Corp. (Oil, Gas & Consumable Fuels) | 7.250% | 06/15/2019 | 875,000 | 826,875 | ||||||||||||
Forest Oil Corp. (Oil, Gas & Consumable Fuels) | (b) | 7.500% | 09/15/2020 | 400,000 | 382,000 | |||||||||||
Halcon Resources Corp. (Oil, Gas & Consumable Fuels) | 9.750% | 07/15/2020 | 900,000 | 902,250 | ||||||||||||
Holly Energy Partners LP / Holly Energy Finance Corp. (Oil, Gas & Consumable Fuels) | 6.500% | 03/01/2020 | 475,000 | 480,937 | ||||||||||||
Inergy Midstream LP / NRGM Finance Corp. (Oil, Gas & Consumable Fuels) | (b) | 6.000% | 12/15/2020 | 400,000 | 388,000 | |||||||||||
Kodiak Oil & Gas Corp. (Oil, Gas & Consumable Fuels) | (b) | 5.500% | 01/15/2021 | 200,000 | 195,250 | |||||||||||
Linn Energy LLC / Linn Energy Finance Corp. (Oil, Gas & Consumable Fuels) | 8.625% | 04/15/2020 | 750,000 | 791,250 | ||||||||||||
Linn Energy LLC / Linn Energy Finance Corp. (Oil, Gas & Consumable Fuels) | 7.750% | 02/01/2021 | 650,000 | 654,875 | ||||||||||||
Linn Energy LLC / Linn Energy Finance Corp. (Oil, Gas & Consumable Fuels) | 6.500% | 05/15/2019 | 50,000 | 49,125 | ||||||||||||
Lone Pine Resources Canada Ltd. (Acquired 02/09/2012 through 07/10/2012, Cost $416,716)(Oil, Gas & Consumable Fuels) | (e) | 10.375% | 02/15/2017 | 425,000 | 310,250 | |||||||||||
MarkWest Energy Partners LP / MarkWest Energy Finance Corp. (Oil, Gas & Consumable Fuels) | 5.500% | 02/15/2023 | 600,000 | 594,000 | ||||||||||||
MarkWest Energy Partners LP / MarkWest Energy Finance Corp. (Oil, Gas & Consumable Fuels) | 4.500% | 07/15/2023 | 400,000 | 368,000 | ||||||||||||
Newfield Exploration Co. (Oil, Gas & Consumable Fuels) | 5.625% | 07/01/2024 | 825,000 | 804,375 | ||||||||||||
Northern Oil and Gas, Inc. (Oil, Gas & Consumable Fuels) | 8.000% | 06/01/2020 | 500,000 | 507,500 | ||||||||||||
Oasis Petroleum, Inc. (Oil, Gas & Consumable Fuels) | 6.500% | 11/01/2021 | 750,000 | 772,500 | ||||||||||||
Oasis Petroleum, Inc. (Oil, Gas & Consumable Fuels) | 6.875% | 01/15/2023 | 300,000 | 310,500 | ||||||||||||
Plains Exploration & Production Co. (Oil, Gas & Consumable Fuels) | 6.750% | 02/01/2022 | 275,000 | 291,710 | ||||||||||||
| 63 | (continued) |
| Ohio National Fund, Inc. | High Income Bond Portfolio (Continued) |
Schedule of Investments | June 30, 2013 (Unaudited) |
| Corporate Bonds (Continued) | Rate | Maturity | Face Amount | Value | ||||||||||||
ENERGY (continued) | ||||||||||||||||
Plains Exploration & Production Co. (Oil, Gas & Consumable Fuels) | 6.125% | 06/15/2019 | $ | 300,000 | $ | 318,323 | ||||||||||
Range Resources Corp. (Oil, Gas & Consumable Fuels) | 5.000% | 03/15/2023 | 275,000 | 270,187 | ||||||||||||
Regency Energy Partners LP / Regency Energy Finance Corp. (Oil, Gas & Consumable Fuels) | 6.875% | 12/01/2018 | 275,000 | 290,812 | ||||||||||||
Regency Energy Partners LP / Regency Energy Finance Corp. (Oil, Gas & Consumable Fuels) | 5.500% | 04/15/2023 | 175,000 | 173,250 | ||||||||||||
Regency Energy Partners LP / Regency Energy Finance Corp. (Oil, Gas & Consumable Fuels) | (b) | 4.500% | 11/01/2023 | 225,000 | 204,187 | |||||||||||
Sabine Pass Liquefaction LLC (Oil, Gas & Consumable Fuels) | (b) | 5.625% | 02/01/2021 | 700,000 | 680,750 | |||||||||||
Sabine Pass Liquefaction LLC (Oil, Gas & Consumable Fuels) | (b) | 5.625% | 04/15/2023 | 225,000 | 213,187 | |||||||||||
SandRidge Energy, Inc. (Oil, Gas & Consumable Fuels) | 7.500% | 03/15/2021 | 325,000 | 312,000 | ||||||||||||
SandRidge Energy, Inc. (Oil, Gas & Consumable Fuels) | 8.125% | 10/15/2022 | 500,000 | 497,500 | ||||||||||||
SM Energy Co. (Oil, Gas & Consumable Fuels) | (b) | 5.000% | 01/15/2024 | 275,000 | 263,312 | |||||||||||
Southern Star Central Corp. (Oil, Gas & Consumable Fuels) | 6.750% | 03/01/2016 | 125,000 | 125,938 | ||||||||||||
Tesoro Logistics LP / Tesoro Logistics Finance Corp. (Oil, Gas & Consumable Fuels) | (b) | 5.875% | 10/01/2020 | 225,000 | 222,750 | |||||||||||
W&T Offshore, Inc. (Oil, Gas & Consumable Fuels) | 8.500% | 06/15/2019 | 1,375,000 | 1,426,563 | ||||||||||||
|
| |||||||||||||||
| 33,541,536 | ||||||||||||||||
|
| |||||||||||||||
FINANCIALS – 4.5% | ||||||||||||||||
Neuberger Berman Group LLC / Neuberger Berman Finance Corp. (Capital Markets) | (b) | 5.875% | 03/15/2022 | 650,000 | 666,250 | |||||||||||
Neuberger Berman Group LLC / Neuberger Berman Finance Corp. (Capital Markets) | (b) | 5.625% | 03/15/2020 | 250,000 | 260,000 | |||||||||||
Nuveen Investments, Inc. (Capital Markets) | (b) | 9.500% | 10/15/2020 | 1,450,000 | 1,450,000 | |||||||||||
CIT Group, Inc. (Commercial Banks) | (b) | 6.625% | 04/01/2018 | 700,000 | 759,500 | |||||||||||
CIT Group, Inc. (Commercial Banks) | 5.250% | 03/15/2018 | 675,000 | 696,938 | ||||||||||||
CIT Group, Inc. (Commercial Banks) | 5.375% | 05/15/2020 | 225,000 | 231,469 | ||||||||||||
CIT Group, Inc. (Commercial Banks) | 5.000% | 05/15/2017 | 575,000 | 590,094 | ||||||||||||
CIT Group, Inc. (Commercial Banks) | 4.250% | 08/15/2017 | 600,000 | 605,250 | ||||||||||||
Ally Financial, Inc. (Consumer Finance) | 8.000% | 11/01/2031 | 225,000 | 271,688 | ||||||||||||
Ally Financial, Inc. (Consumer Finance) | 8.300% | 02/12/2015 | 1,975,000 | 2,133,000 | ||||||||||||
Ally Financial, Inc. (Consumer Finance) | 8.000% | 03/15/2020 | 375,000 | 437,344 | ||||||||||||
Ally Financial, Inc. (Consumer Finance) | 7.500% | 09/15/2020 | 625,000 | 722,656 | ||||||||||||
Ally Financial, Inc. (Consumer Finance) | 6.250% | 12/01/2017 | 300,000 | 321,953 | ||||||||||||
Ally Financial, Inc. (Consumer Finance) | 5.500% | 02/15/2017 | 250,000 | 262,198 | ||||||||||||
Express LLC / Express Finance Corp. (Diversified Financial Svs.) | 8.750% | 03/01/2018 | 250,000 | 268,750 | ||||||||||||
Interactive Data Corp. (Diversified Financial Svs.) | 10.250% | 08/01/2018 | 1,150,000 | 1,279,375 | ||||||||||||
TransUnion Holding Co., Inc. (Diversified Financial Svs.) | 9.625% | 06/15/2018 | 1,125,000 | 1,206,563 | ||||||||||||
TransUnion Holding Co., Inc. (Diversified Financial Svs.) | (b)(c) | 8.125% | 06/15/2018 | 525,000 | 558,469 | |||||||||||
Reliance Intermediate Holdings LP (Insurance) | (b) | 9.500% | 12/15/2019 | 550,000 | 596,750 | |||||||||||
Host Hotels & Resorts LP (Real Estate Investment Trusts) | 6.750% | 06/01/2016 | 44,000 | 44,652 | ||||||||||||
|
| |||||||||||||||
| 13,362,899 | ||||||||||||||||
|
| |||||||||||||||
HEALTH CARE – 10.5% | ||||||||||||||||
Grifols, Inc. (Biotechnology) | 8.250% | 02/01/2018 | 1,000,000 | 1,080,000 | ||||||||||||
Biomet, Inc. (Health Care Equip. & Supplies) | 6.500% | 10/01/2020 | 1,075,000 | 1,077,688 | ||||||||||||
Biomet, Inc. (Health Care Equip. & Supplies) | 6.500% | 08/01/2020 | 1,175,000 | 1,216,859 | ||||||||||||
DJO Finance LLC / DJO Finance Corp. (Health Care Equip. & Supplies) | 9.750% | 10/15/2017 | 250,000 | 256,250 | ||||||||||||
DJO Finance LLC / DJO Finance Corp. (Health Care Equip. & Supplies) | 7.750% | 04/15/2018 | 1,425,000 | 1,414,313 | ||||||||||||
DJO Finance LLC / DJO Finance Corp. (Health Care Equip. & Supplies) | 9.875% | 04/15/2018 | 325,000 | 342,063 | ||||||||||||
DJO Finance LLC / DJO Finance Corp. (Health Care Equip. & Supplies) | 8.750% | 03/15/2018 | 75,000 | 81,375 | ||||||||||||
Hologic, Inc. (Health Care Equip. & Supplies) | 6.250% | 08/01/2020 | 525,000 | 546,984 | ||||||||||||
VWR Funding, Inc. (Health Care Equip. & Supplies) | 7.250% | 09/15/2017 | 1,600,000 | 1,664,000 | ||||||||||||
CRC Health Corp. (Acquired 08/21/2009 through 04/30/2012, Cost $135,713)(Health Care Providers & Svs.) | (e) | 10.750% | 02/01/2016 | 150,000 | 152,719 | |||||||||||
DaVita HealthCare Partners, Inc. (Health Care Providers & Svs.) | 5.750% | 08/15/2022 | 450,000 | 451,125 | ||||||||||||
Envision Healthcare Corp. (Health Care Providers & Svs.) | 8.125% | 06/01/2019 | 1,600,000 | 1,708,000 | ||||||||||||
CDRT Holding Corp. (Health Care Providers & Svs.) | (b)(c) | 9.250% | 10/01/2017 | 1,050,000 | 1,068,375 | |||||||||||
HCA Holdings, Inc. (Health Care Providers & Svs.) | 7.750% | 05/15/2021 | 1,725,000 | 1,867,313 | ||||||||||||
HCA Holdings, Inc. (Health Care Providers & Svs.) | 6.250% | 02/15/2021 | 225,000 | 230,063 | ||||||||||||
HCA, Inc. (Health Care Providers & Svs.) | 7.500% | 11/06/2033 | 225,000 | 232,875 | ||||||||||||
HCA, Inc. (Health Care Providers & Svs.) | 7.500% | 02/15/2022 | 2,475,000 | 2,747,250 | ||||||||||||
HCA, Inc. (Health Care Providers & Svs.) | 6.500% | 02/15/2020 | 550,000 | 596,406 | ||||||||||||
HCA, Inc. (Health Care Providers & Svs.) | 5.875% | 05/01/2023 | 950,000 | 952,375 | ||||||||||||
IASIS Healthcare LLC / IASIS Capital Corp. (Health Care Providers & Svs.) | 8.375% | 05/15/2019 | 1,450,000 | 1,470,844 | ||||||||||||
Jaguar Holding Co. I (Health Care Providers & Svs.) | (b)(c) | 9.375% | 10/15/2017 | 575,000 | 603,750 | |||||||||||
Jaguar Holding Co. II / Jaguar Merger Sub, Inc. (Health Care Providers & Svs.) | (b) | 9.500% | 12/01/2019 | 1,050,000 | 1,165,500 | |||||||||||
Multiplan, Inc. (Health Care Providers & Svs.) | (b) | 9.875% | 09/01/2018 | 1,700,000 | 1,857,250 | |||||||||||
Omnicare, Inc. (Health Care Providers & Svs.) | 7.750% | 06/01/2020 | 850,000 | 935,000 | ||||||||||||
Tenet Healthcare Corp. (Health Care Providers & Svs.) | (b) | 4.500% | 04/01/2021 | 575,000 | 537,625 | |||||||||||
Tenet Healthcare Corp. (Health Care Providers & Svs.) | (b) | 4.375% | 10/01/2021 | 675,000 | 620,156 | |||||||||||
Truven Health Analytics, Inc. (Health Care Providers & Svs.) | (b) | 10.625% | 06/01/2020 | 700,000 | 773,500 | |||||||||||
United Surgical Partners International, Inc. (Health Care Providers & Svs.) | 9.000% | 04/01/2020 | 850,000 | 922,250 | ||||||||||||
Universal Hospital Services, Inc. (Health Care Providers & Svs.) | 7.625% | 08/15/2020 | 1,025,000 | 1,076,250 | ||||||||||||
| 64 | (continued) |
| Ohio National Fund, Inc. | High Income Bond Portfolio (Continued) |
Schedule of Investments | June 30, 2013 (Unaudited) |
| Corporate Bonds (Continued) | Rate | Maturity | Face Amount | Value | ||||||||||||
HEALTH CARE (continued) | ||||||||||||||||
Vanguard Health Holding Co. II LLC / Vanguard Holding Co. II, Inc. (Health Care Providers & Svs.) | 8.000% | 02/01/2018 | $ | 1,325,000 | $ | 1,411,125 | ||||||||||
Emdeon, Inc. (Health Care Technology) | 11.000% | 12/31/2019 | 1,100,000 | 1,245,750 | ||||||||||||
Legend Acquisition Sub, Inc. (Health Care Technology) | (b) | 10.750% | 08/15/2020 | 725,000 | 594,500 | |||||||||||
VPII Escrow Corp. (Pharmaceuticals) | (b) | 7.500% | 07/15/2021 | 450,000 | 466,313 | |||||||||||
VPII Escrow Corp. (Pharmaceuticals) | (b) | 6.750% | 08/15/2018 | 125,000 | 128,281 | |||||||||||
|
| |||||||||||||||
| 31,494,127 | ||||||||||||||||
|
| |||||||||||||||
INDUSTRIALS – 11.8% | ||||||||||||||||
B/E Aerospace, Inc. (Aerospace & Defense) | 5.250% | 04/01/2022 | 750,000 | 750,000 | ||||||||||||
Silver II Borrower / Silver II U.S. Holdings LLC (Aerospace & Defense) | (b) | 7.750% | 12/15/2020 | 975,000 | 984,750 | |||||||||||
TransDigm, Inc. (Aerospace & Defense) | 7.750% | 12/15/2018 | 1,200,000 | 1,269,000 | ||||||||||||
TransDigm, Inc. (Aerospace & Defense) | (b) | 5.500% | 10/15/2020 | 275,000 | 261,250 | |||||||||||
TransDigm, Inc. (Aerospace & Defense) | (b) | 7.500% | 07/15/2021 | 300,000 | 307,500 | |||||||||||
Building Materials Corp. of America (Building Products) | (b) | 7.500% | 03/15/2020 | 225,000 | 241,875 | |||||||||||
Building Materials Corp. of America (Building Products) | (b) | 6.750% | 05/01/2021 | 375,000 | 399,375 | |||||||||||
Masonite International Corp. (Building Products) | (b) | 8.250% | 04/15/2021 | 750,000 | 811,875 | |||||||||||
Nortek, Inc. (Building Products) | 10.000% | 12/01/2018 | 600,000 | 654,000 | ||||||||||||
Nortek, Inc. (Building Products) | 8.500% | 04/15/2021 | 1,025,000 | 1,101,875 | ||||||||||||
Nortek, Inc. (Building Products) | (b) | 8.500% | 04/15/2021 | 225,000 | 239,625 | |||||||||||
Ply Gem Industries, Inc. (Building Products) | 8.250% | 02/15/2018 | 939,000 | 1,004,730 | ||||||||||||
Ply Gem Industries, Inc. (Building Products) | 9.375% | 04/15/2017 | 180,000 | 191,250 | ||||||||||||
Roofing Supply Group LLC / Roofing Supply Finance, Inc. (Building Products) | (b) | 10.000% | 06/01/2020 | 700,000 | 764,750 | |||||||||||
Unifrax I LLC / Unifrax Holding Co. (Paper & Forest Products) | (b) | 7.500% | 02/15/2019 | 375,000 | 384,375 | |||||||||||
ADS Waste Holdings, Inc. (Commercial Svs. & Supplies) | (b) | 8.250% | 10/01/2020 | 575,000 | 589,375 | |||||||||||
Altegrity, Inc. (Acquired 09/29/2010 through 02/08/2011, Cost $180,650)(Commercial Svs. & Supplies) | (b)(e) | 11.750% | 05/01/2016 | 175,000 | 140,875 | |||||||||||
ARAMARK Corp. (Commercial Svs. & Supplies) | (b) | 5.750% | 03/15/2020 | 1,350,000 | 1,387,125 | |||||||||||
Garda World Security Corp. (Commercial Svs. & Supplies) | (b) | 9.750% | 03/15/2017 | 1,200,000 | 1,281,000 | |||||||||||
Iron Mountain, Inc. (Commercial Svs. & Supplies) | 7.750% | 10/01/2019 | 525,000 | 567,000 | ||||||||||||
Iron Mountain, Inc. (Commercial Svs. & Supplies) | 5.750% | 08/15/2024 | 200,000 | 188,500 | ||||||||||||
Maxim Crane Works LP / Maxim Finance Corp. (Commercial Svs. & Supplies) | (b) | 12.250% | 04/15/2015 | 300,000 | 316,500 | |||||||||||
Logo Merger Sub Corp. (Commercial Svs. & Supplies) | (b) | 8.375% | 10/15/2020 | 1,125,000 | 1,164,375 | |||||||||||
United Rentals North America, Inc. (Commercial Svs. & Supplies) | 8.375% | 09/15/2020 | 1,325,000 | 1,440,938 | ||||||||||||
United Rentals North America, Inc. (Commercial Svs. & Supplies) | 7.375% | 05/15/2020 | 100,000 | 107,250 | ||||||||||||
MasTec, Inc. (Construction & Engineering) | 4.875% | 03/15/2023 | 275,000 | 261,938 | ||||||||||||
Belden, Inc. (Electrical Equip.) | (b) | 5.500% | 09/01/2022 | 925,000 | 913,438 | |||||||||||
CommScope Holding Co., Inc. (Electrical Equip.) | (b)(c) | 6.625% | 06/01/2020 | 550,000 | 528,000 | |||||||||||
CommScope, Inc. (Electrical Equip.) | (b) | 8.250% | 01/15/2019 | 1,425,000 | 1,528,313 | |||||||||||
General Cable Corp. (Electrical Equip.) | (b) | 5.750% | 10/01/2022 | 750,000 | 746,250 | |||||||||||
Viasystems, Inc. (Electrical Equip.) | (b) | 7.875% | 05/01/2019 | 725,000 | 768,500 | |||||||||||
Amsted Industries, Inc. (Machinery) | (b) | 8.125% | 03/15/2018 | 175,000 | 185,500 | |||||||||||
Dematic SA / DH Services Luxembourg Sarl (Machinery) | (b) | 7.750% | 12/15/2020 | 600,000 | 630,000 | |||||||||||
Dynacast International LLC / Dynacast Finance, Inc. (Machinery) | 9.250% | 07/15/2019 | 825,000 | 903,375 | ||||||||||||
Mcron Finance Sub. LLC / Mcron Finance Corp. (Machinery) | (b) | 8.375% | 05/15/2019 | 425,000 | 435,625 | |||||||||||
Milacron LLC / Mcron Finance Corp. (Machinery) | (b) | 7.750% | 02/15/2021 | 200,000 | 200,500 | |||||||||||
Mueller Water Products, Inc. (Machinery) | 7.375% | 06/01/2017 | 675,000 | 695,250 | ||||||||||||
Mueller Water Products, Inc. (Machinery) | 8.750% | 09/01/2020 | 480,000 | 525,600 | ||||||||||||
Schaeffler Finance BV (Machinery) | (b) | 8.500% | 02/15/2019 | 875,000 | 980,000 | |||||||||||
Schaeffler Finance BV (Machinery) | (b) | 7.750% | 02/15/2017 | 475,000 | 527,250 | |||||||||||
Schaeffler Finance BV (Machinery) | (b) | 4.750% | 05/15/2021 | 375,000 | 358,125 | |||||||||||
Hertz Corp. / The (Road & Rail) | 7.500% | 10/15/2018 | 100,000 | 107,750 | ||||||||||||
Hertz Corp. / The (Road & Rail) | 6.750% | 04/15/2019 | 1,025,000 | 1,089,063 | ||||||||||||
American Builders & Contractors Supply Co., Inc. (Trading Companies & Distributors) | (b) | 5.625% | 04/15/2021 | 125,000 | 123,125 | |||||||||||
HD Supply, Inc. (Trading Companies & Distributors) | 10.500% | 01/15/2021 | 75,000 | 77,906 | ||||||||||||
Interline Brands, Inc. (Trading Companies & Distributors) | 7.500% | 11/15/2018 | 700,000 | 738,500 | ||||||||||||
Interline Brands, Inc. (Trading Companies & Distributors) | (c) | 10.000% | 11/15/2018 | 1,025,000 | 1,107,000 | |||||||||||
International Lease Finance Corp. (Trading Companies & Distributors) | 8.250% | 12/15/2020 | 275,000 | 309,719 | ||||||||||||
International Lease Finance Corp. (Trading Companies & Distributors) | 8.750% | 03/15/2017 | 1,900,000 | 2,125,625 | ||||||||||||
International Lease Finance Corp. (Trading Companies & Distributors) | 5.750% | 05/15/2016 | 250,000 | 258,122 | ||||||||||||
International Lease Finance Corp. (Trading Companies & Distributors) | 5.875% | 08/15/2022 | 700,000 | 694,050 | ||||||||||||
International Lease Finance Corp. (Trading Companies & Distributors) | 4.625% | 04/15/2021 | 350,000 | 322,656 | ||||||||||||
Rexel SA (Trading Companies & Distributors) | (b) | 6.125% | 12/15/2019 | 1,000,000 | 1,025,000 | |||||||||||
Rexel SA (Trading Companies & Distributors) | (b) | 5.250% | 06/15/2020 | 750,000 | 751,875 | |||||||||||
|
| |||||||||||||||
| 35,467,223 | ||||||||||||||||
|
| |||||||||||||||
INFORMATION TECHNOLOGY – 10.5% | ||||||||||||||||
NCR Corp. (Computers & Peripherals) | 5.000% | 07/15/2022 | 450,000 | 436,500 | ||||||||||||
NCR Corp. (Computers & Peripherals) | 4.625% | 02/15/2021 | 475,000 | 456,000 | ||||||||||||
Seagate HDD Cayman (Computers & Peripherals) | 6.875% | 05/01/2020 | 375,000 | 399,375 | ||||||||||||
Seagate HDD Cayman (Computers & Peripherals) | 7.000% | 11/01/2021 | 300,000 | 322,500 | ||||||||||||
| 65 | (continued) |
| Ohio National Fund, Inc. | High Income Bond Portfolio (Continued) |
Schedule of Investments | June 30, 2013 (Unaudited) |
| Corporate Bonds (Continued) | Rate | Maturity | Face Amount | Value | ||||||||||||
INFORMATION TECHNOLOGY (continued) | ||||||||||||||||
Seagate HDD Cayman (Computers & Peripherals) | (b) | 4.750% | 06/01/2023 | $ | 1,300,000 | $ | 1,218,750 | |||||||||
Anixter, Inc. (Electronic Equip., Instr. & Comp.) | 5.625% | 05/01/2019 | 300,000 | 312,000 | ||||||||||||
Cleaver-Brooks, Inc. (Electronic Equip., Instr. & Comp.) | (b) | 8.750% | 12/15/2019 | 525,000 | 552,563 | |||||||||||
Flextronics International Ltd. (Electronic Equip., Instr. & Comp.) | (b) | 4.625% | 02/15/2020 | 300,000 | 292,500 | |||||||||||
Flextronics International Ltd. (Electronic Equip., Instr. & Comp.) | (b) | 5.000% | 02/15/2023 | 325,000 | 316,063 | |||||||||||
Kemet Corp. (Electronic Equip., Instr. & Comp.) | 10.500% | 05/01/2018 | 1,250,000 | 1,281,250 | ||||||||||||
IAC/InterActiveCorp (Internet Software & Svs.) | (b) | 4.750% | 12/15/2022 | 700,000 | 665,000 | |||||||||||
VeriSign, Inc. (Internet Software & Svs.) | (b) | 4.625% | 05/01/2023 | 250,000 | 243,750 | |||||||||||
Compiler Finance Sub, Inc. (IT Svs.) | (b) | 7.000% | 05/01/2021 | 300,000 | 292,500 | |||||||||||
CoreLogic, Inc. (IT Svs.) | 7.250% | 06/01/2021 | 1,125,000 | 1,203,750 | ||||||||||||
First Data Corp. (IT Svs.) | (b) | 8.750% | 01/15/2022 | 2,825,000 | 2,916,813 | |||||||||||
First Data Corp. (IT Svs.) | (b) | 8.250% | 01/15/2021 | 475,000 | 486,875 | |||||||||||
First Data Corp. (IT Svs.) | (b) | 11.250% | 01/15/2021 | 400,000 | 401,000 | |||||||||||
iGATE Corp. (IT Svs.) | 9.000% | 05/01/2016 | 1,000,000 | 1,045,000 | ||||||||||||
Lender Processing Services, Inc. (IT Svs.) | 5.750% | 04/15/2023 | 1,325,000 | 1,414,438 | ||||||||||||
SunGard Data Systems, Inc. (IT Svs.) | 7.625% | 11/15/2020 | 200,000 | 213,000 | ||||||||||||
SunGard Data Systems, Inc. (IT Svs.) | 7.375% | 11/15/2018 | 175,000 | 185,500 | ||||||||||||
SunGard Data Systems, Inc. (IT Svs.) | (b) | 6.625% | 11/01/2019 | 625,000 | 631,250 | |||||||||||
Advanced Micro Devices, Inc. (Semiconductors & Equip.) | 7.750% | 08/01/2020 | 325,000 | 317,688 | ||||||||||||
Advanced Micro Devices, Inc. (Semiconductors & Equip.) | 7.500% | 08/15/2022 | 300,000 | 291,750 | ||||||||||||
Freescale Semiconductor, Inc. (Semiconductors & Equip.) | (b) | 9.250% | 04/15/2018 | 725,000 | 784,813 | |||||||||||
Freescale Semiconductor, Inc. (Semiconductors & Equip.) | 10.750% | 08/01/2020 | 425,000 | 469,625 | ||||||||||||
MagnaChip Semiconductor SA / MagnaChip Semiconductor Finance Co. (Semiconductors & Equip.) | 10.500% | 04/15/2018 | 925,000 | 1,003,625 | ||||||||||||
NXP BV / NXP Funding LLC (Semiconductors & Equip.) | (b) | 5.750% | 02/15/2021 | 200,000 | 203,500 | |||||||||||
NXP BV / NXP Funding LLC (Semiconductors & Equip.) | (b) | 5.750% | 03/15/2023 | 200,000 | 202,000 | |||||||||||
NXP BV / NXP Funding LLC (Semiconductors & Equip.) | (b) | 3.750% | 06/01/2018 | 375,000 | 369,375 | |||||||||||
Spansion LLC (Semiconductors & Equip.) | 7.875% | 11/15/2017 | 1,200,000 | 1,236,000 | ||||||||||||
Aspect Software, Inc. (Software) | 10.625% | 05/15/2017 | 475,000 | 478,563 | ||||||||||||
Audatex North America, Inc. (Software) | 6.750% | 06/15/2018 | 725,000 | 764,875 | ||||||||||||
Audatex North America, Inc. (Software) | (b) | 6.000% | 06/15/2021 | 300,000 | 300,750 | |||||||||||
Eagle Midco, Inc. (Software) | (b) | 9.000% | 06/15/2018 | 950,000 | 931,000 | |||||||||||
Epicor Software Corp. (Software) | 8.625% | 05/01/2019 | 1,625,000 | 1,673,750 | ||||||||||||
Infor (US), Inc. (Software) | 9.375% | 04/01/2019 | 1,050,000 | 1,143,188 | ||||||||||||
Infor (US), Inc. (Software) | 11.500% | 07/15/2018 | 1,425,000 | 1,620,938 | ||||||||||||
Nuance Communications, Inc. (Software) | (b) | 5.375% | 08/15/2020 | 1,050,000 | 1,031,625 | |||||||||||
Serena Software, Inc. (Software) | 10.375% | 03/15/2016 | 200,000 | 198,000 | ||||||||||||
Sophia LP / Sophia Finance, Inc. (Software) | (b) | 9.750% | 01/15/2019 | 1,650,000 | 1,773,750 | |||||||||||
SSI Investments II Ltd. / SSI Co-Issuer LLC (Software) | 11.125% | 06/01/2018 | 1,250,000 | 1,376,563 | ||||||||||||
|
| |||||||||||||||
| 31,457,755 | ||||||||||||||||
|
| |||||||||||||||
MATERIALS – 8.1% | ||||||||||||||||
Ashland, Inc. (Chemicals) | (b) | 3.875% | 04/15/2018 | 175,000 | 173,906 | |||||||||||
Ashland, Inc. (Chemicals) | (b) | 4.750% | 08/15/2022 | 125,000 | 124,063 | |||||||||||
Axiall Corp. (Chemicals) | (b) | 4.875% | 05/15/2023 | 100,000 | 95,375 | |||||||||||
Eagle Spinco, Inc. (Chemicals) | (b) | 4.625% | 02/15/2021 | 200,000 | 192,750 | |||||||||||
Hexion U.S. Finance Corp / Hexion Nova Scotia Finance ULC (Chemicals) | 8.875% | 02/01/2018 | 900,000 | 922,500 | ||||||||||||
Hexion U.S. Finance Corp / Hexion Nova Scotia Finance ULC (Chemicals) | 9.000% | 11/15/2020 | 650,000 | 624,000 | ||||||||||||
Hexion U.S. Finance Corp. (Chemicals) | (b) | 6.625% | 04/15/2020 | 425,000 | 426,063 | |||||||||||
Huntsman International LLC (Chemicals) | 8.625% | 03/15/2020 | 325,000 | 355,063 | ||||||||||||
Huntsman International LLC (Chemicals) | 4.875% | 11/15/2020 | 250,000 | 248,125 | ||||||||||||
Koppers, Inc. (Chemicals) | 7.875% | 12/01/2019 | 275,000 | 295,625 | ||||||||||||
Momentive Performance Materials, Inc. (Chemicals) | 10.000% | 10/15/2020 | 600,000 | 627,000 | ||||||||||||
OMNOVA Solutions, Inc. (Chemicals) | 7.875% | 11/01/2018 | 1,025,000 | 1,071,125 | ||||||||||||
Rentech Nitrogen Partners LP / Rentech Nitrogen Finance Corp. (Chemicals) | (b) | 6.500% | 04/15/2021 | 275,000 | 273,281 | |||||||||||
Rockwood Specialties Group, Inc. (Chemicals) | 4.625% | 10/15/2020 | 400,000 | 403,500 | ||||||||||||
Scotts Miracle-Gro Co. / The (Chemicals) | 6.625% | 12/15/2020 | 550,000 | 585,750 | ||||||||||||
U.S. Coatings Acquisition, Inc. / Flash Dutch 2 BV (Chemicals) | (b) | 7.375% | 05/01/2021 | 1,125,000 | 1,151,719 | |||||||||||
Union Carbide Corp. (Chemicals) | 7.875% | 04/01/2023 | 100,000 | 123,517 | ||||||||||||
Ardagh Packaging Finance Plc (Containers & Packaging) | (b) | 9.125% | 10/15/2020 | 1,325,000 | 1,419,406 | |||||||||||
Ardagh Packaging Finance PLC / Ardagh MP Holdings U.S.A., Inc. (Containers & Packaging) | (b) | 9.125% | 10/15/2020 | 425,000 | 453,156 | |||||||||||
Ardagh Packaging Finance PLC / Ardagh MP Holdings U.S.A., Inc. (Containers & Packaging) | (b) | 7.000% | 11/15/2020 | 275,000 | 265,719 | |||||||||||
Ball Corp. (Containers & Packaging) | 4.000% | 11/15/2023 | 875,000 | 812,656 | ||||||||||||
Berry Plastics Corp. (Containers & Packaging) | 9.500% | 05/15/2018 | 550,000 | 600,875 | ||||||||||||
BOE Merger Corp. (Containers & Packaging) | (b)(c) | 9.500% | 11/01/2017 | 825,000 | 845,625 | |||||||||||
BWAY Holding Co. (Containers & Packaging) | 10.000% | 06/15/2018 | 900,000 | 990,000 | ||||||||||||
Crown Americas LLC / Crown Americas Capital Corp. IV (Containers & Packaging) | (b) | 4.500% | 01/15/2023 | 175,000 | 165,813 | |||||||||||
Greif, Inc. (Containers & Packaging) | 7.750% | 08/01/2019 | 475,000 | 546,250 | ||||||||||||
Packaging Dynamics Corp. (Containers & Packaging) | (b) | 8.750% | 02/01/2016 | 750,000 | 761,250 | |||||||||||
Pactiv LLC (Containers & Packaging) | 7.950% | 12/15/2025 | 225,000 | 201,375 | ||||||||||||
| 66 | (continued) |
| Ohio National Fund, Inc. | High Income Bond Portfolio (Continued) |
Schedule of Investments | June 30, 2013 (Unaudited) |
| Corporate Bonds (Continued) | Rate | Maturity | Face Amount | Value | ||||||||||||
MATERIALS (continued) | ||||||||||||||||
Reynolds Group Issuer, Inc. / Reynolds Group Issuer LLC (Containers & Packaging) | 8.500% | 05/15/2018 | $ | 775,000 | $ | 802,125 | ||||||||||
Reynolds Group Issuer, Inc. / Reynolds Group Issuer LLC (Containers & Packaging) | 9.000% | 04/15/2019 | 675,000 | 700,313 | ||||||||||||
Reynolds Group Issuer, Inc. / Reynolds Group Issuer LLC (Containers & Packaging) | 8.250% | 02/15/2021 | 1,875,000 | 1,863,281 | ||||||||||||
Reynolds Group Issuer, Inc. / Reynolds Group Issuer LLC (Containers & Packaging) | 9.875% | 08/15/2019 | 1,275,000 | 1,370,625 | ||||||||||||
Reynolds Group Issuer, Inc. / Reynolds Group Issuer LLC (Containers & Packaging) | 7.125% | 04/15/2019 | 175,000 | 185,719 | ||||||||||||
Reynolds Group Issuer, Inc. / Reynolds Group Issuer LLC (Containers & Packaging) | 5.750% | 10/15/2020 | 1,000,000 | 1,010,000 | ||||||||||||
Sealed Air Corp. (Containers & Packaging) | (b) | 8.375% | 09/15/2021 | 1,350,000 | 1,532,250 | |||||||||||
Sealed Air Corp. (Containers & Packaging) | (b) | 6.500% | 12/01/2020 | 125,000 | 132,500 | |||||||||||
Century Aluminum Co. (Metals & Mining) | (b) | 7.500% | 06/01/2021 | 725,000 | 705,969 | |||||||||||
Compass Minerals International, Inc. (Metals & Mining) | 8.000% | 06/01/2019 | 275,000 | 294,250 | ||||||||||||
Steel Dynamics, Inc. (Metals & Mining) | (b) | 5.250% | 04/15/2023 | 125,000 | 122,813 | |||||||||||
Clearwater Paper Corp. (Paper & Forest Products) | (b) | 4.500% | 02/01/2023 | 275,000 | 262,625 | |||||||||||
Longview Fibre Paper & Packaging, Inc. (Paper & Forest Products) | (b) | 8.000% | 06/01/2016 | 450,000 | 469,688 | |||||||||||
|
| |||||||||||||||
| 24,207,645 | ||||||||||||||||
|
| |||||||||||||||
TELECOMMUNICATION SERVICES – 4.9% | ||||||||||||||||
Level 3 Communications, Inc. (Diversified Telecom. Svs.) | 8.875% | 06/01/2019 | 350,000 | 365,313 | ||||||||||||
Level 3 Financing, Inc. (Diversified Telecom. Svs.) | 8.125% | 07/01/2019 | 925,000 | 978,188 | ||||||||||||
Level 3 Financing, Inc. (Diversified Telecom. Svs.) | 8.625% | 07/15/2020 | 275,000 | 293,906 | ||||||||||||
Level 3 Financing, Inc. (Diversified Telecom. Svs.) | 7.000% | 06/01/2020 | 475,000 | 476,188 | ||||||||||||
tw telecom holdings, Inc. (Diversified Telecom. Svs.) | 5.375% | 10/01/2022 | 175,000 | 174,563 | ||||||||||||
Digicel Group Ltd. (Wireless Telecom. Svs.) | (b) | 8.250% | 09/30/2020 | 1,575,000 | 1,638,000 | |||||||||||
Digicel Ltd. (Wireless Telecom. Svs.) | (b) | 8.250% | 09/01/2017 | 675,000 | 705,375 | |||||||||||
Digicel Ltd. (Wireless Telecom. Svs.) | (b) | 6.000% | 04/15/2021 | 600,000 | 568,500 | |||||||||||
MetroPCS Wireless, Inc. (Wireless Telecom. Svs.) | 7.875% | 09/01/2018 | 725,000 | 775,750 | ||||||||||||
MetroPCS Wireless, Inc. (Wireless Telecom. Svs.) | 6.625% | 11/15/2020 | 875,000 | 911,094 | ||||||||||||
MetroPCS Wireless, Inc. (Wireless Telecom. Svs.) | (b) | 6.625% | 04/01/2023 | 450,000 | 459,563 | |||||||||||
Sprint Capital Corp. (Wireless Telecom. Svs.) | 6.875% | 11/15/2028 | 1,100,000 | 1,061,500 | ||||||||||||
Sprint Capital Corp. (Wireless Telecom. Svs.) | 6.900% | 05/01/2019 | 1,875,000 | 1,959,375 | ||||||||||||
Sprint Nextel Corp. (Wireless Telecom. Svs.) | (b) | 9.000% | 11/15/2018 | 1,025,000 | 1,201,813 | |||||||||||
Sprint Nextel Corp. (Wireless Telecom. Svs.) | (b) | 7.000% | 03/01/2020 | 350,000 | 378,875 | |||||||||||
Sprint Nextel Corp. (Wireless Telecom. Svs.) | 6.000% | 11/15/2022 | 1,100,000 | 1,083,500 | ||||||||||||
Syniverse Holdings, Inc. (Wireless Telecom. Svs.) | 9.125% | 01/15/2019 | 1,600,000 | 1,716,000 | ||||||||||||
|
| |||||||||||||||
| 14,747,503 | ||||||||||||||||
|
| |||||||||||||||
UTILITIES – 1.9% | ||||||||||||||||
Energy Future Intermediate Holding Co. LLC / EFIH Finance, Inc. (Electric Utilities) | 10.000% | 12/01/2020 | 500,000 | 550,000 | ||||||||||||
Energy Future Intermediate Holding Co. LLC / EFIH Finance, Inc. (Electric Utilities) | (b) | 12.250% | 03/01/2022 | 625,000 | 693,750 | |||||||||||
Energy Future Intermediate Holding Co. LLC / EFIH Finance, Inc. (Electric Utilities) | (b) | 6.875% | 08/15/2017 | 375,000 | 382,500 | |||||||||||
Suburban Propane Partners LP / Suburban Energy Finance Corp. (Gas Utilities) | 7.500% | 10/01/2018 | 211,000 | 222,605 | ||||||||||||
Suburban Propane Partners LP / Suburban Energy Finance Corp. (Gas Utilities) | 7.375% | 08/01/2021 | 506,000 | 528,770 | ||||||||||||
Calpine Corp. (Ind. Power Prod. & Energy Traders) | (b) | 7.500% | 02/15/2021 | 833,000 | 893,393 | |||||||||||
Dynegy, Inc. (Ind. Power Prod. & Energy Traders) | (b) | 5.875% | 06/01/2023 | 175,000 | 159,688 | |||||||||||
NRG Energy, Inc. (Ind. Power Prod. & Energy Traders) | 8.250% | 09/01/2020 | 750,000 | 811,875 | ||||||||||||
NRG Energy, Inc. (Ind. Power Prod. & Energy Traders) | 7.875% | 05/15/2021 | 475,000 | 509,437 | ||||||||||||
NRG Energy, Inc. (Ind. Power Prod. & Energy Traders) | 7.625% | 05/15/2019 | 700,000 | 735,000 | ||||||||||||
FPL Energy National Wind Portfolio LLC (Acquired 05/27/2009, Cost $110,570)(Multi-Utilities) | (b)(e) | 6.125% | 03/25/2019 | 126,075 | 98,318 | |||||||||||
|
| |||||||||||||||
| 5,585,336 | ||||||||||||||||
|
| |||||||||||||||
Total Corporate Bonds (Cost $283,985,768) | $ | 292,871,521 | ||||||||||||||
|
| |||||||||||||||
| Common Stocks – 0.0% | Shares | Value | ||||||||||||||
CONSUMER DISCRETIONARY – 0.0% | ||||||||||||||||
General Motors Co. (Automobiles) | (a) | 4,443 | $ | 147,996 | ||||||||||||
|
| |||||||||||||||
Total Common Stocks (Cost $415,829) | $ | 147,996 | ||||||||||||||
|
| |||||||||||||||
| Preferred Stocks – 0.1% | Shares | Value | ||||||||||||||
FINANCIALS – 0.1% | ||||||||||||||||
Ally Financial, Inc. (Consumer Finance) | (b) | 346 | $ | 328,884 | ||||||||||||
|
| |||||||||||||||
Total Preferred Stocks (Cost $0) | $ | 328,884 | ||||||||||||||
|
| |||||||||||||||
| Warrants – 0.1% | Quantity | Value | ||||||||||||||
CONSUMER DISCRETIONARY – 0.1% | ||||||||||||||||
General Motors Co. (Automobiles) Expiration: 07/10/16, Exercise Price: $10.00 | (a) | 4,039 | $ | 96,936 | ||||||||||||
General Motors Co. (Automobiles) Expiration: 07/10/19, Exercise Price: $18.33 | (a) | 4,039 | 66,038 | |||||||||||||
|
| |||||||||||||||
Total Warrants (Cost $476,540) | $ | 162,974 | ||||||||||||||
|
| |||||||||||||||
| 67 | (continued) |
| Ohio National Fund, Inc. | High Income Bond Portfolio (Continued) |
Schedule of Investments | June 30, 2013 (Unaudited) |
| Other – 0.0% | Shares | Value | ||||||||||||
CONSUMER DISCRETIONARY – 0.0% | ||||||||||||||
Motors Liquidation Co. GUC Trust (Automobiles) | (a) | 1,116 | $ | 34,261 | ||||||||||
|
| |||||||||||||
Total Other (Cost $0) | $ | 34,261 | ||||||||||||
|
| |||||||||||||
| Money Market Funds – 0.3% | Shares | Value | ||||||||||||
| Fidelity Institutional Money Market Funds Money Market Portfolio – Class I | 809,000 | $ | 809,000 | |||||||||||
|
| |||||||||||||
Total Money Market Funds (Cost $809,000) | $ | 809,000 | ||||||||||||
|
| |||||||||||||
Total Investments – 98.2% (Cost $285,687,137) | (f) | $ | 294,354,636 | |||||||||||
Other Assets in Excess of Liabilities – 1.8% | 5,527,952 | |||||||||||||
|
| |||||||||||||
Net Assets – 100.0% | $ | 299,882,588 | ||||||||||||
|
| |||||||||||||
Percentages are stated as a percent of net assets.
Footnotes:
| (a) | Non-income producing security. |
| (b) | Security exempt from registration under Regulation D of the Securities Act of 1933. These securities may be resold in transactions exempt form registration, normally to qualified buyers under Rule 144A. At June 30, 2013, the value of these securities totaled $105,778,021, or 35.3% of the Portfolio’s net assets. Unless also noted with (e), as defined below, these securities were deemed liquid pursuant to procedures approved by the Board of Directors. |
| (c) | Issuer of the security has the option to make coupon payments in cash or in additional par value of this bond. Rate presented is the coupon rate for the cash option. |
| (d) | Represents a security that is in default. Unless noted by (e), as defined below, these securities were deemed liquid pursuant to procedures approved by the Board of Directors. |
| (e) | Represents a security deemed to be illiquid. At June 30, 2013, the value of illiquid securities in the Portfolio totaled $702,162, or 0.2% of the Portfolio’s net assets. |
| (f) | Represents cost for financial reporting purposes, which may differ from cost basis for federal income tax purposes. See also Note 7 of the Notes to Financial Statements. |
The accompanying notes are an integral part of these financial statements.
| 68 |
| Ohio National Fund, Inc. | Capital Growth Portfolio |
Objective/Strategy
The Capital Growth Portfolio seeks long-term capital appreciation by investing primarily in an actively managed portfolio of equity securities of small cap growth companies.
Performance as of June 30, 2013
Average Annual Returns: | ||||
One year | 22.82% | |||
Five years | 9.36% | |||
Ten years | 11.00% |
Past performance does not guarantee future results. The performance data quoted represents past performance and current returns may be lower or higher. Total return figures include change in share price and reinvestment of dividends and capital gains. The investment return and principal value will fluctuate so that an investor’s shares, when redeemed, may be worth more or less than the original cost. To obtain performance information up to the most recent month end, call toll-free 1-877-781-6392.
The Portfolio is not open to direct retail investment. Beneficial interest in shares is obtained solely by purchase of variable life insurance policies and variable annuity contracts. Actual performance results for variable annuity and variable universal life contracts will be lower due to contract charges. Consult your contract for applicable charges.
Comments
For the six-month period ended June 30, 2013, the Capital Growth Portfolio returned 12.98% versus 17.44% for the current benchmark, the Russell 2000 Growth Index.
Specialty retail holding Vitamin Shoppe, Inc., a strong long-term performer, sold off earlier in the period and contributed to relative under-performance in Consumer Discretionary. Under-performance also transpired within the Information Technology sector, as weak performance by security software stock Fortinet, Inc. dragged down relative returns. The Materials sector experienced a small amount of out-performance during the period due to a modest overweight, as well as solid returns posted by the Portfolio’s holding of Texas Industries, Inc.(1)
The Portfolio’s worst-performing stocks were Geospace Technologies Corp., Vitamin Shoppe, Inc. and Vocera Communications, Inc. Geospace Technologies Corp. makes seismic instruments used in monitoring oil and natural-gas reserves. Shares of the stock took a breather during the quarter upon reaching all-time highs earlier this year, as the firm missed estimates due to the timing of some large contract orders. Geospace Technologies Corp. continues to have strong prospects for its innovative seismic-recording systems. Vitamin Shoppe, Inc. is a specialty retailer of vitamins, sports nutrition, as well as health and beauty-aid products. The stock had been a strong long-term performer; however, a slight earnings miss and back-end-loaded guidance caused a sharp sell-off earlier in the period. Significant secular tailwinds supporting the vitamins and supplements industry (e.g., an aging U.S. baby boomer population and increasing public health awareness) should bode well for Vitamin Shoppe, Inc., given its continued ability to take market share and maintain solid earnings growth. Vocera Communications, Inc. makes hands-free devices used by physicians and many hospital personnel for easy-access communication between highly-mobile and often difficult-to-locate individuals in a fast-paced hospital environment. Vocera Communications, Inc. reported a substantially weaker-than-expected quarter and reduced guidance on reduced near-term growth visibility that was further clouded by recent execution issues.(1)
The Portfolio’s top-performing stocks were Theravance, Inc., Lufkin Industries, Inc. and Salix Pharmaceuticals Ltd. Theravance, Inc. is a biotechnology firm focused on developing therapies for respiratory diseases and bacterial infections. Shares of the stock rose sharply during the period in accordance with the recent Food and Drug Administration (FDA) approval of the firm’s chronic obstructive pulmonary disease (COPD) inhaler-based therapy Breo Ellipta. Lufkin Industries, Inc. manufactures pump jacks used in the enhanced oil recovery process. The company was announced to be acquired by General Electric during the quarter at a substantial premium. Salix Pharmaceuticals Ltd. specializes in drug therapies for gastrointestinal (GI) diseases and conditions. Industry feedback regarding one of its new drugs has been overwhelmingly positive, with the company generating impressive sales growth for the product in a largely underpenetrated market.(1)
Equity markets remained strong during the second quarter despite a scare early in June when the U.S. Federal Reserve indicated it may begin to taper its bond-buying economic stimulus program sooner than the markets had anticipated. Further concerns also had arisen in China, where growth in the world’s largest emerging market appeared not only to slow, but perhaps face a liquidity crisis as well. Modestly higher interest rates are ultimately a double-edged sword, as they should provide a short-term economic boost, while purchasers fearing even higher rates look to secure financing for new homes and autos. Also, the higher rates – and attendant bond-market selloff – should support a reversal of investor flows from fixed income to equities, providing further fuel for the rally. As we move into the second half of the year, housing is expected to be strong; however, housing stocks may tread water in the face of more difficult comparisons next year. In light of the real prospect of rising interest rates, we believe health care should be less economically sensitive and provide leadership in what should be a continued strong environment for equities.
Our neutral outlook for the Energy sector is driven by an uninspired near-term view of commodity prices. Continued growth in North American oil production, coupled with lackluster demand in both emerging and developed economies, suggests a balanced view on the direction of oil prices. The enormous overhang in natural gas inventories has been reduced, but production levels have remained elevated due to the surge in “associated gas” (the industry term for gas produced from oil wells). The longer-term outlook for natural gas appears favorable due to increased demand from a variety of long-lead-time investments (e.g., petrochemical plants), which are now being put into place. In this environment, we are focused on exploration and production (E&P) operators that will benefit from improved well results through the leveraging of new technologies, as well as reduced costs from drilling efficiencies.
Within the Industrials and Materials sectors, we continue to favor companies with exposure to industries that are in the midst of cyclical growth: aerospace and U.S. housing. The fundamental backdrop for the aerospace sector has improved over the past three months as falling jet-fuel prices have bolstered airline profits and strong orders at the Paris air show further reinforced the multi-year backlogs at Boeing and Airbus. The Boeing 787 appears to be tracking according to plan and the Airbus A350 should continue to move toward its planned first delivery in late 2014. Representative holding Hexcel Corp. is exceptionally well-positioned on both of these models and should post strong growth in the coming years. In contrast, the U.S. housing market continues to improve, but cause for concern has arisen as mortgage rates have rebounded sharply, albeit off record low levels. In response, we have reduced our exposure to housing; however, thin inventories of both new and existing homes
| 69 | (continued) |
| Ohio National Fund, Inc. | Capital Growth Portfolio (Continued) |
should continue to drive residential construction activity levels higher. Finally, we continue to hold investments in Industrials and Materials, which will each benefit from the renaissance in North American manufacturing and petrochemical industries.(1)
2013 and 2014 are shaping up to be years of transition as the United States prepares for the implementation of Obamacare. There will inevitably be continued chaos, unexpected surprises and a lot of jockeying for position. That will likely lead to some strange bedfellows, as a variety of unexpected joint ventures, partnerships, mergers and acquisitions are consummated. We believe the future of Health Care will be dominated by one theme: do more with less. It is expected that providers will be asked to treat more patients, but be reimbursed less for the services provided, placing pressure on margins for providers and manufacturers alike.
Against this unpredictable and chaotic backdrop, we are continuing to invest in several themes we expect to play out favorably as the industry evolves toward a “new normal.” One such theme is cash-pay health care, where products or services are not covered by insurance and considered discretionary (e.g., Sirona Dental Systems, Inc. and MWI Veterinary Supply). Medicaid managed care is another area expected to benefit in the current environment, as those companies (e.g., Centene Corp.) focused on Medicaid managed care stand to benefit enormously from the coverage of the uninsured beginning in 2014, as mandated by the Affordable Care Act. We also continue to prefer companies (e.g., PAREXEL International Corp.) offering products and services that have little to no government reimbursement exposure. Lastly, we possess a favorable view on companies (e.g., MedAssets, Inc.) that assist hospitals with revenue-cycle management to reduce costs and collect receivables.(1)
Financial industry profits should begin to recover, with long-term interest rates increasing from historically low levels. A steepening yield curve would enable lending institutions to expand net margins, which have been largely suppressed for some time now, as well as support earnings-growth potential. Importantly, the Federal Reserve maintained that no adjustments to short-term rates are expected prior to unemployment falling below 6.5 percent, despite the previously mentioned potential for the Federal Reserve to scale back the long-term bond-buying economic-stimulus program. That dynamic should provide tailwinds to some extent for financial institutions as the environment for profitability improves. We continue to own stocks we believe will benefit from improving credit fundamentals in housing in addition to possessing exposure to companies (e.g., Home Loan Servicing Solutions Ltd.) whose earnings are well-positioned to grow in a rising-rate environment.(1)
In the Information Technology sector, we are cautiously optimistic that recent increases in home values will potentially result in improved consumer sentiment and business demand in the second half of the year. Telecommunication Services providers’ capital expenditures, which have been weak for some time, appear poised for improvement as well. We expect technology spending by domestic government and European businesses to remain muted. We are, however, finding attractive valuations and expect merger-and-acquisition activity to pick up as a result. We are bullish on internet-related software companies as well as companies exposed to the housing and commercial real-estate industries.
Consumer stocks had a particularly strong second quarter, reflecting a boost in consumer confidence derived from rising home-equity values and stock prices, as well as generally positive outlooks from many bellwether companies. As the Federal Reserve begins tapering off its bond purchases with the attendant result of rising interest rates, we believe consumer stocks have the potential to lag less rate-sensitive sectors, such as Health Care. Also, we continue to favor gaming-equipment suppliers. Also, in light of the expectation of rising interest rates, we reduced our position in housing stock Meritage Homes Corp.(1)
| (1) | The Portfolio’s composition is subject to change. Holdings and weightings are as of June 30, 2013. |
Change in Value of $10,000 Investment

Hypothetical illustration based on past performance. Future performance will vary. The Portfolio’s returns reflect reinvested dividends. The Portfolio’s holdings may differ significantly from the securities in the index. The index is unmanaged and therefore does not reflect the cost of portfolio management and accounting.
The Russell 2000 Growth Index measures the performance of the small-cap growth segment of the U.S. equity universe. It includes those Russell 2000 Index companies with higher price-to-value ratios and higher forecasted growth values. The Russell 2000 Index includes the 2000 firms from the Russell 3000 Index with the smallest market capitalizations. The Russell 3000 Index represents 98% of the investable U.S. equity market. The index presented herein includes the effects of reinvested dividends.
| 70 | (continued) |
| Ohio National Fund, Inc. | Capital Growth Portfolio (Continued) |
Portfolio Composition as of June 30, 2013 (1)
| % of Net Assets | ||||
Common Stocks (3) | 97.6 | |||
Money Market Funds and | 2.4 | |||
|
| |||
| 100.0 | ||||
|
|
Top 10 Portfolio Holdings as of June 30, 2013 (1) (2)
| % of Net Assets | ||||
1. Genesco, Inc. | 3.3 | |||
2. Geospace Technologies Corp. | 2.3 | |||
3. Geo Group, Inc. / The | 2.0 | |||
4. Theravance, Inc. | 1.8 | |||
5. Salix Pharmaceuticals Ltd. | 1.8 | |||
6. Vitamin Shoppe, Inc. | 1.7 | |||
7. SHFL Entertainment, Inc. | 1.7 | |||
8. Bally Technologies, Inc. | 1.7 | |||
9. United Therapeutics Corp. | 1.6 | |||
10. PAREXEL International Corp. | 1.6 |
| (1) | Composition of Portfolio subject to change. |
| (2) | Short-term investments have been excluded from the list of Top 10 Portfolio Holdings. |
| (3) | Sectors: |
| % of Net Assets | ||||
Information Technology | 21.8 | |||
Health Care | 21.3 | |||
Consumer Discretionary | 16.1 | |||
Industrials | 15.2 | |||
Financials | 7.6 | |||
Materials | 6.3 | |||
Energy | 5.4 | |||
Consumer Staples | 3.9 | |||
|
| |||
| 97.6 | ||||
|
|
| 71 |
| Ohio National Fund, Inc. | Capital Growth Portfolio |
Schedule of Investments | June 30, 2013 (Unaudited) |
| Common Stocks – 97.6% | Shares | Value | ||||||||
CONSUMER DISCRETIONARY – 16.1% | ||||||||||
Sotheby’s (Diversified Consumer Svs.) | 5,355 | $ | 203,008 | |||||||
Bally Technologies, Inc. (Hotels, Restaurants & Leisure) | (a) | 19,136 | 1,079,653 | |||||||
BJ’s Restaurants, Inc. (Hotels, Restaurants & Leisure) | (a) | 11,230 | 416,633 | |||||||
Chuy’s Holdings, Inc. (Hotels, Restaurants & Leisure) | (a) | 10,780 | 413,305 | |||||||
Orient-Express Hotels Ltd. Class A (Hotels, Restaurants & Leisure) | (a) | 36,540 | 444,326 | |||||||
Pinnacle Entertainment, Inc. (Hotels, Restaurants & Leisure) | (a) | 24,547 | 482,840 | |||||||
SHFL Entertainment, Inc. (Hotels, Restaurants & Leisure) | (a) | 61,759 | 1,093,752 | |||||||
Meritage Homes Corp. (Household Durables) | (a) | 12,480 | 541,133 | |||||||
Universal Electronics, Inc. (Household Durables) | (a) | 21,647 | 608,930 | |||||||
Chico’s FAS, Inc. (Specialty Retail) | 25,429 | 433,819 | ||||||||
Francesca’s Holdings Corp. (Specialty Retail) | (a) | 25,070 | 696,695 | |||||||
Genesco, Inc. (Specialty Retail) | (a) | 31,565 | 2,114,539 | |||||||
Vitamin Shoppe, Inc. (Specialty Retail) | (a) | 24,991 | 1,120,596 | |||||||
Steven Madden Ltd. (Textiles, Apparel & Luxury Goods) | (a) | 15,099 | 730,490 | |||||||
|
| |||||||||
| 10,379,719 | ||||||||||
|
| |||||||||
CONSUMER STAPLES – 3.9% | ||||||||||
Fresh Market, Inc. / The (Food & Staples Retailing) | (a) | 17,399 | 865,078 | |||||||
Natural Grocers by Vitamin Cottage, Inc. (Food & Staples Retailing) | (a) | 30,804 | 954,924 | |||||||
WhiteWave Foods Co. Class A (Food Products) | (a) | 43,295 | 703,544 | |||||||
|
| |||||||||
| 2,523,546 | ||||||||||
|
| |||||||||
ENERGY – 5.4% | ||||||||||
Dril-Quip, Inc. (Energy Equip. & Svs.) | (a) | 3,694 | 333,531 | |||||||
Geospace Technologies Corp. (Energy Equip. & Svs.) | (a) | 21,893 | 1,512,368 | |||||||
Gulfport Energy Corp. (Oil, Gas & Consumable Fuels) | (a) | 18,836 | 886,611 | |||||||
Oasis Petroleum, Inc. (Oil, Gas & Consumable Fuels) | (a) | 19,485 | 757,382 | |||||||
|
| |||||||||
| 3,489,892 | ||||||||||
|
| |||||||||
FINANCIALS – 7.6% | ||||||||||
UMB Financial Corp. (Commercial Banks) | 10,712 | 596,337 | ||||||||
Cash America International, Inc. (Consumer Finance) | 11,660 | 530,064 | ||||||||
KKR Financial Holdings LLC (Diversified Financial Svs.) | 33,455 | 352,950 | ||||||||
Validus Holdings Ltd. (Insurance) | 22,910 | 827,509 | ||||||||
Geo Group, Inc. / The (Real Estate Investment Trusts) | 37,961 | 1,288,776 | ||||||||
Redwood Trust, Inc. (Real Estate Investment Trusts) | 13,396 | 227,732 | ||||||||
Two Harbors Investment Corp. (Real Estate Investment Trusts) | 44,805 | 459,251 | ||||||||
Home Loan Servicing Solutions Ltd. (Thrifts & Mortgage Finance) | 26,594 | 637,458 | ||||||||
|
| |||||||||
| 4,920,077 | ||||||||||
|
| |||||||||
HEALTH CARE – 21.3% | ||||||||||
Acorda Therapeutics, Inc. (Biotechnology) | (a) | 22,641 | 746,927 | |||||||
Ariad Pharmaceuticals, Inc. (Biotechnology) | (a) | 32,225 | 563,615 | |||||||
Cubist Pharmaceuticals, Inc. (Biotechnology) | (a) | 11,837 | 571,727 | |||||||
Seattle Genetics, Inc. (Biotechnology) | (a) | 14,960 | 470,642 | |||||||
Theravance, Inc. (Biotechnology) | (a) | 29,848 | 1,150,043 | |||||||
United Therapeutics Corp. (Biotechnology) | (a) | 15,935 | 1,048,842 | |||||||
ArthroCare Corp. (Health Care Equip. & Supplies) | (a) | 28,590 | 987,213 | |||||||
Cooper Cos., Inc. / The (Health Care Equip. & Supplies) | 8,015 | 954,186 | ||||||||
HeartWare International, Inc. (Health Care Equip. & Supplies) | (a) | 7,422 | 705,906 | |||||||
Sirona Dental Systems, Inc. (Health Care Equip. & Supplies) | (a) | 15,300 | 1,007,964 | |||||||
Air Methods Corp. (Health Care Providers & Svs.) | 16,552 | 560,782 | ||||||||
Centene Corp. (Health Care Providers & Svs.) | (a) | 19,181 | 1,006,235 | |||||||
Emeritus Corp. (Health Care Providers & Svs.) | (a) | 10,949 | 253,798 | |||||||
Team Health Holdings, Inc. (Health Care Providers & Svs.) | (a) | 13,364 | 548,860 | |||||||
MedAssets, Inc. (Health Care Technology) | (a) | 42,136 | 747,493 | |||||||
Vocera Communications, Inc. (Health Care Technology) | (a) | 13,811 | 203,022 | |||||||
| Common Stocks (Continued) | Shares | Value | ||||||||
HEALTH CARE (continued) | ||||||||||
PAREXEL International Corp. (Life Sciences Tools & Svs.) | (a) | 22,716 | $ | 1,043,573 | ||||||
Salix Pharmaceuticals Ltd. (Pharmaceuticals) | (a) | 17,087 | 1,130,305 | |||||||
|
| |||||||||
| 13,701,133 | ||||||||||
|
| |||||||||
INDUSTRIALS – 15.2% | ||||||||||
Hexcel Corp. (Aerospace & Defense) | (a) | 30,039 | 1,022,828 | |||||||
Triumph Group, Inc. (Aerospace & Defense) | 11,606 | 918,615 | ||||||||
Atlas Air Worldwide Holdings, Inc. (Air Freight & Logistics) | (a) | 9,981 | 436,769 | |||||||
JetBlue Airways Corp. (Airlines) | (a) | 94,010 | 592,263 | |||||||
U.S. Airways Group, Inc. (Airlines) | (a) | 10,593 | 173,937 | |||||||
PGT, Inc. (Building Products) | (a) | 41,039 | 355,808 | |||||||
Trex Co., Inc. (Building Products) | (a) | 8,743 | 415,205 | |||||||
Waste Connections, Inc. (Commercial Svs. & Supplies) | 21,672 | 891,586 | ||||||||
Northwest Pipe Co. (Construction & Engineering) | (a) | 20,161 | 562,492 | |||||||
General Cable Corp. (Electrical Equip.) | 14,998 | 461,189 | ||||||||
Thermon Group Holdings, Inc. (Electrical Equip.) | (a) | 17,660 | 360,264 | |||||||
Chart Industries, Inc. (Machinery) | (a) | 6,082 | 572,255 | |||||||
Colfax Corp. (Machinery) | (a) | 13,079 | 681,547 | |||||||
Manitowoc Co., Inc. / The (Machinery) | 25,894 | 463,762 | ||||||||
WABCO Holdings, Inc. (Machinery) | (a) | 4,857 | 362,769 | |||||||
Woodward, Inc. (Machinery) | 10,909 | 436,360 | ||||||||
Avis Budget Group, Inc. (Road & Rail) | (a) | 10,615 | 305,181 | |||||||
Landstar System, Inc. (Road & Rail) | 10,170 | 523,755 | ||||||||
Quality Distribution, Inc. (Road & Rail) | (a) | 31,184 | 275,667 | |||||||
|
| |||||||||
| 9,812,252 | ||||||||||
|
| |||||||||
INFORMATION TECHNOLOGY – 21.8% | ||||||||||
Ixia (Communications Equip.) | (a) | 16,718 | 307,611 | |||||||
Riverbed Technology, Inc. (Communications Equip.) | (a) | 23,015 | 358,113 | |||||||
Fusion-io, Inc. (Computers & Peripherals) | (a) | 18,310 | 260,734 | |||||||
Coherent, Inc. (Electronic Equip., Instr. & Comp.) | 11,508 | 633,746 | ||||||||
InvenSense, Inc. (Electronic Equip., Instr. & Comp.) | (a) | 42,291 | 650,436 | |||||||
IPG Photonics Corp. (Electronic Equip., Instr. & Comp.) | 11,415 | 693,233 | ||||||||
Universal Display Corp. (Electronic Equip., Instr. & Comp.) | (a) | 8,864 | 249,167 | |||||||
Angie’s List, Inc. (Internet Software & Svs.) | (a) | 17,886 | 474,873 | |||||||
Cornerstone OnDemand, Inc. (Internet Software & Svs.) | (a) | 21,011 | 909,566 | |||||||
Demandware, Inc. (Internet Software & Svs.) | (a) | 12,318 | 522,406 | |||||||
Marin Software, Inc. (Internet Software & Svs.) | (a) | 19,497 | 199,649 | |||||||
Monster Worldwide, Inc. (Internet Software & Svs.) | (a) | 119,471 | 586,603 | |||||||
Trulia, Inc. (Internet Software & Svs.) | (a) | 25,394 | 789,500 | |||||||
Cavium, Inc. (Semiconductors & Equip.) | (a) | 22,185 | 784,683 | |||||||
EZchip Semiconductor Ltd. (Semiconductors & Equip.) | (a) | 13,353 | 360,398 | |||||||
Teradyne, Inc. (Semiconductors & Equip.) | (a) | 42,255 | 742,420 | |||||||
Veeco Instruments, Inc. (Semiconductors & Equip.) | (a) | 16,820 | 595,764 | |||||||
Compuware Corp. (Software) | 28,941 | 299,539 | ||||||||
Concur Technologies, Inc. (Software) | (a) | 6,485 | 527,749 | |||||||
Fortinet, Inc. (Software) | (a) | 37,047 | 648,323 | |||||||
Guidewire Software, Inc. (Software) | (a) | 10,398 | 437,236 | |||||||
Imperva, Inc. (Software) | (a) | 8,231 | 370,724 | |||||||
NICE Systems Ltd. – ADR (Software) | 19,587 | 722,564 | ||||||||
QLIK Technologies, Inc. (Software) | (a) | 26,745 | 756,081 | |||||||
Sourcefire, Inc. (Software) | (a) | 8,105 | 450,233 | |||||||
TIBCO Software, Inc. (Software) | (a) | 13,541 | 289,777 | |||||||
Ultimate Software Group, Inc. (Software) | (a) | 3,467 | 406,644 | |||||||
|
| |||||||||
| 14,027,772 | ||||||||||
|
| |||||||||
MATERIALS – 6.3% | ||||||||||
Axiall Corp. (Chemicals) | 17,351 | 738,806 | ||||||||
Huntsman Corp. (Chemicals) | 33,716 | 558,337 | ||||||||
Quaker Chemical Corp. (Chemicals) | 15,345 | 951,544 | ||||||||
| 72 | (continued) |
| Ohio National Fund, Inc. | Capital Growth Portfolio (Continued) |
Schedule of Investments | June 30, 2013 (Unaudited) |
| Common Stocks (Continued) | Shares | Value | ||||||||
MATERIALS (continued) | ||||||||||
Texas Industries, Inc. (Construction Materials) | (a) | 15,446 | $ | 1,006,152 | ||||||
RTI International Metals, Inc. (Metals & Mining) | (a) | 28,949 | 802,177 | |||||||
|
| |||||||||
| 4,057,016 | ||||||||||
|
| |||||||||
Total Common Stocks (Cost $49,367,386) | $ | 62,911,407 | ||||||||
|
| |||||||||
| Money Market Funds – 2.3% | Shares | Value | ||||||||
Fidelity Institutional Money Market Funds | 1,496,000 | $ | 1,496,000 | |||||||
|
| |||||||||
Total Money Market Funds (Cost $1,496,000) | $ | 1,496,000 | ||||||||
|
| |||||||||
Total Investments – 99.9% (Cost $50,863,386) | (b) | $ | 64,407,407 | |||||||
Other Assets in Excess of Liabilities – 0.1% | 48,481 | |||||||||
|
| |||||||||
Net Assets – 100.0% | $ | 64,455,888 | ||||||||
|
| |||||||||
Percentages are stated as a percent of net assets.
Abbreviations:
ADR: American Depositary Receipts
Footnotes:
| (a) | Non-income producing security. |
| (b) | Represents cost for financial reporting purposes, which may differ from cost basis for federal income tax purposes. See also Note 7 of the Notes to Financial Statements. |
The accompanying notes are an integral part of these financial statements.
| 73 |
| Ohio National Fund, Inc. | Nasdaq-100® Index Portfolio |
Objective/Strategy
The Nasdaq-100® Index Portfolio seeks long-term growth of capital by investing primarily in stocks that are included in the Nasdaq-100® Index. Unlike the other Portfolios of the Fund, the Nasdaq-100® Index Portfolio is a non-diversified portfolio for purposes of Section 5(b) of the Investment Company Act of 1940, as amended.
Performance as of June 30, 2013
Average Annual Total Returns: | ||||
One year | 12.32% | |||
Five years | 10.05% | |||
Ten years | 9.34% |
Past performance does not guarantee future results. The performance data quoted represents past performance and current returns may be lower or higher. Total return figures include change in share price and reinvestment of dividends and capital gains. The investment return and principal value will fluctuate so that an investor’s shares, when redeemed, may be worth more or less than the original cost. To obtain performance information up to the most recent month end, call toll-free 1-877-781-6392.
The Portfolio is not open to direct retail investment. Beneficial interest in shares is obtained solely by purchase of variable life insurance policies and variable annuity contracts. Actual performance results for variable annuity and variable universal life contracts will be lower due to contract charges. Consult your contract for applicable charges.
Comments
For the six-month period ended June 30, 2013, the Nasdaq-100® Index Portfolio returned 9.78% versus 10.09% for the current benchmark, the Nasdaq-100® Index.
The Portfolio’s correlation to the index was 99.8%. The high correlation is due to the fact that the Portfolio invests in each of the 100 stocks in the index. The Portfolio also invests in PowerShares QQQ, an exchange traded fund that mimics the holdings and returns of the Nasdaq-100® Index.(1)
The largest contributors to the index return for the six-month period were Microsoft Corp., Google, Inc., Cisco Systems, Inc., Gilead Sciences, Inc and Intel Corp. The largest detractors for the six-month period were Apple, Inc., Oracle Corp., Cognizant Technology Solutions Corp., Facebook, Inc. and F5 Networks, Inc.(1)
Stocks had a decent first half of 2013. However, in mid-June, Federal Reserve Chairman Bernanke signaled that the central bank would likely begin tapering bond purchases in the latter part of 2013. With the end of quantitative easing in sight, stocks lost some steam.
Stocks could pick up their momentum if economic data does not meet the Federal Reserve’s expectation and quantitative easing continues. The Federal Reserve’s latest comments are relatively dovish, trying to calm investors by saying the central bank’s asset purchases “are by no means on a preset course”, and the Federal Reserve is responding to the data it receives. Stocks may finish out the year relatively strong, with the Federal Reserve still ready to assist the economy if the recovery is not as strong as its expectations.
| (1) | The Portfolio’s composition is subject to change. Holdings and weightings are as of June 30, 2013. |
The Nasdaq-100®, Nasdaq-100 Index®, and Nasdaq® are registered trademarks of The NASDAQ OMX Group, Inc. (which with its affiliates is referred to as “NASDAQ OMX”). Ohio National Investments, Inc. has licensed these marks for the Portfolio’s use. NASDAQ OMX has not passed on the Portfolio’s legality or suitability. NASDAQ OMX does not sponsor, endorse, sell or promote the Portfolio. NASDAQ OMX MAKES NO WARRANTIES AND BEARS NO LIABILITY WITH RESPECT TO THE PORTFOLIO.
Change in Value of $10,000 Investment
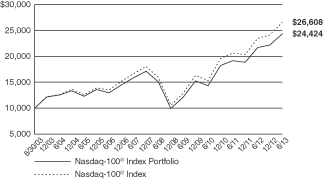
Hypothetical illustration based on past performance. Future performance will vary. The Portfolio’s returns reflect reinvested dividends. The Portfolio’s holdings may differ significantly from the securities in the index. The index is unmanaged and therefore does not reflect the cost of portfolio management and accounting. Investors cannot invest in an index. Although they can invest in its underlying securities or funds.
The Nasdaq-100® Index is a modified capitalization-weighted index of the 100 largest domestic and international non-financial companies listed on the NASDAQ Stock Market. The index presented herein includes the effects of reinvested dividends.
| 74 | (continued) |
| Ohio National Fund, Inc. | Nasdaq-100® Index Portfolio (Continued) |
Portfolio Composition as of June 30, 2013 (1)
| % of Net Assets | ||||
Common Stocks (3) | 98.8 | |||
Exchange Traded Funds and | 1.2 | |||
|
| |||
| 100.0 | ||||
|
|
Top 10 Portfolio Holdings as of June 30, 2013 (1) (2)
| % of Net Assets | ||||
1. Apple, Inc. | 10.8 | |||
2. Microsoft Corp. | 8.4 | |||
3. Google, Inc. Class A | 7.0 | |||
4. Oracle Corp. | 4.2 | |||
5. Cisco Systems, Inc. | 3.8 | |||
6. Amazon.com, Inc. | 3.7 | |||
7. Intel Corp. | 3.5 | |||
8. QUALCOMM, Inc. | 3.1 | |||
9. Comcast Corp. Class A | 2.6 | |||
10. Gilead Sciences, Inc. | 2.3 |
| (1) | Composition of Portfolio subject to change. |
| (2) | Short-term investments have been excluded from the list of Top 10 Portfolio Holdings. |
| (3) | Sectors: |
| % of Net Assets | ||||
Information Technology | 59.6 | |||
Consumer Discretionary | 18.0 | |||
Health Care | 13.0 | |||
Consumer Staples | 4.7 | |||
Industrials | 2.0 | |||
Telecommunication Services | 1.1 | |||
Materials | 0.4 | |||
|
| |||
| 98.8 | ||||
|
|
| 75 |
| Ohio National Fund, Inc. | Nasdaq-100® Index Portfolio |
Schedule of Investments | June 30, 2013 (Unaudited) |
| Common Stocks – 98.8% | Shares | Value | ||||||||
CONSUMER DISCRETIONARY – 18.0% | ||||||||||
Starbucks Corp. (Hotels, Restaurants & Leisure) | 15,175 | $ | 993,811 | |||||||
Wynn Resorts Ltd. (Hotels, Restaurants & Leisure) | 2,050 | 262,400 | ||||||||
Garmin Ltd. (Household Durables) | 3,975 | 143,736 | ||||||||
Amazon.com, Inc. (Internet & Catalog Retail) | (a) | 9,225 | 2,561,690 | |||||||
Expedia, Inc. (Internet & Catalog Retail) | 2,475 | 148,871 | ||||||||
Liberty Interactive Corp. Class A (Internet & Catalog Retail) | (a) | 10,150 | 233,552 | |||||||
Netflix, Inc. (Internet & Catalog Retail) | (a) | 1,125 | 237,476 | |||||||
priceline.com, Inc. (Internet & Catalog Retail) | (a) | 1,025 | 847,808 | |||||||
Mattel, Inc. (Leisure Equip. & Products) | 7,000 | 317,170 | ||||||||
Comcast Corp. Class A (Media) | 43,122 | 1,805,949 | ||||||||
DIRECTV (Media) | (a) | 11,300 | 696,306 | |||||||
Discovery Communications, Inc. Class A (Media) | (a) | 2,950 | 227,770 | |||||||
Liberty Global PLC Class A (Media) | (a) | 2,850 | 211,128 | |||||||
Liberty Media Corp. (Media) | (a) | 2,250 | 285,210 | |||||||
Sirius XM Radio, Inc. (Media) | 129,250 | 432,987 | ||||||||
Twenty-First Century Fox, Inc. Class A (Media) | (a) | 30,700 | 1,000,820 | |||||||
Viacom, Inc. Class B (Media) | 8,775 | 597,139 | ||||||||
Dollar Tree, Inc. (Multiline Retail) | (a) | 4,525 | 230,051 | |||||||
Sears Holdings Corp. (Multiline Retail) | (a) | 2,150 | 90,472 | |||||||
Bed Bath & Beyond, Inc. (Specialty Retail) | (a) | 4,425 | 313,732 | |||||||
O’Reilly Automotive, Inc. (Specialty Retail) | (a) | 2,225 | 250,579 | |||||||
Ross Stores, Inc. (Specialty Retail) | 4,450 | 288,404 | ||||||||
Staples, Inc. (Specialty Retail) | 13,450 | 213,317 | ||||||||
Fossil Group, Inc. (Textiles, Apparel & Luxury Goods) | (a) | 1,200 | 123,972 | |||||||
|
| |||||||||
| 12,514,350 | ||||||||||
|
| |||||||||
CONSUMER STAPLES – 4.7% | ||||||||||
Monster Beverage Corp. (Beverages) | (a) | 3,350 | 203,579 | |||||||
Costco Wholesale Corp. (Food & Staples Retailing) | 8,835 | 976,886 | ||||||||
Whole Foods Market, Inc. (Food & Staples Retailing) | 7,500 | 386,100 | ||||||||
Kraft Foods Group, Inc. (Food Products) | 12,050 | 673,233 | ||||||||
Mondelez International, Inc. Class A (Food Products) | 36,150 | 1,031,359 | ||||||||
|
| |||||||||
| 3,271,157 | ||||||||||
|
| |||||||||
HEALTH CARE – 13.0% | ||||||||||
Alexion Pharmaceuticals, Inc. (Biotechnology) | (a) | 3,950 | 364,348 | |||||||
Amgen, Inc. (Biotechnology) | 15,197 | 1,499,336 | ||||||||
Biogen Idec, Inc. (Biotechnology) | (a) | 4,800 | 1,032,960 | |||||||
Celgene Corp. (Biotechnology) | (a) | 8,450 | 987,889 | |||||||
Gilead Sciences, Inc. (Biotechnology) | (a) | 30,900 | 1,582,389 | |||||||
Regeneron Pharmaceuticals, Inc. (Biotechnology) | (a) | 1,950 | 438,516 | |||||||
Vertex Pharmaceuticals, Inc. (Biotechnology) | (a) | 4,475 | 357,418 | |||||||
DENTSPLY International, Inc. (Health Care Equip. & Supplies) | 2,900 | 118,784 | ||||||||
Intuitive Surgical, Inc. (Health Care Equip. & Supplies) | (a) | 825 | 417,928 | |||||||
Catamaran Corp. (Health Care Providers & Svs.) | (a) | 4,175 | 203,406 | |||||||
Express Scripts Holding Co. (Health Care Providers & Svs.) | (a) | 16,550 | 1,020,969 | |||||||
Henry Schein, Inc. (Health Care Providers & Svs.) | (a) | 1,775 | 169,956 | |||||||
Cerner Corp. (Health Care Technology) | (a) | 3,475 | 333,913 | |||||||
Life Technologies Corp. (Life Sciences Tools & Svs.) | (a) | 3,500 | 259,035 | |||||||
Mylan, Inc. (Pharmaceuticals) | (a) | 7,725 | 239,707 | |||||||
|
| |||||||||
| 9,026,554 | ||||||||||
|
| |||||||||
INDUSTRIALS – 2.0% | ||||||||||
C.H. Robinson Worldwide, Inc. (Air Freight & Logistics) | 3,250 | 183,008 | ||||||||
Expeditors International of Washington, Inc. (Air Freight & Logistics) | 4,175 | 158,692 | ||||||||
Stericycle, Inc. (Commercial Svs. & Supplies) | (a) | 1,750 | 193,253 | |||||||
PACCAR, Inc. (Machinery) | 7,164 | 384,420 | ||||||||
Verisk Analytics, Inc. Class A (Professional Svs.) | (a) | 3,400 | 202,980 | |||||||
Fastenal Co. (Trading Companies & Distributors) | 6,000 | 275,100 | ||||||||
|
| |||||||||
| 1,397,453 | ||||||||||
|
| |||||||||
| Common Stocks (Continued) | Shares | Value | ||||||||
INFORMATION TECHNOLOGY – 59.6% | ||||||||||
Cisco Systems, Inc. (Communications Equip.) | 108,225 | $ | 2,630,950 | |||||||
F5 Networks, Inc. (Communications Equip.) | (a) | 1,600 | 110,080 | |||||||
QUALCOMM, Inc. (Communications Equip.) | 34,995 | 2,137,495 | ||||||||
Apple, Inc. (Computers & Peripherals) | 19,020 | 7,533,442 | ||||||||
Dell, Inc. (Computers & Peripherals) | 35,375 | 472,256 | ||||||||
NetApp, Inc. (Computers & Peripherals) | (a) | 7,310 | 276,172 | |||||||
SanDisk Corp. (Computers & Peripherals) | (a) | 4,925 | 300,918 | |||||||
Seagate Technology PLC (Computers & Peripherals) | 7,250 | 325,018 | ||||||||
Western Digital Corp. (Computers & Peripherals) | 4,775 | 296,480 | ||||||||
Akamai Technologies, Inc. (Internet Software & Svs.) | (a) | 3,600 | 153,180 | |||||||
Baidu, Inc. – ADR (Internet Software & Svs.) | (a) | 5,575 | 527,005 | |||||||
eBay, Inc. (Internet Software & Svs.) | (a) | 26,285 | 1,359,460 | |||||||
Equinix, Inc. (Internet Software & Svs.) | (a) | 1,000 | 184,720 | |||||||
Facebook, Inc. Class A (Internet Software & Svs.) | (a) | 35,425 | 880,665 | |||||||
Google, Inc. Class A (Internet Software & Svs.) | (a) | 5,500 | 4,842,035 | |||||||
Yahoo!, Inc. (Internet Software & Svs.) | (a) | 21,935 | 550,788 | |||||||
Automatic Data Processing, Inc. (IT Svs.) | 9,825 | 676,550 | ||||||||
Cognizant Technology Solutions Corp. Class A (IT Svs.) | (a) | 6,100 | 381,921 | |||||||
Fiserv, Inc. (IT Svs.) | (a) | 2,687 | 234,871 | |||||||
Paychex, Inc. (IT Svs.) | 7,370 | 269,152 | ||||||||
Altera Corp. (Semiconductors & Equip.) | 6,475 | 213,610 | ||||||||
Analog Devices, Inc. (Semiconductors & Equip.) | 6,250 | 281,625 | ||||||||
Applied Materials, Inc. (Semiconductors & Equip.) | 24,325 | 362,686 | ||||||||
Avago Technologies Ltd. (Semiconductors & Equip.) | 5,000 | 186,900 | ||||||||
Broadcom Corp. Class A (Semiconductors & Equip.) | 10,550 | 356,168 | ||||||||
Intel Corp. (Semiconductors & Equip.) | 100,670 | 2,438,227 | ||||||||
KLA-Tencor Corp. (Semiconductors & Equip.) | 3,350 | 186,696 | ||||||||
Linear Technology Corp. (Semiconductors & Equip.) | 4,730 | 174,253 | ||||||||
Maxim Integrated Products, Inc. (Semiconductors & Equip.) | 5,900 | 163,902 | ||||||||
Microchip Technology, Inc. (Semiconductors & Equip.) | 4,000 | 149,000 | ||||||||
Micron Technology, Inc. (Semiconductors & Equip.) | (a) | 20,850 | 298,781 | |||||||
NVIDIA Corp. (Semiconductors & Equip.) | 11,712 | 164,319 | ||||||||
Texas Instruments, Inc. (Semiconductors & Equip.) | 22,450 | 782,832 | ||||||||
Xilinx, Inc. (Semiconductors & Equip.) | 5,355 | 212,112 | ||||||||
Activision Blizzard, Inc. (Software) | 22,625 | 322,633 | ||||||||
Adobe Systems, Inc. (Software) | (a) | 10,155 | 462,662 | |||||||
Autodesk, Inc. (Software) | (a) | 4,550 | 154,427 | |||||||
BMC Software, Inc. (Software) | (a) | 2,925 | 132,035 | |||||||
CA, Inc. (Software) | 9,175 | 262,680 | ||||||||
Check Point Software Technologies Ltd. (Software) | (a) | 3,970 | 197,230 | |||||||
Citrix Systems, Inc. (Software) | (a) | 3,800 | 229,254 | |||||||
Intuit, Inc. (Software) | 6,005 | 366,485 | ||||||||
Microsoft Corp. (Software) | 169,125 | 5,839,886 | ||||||||
Nuance Communications, Inc. (Software) | (a) | 6,425 | 118,092 | |||||||
Oracle Corp. (Software) | 95,160 | 2,923,315 | ||||||||
Symantec Corp. (Software) | 14,098 | 316,782 | ||||||||
|
| |||||||||
| 41,439,750 | ||||||||||
|
| |||||||||
MATERIALS – 0.4% | ||||||||||
Sigma-Aldrich Corp. (Chemicals) | 2,425 | 194,873 | ||||||||
Randgold Resources Ltd. – ADR (Metals & Mining) | 1,000 | 64,050 | ||||||||
|
| |||||||||
| 258,923 | ||||||||||
|
| |||||||||
TELECOMMUNICATION SERVICES – 1.1% | ||||||||||
SBA Communications Corp. Class A (Wireless Telecom. Svs.) | (a) | 2,575 | 190,859 | |||||||
Vodafone Group PLC – ADR (Wireless Telecom. Svs.) | 20,225 | 581,266 | ||||||||
|
| |||||||||
| 772,125 | ||||||||||
|
| |||||||||
Total Common Stocks (Cost $47,925,758) | $ | 68,680,312 | ||||||||
|
| |||||||||
| 76 | (continued) |
| Ohio National Fund, Inc. | Nasdaq-100® Index Portfolio (Continued) |
Schedule of Investments | June 30, 2013 (Unaudited) |
| Exchange Traded Funds – 1.0% | Shares | Value | ||||||||
PowerShares QQQ Trust Series 1 | 9,215 | $ | 656,200 | |||||||
|
| |||||||||
Total Exchange Traded Funds (Cost $678,316) | $ | 656,200 | ||||||||
|
| |||||||||
Total Investments – 99.8% (Cost $48,604,074) | (b) | $ | 69,336,512 | |||||||
Other Assets in Excess of Liabilities – 0.2% | 151,233 | |||||||||
|
| |||||||||
Net Assets – 100.0% | $ | 69,487,745 | ||||||||
|
| |||||||||
Percentages are stated as a percent of net assets.
Abbreviations:
ADR: American Depositary Receipts
Footnotes:
| (a) | Non-income producing security. |
| (b) | Represents cost for financial reporting purposes, which may differ from cost basis for federal income tax purposes. See also Note 7 of the Notes to Financial Statements. |
The accompanying notes are an integral part of these financial statements.
| 77 |
| Ohio National Fund, Inc. | Bristol Portfolio |
Objective/Strategy
The Bristol Portfolio seeks long-term growth of capital by investing primarily in common stocks of the 1,000 largest publicly traded U.S. companies in terms of market capitalization.
Performance as of June 30, 2013
Average Annual Total Returns: | ||||
One year | 25.73% | |||
Five years | 4.01% | |||
Ten years | 7.13% |
Past performance does not guarantee future results. The performance data quoted represents past performance and current returns may be lower or higher. Total return figures include change in share price and reinvestment of dividends and capital gains. The investment return and principal value will fluctuate so that an investor’s shares, when redeemed, may be worth more or less than the original cost. To obtain performance information up to the most recent month end, call toll-free 1-877-781-6392.
The Portfolio is not open to direct retail investment. Beneficial interest in shares is obtained solely by purchase of variable life insurance policies and variable annuity contracts. Actual performance results for variable annuity and variable universal life contracts will be lower due to contract charges. Consult your contract for applicable charges.
Comments
For the six-month period ended June 30, 2013, the Bristol Portfolio returned 14.45% versus 13.82% for the current benchmark, the S&P 500 Index.
Following a strong 2012, the markets continued to advance in the first two quarters of 2013 with more records being set and the S&P 500 Index reaching an all time high of 1,669.16 on May 21. In an utterly predictable manner, the market then corrected downwards in reaction to the remarks of Federal Reserve Chairman Ben Bernanke that were interpreted as indicating that quantitative easing might “taper off” in the near term. As quantitative easing has been seen as powering the equity markets’ rise, it took subsequent remarks of Federal Reserve members to satisfy investors that tapering of this program may be a long way off. With these statements, the markets recovered, but it left the S&P 500 Index down 3.8% from the record high and ended a streak of seven monthly advances. Overall, the returns from the six-month period were the best for the first six months of a calendar year since 1998. Other records were set that are closely related to growth expansion and increasing consumer confidence. Sales of new U.S. homes increased more than forecasted in May to the highest level in almost five years, while home prices increased more than forecasted in the twelve months through April 2013. More Americans signed contracts in May to buy previously owned homes than at any time in more than six years. The VIX index, the best measure of investor sentiment regarding expectations of near-term volatility, dipped below 15 for the first time since 2007, suggesting that investors are not expecting the turmoil of recent years to be repeated. Finally, the fixed income sector suffered the worst drop in corporate debt in almost five years, second only to the declines following the Lehman collapse in September 2008. Clearly, the debt markets’ modest returns and the prospect of higher interest rates in the future made the equity markets the better choice for most investors in the near term.
The Portfolio’s best performers for the period were Vertex Pharmaceuticals, Inc., Delta Air Lines, Inc., Hertz Global Holdings, Inc., Hanesbrands, Inc., and Prudential Financial, Inc. The Portfolio’s worst performers were Infinity Pharmaceuticals, Inc., Apple, Inc., Amarin Corp., Terex Corp., and Abercrombie & Fitch Co. The top
contributors to performance were Vertex Pharmaceuticals, Inc., Hertz Global Holdings, Inc., Delta Air Lines, Inc., Lincoln National Corp., and Hartford Financial Services Group, Inc. The top detractors from performance were Infinity Pharmaceuticals, Inc., Apple, Inc., Terex Corp., Abercrombie & Fitch Co., and Amarin Corp.(1)
The top contributor to the Portfolio’s performance in the period was Vertex Pharmaceuticals, Inc., which contributed 208 basis points as a result of positive drug trials that resulted in a stock price surge in April that outperformed larger competitors Bristol Myers Squibb and Merck over the last six months. Hertz Global Holdings, Inc. added 100 basis points, having benefited from the purchase of Dollar Thrifty and a recent 20% stake in China Auto Rental, the largest rental firm in China, as well as increased revenues as a result of the perceived end of the recession. Delta Air Lines, Inc. contributed 100 basis points as growth reappeared in the economy. Lincoln National Corp. and Hartford Financial Services Group, Inc. contributed 77 basis points and 73 basis points, respectively, as part of our modest overweight in Financials that was maintained in anticipation of future interest rates increases.(1)
Detractors from performance included Infinity Pharmaceuticals, Inc. which lost the Portfolio 118 basis points as a result of adverse health reports in a drug trial. Apple, Inc. detracted 91 basis points as it continues to be out of favor in spite of its iconic stature and large cash haul. Construction equipment manufacturer Terex Corp. detracted 37 basis points as a result of missing earnings expectations. Abercrombie & Fitch Co. detracted 29 basis points after reporting a larger than expected loss for the first quarter and Amarin Corp. detracted 17 basis points when a recently approved and very promising drug did not get the expected unqualified approval of the FDA.(1)
During the six-month period, the Portfolio’s overweight in Consumer Discretionary, represented by an 17.8% average weighting versus 11.7% for the benchmark, generated 39 basis points, reflecting our continued belief in growth. The Portfolio’s underweight in Materials, 2.4% versus the benchmark 3.4%, generated a further 25 basis points. The Portfolio’s overweight in Information Technology detracted 47 basis points following delays in the expected accelerated adoption of smart phones (particularly in China), and has subsequently been reduced.(1)
Looking to the third and fourth quarters of 2013, it appears that the blessings of quantitative easing could continue for the remainder of the year, and into 2014. Turmoil in Turkey and Egypt seems to have had little impact on the markets and the knee-jerk reaction to the troubles of the European Union from prior years seems to be a thing of the past. Even the threat to U.S. businesses from Obamacare’s uncertain medical insurance costs has been delayed for a year for many firms. China caused some concern with stresses in its secondary banking system, but the central government appears to have this under control and China’s growth will not be greatly affected. As we look to the future, we remain committed to the idea of growth through the engine of consumer spending, the generator of 70% of economic activity. It would appear that several generations of Keynesians are coming down from their ivory towers, blinking in the sunlight of rare approval, and claiming victory in both Europe and the U.S. We can argue with their theories, but not with the markets. Quantitative easing has pulled investors out of the doldrums of the past four years, and we expect it will continue to do so in the short term. In the interim, we continue to rely on Uncle Ben and the “Goldilocks” effect of falling unemployment levels, not so low that growth in the economy is not evident, yet not so high that the Federal Reserve signals a reduction in quantitative easing. This median result should suggest strong support for equities for the balance of the year.
| (1) | The Portfolio’s composition is subject to change. Holdings and weightings are as of June 30, 2013. |
| 78 | (continued) |
| Ohio National Fund, Inc. | Bristol Portfolio (Continued) |
Change in Value of $10,000 Investment
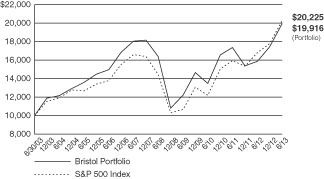
Hypothetical illustration based on past performance. Future performance will vary. The Portfolio’s returns reflect reinvested dividends. The Portfolio’s holdings may differ significantly from the securities in the index. The index is unmanaged and therefore does not reflect the cost of portfolio management and accounting.
The S&P 500 Index is a capitalization-weighted index designed to measure performance of the broad domestic economy through changes in the aggregate market value of 500 stocks representing all major industries. The index presented herein includes the effects of reinvested dividends.
Portfolio Composition as of June 30, 2013 (1)
| % of Net Assets | ||||
Common Stocks (3) | 95.0 | |||
Money Market Funds and | 5.0 | |||
|
| |||
| 100.0 | ||||
|
|
Top 10 Portfolio Holdings as of June 30, 2013 (1) (2)
| % of Net Assets | ||||
1. Apple, Inc. | 2.5 | |||
2. Facebook, Inc. Class A | 2.5 | |||
3. Adobe Systems, Inc. | 2.4 | |||
4. Valeant Pharmaceuticals International, Inc. | 2.4 | |||
5. Vertex Pharmaceuticals, Inc. | 2.4 | |||
6. Hartford Financial Services Group, Inc. | 2.0 | |||
7. Delta Air Lines, Inc. | 2.0 | |||
8. Eaton Corp. PLC | 2.0 | |||
9. Hanesbrands, Inc. | 2.0 | |||
10. Cisco Systems, Inc. | 1.9 |
| (1) | Composition of Portfolio subject to change. |
| (2) | Short-term investments have been excluded from the list of Top 10 Portfolio Holdings. |
| (3) | Sectors: |
| % of Net Assets | ||||
Information Technology | 25.7 | |||
Industrials | 20.1 | |||
Consumer Discretionary | 15.7 | |||
Financials | 13.4 | |||
Health Care | 12.1 | |||
Energy | 6.4 | |||
Consumer Staples | 1.6 | |||
|
| |||
| 95.0 | ||||
|
|
| 79 |
| Ohio National Fund, Inc. | Bristol Portfolio |
Schedule of Investments | June 30, 2013 (Unaudited) |
| Common Stocks – 95.0% | Shares | Value | ||||||||
CONSUMER DISCRETIONARY – 15.7% | ||||||||||
Sotheby’s (Diversified Consumer Svs.) | 108,800 | $ | 4,124,608 | |||||||
Las Vegas Sands Corp. (Hotels, Restaurants & Leisure) | 72,100 | 3,816,253 | ||||||||
CBS Corp. Class B (Media) | 86,900 | 4,246,803 | ||||||||
Time Warner, Inc. (Media) | 71,200 | 4,116,784 | ||||||||
Walt Disney Co. / The (Media) | 63,100 | 3,984,765 | ||||||||
Abercrombie & Fitch Co. Class A (Specialty Retail) | 86,500 | 3,914,125 | ||||||||
Deckers Outdoor Corp. (Textiles, Apparel & Luxury Goods) | (a) | 37,500 | 1,894,125 | |||||||
Hanesbrands, Inc. (Textiles, Apparel & Luxury Goods) | 83,300 | 4,283,286 | ||||||||
V.F. Corp. (Textiles, Apparel & Luxury Goods) | 21,500 | 4,150,790 | ||||||||
|
| |||||||||
| 34,531,539 | ||||||||||
|
| |||||||||
CONSUMER STAPLES – 1.6% | ||||||||||
ConAgra Foods, Inc. (Food Products) | 98,000 | 3,423,140 | ||||||||
|
| |||||||||
ENERGY – 6.4% | ||||||||||
Anadarko Petroleum Corp. (Oil, Gas & Consumable Fuels) | 48,700 | 4,184,791 | ||||||||
Apache Corp. (Oil, Gas & Consumable Fuels) | 36,200 | 3,034,646 | ||||||||
Pioneer Natural Resources Co. (Oil, Gas & Consumable Fuels) | 27,500 | 3,980,625 | ||||||||
Whiting Petroleum Corp. (Oil, Gas & Consumable Fuels) | (a) | 61,600 | 2,839,144 | |||||||
|
| |||||||||
| 14,039,206 | ||||||||||
|
| |||||||||
FINANCIALS – 13.4% | ||||||||||
Capital One Financial Corp. (Consumer Finance) | 65,900 | 4,139,179 | ||||||||
Bank of America Corp. (Diversified Financial Svs.) | 315,900 | 4,062,474 | ||||||||
American International Group, Inc. (Insurance) | (a) | 95,000 | 4,246,500 | |||||||
Hartford Financial Services Group, Inc. (Insurance) | 142,600 | 4,409,192 | ||||||||
Lincoln National Corp. (Insurance) | 116,500 | 4,248,755 | ||||||||
MetLife, Inc. (Insurance) | 90,619 | 4,146,725 | ||||||||
Prudential Financial, Inc. (Insurance) | 56,700 | 4,140,801 | ||||||||
|
| |||||||||
| 29,393,626 | ||||||||||
|
| |||||||||
HEALTH CARE – 12.1% | ||||||||||
Amarin Corp. PLC – ADR (Biotechnology) | (a) | 123,800 | 718,040 | |||||||
Celgene Corp. (Biotechnology) | (a) | 31,100 | 3,635,901 | |||||||
Pharmacyclics, Inc. (Biotechnology) | (a) | 40,200 | 3,194,694 | |||||||
Vertex Pharmaceuticals, Inc. (Biotechnology) | (a) | 64,700 | 5,167,589 | |||||||
Thermo Fisher Scientific, Inc. (Life Sciences Tools & Svs.) | 49,300 | 4,172,259 | ||||||||
Merck & Co., Inc. (Pharmaceuticals) | 91,300 | 4,240,885 | ||||||||
Valeant Pharmaceuticals International, Inc. (Pharmaceuticals) | (a) | 61,600 | 5,302,528 | |||||||
|
| |||||||||
| 26,431,896 | ||||||||||
|
| |||||||||
INDUSTRIALS – 20.1% | ||||||||||
Boeing Co. / The (Aerospace & Defense) | 40,400 | 4,138,576 | ||||||||
FedEx Corp. (Air Freight & Logistics) | 42,900 | 4,229,082 | ||||||||
Delta Air Lines, Inc. (Airlines) | (a) | 233,900 | 4,376,269 | |||||||
Tyco International Ltd. (Commercial Svs. & Supplies) | 124,700 | 4,108,865 | ||||||||
| Common Stocks (Continued) | Shares | Value | ||||||||
INDUSTRIALS (continued) | ||||||||||
Eaton Corp. PLC (Electrical Equip.) | 65,500 | $ | 4,310,555 | |||||||
Pentair Ltd. (Machinery) | 71,700 | 4,136,373 | ||||||||
Snap-On, Inc. (Machinery) | 40,200 | 3,593,076 | ||||||||
Stanley Black & Decker, Inc. (Machinery) | 49,600 | 3,834,080 | ||||||||
Terex Corp. (Machinery) | (a) | 139,300 | 3,663,590 | |||||||
Xylem, Inc. (Machinery) | 133,600 | 3,599,184 | ||||||||
Hertz Global Holdings, Inc. (Road & Rail) | (a) | 163,200 | 4,047,360 | |||||||
|
| |||||||||
| 44,037,010 | ||||||||||
|
| |||||||||
INFORMATION TECHNOLOGY – 25.7% | ||||||||||
Cisco Systems, Inc. (Communications Equip.) | 175,700 | 4,271,267 | ||||||||
Apple, Inc. (Computers & Peripherals) | 13,700 | 5,426,296 | ||||||||
EMC Corp. (Computers & Peripherals) | 170,100 | 4,017,762 | ||||||||
Hewlett-Packard Co. (Computers & Peripherals) | 168,800 | 4,186,240 | ||||||||
eBay, Inc. (Internet Software & Svs.) | (a) | 53,900 | 2,787,708 | |||||||
Facebook, Inc. Class A (Internet Software & Svs.) | (a) | 217,500 | 5,407,050 | |||||||
Google, Inc. Class A (Internet Software & Svs.) | (a) | 4,800 | 4,225,776 | |||||||
International Business Machines Corp. (IT Svs.) | 20,680 | 3,952,155 | ||||||||
Mastercard, Inc. Class A (IT Svs.) | 7,380 | 4,239,810 | ||||||||
Avago Technologies Ltd. (Semiconductors & Equip.) | 111,700 | 4,175,346 | ||||||||
Intel Corp. (Semiconductors & Equip.) | 170,800 | 4,136,776 | ||||||||
Adobe Systems, Inc. (Software) | (a) | 117,200 | 5,339,632 | |||||||
Microsoft Corp. (Software) | 120,400 | 4,157,412 | ||||||||
|
| |||||||||
| 56,323,230 | ||||||||||
|
| |||||||||
Total Common Stocks (Cost $189,971,898) | $ | 208,179,647 | ||||||||
|
| |||||||||
| Money Market Funds – 1.1% | Shares | Value | ||||||||
Fidelity Institutional Money Market Funds | 2,407,000 | $ | 2,407,000 | |||||||
|
| |||||||||
Total Money Market Funds (Cost $2,407,000) | $ | 2,407,000 | ||||||||
|
| |||||||||
Total Investments – 96.1% (Cost $192,378,898) | (b) | $ | 210,586,647 | |||||||
Other Assets in Excess of Liabilities – 3.9% | 8,646,721 | |||||||||
|
| |||||||||
Net Assets – 100.0% | $ | 219,233,368 | ||||||||
|
| |||||||||
Percentages are stated as a percent of net assets.
Abbreviations:
ADR: American Depositary Receipts
Footnotes:
| (a) | Non-income producing security. |
| (b) | Represents cost for financial reporting purposes, which may differ from cost basis for federal income tax purposes. See also Note 7 of the Notes to Financial Statements. |
The accompanying notes are an integral part of these financial statements.
| 80 |
| Ohio National Fund, Inc. | Bryton Growth Portfolio |
Objective/Strategy
The Bryton Growth Portfolio seeks long-term growth of capital by investing primarily in common stocks of growth-oriented U.S. companies smaller than the 500 largest publicly traded U.S. companies in terms of market capitalization.
Performance as of June 30, 2013
Average Annual Total Returns: | ||||
One year | 18.79% | |||
Five years | 4.82% | |||
Ten years | 6.89% |
Past performance does not guarantee future results. The performance data quoted represents past performance and current returns may be lower or higher. Total return figures include change in share price and reinvestment of dividends and capital gains. The investment return and principal value will fluctuate so that an investor’s shares, when redeemed, may be worth more, or less than the original cost. To obtain performance information up to the most recent month end, call toll-free 1-877-781-6392.
The Portfolio is not open to direct retail investment. Beneficial interest in shares is obtained solely by purchase of variable life insurance policies and variable annuity contracts. Actual performance results for variable annuity and variable universal life contracts will be lower due to contract charges. Consult your contract for applicable charges.
Comments
For the six-month period ended June 30, 2013, the Bryton Growth Portfolio returned 14.89% versus 17.44% for the current benchmark, the Russell 2000 Growth Index.
Following a strong 2012, the markets continued to advance in the first two quarters of 2013 with more records being set and the S&P 500 Index reaching an all time high of 1,669.16 on May 21. In an utterly predictable manner, the market then corrected downwards in reaction to the remarks of Federal Reserve Chairman Ben Bernanke that were interpreted as indicating that quantitative easing might “taper off” in the near term. As quantitative easing has been seen as powering the equity markets’ rise, it took subsequent remarks of Federal Reserve members to satisfy investors that tapering of this program may be a long way off. With these statements, the markets recovered, but it left the S&P 500 Index down 3.8% from the record high and ended a streak of seven monthly advances. Overall, the returns for the six-month period were the best for the first six months of a calendar year since 1998. Other records were set that are closely related to growth expansion and increasing consumer confidence. Sales of new U.S. homes increased more than forecasted in May to the highest level in almost five years, while home prices increased more than forecasted in the twelve months through April 2013. More Americans signed contracts in May to buy previously owned homes than at any time in more than six years. The VIX index, the best measure of investor sentiment regarding expectations of near-term volatility, dipped below 15 for the first time since 2007, suggesting that investors are not expecting the turmoil of recent years to be repeated. Finally, the fixed income sector suffered the worst drop in corporate debt in almost five years, second only to the declines following the Lehman collapse in September 2008. Clearly, the debt markets’ modest returns and the prospect of higher interest rates in the future made the equity markets the better choice for most investors in the near term.
The Portfolio’s best performers for the period were Celldex Therapeutics, Inc., Coronado Biosciences, Inc., Infinera Corp., Fifth & Pacific Cos., Inc., and Irobot Corp. The Portfolio’s worst performers were Affymax, Inc., Infinity Pharmaceuticals, Inc., Marin Software, Inc., Energy 21, and Mistras Group, Inc. The top contributors to performance were Infinera Corp., Fifth & Pacific Cos., Inc., Celldex
Therapeutics, Inc., Avis Budget Group, Inc., and Coronado Biosciences, Inc. The top detractors from performance were Affymax, Inc., Infinity Pharmaceuticals, Inc., Energy 21, Mistras Group, Inc., and Geospace Technologies Corp.(1)
The top contributor to the Portfolio’s performance was Infinera Corp., which contributed 115 basis points as a result of showing strong traction with next-generation 100G optical equipment. Fifth & Pacific Cos., Inc. contributed 105 basis points as its core Kate Spade brand continues to sell well and are planning to divest slower-growing business segments. Celldex Therapeutics, Inc. added 100 basis points as a result of an upgrade following very promising results for its cancer drugs. Avis Budget Group, Inc. added 81 basis points as the economy improved. Coronado Biosciences, Inc. contributed a further 80 basis points as a result of very successful clinical trials for treatment of a number of important medical applications.(1)
Detractors from performance during the period included Affymax, Inc. which lost the Portfolio 151 basis points as a result of the withdrawal of a flagship drug that had caused fatalities, following great initial promise and prior FDA approval. The stock was sold in February. Infinity Pharmaceuticals, Inc. detracted 73 basis points as a result of adverse health reports in a drug trial. Energy 21 detracted 71 basis points as a result of repeated production misses in its offshore oil/gas following bad weather and miss-execution. Mistras Group, Inc., an engineering firm, detracted 62 basis points as a result of larger and higher-margin projects being repeatedly postponed. Geospace Technologies Corp. detracted 39 basis points as a result of concerns about a slowdown in North American onshore fracking market which could impact sales of the firm’s seismic equipment.(1)
During the past six months, our overweight in Consumer Staples, represented by an 11.4% average weighting versus 4.6% for the benchmark, generated 32 basis points, reflecting our continued belief in growth. Our modest underweight in Materials, 4.1% versus the benchmark 4.9%, generated a further 16 basis points. Our overweight in Energy detracted 29 basis points, as did our underweight in Health Care.(1)
Looking to the third and fourth quarters of 2013, it appears that the blessings of quantitative easing could continue for the remainder of the year, and into 2014. Turmoil in Turkey and Egypt seems to have had little impact on the markets and the knee-jerk reaction to the troubles of the European Union from prior years seems to be a thing of the past. Even the threat to U.S. businesses from Obamacare’s uncertain medical insurance costs has been delayed for a year for many firms. China caused some concern with stresses in its secondary banking system, but the central government appears to have this under control and China’s growth will not be greatly affected. As we look to the future, we remain committed to the idea of growth through the engine of consumer spending, the generator of 70% of economic activity. It would appear that several generations of Keynesians are coming down from their ivory towers, blinking in the sunlight of rare approval, and claiming victory in both Europe and the U.S. We can argue with their theories, but not with the markets. Quantitative easing has pulled investors out of the doldrums of the past four years, and we expect it will continue to do so in the short term. In the interim, we continue to rely on Uncle Ben and the “Goldilocks” effect of falling unemployment levels, not so low that growth in the economy is not evident, yet not so high that the Federal Reserve signals a reduction in quantitative easing. This median result should suggest strong support for equities for the balance of the year.
| (1) | The Portfolio’s composition is subject to change. Holdings and weightings are as of June 30, 2013. |
| 81 | (continued) |
| Ohio National Fund, Inc. | Bryton Growth Portfolio (Continued) |
Change in Value of $10,000 Investment
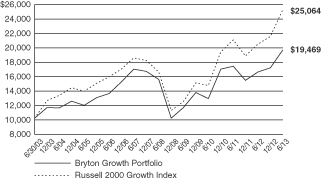
Hypothetical illustration based on past performance. Future performance will vary. The Portfolio’s returns reflect reinvested dividends. The Portfolio’s holdings may differ significantly from the securities in the index. The index is unmanaged and therefore does not reflect the cost of portfolio management and accounting.
The Russell 2000 Growth Index measures the performance of the small-cap growth segment of the U.S. equity universe. It includes the Russell 2000 Index companies with higher price-to-value ratios and higher forecasted growth values. The Russell 2000 Index includes the 2000 firms from the Russell 3000 Index with the smallest market capitalizations. The Russell 3000 Index represents 98% of the investable U.S. equity market. The index presented herein includes the effects of reinvested dividends.
Portfolio Composition as of June 30, 2013 (1)
| % of Net Assets | ||||
Common Stocks (3) | 95.9 | |||
Money Market Funds and | 4.1 | |||
|
| |||
| 100.0 | ||||
|
|
Top 10 Portfolio Holdings as of June 30, 2013 (1) (2)
| % of Net Assets | ||||
1. Peregrine Semiconductor Corp. | 2.4 | |||
2. Emerald Oil, Inc. | 2.1 | |||
3. JetBlue Airways Corp. | 2.0 | |||
4. Sotheby’s | 2.0 | |||
5. G-III Apparel Group Ltd. | 2.0 | |||
6. Lattice Semiconductor Corp. | 1.9 | |||
7. Coronado Biosciences, Inc. | 1.9 | |||
8. Infinera Corp. | 1.9 | |||
9. Movado Group, Inc. | 1.9 | |||
10. PGT, Inc. | 1.9 |
| (1) | Composition of Portfolio subject to change. |
| (2) | Short-term investments have been excluded from the list of Top 10 Portfolio Holdings. |
| (3) | Sectors: |
| % of Net Assets | ||||
Information Technology | 22.4 | |||
Industrials | 20.6 | |||
Consumer Discretionary | 18.2 | |||
Energy | 10.6 | |||
Health Care | 9.4 | |||
Consumer Staples | 8.6 | |||
Materials | 3.0 | |||
Telecommunication Services | 1.6 | |||
Financials | 1.5 | |||
|
| |||
| 95.9 | ||||
|
|
| 82 |
| Ohio National Fund, Inc. | Bryton Growth Portfolio (Continued) |
Schedule of Investments | June 30, 2013 (Unaudited) |
| Common Stocks – 95.9% | Shares | Value | ||||||||
CONSUMER DISCRETIONARY – 18.2% | ||||||||||
Dana Holding Corp. (Auto Components) | 161,700 | $ | 3,114,342 | |||||||
Sotheby’s (Diversified Consumer Svs.) | 87,200 | 3,305,752 | ||||||||
Bob Evans Farms, Inc. (Hotels, Restaurants & Leisure) | 43,600 | 2,048,328 | ||||||||
Bravo Brio Restaurant Group, Inc. (Hotels, Restaurants & Leisure) | (a) | 150,026 | 2,673,463 | |||||||
Jack in the Box, Inc. (Hotels, Restaurants & Leisure) | (a) | 63,700 | 2,502,773 | |||||||
EveryWare Global, Inc. (Household Durables) | (a) | 67,100 | 814,594 | |||||||
Callaway Golf Co. (Leisure Equip. & Products) | 391,100 | 2,573,438 | ||||||||
Five Below, Inc. (Specialty Retail) | (a) | 50,000 | 1,838,000 | |||||||
Fifth & Pacific Cos., Inc. (Textiles, Apparel & Luxury Goods) | (a) | 133,500 | 2,982,390 | |||||||
G-III Apparel Group Ltd. (Textiles, Apparel & Luxury Goods) | (a) | 68,557 | 3,298,963 | |||||||
Movado Group, Inc. (Textiles, Apparel & Luxury Goods) | 92,300 | 3,122,509 | ||||||||
Steven Madden Ltd. (Textiles, Apparel & Luxury Goods) | (a) | 42,900 | 2,075,502 | |||||||
|
| |||||||||
| 30,350,054 | ||||||||||
|
| |||||||||
CONSUMER STAPLES – 8.6% | ||||||||||
Hain Celestial Group, Inc. / The (Food Products) | (a) | 40,800 | 2,650,776 | |||||||
J&J Snack Foods Corp. (Food Products) | 37,600 | 2,925,280 | ||||||||
TreeHouse Foods, Inc. (Food Products) | (a) | 35,300 | 2,313,562 | |||||||
Spectrum Brands Holdings, Inc. (Household Products) | 38,491 | 2,188,983 | ||||||||
Elizabeth Arden, Inc. (Personal Products) | (a) | 50,800 | 2,289,556 | |||||||
Prestige Brands Holdings, Inc. (Personal Products) | (a) | 71,630 | 2,087,298 | |||||||
|
| |||||||||
| 14,455,455 | ||||||||||
|
| |||||||||
ENERGY – 10.6% | ||||||||||
Geospace Technologies Corp. (Energy Equip. & Svs.) | (a) | 42,164 | 2,912,689 | |||||||
Willbros Group, Inc. (Energy Equip. & Svs.) | (a) | 241,827 | 1,484,818 | |||||||
Comstock Resources, Inc. (Oil, Gas & Consumable Fuels) | 157,500 | 2,477,475 | ||||||||
Emerald Oil, Inc. (Oil, Gas & Consumable Fuels) | (a) | 522,755 | 3,586,099 | |||||||
Energy XXI Bermuda Ltd. (Oil, Gas & Consumable Fuels) | 134,700 | 2,987,646 | ||||||||
Synergy Resources Corp. (Oil, Gas & Consumable Fuels) | (a) | 258,200 | 1,890,024 | |||||||
Western Refining, Inc. (Oil, Gas & Consumable Fuels) | 82,500 | 2,315,775 | ||||||||
|
| |||||||||
| 17,654,526 | ||||||||||
|
| |||||||||
FINANCIALS – 1.5% | ||||||||||
FirstMerit Corp. (Commercial Banks) | 125,800 | 2,519,774 | ||||||||
|
| |||||||||
HEALTH CARE – 9.4% | ||||||||||
Amarin Corp. PLC – ADR (Biotechnology) | (a) | 115,500 | 669,900 | |||||||
Array BioPharma, Inc. (Biotechnology) | (a) | 359,113 | 1,630,373 | |||||||
Celldex Therapeutics, Inc. (Biotechnology) | (a) | 130,659 | 2,039,587 | |||||||
Coronado Biosciences, Inc. (Biotechnology) | (a) | 373,601 | 3,212,969 | |||||||
Pharmacyclics, Inc. (Biotechnology) | (a) | 29,800 | 2,368,206 | |||||||
Puma Biotechnology, Inc. (Biotechnology) | (a) | 29,358 | 1,302,615 | |||||||
Endologix, Inc. (Health Care Equip. & Supplies) | (a) | 170,025 | 2,257,932 | |||||||
Unilife Corp. (Health Care Equip. & Supplies) | (a) | 678,912 | 2,152,151 | |||||||
|
| |||||||||
| 15,633,733 | ||||||||||
|
| |||||||||
INDUSTRIALS – 20.6% | ||||||||||
GenCorp, Inc. (Aerospace & Defense) | (a) | 147,600 | 2,399,976 | |||||||
Hub Group, Inc. Class A (Air Freight & Logistics) | (a) | 69,700 | 2,538,474 | |||||||
| Common Stocks (Continued) | Shares | Value | ||||||||
INDUSTRIALS (continued) | ||||||||||
XPO Logistics, Inc. (Air Freight & Logistics) | (a) | 160,500 | $ | 2,903,445 | ||||||
JetBlue Airways Corp. (Airlines) | (a) | 526,200 | 3,315,060 | |||||||
PGT, Inc. (Building Products) | (a) | 359,400 | 3,115,998 | |||||||
Healthcare Services Group, Inc. (Commercial Svs. & Supplies) | 96,100 | 2,356,372 | ||||||||
Acuity Brands, Inc. (Electrical Equip.) | 32,600 | 2,461,952 | ||||||||
Capstone Turbine Corp. (Electrical Equip.) | (a) | 2,452,621 | 2,869,567 | |||||||
Actuant Corp. Class A (Machinery) | 49,600 | 1,635,312 | ||||||||
FreightCar America, Inc. (Machinery) | 108,996 | 1,851,842 | ||||||||
Middleby Corp. (Machinery) | (a) | 15,000 | 2,551,350 | |||||||
Titan International, Inc. (Machinery) | 105,300 | 1,776,411 | ||||||||
Mistras Group, Inc. (Professional Svs.) | (a) | 142,417 | 2,503,691 | |||||||
Roadrunner Transportation Systems, Inc. (Road & Rail) | (a) | 75,004 | 2,088,112 | |||||||
|
| |||||||||
| 34,367,562 | ||||||||||
|
| |||||||||
INFORMATION TECHNOLOGY – 22.4% | ||||||||||
Ciena Corp. (Communications Equip.) | (a) | 127,600 | 2,477,992 | |||||||
Infinera Corp. (Communications Equip.) | (a) | 295,300 | 3,150,851 | |||||||
Fabrinet (Electronic Equip., Instr. & Comp.) | (a) | 165,388 | 2,315,432 | |||||||
Internap Network Services Corp. (Internet Software & Svs.) | (a) | 304,990 | 2,522,267 | |||||||
Marin Software, Inc. (Internet Software & Svs.) | (a) | 156,729 | 1,604,905 | |||||||
Trulia, Inc. (Internet Software & Svs.) | (a) | 90,500 | 2,813,645 | |||||||
Cavium, Inc. (Semiconductors & Equip.) | (a) | 51,100 | 1,807,407 | |||||||
Lattice Semiconductor Corp. (Semiconductors & Equip.) | (a) | 642,061 | 3,255,249 | |||||||
Monolithic Power Systems, Inc. (Semiconductors & Equip.) | 102,800 | 2,478,508 | ||||||||
Peregrine Semiconductor Corp. (Semiconductors & Equip.) | (a) | 363,364 | 3,964,301 | |||||||
Power Integrations, Inc. (Semiconductors & Equip.) | 70,500 | 2,859,480 | ||||||||
Semtech Corp. (Semiconductors & Equip.) | (a) | 77,000 | 2,697,310 | |||||||
Guidewire Software, Inc. (Software) | (a) | 72,520 | 3,049,466 | |||||||
PTC, Inc. (Software) | (a) | 102,400 | 2,511,872 | |||||||
|
| |||||||||
| 37,508,685 | ||||||||||
|
| |||||||||
MATERIALS – 3.0% | ||||||||||
Kronos Worldwide, Inc. (Chemicals) | 145,847 | 2,368,555 | ||||||||
PolyOne Corp. (Chemicals) | 104,200 | 2,582,076 | ||||||||
|
| |||||||||
| 4,950,631 | ||||||||||
|
| |||||||||
TELECOMMUNICATION SERVICES – 1.6% | ||||||||||
Iridium Communications, Inc. (Diversified Telecom. Svs.) | (a) | 349,800 | 2,714,448 | |||||||
|
| |||||||||
Total Common Stocks (Cost $144,969,621) | $ | 160,154,868 | ||||||||
|
| |||||||||
| Money Market Funds – 2.4% | Shares | Value | ||||||||
Fidelity Institutional Money Market Funds | 4,040,000 | $ | 4,040,000 | |||||||
|
| |||||||||
Total Money Market Funds (Cost $4,040,000) | $ | 4,040,000 | ||||||||
|
| |||||||||
Total Investments – 98.3% (Cost $149,009,621) | (b) | $ | 164,194,868 | |||||||
Other Assets in Excess of Liabilities – 1.7% | 2,895,734 | |||||||||
|
| |||||||||
Net Assets – 100.0% | $ | 167,090,602 | ||||||||
|
| |||||||||
Percentages are stated as a percent of net assets.
Abbreviations:
ADR: American Depositary Receipts
Footnotes:
| (a) | Non-income producing security. |
| (b) | Represents cost for financial reporting purposes, which may differ from cost basis for federal income tax purposes. See also Note 7 of the Notes to Financial Statements. |
The accompanying notes are an integral part of these financial statements.
| 83 |
| Ohio National Fund, Inc. | U.S. Equity Portfolio |
Objective/Strategy
The U.S. Equity Portfolio seeks capital appreciation with a secondary objective of capital preservation to provide long term growth by investing at least 80% of its net assets in equity securities traded in the U.S. within under-priced sectors and industries.
Performance as of June 30, 2013
Average Annual Total Returns: | ||||
One year | 20.76% | |||
Five years | 1.19% | |||
Since inception (5/1/04) | 3.46% |
Past performance does not guarantee future results. The performance data quoted represents past performance and current returns may be lower or higher. Total return figures include change in share price and reinvestment of dividends and capital gains. The investment return and principal value will fluctuate so that an investor’s shares, when redeemed, may be worth more or less than the original cost. To obtain performance information up to the most recent month end, call toll-free 1-877-781-6392.
The Portfolio is not open to direct retail investment. Beneficial interest in shares is obtained solely by purchase of variable life insurance policies and variable annuity contracts. Actual performance results for variable annuity and variable universal life contracts will be lower due to contract charges. Consult your contract for applicable charges.
Comments
For the six-month period ended June 30, 2013, the U.S. Equity Portfolio returned 14.61% versus 13.97% for the current benchmark, the S&P Composite 1500 Index.
From a top down perspective, the first key to the Portfolio’s performance was being bullish and minimizing cash. The Portfolio’s market value-to-price (V/P) ratio averaged 1.19 over those six months and served as the foundation for the bullish posture. For sectors, the Portfolio was heavily tilted toward economically sensitive, cyclical sectors and away from defensive, recession proof sectors. The largest sector weight was Consumer Discretionary, which averaged 34.6% of the Portfolio versus only 11.9% in the S&P Composite 1500 Index. Industrials, the second largest average sector position was overweight at 17.9% compared to its 10.9% weighting in the S&P Composite 1500 Index. The Portfolio did not hold Utilities, Consumer Staples or Telecommunication Services, and was underweight Financials and Information Technology. Sector behavior was unusual during this generally rising market that began November 15, 2012. Initially, the economically sensitive sectors along with Financials led; but during March and April, in a short term theme reversal, the defensive sectors led the market higher. During the late April through May advance, the leadership returned to the cyclical sectors. Such short term theme changes during a seven month market advance is unusual, as sector leadership usually stays fairly constant. Overall, the overweight in Consumer Discretionary was favorable, while the underweight in Financials was a drag. The Portfolio favors high quality companies on sale and often misses tarnished turn-around situations, which are prevalent in the Financials sector.(1)
The Portfolio had exposure to 33 of the 154 S&P Composite 1500 Index industries. The five industries contributing the most were all overweight; oil & gas equipment & services, footwear, movies & entertainment, biotechnology and railroads. Three industries stood out as providing the most negative contribution; computer hardware, communications equipment and construction & farm machinery, due not to overweighting, but to individual stock selection.(1)
The top five stock contributors were Celgene Corp., NIKE, Inc., Oceaneering International, Inc., Questcor Pharmaceuticals, Inc. and FMC Technologies, Inc. NIKE, Inc. on average, was the largest holding in the Portfolio and gained 24.3%. Questcor Pharmaceuticals, Inc. was not among the larger holdings at 1.74% of the Portfolio, but it gained 71.6%. The five largest detractors were Apple, Inc., F5 Networks, Inc., Lululemon Athletica, Inc., Caterpillar, Inc. and EMC Corp. Apple, Inc., F5 Networks, Inc., Caterpillar, Inc. and EMC Corp. all had stock price declines concurrently with analyst downward revision of 2013 earnings. Lululemon Athletica, Inc. dropped suddenly when the company pulled its shear yoga pants from the market for being too shear. Within the Portfolio, F5 Networks, Inc. was sold, EMC Corp. was reduced, and the other three remained in the Portfolio at June 30th.(1)
The top five performing stocks were Questcor Pharamceuticals, Inc., up 71.6%, Celgene Corp., up 49.1%, Tyler Technologies, Inc., up 43.7%, Oceaneering International, Inc., up 35.0%, and Wolverine World Wide, Inc., up 33.9%. The five worst performing stocks were the same as the five negative contributors, just in a little different order; F5 Networks, Inc., down 25.6%, Apple, Inc., down 24.6%, Lululemon Athletica, Inc., down 14.1%, Caterpillar, Inc., down 7.4% and EMC Corp., down 6.2%.(1)
In terms of stock selection, the stocks in Consumer Discretionary, Energy, Health Care, Materials and Financials outperformed their sector-specific benchmarks, while stocks in two sectors, Industrials and Information Technology, underperformed due to F5 Networks, Inc., Apple, Inc., Caterpillar, Inc. and EMC Corp. holdings. (1)
We do not see the conditions typical of market peaks. The Portfolio’s market value-to-price ratio ended June at 1.05, still indicating that stocks are not, in general, overpriced. Yet, for the market to deliver above average returns over the next year, we will need interest rate relief. If the run up in the 10-year yield in June was temporary, we could once again get a boost to equity valuations in the coming months.
| (1) | The Portfolio’s composition is subject to change. Holdings and weightings are as of June 30, 2013. |
Change in Value of $10,000 Investment
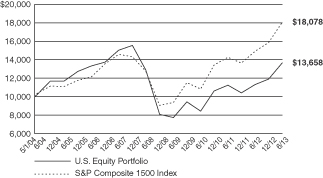
Hypothetical illustration based on past performance. Future performance will vary. The Portfolio’s returns reflect reinvested dividends. The Portfolio’s holdings may differ significantly from the securities in the index. The index is unmanaged and therefore does not reflect the cost of portfolio management and accounting.
The S&P Composite 1500 Index is a broad-based capitalization-weighted index of 1500 U.S. companies and is comprised of the S&P MidCap 400, S&P 500, and the S&P SmallCap 600. It is designed for investors seeking to replicate the performance of the U.S. equity market or benchmark against a representative universe of tradable stocks. The index presented herein includes the effects of reinvested dividends.
| 84 | (continued) |
| Ohio National Fund, Inc. | U.S. Equity Portfolio (Continued) |
Portfolio Composition as of June 30, 2013 (1)
| % of Net Assets | ||||
Common Stocks (3) | 99.5 | |||
Money Market Funds and | 0.5 | |||
|
| |||
| 100.0 | ||||
|
|
Top 10 Portfolio Holdings as of June 30, 2013 (1) (2)
| % of Net Assets | ||||
1. Viacom, Inc. Class B | 5.2 | |||
2. NIKE, Inc. Class B | 5.1 | |||
3. Union Pacific Corp. | 5.0 | |||
4. Time Warner Cable, Inc. | 4.8 | |||
5. TJX Cos., Inc. | 4.3 | |||
6. Oceaneering International, Inc. | 3.6 | |||
7. FMC Technologies, Inc. | 3.6 | |||
8. Emerson Electric Co. | 3.5 | |||
9. Praxair, Inc. | 3.4 | |||
10. Dril-Quip, Inc. | 3.4 |
| (1) | Composition of Portfolio subject to change. |
| (2) | Short-term investments have been excluded from the list of Top 10 Portfolio Holdings. |
| (3) | Sectors: |
| % of Net Assets | ||||
Consumer Discretionary | 38.6 | |||
Industrials | 17.6 | |||
Energy | 12.8 | |||
Information Technology | 8.4 | |||
Health Care | 8.1 | |||
Financials | 7.7 | |||
Materials | 6.3 | |||
|
| |||
| 99.5 | ||||
|
|
| 85 |
| Ohio National Fund, Inc. | U.S. Equity Portfolio |
Schedule of Investments | June 30, 2013 (Unaudited) |
| Common Stocks – 99.5% | Shares | Value | ||||||||
CONSUMER DISCRETIONARY – 38.6% | ||||||||||
Panera Bread Co. Class A (Hotels, Restaurants & Leisure) | (a) | 2,260 | $ | 420,224 | ||||||
Time Warner Cable, Inc. (Media) | 7,740 | 870,595 | ||||||||
Viacom, Inc. Class B (Media) | 13,720 | 933,646 | ||||||||
Walt Disney Co. / The (Media) | 8,090 | 510,883 | ||||||||
Bed Bath & Beyond, Inc. (Specialty Retail) | (a) | 5,280 | 374,352 | |||||||
CST Brands, Inc. (Specialty Retail) | (a) | 1 | 31 | |||||||
Hibbett Sports, Inc. (Specialty Retail) | (a) | 6,940 | 385,170 | |||||||
TJX Cos., Inc. (Specialty Retail) | 15,460 | 773,928 | ||||||||
Tractor Supply Co. (Specialty Retail) | 4,010 | 471,616 | ||||||||
Lululemon Athletica, Inc. (Textiles, Apparel & Luxury Goods) | (a) | 4,940 | 323,669 | |||||||
NIKE, Inc. Class B (Textiles, Apparel & Luxury Goods) | 14,420 | 918,266 | ||||||||
V.F. Corp. (Textiles, Apparel & Luxury Goods) | 3,010 | 581,111 | ||||||||
Wolverine World Wide, Inc. (Textiles, Apparel & Luxury Goods) | 6,670 | 364,249 | ||||||||
|
| |||||||||
| 6,927,740 | ||||||||||
|
| |||||||||
ENERGY – 12.8% | ||||||||||
Dril-Quip, Inc. (Energy Equip. & Svs.) | (a) | 6,680 | 603,137 | |||||||
FMC Technologies, Inc. (Energy Equip. & Svs.) | (a) | 11,530 | 641,990 | |||||||
Oceaneering International, Inc. (Energy Equip. & Svs.) | 9,010 | 650,522 | ||||||||
Valero Energy Corp. (Oil, Gas & Consumable Fuels) | 11,790 | 409,938 | ||||||||
|
| |||||||||
| 2,305,587 | ||||||||||
|
| |||||||||
FINANCIALS – 7.7% | ||||||||||
State Street Corp. (Capital Markets) | 5,450 | 355,395 | ||||||||
Waddell & Reed Financial, Inc. Class A (Capital Markets) | 6,170 | 268,395 | ||||||||
Wells Fargo & Co. (Commercial Banks) | 11,800 | 486,986 | ||||||||
Aon PLC (Insurance) | 4,350 | 279,923 | ||||||||
|
| |||||||||
| 1,390,699 | ||||||||||
|
| |||||||||
HEALTH CARE – 8.1% | ||||||||||
Celgene Corp. (Biotechnology) | (a) | 4,890 | 571,690 | |||||||
Bio-Reference Labs, Inc. (Health Care Providers & Svs.) | (a) | 15,560 | 447,350 | |||||||
Questcor Pharmaceuticals, Inc. (Pharmaceuticals) | 9,390 | 426,869 | ||||||||
|
| |||||||||
| 1,445,909 | ||||||||||
|
| |||||||||
| Common Stocks (Continued) | Shares | Value | ||||||||
INDUSTRIALS – 17.6% | ||||||||||
FedEx Corp. (Air Freight & Logistics) | 1,780 | $ | 175,472 | |||||||
Eaton Corp. PLC (Electrical Equip.) | 4,140 | 272,453 | ||||||||
Emerson Electric Co. (Electrical Equip.) | 11,680 | 637,027 | ||||||||
Caterpillar, Inc. (Machinery) | 5,530 | 456,170 | ||||||||
Dover Corp. (Machinery) | 4,730 | 367,332 | ||||||||
CSX Corp. (Road & Rail) | 14,840 | 344,140 | ||||||||
Union Pacific Corp. (Road & Rail) | 5,850 | 902,538 | ||||||||
|
| |||||||||
| 3,155,132 | ||||||||||
|
| |||||||||
INFORMATION TECHNOLOGY – 8.4% | ||||||||||
Apple, Inc. (Computers & Peripherals) | 1,480 | 586,198 | ||||||||
EMC Corp. (Computers & Peripherals) | 7,210 | 170,300 | ||||||||
Accenture PLC Class A (IT Svs.) | 4,080 | 293,597 | ||||||||
International Business Machines Corp. (IT Svs.) | 2,370 | 452,931 | ||||||||
|
| |||||||||
| 1,503,026 | ||||||||||
|
| |||||||||
MATERIALS – 6.3% | ||||||||||
Praxair, Inc. (Chemicals) | 5,260 | 605,742 | ||||||||
Steel Dynamics, Inc. (Metals & Mining) | 35,540 | 529,901 | ||||||||
|
| |||||||||
| 1,135,643 | ||||||||||
|
| |||||||||
Total Common Stocks (Cost $13,739,466) | $ | 17,863,736 | ||||||||
|
| |||||||||
| Money Market Funds – 0.5% | Shares | Value | ||||||||
Fidelity Institutional Money Market Funds | 88,000 | $ | 88,000 | |||||||
|
| |||||||||
Total Money Market Funds (Cost $88,000) | $ | 88,000 | ||||||||
|
| |||||||||
Total Investments – 100.0% (Cost $13,827,466) | (b) | $ | 17,951,736 | |||||||
Other Assets in Excess of Liabilities – 0.0% | 6,611 | |||||||||
|
| |||||||||
Net Assets – 100.0% | $ | 17,958,347 | ||||||||
|
| |||||||||
Percentages are stated as a percent of net assets.
Footnotes:
| (a) | Non-income producing security. |
| (b) | Represents cost for financial reporting purposes, which may differ from cost basis for federal income tax purposes. See also Note 7 of the Notes to Financial Statements. |
The accompanying notes are an integral part of these financial statements.
| 86 |
| Ohio National Fund, Inc. | Balanced Portfolio |
Objective/Strategy
The Balanced Portfolio seeks capital appreciation and income by investing normally up to 75% of its assets in equity securities within under-priced sectors and industries while maintaining a minimum of 25% of its assets in fixed income securities.
Performance as of June 30, 2013
Average Annual Returns: | ||||
One year | 12.62% | |||
Five years | 5.94% | |||
Since inception (5/1/04) | 6.91% |
Past performance does not guarantee future results. The performance data quoted represents past performance and current returns may be lower or higher. Total return figures include change in share price and reinvestment of dividends and capital gains. The investment return and principal value will fluctuate so that an investor’s shares, when redeemed, may be worth more or less than the original cost. To obtain performance information up to the most recent month end, call toll-free 1-877-781-6392.
The Portfolio is not open to direct retail investment. Beneficial interest in shares is obtained solely by purchase of variable life insurance policies and variable annuity contracts. Actual performance results for variable annuity and variable universal life contracts will be lower due to contract charges. Consult your contract for applicable charges.
Comments
For the six-month period ended June 30, 2013, the Balanced Portfolio returned 8.69% versus 7.25% for the current benchmark, which is composed of 60% S&P Composite 1500 Index and 40% Barclays Capital U.S. Universal Index.
As we entered the beginning of 2013, we saw significant upside potential in the U.S. equity market. Our valuation model indicated that stocks were poised for a strong rally that would be a continuation of the bull market that began way back in March of 2009. Due to our bullish market reading, we began the year with a rather aggressive 70% equity/30% fixed income allocation within the Portfolio. While strong equity market returns and significant fixed income volatility had us making small adjustments to this equity/fixed income blend over the course of the last six months, we maintained a relatively aggressive allocation the majority of the time. However, declining equity valuations and improving fixed income opportunities had us reallocating towards a more standard 60/40 blend at the end of the second quarter.(1)
For the equity portion of the Portfolio, we continued to tilt toward the more cyclical sectors of the market with our largest overweight in the Consumer Discretionary sector. Over the period, the Consumer Discretionary sector averaged a 19% weighting of the Portfolio versus its benchmark weighting of about 12%. This heavy tilt benefitted the Portfolio, with the Consumer Discretionary sector being among the top performers for the period. The Portfolio’s overweight position in the Energy sector was also a major contributor to relative out-performance. The Portfolio’s Energy sector had an average weight of about 12% for the period versus its benchmark weight of just over 10%. While the Energy sector was not a top performer, industry selection within the sector helped the Portfolio to outperform the benchmark. On the flipside, positions in the Consumer Staples and Financials sectors detracted from relative performance, although both sectors were positive contributors to the Portfolio’s total return. We were underweight in the Financials sector based on its relatively low valuation and the sector was among the market leaders. We were about even to the benchmark
weight in the Consumer Staples sector, but stock selection in that sector undermined benchmark relative performance. Overall, however, stock selection had a positive impact on overall benchmark-relative outperformance.(1)
At the industry level, the top five benchmark-relative performers were oil & gas equipment & services, specialty stores, computer hardware, paper products and oil & gas refining and marketing. Oil & gas equipment & services and specialty stores were also the largest positive total return contributors to the Portfolio. At the other end of the spectrum, agricultural products, IT consulting & services, electric utilities, homebuilding and aerospace & defense were the bottom five benchmark-relative performers. Positions in computer hardware and computer storage & peripherals were the two largest detractors to the Portfolio’s total return.(1)
Moving on to individual stock performance within the Portfolio, the five best performers were Actavis, Inc., KapStone Paper & Packaging Co., Oceaneering International, Inc., Wolverine World Wide, Inc., and Tractor Supply Co. Tractor Supply Co. and Oceaneering International, Inc. were also two of the top total return contributors to the Portfolio’s performance. The five stocks that had the worst performance for the six-month period were DFC Global Corp., Apple, Inc., Cognizant Technology Solutions Corp., MDC Holdings, Inc., and Koppers Holdings, Inc. Apple, Inc. and DFC Global Corp were among the largest detractors from Portfolio performance.(1)
Focusing on the fixed income portion of the Portfolio, the first half of 2013 proved to be a volatile time period within the fixed income market. Over the course of six months, the yield on the U.S. Generic Government 10 Year Treasury Yield varied widely from a low of 1.63% in early May to a high of 2.61% in late June. The key driver of the volatility was the emergence of the term “Fed Tapering”, as investors tried to decipher messages from the Federal Reserve regarding the reduction of asset purchases that have been taking place over the course of the last few years. In spite of the volatility, the fixed income portion of the Portfolio was able to navigate the environment and outperform the broad based fixed income benchmark (as measured by the Barclays Capital U.S. Universal Index) during the first half of 2013.
The fixed income portion of the Portfolio was able to outperform the Barclays Capital U.S. Universal Index through a combination of active duration management and strategic allocation between the two main segments of the bond market that we focus on: U.S. Treasuries & corporate bonds. The fixed income portion of the Portfolio began the year with a large Treasury underweight relative to the benchmark and a heavy corporate bond overweight, as attractive valuations and strong economic conditions pointed us in that direction. The relative underweight in Treasuries and overweight in corporate bonds each benefitted performance, as the corporate bond segment of the market produced strong relative returns and contributed to the Portfolio’s fixed income outperformance. In the latter part of the first quarter, we began to see improvement in our Treasury valuation numbers and a corresponding decline in the value of some of the riskier segments of the corporate bond market. This valuation shift resulted in a reallocation of the fixed income portion of the Portfolio where U.S. Treasuries were increased, while lower investment grade and high yield corporate bond exposure were decreased. While this reallocation didn’t result in significant fixed income outperformance, it did allow the Portfolio to participate in the Treasury rally that took place from mid-March to early May. Finally, as Treasury yields fell below 1.65% in early May, our valuation numbers once again shifted as the risk /return relationship of such low rates of return pointed us away from the U.S. Treasury
| 87 | (continued) |
| Ohio National Fund, Inc. | Balanced Portfolio (Continued) |
market. In response to the change in relative valuations, the fixed income portion of the Portfolio not only decreased its exposure to Treasury securities, but also purchased some floating rate securities and held a slightly larger cash balance in order to decrease average Portfolio bond duration and manage interest rate risk exposure. The reduction in duration resulted in fixed income outperformance during the initial phase of this final sell-off. The end result of these Portfolio adjustments was a solid six months of outperformance and downside risk mitigation for the fixed income portion of the Portfolio.(1)
Looking ahead to the second half of 2013, we see overall equity market valuations moving closer to fair value. We also contend that fixed income selling pressure might have over-reached the fundamentals of the underlying asset class. Due to the fixed income selling pressure, we see value in fixed income and have begun to increase our fixed income exposure within the Portfolio. We have also begun to tighten our hedge in order to better protect against possible future volatility in the equity market. We see the current market environment as an opportunity for active, tactical asset managers, like ourselves, to begin utilizing strategies that will not only minimize future portfolio volatility, but also take advantage of mispricing within both the equity and fixed income market. At any rate, we will continue to utilize our bottom-up systematic approach to investing in an attempt to provide benefit to our shareholders.
| (1) | The Portfolio’s composition is subject to change. Holdings and weightings are as of June 30, 2013. |
Change in Value of $10,000 Investment
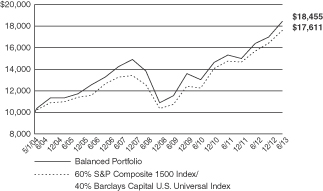
Hypothetical illustration based on past performance. Future performance will vary. The Portfolio’s returns reflect reinvested dividends. The Portfolio’s holdings may differ significantly from the securities in the index. The index is unmanaged and therefore does not reflect the cost of portfolio management and accounting.
The S&P Composite 1500 Index is a broad-based capitalization-weighted index of 1500 U.S. companies and is comprised of the S&P MidCap 400, S&P 500, and the S&P SmallCap 600. It is designed for investors seeking to replicate to the performance of the U.S. equity market or benchmark against a representative universe of tradable stocks. The index presented herein includes the effects of reinvested dividends.
The Barclays Capital U.S. Universal Index represents the union of the U.S. Aggregate Index, U.S. Corporate High Yield Index. Investment Grade 144A Index, Eurodollar Index, U.S. Emerging Markets Index, and the non-ERISA portion of the Commercial Mortgage-Backed Securities (CMBS) Index. The index covers USD-denominated, taxable bonds that are rated either investment grade or high-yield.
Portfolio Composition as of June 30, 2013 (1)
| % of Net Assets | ||||
Common Stocks (3) | 60.0 | |||
Corporate Bonds (3) | 25.7 | |||
U.S. Treasury Obligations | 11.1 | |||
Exchange Traded Funds | 0.7 | |||
Purchased Options | 0.3 | |||
Written Options Outstanding | (0.2 | ) | ||
Money Market Funds | 2.4 | |||
|
| |||
| 100.0 | ||||
|
|
Top 10 Portfolio Holdings as of June 30, 2013 (1) (2)
| % of Net Assets | ||||
1. Tractor Supply Co. | 2.0 | |||
2. American Express Co. | 1.9 | |||
3. Costco Wholesale Corp. | 1.9 | |||
4. W.W. Grainger, Inc. | 1.6 | |||
5. Oceaneering International, Inc. | 1.5 | |||
6. Dril-Quip, Inc. | 1.4 | |||
7. U.S. Treasury Bond 4.500%, 02/15/2036 | 1.4 | |||
8. LyondellBasell Industries NV Class A | 1.4 | |||
9. Westar Energy, Inc. | 1.3 | |||
10. Reynolds American, Inc. | 1.3 |
| (1) | Composition of Portfolio subject to change. |
| (2) | Short-term investments have been excluded from the list of Top 10 Portfolio Holdings. |
| (3) | Sectors (combined): |
| % of Net Assets | ||||
Consumer Discretionary | 16.5 | |||
Financials | 14.6 | |||
Industrials | 11.7 | |||
Consumer Staples | 9.3 | |||
Materials | 8.5 | |||
Information Technology | 6.7 | |||
Health Care | 6.3 | |||
Energy | 5.8 | |||
Utilities | 4.7 | |||
Telecommunication Services | 1.6 | |||
|
| |||
| 85.7 | ||||
|
|
| 88 |
| Ohio National Fund, Inc. | Balanced Portfolio |
Schedule of Investments | June 30, 2013 (Unaudited) |
| Common Stocks – 60.0% | Shares | Value | ||||||||
CONSUMER DISCRETIONARY – 12.6% | ||||||||||
LKQ Corp. (Distributors) | (a) | 27,680 | $ | 712,760 | ||||||
Jarden Corp. (Household Durables) | (a) | 19,515 | 853,781 | |||||||
MDC Holdings, Inc. (Household Durables) | 14,000 | 455,140 | ||||||||
Newell Rubbermaid, Inc. (Household Durables) | 42,600 | 1,118,250 | ||||||||
PulteGroup, Inc. (Household Durables) | (a) | 25,200 | 478,044 | |||||||
Ryland Group, Inc. / The (Household Durables) | (e) | 18,300 | 733,830 | |||||||
Toll Brothers, Inc. (Household Durables) | (a) | 13,400 | 437,242 | |||||||
CBS Corp. Class B (Media) | 32,700 | 1,598,049 | ||||||||
Discovery Communications, Inc. Class A (Media) | (a) | 7,700 | 594,517 | |||||||
Walt Disney Co. / The (Media) | 21,790 | 1,376,039 | ||||||||
Nordstrom, Inc. (Multiline Retail) | 12,230 | 733,066 | ||||||||
Home Depot, Inc. / The (Specialty Retail) | 4,800 | 371,856 | ||||||||
Tiffany & Co. (Specialty Retail) | 11,670 | 850,043 | ||||||||
Tractor Supply Co. (Specialty Retail) | (e) | 21,390 | 2,515,678 | |||||||
NIKE, Inc. Class B (Textiles, Apparel & Luxury Goods) | (e) | 15,880 | 1,011,238 | |||||||
PVH Corp. (Textiles, Apparel & Luxury Goods) | 3,200 | 400,160 | ||||||||
V.F. Corp. (Textiles, Apparel & Luxury Goods) | 5,610 | 1,083,067 | ||||||||
Wolverine World Wide, Inc. (Textiles, Apparel & Luxury Goods) | 10,370 | 566,306 | ||||||||
|
| |||||||||
| 15,889,066 | ||||||||||
|
| |||||||||
CONSUMER STAPLES – 6.1% | ||||||||||
Costco Wholesale Corp. (Food & Staples Retailing) | (e) | 21,530 | 2,380,572 | |||||||
Wal-Mart Stores, Inc. (Food & Staples Retailing) | 4,140 | 308,389 | ||||||||
Bunge Ltd. (Food Products) | 9,410 | 665,946 | ||||||||
Ingredion, Inc. (Food Products) | 9,360 | 614,203 | ||||||||
British American Tobacco PLC – ADR (Tobacco) | 6,000 | 617,640 | ||||||||
Lorillard, Inc. (Tobacco) | 16,510 | 721,157 | ||||||||
Philip Morris International, Inc. (Tobacco) | 8,820 | 763,988 | ||||||||
Reynolds American, Inc. (Tobacco) | 33,520 | 1,621,362 | ||||||||
|
| |||||||||
| 7,693,257 | ||||||||||
|
| |||||||||
ENERGY – 5.4% | ||||||||||
Atwood Oceanics, Inc. (Energy Equip. & Svs.) | (a) | 7,400 | 385,170 | |||||||
Dril-Quip, Inc. (Energy Equip. & Svs.) | (a) | 20,000 | 1,805,800 | |||||||
Oceaneering International, Inc. (Energy Equip. & Svs.) | 26,940 | 1,945,068 | ||||||||
Oil States International, Inc. (Energy Equip. & Svs.) | (a) | 3,800 | 352,032 | |||||||
Energy Transfer Partners LP (Oil, Gas & Consumable Fuels) | 18,950 | 957,733 | ||||||||
Marathon Petroleum Corp. (Oil, Gas & Consumable Fuels) | 4,400 | 312,664 | ||||||||
Phillips 66 (Oil, Gas & Consumable Fuels) | 5,500 | 324,005 | ||||||||
Tesoro Corp. (Oil, Gas & Consumable Fuels) | 7,750 | 405,480 | ||||||||
Valero Energy Corp. (Oil, Gas & Consumable Fuels) | 9,820 | 341,441 | ||||||||
|
| |||||||||
| 6,829,393 | ||||||||||
|
| |||||||||
FINANCIALS – 7.8% | ||||||||||
Franklin Resources, Inc. (Capital Markets) | 3,470 | 471,989 | ||||||||
Invesco Ltd. (Capital Markets) | 12,300 | 391,140 | ||||||||
Northern Trust Corp. (Capital Markets) | 21,880 | 1,266,852 | ||||||||
Waddell & Reed Financial, Inc. Class A (Capital Markets) | 29,500 | 1,283,250 | ||||||||
U.S. Bancorp (Commercial Banks) | 25,000 | 903,750 | ||||||||
Wells Fargo & Co. (Commercial Banks) | (e) | 38,160 | 1,574,863 | |||||||
American Express Co. (Consumer Finance) | (e) | 31,900 | 2,384,844 | |||||||
DFC Global Corp. (Consumer Finance) | (a)(e) | 30,000 | 414,300 | |||||||
World Acceptance Corp. (Consumer Finance) | (a) | 7,540 | 655,528 | |||||||
JPMorgan Chase & Co. (Diversified Financial Svs.) | 7,390 | 390,118 | ||||||||
|
| |||||||||
| 9,736,634 | ||||||||||
|
| |||||||||
HEALTH CARE – 3.3% | ||||||||||
Amgen, Inc. (Biotechnology) | (e) | 11,010 | 1,086,247 | |||||||
Abbott Laboratories (Health Care Equip. & Supplies) | 5,010 | 174,749 | ||||||||
Varian Medical Systems, Inc. (Health Care Equip. & Supplies) | (a) | 10,500 | 708,225 | |||||||
Express Scripts Holding Co. (Health Care Providers & Svs.) | (a) | 8,790 | 542,255 | |||||||
McKesson Corp. (Health Care Providers & Svs.) | 7,180 | 822,110 | ||||||||
Actavis, Inc. (Pharmaceuticals) | (a) | 6,200 | 782,564 | |||||||
|
| |||||||||
| 4,116,150 | ||||||||||
|
| |||||||||
| Common Stocks (Continued) | Shares | Value | ||||||||
INDUSTRIALS – 9.1% | ||||||||||
General Dynamics Corp. (Aerospace & Defense) | 12,830 | $ | 1,004,974 | |||||||
United Technologies Corp. (Aerospace & Defense) | 6,480 | 602,251 | ||||||||
Healthcare Services Group, Inc. (Commercial Svs. & Supplies) | 24,000 | 588,480 | ||||||||
Fluor Corp. (Construction & Engineering) | 24,700 | 1,464,957 | ||||||||
URS Corp. (Construction & Engineering) | 27,700 | 1,307,994 | ||||||||
AMETEK, Inc. (Electrical Equip.) | 18,540 | 784,242 | ||||||||
Crane Co. (Machinery) | 23,900 | 1,432,088 | ||||||||
Union Pacific Corp. (Road & Rail) | (e) | 4,830 | 745,172 | |||||||
Fastenal Co. (Trading Companies & Distributors) | 30,700 | 1,407,595 | ||||||||
W.W. Grainger, Inc. (Trading Companies & Distributors) | 8,090 | 2,040,136 | ||||||||
|
| |||||||||
| 11,377,889 | ||||||||||
|
| |||||||||
INFORMATION TECHNOLOGY – 5.8% | ||||||||||
Apple, Inc. (Computers & Peripherals) | (e) | 2,350 | 930,788 | |||||||
Google, Inc. Class A (Internet Software & Svs.) | (a) | 500 | 440,185 | |||||||
Accenture PLC Class A (IT Svs.) | 7,760 | 558,410 | ||||||||
International Business Machines Corp. (IT Svs.) | 6,310 | 1,205,904 | ||||||||
Mastercard, Inc. Class A (IT Svs.) | (e) | 2,210 | 1,269,645 | |||||||
MAXIMUS, Inc. (IT Svs.) | 12,500 | 931,000 | ||||||||
Visa, Inc. (IT Svs.) | 7,770 | 1,419,968 | ||||||||
ANSYS, Inc. (Software) | (a) | 8,000 | 584,800 | |||||||
|
| |||||||||
| 7,340,700 | ||||||||||
|
| |||||||||
MATERIALS – 5.4% | ||||||||||
Ecolab, Inc. (Chemicals) | 6,090 | 518,807 | ||||||||
FMC Corp. (Chemicals) | 26,300 | 1,605,878 | ||||||||
Koppers Holdings, Inc. (Chemicals) | 14,500 | 553,610 | ||||||||
LyondellBasell Industries NV Class A (Chemicals) | 26,500 | 1,755,890 | ||||||||
Nucor Corp. (Metals & Mining) | 18,200 | 788,424 | ||||||||
Steel Dynamics, Inc. (Metals & Mining) | 34,600 | 515,886 | ||||||||
KapStone Paper and Packaging Corp. (Paper & Forest Products) | 25,200 | 1,012,536 | ||||||||
|
| |||||||||
| 6,751,031 | ||||||||||
|
| |||||||||
UTILITIES – 4.5% | ||||||||||
American Electric Power Co., Inc. (Electric Utilities) | 14,000 | 626,920 | ||||||||
Hawaiian Electric Industries, Inc. (Electric Utilities) | 39,600 | 1,002,276 | ||||||||
Southern Co. / The (Electric Utilities) | 11,470 | 506,171 | ||||||||
Westar Energy, Inc. (Electric Utilities) | 51,500 | 1,645,940 | ||||||||
Xcel Energy, Inc. (Electric Utilities) | 36,500 | 1,034,410 | ||||||||
SCANA Corp. (Multi-Utilities) | 18,000 | 883,800 | ||||||||
|
| |||||||||
| 5,699,517 | ||||||||||
|
| |||||||||
Total Common Stocks (Cost $66,937,124) | $ | 75,433,637 | ||||||||
|
| |||||||||
| 89 | (continued) |
| Ohio National Fund, Inc. | Balanced Portfolio (Continued) |
Schedule of Investments | June 30, 2013 (Unaudited) |
| Corporate Bonds – 25.7% | Rate | Maturity | Face Amount | Value | ||||||||||||
CONSUMER DISCRETIONARY – 3.9% | ||||||||||||||||
Jarden Corp. (Household Durables) | 7.500% | 01/15/2020 | $ | 200,000 | $ | 215,000 | ||||||||||
Lennar Corp. (Household Durables) | 5.600% | 05/31/2015 | 200,000 | 211,000 | ||||||||||||
NVR, Inc. (Household Durables) | 3.950% | 09/15/2022 | 662,000 | 644,481 | ||||||||||||
Toll Brothers Finance Corp. (Household Durables) | 6.750% | 11/01/2019 | 400,000 | 454,000 | ||||||||||||
Toll Brothers Finance Corp. (Household Durables) | 4.950% | 03/15/2014 | 200,000 | 204,750 | ||||||||||||
DIRECTV Holdings LLC / DIRECTV Financing Co., Inc. (Media) | 2.400% | 03/15/2017 | 300,000 | 301,627 | ||||||||||||
DISH DBS Corp. (Media) | 7.125% | 02/01/2016 | 300,000 | 326,250 | ||||||||||||
NBCUniversal Media LLC (Media) | 5.150% | 04/30/2020 | 500,000 | 569,828 | ||||||||||||
Dollar General Corp. (Multiline Retail) | 4.125% | 07/15/2017 | 500,000 | 527,718 | ||||||||||||
Dollar General Corp. (Multiline Retail) | 3.250% | 04/15/2023 | 300,000 | 274,353 | ||||||||||||
Gap, Inc. / The (Specialty Retail) | 5.950% | 04/12/2021 | 500,000 | 553,624 | ||||||||||||
L Brands, Inc. (Specialty Retail) | 5.625% | 02/15/2022 | 500,000 | 510,000 | ||||||||||||
L Brands, Inc. (Specialty Retail) | 6.950% | 03/01/2033 | 150,000 | 150,000 | ||||||||||||
|
| |||||||||||||||
| 4,942,631 | ||||||||||||||||
|
| |||||||||||||||
CONSUMER STAPLES – 3.2% | ||||||||||||||||
Bottling Group LLC (Beverages) | 5.500% | 04/01/2016 | 500,000 | 558,085 | ||||||||||||
Coca-Cola Co. / The (Beverages) | 4.875% | 03/15/2019 | 150,000 | 169,953 | ||||||||||||
Coca-Cola Co. / The (Beverages) | 3.300% | 09/01/2021 | 500,000 | 511,842 | ||||||||||||
Constellation Brands, Inc. (Beverages) | 7.250% | 09/01/2016 | 200,000 | 228,250 | ||||||||||||
PepsiCo, Inc. (Beverages) | 5.000% | 06/01/2018 | 150,000 | 169,926 | ||||||||||||
PepsiCo, Inc. (Beverages) | 3.125% | 11/01/2020 | 500,000 | 509,665 | ||||||||||||
Wal-Mart Stores, Inc. (Food & Staples Retailing) | 7.550% | 02/15/2030 | 200,000 | 275,292 | ||||||||||||
Wal-Mart Stores, Inc. (Food & Staples Retailing) | 3.250% | 10/25/2020 | 300,000 | 310,456 | ||||||||||||
Wal-Mart Stores, Inc. (Food & Staples Retailing) | 4.250% | 04/15/2021 | 100,000 | 109,191 | ||||||||||||
Wal-Mart Stores, Inc. (Food & Staples Retailing) | 4.125% | 02/01/2019 | 100,000 | 110,350 | ||||||||||||
ConAgra Foods, Inc. (Food Products) | 1.900% | 01/25/2018 | 500,000 | 491,896 | ||||||||||||
Kellogg Co. (Food Products) | 4.000% | 12/15/2020 | 100,000 | 105,395 | ||||||||||||
Altria Group, Inc. (Tobacco) | 9.250% | 08/06/2019 | 51,000 | 67,599 | ||||||||||||
Altria Group, Inc. (Tobacco) | 4.125% | 09/11/2015 | 300,000 | 319,817 | ||||||||||||
Lorillard Tobacco Co. (Tobacco) | 6.875% | 05/01/2020 | 100,000 | 115,020 | ||||||||||||
|
| |||||||||||||||
| 4,052,737 | ||||||||||||||||
|
| |||||||||||||||
ENERGY – 0.4% | ||||||||||||||||
Petrobras International Finance Co – Pifco (Oil, Gas & Consumable Fuels) | 7.750% | 09/15/2014 | 50,000 | 53,687 | ||||||||||||
Tesoro Corp. (Oil, Gas & Consumable Fuels) | 4.250% | 10/01/2017 | 400,000 | 412,000 | ||||||||||||
|
| |||||||||||||||
| 465,687 | ||||||||||||||||
|
| |||||||||||||||
FINANCIALS – 6.8% | ||||||||||||||||
Goldman Sachs Group, Inc. / The (Capital Markets) | 5.125% | 01/15/2015 | 500,000 | 527,627 | ||||||||||||
Morgan Stanley (Capital Markets) | 5.375% | 10/15/2015 | 700,000 | 749,637 | ||||||||||||
Morgan Stanley (Capital Markets) | (c) | 3.500% | 10/15/2020 | 50,000 | 50,734 | |||||||||||
Morgan Stanley (Capital Markets) | (b) | 0.579% | 01/09/2014 | 400,000 | 398,982 | |||||||||||
CIT Group, Inc. (Commercial Banks) | 5.000% | 08/15/2022 | 200,000 | 199,390 | ||||||||||||
Wachovia Corp. (Commercial Banks) | 5.750% | 06/15/2017 | 500,000 | 567,890 | ||||||||||||
Wachovia Corp. (Commercial Banks) | (b) | 0.543% | 06/15/2017 | 500,000 | 491,972 | |||||||||||
Wells Fargo & Co. (Commercial Banks) | (b) | 0.476% | 10/28/2015 | 300,000 | 298,798 | |||||||||||
American Express Co. (Consumer Finance) | 7.250% | 05/20/2014 | 500,000 | 528,834 | ||||||||||||
American Express Co. (Consumer Finance) | 5.500% | 09/12/2016 | 500,000 | 558,693 | ||||||||||||
Ford Motor Credit Co. LLC (Consumer Finance) | 8.000% | 06/01/2014 | 100,000 | 105,781 | ||||||||||||
Bank of America NA (Diversified Financial Svs.) | (b) | 0.573% | 06/15/2017 | 50,000 | 47,931 | |||||||||||
Citigroup, Inc. (Diversified Financial Svs.) | 5.125% | 05/05/2014 | 1,000 | 1,033 | ||||||||||||
Citigroup, Inc. (Diversified Financial Svs.) | (b) | 0.544% | 06/09/2016 | 500,000 | 482,815 | |||||||||||
General Electric Capital Corp. (Diversified Financial Svs.) | 4.750% | 09/15/2014 | 200,000 | 209,603 | ||||||||||||
General Electric Capital Corp. (Diversified Financial Svs.) | (b) | 0.445% | 02/15/2017 | 300,000 | 297,328 | |||||||||||
JPMorgan Chase & Co. (Diversified Financial Svs.) | 2.600% | 01/15/2016 | 500,000 | 510,802 | ||||||||||||
JPMorgan Chase Bank NA (Diversified Financial Svs.) | (b) | 0.602% | 06/13/2016 | 250,000 | 245,777 | |||||||||||
Berkshire Hathaway Finance Corp. (Insurance) | 5.400% | 05/15/2018 | 300,000 | 344,876 | ||||||||||||
Berkshire Hathaway Finance Corp. (Insurance) | 3.000% | 05/15/2022 | 300,000 | 290,634 | ||||||||||||
Berkshire Hathaway Finance Corp. (Insurance) | 4.250% | 01/15/2021 | 150,000 | 160,357 | ||||||||||||
Berkshire Hathaway, Inc. (Insurance) | 3.400% | 01/31/2022 | 200,000 | 200,875 | ||||||||||||
HCP, Inc. (Real Estate Investment Trusts) | 6.700% | 01/30/2018 | 200,000 | 234,245 | ||||||||||||
Health Care REIT, Inc. (Real Estate Investment Trusts) | 4.125% | 04/01/2019 | 150,000 | 157,028 | ||||||||||||
Simon Property Group LP (Real Estate Investment Trusts) | 5.100% | 06/15/2015 | 500,000 | 540,771 | ||||||||||||
Ventas Realty LP l Corp. (Real Estate Investment Trusts) | 4.000% | 04/30/2019 | 150,000 | 156,114 | ||||||||||||
Vornado Realty LP (Real Estate Investment Trusts) | 4.250% | 04/01/2015 | 200,000 | 208,270 | ||||||||||||
|
| |||||||||||||||
| 8,566,797 | ||||||||||||||||
|
| |||||||||||||||
| 90 | (continued) |
| Ohio National Fund, Inc. | Balanced Portfolio (Continued) |
Schedule of Investments | June 30, 2013 (Unaudited) |
| Corporate Bonds (Continued) | Rate | Maturity | Face Amount | Value | ||||||||||||
HEALTH CARE – 3.0% | ||||||||||||||||
Celgene Corp. (Biotechnology) | 3.250% | 08/15/2022 | $ | 500,000 | $ | 474,858 | ||||||||||
Gilead Sciences, Inc. (Biotechnology) | 4.400% | 12/01/2021 | 200,000 | 215,027 | ||||||||||||
Gilead Sciences, Inc. (Biotechnology) | 3.050% | 12/01/2016 | 500,000 | 528,848 | ||||||||||||
Baxter International, Inc. (Health Care Equip. & Supplies) | 5.900% | 09/01/2016 | 200,000 | 228,100 | ||||||||||||
Laboratory Corp. of America Holdings (Health Care Providers & Svs.) | 2.200% | 08/23/2017 | 500,000 | 496,740 | ||||||||||||
Thermo Fisher Scientific, Inc. (Life Sciences Tools & Svs.) | 4.500% | 03/01/2021 | 200,000 | 208,401 | ||||||||||||
Thermo Fisher Scientific, Inc. (Life Sciences Tools & Svs.) | 3.200% | 03/01/2016 | 200,000 | 207,693 | ||||||||||||
Endo Health Solutions, Inc. (Pharmaceuticals) | 7.000% | 07/15/2019 | 200,000 | 203,000 | ||||||||||||
Hospira, Inc. (Pharmaceuticals) | 6.050% | 03/30/2017 | 50,000 | 53,533 | ||||||||||||
Johnson & Johnson (Pharmaceuticals) | 2.950% | 09/01/2020 | 300,000 | 305,816 | ||||||||||||
Johnson & Johnson (Pharmaceuticals) | 5.550% | 08/15/2017 | 400,000 | 463,286 | ||||||||||||
Merck & Co., Inc. (Pharmaceuticals) | 6.000% | 09/15/2017 | 200,000 | 233,597 | ||||||||||||
Novartis Capital Corp. (Pharmaceuticals) | 4.400% | 04/24/2020 | 200,000 | 222,315 | ||||||||||||
|
| |||||||||||||||
| 3,841,214 | ||||||||||||||||
|
| |||||||||||||||
INDUSTRIALS – 2.6% | ||||||||||||||||
B/E Aerospace, Inc. (Aerospace & Defense) | 6.875% | 10/01/2020 | 500,000 | 542,500 | ||||||||||||
B/E Aerospace, Inc. (Aerospace & Defense) | 5.250% | 04/01/2022 | 400,000 | 400,000 | ||||||||||||
Lockheed Martin Corp. (Aerospace & Defense) | 4.250% | 11/15/2019 | 700,000 | 762,803 | ||||||||||||
Lockheed Martin Corp. (Aerospace & Defense) | 2.125% | 09/15/2016 | 300,000 | 306,452 | ||||||||||||
TransDigm, Inc. (Aerospace & Defense) | 7.750% | 12/15/2018 | 200,000 | 211,500 | ||||||||||||
United Parcel Service, Inc. (Air Freight & Logistics) | 5.125% | 04/01/2019 | 500,000 | 575,411 | ||||||||||||
Masco Corp. (Building Products) | 6.125% | 10/03/2016 | 225,000 | 244,125 | ||||||||||||
Valmont Industries, Inc. (Machinery) | 6.625% | 04/20/2020 | 150,000 | 171,202 | ||||||||||||
|
| |||||||||||||||
| 3,213,993 | ||||||||||||||||
|
| |||||||||||||||
INFORMATION TECHNOLOGY – 0.9% | ||||||||||||||||
Google, Inc. (Internet Software & Svs.) | 3.625% | 05/19/2021 | 300,000 | 313,905 | ||||||||||||
Google, Inc. (Internet Software & Svs.) | 2.125% | 05/19/2016 | 500,000 | 517,003 | ||||||||||||
Fiserv, Inc. (IT Svs.) | 3.500% | 10/01/2022 | 300,000 | 285,126 | ||||||||||||
|
| |||||||||||||||
| 1,116,034 | ||||||||||||||||
|
| |||||||||||||||
MATERIALS – 3.1% | ||||||||||||||||
CF Industries, Inc. (Chemicals) | 7.125% | 05/01/2020 | 500,000 | 598,766 | ||||||||||||
Ecolab, Inc. (Chemicals) | 4.350% | 12/08/2021 | 200,000 | 211,406 | ||||||||||||
LyondellBasell Industries NV (Chemicals) | 6.000% | 11/15/2021 | 700,000 | 787,516 | ||||||||||||
LyondellBasell Industries NV (Chemicals) | 5.000% | 04/15/2019 | 500,000 | 544,506 | ||||||||||||
PPG Industries, Inc. (Chemicals) | 6.650% | 03/15/2018 | 500,000 | 592,769 | ||||||||||||
Vulcan Materials Co. (Construction Materials) | 6.500% | 12/01/2016 | 200,000 | 217,500 | ||||||||||||
Ball Corp. (Containers & Packaging) | 5.000% | 03/15/2022 | 500,000 | 500,000 | ||||||||||||
MeadWestvaco Corp. (Containers & Packaging) | 7.375% | 09/01/2019 | 200,000 | 236,810 | ||||||||||||
Reliance Steel & Aluminum Co. (Metals & Mining) | 6.200% | 11/15/2016 | 200,000 | 223,438 | ||||||||||||
|
| |||||||||||||||
| 3,912,711 | ||||||||||||||||
|
| |||||||||||||||
TELECOMMUNICATION SERVICES – 1.6% | ||||||||||||||||
AT&T, Inc. (Diversified Telecom. Svs.) | 5.800% | 02/15/2019 | 500,000 | 580,374 | ||||||||||||
AT&T, Inc. (Diversified Telecom. Svs.) | 1.400% | 12/01/2017 | 500,000 | 486,440 | ||||||||||||
CenturyLink, Inc. (Diversified Telecom. Svs.) | 5.800% | 03/15/2022 | 500,000 | 496,250 | ||||||||||||
Telefonica Emisiones SAU (Diversified Telecom. Svs.) | 6.421% | 06/20/2016 | 200,000 | 220,063 | ||||||||||||
Windstream Corp. (Diversified Telecom. Svs.) | 8.125% | 08/01/2013 | 50,000 | 50,200 | ||||||||||||
Comcast Cable Communications Holdings, Inc. (Wireless Telecom. Svs.) | 9.455% | 11/15/2022 | 150,000 | 212,509 | ||||||||||||
|
| |||||||||||||||
| 2,045,836 | ||||||||||||||||
|
| |||||||||||||||
UTILITIES – 0.2% | ||||||||||||||||
Entergy Corp. (Electric Utilities) | 3.625% | 09/15/2015 | 50,000 | 51,823 | ||||||||||||
AmeriGas Finance LLC / AmeriGas Finance Corp. (Gas Utilities) | 7.000% | 05/20/2022 | 150,000 | 154,125 | ||||||||||||
|
| |||||||||||||||
| 205,948 | ||||||||||||||||
|
| |||||||||||||||
Total Corporate Bonds (Cost $33,095,429) | $ | 32,363,588 | ||||||||||||||
|
| |||||||||||||||
| U.S. Treasury Obligations – 11.1% | Rate | Maturity | Face Amount | Value | ||||||||||||
U.S. Treasury Note | 0.250% | 01/31/2015 | $ | 1,000,000 | $ | 999,746 | ||||||||||
U.S. Treasury Note | 0.250% | 02/28/2015 | 500,000 | 499,610 | ||||||||||||
U.S. Treasury Note | 0.375% | 03/15/2016 | 1,000,000 | 994,531 | ||||||||||||
U.S. Treasury Note | 3.250% | 03/31/2017 | 800,000 | 867,187 | ||||||||||||
U.S. Treasury Note | 0.625% | 08/31/2017 | 1,000,000 | 979,219 | ||||||||||||
U.S. Treasury Note | 0.750% | 02/28/2018 | 1,000,000 | 975,195 | ||||||||||||
U.S. Treasury Note | 1.000% | 05/31/2018 | 1,000,000 | 982,500 | ||||||||||||
| 91 | (continued) |
| Ohio National Fund, Inc. | Balanced Portfolio (Continued) |
Schedule of Investments | June 30, 2013 (Unaudited) |
U.S. Treasury Obligations (Continued) | Rate | Maturity | Face Amount | Value | ||||||||||||
U.S. Treasury Note | 1.250% | 01/31/2019 | $ | 700,000 | $ | 688,570 | ||||||||||
U.S. Treasury Note | 1.125% | 12/31/2019 | 1,000,000 | 957,695 | ||||||||||||
U.S. Treasury Note | 1.375% | 05/31/2020 | 500,000 | 482,246 | ||||||||||||
U.S. Treasury Note | 2.625% | 11/15/2020 | 1,000,000 | 1,041,602 | ||||||||||||
U.S. Treasury Note | 1.750% | 05/15/2023 | 1,500,000 | 1,404,024 | ||||||||||||
U.S. Treasury Bond | 4.500% | 02/15/2036 | 1,500,000 | 1,788,164 | ||||||||||||
U.S. Treasury Bond | 2.875% | 05/15/2043 | 1,500,000 | 1,329,609 | ||||||||||||
|
| |||||||||||||||
Total U.S. Treasury Obligations (Cost $14,241,665) | $ | 13,989,898 | ||||||||||||||
|
| |||||||||||||||
| Exchange Traded Funds – 0.7% | Shares | Value | ||||||||||||||
SPDR Barclays High Yield Bond ETF | 21,000 | $ | 829,290 | |||||||||||||
|
| |||||||||||||||
Total Exchange Traded Funds (Cost $822,244) | $ | 829,290 | ||||||||||||||
|
| |||||||||||||||
| Purchased Options – 0.3% | Contracts (d) | Value | ||||||||||||||
S&P 500 Index Put Option | 200 | $ | 430,000 | |||||||||||||
|
| |||||||||||||||
Total Purchased Options (Cost $418,674) | $ | 430,000 | ||||||||||||||
|
| |||||||||||||||
| Money Market Funds – 3.3% | Shares | Value | ||||||||||||||
Fidelity Institutional Money Market Funds | 4,184,000 | $ | 4,184,000 | |||||||||||||
|
| |||||||||||||||
Total Money Market Funds (Cost $4,184,000) | $ | 4,184,000 | ||||||||||||||
|
| |||||||||||||||
Total Investments – 101.1% (Cost $119,699,136) | (f) | $ | 127,230,413 | |||||||||||||
Total Written Options Outstanding – (0.2)% (see following schedule) | (326,500) | |||||||||||||||
Liabilities in Excess of Other Assets – (0.9)% | (1,093,297) | |||||||||||||||
|
| |||||||||||||||
Net Assets – 100.0% | $ | 125,810,616 | ||||||||||||||
|
| |||||||||||||||
Percentages are stated as a percent of net assets.
Abbreviations:
ADR: American Depositary Receipts
Footnotes:
| (a) | Non-income producing security. |
| (b) | Securities are variable rate instruments in which the coupon rates are adjusted quarterly in concert with U.S. LIBOR. Interest rates stated are those in effect at June 30, 2013. |
| (c) | Security was initially issued at one coupon rate, but the coupon rate is scheduled to be updated at later specified dates. The coupon rate shown is the rate that is in effect at June 30, 2013. |
| (d) | 100 shares per contract. |
| (e) | Security is fully or partially pledged as collateral for written call options outstanding. Outstanding written call options are presented in the following schedule. |
| (f) | Represents cost for financial reporting purposes, which may differ from cost basis for federal income tax purposes. See also Note 7 of the Notes to Financial Statements. |
Schedule of Written Options Outstanding | June 30, 2013 (Unaudited) |
| Contracts* | Value | |||||
S&P 500 Index Call Option | ||||||
Expiration: August 2013, Exercise Price: $1,610.00 | 100 | $ | 326,500 | |||
|
|
| ||||
Total Written Options Outstanding (Premiums received $256,663) | 100 | $ | 326,500 | |||
|
|
| ||||
| * | 100 shares per contract. |
The accompanying notes are an integral part of these financial statements.
| 92 |
| Ohio National Fund, Inc. | Income Opportunity Portfolio |
Objective/Strategy
The Income Opportunity Portfolio seeks modest capital appreciation and maximization of realized gains by investing in equity securities traded in the U.S.
Performance as of June 30, 2013
Average Annual Returns: | ||||
One year | 17.13% | |||
Five years | 4.02% | |||
Since inception (5/1/04) | 4.08% |
Past performance does not guarantee future results. The performance data quoted represents past performance and current returns may be lower or higher. Total return figures include change in share price and reinvestment of dividends and capital gains. The investment return and principal value will fluctuate so that an investor’s shares, when redeemed, may be worth more or less than the original cost. To obtain performance information up to the most recent month end, call toll-free 1-877-781-6392.
The Portfolio is not open to direct retail investment. Beneficial interest in shares is obtained solely by purchase of variable life insurance policies and variable annuity contracts. Actual performance results for variable annuity and variable universal life contracts will be lower due to contract charges. Consult your contract for applicable charges.
Comments
For the six-month period ended June 30, 2013, the Income Opportunity Portfolio returned 13.35% versus 13.97% for the current benchmark, the S&P Composite 1500 Index.
As we entered the beginning of 2013, we saw significant upside potential in the U.S. equity market. Our valuation model indicated the bull market that began back in March of 2009 would remain in place. The 10-year Treasury stood at about 1.75% at the end of 2012, continuing to hover at historically low levels. Corporate earnings remained strong and the Federal Reserve maintained its accommodative monetary policy. This environment of stocks selling at a discount to our calculation of fair value and supportive fundamental factors gave us a high degree of confidence in higher equity returns and, in fact, the market did show gains over the period. While the move higher was not without several pullbacks, market volatility was significantly less than in 2012. The macro-economic concerns that had roiled the market last year – intense speculation over a change in Federal Reserve monetary policy, the specter of a significant rise in inflation and the debt crisis in Europe, to name a few – subsided substantially, although not completely.
The Portfolio slightly underperformed the S&P Composite 1500 Index, but with significantly less volatility. The beta of the Portfolio was 0.54 for the six-month period. While the equity portion of the Portfolio outperformed the S&P Composite 1500 Index, the option overlay hedge detracted slightly from the pure equity return. However, because our hedge was minimal – a function of the significant upside potential we saw over the period – the Portfolio captured almost all of the index return while at the same time dampening volatility and reducing downside capture.(1)
Taking a closer look at the performance of the equity holdings, the Portfolio had a significant tilt toward the more cyclical sectors in the market. The largest overweight position was in the Consumer Discretionary sector. The Portfolio maintained an average weighting of about 20.1% over the period versus 10.2% in the benchmark. This sector outperformed the S&P Composite 1500 Index, resulting in relative outperformance. The Portfolio was also overweight in the Energy sector: 11.9% versus 10.2% in the benchmark. The Portfolio
positions within the Energy sector outperformed the index, also resulting in relative outperformance. On the flipside, positions in the Financials and Consumer Staples sectors were among those that detracted from relative performance. Based on its low relative valuation, the Portfolio was underweight in the Financials sector. The Portfolio had an average weight of about 11.3% in the Financials sector over the period versus the benchmark weight of approximately 16.9%. Because the Financials sector was a strong performer over the period, our underweight position resulted in relative underperformance. Our position in the Consumer Staples sector was about the same as in the benchmark, but stock selection within it undermined relative performance. Overall, however, stock selection benefitted relative performance.(1)
At the industry level, the top five benchmark relative performers were specialty stores, paper products, oil & gas equipment & services, oil & gas refining & marketing and footwear. Specialty stores and oil & gas equipment & services were among the top total return contributors to the Portfolio. At the other end of the spectrum, computer hardware, electric utilities, construction & engineering, consumer finance and information technology consulting & services were the bottom five benchmark relative performers. Computer hardware and steel were the two largest total return detractors.(1)
Moving to individual stock performance within the Portfolio, the five best performers were KapStone Paper & Packaging Corp., Tractor Supply Co., Actavis, Inc., Oceaneering International, Inc. and The Walt Disney Co. Tractor Supply Co. and Oceaneering International, Inc. were also two of the top total return contributors to the Portfolio’s performance. The five stocks that had the most negative performance were DFC Global Corp., Apple, Inc., National Oilwell Varco, Inc., Fluor Corp. and Microsoft Corp. DFC Global Corp. and Apple, Inc. were the two largest total return detractors.(1)
Looking ahead, we do not see as much upside potential in the U.S. equity market as we did coming into this year. Our valuation model indicates that stocks are now only slightly undervalued. Though we believe the market has some room to move higher, the probability of the magnitude of the market gains we saw in the first half of this year has diminished. This environment is one in which the Portfolio’s tactical allocation strategy will play a key role in taking advantage of selective opportunities as they emerge. To reduce the downside exposure of the Portfolio, we have tightened our options hedge and have also increased our cash position.
| (1) | The Portfolio’s composition is subject to change. Holdings and weightings are as of June 30, 2013. |
| 93 | (continued) |
| Ohio National Fund, Inc. | Income Opportunity Portfolio (Continued) |
Change in Value of $10,000 Investment
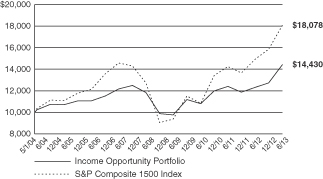
Hypothetical illustration based on past performance. Future performance will vary. The Portfolio’s returns reflect reinvested dividends. The Portfolio’s holdings may differ significantly from the securities in the index. The index is unmanaged and therefore does not reflect the cost of portfolio management and accounting.
The S&P Composite 1500 Index is a broad-based capitalization-weighted index of 1500 U.S. companies and is comprised of the S&P 400 MidCap, S&P 500, and the S&P SmallCap 600. It is designed for investors seeking to replicate the performance of the U.S. equity market or benchmark against a representative universe of tradable stocks. The index presented herein includes the effects of reinvested dividends.
Portfolio Composition as of June 30, 2013 (1)
| % of Net Assets | ||||
Common Stocks (3) | 97.3 | |||
Purchased Options | 0.6 | |||
Written Options Outstanding | (0.5 | ) | ||
Money Market Funds and | 2.6 | |||
|
| |||
| 100.0 | ||||
|
|
Top 10 Portfolio Holdings as of June 30, 2013 (1) (2)
| % of Net Assets | ||||
1. Tractor Supply Co. | 3.9 | |||
2. Walt Disney Co. / The | 3.4 | |||
3. LyondellBasell Industries NV Class A | 3.1 | |||
4. Oceaneering International, Inc. | 2.4 | |||
5. Amgen, Inc. | 2.4 | |||
6. Dril-Quip, Inc. | 2.4 | |||
7. Westar Energy, Inc. | 2.3 | |||
8. Costco Wholesale Corp. | 2.3 | |||
9. Mastercard, Inc. Class A | 2.3 | |||
10. Wells Fargo & Co. | 2.3 |
| (1) | Composition of Portfolio subject to change. |
| (2) | Short-term investments have been excluded from the list of Top 10 Portfolio Holdings. |
| (3) | Sectors: |
| % of Net Assets | ||||
Consumer Discretionary | 19.1 | |||
Financials | 12.6 | |||
Information Technology | 12.1 | |||
Industrials | 11.9 | |||
Energy | 9.2 | |||
Consumer Staples | 8.8 | |||
Materials | 8.6 | |||
Utilities | 7.6 | |||
Health Care | 7.4 | |||
|
| |||
| 97.3 | ||||
|
|
| 94 |
| Ohio National Fund, Inc. | Income Opportunity Portfolio |
Schedule of Investments | June 30, 2013 (Unaudited) |
| Common Stocks – 97.3% | Shares | Value | ||||||||
CONSUMER DISCRETIONARY – 19.1% | ||||||||||
Jarden Corp. (Household Durables) | (a) | 4,050 | $ | 177,188 | ||||||
MDC Holdings, Inc. (Household Durables) | 1,100 | 35,761 | ||||||||
PulteGroup, Inc. (Household Durables) | (a) | 2,000 | 37,940 | |||||||
Ryland Group, Inc. / The (Household Durables) | (b) | 1,900 | 76,190 | |||||||
Toll Brothers, Inc. (Household Durables) | (a) | 1,300 | 42,419 | |||||||
CBS Corp. Class B (Media) | 2,100 | 102,627 | ||||||||
Walt Disney Co. / The (Media) | (b) | 5,400 | 341,010 | |||||||
Nordstrom, Inc. (Multiline Retail) | 1,200 | 71,928 | ||||||||
Tiffany & Co. (Specialty Retail) | 2,900 | 211,236 | ||||||||
Tractor Supply Co. (Specialty Retail) | 3,300 | 388,113 | ||||||||
NIKE, Inc. Class B (Textiles, Apparel & Luxury Goods) | 2,600 | 165,568 | ||||||||
V.F. Corp. (Textiles, Apparel & Luxury Goods) | 900 | 173,754 | ||||||||
Wolverine World Wide, Inc. (Textiles, Apparel & Luxury Goods) | 1,500 | 81,915 | ||||||||
|
| |||||||||
| 1,905,649 | ||||||||||
|
| |||||||||
CONSUMER STAPLES – 8.8% | ||||||||||
Costco Wholesale Corp. (Food & Staples Retailing) | (b) | 2,100 | 232,197 | |||||||
Ingredion, Inc. (Food Products) | 2,200 | 144,364 | ||||||||
Kimberly-Clark Corp. (Household Products) | 1,400 | 135,996 | ||||||||
Philip Morris International, Inc. (Tobacco) | 1,900 | 164,578 | ||||||||
Reynolds American, Inc. (Tobacco) | 4,200 | 203,154 | ||||||||
|
| |||||||||
| 880,289 | ||||||||||
|
| |||||||||
ENERGY – 9.2% | ||||||||||
Atwood Oceanics, Inc. (Energy Equip. & Svs.) | (a) | 1,000 | 52,050 | |||||||
Dril-Quip, Inc. (Energy Equip. & Svs.) | (a) | 2,600 | 234,754 | |||||||
Oceaneering International, Inc. (Energy Equip. & Svs.) | 3,300 | 238,260 | ||||||||
Oil States International, Inc. (Energy Equip. & Svs.) | (a) | 850 | 78,744 | |||||||
Energy Transfer Partners LP (Oil, Gas & Consumable Fuels) | 2,500 | 126,350 | ||||||||
Marathon Petroleum Corp. (Oil, Gas & Consumable Fuels) | 600 | 42,636 | ||||||||
Tesoro Corp. (Oil, Gas & Consumable Fuels) | 1,500 | 78,480 | ||||||||
Valero Energy Corp. (Oil, Gas & Consumable Fuels) | 1,900 | 66,063 | ||||||||
|
| |||||||||
| 917,337 | ||||||||||
|
| |||||||||
FINANCIALS – 12.6% | ||||||||||
Franklin Resources, Inc. (Capital Markets) | 600 | 81,612 | ||||||||
Invesco Ltd. (Capital Markets) | 1,600 | 50,880 | ||||||||
Northern Trust Corp. (Capital Markets) | 3,900 | 225,810 | ||||||||
Waddell & Reed Financial, Inc. Class A (Capital Markets) | 2,200 | 95,700 | ||||||||
U.S. Bancorp (Commercial Banks) | (b) | 3,000 | 108,450 | |||||||
Wells Fargo & Co. (Commercial Banks) | (b) | 5,500 | 226,985 | |||||||
American Express Co. (Consumer Finance) | 1,800 | 134,568 | ||||||||
DFC Global Corp. (Consumer Finance) | (a) | 5,200 | 71,812 | |||||||
World Acceptance Corp. (Consumer Finance) | (a) | 1,100 | 95,634 | |||||||
JPMorgan Chase & Co. (Diversified Financial Svs.) | (b) | 3,100 | 163,649 | |||||||
|
| |||||||||
| 1,255,100 | ||||||||||
|
| |||||||||
HEALTH CARE – 7.4% | ||||||||||
Amgen, Inc. (Biotechnology) | 2,400 | 236,784 | ||||||||
Abbott Laboratories (Health Care Equip. & Supplies) | 3,100 | 108,128 | ||||||||
Varian Medical Systems, Inc. (Health Care Equip. & Supplies) | (a)(b) | 900 | 60,705 | |||||||
Express Scripts Holding Co. (Health Care Providers & Svs.) | (a)(b) | 1,500 | 92,535 | |||||||
McKesson Corp. (Health Care Providers & Svs.) | 1,200 | 137,400 | ||||||||
Actavis, Inc. (Pharmaceuticals) | (a) | 800 | 100,976 | |||||||
|
| |||||||||
| 736,528 | ||||||||||
|
| |||||||||
| Common Stocks (Continued) | Shares | Value | ||||||||
INDUSTRIALS – 11.9% | ||||||||||
United Technologies Corp. (Aerospace & Defense) | (b) | 1,400 | $ | 130,116 | ||||||
Fluor Corp. (Construction & Engineering) | 3,000 | 177,930 | ||||||||
AMETEK, Inc. (Electrical Equip.) | 3,300 | 139,590 | ||||||||
Dover Corp. (Machinery) | (b) | 1,400 | 108,724 | |||||||
Parker Hannifin Corp. (Machinery) | 1,100 | 104,940 | ||||||||
Union Pacific Corp. (Road & Rail) | (b) | 1,200 | 185,136 | |||||||
Fastenal Co. (Trading Companies & Distributors) | 3,100 | 142,135 | ||||||||
W.W. Grainger, Inc. (Trading Companies & Distributors) | 800 | 201,744 | ||||||||
|
| |||||||||
| 1,190,315 | ||||||||||
|
| |||||||||
INFORMATION TECHNOLOGY – 12.1% | ||||||||||
Apple, Inc. (Computers & Peripherals) | (b) | 300 | 118,824 | |||||||
Google, Inc. Class A (Internet Software & Svs.) | (a) | 200 | 176,074 | |||||||
Accenture PLC Class A (IT Svs.) | 1,200 | 86,352 | ||||||||
International Business Machines Corp. (IT Svs.) | (b) | 900 | 171,999 | |||||||
Mastercard, Inc. Class A (IT Svs.) | 400 | 229,800 | ||||||||
MAXIMUS, Inc. (IT Svs.) | 1,300 | 96,824 | ||||||||
Visa, Inc. (IT Svs.) | 600 | 109,650 | ||||||||
ANSYS, Inc. (Software) | (a) | 1,400 | 102,340 | |||||||
Mentor Graphics Corp. (Software) | 5,900 | 115,345 | ||||||||
|
| |||||||||
| 1,207,208 | ||||||||||
|
| |||||||||
MATERIALS – 8.6% | ||||||||||
FMC Corp. (Chemicals) | 3,400 | 207,604 | ||||||||
Koppers Holdings, Inc. (Chemicals) | 1,500 | 57,270 | ||||||||
LyondellBasell Industries NV Class A (Chemicals) | 4,700 | 311,422 | ||||||||
Nucor Corp. (Metals & Mining) | 2,200 | 95,304 | ||||||||
KapStone Paper and Packaging Corp. (Paper & Forest Products) | 4,600 | 184,828 | ||||||||
|
| |||||||||
| 856,428 | ||||||||||
|
| |||||||||
UTILITIES – 7.6% | ||||||||||
American Electric Power Co., Inc. (Electric Utilities) | 2,000 | 89,560 | ||||||||
Hawaiian Electric Industries, Inc. (Electric Utilities) | 5,400 | 136,674 | ||||||||
Southern Co. / The (Electric Utilities) | (b) | 2,100 | 92,673 | |||||||
Westar Energy, Inc. (Electric Utilities) | 7,300 | 233,308 | ||||||||
Xcel Energy, Inc. (Electric Utilities) | 3,300 | 93,522 | ||||||||
SCANA Corp. (Multi-Utilities) | 2,400 | 117,840 | ||||||||
|
| |||||||||
| 763,577 | ||||||||||
|
| |||||||||
Total Common Stocks (Cost $8,029,826) | $ | 9,712,431 | ||||||||
|
| |||||||||
| Purchased Options – 0.6% | Contracts (c) | Value | ||||||||
S&P 500 Index Put Option | 30 | $ | 64,500 | |||||||
|
| |||||||||
Total Purchased Options (Cost $62,801) | $ | 64,500 | ||||||||
|
| |||||||||
| Money Market Funds – 1.7% | Shares | Value | ||||||||
Fidelity Institutional Money Market Funds | 172,000 | $ | 172,000 | |||||||
|
| |||||||||
Total Money Market Funds (Cost $172,000) | $ | 172,000 | ||||||||
|
| |||||||||
Total Investments – 99.6% (Cost $8,264,627) | (d) | $ | 9,948,931 | |||||||
Total Written Options Outstanding – (0.5)% | (48,975) | |||||||||
Other Assets in Excess of Liabilities – 0.9% | 85,150 | |||||||||
|
| |||||||||
Net Assets – 100.0% | $ | 9,985,106 | ||||||||
|
| |||||||||
Percentages are stated as a percent of net assets.
Footnotes:
| (a) | Non-income producing security. |
| (b) | Security is fully or partially pledged as collateral for written call options outstanding. Outstanding written call options are presented in the following schedule. |
| (c) | 100 shares per contract. |
| (d) | Represents cost for financial reporting purposes, which may differ from cost basis for federal income tax purposes. See also Note 7 of the Notes to Financial Statements. |
| 95 | (continued) |
| Ohio National Fund, Inc. | Income Opportunity Portfolio (Continued) |
Schedule of Written Options Outstanding | June 30, 2013 (Unaudited) |
| Contracts* | Value | |||||
S&P 500 Index Call Option | ||||||
Expiration: August 2013, Exercise Price: $1,610.00 | 15 | $ | 48,975 | |||
|
|
| ||||
Total Written Options Outstanding (Premiums received $38,499) | 15 | $ | 48,975 | |||
|
|
| ||||
| * | 100 shares per contract. |
The accompanying notes are an integral part of these financial statements.
| 96 |
| Ohio National Fund, Inc. | Target VIP Portfolio |
Objective/Strategy
The Target VIP Portfolio seeks an above average total return by investing in the common stocks of companies which are identified by a model which applies separate uniquely specialized strategies.
Performance as of June 30, 2013
Average Annual Returns: | ||||
One year | 19.63% | |||
Five years | 2.96% | |||
Since inception (11/2/05) | 2.76% |
Past performance does not guarantee future results. The performance data quoted represents past performance and current returns may be lower or higher. Total return figures include change in share price and reinvestment of dividends and capital gains. The investment return and principal value will fluctuate so that an investor’s shares, when redeemed, may be worth more or less than the original cost. To obtain performance information up to the most recent month end, call toll-free 1-877-781-6392.
The Portfolio is not open to direct retail investment. Beneficial interest in shares is obtained solely by purchase of variable life insurance policies and variable annuity contracts. Actual performance results for variable annuity and variable universal life contracts will be lower due to contract charges. Consult your contract for applicable charges.
Comments
For the six-month period ended June 30, 2013, the Target VIP Portfolio returned 13.27% versus 14.06% for the current benchmark, the Russell 3000 Index.
The first quarter of 2013 was characterized by strong returns in the U.S. equity market, which rose 11.07% on a total return basis, as measured by the Russell 3000 Index. U.S. equities outperformed their foreign peers over the period. A declining unemployment rate and improved macroeconomic data during the first and second quarters augmented the Federal Reserve’s accommodative monetary policy and moved equities higher. Beginning in May, U.S. markets experienced a 5% correction after Federal Reserve Chairman Ben Bernanke said that the central bank may “moderate” its pace of bond purchases later this year due to an improving economy, hinting at a sooner-than-expected quantitative easing tapering. The 10 year Treasury interest rate increased almost 100 basis points in the following weeks, to 2.6%.
The Portfolio had its annual rebalance in early January. Though the selection process for the underlying strategies did not change, there were changes in the sector exposures as a result of the rebalance. The rebalance resulted in an increased exposure to Consumer Discretionary and Health Care and a reduced exposure to Telecommunication Services.(1)
Stock selection in the Utilities sector was the biggest detractor from relative performance. The Portfolio held several European utilities companies in the European 20 strategy within the Portfolio that were responsible for the underperformance. Stock selection in the Telecommunication Services and Energy sectors also weighed on relative performance. An underweight position in Financials, one of the better performing sectors for the period, was also a slight detriment to relative returns.(1)
A large overweight position in Consumer Discretionary stocks was the biggest contributor to relative performance. The sector was the second best performer in the benchmark for the six-month period as improving economic data bolstered the outlook for names in the space. An overweight in Health Care also benefitted relative
performance as the sector was the top performer in the benchmark. Additionally, stock selection within the sector added further to the sector’s relative performance. Stock selection in the Information Technology sector also added to performance, as Yahoo!, Inc. and Seagate Technology, Inc. were large contributors.(1)
The Portfolio’s best performers were Medidata Solutions, Inc., Krispy Kreme Doughnuts, Inc., Multimedia Games Holding Co., Inc., Seagate Technology, Inc. and H&R Block, Inc. The worst performers were American Vanguard Corp., InnerWorkings, Inc., Enel, SpA, RWE AG and Riverbed Technology, Inc. The Portfolio’s top contributors to performance were The Home Depot, Inc., Gilead Sciences, Inc., Yahoo!, Inc., Regeneron Pharmaceuticals, Inc. and Gap, Inc. The top detractors from performance were Oracle Corp., Enel SpA, RWE AG, Eni SpA and Orange.(1)
As we look to the second half of 2013, we view equities as attractive relative to other asset classes, although valuations are not as compelling as they were to start the year. The U.S. continues to be the favored market as other developed markets are struggling to grow and emerging markets face slowing growth expectations (though still higher than developed economies). As always, we remain consistent in the application of the six strategies underlying the Portfolio. The result is a Portfolio with broad exposures across the size and sector spectrum which provides diversification and upside potential.
| (1) | The Portfolio’s composition is subject to change. Holdings and weightings are as of June 30, 2013. |
Change in Value of $10,000 Investment
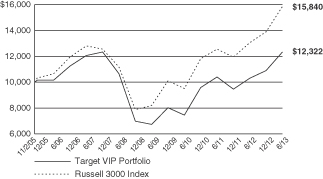
Hypothetical illustration based on past performance. Future performance will vary. The Portfolio’s returns reflect reinvested dividends. The Portfolio’s holdings may differ significantly from the securities in the index. The index is unmanaged and therefore does not reflect the cost of portfolio management and accounting.
The Russell 3000 Index measures the performance of the largest 3000 U.S. companies representing approximately 98% of the investable U.S. equity market. The Russell 3000 Index is constructed to provide a comprehensive, unbiased, and stable barometer of the broad market and is completely reconstituted annually to ensure new and growing equities are reflected. The index presented includes the effects of reinvested dividends.
| 97 | (continued) |
| Ohio National Fund, Inc. | Target VIP Portfolio (Continued) |
Portfolio Composition as of June 30, 2013 (1)
| % of Net Assets | ||||
Common Stocks (3) | 97.9 | |||
Money Market Funds and | 2.1 | |||
|
| |||
| 100.0 | ||||
|
|
Top 10 Portfolio Holdings as of June 30, 2013 (1) (2)
| % of Net Assets | ||||
1. Exxon Mobil Corp. | 4.6 | |||
2. Home Depot, Inc. / The | 4.5 | |||
3. UnitedHealth Group, Inc. | 3.5 | |||
4. Oracle Corp. | 3.3 | |||
5. Pfizer, Inc. | 3.2 | |||
6. Travelers Cos., Inc. / The | 3.2 | |||
7. Regeneron Pharmaceuticals, Inc. | 3.1 | |||
8. Yahoo!, Inc. | 3.1 | |||
9. International Business Machines Corp. | 2.9 | |||
10. Comcast Corp. Class A | 2.8 |
| (1) | Composition of Portfolio subject to change. |
| (2) | Short-term investments have been excluded from the list of Top 10 Portfolio Holdings. |
| (3) | Sectors: |
| % of Net Assets | ||||
Consumer Discretionary | 24.7 | |||
Health Care | 20.0 | |||
Information Technology | 18.1 | |||
Financials | 8.2 | |||
Energy | 7.3 | |||
Industrials | 5.7 | |||
Utilities | 4.7 | |||
Telecommunication Services | 4.2 | |||
Consumer Staples | 3.0 | |||
Materials | 2.0 | |||
|
| |||
| 97.9 | ||||
|
|
| 98 |
| Ohio National Fund, Inc. | Target VIP Portfolio |
Schedule of Investments | June 30, 2013 (Unaudited) |
| Common Stocks – 97.9% | Shares | Value | ||||||||
CONSUMER DISCRETIONARY – 24.7% | ||||||||||
Dorman Products, Inc. (Auto Components) | 955 | $ | 43,577 | |||||||
Daimler AG (Automobiles) | 3,009 | 181,578 | ||||||||
Thor Industries, Inc. (Automobiles) | 1,438 | 70,721 | ||||||||
Winnebago Industries, Inc. (Automobiles) | (a) | 1,949 | 40,909 | |||||||
Carriage Services, Inc. (Diversified Consumer Svs.) | 2,797 | 47,409 | ||||||||
Grand Canyon Education, Inc. (Diversified Consumer Svs.) | (a) | 4,158 | 134,012 | |||||||
H&R Block, Inc. (Diversified Consumer Svs.) | 1,643 | 45,593 | ||||||||
AFC Enterprises, Inc. (Hotels, Restaurants & Leisure) | (a) | 1,269 | 45,608 | |||||||
Domino’s Pizza, Inc. (Hotels, Restaurants & Leisure) | 1,532 | 89,086 | ||||||||
Interval Leisure Group, Inc. (Hotels, Restaurants & Leisure) | 5,255 | 104,680 | ||||||||
Krispy Kreme Doughnuts, Inc. (Hotels, Restaurants & Leisure) | (a) | 5,974 | 104,246 | |||||||
Multimedia Games Holding Co., Inc. (Hotels, Restaurants & Leisure) | (a) | 2,674 | 69,711 | |||||||
Papa John’s International, Inc. (Hotels, Restaurants & Leisure) | (a) | 2,140 | 139,892 | |||||||
Pinnacle Entertainment, Inc. (Hotels, Restaurants & Leisure) | (a) | 5,540 | 108,972 | |||||||
D.R. Horton, Inc. (Household Durables) | 8,828 | 187,860 | ||||||||
Lennar Corp. Class A (Household Durables) | 4,291 | 154,648 | ||||||||
Arctic Cat, Inc. (Leisure Equip. & Products) | 1,234 | 55,505 | ||||||||
Mattel, Inc. (Leisure Equip. & Products) | 2,473 | 112,052 | ||||||||
Comcast Corp. Class A (Media) | 15,329 | 641,978 | ||||||||
DIRECTV (Media) | (a) | 3,634 | 223,927 | |||||||
Discovery Communications, Inc. Class A (Media) | (a) | 1,044 | 80,607 | |||||||
Liberty Global PLC Class C (Media) | (a) | 372 | 25,288 | |||||||
Liberty Global PLC Class A (Media) | (a) | 499 | 36,954 | |||||||
Liberty Media Corp. (Media) | (a) | 792 | 100,394 | |||||||
Sirius XM Radio, Inc. (Media) | 37,406 | 125,310 | ||||||||
Starz (Media) | (a) | 792 | 17,503 | |||||||
Asbury Automotive Group, Inc. (Specialty Retail) | (a) | 2,912 | 116,771 | |||||||
Gap, Inc. / The (Specialty Retail) | 12,846 | 536,064 | ||||||||
Home Depot, Inc. / The (Specialty Retail) | 13,429 | 1,040,345 | ||||||||
Lithia Motors, Inc. Class A (Specialty Retail) | 2,110 | 112,484 | ||||||||
Lumber Liquidators Holdings, Inc. (Specialty Retail) | (a) | 632 | 49,214 | |||||||
Stage Stores, Inc. (Specialty Retail) | 4,327 | 101,684 | ||||||||
TJX Cos., Inc. (Specialty Retail) | 4,352 | 217,861 | ||||||||
Urban Outfitters, Inc. (Specialty Retail) | (a) | 3,916 | 157,502 | |||||||
Williams-Sonoma, Inc. (Specialty Retail) | 2,640 | 147,550 | ||||||||
Gildan Activewear, Inc. (Textiles, Apparel & Luxury Goods) | 3,243 | 131,374 | ||||||||
Movado Group, Inc. (Textiles, Apparel & Luxury Goods) | 1,761 | 59,575 | ||||||||
|
| |||||||||
| 5,658,444 | ||||||||||
|
| |||||||||
CONSUMER STAPLES – 3.0% | ||||||||||
Coca-Cola Enterprises, Inc. (Beverages) | 740 | 26,018 | ||||||||
Susser Holdings Corp. (Food & Staples Retailing) | (a) | 1,938 | 92,791 | |||||||
Clorox Co. / The (Household Products) | 335 | 27,852 | ||||||||
Medifast, Inc. (Personal Products) | (a) | 1,442 | 37,146 | |||||||
Prestige Brands Holdings, Inc. (Personal Products) | (a) | 4,693 | 136,754 | |||||||
Philip Morris International, Inc. (Tobacco) | 4,322 | 374,372 | ||||||||
|
| |||||||||
| 694,933 | ||||||||||
|
| |||||||||
ENERGY – 7.3% | ||||||||||
BP PLC – ADR (Oil, Gas & Consumable Fuels) | 3,954 | 165,040 | ||||||||
Eni SpA – ADR (Oil, Gas & Consumable Fuels) | 3,362 | 137,976 | ||||||||
EPL Oil & Gas, Inc. (Oil, Gas & Consumable Fuels) | (a) | 3,695 | 108,485 | |||||||
Exxon Mobil Corp. (Oil, Gas & Consumable Fuels) | 11,550 | 1,043,542 | ||||||||
Marathon Petroleum Corp. (Oil, Gas & Consumable Fuels) | 288 | 20,465 | ||||||||
Phillips 66 (Oil, Gas & Consumable Fuels) | 533 | 31,399 | ||||||||
Total SA – ADR (Oil, Gas & Consumable Fuels) | 3,169 | 154,330 | ||||||||
|
| |||||||||
| 1,661,237 | ||||||||||
|
| |||||||||
FINANCIALS – 8.2% | ||||||||||
Franklin Resources, Inc. (Capital Markets) | 1,743 | 237,083 | ||||||||
PrivateBancorp, Inc. (Commercial Banks) | 6,804 | 144,313 | ||||||||
ViewPoint Financial Group, Inc. (Commercial Banks) | 3,622 | 75,374 | ||||||||
| Common Stocks (Continued) | Shares | Value | ||||||||
FINANCIALS (continued) | ||||||||||
Western Alliance Bancorp (Commercial Banks) | (a) | 7,890 | $ | 124,899 | ||||||
Discover Financial Services (Consumer Finance) | 4,088 | 194,752 | ||||||||
Netspend Holdings, Inc. (Consumer Finance) | (a) | 6,437 | 102,799 | |||||||
Allstate Corp. / The (Insurance) | 3,931 | 189,160 | ||||||||
Horace Mann Educators Corp. (Insurance) | 3,649 | 88,963 | ||||||||
Travelers Cos., Inc. / The (Insurance) | 9,149 | 731,188 | ||||||||
|
| |||||||||
| 1,888,531 | ||||||||||
|
| |||||||||
HEALTH CARE – 20.0% | ||||||||||
Amgen, Inc. (Biotechnology) | 3,565 | 351,723 | ||||||||
Gilead Sciences, Inc. (Biotechnology) | (a) | 10,862 | 556,243 | |||||||
Regeneron Pharmaceuticals, Inc. (Biotechnology) | (a) | 3,200 | 719,616 | |||||||
Becton Dickinson and Co. (Health Care Equip. & Supplies) | 917 | 90,627 | ||||||||
C.R. Bard, Inc. (Health Care Equip. & Supplies) | 383 | 41,624 | ||||||||
Cyberonics, Inc. (Health Care Equip. & Supplies) | (a) | 2,550 | 132,498 | |||||||
Neogen Corp. (Health Care Equip. & Supplies) | (a) | 2,254 | 125,232 | |||||||
Sirona Dental Systems, Inc. (Health Care Equip. & Supplies) | (a) | 1,460 | 96,185 | |||||||
AMN Healthcare Services, Inc. (Health Care Providers & Svs.) | (a) | 2,863 | 40,998 | |||||||
Gentiva Health Services, Inc. (Health Care Providers & Svs.) | (a) | 2,749 | 27,380 | |||||||
Hanger, Inc. (Health Care Providers & Svs.) | (a) | 3,127 | 98,907 | |||||||
MWI Veterinary Supply, Inc. (Health Care Providers & Svs.) | (a) | 1,175 | 144,807 | |||||||
UnitedHealth Group, Inc. (Health Care Providers & Svs.) | 12,102 | 792,439 | ||||||||
Medidata Solutions, Inc. (Health Care Technology) | (a) | 2,340 | 181,233 | |||||||
AstraZeneca PLC – ADR (Pharmaceuticals) | 3,476 | 164,415 | ||||||||
GlaxoSmithKline PLC – ADR (Pharmaceuticals) | 3,770 | 188,387 | ||||||||
Mylan, Inc. (Pharmaceuticals) | (a) | 2,958 | 91,787 | |||||||
Pfizer, Inc. (Pharmaceuticals) | 26,188 | 733,526 | ||||||||
|
| |||||||||
| 4,577,627 | ||||||||||
|
| |||||||||
INDUSTRIALS – 5.7% | ||||||||||
Northrop Grumman Corp. (Aerospace & Defense) | 1,691 | 140,015 | ||||||||
A.O. Smith Corp. (Building Products) | 2,102 | 76,261 | ||||||||
Apogee Enterprises, Inc. (Building Products) | 1,411 | 33,864 | ||||||||
InnerWorkings, Inc. (Commercial Svs. & Supplies) | (a) | 4,589 | 49,791 | |||||||
Aegion Corp. (Construction & Engineering) | (a) | 3,652 | 82,207 | |||||||
AZZ, Inc. (Electrical Equip.) | 2,305 | 88,881 | ||||||||
Flowserve Corp. (Machinery) | 5,082 | 274,479 | ||||||||
Illinois Tool Works, Inc. (Machinery) | 3,182 | 220,099 | ||||||||
Trimas Corp. (Machinery) | (a) | 3,566 | 132,940 | |||||||
On Assignment, Inc. (Professional Svs.) | (a) | 4,844 | 129,432 | |||||||
DXP Enterprises, Inc. (Trading Companies & Distributors) | (a) | 1,289 | 85,847 | |||||||
|
| |||||||||
| 1,313,816 | ||||||||||
|
| |||||||||
INFORMATION TECHNOLOGY – 18.1% | ||||||||||
Ixia (Communications Equip.) | (a) | 6,762 | 124,421 | |||||||
Seagate Technology PLC (Computers & Peripherals) | 8,949 | 401,184 | ||||||||
Western Digital Corp. (Computers & Peripherals) | 1,766 | 109,651 | ||||||||
Badger Meter, Inc. (Electronic Equip., Instr. & Comp.) | 1,330 | 59,251 | ||||||||
Rogers Corp. (Electronic Equip., Instr. & Comp.) | (a) | 679 | 32,130 | |||||||
eBay, Inc. (Internet Software & Svs.) | (a) | 9,337 | 482,910 | |||||||
Yahoo!, Inc. (Internet Software & Svs.) | (a) | 27,940 | 701,573 | |||||||
International Business Machines Corp. (IT Svs.) | 3,434 | 656,272 | ||||||||
Monolithic Power Systems, Inc. (Semiconductors & Equip.) | 3,284 | 79,177 | ||||||||
Ultratech, Inc. (Semiconductors & Equip.) | (a) | 2,486 | 91,286 | |||||||
BMC Software, Inc. (Software) | (a) | 2,555 | 115,333 | |||||||
Manhattan Associates, Inc. (Software) | (a) | 2,391 | 184,490 | |||||||
Netscout Systems, Inc. (Software) | (a) | 3,872 | 90,372 | |||||||
Oracle Corp. (Software) | 24,665 | 757,709 | ||||||||
Sourcefire, Inc. (Software) | (a) | 2,755 | 153,040 | |||||||
Symantec Corp. (Software) | 4,975 | 111,788 | ||||||||
|
| |||||||||
| 4,150,587 | ||||||||||
|
| |||||||||
| 99 | (continued) |
| Ohio National Fund, Inc. | Target VIP Portfolio (Continued) |
Schedule of Investments | June 30, 2013 (Unaudited) |
| Common Stocks (Continued) | Shares | Value | ||||||||
MATERIALS – 2.0% | ||||||||||
American Vanguard Corp. (Chemicals) | 1,073 | $ | 25,140 | |||||||
CF Industries Holdings, Inc. (Chemicals) | 222 | 38,073 | ||||||||
FMC Corp. (Chemicals) | 486 | 29,675 | ||||||||
LyondellBasell Industries NV Class A (Chemicals) | 2,936 | 194,539 | ||||||||
NewMarket Corp. (Chemicals) | 359 | 94,259 | ||||||||
Sherwin-Williams Co. / The (Chemicals) | 364 | 64,282 | ||||||||
|
| |||||||||
| 445,968 | ||||||||||
|
| |||||||||
TELECOMMUNICATION SERVICES – 4.2% | ||||||||||
Deutsche Telekom AG – ADR (Diversified Telecom. Svs.) | 14,421 | 168,149 | ||||||||
France Telecom SA – ADR (Diversified Telecom. Svs.) | (a) | 15,046 | 142,185 | |||||||
Swisscom AG – ADR (Diversified Telecom. Svs.) | 3,802 | 166,870 | ||||||||
TeliaSonera AB – ADR (Diversified Telecom. Svs.) | 12,116 | 158,174 | ||||||||
Vivendi SA – ADR (Diversified Telecom. Svs.) | 7,267 | 137,346 | ||||||||
Vodafone Group PLC – ADR (Wireless Telecom. Svs.) | 6,515 | 187,241 | ||||||||
|
| |||||||||
| 959,965 | ||||||||||
|
| |||||||||
| Common Stocks (Continued) | Shares | Value | ||||||||
UTILITIES – 4.7% | ||||||||||
Electricite de France SA – ADR (Electric Utilities) | 45,392 | $ | 207,895 | |||||||
Enel SpA – ADR (Electric Utilities) | 39,552 | 122,216 | ||||||||
SSE PLC – ADR (Electric Utilities) | 7,027 | 163,097 | ||||||||
E.ON SE – ADR (Multi-Utilities) | 8,899 | 146,656 | ||||||||
GDF Suez – ADR (Multi-Utilities) | 7,973 | 156,510 | ||||||||
National Grid PLC – ADR (Multi-Utilities) | 2,878 | 163,096 | ||||||||
RWE AG – ADR (Multi-Utilities) | 3,984 | 127,289 | ||||||||
|
| |||||||||
| 1,086,759 | ||||||||||
|
| |||||||||
Total Common Stocks (Cost $19,404,465) | $ | 22,437,867 | ||||||||
|
| |||||||||
| Money Market Funds – 1.6% | Shares | Value | ||||||||
Fidelity Institutional Money Market Funds | 378,000 | $ | 378,000 | |||||||
|
| |||||||||
Total Money Market Funds (Cost $378,000) | $ | 378,000 | ||||||||
|
| |||||||||
Total Investments – 99.5% (Cost $19,782,465) | (b) | $ | 22,815,867 | |||||||
Other Assets in Excess of Liabilities – 0.5% | 113,472 | |||||||||
|
| |||||||||
Net Assets – 100.0% | $ | 22,929,339 | ||||||||
|
| |||||||||
Percentages are stated as a percent of net assets.
Abbreviations:
ADR: American Depositary Receipts
Footnotes:
| (a) | Non-income producing security. |
| (b) | Represents cost for financial reporting purposes, which may differ from cost basis for federal income tax purposes. See also Note 7 of the Notes to Financial Statements. |
The accompanying notes are an integral part of these financial statements.
| 100 |
| Ohio National Fund, Inc. | Target Equity/Income Portfolio |
Objective/Strategy
The Target Equity/Income Portfolio seeks an above average total return by adhering to a disciplined, quantitative investment process that incorporates two distinct strategy methodologies.
Performance as of June 30, 2013
Average Annual Returns: | ||||
One year | 23.89% | |||
Five years | 0.72% | |||
Since inception (11/2/05) | 0.93% |
Past performance does not guarantee future results. The performance data quoted represents past performance and current returns may be lower or higher. Total return figures include change in share price and reinvestment of dividends and capital gains. The investment return and principal value will fluctuate so that an investor’s shares, when redeemed, may be worth more or less than the original cost. To obtain performance information up to the most recent month end, call toll-free 1-877-781-6392.
The Portfolio is not open to direct retail investment. Beneficial interest in shares is obtained solely by purchase of variable life insurance policies and variable annuity contracts. Actual performance results for variable annuity and variable universal life contracts will be lower due to contract charges. Consult your contract for applicable charges.
Comments
For the six-month period ended June 30, 2013, the Target Equity/Income Portfolio returned 16.87% versus 14.06% for the current benchmark, the Russell 3000 Index.
The first quarter of 2013 was characterized by strong returns in the U.S. equity market, which rose 11.07% on a total return basis, as measured by the Russell 3000 Index. U.S. equities outperformed their foreign peers over the period. A declining unemployment rate and improved macroeconomic data during the first and second quarters augmented the Federal Reserve’s accommodative monetary policy and moved equities higher. Beginning in May, U.S. markets experienced a 5% correction after Federal Reserve Chairman Ben Bernanke said that the central bank may “moderate” its pace of bond purchases later this year due to an improving economy, hinting at a sooner-than-expected quantitative easing tapering. The 10 year Treasury interest rate increased almost 100 basis points in the following weeks, to 2.6%.
The Portfolio had its annual rebalance in early January. Though the selection process for the two underlying strategies did not change, there were changes in the sector exposures as a result of the rebalance. The rebalance resulted in a significant increase in exposure to Consumer Discretionary and Financials, while all holdings in the Energy and Telecommunication Services sectors were eliminated. Holdings in the Information Technology, Materials and Utilities sectors were reduced.(1)
Most of the outperformance over the period was due to sector allocation. A significant overweight in Consumer Discretionary stocks, the second best performing sector in the benchmark, was the biggest contributor to relative performance. Positive stock selection also added to relative returns in the sector. A significant underweight in Information Technology stocks, one of the worst sectors in the benchmark, also contributed to the Portfolio outperformance. Financials were also strong contributors to relative performance as both allocation and stock selection were positive.(1)
Poor stock selection in the Materials sector was the biggest drag on relative returns. The sector was the worst performing in both the
benchmark and Portfolio for the period. An underweight to Health Care stocks, the top performing sector in the benchmark, also detracted from relative results.(1)
The Portfolio’s best performers were Lumber Liquidators Holdings, Inc., FirstMerit Corp., AFC Enterprises, Inc., Gap, Inc. and Black Hills Corp. The worst performers were American Vanguard Corp., Lennar Corp., FirstEnergy Corp., Rogers Corp. and Stage Stores, Corp. The Portfolio’s top contributors to performance were The Home Depot, Inc., Gap, Inc., Regeneron Pharmaceuticals, Inc., FirstMerit Corp. and Black Hills Corp. The top detractors from performance were Lennar Corp., FirstEnergy Corp., American Vanguard Corp., Macy’s, Inc. and NewMarket Corp.(1)
As we look to the second half of 2013, we view equities as attractive relative to other asset classes, although valuations are not as compelling as they were to start the year. The U.S. continues to be the favored market as other developed markets are struggling to grow and emerging markets face slowing growth expectations (though still higher than developed economies). The Portfolio remains consistent in its application of the two strategies underlying the Portfolio. The result is a Portfolio with balanced exposure to both dividend paying stocks and growth companies.
| (1) | The Portfolio’s composition is subject to change. Holdings and weightings are as of June 30, 2013. |
Change in Value of $10,000 Investment
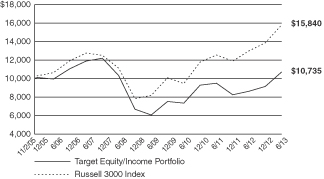
Hypothetical illustration based on past performance. Future performance will vary. The Portfolio’s returns reflect reinvested dividends. The Portfolio’s holdings may differ significantly from the securities in the index. The index is unmanaged and therefore does not reflect the cost of portfolio management and accounting.
The Russell 3000 Index measures the performance of the largest 3000 U.S. companies representing approximately 98% of the investable U.S. equity market. The Russell 3000 index is constructed to provide a comprehensive, unbiased, and stable barometer of the broad market and is completely reconstituted annually to ensure new and growing equities are reflected. The index presented includes the effects of reinvested dividends.
| 101 | (continued) |
| Ohio National Fund, Inc. | Target Equity/Income Portfolio (Continued) |
Portfolio Composition as of June 30, 2013 (1)
| % of Net Assets | ||||
Common Stocks (3) | 98.6 | |||
Money Market Funds and | 1.4 | |||
|
| |||
| 100.0 | ||||
|
|
Top 10 Portfolio Holdings as of June 30, 2013 (1) (2)
| % of Net Assets | ||||
1. Home Depot, Inc. / The | 11.1 | |||
2. Regeneron Pharmaceuticals, Inc. | 6.7 | |||
3. Gap, Inc. / The | 6.0 | |||
4. FirstMerit Corp. | 3.1 | |||
5. Black Hills Corp. | 2.9 | |||
6. Flowserve Corp. | 2.9 | |||
7. First Niagara Financial Group, Inc. | 2.8 | |||
8. People’s United Financial, Inc. | 2.7 | |||
9. Northrop Grumman Corp. | 2.7 | |||
10. Allstate Corp. / The | 2.6 |
| (1) | Composition of Portfolio subject to change. |
| (2) | Short-term investments have been excluded from the list of Top 10 Portfolio Holdings. |
| (3) | Sectors: |
| % of Net Assets | ||||
Consumer Discretionary | 32.9 | |||
Financials | 28.2 | |||
Utilities | 9.6 | |||
Industrials | 9.6 | |||
Health Care | 8.5 | |||
Consumer Staples | 5.0 | |||
Materials | 3.8 | |||
Information Technology | 1.0 | |||
|
| |||
| 98.6 | ||||
|
|
| 102 |
| Ohio National Fund, Inc. | Target Equity/Income Portfolio |
Schedule of Investments | June 30, 2013 (Unaudited) |
| Common Stocks – 98.6% | Shares | Value | ||||||||
CONSUMER DISCRETIONARY – 32.9% | ||||||||||
Dorman Products, Inc. (Auto Components) | 3,005 | $ | 137,118 | |||||||
Thor Industries, Inc. (Automobiles) | 4,529 | 222,736 | ||||||||
Winnebago Industries, Inc. (Automobiles) | (a) | 6,137 | 128,816 | |||||||
Carriage Services, Inc. (Diversified Consumer Svs.) | 8,808 | 149,296 | ||||||||
AFC Enterprises, Inc. (Hotels, Restaurants & Leisure) | (a) | 3,997 | 143,652 | |||||||
Domino’s Pizza, Inc. (Hotels, Restaurants & Leisure) | 4,821 | 280,341 | ||||||||
D.R. Horton, Inc. (Household Durables) | 27,793 | 591,435 | ||||||||
Lennar Corp. Class A (Household Durables) | 13,512 | 486,973 | ||||||||
Gap, Inc. / The (Specialty Retail) | 34,358 | 1,433,759 | ||||||||
Home Depot, Inc. / The (Specialty Retail) | 33,890 | 2,625,458 | ||||||||
Lumber Liquidators Holdings, Inc. (Specialty Retail) | (a) | 1,990 | 154,961 | |||||||
Stage Stores, Inc. (Specialty Retail) | 4,317 | 101,450 | ||||||||
Urban Outfitters, Inc. (Specialty Retail) | (a) | 12,329 | 495,872 | |||||||
Williams-Sonoma, Inc. (Specialty Retail) | 8,310 | 464,446 | ||||||||
Gildan Activewear, Inc. (Textiles, Apparel & Luxury Goods) | 10,212 | 413,688 | ||||||||
|
| |||||||||
| 7,830,001 | ||||||||||
|
| |||||||||
CONSUMER STAPLES – 5.0% | ||||||||||
Mondelez International, Inc. Class A (Food Products) | 20,311 | 579,473 | ||||||||
Universal Corp. (Tobacco) | 10,408 | 602,103 | ||||||||
|
| |||||||||
| 1,181,576 | ||||||||||
|
| |||||||||
FINANCIALS – 28.2% | ||||||||||
BB&T Corp. (Commercial Banks) | 17,783 | 602,488 | ||||||||
First Niagara Financial Group, Inc. (Commercial Banks) | 65,272 | 657,289 | ||||||||
FirstMerit Corp. (Commercial Banks) | 36,334 | 727,770 | ||||||||
FNB Corp. (Commercial Banks) | 48,675 | 587,994 | ||||||||
Trustmark Corp. (Commercial Banks) | 23,079 | 567,282 | ||||||||
United Bankshares, Inc. (Commercial Banks) | 21,341 | 564,470 | ||||||||
Allstate Corp. / The (Insurance) | 12,871 | 619,353 | ||||||||
Cincinnati Financial Corp. (Insurance) | 13,305 | 610,700 | ||||||||
Mercury General Corp. (Insurance) | 12,868 | 565,677 | ||||||||
New York Community Bancorp, Inc. (Thrifts & Mortgage Finance) | 39,647 | 555,058 | ||||||||
People’s United Financial, Inc. (Thrifts & Mortgage Finance) | 42,861 | 638,629 | ||||||||
|
| |||||||||
| 6,696,710 | ||||||||||
|
| |||||||||
HEALTH CARE – 8.5% | ||||||||||
Regeneron Pharmaceuticals, Inc. (Biotechnology) | (a) | 7,030 | 1,580,906 | |||||||
Sirona Dental Systems, Inc. (Health Care Equip. & Supplies) | (a) | 4,599 | 302,982 | |||||||
| Common Stocks (Continued) | Shares | Value | ||||||||
HEALTH CARE (continued) | ||||||||||
AMN Healthcare Services, Inc. (Health Care Providers & Svs.) | (a) | 9,017 | $ | 129,124 | ||||||
|
| |||||||||
| 2,013,012 | ||||||||||
|
| |||||||||
INDUSTRIALS – 9.6% | ||||||||||
Northrop Grumman Corp. (Aerospace & Defense) | 7,684 | 636,235 | ||||||||
A.O. Smith Corp. (Building Products) | 6,618 | 240,101 | ||||||||
Apogee Enterprises, Inc. (Building Products) | 4,442 | 106,608 | ||||||||
Republic Services, Inc. (Commercial Svs. & Supplies) | 17,685 | 600,229 | ||||||||
Flowserve Corp. (Machinery) | 12,738 | 687,979 | ||||||||
|
| |||||||||
| 2,271,152 | ||||||||||
|
| |||||||||
INFORMATION TECHNOLOGY – 1.0% | ||||||||||
Rogers Corp. (Electronic Equip., Instr. & Comp.) | (a) | 2,135 | 101,028 | |||||||
Manhattan Associates, Inc. (Software) | (a) | 1,737 | 134,027 | |||||||
|
| |||||||||
| 235,055 | ||||||||||
|
| |||||||||
MATERIALS – 3.8% | ||||||||||
American Vanguard Corp. (Chemicals) | 3,375 | 79,076 | ||||||||
NewMarket Corp. (Chemicals) | 1,131 | 296,955 | ||||||||
Commercial Metals Co. (Metals & Mining) | 35,603 | 525,856 | ||||||||
|
| |||||||||
| 901,887 | ||||||||||
|
| |||||||||
UTILITIES – 9.6% | ||||||||||
FirstEnergy Corp. (Electric Utilities) | 12,458 | 465,182 | ||||||||
Pinnacle West Capital Corp. (Electric Utilities) | 10,155 | 563,298 | ||||||||
Black Hills Corp. (Multi-Utilities) | 14,347 | 699,416 | ||||||||
Public Service Enterprise Group, Inc. (Multi-Utilities) | 17,136 | 559,662 | ||||||||
|
| |||||||||
| 2,287,558 | ||||||||||
|
| |||||||||
Total Common Stocks (Cost $20,393,295) | $ | 23,416,951 | ||||||||
|
| |||||||||
| Money Market Funds – 1.4% | Shares | Value | ||||||||
Fidelity Institutional Money Market Funds | 336,000 | $ | 336,000 | |||||||
|
| |||||||||
Total Money Market Funds (Cost $336,000) | $ | 336,000 | ||||||||
|
| |||||||||
Total Investments – 100.0% (Cost $20,729,295) | (b) | $ | 23,752,951 | |||||||
Other Assets in Excess of Liabilities – 0.0% | 3,635 | |||||||||
|
| |||||||||
Net Assets – 100.0% | $ | 23,756,586 | ||||||||
|
| |||||||||
Percentages are stated as a percent of net assets.
Footnotes:
| (a) | Non-income producing security. |
| (b) | Represents cost for financial reporting purposes, which may differ from cost basis for federal income tax purposes. See also Note 7 of the Notes to Financial Statements. |
The accompanying notes are an integral part of these financial statements.
| 103 |
| Ohio National Fund, Inc. | Bristol Growth Portfolio |
Objective/Strategy
The Bristol Growth Portfolio seeks long-term growth of capital by investing primarily in common stocks of the 1,000 largest publicly traded U.S. companies in terms of market capitalization.
Performance as of June 30, 2013
Average Annual Returns: | ||||
One year | 19.31% | |||
Five years | 4.88% | |||
Since inception (5/1/07) | 3.12% |
Past performance does not guarantee future results. The performance data quoted represents past performance and current returns may be lower or higher. Total return figures include change in share price and reinvestment of dividends and capital gains. The investment return and principal value will fluctuate so that an investor’s shares, when redeemed, may be worth more or less than the original cost. To obtain performance information up to the most recent month end, call toll-free 1-877-781-6392.
The Portfolio is not open to direct retail investment. Beneficial interest in shares is obtained solely by purchase of variable life insurance policies and variable annuity contracts. Actual performance results for variable annuity and variable universal life contracts will be lower due to contract charges. Consult your contract for applicable charges.
Comments
For the six-month period ended June 30, 2013, the Bristol Growth Portfolio returned 12.20% versus 11.80% for the current benchmark, the Russell 1000 Growth Index.
Following a strong 2012, the markets continued to advance in the first two quarters of 2013 with more records being set and the S&P 500 Index reaching an all-time high of 1,669.16 on May 21, outperforming the Russell 1000 Growth Index. In an utterly predictable manner, the market then corrected downwards in reaction to the remarks of Federal Reserve Chairman Ben Bernanke that were interpreted as indicating that quantitative easing might “taper off” in the near term. As quantitative easing has been seen as powering the equity markets’ rise, it took subsequent remarks of Federal Reserve members to satisfy investors that tapering of this program may be a long way off. With these statements, the markets recovered, but it left the S&P 500 Index down 3.8% from the record high and ended a streak of seven monthly advances. Overall, the returns for the six-month period were the best for the first six months of a calendar year since 1998. Other records were set that are closely related to growth expansion and increasing consumer confidence. Sales of new U.S. homes increased more than forecasted in May to the highest level in almost five years, while home prices increased more than forecasted in the twelve months through April 2013. More Americans signed contracts in May to buy previously owned homes than at any time in more than six years. The VIX index, the best measure of investor sentiment regarding expectations of near-term volatility, dipped below 15 for the first time since 2007, suggesting that investors are not expecting the turmoil of recent years to be repeated. Finally, the fixed income sector suffered the worst drop in corporate debt in almost five years, second only to the declines following the Lehman collapse in September 2008. Clearly, the debt markets’ modest returns and the prospect of higher interest rates in the future made the equity markets the better choice for most investors in the near term.
The Portfolio’s best performers for the period were Vertex Pharmaceuticals, Inc., Delta Air Lines, Inc., Hertz Global Holdings, Inc., Hanesbrands, Inc., and Hartford Financial Services Group, Inc. The Portfolio’s worst performers were Infinity Pharmaceuticals, Inc., Amarin Corp., F5 Networks, Inc., Apple, Inc., and Ariad Pharmaceuticals, Inc. The top
contributors to performance were Vertex Pharmaceuticals, Inc., Delta Air Lines, Inc., Hertz Global Holdings, Inc., Google, Inc., and Hartford Financial Services Group, Inc. The top detractors from performance were Apple, Inc., Infinity Pharmaceuticals, Inc., F5 Networks, Inc., Amarin Corp., and Ariad Pharmaceuticals, Inc.(1)
The top contributor to the Portfolio’s performance was Vertex Pharmaceuticals, Inc., which contributed 189 basis points as a result of positive drug trials that resulted in a stock price surge in April. Delta Air Lines, Inc. contributed 100 basis points as growth reappeared in the economy. Hertz Global Holdings, Inc. added 97 basis points, having benefited from the purchase of Dollar Thrifty and a recent 20% stake in China Auto Rental, the largest rental firm in China, as well as increased earnings as a result of the end of the recession. Google, Inc. added 78 basis points, breaking 900 this year and unchallenged in its dominant position. Hartford Financial Services Group, Inc. contributed 68 basis points as part of our modest overweight in Financials in anticipation of future interest rates increases.(1)
Detractors from performance during the period included Apple, Inc. which lost the Portfolio 126 basis points as it continues to be out of favor in spite of its iconic stature and large cash haul. Infinity Pharmaceuticals, Inc. detracted 117 basis points as a result of adverse health reports in a drug trial. F5 Network, Inc., an information technology equipment and cloud computing company, detracted 43 basis points after the firm guided downwards in April. Amarin Corp. detracted 17 basis points when a recently approved and very promising drug did not get the expected unqualified approval of the FDA. Ariad Pharmaceuticals, Inc. detracted 14 basis points as a result of widening losses incurred by delays in FDA approval for its leukemia drug.(1)
During the past six months, our strong overweight in Industrials, represented by an average weighting of 23.4% versus 12.9% for the benchmark, generated 40 basis points, reflecting our continued belief in growth. Our underweight in Materials, 1.3% versus the benchmark 3.9%, generated a further 18 basis points. Our earlier overweight in Information Technology detracted 29 basis points following delays in the expected accelerated adoption of smart phones (particularly in China), and the weighting has subsequently been reduced.(1)
Looking to the third and fourth quarters of 2013, it appears that the blessings of quantitative easing could continue for the remainder of the year, and into 2014. Turmoil in Turkey and Egypt seems to have had little impact on the markets and the knee-jerk reaction to the troubles of the European Union from prior years seems to be a thing of the past. Even the threat to U.S. businesses from Obamacare’s uncertain medical insurance costs has been delayed for a year for many firms. China caused some concern with stresses in its secondary banking system, but the central government appears to have this under control and China’s growth will not be greatly affected. As we look to the future, we remain committed to the idea of growth through the engine of consumer spending, the generator of 70% of economic activity. It would appear that several generations of Keynesians are coming down from their ivory towers, blinking in the sunlight of rare approval, and claiming victory in both Europe and the U.S. We can argue with their theories, but not with the markets. Quantitative easing has pulled investors out of the doldrums of the past four years, and we expect it will continue to do so in the short term. In the interim, we continue to rely on Uncle Ben and the “Goldilocks” effect of falling unemployment levels, not so low that growth in the economy is not evident, yet not so high that the Federal Reserve signals a reduction in quantitative easing. This median result should suggest strong support for equities for the balance of the year.
| (1) | The Portfolio’s composition is subject to change. Holdings and weightings are as of June 30, 2013. |
| 104 | (continued) |
| Ohio National Fund, Inc. | Bristol Growth Portfolio (Continued) |
Change in Value of $10,000 Investment
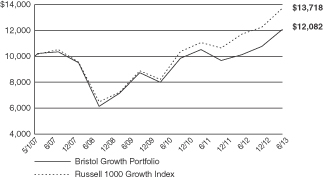
Hypothetical illustration based on past performance. Future performance will vary. The Portfolio’s returns reflect reinvested dividends. The Portfolio’s holdings may differ significantly from the securities in the index. The index is unmanaged and therefore does not reflect the cost of portfolio management and accounting.
The Russell 1000 Growth Index is a market-capitalization weighted index of those firms in the Russell 1000 Index with higher price-to-book ratios and higher forecasted growth values. The Russell 1000 Index measures the performance of the large-cap segment of the U.S. equity universe. The index presented herein includes the effects of requested dividends.
Portfolio Composition as of June 30, 2013 (1)
| % of Net Assets | ||||
Common Stocks (3) | 94.4 | |||
Money Market Funds and | 5.6 | |||
|
| |||
| 100.0 | ||||
|
|
Top 10 Portfolio Holdings as of June 30, 2013 (1) (2)
| % of Net Assets | ||||
1. Google, Inc. Class A | 4.0 | |||
2. Apple, Inc. | 3.8 | |||
3. Microsoft Corp. | 2.8 | |||
4. International Business Machines Corp. | 2.8 | |||
5. Facebook, Inc. Class A | 2.5 | |||
6. Adobe Systems, Inc. | 2.4 | |||
7. Valeant Pharmaceuticals International, Inc. | 2.4 | |||
8. Vertex Pharmaceuticals, Inc. | 2.4 | |||
9. Altera Corp. | 2.2 | |||
10. Boeing Co. / The | 2.0 |
| (1) | Composition of Portfolio subject to change. |
| (2) | Short-term investments have been excluded from the list of Top 10 Portfolio Holdings. |
| (3) | Sectors: |
| % of Net Assets | ||||
Information Technology | 34.2 | |||
Industrials | 23.8 | |||
Consumer Discretionary | 14.0 | |||
Health Care | 11.1 | |||
Energy | 3.3 | |||
Financials | 3.3 | |||
Consumer Staples | 1.9 | |||
Materials | 1.9 | |||
Telecommunication Services | 0.9 | |||
|
| |||
| 94.4 | ||||
|
|
| 105 |
| Ohio National Fund, Inc. | Bristol Growth Portfolio |
Schedule of Investments | June 30, 2013 (Unaudited) |
| Common Stocks – 94.4% | Shares | Value | ||||||||
CONSUMER DISCRETIONARY – 14.0% | ||||||||||
McDonald’s Corp. (Hotels, Restaurants & Leisure) | 22,400 | $ | 2,217,600 | |||||||
Starbucks Corp. (Hotels, Restaurants & Leisure) | 26,700 | 1,748,583 | ||||||||
Wyndham Worldwide Corp. (Hotels, Restaurants & Leisure) | 34,100 | 1,951,543 | ||||||||
CBS Corp. Class B (Media) | 44,400 | 2,169,828 | ||||||||
Walt Disney Co. / The (Media) | 32,900 | 2,077,635 | ||||||||
Cabela’s, Inc. (Specialty Retail) | (a) | 10,300 | 667,028 | |||||||
Deckers Outdoor Corp. (Textiles, Apparel & Luxury Goods) | (a) | 19,900 | 1,005,149 | |||||||
Hanesbrands, Inc. (Textiles, Apparel & Luxury Goods) | 42,100 | 2,164,782 | ||||||||
V.F. Corp. (Textiles, Apparel & Luxury Goods) | 11,310 | 2,183,508 | ||||||||
|
| |||||||||
| 16,185,656 | ||||||||||
|
| |||||||||
CONSUMER STAPLES – 1.9% | ||||||||||
ConAgra Foods, Inc. (Food Products) | 16,100 | 562,373 | ||||||||
Procter & Gamble Co. / The (Household Products) | 22,000 | 1,693,780 | ||||||||
|
| |||||||||
| 2,256,153 | ||||||||||
|
| |||||||||
ENERGY – 3.3% | ||||||||||
Pioneer Natural Resources Co. (Oil, Gas & Consumable Fuels) | 14,500 | 2,098,875 | ||||||||
Whiting Petroleum Corp. (Oil, Gas & Consumable Fuels) | (a) | 36,100 | 1,663,849 | |||||||
|
| |||||||||
| 3,762,724 | ||||||||||
|
| |||||||||
FINANCIALS – 3.3% | ||||||||||
Hartford Financial Services Group, Inc. (Insurance) | 65,800 | 2,034,536 | ||||||||
Prudential Financial, Inc. (Insurance) | 23,600 | 1,723,508 | ||||||||
|
| |||||||||
| 3,758,044 | ||||||||||
|
| |||||||||
HEALTH CARE – 11.1% | ||||||||||
Amarin Corp. PLC – ADR (Biotechnology) | (a) | 66,800 | 387,440 | |||||||
Celgene Corp. (Biotechnology) | (a) | 16,600 | 1,940,706 | |||||||
Gilead Sciences, Inc. (Biotechnology) | (a) | 21,100 | 1,080,531 | |||||||
Pharmacyclics, Inc. (Biotechnology) | (a) | 21,100 | 1,676,817 | |||||||
Vertex Pharmaceuticals, Inc. (Biotechnology) | (a) | 34,100 | 2,723,567 | |||||||
Thermo Fisher Scientific, Inc. (Life Sciences Tools & Svs.) | 26,300 | 2,225,769 | ||||||||
Valeant Pharmaceuticals International, Inc. (Pharmaceuticals) | (a) | 32,410 | 2,789,853 | |||||||
|
| |||||||||
| 12,824,683 | ||||||||||
|
| |||||||||
INDUSTRIALS – 23.8% | ||||||||||
Boeing Co. / The (Aerospace & Defense) | 22,500 | 2,304,900 | ||||||||
United Technologies Corp. (Aerospace & Defense) | 20,100 | 1,868,094 | ||||||||
FedEx Corp. (Air Freight & Logistics) | 16,400 | 1,616,712 | ||||||||
Delta Air Lines, Inc. (Airlines) | (a) | 122,900 | 2,299,459 | |||||||
Tyco International Ltd. (Commercial Svs. & Supplies) | 67,600 | 2,227,420 | ||||||||
Eaton Corp. PLC (Electrical Equip.) | 32,900 | 2,165,149 | ||||||||
| Common Stocks (Continued) | Shares | Value | ||||||||
INDUSTRIALS (continued) | ||||||||||
Rockwell Automation, Inc. (Electrical Equip.) | 20,200 | $ | 1,679,428 | |||||||
Danaher Corp. (Industrial Conglomerates) | 34,000 | 2,152,200 | ||||||||
Pentair Ltd. (Machinery) | 36,400 | 2,099,916 | ||||||||
Snap–On, Inc. (Machinery) | 21,200 | 1,894,856 | ||||||||
Stanley Black & Decker, Inc. (Machinery) | 22,400 | 1,731,520 | ||||||||
Terex Corp. (Machinery) | (a) | 50,900 | 1,338,670 | |||||||
Xylem, Inc. (Machinery) | 73,500 | 1,980,090 | ||||||||
Hertz Global Holdings, Inc. (Road & Rail) | (a) | 85,300 | 2,115,440 | |||||||
|
| |||||||||
| 27,473,854 | ||||||||||
|
| |||||||||
INFORMATION TECHNOLOGY – 34.2% | ||||||||||
QUALCOMM, Inc. (Communications Equip.) | 16,200 | 989,496 | ||||||||
Apple, Inc. (Computers & Peripherals) | 11,000 | 4,356,880 | ||||||||
EMC Corp. (Computers & Peripherals) | 88,900 | 2,099,818 | ||||||||
Hewlett-Packard Co. (Computers & Peripherals) | 44,900 | 1,113,520 | ||||||||
eBay, Inc. (Internet Software & Svs.) | (a) | 40,500 | 2,094,660 | |||||||
Facebook, Inc. Class A (Internet Software & Svs.) | (a) | 114,300 | 2,841,498 | |||||||
Google, Inc. Class A (Internet Software & Svs.) | (a) | 5,210 | 4,586,728 | |||||||
International Business Machines Corp. (IT Svs.) | 16,600 | 3,172,426 | ||||||||
Mastercard, Inc. Class A (IT Svs.) | 3,820 | 2,194,590 | ||||||||
Altera Corp. (Semiconductors & Equip.) | 76,900 | 2,536,931 | ||||||||
Avago Technologies Ltd. (Semiconductors & Equip.) | 59,100 | 2,209,158 | ||||||||
Intel Corp. (Semiconductors & Equip.) | 89,200 | 2,160,424 | ||||||||
Adobe Systems, Inc. (Software) | (a) | 62,000 | 2,824,720 | |||||||
Microsoft Corp. (Software) | 93,400 | 3,225,102 | ||||||||
Oracle Corp. (Software) | 53,300 | 1,637,376 | ||||||||
TIBCO Software, Inc. (Software) | (a) | 66,500 | 1,423,100 | |||||||
|
| |||||||||
| 39,466,427 | ||||||||||
|
| |||||||||
MATERIALS – 1.9% | ||||||||||
E.I. du Pont de Nemours & Co. (Chemicals) | 40,800 | 2,142,000 | ||||||||
|
| |||||||||
TELECOMMUNICATION SERVICES – 0.9% | ||||||||||
Verizon Communications, Inc. (Diversified Telecom. Svs.) | 21,200 | 1,067,208 | ||||||||
|
| |||||||||
Total Common Stocks (Cost $101,023,030) | $ | 108,936,749 | ||||||||
|
| |||||||||
| Money Market Funds – 2.2% | Shares | Value | ||||||||
Fidelity Institutional Money Market Funds | 2,541,000 | $ | 2,541,000 | |||||||
|
| |||||||||
Total Money Market Funds (Cost $2,541,000) | $ | 2,541,000 | ||||||||
|
| |||||||||
Total Investments – 96.6% (Cost $103,564,030) | (b) | $ | 111,477,749 | |||||||
Other Assets in Excess of Liabilities – 3.4% | 3,876,646 | |||||||||
|
| |||||||||
Net Assets – 100.0% | $ | 115,354,395 | ||||||||
|
| |||||||||
Percentages are stated as a percent of net assets.
Abbreviations:
ADR: American Depositary Receipts
Footnotes:
| (a) | Non-income producing security. |
| (b) | Represents cost for financial reporting purposes, which may differ from cost basis for federal income tax purposes. See also Note 7 of the Notes to Financial Statements. |
The accompanying notes are an integral part of these financial statements.
| 106 |
| Ohio National Fund, Inc. |
| June 30, 2013 (Unaudited) |
| Equity Portfolio | Money Market Portfolio | Bond Portfolio | Omni Portfolio | International Portfolio | Capital Appreciation Portfolio | Millennium Portfolio | International Small-Mid Company Portfolio | |||||||||||||||||||||||||
Assets: | ||||||||||||||||||||||||||||||||
Investments in securities, at value* | $ | 200,540,925 | $ | 221,996,546 | $ | 146,113,697 | $ | 33,989,539 | $ | 172,871,126 | $ | 124,454,970 | $ | 37,067,690 | $ | 67,757,663 | ||||||||||||||||
Cash | 565 | 44,927,709 | 535 | 3,427 | — | 953 | 172 | — | ||||||||||||||||||||||||
Foreign currencies, at value** | — | — | — | — | 176,289 | — | — | 38,280 | ||||||||||||||||||||||||
Receivable for securities sold | — | — | — | 1,089,534 | 1,534,039 | 2,071,166 | 2,198,757 | — | ||||||||||||||||||||||||
Due from adviser | — | 48,908 | — | — | — | — | — | — | ||||||||||||||||||||||||
Receivable for fund shares sold | 56,229 | 581,106 | 115,718 | 7,516 | 27,613 | 14,659 | 36,839 | 36,874 | ||||||||||||||||||||||||
Dividends and accrued interest receivable | 165,427 | 706 | 1,495,230 | 99,241 | 310,425 | 67,312 | 2,122 | 71,814 | ||||||||||||||||||||||||
Foreign tax reclaim receivable | — | — | — | — | 151,004 | — | — | 30,055 | ||||||||||||||||||||||||
Prepaid expenses and other assets | 1,651 | 2,053 | 1,316 | 287 | 1,526 | 1,025 | 300 | 567 | ||||||||||||||||||||||||
Net unrealized apppreciation on foreign currency contracts | — | — | — | — | 72,527 | — | — | — | ||||||||||||||||||||||||
|
|
|
|
|
|
|
|
|
|
|
|
|
|
|
| |||||||||||||||||
Total assets | 200,764,797 | 267,557,028 | 147,726,496 | 35,189,544 | 175,144,549 | 126,610,085 | 39,305,880 | 67,935,253 | ||||||||||||||||||||||||
|
|
|
|
|
|
|
|
|
|
|
|
|
|
|
| |||||||||||||||||
Liabilities: | ||||||||||||||||||||||||||||||||
Payable for securities purchased | — | — | — | 1,097,556 | 3,723,468 | 1,125,598 | 2,044,018 | 1,955,430 | ||||||||||||||||||||||||
Payable for fund shares redeemed | 53,883 | 478,775 | 1,330,279 | 15,247 | 42,920 | 50,767 | 44,700 | 51,308 | ||||||||||||||||||||||||
Payable for investment management services | 131,973 | 53,116 | 70,040 | 17,019 | 56,091 | 81,862 | 24,359 | 55,113 | ||||||||||||||||||||||||
Variation margin on futures contracts | — | — | — | — | 7,054 | — | — | — | ||||||||||||||||||||||||
Accrued custody expense | 2,157 | 2,163 | 1,108 | 1,088 | 20,643 | 1,484 | 1,188 | 7,344 | ||||||||||||||||||||||||
Accrued professional fees | 6,104 | 6,104 | 6,104 | 6,104 | 5,858 | 6,104 | 6,104 | 6,026 | ||||||||||||||||||||||||
Accrued accounting fees | 9,883 | 12,883 | 11,793 | 4,239 | 495 | 6,717 | 2,603 | 496 | ||||||||||||||||||||||||
Accrued printing and filing fees | 10,925 | 13,603 | 7,933 | 1,843 | 9,092 | 6,780 | 2,008 | 3,443 | ||||||||||||||||||||||||
Withholding tax payable | — | — | — | — | 23,654 | — | — | 71,146 | ||||||||||||||||||||||||
|
|
|
|
|
|
|
|
|
|
|
|
|
|
|
| |||||||||||||||||
Total liabilities | 214,925 | 566,644 | 1,427,257 | 1,143,096 | 3,889,275 | 1,279,312 | 2,124,980 | 2,150,306 | ||||||||||||||||||||||||
|
|
|
|
|
|
|
|
|
|
|
|
|
|
|
| |||||||||||||||||
Net assets | $ | 200,549,872 | $ | 266,990,384 | $ | 146,299,239 | $ | 34,046,448 | $ | 171,255,274 | $ | 125,330,773 | $ | 37,180,900 | $ | 65,784,947 | ||||||||||||||||
|
|
|
|
|
|
|
|
|
|
|
|
|
|
|
| |||||||||||||||||
Net assets consist of: | ||||||||||||||||||||||||||||||||
Par value, $1 per share | $ | 8,073,950 | $ | 26,699,051 | $ | 9,980,430 | $ | 1,837,011 | $ | 14,205,219 | $ | 4,702,807 | $ | 1,343,749 | $ | 2,641,538 | ||||||||||||||||
Paid-in capital in excess of par value | 249,641,838 | 240,291,333 | 133,022,371 | 31,219,817 | 211,666,090 | 101,133,667 | 35,209,936 | 56,730,096 | ||||||||||||||||||||||||
Accumulated net realized gain (loss) on investments | (96,495,645 | ) | — | (11,943,334 | ) | (1,998,469 | ) | (84,829,819 | ) | (4,086,666 | ) | (3,457,725 | ) | (7,197,940 | ) | |||||||||||||||||
Net unrealized appreciation (depreciation) on: | ||||||||||||||||||||||||||||||||
Investments | 37,937,411 | — | 6,805,464 | 2,668,651 | 23,076,268 | 23,127,564 | 4,231,133 | 13,101,337 | ||||||||||||||||||||||||
Foreign currency contracts | — | — | — | — | 72,527 | — | — | (6,270 | ) | |||||||||||||||||||||||
Futures contracts | — | — | — | — | (46,586 | ) | — | — | — | |||||||||||||||||||||||
Other foreign currency related transactions | — | — | — | — | (3,753 | ) | — | — | (59,291 | ) | ||||||||||||||||||||||
Undistributed net investment income (loss) | 1,392,318 | — | 8,434,308 | 319,438 | 7,115,328 | 453,401 | (146,193 | ) | 575,477 | |||||||||||||||||||||||
|
|
|
|
|
|
|
|
|
|
|
|
|
|
|
| |||||||||||||||||
Net assets | $ | 200,549,872 | $ | 266,990,384 | $ | 146,299,239 | $ | 34,046,448 | $ | 171,255,274 | $ | 125,330,773 | $ | 37,180,900 | $ | 65,784,947 | ||||||||||||||||
|
|
|
|
|
|
|
|
|
|
|
|
|
|
|
| |||||||||||||||||
*Investments in securities, at cost | $ | 162,603,514 | $ | 221,996,546 | $ | 139,308,233 | $ | 31,320,888 | $ | 149,794,858 | $ | 101,327,406 | $ | 32,836,557 | $ | 54,656,326 | ||||||||||||||||
|
|
|
|
|
|
|
|
|
|
|
|
|
|
|
| |||||||||||||||||
**Foreign currencies, at cost | $ | — | $ | — | $ | — | $ | — | $ | 176,348 | $ | — | $ | — | $ | 38,275 | ||||||||||||||||
|
|
|
|
|
|
|
|
|
|
|
|
|
|
|
| |||||||||||||||||
Shares outstanding | 8,073,950 | 26,699,051 | 9,980,430 | 1,837,011 | 14,205,219 | 4,702,807 | 1,343,749 | 2,641,538 | ||||||||||||||||||||||||
|
|
|
|
|
|
|
|
|
|
|
|
|
|
|
| |||||||||||||||||
Authorized Fund shares allocated to Portfolio | 25,000,000 | 55,000,000 | 30,000,000 | 10,000,000 | 45,000,000 | 15,000,000 | 10,000,000 | 10,000,000 | ||||||||||||||||||||||||
|
|
|
|
|
|
|
|
|
|
|
|
|
|
|
| |||||||||||||||||
Net asset value per share | $ | 24.84 | $ | 10.00 | $ | 14.66 | $ | 18.53 | $ | 12.06 | $ | 26.65 | $ | 27.67 | $ | 24.90 | ||||||||||||||||
|
|
|
|
|
|
|
|
|
|
|
|
|
|
|
| |||||||||||||||||
The accompanying notes are an integral part of these financial statements.
| 107 |
| Ohio National Fund, Inc. |
Statements of Assets and Liabilities | June 30, 2013 (Unaudited) |
| Aggressive Growth Portfolio | Small Cap Growth Portfolio | Mid Cap Opportunity Portfolio | S&P 500® Index Portfolio | Strategic Value Portfolio | High Income Bond Portfolio | Capital Growth Portfolio | Nasdaq-100® Index Portfolio | |||||||||||||||||||||||||
Assets: | ||||||||||||||||||||||||||||||||
Investments in securities, at value* | $ | 32,478,559 | $ | 45,139,827 | $ | 73,893,976 | $ | 240,921,048 | $ | 274,941,423 | $ | 294,354,636 | $ | 64,407,407 | $ | 69,336,512 | ||||||||||||||||
Cash | — | 886 | 68 | 1,056,365 | — | 264 | 329 | 132,687 | ||||||||||||||||||||||||
Receivable for securities sold | 189,012 | 497,907 | — | 28,336 | 6,698,165 | 1,574,734 | 235,036 | — | ||||||||||||||||||||||||
Receivable for fund shares sold | 7,703 | 48,763 | 15,670 | 554,434 | 139,621 | 102,865 | 90,582 | 35,294 | ||||||||||||||||||||||||
Dividends and accrued interest receivable | 20,211 | 9,665 | 24,611 | 339,460 | 1,769,235 | 5,566,963 | 23,267 | 47,884 | ||||||||||||||||||||||||
Foreign tax reclaim receivable | 2,507 | — | — | — | 3,549 | — | — | — | ||||||||||||||||||||||||
Prepaid expenses and other assets | 268 | 335 | 591 | 1,862 | 2,304 | 2,537 | 505 | 593 | ||||||||||||||||||||||||
|
|
|
|
|
|
|
|
|
|
|
|
|
|
|
| |||||||||||||||||
Total assets | 32,698,260 | 45,697,383 | 73,934,916 | 242,901,505 | 283,554,297 | 301,601,999 | 64,757,126 | 69,552,970 | ||||||||||||||||||||||||
|
|
|
|
|
|
|
|
|
|
|
|
|
|
|
| |||||||||||||||||
Liabilities: | ||||||||||||||||||||||||||||||||
Cash overdraft | 11,685 | — | — | — | 157 | — | — | — | ||||||||||||||||||||||||
Payable for securities purchased | 80,273 | 108,408 | 338,058 | 499,596 | 533,907 | 1,286,497 | 220,748 | — | ||||||||||||||||||||||||
Payable for fund shares redeemed | 24,921 | 17,431 | 16,267 | 99,326 | 145,859 | 212,337 | 18,154 | 25,788 | ||||||||||||||||||||||||
Payable for investment management services | 21,688 | 33,307 | 51,619 | 73,970 | 167,730 | 169,477 | 47,846 | 23,632 | ||||||||||||||||||||||||
Accrued custody expense | 578 | 2,738 | 1,344 | 2,742 | 2,101 | 2,562 | 925 | 1,406 | ||||||||||||||||||||||||
Accrued professional fees | 6,104 | 6,104 | 6,104 | 6,153 | 6,602 | 6,104 | 6,104 | 6,104 | ||||||||||||||||||||||||
Accrued accounting fees | 2,614 | 2,913 | 4,342 | 14,253 | 14,119 | 26,198 | 3,962 | 4,420 | ||||||||||||||||||||||||
Accrued printing and filing fees | 1,767 | 2,431 | 3,971 | 13,056 | 15,302 | 16,236 | 3,499 | 3,875 | ||||||||||||||||||||||||
Withholding tax payable | 595 | — | — | — | 77,592 | — | — | — | ||||||||||||||||||||||||
|
|
|
|
|
|
|
|
|
|
|
|
|
|
|
| |||||||||||||||||
Total liabilities | 150,225 | 173,332 | 421,705 | 709,096 | 963,369 | 1,719,411 | 301,238 | 65,225 | ||||||||||||||||||||||||
|
|
|
|
|
|
|
|
|
|
|
|
|
|
|
| |||||||||||||||||
Net assets | $ | 32,548,035 | $ | 45,524,051 | $ | 73,513,211 | $ | 242,192,409 | $ | 282,590,928 | $ | 299,882,588 | $ | 64,455,888 | $ | 69,487,745 | ||||||||||||||||
|
|
|
|
|
|
|
|
|
|
|
|
|
|
|
| |||||||||||||||||
Net assets consist of: | ||||||||||||||||||||||||||||||||
Par value, $1 per share | $ | 3,221,031 | $ | 2,481,880 | $ | 3,106,915 | $ | 14,143,885 | $ | 22,966,396 | $ | 19,910,829 | $ | 1,856,539 | $ | 9,245,638 | ||||||||||||||||
Paid-in capital in excess of par value | 20,408,371 | 28,856,485 | 78,270,020 | 156,028,385 | 232,517,791 | 232,932,005 | 42,290,359 | 36,304,198 | ||||||||||||||||||||||||
Accumulated net realized gain (loss) on investments | 1,458,397 | 9,782,761 | (21,734,695 | ) | (2,077,574 | ) | 511,999 | 6,991,530 | 6,868,092 | 2,697,706 | ||||||||||||||||||||||
Net unrealized appreciation (depreciation) on: | ||||||||||||||||||||||||||||||||
Investments | 7,372,913 | 4,516,276 | 13,968,691 | 71,417,338 | 19,054,417 | 8,667,499 | 13,544,021 | 20,732,438 | ||||||||||||||||||||||||
Foreign currency related transactions | (307 | ) | — | — | — | (3,849 | ) | — | — | — | ||||||||||||||||||||||
Undistributed net investment income (loss) | 87,630 | (113,351 | ) | (97,720 | ) | 2,680,375 | 7,544,174 | 31,380,725 | (103,123 | ) | 507,765 | |||||||||||||||||||||
|
|
|
|
|
|
|
|
|
|
|
|
|
|
|
| |||||||||||||||||
Net assets | $ | 32,548,035 | $ | 45,524,051 | $ | 73,513,211 | $ | 242,192,409 | $ | 282,590,928 | $ | 299,882,588 | $ | 64,455,888 | $ | 69,487,745 | ||||||||||||||||
|
|
|
|
|
|
|
|
|
|
|
|
|
|
|
| |||||||||||||||||
*Investments in securities, at cost | $ | 25,105,646 | $ | 40,623,551 | $ | 59,925,285 | $ | 169,503,710 | $ | 255,887,006 | $ | 285,687,137 | $ | 50,863,386 | $ | 48,604,074 | ||||||||||||||||
|
|
|
|
|
|
|
|
|
|
|
|
|
|
|
| |||||||||||||||||
Shares outstanding | 3,221,031 | 2,481,880 | 3,106,915 | 14,143,885 | 22,966,396 | 19,910,829 | 1,856,539 | 9,245,638 | ||||||||||||||||||||||||
|
|
|
|
|
|
|
|
|
|
|
|
|
|
|
| |||||||||||||||||
Authorized Fund shares allocated to Portfolio | 10,000,000 | 10,000,000 | 10,000,000 | 35,000,000 | 40,000,000 | 45,000,000 | 10,000,000 | 25,000,000 | ||||||||||||||||||||||||
|
|
|
|
|
|
|
|
|
|
|
|
|
|
|
| |||||||||||||||||
Net asset value per share | $ | 10.10 | $ | 18.34 | $ | 23.66 | $ | 17.12 | $ | 12.30 | $ | 15.06 | $ | 34.72 | $ | 7.52 | ||||||||||||||||
|
|
|
|
|
|
|
|
|
|
|
|
|
|
|
| |||||||||||||||||
The accompanying notes are an integral part of these financial statements.
| 108 |
| Ohio National Fund, Inc. |
Statements of Assets and Liabilities | June 30, 2013 (Unaudited) |
| Bristol Portfolio | Bryton Growth Portfolio | U.S. Equity Portfolio | Balanced Portfolio | Income Opportunity Portfolio | Target VIP Portfolio | Target Equity/Income Portfolio | Bristol Growth Portfolio | |||||||||||||||||||||||||
Assets: | ||||||||||||||||||||||||||||||||
Investments in securities, at value* | $ | 210,586,647 | $ | 164,194,868 | $ | 17,951,736 | $ | 127,230,413 | $ | 9,948,931 | $ | 22,815,867 | $ | 23,752,951 | $ | 111,477,749 | ||||||||||||||||
Cash | 28,236 | 346 | 157 | 353,515 | 52,751 | 799 | 77 | 13,621 | ||||||||||||||||||||||||
Receivable for securities sold | 17,416,308 | 6,281,692 | — | 674,674 | 32,515 | — | — | 7,395,010 | ||||||||||||||||||||||||
Receivable for fund shares sold | 67,875 | 59,262 | 9,321 | 176,176 | 242 | 87,504 | 2,037 | 44,615 | ||||||||||||||||||||||||
Dividends and accrued interest receivable | 142,552 | 12,946 | 16,876 | 516,908 | 16,862 | 44,414 | 24,866 | 59,427 | ||||||||||||||||||||||||
Foreign tax reclaim receivable | — | — | 1,847 | — | — | 10,373 | — | — | ||||||||||||||||||||||||
Prepaid expenses and other assets | 1,841 | 1,430 | 138 | 761 | 81 | 185 | 245 | 960 | ||||||||||||||||||||||||
|
|
|
|
|
|
|
|
|
|
|
|
|
|
|
| |||||||||||||||||
Total assets | 228,243,459 | 170,550,544 | 17,980,075 | 128,952,447 | 10,051,382 | 22,959,142 | 23,780,176 | 118,991,382 | ||||||||||||||||||||||||
|
|
|
|
|
|
|
|
|
|
|
|
|
|
|
| |||||||||||||||||
Liabilities: | ||||||||||||||||||||||||||||||||
Options written, at value** | — | — | — | 326,500 | 48,975 | — | — | — | ||||||||||||||||||||||||
Payable for securities purchased | 8,737,674 | 3,254,603 | — | 2,386,842 | — | — | — | 3,478,222 | ||||||||||||||||||||||||
Payable for fund shares redeemed | 105,532 | 67,714 | 1,965 | 341,852 | 2,454 | 4,876 | 2,417 | 63,528 | ||||||||||||||||||||||||
Payable for investment management services | 135,662 | 111,643 | 11,054 | 64,562 | 6,567 | 11,393 | 11,757 | 75,153 | ||||||||||||||||||||||||
Accrued custody expense | 2,406 | 2,229 | 118 | 1,025 | 251 | 154 | 163 | 1,635 | ||||||||||||||||||||||||
Accrued professional fees | 6,104 | 6,104 | 6,104 | 6,104 | 6,104 | 6,104 | 6,104 | 6,104 | ||||||||||||||||||||||||
Accrued accounting fees | 10,850 | 8,623 | 1,525 | 8,458 | 1,379 | 2,336 | 1,869 | 6,099 | ||||||||||||||||||||||||
Accrued printing and filing fees | 11,863 | 9,026 | 962 | 6,488 | 546 | 1,247 | 1,280 | 6,246 | ||||||||||||||||||||||||
Withholding tax payable | — | — | — | — | — | 3,693 | — | — | ||||||||||||||||||||||||
|
|
|
|
|
|
|
|
|
|
|
|
|
|
|
| |||||||||||||||||
Total liabilities | 9,010,091 | 3,459,942 | 21,728 | 3,141,831 | 66,276 | 29,803 | 23,590 | 3,636,987 | ||||||||||||||||||||||||
|
|
|
|
|
|
|
|
|
|
|
|
|
|
|
| |||||||||||||||||
Net assets | $ | 219,233,368 | $ | 167,090,602 | $ | 17,958,347 | $ | 125,810,616 | $ | 9,985,106 | $ | 22,929,339 | $ | 23,756,586 | $ | 115,354,395 | ||||||||||||||||
|
|
|
|
|
|
|
|
|
|
|
|
|
|
|
| |||||||||||||||||
Net assets consist of: | ||||||||||||||||||||||||||||||||
Par value, $1 per share | $ | 14,718,647 | $ | 10,613,740 | $ | 1,370,687 | $ | 7,344,800 | $ | 691,856 | $ | 2,004,952 | $ | 2,484,354 | $ | 9,646,623 | ||||||||||||||||
Paid-in capital in excess of par value | 157,678,726 | 121,815,681 | 17,882,284 | 107,909,386 | 6,806,173 | 22,317,435 | 31,391,407 | 80,938,542 | ||||||||||||||||||||||||
Accumulated net realized gain (loss) on investments | 27,605,651 | 19,984,530 | (5,479,858 | ) | 1,881,876 | 671,864 | (4,647,341 | ) | (13,449,232 | ) | 16,418,882 | |||||||||||||||||||||
Net unrealized appreciation (depreciation) on: | ||||||||||||||||||||||||||||||||
Investments | 18,207,749 | 15,185,247 | 4,124,270 | 7,531,277 | 1,684,304 | 3,033,402 | 3,023,656 | 7,913,719 | ||||||||||||||||||||||||
Written options | — | — | — | (69,837 | ) | (10,476 | ) | — | — | — | ||||||||||||||||||||||
Foreign currency related transactions | — | — | — | — | — | (4 | ) | — | — | |||||||||||||||||||||||
Undistributed net investment income (loss) | 1,022,595 | (508,596 | ) | 60,964 | 1,213,114 | 141,385 | 220,895 | 306,401 | 436,629 | |||||||||||||||||||||||
|
|
|
|
|
|
|
|
|
|
|
|
|
|
|
| |||||||||||||||||
Net assets | $ | 219,233,368 | $ | 167,090,602 | $ | 17,958,347 | $ | 125,810,616 | $ | 9,985,106 | $ | 22,929,339 | $ | 23,756,586 | $ | 115,354,395 | ||||||||||||||||
|
|
|
|
|
|
|
|
|
|
|
|
|
|
|
| |||||||||||||||||
*Investments in securities, at cost | $ | 192,378,898 | $ | 149,009,621 | $ | 13,827,466 | $ | 119,699,136 | $ | 8,264,627 | $ | 19,782,465 | $ | 20,729,295 | $ | 103,564,030 | ||||||||||||||||
|
|
|
|
|
|
|
|
|
|
|
|
|
|
|
| |||||||||||||||||
**Premiums received on options written | $ | — | $ | — | $ | — | $ | 256,663 | $ | 38,499 | $ | — | $ | — | $ | — | ||||||||||||||||
|
|
|
|
|
|
|
|
|
|
|
|
|
|
|
| |||||||||||||||||
Shares outstanding | 14,718,647 | 10,613,740 | 1,370,687 | 7,344,800 | 691,856 | 2,004,952 | 2,484,354 | 9,646,623 | ||||||||||||||||||||||||
|
|
|
|
|
|
|
|
|
|
|
|
|
|
|
| |||||||||||||||||
Authorized Fund shares allocated to Portfolio | 40,000,000 | 35,000,000 | 10,000,000 | 25,000,000 | 10,000,000 | 10,000,000 | 10,000,000 | 25,000,000 | ||||||||||||||||||||||||
|
|
|
|
|
|
|
|
|
|
|
|
|
|
|
| |||||||||||||||||
Net asset value per share | $ | 14.89 | $ | 15.74 | $ | 13.10 | $ | 17.13 | $ | 14.43 | $ | 11.44 | $ | 9.56 | $ | 11.96 | ||||||||||||||||
|
|
|
|
|
|
|
|
|
|
|
|
|
|
|
| |||||||||||||||||
The accompanying notes are an integral part of these financial statements.
| 109 |
| Ohio National Fund, Inc. |
| For the Six-Month Period Ended June 30, 2013 (Unaudited) |
| Equity Portfolio | Money Market Portfolio | Bond Portfolio | Omni Portfolio | International Portfolio | Capital Appreciation Portfolio | Millennium Portfolio | International Small-Mid Company Portfolio | |||||||||||||||||||||||||
Investment income: | ||||||||||||||||||||||||||||||||
Interest | $ | — | $ | 71,645 | $ | 3,200,668 | $ | 168,696 | $ | — | $ | — | $ | — | $ | — | ||||||||||||||||
Dividends, net of taxes withheld* | 1,886,878 | 9,340 | 1,063 | 178,210 | 3,108,937 | 913,522 | 26,421 | 656,193 | ||||||||||||||||||||||||
|
|
|
|
|
|
|
|
|
|
|
|
|
|
|
| |||||||||||||||||
Total investment income | 1,886,878 | 80,985 | 3,201,731 | 346,906 | 3,108,937 | 913,522 | 26,421 | 656,193 | ||||||||||||||||||||||||
|
|
|
|
|
|
|
|
|
|
|
|
|
|
|
| |||||||||||||||||
Expenses: | ||||||||||||||||||||||||||||||||
Management fees | 781,951 | 338,599 | 449,428 | 102,861 | 750,408 | 486,859 | 143,250 | 335,106 | ||||||||||||||||||||||||
Custodian fees | 6,185 | 6,269 | 3,371 | 3,336 | 91,502 | 4,553 | 3,551 | 32,607 | ||||||||||||||||||||||||
Directors’ fees | 13,127 | 16,583 | 10,593 | 2,272 | 12,037 | 8,139 | 2,362 | 4,436 | ||||||||||||||||||||||||
Professional fees | 10,215 | 11,294 | 9,479 | 6,989 | 9,640 | 8,739 | 7,016 | 7,556 | ||||||||||||||||||||||||
Accounting fees | 29,780 | 38,630 | 35,358 | 12,700 | 33,281 | 20,267 | 7,885 | 14,907 | ||||||||||||||||||||||||
Printing and filing fees | 11,653 | 15,605 | 8,271 | 1,940 | 9,943 | 7,220 | 2,111 | 3,623 | ||||||||||||||||||||||||
Compliance expense | 5,853 | 5,853 | 5,853 | 5,853 | 5,853 | 5,853 | 5,853 | 5,853 | ||||||||||||||||||||||||
Other | 3,004 | 1,880 | 1,150 | 537 | 3,210 | 1,841 | 586 | 978 | ||||||||||||||||||||||||
|
|
|
|
|
|
|
|
|
|
|
|
|
|
|
| |||||||||||||||||
Total expenses | 861,768 | 434,713 | 523,503 | 136,488 | 915,874 | 543,471 | 172,614 | 405,066 | ||||||||||||||||||||||||
|
|
|
|
|
|
|
|
|
|
|
|
|
|
|
| |||||||||||||||||
Less expenses reduced or reimbursed by adviser | — | (353,728 | ) | — | — | (64,613 | ) | — | — | — | ||||||||||||||||||||||
|
|
|
|
|
|
|
|
|
|
|
|
|
|
|
| |||||||||||||||||
Net expenses | 861,768 | 80,985 | 523,503 | 136,488 | 851,261 | 543,471 | 172,614 | 405,066 | ||||||||||||||||||||||||
|
|
|
|
|
|
|
|
|
|
|
|
|
|
|
| |||||||||||||||||
Net investment income (loss) | 1,025,110 | — | 2,678,228 | 210,418 | 2,257,676 | 370,051 | (146,193 | ) | 251,127 | |||||||||||||||||||||||
|
|
|
|
|
|
|
|
|
|
|
|
|
|
|
| |||||||||||||||||
Realized/unrealized gain (loss) on investments, futures contracts, | ||||||||||||||||||||||||||||||||
Net realized gain (loss) on: | ||||||||||||||||||||||||||||||||
Investments | 13,412,503 | — | 1,151,854 | 2,438,149 | 7,448,853 | 5,915,141 | 3,800,586 | 5,284,354 | ||||||||||||||||||||||||
Futures contracts | — | — | — | — | (147,689 | ) | — | — | — | |||||||||||||||||||||||
Foreign currency contracts | — | — | — | — | 107,765 | — | — | — | ||||||||||||||||||||||||
Other foreign currency related transactions | — | — | — | — | (168,739 | ) | (1,167 | ) | — | (47,926 | ) | |||||||||||||||||||||
Change in unrealized appreciation/depreciation on: | ||||||||||||||||||||||||||||||||
Investments | 13,533,227 | — | (7,979,517 | ) | 687,097 | (13,640,321 | ) | 9,993,194 | 2,148,017 | (1,617,620 | ) | |||||||||||||||||||||
Futures contracts | — | — | — | — | (30,588 | ) | — | — | — | |||||||||||||||||||||||
Foreign currency contracts | — | — | — | — | (676,832 | ) | — | — | — | |||||||||||||||||||||||
Other foreign currency related transactions | — | — | — | — | (4,040 | ) | — | — | (46,199 | ) | ||||||||||||||||||||||
|
|
|
|
|
|
|
|
|
|
|
|
|
|
|
| |||||||||||||||||
Net realized/unrealized gain (loss) on investments, | 26,945,730 | — | (6,827,663 | ) | 3,125,246 | (7,111,591 | ) | 15,907,168 | 5,948,603 | 3,572,609 | ||||||||||||||||||||||
|
|
|
|
|
|
|
|
|
|
|
|
|
|
|
| |||||||||||||||||
Change in net assets from operations | $ | 27,970,840 | $ | — | $ | (4,149,435 | ) | $ | 3,335,664 | $ | (4,853,915 | ) | $ | 16,277,219 | $ | 5,802,410 | $ | 3,823,736 | ||||||||||||||
|
|
|
|
|
|
|
|
|
|
|
|
|
|
|
| |||||||||||||||||
* Taxes withheld | $ | 8,504 | $ | — | $ | — | $ | — | $ | 511,841 | $ | 27,717 | $ | — | $ | 73,457 | ||||||||||||||||
|
|
|
|
|
|
|
|
|
|
|
|
|
|
|
| |||||||||||||||||
The accompanying notes are an integral part of these financial statements.
| 110 |
| Ohio National Fund, Inc. |
Statements of Operations | For the Six-Month Period Ended June 30, 2013 (Unaudited) |
| Aggressive Growth Portfolio | Small Cap Growth Portfolio | Mid Cap Opportunity Portfolio | S&P 500® Index Portfolio | Strategic Value Portfolio | High Income Bond Portfolio | Capital Growth Portfolio | Nasdaq-100® Index Portfolio | |||||||||||||||||||||||||
Investment income: | ||||||||||||||||||||||||||||||||
Interest | $ | 143 | $ | 241 | $ | — | $ | 2 | $ | — | $ | 11,276,686 | $ | — | $ | 3 | ||||||||||||||||
Dividends, net of taxes withheld* | 145,400 | 107,996 | 248,959 | 2,460,268 | 6,410,341 | 13,290 | 207,958 | 495,477 | ||||||||||||||||||||||||
|
|
|
|
|
|
|
|
|
|
|
|
|
|
|
| |||||||||||||||||
Total investment income | 145,543 | 108,237 | 248,959 | 2,460,270 | 6,410,341 | 11,289,976 | 207,958 | 495,480 | ||||||||||||||||||||||||
|
|
|
|
|
|
|
|
|
|
|
|
|
|
|
| |||||||||||||||||
Expenses: | ||||||||||||||||||||||||||||||||
Management fees | 133,737 | 186,081 | 306,274 | 425,167 | 1,008,847 | 1,041,784 | 274,613 | 142,656 | ||||||||||||||||||||||||
Custodian fees | 2,079 | 7,924 | 3,757 | 7,531 | 9,988 | 7,823 | 2,563 | 4,573 | ||||||||||||||||||||||||
Directors’ fees | 2,174 | 2,754 | 4,800 | 15,137 | 18,658 | 20,397 | 4,045 | 4,740 | ||||||||||||||||||||||||
Professional fees | 6,963 | 7,128 | 7,733 | 10,781 | 11,615 | 12,432 | 7,514 | 7,722 | ||||||||||||||||||||||||
Accounting fees | 7,943 | 8,709 | 13,008 | 42,607 | 42,216 | 78,930 | 11,882 | 13,282 | ||||||||||||||||||||||||
Printing and filing fees | 1,873 | 2,575 | 4,199 | 13,897 | 16,104 | 17,084 | 3,733 | 4,087 | ||||||||||||||||||||||||
Compliance expense | 5,853 | 5,853 | 5,853 | 5,853 | 5,853 | 5,853 | 5,853 | 5,853 | ||||||||||||||||||||||||
Other | 469 | 564 | 1,055 | 3,094 | 1,754 | 2,080 | 878 | 1,022 | ||||||||||||||||||||||||
|
|
|
|
|
|
|
|
|
|
|
|
|
|
|
| |||||||||||||||||
Total expenses | 161,091 | 221,588 | 346,679 | 524,067 | 1,115,035 | 1,186,383 | 311,081 | 183,935 | ||||||||||||||||||||||||
|
|
|
|
|
|
|
|
|
|
|
|
|
|
|
| |||||||||||||||||
Net investment income (loss) | (15,548 | ) | (113,351 | ) | (97,720 | ) | 1,936,203 | 5,295,306 | 10,103,593 | (103,123 | ) | 311,545 | ||||||||||||||||||||
|
|
|
|
|
|
|
|
|
|
|
|
|
|
|
| |||||||||||||||||
Realized/unrealized gain (loss) on investments and foreign currency related transactions: | ||||||||||||||||||||||||||||||||
Net realized gain (loss) on: | ||||||||||||||||||||||||||||||||
Investments | 2,389,534 | 4,224,965 | 3,059,208 | 955,320 | 6,607,059 | 2,292,918 | 3,185,815 | 3,018,268 | ||||||||||||||||||||||||
Foreign currency related transactions | (164 | ) | — | — | — | (37,998 | ) | — | — | — | ||||||||||||||||||||||
Change in unrealized appreciation/depreciation on: | ||||||||||||||||||||||||||||||||
Investments | (333,120 | ) | 2,412,300 | 4,347,030 | 25,293,552 | 17,374,325 | (7,474,493 | ) | 4,085,270 | 3,268,981 | ||||||||||||||||||||||
Foreign currency related transactions | (348 | ) | — | — | — | (10,290 | ) | — | — | — | ||||||||||||||||||||||
|
|
|
|
|
|
|
|
|
|
|
|
|
|
|
| |||||||||||||||||
Net realized/unrealized gain (loss) on investments and foreign currency related transactions | 2,055,902 | 6,637,265 | 7,406,238 | 26,248,872 | 23,933,096 | (5,181,575 | ) | 7,271,085 | 6,287,249 | |||||||||||||||||||||||
|
|
|
|
|
|
|
|
|
|
|
|
|
|
|
| |||||||||||||||||
Change in net assets from operations | $ | 2,040,354 | $ | 6,523,914 | $ | 7,308,518 | $ | 28,185,075 | $ | 29,228,402 | $ | 4,922,018 | $ | 7,167,962 | $ | 6,598,794 | ||||||||||||||||
|
|
|
|
|
|
|
|
|
|
|
|
|
|
|
| |||||||||||||||||
* Taxes withheld | $ | 5,512 | $ | 1,219 | $ | 2,094 | $ | 702 | $ | 233,014 | $ | — | $ | 470 | $ | — | ||||||||||||||||
|
|
|
|
|
|
|
|
|
|
|
|
|
|
|
| |||||||||||||||||
The accompanying notes are an integral part of these financial statements.
| 111 |
| Ohio National Fund, Inc. |
Statements of Operations | For the Six-Month Period Ended June 30, 2013 (Unaudited) |
| Bristol Portfolio | Bryton Growth Portfolio | U.S. Equity Portfolio | Balanced Portfolio | Income Opportunity Portfolio | Target VIP Portfolio | Target Equity/Income Portfolio | Bristol Growth Portfolio | |||||||||||||||||||||||||
Investment income: | ||||||||||||||||||||||||||||||||
Interest | $ | — | $ | — | $ | — | $ | 367,180 | $ | — | $ | — | $ | — | $ | — | ||||||||||||||||
Dividends, net of taxes withheld* | 1,482,905 | 244,724 | 122,371 | 578,882 | 79,727 | 234,843 | 283,507 | 717,531 | ||||||||||||||||||||||||
|
|
|
|
|
|
|
|
|
|
|
|
|
|
|
| |||||||||||||||||
Total investment income | 1,482,905 | 244,724 | 122,371 | 946,062 | 79,727 | 234,843 | 283,507 | 717,531 | ||||||||||||||||||||||||
|
|
|
|
|
|
|
|
|
|
|
|
|
|
|
| |||||||||||||||||
Expenses: | ||||||||||||||||||||||||||||||||
Management fees | 810,029 | 672,574 | 64,007 | 327,664 | 39,077 | 67,534 | 70,216 | 448,699 | ||||||||||||||||||||||||
Custodian fees | 7,204 | 6,713 | 383 | 3,317 | 1,172 | 3,465 | 1,363 | 5,297 | ||||||||||||||||||||||||
Directors’ fees | 14,483 | 11,070 | 1,137 | 6,623 | 651 | 1,488 | 1,559 | 7,603 | ||||||||||||||||||||||||
Professional fees | 10,619 | 9,615 | 6,649 | 8,289 | 6,505 | 6,754 | 6,986 | 8,570 | ||||||||||||||||||||||||
Accounting fees | 32,482 | 25,800 | 4,553 | 25,342 | 4,113 | 6,986 | 5,584 | 18,256 | ||||||||||||||||||||||||
Printing and filing fees | 12,531 | 9,424 | 1,031 | 7,177 | 561 | 1,323 | 1,372 | 6,580 | ||||||||||||||||||||||||
Compliance expense | 5,853 | 5,853 | 5,853 | 5,853 | 5,853 | 5,853 | 5,853 | 5,853 | ||||||||||||||||||||||||
Other | 3,119 | 2,432 | 239 | 621 | 169 | 349 | 360 | 1,643 | ||||||||||||||||||||||||
|
|
|
|
|
|
|
|
|
|
|
|
|
|
|
| |||||||||||||||||
Total expenses | 896,320 | 743,481 | 83,852 | 384,886 | 58,101 | 93,752 | 93,293 | 502,501 | ||||||||||||||||||||||||
|
|
|
|
|
|
|
|
|
|
|
|
|
|
|
| |||||||||||||||||
Net investment income (loss) | 586,585 | (498,757 | ) | 38,519 | 561,176 | 21,626 | 141,091 | 190,214 | 215,030 | |||||||||||||||||||||||
|
|
|
|
|
|
|
|
|
|
|
|
|
|
|
| |||||||||||||||||
Realized/unrealized gain (loss) on investments, foreign currency related transactions, and written options: | ||||||||||||||||||||||||||||||||
Net realized gain (loss) on: | ||||||||||||||||||||||||||||||||
Investments | 20,840,471 | 8,687,757 | 286,480 | 2,051,576 | 828,580 | 1,756,949 | 1,865,725 | 10,208,330 | ||||||||||||||||||||||||
Foreign currency related transactions | — | — | — | (8 | ) | — | 30 | 2 | — | |||||||||||||||||||||||
Written options | — | — | — | 159,988 | 18,981 | — | — | — | ||||||||||||||||||||||||
Change in unrealized appreciation/depreciation on: | ||||||||||||||||||||||||||||||||
Investments | 7,647,611 | 14,913,410 | 1,975,611 | 4,799,301 | 360,279 | 871,952 | 1,614,667 | 2,545,972 | ||||||||||||||||||||||||
Foreign currency related transactions | — | — | — | 4 | — | (4 | ) | — | — | |||||||||||||||||||||||
Written options | — | — | — | (69,837 | ) | (10,476 | ) | — | — | — | ||||||||||||||||||||||
|
|
|
|
|
|
|
|
|
|
|
|
|
|
|
| |||||||||||||||||
Net realized/unrealized gain (loss) on investments, foreign currency related transactions, and written options | 28,488,082 | 23,601,167 | 2,262,091 | 6,941,024 | 1,197,364 | 2,628,927 | 3,480,394 | 12,754,302 | ||||||||||||||||||||||||
|
|
|
|
|
|
|
|
|
|
|
|
|
|
|
| |||||||||||||||||
Change in net assets from operations | $ | 29,074,667 | $ | 23,102,410 | $ | 2,300,610 | $ | 7,502,200 | $ | 1,218,990 | $ | 2,770,018 | $ | 3,670,608 | $ | 12,969,332 | ||||||||||||||||
|
|
|
|
|
|
|
|
|
|
|
|
|
|
|
| |||||||||||||||||
* Taxes withheld | $ | — | $ | — | $ | — | $ | 1,988 | $ | 353 | $ | 18,446 | $ | 278 | $ | — | ||||||||||||||||
|
|
|
|
|
|
|
|
|
|
|
|
|
|
|
| |||||||||||||||||
The accompanying notes are an integral part of these financial statements.
| 112 |
| Ohio National Fund, Inc. |
| Equity Portfolio | Money Market Portfolio | Bond Portfolio | Omni Portfolio | |||||||||||||||||||||||||||||
| Six-Month Period Ended June 30, 2013 (Unaudited) | Year Ended December 31, 2012 | Six-Month Period Ended June 30, 2013 (Unaudited) | Year Ended December 31, 2012 | Six-Month Period Ended June 30, 2013 (Unaudited) | Year Ended December 31, 2012 | Six-Month Period Ended June 30, 2013 (Unaudited) | Year Ended December 31, 2012 | |||||||||||||||||||||||||
Increase (Decrease) in net assets: | ||||||||||||||||||||||||||||||||
Operations: | ||||||||||||||||||||||||||||||||
Net investment income (loss) | $ | 1,025,110 | $ | 2,937,620 | $ | — | $ | — | $ | 2,678,228 | $ | 5,756,080 | $ | 210,418 | $ | 512,127 | ||||||||||||||||
Net realized gain (loss) on investments and foreign currency related transactions | 13,412,503 | 15,135,180 | — | — | 1,151,854 | 1,428,098 | 2,438,149 | 1,090,857 | ||||||||||||||||||||||||
Change in unrealized appreciation/depreciation on investments | 13,533,227 | 9,664,589 | — | — | (7,979,517 | ) | 4,568,299 | 687,097 | 2,337,094 | |||||||||||||||||||||||
|
|
|
|
|
|
|
|
|
|
|
|
|
|
|
| |||||||||||||||||
Change in net assets from operations | 27,970,840 | 27,737,389 | — | — | (4,149,435 | ) | 11,752,477 | 3,335,664 | 3,940,078 | |||||||||||||||||||||||
|
|
|
|
|
|
|
|
|
|
|
|
|
|
|
| |||||||||||||||||
Distributions to shareholders: | ||||||||||||||||||||||||||||||||
Distributions from net investment income | — | (2,551,766 | ) | — | — | — | — | — | (434,512 | ) | ||||||||||||||||||||||
|
|
|
|
|
|
|
|
|
|
|
|
|
|
|
| |||||||||||||||||
Capital transactions: | ||||||||||||||||||||||||||||||||
Received from shares sold | 5,105,841 | 12,859,425 | 113,351,487 | 178,859,238 | 17,107,432 | 50,714,394 | 1,169,791 | 2,645,867 | ||||||||||||||||||||||||
Received from dividends reinvested | — | 2,551,766 | — | — | — | — | — | 434,512 | ||||||||||||||||||||||||
Paid for shares redeemed | (19,054,092 | ) | (41,926,289 | ) | (104,967,315 | ) | (206,441,123 | ) | (38,843,208 | ) | (52,317,398 | ) | (3,663,696 | ) | (8,034,239 | ) | ||||||||||||||||
|
|
|
|
|
|
|
|
|
|
|
|
|
|
|
| |||||||||||||||||
Change in net assets from capital transactions | (13,948,251 | ) | (26,515,098 | ) | 8,384,172 | (27,581,885 | ) | (21,735,776 | ) | (1,603,004 | ) | (2,493,905 | ) | (4,953,860 | ) | |||||||||||||||||
|
|
|
|
|
|
|
|
|
|
|
|
|
|
|
| |||||||||||||||||
Change in net assets | 14,022,589 | (1,329,475 | ) | 8,384,172 | (27,581,885 | ) | (25,885,211 | ) | 10,149,473 | 841,759 | (1,448,294 | ) | ||||||||||||||||||||
Net assets: | ||||||||||||||||||||||||||||||||
Beginning of period | 186,527,283 | 187,856,758 | 258,606,212 | 286,188,097 | 172,184,450 | 162,034,977 | 33,204,689 | 34,652,983 | ||||||||||||||||||||||||
|
|
|
|
|
|
|
|
|
|
|
|
|
|
|
| |||||||||||||||||
End of period | $ | 200,549,872 | $ | 186,527,283 | $ | 266,990,384 | $ | 258,606,212 | $ | 146,299,239 | $ | 172,184,450 | $ | 34,046,448 | $ | 33,204,689 | ||||||||||||||||
|
|
|
|
|
|
|
|
|
|
|
|
|
|
|
| |||||||||||||||||
Undistributed net investment income | $ | 1,392,318 | $ | 367,208 | $ | — | $ | — | $ | 8,434,308 | $ | 5,756,080 | $ | 319,438 | $ | 109,020 | ||||||||||||||||
|
|
|
|
|
|
|
|
|
|
|
|
|
|
|
| |||||||||||||||||
The accompanying notes are an integral part of these financial statements.
| 113 |
| Ohio National Fund, Inc. |
Statements of Changes in Net Assets |
| International Portfolio | Capital Appreciation Portfolio | Millennium Portfolio | International Small-Mid Company Portfolio | |||||||||||||||||||||||||||||
| Six-Month Period Ended June 30, 2013 (Unaudited) | Year Ended December 31, 2012 | Six-Month Period Ended June 30, 2013 (Unaudited) | Year Ended December 31, 2012 | Six-Month Period Ended June 30, 2013 (Unaudited) | Year Ended December 31, 2012 | Six-Month Period Ended June 30, 2013 (Unaudited) | Year Ended December 31, 2012 | |||||||||||||||||||||||||
Increase (Decrease) in net assets: | ||||||||||||||||||||||||||||||||
Operations: | ||||||||||||||||||||||||||||||||
Net investment income (loss) | $ | 2,257,676 | $ | 2,974,730 | $ | 370,051 | $ | 765,103 | $ | (146,193 | ) | $ | (167,248 | ) | $ | 251,127 | $ | 399,238 | ||||||||||||||
Net realized gain (loss) on investments, futures contracts, foreign currency contracts, and other foreign currency related transactions | 7,240,190 | 9,475,139 | 5,913,974 | 7,244,718 | 3,800,586 | 4,063,768 | 5,236,428 | 1,226,014 | ||||||||||||||||||||||||
Change in unrealized appreciation/depreciation on investments, futures contracts, foreign currency contracts, and other foreign currency related transactions | (14,351,781 | ) | 20,843,432 | 9,993,194 | 10,984,140 | 2,148,017 | (511,771 | ) | (1,663,819 | ) | 10,919,188 | |||||||||||||||||||||
|
|
|
|
|
|
|
|
|
|
|
|
|
|
|
| |||||||||||||||||
Change in net assets from operations | (4,853,915 | ) | 33,293,301 | 16,277,219 | 18,993,961 | 5,802,410 | 3,384,749 | 3,823,736 | 12,544,440 | |||||||||||||||||||||||
|
|
|
|
|
|
|
|
|
|
|
|
|
|
|
| |||||||||||||||||
Distributions to shareholders: | ||||||||||||||||||||||||||||||||
Distributions from net investment income | — | — | — | (681,205 | ) | — | — | — | — | |||||||||||||||||||||||
|
|
|
|
|
|
|
|
|
|
|
|
|
|
|
| |||||||||||||||||
Capital transactions: | ||||||||||||||||||||||||||||||||
Received from shares sold | 10,995,839 | 16,648,592 | 6,348,664 | 11,383,622 | 1,877,326 | 3,189,215 | 4,671,193 | 10,692,767 | ||||||||||||||||||||||||
Received from dividends reinvested | — | — | — | 681,205 | — | — | — | — | ||||||||||||||||||||||||
Paid for shares redeemed | (15,230,782 | ) | (42,407,744 | ) | (12,962,969 | ) | (29,380,202 | ) | (4,609,919 | ) | (8,938,109 | ) | (7,192,573 | ) | (16,239,923 | ) | ||||||||||||||||
|
|
|
|
|
|
|
|
|
|
|
|
|
|
|
| |||||||||||||||||
Change in net assets from capital transactions | (4,234,943 | ) | (25,759,152 | ) | (6,614,305 | ) | (17,315,375 | ) | (2,732,593 | ) | (5,748,894 | ) | (2,521,380 | ) | (5,547,156 | ) | ||||||||||||||||
|
|
|
|
|
|
|
|
|
|
|
|
|
|
|
| |||||||||||||||||
Change in net assets | (9,088,858 | ) | 7,534,149 | 9,662,914 | 997,381 | 3,069,817 | (2,364,145 | ) | 1,302,356 | 6,997,284 | ||||||||||||||||||||||
Net assets: | ||||||||||||||||||||||||||||||||
Beginning of period | 180,344,132 | 172,809,983 | 115,667,859 | 114,670,478 | 34,111,083 | 36,475,228 | 64,482,591 | 57,485,307 | ||||||||||||||||||||||||
|
|
|
|
|
|
|
|
|
|
|
|
|
|
|
| |||||||||||||||||
End of period | $ | 171,255,274 | $ | 180,344,132 | $ | 125,330,773 | $ | 115,667,859 | $ | 37,180,900 | $ | 34,111,083 | $ | 65,784,947 | $ | 64,482,591 | ||||||||||||||||
|
|
|
|
|
|
|
|
|
|
|
|
|
|
|
| |||||||||||||||||
Undistributed net investment income (loss) | $ | 7,115,328 | $ | 4,857,652 | $ | 453,401 | $ | 83,350 | $ | (146,193 | ) | $ | — | $ | 575,477 | $ | 324,350 | |||||||||||||||
|
|
|
|
|
|
|
|
|
|
|
|
|
|
|
| |||||||||||||||||
The accompanying notes are an integral part of these financial statements.
| 114 |
| Ohio National Fund, Inc. |
Statements of Changes in Net Assets |
| Aggressive Growth Portfolio | Small Cap Growth Portfolio | Mid Cap Opportunity Portfolio | S&P 500® Index Portfolio | |||||||||||||||||||||||||||||
| Six-Month Period Ended June 30, 2013 (Unaudited) | Year Ended December 31, 2012 | Six-Month Period Ended June 30, 2013 (Unaudited) | Year Ended December 31, 2012 | Six-Month Period Ended June 30, 2013 (Unaudited) | Year Ended December 31, 2012 | Six-Month Period Ended June 30, 2013 (Unaudited) | Year Ended December 31, 2012 | |||||||||||||||||||||||||
Increase (Decrease) in net assets: | ||||||||||||||||||||||||||||||||
Operations: | ||||||||||||||||||||||||||||||||
Net investment income (loss) | $ | (15,548 | ) | $ | 104,016 | $ | (113,351 | ) | $ | (69,166 | ) | $ | (97,720 | ) | $ | (57,981 | ) | $ | 1,936,203 | $ | 3,608,504 | |||||||||||
Net realized gain (loss) on investments and foreign currency related transactions | 2,389,370 | (286,285 | ) | 4,224,965 | 5,846,202 | 3,059,208 | 4,035,775 | 955,320 | 1,892,406 | |||||||||||||||||||||||
Change in unrealized appreciation/depreciation on investments and foreign currency related transactions | (333,468 | ) | 5,979,480 | 2,412,300 | (231,728 | ) | 4,347,030 | 7,639,334 | 25,293,552 | 21,351,067 | ||||||||||||||||||||||
|
|
|
|
|
|
|
|
|
|
|
|
|
|
|
| |||||||||||||||||
Change in net assets from operations | 2,040,354 | 5,797,211 | 6,523,914 | 5,545,308 | 7,308,518 | 11,617,128 | 28,185,075 | 26,851,977 | ||||||||||||||||||||||||
|
|
|
|
|
|
|
|
|
|
|
|
|
|
|
| |||||||||||||||||
Distributions to shareholders: | ||||||||||||||||||||||||||||||||
Distributions from net investment income | — | — | — | — | — | — | — | (2,826,655 | ) | |||||||||||||||||||||||
|
|
|
|
|
|
|
|
|
|
|
|
|
|
|
| |||||||||||||||||
Capital transactions: | ||||||||||||||||||||||||||||||||
Received from shares sold | 4,528,748 | 9,567,587 | 10,120,053 | 9,304,509 | 8,595,933 | 11,126,601 | 31,532,520 | 54,598,878 | ||||||||||||||||||||||||
Received from dividends reinvested | — | — | — | — | — | — | — | 2,826,655 | ||||||||||||||||||||||||
Paid for shares redeemed | (7,165,748 | ) | (7,975,462 | ) | (6,103,895 | ) | (11,364,585 | ) | (9,452,846 | ) | (16,745,113 | ) | (25,305,706 | ) | (44,349,542 | ) | ||||||||||||||||
|
|
|
|
|
|
|
|
|
|
|
|
|
|
|
| |||||||||||||||||
Change in net assets from capital transactions | (2,637,000 | ) | 1,592,125 | 4,016,158 | (2,060,076 | ) | (856,913 | ) | (5,618,512 | ) | 6,226,814 | 13,075,991 | ||||||||||||||||||||
|
|
|
|
|
|
|
|
|
|
|
|
|
|
|
| |||||||||||||||||
Change in net assets | (596,646 | ) | 7,389,336 | 10,540,072 | 3,485,232 | 6,451,605 | 5,998,616 | 34,411,889 | 37,101,313 | |||||||||||||||||||||||
Net assets: | ||||||||||||||||||||||||||||||||
Beginning of period | 33,144,681 | 25,755,345 | 34,983,979 | 31,498,747 | 67,061,606 | 61,062,990 | 207,780,520 | 170,679,207 | ||||||||||||||||||||||||
|
|
|
|
|
|
|
|
|
|
|
|
|
|
|
| |||||||||||||||||
End of period | $ | 32,548,035 | $ | 33,144,681 | $ | 45,524,051 | $ | 34,983,979 | $ | 73,513,211 | $ | 67,061,606 | $ | 242,192,409 | $ | 207,780,520 | ||||||||||||||||
|
|
|
|
|
|
|
|
|
|
|
|
|
|
|
| |||||||||||||||||
Undistributed net investment income (loss) | $ | 87,630 | $ | 103,178 | $ | (113,351 | ) | $ | — | $ | (97,720 | ) | $ | — | $ | 2,680,375 | $ | 744,172 | ||||||||||||||
|
|
|
|
|
|
|
|
|
|
|
|
|
|
|
| |||||||||||||||||
The accompanying notes are an integral part of these financial statements.
| 115 |
| Ohio National Fund, Inc. |
Statements of Changes in Net Assets |
| Strategic Value Portfolio | High Income Bond Portfolio | Capital Growth Portfolio | Nasdaq-100® Index Portfolio | |||||||||||||||||||||||||||||
| Six-Month Period Ended June 30, 2013 (Unaudited) | Year Ended December 31, 2012 | Six-Month Period Ended June 30, 2013 (Unaudited) | Year Ended December 31, 2012 | Six-Month Period Ended June 30, 2013 (Unaudited) | Year Ended December 31, 2012 | Six-Month Period Ended June 30, 2013 (Unaudited) | Year Ended December 31, 2012 | |||||||||||||||||||||||||
Increase (Decrease) in net assets: | ||||||||||||||||||||||||||||||||
Operations: | ||||||||||||||||||||||||||||||||
Net investment income (loss) | $ | 5,295,306 | $ | 5,810,288 | $ | 10,103,593 | $ | 21,277,132 | $ | (103,123 | ) | $ | (53,366 | ) | $ | 311,545 | $ | 644,168 | ||||||||||||||
Net realized gain (loss) on investments and foreign currency related transactions | 6,569,061 | 1,644,996 | 2,292,918 | 4,698,612 | 3,185,815 | 3,854,057 | 3,018,268 | 513,180 | ||||||||||||||||||||||||
Change in unrealized appreciation/depreciation on investments and foreign currency related transactions | 17,364,035 | (2,810,944 | ) | (7,474,493 | ) | 13,264,229 | 4,085,270 | 3,014,667 | 3,268,981 | 8,702,070 | ||||||||||||||||||||||
|
|
|
|
|
|
|
|
|
|
|
|
|
|
|
| |||||||||||||||||
Change in net assets from operations | 29,228,402 | 4,644,340 | 4,922,018 | 39,239,973 | 7,167,962 | 6,815,358 | 6,598,794 | 9,859,418 | ||||||||||||||||||||||||
|
|
|
|
|
|
|
|
|
|
|
|
|
|
|
| |||||||||||||||||
Distributions to shareholders: | ||||||||||||||||||||||||||||||||
Distributions from net investment income | — | (3,918,367 | ) | — | — | — | — | — | (447,911 | ) | ||||||||||||||||||||||
|
|
|
|
|
|
|
|
|
|
|
|
|
|
|
| |||||||||||||||||
Capital transactions: | ||||||||||||||||||||||||||||||||
Received from shares sold | 15,183,193 | 257,036,279 | 25,654,833 | 84,212,118 | 11,680,085 | 12,566,131 | 9,536,827 | 26,139,975 | ||||||||||||||||||||||||
Received from dividends reinvested | — | 3,918,367 | — | — | — | — | -— | 447,911 | ||||||||||||||||||||||||
Paid for shares redeemed | (29,984,377 | ) | (35,500,770 | ) | (42,609,200 | ) | (78,999,032 | ) | (9,506,894 | ) | (15,372,139 | ) | (15,190,079 | ) | (22,928,127 | ) | ||||||||||||||||
|
|
|
|
|
|
|
|
|
|
|
|
|
|
|
| |||||||||||||||||
Change in net assets from capital transactions | (14,801,184 | ) | 225,453,876 | (16,954,367 | ) | 5,213,086 | 2,173,191 | (2,806,008 | ) | (5,653,252 | ) | 3,659,759 | ||||||||||||||||||||
|
|
|
|
|
|
|
|
|
|
|
|
|
|
|
| |||||||||||||||||
Change in net assets | 14,427,218 | 226,179,849 | (12,032,349 | ) | 44,453,059 | 9,341,153 | 4,009,350 | 945,542 | 13,071,266 | |||||||||||||||||||||||
Net assets: | ||||||||||||||||||||||||||||||||
Beginning of period | 268,163,710 | 41,983,861 | 311,914,937 | 267,461,878 | 55,114,735 | 51,105,385 | 68,542,203 | 55,470,937 | ||||||||||||||||||||||||
|
|
|
|
|
|
|
|
|
|
|
|
|
|
|
| |||||||||||||||||
End of period | $ | 282,590,928 | $ | 268,163,710 | $ | 299,882,588 | $ | 311,914,937 | $ | 64,455,888 | $ | 55,114,735 | $ | 69,487,745 | $ | 68,542,203 | ||||||||||||||||
|
|
|
|
|
|
|
|
|
|
|
|
|
|
|
| |||||||||||||||||
Undistributed net investment income (loss) | $ | 7,544,174 | $ | 2,248,868 | $ | 31,380,725 | $ | 21,277,132 | $ | (103,123 | ) | $ | — | $ | 507,765 | $ | 196,220 | |||||||||||||||
|
|
|
|
|
|
|
|
|
|
|
|
|
|
|
| |||||||||||||||||
The accompanying notes are an integral part of these financial statements.
| 116 |
| Ohio National Fund, Inc. |
Statements of Changes in Net Assets |
| Bristol Portfolio | Bryton Growth Portfolio | U.S. Equity Portfolio | Balanced Portfolio | |||||||||||||||||||||||||||||
| Six-Month Period Ended June 30, 2013 (Unaudited) | Year Ended December 31, 2012 | Six-Month Period Ended June 30, 2013 (Unaudited) | Year Ended December 31, 2012 | Six-Month Period Ended June 30, 2013 (Unaudited) | Year Ended December 31, 2012 | Six-Month Period Ended June 30, 2013 (Unaudited) | Year Ended December 31, 2012 | |||||||||||||||||||||||||
Increase (Decrease) in net assets: | ||||||||||||||||||||||||||||||||
Operations: | ||||||||||||||||||||||||||||||||
Net investment income (loss) | $ | 586,585 | $ | 1,353,479 | $ | (498,757 | ) | $ | (887,077 | ) | $ | 38,519 | $ | 108,648 | $ | 561,176 | $ | 651,931 | ||||||||||||||
Net realized gain (loss) on investments, foreign currency related transactions, and written options | 20,840,471 | 8,239,659 | 8,687,757 | 12,311,997 | 286,480 | 528,811 | 2,211,556 | 358,264 | ||||||||||||||||||||||||
Change in unrealized appreciation/depreciation on investments, foreign currency related transactions, and written options | 7,647,611 | 16,070,240 | 14,913,410 | 5,904,468 | 1,975,611 | 1,332,996 | 4,729,468 | 2,012,821 | ||||||||||||||||||||||||
|
|
|
|
|
|
|
|
|
|
|
|
|
|
|
| |||||||||||||||||
Change in net assets from operations | 29,074,667 | 25,663,378 | 23,102,410 | 17,329,388 | 2,300,610 | 1,970,455 | 7,502,200 | 3,023,016 | ||||||||||||||||||||||||
|
|
|
|
|
|
|
|
|
|
|
|
|
|
|
| |||||||||||||||||
Distributions to shareholders: | ||||||||||||||||||||||||||||||||
Distributions from net investment income | — | (1,149,626 | ) | — | — | — | (86,203 | ) | — | — | ||||||||||||||||||||||
|
|
|
|
|
|
|
|
|
|
|
|
|
|
|
| |||||||||||||||||
Capital transactions: | ||||||||||||||||||||||||||||||||
Received from shares sold | 6,859,453 | 33,161,237 | 6,949,531 | 33,597,917 | 1,187,617 | 2,935,494 | 54,445,635 | 64,188,382 | ||||||||||||||||||||||||
Received from dividends reinvested | — | 1,149,626 | — | — | — | 86,203 | — | — | ||||||||||||||||||||||||
Paid for shares redeemed | (21,604,498 | ) | (46,593,004 | ) | (20,617,863 | ) | (48,711,366 | ) | (1,092,177 | ) | (2,679,663 | ) | (13,274,146 | ) | (7,131,199 | ) | ||||||||||||||||
|
|
|
|
|
|
|
|
|
|
|
|
|
|
|
| |||||||||||||||||
Change in net assets from capital transactions | (14,745,045 | ) | (12,282,141 | ) | (13,668,332 | ) | (15,113,449 | ) | 95,440 | 342,034 | 41,171,489 | 57,057,183 | ||||||||||||||||||||
|
|
|
|
|
|
|
|
|
|
|
|
|
|
|
| |||||||||||||||||
Change in net assets | 14,329,622 | 12,231,611 | 9,434,078 | 2,215,939 | 2,396,050 | 2,226,286 | 48,673,689 | 60,080,199 | ||||||||||||||||||||||||
Net assets: | ||||||||||||||||||||||||||||||||
Beginning of period | 204,903,746 | 192,672,135 | 157,656,524 | 155,440,585 | 15,562,297 | 13,336,011 | 77,136,927 | 17,056,728 | ||||||||||||||||||||||||
|
|
|
|
|
|
|
|
|
|
|
|
|
|
|
| |||||||||||||||||
End of period | $ | 219,233,368 | $ | 204,903,746 | $ | 167,090,602 | $ | 157,656,524 | $ | 17,958,347 | $ | 15,562,297 | $ | 125,810,616 | $ | 77,136,927 | ||||||||||||||||
|
|
|
|
|
|
|
|
|
|
|
|
|
|
|
| |||||||||||||||||
Undistributed net investment income (loss) | $ | 1,022,595 | $ | 436,010 | $ | (508,596 | ) | $ | (9,839 | ) | $ | 60,964 | $ | 22,445 | $ | 1,213,114 | $ | 651,938 | ||||||||||||||
|
|
|
|
|
|
|
|
|
|
|
|
|
|
|
| |||||||||||||||||
The accompanying notes are an integral part of these financial statements.
| 117 |
| Ohio National Fund, Inc. |
Statements of Changes in Net Assets |
| Income Opportunity Portfolio | Target VIP Portfolio | Target Equity/Income Portfolio | Bristol Growth Portfolio | |||||||||||||||||||||||||||||
| Six-Month Period Ended June 30, 2013 (Unaudited) | Year Ended December 31, 2012 | Six-Month Period Ended June 30, 2013 (Unaudited) | Year Ended December 31, 2012 | Six-Month Period Ended June 30, 2013 (Unaudited) | Year Ended December 31, 2012 | Six-Month Period Ended June 30, 2013 (Unaudited) | Year Ended December 31, 2012 | |||||||||||||||||||||||||
Increase (Decrease) in net assets: | ||||||||||||||||||||||||||||||||
Operations: | ||||||||||||||||||||||||||||||||
Net investment income (loss) | $ | 21,626 | $ | 119,759 | $ | 141,091 | $ | 377,630 | $ | 190,214 | $ | 566,036 | $ | 215,030 | $ | 594,594 | ||||||||||||||||
Net realized gain (loss) on investments, foreign currency related transactions, and written options | 847,561 | (59,440 | ) | 1,756,979 | 632,490 | 1,865,727 | (2,479,335 | ) | 10,208,330 | 6,499,048 | ||||||||||||||||||||||
Change in unrealized appreciation/depreciation on investments, foreign currency related transactions, and written options | 349,803 | 706,465 | 871,948 | 2,048,046 | 1,614,667 | 4,258,398 | 2,545,972 | 4,359,363 | ||||||||||||||||||||||||
|
|
|
|
|
|
|
|
|
|
|
|
|
|
|
| |||||||||||||||||
Change in net assets from operations | 1,218,990 | 766,784 | 2,770,018 | 3,058,166 | 3,670,608 | 2,345,099 | 12,969,332 | 11,453,005 | ||||||||||||||||||||||||
|
|
|
|
|
|
|
|
|
|
|
|
|
|
|
| |||||||||||||||||
Distributions to shareholders: | ||||||||||||||||||||||||||||||||
Distributions from net investment income | — | — | — | (297,777 | ) | — | (449,704 | ) | — | (473,865 | ) | |||||||||||||||||||||
|
|
|
|
|
|
|
|
|
|
|
|
|
|
|
| |||||||||||||||||
Capital transactions: | ||||||||||||||||||||||||||||||||
Received from shares sold | 1,126,754 | 3,644,658 | 666,301 | 2,834,544 | 785,637 | 4,614,373 | 4,726,848 | 21,509,893 | ||||||||||||||||||||||||
Received from dividends reinvested | — | — | — | 297,777 | — | 449,704 | — | 473,865 | ||||||||||||||||||||||||
Paid for shares redeemed | (1,785,134 | ) | (5,821,018 | ) | (1,689,322 | ) | (5,246,749 | ) | (2,626,162 | ) | (6,662,741 | ) | (10,374,924 | ) | (24,843,136 | ) | ||||||||||||||||
|
|
|
|
|
|
|
|
|
|
|
|
|
|
|
| |||||||||||||||||
Change in net assets from capital transactions | (658,380 | ) | (2,176,360 | ) | (1,023,021 | ) | (2,114,428 | ) | (1,840,525 | ) | (1,598,664 | ) | (5,648,076 | ) | (2,859,378 | ) | ||||||||||||||||
|
|
|
|
|
|
|
|
|
|
|
|
|
|
|
| |||||||||||||||||
Change in net assets | 560,610 | (1,409,576 | ) | 1,746,997 | 645,961 | 1,830,083 | 296,731 | 7,321,256 | 8,119,762 | |||||||||||||||||||||||
Net assets: | ||||||||||||||||||||||||||||||||
Beginning of period | 9,424,496 | 10,834,072 | 21,182,342 | 20,536,381 | 21,926,503 | 21,629,772 | 108,033,139 | 99,913,377 | ||||||||||||||||||||||||
|
|
|
|
|
|
|
|
|
|
|
|
|
|
|
| |||||||||||||||||
End of period | $ | 9,985,106 | $ | 9,424,496 | $ | 22,929,339 | $ | 21,182,342 | $ | 23,756,586 | $ | 21,926,503 | $ | 115,354,395 | $ | 108,033,139 | ||||||||||||||||
|
|
|
|
|
|
|
|
|
|
|
|
|
|
|
| |||||||||||||||||
Undistributed net investment income | $ | 141,385 | $ | 119,759 | $ | 220,895 | $ | 79,804 | $ | 306,401 | $ | 116,187 | $ | 436,629 | $ | 221,599 | ||||||||||||||||
|
|
|
|
|
|
|
|
|
|
|
|
|
|
|
| |||||||||||||||||
The accompanying notes are an integral part of these financial statements.
| 118 |
| Ohio National Fund, Inc. |
| Equity Portfolio | Money Market Portfolio | |||||||||||||||||||||||||||||||||||||||
| Six-Month Period Ended June 30, 2013 (Unaudited) | Years Ended December 31, | Six-Month Period Ended June 30, 2013 (Unaudited) | Years Ended December 31, | |||||||||||||||||||||||||||||||||||||
| 2012 | 2011 | 2010 | 2009 | 2012 | 2011 | 2010 | 2009 | |||||||||||||||||||||||||||||||||
Selected per-share data: | ||||||||||||||||||||||||||||||||||||||||
Net asset value, beginning of period | $ | 21.54 | $ | 18.88 | $ | 19.72 | $ | 18.31 | $ | 13.19 | $ | 10.00 | $ | 10.00 | $ | 10.00 | $ | 10.00 | $ | 10.00 | ||||||||||||||||||||
Operations: | ||||||||||||||||||||||||||||||||||||||||
Net investment income | 0.13 | 0.35 | 0.21 | 0.04 | 0.05 | — | — | — | — | — | ||||||||||||||||||||||||||||||
Net realized and unrealized gain (loss) on investments and foreign currency related transactions | 3.17 | 2.61 | (0.88 | ) | 1.41 | 5.11 | — | — | — | — | — | |||||||||||||||||||||||||||||
|
|
|
|
|
|
|
|
|
|
|
|
|
|
|
|
|
|
|
| |||||||||||||||||||||
Total from operations | 3.30 | 2.96 | (0.67 | ) | 1.45 | 5.16 | — | — | — | — | — | |||||||||||||||||||||||||||||
|
|
|
|
|
|
|
|
|
|
|
|
|
|
|
|
|
|
|
| |||||||||||||||||||||
Distributions: | ||||||||||||||||||||||||||||||||||||||||
Distributions from net investment income | — | (0.30 | ) | (0.17 | ) | (0.04 | ) | (0.04 | ) | — | — | — | — | — | ||||||||||||||||||||||||||
|
|
|
|
|
|
|
|
|
|
|
|
|
|
|
|
|
|
|
| |||||||||||||||||||||
Net asset value, end of period | $ | 24.84 | $ | 21.54 | $ | 18.88 | $ | 19.72 | $ | 18.31 | $ | 10.00 | $ | 10.00 | $ | 10.00 | $ | 10.00 | $ | 10.00 | ||||||||||||||||||||
|
|
|
|
|
|
|
|
|
|
|
|
|
|
|
|
|
|
|
| |||||||||||||||||||||
Total return | 15.32 | %(b) | 15.69 | % | –3.38 | % | 7.91 | % | 39.11 | % | 0.00 | %(b) | 0.00 | % | 0.00 | % | 0.00 | % | 0.00 | % | ||||||||||||||||||||
Ratios and supplemental data: | ||||||||||||||||||||||||||||||||||||||||
Net assets at end of period (millions) | $ | 200.5 | $ | 186.5 | $ | 187.9 | $ | 219.4 | $ | 226.5 | $ | 267.0 | $ | 258.6 | $ | 286.2 | $ | 293.4 | $ | 341.2 | ||||||||||||||||||||
Ratios to average net assets: | ||||||||||||||||||||||||||||||||||||||||
Ratios net of expenses reduced or reimbursed by adviser: | ||||||||||||||||||||||||||||||||||||||||
Expenses | 0.87 | %(a) | 0.89 | % | 0.87 | % | 0.87 | % | 0.88 | % | �� | 0.06 | %(a) | 0.09 | % | 0.11 | % | 0.17 | % | 0.19 | % | |||||||||||||||||||
Net investment income | 1.04 | %(a) | 1.55 | % | 1.00 | % | 0.21 | % | 0.27 | % | 0.00 | %(a) | 0.00 | % | 0.00 | % | 0.00 | % | 0.00 | % | ||||||||||||||||||||
Ratios assuming no expenses reduced or reimbursed by adviser: | ||||||||||||||||||||||||||||||||||||||||
Expenses | 0.87 | %(a) | 0.89 | % | 0.87 | % | 0.87 | % | 0.88 | % | 0.35 | %(a) | 0.35 | % | 0.34 | % | 0.35 | % | 0.36 | % | ||||||||||||||||||||
Net investment income (loss) | 1.04 | %(a) | 1.55 | % | 1.00 | % | 0.21 | % | 0.27 | % | –0.29 | %(a) | –0.26 | % | –0.23 | % | –0.18 | % | –0.17 | % | ||||||||||||||||||||
Portfolio turnover rate | 22 | % | 48 | % | 54 | % | 50 | % | 24 | % | 0 | % | 0 | % | 0 | % | 0 | % | 0 | % | ||||||||||||||||||||
| (a) | Annualized. |
| (b) | Not annualized. |
The accompanying notes are an integral part of these financial statements.
| 119 |
| Ohio National Fund, Inc. |
Financial Highlights |
| Bond Portfolio | Omni Portfolio | |||||||||||||||||||||||||||||||||||||||
| Six-Month Period Ended June 30, 2013 (Unaudited) | Years Ended December 31, | Six-Month Period Ended June 30, 2013 (Unaudited) | Years Ended December 31, | |||||||||||||||||||||||||||||||||||||
| 2012 | 2011 | 2010 | 2009 | 2012 | 2011 | 2010 | 2009 | |||||||||||||||||||||||||||||||||
Selected per-share data: | ||||||||||||||||||||||||||||||||||||||||
Net asset value, beginning of period | $ | 15.07 | $ | 14.05 | $ | 13.21 | $ | 12.25 | $ | 10.13 | $ | 16.82 | $ | 15.21 | $ | 16.08 | $ | 14.42 | $ | 11.02 | ||||||||||||||||||||
Operations: | ||||||||||||||||||||||||||||||||||||||||
Net investment income | 0.34 | 0.51 | 0.48 | 0.52 | 0.49 | 0.12 | 0.26 | 0.25 | 0.28 | 0.29 | ||||||||||||||||||||||||||||||
Net realized and unrealized gain (loss) on investments and foreign currency related transactions | (0.75 | ) | 0.51 | 0.36 | 0.44 | 1.63 | 1.59 | 1.57 | (0.91 | ) | 1.62 | 3.36 | ||||||||||||||||||||||||||||
|
|
|
|
|
|
|
|
|
|
|
|
|
|
|
|
|
|
|
| |||||||||||||||||||||
Total from operations | (0.41 | ) | 1.02 | 0.84 | 0.96 | 2.12 | 1.71 | 1.83 | (0.66 | ) | 1.90 | 3.65 | ||||||||||||||||||||||||||||
|
|
|
|
|
|
|
|
|
|
|
|
|
|
|
|
|
|
|
| |||||||||||||||||||||
Distributions: | ||||||||||||||||||||||||||||||||||||||||
Distributions from net investment income | — | — | — | — | — | — | (0.22 | ) | (0.21 | ) | (0.24 | ) | (0.25 | ) | ||||||||||||||||||||||||||
|
|
|
|
|
|
|
|
|
|
|
|
|
|
|
|
|
|
|
| |||||||||||||||||||||
Net asset value, end of period | $ | 14.66 | $ | 15.07 | $ | 14.05 | $ | 13.21 | $ | 12.25 | $ | 18.53 | $ | 16.82 | $ | 15.21 | $ | 16.08 | $ | 14.42 | ||||||||||||||||||||
|
|
|
|
|
|
|
|
|
|
|
|
|
|
|
|
|
|
|
| |||||||||||||||||||||
Total return | –2.72 | %(b) | 7.26 | % | 6.36 | % | 7.84 | % | 20.93 | % | 10.17 | %(b) | 12.04 | % | –4.12 | % | 13.19 | % | 33.15 | % | ||||||||||||||||||||
Ratios and supplemental data: | ||||||||||||||||||||||||||||||||||||||||
Net assets at end of period (millions) | $ | 146.3 | $ | 172.2 | $ | 162.0 | $ | 148.2 | $ | 137.9 | $ | 34.0 | $ | 33.2 | $ | 34.7 | $ | 41.2 | $ | 41.5 | ||||||||||||||||||||
Ratios to average net assets: | ||||||||||||||||||||||||||||||||||||||||
Expenses | 0.65 | %(a) | 0.66 | % | 0.66 | % | 0.67 | % | 0.69 | % | 0.80 | %(a) | 0.81 | % | 0.77 | % | 0.78 | % | 0.79 | % | ||||||||||||||||||||
Net investment income | 3.35 | %(a) | 3.41 | % | 3.70 | % | 3.91 | % | 5.06 | % | 1.23 | %(a) | 1.49 | % | 1.40 | % | 1.71 | % | 2.18 | % | ||||||||||||||||||||
Portfolio turnover rate | 7 | % | 18 | % | 15 | % | 22 | % | 27 | % | 125 | % | 179 | % | 147 | % | 182 | % | 157 | % | ||||||||||||||||||||
| (a) | Annualized. |
| (b) | Not annualized. |
The accompanying notes are an integral part of these financial statements.
| 120 |
| Ohio National Fund, Inc. |
Financial Highlights |
| International Portfolio | Capital Appreciation Portfolio | |||||||||||||||||||||||||||||||||||||||
| Six-Month Period Ended June 30, 2013 (Unaudited) | Years Ended December 31, | Six-Month Period Ended June 30, 2013 (Unaudited) | Years Ended December 31, | |||||||||||||||||||||||||||||||||||||
| 2012 | 2011 | 2010 | 2009 | 2012 | 2011 | 2010 | 2009 | |||||||||||||||||||||||||||||||||
Selected per-share data: | ||||||||||||||||||||||||||||||||||||||||
Net asset value, beginning of period | $ | 12.41 | $ | 10.32 | $ | 12.20 | $ | 10.45 | $ | 7.56 | $ | 23.32 | $ | 19.95 | $ | 20.37 | $ | 17.45 | $ | 12.35 | ||||||||||||||||||||
Operations: | ||||||||||||||||||||||||||||||||||||||||
Net investment income | 0.17 | 0.20 | 0.17 | 0.14 | 0.14 | 0.08 | 0.15 | 0.09 | 0.06 | 0.22 | ||||||||||||||||||||||||||||||
Net realized and unrealized gain (loss) on investments, futures contracts, foreign currency contracts, and other foreign currency related transactions | (0.52 | ) | 1.89 | (2.05 | ) | 1.61 | 2.75 | 3.25 | 3.36 | (0.43 | ) | 2.90 | 5.07 | |||||||||||||||||||||||||||
|
|
|
|
|
|
|
|
|
|
|
|
|
|
|
|
|
|
|
| |||||||||||||||||||||
Total from operations | (0.35 | ) | 2.09 | (1.88 | ) | 1.75 | 2.89 | 3.33 | 3.51 | (0.34 | ) | 2.96 | 5.29 | |||||||||||||||||||||||||||
|
|
|
|
|
|
|
|
|
|
|
|
|
|
|
|
|
|
|
| |||||||||||||||||||||
Distributions: | ||||||||||||||||||||||||||||||||||||||||
Distributions from net investment income | — | — | — | — | — | — | (0.14 | ) | (0.08 | ) | (0.04 | ) | (0.19 | ) | ||||||||||||||||||||||||||
|
|
|
|
|
|
|
|
|
|
|
|
|
|
|
|
|
|
|
| |||||||||||||||||||||
Net asset value, end of period | $ | 12.06 | $ | 12.41 | $ | 10.32 | $ | 12.20 | $ | 10.45 | $ | 26.65 | $ | 23.32 | $ | 19.95 | $ | 20.37 | $ | 17.45 | ||||||||||||||||||||
|
|
|
|
|
|
|
|
|
|
|
|
|
|
|
|
|
|
|
| |||||||||||||||||||||
Total return | –2.82 | %(b) | 20.25 | % | –15.41 | % | 16.75 | % | 38.23 | % | 14.28 | %(b) | 17.59 | % | –1.65 | % | 16.99 | % | 42.84 | % | ||||||||||||||||||||
Ratios and supplemental data: | ||||||||||||||||||||||||||||||||||||||||
Net assets at end of period (millions) | $ | 171.3 | $ | 180.3 | $ | 172.8 | $ | 213.1 | $ | 210.0 | $ | 125.3 | $ | 115.7 | $ | 114.7 | $ | 129.8 | $ | 126.3 | ||||||||||||||||||||
Ratios to average net assets: | ||||||||||||||||||||||||||||||||||||||||
Ratios net of expenses reduced or reimbursed by adviser: | ||||||||||||||||||||||||||||||||||||||||
Expenses | 0.94 | %(a) | 1.02 | % | 1.02 | % | 1.03 | % | 1.07 | % | 0.88 | %(a) | 0.90 | % | 0.88 | % | 0.89 | % | 0.90 | % | ||||||||||||||||||||
Net investment income | 2.49 | %(a) | 1.65 | % | 1.41 | % | 1.15 | % | 1.47 | % | 0.60 | %(a) | 0.66 | % | 0.41 | % | 0.31 | % | 1.38 | % | ||||||||||||||||||||
Ratios assuming no expenses reduced or reimbursed by adviser: | ||||||||||||||||||||||||||||||||||||||||
Expenses | 1.01 | %(a) | 1.02 | % | 1.02 | % | 1.03 | % | 1.07 | % | 0.88 | %(a) | 0.90 | % | 0.88 | % | 0.89 | % | 0.90 | % | ||||||||||||||||||||
Net investment income (loss) | 2.42 | %(a) | 1.65 | % | 1.41 | % | 1.15 | % | 1.47 | % | 0.60 | %(a) | 0.66 | % | 0.41 | % | 0.31 | % | 1.38 | % | ||||||||||||||||||||
Portfolio turnover rate | 32 | % | 61 | % | 58 | % | 67 | % | 168 | % | 29 | % | 39 | % | 61 | % | 58 | % | 84 | % | ||||||||||||||||||||
| (a) | Annualized. |
| (b) | Not annualized. |
The accompanying notes are an integral part of these financial statements.
| 121 |
| Ohio National Fund, Inc. |
Financial Highlights |
| Millennium Portfolio | International Small-Mid Company Portfolio | |||||||||||||||||||||||||||||||||||||||
| Six-Month Period Ended June 30, 2013 (Unaudited) | Years Ended December 31, | Six-Month Period Ended June 30, 2013 (Unaudited) | Years Ended December 31, | |||||||||||||||||||||||||||||||||||||
| 2012 | 2011 | 2010 | 2009 | 2012 | 2011 | 2010 | 2009 | |||||||||||||||||||||||||||||||||
Selected per-share data: | ||||||||||||||||||||||||||||||||||||||||
Net asset value, beginning of period | $ | 23.53 | $ | 21.50 | $ | 21.69 | $ | 17.45 | $ | 14.44 | $ | 23.52 | $ | 19.17 | $ | 23.24 | $ | 19.41 | $ | 13.29 | ||||||||||||||||||||
Operations: | ||||||||||||||||||||||||||||||||||||||||
Net investment income (loss) | (0.11 | ) | (0.12 | ) | (0.16 | ) | (0.27 | ) | (0.07 | ) | 0.10 | 0.17 | 0.26 | 0.07 | 0.07 | |||||||||||||||||||||||||
Net realized and unrealized gain (loss) on investments and foreign currency related transactions | 4.25 | 2.15 | (0.03 | ) | 4.51 | 3.08 | 1.28 | 4.18 | (4.33 | ) | 3.76 | 6.05 | ||||||||||||||||||||||||||||
|
|
|
|
|
|
|
|
|
|
|
|
|
|
|
|
|
|
|
| |||||||||||||||||||||
Total from operations | 4.14 | 2.03 | (0.19 | ) | 4.24 | 3.01 | 1.38 | 4.35 | (4.07 | ) | 3.83 | 6.12 | ||||||||||||||||||||||||||||
|
|
|
|
|
|
|
|
|
|
|
|
|
|
|
|
|
|
|
| |||||||||||||||||||||
Net asset value, end of period | $ | 27.67 | $ | 23.53 | $ | 21.50 | $ | 21.69 | $ | 17.45 | $ | 24.90 | $ | 23.52 | $ | 19.17 | $ | 23.24 | $ | 19.41 | ||||||||||||||||||||
|
|
|
|
|
|
|
|
|
|
|
|
|
|
|
|
|
|
|
| |||||||||||||||||||||
Total return | 17.59 | %(b) | 9.44 | % | –0.88 | % | 24.30 | % | 20.84 | % | 5.87 | %(b) | 22.69 | % | –17.51 | % | 19.73 | % | 46.05 | % | ||||||||||||||||||||
Ratios and supplemental data: | ||||||||||||||||||||||||||||||||||||||||
Net assets at end of period (millions) | $ | 37.2 | $ | 34.1 | $ | 36.5 | $ | 42.1 | $ | 110.3 | $ | 65.8 | $ | 64.5 | $ | 57.5 | $ | 78.6 | $ | 71.1 | ||||||||||||||||||||
Ratios to average net assets: | ||||||||||||||||||||||||||||||||||||||||
Expenses | 0.96 | %(a) | 0.97 | % | 0.94 | % | 0.92 | % | 0.93 | % | 1.21 | %(a) | 1.21 | % | 1.20 | % | 1.25 | % | 1.28 | % | ||||||||||||||||||||
Net investment income (loss) | –0.82 | %(a) | –0.46 | % | –0.65 | % | –0.69 | % | –0.67 | % | 0.75 | %(a) | 0.64 | % | 1.07 | % | 0.32 | % | 0.47 | % | ||||||||||||||||||||
Portfolio turnover rate | 142 | % | 282 | % | 228 | % | 254 | % | 248 | % | 32 | % | 55 | % | 67 | % | 81 | % | 125 | % | ||||||||||||||||||||
| (a) | Annualized. |
| (b) | Not annualized. |
The accompanying notes are an integral part of these financial statements.
| 122 |
| Ohio National Fund, Inc. |
Financial Highlights |
| Aggressive Growth Portfolio | Small Cap Growth Portfolio | |||||||||||||||||||||||||||||||||||||||
| Six-Month Period Ended June 30, 2013 (Unaudited) | Years Ended December 31, | Six-Month Period Ended June 30, 2013 (Unaudited) | Years Ended December 31, | |||||||||||||||||||||||||||||||||||||
| 2012 | 2011 | 2010 | 2009 | 2012 | 2011 | 2010 | 2009 | |||||||||||||||||||||||||||||||||
Selected per-share data: | ||||||||||||||||||||||||||||||||||||||||
Net asset value, beginning of period | $ | 9.51 | $ | 7.74 | $ | 8.17 | $ | 7.43 | $ | 5.21 | $ | 15.59 | $ | 13.21 | $ | 12.86 | $ | 9.89 | $ | 6.56 | ||||||||||||||||||||
Operations: | ||||||||||||||||||||||||||||||||||||||||
Net investment income (loss) | — | 0.03 | — | 0.01 | (0.02 | ) | (0.05 | ) | (0.03 | ) | (0.08 | ) | (0.07 | ) | (0.06 | ) | ||||||||||||||||||||||||
Net realized and unrealized gain (loss) on investments and foreign currency related transactions | 0.59 | 1.74 | (0.43 | ) | 0.73 | 2.24 | 2.80 | 2.41 | 0.43 | 3.04 | 3.39 | |||||||||||||||||||||||||||||
|
|
|
|
|
|
|
|
|
|
|
|
|
|
|
|
|
|
|
| |||||||||||||||||||||
Total from operations | 0.59 | 1.77 | (0.43 | ) | 0.74 | 2.22 | 2.75 | 2.38 | 0.35 | 2.97 | 3.33 | |||||||||||||||||||||||||||||
|
|
|
|
|
|
|
|
|
|
|
|
|
|
|
|
|
|
|
| |||||||||||||||||||||
Net asset value, end of period | $ | 10.10 | $ | 9.51 | $ | 7.74 | $ | 8.17 | $ | 7.43 | $ | 18.34 | $ | 15.59 | $ | 13.21 | $ | 12.86 | $ | 9.89 | ||||||||||||||||||||
|
|
|
|
|
|
|
|
|
|
|
|
|
|
|
|
|
|
|
| |||||||||||||||||||||
Total return | 6.20 | %(b) | 22.87 | % | –5.26 | % | 9.96 | % | 42.61 | % | 17.64 | %(b) | 18.02 | % | 2.72 | % | 30.03 | % | 50.76 | % | ||||||||||||||||||||
Ratios and supplemental data: | ||||||||||||||||||||||||||||||||||||||||
Net assets at end of period (millions) | $ | 32.5 | $ | 33.1 | $ | 25.8 | $ | 29.8 | $ | 27.2 | $ | 45.5 | $ | 35.0 | $ | 31.5 | $ | 32.1 | $ | 22.8 | ||||||||||||||||||||
Ratios to average net assets: | ||||||||||||||||||||||||||||||||||||||||
Expenses | 0.96 | %(a) | 0.99 | % | 1.04 | % | 1.05 | % | 1.04 | % | 1.07 | %(a) | 1.10 | % | 1.08 | % | 1.13 | % | 1.21 | % | ||||||||||||||||||||
Net investment income (loss) | –0.09 | %(a) | 0.34 | % | 0.02 | % | 0.17 | % | –0.23 | % | –0.55 | %(a) | –0.20 | % | –0.60 | % | –0.70 | % | –0.77 | % | ||||||||||||||||||||
Portfolio turnover rate | 29 | % | 17 | % | 47 | % | 37 | % | 28 | % | 53 | % | 65 | % | 58 | % | 94 | % | 50 | % | ||||||||||||||||||||
| (a) | Annualized. |
| (b) | Not annualized. |
The accompanying notes are an integral part of these financial statements.
| 123 |
| Ohio National Fund, Inc. |
Financial Highlights |
| Mid Cap Opportunity Portfolio | S&P 500® Index Portfolio | |||||||||||||||||||||||||||||||||||||||
| Six-Month Period Ended June 30, 2013 (Unaudited) | Years Ended December 31, | Six-Month Period Ended June 30, 2013 (Unaudited) | Years Ended December 31, | |||||||||||||||||||||||||||||||||||||
| 2012 | 2011 | 2010 | 2009 | 2012 | 2011 | 2010 | 2009 | |||||||||||||||||||||||||||||||||
Selected per-share data: | ||||||||||||||||||||||||||||||||||||||||
Net asset value, beginning of period | $ | 21.32 | $ | 17.81 | $ | 18.43 | $ | 15.41 | $ | 10.96 | $ | 15.08 | $ | 13.25 | $ | 13.21 | $ | 11.69 | $ | 9.41 | ||||||||||||||||||||
Operations: | ||||||||||||||||||||||||||||||||||||||||
Net investment income (loss) | (0.03 | ) | (0.02 | ) | (0.06 | ) | (0.06 | ) | (0.05 | ) | 0.14 | 0.26 | 0.22 | 0.19 | 0.17 | |||||||||||||||||||||||||
Net realized and unrealized gain (loss) on investments | 2.37 | 3.53 | (0.56 | ) | 3.08 | 4.50 | 1.90 | 1.78 | 0.01 | 1.50 | 2.26 | |||||||||||||||||||||||||||||
|
|
|
|
|
|
|
|
|
|
|
|
|
|
|
|
|
|
|
| |||||||||||||||||||||
Total from operations | 2.34 | 3.51 | (0.62 | ) | 3.02 | 4.45 | 2.04 | 2.04 | 0.23 | 1.69 | 2.43 | |||||||||||||||||||||||||||||
|
|
|
|
|
|
|
|
|
|
|
|
|
|
|
|
|
|
|
| |||||||||||||||||||||
Distributions: | ||||||||||||||||||||||||||||||||||||||||
Distributions from net investment income | — | — | — | — | — | — | (0.21 | ) | (0.19 | ) | (0.17 | ) | (0.15 | ) | ||||||||||||||||||||||||||
|
|
|
|
|
|
|
|
|
|
|
|
|
|
|
|
|
|
|
| |||||||||||||||||||||
Net asset value, end of period | $ | 23.66 | $ | 21.32 | $ | 17.81 | $ | 18.43 | $ | 15.41 | $ | 17.12 | $ | 15.08 | $ | 13.25 | $ | 13.21 | $ | 11.69 | ||||||||||||||||||||
|
|
|
|
|
|
|
|
|
|
|
|
|
|
|
|
|
|
|
| |||||||||||||||||||||
Total return | 10.98 | %(b) | 19.71 | % | -3.36 | % | 19.60 | % | 40.60 | % | 13.53 | %(b) | 15.40 | % | 1.77 | % | 14.45 | % | 25.83 | % | ||||||||||||||||||||
Ratios and supplemental data: | ||||||||||||||||||||||||||||||||||||||||
Net assets at end of period (millions) | $ | 73.5 | $ | 67.1 | $ | 61.1 | $ | 70.4 | $ | 63.5 | $ | 242.2 | $ | 207.8 | $ | 170.7 | $ | 176.2 | $ | 160.7 | ||||||||||||||||||||
Ratios to average net assets: | ||||||||||||||||||||||||||||||||||||||||
Expenses | 0.96 | %(a) | 0.98 | % | 0.96 | % | 0.98 | % | 0.97 | % | 0.46 | %(a) | 0.48 | % | 0.47 | % | 0.49 | % | 0.51 | % | ||||||||||||||||||||
Net investment income (loss) | –0.27 | %(a) | –0.09 | % | –0.29 | % | –0.35 | % | –0.27 | % | 1.69 | %(a) | 1.87 | % | 1.62 | % | 1.59 | % | 1.85 | % | ||||||||||||||||||||
Portfolio turnover rate | 22 | % | 45 | % | 51 | % | 56 | % | 276 | % | 3 | % | 7 | % | 9 | % | 8 | % | 21 | % | ||||||||||||||||||||
| (a) | Annualized. |
| (b) | Not annualized. |
The accompanying notes are an integral part of these financial statements.
| 124 |
| Ohio National Fund, Inc. |
Financial Highlights |
| Strategic Value Portfolio | High Income Bond Portfolio | |||||||||||||||||||||||||||||||||||||||
| Six-Month Period Ended June 30, 2013 (Unaudited) | Years Ended December 31, | Six-Month Period Ended June 30, 2013 (Unaudited) | Years Ended December 31, | |||||||||||||||||||||||||||||||||||||
| 2012 | 2011 | 2010 | 2009 | 2012 | 2011 | 2010 | 2009 | |||||||||||||||||||||||||||||||||
Selected per-share data: | ||||||||||||||||||||||||||||||||||||||||
Net asset value, beginning of period | $ | 11.09 | $ | 10.50 | $ | 9.36 | $ | 8.64 | $ | 7.97 | $ | 14.83 | $ | 12.97 | $ | 12.31 | $ | 10.79 | $ | 7.21 | ||||||||||||||||||||
Operations: | ||||||||||||||||||||||||||||||||||||||||
Net investment income | 0.24 | 0.13 | 0.33 | 0.35 | 0.27 | 0.56 | 0.99 | 1.08 | 0.58 | 0.46 | ||||||||||||||||||||||||||||||
Net realized and unrealized gain (loss) on investments and foreign currency related transactions | 0.97 | 0.63 | 0.98 | 0.68 | 0.65 | (0.33 | ) | 0.87 | (0.42 | ) | 0.94 | 3.12 | ||||||||||||||||||||||||||||
|
|
|
|
|
|
|
|
|
|
|
|
|
|
|
|
|
|
|
| |||||||||||||||||||||
Total from operations | 1.21 | 0.76 | 1.31 | 1.03 | 0.92 | 0.23 | 1.86 | 0.66 | 1.52 | 3.58 | ||||||||||||||||||||||||||||||
|
|
|
|
|
|
|
|
|
|
|
|
|
|
|
|
|
|
|
| |||||||||||||||||||||
Distributions: | ||||||||||||||||||||||||||||||||||||||||
Distributions from net investment income | — | (0.17 | ) | (0.17 | ) | (0.24 | ) | (0.25 | ) | — | — | — | — | — | ||||||||||||||||||||||||||
Return of capital distributions | — | — | — | (0.07 | ) | — | — | — | — | — | — | |||||||||||||||||||||||||||||
|
|
|
|
|
|
|
|
|
|
|
|
|
|
|
|
|
|
|
| |||||||||||||||||||||
Total distributions | — | (0.17 | ) | (0.17 | ) | (0.31 | ) | (0.25 | ) | — | — | — | — | — | ||||||||||||||||||||||||||
|
|
|
|
|
|
|
|
|
|
|
|
|
|
|
|
|
|
|
| |||||||||||||||||||||
Net asset value, end of period | $ | 12.30 | $ | 11.09 | $ | 10.50 | $ | 9.36 | $ | 8.64 | $ | 15.06 | $ | 14.83 | $ | 12.97 | $ | 12.31 | $ | 10.79 | ||||||||||||||||||||
|
|
|
|
|
|
|
|
|
|
|
|
|
|
|
|
|
|
|
| |||||||||||||||||||||
Total return | 10.91 | %(b) | 7.21 | % | 14.03 | % | 11.98 | % | 11.52 | % | 1.55 | %(b) | 14.34 | % | 5.36 | % | 14.09 | % | 49.65 | % | ||||||||||||||||||||
Ratios and supplemental data: | ||||||||||||||||||||||||||||||||||||||||
Net assets at end of period (millions) | $ | 282.6 | $ | 268.2 | $ | 42.0 | $ | 24.3 | $ | 19.8 | $ | 299.9 | $ | 311.9 | $ | 267.5 | $ | 269.8 | $ | 159.9 | ||||||||||||||||||||
Ratios to average net assets: | ||||||||||||||||||||||||||||||||||||||||
Expenses | 0.79 | %(a) | 0.82 | % | 0.96 | % | 0.96 | % | 1.02 | % | 0.77 | %(a) | 0.79 | % | 0.78 | % | 0.81 | % | 0.88 | % | ||||||||||||||||||||
Net investment income | 3.77 | %(a) | 3.84 | % | 4.07 | % | 4.11 | % | 4.31 | % | 6.52 | %(a) | 7.17 | % | 7.69 | % | 8.03 | % | 9.14 | % | ||||||||||||||||||||
Portfolio turnover rate | 14 | % | 30 | % | 19 | % | 31 | % | 42 | % | 16 | % | 35 | % | 35 | % | 33 | % | 20 | % | ||||||||||||||||||||
| (a) | Annualized. |
| (b) | Not annualized. |
The accompanying notes are an integral part of these financial statements.
| 125 |
| Ohio National Fund, Inc. |
Financial Highlights |
| Capital Growth Portfolio | Nasdaq-100® Index Portfolio | |||||||||||||||||||||||||||||||||||||||
| Six-Month Period Ended June 30, 2013 (Unaudited) | Years Ended December 31, | Six-Month Period Ended June 30, 2013 (Unaudited) | Years Ended December 31, | |||||||||||||||||||||||||||||||||||||
| 2012 | 2011 | 2010 | 2009 | 2012 | 2011 | 2010 | 2009 | |||||||||||||||||||||||||||||||||
Selected per-share data: | ||||||||||||||||||||||||||||||||||||||||
Net asset value, beginning of period | $ | 30.73 | $ | 27.00 | $ | 27.68 | $ | 20.29 | $ | 15.00 | $ | 6.85 | $ | 5.85 | $ | 5.69 | $ | 4.78 | $ | 3.11 | ||||||||||||||||||||
Operations: | ||||||||||||||||||||||||||||||||||||||||
Net investment income (loss) | (0.06 | ) | (0.03 | ) | (0.19 | ) | (0.11 | ) | — | 0.04 | 0.06 | 0.02 | 0.02 | 0.01 | ||||||||||||||||||||||||||
Net realized and unrealized gain (loss) on investments | 4.05 | 3.76 | (0.49 | ) | 7.50 | 5.29 | 0.63 | 0.99 | 0.16 | 0.91 | 1.66 | |||||||||||||||||||||||||||||
|
|
|
|
|
|
|
|
|
|
|
|
|
|
|
|
|
|
|
| |||||||||||||||||||||
Total from operations | 3.99 | 3.73 | (0.68 | ) | 7.39 | 5.29 | 0.67 | 1.05 | 0.18 | 0.93 | 1.67 | |||||||||||||||||||||||||||||
|
|
|
|
|
|
|
|
|
|
|
|
|
|
|
|
|
|
|
| |||||||||||||||||||||
Distributions: | ||||||||||||||||||||||||||||||||||||||||
Distributions from net investment income | — | — | — | — | — | — | (0.05 | ) | (0.02 | ) | (0.02 | ) | — | |||||||||||||||||||||||||||
|
|
|
|
|
|
|
|
|
|
|
|
|
|
|
|
|
|
|
| |||||||||||||||||||||
Net asset value, end of period | $ | 34.72 | $ | 30.73 | $ | 27.00 | $ | 27.68 | $ | 20.29 | $ | 7.52 | $ | 6.85 | $ | 5.85 | $ | 5.69 | $ | 4.78 | ||||||||||||||||||||
|
|
|
|
|
|
|
|
|
|
|
|
|
|
|
|
|
|
|
| |||||||||||||||||||||
Total return | 12.98 | %(b) | 13.81 | % | –2.46 | % | 36.42 | % | 35.27 | % | 9.78 | %(b) | 17.88 | % | 3.19 | % | 19.38 | % | 53.70 | % | ||||||||||||||||||||
Ratios and supplemental data: | ||||||||||||||||||||||||||||||||||||||||
Net assets at end of period (millions) | $ | 64.5 | $ | 55.1 | $ | 51.1 | $ | 52.4 | $ | 36.8 | $ | 69.5 | $ | 68.5 | $ | 55.5 | $ | 54.9 | $ | 47.6 | ||||||||||||||||||||
Ratios to average net assets: | ||||||||||||||||||||||||||||||||||||||||
Expenses | 1.02 | %(a) | 1.04 | % | 1.02 | % | 1.04 | % | 1.07 | % | 0.52 | %(a) | 0.53 | % | 0.52 | % | 0.54 | % | 0.56 | % | ||||||||||||||||||||
Net investment income (loss) | –0.34 | %(a) | –0.10 | % | –0.64 | % | –0.50 | % | 0.02 | % | 0.87 | %(a) | 0.98 | % | 0.41 | % | 0.39 | % | 0.19 | % | ||||||||||||||||||||
Portfolio turnover rate | 19 | % | 42 | % | 44 | % | 56 | % | 67 | % | 11 | % | 25 | % | 44 | % | 30 | % | 29 | % | ||||||||||||||||||||
| (a) | Annualized. |
| (b) | Not annualized. |
The accompanying notes are an integral part of these financial statements.
| 126 |
| Ohio National Fund, Inc. |
Financial Highlights |
| Bristol Portfolio | Bryton Growth Portfolio | |||||||||||||||||||||||||||||||||||||||
| Six-Month Period Ended June 30, 2013 (Unaudited) | Years Ended December 31, | Six-Month Period Ended June 30, 2013 (Unaudited) | Years Ended December 31, | |||||||||||||||||||||||||||||||||||||
| 2012 | 2011 | 2010 | 2009 | 2012 | 2011 | 2010 | 2009 | |||||||||||||||||||||||||||||||||
Selected per-share data: | ||||||||||||||||||||||||||||||||||||||||
Net asset value, beginning of period | $ | 13.01 | $ | 11.56 | $ | 12.51 | $ | 11.12 | $ | 8.23 | $ | 13.70 | $ | 12.31 | $ | 13.57 | $ | 10.94 | $ | 8.06 | ||||||||||||||||||||
Operations: | ||||||||||||||||||||||||||||||||||||||||
Net investment income (loss) | 0.04 | 0.09 | 0.06 | 0.07 | 0.06 | (0.05 | ) | (0.07 | ) | (0.08 | ) | (0.06 | ) | (0.05 | ) | |||||||||||||||||||||||||
Net realized and unrealized gain (loss) on investments and foreign currency related transactions | 1.84 | 1.43 | (0.95 | ) | 1.39 | 2.89 | 2.09 | 1.46 | (1.18 | ) | 2.69 | 2.93 | ||||||||||||||||||||||||||||
|
|
|
|
|
|
|
|
|
|
|
|
|
|
|
|
|
|
|
| |||||||||||||||||||||
Total from operations | 1.88 | 1.52 | (0.89 | ) | 1.46 | 2.95 | 2.04 | 1.39 | (1.26 | ) | 2.63 | 2.88 | ||||||||||||||||||||||||||||
|
|
|
|
|
|
|
|
|
|
|
|
|
|
|
|
|
|
|
| |||||||||||||||||||||
Distributions: | ||||||||||||||||||||||||||||||||||||||||
Distributions from net investment income | — | (0.07 | ) | (0.06 | ) | (0.07 | ) | (0.06 | ) | — | — | — | — | — | ||||||||||||||||||||||||||
|
|
|
|
|
|
|
|
|
|
|
|
|
|
|
|
|
|
|
| |||||||||||||||||||||
Net asset value, end of period | $ | 14.89 | $ | 13.01 | $ | 11.56 | $ | 12.51 | $ | 11.12 | $ | 15.74 | $ | 13.70 | $ | 12.31 | $ | 13.57 | $ | 10.94 | ||||||||||||||||||||
|
|
|
|
|
|
|
|
|
|
|
|
|
|
|
|
|
|
|
| |||||||||||||||||||||
Total return | 14.45 | %(b) | 13.19 | % | –7.16 | % | 13.10 | % | 35.83 | % | 14.89 | %(b) | 11.29 | % | –9.29 | % | 24.04 | % | 35.73 | % | ||||||||||||||||||||
Ratios and supplemental data: | ||||||||||||||||||||||||||||||||||||||||
Net assets at end of period (millions) | $ | 219.2 | $ | 204.9 | $ | 192.7 | $ | 182.6 | $ | 142.8 | $ | 167.1 | $ | 157.7 | $ | 155.4 | $ | 137.4 | $ | 113.4 | ||||||||||||||||||||
Ratios to average net assets: | ||||||||||||||||||||||||||||||||||||||||
Expenses | 0.83 | %(a) | 0.85 | % | 0.84 | % | 0.86 | % | 0.89 | % | 0.90 | %(a) | 0.93 | % | 0.91 | % | 0.93 | % | 0.96 | % | ||||||||||||||||||||
Net investment income (loss) | 0.54 | %(a) | 0.68 | % | 0.52 | % | 0.70 | % | 0.79 | % | –0.60 | %(a) | –0.57 | % | –0.67 | % | –0.49 | % | –0.64 | % | ||||||||||||||||||||
Portfolio turnover rate | 163 | % | 244 | % | 198 | % | 253 | % | 223 | % | 81 | % | 152 | % | 156 | % | 118 | % | 82 | % | ||||||||||||||||||||
| (a) | Annualized. |
| (b) | Not annualized. |
The accompanying notes are an integral part of these financial statements.
| 127 |
| Ohio National Fund, Inc. |
Financial Highlights |
| U.S. Equity Portfolio | Balanced Portfolio | |||||||||||||||||||||||||||||||||||||||
| Six-Month Period Ended June 30, 2013 (Unaudited) | Years Ended December 31, | Six-Month Period Ended June 30, 2013 (Unaudited) | Years Ended December 31, | |||||||||||||||||||||||||||||||||||||
| 2012 | 2011 | 2010 | 2009 | 2012 | 2011 | 2010 | 2009 | |||||||||||||||||||||||||||||||||
Selected per-share data: | ||||||||||||||||||||||||||||||||||||||||
Net asset value, beginning of period | $ | 11.43 | $ | 10.03 | $ | 10.23 | $ | 9.16 | $ | 7.91 | $ | 15.76 | $ | 13.91 | $ | 13.87 | $ | 13.13 | $ | 10.74 | ||||||||||||||||||||
Operations: | ||||||||||||||||||||||||||||||||||||||||
Net investment income | 0.03 | 0.08 | 0.07 | 0.08 | 0.07 | 0.03 | 0.10 | 0.31 | 0.32 | 0.29 | ||||||||||||||||||||||||||||||
Net realized and unrealized gain (loss) on investments, foreign currency related transactions, and written options | 1.64 | 1.38 | (0.27 | ) | 1.06 | 1.24 | 1.34 | 1.75 | (0.00 | ) | 0.70 | 2.39 | ||||||||||||||||||||||||||||
|
|
|
|
|
|
|
|
|
|
|
|
|
|
|
|
|
|
|
| |||||||||||||||||||||
Total from operations | 1.67 | 1.46 | (0.20 | ) | 1.14 | 1.31 | 1.37 | 1.85 | 0.31 | 1.02 | 2.68 | |||||||||||||||||||||||||||||
|
|
|
|
|
|
|
|
|
|
|
|
|
|
|
|
|
|
|
| |||||||||||||||||||||
Distributions: | ||||||||||||||||||||||||||||||||||||||||
Distributions from net investment income | — | (0.06 | ) | — | (0.07 | ) | (0.06 | ) | — | — | (0.27 | ) | (0.28 | ) | (0.29 | ) | ||||||||||||||||||||||||
|
|
|
|
|
|
|
|
|
|
|
|
|
|
|
|
|
|
|
| |||||||||||||||||||||
Net asset value, end of period | $ | 13.10 | $ | 11.43 | $ | 10.03 | $ | 10.23 | $ | 9.16 | $ | 17.13 | $ | 15.76 | $ | 13.91 | $ | 13.87 | $ | 13.13 | ||||||||||||||||||||
|
|
|
|
|
|
|
|
|
|
|
|
|
|
|
|
|
|
|
| |||||||||||||||||||||
Total return | 14.61 | %(b) | 14.61 | % | –1.96 | % | 12.46 | % | 16.57 | % | 8.69 | %(b) | 13.30 | % | 2.29 | % | 7.78 | % | 24.92 | % | ||||||||||||||||||||
Ratios and supplemental data: | ||||||||||||||||||||||||||||||||||||||||
Net assets at end of period (millions)… | $ | 18.0 | $ | 15.6 | $ | 13.3 | $ | 14.5 | $ | 14.6 | $ | 125.8 | $ | 77.1 | $ | 17.1 | $ | 14.5 | $ | 13.6 | ||||||||||||||||||||
Ratios to average net assets: | ||||||||||||||||||||||||||||||||||||||||
Expenses | 0.98 | %(a) | 1.02 | % | 0.99 | % | 1.01 | % | 1.04 | % | 0.76 | %(a) | 0.86 | % | 0.94 | % | 0.99 | % | 1.08 | % | ||||||||||||||||||||
Net investment income | 0.45 | %(a) | 0.73 | % | 0.61 | % | 0.86 | % | 0.90 | % | 1.11 | %(a) | 1.90 | % | 2.33 | % | 2.48 | % | 2.99 | % | ||||||||||||||||||||
Portfolio turnover rate | 13 | % | 53 | % | 75 | % | 98 | % | 173 | % | 26 | % | 60 | % | 47 | % | 56 | % | 72 | % | ||||||||||||||||||||
| (a) | Annualized. |
| (b) | Not annualized. |
The accompanying notes are an integral part of these financial statements.
| 128 |
| Ohio National Fund, Inc. |
Financial Highlights |
| Income Opportunity Portfolio | Target VIP Portfolio | |||||||||||||||||||||||||||||||||||||||
| Six-Month Period Ended June 30, 2013 (Unaudited) | Years Ended December 31, | Six-Month Period Ended June 30, 2013 (Unaudited) | Years Ended December 31, | |||||||||||||||||||||||||||||||||||||
| 2012 | 2011 | 2010 | 2009 | 2012 | 2011 | 2010 | 2009 | |||||||||||||||||||||||||||||||||
Selected per-share data: | ||||||||||||||||||||||||||||||||||||||||
Net asset value, beginning of period | $ | 12.73 | $ | 11.86 | $ | 11.99 | $ | 11.19 | $ | 9.89 | $ | 10.10 | $ | 8.89 | $ | 9.11 | $ | 7.72 | $ | 6.81 | ||||||||||||||||||||
Operations: | ||||||||||||||||||||||||||||||||||||||||
Net investment income (loss) | 0.04 | 0.19 | 0.11 | 0.08 | 0.01 | 0.07 | 0.18 | 0.10 | 0.13 | 0.11 | ||||||||||||||||||||||||||||||
Net realized and unrealized gain (loss) on investments, foreign currency related transactions, and written options | 1.66 | 0.68 | (0.24 | ) | 0.72 | 1.29 | 1.27 | 1.17 | (0.23 | ) | 1.37 | 0.90 | ||||||||||||||||||||||||||||
|
|
|
|
|
|
|
|
|
|
|
|
|
|
|
|
|
|
|
| |||||||||||||||||||||
Total from operations | 1.70 | 0.87 | (0.13 | ) | 0.80 | 1.30 | 1.34 | 1.35 | (0.13 | ) | 1.50 | 1.01 | ||||||||||||||||||||||||||||
|
|
|
|
|
|
|
|
|
|
|
|
|
|
|
|
|
|
|
| |||||||||||||||||||||
Distributions: | ||||||||||||||||||||||||||||||||||||||||
Distributions from net investment income | — | — | — | — | — | — | (0.14 | ) | (0.09 | ) | (0.11 | ) | (0.10 | ) | ||||||||||||||||||||||||||
|
|
|
|
|
|
|
|
|
|
|
|
|
|
|
|
|
|
|
| |||||||||||||||||||||
Net asset value, end of period | $ | 14.43 | $ | 12.73 | $ | 11.86 | $ | 11.99 | $ | 11.19 | $ | 11.44 | $ | 10.10 | $ | 8.89 | $ | 9.11 | $ | 7.72 | ||||||||||||||||||||
|
|
|
|
|
|
|
|
|
|
|
|
|
|
|
|
|
|
|
| |||||||||||||||||||||
Total return | 13.35 | %(b) | 7.34 | % | –1.08 | % | 7.15 | % | 13.14 | % | 13.27 | %(b) | 15.24 | % | –1.41 | % | 19.47 | % | 14.77 | % | ||||||||||||||||||||
Ratios and supplemental data: | ||||||||||||||||||||||||||||||||||||||||
Net assets at end of period (millions) | $ | 10.0 | $ | 9.4 | $ | 10.8 | $ | 9.6 | $ | 6.7 | $ | 22.9 | $ | 21.2 | $ | 20.5 | $ | 21.9 | $ | 20.6 | ||||||||||||||||||||
Ratios to average net assets: | ||||||||||||||||||||||||||||||||||||||||
Ratios net of expenses reduced or reimbursed by adviser: | ||||||||||||||||||||||||||||||||||||||||
Expenses | 1.19 | %(a) | 1.19 | % | 1.18 | % | 1.27 | % | 1.56 | % | 0.83 | %(a) | 0.87 | % | 0.84 | % | 0.82 | % | 0.83 | % | ||||||||||||||||||||
Net investment income (loss) | 0.44 | %(a) | 1.12 | % | 1.04 | % | 0.89 | % | 0.40 | % | 1.25 | %(a) | 1.73 | % | 1.07 | % | 1.50 | % | 1.53 | % | ||||||||||||||||||||
Ratios assuming no expenses reduced or reimbursed by adviser: | ||||||||||||||||||||||||||||||||||||||||
Expenses | 1.19 | %(a) | 1.19 | % | 1.18 | % | 1.30 | % | 1.56 | % | 0.83 | %(a) | 0.87 | % | 0.84 | % | 0.82 | % | 0.83 | % | ||||||||||||||||||||
Net investment income (loss) | 0.44 | %(a) | 1.12 | % | 1.04 | % | 0.87 | % | 0.40 | % | 1.25 | %(a) | 1.73 | % | 1.07 | % | 1.50 | % | 1.53 | % | ||||||||||||||||||||
Portfolio turnover rate | 40 | % | 53 | % | 114 | % | 92 | % | 200 | % | 66 | % | 70 | % | 79 | % | 92 | % | 91 | % | ||||||||||||||||||||
| (a) | Annualized. |
| (b) | Not annualized. |
The accompanying notes are an integral part of these financial statements.
| 129 |
| Ohio National Fund, Inc. |
Financial Highlights |
| Target Equity/Income Portfolio | Bristol Growth Portfolio | |||||||||||||||||||||||||||||||||||||||
| Six-Month Period Ended June 30, 2013 (Unaudited) | Years Ended December 31, | Six-Month Period Ended June 30, 2013 (Unaudited) | Years Ended December 31, | |||||||||||||||||||||||||||||||||||||
| 2012 | 2011 | 2010 | 2009 | 2012 | 2011 | 2010 | 2009 | |||||||||||||||||||||||||||||||||
Selected per-share data: | ||||||||||||||||||||||||||||||||||||||||
Net asset value, beginning of period | $ | 8.18 | $ | 7.52 | $ | 8.61 | $ | 7.07 | $ | 6.41 | $ | 10.66 | $ | 9.63 | $ | 9.84 | $ | 8.75 | $ | 6.15 | ||||||||||||||||||||
Operations: | ||||||||||||||||||||||||||||||||||||||||
Net investment income | 0.08 | 0.22 | 0.15 | 0.12 | 0.15 | 0.02 | 0.06 | 0.04 | 0.02 | 0.01 | ||||||||||||||||||||||||||||||
Net realized and unrealized gain (loss) on investments and foreign currency related transactions | 1.30 | 0.61 | (1.11 | ) | 1.52 | 0.64 | 1.28 | 1.02 | (0.21 | ) | 1.10 | 2.59 | ||||||||||||||||||||||||||||
|
|
|
|
|
|
|
|
|
|
|
|
|
|
|
|
|
|
|
| |||||||||||||||||||||
Total from operations | 1.38 | 0.83 | (0.96 | ) | 1.64 | 0.79 | 1.30 | 1.08 | (0.17 | ) | 1.12 | 2.60 | ||||||||||||||||||||||||||||
|
|
|
|
|
|
|
|
|
|
|
|
|
|
|
|
|
|
|
| |||||||||||||||||||||
Distributions: | ||||||||||||||||||||||||||||||||||||||||
Distributions from net investment income | — | (0.17 | ) | (0.13 | ) | (0.10 | ) | (0.13 | ) | — | (0.05 | ) | (0.04 | ) | (0.03 | ) | — | |||||||||||||||||||||||
|
|
|
|
|
|
|
|
|
|
|
|
|
|
|
|
|
|
|
| |||||||||||||||||||||
Net asset value, end of period | $ | 9.56 | $ | 8.18 | $ | 7.52 | $ | 8.61 | $ | 7.07 | $ | 11.96 | $ | 10.66 | $ | 9.63 | $ | 9.84 | $ | 8.75 | ||||||||||||||||||||
|
|
|
|
|
|
|
|
|
|
|
|
|
|
|
|
|
|
|
| |||||||||||||||||||||
Total return | 16.87 | %(b) | 11.08 | % | –11.09 | % | 23.23 | % | 12.33 | % | 12.20 | %(b) | 11.20 | % | –1.77 | % | 12.79 | % | 42.28 | % | ||||||||||||||||||||
Ratios and supplemental data: | ||||||||||||||||||||||||||||||||||||||||
Net assets at end of period (millions) | $ | 23.8 | $ | 21.9 | $ | 21.6 | $ | 26.6 | $ | 22.6 | $ | 115.4 | $ | 108.0 | $ | 99.9 | $ | 85.3 | $ | 10.5 | ||||||||||||||||||||
Ratios to average net assets: | ||||||||||||||||||||||||||||||||||||||||
Expenses | 0.80 | %(a) | 0.84 | % | 0.78 | % | 0.78 | % | 0.79 | % | 0.88 | %(a) | 0.92 | % | 0.90 | % | 0.93 | % | 1.29 | % | ||||||||||||||||||||
Net investment income | 1.63 | %(a) | 2.48 | % | 1.75 | % | 1.56 | % | 2.03 | % | 0.38 | %(a) | 0.57 | % | 0.41 | % | 0.63 | % | 0.26 | % | ||||||||||||||||||||
Portfolio turnover rate | 76 | % | 83 | % | 99 | % | 90 | % | 95 | % | 151 | % | 229 | % | 187 | % | 268 | % | 218 | % | ||||||||||||||||||||
| (a) | Annualized. |
| (b) | Not annualized. |
The accompanying notes are an integral part of these financial statements.
| 130 |
| Ohio National Fund, Inc. |
| June 30, 2013 (Unaudited) |
| (1) | Organization |
Ohio National Fund, Inc. (the “Fund”) is a Maryland corporation registered under the Investment Company Act of 1940, as amended (the “40 Act”), as an open-end management investment company. The Fund consists of twenty-four separate investment portfolios (the “Portfolios”) that seek the following objectives and strategies:
| ¢ | Equity Portfolio — Long-term growth of capital by investing at least 80% of its assets in equity securities. |
| ¢ | Money Market Portfolio — Maximum current income consistent with preservation of capital and liquidity by investing in high quality money market instruments. |
| ¢ | Bond Portfolio — High level of income and opportunity for capital appreciation consistent with preservation of capital by investing primarily in intermediate-term and long-term fixed income securities. |
| ¢ | Omni Portfolio — High level of long-term total return consistent with preservation of capital by investing in stocks, bonds, and money market instruments. |
| ¢ | International Portfolio — Long term growth of capital by investing at least 80% of its assets in securities of foreign companies. |
| ¢ | Capital Appreciation Portfolio — Long-term capital growth by investing primarily in common stocks of established companies with either current or emerging earnings growth not fully appreciated or recognized by the market. |
| ¢ | Millennium Portfolio — Capital growth by investing primarily in common stocks of small sized companies. |
| ¢ | International Small-Mid Company Portfolio — Long-term growth of capital by investing at least 80% of its assets in equity securities of foreign small and mid-cap companies. |
| ¢ | Aggressive Growth Portfolio — Long-term capital growth by investing primarily in domestic and foreign equity securities selected for growth potential. |
| ¢ | Small Cap Growth Portfolio — Long-term capital appreciation by investing at least 80% of its net assets in stocks of small companies. |
| ¢ | Mid Cap Opportunity Portfolio — Long-term total return by investing at least 80% of its net assets in equity securities of mid-cap companies, primarily those that are strategically positioned for long-term growth. |
| ¢ | S&P 500® Index Portfolio — Total return that approximates the total return of the Standard & Poor’s 500® Index, at a risk level consistent with that of the Standard & Poor’s 500® Index. |
| ¢ | Strategic Value Portfolio — Growth of capital and income by investing primarily in securities of high dividend yielding, undervalued stocks with dividend growth potential. |
| ¢ | High Income Bond Portfolio — High current income by investing at least 80% of its net assets in lower rated corporate debt obligations commonly referred to as “junk bonds”. The Portfolio’s investments are generally rated Ba or lower by Moody’s, or BB or lower by Standard & Poor’s or Fitch. |
| ¢ | Capital Growth Portfolio — Long-term capital appreciation by investing primarily in an actively managed portfolio of equity securities of small cap growth companies. |
| ¢ | Nasdaq-100® Index Portfolio — Long-term growth of capital by investing primarily in stocks that are included in the Nasdaq-100® Index. Unlike the other Portfolios of the Fund, the Nasdaq-100® Index Portfolio is a non-diversified portfolio for purposes of Section 5(b) of the 40 Act. |
| ¢ | Bristol Portfolio — Long-term growth of capital by investing primarily in common stocks of the 1,000 largest publicly traded U.S. companies in terms of market capitalization. |
| ¢ | Bryton Growth Portfolio — Long-term growth of capital by investing primarily in common stocks of growth-oriented U.S. companies smaller than the 500 largest publicly traded U.S. companies in terms of market capitalization. |
| ¢ | U.S. Equity Portfolio — Capital appreciation with a secondary objective of capital preservation to provide long term growth by investing at least 80% of its net assets in equity securities traded in the U.S. within under-priced sectors and industries. |
| 131 | (continued) |
| Ohio National Fund, Inc. |
Notes to Financial Statements (Continued) | June 30, 2013 (Unaudited) |
| ¢ | Balanced Portfolio — Capital appreciation and income by investing normally up to 75% of its assets in equity securities within under-priced sectors and industries while maintaining a minimum of 25% of its assets in fixed income securities. |
| ¢ | Income Opportunity Portfolio — Modest capital appreciation and maximization of realized gains by investing in equity securities traded in the U.S. |
| ¢ | Target VIP Portfolio — Above average total return by investing in the common stocks of companies which are identified by a model that applies separate uniquely specialized strategies. |
| ¢ | Target Equity/Income Portfolio — Above average total return by adhering to a disciplined, quantitative investment process that incorporates two distinct strategy methodologies. |
| ¢ | Bristol Growth Portfolio — Long-term growth of capital by investing primarily in common stocks of the 1,000 largest publicly traded U.S. companies in terms of market capitalization. |
Additional detail regarding portfolio-specific objectives, policies, and investment strategies is provided in the prospectus and Statement of Additional Information of Ohio National Fund, Inc. There are no assurances that these objectives will be met. Each Portfolio, except the Nasdaq-100® Index Portfolio, is classified as diversified for purposes of Section 5(b) of the 40 Act.
At present, the Fund sells its shares only to separate accounts of The Ohio National Life Insurance Company (“ONLIC”), Ohio National Life Assurance Corporation (“ONLAC”), and National Security Life and Annuity Company (“NSLA”) to support certain benefits under variable contracts issued by those entities. In the future, Fund shares may be used for other purposes but, unless there is a change in applicable law, they will not be sold directly to the public.
Interest in each Portfolio is represented by a separate class of the Fund’s capital stock, par value $1. Each share of a Portfolio participates equally in the Portfolio’s dividends, distributions, net assets, and voting matters.
The Fund is authorized to issue 550 million of its capital shares. These authorized shares have been allocated to specific Portfolios of the Fund as follows:
Portfolio | Authorized Shares | |||
Equity | 25,000,000 | |||
Money Market | 55,000,000 | |||
Bond | 30,000,000 | |||
Omni | 10,000,000 | |||
International | 45,000,000 | |||
Capital Appreciation | 15,000,000 | |||
Millennium | 10,000,000 | |||
International Small-Mid Company | 10,000,000 | |||
Aggressive Growth | 10,000,000 | |||
Small Cap Growth | 10,000,000 | |||
Mid Cap Opportunity | 10,000,000 | |||
S&P 500® Index | 35,000,000 | |||
Portfolio | Authorized Shares | |||
Strategic Value | 40,000,000 | |||
High Income Bond | 45,000,000 | |||
Capital Growth | 10,000,000 | |||
Nasdaq-100® Index | 25,000,000 | |||
Bristol | 40,000,000 | |||
Bryton Growth | 35,000,000 | |||
U.S. Equity | 10,000,000 | |||
Balanced | 25,000,000 | |||
Income Opportunity | 10,000,000 | |||
Target VIP | 10,000,000 | |||
Target Equity/Income | 10,000,000 | |||
Bristol Growth | 25,000,000 | |||
The Fund’s Board of Directors (the “Board”) periodically reallocates authorized shares among the Portfolios of the Fund and may authorize additional shares as deemed necessary.
Under the Fund’s organizational documents, its Officers and Directors are indemnified against certain liabilities arising out of the performance of their duties to the Fund. In addition, in the normal course of business, the Fund enters into contracts with its vendors and others that provide for general indemnifications. The Fund’s maximum exposure under these arrangements is unknown as this would involve future claims that may be made against the Fund. However, based on experience, the risk of loss to the Fund is expected to be remote.
| 132 | (continued) |
| Ohio National Fund, Inc. |
Notes to Financial Statements (Continued) | June 30, 2013 (Unaudited) |
| (2) | Significant Accounting Policies |
The following is a summary of significant accounting policies followed by the Fund in preparation of its financial statements:
Use of Estimates
The preparation of financial statements in conformity with U.S. generally accepted accounting principles (“GAAP”) requires management to make estimates and assumptions that affect the reported amounts of assets and liabilities and disclosure of contingent assets and liabilities at the date of the financial statements and the reported amounts of increases and decreases in net assets from operations during the reporting period. Actual results could differ from those estimates.
Security Valuation
Investments are valued using pricing procedures approved by the Board.
Various investments in the Money Market Portfolio are valued at amortized cost in accordance with Rule 2a-7 of the 40 Act. In all Portfolios of the Fund, fixed income instruments that mature in sixty days or less, and of sufficient credit quality, are valued at amortized cost. Amortized cost valuation involves valuing a security at its cost initially and thereafter amortizing to maturity any discounts or premiums on the level-yield method, regardless of the impact of fluctuating market interest rates on the value of the security. In these instances, amortized cost approximates fair value.
Investments, other than those securities aforementioned, are valued as follows:
Domestic equity securities that are traded on U.S. exchanges are valued at the last trade price reported by the primary exchange of each security (4:00 pm Eastern Time for normal trading sessions). Over-the-counter domestic equity securities are valued at the last trade price reported daily as of 4:00 pm Eastern Time (normal trading sessions). Over-the-counter traded ADRs may also be valued at an evaluated price based on the value of the underlying securities. If a domestic equity security is not traded on a particular day, the mean between the bid and ask prices reported at 4:00 pm Eastern Time (normal trading sessions) by the primary exchange will generally be used for valuation purposes. The principal sources for market quotations are independent pricing services that have been approved by the Board.
Fixed income securities that have a remaining maturity exceeding sixty days are generally valued at the mean between the daily close bid and ask prices reported at 4:00 pm Eastern Time (normal trading sessions), as provided by independent pricing services approved by the Board.
Shares of open-end mutual funds are valued at each fund’s last calculated net asset value per share.
Repurchase agreements are valued at amortized cost, which approximates fair value.
Restricted securities, illiquid securities, or other investments for which market quotations or other observable market inputs are not readily available are valued at an estimate of value using methods determined in good faith by the Fund’s Pricing Committee under the supervision of the Board.
Foreign equity securities are initially priced at the reported close price of the exchange on which a security is primarily traded. Securities not traded on a particular day are valued at the mean between the last reported bid and ask quotes at daily close, or the last sale price when appropriate. The principal sources for market quotations are independent pricing services that have been approved by the Board.
Equity securities that are primarily traded on foreign exchanges, other than those in North or South America, are further subjected to fair valuation pricing procedures provided by an independent fair valuation service. The service provides data that can be used to estimate the price of a foreign issue that would prevail in a liquid market given market information available daily at 4:00 pm Eastern Time (normal trading sessions). Multiple factors may be considered in performing this valuation, including an issue’s local close price, relevant general and sector indices, currency fluctuations, and pricing of related depository receipts, exchange traded funds, and futures. The pricing procedures are performed for each individual security for which there is a fairly large degree of certainty that the local close price is not the liquid market price at the time of U.S. market close. The procedures are performed each day there is a change in a consistently used market index from the time of local close to the U.S. market close. Backtesting analysis is performed on a quarterly basis to monitor the effectiveness of these procedures. The testing is reviewed by management of the Fund as well as the Fund’s Board. Prior results have indicated that these procedures have been effective in reaching valuation objectives.
| 133 | (continued) |
| Ohio National Fund, Inc. |
Notes to Financial Statements (Continued) | June 30, 2013 (Unaudited) |
The differences between the aggregate cost and values of investments are reflected as unrealized appreciation or unrealized depreciation.
Pricing inputs used in the Fund’s determination of its investment values are categorized according to a three-tier hierarchy framework. The hierarchy is summarized in three broad levels:
| Level 1: | Quoted prices in active markets for identical securities. |
| Level 2: | Other significant observable inputs, including quoted prices for similar securities, interest rates, prepayment speeds, credit risk, etc. |
| Level 3: | Significant unobservable inputs, including the Fund’s own assumptions used to determine the value of securities. |
The following is a summary of the inputs used in valuing each of the Portfolio’s assets (liabilities) at value as of June 30, 2013:
Portfolio | Financial Instrument Type | Level 1 | Level 2 | Level 3 | ||||||||||
Equity | Common Stocks** | $ | 196,251,925 | $ | — | $ | — | |||||||
| Money Market Funds | 4,289,000 | — | — | |||||||||||
|
|
|
|
|
| |||||||||
| $ | 200,540,925 | $ | — | $ | — | |||||||||
|
|
|
|
|
| |||||||||
Money Market * | Commercial Paper** | $ | — | $ | 169,997,168 | $ | — | |||||||
| U.S. Government Agency Issues | — | 9,999,688 | — | |||||||||||
| U.S. Treasury Obligations | — | 11,999,690 | — | |||||||||||
| Money Market Funds | 30,000,000 | — | — | |||||||||||
|
|
|
|
|
| |||||||||
| $ | 30,000,000 | $ | 191,996,546 | $ | — | |||||||||
|
|
|
|
|
| |||||||||
Bond | Corporate Bonds** | $ | — | $ | 141,457,697 | $ | — | |||||||
| Money Market Funds | 4,656,000 | — | — | |||||||||||
|
|
|
|
|
| |||||||||
| $ | 4,656,000 | $ | 141,457,697 | $ | — | |||||||||
|
|
|
|
|
| |||||||||
Omni | Common Stocks** | $ | 25,991,460 | $ | — | $ | — | |||||||
| Corporate Bonds** | — | 6,553,314 | — | |||||||||||
| U.S. Treasury Obligations | — | 313,765 | — | |||||||||||
| Money Market Funds | 1,131,000 | — | — | |||||||||||
|
|
|
|
|
| |||||||||
| $ | 27,122,460 | $ | 6,867,079 | $ | — | |||||||||
|
|
|
|
|
| |||||||||
International | Common Stocks** | $ | 19,517,388 | $ | 143,617,488 | $ | — | |||||||
| Preferred Stocks** | 1,101,078 | — | — | |||||||||||
| U.S. Treasury Obligations | — | 334,990 | — | |||||||||||
| Money Market Funds | 8,300,182 | — | — | |||||||||||
|
|
|
|
|
| |||||||||
| $ | 28,918,648 | $ | 143,952,478 | $ | — | |||||||||
|
|
|
|
|
| |||||||||
| Foreign currency contracts | $ | 72,527 | $ | — | $ | — | ||||||||
|
|
|
|
|
| |||||||||
| Futures contracts | $ | (46,586 | ) | $ | — | $ | — | |||||||
|
|
|
|
|
| |||||||||
Capital Appreciation | Common Stocks** | $ | 116,946,600 | $ | 4,382,370 | $ | — | |||||||
| Money Market Funds | 3,126,000 | — | — | |||||||||||
|
|
|
|
|
| |||||||||
| $ | 120,072,600 | $ | 4,382,370 | $ | — | |||||||||
|
|
|
|
|
| |||||||||
Millennium | Common Stocks** | $ | 36,075,690 | $ | — | $ | — | |||||||
| Money Market Funds | 992,000 | — | — | |||||||||||
|
|
|
|
|
| |||||||||
| $ | 37,067,690 | $ | — | $ | — | |||||||||
|
|
|
|
|
| |||||||||
International Small-Mid Company | Common Stocks** | $ | 10,183,171 | $ | 50,076,978 | $ | — | |||||||
| Exchange Traded Funds | 920,040 | — | — | |||||||||||
| Money Market Funds | 6,577,474 | — | — | |||||||||||
|
|
|
|
|
| |||||||||
| $ | 17,680,685 | $ | 50,076,978 | $ | — | |||||||||
|
|
|
|
|
| |||||||||
Aggressive Growth | Common Stocks** | $ | 27,185,660 | $ | 5,292,899 | $ | — | |||||||
|
|
|
|
|
| |||||||||
| $ | 27,185,660 | $ | 5,292,899 | $ | — | |||||||||
|
|
|
|
|
| |||||||||
| 134 | (continued) |
| Ohio National Fund, Inc. |
Notes to Financial Statements (Continued) | June 30, 2013 (Unaudited) |
Portfolio | Financial Instrument Type | Level 1 | Level 2 | Level 3 | ||||||||||
Small Cap Growth | Common Stocks** | $ | 41,511,827 | $ | — | $ | — | |||||||
| Money Market Funds | 3,628,000 | — | — | |||||||||||
|
|
|
|
|
| |||||||||
| $ | 45,139,827 | $ | — | $ | — | |||||||||
|
|
|
|
|
| |||||||||
Mid Cap Opportunity. | Common Stocks** | $ | 73,065,976 | $ | — | $ | — | |||||||
| Money Market Funds | 828,000 | — | — | |||||||||||
|
|
|
|
|
| |||||||||
| $ | 73,893,976 | $ | — | $ | — | |||||||||
|
|
|
|
|
| |||||||||
S&P 500® Index | Common Stocks** | $ | 229,292,321 | $ | — | $ | — | |||||||
| Exchange Traded Funds | 11,628,727 | — | — | |||||||||||
|
|
|
|
|
| |||||||||
| $ | 240,921,048 | $ | — | $ | — | |||||||||
|
|
|
|
|
| |||||||||
Strategic Value | Common Stocks** | $ | 205,836,969 | $ | 66,525,454 | $ | — | |||||||
| Money Market Funds | 2,579,000 | — | — | |||||||||||
|
|
|
|
|
| |||||||||
| $ | 208,415,969 | $ | 66,525,454 | $ | — | |||||||||
|
|
|
|
|
| |||||||||
High Income Bond | Corporate Bonds** | $ | — | $ | 292,871,521 | $ | — | |||||||
| Common Stocks** | 147,996 | — | — | |||||||||||
| Preferred Stocks** | 328,884 | — | — | |||||||||||
| Warrants** | 162,974 | — | — | |||||||||||
| Other** | 34,261 | — | — | |||||||||||
| Money Market Funds | 809,000 | — | — | |||||||||||
|
|
|
|
|
| |||||||||
| $ | 1,483,115 | $ | 292,871,521 | $ | — | |||||||||
|
|
|
|
|
| |||||||||
Capital Growth | Common Stocks** | $ | 62,911,407 | $ | — | $ | — | |||||||
| Money Market Funds | 1,496,000 | — | — | |||||||||||
|
|
|
|
|
| |||||||||
| $ | 64,407,407 | $ | — | $ | — | |||||||||
|
|
|
|
|
| |||||||||
Nasdaq-100® Index | Common Stocks** | $ | 68,680,312 | $ | — | $ | — | |||||||
| Exchange Traded Funds | 656,200 | — | — | |||||||||||
|
|
|
|
|
| |||||||||
| $ | 69,336,512 | $ | — | $ | — | |||||||||
|
|
|
|
|
| |||||||||
Bristol | Common Stocks** | $ | 208,179,647 | $ | — | $ | — | |||||||
| Money Market Funds | 2,407,000 | — | — | |||||||||||
|
|
|
|
|
| |||||||||
| $ | 210,586,647 | $ | — | $ | — | |||||||||
|
|
|
|
|
| |||||||||
Bryton Growth | Common Stocks** | $ | 160,154,868 | $ | — | $ | — | |||||||
| Money Market Funds | 4,040,000 | — | — | |||||||||||
|
|
|
|
|
| |||||||||
| $ | 164,194,868 | $ | — | $ | — | |||||||||
|
|
|
|
|
| |||||||||
U.S. Equity | Common Stocks** | $ | 17,863,736 | $ | — | $ | — | |||||||
| Money Market Funds | 88,000 | — | — | |||||||||||
|
|
|
|
|
| |||||||||
| $ | 17,951,736 | $ | — | $ | — | |||||||||
|
|
|
|
|
| |||||||||
Balanced | Common Stocks** | $ | 75,433,637 | $ | — | $ | — | |||||||
| Corporate Bonds** | — | 32,363,588 | — | |||||||||||
| U.S. Treasury Obligations | — | 13,989,898 | — | |||||||||||
| Exchange Traded Funds | 829,290 | — | — | |||||||||||
| Purchased Options | 430,000 | — | — | |||||||||||
| Money Market Funds | 4,184,000 | — | — | |||||||||||
|
|
|
|
|
| |||||||||
| $ | 80,876,927 | $ | 46,353,486 | $ | — | |||||||||
|
|
|
|
|
| |||||||||
| Written Options | $ | (326,500 | ) | $ | — | $ | — | |||||||
|
|
|
|
|
| |||||||||
| 135 | (continued) |
| Ohio National Fund, Inc. |
Notes to Financial Statements (Continued) | June 30, 2013 (Unaudited) |
Portfolio | Financial Instrument Type | Level 1 | Level 2 | Level 3 | ||||||||||
Income Opportunity | Common Stocks** | $ | 9,712,431 | $ | — | $ | — | |||||||
| Purchased Options | 64,500 | — | — | |||||||||||
| Money Market Funds | 172,000 | — | — | |||||||||||
|
|
|
|
|
| |||||||||
| $ | 9,948,931 | $ | — | $ | — | |||||||||
|
|
|
|
|
| |||||||||
| Written Options | $ | (48,975 | ) | $ | — | $ | — | |||||||
|
|
|
|
|
| |||||||||
Target VIP | Common Stocks** | $ | 22,437,867 | $ | — | $ | — | |||||||
| Money Market Funds | 378,000 | — | — | |||||||||||
|
|
|
|
|
| |||||||||
| $ | 22,815,867 | $ | — | $ | — | |||||||||
|
|
|
|
|
| |||||||||
Target Equity/Income | Common Stocks** | $ | 23,416,951 | $ | — | $ | — | |||||||
| Money Market Funds | 336,000 | — | — | |||||||||||
|
|
|
|
|
| |||||||||
| $ | 23,752,951 | $ | — | $ | — | |||||||||
|
|
|
|
|
| |||||||||
Bristol Growth | Common Stocks** | $ | 108,936,749 | $ | — | $ | — | |||||||
| Money Market Funds | 2,541,000 | — | — | |||||||||||
|
|
|
|
|
| |||||||||
| $ | 111,477,749 | $ | — | $ | — | |||||||||
|
|
|
|
|
| |||||||||
| * | At June 30, 2013, the Money Market Portfolio’s investments, with the exception of money market funds, were valued using amortized cost, in accordance with rules under the 40 Act. Amortized cost approximates the current fair value of a security, but since the value is not obtained from a quoted price in an active market, such securities are considered to be valued using Level 2 inputs. |
| ** | For detailed industry descriptions, see the accompanying Schedules of Investments. |
As stated above, the value assigned to the Fund’s foreign securities will, in most cases, not be the quoted or published prices of the investments on their respective primary markets or exchanges. Securities that are priced using fair value estimates are categorized as Level 2 in the fair value hierarchy, whereas securities that do not meet the established criteria are categorized as Level 1. The valuation of a foreign security from one valuation period to the next may result in a transfer between Levels 1 and 2 if the degree of certainty that the local close price is not the liquid market price at the time of U.S. market close is not similar for both periods. The Fund’s policy is to recognize transfers between fair value hierarchy levels at the reporting period end. In the International Portfolio, there was one transfer of a security, which was reported in the Level 1 pricing category at December 31, 2012, to Level 2 at June 30, 2013. This security was that Portfolio’s holding of TAG Immobilien AG common stock. The fair valuation service provider reported that the security did not meet the minimum predictability threshold at December 31, 2012, and was not fair valued in the prior period; whereas at June 30, 2013, the security met the threshold to be fair valued. The value of this holding was $622,350 and $715,630 at June 30, 2013 and December 31, 2012, respectively.
There were no securities in Level 3 during the six-month period ended June 30, 2013.
Foreign Securities and Currency
The books and records of all the Portfolios are maintained in U.S. dollars. All investments and cash quoted in foreign currencies are valued daily in U.S. dollars on the basis of the foreign currency exchange rates provided by an independent source. These exchange rates are currently determined daily, at 4:00 pm Eastern Time for normal trading sessions. Purchases and sales of foreign-denominated investments are recorded at rates of exchange prevailing on the respective dates of such transactions.
The Fund may not fully isolate that portion of the results of operations resulting from changes in foreign exchange rates from fluctuations arising from changes in market prices on foreign currency-denominated investments. For the portion that is isolated, amounts are reflected in the Statements of Operations as other foreign currency related transactions. However, for tax purposes, the Fund does fully isolate the effect of fluctuations in foreign exchange rates when determining the gain or loss upon sale or maturity of such investments to the extent required by federal income tax regulations.
All Portfolios of the Fund may invest in securities of foreign issuers. Securities of foreign issuers that are purchased by the Money Market Portfolio are limited to 50% of that Portfolio’s assets and must be denominated in U.S. dollars and held in custody in the United States of America. The International and International Small-Mid Company Portfolios may be invested entirely in foreign securities. Investments in securities of foreign issuers, including investments in foreign companies through the use of depositary receipts, carry certain risks not ordinarily associated with investments in securities of domestic issuers. Such risks include future
| 136 | (continued) |
| Ohio National Fund, Inc. |
Notes to Financial Statements (Continued) | June 30, 2013 (Unaudited) |
political and economic developments, and the possible imposition of exchange controls or other foreign governmental laws and restrictions. In addition, with respect to certain countries, there is the possibility of expropriation of assets, confiscatory taxation, political or social instability, or diplomatic developments that could adversely affect capital investment within those countries.
Restricted and Illiquid Securities
Restricted securities are those securities purchased through a private offering and cannot be resold to the general public without prior registration under the Securities Act of 1933 (“the 1933 Act”) or pursuant to the resale limitations provided by Rule 144A under the 1933 Act, or an exemption from the registration requirements of the 1933 Act. 144A securities are issued by corporations without registration in reliance on 1933 Act provisions allowing for the private resale of unregistered securities to qualified institutional buyers. Section 4(2) commercial paper is issued pursuant to Section 4(2) of the 1933 Act which exempts an issue from registration. This paper may be used to finance non-current transactions, such as acquisitions, stock repurchase programs, and other long-term assets. Investments by a portfolio in Rule 144A and Section 4(2) securities could have the effect of decreasing the liquidity of a Portfolio during any period in which qualified institutional investors were no longer interested in purchasing these securities.
Typically, the restricted securities noted above are not considered illiquid. The criteria used to determine if a restricted security is illiquid includes frequency of trades and quotes, available dealers willing to make transactions, availability of market makers in the security, and the nature of the security and its trades. The Money Market, Bond, and Omni Portfolios may invest up to 10% of their respective assets in illiquid securities. Each of the other Portfolios of the Fund may invest up to 15% of its net assets in illiquid securities.
Investment Transactions and Related Income
For financial reporting purposes, investment transactions are accounted for on a trade date basis. For purposes of executing separate account shareholder transactions in the normal course of business, however, the Fund’s investment transactions are recorded no later than the first calculation on the first business day following the trade date in accordance with Rule 2a-4 of the 40 Act. Accordingly, differences between the net asset values for financial reporting and for executing separate account shareholder transactions may arise.
Dividend income is recognized on the ex-dividend date, except in the case of those Portfolios holding foreign securities, in which dividends are recorded as soon after the ex-dividend date as the Fund’s information agents become aware of such dividends. Interest income is accrued daily as earned and includes the amortization of premium and accretion of discount. Net realized gain or loss on investments and foreign exchange transactions are determined using the specific identification method.
Distributions to Shareholders and Federal Taxes
Net investment income of the Money Market Portfolio is declared and paid daily as a dividend to shareholders immediately before the computation of the net asset value of Money Market Portfolio shares. Dividends are automatically reinvested in additional Money Market Portfolio shares at the net asset value immediately following such computation. Distributions arising from net investment income and net capital gains from the remaining Portfolios are declared and paid to shareholders periodically as required for each of the Portfolios to continue to qualify as a regulated investment company pursuant to Subchapter M of the Internal Revenue Code. The Fund, excluding the Money Market Portfolio, may also fully or partially satisfy its distribution requirements by using consent dividends rather than cash dividends. The Fund has the intent to continue to comply with tax provisions pertaining to regulated investment companies and make distributions of taxable income sufficient to relieve it from substantially all federal income and excise taxes. As such, no provisions for federal income or excise taxes have been recorded.
The character of income and realized capital gains distributions are determined in accordance with federal income tax regulations and may differ from net investment income and realized gains for financial reporting purposes. These “book/tax” differences are either considered temporary or permanent in nature. To the extent these differences are permanent in nature they are reclassified within the composition of net assets; temporary differences do not require such reclassification. Distributions to shareholders that exceed taxable income and net taxable realized gains are reported as return of capital distributions.
| 137 | (continued) |
| Ohio National Fund, Inc. |
Notes to Financial Statements (Continued) | June 30, 2013 (Unaudited) |
The Fund’s management and its tax agent, U.S. Bancorp Fund Services, LLC, perform an affirmative evaluation of tax positions taken or expected to be taken in the course of preparing the Fund’s tax returns to determine whether it is more-likely-than-not (i.e. greater than 50-percent) that each tax position will be sustained upon examination by a taxing authority based on the technical merits of the position. A tax position that meets the more-likely-than-not recognition threshold is measured to determine the amount of benefit to recognize in the financial statements. Differences between tax positions taken in a tax return and amounts recognized in the financial statements will generally result in an increase in a liability for taxes payable (or a reduction of a tax refund receivable), including the recognition of any related interest and penalties as an operating expense. Implementation of the evaluation included a review of tax positions taken in tax years that remain subject to examination by all major tax jurisdictions, including federal tax and the state of Maryland (i.e., the last four tax year ends and the interim tax period since then). The determination has been made that there are no uncertain tax positions that would require the Portfolios to record a tax liability and, therefore, there is no impact to the Portfolios’ financial statements.
Expense Allocation
Expenses directly attributable to a Portfolio are charged to that Portfolio. Expenses that cannot be directly attributed to a Portfolio are allocated among all the benefited Portfolios on a basis of relative net assets or other appropriate method.
Foreign Withholding Taxes
Certain Portfolios in the Fund may be subject to taxes imposed by countries in which they invest with respect to their investments in issuers existing or operating in such countries. Such taxes are generally withheld based on income earned. These Portfolios accrue such taxes as the related income is earned.
Subsequent Events
Management has evaluated events and transactions through the date the financial statements were issued, for purposes of recognition or disclosure in these financial statements, and there are no subsequent events to report.
| (3) | Related Party and Other Transactions |
The Fund has an Investment Advisory Agreement with Ohio National Investments, Inc. (“ONI”), a wholly-owned subsidiary of ONLIC. Under the terms of this agreement, ONI provides portfolio management and investment advice to the Fund and administers its operations, subject to the supervision of the Fund’s Board. This agreement is renewed annually upon the approval by the Board. As compensation for its services, ONI receives advisory fees from the Fund calculated on the basis of each Portfolio’s average daily net assets and the following current schedule of Board-approved annualized fee breakpoints.
Equity |
0.79% of first $200 million 0.74% of next $800 million 0.70% over $1 billion |
Bond |
0.60% of first $100 million 0.50% of next $150 million 0.45% of next $250 million 0.40% of next $500 million 0.30% of next $1 billion 0.25% over $2 billion |
International 2 |
0.85% of first $100 million 0.80% of next $100 million 0.70% over $200 million |
Millennium |
0.80% of first $150 million 0.75% of next $150 million 0.70% of next $300 million 0.65% over $600 million |
Money Market |
0.30% of first $100 million1 0.25% of next $150 million 0.23% of next $250 million 0.20% of next $500 million 0.15% over $1 billion |
Omni |
0.60% of first $100 million 0.50% of next $150 million 0.45% of next $250 million 0.40% of next $500 million 0.30% of next $1 billion 0.25% over $2 billion |
Capital Appreciation |
0.80% of first $100 million 0.75% of next $300 million 0.65% of next $600 million 0.60% over $1 billion |
| 138 | (continued) |
| Ohio National Fund, Inc. |
Notes to Financial Statements (Continued) | June 30, 2013 (Unaudited) |
Aggressive Growth |
0.80% of first $100 million 0.75% of next $400 million 0.70% over $500 million |
Mid Cap Opportunity |
0.85% of first $100 million 0.80% of next $100 million 0.75% of next $300 million 0.70% over $500 million |
Strategic Value |
0.75% of first $100 million 0.70% of next $400 million 0.65% over $500 million |
Capital Growth |
0.90% of first $100 million 0.85% of next $100 million 0.80% of next $300 million 0.75% over $500 million |
Bristol |
0.80% of first $100 million 0.70% of next $400 million 0.65% over $500 million |
U.S. Equity |
0.75% of first $200 million 0.70% of next $300 million 0.65% over $500 million |
Balanced |
0.65% of first $200 million 0.60% of next $300 million 0.55% over $500 million |
Target VIP |
0.60% of first $100 million 0.55% of next $400 million 0.50% over $500 million |
International Small-Mid Company |
1.00% of first $100 million 0.90% of next $100 million 0.85% over $200 million |
Small Cap Growth |
0.90% of first $150 million 0.80% of next $150 million 0.75% over $300 million |
S&P 500® Index |
0.40% of first $100 million 0.35% of next $150 million 0.33% over $250 million |
High Income Bond |
0.75% of first $75 million 0.70% of next $75 million 0.65% of next $75 million 0.60% over $225 million |
Nasdaq-100® Index |
0.40% of first $100 million 0.35% of next $150 million 0.33% over $250 million |
Bryton Growth |
0.85% of first $100 million 0.75% of next $400 million 0.70% over $500 million |
Income Opportunity |
0.80% of first $200 million 0.75% of next $300 million 0.70% over $500 million |
Target Equity/Income |
0.60% of first $100 million 0.55% of next $400 million 0.50% over $500 million |
Bristol Growth |
0.80% of first $100 million 0.70% of next $400 million 0.65% over $500 million |
| 1 | For the six-month period ended June 30, 2013, ONI waived advisory fees in excess of an annualized rate of 0.25% of the first $100 million of average daily net assets in the Money Market Portfolio. Waivers related to the Money Market Portfolio are voluntary and are not subject to recoupment in subsequent periods. The amount of the waiver for the six-month period ended June 30, 2013 was $25,000. If ONI did not agree to reimburse these expenses, the total expenses incurred by the Money Market Portfolio for the six-month period ended June 30, 2013 would have been higher than the net expenses reflected in the Statements of Operations. |
| 2 | Effective June 1, 2013, ONI agreed to waive advisory fees equal to an annualized rate of 0.44% of the first $200 million, and 0.39% thereafter, of average daily net assets in the International Portfolio. Waivers related to the International Portfolio are voluntary and are not subject to recoupment in subsequent periods. This waiver will continue for a yet undetermined amount of time. The amount of the waiver for the six-month period ended June 30, 2013 was $64,613. If ONI did not agree to reimburse these expenses, the total expenses incurred by the International Portfolio for the six-month period ended June 30, 2013 would have been higher than the net expenses reflected in the Statements of Operations. |
| 139 | (continued) |
| Ohio National Fund, Inc. |
Notes to Financial Statements (Continued) | June 30, 2013 (Unaudited) |
Under the Investment Advisory Agreement, the Fund authorizes ONI to retain sub-advisers (“the Sub-Advisers”) for the Equity, Omni, International, Capital Appreciation, Millennium, International Small-Mid Company, Aggressive Growth, Small Cap Growth, Mid Cap Opportunity, Strategic Value, High Income Bond, Capital Growth, Bristol, Bryton Growth, U.S. Equity, Balanced, Income Opportunity, Target VIP, Target Equity/Income, and Bristol Growth Portfolios subject to the approval of the Board. ONI has entered into sub-advisory agreements with Legg Mason Capital Management, Inc. (“Legg Mason”), Suffolk Capital Management, LLC (“Suffolk”), Federated Global Investment Management Corp. (“Federated Global”), Jennison Associates LLC (“Jennison”), Neuberger Berman Management LLC (“Neuberger Berman”), Janus Capital Management LLC (“Janus”), Goldman Sachs Asset Management, L.P. (“Goldman Sachs”), Federated Equity Management Company of Pennsylvania (“Federated Equity”), Federated Investment Management Company (“Federated Investment”), Eagle Asset Management, Inc. (“Eagle”), ICON Advisers, Inc. (“ICON”), and First Trust Advisors L.P. (“First Trust”), to manage the investment of those Portfolios’ assets, subject to the supervision of ONI. As compensation for their services, the Sub-Advisers receive from ONI a sub-advisory fee calculated on the basis of each of the aforementioned Portfolio’s average daily net assets and the following current Board-approved schedule of annualized fee breakpoints.
Equity (Legg Mason) |
0.40% of first $200 million 0.38% over $200 million |
International (Federated Global) 3 |
0.40% of first $200 million 0.35% over $200 million |
Capital Appreciation (Jennison) |
0.75% of first $10 million 0.50% of next $30 million 0.35% of next $25 million 0.25% of next $335 million 0.22% of next $600 million 0.20% over $1 billion |
Aggressive Growth (Janus) |
0.55% of first $100 million 0.50% of next $400 million 0.45% over $500 million |
Mid Cap Opportunity (GSAM) |
0.60% of first $100 million 0.55% of next $100 million 0.50% over $200 million |
High Income Bond (Federated Investment) |
0.50% of first $30 million 0.40% of next $20 million 0.30% of next $25 million 0.25% over $75 million |
Bristol (Suffolk) |
0.45% of first $100 million 0.40% of next $400 million 0.35% over $500 million |
U.S. Equity (ICON) |
0.50% of first $200 million 0.45% of next $300 million 0.40% over $500 million |
Income Opportunity (ICON) |
0.55% of first $200 million 0.50% of next $300 million 0.45% over $500 million |
Omni (Suffolk) |
0.30% of first $100 million 0.25% of next $150 million 0.225% of next $250 million 0.20% of next $500 million 0.15% of next $1 billion 0.125% over $2 billion |
Millennium (Neuberger Berman) |
0.55% of first $150 million 0.50% of next $150 million 0.40% over $300 million |
International Small-Mid Company (Federated Global) |
0.75% of first $100 million 0.65% over $100 million |
Small Cap Growth (Janus) |
0.60% of first $150 million 0.50% over $150 million |
Strategic Value (Federated Equity) |
0.50% of first $35 million 0.35% of next $65 million 0.25% over $100 million |
Capital Growth (Eagle) |
0.59% of first $100 million 0.55% of next $100 million 0.50% over $200 million |
Bryton Growth (Suffolk) |
0.50% of first $100 million 0.45% of next $400 million 0.40% over $500 million |
Balanced (ICON) |
0.40% of first $200 million 0.35% of next $300 million 0.30% over $500 million |
Target VIP and Target Equity/Income (First Trust) |
0.35% of first $500 million 0.25% over $500 million |
| 140 | (continued) |
| Ohio National Fund, Inc. |
Notes to Financial Statements (Continued) | June 30, 2013 (Unaudited) |
Bristol Growth (Suffolk) |
0.45% of first $100 million 0.40% of next $400 million 0.35% over $500 million |
| 3 | Effective June 1, 2013, Federated Global agreed to waive sub-advisory fees equal to an annualized rate of 0.40% of the first $200 million, and 0.35% thereafter, of average daily net assets in the International Portfolio. Waivers related to the International Portfolio are voluntary and are not subject to recoupment in subsequent periods. This waiver will continue for a yet undetermined amount of time. The amount of the waiver for the six-month period ended June 30, 2013 was $58,740. As sub-advisory fees represent an expense of ONI rather than the Fund, the expenses of the International Portfolio are unaffected by the sub-advisory fee waiver. |
Suffolk, the sub-adviser for the Omni, Bristol, Bryton Growth, and Bristol Growth Portfolios has an affiliation with ONI. Ohio National Financial Services, Inc. (ONFS) owns 100% of ONLIC, the parent company of ONI, and also owns 84.7% of the voting securities of Suffolk. There were no Fund liabilities payable to Suffolk at June 30, 2013 and fees paid to Suffolk are an expense of ONI, not of the Fund.
Pursuant to a service agreement among ONI, ONLIC and the Fund, ONLIC has agreed to provide personnel and facilities to ONI on a cost-reimbursement basis. These personnel members include officers of the Fund. ONLIC also provides clerical and administrative services and such supplies and equipment as may be reasonably required in order for ONI to properly perform its advisory function pursuant to the Investment Advisory Agreement. ONLIC further performs duties to fulfill the transfer agent function on behalf of the Fund. Performance of these duties by ONLIC and availability of facilities, personnel, supplies, and equipment does not represent an expense to the Fund in excess of the advisory fees paid to ONI.
Pursuant to the Investment Advisory Agreement, if the total expenses applicable to any Portfolio during any calendar quarter (excluding taxes, brokerage commissions, interest expense and management fees) exceed 1%, on an annualized basis, evaluated quarterly, of such Portfolio’s average daily net asset value, ONI will reimburse the Portfolio for such excess expenses. There were no expense reimbursements associated with this agreement during the six-month period ended June 30, 2013.
During the six-month period ended June 30, 2013, ONI voluntarily reimbursed the amount of daily gross expenses of the Money Market Portfolio in excess of daily income earned by the Portfolio. The amount reimbursed to the Portfolio for the six-month period ended June 30, 2013 was $328,728, of which $ 48,908 was receivable from ONI at June 30, 2013. This reimbursement is also not subject to recoupment in subsequent periods.
The Investment Advisory Agreement allows for a portion of the expenses related to the Fund’s Chief Compliance Officer and staff to be incurred by the Fund and paid from the Fund to the Fund’s adviser, ONI. Pursuant to the service agreement among ONI, ONLIC, and the Fund, ONLIC has provided the personnel, services, and equipment necessary to perform the Fund’s regulation-mandated compliance function and ONI has reimbursed ONLIC for such costs. For the six-month period ended June 30, 2013, the Fund incurred compliance expenses totaling $140,472, which was equally allocated to the Portfolios. Expenses incurred by the Portfolios are reflected on the Statements of Operations as “Compliance expense”.
Each director of the Board is currently paid a quarterly retainer fee of $11,000, $3,000 for each Board meeting attended, $1,000 for each Audit Committee meeting attended, and $500 for each other Board committee or independent directors meetings attended. The Board chair receives an additional quarterly retainer fee of $3,750, the lead independent director of the Board receives an additional quarterly retainer fee of $3,125, and the Audit Committee chair receives an additional quarterly retainer fee of $1,250. For the six-month period ended June 30, 2013, directors’ compensation and reimbursement of director expenses by the Fund totaled $186,868.
U.S. Bancorp Fund Services, LLC, 615 East Michigan Street, Milwaukee, Wisconsin, serves as the accounting agent for all but the International and International Small-Mid Company Portfolios. U.S. Bank Institutional Trust & Custody, 425 Walnut Street, Cincinnati, Ohio serves as the custodian for all but the International and International Small-Mid Company Portfolios. The accounting agent and custodian for the International and International Small-Mid Company Portfolios is State Street Bank-Kansas City, 801 Pennsylvania Ave., Kansas City, Missouri. For assets held outside the United States, U.S. Bank and State Street Bank-Kansas City enter into sub-custodial agreements, subject to approval by the Board.
| 141 | (continued) |
| Ohio National Fund, Inc. |
Notes to Financial Statements (Continued) | June 30, 2013 (Unaudited) |
| (4) | Capital Share Transactions |
Capital share transactions for the six-month period ended June 30, 2013 and the year ended December 31, 2012 were as follows:
| Equity | Money Market | Bond | ||||||||||||||||||||||
| Six-month Period Ended 6/30/2013 | Year Ended 12/31/2012 | Six-month Period Ended 6/30/2013 | Year Ended 12/31/2012 | Six-month Period Ended 6/30/2013 | Year Ended 12/31/2012 | |||||||||||||||||||
Capital shares issued on sales | 212,942 | 623,661 | 11,335,149 | 17,885,924 | 1,139,087 | 3,488,174 | ||||||||||||||||||
Capital shares issued on reinvested dividends | — | 121,339 | — | — | — | — | ||||||||||||||||||
Capital shares redeemed | (798,512 | ) | (2,033,054 | ) | (10,496,732 | ) | (20,644,112 | ) | (2,584,008 | ) | (3,594,023 | ) | ||||||||||||
|
|
|
|
|
|
|
|
|
|
|
| |||||||||||||
Net increase/(decrease) | (585,570 | ) | (1,288,054 | ) | 838,417 | (2,758,188 | ) | (1,444,921 | ) | (105,849 | ) | |||||||||||||
|
|
|
|
|
|
|
|
|
|
|
| |||||||||||||
| Omni | International | Capital Appreciation | ||||||||||||||||||||||
| Six-month Period Ended 6/30/2013 | Year Ended 12/31/2012 | Six-month Period Ended 6/30/2013 | Year Ended 12/31/2012 | Six-month Period Ended 6/30/2013 | Year Ended 12/31/2012 | |||||||||||||||||||
Capital shares issued on sales | 64,553 | 161,999 | 871,439 | 1,497,944 | 251,880 | 519,553 | ||||||||||||||||||
Capital shares issued on reinvested dividends | — | 26,019 | — | — | — | 30,035 | ||||||||||||||||||
Capital shares redeemed | (201,597 | ) | (492,128 | ) | (1,203,116 | ) | (3,706,950 | ) | (508,241 | ) | (1,339,064 | ) | ||||||||||||
|
|
|
|
|
|
|
|
|
|
|
| |||||||||||||
Net increase/(decrease) | (137,044 | ) | (304,110 | ) | (331,677 | ) | (2,209,006 | ) | (256,361 | ) | (789,476 | ) | ||||||||||||
|
|
|
|
|
|
|
|
|
|
|
| |||||||||||||
| Millennium | International Small-Mid Company | Aggressive Growth | ||||||||||||||||||||||
| Six-month Period Ended 6/30/2013 | Year Ended 12/31/2012 | Six-month Period Ended 6/30/2013 | Year Ended 12/31/2012 | Six-month Period Ended 6/30/2013 | Year Ended 12/31/2012 | |||||||||||||||||||
Capital shares issued on sales | 73,217 | 136,922 | 188,411 | 485,545 | 453,644 | 1,042,101 | ||||||||||||||||||
Capital shares issued on reinvested dividends | — | — | — | — | — | — | ||||||||||||||||||
Capital shares redeemed | (179,325 | ) | (383,783 | ) | (288,068 | ) | (742,828 | ) | (718,585 | ) | (882,813 | ) | ||||||||||||
|
|
|
|
|
|
|
|
|
|
|
| |||||||||||||
Net increase/(decrease) | (106,108 | ) | (246,861 | ) | (99,657 | ) | (257,283 | ) | (264,941 | ) | 159,288 | |||||||||||||
|
|
|
|
|
|
|
|
|
|
|
| |||||||||||||
| Small Cap Growth | Mid Cap Opportunity | S&P 500® Index | ||||||||||||||||||||||
| Six-month Period Ended 6/30/2013 | Year Ended 12/31/2012 | Six-month Period Ended 6/30/2013 | Year Ended 12/31/2012 | Six-month Period Ended 6/30/2013 | Year Ended 12/31/2012 | |||||||||||||||||||
Capital shares issued on sales | 593,195 | 626,681 | 372,248 | 549,005 | 1,894,278 | 3,730,507 | ||||||||||||||||||
Capital shares issued on reinvested dividends | — | — | — | — | — | 189,836 | ||||||||||||||||||
Capital shares redeemed | (355,510 | ) | (767,540 | ) | (410,374 | ) | (831,618 | ) | (1,524,867 | ) | (3,031,332 | ) | ||||||||||||
|
|
|
|
|
|
|
|
|
|
|
| |||||||||||||
Net increase/(decrease) | 237,685 | (140,859 | ) | (38,126 | ) | (282,613 | ) | 369,411 | 889,011 | |||||||||||||||
|
|
|
|
|
|
|
|
|
|
|
| |||||||||||||
| Strategic Value | High Income Bond | Capital Growth | ||||||||||||||||||||||
| Six-month Period Ended 6/30/2013 | Year Ended 12/31/2012 | Six-month Period Ended 6/30/2013 | Year Ended 12/31/2012 | Six-month Period Ended 6/30/2013 | Year Ended 12/31/2012 | |||||||||||||||||||
Capital shares issued on sales | 1,260,961 | 23,078,732 | 1,685,176 | 6,070,090 | 344,955 | 427,102 | ||||||||||||||||||
Capital shares issued on reinvested dividends | — | 351,423 | — | — | — | — | ||||||||||||||||||
Capital shares redeemed | (2,485,702 | ) | (3,236,694 | ) | (2,805,109 | ) | (5,662,829 | ) | (281,677 | ) | (526,289 | ) | ||||||||||||
|
|
|
|
|
|
|
|
|
|
|
| |||||||||||||
Net increase/(decrease) | (1,224,741 | ) | 20,193,461 | (1,119,933 | ) | 407,261 | 63,278 | (99,187 | ) | |||||||||||||||
|
|
|
|
|
|
|
|
|
|
|
| |||||||||||||
| 142 | (continued) |
| Ohio National Fund, Inc. |
Notes to Financial Statements (Continued) | June 30, 2013 (Unaudited) |
| Nasdaq-100® Index | Bristol | Bryton Growth | ||||||||||||||||||||||
| Six-month Period Ended 6/30/2013 | Year Ended 12/31/2012 | Six-month Period Ended 6/30/2013 | Year Ended 12/31/2012 | Six-month Period Ended 6/30/2013 | Year Ended 12/31/2012 | |||||||||||||||||||
Capital shares issued on sales | 1,316,450 | 3,852,022 | 478,622 | 2,698,502 | 457,422 | 2,464,569 | ||||||||||||||||||
Capital shares issued on reinvested dividends | — | 65,966 | — | 89,395 | — | — | ||||||||||||||||||
Capital shares redeemed | (2,078,129 | ) | (3,392,616 | ) | (1,506,076 | ) | (3,705,062 | ) | (1,352,711 | ) | (3,580,153 | ) | ||||||||||||
|
|
|
|
|
|
|
|
|
|
|
| |||||||||||||
Net increase/(decrease) | (761,679 | ) | 525,372 | (1,027,454 | ) | (917,165 | ) | (895,289 | ) | (1,115,584 | ) | |||||||||||||
|
|
|
|
|
|
|
|
|
|
|
| |||||||||||||
| U.S. Equity | Balanced | Income Opportunity | ||||||||||||||||||||||
| Six-month Period Ended 6/30/2013 | Year Ended 12/31/2012 | Six-month Period Ended 6/30/2013 | Year Ended 12/31/2012 | Six-month Period Ended 6/30/2013 | Year Ended 12/31/2012 | |||||||||||||||||||
Capital shares issued on sales | 96,847 | 261,888 | 3,243,676 | 4,132,176 | 79,741 | 293,125 | ||||||||||||||||||
Capital shares issued on reinvested dividends | — | 7,717 | — | — | — | — | ||||||||||||||||||
Capital shares redeemed | (87,096 | ) | (237,667 | ) | (792,561 | ) | (464,792 | ) | (128,223 | ) | (466,598 | ) | ||||||||||||
|
|
|
|
|
|
|
|
|
|
|
| |||||||||||||
Net increase/(decrease) | 9,751 | 31,938 | 2,451,115 | 3,667,384 | (48,482 | ) | (173,473 | ) | ||||||||||||||||
|
|
|
|
|
|
|
|
|
|
|
| |||||||||||||
| Target VIP | Target Equity/Income | Bristol Growth | ||||||||||||||||||||||
| Six-month Period Ended 6/30/2013 | Year Ended 12/31/2012 | Six-month Period Ended 6/30/2013 | Year Ended 12/31/2012 | Six-month Period Ended 6/30/2013 | Year Ended 12/31/2012 | |||||||||||||||||||
Capital shares issued on sales | 59,671 | 292,064 | 86,021 | 575,533 | 407,337 | 2,078,689 | ||||||||||||||||||
Capital shares issued on reinvested dividends | — | 29,837 | — | 55,864 | — | 44,746 | ||||||||||||||||||
Capital shares redeemed | (151,261 | ) | (535,048 | ) | (282,728 | ) | (825,534 | ) | (895,001 | ) | (2,365,571 | ) | ||||||||||||
|
|
|
|
|
|
|
|
|
|
|
| |||||||||||||
Net increase/(decrease) | (91,590 | ) | (213,147 | ) | (196,707 | ) | (194,137 | ) | (487,664 | ) | (242,136 | ) | ||||||||||||
|
|
|
|
|
|
|
|
|
|
|
| |||||||||||||
| (5) | Investment Transactions |
Cost of purchases and proceeds from sales of investments (excluding short-term and government securities) for the six-month period ended June 30, 2013 were as follows:
| Equity | Bond | Omni | International | Capital Appreciation | ||||||||||||||||
Cost of purchases | $ | 42,487,438 | $ | 7,380,748 | $ | 41,374,863 | $ | 56,534,786 | $ | 34,099,782 | ||||||||||
Proceeds from sales | $ | 57,365,463 | $ | 17,343,231 | $ | 43,383,842 | $ | 60,507,899 | $ | 39,522,433 | ||||||||||
| Millennium | International Small-Mid Company | Aggressive Growth | Small Cap Growth | Mid Cap Opportunity | ||||||||||||||||
Cost of purchases | $ | 50,111,571 | $ | 20,136,833 | $ | 8,985,248 | $ | 22,203,959 | $ | 15,934,455 | ||||||||||
Proceeds from sales | $ | 53,691,002 | $ | 23,818,160 | $ | 9,294,938 | $ | 20,884,237 | $ | 16,953,592 | ||||||||||
| S&P 500® Index | Strategic Value | High Income Bond | Capital Growth | Nasdaq-100® Index | ||||||||||||||||
Cost of purchases | $ | 14,509,676 | $ | 37,790,685 | $ | 47,520,050 | $ | 11,983,702 | $ | 7,591,766 | ||||||||||
Proceeds from sales | $ | 7,632,555 | $ | 47,912,375 | $ | 55,494,621 | $ | 11,372,107 | $ | 12,230,462 | ||||||||||
| Bristol | Bryton Growth | U.S. Equity | Balanced | Income Opportunity | ||||||||||||||||
Cost of purchases | $ | 348,127,405 | $ | 129,599,168 | $ | 2,230,860 | $ | 52,098,840 | $ | 3,881,940 | ||||||||||
Proceeds from sales | $ | 369,077,604 | $ | 143,571,240 | $ | 2,231,523 | $ | 22,948,023 | $ | 5,103,367 | ||||||||||
| Target VIP | Target Equity/Income | Bristol Growth | ||||||||||||||||||
Cost of purchases | $ | 14,535,204 | $ | 17,453,930 | $ | 168,188,610 | ||||||||||||||
Proceeds from sales | $ | 15,550,447 | $ | 18,979,061 | $ | 176,216,128 | ||||||||||||||
| 143 | (continued) |
| Ohio National Fund, Inc. |
Notes to Financial Statements (Continued) | June 30, 2013 (Unaudited) |
Cost of purchases and proceeds from sales of government securities for the six-month period ended June 30, 2013 were as follows:
| Bond | Omni | Balanced | ||||||||||
Cost of purchases | $ | 3,027,344 | $ | — | $ | 13,552,336 | ||||||
Proceeds from sales | $ | 11,045,781 | $ | 113,844 | $ | 2,979,149 | ||||||
| (6) | Financial Instruments |
The Fund’s Portfolios, other than the Money Market Portfolio, may trade in financial instruments with off-balance sheet risk for hedging purposes or, otherwise, in accordance with stated investing objectives. These financial instruments may include options, futures, and foreign currency contracts that may involve, to a varying degree, elements of risk in excess of the amounts recognized on financial statements.
Options
A Portfolio may buy and write (i.e., sell) call and put options. In writing call options, the Portfolio gives the purchaser of the call option the right to purchase the underlying securities from the Portfolio at a specified “exercise” price at any time prior to the expiration of the option, normally within nine months. A Portfolio writes a covered call option when it owns the underlying securities and an uncovered call option when it does not. In purchasing put options, a Portfolio pays the seller of the put option a premium for the right of the Portfolio to sell the underlying securities to the seller at a specified exercise price prior to the expiration of the option. When a Portfolio sells a put option, it has the obligation to buy, and the purchaser of the put the right to sell, the underlying security at the exercise price during the option period. Whenever a Portfolio has a written covered call option outstanding, the underlying securities will be segregated by the Custodian and held in an escrow account to assure that such securities will be delivered to the option holder if the option is exercised. While the underlying securities are subject to the option, the Portfolio remains the record owner of the securities, entitling it to receive dividends and to exercise any voting rights. Whenever a Portfolio has a written uncovered call option outstanding, it will segregate with the Custodian cash or liquid assets that, when added to the amounts deposited with the broker as margin, equal to the market value of the securities underlying the call option (but not less than the exercise price of the call option). To cover a written put option, the Portfolio writing the option deposits cash or liquid securities in a segregated account at the Custodian. In order to terminate its position as the writer or the purchaser of an option, the Portfolio may enter into a “closing” transaction, which is the purchase (if the Portfolio has written the option) or sale (if the Portfolio is the purchaser of the option) of an option on the same underlying securities and having the same exercise price and expiration date as the option previously written or purchased by the Portfolio.
When a Portfolio writes a put or call option, an amount equal to the premium received is included on the Statement of Assets and Liabilities as a liability. The amount of the liability is subsequently marked-to-market to reflect the current market value of the option. Such liability is subject to off balance sheet risks to the extent of any future increases in market value of the written options. If an option expires on its stipulated expiration date or if the Portfolio enters into a closing purchase transaction, a gain or loss is realized. If a written call option on an individual security is exercised, a gain or loss is realized for the sale of the underlying security, and the proceeds from the sale are increased by the premium originally received. If a written call option on a securities index is exercised, a gain or loss is realized as determined by the premium originally received, the exercise price and the market value of the index. If a written put option on an individual security is exercised, the cost of the security acquired is decreased by the premium originally received. When a Portfolio purchases a put or call option, an amount equal to the premium paid is included on the Portfolio’s Statement of Assets and Liabilities as an investment, and is subsequently marked-to-market to reflect the current market value of the option. If an option expires on the stipulated expiration date or if the Portfolio enters into a closing sale transaction, a gain or loss is realized. If a Portfolio exercises a call option on an individual security, the cost of the security acquired is increased by the premium paid for the call. If the Portfolio exercises a put option on an individual security, a gain or loss is realized from the sale of the underlying security, and the proceeds from such a sale are decreased by the premium originally paid. If the Portfolio exercises a put option on a security index, a gain or loss is realized as determined by the premium originally paid, the exercise price and the market value of the index.
The Balanced and Income Opportunity Portfolios wrote call options and purchased put options on the S&P 500 Index during the six-month period ended June 30, 2013. These instruments were used by the Portfolios to provide a hedge against equity price risk. During a period in which the prices of the Portfolios’ common stocks may decline, these instruments are designed to increase in value, thus providing price accumulation gains that partially offset the price accumulation losses of the common stocks in the Portfolios.
| 144 | (continued) |
| Ohio National Fund, Inc. |
Notes to Financial Statements (Continued) | June 30, 2013 (Unaudited) |
The Balanced and Income Opportunity Portfolios’ written call options are collateralized by cash and/or securities held with the Portfolios’ prime broker and in segregated accounts at the Portfolios’ custodian. Such collateral for the Portfolios is restricted from use. The cash collateral or borrowings from the prime broker, if necessary, are included on the Statements of Assets and Liabilities. The securities pledged as collateral are noted as such on the Portfolios’ Schedules of Investments. Written and purchased options are non-income producing securities.
The activity in the number of option contracts written and the premiums received by the Balanced Portfolio for the six-month period ended June 30, 2013 was as follows:
| Number of Contracts | Premiums Received | |||||||
Options outstanding, beginning of period | — | $ | — | |||||
Options written | 540 | 959,683 | ||||||
Options exercised | — | — | ||||||
Options expired | — | — | ||||||
Options closed | (440 | ) | (703,020 | ) | ||||
|
|
|
| |||||
Options outstanding, end of period | 100 | $ | 256,663 | |||||
|
|
|
| |||||
Transactions involving purchased options by the Balanced Portfolio for the six-month period ended June 30, 2013 were: Cost of purchases: $1,561,475, Proceeds from sales: $660,180, Expirations: $926,987.
The activity in the number of option contracts written and the premiums received by the Income Opportunity Portfolio for the six-month period ended June 30, 2013 was as follows:
| Number of Contracts | Premiums Received | |||||||
Options outstanding, beginning of period | — | $ | — | |||||
Options written | 98 | 166,460 | ||||||
Options exercised | — | — | ||||||
Options expired | — | — | ||||||
Options closed | (83 | ) | (127,961 | ) | ||||
|
|
|
| |||||
Options outstanding, end of period | 15 | $ | 38,499 | |||||
|
|
|
| |||||
Transactions involving purchased options by the Income Opportunity Portfolio for the six-month period ended June 30, 2013 were: Cost of purchases: $250,006, Proceeds from sales: $77,007, Expirations: $129,103.
Futures Contracts
A Portfolio may buy or sell two kinds of financial futures contracts: stock index futures contracts and interest rate futures contracts. Stock index futures contracts are contracts developed by and traded on national commodity exchanges whereby the buyer will, on a specified future date, pay or receive a final cash payment equal to the difference between the actual value of the stock index on the last day of the contract and the value of the stock index established by the contract multiplied by the specific dollar amount set by the exchange. Futures contracts may be based on broad-based stock indexes such as the S&P 500 Index or on narrow-based stock indexes. A particular index will be selected according to the Adviser’s investment strategy for the particular Portfolio. An interest rate futures contract is an agreement whereby one party agrees to sell and another party agrees to purchase a specified amount of a specified financial instrument (debt security) at a specified price at a specified date, time and place. Although interest rate futures contracts typically require actual future delivery of and payment for financial instruments, the contracts are usually closed out before the delivery date. A public market exists in interest rate futures contracts covering primarily the following financial instruments: U.S. Treasury bonds; U.S. Treasury notes; Government National Mortgage Association (GNMA) modified pass-through mortgage-backed securities; three-month U.S. Treasury bills; 90-day commercial paper; bank certificates of deposit; and Eurodollar certificates of deposit. U.S. futures contracts are traded on exchanges which have been designated “contract markets” by the Commodities Futures Trading Commission (“CFTC”) and must be executed through a futures commission merchant (“FCM”), or brokerage firm, which is a member of the relevant contract market. It is expected that futures contracts trading in additional financial instruments will be authorized.
| 145 | (continued) |
| Ohio National Fund, Inc. |
Notes to Financial Statements (Continued) | June 30, 2013 (Unaudited) |
The Fund, on behalf of each Portfolio, has filed with the National Futures Association, a notice claiming an exclusion from the definition of the term “commodity pool operator” under the Commodity Exchange Act, as amended, and the rules of the Commodity Futures Trading Commission promulgated thereunder, with respect to each Portfolio’s operation. Accordingly, the Portfolios are not subject to registration or regulation as a commodity pool operator.
The buyer or seller of a futures contract is not required to deliver or pay for the underlying instrument unless the contract is held until the delivery date. However, both the buyer and seller are required to deposit “initial margin” for the benefit of the broker when the contract is entered into. Initial margin deposits are equal to a percentage of the contract’s value, as set by the exchange on which the contract is traded, and are similar to good faith deposits or performance bonds.
Unlike margin extended by a securities broker, initial margin payments do not constitute purchasing securities on margin for purposes of a Portfolio’s investment limitations. A Portfolio, its futures commission merchant and the Custodian retain control of the initial margin until the contract is liquidated. If the value of either party’s position declines, that party will be required to make additional “variation margin” payments to settle the change in value on a daily basis. The party that has a gain may be entitled to receive all or a portion of this amount. In the event of the bankruptcy of the FCM that holds margin on behalf of a Portfolio, the Portfolio may be entitled to return of margin owed to the Portfolio only in proportion to the amount received by the FCM’s other customers. ONI and the Sub-Advisers will attempt to minimize this risk by carefully monitoring the creditworthiness of the FCMs with which the Portfolios do business. In addition to the margin restrictions discussed above, transactions in futures contracts and options on futures contracts may involve the segregation of funds pursuant to requirements imposed by the SEC. Under those requirements, where a Portfolio has a long position in a futures contract or sells a put option, it will be required to establish a segregated account (not with an FCM or broker) containing cash or certain liquid assets equal to the purchase price of the contract or the exercise price of the option (less any margin on deposit). For a short position in futures contacts held by a Portfolio or call options sold by a Portfolio, those requirements mandate the establishment of a segregated account (not with a futures commission merchant or broker) containing cash or certain liquid assets that, when added to the amounts deposited as margin, equal the market value of the instruments underlying the futures contracts or call options. However, segregation of assets is not required if a Portfolio “covers” its position.
At June 30, 2013, there was one outstanding futures contract in the International Portfolio. Details of this contract were as follows:
Type | Description | Expiration | Number of Contracts | Counterparty | Contract at Value | Initial contract Amount | Unrealized Appreciation (Depreciation) | Variation Margin Receivable (Payable) | ||||||||||||||||||
Long | Dax Index Future Sept. 2013 | September 20, 2013 | 6 | JP Morgan Securities Inc. | $ | 1,555,439 | $ | 1,602,025 | $ | (46,586 | ) | $ | (7,054 | ) | ||||||||||||
The International Portfolio’s holdings of U.S. Treasury Bills, as noted on the Portfolio’s Schedule of Investments, were pledged at June 30, 2013 as collateral for this contract. The cost and value of the amount pledged at June 30, 2013 were $334,969 and $334,990, respectively.
This futures contract was executed for the purpose of increasing exposure to an attractive equities market, beyond that evidenced by the Portfolio’s investment in common stocks, while maintaining a significant cash balance that could be used for potentially higher-than-average shareholder transactions. There were other index futures contracts that were executed and closed in the International Portfolio during the six-month period ended June 30, 2013. These were executed for similar purposes as those for futures contracts outstanding at June 30, 2013. For the six-month period ended June 30, 2013, the notional values of futures contracts opened and closed prior to contract settlement date by the International Portfolio were approximately $9.0 million and $9.4 million, respectively.
Foreign Currency Contracts
In order to hedge against changes in the exchange rates of foreign currencies in relation to the U.S. dollar, each Portfolio, other than the Money Market Portfolio, may engage in forward foreign currency contracts, foreign currency options and foreign currency futures contracts in connection with the purchase, sale or ownership of a specific security. The International Portfolio, International Small-Mid Company Portfolio, Strategic Value Portfolio and High Income Bond Portfolio may engage in non-hedging related transactions to implement their investment strategies.
| 146 | (continued) |
| Ohio National Fund, Inc. |
Notes to Financial Statements (Continued) | June 30, 2013 (Unaudited) |
The Portfolios generally conduct their foreign currency exchange transactions on a spot (i.e., cash) basis at the spot rate prevailing in the foreign exchange currency market. When a Portfolio purchases or sells a security denominated in or exposed to a foreign currency, it may enter into a forward foreign currency contract (“forward contract”) for the purchase or sale, for a fixed amount of dollars, of the amount of currency involved in the underlying security transaction. A forward contract involves an obligation to purchase or sell a specific currency at a future date, which may be any fixed number of days from the date of the contract agreed upon by the parties, at a price set at the time of the contract. In this manner, a Portfolio may obtain protection against a possible loss resulting from an adverse change in the relationship between the U.S. dollar and the foreign currency during the period between the date the security is purchased or sold and the date upon which payment is made or received. Although such contracts tend to minimize the risk of loss due to the decline in the value of the hedged currency, at the same time they tend to limit any potential gain which might result should the value of such currency increase.
Forward contracts are traded in the interbank market conducted directly between currency traders (usually large commercial banks) and their customers. Generally a forward contract has no deposit requirement, and no commissions are charged. Although foreign exchange dealers do not charge a fee for conversion, they do realize a profit based on the difference between the prices at which they buy and sell various currencies. When the Portfolio manager believes that the currency of a particular foreign country may suffer a substantial decline against the U.S. dollar, a Portfolio may enter into a forward contract to sell, for a fixed amount of dollars, the amount of foreign currency approximating the value of some or all of that Portfolio’s securities denominated in or exposed to such foreign currency. No Portfolio will enter into such forward contracts or maintain a net exposure to such contracts where the consummation of the contracts would obligate the Portfolio to deliver an amount of foreign currency in excess of the value of its assets denominated in or exposed to that currency. At the consummation of a forward contract for delivery by a Portfolio of a foreign currency, the Portfolio may either make delivery of the foreign currency or terminate its contractual obligation to deliver the foreign currency by purchasing an offsetting contract obligating it to purchase, at the same maturity date, the same amount of the foreign currency. If the Portfolio chooses to make delivery of the foreign currency, it may be required to obtain such currency through the sale of its securities denominated in such currency or through conversion of other Portfolio assets into such currency. It is impossible to forecast the market value of Portfolio securities at the expiration of the forward contract. Accordingly, it may be necessary for the Portfolio to purchase additional foreign currency on the spot market (and bear the expense of such purchase) if the market value of the security is less than the amount of foreign currency the Portfolio is obligated to deliver, and if a decision is made to sell the security and make delivery of the foreign currency. Conversely, it may be necessary for the Portfolio to sell on the spot market some of the foreign currency received on the sale of its hedged security if the security’s market value exceeds the amount of foreign currency the Portfolio is obligated to deliver.
If the Portfolio retains the hedged security and engages in an offsetting transaction, it will incur a gain or loss to the extent that there has been movement in spot or forward contract prices. If a Portfolio engages in an offsetting transaction, it may subsequently enter into a new forward contract to sell the foreign currency. Should forward prices decline during the period between the Portfolio’s entering into a forward contract for the sale of a foreign currency and the date it enters into an offsetting contract for the purchase of the foreign currency, the Portfolio will realize a gain to the extent the price of the currency it has agreed to sell exceeds the price of the currency it has agreed to purchase. Should forward prices increase, the Portfolio will suffer a loss to the extent the price of the currency it has agreed to purchase exceeds the price of the currency it has agreed to sell.
Buyers and sellers of foreign currency options and futures contracts are subject to the same risks previously described with respect to options and futures generally. In addition, settlement of currency options and futures contracts with respect to most currencies must occur at a bank located in the issuing nation. The ability to establish and close out positions on such options is subject to the maintenance of a liquid market that may not always be available. Currency rates may fluctuate based on political considerations and governmental actions as opposed to purely economic factors.
Predicting the movements of foreign currency in relation to the U.S. dollar is difficult and requires different skills than those necessary to predict movements in the securities market. There is no assurance that the use of foreign currency hedging transactions can successfully protect a Portfolio against loss resulting from the movements of foreign currency in relation to the U.S. dollar. In addition, it must be remembered that these methods of protecting the value of a Portfolio’s securities against a decline in the value of a currency does not eliminate fluctuations in the underlying prices of the securities. It simply establishes a rate of exchange which can be achieved at some future point in time. Additionally, although such contracts tend to minimize the risk of loss due to the decline in the value of the hedged currency, at the same time they tend to limit any potential gain which might result should the value of such currency increase.
| 147 | (continued) |
| Ohio National Fund, Inc. |
Notes to Financial Statements (Continued) | June 30, 2013 (Unaudited) |
Details of the foreign currency contracts outstanding in the International Portfolio at June 30, 2013 are as follows:
Contracts to buy foreign currency:
Date of contract | Exchange date | Counterparty | Currency to | Currency to deliver | Contract at value | Unrealized appreciation (depreciation) | ||||||||||||
April 5, 2013 | July 9, 2013 | BARC | 1,746,135,000 CLP | $ | 3,676,074 | $ | 3,432,680 | $ | (243,394 | )1 | ||||||||
June 19, 2013 | July 9, 2013 | MSCS | 2,260,000 EUR | $ | 3,002,772 | $ | 2,941,810 | $ | (60,962 | )2 | ||||||||
June 13, 2013 | September 20, 2013 | MSCS | 3,500,000 GBP | $ | 5,484,850 | $ | 5,320,544 | $ | (164,306 | ) | ||||||||
June 13, 2013 | September 20, 2013 | JPM | 5,500,000 GBP | $ | 8,626,668 | $ | 8,360,855 | $ | (265,813 | ) | ||||||||
June 10, 2013 | September 12, 2013 | BARC | 109,900,000 INR | $ | 1,858,302 | $ | 1,826,772 | $ | (31,530 | ) | ||||||||
June 10, 2013 | September 12, 2013 | HSBC | 47,100,000 INR | $ | 795,877 | $ | 782,902 | $ | (12,975 | ) | ||||||||
June 4, 2013 | August 13, 2013 | BARC | 21,930,077 NOK | $ | 3,761,140 | $ | 3,605,059 | $ | (156,081 | )3 | ||||||||
April 8, 2013 | July 11, 2013 | HSBC | 77,300,000 RUB | $ | 2,436,180 | $ | 2,348,911 | $ | (87,269 | ) | ||||||||
May 10, 2013 | August 13, 2013 | HSBC | 20,000,000 SEK | $ | 3,036,007 | $ | 2,979,494 | $ | (56,513 | )4 | ||||||||
|
|
|
|
|
| |||||||||||||
| $ | 32,677,870 | $ | 31,599,027 | $ | (1,078,843 | ) | ||||||||||||
|
|
|
|
|
| |||||||||||||
Contracts to sell foreign currency:
Date of contract | Exchange date | Counterparty | Currency to | Currency to | Contract at value | Unrealized appreciation (depreciation) | ||||||||||
May 9, 2013 | July 9, 2013 | BARC | $ 3,658,743 | 1,746,135,000 CLP | $ | 3,432,680 | $ | 226,063 | 1 | |||||||
April 5, 2013 | July 9, 2013 | MSCS | $ 2,941,141 | 2,260,000 EUR | $ | 2,941,810 | $ | (669 | )2 | |||||||
June 13, 2013 | September 20, 2013 | MSCS | $ 8,255,887 | 781,295,831 JPY | $ | 7,880,463 | $ | 375,424 | ||||||||
June 13, 2013 | September 20, 2013 | HSBC | $ 8,439,393 | 798,704,168 JPY | $ | 8,056,051 | $ | 383,342 | ||||||||
April 5, 2013 | July 9, 2013 | MSCS | $ 3,637,317 | 4,160,000,000 KRW | $ | 3,641,240 | $ | (3,923 | ) | |||||||
May 9, 2013 | August 13, 2013 | BARC | $ 3,775,840 | 21,930,077 NOK | $ | 3,605,059 | $ | 170,781 | 3 | |||||||
May 17, 2013 | August 13, 2013 | HSBC | $ 186,570 | 1,250,000 SEK | $ | 186,218 | $ | 352 | 4 | |||||||
|
|
|
|
| ||||||||||||
$ 30,894,891 | $ | 29,743,521 | $ | 1,151,370 | ||||||||||||
|
|
|
|
| ||||||||||||
Counterparties | Currencies | |
BARC – Barclays Bank PLC | CLP – Chilean Peso | |
MSCS – Morgan Stanley Capital Services, Inc. | EUR – Euro | |
JPM – JPMorgan Chase Bank, N.A. | GBP – British Pound | |
HSBC – HSBC Bank USA, N.A. | INR – Indian Rupee | |
NOK – Norwegian Krone | ||
RUB – New Russian Ruble | ||
SEK – Swedish Krona | ||
JPY – Japanese Yen | ||
KRW – South Korean Won |
Contracts subject to either party’s election to net settlement, per terms of master agreements with respective counterparties:
Net Contract at Value | Net Unrealized Appreciation (Depreciation) | |||
1 | $ — | $ (17,331) | ||
2 | $ — | $ (61,631) | ||
3 | $ — | $ 14,700 | ||
4 | $ 2,793,276 | $ (56,161) |
Foreign currency contracts were executed in the International Portfolio in order to mitigate the effect that exchange rate volatility had on the valuation of the Portfolio’s investments that were either under-weighted or over-weighted in relation to the Portfolio’s benchmark index. The Portfolio was under-weighted in equity investments within the countries of Great Britain, India, Russia, and Sweden. The Portfolio executed contracts to buy those countries’ currencies to mitigate the effects that volatility in those currencies’ exchange rates might otherwise have on the Portfolio’s performance relative to the benchmark. The Portfolio was
| 148 | (continued) |
| Ohio National Fund, Inc. |
Notes to Financial Statements (Continued) | June 30, 2013 (Unaudited) |
over-weighted in equity investments within Japan and South Korea and, likewise, executed contracts to sell those countries’ currencies in order to mitigate the effect that volatility in the exchange rate might otherwise have on relative performance.
The Portfolio entered into other foreign currency contracts during the six-month period for similar benchmark performance hedging purposes. The Portfolio also entered into contracts that were the inverse of previously executed contracts to effectively exit prior contracts earlier than stated contract delivery dates, as investment over-weights or under-weights were reduced, or as previously executed contracts resulted in an attractive return to the Portfolio. For the six-month period ended June 30, 2013, the notional value of foreign currency contracts executed by the International Portfolio were approximately $127 million for currencies bought and approximately $113 million for currencies sold.
The values and financial statement effects of derivative instruments that were not accounted for as hedging instruments as of, and for the six-month period ended June 30, 2013, were as follows:
Portfolio | Instrument | Primary Risk Type | Value- Asset Derivatives | Value- Liability Derivatives | Location on Statements of Assets and Liabilities | |||||||||||
International | Contracts to buy foreign currencies | Currency exchange rate | $ | 31,599,027 | $ | (32,677,870 | ) | (1 | ) | |||||||
|
|
|
| |||||||||||||
Contracts to sell foreign currencies | Currency exchange rate | $ | 30,894,891 | $ | (29,743,521 | ) | (1 | ) | ||||||||
|
|
|
| |||||||||||||
Futures contracts | Equity price | $ | 1,555,439 | $ | (1,602,025 | ) | (2 | ) | ||||||||
|
|
|
| |||||||||||||
Balanced | Purchased options | Equity price | $ | 430,000 | $ | — | (3 | ) | ||||||||
|
|
|
| |||||||||||||
Written options | Equity price | $ | — | $ | (326,500 | ) | (4 | ) | ||||||||
|
|
|
| |||||||||||||
Income Opportunity | Purchased options | Equity price | $ | 64,500 | $ | — | (3 | ) | ||||||||
|
|
|
| |||||||||||||
Written options | Equity price | $ | — | $ | (48,975 | ) | (4 | ) | ||||||||
|
|
|
| |||||||||||||
| (1) | Net unrealized appreciation on foreign currency contacts |
| (2) | Net unrealized appreciation on futures contracts |
| (3) | Investments in securities, at value |
| (4) | Options written, at value |
Portfolio | Instrument | Risk Type | Realized Gain (Loss) on Derivatives Recognized in Income | Change in Unrealized Appreciation/ Depreciation on Derivatives Recognized in Income | Location on Statements of Operations | |||||||||||
International | Foeign currency contracts | Currency exchange rate | $ | 107,765 | $ | (676,832 | ) | (1 | ),(2) | |||||||
|
|
|
| |||||||||||||
Futures contracts | Equity price | $ | (147,689 | ) | $ | (30,588 | ) | (3 | ),(4) | |||||||
|
|
|
| |||||||||||||
Balanced | Purchased options | Equity price | $ | (901,227 | ) | $ | 28,831 | (5 | ),(6) | |||||||
|
|
|
| |||||||||||||
Written options | Equity price | $ | 159,988 | $ | (69,837 | ) | (7 | ),(8) | ||||||||
|
|
|
| |||||||||||||
Income Opportunity | Purchased options | Equity price | $ | (169,999 | ) | $ | 4,200 | (5 | ),(6) | |||||||
|
|
|
| |||||||||||||
Written options | Equity price | $ | 18,981 | $ | (10,476 | ) | (7 | ),(8) | ||||||||
|
|
|
| |||||||||||||
| (1) | Net realized gain (loss) on foreign currency contracts |
| (2) | Change in unrealized appreciation/depreciation on foreign currency contracts |
| (3) | Net realized gain (loss) on futures contracts |
| (4) | Change in unrealized appreciation/depreciation on futures contracts |
| (5) | Net realized gain (loss) on investments |
| (6) | Change in unrealized appreciation/depreciation on investments |
| (7) | Net realized gain (loss) on written options |
| (8) | Change in unrealized appreciation/depreciation on written options |
| 149 | (continued) |
| Ohio National Fund, Inc. |
Notes to Financial Statements (Continued) | June 30, 2013 (Unaudited) |
| (7) | Federal Income Tax Information |
At December 31, 2012, the components of accumulated earnings (deficit) on a tax basis were as follows:
Portfolio | Undistributed Ordinary Income | Undistributed Long-Term Capital Gains (Losses) | Accumulated Earnings | Accumulated Capital and Other Losses | Unrealized Appreciation (Depreciation)(1) | Total Accumulated Earnings (Deficit) | ||||||||||||||||||
Equity | $ | 367,208 | $ | — | $ | 367,208 | $ | (109,176,644 | ) | $ | 23,672,680 | $ | (85,136,756 | ) | ||||||||||
Money Market | — | — | — | — | — | — | ||||||||||||||||||
Bond | 5,756,080 | — | 5,756,080 | (13,095,188 | ) | 14,784,981 | 7,445,873 | |||||||||||||||||
Omni | 116,546 | — | 116,546 | (4,281,450 | ) | 1,818,860 | (2,346,044 | ) | ||||||||||||||||
International. | 5,607,011 | — | 5,607,011 | (91,803,628 | ) | 36,434,497 | (49,762,120 | ) | ||||||||||||||||
Capital Appreciation | 83,350 | — | 83,350 | (9,467,074 | ) | 12,600,804 | 3,217,080 | |||||||||||||||||
Millennium | — | — | — | (7,160,910 | ) | 1,985,715 | (5,175,195 | ) | ||||||||||||||||
International Small-Mid Company | 324,350 | — | 324,350 | (12,428,660 | ) | 14,693,887 | 2,589,577 | |||||||||||||||||
Aggressive Growth | 103,178 | — | 103,178 | (926,592 | ) | 7,701,693 | 6,878,279 | |||||||||||||||||
Small Cap Growth | 1,231,899 | 4,665,376 | 5,897,275 | — | 1,764,497 | 7,661,772 | ||||||||||||||||||
Mid Cap Opportunity. | — | — | — | (24,689,868 | ) | 9,517,626 | (15,172,242 | ) | ||||||||||||||||
S&P 500® Index | 741,137 | — | 741,137 | (1,370,102 | ) | 44,464,029 | 43,835,064 | |||||||||||||||||
Strategic Value | 2,248,868 | — | 2,248,868 | (6,052,041 | ) | 1,681,512 | (2,121,661 | ) | ||||||||||||||||
High Income Bond | 21,490,144 | 4,485,600 | 25,975,744 | — | 16,141,992 | 42,117,736 | ||||||||||||||||||
Capital Growth | 488,764 | 3,302,339 | 3,791,103 | — | 9,349,925 | 13,141,028 | ||||||||||||||||||
Nasdaq-100® Index | 431,659 | 244,406 | 676,065 | — | 16,663,050 | 17,339,115 | ||||||||||||||||||
Bristol | 563,023 | 7,883,154 | 8,446,177 | — | 9,315,151 | 17,761,328 | ||||||||||||||||||
Bryton Growth | 7,458,993 | 4,746,750 | 12,205,743 | — | (646,972 | ) | 11,558,771 | |||||||||||||||||
U.S. Equity | 22,445 | — | 22,445 | (5,766,338 | ) | 2,148,659 | (3,595,234 | ) | ||||||||||||||||
Balanced | 651,938 | — | 651,938 | (344,425 | ) | 2,746,717 | 3,054,230 | |||||||||||||||||
Income Opportunity | 119,759 | — | 119,759 | (178,081 | ) | 1,326,409 | 1,268,087 | |||||||||||||||||
Target VIP | 79,804 | — | 79,804 | (6,313,615 | ) | 2,070,745 | (4,163,066 | ) | ||||||||||||||||
Target Equity/Income | 116,187 | — | 116,187 | (15,288,008 | ) | 1,382,038 | (13,789,783 | ) | ||||||||||||||||
Bristol Growth | 1,134,150 | 5,795,060 | 6,929,210 | — | 4,870,688 | 11,799,898 | ||||||||||||||||||
| (1) | The differences between book-basis and tax-basis unrealized appreciation/(depreciation) are attributed primarliy to tax deferral of losses on wash sales and the realization for tax purposes of unrealized gains/(losses) on certain instruments. |
For Federal income tax purposes, the following Portfolios had capital loss carry forwards as of December 31, 2012 that are available to offset future realized gains, if any:
| Total Loss Carryforward | Expiration | |||||||||||||||||||||||
Portfolio | 2016 | 2017 | 2018 | No Expiration Short Term | No Expiration Long Term | |||||||||||||||||||
Equity | $ | 109,176,644 | $ | 58,736,517 | $ | 47,422,387 | $ | 3,017,740 | $ | — | $ | — | ||||||||||||
Bond | 13,095,188 | 3,572,434 | 9,522,754 | — | — | — | ||||||||||||||||||
Omni | 4,281,450 | — | 4,281,450 | — | — | — | ||||||||||||||||||
International. | 91,803,628 | 26,011,498 | 65,792,130 | — | — | — | ||||||||||||||||||
Capital Appreciation | 9,467,074 | — | 9,467,074 | — | — | — | ||||||||||||||||||
Millennium | 7,160,910 | — | 7,160,910 | — | — | — | ||||||||||||||||||
International Small-Mid Company | 12,428,660 | 1,536,227 | 10,892,433 | — | — | — | ||||||||||||||||||
Aggressive Growth | 926,592 | — | 705,621 | — | 220,971 | — | ||||||||||||||||||
Mid Cap Opportunity. | 24,689,868 | 11,038,408 | 13,651,460 | — | — | — | ||||||||||||||||||
S&P 500® Index | 1,370,102 | — | 58,164 | 1,311,938 | — | — | ||||||||||||||||||
Strategic Value | 6,052,041 | 3,585,588 | 2,272,799 | 193,654 | — | — | ||||||||||||||||||
U.S. Equity | 5,766,338 | 1,759,920 | 4,006,418 | — | — | — | ||||||||||||||||||
Balanced | 344,425 | — | 344,425 | — | — | — | ||||||||||||||||||
Income Opportunity | 178,081 | — | 37,641 | 140,440 | — | — | ||||||||||||||||||
Target VIP | 6,313,615 | — | 6,313,615 | — | — | — | ||||||||||||||||||
Target Equity/Income | 15,288,008 | — | 12,624,380 | — | 2,663,628 | — | ||||||||||||||||||
| 150 | (continued) |
| Ohio National Fund, Inc. |
Notes to Financial Statements (Continued) | June 30, 2013 (Unaudited) |
The Board does not intend to authorize a distribution of any realized gain for a Portfolio until the capital loss carry over has been offset or expires.
The Regulated Investment Company Modernization Act of 2010 (the “Act”) was enacted on December 22, 2010. The Act makes changes to several tax rules impacting the Fund. In general, the provisions of the Act were effective for the Fund’s fiscal year ending December 31, 2012. Although the Act provides several benefits, including the unlimited carryover of future capital losses, there may be a greater likelihood that all or a portion of each Portfolio’s pre-enactment capital loss carryovers may expire without being utilized due to the Act’s requirement that post-enactment capital losses be utilized before pre-enactment capital loss carryovers.
The tax characteristics of distributions paid to shareholders for the year ended December 31, 2012 were as follows:
Portfolio | Ordinary Income | Net Long-Term Capital Gains | Total Distribution Paid | |||||||||
Equity | $ | 2,551,766 | $ | — | $ | 2,551,766 | ||||||
Omni | 434,512 | — | 434,512 | |||||||||
Capital Appreciation | 681,205 | — | 681,205 | |||||||||
S&P 500® Index | 2,826,655 | — | 2,826,655 | |||||||||
Strategic Value | 3,918,367 | — | 3,918,367 | |||||||||
Nasdaq-100® Index | 447,911 | — | 447,911 | |||||||||
Bristol | 1,149,626 | — | 1,149,626 | |||||||||
US Equity | 86,203 | — | 86,203 | |||||||||
Target VIP | 297,777 | — | 297,777 | |||||||||
Target Equity/Income | 449,704 | — | 449,704 | |||||||||
Bristol Growth | 473,865 | — | 473,865 | |||||||||
There were no distributions paid to shareholders for the six-month period ended June 30, 2013.
| 151 | (continued) |
Ohio National Fund, Inc.
Notes to Financial Statements (Continued) | June 30, 2013 (Unaudited) |
During the year ended December 31, 2012, the Fund recorded classifications within the composition of net assets for permanent book/tax differences. These classifications were as follows:
| Equity | Money Market | Bond | Omni | International | Capital Appreciation | Millennium | International Small-Mid Company | Aggressive Growth | Small Cap Growth | Mid Cap Opportunity | S&P 500® Index | |||||||||||||||||||||||||||||||||||||
Consent distributions | ||||||||||||||||||||||||||||||||||||||||||||||||
Paid in capital in excess of par value | $ | 324,074 | $ | — | $ | 5,641,940 | $ | 73,015 | $ | 1,009,365 | $ | 43,504 | $ | — | $ | 729,334 | $ | 3,051 | $ | 1,520,145 | $ | — | $ | 408,791 | ||||||||||||||||||||||||
Undistributed net investment income | (324,074 | ) | — | (5,641,940 | ) | (73,015 | ) | (1,009,365 | ) | (43,504 | ) | — | (729,334 | ) | (3,051 | ) | — | — | (408,791 | ) | ||||||||||||||||||||||||||||
Accumulated net realized gain (loss) on investments | — | — | — | — | — | — | — | — | — | (1,520,145 | ) | — | — | |||||||||||||||||||||||||||||||||||
Undistributed net investment losses | ||||||||||||||||||||||||||||||||||||||||||||||||
Paid in capital in excess of par value | — | — | — | — | — | — | (167,248 | ) | — | — | — | (90,469 | ) | — | ||||||||||||||||||||||||||||||||||
Undistributed net investment income | — | — | — | — | — | — | 167,248 | — | — | 69,184 | 90,469 | — | ||||||||||||||||||||||||||||||||||||
Accumulated net realized gain (loss) on investments | — | — | — | — | — | — | — | — | — | (69,184 | ) | — | — | |||||||||||||||||||||||||||||||||||
Foreign currency related reclassifications | ||||||||||||||||||||||||||||||||||||||||||||||||
Undistributed net investment income | — | — | — | 16 | 3,868,130 | (648 | ) | — | (74,888 | ) | 8 | (18 | ) | — | — | |||||||||||||||||||||||||||||||||
Accumulated net realized gain (loss) on investments | — | — | — | (16 | ) | (3,868,130 | ) | 648 | — | 74,888 | (8 | ) | 18 | — | — | |||||||||||||||||||||||||||||||||
Real estate investment trust (REIT) reclassifications | ||||||||||||||||||||||||||||||||||||||||||||||||
Undistributed net investment income | (16,079 | ) | — | — | — | — | — | — | — | (846 | ) | — | — | (61,826 | ) | |||||||||||||||||||||||||||||||||
Accumulated net realized gain (loss) on investments | 16,079 | — | — | — | — | — | — | — | 846 | — | — | 61,826 | ||||||||||||||||||||||||||||||||||||
Passive Foreign Investment Company (PFIC) reclassifications | ||||||||||||||||||||||||||||||||||||||||||||||||
Undistributed net investment income | — | — | — | 32,253 | — | 5,991 | — | — | — | — | — | — | ||||||||||||||||||||||||||||||||||||
Accumulated net realized gain (loss) on investments | — | — | — | (32,253 | ) | — | (5,991 | ) | — | — | — | — | — | — | ||||||||||||||||||||||||||||||||||
Other permanent differences | ||||||||||||||||||||||||||||||||||||||||||||||||
Paid in capital in excess of par value | — | — | — | — | — | — | — | — | — | — | (295 | ) | — | |||||||||||||||||||||||||||||||||||
Undistributed net investment income | — | — | (2,664 | ) | — | — | (4,526 | ) | — | — | — | — | (32,488 | ) | (4,734 | ) | ||||||||||||||||||||||||||||||||
Accumulated net realized gain (loss) on investments | — | — | 2,664 | — | — | 4,526 | — | — | — | — | 32,783 | 4,734 | ||||||||||||||||||||||||||||||||||||
| 152 | (continued) |
Ohio National Fund, Inc.
Notes to Financial Statements (Continued) | June 30, 2013 (Unaudited) |
| Strategic Value | High Income Bond | Capital Growth | Nasdaq-100® Index | Bristol | Bryton Growth | U.S. Equity | Balanced | Income Opportunity | Target VIP | Target Equity/Income | Bristol Growth | |||||||||||||||||||||||||||||||||||||
Consent distributions | ||||||||||||||||||||||||||||||||||||||||||||||||
Paid in capital in excess of par value | $ | 559,206 | $ | 22,704,018 | $ | 2,711,694 | $ | 4,882,212 | $ | 3,107,885 | $ | 22,416,519 | $ | 87,152 | $ | 57,455 | $ | 108,336 | $ | 24,083 | $ | 50,416 | $ | 7,814,376 | ||||||||||||||||||||||||
Undistributed net investment income | (559,206 | ) | (21,132,185 | ) | — | (20,387 | ) | (76,535 | ) | (830,922 | ) | (87,152 | ) | (57,455 | ) | (108,336 | ) | (24,083 | ) | (50,416 | ) | (20,648 | ) | |||||||||||||||||||||||||
Accumulated net realized gain (loss) on investments | — | (1,571,833 | ) | (2,711,694 | ) | (4,861,825 | ) | (3,031,350 | ) | (21,585,597 | ) | — | — | — | — | — | (7,793,728 | ) | ||||||||||||||||||||||||||||||
Undistributed net investment losses | ||||||||||||||||||||||||||||||||||||||||||||||||
Paid in capital in excess of par value | — | — | — | — | — | — | — | — | — | — | — | — | ||||||||||||||||||||||||||||||||||||
Undistributed net investment income | — | — | 96,135 | — | — | 766,536 | — | — | — | — | — | — | ||||||||||||||||||||||||||||||||||||
Accumulated net realized gain (loss) on investments | — | — | (96,135 | ) | — | — | (766,536 | ) | — | — | — | — | — | — | ||||||||||||||||||||||||||||||||||
Foreign currency related reclassifications | ||||||||||||||||||||||||||||||||||||||||||||||||
Undistributed net investment income | 356,986 | — | — | (37 | ) | 130 | 136 | — | 7 | — | (50 | ) | (145 | ) | — | |||||||||||||||||||||||||||||||||
Accumulated net realized gain (loss) on investments | (356,986 | ) | — | — | 37 | (130 | ) | (136 | ) | — | (7 | ) | — | 50 | 145 | — | ||||||||||||||||||||||||||||||||
Real estate investment trust (REIT) reclassifications | ||||||||||||||||||||||||||||||||||||||||||||||||
Undistributed net investment income | (39 | ) | — | (28,069 | ) | — | — | 111,045 | — | 76 | 7 | — | — | — | ||||||||||||||||||||||||||||||||||
Accumulated net realized gain (loss) on investments | 39 | — | 28,069 | — | — | (111,045 | ) | — | (76 | ) | (7 | ) | — | — | — | |||||||||||||||||||||||||||||||||
Passive Foreign Investment Company (PFIC) reclassifications | ||||||||||||||||||||||||||||||||||||||||||||||||
Undistributed net investment income | — | — | — | — | 238,448 | — | — | — | — | — | — | 104,112 | ||||||||||||||||||||||||||||||||||||
Accumulated net realized gain (loss) on investments | — | — | — | — | (238,448 | ) | — | — | — | — | — | — | (104,112 | ) | ||||||||||||||||||||||||||||||||||
Other permanent differences | ||||||||||||||||||||||||||||||||||||||||||||||||
Paid in capital in excess of par value | — | — | (2,376 | ) | — | — | — | — | — | (66 | ) | — | — | — | ||||||||||||||||||||||||||||||||||
Undistributed net investment income | (1,097 | ) | — | (14,700 | ) | — | — | — | — | — | 486 | — | — | — | ||||||||||||||||||||||||||||||||||
Accumulated net realized gain (loss) on investments | 1,097 | — | 17,076 | — | — | — | — | — | (420 | ) | — | — | — | |||||||||||||||||||||||||||||||||||
| 153 | (continued) |
| Ohio National Fund, Inc. |
Notes to Financial Statements (Continued) | June 30, 2013 (Unaudited) |
The cost basis for federal income tax purposes may differ from the cost basis for financial reporting purposes. The table below details the unrealized appreciation (depreciation) and aggregate cost of securities at June 30, 2013 for federal income tax purposes.
| Equity | Bond | Omni | International | Capital Appreciation | Millennium | |||||||||||||||||||
Gross unrealized: | ||||||||||||||||||||||||
Appreciation | $ | 41,086,698 | $ | 8,939,805 | $ | 3,333,347 | $ | 27,663,747 | $ | 26,266,766 | $ | 4,386,933 | ||||||||||||
Depreciation | (3,880,791 | ) | (2,134,341 | ) | (819,864 | ) | (4,853,860 | ) | (3,672,768 | ) | (253,201 | ) | ||||||||||||
|
|
|
|
|
|
|
|
|
|
|
| |||||||||||||
Net unrealized: | ||||||||||||||||||||||||
Appreciation (Depreciation) | $ | 37,205,907 | $ | 6,805,464 | $ | 2,513,483 | $ | 22,809,887 | $ | 22,593,998 | $ | 4,133,732 | ||||||||||||
|
|
|
|
|
|
|
|
|
|
|
| |||||||||||||
Aggregate cost of securities: | $ | 163,335,018 | $ | 139,308,233 | $ | 31,476,056 | $ | 150,061,239 | $ | 101,860,972 | $ | 32,933,958 | ||||||||||||
|
|
|
|
|
|
|
|
|
|
|
| |||||||||||||
| International Small-Mid Company | Aggressive Growth | Small Cap Growth | Mid Cap Opportunity | S&P 500® Index | Strategic Value | |||||||||||||||||||
Gross unrealized: | ||||||||||||||||||||||||
Appreciation | $ | 14,241,934 | $ | 8,144,461 | $ | 6,066,773 | $ | 15,011,574 | $ | 82,172,307 | $ | 21,802,075 | ||||||||||||
Depreciation | (1,146,305 | ) | (775,929 | ) | (1,889,976 | ) | (1,146,918 | ) | (12,417,761 | ) | (2,752,679 | ) | ||||||||||||
|
|
|
|
|
|
|
|
|
|
|
| |||||||||||||
Net unrealized: | ||||||||||||||||||||||||
Appreciation (Depreciation) | $ | 13,095,629 | $ | 7,368,532 | $ | 4,176,797 | $ | 13,864,656 | $ | 69,754,546 | $ | 19,049,396 | ||||||||||||
|
|
|
|
|
|
|
|
|
|
|
| |||||||||||||
Aggregate cost of securities: | $ | 54,662,034 | $ | 25,110,027 | $ | 40,963,030 | $ | 60,029,320 | $ | 171,166,502 | $ | 255,892,027 | ||||||||||||
|
|
|
|
|
|
|
|
|
|
|
| |||||||||||||
| High Income Bond | Capital Growth | Nasdaq-100® Index | Bristol | Bryton Growth | U.S. Equity | |||||||||||||||||||
Gross unrealized: | ||||||||||||||||||||||||
Appreciation | $ | 12,777,580 | $ | 15,612,714 | $ | 21,475,340 | $ | 22,385,850 | $ | 19,768,197 | $ | 4,183,245 | ||||||||||||
Depreciation | (4,092,843 | ) | (2,177,519 | ) | (1,543,309 | ) | (5,366,574 | ) | (5,491,920 | ) | (58,975 | ) | ||||||||||||
|
|
|
|
|
|
|
|
|
|
|
| |||||||||||||
Net unrealized: | ||||||||||||||||||||||||
Appreciation (Depreciation) | $ | 8,684,737 | $ | 13,435,195 | $ | 19,932,031 | $ | 17,019,276 | $ | 14,276,277 | $ | 4,124,270 | ||||||||||||
|
|
|
|
|
|
|
|
|
|
|
| |||||||||||||
Aggregate cost of securities: | $ | 286,569,337 | $ | 50,972,212 | $ | 49,404,481 | $ | 193,567,371 | $ | 149,918,591 | $ | 13,827,466 | ||||||||||||
|
|
|
|
|
|
|
|
|
|
|
| |||||||||||||
| Balanced | Income Opportunity | Target VIP | Target Equity/ Income | Bristol Growth | ||||||||||||||||||||
Gross unrealized: | ||||||||||||||||||||||||
Appreciation | $ | 9,294,684 | $ | 1,739,245 | $ | 3,828,516 | $ | 3,263,339 | $ | 10,081,314 | ||||||||||||||
Depreciation | (2,005,325 | ) | (91,056 | ) | (885,869 | ) | (266,634 | ) | (2,635,867 | ) | ||||||||||||||
|
|
|
|
|
|
|
|
|
| |||||||||||||||
Net unrealized: | ||||||||||||||||||||||||
Appreciation (Depreciation) | $ | 7,289,359 | $ | 1,648,189 | $ | 2,942,647 | $ | 2,996,705 | $ | 7,445,447 | ||||||||||||||
|
|
|
|
|
|
|
|
|
| |||||||||||||||
Aggregate cost of securities: | $ | 119,941,054 | $ | 8,300,742 | $ | 19,873,220 | $ | 20,756,246 | $ | 104,032,302 | ||||||||||||||
|
|
|
|
|
|
|
|
|
| |||||||||||||||
| (8) | Legal Matters |
In December 2007, the Target Equity/Income Portfolio, as a shareholder of Lyondell Chemical Company (“Lyondell”), participated in a cash out merger of Lyondell in which it received $48 per share of consideration (the “Merger”). The value of the proceeds received by the Target Equity/Income Portfolio as a result of the Merger was $1,772,400. Lyondell later filed for bankruptcy and two entities created by the Lyondell bankruptcy plan of reorganization have initiated lawsuits seeking to recover, or clawback, proceeds received by shareholders in the December 2007 merger based on fraudulent transfer claims.
| 154 | (continued) |
| Ohio National Fund, Inc. |
Notes to Financial Statements (Continued) | June 30, 2013 (Unaudited) |
The first action, Edward S. Weisfelner, as Trustee of the LB Creditor Trust v. Morgan Stanley & Co., Inc., et. al., was initiated on October 22, 2010 (the “Creditor Trust Action”), in the Supreme Court of the State of New York in the County of New York but has subsequently been removed to the U.S. Bankruptcy Court for the Southern District of New York. The second action, Edward S. Weisfelner, as Trustee of the LB Litigation Trust v. Holmes TTEE, et. al., was initiated on December 23, 2010 (the “Litigation Trust Action”), in the U.S. Bankruptcy Court for the Southern District of New York. Both actions attempt to recover the proceeds paid out to the holders of Lyondell shares at the time of the 2007 merger.
On January 4, 2012, the Fund was named in a second amended complaint in the Creditor Trust Action. The Target Equity/Income Portfolio composes part of the Fund. On March 2, 2012, the Fund moved the U.S. Bankruptcy Court for the Southern District of New York to dismiss it from the Creditor Trust Action. The Court has yet to take any action on the motion to dismiss. The outcome of these proceedings on the Portfolio cannot be predicted. Management of the Fund continues to assess the cases and has not yet determined the potential effect, if any, on the net asset value of the Target Equity/Income Portfolio.
Also, in December 2007, the S&P 500® Index and Strategic Value Portfolios, shareholders of the Tribune Company, participated in a similar cash out merger in which shareholders received $34 per share of consideration. The value of the proceeds received by the S&P 500® Index and Strategic Value Portfolios, was $37,910 and $384,200, respectively. The company subsequently filed for bankruptcy and several legal complaints have been initiated by groups of Tribune Company creditors seeking to recover, or clawback, proceeds received by shareholders based on fraudulent transfer claims (the “Tribune Bankruptcy”).
The first action, Official Committee of Unsecured Creditors of Tribune Company v. FitzSimons, et. al., was initiated on November 1, 2010 in the U.S. Bankruptcy Court for the District of Delaware. As a result of these proceedings, the Court agreed to allow individual creditors to file similar complaints in U.S. state courts. The Fund is specifically named in a complaint in the U.S. District Court, Southern District of Ohio, Western Division, Deutsche Bank Trust Company Americas, et. al. v. American Electric Power, et. al., that was initiated in June of 2011. The Fund, along with the Strategic Value Portfolio, is also named in a similar complaint in the U.S. District Court, Eastern District of Pennsylvania, Deutsche Bank Trust Company Americas, et. al. v. Ametek Inc. Employees Master Retirement Trust, et. al. These Tribune litigation actions have been consolidated into a single Multidistrict Litigation (“MDL”) in the U.S. District Court, Southern District of New York. Pursuant to a Court order dated September 7, 2012, certain defendants in the MDL, including the Fund, filed a motion to dismiss on November 6, 2012. On May 23, 2013, the Court heard oral arguments on the motion to dismiss. The Court has now taken the motion to dismiss under advisement. The outcome of these proceedings on the two Portfolios of the Fund cannot be predicted. Management of the Fund continues to assess the litigation and any offers of settlement.
| 155 |
| Ohio National Fund, Inc. |
| June 30, 2013 (Unaudited) |
| (1) | Review and Approval of Advisory and Sub-advisory Agreements |
At a meeting held on May 21, 2013, the Board of Directors (the “Board”), including a majority of the Directors who are not “interested persons” of the Fund (the “Independent Directors”), approved the continuation of the sub-advisory agreements with the Sub-Adviser (each a “Sub-Adviser,” and together the “Sub-Advisers”) for the Equity Portfolio and the Target Equity/Income Portfolio (collectively the Portfolios”), respectively. The Independent Directors were separately represented by independent legal counsel in connection with their consideration of the approval of the continuation of these agreements. At the meeting held on November 13, 2012, on recommendation of ONI (the “Adviser”), the investment adviser to both Portfolios, the Board had approved the continuation of these sub-advisory agreements only through May 31, 2013 due to poor performance. The Adviser had agreed to closely monitor the performance of each Portfolio, with the understanding that the Board would consider approving each agreement through November 30, 2013 at its May meeting and would focus primarily on the Portfolio’s performance in determining whether to do so.
At the May 21, 2013 meeting, the Directors noted that the Adviser is responsible for monitoring the investment performance and other responsibilities of the Sub-Advisers that have day-to-day responsibility for the investment decisions made for the Portfolios. They also noted that the Adviser reports to the Fund’s Board on its analysis of each Sub-Adviser’s performance at the regular meetings of the Board, which are held at least quarterly. Where warranted, the Adviser will add or remove a particular Portfolio from a watchlist that it maintains. Watchlist criteria include, for example: (a) fund performance over various time periods; (b) fund risk issues, such as changes in key personnel involved with fund management or changes in investment philosophy or process; and (c) organizational risk issues, such as regulatory, compliance or legal concerns, or changes in the ownership of the Sub-Adviser. Both Portfolios were on the Adviser’s watchlist at the November 13, 2012 meeting for performance reasons.
In considering the sub-advisory agreements, the Board requested and reviewed a significant amount of information relating to each Portfolio and its Sub-Adviser, including the following: (1) performance data for each Portfolio for various time periods, including year-to-date through April 30, 2013, (2) comparative performance, advisory fee and expense ratio information for a peer group of funds in the respective Portfolio’s Morningstar category (a “Morningstar Peer Group”), as well as management fee peer comparison charts showing where each Portfolio’s sub-advisory fee was located in the dispersion of its peer funds’ sub-advisory fees; (3) comparable performance information for each Portfolio’s relevant benchmark index; (4) comparative data regarding sub-advisory fees, including data regarding the fees charged by the Sub-Advisers for managing other institutional funds and institutional accounts using investment strategies and techniques similar to those used in managing the Portfolios; (5) comparative data regarding the expense ratio of each Portfolio, as compared to its Morningstar Peer Group; and (6) other information regarding the nature, extent and quality of services provided by the Sub-Advisers, as applicable. The Directors also took into account information on the services provided by the Adviser and each Sub-Adviser and performance, fee and expense ratio information regarding each Portfolio provided to them periodically throughout the year. They also met with a representative of the Adviser to review the relative performance of each Portfolio, as compared with its benchmark and peers.
The Independent Directors were assisted by experienced independent legal counsel throughout the contract review process. They discussed the proposed continuances in private session with such counsel at which no representatives of management, the Adviser or Sub-Adviser were present. The Independent Directors relied upon the advice of independent legal counsel and their own business judgment in determining the material factors to be considered in evaluating each sub-advisory agreement and the weight to be given to each such factor. The conclusions reached by the Independent Directors were based on a comprehensive evaluation of all of the information provided and were not the result of any one factor. Moreover, each Independent Director may have afforded different weight to the various factors in reaching his or her conclusions with respect to each sub-advisory agreement.
Nature, Extent and Quality of Services.
The Board evaluated the nature, extent and quality of the sub-advisory services provided to the Portfolios by each Sub-Adviser. The Directors reviewed biographical information on each Sub-Adviser’s portfolio management and other professional staff, and each Sub-Adviser’s brokerage practices, including any soft dollar benefits received. The Directors also reviewed the performance record of each Portfolio managed by the applicable Sub-Adviser. The Directors took into account information they received during the previous year at Board meetings and other discussions and through periodic reports regarding each Sub-Adviser’s performance of its duties. The Board also considered the quality of each Sub-Adviser’s compliance program as it relates to the applicable Portfolio. It was the Directors’ conclusion that overall, they were satisfied with the nature, extent and quality of services provided to each Portfolio.
Investment Performance.
A representative of the Adviser reviewed with the Directors each Portfolio’s performance year-to-date and for the 1-, 3- and 5-year periods ended April 30, 2013, as compared to the Portfolio’s Morningstar Peer Group and benchmark. A discussion of each Portfolio’s performance and the Board’s conclusions regarding that performance is set forth below.
| 156 | (continued) |
| Ohio National Fund, Inc. |
Additional Information (Continued) | June 30, 2013 (Unaudited) |
Fees and Expenses.
The Board considered the fees paid each Sub-Adviser. The Board relied to a degree on the Adviser’s negotiation of each sub-advisory agreement on an arm’s-length basis, noting that in the past the Adviser has negotiated decreases in the sub-advisory fee for certain Portfolios and that the Adviser had always passed on the decrease by reducing its advisory fee by the same amount. Additionally, the Board considered the fees charged by the Sub-Advisers to other investment companies managed by the applicable Sub-Adviser in the same style and, where applicable, to their separately managed institutional accounts, and had no concerns with those rates relative to the fees charged to the Portfolio. The Directors also recognized that it is difficult to make comparisons of advisory fees because there are variations in the services that are included in the fees paid by other funds and separately managed accounts.
Profitability.
The Board considered the reasonableness of the sub-advisory fees paid by the Adviser to each Sub-Adviser. The Directors relied on the ability of the Adviser to negotiate the terms of each sub-advisory agreement, including the sub-advisory fee, at arm’s-length, noting that the Adviser is not affiliated with any Sub-Adviser. Accordingly, the cost of services provided by each Sub-Adviser and the profitability to the Sub-Adviser of its relationship with the applicable Portfolio were not material factors in the Board’s deliberations. For similar reasons, the Board concluded that the potential realization of economies of scale by the Portfolios from the sub-advisory arrangements with the Sub-Advisers should not be a material factor in the Board’s deliberations.
Economies of Scale.
The Directors noted that each sub-advisory fee schedule contains breakpoints that would reduce the sub-advisory fees on assets above a specified level as the applicable Portfolio’s assets increase. The Directors also noted that a Portfolio would realize additional economies of scale if the Portfolio’s assets increase over time proportionately more than certain other expenses. The Directors took into account that each Portfolio had not reached its first breakpoint.
Portfolio-by-Portfolio Analysis.
In addition to the foregoing, the Directors considered the specific factors and related conclusions set forth below with respect to each Portfolio’s performance and sub-advisory fees. The performance data described below for each Portfolio is for periods ending April 30, 2013 and the sub-advisory fee data described below is through the same date.
Equity Portfolio (Sub-Adviser – Legg Mason). The representative of the Adviser indicated, with regard to the Portfolio, that the Portfolio’s recent performance had been good. For the year-to-date and one-year periods, the Portfolio had outperformed its peer group (with relative peer group performance in the 24th and 28th percentile, respectively), although the Portfolio had slightly underperformed its benchmark index. He stated that he was relatively comfortable that the sub-adviser was demonstrating better judgment in its selection of securities, which suggested that the recent trend of outperformance may continue. He also reported that the Adviser had removed the Portfolio from the Adviser’s watchlist. The Directors remarked on the significant improvement in relative performance. The Directors also noted that the Portfolio’s sub-advisory fee was slightly above its peer group average, in the 62nd percentile. Overall, the Board concluded that the Portfolio’s performance was satisfactory and the sub-advisory fee was reasonable.
Target Equity/Income Portfolio (Sub-Adviser – First Trust). The representative of the Adviser indicated, with regard to the Target Equity/Income Portfolio, that the Portfolio’s recent performance had been good. For the year-to-date and one-year periods, the Portfolio had outperformed its benchmark and peer groups (with relative peer group performance in the 13th and 27th percentile, respectively). He noted that the Portfolio was a “quant” fund with a strategy that may be out of favor, as it has significantly underperformed its benchmark and peer group over the long term and significantly underperformed the Target VIP portfolio, the other quant fund portfolio of the Fund managed by the same Sub-Adviser. He reported that the Portfolio remains on the Adviser’s watchlist. The Directors noted the Portfolio’s significant improvement in relative performance. The Directors also noted that the Portfolio’s sub-advisory fee was below its peer group average, in the 28th percentile. Overall, the Board concluded that the Portfolio’s performance was satisfactory and that the sub-advisory fee was reasonable.
After consideration of the foregoing, the Board reached the following conclusions regarding the sub-advisory agreement with respect to each Portfolio, in addition to the conclusions set forth above: (a) the Sub-Adviser had demonstrated that it possessed the capability and resources to perform the duties required of it under the sub-advisory agreement; (b) the investment philosophy, strategies and techniques of the Sub-Adviser were appropriate for pursuing the applicable Portfolio’s investment objective; (c) the Sub-Adviser was likely to execute its investment philosophy, strategies and techniques consistently over time; and (d) the Sub-Adviser maintained appropriate compliance programs. Based on all of the above-mentioned factors and their related conclusions, with no single factor or conclusion being determinative and with each Director not necessarily attributing the same weight to each factor, the Directors unanimously concluded that approval of the continuation of the sub-advisory agreement was in the best interests of each Portfolio and its shareholders. Accordingly, the Board, including all of the Independent Directors, voted unanimously to approve the continuation of the sub-advisory agreement for each Portfolio.
| 157 | (continued) |
| Ohio National Fund, Inc. |
Additional Information (Continued) | June 30, 2013 (Unaudited) |
| (2) | Expense Disclosure |
An individual may not buy or own membership interests of the Fund directly. An individual acquires an indirect interest in the Fund by purchasing a variable annuity contract or variable insurance policy and allocating premiums or purchase payments to Fund Portfolios available through the separate accounts of ONLIC, ONLAC, and NSLA. Separate accounts of these entities are the shareholders of the Fund.
As a shareholder of the Fund, a separate account incurs ongoing costs, including management fees and other Fund expenses. This example is intended to help a policy/contract owner understand ongoing costs (in dollars) associated with the underlying investment in the Fund’s Portfolios by the separate account shareholder and to compare these costs with the ongoing costs associated with investing in other mutual funds.
The example is based on an investment of $1,000 invested at January 1, 2013 and held through June 30, 2013.
Actual Expenses
The table below provides information about investment values and actual expenses associated with each Portfolio of the Fund. The information below, together with the amount of an underlying investment, can be used to estimate expenses paid over the period. An estimate can be obtained by simply dividing an underlying investment value by $1,000 (for example, an $8,600 investment value divided by $1,000 = 8.6), then multiplying the result by the number in the table under the heading entitled “Expenses Paid During Period”.
Portfolio | Beginning Investment Value 1/1/2013 | Ending Investment Value 6/30/2013 | Expense Paid During Period* 1/1/2013 – 6/30/2013 | Expense Ratio During Period 1/1/2013 – 6/30/2013 (Annualized) | ||||||||||||
Equity | $ | 1,000.00 | $ | 1,153.20 | $ | 4.64 | 0.87 | % | ||||||||
Money Market | 1,000.00 | $ | 1,000.00 | $ | 0.30 | 0.06 | % | |||||||||
Bond | 1,000.00 | $ | 972.80 | $ | 3.18 | 0.65 | % | |||||||||
Omni | 1,000.00 | $ | 1,101.70 | $ | 4.17 | 0.80 | % | |||||||||
International | 1,000.00 | $ | 971.80 | $ | 4.60 | 0.94 | % | |||||||||
Capital Appreciation | 1,000.00 | $ | 1,142.80 | $ | 4.68 | 0.88 | % | |||||||||
Millennium | 1,000.00 | $ | 1,175.90 | $ | 5.18 | 0.96 | % | |||||||||
International Small-Mid Company | 1,000.00 | $ | 1,058.70 | $ | 6.18 | 1.21 | % | |||||||||
Aggressive Growth | 1,000.00 | $ | 1,062.00 | $ | 4.91 | 0.96 | % | |||||||||
Small Cap Growth | 1,000.00 | $ | 1,176.40 | $ | 5.77 | 1.07 | % | |||||||||
Mid Cap Opportunity | 1,000.00 | $ | 1,109.80 | $ | 5.02 | 0.96 | % | |||||||||
S&P 500® Index | 1,000.00 | $ | 1,135.30 | $ | 2.44 | 0.46 | % | |||||||||
Strategic Value | 1,000.00 | $ | 1,109.10 | $ | 4.13 | 0.79 | % | |||||||||
High Income Bond | 1,000.00 | $ | 1,015.50 | $ | 3.85 | 0.77 | % | |||||||||
Capital Growth | 1,000.00 | $ | 1,129.80 | $ | 5.39 | 1.02 | % | |||||||||
Nasdaq-100® Index | 1,000.00 | $ | 1,097.80 | $ | 2.70 | 0.52 | % | |||||||||
Bristol | 1,000.00 | $ | 1,144.50 | $ | 4.41 | 0.83 | % | |||||||||
Bryton Growth | 1,000.00 | $ | 1,148.90 | $ | 4.80 | 0.90 | % | |||||||||
U.S. Equity | 1,000.00 | $ | 1,146.10 | $ | 5.21 | 0.98 | % | |||||||||
Balanced | 1,000.00 | $ | 1,086.90 | $ | 3.93 | 0.76 | % | |||||||||
Income Opportunity | 1,000.00 | $ | 1,133.50 | $ | 6.29 | 1.19 | % | |||||||||
Target VIP | 1,000.00 | $ | 1,132.70 | $ | 4.39 | 0.83 | % | |||||||||
Target Equity/Income | 1,000.00 | $ | 1,168.70 | $ | 4.30 | 0.80 | % | |||||||||
Bristol Growth | 1,000.00 | $ | 1,122.00 | $ | 4.63 | 0.88 | % | |||||||||
| 158 | (continued) |
| Ohio National Fund, Inc. |
Additional Information (Continued) | June 30, 2013 (Unaudited) |
Hypothetical Example for Comparison Purposes
The table below provides information about hypothetical investment values and hypothetical expenses based on each respective Portfolio’s actual expense ratio and an assumed rate of return of 5% per year before expenses, which is not an actual return. The hypothetical investment values and expenses may not be used to estimate the actual ending investment balance or expenses actually paid for the period by the shareholders. A policy/contract holder may use this information to compare this 5% hypothetical example with the 5% hypothetical examples that appear in the shareholder reports of other funds.
Portfolio | Beginning Investment Value 1/1/2013 | Ending Investment Value 6/30/2013 | Expense Paid During Period* 1/1/2013 – 6/30/2013 | Expense Ratio During Period 1/1/2013 – 6/30/2013 (Annualized) | ||||||||||||
Equity | $ | 1,000.00 | $ | 1,020.48 | $ | 4.36 | 0.87 | % | ||||||||
Money Market | 1,000.00 | $ | 1,024.50 | $ | 0.30 | 0.06 | % | |||||||||
Bond | 1,000.00 | $ | 1,021.57 | $ | 3.26 | 0.65 | % | |||||||||
Omni | 1,000.00 | $ | 1,020.83 | $ | 4.01 | 0.80 | % | |||||||||
International | 1,000.00 | $ | 1,020.13 | $ | 4.71 | 0.94 | % | |||||||||
Capital Appreciation | 1,000.00 | $ | 1,020.43 | $ | 4.41 | 0.88 | % | |||||||||
Millennium | 1,000.00 | $ | 1,020.03 | $ | 4.81 | 0.96 | % | |||||||||
International Small-Mid Company | 1,000.00 | $ | 1,018.79 | $ | 6.06 | 1.21 | % | |||||||||
Aggressive Growth | 1,000.00 | $ | 1,020.03 | $ | 4.81 | 0.96 | % | |||||||||
Small Cap Growth | 1,000.00 | $ | 1,019.49 | $ | 5.36 | 1.07 | % | |||||||||
Mid Cap Opportunity | 1,000.00 | $ | 1,020.03 | $ | 4.81 | 0.96 | % | |||||||||
S&P 500® Index | 1,000.00 | $ | 1,022.51 | $ | 2.31 | 0.46 | % | |||||||||
Strategic Value | 1,000.00 | $ | 1,020.88 | $ | 3.96 | 0.79 | % | |||||||||
High Income Bond | 1,000.00 | $ | 1,020.98 | $ | 3.86 | 0.77 | % | |||||||||
Capital Growth | 1,000.00 | $ | 1,019.74 | $ | 5.11 | 1.02 | % | |||||||||
Nasdaq-100® Index | 1,000.00 | $ | 1,022.22 | $ | 2.61 | 0.52 | % | |||||||||
Bristol | 1,000.00 | $ | 1,020.68 | $ | 4.16 | 0.83 | % | |||||||||
Bryton Growth | 1,000.00 | $ | 1,020.33 | $ | 4.51 | 0.90 | % | |||||||||
U.S. Equity | 1,000.00 | $ | 1,019.93 | $ | 4.91 | 0.98 | % | |||||||||
Balanced | 1,000.00 | $ | 1,021.03 | $ | 3.81 | 0.76 | % | |||||||||
Income Opportunity | 1,000.00 | $ | 1,018.89 | $ | 5.96 | 1.19 | % | |||||||||
Target VIP | 1,000.00 | $ | 1,020.68 | $ | 4.16 | 0.83 | % | |||||||||
Target Equity/Income | 1,000.00 | $ | 1,020.83 | $ | 4.01 | 0.80 | % | |||||||||
Bristol Growth | 1,000.00 | $ | 1,020.43 | $ | 4.41 | 0.88 | % | |||||||||
| * | Expenses are equal to the average account value times the Fund’s annualized expense ratio multiplied by the number of days in the most recent fiscal half-year (181 days) divided by the number of days in the fiscal year (365 days). Please note that the expenses shown in these tables are meant to highlight ongoing Fund costs only and do not reflect any contract-level expenses or Fund transactional costs, such as sales charges (loads) or exchange fees (if any). Therefore, these tables are useful in comparing ongoing fund costs only, and will not fully assist a policy/contract owner in determining the relative total expenses of different funds. In addition, if transactional costs were included, costs may have been higher for these Portfolios as well as for a fund being compared. |
| 159 |
| Ohio National Fund, Inc. |
| June 30, 2013 (Unaudited) |
Name and Address | Age | Position(s) with the Fund | Term of Office | Number of Portfolios | Principal Occupation(s) and Other Directorships During Past Five Years | |||||||
Independent Directors | ||||||||||||
George M. Vredeveld One Financial Way Cincinnati, Ohio | 70 | Lead Independent Director, Member of Audit and Independent Directors Committees | Indefinite; Since March 1996 | 24 | Professor of Economics: University of Cincinnati | |||||||
John I. Von Lehman One Financial Way Cincinnati, Ohio | 60 | Director, Member of Audit and Independent Directors Committees | Indefinite; Since August 2007 | 24 | Executive Vice President, CFO, Secretary, and Director: The Midland Company (1988-2007); Director, Audit Committee and Corporate Governance Committee Member: American Financial Group, Inc.; Finance Committee and Investment Commitee Member: Life Enriching Communities; Investment Committee: Xavier University Foundation. | |||||||
Madeleine W. Ludlow One Financial Way Cincinnati, Ohio | 58 | Director, Member of Audit and Independent Directors Committees | Indefinite; Since April 2012 | 24 | Founder/Managing Director: West Capital Partners LLC (2010-present), Ludlow Ward Capital Advisors LLC (2005-2009); Director, ALLETE, Inc. (2004-present) | |||||||
Interested Director | ||||||||||||
John J. Palmer One Financial Way Cincinnati, Ohio | 73 | Chairman and Director | Indefinite; Since July 1997 | 24 | Insurance industry consultant (April 2010 to present), President: Ohio National Fund, Inc. (1997-2010); Director and Vice Chairman: ONLIC (1997-2010); President, CEO, and Director: NSLA (2002-2010), Director: ONI and various affiliated companies (1997-2010), Cincinnati Symphony Orchestra, Tucson Symphony Orchestra, and Pima Canyon Estates Homeowners’ Association. | |||||||
Officers | ||||||||||||
Christopher A. Carlson One Financial Way Cincinnati, Ohio | 54 | President | Indefinite; Since March 2000 | 24 | Executive Vice President and Chief Investment Officer: ONLIC; President and Director: ONI; Chief Investment Officer: NSLA; Officer and Director of various other Ohio National-affiliated companies. Prior to March 2010, was Vice President of the Fund. | |||||||
Thomas A. Barefield One Financial Way Cincinnati, Ohio | 60 | Vice President | Indefinite; Since February 1998 | 24 | Executive Vice President — Distribution: ONLIC; Director and Vice President — Marketing: NSLA; Director: ONI; Senior Vice President: Ohio National Equities, Inc.; Recent graduate of class XXIX of Leadership Cincinnati. | |||||||
R. Todd Brockman One Financial Way Cincinnati, Ohio | 44 | Treasurer | Indefinite; Since August 2004 | 24 | Second Vice President, Mutual Fund Operations: ONLIC and NSLA; Treasurer: ONI. | |||||||
Kimberly A. Plante One Financial Way Cincinnati, Ohio | 39 | Secretary | Indefinite; 2005 | 24 | Senior Associate Counsel: ONLIC; Secretary: ONI; Officer of various other Ohio National-affiliated companies. | |||||||
Julie T. Thomas One Financial Way Cincinnati, Ohio | 50 | Chief Compliance Officer | Indefinite; Since June 2013 | 24 | Assistant Vice President: ONLIC; Chief Compliance Officer: ONI, Suffolk, and other Ohio National-affiliated companies. Prior to June 2013, was Fund Compliance Director; Prior to January 2011, was Fund Compliance Officer. | |||||||
Catherine E. Gehr One Financial Way Cincinnati, Ohio | 41 | Assistant Treasurer | Indefinite; Since March 2005 | 24 | Manager, Mutual Fund Operations: ONLIC; Assistant Treasurer: ONI. | |||||||
Emily Bae One Financial Way Cincinnati, Ohio | 28 | Assistant Secretary | Indefinite; Since May 2013 | 24 | Assistant Secretary: ONI; Assistant Counsel: ONLIC. Prior to May 2013, was Counsel with Goodyear Tire & Rubber Company. | |||||||
| 160 |
Ohio National Fund, Inc.
Post Office Box 371
Cincinnati, Ohio 45201
Form 1325 Rev. 8-13
| Item 2. | Code Of Ethics. |
As of the end of the period covered by this report, Ohio National Fund, Inc. (the “Fund”) has adopted a code of ethics that applies to the Fund’s principal executive officer and principal financial officer. There were no substantive amendments or waivers to the Code of Ethics during the period covered by this report. |
A copy of this Code of Ethics is filed as Exhibit EX-99.CODE to this Form N-CSR and is also available, without charge, upon request, by calling 877-781-6392 toll free. |
| Item 3. | Audit Committee Financial Expert. |
The Fund’s Board of Directors has determined that the Fund has an audit committee financial expert serving on its Audit Committee. The Audit Committee financial expert is Mr. John I. VonLehman. Mr. VonLehman is independent for purposes of Item 3 of Form N-CSR. |
| Item 4. | Principal Accountant Fees And Services. |
The aggregate fees for each of the last two fiscal years for professional services rendered by the principal accountant for the audit of the Fund’s annual financial statements or services that are normally provided by the accountant in connection with statutory and regulatory filings or engagements for those fiscal years are listed below. |
| (a) | Audit Fees. |
Fiscal year ended December 31, 2012: $292,000 |
Fiscal year ended December 31, 2011: $284,000 |
| (b) | Audit-Related Fees. |
Professional services rendered in connection with the consent on the Fund’s N1A filing. |
Fiscal year ended December 31, 2012: $5,000 |
Fiscal year ended December 31, 2011: $5,000 |
| (c) | Tax Fees. None. |
| (d) | All Other Fees. None. |
(e)(1) Audit Committee Pre-Approval Policies and Procedures:
The Fund’s Audit Committee has adopted an Audit Committee Charter that requires that the Audit Committee oversee the quality and appropriateness of the accounting methods used in the preparation of the Fund’s financial statements, and the independent audit thereof; approve the selection and compensation of the independent auditors; and pre-approve the performance, by the independent auditors, of non-audit services for the Fund, its investment adviser, or any affiliated entity controlling, controlled by or under common control with the investment adviser that provides ongoing services to the Fund. |
(e)(2) Services Approved Pursuant to Paragraph (c)(7)(i)(C) of Rule 2-01 of Regulation S-X:
During the fiscal years ended December 31, 2012 and 2011, there were no non-audit services provided by the Fund’s principal accountant that would have required pre-approval by the Fund’s Audit Committee. The audit related fees aforementioned were pre-approved by the Fund’s Audit Committee, although not required by paragraph (c) (7) (ii) of Regulation S-X as the audit-related fees were less than five percent of the total amount of revenues paid to the Fund’s principal accountant. |
| (f) | Not applicable. |
| (g) | There were no non-audit services provided by the Fund’s principal accountant, other than items disclosed in item (b) above, in which a fee was billed to the Fund, the Fund’s adviser, and any entity controlling, controlled by, or under common control with the adviser that provides ongoing services to the registrant for the last two fiscal years. |
| (h) | Not applicable, as there were no non-audit services performed by the Fund’s principal accountant that were rendered to the Fund, the Fund’s adviser, or any entity controlling, controlled by, or under common control with the adviser that provided ongoing services to the registrant that were not pre-approved for the last two fiscal years. |
| Item 5. | Audit Committee Of Listed Registrants. |
Not applicable. |
| Item 6. | Schedule of Investments. |
Not applicable. |
| Item 7. | Disclosure Of Proxy Voting Policies And Procedures For Closed-End Management Investment Companies. |
Not Applicable. |
| Item 8. | Portfolio Managers of Closed-End Management Investment Companies. |
Not Applicable. |
| Item 9. | Purchases of Equity Securities by Closed-End Management Investment Company and Affiliated Purchasers. |
Not Applicable. |
| Item 10. | Submission of Matters to a Vote of Security Holders. |
There were no material changes to the procedures by which shareholders may recommend nominees to the Fund’s Board of Directors. |
| Item 11. | Controls and Procedures. |
| (a) | The Fund’s principal executive officer and principal financial officer have concluded, based on their evaluation conducted as of a date within 90 days of the filing of this report, that the Fund’s disclosure controls and procedures are adequately designed and are operating effectively to ensure (i) that material information relating to the Fund, including its consolidated subsidiaries, is made known to them by others within those entities, particularly during the period in which this report is being prepared; and (ii) that information required to be disclosed by the Fund on Form N-CSR is recorded, processed, summarized and reported within the time periods specified in the Securities and Exchange Commission’s rules and forms. |
| (b) | There were no changes in the Fund’s internal control over financial reporting that occurred during the second fiscal quarter of the period covered by this report that have materially affected, or are reasonably likely to materially affect, the Fund’s internal control over financial reporting. |
| Item 12. | Exhibits. |
| (a)(1) | The Fund’s Code of Ethics pursuant to Item 2 of Form N-CSR is filed and attached hereto as EX-99.CODE. |
| (a)(2) | A separate certification for each principal executive officer and principal financial officer of the Fund as required by Rule 30a-2(a) under the Investment Company Act of 1940 (17 CFR 270.30a-2(a)) is attached hereto as EX-99.CERT. |
The certifications required by Section 906 of the Sarbanes-Oxley Act of 2002 are attached hereto as EX-99.906CERT. |
SIGNATURES
Pursuant to the requirements of the Securities Exchange Act of 1934 and the Investment Company Act of 1940, the registrant has duly caused this report to be signed on its behalf by the undersigned, thereunto duly authorized.
Ohio National Fund, Inc.
By: | /s/ Christopher A. Carlson | |
Christopher A. Carlson | ||
President | ||
September 6, 2013 |
Pursuant to the requirements of the Securities Exchange Act of 1934 and the Investment Company Act of 1940, this report has been signed below by the following persons on behalf of the registrant and in the capacities and on the dates indicated.
Ohio National Fund, Inc.
By: | /s/ Christopher A. Carlson | |
Christopher A. Carlson | ||
President | ||
September 6, 2013 | ||
By: | /s/ R. Todd Brockman | |
R. Todd Brockman | ||
Treasurer | ||
September 6, 2013 | ||