UNITED STATES
SECURITIES AND EXCHANGE COMMISSION
Washington, D.C. 20549
FORM N-CSR
CERTIFIED SHAREHOLDER REPORT OF REGISTERED
MANAGEMENT INVESTMENT COMPANIES
Investment Company Act file number 811-03015
Ohio National Fund, Inc.
(Exact name of registrant as specified in charter)
| One Financial Way, Cincinnati, Ohio | 45242 | |||
| (Address of principal executive offices) | (Zip code) | |||
CT Corporation 300 E. Lombard St. Suite 1400 Baltimore, MD 21202
(Name and address of agent for service)
Registrant’s telephone number, including area code: 513-794-6971
Date of fiscal year end: December 31
Date of reporting period: June 30, 2011
Form N-CSR is to be used by management investment companies to file reports with the Commission not later than 10 days after the transmission to stockholders of any report that is required to be transmitted to stockholders under Rule 30e-1 under the Investment Company Act of 1940 (17 CFR 270.30e-1). The Commission may use the information provided on Form N-CSR in its regulatory, disclosure review, inspection, and policymaking roles.
A registrant is required to disclose the information specified by Form N-CSR, and the Commission will make this information public. A registrant is not required to respond to the collection of information contained in Form N-CSR unless the Form displays a currently valid Office of Management and Budget (“OMB”) control number. Please direct comments concerning the accuracy of the information collection burden estimate and any suggestions for reducing the burden to Secretary, Securities and Exchange Commission, 450 Fifth Street, NW, Washington, DC 20549-0609. The OMB has reviewed this collection of information under the clearance requirements of 44 U.S.C. § 3507.
Item 1. Reports To Stockholders.
WEALTH BUILDING OPPORTUNITY
Ohio National Fund, Inc.
Semiannual Report
JUNE 30, 2011
Ohio National Fund, Inc.
OHIO NATIONAL FUND, INC.
| 1 | ||||||
| 2 | ||||||
The following pages contain Performance, Management’s Comments, Change in Value of $10,000 Investment, Portfolio Composition, Top Holdings, and Schedule of Investments for each of the Fund’s Portfolios (Unaudited): | ||||||
| 3 | ||||||
| 7 | ||||||
| 10 | ||||||
| 15 | ||||||
| 20 | ||||||
| 26 | ||||||
| 31 | ||||||
| 34 | ||||||
| 38 | ||||||
| 41 | ||||||
| 45 | ||||||
| 48 | ||||||
| 55 | ||||||
| 58 | ||||||
| 68 | ||||||
| 73 | ||||||
| 77 | ||||||
| 80 | ||||||
| 84 | ||||||
| 87 | ||||||
| 93 | ||||||
| 98 | ||||||
| 102 | ||||||
| 105 | ||||||
| 108 | ||||||
| 111 | ||||||
| 114 | ||||||
| 120 | ||||||
| 132 | ||||||
| 153 | ||||||
| 155 | ||||||
Message |  |
Dear Investor:
If you looked only at the returns of some of the larger indexes for the first half of 2011, you would feel good about the world. The S&P 500® Index was up over 6 percent, and the MSCI EAFE, an index of international companies, was up over 5 percent. The Barclay Capital U.S. Aggregate Index, a corporate bond index, was up over 2.5 percent. These are all respectable performance numbers. There was a slight downturn in March, but the markets quickly got past this and continued to climb. The VIX Index, a measurement of stock market volatility often called the “Fear Index,” was very close to its long-term average and indicated a stable market. In addition, first-quarter corporate profits were very good, and stocks still appeared cheap based on long-term valuation metrics.
Stacked against this positive news, however, were other factors: the persistent problem in the housing market and home finance, high unemployment, fear of a slowing Chinese economy, growing political acrimony in Washington and, most importantly, the European debt crisis continuing to grow. All of these, as well as a number of poor economic reports, led to the significant market downturn that started on July 25 and culminated with the United States’ historic loss of its top-tier AAA credit rating and the 6.65 percent decline in the S&P 500® Index on August 8. The events of the last week of July and first week of August clearly overshadowed the first half of the year.
In general, the Ohio National Fund Portfolios performed reasonably well during the first half of the year with eight of the twenty-one actively managed Portfolios (which excludes the Money Market, S&P 500® Index and NASDAQ-100® Index Portfolios) outperforming their respective benchmarks and ranking in the top half of their
respective peer groups. Another six Portfolios underperformed their respective benchmarks, but outperformed their respective peer groups. The phenomenon of funds underperforming benchmarks but outperforming peer groups highlights the difficulty many active managers are having in a market that does not reward traditional valuation metrics and does not differentiate between companies that have stable cash flows and those that do not. This is particularly difficult for Portfolios like the Equity Portfolio, sub-advised by Legg Mason, and the Mid Cap Opportunity Portfolio, sub-advised by Goldman Sachs.
Looking Forward
Looking forward is now more challenging than ever. With the unprecedented move by Standard and Poor’s in downgrading the U.S. credit rating from AAA to AA+, we are in uncharted waters. People have constantly asked what it means to the economy and the markets, as the tendency is to try to predict future outcomes by past events. Since we have never been here before, looking backward is of little use. Now, more than ever, you should rely on your investment professional to ensure your assets are well diversified to protect them against the kind of market actions of late July and early August.
Sincerely,

Christopher A. Carlson
President
| 1 |
Directors and Officers of Ohio National Fund, Inc.
John J. Palmer, Director |
| James E. Bushman, Director |
| George M. Vredeveld, Director |
| John I. Von Lehman, Director |
| Christopher A. Carlson, President |
| Thomas A. Barefield, Vice President |
| Dennis R. Taney, Chief Compliance Officer |
| R. Todd Brockman, Treasurer |
Catherine E. Gehr, Assistant Treasurer |
Kimberly A. Plante, Secretary |
Katherine L. Carter, Assistant Secretary |
The Statement of Additional Information of Ohio National Fund, Inc. (the “Fund”) includes additional information about the Fund’s Board of Directors (the “Board”) and is available, without charge, upon request, by calling 877-781-6392 (toll-free).
A description of the policies and procedures that the Fund uses in voting proxies relating to Fund securities, as well as information regarding how the Fund voted proxies during the most recent twelve-month period ended June 30, is available without charge, upon request, by calling 877-781-6392 (toll-free) and on the Securities and Exchange Commission (the “Commission”) website at http://www.sec.gov.
The Fund has filed its Schedules of Investments as of March 31 and September 30 with the Commission, as required, on Form N-Q. Form N-Q is required to be filed with the Commission for the first and third quarters of each fiscal year within sixty days after the end of each period and is available on the Commission website upon acceptance of each submission. The Fund’s Forms N-Q may be reviewed and copied at the Commission’s Public Reference Room in Washington, DC. Information about the Public Reference Room is available by calling 1-800-SEC-0330 (toll-free).
This report and the financial statements contained herein are submitted for the general information of the shareholders of the Fund. This report is not authorized for distribution to prospective investors in the Fund unless preceded or accompanied by an effective prospectus of Ohio National Fund, Inc. For a prospectus containing more complete information, including charges and expenses, please contact Ohio National Investments, Inc., One Financial Way, Cincinnati, OH 45242, telephone 513-794-6100.
| 2 |
| Ohio National Fund, Inc. | Equity Portfolio |
Objective/Strategy
The Equity Portfolio seeks long-term growth of capital by investing at least 80% of its assets in equity securities.
Performance as of June 30, 2011
Average Annual Total Returns: | ||||
One year | 23.34% | |||
Five years | -6.17% | |||
Ten years | -1.62% |
Past performance does not guarantee future results. The performance data quoted represents past performance and current returns may be lower or higher. Total return figures include change in share price and reinvestment of dividends and capital gains. The investment return and principal value will fluctuate so that an investor’s shares, when redeemed, may be worth more or less than the original cost. To obtain performance information up to the most recent month end, call toll-free 1-877-781-6392.
The Portfolio is not open to direct retail investment. Beneficial interest in shares is obtained solely by purchase of variable life insurance policies and variable annuity contracts. Actual performance results for variable annuity and variable universal life contracts will be lower due to contract charges. Consult your contract for applicable charges.
Comments
For the six-month period ended June 30, 2011, the Equity Portfolio returned 1.62% versus 6.02% for the current benchmark, the S&P 500 Index.
Relative Portfolio under-performance was driven by both security selection decisions and sector allocation choices. At the sector level, the Portfolio’s relative under-performance was driven by relative underweight positions in Telecommunication Services, Industrials, Consumer Staples, and Energy sectors, which outperformed the benchmark, and relative overweights in the Information Technology and Financials sectors, which under-performed the benchmark. However, a slight relative overweight position in Health Care contributed to the Portfolio’s relative performance over the period as the sector outperformed the benchmark. At the security level, Research in Motion Ltd., Eastman Kodak Co., and Cisco Systems, Inc. were the top three detractors from performance, while Aetna, Inc. and UnitedHealth Group, Inc. were the top contributors to performance during the first half of 2011.(1)
Stocks opened 2011 with the strongest first quarter in more than a decade, as almost every major equity index posted gains between 5% and 10%. Investors continued to find reasons for bullishness despite political unrest in North Africa and the Middle East, as economic data indicated gathering strength in the recovery and a turnaround in the jobs market. In mid-March, the tsunami in Japan sent the S&P 500 Index into a 3.6% dive as investors were uncertain of the disaster’s impact on the world’s third largest economy. U.S. equities quickly recovered from this plunge until the market took a hit in April, after Standard & Poor’s ratcheted down the U.S. credit outlook to “negative” due to large budget deficits and a politically polarized budget process. However, a strong earnings season carried stocks past this dip to post almost 3.0% in gains on the month. Investors have seen a volatile decline since April, and rising commodity prices and emerging evidence of a slowdown in manufacturing growth in China and Europe served to deepen concerns that a global slowdown may gain momentum. Headlines in June focused on weak employment reports, falling second-quarter Gross Domestic Product estimates, the conclusion of quantitative easing, and the
ongoing debate over the U.S. debt ceiling. Markets have also become more short-term oriented and reactionary in the face of broad uncertainty surrounding the growing European sovereign debt problems. In positive news, the market closed out June with the best week in nearly two years on news of resolving mortgage settlement issues, optimistic manufacturing reports, and less onerous bank capital rules than expected.
The S&P 500 Index ended the first half of the year up approximately 6.0%, while the Dow Jones Industrial Average Index finished up 8.9% and the tech-heavy Nasdaq Composite Index climbed 5.0%. Mega caps lagged their smaller cousins slightly as the S&P 100 Index rose 4.9%, compared to the S&P Midcap 400 Index’s 8.6% increase and the small-cap Russell 2000 Index’s 6.2% advance. Growth names edged out their value counterparts by about 90 basis points. The Russell 1000 Growth Index climbed 6.8%, compared to the Russell 1000 Value Index’s 5.9% gain so far this year. Health Care and Energy names have led the S&P 500 Index’s rise thus far, gaining 13.9% and 11.4%, respectively. Financials, down 3.0%, have shown to be the biggest laggard, as it is the only sector to post losses so far this year.
Research in Motion Ltd. reported terrible results for its fiscal first quarter due to continued erosion of market share in the U.S., coupled with a slowdown in demand overseas. Management slashed profit targets for 2011 to $6.00 per share from their prior $7.50 level and shifted their discussion of employee “optimization” to a full layoff. While we believe that Research in Motion Ltd. offers a differentiated product and that investors are focusing way too much on the U.S. business and not the more durable international business that is still rapidly growing, we also acknowledge that the transition to its next-generation operating system has become far more dicey than we previously believed. So, despite a number of positives that make us believe the market overreacted in the short term, we see a big long-term negative that makes us question the appropriateness for this strategy. Therefore, we sold the stock in June to take advantage of what we believed were other, more compelling opportunities.(1)
Over the six months, Cisco Systems, Inc. shares took a beating following quarterly reports that were marked by lower-than-expected forecasts or weak quarterly results. We acknowledge that Cisco Systems, Inc. faces some fundamental challenges; however, the stock is discounting meaningful declines in free cash flow over the next decade, an outcome we consider unlikely given Cisco Systems, Inc.’s leadership in a number of growing markets. The company should benefit from the growing demands on networks due to the centralization of computing and the proliferation of video. We are also encouraged by management’s shareholder-friendly initiatives. The company recently initiated its first ever cash dividend and maintains an authorization to repurchase nearly $12 billion in stock, or 14% of its market cap. With all of that in mind, we continue to monitor Cisco Systems, Inc.’s progress toward improving execution and working through competitive challenges.(1)
Stocks of managed-care organizations Aetna, Inc. and UnitedHealth Group, Inc. were the top contributors so far this year as investors’ anxiety over the possibility of punitive health care reforms faded and as the companies posted strong results for the first quarter. Uncertainty surrounding the outcome of health care reforms restrained managed-care stocks for much of 2009, but the group has managed through the first round of reform implementation without devolving into a utility model, as some investors had feared. The pricing environment continues to be favorable for the industry, evident in consensus-beating quarterly results from Aetna, Inc. and
| 3 | (continued) |
| Ohio National Fund, Inc. | Equity Portfolio (Continued) |
UnitedHealth Group, Inc. Both companies reported better-than-expected sales and earnings for the first quarter and raised their full-year earnings-per-share guidance above analysts’ estimates. UnitedHealth Group, Inc. also boosted its dividend and share-buyback authorization. Despite being up significantly over the past year, shares of both companies trade at lower valuations than their peers and present attractive risk-reward profiles.(1)
We continue to be optimistic about the outlook for stocks heading into the second half of 2011, as we see significant upside in the U.S. equities market, specifically the large-cap space. While the current environment offers ample reasons for worry, including high unemployment, continued housing market weakness, the ongoing Eurozone sovereign debt concerns, political wrangling over the U.S. debt ceiling, and high commodity prices, we regard these risks as manageable and hope that they do not distract investors’ attention from the decidedly positive case we see for U.S. equities. The macro concerns and uncertainties are real, but they are the reason one can buy fine companies at attractive prices. Stocks are very attractively valued based on historic norms and, also, relative to competing alternatives, especially when considering that many quality companies offer dividend yields that exceed the yield of the 10-year U.S. Treasury. The S&P 500 Index’s valuation is not demanding relative to history, as the index is trading at around 13 times the consensus earnings estimate for 2011 and around 12 times the estimate for 2012. These multiples rank near the bottom of S&P 500 Index multiples over the past 20 years, providing an attractive entry point to add to equities. Balance sheets are also in great shape and companies continue to generate significant excess cash and post strong earnings, which are likely to grow. With June’s final week of outstanding performance in particular, we believe that the market may be anticipating an exit from the economic soft patch that we saw in May and June. This may lead to attractive returns over the remainder of 2011 as the economic picture becomes clearer.
| (1) | The Portfolio’s composition is subject to change. Holdings and weightings are as of June 30, 2011. |
Change in Value of $10,000 Investment

Hypothetical illustration based on past performance. Future performance will vary. The Portfolio’s returns reflect reinvested dividends. The Portfolio’s holdings may differ significantly from the securities in the index. The index is unmanaged and therefore does not reflect the cost of portfolio management and accounting.
The S&P 500 Index is a capitalization-weighted index designed to measure performance of the broad domestic economy through changes in the aggregate market value of 500 stocks representing all major industries. The index presented herein includes the effects of reinvested dividends.
| 4 | (continued) |
| Ohio National Fund, Inc. | Equity Portfolio (Continued) |
Portfolio Composition as of June 30, 2011 (1)
| % of Net Assets | ||||
Common Stocks (3) | 97.6 | |||
Repurchase Agreements and | 2.4 | |||
|
| |||
| 100.0 | ||||
|
|
Top 10 Portfolio Holdings as of June 30, 2011 (1) (2)
| % of Net Assets | ||||
1. Microsoft Corp. | 3.0 | |||
2. Apple, Inc. | 2.8 | |||
3. Amazon.com, Inc. | 2.7 | |||
4. Procter & Gamble Co. / The | 2.7 | |||
5. BP PLC – ADR | 2.7 | |||
6. General Electric Co. | 2.6 | |||
7. Wells Fargo & Co. | 2.6 | |||
8. Citigroup, Inc. | 2.6 | |||
9. Hewlett-Packard Co. | 2.5 | |||
10. ConocoPhillips | 2.5 |
| (1) | Composition of Portfolio subject to change. |
| (2) | Short-term investments have been excluded from the list of Top 10 Portfolio Holdings. |
| (3) | Sectors: |
| % of Net Assets | ||||
Information Technology | 24.2 | |||
Financials | 22.4 | |||
Health Care | 16.0 | |||
Consumer Discretionary | 13.0 | |||
Energy | 7.4 | |||
Consumer Staples | 6.6 | |||
Industrials | 5.9 | |||
Utilities | 2.1 | |||
|
| |||
| 97.6 | ||||
|
|
| 5 |
| Ohio National Fund, Inc. | Equity Portfolio |
Schedule of Investments | June 30, 2011 (Unaudited) |
| Common Stocks – 97.6% | Shares | Value | ||||||||
CONSUMER DISCRETIONARY – 13.0% |
| |||||||||
Ford Motor Co. (Automobiles) | (a) | 260,900 | $ | 3,597,811 | ||||||
General Motors Co. (Automobiles) | (a) | 81,000 | 2,459,160 | |||||||
Yum! Brands, Inc. (Hotels, Restaurants & Leisure) | 67,200 | 3,712,128 | ||||||||
Amazon.com, Inc. (Internet & Catalog Retail) | (a) | 27,750 | 5,674,597 | |||||||
Time Warner, Inc. (Media) | 131,200 | 4,771,744 | ||||||||
Target Corp. (Multiline Retail) | 83,200 | 3,902,912 | ||||||||
Best Buy Co., Inc. (Specialty Retail) | 107,600 | 3,379,716 | ||||||||
|
| |||||||||
| 27,498,068 | ||||||||||
|
| |||||||||
CONSUMER STAPLES – 6.6% | ||||||||||
PepsiCo, Inc. (Beverages) | 59,600 | 4,197,628 | ||||||||
CVS Caremark Corp. (Food & Staples Retailing) | 107,000 | 4,021,060 | ||||||||
Procter & Gamble Co. / The (Household Products) | 89,200 | 5,670,444 | ||||||||
|
| |||||||||
| 13,889,132 | ||||||||||
|
| |||||||||
ENERGY – 7.4% | ||||||||||
BP PLC – ADR (Oil, Gas & Consumable Fuels) | 127,200 | 5,633,688 | ||||||||
Chevron Corp. (Oil, Gas & Consumable Fuels) | 44,600 | 4,586,664 | ||||||||
ConocoPhillips (Oil, Gas & Consumable Fuels) | 71,600 | 5,383,604 | ||||||||
|
| |||||||||
| 15,603,956 | ||||||||||
|
| |||||||||
FINANCIALS – 22.4% | ||||||||||
BlackRock, Inc. (Capital Markets) | 26,750 | 5,130,918 | ||||||||
Goldman Sachs Group, Inc. / The (Capital Markets) | 6,000 | 798,540 | ||||||||
Morgan Stanley (Capital Markets) | 127,300 | 2,929,173 | ||||||||
Wells Fargo & Co. (Commercial Banks) | 196,300 | 5,508,178 | ||||||||
American Express Co. (Consumer Finance) | 89,100 | 4,606,470 | ||||||||
Capital One Financial Corp. (Consumer Finance) | 41,800 | 2,159,806 | ||||||||
Bank of America Corp. (Diversified Financial Svs.) | 416,000 | 4,559,360 | ||||||||
Citigroup, Inc. (Diversified Financial Svs.) | 130,970 | 5,453,591 | ||||||||
JPMorgan Chase & Co. (Diversified Financial Svs.) | 131,000 | 5,363,140 | ||||||||
Aflac, Inc. (Insurance) | 89,105 | 4,159,421 | ||||||||
MetLife, Inc. (Insurance) | 107,000 | 4,694,090 | ||||||||
Annaly Capital Management, Inc. (Real Estate Investment Trusts) | 119,100 | 2,148,564 | ||||||||
|
| |||||||||
| 47,511,251 | ||||||||||
|
| |||||||||
HEALTH CARE – 16.0% | ||||||||||
Celgene Corp. (Biotechnology) | (a) | 47,400 | 2,859,168 | |||||||
Gilead Sciences, Inc. (Biotechnology) | (a) | 112,900 | 4,675,189 | |||||||
Medtronic, Inc. (Health Care Equip. & Supplies) | 67,600 | 2,604,628 | ||||||||
Aetna, Inc. (Health Care Providers & Svs.) | 118,909 | 5,242,698 | ||||||||
UnitedHealth Group, Inc. (Health Care Providers & Svs.) | 101,200 | 5,219,896 | ||||||||
| Common Stocks (Continued) | Shares | Value | ||||||||
HEALTH CARE (continued) | ||||||||||
Abbott Laboratories (Pharmaceuticals) | 59,400 | $ | 3,125,628 | |||||||
Johnson & Johnson (Pharmaceuticals) | 51,300 | 3,412,476 | ||||||||
Merck & Co., Inc. (Pharmaceuticals) | 77,500 | 2,734,975 | ||||||||
Pfizer, Inc. (Pharmaceuticals) | 198,100 | 4,080,860 | ||||||||
|
| |||||||||
| 33,955,518 | ||||||||||
|
| |||||||||
INDUSTRIALS – 5.9% | ||||||||||
United Continental Holdings, Inc. (Airlines) | (a) | 182,300 | 4,125,449 | |||||||
General Electric Co. (Industrial Conglomerates) | 296,800 | 5,597,648 | ||||||||
Norfolk Southern Corp. (Road & Rail) | 38,700 | 2,899,791 | ||||||||
|
| |||||||||
| 12,622,888 | ||||||||||
|
| |||||||||
INFORMATION TECHNOLOGY – 24.2% | ||||||||||
Cisco Systems, Inc. (Communications Equip.) | 287,200 | 4,483,192 | ||||||||
Qualcomm, Inc. (Communications Equip.) | 77,300 | 4,389,867 | ||||||||
Apple, Inc. (Computers & Peripherals) | (a) | 17,800 | 5,974,926 | |||||||
EMC Corp. (Computers & Peripherals) | (a) | 183,900 | 5,066,445 | |||||||
Hewlett-Packard Co. (Computers & Peripherals) | 148,600 | 5,409,040 | ||||||||
eBay, Inc. (Internet Software & Svs.) | (a) | 154,800 | 4,995,396 | |||||||
International Business Machines Corp. (IT Svs.) | 29,800 | 5,112,190 | ||||||||
Mastercard, Inc. Class A (IT Svs.) | 2,950 | 888,953 | ||||||||
Intel Corp. (Semiconductors & Equip.) | 203,950 | 4,519,532 | ||||||||
Texas Instruments, Inc. (Semiconductors & Equip.) | 130,400 | 4,281,032 | ||||||||
Microsoft Corp. (Software) | 243,800 | 6,338,800 | ||||||||
|
| |||||||||
| 51,459,373 | ||||||||||
|
| |||||||||
UTILITIES – 2.1% | ||||||||||
AES Corp. / The (Ind. Power Prod. & Energy Traders) | (a) | 353,700 | 4,506,138 | |||||||
|
| |||||||||
Total Common Stocks (Cost $183,769,283) | $ | 207,046,324 | ||||||||
|
| |||||||||
| Repurchase Agreements – 1.5% | Face Amount | Amortized Cost | ||||||||
| U.S Bank, Agreement Date: 06/30/11, Repurchase price $3,237,584 Collateralized by: Freddie Mac 15 yr Gold Giant Pool #G11649 (FGCI) 4.500%, Due 02/01/2020 with a value of $3,302,601 | $ | 3,237,584 | $ | 3,237,584 | ||||||
|
| |||||||||
Total Repurchase Agreements (Cost $3,237,584) | $ | 3,237,584 | ||||||||
|
| |||||||||
Total Investments – 99.1% (Cost $187,006,867) | (b) | $ | 210,283,908 | |||||||
Other Assets in Excess of Liabilities – 0.9% | 1,929,752 | |||||||||
|
| |||||||||
Net Assets – 100.0% | $ | 212,213,660 | ||||||||
|
| |||||||||
Percentages are stated as a percent of net assets.
Abbreviations:
ADR: American Depositary Receipts
Footnotes:
| (a) | Non-income producing security. |
| (b) | Represents cost for financial reporting purposes, which may differ from cost basis for federal income tax purposes. See also Note 7 of the Notes to Financial Statements. |
The accompanying notes are an integral part of these financial statements.
| 6 |
| Ohio National Fund, Inc. | Money Market Portfolio |
Portfolio Composition as of June 30, 2011 (1)
| % of Net Assets | ||||
Commercial Paper (2) | 73.2 | |||
Asset-Backed Securities (2) | 1.2 | |||
Money Market Funds | 14.0 | |||
U.S. Treasury Obligations | 3.5 | |||
Repurchase Agreements and | 8.1 | |||
|
| |||
| 100.0 | ||||
|
|
Top 10 Portfolio Holdings as of June 30, 2011 (1)
| % of Net Assets | ||||
1. Societe Generale North America | 4.9 | |||
2. Prudential Funding LLC | 4.9 | |||
3. U.S. Bank Repurchase Agreement | 4.9 | |||
4. Federated Prime Cash Obligations Fund – | 4.7 | |||
5. Fidelity Institutional Money Market Funds Prime Money Market Portfolio – Class I | 4.7 | |||
6. Fidelity Institutional Money Market Funds Money Market Portfolio – Class I | 4.7 | |||
7. General Electric Capital Corp. | 4.5 | |||
8. Wal-Mart Stores, Inc. | 4.5 | |||
9. Citigroup Funding, Inc. | 3.5 | |||
10. U.S. Treasury Bill | 3.5 |
| (1) | Composition of Portfolio subject to change. |
| (2) | Sectors (combined): |
| % of Net Assets | ||||
Financials | 37.5 | |||
Consumer Staples | 16.0 | |||
Health Care | 8.7 | |||
Energy | 4.5 | |||
Consumer Discretionary | 4.3 | |||
Information Technology | 3.4 | |||
|
| |||
| 74.4 | ||||
|
|
| 7 |
| Ohio National Fund, Inc. | Money Market Portfolio |
Schedule of Investments | June 30, 2011 (Unaudited) |
| Commercial Paper – 73.2% | Rate | Maturity | Face Amount | Amortized Cost | ||||||||||||
CONSUMER DISCRETIONARY – 4.3% | ||||||||||||||||
Walt Disney Co. / The (Media) | (a) | 0.110% | 08/11/2011 | $ | 7,376,000 | $ | 7,375,076 | |||||||||
Walt Disney Co. / The (Media) | (a) | 0.100% | 08/08/2011 | 5,000,000 | 4,999,472 | |||||||||||
|
| |||||||||||||||
| 12,374,548 | ||||||||||||||||
|
| |||||||||||||||
CONSUMER STAPLES – 16.0% | ||||||||||||||||
Coca-Cola Co. / The (Beverages) | (a) | 0.090% | 08/16/2011 | 6,000,000 | 5,999,310 | |||||||||||
Coca-Cola Co. / The (Beverages) | (a) | 0.120% | 07/13/2011 | 5,000,000 | 4,999,800 | |||||||||||
Coca-Cola Co. / The (Beverages) | (a) | 0.130% | 08/10/2011 | 2,000,000 | 1,999,711 | |||||||||||
Wal-Mart Stores, Inc. (Food & Staples Retailing) | (a) | 0.070% | 07/18/2011 | 13,000,000 | 12,999,570 | |||||||||||
Nestle Capital Corp. (Food Products) | (a) | 0.050% | 07/12/2011 | 7,000,000 | 6,999,893 | |||||||||||
Nestle Capital Corp. (Food Products) | (a) | 0.120% | 08/30/2011 | 3,000,000 | 2,999,400 | |||||||||||
Procter & Gamble International Funding SCA (Household Products) | (a) | 0.070% | 07/12/2011 | 10,000,000 | 9,999,786 | |||||||||||
|
| |||||||||||||||
| 45,997,470 | ||||||||||||||||
|
| |||||||||||||||
ENERGY – 4.5% | ||||||||||||||||
Chevron Corp. (Oil, Gas & Consumable Fuels) | 0.030% | 07/11/2011 | 8,000,000 | 7,999,934 | ||||||||||||
Chevron Corp. (Oil, Gas & Consumable Fuels) | 0.060% | 07/06/2011 | 5,000,000 | 4,999,958 | ||||||||||||
|
| |||||||||||||||
| 12,999,892 | ||||||||||||||||
|
| |||||||||||||||
FINANCIALS – 36.3% | ||||||||||||||||
American Honda Finance Corp. (Consumer Finance) | 0.100% | 07/07/2011 | 10,000,000 | 9,999,834 | ||||||||||||
American Express Credit Corp. (Consumer Finance) | 0.070% | 07/14/2011 | 10,000,000 | 9,999,747 | ||||||||||||
Toyota Motor Credit Corp. (Consumer Finance) | 0.120% | 07/18/2011 | 10,000,000 | 9,999,433 | ||||||||||||
John Deere Capital Corp. (Consumer Finance) | (a) | 0.070% | 07/13/2011 | 5,500,000 | 5,499,872 | |||||||||||
John Deere Capital Corp. (Consumer Finance) | (a) | 0.090% | 07/11/2011 | 5,000,000 | 4,999,875 | |||||||||||
Societe Generale North America (Diversified Financial Services) | 0.030% | 07/01/2011 | 14,000,000 | 14,000,000 | ||||||||||||
General Electric Capital Corp. (Diversified Financial Services) | 0.060% | 07/05/2011 | 13,000,000 | 12,999,913 | ||||||||||||
Citigroup Funding, Inc. (Diversified Financial Services) | 0.170% | 07/01/2011 | 10,000,000 | 10,000,000 | ||||||||||||
HSBC Finance Corp. (Diversified Financial Services) | 0.120% | 07/08/2011 | 8,000,000 | 7,999,813 | ||||||||||||
HSBC Finance Corp. (Diversified Financial Services) | 0.040% | 07/08/2011 | 5,000,000 | 4,999,961 | ||||||||||||
Prudential Funding LLC (Insurance) | 0.040% | 07/01/2011 | 14,000,000 | 14,000,000 | ||||||||||||
|
| |||||||||||||||
| 104,498,448 | ||||||||||||||||
|
| |||||||||||||||
HEALTH CARE – 8.7% | ||||||||||||||||
Merck & Co., Inc. (Pharmaceuticals) | (a) | 0.090% | 07/15/2011 | 10,000,000 | 9,999,650 | |||||||||||
Abbott Laboratories (Pharmaceuticals) | (a) | 0.080% | 07/27/2011 | 8,000,000 | 7,999,538 | |||||||||||
Pfizer, Inc. (Pharmaceuticals) | 0.060% | 07/06/2011 | 5,000,000 | 4,999,958 | ||||||||||||
Johnson & Johnson (Pharmaceuticals) | (a) | 0.050% | 07/15/2011 | 2,000,000 | 1,999,961 | |||||||||||
|
| |||||||||||||||
| 24,999,107 | ||||||||||||||||
|
| |||||||||||||||
INFORMATION TECHNOLOGY – 3.4% | ||||||||||||||||
International Business Machines Corp. (Computers & Peripherals) | 0.060% | 07/19/2011 | 10,000,000 | 9,999,700 | ||||||||||||
|
| |||||||||||||||
Total Commercial Paper (Cost $210,869,165) | $ | 210,869,165 | ||||||||||||||
|
| |||||||||||||||
| Asset-Backed Securities – 1.2% | Rate | Maturity | Face Amount | Amortized Cost | ||||||||||||
FINANCIALS – 1.2% | ||||||||||||||||
Ally Auto Receivables Trust 2011-1, Class A1 (Consumer Finance) | 0.315% | 02/15/2012 | $ | 137,287 | $ | 137,287 | ||||||||||
CNH Equipment Trust 2011-A, Class A1 (Consumer Finance) | (a) | 0.336% | 05/15/2012 | 917,299 | 917,299 | |||||||||||
Ford Credit Auto Owner Trust 2011-A, Class A1 (Consumer Finance) | (a) | 0.289% | 02/15/2012 | 121,981 | 121,981 | |||||||||||
Honda Auto Receivables Owner Trust 2010-3, Class A1 (Consumer Finance) | 0.310% | 10/21/2011 | 13,307 | 13,307 | ||||||||||||
Hyundai Auto Receivables Trust 2011-A, Class A1 (Consumer Finance) | 0.318% | 02/15/2012 | 359,789 | 359,789 | ||||||||||||
Hyundai Auto Receivables Trust 2011-B, Class A1 (Consumer Finance) | 0.248% | 05/15/2012 | 1,000,000 | 1,000,000 | ||||||||||||
Nissan Auto Receivables Owners Trust 2010-A, Class A1 (Consumer Finance) | 0.356% | 10/17/2011 | 11,117 | 11,117 | ||||||||||||
Nissan Auto Lease Trust 2010-B, Class A1 (Consumer Finance) | 0.317% | 11/15/2011 | 132,060 | 132,060 | ||||||||||||
Nissan Auto Receivables Owners Trust 2011-A, Class A1 (Consumer Finance) | 0.261% | 04/16/2012 | 761,525 | 761,525 | ||||||||||||
|
| |||||||||||||||
Total Asset-Backed Securities (Cost $3,454,365) | $ | 3,454,365 | ||||||||||||||
|
| |||||||||||||||
| Money Market Funds – 14.0% | Shares | Value | ||||||||||||||
Federated Prime Cash Obligations Fund – Institutional Class | 13,500,000 | $ | 13,500,000 | |||||||||||||
Fidelity Institutional Money Market Funds Money Market Portfolio – Class I | 13,400,000 | 13,400,000 | ||||||||||||||
Fidelity Institutional Money Market Funds Prime Money Market Portfolio – Class I | 13,500,000 | 13,500,000 | ||||||||||||||
|
| |||||||||||||||
Total Money Market Funds (Cost $40,400,000) | $ | 40,400,000 | ||||||||||||||
|
| |||||||||||||||
| 8 | (continued) |
| Ohio National Fund, Inc. | Money Market Portfolio (Continued) |
Schedule of Investments | June 30, 2011 (Unaudited) |
| U.S. Treasury Obligations – 3.5% | Rate | Maturity | Face Amount | Amortized Cost | ||||||||||||
U.S. Treasury Bill | 0.050% | 07/07/2011 | $ | 10,000,000 | $ | 9,999,917 | ||||||||||
|
| |||||||||||||||
Total U.S. Treasury Obligations (Cost $9,999,917) | $ | 9,999,917 | ||||||||||||||
|
| |||||||||||||||
| Repurchase Agreements – 4.9% | Rate | Maturity | Face Amount | Amortized Cost | ||||||||||||
| U.S. Bank, Agreement date: 06/30/11, Repurchase price $14,000,000, Collateralized by: Freddie Mac 30 yr. Gold Giant Pool #G01514 (FGLMC) 5.000%, Due 02/01/2033 with value of $12,662,502, Freddie Mac 15 yr. Gold Giant Pool #G11440 (FGCI) 4.000%, Due 08/01/2018 with value of $1,616,766 | 0.010% | 07/01/2011 | $ | 14,000,000 | $ | 14,000,000 | ||||||||||
|
| |||||||||||||||
Total Repurchase Agreements (Cost $14,000,000) | $ | 14,000,000 | ||||||||||||||
|
| |||||||||||||||
Total Investments – 96.8% (Cost $278,723,447) | (b) | $ | 278,723,447 | |||||||||||||
Other Assets in Excess of Liabilities – 3.2% | 9,115,741 | |||||||||||||||
|
| |||||||||||||||
Net Assets – 100.0% | $ | 287,839,188 | ||||||||||||||
|
| |||||||||||||||
Percentages are stated as a percent of net assets.
Footnotes:
| (a) | Security exempt from registration under Section 4 (2) of the Securities Act of 1933. These securities may be resold in transactions exempt from registration, normally to qualified buyers under Rule 144A. At June 30, 2011, the value of these securities totaled $89,910,194, or 31.2% of the Portfolio’s net assets. These securities were deemed liquid pursuant to procedures approved by the Board of Directors. |
| (b) | Represents cost for federal income tax and financial reporting purposes. See also Note 2 regarding the use of amortized cost for valuation of instruments in this Portfolio. |
The accompanying notes are an integral part of these financial statements.
| 9 |
| Ohio National Fund, Inc. | Bond Portfolio |
Objective/Strategy
The Bond Portfolio seeks to obtain a high level of income and opportunity for capital appreciation consistent with the preservation of capital by investing primarily in intermediate-term and long-term fixed income securities.
Performance as of June 30, 2011
Average Annual Total Returns: | ||||
One year | 5.65% | |||
Five years | 5.36% | |||
Ten years | 5.52% |
Past performance does not guarantee future results. The performance data quoted represents past performance and current returns may be lower or higher. Total return figures include change in share price and reinvestment of dividends and capital gains. The investment return and principal value will fluctuate so that an investor’s shares, when redeemed, may be worth more or less than the original cost. To obtain performance information up to the most recent month end, call toll-free 1-877-781-6392.
The Portfolio is not open to direct retail investment. Beneficial interest in shares is obtained solely by purchase of variable life insurance policies and variable annuity contracts. Actual performance results for variable annuity and variable universal life contracts will be lower due to contract charges. Consult your contract for applicable charges.
Comments
For the six-month period ended June 30, 2011, the Bond Portfolio returned 3.33% versus 3.29% for the current benchmark, the BofA Merrill Lynch U.S. Corporate Master Index (the “Merrill Lynch Index”).
The slight out-performance of the Portfolio was primarily the result of portfolio maturity structure compared to the Merrill Lynch Index. During the first half of 2011, the 5-year U.S. Treasury yield declined 25 basis points, the 10-year U.S. Treasury yield declined 13 basis points, and the 30-year U.S. Treasury yield increased 4 basis points. Because the Portfolio was over-weighted in bonds with maturities of 5 to 7 years, and under-weighted in bonds with maturities of greater than 15 years, the Portfolio was able to achieve better price performance than the Merrill Lynch Index.
We have expected for some time that Treasury yields would rise due to a strengthening of growth in the U.S. economy, eventual tightening of credit on the part of the Federal Reserve, and huge federal budget deficits for at least the next several years. For this reason, the duration of the Portfolio has been maintained shorter than the duration of the Merrill Lynch Index. However, economic growth in the U.S. has been disappointing, the Federal Reserve continued its quantitative easing program, and sovereign debt problems in Europe have increased demand for U.S. Treasury securities. The result of these factors is lower U.S. Treasury yields for all but the longest maturity Treasury bonds. As discussed in the previous paragraph, this benefited the Portfolio because of its shorter maturity bond holdings. Despite weaker economic growth in the U.S., corporate earnings have been strong. Strong corporate earnings resulted in marginally tighter credit spreads during the first half of 2011. Indeed, corporate credit has fully recovered from the depths of the Great Recession.
Several industry weightings had an impact on relative performance during the first half of 2011. The Portfolio’s under-weighting in the banking, energy, and telecommunication services sectors hurt performance, because these three sectors outperformed. The Portfolio’s under-weighting in the auto sector benefited relative
performance because this sector under-performed. The Portfolio also benefited from its over-weighting in the brokerage sector because this sector outperformed. The Portfolio was negatively impacted by its holdings of U.S. Treasuries because credit spreads tightened marginally during the period.(1)
Because Treasury yields declined for most of the yield curve, credit spreads tightened slightly, and no credit problems surfaced in the Portfolio, all of the bonds held in the Portfolio had positive total returns. The five bonds that had the highest total returns were Tenaska Georgia Partners LP, Equity One, Inc., Discover Financial Services, Bunge NA Finance LP, and Janus Capital Group, Inc. The five poorest performing bonds were AT&T Corp., Monsanto Co., BlackRock, Inc., Southwest Gas Corp., and Baxter International, Inc. All five of these bonds under-performed because of their very short maturities in a declining interest rate environment and not because of any underlying credit problems.(1)
We expect the growth rate of the U.S. economy to increase in the second half of this year. Once the growth rate of the economy firms, we expect the Federal Reserve to begin removing its monetary stimulus. This, combined with unprecedented federal budget deficits, should result in an increase in Treasury yields. For this reason, the duration of the Portfolio will be maintained short of the Merrill Lynch Index. Because we expect credit spreads to tighten modestly over the remainder of 2011 as corporate profits rise, purchases for the Portfolio will be skewed toward BBB names, which are slightly lower in quality than the average for the Merrill Lynch Index.
| (1) | The Portfolio’s composition is subject to change. Holdings and weightings are as of June 30, 2011. |
Change in Value of $10,000 Investment
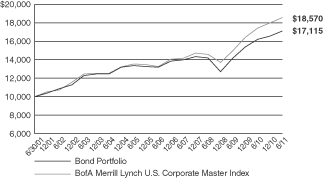
Hypothetical illustration based on past performance. Future performance will vary. The Portfolio’s returns reflect reinvested dividends. The Portfolio’s holdings may differ significantly from the securities in the index. The index is unmanaged and therefore does not reflect the cost of portfolio management and accounting.
The BofA Merrill Lynch U.S. Corporate Master Index tracks the performance of all U.S. dollar-denominated, investment grade corporate public debt issued in the U.S. domestic bond market. Qualifying bonds must have at least one year remaining term to maturity, a fixed coupon schedule, and a minimum amount outstanding of $250 million.
| 10 | (continued) |
| Ohio National Fund, Inc. | Bond Portfolio (Continued) |
Portfolio Composition as of June 30, 2011 (1)
| % of Net Assets | ||||
Corporate Bonds (3) | 90.6 | |||
U.S. Treasury Obligations | 4.1 | |||
Repurchase Agreements and | 5.3 | |||
|
| |||
| 100.0 | ||||
|
|
Top 10 Portfolio Holdings as of June 30, 2011 (1) (2)
| % of Net Assets | ||||
1. United States Treasury Note | 3.4 | |||
2. Kroger Co. / The | 1.1 | |||
3. Fifth Third Bancorp | 1.1 | |||
4. Union Electric Co. | 1.1 | |||
5. Kraft Foods, Inc. | 1.1 | |||
6. Commonwealth Edison Co. | 1.1 | |||
7. Virginia Electric and Power Co. | 1.1 | |||
8. UnitedHealth Group, Inc. | 1.1 | |||
9. Kansas City Power & Light Co. | 1.1 | |||
10. Prudential Financial, Inc. | 1.1 |
| (1) | Composition of Portfolio subject to change. |
| (2) | Short-term investments have been excluded from the list of Top 10 Portfolio Holdings. |
| (3) | Sectors: |
| % of Net Assets | ||||
Financials | 29.4 | |||
Utilities | 15.1 | |||
Consumer Staples | 8.5 | |||
Industrials | 8.2 | |||
Energy | 7.6 | |||
Health Care | 6.9 | |||
Consumer Discretionary | 6.1 | |||
Telecommunication Services | 3.8 | |||
Materials | 2.9 | |||
Information Technology | 2.1 | |||
|
| |||
| 90.6 | ||||
|
|
| 11 |
| Ohio National Fund, Inc. | Bond Portfolio |
Schedule of Investments | June 30, 2011 (Unaudited) |
| Corporate Bonds – 90.6% | Rate | Maturity | Face Amount | Value | ||||||||||||
CONSUMER DISCRETIONARY – 6.1% |
| |||||||||||||||
Newell Rubbermaid, Inc. (Household Durables) | 6.250% | 04/15/2018 | $ | 500,000 | $ | 560,401 | ||||||||||
Comcast Corp. (Media) | 5.875% | 02/15/2018 | 750,000 | 842,348 | ||||||||||||
Discovery Communications LLC (Media) | 4.375% | 06/15/2021 | 1,000,000 | 992,191 | ||||||||||||
News America, Inc. (Media) | (a) | 4.500% | 02/15/2021 | 1,250,000 | 1,236,020 | |||||||||||
Time Warner Cable, Inc. (Media) | 5.850% | 05/01/2017 | 1,000,000 | 1,125,955 | ||||||||||||
Time Warner, Inc. (Media) | 3.150% | 07/15/2015 | 1,250,000 | 1,293,936 | ||||||||||||
Viacom, Inc. (Media) | 4.375% | 09/15/2014 | 1,000,000 | 1,074,824 | ||||||||||||
Macy’s Retail Holdings, Inc. (Multiline Retail) | 5.900% | 12/01/2016 | 1,000,000 | 1,127,563 | ||||||||||||
Home Depot, Inc. (Specialty Retail) | 5.250% | 12/16/2013 | 1,000,000 | 1,093,369 | ||||||||||||
|
| |||||||||||||||
| 9,346,607 | ||||||||||||||||
|
| |||||||||||||||
CONSUMER STAPLES – 8.5% |
| |||||||||||||||
Anheuser-Busch Cos., Inc. (Beverages) | 5.500% | 01/15/2018 | 750,000 | 836,681 | ||||||||||||
CVS Caremark Corp. (Food & Staples Retailing) | 5.750% | 06/01/2017 | 1,000,000 | �� | 1,124,597 | |||||||||||
Kroger Co. / The (Food & Staples Retailing) | 6.400% | 08/15/2017 | 1,500,000 | 1,759,429 | ||||||||||||
Wal-Mart Stores, Inc. (Food & Staples Retailing) | 1.500% | 10/25/2015 | 1,250,000 | 1,234,940 | ||||||||||||
Bunge NA Finance LP (Food Products) | 5.900% | 04/01/2017 | 1,500,000 | 1,641,490 | ||||||||||||
Kraft Foods, Inc. (Food Products) | 6.125% | 02/01/2018 | 1,500,000 | 1,728,025 | ||||||||||||
Mead Johnson Nutrition Co. (Food Products) | 3.500% | 11/01/2014 | 800,000 | 838,180 | ||||||||||||
Sara Lee Corp. (Food Products) | 2.750% | 09/15/2015 | 1,250,000 | 1,247,909 | ||||||||||||
Tyson Foods, Inc. (Food Products) | (b) | 6.850% | 04/01/2016 | 1,000,000 | 1,110,000 | |||||||||||
Procter & Gamble Co. / The (Household Products) | 4.700% | 02/15/2019 | 250,000 | 276,329 | ||||||||||||
Philip Morris International, Inc. (Tobacco) | 4.125% | 05/17/2021 | 1,250,000 | 1,248,035 | ||||||||||||
|
| |||||||||||||||
| 13,045,615 | ||||||||||||||||
|
| |||||||||||||||
ENERGY – 7.6% |
| |||||||||||||||
Weatherford International Ltd. (Energy Equip. & Svs.) | 6.000% | 03/15/2018 | 1,500,000 | 1,646,536 | ||||||||||||
Anadarko Petroleum Corp. (Oil, Gas & Consumable Fuels) | 5.950% | 09/15/2016 | 1,000,000 | 1,126,858 | ||||||||||||
Atlantic Richfield Co. (Oil, Gas & Consumable Fuels) | 8.550% | 03/01/2012 | 200,000 | 208,905 | ||||||||||||
Buckeye Partners LP (Oil, Gas & Consumable Fuels) | 4.875% | 02/01/2021 | 1,000,000 | 1,010,785 | ||||||||||||
Cenovus Energy, Inc. (Oil, Gas & Consumable Fuels) | 5.700% | 10/15/2019 | 1,000,000 | 1,135,052 | ||||||||||||
Energy Transfer Partners LP (Oil, Gas & Consumable Fuels) | 5.650% | 08/01/2012 | 1,000,000 | 1,048,014 | ||||||||||||
EOG Resources, Inc. (Oil, Gas & Consumable Fuels) | 2.950% | 06/01/2015 | 1,250,000 | 1,288,080 | ||||||||||||
Magellan Midstream Partners LP (Oil, Gas & Consumable Fuels) | 4.250% | 02/01/2021 | 1,000,000 | 993,449 | ||||||||||||
ONEOK Partners LP (Oil, Gas & Consumable Fuels) | 3.250% | 02/01/2016 | 1,000,000 | 1,018,214 | ||||||||||||
Shell International Finance BV (Oil, Gas & Consumable Fuels) | 4.375% | 03/25/2020 | 1,250,000 | 1,315,859 | ||||||||||||
Valero Energy Corp. (Oil, Gas & Consumable Fuels) | 6.875% | 04/15/2012 | 750,000 | 784,451 | ||||||||||||
|
| |||||||||||||||
| 11,576,203 | ||||||||||||||||
|
| |||||||||||||||
FINANCIALS – 29.4% |
| |||||||||||||||
BlackRock, Inc. (Capital Markets) | 2.250% | 12/10/2012 | 500,000 | 509,942 | ||||||||||||
Credit Suisse (Capital Markets) | 3.500% | 03/23/2015 | 1,250,000 | 1,289,906 | ||||||||||||
Franklin Resources, Inc. (Capital Markets) | 3.125% | 05/20/2015 | 1,000,000 | 1,042,274 | ||||||||||||
Goldman Sachs Group, Inc. / The (Capital Markets) | 6.150% | 04/01/2018 | 1,250,000 | 1,362,316 | ||||||||||||
Janus Capital Group, Inc. (Capital Markets) | (b) | 6.700% | 06/15/2017 | 1,500,000 | 1,646,412 | |||||||||||
Jefferies Group, Inc. (Capital Markets) | 5.875% | 06/08/2014 | 1,500,000 | 1,640,649 | ||||||||||||
Morgan Stanley (Capital Markets) | 4.750% | 04/01/2014 | 1,250,000 | 1,303,817 | ||||||||||||
Northern Trust Corp. (Capital Markets) | 3.450% | 11/04/2020 | 1,000,000 | 972,537 | ||||||||||||
State Street Corp. (Capital Markets) | 4.375% | 03/07/2021 | 1,250,000 | 1,268,959 | ||||||||||||
TD Ameritrade Holding Corp. (Capital Markets) | 4.150% | 12/01/2014 | 1,000,000 | 1,059,695 | ||||||||||||
BB&T Corp. (Commercial Banks) | 5.200% | 12/23/2015 | 1,000,000 | 1,082,914 | ||||||||||||
Comerica Bank (Commercial Banks) | 5.750% | 11/21/2016 | 1,500,000 | 1,676,298 | ||||||||||||
Deutsche Bank Capital Funding Trust VII (Commercial Banks) | (a)(c) | 5.628% | Perpetual | 1,500,000 | 1,335,000 | |||||||||||
Fifth Third Bancorp (Commercial Banks) | 4.500% | 06/01/2018 | 1,750,000 | 1,741,418 | ||||||||||||
KeyCorp (Commercial Banks) | 5.100% | 03/24/2021 | 500,000 | 510,217 | ||||||||||||
PNC Funding Corp. (Commercial Banks) | 5.250% | 11/15/2015 | 1,500,000 | 1,636,017 | ||||||||||||
SunTrust Bank (Commercial Banks) | 5.000% | 09/01/2015 | 229,000 | 246,359 | ||||||||||||
Wells Fargo & Co. (Commercial Banks) | 4.600% | 04/01/2021 | 1,250,000 | 1,259,390 | ||||||||||||
American Express Co. (Consumer Finance) | 7.000% | 03/19/2018 | 1,250,000 | 1,473,060 | ||||||||||||
Capital One Bank USA NA (Consumer Finance) | 5.125% | 02/15/2014 | 750,000 | 822,568 | ||||||||||||
Discover Financial Services (Consumer Finance) | 6.450% | 06/12/2017 | 750,000 | 832,956 | ||||||||||||
Bank of America Corp. (Diversified Financial Svs.) | 5.650% | 05/01/2018 | 1,000,000 | 1,055,822 | ||||||||||||
Citigroup, Inc. (Diversified Financial Svs.) | 6.125% | 05/15/2018 | 1,250,000 | 1,378,481 | ||||||||||||
General Electric Capital Corp. (Diversified Financial Svs.) | 5.625% | 05/01/2018 | 1,000,000 | 1,095,277 | ||||||||||||
JPMorgan Chase & Co. (Diversified Financial Svs.) | 5.150% | 10/01/2015 | 1,500,000 | 1,621,614 | ||||||||||||
National Rural Utilities Cooperative Finance Corp. (Diversified Financial Svs.) | 1.900% | 11/01/2015 | 1,000,000 | 986,796 | ||||||||||||
Assurant, Inc. (Insurance) | 5.625% | 02/15/2014 | 1,500,000 | 1,603,677 | ||||||||||||
Axis Capital Holdings Ltd. (Insurance) | 5.750% | 12/01/2014 | 1,000,000 | 1,081,394 | ||||||||||||
Berkshire Hathaway, Inc. (Insurance) | 3.200% | 02/11/2015 | 1,250,000 | 1,303,922 | ||||||||||||
| 12 | (continued) |
| Ohio National Fund, Inc. | Bond Portfolio (Continued) |
Schedule of Investments | June 30, 2011 (Unaudited) |
| Corporate Bonds (Continued) | Rate | Maturity | Face Amount | Value | ||||||||||||
FINANCIALS (continued) |
| |||||||||||||||
Hartford Financial Services Group, Inc. (Insurance) | 5.375% | 03/15/2017 | $ | 1,500,000 | $ | 1,581,165 | ||||||||||
Liberty Mutual Group, Inc. (Insurance) | (a) | 5.750% | 03/15/2014 | 1,000,000 | 1,061,746 | |||||||||||
Loews Corp. (Insurance) | 5.250% | 03/15/2016 | 750,000 | 818,056 | ||||||||||||
Metropolitan Life Global Funding I (Insurance) | (a) | 2.875% | 09/17/2012 | 1,000,000 | 1,022,258 | |||||||||||
Prudential Financial, Inc. (Insurance) | 6.100% | 06/15/2017 | 1,500,000 | 1,686,834 | ||||||||||||
StanCorp Financial Group, Inc. (Insurance) | 6.875% | 10/01/2012 | 500,000 | 528,578 | ||||||||||||
Equity One, Inc. (Real Estate Investment Trusts) | 6.250% | 01/15/2017 | 1,250,000 | 1,352,135 | ||||||||||||
HCP, Inc. (Real Estate Investment Trusts) | 5.375% | 02/01/2021 | 1,000,000 | 1,033,352 | ||||||||||||
Mack-Cali Realty LP (Real Estate Investment Trusts) | 4.600% | 06/15/2013 | 1,000,000 | 1,053,963 | ||||||||||||
|
| |||||||||||||||
| 44,977,774 | ||||||||||||||||
|
| |||||||||||||||
HEALTH CARE – 6.9% | ||||||||||||||||
Amgen, Inc. (Biotechnology) | 4.100% | 06/15/2021 | 1,000,000 | 994,118 | ||||||||||||
Celgene Corp. (Biotechnology) | 2.450% | 10/15/2015 | 1,250,000 | 1,243,789 | ||||||||||||
Baxter International, Inc. (Health Care Equip. & Supplies) | 1.800% | 03/15/2013 | 250,000 | 254,297 | ||||||||||||
Becton Dickinson and Co. (Health Care Equip. & Supplies) | 5.000% | 05/15/2019 | 500,000 | 547,078 | ||||||||||||
Covidien International Finance SA (Health Care Equip. & Supplies) | 2.800% | 06/15/2015 | 1,250,000 | 1,282,830 | ||||||||||||
St. Jude Medical, Inc. (Health Care Equip. & Supplies) | 2.200% | 09/15/2013 | 1,000,000 | 1,021,641 | ||||||||||||
AmerisourceBergen Corp. (Health Care Providers & Svs.) | 4.875% | 11/15/2019 | 500,000 | 535,091 | ||||||||||||
UnitedHealth Group, Inc. (Health Care Providers & Svs.) | 6.000% | 02/15/2018 | 1,500,000 | 1,703,174 | ||||||||||||
Thermo Fisher Scientific, Inc. (Life Sciences Tools & Svs.) | 3.250% | 11/20/2014 | 300,000 | 316,538 | ||||||||||||
Abbott Laboratories (Pharmaceuticals) | 2.700% | 05/27/2015 | 1,000,000 | 1,040,542 | ||||||||||||
Merck & Co., Inc. (Pharmaceuticals) | 5.000% | 06/30/2019 | 1,000,000 | 1,108,606 | ||||||||||||
Teva Pharmaceutical Finance II BV / Teva Pharmaceutical Finance III LLC (Pharmaceuticals) | 3.000% | 06/15/2015 | 500,000 | 514,981 | ||||||||||||
|
| |||||||||||||||
| 10,562,685 | ||||||||||||||||
|
| |||||||||||||||
INDUSTRIALS – 8.2% | ||||||||||||||||
BAE Systems Holdings, Inc. (Aerospace & Defense) | (a) | 6.375% | 06/01/2019 | 750,000 | 853,677 | |||||||||||
Raytheon Co. (Aerospace & Defense) | 4.400% | 02/15/2020 | 1,250,000 | 1,295,935 | ||||||||||||
Owens Corning (Building Products) | 6.500% | 12/01/2016 | 1,000,000 | 1,089,327 | ||||||||||||
Republic Services, Inc. (Commercial Svs. & Supplies) | 3.800% | 05/15/2018 | 1,000,000 | 1,005,789 | ||||||||||||
Waste Management, Inc. (Commercial Svs. & Supplies) | 6.100% | 03/15/2018 | 500,000 | 567,892 | ||||||||||||
Emerson Electric Co. (Electrical Equip.) | 4.250% | 11/15/2020 | 1,250,000 | 1,311,689 | ||||||||||||
Caterpillar, Inc. (Machinery) | 5.700% | 08/15/2016 | 1,000,000 | 1,157,630 | ||||||||||||
Deere & Co. (Machinery) | 4.375% | 10/16/2019 | 1,250,000 | 1,325,744 | ||||||||||||
CSX Corp. (Road & Rail) | 5.600% | 05/01/2017 | 1,500,000 | 1,678,542 | ||||||||||||
Ryder System, Inc. (Road & Rail) | 3.600% | 03/01/2016 | 1,000,000 | 1,025,712 | ||||||||||||
Union Pacific Corp. (Road & Rail) | 4.000% | 02/01/2021 | 1,250,000 | 1,267,470 | ||||||||||||
|
| |||||||||||||||
| 12,579,407 | ||||||||||||||||
|
| |||||||||||||||
INFORMATION TECHNOLOGY – 2.1% | ||||||||||||||||
Cisco Systems, Inc. (Communications Equip.) | 2.900% | 11/17/2014 | 300,000 | 315,820 | ||||||||||||
Computer Sciences Corp. (IT Svs.) | 6.500% | 03/15/2018 | 1,500,000 | 1,608,614 | ||||||||||||
International Business Machines Corp. (IT Svs.) | 2.100% | 05/06/2013 | 1,250,000 | 1,282,438 | ||||||||||||
|
| |||||||||||||||
| 3,206,872 | ||||||||||||||||
|
| |||||||||||||||
MATERIALS – 2.9% | ||||||||||||||||
Monsanto Co. (Chemicals) | 7.375% | 08/15/2012 | 1,000,000 | 1,073,234 | ||||||||||||
Praxair, Inc. (Chemicals) | 2.125% | 06/14/2013 | 1,250,000 | 1,282,119 | ||||||||||||
Rio Tinto Finance USA Ltd. (Metals & Mining) | 1.875% | 11/02/2015 | 1,000,000 | 986,577 | ||||||||||||
Teck Resources Ltd. (Metals & Mining) | 7.000% | 09/15/2012 | 1,000,000 | 1,063,826 | ||||||||||||
|
| |||||||||||||||
| 4,405,756 | ||||||||||||||||
|
| |||||||||||||||
TELECOMMUNICATION SERVICES – 3.8% | ||||||||||||||||
AT&T Corp. (Diversified Telecom. Svs.) | (b) | 7.300% | 11/15/2011 | 500,000 | 512,158 | |||||||||||
Embarq Corp. (Diversified Telecom. Svs.) | 6.738% | 06/01/2013 | 1,000,000 | 1,083,694 | ||||||||||||
Telecom Italia Capital SA (Diversified Telecom. Svs.) | 5.250% | 10/01/2015 | 750,000 | 780,456 | ||||||||||||
Verizon Communications, Inc. (Diversified Telecom. Svs.) | 4.600% | 04/01/2021 | 1,250,000 | 1,292,270 | ||||||||||||
America Movil SAB de CV (Wireless Telecom. Svs.) | 5.750% | 01/15/2015 | 1,000,000 | 1,117,336 | ||||||||||||
Rogers Communications, Inc. (Wireless Telecom. Svs.) | 5.500% | 03/15/2014 | 1,000,000 | 1,101,903 | ||||||||||||
|
| |||||||||||||||
| 5,887,817 | ||||||||||||||||
|
| |||||||||||||||
UTILITIES – 15.1% | ||||||||||||||||
Appalachian Power Co. (Electric Utilities) | 4.600% | 03/30/2021 | 1,000,000 | 1,009,089 | ||||||||||||
Commonwealth Edison Co. (Electric Utilities) | 5.950% | 08/15/2016 | 1,500,000 | 1,716,327 | ||||||||||||
Consumers Energy Co. (Electric Utilities) | 6.000% | 02/15/2014 | 1,000,000 | 1,112,898 | ||||||||||||
Duke Energy Corp. (Electric Utilities) | 3.350% | 04/01/2015 | 1,250,000 | 1,299,346 | ||||||||||||
Florida Power Corp. (Electric Utilities) | 4.550% | 04/01/2020 | 500,000 | 526,376 | ||||||||||||
Kansas City Power & Light Co. (Electric Utilities) | 5.850% | 06/15/2017 | 1,500,000 | 1,692,567 | ||||||||||||
| 13 | (continued) |
| Ohio National Fund, Inc. | Bond Portfolio (Continued) |
Schedule of Investments | June 30, 2011 (Unaudited) |
| Corporate Bonds (Continued) | Rate | Maturity | Face Amount | Value | ||||||||||||
UTILITIES (continued) | ||||||||||||||||
Metropolitan Edison Co. (Electric Utilities) | 4.875% | 04/01/2014 | $ | 750,000 | $ | 794,446 | ||||||||||
Pepco Holdings, Inc. (Electric Utilities) | 2.700% | 10/01/2015 | 750,000 | 754,712 | ||||||||||||
Tenaska Georgia Partners LP (Electric Utilities) | 9.500% | 02/01/2030 | 483,118 | 587,093 | ||||||||||||
Union Electric Co. (Electric Utilities) | 6.400% | 06/15/2017 | 1,500,000 | 1,740,920 | ||||||||||||
Virginia Electric and Power Co. (Electric Utilities) | 5.400% | 01/15/2016 | 1,500,000 | 1,706,210 | ||||||||||||
AGL Capital Corp. (Gas Utilities) | 5.250% | 08/15/2019 | 1,000,000 | 1,074,537 | ||||||||||||
CenterPoint Energy Resources Corp. (Gas Utilities) | 5.950% | 01/15/2014 | 500,000 | 550,796 | ||||||||||||
Southwest Gas Corp. (Gas Utilities) | 7.625% | 05/15/2012 | 1,000,000 | 1,047,525 | ||||||||||||
Spectra Energy Capital LLC (Gas Utilities) | 5.500% | 03/01/2014 | 750,000 | 821,161 | ||||||||||||
Energy Future Competitive Holdings Co. (Ind. Power Prod. & Energy Traders) | 7.480% | 01/01/2017 | 521,326 | 446,868 | ||||||||||||
PSEG Power LLC (Ind. Power Prod. & Energy Traders) | 5.000% | 04/01/2014 | 750,000 | 805,136 | ||||||||||||
TransAlta Corp. (Ind. Power Prod. & Energy Traders) | 6.750% | 07/15/2012 | 1,000,000 | 1,055,622 | ||||||||||||
Alliant Energy Corp. (Multi-Utilities) | 4.000% | 10/15/2014 | 1,000,000 | 1,052,823 | ||||||||||||
Avista Corp. (Multi-Utilities) | 5.950% | 06/01/2018 | 1,000,000 | 1,127,287 | ||||||||||||
NextEra Energy Capital Holdings, Inc. (Multi-Utilities) | 2.600% | 09/01/2015 | 1,250,000 | 1,245,488 | ||||||||||||
Xcel Energy, Inc. (Multi-Utilities) | 4.700% | 05/15/2020 | 1,000,000 | 1,041,654 | ||||||||||||
|
| |||||||||||||||
| 23,208,881 | ||||||||||||||||
|
| |||||||||||||||
Total Corporate Bonds (Cost $129,439,840) | $ | 138,797,617 | ||||||||||||||
|
| |||||||||||||||
| U.S. Treasury Obligations – 4.1% | Rate | Maturity | Face Amount | Value | ||||||||||||
United States Treasury Note | 2.375% | 09/30/2014 | $ | 1,000,000 | $ | 1,046,719 | ||||||||||
United States Treasury Note | 3.375% | 11/15/2019 | 5,000,000 | 5,213,280 | ||||||||||||
|
| |||||||||||||||
Total U.S. Treasury Obligations (Cost $6,584,020) | $ | 6,259,999 | ||||||||||||||
|
| |||||||||||||||
| Repurchase Agreements – 4.8% | Rate | Maturity | Face Amount | Amortized Cost | ||||||||||||
| U.S. Bank, Agreement date: 06/30/2011, Repurchase price: $7,338,000, Collateralized by: Freddie Mac 15 yr. Gold Giant Pool #G11440 (FGCI) 4.000%, Due 08/01/2018 with value of $2,814,381, Freddie Mac 15 yr. Gold Giant Pool #G11649 (FGCI) 4.500%, Due 02/01/2020 with value of $4,670,288 | 0.010% | 07/01/2011 | $ | 7,338,000 | $ | 7,338,000 | ||||||||||
|
| |||||||||||||||
Total Repurchase Agreements (Cost $7,338,000) | $ | 7,338,000 | ||||||||||||||
|
| |||||||||||||||
Total Investments – 99.5% (Cost $143,361,860) | (d) | $ | 152,395,616 | |||||||||||||
Other Assets in Excess of Liabilities – 0.5% | 799,085 | |||||||||||||||
|
| |||||||||||||||
Net Assets – 100.0% | $ | 153,194,701 | ||||||||||||||
|
| |||||||||||||||
Percentages are stated as a percent of net assets.
Footnotes:
| (a) | Security exempt from registration under Regulation D of the Securities Act of 1933. These securities may be resold in transactions exempt from registration, normally to qualified buyers under Rule 144A. At June 30, 2011, the value of these securities totaled $5,508,701, or 3.6% of the Portfolio’s net assets. These securities were deemed liquid pursuant to procedures approved by the Board of Directors. |
| (b) | This security is a credit sensitive bond. The coupon rate is a variable rate subject to adjustment based on changes in either Moody’s or S&P ratings. |
| (c) | Fixed-to-floating rate, callable, perpetual life trust preferred security. Interest rates stated are those in effect at June 30, 2011. |
| (d) | Represents cost for financial reporting purposes, which may differ from cost basis for federal income tax purposes. See also Note 7 of the Notes to Financial Statements. |
The accompanying notes are an integral part of these financial statements.
| 14 |
| Ohio National Fund, Inc. | Omni Portfolio |
Objective/Strategy
The Omni Portfolio seeks a high level of long-term total return consistent with preservation of capital by investing in stocks, bonds, and money market instruments.
Performance as of June 30, 2011
Average Annual Total Returns: | ||||
One year | 23.19% | |||
Five years | 5.08% | |||
Ten years | 3.65% |
Past performance does not guarantee future results. The performance data quoted represents past performance and current returns may be lower or higher. Total return figures include change in share price and reinvestment of dividends and capital gains. The investment return and principal value will fluctuate so that an investor’s shares, when redeemed, may be worth more or less than the original cost. To obtain performance information up to the most recent month end, call toll-free 1-877-781-6392.
The Portfolio is not open to direct retail investment. Beneficial interest in shares is obtained solely by purchase of variable life insurance policies and variable annuity contracts. Actual performance results for variable annuity and variable universal life contracts will be lower due to contract charges. Consult your contract for applicable charges.
Comments
For the six-month period ended June 30, 2011, the Omni Portfolio returned 4.60% versus 5.22% for the current benchmark, which is composed of 70% S&P 500 Index and 30% BofA Merrill Lynch U.S. Corporate Master Index (the “Merrill Lynch Index”).
The 62 basis points of relative under-performance is primarily the result of under-performance by the equity portion of the Portfolio versus the S&P 500 Index. The under-performance is also explained, to a lesser extent, by holding approximately 4% of the Portfolio in cash equivalents during a period in which both common stocks and bonds had relatively good positive total returns. The asset allocation decision to over-weight common stocks by approximately 4% during the first half of 2011 benefited relative performance because common stocks out-performed corporate bonds by 2.7%. While common stocks out-performed bonds during the period, the bond portion of the Portfolio out-performed the Merrill Lynch Index.(1)
The equity portion of the Portfolio was up 4.6% after fees, under-performing the S&P 500 Index by 142 basis points in the first half of 2011. The over-weighting in the Financials sector was the major reason for the under-performance. Continued worries about the debt crisis in Europe, the lack of clarity on resolution of the mortgage crisis in the U.S., the inability to clearly define capital requirements for the largest banks, disappointing U.S. Gross Domestic Product growth, and lower-than-expected interest rates combined to hurt the Financials sector. Among the five largest detractors to stock performance were three financial firms: Bank of America Corp., Morgan Stanley and Wells Fargo & Co. The other two largest detractors to relative performance were Royal Caribbean Cruises Ltd., which was hurt by higher fuel prices, and Google, Inc. The five stock investments that had the best contribution to returns were Sun Power Corp., Medicis Pharmaceutical Corp., Rockwell Automation, Inc., Halliburton Co., and Caterpillar, Inc.(1)
The dominant theme for the Portfolio during the first half was that the world would continue to recover from the 2008 recession. So in addition to being over-weighted in financial stocks, the equity portion of the Portfolio was also over-weighted in the Industrials and Consumer Discretionary sectors. Though corporate earnings beat
expectations for many of the cyclical sectors, including Consumer Discretionary and Industrials, the global economy is not recovering as swiftly and robustly as expected.(1)
For the first half of 2011, the bond portion of the Portfolio out-performed the Merrill Lynch Index. This out-performance was primarily the result of bond portfolio maturity structure compared to the Merrill Lynch Index. During the first half of 2011, the 5-year U.S. Treasury yield declined 25 basis points, the 10-year U.S. Treasury yield declined 13 basis points, and the 30-year U.S. Treasury yield increased 4 basis points. Because the bond portion of the Portfolio was over-weighted in bonds with maturities of 5 to 7 years, and under-weighted in bonds with maturities of greater than 15 years, the bond component of the Portfolio was able to achieve better price performance than the Merrill Lynch Index. The bond portion of the Portfolio was under-weighted in the banking sector and over-weighted in the electric utility sector; both of these weightings had a minor negative impact on performance because the banking sector out-performed and the electric utility sector under-performed.(1)
Because Treasury yields declined for most of the yield curve, credit spreads tightened slightly, and no credit problems surfaced in the Portfolio, all of the bonds held in the Portfolio had positive total returns. The five bonds that had the highest total returns were Discover Financial Services, Bunge NA Finance LP, Key Bank NA, Anadarko Petroleum Corp., and HCP, Inc. The five poorest performing bonds were AT&T Corp., Daimler Finance North America LLC, MetLife, Inc., Computer Sciences Corp., and The Goldman Sachs Group, Inc. All five of these bonds under-performed because of their short maturities in a declining interest rate environment and not because of any underlying credit problems.(1)
We are anxiously optimistic about the outlook for the global economy. We are hopeful that job growth will re-accelerate in the U.S., that Europe can deal with its sovereign debt problems, that the U.S. can somehow come to a longer term resolution of its debt ceiling and deficit, and there will be fewer macro shocks like Japanese earthquakes and civil wars in the Middle East and North Africa. We are not confident that everything will turn out alright, but valuations in the stock market perhaps discount the potential of one or more things going wrong.
We expect U.S. Treasury yields to rise if the growth rate of the U.S. economy improves and the Federal Reserve begins to remove its monetary stimulus. For this reason, we expect to maintain the duration of the bond portion of the Portfolio short of the duration of the Merrill Lynch Index. Because we expect credit spreads to tighten modestly over the remainder of 2011 as corporate profits rise, purchases of bonds for the Portfolio will be skewed toward BBB quality names, which are slightly lower in quality than the average for the Merrill Lynch Index.
| (1) | The Portfolio’s composition is subject to change. Holdings and weightings are as of June 30, 2011. |
| 15 | (continued) |
| Ohio National Fund, Inc. | Omni Portfolio (Continued) |
Change in Value of $10,000 Investment

Hypothetical illustration based on past performance. Future performance will vary. The Portfolio’s returns reflect reinvested dividends. The Portfolio’s holdings may differ significantly from the securities in the index. The index is unmanaged and therefore does not reflect the cost of portfolio management and accounting.
The BofA Merrill Lynch U.S. Corporate Master Index tracks the performance of all U.S. dollar-denominated, investment grade corporate public debt issued in the U.S. domestic bond market. Qualifying bonds must have at least one year remaining term to maturity, a fixed coupon schedule, and a minimum amount outstanding of $250 million.
The S&P 500 Index is a capitalization-weighted index designed to measure performance of the broad domestic market through changes in the aggregate market value of 500 stocks representing all major industries. The index presented herein includes the effects of reinvested dividends.
Portfolio Composition as of June 30, 2011 (1)
| % of Net Assets | ||||
Common Stocks (3) | 73.8 | |||
Corporate Bonds (3) | 21.1 | |||
U.S. Treasury Obligations | 0.8 | |||
Money Market Funds and | 4.3 | |||
|
| |||
| 100.0 | ||||
|
|
Top 10 Portfolio Holdings as of June 30, 2011 (1) (2)
| % of Net Assets | ||||
1. Apple, Inc. | 2.7 | |||
2. International Business Machines Corp. | 1.8 | |||
3. Citrix Systems, Inc. | 1.8 | |||
4. Warner Chilcott PLC Class A | 1.7 | |||
5. Avago Technologies Ltd. | 1.7 | |||
6. Johnson Controls, Inc. | 1.6 | |||
7. Google, Inc. Class A | 1.6 | |||
8. Halliburton Co. | 1.6 | |||
9. Chevron Corp. | 1.6 | |||
10. Wells Fargo & Co. | 1.5 |
| (1) | Composition of Portfolio subject to change. |
| (2) | Short-term investments have been excluded from the list of Top 10 Portfolio Holdings. |
| (3) | Sectors (combined): |
| % of Net Assets | ||||
Financials | 20.1 | |||
Consumer Discretionary | 15.0 | |||
Information Technology | 15.1 | |||
Industrials | 12.5 | |||
Energy | 10.8 | |||
Health Care | 6.2 | |||
Consumer Staples | 5.2 | |||
Materials | 4.2 | |||
Utilities | 3.9 | |||
Telecommunication Services | 1.9 | |||
|
| |||
| 94.9 | ||||
|
|
| 16 | (continued) |
| Ohio National Fund, Inc. | Omni Portfolio |
Schedule of Investments | June 30, 2011 (Unaudited) |
| Common Stocks – 73.8% | Shares | Value | ||||||||
CONSUMER DISCRETIONARY – 13.8% |
| |||||||||
Johnson Controls, Inc. (Auto Components) | 15,700 | $ | 654,062 | |||||||
MGM Resorts International (Hotels, Restaurants & Leisure) | (a) | 11,000 | 145,310 | |||||||
Royal Caribbean Cruises Ltd. (Hotels, Restaurants & Leisure) | (a) | 15,400 | 579,656 | |||||||
Starbucks Corp. (Hotels, Restaurants & Leisure) | 15,000 | 592,350 | ||||||||
Amazon.com, Inc. (Internet & Catalog Retail) | (a) | 2,500 | 511,225 | |||||||
Walt Disney Co. / The (Media) | 12,200 | 476,288 | ||||||||
Abercrombie & Fitch Co. Class A (Specialty Retail) | 8,000 | 535,360 | ||||||||
Tiffany & Co. (Specialty Retail) | 6,600 | 518,232 | ||||||||
Coach, Inc. (Textiles, Apparel & Luxury Goods) | 8,600 | 549,798 | ||||||||
Hanesbrands, Inc. (Textiles, Apparel & Luxury Goods) | (a) | 13,200 | 376,860 | |||||||
Warnaco Group, Inc. / The (Textiles, Apparel & Luxury Goods) | (a) | 10,900 | 569,525 | |||||||
|
| |||||||||
| 5,508,666 | ||||||||||
|
| |||||||||
CONSUMER STAPLES – 2.8% | ||||||||||
H.J. Heinz Co. (Food Products) | 10,600 | 564,768 | ||||||||
Kellogg Co. (Food Products) | 2,600 | 143,832 | ||||||||
Kraft Foods, Inc. Class A (Food Products) | 11,500 | 405,145 | ||||||||
|
| |||||||||
| 1,113,745 | ||||||||||
|
| |||||||||
ENERGY – 8.7% | ||||||||||
Dresser-Rand Group, Inc. (Energy Equip. & Svs.) | (a) | 10,000 | 537,500 | |||||||
Halliburton Co. (Energy Equip. & Svs.) | 12,400 | 632,400 | ||||||||
National Oilwell Varco, Inc. (Energy Equip. & Svs.) | 7,100 | 555,291 | ||||||||
Chevron Corp. (Oil, Gas & Consumable Fuels) | 6,100 | 627,324 | ||||||||
Devon Energy Corp. (Oil, Gas & Consumable Fuels) | 7,400 | 583,194 | ||||||||
Occidental Petroleum Corp. (Oil, Gas & Consumable Fuels) | 5,400 | 561,816 | ||||||||
|
| |||||||||
| 3,497,525 | ||||||||||
|
| |||||||||
FINANCIALS – 14.1% | ||||||||||
Morgan Stanley (Capital Markets) | 19,400 | 446,394 | ||||||||
Huntington Bancshares, Inc. (Commercial Banks) | 90,300 | 592,368 | ||||||||
Wells Fargo & Co. (Commercial Banks) | 21,900 | 614,514 | ||||||||
Bank of America Corp. (Diversified Financial Svs.) | 54,100 | 592,936 | ||||||||
Citigroup, Inc. (Diversified Financial Svs.) | 14,200 | 591,288 | ||||||||
JPMorgan Chase & Co. (Diversified Financial Svs.) | 14,100 | 577,254 | ||||||||
Hartford Financial Services Group, Inc. (Insurance) | 21,700 | 572,229 | ||||||||
Lincoln National Corp. (Insurance) | 16,900 | 481,481 | ||||||||
MetLife, Inc. (Insurance) | 13,700 | 601,019 | ||||||||
Prudential Financial, Inc. (Insurance) | 9,400 | 597,746 | ||||||||
|
| |||||||||
| 5,667,229 | ||||||||||
|
| |||||||||
HEALTH CARE – 4.5% | ||||||||||
Cubist Pharmaceuticals, Inc. (Biotechnology) | (a) | 5,100 | 183,549 | |||||||
Vertex Pharmaceuticals, Inc. (Biotechnology) | (a) | 9,000 | 467,910 | |||||||
Medco Health Solutions, Inc. (Health Care Providers & Svs.) | (a) | 8,200 | 463,464 | |||||||
Warner Chilcott PLC Class A (Pharmaceuticals) | 28,800 | 694,944 | ||||||||
|
| |||||||||
| 1,809,867 | ||||||||||
|
| |||||||||
INDUSTRIALS – 11.0% | ||||||||||
Honeywell International, Inc. (Aerospace & Defense) | 9,900 | 589,941 | ||||||||
FedEx Corp. (Air Freight & Logistics) | 6,400 | 607,040 | ||||||||
United Parcel Service, Inc. Class B (Air Freight & Logistics) | 7,500 | 546,975 | ||||||||
United Continental Holdings, Inc. (Airlines) | (a) | 23,200 | 525,016 | |||||||
Rockwell Automation, Inc. (Electrical Equip.) | 5,200 | 451,152 | ||||||||
3M Co. (Industrial Conglomerates) | 5,600 | 531,160 | ||||||||
Caterpillar, Inc. (Machinery) | 5,300 | 564,238 | ||||||||
Pentair, Inc. (Machinery) | 14,300 | 577,148 | ||||||||
|
| |||||||||
| 4,392,670 | ||||||||||
|
| |||||||||
INFORMATION TECHNOLOGY – 14.7% | ||||||||||
Qualcomm, Inc. (Communications Equip.) | 10,700 | 607,653 | ||||||||
Apple, Inc. (Computers & Peripherals) | (a) | 3,200 | 1,074,144 | |||||||
EMC Corp. (Computers & Peripherals) | (a) | 10,400 | 286,520 | |||||||
Google, Inc. Class A (Internet Software & Svs.) | (a) | 1,250 | 632,975 | |||||||
International Business Machines Corp. (IT Svs.) | 4,200 | 720,510 | ||||||||
Avago Technologies Ltd. (Semiconductors & Equip.) | 17,800 | 676,400 | ||||||||
Maxim Integrated Products, Inc. (Semiconductors & Equip.) | 23,300 | 595,548 | ||||||||
Texas Instruments, Inc. (Semiconductors & Equip.) | 9,000 | 295,470 | ||||||||
Citrix Systems, Inc. (Software) | (a) | 9,000 | 720,000 | |||||||
Electronic Arts, Inc. (Software) | (a) | 12,400 | 292,640 | |||||||
|
| |||||||||
| 5,901,860 | ||||||||||
|
| |||||||||
MATERIALS – 4.2% | ||||||||||
E.I. du Pont de Nemours & Co. (Chemicals) | 11,300 | 610,765 | ||||||||
Monsanto Co. (Chemicals) | 6,800 | 493,272 | ||||||||
Potash Corp of Saskatchewan, Inc. (Chemicals) | 10,400 | 592,696 | ||||||||
|
| |||||||||
| 1,696,733 | ||||||||||
|
| |||||||||
Total Common Stocks (Cost $27,808,737) | $ | 29,588,295 | ||||||||
|
| |||||||||
| 17 | (continued) |
| Ohio National Fund, Inc. | Omni Portfolio (Continued) |
Schedule of Investments | June 30, 2011 (Unaudited) |
| Corporate Bonds – 21.1% | Rate | Maturity | Face Amount | Value | ||||||||||||
CONSUMER DISCRETIONARY – 1.2% | ||||||||||||||||
Daimler Finance North America LLC (Automobiles) | 6.500% | 11/15/2013 | $ | 100,000 | $ | 111,310 | ||||||||||
Comcast Corp. (Media) | 5.875% | 02/15/2018 | 150,000 | 168,470 | ||||||||||||
Walt Disney Co. / The (Media) | 6.200% | 06/20/2014 | 100,000 | 114,165 | ||||||||||||
Macy’s Retail Holdings, Inc. (Multiline Retail) | 5.900% | 12/01/2016 | 100,000 | 112,756 | ||||||||||||
|
| |||||||||||||||
| 506,701 | ||||||||||||||||
|
| |||||||||||||||
CONSUMER STAPLES – 2.4% | ||||||||||||||||
Anheuser-Busch Cos., Inc. (Beverages) | 5.500% | 01/15/2018 | 150,000 | 167,336 | ||||||||||||
CVS Caremark Corp. (Food & Staples Retailing) | 5.750% | 06/01/2017 | 150,000 | 168,690 | ||||||||||||
Kroger Co. / The (Food & Staples Retailing) | 6.400% | 08/15/2017 | 150,000 | 175,943 | ||||||||||||
Bunge NA Finance LP (Food Products) | 5.900% | 04/01/2017 | 150,000 | 164,149 | ||||||||||||
Kraft Foods, Inc. (Food Products) | 6.500% | 08/11/2017 | 150,000 | 176,562 | ||||||||||||
Procter & Gamble Co. / The (Household Products) | 4.700% | 02/15/2019 | 100,000 | 110,532 | ||||||||||||
|
| |||||||||||||||
| 963,212 | ||||||||||||||||
|
| |||||||||||||||
ENERGY – 2.1% | ||||||||||||||||
Weatherford International Ltd. (Energy Equip. & Svs.) | 6.000% | 03/15/2018 | 150,000 | 164,654 | ||||||||||||
Anadarko Petroleum Corp. (Oil, Gas & Consumable Fuels) | 5.950% | 09/15/2016 | 100,000 | 112,686 | ||||||||||||
Boardwalk Pipelines LP (Oil, Gas & Consumable Fuels) | 5.500% | 02/01/2017 | 100,000 | 110,347 | ||||||||||||
Enterprise Products Operating LLC (Oil, Gas & Consumable Fuels) | 5.000% | 03/01/2015 | 150,000 | 163,439 | ||||||||||||
Magellan Midstream Partners LP (Oil, Gas & Consumable Fuels) | 6.400% | 07/15/2018 | 150,000 | 175,748 | ||||||||||||
Valero Energy Corp. (Oil, Gas & Consumable Fuels) | 4.750% | 06/15/2013 | 100,000 | 106,380 | ||||||||||||
|
| |||||||||||||||
| 833,254 | ||||||||||||||||
|
| |||||||||||||||
FINANCIALS – 6.0% | ||||||||||||||||
Goldman Sachs Group, Inc. / The (Capital Markets) | 5.150% | 01/15/2014 | 100,000 | 106,837 | ||||||||||||
Jefferies Group, Inc. (Capital Markets) | 5.875% | 06/08/2014 | 150,000 | 164,065 | ||||||||||||
Mellon Funding Corp. (Capital Markets) | 5.500% | 11/15/2018 | 100,000 | 111,767 | ||||||||||||
Morgan Stanley (Capital Markets) | 4.750% | 04/01/2014 | 100,000 | 104,305 | ||||||||||||
BB&T Corp. (Commercial Banks) | 5.200% | 12/23/2015 | 100,000 | 108,291 | ||||||||||||
Deutsche Bank Capital Funding Trust VII (Commercial Banks) | (b)(d) | 5.628% | Perpetual | 100,000 | 89,000 | |||||||||||
KeyBank NA (Commercial Banks) | 5.700% | 11/01/2017 | 150,000 | 161,891 | ||||||||||||
PNC Funding Corp. (Commercial Banks) | 5.250% | 11/15/2015 | 150,000 | 163,602 | ||||||||||||
Capital One Bank USA NA (Consumer Finance) | 5.125% | 02/15/2014 | 100,000 | 109,676 | ||||||||||||
Discover Financial Services (Consumer Finance) | 6.450% | 06/12/2017 | 150,000 | 166,591 | ||||||||||||
Bank of America Corp. (Diversified Financial Svs.) | 5.750% | 08/15/2016 | 150,000 | 158,450 | ||||||||||||
Citigroup, Inc. (Diversified Financial Svs.) | 5.850% | 08/02/2016 | 150,000 | 164,844 | ||||||||||||
General Electric Capital Corp. (Diversified Financial Svs.) | 5.000% | 01/08/2016 | 100,000 | 109,420 | ||||||||||||
JPMorgan Chase & Co. (Diversified Financial Svs.) | 5.150% | 10/01/2015 | 100,000 | 108,108 | ||||||||||||
Assurant, Inc. (Insurance) | 5.625% | 02/15/2014 | 100,000 | 106,912 | ||||||||||||
Liberty Mutual Group, Inc. (Insurance) | (b) | 5.750% | 03/15/2014 | 100,000 | 106,175 | |||||||||||
MetLife, Inc. (Insurance) | 5.375% | 12/15/2012 | 100,000 | 105,815 | ||||||||||||
Duke Realty LP (Real Estate Investment Trusts) | 4.625% | 05/15/2013 | 100,000 | 104,950 | ||||||||||||
HCP, Inc. (Real Estate Investment Trusts) | 6.000% | 01/30/2017 | 150,000 | 165,369 | ||||||||||||
|
| |||||||||||||||
| 2,416,068 | ||||||||||||||||
|
| |||||||||||||||
HEALTH CARE – 1.7% | ||||||||||||||||
UnitedHealth Group, Inc. (Health Care Providers & Svs.) | 6.000% | 02/15/2018 | 150,000 | 170,317 | ||||||||||||
WellPoint, Inc. (Health Care Providers & Svs.) | 5.875% | 06/15/2017 | 150,000 | 171,716 | ||||||||||||
Abbott Laboratories (Pharmaceuticals) | 5.600% | 11/30/2017 | 150,000 | 174,073 | ||||||||||||
Hospira, Inc. (Pharmaceuticals) | 6.050% | 03/30/2017 | 150,000 | 170,459 | ||||||||||||
|
| |||||||||||||||
| 686,565 | ||||||||||||||||
|
| |||||||||||||||
INDUSTRIALS – 1.5% | ||||||||||||||||
Owens Corning (Building Products) | 6.500% | 12/01/2016 | 150,000 | 163,399 | ||||||||||||
Waste Management, Inc. (Commercial Svs. & Supplies) | 6.100% | 03/15/2018 | 75,000 | 85,184 | ||||||||||||
CSX Corp. (Road & Rail) | 5.600% | 05/01/2017 | 150,000 | 167,854 | ||||||||||||
ERAC USA Finance Co. (Road & Rail) | (b) | 6.375% | 10/15/2017 | 150,000 | 172,733 | |||||||||||
|
| |||||||||||||||
| 589,170 | ||||||||||||||||
|
| |||||||||||||||
INFORMATION TECHNOLOGY – 0.4% | ||||||||||||||||
Computer Sciences Corp. (IT Svs.) | 6.500% | 03/15/2018 | 150,000 | 160,861 | ||||||||||||
|
| |||||||||||||||
TELECOMMUNICATION SERVICES – 1.9% | ||||||||||||||||
AT&T Corp. (Diversified Telecommunication Services) | (c) | 7.300% | 11/15/2011 | 100,000 | 102,431 | |||||||||||
Embarq Corp. (Diversified Telecom. Svs.) | 6.738% | 06/01/2013 | 150,000 | 162,554 | ||||||||||||
Telecom Italia Capital SA (Diversified Telecom. Svs.) | 5.250% | 10/01/2015 | 100,000 | 104,061 | ||||||||||||
Verizon Florida LLC (Diversified Telecom. Svs.) | 6.125% | 01/15/2013 | 100,000 | 107,388 | ||||||||||||
America Movil SAB de CV (Wireless Telecom. Svs.) | 5.750% | 01/15/2015 | 100,000 | 111,734 | ||||||||||||
Rogers Communications, Inc. (Wireless Telecom. Svs.) | 5.500% | 03/15/2014 | 150,000 | 165,285 | ||||||||||||
|
| |||||||||||||||
| 753,453 | ||||||||||||||||
|
| |||||||||||||||
| 18 | (continued) |
| Ohio National Fund, Inc. | Omni Portfolio (Continued) |
Schedule of Investments | June 30, 2011 (Unaudited) |
| Corporate Bonds – 21.1% (Continued) | Rate | Maturity | Face Amount | Value | ||||||||||||
UTILITIES – 3.9% | ||||||||||||||||
Commonwealth Edison Co. (Electric Utilities) | 5.950% | 08/15/2016 | $ | 150,000 | $ | 171,633 | ||||||||||
Consumers Energy Co. (Electric Utilities) | 6.000% | 02/15/2014 | 100,000 | 111,290 | ||||||||||||
Kansas City Power & Light Co. (Electric Utilities) | 5.850% | 06/15/2017 | 150,000 | 169,257 | ||||||||||||
Nevada Power Co. (Electric Utilities) | 5.950% | 03/15/2016 | 150,000 | 171,114 | ||||||||||||
Pennsylvania Electric Co. (Electric Utilities) | 6.050% | 09/01/2017 | 150,000 | 168,423 | ||||||||||||
Union Electric Co. (Electric Utilities) | 6.400% | 06/15/2017 | 150,000 | 174,092 | ||||||||||||
Virginia Electric and Power Co. (Electric Utilities) | 4.750% | 03/01/2013 | 100,000 | 106,267 | ||||||||||||
Spectra Energy Capital LLC (Gas Utilities) | 5.500% | 03/01/2014 | 100,000 | 109,488 | ||||||||||||
PSEG Power LLC (Ind. Power Prod. & Energy Traders) | 5.000% | 04/01/2014 | 100,000 | 107,351 | ||||||||||||
Southern Power Co. (Ind. Power Prod. & Energy Traders) | 4.875% | 07/15/2015 | 100,000 | 109,272 | ||||||||||||
American Water Capital Corp. (Water Utilities) | 6.085% | 10/15/2017 | 150,000 | 173,108 | ||||||||||||
|
| |||||||||||||||
| 1,571,295 | ||||||||||||||||
|
| |||||||||||||||
Total Corporate Bonds (Cost $7,658,001) | $ | 8,480,579 | ||||||||||||||
|
| |||||||||||||||
| U.S. Treasury Obligations – 0.8% | Rate | Maturity | Face Amount | Value | ||||||||||||
United States Treasury Note | 3.375% | 11/15/2019 | $ | 300,000 | $ | 312,797 | ||||||||||
|
| |||||||||||||||
Total U.S. Treasury Obligations (Cost $314,041) | $ | 312,797 | ||||||||||||||
|
| |||||||||||||||
| Money Market Funds – 3.8% | Shares | Value | ||||||||||||||
Fidelity Institutional Money Market Funds | 1,507,000 | $ | 1,507,000 | |||||||||||||
|
| |||||||||||||||
Total Money Market Funds (Cost $1,507,000) | $ | 1,507,000 | ||||||||||||||
|
| |||||||||||||||
Total Investments – 99.5% (Cost $37,287,779) | (e) | $ | 39,888,671 | |||||||||||||
Other Assets in Excess of Liabilities – 0.5% | 191,365 | |||||||||||||||
|
| |||||||||||||||
Net Assets – 100.0% | $ | 40,080,036 | ||||||||||||||
|
| |||||||||||||||
Percentages are stated as a percent of net assets.
Abbreviations:
ADR: American Depositary Receipts
Footnotes:
| (a) | Non-income producing security. |
| (b) | Security exempt from registration under Regulation D of the Securities Act of 1933. These securities may be resold in transactions exempt from registration, normally to qualified buyers under Rule 144A. At June 30, 2011, the value of these securities totaled $367,908, or 0.9% of the Portfolio’s net assets. These securities were deemed liquid pursuant to procedures approved by the Board of Directors. |
| (c) | This security is a credit sensitive bond. The coupon rate is a variable rate subject to adjustment based on changes in either Moody’s or S&P ratings. |
| (d) | Fixed-to-floating rate, callable, perpetual life trust preferred security. Interest rates stated are those in effect at June 30, 2011. |
| (e) | Represents cost for financial reporting purposes, which may differ from cost basis for federal income tax purposes. See also Note 7 of the Notes to Financial Statements. |
The accompanying notes are an integral part of these financial statements.
| 19 |
| Ohio National Fund, Inc. | International Portfolio |
Objective/Strategy
The International Portfolio seeks total return on assets by investing at least 80% of its assets in securities of foreign companies.
Performance as of June 30, 2011
Average Annual Total Returns: | ||||
One year | 38.79% | |||
Five years | 1.92% | |||
Ten years | 2.85% |
Past performance does not guarantee future results. The performance data quoted represents past performance and current returns may be lower or higher. Total return figures include change in share price and reinvestment of dividends and capital gains. The investment return and principal value will fluctuate so that an investor’s shares, when redeemed, may be worth more or less than the original cost. To obtain performance information up to the most recent month end, call toll-free 1-877-781-6392.
The Portfolio is not open to direct retail investment. Beneficial interest in shares is obtained solely by purchase of variable life insurance policies and variable annuity contracts. Actual performance results for variable annuity and variable universal life contracts will be lower due to contract charges. Consult your contract for applicable charges.
Comments
For the six-month period ended June 30, 2011, the International Portfolio returned 5.57% versus 3.80% for the current benchmark, the MSCI All Country World ex-USA Index (Net-USD).
The major events of early 2011, including the devastating Japanese earthquake, tsunami, and nuclear disaster, as well as the wave of unrest in the Middle East and North Africa, weighed on the second quarter of 2011; although stock markets held up well and set the stage for a second half rally. The delayed impact of Japan’s “triple disaster” and the headwinds from higher oil prices moderated the global economy. Global leading economic indicators painted a weaker picture of the current state of the global industrial cycle. There are tentative signs that the slowdown was caused by temporary factors, and this has set the stage for upside surprises to both the U.S. and global economy in the second half. After the earthquake, Japan went into recession. The economy was hit especially hard by disrupted supply chains, vehicle sales were down, and Japan’s trade account posted its first deficit in more than two years. There are clear signals that the bottleneck in exports is beginning to clear even as the domestic economy continues to face further headwinds. The Bank of Japan (BoJ) now expects production to recover briskly to pre-disaster levels by July or August. As production levels increase in the third quarter, the BoJ board will continue to upgrade its growth expectations for the Japanese economy.
The start of 2011 was marked by a wave of unrest in the Middle East and North Africa, causing oil prices to rise. Oil subsequently dipped on uncertainty surrounding the stability of the global recovery. Nonetheless, increased oil and food prices, coupled with globally loose monetary conditions, brought inflation concerns to the forefront. The U.S. economy expanded at a slower rate than initially forecast. U.S. jobless claims also unexpectedly rose as the labor market struggled to gain momentum, offsetting higher than expected corporate profits. Meanwhile, Chinese growth also slowed due to inflationary concerns. Globally, central banks continued their shift from accommodative to hawkish as concerns about inflationary pressures in several countries surfaced. Central bank rate hikes that began at the end of 2010 picked up their pace with 67 distinct hikes
in countries ranging from Brazil to Norway to South Korea, as these and many other world economies grew steadily over the quarter. Additionally, declines off the peaks in many commodity prices bode well for these economies in the second half of the year.
The divergence between strong economies and weaker economies continued to play a major role during this six-month period. Nowhere was this key theme more evident than in Europe where the strong German economy continued its economic surge, while the peripheral countries of the Eurozone continued to display economic weakness. Continued concerns about the European debt scenario further weighed on market sentiment. Markets were particularly focused on Greece and the potential for sovereign debt default, especially as the second installment of the Greek bailout came due on June 29. Germany, France, and other European Union member countries are faced with either bailing out Greece or shoring up the entire European banking system upon a Greek default. Bailing out Greece is the lower cost solution. By the end of June, Greece, while still not fully remedied, had a government plan which included additional austerity measures, increased tax revenue, accelerated asset sales, and privatization programs.
Meanwhile, Germany, Europe’s largest economy, reaped the benefits of a weaker Euro and low interest rates. Growth forecasts for Germany continued to accelerate, and investment and production expectations are all positive. German companies continue to achieve record profits and are benefiting from global growth. This conundrum of robust growth in parts of Europe, including France, Netherlands, Norway, and especially Germany, coupled with relatively sluggish growth in the Eurozone periphery, including Spain, Greece, Ireland, and Portugal, suggests German expansion may moderate. However, year-to-date, Germany has maintained a very strong recovery with economic strength that is broad-based, both domestically and internationally.
MSCI Developed Markets, as measured by the MSCI EAFE Index (up 5.0%), outperformed MSCI Emerging Markets (up 0.9%). Top performing developed economies included Ireland, up 17.2%, New Zealand, up 15.9%, France, up 15.5%, Spain, up 15.5%, and Germany, up 14.2%. Top performing emerging economies included the Czech Republic, up 22.8%, Hungary, up 22.3%, Indonesia, up 12.7%, and Poland, up 11.1%.
Country allocation remained a primary driver of the Portfolio’s performance. In Asia, exposure to strong Asian economies, especially South Korea and Indonesia, both key overweights for the Portfolio, contributed positively to Portfolio performance as evidence of robust economic activity and strong growth confirmed the continued expansionary phase of the Asia ex. Japan economies. South Korea, a key overweight for the Portfolio, reported its fastest quarterly rate of expansion in three quarters and benefited from continued demand for manufactured goods and automobiles. This impact benefited key Portfolio holdings such as Hyundai Motor Co., up 45.2%, Kia Motors Corp., up 51.9%, Daewoo Shipbuilding & Marine Engineering Co. Ltd., up 32.3%, and Samsung Heavy Industries Co. Ltd., up 22.8%.(1)
German shares, which represented the Portfolio’s largest overweight allocation, positively impacted performance as better-than-expected economic growth shored up returns and masked poor growth in the peripheral European countries. Germany’s BASF SE, up 27.7%, the world’s largest chemical company, benefited from both strong export and domestic demand. However, Commerzbank AG posted a return of -27.2% due to its exposure to the sovereign risks of Europe, and negatively impacted performance.(1)
| 20 | (continued) |
| Ohio National Fund, Inc. | International Portfolio (Continued) |
The key decision to overweight Japanese hybrid and export companies, such as Mitsubishi Heavy Industries Ltd., due to their discounted valuation (while simultaneously underweighting Japanese domestic companies) contributed positively to performance. Although exports dropped sharply immediately following the triple disaster, bottlenecks cleared faster than anticipated and shipments out of Japan began to pick up by the end of the first half of the year.(1)
The underweight position in Switzerland was a headwind for the Portfolio as the Swiss franc reached all-time highs against both the Euro and the U.S dollar due to the ongoing Eurozone sovereign debt crisis.(1)
The Portfolio maintained its overweight in emerging markets, many of which are healthier in terms of economic conditions than their developed counterparts. Developing economies as a group are creditor nations, whereas the advanced economies as a group increased their debt burdens. Our overweight is spread among several top-quality emerging countries: South Korea, Taiwan, Indonesia, and Mexico. These markets continue to benefit not only from stronger growth dynamics, driven by both export and domestic demand, but also for their superior fiscal and debt positions. We expect this to continue. At the end of the six-month period, our emerging markets weight stood at 36.5%. Excluding South Korea and Taiwan, which some key benchmark providers consider to be developed markets, our emerging market weight is 15.6%.(1)
The Portfolio continued to maintain exposure to select healthy, high sovereign quality, developed markets. We maintained our overweight in Germany as strength in German exports and renewed corporate investment continues to bolster our outlook going forward. We remain overweight in the high-quality Nordic region as each country has strong public finances, with Norway benefiting most from the industrial cycle recovery and Denmark benefiting most from high visibility and high quality with regards to corporate profit streams.(1)
We continue to monitor Japan closely, but feel comfortable in our holdings in companies oriented towards a more globalized chain of production and demand. While tragic, the earthquake, tsunami, and nuclear disaster struck at a time that Japan, and the rest of the global economy, was at a positive point in the business cycle, i.e., the beginning phases of an expansionary phase. That means there was, and remains, a lot of positive upward momentum behind the global growth story, with real gross domestic product expected to expand in the 4% range. While events in Japan, and to some extent the Middle East, elevate the level of uncertainty about the future and the potential for lower growth, we feel the trajectory in the mid/longer term is for positive economic growth, from both cyclical and structural spending.
Hedging of currencies in the Portfolio was conducted by executing foreign currency forwards contracts as well as futures contracts. These hedging instruments were primarily executed for the purpose of mitigating the effects that exchange rate volatility of certain currencies might have on relative performance. These instruments combined to detract 52 basis points from the Portfolio’s performance.
We continue to monitor our investment universe for signs of countries and companies with poor credit quality or unmanageable debt levels, and to focus on countries and companies with strategic expansion opportunities. As developed economies continue to adjust to new debt levels and investors continue to fear a reoccurrence of 2008, markets will continue to be volatile. However, as long-term investors, we feel that fundamentals are supportive of global growth. We expect the winners to maintain higher profitability and gain
market share, while the weaker players, who continue to struggle to gain footing, will under-perform. Governments and central banks are beginning to normalize their policies, but we expect financial conditions to remain accommodative for some time to come.
| (1) | The Portfolio’s composition is subject to change. Holdings and weightings are as of June 30, 2011. |
Change in Value of $10,000 Investment
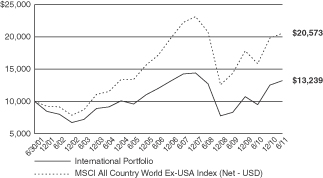
Hypothetical illustration based on past performance. Future performance will vary. The Portfolio’s returns reflect reinvested dividends. The Portfolio’s holdings may differ significantly from the securities in the index. The index is unmanaged and therefore does not reflect the cost of portfolio management and accounting.
The MSCI All Country World Ex-USA Index (Net-USD) is a free float-adjusted market capitalization weighted index that is designed to measure the equity market performance of the developed and emerging markets. Currently, the MSCI All Country World Index consists of 24 developed and 21 emerging market country indices.
| 21 | (continued) |
| Ohio National Fund, Inc. | International Portfolio (Continued) |
Portfolio Composition as of June 30, 2011 (1)
| % of Net Assets | ||||
Common Stocks (3) | 100.5 | |||
U.S. Treasury Obligations | 0.1 | |||
Money Market Funds | (0.6 | ) | ||
|
| |||
| 100.0 | ||||
|
|
Top 10 Portfolio Holdings as of June 30, 2011 (1) (2)
| % of Net Assets | ||||
1. Siemens AG | 3.1 | |||
2. America Movil SAB de CV – ADR | 2.6 | |||
3. BASF SE | 2.2 | |||
4. Samsung Electronics Co. Ltd. | 2.2 | |||
5. Statoil ASA | 2.1 | |||
6. Yara International ASA | 1.8 | |||
7. Allianz SE | 1.8 | |||
8. Muenchener Rueckversicherungs AG | 1.8 | |||
9. Novo Nordisk A/S | 1.7 | |||
10. Daimler AG | 1.7 |
| (1) | Composition of Portfolio subject to change. |
| (2) | Short-term investments have been excluded from the list of Top 10 Portfolio Holdings. |
| (3) | Top 10 Country Weightings (combined): |
| % of Net Assets | ||||
Germany | 21.8 | |||
Japan | 14.5 | |||
South Korea | 12.5 | |||
Mexico | 10.2 | |||
Denmark | 10.0 | |||
Taiwan | 8.9 | |||
Norway | 8.5 | |||
Indonesia | 5.3 | |||
Italy | 3.6 | |||
Luxembourg | 1.4 |
| 22 |
| Ohio National Fund, Inc. | International Portfolio |
Schedule of Investments | June 30, 2011 (Unaudited) |
| Common Stocks – 100.5% | Shares | Value | ||||||||
Germany – 21.8% | ||||||||||
Allianz SE | (b) | 27,000 | $ | 3,765,063 | ||||||
Aurubis AG | (b) | 8,200 | 533,646 | |||||||
BASF SE | (b) | 47,400 | 4,646,209 | |||||||
Bayer AG | (b) | 13,600 | 1,092,305 | |||||||
Bayerische Motoren Werke AG | (b) | 8,500 | 848,801 | |||||||
Bilfinger Berger SE | (b) | 4,651 | 460,617 | |||||||
Commerzbank AG | (a)(b) | 433,000 | 1,865,005 | |||||||
Continental AG | (a)(b) | 14,200 | 1,496,368 | |||||||
Daimler AG | (b) | 46,500 | 3,506,634 | |||||||
Deutsche Bank AG | (b) | 46,850 | 2,765,110 | |||||||
Deutsche Lufthansa AG | (b) | 25,600 | 557,597 | |||||||
Deutsche Telekom AG | (b) | 61,200 | 954,973 | |||||||
Deutsche Wohnen AG | (c) | 75,000 | 1,305,135 | |||||||
Fresenius SE & Co. KGaA | (b) | 17,200 | 1,795,347 | |||||||
Hannover Rueckversicherung AG | (b) | 18,400 | 956,909 | |||||||
Lanxess AG | (b) | 5,000 | 410,143 | |||||||
MAN SE | (b) | 15,200 | 2,024,638 | |||||||
Metro AG | (b) | 18,700 | 1,132,432 | |||||||
MTU Aero Engines Holding AG | (b) | 19,000 | 1,517,564 | |||||||
Muenchener Rueckversicherungs AG | (b) | 24,310 | 3,711,042 | |||||||
SAP AG | (b) | 10,300 | 624,471 | |||||||
Siemens AG | (b) | 47,134 | 6,477,191 | |||||||
Suedzucker AG | (b) | 35,600 | 1,267,610 | |||||||
Vossloh AG | (b) | 9,600 | 1,347,476 | |||||||
Wincor Nixdorf AG | (b) | 10,300 | 744,581 | |||||||
|
| |||||||||
| 45,806,867 | ||||||||||
|
| |||||||||
Japan – 14.5% | ||||||||||
Ajinomoto Co., Inc. | (b) | 48,000 | 569,848 | |||||||
Asahi Kasei Corp. | (b) | 255,000 | 1,718,454 | |||||||
Astellas Pharma, Inc. | (b) | 8,000 | 310,409 | |||||||
Cosmo Oil Co. Ltd. | (b) | 153,000 | 435,583 | |||||||
Daicel Chemical Industries Ltd. | (b) | 90,000 | 594,568 | |||||||
Daiichi Sankyo Co. Ltd. | (b) | 89,600 | 1,750,879 | |||||||
Elpida Memory, Inc. | (a)(b) | 45,000 | 530,043 | |||||||
Hamamatsu Photonics KK | (b) | 29,000 | 1,253,869 | |||||||
Honda Motor Co. Ltd. | (b) | 49,500 | 1,907,082 | |||||||
Kajima Corp. | (b) | 100,000 | 286,890 | |||||||
Kaneka Corp. | (b) | 201,000 | 1,320,688 | |||||||
Kao Corp. | (b) | 20,000 | 525,884 | |||||||
Kose Corp. | (b) | 16,500 | 428,655 | |||||||
Mitsubishi Chemical Holdings Corp. | (b) | 101,500 | 719,242 | |||||||
Mitsubishi Electric Corp. | (b) | 74,000 | 859,591 | |||||||
Mitsubishi Heavy Industries Ltd. | (b) | 310,000 | 1,457,689 | |||||||
Mitsui Chemicals, Inc. | (b) | 181,000 | 659,538 | |||||||
Murata Manufacturing Co. Ltd. | (b) | 6,000 | 401,150 | |||||||
NEC Corp. | (a)(b) | 261,000 | 596,013 | |||||||
Nippon Steel Corp. | (b) | 440,000 | 1,427,426 | |||||||
Nomura Holdings, Inc. | (b) | 270,000 | 1,332,366 | |||||||
Rinnai Corp. | (b) | 13,000 | 938,790 | |||||||
Sega Sammy Holdings, Inc. | (b) | 28,000 | 541,261 | |||||||
Showa Shell Sekiyu KK | (b) | 60,000 | 557,241 | |||||||
SMC Corp. | (b) | 4,900 | 883,323 | |||||||
Sumitomo Corp. | (b) | 50,000 | 680,213 | |||||||
Sumitomo Electric Industries Ltd. | (b) | 164,000 | 2,392,044 | |||||||
Suzuki Motor Corp. | (b) | 62,000 | 1,397,575 | |||||||
Takeda Pharmaceutical Co. Ltd. | (b) | 13,700 | 633,172 | |||||||
Tokuyama Corp. | (b) | 212,000 | 1,067,756 | |||||||
Toshiba Corp. | (b) | 209,451 | 1,104,298 | |||||||
Ube Industries Ltd. | (b) | 340,000 | 1,023,617 | |||||||
|
| |||||||||
| 30,305,157 | ||||||||||
|
| |||||||||
South Korea – 12.5% | ||||||||||
Daewoo Shipbuilding & Marine Engineering | (b) | 41,900 | 1,784,046 | |||||||
Dongkuk Steel Mill Co. Ltd. | (b) | 24,500 | 946,369 | |||||||
Hana Financial Group, Inc. | (b) | 24,500 | 859,700 | |||||||
Hanwha Chem Corp. | (b) | 35,500 | 1,686,520 | |||||||
Hyundai Heavy Industries Co. Ltd. | (b) | 2,880 | 1,201,991 | |||||||
| Common Stocks (Continued) | Shares | Value | ||||||||
South Korea (continued) | ||||||||||
Hyundai Motor Co. | (b) | 13,500 | $ | 3,009,604 | ||||||
KB Financial Group, Inc. | (b) | 12,300 | 584,718 | |||||||
Kia Motors Corp. | (b) | 35,900 | 2,442,209 | |||||||
LG Chem Ltd. | (b) | 2,000 | 919,095 | |||||||
LG Electronics, Inc. | (b) | 8,600 | 670,550 | |||||||
Mando Corp. | (b) | 3,100 | 644,615 | |||||||
POSCO – ADR | 8,900 | 966,718 | ||||||||
Samsung Electronics Co. Ltd. | (b) | 5,950 | 4,624,513 | |||||||
Samsung Engineering Co. Ltd. | (b) | 7,000 | 1,678,709 | |||||||
Samsung Heavy Industries Co. Ltd. | (b) | 24,700 | 1,106,924 | |||||||
Samsung SDI Co. Ltd. | (b) | 6,800 | 1,046,442 | |||||||
SK Innovation Co. Ltd. | (b) | 6,200 | 1,170,648 | |||||||
Woongjin Coway Co. Ltd. | (b) | 23,173 | 826,453 | |||||||
|
| |||||||||
| 26,169,824 | ||||||||||
|
| |||||||||
Mexico – 10.2% | ||||||||||
Alfa SAB de CV | 115,500 | 1,721,378 | ||||||||
America Movil SAB de CV – ADR | 99,500 | 5,361,060 | ||||||||
Fomento Economico Mexicano SAB de CV – ADR | 39,300 | 2,613,057 | ||||||||
Grupo Aeroportuario del Sureste SAB de CV – ADR | 7,500 | 442,050 | ||||||||
Grupo Financiero Banorte SAB de CV | 407,000 | 1,847,898 | ||||||||
Grupo Financiero Inbursa SA | 162,500 | 832,590 | ||||||||
Grupo Mexico SAB de CV | 561,000 | 1,852,352 | ||||||||
Grupo Modelo SAB de CV | 126,883 | 767,247 | ||||||||
Grupo Televisa SA – ADR | 76,700 | 1,886,820 | ||||||||
Industrias Penoles SAB de CV | 38,400 | 1,449,613 | ||||||||
Mexichem SAB de CV | 128,000 | 518,406 | ||||||||
Wal-Mart de Mexico SAB de CV | 715,400 | 2,123,257 | ||||||||
|
| |||||||||
| 21,415,728 | ||||||||||
|
| |||||||||
Denmark – 10.0% | ||||||||||
AP Moller – Maersk A/S | (b) | 274 | 2,365,445 | |||||||
Carlsberg A/S | (b) | 18,150 | 1,976,224 | |||||||
Christian Hansen Holding A/S | (b) | 70,000 | 1,663,261 | |||||||
Danske Bank A/S | (a)(b) | 159,033 | 2,943,363 | |||||||
DSV A/S | (b) | 102,025 | 2,449,076 | |||||||
GN Store Nord A/S | (b) | 67,500 | 650,410 | |||||||
H Lundbeck A/S | (b) | 81,700 | 2,154,550 | |||||||
Novo Nordisk A/S | (b) | 28,825 | 3,611,175 | |||||||
Royal UNIBREW A/S | (b) | 17,500 | 1,154,197 | |||||||
Sydbank A/S | (b) | 30,400 | 679,002 | |||||||
TDC A/S | (a)(c) | 58,000 | 529,323 | |||||||
Tryg A/S | (b) | 12,000 | 692,959 | |||||||
|
| |||||||||
| 20,868,985 | ||||||||||
|
| |||||||||
Taiwan – 8.9% | ||||||||||
Cathay Financial Holding Co. Ltd. | (b) | 1,248,500 | 1,937,631 | |||||||
China Steel Corp. | (b) | 500,000 | 602,980 | |||||||
Chinatrust Financial Holding Co. Ltd. | (b) | 1,038,400 | 906,803 | |||||||
Chunghwa Telecom Co. Ltd. | (b) | 168,000 | 578,108 | |||||||
CMC Magnetics Corp. | (a)(b) | 2,650,000 | 601,714 | |||||||
Coretronic Corp. | (b) | 420,000 | 664,846 | |||||||
Far Eastern New Century Corp. | (b) | 275,540 | 430,758 | |||||||
Formosa Chemicals & Fibre Corp. | (b) | 239,000 | 891,884 | |||||||
Formosa Petrochemical Corp. | (b) | 194,000 | 684,057 | |||||||
Formosa Plastics Corp. | (b) | 257,000 | 928,772 | |||||||
Gigabyte Technology Co. Ltd. | (b) | 345,000 | 387,647 | |||||||
Inventec Co. Ltd. | (b) | 1,381,550 | 723,070 | |||||||
Mega Financial Holding Co. Ltd. | (b) | 356,000 | 311,876 | |||||||
Micro-Star International Co. Ltd. | (b) | 1,050,000 | 509,386 | |||||||
Nan Ya Plastics Corp. | (b) | 474,000 | 1,267,803 | |||||||
Pou Chen Corp. | (b) | 1,281,200 | 1,184,719 | |||||||
Siliconware Precision Industries Co. | (a)(b) | 909,000 | 1,160,802 | |||||||
Taiwan Semiconductor Manufacturing Co. Ltd. | (b) | 825,001 | 2,079,217 | |||||||
United Microelectronics Corp. | (a)(b) | 3,885,000 | 1,935,203 | |||||||
Wan Hai Lines Ltd. | (a)(b) | 1,070,000 | 812,637 | |||||||
|
| |||||||||
| 18,599,913 | ||||||||||
|
| |||||||||
| 23 | (continued) |
| Ohio National Fund, Inc. | International Portfolio (Continued) |
Schedule of Investments | June 30, 2011 (Unaudited) |
| Common Stocks (Continued) | Shares | Value | ||||||||
Norway – 8.5% | ||||||||||
Aker Solutions ASA | (b) | 47,000 | $ | 939,038 | ||||||
DnB NOR ASA | (b) | 187,444 | 2,611,377 | |||||||
Fred Olsen Energy ASA | (b) | 50,200 | 1,773,460 | |||||||
Statoil ASA | (b) | 171,000 | 4,329,036 | |||||||
Statoil Fuel & Retail ASA | (a)(b) | 65,000 | 627,080 | |||||||
Telenor ASA | (b) | 163,700 | 2,678,998 | |||||||
TGS Nopec Geophysical Co. ASA | (b) | 40,400 | 1,133,716 | |||||||
Yara International ASA | (b) | 67,600 | 3,798,123 | |||||||
|
| |||||||||
| 17,890,828 | ||||||||||
|
| |||||||||
Indonesia – 5.3% | ||||||||||
Aneka Tambang Tbk PT | (b) | 1,800,000 | 437,259 | |||||||
Astra International Tbk PT | (b) | 234,000 | 1,739,431 | |||||||
Bank Central Asia Tbk PT | (b) | 880,000 | 786,988 | |||||||
Bank Mandiri Tbk PT | (b) | 1,110,000 | 934,943 | |||||||
Bank Negara Indonesia Persero Tbk PT | (b) | 903,500 | 409,644 | |||||||
Bank Rakyat Indonesia Persero Tbk PT | (b) | 1,090,000 | 829,103 | |||||||
Indofood Sukses Makmur Tbk PT | (b) | 1,690,000 | 1,136,017 | |||||||
International Nickel Indonesia Tbk PT | (b) | 1,640,000 | 863,158 | |||||||
Perusahaan Gas Negara PT | (b) | 1,760,000 | 827,785 | |||||||
Tambang Batubara Bukit Asam Tbk PT | (b) | 305,000 | 741,563 | |||||||
Telekomunikasi Indonesia Tbk PT – ADR | 17,200 | 593,400 | ||||||||
Unilever Indonesia Tbk PT | (b) | 425,000 | 739,597 | |||||||
United Tractors Tbk PT | (b) | 337,540 | 982,821 | |||||||
|
| |||||||||
| 11,021,709 | ||||||||||
|
| |||||||||
Italy – 3.6% | ||||||||||
Credito Emiliano SpA | (b) | 65,000 | 411,544 | |||||||
DiaSorin SpA | (b) | 11,200 | 537,538 | |||||||
ENI SpA | (b) | 49,000 | 1,161,248 | |||||||
Fiat SpA | (b) | 55,000 | 604,344 | |||||||
Geox SpA | (b) | 95,000 | 569,653 | |||||||
Intesa Sanpaolo SpA | (b) | 257,142 | 684,711 | |||||||
Mediobanca SpA | (b) | 70,000 | 708,892 | |||||||
Piaggio & C SpA | (b) | 145,000 | 608,063 | |||||||
Pirelli & C SpA | (b) | 55,000 | 594,753 | |||||||
Prada SpA | (a)(c) | 12,100 | 73,004 | |||||||
Recordati SpA | (b) | 53,400 | 586,895 | |||||||
Saipem SpA | (b) | 10,000 | 516,403 | |||||||
UniCredit SpA | (b) | 210,000 | 444,510 | |||||||
|
| |||||||||
| 7,501,558 | ||||||||||
|
| |||||||||
| Common Stocks (Continued) | Shares | Value | ||||||||
Luxembourg – 1.4% | ||||||||||
Subsea 7 SA | (a)(b) | 116,630 | $ | 2,983,066 | ||||||
|
| |||||||||
Poland – 1.1% | ||||||||||
Bank Millennium SA | (b) | 200,000 | 393,775 | |||||||
KGHM Polska Miedz SA | (b) | 7,700 | 553,031 | |||||||
PGE SA | (b) | 65,000 | 568,499 | |||||||
Synthos SA | (b) | 200,000 | 372,786 | |||||||
Tauron Polska Energia SA | (b) | 170,000 | 408,206 | |||||||
|
| |||||||||
| 2,296,297 | ||||||||||
|
| |||||||||
Sweden – 1.1% | ||||||||||
Nordea Bank AB | (b) | 212,000 | 2,276,881 | |||||||
|
| |||||||||
Bermuda – 1.0% | ||||||||||
Seadrill Ltd. | (b) | 62,100 | 2,183,361 | |||||||
|
| |||||||||
Cyprus – 0.4% | ||||||||||
Songa Offshore SE | (a)(b) | 180,000 | 891,114 | |||||||
|
| |||||||||
Singapore – 0.2% | ||||||||||
Olam International Ltd. | (b) | 209,090 | 464,808 | |||||||
|
| |||||||||
Total Common Stocks (Cost $161,829,629) | $ | 210,676,096 | ||||||||
|
| |||||||||
| U.S. Treasury Obligations – 0.1% | Face Amount | Amortized Cost | ||||||||
U.S. Treasury Bill | $ | 200,000 | $ | 199,999 | ||||||
|
| |||||||||
Total U.S. Treasury Obligations (Cost $199,992) | $ | 199,999 | ||||||||
|
| |||||||||
| Money Market Funds – 0.0% | Shares | Value | ||||||||
State Street Institutional Liquid Reserves Fund Institutional Class 2 | 46,329 | $ | 46,329 | |||||||
|
| |||||||||
Total Money Market Funds (Cost $46,329) | $ | 46,329 | ||||||||
|
| |||||||||
Total Investments – 100.6% (Cost $162,075,950) | (d) | $ | 210,922,424 | |||||||
Liabilities in Excess of Other Assets – (0.6)% | (1,154,932) | |||||||||
|
| |||||||||
Net Assets – 100.0% | $ | 209,767,492 | ||||||||
|
| |||||||||
Percentages are stated as a percent of net assets.
Abbreviations:
ADR: American Depositary Receipts
Footnotes:
| (a) | Non-Income producing security. |
| (b) | Security traded on a foreign exchange has been valued at an estimate of fair value that is different than the local market close price. These fair value estimates are determined by an independent fair valuation service that has been approved by the Board. These securities represent $185,792,788, or 88.6% of the Portfolio’s net assets. |
| (c) | As discussed in Note 2 of the Notes to Financial Statements, not all investments that are traded on a foreign exchange are valued at an estimate that is different from the local close price. In some instances, the independent fair valuation service uses a stock’s local close price because the service’s measure of predictability related to their valuation model of a stock is below a chosen threshold. These securities represent $1,907,462, or 0.9% of the Portfolio’s net assets. |
Other Portfolio securities are not subjected to fair valuation procedures because they are traded on domestic or foreign exchanges that have close times that are consistent with the U.S. market close, normally 4:00 pm Eastern Time. Exchange traded funds and rights are also not evaluated by the fair valuation service.
| (d) | Represents cost for financial reporting purposes, which may differ from cost basis for federal income tax purposes. See also Note 7 of the Notes to Financial Statements. |
| 24 | (continued) |
| Ohio National Fund, Inc. | International Portfolio (Continued) |
Schedule of Investments | June 30, 2011 (Unaudited) |
Sector Classifications: (Percent of net assets)
Financials | 18.0% | |||
Industrials | 16.2% | |||
Materials | 16.1% | |||
Consumer Discretionary | 12.5% | |||
Energy | 9.3% | |||
Information Technology | 9.0% | |||
Consumer Staples | 7.1% | |||
Health Care | 6.3% | |||
Telecommunication Services | 5.1% | |||
Utilities | 0.9% | |||
|
| |||
| 100.5% | ||||
|
|
The accompanying notes are an integral part of these financial statements.
| 25 |
| Ohio National Fund, Inc. | Capital Appreciation Portfolio |
Objective/Strategy
The Capital Appreciation Portfolio seeks long-term capital growth by investing primarily in common stocks of established companies with either current or emerging earnings growth not fully appreciated or recognized by the market.
Performance as of June 30, 2011
Average Annual Total Returns: | ||||
One year | 33.00% | |||
Five years | 4.59% | |||
Ten years | 5.08% |
Past performance does not guarantee future results. The performance data quoted represents past performance and current returns may be lower or higher. Total return figures include change in share price and reinvestment of dividends and capital gains. The investment return and principal value will fluctuate so that an investor’s shares, when redeemed, may be worth more or less than the original cost. To obtain performance information up to the most recent month end, call toll-free 1-877-781-6392.
The Portfolio is not open to direct retail investment. Beneficial interest in shares is obtained solely by purchase of variable life insurance policies and variable annuity contracts. Actual performance results for variable annuity and variable universal life contracts will be lower due to contract charges. Consult your contract for applicable charges.
Comments
For the six-month period ended June 30, 2011, the Capital Appreciation Portfolio returned 7.56% versus 6.02% for the current benchmark, the S&P 500 Index.
Stock selection in the Consumer Discretionary sector made the strongest positive impact on absolute return and drove most of the relative out-performance. Viacom, Inc. was a key contributor. Viacom, Inc. is a pure-play content company that owns a stable of networks including MTV, Nickelodeon, and Comedy Central and also owns the Paramount film studio. Viacom, Inc. beat consensus estimates nine consecutive quarters due to strong growth in advertisements and higher free cash flow. In the second quarter, Viacom, Inc.’s consolidated revenues were $3.27 billion, up 20% on strong double-digit growth in both Media Networks and Film Entertainment. We believe Viacom, Inc. has an enviable business model. Well over 1/3 of company profits are recurring and have grown nearly 10% per year for the past five years, driven primarily by cable network revenues. We also like Viacom, Inc.’s high free cash flow conversion, which is being used to repurchase $4 billion of company stock, and favorable potential for significant improvement in the company’s already high margins. Key dynamics going forward, in our view, include improvement/stabilization of ratings across networks, especially on MTV, cyclical recovery of advertising revenue, international adoption of digital broadcasting, emerging businesses, and movie segments. In our opinion, Viacom, Inc., which is trading at a discount to peers, as well as a large discount to its private market value, remains attractively valued.(1)
Positions in Health Care and Information Technology made an outsized contribution to absolute performance. The latter sector was also a significant source of relative out-performance. Shares of pharmaceutical firm Pfizer, Inc. rose on the buzz of a potential breakup of the company into “Innovative Core” and non-pharma divisions, which include nutritionals, consumer health, animal health, and a capsule manufacturing division called Capsugel. Furthermore, Pfizer, Inc. is evaluating spinning off its entire Established Products division, which is mostly a collection of off-patent medicines that also
includes its Greenstone generics unit and its fledgling generic biologics unit. While separating into these different segments would shrink Pfizer, Inc.’s revenue base by approximately 40%, we think the company can gain focus in doing so. Specifically, in the pharmaceutical industry, we believe scale benefits only to a point, which Pfizer, Inc. is well beyond, and in critical areas like R&D (research and development), Pfizer has run into diseconomies of scale. The spin-offs could also be layered with debt, improving the balance sheet of the remaining Innovative Core side of the business. Almost without exception, major spin-offs done by other pharmaceutical companies over the last many years have done well when measured by share price appreciation. The possible restructuring, along with the nearer-term pipeline opportunities, make Pfizer, Inc. an attractive investment in our opinion.(1)
Cabot Oil & Gas Corp. and Moody’s Corp. were standout performers. Cabot Oil & Gas Corp. is a North American exploration and production company, whose reserves are focused in both conventional and unconventional types. The spotlight is on its two unconventional shale plays with large land positions and upside to current solid reserves in prolific basins. Natural gas production in the Marcellus Shale of Pennsylvania, where the company has a 160,000 acre land position and owns its own gathering system, is the first. The second is the oil play in the Eagle Ford Shale of West Texas, where the company has a 60,000 acre net leasehold with potential reserves of 150 to 300 million barrels of oil equivalent. We continue to like Cabot Oil & Gas Corp.’s production growth profile and low unit costs and believe Cabot Oil & Gas Corp. has more upside potential.(1)
Moody’s Corp. is a provider of credit ratings, credit and economic related research, data and analytical tools, risk management software and quantitative credit risk measures, credit portfolio management solutions, training, and financial credentialing and certification services. Moody’s Corp. operates in two segments: Moody’s Investors Service (MIS) and Moody’s Analytics (MA). Moody’s Corp. updated guidance for full-year 2011 revenue and EPS (earnings per share), due to stronger-than-expected revenues associated with expected robust first-quarter bond market issuance, which benefited MIS, and accelerated completion of software projects for customers of MA. Also for 2011, Moody’s Corp. increased standard pricing on transactions by 7.5%. The company increased its quarterly dividend by 22% in April as well. At the current valuation, we think Moody’s Corp. remains inexpensive. We think corporate debt issuance, globally, should continue to benefit from favorable yields, a still-significant refinancing wall, and potential increase in debt-financed corporate M&A (mergers and acquisitions) and capital expenditures. Moreover, securitization volumes remain substantially below peak levels, and regulatory risks have receded. We do not think Dodd-Frank legislation will significantly impact Moody’s Corp.’s business model. As the risk/reward narrowed during the second quarter, we trimmed the position in Moody’s Corp. by 50%.(1)
Individual key detractors included The Goldman Sachs Group, Inc., Motorola Mobility Holdings, Inc., and Arch Coal, Inc. The Goldman Sachs Group, Inc. fell primarily on fears of a lawsuit related to allegations it misled clients by not disclosing its proprietary interest in certain collateralized debt transactions. We remain comfortable with our position in The Goldman Sachs Group, Inc. and consider its valuation attractive. We view The Goldman Sachs Group, Inc. as best in class and believe its strong capital base and leading global positions in investment banking, capital markets, trading, private equity, and asset management provide attractive exposure to long-term global economic expansion. We expect the company to
| 26 | (continued) |
| Ohio National Fund, Inc. | Capital Appreciation Portfolio (Continued) |
continue to benefit from its strong balance sheet and deft navigation of the markets. We believe global consolidation in the financial services industry could drive meaningful market share gains for the company.(1)
We initiated a position in Motorola Mobility Holdings, Inc., a spin-off of Motorola, in February, 2011. In our view, the market is giving too much attention to XOOM, Motorola Mobility Holdings, Inc.’s tablet, and not giving enough recognition to the smartphone story. Along with Samsung, Motorola Mobility Holdings, Inc. is one of the leading Android vendors, and it is the only pure-play on Android smartphone growth that also has what we consider a terrific management team. We acknowledge that Motorola Mobility Holdings, Inc.’s business is competitive, but we think management can take advantage of a product refresh and momentum. We also like the company’s plans to expand geographically. We think the stock, which is trading at 30% of revenue, is attractively valued.(1)
Despite Arch Coal, Inc.’s weak performance, we retain our conviction in the long-term net asset value expansion potential of the company. Arch Coal, Inc. is among the top producers in the Powder River Basin, which we believe will be in great demand over the coming years. Its recent acquisition of International Coal Group (ICO) increases its exposure to Appalachian metallurgical coal production and the potential export growth story. Lately, the company has come under pressure from the pullback in coal prices but should rebound as it fully integrates ICO, which should broaden the resource base of the company.(1)
The five best performers were Cabot Oil & Gas Corp., Moody’s Corp., Warner Music Group Corp., Expedia, Inc., and Watson Pharmaceuticals, Inc. The five worst performers were Motorola Mobility Holdings, Inc., Arch Coal, Inc., The Goldman Sachs Group, Inc., Marvell Technology Group Ltd., and Delta Air Lines, Inc. The five largest detractors were The Goldman Sachs Group, Inc., Motorola Mobility Holdings, Inc., Arch Coal, Inc., Marvell Technology Group Ltd., and Delta Air Lines, Inc. The five best contributors were Cabot Oil & Gas Corp., Moody’s Corp., Viacom, Inc., Pfizer, Inc., and RSC Holdings, Inc.(1)
Continued strong corporate profits are driving equity market advances despite economic data over the past several months that suggest moderating global activity. With several key variants of the global economy in flux, we believe bottom-up stock selection based on rigorous fundamental research will be the key to outperforming market indexes. We continue to look for new ideas that have compelling risk/rewards with catalysts that should effectively realize the stocks’ full market value over the next 12 to 24 months. Currently, the Portfolio contains both company-specific catalyst driven ideas as well as stocks in industries with secular and cyclical fundamental improvements.(1)
| (1) | The Portfolio’s composition is subject to change. Holdings and weightings are as of June 30, 2011. |
Change in Value of $10,000 Investment

Hypothetical illustration based on past performance. Future performance will vary. The Portfolio’s returns reflect reinvested dividends. The Portfolio’s holdings may differ significantly from the securities in the index. The index is unmanaged and therefore does not reflect the cost of portfolio management and accounting.
The S&P 500 Index is a capitalization-weighted index designed to measure performance of the broad domestic economy through changes in the aggregate market value of 500 stocks representing all major industries. The index presented herein includes the effects of reinvested dividends.
| 27 | (continued) |
| Ohio National Fund, Inc. | Capital Appreciation Portfolio (Continued) |
Portfolio Composition as of June 30, 2011 (1)
| % of Net Assets | ||||
Common Stocks (3) | 99.1 | |||
Money Market Funds | 0.9 | |||
|
| |||
| 100.0 | ||||
|
|
Top 10 Portfolio Holdings as of June 30, 2011 (1) (2)
| % of Net Assets | ||||
1. Pfizer, Inc. | 2.5 | |||
2. Pinnacle Entertainment, Inc. | 2.3 | |||
3. Comcast Corp. Class A | 2.3 | |||
4. Schlumberger Ltd. | 2.2 | |||
5. Xilinx, Inc. | 1.9 | |||
6. Kraft Foods, Inc. Class A | 1.9 | |||
7. Viacom, Inc. Class B | 1.9 | |||
8. Boeing Co. / The | 1.8 | |||
9. Lear Corp. | 1.8 | |||
10. International Game Technology | 1.8 |
| (1) | Composition of Portfolio subject to change. |
| (2) | Short-term investments have been excluded from the list of Top 10 Portfolio Holdings. |
| (3) | Sectors: |
| % of Net Assets | ||||
Consumer Discretionary | 20.3 | |||
Financials | 15.2 | |||
Information Technology | 14.5 | |||
Health Care | 13.7 | |||
Energy | 12.1 | |||
Industrials | 12.0 | |||
Consumer Staples | 6.9 | |||
Materials | 3.4 | |||
Utilities | 1.0 | |||
|
| |||
| 99.1 | ||||
|
|
| 28 |
| Ohio National Fund, Inc. | Capital Appreciation Portfolio |
Schedule of Investments | June 30, 2011 (Unaudited) |
| Common Stocks – 99.1% | Shares | Value | ||||||||
CONSUMER DISCRETIONARY – 20.3% | ||||||||||
Lear Corp. (Auto Components) | 44,990 | $ | 2,406,065 | |||||||
Toyota Motor Corp. – ADR (Automobiles) | 21,270 | 1,753,073 | ||||||||
International Game Technology (Hotels, Restaurants & Leisure) | 136,411 | 2,398,105 | ||||||||
Pinnacle Entertainment, Inc. (Hotels, Restaurants & Leisure) | (a) | 206,825 | 3,081,692 | |||||||
Yum! Brands, Inc. (Hotels, Restaurants & Leisure) | 16,801 | 928,087 | ||||||||
Ryland Group, Inc. (Household Durables) | 96,296 | 1,591,773 | ||||||||
Expedia, Inc. (Internet & Catalog Retail) | 43,220 | 1,252,948 | ||||||||
Comcast Corp. Class A (Media) | 123,409 | 2,990,200 | ||||||||
Liberty Global, Inc. – Series C (Media) | (a) | 30,411 | 1,298,550 | |||||||
News Corp. Class A (Media) | 91,555 | 1,620,524 | ||||||||
Viacom, Inc. Class B (Media) | 48,395 | 2,468,145 | ||||||||
Vivendi SA (Media) | (b) | 69,409 | 1,934,645 | |||||||
GameStop Corp. Class A (Specialty Retail) | (a) | 87,859 | 2,343,200 | |||||||
Staples, Inc. (Specialty Retail) | 51,148 | 808,138 | ||||||||
|
| |||||||||
| 26,875,145 | ||||||||||
|
| |||||||||
CONSUMER STAPLES – 6.9% | ||||||||||
CVS Caremark Corp. (Food & Staples Retailing) | 49,186 | 1,848,410 | ||||||||
Wal-Mart Stores, Inc. (Food & Staples Retailing) | 34,218 | 1,818,345 | ||||||||
Bunge Ltd. (Food Products) | 27,578 | 1,901,503 | ||||||||
Kraft Foods, Inc. Class A (Food Products) | 70,299 | 2,476,634 | ||||||||
Tyson Foods, Inc. Class A (Food Products) | 57,137 | 1,109,601 | ||||||||
|
| |||||||||
| 9,154,493 | ||||||||||
|
| |||||||||
ENERGY – 12.1% | ||||||||||
Cameron International Corp. (Energy Equip. & Svs.) | (a) | 42,293 | 2,126,915 | |||||||
Schlumberger Ltd. (Energy Equip. & Svs.) | 34,315 | 2,964,816 | ||||||||
Arch Coal, Inc. (Oil, Gas & Consumable Fuels) | 58,456 | 1,558,437 | ||||||||
Cabot Oil & Gas Corp. (Oil, Gas & Consumable Fuels) | 30,995 | 2,055,278 | ||||||||
Cobalt International Energy, Inc. (Oil, Gas & Consumable Fuels) | (a) | 65,971 | 899,185 | |||||||
Consol Energy, Inc. (Oil, Gas & Consumable Fuels) | 40,641 | 1,970,276 | ||||||||
Kosmos Energy Ltd. (Oil, Gas & Consumable Fuels) | (a) | 40,252 | 683,479 | |||||||
Occidental Petroleum Corp. (Oil, Gas & Consumable Fuels) | 17,852 | 1,857,322 | ||||||||
Southwestern Energy Co. (Oil, Gas & Consumable Fuels) | (a) | 43,172 | 1,851,215 | |||||||
|
| |||||||||
| 15,966,923 | ||||||||||
|
| |||||||||
FINANCIALS – 15.2% | ||||||||||
Charles Schwab Corp. / The (Capital Markets) | 129,685 | 2,133,318 | ||||||||
Goldman Sachs Group, Inc. / The (Capital Markets) | 16,320 | 2,172,029 | ||||||||
Lazard Ltd. Class A (Capital Markets) | 34,845 | 1,292,749 | ||||||||
Wells Fargo & Co. (Commercial Banks) | 71,758 | 2,013,529 | ||||||||
JPMorgan Chase & Co. (Diversified Financial Svs.) | 45,333 | 1,855,933 | ||||||||
Moody’s Corp. (Diversified Financial Svs.) | 41,774 | 1,602,033 | ||||||||
Marsh & McLennan Cos., Inc. (Insurance) | 72,801 | 2,270,663 | ||||||||
MetLife, Inc. (Insurance) | 45,720 | 2,005,736 | ||||||||
Symetra Financial Corp. (Insurance) | 116,623 | 1,566,247 | ||||||||
Travelers Cos., Inc. / The (Insurance) | 29,093 | 1,698,449 | ||||||||
Validus Holdings Ltd. (Insurance) | 49,538 | 1,533,201 | ||||||||
|
| |||||||||
| 20,143,887 | ||||||||||
|
| |||||||||
HEALTH CARE – 13.7% | ||||||||||
Amarin Corp PLC – ADR (Biotechnology) | (a) | 53,369 | 772,249 | |||||||
Amgen, Inc. (Biotechnology) | (a) | 35,367 | 2,063,664 | |||||||
Celgene Corp. (Biotechnology) | (a) | 17,178 | 1,036,177 | |||||||
Gilead Sciences, Inc. (Biotechnology) | (a) | 47,697 | 1,975,133 | |||||||
Hologic, Inc. (Health Care Equip. & Supplies) | (a) | 85,622 | 1,726,996 | |||||||
HCA Holdings, Inc. (Health Care Providers & Svs.) | (a) | 44,726 | 1,475,958 | |||||||
| Common Stocks (Continued) | Shares | Value | ||||||||
HEALTH CARE (continued) | ||||||||||
Quest Diagnostics, Inc. (Health Care | 31,978 | $ | 1,889,900 | |||||||
Thermo Fisher Scientific, Inc. (Life Sciences | (a) | 18,584 | 1,196,624 | |||||||
Impax Laboratories, Inc. (Pharmaceuticals) | (a) | 61,006 | 1,329,321 | |||||||
Pfizer, Inc. (Pharmaceuticals) | 157,560 | 3,245,736 | ||||||||
Watson Pharmaceuticals, Inc. (Pharmaceuticals) | (a) | 20,347 | 1,398,449 | |||||||
|
| |||||||||
| 18,110,207 | ||||||||||
|
| |||||||||
INDUSTRIALS – 12.0% | ||||||||||
Boeing Co. / The (Aerospace & Defense) | 33,009 | 2,440,355 | ||||||||
ITT Corp. (Aerospace & Defense) | 36,152 | 2,130,437 | ||||||||
Teledyne Technologies, Inc. (Aerospace & Defense) | (a) | 21,310 | 1,073,172 | |||||||
Delta Air Lines, Inc. (Airlines) | (a) | 129,614 | 1,188,560 | |||||||
JetBlue Airways Corp. (Airlines) | (a) | 170,226 | 1,038,379 | |||||||
Republic Services, Inc. (Commercial Svs. & Supplies) | 55,294 | 1,705,820 | ||||||||
Dover Corp. (Machinery) | 16,050 | 1,088,190 | ||||||||
Ingersoll-Rand PLC (Machinery) | 40,681 | 1,847,324 | ||||||||
CSX Corp. (Road & Rail) | 55,588 | 1,457,517 | ||||||||
RSC Holdings, Inc. (Trading Companies & Distributors) | (a) | 158,027 | 1,890,003 | |||||||
|
| |||||||||
| 15,859,757 | ||||||||||
|
| |||||||||
INFORMATION TECHNOLOGY – 14.5% | ||||||||||
Juniper Networks, Inc. (Communications Equip.) | (a) | 42,534 | 1,339,821 | |||||||
Motorola Mobility Holdings, Inc. (Communications Equip.) | (a) | 57,222 | 1,261,173 | |||||||
Dell, Inc. (Computers & Peripherals) | (a) | 118,892 | 1,981,930 | |||||||
EMC Corp. (Computers & Peripherals) | (a) | 69,163 | 1,905,441 | |||||||
Flextronics International Ltd. (Electronic Equip., Instr. & Comp.) | (a) | 118,504 | 760,796 | |||||||
Google, Inc. Class A (Internet Software & Svs.) | (a) | 2,296 | 1,162,648 | |||||||
IAC/InterActiveCorp (Internet Software & Svs.) | (a) | 40,421 | 1,542,870 | |||||||
Mastercard, Inc. Class A (IT Svs.) | 6,470 | 1,949,670 | ||||||||
SAIC, Inc. (IT Svs.) | (a) | 16,675 | 280,474 | |||||||
Marvell Technology Group Ltd. (Semiconductors & Equip.) | (a) | 74,035 | 1,093,127 | |||||||
Xilinx, Inc. (Semiconductors & Equip.) | 69,702 | 2,542,032 | ||||||||
Activision Blizzard, Inc. (Software) | 135,297 | 1,580,269 | ||||||||
Symantec Corp. (Software) | (a) | 88,465 | 1,744,530 | |||||||
|
| |||||||||
| 19,144,781 | ||||||||||
|
| |||||||||
MATERIALS – 3.4% | ||||||||||
Monsanto Co. (Chemicals) | 30,459 | 2,209,496 | ||||||||
Goldcorp, Inc. (Metals & Mining) | 48,656 | 2,348,625 | ||||||||
|
| |||||||||
| 4,558,121 | ||||||||||
|
| |||||||||
UTILITIES – 1.0% | ||||||||||
Calpine Corp. (Ind. Power Prod. & Energy Traders) | (a) | 82,054 | 1,323,531 | |||||||
|
| |||||||||
Total Common Stocks (Cost $111,849,758) | $ | 131,136,845 | ||||||||
|
| |||||||||
| Money Market Funds – 1.5% | Shares | Value | ||||||||
Fidelity Institutional Money Market Funds | 1,926,000 | $ | 1,926,000 | |||||||
|
| |||||||||
Total Money Market Funds (Cost $1,926,000) | $ | 1,926,000 | ||||||||
|
| |||||||||
Total Investments – 100.6% (Cost $113,775,758) | (c) | $ | 133,062,845 | |||||||
Liabilities in Excess of Other Assets – (0.6)% | (795,049 | ) | ||||||||
|
| |||||||||
Net Assets – 100.0% | $ | 132,267,796 | ||||||||
|
| |||||||||
| 29 | (continued) |
| Ohio National Fund, Inc. | Capital Appreciation Portfolio (Continued) |
Schedule of Investments | June 20, 2011 (Unaudited) |
Percentages are stated as a percent of net assets.
Abbreviations:
ADR: American Depositary Receipts
Footnotes:
| (a) | Non-income producing security. |
| (b) | Security traded on a foreign exchange has been valued at an estimate of fair value that is different than the local market close price. These fair value estimates are determined by an independent fair valuation service that has been approved by the Board. These securities represent $1,934,645, or 1.5% of the Portfolio’s net assets. Other Portfolio securities are not subjected to fair valuation procedures because they are traded on domestic or foreign exchanges that have close times that are consistent with the U.S. market close, normally 4:00 pm Eastern Time. |
| (c) | Represents cost for financial reporting purposes, which may differ from cost basis for federal income tax purposes. See also Note 7 of the Notes to Financial Statements. |
The accompanying notes are an integral part of these financial statements.
| 30 |
| Ohio National Fund, Inc. | Millennium Portfolio |
Objective/Strategy
The Millennium Portfolio seeks capital growth by investing primarily in common stocks of small sized companies.
Performance as of June 30, 2011
Average Annual Total Returns: | ||||
One year | 42.41% | |||
Five years | 4.83% | |||
Ten years | 1.86% |
Past performance does not guarantee future results. The performance data quoted represents past performance and current returns may be lower or higher. Total return figures include change in share price and reinvestment of dividends and capital gains. The investment return and principal value will fluctuate so that an investor’s shares, when redeemed, may be worth more or less than the original cost. To obtain performance information up to the most recent month end, call toll-free 1-877-781-6392.
The Portfolio is not open to direct retail investment. Beneficial interest in shares is obtained solely by purchase of variable life insurance policies and variable annuity contracts. Actual performance results for variable annuity and variable universal life contracts will be lower due to contract charges. Consult your contract for applicable charges.
Comments
For the six-month period ended June 30, 2011, the Millennium Portfolio returned 11.62% versus 8.59% for the current benchmark, the Russell 2000 Growth Index.
The best performing sectors for the Portfolio, on an absolute basis, were Health Care, Information Technology, Industrials, and Financials and, while still positive for the period, Materials, Consumer Staples and Energy contributed the least to performance. On a relative basis, Health Care, Industrials, and Financials were positive contributors to performance, while Consumer Discretionary and Information Technology were the primary detractors. For the six-month period, stock selection was additive, while sector allocation slightly detracted. Strong stock selection in Industrials, Health Care, and Financials offset slight under-performance in Consumer Discretionary and Information Technology. Our underweight positions in Energy and Financials were the main sources of allocation under-performance relative to the Russell 2000 Growth Index.
The best performers were Fortinet, Inc., Polypore International, Inc., HFF, Inc., ServiceSource International, Inc., and Zoll Medical Corp. The worst performers were Salix Pharmaceuticals Ltd., Pandora Media, Inc., Dice Holdings, Inc., IntraLinks Holdings, Inc., and ReachLocal, Inc. The largest contributors to performance were HEICO Corp., Zoll Medical Corp., Polypore International, Inc., Fortinet, Inc., and Tractor Supply Co. The largest detractors to performance were Magnum Hunter Resources Corp., Salix Pharmaceuticals Ltd., IntraLinks Holdings, Inc., LogMeln, Inc., and Dice Holdings, Inc.(1)
Based on our expectations for the second half of 2011, we remain overweighted in Consumer Discretionary, Information Technology, Health Care, and Consumer Staples and underweighted in Industrials and Telecommunication Services. As a result of the Russell 2000 Growth Index reconstitution in June, we also ended the quarter underweighted in Energy and Financials. We remain positive on Energy and will likely look to get closer to a market weight, but we will likely remain underweighted in Financials.(1)
Key growth investment themes in the Portfolio for the third quarter are health care equipment innovators, high growth retailers, human resources and talent management, smart phones and tablets, companies that save the health care system money, mobile, cloud
and network computing, and database and security software. Our thematic views are based on data that continues to improve broadly, the outlook and levels of optimism expressed by many of the companies we meet, and the positive growth trends and catalysts that we have identified across various markets.
We are still cautiously optimistic about the second half of the year and expect modest growth and corporate earnings gains to continue. Analyst expectations are likely to moderate, which should be a positive given that they were too high and predicated on an overly optimistic view of the economy’s growth recovery rates. While we expect strategic capital investment and M&A (mergers and acquisitions) activity to continue to be strong, corporations are clearly looking for greater clarity around the economy, as well as regulatory and tax issues out of Washington, before they start substantially allocating cash to expanding headcount. As a result, unemployment will likely remain stubbornly high. While commodity input costs have risen, and food and gas price inflation have impacted a weakened consumer, we are not seeing broad inflation affecting our companies’ financial results and it is likely that a weaker market will serve to further correct those inflated commodity prices. June saw the end of QE II (quantitative easing II) and we don’t expect a third iteration to be immediately on tap as the Federal Reserve has maturing investments from the two previous initiatives that it could reinvest should it deem prudent. We expect interest rates to stay low for the foreseeable future.
We are optimistic that the higher quality biases, those favoring active management and bottom-up, fundamentals-driven stock selection, that have lead for the first half of the year are sustainable and that we can continue to find higher quality growth companies that are attractively valued relative to other areas of the market. Quality typically shines when investors are discriminating and mindful of risk. Given the extended run of lower quality and higher beta names, from the market’s low in March 2009 the potential for a future scarcity of strong earnings and revenue growth, and the prevailing headwinds in the market, we remain confident that now is the time to embrace higher quality.
| (1) | The Portfolio’s composition is subject to change. Holdings and weightings are as of June 30, 2011. |
Change in Value of $10,000 Investment

Hypothetical illustration based on past performance. Future performance will vary. The Portfolio’s returns reflect reinvested dividends. The Portfolio’s holdings may differ significantly from the securities in the index. The index is unmanaged and therefore does not reflect the cost of portfolio management and accounting.
The Russell 2000 Growth Index is a market-weighted total return index that measures the performance of companies within the Russell 2000 Index having higher price to book ratios and higher forecasted growth values. The Russell 2000 Index includes the 2000 firms from the Russell 3000 Index with the smallest market capitalizations. The Russell 3000 Index represents 98% of the investable U.S. equity markets. The index presented herein includes the effects of reinvested dividends.
| 31 | (continued) |
| Ohio National Fund, Inc. | Millennium Portfolio (Continued) |
Portfolio Composition as of June 30, 2011 (1)
| % of Net Assets | ||||
Common Stocks (3) | 100.7 | |||
Money Market Funds | (0.7 | ) | ||
|
| |||
| 100.0 | ||||
|
|
Top 10 Portfolio Holdings as of June 30, 2011 (1) (2)
| % of Net Assets | ||||
1. Ultimate Software Group, Inc. | 3.6 | |||
2. HEICO Corp. | 3.1 | |||
3. Keynote Systems, Inc. | 2.3 | |||
4. Tractor Supply Co. | 2.3 | |||
5. Volcano Corp. | 2.2 | |||
6. LivePerson, Inc. | 2.0 | |||
7. Velti PLC | 2.0 | |||
8. TIBCO Software, Inc. | 1.9 | |||
9. Rosetta Resources, Inc. | 1.8 | |||
10. First Cash Financial Services, Inc. | 1.7 |
| (1) | Composition of Portfolio subject to change. |
| (2) | Short-term investments have been excluded from the list of Top 10 Portfolio Holdings. |
| (3) | Sectors: |
| % of Net Assets | ||||
Information Technology | 27.1 | |||
Health Care | 20.1 | |||
Consumer Discretionary | 17.7 | |||
Industrials | 14.1 | |||
Energy | 7.9 | |||
Financials | 5.2 | |||
Materials | 4.4 | |||
Consumer Staples | 4.2 | |||
|
| |||
| 100.7 | ||||
|
|
| 32 |
| Ohio National Fund, Inc. | Millennium Portfolio |
Schedule of Investments | June 30, 2011 (Unaudited) |
| Common Stocks – 100.7% | Shares | Value | ||||||||
CONSUMER DISCRETIONARY – 17.7% |
| |||||||||
Steiner Leisure Ltd. (Diversified Consumer Svs.) | (a) | 12,500 | $ | 571,000 | ||||||
Orient-Express Hotels Ltd. Class A (Hotels, Restaurants & Leisure) | (a) | 49,000 | 526,750 | |||||||
Panera Bread Co. Class A (Hotels, Restaurants & Leisure) | (a) | 4,300 | 540,338 | |||||||
Peet’s Coffee & Tea, Inc. (Hotels, Restaurants & Leisure) | (a) | 9,500 | 548,150 | |||||||
Shutterfly, Inc. (Internet & Catalog Retail) | (a) | 10,600 | 608,652 | |||||||
Brunswick Corp. (Leisure Equip. & Products) | 21,300 | 434,520 | ||||||||
MDC Partners, Inc. Class A (Media) | 35,100 | 633,906 | ||||||||
GNC Holdings, Inc. Class A (Specialty Retail) | (a) | 22,600 | 492,906 | |||||||
Hibbett Sports, Inc. (Specialty Retail) | (a) | 15,700 | 639,147 | |||||||
Sally Beauty Holdings, Inc. (Specialty Retail) | (a) | 42,400 | 725,040 | |||||||
Tractor Supply Co. (Specialty Retail) | 15,000 | 1,003,200 | ||||||||
Vitamin Shoppe, Inc. (Specialty Retail) | (a) | 14,300 | 654,368 | |||||||
Deckers Outdoor Corp. (Textiles, Apparel & Luxury Goods) | (a) | 5,800 | 511,212 | |||||||
|
| |||||||||
| 7,889,189 | ||||||||||
|
| |||||||||
CONSUMER STAPLES – 4.2% | ||||||||||
Pricesmart, Inc. (Food & Staples Retailing) | 13,900 | 712,097 | ||||||||
Diamond Foods, Inc. (Food Products) | 9,300 | 709,962 | ||||||||
Hain Celestial Group, Inc. / The (Food Products) | (a) | 13,000 | 433,680 | |||||||
|
| |||||||||
| 1,855,739 | ||||||||||
|
| |||||||||
ENERGY – 7.9% | ||||||||||
CARBO Ceramics, Inc. (Energy Equip. & Svs.) | 4,700 | 765,865 | ||||||||
Complete Production Services, Inc. (Energy | (a) | 14,100 | 470,376 | |||||||
Superior Energy Services, Inc. (Energy Equip. & Svs.) | (a) | 14,300 | 531,102 | |||||||
Berry Petroleum Co. Class A (Oil, Gas & Consumable Fuels) | 8,400 | 446,292 | ||||||||
Brigham Exploration Co. (Oil, Gas & Consumable Fuels) | (a) | 16,200 | 484,866 | |||||||
Rosetta Resources, Inc. (Oil, Gas & Consumable Fuels) | (a) | 15,500 | 798,870 | |||||||
|
| |||||||||
| 3,497,371 | ||||||||||
|
| |||||||||
FINANCIALS – 5.2% | ||||||||||
HFF, Inc. Class A (Capital Markets) | (a) | 38,200 | 576,438 | |||||||
Texas Capital Bancshares, Inc. (Commercial Banks) | (a) | 18,900 | 488,187 | |||||||
First Cash Financial Services, Inc. (Consumer Finance) | (a) | 18,500 | 776,815 | |||||||
Portfolio Recovery Associates, Inc. (Diversified Financial Svs.) | (a) | 5,800 | 491,782 | |||||||
|
| |||||||||
| 2,333,222 | ||||||||||
|
| |||||||||
HEALTH CARE – 20.1% | ||||||||||
Hill-Rom Holdings, Inc. (Health Care Equip. & Supplies) | 13,900 | 639,956 | ||||||||
Neogen Corp. (Health Care Equip. & Supplies) | (a) | 12,700 | 574,167 | |||||||
Sirona Dental Systems, Inc. (Health Care Equip. & Supplies) | (a) | 12,100 | 642,510 | |||||||
Volcano Corp. (Health Care Equip. & Supplies) | (a) | 29,600 | 955,784 | |||||||
Zoll Medical Corp. (Health Care Equip. & Supplies) | (a) | 11,800 | 668,588 | |||||||
Accretive Health, Inc. (Health Care Providers & Svs.) | (a) | 21,600 | 621,864 | |||||||
Air Methods Corp. (Health Care Providers & Svs.) | (a) | 7,100 | 530,654 | |||||||
HMS Holdings Corp. (Health Care Providers & Svs.) | (a) | 6,000 | 461,220 | |||||||
IPC The Hospitalist Co., Inc. (Health Care | (a) | 14,900 | 690,615 | |||||||
U.S. Physical Therapy, Inc. (Health Care | 29,800 | 736,954 | ||||||||
| Common Stocks (Continued) | Shares | Value | ||||||||
HEALTH CARE (continued) | ||||||||||
Computer Programs & Systems, Inc. (Health Care Technology) | 7,700 | $ | 488,796 | |||||||
Quality Systems, Inc. (Health Care Technology) | 6,400 | 558,720 | ||||||||
SXC Health Solutions Corp. (Health Care Technology) | (a) | 11,100 | 654,012 | |||||||
Medicis Pharmaceutical Corp. Class A (Pharmaceuticals) | 18,500 | 706,145 | ||||||||
|
| |||||||||
| 8,929,985 | ||||||||||
|
| |||||||||
INDUSTRIALS – 14.1% | ||||||||||
HEICO Corp. (Aerospace & Defense) | 25,006 | 1,368,828 | ||||||||
HUB Group, Inc. Class A (Air Freight & Logistics) | (a) | 14,100 | 531,006 | |||||||
Interface, Inc. Class A (Commercial Svs. & Supplies) | 28,800 | 557,856 | ||||||||
Polypore International, Inc. (Electrical Equip.) | (a) | 11,000 | 746,240 | |||||||
Actuant Corp. Class A (Machinery) | 20,200 | 541,966 | ||||||||
Altra Holdings, Inc. (Machinery) | (a) | 11,300 | 271,087 | |||||||
Gorman-Rupp Co. / The (Machinery) | 15,875 | 522,923 | ||||||||
Old Dominion Freight Line, Inc. (Road & Rail) | (a) | 16,700 | 622,910 | |||||||
Kaman Corp. (Trading Companies & Distributors) | 15,800 | 560,426 | ||||||||
MSC Industrial Direct Co. Class A (Trading Companies & Distributors) | 8,100 | 537,111 | ||||||||
|
| |||||||||
| 6,260,353 | ||||||||||
|
| |||||||||
INFORMATION TECHNOLOGY – 27.1% | ||||||||||
Aruba Networks, Inc. (Communications Equip.) | (a) | 23,200 | 685,560 | |||||||
Riverbed Technology, Inc. (Communications Equip.) | (a) | 13,400 | 530,506 | |||||||
DTS, Inc. (Electronic Equip., Instr. & Comp.) | (a) | 7,800 | 316,290 | |||||||
Keynote Systems, Inc. (Internet Software & Svs.) | 47,600 | 1,029,588 | ||||||||
LivePerson, Inc. (Internet Software & Svs.) | (a) | 64,000 | 904,960 | |||||||
Rackspace Hosting, Inc. (Internet Software & Svs.) | (a) | 12,700 | 542,798 | |||||||
Velti PLC (Internet Software & Svs.) | (a) | 52,400 | 886,084 | |||||||
Echo Global Logistics, Inc. (IT Svs.) | (a) | 27,100 | 481,025 | |||||||
ServiceSource International, Inc. (IT Svs.) | (a) | 24,400 | 542,168 | |||||||
Wright Express Corp. (IT Svs.) | (a) | 10,000 | 520,700 | |||||||
Cavium, Inc. (Semiconductors & Equip.) | (a) | 13,500 | 588,465 | |||||||
BroadSoft, Inc. (Software) | (a) | 3,000 | 114,390 | |||||||
Fortinet, Inc. (Software) | (a) | 21,200 | 578,548 | |||||||
Kenexa Corp. (Software) | (a) | 15,700 | 376,486 | |||||||
QLIK Technologies, Inc. (Software) | (a) | 16,300 | 555,178 | |||||||
SS&C Technologies Holdings, Inc. (Software) | (a) | 21,900 | 435,153 | |||||||
Taleo Corp. Class A (Software) | (a) | 13,200 | 488,796 | |||||||
TIBCO Software, Inc. (Software) | (a) | 29,200 | 847,384 | |||||||
Ultimate Software Group, Inc. (Software) | (a) | 29,400 | 1,600,242 | |||||||
|
| |||||||||
| 12,024,321 | ||||||||||
|
| |||||||||
MATERIALS – 4.4% | ||||||||||
Zagg, Inc. (Chemicals) | (a) | 47,200 | 632,480 | |||||||
Globe Specialty Metals, Inc. (Metals & Mining) | 28,200 | 632,244 | ||||||||
Worthington Industries, Inc. (Metals & Mining) | 30,200 | 697,620 | ||||||||
|
| |||||||||
| 1,962,344 | ||||||||||
|
| |||||||||
Total Common Stocks (Cost $36,413,511) | $ | 44,752,524 | ||||||||
|
| |||||||||
| Money Market Funds – 1.2% | Shares | Value | ||||||||
Fidelity Institutional Money Market Funds | 548,000 | $ | 548,000 | |||||||
|
| |||||||||
Total Money Market Funds (Cost $548,000) | $ | 548,000 | ||||||||
|
| |||||||||
Total Investments – 101.9% (Cost $36,961,511) | (b) | $ | 45,300,524 | |||||||
Liabilities in Excess of Other Assets – (1.9)% | (853,062 | ) | ||||||||
|
| |||||||||
Net Assets – 100.0% | $ | 44,447,462 | ||||||||
|
| |||||||||
Percentages are stated as a percent of net assets.
Footnotes:
| (a) | Non-income producing security. |
| (b) | Represents cost for financial reporting purposes, which may differ from cost basis for federal income tax purposes. See also Note 7 of the Notes to Financial Statements. |
| 33 |
| Ohio National Fund, Inc. | International Small-Mid Company Portfolio |
Objective/Strategy
The International Small-Mid Company Portfolio seeks long-term growth of capital by investing at least 80% of its assets in equity securities of foreign small and mid-cap companies.
Performance as of June 30, 2011
Average Annual Total Returns: | ||||
One year | 42.15% | |||
Five years | 4.00% | |||
Ten years | 8.66% |
Past performance does not guarantee future results. The performance data quoted represents past performance and current returns may be lower or higher. Total return figures include change in share price and reinvestment of dividends and capital gains. The investment return and principal value will fluctuate so that an investor’s shares, when redeemed, may be worth more or less than the original cost. To obtain performance information up to the most recent month end, call toll-free 1-877-781-6392.
The Portfolio is not open to direct retail investment. Beneficial interest in shares is obtained solely by purchase of variable life insurance policies and variable annuity contracts. Actual performance results for variable annuity and variable universal life contracts will be lower due to contract charges. Consult your contract for applicable charges.
Comments
For the six-month period ended June 30, 2011, the International Small-Mid Company Portfolio returned 5.94% versus 4.99% for the current benchmark, the S&P Developed Small Cap Ex-U.S. Growth Index.
Broadly speaking, international equity markets tried to stage two rallies during the first half of the year. The first attempt was thwarted by Japan’s earthquake, tsunami, and nuclear containment challenges. Supply disruptions were felt globally as not only manufacturing was affected, but Japanese shipping ports as well. However, that was relatively short lived, as the underlying global economy continued its upward trajectory until the second economic shock. This latter speed bump came from Greece’s sovereign debt crisis as the country’s debt teetered on default. The European Union scrambled to save one of their own, but the process was fraught with indecisions and demands. In the end, Greece started to help itself by voting for austerity measures in order to continue to get financial help from its European neighbors. Inflation threatens a sustained Asian upturn. Rising inflation pressures have forced central banks in the region to maintain a hawkish stance and to continue raising interest rates. Most paramount was the need to control food and energy inflation to mitigate the development of social unrest. China continued to tap on the brakes and slow its economy to head off inflationary pressures by raising interest rates as well as its reserve requirement ratio. Early evidence indicates that China is succeeding in slowing its economy.
The European region’s growth has improved over last year’s gains, underpinned by exports and firm factory activity. We continue to see significant growth differentials for core and peripheral economies in the Eurozone. Inflation reared its ugly head in Europe as well. The European Central Bank raised its benchmark interest rate by 25 basis points in April with no change in the successive meetings in May and June. The good news is that the recent fall in crude oil and commodity prices should help slow the rate of inflation.
European small caps were the best performers with the S&P Europe SmallCap Growth Index up 9.20%, while the S&P Asia Pacific Ex-Japan SmallCap Growth Index gained 1.26%. The S&P Japan SmallCap Growth Index edged up .88%, in U.S. dollar gross return
basis. Emerging markets continued to ease from the first quarter as the S&P Emerging SmallCap Growth Index posted a -4.82% gross return. Concern over China’s attempts to control growth and inflation weighed on the region. The largest absolute returns were delivered by smaller companies in Germany, France, and the United Kingdom as measured by their respective S&P country indices.
On the currency front, the U.S. dollar lost ground against most major currencies by the end of the first half of the year. The Euro strengthened by 8.33%, while the Yen made a minor gain of .74%. The Canadian dollar appreciated by 3.50% against the U.S. dollar, remaining stronger than parity, while British sterling strengthened by 2.82%.
The Portfolio benefited from being relatively overweighted in Europe versus Asia as we exited many emerging markets at the beginning of the year due to the aforementioned market conditions. Good stock performance aside, the Portfolio’s positioning also gained from unhedged currency gains as cited earlier. Strong relative investment performance also came from investments in Canada and the United Kingdom, as well as being underweighted in Japan. Weaker relative performance came from weaker stock selection in Germany and Hong Kong and exposure to Brazil.(1)
Relative outperforming sectors came from investments in Consumer Discretionary, and Materials through chemical companies. Leoni AG, a German manufacturer of wire, and cables and wiring systems with a clear focus on the automotive industry, climbed 36.6%. The company reported very strong first quarter results with sales and earnings per share growing 38% and 261%, respectively. Due to continuing heavy worldwide demand from the automotive industry, the company has significantly raised its sales forecast for 2011. A more direct play on the automotive industry came from our investments in Kia Motors Corp. The stock gained 44.4% during the time it was held in the first half of this year. The company benefited from a great model year and from an increase in automotive sales at the expense of the Japanese car companies that were confronted with production issues following the earthquake. Rhodia SA, a French manufacturer of specialty chemicals, also performed well during the quarter, rising 38.8% as the company is being acquired by Solvay SA, a Belgium-based chemical company. The merged company will have combined annual sales of €12 billion, with 40% coming from emerging markets.(1)
On a relative basis, weaker performance came from investments in Financials and Information Technology. Dah Sing Financial Holdings Ltd., a Hong Kong-based bank, negatively impacted Portfolio performance by declining 20.6% over the period. Increasing deposit competition and rising loan to deposit ratios weighed on banking operations. Dialog Semiconductor PLC, a German fabless semiconductor company specializing in system power management chips, was down 20.3% during the period as the company’s first quarter results were slightly weaker than expected as capacity constraints from the Japan earthquake negatively impacted gross margins. Keppel Land Ltd. is a Singapore real estate operator with a portfolio of properties including office towers, residential properties, hotels, and resorts. The company’s properties are in China, Singapore, Vietnam, and India. The stock fell 23.3% as concerns mounted over the declining residential markets, with China in particular, owing to stringent government measures.(1)
Despite the road bumps that we’ve experienced in the second quarter, the underlying global economic recovery is still ongoing. Inflation continues to be the watch word as commodity prices have stabilized on the recent price retrenchments, but remain higher than the previous year. Mergers and acquisitions continue to prevail as companies loaded with cash are finding attractive investment
| 34 | (continued) |
| Ohio National Fund, Inc. | International Small-Mid Company Portfolio (Continued) |
opportunities globally. International small-mid cap companies continue to be attractive as targets and long term investments as they actively grow their businesses. While there has been a rotation out of emerging markets this year, valuations make a second look and a renewed investment opportunity possible.
| (1) | The Portfolio’s composition is subject to change. Holdings and weightings are as of June 30, 2011. |
Change in Value of $10,000 Investment

Hypothetical illustration based on past performance. Future performance will vary. The Portfolios returns reflect reinvested dividends. The Portfolios holdings may differ significantly from the securities in the index. The index is unmanaged and therefore does not reflect the cost of portfolio management and accounting.
The S&P Developed Small Cap Ex-U.S. Growth Index. S&P Developed Small Cap Ex-U.S. Growth Index is a subset of the S&P Global Broad Market Index (BMI), a broad index including all publicly listed equities with float-adjusted market values of US$ 100 million or more and annual dollar value traded of at least US$ 50 million in all included countries. The Developed Small Cap component of the BMI includes the equities in the bottom 15% of the market capitalization within each “developed” local market. Ex-U.S. denotes the use of all developed markets excluding the United States. The “Growth” subset includes those companies in each local market that exhibit the characteristics of growth. The index presented includes the effects of reinvested dividends.
Portfolio Composition as of June 30, 2011 (1)
| % of Net Assets | ||||
Common Stocks (3) | 90.6 | |||
Preferred Stocks (3) | 1.0 | |||
Exchange Traded Funds | 1.6 | |||
Money Market Funds | 6.8 | |||
|
| |||
| 100.0 | ||||
|
|
Top 10 Portfolio Holdings as of June 30, 2011 (1) (2)
| % of Net Assets | ||||
1. Leoni AG | 2.2 | |||
2. SNC-Lavalin Group, Inc. | 2.0 | |||
3. Adecco SA | 1.9 | |||
4. Yoox SpA | 1.9 | |||
5. Andritz AG | 1.9 | |||
6. AMEC PLC | 1.7 | |||
7. Faurecia | 1.7 | |||
8. iShares MSCI Japan Index Fund | 1.6 | |||
9. John Wood Group PLC | 1.5 | |||
10. Rightmove PLC | 1.5 |
| (1) | Composition of Portfolio subject to change. |
| (2) | Short-term investments have been excluded from the list of Top 10 Portfolio Holdings. |
| (3) | Top 10 Country Weightings (combined): |
| % of Net Assets | ||||
United Kingdom | 19.3 | |||
Germany | 12.7 | |||
France | 9.1 | |||
Canada | 5.9 | |||
Netherlands | 4.5 | |||
Singapore | 4.0 | |||
Japan | 3.7 | |||
Switzerland | 3.4 | |||
Norway | 3.0 | |||
Jersey | 2.6 |
| 35 |
| Ohio National Fund, Inc. | International Small-Mid Company Portfolio |
Schedule of Investments | June 30, 2011 (Unaudited) |
| Common Stocks – 90.6% | Shares | Value | ||||||||
United Kingdom – 19.3% | ||||||||||
Aggreko PLC | (b) | 37,003 | $ | 1,146,446 | ||||||
AMEC PLC | (b) | 77,469 | 1,353,660 | |||||||
ARM Holdings PLC – ADR | 19,200 | 545,856 | ||||||||
ASOS PLC | (a)(b) | 26,015 | 999,513 | |||||||
Autonomy Corp. PLC | (a)(b) | 12,899 | 353,330 | |||||||
Britvic PLC | (b) | 175,600 | 1,112,868 | |||||||
Carphone Warehouse Group PLC | (c) | 36,100 | �� | 245,081 | ||||||
Cookson Group PLC | (b) | 69,148 | 746,990 | |||||||
Croda International PLC | (b) | 33,542 | 1,015,893 | |||||||
Dialog Semiconductor PLC | (a)(b) | 37,300 | 680,340 | |||||||
Intercontinental Hotels Group PLC | (b) | 40,099 | 820,859 | |||||||
John Wood Group PLC | (b) | 116,643 | 1,210,430 | |||||||
Johnson Matthey PLC | (b) | 20,934 | 661,075 | |||||||
Rightmove PLC | (b) | 62,262 | 1,191,019 | |||||||
Rolls-Royce Group PLC – C Shares | (a)(c) | 2,979,072 | 4,781 | |||||||
Rolls-Royce Holdings PLC | (a)(b) | 31,032 | 321,364 | |||||||
Soco International PLC | (a)(b) | 70,000 | 399,077 | |||||||
Telecity Group PLC | (a)(b) | 77,000 | 684,552 | |||||||
Travis Perkins PLC | (b) | 36,000 | 571,744 | |||||||
Weir Group PLC / The | (b) | 30,250 | 1,032,639 | |||||||
|
| |||||||||
| 15,097,517 | ||||||||||
|
| |||||||||
Germany – 11.7% | ||||||||||
Adidas AG | (b) | 8,126 | 644,242 | |||||||
Aixtron SE NA | (b) | 16,000 | 546,103 | |||||||
Brenntag AG | (b) | 4,100 | 476,866 | |||||||
Commerzbank AG | (a)(b) | 224,794 | 968,226 | |||||||
GEA Group AG | (b) | 32,599 | 1,167,455 | |||||||
Gildemeister AG | (a)(b) | 28,263 | 594,159 | |||||||
HeidelbergCement AG | (b) | 5,796 | 370,687 | |||||||
Hochtief AG | (b) | 11,319 | 945,828 | |||||||
Lanxess AG | (b) | 14,197 | 1,164,560 | |||||||
Leoni AG | (b) | 28,828 | 1,711,717 | |||||||
Rheinmetall AG | (b) | 5,919 | 523,610 | |||||||
|
| |||||||||
| 9,113,453 | ||||||||||
|
| |||||||||
France – 9.1% | ||||||||||
Accor SA | (b) | 13,100 | 586,061 | |||||||
Arkema SA | (b) | 6,034 | 620,608 | |||||||
Bureau Veritas SA | (b) | 6,300 | 532,014 | |||||||
Faurecia | (b) | 30,455 | 1,306,066 | |||||||
JCDecaux SA | (a)(b) | 11,613 | 372,653 | |||||||
Publicis Groupe SA | (b) | 13,987 | 780,811 | |||||||
Remy Cointreau SA | (b) | 7,100 | 597,177 | |||||||
Rhodia SA | (b) | 10,600 | 480,672 | |||||||
Societe Television Francaise 1 | (b) | 46,116 | 841,234 | |||||||
Technip SA | (b) | 8,900 | 954,004 | |||||||
|
| |||||||||
| 7,071,300 | ||||||||||
|
| |||||||||
Canada – 5.9% | ||||||||||
Agrium, Inc. | 9,500 | 834,211 | ||||||||
First Quantum Minerals Ltd. | 4,000 | 583,213 | ||||||||
National Bank of Canada | 9,600 | 778,591 | ||||||||
Pacific Rubiales Energy Corp. | 12,800 | 343,076 | ||||||||
SNC-Lavalin Group, Inc. | 25,818 | 1,576,198 | ||||||||
Thompson Creek Metals Co., Inc. | (a) | 50,600 | 504,988 | |||||||
|
| |||||||||
| 4,620,277 | ||||||||||
|
| |||||||||
Netherlands – 4.5% | ||||||||||
ASML Holding NV | (b) | 18,523 | 683,216 | |||||||
Fugro NV | (b) | 9,348 | 673,315 | |||||||
Imtech NV | (b) | 31,226 | 1,103,806 | |||||||
Koninklijke DSM NV | (b) | 15,587 | 1,011,541 | |||||||
|
| |||||||||
| 3,471,878 | ||||||||||
|
| |||||||||
Singapore – 4.0% | ||||||||||
City Developments Ltd. | (b) | 59,000 | 500,962 | |||||||
Keppel Corp. Ltd. | (b) | 130,900 | 1,184,337 | |||||||
| Common Stocks (Continued) | Shares | Value | ||||||||
Singapore (continued) | ||||||||||
SembCorp Marine Ltd. | (b) | 252,000 | $ | 1,090,555 | ||||||
Straits Asia Resources Ltd. | (b) | 155,000 | 378,856 | |||||||
|
| |||||||||
| 3,154,710 | ||||||||||
|
| |||||||||
Japan – 3.7% | ||||||||||
Fuji Heavy Industries Ltd. | (b) | 43,000 | 334,154 | |||||||
JSR Corp. | (b) | 31,600 | 612,507 | |||||||
Nabtesco Corp. | (b) | 20,000 | 484,505 | |||||||
THK Co. Ltd. | (b) | 28,700 | 733,474 | |||||||
Tokyo Electron Ltd. | (b) | 8,200 | 448,399 | |||||||
Ube Industries Ltd. | (b) | 96,000 | 289,021 | |||||||
|
| |||||||||
| 2,902,060 | ||||||||||
|
| |||||||||
Switzerland – 3.4% | ||||||||||
Adecco SA | (a)(b) | 23,071 | 1,480,820 | |||||||
Clariant AG | (a)(b) | 46,304 | 885,860 | |||||||
Temenos Group AG | (a)(b) | 8,117 | 250,348 | |||||||
|
| |||||||||
| 2,617,028 | ||||||||||
|
| |||||||||
Norway – 3.0% | ||||||||||
Fred Olsen Energy ASA | (b) | 8,647 | 305,480 | |||||||
Opera Software ASA | (b) | 60,000 | 377,838 | |||||||
Petroleum Geo-Services ASA | (a)(b) | 42,797 | 611,388 | |||||||
Yara International ASA | (b) | 18,632 | 1,046,844 | |||||||
|
| |||||||||
| 2,341,550 | ||||||||||
|
| |||||||||
Jersey – 2.6% | ||||||||||
Charter International PLC | (b) | 30,430 | 386,923 | |||||||
United Business Media Ltd. | (b) | 88,081 | 786,903 | |||||||
Wolseley PLC | (b) | 26,400 | 861,736 | |||||||
|
| |||||||||
| 2,035,562 | ||||||||||
|
| |||||||||
Spain – 2.6% | ||||||||||
Obrascon Huarte Lain SA | (b) | 18,909 | 723,244 | |||||||
Tecnicas Reunidas SA | (b) | 16,166 | 829,686 | |||||||
Viscofan SA | (c) | 11,575 | 460,762 | |||||||
|
| |||||||||
| 2,013,692 | ||||||||||
|
| |||||||||
Sweden – 2.1% | ||||||||||
Assa Abloy AB | (b) | 40,600 | 1,091,256 | |||||||
Getinge AB | (b) | 20,613 | 554,313 | |||||||
|
| |||||||||
| 1,645,569 | ||||||||||
|
| |||||||||
Italy – 2.0% | ||||||||||
Prada SpA | (a)(c) | 17,100 | 103,171 | |||||||
Yoox SpA | (a)(b) | 80,000 | 1,472,590 | |||||||
|
| |||||||||
| 1,575,761 | ||||||||||
|
| |||||||||
Thailand – 2.0% | ||||||||||
Bangkok Bank PCL | (b) | 91,600 | 472,732 | |||||||
Bank of Ayudhya PCL | (b) | 486,100 | 436,562 | |||||||
Banpu PCL | (b) | 27,400 | 640,228 | |||||||
|
| |||||||||
| 1,549,522 | ||||||||||
|
| |||||||||
Ireland – 2.0% | ||||||||||
Ingersoll-Rand PLC | 16,600 | 753,806 | ||||||||
Warner Chilcott PLC | 32,900 | 793,877 | ||||||||
|
| |||||||||
| 1,547,683 | ||||||||||
|
| |||||||||
Bermuda – 1.9% | ||||||||||
Invesco Ltd. | 30,839 | 721,633 | ||||||||
Signet Jewelers Ltd. | (a) | 16,700 | 781,727 | |||||||
|
| |||||||||
| 1,503,360 | ||||||||||
|
| |||||||||
Austria – 1.9% | ||||||||||
Andritz AG | (b) | 14,159 | 1,459,914 | |||||||
|
| |||||||||
| 36 | (continued) |
| Ohio National Fund, Inc. | International Small-Mid Company Portfolio (Continued) |
Schedule of Investments | June 30, 2011 (Unaudited) |
| Common Stocks (Continued) | Shares | Value | ||||||||
Cayman Islands – 1.8% | ||||||||||
Boer Power Holdings Ltd. | (b) | 387,000 | $ | 349,529 | ||||||
Herbalife Ltd. | 18,600 | 1,072,104 | ||||||||
|
| |||||||||
| 1,421,633 | ||||||||||
|
| |||||||||
Hong Kong – 1.3% | ||||||||||
Dah Sing Financial Holdings Ltd. | (b) | 88,500 | 453,663 | |||||||
Techtronic Industries Co. | (b) | 488,000 | 583,945 | |||||||
|
| |||||||||
| 1,037,608 | ||||||||||
|
| |||||||||
Indonesia – 1.3% | ||||||||||
Indofood CBP Sukses Makmur TBK PT | (a)(b) | 786,000 | 495,827 | |||||||
United Tractors Tbk PT | (b) | 173,787 | 506,018 | |||||||
|
| |||||||||
| 1,001,845 | ||||||||||
|
| |||||||||
Chile – 1.0% | ||||||||||
Sociedad Quimica y Minera de Chile SA – ADR Series B | 12,400 | 802,528 | ||||||||
|
| |||||||||
Australia – 0.9% | ||||||||||
Boart Longyear Ltd. | (b) | 163,000 | 701,126 | |||||||
|
| |||||||||
Denmark – 0.8% | ||||||||||
Christian Hansen Holding A/S | (b) | 27,340 | 649,622 | |||||||
|
| |||||||||
Mexico – 0.7% | ||||||||||
Mexichem SAB de CV | 138,156 | 559,539 | ||||||||
|
| |||||||||
Israel – 0.6% | ||||||||||
NICE Systems Ltd. – ADR | (a) | 13,700 | 498,132 | |||||||
|
| |||||||||
| Common Stocks (Continued) | Shares | Value | ||||||||
Brazil – 0.5% | ||||||||||
Hypermarcas SA | 40,400 | $ | 380,534 | |||||||
|
| |||||||||
Total Common Stocks (Cost $49,261,506) | $ | 70,773,403 | ||||||||
|
| |||||||||
| Preferred Stocks – 1.0% | Shares | Value | ||||||||
Germany – 1.0% | ||||||||||
Hugo Boss AG | (b) | 7,700 | $ | 782,770 | ||||||
|
| |||||||||
Total Preferred Stocks (Cost $570,243) | $ | 782,770 | ||||||||
|
| |||||||||
| Exchange Traded Funds – 1.6% | Shares | Value | ||||||||
iShares MSCI Japan Index Fund | 122,000 | $ | 1,272,460 | |||||||
|
| |||||||||
Total Exchange Traded Funds (Cost $1,235,988) | $ | 1,272,460 | ||||||||
|
| |||||||||
| Money Market Funds – 8.0% | Shares | Value | ||||||||
State Street Institutional Liquid Reserves Fund Institutional Class 2 | 3,857,963 | $ | 3,857,963 | |||||||
State Street Institutional US Government Money Market Fund Institutional Class | 2,393,030 | 2,393,030 | ||||||||
|
| |||||||||
Total Money Market Funds (Cost $6,250,993) | $ | 6,250,993 | ||||||||
|
| |||||||||
Total Investments – 101.2% (Cost $57,318,730) | $ | 79,079,626 | ||||||||
Liabilities in Excess of Other Assets – (1.2)% | (929,211) | |||||||||
|
| |||||||||
Net Assets – 100.0% | $ | 78,150,415 | ||||||||
|
| |||||||||
Percentages are stated as a percent of net assets.
Abbreviations:
ADR: American Depositary Receipts
Footnotes:
| (a) | Non-Income producing security. |
| (b) | Security traded on a foreign exchange has been valued at an estimate of fair value that is different than the local market close price. These fair value estimates are determined by an independent fair valuation service that has been approved by the Board. These securities represent $59,212,365, or 75.8% of the Portfolio’s net assets. |
| (c) | As discussed in Note 2 of the Notes to Financial Statements, not all investments that are traded on a foreign exchange are valued at an estimate that is different from the local close price. In some instances, the independent fair valuation service uses a stock’s local close price because the service’s measure of predictability related to their valuation model of a stock is below a chosen threshold. These securities represent $813,795, or 1.0% of the Portfolio’s net assets. |
Other Portfolio securities are not subjected to fair valuation procedures because they are traded on domestic or foreign exchanges that have close times that are consistent with the U.S. market close, normally 4:00 pm Eastern Time. Exchange traded funds and rights are also not evaluated by the fair valuation service.
| (d) | Represents cost for financial reporting purposes, which may differ from cost basis for federal income tax purposes. See also Note 7 of the Notes to Financial Statements. |
Sector Classifications: (Percent of net assets)
Industrials | 28.9% | |||
Consumer Discretionary | 18.4% | |||
Materials | 15.5% | |||
Energy | 9.8% | |||
Information Technology | 6.5% | |||
Financials | 5.5% | |||
Consumer Staples | 5.3% | |||
Health Care | 1.7% | |||
|
| |||
| 91.6% | ||||
|
|
The accompanying notes are an integral part of these financial statements.
| 37 |
| Ohio National Fund, Inc. | Aggressive Growth Portfolio |
Objective/Strategy
The Aggressive Growth Portfolio seeks long-term capital growth by investing primarily in domestic and foreign equity securities selected for growth potential.
Performance as of June 30, 2011
Average Annual Total Returns: | ||||
One year | 27.74% | |||
Five years | 5.24% | |||
Ten years | 2.83% |
Past performance does not guarantee future results. The performance data quoted represents past performance and current returns may be lower or higher. Total return figures include change in share price and reinvestment of dividends and capital gains. The investment return and principal value will fluctuate so that an investor’s shares, when redeemed, may be worth more or less than the original cost. To obtain performance information up to the most recent month end, call toll-free 1-877-781-6392.
The Portfolio is not open to direct retail investment. Beneficial interest in shares is obtained solely by purchase of variable life insurance policies and variable annuity contracts. Actual performance results for variable annuity and variable universal life contracts will be lower due to contract charges. Consult your contract for applicable charges.
Comments
For the six-month period ended June 30, 2011, the Aggressive Growth Portfolio returned 4.28% versus 6.02% for the current benchmark, the S&P 500 Index.
Stocks posted gains in the first six months of 2011, despite coming under a variety of macro pressures, including higher oil prices, unrest in the Middle East, and supply-chain disruptions due to the earthquake in Japan. Concerns over Europe’s sovereign debt crisis, moderating economic data out of the U.S., and slowing growth in China weighed on investor sentiment in the latter half of the period. Mid-cap and large-cap indices outperformed small cap indices, while growth-style indices generally topped those associated with value. Health Care and Energy led the S&P 500 Index higher. Utilities and Consumer Discretionary also outperformed while Materials, Financials, and Information Technology lagged. Commodities were mixed, led by gains in unleaded gasoline, heating oil, and silver, while most agricultural commodities were weak, led by declines in wheat and sugar.
Within this environment, the Portfolio under-performed its benchmark. Weak performing holdings within Information Technology and Telecommunication Services, along with our underweight in Energy, drove the Portfolio’s relative under-performance during the six-month period. Meanwhile, our selections within Consumer Staples and Financials provided the largest boost to relative results.
Detractors to the Portfolio’s performance included a U.S. automaker and an internet related company. Shares of Ford Motor Co. declined. The automaker continues to benefit from structural changes, within the industry that have occurred since 2009, namely better pricing discipline and reduced capacity. Due to Ford Motor Co.’s new product launches, we think it will benefit from improved pricing. It was a tough environment for Internet company Google, Inc., which has come under pressure due to concerns about declines in search activity. While Google, Inc. remains a dominant force in Internet search technology, we grew concerned about the decline in search activity and sold the position.(1)
Shares of Microsoft Corp. were also weak. The software company is trading at a very compelling valuation, in our view. We like Microsoft
Corp.’s position in cloud-based computing, improved competitive position in search and online services, and software renewal cycles. We believe these are multi-year growth opportunities that the market has not fully recognized in the stock’s valuation.(1)
The Portfolio’s top contributors included a beverage company and a specialty retail company. Shares of Hansen Natural Corp. continued to perform well. This U.S. beverage provider has a strong position in the growing energy drink market, due to its strong Monster brand, and we believe it has good growth opportunities in its international business. Shares of eBay, Inc. also rose. The company’s marketplace business has improved, in our view, and it has made a string of acquisitions that will enable it to offer a multi-channel retail strategy for matching buyers and sellers. We think this represents an attractive long-term opportunity for the firm.(1)
Specialty retailer Limited Brands, Inc. was another top performer. The company’s sales have been improving, which has helped to drive incremental margins higher. Its key franchise is Victoria’s Secret, which has strong brand recognition worldwide. The company has been aggressive in reducing costs and managing inventory. We think the market has been slow to recognize Limited Brands, Inc.’s potential margin expansion and international business opportunities.(1)
Looking forward, we think valuations remain exceedingly attractive for large and mega-cap companies. These kinds of stocks have under-performed for several quarters and many of the largest companies (with wide competitive moats) trade at some of the widest valuation gaps to smaller companies in decades. We believe that gap will narrow. The projected earnings growth for many companies in the Portfolio is significantly higher than the market’s average. If a business is executing and the market isn’t recognizing it, we believe there’s enormous upside potential. Where there are more upside drivers than headwinds, we think there is a real opportunity for these “coiled springs” to snap back.
Corporate fundamentals remain healthy. Balance sheets are strong and profit margins are near record levels. Eventually, we are likely to see higher capital expenditures and spending as companies put more of their cash to work. Businesses that supply corporate customers are well-positioned to take advantage of this spending. Moreover, we think many of our stocks can deliver earnings growth in a challenging macro environment. Taken together, these factors give us confidence that our holdings offer the most attractive risk-reward opportunities in the market today.
| (1) | The Portfolio’s composition is subject to change. Holdings and weightings are as of June 30, 2011. |
| 38 | (continued) |
| Ohio National Fund, Inc. | Aggressive Growth Portfolio (Continued) |
Change in Value of $10,000 Investment

Hypothetical illustration based on past performance. Future performance will vary. The Portfolio’s returns reflect reinvested dividends. The Portfolio’s holdings may differ significantly from the securities in the index. The index is unmanaged and therefore does not reflect the cost of portfolio management and accounting.
The S&P 500 Index is a capitalization-weighted index designed to measure performance of the broad domestic economy through changes in the aggregate market value of 500 stocks representing all major industries. The index presented herein includes the effects of reinvested dividends.
Portfolio Composition as of June 30, 2011 (1)
| % of Net Assets | ||||
Common Stocks (3) | 99.2 | |||
Money Market Funds | 0.8 | |||
|
| |||
| 100.0 | ||||
|
|
Top 10 Portfolio Holdings as of June 30, 2011 (1) (2)
| % of Net Assets | ||||
1. eBay, Inc. | 7.0 | |||
2. Celgene Corp. | 5.0 | |||
3. Apple, Inc. | 4.3 | |||
4. FANUC Corp. | 4.1 | |||
5. EMC Corp. | 4.1 | |||
6. Medco Health Solutions, Inc. | 3.9 | |||
7. Microsoft Corp. | 3.8 | |||
8. Davide Campari-Milano SpA | 3.7 | |||
9. Crown Castle International Corp. | 3.7 | |||
10. News Corp. Class A | 3.5 |
| (1) | Composition of Portfolio subject to change. |
| (2) | Short-term investments have been excluded from the list of Top 10 Portfolio Holdings. |
| (3) | Sectors: |
| % of Net Assets | ||||
Information Technology | 32.3 | |||
Health Care | 13.3 | |||
Consumer Discretionary | 12.2 | |||
Financials | 11.9 | |||
Industrials | 11.4 | |||
Consumer Staples | 8.5 | |||
Energy | 3.7 | |||
Telecommunication Services | 3.6 | |||
Materials | 2.3 | |||
|
| |||
| 99.2 | ||||
|
|
| 39 | (continued) |
| Ohio National Fund, Inc. | Aggressive Growth Portfolio |
Schedule of Investments | June 30, 2011 (Unaudited) |
| Common Stocks – 99.2% | Shares | Value | ||||||||
CONSUMER DISCRETIONARY – 12.2% | ||||||||||
Ford Motor Co. (Automobiles) | (a) | 50,485 | $ | 696,188 | ||||||
News Corp. Class A (Media) | 57,515 | 1,018,015 | ||||||||
Limited Brands, Inc. (Specialty Retail) | 24,180 | 929,721 | ||||||||
Cie Financiere Richemont SA (Textiles, Apparel & Luxury Goods) | (b) | 10,996 | 720,601 | |||||||
Prada SpA (Textiles, Apparel & Luxury Goods) | (a)(c) | 32,100 | 193,672 | |||||||
|
| |||||||||
| 3,558,197 | ||||||||||
|
| |||||||||
CONSUMER STAPLES – 8.5% | ||||||||||
Anheuser-Busch InBev NV (Beverages) | (b) | 1,608 | 93,325 | |||||||
Davide Campari-Milano SpA (Beverages) | (b) | 130,641 | 1,072,781 | |||||||
Hansen Natural Corp. (Beverages) | (a) | 10,780 | 872,641 | |||||||
Mead Johnson Nutrition Co. (Food Products) | 6,665 | 450,221 | ||||||||
|
| |||||||||
| 2,488,968 | ||||||||||
|
| |||||||||
ENERGY – 3.7% | ||||||||||
Halliburton Co. (Energy Equip. & Svs.) | 14,690 | 749,190 | ||||||||
Southwestern Energy Co. (Oil, Gas & Consumable Fuels) | (a) | 7,425 | 318,384 | |||||||
|
| |||||||||
| 1,067,574 | ||||||||||
|
| |||||||||
FINANCIALS – 11.9% | ||||||||||
Charles Schwab Corp. / The (Capital Markets) | 38,068 | 626,219 | ||||||||
CapitalSource, Inc. (Commercial Banks) | 45,049 | 290,566 | ||||||||
Standard Chartered PLC (Commercial Banks) | (b) | 18,465 | 485,034 | |||||||
AIA Group Ltd. (Insurance) | (a)(b) | 119,600 | 416,331 | |||||||
Prudential PLC (Insurance) | (b) | 58,406 | 674,405 | |||||||
Hang Lung Properties Ltd. (Real Estate Mgmt. & Development) | (b) | 47,000 | 193,247 | |||||||
Walker & Dunlop, Inc. (Thrifts & Mortgage Finance) | (a) | 57,515 | 764,950 | |||||||
|
| |||||||||
| 3,450,752 | ||||||||||
|
| |||||||||
HEALTH CARE – 13.3% | ||||||||||
Celgene Corp. (Biotechnology) | (a) | 23,925 | 1,443,156 | |||||||
Vertex Pharmaceuticals, Inc. (Biotechnology) | (a) | 15,646 | 813,436 | |||||||
Intuitive Surgical, Inc. (Health Care Equip. & Supplies) | (a) | 1,239 | 461,044 | |||||||
Medco Health Solutions, Inc. (Health Care Providers & Svs.) | (a) | 20,270 | 1,145,660 | |||||||
|
| |||||||||
| 3,863,296 | ||||||||||
|
| |||||||||
INDUSTRIALS – 11.4% | ||||||||||
C.H. Robinson Worldwide, Inc. (Air Freight & Logistics) | 8,475 | 668,169 | ||||||||
United Parcel Service, Inc. Class B (Air Freight & Logistics) | 12,485 | 910,531 | ||||||||
Iron Moutain, Inc. (Commercial Services & Supplies) | 5,388 | 183,677 | ||||||||
| Common Stocks (Continued) | Shares | Value | ||||||||
INDUSTRIALS (continued) | ||||||||||
FANUC Corp. (Machinery) | (b) | 7,200 | $ | 1,204,007 | ||||||
CoStar Group, Inc. (Professional Svs.) | (a) | 5,730 | 339,674 | |||||||
|
| |||||||||
| 3,306,058 | ||||||||||
|
| |||||||||
INFORMATION TECHNOLOGY – 32.3% | ||||||||||
Apple, Inc. (Computers & Peripherals) | (a) | 3,695 | 1,240,301 | |||||||
EMC Corp. (Computers & Peripherals) | (a) | 42,880 | 1,181,344 | |||||||
Amphenol Corp. Class A (Electronic Equip., Instr. & Comp.) | 6,025 | 325,290 | ||||||||
TE Connectivity Ltd. (Electronic Equip., Instr. & Comp.) | 16,630 | 611,319 | ||||||||
Trimble Navigation Ltd. (Electronic Equip., Instr. & Comp.) | (a) | 23,310 | 924,008 | |||||||
AOL, Inc. (Internet Software & Svs.) | (a) | 22,750 | 451,815 | |||||||
eBay, Inc. (Internet Software & Svs.) | (a) | 63,240 | 2,040,756 | |||||||
VistaPrint NV (Internet Software & Svs.) | (a) | 11,715 | 560,563 | |||||||
ON Semiconductor Corp. (Semiconductors & Equip.) | (a) | 53,010 | 555,015 | |||||||
Adobe Systems, Inc. (Software) | (a) | 12,650 | 397,842 | |||||||
Microsoft Corp. (Software) | 42,020 | 1,092,520 | ||||||||
|
| |||||||||
| 9,380,773 | ||||||||||
|
| |||||||||
MATERIALS – 2.3% | ||||||||||
Israel Chemicals Ltd. (Chemicals) | (b) | 16,476 | 262,926 | |||||||
Ivanhoe Mines Ltd. (Metals & Mining) | (a) | 15,777 | 399,158 | |||||||
|
| |||||||||
| 662,084 | ||||||||||
|
| |||||||||
TELECOMMUNICATION SERVICES – 3.6% | ||||||||||
Crown Castle International Corp. (Wireless Telecom. Svs.) | (a) | 26,055 | 1,062,783 | |||||||
|
| |||||||||
Total Common Stocks (Cost $23,983,369) | $ | 28,840,485 | ||||||||
|
| |||||||||
| VVPR Strips – 0.0% | (d) | Quantity | Value | |||||||
CONSUMER STAPLES – 0.0% | ||||||||||
Anheuser-Busch InBev NV (Beverages) | (a)(c) | 6,992 | $ | 41 | ||||||
|
| |||||||||
Total VVPR Strips (Cost $0) | $ | 41 | ||||||||
|
| |||||||||
| Money Market Funds – 3.2% | Shares | Value | ||||||||
Fidelity Institutional Money Market Funds | 916,000 | $ | 916,000 | |||||||
|
| |||||||||
Total Money Market Funds (Cost $916,000) | $ | 916,000 | ||||||||
|
| |||||||||
Total Investments – 102.4% (Cost $24,899,369) | (e) | $ | 29,756,526 | |||||||
Liabilities in Excess of Other Assets – (2.4)% | (694,832) | |||||||||
|
| |||||||||
Net Assets – 100.0% | $ | 29,061,694 | ||||||||
|
| |||||||||
Percentages are stated as a percent of net assets.
Footnotes:
| (a) | Non-income producing security. |
| (b) | Security traded on a foreign exchange has been valued at an estimate of fair value that is different than the local market close price. These fair value estimates are determined by an independent fair valuation service that has been approved by the Board. These securities represent $5,122,657, or 17.6% of the Portfolio’s net assets. |
| (c) | As discussed in Note 2 of the Notes to Financial Statements, not all investments that are traded on a foreign exchange are valued at an estimate that is different from the local close price. In some instances, the independent fair valuation service uses a stock’s local close price because the service’s measure of predictability related to the valuation model of a stock is below a chosen threshold. These securities represent $193,713, or 0.7% of the Portfolio’s net assets. |
Other Portfolio securities are not subjected to fair value procedures because they are traded on domestic or foreign exchanges that have close times that are consistent with the U.S. market close, normally 4:00 pm Eastern Time.
| (d) | A VVPR Strip is a coupon attached to specific ordinary common shares that offers tax advantages. The coupon entitles a holder to reduced withholding tax rates on the dividends generated from the related common shares. |
| (e) | Represents cost for financial reporting purposes, which may differ from cost basis for federal income tax purposes. See also Note 7 of the Notes to Financial Statements. |
The accompanying notes are an integral part of these financial statements.
| 40 |
| Ohio National Fund, Inc. | Small Cap Growth Portfolio |
Objective/Strategy
The Small Cap Growth Portfolio seeks long-term capital appreciation by investing at least 80% of its net assets in stocks of small companies.
Performance as of June 30, 2011
Average Annual Total Returns: | ||||
One year | 45.95% | |||
Five years | 9.00% | |||
Ten years | 5.26% |
Past performance does not guarantee future results. The performance data quoted represents past performance and current returns may be lower or higher. Total return figures include change in share price and reinvestment of dividends and capital gains. The investment return and principal value will fluctuate so that an investor’s shares, when redeemed, may be worth more or less than the original cost. To obtain performance information up to the most recent month end, call toll-free 1-877-781-6392.
The Portfolio is not open to direct retail investment. Beneficial interest in shares is obtained solely by purchase of variable life insurance policies and variable annuity contracts. Actual performance results for variable annuity and variable universal life contracts will be lower due to contract charges. Consult your contract for applicable charges.
Comments
For the six-month period ended June 30, 2011, the Small Cap Growth Portfolio returned 12.13% versus 8.59% for the current benchmark, the Russell 2000 Growth Index.
After strong performance early in the year, stocks came under pressure in May and June mainly due to macro issues such as the debt crisis in Europe, softening economic data in the U.S., and the battle in Washington over raising the federal debt limit. Recent months have generally been a challenging time for fundamental investing. However, our emphasis on owning what we believe to be higher quality businesses with competitive advantages and large addressable markets, trading at attractive risk/reward profiles, provides a compelling investment option regardless of the environment. While our market-cap universe can be volatile, we believe these types of stocks have less downside risk and provide ballast during periods of heightened uncertainty and market turbulence. Additionally, these businesses do not generally require a strong macro-environment to generate compelling returns.
The Portfolio’s stock selections in Consumer Discretionary, Health Care, and Information Technology were the largest contributors to relative performance during the six-month period. Our stock selections in Materials and Telecommunications Services detracted from relative results. Sector allocation had minimal impact on the Portfolio’s relative performance.(1)
On an individual basis, Polaris Industries, Inc. posted strong returns. We have owned this recreational vehicle and ATV manufacturer for some time on the thesis that it can continue to gain market share through product innovation, product line extensions, and new market and international expansion efforts. We believe the company’s manufacturing and supply chain are key differentiators that will enable Polaris Industries, Inc. to perform well despite the overall industry headwinds.(1)
Ceva, Inc. was another top contributor. We are attracted to the business model and competitive positioning of this firm, following the exit of a large technology company from its digital signal processor (DSP) licensing business. We expect Ceva, Inc. to capture a significant share of this business. The company receives up-front
licensing fees and ongoing royalties on each device, typically a mobile phone, that includes its DSP technology.(1)
Wolverine World Wide, the global footwear manufacturer, was another strong performer in the six-month period. The firm’s penetration in the footwear market remains low and we think there is attractive upside potential to compound value over a three- to five-year period. In particular, we believe the Merrill brand has a significant growth opportunity.(1)
Resources Connection, Inc. was the largest individual detractor. In comparing Resources Connection, Inc. to other major professional staffing firms, we believe the company has a compelling cost advantage while maintaining an equally qualified personnel base. The firm has suffered as the big competitors in its space have offered unusually (and unsustainably) low rates to attract business during the downturn. We think Resources Connection, Inc. will benefit as this pricing trend reverses.(1)
Horizon Lines, Inc. was another weak performer. As long time owners of the ocean shipping company, we appreciate its highly-regulated market in the U.S. and territorial ports and the limitations that puts on competition. Given it solid customer base and position in the market it serves, we think the long term cash flow generation for the business is compelling.(1)
National Cinemedia, Inc. was also a key detractor. The company provides pre-feature advertising in cinemas. Among the reasons we like the company are its long-term exclusive agreements with the three largest theater owners, that together control a majority of the top markets in the U.S.(1)
With smaller companies trading at historically high valuations, we aren’t surprised to see short periods of under-performance. However, we think there are justifiable reasons for the premium. Small and midcap companies generally offer faster revenue growth than large caps since they are earlier in their life cycles and have more opportunities to gain market share. Smaller companies also tend to be earlier in their international expansion, presenting more opportunities for foreign growth than large caps, many of which have taken their percentage of international revenues to 50%. Margins for smaller companies are also below peak levels (and lower than large cap margins). That makes sense because these companies are still investing in infrastructure to support their expansion. As their investments pay off, we would expect to see healthy incremental margins. The combination of faster top-line growth and margin expansion tends to produce considerably higher bottom-line growth. For that reason alone, we think small and mid-caps deserve a premium valuation.
The more difficult question to answer is how large of a premium do they deserve. The premium today is high, raising some concern, yet we would expect the Portfolio to perform well in a period of large-cap out-performance. We believe the types of companies that we invest in are of generally high quality, with good business models, and with lower downside risk. Our goal is to find stocks compounding at a 15% annual return, which pushes them up the market cap spectrum over a period of years. We think this approach offers the best opportunity to deliver attractive long-term returns.
| (1) | The Portfolio’s composition is subject to change. Holdings and weightings are as of June 30, 2011. |
| 41 | (continued) |
| Ohio National Fund, Inc. | Small Cap Growth Portfolio (Continued) |
Change in Value of $10,000 Investment
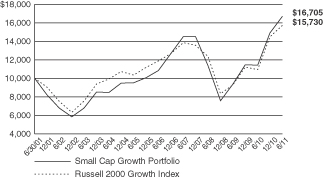
Hypothetical illustration based on past performance. Future performance will vary. The Portfolio’s returns reflect reinvested dividends. The Portfolio’s holdings may differ significantly from the securities in the index. The index is unmanaged and therefore does not reflect the cost of portfolio management and accounting.
The Russell 2000 Growth Index is a market-weighted total return index that measures the performance of companies within the Russell 2000 Index having higher price to book ratios and higher forecasted growth values. The Russell 2000 Index includes the 2000 firms from the Russell 3000 Index with the smallest market capitalizations. The Russell 3000 Index represents 98% of the investable U.S. equity markets. The index presented herein includes the effects of reinvested dividends.
Portfolio Composition as of June 30, 2011 (1)
| % of Net Assets | ||||
Common Stocks (3) | 99.7 | |||
Money Market Funds | 0.3 | |||
|
| |||
| 100.0 | ||||
|
|
Top 10 Portfolio Holdings as of June 30, 2011 (1) (2)
| % of Net Assets | ||||
1. MarketAxess Holdings, Inc. | 2.4 | |||
2. Wolverine World Wide, Inc. | 2.2 | |||
3. Dresser-Rand Group, Inc. | 2.1 | |||
4. Blackboard, Inc. | 2.1 | |||
5. CoStar Group, Inc. | 1.9 | |||
6. Ritchie Bros Auctioneers, Inc. | 1.8 | |||
7. PSS World Medical, Inc. | 1.8 | |||
8. World Fuel Services Corp. | 1.8 | |||
9. Vocus, Inc. | 1.8 | |||
10. WESCO International, Inc. | 1.7 |
| (1) | Composition of Portfolio subject to change. |
| (2) | Short-term investments have been excluded from the list of Top 10 Portfolio Holdings. |
| (3) | Sectors: |
| % of Net Assets | ||||
Information Technology | 22.7 | |||
Industrials | 20.9 | |||
Health Care | 19.6 | |||
Consumer Discretionary | 16.3 | |||
Financials | 8.6 | |||
Energy | 6.1 | |||
Consumer Staples | 2.7 | |||
Telecommunication Services | 1.5 | |||
Materials | 1.3 | |||
|
| |||
| 99.7 | ||||
|
|
| 42 | (continued) |
| Ohio National Fund, Inc. | Small Cap Growth Portfolio |
Schedule of Investments | June 30, 2011 (Unaudited) |
| Common Stocks – 99.7% | Shares | Value | ||||||||
CONSUMER DISCRETIONARY – 16.3% | ||||||||||
Peet’s Coffee & Tea, Inc. (Hotels, Restaurants & Leisure) | (a) | 3,945 | $ | 227,626 | ||||||
Jarden Corp. (Household Durables) | 12,087 | 417,122 | ||||||||
SodaStream International Ltd. (Household Durables) | (a) | 4,260 | 259,051 | |||||||
HomeAway, Inc. (Internet & Catalog Retail) | (a) | 2,075 | 80,302 | |||||||
Polaris Industries, Inc. (Leisure Equip. & Products) | 5,215 | 579,752 | ||||||||
Genius Products, Inc. (Media) | (a) | 209 | 418 | |||||||
National CineMedia, Inc. (Media) | 33,555 | 567,415 | ||||||||
Gordmans Stores, Inc. (Multiline Retail) | 15,805 | 274,849 | ||||||||
Hibbett Sports, Inc. (Specialty Retail) | (a) | 10,055 | 409,339 | |||||||
Lumber Liquidators Holdings, Inc. (Specialty Retail) | (a) | 12,225 | 310,515 | |||||||
Monro Muffler Brake, Inc. (Specialty Retail) | 6,330 | 236,046 | ||||||||
Carter’s, Inc. (Textiles, Apparel & Luxury Goods) | (a) | 17,435 | 536,301 | |||||||
Maidenform Brands, Inc. (Textiles, Apparel & Luxury Goods) | (a) | 20,940 | 579,200 | |||||||
Quiksilver, Inc. (Textiles, Apparel & Luxury Goods) | (a) | 62,770 | 295,019 | |||||||
Under Armour, Inc. Class A (Textiles, Apparel & Luxury Goods) | (a) | 3,060 | 236,569 | |||||||
Wolverine World Wide, Inc. (Textiles, Apparel & Luxury Goods) | 18,920 | 789,910 | ||||||||
|
| |||||||||
| 5,799,434 | ||||||||||
|
| |||||||||
CONSUMER STAPLES – 2.7% | ||||||||||
Primo Water Corp. (Beverages) | (a) | 23,560 | 339,028 | |||||||
Casey’s General Stores, Inc. (Food & Staples Retailing) | 10,045 | 441,980 | ||||||||
Snyders-Lance, Inc. (Food Products) | 8,850 | 191,425 | ||||||||
|
| |||||||||
| 972,433 | ||||||||||
|
| |||||||||
ENERGY – 6.1% | ||||||||||
Dresser-Rand Group, Inc. (Energy Equip. & Svs.) | (a) | 13,865 | 745,244 | |||||||
Dril-Quip, Inc. (Energy Equip. & Svs.) | (a) | 4,980 | 337,793 | |||||||
Targa Resources Corp. (Oil, Gas & Consumable Fuels) | 13,982 | 467,838 | ||||||||
World Fuel Services Corp. (Oil, Gas & Consumable Fuels) | 17,878 | 642,357 | ||||||||
|
| |||||||||
| 2,193,232 | ||||||||||
|
| |||||||||
FINANCIALS – 8.6% | ||||||||||
Epoch Holding Corp. (Capital Markets) | 25,137 | 448,695 | ||||||||
Financial Engines, Inc. (Capital Markets) | (a) | 7,493 | 194,219 | |||||||
Gluskin Sheff + Associates, Inc. (Capital Markets) | 14,630 | 285,182 | ||||||||
Cash Store Financial Services, Inc. / The (Consumer Finance) | 19,210 | 254,340 | ||||||||
Credit Acceptance Corp. (Consumer Finance) | (a) | 4,557 | 384,930 | |||||||
Netspend Holdings, Inc. (Consumer Finance) | (a) | 30,526 | 305,260 | |||||||
MarketAxess Holdings, Inc. (Diversified Financial Svs.) | 34,030 | 852,792 | ||||||||
MSCI, Inc. Class A (Diversified Financial Svs.) | (a) | 9,056 | 341,230 | |||||||
|
| |||||||||
| 3,066,648 | ||||||||||
|
| |||||||||
HEALTH CARE – 19.6% | ||||||||||
Achillion Pharmaceuticals, Inc. (Biotechnology) | (a) | 24,977 | 185,829 | |||||||
Ariad Pharmaceuticals, Inc. (Biotechnology) | (a) | 22,390 | 253,679 | |||||||
Incyte Corp Ltd. (Biotechnology) | (a) | 14,770 | 279,744 | |||||||
Seattle Genetics, Inc. (Biotechnology) | (a) | 12,130 | 248,908 | |||||||
Conceptus, Inc. (Health Care Equip. & Supplies) | (a) | 14,270 | 166,531 | |||||||
Gen-Probe, Inc. (Health Care Equip. & Supplies) | (a) | 6,665 | 460,885 | |||||||
HeartWare International, Inc. (Health Care Equip. & Supplies) | (a) | 2,670 | 197,794 | |||||||
Masimo Corp. (Health Care Equip. & Supplies) | 18,480 | 548,486 | ||||||||
NuVasive, Inc. (Health Care Equip. & Supplies) | (a) | 12,880 | 423,494 | |||||||
Quidel Corp. (Health Care Equip. & Supplies) | (a) | 28,141 | 426,336 | |||||||
Volcano Corp. (Health Care Equip. & Supplies) | (a) | 14,295 | 461,586 | |||||||
Bio-Reference Labs, Inc. (Health Care Providers & Svs.) | (a) | 14,390 | 300,751 | |||||||
Catalyst Health Solutions, Inc. (Health Care Providers & Svs.) | (a) | 5,602 | 312,704 | |||||||
ExamWorks Group, Inc. (Health Care Providers & Svs.) | (a) | 9,775 | 248,187 | |||||||
MWI Veterinary Supply, Inc. (Health Care Providers & Svs.) | (a) | 4,820 | 389,311 | |||||||
| Common Stocks (Continued) | Shares | Value | ||||||||
HEALTH CARE (continued) | ||||||||||
PSS World Medical, Inc. (Health Care Providers & Svs.) | (a) | 23,242 | $ | 651,008 | ||||||
athenahealth, Inc. (Health Care Technology) | (a) | 11,254 | 462,539 | |||||||
Omnicell, Inc. (Health Care Technology) | (a) | 13,125 | 204,619 | |||||||
SXC Health Solutions Corp. (Health Care Technology) | (a) | 6,118 | 360,473 | |||||||
Techne Corp. (Life Sciences Tools & Svs.) | 4,787 | 399,092 | ||||||||
|
| |||||||||
| 6,981,956 | ||||||||||
|
| |||||||||
INDUSTRIALS – 20.9% | ||||||||||
HEICO Corp. Class A (Aerospace & Defense) | 10,702 | 425,512 | ||||||||
TransDigm Group, Inc. (Aerospace & Defense) | (a) | 5,145 | 469,173 | |||||||
HUB Group, Inc. Class A (Air Freight & Logistics) | (a) | 10,395 | 391,476 | |||||||
Clean Harbors, Inc. (Commercial Svs. & Supplies) | (a) | 3,800 | 392,350 | |||||||
Heritage-Crystal Clean, Inc. (Commercial Svs. & Supplies) | (a) | 5,296 | 101,577 | |||||||
Higher One Holdings, Inc. (Commercial Svs. & Supplies) | (a) | 12,750 | 241,230 | |||||||
Ritchie Bros Auctioneers, Inc. (Commercial Svs. & Supplies) | 23,741 | 652,640 | ||||||||
Standard Parking Corp. (Commercial Svs. & Supplies) | (a) | 22,805 | 364,196 | |||||||
Thermon Group Holdings, Inc. (Electrical Equip.) | (a) | 21,732 | 260,784 | |||||||
Barnes Group, Inc. (Machinery) | 19,868 | 492,925 | ||||||||
Wabtec Corp. (Machinery) | 6,308 | 414,562 | ||||||||
Horizon Lines, Inc. Class A (Marine) | 33,583 | 40,635 | ||||||||
Acacia Research - Acacia Technologies (Professional Svs.) | (a) | 5,185 | 190,238 | |||||||
CoStar Group, Inc. (Professional Svs.) | (a) | 11,488 | 681,009 | |||||||
Resources Connection, Inc. (Professional Svs.) | 26,882 | 323,659 | ||||||||
Landstar System, Inc. (Road & Rail) | 8,825 | 410,186 | ||||||||
Old Dominion Freight Line, Inc. (Road & Rail) | (a) | 15,103 | 563,342 | |||||||
Zipcar, Inc. (Road & Rail) | (a) | 6,605 | 134,808 | |||||||
Rush Enterprises, Inc. Class B (Trading Companies & Distributors) | (a) | 18,469 | 297,351 | |||||||
WESCO International, Inc. (Trading Companies & Distributors) | (a) | 10,900 | 589,581 | |||||||
|
| |||||||||
| 7,437,234 | ||||||||||
|
| |||||||||
INFORMATION TECHNOLOGY – 22.7% | ||||||||||
DTS, Inc. (Electronic Equip., Instr. & Comp.) | (a) | 14,326 | 580,919 | |||||||
Measurement Specialties, Inc. (Electronic Equip., Instr. & Comp.) | (a) | 15,276 | 545,353 | |||||||
Cornerstone OnDemand, Inc. (Internet Software & Svs.) | (a) | 5,315 | 93,810 | |||||||
Envestnet, Inc. (Internet Software & Svs.) | (a) | 13,155 | 195,352 | |||||||
LivePerson, Inc. (Internet Software & Svs.) | (a) | 28,205 | 398,819 | |||||||
NIC, Inc. (Internet Software & Svs.) | 18,451 | 248,350 | ||||||||
VistaPrint NV (Internet Software & Svs.) | (a) | 11,900 | 569,415 | |||||||
Vocus, Inc. (Internet Software & Svs.) | (a) | 20,707 | 633,841 | |||||||
Cardtronics, Inc. (IT Svs.) | (a) | 21,370 | 501,126 | |||||||
Euronet Worldwide, Inc. (IT Svs.) | (a) | 31,177 | 480,438 | |||||||
Gartner, Inc. (IT Svs.) | (a) | 10,845 | 436,945 | |||||||
Ceva, Inc. (Semiconductors & Equip.) | (a) | 18,710 | 569,907 | |||||||
International Rectifier Corp. (Semiconductors & Equip.) | (a) | 5,985 | 167,400 | |||||||
Blackboard, Inc. (Software) | (a) | 17,053 | 739,930 | |||||||
Convio, Inc. (Software) | (a) | 30,191 | 326,365 | |||||||
MICROS Systems, Inc. (Software) | (a) | 4,645 | 230,903 | |||||||
RealD, Inc. (Software) | (a) | 14,360 | 335,880 | |||||||
RealPage, Inc. (Software) | (a) | 5,975 | 158,158 | |||||||
SS&C Technologies Holdings, Inc. (Software) | (a) | 22,290 | 442,902 | |||||||
Tyler Technologies, Inc. (Software) | (a) | 16,290 | 436,246 | |||||||
|
| |||||||||
| 8,092,059 | ||||||||||
|
| |||||||||
MATERIALS – 1.3% | ||||||||||
Intrepid Potash, Inc. (Chemicals) | (a) | 13,745 | 446,712 | |||||||
|
| |||||||||
TELECOMMUNICATION SERVICES – 1.5% | ||||||||||
SBA Communications Corp. Class A (Wireless Telecom. Svs.) | (a) | 13,826 | 528,015 | |||||||
|
| |||||||||
Total Common Stocks (Cost $28,795,054) | $ | 35,517,723 | ||||||||
|
| |||||||||
| 43 | (continued) |
| Ohio National Fund, Inc. | Small Cap Growth Portfolio (Continued) |
Schedule of Investments | June 30, 2011 (Unaudited) |
| Money Market Funds – 0.5% | Shares | Value | ||||||||
Fidelity Institutional Money Market Funds | 191,000 | $ | 191,000 | |||||||
|
| |||||||||
Total Money Market Funds (Cost $191,000) | $ | 191,000 | ||||||||
|
| |||||||||
Total Investments – 100.2% (Cost $28,986,054) | (b) | $ | 35,708,723 | |||||||
Liabilities in Excess of Other Assets – (0.2)% | (70,170) | |||||||||
|
| |||||||||
Net Assets – 100.0% | $ | 35,638,553 | ||||||||
|
| |||||||||
Percentages are stated as a percent of net assets.
Footnotes:
| (a) | Non-income producing security. |
| (b) | Represents cost for financial reporting purposes, which may differ from cost basis for federal income tax purposes. See also Note 7 of the Notes to Financial Statements. |
The accompanying notes are an integral part of these financial statements.
| 44 |
| Ohio National Fund, Inc. | Mid Cap Opportunity Portfolio |
Objective/Strategy
The Mid Cap Opportunity Portfolio seeks long-term total return by investing at least 80% of its net assets in equity securities of mid-cap companies, primarily those that are strategically positioned for long-term growth.
Performance as of June 30, 2011
Average Annual Total Returns: | ||||
One year | 32.38% | |||
Five years | 1.11% | |||
Ten years | 2.94% |
Past performance does not guarantee future results. The performance data quoted represents past performance and current returns may be lower or higher. Total return figures include change in share price and reinvestment of dividends and capital gains. The investment return and principal value will fluctuate so that an investor’s shares, when redeemed, may be worth more or less than the original cost. To obtain performance information up to the most recent month end, call toll-free 1-877-781-6392.
The Portfolio is not open to direct retail investment. Beneficial interest in shares is obtained solely by purchase of variable life insurance policies and variable annuity contracts. Actual performance results for variable annuity and variable universal life contracts will be lower due to contract charges. Consult your contract for applicable charges.
Comments
For the six-month period ended June 30, 2011, the Mid Cap Opportunity Portfolio returned 4.94% versus 9.59% for the current benchmark, the Russell Midcap Growth Index.
The Portfolio delivered a positive absolute return but lagged its benchmark. Weakness in select Consumer Discretionary and Consumer Staples holdings detracted from relative returns, while positive stock selection in the Industrials and Information Technology sectors contributed to relative performance.
Staples, Inc. detracted from performance after the company reported its second straight quarter of disappointing results. The company reported earnings that were below consensus estimates and lowered guidance for 2011. Management indicated that Staples, Inc. has been facing margin pressure, an issue that we view as transitory. We believe Staples, Inc. is aggressively pricing some of its products in the U.S., which may enable the company to gain market share. It is our belief that recent actions taken by management may pressure competitors to lower prices, which should have the greatest impact on companies that have limited margin flexibility. In our view, Staples, Inc. may be in a position to gain additional market share if competitors are weakened and the industry becomes more consolidated. Despite ongoing pressure on the stock, we continue to believe that the current macroeconomic headwinds are cyclical in nature and are not evidence of structural issues associated with the company’s business model. In addition to its retail locations, Staples, Inc. has a significant online business and is one of the largest online retailers in North America.(1)
Lamar Advertising Co., an outdoor advertising company, also detracted from performance. Shares of the company fell after it reported disappointing revenue growth for its fiscal first quarter. In our view, outdoor advertising continues to be a share gainer in media and Lamar Advertising Co., specifically, should benefit as the company converts its billboards from static to digital in order to better monetize existing locations and attract more advertisers to the medium.(1)
Northern Trust Corp. detracted from performance, as its shares declined after the company reported disappointing fiscal fourth
quarter earnings. The company’s earnings continue to be pressured by persistently low interest rates. The company’s positioning in its private wealth business and institutional custody business helped offset weakness in other areas of the business that were impacted by macro factors. Northern Trust Corp. remains focused on expanding its business in core markets and, given the company’s solid balance sheet and cash position, we believe that the company’s management should begin to redeploy capital through stock buybacks and dividend increases.(1)
Within Industrials, Iron Mountain, Inc., a leader in records management, data storage, and online backup, contributed to performance. It shares rose after its management announced a strategic plan for enhancing shareholder value. While we continue to believe that Iron Mountain, Inc. holds dominant market share position and scale advantages, we decided to take advantage of the run-up in share price and exited our position as the gap between stock price and the economic value of its business closed.(1)
Xilinx, Inc., a semiconductor chip company that is a leader in programmable logic devices (PLDs), was a top contributor. Shares were up after the company reported strong revenue growth and management issued a positive outlook. The PLD industry is a duopoly structure with high barriers to entry and, in our view, Xilinx, Inc. should benefit from the long-term secular trend of PLDs taking market share from application-specific integrated circuits (ASICs), an alternative semiconductor chip. We believe that the addressable market for PLDs will continue to expand as PLDs offer significant benefits over ASICs such as lower development costs, shorter development time, and upgradeability.(1)
SLM Corp., a student loan originator and servicer, contributed to performance after the company reported strong quarterly earnings. The strong results were driven by higher interest and fee income as well as a lower loss provision. The company was also able to improve margins behind positive credit trends. In addition, SLM Corp. completed an unsecured debt deal that we believe will improve the company’s liquidity position. We believe that SLM Corp. has three strong businesses that are underappreciated by the market. In our view, the company has the potential to grow earnings significantly as the credit market continues to normalize.(1)
The Portfolio’s top performers were Intuitive Surgical, Inc., Iron Mountain, Inc., Petrohawk Energy Corp., SLM Corp., and Altera Corp. The Portfolio’s worst performers were Renren, Inc., NVIDIA Corp., Lamar Advertising Co., Staples, Inc., and DigitalGlobe, Inc. The Portfolio’s top contributors to performance were Iron Mountain, Inc., Xilinx, Inc., SLM Corp., CB Richard Ellis Group, Inc., and GSI Commerce, Inc. The largest detractors from performance were Staples, Inc., Lamar Advertising Co., Northern Trust Corp., NVIDIA Corp., and Renren Inc.(1)
Midway through 2011, we believe the most significant factor for the U.S. equity markets for the remainder of the year will be the fallout from the completion of the Federal Reserve Board’s second round of quantitative easing (referred to as “QE2”). We believe the program has created a fertile environment for forward-looking stock pickers as the momentum rally ends and companies begin to trade more in line with underlying fundamentals. In our view, the Federal Reserve’s actions have led to rising commodity costs and we believe certain companies will be challenged to maintain cost structure without sacrificing revenue growth. We believe companies with strong brands and pricing power will be able to pass along inflationary pressures and maintain margins throughout the recovery. Specifically, we believe our Portfolio is well positioned due to its focus on identifying the companies that can provide a differentiated
| 45 | (continued) |
| Ohio National Fund, Inc. | Mid Cap Opportunity Portfolio (Continued) |
product or service, and those that benefit from secular tailwinds that we believe will enable these types of companies to sustain growth without sacrificing price.
| (1) | The Portfolio’s composition is subject to change. Holdings and weightings are as of June 30, 2011. |
Change in Value of $10,000 Investment
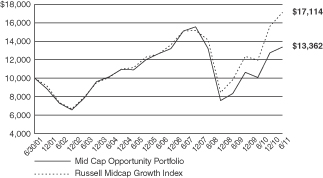
Hypothetical illustration based on past performance. Future performance will vary. The Portfolio’s returns reflect reinvested dividends. The Portfolio’s holdings may differ significantly from the securities in the index. The index is unmanaged and therefore does not reflect the cost of portfolio management and accounting.
The Russell Midcap Growth Index is a subset of the Russell Midcap Index, which measures the performance of the 800 smallest companies in the Russell 1000 Index. The Russell Midcap Growth Index measures the performance of those stocks of the Russell Midcap Index with higher price-to-book ratios and higher relative forecasted growth rates. The index presented herein includes the effects of reinvested dividends.
Portfolio Composition as of June 30, 2011 (1)
| % of Net Assets | ||||
Common Stocks (3) | 99.1 | |||
Money Market Funds and | 0.9 | |||
|
| |||
| 100.0 | ||||
|
|
Top 10 Portfolio Holdings as of June 30, 2011 (1) (2)
| % of Net Assets | ||||
1. Global Payments, Inc. | 2.6 | |||
2. Xilinx, Inc. | 2.5 | |||
3. Cameron International Corp. | 2.3 | |||
4. SBA Communications Corp. Class A | 2.3 | |||
5. Kennametal, Inc. | 2.2 | |||
6. PetSmart, Inc. | 2.2 | |||
7. Phillips-Van Heusen Corp. | 2.2 | |||
8. Bed Bath & Beyond, Inc. | 2.1 | |||
9. IntercontinentalExchange, Inc. | 2.1 | |||
10. Coinstar, Inc. | 2.0 |
| (1) | Composition of Portfolio subject to change. |
| (2) | Short-term investments have been excluded from the list of Top 10 Portfolio Holdings. |
| (3) | Sectors: |
| % of Net Assets | ||||
Information Technology | 26.7 | |||
Consumer Discretionary | 19.7 | |||
Financials | 13.8 | |||
Energy | 11.1 | |||
Industrials | 11.0 | |||
Health Care | 7.9 | |||
Telecommunication Services | 5.0 | |||
Materials | 2.0 | |||
Consumer Staples | 1.9 | |||
|
| |||
| 99.1 | ||||
|
|
| 46 |
| Ohio National Fund, Inc. | Mid Cap Opportunity Portfolio |
Schedule of Investments | June 30, 2011 (Unaudited) |
| Common Stocks – 99.1% | Shares | Value | ||||||||
CONSUMER DISCRETIONARY – 19.7% | ||||||||||
Coinstar, Inc. (Diversified Consumer Svs.) | (a) | 26,281 | $ | 1,433,366 | ||||||
Darden Restaurants, Inc. (Hotels, Restaurants & Leisure) | 14,471 | 720,077 | ||||||||
Marriott International, Inc. Class A (Hotels, Restaurants & Leisure) | 15,030 | 533,415 | ||||||||
Newell Rubbermaid, Inc. (Household Durables) | 68,476 | 1,080,551 | ||||||||
Lamar Advertising Co. Class A (Media) | (a) | 26,996 | 738,881 | |||||||
Scripps Networks Interactive, Inc. Class A (Media) | 14,373 | 702,552 | ||||||||
Bed Bath & Beyond, Inc. (Specialty Retail) | (a) | 25,693 | 1,499,700 | |||||||
Dick’s Sporting Goods, Inc. (Specialty Retail) | (a) | 20,279 | 779,728 | |||||||
GameStop Corp. Class A (Specialty Retail) | (a) | 25,018 | 667,230 | |||||||
PetSmart, Inc. (Specialty Retail) | 34,549 | 1,567,488 | ||||||||
Staples, Inc. (Specialty Retail) | 71,974 | 1,137,189 | ||||||||
Urban Outfitters, Inc. (Specialty Retail) | (a) | 34,767 | 978,691 | |||||||
Phillips-Van Heusen Corp. (Textiles, Apparel & Luxury Goods) | 23,348 | 1,528,594 | ||||||||
Polo Ralph Lauren Corp. (Textiles, Apparel & Luxury Goods) | 2,790 | 369,982 | ||||||||
|
| |||||||||
| 13,737,444 | ||||||||||
|
| |||||||||
CONSUMER STAPLES – 1.9% | ||||||||||
Avon Products, Inc. (Personal Products) | 47,574 | 1,332,072 | ||||||||
|
| |||||||||
ENERGY – 11.1% | ||||||||||
Cameron International Corp. (Energy Equip. & Svs.) | (a) | 32,651 | 1,642,020 | |||||||
Core Laboratories NV (Energy Equip. & Svs.) | 7,836 | 874,027 | ||||||||
Dril-Quip, Inc. (Energy Equip. & Svs.) | (a) | 17,452 | 1,183,769 | |||||||
Petrohawk Energy Corp. (Oil, Gas & Consumable Fuels) | (a) | 28,354 | 699,493 | |||||||
Pioneer Natural Resources Co. (Oil, Gas & Consumable Fuels) | 13,974 | 1,251,651 | ||||||||
Southwestern Energy Co. (Oil, Gas & Consumable Fuels) | (a) | 21,040 | 902,195 | |||||||
Whiting Petroleum Corp. (Oil, Gas & Consumable Fuels) | (a) | 21,625 | 1,230,679 | |||||||
|
| |||||||||
| 7,783,834 | ||||||||||
|
| |||||||||
FINANCIALS – 13.8% | ||||||||||
Affiliated Managers Group, Inc. (Capital Markets) | (a) | 3,863 | 391,901 | |||||||
Invesco Ltd. (Capital Markets) | 16,072 | 376,085 | ||||||||
Lazard Ltd. Class A (Capital Markets) | 26,732 | 991,757 | ||||||||
Northern Trust Corp. (Capital Markets) | 25,346 | 1,164,902 | ||||||||
TD Ameritrade Holding Corp. (Capital Markets) | 35,936 | 701,111 | ||||||||
First Republic Bank (Commercial Banks) | (a) | 22,746 | 734,241 | |||||||
SLM Corp. (Consumer Finance) | 42,680 | 717,451 | ||||||||
IntercontinentalExchange, Inc. (Diversified Financial Svs.) | (a) | 12,006 | 1,497,268 | |||||||
MSCI, Inc. Class A (Diversified Financial Svs.) | (a) | 25,925 | 976,854 | |||||||
Principal Financial Group, Inc. (Insurance) | 32,359 | 984,361 | ||||||||
CB Richard Ellis Group, Inc. Class A (Real Estate Mgmt. & Development) | (a) | 44,413 | 1,115,210 | |||||||
|
| |||||||||
| 9,651,141 | ||||||||||
|
| |||||||||
HEALTH CARE – 7.9% | ||||||||||
C.R. Bard, Inc. (Health Care Equip. & Supplies) | 8,860 | 973,360 | ||||||||
CareFusion Corp. (Health Care Equip. & Supplies) | (a) | 39,361 | 1,069,438 | |||||||
Intuitive Surgical, Inc. (Health Care Equip. & Supplies) | (a) | 1,792 | 666,821 | |||||||
St. Jude Medical, Inc. (Health Care Equip. & Supplies) | 25,336 | 1,208,021 | ||||||||
Henry Schein, Inc. (Health Care Providers & Svs.) | (a) | 15,735 | 1,126,469 | |||||||
Emdeon, Inc. Class A (Health Care Technology) | (a) | 37,869 | 496,841 | |||||||
|
| |||||||||
| 5,540,950 | ||||||||||
|
| |||||||||
| Common Stocks (Continued) | Shares | Value | ||||||||
INDUSTRIALS – 11.0% | ||||||||||
DigitalGlobe, Inc. (Aerospace & Defense) | (a) | 22,445 | $ | 570,327 | ||||||
Raytheon Co. (Aerospace & Defense) | 16,420 | 818,537 | ||||||||
C.H. Robinson Worldwide, Inc. (Air Freight & Logistics) | 5,860 | 462,002 | ||||||||
Ritchie Bros Auctioneers, Inc. (Commercial Svs. & Supplies) | 19,374 | 532,591 | ||||||||
Quanta Services, Inc. (Construction & Engineering) | (a) | 47,874 | 967,055 | |||||||
Rockwell Automation, Inc. (Electrical Equip.) | 5,909 | 512,665 | ||||||||
Roper Industries, Inc. (Electrical Equip.) | 14,712 | 1,225,510 | ||||||||
Kennametal, Inc. (Machinery) | 37,261 | 1,572,787 | ||||||||
Verisk Analytics, Inc. Class A (Professional Svs.) | (a) | 29,988 | 1,038,185 | |||||||
|
| |||||||||
| 7,699,659 | ||||||||||
|
| |||||||||
INFORMATION TECHNOLOGY – 26.7% | ||||||||||
NetApp, Inc. (Computers & Peripherals) | (a) | 20,466 | 1,080,195 | |||||||
Amphenol Corp. Class A (Electronic Equip., Instr. & Comp.) | 25,876 | 1,397,045 | ||||||||
Dolby Laboratories, Inc. Class A (Electronic Equip., Instr. & Comp.) | (a) | 15,356 | 652,016 | |||||||
FLIR Systems, Inc. (Electronic Equip., Instr. & Comp.) | 28,625 | 964,949 | ||||||||
Equinix, Inc. (Internet Software & Svs.) | (a) | 10,361 | 1,046,668 | |||||||
Rackspace Hosting, Inc. (Internet Software & Svs.) | (a) | 8,900 | 380,386 | |||||||
Renren, Inc. – ADR (Internet Software & Svs.) | (a) | 43,944 | 388,904 | |||||||
FleetCor Technologies, Inc. (IT Svs.) | (a) | 9,889 | 293,110 | |||||||
Genpact Ltd. (IT Svs.) | (a) | 45,446 | 783,489 | |||||||
Global Payments, Inc. (IT Svs.) | 36,333 | 1,852,983 | ||||||||
VeriFone Systems, Inc. (IT Svs.) | (a) | 19,837 | 879,771 | |||||||
Western Union Co. / The (IT Svs.) | 44,839 | 898,125 | ||||||||
Altera Corp. (Semiconductors & Equip.) | 18,348 | 850,430 | ||||||||
Linear Technology Corp. (Semiconductors & Equip.) | 18,963 | 626,158 | ||||||||
NVIDIA Corp. (Semiconductors & Equip.) | (a) | 46,047 | 733,759 | |||||||
Xilinx, Inc. (Semiconductors & Equip.) | 47,929 | 1,747,971 | ||||||||
Citrix Systems, Inc. (Software) | (a) | 13,262 | 1,060,960 | |||||||
RealD, Inc. (Software) | (a) | 45,661 | 1,068,011 | |||||||
Salesforce.com, Inc. (Software) | (a) | 7,013 | 1,044,797 | |||||||
SuccessFactors, Inc. (Software) | (a) | 30,847 | 906,902 | |||||||
|
| |||||||||
| 18,656,629 | ||||||||||
|
| |||||||||
MATERIALS – 2.0% | ||||||||||
Ecolab, Inc. (Chemicals) | 12,435 | 701,085 | ||||||||
Nalco Holding Co. (Chemicals) | 25,314 | 703,982 | ||||||||
|
| |||||||||
| 1,405,067 | ||||||||||
|
| |||||||||
TELECOMMUNICATION SERVICES – 5.0% | ||||||||||
tw telecom, Inc. (Diversified Telecom. Svs.) | (a) | 53,477 | 1,097,883 | |||||||
Crown Castle International Corp. (Wireless Telecom. Svs.) | (a) | 19,621 | 800,341 | |||||||
SBA Communications Corp. Class A (Wireless Telecom. Svs.) | (a) | 41,422 | 1,581,906 | |||||||
|
| |||||||||
| 3,480,130 | ||||||||||
|
| |||||||||
Total Common Stocks (Cost $60,289,181) | $ | 69,286,926 | ||||||||
|
| |||||||||
| Money Market Funds – 0.8% | Shares | Value | ||||||||
Fidelity Institutional Money Market Funds | 537,000 | $ | 537,000 | |||||||
|
| |||||||||
Total Money Market Funds (Cost $537,000) | $ | 537,000 | ||||||||
|
| |||||||||
Total Investments – 99.9% (Cost $60,826,181) | (b) | $ | 69,823,926 | |||||||
Other Assets in Excess of Liabilities – 0.1% | 100,143 | |||||||||
|
| |||||||||
Net Assets – 100.0% | $ | 69,924,069 | ||||||||
|
| |||||||||
Percentages are stated as a percent of net assets.
Footnotes:
| (a) | Non-income producing security. |
| (b) | Represents cost for financial reporting purposes, which may differ from cost basis for federal income tax purposes. See also Note 7 of the Notes to Financial Statements. |
The accompanying notes are an integral part of these financial statements.
| 47 |
| Ohio National Fund, Inc. | S&P 500® Index Portfolio |
Objective/Strategy
The S&P 500® Index Portfolio seeks total return that approximates the total return of the Standard & Poor’s 500® Index (S&P 500® Index), at a risk level consistent with that of the Standard & Poor’s 500® Index.
Performance as of June 30, 2011
Average Annual Total Returns: | ||||
One year | 30.02% | |||
Five years | 2.45% | |||
Ten years | 2.15% |
Past performance does not guarantee future results. The performance data quoted represents past performance and current returns may be lower or higher. Total return figures include change in share price and reinvestment of dividends and capital gains. The investment return and principal value will fluctuate so that an investor’s shares, when redeemed, may be worth more or less than the original cost. To obtain performance information up to the most recent month end, call toll-free 1-877-781-6392.
The Portfolio is not open to direct retail investment. Beneficial interest in shares is obtained solely by purchase of variable life insurance policies and variable annuity contracts. Actual performance results for variable annuity and variable universal life contracts will be lower due to contract charges. Consult your contract for applicable charges.
Comments
For the six-month period ended June 30, 2011, the S&P 500® Index Portfolio returned 5.83% versus 6.02% for the current benchmark, the S&P 500® Index.
The Portfolio’s correlation with the S&P 500® Index was 99.9%. The high correlation is due to the fact that the Portfolio invests in each of the 500 stocks in the index. The Portfolio also invests in the SPDR S&P 500 ETF Trust, an exchange traded fund that mimics the holdings and returns of the S&P 500® Index.(1)
The largest contributors to the index return for the six-month period were Exxon Mobil Corp., International Business Machines Corp., Pfizer, Inc., Chevron Corp., and UnitedHealth Group, Inc. The largest detractors for the six-month period were Cisco Systems, Inc., Bank of America Corp., Google, Inc. Class A, The Goldman Sachs Group, Inc., and Citigroup. Inc.(1)
Stocks had a decent first half of 2011, with all major U.S. stock indices posting gains. Most U.S. indices hit a couple of rough patches due to investors’ doubts about the strength of the U.S. financial recovery and the sovereign debt fears in Greece, Portugal, Ireland, Italy, and Spain. QE2 (second quantitative easing) is drawing to an end and there is a debate to enact a QE3 (third quantitative easing). Interest rates should continue to remain at historical lows for the foreseeable future, making risk assets such as equities more attractive. Unemployment, the housing market, and the U.S. debt ceiling/budget will be important themes for the balance of 2011.
| (1) | The Portfolio’s composition is subject to change. Holdings and weightings are as of June 30, 2011. |
“Standard & Poor’s®”, “S&P®”, “S&P 500®” and “Standard & Poor’s 500” are trademarks of The McGraw-Hill Companies, Inc. and have been licensed for use by Ohio National Investments, Inc. (ONI). The S&P 500® Index Portfolio is not sponsored, endorsed, sold or promoted by Standard & Poor’s (“S&P”) and S&P makes no representation regarding the advisability of investing in the S&P 500® Index Portfolio. S&P makes no representation or warranty, express or implied, to the owners of the Portfolio or any member of the public regarding the advisability of investing in securities generally or in the Portfolio particularly or the ability of the S&P 500® Index to track general stock market performance. S&P’s only
relationship to ONI is the licensing of certain trademarks and trade names of S&P® and of the S&P 500® Index which is determined, composed and calculated by S&P® without regard to ONI or the S&P 500® Index Portfolio. S&P® has no obligation to take the needs of ONI or the owners of the Portfolio into consideration in determining, composing or calculating the S&P 500® Index. S&P® is not responsible for and has not participated in the determination of the prices and amount of the Portfolio or the timing of the issuance or sale of the Portfolio or in the determination or calculation of the equation by which the Portfolio is to be converted into cash. S&P® has no obligation or liability in connection with the administration, marketing or trading of the Portfolio.
Change in Value of $10,000 Investment
Hypothetical illustration based on past performance. Future performance will vary. The Portfolio’s returns reflect reinvested dividends. The Portfolio’s holdings may differ significantly from the securities in the index. The index is unmanaged and therefore does not reflect the cost of portfolio management and accounting. Investors cannot invest directly in an index, although they can invest in its underlying securities or funds.
The S&P 500® Index is a capitalization-weighted index designed to measure performance of the broad domestic economy through changes in the aggregate market value of 500 stocks representing all major industries. The index presented herein includes the effects of reinvested dividends.
| 48 | (continued) |
| Ohio National Fund, Inc. | S&P 500® Index Portfolio (Continued) |
Portfolio Composition as of June 30, 2011 (1)
| % of Net Assets | ||||
Common Stocks (3) | 99.1 | |||
Exchange Traded Funds and | 0.9 | |||
|
| |||
| 100.0 | ||||
|
|
Top 10 Portfolio Holdings as of June 30, 2011 (1) (2)
| % of Net Assets | ||||
1. Exxon Mobil Corp. | 3.3 | |||
2. Apple, Inc. | 2.6 | |||
3. International Business Machines Corp. | 1.7 | |||
4. Chevron Corp. | 1.7 | |||
5. General Electric Co. | 1.7 | |||
6. Microsoft Corp. | 1.6 | |||
7. AT&T, Inc. | 1.5 | |||
8. Johnson & Johnson | 1.5 | |||
9. Procter & Gamble Co. / The | 1.5 | |||
10. Pfizer, Inc. | 1.3 |
| (1) | Composition of Portfolio subject to change. |
| (2) | Short-term investments have been excluded from the list of Top 10 Portfolio Holdings. |
| (3) | Sectors: |
| % of Net Assets | ||||
Information Technology | 17.6 | |||
Financials | 15.0 | |||
Energy | 12.6 | |||
Health Care | 11.6 | |||
Industrials | 11.2 | |||
Consumer Staples | 10.5 | |||
Consumer Discretionary | 10.5 | |||
Materials | 3.6 | |||
Utilities | 3.4 | |||
Telecommunication Services | 3.1 | |||
|
| |||
| 99.1 | ||||
|
|
| 49 |
| Ohio National Fund, Inc. | S&P 500® Index Portfolio |
Schedule of Investments | June 30, 2011 (Unaudited) |
| Common Stocks – 99.1% | Shares | Value | ||||||||
CONSUMER DISCRETIONARY – 10.5% | ||||||||||
Goodyear Tire & Rubber Co. / The (Auto Components) | (a) | 3,700 | $ | 62,049 | ||||||
Johnson Controls, Inc. (Auto Components) | 10,200 | 424,932 | ||||||||
Ford Motor Co. (Automobiles) | (a) | 57,387 | 791,367 | |||||||
Harley-Davidson, Inc. (Automobiles) | 3,600 | 147,492 | ||||||||
Genuine Parts Co. (Distributors) | 2,400 | 130,560 | ||||||||
Apollo Group, Inc. Class A (Diversified Consumer Svs.) | (a) | 1,800 | 78,624 | |||||||
DeVry, Inc. (Diversified Consumer Svs.) | 900 | 53,217 | ||||||||
H&R Block, Inc. (Diversified Consumer Svs.) | 4,600 | 73,784 | ||||||||
Carnival Corp. (Hotels, Restaurants & Leisure) | 6,500 | 244,595 | ||||||||
Chipotle Mexican Grill, Inc. (Hotels, Restaurants & Leisure) | (a) | 450 | 138,685 | |||||||
Darden Restaurants, Inc. (Hotels, Restaurants & Leisure) | 2,100 | 104,496 | ||||||||
International Game Technology (Hotels, Restaurants & Leisure) | 4,500 | 79,110 | ||||||||
Marriott International, Inc. Class A (Hotels, Restaurants & Leisure) | 4,246 | 150,691 | ||||||||
McDonald’s Corp. (Hotels, Restaurants & Leisure) | 15,700 | 1,323,824 | ||||||||
Starbucks Corp. (Hotels, Restaurants & Leisure) | 11,300 | 446,237 | ||||||||
Starwood Hotels & Resorts Worldwide, Inc. (Hotels, Restaurants & Leisure) | 2,900 | 162,516 | ||||||||
Wyndham Worldwide Corp. (Hotels, Restaurants & Leisure) | 2,560 | 86,144 | ||||||||
Wynn Resorts Ltd. (Hotels, Restaurants & Leisure) | 1,100 | 157,894 | ||||||||
Yum! Brands, Inc. (Hotels, Restaurants & Leisure) | 7,000 | 386,680 | ||||||||
D.R. Horton, Inc. (Household Durables) | 4,200 | 48,384 | ||||||||
Fortune Brands, Inc. (Household Durables) | 2,300 | 146,671 | ||||||||
Harman International Industries, Inc. (Household Durables) | 1,100 | 50,127 | ||||||||
Leggett & Platt, Inc. (Household Durables) | 2,200 | 53,636 | ||||||||
Lennar Corp. Class A (Household Durables) | 2,400 | 43,560 | ||||||||
Newell Rubbermaid, Inc. (Household Durables) | 4,400 | 69,432 | ||||||||
Pulte Group, Inc. (Household Durables) | (a) | 5,050 | 38,683 | |||||||
Whirlpool Corp. (Household Durables) | 1,155 | 93,925 | ||||||||
Amazon.com, Inc. (Internet & Catalog Retail) | (a) | 5,400 | 1,104,246 | |||||||
Expedia, Inc. (Internet & Catalog Retail) | 3,000 | 86,970 | ||||||||
Netflix, Inc. (Internet & Catalog Retail) | (a) | 650 | 170,748 | |||||||
priceline.com, Inc. (Internet & Catalog Retail) | (a) | 750 | 383,947 | |||||||
Hasbro, Inc. (Leisure Equip. & Products) | 2,100 | 92,253 | ||||||||
Mattel, Inc. (Leisure Equip. & Products) | 5,200 | 142,948 | ||||||||
Cablevision Systems Corp. Class A (Media) | 3,500 | 126,735 | ||||||||
CBS Corp. Class B (Media) | 10,050 | 286,324 | ||||||||
Comcast Corp. Class A (Media) | 41,753 | 1,058,021 | ||||||||
DIRECTV Class A (Media) | (a) | 11,600 | 589,512 | |||||||
Discovery Communications, Inc. Class A (Media) | (a) | 4,200 | 172,032 | |||||||
Gannett Co., Inc. (Media) | 3,600 | 51,552 | ||||||||
Interpublic Group of Cos., Inc. / The (Media) | 7,423 | 92,787 | ||||||||
McGraw-Hill Cos., Inc. / The (Media) | 4,600 | 192,786 | ||||||||
News Corp. Class A (Media) | 34,500 | 610,650 | ||||||||
Omnicom Group, Inc. (Media) | 4,200 | 202,272 | ||||||||
Scripps Networks Interactive, Inc. Class A (Media) | 1,400 | 68,432 | ||||||||
Time Warner Cable, Inc. (Media) | 5,032 | 392,697 | ||||||||
Time Warner, Inc. (Media) | 16,166 | 587,957 | ||||||||
Viacom, Inc. Class B (Media) | 8,850 | 451,350 | ||||||||
Walt Disney Co. / The (Media) | 28,500 | 1,112,640 | ||||||||
Washington Post Co. / The Class B (Media) | 75 | 31,421 | ||||||||
Big Lots, Inc. (Multiline Retail) | (a) | 1,100 | 36,465 | |||||||
Family Dollar Stores, Inc. (Multiline Retail) | 1,800 | 94,608 | ||||||||
J.C. Penney Co., Inc. (Multiline Retail) | 3,200 | 110,528 | ||||||||
Kohl’s Corp. (Multiline Retail) | 4,200 | 210,042 | ||||||||
Macy’s, Inc. (Multiline Retail) | 6,476 | 189,358 | ||||||||
Nordstrom, Inc. (Multiline Retail) | 2,500 | 117,350 | ||||||||
Sears Holdings Corp. (Multiline Retail) | (a) | 601 | 42,935 | |||||||
Target Corp. (Multiline Retail) | 10,400 | 487,864 | ||||||||
Abercrombie & Fitch Co. Class A (Specialty Retail) | 1,300 | 86,996 | ||||||||
AutoNation, Inc. (Specialty Retail) | (a) | 1,000 | 36,610 | |||||||
AutoZone, Inc. (Specialty Retail) | (a) | 400 | 117,940 | |||||||
Bed Bath & Beyond, Inc. (Specialty Retail) | (a) | 3,800 | 221,806 | |||||||
Best Buy Co., Inc. (Specialty Retail) | 4,875 | 153,124 | ||||||||
| Common Stocks (Continued) | Shares | Value | ||||||||
CONSUMER DISCRETIONARY (continued) | ||||||||||
CarMax, Inc. (Specialty Retail) | (a) | 3,400 | $ | 112,438 | ||||||
GameStop Corp. Class A (Specialty Retail) | (a) | 2,100 | 56,007 | |||||||
Gap, Inc. / The (Specialty Retail) | 5,850 | 105,885 | ||||||||
Home Depot, Inc. (Specialty Retail) | 24,000 | 869,280 | ||||||||
Lowe’s Cos., Inc. (Specialty Retail) | 19,700 | 459,207 | ||||||||
Limited Brands, Inc. (Specialty Retail) | 3,800 | 146,110 | ||||||||
O’Reilly Automotive, Inc. (Specialty Retail) | (a) | 2,100 | 137,571 | |||||||
Ross Stores, Inc. (Specialty Retail) | 1,800 | 144,216 | ||||||||
Staples, Inc. (Specialty Retail) | 10,800 | 170,640 | ||||||||
Tiffany & Co. (Specialty Retail) | 1,900 | 149,188 | ||||||||
TJX Cos., Inc. (Specialty Retail) | 5,800 | 304,674 | ||||||||
Urban Outfitters, Inc. (Specialty Retail) | (a) | 1,900 | 53,485 | |||||||
Coach, Inc. (Textiles, Apparel & Luxury Goods) | 4,400 | 281,292 | ||||||||
NIKE, Inc. Class B (Textiles, Apparel & Luxury Goods) | 5,700 | 512,886 | ||||||||
Polo Ralph Lauren Corp. (Textiles, Apparel & Luxury Goods) | 1,000 | 132,610 | ||||||||
V.F. Corp. (Textiles, Apparel & Luxury Goods) | 1,300 | 141,128 | ||||||||
|
| |||||||||
| 19,277,838 | ||||||||||
|
| |||||||||
CONSUMER STAPLES – 10.5% | ||||||||||
Brown-Forman Corp. Class B (Beverages) | 1,550 | 115,769 | ||||||||
Coca-Cola Co. / The (Beverages) | 34,600 | 2,328,234 | ||||||||
Coca-Cola Enterprises, Inc. (Beverages) | 4,900 | 142,982 | ||||||||
Constellation Brands, Inc. Class A (Beverages) | (a) | 2,700 | 56,214 | |||||||
Dr Pepper Snapple Group, Inc. (Beverages) | 3,300 | 138,369 | ||||||||
Molson Coors Brewing Co. Class B (Beverages) | 2,400 | 107,376 | ||||||||
PepsiCo, Inc. (Beverages) | 23,847 | 1,679,544 | ||||||||
Costco Wholesale Corp. (Food & Staples Retailing) | 6,600 | 536,184 | ||||||||
CVS Caremark Corp. (Food & Staples Retailing) | 20,420 | 767,384 | ||||||||
Kroger Co. / The (Food & Staples Retailing) | 9,200 | 228,160 | ||||||||
Safeway, Inc. (Food & Staples Retailing) | 5,300 | 123,861 | ||||||||
SUPERVALU, Inc. (Food & Staples Retailing) | 3,219 | 30,291 | ||||||||
Sysco Corp. (Food & Staples Retailing) | 8,800 | 274,384 | ||||||||
Walgreen Co. (Food & Staples Retailing) | 13,800 | 585,948 | ||||||||
Wal-Mart Stores, Inc. (Food & Staples Retailing) | 28,800 | 1,530,432 | ||||||||
Whole Foods Market, Inc. (Food & Staples Retailing) | 2,300 | 145,935 | ||||||||
Archer-Daniels-Midland Co. (Food Products) | 10,250 | 309,037 | ||||||||
Campbell Soup Co. (Food Products) | 2,800 | 96,740 | ||||||||
ConAgra Foods, Inc. (Food Products) | 6,200 | 160,022 | ||||||||
Dean Foods Co. (Food Products) | (a) | 2,800 | 34,356 | |||||||
General Mills, Inc. (Food Products) | 9,600 | 357,312 | ||||||||
Hershey Co. / The (Food Products) | 2,300 | 130,755 | ||||||||
HJ Heinz Co. (Food Products) | 4,900 | 261,072 | ||||||||
Hormel Foods Corp. (Food Products) | 2,100 | 62,601 | ||||||||
J.M. Smucker Co. / The (Food Products) | 1,800 | 137,592 | ||||||||
Kellogg Co. (Food Products) | 3,800 | 210,216 | ||||||||
Kraft Foods, Inc. Class A (Food Products) | 26,576 | 936,272 | ||||||||
McCormick & Co., Inc. (Food Products) | 2,000 | 99,140 | ||||||||
Mead Johnson Nutrition Co. (Food Products) | 3,051 | 206,095 | ||||||||
Sara Lee Corp. (Food Products) | 8,800 | 167,112 | ||||||||
Tyson Foods, Inc. Class A (Food Products) | 4,500 | 87,390 | ||||||||
Clorox Co. (Household Products) | 2,000 | 134,880 | ||||||||
Colgate-Palmolive Co. (Household Products) | 7,400 | 646,834 | ||||||||
Kimberly-Clark Corp. (Household Products) | 5,900 | 392,704 | ||||||||
Procter & Gamble Co. / The (Household Products) | 42,122 | 2,677,696 | ||||||||
Avon Products, Inc. (Personal Products) | 6,500 | 182,000 | ||||||||
Estee Lauder Cos., Inc. / The Class A (Personal Products) | 1,700 | 178,823 | ||||||||
Altria Group, Inc. (Tobacco) | 31,600 | 834,556 | ||||||||
Lorillard, Inc. (Tobacco) | 2,197 | 239,187 | ||||||||
Philip Morris International, Inc. (Tobacco) | 26,800 | 1,789,436 | ||||||||
Reynolds American, Inc. (Tobacco) | 5,100 | 188,955 | ||||||||
|
| |||||||||
| 19,311,850 | ||||||||||
|
| |||||||||
ENERGY – 12.6% | ||||||||||
Baker Hughes, Inc. (Energy Equip. & Svs.) | 6,541 | 474,615 | ||||||||
Cameron International Corp. (Energy Equip. & Svs.) | (a) | 3,700 | 186,073 | |||||||
Diamond Offshore Drilling, Inc. (Energy Equip. & Svs.) | 1,000 | 70,410 | ||||||||
FMC Technologies, Inc. (Energy Equip. & Svs.) | (a) | 3,600 | 161,244 | |||||||
| 50 | (continued) |
| Ohio National Fund, Inc. | S&P 500® Index Portfolio (Continued) |
Schedule of Investments | June 30, 2011 (Unaudited) |
| Common Stocks (Continued) | Shares | Value | ||||||||
ENERGY (continued) | ||||||||||
Halliburton Co. (Energy Equip. & Svs.) | 13,800 | $ | 703,800 | |||||||
Helmerich & Payne, Inc. (Energy Equip. & Svs.) | 1,600 | 105,792 | ||||||||
Nabors Industries Ltd. (Energy Equip. & Svs.) | (a) | 4,300 | 105,952 | |||||||
National Oilwell Varco, Inc. (Energy Equip. & Svs.) | 6,400 | 500,544 | ||||||||
Noble Corp. (Energy Equip. & Svs.) | 3,800 | 149,758 | ||||||||
Rowan Cos., Inc. (Energy Equip. & Svs.) | (a) | 1,900 | 73,739 | |||||||
Schlumberger Ltd. (Energy Equip. & Svs.) | 20,447 | 1,766,621 | ||||||||
Alpha Natural Resources, Inc. (Oil, Gas & Consumable Fuels) | (a) | 3,440 | 156,314 | |||||||
Anadarko Petroleum Corp. (Oil, Gas & Consumable Fuels) | 7,500 | 575,700 | ||||||||
Apache Corp. (Oil, Gas & Consumable Fuels) | 5,772 | 712,207 | ||||||||
Cabot Oil & Gas Corp. (Oil, Gas & Consumable Fuels) | 1,600 | 106,096 | ||||||||
Chesapeake Energy Corp. (Oil, Gas & Consumable Fuels) | 9,900 | 293,931 | ||||||||
Chevron Corp. (Oil, Gas & Consumable Fuels) | 30,338 | 3,119,960 | ||||||||
ConocoPhillips (Oil, Gas & Consumable Fuels) | 21,300 | 1,601,547 | ||||||||
Consol Energy, Inc. (Oil, Gas & Consumable Fuels) | 3,400 | 164,832 | ||||||||
Denbury Resources, Inc. (Oil, Gas & Consumable Fuels) | (a) | 6,000 | 120,000 | |||||||
Devon Energy Corp. (Oil, Gas & Consumable Fuels) | 6,400 | 504,384 | ||||||||
El Paso Corp. (Oil, Gas & Consumable Fuels) | 11,600 | 234,320 | ||||||||
EOG Resources, Inc. (Oil, Gas & Consumable Fuels) | 4,050 | 423,427 | ||||||||
EQT Corp. (Oil, Gas & Consumable Fuels) | 2,300 | 120,796 | ||||||||
Exxon Mobil Corp. (Oil, Gas & Consumable Fuels) | 74,364 | 6,051,742 | ||||||||
Hess Corp. (Oil, Gas & Consumable Fuels) | 4,600 | 343,896 | ||||||||
Marathon Oil Corp. (Oil, Gas & Consumable Fuels) | 10,720 | 564,730 | ||||||||
Murphy Oil Corp. (Oil, Gas & Consumable Fuels) | 2,900 | 190,414 | ||||||||
Newfield Exploration Co. (Oil, Gas & Consumable Fuels) | (a) | 2,000 | 136,040 | |||||||
Noble Energy, Inc. (Oil, Gas & Consumable Fuels) | 2,700 | 242,001 | ||||||||
Occidental Petroleum Corp. (Oil, Gas & Consumable Fuels) | 12,300 | 1,279,692 | ||||||||
Peabody Energy Corp. (Oil, Gas & Consumable Fuels) | 4,100 | 241,531 | ||||||||
Pioneer Natural Resources Co. (Oil, Gas & Consumable Fuels) | 1,800 | 161,226 | ||||||||
QEP Resources, Inc. (Oil, Gas & Consumable Fuels) | 2,700 | 112,941 | ||||||||
Range Resources Corp. (Oil, Gas & Consumable Fuels) | 2,400 | 133,200 | ||||||||
Southwestern Energy Co. (Oil, Gas & Consumable Fuels) | (a) | 5,300 | 227,264 | |||||||
Spectra Energy Corp. (Oil, Gas & Consumable Fuels) | 9,818 | 269,111 | ||||||||
Sunoco, Inc. (Oil, Gas & Consumable Fuels) | 1,800 | 75,078 | ||||||||
Tesoro Corp. (Oil, Gas & Consumable Fuels) | (a) | 2,200 | 50,402 | |||||||
Valero Energy Corp. (Oil, Gas & Consumable Fuels) | 8,600 | 219,902 | ||||||||
Williams Cos., Inc. / The (Oil, Gas & Consumable Fuels) | 8,900 | 269,225 | ||||||||
|
| |||||||||
| 23,000,457 | ||||||||||
|
| |||||||||
FINANCIALS – 15.0% | ||||||||||
Ameriprise Financial, Inc. (Capital Markets) | 3,680 | 212,262 | ||||||||
Bank of New York Mellon Corp. / The (Capital Markets) | 18,711 | 479,376 | ||||||||
BlackRock, Inc. (Capital Markets) | 1,450 | 278,125 | ||||||||
Charles Schwab Corp. / The (Capital Markets) | 15,100 | 248,395 | ||||||||
E*Trade Financial Corp. (Capital Markets) | (a) | 3,790 | 52,302 | |||||||
Federated Investors, Inc. Class B (Capital Markets) | 1,400 | 33,376 | ||||||||
Franklin Resources, Inc. (Capital Markets) | 2,200 | 288,838 | ||||||||
Goldman Sachs Group, Inc. / The (Capital Markets) | 7,850 | 1,044,757 | ||||||||
Invesco Ltd. (Capital Markets) | 7,000 | 163,800 | ||||||||
Janus Capital Group, Inc. (Capital Markets) | 2,800 | 26,432 | ||||||||
Legg Mason, Inc. (Capital Markets) | 2,200 | 72,072 | ||||||||
Morgan Stanley (Capital Markets) | 23,300 | 536,133 | ||||||||
Northern Trust Corp. (Capital Markets) | 3,700 | 170,052 | ||||||||
State Street Corp. (Capital Markets) | 7,600 | 342,684 | ||||||||
T. Rowe Price Group, Inc. (Capital Markets) | 3,900 | 235,326 | ||||||||
BB&T Corp. (Commercial Banks) | 10,500 | 281,820 | ||||||||
Comerica, Inc. (Commercial Banks) | 2,700 | 93,339 | ||||||||
Fifth Third Bancorp (Commercial Banks) | 13,850 | 176,588 | ||||||||
First Horizon National Corp. (Commercial Banks) | 3,964 | 37,817 | ||||||||
| Common Stocks (Continued) | Shares | Value | ||||||||
FINANCIALS (continued) | ||||||||||
Huntington Bancshares, Inc. (Commercial Banks) | 13,000 | $ | 85,280 | |||||||
KeyCorp (Commercial Banks) | 14,400 | 119,952 | ||||||||
M&T Bank Corp. (Commercial Banks) | 1,900 | 167,105 | ||||||||
Marshall & Ilsley Corp. (Commercial Banks) | 8,000 | 63,760 | ||||||||
PNC Financial Services Group, Inc. (Commercial Banks) | 7,942 | 473,423 | ||||||||
Regions Financial Corp. (Commercial Banks) | 18,975 | 117,645 | ||||||||
SunTrust Banks, Inc. (Commercial Banks) | 8,100 | 208,980 | ||||||||
U.S. Bancorp (Commercial Banks) | 29,090 | 742,086 | ||||||||
Wells Fargo & Co. (Commercial Banks) | 79,813 | 2,239,553 | ||||||||
Zions Bancorporation (Commercial Banks) | 2,800 | 67,228 | ||||||||
American Express Co. (Consumer Finance) | 15,800 | 816,860 | ||||||||
Capital One Financial Corp. (Consumer Finance) | 6,973 | 360,295 | ||||||||
Discover Financial Services (Consumer Finance) | 8,250 | 220,688 | ||||||||
SLM Corp. (Consumer Finance) | 8,000 | 134,480 | ||||||||
Bank of America Corp. (Diversified Financial Svs.) | 152,927 | 1,676,080 | ||||||||
Citigroup, Inc. (Diversified Financial Svs.) | 44,136 | 1,837,823 | ||||||||
CME Group, Inc. (Diversified Financial Svs.) | 1,025 | 298,880 | ||||||||
IntercontinentalExchange, Inc. (Diversified Financial Svs.) | (a) | 1,100 | 137,181 | |||||||
JPMorgan Chase & Co. (Diversified Financial Svs.) | 59,943 | 2,454,066 | ||||||||
Leucadia National Corp. (Diversified Financial Svs.) | 3,000 | 102,300 | ||||||||
Moody’s Corp. (Diversified Financial Svs.) | 3,000 | 115,050 | ||||||||
NASDAQ OMX Group, Inc. / The (Diversified Financial Svs.) | (a) | 2,300 | 58,190 | |||||||
NYSE Euronext (Diversified Financial Svs.) | 4,000 | 137,080 | ||||||||
ACE Ltd. (Insurance) | 5,100 | 335,682 | ||||||||
Aflac, Inc. (Insurance) | 7,100 | 331,428 | ||||||||
Allstate Corp. / The (Insurance) | 7,900 | 241,187 | ||||||||
American International Group, Inc. (Insurance) | (a) | 6,595 | 193,365 | |||||||
AON Corp. (Insurance) | 5,000 | 256,500 | ||||||||
Assurant, Inc. (Insurance) | 1,500 | 54,405 | ||||||||
Berkshire Hathaway, Inc. Class B (Insurance) | (a) | 26,091 | 2,019,182 | |||||||
Chubb Corp. (Insurance) | 4,400 | 275,484 | ||||||||
Cincinnati Financial Corp. (Insurance) | 2,466 | 71,958 | ||||||||
Genworth Financial, Inc. Class A (Insurance) | (a) | 7,400 | 76,072 | |||||||
Hartford Financial Services Group, Inc. (Insurance) | 6,700 | 176,679 | ||||||||
Lincoln National Corp. (Insurance) | 4,686 | 133,504 | ||||||||
Loews Corp. (Insurance) | 4,661 | 196,181 | ||||||||
Marsh & McLennan Cos., Inc. (Insurance) | 8,300 | 258,877 | ||||||||
MetLife, Inc. (Insurance) | 16,000 | 701,920 | ||||||||
Principal Financial Group, Inc. (Insurance) | 4,900 | 149,058 | ||||||||
Progressive Corp. / The (Insurance) | 9,900 | 211,662 | ||||||||
Prudential Financial, Inc. (Insurance) | 7,400 | 470,566 | ||||||||
Torchmark Corp. (Insurance) | 1,100 | 70,554 | ||||||||
Travelers Cos., Inc. / The (Insurance) | 6,359 | 371,238 | ||||||||
Unum Group (Insurance) | 4,600 | 117,208 | ||||||||
XL Group Plc (Insurance) | 4,700 | 103,306 | ||||||||
Apartment Investment & Management Co. Class A (Real Estate Investment Trusts) | 1,773 | 45,265 | ||||||||
AvalonBay Communities, Inc. (Real Estate Investment Trusts) | 1,331 | 170,900 | ||||||||
Boston Properties, Inc. (Real Estate Investment Trusts) | 2,200 | 233,552 | ||||||||
Equity Residential (Real Estate Investment Trusts) | 4,400 | 264,000 | ||||||||
HCP, Inc. (Real Estate Investment Trusts) | 6,100 | 223,809 | ||||||||
Health Care REIT, Inc. (Real Estate Investment Trusts) | 2,700 | 141,561 | ||||||||
Host Hotels & Resorts, Inc. (Real Estate Investment Trusts) | 10,402 | 176,314 | ||||||||
Kimco Realty Corp. (Real Estate Investment Trusts) | 6,100 | 113,704 | ||||||||
Plum Creek Timber Co., Inc. (Real Estate Investment Trusts) | 2,400 | 97,296 | ||||||||
ProLogis, Inc. (Real Estate Investment Trusts) | 6,839 | 245,110 | ||||||||
Public Storage (Real Estate Investment Trusts) | 2,100 | 239,421 | ||||||||
Simon Property Group, Inc. (Real Estate Investment Trusts) | 4,462 | 518,618 | ||||||||
Ventas, Inc. (Real Estate Investment Trusts) | 2,500 | 131,775 | ||||||||
Vornado Realty Trust (Real Estate Investment Trusts) | 2,493 | 232,298 | ||||||||
Weyerhaeuser Co. (Real Estate Investment Trusts) | 8,163 | 178,443 | ||||||||
| 51 | (continued) |
| Ohio National Fund, Inc. | S&P 500® Index Portfolio (Continued) |
Schedule of Investments | June 30, 2011 (Unaudited) |
| Common Stocks (Continued) | Shares | Value | ||||||||
FINANCIALS (continued) | ||||||||||
CB Richard Ellis Group, Inc. Class A (Real Estate Mgmt. & Development) | (a) | 4,400 | $ | 110,484 | ||||||
Hudson City Bancorp, Inc. (Thrifts & Mortgage Finance) | 8,000 | 65,520 | ||||||||
People’s United Financial, Inc. (Thrifts & Mortgage Finance) | 5,400 | 72,576 | ||||||||
|
| |||||||||
| 27,484,141 | ||||||||||
|
| |||||||||
HEALTH CARE – 11.6% | ||||||||||
Amgen, Inc. (Biotechnology) | (a) | 14,006 | 817,250 | |||||||
Biogen Idec, Inc. (Biotechnology) | (a) | 3,645 | 389,723 | |||||||
Celgene Corp. (Biotechnology) | (a) | 7,000 | 422,240 | |||||||
Cephalon, Inc. (Biotechnology) | (a) | 1,200 | 95,880 | |||||||
Gilead Sciences, Inc. (Biotechnology) | (a) | 11,900 | 492,779 | |||||||
Baxter International, Inc. (Health Care Equip. & Supplies) | 8,600 | 513,334 | ||||||||
Becton Dickinson and Co. (Health Care Equip. & Supplies) | 3,300 | 284,361 | ||||||||
Boston Scientific Corp. (Health Care Equip. & Supplies) | (a) | 23,103 | 159,642 | |||||||
CareFusion Corp. (Health Care Equip. & Supplies) | (a) | 3,350 | 91,020 | |||||||
Covidien PLC (Health Care Equip. & Supplies) | 7,500 | 399,225 | ||||||||
C.R. Bard, Inc. (Health Care Equip. & Supplies) | 1,300 | 142,818 | ||||||||
DENTSPLY International, Inc. (Health Care Equip. & Supplies) | 2,100 | 79,968 | ||||||||
Edwards Lifesciences Corp. (Health Care Equip. & Supplies) | (a) | 1,700 | 148,206 | |||||||
Intuitive Surgical, Inc. (Health Care Equip. & Supplies) | (a) | 600 | 223,266 | |||||||
Medtronic, Inc. (Health Care Equip. & Supplies) | 16,100 | 620,333 | ||||||||
St. Jude Medical, Inc. (Health Care Equip. & Supplies) | 5,000 | 238,400 | ||||||||
Stryker Corp. (Health Care Equip. & Supplies) | 5,000 | 293,450 | ||||||||
Varian Medical Systems, Inc. (Health Care Equip. & Supplies) | (a) | 1,800 | 126,036 | |||||||
Zimmer Holdings, Inc. (Health Care Equip. & Supplies) | (a) | 2,870 | 181,384 | |||||||
Aetna, Inc. (Health Care Providers & Svs.) | 5,700 | 251,313 | ||||||||
AmerisourceBergen Corp. (Health Care Providers & Svs.) | 4,100 | 169,740 | ||||||||
Cardinal Health, Inc. (Health Care Providers & Svs.) | 5,300 | 240,726 | ||||||||
CIGNA Corp. (Health Care Providers & Svs.) | 4,100 | 210,863 | ||||||||
Coventry Health Care, Inc. (Health Care Providers & Svs.) | (a) | 2,200 | 80,234 | |||||||
DaVita, Inc. (Health Care Providers & Svs.) | (a) | 1,400 | 121,254 | |||||||
Express Scripts, Inc. (Health Care Providers & Svs.) | (a) | 8,000 | 431,840 | |||||||
Humana, Inc. (Health Care Providers & Svs.) | 2,500 | 201,350 | ||||||||
Laboratory Corp of America Holdings (Health Care Providers & Svs.) | (a) | 1,500 | 145,185 | |||||||
McKesson Corp. (Health Care Providers & Svs.) | 3,800 | 317,870 | ||||||||
Medco Health Solutions, Inc. (Health Care Providers & Svs.) | (a) | 6,076 | 343,416 | |||||||
Patterson Cos., Inc. (Health Care Providers & Svs.) | 1,400 | 46,046 | ||||||||
Quest Diagnostics, Inc. (Health Care Providers & Svs.) | 2,400 | 141,840 | ||||||||
Tenet Healthcare Corp. (Health Care Providers & Svs.) | (a) | 7,350 | 45,864 | �� | ||||||
UnitedHealth Group, Inc. (Health Care Providers & Svs.) | 16,400 | 845,912 | ||||||||
WellPoint, Inc. (Health Care Providers & Svs.) | 5,500 | 433,235 | ||||||||
Cerner Corp. (Health Care Technology) | (a) | 2,200 | 134,442 | |||||||
Agilent Technologies, Inc. (Life Sciences Tools & Svs.) | (a) | 5,300 | 270,883 | |||||||
Life Technologies Corp. (Life Sciences Tools & Svs.) | (a) | 2,717 | 141,474 | |||||||
PerkinElmer, Inc. (Life Sciences Tools & Svs.) | 1,700 | 45,747 | ||||||||
Thermo Fisher Scientific, Inc. (Life Sciences Tools & Svs.) | (a) | 5,800 | 373,462 | |||||||
Waters Corp. (Life Sciences Tools & Svs.) | (a) | 1,400 | 134,036 | |||||||
Abbott Laboratories (Pharmaceuticals) | 23,500 | 1,236,570 | ||||||||
Allergan, Inc. (Pharmaceuticals) | 4,600 | 382,950 | ||||||||
Bristol-Myers Squibb Co. (Pharmaceuticals) | 25,769 | 746,270 | ||||||||
Eli Lilly & Co. (Pharmaceuticals) | 15,400 | 577,962 | ||||||||
Forest Laboratories, Inc. (Pharmaceuticals) | (a) | 4,300 | 169,162 | |||||||
Hospira, Inc. (Pharmaceuticals) | (a) | 2,510 | 142,217 | |||||||
Johnson & Johnson (Pharmaceuticals) | 41,400 | $ | 2,753,928 | |||||||
| Common Stocks (Continued) | Shares | Value | ||||||||
HEALTH CARE (continued) | ||||||||||
Merck & Co., Inc. (Pharmaceuticals) | 46,594 | $ | 1,644,302 | |||||||
Mylan, Inc. (Pharmaceuticals) | (a) | 6,600 | 162,822 | |||||||
Pfizer, Inc. (Pharmaceuticals) | 119,310 | 2,457,786 | ||||||||
Watson Pharmaceuticals, Inc. (Pharmaceuticals) | (a) | 1,900 | 130,587 | |||||||
|
| |||||||||
| 21,250,603 | ||||||||||
|
| |||||||||
INDUSTRIALS – 11.2% | ||||||||||
Boeing Co. / The (Aerospace & Defense) | 11,100 | 820,623 | ||||||||
General Dynamics Corp. (Aerospace & Defense) | 5,600 | 417,312 | ||||||||
Goodrich Corp. (Aerospace & Defense) | 1,900 | 181,450 | ||||||||
Honeywell International, Inc. (Aerospace & Defense) | 11,900 | 709,121 | ||||||||
ITT Corp. (Aerospace & Defense) | 2,800 | 165,004 | ||||||||
L-3 Communications Holdings, Inc. (Aerospace & Defense) | 1,600 | 139,920 | ||||||||
Lockheed Martin Corp. (Aerospace & Defense) | 4,300 | 348,171 | ||||||||
Northrop Grumman Corp. (Aerospace & Defense) | 4,400 | 305,140 | ||||||||
Precision Castparts Corp. (Aerospace & Defense) | 2,200 | 362,230 | ||||||||
Raytheon Co. (Aerospace & Defense) | 5,400 | 269,190 | ||||||||
Rockwell Collins, Inc. (Aerospace & Defense) | 2,300 | 141,887 | ||||||||
Textron, Inc. (Aerospace & Defense) | 4,200 | 99,162 | ||||||||
United Technologies Corp. (Aerospace & Defense) | 13,800 | 1,221,438 | ||||||||
C.H. Robinson Worldwide, Inc. (Air Freight & Logistics) | 2,500 | 197,100 | ||||||||
Expeditors International of Washington, Inc. (Air Freight & Logistics) | 3,200 | 163,808 | ||||||||
FedEx Corp. (Air Freight & Logistics) | 4,800 | 455,280 | ||||||||
United Parcel Service, Inc. Class B (Air Freight & Logistics) | 14,900 | 1,086,657 | ||||||||
Southwest Airlines Co. (Airlines) | 12,000 | 137,040 | ||||||||
Masco Corp. (Building Products) | 5,400 | 64,962 | ||||||||
Avery Dennison Corp. (Commercial Svs. & Supplies) | 1,600 | 61,808 | ||||||||
Cintas Corp. (Commercial Svs. & Supplies) | 1,900 | 62,757 | ||||||||
Iron Mountain, Inc. (Commercial Svs. & Supplies) | 3,000 | 102,270 | ||||||||
Pitney Bowes, Inc. (Commercial Svs. & Supplies) | 3,100 | 71,269 | ||||||||
Republic Services, Inc. (Commercial Svs. & Supplies) | 4,580 | 141,293 | ||||||||
R.R. Donnelley & Sons Co. (Commercial Svs. & Supplies) | 2,800 | 54,908 | ||||||||
Stericycle, Inc. (Commercial Svs. & Supplies) | (a) | 1,300 | 115,856 | |||||||
Waste Management, Inc. (Commercial Svs. & Supplies) | 7,200 | 268,344 | ||||||||
Fluor Corp. (Construction & Engineering) | 2,600 | 168,116 | ||||||||
Jacobs Engineering Group, Inc. (Construction & Engineering) | (a) | 1,900 | 82,175 | |||||||
Quanta Services, Inc. (Construction & Engineering) | (a) | 3,300 | 66,660 | |||||||
Emerson Electric Co. (Electrical Equip.) | 11,300 | 635,625 | ||||||||
Rockwell Automation, Inc. (Electrical Equip.) | 2,200 | 190,872 | ||||||||
Roper Industries, Inc. (Electrical Equip.) | 1,400 | 116,620 | ||||||||
3M Co. (Industrial Conglomerates) | 10,700 | 1,014,895 | ||||||||
General Electric Co. (Industrial Conglomerates) | 160,100 | 3,019,486 | ||||||||
Tyco International Ltd. (Industrial Conglomerates) | 7,100 | 350,953 | ||||||||
Caterpillar, Inc. (Machinery) | 9,700 | 1,032,662 | ||||||||
Cummins, Inc. (Machinery) | 3,000 | 310,470 | ||||||||
Danaher Corp. (Machinery) | 8,200 | 434,518 | ||||||||
Deere & Co. (Machinery) | 6,300 | 519,435 | ||||||||
Dover Corp. (Machinery) | 2,800 | 189,840 | ||||||||
Eaton Corp. (Machinery) | 5,200 | 267,540 | ||||||||
Flowserve Corp. (Machinery) | 800 | 87,912 | ||||||||
Illinois Tool Works, Inc. (Machinery) | 7,500 | 423,675 | ||||||||
Ingersoll-Rand PLC (Machinery) | 5,000 | 227,050 | ||||||||
Joy Global, Inc. (Machinery) | 1,600 | 152,384 | ||||||||
PACCAR, Inc. (Machinery) | 5,512 | 281,608 | ||||||||
Pall Corp. (Machinery) | 1,800 | 101,214 | ||||||||
Parker Hannifin Corp. (Machinery) | 2,400 | 215,376 | ||||||||
Snap-On, Inc. (Machinery) | 900 | 56,232 | ||||||||
Stanley Black & Decker, Inc. (Machinery) | 2,547 | 183,511 | ||||||||
Dun & Bradstreet Corp. (Professional Svs.) | 700 | 52,878 | ||||||||
Equifax, Inc. (Professional Svs.) | 1,900 | 65,968 | ||||||||
Robert Half International, Inc. (Professional Svs.) | 2,200 | 59,466 | ||||||||
CSX Corp. (Road & Rail) | 16,600 | 435,252 | ||||||||
Norfolk Southern Corp. (Road & Rail) | 5,300 | 397,129 | ||||||||
Ryder System, Inc. (Road & Rail) | 800 | 45,480 | ||||||||
| 52 | (continued) |
| Ohio National Fund, Inc. | S&P 500® Index Portfolio (Continued) |
Schedule of Investments | June 30, 2011 (Unaudited) |
| Common Stocks (Continued) | Shares | Value | ||||||||
INDUSTRIALS (continued) | ||||||||||
Union Pacific Corp. (Road & Rail) | 7,400 | $ | 772,560 | |||||||
Fastenal Co. (Trading Companies & Distributors) | 4,500 | 161,955 | ||||||||
W.W. Grainger, Inc. (Trading Companies & Distributors) | 900 | 138,285 | ||||||||
|
| |||||||||
| 20,421,802 | ||||||||||
|
| |||||||||
INFORMATION TECHNOLOGY – 17.6% | ||||||||||
Cisco Systems, Inc. (Communications Equip.) | 83,000 | 1,295,630 | ||||||||
F5 Networks, Inc. (Communications Equip.) | (a) | 1,200 | 132,300 | |||||||
Harris Corp. (Communications Equip.) | 1,900 | 85,614 | ||||||||
JDS Uniphase Corp. (Communications Equip.) | (a) | 3,475 | 57,894 | |||||||
Juniper Networks, Inc. (Communications Equip.) | (a) | 8,000 | 252,000 | |||||||
Motorola Mobility Holdings, Inc. (Communications Equip.) | (a) | 4,475 | 98,629 | |||||||
Motorola Solutions, Inc. (Communications Equip.) | (a) | 5,114 | 235,449 | |||||||
Qualcomm, Inc. (Communications Equip.) | 25,200 | 1,431,108 | ||||||||
Tellabs, Inc. (Communications Equip.) | 5,500 | 25,355 | ||||||||
Apple, Inc. (Computers & Peripherals) | (a) | 13,950 | 4,682,597 | |||||||
Dell, Inc. (Computers & Peripherals) | (a) | 24,800 | 413,416 | |||||||
EMC Corp. (Computers & Peripherals) | (a) | 31,100 | 856,805 | |||||||
Hewlett-Packard Co. (Computers & Peripherals) | 31,300 | 1,139,320 | ||||||||
Lexmark International, Inc. Class A (Computers & Peripherals) | (a) | 1,200 | 35,112 | |||||||
NetApp, Inc. (Computers & Peripherals) | (a) | 5,600 | 295,568 | |||||||
SanDisk Corp. (Computers & Peripherals) | (a) | 3,600 | 149,400 | |||||||
Western Digital Corp. (Computers & Peripherals) | (a) | 3,500 | 127,330 | |||||||
Amphenol Corp. Class A (Electronic Equip., Instr. & Comp.) | 2,700 | 145,773 | ||||||||
Corning, Inc. (Electronic Equip., Instr. & Comp.) | 23,700 | 430,155 | ||||||||
FLIR Systems, Inc. (Electronic Equip., Instr. & Comp.) | 2,400 | 80,904 | ||||||||
Jabil Circuit, Inc. (Electronic Equip., Instr. & Comp.) | 3,000 | 60,600 | ||||||||
Molex, Inc. (Electronic Equip., Instr. & Comp.) | 2,100 | 54,117 | ||||||||
Akamai Technologies, Inc. (Internet Software & Svs.) | (a) | 2,800 | 88,116 | |||||||
eBay, Inc. (Internet Software & Svs.) | (a) | 17,200 | 555,044 | |||||||
Google, Inc. Class A (Internet Software & Svs.) | (a) | 3,800 | 1,924,244 | |||||||
Monster Worldwide, Inc. (Internet Software & Svs.) | (a) | 2,000 | 29,320 | |||||||
VeriSign, Inc. (Internet Software & Svs.) | 2,500 | 83,650 | ||||||||
Yahoo!, Inc. (Internet Software & Svs.) | (a) | 19,700 | 296,288 | |||||||
Automatic Data Processing, Inc. (IT Svs.) | 7,500 | 395,100 | ||||||||
Cognizant Technology Solutions Corp. Class A (IT Svs.) | (a) | 4,600 | 337,364 | |||||||
Computer Sciences Corp. (IT Svs.) | 2,300 | 87,308 | ||||||||
Fidelity National Information Services, Inc. (IT Svs.) | 4,100 | 126,239 | ||||||||
Fiserv, Inc. (IT Svs.) | (a) | 2,200 | 137,786 | |||||||
International Business Machines Corp. (IT Svs.) | 18,300 | 3,139,365 | ||||||||
Mastercard, Inc. Class A (IT Svs.) | 1,425 | 429,410 | ||||||||
Paychex, Inc. (IT Svs.) | 4,900 | 150,528 | ||||||||
SAIC, Inc. (IT Svs.) | (a) | 4,200 | 70,644 | |||||||
Teradata Corp. (IT Svs.) | (a) | 2,500 | 150,500 | |||||||
Total System Services, Inc. (IT Svs.) | 2,477 | 46,023 | ||||||||
Visa, Inc. (IT Svs.) | 7,200 | 606,672 | ||||||||
Western Union Co. / The (IT Svs.) | 9,547 | 191,226 | ||||||||
Xerox Corp. (Office Electronics) | 21,202 | 220,713 | ||||||||
Advanced Micro Devices, Inc. (Semiconductors & Equip.) | (a) | 8,700 | 60,813 | |||||||
Altera Corp. (Semiconductors & Equip.) | 4,900 | 227,115 | ||||||||
Analog Devices, Inc. (Semiconductors & Equip.) | 4,500 | 176,130 | ||||||||
Applied Materials, Inc. (Semiconductors & Equip.) | 19,900 | 258,899 | ||||||||
Broadcom Corp. Class A (Semiconductors & Equip.) | (a) | 7,250 | 243,890 | |||||||
First Solar, Inc. (Semiconductors & Equip.) | (a) | 850 | 112,430 | |||||||
Intel Corp. (Semiconductors & Equip.) | 80,000 | 1,772,800 | ||||||||
KLA-Tencor Corp. (Semiconductors & Equip.) | 2,500 | 101,200 | ||||||||
Linear Technology Corp. (Semiconductors & Equip.) | 3,400 | 112,268 | ||||||||
LSI Corp. (Semiconductors & Equip.) | (a) | 9,100 | 64,792 | |||||||
MEMC Electronic Materials, Inc. (Semiconductors & Equip.) | (a) | 3,500 | 29,855 | |||||||
Microchip Technology, Inc. (Semiconductors & Equip.) | 2,900 | 109,939 | ||||||||
Micron Technology, Inc. (Semiconductors & Equip.) | (a) | 13,000 | 97,240 | |||||||
National Semiconductor Corp. (Semiconductors & Equip.) | 3,600 | 88,596 | ||||||||
| Common Stocks (Continued) | Shares | Value | ||||||||
INFORMATION TECHNOLOGY (continued) | ||||||||||
Novellus Systems, Inc. (Semiconductors & Equip.) | (a) | 1,300 | $ | 46,982 | ||||||
NVIDIA Corp. (Semiconductors & Equip.) | (a) | 9,100 | 145,009 | |||||||
Teradyne, Inc. (Semiconductors & Equip.) | (a) | 2,800 | 41,440 | |||||||
Texas Instruments, Inc. (Semiconductors & Equip.) | 17,500 | 574,525 | ||||||||
Xilinx, Inc. (Semiconductors & Equip.) | 4,000 | 145,880 | ||||||||
Adobe Systems, Inc. (Software) | (a) | 7,600 | 239,020 | |||||||
Autodesk, Inc. (Software) | (a) | 3,500 | 135,100 | |||||||
BMC Software, Inc. (Software) | (a) | 2,700 | 147,690 | |||||||
CA, Inc. (Software) | 5,700 | 130,188 | ||||||||
Citrix Systems, Inc. (Software) | (a) | 2,800 | 224,000 | |||||||
Compuware Corp. (Software) | (a) | 3,300 | 32,208 | |||||||
Electronic Arts, Inc. (Software) | (a) | 5,000 | 118,000 | |||||||
Intuit, Inc. (Software) | (a) | 4,100 | 212,626 | |||||||
Microsoft Corp. (Software) | 112,000 | 2,912,000 | ||||||||
Oracle Corp. (Software) | 58,800 | 1,935,108 | ||||||||
Red Hat, Inc. (Software) | (a) | 2,900 | 133,110 | |||||||
Salesforce.com, Inc. (Software) | (a) | 1,800 | 268,164 | |||||||
Symantec Corp. (Software) | (a) | 11,394 | 224,690 | |||||||
|
| |||||||||
| 32,272,323 | ||||||||||
|
| |||||||||
MATERIALS – 3.6% | ||||||||||
Air Products & Chemicals, Inc. (Chemicals) | 3,200 | 305,856 | ||||||||
Airgas, Inc. (Chemicals) | 1,100 | 77,044 | ||||||||
CF Industries Holdings, Inc. (Chemicals) | 1,100 | 155,837 | ||||||||
Dow Chemical Co. / The (Chemicals) | 17,700 | 637,200 | ||||||||
Eastman Chemical Co. (Chemicals) | 1,100 | 112,277 | ||||||||
Ecolab, Inc. (Chemicals) | 3,500 | 197,330 | ||||||||
E.I. du Pont de Nemours & Co. (Chemicals) | 14,000 | 756,700 | ||||||||
FMC Corp. (Chemicals) | 1,100 | 94,622 | ||||||||
International Flavors & Fragrances, Inc. (Chemicals) | 1,200 | 77,088 | ||||||||
Monsanto Co. (Chemicals) | 8,086 | 586,558 | ||||||||
PPG Industries, Inc. (Chemicals) | 2,400 | 217,896 | ||||||||
Praxair, Inc. (Chemicals) | 4,600 | 498,594 | ||||||||
Sherwin-Williams Co. / The (Chemicals) | 1,300 | 109,031 | ||||||||
Sigma-Aldrich Corp. (Chemicals) | 1,800 | 132,084 | ||||||||
Vulcan Materials Co. (Construction Materials) | 1,900 | 73,207 | ||||||||
Ball Corp. (Containers & Packaging) | 2,500 | 96,150 | ||||||||
Bemis Co., Inc. (Containers & Packaging) | 1,600 | 54,048 | ||||||||
Owens-Illinois, Inc. (Containers & Packaging) | (a) | 2,500 | 64,525 | |||||||
Sealed Air Corp. (Containers & Packaging) | 2,400 | 57,096 | ||||||||
AK Steel Holding Corp. (Metals & Mining) | 1,700 | 26,792 | ||||||||
Alcoa, Inc. (Metals & Mining) | 16,100 | 255,346 | ||||||||
Allegheny Technologies, Inc. (Metals & Mining) | 1,600 | 101,552 | ||||||||
Cliffs Natural Resources, Inc. (Metals & Mining) | 2,200 | 203,390 | ||||||||
Freeport-McMoRan Copper & Gold, Inc. (Metals & Mining) | 14,252 | 753,931 | ||||||||
Newmont Mining Corp. (Metals & Mining) | 7,500 | 404,775 | ||||||||
Nucor Corp. (Metals & Mining) | 4,800 | 197,856 | ||||||||
Titanium Metals Corp. (Metals & Mining) | 1,400 | 25,648 | ||||||||
United States Steel Corp. (Metals & Mining) | 2,200 | 101,288 | ||||||||
International Paper Co. (Paper & Forest Products) | 6,600 | 196,812 | ||||||||
MeadWestvaco Corp. (Paper & Forest Products) | 2,600 | 86,606 | ||||||||
|
| |||||||||
| 6,657,139 | ||||||||||
|
| |||||||||
TELECOMMUNICATION SERVICES – 3.1% | ||||||||||
AT&T, Inc. (Diversified Telecom. Svs.) | 89,378 | 2,807,363 | ||||||||
CenturyLink, Inc. (Diversified Telecom. Svs.) | 9,072 | 366,781 | ||||||||
Frontier Communications Corp. (Diversified Telecom. Svs.) | 15,041 | 121,381 | ||||||||
Verizon Communications, Inc. (Diversified Telecom. Svs.) | 42,700 | 1,589,721 | ||||||||
Windstream Corp. (Diversified Telecom. Svs.) | 7,696 | 99,740 | ||||||||
American Tower Corp. Class A (Wireless Telecom. Svs.) | (a) | 6,000 | 313,980 | |||||||
MetroPCS Communications, Inc. (Wireless Telecom. Svs.) | (a) | 4,000 | 68,840 | |||||||
Sprint Nextel Corp. (Wireless Telecom. Svs.) | (a) | 45,132 | 243,261 | |||||||
|
| |||||||||
| 5,611,067 | ||||||||||
|
| |||||||||
| 53 | (continued) |
| Ohio National Fund, Inc. | S&P 500® Index Portfolio (Continued) |
Schedule of Investments | June 30, 2011 (Unaudited) |
| Common Stocks (Continued) | Shares | Value | ||||||||
UTILITIES – 3.4% | ||||||||||
American Electric Power Co., Inc. (Electric Utilities) | 7,300 | $ | 275,064 | |||||||
Duke Energy Corp. (Electric Utilities) | 20,136 | 379,161 | ||||||||
Edison International (Electric Utilities) | 4,900 | 189,875 | ||||||||
Entergy Corp. (Electric Utilities) | 2,700 | 184,356 | ||||||||
Exelon Corp. (Electric Utilities) | 10,000 | 428,400 | ||||||||
FirstEnergy Corp. (Electric Utilities) | 6,334 | 279,646 | ||||||||
NextEra Energy, Inc. (Electric Utilities) | 6,400 | 367,744 | ||||||||
Northeast Utilities (Electric Utilities) | 2,700 | 94,959 | ||||||||
Pepco Holdings, Inc. (Electric Utilities) | 3,400 | 66,742 | ||||||||
Pinnacle West Capital Corp. (Electric Utilities) | 1,600 | 71,328 | ||||||||
PPL Corp. (Electric Utilities) | 8,700 | 242,121 | ||||||||
Progress Energy, Inc. (Electric Utilities) | 4,400 | 211,244 | ||||||||
Southern Co. (Electric Utilities) | 12,800 | 516,864 | ||||||||
Nicor, Inc. (Gas Utilities) | 700 | 38,318 | ||||||||
Oneok, Inc. (Gas Utilities) | 1,600 | 118,416 | ||||||||
AES Corp. / The (Ind. Power Prod. & Energy Traders) | (a) | 9,900 | 126,126 | |||||||
Constellation Energy Group, Inc. (Ind. Power Prod. & Energy Traders) | 3,000 | 113,880 | ||||||||
NRG Energy, Inc. (Ind. Power Prod. & Energy Traders) | (a) | 3,600 | 88,488 | |||||||
Ameren Corp. (Multi-Utilities) | 3,600 | 103,824 | ||||||||
CenterPoint Energy, Inc. (Multi-Utilities) | 6,400 | 123,840 | ||||||||
CMS Energy Corp. (Multi-Utilities) | 3,800 | 74,822 | ||||||||
Consolidated Edison, Inc. (Multi-Utilities) | 4,400 | 234,256 | ||||||||
Dominion Resources, Inc. (Multi-Utilities) | 8,700 | 419,949 | ||||||||
| Common Stocks (Continued) | Shares | Value | ||||||||
UTILITIES (continued) | ||||||||||
DTE Energy Co. (Multi-Utilities) | 2,600 | $ | 130,052 | |||||||
Integrys Energy Group, Inc. (Multi-Utilities) | 1,212 | 62,830 | ||||||||
NiSource, Inc. (Multi-Utilities) | 4,200 | 85,050 | ||||||||
PG&E Corp. (Multi-Utilities) | 6,000 | 252,180 | ||||||||
Public Service Enterprise Group, Inc. (Multi-Utilities) | 7,600 | 248,064 | ||||||||
SCANA Corp. (Multi-Utilities) | 1,700 | 66,929 | ||||||||
Sempra Energy (Multi-Utilities) | 3,600 | 190,368 | ||||||||
TECO Energy, Inc. (Multi-Utilities) | 3,200 | 60,448 | ||||||||
Wisconsin Energy Corp. (Multi-Utilities) | 3,500 | 109,725 | ||||||||
Xcel Energy, Inc. (Multi-Utilities) | 7,300 | 177,390 | ||||||||
|
| |||||||||
| 6,132,459 | ||||||||||
|
| |||||||||
Total Common Stocks (Cost $148,589,950) | $ | 181,419,679 | ||||||||
|
| |||||||||
| Exchange Traded Funds - 0.8% | Shares | Value | ||||||||
SPDR S&P 500 ETF Trust | 10,675 | $ | 1,408,780 | |||||||
|
| |||||||||
Total Exchange Traded Funds (Cost $1,376,438) | $ | 1,408,780 | ||||||||
|
| |||||||||
Total Investments – 99.9% (Cost $149,966,388) | (b) | $ | 182,828,459 | |||||||
Other Assets in Excess of Liabilities – 0.1% | 156,228 | |||||||||
|
| |||||||||
Net Assets – 100.0% | $ | 182,984,687 | ||||||||
|
| |||||||||
Percentages are stated as a percent of net assets.
Footnotes:
| (a) | Non-income producing security. |
| (b) | Represents cost for financial reporting purposes, which may differ from cost basis for federal income tax purposes. See also Note 7 of the Notes to Financial Statements. |
The accompanying notes are an integral part of these financial statements.
| 54 |
| Ohio National Fund, Inc. | Strategic Value Portfolio |
Objective/Strategy
The Strategic Value Portfolio seeks growth of capital and income by investing primarily in securities of high dividend yielding, undervalued stocks with dividend growth potential.
Performance as of June 30, 2011
Average Annual Total Returns: | ||||
One year | 29.18% | |||
Five years | 0.43% | |||
Ten years | 1.45% |
Past performance does not guarantee future results. The performance data quoted represents past performance and current returns may be lower or higher. Total return figures include change in share price and reinvestment of dividends and capital gains. The investment return and principal value will fluctuate so that an investor’s shares, when redeemed, may be worth more or less than the original cost. To obtain performance information up to the most recent month end, call toll-free 1-877-781-6392.
The Portfolio is not open to direct retail investment. Beneficial interest in shares is obtained solely by purchase of variable life insurance policies and variable annuity contracts. Actual performance results for variable annuity and variable universal life contracts will be lower due to contract charges. Consult your contract for applicable charges.
Comments
For the six-month period ended June 30, 2011, the Strategic Value Portfolio returned 8.55% versus 8.39% for the current benchmark, the Dow Jones U.S. Select Dividend Index.
Despite all of the recent volatility in the markets, the Portfolio marched toward its annual targeted return of 10%. The outperformance of the Portfolio in relation to its benchmark was a function of the Portfolio’s ability to keep pace with the early year rally catalyzed by the Federal Reserve, as well as to offer downside protection during a difficult month of June.
Market preferences in the first six months of the year moved against low-yielding, high beta, low quality stocks and thus, the Portfolio benefited from its high yield, low beta, high quality holdings. On a sector basis, the Portfolio’s sizeable exposure to Consumer Staples and Health Care proved to be beneficial, as did its absence in the non-dividend-friendly Industrials sector. Tobacco stocks saw tremendous performance within Consumer Staples with Lorillard, Inc. up 36% and Reynolds American, Inc. up 17%. Global pharmaceutical companies were also in favor in the first half of the year as investors sought security in these defensive stocks. Stock selection was a notable factor in performance as GlaxoSmithKline PLC, AstraZeneca PLC, and Bristol-Myers Squibb Co. returned 13.8%, 13.8%, and 13.4%, respectively. Another tailwind to performance was the Portfolio’s underweight position in the declining Financials sector. Global debt concerns and issues with the mortgage market have taken their toll on the sector, which was down 6.9% year-to-date. Conversely, the Portfolio was slightly penalized for its absence within the Materials sector, which was up 12.6% year-to-date. It is important to note, however, that this highly cyclical sector has recently slowed, posting only a 0.5% return over the past three months.(1)
The best performers were Lorillard, Inc., CenterPoint Energy, Inc., National Grid PLC, Reynolds American, Inc., and Philip Morris International, Inc. The worst performers were New York Community Bancorp, Inc., Mercury General Corp., CenturyLink, Inc., National
Retail Properties, Inc., and Cincinnati Financial Corp. The largest detractors to performance were New York Community Bancorp, Inc., CenturyLink, Inc., Mercury General Corp., Cincinnati Financial Corp., and Windstream Corp. The largest contributors to performance were Lorillard, Inc., GlaxoSmithKline PLC, Bristol-Myers Squibb Co., National Grid PLC, and AT&T, Inc.(1)
The Portfolio is objective-driven, focused on identifying those stocks that offer attractive valuations, high current income, and dividend growth potential. The Portfolio seeks to invest in strong, reliable, cash-flow generative companies that have both the ability and the inclination to pay and increase their dividends. We believe that these companies will achieve superior total returns over the long-run due to their strong balance sheets, solid business models, and their ability to generate cash flow regardless of market conditions. These superior returns should come from large current dividends and dividend growth. We believe that price appreciation will follow hand-in-hand with dividend growth.
A priority of the Portfolio is to be diversified across the dividend-paying universe. As a result, the Portfolio has a notable investment in sectors such as Consumer Staples, Health Care, Telecommunication Services, and Utilities. Conversely, sectors with companies that traditionally pay little to no dividends and sectors with companies whose dividend payments are dependent on market cyclicality receive modest investment, if any. These sectors include Industrials, Information Technology, and Materials.(1)
The Portfolio uses the Dow Jones U.S. Select Dividend Index (DJSD Index) as its primary benchmark. The DSJD Index is an index that takes the 100 highest yielding U.S. companies that have paid dividends for the past five years and have a non-negative five-year dividend growth rate. At the end of June, the DJSD Index had a yield of 3.92%, which is notably below the 4.95% yield of the Portfolio. Comparing the sector allocations between the Portfolio and the index, several distinct variances can be identified. The Portfolio invests little to none in the cyclically-exposed Industrials and Materials sectors, but the DJSD Index has a sizeable weight in those sectors. Also, the Portfolio invests a sizeable portion in Utilities, but it pales in comparison to the index’s 33.8% weighting in the sector. Despite the differences in yield and sector weights, the DJSD Index is the closest benchmark comparison to the Portfolio’s unique strategy.(1)
The overall market affords little dividend opportunity for investors. The S&P 500 Index held a 1.99% yield at the end of June, meaning that when people invest in the broad market, they must pay a price that is 50 times the income that is generated from the investment. We view this as illogical and impractical and will continue to invest in low beta, high quality, high yield stocks. We believe that large cash returns from dividends, combined with attractively low valuations and dividend growth, will produce superior returns while involving less risk.
| (1) | The Portfolio’s composition is subject to change. Holdings and weightings are as of June 30, 2011. |
| 55 | (continued) |
| Ohio National Fund, Inc. | Strategic Value Portfolio (Continued) |
Change in Value of $10,000 Investment
Hypothetical illustration based on past performance. Future performance will vary. The Portfolio’s returns reflect reinvested dividends. The Portfolio’s holdings may differ significantly from the securities in the index. The index is unmanaged and therefore does not reflect the cost of portfolio management and accounting.
The Dow Jones U.S. Select Dividend Index is comprised of all dividend-paying companies in the Dow Jones U.S. Index that have a non-negative historical five-year dividend-per-share growth rate, a five-year average dividend to earnings-per-share ratio of less than or equal to 60%, and a three-month average daily trading volume of 200,000 shares. Current index components are included in the universe regardless of their dividend payout ratio. The Dow Jones U.S. Index aims to consistently represent the top 95% of U.S. companies based on float-adjusted market capitalization, excluding the very smallest and least-liquid stocks. The index presented includes the effects of reinvested dividends.
Portfolio Composition as of June 30, 2011 (1)
| % of Net Assets | ||||
Common Stocks (3) | 98.4 | |||
Money Market Funds and | 1.6 | |||
|
| |||
| 100.0 | ||||
|
|
Top 10 Portfolio Holdings as of June 30, 2011 (1) (2)
| % of Net Assets | ||||
1. AT&T, Inc. | 3.9 | |||
2. Abbott Laboratories | 3.9 | |||
3. Telefonica S.A. | 3.7 | |||
4. Royal Dutch Shell PLC | 3.6 | |||
5. Bristol-Myers Squibb Co. | 3.6 | |||
6. Kimberly-Clark Corp. | 3.5 | |||
7. Eli Lilly & Co. | 3.5 | |||
8. National Grid PLC | 3.4 | |||
9. GlaxoSmithKline PLC | 3.4 | |||
10. AstraZeneca PLC | 3.4 |
| (1) | Composition of Portfolio subject to change. |
| (2) | Short-term investments have been excluded from the list of Top 10 Portfolio Holdings. |
| (3) | Sectors: |
| % of Net Assets | ||||
Consumer Staples | 23.0 | |||
Health Care | 21.1 | |||
Telecommunication Services | 20.9 | |||
Utilities | 16.9 | |||
Energy | 10.1 | |||
Financials | 4.4 | |||
Consumer Discretionary | 2.0 | |||
|
| |||
| 98.4 | ||||
|
|
| 56 |
| Ohio National Fund, Inc. | Strategic Value Portfolio |
Schedule of Investments | June 30, 2011 (Unaudited) |
| Common Stocks – 98.4% | Shares | Value | ||||||||
CONSUMER DISCRETIONARY – 2.0% | ||||||||||
McDonald’s Corp. (Hotels, Restaurants & Leisure) | 6,825 | $ | 575,484 | |||||||
|
| |||||||||
CONSUMER STAPLES – 23.0% | ||||||||||
Coca-Cola Co. / The (Beverages) | 4,115 | 276,898 | ||||||||
H.J. Heinz Co. (Food Products) | 13,175 | 701,964 | ||||||||
Kellogg Co. (Food Products) | 4,900 | 271,068 | ||||||||
Unilever PLC (Food Products) | (a) | 25,710 | 829,563 | |||||||
Clorox Co. (Household Products) | 5,100 | 343,944 | ||||||||
Kimberly-Clark Corp. (Household Products) | 15,075 | 1,003,392 | ||||||||
Procter & Gamble Co. / The (Household Products) | 7,260 | 461,518 | ||||||||
Altria Group, Inc. (Tobacco) | 32,320 | 853,571 | ||||||||
Lorillard, Inc. (Tobacco) | 5,400 | 587,898 | ||||||||
Philip Morris International, Inc. (Tobacco) | 10,735 | 716,776 | ||||||||
Reynolds American, Inc. (Tobacco) | 16,020 | 593,541 | ||||||||
|
| |||||||||
| 6,640,133 | ||||||||||
|
| |||||||||
ENERGY – 10.1% | ||||||||||
Chevron Corp. (Oil, Gas & Consumable Fuels) | 2,650 | 272,526 | ||||||||
ConocoPhillips (Oil, Gas & Consumable Fuels) | 10,105 | 759,795 | ||||||||
Royal Dutch Shell PLC (Oil, Gas & Consumable Fuels) | (a) | 29,420 | 1,049,884 | |||||||
Total S.A. (Oil, Gas & Consumable Fuels) | (a) | 14,420 | 833,675 | |||||||
|
| |||||||||
| 2,915,880 | ||||||||||
|
| |||||||||
FINANCIALS – 4.4% | ||||||||||
Cincinnati Financial Corp. (Insurance) | 10,000 | 291,800 | ||||||||
CommonWealth REIT (Real Estate Investment Trusts) | 9,000 | 232,560 | ||||||||
Senior Housing Properties Trust (Real Estate Investment Trusts) | 12,300 | 287,943 | ||||||||
New York Community Bancorp, Inc. (Thrifts & Mortgage Finance) | 30,400 | 455,696 | ||||||||
|
| |||||||||
| 1,267,999 | ||||||||||
|
| |||||||||
HEALTH CARE – 21.1% | ||||||||||
Abbott Laboratories (Pharmaceuticals) | 21,250 | 1,118,175 | ||||||||
AstraZeneca PLC (Pharmaceuticals) | (a) | 19,600 | 979,636 | |||||||
Bristol-Myers Squibb Co. (Pharmaceuticals) | 35,775 | 1,036,044 | ||||||||
Eli Lilly & Co. (Pharmaceuticals) | 26,700 | 1,002,051 | ||||||||
| Common Stocks (Continued) | Shares | Value | ||||||||
HEALTH CARE (continued) | ||||||||||
GlaxoSmithKline PLC (Pharmaceuticals) | (a) | 46,316 | $ | 992,752 | ||||||
Johnson & Johnson (Pharmaceuticals) | 14,260 | 948,575 | ||||||||
|
| |||||||||
| 6,077,233 | ||||||||||
|
| |||||||||
TELECOMMUNICATION SERVICES – 20.9% | ||||||||||
AT&T, Inc. (Diversified Telecom. Svs.) | 35,900 | 1,127,619 | ||||||||
BCE, Inc. (Diversified Telecom. Svs.) | 21,280 | 834,475 | ||||||||
CenturyLink, Inc. (Diversified Telecom. Svs.) | 19,625 | 793,439 | ||||||||
Telefonica S.A. (Diversified Telecom. Svs.) | (a) | 43,464 | 1,061,560 | |||||||
Verizon Communications, Inc. (Diversified Telecom. Svs.) | 24,620 | 916,603 | ||||||||
Windstream Corp. (Diversified Telecom. Svs.) | 43,105 | 558,641 | ||||||||
Vodafone Group PLC – ADR (Wireless Telecom. Svs.) | 27,570 | 736,670 | ||||||||
|
| |||||||||
| 6,029,007 | ||||||||||
|
| |||||||||
UTILITIES – 16.9% | ||||||||||
Duke Energy Corp. (Electric Utilities) | 49,920 | 939,994 | ||||||||
Pepco Holdings, Inc. (Electric Utilities) | 21,200 | 416,156 | ||||||||
PPL Corp. (Electric Utilities) | 28,400 | 790,372 | ||||||||
Southern Co. (Electric Utilities) | 20,960 | 846,365 | ||||||||
Consolidated Edison, Inc. (Multi-Utilities) | 6,000 | 319,440 | ||||||||
Dominion Resources, Inc. (Multi-Utilities) | 5,025 | 242,557 | ||||||||
National Grid PLC (Multi-Utilities) | (a) | 100,900 | 993,283 | |||||||
SCANA Corp. (Multi-Utilities) | 7,875 | 310,039 | ||||||||
|
| |||||||||
| 4,858,206 | ||||||||||
|
| |||||||||
Total Common Stocks (Cost $25,081,191) | $ | 28,363,942 | ||||||||
|
| |||||||||
| Money Market Funds – 1.3% | Shares | Value | ||||||||
Fidelity Institutional Money Market Funds | 363,000 | $ | 363,000 | |||||||
|
| |||||||||
Total Money Market Funds (Cost $363,000) | $ | 363,000 | ||||||||
|
| |||||||||
Total Investments – 99.7% (Cost $25,444,191) | (b) | $ | 28,726,942 | |||||||
Other Assets in Excess of Liabilities – 0.3% | 95,655 | |||||||||
|
| |||||||||
Net Assets – 100.0% | $ | 28,822,597 | ||||||||
|
| |||||||||
Percentages are stated as a percent of net assets.
Abbreviations:
ADR: American Depositary Receipts
Footnotes:
| (a) | Security traded on a foreign exchange has been valued at an estimate of fair value that is different than the local market close price. These fair value estimates are determined by an independent fair valuation service that has been approved by the Board. These securities represent $6,740,353, or 23.4% of the Portfolio’s net assets. |
Other Portfolio securities are not subjected to fair value procedures because they are traded on domestic or foreign exchanges that have close times that are consistent with the U.S. market close, normally 4:00 pm Eastern Time.
| (b) | Represents cost for financial reporting purposes, which may differ from cost basis for federal income tax purposes. See also Note 7 of the Notes to Financial Statements. |
The accompanying notes are an integral part of these financial statements.
| 57 |
| Ohio National Fund, Inc. | High Income Bond Portfolio |
Objective/Strategy
The High Income Bond Portfolio seeks high current income by investing at least 80% of its net assets in lower rated corporate debt obligations commonly referred to as “junk bonds”. The Portfolio’s investments are generally rated Ba or lower by Moody’s, or BB or lower by Standard & Poor’s or Fitch.
Performance as of June 30, 2011
Average Annual Total Returns: | ||||
One year | 14.13% | |||
Five years | 8.12% | |||
Ten years | 8.41% |
Past performance does not guarantee future results. The performance data quoted represents past performance and current returns may be lower or higher. Total return figures include change in share price and reinvestment of dividends and capital gains. The investment return and principal value will fluctuate so that an investor’s shares, when redeemed, may be worth more or less than the original cost. To obtain performance information up to the most recent month end, call toll-free 1-877-781-6392.
The Portfolio is not open to direct retail investment. Beneficial interest in shares is obtained solely by purchase of variable life insurance policies and variable annuity contracts. Actual performance results for variable annuity and variable universal life contracts will be lower due to contract charges. Consult your contract for applicable charges.
Comments
For the six-month period ended June 30, 2011, the High Income Bond Portfolio returned 4.31% versus 4.98% for the current benchmark, the Barclays Capital High Yield 2% Issuer Constrained Index (“BCHY2%ICI”).
The high yield market started 2011 on a strong note as the combination of moderated economic growth and strong corporate earnings pushed high yield bond prices higher. However, a combination of factors caused considerable uncertainty in financial markets through the later stages of the semi-annual period, tempering the market gains. These factors included political unrest in the Middle East and North Africa that caused a surge in oil prices, a devastating earthquake/tsunami in Japan that caused massive worldwide supply chain disruptions, lingering Eurozone debt issues highlighted by Greek austerity negotiations, as well as debt ceiling/budget reduction discussions in the U.S. These events called into question the resiliency of the U.S. economic expansion and its ability to rebound. Throughout the six-month period, corporate credit conditions remained strong and high yield default rates continued to be well below historical averages. The yield spread between the Credit Suisse High Yield Bond Index and U.S. Treasury securities with comparable maturities decreased early in the period to slightly inside of 500 basis points (bp), then increased to its high for the year at approximately 600 bp in mid-June before settling in at 569 bp on June 30, 2011.
Within the high yield market, the strongest performing major industries relative to the BCHY2%ICI were electric utilities, natural gas utilities, technology, wireless telecommunications and financial institutions. Under-performing major industries included industrial-other, transportation, home construction, building material and packaging. From a quality perspective, the lowest quality CCC-rated sector of the BCHY2%ICI led the way, returning 5.73%, followed by the highest quality BB-rated sector, which returned 5.07%, followed by the B-rated sector which returned 4.53%.
The Portfolio was negatively impacted relative to the BCHY2%ICI by security selection in the natural gas utility, chemicals, financial
institution, retail, and technology sectors. Overweights in the under-performing industrial-other and media non-cable negatively impacted performance, although much of this was offset by strong security selection in these sectors. The Portfolio was also negatively impacted by an underweight in the strong-performing electric utility sector. Specific high yield issuers held by the Portfolio that substantially under-performed the BCHY2%ICI included: CHC Helicopter S.A., Gymboree Corp., Lender Processing Service, Inc., West Corp., and Reynolds Group Issuer, Inc./Reynolds Group Issuer LLC.(1)
The Portfolio was positively impacted relative to the BCHY2%ICI by strong security selection in the food & beverage and packaging sectors. The Portfolio also benefited by an underweight in the home construction sector and an overweight in Information Technology. Specific high yield issuers held by the Portfolio that substantially outperformed the BCHY2%ICI included: Macy’s Retail Holdings, Inc., Dynegy Holdings, Inc., Sitel LLC Corp., Universal City Development, and Diversey Inc.(1)
While the second quarter was characterized by considerable uncertainty, it ended with a flourish as equities surged and high yield bond spreads tightened from their widest levels. The rally was triggered by indications that the second quarter’s economic concerns represented a soft patch and not a double dip. Yield spreads for high yield bonds are above historical medians and credit quality by many measures continues to very strong, setting the stage for good relative performance should the economy cooperate.
| (1) | The Portfolio’s composition is subject to change. Holdings and weightings are as of June 30, 2011. |
Change in Value of $10,000 Investment
Hypothetical illustration based on past performance. Future performance will vary. All returns reflect reinvested dividends. The Portfolio’s holdings may differ significantly from the securities in the index. The index is unmanaged and therefore does not reflect the cost of Portfolio management or trading. Neither the Portfolio nor the index is open to direct investment.
The Barclays Capital High Yield 2% Issuer Constrained Index is the 2% Issuer Cap component of the Barclays Capital U.S. Corporate High Yield Bond Index. The Barclays Capital U.S. Corporate High Yield Bond Index is an unmanaged index that includes all fixed income securities having a maximum quality rating of Ba1, a minimum amount outstanding of $150 million, and a least 1 year to maturity. The 2% Issuer Cap component limits an issuer to 2% of the aggregate market capitalization. The index is presented on a total return basis.
| 58 | (continued) |
| Ohio National Fund, Inc. | High Income Bond Portfolio (Continued) |
Portfolio Composition as of June 30, 2011 (1)
| % of Net Assets | ||||
Corporate Bonds (3) | 96.3 | |||
Convertible Bonds (3) | 0.1 | |||
Common Stocks (3) | 0.1 | |||
Preferred Stocks (3) | 0.1 | |||
Warrants (3) | 0.1 | |||
Money Market Funds and | 3.3 | |||
|
| |||
| 100.0 | ||||
|
|
Top 10 Portfolio Holdings as of June 30, 2011 (1) (2)
| % of Net Assets | ||||
1. CIT Group, Inc. | 1.9 | |||
2. HCA, Inc. | 1.6 | |||
3. Ford Motor Credit Co. LLC | 1.2 | |||
4. Sprint Capital Corp. | 1.2 | |||
5. Ally Financial, Inc. | 0.9 | |||
6. Biomet, Inc. | 0.9 | |||
7. International Lease Finance Corp. | 0.9 | |||
8. Intelsat Jackson Holdings, S.A. | 0.7 | |||
9. Nuveen Investments, Inc. | 0.7 | |||
10. VWR Funding, Inc. | 0.7 |
| (1) | Composition of Portfolio subject to change. |
| (2) | Short-term investments have been excluded from the list of Top 10 Portfolio Holdings. |
| (3) | Sectors (combined): |
| % of Net Assets | ||||
Consumer Discretionary | 30.0 | |||
Industrials | 13.0 | |||
Health Care | 9.0 | |||
Information Technology | 8.9 | |||
Energy | 8.4 | |||
Materials | 8.2 | |||
Financials | 8.0 | |||
Telecommunication Services | 4.7 | |||
Consumer Staples | 4.1 | |||
Utilities | 2.4 | |||
|
| |||
| 96.7 | ||||
|
|
| 59 |
| Ohio National Fund, Inc. | High Income Bond Portfolio |
Schedule of Investments | June 30, 2011 (Unaudited) |
| Corporate Bonds – 96.3% | Rate | Maturity | Face Amount | Value | ||||||||||||
CONSUMER DISCRETIONARY – 29.8% | ||||||||||||||||
Allison Transmission, Inc. (Auto Components) | (b) | 7.125% | 05/15/2019 | $ | 450,000 | $ | 439,875 | |||||||||
American Axle & Manufacturing Holdings, Inc. (Auto Components) | (b) | 9.250% | 01/15/2017 | 720,000 | 788,400 | |||||||||||
American Tire Distributors, Inc. (Auto Components) | 9.750% | 06/01/2017 | 650,000 | 702,000 | ||||||||||||
Cooper-Standard Automotive, Inc. (Auto Components) | 8.500% | 05/01/2018 | 775,000 | 821,500 | ||||||||||||
Dana Holding Corp. (Auto Components) | 6.750% | 02/15/2021 | 100,000 | 99,125 | ||||||||||||
Dana Holding Corp. (Auto Components) | 6.500% | 02/15/2019 | 100,000 | 99,500 | ||||||||||||
Exide Technologies (Auto Components) | (b) | 8.625% | 02/01/2018 | 1,050,000 | 1,097,250 | |||||||||||
International Automotive Components Group SL (Acquired 05/26/2011, Cost $950,000) (Auto Components) | (b)(h) | 9.125% | 06/01/2018 | 950,000 | 976,125 | |||||||||||
Lear Corp. (Auto Components) | 8.125% | 03/15/2020 | 75,000 | 81,187 | ||||||||||||
Lear Corp. (Auto Components) | 7.875% | 03/15/2018 | 475,000 | 513,000 | ||||||||||||
Pittsburgh Glass Works LLC (Auto Components) | (b) | 8.500% | 04/15/2016 | 425,000 | 438,812 | |||||||||||
Stoneridge, Inc. (Auto Components) | (b) | 9.500% | 10/15/2017 | 725,000 | 804,750 | |||||||||||
Tenneco, Inc. (Auto Components) | 7.750% | 08/15/2018 | 325,000 | 342,062 | ||||||||||||
Tenneco, Inc. (Auto Components) | 6.875% | 12/15/2020 | 450,000 | 460,125 | ||||||||||||
Tower Automotive Holdings USA LLC / TA Holdings Finance, Inc. (Auto Components) | (b) | 10.625% | 09/01/2017 | 450,000 | 487,125 | |||||||||||
UCI International, Inc. (Auto Components) | 8.625% | 02/15/2019 | 1,125,000 | 1,164,375 | ||||||||||||
Chrysler Group LLC / CG Co-Issuer, Inc. (Automobiles) | (b) | 8.250% | 06/15/2021 | 1,050,000 | 1,034,250 | |||||||||||
Chrysler Group LLC / CG Co-Issuer, Inc. (Automobiles) | (b) | 8.000% | 06/15/2019 | 525,000 | 518,437 | |||||||||||
General Motors Corp. (Acquired 04/22/2011, Cost $0)(Automobiles) | (f)(g)(h) | 0.000% | 09/01/2025 | 1,100,000 | 33,000 | |||||||||||
Jaguar Land Rover PLC (Automobiles) | (b) | 8.125% | 05/15/2021 | 100,000 | 101,250 | |||||||||||
Jaguar Land Rover PLC (Automobiles) | (b) | 7.750% | 05/15/2018 | 100,000 | 101,000 | |||||||||||
Affinia Group, Inc. (Acquired 11/16/2009 through 02/01/2010, Cost $510,941) (Distributors) | (b)(h) | 10.750% | 08/15/2016 | 475,000 | 532,000 | |||||||||||
Affinia Group, Inc. (Distributors) | 9.000% | 11/30/2014 | 450,000 | 459,000 | ||||||||||||
McJunkin Red Man Corp. (Acquired 07/09/2010, Cost $267,152) (Distributors) | (b)(h) | 9.500% | 12/15/2016 | 275,000 | 281,187 | |||||||||||
Knowledge Learning Corp. (Diversified Consumer Svs.) | (b) | 7.750% | 02/01/2015 | 1,150,000 | 1,134,187 | |||||||||||
American Casino & Entertainment Properties LLC (Hotels, Restaurants & Leisure) | 11.000% | 06/15/2014 | 641,000 | 673,050 | ||||||||||||
Ameristar Casinos, Inc. (Hotels, Restaurants & Leisure) | (b) | 7.500% | 04/15/2021 | 550,000 | 569,937 | |||||||||||
Caesars Entertainment Operating Co., Inc. (Hotels, Restaurants & Leisure) | 11.250% | 06/01/2017 | 1,450,000 | 1,607,687 | ||||||||||||
Cedar Fair LP / Canada’s Wonderland Co. / Magnum Management Corp. (Hotels, Restaurants & Leisure) | 9.125% | 08/01/2018 | 1,000,000 | 1,072,500 | ||||||||||||
DineEquity, Inc. (Hotels, Restaurants & Leisure) | (b) | 9.500% | 10/30/2018 | 1,400,000 | 1,526,000 | |||||||||||
Dunkin Finance Corp. (Hotels, Restaurants & Leisure) | (b) | 9.625% | 12/01/2018 | 884,000 | 896,146 | |||||||||||
Great Canadian Gaming Corp. (Acquired 02/07/2007 through 12/14/2010, Cost $1,322,779) (Hotels, Restaurants & Leisure) | (b)(h) | 7.250% | 02/15/2015 | 1,325,000 | 1,361,437 | |||||||||||
Jacobs Entertainment, Inc. (Hotels, Restaurants & Leisure) | 9.750% | 06/15/2014 | 1,100,000 | 1,122,000 | ||||||||||||
MGM Resorts International (Hotels, Restaurants & Leisure) | 7.500% | 06/01/2016 | 1,900,000 | 1,814,500 | ||||||||||||
MGM Resorts International (Hotels, Restaurants & Leisure) | 11.125% | 11/15/2017 | 425,000 | 487,687 | ||||||||||||
MGM Resorts International (Hotels, Restaurants & Leisure) | 10.375% | 05/15/2014 | 50,000 | 57,000 | ||||||||||||
MGM Resorts International (Hotels, Restaurants & Leisure) | 11.375% | 03/01/2018 | 175,000 | 197,312 | ||||||||||||
NPC International, Inc. (Hotels, Restaurants & Leisure) | 9.500% | 05/01/2014 | 1,225,000 | 1,249,500 | ||||||||||||
Peninsula Gaming LLC / Peninsula Gaming Corp. (Hotels, Restaurants & Leisure) | 10.750% | 08/15/2017 | 575,000 | 631,062 | ||||||||||||
Peninsula Gaming LLC / Peninsula Gaming Corp. (Hotels, Restaurants & Leisure) | 8.375% | 08/15/2015 | 600,000 | 633,000 | ||||||||||||
Peninsula Gaming LLC / Peninsula Gaming Corp. (Hotels, Restaurants & Leisure) | (b) | 8.375% | 08/15/2015 | 125,000 | 131,875 | |||||||||||
Penn National Gaming, Inc. (Hotels, Restaurants & Leisure) | 6.750% | 03/01/2015 | 425,000 | 436,687 | ||||||||||||
Penn National Gaming, Inc. (Hotels, Restaurants & Leisure) | 8.750% | 08/15/2019 | 225,000 | 245,812 | ||||||||||||
San Pasqual Casino (Hotels, Restaurants & Leisure) | (b) | 8.000% | 09/15/2013 | 350,000 | 348,250 | |||||||||||
Seminole Hard Rock Entertainment, Inc. (Acquired 02/27/2007 through 10/19/2010, Cost $957,907) (Hotels, Restaurants & Leisure) | (b)(e)(h) | 2.747% | 03/15/2014 | 1,075,000 | 1,010,500 | |||||||||||
The Seminole Tribe of Florida, Inc. (Hotels, Restaurants & Leisure) | (b) | 7.804% | 10/01/2020 | 825,000 | 811,635 | |||||||||||
The Seminole Tribe of Florida, Inc. (Hotels, Restaurants & Leisure) | (b) | 7.750% | 10/01/2017 | 150,000 | 156,000 | |||||||||||
Sugarhouse HSP Gaming Prop Mezz LP / Sugarhouse HSP Gaming Finance Corp. (Acquired 04/12/2011 through 06/17/2011, Cost $847,234) (Hotels, Restaurants & Leisure) | (b)(h) | 8.625% | 04/15/2016 | 825,000 | 853,875 | |||||||||||
Universal City Development Partners Ltd. / UCDP Finance, Inc. (Hotels, Restaurants & Leisure) | 8.875% | 11/15/2015 | 800,000 | 894,000 | ||||||||||||
Universal City Development Partners Ltd. / UCDP Finance, Inc. (Hotels, Restaurants & Leisure) | 10.875% | 11/15/2016 | 600,000 | 717,000 | ||||||||||||
Wynn Las Vegas LLC / Wynn Las Vegas Capital Corp. (Hotels, Restaurants & Leisure) | 7.875% | 11/01/2017 | 325,000 | 355,469 | ||||||||||||
Wynn Las Vegas LLC / Wynn Las Vegas Capital Corp. (Hotels, Restaurants & Leisure) | 7.750% | 08/15/2020 | 375,000 | 409,219 | ||||||||||||
Hillman Group, Inc. (Household Durables) | 10.875% | 06/01/2018 | 675,000 | 731,531 | ||||||||||||
Hillman Group, Inc. (Household Durables) | (b) | 10.875% | 06/01/2018 | 225,000 | 243,844 | |||||||||||
Jarden Corp. (Household Durables) | 7.500% | 05/01/2017 | 725,000 | 756,719 | ||||||||||||
Jarden Corp. (Household Durables) | 8.000% | 05/01/2016 | 225,000 | 245,250 | ||||||||||||
Libbey Glass, Inc. (Household Durables) | 10.000% | 02/15/2015 | 719,000 | 783,710 | ||||||||||||
Norcraft Cos. LP / Norcraft Finance Corp. (Household Durables) | 10.500% | 12/15/2015 | 1,150,000 | 1,173,000 | ||||||||||||
Norcraft Cos. LP / Norcraft Finance Corp. (Household Durables) | (b) | 10.500% | 12/15/2015 | 225,000 | 229,500 | |||||||||||
Sealy Mattress Co. (Household Durables) | 8.250% | 06/15/2014 | 1,575,000 | 1,586,812 | ||||||||||||
Sealy Mattress Co. (Household Durables) | (b) | 10.875% | 04/15/2016 | 315,000 | 351,225 | |||||||||||
Simmons Bedding Co. (Acquired 02/02/2010 through 07/13/2010, Cost $1,272,665) (Household Durables) | (b)(h) | 11.250% | 07/15/2015 | 1,200,000 | 1,266,000 | |||||||||||
CDW Escrow Corp. (Internet & Catalog Retail) | (b) | 8.500% | 04/01/2019 | 1,850,000 | 1,822,250 | |||||||||||
CDW LLC / CDW Finance Corp. (Internet & Catalog Retail) | 12.535% | 10/12/2017 | 250,000 | 270,625 | ||||||||||||
Easton-Bell Sports, Inc. (Leisure Equip. & Products) | 9.750% | 12/01/2016 | 750,000 | 830,625 | ||||||||||||
AMC Networks, Inc. (Media) | (b) | 7.750% | 07/15/2021 | 275,000 | 288,062 | |||||||||||
CCH II LLC / CCH II Capital Corp. (Media) | 13.500% | 11/30/2016 | 225,000 | 266,062 | ||||||||||||
| 60 | (continued) |
| Ohio National Fund, Inc. | High Income Bond Portfolio (Continued) |
Schedule of Investments | June 30, 2011 (Unaudited) |
| Corporate Bonds (Continued) | Rate | Maturity | Face Amount | Value | ||||||||||||
CONSUMER DISCRETIONARY (continued) | ||||||||||||||||
CCO Holdings, LLC / CCO Holdings Capital Corp. (Media) | 8.125% | 04/30/2020 | $ | 75,000 | $ | 81,375 | ||||||||||
CCO Holdings, LLC / CCO Holdings Capital Corp. (Media) | 7.875% | 04/30/2018 | 1,025,000 | 1,085,219 | ||||||||||||
CCO Holdings, LLC / CCO Holdings Capital Corp. (Media) | 7.000% | 01/15/2019 | 125,000 | 129,375 | ||||||||||||
CCO Holdings, LLC / CCO Holdings Capital Corp. (Media) | (b) | 7.000% | 01/15/2019 | 300,000 | 309,750 | |||||||||||
Cequel Communications Holdings I LLC and Cequel Capital Corp. (Media) | (b) | 8.625% | 11/15/2017 | 175,000 | 182,875 | |||||||||||
Cinemark U.S.A, Inc. (Media) | 8.625% | 06/15/2019 | 950,000 | 1,045,000 | ||||||||||||
Cinemark U.S.A, Inc. (Acquired 05/31/2011 through 06/16/2011, Cost $373,500) (Media) | (b)(h) | 7.375% | 06/15/2021 | 375,000 | 375,000 | |||||||||||
Citadel Broadcasting Corp. (Media) | (b) | 7.750% | 12/15/2018 | 150,000 | 160,125 | |||||||||||
Clear Channel Communications, Inc. (Media) | (b) | 9.000% | 03/01/2021 | 1,325,000 | 1,275,312 | |||||||||||
Clear Channel Worldwide Holdings, Inc. (Media) | 9.250% | 12/15/2017 | 925,000 | 1,012,875 | ||||||||||||
Clear Channel Worldwide Holdings, Inc. (Media) | 9.250% | 12/15/2017 | 325,000 | 355,062 | ||||||||||||
Crown Media Holdings, Inc. (Media) | (b) | 10.500% | 07/15/2019 | 625,000 | 646,875 | |||||||||||
Cumulus Media, Inc. (Media) | (b) | 7.750% | 05/01/2019 | 875,000 | 848,750 | |||||||||||
DISH DBS Corp. (Media) | 6.625% | 10/01/2014 | 525,000 | 553,875 | ||||||||||||
Entravision Communications Corp. (Media) | 8.750% | 08/01/2017 | 600,000 | 624,000 | ||||||||||||
Fox Acquisition Sub LLC (Media) | (b) | 13.375% | 07/15/2016 | 1,000,000 | 1,110,000 | |||||||||||
Houghton Mifflin Harcourt Publishing Co. (Media) | (b) | 10.500% | 06/01/2019 | 1,050,000 | 1,039,500 | |||||||||||
Insight Communications Co., Inc. (Media) | (b) | 9.375% | 07/15/2018 | 675,000 | 744,187 | |||||||||||
Intelsat Jackson Holdings, S.A. (Media) | 11.250% | 06/15/2016 | 2,025,000 | 2,151,562 | ||||||||||||
Intelsat Jackson Holdings, S.A. (Media) | (b) | 7.250% | 04/01/2019 | 700,000 | 696,500 | |||||||||||
Intelsat Jackson Holdings, S.A. (Media) | (b) | 7.500% | 04/01/2021 | 450,000 | 448,312 | |||||||||||
Intelsat Jackson Holdings, S.A. (Media) | 8.500% | 11/01/2019 | 675,000 | 717,187 | ||||||||||||
Lamar Media Corp. (Media) | 6.625% | 08/15/2015 | 950,000 | 966,625 | ||||||||||||
Lamar Media Corp. (Media) | 6.625% | 08/15/2015 | 375,000 | 381,094 | ||||||||||||
MDC Partners, Inc. (Media) | 11.000% | 11/01/2016 | 1,175,000 | 1,323,344 | ||||||||||||
MDC Partners, Inc. (Acquired 04/14/2011, Cost $276,711) (Media) | (b)(h) | 11.000% | 11/01/2016 | 250,000 | 279,062 | |||||||||||
MediMedia USA, Inc. (Acquired 06/11/2007 through 07/28/2010, Cost $901,964) (Media) | (b)(h) | 11.375% | 11/15/2014 | 1,000,000 | 865,000 | |||||||||||
Nexstar Broadcasting, Inc. / Mission Broadcasting, Inc. (Media) | 8.875% | 04/15/2017 | 550,000 | 581,625 | ||||||||||||
Nexstar Broadcasting, Inc. (Media) | 7.000% | 01/15/2014 | 225,000 | 223,875 | ||||||||||||
Nexstar Broadcasting, Inc. (Media) | 7.000% | 01/15/2014 | 433,346 | 431,179 | ||||||||||||
Nielsen Finance LLC / Nielsen Finance Co. (Media) | 11.500% | 05/01/2016 | 275,000 | 323,125 | ||||||||||||
Nielsen Finance LLC / Nielsen Finance Co. (Media) | 11.625% | 02/01/2014 | 293,000 | 343,542 | ||||||||||||
Nielsen Finance LLC / Nielsen Finance Co. (Media) | (b) | 7.750% | 10/15/2018 | 400,000 | 422,000 | |||||||||||
ProQuest LLC / ProQuest Notes Co. (Acquired 09/16/2010 through 10/04/2010, Cost $756,103) (Media) | (b)(h) | 9.000% | 10/15/2018 | 750,000 | 772,500 | |||||||||||
Regal Cinemas Corp. (Media) | 8.625% | 07/15/2019 | 1,050,000 | 1,107,750 | ||||||||||||
Sirius XM Radio, Inc. (Media) | (b) | 8.750% | 04/01/2015 | 1,000,000 | 1,107,500 | |||||||||||
Sitel LLC / Sitel Finance Corp. (Media) | 11.500% | 04/01/2018 | 1,075,000 | 989,000 | ||||||||||||
Virgin Media Finance PLC (Media) | 9.500% | 08/15/2016 | 1,025,000 | 1,163,375 | ||||||||||||
Visant Corp. (Media) | 10.000% | 10/01/2017 | 1,775,000 | 1,846,000 | ||||||||||||
XM Satellite Radio, Inc. (Media) | (b) | 7.625% | 11/01/2018 | 475,000 | 498,750 | |||||||||||
Dollar General Corp. (Multiline Retail) | (d) | 11.875% | 07/15/2017 | 635,000 | 727,075 | |||||||||||
Macy’s Retail Holdings, Inc. (Multiline Retail) | 7.000% | 02/15/2028 | 100,000 | 113,188 | ||||||||||||
Macy’s Retail Holdings, Inc. (Multiline Retail) | 6.900% | 01/15/2032 | 50,000 | 53,864 | ||||||||||||
QVC, Inc. (Multiline Retail) | (b) | 7.500% | 10/01/2019 | 1,025,000 | 1,091,625 | |||||||||||
QVC, Inc. (Multiline Retail) | (b) | 7.125% | 04/15/2017 | 200,000 | 211,000 | |||||||||||
Toys “R” Us Property Co. I LLC (Multiline Retail) | 10.750% | 07/15/2017 | 1,025,000 | 1,145,437 | ||||||||||||
Giraffe Acquisition Corp. (Specialty Retail) | (b) | 9.125% | 12/01/2018 | 1,125,000 | 1,063,125 | |||||||||||
Limited Brands, Inc. (Specialty Retail) | 8.500% | 06/15/2019 | 525,000 | 601,125 | ||||||||||||
Needle Merger Sub Corp. (Specialty Retail) | (b) | 8.125% | 03/15/2019 | 1,300,000 | 1,316,250 | |||||||||||
Penske Automotive Group, Inc. (Specialty Retail) | 7.750% | 12/15/2016 | 1,275,000 | 1,306,875 | ||||||||||||
PETCO Animal Supplies Stores, Inc. (Specialty Retail) | (b) | 9.250% | 12/01/2018 | 1,350,000 | 1,441,125 | |||||||||||
Sally Holdings LLC / Sally Capital, Inc. (Specialty Retail) | 10.500% | 11/15/2016 | 1,250,000 | 1,340,625 | ||||||||||||
Yankee Candle Co., Inc. (Specialty Retail) | 9.750% | 02/15/2017 | 1,725,000 | 1,824,188 | ||||||||||||
YCC Holdings LLC / Yankee Finance, Inc. (Specialty Retail) | (b)(d) | 10.250% | 02/15/2016 | 700,000 | 705,250 | |||||||||||
|
| |||||||||||||||
| 86,782,691 | ||||||||||||||||
|
| |||||||||||||||
CONSUMER STAPLES – 4.1% | ||||||||||||||||
U.S. Foodservice (Acquired 05/06/2011 through 06/22/2011, Cost $1,321,441) (Food & Staples Retailing) | (b)(h) | 8.500% | 06/30/2019 | 1,325,000 | 1,291,875 | |||||||||||
B&G Foods, Inc. (Food Products) | 7.625% | 01/15/2018 | 525,000 | 555,187 | ||||||||||||
Blue Merger Sub, Inc. (Food Products) | (b) | 7.625% | 02/15/2019 | 550,000 | 558,250 | |||||||||||
Darling International, Inc. (Food Products) | (b) | 8.500% | 12/15/2018 | 125,000 | 135,625 | |||||||||||
Dean Foods Co. (Food Products) | 7.000% | 06/01/2016 | 1,400,000 | 1,393,000 | ||||||||||||
Dean Foods Co. (Acquired 12/09/2010, Cost $700,000) (Food Products) | (b)(h) | 9.750% | 12/15/2018 | 700,000 | 747,250 | |||||||||||
Michael Foods, Inc. (Acquired 06/22/2010 through 06/27/2011, Cost $1,711,423) (Food Products) | (b)(h) | 9.750% | 07/15/2018 | 1,625,000 | 1,746,875 | |||||||||||
Pinnacle Foods Finance LLC / Pinnacle Foods Finance Corp. (Food Products) | 9.250% | 04/01/2015 | 875,000 | 912,187 | ||||||||||||
Pinnacle Foods Finance LLC / Pinnacle Foods Finance Corp. (Food Products) | 10.625% | 04/01/2017 | 425,000 | 455,281 | ||||||||||||
Pinnacle Foods Finance LLC / Pinnacle Foods Finance Corp. (Food Products) | 8.250% | 09/01/2017 | 500,000 | 521,250 | ||||||||||||
Smithfield Foods, Inc. (Food Products) | 7.750% | 07/01/2017 | 725,000 | 755,812 | ||||||||||||
Central Garden and Pet Co. (Household Products) | 8.250% | 03/01/2018 | 550,000 | 570,625 | ||||||||||||
| 61 | (continued) |
| Ohio National Fund, Inc. | High Income Bond Portfolio (Continued) |
Schedule of Investments | June 30, 2011 (Unaudited) |
| Corporate Bonds (Continued) | Rate | Maturity | Face Amount | Value | ||||||||||||
CONSUMER STAPLES (continued) | ||||||||||||||||
Spectrum Brands, Inc. (Household Products) | (b) | 9.500% | 06/15/2018 | $ | 300,000 | $ | 330,000 | |||||||||
Spectrum Brands Holdings, Inc. (Household Products) | (d) | 12.000% | 08/28/2019 | 1,221,650 | 1,356,031 | |||||||||||
Prestige Brands, Inc. (Personal Products) | (b) | 8.250% | 04/01/2018 | 725,000 | 763,062 | |||||||||||
|
| |||||||||||||||
| 12,092,310 | ||||||||||||||||
|
| |||||||||||||||
ENERGY – 8.4% | ||||||||||||||||
Basic Energy Services, Inc. (Energy Equip. & Svs.) | 7.125% | 04/15/2016 | 850,000 | 854,250 | ||||||||||||
Basic Energy Services, Inc. (Acquired 02/03/2011 through 06/08/2011, Cost $427,999) (Energy Equip. & Svs.) | (b)(h) | 7.750% | 02/15/2019 | 425,000 | 428,187 | |||||||||||
Cie Generale de Geophysique – Veritas (Energy Equip. & Svs.) | 7.750% | 05/15/2017 | 1,100,000 | 1,138,500 | ||||||||||||
Cie Generale de Geophysique – Veritas (Energy Equip. & Svs.) | 9.500% | 05/15/2016 | 400,000 | 439,000 | ||||||||||||
Complete Production Services, Inc. (Energy Equip. & Svs.) | 8.000% | 12/15/2016 | 600,000 | 630,000 | ||||||||||||
Crosstex Energy LP / Crosstex Energy Finance Corp. (Energy Equip. & Svs.) | 8.875% | 02/15/2018 | 1,275,000 | 1,364,250 | ||||||||||||
Dresser-Rand Group, Inc. (Energy Equip. & Svs.) | (b) | 6.500% | 05/01/2021 | 375,000 | 388,125 | |||||||||||
Forbes Energy Services Ltd. (Energy Equip. & Svs.) | (b) | 9.000% | 06/15/2019 | 800,000 | 792,000 | |||||||||||
PHI, Inc. (Energy Equip. & Svs.) | 8.625% | 10/15/2018 | 775,000 | 813,750 | ||||||||||||
SESI LLC (Acquired 04/20/2011, Cost $275,000) (Energy Equip. & Svs.) | (b)(h) | 6.375% | 05/01/2019 | 275,000 | 272,937 | |||||||||||
Aquilex Holdings LLC / Aquilex Finance Corp. (Oil, Gas & Consumable Fuels) | 11.125% | 12/15/2016 | 575,000 | 562,062 | ||||||||||||
ATP Oil & Gas Corp. (Oil, Gas & Consumable Fuels) | 11.875% | 05/01/2015 | 1,050,000 | 1,071,000 | ||||||||||||
Berry Petroleum Co. (Oil, Gas & Consumable Fuels) | 6.750% | 11/01/2020 | 150,000 | 151,125 | ||||||||||||
Brigham Exploration Co. (Oil, Gas & Consumable Fuels) | (b) | 6.875% | 06/01/2019 | 175,000 | 174,562 | |||||||||||
Chaparral Energy, Inc. (Oil, Gas & Consumable Fuels) | 9.875% | 10/01/2020 | 750,000 | 813,750 | ||||||||||||
Chesapeake Energy Corp. (Oil, Gas & Consumable Fuels) | 6.875% | 11/15/2020 | 425,000 | 451,031 | ||||||||||||
Chesapeake Energy Corp. (Oil, Gas & Consumable Fuels) | 9.500% | 02/15/2015 | 425,000 | 495,125 | ||||||||||||
Chesapeake Energy Corp. (Oil, Gas & Consumable Fuels) | 6.875% | 08/15/2018 | 325,000 | 342,875 | ||||||||||||
Coffeyville Resources LLC / Coffeyville Finance, Inc. (Oil, Gas & Consumable Fuels) | (b) | 10.875% | 04/01/2017 | 875,000 | 997,500 | |||||||||||
Comstock Resources, Inc. (Oil, Gas & Consumable Fuels) | 7.750% | 04/01/2019 | 550,000 | 554,812 | ||||||||||||
Concho Resources, Inc. (Oil, Gas & Consumable Fuels) | 7.000% | 01/15/2021 | 525,000 | 544,687 | ||||||||||||
Copano Energy LLC / Copano Energy Finance Corp. (Oil, Gas & Consumable Fuels) | 7.125% | 04/01/2021 | 300,000 | 297,000 | ||||||||||||
Denbury Resources, Inc. (Oil, Gas & Consumable Fuels) | 8.250% | 02/15/2020 | 273,000 | 298,935 | ||||||||||||
Denbury Resources, Inc. (Oil, Gas & Consumable Fuels) | 9.750% | 03/01/2016 | 125,000 | 140,312 | ||||||||||||
Denbury Resources, Inc. (Oil, Gas & Consumable Fuels) | 6.375% | 08/15/2021 | 275,000 | 275,687 | ||||||||||||
Energy Transfer Equity LP (Oil, Gas & Consumable Fuels) | 7.500% | 10/15/2020 | 1,075,000 | 1,144,875 | ||||||||||||
Hilcorp Energy I LP / Hilcorp Finance Co. (Oil, Gas & Consumable Fuels) | (b) | 7.750% | 11/01/2015 | 400,000 | 414,000 | |||||||||||
Holly Energy Partners LP / Holly Energy Finance Corp. (Oil, Gas & Consumable Fuels) | 6.250% | 03/01/2015 | 650,000 | 653,250 | ||||||||||||
Inergy LP / Inergy Finance Corp. (Oil, Gas & Consumable Fuels) | 8.750% | 03/01/2015 | 276,000 | 295,320 | ||||||||||||
Inergy LP / Inergy Finance Corp. (Oil, Gas & Consumable Fuels) | (b) | 6.875% | 08/01/2021 | 600,000 | 600,750 | |||||||||||
Inergy LP / Inergy Finance Corp. (Oil, Gas & Consumable Fuels) | 7.000% | 10/01/2018 | 250,000 | 253,750 | ||||||||||||
Linn Energy LLC / Linn Energy Finance Corp. (Oil, Gas & Consumable Fuels) | (b) | 7.750% | 02/01/2021 | 500,000 | 522,500 | |||||||||||
Linn Energy LLC / Linn Energy Finance Corp. (Oil, Gas & Consumable Fuels) | 8.625% | 04/15/2020 | 675,000 | 735,750 | ||||||||||||
Linn Energy LLC / Linn Energy Finance Corp. (Oil, Gas & Consumable Fuels) | (b) | 6.500% | 05/15/2019 | 50,000 | 49,625 | |||||||||||
Niska Gas Storage U.S. LLC / Niska Gas Storage Canada ULC (Oil, Gas & Consumable Fuels) | 8.875% | 03/15/2018 | 875,000 | 923,125 | ||||||||||||
Petrohawk Energy Corp. (Oil, Gas & Consumable Fuels) | 7.250% | 08/15/2018 | 1,350,000 | 1,392,187 | ||||||||||||
Pioneer Natural Resources Co. (Oil, Gas & Consumable Fuels) | 6.875% | 05/01/2018 | 300,000 | 325,405 | ||||||||||||
Plains Exploration & Production Co. (Oil, Gas & Consumable Fuels) | 7.000% | 03/15/2017 | 125,000 | 129,375 | ||||||||||||
Plains Exploration & Production Co. (Oil, Gas & Consumable Fuels) | 7.750% | 06/15/2015 | 600,000 | 624,750 | ||||||||||||
Regency Energy Partners LP / Regency Energy Finance Corp. (Oil, Gas & Consumable Fuels) | 6.875% | 12/01/2018 | 275,000 | 286,000 | ||||||||||||
Regency Energy Partners LP / Regency Energy Finance Corp. (Oil, Gas & Consumable Fuels) | 9.375% | 06/01/2016 | 600,000 | 672,000 | ||||||||||||
Southern Star Central Corp. (Oil, Gas & Consumable Fuels) | 6.750% | 03/01/2016 | 225,000 | 227,250 | ||||||||||||
W&T Offshore, Inc. (Oil, Gas & Consumable Fuels) | (b) | 8.500% | 06/15/2019 | 775,000 | 786,625 | |||||||||||
|
| |||||||||||||||
| 24,327,999 | ||||||||||||||||
|
| |||||||||||||||
FINANCIALS – 7.9% | ||||||||||||||||
Nuveen Investments, Inc. (Capital Markets) | 10.500% | 11/15/2015 | 1,975,000 | 2,029,313 | ||||||||||||
Pinafore LLC / Pinafore, Inc. (Capital Markets) | (b) | 9.000% | 10/01/2018 | 625,000 | 676,562 | |||||||||||
CIT Group, Inc. (Commercial Banks) | (b) | 6.625% | 04/01/2018 | 275,000 | 288,062 | |||||||||||
CIT Group, Inc. (Commercial Banks) | (b) | 7.000% | 05/02/2017 | 5,500,000 | 5,500,000 | |||||||||||
Ally Financial, Inc. (Consumer Finance) | 7.000% | 02/01/2012 | 625,000 | 638,437 | ||||||||||||
Ally Financial, Inc. (Consumer Finance) | 6.875% | 09/15/2011 | 800,000 | 807,000 | ||||||||||||
Ally Financial, Inc. (Consumer Finance) | 8.000% | 11/01/2031 | 225,000 | 244,687 | ||||||||||||
Ally Financial, Inc. (Consumer Finance) | 8.300% | 02/12/2015 | 2,425,000 | 2,716,000 | ||||||||||||
Ally Financial, Inc. (Consumer Finance) | 8.000% | 03/15/2020 | 375,000 | 399,375 | ||||||||||||
Ally Financial, Inc. (Consumer Finance) | 7.500% | 09/15/2020 | 250,000 | 262,500 | ||||||||||||
Ford Motor Credit Co. LLC (Consumer Finance) | 8.000% | 12/15/2016 | 3,175,000 | 3,578,181 | ||||||||||||
Ford Motor Credit Co. LLC (Consumer Finance) | 8.000% | 06/01/2014 | 650,000 | 713,542 | ||||||||||||
Ford Motor Credit Co. LLC (Consumer Finance) | 7.500% | 08/01/2012 | 400,000 | 418,994 | ||||||||||||
Ford Motor Credit Co. LLC (Consumer Finance) | 8.125% | 01/15/2020 | 150,000 | 174,324 | ||||||||||||
GMAC, Inc. (Consumer Finance) | (b) | 6.250% | 12/01/2017 | 300,000 | 299,125 | |||||||||||
Express LLC / Express Finance Corp. (Diversified Financial Svs.) | 8.750% | 03/01/2018 | 550,000 | 596,750 | ||||||||||||
Interactive Data Corp. (Diversified Financial Svs.) | (b) | 10.250% | 08/01/2018 | 1,050,000 | 1,147,125 | |||||||||||
| 62 | (continued) |
| Ohio National Fund, Inc. | High Income Bond Portfolio (Continued) |
Schedule of Investments | June 30, 2011 (Unaudited) |
| Corporate Bonds (Continued) | Rate | Maturity | Face Amount | Value | ||||||||||||
FINANCIALS (continued) | ||||||||||||||||
TransUnion LLC / TransUnion Financing Corp. (Diversified Financial Svs.) | 11.375% | 06/15/2018 | $ | 750,000 | $ | 851,250 | ||||||||||
Reliance Intermediate Holdings LP (Acquired 07/23/2009 through 08/06/2009, Cost $533,056) (Insurance) | (b)(h) | 9.500% | 12/15/2019 | 550,000 | 602,938 | |||||||||||
Host Hotels & Resorts LP (Real Estate Investment Trusts) | 6.375% | 03/15/2015 | 175,000 | 179,375 | ||||||||||||
Host Hotels & Resorts LP (Real Estate Investment Trusts) | 6.750% | 06/01/2016 | 100,000 | 103,750 | ||||||||||||
Host Hotels & Resorts LP (Real Estate Investment Trusts) | 6.875% | 11/01/2014 | 250,000 | 257,500 | ||||||||||||
Ventas Realty LP l Corp. (Real Estate Investment Trusts) | 6.500% | 06/01/2016 | 325,000 | 336,126 | ||||||||||||
Ventas Realty LP l Corp. (Real Estate Investment Trusts) | 6.500% | 06/01/2016 | 225,000 | 232,668 | ||||||||||||
|
| |||||||||||||||
| 23,053,584 | ||||||||||||||||
|
| |||||||||||||||
HEALTH CARE – 9.0% | ||||||||||||||||
Giant Funding Corp. (Biotechnology) | (b) | 8.250% | 02/01/2018 | 450,000 | 471,375 | |||||||||||
Alere, Inc. (Health Care Equip. & Supplies) | 7.875% | 02/01/2016 | 525,000 | 546,000 | ||||||||||||
Alere, Inc. (Health Care Equip. & Supplies) | 9.000% | 05/15/2016 | 925,000 | 967,781 | ||||||||||||
Bausch & Lomb, Inc. (Health Care Equip. & Supplies) | 9.875% | 11/01/2015 | 950,000 | 1,011,750 | ||||||||||||
Biomet, Inc. (Health Care Equip. & Supplies) | 11.625% | 10/15/2017 | 2,425,000 | 2,697,813 | ||||||||||||
DJO Finance LLC / DJO Finance Corp. (Health Care Equip. & Supplies) | (b) | 9.750% | 10/15/2017 | 250,000 | 255,000 | |||||||||||
DJO Finance LLC / DJO Finance Corp. (Health Care Equip. & Supplies) | (b) | 7.750% | 04/15/2018 | 550,000 | 550,000 | |||||||||||
VWR Funding, Inc. (Health Care Equip. & Supplies) | (d) | 10.250% | 07/15/2015 | 1,929,843 | 2,026,335 | |||||||||||
CDRT Merger Sub, Inc. (Health Care Providers & Svs.) | (b) | 8.125% | 06/01/2019 | 1,300,000 | 1,303,250 | |||||||||||
CRC Health Corp. (Health Care Providers & Svs.) | 10.750% | 02/01/2016 | 550,000 | 562,375 | ||||||||||||
Fresenius U.S. Finance II, Inc. (Health Care Providers & Svs.) | (b) | 9.000% | 07/15/2015 | 325,000 | 369,281 | |||||||||||
HCA Holdings, Inc. (Health Care Providers & Svs.) | (b) | 7.750% | 05/15/2021 | 650,000 | 677,625 | |||||||||||
HCA, Inc. (Health Care Providers & Svs.) | 7.500% | 11/06/2033 | 225,000 | 204,750 | ||||||||||||
HCA, Inc. (Health Care Providers & Svs.) | 9.250% | 11/15/2016 | 550,000 | 586,438 | ||||||||||||
HCA, Inc. (Health Care Providers & Svs.) | (d) | 9.625% | 11/15/2016 | 4,251,516 | 4,533,179 | |||||||||||
HCA, Inc. (Health Care Providers & Svs.) | 7.875% | 02/15/2020 | 275,000 | 299,750 | ||||||||||||
HCA, Inc. (Health Care Providers & Svs.) | 9.875% | 02/15/2017 | 145,000 | 162,038 | ||||||||||||
IASIS Healthcare LLC / IASIS Capital Corp. (Health Care Providers & Svs.) | (b) | 8.375% | 05/15/2019 | 800,000 | 792,000 | |||||||||||
Inventiv Health, Inc. (Health Care Providers & Svs.) | (b) | 10.000% | 08/15/2018 | 825,000 | 783,750 | |||||||||||
MultiPlan, Inc. (Health Care Providers & Svs.) | (b) | 9.875% | 09/01/2018 | 1,450,000 | 1,547,875 | |||||||||||
Omnicare, Inc. (Health Care Providers & Svs.) | 6.875% | 12/15/2015 | 775,000 | 797,281 | ||||||||||||
Omnicare, Inc. (Health Care Providers & Svs.) | 7.750% | 06/01/2020 | 475,000 | 506,469 | ||||||||||||
STHI Holding Corp. (Health Care Providers & Svs.) | (b) | 8.000% | 03/15/2018 | 200,000 | 204,000 | |||||||||||
United Surgical Partners International, Inc. (Health Care Providers & Svs.) | (d) | 9.250% | 05/01/2017 | 1,250,000 | 1,312,500 | |||||||||||
Universal Hospital Services, Inc. (Health Care Providers & Svs.) | (d) | 8.500% | 06/01/2015 | 1,150,000 | 1,190,250 | |||||||||||
Universal Hospital Services, Inc. (Health Care Providers & Svs.) | (e) | 3.778% | 06/01/2015 | 150,000 | 144,750 | |||||||||||
Universal Hospital Services, Inc. (Health Care Providers & Svs.) | (b)(d) | 8.500% | 06/01/2015 | 325,000 | 336,375 | |||||||||||
Vanguard Health Holding Co. II LLC / Vanguard Holding Co. II, Inc. (Health Care Providers & Svs.) | 8.000% | 02/01/2018 | 1,450,000 | 1,504,375 | ||||||||||||
|
| |||||||||||||||
| 26,344,365 | ||||||||||||||||
|
| |||||||||||||||
INDUSTRIALS – 12.9% | ||||||||||||||||
Alliant Techsystems, Inc. (Aerospace & Defense) | 6.750% | 04/01/2016 | 500,000 | 512,500 | ||||||||||||
L-3 Communications Corp. (Aerospace & Defense) | 6.375% | 10/15/2015 | 225,000 | 231,750 | ||||||||||||
Sequa Corp. (Aerospace & Defense) | (b) | 11.750% | 12/01/2015 | 300,000 | 327,000 | |||||||||||
Sequa Corp. (Aerospace & Defense) | (b) | 13.500% | 12/01/2015 | 183,054 | 200,444 | |||||||||||
TransDigm, Inc. (Aerospace & Defense) | (b) | 7.750% | 12/15/2018 | 1,475,000 | 1,556,125 | |||||||||||
CHC Helicopter S.A. (Air Freight & Logistics) | (b) | 9.250% | 10/15/2020 | 900,000 | 816,750 | |||||||||||
American Standard Americas (Acquired 01/13/2011, Cost $100,000) (Building Products) | (b)(h) | 10.750% | 01/15/2016 | 100,000 | 96,625 | |||||||||||
Associated Materials, Inc. (Building Products) | (b) | 9.125% | 11/01/2017 | 575,000 | 575,000 | |||||||||||
Building Materials Corp. of America (Building Products) | (b) | 7.500% | 03/15/2020 | 225,000 | 237,938 | |||||||||||
Building Materials Corp. of America (Building Products) | (b) | 6.750% | 05/01/2021 | 225,000 | 226,688 | |||||||||||
Griffon Corp. (Building Products) | (b) | 7.125% | 04/01/2018 | 550,000 | 554,813 | |||||||||||
Masonite International Corp. (Building Products) | (b) | 8.250% | 04/15/2021 | 875,000 | 873,906 | |||||||||||
Nortek, Inc. (Building Products) | (b) | 10.000% | 12/01/2018 | 600,000 | 603,000 | |||||||||||
Nortek, Inc. (Building Products) | (b) | 8.500% | 04/15/2021 | 875,000 | 813,750 | |||||||||||
Ply Gem Industries, Inc. (Building Products) | (b) | 8.250% | 02/15/2018 | 700,000 | 666,750 | |||||||||||
RBS Global, Inc. (Building Products) | 8.500% | 05/01/2018 | 1,250,000 | 1,326,563 | ||||||||||||
Thermon Industries, Inc. (Building Products) | 9.500% | 05/01/2017 | 460,000 | 495,650 | ||||||||||||
Altegrity, Inc. (Commercial Svs. & Supplies) | (b) | 11.750% | 05/01/2016 | 750,000 | 791,250 | |||||||||||
Altegrity, Inc. (Commercial Svs. & Supplies) | (b) | 10.500% | 11/01/2015 | 425,000 | 442,000 | |||||||||||
ARAMARK Corp. (Commercial Svs. & Supplies) | 8.500% | 02/01/2015 | 1,150,000 | 1,200,313 | ||||||||||||
ARAMARK Corp. (Commercial Svs. & Supplies) | (e) | 3.773% | 02/01/2015 | 150,000 | 146,625 | |||||||||||
ARAMARK Holdings Corp. (Commercial Svs. & Supplies) | (b)(d) | 8.625% | 05/01/2016 | 1,000,000 | 1,022,500 | |||||||||||
Diversey Holdings, Inc. (Commercial Svs. & Supplies) | 10.500% | 05/15/2020 | 1,128,616 | 1,399,483 | ||||||||||||
Diversey, Inc. (Commercial Svs. & Supplies) | 8.250% | 11/15/2019 | 350,000 | 412,125 | ||||||||||||
Garda World Security Corp. (Commercial Svs. & Supplies) | (b) | 9.750% | 03/15/2017 | 1,075,000 | 1,142,188 | |||||||||||
International Lease Finance Corp. (Commercial Svs. & Supplies) | 8.250% | 12/15/2020 | 275,000 | 297,688 | ||||||||||||
International Lease Finance Corp. (Commercial Svs. & Supplies) | 8.625% | 09/15/2015 | 450,000 | 489,375 | ||||||||||||
International Lease Finance Corp. (Commercial Svs. & Supplies) | 8.750% | 03/15/2017 | 2,425,000 | 2,658,406 | ||||||||||||
| 63 | (continued) |
| Ohio National Fund, Inc. | High Income Bond Portfolio (Continued) |
Schedule of Investments | June 30, 2011 (Unaudited) |
| Corporate Bonds (Continued) | Rate | Maturity | Face Amount | Value | ||||||||||||
INDUSTRIALS (continued) | ||||||||||||||||
International Lease Finance Corp. (Commercial Svs. & Supplies) | 5.750% | 05/15/2016 | $ | 250,000 | $ | 246,437 | ||||||||||
International Lease Finance Corp. (Commercial Svs. & Supplies) | 6.250% | 05/15/2019 | 225,000 | 220,176 | ||||||||||||
Maxim Crane Works, L.P. (Acquired 03/31/2010 through 05/04/2011, Cost $844,756) (Commercial Svs. & Supplies) | (b)(h) | 12.250% | 04/15/2015 | 850,000 | 854,250 | |||||||||||
RSC Equipment Rental, Inc. / RSC Holdings III LLC (Commercial Svs. & Supplies) | 9.500% | 12/01/2014 | 304,000 | 313,120 | ||||||||||||
RSC Equipment Rental, Inc. / RSC Holdings III LLC (Commercial Svs. & Supplies) | (b) | 10.000% | 07/15/2017 | 175,000 | 196,000 | |||||||||||
RSC Equipment Rental, Inc. / RSC Holdings III LLC (Commercial Svs. & Supplies) | 10.250% | 11/15/2019 | 475,000 | 522,500 | ||||||||||||
RSC Equipment Rental, Inc. / RSC Holdings III LLC (Commercial Svs. & Supplies) | 8.250% | 02/01/2021 | 200,000 | 200,000 | ||||||||||||
SGS International, Inc. (Commercial Svs. & Supplies) | 12.000% | 12/15/2013 | 900,000 | 927,000 | ||||||||||||
United Rentals North America, Inc. (Commercial Svs. & Supplies) | 8.375% | 09/15/2020 | 1,125,000 | 1,144,688 | ||||||||||||
West Corp. (Commercial Svs. & Supplies) | 11.000% | 10/15/2016 | 1,325,000 | 1,411,125 | ||||||||||||
West Corp. (Commercial Svs. & Supplies) | (b) | 8.625% | 10/01/2018 | 175,000 | 177,625 | |||||||||||
West Corp. (Commercial Svs. & Supplies) | (b) | 7.875% | 01/15/2019 | 800,000 | 778,000 | |||||||||||
Atkore International, Inc. (Electrical Equip.) | (b) | 9.875% | 01/01/2018 | 275,000 | 290,125 | |||||||||||
Belden, Inc. (Electrical Equip.) | 7.000% | 03/15/2017 | 450,000 | 463,500 | ||||||||||||
Belden, Inc. (Electrical Equip.) | 9.250% | 06/15/2019 | 200,000 | 223,500 | ||||||||||||
CommScope, Inc. (Electrical Equip.) | (b) | 8.250% | 01/15/2019 | 1,375,000 | 1,423,125 | |||||||||||
General Cable Corp. (Electrical Equip.) | 7.125% | 04/01/2017 | 600,000 | 616,500 | ||||||||||||
International Wire Group, Inc. (Electrical Equip.) | (b) | 9.750% | 04/15/2015 | 625,000 | 662,500 | |||||||||||
Viasystems, Inc. (Electrical Equip.) | (b) | 12.000% | 01/15/2015 | 275,000 | 303,188 | |||||||||||
Amsted Industries, Inc. (Acquired 03/12/2010, Cost $198,560) (Machinery) | (b)(h) | 8.125% | 03/15/2018 | 200,000 | 211,000 | |||||||||||
Case New Holland, Inc. (Machinery) | (b) | 7.875% | 12/01/2017 | 225,000 | 248,625 | |||||||||||
Meritor, Inc. (Machinery) | 10.625% | 03/15/2018 | 775,000 | 873,813 | ||||||||||||
Mueller Water Products, Inc. (Machinery) | 7.375% | 06/01/2017 | 675,000 | 637,875 | ||||||||||||
Mueller Water Products, Inc. (Machinery) | 8.750% | 09/01/2020 | 600,000 | 652,500 | ||||||||||||
Navistar International Corp. (Machinery) | 8.250% | 11/01/2021 | 400,000 | 430,000 | ||||||||||||
Stena AB (Marine) | 7.000% | 12/01/2016 | 175,000 | 171,500 | ||||||||||||
Avis Budget Car Rental LLC / Avis Budget Finance, Inc. (Road & Rail) | 9.625% | 03/15/2018 | 925,000 | 992,063 | ||||||||||||
Avis Budget Car Rental LLC / Avis Budget Finance, Inc. (Road & Rail) | 8.250% | 01/15/2019 | 575,000 | 585,063 | ||||||||||||
Hertz Corp. / The (Road & Rail) | 8.875% | 01/01/2014 | 74,000 | 76,220 | ||||||||||||
Hertz Corp. / The (Road & Rail) | (b) | 7.500% | 10/15/2018 | 100,000 | 103,500 | |||||||||||
Hertz Corp. / The (Road & Rail) | (b) | 6.750% | 04/15/2019 | 1,025,000 | 1,019,875 | |||||||||||
Kansas City Southern Railway (Road & Rail) | 8.000% | 06/01/2015 | 250,000 | 269,375 | ||||||||||||
Interline Brands, Inc. (Trading Companies & Distributors) | 7.000% | 11/15/2018 | 250,000 | 254,375 | ||||||||||||
|
| |||||||||||||||
| 37,616,348 | ||||||||||||||||
|
| |||||||||||||||
INFORMATION TECHNOLOGY – 8.9% | ||||||||||||||||
Seagate HDD Cayman (Computers & Peripherals) | (b) | 6.875% | 05/01/2020 | 375,000 | 374,063 | |||||||||||
Seagate HDD Cayman (Computers & Peripherals) | (b) | 7.750% | 12/15/2018 | 400,000 | 422,000 | |||||||||||
Seagate HDD Cayman (Computers & Peripherals) | (b) | 7.000% | 11/01/2021 | 300,000 | 301,500 | |||||||||||
Seagate Technology HDD Holdings (Computers & Peripherals) | 6.800% | 10/01/2016 | 575,000 | 608,063 | ||||||||||||
Cleaver-Brooks, Inc. (Acquired 04/21/2010 through 12/10/2010, Cost $783,317) (Electronic Equip., Instr. & Comp.) | (b)(h) | 12.250% | 05/01/2016 | 775,000 | 802,125 | |||||||||||
Kemet Corp. (Electronic Equip., Instr. & Comp.) | 10.500% | 05/01/2018 | 825,000 | 915,750 | ||||||||||||
Bankrate, Inc. (Internet Software & Svs.) | (b) | 11.750% | 07/15/2015 | 178,000 | 203,810 | |||||||||||
Ceridian Corp. (IT Svs.) | 11.250% | 11/15/2015 | 250,000 | 251,250 | ||||||||||||
CompuCom Systems, Inc. (Acquired 09/19/2007 through 10/04/2010, Cost $1,084,239) (IT Svs.) | (b)(h) | 12.500% | 10/01/2015 | 1,125,000 | 1,189,688 | |||||||||||
CoreLogic, Inc. (IT Svs.) | (b) | 7.250% | 06/01/2021 | 1,025,000 | 1,004,500 | |||||||||||
Fidelity National Information Services, Inc. (IT Svs.) | 7.875% | 07/15/2020 | 125,000 | 133,281 | ||||||||||||
Fidelity National Information Services, Inc. (IT Svs.) | 7.625% | 07/15/2017 | 1,025,000 | 1,092,906 | ||||||||||||
iGate Corp. (IT Svs.) | (b) | 9.000% | 05/01/2016 | 1,050,000 | 1,065,750 | |||||||||||
Lender Processing Services, Inc. (IT Svs.) | 8.125% | 07/01/2016 | 1,150,000 | 1,127,000 | ||||||||||||
Mantech International Corp. (IT Svs.) | 7.250% | 04/15/2018 | 200,000 | 210,000 | ||||||||||||
Stream Global Services, Inc. (IT Svs.) | 11.250% | 10/01/2014 | 775,000 | 829,250 | ||||||||||||
SunGard Data Systems, Inc. (IT Svs.) | 10.250% | 08/15/2015 | 1,250,000 | 1,296,876 | ||||||||||||
SunGard Data Systems, Inc. (IT Svs.) | 10.625% | 05/15/2015 | 975,000 | 1,060,313 | ||||||||||||
SunGard Data Systems, Inc. (IT Svs.) | 7.625% | 11/15/2020 | 175,000 | 177,625 | ||||||||||||
SunGard Data Systems, Inc. (IT Svs.) | 7.375% | 11/15/2018 | 175,000 | 175,875 | ||||||||||||
Advanced Micro Devices, Inc. (Semiconductors & Equip.) | 8.125% | 12/15/2017 | 725,000 | 761,250 | ||||||||||||
Advanced Micro Devices, Inc. (Semiconductors & Equip.) | 7.750% | 08/01/2020 | 175,000 | 181,125 | ||||||||||||
Freescale Semiconductor, Inc. (Semiconductors & Equip.) | (b) | 9.250% | 04/15/2018 | 725,000 | 784,813 | |||||||||||
Freescale Semiconductor, Inc. (Semiconductors & Equip.) | (b) | 10.750% | 08/01/2020 | 1,125,000 | 1,276,875 | |||||||||||
Freescale Semiconductor, Inc. (Semiconductors & Equip.) | (b) | 8.050% | 02/01/2020 | 600,000 | 606,000 | |||||||||||
MagnaChip Semiconductor SA / MagnaChip Semiconductor Finance Co. (Semiconductors & Equip.) | 10.500% | 04/15/2018 | 925,000 | 1,017,500 | ||||||||||||
Spansion LLC (Semiconductors & Equip.) | (b) | 7.875% | 11/15/2017 | 900,000 | 918,000 | |||||||||||
Allen Systems Group, Inc. (Acquired 11/12/2010 through 02/07/2011, Cost $1,091,178) (Software) | (b)(h) | 10.500% | 11/15/2016 | 1,075,000 | 1,085,750 | |||||||||||
Aspect Software, Inc. (Software) | 10.625% | 05/07/2017 | 1,075,000 | 1,161,000 | ||||||||||||
Audatex North America, Inc. (Acquired 06/10/2011, Cost $525,000) (Software) | (b)(h) | 6.750% | 06/15/2018 | 525,000 | 530,250 | |||||||||||
Eagle Parent, Inc. (Software) | (b) | 8.625% | 05/01/2019 | 1,300,000 | 1,259,375 | |||||||||||
Serena Software, Inc. (Software) | 10.375% | 03/15/2016 | 850,000 | 895,688 | ||||||||||||
SoftBrands, Inc. / Atlantis (Software) | (b) | 11.500% | 07/15/2018 | 650,000 | 598,930 | |||||||||||
| 64 | (continued) |
| Ohio National Fund, Inc. | High Income Bond Portfolio (Continued) |
Schedule of Investments | June 30, 2011 (Unaudited) |
| Corporate Bonds (Continued) | Rate | Maturity | Face Amount | Value | ||||||||||||
INFORMATION TECHNOLOGY (continued) | ||||||||||||||||
SS&C Technologies, Inc. (Software) | 11.750% | 12/01/2013 | $ | 163,000 | $ | 168,298 | ||||||||||
SSI Investments II / SSI Co-Issuer LLC (Software) | 11.125% | 06/01/2018 | 1,200,000 | 1,332,000 | ||||||||||||
|
| |||||||||||||||
| 25,818,479 | ||||||||||||||||
|
| |||||||||||||||
MATERIALS – 8.2% | ||||||||||||||||
Celanese U.S. Holdings LLC (Chemicals) | 6.625% | 10/15/2018 | 150,000 | 159,000 | ||||||||||||
Ferro Corp. (Chemicals) | 7.875% | 08/15/2018 | 500,000 | 521,250 | ||||||||||||
Hexion U.S. Finance Corp. / Hexion Nova Scotia Finance ULC (Chemicals) | 8.875% | 02/01/2018 | 1,150,000 | 1,201,750 | ||||||||||||
Hexion U.S. Finance Corp. / Hexion Nova Scotia Finance ULC (Chemicals) | 9.000% | 11/15/2020 | 400,000 | 412,000 | ||||||||||||
Huntsman International LLC (Chemicals) | 5.500% | 06/30/2016 | 725,000 | 716,844 | ||||||||||||
Huntsman International LLC (Chemicals) | 8.625% | 03/15/2020 | 550,000 | 602,250 | ||||||||||||
Huntsman International LLC (Chemicals) | 8.625% | 03/15/2021 | 525,000 | 573,563 | ||||||||||||
Koppers, Inc. (Chemicals) | 7.875% | 12/01/2019 | 575,000 | 616,688 | ||||||||||||
Momentive Performance Materials, Inc. (Chemicals) | 9.000% | 01/15/2021 | 675,000 | 691,875 | ||||||||||||
Nalco Co. (Chemicals) | 8.250% | 05/15/2017 | 575,000 | 631,063 | ||||||||||||
Nalco Co. (Chemicals) | (b) | 6.625% | 01/15/2019 | 250,000 | 257,500 | |||||||||||
OMNOVA Solutions, Inc. (Chemicals) | (b) | 7.875% | 11/01/2018 | 250,000 | 241,563 | |||||||||||
OXEA Finance & Cy SCA (Chemicals) | (b) | 9.500% | 07/15/2017 | 634,000 | 664,908 | |||||||||||
Scotts Miracle-Gro Co. / The (Chemicals) | (b) | 6.625% | 12/15/2020 | 550,000 | 565,125 | |||||||||||
Solutia, Inc. (Chemicals) | 8.750% | 11/01/2017 | 1,025,000 | 1,117,250 | ||||||||||||
Solutia, Inc. (Chemicals) | 7.875% | 03/15/2020 | 150,000 | 161,250 | ||||||||||||
Union Carbide Corp. (Chemicals) | 7.875% | 04/01/2023 | 100,000 | 115,777 | ||||||||||||
Union Carbide Corp. (Chemicals) | 7.500% | 06/01/2025 | 50,000 | 56,580 | ||||||||||||
Vertellus Specialties, Inc. (Chemicals) | (b) | 9.375% | 10/01/2015 | 375,000 | 389,063 | |||||||||||
Ardagh Packaging Finance Plc (Containers & Packaging) | (b) | 9.125% | 10/15/2020 | 1,000,000 | 1,057,500 | |||||||||||
Berry Plastics Corp. (Containers & Packaging) | 9.500% | 05/15/2018 | 550,000 | 548,625 | ||||||||||||
BWAY Holding Co. (Containers & Packaging) | 10.000% | 06/15/2018 | 900,000 | 986,625 | ||||||||||||
BWAY Parent Co., Inc. (Containers & Packaging) | (b)(d) | 10.125% | 11/01/2015 | 607,134 | 610,170 | |||||||||||
Cascades, Inc. (Containers & Packaging) | 7.875% | 01/15/2020 | 400,000 | 418,500 | ||||||||||||
Crown Americas LLC / Crown Americas Capital Corp. II (Containers & Packaging) | 7.625% | 05/15/2017 | 75,000 | 80,344 | ||||||||||||
Crown Americas LLC / Crown Americas Capital Corp. III (Containers & Packaging) | (b) | 6.250% | 02/01/2021 | 450,000 | 456,750 | |||||||||||
Graham Packaging Co. LP / GPC Capital Corp. I (Containers & Packaging) | 8.250% | 10/01/2018 | 325,000 | 363,188 | ||||||||||||
Graham Packaging Co. LP / GPC Capital Corp. I (Containers & Packaging) | 8.250% | 01/01/2017 | 975,000 | 1,092,000 | ||||||||||||
Graphic Packaging International, Inc. (Containers & Packaging) | 9.500% | 08/15/2013 | 460,000 | 466,900 | ||||||||||||
Graphic Packaging International, Inc. (Containers & Packaging) | 9.500% | 06/15/2017 | 950,000 | 1,045,000 | ||||||||||||
Greif, Inc. (Containers & Packaging) | 7.750% | 08/01/2019 | 475,000 | 515,375 | ||||||||||||
Owens-Brockway Glass Container, Inc. (Containers & Packaging) | 7.375% | 05/15/2016 | 200,000 | 218,500 | ||||||||||||
Packaging Dynamics Corp. (Acquired 01/25/2011 through 04/08/2011, Cost $890,364) (Containers & Packaging) | (b)(h) | 8.750% | 02/01/2016 | 875,000 | 892,500 | |||||||||||
Reynolds Group Issuer, Inc. / Reynolds Group Issuer LLC (Containers & Packaging) | (b) | 8.500% | 10/15/2016 | 1,100,000 | 1,152,250 | |||||||||||
Reynolds Group Issuer, Inc. / Reynolds Group Issuer LLC (Containers & Packaging) | (b) | 8.750% | 05/15/2018 | 775,000 | 765,313 | |||||||||||
Reynolds Group Issuer, Inc. / Reynolds Group Issuer LLC (Containers & Packaging) | (b) | 9.000% | 04/15/2019 | 675,000 | 669,938 | |||||||||||
Reynolds Group Issuer, Inc. / Reynolds Group Issuer LLC (Containers & Packaging) | (b) | 7.125% | 04/15/2019 | 175,000 | 174,563 | |||||||||||
Reynolds Group Issuer, Inc. / Reynolds Group Issuer LLC (Containers & Packaging) | (b) | 8.250% | 02/15/2021 | 100,000 | 94,000 | |||||||||||
Rock-Tenn Co. (Containers & Packaging) | 9.250% | 03/15/2016 | 450,000 | 488,250 | ||||||||||||
Compass Minerals International, Inc. (Metals & Mining) | 8.000% | 06/01/2019 | 275,000 | 301,813 | ||||||||||||
Boise Paper Holdings LLC / Boise Finance Co. (Paper & Forest Products) | 9.000% | 11/01/2017 | 750,000 | 819,375 | ||||||||||||
Clearwater Paper Corp. (Paper & Forest Products) | 10.625% | 06/15/2016 | 125,000 | 140,781 | ||||||||||||
Clearwater Paper Corp. (Paper & Forest Products) | 7.125% | 11/01/2018 | 125,000 | 128,750 | ||||||||||||
Longview Fibre Paper & Packaging, Inc. (Paper & Forest Products) | (b) | 8.000% | 06/01/2016 | 575,000 | 580,750 | |||||||||||
|
| |||||||||||||||
| 23,763,059 | ||||||||||||||||
|
| |||||||||||||||
TELECOMMUNICATION SERVICES – 4.7% | ||||||||||||||||
GXS Worldwide, Inc. (Diversified Telecom. Svs.) | 9.750% | 06/15/2015 | 1,150,000 | 1,170,125 | ||||||||||||
Level 3 Escrow, Inc. (Diversified Telecom. Svs.) | (b) | 8.125% | 07/01/2019 | 150,000 | 151,125 | |||||||||||
tw telecom holdings, Inc. (Diversified Telecom. Svs.) | 8.000% | 03/01/2018 | 375,000 | 401,719 | ||||||||||||
Windstream Corp. (Diversified Telecom. Svs.) | 8.125% | 09/01/2018 | 650,000 | 692,250 | ||||||||||||
Buccaneer Merger Sub, Inc. (Wireless Telecom. Svs.) | (b) | 9.125% | 01/15/2019 | 1,400,000 | 1,463,000 | |||||||||||
Digicel Group Ltd. (Acquired 01/09/2009 through 07/15/2009, Cost $347,305)(Wireless Telecom. Svs.) | (b)(f)(h) | 8.875% | 01/15/2015 | 425,000 | 436,688 | |||||||||||
Digicel Group Ltd. (Acquired 02/22/2007 through 07/01/2010, Cost $968,586)(Wireless Telecom. Svs.) | (b)(f)(h) | 9.125% | 01/15/2015 | 987,000 | 1,014,143 | |||||||||||
Digicel Ltd. (Acquired 03/06/2009 through 01/05/2010, Cost $653,156)(Wireless Telecom. Svs.) | (b)(f)(h) | 12.000% | 04/01/2014 | 650,000 | 755,625 | |||||||||||
Digicel Ltd. (Acquired 11/23/2009 through 06/25/2010, Cost $414,423)(Wireless Telecom. Svs.) | (b)(f)(h) | 8.250% | 09/01/2017 | 425,000 | 443,063 | |||||||||||
MetroPCS Wireless, Inc. (Wireless Telecom. Svs.) | 7.875% | 09/01/2018 | 925,000 | 983,969 | ||||||||||||
MetroPCS Wireless, Inc. (Wireless Telecom. Svs.) | 6.625% | 11/15/2020 | 800,000 | 794,000 | ||||||||||||
Nextel Communications, Inc. (Wireless Telecom. Svs.) | 7.375% | 08/01/2015 | 1,200,000 | 1,206,000 | ||||||||||||
Sprint Capital Corp. (Wireless Telecom. Svs.) | 6.900% | 05/01/2019 | 3,450,000 | 3,570,750 | ||||||||||||
Sprint Nextel Corp. (Wireless Telecom. Svs.) | 6.000% | 12/01/2016 | 700,000 | 702,625 | ||||||||||||
|
| |||||||||||||||
| 13,785,082 | ||||||||||||||||
|
| |||||||||||||||
| 65 | (continued) |
| Ohio National Fund, Inc. | High Income Bond Portfolio (Continued) |
Schedule of Investments | June 30, 2011 (Unaudited) |
| Corporate Bonds (Continued) | Rate | Maturity | Face Amount | Value | ||||||||||||
UTILITIES – 2.4% | ||||||||||||||||
Edison Mission Energy (Electric Utilities) | 7.750% | 06/15/2016 | $ | 250,000 | $ | 226,250 | ||||||||||
Edison Mission Energy (Electric Utilities) | 7.000% | 05/15/2017 | 600,000 | 489,000 | ||||||||||||
Energy Future Intermediate Holding Co. LLC / EFIH Finance, Inc. (Electric Utilities) | 10.000% | 12/01/2020 | 500,000 | 535,730 | ||||||||||||
NV Energy, Inc. (Electric Utilities) | 6.750% | 08/15/2017 | 425,000 | 437,456 | ||||||||||||
Texas Competitive Electric Holdings Co. LLC / TCEH Finance, Inc. (Electric Utilities) | 10.250% | 11/01/2015 | 850,000 | 518,500 | ||||||||||||
Texas Competitive Electric Holdings Co. LLC / TCEH Finance, Inc. (Acquired 04/19/2011, Cost $124,119) (Electric Utilities) | (b)(h) | 11.500% | 10/01/2020 | 125,000 | 123,438 | |||||||||||
AmeriGas Partners LP / AmeriGas Eagle Finance Corp. (Gas Utilities) | 7.125% | 05/20/2016 | 400,000 | 414,000 | ||||||||||||
Ferrellgas LP / Ferrellgas Finance Corp. (Gas Utilities) | (b) | 6.500% | 05/01/2021 | 250,000 | 237,500 | |||||||||||
Suburban Propane Partners LP / Suburban Energy Finance Corp. (Gas Utilities) | 7.375% | 03/15/2020 | 200,000 | 210,000 | ||||||||||||
Calpine Corp. (Ind. Power Prod. & Energy Traders) | (b) | 7.500% | 02/15/2021 | 925,000 | 948,125 | |||||||||||
Dynegy Holdings, Inc. (Ind. Power Prod. & Energy Traders) | 7.750% | 06/01/2019 | 525,000 | 384,563 | ||||||||||||
NRG Energy, Inc. (Ind. Power Prod. & Energy Traders) | 7.375% | 01/15/2017 | 200,000 | 210,000 | ||||||||||||
NRG Energy, Inc. (Ind. Power Prod. & Energy Traders) | 8.250% | 09/01/2020 | 750,000 | 768,750 | ||||||||||||
NRG Energy, Inc. (Ind. Power Prod. & Energy Traders) | (b) | 7.875% | 05/15/2021 | 475,000 | 475,000 | |||||||||||
NRG Energy, Inc. (Ind. Power Prod. & Energy Traders) | (b) | 7.625% | 05/15/2019 | 700,000 | 698,250 | |||||||||||
FPL Energy National Wind Portfolio LLC (Acquired 02/16/2005 through 05/27/2009, Cost $169,853) (Multi-Utilities) | (b)(h) | 6.125% | 03/25/2019 | 199,988 | 195,121 | |||||||||||
|
| |||||||||||||||
| 6,871,683 | ||||||||||||||||
|
| |||||||||||||||
Total Corporate Bonds (Cost $266,498,467) | $ | 280,455,600 | ||||||||||||||
|
| |||||||||||||||
| Convertible Bonds – 0.1% | Rate | Maturity | Face Amount | Value | ||||||||||||
INDUSTRIALS – 0.1% | ||||||||||||||||
School Specialty, Inc. (Professional Svs.) | 3.750% | 11/30/2026 | $ | 225,000 | $ | 226,688 | ||||||||||
|
| |||||||||||||||
Total Convertible Bonds (Cost $207,261) | $ | 226,688 | ||||||||||||||
|
| |||||||||||||||
| Common Stocks – 0.1% | Shares | Value | ||||||||||||||
CONSUMER DISCRETIONARY – 0.1% | ||||||||||||||||
General Motors Co. (Automobiles) | (a) | 4,241 | $ | 128,757 | ||||||||||||
|
| |||||||||||||||
Total Common Stocks (Cost $415,829) | $ | 128,757 | ||||||||||||||
|
| |||||||||||||||
| Preferred Stocks – 0.1% | Shares | Value | ||||||||||||||
FINANCIALS – 0.1% | ||||||||||||||||
Ally Financial, Inc. (Consumer Finance) | (b) | 346 | $ | 325,197 | ||||||||||||
|
| |||||||||||||||
Total Preferred Stocks (Cost $0) | $ | 325,197 | ||||||||||||||
|
| |||||||||||||||
| Warrants – 0.1% | Quantity | Value | ||||||||||||||
CONSUMER DISCRETIONARY – 0.1% | ||||||||||||||||
General Motors Co. (Automobiles) Expiration: 07/10/16, Exercise Price: $10.00 | (a) | 3,856 | $ | 82,518 | ||||||||||||
General Motors Co. (Automobiles) Expiration: 07/10/19, Exercise Price: $18.33 | (a) | 3,856 | 61,426 | |||||||||||||
|
| |||||||||||||||
Total Warrants (Cost $476,540) | $ | 143,944 | ||||||||||||||
|
| |||||||||||||||
| Other – 0.0% | Shares | Value | ||||||||||||||
SuperMedia, Inc. Litigation Trust Interests (Acquired 01/04/2010, Cost $0) | (a)(c)(h) | 625,000 | $ | 8,203 | ||||||||||||
|
| |||||||||||||||
Total Other (Cost $0) | $ | 8,203 | ||||||||||||||
|
| |||||||||||||||
| Money Market Funds – 2.0% | Shares | Value | ||||||||||||||
Fidelity Institutional Money Market Funds Money Market Portfolio – Class I | 5,961,000 | $ | 5,961,000 | |||||||||||||
|
| |||||||||||||||
Total Money Market Funds (Cost $5,961,000) | $ | 5,961,000 | ||||||||||||||
|
| |||||||||||||||
Total Investments (Cost $273,559,097) – 98.7% | (i) | $ | 287,249,389 | |||||||||||||
Other Assets in Excess of Liabilities – 1.3% | 3,925,573 | |||||||||||||||
|
| |||||||||||||||
Net Assets – 100.0% | $ | 291,174,962 | ||||||||||||||
|
| |||||||||||||||
Percentages are stated as a percent of net assets.
Footnotes:
| (a) | Non-income producing security. |
| (b) | Security exempt from registration under Regulation D of the Securities Act of 1933. These securities may be resold in transactions exempt form registration, normally to qualified buyers under Rule 144A. At June 30, 2011, the value of these securities totaled $110,491,785, or 37.9% of the Portfolio’s net assets. Unless also noted with (h), as defined below, these securities were deemed liquid pursuant to procedures approved by the Board of Directors. |
| (c) | A market quotation for this investment was not readily available at June 30, 2011. As discussed in Note 2 of the Notes to Financial Statements, the price for this issue was derived from an estimate of fair market value using methods determined in good faith by the Fund’s Pricing Committee under the supervision of the Board. This security represents $8,203, or 0.0% of the Portfolio’s net assets. |
| 66 | (continued) |
| Ohio National Fund, Inc. | High Income Bond Portfolio (Continued) |
Schedule of Investments | June 30, 2011 (Unaudited) |
| (d) | Issuer of the security has the option to make coupon payments in cash or in additional par value of this bond. Coupon stated is the rate stated for the cash option. |
| (e) | Security is a variable rate instrument in which the coupon rate is adjusted quarterly, or semi-annually, in concert with U.S. LIBOR. Interest rates stated are those in effect at June 30, 2011. |
| (f) | Denotes a restricted security that is subject to a contractual restriction on public sales. At June 30, 2011, the value of these securities totaled $2,682,519, or 0.9% of the Portfolio’s net assets. |
| (g) | Represents a security that is in default. Unless also noted by (h), as defined below, these securities were deemed liquid pursuant to procedures approved by the Board of Directors. |
| (h) | Represents a security deemed to be illiquid. At June 30, 2011, the value of illiquid securities in the Portfolio totaled $22,334,217, or 7.7% of the Portfolio’s net assets. |
| (i) | Represents cost for financial reporting purposes, which may differ from cost basis for federal income tax purposes. See also Note 7 of the Notes to Financial Statements. |
The accompanying notes are an integral part of these financial statements.
| 67 |
| Ohio National Fund, Inc. | Capital Growth Portfolio |
Objective/Strategy
The Capital Growth Portfolio seeks long-term capital appreciation by investing in and actively managing equity securities of small-cap growth companies.
Performance as of June 30, 2011
Average Annual Total Returns: | ||||
One year | 53.62% | |||
Five years | 10.32% | |||
Ten years | 4.86% |
Past performance does not guarantee future results. The performance data quoted represents past performance and current returns may be lower or higher. Total return figures include change in share price and reinvestment of dividends and capital gains. The investment return and principal value will fluctuate so that an investor’s shares, when redeemed, may be worth more or less than the original cost. To obtain performance information up to the most recent month end, call toll-free 1-877-781-6392.
The Portfolio is not open to direct retail investment. Beneficial interest in shares is obtained solely by purchase of variable life insurance policies and variable annuity contracts. Actual performance results for variable annuity and variable universal life contracts will be lower due to contract charges. Consult your contract for applicable charges.
Comments
For the six-month period ended June 30, 2011, the Capital Growth Portfolio returned 12.83% versus 8.59% for the current benchmark, the Russell 2000 Growth Index.
On a relative basis, the Portfolio outperformed its benchmark in the Health Care, Information Technology, and Consumer sectors. Top performers included Lufkin Industries, Inc., Genesco, Inc., and Cash America International, Inc. Lufkin Industries, Inc. makes pump jacks used in enhanced oil recovery. The stock continues to benefit from strong oil prices and an increase in the number of active drilling rigs. Genesco, Inc. is a retailer of headwear, footwear and clothing accessories. The stock has benefited from strong earnings growth and its recent acquisition of Schuh Group. Cash America International, Inc. is a pawn-shop operator and a long-term holding. The stock has recovered from an overhang on valuation due to speculation the company could face stiffer regulations. We believe any potential new regulations will not be as draconian as some originally thought.(1)
We had positive absolute returns across all sectors during the six-month period, but we failed to match the index’s returns in the Industrials sector. Also, we had no exposure to the relatively small Telecommunication Services sector, which appreciated within the index.
Our worst-performing stocks were DTS, Inc., MedAssets, Inc. and Meritor, Inc. DTS, Inc. provides high-quality branded entertainment technology. The stock has been somewhat volatile in the first half of the year as the company works to gain traction in the BluRay-compatible computer segment. We see upside potential in the networked-device space with internet-connected television manufacturers setting the tone for eventual DTS-encoded streaming content to supplement its current BluRay revenues. MedAssets, Inc. provides software solutions that help hospitals and health systems improve their operating margins by lowering supply costs and increasing revenue capture. The company’s consulting services division has grown so quickly that it did not have the infrastructure in place to deliver on targets that would have earned it certain bonuses. The company’s management has taken actions to slow the
growth of this business until it has the proper infrastructure in place. We believe the stock is oversold. Meritor, Inc. is a supplier of automotive components, including drive trains used in commercial trucking. The trucking cycle is picking up steam, which we believe will create strong long-term growth opportunities; however, profitability in the short-term has not increased as quickly as we would like due to increasing steel prices. There is a lag between when steel prices increase and when the company can pass through those costs to customers, but we believe the situation will soon work itself out.(1)
The Portfolio’s top performers were Regeneron Pharmaceuticals, Inc., Herbalife Ltd., Fortinet, Inc., EMS Technologies, Inc., and Varian Semiconductor Equipment. The Portfolio’s worst performers were Delcath Systems, Inc., Monster Worldwide, Inc., MedAssets, Inc., Universal Display Corp., and Duff & Phelps Corp. The Portfolio’s best contributors to performance were Lufkin Industries, Inc., Genesco, Inc., Cash America International, Inc., TIBCO Software, Inc., and EMS Technologies, Inc. The Portfolio’s largest detractors to performance were DTS, Inc., MedAssets, Inc., Meritor, Inc., Shuffle Master, Inc., and Monster Worldwide, Inc.(1)
We view the selloff for the bulk of the second quarter as a normal correction within what we see as a positive environment for equities. Lower gasoline prices and a rebound in auto production following the earthquake in Japan should enable reasonable economic growth for the balance of the year. Continued government stimulus focused on reducing unemployment, sure to be a theme of the 2012 presidential election, will also be a plus. While small caps may appear expensive relative to large caps, their average price/earnings ratio is approximately in line with historical averages. Small caps continue to be boosted by high levels of mergers and acquisitions and continued strong earnings growth projected into 2012.
We remain positive on Energy, with our longstanding preference toward companies leveraged to oil rather than to natural gas. Ironically, we believe that the International Energy Agency’s decision to release 60 million barrels of oil from the strategic reserve actually benefited the energy industry by lowering prices enough to help shore up demand. The industry’s rush toward emerging oil plays such as the Permian Basin and the Bakken Shale Formation continues to accelerate, as evidenced by the stunning 18% sequential increase in the oil rig count in the second quarter. We continue to favor companies which hold large acreage positions in these plays, such as Oasis Petroleum, Inc.(1)
Within the Materials and Industrials sectors, we continue to favor companies with exposure to the aerospace industry. Both Boeing and Airbus reported sizable orders at the recently held Paris Air Show. With backlogs at record levels, both companies are increasing their production rates, which should have positive implications for suppliers such as Triumph Group. Additionally, we expect Boeing to finally deliver the long awaited 787 plane during the third quarter, which should serve as a meaningful catalyst for titanium suppliers such as RTI International Metals, Inc. and Titanium Metals Corp. From a macro perspective, we believe industrial activity in the U.S. should benefit from an expected uptick in auto production as supply chain constraints stemming from the devastating earthquake in Japan begin to ease. Encouragingly, recent manufacturing surveys have shown modest improvements following a modest pullback in the spring.(1)
The yield curve flattened in the second quarter as weaker economic data helped to quell concerns over inflationary pressures and demand for U.S. Treasury securities seemed to increase, driven by
| 68 | (continued) |
| Ohio National Fund, Inc. | Capital Growth Portfolio (Continued) |
fears over sovereign debt problems in Europe. A flatter yield curve is not usually good news for bank stocks, as it will typically put pressure on net interest margins. We currently own shares of one bank, UMB Financial Corp., largely because it derives nearly half of its revenues from fees rather than interest, and also because of its significant insider ownership, which we think helps to ensure good loan quality. Looking ahead, financial stocks continue to be challenged by the slow pace of the economic recovery, and it remains hard to find names that have good underlying fundamentals that will support quality earnings growth.(1)
The American Recovery and Reinvestment Act allocated more than $30 billion in stimulus funds to dramatically increase the adoption of electronic health records by physicians and hospitals. Business trends have been accelerating for those vendors, such as Quality Systems, Inc. and Allscripts Healthcare Solutions, Inc., who can offer a certified electronic health record to the physician and hospital markets. While Health Care certainly had strong relative performance during the second quarter of 2011, the gains were largely the result of a rotation into defensive stocks at this stage of the market cycle. There is enormous change occurring in the health care industry, including health care reform, a reluctance to approve new drugs and devices by the Food & Drug Administration, sluggish utilization of health care resources by patients due to the economy, and constant pressure on profit margins. The future winners of the health care industry will be those that can overcome these challenging headwinds.(1)
In Information Technology, we continue to focus on companies that have a secular, rather than cyclical, growth story and continue to look for names with the potential for accelerating earnings growth. Recently, we have favored software companies which offer strong competitive positions, high margins and operating leverage, recurring revenue streams, high barriers to entry and large switching costs, and have the potential to be acquired. For example, we are excited about Qlik Technologies, Inc., a vendor of business intelligence, which is an easy-to-use analytics software built for widespread adoption rather than for the tech-savvy computer technician. As we move closer to the end of the year, we will likely increase our weighting in semiconductor stocks that offer attractive valuations.(1)
Following the recent rally in consumer stocks, we believe that those stocks will likely perform in line with the broader market. We finished the quarter with a modest overweight in Consumer Discretionary due to very strong stock selection as well as the lowering of the sector weight in the index that resulted from the annual Russell reconstitution in June. While we are comfortable with the names we currently own, over time we may reduce our weightings to be more in line with the benchmark.
| (1) | The Portfolio’s composition is subject to change. Holdings and weightings are as of June 30, 2011. |
Change in Value of $10,000 Investment
Hypothetical illustration based on past performance. Future performance will vary. The Portfolio’s returns reflect reinvested dividends. The Portfolio’s holdings may differ significantly from the securities in the index. The index is unmanaged and therefore does not reflect the cost of portfolio management and accounting.
The Russell 2000 Growth Index is a market-weighted total return index that measures the performance of companies within the Russell 2000 Index having higher price-to-book ratios and higher forecasted growth values. The Russell 2000 Index includes the 2000 firms from the Russell 3000 Index with the smallest market capitalizations. The Russell 3000 Index represents 98% of the investable U.S. equity market. The index presented herein includes the effects of reinvested dividends.
| 69 | (continued) |
| Ohio National Fund, Inc. | Capital Growth Portfolio (Continued) |
Portfolio Composition as of June 30, 2011 (1)
| % of Net Assets | ||||
Common Stocks (3) | 98.8 | |||
Money Market Funds and | 1.2 | |||
|
| |||
| 100.0 | ||||
|
|
Top 10 Portfolio Holdings as of June 30, 2011 (1) (2)
| % of Net Assets | ||||
1. Genesco, Inc. | 3.6 | |||
2. Lufkin Industries, Inc. | 3.6 | |||
3. Vitamin Shoppe, Inc. | 2.6 | |||
4. Cash America International, Inc. | 2.5 | |||
5. WABCO Holdings, Inc. | 2.3 | |||
6. TIBCO Software, Inc. | 2.2 | |||
7. GrafTech International Ltd. | 2.0 | |||
8. Sapient Corp. | 1.9 | |||
9. RTI International Metals, Inc. | 1.8 | |||
10. Huntsman Corp. | 1.8 |
| (1) | Composition of Portfolio subject to change. |
| (2) | Short-term investments have been excluded from the list of Top 10 Portfolio Holdings. |
| (3) | Sectors: |
| % of Net Assets | ||||
Information Technology | 25.4 | |||
Consumer Discretionary | 19.1 | |||
Health Care | 17.3 | |||
Industrials | 16.0 | |||
Materials | 7.4 | |||
Energy | 7.1 | |||
Financials | 4.4 | |||
Consumer Staples | 2.1 | |||
|
| |||
| 98.8 | ||||
|
|
| 70 |
| Ohio National Fund, Inc. | Capital Growth Portfolio |
Schedule of Investments | June 30, 2011 (Unaudited) |
| Common Stocks – 98.8% | Shares | Value | ||||||||
CONSUMER DISCRETIONARY – 19.1% | ||||||||||
American Axle & Manufacturing Holdings, Inc. (Auto Components) | (a) | 25,671 | $ | 292,136 | ||||||
Gentex Corp. (Auto Components) | 25,920 | 783,562 | ||||||||
Sotheby’s (Diversified Consumer Svs.) | 16,075 | 699,262 | ||||||||
Bally Technologies, Inc. (Hotels, Restaurants & Leisure) | (a) | 22,516 | 915,951 | |||||||
BJ’s Restaurants, Inc. (Hotels, Restaurants & Leisure) | (a) | 20,611 | 1,079,192 | |||||||
Buffalo Wild Wings, Inc. (Hotels, Restaurants & Leisure) | (a) | 9,680 | 641,881 | |||||||
Orient-Express Hotels Ltd. Class A (Hotels, Restaurants & Leisure) | (a) | 39,810 | 427,957 | |||||||
Pinnacle Entertainment, Inc. (Hotels, Restaurants & Leisure) | (a) | 31,349 | 467,100 | |||||||
Shuffle Master, Inc. (Hotels, Restaurants & Leisure) | (a) | 83,281 | 779,094 | |||||||
Universal Electronics, Inc. (Household Durables) | (a) | 25,136 | 634,935 | |||||||
Pandora Media, Inc. (Media) | (a) | 14,530 | 274,762 | |||||||
Chico’s FAS, Inc. (Specialty Retail) | 20,745 | 315,946 | ||||||||
Genesco, Inc. (Specialty Retail) | (a) | 42,619 | 2,220,450 | |||||||
Vitamin Shoppe, Inc. (Specialty Retail) | (a) | 34,728 | 1,589,153 | |||||||
Steven Madden Ltd. (Textiles, Apparel & Luxury Goods) | (a) | 18,291 | 686,095 | |||||||
|
| |||||||||
| 11,807,476 | ||||||||||
|
| |||||||||
CONSUMER STAPLES – 2.1% | ||||||||||
Fresh Market, Inc. / The (Food & Staples Retailing) | (a) | 17,174 | 664,290 | |||||||
Herbalife Ltd. (Personal Products) | 10,640 | 613,290 | ||||||||
|
| |||||||||
| 1,277,580 | ||||||||||
|
| |||||||||
ENERGY – 7.1% | ||||||||||
Lufkin Industries, Inc. (Energy Equip. & Svs.) | 25,680 | 2,209,764 | ||||||||
OYO Geospace Corp. (Energy Equip. & Svs.) | (a) | 9,060 | 906,000 | |||||||
Cloud Peak Energy, Inc. (Oil, Gas & Consumable Fuels) | (a) | 12,665 | 269,764 | |||||||
Oasis Petroleum, Inc. (Oil, Gas & Consumable Fuels) | (a) | 33,300 | 988,344 | |||||||
|
| |||||||||
| 4,373,872 | ||||||||||
|
| |||||||||
FINANCIALS – 4.4% | ||||||||||
Duff & Phelps Corp. Class A (Capital Markets) | 21,180 | 271,739 | ||||||||
optionsXpress Holdings, Inc. (Capital Markets) | 16,810 | 280,391 | ||||||||
UMB Financial Corp. (Commercial Banks) | 5,200 | 217,776 | ||||||||
Cash America International, Inc. (Consumer Finance) | 27,148 | 1,571,055 | ||||||||
Redwood Trust, Inc. (Real Estate Investment Trusts) | 26,406 | 399,259 | ||||||||
|
| |||||||||
| 2,740,220 | ||||||||||
|
| |||||||||
HEALTH CARE – 17.3% | ||||||||||
BioMarin Pharmaceutical, Inc. (Biotechnology) | (a) | 21,260 | 578,485 | |||||||
Cepheid, Inc. (Biotechnology) | (a) | 18,256 | 632,388 | |||||||
Regeneron Pharmaceuticals, Inc. (Biotechnology) | (a) | 7,750 | 439,502 | |||||||
Seattle Genetics, Inc. (Biotechnology) | (a) | 20,510 | 420,865 | |||||||
Arthrocare Corp. (Health Care Equip. & Supplies) | (a) | 24,050 | 804,953 | |||||||
Delcath Systems, Inc. (Health Care Equip. & Supplies) | (a) | 23,805 | 122,834 | |||||||
Sirona Dental Systems, Inc. (Health Care Equip. & Supplies) | (a) | 16,515 | 876,946 | |||||||
Thoratec Corp. (Health Care Equip. & Supplies) | (a) | 28,838 | 946,463 | |||||||
Catalyst Health Solutions, Inc. (Health Care Providers & Svs.) | (a) | 14,074 | 785,611 | |||||||
Centene Corp. (Health Care Providers & Svs.) | (a) | 21,646 | 769,082 | |||||||
Allscripts Healthcare Solutions, Inc. (Health Care Technology) | (a) | 34,089 | 662,008 | |||||||
MedAssets, Inc. (Health Care Technology) | (a) | 24,646 | 329,271 | |||||||
Medidata Solutions, Inc. (Health Care Technology) | (a) | 1,989 | 47,477 | |||||||
Quality Systems, Inc. (Health Care Technology) | 12,482 | 1,089,679 | ||||||||
| Common Stocks (Continued) | Shares | Value | ||||||||
HEALTH CARE (continued) | ||||||||||
Bruker Corp. (Life Sciences Tools & Svs.) | (a) | 37,304 | $ | 759,509 | ||||||
ICON PLC – ADR (Life Sciences Tools & Svs.) | (a) | 20,883 | 492,003 | |||||||
Parexel International Corp. (Life Sciences Tools & Svs.) | (a) | 14,126 | 332,809 | |||||||
Salix Pharmaceuticals Ltd. (Pharmaceuticals) | (a) | 15,295 | 609,200 | |||||||
|
| |||||||||
| 10,699,085 | ||||||||||
|
| |||||||||
INDUSTRIALS – 16.0% | ||||||||||
Triumph Group, Inc. (Aerospace & Defense) | 8,557 | 852,106 | ||||||||
Atlas Air Worldwide Holdings, Inc. (Air Freight & Logistics) | (a) | 15,300 | 910,503 | |||||||
JetBlue Airways Corp. (Airlines) | (a) | 94,805 | 578,311 | |||||||
Geo Group, Inc. / The (Commercial Svs. & Supplies) | (a) | 38,700 | 891,261 | |||||||
Waste Connections, Inc. (Commercial Svs. & Supplies) | 29,622 | 939,906 | ||||||||
Northwest Pipe Co. (Construction & Engineering) | (a) | 15,825 | 412,399 | |||||||
GrafTech International Ltd. (Electrical Equip.) | (a) | 61,915 | 1,255,017 | |||||||
Regal-Beloit Corp. (Electrical Equip.) | 11,067 | 738,944 | ||||||||
Meritor, Inc. (Machinery) | (a) | 41,510 | 665,820 | |||||||
WABCO Holdings, Inc. (Machinery) | (a) | 20,596 | 1,422,360 | |||||||
Acacia Research – Acacia Technologies (Professional Svs.) | (a) | 17,474 | 641,121 | |||||||
Landstar System, Inc. (Road & Rail) | 12,690 | 589,831 | ||||||||
|
| |||||||||
| 9,897,579 | ||||||||||
|
| |||||||||
INFORMATION TECHNOLOGY – 25.4% | ||||||||||
EMS Technologies, Inc. (Communications Equip.) | (a) | 32,465 | 1,070,371 | |||||||
Riverbed Technology, Inc. (Communications Equip.) | (a) | 17,955 | 710,838 | |||||||
Coherent, Inc. (Electronic Equip., Instr. & Comp.) | (a) | 15,755 | 870,779 | |||||||
DTS, Inc. (Electronic Equip., Instr. & Comp.) | (a) | 25,845 | 1,048,015 | |||||||
Universal Display Corp. (Electronic Equip., Instr. & Comp.) | (a) | 7,597 | 266,579 | |||||||
Monster Worldwide, Inc. (Internet Software & Svs.) | (a) | 12,295 | 180,245 | |||||||
Sapient Corp. (IT Svs.) | (a) | 76,863 | 1,155,251 | |||||||
Netlogic Microsystems, Inc. (Semiconductors & Equip.) | (a) | 20,780 | 839,928 | |||||||
Teradyne, Inc. (Semiconductors & Equip.) | (a) | 37,075 | 548,710 | |||||||
Veeco Instruments, Inc. (Semiconductors & Equip.) | (a) | 13,710 | 663,701 | |||||||
ANSYS, Inc. (Software) | (a) | 16,730 | 914,629 | |||||||
Compuware Corp. (Software) | (a) | 69,418 | 677,520 | |||||||
Fortinet, Inc. (Software) | (a) | 39,622 | 1,081,284 | |||||||
Informatica Corp. (Software) | (a) | 17,970 | 1,049,987 | |||||||
NICE Systems Ltd. – ADR (Software) | (a) | 20,017 | 727,818 | |||||||
Progress Software Corp. (Software) | (a) | 21,627 | 521,860 | |||||||
QLIK Technologies, Inc. (Software) | (a) | 20,510 | 698,571 | |||||||
Radiant Systems, Inc. (Software) | (a) | 36,425 | 761,283 | |||||||
SuccessFactors, Inc. (Software) | (a) | 18,762 | 551,603 | |||||||
TIBCO Software, Inc. (Software) | (a) | 46,406 | 1,346,702 | |||||||
|
| |||||||||
| 15,685,674 | ||||||||||
|
| |||||||||
MATERIALS – 7.4% | ||||||||||
Huntsman Corp. (Chemicals) | 58,396 | 1,100,765 | ||||||||
Intrepid Potash, Inc. (Chemicals) | (a) | 15,807 | 513,728 | |||||||
Quaker Chemical Corp. (Chemicals) | 9,235 | 397,197 | ||||||||
Texas Industries, Inc. (Construction Materials) | 20,663 | 860,201 | ||||||||
RTI International Metals, Inc. (Metals & Mining) | (a) | 28,956 | 1,111,042 | |||||||
Titanium Metals Corp. (Metals & Mining) | 33,546 | 614,563 | ||||||||
|
| |||||||||
| 4,597,496 | ||||||||||
|
| |||||||||
Total Common Stocks (Cost $41,938,399) | $ | 61,078,982 | ||||||||
|
| |||||||||
| 71 | (continued) |
| Ohio National Fund, Inc. | Capital Growth Portfolio (Continued) |
Schedule of Investments | June 30, 2011 (Unaudited) |
| Money Market Funds – 0.8% | Shares | Value | ||||||||
Fidelity Institutional Money Market Funds | 477,000 | $ | 477,000 | |||||||
|
| |||||||||
Total Money Market Funds (Cost $477,000) | $ | 477,000 | ||||||||
|
| |||||||||
Total Investments – 99.6% (Cost $42,415,399) | (b) | $ | 61,555,982 | |||||||
Other Assets in Excess of Liabilities – 0.4% | 260,860 | |||||||||
|
| |||||||||
Net Assets – 100.0% | $ | 61,816,842 | ||||||||
|
| |||||||||
Percentages are stated as a percent of net assets.
Abbreviations:
ADR: American Depositary Receipts
Footnotes:
| (a) | Non-income producing security. |
| (b) | Represents cost for financial reporting purposes, which may differ from cost basis for federal income tax purposes. See also Note 7 of the Notes to Financial Statements. |
The accompanying notes are an integral part of these financial statements.
| 72 |
| Ohio National Fund, Inc. | Nasdaq-100® Index Portfolio |
Objective/Strategy
The Nasdaq-100® Index Portfolio seeks long-term growth of capital by investing primarily in stocks that are included in the Nasdaq-100® Index. Unlike the other Portfolios of the Fund, the Nasdaq-100® Index Portfolio is a non-diversified portfolio for purposes of Section 5(b) of the Investment Company Act of 1940, as amended.
Performance as of June 30, 2011
Average Annual Total Returns: | ||||
One year | 33.87% | |||
Five years | 8.12% | |||
Ten years | 2.40% |
Past performance does not guarantee future results. The performance data quoted represents past performance and current returns may be lower or higher. Total return figures include change in share price and reinvestment of dividends and capital gains. The investment return and principal value will fluctuate so that an investor’s shares, when redeemed, may be worth more or less than the original cost. To obtain performance information up to the most recent month end, call toll-free 1-877-781-6392.
The Portfolio is not open to direct retail investment. Beneficial interest in shares is obtained solely by purchase of variable life insurance policies and variable annuity contracts. Actual performance results for variable annuity and variable universal life contracts will be lower due to contract charges. Consult your contract for applicable charges.
Comments
For the six-month period ended June 30, 2011, the Nasdaq-100® Index Portfolio returned 5.10% versus 5.23% for the current benchmark, the Nasdaq-100® Index.
The Portfolio’s correlation to the index was 99.8%. The high correlation is due to the fact that the Portfolio invests in each of the 100 stocks in the index. The Portfolio also invests in PowerShares QQQ, an exchange traded fund that mimics the holdings and returns of the Nasdaq-100® Index.
The largest contributors to the index return for the six-month period were Apple, Inc., Qualcomm, Inc., Baidu, Inc., Biogen IDEC Inc., and Amazon.com, Inc. The largest detractors for the six-month period were Google, Inc., Cisco Systems, Inc., Research in Motion Ltd., Microsoft Corp., and Broadcom Corp. Class A.(1)
Stocks had a decent first half of 2011, with all major U.S. stock indices posting gains. Most U.S. indices hit a couple of rough patches due to investors’ doubts about the strength of the U.S. financial recovery and the sovereign debt fears in Greece, Portugal, Ireland, Italy, and Spain. QE2 (second quantitative easing) is drawing to an end and there is a debate to enact a QE3 (third quantitative easing). Interest rates should continue to remain at historical lows for the foreseeable future, making risk assets such as equities more attractive. Unemployment, the housing market, and the U.S. debt ceiling/budget will be important themes for the balance of 2011.
| (1) | The Portfolio’s composition is subject to change. Holdings and weightings are as of June 30, 2011. |
The Nasdaq-100®, Nasdaq-100 Index®, and Nasdaq® are registered trademarks of The NASDAQ OMX Group, Inc. (which with its affiliates is referred to as “NASDAQ OMX”). Ohio National Investments, Inc. has licensed these marks for the Portfolio’s use. NASDAQ OMX has not passed on the Portfolio’s legality or suitability. NASDAQ OMX does not sponsor, endorse, sell or promote the Portfolio. NASDAQ OMX MAKES NO WARRANTIES AND BEARS NO LIABILITY WITH RESPECT TO THE PORTFOLIO.
Change in Value of $10,000 Investment
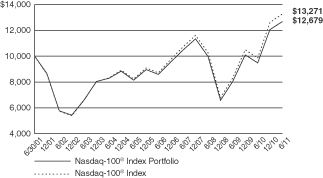
Hypothetical illustration based on past performance. Future performance will vary. The Portfolio’s returns reflect reinvested dividends. The Portfolio’s holdings may differ significantly from the securities in the index. The index is unmanaged and therefore does not reflect the cost of portfolio management and accounting. Investors cannot invest in an index. Although they can invest in its underlying securities or funds.
The Nasdaq-100® Index is a modified capitalization-weighted index of the 100 largest domestic and international non-financial companies listed on the National Market tier of The NASDAQ Stock Market. The index presented herein includes the effects of reinvested dividends.
| 73 | (continued) |
| Ohio National Fund, Inc. | Nasdaq-100® Index Portfolio (Continued) |
Portfolio Composition as of June 30, 2011 (1)
| % of Net Assets | ||||
Common Stocks (3) | 98.3 | |||
Exchange Traded Funds and | 1.7 | |||
|
| |||
| 100.0 | ||||
|
|
Top 10 Portfolio Holdings as of June 30, 2011 (1) (2)
| % of Net Assets | ||||
1. Apple, Inc. | 11.9 | |||
2. Microsoft Corp. | 8.4 | |||
3. Oracle Corp. | 6.4 | |||
4. Google, Inc. Class A | 4.9 | |||
5. Intel Corp. | 4.5 | |||
6. Qualcomm, Inc. | 3.6 | |||
7. Amazon.com, Inc. | 3.5 | |||
8. Cisco Systems, Inc. | 3.3 | |||
9. Amgen, Inc. | 2.1 | |||
10. Comcast Corp. Class A | 2.0 |
| (1) | Composition of Portfolio subject to change. |
| (2) | Short-term investments have been excluded from the list of Top 10 Portfolio Holdings. |
| (3) | Sectors: |
| % of Net Assets | ||||
Information Technology | 63.8 | |||
Consumer Discretionary | 16.2 | |||
Health Care | 11.7 | |||
Industrials | 2.7 | |||
Consumer Staples | 2.3 | |||
Telecommunication Services | 1.2 | |||
Materials | 0.4 | |||
|
| |||
| 98.3 | ||||
|
|
| 74 |
| Ohio National Fund, Inc. | Nasdaq-100® Index Portfolio |
Schedule of Investments | June 30, 2011 (Unaudited) |
| Common Stocks – 98.3% | Shares | Value | ||||||||
CONSUMER DISCRETIONARY – 16.2% | ||||||||||
Apollo Group, Inc. Class A (Diversified Consumer Svs.) | (a) | 2,950 | $ | 128,856 | ||||||
Ctrip.com International Ltd. – ADR (Hotels, Restaurants & Leisure) | (a) | 3,075 | 132,471 | |||||||
Starbucks Corp. (Hotels, Restaurants & Leisure) | 15,650 | 618,018 | ||||||||
Wynn Resorts Ltd. (Hotels, Restaurants & Leisure) | 2,600 | 373,204 | ||||||||
Garmin Ltd. (Household Durables) | 4,350 | 143,680 | ||||||||
Amazon.com, Inc. (Internet & Catalog Retail) | (a) | 9,425 | 1,927,318 | |||||||
Expedia, Inc. (Internet & Catalog Retail) | 5,175 | 150,023 | ||||||||
Liberty Media Corp – Interactive (Internet & Catalog Retail) | (a) | 11,950 | 200,401 | |||||||
Netflix, Inc. (Internet & Catalog Retail) | (a) | 1,100 | 288,959 | |||||||
priceline.com, Inc. (Internet & Catalog Retail) | (a) | 1,025 | 524,728 | |||||||
Mattel, Inc. (Leisure Equip. & Products) | 7,250 | 199,302 | ||||||||
Comcast Corp. Class A (Media) | 43,522 | 1,102,847 | ||||||||
DIRECTV Class A (Media) | (a) | 16,025 | 814,390 | |||||||
News Corp. Class A (Media) | 38,175 | 675,698 | ||||||||
Virgin Media, Inc. (Media) | 6,625 | 198,286 | ||||||||
Dollar Tree, Inc. (Multiline Retail) | (a) | 2,550 | 169,881 | |||||||
Sears Holdings Corp. (Multiline Retail) | (a) | 2,250 | 160,740 | |||||||
Bed Bath & Beyond, Inc. (Specialty Retail) | (a) | 5,200 | 303,524 | |||||||
O’Reilly Automotive, Inc. (Specialty Retail) | (a) | 2,875 | 188,341 | |||||||
Ross Stores, Inc. (Specialty Retail) | 2,450 | 196,294 | ||||||||
Staples, Inc. (Specialty Retail) | 14,900 | 235,420 | ||||||||
Urban Outfitters, Inc. (Specialty Retail) | (a) | 3,375 | 95,006 | |||||||
|
| |||||||||
| 8,827,387 | ||||||||||
|
| |||||||||
CONSUMER STAPLES – 2.3% | ||||||||||
Costco Wholesale Corp. (Food & Staples Retailing) | 9,110 | 740,096 | ||||||||
Whole Foods Market, Inc. (Food & Staples Retailing) | 3,675 | 233,179 | ||||||||
Green Mountain Coffee Roasters, Inc. (Food Products) | (a) | 3,200 | 285,632 | |||||||
|
| |||||||||
| 1,258,907 | ||||||||||
|
| |||||||||
HEALTH CARE – 11.7% | ||||||||||
Alexion Pharmaceuticals, Inc. (Biotechnology) | (a) | 3,850 | 181,066 | |||||||
Amgen, Inc. (Biotechnology) | (a) | 19,422 | 1,133,274 | |||||||
Biogen Idec, Inc. (Biotechnology) | (a) | 5,050 | 539,946 | |||||||
Celgene Corp. (Biotechnology) | (a) | 9,650 | 582,088 | |||||||
Cephalon, Inc. (Biotechnology) | (a) | 1,600 | 127,840 | |||||||
Gilead Sciences, Inc. (Biotechnology) | (a) | 16,425 | 680,159 | |||||||
Vertex Pharmaceuticals, Inc. (Biotechnology) | (a) | 4,300 | 223,557 | |||||||
DENTSPLY International, Inc. (Health Care Equip. & Supplies) | 2,950 | 112,336 | ||||||||
Intuitive Surgical, Inc. (Health Care Equip. & Supplies) | (a) | 825 | 306,991 | |||||||
Express Scripts, Inc. (Health Care Providers & Svs.) | (a) | 11,050 | 596,479 | |||||||
Henry Schein, Inc. (Health Care Providers & Svs.) | (a) | 1,925 | 137,811 | |||||||
Cerner Corp. (Health Care Technology) | (a) | 3,500 | 213,885 | |||||||
Illumina, Inc. (Life Sciences Tools & Svs.) | (a) | 2,575 | 193,511 | |||||||
Life Technologies Corp. (Life Sciences Tools & Svs.) | (a) | 3,725 | 193,961 | |||||||
QIAGEN NV (Life Sciences Tools & Svs.) | (a) | 4,875 | 92,723 | |||||||
Mylan, Inc. (Pharmaceuticals) | (a) | 9,175 | 226,347 | |||||||
Teva Pharmaceutical Industries Ltd. – ADR (Pharmaceuticals) | 14,685 | 708,111 | ||||||||
Warner Chilcott PLC Class A (Pharmaceuticals) | 5,300 | 127,889 | ||||||||
|
| |||||||||
| 6,377,974 | ||||||||||
|
| |||||||||
INDUSTRIALS – 2.7% | ||||||||||
C.H. Robinson Worldwide, Inc. (Air Freight & Logistics) | 3,450 | 271,998 | ||||||||
Expeditors International of Washington, Inc. (Air Freight & Logistics) | 4,425 | 226,516 | ||||||||
Stericycle, Inc. (Commercial Svs. & Supplies) | (a) | 1,800 | 160,416 | |||||||
Joy Global, Inc. (Machinery) | 2,200 | 209,528 | ||||||||
PACCAR, Inc. (Machinery) | 7,639 | 390,277 | ||||||||
Fastenal Co. (Trading Companies & Distributors) | 6,150 | 221,339 | ||||||||
|
| |||||||||
| 1,480,074 | ||||||||||
|
| |||||||||
INFORMATION TECHNOLOGY – 63.8% | ||||||||||
Cisco Systems, Inc. (Communications Equip.) | 114,825 | 1,792,418 | ||||||||
F5 Networks, Inc. (Communications Equip.) | (a) | 1,700 | 187,425 | |||||||
Qualcomm, Inc. (Communications Equip.) | 34,845 | 1,978,848 | ||||||||
Research In Motion Ltd. (Communications Equip.) | (a) | 10,925 | 315,186 | |||||||
| Common Stocks (Continued) | Shares | Value | ||||||||
INFORMATION TECHNOLOGY (continued) | ||||||||||
Apple, Inc. (Computers & Peripherals) | (a) | 19,295 | $ | 6,476,753 | ||||||
Dell, Inc. (Computers & Peripherals) | (a) | 39,400 | 656,798 | |||||||
NetApp, Inc. (Computers & Peripherals) | (a) | 7,685 | 405,614 | |||||||
SanDisk Corp. (Computers & Peripherals) | (a) | 4,975 | 206,463 | |||||||
Seagate Technology PLC (Computers & Peripherals) | 8,975 | 145,036 | ||||||||
Flextronics International Ltd. (Electronic Equip., Instr. & Comp.) | (a) | 15,825 | 101,597 | |||||||
FLIR Systems, Inc. (Electronic Equip., Instr. & Comp.) | 3,325 | 112,086 | ||||||||
Akamai Technologies, Inc. (Internet Software & Svs.) | (a) | 3,900 | 122,733 | |||||||
Baidu, Inc. – ADR (Internet Software & Svs.) | (a) | 5,650 | 791,735 | |||||||
eBay, Inc. (Internet Software & Svs.) | (a) | 27,085 | 874,033 | |||||||
Google, Inc. Class A (Internet Software & Svs.) | (a) | 5,275 | 2,671,155 | |||||||
VeriSign, Inc. (Internet Software & Svs.) | 3,505 | 117,277 | ||||||||
Yahoo!, Inc. (Internet Software & Svs.) | (a) | 27,210 | 409,238 | |||||||
Automatic Data Processing, Inc. (IT Svs.) | 10,425 | 549,189 | ||||||||
Cognizant Technology Solutions Corp. Class A (IT Svs.) | (a) | 6,350 | 465,709 | |||||||
Fiserv, Inc. (IT Svs.) | (a) | 2,987 | 187,076 | |||||||
Infosys Ltd. – ADR (IT Svs.) | 2,100 | 136,983 | ||||||||
Paychex, Inc. (IT Svs.) | 7,545 | 231,782 | ||||||||
Altera Corp. (Semiconductors & Equip.) | 6,725 | 311,704 | ||||||||
Applied Materials, Inc. (Semiconductors & Equip.) | 27,525 | 358,100 | ||||||||
Broadcom Corp. Class A (Semiconductors & Equip.) | (a) | 10,075 | 338,923 | |||||||
First Solar, Inc. (Semiconductors & Equip.) | (a) | 1,800 | 238,086 | |||||||
Intel Corp. (Semiconductors & Equip.) | 110,695 | 2,453,001 | ||||||||
KLA-Tencor Corp. (Semiconductors & Equip.) | 3,500 | 141,680 | ||||||||
Lam Research Corp. (Semiconductors & Equip.) | (a) | 2,600 | 115,128 | |||||||
Linear Technology Corp. (Semiconductors & Equip.) | 4,755 | 157,010 | ||||||||
Marvell Technology Group Ltd. (Semiconductors & Equip.) | (a) | 12,750 | 188,254 | |||||||
Maxim Integrated Products, Inc. (Semiconductors & Equip.) | 6,175 | 157,833 | ||||||||
Microchip Technology, Inc. (Semiconductors & Equip.) | 3,975 | 150,692 | ||||||||
Micron Technology, Inc. (Semiconductors & Equip.) | (a) | 20,900 | 156,332 | |||||||
NVIDIA Corp. (Semiconductors & Equip.) | (a) | 12,537 | 199,777 | |||||||
Xilinx, Inc. (Semiconductors & Equip.) | 5,555 | 202,591 | ||||||||
Activision Blizzard, Inc. (Software) | 23,875 | 278,860 | ||||||||
Adobe Systems, Inc. (Software) | (a) | 10,530 | 331,169 | |||||||
Autodesk, Inc. (Software) | (a) | 4,800 | 185,280 | |||||||
BMC Software, Inc. (Software) | (a) | 3,700 | 202,390 | |||||||
CA, Inc. (Software) | 10,575 | 241,533 | ||||||||
Check Point Software Technologies Ltd. (Software) | (a) | 4,345 | 247,013 | |||||||
Citrix Systems, Inc. (Software) | (a) | 3,925 | 314,000 | |||||||
Electronic Arts, Inc. (Software) | (a) | 6,930 | 163,548 | |||||||
Intuit, Inc. (Software) | (a) | 6,305 | 326,977 | |||||||
Microsoft Corp. (Software) | 176,050 | 4,577,300 | ||||||||
Oracle Corp. (Software) | 105,635 | 3,476,448 | ||||||||
Symantec Corp. (Software) | (a) | 15,773 | 311,044 | |||||||
|
| |||||||||
| 34,759,807 | ||||||||||
|
| |||||||||
MATERIALS – 0.4% | ||||||||||
Sigma-Aldrich Corp. (Chemicals) | 2,550 | $ | 187,119 | |||||||
|
| |||||||||
TELECOMMUNICATION SERVICES – 1.2% | ||||||||||
NII Holdings, Inc. (Wireless Telecom. Svs.) | (a) | 3,550 | 150,449 | |||||||
Vodafone Group PLC-ADR (Wireless Telecom. Svs.) | 18,100 | 483,632 | ||||||||
|
| |||||||||
| 634,081 | ||||||||||
|
| |||||||||
Total Common Stocks (Cost $43,457,510) | $ | 53,525,349 | ||||||||
|
| |||||||||
| Exchange Traded Funds – 1.4% | Shares | Value | ||||||||
PowerShares QQQ Trust Series 1 | 13,965 | $ | 796,703 | |||||||
|
| |||||||||
Total Exchange Traded Funds (Cost $802,099) | $ | 796,703 | ||||||||
|
| |||||||||
Total Investments – 99.7% (Cost $44,259,609) | (b) | $ | 54,322,052 | |||||||
Other Assets in Excess of Liabilities – 0.3% | 145,707 | |||||||||
|
| |||||||||
Net Assets – 100.0% | $ | 54,467,759 | ||||||||
|
| |||||||||
| 75 | (continued) |
| Ohio National Fund, Inc. | Nasdaq-100® Index Portfolio (Continued) |
Schedule of Investments | June 30, 2011 (Unaudited) |
Percentages are stated as a percent of net assets.
Abbreviations:
ADR: American Depositary Receipts
Footnotes:
| (a) | Non-income producing security. |
| (b) | Represents cost for financial reporting purposes, which may differ from cost basis for federal income tax purposes. See also Note 7 of the Notes to Financial Statements. |
The accompanying notes are an integral part of these financial statements.
| 76 |
| Ohio National Fund, Inc. | Bristol Portfolio |
Objective/Strategy
The Bristol Portfolio seeks long-term growth of capital by investing primarily in common stocks of the 1,000 largest publicly traded U.S. companies in terms of market capitalization.
Performance as of June 30, 2011
Average Annual Total Returns: | ||||
One year | 28.99% | |||
Five years | 3.01% | |||
Since inception (5/1/02) | 4.73% |
Past performance does not guarantee future results. The performance data quoted represents past performance and current returns may be lower or higher. Total return figures include change in share price and reinvestment of dividends and capital gains. The investment return and principal value will fluctuate so that an investor’s shares, when redeemed, may be worth more or less than the original cost. To obtain performance information up to the most recent month end, call toll-free 1-877-781-6392.
The Portfolio is not open to direct retail investment. Beneficial interest in shares is obtained solely by purchase of variable life insurance policies and variable annuity contracts. Actual performance results for variable annuity and variable universal life contracts will be lower due to contract charges. Consult your contract for applicable charges.
Comments
For the six-month period ended June 30, 2011, the Bristol Portfolio returned 4.72% versus 6.02% for the current benchmark, the S&P 500 Index.
The overweight in Financials was the major reason for the relative under-performance. Continued worries about the debt crisis in Europe, the lack of clarity on resolution of the mortgage meltdown in the U.S., the inability to clearly define capital requirements for the largest U.S. banks, and lower-than-expected interest rates combined to negatively impact the Financials sector.(1)
The Portfolio’s best performers were SunPower Corp., Medicis Pharmaceutical Corp., Rockwell Automation, Inc., Caterpillar, Inc., and Johnson Controls, Inc. The Portfolio’s worst performers were Royal Caribbean Cruises Ltd., ConocoPhilips, Bank of America Corp., Morgan Stanley, and United Continental Holdings, Inc. The top contributors to performance were SunPower Corp., Caterpillar, Inc., Rockwell Automation, Inc., Medicis Pharmaceutical Corp., and Halliburton Co. The top detractors to performance were Bank of America Corp., Royal Caribbean Cruises Ltd., Google, Inc., Morgan Stanley, and United Continental Holdings, Inc.(1)
The top contributors to the Portfolio’s year-to-date performance included SunPower Corp., which benefited performance when Total, a French multi-national oil company took over a controlling stake of SunPower Corp., relatively contributing 92 basis points. Medicis Pharmaceutical Corp. contributed 43 basis points due to a settlement with Teva Pharmaceutical Industries in regards to a patent on their most profitable product, Solodyn. During the first quarter, Rockwell Automation, Inc. contributed 43 basis points as they exceeded estimates due to their positioning in China. Caterpillar, Inc. beat and raised estimates with continued strength in the growth of its mining and equipment markets, which contributed 37 basis points. Due to a rise in its earnings estimates, Johnson Controls, Inc., contributed 34 basis points as the company provided better prospects for faster recovery from supply disruptions from Japan’s disaster.(1)
Detractors to performance during the six-month period included Royal Caribbean Cruises Ltd., which under-performed by 33 basis
points due to high oil prices and weak demand in Europe. ConocoPhillips detracted from the Portfolio’s performance by 30 basis points due to slower return of capital to shareholders and falling oil prices. Bank of America Corp. detracted from the Portfolio’s performance by 28 basis points as a series of mortgage repurchase settlements were more costly than investor expectations. Morgan Stanley under-performed by 27 basis points as trading revenue and earnings expectations for the industry declined over the course of the first half of the year, driven by lower client activity levels. United Continental Holdings, Inc. detracted from the Portfolio’s performance by 25 basis points, because of higher oil prices combined with slightly weaker revenue in June due to the weaker economy.(1)
The Portfolio’s main sector weight changes were adding to Consumer Discretionary, while lowering the Portfolio’s exposure to Information Technology. This was not done with any particular macro intent, as both probably exhibit similar correlations to Gross Domestic Product growth, consumer spending, and general market sentiment. Specifically, we added Abercrombie & Fitch Co., Starbucks Corp., Hanesbrands Inc., MGM Resorts International, and United Continental Holdings, Inc. while selling Cisco Systems, Inc., Oracle Corp., Hewlett-Packard Co., and SunPower Corp.(1)
The dominant theme was that the world would continue to recover from the 2008 recession. That does not seem to be happening as swiftly and robustly as one would have hoped. The chance of a second global recession still looms on the horizon. Although earnings beat expectations for many of the cyclical sectors, including Consumer Discretionary and Industrials, this would not be the case if the world fell into a global recession.(1)
If Europe can’t get a handle on its debt problems in the weaker nations, and if the U.S. can’t recover from a recession while simultaneously also dealing with its longer term deficit problem, then it seems likely we will experience a second, perhaps deeper and longer, recession.
We are hopeful that job growth will re-accelerate in the U.S., that Europe can deal with its debt problems, that somehow the U.S. can come to some longer-term resolution on the deficit, and that there will be fewer macro shocks like Japanese earthquakes and civil wars through the Middle East and North Africa.
| (1) | The Portfolio’s composition is subject to change. Holdings and weightings are as of June 30, 2011. |
| 77 | (continued) |
| Ohio National Fund, Inc. | Bristol Portfolio (Continued) |
Change in Value of $10,000 Investment

Hypothetical illustration based on past performance. Future performance will vary. The Portfolio’s returns reflect reinvested dividends. The Portfolio’s holdings may differ significantly from the securities in the index. The index is unmanaged and therefore does not reflect the cost of portfolio management and accounting.
The S&P 500 Index is a capitalization-weighted index designed to measure performance of the broad domestic economy through changes in the aggregate market value of 500 stocks representing all major industries. The index presented herein includes the effects of reinvested dividends.
Portfolio Composition as of June 30, 2011 (1)
| % of Net Assets | ||||
Common Stocks (3) | 97.5 | |||
Money Market Funds | 2.5 | |||
|
| |||
| 100.0 | ||||
|
|
Top 10 Portfolio Holdings as of June 30, 2011 (1) (2)
| % of Net Assets | ||||
1. Apple, Inc | 3.4 | |||
2. International Business Machines Corp. | 2.6 | |||
3. Citrix Systems, Inc. | 2.2 | |||
4. Avago Technologies Ltd. | 2.2 | |||
5. Warner Chilcott PLC Class A | 2.2 | |||
6. Johnson Controls, Inc. | 2.1 | |||
7. Starbucks Corp. | 2.1 | |||
8. Google, Inc. Class A | 2.1 | |||
9. Chevron Corp. | 2.1 | |||
10. Dresser-Rand Group, Inc. | 2.0 |
| (1) | Composition of Portfolio subject to change. |
| (2) | Short-term investments have been excluded from the list of Top 10 Portfolio Holdings. |
| (3) | Sectors: |
| % of Net Assets | ||||
Information Technology | 19.6 | |||
Consumer Discretionary | 18.3 | |||
Financials | 17.9 | |||
Industrials | 14.6 | |||
Energy | 11.6 | |||
Health Care | 6.0 | |||
Materials | 5.5 | |||
Consumer Staples | 4.0 | |||
|
| |||
| 97.5 | ||||
|
|
| 78 |
| Ohio National Fund, Inc. | Bristol Portfolio |
Schedule of Investments | June 30, 2011 (Unaudited) |
| Common Stocks – 97.5% | Shares | Value | ||||||||
CONSUMER DISCRETIONARY – 18.3% | ||||||||||
Johnson Controls, Inc. (Auto Components) | 101,600 | $ | 4,232,656 | |||||||
MGM Resorts International (Hotels, Restaurants & Leisure) | (a) | 72,000 | 951,120 | |||||||
Royal Caribbean Cruises Ltd. (Hotels, Restaurants & Leisure) | (a) | 94,300 | 3,549,452 | |||||||
Starbucks Corp. (Hotels, Restaurants & Leisure) | 106,800 | 4,217,532 | ||||||||
Amazon.com, Inc. (Internet & Catalog Retail) | (a) | 16,500 | 3,374,085 | |||||||
Walt Disney Co. / The (Media) | 89,000 | 3,474,560 | ||||||||
Abercrombie & Fitch Co. Class A (Specialty Retail) | 50,900 | 3,406,228 | ||||||||
Tiffany & Co. (Specialty Retail) | 36,500 | 2,865,980 | ||||||||
Coach, Inc. (Textiles, Apparel & Luxury Goods) | 54,100 | 3,458,613 | ||||||||
Hanesbrands, Inc. (Textiles, Apparel & Luxury Goods) | (a) | 107,300 | 3,063,415 | |||||||
Warnaco Group, Inc. / The (Textiles, Apparel & Luxury Goods) | (a) | 69,700 | 3,641,825 | |||||||
|
| |||||||||
| 36,235,466 | ||||||||||
|
| |||||||||
CONSUMER STAPLES – 4.0% | ||||||||||
H.J. Heinz Co. (Food Products) | 68,600 | 3,655,008 | ||||||||
Kellogg Co. (Food Products) | 17,100 | 945,972 | ||||||||
Kraft Foods, Inc. Class A (Food Products) | 92,400 | 3,255,252 | ||||||||
|
| |||||||||
| 7,856,232 | ||||||||||
|
| |||||||||
ENERGY – 11.6% | ||||||||||
Dresser-Rand Group, Inc. (Energy Equip. & Svs.) | (a) | 73,600 | 3,956,000 | |||||||
Halliburton Co. (Energy Equip. & Svs.) | 74,200 | 3,784,200 | ||||||||
National Oilwell Varco, Inc. (Energy Equip. & Svs.) | 45,600 | 3,566,376 | ||||||||
Chevron Corp. (Oil, Gas & Consumable Fuels) | 40,100 | 4,123,884 | ||||||||
Devon Energy Corp. (Oil, Gas & Consumable Fuels) | 46,900 | 3,696,189 | ||||||||
Occidental Petroleum Corp. (Oil, Gas & Consumable Fuels) | 37,500 | 3,901,500 | ||||||||
|
| |||||||||
| 23,028,149 | ||||||||||
|
| |||||||||
FINANCIALS – 17.9% | ||||||||||
Morgan Stanley (Capital Markets) | 126,900 | 2,919,969 | ||||||||
Huntington Bancshares, Inc. (Commercial Banks) | 544,100 | 3,569,296 | ||||||||
Wells Fargo & Co. (Commercial Banks) | 135,900 | 3,813,354 | ||||||||
Bank of America Corp. (Diversified Financial Svs.) | 330,600 | 3,623,376 | ||||||||
Citigroup, Inc. (Diversified Financial Svs.) | 92,900 | 3,868,356 | ||||||||
JPMorgan Chase & Co. (Diversified Financial Svs.) | 94,700 | 3,877,018 | ||||||||
Hartford Financial Services Group, Inc. (Insurance) | 121,200 | 3,196,044 | ||||||||
Lincoln National Corp. (Insurance) | 99,800 | 2,843,302 | ||||||||
MetLife, Inc. (Insurance) | 86,200 | 3,781,594 | ||||||||
Prudential Financial, Inc. (Insurance) | 60,100 | 3,821,759 | ||||||||
|
| |||||||||
| 35,314,068 | ||||||||||
|
| |||||||||
HEALTH CARE – 6.0% | ||||||||||
Cubist Pharmaceuticals, Inc. (Biotechnology) | (a) | 33,300 | 1,198,467 | |||||||
Vertex Pharmaceuticals, Inc. (Biotechnology) | (a) | 68,000 | 3,535,320 | |||||||
| Common Stocks (Continued) | Shares | Value | ||||||||
HEALTH CARE (continued) | ||||||||||
Medco Health Solutions, Inc. (Health Care Providers & Svs.) | (a) | 51,000 | $ | 2,882,520 | ||||||
Warner Chilcott PLC Class A (Pharmaceuticals) | 178,200 | 4,299,966 | ||||||||
|
| |||||||||
| 11,916,273 | ||||||||||
|
| |||||||||
INDUSTRIALS – 14.6% | ||||||||||
Honeywell International, Inc. (Aerospace & Defense) | 66,200 | 3,944,858 | ||||||||
FedEx Corp. (Air Freight & Logistics) | 41,100 | 3,898,335 | ||||||||
United Parcel Service, Inc. Class B (Air Freight & Logistics) | 49,100 | 3,580,863 | ||||||||
United Continental Holdings, Inc. (Airlines) | (a) | 146,800 | 3,322,084 | |||||||
Rockwell Automation, Inc. (Electrical Equip.) | 31,500 | 2,732,940 | ||||||||
3M Co. (Industrial Conglomerates) | 40,500 | 3,841,425 | ||||||||
Caterpillar, Inc. (Machinery) | 34,200 | 3,640,932 | ||||||||
Pentair, Inc. (Machinery) | 95,500 | 3,854,380 | ||||||||
|
| |||||||||
| 28,815,817 | ||||||||||
|
| |||||||||
INFORMATION TECHNOLOGY – 19.6% | ||||||||||
Qualcomm, Inc. (Communications Equip.) | 66,900 | 3,799,251 | ||||||||
Apple, Inc. (Computers & Peripherals) | (a) | 19,900 | 6,679,833 | |||||||
EMC Corp. (Computers & Peripherals) | (a) | 87,700 | 2,416,135 | |||||||
Google, Inc. Class A (Internet Software & Svs.) | (a) | 8,200 | 4,152,316 | |||||||
International Business Machines Corp. (IT Svs.) | 30,300 | 5,197,965 | ||||||||
Avago Technologies Ltd. (Semiconductors & Equip.) | 113,800 | 4,324,400 | ||||||||
Maxim Integrated Products, Inc. (Semiconductors & Equip.) | 146,700 | 3,749,652 | ||||||||
Texas Instruments, Inc. (Semiconductors & Equip.) | 58,700 | 1,927,121 | ||||||||
Citrix Systems, Inc. (Software) | (a) | 54,900 | 4,392,000 | |||||||
Electronic Arts, Inc. (Software) | (a) | 95,100 | 2,244,360 | |||||||
|
| |||||||||
| 38,883,033 | ||||||||||
|
| |||||||||
MATERIALS – 5.5% | ||||||||||
E.I. du Pont de Nemours & Co. (Chemicals) | 72,700 | 3,929,435 | ||||||||
Monsanto Co. (Chemicals) | 42,900 | 3,111,966 | ||||||||
Potash Corp of Saskatchewan, Inc. (Chemicals) | 67,600 | 3,852,524 | ||||||||
|
| |||||||||
| 10,893,925 | ||||||||||
|
| |||||||||
Total Common Stocks (Cost $181,200,789) | $ | 192,942,963 | ||||||||
|
| |||||||||
| Money Market Funds – 2.7% | Shares | Value | ||||||||
Fidelity Institutional Money Market Funds | 5,353,000 | $ | 5,353,000 | |||||||
|
| |||||||||
Total Money Market Funds (Cost $5,353,000) | $ | 5,353,000 | ||||||||
|
| |||||||||
Total Investments – 100.2% (Cost $186,553,789) | (b) | $ | 198,295,963 | |||||||
Liabilities in Excess of Other Assets – (0.2)% | (399,177) | |||||||||
|
| |||||||||
Net Assets – 100.0% | $ | 197,896,786 | ||||||||
|
| |||||||||
Percentages are stated as a percent of net assets.
Footnotes:
| (a) | Non-income producing security. |
| (b) | Represents cost for financial reporting purposes, which may differ from cost basis for federal income tax purposes. See also Note 7 of the Notes to Financial Statements. |
The accompanying notes are an integral part of these financial statements.
| 79 |
| Ohio National Fund, Inc. | Bryton Growth Portfolio |
Objective/Strategy
The Bryton Growth Portfolio seeks long-term growth of capital by investing primarily in common stocks of growth-oriented U.S. companies smaller than the 500 largest publicly traded U.S. companies in terms of market capitalization.
Performance as of June 30, 2011
Average Annual Total Returns: | ||||
One year | 35.58% | |||
Five years | 5.14% | |||
Since inception (5/1/02) | 3.74% |
Past performance does not guarantee future results. The performance data quoted represents past performance and current returns may be lower or higher. Total return figures include change in share price and reinvestment of dividends and capital gains. The investment return and principal value will fluctuate so that an investor’s shares, when redeemed, may be worth more, or less than the original cost. To obtain performance information up to the most recent month end, call toll-free 1-877-781-6392.
The Portfolio is not open to direct retail investment. Beneficial interest in shares is obtained solely by purchase of variable life insurance policies and variable annuity contracts. Actual performance results for variable annuity and variable universal life contracts will be lower due to contract charges. Consult your contract for applicable charges.
Comments
For the six-month period ended June��30, 2011, the Bryton Growth Portfolio returned 2.51% versus 8.59% for the current benchmark, the Russell 2000 Growth Index.
Various sector weightings affected the Portfolio’s performance. We had a significant bet on biotechnology stocks, whose specific drivers helped them to contribute positively, while our overexposure to Materials and Information Technology stocks generally detracted from relative performance. We also owned several semiconductor stocks that suffered as investors became concerned that a potential global slowdown would slow broad-based demand and create pressure on inventory levels.(1)
Equity markets continued to be volatile, as investors assessed the impact of rising inflationary pressures, the ability of the global supply chain to digest the Japanese tragedy, and Europe’s efforts to resolve their debt concerns. A strong rally at the end of June brought small cap stocks back to being largely flat for the second quarter. When facing the aforementioned uncertainties, investors understandably rotated to more defensive parts of the market. Obviously, that explained why Health Care and Consumer Staples outperformed year-to-date. In addition, smaller, higher beta stocks were also being avoided. We witnessed the unusual out-performance of larger cap stocks in both up-market and down-market as they were perceived as safe. In that regard, the Portfolio has a higher beta and a lower median market cap than the benchmark. These characteristics, therefore, also negatively impacted relative performance.(1)
The tragedy in Japan also significantly impacted the performance of the Portfolio. One of the companies the Portfolio owned, Paladin Energy Ltd., a uranium producer, was down significantly as the nuclear disaster in Japan undermined the prospect of global nuclear power utilization. Other holdings in the Portfolio, particularly our Consumer Discretionary and semiconductor stocks, were also affected. Hawaiian Holdings, Inc. saw substantial drop off in passenger traffic from Japan. Maxlinear, Inc. and Silicon Image, Inc. under-performed partly due to direct exposure to the Japanese market. Several other semiconductor stocks also suffered as
investors became concerned that a potential global slowdown would hurt broad-based demand and create pressure on inventory levels.(1)
Rising energy and commodity prices increased the costs for goods and reduced the purchasing power of consumers. As a result, consumers became even more price sensitive and promotion driven. For some of the Portfolio’s holdings, such as Talbots, Inc., Liz Claiborne, Inc., and The Warnaco Group, Inc., those factors created more headwind as these companies tried to reduce discounting and pass on rising commodity costs.(1)
Several of the Portfolio’s holdings, OCZ Technology, Northern Oil & Gas, Inc., and Ebix, Inc. were subjects of short seller attacks. Though no wrong-doing by the companies was found, the performance of the stocks was negatively impacted.(1)
The Portfolio’s top performers were Pharmasset, Inc., Amarin Corporation PLC, SMART Modular Technologies, Inc., Savvis, Inc., and Pharmacyclics, Inc. The Portfolio’s worst performers were Anadigics, Inc., Nektar Therapeutics, CIENA Corp., Liz Claiborne, Inc., and MaxLinear, Inc. The Portfolio’s top contributors to performance were Pharmasset, Inc., Amarin Corporation PLC, Savvis, Inc., SMART Modular Technologies, Inc., and Pharmacyclics, Inc. The Portfolio’s largest detractors to performance were Anadigics, Inc., Nektar Therapeutics, CIENA Corp., Liz Claiborne, Inc., and Satcon Technology Corp.(1)
Positive contributors included several biotechs that saw positive clinical and regulatory news, including Amarin Corp., Pharmasset, Inc., and Pharmacyclics, Inc. We also owned a semiconductor company, Smart Modular Corp., that benefited from improving DRAM (dynamic random-access memory) prices and a nascent SSD (solid state drive) business before being purchased by Silver Lake in late April.(1)
Several selections detracted from the Portfolio’s performance. The Portfolio owned Ciena Corp., a leading optical vendor, into the quarterly earnings report as we believed their technological edge in 40/100G equipment would help them gain a larger share of strong global telecom capital expenditure budgets. During the previous quarter, management also forecasted that sales would be more weighted to second half 2011, with a resulting margin boost. However, the company disappointed, with guidance below consensus and vague promises on how they would improve their long-term financial model. Anadigics, Inc. and Triquint Semiconductor, Inc. were two other selections that under-performed. Both are suppliers of power amplifiers, with significant exposure to the handset market. Through the quarter, there were concerns that macro weakness, a slow ramp of 3G phones in China, and Japan’s impact on inventory levels would ultimately hurt end-market demand. Both companies also struggled with design changes at key customers that raised concerns for near-term sales. Another position that under-performed was SatCon Technology Corp., a manufacturer of solar inverters that suffered from uncertainty as various national governments pulled back on clean energy subsidies, creating spending pauses and component gluts that have yet to be resolved. Continued overinvestment in the sector, largely by Chinese firms, has also pressured the industry.(1)
The Portfolio made some changes in sector weighting. The Portfolio bought three banks: Cathay General Bancorp, First Midwest Bancorp, Inc., and Hancock Holding Co. All three are trading at relatively inexpensive valuations with strong capital. The companies stand to benefit from improved credit trends as the economy continues to improve. The Portfolio reduced its holdings in Consumer Discretionary.
| 80 | (continued) |
| Ohio National Fund, Inc. | Bryton Growth Portfolio (Continued) |
We sold Liz Claiborne, Inc. and Talbots, Inc. as they continued to struggle in trying to turn around their business. We also sold Cooper Tire & Rubber Co. as the company’s price increases were not able to offset increases in its costs. The Portfolio also trimmed its exposure to restaurants, selling Buffalo Wild Wings, Inc., California Pizza Kitchen, Inc., and P.F. Changs China Bistro, Inc., as we believe rising food costs could hurt margins and as they face limited headroom in expanding locations.(1)
The dominant theme was that the world would continue to recover from the 2008 recession. That does not seem to be happening as swiftly and robustly as one would have hoped. The chance of a second global recession still looms on the horizon. Although earnings beat expectations for many of the cyclical sectors, including Consumer Discretionary and Industrials, this would not be the case if the world fell into a global recession.(1)
If Europe can’t get a handle on its debt problems in the weaker nations, and if the U.S. can’t recover from a recession while simultaneously also dealing with its longer term deficit problem, then it seems likely we will experience a second, perhaps deeper and longer, recession.
We are hopeful that job growth will re-accelerate in the U.S., that Europe can deal with its debt problems, that somehow the U.S. can come to some longer-term resolution on the deficit, and that there will be fewer macro shocks like Japanese earthquakes and civil wars through the Middle East and North Africa.
| (1) | The Portfolio’s composition is subject to change. Holdings and weightings are as of June 30, 2011. |
Change in Value of $10,000 Investment
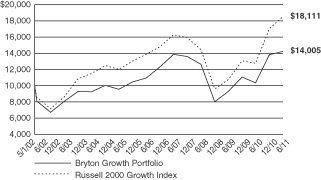
Hypothetical illustration based on past performance. Future performance will vary. The Portfolio’s returns reflect reinvested dividends. The Portfolio’s holdings may differ significantly from the securities in the index. The index is unmanaged and therefore does not reflect the cost of portfolio management and accounting.
The Russell 2000 Growth Index is a market-weighted total return index that measures the performance of companies within the Russell 2000 Index having higher price-to-book ratios and higher forecasted growth values. The Russell 2000 Index includes the 2000 firms from the Russell 3000 Index with the smallest market capitalizations. The Russell 3000 Index represents 98% of the investable U.S. equity market. The index presented herein includes the effects of reinvested dividends.
| 81 | (continued) |
| Ohio National Fund, Inc. | Bryton Growth Portfolio (Continued) |
Portfolio Composition as of June 30, 2011 (1)
| % of Net Assets | ||||
Common Stocks (3) | 95.1 | |||
Money Market Funds and | 4.9 | |||
|
| |||
| 100.0 | ||||
|
|
Top 10 Portfolio Holdings as of June 30, 2011 (1) (2)
| % of Net Assets | ||||
1. Diamond Foods, Inc. | 2.3 | |||
2. RightNow Technologies, Inc. | 2.3 | |||
3. Rosetta Resources, Inc. | 2.2 | |||
4. Kenexa Corp. | 2.1 | |||
5. Pharmacyclics, Inc. | 2.1 | |||
6. Genesee & Wyoming, Inc. Class A | 2.1 | |||
7. OYO Geospace Corp. | 2.1 | |||
8. Healthsouth Corp. | 2.1 | |||
9. OCZ Technology Group, Inc. | 2.1 | |||
10. Middleby Corp. | 2.1 |
| (1) | Composition of Portfolio subject to change. |
| (2) | Short-term investments have been excluded from the list of Top 10 Portfolio Holdings. |
| (3) | Sectors: |
| % of Net Assets | ||||
Information Technology | 30.4 | |||
Health Care | 16.9 | |||
Industrials | 12.3 | |||
Consumer Discretionary | 11.5 | |||
Materials | 7.6 | |||
Energy | 7.3 | |||
Consumer Staples | 5.0 | |||
Financials | 2.4 | |||
Telecommunication Services | 1.7 | |||
|
| |||
| 95.1 | ||||
|
|
| 82 |
| Ohio National Fund, Inc. | Bryton Growth Portfolio (Continued) |
Schedule of Investments | June 30, 2011 (Unaudited) |
| Common Stocks – 95.1% | Shares | Value | ||||||||
CONSUMER DISCRETIONARY – 11.5% | ||||||||||
Orient-Express Hotels Ltd. Class A (Hotels, Restaurants & Leisure) | (a) | 220,000 | $ | 2,365,000 | ||||||
Bebe Stores, Inc. (Specialty Retail) | 160,000 | 977,600 | ||||||||
DSW, Inc. Class A (Specialty Retail) | (a) | 60,000 | 3,036,600 | |||||||
Finish Line, Inc. / The Class A (Specialty Retail) | 135,000 | 2,889,000 | ||||||||
Jos. A. Bank Clothiers, Inc. (Specialty Retail) | (a) | 57,000 | 2,850,570 | |||||||
Columbia Sportswear Co. (Textiles, Apparel & Luxury Goods) | 40,000 | 2,536,000 | ||||||||
Warnaco Group, Inc. / The (Textiles, Apparel & Luxury Goods) | (a) | 52,000 | 2,717,000 | |||||||
|
| |||||||||
| 17,371,770 | ||||||||||
|
| |||||||||
CONSUMER STAPLES – 5.0% | ||||||||||
Boston Beer Co., Inc. Class A (Beverages) | (a) | 17,000 | 1,523,200 | |||||||
Diamond Foods, Inc. (Food Products) | 45,000 | 3,435,300 | ||||||||
Elizabeth Arden, Inc. (Personal Products) | (a) | 90,000 | 2,612,700 | |||||||
|
| |||||||||
| 7,571,200 | ||||||||||
|
| |||||||||
ENERGY – 7.3% | ||||||||||
OYO Geospace Corp. (Energy Equip. & Svs.) | (a) | 32,241 | 3,224,100 | |||||||
Brigham Exploration Co. (Oil, Gas & Consumable Fuels) | (a) | 80,000 | 2,394,400 | |||||||
Clean Energy Fuels Corp. (Oil, Gas & Consumable Fuels) | (a) | 155,000 | 2,038,250 | |||||||
Rosetta Resources, Inc. (Oil, Gas & Consumable Fuels) | (a) | 65,000 | 3,350,100 | |||||||
|
| |||||||||
| 11,006,850 | ||||||||||
|
| |||||||||
FINANCIALS – 2.4% | ||||||||||
First Midwest Bancorp, Inc. (Commercial Banks) | 150,000 | 1,843,500 | ||||||||
Hancock Holding Co. (Commercial Banks) | 60,000 | 1,858,800 | ||||||||
|
| |||||||||
| 3,702,300 | ||||||||||
|
| |||||||||
HEALTH CARE – 16.9% | ||||||||||
Cubist Pharmaceuticals, Inc. (Biotechnology) | (a) | 25,184 | 906,372 | |||||||
Enzon Pharmaceuticals, Inc. (Biotechnology) | (a) | 150,000 | 1,507,500 | |||||||
Inhibitex, Inc. (Biotechnology) | (a) | 527,000 | 2,065,840 | |||||||
Oncothyreon, Inc. (Biotechnology) | (a) | 189,700 | 1,743,343 | |||||||
Pharmacyclics, Inc. (Biotechnology) | (a) | 310,000 | 3,236,400 | |||||||
Targacept, Inc. (Biotechnology) | (a) | 77,000 | 1,622,390 | |||||||
YM Biosciences, Inc. (Biotechnology) | (a) | 510,000 | 1,433,100 | |||||||
Arthrocare Corp. (Health Care Equip. & Supplies) | (a) | 56,900 | 1,904,443 | |||||||
Masimo Corp. (Health Care Equip. & Supplies) | 90,000 | 2,671,200 | ||||||||
NxStage Medical, Inc. (Health Care Equip. & Supplies) | (a) | 92,240 | 1,920,437 | |||||||
Healthsouth Corp. (Health Care Providers & Svs.) | (a) | 120,000 | 3,150,000 | |||||||
Pacific Biosciences of California, Inc. (Life Sciences Tools & Svs.) | (a) | 180,000 | 2,106,000 | |||||||
Nektar Therapeutics (Pharmaceuticals) | (a) | 180,000 | 1,308,600 | |||||||
|
| |||||||||
| 25,575,625 | ||||||||||
|
| |||||||||
INDUSTRIALS – 12.3% | ||||||||||
Acuity Brands, Inc. (Electrical Equip.) | 50,000 | 2,789,000 | ||||||||
Satcon Technology Corp. (Electrical Equip.) | (a) | 717,310 | 1,714,371 | |||||||
Middleby Corp. (Machinery) | (a) | 33,000 | 3,103,320 | |||||||
Avis Budget Group, Inc. (Road & Rail) | (a) | 175,000 | 2,990,750 | |||||||
| Common Stocks (Continued) | Shares | Value | ||||||||
INDUSTRIALS (continued) | ||||||||||
Genesee & Wyoming, Inc. Class A (Road & Rail) | (a) | 55,000 | $ | 3,225,200 | ||||||
RSC Holdings, Inc. (Trading Companies & Distributors) | (a) | 142,200 | 1,700,712 | |||||||
United Rentals, Inc. (Trading Companies & Distributors) | (a) | 120,000 | 3,048,000 | |||||||
|
| |||||||||
| 18,571,353 | ||||||||||
|
| |||||||||
INFORMATION TECHNOLOGY – 30.4% | ||||||||||
Ciena Corp. (Communications Equip.) | (a) | 115,000 | 2,113,700 | |||||||
OCZ Technology Group, Inc. (Computers & Peripherals) | (a) | 393,400 | 3,147,200 | |||||||
Fabrinet (Electronic Equip., Instr. & Comp.) | (a) | 125,000 | 3,035,000 | |||||||
comScore, Inc. (Internet Software & Svs.) | (a) | 90,000 | 2,331,000 | |||||||
Digital River, Inc. (Internet Software & Svs.) | (a) | 85,000 | 2,733,600 | |||||||
Internap Network Services Corp. (Internet Software & Svs.) | (a) | 396,625 | 2,915,194 | |||||||
RightNow Technologies, Inc. (Internet Software & Svs.) | (a) | 105,217 | 3,409,031 | |||||||
Velti PLC (Internet Software & Svs.) | (a) | 175,000 | 2,959,250 | |||||||
Amkor Technology, Inc. (Semiconductors & Equip.) | (a) | 450,000 | 2,776,500 | |||||||
Cavium, Inc. (Semiconductors & Equip.) | (a) | 60,000 | 2,615,400 | |||||||
MaxLinear, Inc. Class A (Semiconductors & Equip.) | (a) | 259,652 | 2,248,586 | |||||||
Netlogic Microsystems, Inc. (Semiconductors & Equip.) | (a) | 75,000 | 3,031,500 | |||||||
RF Micro Devices, Inc. (Semiconductors & Equip.) | (a) | 470,000 | 2,876,400 | |||||||
Silicon Image, Inc. (Semiconductors & Equip.) | (a) | 330,000 | 2,131,800 | |||||||
TriQuint Semiconductor, Inc. (Semiconductors & Equip.) | (a) | 220,000 | 2,241,800 | |||||||
Ebix, Inc. (Software) | (a) | 115,000 | 2,190,750 | |||||||
Kenexa Corp. (Software) | (a) | 135,000 | 3,237,300 | |||||||
|
| |||||||||
| 45,994,011 | ||||||||||
|
| |||||||||
MATERIALS – 7.6% | ||||||||||
Intrepid Potash, Inc. (Chemicals) | (a) | 90,000 | 2,925,000 | |||||||
Solutia, Inc. (Chemicals) | (a) | 120,000 | 2,742,000 | |||||||
RTI International Metals, Inc. (Metals & Mining) | (a) | 75,000 | 2,877,750 | |||||||
Stillwater Mining Co. (Metals & Mining) | (a) | 135,000 | 2,971,350 | |||||||
|
| |||||||||
| 11,516,100 | ||||||||||
|
| |||||||||
TELECOMMUNICATION SERVICES – 1.7% | ||||||||||
PAETEC Holding Corp. (Diversified Telecom. Svs.) | (a) | 550,000 | 2,634,500 | |||||||
|
| |||||||||
Total Common Stocks (Cost $131,393,394) | $ | 143,943,709 | ||||||||
|
| |||||||||
| Money Market Funds – 3.3% | Shares | Value | ||||||||
Fidelity Institutional Money Market Funds | 4,924,000 | $ | 4,924,000 | |||||||
|
| |||||||||
Total Money Market Funds (Cost $4,924,000) | $ | 4,924,000 | ||||||||
|
| |||||||||
Total Investments – 98.4% (Cost $136,317,394) | (b) | $ | 148,867,709 | |||||||
Other Assets in Excess of Liabilities – 1.6% | 2,428,663 | |||||||||
|
| |||||||||
Net Assets – 100.0% | $ | 151,296,372 | ||||||||
|
| |||||||||
Percentages are stated as a percent of net assets.
Footnotes:
| (a) | Non-income producing security. |
| (b) | Represents cost for financial reporting purposes, which may differ from cost basis for federal income tax purposes. See also Note 7 of the Notes to Financial Statements. |
The accompanying notes are an integral part of these financial statements.
| 83 |
| Ohio National Fund, Inc. | U.S. Equity Portfolio |
Objective/Strategy
The U.S. Equity Portfolio seeks capital appreciation with a secondary objective of capital preservation to provide long term growth by investing at least 80% of its net assets in equity securities traded in the U.S. within under-priced sectors and industries.
Performance as of June 30, 2011
Average Annual Total Returns: | ||||
One year | 33.53% | |||
Five years | -3.29% | |||
Since inception (5/1/04) | 1.67% |
Past performance does not guarantee future results. The performance data quoted represents past performance and current returns may be lower or higher. Total return figures include change in share price and reinvestment of dividends and capital gains. The investment return and principal value will fluctuate so that an investor’s shares, when redeemed, may be worth more or less than the original cost. To obtain performance information up to the most recent month end, call toll-free 1-877-781-6392.
The Portfolio is not open to direct retail investment. Beneficial interest in shares is obtained solely by purchase of variable life insurance policies and variable annuity contracts. Actual performance results for variable annuity and variable universal life contracts will be lower due to contract charges. Consult your contract for applicable charges.
Comments
For the six-month period ended June 30, 2011, the U.S. Equity Portfolio returned 6.16% versus 6.30% for the current benchmark, the S&P Composite 1500 Index.
The Portfolio was heavily tilted toward economically sensitive sectors and underweighted in the defensive sectors. That positioning favored the Portfolio when the market advanced through the end of April but detracted from the Portfolio when the market retreated in May and the first half of June. In particular, overweights in the Industrials and Consumer Discretionary sectors and above average stock selection in those sectors contributed the most to relative performance. An underweight in the Financials sector and avoidance of large financial institutions in favor of advancing consumer finance stocks also contributed to relative performance. On the negative, however, under-weighting defensive sectors like the Health Care and Consumer Staples sectors, combined with a few sub-par stock selections in those two sectors, ultimately kept the Portfolio from matching the performance of its benchmark.(1)
The Portfolio’s best performers were Cash America International, Inc., Tupperware Brands Corp., Wolverine World Wide, Inc., Ezcorp, Inc., and Viacom, Inc. The worst performers were Alpha Natural Resources, Inc., Family Dollar Stores, Inc., Bio-Reference Labs, Inc., Kinross Gold, and Freeport-McMoRan Copper & Gold, Inc. The Portfolio’s top contributors to performance were Bed Bath & Beyond, Inc., Kirby Corp., Ezcorp, Inc., Time Warner Cable, Inc., and Tupperware Brands Corp. The largest detractors to performance were Alpha Natural Resources, Inc., Bio-Reference Labs, Inc., Steel Dynamics, Inc., Corning, Inc., and Freeport-McMoRan Copper & Gold, Inc.(1)
In our opinion, the earthquake, tsunami, and nuclear reactor events in Japan and the subsequent potential disruptions in commerce detracted from the Information Technology positions in the Portfolio. We expect this condition to be temporary and will continue to hold positions judged to be under-priced relative to our estimation of intrinsic value.(1)
Based on the perceived under-pricing relative to estimated value, this Portfolio is invested to participate in the multi-year market
recovery that we believe is underway. Generally, value has pulled us toward cyclical, economically-sensitive industries and sectors the last couple of years. The Portfolio does not do well when there are short-term theme reversals along the way. The market retreated and experienced a sector theme reversal for six weeks in May and early June as investors were concerned over lower than expected first quarter gross domestic product, China slowing its economy to fight inflation, Greece’s sovereign debt, and supply disruptions from Japan. Based on our valuation readings and the expectation that all those events will pass and fade, we chose not to trade and react.
In mid-June, the ICON Value/Price ratio for domestic stocks hit a high of 1.20, indicating to us the likelihood of an impressive market advance over the second half of the year. Since then, stocks have advanced, giving us a reading of 1.11 as of July 7th, 2011, which is still bullish. The sector readings are tighter than normal, suggesting a market advance with broad participation with leadership coming from cyclical and defensive industries.
| (1) | The Portfolio’s composition is subject to change. Holdings and weightings are as of June 30, 2011. |
Change in Value of $10,000 Investment
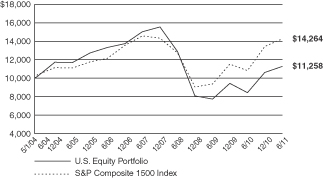
Hypothetical illustration based on past performance. Future performance will vary. The Portfolio’s returns reflect reinvested dividends. The Portfolio’s holdings may differ significantly from the securities in the index. The index is unmanaged and therefore does not reflect the cost of portfolio management and accounting.
The S&P Composite 1500 Index is a broad-based capitalization-weighted index of 1500 U.S. companies and is comprised of the S&P 400, S&P 500, and the S&P 600. The index was developed with a base value of 100 as of December 30, 1994. The index presented herein includes the effects of reinvested dividends.
| 84 | (continued) |
| Ohio National Fund, Inc. | U.S. Equity Portfolio (Continued) |
Portfolio Composition as of June 30, 2011 (1)
| % of Net Assets | ||||
Common Stocks (3) | 99.9 | |||
Other Net Assets | 0.1 | |||
|
| |||
| 100.0 | ||||
|
|
Top 10 Portfolio Holdings as of June 30, 2011 (1) (2)
| % of Net Assets | ||||
1. Apple, Inc. | 4.4 | |||
2. NIKE, Inc. Class B | 3.8 | |||
3. Bed Bath & Beyond, Inc. | 3.8 | |||
4. Caterpillar, Inc. | 3.6 | |||
5. International Business Machines Corp. | 3.3 | |||
6. Comcast Corp. Class A | 3.1 | |||
7. Siemens AG – ADR | 3.1 | |||
8. Chevron Corp. | 3.1 | |||
9. Exxon Mobil Corp. | 3.0 | |||
10. Praxair, Inc. | 2.9 |
| (1) | Composition of Portfolio subject to change. |
| (2) | Short-term investments have been excluded from the list of Top 10 Portfolio Holdings. |
| (3) | Sectors: |
| % of Net Assets | ||||
Industrials | 29.4 | |||
Consumer Discretionary | 22.6 | |||
Information Technology | 13.4 | |||
Energy | 12.2 | |||
Materials | 11.7 | |||
Health Care | 6.8 | |||
Financials | 2.8 | |||
Consumer Staples | 1.0 | |||
|
| |||
| 99.9 | ||||
|
|
| 85 |
| Ohio National Fund, Inc. | U.S. Equity Portfolio |
Schedule of Investments | June 30, 2011 (Unaudited) |
| Common Stocks – 99.9% | Shares | Value | ||||||||
CONSUMER DISCRETIONARY – 22.6% |
| |||||||||
Tupperware Brands Corp. (Household Durables) | 2,160 | $ | 145,692 | |||||||
Comcast Corp. Class A (Media) | 18,030 | 456,880 | ||||||||
Time Warner Cable, Inc. (Media) | 4,900 | 382,396 | ||||||||
Viacom, Inc. Class B (Media) | 3,950 | 201,450 | ||||||||
Walt Disney Co. / The (Media) | 3,930 | 153,427 | ||||||||
Bed Bath & Beyond, Inc. (Specialty Retail) | (a) | 9,500 | 554,515 | |||||||
Ross Stores, Inc. (Specialty Retail) | 4,230 | 338,908 | ||||||||
TJX Cos., Inc. (Specialty Retail) | 7,630 | 400,804 | ||||||||
NIKE, Inc. Class B (Textiles, Apparel & Luxury Goods) | 6,200 | 557,876 | ||||||||
Wolverine World Wide, Inc. (Textiles, Apparel & Luxury Goods) | 2,480 | 103,540 | ||||||||
|
| |||||||||
| 3,295,488 | ||||||||||
|
| |||||||||
CONSUMER STAPLES – 1.0% | ||||||||||
Archer-Daniels-Midland Co. (Food Products) | 4,740 | 142,911 | ||||||||
|
| |||||||||
ENERGY – 12.2% | ||||||||||
Alpha Natural Resources, Inc. (Oil, Gas & Consumable Fuels) | (a) | 6,810 | 309,446 | |||||||
Chevron Corp. (Oil, Gas & Consumable Fuels) | 4,340 | 446,326 | ||||||||
ConocoPhillips (Oil, Gas & Consumable Fuels) | 5,430 | 408,282 | ||||||||
Exxon Mobil Corp. (Oil, Gas & Consumable Fuels) | 5,440 | 442,707 | ||||||||
Valero Energy Corp. (Oil, Gas & Consumable Fuels) | 6,640 | 169,785 | ||||||||
|
| |||||||||
| 1,776,546 | ||||||||||
|
| |||||||||
FINANCIALS – 2.8% | ||||||||||
Cash America International, Inc. (Consumer Finance) | 2,030 | 117,476 | ||||||||
Ezcorp, Inc. Class A (Consumer Finance) | (a) | 7,980 | 283,889 | |||||||
|
| |||||||||
| 401,365 | ||||||||||
|
| |||||||||
HEALTH CARE – 6.8% | ||||||||||
Celgene Corp. (Biotechnology) | (a) | 6,700 | 404,144 | |||||||
ResMed, Inc. (Health Care Equip. & Supplies) | (a) | 9,160 | 283,502 | |||||||
Bio-Reference Labs, Inc. (Health Care Providers & Svs.) | (a) | 14,440 | 301,796 | |||||||
|
| |||||||||
| 989,442 | ||||||||||
|
| |||||||||
INDUSTRIALS – 29.4% | ||||||||||
General Dynamics Corp. (Aerospace & Defense) | 2,070 | 154,256 | ||||||||
Cooper Industries PLC (Electrical Equip.) | 4,290 | 255,984 | ||||||||
| Common Stocks (Continued) | Shares | Value | ||||||||
INDUSTRIALS (continued) | ||||||||||
Emerson Electric Co. (Electrical Equip.) | 7,010 | $ | 394,313 | |||||||
Thomas & Betts Corp. (Electrical Equip.) | (a) | 5,050 | 271,943 | |||||||
General Electric Co. (Industrial Conglomerates) | 17,030 | 321,186 | ||||||||
Siemens AG – ADR (Industrial Conglomerates) | 3,280 | 451,098 | ||||||||
Caterpillar, Inc. (Machinery) | 4,950 | 526,977 | ||||||||
Dover Corp. (Machinery) | 4,730 | 320,694 | ||||||||
Eaton Corp. (Machinery) | 2,800 | 144,060 | ||||||||
Illinois Tool Works, Inc. (Machinery) | 4,060 | 229,349 | ||||||||
Parker Hannifin Corp. (Machinery) | 820 | 73,587 | ||||||||
Kirby Corp. (Marine) | (a) | 6,500 | 368,355 | |||||||
CSX Corp. (Road & Rail) | 11,310 | 296,548 | ||||||||
Union Pacific Corp. (Road & Rail) | 2,490 | 259,956 | ||||||||
W.W. Grainger, Inc. (Trading Companies & Distributors) | 1,390 | 213,574 | ||||||||
|
| |||||||||
| 4,281,880 | ||||||||||
|
| |||||||||
INFORMATION TECHNOLOGY – 13.4% | ||||||||||
Apple, Inc. (Computers & Peripherals) | (a) | 1,890 | 634,416 | |||||||
Corning, Inc. (Electronic Equip., Instr. & Comp.) | 15,380 | 279,147 | ||||||||
Accenture PLC Class A (IT Svs.) | 3,120 | 188,510 | ||||||||
CACI International, Inc. Class A (IT Svs.) | (a) | 5,870 | 370,280 | |||||||
International Business Machines Corp. (IT Svs.) | 2,830 | 485,487 | ||||||||
|
| |||||||||
| 1,957,840 | ||||||||||
|
| |||||||||
MATERIALS – 11.7% | ||||||||||
Monsanto Co. (Chemicals) | 5,110 | 370,679 | ||||||||
Praxair, Inc. (Chemicals) | 3,890 | 421,637 | ||||||||
Cliffs Natural Resources, Inc. (Metals & Mining) | 1,840 | 170,108 | ||||||||
Nucor Corp. (Metals & Mining) | 4,820 | 198,680 | ||||||||
Steel Dynamics, Inc. (Metals & Mining) | 24,380 | 396,175 | ||||||||
Walter Energy, Inc. (Metals & Mining) | 1,230 | 142,434 | ||||||||
|
| |||||||||
| 1,699,713 | ||||||||||
|
| |||||||||
Total Common Stocks (Cost $12,419,191) | $ | 14,545,185 | ||||||||
|
| |||||||||
Total Investments – 99.9% (Cost $12,419,191) | (b) | $ | 14,545,185 | |||||||
Other Assets in Excess of Liabilities – 0.1% | 13,675 | |||||||||
|
| |||||||||
Net Assets – 100.0% | $ | 14,558,860 | ||||||||
|
| |||||||||
Percentages are stated as a percent of net assets.
Abbreviations:
ADR: American Depositary Receipts
Footnotes:
| (a) | Non-income producing security. |
| (b) | Represents cost for financial reporting purposes, which may differ from cost basis for federal income tax purposes. See also Note 7 of the Notes to Financial Statements. |
The accompanying notes are an integral part of these financial statements.
| 86 |
| Ohio National Fund, Inc. | Balanced Portfolio |
Objective/Strategy
The Balanced Portfolio seeks capital appreciation and income by investing normally up to 75% of its assets in equity securities within under-priced sectors and industries while maintaining a minimum of 25% of its assets in fixed income securities.
Performance as of June 30, 2011
Average Annual Total Returns: | ||||
One year | 17.61% | |||
Five years | 4.07% | |||
Since inception (5/1/04) | 6.13% |
Past performance does not guarantee future results. The performance data quoted represents past performance and current returns may be lower or higher. Total return figures include change in share price and reinvestment of dividends and capital gains. The investment return and principal value will fluctuate so that an investor’s shares, when redeemed, may be worth more or less than the original cost. To obtain performance information up to the most recent month end, call toll-free 1-877-781-6392.
The Portfolio is not open to direct retail investment. Beneficial interest in shares is obtained solely by purchase of variable life insurance policies and variable annuity contracts. Actual performance results for variable annuity and variable universal life contracts will be lower due to contract charges. Consult your contract for applicable charges.
Comments
For the six-month period ended June 30, 2011, the Balanced Portfolio returned 4.54% versus 4.96% for the current benchmark, which is composed of 60% S&P Composite 1500 Index and 40% Barclays Capital U.S. Universal Index.
While the bond portion of the Portfolio underperformed the Barclays Capital U.S. Universal Index, the equity portion of the Portfolio beat the S&P Composite 1500 Index. The biggest contributors were the overweight positions in the Health Care and Industrials sectors and the better-than-average stock selection within those sectors. Also contributing was an underweight in Financials and avoidance of some negative individual stocks returns in that sector. Defensive sectors like Utilities, Consumer Staples, and Telecommunication Services came alive as investors worried about a slowing economy. Generally, those sectors were underweighted and stock selection was sub-par, creating a slight drag on relative performance.(1)
The bond market followed two completely different paths during the first half of 2011. During the first quarter we saw continued strength in corporate bonds as economic conditions continued to improve and strong balance sheets brought on a wave of credit based upgrades. Also during this time, Treasuries under-performed as investors turned their focus towards riskier investments. The second quarter ended up, presenting a completely different environment as concerns about European debt contagion pushed investors towards risk free investments. This caused a reversal in the fixed income market as Treasuries ended up, being the best performing asset while credit spreads widened out and corporate bonds as a whole under-performed.
In spite of the volatility, we maintained a consistent allocation during the first six months of the year based on three specific stances. First, we believe the current environment is ideal for corporate spread tightening as continued economic growth and extremely strong balance sheets bodes well for corporate debt. Second, the high yield space looks attractive due to extremely low default rates that increase the chance for credit upgrades. Third, although short-term “flight to safety” trades might result in Treasury out-
performance, we continue to believe this segment of the fixed income market is overvalued. Because of our stance, we were able to outperform relative to the Barclays Capital U.S. Universal Index during the first quarter of the year, but under-performed during the second quarter.
The Portfolio’s best performers were Aetna, Inc., Marathon Oil Corp., Mastercard, Inc., Accenture PLC, and Lubrizon Corp. The worst performers were Lender Processing Services, Inc., Aeropostale, Inc., Multi-Fineline Electronix, Inc., Delta Air Lines, Inc., and Target Corp. The Portfolio’s best contributors to performance were International Business Machines Corp., Aetna, Inc., Mastercard, Inc., and Exxon Mobil Corp. The largest detractors to performance were Lender Processing Services, Inc., Kinross Gold, Aeropostale, Inc., Target Corp., and Multi-Fineline Electronix, Inc.(1)
In mid-June, the ICON Value/Price ratio for domestic stocks hit a high of 1.20, indicating to us the likelihood of an impressive market advance over the second half of the year. Since then, stocks have advanced, giving us a reading as of July 6th, 2011 of 1.11, which is still bullish. The sector readings are tighter than normal suggesting a market advance with broad participation with leadership coming from cyclical and defensive industries.
Going into the second half of 2011 we continue to remain bullish on corporate debt with an emphasis on the middle duration, lower investment grade space. Additionally, we continue to believe that Treasuries are overvalued and, therefore, will remain underweighted in the Portfolio.
| (1) | The Portfolio’s composition is subject to change. Holdings and weightings are as of June 30, 2011. |
Change in Value of $10,000 Investment
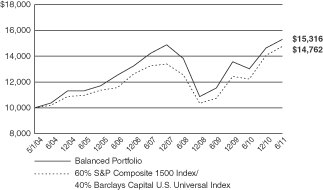
Hypothetical illustration based on past performance. Future performance will vary. The Portfolio’s returns reflect reinvested dividends. The Portfolio’s holdings may differ significantly from the securities in the index. The index is unmanaged and therefore does not reflect the cost of portfolio management and accounting.
The S&P Composite 1500 Index is a broad-based capitalization-weighted index of 1500 U.S. companies and is comprised of the S&P 400, S&P 500, and the S&P 600. The index was developed with a base value of 100 as of December 30, 1994. The index presented herein includes the effects of reinvested dividends.
The Barclays Capital U.S. Universal Index represents the union of the U.S. Aggregate Index, the U.S. High-Yield Corporate Index, the 144A Index, the Eurodollar Index, the Emerging Markets Index, the non-ERISA portion of the Commercial Mortgage-Backed Securities (CMBS) Index and the CMBS High-Yield Index. All securities in this market-value weighted index have at least one year remaining to maturity and meet certain minimum issue size criteria.
| 87 | (continued) |
| Ohio National Fund, Inc. | Balanced Portfolio (Continued) |
Portfolio Composition as of June 30, 2011 (1)
| % of Net Assets | ||||
Common Stocks (3) | 65.2 | |||
Corporate Bonds (3) | 31.0 | |||
U.S. Government Agency Issues | 0.1 | |||
U.S. Treasury Obligations | 0.5 | |||
Money Market Funds and | 3.2 | |||
|
| |||
| 100.0 | ||||
|
|
Top 10 Portfolio Holdings as of June 30, 2011 (1) (2)
| % of Net Assets | ||||
1. Exxon Mobil Corp. | 1.9 | |||
2. PPL Energy Supply LLC | 1.6 | |||
3. International Business Machines Corp. | 1.5 | |||
4. Chevron Corp. | 1.3 | |||
5. American International Group, Inc. | 1.3 | |||
6. Comcast Corp. Class A | 1.3 | |||
7. General Electric Co. | 1.3 | |||
8. Union Pacific Corp. | 1.2 | |||
9. Apple, Inc. | 1.1 | |||
10. Toys R Us, Inc. | 1.1 |
| (1) | Composition of Portfolio subject to change. |
| (2) | Short-term investments have been excluded from the list of Top 10 Portfolio Holdings. |
| (3) | Sectors (combined): |
| % of Net Assets | ||||
Financials | 19.5 | |||
Industrials | 14.5 | |||
Information Technology | 12.4 | |||
Health Care | 11.5 | |||
Consumer Discretionary | 9.1 | |||
Consumer Staples | 7.9 | |||
Materials | 7.8 | |||
Energy | 5.9 | |||
Utilities | 5.8 | |||
Telecommunication Services | 1.8 | |||
|
| |||
| 96.2 | ||||
|
|
| 88 |
| Ohio National Fund, Inc. | Balanced Portfolio |
Schedule of Investments | June 30, 2011 (Unaudited) |
| Common Stocks – 65.2% | Shares | Value | ||||||||
CONSUMER DISCRETIONARY – 4.9% |
| |||||||||
Comcast Corp. Class A (Media) | 9,000 | $ | 228,060 | |||||||
Time Warner Cable, Inc. (Media) | 1,500 | 117,060 | ||||||||
Target Corp. (Multiline Retail) | 1,520 | 71,303 | ||||||||
Aeropostale, Inc. (Specialty Retail) | (a) | 3,500 | 61,250 | |||||||
GameStop Corp. Class A (Specialty Retail) | (a) | 2,500 | 66,675 | |||||||
Guess?, Inc. (Specialty Retail) | 1,500 | 63,090 | ||||||||
Lowe’s Cos., Inc. (Specialty Retail) | 3,000 | 69,930 | ||||||||
TJX Cos., Inc. (Specialty Retail) | 3,590 | 188,583 | ||||||||
|
| |||||||||
| 865,951 | ||||||||||
|
| |||||||||
CONSUMER STAPLES – 6.0% | ||||||||||
CVS Caremark Corp. (Food & Staples Retailing) | 1,820 | 68,396 | ||||||||
Kroger Co. / The (Food & Staples Retailing) | 4,000 | 99,200 | ||||||||
Sysco Corp. (Food & Staples Retailing) | 2,200 | 68,596 | ||||||||
Walgreen Co. (Food & Staples Retailing) | 1,940 | 82,372 | ||||||||
Archer-Daniels-Midland Co. (Food Products) | 2,000 | 60,300 | ||||||||
Bunge Ltd. (Food Products) | 1,120 | 77,224 | ||||||||
Corn Products International, Inc. (Food Products) | 1,530 | 84,578 | ||||||||
Colgate-Palmolive Co. (Household Products) | 2,070 | 180,939 | ||||||||
Kimberly-Clark Corp. (Household Products) | 2,640 | 175,718 | ||||||||
Procter & Gamble Co. / The (Household Products) | 2,680 | 170,368 | ||||||||
|
| |||||||||
| 1,067,691 | ||||||||||
|
| |||||||||
ENERGY – 4.7% | ||||||||||
Chevron Corp. (Oil, Gas & Consumable Fuels) | 2,280 | 234,475 | ||||||||
ConocoPhillips (Oil, Gas & Consumable Fuels) | 2,040 | 153,388 | ||||||||
Exxon Mobil Corp. (Oil, Gas & Consumable Fuels) | 4,100 | 333,658 | ||||||||
Marathon Oil Corp. (Oil, Gas & Consumable Fuels) | 2,200 | 115,896 | ||||||||
|
| |||||||||
| 837,417 | ||||||||||
|
| |||||||||
FINANCIALS – 5.0% | ||||||||||
U.S. Bancorp (Commercial Banks) | 3,000 | 76,530 | ||||||||
Wells Fargo & Co. (Commercial Banks) | 5,000 | 140,300 | ||||||||
World Acceptance Corp. (Consumer Finance) | (a) | 1,660 | 108,846 | |||||||
IntercontinentalExchange, Inc. (Diversified Financial Svs.) | (a) | 1,000 | 124,710 | |||||||
HCC Insurance Holdings, Inc. (Insurance) | 4,500 | 141,750 | ||||||||
Travelers Cos., Inc. / The (Insurance) | 1,500 | 87,570 | ||||||||
Willis Group Holdings PLC (Insurance) | 3,500 | 143,885 | ||||||||
Annaly Capital Management, Inc. (Real Estate Investment Trusts) | 4,210 | 75,948 | ||||||||
|
| |||||||||
| 899,539 | ||||||||||
|
| |||||||||
HEALTH CARE – 11.5% | ||||||||||
Celgene Corp. (Biotechnology) | (a) | 1,700 | 102,544 | |||||||
PDL BioPharma, Inc. (Biotechnology) | 15,730 | 92,335 | ||||||||
Covidien PLC (Health Care Equip. & Supplies) | 2,170 | 115,509 | ||||||||
Stryker Corp. (Health Care Equip. & Supplies) | 740 | 43,431 | ||||||||
Aetna, Inc. (Health Care Providers & Svs.) | 3,000 | 132,270 | ||||||||
AmerisourceBergen Corp. (Health Care Providers & Svs.) | 2,000 | 82,800 | ||||||||
Cardinal Health, Inc. (Health Care Providers & Svs.) | 2,650 | 120,363 | ||||||||
Laboratory Corp of America Holdings (Health Care Providers & Svs.) | (a) | 1,800 | 174,222 | |||||||
Lincare Holdings, Inc. (Health Care Providers & Svs.) | 5,060 | 148,106 | ||||||||
McKesson Corp. (Health Care Providers & Svs.) | 2,000 | 167,300 | ||||||||
Mednax, Inc. (Health Care Providers & Svs.) | (a) | 1,820 | 131,386 | |||||||
UnitedHealth Group, Inc. (Health Care Providers & Svs.) | 3,440 | 177,435 | ||||||||
Abbott Laboratories (Pharmaceuticals) | 3,450 | 181,539 | ||||||||
Eli Lilly & Co. (Pharmaceuticals) | 1,000 | 37,530 | ||||||||
Johnson & Johnson (Pharmaceuticals) | 2,660 | 176,943 | ||||||||
Merck & Co., Inc. (Pharmaceuticals) | 2,000 | 70,580 | ||||||||
Pfizer, Inc. (Pharmaceuticals) | 5,000 | 103,000 | ||||||||
|
| |||||||||
| 2,057,293 | ||||||||||
|
| |||||||||
INDUSTRIALS – 13.1% | ||||||||||
General Dynamics Corp. (Aerospace & Defense) | 1,500 | 111,780 | ||||||||
L-3 Communications Holdings, Inc. (Aerospace & Defense) | 1,300 | 113,685 | ||||||||
Lockheed Martin Corp. (Aerospace & Defense) | 1,520 | 123,074 | ||||||||
Northrop Grumman Corp. (Aerospace & Defense) | 500 | 34,675 | ||||||||
United Technologies Corp. (Aerospace & Defense) | 950 | 84,085 | ||||||||
R.R. Donnelley & Sons Co. (Commercial Svs. & Supplies) | 3,990 | 78,244 | ||||||||
Cooper Industries PLC (Electrical Equip.) | 1,220 | 72,797 | ||||||||
Hubbell, Inc. Class B (Electrical Equip.) | 2,000 | 129,900 | ||||||||
| 89 | (continued) |
| Ohio National Fund, Inc. | Balanced Portfolio (Continued) |
Schedule of Investments | June 30, 2011 (Unaudited) |
| Common Stocks (Continued) | Shares | Value | ||||||||
INDUSTRIALS (continued) | ||||||||||
Thomas & Betts Corp. (Electrical Equip.) | (a) | 1,500 | $ | 80,775 | ||||||
General Electric Co. (Industrial Conglomerates) | 11,970 | 225,754 | ||||||||
Siemens AG – ADR (Industrial Conglomerates) | 960 | 132,029 | ||||||||
Danaher Corp. (Machinery) | 3,080 | 163,209 | ||||||||
Dover Corp. (Machinery) | 1,930 | 130,854 | ||||||||
Eaton Corp. (Machinery) | 2,130 | 109,589 | ||||||||
Valmont Industries, Inc. (Machinery) | 1,290 | 124,343 | ||||||||
FTI Consulting, Inc. (Professional Svs.) | (a) | 2,500 | 94,850 | |||||||
Canadian National Railway Co. (Road & Rail) | 1,760 | 140,624 | ||||||||
CSX Corp. (Road & Rail) | 6,480 | 169,906 | ||||||||
Union Pacific Corp. (Road & Rail) | 1,970 | 205,668 | ||||||||
|
| |||||||||
| 2,325,841 | ||||||||||
|
| |||||||||
INFORMATION TECHNOLOGY – 11.8% | ||||||||||
Comtech Telecommunications Corp. (Communications Equip.) | 2,500 | 70,100 | ||||||||
Apple, Inc. (Computers & Peripherals) | (a) | 590 | 198,045 | |||||||
Anixter International, Inc. (Electronic Equip., Instr. & Comp.) | 1,480 | 96,703 | ||||||||
Arrow Electronics, Inc. (Electronic Equip., Instr. & Comp.) | (a) | 2,070 | 85,905 | |||||||
Flextronics International Ltd. (Electronic Equip., Instr. & Comp.) | (a) | 9,410 | 60,412 | |||||||
Ingram Micro, Inc. Class A (Electronic Equip., Instr. & Comp.) | (a) | 3,940 | 71,472 | |||||||
Multi-Fineline Electronix, Inc. (Electronic Equip., Instr. & Comp.) | (a) | 2,580 | 55,754 | |||||||
Tech Data Corp. (Electronic Equip., Instr. & Comp.) | (a) | 1,810 | 88,491 | |||||||
Accenture PLC Class A (IT Svs.) | 2,930 | 177,031 | ||||||||
Automatic Data Processing, Inc. (IT Svs.) | 2,500 | 131,700 | ||||||||
CACI International, Inc. Class A (IT Svs.) | (a) | 2,590 | 163,377 | |||||||
Cognizant Technology Solutions Corp. Class A (IT Svs.) | (a) | 1,910 | 140,079 | |||||||
International Business Machines Corp. (IT Svs.) | 1,600 | 274,480 | ||||||||
Lender Processing Services, Inc. (IT Svs.) | 2,370 | 49,557 | ||||||||
Mastercard, Inc. Class A (IT Svs.) | 520 | 156,697 | ||||||||
Cymer, Inc. (Semiconductors & Equip.) | (a) | 1,510 | 74,760 | |||||||
Novellus Systems, Inc. (Semiconductors & Equip.) | (a) | 2,140 | 77,340 | |||||||
Microsoft Corp. (Software) | 5,020 | 130,520 | ||||||||
|
| |||||||||
| 2,102,423 | ||||||||||
|
| |||||||||
MATERIALS – 3.6% | ||||||||||
Air Products & Chemicals, Inc. (Chemicals) | 1,410 | 134,768 | ||||||||
Monsanto Co. (Chemicals) | 1,700 | 123,318 | ||||||||
Mosaic Co. / The (Chemicals) | 980 | 66,375 | ||||||||
Potash Corp of Saskatchewan, Inc. (Chemicals) | 1,360 | 77,506 | ||||||||
Praxair, Inc. (Chemicals) | 1,240 | 134,404 | ||||||||
Freeport-McMoRan Copper & Gold, Inc. (Metals & Mining) | 2,000 | 105,800 | ||||||||
|
| |||||||||
| 642,171 | ||||||||||
|
| |||||||||
TELECOMMUNICATION SERVICES – 1.8% | ||||||||||
AT&T, Inc. (Diversified Telecom. Svs.) | 2,300 | 72,243 | ||||||||
Nippon Telegraph & Telephone Corp. – ADR (Diversified Telecom. Svs.) | 3,580 | 86,564 | ||||||||
Philippine Long Distance Telephone Co. – ADR (Wireless Telecom. Svs.) | 1,510 | 81,600 | ||||||||
Rogers Communications, Inc. Class B (Wireless Telecom. Svs.) | 2,190 | 86,549 | ||||||||
|
| |||||||||
| 326,956 | ||||||||||
|
| |||||||||
UTILITIES – 2.8% | ||||||||||
Exelon Corp. (Electric Utilities) | 1,690 | 72,400 | ||||||||
FirstEnergy Corp. (Electric Utilities) | 1,700 | 75,055 | ||||||||
Consolidated Edison, Inc. (Multi-Utilities) | 1,250 | 66,550 | ||||||||
Public Service Enterprise Group, Inc. (Multi-Utilities) | 1,950 | 63,648 | ||||||||
RWE AG – ADR (Multi-Utilities) | 1,000 | 55,500 | ||||||||
American Water Works Co., Inc. (Water Utilities) | 5,620 | 165,509 | ||||||||
|
| |||||||||
| 498,662 | ||||||||||
|
| |||||||||
Total Common Stocks (Cost $10,395,248) | $ | 11,623,944 | ||||||||
|
| |||||||||
| 90 | (continued) |
| Ohio National Fund, Inc. | Balanced Portfolio (Continued) |
Schedule of Investments | June 30, 2011 (Unaudited) |
| Corporate Bonds – 31.0% | Rate | Maturity | Face Amount | Value | ||||||||||||
CONSUMER DISCRETIONARY – 4.2% | ||||||||||||||||
Cooper Tire & Rubber Co. (Auto Components) | 7.625% | 03/15/2027 | $ | 100,000 | $ | 96,750 | ||||||||||
Goodyear Tire & Rubber Co. / The (Auto Components) | 8.250% | 08/15/2020 | 100,000 | 108,500 | ||||||||||||
Daimler Finance North America LLC (Automobiles) | 6.500% | 11/15/2013 | 30,000 | 33,393 | ||||||||||||
Time Warner, Inc. (Media) | 7.625% | 04/15/2031 | 100,000 | 120,308 | ||||||||||||
Dillard’s, Inc. (Multiline Retail) | 9.125% | 08/01/2011 | 46,000 | 46,247 | ||||||||||||
J.C. Penney Corp, Inc. (Multiline Retail) | 7.950% | 04/01/2017 | 50,000 | 56,562 | ||||||||||||
Gap, Inc. / The (Specialty Retail) | 5.950% | 04/12/2021 | 100,000 | 96,245 | ||||||||||||
Toys R Us, Inc. (Specialty Retail) | 7.375% | 10/15/2018 | 200,000 | 195,250 | ||||||||||||
|
| |||||||||||||||
| 753,255 | ||||||||||||||||
|
| |||||||||||||||
CONSUMER STAPLES – 1.9% | ||||||||||||||||
Dean Foods Co. (Food Products) | 6.900% | 10/15/2017 | 50,000 | 49,250 | ||||||||||||
Dole Food Co., Inc. (Food Products) | 8.750% | 07/15/2013 | 68,000 | 74,290 | ||||||||||||
Lorillard Tobacco Co. (Tobacco) | 6.875% | 05/01/2020 | 100,000 | 108,674 | ||||||||||||
Reynolds American, Inc. (Tobacco) | 7.250% | 06/01/2013 | 100,000 | 110,605 | ||||||||||||
|
| |||||||||||||||
| 342,819 | ||||||||||||||||
|
| |||||||||||||||
ENERGY – 1.2% | ||||||||||||||||
Alpha Appalachia Holdings, Inc. (Oil, Gas & Consumable Fuels) | 6.875% | 12/15/2013 | 50,000 | 50,750 | ||||||||||||
Petrobras International Finance Co. – Pifco (Oil, Gas & Consumable Fuels) | 7.750% | 09/15/2014 | 50,000 | 57,588 | ||||||||||||
Petrobras International Finance Co. – Pifco (Oil, Gas & Consumable Fuels) | 5.375% | 01/27/2021 | 100,000 | 103,181 | ||||||||||||
|
| |||||||||||||||
| 211,519 | ||||||||||||||||
|
| |||||||||||||||
FINANCIALS – 14.5% | ||||||||||||||||
Goldman Sachs Group, Inc. / The (Capital Markets) | 5.125% | 01/15/2015 | 100,000 | 107,397 | ||||||||||||
Goldman Sachs Group, Inc. / The (Capital Markets) | 5.950% | 01/15/2027 | 100,000 | 98,270 | ||||||||||||
Merrill Lynch & Co., Inc. (Capital Markets) | 5.000% | 02/03/2014 | 10,000 | 10,773 | ||||||||||||
Merrill Lynch & Co., Inc. (Capital Markets) | 5.450% | 02/05/2013 | 150,000 | 159,180 | ||||||||||||
Merrill Lynch & Co., Inc. (Capital Markets) | (b) | 4.730% | 05/05/2014 | 150,000 | 152,614 | |||||||||||
Morgan Stanley (Capital Markets) | 5.375% | 10/15/2015 | 100,000 | 107,002 | ||||||||||||
Morgan Stanley (Capital Markets) | (b) | 0.783% | 10/15/2015 | 100,000 | 94,753 | |||||||||||
Morgan Stanley (Capital Markets) | (c) | 3.500% | 10/15/2020 | 50,000 | 49,702 | |||||||||||
UBS AG (Capital Markets) | 5.875% | 12/20/2017 | 100,000 | 109,845 | ||||||||||||
Wachovia Corp. (Commercial Banks) | 5.750% | 02/01/2018 | 50,000 | 55,366 | ||||||||||||
Wells Fargo Bank NA (Commercial Banks) | (b) | 0.471% | 05/16/2016 | 100,000 | 93,278 | |||||||||||
HSBC Finance Corp. (Consumer Finance) | 7.000% | 05/15/2012 | 50,000 | 52,673 | ||||||||||||
HSBC Finance Corp. (Consumer Finance) | 6.375% | 11/27/2012 | 50,000 | 53,509 | ||||||||||||
HSBC Finance Corp. (Consumer Finance) | (b) | 5.360% | 11/10/2013 | 100,000 | 102,140 | |||||||||||
Bank of America Corp. (Diversified Financial Svs.) | 5.625% | 07/01/2020 | 100,000 | 103,433 | ||||||||||||
Bank of America Corp. (Diversified Financial Svs.) | 6.800% | 03/15/2028 | 100,000 | 102,461 | ||||||||||||
Bank of America NA (Diversified Financial Svs.) | (b) | 0.547% | 06/15/2017 | 50,000 | 44,530 | |||||||||||
Bear Stearns Cos. LLC / The (Diversified Financial Svs.) | (b) | 0.648% | 11/21/2016 | 50,000 | 47,925 | |||||||||||
Citigroup, Inc. (Diversified Financial Svs.) | 5.125% | 05/05/2014 | 40,000 | 42,902 | ||||||||||||
Citigroup, Inc. (Diversified Financial Svs.) | 5.300% | 10/17/2012 | 50,000 | 52,491 | ||||||||||||
Citigroup, Inc. (Diversified Financial Svs.) | 6.000% | 08/15/2017 | 50,000 | 54,825 | ||||||||||||
American International Group, Inc. (Insurance) | 4.250% | 05/15/2013 | 100,000 | 102,897 | ||||||||||||
American International Group, Inc. (Insurance) | 8.250% | 08/15/2018 | 200,000 | 229,825 | ||||||||||||
American International Group, Inc. (Insurance) | 5.375% | 10/18/2011 | 50,000 | 50,625 | ||||||||||||
Aspen Insurance Holdings Ltd. (Insurance) | 6.000% | 12/15/2020 | 100,000 | 103,543 | ||||||||||||
Delphi Financial Group, Inc. (Insurance) | 7.875% | 01/31/2020 | 50,000 | 55,734 | ||||||||||||
Hartford Financial Services Group, Inc. (Insurance) | 5.375% | 03/15/2017 | 50,000 | 52,706 | ||||||||||||
Hartford Financial Services Group, Inc. (Insurance) | 6.300% | 03/15/2018 | 100,000 | 108,890 | ||||||||||||
Prudential Financial, Inc. (Insurance) | 5.100% | 09/20/2014 | 100,000 | 108,799 | ||||||||||||
Swiss Re Solutions Holding Corp. (Insurance) | 7.000% | 02/15/2026 | 40,000 | 43,869 | ||||||||||||
Unum Group (Insurance) | 7.190% | 02/01/2028 | 30,000 | 30,479 | ||||||||||||
|
| |||||||||||||||
| 2,582,436 | ||||||||||||||||
|
| |||||||||||||||
INDUSTRIALS – 1.4% | ||||||||||||||||
R.R. Donnelley & Sons Co. (Commercial Svs. & Supplies) | 6.125% | 01/15/2017 | 150,000 | 146,796 | ||||||||||||
R.R. Donnelley & Sons Co. (Commercial Svs. & Supplies) | 6.625% | 04/15/2029 | 100,000 | 89,571 | ||||||||||||
General Electric Co. (Industrial Conglomerates) | 5.000% | 02/01/2013 | 15,000 | 15,927 | ||||||||||||
|
| |||||||||||||||
| 252,294 | ||||||||||||||||
|
| |||||||||||||||
INFORMATION TECHNOLOGY – 0.6% | ||||||||||||||||
Western Union Co. / The (IT Svs.) | 5.400% | 11/17/2011 | 100,000 | 101,812 | ||||||||||||
|
| |||||||||||||||
MATERIALS – 4.2% | ||||||||||||||||
Alcoa, Inc. (Metals & Mining) | 5.720% | 02/23/2019 | 150,000 | 156,260 | ||||||||||||
Alcoa, Inc. (Metals & Mining) | 6.750% | 01/15/2028 | 100,000 | 104,641 | ||||||||||||
AngloGold Ashanti Holdings PLC (Metals & Mining) | 5.375% | 04/15/2020 | 100,000 | 98,631 | ||||||||||||
ArcelorMittal (Metals & Mining) | 5.500% | 03/01/2021 | 100,000 | 100,342 | ||||||||||||
| 91 | (continued) |
| Ohio National Fund, Inc. | Balanced Portfolio (Continued) |
Schedule of Investments | June 30, 2011 (Unaudited) |
| Corporate Bonds (Continued) | Rate | Maturity | Face Amount | Value | ||||||||||||
MATERIALS (continued) | ||||||||||||||||
Southern Copper Corp. (Metals & Mining) | 5.375% | 04/16/2020 | $ | 150,000 | $ | 154,395 | ||||||||||
Vale Overseas Ltd. (Metals & Mining) | 8.250% | 01/17/2034 | 100,000 | 122,838 | ||||||||||||
|
| |||||||||||||||
| 737,107 | ||||||||||||||||
|
| |||||||||||||||
UTILITIES – 3.0% | ||||||||||||||||
Arizona Public Service Co. (Electric Utilities) | 6.375% | 10/15/2011 | 50,000 | 50,787 | ||||||||||||
Exelon Generation Co. LLC (Ind. Power Prod. & Energy Traders) | 5.350% | 01/15/2014 | 100,000 | 108,298 | ||||||||||||
Exelon Generation Co. LLC (Ind. Power Prod. & Energy Traders) | 4.000% | 10/01/2020 | 100,000 | 94,561 | ||||||||||||
PPL Energy Supply LLC (Ind. Power Prod. & Energy Traders) | 6.500% | 05/01/2018 | 250,000 | 282,459 | ||||||||||||
|
| |||||||||||||||
| 536,105 | ||||||||||||||||
|
| |||||||||||||||
Total Corporate Bonds (Cost $5,303,531) | $ | 5,517,347 | ||||||||||||||
|
| |||||||||||||||
| U.S. Government Agency Issues – 0.1% | Rate | Maturity | Face Amount | Value | ||||||||||||
Federal Home Loan Bank | 5.375% | 08/15/2018 | $ | 20,000 | $ | 23,219 | ||||||||||
|
| |||||||||||||||
Total U.S. Government Agency Issues (Cost $20,329) | $ | 23,219 | ||||||||||||||
|
| |||||||||||||||
| U.S. Treasury Obligations – 0.5% | Rate | Maturity | Face Amount | Value | ||||||||||||
U.S. Treasury Note | 2.625% | 11/15/2020 | $ | 100,000 | $ | 96,328 | ||||||||||
|
| |||||||||||||||
Total U.S. Treasury Obligations (Cost $94,397) | $ | 96,328 | ||||||||||||||
|
| |||||||||||||||
| Money Market Funds – 2.0% | Shares | Value | ||||||||||||||
Fidelity Institutional Money Market Funds | 347,000 | $ | 347,000 | |||||||||||||
|
| |||||||||||||||
Total Money Market Funds (Cost $347,000) | $ | 347,000 | ||||||||||||||
|
| |||||||||||||||
Total Investments – 98.8% (Cost $16,160,505) | (d) | $ | 17,607,838 | |||||||||||||
Other Assets in Excess of Liabilities – 1.2% | 222,466 | |||||||||||||||
|
| |||||||||||||||
Net Assets – 100.0% | $ | 17,830,304 | ||||||||||||||
|
| |||||||||||||||
Percentages are stated as a percent of net assets.
Abbreviations:
ADR: American Depositary Receipts
Footnotes:
| (a) | Non-income producing security. |
| (b) | Security is a variable rate instrument in which the coupon rate is adjusted monthly or quarterly in concert with U.S. LIBOR or Consumer Price Index. Interest rates stated are those in effect at June 30, 2011. |
| (c) | Security was initially issued at one coupon rate, but the coupon rate is scheduled to be updated at later specified dates. The coupon rate shown is the rate that is in effect at June 30, 2011. |
| (d) | Represents cost for financial reporting purposes, which may differ from cost basis for federal income tax purposes. See also Note 7 of the Notes to Financial Statements. |
The accompanying notes are an integral part of these financial statements.
| 92 |
| Ohio National Fund, Inc. | Income Opportunity Portfolio |
Objective/Strategy
The Income Opportunity Portfolio seeks modest capital appreciation and maximization of realized gains by investing in equity securities traded in the U.S.
Performance as of June 30, 2011
Average Annual Total Returns: | ||||
One year | 14.80% | |||
Five years | 2.29% | |||
Since inception (5/1/04) | 3.06% |
Past performance does not guarantee future results. The performance data quoted represents past performance and current returns may be lower or higher. Total return figures include change in share price and reinvestment of dividends and capital gains. The investment return and principal value will fluctuate so that an investor’s shares, when redeemed, may be worth more or less than the original cost. To obtain performance information up to the most recent month end, call toll-free 1-877-781-6392.
The Portfolio is not open to direct retail investment. Beneficial interest in shares is obtained solely by purchase of variable life insurance policies and variable annuity contracts. Actual performance results for variable annuity and variable universal life contracts will be lower due to contract charges. Consult your contract for applicable charges.
Comments
For the six-month period ended June 30, 2011, the Income Opportunity Portfolio returned 3.50% versus 6.30% for the current benchmark, the S&P Composite 1500 Index.
The Portfolio lagged its benchmark, but with significantly less volatility. The six-month period was marked by large market swings that appeared to stem from the ongoing macroeconomic concerns that have troubled investors for some time now. Turmoil in the Eurozone continued to weigh heavily on investor sentiment and caused intermittent wide fluctuations in global equity markets. Concerns over the persistently high unemployment rate and the malaise in the housing market also appeared to roil the market as uneven economic data was released. Unrest in the Middle East and North Africa, along with the Tsunami and earthquakes in Japan, further exacerbated the sharp ups and downs in world equity markets.
Despite all of the aforementioned events and concerns, corporate profits continued to grow and that appeared to be the driving force behind the ongoing rally in the U.S. equity market. Through the first quarter of last year, the median year-over-year growth rate for all stocks in the S&P 500 Index was 18.3%. Stocks in the Industrials and Materials sectors posted the highest growth rates, at about 30% each. Not only was the growth in corporate profits quite strong, it also came in higher than expected in many cases. Of the 500 S&P stocks, 352 posted better than expected first quarter earnings.
While the Portfolio did not capture all of the positive return of the benchmark, it did provide a smoother ride through the extreme market fluctuations. The Portfolio’s hedging strategy of writing S&P 500 Index call options and buying out-of-the money S&P 500 Index put options dampened the effect of market volatility on the Portfolio. The beta for the Portfolio was 0.29. As should generally be expected, the Portfolio sacrificed some of the market upside in exchange for dampening the negative benchmark returns when the market experienced sharp sudden drops during the period. The options hedging strategy, writing call options and purchasing put options, detracted approximately 270 basis points from the Portfolio’s performance. Setting aside the option hedge overlay, the return of the Portfolio can be assessed at the sector, industry, and stock levels.(1)
Our bottom-up valuation methodology continued to lead us toward the more cyclical sectors of the market. The Industrials were the Portfolio’s largest sector weight. This overweight position was a significant positive contributor to the Portfolio’s relative performance, accounting for 2.1% of the Portfolio’s return. The largest detractor to the Portfolio’s relative performance was the position in the Materials sector. The Portfolio had a 7% position in the sector versus the sector’s 4% weight in the benchmark. The overweight in this sector detracted 0.54% from the Portfolio’s performance.(1)
Drilling down to industry level, positions in the information technology consulting & other services, integrated oil & gas, consumer finance and railroads were among the top contributors to the Portfolio’s performance. Combined, these industries accounted for about 2.81% of positive performance. At the other end of the spectrum, the four largest detractors to the Portfolio’s performance were the steel, general merchandise stores, investment banking & brokerage and computer hardware industries. These four industries combined to detract about 1.26% from performance.(1)
Moving down to the stock level, International Business Machines Corp. was the best contributor to the Portfolio’s performance adding 0.52% of positive return. The railroad company CSX Corp. contributed 0.41%. Chevron Corp. in the integrated oil & gas industry added 0.33%, Cash America International, Inc. in the consumer finance industry contributed 0.28% and the cable & satellite provider, DIRECTV, contributed 0.27%. The largest detractors to the Portfolio’s performance were the Brazilian based Steel company Vale S.A., Hewlett-Packard Co., Target Corp., The Goldman Sachs Group, Inc., and Microsoft Corp. These five stocks detracted 0.48%, 0.34%, 0.27%, 0.22%, and 0.19% respectively.(1)
From a total return perspective, the Portfolio’s top five performers were Aetna, Inc., Cash America International Inc., Ashland, Inc., Wolverine World Wide, Inc., and Ezcorp. The five worst performers were Vale S.A., Target Corp., Hewlett-Packard Co., The Goldman Sachs Group, Inc., and Bank of New York Mellon Corp.(1)
Looking ahead to the second half of the year, we continue to believe that stocks will move higher. Our valuation model indicates that additional upside potential remains with participation from all sectors. We are maintaining the Portfolio’s tilt toward economically-sensitive sectors such as Industrials and Materials because we still believe the market will be led higher by sectors that tend to benefit in an improving economic environment.
The 10-year Treasury ended last year at 3.3%, and stood at 3.16% on June 30. These rates are near historical lows and, all else equal, make stocks a generally attractive investment. Moreover, corporate profit growth remains strong and the Federal Reserve continues to signal that it will hold its accommodative monetary policy in place for an extended period of time. Given these positive underpinnings for economic growth, we expect further gains led by areas of the market that do best in a recovering economy.
| (1) | The Portfolio’s composition is subject to change. Holdings and weightings are as of June 30, 2011. |
| 93 | (continued) |
| Ohio National Fund, Inc. | Income Opportunity Portfolio (Continued) |
Change in Value of $10,000 Investment
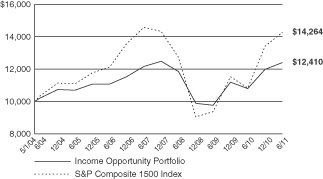
Hypothetical illustration based on past performance. Future performance will vary. The Portfolio’s returns reflect reinvested dividends. The Portfolio’s holdings may differ significantly from the securities in the index. The index is unmanaged and therefore does not reflect the cost of portfolio management and accounting.
The S&P Composite 1500 Index is a broad-based capitalization-weighted index of 1500 U.S. companies and is comprised of the S&P 400, S&P 500, and the S&P 600. The index was developed with a base value of 100 as of December 30, 1994. The index presented herein includes the effects of reinvested dividends.
Portfolio Composition as of June 30, 2011 (1)
| % of Net Assets | ||||
Common Stocks (3) | 100.8 | |||
Written Options Outstanding | (2.1 | ) | ||
Purchased Options | 0.1 | |||
Money Market Funds | 1.2 | |||
|
| |||
| 100.0 | ||||
|
|
Top 10 Portfolio Holdings as of June 30, 2011 (1) (2)
| % of Net Assets | ||||
1. International Business Machines Corp. | 3.8 | |||
2. Apple, Inc. | 3.1 | |||
3. Exxon Mobil Corp. | 2.5 | |||
4. CSX Corp. | 2.3 | |||
5. Chevron Corp. | 2.3 | |||
6. 3M Co. | 2.3 | |||
7. ConocoPhillips | 2.1 | |||
8. Caterpillar, Inc. | 2.1 | |||
9. Union Pacific Corp. | 1.8 | |||
10. C.R. Bard, Inc. | 1.7 |
| (1) | Composition of Portfolio subject to change. |
| (2) | Short-term investments have been excluded from the list of Top 10 Portfolio Holdings. |
| (3) | Sectors: |
| % of Net Assets | ||||
Industrials | 20.8 | |||
Health Care | 12.4 | |||
Information Technology | 11.8 | |||
Consumer Staples | 11.7 | |||
Consumer Discretionary | 10.2 | |||
Energy | 10.0 | |||
Financials | 9.8 | |||
Materials | 7.3 | |||
Utilities | 5.0 | |||
Telecommunication Services | 1.8 | |||
|
| |||
| 100.8 | ||||
|
|
| 94 |
| Ohio National Fund, Inc. | Income Opportunity Portfolio |
Schedule of Investments | June 30, 2011 (Unaudited) |
| Common Stocks – 100.8% | Shares | Value | ||||||||
CONSUMER DISCRETIONARY – 10.2% |
| |||||||||
DIRECTV Class A (Media) | (a) | 3,100 | $ | 157,542 | ||||||
Time Warner Cable, Inc. (Media) | (b) | 2,000 | 156,080 | |||||||
Target Corp. (Multiline Retail) | (b) | 3,300 | 154,803 | |||||||
AutoZone, Inc. (Specialty Retail) | (a)(b) | 400 | 117,940 | |||||||
Guess?, Inc. (Specialty Retail) | 2,500 | 105,150 | ||||||||
Jos. A. Bank Clothiers, Inc. (Specialty Retail) | (a)(b) | 2,050 | 102,520 | |||||||
O’Reilly Automotive, Inc. (Specialty Retail) | (a) | 400 | 26,204 | |||||||
Ross Stores, Inc. (Specialty Retail) | 700 | 56,084 | ||||||||
TJX Cos., Inc. (Specialty Retail) | (b) | 3,400 | 178,602 | |||||||
Wolverine World Wide, Inc. (Textiles, Apparel & Luxury Goods) | 1,200 | 50,100 | ||||||||
|
| |||||||||
| 1,105,025 | ||||||||||
|
| |||||||||
CONSUMER STAPLES – 11.7% | ||||||||||
PepsiCo, Inc. (Beverages) | (b) | 1,492 | 105,082 | |||||||
CVS Caremark Corp. (Food & Staples Retailing) | 2,200 | 82,676 | ||||||||
Walgreen Co. (Food & Staples Retailing) | 1,900 | 80,674 | ||||||||
Wal-Mart Stores, Inc. (Food & Staples Retailing) | 2,200 | 116,908 | ||||||||
Archer-Daniels-Midland Co. (Food Products) | 5,000 | 150,750 | ||||||||
Bunge Ltd. (Food Products) | 1,000 | 68,950 | ||||||||
J.M. Smucker Co. / The (Food Products) | 1,100 | 84,084 | ||||||||
Kellogg Co. (Food Products) | 1,400 | 77,448 | ||||||||
Nestle SA – ADR (Food Products) | 1,300 | 81,094 | ||||||||
Unilever PLC – ADR (Food Products) | 1,900 | 61,541 | ||||||||
Colgate-Palmolive Co. (Household Products) | 900 | 78,669 | ||||||||
Kimberly-Clark Corp. (Household Products) | 1,100 | 73,216 | ||||||||
Procter & Gamble Co. / The (Household Products) | 2,100 | 133,497 | ||||||||
Altria Group, Inc. (Tobacco) | (b) | 3,100 | 81,871 | |||||||
|
| |||||||||
| 1,276,460 | ||||||||||
|
| |||||||||
ENERGY – 10.0% | ||||||||||
Chevron Corp. (Oil, Gas & Consumable Fuels) | (b) | 2,400 | 246,816 | |||||||
China Petroleum & Chemical Corp. – ADR (Oil, Gas & Consumable Fuels) | 700 | 71,008 | ||||||||
ConocoPhillips (Oil, Gas & Consumable Fuels) | (b) | 3,000 | 225,570 | |||||||
Exxon Mobil Corp. (Oil, Gas & Consumable Fuels) | 3,300 | 268,554 | ||||||||
Murphy Oil Corp. (Oil, Gas & Consumable Fuels) | 1,400 | 91,924 | ||||||||
Occidental Petroleum Corp. (Oil, Gas & Consumable Fuels) | (b) | 1,300 | 135,252 | |||||||
Royal Dutch Shell PLC – ADR (Oil, Gas & Consumable Fuels) | 700 | 49,791 | ||||||||
|
| |||||||||
| 1,088,915 | ||||||||||
|
| |||||||||
FINANCIALS – 9.8% | ||||||||||
Ameriprise Financial, Inc. (Capital Markets) | (b) | 500 | 28,840 | |||||||
Bank of New York Mellon Corp. / The (Capital Markets) | 2,100 | 53,802 | ||||||||
American Express Co. (Consumer Finance) | (b) | 1,400 | 72,380 | |||||||
Cash America International, Inc. (Consumer Finance) | 1,700 | 98,379 | ||||||||
Ezcorp, Inc. Class A (Consumer Finance) | (a)(b) | 2,900 | 103,168 | |||||||
CME Group, Inc. (Diversified Financial Svs.) | 200 | 58,318 | ||||||||
IntercontinentalExchange, Inc. (Diversified Financial Svs.) | (a) | 500 | 62,355 | |||||||
NASDAQ OMX Group, Inc. / The (Diversified Financial Svs.) | (a) | 2,100 | 53,130 | |||||||
American Financial Group, Inc. (Insurance) | 1,300 | 46,397 | ||||||||
Assurant, Inc. (Insurance) | 1,100 | 39,897 | ||||||||
Delphi Financial Group, Inc. Class A (Insurance) | (b) | 1,500 | 43,815 | |||||||
Loews Corp. (Insurance) | 2,000 | 84,180 | ||||||||
Prudential Financial, Inc. (Insurance) | (b) | 2,700 | 171,693 | |||||||
Torchmark Corp. (Insurance) | (b) | 1,700 | 109,038 | |||||||
Travelers Cos., Inc. / The (Insurance) | (b) | 600 | 35,028 | |||||||
|
| |||||||||
| 1,060,420 | ||||||||||
|
| |||||||||
HEALTH CARE – 12.4% | ||||||||||
Becton Dickinson and Co. (Health Care Equip. & Supplies) | (b) | 1,300 | 112,021 | |||||||
C.R. Bard, Inc. (Health Care Equip. & Supplies) | 1,700 | 186,762 | ||||||||
| Common Stocks (Continued) | Shares | Value | ||||||||
HEALTH CARE (continued) | ||||||||||
Medtronic, Inc. (Health Care Equip. & Supplies) | 3,400 | $ | 131,002 | |||||||
Varian Medical Systems, Inc. (Health Care Equip. & Supplies) | (a)(b) | 1,600 | 112,032 | |||||||
AmerisourceBergen Corp. (Health Care Providers & Svs.) | (b) | 2,400 | 99,360 | |||||||
Cardinal Health, Inc. (Health Care Providers & Svs.) | (b) | 1,900 | 86,298 | |||||||
Express Scripts, Inc. (Health Care Providers & Svs.) | (a)(b) | 900 | 48,582 | |||||||
Laboratory Corp. of America Holdings (Health Care Providers & Svs.) | (a) | 600 | 58,074 | |||||||
Lincare Holdings, Inc. (Health Care Providers & Svs.) | 2,100 | 61,467 | ||||||||
Medco Health Solutions, Inc. (Health Care Providers & Svs.) | (a) | 1,700 | 96,084 | |||||||
Bristol-Myers Squibb Co. (Pharmaceuticals) | (b) | 3,500 | 101,360 | |||||||
Eli Lilly & Co. (Pharmaceuticals) | (b) | 3,000 | 112,590 | |||||||
Johnson & Johnson (Pharmaceuticals) | 900 | 59,868 | ||||||||
Merck & Co., Inc. (Pharmaceuticals) | 2,300 | 81,167 | ||||||||
|
| |||||||||
| 1,346,667 | ||||||||||
|
| |||||||||
INDUSTRIALS – 20.8% | ||||||||||
General Dynamics Corp. (Aerospace & Defense) | 500 | 37,260 | ||||||||
Northrop Grumman Corp. (Aerospace & Defense) | (b) | 1,400 | 97,090 | |||||||
Raytheon Co. (Aerospace & Defense) | 1,300 | 64,805 | ||||||||
United Technologies Corp. (Aerospace & Defense) | (b) | 1,400 | 123,914 | |||||||
United Parcel Service, Inc. Class B (Air Freight & Logistics) | (b) | 1,200 | 87,516 | |||||||
Cooper Industries PLC (Electrical Equip.) | 1,200 | 71,604 | ||||||||
3M Co. (Industrial Conglomerates) | (b) | 2,600 | 246,610 | |||||||
General Electric Co. (Industrial Conglomerates) | (b) | 7,800 | 147,108 | |||||||
Siemens AG – ADR (Industrial Conglomerates) | (b) | 1,200 | 165,036 | |||||||
Barnes Group, Inc. (Machinery) | 2,400 | 59,544 | ||||||||
Caterpillar, Inc. (Machinery) | (b) | 2,100 | 223,566 | |||||||
Danaher Corp. (Machinery) | (b) | 1,600 | 84,784 | |||||||
Deere & Co. (Machinery) | (b) | 1,200 | 98,940 | |||||||
Dover Corp. (Machinery) | 2,000 | 135,600 | ||||||||
Ingersoll-Rand PLC (Machinery) | 2,000 | 90,820 | ||||||||
CSX Corp. (Road & Rail) | (b) | 9,600 | 251,712 | |||||||
Union Pacific Corp. (Road & Rail) | (b) | 1,900 | 198,360 | |||||||
W.W. Grainger, Inc. (Trading Companies & Distributors) | (b) | 500 | 76,825 | |||||||
|
| |||||||||
| 2,261,094 | ||||||||||
|
| |||||||||
INFORMATION TECHNOLOGY – 11.8% | ||||||||||
Apple, Inc. (Computers & Peripherals) | (a)(b) | 1,000 | 335,670 | |||||||
Arrow Electronics, Inc. (Electronic Equip., Instr. & Comp.) | (a) | 2,200 | 91,300 | |||||||
Accenture PLC Class A (IT Svs.) | 2,100 | 126,882 | ||||||||
Automatic Data Processing, Inc. (IT Svs.) | 2,400 | 126,432 | ||||||||
Cognizant Technology Solutions Corp. Class A (IT Svs.) | (a) | 500 | 36,670 | |||||||
International Business Machines Corp. (IT Svs.) | (b) | 2,400 | 411,720 | |||||||
Intel Corp. (Semiconductors & Equip.) | (b) | 6,900 | 152,904 | |||||||
|
| |||||||||
| 1,281,578 | ||||||||||
|
| |||||||||
MATERIALS – 7.3% | ||||||||||
Air Products & Chemicals, Inc. (Chemicals) | 1,300 | 124,254 | ||||||||
CF Industries Holdings, Inc. (Chemicals) | 300 | 42,501 | ||||||||
E.I. du Pont de Nemours & Co. (Chemicals) | 2,800 | 151,340 | ||||||||
Monsanto Co. (Chemicals) | 800 | 58,032 | ||||||||
Potash Corp of Saskatchewan, Inc. (Chemicals) | (b) | 800 | 45,592 | |||||||
Praxair, Inc. (Chemicals) | 1,100 | 119,229 | ||||||||
Rock-Tenn Co. Class A (Containers & Packaging) | 2,100 | 139,314 | ||||||||
BHP Billiton Ltd. – ADR (Metals & Mining) | 400 | 37,852 | ||||||||
Freeport-McMoRan Copper & Gold, Inc. (Metals & Mining) | (b) | 1,400 | 74,060 | |||||||
|
| |||||||||
| 792,174 | ||||||||||
|
| |||||||||
TELECOMMUNICATION SERVICES – 1.8% | ||||||||||
AT&T, Inc. (Diversified Telecom. Svs.) | (b) | 1,800 | 56,538 | |||||||
| 95 | (continued) |
| Ohio National Fund, Inc. | Income Opportunity Portfolio (Continued) |
Schedule of Investments | June 30, 2011 (Unaudited) |
| Common Stocks (Continued) | Shares | Value | ||||||||
TELECOMMUNICATION SERVICES (continued) | ||||||||||
Verizon Communications, Inc. (Diversified Telecom. Svs.) | (b) | 2,300 | $ | 85,629 | ||||||
SK Telecom Co. Ltd. – ADR (Wireless Telecom. Svs.) | 2,800 | 52,360 | ||||||||
|
| |||||||||
| 194,527 | ||||||||||
|
| |||||||||
UTILITIES – 5.0% | ||||||||||
PPL Corp. (Electric Utilities) | 2,700 | 75,141 | ||||||||
Southern Co. (Electric Utilities) | (b) | 2,200 | 88,836 | |||||||
AGL Resources, Inc. (Gas Utilities) | (b) | 2,700 | 109,917 | |||||||
UGI Corp. (Gas Utilities) | 2,500 | 79,725 | ||||||||
Sempra Energy (Multi-Utilities) | 1,500 | 79,320 | ||||||||
Xcel Energy, Inc. (Multi-Utilities) | 2,200 | 53,460 | ||||||||
American Water Works Co., Inc. (Water Utilities) | 1,800 | 53,010 | ||||||||
|
| |||||||||
| 539,409 | ||||||||||
|
| |||||||||
Total Common Stocks (Cost $9,457,021) | $ | 10,946,269 | ||||||||
|
| |||||||||
| Purchased Options – 0.1% | Contracts (c) | Value | ||||||||
S&P 500 Index Put Option | 16 | $ | 16,000 | |||||||
|
| |||||||||
Total Purchased Options (Cost $48,538) | $ | 16,000 | ||||||||
|
| |||||||||
| Money Market Funds – 1.9% | Shares | Value | ||||||||
Fidelity Institutional Money Market Funds | 206,000 | $ | 206,000 | |||||||
|
| |||||||||
Total Money Market Funds (Cost $206,000) | $ | 206,000 | ||||||||
|
| |||||||||
Total Investments – 102.8% (Cost $9,711,559) | (d) | $ | 11,168,269 | |||||||
Total Written Options Outstanding – (2.1)% (see following schedule) | (231,468) | |||||||||
Liabilities in Excess of Other Assets – (0.7)% | (73,105) | |||||||||
|
| |||||||||
Net Assets – 100.0% | $ | 10,863,696 | ||||||||
|
| |||||||||
Percentages are stated as a percent of net assets.
Abbreviations:
ADR: American Depositary Receipts
Footnotes:
| (a) | Non-income producing security. |
| (b) | Security is fully or partially pledged as collateral for written call options outstanding. Outstanding written call options are presented in the following schedule. |
| (c) | 100 shares per contract. |
| (d) | Represents cost for financial reporting purposes, which may differ from cost basis for federal income tax purposes. See also Note 7 of the Notes to Financial Statements. |
The accompanying notes are an integral part of these financial statements.
| 96 |
| Ohio National Fund, Inc. | Income Opportunity Portfolio |
Schedule of Written Options Outstanding | June 30, 2011 (Unaudited) |
| Contracts* | Value | |||||
S&P 500 Index Call Option |
| |||||
Expiration: August 2011, | ||||||
Exercise Price: $1,290.00 | 42 | $ | 191,268 | |||
S&P 500 Index Call Option | ||||||
Expiration: August 2011, | ||||||
Exercise Price: $1,310.00 | 12 | 40,200 | ||||
|
|
| ||||
Total Written Options Outstanding (Premiums received $132,077) | 54 | $ | 231,468 | |||
|
|
| ||||
| * | 100 shares per contract. |
The accompanying notes are an integral part of these financial statements.
| 97 |
| Ohio National Fund, Inc. | Target VIP Portfolio |
Objective/Strategy
The Target VIP Portfolio seeks an above average total return by investing in the common stocks of companies which are identified by a model which applies separate uniquely specialized strategies.
Performance as of June 30, 2011
Average Annual Total Returns: | ||||
One year | 39.70% | |||
Five years | 0.48% | |||
Since inception (11/2/05) | 0.67% |
Past performance does not guarantee future results. The performance data quoted represents past performance and current returns may be lower or higher. Total return figures include change in share price and reinvestment of dividends and capital gains. The investment return and principal value will fluctuate so that an investor’s shares, when redeemed, may be worth more or less than the original cost. To obtain performance information up to the most recent month end, call toll-free 1-877-781-6392.
The Portfolio is not open to direct retail investment. Beneficial interest in shares is obtained solely by purchase of variable life insurance policies and variable annuity contracts. Actual performance results for variable annuity and variable universal life contracts will be lower due to contract charges. Consult your contract for applicable charges.
Comments
For the six-month period ended June 30, 2011, the Target VIP Portfolio returned 8.45% versus 6.35% for the current benchmark, the Russell 3000 Index.
Stock selection accounted for the out-performance over the six-month period as sector allocation was a modest drag on relative returns. Positive stock selection in the Information Technology sector was the biggest contributor to relative performance. Positive stock selection along with an underweight in Financials, the only sector in the benchmark to post a negative return for the six-month period, also added to relative performance. Stock selection in Consumer Discretionary, Consumer Staples, and Telecommunication Services was also positive. Stock selection in Industrials was a modest drag on relative performance, as was an underweight in Energy, the second best sector in the benchmark for the period. (1)
The Portfolio’s best performers were GT Solar International, Inc., Fossil, Inc., Biogen Idec, Inc., Netflix, Inc., and Teradata Corp. The worst performers were Smith Micro Software, Inc., Oclaro, Inc., USEC, Inc., Finisar Corp., and Tata Motors Ltd. – ADR. The Portfolio’s top contributors to performance were Baidu, Inc. – ADR, Netflix, Inc., International Business Machines Corp., Biogen Idec, Inc., and Fossil, Inc. The top detractors to performance were Ford Motor Co., Tata Motors Ltd. – ADR, Smith Micro Software, Inc., Microsoft Corp., and Finisar Corp. (1)
U.S. stocks posted solid gains in the first half of 2011, building off of the rally that started in March 2009. Strong earnings growth by corporate America fueled the gains. The period was not without its share of turbulence, however, as unrest in the Middle East and Africa, a tsunami and resultant nuclear disaster in Japan, and moderating economic growth at home weighed on stocks at various times over the period.
The year started where it left off in 2010, with equities rising steadily through mid-February. According to Standard & Poor’s, fourth quarter operating earnings per share grew almost 28% compared to the prior year quarter. The rally faltered briefly through mid-March as rising unrest in the Middle East and North Africa and the nuclear
disaster in Japan compelled investors to take risk off the table. The Middle East tensions pushed oil well above $100/barrel and took energy shares along with it. Energy was the best performing sector in the first quarter by a wide margin.
Following the brief pull back, equities resumed their rally to new 2011 highs by the end of April. Strong corporate earnings and the general perception of equities’ relative attractiveness versus other asset classes drove the performance. Commodities, particularly gold, silver and oil, continued to gain alongside equities.
Equities stumbled during the latter portion of the period as economic data cast doubt on the strength of the economy. Employment growth remained sluggish while consumer confidence and industrial activity slumped. The re-emergence of European sovereign debt worries, especially in Greece, added further to the selloff. During this period defensive sectors led as investors reduced risk exposure. Health Care was the best performing sector for both the second quarter and first half of 2011 due to its defensive characteristics and cheap valuations.
We have a positive outlook on the economy and equity markets for the second half of 2011. We view the recent softness in the economic data as temporary and expect economic growth to prove resilient in the second half of 2011. Given this outlook, we look for equities to post further gains. Given the Portfolio’s well diversified holdings, we expect it to participate in the upside.
| (1) | The Portfolio’s composition is subject to change. Holdings and weightings are as of June 30, 2011. |
Change in Value of $10,000 Investment
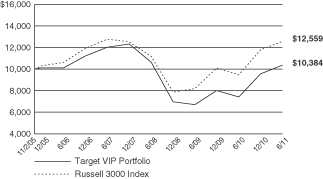
Hypothetical illustration based on past performance. Future performance will vary. The Portfolio’s returns reflect reinvested dividends. The Portfolio’s holdings may differ significantly from the securities in the index. The index is unmanaged and therefore does not reflect the cost of portfolio management and accounting.
The Russell 3000 Index measures the performance of the largest 3000 U.S. companies representing approximately 98% of the investable U.S. equity market. The Russell 3000 Index is constructed to provide a comprehensive, unbiased, and stable barometer of the broad market and is completely reconstituted annually to ensure new and growing equities are reflected. The index presented includes the effects of reinvested dividends.
| 98 | (continued) |
| Ohio National Fund, Inc. | Target VIP Portfolio (Continued) |
Portfolio Composition as of June 30, 2011 (1)
| % of Net Assets | ||||
Common Stocks (3) | 98.3 | |||
Money Market Funds and | 1.7 | |||
|
| |||
| 100.0 | ||||
|
|
Top 10 Portfolio Holdings as of June 30, 2011 (1) (2)
| % of Net Assets | ||||
1. Apple, Inc. | 3.9 | |||
2. International Business Machines Corp. | 3.6 | |||
3. McDonald’s Corp. | 3.3 | |||
4. AT&T, Inc. | 3.3 | |||
5. Home Depot, Inc. | 3.2 | |||
6. Ford Motor Co. | 3.1 | |||
7. Microsoft Corp. | 2.8 | |||
8. eBay, Inc. | 2.5 | |||
9. Texas Instruments, Inc. | 2.3 | |||
10. Baidu, Inc. – ADR | 2.2 |
| (1) | Composition of Portfolio subject to change. |
| (2) | Short-term investments have been excluded from the list of Top 10 Portfolio Holdings. |
| (3) | Sectors: |
| % of Net Assets | ||||
Information Technology | 28.6 | |||
Consumer Discretionary | 26.0 | |||
Telecommunication Services | 8.6 | |||
Financials | 8.4 | |||
Health Care | 6.2 | |||
Utilities | 6.1 | |||
Industrials | 5.4 | |||
Energy | 4.6 | |||
Consumer Staples | 2.8 | |||
Materials | 1.6 | |||
|
| |||
| 98.3 | ||||
|
|
| 99 |
| Ohio National Fund, Inc. | Target VIP Portfolio |
Schedule of Investments | June 30, 2011 (Unaudited) |
| Common Stocks – 98.3% | Shares | Value | ||||||||
CONSUMER DISCRETIONARY – 26.0% | ||||||||||
Autoliv, Inc. (Auto Components) | 3,104 | $ | 243,509 | |||||||
Tenneco, Inc. (Auto Components) | (a) | 2,130 | 93,869 | |||||||
TRW Automotive Holdings Corp. (Auto Components) | (a) | 4,213 | 248,693 | |||||||
Ford Motor Co. (Automobiles) | (a) | 53,915 | 743,488 | |||||||
Pre-Paid Legal Services, Inc. (Diversified Consumer Svs.) | (a) | 916 | 60,905 | |||||||
McDonald’s Corp. (Hotels, Restaurants & Leisure) | 9,382 | 791,090 | ||||||||
Texas Roadhouse, Inc. (Hotels, Restaurants & Leisure) | 6,717 | 117,783 | ||||||||
Liberty Media Corp – Interactive (Internet & Catalog Retail) | (a) | 7,845 | 131,561 | |||||||
Netflix, Inc. (Internet & Catalog Retail) | (a) | 1,523 | 400,077 | |||||||
priceline.com, Inc. (Internet & Catalog Retail) | (a) | 679 | 347,600 | |||||||
Sturm Ruger & Co., Inc. (Leisure Equip. & Products) | 1,761 | 38,654 | ||||||||
Arbitron, Inc. (Media) | 2,554 | 105,557 | ||||||||
Valassis Communications, Inc. (Media) | (a) | 1,737 | 52,631 | |||||||
Virgin Media, Inc. (Media) | 4,380 | 131,093 | ||||||||
Dillard’s, Inc. Class A (Multiline Retail) | 2,043 | 106,522 | ||||||||
Dollar Tree, Inc. (Multiline Retail) | (a) | 1,722 | 114,720 | |||||||
Family Dollar Stores, Inc. (Multiline Retail) | 1,851 | 97,289 | ||||||||
AutoZone, Inc. (Specialty Retail) | (a) | 643 | 189,589 | |||||||
Childrens Place Retail Stores, Inc. / The (Specialty Retail) | (a) | 2,430 | 108,111 | |||||||
Hibbett Sports, Inc. (Specialty Retail) | (a) | 2,626 | 106,904 | |||||||
Home Depot, Inc. (Specialty Retail) | 20,703 | 749,863 | ||||||||
Monro Muffler Brake, Inc. (Specialty Retail) | 2,836 | 105,754 | ||||||||
Pier 1 Imports, Inc. (Specialty Retail) | (a) | 3,401 | 39,350 | |||||||
Ross Stores, Inc. (Specialty Retail) | 1,644 | 131,717 | ||||||||
Sally Beauty Holdings, Inc. (Specialty Retail) | (a) | 6,324 | 108,140 | |||||||
Vitamin Shoppe, Inc. (Specialty Retail) | (a) | 2,636 | 120,623 | |||||||
Deckers Outdoor Corp. (Textiles, Apparel & Luxury Goods) | (a) | 1,390 | 122,515 | |||||||
Fossil, Inc. (Textiles, Apparel & Luxury Goods) | (a) | 2,339 | 275,347 | |||||||
G-III Apparel Group Ltd. (Textiles, Apparel & Luxury Goods) | (a) | 1,812 | 62,478 | |||||||
Maidenform Brands, Inc. (Textiles, Apparel & Luxury Goods) | (a) | 2,214 | 61,239 | |||||||
Steven Madden Ltd. (Textiles, Apparel & Luxury Goods) | (a) | 3,956 | 148,390 | |||||||
|
| |||||||||
| 6,155,061 | ||||||||||
|
| |||||||||
CONSUMER STAPLES – 2.8% | ||||||||||
Diamond Foods, Inc. (Food Products) | 2,073 | 158,253 | ||||||||
Mead Johnson Nutrition Co. (Food Products) | 686 | 46,339 | ||||||||
Lorillard, Inc. (Tobacco) | 496 | 54,000 | ||||||||
Philip Morris International, Inc. (Tobacco) | 6,020 | 401,955 | ||||||||
|
| |||||||||
| 660,547 | ||||||||||
|
| |||||||||
ENERGY – 4.6% | ||||||||||
FMC Technologies, Inc. (Energy Equip. & Svs.) | (a) | 271 | 12,138 | |||||||
RPC, Inc. (Energy Equip. & Svs.) | 5,256 | 128,982 | ||||||||
ENI SpA – ADR (Oil, Gas & Consumable Fuels) | 4,350 | 206,843 | ||||||||
Exxon Mobil Corp. (Oil, Gas & Consumable Fuels) | 5,829 | 474,364 | ||||||||
Newfield Exploration Co. (Oil, Gas & Consumable Fuels) | (a) | 154 | 10,475 | |||||||
Total SA – ADR (Oil, Gas & Consumable Fuels) | 3,542 | 204,869 | ||||||||
USEC, Inc. (Oil, Gas & Consumable Fuels) | (a) | 10,950 | 36,573 | |||||||
|
| |||||||||
| 1,074,244 | ||||||||||
|
| |||||||||
FINANCIALS – 8.4% | ||||||||||
Banco Bilbao Vizcaya Argentaria SA – ADR (Commercial Banks) | 18,895 | 221,827 | ||||||||
Banco Santander SA – ADR (Commercial Banks) | 17,983 | 206,984 | ||||||||
Bank of the Ozarks, Inc. (Commercial Banks) | 1,603 | 83,452 | ||||||||
Community Bank System, Inc. (Commercial Banks) | 3,156 | 78,237 | ||||||||
FNB Corp. (Commercial Banks) | 10,869 | 112,494 | ||||||||
Susquehanna Bancshares, Inc. (Commercial Banks) | 12,354 | 98,832 | ||||||||
Ezcorp, Inc. Class A (Consumer Finance) | (a) | 4,401 | 156,566 | |||||||
World Acceptance Corp. (Consumer Finance) | (a) | 1,501 | 98,421 | |||||||
| Common Stocks (Continued) | Shares | Value | ||||||||
FINANCIALS (continued) | ||||||||||
Portfolio Recovery Associates, Inc. (Diversified Financial Svs.) | (a) | 1,620 | $ | 137,360 | ||||||
ACE Ltd. (Insurance) | 1,695 | 111,565 | ||||||||
Berkshire Hathaway, Inc. Class B (Insurance) | (a) | 5,188 | 401,499 | |||||||
Chubb Corp. (Insurance) | 1,525 | 95,480 | ||||||||
Zurich Financial Services AG – ADR (Insurance) | (a) | 7,345 | 186,122 | |||||||
|
| |||||||||
| 1,988,839 | ||||||||||
|
| |||||||||
HEALTH CARE – 6.2% | ||||||||||
Biogen Idec, Inc. (Biotechnology) | (a) | 3,010 | 321,829 | |||||||
C.R. Bard, Inc. (Health Care Equip. & Supplies) | 1,178 | 129,415 | ||||||||
Cyberonics, Inc. (Health Care Equip. & Supplies) | (a) | 2,638 | 73,732 | |||||||
Varian Medical Systems, Inc. (Health Care Equip. & Supplies) | (a) | 1,524 | 106,710 | |||||||
Air Methods Corp. (Health Care Providers & Svs.) | (a) | 1,177 | 87,969 | |||||||
Hanger Orthopedic Group, Inc. (Health Care Providers & Svs.) | (a) | 3,118 | 76,297 | |||||||
Parexel International Corp. (Life Sciences Tools & Svs.) | (a) | 5,514 | 129,910 | |||||||
AstraZeneca PLC – ADR (Pharmaceuticals) | 4,116 | 206,088 | ||||||||
GlaxoSmithKline PLC – ADR (Pharmaceuticals) | 4,840 | 207,636 | ||||||||
Impax Laboratories, Inc. (Pharmaceuticals) | (a) | 6,051 | 131,851 | |||||||
|
| |||||||||
| 1,471,437 | ||||||||||
|
| |||||||||
INDUSTRIALS – 5.4% | ||||||||||
GeoEye, Inc. (Aerospace & Defense) | (a) | 2,094 | 78,316 | |||||||
Huntington Ingalls Industries, Inc. (Aerospace & Defense) | (a) | 553 | 19,079 | |||||||
Northrop Grumman Corp. (Aerospace & Defense) | 3,505 | 243,072 | ||||||||
Park-Ohio Holdings Corp. (Air Freight & Logistics) | (a) | 1,700 | 35,938 | |||||||
U.S. Airways Group, Inc. (Airlines) | (a) | 5,593 | 49,834 | |||||||
Joy Global, Inc. (Machinery) | 1,435 | 136,669 | ||||||||
NN, Inc. (Machinery) | (a) | 2,983 | 44,626 | |||||||
Pall Corp. (Machinery) | 1,393 | 78,328 | ||||||||
Tata Motors Ltd. – ADR (Machinery) | 18,619 | 419,114 | ||||||||
United Rentals, Inc. (Trading Companies & Distributors) | (a) | 2,148 | 54,559 | |||||||
W.W. Grainger, Inc. (Trading Companies & Distributors) | 831 | 127,683 | ||||||||
|
| |||||||||
| 1,287,218 | ||||||||||
|
| |||||||||
INFORMATION TECHNOLOGY – 28.6% | ||||||||||
Finisar Corp. (Communications Equip.) | (a) | 2,893 | 52,161 | |||||||
Netgear, Inc. (Communications Equip.) | (a) | 3,402 | 148,735 | |||||||
Oclaro, Inc. (Communications Equip.) | (a) | 4,661 | 31,322 | |||||||
Apple, Inc. (Computers & Peripherals) | (a) | 2,775 | 931,484 | |||||||
SanDisk Corp. (Computers & Peripherals) | (a) | 3,273 | 135,830 | |||||||
DTS, Inc. (Electronic Equip., Instr. & Comp.) | (a) | 1,610 | 65,286 | |||||||
Power-One, Inc. (Electronic Equip., Instr. & Comp.) | (a) | 3,476 | 28,156 | |||||||
Vishay Intertechnology, Inc. (Electronic Equip., Instr. & Comp.) | (a) | 5,330 | 80,163 | |||||||
Baidu, Inc. – ADR (Internet Software & Svs.) | (a) | 3,673 | 514,697 | |||||||
eBay, Inc. (Internet Software & Svs.) | (a) | 18,054 | 582,603 | |||||||
j2 Global Communications, Inc. (Internet Software & Svs.) | (a) | 4,321 | 121,982 | |||||||
Cardtronics, Inc. (IT Svs.) | (a) | 4,000 | 93,800 | |||||||
Cognizant Technology Solutions Corp. Class A (IT Svs.) | (a) | 4,147 | 304,141 | |||||||
International Business Machines Corp. (IT Svs.) | 4,930 | 845,742 | ||||||||
Teradata Corp. (IT Svs.) | (a) | 2,352 | 141,590 | |||||||
Altera Corp. (Semiconductors & Equip.) | 4,328 | 200,603 | ||||||||
Atmel Corp. (Semiconductors & Equip.) | (a) | 16,401 | 230,762 | |||||||
Fairchild Semiconductor International, Inc. (Semiconductors & Equip.) | (a) | 4,396 | 73,457 | |||||||
GT Solar International, Inc. (Semiconductors & Equip.) | (a) | 13,593 | 220,207 | |||||||
Lam Research Corp. (Semiconductors & Equip.) | (a) | 1,707 | 75,586 | |||||||
RF Micro Devices, Inc. (Semiconductors & Equip.) | (a) | 9,860 | 60,343 | |||||||
Texas Instruments, Inc. (Semiconductors & Equip.) | 16,339 | 536,409 | ||||||||
TriQuint Semiconductor, Inc. (Semiconductors & Equip.) | (a) | 5,626 | 57,329 | |||||||
| 100 | (continued) |
| Ohio National Fund, Inc. | Target VIP Portfolio (Continued) |
Schedule of Investments | June 30, 2011 (Unaudited) |
| Common Stocks (Continued) | Shares | Value | ||||||||
INFORMATION TECHNOLOGY (continued) | ||||||||||
Xilinx, Inc. (Semiconductors & Equip.) | 3,639 | $ | 132,714 | |||||||
ACI Worldwide, Inc. (Software) | (a) | 3,105 | 104,856 | |||||||
Microsoft Corp. (Software) | 25,824 | 671,424 | ||||||||
Netscout Systems, Inc. (Software) | (a) | 3,896 | 81,387 | |||||||
Smith Micro Software, Inc. (Software) | (a) | 3,245 | 13,661 | |||||||
Synchronoss Technologies, Inc. (Software) | (a) | 3,439 | 109,119 | |||||||
Ultimate Software Group, Inc. (Software) | (a) | 2,371 | 129,054 | |||||||
|
| |||||||||
| 6,774,603 | ||||||||||
|
| |||||||||
MATERIALS – 1.6% | ||||||||||
Innophos Holdings, Inc. (Chemicals) | 2,026 | 98,869 | ||||||||
PPG Industries, Inc. (Chemicals) | 292 | 26,511 | ||||||||
Sherwin-Williams Co. / The (Chemicals) | 194 | 16,271 | ||||||||
Boise, Inc. (Containers & Packaging) | 8,019 | 62,468 | ||||||||
Freeport-McMoRan Copper & Gold, Inc. (Metals & Mining) | 1,686 | 89,189 | ||||||||
KapStone Paper and Packaging Corp. (Paper & Forest Products) | (a) | 4,358 | 72,212 | |||||||
|
| |||||||||
| 365,520 | ||||||||||
|
| |||||||||
TELECOMMUNICATION SERVICES – 8.6% | ||||||||||
AT&T, Inc. (Diversified Telecom. Svs.) | 24,643 | 774,037 | ||||||||
Deutsche Telekom AG – ADR (Diversified Telecom. Svs.) | 14,874 | 232,481 | ||||||||
France Telecom SA – ADR (Diversified Telecom. Svs.) | 9,056 | 192,802 | ||||||||
General Communication, Inc. Class A (Diversified Telecom. Svs.) | (a) | 2,724 | 32,879 | |||||||
Koninklijke KPN NV – ADR (Diversified Telecom. Svs.) | 12,975 | 189,954 | ||||||||
| Common Stocks (Continued) | Shares | Value | ||||||||
TELECOMMUNICATION SERVICES (continued) | ||||||||||
Telefonica SA – ADR (Diversified Telecom. Svs.) | 8,360 | $ | 204,736 | |||||||
MetroPCS Communications, Inc. (Wireless Telecom. Svs.) | (a) | 12,689 | 218,378 | |||||||
Vodafone Group PLC – ADR (Wireless Telecom. Svs.) | 7,222 | 192,972 | ||||||||
|
| |||||||||
| 2,038,239 | ||||||||||
|
| |||||||||
UTILITIES – 6.1% | ||||||||||
E.ON AG – ADR (Electric Utilities) | 6,278 | 178,546 | ||||||||
Enel SpA – ADR (Electric Utilities) | 38,017 | 249,772 | ||||||||
Iberdrola SA – ADR (Electric Utilities) | 6,191 | 221,266 | ||||||||
Scottish & Southern Energy PLC – ADR (Electric Utilities) | 9,768 | 219,975 | ||||||||
GDF Suez – ADR (Multi-Utilities) | 5,244 | 192,717 | ||||||||
National Grid PLC – ADR (Multi-Utilities) | 4,270 | 211,066 | ||||||||
RWE AG – ADR (Multi-Utilities) | 2,878 | 159,729 | ||||||||
|
| |||||||||
| 1,433,071 | ||||||||||
|
| |||||||||
Total Common Stocks (Cost $20,845,192) | $ | 23,248,779 | ||||||||
|
| |||||||||
| Money Market Funds – 1.5% | Shares | Value | ||||||||
Fidelity Institutional Money Market Funds Money Market Portfolio – Class I | 369,000 | $ | 369,000 | |||||||
|
| |||||||||
Total Money Market Funds (Cost $369,000) | $ | 369,000 | ||||||||
|
| |||||||||
Total Investments – 99.8% (Cost $21,214,192) | (b) | $ | 23,617,779 | |||||||
Other Assets in Excess of Liabilities – 0.2% | 38,470 | |||||||||
|
| |||||||||
Net Assets – 100.0% | $ | 23,656,249 | ||||||||
|
| |||||||||
Percentages are stated as a percent of net assets.
Abbreviations:
ADR: American Depositary Receipts
Footnotes:
| (a) | Non-income producing security. |
| (b) | Represents cost for financial reporting purposes, which may differ from cost basis for federal income tax purposes. See also Note 7 of the Notes to Financial Statements. |
The accompanying notes are an integral part of these financial statements.
| 101 |
| Ohio National Fund, Inc. | Target Equity/Income Portfolio |
Objective/Strategy
The Target Equity/Income Portfolio seeks an above average total return by adhering to a disciplined, quantitative investment process that incorporates two distinct strategy methodologies.
Performance as of June 30, 2011
Average Annual Total Returns: | ||||
One year | 29.20% | |||
Five years | -0.93% | |||
Since inception (11/2/05) | -0.87% |
Past performance does not guarantee future results. The performance data quoted represents past performance and current returns may be lower or higher. Total return figures include change in share price and reinvestment of dividends and capital gains. The investment return and principal value will fluctuate so that an investor’s shares, when redeemed, may be worth more or less than the original cost. To obtain performance information up to the most recent month end, call toll-free 1-877-781-6392.
The Portfolio is not open to direct retail investment. Beneficial interest in shares is obtained solely by purchase of variable life insurance policies and variable annuity contracts. Actual performance results for variable annuity and variable universal life contracts will be lower due to contract charges. Consult your contract for applicable charges.
Comments
For the six-month period ended June 30, 2011, the Target Equity/Income Portfolio returned 2.32% versus 6.35% for the current benchmark, the Russell 3000 Index.
Stock selection, particularly in the Consumer Discretionary and Industrials sectors, was primarily responsible for the relative under-performance. The Portfolio’s minimal Health Care exposure was also a drag on relative performance as it was the top performing sector in the benchmark for the period. An underweight in Financials helped offset some of the relative under-performance, as the sector was the worst performer in the benchmark. A large overweight in Utilities along with positive stock selection in the Energy and Materials sectors also contributed positively to relative performance. (1)
The Portfolio’s top performers were Fossil, Inc., Dillards, Inc., MetroPCS Communications, Inc., RPC, Inc., and MeadWestvaco Corp. The worst performers were Finisar Corp., Tata Motors Ltd. – ADR, Power-One, Inc., Ford Motor Co., and RF Micro Devices, Inc. The Portfolio’s top contributors to performance were Fossil, Inc., MetroPCS Communications, Inc., MeadWestvaco Corp., RPC, Inc., and Northrop Grumman Corp. The largest detractors to performance were Ford Motor Co., Tata Motors Ltd. – ADR, Finisar Corp., CenturyLink, Inc., and RF Micro Devices, Inc. (1)
U.S. stocks posted solid gains in the first half of 2011, building off of the rally that started in March 2009. Strong earnings growth by corporate America fueled the gains. The period was not without its share of turbulence, however, as unrest in the Middle East and Africa, a tsunami and resultant nuclear disaster in Japan, and moderating economic growth at home weighed on stocks at various times over the period.
The year started where it left off in 2010 with equities rising steadily through mid-February. According to Standard & Poor’s, fourth quarter operating earnings per share grew almost 28% compared to the prior year quarter. The rally faltered briefly through mid-March as rising unrest in the Middle East and North Africa and the nuclear
disaster in Japan compelled investors to take risk off the table. The Middle East tensions pushed oil well above $100/barrel and took energy shares along with it. Energy was the best performing sector in the first quarter by a wide margin.
Following the brief pull back, equities resumed their rally to new 2011 highs by the end of April. Strong corporate earnings and the general perception of equities’ relative attractiveness versus other asset classes drove the performance. Commodities, particularly gold, silver and oil, continued to gain alongside equities.
Equities stumbled during the latter portion of the period as economic data cast doubt on the strength of the economy. Employment growth remained sluggish while consumer confidence and industrial activity slumped. The re-emergence of European sovereign debt worries, especially in Greece, added further to the selloff. During this period defensive sectors led as investors reduced risk exposure. Health Care was the best performing sector for both the second quarter and first half of 2011 due to its defensive characteristics and cheap valuations. Equities then rallied sharply in the final week of the period to end the first half of the year on a high note. For the first half, the S&P 500 Index returned 6.0% while the S&P 400 Midcap Index and S&P 600 SmallCap Index returned 8.6% and 7.5%, respectively.
We have a positive outlook on the economy and equity markets for the second half of 2011. We view the recent softness in the economic data as temporary and expect economic growth to prove resilient in the second half of 2011. Given this outlook, we look for equities to post further gains. Given the Portfolio’s balance between dividends and growth, we expect it to participate in the upside.
| (1) | The Portfolio’s composition is subject to change. Holdings and weightings are as of June 30, 2011. |
Change in Value of $10,000 Investment
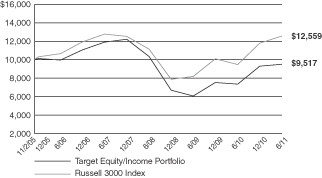
Hypothetical illustration based on past performance. Future performance will vary. The Portfolio’s returns reflect reinvested dividends. The Portfolio’s holdings may differ significantly from the securities in the index. The index is unmanaged and therefore does not reflect the cost of portfolio management and accounting.
The Russell 3000 Index measures the performance of the largest 3000 U.S. companies representing approximately 98% of the investable U.S. equity market. The Russell 3000 index is constructed to provide a comprehensive, unbiased, and stable barometer of the broad market and is completely reconstituted annually to ensure new and growing equities are reflected. The index presented includes the effects of reinvested dividends.
| 102 | (continued) |
| Ohio National Fund, Inc. | Target Equity/Income Portfolio (Continued) |
Portfolio Composition as of June 30, 2011 (1)
| % of Net Assets | ||||
Common Stocks (3) | 98.9 | |||
Money Market Funds and | 1.1 | |||
|
| |||
| 100.0 | ||||
|
|
Top 10 Portfolio Holdings as of June 30, 2011 (1) (2)
| % of Net Assets | ||||
1. Ford Motor Co. | 10.0 | |||
2. Tata Motors Ltd. – ADR | 5.6 | |||
3. Fossil, Inc. | 3.7 | |||
4. TRW Automotive Holdings Corp. | 3.3 | |||
5. Autoliv, Inc. | 3.3 | |||
6. Atmel Corp. | 3.1 | |||
7. MeadWestvaco Corp. | 3.1 | |||
8. MetroPCS Communications, Inc. | 2.9 | |||
9. NiSource, Inc. | 2.8 | |||
10. R.R. Donnelley & Sons Co. | 2.8 |
| (1) | Composition of Portfolio subject to change. |
| (2) | Short-term investments have been excluded from the list of Top 10 Portfolio Holdings. |
| (3) | Sectors: |
| % of Net Assets | ||||
Consumer Discretionary | 29.8 | |||
Utilities | 20.5 | |||
Industrials | 15.9 | |||
Financials | 9.3 | |||
Telecommunication Services | 8.1 | |||
Information Technology | 7.8 | |||
Energy | 4.4 | |||
Materials | 3.1 | |||
|
| |||
| 98.9 | ||||
|
|
| 103 |
| Ohio National Fund, Inc. | Target Equity/Income Portfolio |
Schedule of Investments | June 30, 2011 (Unaudited) |
| Common Stocks – 98.9% | Shares | Value | ||||||||
CONSUMER DISCRETIONARY – 29.8% | ||||||||||
Autoliv, Inc. (Auto Components) | 10,853 | $ | 851,418 | |||||||
Tenneco, Inc. (Auto Components) | (a) | 7,448 | 328,233 | |||||||
TRW Automotive Holdings Corp. (Auto Components) | (a) | 14,735 | 869,807 | |||||||
Ford Motor Co. (Automobiles) | (a) | 188,529 | 2,599,815 | |||||||
Leggett & Platt, Inc. (Household Durables) | 27,358 | 666,988 | ||||||||
Valassis Communications, Inc. (Media) | (a) | 6,074 | 184,042 | |||||||
Dillard’s, Inc. Class A (Multiline Retail) | 7,145 | 372,540 | ||||||||
Pier 1 Imports, Inc. (Specialty Retail) | (a) | 11,891 | 137,579 | |||||||
Sally Beauty Holdings, Inc. (Specialty Retail) | (a) | 22,114 | 378,149 | |||||||
Deckers Outdoor Corp. (Textiles, Apparel & Luxury Goods) | (a) | 4,858 | 428,184 | |||||||
Fossil, Inc. (Textiles, Apparel & Luxury Goods) | (a) | 8,181 | 963,067 | |||||||
|
| |||||||||
| 7,779,822 | ||||||||||
|
| |||||||||
ENERGY – 4.4% | ||||||||||
RPC, Inc. (Energy Equip. & Svs.) | 18,378 | 450,996 | ||||||||
Chevron Corp. (Oil, Gas & Consumable Fuels) | 6,911 | 710,727 | ||||||||
|
| |||||||||
| 1,161,723 | ||||||||||
|
| |||||||||
FINANCIALS – 9.3% | ||||||||||
FNB Corp. (Commercial Banks) | 62,956 | 651,595 | ||||||||
Allstate Corp. / The (Insurance) | 19,789 | 604,158 | ||||||||
Cincinnati Financial Corp. (Insurance) | 19,752 | 576,363 | ||||||||
First Niagara Financial Group, Inc. (Thrifts & Mortgage Finance) | 44,438 | 586,582 | ||||||||
|
| |||||||||
| 2,418,698 | ||||||||||
|
| |||||||||
INDUSTRIALS – 15.9% | ||||||||||
Huntington Ingalls Industries, Inc. (Aerospace & Defense) | (a) | 1,535 | 52,958 | |||||||
Northrop Grumman Corp. (Aerospace & Defense) | 9,733 | 674,984 | ||||||||
Park-Ohio Holdings Corp. (Air Freight & Logistics) | (a) | 5,945 | 125,677 | |||||||
U.S. Airways Group, Inc. (Airlines) | (a) | 19,555 | 174,235 | |||||||
Masco Corp. (Building Products) | 49,682 | 597,675 | ||||||||
R.R. Donnelley & Sons Co. (Commercial Svs. & Supplies) | 36,926 | 724,119 | ||||||||
NN, Inc. (Machinery) | (a) | 10,429 | 156,018 | |||||||
Tata Motors Ltd. – ADR (Machinery) | 65,108 | 1,465,581 | ||||||||
United Rentals, Inc. (Trading Companies & Distributors) | (a) | 7,510 | 190,754 | |||||||
|
| |||||||||
| 4,162,001 | ||||||||||
|
| |||||||||
INFORMATION TECHNOLOGY – 7.8% | ||||||||||
Finisar Corp. (Communications Equip.) | (a) | 10,118 | 182,428 | |||||||
| Common Stocks (Continued) | Shares | Value | ||||||||
INFORMATION TECHNOLOGY (continued) | ||||||||||
Power-One, Inc. (Electronic Equip., Instr. & Comp.) | (a) | 12,154 | $ | 98,447 | ||||||
Vishay Intertechnology, Inc. (Electronic Equip., Instr. & Comp.) | (a) | 18,640 | 280,346 | |||||||
Atmel Corp. (Semiconductors & Equip.) | (a) | 57,351 | 806,929 | |||||||
Fairchild Semiconductor International, Inc. (Semiconductors & Equip.) | (a) | 15,372 | 256,866 | |||||||
RF Micro Devices, Inc. (Semiconductors & Equip.) | (a) | 34,482 | 211,030 | |||||||
TriQuint Semiconductor, Inc. (Semiconductors & Equip.) | (a) | 19,676 | 200,498 | |||||||
|
| |||||||||
| 2,036,544 | ||||||||||
|
| |||||||||
MATERIALS – 3.1% | ||||||||||
MeadWestvaco Corp. (Paper & Forest Products) | 23,974 | 798,574 | ||||||||
|
| |||||||||
TELECOMMUNICATION SERVICES – 8.1% | ||||||||||
AT&T, Inc. (Diversified Telecom. Svs.) | 21,544 | 676,697 | ||||||||
CenturyLink, Inc. (Diversified Telecom. Svs.) | 13,653 | 551,991 | ||||||||
General Communication, Inc. Class A (Diversified Telecom. Svs.) | (a) | 9,525 | 114,967 | |||||||
MetroPCS Communications, Inc. (Wireless Telecom. Svs.) | (a) | 44,371 | 763,625 | |||||||
|
| |||||||||
| 2,107,280 | ||||||||||
|
| |||||||||
UTILITIES – 20.5% | ||||||||||
Cleco Corp. (Electric Utilities) | 20,343 | 708,954 | ||||||||
Edison International (Electric Utilities) | 16,300 | 631,625 | ||||||||
Entergy Corp. (Electric Utilities) | 8,883 | 606,531 | ||||||||
Pinnacle West Capital Corp. (Electric Utilities) | 15,142 | 675,030 | ||||||||
Alliant Energy Corp. (Multi-Utilities) | 17,134 | 696,668 | ||||||||
Black Hills Corp. (Multi-Utilities) | 20,799 | 625,842 | ||||||||
Integrys Energy Group, Inc. (Multi-Utilities) | 12,879 | 667,647 | ||||||||
NiSource, Inc. (Multi-Utilities) | 35,816 | 725,274 | ||||||||
|
| |||||||||
| 5,337,571 | ||||||||||
|
| |||||||||
Total Common Stocks (Cost $25,206,307) | $ | 25,802,213 | ||||||||
|
| |||||||||
| Money Market Funds – 1.0% | Shares | Value | ||||||||
Fidelity Institutional Money Market Funds | 254,000 | $ | 254,000 | |||||||
|
| |||||||||
Total Money Market Funds (Cost $254,000) | $ | 254,000 | ||||||||
|
| |||||||||
Total Investments – 99.9% (Cost $25,460,307) | (b) | $ | 26,056,213 | |||||||
Other Assets in Excess of Liabilities – 0.1% | 24,084 | |||||||||
|
| |||||||||
Net Assets – 100.0% | $ | 26,080,297 | ||||||||
|
| |||||||||
Percentages are stated as a percent of net assets.
Abbreviations:
ADR: American Depositary Receipts
Footnotes:
| (a) | Non-income producing security. |
| (b) | Represents cost for financial reporting purposes, which may differ from cost basis for federal income tax purposes. See also Note 7 of the Notes to Financial Statements. |
The accompanying notes are an integral part of these financial statements.
| 104 |
| Ohio National Fund, Inc. | Bristol Growth Portfolio |
Objective/Strategy
The Bristol Growth Portfolio seeks long-term growth of capital by investing primarily in common stocks of the 1,000 largest publicly traded U.S. companies in terms of market capitalization.
Performance as of June 30, 2011
Average Annual Total Returns: | ||||
One year | 31.64% | |||
Since inception (5/1/07) | 1.23% |
Past performance does not guarantee future results. The performance data quoted represents past performance and current returns may be lower or higher. Total return figures include change in share price and reinvestment of dividends and capital gains. The investment return and principal value will fluctuate so that an investor’s shares, when redeemed, may be worth more or less than the original cost. To obtain performance information up to the most recent month end, call toll-free 1-877-781-6392.
The Portfolio is not open to direct retail investment. Beneficial interest in shares is obtained solely by purchase of variable life insurance policies and variable annuity contracts. Actual performance results for variable annuity and variable universal life contracts will be lower due to contract charges. Consult your contract for applicable charges.
Comments
For the six-month period ended June 30, 2011, the Bristol Growth Portfolio returned 6.71% versus 6.83% for the current benchmark, the Russell 1000 Growth Index.
The Portfolio’s overweight in the Financials sector was the major reason for the slight relative under-performance. Continued worries about the debt crisis in Europe, the lack of clarity on resolution of the mortgage meltdown in the U.S., the inability to clearly define capital requirements for the largest bank, and lower than expected interest rates combined to negatively impact the Financials sector.
The Portfolio’s best performers were SunPower Corp., Medicis Pharmaceutical Corp., Rockwell Automation, Caterpillar, Inc., and Johnson Controls, Inc. The worst performers were Bank of America Corp., Royal Caribbean Cruises, Advanced Micro Devices, Inc., United Continental Holdings, Inc., and Hanesbrands, Inc. The Portfolio’s top contributors to performance were SunPower Corp., International Business Machines Corp., QUALCOMM, Inc., Caterpillar, Inc., and Medicis Pharmaceutical Corp. The Portfolio’s largest detractors to performance were Google, Inc., Bank of America Corp., Royal Caribbean Cruises, Cisco Systems, Inc., and Advanced Micro Devices, Inc.(1)
Top contributors to the Portfolio’s performance included SunPower Corp., which benefited performance when Total, a French multi-national oil company took over a controlling stake of SunPower Corp., relatively contributing 86 basis points. Medicis Pharmaceutical Corp. contributed 46 basis points due to a settlement with Teva Pharmaceutical Industries in regards to a patent on their most profitable product, Solodyn. During the first quarter, Rockwell Automation, Inc. contributed 42 basis points as they exceeded estimates due to their positioning in China. Caterpillar, Inc. beat and raised estimates with continued strength in the growth of its mining and equipment markets, which contributed 36 basis points. Due to a rise in its earnings estimates, Johnson Controls, Inc. contributed 36 basis points as the company provided better prospects for faster recovery from supply disruptions from Japan’s disaster.(1)
Detractors to the Portfolio’s performance during the six-month period included Bank of America Corp., which detracted from
performance of the Portfolio by 44 basis points as a series of mortgage repurchase settlements were more costly than investor expectations. Royal Caribbean Cruises Ltd. under-performed by 37 basis points due to high oil prices and weak demand in Europe. Advanced Micro Devices, Inc. under-performed by 29 basis points due to low yields and production issues for new microprocessors. United Continental Holdings, Inc. detracted from the Portfolio 25 basis points, because of higher oil prices combined with slightly weaker revenue in June due to the weaker economy. Hanesbrands, Inc. under-performed by 23 basis points due to concerns on higher costs for cotton and transportation and their inability to offset price concerns.(1)
The Portfolio’s main sector weight changes were an addition to Consumer Discretionary and a lessening of exposure to Information Technology. This was not done with any particular macro intent, as both probably exhibit similar correlations to Gross Domestic Product growth, consumer spending, and general market sentiment. Specifically, we added Abercrombie & Fitch Co., Starbucks Corporation, Hanesbrands, Inc., MGM Resorts International, and United Continental Holdings, Inc. while selling Cisco Systems, Inc., Microsoft Corp., Oracle Corp., Hewlett-Packard Co., and SunPower Corp.(1)
The dominant theme was that the world would continue to recover from the 2008 recession. That does not seem to be happening as swiftly and robustly as one would have hoped. The chance of a second global recession still looms on the horizon. Although earnings beat expectations for many of the cyclical sectors, including Consumer Discretionary and Industrials, this would not be the case if the world fell into a global recession.(1)
If Europe can’t get a handle on its debt problems in the weaker nations, and if the U.S. can’t recover from a recession while simultaneously also dealing with its longer term deficit problem, then it seems likely we will experience a second, perhaps deeper and longer, recession.
We are hopeful that job growth will re-accelerate in the U.S., that Europe can deal with its debt problems, that somehow the U.S. can come to some longer-term resolution on the deficit, and that there will be less macro shocks like Japanese earthquakes and civil wars through the Middle East and North Africa.
| (1) | The Portfolio’s composition is subject to change. Holdings and weightings are as of June 30, 2011. |
| 105 | (continued) |
| Ohio National Fund, Inc. | Bristol Growth Portfolio (Continued) |
Change in Value of $10,000 Investment
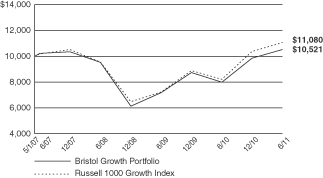
Hypothetical illustration based on past performance. Future performance will vary. The Portfolio’s returns reflect reinvested dividends. The Portfolio’s holdings may differ significantly from the securities in the index. The index is unmanaged and therefore does not reflect the cost of portfolio management and accounting.
The Russell 1000 Growth Index is a market-capitalization weighted index of those firms in the Russell 1000 with higher price-to-book ratios and higher forecasted growth values. The index presented herein includes the effects of requested dividends.
Portfolio Composition as of June 30, 2011 (1)
| % of Net Assets | ||||
Common Stocks (3) | 96.5 | |||
Money Market Funds and | 3.5 | |||
|
| |||
| 100.0 | ||||
|
|
Top 10 Portfolio Holdings as of June 30, 2011 (1) (2)
| % of Net Assets | ||||
1. Apple, Inc. | 4.3 | |||
2. International Business Machines Corp. | 3.8 | |||
3. Exxon Mobil Corp. | 2.9 | |||
4. Google, Inc. Class A | 2.8 | |||
5. Qualcomm, Inc. | 2.4 | |||
6. Avago Technologies Ltd. | 2.2 | |||
7. Citrix Systems, Inc. | 2.2 | |||
8. Starbucks Corp. | 2.2 | |||
9. Johnson Controls, Inc. | 2.1 | |||
10. Warner Chilcott PLC Class A | 2.1 |
| (1 | Composition of Portfolio subject to change. |
| (2) | Short-term investments have been excluded from the list of Top 10 Portfolio Holdings. |
| (3) | Sectors: |
| % of Net Assets | ||||
Information Technology | 26.1 | |||
Consumer Discretionary | 17.9 | |||
Industrials | 14.5 | |||
Energy | 14.0 | |||
Financials | 7.2 | |||
Health Care | 5.8 | |||
Consumer Staples | 5.5 | |||
Materials | 5.5 | |||
|
| |||
| 96.5 | ||||
|
|
| 106 |
| Ohio National Fund, Inc. | Bristol Growth Portfolio |
Schedule of Investments | June 30, 2011 (Unaudited) |
| Common Stocks – 96.5% | Shares | Value | ||||||||
CONSUMER DISCRETIONARY – 17.9% | ||||||||||
Johnson Controls, Inc. (Auto Components) | 50,400 | $ | 2,099,664 | |||||||
MGM Resorts International (Hotels, Restaurants & Leisure) | (a) | 35,800 | 472,918 | |||||||
Royal Caribbean Cruises Ltd. (Hotels, Restaurants & Leisure) | (a) | 47,600 | 1,791,664 | |||||||
Starbucks Corp. (Hotels, Restaurants & Leisure) | 53,400 | 2,108,766 | ||||||||
Starwood Hotels & Resorts Worldwide, Inc. (Hotels, Restaurants & Leisure) | 21,400 | 1,199,256 | ||||||||
Amazon.com, Inc. (Internet & Catalog Retail) | (a) | 8,700 | 1,779,063 | |||||||
Abercrombie & Fitch Co. Class A (Specialty Retail) | 25,100 | 1,679,692 | ||||||||
Tiffany & Co. (Specialty Retail) | 16,700 | 1,311,284 | ||||||||
Coach, Inc. (Textiles, Apparel & Luxury Goods) | 26,700 | 1,706,931 | ||||||||
Hanesbrands, Inc. (Textiles, Apparel & Luxury Goods) | (a) | 53,100 | 1,516,005 | |||||||
Warnaco Group, Inc. / The (Textiles, Apparel & Luxury Goods) | (a) | 34,500 | 1,802,625 | |||||||
|
| |||||||||
| 17,467,868 | ||||||||||
|
| |||||||||
CONSUMER STAPLES – 5.5% | ||||||||||
H.J. Heinz Co. (Food Products) | 35,300 | 1,880,784 | ||||||||
Kellogg Co. (Food Products) | 33,400 | 1,847,688 | ||||||||
Kraft Foods, Inc. Class A (Food Products) | 46,700 | 1,645,241 | ||||||||
|
| |||||||||
| 5,373,713 | ||||||||||
|
| |||||||||
ENERGY – 14.0% | ||||||||||
Dresser-Rand Group, Inc. (Energy Equip. & Svs.) | (a) | 36,600 | 1,967,250 | |||||||
Halliburton Co. (Energy Equip. & Svs.) | 34,900 | 1,779,900 | ||||||||
National Oilwell Varco, Inc. (Energy Equip. & Svs.) | 22,600 | 1,767,546 | ||||||||
Chevron Corp. (Oil, Gas & Consumable Fuels) | 18,700 | 1,923,108 | ||||||||
Devon Energy Corp. (Oil, Gas & Consumable Fuels) | 19,000 | 1,497,390 | ||||||||
Exxon Mobil Corp. (Oil, Gas & Consumable Fuels) | 34,300 | 2,791,334 | ||||||||
Occidental Petroleum Corp. (Oil, Gas & Consumable Fuels) | 18,600 | 1,935,144 | ||||||||
|
| |||||||||
| 13,661,672 | ||||||||||
|
| |||||||||
FINANCIALS – 7.2% | ||||||||||
Bank of America Corp. (Diversified Financial Svs.) | 127,700 | 1,399,592 | ||||||||
JPMorgan Chase & Co. (Diversified Financial Svs.) | 46,200 | 1,891,428 | ||||||||
Hartford Financial Services Group, Inc. (Insurance) | 60,900 | 1,605,933 | ||||||||
Lincoln National Corp. (Insurance) | 42,900 | 1,222,221 | ||||||||
MetLife, Inc. (Insurance) | 21,700 | 951,979 | ||||||||
|
| |||||||||
| 7,071,153 | ||||||||||
|
| |||||||||
HEALTH CARE – 5.8% | ||||||||||
Cubist Pharmaceuticals, Inc. (Biotechnology) | (a) | 16,600 | 597,434 | |||||||
Vertex Pharmaceuticals, Inc. (Biotechnology) | (a) | 29,700 | 1,544,103 | |||||||
Medco Health Solutions, Inc. (Health Care | (a) | 25,100 | 1,418,652 | |||||||
Warner Chilcott PLC Class A (Pharmaceuticals) | 86,500 | 2,087,245 | ||||||||
|
| |||||||||
| 5,647,434 | ||||||||||
|
| |||||||||
| Common Stocks (Continued) | Shares | Value | ||||||||
INDUSTRIALS – 14.5% | ||||||||||
Honeywell International, Inc. (Aerospace & Defense) | 33,100 | $ | 1,972,429 | |||||||
FedEx Corp. (Air Freight & Logistics) | 19,100 | 1,811,635 | ||||||||
United Parcel Service, Inc. Class B (Air Freight & Logistics) | 24,400 | 1,779,492 | ||||||||
United Continental Holdings, Inc. (Airlines) | (a) | 72,600 | 1,642,938 | |||||||
Rockwell Automation, Inc. (Electrical Equip.) | 15,000 | 1,301,400 | ||||||||
3M Co. (Industrial Conglomerates) | 20,000 | 1,897,000 | ||||||||
Caterpillar, Inc. (Machinery) | 18,600 | 1,980,156 | ||||||||
Pentair, Inc. (Machinery) | 45,400 | 1,832,344 | ||||||||
|
| |||||||||
| 14,217,394 | ||||||||||
|
| |||||||||
INFORMATION TECHNOLOGY – 26.1% | ||||||||||
Qualcomm, Inc. (Communications Equip.) | 41,200 | 2,339,748 | ||||||||
Apple, Inc. (Computers & Peripherals) | (a) | 12,550 | 4,212,658 | |||||||
EMC Corp. (Computers & Peripherals) | (a) | 69,000 | 1,900,950 | |||||||
Google, Inc. Class A (Internet Software & Svs.) | (a) | 5,410 | 2,739,516 | |||||||
International Business Machines Corp. (IT Svs.) | 21,900 | 3,756,945 | ||||||||
Advanced Micro Devices, Inc. (Semiconductors & Equip.) | (a) | 169,200 | 1,182,708 | |||||||
Avago Technologies Ltd. (Semiconductors & Equip.) | 56,500 | 2,147,000 | ||||||||
Maxim Integrated Products, Inc. (Semiconductors & Equip.) | 71,100 | 1,817,316 | ||||||||
Texas Instruments, Inc. (Semiconductors & Equip.) | 43,900 | 1,441,237 | ||||||||
Citrix Systems, Inc. (Software) | (a) | 26,500 | 2,120,000 | |||||||
Electronic Arts, Inc. (Software) | (a) | 80,800 | 1,906,880 | |||||||
|
| |||||||||
| 25,564,958 | ||||||||||
|
| |||||||||
MATERIALS – 5.5% | ||||||||||
E.I. du Pont de Nemours & Co. (Chemicals) | 36,100 | 1,951,205 | ||||||||
Monsanto Co. (Chemicals) | 20,300 | 1,472,562 | ||||||||
Potash Corp of Saskatchewan, Inc. (Chemicals) | 33,700 | 1,920,563 | ||||||||
|
| |||||||||
| 5,344,330 | ||||||||||
|
| |||||||||
Total Common Stocks (Cost $86,174,303) | $ | 94,348,522 | ||||||||
|
| |||||||||
| Money Market Funds – 3.4% | Shares | Value | ||||||||
Fidelity Institutional Money Market Funds Money Market Portfolio – Class I | 3,279,000 | $ | 3,279,000 | |||||||
|
| |||||||||
Total Money Market Funds (Cost $3,279,000) | $ | 3,279,000 | ||||||||
|
| |||||||||
Total Investments – 99.9% (Cost $89,453,303) | (b) | $ | 97,627,522 | |||||||
Other Assets in Excess of Liabilities – 0.1% | 112,269 | |||||||||
|
| |||||||||
Net Assets – 100.0% | $ | 97,739,791 | ||||||||
|
| |||||||||
Percentages are stated as a percent of net assets.
Abbreviations:
ADR: American Depositary Receipts
Footnotes:
| (a) | Non-income producing security. |
| (b) | Represents cost for financial reporting purposes, which may differ from cost basis for federal income tax purposes. See also Note 7 of the Notes to Financial Statements. |
The accompanying notes are an integral part of these financial statements.
| 107 |
| Ohio National Fund, Inc. |
| June 30, 2011 (Unaudited) |
Equity Portfolio | Money Market Portfolio | Bond Portfolio | Omni Portfolio | International Portfolio | Capital Appreciation Portfolio | Millennium Portfolio | International Portfolio | |||||||||||||||||||||||||
Assets: | ||||||||||||||||||||||||||||||||
Investments in securities, at value* | $ | 207,046,324 | $ | 264,723,447 | $ | 145,057,616 | $ | 39,888,671 | $ | 210,922,424 | $ | 133,062,845 | $ | 45,300,524 | $ | 79,079,626 | ||||||||||||||||
Repurchase agreements | 3,237,584 | 14,000,000 | 7,338,000 | — | — | — | — | — | ||||||||||||||||||||||||
Cash | 1 | 8,061,226 | 18 | 1,762 | — | 18,020 | 577 | — | ||||||||||||||||||||||||
Foreign currencies, at value** | — | — | — | — | 287,724 | — | — | 19,691 | ||||||||||||||||||||||||
Receivable for securities sold | 2,209,339 | — | — | 654,788 | 535,479 | 901,114 | 636,093 | 191,623 | ||||||||||||||||||||||||
Variation margin receivable from broker | — | — | — | — | 5,043 | — | — | — | ||||||||||||||||||||||||
Due from adviser | — | 46,448 | — | — | — | — | — | — | ||||||||||||||||||||||||
Receivable for fund shares sold | 1,080,656 | 1,775,795 | 194,543 | 19,856 | 49,360 | 41,352 | 5,371 | 31,033 | ||||||||||||||||||||||||
Dividends and accrued interest receivable | 162,690 | 4,421 | 1,576,831 | 135,489 | 420,719 | 85,997 | 5,421 | 140,471 | ||||||||||||||||||||||||
Foreign tax reclaim receivable | — | — | — | — | 196,508 | — | — | 54,986 | ||||||||||||||||||||||||
Prepaid expenses and other assets | 3,157 | 3,055 | 1,450 | 586 | 3,013 | 1,848 | 586 | 1,050 | ||||||||||||||||||||||||
|
|
|
|
|
|
|
|
|
|
|
|
|
|
|
| |||||||||||||||||
Total assets | 213,739,751 | 288,614,392 | 154,168,458 | 40,701,152 | 212,420,270 | 134,111,176 | 45,948,572 | 79,518,480 | ||||||||||||||||||||||||
|
|
|
|
|
|
|
|
|
|
|
|
|
|
|
| |||||||||||||||||
Liabilities: | ||||||||||||||||||||||||||||||||
Net unrealized depreciation on foreign currency contracts | — | — | — | — | 405,070 | — | — | — | ||||||||||||||||||||||||
Payable for securities purchased | 1,075,583 | — | — | 582,658 | 606,069 | 1,481,789 | 1,306,004 | 1,091,292 | ||||||||||||||||||||||||
Payable for fund shares redeemed | 284,821 | 676,880 | 875,613 | 5,842 | 1,345,182 | 256,407 | 155,135 | 108,654 | ||||||||||||||||||||||||
Payable for investment management services | 134,582 | 58,742 | 71,726 | 19,376 | 139,779 | 83,889 | 27,916 | 63,289 | ||||||||||||||||||||||||
Accrued custody expense | 2,078 | 1,713 | 704 | 708 | 55,918 | 682 | 695 | 15,849 | ||||||||||||||||||||||||
Accrued professional fees | 5,818 | 5,818 | 5,818 | 5,818 | 5,818 | 5,818 | 5,818 | 5,818 | ||||||||||||||||||||||||
Accrued accounting fees | 12,263 | 16,504 | 11,478 | 4,643 | 469 | 7,963 | 3,325 | 469 | ||||||||||||||||||||||||
Accrued printing and filing fees | 10,946 | 15,547 | 8,418 | 2,071 | 10,959 | 6,832 | 2,217 | 4,108 | ||||||||||||||||||||||||
Withholding tax payable | — | — | — | — | 83,514 | — | — | 78,586 | ||||||||||||||||||||||||
|
|
|
|
|
|
|
|
|
|
|
|
|
|
|
| |||||||||||||||||
Total liabilities | 1,526,091 | 775,204 | 973,757 | 621,116 | 2,652,778 | 1,843,380 | 1,501,110 | 1,368,065 | ||||||||||||||||||||||||
|
|
|
|
|
|
|
|
|
|
|
|
|
|
|
| |||||||||||||||||
Net assets | $ | 212,213,660 | $ | 287,839,188 | $ | 153,194,701 | $ | 40,080,036 | $ | 209,767,492 | $ | 132,267,796 | $ | 44,447,462 | $ | 78,150,415 | ||||||||||||||||
|
|
|
|
|
|
|
|
|
|
|
|
|
|
|
| |||||||||||||||||
Net assets consist of: | ||||||||||||||||||||||||||||||||
Par value, $1 per share | $ | 10,589,163 | $ | 28,783,931 | $ | 11,225,850 | $ | 2,382,415 | $ | 16,285,635 | $ | 6,037,369 | $ | 1,835,621 | $ | 3,174,704 | ||||||||||||||||
Paid-in capital in excess of par value | 299,183,637 | 259,055,257 | 139,280,612 | 39,580,223 | 230,563,990 | 129,562,938 | 46,615,121 | 67,074,208 | ||||||||||||||||||||||||
Accumulated net realized gain (loss) on investments | (121,470,647 | ) | — | (15,009,751 | ) | (4,835,008 | ) | (90,880,341 | ) | (22,957,785 | ) | (12,189,423 | ) | (14,399,553 | ) | |||||||||||||||||
Net unrealized appreciation (depreciation) on: | ||||||||||||||||||||||||||||||||
Investments | 23,277,041 | — | 9,033,756 | 2,600,892 | 48,846,474 | 19,287,087 | 8,339,013 | 21,760,896 | ||||||||||||||||||||||||
Foreign currency contracts | — | — | — | — | (405,070 | ) | — | — | — | |||||||||||||||||||||||
Futures contracts | — | — | — | — | 13,117 | — | — | — | ||||||||||||||||||||||||
Other foreign currency related transactions | — | — | — | — | 7,821 | — | — | (62,994 | ) | |||||||||||||||||||||||
Undistributed net investment income (loss) | 634,466 | — | 8,664,234 | 351,514 | 5,335,866 | 338,187 | (152,870 | ) | 603,154 | |||||||||||||||||||||||
|
|
|
|
|
|
|
|
|
|
|
|
|
|
|
| |||||||||||||||||
Net assets | $ | 212,213,660 | $ | 287,839,188 | $ | 153,194,701 | $ | 40,080,036 | $ | 209,767,492 | $ | 132,267,796 | $ | 44,447,462 | $ | 78,150,415 | ||||||||||||||||
|
|
|
|
|
|
|
|
|
|
|
|
|
|
|
| |||||||||||||||||
* Investments in securities, at cost | $ | 183,769,283 | $ | 264,723,447 | $ | 136,023,860 | $ | 37,287,779 | $ | 162,075,950 | $ | 113,775,758 | $ | 36,961,511 | $ | 57,318,730 | ||||||||||||||||
|
|
|
|
|
|
|
|
|
|
|
|
|
|
|
| |||||||||||||||||
** Foreign currencies, at cost | $ | — | $ | — | $ | — | $ | — | $ | 287,547 | $ | — | $ | — | $ | 21,800 | ||||||||||||||||
|
|
|
|
|
|
|
|
|
|
|
|
|
|
|
| |||||||||||||||||
Shares outstanding | 10,589,163 | 28,783,931 | 11,225,850 | 2,382,415 | 16,285,635 | 6,037,369 | 1,835,621 | 3,174,704 | ||||||||||||||||||||||||
|
|
|
|
|
|
|
|
|
|
|
|
|
|
|
| |||||||||||||||||
Authorized Fund shares allocated to Portfolio | 30,000,000 | 80,000,000 | 30,000,000 | 10,000,000 | 45,000,000 | 15,000,000 | 10,000,000 | 10,000,000 | ||||||||||||||||||||||||
|
|
|
|
|
|
|
|
|
|
|
|
|
|
|
| |||||||||||||||||
Net asset value per share | $ | 20.04 | $ | 10.00 | $ | 13.65 | $ | 16.82 | $ | 12.88 | $ | 21.91 | $ | 24.21 | $ | 24.62 | ||||||||||||||||
|
|
|
|
|
|
|
|
|
|
|
|
|
|
|
| |||||||||||||||||
The accompanying notes are an integral part of these financial statements.
| 108 |
| Ohio National Fund, Inc. |
Statements of Assets and Liabilities | June 30, 2011 (Unaudited) |
| Aggressive Growth Portfolio | Small Cap Growth Portfolio | Mid Cap Opportunity Portfolio | S&P 500® Portfolio | Strategic Value Portfolio | High Income Portfolio | Capital Growth Portfolio | Nasdaq-100® Index Portfolio | |||||||||||||||||||||||||
Assets: | ||||||||||||||||||||||||||||||||
Investments in securities, at value* | $ | 29,756,526 | $ | 35,708,723 | $ | 69,823,926 | $ | 182,828,459 | $ | 28,726,942 | $ | 287,249,389 | $ | 61,555,982 | $ | 54,322,052 | ||||||||||||||||
Cash | 553 | 285 | 394 | — | 180 | 691,648 | 503 | — | ||||||||||||||||||||||||
Receivable for securities sold | — | 98,648 | 120,431 | 204,277 | — | 172,855 | 350,113 | 242,902 | ||||||||||||||||||||||||
Receivable for fund shares sold | 63,718 | �� | 25,469 | 89,892 | 60,141 | 26,182 | 593,266 | 131,843 | 200,291 | |||||||||||||||||||||||
Dividends and accrued interest receivable | 34,355 | 2,970 | 26,851 | 238,175 | 178,100 | 5,314,936 | 14,026 | 26,933 | ||||||||||||||||||||||||
Foreign tax reclaim receivable | 3,467 | — | — | — | 3,553 | — | — | — | ||||||||||||||||||||||||
Prepaid expenses and other assets | 403 | 444 | 986 | 2,499 | 354 | 2,712 | 734 | 754 | ||||||||||||||||||||||||
|
|
|
|
|
|
|
|
|
|
|
|
|
|
|
| |||||||||||||||||
Total assets | 29,859,022 | 35,836,539 | 70,062,480 | 183,333,551 | 28,935,311 | 294,024,806 | 62,053,201 | 54,792,932 | ||||||||||||||||||||||||
|
|
|
|
|
|
|
|
|
|
|
|
|
|
|
| |||||||||||||||||
Liabilities: | ||||||||||||||||||||||||||||||||
Cash overdraft | — | — | — | 187,736 | — | — | — | 237,249 | ||||||||||||||||||||||||
Payable for securities purchased | 681,481 | 97,442 | 44,132 | — | — | 2,309,239 | 86,055 | — | ||||||||||||||||||||||||
Payable for fund shares redeemed | 85,525 | 62,805 | 31,540 | 75,658 | 77,635 | 331,135 | 93,640 | 57,134 | ||||||||||||||||||||||||
Payable for investment management services | 18,532 | 25,533 | 47,756 | 55,379 | 17,471 | 160,945 | 43,216 | 17,552 | ||||||||||||||||||||||||
Accrued custody expense | 1,325 | 1,577 | 861 | 1,515 | 369 | 1,323 | 386 | 520 | ||||||||||||||||||||||||
Accrued professional fees | 5,818 | 5,818 | 5,818 | 5,818 | 5,818 | 5,818 | 5,818 | 5,818 | ||||||||||||||||||||||||
Accrued accounting fees | 2,822 | 2,988 | 4,708 | 13,318 | 2,526 | 25,660 | 4,168 | 4,136 | ||||||||||||||||||||||||
Accrued printing and filing fees | 1,482 | 1,823 | 3,596 | 9,440 | 1,522 | 15,724 | 3,076 | 2,764 | ||||||||||||||||||||||||
Withholding tax payable | 343 | — | — | — | 7,373 | — | — | — | ||||||||||||||||||||||||
|
|
|
|
|
|
|
|
|
|
|
|
|
|
|
| |||||||||||||||||
Total liabilities | 797,328 | 197,986 | 138,411 | 348,864 | 112,714 | 2,849,844 | 236,359 | 325,173 | ||||||||||||||||||||||||
|
|
|
|
|
|
|
|
|
|
|
|
|
|
|
| |||||||||||||||||
Net assets | $ | 29,061,694 | $ | 35,638,553 | $ | 69,924,069 | $ | 182,984,687 | $ | 28,822,597 | $ | 291,174,962 | $ | 61,816,842 | $ | 54,467,759 | ||||||||||||||||
|
|
|
|
|
|
|
|
|
|
|
|
|
|
|
| |||||||||||||||||
Net assets consists of: | ||||||||||||||||||||||||||||||||
Par value, $1 per share | $ | 3,412,537 | $ | 2,470,707 | $ | 3,615,937 | $ | 13,088,282 | $ | 2,837,737 | $ | 22,673,894 | $ | 1,979,343 | $ | 9,109,890 | ||||||||||||||||
Paid-in capital in excess of par value | 21,910,377 | 26,667,985 | 87,930,756 | 139,514,564 | 29,746,077 | 226,700,910 | 42,618,543 | 31,377,632 | ||||||||||||||||||||||||
Accumulated net realized gain (loss) on investments | (1,228,243 | ) | (98,256 | ) | (30,499,771 | ) | (4,190,790 | ) | (7,580,439 | ) | (180,250 | ) | (1,745,524 | ) | 3,830,885 | |||||||||||||||||
Net unrealized appreciation (depreciation) on: | ||||||||||||||||||||||||||||||||
Investments | 4,857,157 | 6,722,669 | 8,997,745 | 32,862,071 | 3,282,751 | 13,690,292 | 19,140,583 | 10,062,443 | ||||||||||||||||||||||||
Foreign currency related transactions | 846 | — | — | — | (845 | ) | — | — | — | |||||||||||||||||||||||
Undistributed net investment income (loss) | 109,020 | (124,552 | ) | (120,598 | ) | 1,710,560 | 537,316 | 28,290,116 | (176,103 | ) | 86,909 | |||||||||||||||||||||
|
|
|
|
|
|
|
|
|
|
|
|
|
|
|
| |||||||||||||||||
Net assets | $ | 29,061,694 | $ | 35,638,553 | $ | 69,924,069 | $ | 182,984,687 | $ | 28,822,597 | $ | 291,174,962 | $ | 61,816,842 | $ | 54,467,759 | ||||||||||||||||
|
|
|
|
|
|
|
|
|
|
|
|
|
|
|
| |||||||||||||||||
* Investments in securities, at cost | $ | 24,899,369 | $ | 28,986,054 | $ | 60,826,181 | $ | 149,966,388 | $ | 25,444,191 | $ | 273,559,097 | $ | 42,415,399 | $ | 44,259,609 | ||||||||||||||||
|
|
|
|
|
|
|
|
|
|
|
|
|
|
|
| |||||||||||||||||
Shares outstanding | 3,412,537 | 2,470,707 | 3,615,937 | 13,088,282 | 2,837,737 | 22,673,894 | 1,979,343 | 9,109,890 | ||||||||||||||||||||||||
|
|
|
|
|
|
|
|
|
|
|
|
|
|
|
| |||||||||||||||||
Authorized Fund shares allocated to Portfolio | 10,000,000 | 10,000,000 | 10,000,000 | 35,000,000 | 10,000,000 | 60,000,000 | 10,000,000 | 25,000,000 | ||||||||||||||||||||||||
|
|
|
|
|
|
|
|
|
|
|
|
|
|
|
| |||||||||||||||||
Net asset value per share | $ | 8.52 | $ | 14.42 | $ | 19.34 | $ | 13.98 | $ | 10.16 | $ | 12.84 | $ | 31.23 | $ | 5.98 | ||||||||||||||||
|
|
|
|
|
|
|
|
|
|
|
|
|
|
|
| |||||||||||||||||
The accompanying notes are an integral part of these financial statements.
| 109 |
| Ohio National Fund, Inc. |
Statements of Assets and Liabilities | June 30, 2011 (Unaudited) |
| Bristol Portfolio | Bryton Growth Portfolio | U.S. Equity Portfolio | Balanced Portfolio | Income Opportunity Portfolio | Target VIP Portfolio | Target Equity/Income Portfolio | Bristol Growth Portfolio | |||||||||||||||||||||||||
Assets: | ||||||||||||||||||||||||||||||||
Investments in securities, at value* | $ | 198,295,963 | $ | 148,867,709 | $ | 14,545,185 | $ | 17,607,838 | $ | 11,168,269 | $ | 23,617,779 | $ | 26,056,213 | $ | 97,627,522 | ||||||||||||||||
Cash | 10,856 | 340 | — | 742 | — | 244 | 330 | 5,558 | ||||||||||||||||||||||||
Receivable for securities sold | 3,894,257 | 2,829,875 | 56,464 | 216,922 | 70,450 | — | — | 2,885,247 | ||||||||||||||||||||||||
Receivable for fund shares sold | 1,348,708 | 3,143,372 | 1,323 | 1,705 | 15,472 | 17,862 | 21,838 | 99,669 | ||||||||||||||||||||||||
Dividends and accrued interest receivable | 137,144 | 2,059 | 15,635 | 104,698 | 15,524 | 44,507 | 25,064 | 65,676 | ||||||||||||||||||||||||
Foreign tax reclaim receivable | — | — | 642 | 578 | 142 | 3,762 | — | — | ||||||||||||||||||||||||
Prepaid expenses and other assets | 2,606 | 1,939 | 204 | 210 | 129 | 306 | 362 | 1,239 | ||||||||||||||||||||||||
|
|
|
|
|
|
|
|
|
|
|
|
|
|
|
| |||||||||||||||||
Total assets | 203,689,534 | 154,845,294 | 14,619,453 | 17,932,693 | 11,269,986 | 23,684,460 | 26,103,807 | 100,684,911 | ||||||||||||||||||||||||
|
|
|
|
|
|
|
|
|
|
|
|
|
|
|
| |||||||||||||||||
Liabilities: | ||||||||||||||||||||||||||||||||
Cash overdraft | — | — | 39,760 | — | 44,311 | — | — | — | ||||||||||||||||||||||||
Options written, at value** | — | — | — | — | 231,468 | — | — | — | ||||||||||||||||||||||||
Payable for securities purchased | 5,409,459 | 3,327,858 | — | — | 114,016 | — | — | 2,480,220 | ||||||||||||||||||||||||
Payable for fund shares redeemed | 238,693 | 102,184 | 3,844 | 82,263 | 817 | 3,764 | 1,412 | 385,751 | ||||||||||||||||||||||||
Payable for investment management services | 116,649 | 96,045 | 8,761 | 9,312 | 6,919 | 11,228 | 12,577 | 61,672 | ||||||||||||||||||||||||
Accrued custody expense | 1,296 | 843 | 84 | 133 | 508 | 717 | 204 | 901 | ||||||||||||||||||||||||
Accrued professional fees | 5,818 | 5,818 | 5,818 | 5,818 | 5,818 | 5,818 | 5,818 | 5,818 | ||||||||||||||||||||||||
Accrued accounting fees | 10,919 | 8,709 | 1,579 | 3,560 | 1,730 | 2,487 | 2,154 | 5,783 | ||||||||||||||||||||||||
Accrued printing and filing fees | 9,914 | 7,465 | 747 | 958 | 564 | 1,214 | 1,345 | 4,975 | ||||||||||||||||||||||||
Withholding tax payable | — | — | — | 345 | 139 | 2,983 | — | — | ||||||||||||||||||||||||
|
|
|
|
|
|
|
|
|
|
|
|
|
|
|
| |||||||||||||||||
Total liabilities | 5,792,748 | 3,548,922 | 60,593 | 102,389 | 406,290 | 28,211 | 23,510 | 2,945,120 | ||||||||||||||||||||||||
|
|
|
|
|
|
|
|
|
|
|
|
|
|
|
| |||||||||||||||||
Net assets | $ | 197,896,786 | $ | 151,296,372 | $ | 14,558,860 | $ | 17,830,304 | $ | 10,863,696 | $ | 23,656,249 | $ | 26,080,297 | $ | 97,739,791 | ||||||||||||||||
|
|
|
|
|
|
|
|
|
|
|
|
|
|
|
| |||||||||||||||||
Net assets consist of: | ||||||||||||||||||||||||||||||||
Par value, $1 per share | $ | 15,111,638 | $ | 10,875,981 | $ | 1,340,471 | $ | 1,229,974 | $ | 875,637 | $ | 2,394,316 | $ | 2,959,264 | $ | 9,311,816 | ||||||||||||||||
Paid-in capital in excess of par value | 164,240,846 | 107,944,523 | 17,496,771 | 15,711,821 | 8,826,335 | 25,809,213 | 34,931,424 | 68,307,528 | ||||||||||||||||||||||||
Accumulated net realized gain (loss) on investments | 6,316,708 | 20,448,056 | (6,462,800 | ) | (791,111 | ) | (314,079 | ) | (7,104,657 | ) | (12,660,530 | ) | 11,772,183 | |||||||||||||||||||
Net unrealized appreciation (depreciation) on: | ||||||||||||||||||||||||||||||||
Investments | 11,742,174 | 12,550,315 | 2,125,994 | 1,447,333 | 1,456,710 | 2,403,587 | 595,906 | 8,174,219 | ||||||||||||||||||||||||
Foreign currency related transactions | — | — | — | 25 | — | — | — | — | ||||||||||||||||||||||||
Written options | — | — | — | — | (99,391 | ) | — | — | — | |||||||||||||||||||||||
Undistributed net investment income (loss) | 485,420 | (522,503 | ) | 58,424 | 232,262 | 118,484 | 153,790 | 254,233 | 174,045 | |||||||||||||||||||||||
|
|
|
|
|
|
|
|
|
|
|
|
|
|
|
| |||||||||||||||||
Net assets | $ | 197,896,786 | $ | 151,296,372 | $ | 14,558,860 | $ | 17,830,304 | $ | 10,863,696 | $ | 23,656,249 | $ | 26,080,297 | $ | 97,739,791 | ||||||||||||||||
|
|
|
|
|
|
|
|
|
|
|
|
|
|
|
| |||||||||||||||||
* Investments in securities, at cost | $ | 186,553,789 | $ | 136,317,394 | $ | 12,419,191 | $ | 16,160,505 | $ | 9,711,559 | $ | 21,214,192 | $ | 25,460,307 | $ | 89,453,303 | ||||||||||||||||
|
|
|
|
|
|
|
|
|
|
|
|
|
|
|
| |||||||||||||||||
** Premiums received on options written | $ | — | $ | — | $ | — | $ | — | $ | 132,077 | $ | — | $ | — | $ | — | ||||||||||||||||
|
|
|
|
|
|
|
|
|
|
|
|
|
|
|
| |||||||||||||||||
Shares outstanding | 15,111,638 | 10,875,981 | 1,340,471 | 1,229,974 | 875,637 | 2,394,316 | 2,959,264 | 9,311,816 | ||||||||||||||||||||||||
|
|
|
|
|
|
|
|
|
|
|
|
|
|
|
| |||||||||||||||||
Authorized Fund shares allocated to Portfolio | 40,000,000 | 35,000,000 | 10,000,000 | 10,000,000 | 10,000,000 | 10,000,000 | 10,000,000 | 25,000,000 | ||||||||||||||||||||||||
|
|
|
|
|
|
|
|
|
|
|
|
|
|
|
| |||||||||||||||||
Net asset value per share | $ | 13.10 | $ | 13.91 | $ | 10.86 | $ | 14.50 | $ | 12.41 | $ | 9.88 | $ | 8.81 | $ | 10.50 | ||||||||||||||||
|
|
|
|
|
|
|
|
|
|
|
|
|
|
|
| |||||||||||||||||
The accompanying notes are an integral part of these financial statements.
| 110 |
| Ohio National Fund, Inc. |
| For the Six-Month Period Ended June 30, 2011 (Unaudited) |
| Equity Portfolio | Money Market Portfolio | Bond Portfolio | Omni Portfolio | International Portfolio | Capital Appreciation Portfolio | Millennium Portfolio | International Small-Mid Company Portfolio | |||||||||||||||||||||||||
Investment income: | ||||||||||||||||||||||||||||||||
Interest | $ | 1,615 | $ | 200,839 | $ | 3,310,243 | $ | 231,451 | $ | 159 | $ | 3,961 | $ | 690 | $ | 67 | ||||||||||||||||
Dividends, net of taxes withheld* | 1,564,863 | — | — | 189,660 | 3,302,123 | 826,202 | 49,285 | 978,040 | ||||||||||||||||||||||||
|
|
|
|
|
|
|
|
|
|
|
|
|
|
|
| |||||||||||||||||
Total investment income | 1,566,478 | 200,839 | 3,310,243 | 421,111 | 3,302,282 | 830,163 | 49,975 | 978,107 | ||||||||||||||||||||||||
|
|
|
|
|
|
|
|
|
|
|
|
|
|
|
| |||||||||||||||||
Expenses: | ||||||||||||||||||||||||||||||||
Management fees | 864,841 | 377,402 | 418,991 | 122,828 | 866,866 | 519,658 | 173,403 | 388,587 | ||||||||||||||||||||||||
Custodian fees | 12,262 | 10,000 | 4,087 | 3,939 | 130,126 | 4,328 | 3,529 | 37,088 | ||||||||||||||||||||||||
Directors’ fees | 11,060 | 14,118 | 7,354 | 2,046 | 10,531 | 6,587 | 2,165 | 3,875 | ||||||||||||||||||||||||
Professional fees | 9,068 | 10,058 | 8,101 | 6,586 | 8,958 | 7,860 | 6,625 | 7,090 | ||||||||||||||||||||||||
Accounting fees | 37,064 | 47,319 | 33,954 | 14,202 | 32,878 | 23,953 | 10,034 | 15,034 | ||||||||||||||||||||||||
Printing and filing fees | 15,063 | 22,117 | 11,125 | 2,840 | 15,246 | 9,352 | 3,002 | 5,676 | ||||||||||||||||||||||||
Compliance expense | 3,167 | 3,167 | 3,167 | 3,167 | 3,167 | 3,167 | 3,167 | 3,167 | ||||||||||||||||||||||||
Other | 3,847 | 2,854 | 1,268 | 717 | 4,915 | 2,223 | 920 | 1,756 | ||||||||||||||||||||||||
|
|
|
|
|
|
|
|
|
|
|
|
|
|
|
| |||||||||||||||||
Total expenses | 956,372 | 487,035 | 488,047 | 156,325 | 1,072,687 | 577,128 | 202,845 | 462,273 | ||||||||||||||||||||||||
|
|
|
|
|
|
|
|
|
|
|
|
|
|
|
| |||||||||||||||||
Less expenses reduced or reimbursed by adviser | — | (286,196 | ) | — | — | — | — | — | — | |||||||||||||||||||||||
|
|
|
|
|
|
|
|
|
|
|
|
|
|
|
| |||||||||||||||||
Net expenses | 956,372 | 200,839 | 488,047 | 156,325 | 1,072,687 | 577,128 | 202,845 | 462,273 | ||||||||||||||||||||||||
|
|
|
|
|
|
|
|
|
|
|
|
|
|
|
| |||||||||||||||||
Net investment income (loss) | 610,106 | — | 2,822,196 | 264,786 | 2,229,595 | 253,035 | (152,870 | ) | 515,834 | |||||||||||||||||||||||
|
|
|
|
|
|
|
|
|
|
|
|
|
|
|
| |||||||||||||||||
Realized/unrealized gain (loss) on investments, futures contracts, foreign currency contracts, and other foreign currency related transactions: | ||||||||||||||||||||||||||||||||
Net realized gain (loss) on: | ||||||||||||||||||||||||||||||||
Investments | 2,021,661 | — | 340,911 | 3,039,939 | 15,583,209 | 7,682,078 | 4,588,463 | 6,320,237 | ||||||||||||||||||||||||
Futures contracts | — | — | — | — | (23,404 | ) | — | — | — | |||||||||||||||||||||||
Foreign currency contracts | — | — | — | — | (974,653 | ) | — | — | — | |||||||||||||||||||||||
Other foreign currency related transactions | — | — | — | (2 | ) | (15,894 | ) | (6,532 | ) | — | (43,738 | ) | ||||||||||||||||||||
Change in unrealized appreciation/depreciation on: | ||||||||||||||||||||||||||||||||
Investments | 1,095,859 | — | 1,673,462 | (1,422,651 | ) | (4,998,666 | ) | 1,728,981 | 320,696 | (2,300,729 | ) | |||||||||||||||||||||
Futures contracts | — | — | — | — | 36,727 | — | — | — | ||||||||||||||||||||||||
Foreign currency contracts | — | — | — | — | (131,576 | ) | — | — | — | |||||||||||||||||||||||
Other foreign currency related transactions | — | — | — | — | (13,166 | ) | — | — | 34,153 | |||||||||||||||||||||||
|
|
|
|
|
|
|
|
|
|
|
|
|
|
|
| |||||||||||||||||
Net realized/unrealized gain (loss) on investments, futures contracts, foreign currency contracts, and other foreign currency related transactions | 3,117,520 | — | 2,014,373 | 1,617,286 | 9,462,577 | 9,404,527 | 4,909,159 | 4,009,923 | ||||||||||||||||||||||||
|
|
|
|
|
|
|
|
|
|
|
|
|
|
|
| |||||||||||||||||
Change in net assets from operations | $ | 3,727,626 | $ | — | $ | 4,836,569 | $ | 1,882,072 | $ | 11,692,172 | $ | 9,657,562 | $ | 4,756,289 | $ | 4,525,757 | ||||||||||||||||
|
|
|
|
|
|
|
|
|
|
|
|
|
|
|
| |||||||||||||||||
* Taxes withheld | $ | — | $ | — | $ | — | $ | 326 | $ | 581,520 | $ | 23,046 | $ | 1,036 | $ | 108,705 | ||||||||||||||||
|
|
|
|
|
|
|
|
|
|
|
|
|
|
|
| |||||||||||||||||
The accompanying notes are an integral part of these financial statements.
| 111 |
| Ohio National Fund, Inc. |
Statements of Operations | For the Six-Month Period Ended June 30, 2011 (Unaudited) |
Aggressive Growth Portfolio | Small Cap Growth Portfolio | Mid Cap Opportunity Portfolio | S&P 500® Index Portfolio | Strategic Value Portfolio | High Income Bond Portfolio | Capital Growth Portfolio | Nasdaq-100® Index Portfolio | |||||||||||||||||||||||||
Investment income: | ||||||||||||||||||||||||||||||||
Interest | $ | 721 | $ | 855 | $ | 1,210 | $ | 97 | $ | 362 | $ | 11,577,460 | $ | 544 | $ | 27 | ||||||||||||||||
Dividends, net of taxes withheld* | 147,644 | 61,618 | 218,536 | 1,768,912 | 706,929 | 12,177 | 78,732 | 209,868 | ||||||||||||||||||||||||
|
|
|
|
|
|
|
|
|
|
|
|
|
|
|
| |||||||||||||||||
Total investment income | 148,365 | 62,473 | 219,746 | 1,769,009 | 707,291 | 11,589,637 | 79,276 | 209,895 | ||||||||||||||||||||||||
|
|
|
|
|
|
|
|
|
|
|
|
|
|
|
| |||||||||||||||||
Expenses: | ||||||||||||||||||||||||||||||||
Management fees | 117,307 | 154,754 | 300,997 | 342,004 | 100,603 | 945,979 | 257,776 | 112,385 | ||||||||||||||||||||||||
Custodian fees | 11,569 | 8,876 | 5,236 | 7,806 | 1,909 | 7,977 | 2,379 | 2,691 | ||||||||||||||||||||||||
Directors’ fees | 1,475 | 1,739 | 3,553 | 9,096 | 1,362 | 13,898 | 2,879 | 2,831 | ||||||||||||||||||||||||
Professional fees | 6,420 | 6,498 | 7,004 | 8,551 | 6,391 | 9,940 | 6,819 | 6,795 | ||||||||||||||||||||||||
Accounting fees | 8,621 | 9,024 | 14,264 | 40,330 | 7,561 | 77,148 | 12,481 | 12,706 | ||||||||||||||||||||||||
Printing and filing fees | 2,037 | 2,485 | 4,931 | 12,804 | 2,016 | 20,545 | 4,144 | 3,795 | ||||||||||||||||||||||||
Compliance expense | 3,167 | 3,167 | 3,167 | 3,167 | 3,167 | 3,167 | 3,167 | 3,167 | ||||||||||||||||||||||||
Other | 477 | 477 | 1,192 | 2,917 | 397 | 2,067 | 783 | 847 | ||||||||||||||||||||||||
|
|
|
|
|
|
|
|
|
|
|
|
|
|
|
| |||||||||||||||||
Total expenses | 151,073 | 187,020 | 340,344 | 426,675 | 123,406 | 1,080,721 | 290,428 | 145,217 | ||||||||||||||||||||||||
|
|
|
|
|
|
|
|
|
|
|
|
|
|
|
| |||||||||||||||||
Net investment income (loss) | (2,708 | ) | (124,547 | ) | (120,598 | ) | 1,342,334 | 583,885 | 10,508,916 | (211,152 | ) | 64,678 | ||||||||||||||||||||
|
|
|
|
|
|
|
|
|
|
|
|
|
|
|
| |||||||||||||||||
Realized/unrealized gain (loss) on investments, foreign currency contracts, and other foreign currency related transactions: | ||||||||||||||||||||||||||||||||
Net realized gain (loss) on: | ||||||||||||||||||||||||||||||||
Investments | 1,512,876 | 3,518,260 | 4,130,361 | 274,495 | 694,961 | 3,245,355 | 3,808,394 | 7,088,956 | ||||||||||||||||||||||||
Foreign currency contracts | — | — | — | — | 57,516 | — | — | — | ||||||||||||||||||||||||
Other foreign currency related transactions | 349 | (62 | ) | — | — | (9,499 | ) | — | — | — | ||||||||||||||||||||||
Change in unrealized appreciation/depreciation on: | ||||||||||||||||||||||||||||||||
Investments | (280,136 | ) | 481,943 | (600,914 | ) | 8,578,494 | 912,776 | (2,214,405 | ) | 3,372,758 | (4,516,254 | ) | ||||||||||||||||||||
Foreign currency contracts | — | — | — | — | (57,516 | ) | — | — | — | |||||||||||||||||||||||
Other foreign currency related transactions | 486 | — | — | — | (625 | ) | — | — | — | |||||||||||||||||||||||
|
|
|
|
|
|
|
|
|
|
|
|
|
|
|
| |||||||||||||||||
Net realized/unrealized gain (loss) on investments, foreign currency contracts, and other foreign currency related transactions | 1,233,575 | 4,000,141 | 3,529,447 | 8,852,989 | 1,597,613 | 1,030,950 | 7,181,152 | 2,572,702 | ||||||||||||||||||||||||
|
|
|
|
|
|
|
|
|
|
|
|
|
|
|
| |||||||||||||||||
Change in net assets from operations | $ | 1,230,867 | $ | 3,875,594 | $ | 3,408,849 | $ | 10,195,323 | $ | 2,181,498 | $ | 11,539,866 | $ | 6,970,000 | $ | 2,637,380 | ||||||||||||||||
|
|
|
|
|
|
|
|
|
|
|
|
|
|
|
| |||||||||||||||||
* Taxes withheld | $ | 6,861 | $ | 2,119 | $ | 1,078 | $ | — | $ | 24,017 | $ | — | $ | — | $ | 835 | ||||||||||||||||
|
|
|
|
|
|
|
|
|
|
|
|
|
|
|
| |||||||||||||||||
The accompanying notes are an integral part of these financial statements.
| 112 |
| Ohio National Fund, Inc. |
Statements of Operations | For the Six-Month Period Ended June 30, 2011 (Unaudited) |
| Bristol Portfolio | Bryton Growth Portfolio | U.S. Equity Portfolio | Balanced Portfolio | Income Opportunity Portfolio | Target VIP | Target Equity/Income Portfolio | Bristol Growth Portfolio | |||||||||||||||||||||||||
Investment income: | ||||||||||||||||||||||||||||||||
Interest | $ | 3,789 | $ | 4,416 | $ | 410 | $ | 157,041 | $ | 178 | $ | 313 | $ | 349 | $ | 2,337 | ||||||||||||||||
Dividends, net of taxes withheld* | 1,171,844 | 119,672 | 115,050 | 100,805 | 107,946 | 217,018 | 295,212 | 568,839 | ||||||||||||||||||||||||
|
|
|
|
|
|
|
|
|
|
|
|
|
|
|
| |||||||||||||||||
Total investment income | 1,175,633 | 124,088 | 115,460 | 257,846 | 108,124 | 217,331 | 295,561 | 571,176 | ||||||||||||||||||||||||
|
|
|
|
|
|
|
|
|
|
|
|
|
|
|
| |||||||||||||||||
Expenses: | ||||||||||||||||||||||||||||||||
Management fees | 715,200 | 584,739 | 55,498 | 51,559 | 40,075 | 67,110 | 78,697 | 368,804 | ||||||||||||||||||||||||
Custodian fees | 7,406 | 5,179 | 721 | 736 | 3,580 | 5,053 | 1,490 | 4,910 | ||||||||||||||||||||||||
Directors’ fees | 9,526 | 7,068 | 743 | 788 | 495 | 1,111 | 1,312 | 4,639 | ||||||||||||||||||||||||
Professional fees | 8,672 | 8,023 | 6,223 | 6,240 | 6,157 | 6,329 | 6,380 | 7,308 | ||||||||||||||||||||||||
Accounting fees | 33,001 | 25,973 | 4,823 | 10,665 | 5,360 | 7,441 | 6,500 | 17,373 | ||||||||||||||||||||||||
Printing and filing fees | 13,565 | 10,176 | 1,023 | 1,243 | 750 | 1,620 | 1,852 | 6,684 | ||||||||||||||||||||||||
Compliance expense | 3,167 | 3,167 | 3,167 | 3,167 | 3,167 | 3,167 | 3,167 | 3,167 | ||||||||||||||||||||||||
Other | 2,970 | 2,266 | 239 | 244 | 145 | 377 | 430 | 1,204 | ||||||||||||||||||||||||
|
|
|
|
|
|
|
|
|
|
|
|
|
|
|
| |||||||||||||||||
Total expenses | 793,507 | 646,591 | 72,437 | 74,642 | 59,729 | 92,208 | 99,828 | 414,089 | ||||||||||||||||||||||||
|
|
|
|
|
|
|
|
|
|
|
|
|
|
|
| |||||||||||||||||
Net investment income (loss) | 382,126 | (522,503 | ) | 43,023 | 183,204 | 48,395 | 125,123 | 195,733 | 157,087 | |||||||||||||||||||||||
|
|
|
|
|
|
|
|
|
|
|
|
|
|
|
| |||||||||||||||||
Realized/unrealized gain (loss) on investments, foreign currency related transactions, and written options: | ||||||||||||||||||||||||||||||||
Net realized gain (loss) on: | ||||||||||||||||||||||||||||||||
Investments | 17,657,663 | 19,249,993 | 722,502 | 248,839 | 326,334 | 2,467,166 | 3,870,142 | 8,207,894 | ||||||||||||||||||||||||
Foreign currency related transactions | (13 | ) | — | — | 23 | — | — | — | (6 | ) | ||||||||||||||||||||||
Written options | — | — | — | — | (73,995 | ) | — | — | — | |||||||||||||||||||||||
Change in unrealized appreciation/depreciation on: | ||||||||||||||||||||||||||||||||
Investments | (9,411,518 | ) | (15,136,438 | ) | 104,907 | 249,040 | 47,405 | (769,904 | ) | (3,450,507 | ) | (2,509,041 | ) | |||||||||||||||||||
Foreign currency related transactions | — | — | — | 25 | — | — | — | — | ||||||||||||||||||||||||
Written options | — | — | — | — | 5,105 | — | — | — | ||||||||||||||||||||||||
|
|
|
|
|
|
|
|
|
|
|
|
|
|
|
| |||||||||||||||||
Net realized/unrealized gain (loss) on investments, foreign currency related transactions, and written options | 8,246,132 | 4,113,555 | 827,409 | 497,927 | 304,849 | 1,697,262 | 419,635 | 5,698,847 | ||||||||||||||||||||||||
|
|
|
|
|
|
|
|
|
|
|
|
|
|
|
| |||||||||||||||||
Change in net assets from operations | $ | 8,628,258 | $ | 3,591,052 | $ | 870,432 | $ | 681,131 | $ | 353,244 | $ | 1,822,385 | $ | 615,368 | $ | 5,855,934 | ||||||||||||||||
|
|
|
|
|
|
|
|
|
|
|
|
|
|
|
| |||||||||||||||||
* Taxes withheld | $ | 1,986 | $ | — | $ | 877 | $ | 1,904 | $ | 678 | $ | 17,715 | $ | — | $ | 951 | ||||||||||||||||
|
|
|
|
|
|
|
|
|
|
|
|
|
|
|
| |||||||||||||||||
The accompanying notes are an integral part of these financial statements.
| 113 |
| Ohio National Fund, Inc. |
| Equity Portfolio | Money Market Portfolio | Bond Portfolio | Omni Portfolio | |||||||||||||||||||||||||||||
| Six-Month Period Ended June 30, 2011 (Unaudited) | Year Ended December 31, 2010 | Six-Month Period Ended June 30, 2011 (Unaudited) | Year Ended December 31, 2010 | Six-Month Period Ended June 30, 2011 (Unaudited) | Year Ended December 31, 2010 | Six-Month Period Ended June 30, 2011 (Unaudited) | Year Ended December 31, 2010 | |||||||||||||||||||||||||
Increase (Decrease) in Net Assets: | ||||||||||||||||||||||||||||||||
Operations: | ||||||||||||||||||||||||||||||||
Net investment income (loss) | $ | 610,106 | $ | 450,304 | $ | — | $ | — | $ | 2,822,196 | $ | 5,839,374 | $ | 264,786 | $ | 693,415 | ||||||||||||||||
Net realized gain (loss) on investments and foreign currency | 2,021,661 | (1,138,078 | ) | — | — | 340,911 | 1,961,700 | 3,039,937 | 2,963,526 | |||||||||||||||||||||||
Change in unrealized appreciation/depreciation on investments | 1,095,859 | 17,726,044 | — | — | 1,673,462 | 3,535,443 | (1,422,651 | ) | 1,338,298 | |||||||||||||||||||||||
|
|
|
|
|
|
|
|
|
|
|
|
|
|
|
| |||||||||||||||||
Change in net assets from operations | 3,727,626 | 17,038,270 | — | — | 4,836,569 | 11,336,517 | 1,882,072 | 4,995,239 | ||||||||||||||||||||||||
|
|
|
|
|
|
|
|
|
|
|
|
|
|
|
| |||||||||||||||||
Distributions to shareholders: | ||||||||||||||||||||||||||||||||
Distributions from net investment income | — | (425,944 | ) | — | — | — | — | — | (606,516 | ) | ||||||||||||||||||||||
|
|
|
|
|
|
|
|
|
|
|
|
|
|
|
| |||||||||||||||||
Capital transactions: | ||||||||||||||||||||||||||||||||
Received from shares sold | 11,750,684 | 21,954,910 | 154,177,227 | 305,026,132 | 20,503,902 | 57,209,206 | 1,578,841 | 3,734,570 | ||||||||||||||||||||||||
Received from dividends reinvested | — | 425,944 | — | — | — | — | — | 606,516 | ||||||||||||||||||||||||
Paid for shares redeemed | (22,696,132 | ) | (46,072,388 | ) | (159,784,976 | ) | (352,822,395 | ) | (20,322,812 | ) | (58,280,990 | ) | (4,558,097 | ) | (9,069,964 | ) | ||||||||||||||||
|
|
|
|
|
|
|
|
|
|
|
|
|
|
|
| |||||||||||||||||
Change in net assets from capital transactions | (10,945,448 | ) | (23,691,534 | ) | (5,607,749 | ) | (47,796,263 | ) | 181,090 | (1,071,784 | ) | (2,979,256 | ) | (4,728,878 | ) | |||||||||||||||||
|
|
|
|
|
|
|
|
|
|
|
|
|
|
|
| |||||||||||||||||
Change in net assets | (7,217,822 | ) | (7,079,208 | ) | (5,607,749 | ) | (47,796,263 | ) | 5,017,659 | 10,264,733 | (1,097,184 | ) | (340,155 | ) | ||||||||||||||||||
Net Assets: | ||||||||||||||||||||||||||||||||
Beginning of period | 219,431,482 | 226,510,690 | 293,446,937 | 341,243,200 | 148,177,042 | 137,912,309 | 41,177,220 | 41,517,375 | ||||||||||||||||||||||||
|
|
|
|
|
|
|
|
|
|
|
|
|
|
|
| |||||||||||||||||
End of period | $ | 212,213,660 | $ | 219,431,482 | $ | 287,839,188 | $ | 293,446,937 | $ | 153,194,701 | $ | 148,177,042 | $ | 40,080,036 | $ | 41,177,220 | ||||||||||||||||
|
|
|
|
|
|
|
|
|
|
|
|
|
|
|
| |||||||||||||||||
Undistributed net investment income | $ | 634,466 | $ | 24,360 | $ | — | $ | — | $ | 8,664,234 | $ | 5,842,038 | $ | 351,514 | $ | 86,728 | ||||||||||||||||
|
|
|
|
|
|
|
|
|
|
|
|
|
|
|
| |||||||||||||||||
The accompanying notes are an integral part of these financial statements.
| 114 |
| Ohio National Fund, Inc. |
Statements of Changes in Net Assets |
| International Portfolio | Capital Appreciation Portfolio | Millennium Portfolio | International Small-Mid Company Portfolio | |||||||||||||||||||||||||||||
| Six-Month Period Ended June 30, 2011 (Unaudited) | Year Ended December 31, 2010 | Six-Month Period Ended June 30, 2011 (Unaudited) | Year Ended December 31, 2010 | Six-Month Period Ended June 30, 2011 (Unaudited) | Year Ended December 31, 2010 | Six-Month Period Ended June 30, 2011 (Unaudited) | Year Ended December 31, 2010 | |||||||||||||||||||||||||
Increase (Decrease) in Net Assets: | ||||||||||||||||||||||||||||||||
Operations: | ||||||||||||||||||||||||||||||||
Net investment income (loss) | $ | 2,229,595 | $ | 2,332,430 | $ | 253,035 | $ | 387,840 | $ | (152,870 | ) | $ | (527,603 | ) | $ | 515,834 | $ | 218,206 | ||||||||||||||
Net realized gain (loss) on investments, futures contracts, foreign currency contracts, and other foreign currency related transactions | 14,569,258 | 24,752,616 | 7,675,546 | 11,430,819 | 4,588,463 | 16,124,928 | 6,276,499 | 6,361,321 | ||||||||||||||||||||||||
Change in unrealized appreciation/depreciation on investments, futures contracts, foreign currency contracts, and other foreign currency related transactions | (5,106,681 | ) | 5,614,028 | 1,728,981 | 7,958,092 | 320,696 | (9,539,756 | ) | (2,266,576 | ) | 5,982,508 | |||||||||||||||||||||
|
|
|
|
|
|
|
|
|
|
|
|
|
|
|
| |||||||||||||||||
Change in net assets from operations | 11,692,172 | 32,699,074 | 9,657,562 | 19,776,751 | 4,756,289 | 6,057,569 | 4,525,757 | 12,562,035 | ||||||||||||||||||||||||
|
|
|
|
|
|
|
|
|
|
|
|
|
|
|
| |||||||||||||||||
Distributions to shareholders: | ||||||||||||||||||||||||||||||||
Distributions from net investment income | — | — | — | (284,477 | ) | — | — | — | — | |||||||||||||||||||||||
|
|
|
|
|
|
|
|
|
|
|
|
|
|
|
| |||||||||||||||||
Capital transactions: | ||||||||||||||||||||||||||||||||
Received from shares sold | 6,574,944 | 24,045,087 | 6,221,126 | 12,695,267 | 3,537,884 | 20,100,436 | 5,787,551 | 12,335,886 | ||||||||||||||||||||||||
Received from dividends reinvested | — | — | — | 284,477 | — | — | — | — | ||||||||||||||||||||||||
Paid for shares redeemed | (21,585,416 | ) | (53,704,699 | ) | (13,411,951 | ) | (28,925,158 | ) | (5,924,044 | ) | (94,390,633 | ) | (10,775,473 | ) | (17,349,611 | ) | ||||||||||||||||
|
|
|
|
|
|
|
|
|
|
|
|
|
|
|
| |||||||||||||||||
Change in net assets from capital transactions | (15,010,472 | ) | (29,659,612 | ) | (7,190,825 | ) | (15,945,414 | ) | (2,386,160 | ) | (74,290,197 | ) | (4,987,922 | ) | (5,013,725 | ) | ||||||||||||||||
|
|
|
|
|
|
|
|
|
|
|
|
|
|
|
| |||||||||||||||||
Change in net assets | (3,318,300 | ) | 3,039,462 | 2,466,737 | 3,546,860 | 2,370,129 | (68,232,628 | ) | (462,165 | ) | 7,548,310 | |||||||||||||||||||||
Net Assets: | ||||||||||||||||||||||||||||||||
Beginning of period | 213,085,792 | 210,046,330 | 129,801,059 | 126,254,199 | 42,077,333 | 110,309,961 | 78,612,580 | 71,064,270 | ||||||||||||||||||||||||
|
|
|
|
|
|
|
|
|
|
|
|
|
|
|
| |||||||||||||||||
End of period | $ | 209,767,492 | $ | 213,085,792 | $ | 132,267,796 | $ | 129,801,059 | $ | 44,447,462 | $ | 42,077,333 | $ | 78,150,415 | $ | 78,612,580 | ||||||||||||||||
|
|
|
|
|
|
|
|
|
|
|
|
|
|
|
| |||||||||||||||||
Undistributed net investment income (loss) | $ | 5,335,866 | $ | 3,106,271 | $ | 338,187 | $ | 85,152 | $ | (152,870 | ) | $ | — | $ | 603,154 | $ | 87,320 | |||||||||||||||
|
|
|
|
|
|
|
|
|
|
|
|
|
|
|
| |||||||||||||||||
The accompanying notes are an integral part of these financial statements.
| 115 |
| Ohio National Fund, Inc. |
Statements of Changes in Net Assets |
| Aggressive Growth Portfolio | Small Cap Growth Portfolio | Mid Cap Opportunity Portfolio | S&P 500® Index Portfolio | |||||||||||||||||||||||||||||
| Six-Month Period Ended June 30, 2011 (Unaudited) | Year Ended December 31, 2010 | Six-Month Period Ended June 30, 2011 (Unaudited) | Year Ended December 31, 2010 | Six-Month Period Ended June 30, 2011 (Unaudited) | Year Ended December 31, 2010 | Six-Month Period Ended June 30, 2011 (Unaudited) | Year Ended December 31, 2010 | |||||||||||||||||||||||||
Increase (Decrease) in Net Assets: | ||||||||||||||||||||||||||||||||
Operations: | ||||||||||||||||||||||||||||||||
Net investment income (loss) | $ | (2,708 | ) | $ | 46,348 | $ | (124,547 | ) | $ | (173,333 | ) | $ | (120,598 | ) | $ | (221,534 | ) | $ | 1,342,334 | $ | 2,555,633 | |||||||||||
Net realized gain (loss) on investments and foreign currency related transactions | 1,513,225 | 340,613 | 3,518,198 | 2,457,211 | 4,130,361 | 5,891,311 | 274,495 | (322,308 | ) | |||||||||||||||||||||||
Change in unrealized appreciation/depreciation on investments and foreign currency related transactions | (279,650 | ) | 2,014,140 | 481,943 | 4,610,166 | (600,914 | ) | 6,025,662 | 8,578,494 | 20,060,180 | ||||||||||||||||||||||
|
|
|
|
|
|
|
|
|
|
|
|
|
|
|
| |||||||||||||||||
Change in net assets from operations | 1,230,867 | 2,401,101 | 3,875,594 | 6,894,044 | 3,408,849 | 11,695,439 | 10,195,323 | 22,293,505 | ||||||||||||||||||||||||
|
|
|
|
|
|
|
|
|
|
|
|
|
|
|
| |||||||||||||||||
Distributions to shareholders: | ||||||||||||||||||||||||||||||||
Distributions from net investment income | — | — | — | — | — | — | — | (2,196,659 | ) | |||||||||||||||||||||||
|
|
|
|
|
|
|
|
|
|
|
|
|
|
|
| |||||||||||||||||
Capital transactions: | ||||||||||||||||||||||||||||||||
Received from shares sold | 3,587,184 | 9,372,757 | 5,378,526 | 10,622,179 | 4,950,807 | 9,304,135 | 19,431,670 | 32,754,237 | ||||||||||||||||||||||||
Received from dividends reinvested | — | — | — | — | — | — | — | 2,196,659 | ||||||||||||||||||||||||
Paid for shares redeemed | (5,513,609 | ) | (9,193,403 | ) | (5,715,002 | ) | (8,178,329 | ) | (8,803,030 | ) | (14,133,909 | ) | (22,821,360 | ) | (39,577,141 | ) | ||||||||||||||||
|
|
|
|
|
|
|
|
|
|
|
|
|
|
|
| |||||||||||||||||
Change in net assets from capital transactions | (1,926,425 | ) | 179,354 | (336,476 | ) | 2,443,850 | (3,852,223 | ) | (4,829,774 | ) | (3,389,690 | ) | (4,626,245 | ) | ||||||||||||||||||
|
|
|
|
|
|
|
|
|
|
|
|
|
|
|
| |||||||||||||||||
Change in net assets | (695,558 | ) | 2,580,455 | 3,539,118 | 9,337,894 | (443,374 | ) | 6,865,665 | 6,805,633 | 15,470,601 | ||||||||||||||||||||||
Net Assets: | ||||||||||||||||||||||||||||||||
Beginning of period | 29,757,252 | 27,176,797 | 32,099,435 | 22,761,541 | 70,367,443 | 63,501,778 | 176,179,054 | 160,708,453 | ||||||||||||||||||||||||
|
|
|
|
|
|
|
|
|
|
|
|
|
|
|
| |||||||||||||||||
End of period | $ | 29,061,694 | $ | 29,757,252 | $ | 35,638,553 | $ | 32,099,435 | $ | 69,924,069 | $ | 70,367,443 | $ | 182,984,687 | $ | 176,179,054 | ||||||||||||||||
|
|
|
|
|
|
|
|
|
|
|
|
|
|
|
| |||||||||||||||||
Undistributed net investment income (loss) | $ | 109,020 | $ | 111,728 | $ | (124,552 | ) | $ | (5 | ) | $ | (120,598 | ) | $ | — | $ | 1,710,560 | $ | 368,226 | |||||||||||||
|
|
|
|
|
|
|
|
|
|
|
|
|
|
|
| |||||||||||||||||
The accompanying notes are an integral part of these financial statements.
| 116 |
| Ohio National Fund, Inc. |
Statements of Changes in Net Assets |
| Strategic Value Portfolio | High Income Bond Portfolio | Capital Growth Portfolio | Nasdaq-100® Index Portfolio | |||||||||||||||||||||||||||||
| Six-Month Period Ended June 30, 2011 (Unaudited) | Year Ended December 31, 2010 | Six-Month Period Ended June 30, 2011 (Unaudited) | Year Ended December 31, 2010 | Six-Month Period Ended June 30, 2011 (Unaudited) | Year Ended December 31, 2010 | Six-Month Period Ended June 30, 2011 (Unaudited) | Year Ended December 31, 2010 | |||||||||||||||||||||||||
Increase (Decrease) in Net Assets: | ||||||||||||||||||||||||||||||||
Operations: | ||||||||||||||||||||||||||||||||
Net investment income (loss) | $ | 583,885 | $ | 876,152 | $ | 10,508,916 | $ | 17,715,261 | $ | (211,152 | ) | $ | (200,594 | ) | $ | 64,678 | $ | 180,606 | ||||||||||||||
Net realized gain (loss) on investments, foreign currency contracts, and foreign currency related transactions | 742,978 | (439,471 | ) | 3,245,355 | (1,283,156 | ) | 3,808,394 | 4,848,954 | 7,088,956 | 2,684,393 | ||||||||||||||||||||||
Change in unrealized appreciation/depreciation on investments, foreign currency contracts, and other foreign currency related transactions | 854,635 | 2,138,874 | (2,214,405 | ) | 13,632,138 | 3,372,758 | 8,739,357 | (4,516,254 | ) | 5,413,358 | ||||||||||||||||||||||
|
|
|
|
|
|
|
|
|
|
|
|
|
|
|
| |||||||||||||||||
Change in net assets from operations | 2,181,498 | 2,575,555 | 11,539,866 | 30,064,243 | 6,970,000 | 13,387,717 | 2,637,380 | 8,278,357 | ||||||||||||||||||||||||
|
|
|
|
|
|
|
|
|
|
|
|
|
|
|
| |||||||||||||||||
Distributions to shareholders: | ||||||||||||||||||||||||||||||||
Distributions from net investment income | — | (591,141 | ) | — | — | — | — | — | (158,375 | ) | ||||||||||||||||||||||
Return of capital distributions | — | (175,066 | ) | — | — | — | — | — | — | |||||||||||||||||||||||
|
|
|
|
|
|
|
|
|
|
|
|
|
|
|
| |||||||||||||||||
Total distributions | — | (766,207 | ) | — | — | — | — | — | (158,375 | ) | ||||||||||||||||||||||
|
|
|
|
|
|
|
|
|
|
|
|
|
|
|
| |||||||||||||||||
Capital transactions: | ||||||||||||||||||||||||||||||||
Received from shares sold | 6,461,534 | 9,495,133 | 47,475,620 | 152,858,080 | 12,236,232 | 13,911,151 | 8,499,064 | 18,796,999 | ||||||||||||||||||||||||
Received from dividends reinvested | — | 766,207 | — | — | — | — | — | 158,375 | ||||||||||||||||||||||||
Paid for shares redeemed | (4,167,695 | ) | (7,486,436 | ) | (37,627,687 | ) | (73,042,369 | ) | (9,800,796 | ) | (11,671,289 | ) | (11,607,082 | ) | (19,725,238 | ) | ||||||||||||||||
|
|
|
|
|
|
|
|
|
|
|
|
|
|
|
| |||||||||||||||||
Change in net assets from capital transactions | 2,293,839 | 2,774,904 | 9,847,933 | 79,815,711 | 2,435,436 | 2,239,862 | (3,108,018 | ) | (769,864 | ) | ||||||||||||||||||||||
|
|
|
|
|
|
|
|
|
|
|
|
|
|
|
| |||||||||||||||||
Change in net assets | 4,475,337 | 4,584,252 | 21,387,799 | 109,879,954 | 9,405,436 | 15,627,579 | (470,638 | ) | 7,350,118 | |||||||||||||||||||||||
Net Assets: | ||||||||||||||||||||||||||||||||
Beginning of period | 24,347,260 | 19,763,008 | 269,787,163 | 159,907,209 | 52,411,406 | 36,783,827 | 54,938,397 | 47,588,279 | ||||||||||||||||||||||||
|
|
|
|
|
|
|
|
|
|
|
|
|
|
|
| |||||||||||||||||
End of period | $ | 28,822,597 | $ | 24,347,260 | $ | 291,174,962 | $ | 269,787,163 | $ | 61,816,842 | $ | 52,411,406 | $ | 54,467,759 | $ | 54,938,397 | ||||||||||||||||
|
|
|
|
|
|
|
|
|
|
|
|
|
|
|
| |||||||||||||||||
Undistributed net investment income (loss) | $ | 537,316 | $ | (46,569 | ) | $ | 28,290,116 | $ | 17,781,200 | $ | (176,103 | ) | $ | 35,049 | $ | 86,909 | $ | 22,231 | ||||||||||||||
|
|
|
|
|
|
|
|
|
|
|
|
|
|
|
| |||||||||||||||||
The accompanying notes are an integral part of these financial statements.
| 117 |
| Ohio National Fund, Inc. |
Statements of Changes in Net Assets |
| Bristol Portfolio | Bryton Growth Portfolio | U.S. Equity Portfolio | Balanced Portfolio | |||||||||||||||||||||||||||||
| Six-Month Period Ended June 30, 2011 (Unaudited) | Year Ended December 31, 2010 | Six-Month Period Ended June 30, 2011 (Unaudited) | Year Ended December 31, 2010 | Six-Month Period Ended June 30, 2011 (Unaudited) | Year Ended December 31, 2010 | Six-Month Period Ended June 30, 2011 (Unaudited) | Year Ended December 31, 2010 | |||||||||||||||||||||||||
Increase (Decrease) in Net Assets: | ||||||||||||||||||||||||||||||||
Operations: | ||||||||||||||||||||||||||||||||
Net investment income (loss) | $ | 382,126 | $ | 1,099,120 | $ | (522,503 | ) | $ | (594,575 | ) | $ | 43,023 | $ | 114,584 | $ | 183,204 | $ | 331,961 | ||||||||||||||
Net realized gain (loss) on investments and foreign currency related transactions | 17,657,650 | 13,165,753 | 19,249,993 | 15,009,999 | 722,502 | 1,360,515 | 248,862 | 680,867 | ||||||||||||||||||||||||
Change in unrealized appreciation/depreciation on investments and foreign currency related transactions | (9,411,518 | ) | 8,557,768 | (15,136,438 | ) | 12,578,232 | 104,907 | 160,094 | 249,065 | (1,024 | ) | |||||||||||||||||||||
|
|
|
|
|
|
|
|
|
|
|
|
|
|
|
| |||||||||||||||||
Change in net assets from operations | 8,628,258 | 22,822,641 | 3,591,052 | 26,993,656 | 870,432 | 1,635,193 | 681,131 | 1,011,804 | ||||||||||||||||||||||||
|
|
|
|
|
|
|
|
|
|
|
|
|
|
|
| |||||||||||||||||
Distributions to shareholders: | ||||||||||||||||||||||||||||||||
Distributions from net investment income | — | (995,109 | ) | — | — | — | (99,183 | ) | — | (282,940 | ) | |||||||||||||||||||||
|
|
|
|
|
|
|
|
|
|
|
|
|
|
|
| |||||||||||||||||
Capital transactions: | ||||||||||||||||||||||||||||||||
Received from shares sold | 22,392,892 | 51,108,856 | 22,017,719 | 38,665,672 | 1,175,105 | 1,837,204 | 4,756,961 | 3,408,481 | ||||||||||||||||||||||||
Received from dividends reinvested | — | 995,109 | — | — | — | 99,183 | — | 282,940 | ||||||||||||||||||||||||
Paid for shares redeemed | (15,768,994 | ) | (34,085,789 | ) | (11,724,211 | ) | (41,681,638 | ) | (1,995,664 | ) | (3,593,412 | ) | (2,100,734 | ) | (3,509,686 | ) | ||||||||||||||||
|
|
|
|
|
|
|
|
|
|
|
|
|
|
|
| |||||||||||||||||
Change in net assets from capital transactions | 6,623,898 | 18,018,176 | 10,293,508 | (3,015,966 | ) | (820,559 | ) | (1,657,025 | ) | 2,656,227 | 181,735 | |||||||||||||||||||||
|
|
|
|
|
|
|
|
|
|
|
|
|
|
|
| |||||||||||||||||
Change in net assets | 15,252,156 | 39,845,708 | 13,884,560 | 23,977,690 | 49,873 | (121,015 | ) | 3,337,358 | 910,599 | |||||||||||||||||||||||
Net Assets: | ||||||||||||||||||||||||||||||||
Beginning of period | 182,644,630 | 142,798,922 | 137,411,812 | 113,434,122 | 14,508,987 | 14,630,002 | 14,492,946 | 13,582,347 | ||||||||||||||||||||||||
|
|
|
|
|
|
|
|
|
|
|
|
|
|
|
| |||||||||||||||||
End of period | $ | 197,896,786 | $ | 182,644,630 | $ | 151,296,372 | $ | 137,411,812 | $ | 14,558,860 | $ | 14,508,987 | $ | 17,830,304 | $ | 14,492,946 | ||||||||||||||||
|
|
|
|
|
|
|
|
|
|
|
|
|
|
|
| |||||||||||||||||
Undistributed net investment income (loss) | $ | 485,420 | $ | 103,294 | $ | (522,503 | ) | $ | — | $ | 58,424 | $ | 15,401 | $ | 232,262 | $ | 49,058 | |||||||||||||||
|
|
|
|
|
|
|
|
|
|
|
|
|
|
|
| |||||||||||||||||
The accompanying notes are an integral part of these financial statements.
| 118 |
| Ohio National Fund, Inc. |
Statements of Changes in Net Assets |
| Income Opportunity Portfolio | Target VIP Portfolio | Target Equity/Income Portfolio | Bristol Growth Portfolio | |||||||||||||||||||||||||||||
| Six-Month Period Ended June 30, 2011 (Unaudited) | Year Ended December 31, 2010 | Six-Month Period Ended June 30, 2011 (Unaudited) | Year Ended December 31, 2010 | Six-Month Period Ended June 30, 2011 (Unaudited) | Year Ended December 31, 2010 | Six-Month Period Ended June 30, 2011 (Unaudited) | Year Ended December 31, 2010 | |||||||||||||||||||||||||
Increase (Decrease) in Net Assets: | ||||||||||||||||||||||||||||||||
Operations: | ||||||||||||||||||||||||||||||||
Net investment income (loss) | $ | 48,395 | $ | 70,078 | $ | 125,123 | $ | 297,878 | $ | 195,733 | $ | 363,652 | $ | 157,087 | $ | 276,215 | ||||||||||||||||
Net realized gain (loss) on investments, foreign currency | 252,339 | (15,176 | ) | 2,467,166 | 1,642,994 | 3,870,142 | 1,618,442 | 8,207,888 | 5,178,457 | |||||||||||||||||||||||
Change in unrealized appreciation/depreciation on investments, foreign currency related transactions, and written options | 52,510 | 525,550 | (769,904 | ) | 1,712,578 | (3,450,507 | ) | 3,054,237 | (2,509,041 | ) | 9,642,592 | |||||||||||||||||||||
|
|
|
|
|
|
|
|
|
|
|
|
|
|
|
| |||||||||||||||||
Change in net assets from operations | 353,244 | 580,452 | 1,822,385 | 3,653,450 | 615,368 | 5,036,331 | 5,855,934 | 15,097,264 | ||||||||||||||||||||||||
|
|
|
|
|
|
|
|
|
|
|
|
|
|
|
| |||||||||||||||||
Distributions to shareholders: | ||||||||||||||||||||||||||||||||
Distributions from net investment income | — | — | — | (266,234 | ) | — | (305,152 | ) | — | (259,134 | ) | |||||||||||||||||||||
|
|
|
|
|
|
|
|
|
|
|
|
|
|
|
| |||||||||||||||||
Capital transactions: | ||||||||||||||||||||||||||||||||
Received from shares sold | 1,832,254 | 3,876,875 | 3,018,390 | 3,229,205 | 2,753,574 | 6,337,967 | 14,954,144 | 73,946,057 | ||||||||||||||||||||||||
Received from dividends reinvested | — | — | — | 266,234 | — | 305,152 | — | 259,134 | ||||||||||||||||||||||||
Paid for shares redeemed | (970,036 | ) | (1,500,541 | ) | (3,040,781 | ) | (5,607,398 | ) | (3,850,261 | ) | (7,429,363 | ) | (8,366,460 | ) | (14,244,723 | ) | ||||||||||||||||
|
|
|
|
|
|
|
|
|
|
|
|
|
|
|
| |||||||||||||||||
Change in net assets from capital transactions | 862,218 | 2,376,334 | (22,391 | ) | (2,111,959 | ) | (1,096,687 | ) | (786,244 | ) | 6,587,684 | 59,960,468 | ||||||||||||||||||||
|
|
|
|
|
|
|
|
|
|
|
|
|
|
|
| |||||||||||||||||
Change in net assets | 1,215,462 | 2,956,786 | 1,799,994 | 1,275,257 | (481,319 | ) | 3,944,935 | 12,443,618 | 74,798,598 | |||||||||||||||||||||||
Net Assets: | ||||||||||||||||||||||||||||||||
Beginning of period | 9,648,234 | 6,691,448 | 21,856,255 | 20,580,998 | 26,561,616 | 22,616,681 | 85,296,173 | 10,497,575 | ||||||||||||||||||||||||
|
|
|
|
|
|
|
|
|
|
|
|
|
|
|
| |||||||||||||||||
End of period | $ | 10,863,696 | $ | 9,648,234 | $ | 23,656,249 | $ | 21,856,255 | $ | 26,080,297 | $ | 26,561,616 | $ | 97,739,791 | $ | 85,296,173 | ||||||||||||||||
|
|
|
|
|
|
|
|
|
|
|
|
|
|
|
| |||||||||||||||||
Undistributed net investment income | $ | 118,484 | $ | 70,089 | $ | 153,790 | $ | 28,667 | $ | 254,233 | $ | 58,500 | $ | 174,045 | $ | 16,958 | ||||||||||||||||
|
|
|
|
|
|
|
|
|
|
|
|
|
|
|
| |||||||||||||||||
The accompanying notes are an integral part of these financial statements.
| 119 |
| Ohio National Fund, Inc. |
| Equity Portfolio | Money Market Portfolio | |||||||||||||||||||||||||||||||||||||||
| Six-Month Period Ended June 30, 2011 (Unaudited) | Years Ended December 31, | Six-Month Period Ended June 30, 2011 (Unaudited) | Years Ended December 31, | |||||||||||||||||||||||||||||||||||||
| 2010 | 2009 | 2008 | 2007 | 2010 | 2009 | 2008 | 2007 | |||||||||||||||||||||||||||||||||
Selected Per-Share Data: | ||||||||||||||||||||||||||||||||||||||||
Net asset value, beginning of period | $ | 19.72 | $ | 18.31 | $ | 13.19 | $ | 29.65 | $ | 31.52 | $ | 10.00 | $ | 10.00 | $ | 10.00 | $ | 10.00 | $ | 10.00 | ||||||||||||||||||||
Operations: | ||||||||||||||||||||||||||||||||||||||||
Net investment income | 0.06 | 0.04 | 0.05 | 0.22 | 0.02 | — | — | — | 0.17 | 0.48 | ||||||||||||||||||||||||||||||
Net realized and unrealized gain (loss) on investments and | 0.26 | 1.41 | 5.11 | (16.48 | ) | (1.88 | ) | — | — | — | — | — | ||||||||||||||||||||||||||||
|
|
|
|
|
|
|
|
|
|
|
|
|
|
|
|
|
|
|
| |||||||||||||||||||||
Total from operations | 0.32 | 1.45 | 5.16 | (16.26 | ) | (1.86 | ) | — | — | — | 0.17 | 0.48 | ||||||||||||||||||||||||||||
|
|
|
|
|
|
|
|
|
|
|
|
|
|
|
|
|
|
|
| |||||||||||||||||||||
Distributions: | ||||||||||||||||||||||||||||||||||||||||
Distributions from net investment income | — | (0.04 | ) | (0.04 | ) | (0.20 | ) | (0.01 | ) | — | — | — | (0.17 | ) | (0.48 | ) | ||||||||||||||||||||||||
|
|
|
|
|
|
|
|
|
|
|
|
|
|
|
|
|
|
|
| |||||||||||||||||||||
Net asset value, end of period | $ | 20.04 | $ | 19.72 | $ | 18.31 | $ | 13.19 | $ | 29.65 | $ | 10.00 | $ | 10.00 | $ | 10.00 | $ | 10.00 | $ | 10.00 | ||||||||||||||||||||
|
|
|
|
|
|
|
|
|
|
|
|
|
|
|
|
|
|
|
| |||||||||||||||||||||
Total return | 1.62 | %(b) | 7.91 | % | 39.11 | % | –54.81 | % | –5.89 | % | 0.00 | %(b) | 0.00 | % | 0.00 | % | 1.77 | % | 4.92 | % | ||||||||||||||||||||
Ratios and supplemental data: | ||||||||||||||||||||||||||||||||||||||||
Net assets at end of period (millions) | $ | 212.2 | $ | 219.4 | $ | 226.5 | $ | 187.5 | $ | 505.1 | $ | 287.8 | $ | 293.4 | $ | 341.2 | $ | 402.5 | $ | 336.2 | ||||||||||||||||||||
Ratios to average net assets: | ||||||||||||||||||||||||||||||||||||||||
Ratios net of expenses reduced or reimbursed by adviser: | ||||||||||||||||||||||||||||||||||||||||
Expenses | 0.87 | %(a) | 0.87 | % | 0.88 | % | 0.84 | % | 0.84 | % | 0.14 | %(a) | 0.17 | % | 0.19 | % | 0.32 | % | 0.31 | % | ||||||||||||||||||||
Net investment income | 0.55 | %(a) | 0.21 | % | 0.27 | % | 0.89 | % | 0.05 | % | 0.00 | %(a) | 0.00 | % | 0.00 | % | 1.72 | % | 4.79 | % | ||||||||||||||||||||
Ratios assuming no expenses reduced or reimbursed by adviser: | ||||||||||||||||||||||||||||||||||||||||
Expenses | 0.87 | %(a) | 0.87 | % | 0.88 | % | 0.84 | % | 0.84 | % | 0.34 | %(a) | 0.35 | % | 0.36 | % | 0.35 | % | 0.32 | % | ||||||||||||||||||||
Net investment income | 0.55 | %(a) | 0.21 | % | 0.27 | % | 0.89 | % | 0.05 | % | –0.20 | %(a) | –0.18 | % | –0.17 | % | 1.68 | % | 4.77 | % | ||||||||||||||||||||
Portfolio turnover rate | 26 | % | 50 | % | 24 | % | 39 | % | 23 | % | 0 | % | 0 | % | 0 | % | 0 | % | 0 | % | ||||||||||||||||||||
| (a) | Annualized. |
| (b) | Not annualized. |
The accompanying notes are an integral part of these financial statements.
| 120 |
| Ohio National Fund, Inc. |
Financial Highlights |
| Bond Portfolio | Omni Portfolio | |||||||||||||||||||||||||||||||||||||||
| Six-Month Period Ended June 30, 2011 (Unaudited) | Years Ended December 31, | Six-Month Period Ended June 30, 2011 (Unaudited) | Years Ended December 31, | |||||||||||||||||||||||||||||||||||||
| 2010 | 2009 | 2008 | 2007 | 2010 | 2009 | 2008 | 2007 | |||||||||||||||||||||||||||||||||
Selected Per-Share Data: | ||||||||||||||||||||||||||||||||||||||||
Net asset value, beginning of period | $ | 13.21 | $ | 12.25 | $ | 10.13 | $ | 11.44 | $ | 11.03 | $ | 16.08 | $ | 14.42 | $ | 11.02 | $ | 16.60 | $ | 15.79 | ||||||||||||||||||||
Operations: | ||||||||||||||||||||||||||||||||||||||||
Net investment income | 0.25 | 0.52 | 0.49 | 1.04 | 0.58 | 0.11 | 0.28 | 0.29 | 0.40 | 0.34 | ||||||||||||||||||||||||||||||
Net realized and unrealized gain (loss) on investments and foreign currency related transactions | 0.19 | 0.44 | 1.63 | (2.35 | ) | (0.17 | ) | 0.63 | 1.62 | 3.36 | (5.63 | ) | 0.76 | |||||||||||||||||||||||||||
|
|
|
|
|
|
|
|
|
|
|
|
|
|
|
|
|
|
|
| |||||||||||||||||||||
Total from operations | 0.44 | 0.96 | 2.12 | (1.31 | ) | 0.41 | 0.74 | 1.90 | 3.65 | (5.23 | ) | 1.10 | ||||||||||||||||||||||||||||
|
|
|
|
|
|
|
|
|
|
|
|
|
|
|
|
|
|
|
| |||||||||||||||||||||
Distributions: | ||||||||||||||||||||||||||||||||||||||||
Distributions from net investment income | — | — | — | — | — | — | (0.24 | ) | (0.25 | ) | (0.35 | ) | (0.29 | ) | ||||||||||||||||||||||||||
|
|
|
|
|
|
|
|
|
|
|
|
|
|
|
|
|
|
|
| |||||||||||||||||||||
Net asset value, end of period | $ | 13.65 | $ | 13.21 | $ | 12.25 | $ | 10.13 | $ | 11.44 | $ | 16.82 | $ | 16.08 | $ | 14.42 | $ | 11.02 | $ | 16.60 | ||||||||||||||||||||
|
|
|
|
|
|
|
|
|
|
|
|
|
|
|
|
|
|
|
| |||||||||||||||||||||
Total return | 3.33 | %(b) | 7.84 | % | 20.93 | % | –11.45 | % | 3.72 | % | 4.60 | %(b) | 13.19 | % | 33.15 | % | –31.46 | % | 6.99 | % | ||||||||||||||||||||
Ratios and supplemental data: | ||||||||||||||||||||||||||||||||||||||||
Net assets at end of period (millions) | $ | 153.2 | $ | 148.2 | $ | 137.9 | $ | 107.8 | $ | 177.7 | $ | 40.1 | $ | 41.2 | $ | 41.5 | $ | 34.9 | $ | 61.8 | ||||||||||||||||||||
Ratios to average net assets: | ||||||||||||||||||||||||||||||||||||||||
Expenses | 0.66 | %(a) | 0.67 | % | 0.69 | % | 0.66 | % | 0.63 | % | 0.76 | %(a) | 0.78 | % | 0.79 | % | 0.74 | % | 0.71 | % | ||||||||||||||||||||
Net investment income | 3.82 | %(a) | 3.91 | % | 5.06 | % | 5.35 | % | 4.99 | % | 1.29 | %(a) | 1.71 | % | 2.18 | % | 2.43 | % | 1.85 | % | ||||||||||||||||||||
Portfolio turnover rate | 12 | % | 22 | % | 27 | % | 15 | % | 13 | % | 80 | % | 182 | % | 157 | % | 128 | % | 143 | % | ||||||||||||||||||||
| (a) | Annualized. |
| (b) | Not annualized. |
The accompanying notes are an integral part of these financial statements.
| 121 |
| Ohio National Fund, Inc. |
Financial Highlights |
| International Portfolio | Capital Appreciation Portfolio | |||||||||||||||||||||||||||||||||||||||
| Six-Month Period Ended June 30, 2011 (Unaudited) | Years Ended December 31, | Six-Month Period Ended June 30, 2011 (Unaudited) | Years Ended December 31, | |||||||||||||||||||||||||||||||||||||
| 2010 | 2009 | 2008 | 2007 | 2010 | 2009 | 2008 | 2007 | |||||||||||||||||||||||||||||||||
Selected per-share data: | ||||||||||||||||||||||||||||||||||||||||
Net asset value, beginning of period | $ | 12.20 | $ | 10.45 | $ | 7.56 | $ | 14.02 | $ | 12.81 | $ | 20.37 | $ | 17.45 | $ | 12.35 | $ | 20.45 | $ | 19.79 | ||||||||||||||||||||
Operations: | ||||||||||||||||||||||||||||||||||||||||
Net investment income | 0.15 | 0.14 | 0.14 | 0.13 | 0.09 | 0.04 | 0.06 | 0.22 | 0.14 | 0.11 | ||||||||||||||||||||||||||||||
Net realized and unrealized gain (loss) on investments, futures contracts, foreign currency contracts, and other foreign currency related transactions | 0.53 | 1.61 | 2.75 | (6.59 | ) | 1.12 | 1.50 | 2.90 | 5.07 | (8.12 | ) | 0.65 | ||||||||||||||||||||||||||||
|
|
|
|
|
|
|
|
|
|
|
|
|
|
|
|
|
|
|
| |||||||||||||||||||||
Total from operations | 0.68 | 1.75 | 2.89 | (6.46 | ) | 1.21 | 1.54 | 2.96 | 5.29 | (7.98 | ) | 0.76 | ||||||||||||||||||||||||||||
|
|
|
|
|
|
|
|
|
|
|
|
|
|
|
|
|
|
|
| |||||||||||||||||||||
Distributions: | ||||||||||||||||||||||||||||||||||||||||
Distributions from net investment income | — | — | — | — | — | — | (0.04 | ) | (0.19 | ) | (0.12 | ) | (0.10 | ) | ||||||||||||||||||||||||||
|
|
|
|
|
|
|
|
|
|
|
|
|
|
|
|
|
|
|
| |||||||||||||||||||||
Net asset value, end of period | $ | 12.88 | $ | 12.20 | $ | 10.45 | $ | 7.56 | $ | 14.02 | $ | 21.91 | $ | 20.37 | $ | 17.45 | $ | 12.35 | $ | 20.45 | ||||||||||||||||||||
|
|
|
|
|
|
|
|
|
|
|
|
|
|
|
|
|
|
|
| |||||||||||||||||||||
Total return | 5.57 | %(b) | 16.75 | % | 38.23 | % | –46.08 | % | 9.45 | % | 7.56 | %(b) | 16.99 | % | 42.84 | % | –39.01 | % | 3.82 | % | ||||||||||||||||||||
Ratios and supplemental data: | ||||||||||||||||||||||||||||||||||||||||
Net assets at end of period (millions) | $ | 209.8 | $ | 213.1 | $ | 210.0 | $ | 179.7 | $ | 389.2 | $ | 132.3 | $ | 129.8 | $ | 126.3 | $ | 103.6 | $ | 197.6 | ||||||||||||||||||||
Ratios to average net assets: | ||||||||||||||||||||||||||||||||||||||||
Expenses | 1.01 | %(a) | 1.03 | % | 1.07 | % | 0.91 | % | 0.99 | % | 0.87 | %(a) | 0.89 | % | 0.90 | % | 0.87 | % | 0.84 | % | ||||||||||||||||||||
Net investment income | 2.10 | %(a) | 1.15 | % | 1.47 | % | 1.03 | % | 0.66 | % | 0.38 | %(a) | 0.31 | % | 1.38 | % | 0.71 | % | 0.46 | % | ||||||||||||||||||||
Portfolio turnover rate | 23 | % | 67 | % | 168 | % | 214 | % | 123 | % | 34 | % | 58 | % | 84 | % | 79 | % | 69 | % | ||||||||||||||||||||
| (a) | Annualized. |
| (b) | Not annualized. |
The accompanying notes are an integral part of these financial statements.
| 122 |
| Ohio National Fund, Inc. |
Financial Highlights |
| Millennium Portfolio | International Small-Mid Company Portfolio | |||||||||||||||||||||||||||||||||||||||
| Six-Month Period Ended June 30, 2011 (Unaudited) | Years Ended December 31, | Six-Month Period Ended June 30, 2011 (Unaudited) | Years Ended December 31, | |||||||||||||||||||||||||||||||||||||
| 2010 | 2009 | 2008 | 2007 | 2010 | 2009 | 2008 | 2007 | |||||||||||||||||||||||||||||||||
Selected Per-Share Data: | ||||||||||||||||||||||||||||||||||||||||
Net asset value, beginning of period | $ | 21.69 | $ | 17.45 | $ | 14.44 | $ | 25.13 | $ | 19.94 | $ | 23.24 | $ | 19.41 | $ | 13.29 | $ | 27.29 | $ | 23.23 | ||||||||||||||||||||
Operations: | ||||||||||||||||||||||||||||||||||||||||
Net investment income (loss) | (0.08 | ) | (0.27 | ) | (0.07 | ) | (0.16 | ) | (0.16 | ) | 0.16 | 0.07 | 0.07 | 0.08 | 0.07 | |||||||||||||||||||||||||
Net realized and unrealized gain (loss) on investments and foreign currency related transactions | 2.60 | 4.51 | 3.08 | (10.53 | ) | 5.35 | 1.22 | 3.76 | 6.05 | (14.08 | ) | 3.99 | ||||||||||||||||||||||||||||
|
|
|
|
|
|
|
|
|
|
|
|
|
|
|
|
|
|
|
| |||||||||||||||||||||
Total from operations | 2.52 | 4.24 | 3.01 | (10.69 | ) | 5.19 | 1.38 | 3.83 | 6.12 | (14.00 | ) | 4.06 | ||||||||||||||||||||||||||||
|
|
|
|
|
|
|
|
|
|
|
|
|
|
|
|
|
|
|
| |||||||||||||||||||||
Net asset value, end of period | $ | 24.21 | $ | 21.69 | $ | 17.45 | $ | 14.44 | $ | 25.13 | $ | 24.62 | $ | 23.24 | $ | 19.41 | $ | 13.29 | $ | 27.29 | ||||||||||||||||||||
|
|
|
|
|
|
|
|
|
|
|
|
|
|
|
|
|
|
|
| |||||||||||||||||||||
Total return | 11.62 | %(b) | 24.30 | % | 20.84 | % | –42.54 | % | 26.03 | % | 5.94 | %(b) | 19.73 | % | 46.05 | % | –51.30 | % | 17.48 | % | ||||||||||||||||||||
Ratios and supplemental data: | ||||||||||||||||||||||||||||||||||||||||
Net assets at end of period (millions) | $ | 44.4 | $ | 42.1 | $ | 110.3 | $ | 34.2 | $ | 71.1 | $ | 78.2 | $ | 78.6 | $ | 71.1 | $ | 52.7 | $ | 113.0 | ||||||||||||||||||||
Ratios to average net assets: | ||||||||||||||||||||||||||||||||||||||||
Expenses | 0.94 | %(a) | 0.92 | % | 0.93 | % | 0.92 | % | 0.89 | % | 1.19 | %(a) | 1.25 | % | 1.28 | % | 1.19 | % | 1.29 | % | ||||||||||||||||||||
Net investment income (loss) | –0.71 | %(a) | –0.69 | % | –0.67 | % | –0.70 | % | –0.70 | % | 1.33 | %(a) | 0.32 | % | 0.47 | % | 0.36 | % | 0.27 | % | ||||||||||||||||||||
Portfolio turnover rate | 85 | % | 254 | % | 248 | % | 224 | % | 156 | % | 25 | % | 81 | % | 125 | % | 75 | % | 53 | % | ||||||||||||||||||||
| (a) | Annualized. |
| (b) | Not annualized. |
The accompanying notes are an integral part of these financial statements.
| 123 |
| Ohio National Fund, Inc. |
Financial Highlights |
| Aggressive Growth Portfolio | Small Cap Growth Portfolio | |||||||||||||||||||||||||||||||||||||||
| Six-Month Period Ended June 30, 2011 (Unaudited) | Years Ended December 31, | Six-Month Period Ended June 30, 2011 (Unaudited) | Years Ended December 31, | |||||||||||||||||||||||||||||||||||||
| 2010 | 2009 | 2008 | 2007 | 2010 | 2009 | 2008 | 2007 | |||||||||||||||||||||||||||||||||
Selected Per-Share Data: | ||||||||||||||||||||||||||||||||||||||||
Net asset value, beginning of period | $ | 8.17 | $ | 7.43 | $ | 5.21 | $ | 9.25 | $ | 7.14 | $ | 12.86 | $ | 9.89 | $ | 6.56 | $ | 12.54 | $ | 10.94 | ||||||||||||||||||||
Operations: | ||||||||||||||||||||||||||||||||||||||||
Net investment income (loss) | — | 0.01 | (0.02 | ) | (0.01 | ) | 0.02 | (0.05 | ) | (0.07 | ) | (0.06 | ) | (0.08 | ) | (0.09 | ) | |||||||||||||||||||||||
Net realized and unrealized gain (loss) on investments and foreign currency related transactions | 0.35 | 0.73 | 2.24 | (4.03 | ) | 2.09 | 1.61 | 3.04 | 3.39 | (5.90 | ) | 1.69 | ||||||||||||||||||||||||||||
|
|
|
|
|
|
|
|
|
|
|
|
|
|
|
|
|
|
|
| |||||||||||||||||||||
Total from operations | 0.35 | 0.74 | 2.22 | (4.04 | ) | 2.11 | 1.56 | 2.97 | 3.33 | (5.98 | ) | 1.60 | ||||||||||||||||||||||||||||
|
|
|
|
|
|
|
|
|
|
|
|
|
|
|
|
|
|
|
| |||||||||||||||||||||
Net asset value, end of period | $ | 8.52 | $ | 8.17 | $ | 7.43 | $ | 5.21 | $ | 9.25 | $ | 14.42 | $ | 12.86 | $ | 9.89 | $ | 6.56 | $ | 12.54 | ||||||||||||||||||||
|
|
|
|
|
|
|
|
|
|
|
|
|
|
|
|
|
|
|
| |||||||||||||||||||||
Total return | 4.28 | %(b) | 9.96 | % | 42.61 | % | –43.68 | % | 29.55 | % | 12.13 | %(b) | 30.03 | % | 50.76 | % | –47.69 | % | 14.63 | % | ||||||||||||||||||||
Ratios and supplemental data: | ||||||||||||||||||||||||||||||||||||||||
Net assets at end of period (millions) | $ | 29.1 | $ | 29.8 | $ | 27.2 | $ | 18.0 | $ | 28.8 | $ | 35.6 | $ | 32.1 | $ | 22.8 | $ | 13.2 | $ | 27.0 | ||||||||||||||||||||
Ratios to average net assets: | ||||||||||||||||||||||||||||||||||||||||
Expenses | 1.03 | %(a) | 1.05 | % | 1.04 | % | 0.98 | % | 0.97 | % | 1.09 | % (a) | 1.13 | % | 1.21 | % | 1.18 | % | 1.15 | % | ||||||||||||||||||||
Net investment income (loss) | –0.02 | %(a) | 0.17 | % | –0.23 | % | –0.04 | % | 0.34 | % | –0.72 | %(a) | –0.70 | % | –0.77 | % | –0.84 | % | –0.77 | % | ||||||||||||||||||||
Portfolio turnover rate | 34 | % | 37 | % | 28 | % | 43 | % | 29 | % | 32 | % | 94 | % | 50 | % | 37 | % | 74 | % | ||||||||||||||||||||
| (a) | Annualized. |
| (b) | Not annualized. |
The accompanying notes are an integral part of these financial statements.
| 124 |
| Ohio National Fund, Inc. |
Financial Highlights |
| Mid Cap Opportunity Portfolio | S&P 500® Index Portfolio | |||||||||||||||||||||||||||||||||||||||
| Six-Month Period Ended June 30, 2011 (Unaudited) | Years Ended December 31, | Six-Month Period Ended June 30, 2011 (Unaudited) | Years Ended December 31, | |||||||||||||||||||||||||||||||||||||
| 2010 | 2009 | 2008 | 2007 | 2010 | 2009 | 2008 | 2007 | |||||||||||||||||||||||||||||||||
Selected Per-Share Data: | ||||||||||||||||||||||||||||||||||||||||
Net asset value, beginning of period | $ | 18.43 | $ | 15.41 | $ | 10.96 | $ | 22.50 | $ | 19.09 | $ | 13.21 | $ | 11.69 | $ | 9.41 | $ | 15.36 | $ | 14.82 | ||||||||||||||||||||
Operations: | ||||||||||||||||||||||||||||||||||||||||
Net investment income (loss) | (0.03 | ) | (0.06 | ) | (0.05 | ) | (0.07 | ) | (0.09 | ) | 0.10 | 0.19 | 0.17 | 0.24 | 0.24 | |||||||||||||||||||||||||
Net realized and unrealized gain (loss) on investments | 0.94 | 3.08 | 4.50 | (11.47 | ) | 3.50 | 0.67 | 1.50 | 2.26 | (5.98 | ) | 0.51 | ||||||||||||||||||||||||||||
|
|
|
|
|
|
|
|
|
|
|
|
|
|
|
|
|
|
|
| |||||||||||||||||||||
Total from operations | 0.91 | 3.02 | 4.45 | (11.54 | ) | 3.41 | 0.77 | 1.69 | 2.43 | (5.74 | ) | 0.75 | ||||||||||||||||||||||||||||
|
|
|
|
|
|
|
|
|
|
|
|
|
|
|
|
|
|
|
| |||||||||||||||||||||
Distributions: | ||||||||||||||||||||||||||||||||||||||||
Distributions from net investment income | — | — | — | — | — | — | (0.17 | ) | (0.15 | ) | (0.21 | ) | (0.21 | ) | ||||||||||||||||||||||||||
|
|
|
|
|
|
|
|
|
|
|
|
|
|
|
|
|
|
|
| |||||||||||||||||||||
Net asset value, end of period | $ | 19.34 | $ | 18.43 | $ | 15.41 | $ | 10.96 | $ | 22.50 | $ | 13.98 | $ | 13.21 | $ | 11.69 | $ | 9.41 | $ | 15.36 | ||||||||||||||||||||
|
|
|
|
|
|
|
|
|
|
|
|
|
|
|
|
|
|
|
| |||||||||||||||||||||
Total return | 4.94 | %(b) | 19.60 | % | 40.60 | % | –51.29 | % | 17.86 | % | 5.83 | %(b) | 14.45 | % | 25.83 | % | –37.30 | % | 5.06 | % | ||||||||||||||||||||
Ratios and supplemental data: | ||||||||||||||||||||||||||||||||||||||||
Net assets at end of period (millions) | $ | 69.9 | $ | 70.4 | $ | 63.5 | $ | 79.6 | $ | 115.4 | $ | 183.0 | $ | 176.2 | $ | 160.7 | $ | 106.2 | $ | 179.4 | ||||||||||||||||||||
Ratios to average net assets: | ||||||||||||||||||||||||||||||||||||||||
Expenses | 0.96 | %(a) | 0.98 | % | 0.97 | % | 0.94 | % | 0.93 | % | 0.47 | %(a) | 0.49 | % | 0.51 | % | 0.48 | % | 0.45 | % | ||||||||||||||||||||
Net investment income (loss) | –0.34 | %(a) | –0.35 | % | –0.27 | % | –0.53 | % | –0.45 | % | 1.48 | %(a) | 1.59 | % | 1.85 | % | 1.85 | % | 1.50 | % | ||||||||||||||||||||
Portfolio turnover rate | 24 | % | 56 | % | 276 | % | 297 | % | 267 | % | 4 | % | 8 | % | 21 | % | 12 | % | 7 | % | ||||||||||||||||||||
| (a) | Annualized. |
| (b) | Not annualized. |
The accompanying notes are an integral part of these financial statements.
| 125 |
| Ohio National Fund, Inc. |
Financial Highlights |
| Strategic Value Portfolio | High Income Bond Portfolio | |||||||||||||||||||||||||||||||||||||||
| Six-Month Period Ended June 30, 2011 (Unaudited) | Years Ended December 31, | Six-Month Period Ended June 30, 2011 (Unaudited) | Years Ended December 31, | |||||||||||||||||||||||||||||||||||||
| 2010 | 2009 | 2008 | 2007 | 2010 | 2009 | 2008 | 2007 | |||||||||||||||||||||||||||||||||
Selected Per-Share Data: | ||||||||||||||||||||||||||||||||||||||||
Net asset value, beginning of period | $ | 9.36 | $ | 8.64 | $ | 7.97 | $ | 11.81 | $ | 13.10 | $ | 12.31 | $ | 10.79 | $ | 7.21 | $ | 9.68 | $ | 9.35 | ||||||||||||||||||||
Operations: | ||||||||||||||||||||||||||||||||||||||||
Net investment income | 0.21 | 0.35 | 0.27 | 0.56 | 0.17 | 0.44 | 0.58 | 0.46 | 0.68 | 0.59 | ||||||||||||||||||||||||||||||
Net realized and unrealized gain (loss) on investments and foreign currency related transactions | 0.59 | 0.68 | 0.65 | (3.91 | ) | (1.31 | ) | 0.09 | 0.94 | 3.12 | (3.15 | ) | (0.26 | ) | ||||||||||||||||||||||||||
|
|
|
|
|
|
|
|
|
|
|
|
|
|
|
|
|
|
|
| |||||||||||||||||||||
Total from operations | 0.80 | 1.03 | 0.92 | (3.35 | ) | (1.14 | ) | 0.53 | 1.52 | 3.58 | (2.47 | ) | 0.33 | |||||||||||||||||||||||||||
|
|
|
|
|
|
|
|
|
|
|
|
|
|
|
|
|
|
|
| |||||||||||||||||||||
Distributions: | ||||||||||||||||||||||||||||||||||||||||
Distributions from net investment income | — | (0.24 | ) | (0.25 | ) | (0.49 | ) | (0.15 | ) | — | — | — | — | — | ||||||||||||||||||||||||||
Return of capital distributions | — | (0.07 | ) | — | — | — | — | — | — | — | — | |||||||||||||||||||||||||||||
|
|
|
|
|
|
|
|
|
|
|
|
|
|
|
|
|
|
|
| |||||||||||||||||||||
Total distributions | — | (0.31 | ) | (0.25 | ) | (0.49 | ) | (0.15 | ) | — | — | — | — | — | ||||||||||||||||||||||||||
|
|
|
|
|
|
|
|
|
|
|
|
|
|
|
|
|
|
|
| |||||||||||||||||||||
Net asset value, end of period | $ | 10.16 | $ | 9.36 | $ | 8.64 | $ | 7.97 | $ | 11.81 | $ | 12.84 | $ | 12.31 | $ | 10.79 | $ | 7.21 | $ | 9.68 | ||||||||||||||||||||
|
|
|
|
|
|
|
|
|
|
|
|
|
|
|
|
|
|
|
| |||||||||||||||||||||
Total return | 8.55 | %(b) | 11.98 | % | 11.52 | % | –28.27 | % | –8.74 | % | 4.31 | %(b) | 14.09 | % | 49.65 | % | –25.52 | % | 3.53 | % | ||||||||||||||||||||
Ratios and supplemental data: | ||||||||||||||||||||||||||||||||||||||||
Net assets at end of period (millions) | $ | 28.8 | $ | 24.3 | $ | 19.8 | $ | 13.3 | $ | 28.4 | $ | 291.2 | $ | 269.8 | $ | 159.9 | $ | 71.3 | $ | 89.0 | ||||||||||||||||||||
Ratios to average net assets: | ||||||||||||||||||||||||||||||||||||||||
Expenses | 0.92 | %(a) | 0.96 | % | 1.02 | % | 0.96 | % | 0.87 | % | 0.78 | %(a) | 0.81 | % | 0.88 | % | 0.88 | % | 0.87 | % | ||||||||||||||||||||
Net investment income | 4.35 | %(a) | 4.11 | % | 4.31 | % | 4.68 | % | 1.18 | % | 7.56 | %(a) | 8.03 | % | 9.14 | % | 8.77 | % | 7.05 | % | ||||||||||||||||||||
Portfolio turnover rate | 15 | % | 31 | % | 42 | % | 162 | % | 63 | % | 17 | % | 33 | % | 20 | % | 18 | % | 32 | % | ||||||||||||||||||||
| (a) | Annualized. |
| (b) | Not annualized. |
The accompanying notes are an integral part of these financial statements.
| 126 |
| Ohio National Fund, Inc. |
Financial Highlights |
| Capital Growth Portfolio | Nasdaq-100® Index Portfolio | |||||||||||||||||||||||||||||||||||||||
| Six-Month Period Ended June 30, 2011 (Unaudited) | Years Ended December 31, | Six-Month Period Ended June 30, 2011 (Unaudited) | Years Ended December 31, | |||||||||||||||||||||||||||||||||||||
| 2010 | 2009 | 2008 | 2007 | 2010 | 2009 | 2008 | 2007 | |||||||||||||||||||||||||||||||||
Selected Per-Share Data: | ||||||||||||||||||||||||||||||||||||||||
Net asset value, beginning of period | $ | 27.68 | $ | 20.29 | $ | 15.00 | $ | 23.57 | $ | 21.19 | $ | 5.69 | $ | 4.78 | $ | 3.11 | $ | 5.36 | $ | 4.52 | ||||||||||||||||||||
Operations: | ||||||||||||||||||||||||||||||||||||||||
Net investment income (loss) | (0.11 | ) | (0.11 | ) | — | (0.12 | ) | (0.16 | ) | 0.01 | 0.02 | 0.01 | — | — | ||||||||||||||||||||||||||
Net realized and unrealized gain (loss) on investments | 3.66 | 7.50 | 5.29 | (8.45 | ) | 2.54 | 0.28 | 0.91 | 1.66 | (2.25 | ) | 0.84 | ||||||||||||||||||||||||||||
|
|
|
|
|
|
|
|
|
|
|
|
|
|
|
|
|
|
|
| |||||||||||||||||||||
Total from operations | 3.55 | 7.39 | 5.29 | (8.57 | ) | 2.38 | 0.29 | 0.93 | 1.67 | (2.25 | ) | 0.84 | ||||||||||||||||||||||||||||
|
|
|
|
|
|
|
|
|
|
|
|
|
|
|
|
|
|
|
| |||||||||||||||||||||
Distributions: | ||||||||||||||||||||||||||||||||||||||||
Distributions from net investment income | — | — | — | — | — | — | (0.02 | ) | — | — | — | |||||||||||||||||||||||||||||
|
|
|
|
|
|
|
|
|
|
|
|
|
|
|
|
|
|
|
| |||||||||||||||||||||
Net asset value, end of period | $ | 31.23 | $ | 27.68 | $ | 20.29 | $ | 15.00 | $ | 23.57 | $ | 5.98 | $ | 5.69 | $ | 4.78 | $ | 3.11 | $ | 5.36 | ||||||||||||||||||||
|
|
|
|
|
|
|
|
|
|
|
|
|
|
|
|
|
|
|
| |||||||||||||||||||||
Total return | 12.83 | %(b) | 36.42 | % | 35.27 | % | –36.36 | % | 11.23 | % | 5.10 | %(b) | 19.38 | % | 53.70 | % | –41.98 | % | 18.58 | % | ||||||||||||||||||||
Ratios and supplemental data: | ||||||||||||||||||||||||||||||||||||||||
Net assets at end of period (millions) | $ | 61.8 | $ | 52.4 | $ | 36.8 | $ | 27.1 | $ | 38.2 | $ | 54.5 | $ | 54.9 | $ | 47.6 | $ | 28.1 | $ | 48.6 | ||||||||||||||||||||
Ratios to average net assets: | ||||||||||||||||||||||||||||||||||||||||
Expenses | 1.01 | %(a) | 1.04 | % | 1.07 | % | 1.04 | % | 1.02 | % | 0.52 | %(a) | 0.54 | % | 0.56 | % | 0.54 | % | 0.51 | % | ||||||||||||||||||||
Net investment income (loss) | –0.74 | %(a) | –0.50 | % | 0.02 | % | –0.66 | % | –0.70 | % | 0.23 | %(a) | 0.39 | % | 0.19 | % | 0.01 | % | –0.01 | % | ||||||||||||||||||||
Portfolio turnover rate | 19 | % | 56 | % | 67 | % | 63 | % | 63 | % | 27 | % | 30 | % | 29 | % | 27 | % | 13 | % | ||||||||||||||||||||
| (a) | Annualized. |
| (b) | Not annualized. |
The accompanying notes are an integral part of these financial statements.
| 127 |
| Ohio National Fund, Inc. |
Financial Highlights |
| Bristol Portfolio | Bryton Growth Portfolio | |||||||||||||||||||||||||||||||||||||||
| Six-Month Period Ended June 30, 2011 (Unaudited) | Years Ended December 31, | Six-Month Period Ended June 30, 2011 (Unaudited) | Years Ended December 31, | |||||||||||||||||||||||||||||||||||||
| 2010 | 2009 | 2008 | 2007 | 2010 | 2009 | 2008 | 2007 | |||||||||||||||||||||||||||||||||
Selected Per-Share Data: | ||||||||||||||||||||||||||||||||||||||||
Net asset value, beginning of period | $ | 12.51 | $ | 11.12 | $ | 8.23 | $ | 14.02 | $ | 13.08 | $ | 13.57 | $ | 10.94 | $ | 8.06 | $ | 13.33 | $ | 12.13 | ||||||||||||||||||||
Operations: | ||||||||||||||||||||||||||||||||||||||||
Net investment income (loss) | 0.03 | 0.07 | 0.06 | 0.11 | 0.08 | (0.05 | ) | (0.06 | ) | (0.05 | ) | (0.05 | ) | (0.05 | ) | |||||||||||||||||||||||||
Net realized and unrealized gain (loss) on investments and foreign currency related transactions | 0.56 | 1.39 | 2.89 | (5.80 | ) | 0.93 | 0.39 | 2.69 | 2.93 | (5.22 | ) | 1.25 | ||||||||||||||||||||||||||||
|
|
|
|
|
|
|
|
|
|
|
|
|
|
|
|
|
|
|
| |||||||||||||||||||||
Total from operations | 0.59 | 1.46 | 2.95 | (5.69 | ) | 1.01 | 0.34 | 2.63 | 2.88 | (5.27 | ) | 1.20 | ||||||||||||||||||||||||||||
|
|
|
|
|
|
|
|
|
|
|
|
|
|
|
|
|
|
|
| |||||||||||||||||||||
Distributions: | ||||||||||||||||||||||||||||||||||||||||
Distributions from net investment income | — | (0.07 | ) | (0.06 | ) | (0.10 | ) | (0.07 | ) | — | — | — | — | — | ||||||||||||||||||||||||||
|
|
|
|
|
|
|
|
|
|
|
|
|
|
|
|
|
|
|
| |||||||||||||||||||||
Net asset value, end of period | $ | 13.10 | $ | 12.51 | $ | 11.12 | $ | 8.23 | $ | 14.02 | $ | 13.91 | $ | 13.57 | $ | 10.94 | $ | 8.06 | $ | 13.33 | ||||||||||||||||||||
|
|
|
|
|
|
|
|
|
|
|
|
|
|
|
|
|
|
|
| |||||||||||||||||||||
Total return | 4.72 | %(b) | 13.10 | % | 35.83 | % | –40.54 | % | 7.75 | % | 2.51 | %(b) | 24.04 | % | 35.73 | % | –39.53 | % | 9.89 | % | ||||||||||||||||||||
Ratios and supplemental data: | ||||||||||||||||||||||||||||||||||||||||
Net assets at end of period (millions) | $ | 197.9 | $ | 182.6 | $ | 142.8 | $ | 81.5 | $ | 97.1 | $ | 151.3 | $ | 137.4 | $ | 113.4 | $ | 59.0 | $ | 65.2 | ||||||||||||||||||||
Ratios to average net assets: | ||||||||||||||||||||||||||||||||||||||||
Expenses | 0.83 | %(a) | 0.86 | % | 0.89 | % | 0.90 | % | 0.89 | % | 0.91 | %(a) | 0.93 | % | 0.96 | % | 0.96 | % | 0.96 | % | ||||||||||||||||||||
Net investment income (loss) | 0.40 | %(a) | 0.70 | % | 0.79 | % | 1.13 | % | 0.69 | % | –0.73 | %(a) | –0.49 | % | –0.64 | % | –0.62 | % | –0.54 | % | ||||||||||||||||||||
Portfolio turnover rate | 105 | % | 253 | % | 223 | % | 184 | % | 176 | % | 78 | % | 118 | % | 82 | % | 54 | % | 55 | % | ||||||||||||||||||||
| (a) | Annualized. |
| (b) | Not annualized. |
The accompanying notes are an integral part of these financial statements.
| 128 |
| Ohio National Fund, Inc. |
Financial Highlights |
| U.S. Equity Portfolio | Balanced Portfolio | |||||||||||||||||||||||||||||||||||||||
| Six-Month Period Ended June 30, 2011 (Unaudited) | Years Ended December 31, | Six-Month Period Ended June 30, 2011 (Unaudited) | Years Ended December 31, | |||||||||||||||||||||||||||||||||||||
| 2010 | 2009 | 2008 | 2007 | 2010 | 2009 | 2008 | 2007 | |||||||||||||||||||||||||||||||||
Selected Per-Share Data: | ||||||||||||||||||||||||||||||||||||||||
Net asset value, beginning of period | $ | 10.23 | $ | 9.16 | $ | 7.91 | $ | 15.45 | $ | 13.70 | $ | 13.87 | $ | 13.13 | $ | 10.74 | $ | 14.70 | $ | 13.09 | ||||||||||||||||||||
Operations: | ||||||||||||||||||||||||||||||||||||||||
Net investment income | 0.03 | 0.08 | 0.07 | 0.14 | 0.06 | 0.14 | 0.32 | 0.29 | 0.25 | 0.20 | ||||||||||||||||||||||||||||||
Net realized and unrealized gain (loss) on investments and foreign currency related transactions | 0.60 | 1.06 | 1.24 | (7.56 | ) | 1.74 | 0.49 | 0.70 | 2.39 | (4.21 | ) | 1.41 | ||||||||||||||||||||||||||||
|
|
|
|
|
|
|
|
|
|
|
|
|
|
|
|
|
|
|
| |||||||||||||||||||||
Total from operations | 0.63 | 1.14 | 1.31 | (7.42 | ) | 1.80 | 0.63 | 1.02 | 2.68 | (3.96 | ) | 1.61 | ||||||||||||||||||||||||||||
|
|
|
|
|
|
|
|
|
|
|
|
|
|
|
|
|
|
|
| |||||||||||||||||||||
Distributions: | ||||||||||||||||||||||||||||||||||||||||
Distributions from net investment income | — | (0.07 | ) | (0.06 | ) | (0.12 | ) | (0.05 | ) | — | (0.28 | ) | (0.29 | ) | — | — | ||||||||||||||||||||||||
|
|
|
|
|
|
|
|
|
|
|
|
|
|
|
|
|
|
|
| |||||||||||||||||||||
Net asset value, end of period | $ | 10.86 | $ | 10.23 | $ | 9.16 | $ | 7.91 | $ | 15.45 | $ | 14.50 | $ | 13.87 | $ | 13.13 | $ | 10.74 | $ | 14.70 | ||||||||||||||||||||
|
|
|
|
|
|
|
|
|
|
|
|
|
|
|
|
|
|
|
| |||||||||||||||||||||
Total return | 6.16 | %(b) | 12.46 | % | 16.57 | % | –47.98 | % | 13.17 | % | 4.54 | %(b) | 7.78 | % | 24.92 | % | –26.94 | % | 12.30 | % | ||||||||||||||||||||
Ratios and supplemental data: | ||||||||||||||||||||||||||||||||||||||||
Net assets at end of period (millions) | $ | 14.6 | $ | 14.5 | $ | 14.6 | $ | 13.0 | $ | 24.8 | $ | 17.8 | $ | 14.5 | $ | 13.6 | $ | 9.6 | $ | 11.0 | ||||||||||||||||||||
Ratios to average net assets: | ||||||||||||||||||||||||||||||||||||||||
Expenses | 0.98 | %(a) | 1.01 | % | 1.04 | % | 0.96 | % | 0.91 | % | 0.94 | %(a) | 0.99 | % | 1.08 | % | 1.09 | % | 1.13 | % | ||||||||||||||||||||
Net investment income | 0.58 | %(a) | 0.86 | % | 0.90 | % | 1.19 | % | 0.41 | % | 2.31 | %(a) | 2.48 | % | 2.99 | % | 2.29 | % | 1.77 | % | ||||||||||||||||||||
Portfolio turnover rate | 37 | % | 98 | % | 173 | % | 216 | % | 128 | % | 26 | % | 56 | % | 72 | % | 80 | % | 81 | % | ||||||||||||||||||||
| (a) | Annualized. |
| (b) | Not annualized. |
The accompanying notes are an integral part of these financial statements.
| 129 |
| Ohio National Fund, Inc. |
Financial Highlights |
| Income Opportunity Portfolio | Target VIP Portfolio | |||||||||||||||||||||||||||||||||||||||
| Six-Month Period Ended June 30, 2011 (Unaudited) | Years Ended December 31, | Six-Month Period Ended June 30, 2011 (Unaudited) | Years Ended December 31, | |||||||||||||||||||||||||||||||||||||
| 2010 | 2009 | 2008 | 2007 | 2010 | 2009 | 2008 | 2007 | |||||||||||||||||||||||||||||||||
Selected Per-Share Data: | ||||||||||||||||||||||||||||||||||||||||
Net asset value, beginning of period | $ | 11.99 | $ | 11.19 | $ | 9.89 | $ | 12.49 | $ | 11.53 | $ | 9.11 | $ | 7.72 | $ | 6.81 | $ | 12.23 | $ | 11.23 | ||||||||||||||||||||
Operations: | ||||||||||||||||||||||||||||||||||||||||
Net investment income (loss) | 0.05 | 0.08 | 0.01 | 0.10 | 0.00 | 0.05 | 0.13 | 0.11 | 0.12 | 0.09 | ||||||||||||||||||||||||||||||
Net realized and unrealized gain (loss) on investments, foreign currency related transactions, and written options | 0.37 | 0.72 | 1.29 | (2.70 | ) | 0.96 | 0.72 | 1.37 | 0.90 | (5.42 | ) | 1.00 | ||||||||||||||||||||||||||||
|
|
|
|
|
|
|
|
|
|
|
|
|
|
|
|
|
|
|
| |||||||||||||||||||||
Total from operations | 0.42 | 0.80 | 1.30 | (2.60 | ) | 0.96 | 0.77 | 1.50 | 1.01 | (5.30 | ) | 1.09 | ||||||||||||||||||||||||||||
|
|
|
|
|
|
|
|
|
|
|
|
|
|
|
|
|
|
|
| |||||||||||||||||||||
Distributions: | ||||||||||||||||||||||||||||||||||||||||
Distributions from net investment income | — | — | — | — | — | — | (0.11 | ) | (0.10 | ) | (0.12 | ) | (0.09 | ) | ||||||||||||||||||||||||||
|
|
|
|
|
|
|
|
|
|
|
|
|
|
|
|
|
|
|
| |||||||||||||||||||||
Net asset value, end of period | $ | 12.41 | $ | 11.99 | $ | 11.19 | $ | 9.89 | $ | 12.49 | $ | 9.88 | $ | 9.11 | $ | 7.72 | $ | 6.81 | $ | 12.23 | ||||||||||||||||||||
|
|
|
|
|
|
|
|
|
|
|
|
|
|
|
|
|
|
|
| |||||||||||||||||||||
Total return | 3.50 | %(b) | 7.15 | % | 13.14 | % | –20.82 | % | 8.33 | % | 8.45 | %(b) | 19.47 | % | 14.77 | % | –43.34 | % | 9.74 | % | ||||||||||||||||||||
Ratios and supplemental data: | ||||||||||||||||||||||||||||||||||||||||
Net assets at end of period (millions) | $ | 10.9 | $ | 9.6 | $ | 6.7 | $ | 4.5 | $ | 5.2 | $ | 23.7 | $ | 21.9 | $ | 20.6 | $ | 18.2 | $ | 23.1 | ||||||||||||||||||||
Ratios to average net assets: | ||||||||||||||||||||||||||||||||||||||||
Ratios net of expenses reduced or reimbursed by adviser: | ||||||||||||||||||||||||||||||||||||||||
Expenses | 1.19 | %(a) | 1.27 | % | 1.56 | % | 1.62 | % | 1.46 | % | 0.82 | %(a) | 0.82 | % | 0.83 | % | 0.80 | % | 0.83 | % | ||||||||||||||||||||
Net investment income (loss) | 0.97 | %(a) | 0.89 | % | 0.40 | % | 0.98 | % | –0.04 | % | 1.12 | %(a) | 1.50 | % | 1.53 | % | 1.45 | % | 1.22 | % | ||||||||||||||||||||
Ratios assuming no expenses reduced or reimbursed by adviser: | ||||||||||||||||||||||||||||||||||||||||
Expenses | 1.19 | %(a) | 1.30 | % | 1.56 | % | 1.62 | % | 1.46 | % | 0.82 | %(a) | 0.82 | % | 0.83 | % | 0.80 | % | 0.83 | % | ||||||||||||||||||||
Net investment income (loss) | 0.97 | %(a) | 0.87 | % | 0.40 | % | 0.98 | % | –0.04 | % | 1.12 | %(a) | 1.50 | % | 1.53 | % | 1.45 | % | 1.22 | % | ||||||||||||||||||||
Portfolio turnover rate | 51 | % | 92 | % | 200 | % | 203 | % | 159 | % | 75 | % | 92 | % | 91 | % | 79 | % | 52 | % | ||||||||||||||||||||
| (a) | Annualized. |
| (b) | Not annualized. |
The accompanying notes are an integral part of these financial statements.
| 130 |
| Ohio National Fund, Inc. |
Financial Highlights |
| Target Equity/Income Portfolio | Bristol Growth Portfolio | |||||||||||||||||||||||||||||||||||||||
| Six-Month Period Ended June 30, 2011 (Unaudited) | Years Ended December 31, | Six-Month Period Ended June 30, 2011 (Unaudited) | Years Ended December 31, | Period from May 1, 2007* to December 31, 2007 | ||||||||||||||||||||||||||||||||||||
| 2010 | 2009 | 2008 | 2007 | 2010 | 2009 | 2008 | ||||||||||||||||||||||||||||||||||
Selected Per-Share Data: | ||||||||||||||||||||||||||||||||||||||||
Net asset value, beginning of period | $ | 8.61 | $ | 7.07 | $ | 6.41 | $ | 12.00 | $ | 11.01 | $ | 9.84 | $ | 8.75 | $ | 6.15 | $ | 10.35 | $ | 10.00 | ||||||||||||||||||||
Operations: | ||||||||||||||||||||||||||||||||||||||||
Net investment income | 0.07 | 0.12 | 0.15 | 0.19 | 0.16 | 0.02 | 0.02 | 0.01 | 0.01 | 0.01 | ||||||||||||||||||||||||||||||
Net realized and unrealized gain (loss) on investments | 0.13 | 1.52 | 0.64 | (5.61 | ) | 0.99 | 0.64 | 1.10 | 2.59 | (4.21 | ) | 0.34 | ||||||||||||||||||||||||||||
|
|
|
|
|
|
|
|
|
|
|
|
|
|
|
|
|
|
|
| |||||||||||||||||||||
Total from operations | 0.20 | 1.64 | 0.79 | (5.42 | ) | 1.15 | 0.66 | 1.12 | 2.60 | (4.20 | ) | 0.35 | ||||||||||||||||||||||||||||
|
|
|
|
|
|
|
|
|
|
|
|
|
|
|
|
|
|
|
| |||||||||||||||||||||
Distributions: | ||||||||||||||||||||||||||||||||||||||||
Distributions from net investment income | — | (0.10 | ) | (0.13 | ) | (0.17 | ) | (0.16 | ) | — | (0.03 | ) | — | — | — | |||||||||||||||||||||||||
|
|
|
|
|
|
|
|
|
|
|
|
|
|
|
|
|
|
|
| |||||||||||||||||||||
Net asset value, end of period | $ | 8.81 | $ | 8.61 | $ | 7.07 | $ | 6.41 | $ | 12.00 | $ | 10.50 | $ | 9.84 | $ | 8.75 | $ | 6.15 | $ | 10.35 | ||||||||||||||||||||
|
|
|
|
|
|
|
|
|
|
|
|
|
|
|
|
|
|
|
| |||||||||||||||||||||
Total return | 2.32 | %(b) | 23.23 | % | 12.33 | % | –45.07 | % | 10.42 | % | 6.71 | %(b) | 12.79 | % | 42.28 | % | –40.58 | % | 3.50 | %(b) | ||||||||||||||||||||
Ratios and supplemental data: | ||||||||||||||||||||||||||||||||||||||||
Net assets at end of period (millions) | $ | 26.1 | $ | 26.6 | $ | 22.6 | $ | 24.1 | $ | 40.4 | $ | 97.7 | $ | 85.3 | $ | 10.5 | $ | 4.8 | $ | 7.3 | ||||||||||||||||||||
Ratios to average net assets: | ||||||||||||||||||||||||||||||||||||||||
Expenses | 0.76 | %(a) | 0.78 | % | 0.79 | % | 0.74 | % | 0.73 | % | 0.90 | %(a) | 0.93 | % | 1.29 | % | 1.26 | % | 1.30 | %(a) | ||||||||||||||||||||
Net investment income | 1.49 | %(a) | 1.56 | % | 2.03 | % | 2.05 | % | 1.83 | % | 0.34 | %(a) | 0.63 | % | 0.26 | % | 0.18 | % | 0.10 | %(a) | ||||||||||||||||||||
Portfolio turnover rate | 88 | % | 90 | % | 95 | % | 105 | % | 54 | % | 99 | % | 268 | % | 218 | % | 175 | % | 107 | % | ||||||||||||||||||||
| (a) | Annualized. |
| (b) | Not annualized. |
| * | Represents date of commencement of operations. |
The accompanying notes are an integral part of these financial statements.
| 131 |
| Ohio National Fund, Inc. |
Notes to Financial Statements | June 30, 2011 (Unaudited) |
| (1) | Organization |
Ohio National Fund, Inc. (the “Fund”) is a Maryland corporation registered under the Investment Company Act of 1940, as amended (the “40 Act”), as an open-end management investment company. The Fund consists of twenty-four separate investment portfolios (the “Portfolios”) that seek the following objectives and strategies:
| ¢ | Equity Portfolio — Long-term growth of capital by investing at least 80% of its assets in equity securities. |
| ¢ | Money Market Portfolio — Maximum current income consistent with preservation of capital and liquidity by investing in high quality money market instruments. |
| ¢ | Bond Portfolio — High level of income and opportunity for capital appreciation consistent with preservation of capital by investing primarily in intermediate-term and long-term fixed income securities. |
| ¢ | Omni Portfolio — High level of long-term total return consistent with preservation of capital by investing in stocks, bonds, and money market instruments. |
| ¢ | International Portfolio — Total return on assets by investing at least 80% of its assets in securities of foreign companies. |
| ¢ | Capital Appreciation Portfolio — Long-term capital growth by investing primarily in common stocks of established companies with either current or emerging earnings growth not fully appreciated or recognized by the market. |
| ¢ | Millennium Portfolio — Capital growth by investing primarily in common stocks of small sized companies. |
| ¢ | International Small-Mid Company Portfolio — Long-term growth of capital by investing at least 80% of its assets in equity securities of foreign small and mid-cap companies. |
| ¢ | Aggressive Growth Portfolio — Long-term capital growth by investing primarily in domestic and foreign equity securities selected for growth potential. |
| ¢ | Small Cap Growth Portfolio — Long-term capital appreciation by investing at least 80% of its net assets in stocks of small companies. |
| ¢ | Mid Cap Opportunity Portfolio — Long-term total return by investing at least 80% of its net assets in equity securities of mid-cap companies, primarily those that are strategically positioned for long-term growth. |
| ¢ | S&P 500® Index Portfolio — Total return that approximates the total return of the Standard & Poor’s 500® Index, at a risk level consistent with that of the Standard & Poor’s 500® Index. |
| ¢ | Strategic Value Portfolio — Growth of capital and income by investing primarily in securities of high dividend yielding, undervalued stocks with dividend growth potential. |
| ¢ | High Income Bond Portfolio — High current income by investing at least 80% of its net assets in lower rated corporate debt obligations commonly referred to as “junk bonds”. The Portfolio’s investments are generally rated Ba or lower by Moody’s, or BB or lower by Standard & Poor’s or Fitch. |
| ¢ | Capital Growth Portfolio — Long-term capital appreciation by investing in and actively managing equity securities of small cap growth companies. |
| ¢ | Nasdaq-100® Index Portfolio — Long-term growth of capital by investing primarily in stocks that are included in the Nasdaq-100® Index. Unlike the other Portfolios of the Fund, the Nasdaq-100® Index Portfolio is a non-diversified portfolio for purposes of Section 5(b) of the 40 Act. |
| ¢ | Bristol Portfolio — Long-term growth of capital by investing primarily in common stocks of the 1,000 largest publicly traded U.S. companies in terms of market capitalization. |
| ¢ | Bryton Growth Portfolio — Long-term growth of capital by investing primarily in common stocks of growth-oriented U.S. companies smaller than the 500 largest publicly traded U.S. companies in terms of market capitalization. |
| ¢ | U.S. Equity Portfolio — Capital appreciation with a secondary objective of capital preservation to provide long term growth by investing at least 80% of its net assets in equity securities traded in the U.S. within under-priced sectors and industries. |
| 132 | (continued) |
| Ohio National Fund, Inc. |
Notes to Financial Statements (Continued) | June 30, 2011 (Unaudited) |
| ¢ | Balanced Portfolio — Capital appreciation and income by investing normally up to 75% of its assets in equity securities within under-priced sectors and industries while maintaining a minimum of 25% of its assets in fixed income securities. |
| ¢ | Income Opportunity Portfolio — Modest capital appreciation and maximization of realized gains by investing in equity securities traded in the U.S. |
| ¢ | Target VIP Portfolio — Above average total return by investing in the common stocks of companies which are identified by a model that applies separate uniquely specialized strategies. |
| ¢ | Target Equity/Income Portfolio — Above average total return by adhering to a disciplined, quantitative investment process that incorporates two distinct strategy methodologies. |
| ¢ | Bristol Growth Portfolio — Long-term growth of capital by investing primarily in common stocks of the 1,000 largest publicly traded U.S. companies in terms of market capitalization. |
Additional detail regarding portfolio-specific objectives, policies, and investment strategies is provided in the prospectus and Statement of Additional Information of Ohio National Fund, Inc. There are no assurances that these objectives will be met. Each Portfolio, except the Nasdaq-100® Index Portfolio, is classified as diversified for purposes of Section 5(b) of the 40 Act.
At present, the Fund sells its shares only to separate accounts of The Ohio National Life Insurance Company (“ONLIC”), Ohio National Life Assurance Corporation (“ONLAC”), and National Security Life and Annuity Company (“NSLA”) to support certain benefits under variable contracts issued by those entities. In the future, Fund shares may be used for other purposes but, unless there is a change in applicable law, they will not be sold directly to the public.
Interest in each Portfolio is represented by a separate class of the Fund’s capital stock, par value $1. Each share of a Portfolio participates equally in the Portfolio’s dividends, distributions, net assets, and voting matters.
The Fund is authorized to issue 550 million of its capital shares. These authorized shares have been allocated to specific Portfolios of the Fund as follows:
Portfolio | Authorized Shares | |||
Equity | 30,000,000 | |||
Money Market | 80,000,000 | |||
Bond | 30,000,000 | |||
Omni | 10,000,000 | |||
International | 45,000,000 | |||
Capital Appreciation | 15,000,000 | |||
Millennium | 10,000,000 | |||
International Small-Mid Company | 10,000,000 | |||
Aggressive Growth | 10,000,000 | |||
Small Cap Growth | 10,000,000 | |||
Mid Cap Opportunity | 10,000,000 | |||
S&P 500® Index | 35,000,000 | |||
Portfolio | Authorized Shares | |||
Strategic Value | 10,000,000 | |||
High Income Bond | 60,000,000 | |||
Capital Growth | 10,000,000 | |||
Nasdaq-100® Index | 25,000,000 | |||
Bristol | 40,000,000 | |||
Bryton Growth | 35,000,000 | |||
U.S. Equity | 10,000,000 | |||
Balanced | 10,000,000 | |||
Income Opportunity | 10,000,000 | |||
Target VIP | 10,000,000 | |||
Target Equity/Income | 10,000,000 | |||
Bristol Growth | 25,000,000 | |||
The Fund’s Board of Directors (the “Board”) periodically reallocates authorized shares among the Portfolios of the Fund and may authorize additional shares as deemed necessary.
Under the Fund’s organizational documents, its Officers and Directors are indemnified against certain liabilities arising out of the performance of their duties to the Fund. In addition, in the normal course of business, the Fund enters into contracts with its vendors and others that provide for general indemnifications. The Fund’s maximum exposure under these arrangements is unknown as this would involve future claims that may be made against the Fund. However, based on experience, the risk of loss to the Fund is expected to be remote.
| 133 | (continued) |
| Ohio National Fund, Inc. |
Notes to Financial Statements (Continued) | June 30, 2011 (Unaudited) |
| (2) | Significant Accounting Policies |
The following is a summary of significant accounting policies followed by the Fund in preparation of its financial statements:
Use of Estimates
The preparation of financial statements in conformity with U.S. generally accepted accounting principles (“GAAP”) requires management to make estimates and assumptions that affect the reported amounts of assets and liabilities and disclosure of contingent assets and liabilities at the date of the financial statements and the reported amounts of increases and decreases in net assets from operations during the reporting period. Actual results could differ from those estimates.
Security Valuation
Investments are valued using pricing procedures approved by the Board.
Investments in the Money Market Portfolio are valued at amortized cost in accordance with Rule 2a-7 of the 40 Act. In all Portfolios of the Fund, fixed income instruments that mature in sixty days or less, and of sufficient credit quality, are valued at amortized cost. Amortized cost valuation involves valuing a security at its cost initially and thereafter amortizing to maturity any discounts or premiums on the level-yield method, regardless of the impact of fluctuating market interest rates on the value of the security. In these instances, amortized cost approximates fair value.
Investments, other than those securities aforementioned, are valued as follows:
Domestic equity securities that are traded on U.S. exchanges, with the exception of options, are valued at the last trade price reported by the primary exchange of each security (4:00 pm Eastern Time for normal trading sessions). Option securities are currently valued on a composite close price basis. Over-the-counter domestic equity securities are valued at the last trade price reported daily as of 4:00 pm Eastern Time (normal trading sessions). Over-the-counter traded ADRs may be valued at an evaluated price based on the value of the underlying securities. If a domestic equity security is not traded on a particular day, the mean between the bid and ask prices reported at 4:00 pm Eastern Time (normal trading sessions) by the primary exchange will generally be used for valuation purposes. The principal sources for market quotations are independent pricing services that have been approved by the Board.
Fixed income securities that have a remaining maturity exceeding sixty days are generally valued at the mean between the daily close bid and ask prices, as provided by independent pricing services approved by the Board.
Shares of open-end mutual funds are valued at each fund’s last calculated net asset value per share.
Repurchase agreements are valued at amortized cost, which approximates fair value.
Restricted securities, illiquid securities, or other investments for which market quotations or other observable market inputs are not readily available are valued at an estimate of value using methods determined in good faith by the Fund’s Pricing Committee under the supervision of the Board.
Foreign equity securities are initially priced at the reported close price of the exchange on which a security is primarily traded. Securities not traded on a particular day are valued at the mean between the last reported bid and ask quotes at daily close, or the last sale price when appropriate. The principal sources for market quotations are independent pricing services that have been approved by the Board.
Equity securities that are primarily traded on foreign exchanges, other than those in North or South America, are further subjected to fair valuation pricing procedures provided by an independent fair valuation service. The service provides data that can be used to estimate the price of a foreign issue that would prevail in a liquid market given market information available daily at 4:00 pm Eastern Time (normal trading sessions). Multiple factors may be considered in performing this valuation, including an issue’s local close price, relevant general and sector indices, currency fluctuations, and pricing of related depository receipts, exchange traded funds, and futures. The pricing procedures are performed for each individual security for which there is a fairly large degree of certainty that the local close price is not the liquid market price at the time
| 134 | (continued) |
| Ohio National Fund, Inc. |
Notes to Financial Statements (Continued) | June 30, 2011 (Unaudited) |
of U.S. market close, each day there is a change in a consistently used market index from the time of local close to the U.S. market close. Backtesting analysis is performed on a quarterly basis to monitor the effectiveness of these procedures. The testing is reviewed by management of the Fund as well as the Fund’s Board. Prior results have indicated that these procedures have been effective in reaching valuation objectives.
The differences between the aggregate cost and values of investments are reflected as unrealized appreciation or unrealized depreciation.
Pricing inputs used in the Fund’s determination of its investment values are categorized according to a three-tier hierarchy framework. The hierarchy is summarized in three broad levels:
| Level 1: | Quoted prices in active markets for identical securities. |
| Level 2: | Other significant observable inputs, including quoted prices for similar securities, interest rates, prepayment speeds, credit risk, etc. |
| Level 3: | Significant unobservable inputs, including the Fund’s own assumptions used to determine the value of securities. |
The following is a summary of the inputs used in valuing each of the Portfolio’s assets (liabilities) at value as of June 30, 2011:
Portfolio | Financial Instrument Type | Level 1 | Level 2 | Level 3 | ||||||||||
Equity | Common Stocks | $ | 207,046,324 | $ | — | $ | — | |||||||
| Repurchase Agreements | — | 3,237,584 | — | |||||||||||
|
|
|
|
|
| |||||||||
| $ | 207,046,324 | $ | 3,237,584 | $ | — | |||||||||
|
|
|
|
|
| |||||||||
Money Market * | Commercial Paper | $ | — | $ | 210,869,165 | $ | — | |||||||
| Asset-Backed Securities | — | 3,454,365 | — | |||||||||||
| Money Market Funds | 40,400,000 | — | — | |||||||||||
| U.S. Treasury Obligations | — | 9,999,917 | — | |||||||||||
| Repurchase Agreements | — | 14,000,000 | — | |||||||||||
|
|
|
|
|
| |||||||||
| $ | 40,400,000 | $ | 238,323,447 | $ | — | |||||||||
|
|
|
|
|
| |||||||||
Bond | Corporate Bonds | $ | — | $ | 138,797,617 | $ | — | |||||||
| U.S. Treasury Obligations | — | 6,259,999 | — | |||||||||||
| Repurchase Agreements | — | 7,338,000 | — | |||||||||||
|
|
|
|
|
| |||||||||
| $ | — | $ | 152,395,616 | $ | — | |||||||||
|
|
|
|
|
| |||||||||
Omni | Common Stocks | $ | 29,588,295 | $ | — | $ | — | |||||||
| Corporate Bonds | — | 8,480,579 | — | |||||||||||
| U.S. Treasury Obligations | — | 312,797 | — | |||||||||||
| Money Market Funds | 1,507,000 | — | — | |||||||||||
|
|
|
|
|
| |||||||||
| $ | 31,095,295 | $ | 8,793,376 | $ | — | |||||||||
|
|
|
|
|
| |||||||||
International | Common Stocks | $ | 24,883,308 | $ | 185,792,788 | $ | — | |||||||
| U.S. Treasury Obligations | — | 199,999 | — | |||||||||||
| Money Market Funds | 46,329 | — | — | |||||||||||
|
|
|
|
|
| |||||||||
| $ | 24,929,637 | $ | 185,992,787 | $ | — | |||||||||
|
|
|
|
|
| |||||||||
| Foreign currency contracts | $ | (405,070 | ) | $ | — | $ | — | |||||||
|
|
|
|
|
| |||||||||
| Futures contracts | $ | 13,117 | $ | — | $ | — | ||||||||
|
|
|
|
|
| |||||||||
Capital Appreciation | Common Stocks | $ | 129,202,200 | $ | 1,934,645 | $ | — | |||||||
| Money Market Funds | 1,926,000 | — | — | |||||||||||
|
|
|
|
|
| |||||||||
| $ | 131,128,200 | $ | 1,934,645 | $ | — | |||||||||
|
|
|
|
|
| |||||||||
Millennium | Common Stocks | $ | 44,752,524 | $ | — | $ | — | |||||||
| Money Market Funds | 548,000 | — | — | |||||||||||
|
|
|
|
|
| |||||||||
| $ | 45,300,524 | $ | — | $ | — | |||||||||
|
|
|
|
|
| |||||||||
| 135 | (continued) |
| Ohio National Fund, Inc. |
Notes to Financial Statements (Continued) | June 30, 2011 (Unaudited) |
Portfolio | Financial Instrument Type | Level 1 | Level 2 | Level 3 | ||||||||||
International Small-Mid Company | Common Stocks | $ | 11,556,255 | $ | 59,217,148 | $ | — | |||||||
| Preferred Stocks | — | 782,770 | — | |||||||||||
| Exchange Traded Funds | 1,272,460 | — | — | |||||||||||
Money Market Funds | 6,250,993 | — | — | |||||||||||
|
|
|
|
|
| |||||||||
| $ | 19,079,708 | $ | 59,999,918 | $ | — | |||||||||
|
|
|
|
|
| |||||||||
Aggressive Growth | Common Stocks | $ | 23,717,828 | $ | 5,122,657 | $ | — | |||||||
| VVPR Strips | 41 | — | — | |||||||||||
| Money Market Funds | 916,000 | — | — | |||||||||||
|
|
|
|
|
| |||||||||
| $ | 24,633,869 | $ | 5,122,657 | $ | — | |||||||||
|
|
|
|
|
| |||||||||
Small Cap Growth | Common Stocks | $ | 35,517,723 | $ | — | $ | — | |||||||
| Money Market Funds | 191,000 | — | — | |||||||||||
|
|
|
|
|
| |||||||||
| $ | 35,708,723 | $ | — | $ | — | |||||||||
|
|
|
|
|
| |||||||||
Mid Cap Opportunity | Common Stocks | $ | 69,286,926 | $ | — | $ | — | |||||||
| Money Market Funds | 537,000 | — | — | |||||||||||
|
|
|
|
|
| |||||||||
| $ | 69,823,926 | $ | — | $ | — | |||||||||
|
|
|
|
|
| |||||||||
S&P 500® Index | Common Stocks | $ | 181,419,679 | $ | — | $ | — | |||||||
| Exchange Traded Funds | 1,408,780 | — | — | |||||||||||
|
|
|
|
|
| |||||||||
| $ | 182,828,459 | $ | — | $ | — | |||||||||
|
|
|
|
|
| |||||||||
Strategic Value | Common Stocks | $ | 21,623,589 | $ | 6,740,353 | $ | — | |||||||
| Money Market Funds | 363,000 | — | — | |||||||||||
|
|
|
|
|
| |||||||||
| $ | 21,986,589 | $ | 6,740,353 | $ | — | |||||||||
|
|
|
|
|
| |||||||||
High Income Bond | Corporate Bonds | $ | — | $ | 280,455,600 | $ | — | |||||||
| Convertible Bonds | — | 226,688 | — | |||||||||||
| Common Stocks | 128,757 | — | — | |||||||||||
| Preferred Stocks | — | 325,197 | — | |||||||||||
| Warrants | 143,944 | — | — | |||||||||||
| Other | — | — | 8,203 | |||||||||||
| Money Market Funds | 5,961,000 | — | — | |||||||||||
|
|
|
|
|
| |||||||||
| $ | 6,233,701 | $ | 281,007,485 | $ | 8,203 | |||||||||
|
|
|
|
|
| |||||||||
| Capital Growth | Common Stocks | $ | 61,078,982 | $ | — | $ | — | |||||||
| Money Market Funds | 477,000 | — | — | |||||||||||
|
|
|
|
|
| |||||||||
| $ | 61,555,982 | $ | — | $ | — | |||||||||
|
|
|
|
|
| |||||||||
Nasdaq-100® Index | Common Stocks | $ | 53,525,349 | $ | — | $ | — | |||||||
| Exchange Traded Funds | 796,703 | — | — | |||||||||||
|
|
|
|
|
| |||||||||
| $ | 54,322,052 | $ | — | $ | — | |||||||||
|
|
|
|
|
| |||||||||
Bristol | Common Stocks | $ | 192,942,963 | $ | — | $ | — | |||||||
| Money Market Funds | 5,353,000 | — | — | |||||||||||
|
|
|
|
|
| |||||||||
| $ | 198,295,963 | $ | — | $ | — | |||||||||
|
|
|
|
|
| |||||||||
Bryton Growth | Common Stocks | $ | 143,943,709 | $ | — | $ | — | |||||||
| Money Market Funds | 4,924,000 | — | — | |||||||||||
|
|
|
|
|
| |||||||||
| $ | 148,867,709 | $ | — | $ | — | |||||||||
|
|
|
|
|
| |||||||||
U.S. Equity | Common Stocks | $ | 14,545,185 | $ | — | $ | — | |||||||
|
|
|
|
|
| |||||||||
| 136 | (continued) |
| Ohio National Fund, Inc. |
Notes to Financial Statements (Continued) | June 30, 2011 (Unaudited) |
Portfolio | Financial Instrument Type | Level 1 | Level 2 | Level 3 | ||||||||||
Balanced | Common Stocks | $ | 11,623,944 | $ | — | $ | — | |||||||
| Corporate Bonds | — | 5,517,347 | — | |||||||||||
| U.S. Government Agency Issues | — | 23,219 | — | |||||||||||
| U.S. Treasury Obligations | — | 96,328 | — | |||||||||||
Money Market Funds | 347,000 | — | — | |||||||||||
|
|
|
|
|
| |||||||||
| $ | 11,970,944 | $ | 5,636,894 | $ | — | |||||||||
|
|
|
|
|
| |||||||||
Income Opportunity | Common Stocks | $ | 10,946,269 | $ | — | $ | — | |||||||
| Purchased Options | 16,000 | — | — | |||||||||||
| Money Market Funds | 206,000 | — | — | |||||||||||
|
|
|
|
|
| |||||||||
| $ | 11,168,269 | $ | — | $ | — | |||||||||
|
|
|
|
|
| |||||||||
| Written Options Outstanding | $ | (231,468 | ) | $ | — | $ | — | |||||||
|
|
|
|
|
| |||||||||
Target VIP | Common Stocks | $ | 23,248,779 | $ | — | $ | — | |||||||
| Money Market Funds | 369,000 | — | — | |||||||||||
|
|
|
|
|
| |||||||||
| $ | 23,617,779 | $ | — | $ | — | |||||||||
|
|
|
|
|
| |||||||||
Target Equity/Income | Common Stocks | $ | 25,802,213 | $ | — | $ | — | |||||||
| Money Market Funds | 254,000 | — | — | |||||||||||
|
|
|
|
|
| |||||||||
| $ | 26,056,213 | $ | — | $ | — | |||||||||
|
|
|
|
|
| |||||||||
Bristol Growth | Common Stocks | $ | 94,348,522 | $ | — | $ | — | |||||||
| Money Market Funds | 3,279,000 | — | — | |||||||||||
|
|
|
|
|
| |||||||||
| $ | 97,627,522 | $ | — | $ | — | |||||||||
|
|
|
|
|
| |||||||||
| * | At June 30, 2011, the Money Market Portfolio’s investments, with the exception of money market funds, were valued using amortized cost, in accordance with rules under the 40 Act. Amortized cost approximates the current fair value of a security, but since the value is not obtained from a quoted price in an active market, such securities are considered to be valued using Level 2 inputs. |
As stated above, the value assigned to the Fund’s foreign securities will, in most cases, not be the quoted or published prices of the investments on their respective primary markets or exchanges. Securities that are priced using fair value estimates are categorized as Level 2 in the fair value hierarchy, whereas securities that do not meet the established criteria are categorized as Level 1. The valuation of a foreign security from one valuation period to the next may result in a transfer between Levels 1 and 2 if the degree of certainty that the local close price is not the liquid market price at the time of U.S. market close is not similar for both periods. The Fund’s policy is to recognize significant transfers between fair value hierarchy levels at the reporting period end. There were no significant transfers between Level 1 and Level 2 during the six-month period ended June 30, 2011.
Below is a reconciliation that details the activity of securities in Level 3 during the six-month period ended June 30, 2011:
Corporate Bonds | High Income Bond | |||
Beginning Balance – January 1, 2011 | $ | 4,688 | ||
Total gains or losses (realized/unrealized): | ||||
Included in earnings (or changes in net assets) | 3,515 | |||
Purchases, issuances, and settlements | — | |||
Transfers in and/or out of Level 3 | — | |||
|
| |||
Ending Balance – June 30, 2011 | $ | 8,203 | ||
|
| |||
The amount of total gains or losses for the period included in earnings (or changes in net assets) attributable to the change in unrealized gains or losses relating to assets still held at the reporting date | $ | — | ||
|
| |||
Foreign Securities and Currency
The books and records of all the Portfolios are maintained in U.S. dollars. All investments and cash quoted in foreign currencies are valued daily in U.S. dollars on the basis of the foreign currency exchange rates provided by an independent source. These
| 137 | (continued) |
| Ohio National Fund, Inc. |
Notes to Financial Statements (Continued) | June 30, 2011 (Unaudited) |
exchange rates are currently determined daily, at 4:00 pm Eastern Time for normal trading sessions. Purchases and sales of foreign-denominated investments are recorded at rates of exchange prevailing on the respective dates of such transactions.
The Fund may not fully isolate that portion of the results of operations resulting from changes in foreign exchange rates from fluctuations arising from changes in market prices on foreign currency-denominated investments. However, for tax purposes, the Fund does fully isolate the effect of fluctuations in foreign exchange rates when determining the gain or loss upon sale or maturity of such investments to the extent required by federal income tax regulations.
All Portfolios of the Fund, other than the Target VIP and Target Equity/Income Portfolios, may invest in securities of foreign issuers, although foreign securities purchased by the Money Market Portfolio must be denominated in U.S. dollars and held in custody in the United States of America. The International and International Small-Mid Company Portfolios may be invested entirely in foreign securities. Investments in securities of foreign issuers, including investments in foreign companies through the use of depositary receipts, carry certain risks not ordinarily associated with investments in securities of domestic issuers. Such risks include future political and economic developments, and the possible imposition of exchange controls or other foreign governmental laws and restrictions. In addition, with respect to certain countries, there is the possibility of expropriation of assets, confiscatory taxation, political or social instability, or diplomatic developments that could adversely affect capital investment within those countries.
Repurchase Agreements
The Portfolios may acquire repurchase agreements from member banks of the Federal Reserve System which are deemed creditworthy under guidelines approved by the Board, subject to the seller’s agreement to repurchase such securities at a mutually agreed upon date and price. The repurchase price generally equals the price paid by a Portfolio plus interest negotiated on the basis of current short-term rates, which may be more or less than the rate on the underlying securities. The maturities of these instruments vary from overnight to one week. The seller, under a repurchase agreement, is required to maintain as collateral for the repurchase transaction securities in which the Portfolio has a perfected security interest with a value not less than 100% of the repurchase price (including accrued interest). Securities subject to repurchase agreements are held by the Portfolio’s custodian or another qualified custodian or in the Federal Reserve/Treasury book-entry system. In the event of counterparty default, the Fund has the right to use the collateral to offset losses incurred. There is potential for loss to the Fund in the event the Fund is delayed or prevented from exercising its rights to dispose of the collateral securities, including the risk of a possible decline in the value of the underlying securities during the period while the Fund seeks to assert its rights.
Restricted and Illiquid Securities
Restricted securities are those securities purchased through a private offering and cannot be resold to the general public without prior registration under the Securities Act of 1933 (“the 1933 Act”) or pursuant to the resale limitations provided by Rule 144A under the 1933 Act, or an exemption from the registration requirements of the 1933 Act. 144A securities are issued by corporations without registration in reliance on 1933 Act provisions allowing for the private resale of unregistered securities to qualified institutional buyers. Section 4(2) commercial paper is issued pursuant to Section 4(2) of the 1933 Act which exempts an issue from registration. This paper may be used to finance non-current transactions, such as acquisitions, stock repurchase programs, and other long-term assets. Investments by a portfolio in Rule 144A and Section 4(2) securities could have the effect of decreasing the liquidity of a Portfolio during any period in which qualified institutional investors were no longer interested in purchasing these securities.
Typically, the restricted securities noted above are not considered illiquid. The criteria used to determine if a restricted security is illiquid includes frequency of trades and quotes, available dealers willing to make transactions, availability of market makers in the security, and the nature of the security and its trades. The Money Market, Bond, and Omni Portfolios may invest up to 10% of their respective assets in illiquid securities. Each of the other Portfolios of the Fund may invest up to 15% of its net assets in illiquid securities.
Investment Transactions and Related Income
For financial reporting purposes, investment transactions are accounted for on a trade date basis. For purposes of executing separate account shareholder transactions in the normal course of business, however, the Fund’s investment transactions are
| 138 | (continued) |
| Ohio National Fund, Inc. |
Notes to Financial Statements (Continued) | June 30, 2011 (Unaudited) |
recorded no later than the first calculation on the first business day following the trade date in accordance with Rule 2a-4 of the 40 Act. Accordingly, differences between the net asset values for financial reporting and for executing separate account shareholder transactions may arise.
Dividend income is recognized on the ex-dividend date, except in the case of those Portfolios holding foreign securities, in which dividends are recorded as soon after the ex-dividend date as the Fund’s information agents become aware of such dividends. Interest income is accrued daily as earned and includes the amortization of premium and accretion of discount. Net realized gain or loss on investments and foreign exchange transactions are determined using the specific identification method.
Distributions to Shareholders and Federal Taxes
Net investment income of the Money Market Portfolio is declared and paid daily as a dividend to shareholders immediately before the computation of the net asset value of Money Market Portfolio shares. Dividends are automatically reinvested in additional Money Market Portfolio shares at the net asset value immediately following such computation. Distributions arising from net investment income and net capital gains from the remaining Portfolios are declared and paid to shareholders periodically as required for each of the Portfolios to continue to qualify as a regulated investment company pursuant to Subchapter M of the Internal Revenue Code. The Fund, excluding the Money Market Portfolio, may also satisfy its distribution requirements by using consent dividends rather than cash dividends. The Fund has the intent to continue to comply with tax provisions pertaining to regulated investment companies and make distributions of taxable income sufficient to relieve it from substantially all federal income and excise taxes. As such, no provisions for federal income or excise taxes have been recorded.
The character of income and realized capital gains distributions are determined in accordance with federal income tax regulations and may differ from net investment income and realized gains for financial reporting purposes. These “book/tax” differences are either considered temporary or permanent in nature. To the extent these differences are permanent in nature they are reclassified within the composition of net assets; temporary differences do not require such reclassification. Distributions to shareholders that exceed taxable income and net taxable realized gains are reported as return of capital distributions.
The Fund’s management and its tax agent, U.S. Bancorp Fund Services, LLC, perform an affirmative evaluation of tax positions taken or expected to be taken in the course of preparing the Fund’s tax returns to determine whether it is more-likely-than-not (i.e. greater than 50-percent) that each tax position will be sustained upon examination by a taxing authority based on the technical merits of the position. A tax position that meets the more-likely-than-not recognition threshold is measured to determine the amount of benefit to recognize in the financial statements. Differences between tax positions taken in a tax return and amounts recognized in the financial statements will generally result in an increase in a liability for taxes payable (or a reduction of a tax refund receivable), including the recognition of any related interest and penalties as an operating expense. Implementation of the evaluation included a review of tax positions taken in tax years that remain subject to examination by all major tax jurisdictions, including federal tax and the state of Maryland (i.e., the last four tax year ends and the interim tax period since then). The determination has been made that there are no uncertain tax positions that would require the Portfolios to record a tax liability and, therefore, there is no impact to the Portfolios’ financial statements.
Expense Allocation
Expenses directly attributable to a Portfolio are charged to that Portfolio. Expenses that cannot be directly attributed to a Portfolio are allocated among all the benefited Portfolios on a basis of relative net assets or other appropriate method.
Foreign Withholding Taxes
Certain Portfolios in the Fund may be subject to taxes imposed by countries in which they invest with respect to their investments in issuers existing or operating in such countries. Such taxes are generally withheld based on income earned. These Portfolios accrue such taxes as the related income is earned.
Subsequent Events
Management has evaluated events and transactions through the date the financial statements were available to be issued, for purposes of recognition or disclosure in these financial statements, and there are no subsequent events to report.
| 139 | (continued) |
| Ohio National Fund, Inc. |
Notes to Financial Statements (Continued) | June 30, 2011 (Unaudited) |
| (3) | Related Party and Other Transactions |
The Fund has an Investment Advisory Agreement with Ohio National Investments, Inc. (“ONI”), a wholly-owned subsidiary of ONLIC. Under the terms of this agreement, ONI provides portfolio management and investment advice to the Fund and administers its operations, subject to the supervision of the Fund’s Board. This agreement is renewed annually upon the approval by the Board. As compensation for its services, ONI receives advisory fees from the Fund calculated on the basis of each Portfolio’s average daily net assets and the following current schedule of Board-approved annualized fee breakpoints.
Equity |
| 0.79% of first $200 million |
| 0.74% of next $800 million |
| 0.70% over $1 billion |
Bond |
| 0.60% of first $100 million |
| 0.50% of next $150 million |
| 0.45% of next $250 million |
| 0.40% of next $500 million |
| 0.30% of next $1 billion |
| 0.25% over $2 billion |
International |
| 0.85% of first $100 million |
| 0.80% of next $100 million |
| 0.70% over $200 million |
Millennium |
| 0.80% of first $150 million |
| 0.75% of next $150 million |
| 0.70% of next $300 million |
| 0.65% over $600 million |
Aggressive Growth |
| 0.80% of first $100 million |
| 0.75% of next $400 million |
| 0.70% over $500 million |
Mid Cap Opportunity |
| 0.85% of first $100 million |
| 0.80% of next $100 million |
| 0.75% of next $300 million |
| 0.70% over $500 million |
Strategic Value |
| 0.75% of first $100 million |
| 0.70% of next $400 million |
| 0.65% over $500 million |
Capital Growth |
| 0.90% of first $100 million |
| 0.85% of next $100 million |
| 0.80% of next $300 million |
| 0.75% over $500 million |
Bristol |
| 0.80% of first $100 million |
| 0.70% of next $400 million |
| 0.65% over $500 million |
U.S. Equity |
| 0.75% of first $200 million |
| 0.70% of next $300 million |
| 0.65% over $500 million |
Money Market |
| 0.30% of first $100 million 1 |
| 0.25% of next $150 million |
| 0.23% of next $250 million |
| 0.20% of next $500 million |
| 0.15% over $1 billion |
Omni |
| 0.60% of first $100 million |
| 0.50% of next $150 million |
| 0.45% of next $250 million |
| 0.40% of next $500 million |
| 0.30% of next $1 billion |
| 0.25% over $2 billion |
Capital Appreciation |
| 0.80% of first $100 million |
| 0.75% of next $300 million |
| 0.65% of next $600 million |
| 0.60% over $1 billion |
International Small-Mid Company |
| 1.00% of first $100 million |
| 0.90% of next $100 million |
| 0.85% over $200 million |
Small Cap Growth |
| 0.90% of first $150 million |
| 0.80% of next $150 million |
| 0.75% over $300 million |
S&P 500® Index |
| 0.40% of first $100 million |
| 0.35% of next $150 million |
| 0.33% over $250 million |
High Income Bond |
| 0.75% of first $75 million |
| 0.70% of next $75 million |
| 0.65% of next $75 million |
| 0.60% over $225 million |
Nasdaq-100® Index |
| 0.40% of first $100 million |
| 0.35% of next $150 million |
| 0.33% over $250 million |
Bryton Growth |
| 0.85% of first $100 million |
| 0.75% of next $400 million |
| 0.70% over $500 million |
Income Opportunity |
| 0.80% of first $200 million |
| 0.75% of next $300 million |
| 0.70% over $500 million |
| 140 | (continued) |
| Ohio National Fund, Inc. |
Notes to Financial Statements (Continued) | June 30, 2011 (Unaudited) |
Balanced |
| 0.65% of first $200 million |
| 0.60% of next $300 million |
| 0.55% over $500 million |
Target VIP |
| 0.60% of first $100 million |
| 0.55% of next $400 million |
| 0.50% over $500 million |
Target Equity/Income |
| 0.60% of first $100 million |
| 0.55% of next $400 million |
| 0.50% over $500 million |
Bristol Growth |
| 0.80% of first $100 million |
| 0.70% of next $400 million |
| 0.65% over $500 million |
| 1 | For the six-month period ended June 30, 2011, ONI waived advisory fees in excess of an annualized rate of 0.25% of the first $100 million of average daily net assets in the Money Market Portfolio. Waivers related to the Money Market Portfolio are voluntary and are not subject to recoupment in subsequent periods. The amount of the waiver for the six-month period ended June 30, 2011 was $25,000. If ONI did not agree to reimburse these expenses, the total expenses incurred by the Money Market Portfolio for the six-month period ended June 30, 2011 would have been higher than the net expenses reflected in the Statements of Operations. |
Under the Investment Advisory Agreement, the Fund authorizes ONI to retain sub-advisers (“the Sub-Advisers”) for the Equity, Omni, International, Capital Appreciation, Millennium, International Small-Mid Company, Aggressive Growth, Small Cap Growth, Mid Cap Opportunity, Strategic Value, High Income Bond, Capital Growth, Bristol, Bryton Growth, U.S. Equity, Balanced, Income Opportunity, Target VIP, Target Equity/Income, and Bristol Growth Portfolios subject to the approval of the Board. ONI has entered into sub-advisory agreements with Legg Mason Capital Management, Inc. (“Legg Mason”), Suffolk Capital Management, LLC (“Suffolk”), Federated Global Investment Management Corp. (“Federated Global”), Jennison Associates LLC (“Jennison”), Neuberger Berman Management LLC (“Neuberger Berman”), Janus Capital Management LLC (“Janus”), Goldman Sachs Asset Management, L.P. (“Goldman Sachs”), Federated Equity Management Company of Pennsylvania (“Federated Equity”), Federated Investment Management Company (“Federated Investment”), Eagle Asset Management, Inc. (“Eagle”), ICON Advisers, Inc. (“ICON”), and First Trust Advisors L.P. (“First Trust”), to manage the investment of those Portfolios’ assets, subject to the supervision of ONI. As compensation for their services, the Sub-advisers receive from ONI a sub-advisory fee calculated on the basis of each of the aforementioned Portfolio’s average daily net assets and the following current Board-approved schedule of annualized fee breakpoints.
Equity (Legg Mason) |
| 0.40% of first $200 million |
| 0.38% over $200 million |
International (Federated Global) |
| 0.40% of first $200 million |
| 0.35% over $200 million |
Capital Appreciation (Jennison) |
| 0.75% of first $10 million |
| 0.50% of next $30 million |
| 0.35% of next $25 million |
| 0.25% of next $335 million |
| 0.22% of next $600 million |
| 0.20% over $1 billion |
Aggressive Growth (Janus) |
| 0.55% of first $100 million |
| 0.50% of next $400 million |
| 0.45% over $500 million |
Mid Cap Opportunity (GSAM) |
| 0.60% of first $100 million |
| 0.55% of next $100 million |
| 0.50% over $200 million |
Omni (Suffolk) |
| 0.30% of first $100 million |
| 0.25% of next $150 million |
| 0.225% of next $250 million |
| 0.20% of next $500 million |
| 0.15% of next $1 billion |
| 0.125% over $2 billion |
Millennium (Neuberger Berman) |
| 0.55% of first $150 million |
| 0.50% of next $150 million |
| 0.40% over $300 million |
International Small-Mid Company (Federated Global) |
| 0.75% of first $100 million |
| 0.65% over $100 million |
Small Cap Growth (Janus) |
| 0.60% of next $150 million |
| 0.50% over $150 million |
Strategic Value (Federated Equity) |
| 0.50% of first $35 million |
| 0.35% of next $65 million |
| 0.25% over $100 million |
| 141 | (continued) |
| Ohio National Fund, Inc. |
Notes to Financial Statements (Continued) | June 30, 2011 (Unaudited) |
High Income Bond (Federated Investment) |
| 0.50% of first $30 million |
| 0.40% of next $20 million |
| 0.30% of next $25 million |
| 0.25% over $75 million |
Bristol (Suffolk) |
| 0.45% of first $100 million |
| 0.40% of next $400 million |
| 0.35% over $500 million |
U.S. Equity (ICON) |
| 0.50% of first $200 million |
| 0.45% of next $300 million |
| 0.40% over $500 million |
Income Opportunity (ICON) |
| 0.55% of first $200 million |
| 0.50% of next $300 million |
| 0.45% over $500 million |
Bristol Growth (Suffolk) |
| 0.45% of first $100 million |
| 0.40% of next $400 million |
| 0.35% over $500 million |
Capital Growth (Eagle) |
| 0.59% of first $100 million |
| 0.55% of next $100 million |
| 0.50% over $200 million |
Bryton Growth (Suffolk) |
| 0.50% of first $100 million |
| 0.45% of next $400 million |
| 0.40% over $500 million |
Balanced (ICON) |
| 0.40% of first $200 million |
| 0.35% of next $300 million |
| 0.30% over $500 million |
Target VIP and Target Equity/Income (First Trust) |
| 0.35% of first $500 million |
| 0.25% over $500 million |
Suffolk, the sub-adviser for the Omni, Bristol, Bryton Growth, and Bristol Growth Portfolios has an affiliation with ONI. Ohio National Financial Services, Inc. (ONFS) owns 100% of ONLIC, the parent company of ONI, and also owns 83% of the voting securities of Suffolk. There were no Fund liabilities payable to Suffolk at June 30, 2011 and fees paid to Suffolk are an expense of ONI, not of the Fund.
Pursuant to a service agreement among ONI, ONLIC and the Fund, ONLIC has agreed to provide personnel and facilities to ONI on a cost-reimbursement basis. These personnel members include officers of the Fund. ONLIC also provides clerical and administrative services and such supplies and equipment as may be reasonably required in order for ONI to properly perform its advisory function pursuant to the Investment Advisory Agreement. ONLIC further performs duties to fulfill the transfer agent function on behalf of the Fund. Performance of these duties by ONLIC and availability of facilities, personnel, supplies, and equipment does not represent an expense to the Fund in excess of the advisory fees paid to ONI.
Pursuant to the Investment Advisory Agreement, if the total expenses applicable to any Portfolio during any calendar quarter (excluding taxes, brokerage commissions, interest expense and management fees) exceed 1%, on an annualized basis, evaluated quarterly, of such Portfolio’s average daily net asset value, ONI will reimburse the Portfolio for such excess expenses. There were no expense reimbursements during the six-month period ended June 30, 2011.
During the six-month period ended June 30, 2011, ONI voluntarily reimbursed the amount of daily gross expenses of the Money Market Portfolio in excess of daily income earned by the Portfolio. The amount reimbursed to the Portfolio for the six-month period ended June 30, 2011 was $261,196, of which $46,448 was receivable from ONI at June 30, 2011. This reimbursement is also not subject to recoupment in subsequent periods.
The Investment Advisory Agreement allows for a portion of the expenses related to the Fund’s Chief Compliance Officer and staff to be incurred by the Fund and paid from the Fund to the Fund’s adviser, ONI. Pursuant to the service agreement among ONI, ONLIC, and the Fund, ONLIC has provided the personnel, services, and equipment necessary to perform the Fund’s regulation-mandated compliance function and ONI has reimbursed ONLIC for such costs. For the six-month period ended June 30, 2011, the Fund incurred compliance expenses totaling $76,008, which was equally allocated to the Portfolios. Expenses incurred by the Portfolios are reflected on the Statements of Operations as “Compliance expense”.
Each director of the Board is currently paid a quarterly retainer fee of $8,000, $3,000 for each Board meeting attended, $1,000 for each Audit Committee meeting attended, and $500 for each other Board committee or independent directors meetings attended. The Board chair receives an additional quarterly retainer fee of $3,750, the lead independent director of the Board receives an additional quarterly retainer fee of $3,125, and the Audit Committee chair receives an additional quarterly retainer fee of $1,250. For the six-month period ended June 30, 2011, compensation of these directors by the Fund totaled $117,750.
| 142 | (continued) |
| Ohio National Fund, Inc. |
Notes to Financial Statements (Continued) | June 30, 2011 (Unaudited) |
U.S. Bancorp Fund Services, LLC, 615 East Michigan Street, Milwaukee, Wisconsin, serves as the accounting agent for all but the International and International Small-Mid Company Portfolios. U.S. Bank Institutional Trust & Custody, 425 Walnut Street, Cincinnati, Ohio serves as the custodian for all but the International and International Small-Mid Company Portfolios. The accounting agent and custodian for the International and International Small-Mid Company Portfolios is State Street Bank-Kansas City, 801 Pennsylvania Ave., Kansas City, Missouri. For assets held outside the United States, U.S. Bank and State Street Bank-Kansas City enter into sub-custodial agreements, subject to approval by the Board.
| (4) | Capital Share Transactions |
Capital share transactions for the six-month period ended June 30, 2011 and the year ended December 31, 2010 were as follows:
| Equity | Money Market | Bond | ||||||||||||||||||||||
| Six-Month Period Ended 6/30/2011 (Unaudited) | Year Ended 12/31/2010 | Six-Month Period Ended 6/30/2011 (Unaudited) | Year Ended 12/31/2010 | Six-Month Period Ended 6/30/2011 (Unaudited) | Year Ended 12/31/2010 | |||||||||||||||||||
Capital shares issued on sales | 574,075 | 1,223,514 | 15,417,722 | 30,502,612 | 1,522,320 | 4,431,294 | ||||||||||||||||||
Capital shares issued on reinvested dividends | — | 21,933 | — | — | — | — | ||||||||||||||||||
Capital shares redeemed | (1,112,229 | ) | (2,490,299 | ) | (15,978,498 | ) | (35,282,239 | ) | (1,515,416 | ) | (4,470,717 | ) | ||||||||||||
|
|
|
|
|
|
|
|
|
|
|
| |||||||||||||
Net increase/(decrease) | (538,154 | ) | (1,244,852 | ) | (560,776 | ) | (4,779,627 | ) | 6,904 | (39,423 | ) | |||||||||||||
|
|
|
|
|
|
|
|
|
|
|
| |||||||||||||
| Omni | International | Capital Appreciation | ||||||||||||||||||||||
| Six-Month Period Ended 6/30/2011 (Unaudited) | Year Ended 12/31/2010 | Six-Month Period Ended 6/30/2011 (Unaudited) | Year Ended 12/31/2010 | Six-Month Period Ended 6/30/2011 (Unaudited) | Year Ended 12/31/2010 | |||||||||||||||||||
Capital shares issued on sales | 94,784 | 250,970 | 523,256 | 2,373,065 | 292,165 | 707,427 | ||||||||||||||||||
Capital shares issued on reinvested dividends | — | 38,339 | — | — | — | 14,274 | ||||||||||||||||||
Capital shares redeemed | (273,870 | ) | (607,491 | ) | (1,708,568 | ) | (5,011,586 | ) | (627,681 | ) | (1,582,714 | ) | ||||||||||||
|
|
|
|
|
|
|
|
|
|
|
| |||||||||||||
Net increase/(decrease) | (179,086 | ) | (318,182 | ) | (1,185,312 | ) | (2,638,521 | ) | (335,516 | ) | (861,013 | ) | ||||||||||||
|
|
|
|
|
|
|
|
|
|
|
| |||||||||||||
| Millennium | International Small-Mid Company | Aggressive Growth | ||||||||||||||||||||||
| Six-Month Period Ended 6/30/2011 (Unaudited) | Year Ended 12/31/2010 | Six-Month Period Ended 6/30/2011 (Unaudited) | Year Ended 12/31/2010 | Six-Month Period Ended 6/30/2011 (Unaudited) | Year Ended 12/31/2010 | |||||||||||||||||||
Capital shares issued on sales | 152,700 | 1,118,283 | 242,872 | 610,069 | 427,425 | 1,232,038 | ||||||||||||||||||
Capital shares issued on reinvested dividends | — | — | — | — | — | — | ||||||||||||||||||
Capital shares redeemed | (257,460 | ) | (5,500,575 | ) | (451,349 | ) | (888,134 | ) | (658,831 | ) | (1,244,007 | ) | ||||||||||||
|
|
|
|
|
|
|
|
|
|
|
| |||||||||||||
Net increase/(decrease) | (104,760 | ) | (4,382,292 | ) | (208,477 | ) | (278,065 | ) | (231,406 | ) | (11,969 | ) | ||||||||||||
|
|
|
|
|
|
|
|
|
|
|
| |||||||||||||
| Small Cap Growth | Mid Cap Opportunity | S&P 500® Index | ||||||||||||||||||||||
| Six-Month Period Ended 6/30/2011 (Unaudited) | Year Ended 12/31/2010 | Six-Month Period Ended 6/30/2011 (Unaudited) | Year Ended 12/31/2010 | Six-Month Period Ended 6/30/2011 (Unaudited) | Year Ended 12/31/2010 | |||||||||||||||||||
Capital shares issued on sales | 392,392 | 964,480 | 258,332 | �� | 574,210 | 1,406,694 | 2,719,718 | |||||||||||||||||
Capital shares issued on reinvested dividends | — | — | — | — | — | 169,365 | ||||||||||||||||||
Capital shares redeemed | (418,257 | ) | (769,998 | ) | (459,586 | ) | (878,425 | ) | (1,650,803 | ) | (3,306,639 | ) | ||||||||||||
|
|
|
|
|
|
|
|
|
|
|
| |||||||||||||
Net increase/(decrease) | (25,865 | ) | 194,482 | (201,254 | ) | (304,215 | ) | (244,109 | ) | (417,556 | ) | |||||||||||||
|
|
|
|
|
|
|
|
|
|
|
| |||||||||||||
| 143 | (continued) |
| Ohio National Fund, Inc. |
Notes to Financial Statements (Continued) | June 30, 2011 (Unaudited) |
| Strategic Value | High Income Bond | Capital Growth | ||||||||||||||||||||||
| Six-Month Period Ended 6/30/2011 (Unaudited) | Year Ended 12/31/2010 | Six-Month Period Ended 6/30/2011 (Unaudited) | Year Ended 12/31/2010 | Six-Month Period Ended 6/30/2011 (Unaudited) | Year Ended 12/31/2010 | |||||||||||||||||||
Capital shares issued on sales | 661,094 | 1,068,567 | 3,719,384 | 13,405,135 | 417,744 | 597,843 | ||||||||||||||||||
Capital shares issued on reinvested dividends | — | 82,744 | — | — | — | — | ||||||||||||||||||
Capital shares redeemed | (424,142 | ) | (838,057 | ) | (2,957,782 | ) | (6,312,809 | ) | (331,832 | ) | (517,165 | ) | ||||||||||||
|
|
|
|
|
|
|
|
|
|
|
| |||||||||||||
Net increase/(decrease) | 236,952 | 313,254 | 761,602 | 7,092,326 | 85,912 | 80,678 | ||||||||||||||||||
|
|
|
|
|
|
|
|
|
|
|
| |||||||||||||
| Nasdaq-100® Index | Bristol | Bryton Growth | ||||||||||||||||||||||
| Six-Month Period Ended 6/30/2011 (Unaudited) | Year Ended 12/31/2010 | Six-Month Period Ended 6/30/2011 (Unaudited) | Year Ended 12/31/2010 | Six-Month Period Ended 6/30/2011 (Unaudited) | Year Ended 12/31/2010 | |||||||||||||||||||
Capital shares issued on sales | 1,422,688 | 3,638,876 | 1,726,631 | 4,647,343 | 1,594,408 | 3,395,424 | ||||||||||||||||||
Capital shares issued on reinvested dividends | — | 27,981 | — | 80,969 | — | — | ||||||||||||||||||
Capital shares redeemed | (1,960,608 | ) | (3,966,054 | ) | (1,215,298 | ) | (2,975,049 | ) | (847,443 | ) | (3,633,074 | ) | ||||||||||||
|
|
|
|
|
|
|
|
|
|
|
| |||||||||||||
Net increase/(decrease) | (537,920 | ) | (299,197 | ) | 511,333 | 1,753,263 | 746,965 | (237,650 | ) | |||||||||||||||
|
|
|
|
|
|
|
|
|
|
|
| |||||||||||||
| U.S. Equity | Balanced | Income Opportunity | ||||||||||||||||||||||
| Six-Month Period Ended 6/30/2011 (Unaudited) | Year Ended 12/31/2010 | Six-Month Period Ended 6/30/2011 (Unaudited) | Year Ended 12/31/2010 | Six-Month Period Ended 6/30/2011 (Unaudited) | Year Ended 12/31/2010 | |||||||||||||||||||
Capital shares issued on sales | 109,954 | 202,103 | 331,076 | 255,879 | 150,351 | 339,658 | ||||||||||||||||||
Capital shares issued on reinvested dividends | — | 9,859 | — | 20,743 | — | — | ||||||||||||||||||
Capital shares redeemed | (188,324 | ) | (390,570 | ) | (146,236 | ) | (266,039 | ) | (79,540 | ) | (132,957 | ) | ||||||||||||
|
|
|
|
|
|
|
|
|
|
|
| |||||||||||||
Net increase/(decrease) | (78,370 | ) | (178,608 | ) | 184,840 | 10,583 | 70,811 | 206,701 | ||||||||||||||||
|
|
|
|
|
|
|
|
|
|
|
| |||||||||||||
| Target VIP | Target Equity/Income | Bristol Growth | ||||||||||||||||||||||
| Six-Month Period Ended 6/30/2011 (Unaudited) | Year Ended 12/31/2010 | Six-Month Period Ended 6/30/2011 (Unaudited) | Year Ended 12/31/2010 | Six-Month Period Ended 6/30/2011 (Unaudited) | Year Ended 12/31/2010 | |||||||||||||||||||
Capital shares issued on sales | 312,268 | 397,747 | 312,828 | 830,343 | 1,452,892 | 9,076,046 | ||||||||||||||||||
Capital shares issued on reinvested dividends | — | 29,483 | — | 36,027 | — | 26,660 | ||||||||||||||||||
Capital shares redeemed | (317,645 | ) | (693,534 | ) | (439,668 | ) | (981,024 | ) | (810,312 | ) | (1,633,468 | ) | ||||||||||||
|
|
|
|
|
|
|
|
|
|
|
| |||||||||||||
Net increase/(decrease) | (5,377 | ) | (266,304 | ) | (126,840 | ) | (114,654 | ) | 642,580 | 7,469,238 | ||||||||||||||
|
|
|
|
|
|
|
|
|
|
|
| |||||||||||||
| (5) | Investment Transactions |
Cost of purchases and proceeds from sales of investments (excluding short-term and government securities) for the six-month period ended June 30, 2011 were as follows:
| Equity | Bond | Omni | International | Capital Appreciation | Millennium | |||||||||||||||||||
Cost of purchases | $ | 56,382,872 | $ | 13,674,060 | $ | 31,530,115 | $ | 49,255,704 | $ | 43,686,281 | $ | 37,196,333 | ||||||||||||
Proceeds from sales | $ | 65,982,181 | $ | 9,374,680 | $ | 34,103,541 | $ | 63,034,339 | $ | 48,612,561 | $ | 38,984,493 | ||||||||||||
| International Small-Mid Company | Aggressive Growth | Small Cap Growth | Mid Cap Opportunity | S&P 500® Index | Strategic Value | |||||||||||||||||||
Cost of purchases | $ | 19,628,923 | $ | 9,895,303 | $ | 10,967,899 | $ | 16,586,749 | $ | 7,331,515 | $ | 7,102,758 | ||||||||||||
Proceeds from sales | $ | 28,482,405 | $ | 10,564,909 | $ | 10,687,335 | $ | 18,509,595 | $ | 9,106,916 | $ | 4,060,210 | ||||||||||||
| 144 | (continued) |
| Ohio National Fund, Inc. |
Notes to Financial Statements (Continued) | June 30, 2011 (Unaudited) |
| High Income Bond | Capital Growth | Nasdaq-100® Index | Bristol | Bryton Growth | U.S. Equity | |||||||||||||||||||
Cost of purchases | $ | 63,351,314 | $ | 12,662,783 | $ | 15,070,596 | $ | 203,836,548 | $ | 115,465,765 | $ | 5,780,963 | ||||||||||||
Proceeds from sales | $ | 46,107,419 | $ | 10,802,410 | $ | 18,576,467 | $ | 199,130,621 | $ | 110,248,551 | $ | 5,424,431 | ||||||||||||
| Balanced | Income Opportunity | Target VIP | Target Equity/Income | Bristol Growth | ||||||||||||||||||||
Cost of purchases | $ | 6,899,398 | $ | 5,837,299 | $ | 16,975,267 | $ | 23,109,072 | $ | 95,922,617 | ||||||||||||||
Proceeds from sales | $ | 3,028,675 | $ | 5,256,259 | $ | 16,867,217 | $ | 23,749,660 | $ | 90,431,820 | ||||||||||||||
Cost of purchases and proceeds from sales of government securities for the six-month period ended June 30, 2011 were as follows:
| Bond | Omni | Balanced | ||||||||||
Cost of purchases | $ | 9,297,031 | $ | 153,750 | $ | — | ||||||
Proceeds from sales | $ | 7,202,188 | $ | — | $ | 1,059,629 | ||||||
| (6) | Financial Instruments |
The Fund’s Portfolios may trade in financial instruments with off-balance sheet risk for hedging purposes or, otherwise, in accordance with stated investing objectives. These financial instruments may include options, futures, and foreign currency contracts that may involve, to a varying degree, elements of risk in excess of the amounts recognized on financial statements.
Options
Each Portfolio, other than the Money Market Portfolio, for hedging purposes, may (a) write call options traded on a registered national securities exchange if such Portfolio owns the underlying securities subject to such options, and purchase call options for the purpose of closing out positions it has written, (b) purchase put options on securities owned, and sell such options in order to close its positions in put options, (c) purchase and sell financial futures and options thereon, and (d) purchase and sell financial index options; provided, however, that no option or futures contract shall be purchased or sold if, as a result, more than one-third of the total assets of the Portfolio would be hedged by options or futures contracts, and no more than 5% of any Portfolio’s total assets, at fair value, may be used for premiums on open options and initial margin deposits on futures contracts. The Small Cap Growth Portfolio may also participate in the above activities to protect against adverse changes in security prices or interest rates and may, for these purposes or hedging purposes, sell put options or purchase call options at any time. The S&P 500® Index and Income Opportunity Portfolios are not subject to the above limitations, as these Portfolios may engage in the purchase or selling of put or call options in accordance with those Portfolios’ stated investment objectives. The Portfolios making use of options bear the market risk of an unfavorable change in the price of securities or indices underlying the options and, for purchase options, are subject to the risk that the options will expire before being exercised. A further risk associated with investing in options is that there may not be enough buyers and sellers in the market to permit a Portfolio to close a position. To limit the risk, a Portfolio will invest only where there is an established market.
When a Portfolio writes a put or call option, an amount equal to the premium received is included on the Statement of Assets and Liabilities as a liability. The amount of the liability is subsequently marked-to-market to reflect the current market value of the option. Such liability is subject to off balance sheet risks to the extent of any future increases in market value of the written options. If an option expires on its stipulated expiration date or if the Portfolio enters into a closing purchase transaction, a gain or loss is realized. If a written call option on an individual security is exercised, a gain or loss is realized for the sale of the underlying security, and the proceeds from the sale are increased by the premium originally received. If a written call option on a securities index is exercised, a gain or loss is realized as determined by the premium originally received, the exercise price and the market value of the index. If a written put option on an individual security is exercised, the cost of the security acquired is decreased by the premium originally received. When a Portfolio purchases a put or call option, an amount equal to the premium paid is included on the Portfolio’s Statement of Assets and Liabilities as an investment, and is subsequently marked-to-market to reflect the current market value of the option. If an option expires on the stipulated expiration date or if the Portfolio enters into a closing sale transaction, a gain or loss is realized. If a Portfolio exercises a call option on an individual security, the cost of the security acquired is increased by the premium paid for the call. If the Portfolio exercises a put option on an individual security, a gain or loss is realized from the sale of the underlying security, and the proceeds from such a sale are decreased by the premium originally paid. If the Portfolio exercises a put option on a security index, a gain or loss is realized as determined by the premium originally paid, the exercise price and the market value of the index.
| 145 | (continued) |
| Ohio National Fund, Inc. |
Notes to Financial Statements (Continued) | June 30, 2011 (Unaudited) |
The Income Opportunity Portfolio’s written options are collateralized by cash and/or securities held with the Portfolio’s prime broker and in a segregated account at the Portfolio’s custodian. Such collateral for the Portfolio is restricted from use. The cash collateral or borrowings from the prime broker, if necessary, are included on the Statement of Assets and Liabilities. The securities pledged as collateral are noted as such on the Portfolio’s Schedule of Investments. Written and purchased options are non-income producing securities.
The activity in the number of option contracts written and the premiums received by the Income Opportunity Portfolio for the six-month period ended June 30, 2011 were as follows:
| Number of Contracts | Premiums Received | |||||||
Options outstanding, beginning of year | 64 | $ | 190,784 | |||||
Options written | 511 | 1,162,865 | ||||||
Options exercised | — | — | ||||||
Options expired | — | — | ||||||
Options closed | (521 | ) | (1,221,572 | ) | ||||
|
|
|
| |||||
Options outstanding, end of year | 54 | $ | 132,077 | |||||
|
|
|
| |||||
Transactions involving purchased options by the Income Opportunity Portfolio for the six-month period ended June 30, 2011 were: Purchases: $403,824, Sales: $217,813, Expirations: $81,500.
Futures Contracts
Each Portfolio, other than the Money Market Portfolio may, primarily for hedging purposes, purchase and sell futures contracts. Futures contracts are used for the purpose of hedging existing Portfolio securities, or securities that the Portfolio intends to purchase, against fluctuations in value caused by variations in market rates. Upon entering into a futures contract, a Portfolio is required to pledge to the broker an amount of cash or securities equal to a percentage of the contract amount, known as the initial margin deposit. Subsequent payments, known as “variation margin”, are made or received by the Portfolios each day, depending on the daily fluctuations in the value of the underlying contacts. The Portfolios recognize unrealized appreciation (depreciation) equal to the cumulative daily variation margin transactions. When the contracts are closed, a Portfolio records a realized gain or loss equal to the difference between the value of the contracts at the time they were opened and the value at the time they were closed.
Should market conditions move unexpectedly, the Portfolios may not achieve the anticipated benefits of the futures contracts and may realize a loss. The use of futures transactions involves the risk of imperfect correlation in movements in the price of futures contracts interest rates, and the underlying hedged assets. A further risk associated with investing in futures contracts is that there may not be enough buyers and sellers in the market to permit a Portfolio to close a position when it wants to do so. To limit the risk, a Portfolio will invest only where there is an established market. The S&P 500® Index Portfolio may purchase or sell stock index futures contracts and the Nasdaq-100® Index Portfolio may purchase or sell derivative securities designed to replicate the Nasdaq-100® Index in accordance with their stated investment objectives.
At June 30, 2011, there was one outstanding futures contract in the International Portfolio. Details of this contract were as follows:
Type | Description | Expiration | Number of Contracts | Counterparty | Contract at Value | Initial Contract Amount | Unrealized Appreciation (Depreciation) | Variation Margin Receivable (Payable) | ||||||||||||||||
Long | DAX Index Futures | September 16, 2011 | 2 | JP Morgan | $ | 535,939 | $ | 522,822 | $ | 13,117 | $ | 5,043 | ||||||||||||
The International Portfolio’s holding of U.S. Treasury Bill #9127953D1 was pledged at June 30, 2011 as collateral for this contract. The cost and value of this instrument at June 30, 2011 were $199,992 and $199,999, respectively.
This futures contract was executed for the purpose of increasing exposure to an attractive equities market, beyond that evidenced by the Portfolio’s investment in common stocks, while maintaining a significant cash balance in the Portfolio in anticipation of potentially higher-than-average quarter-end, shareholder rebalancing transactions. There were other index futures contracts that were executed and closed in the International Portfolio during the six-month period ended June 30, 2011.
| 146 | (continued) |
| Ohio National Fund, Inc. |
Notes to Financial Statements (Continued) | June 30, 2011 (Unaudited) |
These were executed for the same purpose as those futures contracts outstanding at June 30, 2011. For the six-month period ended June 30, 2011, the notional value of futures contracts opened and closed prior to contract settlement date by the International Portfolio was approximately $4.2 million and $6.9 million, respectively.
Foreign Currency Contracts
In order to hedge against changes in the exchange rates of foreign currencies in relation to the U.S. dollar, each Portfolio, other than the Money Market Portfolio, may engage in forward foreign currency contracts. A forward foreign currency contract involves an obligation to purchase or sell a foreign currency at a future date, at a negotiated rate. The value of a foreign currency contract will typically fluctuate with changes in forward currency exchange rates. All commitments are marked to market daily at the applicable exchange rates and any resulting unrealized appreciation or depreciation is recorded. With respect to sales of currency exchange contracts, a Portfolio would incur a realized loss if the value of the contract increases between the date the forward contract is opened and the date the forward contract is closed. A Portfolio incurs a realized gain if the value of the contract decreases between those dates. With respect to purchases of currency exchange contracts, a Portfolio would incur a realized loss if the value of the contract decreases between the date the forward contract is opened and the date the forward contract is closed.
The use of foreign currency contracts might not successfully protect a Portfolio against a loss resulting from the movements of foreign currency in relation to the U.S. dollar and does not eliminate fluctuations in the prices of other currencies or securities. A Portfolio is also exposed to credit risk associated with counterparty nonperformance on these currency exchange contracts, which is typically limited to the unrealized gain on each open contract.
Details of the contracts outstanding at June 30, 2011 are as follows:
Contracts to buy foreign currency:
International | ||||||||||||||||
Date of contract | Exchange date | Counterparty | Currency to receive | Currency to | Contract at value | Unrealized appreciation (depreciation) | ||||||||||
April 19, 2011 | July 21, 2011 | HSBC | 7,900,000 GBP | $12,878,344 | $ | 12,676,625 | $ | (201,719 | ) | |||||||
June 9, 2011 | July 21, 2011 | MSCS | 4,900,000 GBP | $ 8,017,458 | $ | 7,862,717 | $ | (154,741 | ) | |||||||
April 19, 2011 | July 21, 2011 | HSBC | 5,300,000 NZD | $ 4,153,080 | $ | 4,386,311 | $ | 233,231 | ||||||||
June 9, 2011 | July 21, 2011 | MSCS | 1,687,232 NZD | $ 1,389,013 | $ | 1,396,363 | $ | 7,350 | ||||||||
June 10, 2011 | July 21, 2011 | MSCS | 3,169,000 NZD | $ 2,615,534 | $ | 2,622,683 | $ | 7,149 | ||||||||
April 19, 2011 | July 21, 2011 | MSCS | 31,191,810 SEK | $ 4,990,051 | $ | 4,926,809 | $ | (63,242 | ) | |||||||
|
|
|
|
| ||||||||||||
| $34,043,480 | $ | 33,871,508 | $ | (171,972 | ) | |||||||||||
|
|
|
|
| ||||||||||||
Contracts to sell foreign currency:
International | ||||||||||||||||
Date of contract | Exchange date | Counterparty | Currency to receive | Currency to deliver | Contract at value | Unrealized appreciation (depreciation) | ||||||||||
April 19, 2011 | July 21, 2011 | BONY | $ 11,441,419 | 7,996,295 EUR | $ | 11,590,664 | $ | (149,245 | ) | |||||||
June 1, 2011 | September 2, 2011 | HSBC | $ 17,311,735 | 1,400,000,000 JPY | $ | 17,395,588 | $ | (83,853 | ) | |||||||
|
|
|
|
| ||||||||||||
$ 28,753,154 | $ | 28,986,252 | $ | (233,098 | ) | |||||||||||
|
|
|
|
| ||||||||||||
Counterparties | Currencies | |
BONY – Bank of New York Mellon | EUR – Euro | |
HSBC – HSBC Bank USA | GBP – British Pound | |
MSCS – Morgan Stanley Capital Services | JPY – Japanese Yen | |
NZD – New Zealand Dollar | ||
SEK – Swedish Krona |
| 147 | (continued) |
| Ohio National Fund, Inc. |
Notes to Financial Statements (Continued) | June 30, 2011 (Unaudited) |
Foreign currency contracts were executed in the International Portfolio primarily to mitigate the effect that exchange rate volatility had on the valuation of certain groupings of the Portfolio’s investments that were either under-weighted or over-weighted in relation to the Portfolio’s benchmark index. The Portfolio was under-weighted in equity investments within the countries of Great Britain, New Zealand, and Sweden. The Portfolio executed contracts to buy those countries’ currencies to mitigate the effects that volatility in those currencies’ exchange rates might otherwise have on the Portfolio’s performance relative to the benchmark. The Portfolio was over-weighted in investments denominated in Euros and, likewise, executed contracts to sell that currency in order to mitigate the effect that volatility in the exchange rate might otherwise have on relative performance. Although the Portfolio’s holding of common stocks denominated in Japanese Yen was approximately equal in weighting to Japanese Yen - denominated stocks included in the benchmark index, a contract to sell Japanese Yen was executed for the purpose of lowering the overall exposure and volatility of the second largest country allocation of the Portfolio.
The Portfolio entered into other foreign currency contracts during the year for similar benchmark performance hedging purposes. The Portfolio also entered into contracts that were the inverse of previously executed contracts to effectively exit prior contracts earlier than stated contract delivery dates, as over-weights or under-weights were reduced, or as previously executed contracts resulted in an attractive return to the Portfolio. For the six-month period ended June 30, 2011, the notional value of other foreign currency contracts that were both opened and closed by the International Portfolio was approximately $71.8 million for currencies bought and approximately $54.1 million for currencies sold.
For the six-month period ended June 30, 2011, the notional value of foreign currency contracts that were closed by the Strategic Value Portfolio was approximately $2.9 million for currencies bought and approximately $2.9 million for currencies sold. There were no new contracts executed in the Strategic Value Portfolio during the six-month period ended June 30, 2011.
The values and financial statement effects of derivative instruments that were not accounted for as hedging instruments as of, and for the six-month period ended, June 30, 2011 were as follows:
Portfolio | Instrument | Primary Risk Type | Value - Asset Derivatives | Value - Liability Derivatives | Location on Statements of Assets and Liabilities | |||||||||||
International | Contracts to buy foreign currencies | Currency exchange rate | $ | 33,871,508 | $ | (34,043,480 | ) | (1 | ) | |||||||
|
|
|
| |||||||||||||
Contracts to sell foreign currencies | Currency exchange rate | $ | 28,753,154 | $ | (28,986,252 | ) | (1 | ) | ||||||||
|
|
|
| |||||||||||||
Futures contracts | Equity price | $ | 535,939 | $ | (522,822 | ) | (2 | ) | ||||||||
|
|
|
| |||||||||||||
Income Opportunity | Purchased options | Equity price | $ | 16,000 | $ | — | (3 | ) | ||||||||
|
|
|
| |||||||||||||
Written options | Equity price | $ | — | $ | (231,468 | ) | (4 | ) | ||||||||
|
|
|
| |||||||||||||
| (1) | Net unrealized appreciation on foreign currency contacts |
| (2) | Net unrealized appreciation on futures contracts |
| (3) | Investments in securities, at value |
| (4) | Options written, at value |
| 148 | (continued) |
| Ohio National Fund, Inc. |
Notes to Financial Statements (Continued) | June 30, 2011 (Unaudited) |
Portfolio | Instrument | Risk Type | Realized Gain (Loss) on Derivatives Recognized in Income | Change in Unrealized Appreciation/ Depreciation on Derivatives Recognized in Income | Location on Statements of Operations | |||||||||||
International | Foeign currency contracts | Currency exchange rate | $ | (974,653 | ) | $ | (131,576) | (1 | ),(2) | |||||||
|
|
|
| |||||||||||||
Futures contracts | Equity price | $ | (23,404 | ) | $ | 36,727 | (3 | ),(4) | ||||||||
|
|
|
| |||||||||||||
Strategic Value | Foeign currency contracts | Currency exchange rate | $ | 57,516 | $ | (57,516) | (1 | ),(2) | ||||||||
|
|
|
| |||||||||||||
Income Opportunity | Purchased options | Equity price | $ | (162,376 | ) | $ | (12,585) | (5 | ),(6) | |||||||
|
|
|
| |||||||||||||
Written options | Equity price | $ | (73,995 | ) | $ | 5,105 | (7 | ),(8) | ||||||||
|
|
|
| |||||||||||||
| (1) | Net realized gain (loss) on foreign currency contracts |
| (2) | Change in unrealized appreciation/depreciation on foreign currency contracts |
| (3) | Net realized gain (loss) on futures contracts |
| (4) | Change in unrealized appreciation/depreciation on futures contracts |
| (5) | Net realized gain (loss) on investments |
| (6) | Change in unrealized appreciation/depreciation on investments |
| (7) | Net realized gain (loss) on written options |
| (8) | Change in unrealized appreciation/depreciation on written options |
| (7) | Federal Income Tax Information |
At December 31, 2010, the components of accumulated earnings (deficit) on a tax basis were as follows:
Portfolio | Undistributed Ordinary Income | Undistributed Long-Term Capital Gains (Losses) | Accumulated Earnings | Accumulated Capital and Other Losses | Unrealized Appreciation (Depreciation)(1) | Total Accumulated Earnings (Deficit) | ||||||||||||||||||
Equity | $ | 24,360 | $ | — | $ | 24,360 | $ | (119,187,916 | ) | $ | 17,876,790 | $ | (101,286,766 | ) | ||||||||||
Money Market | — | — | — | — | — | — | ||||||||||||||||||
Bond | 5,839,374 | — | 5,839,374 | (15,350,662 | ) | 7,362,958 | (2,148,330 | ) | ||||||||||||||||
Omni | 85,853 | — | 85,853 | (7,698,101 | ) | 3,847,574 | (3,764,674 | ) | ||||||||||||||||
International | 4,698,567 | — | 4,698,567 | (107,096,789 | ) | 53,623,917 | (48,774,305 | ) | ||||||||||||||||
Capital Appreciation | 75,833 | — | 75,833 | (29,715,237 | ) | 16,649,331 | (12,990,073 | ) | ||||||||||||||||
Millennium | — | — | — | (16,633,695 | ) | 7,874,126 | (8,759,569 | ) | ||||||||||||||||
International Small-Mid Company | 227,790 | — | 227,790 | (20,691,770 | ) | 23,839,726 | 3,375,746 | |||||||||||||||||
Aggressive Growth | 46,825 | — | 46,825 | (2,711,455 | ) | 5,172,543 | 2,507,913 | |||||||||||||||||
Small Cap Growth | — | — | — | (3,508,597 | ) | 6,132,864 | 2,624,267 | |||||||||||||||||
Mid Cap Opportunity | — | — | — | (34,494,956 | ) | 9,463,483 | (25,031,473 | ) | ||||||||||||||||
S&P 500® Index | 340,609 | — | 340,609 | (3,372,018 | ) | 23,217,927 | 20,186,518 | |||||||||||||||||
Strategic Value | — | — | — | (8,305,592 | ) | 2,362,877 | (5,942,715 | ) | ||||||||||||||||
High Income Bond | 17,781,200 | — | 17,781,200 | (3,425,604 | ) | 15,904,697 | 30,260,293 | |||||||||||||||||
Capital Growth | — | — | — | (5,413,775 | ) | 15,662,731 | 10,248,956 | |||||||||||||||||
Nasdaq-100® Index | 22,231 | — | 22,231 | (2,253,090 | ) | 13,573,716 | 11,342,857 | |||||||||||||||||
Bristol | 97,687 | — | 97,687 | (10,167,697 | ) | 19,986,054 | 9,916,044 | |||||||||||||||||
Bryton Growth | — | 1,253,733 | 1,253,733 | — | 27,631,083 | 28,884,816 | ||||||||||||||||||
U.S. Equity | 15,401 | — | 15,401 | (7,185,302 | ) | 2,021,087 | (5,148,814 | ) | ||||||||||||||||
Balanced | 49,058 | — | 49,058 | (1,039,973 | ) | 1,198,293 | 207,378 | |||||||||||||||||
Income Opportunity | 70,012 | — | 70,012 | (690,564 | ) | 1,429,032 | 808,480 | |||||||||||||||||
Target VIP | 28,667 | — | 28,667 | (9,508,731 | ) | 3,110,399 | (6,369,665 | ) | ||||||||||||||||
Target Equity/Income | 58,500 | — | 58,500 | (16,426,102 | ) | 3,941,843 | (12,425,759 | ) | ||||||||||||||||
Bristol Growth. | 3,542,876 | 198,047 | 3,740,923 | (54,334 | ) | 10,577,924 | 14,264,513 | |||||||||||||||||
| (1) | The differences between book-basis and tax-basis unrealized appreciation/(depreciation) are attributed primarily to tax deferral of losses on wash sales and the realization for tax purposes of unrealized gains/(losses) on certain instruments. |
| 149 | (continued) |
| Ohio National Fund, Inc. |
Notes to Financial Statements (Continued) | June 30, 2011 (Unaudited) |
Under current tax regulations, capital losses realized after October 31 of a Portfolio’s fiscal year may be deferred and treated as occurring on the first business day of the following fiscal year. The following Portfolios had deferred post-October capital losses, which will be treated as arising on the first business day of the fiscal year ending December 31, 2011:
Portfolio | Post-October Losses | Post-October Currency Losses | ||||||
International | $ | — | $ | 1,865,790 | ||||
Capital Appreciation | — | 686 | ||||||
International Small-Mid Company | — | 17,949 | ||||||
Small Cap Growth | — | 5 | ||||||
S&P 500® Index | 109,340 | — | ||||||
High Income Bond. | 715,253 | — | ||||||
Income Opportunity | 71,954 | — | ||||||
Bristol Growth | 54,334 | — | ||||||
For Federal income tax purposes, the following Portfolios had capital loss carry forwards as of December 31, 2010 that are available to offset future realized gains, if any:
| Total Loss Carryforward | Expiration Amount by Year | |||||||||||||||||||||||||||||||||||
Portfolio | 2011 | 2012 | 2013 | 2014 | 2015 | 2016 | 2017 | 2018 | ||||||||||||||||||||||||||||
Equity | $ | 119,187,916 | $ | — | $ | — | $ | — | $ | — | $ | — | $ | 68,747,789 | $ | 47,422,387 | $ | 3,017,740 | ||||||||||||||||||
Bond | 15,350,662 | — | — | — | 718,762 | — | 5,109,146 | 9,522,754 | — | |||||||||||||||||||||||||||
Omni | 7,698,101 | — | — | — | — | — | 2,402,376 | 5,295,725 | — | |||||||||||||||||||||||||||
International | 105,230,999 | — | — | — | — | — | 39,438,869 | 65,792,130 | — | |||||||||||||||||||||||||||
Capital Appreciation | 29,714,551 | — | — | — | — | — | — | 29,714,551 | — | |||||||||||||||||||||||||||
Millennium | 16,633,695 | 1,610,585 | — | — | — | — | 7,511,040 | 7,512,070 | — | |||||||||||||||||||||||||||
International Small-Mid | ||||||||||||||||||||||||||||||||||||
Company | 20,673,821 | — | — | — | — | — | 9,781,388 | 10,892,433 | — | |||||||||||||||||||||||||||
Aggressive Growth | 2,711,455 | — | — | — | — | — | 694,915 | 2,016,540 | — | |||||||||||||||||||||||||||
Small Cap Growth | 3,508,592 | — | — | — | — | — | 785,300 | 2,723,292 | — | |||||||||||||||||||||||||||
Mid Cap Opportunity | 34,494,956 | — | — | — | — | — | 20,843,496 | 13,651,460 | — | |||||||||||||||||||||||||||
S&P 500® Index | 3,262,678 | — | 134,482 | — | — | — | 1,597,902 | 218,356 | 1,311,938 | |||||||||||||||||||||||||||
Strategic Value | 8,305,592 | 75,015 | — | — | — | — | 5,765,741 | 2,272,799 | 192,037 | |||||||||||||||||||||||||||
High Income Bond | 2,710,351 | 563,087 | — | — | — | — | 508,108 | 974,532 | 664,624 | |||||||||||||||||||||||||||
Capital Growth | 5,413,775 | — | — | — | — | — | — | 5,413,775 | — | |||||||||||||||||||||||||||
Nasdaq-100® Index | 2,253,090 | — | 206,000 | 531,984 | 215,042 | 30,818 | — | 1,269,246 | — | |||||||||||||||||||||||||||
Bristol | 10,167,697 | — | — | — | — | — | 106,106 | 10,061,591 | — | |||||||||||||||||||||||||||
U.S. Equity | 7,185,302 | — | — | — | — | — | 3,178,884 | 4,006,418 | — | |||||||||||||||||||||||||||
Balanced | 1,039,973 | — | — | — | — | — | 498,379 | 541,594 | — | |||||||||||||||||||||||||||
Income Opportunity | 618,610 | — | — | — | — | — | — | 478,170 | 140,440 | |||||||||||||||||||||||||||
Target VIP | 9,508,731 | — | — | — | — | — | — | 9,508,731 | — | |||||||||||||||||||||||||||
Target Equity/Income | 16,426,102 | — | — | — | — | — | — | 16,426,102 | — | |||||||||||||||||||||||||||
The Board does not intend to authorize a distribution of any realized gain for a Portfolio until the capital loss carry over has been offset or expires.
The Regulated Investment Company Modernization Act of 2010 (the “Act”) was enacted on December 22, 2010. The Act makes changes to several tax rules impacting the Fund. In general, the provisions of the Act will be effective for the Fund’s fiscal year ending December 31, 2011. Although the Act provides several benefits, including the unlimited carryover of future capital losses, there may be a greater likelihood that all or a portion of each Portfolio’s pre-enactment capital loss carryovers may expire without being utilized due to the Act’s requirement that post-enactment capital losses be utilized before pre-enactment capital loss carryovers. Relevant information regarding the impact of the Act on the Fund, if any, will be contained within the “Federal Income Tax Information” section of the Notes to Financial Statements for the fiscal year ending December 31, 2011.
| 150 | (continued) |
| Ohio National Fund, Inc. |
Notes to Financial Statements (Continued) | June 30, 2011 (Unaudited) |
The tax characteristics of dividends paid to shareholders for the year ended December 31, 2010, were as follows:
Portfolio | Ordinary Income | Net Long-Term Capital Gains | Return of Capital | Total Distribution Paid | ||||||||||||
Equity | $ | 425,944 | $ | — | $ | — | $ | 425,944 | ||||||||
Omni | 606,516 | — | — | 606,516 | ||||||||||||
Capital Appreciation | 284,477 | — | — | 284,477 | ||||||||||||
S&P 500® Index | 2,196,659 | — | — | 2,196,659 | ||||||||||||
Strategic Value. | 591,141 | — | 175,066 | 766,207 | ||||||||||||
Nasdaq-100® Index | 158,375 | — | — | 158,375 | ||||||||||||
Bristol | 995,109 | — | — | 995,109 | ||||||||||||
U.S. Equity | 99,183 | — | — | 99,183 | ||||||||||||
Balanced | 282,940 | — | — | 282,940 | ||||||||||||
Target VIP | 266,234 | — | — | 266,234 | ||||||||||||
Target Equity/Income | 305,152 | — | — | 305,152 | ||||||||||||
Bristol Growth | 259,134 | — | — | 259,134 | ||||||||||||
The cost basis for federal income tax purposes may differ from the cost basis for financial reporting purposes. The table below details the unrealized appreciation (depreciation) and aggregate cost of securities at June 30, 2011 for federal income tax purposes.
| Equity | Bond | Omni | International | Capital Appreciation | Millennium | |||||||||||||||||||
Gross unrealized: | ||||||||||||||||||||||||
Appreciation | $ | 30,350,265 | $ | 9,367,601 | $ | 3,303,913 | $ | 52,635,059 | $ | 21,065,324 | $ | 8,525,584 | ||||||||||||
Depreciation | (11,377,616 | ) | (331,181 | ) | (878,990 | ) | (4,007,185 | ) | (2,687,012 | ) | (330,762 | ) | ||||||||||||
|
|
|
|
|
|
|
|
|
|
|
| |||||||||||||
Net unrealized: | ||||||||||||||||||||||||
Appreciation | $ | 18,972,649 | $ | 9,036,420 | $ | 2,424,923 | $ | 48,627,874 | $ | 18,378,312 | $ | 8,194,822 | ||||||||||||
|
|
|
|
|
|
|
|
|
|
|
| |||||||||||||
Aggregate cost of securities: | $ | 191,311,259 | $ | 143,359,196 | $ | 37,463,748 | $ | 162,294,550 | $ | 114,684,533 | $ | 37,105,702 | ||||||||||||
|
|
|
|
|
|
|
|
|
|
|
| |||||||||||||
| International Small-Mid Company | Aggressive Growth | Small Cap Growth | Mid Cap Opportunity | S&P 500® Index | Strategic Value | |||||||||||||||||||
Gross unrealized: | ||||||||||||||||||||||||
Appreciation | $ | 22,656,957 | $ | 5,866,428 | $ | 7,386,171 | $ | 11,116,245 | $ | 52,845,244 | $ | 3,445,809 | ||||||||||||
Depreciation | (1,020,813 | ) | (974,381 | ) | (771,364 | ) | (2,253,676 | ) | (21,048,823 | ) | (112,420 | ) | ||||||||||||
|
|
|
|
|
|
|
|
|
|
|
| |||||||||||||
Net unrealized: | ||||||||||||||||||||||||
Appreciation | $ | 21,636,144 | $ | 4,892,047 | $ | 6,614,807 | $ | 8,862,569 | $ | 31,796,421 | $ | 3,333,389 | ||||||||||||
|
|
|
|
|
|
|
|
|
|
|
| |||||||||||||
Aggregate cost of securities: | $ | 57,443,482 | $ | 24,864,479 | $ | 29,093,916 | $ | 60,961,357 | $ | 151,032,038 | $ | 25,393,553 | ||||||||||||
|
|
|
|
|
|
|
|
|
|
|
| |||||||||||||
| High Income Bond | Capital Growth | Nasdaq-100® Index | Bristol | Bryton Growth | U.S. Equity | |||||||||||||||||||
Gross unrealized: | ||||||||||||||||||||||||
Appreciation | $ | 15,750,696 | $ | 20,119,134 | $ | 11,877,572 | $ | 16,069,536 | $ | 19,538,014 | $ | 2,290,926 | ||||||||||||
Depreciation | (2,060,404 | ) | (1,083,645 | ) | (2,820,110 | ) | (5,495,000 | ) | (7,043,369 | ) | (164,932 | ) | ||||||||||||
|
|
|
|
|
|
|
|
|
|
|
| |||||||||||||
Net unrealized: | ||||||||||||||||||||||||
Appreciation | $ | 13,690,292 | $ | 19,035,489 | $ | 9,057,462 | $ | 10,574,536 | $ | 12,494,645 | $ | 2,125,994 | ||||||||||||
|
|
|
|
|
|
|
|
|
|
|
| |||||||||||||
Aggregate cost of securities: | $ | 273,559,097 | $ | 42,520,493 | $ | 45,264,590 | $ | 187,721,427 | $ | 136,373,064 | $ | 12,419,191 | ||||||||||||
|
|
|
|
|
|
|
|
|
|
|
| |||||||||||||
| 151 | (continued) |
| Ohio National Fund, Inc. |
Notes to Financial Statements (Continued) | June 30, 2011 (Unaudited) |
| Balanced | Income Opportunity | Target VIP | Target Equity/ Income | Bristol Growth | ||||||||||||||||||
Gross unrealized: | ||||||||||||||||||||||
Appreciation | $ | 1,830,791 | $ | 1,539,640 | $ | 3,262,302 | $ | 2,252,248 | $ | 10,034,316 | ||||||||||||
Depreciation | (383,458 | ) | 41,293 | (921,807 | ) | (1,760,912 | ) | (1,965,433 | ) | |||||||||||||
|
|
|
|
|
|
|
|
|
| |||||||||||||
Net unrealized: | ||||||||||||||||||||||
Appreciation | $ | 1,447,333 | $ | 1,580,933 | $ | 2,340,495 | $ | 491,336 | $ | 8,068,883 | ||||||||||||
|
|
|
|
|
|
|
|
|
| |||||||||||||
Aggregate cost of securities: | $ | 16,160,505 | $ | 9,587,336 | $ | 21,277,284 | $ | 25,564,877 | $ | 89,558,639 | ||||||||||||
|
|
|
|
|
|
|
|
|
| |||||||||||||
| (8) | Legal Matters |
In December 2007, the Target Equity/Income Portfolio, as a shareholder of Lyondell Chemical Company (“Lyondell”), participated in a cash out merger of Lyondell in which it received $48 per share of consideration. Lyondell later filed for bankruptcy and two entities created by the Lyondell bankruptcy plan of reorganization have initiated lawsuits seeking to recover, or clawback, proceeds received by shareholders in the December 2007 merger based on fraudulent transfer claims.
The first action, Edward S. Weisfelner, as Trustee of the LB Creditor Trust v. Morgan Stanley & Co., Inc., et. al., was initiated on October 22, 2010, in the Supreme Court of the State of New York in the County of New York but has subsequently been removed to the U.S. Bankruptcy Court for the Southern District of New York. The second action, Edward S. Weisfelner, as Trustee of the LB Litigation Trust v. A Holmes & H Holmes TTEE, et. al., was initiated on December 23, 2010, in the U.S. Bankruptcy Court for the Southern District of New York. Both actions attempt to recover the proceeds paid out to the holders of Lyondell shares at the time of the 2007 merger.
The value of the proceeds received by the Target Equity/Income Portfolio was $1,772,400. The Portfolio has yet to be specifically named in these actions. If named, the outcome of these proceedings on the Portfolio cannot be predicted. Management of the Fund is currently assessing the cases and has not yet determined the potential effect, if any, on the net asset value of the Target Equity/Income Portfolio.
Also, in December 2007, the S&P 500® Index and Strategic Value Portfolios, as shareholders of the Tribune Company, participated in a similar cash out merger in which shareholders received $34 per share of consideration. The company subsequently filed for bankruptcy and several legal complaints have been initiated by groups of Tribune Company creditors seeking to recover, or clawback, proceeds received by shareholders based on fraudulent transfer claims.
The first action, Official Committee of Unsecured Creditors of Tribune Company v. FitzSimons et al., was initiated on November 1, 2010 in the U.S. Bankruptcy Court for the District of Delaware. As a result of these proceedings, the Court agreed to allow individual creditors to file similar complaints in U.S. state courts. The Fund is specifically named in a complaint in the U.S. District Court Southern District of Ohio Western Division, Deutsche Bank Trust Company Americas et al. v. American Electric Power et al., that was initiated in June of 2011. The Strategic Value Portfolio is named in a similar complaint in the U.S. District Court Eastern District of Pennsylvania, Deutsche Bank Trust Company Americas, et al. v. Ametek Inc. Employees Master Retirement Trust, et al. The value of the proceeds received by the S&P 500® Index and Strategic Value Portfolios, was $37,910 and $384,200, respectively. The outcome of these proceedings on the two Portfolios of the Fund cannot be predicted. Management of the Fund is currently assessing the complaints and has not yet determined the potential effect, if any, on the respective net assets values of those Portfolios.
| 152 |
| Ohio National Fund, Inc. |
Additional Information | June 30, 2011 (Unaudited) |
| (1) | Review and Approval of Advisory and Sub-advisory Agreements |
There were no approvals of advisory or sub-advisory contracts during the six-month period ended June 30, 2011. The most recent comprehensive annual approval of advisory and sub-advisory contracts occurred during the September 22, 2010 and November 11, 2010 meetings of the Fund’s Board.
| (2) | Expense Disclosure |
An individual may not buy or own membership interests of the Fund directly. An individual acquires an indirect interest in the Fund by purchasing a variable annuity contract or variable insurance policy and allocating premiums or purchase payments to Fund Portfolios available through the separate accounts of ONLIC, ONLAC, and NSLA. Separate accounts of these entities are the shareholders of the Fund.
As a shareholder of the Fund, a separate account incurs ongoing costs, including management fees and other Fund expenses. This example is intended to help a policy/contract owner understand ongoing costs (in dollars) associated with the underlying investment in the Fund’s Portfolios by the separate account shareholder and to compare these costs with the ongoing costs associated with investing in other mutual funds.
The example is based on an investment of $1,000 invested at January 1, 2011 and held through June 30, 2011.
Actual Expenses
The table below provides information about investment values and actual expenses associated with each Portfolio of the Fund. The information below, together with the amount of an underlying investment, can be used to estimate expenses paid over the period. An estimate can be obtained by simply dividing an underlying investment value by $1,000 (for example, an $8,600 investment value divided by $1,000 = 8.6), then multiplying the result by the number in the table under the heading entitled “Expenses Paid During Period”.
Portfolio | Beginning Investment Value 1/1/2011 | Ending Investment Value 6/30/2011 | Expense Paid During Period* 1/1/2011 - 6/30/2011 | Expense Ratio During Period 1/1/2011 - 6/30/2011 (Annualized) | ||||||||||||
Equity | $ | 1,000.00 | $ | 1,016.23 | $ | 4.35 | 0.87 | % | ||||||||
Money Market | 1,000.00 | $ | 1,000.00 | $ | 0.69 | 0.14 | % | |||||||||
Bond | 1,000.00 | $ | 1,033.31 | $ | 3.33 | 0.66 | % | |||||||||
Omni | 1,000.00 | $ | 1,046.02 | $ | 3.86 | 0.76 | % | |||||||||
International | 1,000.00 | $ | 1,055.74 | $ | 5.15 | 1.01 | % | |||||||||
Capital Appreciation | 1,000.00 | $ | 1,075.60 | $ | 4.48 | 0.87 | % | |||||||||
Millennium | 1,000.00 | $ | 1,116.18 | $ | 4.93 | 0.94 | % | |||||||||
International Small-Mid Company | 1,000.00 | $ | 1,059.38 | $ | 6.08 | 1.19 | % | |||||||||
Aggressive Growth | 1,000.00 | $ | 1,042.84 | $ | 5.22 | 1.03 | % | |||||||||
Small Cap Growth | 1,000.00 | $ | 1,121.31 | $ | 5.73 | 1.09 | % | |||||||||
Mid Cap Opportunity | 1,000.00 | $ | 1,049.38 | $ | 4.88 | 0.96 | % | |||||||||
S&P 500® Index | 1,000.00 | $ | 1,058.29 | $ | 2.40 | 0.47 | % | |||||||||
Strategic Value | 1,000.00 | $ | 1,085.47 | $ | 4.76 | 0.92 | % | |||||||||
High Income Bond | 1,000.00 | $ | 1,043.05 | $ | 3.95 | 0.78 | % | |||||||||
Capital Growth | 1,000.00 | $ | 1,128.25 | $ | 5.33 | 1.01 | % | |||||||||
Nasdaq-100® Index | 1,000.00 | $ | 1,050.97 | $ | 2.64 | 0.52 | % | |||||||||
Bristol | 1,000.00 | $ | 1,047.16 | $ | 4.21 | 0.83 | % | |||||||||
Bryton Growth | 1,000.00 | $ | 1,025.06 | $ | 4.57 | 0.91 | % | |||||||||
U.S. Equity | 1,000.00 | $ | 1,061.58 | $ | 5.01 | 0.98 | % | |||||||||
Balanced | 1,000.00 | $ | 1,045.42 | $ | 4.77 | 0.94 | % | |||||||||
Income Opportunity | 1,000.00 | $ | 1,035.03 | $ | 6.00 | 1.19 | % | |||||||||
Target VIP | 1,000.00 | $ | 1,084.52 | $ | 4.24 | 0.82 | % | |||||||||
Target Equity/Income | 1,000.00 | $ | 1,023.23 | $ | 3.81 | 0.76 | % | |||||||||
Bristol Growth | 1,000.00 | $ | 1,067.07 | $ | 4.61 | 0.90 | % | |||||||||
| 153 | (continued) |
| Ohio National Fund, Inc. |
Additional Information (Continued) | June 30, 2011 (Unaudited) |
Hypothetical Example for Comparison Purposes
The table below provides information about hypothetical investment values and hypothetical expenses based on each respective Portfolio’s actual expense ratio and an assumed rate of return of 5% per year before expenses, which is not an actual return. The hypothetical investment values and expenses may not be used to estimate the actual ending investment balance or expenses actually paid for the period by the shareholders. A policy/contract holder may use this information to compare this 5% hypothetical example with the 5% hypothetical examples that appear in the shareholder reports of other funds.
Portfolio | Beginning Investment Value 1/1/2011 | Ending Investment Value 6/30/2011 | Expense Paid During Period* 1/1/2011 - 6/30/2011 | Expense Ratio During Period 1/1/2011 - 6/30/2011 (Annualized) | ||||||||||||
Equity | $ | 1,000.00 | $ | 1,020.48 | $ | 4.36 | 0.87 | % | ||||||||
Money Market | 1,000.00 | $ | 1,024.10 | $ | 0.70 | 0.14 | % | |||||||||
Bond | 1,000.00 | $ | 1,021.52 | $ | 3.31 | 0.66 | % | |||||||||
Omni | 1,000.00 | $ | 1,021.03 | $ | 3.81 | 0.76 | % | |||||||||
International | 1,000.00 | $ | 1,019.79 | $ | 5.06 | 1.01 | % | |||||||||
Capital Appreciation | 1,000.00 | $ | 1,020.48 | $ | 4.36 | 0.87 | % | |||||||||
Millennium | 1,000.00 | $ | 1,020.13 | $ | 4.71 | 0.94 | % | |||||||||
International Small-Mid Company | 1,000.00 | $ | 1,018.89 | $ | 5.96 | 1.19 | % | |||||||||
Aggressive Growth | 1,000.00 | $ | 1,019.69 | $ | 5.16 | 1.03 | % | |||||||||
Small Cap Growth | 1,000.00 | $ | 1,019.39 | $ | 5.46 | 1.09 | % | |||||||||
Mid Cap Opportunity | 1,000.00 | $ | 1,020.03 | $ | 4.81 | 0.96 | % | |||||||||
S&P 500® Index | 1,000.00 | $ | 1,022.46 | $ | 2.36 | 0.47 | % | |||||||||
Strategic Value | 1,000.00 | $ | 1,020.23 | $ | 4.61 | 0.92 | % | |||||||||
High Income Bond | 1,000.00 | $ | 1,020.93 | $ | 3.91 | 0.78 | % | |||||||||
Capital Growth | 1,000.00 | $ | 1,019.79 | $ | 5.06 | 1.01 | % | |||||||||
Nasdaq-100® Index | 1,000.00 | $ | 1,022.22 | $ | 2.61 | 0.52 | % | |||||||||
Bristol | 1,000.00 | $ | 1,020.68 | $ | 4.16 | 0.83 | % | |||||||||
Bryton Growth | 1,000.00 | $ | 1,020.28 | $ | 4.56 | 0.91 | % | |||||||||
U.S. Equity | 1,000.00 | $ | 1,019.93 | $ | 4.91 | 0.98 | % | |||||||||
Balanced | 1,000.00 | $ | 1,020.13 | $ | 4.71 | 0.94 | % | |||||||||
Income Opportunity | 1,000.00 | $ | 1,018.89 | $ | 5.96 | 1.19 | % | |||||||||
Target VIP | 1,000.00 | $ | 1,020.73 | $ | 4.11 | 0.82 | % | |||||||||
Target Equity/Income | 1,000.00 | $ | 1,021.03 | $ | 3.81 | 0.76 | % | |||||||||
Bristol Growth | 1,000.00 | $ | 1,020.33 | $ | 4.51 | 0.90 | % | |||||||||
| * | Expenses are equal to the average account value times the Fund’s annualized expense ratio multiplied by the number of days in the most recent fiscal half-year divided by the number of days in the fiscal year. Please note that the expenses shown in these tables are meant to highlight ongoing Fund costs only and do not reflect any contract-level expenses or Fund transactional costs, such as sales charges (loads) or exchange fees (if any). Therefore, these tables are useful in comparing ongoing fund costs only, and will not fully assist a policy/contract owner in determining the relative total expenses of different funds. In addition, if transactional costs were included, costs may have been higher for these Portfolios as well as for a fund being compared. |
| 154 |
| Ohio National Fund, Inc. |
Information about Directors and Officers | June 30, 2011 (Unaudited) |
Name and Address | Age | Position with the Fund | Term served or Director | Number of Portfolios | Principal Occupation and Other Directorships During Past Five Years | |||||||
Independent Directors | ||||||||||||
James E. Bushman 100 W. Rivercenter Boulevard, 2C | 66 | Director, Chairman of Audit Committee and Member of Independent Directors Committee | Since March 2000 | 24 | Director, Chairman and CEO: Cast-Fab Technologies, Inc. (a manufacturing company); Director: The Midland Company (1998-2008), Air Transport Services Group, Inc., The Littleford Group, Inc. (1984-2010), Hilltop Basic Resources, Inc., The Elizabeth Gamble Deaconess Home Association, The Christ Hospital, and The University of Cincinnati Foundation. | |||||||
| George M. Vredeveld University of Cincinnati Economics Center for Education & Research 90 West Daniels Cincinnati, Ohio | 68 | Lead Independent Director, Member of Audit and Independent Directors Committees | Since March 1996 | 24 | Alpaugh Professor of Economics: University of Cincinnati; President: Economics Center for Education & Research. | |||||||
John I. Von Lehman 10 Creek Side Drive Cincinnati, Ohio | 58 | Director, Member of Audit and Independent Directors Committees | Since August 2007 | 24 | Former Executive Vice President, CFO, Secretary, and Director: The Midland Company (1988-2007); Director, Audit Committee and Corporate Governance Committee Member: American Financial Group, Inc.; Finance Committee and Investment Commitee member: Life Enriching Communities; Investment Committee: Xavier University Foundation. | |||||||
Interested Director | ||||||||||||
John J. Palmer 2283 E. Sentry Ridge Ct. Tucson, Arizona | 71 | Chairman of the Board and Director | Since July 1997 | 24 | Insurance industry consultant (April 2010 to present), Director: NSLA and Fiduciary Capital Management, Inc. (Ohio National-affiliated companies); Director: Cincinnati Symphony Orchestra; Trustee: Cincinnati Opera. Prior to March 2010, was President of the Fund, Director and Vice Chairman of ONLIC; Prior to May 2010 was President and CEO of NSLA, Director of ONI and various other Ohio National-affiliated companies. | |||||||
Officers | ||||||||||||
| Christopher A. Carlson One Financial Way Cincinnati, Ohio | 52 | President | Since March 2000 | 24 | Executive Vice President and Chief Investment Officer: ONLIC; President and Director: ONI; Chief Investment Officer: NSLA; Officer and Director of various other Ohio National-affiliated companies. Prior to March 2010, was Vice President of the Fund. | |||||||
| Thomas A. Barefield One Financial Way Cincinnati, Ohio | 58 | Vice President | Since February 1998 | 24 | Executive Vice President and Chief Marketing Officer - Institutional Sales: ONLIC; Director and Vice President - Marketing: NSLA; Director: ONI; Senior Vice President: Ohio National Equities, Inc.; Recent graduate of class XXIX of Leadership Cincinnati. | |||||||
| Dennis R. Taney One Financial Way Cincinnati, Ohio | 63 | Chief Compliance Officer | Since August 2004 | 24 | Second Vice President: ONLIC, Chief Compliance Officer: ONLIC, ONI, NSLA, and other Ohio National-affiliated companies. | |||||||
| R. Todd Brockman One Financial Way Cincinnati, Ohio | 42 | Treasurer | Since August 2004 | 24 | Second Vice President, Mutual Fund Operations: ONLIC and NSLA; Treasurer: ONI. | |||||||
| Kimberly A. Plante One Financial Way Cincinnati, Ohio | 37 | Secretary | Since March 2005 | 24 | Prior to August 2007 was Assistant Secretary, Senior Associate Counsel: ONLIC; Secretary: ONI and Suffolk; Assistant Secretary of various other Ohio National-affiliated companies. | |||||||
| 155 | (continued) |
| Ohio National Fund, Inc. |
Information about Directors and Officers (Continued) | June 30, 2011 (Unaudited) |
Name and Address | Age | Position with the Fund | Term served or Director | Number of Portfolios | Principal Occupation and Other Directorships During Past Five Years | |||||||
| Catherine E. Gehr One Financial Way Cincinnati, Ohio | 39 | Assistant Treasurer | Since March 2005 | 24 | Manager, Mutual Fund Operations: ONLIC; Assistant Treasurer: ONI. | |||||||
| Katherine L. Carter One Financial Way Cincinnati, Ohio | 32 | Assistant Secretary | Since August 2007 | 24 | Assistant Counsel: ONLIC; Prior to July 2007 was Compliance Officer with Fifth Third Securities, Inc. | |||||||
| 156 |
Ohio National Fund, Inc.
Post Office Box 371
Cincinnati, Ohio 45201
Form 1325 Rev. 8-11
Item 2. Code Of Ethics.
As of the end of the period covered by this report, Ohio National Fund, Inc. (the “Fund”) has adopted a code of ethics that applies to the Fund’s principal executive officer and principal financial officer. There were no substantive amendments or waivers to the Code of Ethics during the period covered by this report.
A copy of this Code of Ethics is filed as Exhibit EX-99.CODE to this Form N-CSR and is also available, without charge, upon request, by calling 877-781-6392 toll free.
Item 3. Audit Committee Financial Expert.
The Fund’s Board of Directors has determined that the Fund has an audit committee financial expert serving on its Audit Committee. The Audit Committee financial expert is Mr. James E. Bushman. Mr. Bushman is independent for purposes of Item 3 of Form N-CSR.
Item 4. Principal Accountant Fees And Services.
The aggregate fees for each of the last two fiscal years for professional services rendered by the principal accountant for the audit of the Fund’s annual financial statements or services that are normally provided by the accountant in connection with statutory and regulatory filings or engagements for those fiscal years are listed below.
| (a) | Audit Fees. |
Fiscal year ended December 31, 2010: $276,000
Fiscal year ended December 31, 2009: $276,000
| (b) | Audit-Related Fees. |
Professional services rendered in connection with the consent on the Fund’s N1A filing.
Fiscal year ended December 31, 2010: $4,750
Fiscal year ended December 31, 2009: $4,600
| (c) | Tax Fees. None. |
| (d) | All Other Fees. None. |
| (e)(1) | Audit Committee Pre-Approval Policies and Procedures: |
The Fund’s Audit Committee has adopted an Audit Committee Charter that requires that the Audit Committee oversee the quality and appropriateness of the accounting methods used in the preparation of the Fund’s financial statements, and the independent audit thereof; approve the selection and compensation of the independent auditors; and pre-approve the performance, by the independent auditors, of non-audit services for the Fund, its investment adviser, or any affiliated entity controlling, controlled by or under common control with the investment adviser that provides ongoing services to the Fund.
| (e)(2) | Services Approved Pursuant to Paragraph (c)(7)(i)(C) of Rule 2-01 of Regulation S-X: |
During the fiscal years ended December 31, 2010 and 2009, there were no non-audit services provided by the Fund’s principal accountant that would have required pre-approval by the Fund’s Audit Committee. The audit related fees aforementioned were pre-approved by the Fund’s Audit Committee, although not required by paragraph (c) (7) (ii) of Regulation S-X as the audit-related fees were less than five percent of the total amount of revenues paid to the Fund’s principal accountant.
| (f) | Not applicable. |
| (g) | There were no non-audit services provided by the Fund’s principal accountant, other than items disclosed in item (b) above, in which a fee was billed to the Fund, the Fund’s adviser, and any entity controlling, controlled by, or under common control with the adviser that provides ongoing services to the registrant for the last two fiscal years. |
| (h) | Not applicable, as there were no non-audit services performed by the Fund’s principal accountant that were rendered to the Fund, the Fund’s adviser, or any entity controlling, controlled by, or under common control with the adviser that provided ongoing services to the registrant that were not pre-approved for the last two fiscal years. |
Item 5. Audit Committee Of Listed Registrants.
Not applicable.
Item 6. Schedule of Investments.
Not applicable.
Item 7. Disclosure Of Proxy Voting Policies And Procedures For Closed-End Management Investment Companies.
Not Applicable.
Item 8. Portfolio Managers of Closed-End Management Investment Companies.
Not Applicable.
Item 9. Purchases of Equity Securities by Closed-End Management Investment Company and Affiliated Purchasers.
Not Applicable.
Item 10. Submission of Matters to a Vote of Security Holders.
There were no material changes to the procedures by which shareholders may recommend nominees to the Fund’s Board of Directors.
Item 11. Controls and Procedures.
| (a) | The Fund’s principal executive officer and principal financial officer have concluded, based on their evaluation conducted as of a date within 90 days of the filing of this report, that the Fund’s disclosure controls and procedures are adequately designed and are operating effectively to ensure (i) that material information relating to the Fund, including its consolidated subsidiaries, is made known to them by others within those entities, particularly during the period in which this report is being prepared; and (ii) that information required to be disclosed by the Fund on Form N-CSR is recorded, processed, summarized and reported within the time periods specified in the Securities and Exchange Commission’s rules and forms. |
| (b) | There were no changes in the Fund’s internal control over financial reporting that occurred during the second fiscal quarter of the period covered by this report that have materially affected, or are reasonably likely to materially affect, the Fund’s internal control over financial reporting. |
Item 12. Exhibits.
| (a)(1) | The Fund’s Code of Ethics pursuant to Item 2 of Form N-CSR is filed and attached hereto as EX-99.CODE. |
| (a)(2) | A separate certification for each principal executive officer and principal financial officer of the Fund as required by Rule 30a-2(a) under the Investment Company Act of 1940 (17 CFR 270.30a-2(a)) is attached hereto as |
EX-99.CERT.
The certifications required by Section 906 of the Sarbanes-Oxley Act of 2002 are attached hereto as
EX-99.906CERT.
SIGNATURES
Pursuant to the requirements of the Securities Exchange Act of 1934 and the Investment Company Act of 1940, the registrant has duly caused this report to be signed on its behalf by the undersigned, thereunto duly authorized.
| Ohio National Fund, Inc. | ||
| By: | /s/ Christopher A. Carlson | |
Christopher A. Carlson President September 6, 2011 | ||
Pursuant to the requirements of the Securities Exchange Act of 1934 and the Investment Company Act of 1940, this report has been signed below by the following persons on behalf of the registrant and in the capacities and on the dates indicated.
| Ohio National Fund, Inc. | ||
| By: | /s/ Christopher A. Carlson | |
Christopher A. Carlson President September 6, 2011 | ||
| By: | /s/ R. Todd Brockman | |
R. Todd Brockman Treasurer September 6, 2011 | ||