UNITED STATES
SECURITIES AND EXCHANGE COMMISSION
Washington, D.C. 20549
FORM N-CSR
CERTIFIED SHAREHOLDER REPORT OF REGISTERED
MANAGEMENT INVESTMENT COMPANIES
Investment Company Act file number 811-03015
Ohio National Fund, Inc.
(Exact name of registrant as specified in charter)
One Financial Way, Cincinnati, Ohio | 45242
| |
(Address of principal executive offices) |
(Zip code) |
CT Corporation 300 E. Lombard St. Suite 1400 Baltimore, MD 21202
(Name and address of agent for service)
Registrant’s telephone number, including area code: 513-794-6971
Date of fiscal year end: December 31
Date of reporting period: June 30, 2015
Form N-CSR is to be used by management investment companies to file reports with the Commission not later than 10 days after the transmission to stockholders of any report that is required to be transmitted to stockholders under Rule 30e-1 under the Investment Company Act of 1940 (17 CFR 270.30e-1). The Commission may use the information provided on Form N-CSR in its regulatory, disclosure review, inspection, and policymaking roles.
A registrant is required to disclose the information specified by Form N-CSR, and the Commission will make this information public. A registrant is not required to respond to the collection of information contained in Form N-CSR unless the Form displays a currently valid Office of Management and Budget (“OMB”) control number. Please direct comments concerning the accuracy of the information collection burden estimate and any suggestions for reducing the burden to Secretary, Securities and Exchange Commission, 450 Fifth Street, NW, Washington, DC 20549-0609. The OMB has reviewed this collection of information under the clearance requirements of 44 U.S.C. § 3507.
| Item 1. | Reports To Stockholders. |

OHIO NATIONAL FUND, INC.
| 1 | ||||
| 2 | ||||
| 3 | ||||
| 8 | ||||
| 10 | ||||
| 15 | ||||
| 21 | ||||
| 27 | ||||
| 31 | ||||
| 37 | ||||
| 40 | ||||
| 45 | ||||
| 49 | ||||
| 56 | ||||
| 60 | ||||
| 70 | ||||
| 74 | ||||
| 78 | ||||
| 81 | ||||
| 84 | ||||
| 91 | ||||
| 95 | ||||
| 98 | ||||
| 109 | ||||
| 112 | ||||
| 115 | ||||
| 121 | ||||
| 132 | ||||
| 157 | ||||
| 159 | ||||
Message |  |
Dear Investor:
Recently, I asked a colleague to describe the equity markets during the first half of the year, and this was the response I received, “flat, with brief spikes of volatility.”
After giving this some thought, I decided this statement is a fairly accurate description - or, at the very least, a reasonable response. Entertaining my curiosity to hear from others, I asked a few more investment professionals for their one-sentence description of the market. The first described the equity markets as “muted returns with volatility.” That sounded similar to the initial description and consistent with my view. The second reply is more interesting: “fairly valued with low volatility.” This colleague added that his assessment may be contrary to others’ opinions. His latter comment was certainly true, leading me to ponder which characterization of volatility is correct.
Muted equity markets
Determining whether equity market returns during the first half of the year were flat or muted is fairly simple. The two most well-known equity market indices, the S&P 500® Index and the Dow Jones Industrial Average, were up 1.2 percent and 0.03 percent respectively. These returns easily qualify as flat or muted. The MSCI All Country World Index, representing a more global view, was up 2.7 percent, which is also consistent with these descriptions.
Determining whether the equity markets are fairly valued is slightly more complicated, but not much. According to FactSet, the S&P 500® Index’s current price-to-earnings ratio is 16.6 times forward earnings. This is higher than both the five-year average of 13.9 and the 10-year average of 14.1, and just slightly above longer-term averages.
Based on these comparisons, I believe that equities are close to fair value.
More important, future expectations for additional returns based on an assumed current under-valuation are not likely. Equity returns have been flat this year, but fairly valued. Increased returns will now more likely be reliant on economic growth, which has not been very strong.
Assessing volatility
There is little question that equity markets have been muted. However, assessing volatility is more complicated. Perhaps that is one reason for the contradictory responses from my colleagues.
Let’s start by comparing 2015 year-to-date volatility with 2014: In 2014, average volatility as measured by the Chicago Board Options Exchange Volatility Index (VIX) was 14.2 percent. With a 15.1 percent average in 2015, volatility is higher, but not by much. Comparing the median volatility tells a similar story: 13.7 percent for 2014 and 14.2 percent for year-to-date 2015. It is worth noting that there was greater variability in volatility throughout 2014, with a higher peak and a lower trough than we’ve experienced so far in 2015. Even when factoring in variability, the difference in volatility between the two periods is small, and volatility remains relatively low.
The European markets paint a different picture. Volatility increased in Europe by 28 to 34 percent, depending on the index. This is not a surprise, considering that most of the triggering events that increased volatility occurred outside of the United States, with Greece being the most notable. My conclusion: assessing whether volatility increased or was just low depends on where you look.
| 1 |
The Ohio National Fund, Inc.
I’m pleased to report that most of the Ohio National Fund, Inc. Portfolios performed well during the first half of 2015. Eleven out of the 17 actively managed Portfolios either outperformed their benchmark, or ranked in the top half of their peer group. Some of our better performing Portfolios include the International Portfolio and the International Small-Mid Company Portfolio, both subadvised by Federated Global Investment Management Corp.; the Aggressive Growth Portfolio and the Small Cap Growth Portfolio, both subadvised by Janus Capital Management LLC; and all of the Portfolios subadvised by Suffolk Capital Management, LLC.
As always, it is important to stay diversified, because no one can accurately predict the future. Please consult your financial professional to make sure you are positioned appropriately. Thank you for entrusting your assets to the Ohio National Fund, Inc. We look forward to continuing to serve your investment needs.
Sincerely,

Christopher A. Carlson
President
Directors and Officers of Ohio National Fund, Inc.
John J. Palmer, Director
Madeleine W. Ludlow, Director
George M. Vredeveld, Director
John I. Von Lehman, Director
Geoffrey Keenan, Director
Christopher A. Carlson, President
Thomas A. Barefield, Vice President
R. Todd Brockman, Treasurer
Kimberly A. Plante, Secretary
Julie T. Thomas, Chief Compliance Officer
Catherine E. Gehr, Assistant Treasurer
Emily Bae, Assistant Secretary
The Statement of Additional Information of Ohio National Fund, Inc. (the “Fund”) includes additional information about the Fund’s Board of Directors (the “Board”) and is available at http://www.ohionationalfund.com or upon request, without charge, by calling 877-781-6392 (toll-free).
A description of the policies and procedures that the Fund uses in voting proxies relating to Fund securities, as well as information regarding how the Fund voted proxies during the most recent twelve-month period ended June 30, is available without charge, upon request, by calling 877-781-6392 (toll-free) and on the Securities and Exchange Commission (the “Commission”) website at http://www.sec.gov.
The Fund has filed its Schedules of Investments as of March 31 and September 30 with the Commission, as required, on Form N-Q. Form N-Q is required to be filed with the Commission for the first and third quarters of each fiscal year within sixty days after the end of each period and is available on the Commission website upon acceptance of each submission. The Fund’s Forms N-Q may be reviewed and copied at the Commission’s Public Reference Room in Washington, DC. Information about the Public Reference Room is available by calling 1-800-SEC-0330 (toll-free).
This report and the financial statements contained herein are submitted for the general information of the shareholders of the Fund. This report is not authorized for distribution to prospective investors in the Fund unless preceded or accompanied by an effective prospectus of Ohio National Fund, Inc. For a prospectus containing more complete information, including charges and expenses, please contact Ohio National Investments, Inc., One Financial Way, Cincinnati, OH 45242, telephone 877-781-6392 (toll-free).
| 2 |
| Ohio National Fund, Inc. | Equity Portfolio |
Objective/Strategy
The Equity Portfolio seeks long-term growth of capital by investing at least 80% of its assets in equity securities.
Performance as of June 30, 2015
Average Annual Returns: | ||||
One year | 6.79% | |||
Five years | 16.51% | |||
Ten years | 2.72% |
Past performance does not guarantee future results. The performance data quoted represents past performance and current returns may be lower or higher. Total return figures include change in share price and reinvestment of dividends and capital gains. The investment return and principal value will fluctuate so that an investor’s shares, when redeemed, may be worth more or less than the original cost. To obtain performance information up to the most recent month end, call toll-free 1-877-781-6392.
The Portfolio is not open to direct retail investment. Beneficial interest in shares is obtained solely by purchase of variable life insurance policies and variable annuity contracts. Actual performance results for variable annuity and variable universal life contracts will be lower due to contract charges. Consult your contract for applicable charges.
Comments
For the six-month period ended June 30, 2015, the Equity Portfolio returned 0.75% versus 1.23% for the current benchmark, the S&P 500 Index.
Relative portfolio performance was driven by security selection effects and sector allocation, partially offset by positive interaction of sector allocation and security selection. An overweight position in Utilities generated the largest detraction due to sector allocation, as the sector underperformed the index. An underweight to Industrials contributed positively to allocation effects, as the sector also lagged the benchmark. Amazon.com, Inc., NXP Semiconductors NV, LyondellBasell Industries NV, UnitedHealth Group, Inc. and Broadcom Corp. were the largest contributors to performance, while the biggest detractors included Keurig Green Mountain, Inc., CONSOL Energy, Inc., Yahoo!, Inc., Calpine Corp. and Ralph Lauren Corp. (1)
The Nasdaq Composite separated from other major indices in the first half of the year, climbing 6.0% relative to the 1.2% advance for the S&P 500 Index and the stagnant performance of the Dow Jones Industrial Average. Growth stocks outperformed their value-oriented peers, with the Russell 1000 Growth Index returning 4.0% against a 0.6% loss in the Russell 1000 Value Index. Size has not aided performance thus far in 2015, with large caps trailing mid caps, which lag small caps. The Russell 1000, Russell Midcap and Russell 2000 indices returned 1.7%, 2.4% and 4.8% throughout the period, respectively. Within the S&P 500 Index, Utilities was the top detractor, down more than 10.0%, while Energy and Industrials fell 4.7% and 3.1%, respectively. On the upside, Health Care and Consumer Discretionary stood out, up 9.6% and 6.8%, respectively.
Major U.S. averages opened the year with mixed gains, as investors continued to focus on the Federal Reserve’s rate strategy amid mixed economic reports, suppressed crude prices and the climbing dollar, as well as another flurry of merger and acquisition announcements. Outside the U.S., continued Greek debt squabbles, European deflationary concerns and a market sell-off in China dominated the headlines. The U.S. dollar strengthened 9% against the euro over the period, and is now up nearly 20% against a broad basket of foreign currencies over the past twelve months. The 10-Year Treasury yield extended its slide to a low of 1.64% in
January before recovering to hit a June high of 2.48%; a level not seen since September of 2014. Oil prices fluctuated between $50 and $60 per barrel throughout the quarter, largely reacting to reports that capacity in Cushing, Oklahoma is running out for crude supplies, and the potential for Iranian supply to come back to the U.S. market.
U.S. gross domestic product expanded at an annualized rate of 2.2% in the fourth quarter of 2014, followed by a 0.2% contraction in the first quarter; both below consensus and well short of the 2014 third quarter’s 5.0% growth. Retail sales, excluding energy, declined three months in a row between December and February, with reports pointing to record-cold temperatures during the season as the culprit for the disappointment. Though personal spending and retail sales rebounded in the second quarter, consumer prices are flat relative to where the consumer price index closed the second quarter of 2014. On a positive note, U.S. employers added 1.23 million jobs in the first six months of the year, pushing down the unemployment rate to 5.3% from 5.6% at the end of year 2014. Consumer confidence also unexpectedly spiked to the highest level in 11 years.
The mixed bag of economic data once again spurred further target rate speculation, and minutes from the recent meetings indicate that officials are at odds over when to raise the target rate. Federal Reserve Chair Yellen commented that “if the economy continues to improve as I expect, I think it will be appropriate at some point this year to take the initial step to raise the federal funds rate target and begin the process of normalizing monetary policy.” Futures currently show the odds of a December hike at roughly 35%. However, the Federal Reserve Chair also commented that the timing of the initial rate increase is not what matters; rather it is the “entire path of rates.” Additionally, Yellen addressed the labor market, allowing that “wage increases are still running at a low level but there have been some tentative signs that wage growth is picking up.”
Roughly 70% of the S&P 500 Index’s constituents reported better-than-expected bottom-line results during both earnings seasons, while approximately 20% disappointed. However, many companies tempered guidance for 2015, citing significant foreign exchange headwinds. Meanwhile, low borrowing rates continued to foster merger & acquisition activity, as a slew of multibillion-dollar deals were announced recently, particularly in the health care sector. Notably, Royal Dutch Shell announced plans to purchase integrated gas company BG Group for a whopping seventy billion, Comcast walked away from its blockbuster deal with Time Warner Cable amid regulatory resistance and Blackstone Group LP and Wells Fargo & Co. joined to acquire a real estate portfolio from General Electric for roughly thirty billion dollars. In the Health Care sector, Netherlands-based Mylan began to fight against an unsolicited forty billion dollar bid from Teva amid its own attempt to acquire generic pharmaceutical manufacturer Perrigo Co. PLC for around thirty billion, and Aetna agreed to buy Humana. Elsewhere, H.J. Heinz and Kraft Foods Group signed a definitive merger agreement to form the Kraft Heinz Company, which will create the third-largest food and beverage company in North America. In other news, the Federal Reserve announced that its annual “stress test” of the thirty-one largest banks operating in the U.S. found that all the banks had sufficient capital to withstand a hypothetical economic shock. Nearly every bank’s capital return proposals passed the comprehensive capital analysis and review tests as well.
The World Bank lowered its 2015 growth expectations early in the year due to weakness in Japan and the Eurozone, though it pointed to the U.S. as one of the strongest economies. This tempered forecast was underscored by China’s 7.4% gross domestic product (“GDP”) expansion in 2014, its weakest pace in over 20 years.
| 3 | (continued) |
| Ohio National Fund, Inc. | Equity Portfolio (Continued) |
European GDP also expanded by only 0.3% in the fourth quarter thanks to German output buoying contractions and stagnation in other member countries. European Central Bank President Mario Draghi announced an expanded asset-purchase program through at least September 2016 to combat threats of deflation.
Elsewhere, after creditors approved a four-month loan extension in the first quarter, back-and-forth debt negotiations in Greece dominated the headlines in the final weeks of June. Greek Prime Minister Tsipras surprisingly called for a voter referendum that caused European officials to suspend financial support programs for Greece. Greek voters ultimately rejected the austerity measures demanded by creditors in return for additional aid, increasing the possibility that Greece could exit the euro.
Keurig Green Mountain, Inc. sold off recently after its management offered disappointing guidance and as the company’s KOLD brewing system demo saw mixed reviews. The weak guidance is a function of a rocky transition to Keurig 2.0, which is not compatible with unlicensed K-cups, and a mix shift in K-cup sales towards partnered brands like Starbucks. We expect the transition to Keurig 2.0 to improve as consumers begin to phase out unlicensed K-cups and embrace the improved model. Conversations with management have also confirmed that the negative sales impact from the mix shifting toward partnered portion pack sales is due to higher growth for the external brands, and is offset to a large extent by the higher margin on these partnered portion packs. Finally, we believe the stock embeds extreme pessimism for the KOLD system and does not reflect the potential for product improvements and cost reductions, both of which were part of the hot system’s evolution to current models. Our updated analysis points to an oversold stock with an attractive risk/reward profile. We are, therefore, maintaining our position in Keurig Green Mountain, Inc. (1)
CONSOL Energy Corp. has suffered as the fundamentals of the thermal coal industry have deteriorated due to a slew of headwinds. The global market is oversupplied, with new capacity coming online recently while demand is faltering. China, a major coal consumer, is pulling back on its massive infrastructure build out and U.S. power companies are shutting down coal plants and shifting towards gas. CONSOL Energy Corp., unlike many of its peers, boasts a decent balance sheet with little risk of breaking its debt covenants. The company is likely to survive this cycle and actually benefit from shuttering of supply. CONSOL Energy Corp. owns high-quality and low-cost coal assets, and management is improving its portfolio by spinning out and selling some of its coal businesses. The company also holds high-quality natural gas assets, which will provide substantial tailwinds should gas prices improve from these depressed levels. The market is still punishing the stock for its coal exposure, and we are effectively buying the gas business at a very attractive price. So, despite the challenged fundamentals of the industry, our analysis indicates an attractive price/value gap in CNX, and we are maintaining our position. (1)
Calpine Corp. detracted from returns, as the power generation industry has suffered from depressed prices stemming from weak demand. Supply and demand fundamentals will improve with time, but we expect the retirement of many coal-fired power generation plants in the meantime. Fortunately, the lack of any current fundamental tailwinds is allowing us to buy trough fundamentals at trough valuation levels. Calpine Corp. generates very strong free-cash-flow (FCF) streams, is valued at a double-digit FCF yield, and will benefit from any improvements in power pricing. We believe the stock’s valuation does not reflect an incredibly cheap option on potential power price volatility, especially in New England and Mid-Atlantic
power markets. We also see long-term power pricing potential from power demand increases in Texas power markets. Additionally, management’s capital allocation history is excellent. They consistently recognize the inherent value of the business, and have reduced share count well by nearly 25% over the past four years at prices well below fair value. (1)
Amazon.com, Inc. stock spiked after each earnings release over the past six months, bringing its year-to-date return at June 30 to roughly 40%. The company reported two straight quarters of earnings above Street estimates, with sales growing despite foreign exchange rate headwinds and margins improving. Additionally, management broke out the Amazon Web Services (“AWS”) business separately for the first time ever, surprising investors with 50% topline growth and a profitable bottom line. We expect this business to be a source of strong growth for Amazon.com, Inc. going forward. Finally, we remain encouraged with the new tone from management focusing on cost management and on transparency in operating reporting; moves that suggest we could see a much more shareholder-friendly management team going forward. We believe the company is poised to expand its operating margins into the double digits by leveraging its hefty fulfillment center investments and by growing its AWS business. (1)
NXP Semiconductors NV shares rallied after the company announced a deal to acquire Freescale Semiconductor to create the fourth-largest semiconductor company. NXP Semiconductors NV is using stock to fund the bulk of the deal, though the slim premium limits the shareholder value at risk, according to our analysis. The combined entity will enjoy a strong competitive positioning as the market-leading automotive semiconductor company and broad-based microcontroller unit (“MCU”) supplier, and should generate substantial cash synergy beyond the two hundred million to five hundred million dollar range that management projects. As such, we continue to hold the stock despite the recent rally. (1)
Broadcom Corp. was a top contributor this quarter after the stock spiked on a takeout offer by Avago Technologies. The stock also had a strong run in 2014 after announcing plans to exit its unprofitable cellular baseband business. We maintained our position going into 2015, as our analysis indicated that the company’s remaining wireless connectivity, infrastructure and broadband businesses were still undervalued. Following the bid by Avago Technologies, which put shares near our estimate of intrinsic value, we exited our position in Broadcom Corp. and allocated the capital elsewhere. (1)
Despite a broad industry shift towards passive investing, this cycle has featured dominant active stock pickers in the guise of the companies themselves. In many ways, companies have acted as managers of single-stock portfolios and, in aggregate, have aggressively bought back $1.7 trillion of their own stocks since 2009. As animal spirits have risen, boards have become increasingly comfortable with an uncertain future and have started to acquire other companies. The financial engineering logic behind these deals speaks for itself, given the ability to buy existing cash flow streams with cheap debt. Remarkably, roughly 2/3 of buying companies are seeing their stocks increase along with the selling companies.
Increasingly, deal activity is coming to dominate the returns in U.S. stocks, especially against the backdrop of flattish equity returns year-to-date. We have benefitted directly from deal activity, both as owners of acquiring companies, such as NXP Semiconductors NV and Expedia, and as owners of targeted companies, such as Perrigo Co. LLC and Broadcom Corp. In the case of the two targets, the offer price was very close to our assessment of business value, which
| 4 | (continued) |
| Ohio National Fund, Inc. | Equity Portfolio (Continued) |
suggests good valuation work on our part, and provided a welcome catalyst for price-and-value convergence. (1)
The challenge for long-term investors is that deals are now pushing prices towards fair value and beyond. Not surprisingly, at this point, we find many U.S. stocks broadly uninteresting, and yet we expect pro-cyclical deal activity to likely push prices well above business value for many stocks. Besides this rising valuation risk, we also expect that many deals will fail to meet current investor and boardroom expectations, and some of the popular current roll-up companies will inevitably blow up due to poorly executed integration and mismanaged complexity. As in all market cycles, as the perception of future uncertainty fades, valuation and risk rise, and our jobs as valuation managers gets tougher.
Fortunately, as active managers we have the luxury and the discipline not to buy most stocks, and we are still finding exploitable pockets of absolute value in financials, legacy tech and in the broad power generation sector.
Our financial stocks have recently performed well, as interest rates have moved up, and some of our holdings are closing in on fair value. However, the majority of our financial holdings are still just climbing out of the valuation basement of the housing crisis, persistently low interest rates and crushing regulatory costs. As a result, our core financial holdings, including Citigroup, Inc. and American International Group, Inc., are currently enjoying improving fundamentals and capital return profiles, which we think are still not fully reflected in their prices. (1)
The legacy technology names we own, such as Microsoft Corp. and Cisco Systems, Inc., continue to generate massive free-cash-flow streams, which are valued at narrowing, but still substantial, discounts from the overall market. The valuation discount of legacy tech reflects the ever-present risk of disruption, especially from the accelerating and dramatic transition to the cloud. Our goal is to find tech stocks that reflect the disruption risk of cloud, but have durable cash flow streams that will allow them to transition, and in some cases thrive, in a cloud-based world. (1)
The power generation, natural gas and coal sectors are all in various states of recession to depression. Power prices are depressed from weak demand, natural gas remains over-supplied, thanks to massive productivity gains from shale drilling, and the coal industry needs to cut supply by almost 40% to balance the market. Supply and demand fundamentals will improve with time, but we expect a rash of coal bankruptcies, further gas supply cuts and the retirement of many coal-fired power generation plants in the meantime. Fortunately, the lack of any current fundamental tailwinds and the time required to improve these fundamentals over the next several quarters is allowing us to buy trough fundamentals at trough valuation levels. In particular, AES Corp. and Calpine Corp. continue to generate very strong free-cash-flow streams, are valued at double-digit free cash flow yields, and will benefit from any improvements in power pricing. In the even-more-depressed gas and coal sector, CONSOL Energy, Inc. is one of the few well-capitalized coal and natural gas companies, with low-cost production assets in both segments. Fortunately, CONSOL Energy, Inc. saw the writing on the wall for coal during the China-induced coal boom of the last decade, and wisely diversified into gas. CONSOL Energy, Inc. is now proactively separating its coal and gas assets, and we think we are getting very cheap high-quality gas assets due to the coal overhang. (1)
Even with the continued convergence of price and value in most U.S. stocks, our focus on absolute value has allowed us to maintain what we believe is attractive potential risk-adjusted upside in the Portfolio.
We track this potential on a daily basis, and the current potential return profile of the Portfolio is similar to levels achieved during the deflationary-driven correction that occurred last October. While this upside potential is not at the home run levels we enjoyed a few years ago, we believe it is still absolutely attractive, and extremely attractive relative to most fixed-income alternatives.
In closing, we are in the judgment business, and our job is to execute an investment process that exploits expectation-driven gaps between price and underlying business value. Our judgment of these valuation opportunities is constantly evaluated by a probability-driven framework, which reinforces humility and constant learning. We could not execute this process without the long-term culture of ClearBridge that encourages investors to truly invest, and more importantly, the quality and long-term orientation of our shareholders.
| (1) | The Portfolio’s composition is subject to change. Holdings and weightings are as of June 30, 2015. |
Change in Value of $10,000 Investment
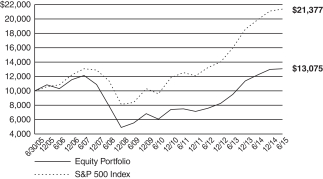
Hypothetical illustration based on past performance. Future performance will vary. The Portfolio’s returns reflect reinvested dividends. The Portfolio’s holdings may differ significantly from the securities in the index. The index is unmanaged and therefore does not reflect the cost of portfolio management and accounting.
The S&P 500 Index is a capitalization-weighted index designed to measure performance of the broad domestic economy through changes in the aggregate market value of 500 stocks representing all major industries. The index presented herein includes the effects of reinvested dividends.
| 5 | (continued) |
| Ohio National Fund, Inc. | Equity Portfolio (Continued) |
Portfolio Composition as of June 30, 2015 (1)
| % of Net Assets | ||||
Common Stocks (3) | �� | 97.5 | ||
Master Limited Partnerships (3) | 1.5 | |||
Money Market Funds | 1.0 | |||
|
| |||
| 100.0 | ||||
|
|
Top 10 Portfolio Holdings as of June 30, 2015 (1) (2)
| % of Net Assets | ||||
1. Citigroup, Inc. | 4.3 | |||
2. Microsoft Corp. | 4.0 | |||
3. JPMorgan Chase & Co. | 3.2 | |||
4. Amazon.com, Inc. | 3.1 | |||
5. Wells Fargo & Co. | 3.0 | |||
6. Merck & Co., Inc. | 3.0 | |||
7. Cisco Systems, Inc. | 2.9 | |||
8. American International Group, Inc. | 2.9 | |||
9. UnitedHealth Group, Inc. | 2.7 | |||
10. Yahoo!, Inc. | 2.7 |
| (1) | Composition of Portfolio subject to change. |
| (2) | Short-term investments have been excluded from the list of Top 10 Portfolio Holdings. |
| (3) | Sectors (combined): |
| % of Net Assets | ||||
Financials | 24.0 | |||
Health Care | 16.7 | |||
Information Technology | 16.1 | |||
Consumer Discretionary | 13.1 | |||
Energy | 8.3 | |||
Industrials | 7.1 | |||
Materials | 5.2 | |||
Utilities | 4.9 | |||
Consumer Staples | 3.6 | |||
|
| |||
| 99.0 | ||||
|
|
| 6 |
| Ohio National Fund, Inc. | Equity Portfolio |
Schedule of Investments | June 30, 2015 (Unaudited) |
| Common Stocks – 97.5% | Shares | Value | ||||||||
CONSUMER DISCRETIONARY – 13.1% |
| |||||||||
McDonald’s Corp. (Hotels, Restaurants & Leisure) | 100,909 | $ | 9,593,419 | |||||||
PulteGroup, Inc. (Household Durables) | 689,697 | 13,897,395 | ||||||||
Amazon.com, Inc. (Internet & Catalog Retail) | (a) | 36,610 | 15,892,035 | |||||||
Expedia, Inc. (Internet & Catalog Retail) | 95,070 | 10,395,904 | ||||||||
Lowe’s Cos., Inc. (Specialty Retail) | 142,520 | 9,544,564 | ||||||||
Ralph Lauren Corp. (Textiles, Apparel & Luxury Goods) | 60,280 | 7,978,661 | ||||||||
|
| |||||||||
| 67,301,978 | ||||||||||
|
| |||||||||
CONSUMER STAPLES – 3.6% | ||||||||||
Keurig Green Mountain, Inc. (Food Products) | 139,330 | 10,676,858 | ||||||||
Colgate-Palmolive Co. (Household Products) | 121,360 | 7,938,158 | ||||||||
|
| |||||||||
| 18,615,016 | ||||||||||
|
| |||||||||
ENERGY – 8.3% | ||||||||||
Baker Hughes, Inc. (Energy Equip. & Svs.) | 116,430 | 7,183,731 | ||||||||
Apache Corp. (Oil, Gas & Consumable Fuels) | 186,210 | 10,731,282 | ||||||||
Chevron Corp. (Oil, Gas & Consumable Fuels) | 94,750 | 9,140,532 | ||||||||
CONSOL Energy, Inc. (Oil, Gas & Consumable Fuels) | 391,400 | 8,509,036 | ||||||||
Devon Energy Corp. (Oil, Gas & Consumable Fuels) | 118,830 | 7,069,197 | ||||||||
|
| |||||||||
| 42,633,778 | ||||||||||
|
| |||||||||
FINANCIALS – 22.5% | ||||||||||
Citigroup, Inc. (Banks) | 401,850 | 22,198,194 | ||||||||
Citizens Financial Group, Inc. (Banks) | 271,290 | 7,408,930 | ||||||||
JPMorgan Chase & Co. (Banks) | 244,190 | 16,546,314 | ||||||||
Wells Fargo & Co. (Banks) | 275,550 | 15,496,932 | ||||||||
E*TRADE Financial Corp. (Capital Markets) | (a) | 271,520 | 8,132,024 | |||||||
American Express Co. (Consumer Finance) | 59,410 | 4,617,345 | ||||||||
American International Group, Inc. (Insurance) | 239,160 | 14,784,871 | ||||||||
Genworth Financial, Inc. Class A (Insurance) | (a) | 994,830 | 7,530,863 | |||||||
Hartford Financial Services Group, Inc. / The (Insurance) | 211,270 | 8,782,494 | ||||||||
American Homes 4 Rent (Real Estate Investment Trusts) | 649,230 | 10,413,649 | ||||||||
|
| |||||||||
| 115,911,616 | ||||||||||
|
| |||||||||
HEALTH CARE – 16.7% | ||||||||||
Alexion Pharmaceuticals, Inc. (Biotechnology) | (a) | 48,541 | 8,774,757 | |||||||
Amgen, Inc. (Biotechnology) | 88,670 | 13,612,618 | ||||||||
Medtronic PLC (Health Care Equip. & Supplies) | 179,210 | 13,279,461 | ||||||||
Express Scripts Holding Co. (Health Care Providers & Svs.) | (a) | 130,650 | 11,620,011 | |||||||
UnitedHealth Group, Inc. (Health Care Providers & Svs.) | 115,194 | 14,053,668 | ||||||||
AbbVie, Inc. (Pharmaceuticals) | 138,776 | 9,324,359 | ||||||||
Merck & Co., Inc. (Pharmaceuticals) | 269,850 | 15,362,561 | ||||||||
|
| |||||||||
| 86,027,435 | ||||||||||
|
| |||||||||
| Common Stocks (Continued) | Shares | Value | ||||||||
INDUSTRIALS – 7.1% | ||||||||||
Boeing Co. / The (Aerospace & Defense) | 60,370 | $ | 8,374,526 | |||||||
United Continental Holdings, Inc. (Airlines) | (a) | 187,050 | 9,915,520 | |||||||
Rockwell Automation, Inc. (Electrical Equip.) | 77,070 | 9,606,005 | ||||||||
PACCAR, Inc. (Machinery) | 130,695 | 8,339,648 | ||||||||
|
| |||||||||
| 36,235,699 | ||||||||||
|
| |||||||||
INFORMATION TECHNOLOGY – 16.1% | ||||||||||
Cisco Systems, Inc. (Communications Equip.) | 550,530 | 15,117,554 | ||||||||
Yahoo!, Inc. (Internet Software & Svs.) | (a) | 354,920 | 13,944,807 | |||||||
NXP Semiconductors NV (Semiconductors & Equip.) | (a) | 94,497 | 9,279,605 | |||||||
Microsoft Corp. (Software) | 464,120 | 20,490,898 | ||||||||
Apple, Inc. (Tech. Hardware, Storage & Periph.) | 84,245 | 10,566,429 | ||||||||
EMC Corp. (Tech. Hardware, Storage & Periph.) | 509,530 | 13,446,497 | ||||||||
|
| |||||||||
| 82,845,790 | ||||||||||
|
| |||||||||
MATERIALS – 5.2% | ||||||||||
Albemarle Corp. (Chemicals) | 96,050 | 5,308,684 | ||||||||
LyondellBasell Industries NV Class A (Chemicals) | 116,410 | 12,050,763 | ||||||||
Steel Dynamics, Inc. (Metals & Mining) | 443,296 | 9,182,877 | ||||||||
|
| |||||||||
| 26,542,324 | ||||||||||
|
| |||||||||
UTILITIES – 4.9% | ||||||||||
AES Corp. (Ind. Power & Renewable Elec.) | 974,371 | 12,920,159 | ||||||||
Calpine Corp. (Ind. Power & Renewable Elec.) | (a) | 688,830 | 12,392,052 | |||||||
|
| |||||||||
| 25,312,211 | ||||||||||
|
| |||||||||
Total Common Stocks (Cost $460,359,443) | $ | 501,425,847 | ||||||||
|
| |||||||||
| Master Limited Partnerships – 1.5% | Shares | Value | ||||||||
FINANCIALS – 1.5% | ||||||||||
KKR & Co. LP (Capital Markets) | 344,830 | $ | 7,879,366 | |||||||
|
| |||||||||
Total Master Limited Partnerships (Cost $7,250,558) | $ | 7,879,366 | ||||||||
|
| |||||||||
| Money Market Funds – 2.1% | Shares | Value | ||||||||
Fidelity Institutional Money Market Funds | 10,822,000 | $ | 10,822,000 | |||||||
|
| |||||||||
Total Money Market Funds (Cost $10,822,000) | $ | 10,822,000 | ||||||||
|
| |||||||||
Total Investments – 101.1% (Cost $478,432,001) | (b) | $ | 520,127,213 | |||||||
Liabilities in Excess of Other Assets – (1.1)% | (5,557,319) | |||||||||
|
| |||||||||
Net Assets – 100.0% | $ | 514,569,894 | ||||||||
|
| |||||||||
Percentages are stated as a percent of net assets.
Footnotes:
| (a) | Non-income producing security. |
| (b) | Represents cost for financial reporting purposes, which may differ from cost basis for federal income tax purposes. See also Note 7 of the Notes to Financial Statements. |
The accompanying notes are an integral part of these financial statements.
| 7 |
| Ohio National Fund, Inc. | Money Market Portfolio |
Portfolio Composition as of June 30, 2015 (1)
| % of Net Assets | ||||
Commercial Paper (2) | 54.0 | |||
U.S. Government Agency Issues | 4.1 | |||
Money Market Funds and | 41.9 | |||
|
| |||
| 100.0 | ||||
|
|
Top 10 Portfolio Holdings as of June 30, 2015 (1) (2)
| % of Net Assets |
1. Prudential Funding LLC | 4.6 | |||
2. U.S. Bank | 4.6 | |||
3. Federated Prime Cash Obligations | 4.6 | |||
4. Fidelity Institutional Money Market | 4.6 | |||
5. First American Prime Obligations | 4.6 | |||
6. Wal-Mart Stores, Inc. | 4.6 | |||
7. Exxon Mobil Corp. | 4.6 | |||
8. Nestle Capital Corp. | 4.6 | |||
9. Johnson & Johnson | 4.6 | |||
10. Toyota Motor Credit Corp. | 4.6 |
| (1) | Composition of Portfolio subject to change. |
| (2) | Sectors: |
| % of Net Assets | ||||
Financials | 22.3 | |||
Consumer Staples | 9.1 | |||
Information Technology | 8.6 | |||
Energy | 5.3 | |||
Health Care | 4.6 | |||
Consumer Discretionary | 4.1 | |||
|
| |||
| 54.0 | ||||
|
|
| 8 |
| Ohio National Fund, Inc. | Money Market Portfolio |
Schedule of Investments | June 30, 2015 (Unaudited) |
| Commercial Paper – 54.0% | (b) Rate | Maturity | Face Amount | Amortized Cost | ||||||||||||
CONSUMER DISCRETIONARY – 4.1% | ||||||||||||||||
Walt Disney Co. / The (Media) | (a) | 0.070% | 07/01/2015 | $ | 8,000,000 | $ | 8,000,000 | |||||||||
|
| |||||||||||||||
CONSUMER STAPLES – 9.1% | ||||||||||||||||
Wal-Mart Stores, Inc. (Food & Staples Retailing) | (a) | 0.050% | 07/06/2015 | 9,000,000 | 8,999,938 | |||||||||||
Nestle Capital Corp. (Food Products) | (a) | 0.060% | 07/20/2015 | 9,000,000 | 8,999,715 | |||||||||||
|
| |||||||||||||||
| 17,999,653 | ||||||||||||||||
|
| |||||||||||||||
ENERGY – 5.3% | ||||||||||||||||
Chevron Corp. (Oil, Gas & Consumable Fuels) | (a) | 0.080% | 07/16/2015 | 1,500,000 | 1,499,950 | |||||||||||
Exxon Mobil Corp. (Oil, Gas & Consumable Fuels) | 0.080% | 07/06/2015 | 9,000,000 | 8,999,900 | ||||||||||||
|
| |||||||||||||||
| 10,499,850 | ||||||||||||||||
|
| |||||||||||||||
FINANCIALS – 22.3% | ||||||||||||||||
U.S. Bank (Commercial Banks) | 0.050% | 07/01/2015 | 9,000,000 | 9,000,000 | ||||||||||||
American Honda Finance Corp. (Consumer Finance) | 0.110% | 07/23/2015 | 9,000,000 | 8,999,395 | ||||||||||||
John Deere Capital Corp. (Consumer Finance) | (a) | 0.120% | 07/21/2015 | 8,000,000 | 7,999,466 | |||||||||||
Toyota Motor Credit Corp. (Consumer Finance) | 0.100% | 07/13/2015 | 9,000,000 | 8,999,700 | ||||||||||||
Prudential Funding LLC (Insurance) | 0.030% | 07/01/2015 | 9,000,000 | 9,000,000 | ||||||||||||
|
| |||||||||||||||
| 43,998,561 | ||||||||||||||||
|
| |||||||||||||||
HEALTH CARE – 4.6% | ||||||||||||||||
Johnson & Johnson (Pharmaceuticals) | (a) | 0.050% | 07/24/2015 | 9,000,000 | 8,999,713 | |||||||||||
|
| |||||||||||||||
INFORMATION TECHNOLOGY – 8.6% | ||||||||||||||||
International Business Machines Corp. (IT Services) | (a) | 0.090% | 07/27/2015 | 9,000,000 | 8,999,415 | |||||||||||
Microsoft Corp. (Software) | (a) | 0.070% | 07/22/2015 | 8,000,000 | 7,999,673 | |||||||||||
|
| |||||||||||||||
| 16,999,088 | ||||||||||||||||
|
| |||||||||||||||
Total Commercial Paper (Cost $106,496,865) | $ | 106,496,865 | ||||||||||||||
|
| |||||||||||||||
| U.S. Government Agency Issues – 4.1% | Rate | Maturity | Face Amount | Amortized Cost | ||||||||||||
Federal Home Loan Bank | 0.030% | 07/15/2015 | $ | 8,000,000 | $ | 7,999,907 | ||||||||||
|
| |||||||||||||||
Total U.S. Government Agency Issues (Cost $7,999,907) | $ | 7,999,907 | ||||||||||||||
|
| |||||||||||||||
| Money Market Funds – 13.7% | Shares | Value | ||||||||||||||
Federated Prime Cash Obligations Fund – Institutional Class | 0.070% | 07/01/2015 | 9,000,000 | $ | 9,000,000 | |||||||||||
Fidelity Institutional Money Market Funds Money Market Portfolio – Class I | 0.100% | 07/01/2015 | 9,000,000 | 9,000,000 | ||||||||||||
First American Prime Obligations Fund – Class Z | 0.030% | 07/01/2015 | 9,000,000 | 9,000,000 | ||||||||||||
|
| |||||||||||||||
Total Money Market Funds (Cost $27,000,000) | $ | 27,000,000 | ||||||||||||||
|
| |||||||||||||||
Total Investments – 71.8% (Cost $141,496,772) | (c) | $ | 141,496,772 | |||||||||||||
Other Assets in Excess of Liabilities – 28.2% | 55,694,038 | |||||||||||||||
|
| |||||||||||||||
Net Assets – 100.0% | $ | 197,190,810 | ||||||||||||||
|
| |||||||||||||||
Percentages are stated as a percent of net assets.
Footnotes:
| (a) | Security exempt from registration under Section 4 (2) of the Securities Act of 1933. These securities may be resold in transactions exempt from registration, normally to qualified buyers under Rule 144A. At June 30, 2015, the value of these securities totaled $61,497,870, or 31.2% of the Portfolio’s net assets. These securities were deemed liquid pursuant to procedures approved by the Board of Directors. |
| (b) | Rate presented is the effective yield at the time of purchase. |
| (c) | Represents cost for federal income tax and financial reporting purposes. See also Note 2 regarding the use of amortized cost for valuation of instruments in this Portfolio. |
The accompanying notes are an integral part of these financial statements.
| 9 |
| Ohio National Fund, Inc. | Bond Portfolio |
Objective/Strategy
The Bond Portfolio seeks to obtain a high level of income and opportunity for capital appreciation consistent with the preservation of capital by investing primarily in intermediate-term and long-term fixed income securities.
Performance as of June 30, 2015
Average Annual Returns: | ||||
One year | 0.78% | |||
Five years | 3.79% | |||
Ten years | 3.87% |
Past performance does not guarantee future results. The performance data quoted represents past performance and current returns may be lower or higher. Total return figures include change in share price and reinvestment of dividends and capital gains. The investment return and principal value will fluctuate so that an investor’s shares, when redeemed, may be worth more or less than the original cost. To obtain performance information up to the most recent month end, call toll-free 1-877-781-6392.
The Portfolio is not open to direct retail investment. Beneficial interest in shares is obtained solely by purchase of variable life insurance policies and variable annuity contracts. Actual performance results for variable annuity and variable universal life contracts will be lower due to contract charges. Consult your contract for applicable charges.
Comments
For the six-month period ended June 30, 2015, the Bond Portfolio returned -0.58% versus -0.46% for the current benchmark, the BofA Merrill Lynch U.S. Corporate Master Index (the “Index”).
Both the Portfolio and the Index had small negative returns for the six-month period because U.S. Treasury yields increased across much of the yield curve, particularly on the long end, and credit spreads widened marginally. For the six-month period, the 10-year Treasury yield increased 18 basis points and the 30-year Treasury yield increased 37 basis points. Interest rates moved higher in anticipation of the Federal Reserve beginning to tighten credit later this year. As measured by the Index, credit spreads widened 4 basis points during the period. Credit spreads widened, primarily because of weakness in energy-related industries as a result of the collapse in oil prices last year and, to a lesser extent, from shareholder-friendly actions taken by companies that increased leverage marginally.
The Portfolio under-performed the Index by 12 basis points during the six-month period, primarily due to the Portfolio’s expenses. For the period, the Portfolio’s expense ratio was 32 basis points (not annualized). Other factors impacting relative performance include the Portfolio’s duration, its credit quality and the allocation to the energy sector. The Portfolio’s duration positioning benefited relative performance because the Portfolio’s duration was approximately 0.25 years short of the Index during a time period when Treasury yields rose. The Portfolio’s credit quality stratification also benefited relative performance. The Portfolio was under-weighted in A and AA rated securities, which under-performed, and was over-weighted in BBB rated securities which outperformed. The approximate 2% weighting in BB rated securities also added to relative performance. (1)
With the exception of one industry sector, differences in industry weighting between the Portfolio and the Index had little impact on relative performance. The Portfolio had a 4% under-weighting to the oil and gas sector at the start of the year, but after the energy sector performed so poorly early in the year, bonds in the oil and gas sector were purchased, bringing the allocation to this sector to a near 1% over-weighting by the end of the first-half. The increase in the
weighting to the oil and gas sector benefited relative performance because this sector performed very well late in the first-half of 2015. The approximate 10% under-weighting in the banking sector had little impact on relative performance because the banking sector performed about as well as the Index did overall. The Portfolio was over-weighted in the utilities sector by approximately 4% and this had a minor negative impact on relative performance because utilities under-performed. The approximate 4% under-weighting to the telecommunications sector also benefited relative performance because this sector underperformed. (1)
Because the U.S. economy continues its slow growth, and there were no significant leveraging events during the first half of 2015, the credit quality of the holdings in the Portfolio was maintained. That being said, the five bonds that performed the worst were Time Warner Cable, Inc., The Allstate Corp., Chesapeake Energy Corp., South Carolina Electric and Gas Co., and American International Group, Inc. All but one of these bonds have long maturities, and their bond prices were negatively impacted as interest rates rose during the period. In addition to having a long maturity, the price of the Time Warner Cable, Inc. bond was hurt when its merger with Comcast Corp. was called off and the company later agreed to a merger with Charter Communications, Inc. The price of the Chesapeake Energy Corp. security was negatively impacted by low oil prices. (1)
The five best performing bonds were The Williams Cos., Inc., Southwestern Energy Co., Targa Resources Partners LP, Kohl’s Corp., and LG&E and KU Energy LLC. The Williams Cos., Inc., bond performed very well on news that the holding company would be merged into its operating company. One energy-related name, Targa Resources Partners LP, was both bought and sold during the six-month period to take advantage of the opportunities available in the energy sector. (1)
We expect the U.S. economy to continue to grow through the end of the year. While concerns regarding China and Greece have made their way into the headlines, the risks to both regions should not impact the U.S. economy. The corporate profit picture looks positive but shareholder-friendly actions taken by companies will increase leverage and could pressure credit spreads. We can also expect rising interest rates as the year progresses because the Federal Reserve will likely begin to tighten the federal funds rate sometime in the second half of the year. For this reason, we expect to maintain the duration of the Portfolio short of the Index duration. Interest rates are so low now that the risk for fixed income investors is a rise in rates. Because the outlook for corporate profits continues to be good, we plan to continue to overweight what we consider to be solid BBB investment grade bonds. We also expect to add some BB high yield bonds to the Portfolio if credit spreads for these securities widen. We would rather take credit risk than interest rate risk given the low level of interest rates. (1)
| (1) | The Portfolio’s composition is subject to change. Holdings and weightings are as of June 30, 2015. |
| 10 | (continued) |
| Ohio National Fund, Inc. | Bond Portfolio (Continued) |
Change in Value of $10,000 Investment
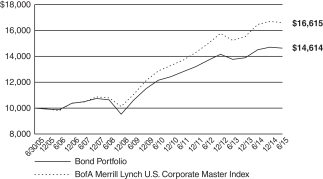
Hypothetical illustration based on past performance. Future performance will vary. The Portfolio’s returns reflect reinvested dividends. The Portfolio’s holdings may differ significantly from the securities in the index. The index is unmanaged and therefore does not reflect the cost of portfolio management and accounting.
The BofA Merrill Lynch U.S. Corporate Master Index tracks the performance of all U.S. dollar-denominated, investment grade corporate public debt issued in the U.S. domestic bond market. Qualifying bonds must have an investment grade rating (based on an average of Moody’s, S&P, and Fitch). In addition, qualifying securities must have at least one year remaining term to maturity, a fixed coupon schedule, and a minimum amount outstanding of $250 million.
Portfolio Composition as of June 30, 2015 (1)
| % of Net Assets | ||||
Corporate Bonds (3) | 97.2 | |||
Asset-Backed Securities (3) | 0.6 | |||
Money Market Funds and | 2.2 | |||
|
| |||
| 100.0 | ||||
|
|
Top 10 Portfolio Holdings as of June 30, 2015 (1) (2)
| % of Net Assets |
1. Fifth Third Bancorp | 1.2 | |||
2. Union Electric Co. | 1.0 | |||
3. Janus Capital Group, Inc. | 1.0 | |||
4. Prudential Financial, Inc. | 1.0 | |||
5. Kansas City Power & Light Co. | 1.0 | |||
6. CSX Corp. | 1.0 | |||
7. Bunge NA Finance LP | 1.0 | |||
8. Comerica Bank | 1.0 | |||
9. Weatherford International Ltd. | 1.0 | |||
10. Hartford Financial Services | 1.0 |
| (1) | Composition of Portfolio subject to change. |
| (2) | Short-term investments have been excluded from the list of Top 10 Portfolio Holdings. |
| (3) | Sectors (combined): |
| % of Net Assets | ||||
Financials | 26.4 | |||
Energy | 16.8 | |||
Utilities | 12.0 | |||
Industrials | 10.6 | |||
Consumer Discretionary | 9.0 | |||
Health Care | 6.1 | |||
Information Technology | 5.7 | |||
Materials | 5.1 | |||
Consumer Staples | 4.1 | |||
Telecommunication Services | 2.0 | |||
|
| |||
| 97.8 | ||||
|
|
| 11 | (continued) |
| Ohio National Fund, Inc. | Bond Portfolio |
Schedule of Investments | June 30, 2015 (Unaudited) |
| Corporate Bonds – 97.2% | Rate | Maturity | Face Amount | Value | ||||||||||||
CONSUMER DISCRETIONARY – 9.0% |
| |||||||||||||||
Magna International, Inc. (Auto Components) | 3.625% | 06/15/2024 | $ | 1,000,000 | $ | 983,441 | ||||||||||
General Motors Co. (Automobiles) | 5.000% | 04/01/2035 | 900,000 | 883,669 | ||||||||||||
Darden Restaurants, Inc. (Hotels, Restaurants & Leisure) | 3.350% | 11/01/2022 | 206,000 | 193,130 | ||||||||||||
Newell Rubbermaid, Inc. (Household Durables) | 6.250% | 04/15/2018 | 500,000 | 553,919 | ||||||||||||
Mattel, Inc. (Leisure Products) | 2.350% | 05/06/2019 | 1,000,000 | 997,568 | ||||||||||||
Mattel, Inc. (Leisure Products) | 3.150% | 03/15/2023 | 625,000 | 604,379 | ||||||||||||
21st Century Fox America, Inc. (Media) | 4.500% | 02/15/2021 | 1,250,000 | 1,351,708 | ||||||||||||
Comcast Corp. (Media) | 4.250% | 01/15/2033 | 750,000 | 731,260 | ||||||||||||
Discovery Communications, LLC (Media) | 4.375% | 06/15/2021 | 1,000,000 | 1,050,889 | ||||||||||||
Discovery Communications, LLC (Media) | 3.300% | 05/15/2022 | 275,000 | 270,081 | ||||||||||||
Time Warner Cable, Inc. (Media) | 4.500% | 09/15/2042 | 425,000 | 348,240 | ||||||||||||
Time Warner, Inc. (Media) | 2.100% | 06/01/2019 | 1,400,000 | 1,389,786 | ||||||||||||
Viacom, Inc. (Media) | 4.850% | 12/15/2034 | 1,500,000 | 1,383,257 | ||||||||||||
Walt Disney Co. / The (Media) | 3.700% | 12/01/2042 | 925,000 | 846,322 | ||||||||||||
Kohl’s Corp. (Multiline Retail) | 4.000% | 11/01/2021 | 925,000 | 978,808 | ||||||||||||
AutoZone, Inc. (Specialty Retail) | 3.125% | 07/15/2023 | 925,000 | 895,838 | ||||||||||||
Bed Bath & Beyond, Inc. (Specialty Retail) | 5.165% | 08/01/2044 | 900,000 | 890,363 | ||||||||||||
|
| |||||||||||||||
| 14,352,658 | ||||||||||||||||
|
| |||||||||||||||
CONSUMER STAPLES – 4.1% |
| |||||||||||||||
Anheuser-Busch Cos., LLC (Beverages) | 5.500% | 01/15/2018 | 750,000 | 824,456 | ||||||||||||
Anheuser-Busch InBev Finance, Inc. (Beverages) | 4.000% | 01/17/2043 | 750,000 | 685,949 | ||||||||||||
CVS Health Corp. (Food & Staples Retailing) | 5.750% | 06/01/2017 | 301,000 | 325,243 | ||||||||||||
Kroger Co. / The (Food & Staples Retailing) | 2.950% | 11/01/2021 | 900,000 | 895,544 | ||||||||||||
Sysco Corp. (Food & Staples Retailing) | 4.350% | 10/02/2034 | 900,000 | 909,000 | ||||||||||||
Bunge NA Finance LP (Food Products) | 5.900% | 04/01/2017 | 1,500,000 | 1,602,162 | ||||||||||||
Philip Morris International, Inc. (Tobacco) | 4.125% | 05/17/2021 | 1,250,000 | 1,347,329 | ||||||||||||
|
| |||||||||||||||
| 6,589,683 | ||||||||||||||||
|
| |||||||||||||||
ENERGY – 16.8% | ||||||||||||||||
Ensco PLC (Energy Equip. & Svs.) | 5.200% | 03/15/2025 | 900,000 | 889,791 | ||||||||||||
Noble Holding International Ltd. (Energy Equip. & Svs.) | 4.000% | 03/16/2018 | 900,000 | 920,993 | ||||||||||||
Noble Holding International Ltd. (Energy Equip. & Svs.) | 5.950% | 04/01/2025 | 1,000,000 | 984,619 | ||||||||||||
Weatherford International Ltd. (Energy Equip. & Svs.) | 6.000% | 03/15/2018 | 1,500,000 | 1,596,049 | ||||||||||||
Anadarko Petroleum Corp. (Oil, Gas & Consumable Fuels) | 5.950% | 09/15/2016 | 1,000,000 | 1,054,080 | ||||||||||||
Buckeye Partners LP (Oil, Gas & Consumable Fuels) | 4.875% | 02/01/2021 | 1,000,000 | 1,041,702 | ||||||||||||
Chesapeake Energy Corp. (Oil, Gas & Consumable Fuels) | 4.875% | 04/15/2022 | 1,000,000 | 870,000 | ||||||||||||
Columbia Pipeline Group, Inc. (Oil, Gas & Consumable Fuels) | (a) | 4.500% | 06/01/2025 | 900,000 | 886,496 | |||||||||||
ConocoPhillips Co. (Oil, Gas & Consumable Fuels) | 3.350% | 05/15/2025 | 1,350,000 | 1,332,054 | ||||||||||||
Devon Energy Corp. (Oil, Gas & Consumable Fuels) | 3.250% | 05/15/2022 | 900,000 | 888,502 | ||||||||||||
Energy Transfer Partners LP (Oil, Gas & Consumable Fuels) | 4.750% | 01/15/2026 | 400,000 | 394,269 | ||||||||||||
Enterprise Products Operating LLC (Oil, Gas & Consumable Fuels) | 3.900% | 02/15/2024 | 1,000,000 | 1,002,810 | ||||||||||||
Kinder Morgan Energy Partners LP (Oil, Gas & Consumable Fuels) | 4.150% | 03/01/2022 | 1,000,000 | 1,000,510 | ||||||||||||
Kinder Morgan, Inc. (Oil, Gas & Consumable Fuels) | 5.300% | 12/01/2034 | 1,000,000 | 921,737 | ||||||||||||
Magellan Midstream Partners LP (Oil, Gas & Consumable Fuels) | 4.250% | 02/01/2021 | 1,000,000 | 1,062,923 | ||||||||||||
Marathon Oil Corp. (Oil, Gas & Consumable Fuels) | 3.850% | 06/01/2025 | 850,000 | 831,792 | ||||||||||||
Marathon Petroleum Corp. (Oil, Gas & Consumable Fuels) | 4.750% | 09/15/2044 | 1,000,000 | 909,481 | ||||||||||||
MarkWest Energy Partners LP / MarkWest Energy Finance Corp. (Oil, Gas & Consumable Fuels) | 4.875% | 12/01/2024 | 1,000,000 | 977,500 | ||||||||||||
Murphy Oil Corp. (Oil, Gas & Consumable Fuels) | 3.700% | 12/01/2022 | 1,400,000 | 1,279,509 | ||||||||||||
Occidental Petroleum Corp. (Oil, Gas & Consumable Fuels) | 3.125% | 02/15/2022 | 1,000,000 | 1,001,416 | ||||||||||||
Phillips 66 (Oil, Gas & Consumable Fuels) | 4.300% | 04/01/2022 | 1,300,000 | 1,363,059 | ||||||||||||
Plains All American Pipeline LP / PAA Finance Corp. (Oil, Gas & Consumable Fuels) | 2.850% | 01/31/2023 | 1,000,000 | 937,367 | ||||||||||||
Shell International Finance BV (Oil, Gas & Consumable Fuels) | 4.375% | 03/25/2020 | 1,250,000 | 1,367,314 | ||||||||||||
Southwestern Energy Co. (Oil, Gas & Consumable Fuels) | 4.050% | 01/23/2020 | 900,000 | 924,186 | ||||||||||||
TransCanada PipeLines Ltd. (Oil, Gas & Consumable Fuels) | 2.500% | 08/01/2022 | 1,425,000 | 1,350,129 | ||||||||||||
Williams Cos., Inc. / The (Oil, Gas & Consumable Fuels) | 5.750% | 06/24/2044 | 1,000,000 | 925,047 | ||||||||||||
|
| |||||||||||||||
| 26,713,335 | ||||||||||||||||
|
| |||||||||||||||
FINANCIALS – 26.4% |
| |||||||||||||||
Bank of America Corp. (Banks) | 5.650% | 05/01/2018 | 1,000,000 | 1,097,966 | ||||||||||||
Bank of America Corp. (Banks) | 4.200% | 08/26/2024 | 500,000 | 498,087 | ||||||||||||
Citigroup, Inc. (Banks) | 4.400% | 06/10/2025 | 900,000 | 895,296 | ||||||||||||
Comerica Bank (Banks) | 5.750% | 11/21/2016 | 1,500,000 | 1,598,994 | ||||||||||||
Fifth Third Bancorp (Banks) | 4.500% | 06/01/2018 | 1,750,000 | 1,852,685 | ||||||||||||
KeyCorp (Banks) | 5.100% | 03/24/2021 | 500,000 | 554,194 | ||||||||||||
PNC Bank NA (Banks) | 3.250% | 06/01/2025 | 850,000 | 828,821 | ||||||||||||
SunTrust Banks, Inc. (Banks) | 2.500% | 05/01/2019 | 1,400,000 | 1,406,898 | ||||||||||||
Wells Fargo & Co. (Banks) | 4.650% | 11/04/2044 | 1,000,000 | 954,987 | ||||||||||||
Goldman Sachs Group, Inc. / The (Capital Markets) | 3.750% | 05/22/2025 | 1,400,000 | 1,379,445 | ||||||||||||
Janus Capital Group, Inc. (Capital Markets) | (b) | 6.700% | 06/15/2017 | 1,500,000 | 1,632,186 | |||||||||||
| 12 | (continued) |
| Ohio National Fund, Inc. | Bond Portfolio (Continued) |
Schedule of Investments | June 30, 2015 (Unaudited) |
| Corporate Bonds (Continued) | Rate | Maturity | Face Amount | Value | ||||||||||||
FINANCIALS (continued) | ||||||||||||||||
Morgan Stanley (Capital Markets) | 3.750% | 02/25/2023 | $ | 1,250,000 | $ | 1,265,268 | ||||||||||
Morgan Stanley (Capital Markets) | 3.950% | 04/23/2027 | 1,000,000 | 941,241 | ||||||||||||
Northern Trust Corp. (Capital Markets) | 3.450% | 11/04/2020 | 1,000,000 | 1,057,036 | ||||||||||||
State Street Corp. (Capital Markets) | 4.375% | 03/07/2021 | 1,250,000 | 1,375,481 | ||||||||||||
Ally Financial, Inc. (Consumer Finance) | 5.125% | 09/30/2024 | 1,000,000 | 1,002,500 | ||||||||||||
Capital One Financial Corp. (Consumer Finance) | 2.450% | 04/24/2019 | 925,000 | 924,441 | ||||||||||||
Discover Financial Services (Consumer Finance) | 6.450% | 06/12/2017 | 750,000 | 814,441 | ||||||||||||
Synchrony Financial (Consumer Finance) | 4.250% | 08/15/2024 | 900,000 | 902,614 | ||||||||||||
General Electric Capital Corp. (Diversified Financial Svs.) | 5.625% | 05/01/2018 | 1,000,000 | 1,106,276 | ||||||||||||
Moody’s Corp. (Diversified Financial Svs.) | 5.250% | 07/15/2044 | 1,000,000 | 1,024,593 | ||||||||||||
Aflac, Inc. (Insurance) | 3.625% | 06/15/2023 | 1,425,000 | 1,438,184 | ||||||||||||
Allstate Corp. / The (Insurance) | 5.200% | 01/15/2042 | 500,000 | 526,195 | ||||||||||||
American International Group, Inc. (Insurance) | 3.875% | 01/15/2035 | 1,400,000 | 1,264,785 | ||||||||||||
Hartford Financial Services Group, Inc. / The (Insurance) | 5.375% | 03/15/2017 | 1,500,000 | 1,593,770 | ||||||||||||
Liberty Mutual Group, Inc. (Insurance) | (a) | 4.850% | 08/01/2044 | 1,500,000 | 1,444,116 | |||||||||||
Marsh & McLennan Cos., Inc. (Insurance) | 3.500% | 06/03/2024 | 1,400,000 | 1,393,564 | ||||||||||||
Metropolitan Life Global Funding I (Insurance) | (a) | 2.300% | 04/10/2019 | 1,500,000 | 1,508,269 | |||||||||||
New York Life Global Funding (Insurance) | (a) | 2.150% | 06/18/2019 | 1,000,000 | 1,001,832 | |||||||||||
Prudential Financial, Inc. (Insurance) | 6.100% | 06/15/2017 | 1,500,000 | 1,629,681 | ||||||||||||
Boston Properties LP (Real Estate Investment Trusts) | 3.125% | 09/01/2023 | 925,000 | 897,970 | ||||||||||||
Camden Property Trust (Real Estate Investment Trusts) | 4.250% | 01/15/2024 | 500,000 | 513,701 | ||||||||||||
Equity One, Inc. (Real Estate Investment Trusts) | 6.250% | 01/15/2017 | 1,250,000 | 1,332,269 | ||||||||||||
Federal Realty Investment Trust (Real Estate Investment Trusts) | 3.000% | 08/01/2022 | 1,425,000 | 1,402,180 | ||||||||||||
HCP, Inc. (Real Estate Investment Trusts) | 4.000% | 06/01/2025 | 1,500,000 | 1,466,262 | ||||||||||||
Simon Property Group LP (Real Estate Investment Trusts) | 3.750% | 02/01/2024 | 1,475,000 | 1,508,888 | ||||||||||||
|
| |||||||||||||||
| 42,035,116 | ||||||||||||||||
|
| |||||||||||||||
HEALTH CARE – 6.1% | ||||||||||||||||
Amgen, Inc. (Biotechnology) | 4.100% | 06/15/2021 | 1,000,000 | 1,064,141 | ||||||||||||
Baxalta, Inc. (Biotechnology) | (a) | 4.000% | 06/23/2025 | 1,400,000 | 1,390,844 | |||||||||||
Gilead Sciences, Inc. (Biotechnology) | 4.500% | 02/01/2045 | 900,000 | 893,127 | ||||||||||||
Becton Dickinson and Co. (Health Care Equip. & Supplies) | 5.000% | 05/15/2019 | 500,000 | 546,273 | ||||||||||||
AmerisourceBergen Corp. (Health Care Providers & Svs.) | 4.875% | 11/15/2019 | 500,000 | 550,907 | ||||||||||||
Express Scripts Holding Co. (Health Care Providers & Svs.) | 2.250% | 06/15/2019 | 1,400,000 | 1,387,644 | ||||||||||||
Laboratory Corp. of America Holdings (Health Care Providers & Svs.) | 3.750% | 08/23/2022 | 425,000 | 429,362 | ||||||||||||
Quest Diagnostics, Inc. (Health Care Providers & Svs.) | 2.700% | 04/01/2019 | 1,000,000 | 1,007,561 | ||||||||||||
AbbVie, Inc. (Pharmaceuticals) | 2.900% | 11/06/2022 | 1,425,000 | 1,378,575 | ||||||||||||
Merck Sharp & Dohme Corp. (Pharmaceuticals) | 5.000% | 06/30/2019 | 1,000,000 | 1,112,711 | ||||||||||||
|
| |||||||||||||||
| 9,761,145 | ||||||||||||||||
|
| |||||||||||||||
INDUSTRIALS – 10.0% | ||||||||||||||||
BAE Systems Holdings, Inc. (Aerospace & Defense) | (a) | 6.375% | 06/01/2019 | 750,000 | 854,739 | |||||||||||
Lockheed Martin Corp. (Aerospace & Defense) | 3.350% | 09/15/2021 | 1,000,000 | 1,028,106 | ||||||||||||
Lockheed Martin Corp. (Aerospace & Defense) | 3.600% | 03/01/2035 | 1,000,000 | 920,609 | ||||||||||||
Raytheon Co. (Aerospace & Defense) | 4.400% | 02/15/2020 | 1,250,000 | 1,367,560 | ||||||||||||
FedEx Corp. (Air Freight & Logistics) | 4.900% | 01/15/2034 | 1,425,000 | 1,473,055 | ||||||||||||
American Airlines Group, Inc. (Airlines) | (a) | 4.625% | 03/01/2020 | 1,000,000 | 967,500 | |||||||||||
Waste Management, Inc. (Commercial Svs. & Supplies) | 6.100% | 03/15/2018 | 500,000 | 557,927 | ||||||||||||
Deere & Co. (Machinery) | 4.375% | 10/16/2019 | 1,250,000 | 1,369,761 | ||||||||||||
Illinois Tool Works, Inc. (Machinery) | 3.375% | 09/15/2021 | 500,000 | 521,785 | ||||||||||||
Parker-Hannifin Corp. (Machinery) | 4.200% | 11/21/2034 | 1,400,000 | 1,391,340 | ||||||||||||
Burlington Northern Santa Fe, LLC (Road & Rail) | 4.550% | 09/01/2044 | 900,000 | 887,522 | ||||||||||||
CSX Corp. (Road & Rail) | 5.600% | 05/01/2017 | 1,500,000 | 1,616,664 | ||||||||||||
Norfolk Southern Corp. (Road & Rail) | 3.000% | 04/01/2022 | 600,000 | 596,167 | ||||||||||||
Union Pacific Corp. (Road & Rail) | 4.000% | 02/01/2021 | 1,250,000 | 1,348,208 | ||||||||||||
Union Pacific Corp. (Road & Rail) | 3.250% | 08/15/2025 | 1,000,000 | 988,005 | ||||||||||||
|
| |||||||||||||||
| 15,888,948 | ||||||||||||||||
|
| |||||||||||||||
INFORMATION TECHNOLOGY – 5.7% | ||||||||||||||||
Harris Corp. (Communications Equip.) | 2.700% | 04/27/2020 | 900,000 | 887,724 | ||||||||||||
QUALCOMM, Inc. (Communications Equip.) | 3.450% | 05/20/2025 | 1,000,000 | 972,959 | ||||||||||||
Denali Borrower LLC / Denali Finance Corp. (Computers & Peripherals) | (a) | 5.625% | 10/15/2020 | 900,000 | 946,125 | |||||||||||
Computer Sciences Corp. (IT Svs.) | 6.500% | 03/15/2018 | 1,000,000 | 1,104,148 | ||||||||||||
Intel Corp. (Semiconductors & Equip.) | 4.000% | 12/15/2032 | 1,500,000 | 1,433,273 | ||||||||||||
KLA-Tencor Corp. (Semiconductors & Equip.) | 3.375% | 11/01/2019 | 900,000 | 923,756 | ||||||||||||
Microsoft Corp. (Software) | 3.500% | 02/12/2035 | 400,000 | 364,499 | ||||||||||||
Oracle Corp. (Software) | 4.300% | 07/08/2034 | 1,500,000 | 1,474,769 | ||||||||||||
Apple, Inc. (Tech. Hardware, Storage & Periph.) | 2.500% | 02/09/2025 | 1,000,000 | 936,210 | ||||||||||||
|
| |||||||||||||||
| 9,043,463 | ||||||||||||||||
|
| |||||||||||||||
| 13 | (continued) |
| Ohio National Fund, Inc. | Bond Portfolio (Continued) |
Schedule of Investments | June 30, 2015 (Unaudited) |
| Corporate Bonds (Continued) | Rate | Maturity | Face Amount | Value | ||||||||||||
MATERIALS – 5.1% | ||||||||||||||||
Dow Chemical Co. / The (Chemicals) | 4.250% | 10/01/2034 | $ | 1,400,000 | $ | 1,311,128 | ||||||||||
Eastman Chemical Co. (Chemicals) | 3.600% | 08/15/2022 | 1,000,000 | 1,009,683 | ||||||||||||
FMC Corp. (Chemicals) | 3.950% | 02/01/2022 | 1,000,000 | 1,013,966 | ||||||||||||
Praxair, Inc. (Chemicals) | 2.650% | 02/05/2025 | 1,000,000 | 954,084 | ||||||||||||
Packaging Corp. of America (Containers & Packaging) | 4.500% | 11/01/2023 | 675,000 | 695,238 | ||||||||||||
Freeport-McMoRan, Inc. (Metals & Mining) | 3.550% | 03/01/2022 | 925,000 | 855,266 | ||||||||||||
Newmont Mining Corp. (Metals & Mining) | 3.500% | 03/15/2022 | 1,425,000 | 1,358,425 | ||||||||||||
Teck Resources Ltd. (Metals & Mining) | 3.750% | 02/01/2023 | 1,000,000 | 859,159 | ||||||||||||
|
| |||||||||||||||
| 8,056,949 | ||||||||||||||||
|
| |||||||||||||||
TELECOMMUNICATION SERVICES – 2.0% | ||||||||||||||||
AT&T, Inc. (Diversified Telecom. Svs.) | 3.400% | 05/15/2025 | 900,000 | 854,528 | ||||||||||||
Verizon Communications, Inc. (Diversified Telecom. Svs.) | 4.600% | 04/01/2021 | 1,250,000 | 1,341,921 | ||||||||||||
Verizon Communications, Inc. (Diversified Telecom. Svs.) | 3.850% | 11/01/2042 | 425,000 | 350,014 | ||||||||||||
Rogers Communications, Inc. (Wireless Telecom. Svs.) | 3.000% | 03/15/2023 | 700,000 | 671,505 | ||||||||||||
|
| |||||||||||||||
| 3,217,968 | ||||||||||||||||
|
| |||||||||||||||
UTILITIES – 12.0% | ||||||||||||||||
Appalachian Power Co. (Electric Utilities) | 4.600% | 03/30/2021 | 1,000,000 | 1,086,105 | ||||||||||||
Commonwealth Edison Co. (Electric Utilities) | 5.950% | 08/15/2016 | 1,500,000 | 1,581,858 | ||||||||||||
DTE Electric Co. (Electric Utilities) | 3.375% | 03/01/2025 | 1,000,000 | 1,010,833 | ||||||||||||
Duke Energy Florida, Inc. (Electric Utilities) | 4.550% | 04/01/2020 | 500,000 | 549,053 | ||||||||||||
ITC Holdings Corp. (Electric Utilities) | 3.650% | 06/15/2024 | 500,000 | 494,337 | ||||||||||||
Kansas City Power & Light Co. (Electric Utilities) | 5.850% | 06/15/2017 | 1,500,000 | 1,624,940 | ||||||||||||
South Carolina Electric & Gas Co. (Electric Utilities) | 4.350% | 02/01/2042 | 1,000,000 | 954,938 | ||||||||||||
Tenaska Georgia Partners LP (Electric Utilities) | 9.500% | 02/01/2030 | 439,987 | 547,328 | ||||||||||||
Union Electric Co. (Electric Utilities) | 6.400% | 06/15/2017 | 1,500,000 | 1,643,427 | ||||||||||||
Westar Energy, Inc. (Electric Utilities) | 4.125% | 03/01/2042 | 500,000 | 482,569 | ||||||||||||
Xcel Energy, Inc. (Electric Utilities) | 4.700% | 05/15/2020 | 1,000,000 | 1,089,847 | ||||||||||||
AGL Capital Corp. (Gas Utilities) | 5.250% | 08/15/2019 | 1,000,000 | 1,104,664 | ||||||||||||
Southwest Gas Corp. (Gas Utilities) | 3.875% | 04/01/2022 | 1,250,000 | 1,308,328 | ||||||||||||
Spectra Energy Capital LLC (Gas Utilities) | 3.300% | 03/15/2023 | 1,425,000 | 1,305,162 | ||||||||||||
Avista Corp. (Multi-Utilities) | 5.950% | 06/01/2018 | 1,000,000 | 1,120,865 | ||||||||||||
LG&E and KU Energy LLC (Multi-Utilities) | 4.375% | 10/01/2021 | 1,000,000 | 1,083,465 | ||||||||||||
Public Service Electric & Gas Co. (Multi-Utilities) | 3.950% | 05/01/2042 | 750,000 | 708,781 | ||||||||||||
American Water Capital Corp. (Water Utilities) | 4.300% | 12/01/2042 | 1,400,000 | 1,374,097 | ||||||||||||
|
| |||||||||||||||
| 19,070,597 | ||||||||||||||||
|
| |||||||||||||||
Total Corporate Bonds (Cost $152,543,352) | $ | 154,729,862 | ||||||||||||||
|
| |||||||||||||||
| Asset-Backed Securities – 0.6% | Rate | Maturity | Face Amount | Value | ||||||||||||
INDUSTRIALS – 0.6% | ||||||||||||||||
American Airlines 2015-1 Class B Pass Through Trust (Airlines) | 3.700% | 05/01/2023 | $ | 900,000 | $ | 882,000 | ||||||||||
|
| |||||||||||||||
Total Asset-Backed Securities (Cost $900,000) | $ | 882,000 | ||||||||||||||
|
| |||||||||||||||
| Money Market Funds – 0.7% | Shares | Value | ||||||||||||||
Fidelity Institutional Money Market Funds | 1,186,000 | $ | 1,186,000 | |||||||||||||
|
| |||||||||||||||
Total Money Market Funds (Cost $1,186,000) | $ | 1,186,000 | ||||||||||||||
|
| |||||||||||||||
Total Investments – 98.5% (Cost $154,629,352) | (c) | $ | 156,797,862 | |||||||||||||
Other Assets in Excess of Liabilities – 1.5% | 2,432,853 | |||||||||||||||
|
| |||||||||||||||
Net Assets – 100.0% | $ | 159,230,715 | ||||||||||||||
|
| |||||||||||||||
Percentages are stated as a percent of net assets.
Footnotes:
| (a) | Security exempt from registration under Regulation D of the Securities Act of 1933. These securities may be resold in transactions exempt from registration, normally to qualified buyers under Rule 144A. At June 30, 2015, the value of these securities totaled $8,999,921, or 5.7% of the Portfolio’s net assets. These securities were deemed liquid pursuant to procedures approved by the Board of Directors. |
| (b) | Represents bonds that are credit sensitive. The coupon rates for these bonds are subject to adjustment based on changes in national credit rating agency ratings. |
| (c) | Represents cost for financial reporting purposes, which may differ from cost basis for federal income tax purposes. See also Note 7 of the Notes to Financial Statements. |
The accompanying notes are an integral part of these financial statements.
| 14 |
| Ohio National Fund, Inc. | Omni Portfolio |
Objective/Strategy
The Omni Portfolio seeks a high level of long-term total return consistent with preservation of capital by investing in stocks, bonds, and money market instruments.
Performance as of June 30, 2015
Average Annual Returns: | ||||
One year | 9.71% | |||
Five years | 14.12% | |||
Ten years | 7.99% |
Past performance does not guarantee future results. The performance data quoted represents past performance and current returns may be lower or higher. Total return figures include change in share price and reinvestment of dividends and capital gains. The investment return and principal value will fluctuate so that an investor’s shares, when redeemed, may be worth more or less than the original cost. To obtain performance information up to the most recent month end, call toll-free 1-877-781-6392.
The Portfolio is not open to direct retail investment. Beneficial interest in shares is obtained solely by purchase of variable life insurance policies and variable annuity contracts. Actual performance results for variable annuity and variable universal life contracts will be lower due to contract charges. Consult your contract for applicable charges.
Comments
For the six-month period ended June 30, 2015, the Omni Portfolio returned 4.55% versus 0.81% for the current benchmark, which is comprised of 70% S&P 500 Index and 30% BofA Merrill Lynch U.S. Corporate Master Index (the “Merrill Lynch Index”).
The 374 basis points of outperformance for the Portfolio versus the benchmark is the result of several factors, including outperformance by the equity portion of the Portfolio versus the S&P 500 Index, and outperformance of the bond portion of the Portfolio versus the Merrill Lynch Index. The asset allocation decision to overweight stocks and underweight bonds versus the blended benchmark also benefited relative performance because stocks outperformed bonds for the six-month period. (1)
The year began with many thinking macroeconomic fundamentals had firmed amidst global monetary easing. While the U.S. Federal Reserve ended its historic bond-buying stimulus program, the European Central Bank continued its own stimulus measures and the Japanese Central Bank continued efforts to create growth and inflation. But the end of the Federal Reserve’s quantitative easing introduced new controversy, as investors shifted to debating the timing of potential interest rate hikes. Economic data points that traditionally would have been seen as positive indicators began to raise fears that yields could move higher sooner than expected. Meanwhile, Greece reappeared in the headlines, as its position within the European Union became more uncertain. The Greek government finally agreed to more austerity and it appears that Greece will receive another bailout. Domestically, the turmoil in the North American energy sector continued to work its way through the system, with a lack of consensus about the length and depth of the downturn. These uncertainties were compounded by fear of the potential return of Iranian oil to global markets.
For the six-month period ended June 30, 2015, the equity portion of the Portfolio returned 6.51% versus 1.23% for the S&P 500 Index, for outperformance of 528 basis points. The Portfolio’s best performing stocks for the first half of 2015 were Intercept Pharmaceuticals, Inc., Pharmacyclics, Inc., Valeant Pharmaceuticals International, Inc., Humana, Inc. and Clovis Oncology, Inc. The Portfolio’s worst per-
forming stocks were Hewlett-Packard Co., PVH Corp., VeriFone Systems, Inc., Avago Technologies Ltd., and Intel Corp. The top contributors to stock performance were Clovis Oncology, Inc., Pharmacyclics, Inc., Intercept Pharmaceuticals, Inc., Valeant Pharmaceuticals International, Inc., and Mylan, Inc. The top detractors from stock performance were Hewlett-Packard Co., PVH Corp., Intel Corp., Yahoo!, Inc., and Avago Technologies Ltd. (1)
During the past six months, the equity portion of the Portfolio was overweighted in the Health Care sector, which added 748 basis points to performance, and was also overweighted in the Consumer Discretionary sector, which contributed 35 basis points to performance. The overweighted equity position in the Financials sector added 75 basis points to performance, while the overweighted equity position in the Information Technology sector detracted 97 basis points of performance. The underweighted position in the Industrials sector detracted 43 basis points, while the slight overweight in the Materials sector detracted 24 basis points of performance. (1)
For the six-month period, the bond portion of the Portfolio had a return of -0.21% versus -0.46% for the Merrill Lynch Index, for outperformance of 25 basis points. Both the bond portion of the Portfolio and the Merrill Lynch Index had small negative returns because U.S. Treasury yields increased across much of the yield curve, particularly on the long end, and credit spreads widened marginally. U.S. Treasury yields increased in anticipation of the Federal Reserve beginning to tighten credit later this year. The bond portion of the Portfolio outperformed the Merrill Lynch Index primarily because the duration of the bond portion of the Portfolio was approximately 0.4 years shorter than the Merrill Lynch Index for much of the period, thus resulting in less bond price depreciation than the index as Treasury yields increased. The credit stratification of the bond portion of the Portfolio benefited performance because the Portfolio was under-weighted in A and AA rated bonds, which under-performed, and was over-weighted in BBB rated bonds, which outperformed. The increase in the weighting to the oil and gas sector, from a 7% under-weighting at the start of 2015 to a neutral weighting by mid-year, benefited relative performance because this sector performed poorly earlier in the year, and then performed very well after the weighting had been increased. The bond portion of the Portfolio included a position in U.S. Treasury securities, which ranged from 4% to 13% of bonds, and this benefited relative performance because credit spreads widened during the first half of 2015. (1)
Because the U.S. economy continued to grow, and there were no significant leveraging events during the six-month period, the credit quality of the bond holdings in the Portfolio was maintained. That being said, the five bonds that performed the worst were Time Warner Cable, Inc., South Carolina Electric and Gas Co., American International Group, Inc., Microsoft Corp., and Burlington Northern Sante Fe, LLC. All of these bonds have long maturities, and their bond prices were hurt as interest rates increased during the period. The five best performing bonds were Southwestern Energy Co., Kohl’s Corp., Noble Holding International Ltd., Newmont Mining Corp., and Hospira, Inc. (1)
We remain optimistic on the prospects for stocks for the balance of the year. While concerns regarding China and Greece have made their way into the headlines again, the risks to both regions should be contained. The Chinese government still has many levers to pull to stimulate its economy, and it appears that Greece will continue to be a member of the European Union. The corporate profit picture looks positive and the stock market seems well prepared for an
| 15 | (continued) |
| Ohio National Fund, Inc. | Omni Portfolio (Continued) |
increase in interest rates as the Federal Reserve begins to raise its Federal Funds rate. With valuations “fair” at this point, we believe our continued focus on companies with a strong competitive position and an ability to gain market share will benefit stock performance going forward. Because of the positive outlook for stocks and the expectation for higher interest rates, we expect to remain approximately 5% over-weighted in stocks versus the blended benchmark. We will plan for the allocation to bonds to, therefore, be less than the weighting in the blended benchmark. Because we expect higher interest rates later in 2015, we expect that the duration of the bond portion of the Portfolio will be maintained shorter than the Merrill Lynch Index. (1)
| (1) | The Portfolio’s composition is subject to change. Holdings and weightings are as of June 30, 2015. |
Change in Value of $10,000 Investment
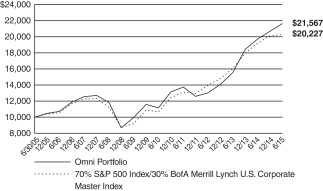
Hypothetical illustration based on past performance. Future performance will vary. The Portfolio’s returns reflect reinvested dividends. The Portfolio’s holdings may differ significantly from the securities in the index. The index is unmanaged and therefore does not reflect the cost of portfolio management and accounting.
The S&P 500 Index is a capitalization-weighted index designed to measure performance of the broad domestic market through changes in the aggregate market value of 500 stocks representing all major industries. The index presented herein includes the effects of reinvested dividends.
The BofA Merrill Lynch U.S. Corporate Master Index tracks the performance of all U.S. dollar-denominated, investment grade corporate public debt issued in the U.S. domestic bond market. Qualifying bonds must have an investment grade rating (based on an average of Moody’s, S&P, and Fitch). In addition, qualifying securities must have at least one year remaining term to maturity, a fixed coupon schedule, and a minimum amount outstanding of $250 million.
Portfolio Composition as of June 30, 2015 (1)
| % of Net Assets | ||||
Common Stocks (3) | 75.7 | |||
Corporate Bonds (3) | 20.4 | |||
U.S. Treasury Obligations | 2.4 | |||
Asset-Backed Securities (3) | 0.2 | |||
Money Market Funds and | 1.3 | |||
|
| |||
| 100.0 | ||||
|
|
Top 10 Portfolio Holdings as of June 30, 2015 (1) (2)
| % of Net Assets | ||||
1. Apple, Inc. | 2.9 | |||
2. Microsoft Corp. | 1.9 | |||
3. Allergan PLC | 1.9 | |||
4. Citigroup, Inc. | 1.9 | |||
5. Prudential Financial, Inc. | 1.9 | |||
6. Mylan NV | 1.8 | |||
7. Thermo Fisher Scientific, Inc. | 1.8 | |||
8. Hewlett-Packard Co. | 1.7 | |||
9. MetLife, Inc. | 1.6 | |||
10. JPMorgan Chase & Co. | 1.6 |
| (1) | Composition of Portfolio subject to change. |
| (2) | Short-term investments have been excluded from the list of Top 10 Portfolio Holdings. |
| (3) | Sectors (combined): |
| % of Net Assets | ||||
Information Technology | 18.7 | |||
Financials | 17.5 | |||
Health Care | 17.2 | |||
Consumer Discretionary | 16.2 | |||
Industrials | 8.4 | |||
Energy | 7.2 | |||
Consumer Staples | 4.4 | |||
Materials | 4.4 | |||
Utilities | 1.9 | |||
Telecommunication Services | 0.4 | |||
|
| |||
| 96.3 | ||||
|
|
| 16 |
| Ohio National Fund, Inc. | Omni Portfolio |
Schedule of Investments | June 30, 2015 (Unaudited) |
| Common Stocks – 75.7% | Shares | Value | ||||||||
CONSUMER DISCRETIONARY – 14.2% | ||||||||||
Johnson Controls, Inc. (Auto Components) | 14,249 | $ | 705,753 | |||||||
Jarden Corp. (Household Durables) | (a) | 13,350 | 690,862 | |||||||
Amazon.com, Inc. (Internet & Catalog Retail) | (a) | 1,792 | 777,889 | |||||||
CBS Corp. Class B (Media) | 13,728 | 761,904 | ||||||||
Time Warner, Inc. (Media) | 8,501 | 743,072 | ||||||||
Viacom, Inc. Class B (Media) | 11,531 | 745,364 | ||||||||
Walt Disney Co. / The (Media) | 6,860 | 783,000 | ||||||||
Lowe’s Cos., Inc. (Specialty Retail) | 11,138 | 745,912 | ||||||||
Tiffany & Co. (Specialty Retail) | 4,844 | 444,679 | ||||||||
PVH Corp. (Textiles, Apparel & Luxury Goods) | 6,740 | 776,448 | ||||||||
|
| |||||||||
| 7,174,883 | ||||||||||
|
| |||||||||
CONSUMER STAPLES – 3.1% | ||||||||||
Mondelez International, Inc. Class A (Food Products) | 19,005 | 781,866 | ||||||||
Tyson Foods, Inc. Class A (Food Products) | 17,925 | 764,143 | ||||||||
|
| |||||||||
| 1,546,009 | ||||||||||
|
| |||||||||
ENERGY – 3.1% | ||||||||||
Anadarko Petroleum Corp. (Oil, Gas & Consumable Fuels) | 8,827 | 689,036 | ||||||||
Devon Energy Corp. (Oil, Gas & Consumable Fuels) | 12,398 | 737,557 | ||||||||
Newfield Exploration Co. (Oil, Gas & Consumable Fuels) | (a) | 3,895 | 140,687 | |||||||
|
| |||||||||
| 1,567,280 | ||||||||||
|
| |||||||||
FINANCIALS – 12.9% | ||||||||||
Bank of America Corp. (Banks) | 45,511 | 774,597 | ||||||||
BankUnited, Inc. (Banks) | 10,505 | 377,445 | ||||||||
Citigroup, Inc. (Banks) | 17,200 | 950,128 | ||||||||
JPMorgan Chase & Co. (Banks) | 12,118 | 821,116 | ||||||||
Capital One Financial Corp. (Consumer Finance) | 8,767 | 771,233 | ||||||||
Hartford Financial Services Group, Inc. / The (Insurance) | 17,637 | 733,170 | ||||||||
Lincoln National Corp. (Insurance) | 5,986 | 354,491 | ||||||||
MetLife, Inc. (Insurance) | 14,742 | 825,405 | ||||||||
Prudential Financial, Inc. (Insurance) | 10,813 | 946,354 | ||||||||
|
| |||||||||
| 6,553,939 | ||||||||||
|
| |||||||||
HEALTH CARE – 15.8% | ||||||||||
Amgen, Inc. (Biotechnology) | 4,601 | 706,345 | ||||||||
Celgene Corp. (Biotechnology) | (a) | 4,022 | 465,486 | |||||||
Receptos, Inc. (Biotechnology) | (a) | 3,320 | 630,966 | |||||||
St. Jude Medical, Inc. (Health Care Equip. & Supplies) | 10,094 | 737,569 | ||||||||
Aetna, Inc. (Health Care Providers & Svs.) | 4,456 | 567,962 | ||||||||
HCA Holdings, Inc. (Health Care Providers & Svs.) | (a) | 8,157 | 740,003 | |||||||
Thermo Fisher Scientific, Inc. (Life Sciences Tools & Svs.) | 6,936 | 900,015 | ||||||||
Allergan PLC (Pharmaceuticals) | (a) | 3,167 | 961,058 | |||||||
Mylan NV (Pharmaceuticals) | (a) | 13,485 | 915,092 | |||||||
Pfizer, Inc. (Pharmaceuticals) | 18,856 | 632,242 | ||||||||
Valeant Pharmaceuticals International, Inc. (Pharmaceuticals) | (a) | 3,260 | 724,209 | |||||||
|
| |||||||||
| 7,980,947 | ||||||||||
|
| |||||||||
INDUSTRIALS – 6.5% | ||||||||||
Honeywell International, Inc. (Aerospace & Defense) | 7,074 | 721,336 | ||||||||
Lockheed Martin Corp. (Aerospace & Defense) | 4,071 | 756,799 | ||||||||
FedEx Corp. (Air Freight & Logistics) | 4,255 | 725,052 | ||||||||
General Electric Co. (Industrial Conglomerates) | 13,160 | 349,661 | ||||||||
Xylem, Inc. (Machinery) | 20,574 | 762,678 | ||||||||
|
| |||||||||
| 3,315,526 | ||||||||||
|
| |||||||||
INFORMATION TECHNOLOGY – 16.6% | ||||||||||
Cisco Systems, Inc. (Communications Equip.) | 26,636 | 731,424 | ||||||||
Facebook, Inc. Class A (Internet Software & Svs.) | (a) | 8,873 | 760,993 | |||||||
Google, Inc. Class A (Internet Software & Svs.) | (a) | 631 | 340,765 | |||||||
Google, Inc. Class C (Internet Software & Svs.) | (a) | 570 | 296,691 | |||||||
MasterCard, Inc. Class A (IT Svs.) | 8,250 | 771,210 | ||||||||
Avago Technologies Ltd. (Semiconductors & Equip.) | 5,737 | 762,619 | ||||||||
Intel Corp. (Semiconductors & Equip.) | 24,452 | 743,707 | ||||||||
Microsoft Corp. (Software) | 21,985 | 970,638 | ||||||||
Oracle Corp. (Software) | 17,086 | 688,566 | ||||||||
Apple, Inc. (Tech. Hardware, Storage & Periph.) | 11,822 | 1,482,774 | ||||||||
Hewlett-Packard Co. (Tech. Hardware, Storage & Periph.) | 28,384 | 851,804 | ||||||||
|
| |||||||||
| 8,401,191 | ||||||||||
|
| |||||||||
| 17 | (continued) |
| Ohio National Fund, Inc. | Omni Portfolio (Continued) |
Schedule of Investments | June 30, 2015 (Unaudited) |
| Common Stocks (Continued) | Shares | Value | ||||||||
MATERIALS – 3.5% | ||||||||||
Dow Chemical Co. / The (Chemicals) | 14,553 | $ | 744,677 | |||||||
Huntsman Corp. (Chemicals) | 30,250 | 667,618 | ||||||||
Monsanto Co. (Chemicals) | 3,247 | 346,098 | ||||||||
|
| |||||||||
| 1,758,393 | ||||||||||
|
| |||||||||
Total Common Stocks (Cost $36,832,497) | $ | 38,298,168 | ||||||||
|
| |||||||||
| Corporate Bonds – 20.4% | Rate | Maturity | Face Amount | Value | ||||||||||||
CONSUMER DISCRETIONARY – 2.0% | ||||||||||||||||
General Motors Co. (Automobiles) | 5.000% | 04/01/2035 | $ | 100,000 | $ | 98,185 | ||||||||||
Darden Restaurants, Inc. (Hotels, Restaurants & Leisure) | 3.350% | 11/01/2022 | 11,000 | 10,313 | ||||||||||||
Mattel, Inc. (Leisure Products) | 3.150% | 03/15/2023 | 75,000 | 72,525 | ||||||||||||
21st Century Fox America, Inc. (Media) | 4.500% | 02/15/2021 | 100,000 | 108,137 | ||||||||||||
Comcast Corp. (Media) | 5.875% | 02/15/2018 | 75,000 | 83,189 | ||||||||||||
Discovery Communications, LLC (Media) | 3.300% | 05/15/2022 | 75,000 | 73,659 | ||||||||||||
Time Warner Cable, Inc. (Media) | 4.500% | 09/15/2042 | 75,000 | 61,454 | ||||||||||||
Time Warner, Inc. (Media) | 2.100% | 06/01/2019 | 100,000 | 99,270 | ||||||||||||
Viacom, Inc. (Media) | 4.250% | 09/01/2023 | 75,000 | 75,499 | ||||||||||||
Walt Disney Co. / The (Media) | 3.700% | 12/01/2042 | 75,000 | 68,621 | ||||||||||||
Kohl’s Corp. (Multiline Retail) | 4.000% | 11/01/2021 | 75,000 | 79,363 | ||||||||||||
AutoZone, Inc. (Specialty Retail) | 3.125% | 07/15/2023 | 75,000 | 72,636 | ||||||||||||
Bed Bath & Beyond, Inc. (Specialty Retail) | 5.165% | 08/01/2044 | 100,000 | 98,929 | ||||||||||||
|
| |||||||||||||||
| 1,001,780 | ||||||||||||||||
|
| |||||||||||||||
CONSUMER STAPLES – 1.3% | ||||||||||||||||
Anheuser-Busch Cos., LLC (Beverages) | 5.500% | 01/15/2018 | 150,000 | 164,891 | ||||||||||||
CVS Health Corp. (Food & Staples Retailing) | 5.750% | 06/01/2017 | 45,000 | 48,624 | ||||||||||||
Kroger Co. / The (Food & Staples Retailing) | 2.950% | 11/01/2021 | 100,000 | 99,505 | ||||||||||||
Sysco Corp. (Food & Staples Retailing) | 4.350% | 10/02/2034 | 100,000 | 101,000 | ||||||||||||
Bunge NA Finance LP (Food Products) | 5.900% | 04/01/2017 | 150,000 | 160,216 | ||||||||||||
Procter & Gamble Co. / The (Household Products) | 4.700% | 02/15/2019 | 100,000 | 110,155 | ||||||||||||
|
| |||||||||||||||
| 684,391 | ||||||||||||||||
|
| |||||||||||||||
ENERGY – 4.1% | ||||||||||||||||
Ensco PLC (Energy Equip. & Svs.) | 5.200% | 03/15/2025 | 100,000 | 98,866 | ||||||||||||
Noble Holding International Ltd. (Energy Equip. & Svs.) | 4.000% | 03/16/2018 | 100,000 | 102,332 | ||||||||||||
Weatherford International Ltd. (Energy Equip. & Svs.) | 6.000% | 03/15/2018 | 150,000 | 159,605 | ||||||||||||
Anadarko Petroleum Corp. (Oil, Gas & Consumable Fuels) | 5.950% | 09/15/2016 | 100,000 | 105,408 | ||||||||||||
Boardwalk Pipelines LP (Oil, Gas & Consumable Fuels) | 5.500% | 02/01/2017 | 100,000 | 103,674 | ||||||||||||
Columbia Pipeline Group, Inc. (Oil, Gas & Consumable Fuels) | (b) | 4.500% | 06/01/2025 | 100,000 | 98,500 | |||||||||||
ConocoPhillips Co. (Oil, Gas & Consumable Fuels) | 3.350% | 05/15/2025 | 150,000 | 148,006 | ||||||||||||
Devon Energy Corp. (Oil, Gas & Consumable Fuels) | 3.250% | 05/15/2022 | 100,000 | 98,722 | ||||||||||||
Energy Transfer Partners LP (Oil, Gas & Consumable Fuels) | 4.750% | 01/15/2026 | 100,000 | 98,567 | ||||||||||||
Enterprise Products Operating LLC (Oil, Gas & Consumable Fuels) | 3.900% | 02/15/2024 | 100,000 | 100,281 | ||||||||||||
EOG Resources, Inc. (Oil, Gas & Consumable Fuels) | 3.150% | 04/01/2025 | 100,000 | 97,408 | ||||||||||||
Kinder Morgan Energy Partners LP (Oil, Gas & Consumable Fuels) | 4.150% | 03/01/2022 | 75,000 | 75,038 | ||||||||||||
Magellan Midstream Partners LP (Oil, Gas & Consumable Fuels) | 6.400% | 07/15/2018 | 150,000 | 167,027 | ||||||||||||
Marathon Oil Corp. (Oil, Gas & Consumable Fuels) | 3.850% | 06/01/2025 | 150,000 | 146,787 | ||||||||||||
Murphy Oil Corp. (Oil, Gas & Consumable Fuels) | 3.700% | 12/01/2022 | 100,000 | 91,393 | ||||||||||||
Phillips 66 (Oil, Gas & Consumable Fuels) | 4.300% | 04/01/2022 | 100,000 | 104,851 | ||||||||||||
Shell International Finance BV (Oil, Gas & Consumable Fuels) | 3.250% | 05/11/2025 | 100,000 | 98,871 | ||||||||||||
Southwestern Energy Co. (Oil, Gas & Consumable Fuels) | 4.050% | 01/23/2020 | 100,000 | 102,687 | ||||||||||||
TransCanada PipeLines Ltd. (Oil, Gas & Consumable Fuels) | 2.500% | 08/01/2022 | 75,000 | 71,059 | ||||||||||||
|
| |||||||||||||||
| 2,069,082 | ||||||||||||||||
|
| |||||||||||||||
FINANCIALS – 4.6% | ||||||||||||||||
Bank of America Corp. (Banks) | 5.750% | 08/15/2016 | 75,000 | 78,530 | ||||||||||||
Citigroup, Inc. (Banks) | 5.850% | 08/02/2016 | 75,000 | 78,690 | ||||||||||||
Citigroup, Inc. (Banks) | 4.400% | 06/10/2025 | 100,000 | 99,477 | ||||||||||||
Comerica, Inc. (Banks) | 3.800% | 07/22/2026 | 100,000 | 96,998 | ||||||||||||
JPMorgan Chase & Co. (Banks) | 3.250% | 09/23/2022 | 100,000 | 99,231 | ||||||||||||
KeyBank NA (Banks) | 5.700% | 11/01/2017 | 150,000 | 162,964 | ||||||||||||
PNC Bank NA (Banks) | 3.250% | 06/01/2025 | 150,000 | 146,262 | ||||||||||||
SunTrust Banks, Inc. (Banks) | 2.500% | 05/01/2019 | 100,000 | 100,493 | ||||||||||||
Wells Fargo & Co. (Banks) | 3.500% | 03/08/2022 | 75,000 | 77,028 | ||||||||||||
Goldman Sachs Group, Inc. / The (Capital Markets) | 3.750% | 05/22/2025 | 100,000 | 98,532 | ||||||||||||
Mellon Funding Corp. (Capital Markets) | 5.500% | 11/15/2018 | 100,000 | 110,966 | ||||||||||||
Morgan Stanley (Capital Markets) | 3.750% | 02/25/2023 | 75,000 | 75,916 | ||||||||||||
Northern Trust Corp. (Capital Markets) | 3.950% | 10/30/2025 | 75,000 | 77,371 | ||||||||||||
Capital One Financial Corp. (Consumer Finance) | 2.450% | 04/24/2019 | 75,000 | 74,955 | ||||||||||||
| 18 | (continued) |
| Ohio National Fund, Inc. | Omni Portfolio (Continued) |
Schedule of Investments | June 30, 2015 (Unaudited) |
| Corporate Bonds (Continued) | Rate | Maturity | Face Amount | Value | ||||||||||||
FINANCIALS (continued) | ||||||||||||||||
Discover Financial Services (Consumer Finance) | 6.450% | 06/12/2017 | $ | 150,000 | $ | 162,888 | ||||||||||
Synchrony Financial (Consumer Finance) | 4.250% | 08/15/2024 | 100,000 | 100,291 | ||||||||||||
Aflac, Inc. (Insurance) | 3.625% | 06/15/2023 | 75,000 | 75,694 | ||||||||||||
Allstate Corp. / The (Insurance) | 3.150% | 06/15/2023 | 75,000 | 74,997 | ||||||||||||
American International Group, Inc. (Insurance) | 3.875% | 01/15/2035 | 100,000 | 90,342 | ||||||||||||
Marsh & McLennan Cos., Inc. (Insurance) | 3.500% | 06/03/2024 | 100,000 | 99,540 | ||||||||||||
Boston Properties LP (Real Estate Investment Trusts) | 3.125% | 09/01/2023 | 75,000 | 72,808 | ||||||||||||
Camden Property Trust (Real Estate Investment Trusts) | 3.500% | 09/15/2024 | 100,000 | 97,305 | ||||||||||||
Federal Realty Investment Trust (Real Estate Investment Trusts) | 3.000% | 08/01/2022 | 75,000 | 73,799 | ||||||||||||
Simon Property Group LP (Real Estate Investment Trusts) | 3.750% | 02/01/2024 | 75,000 | 76,723 | ||||||||||||
|
| |||||||||||||||
| 2,301,800 | ||||||||||||||||
|
| |||||||||||||||
HEALTH CARE – 1.4% | ||||||||||||||||
Baxalta, Inc. (Biotechnology) | (b) | 4.000% | 06/23/2025 | 100,000 | 99,346 | |||||||||||
Gilead Sciences, Inc. (Biotechnology) | 4.500% | 02/01/2045 | 100,000 | 99,236 | ||||||||||||
Anthem, Inc. (Health Care Providers & Svs.) | 5.875% | 06/15/2017 | 150,000 | 162,865 | ||||||||||||
Express Scripts Holding Co. (Health Care Providers & Svs.) | 2.250% | 06/15/2019 | 100,000 | 99,117 | ||||||||||||
Laboratory Corp. of America Holdings (Health Care Providers & Svs.) | 3.750% | 08/23/2022 | 75,000 | 75,770 | ||||||||||||
AbbVie, Inc. (Pharmaceuticals) | 2.900% | 11/06/2022 | 75,000 | 72,557 | ||||||||||||
Hospira, Inc. (Pharmaceuticals) | 6.050% | 03/30/2017 | 75,000 | 80,686 | ||||||||||||
|
| |||||||||||||||
| 689,577 | ||||||||||||||||
|
| |||||||||||||||
INDUSTRIALS – 1.7% | ||||||||||||||||
Lockheed Martin Corp. (Aerospace & Defense) | 3.600% | 03/01/2035 | 100,000 | 92,061 | ||||||||||||
FedEx Corp. (Air Freight & Logistics) | 4.900% | 01/15/2034 | 75,000 | 77,529 | ||||||||||||
Waste Management, Inc. (Commercial Svs. & Supplies) | 6.100% | 03/15/2018 | 75,000 | 83,689 | ||||||||||||
Parker-Hannifin Corp. (Machinery) | 4.200% | 11/21/2034 | 100,000 | 99,381 | ||||||||||||
Burlington Northern Santa Fe, LLC (Road & Rail) | 4.550% | 09/01/2044 | 100,000 | 98,614 | ||||||||||||
ERAC U.S.A. Finance LLC (Road & Rail) | (b)(c) | 6.375% | 10/15/2017 | 150,000 | 164,862 | |||||||||||
Norfolk Southern Corp. (Road & Rail) | 3.000% | 04/01/2022 | 75,000 | 74,521 | ||||||||||||
Ryder System, Inc. (Road & Rail) | 2.650% | 03/02/2020 | 100,000 | 99,753 | ||||||||||||
Union Pacific Corp. (Road & Rail) | 3.250% | 08/15/2025 | 100,000 | 98,801 | ||||||||||||
|
| |||||||||||||||
| 889,211 | ||||||||||||||||
|
| |||||||||||||||
INFORMATION TECHNOLOGY – 2.1% | ||||||||||||||||
Harris Corp. (Communications Equip.) | 2.700% | 04/27/2020 | 100,000 | 98,636 | ||||||||||||
QUALCOMM, Inc. (Communications Equip.) | 3.450% | 05/20/2025 | 100,000 | 97,296 | ||||||||||||
Denali Borrower LLC / Denali Finance Corp. (Computers & Peripherals) | (b) | 5.625% | 10/15/2020 | 100,000 | 105,125 | |||||||||||
Amphenol Corp. (Electronic Equip., Instr. & Comp.) | 3.125% | 09/15/2021 | 100,000 | 99,962 | ||||||||||||
Computer Sciences Corp. (IT Svs.) | 6.500% | 03/15/2018 | 150,000 | 165,622 | ||||||||||||
Intel Corp. (Semiconductors & Equip.) | 4.000% | 12/15/2032 | 100,000 | 95,552 | ||||||||||||
KLA-Tencor Corp. (Semiconductors & Equip.) | 3.375% | 11/01/2019 | 100,000 | 102,640 | ||||||||||||
Microsoft Corp. (Software) | 3.500% | 02/12/2035 | 100,000 | 91,125 | ||||||||||||
Oracle Corp. (Software) | 4.300% | 07/08/2034 | 100,000 | 98,318 | ||||||||||||
Apple, Inc. (Tech. Hardware, Storage & Periph.) | 2.500% | 02/09/2025 | 100,000 | 93,621 | ||||||||||||
|
| |||||||||||||||
| 1,047,897 | ||||||||||||||||
|
| |||||||||||||||
MATERIALS – 0.9% | ||||||||||||||||
CF Industries, Inc. (Chemicals) | 3.450% | 06/01/2023 | 75,000 | 72,521 | ||||||||||||
Dow Chemical Co. / The (Chemicals) | 4.250% | 10/01/2034 | 100,000 | 93,652 | ||||||||||||
Packaging Corp. of America (Containers & Packaging) | 4.500% | 11/01/2023 | 75,000 | 77,249 | ||||||||||||
Freeport-McMoRan, Inc. (Metals & Mining) | 3.550% | 03/01/2022 | 75,000 | 69,346 | ||||||||||||
Newmont Mining Corp. (Metals & Mining) | 3.500% | 03/15/2022 | 75,000 | 71,496 | ||||||||||||
Teck Resources Ltd. (Metals & Mining) | 3.750% | 02/01/2023 | 75,000 | 64,437 | ||||||||||||
|
| |||||||||||||||
| 448,701 | ||||||||||||||||
|
| |||||||||||||||
TELECOMMUNICATION SERVICES – 0.4% | ||||||||||||||||
AT&T, Inc. (Diversified Telecom. Svs.) | 3.400% | 05/15/2025 | 100,000 | 94,948 | ||||||||||||
Verizon Communications, Inc. (Diversified Telecom. Svs.) | 3.850% | 11/01/2042 | 75,000 | 61,767 | ||||||||||||
Rogers Communications, Inc. (Wireless Telecom. Svs.) | 3.000% | 03/15/2023 | 75,000 | 71,947 | ||||||||||||
|
| |||||||||||||||
| 228,662 | ||||||||||||||||
|
| |||||||||||||||
UTILITIES – 1.9% | ||||||||||||||||
Commonwealth Edison Co. (Electric Utilities) | 5.950% | 08/15/2016 | 75,000 | 79,093 | ||||||||||||
Kansas City Power & Light Co. (Electric Utilities) | 5.850% | 06/15/2017 | 150,000 | 162,494 | ||||||||||||
Pennsylvania Electric Co. (Electric Utilities) | 6.050% | 09/01/2017 | 150,000 | 163,697 | ||||||||||||
South Carolina Electric & Gas Co. (Electric Utilities) | 4.350% | 02/01/2042 | 75,000 | 71,620 | ||||||||||||
Union Electric Co. (Electric Utilities) | 6.400% | 06/15/2017 | 150,000 | 164,343 | ||||||||||||
Westar Energy, Inc. (Electric Utilities) | 4.125% | 03/01/2042 | 75,000 | 72,385 | ||||||||||||
Southwest Gas Corp. (Gas Utilities) | 3.875% | 04/01/2022 | 75,000 | 78,500 | ||||||||||||
| 19 | (continued) |
| Ohio National Fund, Inc. | Omni Portfolio (Continued) |
Schedule of Investments | June 30, 2015 (Unaudited) |
| Corporate Bonds (Continued) | Rate | Maturity | Face Amount | Value | ||||||||||||
UTILITIES (continued) | ||||||||||||||||
Spectra Energy Capital LLC (Gas Utilities) | 3.300% | 03/15/2023 | $ | 75,000 | $ | 68,693 | ||||||||||
American Water Capital Corp. (Water Utilities) | 4.300% | 12/01/2042 | 100,000 | 98,150 | ||||||||||||
|
| |||||||||||||||
| 958,975 | ||||||||||||||||
|
| |||||||||||||||
Total Corporate Bonds (Cost $10,239,962) | $ | 10,320,076 | ||||||||||||||
|
| |||||||||||||||
| Asset-Backed Securities – 0.2% | Rate | Maturity | Face Amount | Value | ||||||||||||
INDUSTRIALS – 0.2% | ||||||||||||||||
American Airlines 2015-1 Class B Pass Through Trust (Airlines) | 3.700% | 05/01/2023 | $ | 100,000 | $ | 98,000 | ||||||||||
|
| |||||||||||||||
Total Asset-Backed Securities (Cost $100,000) | $ | 98,000 | ||||||||||||||
|
| |||||||||||||||
| U.S. Treasury Obligations – 2.4% | Rate | Maturity | Face Amount | Value | ||||||||||||
United States Treasury Note | 1.125% | 04/30/2020 | $ | 400,000 | $ | 390,438 | ||||||||||
United States Treasury Note | 2.125% | 06/30/2021 | 200,000 | 202,297 | ||||||||||||
United States Treasury Note | 2.000% | 02/15/2025 | 400,000 | 388,062 | ||||||||||||
United States Treasury Note | 2.500% | 02/15/2045 | 300,000 | 262,781 | ||||||||||||
|
| |||||||||||||||
Total U.S. Treasury Obligations (Cost $1,253,410) | $ | 1,243,578 | ||||||||||||||
|
| |||||||||||||||
| Money Market Funds – 1.1% | Shares | Value | ||||||||||||||
Fidelity Institutional Money Market Funds | 540,000 | $ | 540,000 | |||||||||||||
|
| |||||||||||||||
Total Money Market Funds (Cost $540,000) | $ | 540,000 | ||||||||||||||
|
| |||||||||||||||
Total Investments – 99.8% (Cost $48,965,869) | (d) | $ | 50,499,822 | |||||||||||||
Other Assets in Excess of Liabilities – 0.2% | 92,516 | |||||||||||||||
|
| |||||||||||||||
Net Assets – 100.0% | $ | 50,592,338 | ||||||||||||||
|
| |||||||||||||||
Percentages are stated as a percent of net assets.
Footnotes:
| (a) | Non-income producing security. |
| (b) | Security exempt from registration under Regulation D of the Securities Act of 1933. These securities may be resold in transactions exempt from registration, normally to qualified buyers under Rule 144A. At June 30, 2015, the value of these securities totaled $467,833, or 0.9% of the Portfolio’s net assets. These securities were deemed liquid pursuant to procedures approved by the Board of Directors. |
| (c) | Represents bonds that are credit sensitive. The coupon rates for these bonds are subject to adjustment based on changes in national credit rating agency ratings. |
| (d) | Represents cost for financial reporting purposes, which may differ from cost basis for federal income tax purposes. See also Note 7 of the Notes to Financial Statements. |
The accompanying notes are an integral part of these financial statements.
| 20 |
| Ohio National Fund, Inc. | International Portfolio |
Objective/Strategy
The International Portfolio seeks long-term growth of capital by investing at least 80% of its assets in securities of foreign companies.
Performance as of June 30, 2015
Average Annual Returns: | ||||
One year | -5.82% | |||
Five years | 7.42% | |||
Ten years | 3.55% |
Past performance does not guarantee future results. The performance data quoted represents past performance and current returns may be lower or higher. Total return figures include change in share price and reinvestment of dividends and capital gains. The investment return and principal value will fluctuate so that an investor’s shares, when redeemed, may be worth more or less than the original cost. To obtain performance information up to the most recent month end, call toll-free 1-877-781-6392.
The Portfolio is not open to direct retail investment. Beneficial interest in shares is obtained solely by purchase of variable life insurance policies and variable annuity contracts. Actual performance results for variable annuity and variable universal life contracts will be lower due to contract charges. Consult your contract for applicable charges.
Comments
For the six-month period ended June 30, 2015, the International Portfolio returned 5.74% versus 4.03% for the current benchmark, the MSCI All Country World ex-USA Index (Net-USD).
Global equity markets modestly appreciated in the first half, returning 2.66%, as measured by the MSCI AC World Index. Developed markets, up 5.52% as measured by the MSCI EAFE Index, beat Emerging Markets, up 2.95% as measured by the MSCI Emerging Markets Index. The U.S. stock market, as measured by MSCI USA, trailed both developed and emerging markets, returning 1.40% over the period. Asian markets had a strong half, as both Japan and China, as measured by MSCI Japan and MSCI China, rallied 13.62% and 14.65%, respectively.
Economic activity and inflation expectations across the non-U.S. markets varied by country and region, influenced by central bank policy and geopolitical events. Consensus expectations for global growth remain modest at 2.7% for the full year. For the first half of 2015, the U.S. economy weakened, as the strength in the U.S. dollar hindered manufacturing activity, but the European and Japanese economies both strengthened due to substantial monetary easing. Early in the year, with short-term interest rates already below zero, the European Central Bank (“ECB”) began its 1.1 trillion euro asset purchase program.
The ECB’s quantitative easing program, which started six years after the U.S. Federal Reserve began its own quantitative easing (“QE”) program sent the euro tumbling, about 12% in the first quarter this year and a total cumulative decline of 20% during the prior 52 weeks. Also in the first half of 2015, European equity market volatility rose, as the uncertainty with the ongoing situation in Greece continued. A referendum vote called by the Greek government during the first week of the July should bring greater visibility for markets regardless of the outcome. Unlike the last threat of a Greek default, contagion to other European countries and to the overall economic recovery in Europe appears to be limited. Economic conditions have improved across the broader euro zone due to stronger consumer and business sentiment, an unambiguously stimulative ECB policy stance, subdued inflation, and rising household consumption. Reversing the direction from last quarter, European bond
yields rose and the spread between U.S. Treasuries and German bunds tightened.
European markets strengthened during the period, as measured by MSCI AC Europe Index, which was up 3.82% for U.S. dollar based investors and up 7.25% in local returns. For most of the period, European equities traded at higher levels, but the news in late June that Greece rejected bailout terms set by the ECB and International Monetary Fund (“IMF”) sent the markets lower. Despite the volatility and uncertainty caused by a potential Greek exit from the euro, overall sentiment throughout the euro zone was positive as oil prices stabilized and borrowing costs remained low. Denmark led developed European markets higher (up 18.55%), followed by Ireland (up 12.43%), due to strong gross domestic product (“GDP”) growth and a fifth straight year of fiscal outperformance. In Germany, consumer confidence, which was aided by a strong labor market, hit a 13-year high and household consumption grew. In Spain, where the 2015 GDP forecast of 2.9% exceeds the forecasts for the U.S. and the UK, household consumption increased 0.7% during the first quarter. French consumer spending and business investment exceeded expectations. However, Spanish equities underperformed during the period, declining 2.61% after the anti-austerity party Podemos won several key local races in regional elections, leading to concerns that Spain could follow the same political path as Greece. The UK election results surprised the market, as the Conservative party won a strong majority, which eased investor uncertainty.
Japanese structural reforms under the “three arrows” of Japan’s Abenomics are slowly taking effect, improving the growth and long run inflation outlook. After GDP growth soared by 1.0% in the first quarter of 2015, the second quarter was a steady, uneventful quarter for Japan with no major economic reform announcements. Japanese corporate data has been very strong year-to-date, with an ongoing earnings ‘boom’ given the sustained weakness of the yen, cheaper energy prices, and a nascent economic recovery following last year’s slowdown. Unemployment fell to its lowest level since 1997. Inflation remained below the Bank of Japan’s (“BOJ”) 2% target, although it is expected to accelerate later in the year. The yen fell to a 13-year low versus the dollar in June before strengthening after Bank of Japan Governor Kuroda said that the currency was “very” weak relative to its trading partners. Corporations continue to focus on shareholder-friendly reforms, which have resulted in higher dividend payouts, greater share repurchases, and higher profitability.
Emerging markets strengthened (up 2.95%) for the period, led by Eastern Europe (up 16.68%), as measured by MSCI EM Eastern Europe. MSCI Hungary and MSCI Russia rallied sharply, up 26.52% and 27.59%, respectively, as geopolitical events in the Ukraine stabilized. Asian markets outperformed, led by China and Taiwan, up 14.65% and 5.01% respectively, where China was aided by its dollar peg. After hitting a high in April, China fell nearly 11%, as growth slowed amid a slowdown in construction and manufacturing. To counter sputtering growth, the People’s Bank of China (“PBOC”) announced a series of accommodative measures, including cuts in the one-year lending and deposit rates and a cut in the Reserve Requirement Ratio for financial institutions. The combination of rate cuts and adjustment to the Reserve Requirement Ratio was last used during the 2008 financial crisis. In Indonesia, despite strong private consumption, GDP growth disappointed as first quarter growth came in at the slowest rate in five years on disappointing domestic growth and sluggish export demand. For the period, MSCI Indonesia trailed all emerging markets and was down 12.05%. In Brazil, a $65 billion infrastructure package was announced by the government to help revive economic growth.
| 21 | (continued) |
| Ohio National Fund, Inc. | International Portfolio (Continued) |
For the reporting period, the MSCI USA Index (up 1.40%) underperformed both the MSCI Emerging Market Index (up 2.95%), and MSCI EAFE Index (up 5.52%). There was a strong divergence amongst country returns. The top performing major developed countries were Denmark (up 18.55%) and Japan (up 13.62%), while underperforming major markets included Canada (down 6.91%) and Spain (down 2.61%). In emerging markets, despite the strength of the dollar, leading major markets were Russia (up 27.59%), Hungary (up 26.52%) and China (up 14.65%), while laggards were Greece (down 25.66%) and Turkey (down 15.15%).
Country allocation remained a key driver of performance for the period, as it consistently has been in the past. In Asia, strong relative performance was driven by the Portfolio’s overweight allocation to Japanese equities, which reached their highest level in nineteen years. Equity purchases from the nation’s giant state-run pension fund GPIF, along with BOJ monetary stimulus, which will continue indefinitely, have had a large impact on Japanese equity returns. “Third Arrow” Growth Strategy has increased corporate payout ratios, focused companies on investor returns and prioritized labor reforms. “Third Arrow” implementation pushed shares higher, including technology exporter Murata Manufacturing Co. Ltd. (up 58.80%), pharmaceutical manufacturer Shionogi & Co. Ltd. (up 49.69%) and travel site Ikyu Corp. (up 91.28%). Elsewhere in Asia, the Portfolio’s underweight to China was a detractor during the period, as fiscal and monetary stimulus aided Chinese equities despite a late second quarter correction. Other Asian countries, including Indonesia and Thailand, experienced weaker growth amid slowing exports, which weighed on the Portfolio’s results. In Taiwan, Evergreen Marine Corp. Taiwan Ltd. (down 32.47%), an Asian container shipping company, declined as freight rates fell due to weak exports. (1)
Contributions from European equities and currencies were mixed during the period. High quality Danish companies led all developed European markets, returning 18.55%. Shares of Novo Nordisk AS (up 30.47%) rallied on positive news from the U.S. FDA, while local bank Sydbank AS returned 26.68% on improving credit quality and profitability. In response to unprecedented QE from the European Central Bank (“ECB”) and the prospect of interest rate hikes from the U.S. Federal Reserve later this year, the euro fell 7.92% during the period. Despite accelerating economies, the Portfolio’s allocations to Spain and Austria detracted from performance. Additionally, Spanish equities underperformed after anti-austerity party Podemos won several key local races in regional elections threatening to lead Spain down the same political path as Greece. During the period, Spanish Banco Santander SA (down 14.33%) and Austrian insurance company Uniqa Insurance Group (down 9.29%) underperformed. The Portfolio’s investments in Italy contributed positively, as the country’s economy expanded in the first quarter for the first time in over three years. Helped by the weaker euro, global auto company Fiat Chrysler Automobiles NV (up 26.03%) and eyewear designer Luxottica Group SpA (up 22.90%) contributed to relative performance. The Portfolio’s holdings in Ireland also benefitted from the weaker euro, including construction products and materials company CRH PLC (up 18.81%). Elsewhere, in Turkey, the Portfolio’s overweight detracted from performance, as the Turkish economy remained sluggish despite lower inflation expectations and a rate cut by Turkey’s Central Bank in February. In the United Kingdom, which continues to be mired in a weak fiscal condition with dual budgets, the Portfolio’s underweight contributed positively to relative performance.(1)
In the Americas, the Portfolio’s underweight allocation to Canada contributed positively, as Canada’s economy slowed on declining oil
exports due to lower prices and weaker global demand. The Portfolio’s underweight to Brazil also contributed positively, as that country’s economy struggles with high inflation and a weak labor market.(1)
Elsewhere around the world, the Portfolio’s underweight positioning to Australian equities helped performance, as the commodity slump created a weak outlook in the period. (1)
The Portfolio used foreign exchange (“FX”) currency forwards to manage our currency exposure relative to the benchmark. In the period, the overall net returns of the FX forward positions contributed positively to performance. Significant positive contribution came principally from the Portfolio’s short positions versus the U.S. dollar in the Yen, Euro and the Canadian Dollar. (1)
We are consistently applying our long-term methodology, which seeks to identify countries and stocks with growth and stability in earnings and cash flows. Our country ranking process seeks to identify strong economies trading at reasonable valuation levels with favorable macroeconomic outlooks. We continue to find country and stock holdings attractive for the long-term.
The latest research shows that country effects have become even more influential in a well-diversified international portfolio. Portfolio management believes the greater importance of country divergences is likely to persist given the increasing fundamental divergences between countries (even within the euro area), increased macro instability related to sovereign indebtedness and varying trend growth.
The Portfolio maintained exposure to select healthy, high quality developed markets. Our highest conviction overweight investments in major developed markets include Japan and Germany. In Europe, our core view is that the euro area recovery and growth cycle are genuine and will carry on once the Greece situation is sorted out. In the Portfolio, we have high convictions in Germany, Spain and Ireland, which should benefit from quantitative easing. We are also overweight in favored Scandinavian countries, such as Norway, Sweden and Denmark. In other major European markets, we remain underweight the United Kingdom and France. France, in particular, is struggling to gain momentum as high unemployment, last year’s tax increases, public spending cuts and deteriorating corporate fundamentals are hampering economic activity. We expect that the European export-led economies will benefit from a weaker euro, low borrowing costs and an improving outlook as the year progresses. Across the Portfolio, we remain partially hedged vs. U.S. dollar appreciation, as we believe the divergence in growth expectations and inflation will continue to drive the dollar higher. We are currently underweight to emerging markets, as our view is the effects of the strong dollar and lower energy prices will benefit many emerging economies in the long-term; however, the slowdown in China and Asian export growth, and the uncertainty over Greece is a drag in the short-term. (1)
At the end of the period, our highest conviction overweight is Japanese companies. We continue to believe there are multiple reasons why the Japanese stock market is the most attractive over the medium to long-term. Reasons for maintaining our conviction include: (1) Japanese corporate earnings and sales revisions are among the strongest across all regions we monitor, (2) Japanese corporate profitability, measured by ROE, is at a 25-year high due to rising margins, (3) the yen has hit a 13-year low, following the BOJ’s stimulus announcement which is a strong support for Japanese equities and (4) the delay of the 2015 consumption tax hike. Our Japanese investments are composed mainly of exporting companies, which will benefit from the weaker yen, and domestic stocks
| 22 | (continued) |
| Ohio National Fund, Inc. | International Portfolio (Continued) |
focused on tourism, which is booming as richer Asian tourists visit for the first time. Elsewhere in Asia, we maintained an overweight position in Taiwan on strength of the sovereign balance sheet and continued global tech demand. (1)
We continue to monitor our investment universe for signs of countries and companies with poor credit quality (or unmanageable debt levels), preferring to focus on countries and companies with healthy balance sheets and strategic expansion opportunities. As developed economies continue to adjust to new debt levels, and investors continue to fear a reoccurrence of a global financial crisis, markets may see periods of volatility. However, as long-term investors, we feel that fundamentals are supportive of global growth in the mid to long term. The Portfolio managers expect the winners to maintain higher profitability and gain market share, while the weaker players, who continue to struggle to gain footing, to underperform. Despite the expectation of the U.S. Federal Reserve to raise rates, we expect global financial conditions to remain accommodative for some time to come.
| (1) | The Portfolio’s composition is subject to change. Holdings and weightings are as of June 30, 2015. |
Change in Value of $10,000 Investment
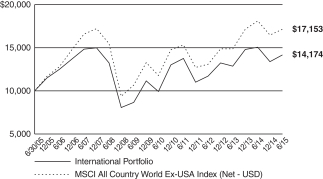
Hypothetical illustration based on past performance. Future performance will vary. The Portfolio’s returns reflect reinvested dividends. The Portfolio’s holdings may differ significantly from the securities in the index. The index is unmanaged and therefore does not reflect the cost of portfolio management and accounting.
The MSCI All Country World Ex-USA Index (Net-USD) is a free float-adjusted market capitalization weighted index that is designed to measure the equity market performance of the developed and emerging markets. The MSCI All Country World Index consists of 24 developed and 21 emerging market country indices.
Portfolio Composition as of June 30, 2015 (1)
| % of Net Assets | ||||
Common Stocks (3) | 84.7 | |||
Preferred Stocks (3) | 0.6 | |||
Money Market Funds and | 14.7 | |||
|
| |||
| 100.0 | ||||
|
|
Top 10 Portfolio Holdings as of June 30, 2015 (1) (2)
| % of Net Assets | ||||
1. Novo Nordisk A/S – ADR | 2.9 | |||
2. Banco Santander SA | 2.4 | |||
3. Kubota Corp. | 2.1 | |||
4. Danske Bank A/S | 2.1 | |||
5. Murata Manufacturing Co. Ltd. | 1.9 | |||
6. Sekisui House Ltd. | 1.9 | |||
7. Honda Motor Co. Ltd. | 1.9 | |||
8. Aisin Seiki Co. Ltd. | 1.8 | |||
9. Shionogi & Co. Ltd. | 1.7 | |||
10. CRH PLC | 1.6 |
| (1) | Composition of Portfolio subject to change. |
| (2) | Short-term investments have been excluded from the list of Top 10 Portfolio Holdings. |
| (3) | Top 10 Country Weightings (combined): |
| % of Net Assets | ||||
Japan | 28.8 | |||
Germany | 12.2 | |||
Sweden | 10.7 | |||
Denmark | 9.5 | |||
Spain | 7.4 | |||
Taiwan | 4.8 | |||
Ireland | 4.6 | |||
Norway | 3.6 | |||
Italy | 1.9 | |||
United States | 1.3 |
| 23 |
| Ohio National Fund, Inc. | International Portfolio |
Schedule of Investments | June 30, 2015 (Unaudited) |
| Common Stocks – 84.7% | Shares | Value | ||||||||
Japan – 28.8% | ||||||||||
Aisin Seiki Co. Ltd. | (c) | 74,600 | $ | 3,171,935 | ||||||
Alps Electric Co. Ltd. | (c) | 49,500 | 1,526,554 | |||||||
Asahi Kasei Corp. | (c) | 221,000 | 1,812,771 | |||||||
Chugai Pharmaceutical Co. Ltd. | (c) | 60,900 | 2,100,645 | |||||||
Disco Corp. | (c) | 27,500 | 2,273,391 | |||||||
Fuji Heavy Industries Ltd. | (c) | 74,700 | 2,746,777 | |||||||
HIS Co. Ltd. | (c) | 22,500 | 766,285 | |||||||
Hitachi Ltd. | (c) | 318,000 | 2,094,839 | |||||||
Honda Motor Co. Ltd. | (c) | 102,500 | 3,312,783 | |||||||
Hoshino Resorts REIT, Inc. | (c) | 138 | 1,524,684 | |||||||
Ikyu Corp. | (c) | 87,100 | 1,860,058 | |||||||
Japan Hotel REIT Investment Corp. | (c) | 1,850 | 1,231,091 | |||||||
Kawasaki Heavy Industries Ltd. | (c) | 246,000 | 1,146,653 | |||||||
Kubota Corp. | (c) | 232,700 | 3,689,777 | |||||||
Mitsui & Co. Ltd. | (c) | 155,300 | 2,109,925 | |||||||
Murata Manufacturing Co. Ltd. | (c) | 19,100 | 3,333,242 | |||||||
Nippon Express Co. Ltd. | (c) | 307,000 | 1,508,421 | |||||||
Oriental Land Co. Ltd. / Japan | (c) | 21,600 | 1,377,845 | |||||||
Osaka Gas Co. Ltd. | (c) | 435,000 | 1,716,857 | |||||||
Resorttrust, Inc. | (c) | 55,400 | 1,346,829 | |||||||
Sekisui House Ltd. | (c) | 209,000 | 3,319,118 | |||||||
Shionogi & Co. Ltd. | (c) | 77,600 | 3,007,250 | |||||||
Sumitomo Mitsui Financial Group, Inc. | (c) | 54,000 | 2,404,036 | |||||||
Yamaha Motor Co. Ltd. | (c) | 61,900 | 1,352,494 | |||||||
|
| |||||||||
| 50,734,260 | ||||||||||
|
| |||||||||
Germany – 11.6% | ||||||||||
Allianz SE | (c) | 11,300 | 1,762,246 | |||||||
BASF SE | (c) | 22,000 | 1,935,844 | |||||||
Bayer AG | (c) | 15,800 | 2,212,633 | |||||||
Daimler AG | (c) | 25,700 | 2,341,157 | |||||||
Deutsche Telekom AG | (c) | 117,000 | 2,017,114 | |||||||
Dialog Semiconductor PLC | (a)(c) | 52,000 | 2,811,889 | |||||||
HeidelbergCement AG | (c) | 7,000 | 554,798 | |||||||
ProSiebenSat.1 Media AG | (c) | 41,600 | 2,054,795 | |||||||
SAP SE | (c) | 28,600 | 2,004,181 | |||||||
Siemens AG | (c) | 10,700 | 1,082,534 | |||||||
Symrise AG | (c) | 26,300 | 1,633,363 | |||||||
|
| |||||||||
| 20,410,554 | ||||||||||
|
| |||||||||
Sweden – 10.7% | ||||||||||
Hennes & Mauritz AB | (c) | 68,900 | 2,651,872 | |||||||
Hoist Finance AB | (a)(b)(d) | 19,380 | 146,112 | |||||||
Husqvarna AB | (c) | 263,400 | 1,984,099 | |||||||
JM AB | (c) | 38,200 | 1,041,128 | |||||||
Nordax Group AB | (a)(b)(d) | 260,175 | 1,393,484 | |||||||
Nordea Bank AB | (c) | 189,400 | 2,362,149 | |||||||
Peab AB | (c) | 190,600 | 1,408,078 | |||||||
Skandinaviska Enskilda Banken AB | (c) | 108,900 | 1,392,977 | |||||||
SKF AB | (c) | 47,700 | 1,088,419 | |||||||
Swedbank AB | (c) | 55,900 | 1,303,275 | |||||||
Telefonaktiebolaget LM Ericsson | (c) | 135,100 | 1,407,084 | |||||||
Volvo AB | (c) | 216,800 | 2,692,119 | |||||||
|
| |||||||||
| 18,870,796 | ||||||||||
|
| |||||||||
Denmark – 9.5% | ||||||||||
AP Moeller – Maersk A/S | (c) | 1,121 | 2,026,813 | |||||||
Danske Bank A/S | (c) | 124,000 | 3,645,226 | |||||||
DSV A/S | (c) | 76,800 | 2,486,854 | |||||||
NKT Holding A/S | (c) | 22,671 | 1,300,478 | |||||||
NNIT A/S | (a)(b)(d) | 3,778 | 85,814 | |||||||
Novo Nordisk A/S – ADR | 94,900 | 5,196,724 | ||||||||
Sydbank A/S | (c) | 50,800 | 1,940,456 | |||||||
|
| |||||||||
| 16,682,365 | ||||||||||
|
| |||||||||
Spain – 7.4% | ||||||||||
ACS Actividades de Construccion y Servicios SA | (c) | 57,947 | 1,869,135 | |||||||
Amadeus IT Holding SA | (c) | 18,600 | 742,516 | |||||||
Banco Bilbao Vizcaya Argentaria SA | (c) | 184,200 | 1,815,098 | |||||||
| Common Stocks (Continued) | Shares | Value | ||||||||
Spain (continued) | ||||||||||
Banco Santander SA | (c) | 600,770 | $ | 4,225,823 | ||||||
Cellnex Telecom SAU | (a)(b)(d) | 7,740 | 130,944 | |||||||
Iberdrola SA | (c) | 386,653 | 2,610,504 | |||||||
Inditex SA | (c) | 51,500 | 1,679,791 | |||||||
|
| |||||||||
| 13,073,811 | ||||||||||
|
| |||||||||
Taiwan – 4.8% | ||||||||||
Asia Cement Corp. | (c) | 572,000 | 676,424 | |||||||
AU Optronics Corp. – ADR | 197,700 | 881,742 | ||||||||
Chunghwa Telecom Co. Ltd. | (c) | 266,000 | 848,891 | |||||||
First Financial Holding Co. Ltd. | (c) | 2,029,000 | 1,242,895 | |||||||
Formosa Chemicals & Fibre Corp. | (c) | 394,000 | 947,714 | |||||||
Fubon Financial Holding Co. Ltd. | (c) | 235,000 | 467,036 | |||||||
Hon Hai Precision Industry Co. Ltd. | (c) | 243,000 | 763,599 | |||||||
Nan Ya Plastics Corp. | (c) | 224,000 | 525,773 | |||||||
Taiwan Semiconductor Manufacturing Co. Ltd. | (c) | 330,000 | 1,501,044 | |||||||
United Microelectronics Corp. | (c) | 1,344,000 | 567,632 | |||||||
|
| |||||||||
| 8,422,750 | ||||||||||
|
| |||||||||
Ireland – 4.6% | ||||||||||
Bank of Ireland | (a)(c) | 5,720,000 | 2,315,435 | |||||||
CRH PLC | (c) | 101,228 | 2,853,914 | |||||||
Kerry Group PLC | (c) | 27,700 | 2,054,807 | |||||||
Smurfit Kappa Group PLC | (c) | 35,500 | 978,447 | |||||||
|
| |||||||||
| 8,202,603 | ||||||||||
|
| |||||||||
Norway – 3.6% | ||||||||||
DNB ASA | (c) | 103,885 | 1,730,060 | |||||||
Statoil ASA | (c) | 133,600 | 2,389,170 | |||||||
Yara International ASA | (c) | 43,798 | 2,282,231 | |||||||
|
| |||||||||
| 6,401,461 | ||||||||||
|
| |||||||||
Italy – 1.9% | ||||||||||
Azimut Holding SpA | (c) | 20,800 | 608,854 | |||||||
Cerved Information Solutions SpA | (d) | 129,100 | 993,097 | |||||||
Luxottica Group SpA | (c) | 11,300 | 751,652 | |||||||
UniCredit SpA | (c) | 146,996 | 987,941 | |||||||
|
| |||||||||
| 3,341,544 | ||||||||||
|
| |||||||||
United States – 1.3% | ||||||||||
Royal Caribbean Cruises Ltd. | 30,250 | 2,380,373 | ||||||||
|
| |||||||||
United Kingdom – 0.5% | ||||||||||
Fiat Chrysler Automobiles NV | (a)(c) | 62,535 | 917,397 | |||||||
|
| |||||||||
Total Common Stocks (Cost $133,597,931) | $ | 149,437,914 | ||||||||
|
| |||||||||
| Preferred Stocks – 0.6% | Shares | Value | ||||||||
Germany – 0.6% | ||||||||||
Henkel AG & Co. KGaA | (c) | 9,200 | $ | 1,032,387 | ||||||
|
| |||||||||
Total Preferred Stocks (Cost $1,109,178) | $ | 1,032,387 | ||||||||
|
| |||||||||
| Money Market Funds – 13.3% | Shares | Value | ||||||||
State Street Institutional Liquid Reserves Fund Institutional Class | 8,768,027 | $ | 8,768,027 | |||||||
State Street Institutional U.S. Government Money Market Fund Institutional Class | 14,742,372 | 14,742,372 | ||||||||
|
| |||||||||
Total Money Market Funds (Cost $23,510,399) | $ | 23,510,399 | ||||||||
|
| |||||||||
Total Investments – 98.6% (Cost $158,217,508) | (e) | $ | 173,980,700 | |||||||
Other Assets in Excess of Liabilities – 1.4% | (f) | 2,448,314 | ||||||||
|
| |||||||||
Net Assets – 100.0% | $ | 176,429,014 | ||||||||
|
| |||||||||
| 24 | (continued) |
| Ohio National Fund, Inc. | International Portfolio (Continued) |
Schedule of Investments | June 30, 2015 (Unaudited) |
Percentages are stated as a percent of net assets.
Abbreviations:
ADR: American Depositary Receipts
Footnotes:
| (a) | Non-income producing security. |
| (b) | Security exempt from registration under Regulation D of the Securities Act of 1933. These securities may be resold in transactions exempt from registration, normally to qualified buyers under Rule 144A. At June 30, 2015, the value of these securities totaled $1,756,354, or 1.0% of the Portfolio’s net assets. These securities were deemed liquid pursuant to procedures approved by the Board of Directors. |
| (c) | Security traded on a foreign exchange has been valued at an estimate of fair value that is different than the local market close price. These fair value estimates are determined by an independent fair valuation service that has been approved by the Board. These securities represent $139,262,011, or 78.9% of the Portfolio’s net assets. |
| (d) | As discussed in Note 2 of the Notes to Financial Statements, not all investments that are traded on a foreign exchange are valued at an estimate that is different from the local close price. In some instances, the independent fair valuation service uses a stock’s local close price because the service’s measure of predictability related to their valuation model of a stock is below a chosen threshold. These securities represent $2,749,451, or 1.6% of the Portfolio’s net assets. |
| Other Portfolio securities are not subjected to fair valuation procedures because they are traded on domestic or foreign exchanges that have close times that are consistent with the U.S. market close, normally 4:00 pm Eastern Time. |
| (e) | Represents cost for financial reporting purposes, which may differ from cost basis for federal income tax purposes. See also Note 7 of the Notes to Financial Statements. |
| (f) | Includes $2,172,003 of cash pledged as collateral for the following futures contracts outstanding at June 30, 2015: |
Type | Description | Expiration | Number of Contracts | Contract | Initial Contract Amount | Unrealized Appreciation (Depreciation) | Variation Margin Receivable (Payable) | |||||||||||||||
Long | JPX Nikkei Index 400 Future | September 10, 2015 | 211 | $ 2,536,965 | $ | 2,602,430 | $ | (65,465 | ) | $ | 13,718 | |||||||||||
Long | DAX Index Future | September 18, 2015 | 17 | $ 5,212,632 | $ | 5,354,349 | $ | (141,717 | ) | $ | (44,905 | ) | ||||||||||
Long | Hang Seng China Enterprises (HSCE) Index Future | July 30, 2015 | 112 | $ 9,337,487 | $ | 9,821,230 | $ | (483,743 | ) | $ | 196,411 | |||||||||||
Long | OMX Stockholm 30 Index Future | July 17, 2015 | 100 | $ 1,859,804 | $ | 1,891,228 | $ | (31,424 | ) | $ | (21,019 | ) | ||||||||||
|
|
|
|
|
|
| ||||||||||||||||
| $18,946,890 | $ | 19,669,239 | $ | (722,349 | ) | $ | 144,205 | |||||||||||||||
|
|
|
|
|
|
| ||||||||||||||||
| Details of the foreign currency contracts outstanding in the International Portfolio at June 30, 2015 are as follows: |
Contracts to buy foreign currency:
Date of contract | Exchange date | Counterparty | Currency to receive | Currency to deliver | Contract at value | Unrealized Appreciation (Depreciation) | ||||||||||||||
April 9, 2015 | July 10, 2015 | JPM | 98,905,000 RUB | $ | 1,835,654 | $ | 1,787,095 | $ | (48,559 | ) | ||||||||||
April 21, 2015 | July 27, 2015 | MSCS | 8,739,810 CHF | $ | 9,153,550 | $ | 9,356,621 | $ | 203,071 | |||||||||||
|
|
|
|
|
| |||||||||||||||
| $ | 10,989,204 | $ | 11,143,716 | $ | 154,512 | |||||||||||||||
|
|
|
|
|
| |||||||||||||||
Contracts to sell foreign currency:
Date of contract | Exchange date | Counterparty | Currency to receive | Currency to deliver | Contract at value | Unrealized Appreciation (Depreciation) | ||||||||||||||
April 21, 2015 | July 27, 2015 | MSCS | $ | 9,153,550 | 8,550,000 EUR | $ | 9,535,059 | $ | (381,509 | ) | ||||||||||
June 12, 2015 | September 15, 2015 | CITI | $ | 19,473,299 | 17,325,000 EUR | $ | 19,334,979 | $ | 138,320 | |||||||||||
June 12, 2015 | September 15, 2015 | HSBC | $ | 26,422,451 | 3,253,000,000 JPY | $ | 26,605,579 | $ | (183,128 | ) | ||||||||||
|
|
|
|
|
| |||||||||||||||
| $ | 55,049,300 | $ | 55,475,617 | $ | (426,317 | ) | ||||||||||||||
|
|
|
|
|
| |||||||||||||||
Counterparties | Currencies | |
JPM –J.P. Morgan Chase Bank, N.A. | RUB – Russian Ruble | |
MSCS – Morgan Stanley Capital Services, Inc. | CHF – Swiss Franc | |
CITI – Citigroup Global Markets, Inc. | EUR – Euro | |
HSBC – HSBC Bank USA, N.A. | JPY – Japanese Yen |
| 25 | (continued) |
| Ohio National Fund, Inc. | International Portfolio (Continued) |
Schedule of Investments | June 30, 2015 (Unaudited) |
Sector Classifications (Common Stocks & Preferred Stocks): (Percent of net assets)
Consumer Discretionary | 19.9% | |||
Financials | 18.9% | |||
Industrials | 12.7% | |||
Information Technology | 11.3% | |||
Materials | 8.0% | |||
Health Care | 7.1% | |||
Utilities | 2.5% | |||
Consumer Staples | 1.8% | |||
Telecommunication Services | 1.7% | |||
Energy | 1.4% | |||
|
| |||
| 85.3% | ||||
|
|
The accompanying notes are an integral part of these financial statements.
| 26 |
| Ohio National Fund, Inc. | Capital Appreciation Portfolio |
Objective/Strategy
The Capital Appreciation Portfolio seeks long-term capital growth by investing primarily in common stocks of established companies with either current or emerging earnings growth not fully appreciated or recognized by the market.
Performance as of June 30, 2015
Average Annual Returns: | ||||
One year | 2.71% | |||
Five years | 16.79% | |||
Ten years | 8.87% |
Past performance does not guarantee future results. The performance data quoted represents past performance and current returns may be lower or higher. Total return figures include change in share price and reinvestment of dividends and capital gains. The investment return and principal value will fluctuate so that an investor’s shares, when redeemed, may be worth more or less than the original cost. To obtain performance information up to the most recent month end, call toll-free 1-877-781-6392.
The Portfolio is not open to direct retail investment. Beneficial interest in shares is obtained solely by purchase of variable life insurance policies and variable annuity contracts. Actual performance results for variable annuity and variable universal life contracts will be lower due to contract charges. Consult your contract for applicable charges.
Comments
For the six-month period ended June 30, 2015, the Capital Appreciation Portfolio returned 4.05% versus 1.23% for the current benchmark, the S&P 500 Index.
For the period ended June 30, 2015, the broad equity markets posted moderate gains; the Russell 3000 Index returned 1.9% and the S&P 500 Index returned 1.2%. Growth (Russell 3000 Growth) outperformed value (Russell 3000 Value) across all capitalizations, and small caps (Russell 2000) outperformed large caps (Russell 1000). Within the Index, Health Care and Consumer Discretionary gained the most, while Energy and Utilities posted the largest losses.
The Portfolio generated a solid absolute gain and comfortably outperformed the broad market. We were pleased to see market recognition of the catalysts that we identified in a number of different companies across sectors and industries. As always, our stock selection is driven by company-specific fundamentals and our risk-reward discipline. Our excess return was almost all due to stock selection.
In the current environment, companies are engaging in merger and acquisition (“M&A”) activity to enhance shareholder value. With the cost of capital historically cheap, many companies are using their strong balance sheets for M&A to offset the late-cycle slowdown in their earnings and top line revenues. While we don’t invest in companies with M&A as a thesis, the underlying fundamentals we look for are often characteristics that acquirers seek out in targets. There are several companies that we owned that benefited from this dynamic. Gaming and Leisure Properties made a hostile bid for Pinnacle Entertainment, Inc.’s real estate assets at a premium. Shares of Altera Corp. rose on the news that Intel would buy the company at a significant premium to Altera Corp.’s five-year trading range, thus realizing the value that we thought would present itself as new products gained share. Other holdings that reported upside earnings surprises versus expectations and/or fundamental improvement were Hologic, Inc. and Fortinet, Inc. (1)
Hologic, Inc. reported stronger than expected results as investors became more confident that the new management team would
reaccelerate organic growth. This turnaround is cornerstone to our investment thesis. We think a higher level of organic growth is sustainable into the medium-term, and that the company’s narrow focus on women’s health gives it a competitive advantage with product innovation and specialized distribution. (1)
Fortinet, Inc., a provider of network security solutions and appliances, tacked on more gains after strong performance in fourth quarter 2014 and first quarter 2015. We expect Fortinet, Inc. to continue executing on its plan to accelerate revenue growth and capitalize on its subscription revenue model. Fortinet, Inc. is gaining share in a very high profile security market, and increasing its competitive differentiation through product refreshes and increasing functionality, competitive advantage with product innovation and specialized distribution. (1)
The Portfolio was not without a few individual disappointments. Shares of Rovi Corp. were weak, primarily in the first quarter, as ongoing litigation with Netflix over licensing revenue generated investor concern. Later in the quarter, an activist investor began a proxy fight for at least four directors at the company, which we think could unlock shareholder value. In the meantime, we are optimistic around upcoming license renewals and expect positive results from patent negotiations occurring through 2016. Our core thesis is that these renewals should lead nearly a 100% rise in free cash flow generation over the coming two years. We believe this growth is currently not priced into the stock. (1)
FirstEnergy Corp. also performed poorly in the first quarter when it reduced guidance for 2015. We think the new CEO is setting up for a new phase of growth and that FirstEnergy Corp, is well positioned to benefit from the rising power price environment being driven by new EPA capacity performance rules. (1)
Shares of Constellium NV sold off on concerns around the growth of its high margin aerospace and automotive businesses. Higher costs related to increased capacity at several plants, integration of the Wise Metals acquisition, and the potential impact of re-pricing several contracts in the packaging business segment were other headwinds. While the negative share price performance has been significant and earnings estimates for the back half 2015 and front half 2016 have come down, we still believe in the long-term thesis and believe that the market overreacted on the downside. Over the longer term, we think Constellium NV is wisely adding capacity and will successfully execute its plan to transition the bulk of its revenues and earnings into the more profitable and high value add aerospace and automotive segments. In the meantime, our position size has come down to reflect a slightly higher risk profile. (1)
We continue to find ideas across the market cap and style spectrum. As always, the focus of our research is on businesses that we expect to experience a dynamic upward trend in fundamentals and other catalysts over the next 12-18 months, or are demonstrating good growth characteristics but that are being mispriced by the market. With the multi-year run-up that we have gone through (especially dividend/income stocks), understanding the downside risk in each name is especially critical today. Our analysis will attempt to identify areas of the market where we see that expectations are too high.
| (1) | The Portfolio’s composition is subject to change. Holdings and weightings are as of June 30, 2015. |
| 27 | (continued) |
| Ohio National Fund, Inc. | Capital Appreciation Portfolio (Continued) |
Change in Value of $10,000 Investment
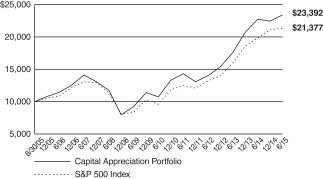
Hypothetical illustration based on past performance. Future performance will vary. The Portfolio’s returns reflect reinvested dividends. The Portfolio’s holdings may differ significantly from the securities in the index. The index is unmanaged and therefore does not reflect the cost of portfolio management and accounting.
The S&P 500 Index is a capitalization-weighted index designed to measure performance of the broad domestic economy through changes in the aggregate market value of 500 stocks representing all major industries. The index presented herein includes the effects of reinvested dividends.
Portfolio Composition as of June 30, 2015 (1)
| % of Net Assets | ||||
Common Stocks (3) | 98.1 | |||
Money Market Funds | 1.9 | |||
|
| |||
| 100.0 | ||||
|
|
Top 10 Portfolio Holdings as of June 30, 2015 (1) (2)
| % of Net Assets |
1. Carnival Corp. | 2.3 | |||
2. Goldman Sachs Group, Inc. / The | 2.1 | |||
3. PNC Financial Services Group, Inc. / The | 2.0 | |||
4. Comcast Corp. Class A | 2.0 | |||
5. JPMorgan Chase & Co. | 2.0 | |||
6. Bristol-Myers Squibb Co. | 1.9 | |||
7. Diamond Foods, Inc. | 1.9 | |||
8. Wells Fargo & Co. | 1.9 | |||
9. FirstEnergy Corp. | 1.8 | |||
10. MetLife, Inc. | 1.8 |
| (1) | Composition of Portfolio subject to change. |
| (2) | Short-term investments have been excluded from the list of Top 10 Portfolio Holdings. |
| (3) | Sectors: |
| % of Net Assets | ||||
Information Technology | 20.8 | |||
Consumer Discretionary | 19.4 | |||
Financials | 15.1 | |||
Health Care | 12.2 | |||
Industrials | 9.2 | |||
Energy | 7.2 | |||
Utilities | 4.9 | |||
Materials | 4.2 | |||
Consumer Staples | 4.1 | |||
Telecommunication Services | 1.0 | |||
|
| |||
| 98.1 | ||||
|
|
| 28 |
| Ohio National Fund, Inc. | Capital Appreciation Portfolio |
Schedule of Investments | June 30, 2015 (Unaudited) |
| Common Stocks – 98.1% | Shares | Value | ||||||||
CONSUMER DISCRETIONARY – 19.4% |
| |||||||||
Lear Corp. (Auto Components) | 39,531 | $ | 4,437,750 | |||||||
Carnival Corp. (Hotels, Restaurants & Leisure) | 203,107 | 10,031,455 | ||||||||
Hyatt Hotels Corp. Class A (Hotels, Restaurants & Leisure) | (a) | 130,801 | 7,415,109 | |||||||
MGM Resorts International (Hotels, Restaurants & Leisure) | (a) | 227,419 | 4,150,397 | |||||||
Pinnacle Entertainment, Inc. (Hotels, Restaurants & Leisure) | (a) | 188,196 | 7,015,947 | |||||||
Wendy’s Co. / The (Hotels, Restaurants & Leisure) | 401,873 | 4,533,127 | ||||||||
Ryland Group, Inc. / The (Household Durables) | 116,427 | 5,398,720 | ||||||||
Comcast Corp. Class A (Media) | 147,621 | 8,848,403 | ||||||||
Live Nation Entertainment, Inc. (Media) | (a) | 255,761 | 7,030,870 | |||||||
Nine Entertainment Co. Holdings Ltd. (Media) | (c) | 351,667 | 295,214 | |||||||
Nine Entertainment Co. Holdings Ltd. (Media) | (b)(c) | 305,683 | 489,429 | |||||||
Twenty-First Century Fox, Inc. Class A (Media) | 139,311 | 4,533,877 | ||||||||
Viacom, Inc. Class B (Media) | 68,392 | 4,420,859 | ||||||||
Vivendi SA (Media) | (c) | 255,230 | 6,471,778 | |||||||
Target Corp. (Multiline Retail) | 96,779 | 7,900,070 | ||||||||
Coach, Inc. (Textiles, Apparel & Luxury Goods) | 89,009 | 3,080,601 | ||||||||
|
| |||||||||
| 86,053,606 | ||||||||||
|
| |||||||||
CONSUMER STAPLES – 4.1% | ||||||||||
CVS Health Corp. (Food & Staples Retailing) | 32,062 | 3,362,663 | ||||||||
Diamond Foods, Inc. (Food Products) | (a) | 267,167 | 8,383,700 | |||||||
Mondelez International, Inc. Class A (Food Products) | 160,069 | 6,585,239 | ||||||||
|
| |||||||||
| 18,331,602 | ||||||||||
|
| |||||||||
ENERGY – 7.2% | ||||||||||
Patterson-UTI Energy, Inc. (Energy Equip. & Svs.) | 216,455 | 4,072,601 | ||||||||
Anadarko Petroleum Corp. (Oil, Gas & Consumable Fuels) | 94,466 | 7,374,016 | ||||||||
Cobalt International Energy, Inc. (Oil, Gas & Consumable Fuels) | (a) | 251,829 | 2,445,260 | |||||||
Laredo Petroleum, Inc. (Oil, Gas & Consumable Fuels) | (a) | 286,652 | 3,606,082 | |||||||
Noble Energy, Inc. (Oil, Gas & Consumable Fuels) | 161,753 | 6,903,618 | ||||||||
Occidental Petroleum Corp. (Oil, Gas & Consumable Fuels) | 58,584 | 4,556,078 | ||||||||
Rice Energy, Inc. (Oil, Gas & Consumable Fuels) | (a) | 147,734 | 3,077,299 | |||||||
|
| |||||||||
| 32,034,954 | ||||||||||
|
| |||||||||
FINANCIALS – 15.1% | ||||||||||
Bank of America Corp. (Banks) | 447,468 | 7,615,905 | ||||||||
Citigroup, Inc. (Banks) | 80,475 | 4,445,439 | ||||||||
JPMorgan Chase & Co. (Banks) | 129,212 | 8,755,405 | ||||||||
PNC Financial Services Group, Inc. / The (Banks) | 93,570 | 8,949,971 | ||||||||
Wells Fargo & Co. (Banks) | 147,614 | 8,301,811 | ||||||||
Goldman Sachs Group, Inc. / The (Capital Markets) | 43,714 | 9,127,046 | ||||||||
Voya Financial, Inc. (Diversified Financial Svs.) | 165,932 | 7,710,860 | ||||||||
MetLife, Inc. (Insurance) | 145,364 | 8,138,930 | ||||||||
Symetra Financial Corp. (Insurance) | 159,425 | 3,853,302 | ||||||||
|
| |||||||||
| 66,898,669 | ||||||||||
|
| |||||||||
HEALTH CARE – 12.2% | ||||||||||
Hologic, Inc. (Health Care Equip. & Supplies) | (a) | 165,950 | 6,316,057 | |||||||
Express Scripts Holding Co. (Health Care Providers & Svs.) | (a) | 49,829 | 4,431,791 | |||||||
AbbVie, Inc. (Pharmaceuticals) | 78,581 | 5,279,857 | ||||||||
Bristol-Myers Squibb Co. (Pharmaceuticals) | 127,548 | 8,487,044 | ||||||||
Merck & Co., Inc. (Pharmaceuticals) | 126,769 | 7,216,959 | ||||||||
Mylan NV (Pharmaceuticals) | (a) | 113,758 | 7,719,618 | |||||||
Pfizer, Inc. (Pharmaceuticals) | 239,508 | 8,030,703 | ||||||||
Shire PLC – ADR (Pharmaceuticals) | 27,304 | 6,593,643 | ||||||||
|
| |||||||||
| 54,075,672 | ||||||||||
|
| |||||||||
| Common Stocks (Continued) | Shares | Value | ||||||||
INDUSTRIALS – 9.2% | ||||||||||
Boeing Co. / The (Aerospace & Defense) | 47,079 | $ | 6,530,799 | |||||||
United Technologies Corp. (Aerospace & Defense) | 43,934 | 4,873,599 | ||||||||
FedEx Corp. (Air Freight & Logistics) | 25,848 | 4,404,499 | ||||||||
ADT Corp. / The (Commercial Svs. & Supplies) | 223,068 | 7,488,393 | ||||||||
Brink’s Co. / The (Commercial Svs. & Supplies) | 143,334 | 4,218,320 | ||||||||
Eaton Corp. PLC (Electrical Equip.) | 65,143 | 4,396,501 | ||||||||
SPX Corp. (Machinery) | 54,551 | 3,948,947 | ||||||||
ManpowerGroup, Inc. (Professional Svs.) | 56,471 | 5,047,378 | ||||||||
|
| |||||||||
| 40,908,436 | ||||||||||
|
| |||||||||
INFORMATION TECHNOLOGY – 20.8% | ||||||||||
Brocade Communications Systems, Inc. (Communications Equip.) | 601,485 | 7,145,642 | ||||||||
JDS Uniphase Corp. (Communications Equip.) | (a) | 492,605 | 5,704,366 | |||||||
Juniper Networks, Inc. (Communications Equip.) | 213,023 | 5,532,207 | ||||||||
Polycom, Inc. (Communications Equip.) | (a) | 357,903 | 4,094,410 | |||||||
Benchmark Electronics, Inc. (Electronic Equip., Instr. & Comp.) | (a) | 170,159 | 3,706,063 | |||||||
Trimble Navigation Ltd. (Electronic Equip., Instr. & Comp.) | (a) | 112,799 | 2,646,265 | |||||||
Google, Inc. Class C (Internet Software & Svs.) | (a) | 12,438 | 6,474,103 | |||||||
Altera Corp. (Semiconductors & Equip.) | 88,523 | 4,532,378 | ||||||||
Maxim Integrated Products, Inc. (Semiconductors & Equip.) | 156,800 | 5,421,360 | ||||||||
Cadence Design Systems, Inc. (Software) | (a) | 300,706 | 5,911,880 | |||||||
Fortinet, Inc. (Software) | (a) | 127,617 | 5,274,411 | |||||||
Guidewire Software, Inc. (Software) | (a) | 121,768 | 6,445,180 | |||||||
Microsoft Corp. (Software) | 107,073 | 4,727,273 | ||||||||
PTC, Inc. (Software) | (a) | 98,733 | 4,050,028 | |||||||
Rovi Corp. (Software) | (a) | 427,872 | 6,824,558 | |||||||
Apple, Inc. (Tech. Hardware, Storage & Periph.) | 60,383 | 7,573,538 | ||||||||
Diebold, Inc. (Tech. Hardware, Storage & Periph.) | 167,979 | 5,879,265 | ||||||||
|
| |||||||||
| 91,942,927 | ||||||||||
|
| |||||||||
MATERIALS – 4.2% | ||||||||||
Monsanto Co. (Chemicals) | 58,819 | 6,269,517 | ||||||||
Potash Corp. of Saskatchewan, Inc. (Chemicals) | 228,144 | 7,065,620 | ||||||||
Constellium NV Class A (Metals & Mining) | (a) | 229,440 | 2,714,275 | |||||||
Louisiana-Pacific Corp. (Paper & Forest Products) | (a) | 158,009 | 2,690,893 | |||||||
|
| |||||||||
| 18,740,305 | ||||||||||
|
| |||||||||
TELECOMMUNICATION SERVICES – 1.0% | ||||||||||
Frontier Communications Corp. (Diversified Telecom. Svs.) | 911,869 | 4,513,752 | ||||||||
|
| |||||||||
UTILITIES – 4.9% | ||||||||||
FirstEnergy Corp. (Electric Utilities) | 250,508 | 8,154,035 | ||||||||
PPL Corp. (Electric Utilities) | 198,730 | 5,856,573 | ||||||||
Calpine Corp. (Ind. Power & Renewable Elec.) | (a) | 230,558 | 4,147,738 | |||||||
PG&E Corp. (Multi-Utilities) | 68,312 | 3,354,119 | ||||||||
|
| |||||||||
| 21,512,465 | ||||||||||
|
| |||||||||
Total Common Stocks (Cost $407,579,006) | $ | 435,012,388 | ||||||||
|
| |||||||||
| Money Market Funds – 2.9% | Shares | Value | ||||||||
Fidelity Institutional Money Market Funds | 12,818,000 | $ | 12,818,000 | |||||||
|
| |||||||||
Total Money Market Funds (Cost $12,818,000) | $ | 12,818,000 | ||||||||
|
| |||||||||
Total Investments – 101.0% (Cost $420,397,006) | (d) | $ | 447,830,388 | |||||||
Liabilities in Excess of Other Assets – (1.0)% | (4,413,950) | |||||||||
|
| |||||||||
Net Assets – 100.0% | $ | 443,416,438 | ||||||||
|
| |||||||||
| 29 | (continued) |
| Ohio National Fund, Inc. | Capital Appreciation Portfolio (Continued) |
Schedule of Investments | June 30, 2015 (Unaudited) |
Percentages are stated as a percent of net assets.
Abbreviations:
ADR: American Depositary Receipts
Footnotes:
| (a) | Non-income producing security. |
| (b) | Security exempt from registration under Regulation D of the Securities Act of 1933. These securities may be resold in transactions exempt from registration, normally to qualified buyers under Rule 144A. At June 30, 2015, the value of these securities totaled $489,429, or 0.1% of the Portfolio’s net assets. These securities were deemed liquid pursuant to procedures approved by the Board of Directors. |
| (c) | Security traded on a foreign exchange has been valued at an estimate of fair value that is different than the local market close price. These fair value estimates are determined by an independent fair valuation service that has been approved by the Board. These securities represent $7,256,421, or 1.6% of the Portfolio’s net assets. |
Other Portfolio securities are not subjected to fair value procedures because they are traded on domestic or foreign exchanges that have close times that are consistent with the U.S. market close, normally 4:00 pm Eastern Time.
| (d) | Represents cost for financial reporting purposes, which may differ from cost basis for federal income tax purposes. See also Note 7 of the Notes to Financial Statements. |
The accompanying notes are an integral part of these financial statements.
| 30 |
| Ohio National Fund, Inc. | International Small-Mid Company Portfolio |
Objective/Strategy
The International Small-Mid Company Portfolio seeks long-term growth of capital by investing at least 80% of its assets in equity securities of foreign small and mid-cap companies.
Performance as of June 30, 2015
Average Annual Returns: | ||||
One year | 5.57% | |||
Five years | 12.53% | |||
Ten years | 7.70% |
Past performance does not guarantee future results. The performance data quoted represents past performance and current returns may be lower or higher. Total return figures include change in share price and reinvestment of dividends and capital gains. The investment return and principal value will fluctuate so that an investor’s shares, when redeemed, may be worth more or less than the original cost. To obtain performance information up to the most recent month end, call toll-free 1-877-781-6392.
The Portfolio is not open to direct retail investment. Beneficial interest in shares is obtained solely by purchase of variable life insurance policies and variable annuity contracts. Actual performance results for variable annuity and variable universal life contracts will be lower due to contract charges. Consult your contract for applicable charges.
Comments
For the six-month period ended June 30, 2015, the International Small-Mid Company Portfolio returned 14.09% versus 6.67% for the current benchmark, the MSCI ACWI Ex USA SMID Cap Index (Net-USD) and 9.34% for the former benchmark, the S&P Developed Small Cap Ex-U.S. Growth Index.
Global equity markets modestly appreciated in the first half, returning 2.66%, as measured by the MSCI AC World Index. Developed markets, up 5.52% as measured by the MSCI EAFE Index, beat Emerging Markets, up 2.95% as measured by the MSCI Emerging Markets Index. The U.S. stock market, as measured by MSCI USA, trailed both developed and emerging markets, returning 1.40% over the period. Asian markets had a strong half, as both Japan and China, as measured by MSCI Japan and MSCI China, rallied 13.62% and 14.65%, respectively.
Economic activity and inflation expectations across the non-U.S. markets varied by country and region, influenced by central bank policy and geopolitical events. Consensus expectations for global growth remain modest at 2.7% for the full year. For the first half of 2015, the U.S. economy weakened, as the strength in the U.S. dollar hindered manufacturing activity, but the European and Japanese economies both strengthened due to substantial monetary easing. Early in the year, with short-term interest rates already below zero, the European Central Bank (“ECB”) began its 1.1 trillion euro asset purchase program.
The ECB’s quantitative easing program, which started six years after the U.S. Fed began its own quantitative easing (“QE”) program, sent the euro tumbling – about 12% in the first quarter this year and a total cumulative decline of 20% during the prior 52-weeks. Also in the first half of 2015, European equity market volatility rose, as the uncertainty with the ongoing situation in Greece continued. A referendum vote called by the Greek government during the first week of the July should bring greater visibility for markets regardless of the outcome. Unlike the last threat of a Greek default, contagion to other European countries and to the overall economic recovery in Europe appears to be limited. Economic conditions have improved across the broader euro zone due to stronger consumer and business sentiment, an unambiguously stimulative ECB policy stance,
subdued inflation, and rising household consumption. Reversing the direction from last quarter, European bond yields rose and the spread between U.S. Treasuries and German bunds tightened.
European markets strengthened during the period, as measured by MSCI AC Europe Index, which was up 3.90% for U.S. dollar based investors and up 7.26% in local returns. For most of the period, European equities traded at higher levels, but the news in late June that Greece rejected bailout terms set by the ECB and International Monetary Fund (“IMF”) sent the markets lower. Despite the volatility and uncertainty caused by a potential Greek exit from the euro, overall sentiment throughout the euro zone was positive as oil prices stabilized and borrowing costs remained low. Denmark led developed European markets higher (up 18.55%), followed by Ireland (up 12.43%), due to strong gross domestic product (“GDP”) growth and a fifth straight year of fiscal outperformance. In Germany consumer confidence, which was aided by a strong labor market, hit a 13-year high and household consumption grew. In Spain, where the 2015 GDP forecast of 2.9% exceeds the forecasts for the U.S. and the UK, household consumption increased 0.7% during the first quarter. French consumer spending and business investment exceeded expectations. However, Spanish equities underperformed during the period, declining 2.61% after the anti-austerity party Podemos won several key local races in regional elections, leading to concerns that Spain could follow the same political path as Greece. The UK election results surprised the market, as the Conservative party won a strong majority, which eased investor uncertainty.
Japanese structural reforms under the “three arrows” of Japan’s Abenomics are slowly taking effect, improving the growth and long run inflation outlook. After GDP growth soared by 1.0% in first quarter of 2015, the second quarter was a steady, uneventful quarter for Japan with no major economic reform announcements. Japanese corporate data has been very strong year-to-date with an ongoing earnings ‘boom’ given the sustained weakness of the yen, cheaper energy prices, and a nascent economic recovery following last year’s slowdown. Unemployment fell to its lowest level since 1997. Inflation remained below the Bank of Japan’s (“BOJ”) 2% target, although it is expected to accelerate later in the year. The yen fell to a 13-year low versus the dollar in June before strengthening after Bank of Japan Governor Kuroda said that the currency was “very” weak relative to its trading partners. Corporations continue to focus on shareholder-friendly reforms, which have resulted in higher dividend payouts, greater share repurchases, and higher profitability.
Emerging markets strengthened (up 2.95%) for the period, led by Eastern Europe (up 16.68%), as measured by MSCI EM Eastern Europe. MSCI Hungary and MSCI Russia rallied sharply up 26.52% and up 27.59%, respectively, as geopolitical events in the Ukraine stabilized. Asian markets outperformed, led by China and Taiwan, up 14.65% and up 5.01% respectively, where China was aided by its dollar peg. After hitting a high in April, China fell nearly 11%, as growth slowed amid a slowdown in construction and manufacturing. To counter sputtering growth, the People’s Bank of China (“PBOC”) announced a series of accommodative measures, including cuts in the one-year lending and deposit rates and a cut in the Reserve Requirement Ratio for financial institutions. The combination of rate cuts and adjustment to the Reserve Requirement Ratio was last used during the 2008 financial crisis. In Indonesia, despite strong private consumption, GDP growth disappointed as first quarter growth came in at the slowest rate in five years on disappointing domestic growth and sluggish export demand. For the period, MSCI Indonesia trailed all emerging markets and was down 12.05%. In Brazil, a $65 billion infrastructure package was announced by the government to help revive economic growth.
| 31 | (continued) |
| Ohio National Fund, Inc. | International Small-Mid Company Portfolio (Continued) |
For the reporting period, the MSCI USA Index (up 1.40%) underperformed both the EM Index (up 2.95%) and MSCI EAFE Index (up 5.52%). There was a strong divergence amongst country returns. The top performing major developed countries were Denmark (up 18.55%) and Japan (up 13.62%), while major markets underperforming included Canada (down 6.91%) and Spain (down 2.61%). In emerging markets, despite the strength of the U.S. dollar, leading major markets were Russia (up 27.59%), Hungary (up 26.52%) and China (up 14.65%), while laggards were Greece (down 25.66%) and Turkey (down 15.15%).
As is typical in a fundamentally-driven investment process, stock selection accounted for the majority of relative outperformance. Our currency hedges, which reduced our exposure to the Euro, contributed positively to performance as well in the first half of 2015. The strongest contributors to the Portfolio’s outperformance came from stock selection in the Consumer Discretionary, Financial Services, Industrials and Information Technology sectors. The Portfolio had positive stock selection in 8 out of the 10 GICS sectors, while posting slight negative selection in Energy and Consumer Staples. Those latter sectors, however, only combined for approximately 2% of the overall Portfolio weighting. Top contributors on a country basis were Italy and Canada.(1)
The biggest positive contributor to the Portfolio’s performance was Dialog Semiconductor PLC (up 52%), which benefited significantly from stronger than expected sales derived from the iPhone 6/6+ and Apple iWatch as well as continued margin improvement. Increasing penetration of large screens in iPhones and iPads should continue to support the stock. (1)
Strong stock selection in the Financials sector resulted in two Italian asset managers ranking among the Portfolio’s top 5 contributors. Both Anima Holding SpA (up 77%) and Azimut Holding SpA (up 37%) benefited from ECB’s quantitative easing and improving investor sentiment across Europe, which resulted in better fund inflows versus expectations. (1)
Two consumer-related names rounded out the list of Top 5 largest contributors to the Portfolio. Pandora A/S (up 32%) had a very significant earnings beat due to strong volumes, new channels and declining silver prices. Pandora A/S will continue to be supported by the rollout of its Disney products, a new website in the U.S. and an ongoing share buyback program. Yoox SpA (up 45%) benefited from a merger with Richemont’s Net-A-Porter. The deal is expected to be 60% accretive to earnings over the next three years and now makes the combined company the undisputed leader in on-line luxury. (1)
The largest detractor in the period was Soco International PLC (down 38%), which disappointed the market with a profit warning and significant oil reserve reclassification that was triggered by the deteriorating pricing environment. Another detractor in the energy space was Tidewater, Inc. (down 20%), where we started building a position a little bit too early. We continue to think that the stock is very inexpensive at current levels and will benefit from a very young fleet and declining capital expenditure going forward. (1)
The remaining three top detracting names came from Information Technology, Consumer Discretionary and Health Care. Prada SpA (down 17%), in the consumer space, was under pressure following weaker than expected Asian sales in the first quarter. The company is on the verge of the biggest product launch since 2007, which we believe has potential to be very successful. Wirecard AG (down 13%), in the Information Technology sector, underperformed due to its exposure to emerging markets and a rise in investors’ risk perception. Closing out the laggard group is Health Care stock
MorphoSys AG (down 23%), which became a victim of Celgene’s unexpected announcement that it would terminate collaboration on the development of a drug for the treatment of multiple myeloma. (1)
During the first quarter, prior to the ECB’s QE announcement, we established a short position in the euro, effectively neutralizing our exposure relative to the benchmark. We believe the divergence in expectations for growth and inflation will continue to drive the U.S. dollar higher. We expect that the European economies will benefit from a weaker euro, low borrowing costs and an improving outlook as the year progresses. We remain overweight Europe, as ongoing QE and Euro weakness should be favorable for corporate profits. Companies in countries such as France and Germany will be the largest beneficiaries of a weaker euro. Despite a more defensive stance on the part of investors during the most recent quarter, we continued to pursue our interests in those markets and in companies exposed to a global economic recovery led by the U.S. and helped by the improving outlooks for both Europe and Japan. The Portfolio remains underweight emerging markets, with the majority of our exposure to Asia, where we believe further economic stimulus measures are being considered. In terms of sector exposure, we continue to have a cyclical bias with an overweight to Consumer Discretionary and Industrials, while we remain underweight the Energy sector. Our cyclical bias stems from our belief that the economic recovery will continue to support valuations and cash flow generation. (1)
| (1) | The Portfolio’s composition is subject to change. Holdings and weightings are as of June 30, 2015. |
Change in Value of $10,000 Investment
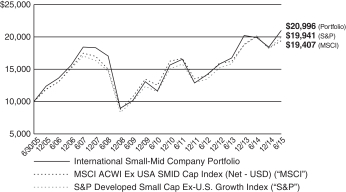
Hypothetical illustration based on past performance. Future performance will vary. The Portfolios returns reflect reinvested dividends. The Portfolios holdings may differ significantly from the securities in the index. The index is unmanaged and therefore does not reflect the cost of portfolio management and accounting.
The MSCI ACWI ex USA SMID Cap Index captures mid and small cap representation across 22 of 23 developed market countries (excluding the U.S.) and 23 emerging markets countries. With over 5,000 constituents, the index covers approximately 28% of the free float-adjusted market capitalization in each country. The returns presented for this index include the effects of reinvested dividends, net of taxes, and adjustment to U.S Dollar denomination.
The S&P Developed Small Cap Ex-U.S. Growth Index is a subset of the S&P Global Broad Market Index (BMI), a broad index including all publicly listed equities with float-adjusted market values of US$ 100 million or more and annual dollar value traded of at least US$ 50 million in all included countries. The Developed Small Cap component of the BMI includes the equities in the bottom 15% of the market capitalization within each “developed” local market. Ex-U.S. denotes the use of all developed markets excluding the United States. The “Growth” subset includes those companies in each local market that exhibit the characteristics of growth. The index presented includes the effects of reinvested dividends.
| 32 | (continued) |
| Ohio National Fund, Inc. | International Small-Mid Company Portfolio (Continued) |
Portfolio Composition as of June 30, 2015 (1)
| % of Net Assets | ||||
Common Stocks (3) | 97.8 | |||
Exchange Traded Funds | 0.5 | |||
Money Market Funds | 1.7 | |||
|
| |||
| 100.0 | ||||
|
|
Top 10 Portfolio Holdings as of June 30, 2015 (1) (2)
| % of Net Assets | ||||
1. Ashtead Group PLC | 2.5 | |||
2. Dialog Semiconductor PLC | 2.1 | |||
3. Pandora A/S | 1.9 | |||
4. St. James’s Place PLC | 1.8 | |||
5. Criteo SA – ADR | 1.7 | |||
6. China Everbright International Ltd. | 1.5 | |||
7. Schroders PLC | 1.5 | |||
8. UBISOFT Entertainment | 1.5 | |||
9. Babcock International Group PLC | 1.4 | |||
10. lululemon athletica, Inc. | 1.3 |
| (1) | Composition of Portfolio subject to change. |
| (2) | Short-term investments have been excluded from the list of Top 10 Portfolio Holdings. |
| (3) | Top 10 Country Weightings: |
| % of Net Assets | ||||
United Kingdom | 19.2 | |||
Japan | 14.1 | |||
France | 10.5 | |||
Germany | 10.4 | |||
Italy | 7.6 | |||
Hong Kong | 7.4 | |||
Canada | 4.2 | |||
China | 3.4 | |||
United States | 3.2 | |||
Ireland | 2.7 |
| 33 |
| Ohio National Fund, Inc. | International Small-Mid Company Portfolio |
Schedule of Investments | June 30, 2015 (Unaudited) |
| Common Stocks – 97.8% | Shares | Value | ||||||||
United Kingdom – 19.2% | ||||||||||
Ashtead Group PLC | (e) | 124,301 | $ | 2,142,300 | ||||||
Auto Trader Group PLC | (a)(b)(e) | 129,348 | 622,418 | |||||||
Babcock International Group PLC | (e) | 69,353 | 1,175,009 | |||||||
BTG PLC | (a)(e) | 49,476 | 487,869 | |||||||
Burberry Group PLC | (e) | 23,707 | 584,860 | |||||||
Croda International PLC | (e) | 23,413 | 1,012,357 | |||||||
Essentra PLC | (e) | 58,570 | 913,399 | |||||||
Howden Joinery Group PLC | (e) | 81,778 | 663,773 | |||||||
InterContinental Hotels Group PLC | (e) | 21,958 | 885,275 | |||||||
John Wood Group PLC | (e) | 40,445 | 409,334 | |||||||
London Stock Exchange Group PLC | (e) | 20,999 | 781,176 | |||||||
Michael Page International PLC | (e) | 61,125 | 522,825 | |||||||
Rightmove PLC | (e) | 13,418 | 690,400 | |||||||
Schroders PLC | (e) | 25,469 | 1,270,821 | |||||||
Shawbrook Group PLC | (a)(b)(e) | 169,045 | 972,978 | |||||||
Soco International PLC | (e) | 185,284 | 511,649 | |||||||
St. James’s Place PLC | (e) | 111,961 | 1,592,037 | |||||||
Stock Spirits Group PLC | (e) | 297,133 | 898,754 | |||||||
Vectura Group PLC | (a)(e) | 178,280 | 503,623 | |||||||
|
| |||||||||
| 16,640,857 | ||||||||||
|
| |||||||||
Japan – 14.1% | ||||||||||
Aisin Seiki Co. Ltd. | (e) | 21,400 | 909,912 | |||||||
Chugai Pharmaceutical Co. Ltd. | (e) | 30,100 | 1,038,250 | |||||||
Daifuku Co. Ltd. | (e) | 70,900 | 1,090,689 | |||||||
Disco Corp. | (e) | 4,500 | 372,009 | |||||||
Don Quijote Holdings Co. Ltd. | (e) | 27,000 | 1,148,822 | |||||||
Doutor Nichires Holdings Co. Ltd. | (e) | 25,900 | 453,937 | |||||||
Horiba Ltd. | (e) | 23,300 | 946,458 | |||||||
JSR Corp. | (e) | 24,200 | 427,210 | |||||||
Kakaku.com, Inc. | (e) | 67,101 | 970,862 | |||||||
Kanamoto Co. Ltd. | (e) | 30,600 | 775,747 | |||||||
NSK Ltd. | (e) | 69,200 | 1,067,009 | |||||||
NTN Corp. | (e) | 59,000 | 370,648 | |||||||
Ono Pharmaceutical Co. Ltd. | (e) | 4,600 | 502,067 | |||||||
Shionogi & Co. Ltd. | (e) | 21,200 | 821,568 | |||||||
Tadano Ltd. | (e) | 30,000 | 448,076 | |||||||
THK Co. Ltd. | (e) | 19,600 | 422,972 | |||||||
United Arrows Ltd. | (e) | 15,600 | 488,800 | |||||||
|
| |||||||||
| 12,255,036 | ||||||||||
|
| |||||||||
France – 10.5% | ||||||||||
Accor SA | (e) | 12,756 | 645,582 | |||||||
Criteo SA – ADR | (a) | 30,867 | 1,471,430 | |||||||
Edenred | (e) | 30,987 | 765,650 | |||||||
Ingenico Group | (e) | 7,200 | 847,072 | |||||||
Ipsen SA | (e) | 14,857 | 823,506 | |||||||
JCDecaux SA | (e) | 23,266 | 972,944 | |||||||
Publicis Groupe SA | (e) | 7,035 | 521,455 | |||||||
Teleperformance | (e) | 14,432 | 1,020,295 | |||||||
UBISOFT Entertainment | (a)(e) | 70,463 | 1,259,786 | |||||||
Zodiac Aerospace | (e) | 23,594 | 768,545 | |||||||
|
| |||||||||
| 9,096,265 | ||||||||||
|
| |||||||||
Germany – 10.4% | ||||||||||
Commerzbank AG | (a)(e) | 29,726 | 380,006 | |||||||
Deutz AG | (e) | 162,150 | 929,385 | |||||||
Dialog Semiconductor PLC | (a)(e) | 34,400 | 1,860,173 | |||||||
GEA Group AG | (e) | 20,250 | 903,412 | |||||||
HeidelbergCement AG | (e) | 10,966 | 869,130 | |||||||
Kloeckner & Co. SE | (e) | 82,933 | 748,908 | |||||||
MorphoSys AG | (a)(f) | 1,611 | 115,628 | |||||||
OSRAM Licht AG | (e) | 10,187 | 487,353 | |||||||
Rheinmetall AG | (e) | 17,942 | 910,070 | |||||||
SAF-Holland SA | (e) | 40,643 | 627,186 | |||||||
Wirecard AG | (e) | 30,361 | 1,162,027 | |||||||
|
| |||||||||
| 8,993,278 | ||||||||||
|
| |||||||||
Italy – 7.6% | ||||||||||
Anima Holding SpA | (b)(e) | 128,187 | 1,125,898 | |||||||
Azimut Holding SpA | (e) | 38,008 | 1,112,563 | |||||||
| Common Stocks (Continued) | Shares | Value | ||||||||
Italy (continued) | ||||||||||
Banca Generali SpA | (e) | 25,846 | $ | 910,123 | ||||||
Infrastrutture Wireless Italiane SpA | (a)(b)(f) | 143,119 | 646,202 | |||||||
Massimo Zanetti Beverage Group SpA | (a)(b)(f) | 47,725 | 583,140 | |||||||
Prada SpA | (e) | 146,600 | 703,802 | |||||||
Sorin SpA | (a)(e) | 245,161 | 686,305 | |||||||
Yoox SpA | (a)(e) | 26,400 | 854,340 | |||||||
|
| |||||||||
| 6,622,373 | ||||||||||
|
| |||||||||
Hong Kong – 7.4% | ||||||||||
Beijing Enterprises Water Group Ltd. | (e) | 1,290,000 | 1,058,258 | |||||||
Brilliance China Automotive Holdings Ltd. | (e) | 428,000 | 667,036 | |||||||
China Everbright International Ltd. | (e) | 710,000 | 1,278,926 | |||||||
Haier Electronics Group Co. Ltd. | (e) | 255,000 | 684,943 | |||||||
PAX Global Technology Ltd. | (a)(e) | 509,000 | 729,097 | |||||||
Shun Tak Holdings Ltd. | (e) | 2,080,000 | 1,152,576 | |||||||
Techtronic Industries Co. Ltd. | (e) | 248,000 | 814,059 | |||||||
|
| |||||||||
| 6,384,895 | ||||||||||
|
| |||||||||
Canada – 4.2% | ||||||||||
Canadian Western Bank | 34,100 | 785,474 | ||||||||
Dollarama, Inc. | 11,157 | 676,209 | ||||||||
Hudson’s Bay Co. | 43,626 | 969,273 | ||||||||
lululemon athletica, Inc. | (a) | 17,800 | 1,162,340 | |||||||
|
| |||||||||
| 3,593,296 | ||||||||||
|
| |||||||||
China – 3.4% | ||||||||||
China ZhengTong Auto Services Holdings Ltd. | (e) | 1,061,000 | 689,920 | |||||||
CT Environmental Group Ltd. | (e) | 848,000 | 1,124,760 | |||||||
Fuyao Glass Industry Group Co. Ltd. | (a)(b)(f) | 56,400 | 138,098 | |||||||
SouFun Holdings Ltd. – ADR | 84,895 | 713,967 | ||||||||
Sound Global Ltd. | (a)(c)(g) | 372,000 | 299,028 | |||||||
|
| |||||||||
| 2,965,773 | ||||||||||
|
| |||||||||
United States – 3.2% | ||||||||||
Marketo, Inc. | (a) | 22,073 | 619,368 | |||||||
Nexteer Automotive Group Ltd. | (e) | 866,000 | 900,614 | |||||||
Tidewater, Inc. | 28,100 | 638,713 | ||||||||
Vertex Pharmaceuticals, Inc. | (a) | 5,200 | 642,096 | |||||||
|
| |||||||||
| 2,800,791 | ||||||||||
|
| |||||||||
Ireland – 2.7% | ||||||||||
Grafton Group PLC | (e) | 55,883 | 681,199 | |||||||
Shire PLC | (e) | 6,500 | 522,272 | |||||||
Smurfit Kappa Group PLC | (e) | 40,600 | 1,119,013 | |||||||
|
| |||||||||
| 2,322,484 | ||||||||||
|
| |||||||||
Israel – 2.4% | ||||||||||
Caesarstone Sdot-Yam Ltd. | 15,829 | 1,084,920 | ||||||||
NICE-Systems Ltd. – ADR | 15,400 | 979,286 | ||||||||
|
| |||||||||
| 2,064,206 | ||||||||||
|
| |||||||||
Netherlands – 2.4% | ||||||||||
GrandVision NV | (a)(b)(f) | 26,678 | 659,082 | |||||||
Koninklijke DSM NV | (e) | 10,844 | 629,605 | |||||||
NN Group NV | (e) | 26,487 | 745,934 | |||||||
|
| |||||||||
| 2,034,621 | ||||||||||
|
| |||||||||
South Korea – 2.3% | ||||||||||
Hotel Shilla Co. Ltd. | (e) | 11,208 | 1,120,463 | |||||||
Samsung Electronics Co. Ltd. | (e) | 761 | 863,419 | |||||||
|
| |||||||||
| 1,983,882 | ||||||||||
|
| |||||||||
Sweden – 2.0% | ||||||||||
Alimak Group AB | (a)(b)(f) | 25,187 | 291,676 | |||||||
Capio AB | (a)(b)(f) | 91,176 | 533,428 | |||||||
Hoist Finance AB | (a)(b)(f) | 54,959 | 414,355 | |||||||
Nordax Group AB | (a)(b)(f) | 87,492 | 468,603 | |||||||
|
| |||||||||
| 1,708,062 | ||||||||||
|
| |||||||||
Denmark – 1.9% | ||||||||||
Pandora A/S | (e) | 15,473 | 1,660,318 | |||||||
|
| |||||||||
| 34 | (continued) |
| Ohio National Fund, Inc. | International Small-Mid Company Portfolio (Continued) |
Schedule of Investments | June 30, 2015 (Unaudited) |
| Common Stocks (Continued) | Shares | Value | ||||||||
Switzerland – 1.1% | ||||||||||
Julius Baer Group Ltd. | (e) | 17,269 | $ | 969,032 | ||||||
|
| |||||||||
Spain – 1.0% | ||||||||||
Cellnex Telecom SAU | (a)(b)(f) | 51,673 | 874,196 | |||||||
|
| |||||||||
Bermuda – 0.7% | ||||||||||
Arch Capital Group Ltd. | (a) | 9,600 | 642,816 | |||||||
|
| |||||||||
Mexico – 0.7% | ||||||||||
Grupo Aeroportuario del Sureste SAB de CV – ADR | 4,200 | 595,854 | ||||||||
|
| |||||||||
Belgium – 0.6% | ||||||||||
UCB SA | (e) | 7,808 | 561,436 | |||||||
|
| |||||||||
Total Common Stocks (Cost $67,189,826) | $ | 84,769,471 | ||||||||
|
| |||||||||
| Exchange Traded Funds – 0.5% | Shares | Value | ||||||||
iShares MSCI Emerging Markets ETF | 10,187 | $ | 403,609 | |||||||
|
| |||||||||
Total Exchange Traded Funds (Cost $419,068) | $ | 403,609 | ||||||||
|
| |||||||||
| Rights – 0.0% | Quantity | Value | ||||||||
Italy – 0.0% | ||||||||||
Sorin SpA | (a)(d) | 245,161 | $ | 9 | ||||||
|
| |||||||||
Total Rights (Cost $0) | $ | 9 | ||||||||
|
| |||||||||
| Money Market Funds – 2.5% | Shares | Value | ||||||||
State Street Institutional Liquid Reserves Fund Institutional Class | 2,220,810 | $ | 2,220,810 | |||||||
|
| |||||||||
Total Money Market Funds (Cost $2,220,810) | $ | 2,220,810 | ||||||||
|
| |||||||||
Total Investments – 100.8% (Cost $69,829,704) | (h) | $ | 87,393,899 | |||||||
Liabilities in Excess of Other Assets – (0.8)% | (706,056) | |||||||||
|
| |||||||||
Net Assets – 100.0% | $ | 86,687,843 | ||||||||
|
| |||||||||
Percentages are stated as a percent of net assets.
Abbreviations:
ADR: American Depositary Receipts
Footnotes:
| (a) | Non-income producing security. |
| (b) | Security exempt from registration under Regulation D of the Securities Act of 1933. These securities may be resold in transactions exempt from registration, normally to qualified buyers under Rule 144A. At June 30, 2015, the value of these securities totaled $7,330,074, or 8.5% of the Portfolio’s net assets. These securities were deemed liquid pursuant to procedures approved by the Board of Directors. |
| (c) | A market quotation for this investment was not readily available at June 30, 2015. As discussed in Note 2 of the Notes to Financial Statements, the price for this issue was derived from an estimate of fair market value using methods determined in good faith by the Fund’s Pricing Committee under supervision of the Board. This security represents $299,028, or 0.3% of the Portfolio’s net assets. |
| (d) | A market quotation for this investment was not readily available at June 30, 2015. As discussed in Note 2 of the Notes to Financial Statements, the price for this issue was derived from an estimate of fair market value using methods determined in good faith by the Fund’s pricing policy approved by the Board. This security represents $9, or 0.0% of the Portfolio’s net assets. |
| (e) | Security traded on a foreign exchange has been valued at an estimate of fair value that is different than the local market close price. These fair value estimates are determined by an independent fair valuation service that has been approved by the Board. These securities represent $68,764,289, or 79.3% of the Portfolio’s net assets. |
| (f) | As discussed in Note 2 of the Notes to Financial Statements, not all investments that are traded on a foreign exchange are valued at an estimate that is different from the local close price. In some instances, the independent fair valuation service uses a stock’s local close price because the service’s measure of predictability related to their valuation model of a stock is below a chosen threshold. These securities represent $4,724,408, or 5.4% of the Portfolio’s net assets. |
| (g) | Represents a security deemed to be illiquid. At June 30, 2015, the value of illiquid securities in the Portfolio totaled $299,028, or 0.3% of the Portfolio’s net assets. |
| (h) | Represents cost for financial reporting purposes, which may differ from cost basis for federal income tax purposes. See also Note 7 of the Notes to Financial Statements. |
| Details of the foreign currency contracts outstanding in the International Small-Mid Company Portfolio at June 30, 2015 are as follows: |
Contracts to sell foreign currency:
Date of contract | Exchange date | Counterparty | Currency to receive | Currency to deliver | Contract at value | Unrealized Depreciation | ||||||||||||||
April 21, 2015 | July 27, 2015 | MSCS | $ | 8,217,845 | 7,670,000 EUR | $ | 8,553,673 | $ | (335,828 | ) | ||||||||||
|
|
|
|
|
| |||||||||||||||
Counterparties | Currencies | |
MSCS - Morgan Stanley Capital Services, Inc. | EUR – Euro |
| 35 | (continued) |
| Ohio National Fund, Inc. | International Small-Mid Company Portfolio (Continued) |
Schedule of Investments | June 30, 2015 (Unaudited) |
Sector Classifications (Common stocks and Rights): (Percent of net assets)
Consumer Discretionary | 23.4% | |||
Industrials | 22.6% | |||
Information Technology | 15.5% | |||
Financials | 14.0% | |||
Health Care | 8.4% | |||
Materials | 5.7% | |||
Utilities | 2.9% | |||
Energy | 1.8% | |||
Telecommunication Services | 1.8% | |||
Consumer Staples | 1.7% | |||
|
| |||
| 97.8% | ||||
|
|
The accompanying notes are an integral part of these financial statements.
| 36 |
| Ohio National Fund, Inc. | Aggressive Growth Portfolio |
Objective/Strategy
The Aggressive Growth Portfolio seeks long-term capital growth by investing primarily in domestic and foreign equity securities selected for growth potential.
Performance as of June 30, 2015
Average Annual Returns: | ||||
One year | 17.22% | |||
Five years | 17.12% | |||
Ten years | 9.41% |
Past performance does not guarantee future results. The performance data quoted represents past performance and current returns may be lower or higher. Total return figures include change in share price and reinvestment of dividends and capital gains. The investment return and principal value will fluctuate so that an investor’s shares, when redeemed, may be worth more or less than the original cost. To obtain performance information up to the most recent month end, call toll-free 1-877-781-6392.
The Portfolio is not open to direct retail investment. Beneficial interest in shares is obtained solely by purchase of variable life insurance policies and variable annuity contracts. Actual performance results for variable annuity and variable universal life contracts will be lower due to contract charges. Consult your contract for applicable charges.
Comments
For the six-month period ended June 30, 2015, the Aggressive Growth Portfolio returned 7.30% versus 1.23% for the current benchmark, the S&P 500 Index.
U.S. equities ended the period slightly higher. Stocks were up in the first quarter, driven by signs of an improving domestic economy and a strong U.S. consumer. Heading into the second quarter, volatility remained low and stocks generally traded in a narrow range for much of April and May, as the market continued to digest what the eventual end of the Federal Reserve’s accommodative monetary policies will mean for both the stock market and broader economy. After drifting higher during the period, equities sold off at the end of the quarter, as Greece moved closer to a potential exit from the eurozone.
As part of our investment strategy, we seek companies that have clear, sustainable competitive moats around their businesses that should help them grow market share within their respective industries over time. Important competitive advantages could include a strong brand, network effects from a product or service that would be hard for a competitor to replicate, a lower cost structure than competitors in the industry, a distribution advantage or patent protection over valuable intellectual property. We think emphasizing such sustainable competitive advantages can be a meaningful driver of outperformance over time, because the market often underestimates the duration of growth for these companies and the long-term potential return to shareholders. In addition to these competitively advantaged companies that we believe will have superior compounded growth over time, we also dedicate a smaller portion of the Portfolio (roughly 10% to 15%) to companies that we believe have “blue sky” opportunities. For these companies, the competitive moat is less well defined, but we see considerable growth ahead as they invest and solidify that moat. We also invest a small portion of the Portfolio (10% to 15%) in “special situations,” which can broadly be defined as companies undergoing a change that has been unrecognized by the market, but gives the potential for compound growth in the future. (1)
Over the reporting period, much of the Portfolio’s outperformance was driven by specific stocks in our “blue sky” opportunity category, and by large positions that fall into our compound growth category. At the sector level, our stock selection in the Health Care and Consumer Discretionary sectors were large contributors to relative performance. Our stock selection in the Industrials and Telecommunications Services sectors detracted from relative results. (1)
Contributors included Valeant Pharmaceuticals International, Inc., Pharmacyclics, Inc., Amazon.com, Inc., Starbucks Corp., and Delphi Automotive PLC. Valeant Pharmaceuticals International, Inc. is a multinational specialty pharmaceutical company that develops, manufactures and markets a range of pharmaceutical products. We believe management has transformed the specialty pharmaceutical company by improving margins, incentives and the company’s growth profile. Valeant Pharmaceuticals International, Inc. has a strong and growing presence in two key emerging markets, Latin America and Eastern Europe, and it has demonstrated an ability to make value-enhancing acquisitions. We like the commercial-stage biotechnology company, Pharmacyclics, Inc., for its cancer drug Imbruvica, a well-tolerated and effective maintenance treatment for chronic lymphocytic leukemia, a relatively high prevalence form of leukemia, and mantle cell lymphoma, a rare and aggressive type of blood cancer. We sold the position after the announcement that the company would be acquired by AbbVie. Amazon.com, Inc. offers a wide range of products, including books, music, videotapes, computers, electronics, home and garden, and numerous other products. Amazon.com, Inc. offers personalized shopping services, Web-based credit card payment and direct shipping to customers. We believe the company’s competitive advantages of a low overhead cost structure, allowing for an aggressive pricing structure, and faster shipping will cause consumers to shift an increasing amount of their general merchandise spending toward it. Given that over 90% of retail sales are still sold offline, we believe Amazon.com, Inc. has significant opportunities ahead, particularly as it expands into new business lines and geographies. Starbucks Corp., the coffee retailer, which also offers other beverages and a variety of fresh food items through company-operated and licensed stores, is well positioned to continue gaining share in the coffee industry, including the premium packaged coffee and single-cup markets. Lower coffee costs are allowing the company to increase investments in growth initiatives such as its Teavana tea shops, La Boulange bakery and its newly launched Verismo single-serve beverage system. We also believe Starbucks Corp.’s expansion into Asia will continue to add meaningfully to sales and profits, given that region’s higher operating margins and Starbucks Corp.’s underpenetrated market positioning. We also believe a new mobile app will increase both sales and throughput. Many of Delphi Automotive PLC’s products are focused on making automobiles more safe, green and connected, which are three long-term trends in auto production. We also believe the company has distribution and cost advantages over its competitors. (1)
Detractors included Precision Castparts Corp., Canadian Pacific Railway Ltd., Alibaba Group Holding Ltd., United Continental Holdings, Inc., and Chipotle Mexican Grill, Inc. Precision Castparts Corp. makes castings, forgings and airframe products for the aerospace and power industries. We sold the stock after some disappointing results from the company. Canadian Pacific Railway Ltd. operates a rail system connecting the major business centers in Canada. We like that the company operates in an industry that has significant barriers to entry. We believe a new management team is improving the railroad company’s culture, operational performance and capital
| 37 | (continued) |
| Ohio National Fund, Inc. | Aggressive Growth Portfolio (Continued) |
allocation decisions. Alibaba Group Holding Ltd. is a Chinese e-commerce company providing consumer-to-consumer, business-to-consumer and business-to-business sales services via web and mobile platforms. We think increasing spending power for the Chinese consumer and rapid growth in e-commerce in China are long-term tailwinds for the company. United Continental Holdings, Inc. is one of the world’s largest airline carriers. The company has upside potential, in our view. Returns on invested capital are rising and likely to improve due to scale advantages after United’s merger with Continental. Moreover, the airline industry has pricing power for the first time in years due to capacity reductions in the industry. We think Chipotle Mexican Grill, Inc. is still early in its store unit growth. As consumers continue to seek healthier, more natural foods, we believe Chipotle Mexican Grill, Inc.’s commitment to simple, sustainably grown and produced food without the use of additives is a differentiator as compared to other fast food, family dining and fast casual establishments. (1)
We believe the U.S. economy is in generally good shape. We have yet to see a significant pickup in consumer spending, but believe early signs of wage growth and the savings consumers are receiving from lower gasoline prices will eventually flow through the economy. A housing market that we believe is still only in the middle innings of a recovery should also provide a long-term tailwind for the economy.
While we remain positive on the broader economy, we would expect a lower return environment for U.S. equities in the coming months. Equity markets are beginning to price in higher interest rates, but with rates poised to move up it is hard to foresee further multiple expansion for U.S. stocks. The strength of the U.S. dollar means that revenue growth, at least overseas, will be harder to come by. These factors do not make us bearish on equities, but in an environment
where multiples are not likely to expand and revenue growth could be more of a challenge, we think it underscores the importance of finding those select companies with truly sustainable competitive advantages who can take market share and continue to grow earnings in excess of the market.
| (1) | The Portfolio’s composition is subject to change. Holdings and weightings are as of June 30, 2015. |
Change in Value of $10,000 Investment
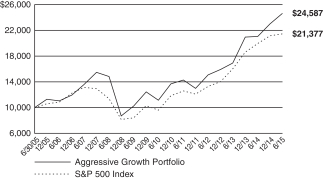
Hypothetical illustration based on past performance. Future performance will vary. The Portfolio’s returns reflect reinvested dividends. The Portfolio’s holdings may differ significantly from the securities in the index. The index is unmanaged and therefore does not reflect the cost of portfolio management and accounting.
The S&P 500 Index is a capitalization-weighted index designed to measure performance of the broad domestic economy through changes in the aggregate market value of 500 stocks representing all major industries. The index presented herein includes the effects of reinvested dividends.
Portfolio Composition as of June 30, 2015 (1)
| % of Net Assets | ||||
Common Stocks (3) | 96.5 | |||
Money Market Funds and | 3.5 | |||
|
| |||
| 100.0 | ||||
|
|
Top 10 Portfolio Holdings as of June 30, 2015 (1) (2)
| % of Net Assets |
1. Lowe’s Cos., Inc. | 4.7 | |||
2. Valeant Pharmaceuticals International, Inc. | 3.6 | |||
3. Google, Inc. Class C | 3.6 | |||
4. MasterCard, Inc. Class A | 3.5 | |||
5. Starbucks Corp. | 3.3 | |||
6. Zoetis, Inc. | 3.2 | |||
7. Priceline Group, Inc. / The | 3.0 | |||
8. General Electric Co. | 3.0 | |||
9. Nielsen NV | 2.8 | |||
10. Apple, Inc. | 2.7 |
| (1) | Composition of Portfolio subject to change. |
| (2) | Short-term investments have been excluded from the list of Top 10 Portfolio Holdings. |
| (3) | Sectors: |
| % of Net Assets | ||||
Consumer Discretionary | 28.9 | |||
Information Technology | 23.8 | |||
Health Care | 14.8 | |||
Financials | 14.7 | |||
Industrials | 10.9 | |||
Materials | 2.2 | |||
Energy | 1.2 | |||
|
| |||
| 96.5 | ||||
|
|
| 38 |
| Ohio National Fund, Inc. | Aggressive Growth Portfolio |
Schedule of Investments | June 30, 2015 (Unaudited) |
| Common Stocks – 96.5% | Shares | Value | ||||||||
CONSUMER DISCRETIONARY – 28.9% | ||||||||||
Delphi Automotive PLC (Auto Components) | 13,353 | $ | 1,136,207 | |||||||
Chipotle Mexican Grill, Inc. (Hotels, Restaurants & Leisure) | (a) | 1,957 | 1,183,965 | |||||||
Las Vegas Sands Corp. (Hotels, Restaurants & Leisure) | 11,096 | 583,317 | ||||||||
Norwegian Cruise Line Holdings Ltd. (Hotels, Restaurants & Leisure) | (a) | 19,183 | 1,075,015 | |||||||
Starbucks Corp. (Hotels, Restaurants & Leisure) | 28,736 | 1,540,681 | ||||||||
Amazon.com, Inc. (Internet & Catalog Retail) | (a) | 2,931 | 1,272,318 | |||||||
Ctrip.com International Ltd. – ADR (Internet & Catalog Retail) | (a) | 4,050 | 294,111 | |||||||
Priceline Group, Inc. / The (Internet & Catalog Retail) | (a) | 1,218 | 1,402,369 | |||||||
Wayfair, Inc. Class A (Internet & Catalog Retail) | (a) | 12,438 | 468,166 | |||||||
Lowe’s Cos., Inc. (Specialty Retail) | 32,682 | 2,188,714 | ||||||||
TJX Cos., Inc. / The (Specialty Retail) | 16,023 | 1,060,242 | ||||||||
Gildan Activewear, Inc. (Textiles, Apparel & Luxury Goods) | 37,693 | 1,252,915 | ||||||||
|
| |||||||||
| 13,458,020 | ||||||||||
|
| |||||||||
ENERGY – 1.2% | ||||||||||
Baker Hughes, Inc. (Energy Equip. & Svs.) | 9,166 | 565,542 | ||||||||
|
| |||||||||
FINANCIALS – 14.7% | ||||||||||
PacWest Bancorp (Banks) | 22,451 | 1,049,809 | ||||||||
Charles Schwab Corp. / The (Capital Markets) | 30,038 | 980,741 | ||||||||
E*TRADE Financial Corp. (Capital Markets) | (a) | 36,705 | 1,099,315 | |||||||
Moelis & Co. Class A (Capital Markets) | 16,936 | 486,233 | ||||||||
Intercontinental Exchange, Inc. (Diversified Financial Svs.) | 3,816 | 853,296 | ||||||||
Aon PLC (Insurance) | 11,778 | 1,174,031 | ||||||||
Crown Castle International Corp. (Real Estate Investment Trusts) | 15,181 | 1,219,034 | ||||||||
|
| |||||||||
| 6,862,459 | ||||||||||
|
| |||||||||
HEALTH CARE – 14.8% | ||||||||||
Celgene Corp. (Biotechnology) | (a) | 9,210 | 1,065,919 | |||||||
Regeneron Pharmaceuticals, Inc. (Biotechnology) | (a) | 1,541 | 786,110 | |||||||
Endo International PLC (Pharmaceuticals) | (a) | 13,389 | 1,066,434 | |||||||
Pacira Pharmaceuticals, Inc. (Pharmaceuticals) | (a) | 5,125 | 362,440 | |||||||
Phibro Animal Health Corp. Class A (Pharmaceuticals) | 12,185 | 474,484 | ||||||||
Valeant Pharmaceuticals International, Inc. (Pharmaceuticals) | (a) | 7,578 | 1,683,453 | |||||||
Zoetis, Inc. (Pharmaceuticals) | 30,718 | 1,481,222 | ||||||||
|
| |||||||||
| 6,920,062 | ||||||||||
|
| |||||||||
| Common Stocks (Continued) | Shares | Value | ||||||||
INDUSTRIALS – 10.9% | ||||||||||
United Continental Holdings, Inc. (Airlines) | (a) | 10,704 | $ | 567,419 | ||||||
General Electric Co. (Industrial Conglomerates) | 51,999 | 1,381,613 | ||||||||
Colfax Corp. (Machinery) | (a) | 14,778 | 682,005 | |||||||
Nielsen NV (Professional Svs.) | 28,846 | 1,291,435 | ||||||||
Canadian Pacific Railway Ltd. (Road & Rail) | 7,382 | 1,182,818 | ||||||||
|
| |||||||||
| 5,105,290 | ||||||||||
|
| |||||||||
INFORMATION TECHNOLOGY – 23.8% | ||||||||||
Alibaba Group Holding Ltd. – ADR (Internet Software & Svs.) | (a) | 14,699 | 1,209,287 | |||||||
CoStar Group, Inc. (Internet Software & Svs.) | (a) | 4,701 | 946,123 | |||||||
Facebook, Inc. Class A (Internet Software & Svs.) | (a) | 11,543 | 989,985 | |||||||
Google, Inc. Class C (Internet Software & Svs.) | (a) | 3,214 | 1,672,919 | |||||||
LinkedIn Corp. (Internet Software & Svs.) | (a) | 2,650 | 547,569 | |||||||
MasterCard, Inc. Class A (IT Svs.) | 17,617 | 1,646,837 | ||||||||
WEX, Inc. (IT Svs.) | (a) | 4,452 | 507,394 | |||||||
ARM Holdings PLC – ADR (Semiconductors & Equip.) | 14,344 | 706,729 | ||||||||
NetSuite, Inc. (Software) | (a) | 4,270 | 391,773 | |||||||
Salesforce.com, Inc. (Software) | (a) | 17,224 | 1,199,307 | |||||||
Apple, Inc. (Tech. Hardware, Storage & Periph.) | 10,216 | 1,281,342 | ||||||||
|
| |||||||||
| 11,099,265 | ||||||||||
|
| |||||||||
MATERIALS – 2.2% | ||||||||||
Vulcan Materials Co. (Construction Materials) | 12,238 | 1,027,135 | ||||||||
|
| |||||||||
Total Common Stocks (Cost $38,062,989) | $ | 45,037,773 | ||||||||
|
| |||||||||
| Money Market Funds – 3.2% | Shares | Value | ||||||||
Fidelity Institutional Money Market Funds | 1,474,000 | $ | 1,474,000 | |||||||
|
| |||||||||
Total Money Market Funds (Cost $1,474,000) | $ | 1,474,000 | ||||||||
|
| |||||||||
Total Investments – 99.7% (Cost $39,536,989) | (b) | $ | 46,511,773 | |||||||
Other Assets in Excess of Liabilities – 0.3% | 132,773 | |||||||||
|
| |||||||||
Net Assets – 100.0% | $ | 46,644,546 | ||||||||
|
| |||||||||
Percentages are stated as a percent of net assets.
Abbreviations:
ADR: American Depositary Receipts
Footnotes:
| (a) | Non-income producing security. |
| (b) | Represents cost for financial reporting purposes, which may differ from cost basis for federal income tax purposes. See also Note 7 of the Notes to Financial Statements. |
The accompanying notes are an integral part of these financial statements.
| 39 |
| Ohio National Fund, Inc. | Small Cap Growth Portfolio |
Objective/Strategy
The Small Cap Growth Portfolio seeks long-term capital appreciation by investing at least 80% of its net assets in stocks of small companies.
Performance as of June 30, 2015
Average Annual Returns: | ||||
One year | 16.24% | |||
Five years | 22.32% | |||
Ten years | 12.64% |
Past performance does not guarantee future results. The performance data quoted represents past performance and current returns may be lower or higher. Total return figures include change in share price and reinvestment of dividends and capital gains. The investment return and principal value will fluctuate so that an investor’s shares, when redeemed, may be worth more or less than the original cost. To obtain performance information up to the most recent month end, call toll-free 1-877-781-6392.
The Portfolio is not open to direct retail investment. Beneficial interest in shares is obtained solely by purchase of variable life insurance policies and variable annuity contracts. Actual performance results for variable annuity and variable universal life contracts will be lower due to contract charges. Consult your contract for applicable charges.
Comments
For the six-month period ended June 30, 2015, the Small Cap Growth Portfolio returned 7.90% versus 8.74% for the current benchmark, the Russell 2000 Growth Index.
Small-cap growth stocks climbed sharply in the first quarter of 2015, helped by the perception that the Federal Reserve will likely be slower to raise interest rates than many expected heading into the year. For much of the second quarter, volatility remained low, as the market continued to digest what the eventual end of the Federal Reserve’s accommodative monetary policies will mean for both the stock market and broader economy. However, small-cap stocks sold off late in June, as Greece moved closer to a potential exit from the eurozone.
We have taken a high-quality approach to investing in small caps. Many of the companies in the Portfolio have predictable, recurring revenue streams. Our companies also typically generate a high return on invested capital and have demonstrated a proven ability to expand profit margins. We also put a great emphasis on identifying companies with sustainable competitive advantages that should help them gain market share and grow in a variety of market environments. Given our high-quality focus, we expect the Portfolio to produce positive results during market rallies, and to outperform the benchmark in weak or uncertain market environments, creating a smoother path to investing in small caps and a better opportunity to generate higher compounded returns over full market cycles. When markets are up sharply, as they were for much of the six-month period, it is not our ideal backdrop for relative outperformance.
At the sector level, our stock selection and underweight to the Health Care sector detracted from relative results, as did our stock selection in the Energy sector. Our stock selection in the Materials and Consumer Discretionary sectors were large contributors to relative performance. (1)
There has been a lot of momentum chasing small-cap biotech companies and this has driven valuations for biotech stocks up considerably. We have taken a selective approach to investing in the industry. We typically take larger positions with those compa-
nies that already have innovative therapies approved by the FDA or have multiple products in their pipelines, and have smaller exposure to companies whose performance will be determined largely by the success or failure of a clinical trial for a single drug under development. Some of those holdings have fared well for us in the period, as you will see in our list of top contributors on an absolute basis. However, in a period in which momentum continued to indiscriminately push most biotech stocks broadly higher, we were not surprised to underperform the index in the Health Care sector.
The Portfolio’s relative outperformance in the Materials and Consumer Discretionary sectors were stock specific, rather than a specific underlying theme we were exposed to or avoided. (1)
Contributors to performance included Synageva BioPharma Corp., Dyax Corp., Eagle Pharmaceuticals, Inc., Insys Therapeutics, Inc., and Masimo Corp. Synageva BioPharma Corp. focuses on the development of enzyme replacement therapies, an attractive business model, in our view. We like Synageva BioPharma Corp. for its therapy for lysosomal acid lipase deficiency (“LAL-D”), a rare, unmet disorder. This enzyme plays an important role in breaking down fatty material in the body. Infants, children and adults who suffer from LAL-D experience a range of serious health problems. The company’s novel protein expression platform has also produced four additional pipeline drugs. The company was acquired by Alexion Pharmaceuticals during the period. Dyax Corp. is a biotech company focused on hereditary angioedema (“HAE”). Current treatments include both prophylactic and acute-use options. We believe that Dyax Corp. will be able to dominate the prophylactic HAE market with a new self-injectable antibody. It is our view that the company will continue to generate revenues from its acute-use treatment, Kalbitor, and finally collect royalties on a portfolio of antibody therapeutics. Eagle Pharmaceuticals, Inc., specialty pharmaceutical company, focuses on improving formulations of existing hospital administered drugs. We believe the value of the company’s product pipeline remains underappreciated, particularly the potential of a licensing agreement with Teva Pharmaceuticals for a new formulation to treat chronic lymphocytic leukemia and non-Hodgkin lymphoma. Insys Therapeutics, Inc., a commercial-stage specialty pharmaceutical company, develops and markets innovative supportive care products. Insys Therapeutics, Inc.’s products include Subsys, a fast-acting sublingual spray for cancer pain, and a dronabinol product used to treat chemotherapy-induced nausea and vomiting and to stimulate appetite in AIDS patients. Subsys has already captured a significant portion of the market in the one year since its launch. Despite Subsys’ success, we believe the market continues to underappreciate the drug’s potential and its ability to drive profit growth for Insys Therapeutics, Inc. We also think the company can use the technology from Subsys to develop other drugs as well, which could provide further appreciation in the stock. Masimo Corp. is a medical technology company that focuses on patient monitoring. The company has differentiated product technology and will continue to grow market share, in our view. (1)
Detractors from performance included FXCM, Inc., Stratasys Ltd., Rexnord Corp., Dominion Midstream Partners, LP, and Novadaq Technologies, Inc. FXCM, Inc. offers an online forex trading platform. We sold this position after earnings for the company were materially impaired, as they forgave negative client balances that had been affected by the appreciation of the Swiss franc against the euro. Stratasys Ltd. makes and sells three-dimensional printing services, which companies use in computer-assisted design. We believe we are in the early innings of the use of 3-D printers, which should gain wider adoption since they speed up the design process from concept to physical product. We also like the recurring revenue the
| 40 | (continued) |
| Ohio National Fund, Inc. | Small Cap Growth Portfolio (Continued) |
company receives from the proprietary consumable materials that are used by its printers. Rexnord Corp. conducts process and motion control, as well as water management operations. Rexnord Corp. offers gears, seals, couplings, industrial and aerospace bearings, special components, industrial chain, conveying equipment, grade specification plumbing, water treatment and wastewater control products. We consider Rexnord Corp. a high-quality industrial firm with stable core business segments and strengthening end markets. We appreciate its historical ability to generate high incremental margins and that its products are offered at a relatively low cost to its customers, who give the firm high ratings. DCP Midstream Partners, LP is a high-growth Master Limited Partnership with exposure to the Marcellus and Utica plays. Growth is supported by the sponsor’s large backlog of high-quality assets augmented by long-term take-or-pay commitments. Novadaq Technologies, Inc.’s technology allows surgeons to assess blood flow and other potential complications during surgery, leading to a reduction in post-surgical complications. We believe we are in the early stages of adoption of Novadaq Technologies, Inc.’s technology and that more applications for its technology will develop. (1)
We’ve mentioned in previous investment commentaries that price to earnings ratios looked stretched for a number of small-cap stocks. That statement remains true. We believe markets have shown an uncanny ability to shrug off risks, largely overlooking geopolitical tensions in Russia, a weakening energy complex in the U.S., weakness in emerging markets and a slowdown in China. None of these concerns have us calling for a market correction. Finding a specific catalyst, especially when the U.S. economy is showing some genuine signs of improvement, is hard, if not impossible, to predict. We would suggest, however, that a lower aggregate return environment is likely to persist in the coming months, and that higher volatility is likely ahead. From the standpoint of relative performance, we welcome such an environment. With valuations already on the high end of historical averages, it is hard to imagine they will expand any
further. Companies will need to demonstrate true earnings growth for stock prices to grind higher. We believe this can benefit many of the higher-quality companies we tend to focus on, which have demonstrated a steady path toward growing earnings.
| (1) | The Portfolio’s composition is subject to change. Holdings and weightings are as of June 30, 2015. |
Change in Value of $10,000 Investment
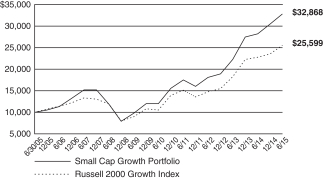
Hypothetical illustration based on past performance. Future performance will vary. The Portfolio’s returns reflect reinvested dividends. The Portfolio’s holdings may differ significantly from the securities in the index. The index is unmanaged and therefore does not reflect the cost of portfolio management and accounting.
The Russell 2000 Growth Index measures the performance of the small-cap growth segment of the U.S. equity universe. It includes the Russell 2000 Index companies with higher price-to-value ratios and higher forecasted growth values. The Russell 2000 Index includes the 2000 firms from the Russell 3000 Index with the smallest market capitalizations. The Russell 3000 Index represents 98% of the investable U.S. equity markets. The index presented herein includes the effects of reinvested dividends.
Portfolio Composition as of June 30, 2015 (1)
| % of Net Assets | ||||
Common Stocks (3) | 99.2 | |||
Master Limited Partnerships (3) | 0.7 | |||
Money Market Funds | 0.1 | |||
|
| |||
| 100.0 | ||||
|
|
Top 10 Portfolio Holdings as of June 30, 2015 (1) (2)
| % of Net Assets | ||||
1. SS&C Technologies Holdings, Inc. | 2.2 | |||
2. Sensient Technologies Corp. | 2.0 | |||
3. Rexnord Corp. | 1.9 | |||
4. Carter’s, Inc. | 1.8 | |||
5. EnerSys | 1.8 | |||
6. Broadridge Financial Solutions, Inc. | 1.7 | |||
7. Cadence Design Systems, Inc. | 1.7 | |||
8. NICE-Systems Ltd. – ADR | 1.7 | |||
9. Solera Holdings, Inc. | 1.7 | |||
10. Euronet Worldwide, Inc. | 1.6 |
| 41 | (continued) |
| Ohio National Fund, Inc. | Small Cap Growth Portfolio (Continued) |
| (1) | Composition of Portfolio subject to change. |
| (2) | Short-term investments have been excluded from the list of Top 10 Portfolio Holdings. |
| (3) | Sectors (combined): |
| % of Net Assets | ||||
Information Technology | 33.4 | |||
Health Care | 21.5 | |||
Industrials | 18.3 | |||
Consumer Discretionary | 12.7 | |||
Financials | 8.7 | |||
Materials | 2.0 | |||
Consumer Staples | 2.0 | |||
Energy | 1.3 | |||
|
| |||
| 99.9 | ||||
|
|
| 42 |
| Ohio National Fund, Inc. | Small Cap Growth Portfolio |
Schedule of Investments | June 30, 2015 (Unaudited) |
| Common Stocks – 99.2% | Shares | Value | ||||||||
CONSUMER DISCRETIONARY – 12.7% | ||||||||||
ServiceMaster Global Holdings, Inc. (Diversified Consumer Svs.) | (a) | 56,252 | $ | 2,034,635 | ||||||
Biglari Holdings, Inc. (Hotels, Restaurants & Leisure) | (a) | 8,034 | 3,324,067 | |||||||
Bojangles’, Inc. (Hotels, Restaurants & Leisure) | (a) | 10,828 | 258,356 | |||||||
Diamond Resorts International, Inc. (Hotels, Restaurants & Leisure) | (a) | 67,588 | 2,132,401 | |||||||
Domino’s Pizza Group PLC (Hotels, Restaurants & Leisure) | (b) | 107,060 | 1,306,671 | |||||||
Manchester United PLC Class A (Media) | (a) | 75,977 | 1,356,949 | |||||||
National CineMedia, Inc. (Media) | 149,546 | 2,386,754 | ||||||||
SFX Entertainment, Inc. (Media) | (a) | 128,198 | 575,609 | |||||||
DavidsTea, Inc. (Specialty Retail) | (a) | 11,413 | 245,265 | |||||||
Hibbett Sports, Inc. (Specialty Retail) | (a) | 27,484 | 1,280,205 | |||||||
Monro Muffler Brake, Inc. (Specialty Retail) | 17,110 | 1,063,558 | ||||||||
Party City Holdco, Inc. (Specialty Retail) | (a) | 24,005 | 486,581 | |||||||
Sally Beauty Holdings, Inc. (Specialty Retail) | (a) | 110,485 | 3,489,116 | |||||||
Carter’s, Inc. (Textiles, Apparel & Luxury Goods) | 37,926 | 4,031,534 | ||||||||
Tumi Holdings, Inc. (Textiles, Apparel & Luxury Goods) | (a) | 53,978 | 1,107,629 | |||||||
Wolverine World Wide, Inc. (Textiles, Apparel & Luxury Goods) | 115,966 | 3,302,712 | ||||||||
|
| |||||||||
| 28,382,042 | ||||||||||
|
| |||||||||
CONSUMER STAPLES – 2.0% | ||||||||||
Casey’s General Stores, Inc. (Food & Staples Retailing) | 17,477 | 1,673,248 | ||||||||
Ontex Group NV (Personal Products) | (b) | 90,121 | 2,705,186 | |||||||
|
| |||||||||
| 4,378,434 | ||||||||||
|
| |||||||||
ENERGY – 0.6% | ||||||||||
Dril-Quip, Inc. (Energy Equip. & Svs.) | (a) | 18,877 | 1,420,494 | |||||||
|
| |||||||||
FINANCIALS – 8.7% | ||||||||||
Bank of the Ozarks, Inc. (Banks) | 34,185 | 1,563,964 | ||||||||
Artisan Partners Asset Management, Inc. Class A (Capital Markets) | 31,895 | 1,481,842 | ||||||||
Financial Engines, Inc. (Capital Markets) | 26,138 | 1,110,342 | ||||||||
LPL Financial Holdings, Inc. (Capital Markets) | 73,076 | 3,397,303 | ||||||||
Virtu Financial, Inc. Class A (Capital Markets) | (a) | 27,727 | 651,030 | |||||||
WisdomTree Investments, Inc. (Capital Markets) | 88,691 | 1,948,098 | ||||||||
MSCI, Inc. (Diversified Financial Svs.) | 42,950 | 2,643,572 | ||||||||
RLI Corp. (Insurance) | 22,746 | 1,168,917 | ||||||||
Easterly Government Properties, Inc. (Real Estate Investment Trusts) | 65,168 | 1,037,475 | ||||||||
Jones Lang LaSalle, Inc. (Real Estate Mgmt. & Development) | 9,521 | 1,628,091 | ||||||||
RE/MAX Holdings, Inc. (Real Estate Mgmt. & Development) | 21,059 | 747,805 | ||||||||
St. Joe Co. / The (Real Estate Mgmt. & Development) | (a) | 68,635 | 1,065,902 | |||||||
LendingTree, Inc. (Thrifts & Mortgage Finance) | (a) | 13,074 | 1,027,747 | |||||||
|
| |||||||||
| 19,472,088 | ||||||||||
|
| |||||||||
HEALTH CARE – 21.5% | ||||||||||
ACADIA Pharmaceuticals, Inc. (Biotechnology) | (a) | 31,463 | 1,317,670 | |||||||
Achillion Pharmaceuticals, Inc. (Biotechnology) | (a) | 38,725 | 343,103 | |||||||
Anacor Pharmaceuticals, Inc. (Biotechnology) | (a) | 6,071 | 470,078 | |||||||
Chimerix, Inc. (Biotechnology) | (a) | 32,237 | 1,489,349 | |||||||
Dyax Corp. (Biotechnology) | (a) | 87,887 | 2,329,005 | |||||||
Eagle Pharmaceuticals, Inc. (Biotechnology) | (a) | 25,348 | 2,049,639 | |||||||
Insys Therapeutics, Inc. (Biotechnology) | (a) | 53,478 | 1,920,930 | |||||||
Ironwood Pharmaceuticals, Inc. (Biotechnology) | (a) | 93,781 | 1,130,999 | |||||||
Ligand Pharmaceuticals, Inc. (Biotechnology) | (a) | 12,282 | 1,239,254 | |||||||
Medivation, Inc. (Biotechnology) | (a) | 6,113 | 698,105 | |||||||
OvaScience, Inc. (Biotechnology) | (a) | 22,716 | 657,174 | |||||||
Puma Biotechnology, Inc. (Biotechnology) | (a) | 6,820 | 796,235 | |||||||
Seres Therapeutics, Inc. (Biotechnology) | (a) | 3,774 | 156,621 | |||||||
EndoChoice Holdings, Inc. (Health Care Equip. & Supplies) | (a) | 34,442 | 563,127 | |||||||
| Common Stocks (Continued) | Shares | Value | ||||||||
HEALTH CARE (continued) | ||||||||||
Endologix, Inc. (Health Care Equip. & Supplies) | (a) | 141,999 | $ | 2,178,265 | ||||||
Glaukos Corp. (Health Care Equip. & Supplies) | (a) | 1,404 | 40,688 | |||||||
LDR Holding Corp. (Health Care Equip. & Supplies) | (a) | 49,798 | 2,153,763 | |||||||
Masimo Corp. (Health Care Equip. & Supplies) | (a) | 53,734 | 2,081,655 | |||||||
Novadaq Technologies, Inc. (Health Care Equip. & Supplies) | (a) | 136,287 | 1,650,436 | |||||||
Quidel Corp. (Health Care Equip. & Supplies) | (a) | 54,864 | 1,259,129 | |||||||
Trinity Biotech PLC – ADR (Health Care Equip. & Supplies) | 32,848 | 593,235 | ||||||||
Wright Medical Group, Inc. (Health Care Equip. & Supplies) | (a) | 34,120 | 895,991 | |||||||
Aceto Corp. (Health Care Providers & Svs.) | 52,890 | 1,302,681 | ||||||||
Capital Senior Living Corp. (Health Care Providers & Svs.) | (a) | 50,238 | 1,230,831 | |||||||
HealthEquity, Inc. (Health Care Providers & Svs.) | (a) | 43,187 | 1,384,143 | |||||||
Teladoc, Inc. (Health Care Providers & Svs.) | (a) | 5,921 | 112,499 | |||||||
athenahealth, Inc. (Health Care Technology) | (a) | 12,013 | 1,376,450 | |||||||
Evolent Health, Inc. (Health Care Technology) | (a) | 14,358 | 279,981 | |||||||
Bio-Techne Corp. (Life Sciences Tools & Svs.) | 20,087 | 1,977,967 | ||||||||
Catalent, Inc. (Pharmaceuticals) | (a) | 94,958 | 2,785,118 | |||||||
Concordia Healthcare Corp. (Pharmaceuticals) | 14,263 | 1,030,613 | ||||||||
Flamel Technologies SA – ADR (Pharmaceuticals) | (a) | 71,667 | 1,518,624 | |||||||
GW Pharmaceuticals PLC – ADR (Pharmaceuticals)(a) | 4,894 | 601,179 | ||||||||
IGI Laboratories, Inc. (Pharmaceuticals) | (a) | 104,069 | 655,635 | |||||||
Mallinckrodt PLC (Pharmaceuticals) | (a) | 9,950 | 1,171,314 | |||||||
Pacira Pharmaceuticals, Inc. (Pharmaceuticals) | (a) | 12,383 | 875,726 | |||||||
Pernix Therapeutics Holdings, Inc. (Pharmaceuticals) | (a) | 79,046 | 467,952 | |||||||
Phibro Animal Health Corp. Class A (Pharmaceuticals) | 46,964 | 1,828,778 | ||||||||
Prestige Brands Holdings, Inc. (Pharmaceuticals) | (a) | 46,884 | 2,167,916 | |||||||
Relypsa, Inc. (Pharmaceuticals) | (a) | 39,489 | 1,306,691 | |||||||
|
| |||||||||
| 48,088,549 | ||||||||||
|
| |||||||||
INDUSTRIALS – 18.3% | ||||||||||
HEICO Corp. Class A (Aerospace & Defense) | 66,558 | 3,379,150 | ||||||||
Sparton Corp. (Aerospace & Defense) | (a) | 33,071 | 903,500 | |||||||
Hub Group, Inc. Class A (Air Freight & Logistics) | (a) | 40,618 | 1,638,530 | |||||||
A.O. Smith Corp. (Building Products) | 42,793 | 3,080,240 | ||||||||
ABM Industries, Inc. (Commercial Svs. & Supplies) | 36,487 | 1,199,328 | ||||||||
Heritage-Crystal Clean, Inc. (Commercial Svs. & Supplies) | (a) | 34,978 | 514,177 | |||||||
SP Plus Corp. (Commercial Svs. & Supplies) | (a) | 66,046 | 1,724,461 | |||||||
EnerSys (Electrical Equip.) | 56,078 | 3,941,723 | ||||||||
Raven Industries, Inc. (Industrial Conglomerates) | 71,993 | 1,463,618 | ||||||||
CIRCOR International, Inc. (Machinery) | 10,717 | 584,398 | ||||||||
Kennametal, Inc. (Machinery) | 97,122 | 3,313,803 | ||||||||
Nordson Corp. (Machinery) | 33,106 | 2,578,626 | ||||||||
Proto Labs, Inc. (Machinery) | (a) | 10,620 | 716,638 | |||||||
Rexnord Corp. (Machinery) | (a) | 177,606 | 4,246,559 | |||||||
Wabtec Corp. (Machinery) | 25,147 | 2,369,853 | ||||||||
Advisory Board Co. / The (Professional Svs.) | (a) | 26,068 | 1,425,138 | |||||||
CEB, Inc. (Professional Svs.) | 26,226 | 2,283,236 | ||||||||
Old Dominion Freight Line, Inc. (Road & Rail) | (a) | 20,020 | 1,373,472 | |||||||
Saia, Inc. (Road & Rail) | (a) | 22,336 | 877,581 | |||||||
WESCO International, Inc. (Trading Companies & Distributors) | (a) | 48,144 | 3,304,604 | |||||||
|
| |||||||||
| 40,918,635 | ||||||||||
|
| |||||||||
INFORMATION TECHNOLOGY – 33.4% | ||||||||||
Belden, Inc. (Electronic Equip., Instr. & Comp.) | 36,222 | 2,942,313 | ||||||||
CTS Corp. (Electronic Equip., Instr. & Comp.) | 134,103 | 2,584,165 | ||||||||
FEI Co. (Electronic Equip., Instr. & Comp.) | 20,682 | 1,715,158 | ||||||||
National Instruments Corp. (Electronic Equip., Instr. & Comp.) | 42,738 | 1,259,061 | ||||||||
OSI Systems, Inc. (Electronic Equip., Instr. & Comp.) | (a) | 25,567 | 1,809,888 | |||||||
| 43 | (continued) |
| Ohio National Fund, Inc. | Small Cap Growth Portfolio (Continued) |
Schedule of Investments | June 30, 2015 (Unaudited) |
| Common Stocks (Continued) | Shares | Value | ||||||||
INFORMATION TECHNOLOGY (continued) | ||||||||||
Alarm.com Holdings, Inc. (Internet Software & Svs.) | (a) | 37,564 | $ | 577,734 | ||||||
ChannelAdvisor Corp. (Internet Software & Svs.) | (a) | 42,609 | 509,178 | |||||||
Cimpress NV (Internet Software & Svs.) | (a) | 20,754 | 1,746,657 | |||||||
CoStar Group, Inc. (Internet Software & Svs.) | (a) | 6,794 | 1,367,360 | |||||||
Demandware, Inc. (Internet Software & Svs.) | (a) | 12,656 | 899,588 | |||||||
Endurance International Group Holdings, Inc. (Internet Software & Svs.) | (a) | 128,254 | 2,649,728 | |||||||
Envestnet, Inc. (Internet Software & Svs.) | (a) | 33,553 | 1,356,548 | |||||||
HomeAway, Inc. (Internet Software & Svs.) | (a) | 31,201 | 970,975 | |||||||
j2 Global, Inc. (Internet Software & Svs.) | 39,847 | 2,707,205 | ||||||||
Textura Corp. (Internet Software & Svs.) | (a) | 30,798 | 857,108 | |||||||
Zillow Group, Inc. Class A (Internet Software & Svs.) | (a) | 13,261 | 1,150,259 | |||||||
Blackhawk Network Holdings, Inc. (IT Svs.) | (a) | 46,775 | 1,927,130 | |||||||
Broadridge Financial Solutions, Inc. (IT Svs.) | 76,306 | 3,816,063 | ||||||||
Euronet Worldwide, Inc. (IT Svs.) | (a) | 57,796 | 3,566,013 | |||||||
MAXIMUS, Inc. (IT Svs.) | 17,714 | 1,164,341 | ||||||||
WEX, Inc. (IT Svs.) | (a) | 17,617 | 2,007,809 | |||||||
Atmel Corp. (Semiconductors & Equip.) | 333,011 | 3,281,823 | ||||||||
ON Semiconductor Corp. (Semiconductors & Equip.) | (a) | 257,430 | 3,009,357 | |||||||
SolarEdge Technologies, Inc. (Semiconductors & Equip.) | (a) | 27,939 | 1,015,583 | |||||||
ACI Worldwide, Inc. (Software) | (a) | 56,750 | 1,394,347 | |||||||
Barracuda Networks, Inc. (Software) | (a) | 18,160 | 719,499 | |||||||
Blackbaud, Inc. (Software) | 58,705 | 3,343,250 | ||||||||
Cadence Design Systems, Inc. (Software) | (a) | 193,079 | 3,795,933 | |||||||
Fleetmatics Group PLC (Software) | (a) | 38,355 | 1,796,165 | |||||||
Guidewire Software, Inc. (Software) | (a) | 24,621 | 1,303,190 | |||||||
NICE-Systems Ltd. – ADR (Software) | 59,147 | 3,761,158 | ||||||||
| Common Stocks (Continued) | Shares | Value | ||||||||
INFORMATION TECHNOLOGY (continued) | ||||||||||
Paylocity Holding Corp. (Software) | (a) | 23,089 | $ | 827,741 | ||||||
RealPage, Inc. (Software) | (a) | 92,100 | 1,756,347 | |||||||
Solera Holdings, Inc. (Software) | 83,920 | 3,739,475 | ||||||||
SS&C Technologies Holdings, Inc. (Software) | 78,668 | 4,916,750 | ||||||||
Tyler Technologies, Inc. (Software) | (a) | 9,966 | 1,289,401 | |||||||
Stratasys Ltd. (Tech. Hardware, Storage & Periph.) | (a) | 27,973 | 977,097 | |||||||
|
| |||||||||
| 74,511,397 | ||||||||||
|
| |||||||||
MATERIALS – 2.0% | ||||||||||
Sensient Technologies Corp. (Chemicals) | 66,265 | 4,528,550 | ||||||||
|
| |||||||||
Total Common Stocks (Cost $189,248,373) | $ | 221,700,189 | ||||||||
|
| |||||||||
| Master Limited Partnerships – 0.7% | Shares | Value | ||||||||
ENERGY – 0.7% | ||||||||||
DCP Midstream Partners LP (Oil, Gas & Consumable Fuels) | 55,177 | $ | 1,693,382 | |||||||
|
| |||||||||
Total Master Limited Partnerships (Cost $2,618,933) | $ | 1,693,382 | ||||||||
|
| |||||||||
| Money Market Funds – 1.6% | Shares | Value | ||||||||
Fidelity Institutional Money Market Funds | 3,504,000 | $ | 3,504,000 | |||||||
|
| |||||||||
Total Money Market Funds (Cost $3,504,000) | $ | 3,504,000 | ||||||||
|
| |||||||||
Total Investments – 101.5% (Cost $195,371,306) | (c) | $ | 226,897,571 | |||||||
Liabilities in Excess of Other Assets – (1.5)% | (3,442,257) | |||||||||
|
| |||||||||
Net Assets – 100.0% | $ | 223,455,314 | ||||||||
|
| |||||||||
Percentages are stated as a percent of net assets.
Abbreviations:
ADR: American Depositary Receipts
Footnotes:
| (a) | Non-income producing security. |
| (b) | Security traded on a foreign exchange has been valued at an estimate of fair value that is different than the local market close price. These fair value estimates are determined by an independent fair valuation service that has been approved by the Board. These securities represent $4,011,857, or 1.8% of the Portfolio’s net assets. |
Other Portfolio securities are not subjected to fair value procedures because they are traded on domestic or foreign exchanges that have close times that are consistent with the U.S. market close, normally 4:00 pm Eastern Time.
| (c) | Represents cost for financial reporting purposes, which may differ from cost basis for federal income tax purposes. See also Note 7 of the Notes to Financial Statements. |
The accompanying notes are an integral part of these financial statements.
| 44 |
| Ohio National Fund, Inc. | Mid Cap Opportunity Portfolio |
Objective/Strategy
The Mid Cap Opportunity Portfolio seeks long-term total return by investing at least 80% of its net assets in equity securities of mid-cap companies, primarily those that are strategically positioned for long-term growth.
Performance as of June 30, 2015
Average Annual Returns: | ||||
One year | 8.30% | |||
Five years | 17.05% | |||
Ten years | 7.37% |
Past performance does not guarantee future results. The performance data quoted represents past performance and current returns may be lower or higher. Total return figures include change in share price and reinvestment of dividends and capital gains. The investment return and principal value will fluctuate so that an investor’s shares, when redeemed, may be worth more or less than the original cost. To obtain performance information up to the most recent month end, call toll-free 1-877-781-6392.
The Portfolio is not open to direct retail investment. Beneficial interest in shares is obtained solely by purchase of variable life insurance policies and variable annuity contracts. Actual performance results for variable annuity and variable universal life contracts will be lower due to contract charges. Consult your contract for applicable charges.
Comments
For the six-month period ended June 30, 2015, the Mid Cap Opportunity Portfolio returned 1.94% versus 4.18% for the current benchmark, the Russell Midcap Growth Index.
Relative underperformance was due to weakness in select Consumer Staples and Health Care holdings somewhat offset by positive stock selection in the Information Technology and Financials. Sector allocation did not significantly impact relative performance during the period. (1)
The top performers were Netflix, Inc., DexCom, Inc., Axalta Coating Systems Ltd., Under Armour, Inc., and First Republic Bank. The top detractors were Keurig Green Mountain, Inc., Kate Spade & Co., Kansas City Southern, Whole Foods Market, Inc., and HMS Holdings Corp. The top contributors to relative returns were Netflix, Inc., First Republic Bank, Mylan, Inc., Ulta Salon, Cosmetics & Fragrance, Inc., and Axalta Coating Systems Ltd. The worst performers were Kate Spade & Co., Kansas City Southern, Keurig Green Mountain, Inc., Whole Foods Market, Inc., and Navient Corp. (1)
Kate Spade & Co. was a top detractor from performance. The company reported first quarter earnings in May that were disappointing and resulted in a spike of speculation surrounding competitive risks. The company reported revenue figures that topped our expectations; however, sales growth was light relative to forecasts. In our view, strong underlying fundamentals remain intact and the catalysts for growth are unchanged. Wholesale expansion, merchandising initiatives and the company’s strategic partnership with Exclusive Brands is expected to fuel revenue growth and support the company’s attractive valuation. (1)
Transportation holding company, Kansas City Southern was another top detractor from returns. During the period, the company lowered its full year 2015 outlook, largely driven by slower year-to-date carload growth from the energy sector. Despite the weakness, we continue to believe the company is a high quality growth business with a favorable market structure, high barriers to entry, attractive valuation and strong underlying fundamentals. We are positive on
Kansas City Southern’s long-term growth trajectory and believe that the company is further reinforced by the significant track and locomotive investments it has made over the past 15 years. Furthermore, Kansas City Southern has significant exposure to cross-border trade with Mexico, which has been growing rapidly. The company also has the potential for significant margin improvement as it improves efficiency. (1)
Whole Foods Market, Inc. also detracted from returns. Recent underperformance is attributed to the industry-wide pull back stemming from weak data points in grocery store sales. With a strong rally in the latter half of 2014, recent grocery store sales data resulted in fears and speculation of business slowdown. In our view, the market overreacted to the data release and is undervaluing a strong franchise with favorable long-term growth prospects. The company has seen progress in its initiatives aimed at cost cutting, improving profitability and reaccelerating top-line growth. These factors have become increasingly well-received by the market. In addition, we believe lower fuel prices could continue to support demand for discretionary consumables, such as natural and organic products. Our growth thesis on Whole Foods Market, Inc. remains unchanged, as we are optimistic on the company and its dominant market position. (1)
Netflix, Inc. was a top contributor to returns. In April, the company reported first quarter earnings that exceeded market expectations on both earnings per share and key subscription metrics. New-user additions continue to thrive due to improving content availability and increasing success of Netflix Original series offerings. In our view, sentiment around subscriber growth and pricing continues to show signs of improvement and reflects Netflix, Inc.’s ability to execute and deliver unique, high quality content. We continue to have conviction in the strength of Netflix, Inc.’s franchise and believe that the company’s international expansion initiatives and secular tailwinds will be key drivers of future growth. (1)
Mylan, Inc., a U.S.-based pharmaceutical company that develops, manufactures and distributes generic and specialty pharmaceuticals globally, was a top contributor to performance, driven by news around potential industry consolidation. Early in the second quarter, the company announced a plan to acquire one of its competitors, Perrigo Company Plc. Subsequently, Teva Pharmaceuticals announced a plan to acquire Mylan, Inc. at a significant premium to its current market value, causing shares to gain. We believe the high level of interest in Mylan Inc.’s assets demonstrate its strong industry position and high quality nature of its franchise. Despite the move up in the share price, we continue to like Mylan, Inc.’s growth and earnings profile and its position in a consolidating industry. (1)
In April, we initiated a position in First Republic Bank, a regional bank that offers lending and private banking services to higher end customers in select markets on the east and west coasts of the U.S. In our view, First Republic Bank demonstrates strong organic growth and takeout potential. We believe a combination of strong management, a high quality franchise and strategic industry positioning makes First Republic Bank an attractive investment opportunity. During the reporting period, First Republic Bank was a top contributor to portfolio returns. (1)
We continue to believe U.S. equities have further upside potential as the U.S. economy accelerates and as real earnings growth serves as a fundamental driver of performance going forward. We believe that U.S. corporate fundamentals are strong, evidenced by both healthy balance sheets and earnings resilience, and could provide companies with a number of options to increase shareholder value.
| 45 | (continued) |
| Ohio National Fund, Inc. | Mid Cap Opportunity Portfolio (Continued) |
While we are cognizant of potential headwinds, such as foreign exchange volatility or unanticipated changes in monetary policy, we ultimately remain constructive on the direction of U.S. equity markets. We believe the U.S. has the best macroeconomic outlook of the developed economies and we are optimistic on the strengthening U.S. housing and employment markets, as well as the potential for a continued recovery in consumer spending. Consumption, which accounts for approximately 70% of U.S. gross domestic product, could also benefit from relatively low gas prices, increasing consumer confidence and a continued strong U.S. dollar. Looking forward, we believe that as the U.S. economy improves, companies can reinvest for future growth by increasing capital expenditures, research and development, hiring, and through merger and acquisition activity, rather than keeping excess cash on balance sheets. In our view, equity valuations are fair, considering the positive macro environment, and inexpensive relative to fixed income. We find that focusing on corporate fundamentals and stock selection, while being aware of various macroeconomic factors, is more in line with variables that we believe generate long-term returns, such as earnings growth and valuation.
Regardless of the market direction, our fundamental, bottom-up stock selection continues to drive our process, rather than headlines or sentiment. We maintain high conviction in the companies that we own and believe they have the potential to outperform relative to the broader market regardless of the growth environment. We continue to focus on undervalued companies that we believe are in control of their own future, such as innovators with differentiated products, companies with low-cost structures, or ones that have been investing in their own businesses and are poised to gain market share. We maintain our discipline in identifying companies with strong or improving balance sheets, led by quality management
teams, and trading at discounted valuations, and remain focused on the long-term outperformance of the Portfolio.
| (1) | The Portfolio’s composition is subject to change. Holdings and weightings are as of June 30, 2015. |
Change in Value of $10,000 Investment
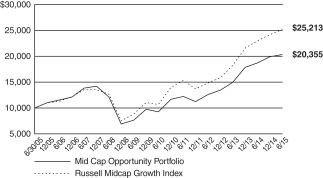
Hypothetical illustration based on past performance. Future performance will vary. The Portfolio’s returns reflect reinvested dividends. The Portfolio’s holdings may differ significantly from the securities in the index. The index is unmanaged and therefore does not reflect the cost of portfolio management and accounting.
The Russell Midcap Growth Index is a subset of the Russell Midcap Index, which measures the performance of the 800 smallest companies in the Russell 1000 Index. The Russell Midcap Growth Index measures the performance of those stocks of the Russell Midcap Index with higher price-to-book ratios and higher relative forecasted growth rates. The index presented herein includes the effects of reinvested dividends.
Portfolio Composition as of June 30, 2015 (1)
| % of Net Assets | ||||
Common Stocks (3) | 99.3 | |||
Money Market Funds | 0.7 | |||
|
| |||
| 100.0 | ||||
|
|
Top 10 Portfolio Holdings as of June 30, 2015 (1) (2)
| % of Net Assets | ||||
1. Equinix, Inc. | 2.3 | |||
2. W.W. Grainger, Inc. | 2.3 | |||
3. PVH Corp. | 2.1 | |||
4. Intercontinental Exchange, Inc. | 2.0 | |||
5. Ulta Salon Cosmetics & Fragrance, Inc. | 2.0 | |||
6. First Republic Bank | 2.0 | |||
7. SBA Communications Corp. Class A | 2.0 | |||
8. Kansas City Southern | 1.9 | |||
9. Advance Auto Parts, Inc. | 1.9 | |||
10. Whole Foods Market, Inc. | 1.9 |
| (1) | Composition of Portfolio subject to change. |
| (2) | Short-term investments have been excluded from the list of Top 10 Portfolio Holdings. |
| (3) | Sectors: |
| % of Net Assets | ||||
Consumer Discretionary | 25.2 | |||
Information Technology | 17.5 | |||
Health Care | 15.6 | |||
Industrials | 14.2 | |||
Financials | 10.5 | |||
Consumer Staples | 7.4 | |||
Materials | 4.0 | |||
Telecommunication Services | 2.9 | |||
Energy | 2.0 | |||
|
| |||
| 99.3 | ||||
|
|
| 46 |
| Ohio National Fund, Inc. | Mid Cap Opportunity Portfolio |
Schedule of Investments | June 30, 2015 (Unaudited) |
| Common Stocks – 99.3% | Shares | Value | ||||||||
CONSUMER DISCRETIONARY – 25.2% | ||||||||||
BorgWarner, Inc. (Auto Components) | 22,568 | $ | 1,282,765 | |||||||
LKQ Corp. (Distributors) | (a) | 41,124 | 1,243,795 | |||||||
Chipotle Mexican Grill, Inc. (Hotels, Restaurants & Leisure) | (a) | 1,836 | 1,110,762 | |||||||
Hilton Worldwide Holdings, Inc. (Hotels, Restaurants & Leisure) | (a) | 47,679 | 1,313,556 | |||||||
Panera Bread Co. Class A (Hotels, Restaurants & Leisure) | (a) | 9,127 | 1,595,126 | |||||||
Netflix, Inc. (Internet & Catalog Retail) | (a) | 1,517 | 996,578 | |||||||
TripAdvisor, Inc. (Internet & Catalog Retail) | (a) | 6,645 | 579,045 | |||||||
Burlington Stores, Inc. (Multiline Retail) | (a) | 16,866 | 863,539 | |||||||
Advance Auto Parts, Inc. (Specialty Retail) | 10,693 | 1,703,288 | ||||||||
Five Below, Inc. (Specialty Retail) | (a) | 29,311 | 1,158,664 | |||||||
L Brands, Inc. (Specialty Retail) | 9,140 | 783,572 | ||||||||
Restoration Hardware Holdings, Inc. (Specialty Retail) | (a) | 10,014 | 977,667 | |||||||
Tractor Supply Co. (Specialty Retail) | 16,020 | 1,440,839 | ||||||||
Ulta Salon Cosmetics & Fragrance, Inc. (Specialty Retail) | (a) | 11,583 | 1,788,994 | |||||||
Kate Spade & Co. (Textiles, Apparel & Luxury Goods) | (a) | 63,052 | 1,358,140 | |||||||
PVH Corp. (Textiles, Apparel & Luxury Goods) | 16,129 | 1,858,061 | ||||||||
Under Armour, Inc. Class A (Textiles, Apparel & Luxury Goods) | (a) | 14,849 | 1,239,001 | |||||||
V.F. Corp. (Textiles, Apparel & Luxury Goods) | 15,420 | 1,075,391 | ||||||||
|
| |||||||||
| 22,368,783 | ||||||||||
|
| |||||||||
CONSUMER STAPLES – 7.4% | ||||||||||
Whole Foods Market, Inc. (Food & Staples Retailing) | 42,720 | 1,684,877 | ||||||||
Hain Celestial Group, Inc. / The (Food Products) | (a) | 20,703 | 1,363,500 | |||||||
Keurig Green Mountain, Inc. (Food Products) | 11,237 | 861,091 | ||||||||
McCormick & Co., Inc. (Food Products) | 20,390 | 1,650,570 | ||||||||
TreeHouse Foods, Inc. (Food Products) | (a) | 12,555 | 1,017,332 | |||||||
|
| |||||||||
| 6,577,370 | ||||||||||
|
| |||||||||
ENERGY – 2.0% | ||||||||||
Dril-Quip, Inc. (Energy Equip. & Svs.) | (a) | 12,181 | 916,620 | |||||||
Weatherford International PLC (Energy Equip. & Svs.) | (a) | 35,918 | 440,714 | |||||||
Pioneer Natural Resources Co. (Oil, Gas & Consumable Fuels) | 3,166 | 439,092 | ||||||||
|
| |||||||||
| 1,796,426 | ||||||||||
|
| |||||||||
FINANCIALS – 10.5% | ||||||||||
Eagle Bancorp, Inc. (Banks) | (a) | 13,863 | 609,417 | |||||||
First Republic Bank (Banks) | 28,225 | 1,779,022 | ||||||||
Navient Corp. (Consumer Finance) | 57,866 | 1,053,740 | ||||||||
SLM Corp. (Consumer Finance) | (a) | 92,357 | 911,564 | |||||||
Intercontinental Exchange, Inc. (Diversified Financial Svs.) | 8,015 | 1,792,234 | ||||||||
Equinix, Inc. (Real Estate Investment Trusts) | 8,085 | 2,053,590 | ||||||||
CBRE Group, Inc. (Real Estate Mgmt. & Development) | (a) | 31,339 | 1,159,543 | |||||||
|
| |||||||||
| 9,359,110 | ||||||||||
|
| |||||||||
HEALTH CARE – 15.6% | ||||||||||
Alkermes PLC (Biotechnology) | (a) | 11,262 | 724,597 | |||||||
Bluebird Bio, Inc. (Biotechnology) | (a) | 1,625 | 273,601 | |||||||
Cepheid (Biotechnology) | (a) | 21,773 | 1,331,419 | |||||||
Medivation, Inc. (Biotechnology) | (a) | 7,125 | 813,675 | |||||||
Vertex Pharmaceuticals, Inc. (Biotechnology) | (a) | 5,601 | 691,611 | |||||||
DexCom, Inc. (Health Care Equip. & Supplies) | (a) | 7,804 | 624,164 | |||||||
Intuitive Surgical, Inc. (Health Care Equip. & Supplies) | (a) | 2,388 | 1,156,986 | |||||||
Teleflex, Inc. (Health Care Equip. & Supplies) | 7,837 | 1,061,522 | ||||||||
Cardinal Health, Inc. (Health Care Providers & Svs.) | 14,640 | 1,224,636 | ||||||||
Henry Schein, Inc. (Health Care Providers & Svs.) | (a) | 8,157 | 1,159,273 | |||||||
Cerner Corp. (Health Care Technology) | (a) | 18,226 | 1,258,688 | |||||||
| Common Stocks (Continued) | Shares | Value | ||||||||
HEALTH CARE (continued) | ||||||||||
HMS Holdings Corp. (Health Care Technology) | (a) | 31,248 | $ | 536,528 | ||||||
Agilent Technologies, Inc. (Life Sciences Tools & Svs.) | 21,569 | 832,132 | ||||||||
Mettler-Toledo International, Inc. (Life Sciences Tools & Svs.) | (a) | 2,884 | 984,771 | |||||||
Mylan NV (Pharmaceuticals) | (a) | 17,942 | 1,217,544 | |||||||
|
| |||||||||
| 13,891,147 | ||||||||||
|
| |||||||||
INDUSTRIALS – 14.2% | ||||||||||
Fortune Brands Home & Security, Inc. (Building Products) | 21,588 | 989,162 | ||||||||
AMETEK, Inc. (Electrical Equip.) | 24,601 | 1,347,643 | ||||||||
Generac Holdings, Inc. (Electrical Equip.) | (a) | 24,006 | 954,238 | |||||||
Hubbell, Inc. Class B (Electrical Equip.) | 9,494 | 1,028,010 | ||||||||
Sensata Technologies Holding NV (Electrical Equip.) | (a) | 27,031 | 1,425,615 | |||||||
Flowserve Corp. (Machinery) | 16,371 | 862,097 | ||||||||
Graco, Inc. (Machinery) | 19,204 | 1,364,060 | ||||||||
Middleby Corp. / The (Machinery) | (a) | 7,542 | 846,439 | |||||||
Kansas City Southern (Road & Rail) | 18,854 | 1,719,485 | ||||||||
W.W. Grainger, Inc. (Trading Companies & Distributors) | 8,549 | 2,023,121 | ||||||||
|
| |||||||||
| 12,559,870 | ||||||||||
|
| |||||||||
INFORMATION TECHNOLOGY – 17.5% | ||||||||||
Amphenol Corp. Class A (Electronic Equip., Instr. & Comp.) | 26,236 | 1,520,901 | ||||||||
GoDaddy, Inc. Class A (Internet Software & Svs.) | (a) | 6,104 | 172,072 | |||||||
LinkedIn Corp. (Internet Software & Svs.) | (a) | 8,007 | 1,654,486 | |||||||
Pandora Media, Inc. (Internet Software & Svs.) | (a) | 22,764 | 353,753 | |||||||
Twitter, Inc. (Internet Software & Svs.) | (a) | 9,546 | 345,756 | |||||||
Black Knight Financial Services, Inc. Class A (IT Svs.) | (a) | 24,254 | 748,721 | |||||||
Fidelity National Information Services, Inc. (IT Svs.) | 15,557 | 961,423 | ||||||||
FleetCor Technologies, Inc. (IT Svs.) | (a) | 7,822 | 1,220,701 | |||||||
Global Payments, Inc. (IT Svs.) | 6,418 | 663,942 | ||||||||
Broadcom Corp. Class A (Semiconductors & Equip.) | 13,672 | 703,971 | ||||||||
Qorvo, Inc. (Semiconductors & Equip.) | (a) | 15,993 | 1,283,758 | |||||||
Guidewire Software, Inc. (Software) | (a) | 21,557 | 1,141,012 | |||||||
Intuit, Inc. (Software) | 15,651 | 1,577,151 | ||||||||
Red Hat, Inc. (Software) | (a) | 16,231 | 1,232,420 | |||||||
ServiceNow, Inc. (Software) | (a) | 15,291 | 1,136,274 | |||||||
Splunk, Inc. (Software) | (a) | 12,130 | 844,491 | |||||||
|
| |||||||||
| 15,560,832 | ||||||||||
|
| |||||||||
MATERIALS – 4.0% | ||||||||||
Ashland, Inc. (Chemicals) | 8,950 | 1,091,005 | ||||||||
Axalta Coating Systems Ltd. (Chemicals) | (a) | 43,165 | 1,427,898 | |||||||
Sherwin-Williams Co. / The (Chemicals) | 3,730 | 1,025,825 | ||||||||
|
| |||||||||
| 3,544,728 | ||||||||||
|
| |||||||||
TELECOMMUNICATION SERVICES – 2.9% | ||||||||||
Level 3 Communications, Inc. (Diversified Telecom. Svs.) | (a) | 14,385 | 757,658 | |||||||
SBA Communications Corp. Class A (Wireless Telecom. Svs.) | (a) | 15,386 | 1,768,928 | |||||||
|
| |||||||||
| 2,526,586 | ||||||||||
|
| |||||||||
Total Common Stocks (Cost $74,440,398) | $ | 88,184,852 | ||||||||
|
| |||||||||
| Money Market Funds – 1.6% | Shares | Value | ||||||||
Fidelity Institutional Money Market Funds | 1,430,000 | $ | 1,430,000 | |||||||
|
| |||||||||
Total Money Market Funds (Cost $1,430,000) | $ | 1,430,000 | ||||||||
|
| |||||||||
Total Investments – 100.9% (Cost $75,870,398) | (b) | $ | 89,614,852 | |||||||
Liabilities in Excess of Other Assets – (0.9)% | (810,118) | |||||||||
|
| |||||||||
Net Assets – 100.0% | $ | 88,804,734 | ||||||||
|
| |||||||||
| 47 | (continued) |
| Ohio National Fund, Inc. | Mid Cap Opportunity Portfolio (Continued) |
Schedule of Investments | June 30, 2015 (Unaudited) |
Percentages are stated as a percent of net assets.
Footnotes:
| (a) | Non-income producing security. |
| (b) | Represents cost for financial reporting purposes, which may differ from cost basis for federal income tax purposes. See also Note 7 of the Notes to Financial Statements. |
The accompanying notes are an integral part of these financial statements.
| 48 |
| Ohio National Fund, Inc. | S&P 500® Index Portfolio |
Objective/Strategy
The S&P 500® Index Portfolio seeks total return that approximates the total return of the Standard & Poor’s 500® Index (S&P 500® Index), at a risk level consistent with that of the Standard & Poor’s 500® Index.
Performance as of June 30, 2015
Average Annual Returns: | ||||
One year | 6.95% | |||
Five years | 16.78% | |||
Ten years | 7.39% |
Past performance does not guarantee future results. The performance data quoted represents past performance and current returns may be lower or higher. Total return figures include change in share price and reinvestment of dividends and capital gains. The investment return and principal value will fluctuate so that an investor’s shares, when redeemed, may be worth more or less than the original cost. To obtain performance information up to the most recent month end, call toll-free 1-877-781-6392.
The Portfolio is not open to direct retail investment. Beneficial interest in shares is obtained solely by purchase of variable life insurance policies and variable annuity contracts. Actual performance results for variable annuity and variable universal life contracts will be lower due to contract charges. Consult your contract for applicable charges.
Comments
For the six-month period ended June 30, 2015, the S&P 500® Index Portfolio returned 1.00% versus 1.23% for the current benchmark, the S&P 500® Index.
The Portfolio’s correlation with the S&P 500® Index was 99.9%. The high correlation is due to the fact that the Portfolio invests in each of the 500 stocks in the index. The Portfolio also invests in the SPDR S&P 500 ETF Trust, an exchange traded fund that mimics the holdings and returns of the S&P 500® Index. (1)
The largest contributors to the index return for the reporting period were Apple, Inc., Amazon.com, Inc., Gilead Sciences, Inc. The Walt Disney Co., and Starbucks Corp. The largest detractors for the index for the reporting period were Exxon Mobil Corp., The Procter & Gamble Co., Chevron Corp., Intel Corp., and Berkshire Hathaway, Inc. Class B. (1)
U.S. indices ended the reporting period in positive territory, despite early year weakness due to bad weather and the ongoing drama in Greece. The Federal Reserve has signaled that it expects to begin raising rates by the end of the year, as economic data continues to confirm a strengthening U.S. economy. We would expect moderate growth in U.S. equity indices for the rest of 2015.
| (1) | The Portfolio’s composition is subject to change. Holdings and weightings are as of June 30, 2015. |
Change in Value of $10,000 Investment
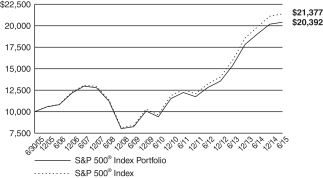
Hypothetical illustration based on past performance. Future performance will vary. The Portfolio’s returns reflect reinvested dividends. The Portfolio’s holdings may differ significantly from the securities in the index. The index is unmanaged and therefore does not reflect the cost of portfolio management and accounting. Investors cannot invest directly in an index, although they can invest in its underlying securities or funds.
The S&P 500® Index is a capitalization-weighted index designed to measure performance of the broad domestic economy through changes in the aggregate market value of 500 stocks representing all major industries. The index presented herein includes the effects of reinvested dividends.
“Standard & Poor’s®”, “S&P®”, “S&P 500®” and “Standard & Poor’s 500” are trademarks of The McGraw-Hill Companies, Inc. and have been licensed for use by Ohio National Investments, Inc. (ONI). The S&P 500® Index Portfolio is not sponsored, endorsed, sold or promoted by Standard & Poor’s (“S&P”) and S&P makes no representation regarding the advisability of investing in the S&P 500® Index Portfolio. S&P makes no representation or warranty, express or implied, to the owners of the Portfolio or any member of the public regarding the advisability of investing in securities generally or in the Portfolio particularly or the ability of the S&P 500® Index to track general stock market performance. S&P’s only relationship to ONI is the licensing of certain trademarks and trade names of S&P® and of the S&P 500® Index which is determined, composed and calculated by S&P® without regard to ONI or the S&P 500® Index Portfolio. S&P® has no obligation to take the needs of ONI or the owners of the Portfolio into consideration in determining, composing or calculating the S&P 500® Index. S&P® is not responsible for and has not participated in the determination of the prices and amount of the Portfolio or the timing of the issuance or sale of the Portfolio or in the determination or calculation of the equation by which the Portfolio is to be converted into cash. S&P® has no obligation or liability in connection with the administration, marketing or trading of the Portfolio.
| 49 | (continued) |
| Ohio National Fund, Inc. | S&P 500® Index Portfolio (Continued) |
Portfolio Composition as of June 30, 2015 (1)
| % of Net Assets | ||||
Common Stocks (3) | 95.6 | |||
Exchange Traded Funds and | 4.4 | |||
|
| |||
| 100.0 | ||||
|
|
Top 10 Portfolio Holdings as of June 30, 2015 (1) (2)
| % of Net Assets | ||||
1. SPDR S&P 500 ETF Trust | 4.0 | |||
2. Apple, Inc. | 3.8 | |||
3. Microsoft Corp. | 1.9 | |||
4. Exxon Mobil Corp. | 1.8 | |||
5. Johnson & Johnson | 1.4 | |||
6. General Electric Co. | 1.4 | |||
7. Wells Fargo & Co. | 1.4 | |||
8. JPMorgan Chase & Co. | 1.3 | |||
9. Berkshire Hathaway, Inc. Class B | 1.3 | |||
10. Procter & Gamble Co. / The | 1.1 |
| (1) | Composition of Portfolio subject to change. |
| (2) | Short-term investments have been excluded from the list of Top 10 Portfolio Holdings. |
| (3) | Sectors: |
| % of Net Assets | ||||
Information Technology | 18.8 | |||
Financials | 15.8 | |||
Health Care | 14.8 | |||
Consumer Discretionary | 12.2 | |||
Industrials | 9.7 | |||
Consumer Staples | 9.0 | |||
Energy | 7.5 | |||
Materials | 3.0 | |||
Utilities | 2.7 | |||
Telecommunication Services | 2.1 | |||
|
| |||
| 95.6 | ||||
|
|
| 50 |
| Ohio National Fund, Inc. | S&P 500® Index Portfolio |
Schedule of Investments | June 30, 2015 (Unaudited) |
| Common Stocks – 95.6% | Shares | Value | ||||||||
CONSUMER DISCRETIONARY – 12.2% | ||||||||||
BorgWarner, Inc. (Auto Components) | 4,900 | $ | 278,516 | |||||||
Delphi Automotive PLC (Auto Components) | 6,200 | 527,558 | ||||||||
Goodyear Tire & Rubber Co. / The (Auto Components) | 5,800 | 174,870 | ||||||||
Johnson Controls, Inc. (Auto Components) | 14,100 | 698,373 | ||||||||
Ford Motor Co. (Automobiles) | 85,487 | 1,283,160 | ||||||||
General Motors Co. (Automobiles) | 29,000 | 966,570 | ||||||||
Harley-Davidson, Inc. (Automobiles) | 4,500 | 253,575 | ||||||||
Genuine Parts Co. (Distributors) | 3,300 | 295,449 | ||||||||
H&R Block, Inc. (Diversified Consumer Svs.) | 5,900 | 174,935 | ||||||||
Carnival Corp. (Hotels, Restaurants & Leisure) | 9,700 | 479,083 | ||||||||
Chipotle Mexican Grill, Inc. (Hotels, Restaurants & Leisure) | (a) | 650 | 393,243 | |||||||
Darden Restaurants, Inc. (Hotels, Restaurants & Leisure) | 2,700 | 191,916 | ||||||||
Marriott International, Inc. Class A (Hotels, Restaurants & Leisure) | 4,446 | 330,738 | ||||||||
McDonald’s Corp. (Hotels, Restaurants & Leisure) | 20,600 | 1,958,442 | ||||||||
Royal Caribbean Cruises Ltd. (Hotels, Restaurants & Leisure) | 3,500 | 275,415 | ||||||||
Starbucks Corp. (Hotels, Restaurants & Leisure) | 32,200 | 1,726,403 | ||||||||
Starwood Hotels & Resorts Worldwide, Inc. (Hotels, Restaurants & Leisure) | 3,700 | 300,033 | ||||||||
Wyndham Worldwide Corp. (Hotels, Restaurants & Leisure) | 2,560 | 209,690 | ||||||||
Wynn Resorts Ltd. (Hotels, Restaurants & Leisure) | 1,800 | 177,606 | ||||||||
Yum! Brands, Inc. (Hotels, Restaurants & Leisure) | 9,300 | 837,744 | ||||||||
D.R. Horton, Inc. (Household Durables) | 7,200 | 196,992 | ||||||||
Garmin Ltd. (Household Durables) | 2,600 | 114,218 | ||||||||
Harman International Industries, Inc. (Household Durables) | 1,500 | 178,410 | ||||||||
Leggett & Platt, Inc. (Household Durables) | 3,000 | 146,040 | ||||||||
Lennar Corp. Class A (Household Durables) | 3,800 | 193,952 | ||||||||
Mohawk Industries, Inc. (Household Durables) | (a) | 1,300 | 248,170 | |||||||
Newell Rubbermaid, Inc. (Household Durables) | 5,800 | 238,438 | ||||||||
PulteGroup, Inc. (Household Durables) | 7,050 | 142,057 | ||||||||
Whirlpool Corp. (Household Durables) | 1,655 | 286,398 | ||||||||
Amazon.com, Inc. (Internet & Catalog Retail) | (a) | 8,200 | 3,559,538 | |||||||
Expedia, Inc. (Internet & Catalog Retail) | 2,100 | 229,635 | ||||||||
Netflix, Inc. (Internet & Catalog Retail) | (a) | 1,300 | 854,022 | |||||||
Priceline Group, Inc. / The (Internet & Catalog Retail) | (a) | 1,100 | 1,266,507 | |||||||
TripAdvisor, Inc. (Internet & Catalog Retail) | (a) | 2,400 | 209,136 | |||||||
Hasbro, Inc. (Leisure Products) | 2,400 | 179,496 | ||||||||
Mattel, Inc. (Leisure Products) | 7,300 | 187,537 | ||||||||
Cablevision Systems Corp. Class A (Media) | 4,700 | 112,518 | ||||||||
CBS Corp. Class B (Media) | 9,750 | 541,125 | ||||||||
Comcast Corp. Class A (Media) | 54,053 | 3,250,747 | ||||||||
DIRECTV (Media) | (a) | 10,800 | 1,002,132 | |||||||
Discovery Communications, Inc. Class A (Media) | (a) | 3,200 | 106,432 | |||||||
Discovery Communications, Inc. Class C (Media) | (a) | 5,600 | 174,048 | |||||||
Gannett Co., Inc. (Media) | (a) | 2,450 | 34,275 | |||||||
Interpublic Group of Cos., Inc. / The (Media) | 8,923 | 171,946 | ||||||||
News Corp. Class A (Media) | (a) | 10,775 | 157,207 | |||||||
Omnicom Group, Inc. (Media) | 5,300 | 368,297 | ||||||||
Scripps Networks Interactive, Inc. Class A (Media) | 2,000 | 130,740 | ||||||||
TEGNA, Inc. (Media) | 4,900 | 157,143 | ||||||||
Time Warner Cable, Inc. (Media) | 6,032 | 1,074,721 | ||||||||
Time Warner, Inc. (Media) | 17,766 | 1,552,926 | ||||||||
Twenty-First Century Fox, Inc. Class A (Media) | 38,000 | 1,236,710 | ||||||||
Viacom, Inc. Class B (Media) | 7,650 | 494,496 | ||||||||
Walt Disney Co. / The (Media) | 33,500 | 3,823,690 | ||||||||
Dollar General Corp. (Multiline Retail) | 6,400 | 497,536 | ||||||||
Dollar Tree, Inc. (Multiline Retail) | (a) | 4,400 | 347,556 | |||||||
Family Dollar Stores, Inc. (Multiline Retail) | 2,100 | 165,501 | ||||||||
Kohl’s Corp. (Multiline Retail) | 4,300 | 269,223 | ||||||||
Macy’s, Inc. (Multiline Retail) | 7,276 | 490,912 | ||||||||
Nordstrom, Inc. (Multiline Retail) | 3,000 | 223,500 | ||||||||
Target Corp. (Multiline Retail) | 13,700 | 1,118,331 | ||||||||
| Common Stocks (Continued) | Shares | Value | ||||||||
CONSUMER DISCRETIONARY (continued) | ||||||||||
AutoNation, Inc. (Specialty Retail) | (a) | 1,600 | $ | 100,768 | ||||||
AutoZone, Inc. (Specialty Retail) | (a) | 675 | 450,158 | |||||||
Bed Bath & Beyond, Inc. (Specialty Retail) | (a) | 3,700 | 255,226 | |||||||
Best Buy Co., Inc. (Specialty Retail) | 6,275 | 204,628 | ||||||||
CarMax, Inc. (Specialty Retail) | (a) | 4,500 | 297,945 | |||||||
GameStop Corp. Class A (Specialty Retail) | 2,300 | 98,808 | ||||||||
Gap, Inc. / The (Specialty Retail) | 5,650 | 215,660 | ||||||||
Home Depot, Inc. / The (Specialty Retail) | 27,900 | 3,100,527 | ||||||||
L Brands, Inc. (Specialty Retail) | 5,300 | 454,369 | ||||||||
Lowe’s Cos., Inc. (Specialty Retail) | 20,000 | 1,339,400 | ||||||||
O’Reilly Automotive, Inc. (Specialty Retail) | (a) | 2,200 | 497,156 | |||||||
Ross Stores, Inc. (Specialty Retail) | 8,900 | 432,629 | ||||||||
Staples, Inc. (Specialty Retail) | 13,800 | 211,278 | ||||||||
Tiffany & Co. (Specialty Retail) | 2,400 | 220,320 | ||||||||
TJX Cos., Inc. / The (Specialty Retail) | 14,600 | 966,082 | ||||||||
Tractor Supply Co. (Specialty Retail) | 2,900 | 260,826 | ||||||||
Urban Outfitters, Inc. (Specialty Retail) | (a) | 2,100 | 73,500 | |||||||
Coach, Inc. (Textiles, Apparel & Luxury Goods) | 5,900 | 204,199 | ||||||||
Fossil Group, Inc. (Textiles, Apparel & Luxury Goods) | (a) | 900 | 62,424 | |||||||
Hanesbrands, Inc. (Textiles, Apparel & Luxury Goods) | 8,600 | 286,552 | ||||||||
Michael Kors Holdings Ltd. (Textiles, Apparel & Luxury Goods) | (a) | 4,300 | 180,987 | |||||||
NIKE, Inc. Class B (Textiles, Apparel & Luxury Goods) | 15,000 | 1,620,300 | ||||||||
PVH Corp. (Textiles, Apparel & Luxury Goods) | 1,800 | 207,360 | ||||||||
Ralph Lauren Corp. (Textiles, Apparel & Luxury Goods) | 1,300 | 172,068 | ||||||||
Under Armour, Inc. Class A (Textiles, Apparel & Luxury Goods) | (a) | 3,600 | 300,384 | |||||||
V.F. Corp. (Textiles, Apparel & Luxury Goods) | 7,300 | 509,102 | ||||||||
|
| |||||||||
| 49,988,233 | ||||||||||
|
| |||||||||
CONSUMER STAPLES – 9.0% | ||||||||||
Brown-Forman Corp. Class B (Beverages) | 3,375 | 338,107 | ||||||||
Coca-Cola Co. / The (Beverages) | 84,300 | 3,307,089 | ||||||||
Coca-Cola Enterprises, Inc. (Beverages) | 4,600 | 199,824 | ||||||||
Constellation Brands, Inc. Class A (Beverages) | 3,600 | 417,672 | ||||||||
Dr Pepper Snapple Group, Inc. (Beverages) | 4,100 | 298,890 | ||||||||
Molson Coors Brewing Co. Class B (Beverages) | 3,400 | 237,354 | ||||||||
Monster Beverage Corp. (Beverages) | (a) | 3,100 | 415,462 | |||||||
PepsiCo, Inc. (Beverages) | 31,747 | 2,963,265 | ||||||||
Costco Wholesale Corp. (Food & Staples Retailing) | 9,400 | 1,269,564 | ||||||||
CVS Health Corp. (Food & Staples Retailing) | 24,220 | 2,540,194 | ||||||||
Kroger Co. / The (Food & Staples Retailing) | 10,500 | 761,355 | ||||||||
Sysco Corp. (Food & Staples Retailing) | 12,800 | 462,080 | ||||||||
Walgreens Boots Alliance, Inc. (Food & Staples Retailing) | 18,800 | 1,587,472 | ||||||||
Wal-Mart Stores, Inc. (Food & Staples Retailing) | 33,900 | 2,404,527 | ||||||||
Whole Foods Market, Inc. (Food & Staples Retailing) | 7,700 | 303,688 | ||||||||
Archer-Daniels-Midland Co. (Food Products) | 13,350 | 643,737 | ||||||||
Campbell Soup Co. (Food Products) | 3,800 | 181,070 | ||||||||
ConAgra Foods, Inc. (Food Products) | 9,200 | 402,224 | ||||||||
General Mills, Inc. (Food Products) | 12,800 | 713,216 | ||||||||
Hershey Co. / The (Food Products) | 3,200 | 284,256 | ||||||||
Hormel Foods Corp. (Food Products) | 2,900 | 163,473 | ||||||||
J.M. Smucker Co. / The (Food Products) | 2,100 | 227,661 | ||||||||
Kellogg Co. (Food Products) | 5,400 | 338,580 | ||||||||
Keurig Green Mountain, Inc. (Food Products) | 2,500 | 191,575 | ||||||||
Kraft Foods Group, Inc. (Food Products) | 12,725 | 1,083,406 | ||||||||
McCormick & Co., Inc. (Food Products) | 2,700 | 218,565 | ||||||||
Mead Johnson Nutrition Co. (Food Products) | 4,351 | 392,547 | ||||||||
Mondelez International, Inc. Class A (Food Products) | 34,976 | 1,438,913 | ||||||||
Tyson Foods, Inc. Class A (Food Products) | 6,300 | 268,569 | ||||||||
Clorox Co. / The (Household Products) | 2,800 | 291,256 | ||||||||
Colgate-Palmolive Co. (Household Products) | 18,300 | 1,197,003 | ||||||||
| 51 | (continued) |
| Ohio National Fund, Inc. | S&P 500® Index Portfolio (Continued) |
Schedule of Investments | June 30, 2015 (Unaudited) |
| Common Stocks (Continued) | Shares | Value | ||||||||
CONSUMER STAPLES (continued) | ||||||||||
Kimberly-Clark Corp. (Household Products) | 7,800 | $ | 826,566 | |||||||
Procter & Gamble Co. / The (Household Products) | 58,322 | 4,563,113 | ||||||||
Estee Lauder Cos., Inc. / The Class A (Personal Products) | 4,800 | 415,968 | ||||||||
Altria Group, Inc. (Tobacco) | 42,300 | 2,068,893 | ||||||||
Philip Morris International, Inc. (Tobacco) | 33,300 | 2,669,661 | ||||||||
Reynolds American, Inc. (Tobacco) | 8,937 | 667,236 | ||||||||
|
| |||||||||
| 36,754,031 | ||||||||||
|
| |||||||||
ENERGY – 7.5% | ||||||||||
Baker Hughes, Inc. (Energy Equip. & Svs.) | 9,341 | 576,340 | ||||||||
Cameron International Corp. (Energy Equip. & Svs.) | (a) | 4,100 | 214,717 | |||||||
Diamond Offshore Drilling, Inc. (Energy Equip. & Svs.) | 1,400 | 36,134 | ||||||||
Ensco PLC Class A (Energy Equip. & Svs.) | 5,000 | 111,350 | ||||||||
FMC Technologies, Inc. (Energy Equip. & Svs.) | (a) | 5,000 | 207,450 | |||||||
Halliburton Co. (Energy Equip. & Svs.) | 18,300 | 788,181 | ||||||||
Helmerich & Payne, Inc. (Energy Equip. & Svs.) | 2,300 | 161,966 | ||||||||
National Oilwell Varco, Inc. (Energy Equip. & Svs.) | 8,300 | 400,724 | ||||||||
Noble Corp. PLC (Energy Equip. & Svs.) | 5,200 | 80,028 | ||||||||
Schlumberger Ltd. (Energy Equip. & Svs.) | 27,247 | 2,348,419 | ||||||||
Transocean Ltd. (Energy Equip. & Svs.) | 7,300 | 117,676 | ||||||||
Anadarko Petroleum Corp. (Oil, Gas & Consumable Fuels) | 10,900 | 850,854 | ||||||||
Apache Corp. (Oil, Gas & Consumable Fuels) | 8,072 | 465,189 | ||||||||
Cabot Oil & Gas Corp. (Oil, Gas & Consumable Fuels) | 8,900 | 280,706 | ||||||||
Chesapeake Energy Corp. (Oil, Gas & Consumable Fuels) | 11,100 | 123,987 | ||||||||
Chevron Corp. (Oil, Gas & Consumable Fuels) | 40,438 | 3,901,054 | ||||||||
Cimarex Energy Co. (Oil, Gas & Consumable Fuels) | 2,000 | 220,620 | ||||||||
ConocoPhillips (Oil, Gas & Consumable Fuels) | 26,500 | 1,627,365 | ||||||||
CONSOL Energy, Inc. (Oil, Gas & Consumable Fuels) | 4,900 | 106,526 | ||||||||
Devon Energy Corp. (Oil, Gas & Consumable Fuels) | 8,300 | 493,767 | ||||||||
EOG Resources, Inc. (Oil, Gas & Consumable Fuels) | 11,800 | 1,033,090 | ||||||||
EQT Corp. (Oil, Gas & Consumable Fuels) | 3,300 | 268,422 | ||||||||
Exxon Mobil Corp. (Oil, Gas & Consumable Fuels) | 89,864 | 7,476,685 | ||||||||
Hess Corp. (Oil, Gas & Consumable Fuels) | 5,200 | 347,776 | ||||||||
Kinder Morgan, Inc. (Oil, Gas & Consumable Fuels) | 37,273 | 1,430,910 | ||||||||
Marathon Oil Corp. (Oil, Gas & Consumable Fuels) | 14,520 | 385,361 | ||||||||
Marathon Petroleum Corp. (Oil, Gas & Consumable Fuels) | 11,720 | 613,073 | ||||||||
Murphy Oil Corp. (Oil, Gas & Consumable Fuels) | 3,600 | 149,652 | ||||||||
Newfield Exploration Co. (Oil, Gas & Consumable Fuels) | (a) | 3,500 | 126,420 | |||||||
Noble Energy, Inc. (Oil, Gas & Consumable Fuels) | 8,300 | 354,244 | ||||||||
Occidental Petroleum Corp. (Oil, Gas & Consumable Fuels) | 16,500 | 1,283,205 | ||||||||
ONEOK, Inc. (Oil, Gas & Consumable Fuels) | 4,500 | 177,660 | ||||||||
Phillips 66 (Oil, Gas & Consumable Fuels) | 11,650 | 938,524 | ||||||||
Pioneer Natural Resources Co. (Oil, Gas & Consumable Fuels) | 3,200 | 443,808 | ||||||||
Range Resources Corp. (Oil, Gas & Consumable Fuels) | 3,600 | 177,768 | ||||||||
Southwestern Energy Co. (Oil, Gas & Consumable Fuels) | (a) | 8,300 | 188,659 | |||||||
Spectra Energy Corp. (Oil, Gas & Consumable Fuels) | 14,418 | 470,027 | ||||||||
Tesoro Corp. (Oil, Gas & Consumable Fuels) | 2,700 | 227,907 | ||||||||
Valero Energy Corp. (Oil, Gas & Consumable Fuels) | 10,900 | 682,340 | ||||||||
Williams Cos., Inc. / The (Oil, Gas & Consumable Fuels) | 14,500 | 832,155 | ||||||||
|
| |||||||||
| 30,720,739 | ||||||||||
|
| |||||||||
FINANCIALS – 15.8% | ||||||||||
Bank of America Corp. (Banks) | 225,727 | 3,841,874 | ||||||||
BB&T Corp. (Banks) | 15,700 | 632,867 | ||||||||
Citigroup, Inc. (Banks) | 65,236 | 3,603,637 | ||||||||
Comerica, Inc. (Banks) | 3,800 | 195,016 | ||||||||
| Common Stocks (Continued) | Shares | Value | ||||||||
FINANCIALS (continued) | ||||||||||
Fifth Third Bancorp (Banks) | 17,450 | $ | 363,309 | |||||||
Huntington Bancshares, Inc. (Banks) | 17,400 | 196,794 | ||||||||
JPMorgan Chase & Co. (Banks) | 79,743 | 5,403,386 | ||||||||
KeyCorp (Banks) | 18,200 | 273,364 | ||||||||
M&T Bank Corp. (Banks) | 2,900 | 362,297 | ||||||||
People’s United Financial, Inc. (Banks) | 6,600 | 106,986 | ||||||||
PNC Financial Services Group, Inc. / The (Banks) | 11,142 | 1,065,732 | ||||||||
Regions Financial Corp. (Banks) | 28,775 | 298,109 | ||||||||
SunTrust Banks, Inc. (Banks) | 11,100 | 477,522 | ||||||||
U.S. Bancorp (Banks) | 38,090 | 1,653,106 | ||||||||
Wells Fargo & Co. (Banks) | 100,713 | 5,664,099 | ||||||||
Zions Bancorporation (Banks) | 4,400 | 139,634 | ||||||||
Affiliated Managers Group, Inc. (Capital Markets) | (a) | 1,200 | 262,320 | |||||||
Ameriprise Financial, Inc. (Capital Markets) | 3,880 | 484,728 | ||||||||
Bank of New York Mellon Corp. / The (Capital Markets) | 24,111 | 1,011,939 | ||||||||
BlackRock, Inc. (Capital Markets) | 2,700 | 934,146 | ||||||||
Charles Schwab Corp. / The (Capital Markets) | 24,800 | 809,720 | ||||||||
E*TRADE Financial Corp. (Capital Markets) | (a) | 6,190 | 185,390 | |||||||
Franklin Resources, Inc. (Capital Markets) | 8,400 | 411,852 | ||||||||
Goldman Sachs Group, Inc. / The (Capital Markets) | 8,650 | 1,806,033 | ||||||||
Invesco Ltd. (Capital Markets) | 9,300 | 348,657 | ||||||||
Legg Mason, Inc. (Capital Markets) | 2,100 | 108,213 | ||||||||
Morgan Stanley (Capital Markets) | 33,000 | 1,280,070 | ||||||||
Northern Trust Corp. (Capital Markets) | 4,700 | 359,362 | ||||||||
State Street Corp. (Capital Markets) | 8,800 | 677,600 | ||||||||
T. Rowe Price Group, Inc. (Capital Markets) | 5,600 | 435,288 | ||||||||
American Express Co. (Consumer Finance) | 18,800 | 1,461,136 | ||||||||
Capital One Financial Corp. (Consumer Finance) | 11,773 | 1,035,671 | ||||||||
Discover Financial Services (Consumer Finance) | 9,550 | 550,271 | ||||||||
Navient Corp. (Consumer Finance) | 8,400 | 152,964 | ||||||||
Berkshire Hathaway, Inc. Class B (Diversified Financial Svs.) | (a) | 39,191 | 5,334,287 | |||||||
CME Group, Inc. (Diversified Financial Svs.) | 6,775 | 630,481 | ||||||||
Intercontinental Exchange, Inc. (Diversified Financial Svs.) | 2,432 | 543,820 | ||||||||
Leucadia National Corp. (Diversified Financial Svs.) | 6,800 | 165,104 | ||||||||
McGraw Hill Financial, Inc. (Diversified Financial Svs.) | 5,900 | 592,655 | ||||||||
Moody’s Corp. (Diversified Financial Svs.) | 3,800 | 410,248 | ||||||||
NASDAQ OMX Group, Inc. / The (Diversified Financial Svs.) | 2,500 | 122,025 | ||||||||
ACE Ltd. (Insurance) | 7,000 | 711,760 | ||||||||
Aflac, Inc. (Insurance) | 9,300 | 578,460 | ||||||||
Allstate Corp. / The (Insurance) | 8,800 | 570,856 | ||||||||
American International Group, Inc. (Insurance) | 28,695 | 1,773,925 | ||||||||
Aon PLC (Insurance) | 6,100 | 608,048 | ||||||||
Assurant, Inc. (Insurance) | 1,500 | 100,500 | ||||||||
Chubb Corp. / The (Insurance) | 4,900 | 466,186 | ||||||||
Cincinnati Financial Corp. (Insurance) | 3,166 | 158,870 | ||||||||
Genworth Financial, Inc. Class A (Insurance) | (a) | 10,700 | 80,999 | |||||||
Hartford Financial Services Group, Inc. / The (Insurance) | 9,000 | 374,130 | ||||||||
Lincoln National Corp. (Insurance) | 5,486 | 324,881 | ||||||||
Loews Corp. (Insurance) | 6,361 | 244,962 | ||||||||
Marsh & McLennan Cos., Inc. (Insurance) | 11,600 | 657,720 | ||||||||
MetLife, Inc. (Insurance) | 24,000 | 1,343,760 | ||||||||
Principal Financial Group, Inc. (Insurance) | 5,900 | 302,611 | ||||||||
Progressive Corp. / The (Insurance) | 11,500 | 320,045 | ||||||||
Prudential Financial, Inc. (Insurance) | 9,700 | 848,944 | ||||||||
Torchmark Corp. (Insurance) | 2,675 | 155,738 | ||||||||
Travelers Cos., Inc. / The (Insurance) | 6,859 | 662,991 | ||||||||
Unum Group (Insurance) | 5,400 | 193,050 | ||||||||
XL Group PLC (Insurance) | 6,600 | 245,520 | ||||||||
American Tower Corp. (Real Estate Investment Trusts) | 9,100 | 848,939 | ||||||||
Apartment Investment & Management Co. Class A (Real Estate Investment Trusts) | 3,373 | 124,565 | ||||||||
| 52 | (continued) |
| Ohio National Fund, Inc. | S&P 500® Index Portfolio (Continued) |
Schedule of Investments | June 30, 2015 (Unaudited) |
| Common Stocks (Continued) | Shares | Value | ||||||||
FINANCIALS (continued) | ||||||||||
AvalonBay Communities, Inc. (Real Estate Investment Trusts) | 2,831 | $ | 452,592 | |||||||
Boston Properties, Inc. (Real Estate Investment Trusts) | 3,300 | 399,432 | ||||||||
Crown Castle International Corp. (Real Estate Investment Trusts) | 7,300 | 586,190 | ||||||||
Equity Residential (Real Estate Investment Trusts) | 7,800 | 547,326 | ||||||||
Essex Property Trust, Inc. (Real Estate Investment Trusts) | 1,400 | 297,500 | ||||||||
General Growth Properties, Inc. (Real Estate Investment Trusts) | 13,500 | 346,410 | ||||||||
HCP, Inc. (Real Estate Investment Trusts) | 9,900 | 361,053 | ||||||||
Health Care REIT, Inc. (Real Estate Investment Trusts) | 7,500 | 492,225 | ||||||||
Host Hotels & Resorts, Inc. (Real Estate Investment Trusts) | 16,302 | 323,269 | ||||||||
Iron Mountain, Inc. (Real Estate Investment Trusts) | 4,028 | 124,868 | ||||||||
Kimco Realty Corp. (Real Estate Investment Trusts) | 8,900 | 200,606 | ||||||||
Macerich Co. / The (Real Estate Investment Trusts) | 3,000 | 223,800 | ||||||||
Plum Creek Timber Co., Inc. (Real Estate Investment Trusts) | 3,800 | 154,166 | ||||||||
Prologis, Inc. (Real Estate Investment Trusts) | 11,239 | 416,967 | ||||||||
Public Storage (Real Estate Investment Trusts) | 3,100 | 571,547 | ||||||||
Realty Income Corp. (Real Estate Investment Trusts) | 5,000 | 221,950 | ||||||||
Simon Property Group, Inc. (Real Estate Investment Trusts) | 6,662 | 1,152,659 | ||||||||
SL Green Realty Corp. (Real Estate Investment Trusts) | 2,100 | 230,769 | ||||||||
Ventas, Inc. (Real Estate Investment Trusts) | 7,100 | 440,839 | ||||||||
Vornado Realty Trust (Real Estate Investment Trusts) | 3,793 | 360,069 | ||||||||
Weyerhaeuser Co. (Real Estate Investment Trusts) | 11,163 | 351,634 | ||||||||
CBRE Group, Inc. (Real Estate Mgmt. & Development) | (a) | 6,000 | 222,000 | |||||||
Hudson City Bancorp, Inc. (Thrifts & Mortgage Finance) | 10,400 | 102,752 | ||||||||
|
| |||||||||
| 64,669,795 | ||||||||||
|
| |||||||||
HEALTH CARE – 14.8% | ||||||||||
Alexion Pharmaceuticals, Inc. (Biotechnology) | (a) | 4,800 | 867,696 | |||||||
Amgen, Inc. (Biotechnology) | 16,306 | 2,503,297 | ||||||||
Biogen, Inc. (Biotechnology) | (a) | 5,045 | 2,037,877 | |||||||
Celgene Corp. (Biotechnology) | (a) | 17,000 | 1,967,495 | |||||||
Gilead Sciences, Inc. (Biotechnology) | 31,600 | 3,699,728 | ||||||||
Regeneron Pharmaceuticals, Inc. (Biotechnology) | (a) | 1,650 | 841,714 | |||||||
Vertex Pharmaceuticals, Inc. (Biotechnology) | (a) | 5,200 | 642,096 | |||||||
Abbott Laboratories (Health Care Equip. & Supplies) | 32,000 | 1,570,560 | ||||||||
Baxter International, Inc. (Health Care Equip. & Supplies) | 11,700 | 818,181 | ||||||||
Becton Dickinson and Co. (Health Care Equip. & Supplies) | 4,537 | 642,666 | ||||||||
Boston Scientific Corp. (Health Care Equip. & Supplies) | (a) | 28,803 | 509,813 | |||||||
C.R. Bard, Inc. (Health Care Equip. & Supplies) | 1,600 | 273,120 | ||||||||
DENTSPLY International, Inc. (Health Care Equip. & Supplies) | 3,000 | 154,650 | ||||||||
Edwards Lifesciences Corp. (Health Care Equip. & Supplies) | (a) | 2,300 | 327,589 | |||||||
Intuitive Surgical, Inc. (Health Care Equip. & Supplies) | (a) | 775 | 375,488 | |||||||
Medtronic PLC (Health Care Equip. & Supplies) | 30,590 | 2,266,719 | ||||||||
St. Jude Medical, Inc. (Health Care Equip. & Supplies) | 6,000 | 438,420 | ||||||||
Stryker Corp. (Health Care Equip. & Supplies) | 6,400 | 611,648 | ||||||||
Varian Medical Systems, Inc. (Health Care Equip. & Supplies) | (a) | 2,100 | 177,093 | |||||||
Zimmer Biomet Holdings, Inc. (Health Care Equip. & Supplies) | 3,670 | 400,874 | ||||||||
| Common Stocks (Continued) | Shares | Value | ||||||||
HEALTH CARE (continued) | ||||||||||
Aetna, Inc. (Health Care Providers & Svs.) | 7,554 | $ | 962,833 | |||||||
AmerisourceBergen Corp. (Health Care Providers & Svs.) | 4,500 | 478,530 | ||||||||
Anthem, Inc. (Health Care Providers & Svs.) | 5,700 | 935,598 | ||||||||
Cardinal Health, Inc. (Health Care Providers & Svs.) | 7,100 | 593,915 | ||||||||
Cigna Corp. (Health Care Providers & Svs.) | 5,500 | 891,000 | ||||||||
DaVita HealthCare Partners, Inc. (Health Care Providers & Svs.) | (a) | 3,700 | 294,039 | |||||||
Express Scripts Holding Co. (Health Care Providers & Svs.) | (a) | 15,678 | 1,394,401 | |||||||
HCA Holdings, Inc. (Health Care Providers & Svs.) | (a) | 6,200 | 562,464 | |||||||
Henry Schein, Inc. (Health Care Providers & Svs.) | (a) | 1,800 | 255,816 | |||||||
Humana, Inc. (Health Care Providers & Svs.) | 3,200 | 612,096 | ||||||||
Laboratory Corp. of America Holdings (Health Care Providers & Svs.) | (a) | 2,200 | 266,684 | |||||||
McKesson Corp. (Health Care Providers & Svs.) | 5,000 | 1,124,050 | ||||||||
Patterson Cos., Inc. (Health Care Providers & Svs.) | 1,800 | 87,570 | ||||||||
Quest Diagnostics, Inc. (Health Care Providers & Svs.) | 3,100 | 224,812 | ||||||||
Tenet Healthcare Corp. (Health Care Providers & Svs.) | (a) | 2,112 | 122,243 | |||||||
UnitedHealth Group, Inc. (Health Care Providers & Svs.) | 20,500 | 2,501,000 | ||||||||
Universal Health Services, Inc. Class B (Health Care Providers & Svs.) | 2,000 | 284,200 | ||||||||
Cerner Corp. (Health Care Technology) | (a) | 6,600 | 455,796 | |||||||
Agilent Technologies, Inc. (Life Sciences Tools & Svs.) | 7,200 | 277,776 | ||||||||
PerkinElmer, Inc. (Life Sciences Tools & Svs.) | 2,400 | 126,336 | ||||||||
Thermo Fisher Scientific, Inc. (Life Sciences Tools & Svs.) | 8,600 | 1,115,936 | ||||||||
Waters Corp. (Life Sciences Tools & Svs.) | (a) | 1,800 | 231,084 | |||||||
AbbVie, Inc. (Pharmaceuticals) | 37,000 | 2,486,030 | ||||||||
Allergan PLC (Pharmaceuticals) | (a) | 8,440 | 2,561,202 | |||||||
Bristol-Myers Squibb Co. (Pharmaceuticals) | 35,869 | 2,386,723 | ||||||||
Eli Lilly & Co. (Pharmaceuticals) | 21,000 | 1,753,290 | ||||||||
Endo International PLC (Pharmaceuticals) | (a) | 4,400 | 350,460 | |||||||
Hospira, Inc. (Pharmaceuticals) | (a) | 3,710 | 329,114 | |||||||
Johnson & Johnson (Pharmaceuticals) | 59,600 | 5,808,616 | ||||||||
Mallinckrodt PLC (Pharmaceuticals) | (a) | 2,500 | 294,300 | |||||||
Merck & Co., Inc. (Pharmaceuticals) | 60,694 | 3,455,309 | ||||||||
Mylan NV (Pharmaceuticals) | (a) | 8,800 | 597,168 | |||||||
Perrigo Co. PLC (Pharmaceuticals) | 3,100 | 572,973 | ||||||||
Pfizer, Inc. (Pharmaceuticals) | 132,310 | 4,436,354 | ||||||||
Zoetis, Inc. (Pharmaceuticals) | 10,700 | 515,954 | ||||||||
|
| |||||||||
| 60,472,396 | ||||||||||
|
| |||||||||
INDUSTRIALS – 9.7% | ||||||||||
Boeing Co. / The (Aerospace & Defense) | 13,800 | 1,914,336 | ||||||||
General Dynamics Corp. (Aerospace & Defense) | 6,700 | 949,323 | ||||||||
Honeywell International, Inc. (Aerospace & Defense) | 16,800 | 1,713,096 | ||||||||
L-3 Communications Holdings, Inc. (Aerospace & Defense) | 1,800 | 204,084 | ||||||||
Lockheed Martin Corp. (Aerospace & Defense) | 5,800 | 1,078,220 | ||||||||
Northrop Grumman Corp. (Aerospace & Defense) | 4,200 | 666,246 | ||||||||
Precision Castparts Corp. (Aerospace & Defense) | 3,000 | 599,610 | ||||||||
Raytheon Co. (Aerospace & Defense) | 6,600 | 631,488 | ||||||||
Rockwell Collins, Inc. (Aerospace & Defense) | 2,800 | 258,580 | ||||||||
Textron, Inc. (Aerospace & Defense) | 6,000 | 267,780 | ||||||||
United Technologies Corp. (Aerospace & Defense) | 17,800 | 1,974,554 | ||||||||
C.H. Robinson Worldwide, Inc. (Air Freight & Logistics) | 3,100 | 193,409 | ||||||||
Expeditors International of Washington, Inc. (Air Freight & Logistics) | 4,100 | 189,031 | ||||||||
FedEx Corp. (Air Freight & Logistics) | 5,700 | 971,280 | ||||||||
United Parcel Service, Inc. Class B (Air Freight & Logistics) | 14,900 | 1,443,959 | ||||||||
American Airlines Group, Inc. (Airlines) | 14,900 | 595,032 | ||||||||
| 53 | (continued) |
| Ohio National Fund, Inc. | S&P 500® Index Portfolio (Continued) |
Schedule of Investments | June 30, 2015 (Unaudited) |
| Common Stocks (Continued) | Shares | Value | ||||||||
INDUSTRIALS (continued) | ||||||||||
Delta Air Lines, Inc. (Airlines) | 17,700 | $ | 727,116 | |||||||
Southwest Airlines Co. (Airlines) | 14,400 | 476,496 | ||||||||
Allegion PLC (Building Products) | 2,100 | 126,294 | ||||||||
Masco Corp. (Building Products) | 7,500 | 200,025 | ||||||||
ADT Corp. / The (Commercial Svs. & Supplies) | 3,650 | 122,531 | ||||||||
Cintas Corp. (Commercial Svs. & Supplies) | 2,000 | 169,180 | ||||||||
Pitney Bowes, Inc. (Commercial Svs. & Supplies) | 4,300 | 89,483 | ||||||||
Republic Services, Inc. (Commercial Svs. & Supplies) | 5,380 | 210,735 | ||||||||
Stericycle, Inc. (Commercial Svs. & Supplies) | (a) | 1,800 | 241,038 | |||||||
Tyco International PLC (Commercial Svs. & Supplies) | 9,000 | 346,320 | ||||||||
Waste Management, Inc. (Commercial Svs. & Supplies) | 9,200 | 426,420 | ||||||||
Fluor Corp. (Construction & Engineering) | 3,200 | 169,632 | ||||||||
Jacobs Engineering Group, Inc. (Construction & Engineering) | (a) | 2,700 | 109,674 | |||||||
Quanta Services, Inc. (Construction & Engineering) | (a) | 4,600 | 132,572 | |||||||
AMETEK, Inc. (Electrical Equip.) | 5,200 | 284,856 | ||||||||
Eaton Corp. PLC (Electrical Equip.) | 10,036 | 677,330 | ||||||||
Emerson Electric Co. (Electrical Equip.) | 14,400 | 798,192 | ||||||||
Rockwell Automation, Inc. (Electrical Equip.) | 2,900 | 361,456 | ||||||||
3M Co. (Industrial Conglomerates) | 13,600 | 2,098,480 | ||||||||
Danaher Corp. (Industrial Conglomerates) | 13,200 | 1,129,788 | ||||||||
General Electric Co. (Industrial Conglomerates) | 216,600 | 5,755,062 | ||||||||
Roper Technologies, Inc. (Industrial Conglomerates) | 2,200 | 379,412 | ||||||||
Caterpillar, Inc. (Machinery) | 13,000 | 1,102,660 | ||||||||
Cummins, Inc. (Machinery) | 3,600 | 472,284 | ||||||||
Deere & Co. (Machinery) | 7,200 | 698,760 | ||||||||
Dover Corp. (Machinery) | 3,400 | 238,612 | ||||||||
Flowserve Corp. (Machinery) | 2,900 | 152,714 | ||||||||
Illinois Tool Works, Inc. (Machinery) | 7,300 | 670,067 | ||||||||
Ingersoll-Rand PLC (Machinery) | 5,700 | 384,294 | ||||||||
Joy Global, Inc. (Machinery) | 2,100 | 76,020 | ||||||||
PACCAR, Inc. (Machinery) | 7,612 | 485,722 | ||||||||
Pall Corp. (Machinery) | 2,300 | 286,235 | ||||||||
Parker-Hannifin Corp. (Machinery) | 3,000 | 348,990 | ||||||||
Pentair PLC (Machinery) | 3,903 | 268,331 | ||||||||
Snap-on, Inc. (Machinery) | 1,300 | 207,025 | ||||||||
Stanley Black & Decker, Inc. (Machinery) | 3,347 | 352,238 | ||||||||
Xylem, Inc. (Machinery) | 3,900 | 144,573 | ||||||||
Dun & Bradstreet Corp. / The (Professional Svs.) | 800 | 97,600 | ||||||||
Equifax, Inc. (Professional Svs.) | 2,600 | 252,434 | ||||||||
Nielsen NV (Professional Svs.) | 7,900 | 353,683 | ||||||||
Robert Half International, Inc. (Professional Svs.) | 2,900 | 160,950 | ||||||||
CSX Corp. (Road & Rail) | 21,200 | 692,180 | ||||||||
J.B. Hunt Transport Services, Inc. (Road & Rail) | 1,900 | 155,971 | ||||||||
Kansas City Southern (Road & Rail) | 2,400 | 218,880 | ||||||||
Norfolk Southern Corp. (Road & Rail) | 6,600 | 576,576 | ||||||||
Ryder System, Inc. (Road & Rail) | 1,100 | 96,107 | ||||||||
Union Pacific Corp. (Road & Rail) | 18,800 | 1,792,956 | ||||||||
Fastenal Co. (Trading Companies & Distributors) | 5,800 | 244,644 | ||||||||
United Rentals, Inc. (Trading Companies & Distributors) | (a) | 2,100 | 184,002 | |||||||
W.W. Grainger, Inc. (Trading Companies & Distributors) | 1,300 | 307,645 | ||||||||
|
| |||||||||
| 39,704,273 | ||||||||||
|
| |||||||||
INFORMATION TECHNOLOGY – 18.8% | ||||||||||
Cisco Systems, Inc. (Communications Equip.) | 109,300 | 3,001,378 | ||||||||
F5 Networks, Inc. (Communications Equip.) | (a) | 1,500 | 180,525 | |||||||
Harris Corp. (Communications Equip.) | 2,600 | 199,966 | ||||||||
Juniper Networks, Inc. (Communications Equip.) | 7,600 | 197,372 | ||||||||
Motorola Solutions, Inc. (Communications Equip.) | 4,014 | 230,163 | ||||||||
QUALCOMM, Inc. (Communications Equip.) | 35,000 | 2,192,050 | ||||||||
Amphenol Corp. Class A (Electronic Equip., Instr. & Comp.) | 6,600 | 382,602 | ||||||||
Corning, Inc. (Electronic Equip., Instr. & Comp.) | 27,000 | 532,710 | ||||||||
| Common Stocks (Continued) | Shares | Value | ||||||||
INFORMATION TECHNOLOGY (continued) | ||||||||||
FLIR Systems, Inc. (Electronic Equip., Instr. & Comp.) | 3,000 | $ | 92,460 | |||||||
TE Connectivity Ltd. (Electronic Equip., Instr. & Comp.) | 8,700 | 559,410 | ||||||||
Akamai Technologies, Inc. (Internet Software & Svs.) | (a) | 3,800 | 265,316 | |||||||
eBay, Inc. (Internet Software & Svs.) | (a) | 23,800 | 1,433,712 | |||||||
Equinix, Inc. (Internet Software & Svs.) | 1,200 | 304,800 | ||||||||
Facebook, Inc. Class A (Internet Software & Svs.) | (a) | 45,300 | 3,885,155 | |||||||
Google, Inc. Class A (Internet Software & Svs.) | (a) | 6,125 | 3,307,745 | |||||||
Google, Inc. Class C (Internet Software & Svs.) | (a) | 6,141 | 3,196,452 | |||||||
VeriSign, Inc. (Internet Software & Svs.) | (a) | 2,300 | 141,956 | |||||||
Yahoo!, Inc. (Internet Software & Svs.) | (a) | 18,800 | 738,652 | |||||||
Accenture PLC Class A (IT Svs.) | 13,500 | 1,306,530 | ||||||||
Alliance Data Systems Corp. (IT Svs.) | (a) | 1,300 | 379,522 | |||||||
Automatic Data Processing, Inc. (IT Svs.) | 10,100 | 810,323 | ||||||||
Cognizant Technology Solutions Corp. Class A (IT Svs.) | (a) | 13,100 | 800,279 | |||||||
Computer Sciences Corp. (IT Svs.) | 3,000 | 196,920 | ||||||||
Fidelity National Information Services, Inc. (IT Svs.) | 6,100 | 376,980 | ||||||||
Fiserv, Inc. (IT Svs.) | (a) | 5,100 | 422,433 | |||||||
International Business Machines Corp. (IT Svs.) | 19,650 | 3,196,269 | ||||||||
MasterCard, Inc. Class A (IT Svs.) | 20,800 | 1,944,384 | ||||||||
Paychex, Inc. (IT Svs.) | 7,000 | 328,160 | ||||||||
Teradata Corp. (IT Svs.) | (a) | 3,100 | 114,700 | |||||||
Total System Services, Inc. (IT Svs.) | 3,477 | 145,234 | ||||||||
Visa, Inc. (IT Svs.) | 41,500 | 2,786,725 | ||||||||
Western Union Co. / The (IT Svs.) | 11,047 | 224,586 | ||||||||
Xerox Corp. (IT Svs.) | 22,302 | 237,293 | ||||||||
Altera Corp. (Semiconductors & Equip.) | 6,500 | 332,800 | ||||||||
Analog Devices, Inc. (Semiconductors & Equip.) | 6,700 | 430,040 | ||||||||
Applied Materials, Inc. (Semiconductors & Equip.) | 26,500 | 509,330 | ||||||||
Avago Technologies Ltd. (Semiconductors & Equip.) | 5,500 | 731,115 | ||||||||
Broadcom Corp. Class A (Semiconductors & Equip.) | 11,650 | 599,859 | ||||||||
First Solar, Inc. (Semiconductors & Equip.) | (a) | 1,650 | 77,517 | |||||||
Intel Corp. (Semiconductors & Equip.) | 102,000 | 3,102,330 | ||||||||
KLA-Tencor Corp. (Semiconductors & Equip.) | 3,400 | 191,114 | ||||||||
Lam Research Corp. (Semiconductors & Equip.) | 3,425 | 278,624 | ||||||||
Linear Technology Corp. (Semiconductors & Equip.) | 5,100 | 225,573 | ||||||||
Microchip Technology, Inc. (Semiconductors & Equip.) | 4,300 | 203,928 | ||||||||
Micron Technology, Inc. (Semiconductors & Equip.) | (a) | 23,200 | 437,088 | |||||||
NVIDIA Corp. (Semiconductors & Equip.) | 11,000 | 221,210 | ||||||||
Qorvo, Inc. (Semiconductors & Equip.) | (a) | 3,200 | 256,864 | |||||||
Skyworks Solutions, Inc. (Semiconductors & Equip.) | 4,100 | 426,810 | ||||||||
Texas Instruments, Inc. (Semiconductors & Equip.) | 22,400 | 1,153,824 | ||||||||
Xilinx, Inc. (Semiconductors & Equip.) | 5,600 | 247,296 | ||||||||
Adobe Systems, Inc. (Software) | (a) | 10,200 | 826,302 | |||||||
Autodesk, Inc. (Software) | (a) | 4,900 | 245,368 | |||||||
CA, Inc. (Software) | 6,800 | 199,172 | ||||||||
Citrix Systems, Inc. (Software) | (a) | 3,400 | 238,544 | |||||||
Electronic Arts, Inc. (Software) | (a) | 6,700 | 445,550 | |||||||
Intuit, Inc. (Software) | 5,900 | 594,543 | ||||||||
Microsoft Corp. (Software) | 173,900 | 7,677,685 | ||||||||
Oracle Corp. (Software) | 68,500 | 2,760,550 | ||||||||
Red Hat, Inc. (Software) | (a) | 3,900 | 296,127 | |||||||
Salesforce.com, Inc. (Software) | (a) | 13,100 | 912,153 | |||||||
Symantec Corp. (Software) | 14,594 | 339,311 | ||||||||
Apple, Inc. (Tech. Hardware, Storage & Periph.) | 123,800 | 15,527,615 | ||||||||
EMC Corp. (Tech. Hardware, Storage & Periph.) | 41,700 | 1,100,463 | ||||||||
Hewlett-Packard Co. (Tech. Hardware, Storage & Periph.) | 38,800 | 1,164,388 | ||||||||
NetApp, Inc. (Tech. Hardware, Storage & Periph.) | 6,700 | 211,452 | ||||||||
SanDisk Corp. (Tech. Hardware, Storage & Periph.) | 4,500 | 261,990 | ||||||||
| 54 | (continued) |
| Ohio National Fund, Inc. | S&P 500® Index Portfolio (Continued) |
Schedule of Investments | June 30, 2015 (Unaudited) |
| Common Stocks (Continued) | Shares | Value | ||||||||
INFORMATION TECHNOLOGY (Continued) | ||||||||||
Seagate Technology PLC (Tech. Hardware, Storage & Periph.) | 6,800 | $ | 323,000 | |||||||
Western Digital Corp. (Tech. Hardware, Storage & Periph.) | 4,700 | 368,574 | ||||||||
|
| |||||||||
| 77,030,871 | ||||||||||
|
| |||||||||
MATERIALS – 3.0% | ||||||||||
Air Products & Chemicals, Inc. (Chemicals) | 4,200 | 574,686 | ||||||||
Airgas, Inc. (Chemicals) | 1,500 | 158,670 | ||||||||
CF Industries Holdings, Inc. (Chemicals) | 5,100 | 327,828 | ||||||||
Dow Chemical Co. / The (Chemicals) | 23,300 | 1,192,261 | ||||||||
Eastman Chemical Co. (Chemicals) | 3,200 | 261,824 | ||||||||
Ecolab, Inc. (Chemicals) | 5,800 | 655,806 | ||||||||
E.I. du Pont de Nemours & Co. (Chemicals) | 19,500 | 1,247,025 | ||||||||
FMC Corp. (Chemicals) | 2,900 | 152,395 | ||||||||
International Flavors & Fragrances, Inc. (Chemicals) | 1,700 | 185,793 | ||||||||
LyondellBasell Industries NV Class A (Chemicals) | 8,400 | 869,568 | ||||||||
Monsanto Co. (Chemicals) | 10,186 | 1,085,726 | ||||||||
Mosaic Co. / The (Chemicals) | 6,700 | 313,895 | ||||||||
PPG Industries, Inc. (Chemicals) | 5,800 | 665,376 | ||||||||
Praxair, Inc. (Chemicals) | 6,200 | 741,210 | ||||||||
Sherwin-Williams Co. / The (Chemicals) | 1,700 | 467,534 | ||||||||
Sigma-Aldrich Corp. (Chemicals) | 2,600 | 362,310 | ||||||||
Martin Marietta Materials, Inc. (Construction Materials) | 1,300 | 183,963 | ||||||||
Vulcan Materials Co. (Construction Materials) | 2,900 | 243,397 | ||||||||
Avery Dennison Corp. (Containers & Packaging) | 2,000 | 121,880 | ||||||||
Ball Corp. (Containers & Packaging) | 3,000 | 210,450 | ||||||||
MeadWestvaco Corp. (Containers & Packaging) | 7,100 | 335,049 | ||||||||
Owens-Illinois, Inc. (Containers & Packaging) | (a) | 3,500 | 80,290 | |||||||
Sealed Air Corp. (Containers & Packaging) | 4,500 | 231,210 | ||||||||
Alcoa, Inc. (Metals & Mining) | 26,300 | 293,245 | ||||||||
Allegheny Technologies, Inc. (Metals & Mining) | 2,300 | 69,460 | ||||||||
Freeport-McMoRan, Inc. (Metals & Mining) | 22,352 | 416,194 | ||||||||
Newmont Mining Corp. (Metals & Mining) | 11,400 | 266,304 | ||||||||
Nucor Corp. (Metals & Mining) | 6,900 | 304,083 | ||||||||
International Paper Co. (Paper & Forest Products) | 9,100 | 433,069 | ||||||||
|
| |||||||||
| 12,450,501 | ||||||||||
|
| |||||||||
TELECOMMUNICATION SERVICES – 2.1% | ||||||||||
AT&T, Inc. (Diversified Telecom. Svs.) | 111,578 | 3,963,251 | ||||||||
CenturyLink, Inc. (Diversified Telecom. Svs.) | 12,072 | 354,675 | ||||||||
Frontier Communications Corp. (Diversified Telecom. Svs.) | 24,741 | 122,468 | ||||||||
Level 3 Communications, Inc. (Diversified Telecom. Svs.) | (a) | 6,300 | 331,821 | |||||||
Verizon Communications, Inc. (Diversified Telecom. Svs.) | 87,700 | 4,087,697 | ||||||||
|
| |||||||||
| 8,859,912 | ||||||||||
|
| |||||||||
| Common Stocks (Continued) | Shares | Value | ||||||||
UTILITIES – 2.7% | ||||||||||
American Electric Power Co., Inc. (Electric Utilities) | 10,500 | $ | 556,185 | |||||||
Duke Energy Corp. (Electric Utilities) | 14,843 | 1,048,213 | ||||||||
Edison International (Electric Utilities) | 7,000 | 389,060 | ||||||||
Entergy Corp. (Electric Utilities) | 3,900 | 274,950 | ||||||||
Eversource Energy (Electric Utilities) | 6,800 | 308,788 | ||||||||
Exelon Corp. (Electric Utilities) | 18,490 | 580,956 | ||||||||
FirstEnergy Corp. (Electric Utilities) | 9,034 | 294,057 | ||||||||
NextEra Energy, Inc. (Electric Utilities) | 9,500 | 931,285 | ||||||||
Pepco Holdings, Inc. (Electric Utilities) | 5,400 | 145,476 | ||||||||
Pinnacle West Capital Corp. (Electric Utilities) | 2,400 | 136,536 | ||||||||
PPL Corp. (Electric Utilities) | 14,400 | 424,368 | ||||||||
Southern Co. / The (Electric Utilities) | 19,500 | 817,050 | ||||||||
Xcel Energy, Inc. (Electric Utilities) | 10,900 | 350,762 | ||||||||
AGL Resources, Inc. (Gas Utilities) | 2,586 | 120,404 | ||||||||
AES Corp. (Ind. Power & Renewable Elec.) | 14,700 | 194,922 | ||||||||
NRG Energy, Inc. (Ind. Power & Renewable Elec.) | 7,200 | 164,736 | ||||||||
Ameren Corp. (Multi-Utilities) | 5,200 | 195,936 | ||||||||
CenterPoint Energy, Inc. (Multi-Utilities) | 9,200 | 175,076 | ||||||||
CMS Energy Corp. (Multi-Utilities) | 5,900 | 187,856 | ||||||||
Consolidated Edison, Inc. (Multi-Utilities) | 6,300 | 364,644 | ||||||||
Dominion Resources, Inc. (Multi-Utilities) | 12,800 | 855,936 | ||||||||
DTE Energy Co. (Multi-Utilities) | 3,900 | 291,096 | ||||||||
NiSource, Inc. (Multi-Utilities) | 6,800 | 310,012 | ||||||||
PG&E Corp. (Multi-Utilities) | 10,300 | 505,730 | ||||||||
Public Service Enterprise Group, Inc. (Multi-Utilities) | 10,900 | 428,152 | ||||||||
SCANA Corp. (Multi-Utilities) | 3,100 | 157,015 | ||||||||
Sempra Energy (Multi-Utilities) | 5,000 | 494,700 | ||||||||
TECO Energy, Inc. (Multi-Utilities) | 5,100 | 90,066 | ||||||||
WEC Energy Group, Inc. (Multi-Utilities) | 6,731 | 302,699 | ||||||||
|
| |||||||||
| 11,096,666 | ||||||||||
|
| |||||||||
Total Common Stocks (Cost $253,834,963) | $ | 391,747,417 | ||||||||
|
| |||||||||
| Exchange Traded Funds – 4.0% | Shares | Value | ||||||||
SPDR S&P 500 ETF Trust | 80,125 | $ | 16,493,731 | |||||||
|
| |||||||||
Total Exchange Traded Funds (Cost $16,553,999) | $ | 16,493,731 | ||||||||
|
| |||||||||
Total Investments – 99.6% (Cost $270,388,962) | (b) | $ | 408,241,148 | |||||||
Other Assets in Excess of Liabilities – 0.4% | 1,489,563 | |||||||||
|
| |||||||||
Net Assets – 100.0% | $ | 409,730,711 | ||||||||
|
| |||||||||
Percentages are stated as a percent of net assets.
Footnotes:
| (a) | Non-income producing security. |
| (b) | Represents cost for financial reporting purposes, which may differ from cost basis for federal income tax purposes. See also Note 7 of the Notes to Financial Statements. |
The accompanying notes are an integral part of these financial statements.
| 55 |
| Ohio National Fund, Inc. | Strategic Value Portfolio |
Objective/Strategy
The Strategic Value Portfolio seeks growth of capital and income by investing primarily in securities of high dividend yielding, undervalued stocks with dividend growth potential.
Performance as of June 30, 2015
Average Annual Returns; | ||||
One year | -1.00% | |||
Five years | 14.54% | |||
Ten years | 5.08% |
Past performance does not guarantee future results. The performance data quoted represents past performance and current returns may be lower or higher. Total return figures include change in share price and reinvestment of dividends and capital gains. The investment return and principal value will fluctuate so that an investor’s shares, when redeemed, may be worth more or less than the original cost. To obtain performance information up to the most recent month end, call toll-free 1-877-781-6392.
The Portfolio is not open to direct retail investment. Beneficial interest in shares is obtained solely by purchase of variable life insurance policies and variable annuity contracts. Actual performance results for variable annuity and variable universal life contracts will be lower due to contract charges. Consult your contract for applicable charges.
Comments
For the six-month period ended June 30, 2015, the Strategic Value Portfolio returned -0.36% versus -3.57% for the current benchmark, the Dow Jones U.S. Select Dividend Index (“DJSDI”).
In spite of the recent commotion in the markets, precipitated by uncertainty in Greece and the Federal Reserve’s future interest rate plans, the Portfolio remained focused, as always, on providing investors with a high dividend yield and dividend growth. At the end of June, the Portfolio’s gross dividend yield measured 4.4%, higher than that of the broad market S&P 500 Index (2.1%) and the Dow Jones U.S. Select Dividend Index (3.8%), which aims to reflect the domestic dividend-paying universe.(1)
During the first half of the year, the Portfolio realized 17 dividend increases. The most notable of these increases came from The Williams Cos., Inc., The Coca-Cola Co., Dominion Resources, Inc., PepsiCo, Inc., General Mills, Inc., and Johnson & Johnson, as they raised their dividends by 10.3%, 8.2%, 7.9%, 7.3%, 7.3% and 7.1%, respectively. Johnson & Johnson’s April 2015 dividend hike marked the 53rd consecutive year that the company has raised its dividend.(1)
The Portfolio primarily invests in high yield, low beta, large cap, high quality holdings, which are representative of a dividend-oriented strategy. Despite the strong “risk on” environment during the first half of the year, which creates a significant headwind for a large cap, high yielding, low beta strategy, the Portfolio handled these obstacles well. Of note, when quintiling the S&P 500 Index, low quality (“C/D”) has outperformed high quality (“A+”) by 13.0%, low yield has outperformed high yield by 7.7%, high beta has outperformed low beta by 2.3%, and small caps have outperformed large caps by 1.6%. These characteristics are not conducive to a dividend-oriented strategy.(1)
On an absolute performance basis, the Portfolio’s holdings in real estate investment trusts (“REITs”) and Utilities detracted from performance, as they both experienced short-term price pressure due to speculation around when the Federal Reserve might raise rates. The Portfolio’s holdings in these areas are, nonetheless, very
supportive of an income-oriented investment strategy, evidenced by their average dividend yields of 5.3% and 4.8%, respectively.(1)
The Portfolio’s absolute performance was primarily driven by our notable weight in Consumer Staples, which returned 6.5% in the Portfolio dominated by two investments, Kraft Foods Group, Inc. (up 36.7%) and Reynolds American, Inc. (up 18.4%). Kraft Foods Group, Inc.’s shares rose 35.6% on March 25th after the announcement of its merger agreement with Heinz. Under the terms of the deal, current Kraft Foods Group, Inc. shareholders will own 49% of the new company, while existing Heinz shareholders will own 51% and 3G Capital and Warren Buffet will be returning cash to existing Kraft Foods Group, Inc. shareholders worth $10 billion, or $16.50/share. Reynolds American, Inc. shares have also been propelled by its merger agreement with Lorillard, which was completed on June 12, 2015. Strong revenue growth and strong pricing (cigarette pricing up 5.9% year over year) has also added to Reynolds American, Inc.’s strong performance. Separately, The Williams Cos., Inc. within Energy, added positively to performance, as it returned 26.0% for the period. The Williams Cos., Inc.’s shares rose after the news of the potential buyout offer from Energy Transfer Equity L.P. (1)
The Portfolio’s five best performing securities were Kraft Foods Group, Inc. (up 36.7%), The Williams Cos., Inc. (up 26.0%), Reynolds American, Inc. (up 18.4%), Sanofi (up 15.2%), and Vodafone Group PLC (up 10.1%). The Portfolio’s five worst performing securities were, Royal Dutch Shell PLC (down 15.7%), HCP, Inc. (down 14.9%), Duke Energy Corp. (down 13.7%), National Retail Properties, Inc. (down 13.3%) and The Procter & Gamble Co. (down 12.8%). The Procter & Gamble Co. had disappointing first quarter results as organic sales came in below expectations. Most defensive investments experience near term pressure due to concerns surrounding interest rate volatility. (1)
On a relative basis, the Portfolio’s strongest contribution came from the notable performance within Consumer Staples. The Portfolio’s 31.5% Consumer Staples exposure posted a return of 6.5%, compared to an average return of 1.7% for the Staples holdings within the benchmark. The most notable performers in Consumer Staples were Kraft Foods Group, Inc., Reynolds American, Inc. and Unilever PLC. The Portfolio’s significant underweight in Utilities versus the benchmark also contributed significantly to relative performance, adding 1.5%. Lastly, the Portfolio’s superior stock selection in Telecommunication Services added 2.0% to relative performance. This substantial outperformance was driven by the Portfolio’s exposure to Vodafone Group PLC (up 10.1%) and AT&T, Inc. (up 8.8%), while avoiding CenturyLink, Inc., which posted a -23.4% return in the index for the period. (1)
The primary driver of relative weakness was Financials, which was the third best performer in the index posting a return of 4.5%. While the Portfolio’s only exposure in Financials is the position in REITs, REITs underperformed during the period driven by the speculation around rising rates. The index’s 4.8% average weight in Commercial Banks posted a return of 10.6%, as Commercial Banks tend to outperform in a rising rate environment. Due to the financial crisis of 2008, however, dividend payout ratios within Financials were greatly reduced. As a result, the Financials sector is not an optimal sector to find investments with a strong history of consecutively paying and an increasing dividend.(1)
The Portfolio has not changed its basic positioning, as it continues to invest in companies that exhibit both the ability and the inclination to pay and increase their dividends, although the security makeup of the Portfolio has changed modestly over the first half of the year.
| 56 | (continued) |
| Ohio National Fund, Inc. | Strategic Value Portfolio (Continued) |
Changes to sector exposures included a 4.4% decrease in the Energy exposure and a 1.8% increase in Consumer Staples and Telecommunication Services. Energy decreased as a result of eliminating our positions in ConocoPhillips and The Williams Cos., Inc. We exited our position in ConocoPhillips because the company does not have a downstream business that would have aided it through this period of low energy prices. The company spun off its refining business, Phillips 66, back in early 2012, which would have benefited from lower input costs associated with lower oil prices. Without the benefit of a downstream business, ConocoPhillips failed our dividend safety stress test and was subsequently eliminated. We also exited The Williams Cos., Inc. after the shares soared 26% on June 22, based on the news of a potential buyout from Energy Transfer Equity L.P.(1)
Consumer Staples increased as a result of adding to existing positions in Altria Group, Inc., Philip Morris International, Inc. and The Procter & Gamble Co., three companies that have a very strong history of paying consecutive dividends. Altria Group, Inc. and Philip Morris International, Inc. have been paying consecutive dividends every year since 1928 and The Procter & Gamble Co. has paid consecutive dividends every year since 1890! Exposure to the Telecommunication Services sector increased due to increases to an existing position in BCE, Inc. BCE, Inc. currently yields 4.2% and increased its dividend by over 5.3% in February. BCE, Inc. has a high commitment to the dividend and a long track record of paying and growing the dividend. There was one new addition in Heath Care, Sanofi, which currently yields 3.2%. The company’s ability and willingness to share a fair amount of its profits with shareholders makes Sanofi a compelling investment option for a dividend-focused strategy.(1)
The year 2015 has been a tumultuous year so far for stocks, as several issues continue to trigger volatility in the market. Speculation around when the Federal Reserve will raise rates, the potential Greece default, China’s declining growth rate, and the volatility within oil prices have been the major concerns driving market volatility. Globally, the potential default of Greece, and its possible exit from the European Union, is causing volatility throughout the European markets. Domestically, oil prices have dropped again on the threat of Iranian supply coming online, and an increase in U.S. drilling has added to signs that producers will keep adding to an already oversupplied market. The Federal Reserve is expected to raise rates by the end of the year, with some speculating the raise to occur as early as September. The U.S. markets have seen solid economic growth and job growth, but the stagnant pace of inflation may cause the Federal Reserve to hold off on raising rates even longer.
The Portfolio’s unchanging investment strategy looks beyond short-term market noise and focuses instead on the long-term drivers of total return. As the broad market constantly ebbs and flows in its unpredictable fashion, the Portfolio provides a steadfast, objectives-based investment approach that we believe is designed to provide a meaningful source of income, growth in that income which can offset inflation, downside protection characteristics and a long-term investment approach positioned to outperform the broad market.
| (1) | The Portfolio’s composition is subject to change. Holdings and weightings are as of June 30, 2015. |
Change in Value of $10,000 Investment
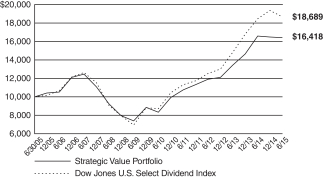
Hypothetical illustration based on past performance. Future performance will vary. The Portfolio’s returns reflect reinvested dividends. The Portfolio’s holdings may differ significantly from the securities in the index. The index is unmanaged and therefore does not reflect the cost of portfolio management and accounting.
The Dow Jones U.S. Select Dividend Index is comprised of all dividend-paying companies in the Dow Jones U.S. Index that have a non-negative historical five-year dividend-per-share growth rate, a five-year average dividend to earnings-per-share ratio of less than or equal to 60%, paid dividends in each of the previous five years, and a three-month average daily trading volume of 200,000 shares. Current index components are included in the universe regardless of their dividend payout ratio or trading volume. The Dow Jones U.S. Index aims to consistently represent the top 95% of U.S. companies based on float-adjusted market capitalization, excluding non common issues and illiquid stocks. The index presented includes the effects of reinvested dividends.
| 57 | (continued) |
| Ohio National Fund, Inc. | Strategic Value Portfolio (Continued) |
Portfolio Composition as of June 30, 2015 (1)
| % of Net Assets | ||||
Common Stocks (3) | 97.6 | |||
Money Market Funds and | 2.4 | |||
|
| |||
| 100.0 | ||||
|
|
Top 10 Portfolio Holdings as of June 30, 2015 (1) (2)
| % of Net Assets | ||||
1. Kraft Foods Group, Inc. | 5.3 | |||
2. AT&T, Inc. | 4.7 | |||
3. Altria Group, Inc. | 4.7 | |||
4. Reynolds American, Inc. | 4.6 | |||
5. Verizon Communications, Inc. | 4.3 | |||
6. McDonald’s Corp. | 4.3 | |||
7. National Grid PLC | 4.3 | |||
8. Philip Morris International, Inc. | 4.2 | |||
9. GlaxoSmithKline PLC | 4.0 | |||
10. Vodafone Group PLC – ADR | 3.7 |
| (1) | Composition of Portfolio subject to change. |
| (2) | Short-term investments have been excluded from the list of Top 10 Portfolio Holdings. |
| (3) | Sectors: |
| % of Net Assets | ||||
Consumer Staples | 32.7 | |||
Telecommunication Services | 14.8 | |||
Utilities | 14.5 | |||
Energy | 13.3 | |||
Health Care | 9.1 | |||
Financials | 8.9 | |||
Consumer Discretionary | 4.3 | |||
|
| |||
| 97.6 | ||||
|
|
| 58 |
| Ohio National Fund, Inc. | Strategic Value Portfolio |
Schedule of Investments | June 30, 2015 (Unaudited) |
| Common Stocks – 97.6% | Shares | Value | ||||||||
CONSUMER DISCRETIONARY – 4.3% | ||||||||||
McDonald’s Corp. (Hotels, Restaurants & Leisure) | 149,645 | $ | 14,226,750 | |||||||
|
| |||||||||
CONSUMER STAPLES – 32.7% | ||||||||||
Coca-Cola Co. / The (Beverages) | 119,450 | 4,686,023 | ||||||||
PepsiCo, Inc. (Beverages) | 36,700 | 3,425,578 | ||||||||
General Mills, Inc. (Food Products) | 97,100 | 5,410,412 | ||||||||
Kellogg Co. (Food Products) | 54,075 | 3,390,502 | ||||||||
Kraft Foods Group, Inc. (Food Products) | 206,730 | 17,600,992 | ||||||||
Kimberly-Clark Corp. (Household Products) | 78,475 | 8,315,996 | ||||||||
Procter & Gamble Co. / The (Household Products) | 140,350 | 10,980,984 | ||||||||
Unilever PLC (Personal Products) | (a) | 215,600 | 9,257,624 | |||||||
Altria Group, Inc. (Tobacco) | 315,195 | 15,416,187 | ||||||||
Philip Morris International, Inc. (Tobacco) | 174,545 | 13,993,273 | ||||||||
Reynolds American, Inc. (Tobacco) | 203,620 | 15,202,269 | ||||||||
|
| |||||||||
| 107,679,840 | ||||||||||
|
| |||||||||
ENERGY – 13.3% | ||||||||||
BP PLC (Oil, Gas & Consumable Fuels) | (a) | 1,685,300 | 11,184,726 | |||||||
Chevron Corp. (Oil, Gas & Consumable Fuels) | 110,980 | 10,706,241 | ||||||||
Kinder Morgan, Inc. (Oil, Gas & Consumable Fuels) | 137,390 | 5,274,402 | ||||||||
Royal Dutch Shell PLC (Oil, Gas & Consumable Fuels) | (a) | 321,220 | 9,145,244 | |||||||
TOTAL SA (Oil, Gas & Consumable Fuels) | (a) | 152,420 | 7,476,363 | |||||||
|
| |||||||||
| 43,786,976 | ||||||||||
|
| |||||||||
FINANCIALS – 8.9% | ||||||||||
Digital Realty Trust, Inc. (Real Estate Investment Trusts) | 85,700 | 5,714,476 | ||||||||
HCP, Inc. (Real Estate Investment Trusts) | 155,190 | 5,659,779 | ||||||||
Health Care REIT, Inc. (Real Estate Investment Trusts) | 81,800 | 5,368,534 | ||||||||
National Retail Properties, Inc. (Real Estate Investment Trusts) | 83,000 | 2,905,830 | ||||||||
Realty Income Corp. (Real Estate Investment Trusts) | 80,800 | 3,586,712 | ||||||||
Ventas, Inc. (Real Estate Investment Trusts) | 97,530 | 6,055,638 | ||||||||
|
| |||||||||
| 29,290,969 | ||||||||||
|
| |||||||||
| Common Stocks (Continued) | Shares | Value | ||||||||
HEALTH CARE – 9.1% | ||||||||||
GlaxoSmithKline PLC (Pharmaceuticals) | (a) | 629,156 | $ | 13,081,295 | ||||||
Johnson & Johnson (Pharmaceuticals) | 51,860 | 5,054,276 | ||||||||
Merck & Co., Inc. (Pharmaceuticals) | 145,800 | 8,300,394 | ||||||||
Sanofi (Pharmaceuticals) | (a) | 37,036 | 3,663,977 | |||||||
|
| |||||||||
| 30,099,942 | ||||||||||
|
| |||||||||
TELECOMMUNICATION SERVICES – 14.8% | ||||||||||
AT&T, Inc. (Diversified Telecom. Svs.) | 439,223 | 15,601,201 | ||||||||
BCE, Inc. (Diversified Telecom. Svs.) | 160,280 | 6,809,013 | ||||||||
Verizon Communications, Inc. (Diversified Telecom. Svs.) | 307,101 | 14,313,978 | ||||||||
Vodafone Group PLC – ADR (Wireless Telecom. Svs.) | 331,893 | 12,097,500 | ||||||||
|
| |||||||||
| 48,821,692 | ||||||||||
|
| |||||||||
UTILITIES – 14.5% | ||||||||||
American Electric Power Co., Inc. (Electric Utilities) | 74,600 | 3,951,562 | ||||||||
Duke Energy Corp. (Electric Utilities) | 139,906 | 9,880,162 | ||||||||
PPL Corp. (Electric Utilities) | 251,900 | 7,423,493 | ||||||||
Southern Co. / The (Electric Utilities) | 194,860 | 8,164,634 | ||||||||
Dominion Resources, Inc. (Multi-Utilities) | 61,225 | 4,094,116 | ||||||||
National Grid PLC (Multi-Utilities) | (a) | 1,103,800 | 14,206,732 | |||||||
|
| |||||||||
| 47,720,699 | ||||||||||
|
| |||||||||
Total Common Stocks (Cost $305,147,781) | $ | 321,626,868 | ||||||||
|
| |||||||||
| Money Market Funds – 2.0% | Shares | Value | ||||||||
Fidelity Institutional Money Market Funds | 6,640,000 | $ | 6,640,000 | |||||||
|
| |||||||||
Total Money Market Funds (Cost $6,640,000) | $ | 6,640,000 | ||||||||
|
| |||||||||
Total Investments – 99.6% (Cost $311,787,781) | (b) | $ | 328,266,868 | |||||||
Other Assets in Excess of Liabilities – 0.4% | 1,331,604 | |||||||||
|
| |||||||||
Net Assets – 100.0% | $ | 329,598,472 | ||||||||
|
| |||||||||
Percentages are stated as a percent of net assets.
Abbreviations:
ADR: American Depositary Receipts
Footnotes:
| (a) | Security traded on a foreign exchange has been valued at an estimate of fair value that is different than the local market close price. These fair value estimates are determined by an independent fair valuation service that has been approved by the Board. These securities represent $68,015,961, or 20.6% of the Portfolio’s net assets. Other Portfolio securities are not subjected to fair value procedures because they are traded on domestic or foreign exchanges that have close times that are consistent with the U.S. market close, normally 4:00 pm Eastern Time. |
| (b) | Represents cost for financial reporting purposes, which may differ from cost basis for federal income tax purposes. See also Note 7 of the Notes to Financial Statements. |
The accompanying notes are an integral part of these financial statements.
| 59 |
| Ohio National Fund, Inc. | High Income Bond Portfolio |
Objective/Strategy
The High Income Bond Portfolio seeks high current income by investing at least 80% of its net assets in lower rated corporate debt obligations commonly referred to as “junk bonds”. The Portfolio’s investments are generally rated Ba or lower by Moody’s, or BB or lower by Standard & Poor’s or Fitch.
Performance as of June 30, 2015
Average Annual Returns: | ||||
One year | 0.48% | |||
Five years | 8.22% | |||
Ten years | 7.28% |
Past performance does not guarantee future results. The performance data quoted represents past performance and current returns may be lower or higher. Total return figures include change in share price and reinvestment of dividends and capital gains. The investment return and principal value will fluctuate so that an investor’s shares, when redeemed, may be worth more or less than the original cost. To obtain performance information up to the most recent month end, call toll-free 1-877-781-6392.
The Portfolio is not open to direct retail investment. Beneficial interest in shares is obtained solely by purchase of variable life insurance policies and variable annuity contracts. Actual performance results for variable annuity and variable universal life contracts will be lower due to contract charges. Consult your contract for applicable charges.
Comments
For the six-month period ended June 30, 2015, the High Income Bond Portfolio returned 2.33% versus 2.53% for the current benchmark, the Barclays Capital U.S. Corporate High Yield 2% Issuer Capped Index (“BCHY2%”).
The high yield market generated attractive relative returns during the reporting period. For comparison, the Barclays U.S. Aggregate Index, a measure of high quality bond performance, returned (0.10%) versus the 2.53% for the BCHY2%. The high yield market benefitted from the general perception that the U.S. economy was in a modest self-sustaining economic expansion, led by rising employment levels and consumer confidence. This provided an environment for strong corporate credit conditions in non-commodity based industries. Even issuers in the Energy sector rebounded from year end levels, as the worst outcomes for oil prices did not materialize in the first half. The market’s strength is illustrated by the narrowing of yield spreads between the Credit Suisse High Yield Bond Index and U.S. Treasury securities with comparable maturities which began the period at 564 basis points and ended the period at 535 basis points.
Within the high-yield market, major industry sectors that substantially outperformed the overall BCHY2% included: midstream, oil field services, food/beverages, consumer cyclical services and leisure. Major industry sectors that substantially underperformed the overall BCHY2% included: metals/mining, wireline telecommunications, aerospace/defense, cable/satellite and construction machinery. From a ratings quality perspective, the more interest rate sensitive BB-rated securities were the worst performer at a still respectable 2.31%. The B-rated sector led the way returning 3.01% followed by the CCC-rated sector which returned 2.50%.
The Portfolio was positively impacted by its underweight to the poor performing metals/mining and wireline telecommunication sector. The Portfolio benefitted from strong security selection in the independent energy, aerospace/defense, gaming and retail sectors. Specific Portfolio holdings that substantially outperformed the BCHY2% included: Approach Resources, Inc., Northern Oil & Gas,
Inc., Hiland Partners LP/Hiland Partners Finance Corp., Oasis Petroleum, Inc. and Laredo Petroleum, Inc. The Portfolio was negatively impacted by security selection in the Information Technology sector. Specific Portfolio holdings that substantially underperformed the BCHY2% included: Chaparral Energy, Inc., Energy XXI Gulf Coast, Inc., SandRidge Energy, Inc., Intelsat SA and BMC Software Finance, Inc. The Portfolio was positively impacted by its underweight to the poor performing metals/mining and wireline telecommunication sector. (1)
As the third quarter begins, two major uncertainties dominate the headlines, the ongoing financial problems in Greece and the timing of the Federal Reserve’s first move to raise the federal funds rate. From an intermediate-to-longer-term perspective, we believe the strengthening U.S. economic climate, supported by stimulative central bank policies outside the U.S., will have a much greater impact on the high yield market than Greece or the Federal Reserve’s modest tightening actions. We believe credit spreads will tighten, offsetting any increase in intermediate U.S. Treasury rates. The credit deterioration in the metals & mining and energy sectors will most likely serve as a headwind for the overall high yield market should commodity prices not improve from current levels.
| (1) | The Portfolio’s composition is subject to change. Holdings and weightings are as of June 30, 2015. |
Change in Value of $10,000 Investment
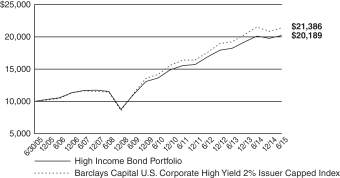
Hypothetical illustration based on past performance. Future performance will vary. All returns reflect reinvested dividends. The Portfolio’s holdings may differ significantly from the securities in the index. The index is unmanaged and therefore does not reflect the cost of Portfolio management or trading. Neither the Portfolio nor the index is open to direct investment.
The Barclays Capital U.S. Corporate High Yield 2% Issuer Capped Index is the 2% Issuer Cap component of the Barclays Capital U.S. Corporate High Yield Bond Index. The Barclays Capital U.S. Corporate High Yield Bond Index is an unmanaged index that includes all fixed income securities having a maximum quality rating of Ba1/BB+/BB+, a minimum amount outstanding of $150 million, and a least 1 year to maturity. The 2% Issuer Cap component limits the exposure of each issuer to 2% of the total market value and distributes any excess market value index–wide on a pro–rata basis. The index is presented on a total return basis.
| 60 | (continued) |
| Ohio National Fund, Inc. | High Income Bond Portfolio (Continued) |
Portfolio Composition as of June 30, 2015 (1)
| % of Net Assets | ||||
Corporate Bonds (3) | 97.7 | |||
Money Market Funds and | 2.3 | |||
|
| |||
| 100.0 | ||||
|
|
Top 10 Portfolio Holdings as of June 30, 2015 (1) (2)
| % of Net Assets | ||||
1. First Data Corp. | 1.3 | |||
2. HCA, Inc. | 1.0 | |||
3. Energy Transfer Equity LP | 0.8 | |||
4. Infor Software Parent LLC / Infor Software Parent, Inc. | 0.8 | |||
5. DISH DBS Corp. | 0.7 | |||
6. Crimson Merger Sub., Inc. | 0.7 | |||
7. Berry Plastics Corp. | 0.6 | |||
8. Aramark Services, Inc. | 0.6 | |||
9. Signode Industrial Group Lux SA / Signode Industrial Group U.S., Inc. | 0.6 | |||
10. Serta Simmons Holdings LLC | 0.6 |
| (1) | Composition of Portfolio subject to change. |
| (2) | Short-term investments have been excluded from the list of Top 10 Portfolio Holdings. |
| (3) | Sectors: |
| % of Net Assets | ||||
Consumer Discretionary | 29.9 | |||
Health Care | 12.1 | |||
Industrials | 11.7 | |||
Energy | 11.2 | |||
Information Technology | 10.4 | |||
Materials | 9.1 | |||
Telecommunication Services | 4.0 | |||
Consumer Staples | 3.9 | |||
Financials | 3.2 | |||
Utilities | 2.2 | |||
|
| |||
| 97.7 | ||||
|
|
| 61 |
| Ohio National Fund, Inc. | High Income Bond Portfolio |
Schedule of Investments | June 30, 2015 (Unaudited) |
| Corporate Bonds – 97.7% | Rate | Maturity | Face Amount | Value | ||||||||||||
CONSUMER DISCRETIONARY – 29.9% | ||||||||||||||||
American Axle & Manufacturing, Inc. (Auto Components) | 6.625% | 10/15/2022 | $ | 625,000 | $ | 656,250 | ||||||||||
American Axle & Manufacturing, Inc. (Auto Components) | 6.250% | 03/15/2021 | 400,000 | 420,000 | ||||||||||||
Gates Global LLC / Gates Global Co. (Auto Components) | (b) | 6.000% | 07/15/2022 | 900,000 | 814,500 | |||||||||||
International Automotive Components Group SL (Auto Components) | (b) | 9.125% | 06/01/2018 | 850,000 | 867,000 | |||||||||||
J.B. Poindexter & Co., Inc. (Auto Components) | (b) | 9.000% | 04/01/2022 | 725,000 | 775,750 | |||||||||||
Lear Corp. (Auto Components) | 5.375% | 03/15/2024 | 225,000 | 228,375 | ||||||||||||
Lear Corp. (Auto Components) | 4.750% | 01/15/2023 | 625,000 | 615,625 | ||||||||||||
Lear Corp. (Auto Components) | 5.250% | 01/15/2025 | 100,000 | 98,250 | ||||||||||||
MPG Holdco I, Inc. (Auto Components) | 7.375% | 10/15/2022 | 700,000 | 745,500 | ||||||||||||
Omega U.S. Sub, LLC (Auto Components) | (b) | 8.750% | 07/15/2023 | 300,000 | 299,250 | |||||||||||
Stackpole International Intermediate / Stackpole International Powder (Auto Components) | (b) | 7.750% | 10/15/2021 | 625,000 | 615,625 | |||||||||||
Tenneco, Inc. (Auto Components) | 5.375% | 12/15/2024 | 225,000 | 231,187 | ||||||||||||
UCI International, Inc. (Auto Components) | 8.625% | 02/15/2019 | 825,000 | 734,250 | ||||||||||||
ZF North America Capital, Inc. (Auto Components) | (b) | 4.750% | 04/29/2025 | 325,000 | 315,250 | |||||||||||
General Motors Co. (Automobiles) | 4.000% | 04/01/2025 | 500,000 | 491,643 | ||||||||||||
General Motors Financial Co., Inc. (Automobiles) | 4.250% | 05/15/2023 | 325,000 | 328,442 | ||||||||||||
General Motors Financial Co., Inc. (Automobiles) | 4.000% | 01/15/2025 | 150,000 | 147,775 | ||||||||||||
Affinia Group, Inc. (Distributors) | 7.750% | 05/01/2021 | 1,125,000 | 1,175,625 | ||||||||||||
ServiceMaster Co. LLC / The (Diversified Consumer Svs.) | 7.100% | 03/01/2018 | 450,000 | 472,500 | ||||||||||||
ServiceMaster Co. LLC / The (Diversified Consumer Svs.) | 7.450% | 08/15/2027 | 300,000 | 303,000 | ||||||||||||
ServiceMaster Co. LLC / The (Diversified Consumer Svs.) | 7.000% | 08/15/2020 | 649,000 | 685,506 | ||||||||||||
1011778 B.C. ULC / New Red Finance, Inc. (Hotels, Restaurants & Leisure) | (b) | 6.000% | 04/01/2022 | 1,175,000 | 1,207,312 | |||||||||||
1011778 B.C. ULC / New Red Finance, Inc. (Hotels, Restaurants & Leisure) | (b) | 4.625% | 01/15/2022 | 375,000 | 369,375 | |||||||||||
Affinity Gaming LLC / Affinity Gaming Finance Corp. (Hotels, Restaurants & Leisure) | 9.000% | 05/15/2018 | 250,000 | 248,750 | ||||||||||||
Boyd Gaming Corp. (Hotels, Restaurants & Leisure) | 6.875% | 05/15/2023 | 375,000 | 384,375 | ||||||||||||
Cedar Fair LP / Canada’s Wonderland Co. / Magnum Management Corp. (Hotels, Restaurants & Leisure) | 5.250% | 03/15/2021 | 125,000 | 128,437 | ||||||||||||
Cedar Fair LP / Canada’s Wonderland Co. / Magnum Management Corp. (Hotels, Restaurants & Leisure) | 5.375% | 06/01/2024 | 375,000 | 379,200 | ||||||||||||
Chester Downs & Marina LLC (Hotels, Restaurants & Leisure) | (b) | 9.250% | 02/01/2020 | 450,000 | 351,000 | |||||||||||
Churchill Downs, Inc. (Hotels, Restaurants & Leisure) | 5.375% | 12/15/2021 | 225,000 | 230,625 | ||||||||||||
ESH Hospitality, Inc. (Hotels, Restaurants & Leisure) | (b) | 5.250% | 05/01/2025 | 225,000 | 218,812 | |||||||||||
GLP Capital LP / GLP Financing II, Inc. (Hotels, Restaurants & Leisure) | 5.375% | 11/01/2023 | 375,000 | 385,312 | ||||||||||||
GLP Capital LP / GLP Financing II, Inc. (Hotels, Restaurants & Leisure) | 4.875% | 11/01/2020 | 625,000 | 635,937 | ||||||||||||
Hilton Worldwide Finance LLC / Hilton Worldwide Finance Corp. (Hotels, Restaurants & Leisure) | 5.625% | 10/15/2021 | 300,000 | 311,610 | ||||||||||||
MGM Resorts International (Hotels, Restaurants & Leisure) | 7.750% | 03/15/2022 | 1,125,000 | 1,237,500 | ||||||||||||
MGM Resorts International (Hotels, Restaurants & Leisure) | 6.750% | 10/01/2020 | 425,000 | 449,352 | ||||||||||||
Mohegan Tribal Gaming Authority (Hotels, Restaurants & Leisure) | 9.750% | 09/01/2021 | 450,000 | 471,375 | ||||||||||||
NPC International, Inc. / NPC Operating Co. A, Inc. / NPC Operating Co. B, Inc. (Hotels, Restaurants & Leisure) | 10.500% | 01/15/2020 | 900,000 | 942,750 | ||||||||||||
Penn National Gaming, Inc. (Hotels, Restaurants & Leisure) | 5.875% | 11/01/2021 | 1,075,000 | 1,083,062 | ||||||||||||
Pinnacle Entertainment, Inc. (Hotels, Restaurants & Leisure) | 7.500% | 04/15/2021 | 225,000 | 238,219 | ||||||||||||
Pinnacle Entertainment, Inc. (Hotels, Restaurants & Leisure) | 6.375% | 08/01/2021 | 650,000 | 689,812 | ||||||||||||
Rivers Pittsburgh Borrower LP / Rivers Pittsburgh Finance Corp. (Hotels, Restaurants & Leisure) | (b) | 9.500% | 06/15/2019 | 577,000 | 606,571 | |||||||||||
Seminole Hard Rock Entertainment, Inc. / Seminole Hard Rock International LLC (Hotels, Restaurants & Leisure) | (b) | 5.875% | 05/15/2021 | 1,225,000 | 1,237,250 | |||||||||||
Seminole Indian Tribe of Florida (Hotels, Restaurants & Leisure) | (b) | 7.804% | 10/01/2020 | 745,000 | 795,287 | |||||||||||
Six Flags Entertainment Corp. (Hotels, Restaurants & Leisure) | (b) | 5.250% | 01/15/2021 | 800,000 | 816,000 | |||||||||||
Station Casinos LLC (Hotels, Restaurants & Leisure) | 7.500% | 03/01/2021 | 800,000 | 856,000 | ||||||||||||
RSI Home Products, Inc. (Household Durables) | (b) | 6.500% | 03/15/2023 | 550,000 | 554,125 | |||||||||||
Serta Simmons Holdings LLC (Household Durables) | (b) | 8.125% | 10/01/2020 | 1,275,000 | 1,345,125 | |||||||||||
CDW LLC / CDW Finance Corp. (Internet & Catalog Retail) | 6.000% | 08/15/2022 | 100,000 | 103,250 | ||||||||||||
CDW LLC / CDW Finance Corp. (Internet & Catalog Retail) | 5.500% | 12/01/2024 | 525,000 | 519,750 | ||||||||||||
CDW LLC / CDW Finance Corp. (Internet & Catalog Retail) | 5.000% | 09/01/2023 | 550,000 | 540,375 | ||||||||||||
FGI Operating Co. LLC / FGI Finance, Inc. (Leisure Equip. & Products) | 7.875% | 05/01/2020 | 800,000 | 612,000 | ||||||||||||
Altice SA (Media) | (b) | 7.750% | 05/15/2022 | 875,000 | 846,562 | |||||||||||
Altice SA (Media) | (b) | 7.625% | 02/15/2025 | 250,000 | 235,000 | |||||||||||
Altice U.S. Finance I Corp. (Media) | (b) | 5.375% | 07/15/2023 | 375,000 | 364,687 | |||||||||||
Altice U.S. Finance II Corp. (Media) | (b) | 7.750% | 07/15/2025 | 200,000 | 194,000 | |||||||||||
AMC Networks, Inc. (Media) | 7.750% | 07/15/2021 | 475,000 | 513,000 | ||||||||||||
AMC Networks, Inc. (Media) | 4.750% | 12/15/2022 | 350,000 | 350,000 | ||||||||||||
CCO Holdings LLC / CCO Holdings Capital Corp. (Media) | 6.625% | 01/31/2022 | 400,000 | 417,000 | ||||||||||||
CCO Holdings LLC / CCO Holdings Capital Corp. (Media) | 5.125% | 02/15/2023 | 150,000 | 146,250 | ||||||||||||
CCO Holdings LLC / CCO Holdings Capital Corp. (Media) | 5.750% | 01/15/2024 | 1,275,000 | 1,284,562 | ||||||||||||
CCO Holdings LLC / CCO Holdings Capital Corp. (Media) | 5.750% | 09/01/2023 | 325,000 | 325,609 | ||||||||||||
CCO Holdings LLC / CCO Holdings Capital Corp. (Media) | (b) | 5.375% | 05/01/2025 | 175,000 | 170,406 | |||||||||||
CCO Holdings LLC / CCO Holdings Capital Corp. (Media) | (b) | 5.875% | 05/01/2027 | 150,000 | 146,437 | |||||||||||
Cequel Communications Holdings I LLC / Cequel Capital Corp. (Media) | (b) | 6.375% | 09/15/2020 | 350,000 | 347,637 | |||||||||||
Cequel Communications Holdings I LLC / Cequel Capital Corp. (Media) | (b) | 5.125% | 12/15/2021 | 750,000 | 681,094 | |||||||||||
| 62 | (continued) |
| Ohio National Fund, Inc. | High Income Bond Portfolio (Continued) |
Schedule of Investments | June 30, 2015 (Unaudited) |
| Corporate Bonds (Continued) | Rate | Maturity | Face Amount | Value | ||||||||||||
CONSUMER DISCRETIONARY (continued) | ||||||||||||||||
Cequel Communications Holdings I LLC / Cequel Capital Corp. (Media) | (b) | 5.125% | 12/15/2021 | $ | 100,000 | $ | 90,812 | |||||||||
Clear Channel Worldwide Holdings, Inc. (Media) | 6.500% | 11/15/2022 | 275,000 | 281,531 | ||||||||||||
Clear Channel Worldwide Holdings, Inc. (Media) | 6.500% | 11/15/2022 | 1,125,000 | 1,171,406 | ||||||||||||
Crown Media Holdings, Inc. (Media) | 10.500% | 07/15/2019 | 700,000 | 739,375 | ||||||||||||
Cumulus Media Holdings, Inc. (Media) | 7.750% | 05/01/2019 | 350,000 | 321,125 | ||||||||||||
DISH DBS Corp. (Media) | 5.875% | 07/15/2022 | 1,600,000 | 1,568,000 | ||||||||||||
Entercom Radio LLC (Media) | 10.500% | 12/01/2019 | 500,000 | 536,250 | ||||||||||||
Expo Event Transco, Inc. (Media) | (b) | 9.000% | 06/15/2021 | 800,000 | 828,000 | |||||||||||
Gray Television, Inc. (Media) | 7.500% | 10/01/2020 | 700,000 | 742,000 | ||||||||||||
Igloo Holdings Corp. (Media) | (b)(d) | 8.250% | 12/15/2017 | 875,000 | 885,937 | |||||||||||
iHeartCommunications, Inc. (Media) | 9.000% | 03/01/2021 | 700,000 | 637,875 | ||||||||||||
Intelsat Jackson Holdings SA (Media) | 6.625% | 12/15/2022 | 825,000 | 755,906 | ||||||||||||
Intelsat Jackson Holdings SA (Media) | 5.500% | 08/01/2023 | 550,000 | 486,750 | ||||||||||||
Intelsat Luxembourg SA (Media) | 7.750% | 06/01/2021 | 325,000 | 271,375 | ||||||||||||
Intelsat Luxembourg SA (Media) | 8.125% | 06/01/2023 | 750,000 | 615,000 | ||||||||||||
Lamar Media Corp. (Media) | 5.875% | 02/01/2022 | 250,000 | 258,750 | ||||||||||||
Lamar Media Corp. (Media) | 5.000% | 05/01/2023 | 725,000 | 717,750 | ||||||||||||
LIN Television Corp. (Media) | (b) | 5.875% | 11/15/2022 | 150,000 | 151,875 | |||||||||||
Nexstar Broadcasting, Inc. (Media) | (b) | 6.125% | 02/15/2022 | 475,000 | 482,125 | |||||||||||
Nielsen Co. Luxembourg SARL / The (Media) | (b) | 5.500% | 10/01/2021 | 175,000 | 176,750 | |||||||||||
Nielsen Finance LLC / Nielsen Finance Co. (Media) | 4.500% | 10/01/2020 | 450,000 | 447,750 | ||||||||||||
Nielsen Finance LLC / Nielsen Finance Co. (Media) | (b) | 5.000% | 04/15/2022 | 1,025,000 | 1,007,062 | |||||||||||
Numericable Group SA (Media) | (b) | 6.000% | 05/15/2022 | 575,000 | 566,734 | |||||||||||
Numericable Group SA (Media) | (b) | 6.250% | 05/15/2024 | 400,000 | 393,500 | |||||||||||
Outfront Media Capital LLC / Outfront Media Capital Corp. (Media) | 5.625% | 02/15/2024 | 75,000 | 76,687 | ||||||||||||
Outfront Media Capital LLC / Outfront Media Capital Corp. (Media) | 5.250% | 02/15/2022 | 100,000 | 101,250 | ||||||||||||
Radio One, Inc. (Media) | (b) | 9.250% | 02/15/2020 | 650,000 | 591,500 | |||||||||||
Radio One, Inc. (Media) | (b) | 7.375% | 04/15/2022 | 475,000 | 465,500 | |||||||||||
Regal Entertainment Group (Media) | 5.750% | 02/01/2025 | 550,000 | 536,937 | ||||||||||||
Regal Entertainment Group (Media) | 5.750% | 03/15/2022 | 100,000 | 101,120 | ||||||||||||
Sinclair Television Group, Inc. (Media) | (b) | 5.625% | 08/01/2024 | 875,000 | 855,312 | |||||||||||
Sirius XM Radio, Inc. (Media) | (b) | 4.250% | 05/15/2020 | 150,000 | 149,250 | |||||||||||
Sirius XM Radio, Inc. (Media) | (b) | 4.625% | 05/15/2023 | 1,400,000 | 1,314,250 | |||||||||||
Sirius XM Radio, Inc. (Media) | (b) | 6.000% | 07/15/2024 | 275,000 | 277,750 | |||||||||||
Sirius XM Radio, Inc. (Media) | (b) | 5.375% | 04/15/2025 | 150,000 | 145,125 | |||||||||||
Gannett Co., Inc. (Media) | (b) | 5.500% | 09/15/2024 | 75,000 | 74,250 | |||||||||||
Gannett Co., Inc. (Media) | (b) | 4.875% | 09/15/2021 | 75,000 | 74,437 | |||||||||||
TEGNA, Inc. (Media) | 6.375% | 10/15/2023 | 775,000 | 806,969 | ||||||||||||
Time, Inc. (Media) | (b) | 5.750% | 04/15/2022 | 475,000 | 459,562 | |||||||||||
Townsquare Media, Inc. (Media) | (b) | 6.500% | 04/01/2023 | 500,000 | 495,000 | |||||||||||
Tribune Media Co. (Media) | (b) | 5.875% | 07/15/2022 | 600,000 | 604,500 | |||||||||||
Unitymedia KabelBW GmbH (Media) | (b) | 6.125% | 01/15/2025 | 425,000 | 444,125 | |||||||||||
Unitymedia Hessen GmbH & Co. KG / Unitymedia NRW GmbH (Media) | (b) | 5.500% | 01/15/2023 | 475,000 | 484,203 | |||||||||||
Lynx II Corp. (Media) | (b) | 6.375% | 04/15/2023 | 475,000 | 491,031 | |||||||||||
Virgin Media Finance PLC (Media) | (b) | 5.750% | 01/15/2025 | 200,000 | 200,000 | |||||||||||
Virgin Media Secured Finance PLC (Media) | (b) | 5.250% | 01/15/2026 | 425,000 | 410,656 | |||||||||||
Family Tree Escrow, LLC (Multiline Retail) | (b) | 5.250% | 03/01/2020 | 75,000 | 78,469 | |||||||||||
Family Tree Escrow, LLC (Multiline Retail) | (b) | 5.750% | 03/01/2023 | 325,000 | 339,625 | |||||||||||
Academy Ltd. / Academy Finance Corp. (Specialty Retail) | (b) | 9.250% | 08/01/2019 | 800,000 | 840,560 | |||||||||||
Argos Merger Sub, Inc. (Specialty Retail) | (b) | 7.125% | 03/15/2023 | 925,000 | 968,937 | |||||||||||
Jo-Ann Stores Holdings, Inc. (Specialty Retail) | (b)(d) | 9.750% | 10/15/2019 | 375,000 | 335,625 | |||||||||||
Jo-Ann Stores, Inc. (Specialty Retail) | (b) | 8.125% | 03/15/2019 | 250,000 | 235,312 | |||||||||||
L Brands, Inc. (Specialty Retail) | 5.625% | 02/15/2022 | 725,000 | 763,062 | ||||||||||||
Michaels Stores, Inc. (Specialty Retail) | (b) | 5.875% | 12/15/2020 | 925,000 | 966,625 | |||||||||||
Neiman Marcus Group LTD, Inc. (Specialty Retail) | (b)(d) | 8.750% | 10/15/2021 | 750,000 | 805,312 | |||||||||||
New Academy Finance Co. LLC / New Academy Finance Corp. (Specialty Retail) | (b)(d) | 8.000% | 06/15/2018 | 750,000 | 757,500 | |||||||||||
Party City Holdings, Inc. (Specialty Retail) | 8.875% | 08/01/2020 | 550,000 | 587,125 | ||||||||||||
Petco Animal Supplies, Inc. (Specialty Retail) | (b) | 9.250% | 12/01/2018 | 525,000 | 548,625 | |||||||||||
Petco Holdings, Inc. (Specialty Retail) | (b)(d) | 8.500% | 10/15/2017 | 750,000 | 770,625 | |||||||||||
PVH Corp. (Textiles, Apparel & Luxury Goods) | 4.500% | 12/15/2022 | 275,000 | 272,250 | ||||||||||||
Springs Industries, Inc. (Textiles, Apparel & Luxury Goods) | 6.250% | 06/01/2021 | 625,000 | 610,937 | ||||||||||||
|
| |||||||||||||||
| 67,165,736 | ||||||||||||||||
|
| |||||||||||||||
CONSUMER STAPLES – 3.9% | ||||||||||||||||
Rite Aid Corp. (Food & Staples Retailing) | (b) | 6.125% | 04/01/2023 | 475,000 | 489,250 | |||||||||||
B&G Foods, Inc. (Food Products) | 4.625% | 06/01/2021 | 250,000 | 246,250 | ||||||||||||
Dean Foods Co. (Food Products) | (b) | 6.500% | 03/15/2023 | 475,000 | 484,500 | |||||||||||
Hearthside Group Holdings LLC / Hearthside Finance Co. (Food Products) | (b) | 6.500% | 05/01/2022 | 1,100,000 | 1,050,500 | |||||||||||
Kraft Heinz Foods Co. (Food Products) | 4.250% | 10/15/2020 | 1,100,000 | 1,123,375 | ||||||||||||
| 63 | (continued) |
| Ohio National Fund, Inc. | High Income Bond Portfolio (Continued) |
Schedule of Investments | June 30, 2015 (Unaudited) |
| Corporate Bonds (Continued) | Rate | Maturity | Face Amount | Value | ||||||||||||
CONSUMER STAPLES (continued) | ||||||||||||||||
H.J. Heinz Co. (Food Products) | (b) | 4.875% | 02/15/2025 | $ | 275,000 | $ | 299,406 | |||||||||
Pinnacle Foods Finance LLC / Pinnacle Foods Finance Corp. (Food Products) | 4.875% | 05/01/2021 | 1,175,000 | 1,157,375 | ||||||||||||
Smithfield Foods, Inc. (Food Products) | 6.625% | 08/15/2022 | 1,050,000 | 1,120,875 | ||||||||||||
Sun Merger Sub., Inc. (Food Products) | (b) | 5.875% | 08/01/2021 | 100,000 | 103,250 | |||||||||||
TreeHouse Foods, Inc. (Food Products) | 4.875% | 03/15/2022 | 75,000 | 75,562 | ||||||||||||
Spectrum Brands, Inc. (Household Products) | 6.750% | 03/15/2020 | 650,000 | 684,450 | ||||||||||||
Spectrum Brands, Inc. (Household Products) | (b) | 6.125% | 12/15/2024 | 175,000 | 181,562 | |||||||||||
Spectrum Brands, Inc. (Household Products) | (b) | 5.750% | 07/15/2025 | 200,000 | 203,000 | |||||||||||
First Quality Finance Co., Inc. (Personal Products) | (b) | 4.625% | 05/15/2021 | 675,000 | 631,125 | |||||||||||
Prestige Brands, Inc. (Personal Products) | 8.125% | 02/01/2020 | 175,000 | 186,812 | ||||||||||||
Prestige Brands, Inc. (Personal Products) | (b) | 5.375% | 12/15/2021 | 625,000 | 625,000 | |||||||||||
|
| |||||||||||||||
| 8,662,292 | ||||||||||||||||
|
| |||||||||||||||
ENERGY – 11.2% | ||||||||||||||||
CGG SA (Energy Equip. & Svs.) | 6.875% | 01/15/2022 | 400,000 | 332,000 | ||||||||||||
Chaparral Energy, Inc. (Energy Equip. & Svs.) | 7.625% | 11/15/2022 | 200,000 | 144,000 | ||||||||||||
FTS International, Inc. (Energy Equip. & Svs.) | 6.250% | 05/01/2022 | 375,000 | 275,625 | ||||||||||||
Antero Resources Corp. (Oil, Gas & Consumable Fuels) | 6.000% | 12/01/2020 | 775,000 | 782,750 | ||||||||||||
Antero Resources Corp. (Oil, Gas & Consumable Fuels) | 5.125% | 12/01/2022 | 200,000 | 189,000 | ||||||||||||
Antero Resources Corp. (Oil, Gas & Consumable Fuels) | (b) | 5.625% | 06/01/2023 | 125,000 | 120,781 | |||||||||||
Approach Resources, Inc. (Oil, Gas & Consumable Fuels) | 7.000% | 06/15/2021 | 650,000 | 585,000 | ||||||||||||
Blue Racer Midstream LLC / Blue Racer Finance Corp. (Oil, Gas & Consumable Fuels) | (b) | 6.125% | 11/15/2022 | 325,000 | 334,750 | |||||||||||
BreitBurn Energy Partners LP / BreitBurn Finance Corp. (Oil, Gas & Consumable Fuels) | 7.875% | 04/15/2022 | 225,000 | 187,875 | ||||||||||||
California Resources Corp. (Oil, Gas & Consumable Fuels) | 6.000% | 11/15/2024 | 725,000 | 622,594 | ||||||||||||
California Resources Corp. (Oil, Gas & Consumable Fuels) | 5.500% | 09/15/2021 | 150,000 | 129,937 | ||||||||||||
Carrizo Oil & Gas, Inc. (Oil, Gas & Consumable Fuels) | 7.500% | 09/15/2020 | 575,000 | 605,187 | ||||||||||||
Carrizo Oil & Gas, Inc. (Oil, Gas & Consumable Fuels) | 6.250% | 04/15/2023 | 100,000 | 100,250 | ||||||||||||
Chesapeake Energy Corp. (Oil, Gas & Consumable Fuels) | 6.875% | 11/15/2020 | 675,000 | 658,125 | ||||||||||||
Chesapeake Energy Corp. (Oil, Gas & Consumable Fuels) | 5.375% | 06/15/2021 | 525,000 | 475,125 | ||||||||||||
Crestwood Midstream Partners LP / Crestwood Midstream Finance Corp. (Oil, Gas & Consumable Fuels) | (b) | 6.250% | 04/01/2023 | 450,000 | 466,875 | |||||||||||
CrownRock LP / CrownRock Finance, Inc. (Oil, Gas & Consumable Fuels) | (b) | 7.750% | 02/15/2023 | 175,000 | 186,375 | |||||||||||
CVR Refining LLC / Coffeyville Finance, Inc. (Oil, Gas & Consumable Fuels) | 6.500% | 11/01/2022 | 325,000 | 325,000 | ||||||||||||
Energy Transfer Equity LP (Oil, Gas & Consumable Fuels) | 5.875% | 01/15/2024 | 1,725,000 | 1,788,825 | ||||||||||||
Energy XXI Gulf Coast, Inc. (Oil, Gas & Consumable Fuels) | 7.500% | 12/15/2021 | 350,000 | 113,750 | ||||||||||||
Energy XXI Gulf Coast, Inc. (Oil, Gas & Consumable Fuels) | 6.875% | 03/15/2024 | 125,000 | 40,625 | ||||||||||||
EP Energy LLC / Everest Acquisition Finance, Inc. (Oil, Gas & Consumable Fuels) | 9.375% | 05/01/2020 | 350,000 | 374,937 | ||||||||||||
EP Energy LLC / Everest Acquisition Finance, Inc. (Oil, Gas & Consumable Fuels) | 7.750% | 09/01/2022 | 100,000 | 105,000 | ||||||||||||
EP Energy LLC / Everest Acquisition Finance, Inc. (Oil, Gas & Consumable Fuels) | (b) | 6.375% | 06/15/2023 | 200,000 | 200,500 | |||||||||||
Gulfport Energy Corp. (Oil, Gas & Consumable Fuels) | 7.750% | 11/01/2020 | 350,000 | 366,625 | ||||||||||||
Gulfport Energy Corp. (Oil, Gas & Consumable Fuels) | (b) | 6.625% | 05/01/2023 | 225,000 | 227,812 | |||||||||||
Halcon Resources Corp. (Oil, Gas & Consumable Fuels) | (b) | 8.625% | 02/01/2020 | 200,000 | 197,500 | |||||||||||
Hiland Partners LP / Hiland Partners Finance Corp. (Oil, Gas & Consumable Fuels) | (b) | 5.500% | 05/15/2022 | 250,000 | 260,000 | |||||||||||
Holly Energy Partners LP / Holly Energy Finance Corp. (Oil, Gas & Consumable Fuels) | 6.500% | 03/01/2020 | 475,000 | 473,813 | ||||||||||||
Kinder Morgan, Inc. (Oil, Gas & Consumable Fuels) | (b) | 5.625% | 11/15/2023 | 550,000 | 584,335 | |||||||||||
Laredo Petroleum, Inc. (Oil, Gas & Consumable Fuels) | 5.625% | 01/15/2022 | 225,000 | 222,750 | ||||||||||||
Laredo Petroleum, Inc. (Oil, Gas & Consumable Fuels) | 7.375% | 05/01/2022 | 100,000 | 105,250 | ||||||||||||
Laredo Petroleum, Inc. (Oil, Gas & Consumable Fuels) | 6.250% | 03/15/2023 | 125,000 | 127,187 | ||||||||||||
Legacy Reserves LP / Legacy Reserves Finance Corp. (Oil, Gas & Consumable Fuels) | 6.625% | 12/01/2021 | 850,000 | 688,500 | ||||||||||||
Linn Energy LLC / Linn Energy Finance Corp. (Oil, Gas & Consumable Fuels) | 8.625% | 04/15/2020 | 350,000 | 287,073 | ||||||||||||
Linn Energy LLC / Linn Energy Finance Corp. (Oil, Gas & Consumable Fuels) | 7.750% | 02/01/2021 | 300,000 | 233,250 | ||||||||||||
Linn Energy LLC / Linn Energy Finance Corp. (Oil, Gas & Consumable Fuels) | 6.500% | 09/15/2021 | 125,000 | 93,125 | ||||||||||||
MarkWest Energy Partners LP / MarkWest Energy Finance Corp. (Oil, Gas & Consumable Fuels) | 5.500% | 02/15/2023 | 600,000 | 618,000 | ||||||||||||
MarkWest Energy Partners LP / MarkWest Energy Finance Corp. (Oil, Gas & Consumable Fuels) | 4.500% | 07/15/2023 | 325,000 | 318,500 | ||||||||||||
MarkWest Energy Partners LP / MarkWest Energy Finance Corp. (Oil, Gas & Consumable Fuels) | 4.875% | 12/01/2024 | 75,000 | 73,312 | ||||||||||||
Northern Oil and Gas, Inc. (Oil, Gas & Consumable Fuels) | 8.000% | 06/01/2020 | 850,000 | 765,000 | ||||||||||||
Oasis Petroleum, Inc. (Oil, Gas & Consumable Fuels) | 6.875% | 03/15/2022 | 625,000 | 634,375 | ||||||||||||
Range Resources Corp. (Oil, Gas & Consumable Fuels) | (b) | 4.875% | 05/15/2025 | 622,000 | 604,211 | |||||||||||
Regency Energy Partners LP / Regency Energy Finance Corp. (Oil, Gas & Consumable Fuels) | 5.500% | 04/15/2023 | 175,000 | 178,115 | ||||||||||||
Regency Energy Partners LP / Regency Energy Finance Corp. (Oil, Gas & Consumable Fuels) | 4.500% | 11/01/2023 | 225,000 | 217,125 | ||||||||||||
Regency Energy Partners LP / Regency Energy Finance Corp. (Oil, Gas & Consumable Fuels) | 5.875% | 03/01/2022 | 150,000 | 159,516 | ||||||||||||
Regency Energy Partners LP / Regency Energy Finance Corp. (Oil, Gas & Consumable Fuels) | 5.000% | 10/01/2022 | 200,000 | 202,935 | ||||||||||||
Rice Energy, Inc. (Oil, Gas & Consumable Fuels) | 6.250% | 05/01/2022 | 500,000 | 496,250 | ||||||||||||
Rice Energy, Inc. (Oil, Gas & Consumable Fuels) | (b) | 7.250% | 05/01/2023 | 75,000 | 76,875 | |||||||||||
Rose Rock Midstream LP / Rose Rock Finance Corp. (Oil, Gas & Consumable Fuels) | 5.625% | 07/15/2022 | 600,000 | 586,500 | ||||||||||||
Rose Rock Midstream LP / Rose Rock Finance Corp. (Oil, Gas & Consumable Fuels) | (b) | 5.625% | 11/15/2023 | 225,000 | 217,687 | |||||||||||
RSP Permian, Inc. (Oil, Gas & Consumable Fuels) | (b) | 6.625% | 10/01/2022 | 275,000 | 281,187 | |||||||||||
Sabine Pass Liquefaction, LLC (Oil, Gas & Consumable Fuels) | 5.625% | 02/01/2021 | 950,000 | 969,000 | ||||||||||||
Sabine Pass Liquefaction, LLC (Oil, Gas & Consumable Fuels) | 5.625% | 04/15/2023 | 225,000 | 224,226 | ||||||||||||
Sabine Pass Liquefaction, LLC (Oil, Gas & Consumable Fuels) | 6.250% | 03/15/2022 | 300,000 | 310,500 | ||||||||||||
| 64 | (continued) |
| Ohio National Fund, Inc. | High Income Bond Portfolio (Continued) |
Schedule of Investments | June 30, 2015 (Unaudited) |
| Corporate Bonds (Continued) | Rate | Maturity | Face Amount | Value | ||||||||||||
ENERGY (continued) | ||||||||||||||||
Sabine Pass Liquefaction, LLC (Oil, Gas & Consumable Fuels) | (b) | 5.625% | 03/01/2025 | $ | 375,000 | $ | 371,250 | |||||||||
SandRidge Energy, Inc. (Oil, Gas & Consumable Fuels) | 7.500% | 03/15/2021 | 50,000 | 22,000 | ||||||||||||
SandRidge Energy, Inc. (Oil, Gas & Consumable Fuels) | 8.125% | 10/15/2022 | 500,000 | 213,750 | ||||||||||||
SandRidge Energy, Inc. (Oil, Gas & Consumable Fuels) | 7.500% | 02/15/2023 | 200,000 | 84,540 | ||||||||||||
SM Energy Co. (Oil, Gas & Consumable Fuels) | 5.000% | 01/15/2024 | 275,000 | 260,562 | ||||||||||||
SM Energy Co. (Oil, Gas & Consumable Fuels) | 5.625% | 06/01/2025 | 150,000 | 148,470 | ||||||||||||
Summit Midstream Holdings LLC / Summit Midstream Finance Corp. (Oil, Gas & Consumable Fuels) | 5.500% | 08/15/2022 | 650,000 | 620,750 | ||||||||||||
Targa Resources Partners LP / Targa Resources Partners Finance Corp. (Oil, Gas & Consumable Fuels) | 5.250% | 05/01/2023 | 350,000 | 346,500 | ||||||||||||
Targa Resources Partners LP / Targa Resources Partners Finance Corp. (Oil, Gas & Consumable Fuels) | (b) | 5.000% | 01/15/2018 | 200,000 | 204,500 | |||||||||||
Tesoro Corp. (Oil, Gas & Consumable Fuels) | 5.125% | 04/01/2024 | 425,000 | 427,125 | ||||||||||||
Tesoro Logistics LP / Tesoro Logistics Finance Corp. (Oil, Gas & Consumable Fuels) | 6.125% | 10/15/2021 | 325,000 | 338,812 | ||||||||||||
Tesoro Logistics LP / Tesoro Logistics Finance Corp. (Oil, Gas & Consumable Fuels) | 5.875% | 10/01/2020 | 547,000 | 562,042 | ||||||||||||
Tesoro Logistics LP / Tesoro Logistics Finance Corp. (Oil, Gas & Consumable Fuels) | (b) | 6.250% | 10/15/2022 | 75,000 | 77,625 | |||||||||||
Tesoro Logistics LP / Tesoro Logistics Finance Corp. (Oil, Gas & Consumable Fuels) | (b) | 5.500% | 10/15/2019 | 50,000 | 51,875 | |||||||||||
W&T Offshore, Inc. (Oil, Gas & Consumable Fuels) | 8.500% | 06/15/2019 | 775,000 | 545,135 | ||||||||||||
Western Refining Logistics LP / WNRL Finance Corp. (Oil, Gas & Consumable Fuels) | (b) | 7.500% | 02/15/2023 | 300,000 | 309,000 | |||||||||||
Whiting Petroleum Corp. (Oil, Gas & Consumable Fuels) | (b) | 6.250% | 04/01/2023 | 425,000 | 421,812 | |||||||||||
Williams Partners LP / ACMP Finance Corp. (Oil, Gas & Consumable Fuels) | 6.125% | 07/15/2022 | 225,000 | 237,937 | ||||||||||||
|
| |||||||||||||||
| 25,189,105 | ||||||||||||||||
|
| |||||||||||||||
FINANCIALS – 3.2% | ||||||||||||||||
CIT Group, Inc. (Banks) | 5.250% | 03/15/2018 | 675,000 | 697,781 | ||||||||||||
CIT Group, Inc. (Banks) | 5.375% | 05/15/2020 | 225,000 | 234,562 | ||||||||||||
CIT Group, Inc. (Banks) | 5.000% | 08/01/2023 | 475,000 | 467,875 | ||||||||||||
Ally Financial, Inc. (Consumer Finance) | 4.750% | 09/10/2018 | 300,000 | 309,375 | ||||||||||||
Ally Financial, Inc. (Consumer Finance) | 4.125% | 02/13/2022 | 475,000 | 456,000 | ||||||||||||
Ally Financial, Inc. (Consumer Finance) | 4.125% | 03/30/2020 | 125,000 | 124,765 | ||||||||||||
Ally Financial, Inc. (Consumer Finance) | 4.625% | 03/30/2025 | 400,000 | 382,200 | ||||||||||||
Ally Financial, Inc. (Consumer Finance) | 4.625% | 05/19/2022 | 250,000 | 246,875 | ||||||||||||
Interactive Data Corp. (Diversified Financial Svs.) | (b) | 5.875% | 04/15/2019 | 700,000 | 703,500 | |||||||||||
MSCI, Inc. (Diversified Financial Svs.) | (b) | 5.250% | 11/15/2024 | 150,000 | 151,875 | |||||||||||
Hockey Merger Sub 2, Inc. (Insurance) | (b) | 7.875% | 10/01/2021 | 800,000 | 816,000 | |||||||||||
Onex York Acquisition Corp. (Insurance) | (b) | 8.500% | 10/01/2022 | 325,000 | 286,406 | |||||||||||
Iron Mountain, Inc. (Real Estate Investment Trusts) | 7.750% | 10/01/2019 | 525,000 | 548,625 | ||||||||||||
Outfront Media Capital LLC / Outfront Media Capital Corp. (Real Estate Investment Trusts) | (b) | 5.625% | 02/15/2024 | 225,000 | 230,062 | |||||||||||
RHP Hotel Properties LP / RHP Finance Corp. (Real Estate Investment Trusts) | (b) | 5.000% | 04/15/2023 | 100,000 | 98,000 | |||||||||||
Hub Holdings, LLC / Hub Holdings Finance, Inc. (Real Estate Mgmt. & Development) | (b)(d) | 8.125% | 07/15/2019 | 600,000 | 597,000 | |||||||||||
Quicken Loans, Inc. (Thrifts & Mortgage Finance) | (b) | 5.750% | 05/01/2025 | 775,000 | 742,063 | |||||||||||
|
| |||||||||||||||
| 7,092,964 | ||||||||||||||||
|
| |||||||||||||||
HEALTH CARE – 12.1% | ||||||||||||||||
Grifols Worldwide Operations Ltd. (Biotechnology) | 5.250% | 04/01/2022 | 675,000 | 676,688 | ||||||||||||
Crimson Merger Sub., Inc. (Health Care Equip. & Supplies) | (b) | 6.625% | 05/15/2022 | 1,775,000 | 1,566,438 | |||||||||||
Hologic, Inc. (Health Care Equip. & Supplies) | 6.250% | 08/01/2020 | 525,000 | 543,060 | ||||||||||||
Hologic, Inc. (Health Care Equip. & Supplies) | (b) | 5.250% | 07/15/2022 | 300,000 | 306,375 | |||||||||||
Sterigenics-Nordion Holdings LLC (Health Care Equip. & Supplies) | (b) | 6.500% | 05/15/2023 | 625,000 | 628,125 | |||||||||||
Teleflex, Inc. (Health Care Equip. & Supplies) | 5.250% | 06/15/2024 | 275,000 | 278,493 | ||||||||||||
VWR Funding, Inc. (Health Care Equip. & Supplies) | 7.250% | 09/15/2017 | 850,000 | 878,688 | ||||||||||||
Air Medical Merger Sub Corp. (Health Care Providers & Svs.) | (b) | 6.375% | 05/15/2023 | 575,000 | 540,500 | |||||||||||
Amsurg Corp. (Health Care Providers & Svs.) | 5.625% | 07/15/2022 | 675,000 | 680,906 | ||||||||||||
CHS / Community Health Systems, Inc. (Health Care Providers & Svs.) | 6.875% | 02/01/2022 | 1,175,000 | 1,241,094 | ||||||||||||
CHS / Community Health Systems, Inc. (Health Care Providers & Svs.) | 5.125% | 08/01/2021 | 300,000 | 305,625 | ||||||||||||
DaVita HealthCare Partners, Inc. (Health Care Providers & Svs.) | 5.750% | 08/15/2022 | 350,000 | 371,000 | ||||||||||||
DaVita HealthCare Partners, Inc. (Health Care Providers & Svs.) | 5.125% | 07/15/2024 | 450,000 | 442,406 | ||||||||||||
Envision Healthcare Corp. (Health Care Providers & Svs.) | (b) | 5.125% | 07/01/2022 | 875,000 | 881,563 | |||||||||||
HCA, Inc. (Health Care Providers & Svs.) | 6.500% | 02/15/2020 | 275,000 | 307,313 | ||||||||||||
HCA, Inc. (Health Care Providers & Svs.) | 5.875% | 05/01/2023 | 275,000 | 292,188 | ||||||||||||
HCA, Inc. (Health Care Providers & Svs.) | 5.000% | 03/15/2024 | 2,175,000 | 2,213,063 | ||||||||||||
HCA, Inc. (Health Care Providers & Svs.) | 5.250% | 04/15/2025 | 450,000 | 466,031 | ||||||||||||
HCA, Inc. (Health Care Providers & Svs.) | 5.375% | 02/01/2025 | 1,200,000 | 1,212,000 | ||||||||||||
Jaguar Holding Co. I (Health Care Providers & Svs.) | (b)(d) | 9.375% | 10/15/2017 | 725,000 | 740,406 | |||||||||||
Jaguar Holding Co. II / Jaguar Merger Sub, Inc. (Health Care Providers & Svs.) | (b) | 9.500% | 12/01/2019 | 800,000 | 852,000 | |||||||||||
LifePoint Hospitals, Inc. (Health Care Providers & Svs.) | 5.500% | 12/01/2021 | 750,000 | 774,375 | ||||||||||||
MPH Acquisition Holdings LLC (Health Care Providers & Svs.) | (b) | 6.625% | 04/01/2022 | 1,300,000 | 1,327,625 | |||||||||||
Omnicare, Inc. (Health Care Providers & Svs.) | 4.750% | 12/01/2022 | 100,000 | 106,000 | ||||||||||||
Omnicare, Inc. (Health Care Providers & Svs.) | 5.000% | 12/01/2024 | 50,000 | 53,750 | ||||||||||||
Surgical Care Affiliates, Inc. (Health Care Providers & Svs.) | (b) | 6.000% | 04/01/2023 | 475,000 | 475,000 | |||||||||||
Tenet Healthcare Corp. (Health Care Providers & Svs.) | 4.500% | 04/01/2021 | 350,000 | 346,500 | ||||||||||||
| 65 | (continued) |
| Ohio National Fund, Inc. | High Income Bond Portfolio (Continued) |
Schedule of Investments | June 30, 2015 (Unaudited) |
| Corporate Bonds (Continued) | Rate | Maturity | Face Amount | Value | ||||||||||||
HEALTH CARE (continued) | ||||||||||||||||
Tenet Healthcare Corp. (Health Care Providers & Svs.) | 8.125% | 04/01/2022 | $ | 900,000 | $ | 985,500 | ||||||||||
Tenet Healthcare Corp. (Health Care Providers & Svs.) | 4.375% | 10/01/2021 | 850,000 | 830,875 | ||||||||||||
Tenet Healthcare Corp. (Health Care Providers & Svs.) | (b) | 6.750% | 06/15/2023 | 300,000 | 306,188 | |||||||||||
United Surgical Partners International, Inc. (Health Care Providers & Svs.) | 9.000% | 04/01/2020 | 850,000 | 907,375 | ||||||||||||
Emdeon, Inc. (Health Care Technology) | 11.000% | 12/31/2019 | 400,000 | 434,000 | ||||||||||||
Truven Health Analytics, Inc. (Health Care Technology) | 10.625% | 06/01/2020 | 600,000 | 628,500 | ||||||||||||
Quintiles Transnational Corp. (Life Sciences Tools & Svs.) | (b) | 4.875% | 05/15/2023 | 250,000 | 251,250 | |||||||||||
Endo Finance LLC / Endo Ltd. / Endo Finco, Inc. (Pharmaceuticals) | (b) | 6.000% | 02/01/2025 | 625,000 | 635,156 | |||||||||||
Endo Finance LLC / Endo Ltd. / Endo Finco, Inc. (Pharmaceuticals) | (b) | 6.000% | 07/15/2023 | 250,000 | 255,938 | |||||||||||
Mallinckrodt International Finance SA (Pharmaceuticals) | 4.750% | 04/15/2023 | 175,000 | 163,297 | ||||||||||||
Mallinckrodt International Finance SA / Mallinckrodt CB LLC (Pharmaceuticals) | (b) | 4.875% | 04/15/2020 | 100,000 | 101,755 | |||||||||||
Mallinckrodt International Finance SA / Mallinckrodt CB LLC (Pharmaceuticals) | (b) | 5.500% | 04/15/2025 | 200,000 | 194,000 | |||||||||||
VPII Escrow Corp. (Pharmaceuticals) | (b) | 7.500% | 07/15/2021 | 1,150,000 | 1,243,438 | |||||||||||
Valeant Pharmaceuticals International, Inc. (Pharmaceuticals) | (b) | 5.500% | 03/01/2023 | 175,000 | 176,750 | |||||||||||
VRX Escrow Corp. (Pharmaceuticals) | (b) | 6.125% | 04/15/2025 | 725,000 | 746,750 | |||||||||||
VRX Escrow Corp. (Pharmaceuticals) | (b) | 5.875% | 05/15/2023 | 825,000 | 844,594 | |||||||||||
VRX Escrow Corp. (Pharmaceuticals) | (b) | 5.375% | 03/15/2020 | 50,000 | 51,625 | |||||||||||
|
| |||||||||||||||
| 27,264,203 | ||||||||||||||||
|
| |||||||||||||||
INDUSTRIALS – 11.7% | ||||||||||||||||
Silver II Borrower / Silver II U.S. Holdings LLC (Aerospace & Defense) | (b) | 7.750% | 12/15/2020 | 600,000 | 555,000 | |||||||||||
KLX, Inc. (Aerospace & Defense) | (b) | 5.875% | 12/01/2022 | 425,000 | 429,203 | |||||||||||
TransDigm, Inc. (Aerospace & Defense) | 5.500% | 10/15/2020 | 275,000 | 273,281 | ||||||||||||
TransDigm, Inc. (Aerospace & Defense) | 7.500% | 07/15/2021 | 300,000 | 322,500 | ||||||||||||
TransDigm, Inc. (Aerospace & Defense) | 6.500% | 07/15/2024 | 475,000 | 469,063 | ||||||||||||
TransDigm, Inc. (Aerospace & Defense) | 6.000% | 07/15/2022 | 550,000 | 543,125 | ||||||||||||
TransDigm, Inc. (Aerospace & Defense) | (b) | 6.500% | 05/15/2025 | 50,000 | 49,500 | |||||||||||
Allegion U.S. Holding Co., Inc. (Building Products) | 5.750% | 10/01/2021 | 325,000 | 335,563 | ||||||||||||
CPG Merger Sub. LLC (Building Products) | (b) | 8.000% | 10/01/2021 | 475,000 | 490,913 | |||||||||||
Hillman Group, Inc. / The (Building Products) | (b) | 6.375% | 07/15/2022 | 625,000 | 590,625 | |||||||||||
Masonite International Corp. (Building Products) | (b) | 5.625% | 03/15/2023 | 150,000 | 152,438 | |||||||||||
NCI Building Systems, Inc. (Building Products) | (b) | 8.250% | 01/15/2023 | 425,000 | 452,625 | |||||||||||
Nortek, Inc. (Building Products) | 8.500% | 04/15/2021 | 550,000 | 587,125 | ||||||||||||
USG Corp. (Building Products) | (b) | 5.875% | 11/01/2021 | 175,000 | 182,875 | |||||||||||
USG Corp. (Building Products) | (b) | 5.500% | 03/01/2025 | 50,000 | 49,813 | |||||||||||
Unifrax I LLC / Unifrax Holding Co. (Building Products) | (b) | 7.500% | 02/15/2019 | 625,000 | 628,125 | |||||||||||
Unifrax I LLC / Unifrax Holding Co. (Building Products) | (b) | 7.500% | 02/15/2019 | 150,000 | 150,750 | |||||||||||
Aramark Services, Inc. (Commercial Svs. & Supplies) | 5.750% | 03/15/2020 | 1,350,000 | 1,409,400 | ||||||||||||
Garda World Security Corp. (Commercial Svs. & Supplies) | (b) | 7.250% | 11/15/2021 | 600,000 | 576,000 | |||||||||||
Garda World Security Corp. (Commercial Svs. & Supplies) | (b) | 7.250% | 11/15/2021 | 650,000 | 624,000 | |||||||||||
Jurassic Holdings III, Inc. (Commercial Svs. & Supplies) | (b) | 6.875% | 02/15/2021 | 775,000 | 601,594 | |||||||||||
Multi-Color Corp. (Commercial Svs. & Supplies) | (b) | 6.125% | 12/01/2022 | 650,000 | 664,625 | |||||||||||
Southern Graphics, Inc. (Commercial Svs. & Supplies) | (b) | 8.375% | 10/15/2020 | 1,200,000 | 1,230,000 | |||||||||||
United Rentals North America, Inc. (Commercial Svs. & Supplies) | 6.125% | 06/15/2023 | 100,000 | 102,125 | ||||||||||||
United Rentals North America, Inc. (Commercial Svs. & Supplies) | 7.375% | 05/15/2020 | 100,000 | 106,699 | ||||||||||||
United Rentals North America, Inc. (Commercial Svs. & Supplies) | 5.750% | 11/15/2024 | 100,000 | 98,500 | ||||||||||||
United Rentals North America, Inc. (Commercial Svs. & Supplies) | 4.625% | 07/15/2023 | 225,000 | 220,635 | ||||||||||||
United Rentals North America, Inc. (Commercial Svs. & Supplies) | 5.500% | 07/15/2025 | 750,000 | 724,688 | ||||||||||||
EnerSys (Electrical Equip.) | (b) | 5.000% | 04/30/2023 | 225,000 | 222,539 | |||||||||||
Sensata Technologies BV (Electrical Equip.) | (b) | 5.625% | 11/01/2024 | 225,000 | 231,750 | |||||||||||
Sensata Technologies BV (Electrical Equip.) | (b) | 5.000% | 10/01/2025 | 300,000 | 292,125 | |||||||||||
ATS Automation Tooling Systems, Inc. (Machinery) | (b) | 6.500% | 06/15/2023 | 300,000 | 306,375 | |||||||||||
Dematic SA / DH Services Luxembourg Sarl (Machinery) | (b) | 7.750% | 12/15/2020 | 1,100,000 | 1,141,250 | |||||||||||
Gardner Denver, Inc. (Machinery) | (b) | 6.875% | 08/15/2021 | 800,000 | 729,000 | |||||||||||
Milacron LLC / Mcron Finance Corp. (Machinery) | (b) | 7.750% | 02/15/2021 | 225,000 | 231,750 | |||||||||||
Schaeffler Finance BV (Machinery) | (b) | 4.750% | 05/15/2021 | 375,000 | 376,875 | |||||||||||
Schaeffler Finance BV (Machinery) | (b) | 4.250% | 05/15/2021 | 250,000 | 243,750 | |||||||||||
Schaeffler Finance BV (Machinery) | (b) | 4.750% | 05/15/2023 | 200,000 | 195,000 | |||||||||||
Schaeffler Holding Finance BV (Machinery) | (b)(d) | 6.875% | 08/15/2018 | 475,000 | 491,625 | |||||||||||
Schaeffler Holding Finance BV (Machinery) | (b)(d) | 6.750% | 11/15/2022 | 400,000 | 431,500 | |||||||||||
Anna Merger Sub., Inc. (Professional Svs.) | (b) | 7.750% | 10/01/2022 | 1,325,000 | 1,334,938 | |||||||||||
IHS, Inc. (Professional Svs.) | (b) | 5.000% | 11/01/2022 | 175,000 | 173,906 | |||||||||||
TransUnion (Professional Svs.) | (d) | 9.625% | 06/15/2018 | 1,125,000 | 1,128,150 | |||||||||||
TransUnion (Professional Svs.) | 8.125% | 06/15/2018 | 525,000 | 536,550 | ||||||||||||
Hertz Corp. / The (Road & Rail) | 6.750% | 04/15/2019 | 625,000 | 644,938 | ||||||||||||
Hertz Corp. / The (Road & Rail) | 6.250% | 10/15/2022 | 375,000 | 380,625 | ||||||||||||
AerCap Ireland Capital Ltd. / AerCap Global Aviation Trust (Trading Companies & Distributors) | 4.625% | 07/01/2022 | 150,000 | 150,188 | ||||||||||||
American Builders & Contractors Supply Co., Inc. (Trading Companies & Distributors) | (b) | 5.625% | 04/15/2021 | 625,000 | 635,938 | |||||||||||
HD Supply, Inc. (Trading Companies & Distributors) | 7.500% | 07/15/2020 | 50,000 | 52,875 | ||||||||||||
| 66 | (continued) |
| Ohio National Fund, Inc. | High Income Bond Portfolio (Continued) |
Schedule of Investments | June 30, 2015 (Unaudited) |
| Corporate Bonds (Continued) | Rate | Maturity | Face Amount | Value | ||||||||||||
INDUSTRIALS (continued) | ||||||||||||||||
HD Supply, Inc. (Trading Companies & Distributors) | (b) | 5.250% | 12/15/2021 | $ | 75,000 | $ | 76,031 | |||||||||
Interline Brands, Inc. (Trading Companies & Distributors) | (d) | 10.000% | 11/15/2018 | 605,000 | 632,225 | |||||||||||
International Lease Finance Corp. (Trading Companies & Distributors) | 5.875% | 08/15/2022 | 1,075,000 | 1,162,344 | ||||||||||||
International Lease Finance Corp. (Trading Companies & Distributors) | 4.625% | 04/15/2021 | 1,150,000 | 1,161,500 | ||||||||||||
Rexel SA (Trading Companies & Distributors) | (b) | 5.250% | 06/15/2020 | 450,000 | 468,000 | |||||||||||
WESCO Distribution, Inc. (Trading Companies & Distributors) | 5.375% | 12/15/2021 | 225,000 | 227,250 | ||||||||||||
|
| |||||||||||||||
| 26,279,787 | ||||||||||||||||
|
| |||||||||||||||
INFORMATION TECHNOLOGY – 10.4% | ||||||||||||||||
CommScope Holding Co., Inc. (Communications Equip.) | (b)(d) | 6.625% | 06/01/2020 | 1,025,000 | 1,063,438 | |||||||||||
CommScope, Inc. (Communications Equip.) | (b) | 5.500% | 06/15/2024 | 525,000 | 510,563 | |||||||||||
Anixter, Inc. (Electronic Equip., Instr. & Comp.) | 5.625% | 05/01/2019 | 300,000 | 318,750 | ||||||||||||
Belden, Inc. (Electronic Equip., Instr. & Comp.) | (b) | 5.500% | 09/01/2022 | 725,000 | 719,563 | |||||||||||
Belden, Inc. (Electronic Equip., Instr. & Comp.) | (b) | 5.250% | 07/15/2024 | 375,000 | 363,750 | |||||||||||
Cleaver-Brooks, Inc. (Electronic Equip., Instr. & Comp.) | (b) | 8.750% | 12/15/2019 | 575,000 | 566,375 | |||||||||||
Zebra Technologies Corp. (Electronic Equip., Instr. & Comp.) | (b) | 7.250% | 10/15/2022 | 500,000 | 541,250 | |||||||||||
Blackboard, Inc. (Internet Software & Svs.) | (b) | 7.750% | 11/15/2019 | 400,000 | 376,000 | |||||||||||
IAC / InterActiveCorp (Internet Software & Svs.) | 4.750% | 12/15/2022 | 1,100,000 | 1,078,000 | ||||||||||||
VeriSign, Inc. (Internet Software & Svs.) | 4.625% | 05/01/2023 | 300,000 | 287,250 | ||||||||||||
VeriSign, Inc. (Internet Software & Svs.) | (b) | 5.250% | 04/01/2025 | 125,000 | 124,688 | |||||||||||
Compiler Finance Sub, Inc. (Acquired 05/02/2013 through 02/25/2014, Cost $749,813)(IT Svs.) | (b)(f) | 7.000% | 05/01/2021 | 750,000 | 570,000 | |||||||||||
CoreLogic, Inc. (IT Svs.) | 7.250% | 06/01/2021 | 850,000 | 898,875 | ||||||||||||
First Data Corp. (IT Svs.) | (b) | 8.750% | 01/15/2022 | 2,825,000 | 3,003,328 | |||||||||||
Sabre GLBL, Inc. (IT Svs.) | (b) | 5.375% | 04/15/2023 | 350,000 | 344,750 | |||||||||||
SunGard Data Systems, Inc. (IT Svs.) | 7.625% | 11/15/2020 | 200,000 | 209,000 | ||||||||||||
SunGard Data Systems, Inc. (IT Svs.) | 6.625% | 11/01/2019 | 875,000 | 903,438 | ||||||||||||
Advanced Micro Devices, Inc. (Semiconductors & Equip.) | 7.500% | 08/15/2022 | 250,000 | 220,625 | ||||||||||||
Advanced Micro Devices, Inc. (Semiconductors & Equip.) | 7.000% | 07/01/2024 | 550,000 | 464,750 | ||||||||||||
Entegris, Inc. (Semiconductors & Equip.) | (b) | 6.000% | 04/01/2022 | 925,000 | 950,438 | |||||||||||
Magnachip Semiconductor Corp. (Semiconductors & Equip.) | 6.625% | 07/15/2021 | 175,000 | 138,250 | ||||||||||||
Micron Technology, Inc. (Semiconductors & Equip.) | (b) | 5.250% | 08/01/2023 | 400,000 | 383,500 | |||||||||||
Micron Technology, Inc. (Semiconductors & Equip.) | (b) | 5.250% | 01/15/2024 | 175,000 | 165,266 | |||||||||||
NXP BV / NXP Funding LLC (Semiconductors & Equip.) | (b) | 5.750% | 02/15/2021 | 200,000 | 208,000 | |||||||||||
NXP BV / NXP Funding LLC (Semiconductors & Equip.) | (b) | 5.750% | 03/15/2023 | 200,000 | 208,000 | |||||||||||
Audatex North America, Inc. (Software) | (b) | 6.000% | 06/15/2021 | 825,000 | 847,688 | |||||||||||
Audatex North America, Inc. (Software) | (b) | 6.125% | 11/01/2023 | 100,000 | 102,750 | |||||||||||
Blue Coat Holdings, Inc. (Software) | (b) | 8.375% | 06/01/2023 | 550,000 | 559,625 | |||||||||||
BMC Software Finance, Inc. (Software) | (b) | 8.125% | 07/15/2021 | 600,000 | 486,000 | |||||||||||
Boxer Parent Co., Inc. (Software) | (b)(d) | 9.000% | 10/15/2019 | 775,000 | 550,250 | |||||||||||
Infor Software Parent LLC / Infor Software Parent, Inc. (Software) | (b)(d) | 7.125% | 05/01/2021 | 1,725,000 | 1,731,469 | |||||||||||
Infor U.S., Inc. (Software) | (b) | 6.500% | 05/15/2022 | 775,000 | 790,500 | |||||||||||
Italics Merger Sub, Inc. (Software) | (b) | 7.125% | 07/15/2023 | 575,000 | 567,813 | |||||||||||
Nuance Communications, Inc. (Software) | (b) | 5.375% | 08/15/2020 | 1,050,000 | 1,055,250 | |||||||||||
Open Text Corp. (Software) | (b) | 5.625% | 01/15/2023 | 475,000 | 470,250 | |||||||||||
Sophia Holding Finance LP / Sophia Holding Finance, Inc. (Software) | (b)(d) | 9.625% | 12/01/2018 | 200,000 | 202,500 | |||||||||||
SS&C Technologies Holdings, Inc. (Software) | (b) | 5.875% | 07/15/2023 | 250,000 | 252,500 | |||||||||||
NCR Corp. (Tech. Hardware, Storage & Periph.) | 5.000% | 07/15/2022 | 450,000 | 456,188 | ||||||||||||
NCR Corp. (Tech. Hardware, Storage & Periph.) | 4.625% | 02/15/2021 | 475,000 | 476,188 | ||||||||||||
NCR Corp. (Tech. Hardware, Storage & Periph.) | 6.375% | 12/15/2023 | 225,000 | 238,500 | ||||||||||||
|
| |||||||||||||||
| 23,405,318 | ||||||||||||||||
|
| |||||||||||||||
MATERIALS – 9.1% | ||||||||||||||||
Ashland, Inc. (Chemicals) | 4.750% | 08/15/2022 | 600,000 | 588,750 | ||||||||||||
U.S. Coatings Acquisition, Inc. / Flash Dutch 2 BV (Chemicals) | (b) | 7.375% | 05/01/2021 | 825,000 | 883,781 | |||||||||||
Axiall Corp. (Chemicals) | 4.875% | 05/15/2023 | 100,000 | 96,500 | ||||||||||||
Celanese U.S. Holdings LLC (Chemicals) | 4.625% | 11/15/2022 | 325,000 | 321,750 | ||||||||||||
Eagle Spinco, Inc. (Chemicals) | 4.625% | 02/15/2021 | 250,000 | 242,500 | ||||||||||||
Eco Services Operations LLC / Eco Finance Corp. (Chemicals) | (b) | 8.500% | 11/01/2022 | 300,000 | 301,500 | |||||||||||
Hexion, Inc. (Chemicals) | 8.875% | 02/01/2018 | 800,000 | 722,000 | ||||||||||||
Hexion, Inc. (Chemicals) | 6.625% | 04/15/2020 | 425,000 | 389,938 | ||||||||||||
Huntsman International LLC (Chemicals) | 4.875% | 11/15/2020 | 250,000 | 249,375 | ||||||||||||
Huntsman International LLC (Chemicals) | (b) | 5.125% | 11/15/2022 | 200,000 | 197,000 | |||||||||||
Platform Specialty Products Corp. (Chemicals) | (b) | 6.500% | 02/01/2022 | 650,000 | 671,125 | |||||||||||
W.R. Grace & Co. (Chemicals) | (b) | 5.625% | 10/01/2024 | 150,000 | 151,875 | |||||||||||
W.R. Grace & Co. (Chemicals) | (b) | 5.125% | 10/01/2021 | 150,000 | 151,125 | |||||||||||
Ardagh Packaging Finance PLC (Containers & Packaging) | (b) | 9.125% | 10/15/2020 | 675,000 | 712,125 | |||||||||||
Ardagh Packaging Finance PLC / Ardagh MP Holdings U.S.A., Inc. (Containers & Packaging) | (b) | 9.125% | 10/15/2020 | 425,000 | 446,250 | |||||||||||
Ardagh Packaging Finance PLC / Ardagh MP Holdings U.S.A., Inc. (Containers & Packaging) | (b) | 7.000% | 11/15/2020 | 48,529 | 49,500 | |||||||||||
Ardagh Packaging Finance PLC / Ardagh Holdings U.S.A., Inc. (Containers & Packaging) | (b) | 6.750% | 01/31/2021 | 200,000 | 204,500 | |||||||||||
Ardagh Packaging Finance PLC / Ardagh Holdings U.S.A., Inc. (Containers & Packaging) | (b)(e) | 3.286% | 12/15/2019 | 200,000 | 194,500 | |||||||||||
| 67 | (continued) |
| Ohio National Fund, Inc. | High Income Bond Portfolio (Continued) |
Schedule of Investments | June 30, 2015 (Unaudited) |
| Corporate Bonds (Continued) | Rate | Maturity | Face Amount | Value | ||||||||||||
MATERIALS (continued) | ||||||||||||||||
Ardagh Packaging Finance PLC / Ardagh Holdings U.S.A., Inc. (Containers & Packaging) | (b) | 6.000% | 06/30/2021 | $ | 200,000 | $ | 200,500 | |||||||||
Ball Corp. (Containers & Packaging) | 4.000% | 11/15/2023 | 875,000 | 811,563 | ||||||||||||
Ball Corp. (Containers & Packaging) | 5.250% | 07/01/2025 | 225,000 | 223,313 | ||||||||||||
Berry Plastics Corp. (Containers & Packaging) | 5.500% | 05/15/2022 | 1,425,000 | 1,428,563 | ||||||||||||
Berry Plastics Corp. (Containers & Packaging) | 5.125% | 07/15/2023 | 250,000 | 243,750 | ||||||||||||
BWAY Holding Co. (Containers & Packaging) | (b) | 9.125% | 08/15/2021 | 1,150,000 | 1,184,500 | |||||||||||
Crown Americas LLC / Crown Americas Capital Corp. IV (Containers & Packaging) | 4.500% | 01/15/2023 | 725,000 | 684,676 | ||||||||||||
Graphic Packaging International, Inc. (Containers & Packaging) | 4.875% | 11/15/2022 | 350,000 | 351,750 | ||||||||||||
Greif, Inc. (Containers & Packaging) | 7.750% | 08/01/2019 | 475,000 | 528,438 | ||||||||||||
Mustang Merger Corp. (Commercial Svs. & Supplies) | (b) | 8.500% | 08/15/2021 | 775,000 | 786,625 | |||||||||||
Owens-Brockway Glass Container, Inc. (Containers & Packaging) | (b) | 5.000% | 01/15/2022 | 100,000 | 98,750 | |||||||||||
Owens-Brockway Glass Container, Inc. (Containers & Packaging) | (b) | 5.375% | 01/15/2025 | 200,000 | 195,500 | |||||||||||
Pactiv LLC (Containers & Packaging) | 7.950% | 12/15/2025 | 225,000 | 222,750 | ||||||||||||
Reynolds Group Issuer, Inc. / Reynolds Group Issuer LLC (Containers & Packaging) | 8.250% | 02/15/2021 | 975,000 | 1,011,563 | ||||||||||||
Reynolds Group Issuer, Inc. / Reynolds Group Issuer LLC (Containers & Packaging) | 5.750% | 10/15/2020 | 1,025,000 | 1,050,625 | ||||||||||||
Sealed Air Corp. (Containers & Packaging) | (b) | 6.500% | 12/01/2020 | 125,000 | 137,813 | |||||||||||
Sealed Air Corp. (Containers & Packaging) | (b) | 4.875% | 12/01/2022 | 300,000 | 295,500 | |||||||||||
Sealed Air Corp. (Containers & Packaging) | (b) | 5.125% | 12/01/2024 | 300,000 | 295,875 | |||||||||||
Sealed Air Corp. (Containers & Packaging) | (b) | 5.500% | 09/15/2025 | 300,000 | 302,250 | |||||||||||
Signode Industrial Group Lux SA / Signode Industrial Group U.S., Inc. (Containers & Packaging) | (b) | 6.375% | 05/01/2022 | 1,450,000 | 1,406,500 | |||||||||||
ArcelorMittal (Metals & Mining) | 6.125% | 06/01/2025 | 300,000 | 299,063 | ||||||||||||
Steel Dynamics, Inc. (Metals & Mining) | 5.250% | 04/15/2023 | 125,000 | 124,063 | ||||||||||||
Steel Dynamics, Inc. (Metals & Mining) | 5.125% | 10/01/2021 | 200,000 | 200,400 | ||||||||||||
Steel Dynamics, Inc. (Metals & Mining) | 5.500% | 10/01/2024 | 350,000 | 350,000 | ||||||||||||
Wise Metals Intermediate Holdings LLC / Wise Holdings Finance Corp. (Metals & Mining) | (b) | 9.750% | 06/15/2019 | 325,000 | 346,125 | |||||||||||
Clearwater Paper Corp. (Paper & Forest Products) | 4.500% | 02/01/2023 | 750,000 | 710,625 | ||||||||||||
Clearwater Paper Corp. (Paper & Forest Products) | (b) | 5.375% | 02/01/2025 | 500,000 | 490,000 | |||||||||||
|
| |||||||||||||||
| 20,555,174 | ||||||||||||||||
|
| |||||||||||||||
TELECOMMUNICATION SERVICES – 4.0% | ||||||||||||||||
Level 3 Communications, Inc. (Diversified Telecom. Svs.) | 5.750% | 12/01/2022 | 375,000 | 372,188 | ||||||||||||
Level 3 Financing, Inc. (Diversified Telecom. Svs.) | (b) | 5.375% | 05/01/2025 | 600,000 | 578,250 | |||||||||||
Altice Financing SA (Wireless Telecom. Svs.) | (b) | 6.625% | 02/15/2023 | 200,000 | 198,560 | |||||||||||
Digicel Group Ltd. (Wireless Telecom. Svs.) | (b) | 8.250% | 09/30/2020 | 1,075,000 | 1,075,000 | |||||||||||
Sprint Capital Corp. (Wireless Telecom. Svs.) | 6.875% | 11/15/2028 | 925,000 | 793,188 | ||||||||||||
Sprint Capital Corp. (Wireless Telecom. Svs.) | 6.900% | 05/01/2019 | 525,000 | 535,500 | ||||||||||||
Sprint Nextel Corp. (Wireless Telecom. Svs.) | (b) | 7.000% | 03/01/2020 | 350,000 | 380,695 | |||||||||||
Sprint Communications, Inc. (Wireless Telecom. Svs.) | 6.000% | 11/15/2022 | 875,000 | 799,531 | ||||||||||||
Sprint Corp. (Wireless Telecom. Svs.) | 7.875% | 09/15/2023 | 675,000 | 658,125 | ||||||||||||
Sprint Corp. (Wireless Telecom. Svs.) | 7.125% | 06/15/2024 | 275,000 | 255,090 | ||||||||||||
Syniverse Holdings, Inc. (Wireless Telecom. Svs.) | 9.125% | 01/15/2019 | 750,000 | 660,000 | ||||||||||||
T-Mobile U.S.A., Inc. (Wireless Telecom. Svs.) | 6.625% | 11/15/2020 | 875,000 | 910,000 | ||||||||||||
T-Mobile U.S.A., Inc. (Wireless Telecom. Svs.) | 6.731% | 04/28/2022 | 75,000 | 78,188 | ||||||||||||
T-Mobile U.S.A., Inc. (Wireless Telecom. Svs.) | 6.500% | 01/15/2024 | 625,000 | 645,313 | ||||||||||||
T-Mobile U.S.A., Inc. (Wireless Telecom. Svs.) | 6.125% | 01/15/2022 | 200,000 | 206,500 | ||||||||||||
T-Mobile U.S.A., Inc. (Wireless Telecom. Svs.) | 6.625% | 04/01/2023 | 450,000 | 467,438 | ||||||||||||
T-Mobile U.S.A., Inc. (Wireless Telecom. Svs.) | 6.375% | 03/01/2025 | 225,000 | 230,906 | ||||||||||||
T-Mobile U.S.A., Inc. (Wireless Telecom. Svs.) | 6.000% | 03/01/2023 | 150,000 | 153,563 | ||||||||||||
|
| |||||||||||||||
| 8,998,035 | ||||||||||||||||
|
| |||||||||||||||
UTILITIES – 2.2% | ||||||||||||||||
Ferrellgas LP / Ferrellgas Finance Corp. (Gas Utilities) | 6.500% | 05/01/2021 | 450,000 | 448,875 | ||||||||||||
Ferrellgas LP / Ferrellgas Finance Corp. (Gas Utilities) | 6.750% | 01/15/2022 | 500,000 | 501,250 | ||||||||||||
Ferrellgas LP / Ferrellgas Finance Corp. (Gas Utilities) | (b) | 6.750% | 06/15/2023 | 200,000 | 201,000 | |||||||||||
Suburban Propane Partners LP / Suburban Energy Finance Corp. (Gas Utilities) | 7.375% | 08/01/2021 | 372,000 | 397,110 | ||||||||||||
Suburban Propane Partners LP / Suburban Energy Finance Corp. (Gas Utilities) | 5.500% | 06/01/2024 | 825,000 | 829,125 | ||||||||||||
Calpine Corp. (Ind. Power Prod. & Energy Traders) | (b) | 6.000% | 01/15/2022 | 175,000 | 185,063 | |||||||||||
Calpine Corp. (Ind. Power & Renewable Elec.) | 5.750% | 01/15/2025 | 1,275,000 | 1,239,938 | ||||||||||||
NRG Energy, Inc. (Ind. Power & Renewable Elec.) | 6.250% | 05/01/2024 | 725,000 | 719,563 | ||||||||||||
TerraForm Power Operating LLC (Ind. Power & Renewable Elec.) | (b) | 5.875% | 02/01/2023 | 375,000 | 380,625 | |||||||||||
FPL Energy National Wind Portfolio LLC (Acquired 05/27/2009, Cost $13,126)(Multi-Utilities) | (b)(f) | 6.125% | 03/25/2019 | 14,374 | 14,374 | |||||||||||
|
| |||||||||||||||
| 4,916,923 | ||||||||||||||||
|
| |||||||||||||||
Total Corporate Bonds (Cost $221,966,488) | $ | 219,529,537 | ||||||||||||||
|
| |||||||||||||||
| Common Stocks – 0.0% | Shares | Value | ||||||||||||||
ENERGY – 0.0% | ||||||||||||||||
Lone Pine Resources Canada Ltd. (Acquired 07/10/2012, Cost $48,614)(Oil, Gas & Consumable Fuels) | (a)(c)(f) | 6,236 | $ | 11,350 | ||||||||||||
|
| |||||||||||||||
Total Common Stocks (Cost $48,613) | $ | 11,350 | ||||||||||||||
|
| |||||||||||||||
| 68 | (continued) |
| Ohio National Fund, Inc. | High Income Bond Portfolio (Continued) |
Schedule of Investments | June 30, 2015 (Unaudited) |
| Money Market Funds – 1.5% | Shares | Value | ||||||||||||
Fidelity Institutional Money Market Funds | 3,317,000 | $ | 3,317,000 | |||||||||||
|
| |||||||||||||
Total Money Market Funds (Cost $3,317,000) | $ | 3,317,000 | ||||||||||||
|
| |||||||||||||
Total Investments – 99.2% (Cost $225,332,101) | (g) | $ | 222,857,887 | |||||||||||
Other Assets in Excess of Liabilities – 0.8% | 1,903,366 | |||||||||||||
|
| |||||||||||||
Net Assets – 100.0% | $ | 224,761,253 | ||||||||||||
|
| |||||||||||||
Percentages are stated as a percent of net assets.
Footnotes:
| (a) | Non-income producing security. |
| (b) | Security exempt from registration under Regulation D of the Securities Act of 1933. These securities may be resold in transactions exempt from registration, normally to qualified buyers under Rule 144A. At June 30, 2015, the value of these securities totaled $103,396,169, or 46.0% of the Portfolio’s net assets. Unless also noted with (f), as defined below, these securities were deemed liquid pursuant to procedures approved by the Board of Directors. |
| (c) | A market quotation for this investment was not readily available at June 30, 2015. As discussed in Note 2 of the Notes to Financial Statements, the price for this issue was derived from an estimate of fair market value using methods determined in good faith by the Fund’s Pricing Committee under supervision of the Board. This security represents $11,350 or 0.0% of the Portfolio’s net assets. |
| (d) | Issuer of the security has the option to make coupon payments in cash or in additional par value of this bond. Rate presented is the coupon rate for the cash option. |
| (e) | Security is a variable rate instrument in which the coupon rate is adjusted quarterly in concert with U.S. LIBOR. Interest rates stated are those in effect at June 30, 2015. |
| (f) | Represents a security deemed to be illiquid. At June 30, 2015, the value of illiquid securities in the Portfolio totaled $595,724, or 0.3% of the Portfolio’s net assets. |
| (g) | Represents cost for financial reporting purposes, which may differ from cost basis for federal income tax purposes. See also Note 7 of the Notes to Financial Statements. |
The accompanying notes are an integral part of these financial statements.
| 69 |
| Ohio National Fund, Inc. | Capital Growth Portfolio |
Objective/Strategy
The Capital Growth Portfolio seeks long-term capital appreciation by investing primarily in an actively managed portfolio of equity securities of small cap growth companies.
Performance as of June 30, 2015
Average Annual Returns: | ||||
One year | 8.21% | |||
Five years | 16.70% | |||
Ten years | 10.03% |
Past performance does not guarantee future results. The performance data quoted represents past performance and current returns may be lower or higher. Total return figures include change in share price and reinvestment of dividends and capital gains. The investment return and principal value will fluctuate so that an investor’s shares, when redeemed, may be worth more or less than the original cost. To obtain performance information up to the most recent month end, call toll-free 1-877-781-6392.
The Portfolio is not open to direct retail investment. Beneficial interest in shares is obtained solely by purchase of variable life insurance policies and variable annuity contracts. Actual performance results for variable annuity and variable universal life contracts will be lower due to contract charges. Consult your contract for applicable charges.
Comments
For the six-month period ended June 30, 2015, the Capital Growth Portfolio returned 7.29% versus 8.74% for the current benchmark, the Russell 2000 Growth Index.
For the reporting period, the Portfolio was outpaced by the benchmark Russell 2000 Growth Index; however, we narrowed the gap to a degree during the second quarter. Consumer Discretionary was the most notable detracting sector, as select Portfolio holdings within the specialty retail industry trailed behind related positions in the Portfolio’s benchmark. The Portfolio also encountered difficulty to a lesser extent in the Financials sector, where poor performance within the capital markets industry weighed on relative performance. The Portfolio experienced solid outperformance in the Industrials sector, as well as a modest amount of outperformance in the Materials sector. (1)
The Portfolio’s best-performing stocks for the period included Centene Corp., Anacor Pharmaceuticals, Inc. and JetBlue Airways Corp. Medicaid managed-care program operator Centene Corp. continues to benefit from its close alignment with the Affordable Care Act (“ACA”), both through participation in ACA-facilitated healthcare exchanges and through a shift of previously uninsured state populations into Medicaid programs administered by Centene Corp. Anacor Pharmaceuticals, Inc. develops several skin-related treatments. Anacor Pharmaceuticals, Inc. recently launched an antifungal treatment that has been well-received as partner firm Sandoz markets the drug among physicians. JetBlue Airways Corp. continues to benefit from a more disciplined and rational competitive environment as well as lower fuel prices. Additionally, JetBlue Airways Corp.’s plans to increase revenues and margins by adding additional seats to each plane, and introducing a fee for checked luggage has been largely well-received by the investor community. (1)
The Portfolio’s worst-performing stocks for the period included FXCM, Inc., Universal Electronics, Inc. and Vitamin Shoppe, Inc. Online foreign-exchange platform operator FXCM, Inc. encountered an unexpected move by the Swiss National Bank to remove its currency peg to the euro, which caught many investors by surprise,
including many of FXCM, Inc.’s clients who were holding positions that suffered as a result of the move. Those losses significantly impaired FXCM, Inc.’s balance sheet, resulting in the need to raise additional capital to meet regulatory capital requirements. Remote control and associated software producer Universal Electronics, Inc. encountered substantial destocking on the part of its largest customer, Comcast, ahead of a voice-activated remote projected to start hitting the market later this year. Despite the near-term order lull, we would expect Universal Electronics, Inc. to benefit from the approaching new-product launch through renewed order growth and the increased dollar content contributed to the next-generation remotes. Vitamin and supplements retailer Vitamin Shoppe, Inc. saw its shares sell off modestly after it reported lighter-than-expected same-store sales growth and slightly tempered full-year earnings guidance. Despite the near-term breather, we continue to see significant secular tailwinds supporting the vitamins and supplements industry (e.g., an aging U.S. baby boomer population and increasing public-health awareness), which should bode well for Vitamin Shoppe, Inc. (1)
As of this writing, equity markets appear to be facing myriad potential problems. First and foremost, valuations are high, with the S&P 500 Index at 17 times forward earnings and the Russell 2000 Index at 19 times for the comparable ratio. Economic growth in China appears to be slowing, resulting in extreme pressure on commodities, particularly oil and copper. Well-publicized issues in Greece have contributed to the strong U.S. dollar, which - in turn - will consequently result in a challenging competitive environment for U.S. multinationals. The transport index, a leading market indicator, has been very weak as of late, while auto sales appear to be peaking. Finally, the U.S. Federal Reserve appears committed to an interest-rate increase later this year. The current environment can change rapidly, but it appears to us that caution would be a watchword for the third quarter.
On the Portfolio front, we maintain a constructive view of the Energy sector, as the oil market continues a painful rebalancing process. Against a near-term backdrop of subdued commodity prices, we continue to avoid oil-service companies and favor oil producers with access to best acreage and that can still generate strong returns on invested capital. We maintain a balanced view of the Materials and Industrials sectors and continue to favor companies with exposure to both residential and non-residential construction in North America. We hold an optimistic view of commercial aerospace industry where industry management teams maintain a disciplined approach to growing capacity. (1)
In Health Care, we continue to identify opportunities in certain trends, such as Medicaid managed-care companies that take over the administration of state Medicaid programs from the states. We continue to be positioned in select biotech stocks with drugs that possess strong clinical profiles, clear and impressive value propositions as well as validated mechanisms of action. We expect a clear and growing trend toward more consolidation, which has been evident thus far in 2015.
In Financials, we would expect to see an eventual rise in interest rates temper the performance of more yield-oriented investments (e.g., real-estate investment trusts and business-development companies), and ultimately provide a boost to banks and other market-driven firms as spreads recover and profitability shows improvement.
Despite increasing macroeconomic volatility in Europe, technology spending in the U.S. and other parts of the world remains healthy.
| 70 | (continued) |
| Ohio National Fund, Inc. | Capital Growth Portfolio (Continued) |
We believe that increasing capital spending should help provide for stable technology trends moving into the latter half of 2015. Merger-and-acquisition activity across the technology landscape continues; especially within the semiconductor space. We remain focused on what we believe are high-quality companies with strong management teams that are well-positioned to gain market share. Additionally, we are looking for names that benefit from long-term secular growth trends with themes that include security software, cloud computing, mobility, e-commerce and alternative energy. We remain cautious on the semiconductor cycle, as fundamentals may be peaking while the lackluster telecommunications equipment cycle may begin to show improvement in the coming quarters.
Finally, we believe consumer stocks should hold up relatively well considering our concerns over both China and Europe. A new fashion cycle in shoes stands to benefit two of our shoe companies. We also favor companies that we believe will benefit from lower gasoline prices. (1)
| (1) | The Portfolio’s composition is subject to change. Holdings and weightings are as of June 30, 2015. |
Change in Value of $10,000 Investment
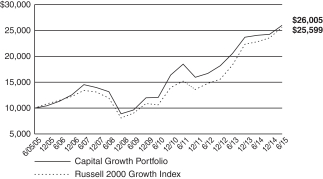
Hypothetical illustration based on past performance. Future performance will vary. The Portfolio’s returns reflect reinvested dividends. The Portfolio’s holdings may differ significantly from the securities in the index. The index is unmanaged and therefore does not reflect the cost of portfolio management and accounting.
The Russell 2000 Growth Index measures the performance of the small-cap growth segment of the U.S. equity universe. It includes those Russell 2000 Index companies with higher price-to-value ratios and higher forecasted growth values. The Russell 2000 Index includes the 2000 firms from the Russell 3000 Index with the smallest market capitalizations. The Russell 3000 Index represents 98% of the investable U.S. equity market. The index presented herein includes the effects of reinvested dividends.
Portfolio Composition as of June 30, 2015 (1)
| % of Net Assets | ||||
Common Stocks (3) | 99.1 | |||
Master Limited Partnerships (3) | 0.6 | |||
Money Market Funds and | 0.3 | |||
|
| |||
| 100.0 | ||||
|
|
Top 10 Portfolio Holdings as of June 30, 2015 (1) (2)
| % of Net Assets | ||||
1. Genesco, Inc. | 2.7 | |||
2. JetBlue Airways Corp. | 2.5 | |||
3. Centene Corp. | 2.4 | |||
4. Quaker Chemical Corp. | 2.3 | |||
5. Imperva, Inc. | 2.1 | |||
6. Cavium, Inc. | 2.0 | |||
7. Hexcel Corp. | 1.9 | |||
8. Universal Electronics, Inc. | 1.8 | |||
9. WhiteWave Foods Co. / The | 1.6 | |||
10. Fortinet, Inc. | 1.6 |
| (1) | Composition of Portfolio subject to change. |
| (2) | Short-term investments have been excluded from the list of Top 10 Portfolio Holdings. |
| (3) | Sectors (combined): |
| % of Net Assets | ||||
Information Technology | 26.8 | |||
Health Care | 25.6 | |||
Consumer Discretionary | 14.7 | |||
Industrials | 14.6 | |||
Financials | 6.9 | |||
Materials | 4.0 | |||
Consumer Staples | 3.7 | |||
Energy | 3.4 | |||
|
| |||
| 99.7 | ||||
|
|
| 71 |
| Ohio National Fund, Inc. | Capital Growth Portfolio |
Schedule of Investments | June 30, 2015 (Unaudited) |
| Common Stocks – 99.1% | Shares | Value | ||||||||
CONSUMER DISCRETIONARY – 14.7% | ||||||||||
Bright Horizons Family Solutions, Inc. (Diversified Consumer Svs.) | (a) | 10,627 | $ | 614,241 | ||||||
Grand Canyon Education, Inc. (Diversified Consumer Svs.) | (a) | 7,970 | 337,928 | |||||||
Sotheby’s (Diversified Consumer Svs.) | 6,273 | 283,790 | ||||||||
Belmond Ltd. Class A (Hotels, Restaurants & Leisure) | (a) | 93,214 | 1,164,243 | |||||||
Bojangles’, Inc. (Hotels, Restaurants & Leisure) | (a) | 11,311 | 269,880 | |||||||
Buffalo Wild Wings, Inc. (Hotels, Restaurants & Leisure) | (a) | 2,342 | 366,968 | |||||||
Chuy’s Holdings, Inc. (Hotels, Restaurants & Leisure) | (a) | 17,552 | 470,218 | |||||||
Cracker Barrel Old Country Store, Inc. (Hotels, Restaurants & Leisure) | 2,113 | 315,175 | ||||||||
Vail Resorts, Inc. (Hotels, Restaurants & Leisure) | 1,779 | 194,267 | ||||||||
KB Home (Household Durables) | 26,585 | 441,311 | ||||||||
Universal Electronics, Inc. (Household Durables) | (a) | 27,274 | 1,359,336 | |||||||
Brunswick Corp. (Leisure Products) | 14,570 | 741,030 | ||||||||
Genesco, Inc. (Specialty Retail) | (a) | 30,870 | 2,038,346 | |||||||
MarineMax, Inc. (Specialty Retail) | (a) | 13,287 | 312,377 | |||||||
Vitamin Shoppe, Inc. (Specialty Retail) | (a) | 28,165 | 1,049,710 | |||||||
Steven Madden Ltd. (Textiles, Apparel & Luxury Goods) | (a) | 19,555 | 836,563 | |||||||
Tumi Holdings, Inc. (Textiles, Apparel & Luxury Goods) | (a) | 16,526 | 339,114 | |||||||
|
| |||||||||
| 11,134,497 | ||||||||||
|
| |||||||||
CONSUMER STAPLES – 3.7% | ||||||||||
Casey’s General Stores, Inc. (Food & Staples Retailing) | 6,093 | 583,344 | ||||||||
Natural Grocers by Vitamin Cottage, Inc. (Food & Staples Retailing) | (a) | 26,282 | 647,063 | |||||||
United Natural Foods, Inc. (Food & Staples Retailing) | (a) | 5,830 | 371,254 | |||||||
WhiteWave Foods Co. / The (Food Products) | (a) | 25,359 | 1,239,548 | |||||||
|
| |||||||||
| 2,841,209 | ||||||||||
|
| |||||||||
ENERGY – 3.4% | ||||||||||
Geospace Technologies Corp. (Energy Equip. & Svs.) | (a) | 14,523 | 334,755 | |||||||
Gulfport Energy Corp. (Oil, Gas & Consumable Fuels) | (a) | 17,090 | 687,872 | |||||||
Rice Energy, Inc. (Oil, Gas & Consumable Fuels) | (a) | 36,773 | 765,982 | |||||||
RSP Permian, Inc. (Oil, Gas & Consumable Fuels) | (a) | 27,401 | 770,242 | |||||||
|
| |||||||||
| 2,558,851 | ||||||||||
|
| |||||||||
FINANCIALS – 6.3% | ||||||||||
Synovus Financial Corp. (Banks) | 8,592 | 264,805 | ||||||||
UMB Financial Corp. (Banks) | 12,547 | 715,430 | ||||||||
Stifel Financial Corp. (Capital Markets) | (a) | 18,742 | 1,082,163 | |||||||
PRA Group, Inc. (Consumer Finance) | (a) | 5,063 | 315,475 | |||||||
Enstar Group Ltd. (Insurance) | (a) | 3,039 | 470,893 | |||||||
GEO Group, Inc. / The (Real Estate Investment Trusts) | 24,366 | 832,343 | ||||||||
Two Harbors Investment Corp. (Real Estate Investment Trusts) | 33,605 | 327,313 | ||||||||
MGIC Investment Corp. (Thrifts & Mortgage Finance) | (a) | 69,885 | 795,291 | |||||||
|
| |||||||||
| 4,803,713 | ||||||||||
|
| |||||||||
HEALTH CARE – 25.6% | ||||||||||
Acorda Therapeutics, Inc. (Biotechnology) | (a) | 19,951 | 664,967 | |||||||
Akebia Therapeutics, Inc. (Biotechnology) | (a) | 29,249 | 300,972 | |||||||
Alder Biopharmaceuticals, Inc. (Biotechnology) | (a) | 12,704 | 672,931 | |||||||
Anacor Pharmaceuticals, Inc. (Biotechnology) | (a) | 12,054 | 933,341 | |||||||
Chimerix, Inc. (Biotechnology) | (a) | 11,815 | 545,853 | |||||||
Enanta Pharmaceuticals, Inc. (Biotechnology) | (a) | 7,127 | 320,644 | |||||||
Neurocrine Biosciences, Inc. (Biotechnology) | (a) | 10,733 | 512,608 | |||||||
Ophthotech Corp. (Biotechnology) | (a) | 16,314 | 849,307 | |||||||
Portola Pharmaceuticals, Inc. (Biotechnology) | (a) | 12,437 | 566,505 | |||||||
Receptos, Inc. (Biotechnology) | (a) | 3,800 | 722,190 | |||||||
Sage Therapeutics, Inc. (Biotechnology) | (a) | 8,185 | 597,505 | |||||||
Cooper Cos., Inc. / The (Health Care Equip. & Supplies) | 3,547 | 631,260 | ||||||||
DexCom, Inc. (Health Care Equip. & Supplies) | (a) | 9,051 | 723,899 | |||||||
| Common Stocks (Continued) | Shares | Value | ||||||||
HEALTH CARE (continued) | ||||||||||
Natus Medical, Inc. (Health Care Equip. & Supplies) | (a) | 27,525 | $ | 1,171,464 | ||||||
Sirona Dental Systems, Inc. (Health Care Equip. & Supplies) | (a) | 7,684 | 771,627 | |||||||
Spectranetics Corp. / The (Health Care Equip. & Supplies) | (a) | 25,968 | 597,524 | |||||||
STERIS Corp. (Health Care Equip. & Supplies) | 7,737 | 498,572 | ||||||||
Thoratec Corp. (Health Care Equip. & Supplies) | (a) | 25,391 | 1,131,677 | |||||||
Zeltiq Aesthetics, Inc. (Health Care Equip. & Supplies) | (a) | 13,129 | 386,912 | |||||||
Acadia Healthcare Co., Inc. (Health Care Providers & Svs.) | (a) | 8,459 | 662,593 | |||||||
Air Methods Corp. (Health Care Providers & Svs.) | (a) | 11,532 | 476,733 | |||||||
Centene Corp. (Health Care Providers & Svs.) | (a) | 22,916 | 1,842,446 | |||||||
ExamWorks Group, Inc. (Health Care Providers & Svs.) | (a) | 9,810 | 383,571 | |||||||
HealthSouth Corp. (Health Care Providers & Svs.) | 12,328 | 567,828 | ||||||||
Team Health Holdings, Inc. (Health Care Providers & Svs.) | (a) | 13,771 | 899,659 | |||||||
MedAssets, Inc. (Health Care Technology) | (a) | 19,668 | 433,876 | |||||||
Medidata Solutions, Inc. (Health Care Technology) | (a) | 9,519 | 517,072 | |||||||
PAREXEL International Corp. (Life Sciences Tools & Svs.) | (a) | 8,410 | 540,847 | |||||||
Prestige Brands Holdings, Inc. (Pharmaceuticals) | (a) | 9,294 | 429,755 | |||||||
Theravance Biopharma, Inc. (Pharmaceuticals) | (a) | 8,030 | 104,551 | |||||||
|
| |||||||||
| 19,458,689 | ||||||||||
|
| |||||||||
INDUSTRIALS – 14.6% | ||||||||||
Hexcel Corp. (Aerospace & Defense) | 28,636 | 1,424,355 | ||||||||
JetBlue Airways Corp. (Airlines) | (a) | 91,789 | 1,905,540 | |||||||
PGT, Inc. (Building Products) | (a) | 28,330 | 411,068 | |||||||
Trex Co., Inc. (Building Products) | (a) | 21,197 | 1,047,768 | |||||||
Waste Connections, Inc. (Commercial Svs. & Supplies) | 23,043 | 1,085,786 | ||||||||
EMCOR Group, Inc. (Construction & Engineering) | 8,630 | 412,255 | ||||||||
Northwest Pipe Co. (Construction & Engineering) | (a) | 21,235 | 432,557 | |||||||
Thermon Group Holdings, Inc. (Electrical Equip.) | (a) | 23,380 | 562,757 | |||||||
Chart Industries, Inc. (Machinery) | (a) | 10,075 | 360,181 | |||||||
Colfax Corp. (Machinery) | (a) | 12,424 | 573,368 | |||||||
Proto Labs, Inc. (Machinery) | (a) | 5,261 | 355,012 | |||||||
WABCO Holdings, Inc. (Machinery) | (a) | 5,572 | 689,368 | |||||||
Woodward, Inc. (Machinery) | 13,894 | 764,031 | ||||||||
Advisory Board Co. / The (Professional Svs.) | (a) | 6,547 | 357,924 | |||||||
Landstar System, Inc. (Road & Rail) | 10,841 | 724,938 | ||||||||
|
| |||||||||
| 11,106,908 | ||||||||||
|
| |||||||||
INFORMATION TECHNOLOGY – 26.8% | ||||||||||
Finisar Corp. (Communications Equip.) | (a) | 16,964 | 303,147 | |||||||
Palo Alto Networks, Inc. (Communications Equip.) | (a) | 4,528 | 791,042 | |||||||
Cognex Corp. (Electronic Equip., Instr. & Comp.) | 12,695 | 610,629 | ||||||||
Coherent, Inc. (Electronic Equip., Instr. & Comp.) | (a) | 11,944 | 758,205 | |||||||
IPG Photonics Corp. (Electronic Equip., Instr. & Comp.) | (a) | 13,847 | 1,179,418 | |||||||
Cornerstone OnDemand, Inc. (Internet Software & Svs.) | (a) | 22,075 | 768,210 | |||||||
Demandware, Inc. (Internet Software & Svs.) | (a) | 13,830 | 983,036 | |||||||
HomeAway, Inc. (Internet Software & Svs.) | (a) | 22,100 | 687,752 | |||||||
WebMD Health Corp. (Internet Software & Svs.) | (a) | 11,450 | 507,006 | |||||||
Yelp, Inc. (Internet Software & Svs.) | (a) | 10,275 | 442,133 | |||||||
Zillow Group, Inc. Class A (Internet Software & Svs.) | (a) | 7,280 | 631,467 | |||||||
Global Cash Access Holdings, Inc. (IT Svs.) | (a) | 38,046 | 294,476 | |||||||
Cavium, Inc. (Semiconductors & Equip.) | (a) | 21,829 | 1,502,053 | |||||||
Kulicke & Soffa Industries, Inc. (Semiconductors & Equip.) | (a) | 18,534 | 217,033 | |||||||
Qorvo, Inc. (Semiconductors & Equip.) | (a) | 8,971 | 720,102 | |||||||
Veeco Instruments, Inc. (Semiconductors & Equip.) | (a) | 24,285 | 697,951 | |||||||
Aspen Technology, Inc. (Software) | (a) | 13,938 | 634,876 | |||||||
Fortinet, Inc. (Software) | (a) | 28,572 | 1,180,881 | |||||||
Guidewire Software, Inc. (Software) | (a) | 14,048 | 743,561 | |||||||
Imperva, Inc. (Software) | (a) | 23,065 | 1,561,501 | |||||||
| 72 | (continued) |
| Ohio National Fund, Inc. | Capital Growth Portfolio (Continued) |
Schedule of Investments | June 30, 2015 (Unaudited) |
| Common Stocks (Continued) | Shares | Value | ||||||||
INFORMATION TECHNOLOGY (continued) | ||||||||||
Manhattan Associates, Inc. (Software) | (a) | 9,228 | $ | 550,450 | ||||||
Paylocity Holding Corp. (Software) | (a) | 13,824 | 495,590 | |||||||
PTC, Inc. (Software) | (a) | 20,409 | 837,177 | |||||||
Qualys, Inc. (Software) | (a) | 27,174 | 1,096,471 | |||||||
Tableau Software, Inc. Class A (Software) | (a) | 6,839 | 788,537 | |||||||
Ultimate Software Group, Inc. / The (Software) | (a) | 5,214 | 856,869 | |||||||
Varonis Systems, Inc. (Software) | (a) | 13,142 | 290,307 | |||||||
Stratasys Ltd. (Tech. Hardware, Storage & Periph.) | (a) | 7,318 | 255,618 | |||||||
|
| |||||||||
| 20,385,498 | ||||||||||
|
| |||||||||
MATERIALS – 4.0% | ||||||||||
Huntsman Corp. (Chemicals) | 26,366 | 581,898 | ||||||||
Quaker Chemical Corp. (Chemicals) | 19,304 | 1,714,967 | ||||||||
Martin Marietta Materials, Inc. (Construction Materials) | 5,275 | 746,465 | ||||||||
|
| |||||||||
| 3,043,330 | ||||||||||
|
| |||||||||
Total Common Stocks (Cost $57,271,886) | $ | 75,332,695 | ||||||||
|
| |||||||||
| Master Limited Partnerships – 0.6% | Shares | Value | ||||||||
FINANCIALS – 0.6% | ||||||||||
Fortress Investment Group LLC Class A (Capital Markets) | 60,506 | $ | 441,694 | |||||||
|
| |||||||||
Total Master Limited Partnerships (Cost $398,400) | $ | 441,694 | ||||||||
|
| |||||||||
| Money Market Funds – 0.1% | Shares | Value | ||||||||
Fidelity Institutional Money Market Funds | 118,000 | $ | 118,000 | |||||||
|
| |||||||||
Total Money Market Funds (Cost $118,000) | $ | 118,000 | ||||||||
|
| |||||||||
Total Investments – 99.8% (Cost $57,788,286) | (b) | $ | 75,892,389 | |||||||
Other Assets in Excess of Liabilities – 0.2% | 151,794 | |||||||||
|
| |||||||||
Net Assets – 100.0% | $ | 76,044,183 | ||||||||
|
| |||||||||
Percentages are stated as a percent of net assets.
Footnotes:
| (a) | Non-income producing security. |
| (b) | Represents cost for financial reporting purposes, which may differ from cost basis for federal income tax purposes. See also Note 7 of the Notes to Financial Statements. |
The accompanying notes are an integral part of these financial statements.
| 73 |
| Ohio National Fund, Inc. | Nasdaq-100® Index Portfolio |
Objective/Strategy
The Nasdaq-100® Index Portfolio seeks long-term growth of capital by investing primarily in stocks that are included in the Nasdaq-100® Index. Unlike the other Portfolios of the Fund, the Nasdaq-100® Index Portfolio is a non-diversified portfolio for purposes of Section 5(b) of the Investment Company Act of 1940, as amended.
Performance as of June 30, 2015
Average Annual Total Returns: | ||||
One year | 14.98% | |||
Five years | 21.11% | |||
Ten years | 11.73% |
Past performance does not guarantee future results. The performance data quoted represents past performance and current returns may be lower or higher. Total return figures include change in share price and reinvestment of dividends and capital gains. The investment return and principal value will fluctuate so that an investor’s shares, when redeemed, may be worth more or less than the original cost. To obtain performance information up to the most recent month end, call toll-free 1-877-781-6392.
The Portfolio is not open to direct retail investment. Beneficial interest in shares is obtained solely by purchase of variable life insurance policies and variable annuity contracts. Actual performance results for variable annuity and variable universal life contracts will be lower due to contract charges. Consult your contract for applicable charges.
Comments
For the six-month period ended June 30, 2015, the Nasdaq-100® Index Portfolio returned 4.14% versus 4.42% for the current benchmark, the Nasdaq-100® Index.
The Portfolio’s correlation to the index for the reporting period was 99.9%. The high correlation is due to the fact that the Portfolio invests in each of the 100 stocks in the index. The Portfolio also invests in PowerShares QQQ Trust Series 1, an exchange traded fund that mimics the holdings and returns of the Nasdaq-100® Index. (1)
The largest contributors to the index return for the reporting period were Apple, Inc., Amazon.com, Inc., Gilead Sciences, Inc., Starbucks Corp., and Netflix, Inc. The largest detractors for the reporting period were Intel Corp., Microsoft Corp., QUALCOMM, Inc., Micron Technology, Inc., and Yahoo!, Inc. (1)
U.S. indices ended the reporting period in positive territory, despite earlier weakness due to bad weather and the ongoing drama in Greece. The Federal Reserve has signaled that it expects to begin raising rates by the end of the year, as economic data continues to confirm a strengthening U.S. economy. We would expect moderate growth in U.S. equity indices for the rest of 2015.
| (1) | The Portfolio’s composition is subject to change. Holdings and weightings are as of June 30, 2015. |
Change in Value of $10,000 Investment
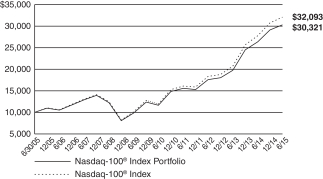
Hypothetical illustration based on past performance. Future performance will vary. The Portfolio’s returns reflect reinvested dividends. The Portfolio’s holdings may differ significantly from the securities in the index. The index is unmanaged and therefore does not reflect the cost of portfolio management and accounting. Investors cannot invest in an index. Although they can invest in its underlying securities or funds.
The Nasdaq-100® Index is a modified capitalization-weighted index of the 100 largest domestic and international non-financial companies listed on the NASDAQ Stock Market. The index presented herein includes the effects of reinvested dividends.
The Nasdaq-100®, Nasdaq-100 Index®, and Nasdaq® are registered trademarks of The NASDAQ OMX Group, Inc. (which with its affiliates is referred to as “NASDAQ OMX”). Ohio National Investments, Inc. has licensed these marks for the Portfolio’s use. NASDAQ OMX has not passed on the Portfolio’s legality or suitability. NASDAQ OMX does not sponsor, endorse, sell or promote the Portfolio. NASDAQ OMX MAKES NO WARRANTIES AND BEARS NO LIABILITY WITH RESPECT TO THE PORTFOLIO.
| 74 | (continued) |
| Ohio National Fund, Inc. | Nasdaq-100® Index Portfolio (Continued) |
Portfolio Composition as of June 30, 2015 (1)
| % of Net Assets | ||||
Common Stocks (3) | 97.1 | |||
Exchange Traded Funds | 2.9 | |||
|
| |||
| 100.0 | ||||
|
|
Top 10 Portfolio Holdings as of June 30, 2015 (1) (2)
| % of Net Assets | ||||
1. Apple, Inc. | 13.9 | |||
2. Microsoft Corp. | 6.9 | |||
3. Amazon.com, Inc. | 3.9 | |||
4. Facebook, Inc. Class A | 3.7 | |||
5. Google, Inc. Class C | 3.4 | |||
6. Gilead Sciences, Inc. | 3.3 | |||
7. Google, Inc. Class A | 3.0 | |||
8. PowerShares QQQ Trust Series 1 | 2.9 | |||
9. Intel Corp. | 2.8 | |||
10. Cisco Systems, Inc. | 2.7 |
| (1) | Composition of Portfolio subject to change. |
| (2) | Short-term investments have been excluded from the list of Top 10 Portfolio Holdings. |
| (3) | Sectors: |
| % of Net Assets | ||||
Information Technology | 53.5 | |||
Consumer Discretionary | 19.2 | |||
Health Care | 15.2 | |||
Consumer Staples | 6.1 | |||
Industrials | 2.0 | |||
Telecommunication Services | 0.8 | |||
Materials | 0.3 | |||
|
| |||
| 97.1 | ||||
|
|
| 75 |
| Ohio National Fund, Inc. | Nasdaq-100® Index Portfolio |
Schedule of Investments | June 30, 2015 (Unaudited) |
| Common Stocks – 97.1% | Shares | Value | ||||||||
CONSUMER DISCRETIONARY – 19.2% | ||||||||||
Tesla Motors, Inc. (Automobiles) | (a) | 3,150 | $ | 845,019 | ||||||
Marriott International, Inc. Class A (Hotels, Restaurants & Leisure) | 6,850 | 509,571 | ||||||||
Starbucks Corp. (Hotels, Restaurants & Leisure) | 37,375 | 2,003,861 | ||||||||
Wynn Resorts Ltd. (Hotels, Restaurants & Leisure) | 2,525 | 249,142 | ||||||||
Garmin Ltd. (Household Durables) | 4,775 | 209,766 | ||||||||
Amazon.com, Inc. (Internet & Catalog Retail) | (a) | 11,600 | 5,035,444 | |||||||
Liberty Interactive Corp. QVC Group Class A (Internet & Catalog Retail) | (a) | 11,050 | 306,637 | |||||||
Liberty Ventures (Internet & Catalog Retail) | (a) | 3,363 | 132,065 | |||||||
Netflix, Inc. (Internet & Catalog Retail) | (a) | 1,500 | 985,410 | |||||||
Priceline Group, Inc. / The (Internet & Catalog Retail) | (a) | 1,290 | 1,485,267 | |||||||
TripAdvisor, Inc. (Internet & Catalog Retail) | (a) | 3,250 | 283,205 | |||||||
Mattel, Inc. (Leisure Products) | 8,425 | 216,438 | ||||||||
Charter Communications, Inc. Class A (Media) | (a) | 2,800 | 479,500 | |||||||
Comcast Corp. Class A (Media) | 52,872 | 3,179,722 | ||||||||
Comcast Corp. Class A Special (Media) | 9,500 | 569,430 | ||||||||
DIRECTV (Media) | (a) | 12,550 | 1,164,514 | |||||||
Discovery Communications, Inc. Class A (Media) | (a) | 3,725 | 123,894 | |||||||
Discovery Communications, Inc. Class C (Media) | (a) | 6,825 | 212,121 | |||||||
DISH Network Corp. Class A (Media) | (a) | 5,575 | 377,483 | |||||||
Liberty Global PLC Class A (Media) | (a) | 6,275 | 339,289 | |||||||
Liberty Global PLC Class C (Media) | (a) | 15,425 | 780,968 | |||||||
Liberty Media Corp. Class A (Media) | (a) | 2,600 | 93,704 | |||||||
Liberty Media Corp. Class C (Media) | (a) | 5,650 | 202,835 | |||||||
Sirius XM Holdings, Inc. (Media) | (a) | 136,275 | 508,306 | |||||||
Twenty-First Century Fox, Inc. Class A (Media) | 31,350 | 1,020,286 | ||||||||
Twenty-First Century Fox, Inc. Class B (Media) | 19,875 | 640,372 | ||||||||
Viacom, Inc. Class B (Media) | 8,625 | 557,520 | ||||||||
Dollar Tree, Inc. (Multiline Retail) | (a) | 5,125 | 404,824 | |||||||
Bed Bath & Beyond, Inc. (Specialty Retail) | (a) | 4,275 | 294,889 | |||||||
O’Reilly Automotive, Inc. (Specialty Retail) | (a) | 2,525 | 570,599 | |||||||
Ross Stores, Inc. (Specialty Retail) | 10,300 | 500,683 | ||||||||
Staples, Inc. (Specialty Retail) | 15,950 | 244,194 | ||||||||
Tractor Supply Co. (Specialty Retail) | 3,400 | 305,796 | ||||||||
|
| |||||||||
| 24,832,754 | ||||||||||
|
| |||||||||
CONSUMER STAPLES – 6.1% | ||||||||||
Monster Beverage Corp. (Beverages) | (a) | 4,225 | 566,234 | |||||||
Costco Wholesale Corp. (Food & Staples Retailing) | 10,960 | 1,480,258 | ||||||||
Walgreens Boots Alliance, Inc. (Food & Staples Retailing) | 27,150 | 2,292,546 | ||||||||
Whole Foods Market, Inc. (Food & Staples Retailing) | 8,925 | 352,002 | ||||||||
Keurig Green Mountain, Inc. (Food Products) | 3,825 | 293,110 | ||||||||
Kraft Foods Group, Inc. (Food Products) | 14,750 | 1,255,815 | ||||||||
Mondelez International, Inc. Class A (Food Products) | 40,500 | 1,666,170 | ||||||||
|
| |||||||||
| 7,906,135 | ||||||||||
|
| |||||||||
HEALTH CARE – 15.2% | ||||||||||
Alexion Pharmaceuticals, Inc. (Biotechnology) | (a) | 4,975 | 899,331 | |||||||
Amgen, Inc. (Biotechnology) | 18,922 | 2,904,905 | ||||||||
Biogen, Inc. (Biotechnology) | (a) | 5,850 | 2,363,049 | |||||||
Celgene Corp. (Biotechnology) | (a) | 19,750 | 2,285,766 | |||||||
Gilead Sciences, Inc. (Biotechnology) | 36,600 | 4,285,128 | ||||||||
Regeneron Pharmaceuticals, Inc. (Biotechnology) | (a) | 2,525 | 1,288,078 | |||||||
Vertex Pharmaceuticals, Inc. (Biotechnology) | (a) | 6,075 | 750,141 | |||||||
Intuitive Surgical, Inc. (Health Care Equip. & Supplies) | (a) | 925 | 448,162 | |||||||
Catamaran Corp. (Health Care Providers & Svs.) | (a) | 5,175 | 316,089 | |||||||
Express Scripts Holding Co. (Health Care Providers & Svs.) | (a) | 18,150 | 1,614,261 | |||||||
Henry Schein, Inc. (Health Care Providers & Svs.) | (a) | 2,075 | 294,899 | |||||||
Cerner Corp. (Health Care Technology) | (a) | 8,575 | 592,189 | |||||||
Illumina, Inc. (Life Sciences Tools & Svs.) | (a) | 3,600 | 786,096 | |||||||
Mylan NV (Pharmaceuticals) | (a) | 12,200 | 827,892 | |||||||
|
| |||||||||
| 19,655,986 | ||||||||||
|
| |||||||||
| Common Stocks (Continued) | Shares | Value | ||||||||
INDUSTRIALS – 2.0% | ||||||||||
C.H. Robinson Worldwide, Inc. (Air Freight & Logistics) | 3,625 | $ | 226,164 | |||||||
Expeditors International of Washington, Inc. (Air Freight & Logistics) | 4,775 | 220,151 | ||||||||
American Airlines Group, Inc. (Airlines) | 17,250 | 688,879 | ||||||||
Stericycle, Inc. (Commercial Svs. & Supplies) | (a) | 2,125 | 284,559 | |||||||
PACCAR, Inc. (Machinery) | 8,839 | 564,017 | ||||||||
Verisk Analytics, Inc. (Professional Svs.) | (a) | 4,200 | 305,592 | |||||||
Fastenal Co. (Trading Companies & Distributors) | 7,325 | 308,969 | ||||||||
|
| |||||||||
| 2,598,331 | ||||||||||
|
| |||||||||
INFORMATION TECHNOLOGY – 53.5% | ||||||||||
Cisco Systems, Inc. (Communications Equip.) | 126,650 | 3,477,809 | ||||||||
QUALCOMM, Inc. (Communications Equip.) | 40,595 | 2,542,465 | ||||||||
Akamai Technologies, Inc. (Internet Software & Svs.) | (a) | 4,450 | 310,699 | |||||||
Baidu, Inc. – ADR (Internet Software & Svs.) | (a) | 6,900 | 1,373,652 | |||||||
eBay, Inc. (Internet Software & Svs.) | (a) | 30,260 | 1,822,862 | |||||||
Facebook, Inc. Class A (Internet Software & Svs.) | (a) | 56,000 | 4,802,840 | |||||||
Google, Inc. Class A (Internet Software & Svs.) | (a) | 7,175 | 3,874,787 | |||||||
Google, Inc. Class C (Internet Software & Svs.) | (a) | 8,523 | 4,436,307 | |||||||
Yahoo!, Inc. (Internet Software & Svs.) | (a) | 23,360 | 917,814 | |||||||
Automatic Data Processing, Inc. (IT Svs.) | 11,700 | 938,691 | ||||||||
Cognizant Technology Solutions Corp. Class A (IT Svs.) | (a) | 15,200 | 928,568 | |||||||
Fiserv, Inc. (IT Svs.) | (a) | 5,899 | 488,614 | |||||||
Paychex, Inc. (IT Svs.) | 9,045 | 424,030 | ||||||||
Altera Corp. (Semiconductors & Equip.) | 7,500 | 384,000 | ||||||||
Analog Devices, Inc. (Semiconductors & Equip.) | 7,800 | 500,643 | ||||||||
Applied Materials, Inc. (Semiconductors & Equip.) | 30,675 | 589,574 | ||||||||
Avago Technologies Ltd. (Semiconductors & Equip.) | 6,400 | 850,752 | ||||||||
Broadcom Corp. Class A (Semiconductors & Equip.) | 13,775 | 709,275 | ||||||||
Intel Corp. (Semiconductors & Equip.) | 118,120 | 3,592,620 | ||||||||
KLA-Tencor Corp. (Semiconductors & Equip.) | 3,975 | 223,435 | ||||||||
Lam Research Corp. (Semiconductors & Equip.) | 3,950 | 321,332 | ||||||||
Linear Technology Corp. (Semiconductors & Equip.) | 5,955 | 263,390 | ||||||||
Micron Technology, Inc. (Semiconductors & Equip.) | (a) | 26,925 | 507,267 | |||||||
NVIDIA Corp. (Semiconductors & Equip.) | 13,387 | 269,213 | ||||||||
NXP Semiconductors NV (Semiconductors & Equip.) | (a) | 6,275 | 616,205 | |||||||
Texas Instruments, Inc. (Semiconductors & Equip.) | 25,900 | 1,334,109 | ||||||||
Xilinx, Inc. (Semiconductors & Equip.) | 6,430 | 283,949 | ||||||||
Activision Blizzard, Inc. (Software) | 18,075 | 437,596 | ||||||||
Adobe Systems, Inc. (Software) | (a) | 12,455 | 1,008,980 | |||||||
Autodesk, Inc. (Software) | (a) | 5,675 | 284,176 | |||||||
CA, Inc. (Software) | 10,950 | 320,725 | ||||||||
Check Point Software Technologies Ltd. (Software) | (a) | 4,495 | 357,577 | |||||||
Citrix Systems, Inc. (Software) | (a) | 4,000 | 280,640 | |||||||
Electronic Arts, Inc. (Software) | (a) | 7,825 | 520,363 | |||||||
Intuit, Inc. (Software) | 6,855 | 690,778 | ||||||||
Microsoft Corp. (Software) | 201,425 | 8,892,914 | ||||||||
Symantec Corp. (Software) | 16,948 | 394,041 | ||||||||
Apple, Inc. (Tech. Hardware, Storage & Periph.) | 143,460 | 17,993,470 | ||||||||
NetApp, Inc. (Tech. Hardware, Storage & Periph.) | 7,760 | 244,906 | ||||||||
SanDisk Corp. (Tech. Hardware, Storage & Periph.) | 5,175 | 301,289 | ||||||||
Seagate Technology PLC (Tech. Hardware, Storage & Periph.) | 7,900 | 375,250 | ||||||||
Western Digital Corp. (Tech. Hardware, Storage & Periph.) | 5,750 | 450,915 | ||||||||
|
| |||||||||
| 69,338,522 | ||||||||||
|
| |||||||||
MATERIALS – 0.3% | ||||||||||
Sigma-Aldrich Corp. (Chemicals) | 2,975 | 414,566 | ||||||||
|
| |||||||||
| 76 | (continued) |
| Ohio National Fund, Inc. | Nasdaq-100® Index Portfolio (Continued) |
Schedule of Investments | June 30, 2015 (Unaudited) |
| Common Stocks (Continued) | Shares | Value | ||||||||
TELECOMMUNICATION SERVICES – 0.8% | ||||||||||
SBA Communications Corp. Class A (Wireless Telecom. Svs.) | (a) | 3,225 | $ | 370,778 | ||||||
VimpelCom Ltd. – ADR (Wireless Telecom. Svs.) | 43,750 | 217,438 | ||||||||
Vodafone Group PLC – ADR (Wireless Telecom. Svs.) | 10,604 | 386,516 | ||||||||
|
| |||||||||
| 974,732 | ||||||||||
|
| |||||||||
Total Common Stocks (Cost $75,027,107) | $ | 125,721,026 | ||||||||
|
| |||||||||
| Exchange Traded Funds – 2.9% | Shares | Value | ||||||||
PowerShares QQQ Trust Series 1 | 35,375 | $ | 3,787,601 | |||||||
|
| |||||||||
Total Exchange Traded Funds (Cost $3,797,757) | $ | 3,787,601 | ||||||||
|
| |||||||||
Total Investments – 100.0% (Cost $78,824,864) | (b) | $ | 129,508,627 | |||||||
Liabilities in Excess of Other Assets – (0.0)% | (15,001) | |||||||||
|
| |||||||||
Net Assets – 100.0% | $ | 129,493,626 | ||||||||
|
| |||||||||
Percentages are stated as a percent of net assets.
Abbreviations:
ADR: American Depositary Receipts
Footnotes:
| (a) | Non-income producing security. |
| (b) | Represents cost for financial reporting purposes, which may differ from cost basis for federal income tax purposes. See also Note 7 of the Notes to Financial Statements. |
The accompanying notes are an integral part of these financial statements.
| 77 |
| Ohio National Fund, Inc. | Bristol Portfolio |
Objective/Strategy
The Bristol Portfolio seeks long-term growth of capital by investing primarily in common stocks of the 1,000 largest publicly traded U.S. companies in terms of market capitalization.
Performance as of June 30, 2015
Average Annual Total Returns: | ||||
One year | 13.00% | |||
Five years | 17.28% | |||
Ten years | 8.20% |
Past performance does not guarantee future results. The performance data quoted represents past performance and current returns may be lower or higher. Total return figures include change in share price and reinvestment of dividends and capital gains. The investment return and principal value will fluctuate so that an investor’s shares, when redeemed, may be worth more or less than the original cost. To obtain performance information up to the most recent month end, call toll-free 1-877-781-6392.
The Portfolio is not open to direct retail investment. Beneficial interest in shares is obtained solely by purchase of variable life insurance policies and variable annuity contracts. Actual performance results for variable annuity and variable universal life contracts will be lower due to contract charges. Consult your contract for applicable charges.
Comments
For the six-month period ended June 30, 2015, the Bristol Portfolio returned 6.60% versus 1.23% for the current benchmark, the S&P 500 Index.
The year began with many thinking macroeconomic fundamentals had firmed amidst global monetary easing. While the U.S. Federal Reserve ended its historic bond-buying stimulus program, the European Central Bank continued its own stimulus measures and the Japanese Central Bank continued efforts to create growth and inflation. The end of the Federal Reserve’s quantitative easing introduced new controversy, as investors shifted to debating the timing of potential interest rate hikes. Economic data points that traditionally would have been seen as positive indicators began to raise fears that yields could move higher sooner than expected. Meanwhile, Greece reappeared in the headlines, as its position within the European Union became more uncertain. A new Greek government was elected with a mandate to take a hard stance on its debt obligations, while the European Troika refused to renegotiate. Domestically, the turmoil in the North American energy sector continued to work its way through the system, with a lack of consensus about the length and depth of the downturn. These uncertainties were compounded by fear of the potential return of Iranian oil to global markets.
The outperformance for the period was driven primarily by the 621 basis point outperformance in Health Care, most of which resulted from positive stock selection rather than the sector’s overweight. Financials also benefited from positive stock selection, but weakness in Information Technology names detracted on a relative basis.(1)
The Portfolio’s best performers for the period were Intercept Pharmaceuticals, Inc., Pharmacyclics, Inc., Valeant Pharmaceuticals International, Inc., Humana, Inc., and Clovis Oncology, Inc. The Portfolio’s worst performers were Hewlett-Packard Co., PVH Corp., Verifone Systems, Inc., Avago Technologies Ltd., and Intel Corp. The top contributors to performance were Clovis Oncology, Inc., Pharmacyclics, Inc., Intercept Pharmaceuticals, Inc., Valeant Pharmaceuticals International, Inc., and Mylan, Inc. The top detractors from perform-
ance were Hewlett-Packard Co., PVH Corp., Intel Corp., Yahoo!, Inc. and Avago Technologies Ltd. (1)
The top contributor to the Portfolio’s performance, at 125 basis points, was Clovis Oncology, Inc. due to mediocre results from its main competitor Astra Zeneca as well as positive data on its ovarian cancer drug. Pharmacyclics, Inc. contributed 116 basis points as its new cancer drug expectations were raised and the company was eventually purchased. Intercept Pharmaceuticals, Inc. contributed 106 basis points due to positive results from its NASH drug, as well as the failure of competitor drugs. Valeant Pharmaceuticals International, Inc. contributed 102 basis points, due to increased earnings guidance for the year. Mylan, Inc. contributed 53 basis points, initially due its bid for Perrigo Company Plc, followed by a bid for the company by Teva Pharmaceutical. (1)
Detractors from performance during the period included Hewlett Packard Co., detracting 65 basis points due to weak PC sales, as well as additional costs due to the breakup of the company. PVH Corp. detracted 42 basis points due to currency translation impacts from the weak Euro. Intel Corp. detracted 32 basis points due to weak PC sales. Yahoo!, Inc. detracted 29 basis points due to concerns regarding its ability to spinoff Alibaba in a tax efficient manner, and Avago Technologies Ltd. detracted 26 basis points due to concerns about handset weakness. (1)
For the balance of the year, we remain optimistic. While concerns regarding China and Greece have made their way into the headlines again, the risks to both regions should be contained. The Chinese government still has many levers to pull to stimulate its economy and Greece should have a minimal impact on the European economy even if it exits the European Union. The corporate profit picture looks positive though slightly below historical trendline and the market seems well prepared for an increase in interest rates as the Federal Reserve tries to normalize. With valuations being “fair” at this point, we believe our continued focus on companies with a strong competitive position and ability to gain share will help benefit the Portfolio’s performance going forward.
| (1) | The Portfolio’s composition is subject to change. Holdings and weightings are as of June 30, 2015. |
Change in Value of $10,000 Investment
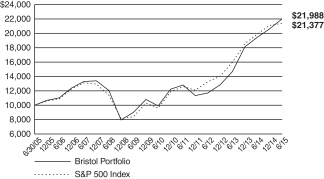
Hypothetical illustration based on past performance. Future performance will vary. The Portfolio’s returns reflect reinvested dividends. The Portfolio’s holdings may differ significantly from the securities in the index. The index is unmanaged and therefore does not reflect the cost of portfolio management and accounting.
The S&P 500 Index is a capitalization-weighted index designed to measure performance of the broad domestic economy through changes in the aggregate market value of 500 stocks representing all major industries. The index presented herein includes the effects of reinvested dividends.
| 78 | (continued) |
| Ohio National Fund, Inc. | Bristol Portfolio (Continued) |
Portfolio Composition as of June 30, 2015 (1)
| % of Net Assets | ||||
Common Stocks (3) | 99.2 | |||
Money Market Funds and | 0.8 | |||
|
| |||
| 100.0 | ||||
|
|
Top 10 Portfolio Holdings as of June 30, 2015 (1) (2)
| % of Net Assets | ||||
1. Apple, Inc. | 3.5 | |||
2. Thermo Fisher Scientific, Inc. | 2.6 | |||
3. Microsoft Corp. | 2.6 | |||
4. Allergan PLC | 2.5 | |||
5. Citigroup, Inc. | 2.5 | |||
6. Prudential Financial, Inc. | 2.5 | |||
7. MetLife, Inc. | 2.4 | |||
8. Mylan NV | 2.4 | |||
9. JPMorgan Chase & Co. | 2.3 | |||
10. Walt Disney Co. / The | 2.1 |
| (1) | Composition of Portfolio subject to change. |
| (2) | Short-term investments have been excluded from the list of Top 10 Portfolio Holdings. |
| (3) | Sectors: |
| % of Net Assets | ||||
Information Technology | 21.6 | |||
Health Care | 19.4 | |||
Consumer Discretionary | 19.1 | |||
Financials | 17.5 | |||
Industrials | 8.6 | |||
Materials | 4.7 | |||
Energy | 4.3 | |||
Consumer Staples | 4.0 | |||
|
| |||
| 99.2 | ||||
|
|
| 79 |
| Ohio National Fund, Inc. | Bristol Portfolio |
Schedule of Investments | June 30, 2015 (Unaudited) |
| Common Stocks – 99.2% | Shares | Value | ||||||||
CONSUMER DISCRETIONARY – 19.1% |
| |||||||||
Johnson Controls, Inc. (Auto Components) | 92,517 | $ | 4,582,367 | |||||||
Jarden Corp. (Household Durables) | (a) | 88,651 | 4,587,689 | |||||||
Amazon.com, Inc. (Internet & Catalog Retail) | (a) | 10,821 | 4,697,288 | |||||||
CBS Corp. Class B (Media) | 82,600 | 4,584,300 | ||||||||
Time Warner, Inc. (Media) | 54,490 | 4,762,971 | ||||||||
Viacom, Inc. Class B (Media) | 66,210 | 4,279,814 | ||||||||
Walt Disney Co. / The (Media) | 43,359 | 4,948,996 | ||||||||
Lowe’s Cos., Inc. (Specialty Retail) | 68,116 | 4,561,728 | ||||||||
Tiffany & Co. (Specialty Retail) | 28,384 | 2,605,651 | ||||||||
PVH Corp. (Textiles, Apparel & Luxury Goods) | 40,702 | 4,688,870 | ||||||||
|
| |||||||||
| 44,299,674 | ||||||||||
|
| |||||||||
CONSUMER STAPLES – 4.0% | ||||||||||
Mondelez International, Inc. Class A (Food Products) | 114,549 | 4,712,546 | ||||||||
Tyson Foods, Inc. Class A (Food Products) | 108,509 | 4,625,739 | ||||||||
|
| |||||||||
| 9,338,285 | ||||||||||
|
| |||||||||
ENERGY – 4.3% | ||||||||||
Anadarko Petroleum Corp. (Oil, Gas & Consumable Fuels) | 57,560 | 4,493,134 | ||||||||
Devon Energy Corp. (Oil, Gas & Consumable Fuels) | 74,867 | 4,453,838 | ||||||||
Newfield Exploration Co. (Oil, Gas & Consumable Fuels) | (a) | 31,706 | 1,145,221 | |||||||
|
| |||||||||
| 10,092,193 | ||||||||||
|
| |||||||||
FINANCIALS – 17.5% | ||||||||||
Bank of America Corp. (Banks) | 274,835 | 4,677,692 | ||||||||
BankUnited, Inc. (Banks) | 65,190 | 2,342,277 | ||||||||
Citigroup, Inc. (Banks) | 103,536 | 5,719,329 | ||||||||
JPMorgan Chase & Co. (Banks) | 77,673 | 5,263,122 | ||||||||
Capital One Financial Corp. (Consumer Finance) | 52,710 | 4,636,899 | ||||||||
Hartford Financial Services Group, Inc. / The (Insurance) | 110,371 | 4,588,122 | ||||||||
Lincoln National Corp. (Insurance) | 36,816 | 2,180,244 | ||||||||
MetLife, Inc. (Insurance) | 98,671 | 5,524,589 | ||||||||
Prudential Financial, Inc. (Insurance) | 65,182 | 5,704,729 | ||||||||
|
| |||||||||
| 40,637,003 | ||||||||||
|
| |||||||||
HEALTH CARE – 19.4% | ||||||||||
Amgen, Inc. (Biotechnology) | 25,914 | 3,978,317 | ||||||||
Celgene Corp. (Biotechnology) | (a) | 25,284 | 2,926,244 | |||||||
Receptos, Inc. (Biotechnology) | (a) | 20,721 | 3,938,026 | |||||||
St. Jude Medical, Inc. (Health Care Equip. & Supplies) | 65,645 | 4,796,680 | ||||||||
Aetna, Inc. (Health Care Providers & Svs.) | 26,508 | 3,378,710 | ||||||||
HCA Holdings, Inc. (Health Care Providers & Svs.) | (a) | 49,169 | 4,460,612 | |||||||
Thermo Fisher Scientific, Inc. (Life Sciences Tools & Svs.) | 46,208 | 5,995,950 | ||||||||
| Common Stocks (Continued) | Shares | Value | ||||||||
HEALTH CARE (continued) | ||||||||||
Allergan PLC (Pharmaceuticals) | (a) | 19,064 | $ | 5,785,161 | ||||||
Mylan NV (Pharmaceuticals) | (a) | 81,279 | 5,515,593 | |||||||
Valeant Pharmaceuticals International, Inc. (Pharmaceuticals) | (a) | 19,746 | 4,386,574 | |||||||
|
| |||||||||
| 45,161,867 | ||||||||||
|
| |||||||||
INDUSTRIALS – 8.6% | ||||||||||
Honeywell International, Inc. (Aerospace & Defense) | 44,312 | 4,518,495 | ||||||||
Lockheed Martin Corp. (Aerospace & Defense) | 24,615 | 4,575,928 | ||||||||
FedEx Corp. (Air Freight & Logistics) | 25,684 | 4,376,554 | ||||||||
General Electric Co. (Industrial Conglomerates) | 73,053 | 1,941,018 | ||||||||
Xylem, Inc. (Machinery) | 123,796 | 4,589,118 | ||||||||
|
| |||||||||
| 20,001,113 | ||||||||||
|
| |||||||||
INFORMATION TECHNOLOGY – 21.6% |
| |||||||||
Cisco Systems, Inc. (Communications Equip.) | 155,111 | 4,259,348 | ||||||||
Facebook, Inc. Class A (Internet Software & Svs.) | (a) | 53,412 | 4,580,880 | |||||||
Google, Inc. Class A (Internet Software & Svs.) | (a) | 5,007 | 2,703,980 | |||||||
Google, Inc. Class C (Internet Software & Svs.) | (a) | 3,900 | 2,029,989 | |||||||
MasterCard, Inc. Class A (IT Svs.) | 51,634 | 4,826,746 | ||||||||
Avago Technologies Ltd. (Semiconductors & Equip.) | 34,520 | 4,588,744 | ||||||||
Intel Corp. (Semiconductors & Equip.) | 147,400 | 4,483,171 | ||||||||
Microsoft Corp. (Software) | 134,883 | 5,955,084 | ||||||||
Oracle Corp. (Software) | 107,220 | 4,320,966 | ||||||||
Apple, Inc. (Tech. Hardware, Storage & Periph.) | 64,732 | 8,119,011 | ||||||||
Hewlett-Packard Co. (Tech. Hardware, Storage & Periph.) | 147,513 | 4,426,865 | ||||||||
|
| |||||||||
| 50,294,784 | ||||||||||
|
| |||||||||
MATERIALS – 4.7% | ||||||||||
Dow Chemical Co. / The (Chemicals) | 87,715 | 4,488,377 | ||||||||
Huntsman Corp. (Chemicals) | 191,210 | 4,220,005 | ||||||||
Monsanto Co. (Chemicals) | 20,317 | 2,165,589 | ||||||||
|
| |||||||||
| 10,873,971 | ||||||||||
|
| |||||||||
Total Common Stocks (Cost $219,489,740) | $ | 230,698,890 | ||||||||
|
| |||||||||
| Money Market Funds – 0.3% | Shares | Value | ||||||||
Fidelity Institutional Money Market Funds | 706,000 | $ | 706,000 | |||||||
|
| |||||||||
Total Money Market Funds (Cost $706,000) | $ | 706,000 | ||||||||
|
| |||||||||
Total Investments – 99.5% (Cost $220,195,740) | (b) | $ | 231,404,890 | |||||||
Other Assets in Excess of Liabilities – 0.5% | 1,039,707 | |||||||||
|
| |||||||||
Net Assets – 100.0% | $ | 232,444,597 | ||||||||
|
| |||||||||
Percentages are stated as a percent of net assets.
Footnotes:
| (a) | Non-income producing security. |
| (b) | Represents cost for financial reporting purposes, which may differ from cost basis for federal income tax purposes. See also Note 7 of the Notes to Financial Statements. |
The accompanying notes are an integral part of these financial statements.
| 80 |
| Ohio National Fund, Inc. | Bryton Growth Portfolio |
Objective/Strategy
The Bryton Growth Portfolio seeks long-term growth of capital by investing primarily in common stocks of growth-oriented U.S. companies smaller than the 500 largest publicly traded U.S. companies in terms of market capitalization.
Performance as of June 30, 2015
Average Annual Total Returns: | ||||
One year | 11.02% | |||
Five years | 17.18% | |||
Ten years | 9.07% |
Past performance does not guarantee future results. The performance data quoted represents past performance and current returns may be lower or higher. Total return figures include change in share price and reinvestment of dividends and capital gains. The investment return and principal value will fluctuate so that an investor’s shares, when redeemed, may be worth more, or less than the original cost. To obtain performance information up to the most recent month end, call toll-free 1-877-781-6392.
The Portfolio is not open to direct retail investment. Beneficial interest in shares is obtained solely by purchase of variable life insurance policies and variable annuity contracts. Actual performance results for variable annuity and variable universal life contracts will be lower due to contract charges. Consult your contract for applicable charges.
Comments
For the six-month period ended June 30, 2015, the Bryton Growth Portfolio returned 10.75% versus 8.74% for the current benchmark, the Russell 2000 Growth Index.
The year began with many thinking macroeconomic fundamentals had firmed amidst global monetary easing. While the U.S. Federal Reserve ended its historic bond-buying stimulus program, the European Central Bank introduced its own stimulus measures and the Japanese Central Bank continued efforts to create growth and inflation. The end of the Federal Reserve’s quantitative easing introduced new controversy, as investors shifted to debating the timing of potential interest rate hikes. Economic data points that traditionally would have been seen as positive indicators began to raise fears that yields could move higher sooner than expected. Meanwhile, Greece reappeared in the headlines, as its position within the European Union became more uncertain. A new Greek government was elected with a mandate to take a hard stance on its debt obligations, while the European Troika refused to renegotiate. Domestically, the turmoil in the North American energy sector continued to work its way through the system, with a lack of consensus about the length and depth of the downturn. These uncertainties were compounded by fear of the potential return of Iranian oil to global markets.
The Portfolio’s outperformance resulted from positive stock selection in several sectors, led by Industrials. Stock section in the Industrials sector provided 212 basis points to relative performance, while stock selection in Materials, Financials, and Energy was also positive. Although also positive, there were no significant individual contributions to relative performance due to sector allocation.(1)
The Portfolio’s best performers for the period were Ligand Pharmaceuticals, Inc., Bluebird Bio, Inc., Intercept Pharmaceuticals, Inc., Rally Software Development Corp. and TESARO, Inc. The Portfolio’s worst performers were Tekmira Pharmaceuticals Corp., Puma Biotechnology, Inc., Lands’ End, Inc., BioDelivery Sciences International, Inc. and IGI Laboratories, Inc. The top contributors to performance were Ligand Pharmaceuticals, Inc., Clovis Oncology,
Inc., Rally Software Development Corp., Bluebird Bio, Inc. and Intercept Pharmaceuticals, Inc. The top detractors from performance were Tekmira Pharmaceuticals Corp., BioDelivery Sciences International, Inc., IGI Laboratories, Inc., Lands’ End, Inc. and Build-A-Bear Workshop, Inc. (1)
The top contributor to the Portfolio’s performance was Ligand Pharmaceuticals, Inc., which generated 113 basis points. The stock steadily climbed due to its partner Amgen reporting interim data for a potentially blockbuster Myeloma drug, along with the belief that the company has a rich drug pipeline ahead of it. Clovis Oncology, Inc. contributed 106 basis points, thanks to optimism around its lung and cancer ovarian therapies. Rally Software Development Corp. was a software company attempting to turn itself around, before eventually selling themselves to CA, Inc., generating 92 basis points. Bluebird Bio, Inc. released positive data for its experimental gene therapies, and the stock contributed 78 points. Intercept Pharmaceuticals, Inc. added 76 points, as some felt safety concerns about its liver drug were overdone and the stock rebounded to previous levels. (1)
Detractors from performance during the period included Tekmira Pharmaceuticals Corp., which cost the Portfolio 66 basis points. There are concerns the company is still in an early stage and lacks near-term catalysts with potential competition looming. BioDelivery Sciences International, Inc. dropped after it was unable to show effectiveness in a drug trial for painful diabetic neuropathy, losing 60 points. IGI Laboratories, Inc. reported conservative guidance, subtracting 51 points. Lands’ End, Inc. preannounced negatively in the beginning of the year, citing struggles within its domestic e-commerce business and international sales. This impacted the Portfolio negatively by 48 points. Build-A-Bear Workshop, Inc. detracted 44 points after reporting weak spring comps. (1)
For the balance of the year the prospects for the markets look good. Absent an external shock - less likely, even as turmoil continues in the Middle East - the corporate profit picture looks good. While Greece’s status in the European Union and the volatility in China remain overhangs, many have come to terms with the Federal Reserve raising interest rates at least once this year. Meanwhile, employment figures, corporate profits, and other leading economic indicators remain positive, while inflation and interest rates remain at historically low levels.
| (1) | The Portfolio’s composition is subject to change. Holdings and weightings are as of June 30, 2015. |
| 81 | (continued) |
| Ohio National Fund, Inc. | Bryton Growth Portfolio (Continued) |
Change in Value of $10,000 Investment
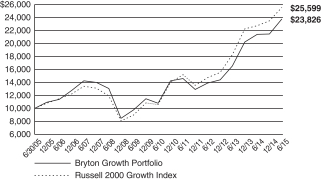
Hypothetical illustration based on past performance. Future performance will vary. The Portfolio’s returns reflect reinvested dividends. The Portfolio’s holdings may differ significantly from the securities in the index. The index is unmanaged and therefore does not reflect the cost of portfolio management and accounting.
The Russell 2000 Growth Index measures the performance of the small-cap growth segment of the U.S. equity universe. It includes the Russell 2000 Index companies with higher price-to-value ratios and higher forecasted growth values. The Russell 2000 Index includes the 2000 firms from the Russell 3000 Index with the smallest market capitalizations. The Russell 3000 Index represents 98% of the investable U.S. equity market. The index presented herein includes the effects of reinvested dividends.
Portfolio Composition as of June 30, 2015 (1)
| % of Net Assets | ||||
Common Stocks (3) | 98.2 | |||
Money Market Funds | 1.8 | |||
|
| |||
| 100.0 | ||||
|
|
Top 10 Portfolio Holdings as of June 30, 2015 (1) (2)
| % of Net Assets | ||||
1. J&J Snack Foods Corp. | 1.9 | |||
2. Healthcare Services Group, Inc. | 1.9 | |||
3. Eagle Bancorp, Inc. | 1.9 | |||
4. AngioDynamics, Inc. | 1.9 | |||
5. Receptos, Inc. | 1.9 | |||
6. ClubCorp Holdings, Inc. | 1.8 | |||
7. Alliqua BioMedical, Inc. | 1.8 | |||
8. Remy International, Inc. | 1.8 | |||
9. Phibro Animal Health Corp. Class A | 1.8 | |||
10. State Bank Financial Corp. | 1.7 |
| (1) | Composition of Portfolio subject to change. |
| (2) | Short-term investments have been excluded from the list of Top 10 Portfolio Holdings. |
| (3) | Sectors: |
| % of Net Assets | ||||
Information Technology | 28.6 | |||
Health Care | 28.4 | |||
Industrials | 14.1 | |||
Consumer Discretionary | 9.6 | |||
Energy | 6.3 | |||
Financials | 5.0 | |||
Consumer Staples | 3.3 | |||
Materials | 2.9 | |||
|
| |||
| 98.2 | ||||
|
|
| 82 |
| Ohio National Fund, Inc. | Bryton Growth Portfolio |
Schedule of Investments | June 30, 2015 (Unaudited) |
| Common Stocks – 98.2% | Shares | Value | ||||||||
CONSUMER DISCRETIONARY – 9.6% | ||||||||||
Motorcar Parts of America, Inc. (Auto Components) | (a) | 85,919 | $ | 2,585,303 | ||||||
Remy International, Inc. (Auto Components) | 145,508 | 3,217,182 | ||||||||
Buffalo Wild Wings, Inc. (Hotels, Restaurants & Leisure) | (a) | 16,861 | 2,641,950 | |||||||
ClubCorp Holdings, Inc. (Hotels, Restaurants & Leisure) | 136,337 | 3,255,728 | ||||||||
Callaway Golf Co. (Leisure Products) | 309,094 | 2,763,300 | ||||||||
Build-A-Bear Workshop, Inc. (Specialty Retail) | (a) | 180,784 | 2,890,736 | |||||||
|
| |||||||||
| 17,354,199 | ||||||||||
|
| |||||||||
CONSUMER STAPLES – 3.3% | ||||||||||
Boston Beer Co., Inc. / The Class A (Beverages) | (a) | 11,045 | 2,562,330 | |||||||
J&J Snack Foods Corp. (Food Products) | 31,247 | 3,458,105 | ||||||||
|
| |||||||||
| 6,020,435 | ||||||||||
|
| |||||||||
ENERGY – 6.3% | ||||||||||
Ardmore Shipping Corp. (Oil, Gas & Consumable Fuels) | 175,421 | 2,124,348 | ||||||||
Diamondback Energy, Inc. (Oil, Gas & Consumable Fuels) | (a) | 23,536 | 1,774,144 | |||||||
GasLog Ltd. (Oil, Gas & Consumable Fuels) | 138,200 | 2,757,090 | ||||||||
Scorpio Tankers, Inc. (Oil, Gas & Consumable Fuels) | 209,378 | 2,112,624 | ||||||||
Synergy Resources Corp. (Oil, Gas & Consumable Fuels) | (a) | 225,889 | 2,581,911 | |||||||
|
| |||||||||
| 11,350,117 | ||||||||||
|
| |||||||||
FINANCIALS – 5.0% | ||||||||||
Bank of the Ozarks, Inc. (Banks) | 56,336 | 2,577,372 | ||||||||
Eagle Bancorp, Inc. (Banks) | (a) | 76,783 | 3,375,381 | |||||||
State Bank Financial Corp. (Banks) | 143,053 | 3,104,250 | ||||||||
|
| |||||||||
| 9,057,003 | ||||||||||
|
| |||||||||
HEALTH CARE – 28.4% | ||||||||||
Bluebird Bio, Inc. (Biotechnology) | (a) | 8,114 | 1,366,154 | |||||||
Celldex Therapeutics, Inc. (Biotechnology) | (a) | 98,477 | 2,483,590 | |||||||
Cepheid (Biotechnology) | (a) | 21,800 | 1,333,070 | |||||||
Ligand Pharmaceuticals, Inc. (Biotechnology) | (a) | 24,569 | 2,479,012 | |||||||
MacroGenics, Inc. (Biotechnology) | (a) | 72,388 | 2,748,572 | |||||||
Organovo Holdings, Inc. (Biotechnology) | (a) | 242,500 | 914,225 | |||||||
Receptos, Inc. (Biotechnology) | (a) | 17,727 | 3,369,016 | |||||||
Sangamo BioSciences, Inc. (Biotechnology) | (a) | 197,000 | 2,184,730 | |||||||
Tekmira Pharmaceuticals Corp. (Biotechnology) | (a) | 207,417 | 2,459,966 | |||||||
TESARO, Inc. (Biotechnology) | (a) | 33,269 | 1,955,885 | |||||||
Alliqua BioMedical, Inc. (Health Care Equip. & Supplies) | (a) | 614,293 | 3,237,324 | |||||||
AngioDynamics, Inc. (Health Care Equip. & Supplies) | (a) | 205,599 | 3,371,824 | |||||||
Wright Medical Group, Inc. (Health Care | (a) | 66,346 | 1,742,246 | |||||||
Team Health Holdings, Inc. (Health Care Providers & Svs.) | (a) | 40,227 | 2,628,030 | |||||||
Cambrex Corp. (Life Sciences Tools & Svs.) | (a) | 65,100 | 2,860,494 | |||||||
Alimera Sciences, Inc. (Pharmaceuticals) | (a) | 642,168 | 2,960,394 | |||||||
BioDelivery Sciences International, Inc. (Pharmaceuticals) | (a) | 353,690 | 2,815,372 | |||||||
Flamel Technologies SA-ADR (Pharmaceuticals) | (a) | 129,626 | 2,746,775 | |||||||
IGI Laboratories, Inc. (Pharmaceuticals) | (a) | 388,792 | 2,449,390 | |||||||
Phibro Animal Health Corp. Class A (Pharmaceuticals) | 81,707 | 3,181,671 | ||||||||
Prestige Brands Holdings, Inc. (Pharmaceuticals) | (a) | 40,834 | 1,888,164 | |||||||
|
| |||||||||
| 51,175,904 | ||||||||||
|
| |||||||||
| Common Stocks (Continued) | Shares | Value | ||||||||
INDUSTRIALS – 14.1% | ||||||||||
Aerojet Rocketdyne Holdings, Inc. (Aerospace & Defense) | (a) | 135,115 | $ | 2,784,720 | ||||||
Hub Group, Inc. Class A (Air Freight & Logistics) | (a) | 57,173 | 2,306,359 | |||||||
XPO Logistics, Inc. (Air Freight & Logistics) | (a) | 62,058 | 2,803,780 | |||||||
PGT, Inc. (Building Products) | (a) | 198,893 | 2,885,937 | |||||||
Healthcare Services Group, Inc. (Commercial Svs. & Supplies) | 103,228 | 3,411,685 | ||||||||
Mobile Mini, Inc. (Commercial Svs. & Supplies) | 69,200 | 2,909,168 | ||||||||
Power Solutions International, Inc. (Electrical Equip.) | (a) | 51,962 | 2,806,987 | |||||||
Actuant Corp. Class A (Machinery) | 119,300 | 2,754,637 | ||||||||
Mueller Water Products, Inc. Class A (Machinery) | 299,759 | 2,727,807 | ||||||||
|
| |||||||||
| 25,391,080 | ||||||||||
|
| |||||||||
INFORMATION TECHNOLOGY – 28.6% | ||||||||||
Ubiquiti Networks, Inc. (Communications Equip.) | 91,480 | 2,919,584 | ||||||||
Belden, Inc. (Electronic Equip., Instr. & Comp.) | 30,052 | 2,441,124 | ||||||||
Cognex Corp. (Electronic Equip., Instr. & Comp.) | 55,614 | 2,675,033 | ||||||||
FARO Technologies, Inc. (Electronic Equip., Instr. & Comp.) | (a) | 39,888 | 1,862,770 | |||||||
Perceptron, Inc. (Electronic Equip., Instr. & Comp.) | 252,201 | 2,663,243 | ||||||||
Cvent, Inc. (Internet Software & Svs.) | (a) | 110,220 | 2,841,472 | |||||||
Demandware, Inc. (Internet Software & Svs.) | (a) | 41,860 | 2,975,409 | |||||||
Textura Corp. (Internet Software & Svs.) | (a) | 106,383 | 2,960,639 | |||||||
Euronet Worldwide, Inc. (IT Svs.) | (a) | 43,128 | 2,660,998 | |||||||
Cypress Semiconductor Corp. (Semiconductors & Equip.) | 204,474 | 2,404,614 | ||||||||
Microsemi Corp. (Semiconductors & Equip.) | (a) | 86,771 | 3,032,646 | |||||||
Power Integrations, Inc. (Semiconductors & Equip.) | 64,502 | 2,914,200 | ||||||||
CommVault Systems, Inc. (Software) | (a) | 64,200 | 2,722,722 | |||||||
Imperva, Inc. (Software) | (a) | 28,527 | 1,931,278 | |||||||
Infoblox, Inc. (Software) | (a) | 103,456 | 2,711,582 | |||||||
Qlik Technologies, Inc. (Software) | (a) | 78,304 | 2,737,508 | |||||||
Telenav, Inc. (Software) | (a) | 336,955 | 2,712,488 | |||||||
Electronics For Imaging, Inc. (Tech. Hardware, Storage & Periph.) | (a) | 66,403 | 2,889,195 | |||||||
Immersion Corp. (Tech. Hardware, Storage & Periph.) | (a) | 70,650 | 895,135 | |||||||
Quantum Corp. (Tech. Hardware, Storage & Periph.) | (a) | 1,611,656 | 2,707,582 | |||||||
|
| |||||||||
| 51,659,222 | ||||||||||
|
| |||||||||
MATERIALS – 2.9% | ||||||||||
Ferro Corp. (Chemicals) | (a) | 150,590 | 2,526,900 | |||||||
PolyOne Corp. (Chemicals) | 70,771 | 2,772,100 | ||||||||
|
| |||||||||
| 5,299,000 | ||||||||||
|
| |||||||||
Total Common Stocks (Cost $166,419,688) | $ | 177,306,960 | ||||||||
|
| |||||||||
| Money Market Funds – 2.7% | Shares | Value | ||||||||
Fidelity Institutional Money Market Funds | 4,905,000 | $ | 4,905,000 | |||||||
|
| |||||||||
Total Money Market Funds (Cost $4,905,000) | $ | 4,905,000 | ||||||||
|
| |||||||||
Total Investments – 100.9% (Cost $171,324,688) | (b) | $ | 182,211,960 | |||||||
Liabilities in Excess of Other Assets – (0.9)% | (1,669,637) | |||||||||
|
| |||||||||
Net Assets – 100.0% | $ | 180,542,323 | ||||||||
|
| |||||||||
Percentages are stated as a percent of net assets.
Abbreviations:
ADR: American Depositary Receipts
Footnotes:
| (a) | Non-income producing security. |
| (b) | Represents cost for financial reporting purposes, which may differ from cost basis for federal income tax purposes. See also Note 7 of the Notes to Financial Statements. |
The accompanying notes are an integral part of these financial statements.
| 83 |
| Ohio National Fund, Inc. | Balanced Portfolio |
Objective/Strategy
The Balanced Portfolio seeks capital appreciation and income by investing normally up to 75% of its assets in equity securities within under-priced sectors and industries while maintaining a minimum of 25% of its assets in fixed income securities.
Performance as of June 30, 2015
Average Annual Returns: | ||||
One year | 3.99% | |||
Five years | 10.39% | |||
Ten years | 6.54% |
Past performance does not guarantee future results. The performance data quoted represents past performance and current returns may be lower or higher. Total return figures include change in share price and reinvestment of dividends and capital gains. The investment return and principal value will fluctuate so that an investor’s shares, when redeemed, may be worth more or less than the original cost. To obtain performance information up to the most recent month end, call toll-free 1-877-781-6392.
The Portfolio is not open to direct retail investment. Beneficial interest in shares is obtained solely by purchase of variable life insurance policies and variable annuity contracts. Actual performance results for variable annuity and variable universal life contracts will be lower due to contract charges. Consult your contract for applicable charges.
Comments
For the six-month period ended June 30, 2015, the Balanced Portfolio returned 2.90% versus 1.14% for the current benchmark, which is comprised of 60% S&P Composite 1500 Index and 40% Barclays Capital U.S. Universal Index.
As we entered 2015, our equity valuation model viewed the overall broad domestic market as approximately 5% below our estimate of fair value, indicating some upside opportunity over the next 9 to 12 month time frame. While our returns expectations were relatively muted for the overall market, our system saw opportunities in specific sectors and industries. In an attempt to take advantage of those opportunities, the Portfolio was slightly overweight in equities relative to the blended benchmark, with a specific focus on the Consumer Discretionary, Financials, and Information Technology sectors. However, because of our lower overall market value readings, we implemented a hedge strategy by buying both out-of-the-money S&P 500 put options and writing out-of-the-money S&P 500 call options in an attempt to reduce the effects of market-based volatility on the Portfolio. Relative to the fixed income portion of the benchmark, the fixed income portion of the Portfolio began the year with an overweight position in the corporate debt segment of the market, with specific focus on rating crossover plays and high yield yield-to-call paper. Value was tough to find due to tight corporate bond spreads. Further, relative to the fixed income portion of the blended benchmark, the Portfolio maintained a shorter overall duration and was underweight U.S. Treasuries. Overall, this portfolio strategy turned out to be advantageous during the first month of the year, as the equity market fell by about 2.87% due to a combination of macro-economic concerns and a U.S. gross domestic product (“GDP”) slowdown. The decline in equities had many investors fleeing to the safety of U.S. Treasuries, as yields on the U.S. 10-year Treasury fell from 2.17% on January 1, 2015 to 1.64% on January 31, 2015. While the underlying holdings in the Portfolio were generally in line with the benchmark during this sell-off, our hedging profile helped the Portfolio outperform the blended benchmark during this initial move. The initial bout of equity volatility provided some attractive entry points within certain sectors, according to our system, and
we began to increase the Portfolio’s equity exposure throughout the remainder of the first quarter. In addition, we realized some profits from our option holdings and loosened the hedge on the equity portion of the Portfolio to put it in position to participate in the anticipated upside move. Increasing the equity exposure and loosening the hedge turned out to be a positive contribution to returns, as the equity market reversed course and rallied aggressively through the end of the first quarter. Further, positive selection effect in both the equity and fixed income portion of the Portfolio produced market-beating returns during this move. (1)
The second quarter of 2015 proved to be relatively uneventful from a price movement standpoint, although volatility returned to the marketplace near the end of June as concerns over Greece reemerged. Over the course of the second quarter, our methodology indicated decreasing value and fewer attractive opportunities in the equity market, leading us to reduce our equity exposure in a systematic fashion, and increase our fixed income exposure in both corporate bonds and U.S. Treasuries. Additionally, the hedge was slowly increased throughout the second quarter, as stretched valuations made us wary of increased market volatility ahead. Again, positive selection effect in both the equity and fixed income portions of the Portfolio outperformed the benchmark for the second quarter of 2015. Ultimately, over the entire first half of 2015, the Portfolio had both higher returns and reduced volatility relative to the blended benchmark.
Focusing on the equity portion of the Portfolio, the largest sector contributor to performance over the first six months of the year was the Consumer Discretionary sector. The combination of the Portfolio’s overweight position and positive selection effect in this sector produced positive returns relative to the benchmark. Other sectors that contributed positively to the Portfolio’s performance included Financials, Health Care, and Information Technology. Inversely, the Portfolio’s positions in the Utilities and Industrials sectors produced negative contributions to Portfolio returns during the period. (1)
On the individual equity security level, the five biggest contributors to performance relative to the benchmark were SVB Financial Group, Signature Bank, DST Systems, Inc., Jones Lang LaSalle, Inc., and Starbucks Corp. The five biggest detractors from performance relative to the benchmark were Delta Air Lines, Inc., Union Pacific Corp., Applied Materials, Inc., Precision Castparts Corp., and Discover Financial Services. (1)
Focusing on the fixed income portion of the Portfolio, the first month of 2015 saw an aggressive rally in U.S. Treasury bonds as yields fell across the board. This rally in the U.S. Treasury market was coupled with a widening in corporate bond spreads throughout a good portion of the first half of the year. This widening occurred in both investment grade and high yield corporate bonds, as investors focused on low overall returns in the fixed income market. The fixed income portion of the Portfolio maintained a lower overall duration over the course of the first half of 2015, resulting in less relative curve effect during the rally at the beginning of the year. Ultimately, the Portfolio was able to outperform the fixed income portion of the benchmark during the first half of the year through a combination of individual bond selections within the corporate bond segment of the market and an active allocation to both preferred shares and closed-end fund positions. As we saw less and less value in the overall fixed income market, the Portfolio focused on holdings in preferred shares and closed-end fund discount arbitrage plays to produce positive returns relative to the fixed income benchmark and contribute to overall Portfolio performance. (1)
| 84 | (continued) |
| Ohio National Fund, Inc. | Balanced Portfolio (Continued) |
Looking ahead to the second half of 2015, our equity valuation model currently sees the overall equity market as close to our estimate of fair value. However, we continue to see clear opportunities in certain sectors and industries. The Portfolio heads into the second half of the year with a slight equity underweight relative to the blended benchmark’s allocation of 60% equities and 40% fixed income. From a sector standpoint, the equity portion of the Portfolio is overweight in both the Financials and Utilities sectors, as these sectors remain attractive according to our system. The equity hedge is currently targeting a beta of approximately 0.76, which is at the lower end of our historical range, as we anticipate the second half of the year could see increased volatility due to stretched equity valuations. In the fixed income portion of the Portfolio, we continue to be selective in our individual bond positions as tight spreads force us to focus on downside risks. However, we still see opportunities in certain lower investment grade and high yield segments of the corporate bond market, preferred securities, and closed-end funds. Regardless of how the market behaves, we will continue to manage the Portfolio with the goal of providing returns while reducing the effects of market volatility. (1)
| (1) | The Portfolio’s composition is subject to change. Holdings and weightings are as of June 30, 2015. |
Change in Value of $10,000 Investment
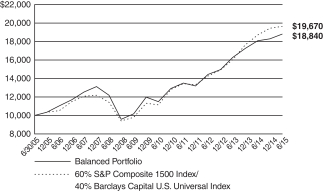
Hypothetical illustration based on past performance. Future performance will vary. The Portfolio’s returns reflect reinvested dividends. The Portfolio’s holdings may differ significantly from the securities in the index. The index is unmanaged and therefore does not reflect the cost of portfolio management and accounting.
The S&P Composite 1500 Index is a broad-based capitalization-weighted index of 1500 U.S. companies and is comprised of the S&P MidCap 400, S&P 500, and the S&P SmallCap 600. It is designed for investors seeking to replicate to the performance of the U.S. equity market or benchmark against a representative universe of tradable stocks. The index presented herein includes the effects of reinvested dividends.
The Barclays Capital U.S. Universal Index represents the union of the U.S. Aggregate Index, U.S. Corporate High Yield Index. Investment Grade 144A Index, Eurodollar Index, U.S. Emerging Markets Index, and the non-ERISA portion of the Commercial Mortgage-Backed Securities (CMBS) Index. The index covers USD-denominated, taxable bonds that are rated either investment grade or high-yield.
Portfolio Composition as of June 30, 2015 (1)
| % of Net Assets | ||||
Common Stocks (3) | 54.1 | |||
Corporate Bonds (3) | 22.3 | |||
U.S. Treasury Obligations | 9.6 | |||
Trust Preferred Securities (3) | 3.9 | |||
Closed-End Mutual Funds | 3.0 | |||
Asset-Backed / Mortgage-Backed Securities (3) | 2.3 | |||
Preferred Stocks (3) | 1.5 | |||
Exchange Traded Funds | 0.9 | |||
Purchased Options | 0.6 | |||
Municipal Bonds | 0.4 | |||
Money Market Funds | 1.4 | |||
|
| |||
| 100.0 | ||||
|
|
Top 10 Portfolio Holdings as of June 30, 2015 (1) (2)
| % of Net Assets | ||||
1. U.S. Treasury Note 1.000%, 09/15/2017 | 2.3 | |||
2. U.S. Treasury Note 0.500%, 09/30/2016 | 2.3 | |||
3. McKesson Corp. | 1.9 | |||
4. Signature Bank | 1.9 | |||
5. Jones Lang LaSalle, Inc. | 1.8 | |||
6. SVB Financial Group | 1.8 | |||
7. Delta Air Lines, Inc. | 1.8 | |||
8. U.S. Treasury Note 2.250%, 11/15/2024 | 1.7 | |||
9. Google, Inc. Class C | 1.6 | |||
10. Allergan PLC | 1.5 |
| (1) | Composition of Portfolio subject to change. |
| (2) | Short-term investments have been excluded from the list of Top 10 Portfolio Holdings. |
| (3) | Sectors (combined): |
| % of Net Assets | ||||
Financials | 27.3 | |||
Health Care | 11.7 | |||
Information Technology | 11.5 | |||
Industrials | 10.3 | |||
Consumer Discretionary | 9.2 | |||
Consumer Staples | 3.5 | |||
Materials | 3.3 | |||
Utilities | 3.3 | |||
Energy | 2.3 | |||
Telecommunication Services | 1.7 | |||
|
| |||
| 84.1 | ||||
|
|
| 85 |
| Ohio National Fund, Inc. | Balanced Portfolio |
Schedule of Investments | June 30, 2015 (Unaudited) |
| Common Stocks – 54.1% | Shares | Value | ||||||||
CONSUMER DISCRETIONARY – 8.1% | ||||||||||
BorgWarner, Inc. (Auto Components) | 112,146 | $ | 6,374,379 | |||||||
Delphi Automotive PLC (Auto Components) | 58,524 | 4,979,807 | ||||||||
Gentherm, Inc. (Auto Components) | (a) | 50,000 | 2,745,500 | |||||||
Chipotle Mexican Grill, Inc. (Hotels, Restaurants & Leisure) | (a) | 20,500 | 12,402,295 | |||||||
Royal Caribbean Cruises Ltd. (Hotels, Restaurants & Leisure) | 60,000 | 4,721,400 | ||||||||
Starbucks Corp. (Hotels, Restaurants & Leisure) | (d) | 40,000 | 2,144,600 | |||||||
Jarden Corp. (Household Durables) | (a) | 122,197 | 6,323,695 | |||||||
CBS Corp. Class B (Media) | 149,704 | 8,308,572 | ||||||||
Comcast Corp. Class A (Media) | (d) | 34,044 | 2,047,406 | |||||||
Walt Disney Co. / The (Media) | 60,280 | 6,880,359 | ||||||||
Advance Auto Parts, Inc. (Specialty Retail) | 60,000 | 9,557,400 | ||||||||
Home Depot, Inc. / The (Specialty Retail) | 40,000 | 4,445,200 | ||||||||
|
| |||||||||
| 70,930,613 | ||||||||||
|
| |||||||||
CONSUMER STAPLES – 1.6% | ||||||||||
CVS Health Corp. (Food & Staples Retailing) | 50,000 | 5,244,000 | ||||||||
Tyson Foods, Inc. Class A (Food Products) | 200,000 | 8,526,000 | ||||||||
|
| |||||||||
| 13,770,000 | ||||||||||
|
| |||||||||
ENERGY – 1.4% | ||||||||||
Schlumberger Ltd. (Energy Equip. & Svs.) | 45,000 | 3,878,550 | ||||||||
EQT Corp. (Oil, Gas & Consumable Fuels) | 45,010 | 3,661,113 | ||||||||
Valero Energy Corp. (Oil, Gas & Consumable Fuels) | 75,000 | 4,695,000 | ||||||||
|
| |||||||||
| 12,234,663 | ||||||||||
|
| |||||||||
FINANCIALS – 13.0% | ||||||||||
Bank of America Corp. (Banks) | 540,000 | 9,190,800 | ||||||||
Signature Bank (Banks) | (a)(d) | 113,270 | 16,581,595 | |||||||
SVB Financial Group (Banks) | (a) | 110,000 | 15,837,800 | |||||||
Wells Fargo & Co. (Banks) | (d) | 79,000 | 4,442,960 | |||||||
Invesco Ltd. (Capital Markets) | 202,900 | 7,606,721 | ||||||||
Waddell & Reed Financial, Inc. Class A (Capital Markets) | 92,000 | 4,352,520 | ||||||||
Discover Financial Services (Consumer Finance) | 162,080 | 9,339,050 | ||||||||
Encore Capital Group, Inc. (Consumer Finance) | (a)(d) | 235,370 | 10,059,714 | |||||||
Arthur J. Gallagher & Co. (Insurance) | 85,670 | 4,052,191 | ||||||||
Sun Life Financial, Inc. (Insurance) | 122,725 | 4,099,015 | ||||||||
CBRE Group, Inc. (Real Estate Mgmt. & Development) | (a) | 355,000 | 13,135,000 | |||||||
Jones Lang LaSalle, Inc. (Real Estate Mgmt. & Development) | (d) | 95,000 | 16,245,000 | |||||||
|
| |||||||||
| 114,942,366 | ||||||||||
|
| |||||||||
HEALTH CARE – 7.8% | ||||||||||
Biogen, Inc. (Biotechnology) | (a) | 23,000 | 9,290,620 | |||||||
Gilead Sciences, Inc. (Biotechnology) | 55,530 | 6,501,452 | ||||||||
McKesson Corp. (Health Care Providers & Svs.) | 75,000 | 16,860,750 | ||||||||
AbbVie, Inc. (Pharmaceuticals) | 100,000 | 6,719,000 | ||||||||
Allergan PLC (Pharmaceuticals) | (a) | 43,700 | 13,261,202 | |||||||
Jazz Pharmaceuticals PLC (Pharmaceuticals) | (a) | 45,000 | 7,923,150 | |||||||
Johnson & Johnson (Pharmaceuticals) | 85,000 | 8,284,100 | ||||||||
|
| |||||||||
| 68,840,274 | ||||||||||
|
| |||||||||
INDUSTRIALS – 6.9% | ||||||||||
Curtiss-Wright Corp. (Aerospace & Defense) | 89,563 | 6,487,944 | ||||||||
General Dynamics Corp. (Aerospace & Defense) | 50,000 | 7,084,500 | ||||||||
Precision Castparts Corp. (Aerospace & Defense) | 35,083 | 7,012,039 | ||||||||
Delta Air Lines, Inc. (Airlines) | (d) | 385,000 | 15,815,800 | |||||||
Southwest Airlines Co. (Airlines) | 60,000 | 1,985,400 | ||||||||
United Continental Holdings, Inc. (Airlines) | (a) | 40,000 | 2,120,400 | |||||||
Genesee & Wyoming, Inc. Class A (Road & Rail) | (a) | 40,200 | 3,062,436 | |||||||
Ryder System, Inc. (Road & Rail) | 45,000 | 3,931,650 | ||||||||
Union Pacific Corp. (Road & Rail) | (d) | 138,160 | 13,176,319 | |||||||
|
| |||||||||
| 60,676,488 | ||||||||||
|
| |||||||||
| Common Stocks (Continued) | Shares | Value | ||||||||
INFORMATION TECHNOLOGY – 9.7% | ||||||||||
IPG Photonics Corp. (Electronic Equip., Instr. & Comp.) | (a) | 52,172 | $ | 4,443,750 | ||||||
Facebook, Inc. Class A (Internet Software & Svs.) | (a) | 150,000 | 12,864,750 | |||||||
Google, Inc. Class A (Internet Software & Svs.) | (a) | 700 | 378,028 | |||||||
Google, Inc. Class C (Internet Software & Svs.) | (a) | 27,776 | 14,457,686 | |||||||
Accenture PLC Class A (IT Svs.) | 45,786 | 4,431,169 | ||||||||
DST Systems, Inc. (IT Svs.) | 65,000 | 8,188,700 | ||||||||
MasterCard, Inc. Class A (IT Svs.) | (d) | 96,600 | 9,030,168 | |||||||
Visa, Inc. (IT Svs.) | 131,400 | 8,823,510 | ||||||||
Applied Materials, Inc. (Semiconductors & Equip.) | 570,000 | 10,955,400 | ||||||||
Synaptics, Inc. (Semiconductors & Equip.) | (a) | 27,000 | 2,341,845 | |||||||
Apple, Inc. (Tech. Hardware, Storage & Periph.) | 78,910 | 9,897,287 | ||||||||
|
| |||||||||
| 85,812,293 | ||||||||||
|
| |||||||||
MATERIALS – 3.1% | ||||||||||
Ashland, Inc. (Chemicals) | 70,000 | 8,533,000 | ||||||||
Methanex Corp. (Chemicals) | (d) | 65,183 | 3,628,086 | |||||||
Monsanto Co. (Chemicals) | 70,000 | 7,461,300 | ||||||||
Eagle Materials, Inc. (Construction Materials) | 105,000 | 8,014,650 | ||||||||
|
| |||||||||
| 27,637,036 | ||||||||||
|
| |||||||||
UTILITIES – 2.5% | ||||||||||
ALLETE, Inc. (Electric Utilities) | 90,000 | 4,175,100 | ||||||||
OGE Energy Corp. (Electric Utilities) | 125,190 | 3,576,678 | ||||||||
Atmos Energy Corp. (Gas Utilities) | 85,000 | 4,358,800 | ||||||||
Ameren Corp. (Multi-Utilities) | 100,000 | 3,768,000 | ||||||||
CMS Energy Corp. (Multi-Utilities) | 186,300 | 5,931,792 | ||||||||
|
| |||||||||
| 21,810,370 | ||||||||||
|
| |||||||||
Total Common Stocks (Cost $439,256,753) | $ | 476,654,103 | ||||||||
|
| |||||||||
| 86 | (continued) |
| Ohio National Fund, Inc. | Balanced Portfolio (Continued) |
Schedule of Investments | June 30, 2015 (Unaudited) |
| Corporate Bonds – 22.3% | Rate | Maturity | Face Amount | Value | ||||||||||||
CONSUMER DISCRETIONARY – 1.1% | ||||||||||||||||
Darden Restaurants, Inc. (Hotels, Restaurants & Leisure) | (i) | 7.050% | 10/15/2037 | $ | 3,500,000 | $ | 4,241,720 | |||||||||
Eldorado Resorts LLC / Eldorado Capital Corp. (Hotels, Restaurants & Leisure) | (b) | 8.625% | 06/15/2019 | 1,875,000 | 1,954,688 | |||||||||||
Marina District Finance Co., Inc. (Hotels, Restaurants & Leisure) | 9.875% | 08/15/2018 | 1,710,000 | 1,757,025 | ||||||||||||
Pinnacle Entertainment, Inc. (Hotels, Restaurants & Leisure) | 7.500% | 04/15/2021 | 475,000 | 502,906 | ||||||||||||
Intelsat Jackson Holdings SA (Media) | 7.250% | 04/01/2019 | 1,482,000 | 1,504,230 | ||||||||||||
|
| |||||||||||||||
| 9,960,569 | ||||||||||||||||
|
| |||||||||||||||
CONSUMER STAPLES – 1.9% | ||||||||||||||||
Kraft Heinz Foods Co. (Food Products) | (b) | 4.875% | 02/15/2025 | 6,100,000 | 6,641,375 | |||||||||||
Altria Group, Inc. (Tobacco) | 9.250% | 08/06/2019 | 7,967,000 | 10,004,417 | ||||||||||||
|
| |||||||||||||||
| 16,645,792 | ||||||||||||||||
|
| |||||||||||||||
ENERGY – 0.9% | ||||||||||||||||
Alliance Pipeline LP / United States (Oil, Gas & Consumable Fuels) | (b) | 7.877% | 12/31/2025 | 2,000,000 | 2,437,328 | |||||||||||
BG Energy Capital PLC (Oil, Gas & Consumable Fuels) | (b) | 4.000% | 10/15/2021 | 3,090,000 | 3,274,476 | |||||||||||
United Refining Co. (Oil, Gas & Consumable Fuels) | 10.500% | 02/28/2018 | 1,812,000 | 1,902,600 | ||||||||||||
|
| |||||||||||||||
| 7,614,404 | ||||||||||||||||
|
| |||||||||||||||
FINANCIALS – 7.2% | ||||||||||||||||
City National Corp. (Banks) | 5.250% | 09/15/2020 | 1,500,000 | 1,695,711 | ||||||||||||
Hancock Holding Co. (Banks) | 5.875% | 04/01/2017 | 2,950,000 | 3,091,765 | ||||||||||||
E*TRADE Financial Corp. (Capital Markets) | 5.375% | 11/15/2022 | 3,040,000 | 3,116,000 | ||||||||||||
Neuberger Berman Group LLC / Neuberger Berman Finance Corp. (Capital Markets) | (b) | 5.875% | 03/15/2022 | 5,800,000 | 6,198,750 | |||||||||||
Ally Financial, Inc. (Consumer Finance) | 8.000% | 03/15/2020 | 1,950,000 | 2,296,125 | ||||||||||||
General Electric Capital Corp. / LJ VP Holdings LLC (Diversified Financial Svs.) | (b) | 3.800% | 06/18/2019 | 2,750,000 | 2,905,911 | |||||||||||
Alleghany Corp. (Insurance) | 5.625% | 09/15/2020 | 1,000,000 | 1,118,768 | ||||||||||||
Glen Meadow Pass-Through Trust (Insurance) | (b)(f) | 6.505% | 02/12/2067 | 395,000 | 367,350 | |||||||||||
MBIA, Inc. (Insurance) | 6.625% | 10/01/2028 | 2,810,000 | 2,585,200 | ||||||||||||
Old Republic International Corp. (Insurance) | 4.875% | 10/01/2024 | 5,000,000 | 5,165,585 | ||||||||||||
ProAssurance Corp. (Insurance) | 5.300% | 11/15/2023 | 5,063,000 | 5,394,976 | ||||||||||||
Protective Life Corp. (Insurance) | 6.250% | 05/15/2042 | 32,350 | 829,454 | ||||||||||||
Prudential Financial, Inc. (Insurance) | (f) | 8.875% | 06/15/2068 | 8,635,000 | 10,102,950 | |||||||||||
Prudential Insurance Co. of America / The (Insurance) | (b) | 8.300% | 07/01/2025 | 2,500,000 | 3,324,095 | |||||||||||
Reinsurance Group of America, Inc. (Insurance) | 6.450% | 11/15/2019 | 1,000,000 | 1,151,204 | ||||||||||||
SAFG Retirement Services, Inc. (Insurance) | 8.125% | 04/28/2023 | 500,000 | 626,067 | ||||||||||||
StanCorp Financial Group, Inc. (Insurance) | (f) | 6.900% | 06/01/2067 | 4,500,000 | 4,185,000 | |||||||||||
Travelers Property Casualty Corp. (Insurance) | 7.750% | 04/15/2026 | 5,400,000 | 7,102,150 | ||||||||||||
Hunt Cos., Inc. (Real Estate Mgmt. & Development) | (b) | 9.625% | 03/01/2021 | 2,100,000 | 2,163,000 | |||||||||||
|
| |||||||||||||||
| 63,420,061 | ||||||||||||||||
|
| |||||||||||||||
HEALTH CARE – 3.9% | ||||||||||||||||
Highmark, Inc. (Health Care Providers & Svs.) | (b) | 4.750% | 05/15/2021 | 3,500,000 | 3,582,526 | |||||||||||
Highmark, Inc. (Health Care Providers & Svs.) | (b) | 6.125% | 05/15/2041 | 2,100,000 | 2,058,594 | |||||||||||
inVentiv Health, Inc. (Health Care Providers & Svs.) | (b) | 9.000% | 01/15/2018 | 3,405,000 | 3,549,713 | |||||||||||
Omnicare, Inc. (Health Care Providers & Svs.) | 4.750% | 12/01/2022 | 10,726,000 | 11,369,560 | ||||||||||||
Prospect Medical Holdings, Inc. (Health Care Providers & Svs.) | (b) | 8.375% | 05/01/2019 | 5,035,000 | 5,353,716 | |||||||||||
Hospira, Inc. (Pharmaceuticals) | 5.800% | 08/12/2023 | 7,490,000 | 8,706,885 | ||||||||||||
|
| |||||||||||||||
| 34,620,994 | ||||||||||||||||
|
| |||||||||||||||
INDUSTRIALS – 3.4% | ||||||||||||||||
Air Canada (Airlines) | (b) | 8.750% | 04/01/2020 | 1,460,000 | 1,613,300 | |||||||||||
Goodman Networks, Inc. (Building Products) | 12.125% | 07/01/2018 | 2,570,000 | 2,133,100 | ||||||||||||
Masco Corp. (Building Products) | (i) | 6.125% | 10/03/2016 | 5,000,000 | 5,262,500 | |||||||||||
Masco Corp. (Building Products) | 5.950% | 03/15/2022 | 4,934,000 | 5,538,415 | ||||||||||||
USG Corp. (Building Products) | (b) | 7.875% | 03/30/2020 | 4,000,000 | 4,280,000 | |||||||||||
Siemens Financieringsmaatschappij NV (Industrial Conglomerates) | (b) | 6.125% | 08/17/2026 | 3,000,000 | 3,639,420 | |||||||||||
Case New Holland Industrial, Inc. (Machinery) | 7.875% | 12/01/2017 | 980,000 | 1,073,100 | ||||||||||||
Ingersoll-Rand Co. (Machinery) | 6.391% | 11/15/2027 | 2,215,000 | 2,613,126 | ||||||||||||
Ingersoll-Rand Co. (Machinery) | 6.443% | 11/15/2027 | 1,800,000 | 2,151,299 | ||||||||||||
Brightstar Corp. (Trading Companies & Distributors) | (b) | 7.250% | 08/01/2018 | 1,832,000 | 1,937,340 | |||||||||||
|
| |||||||||||||||
| 30,241,600 | ||||||||||||||||
|
| |||||||||||||||
INFORMATION TECHNOLOGY – 1.8% | ||||||||||||||||
Corning, Inc. (Electronic Equip., Instr. & Comp.) | 7.250% | 08/15/2036 | 2,180,000 | 2,743,813 | ||||||||||||
EarthLink Holdings Corp. (Internet Software & Svs.) | 7.375% | 06/01/2020 | 2,400,000 | 2,496,000 | ||||||||||||
First Data Corp. (IT Svs.) | 12.625% | 01/15/2021 | 3,584,000 | 4,139,520 | ||||||||||||
Lender Processing Services, Inc. / Black Knight Lending Solutions, Inc. (IT Svs.) | 5.750% | 04/15/2023 | 6,275,000 | 6,604,437 | ||||||||||||
|
| |||||||||||||||
| 15,983,770 | ||||||||||||||||
|
| |||||||||||||||
MATERIALS – 0.2% | ||||||||||||||||
Vulcan Materials Co. (Construction Materials) | 4.500% | 04/01/2025 | 1,250,000 | 1,246,875 | ||||||||||||
|
| |||||||||||||||
| 87 | (continued) |
| Ohio National Fund, Inc. | Balanced Portfolio (Continued) |
Schedule of Investments | June 30, 2015 (Unaudited) |
| Corporate Bonds (Continued) | Rate | Maturity | Face Amount | Value | ||||||||||||
TELECOMMUNICATION SERVICES – 1.7% | ||||||||||||||||
Cincinnati Bell, Inc. (Diversified Telecom. Svs.) | 8.375% | 10/15/2020 | $ | 3,950,000 | $ | 4,152,438 | ||||||||||
Level 3 Financing, Inc. (Diversified Telecom. Svs.) | 7.000% | 06/01/2020 | 2,000,000 | 2,122,500 | ||||||||||||
Clearwire Communications LLC / Clearwire Finance, Inc. (Wireless Telecom. Svs.) | (b) | 14.750% | 12/01/2016 | 4,506,000 | 5,215,695 | |||||||||||
Sprint Communications, Inc. (Wireless Telecom. Svs.) | 6.000% | 11/15/2022 | 1,755,000 | 1,603,631 | ||||||||||||
Vodafone Group PLC (Wireless Telecom. Svs.) | 6.250% | 11/30/2032 | 1,683,000 | 1,838,612 | ||||||||||||
|
| |||||||||||||||
| 14,932,876 | ||||||||||||||||
|
| |||||||||||||||
UTILITIES – 0.2% | ||||||||||||||||
Tenaska Georgia Partners LP (Electric Utilities) | 9.500% | 02/01/2030 | 1,319,962 | 1,641,984 | ||||||||||||
|
| |||||||||||||||
Total Corporate Bonds (Cost $199,791,915) | $ | 196,308,925 | ||||||||||||||
|
| |||||||||||||||
| Municipal Bonds – 0.4% | Rate | Maturity | Face Amount | Value | ||||||||||||
City of Cape Coral, FL Gas Tax Revenue | 7.147% | 10/01/2030 | $ | 3,000,000 | $ | 3,558,720 | ||||||||||
|
| |||||||||||||||
Total Municipal Bonds (Cost $3,563,851) | $ | 3,558,720 | ||||||||||||||
|
| |||||||||||||||
| Preferred Stocks – 1.5% | Rate | Quantity | Value | |||||||||||||
FINANCIALS – 1.5% | ||||||||||||||||
Charles Schwab Corp. Series A / The (Capital Markets) | (h) | 7.000% | 4,000,000 | $ | 4,643,880 | |||||||||||
Oxford Lane Capital Corp. (Capital Markets) | 8.500% | 2,000 | 50,220 | |||||||||||||
General Electric Capital Corp. (Diversified Financial Svs.) | (h) | 7.125% | 2,500,000 | 2,884,375 | ||||||||||||
Digital Realty Trust, Inc. (Real Estate Investment Trusts) | 7.000% | 22,420 | 573,055 | |||||||||||||
Equity Commonwealth (Real Estate Investment Trusts) | 7.250% | 92,011 | 2,347,201 | |||||||||||||
Gramercy Property Trust, Inc. (Acquired 08/26/2014 through 06/10/2015, Cost $2,380,961)(Real Estate Investment Trusts) | (j) | 7.125% | 102,979 | 2,728,943 | ||||||||||||
|
| |||||||||||||||
Total Preferred Stocks (Cost $13,170,621) | $ | 13,227,674 | ||||||||||||||
|
| |||||||||||||||
| Trust Preferred Securities – 3.9% | Rate | Quantity | Value | |||||||||||||
FINANCIALS – 3.3% | ||||||||||||||||
PNC Preferred Funding Trust II (Banks) | (b)(h) | 1.508% | 4,000,000 | $ | 3,600,000 | |||||||||||
RBS Capital Funding Trust V (Banks) | 5.900% | 246,303 | 5,967,922 | |||||||||||||
USB Capital IX (Banks) | (h) | 3.500% | 1,500,000 | 1,238,250 | ||||||||||||
USB Realty Corp. (Banks) | (b)(h) | 1.422% | 5,000,000 | 4,568,750 | ||||||||||||
NTC Capital I (Capital Markets) | (e) | 0.795% | 3,300,000 | 2,862,750 | ||||||||||||
State Street Capital Trust I (Capital Markets) | (g) | 0.834% | 5,123,000 | 4,444,203 | ||||||||||||
GMAC Capital Trust I (Consumer Finance) | 8.125% | 143,287 | 3,722,596 | |||||||||||||
ILFC E-Capital Trust II (Diversified Financial Svs.) | (b)(f) | 6.250% | 2,900,000 | 2,842,000 | ||||||||||||
|
| |||||||||||||||
| 29,246,471 | ||||||||||||||||
|
| |||||||||||||||
UTILITIES – 0.6% | ||||||||||||||||
PECO Energy Capital Trust IV (Electric Utilities) | 5.750% | 5,000,000 | 4,843,925 | |||||||||||||
|
| |||||||||||||||
Total Trust Preferred Securities (Cost $34,777,379) | $ | 34,090,396 | ||||||||||||||
|
| |||||||||||||||
| Asset-Backed / Mortgage-Backed Securities – 2.3% | Rate | Maturity | Face Amount | Value | ||||||||||||
FINANCIALS – 2.3% | ||||||||||||||||
Citigroup Mortgage Loan Trust 2013-J1 Class B2 (Acquired 05/21/2015, Cost $1,996,379) | (b)(j) | 3.567% | 10/25/2043 | $ | 2,001,383 | $ | 1,995,769 | |||||||||
Citigroup Mortgage Loan Trust, Inc. 2004-NCM2 Class 2CB1 | 5.500% | 08/25/2034 | 1,404,546 | 1,513,946 | ||||||||||||
Fannie Mae Trust 2003-W2 Class 1A4 | 2.986% | 07/25/2042 | 1,631,971 | 1,719,350 | ||||||||||||
MASTR Seasoned Securitization Trust 2005-1 Class 1A1 | 6.617% | 09/25/2032 | 2,336,014 | 2,556,048 | ||||||||||||
Sequoia Mortgage Trust 2013-1 Class B2 (Acquired 04/15/2015, Cost $4,917,160) | (j) | 3.645% | 02/25/2043 | 4,870,385 | 4,690,434 | |||||||||||
Sequoia Mortgage Trust 2013-10 Class B2 (Acquired 02/17/2015, Cost $4,306,412) | (b)(j) | 3.586% | 08/25/2043 | 4,416,833 | 4,149,818 | |||||||||||
Sequoia Mortgage Trust 2014-4 Class B2 (Acquired 03/11/2015, Cost $3,503,715) | (b)(j) | 3.905% | 11/25/2044 | 3,521,322 | 3,496,285 | |||||||||||
|
| |||||||||||||||
Total Asset-Backed / Mortgage-Backed Securities (Cost $20,508,285) | $ | 20,121,650 | ||||||||||||||
|
| |||||||||||||||
| U.S. Treasury Obligations – 9.6% | Rate | Maturity | Face Amount | Value | ||||||||||||
U.S. Treasury Inflation Indexed Bonds | 0.125% | 04/15/2019 | $ | 10,097,300 | $ | 10,216,418 | ||||||||||
U.S. Treasury Inflation Indexed Bonds | 0.125% | 07/15/2024 | 9,964,300 | 9,692,613 | ||||||||||||
U.S. Treasury Note | 0.500% | 09/30/2016 | 20,000,000 | 20,018,760 | ||||||||||||
U.S. Treasury Note | 1.000% | 09/15/2017 | 20,000,000 | 20,110,940 | ||||||||||||
U.S. Treasury Note | 1.875% | 05/31/2022 | 10,000,000 | 9,878,910 | ||||||||||||
U.S. Treasury Note | 2.250% | 11/15/2024 | 15,000,000 | 14,882,820 | ||||||||||||
|
| |||||||||||||||
Total U.S. Treasury Obligations (Cost $83,637,946) | $ | 84,800,461 | ||||||||||||||
|
| |||||||||||||||
| 88 | (continued) |
| Ohio National Fund, Inc. | Balanced Portfolio (Continued) |
Schedule of Investments | June 30, 2015 (Unaudited) |
| Closed-End Mutual Funds – 3.0% | Shares | Value | ||||||||||||
Alliance New York Municipal Income Fund, Inc. | 135,448 | $ | 1,904,399 | |||||||||||
BlackRock Enhanced Government Fund, Inc. | 77,605 | 1,049,996 | ||||||||||||
Delaware Investments Dividend & Income Fund, Inc. | 61,025 | 604,148 | ||||||||||||
Deutsche Global High Income Fund, Inc. | 177,040 | 1,441,106 | ||||||||||||
Diversified Real Asset Income Fund | 149,548 | 2,623,072 | ||||||||||||
Federated Enhanced Treasury Income Fund | 246,001 | 3,249,673 | ||||||||||||
Firsthand Technology Value Fund, Inc. | 70,965 | 912,610 | ||||||||||||
Fort Dearborn Income Securities, Inc. | 107,539 | 1,484,038 | ||||||||||||
LMP Real Estate Income Fund, Inc. | 299,923 | 3,509,099 | ||||||||||||
MFS InterMarket Income Trust I | 212,181 | 1,788,686 | ||||||||||||
Montgomery Street Income Securities, Inc. | 113,373 | 1,858,183 | ||||||||||||
Nuveen Mortgage Opportunity Term Fund | 90,658 | 2,057,030 | ||||||||||||
Western Asset/Claymore Inflation-Linked Opportunities & Income Fund | 92,202 | 1,031,740 | ||||||||||||
Western Asset/Claymore Inflation-Linked Securities & Income Fund | 234,910 | 2,647,436 | ||||||||||||
|
| |||||||||||||
Total Closed-End Mutual Funds (Cost $27,611,924) | $ | 26,161,216 | ||||||||||||
|
| |||||||||||||
| Exchange Traded Funds – 0.9% | Shares | Value | ||||||||||||
SPDR S&P 500 ETF Trust | 40,000 | $ | 8,234,000 | |||||||||||
|
| |||||||||||||
Total Exchange Traded Funds (Cost $8,503,704) | $ | 8,234,000 | ||||||||||||
|
| |||||||||||||
| Purchased Options – 0.6% | Contracts (c) | Value | ||||||||||||
S&P 500 Index Put Option | 1,000 | $ | 4,240,000 | |||||||||||
S&P 500 Index Put Option | 500 | 1,565,000 | ||||||||||||
|
| |||||||||||||
Total Purchased Options (Cost $4,575,913) | $ | 5,805,000 | ||||||||||||
|
| |||||||||||||
| Money Market Funds – 2.3% | Shares | Value | ||||||||||||
Fidelity Institutional Money Market Funds | 20,264,000 | $ | 20,264,000 | |||||||||||
|
| |||||||||||||
Total Money Market Funds (Cost $20,264,000) | $ | 20,264,000 | ||||||||||||
|
| |||||||||||||
Total Investments – 100.9% (Cost $855,662,291) | (k) | $ | 889,226,145 | |||||||||||
Total Written Options Outstanding – (0.0)% (see following schedule) | (115,150) | |||||||||||||
Liabilities in Excess of Other Assets – (0.9)% | (d) | (7,719,820) | ||||||||||||
|
| |||||||||||||
Net Assets – 100.0% | $ | 881,391,175 | ||||||||||||
|
| |||||||||||||
Percentages are stated as a percent of net assets.
Footnotes:
| (a) | Non-income producing security. |
| (b) | Security exempt from registration under Regulation D of the Securities Act of 1933. These securities may be resold in transactions exempt from registration, normally to qualified buyers under Rule 144A. At June 30, 2015, the value of these securities totaled $81,149,899, or 9.2% of the Portfolio’s net assets. These securities were deemed liquid pursuant to procedures approved by the Board of Directors. |
| (c) | 100 shares per contract. |
| (d) | Security is fully or partially pledged as collateral for written call options outstanding. Collateral also includes a portion of the Portfolio’s cash holdings. Outstanding written call options are presented in the following schedule. |
| (e) | Security is a variable rate instrument in which the coupon rate is adjusted quarterly in concert with U.S. LIBOR. Interest rates stated are those in effect at June 30, 2015. |
| (f) | Security is a variable rate instrument in which the coupon rate is fixed until a later specified date, then is adjusted quarterly in concert with U.S. LIBOR, 10 Year Constant Maturity Treasury Rate, or 30 Year Constant Maturity Treasury Rate. Interest rates stated are those in effect at June 30, 2015. |
| (g) | Security is a variable rate trust preferred security in which the dividend rate is adjusted quarterly in concert with U.S. LIBOR. Dividend rates stated are those in effect at June 30, 2015. |
| (h) | Security is a variable rate preferred stock or trust preferred security in which the dividend rate is fixed until a later specified date, then is adjusted quarterly in concert with U.S. LIBOR. Dividend rates stated are those in effect at June 30, 2015. |
| (i) | Represents bonds that are credit sensitive. The coupon rates for these bonds are subject to adjustment based on changes in national credit rating agency ratings. |
| (j) | Represents a security deemed to be illiquid. At June 30, 2015, the value of illiquid securities in the Portfolio totaled $17,061,249, or 1.9% of the Portfolio’s net assets. |
| (k) | Represents cost for financial reporting purposes, which may differ from cost basis for federal income tax purposes. See also Note 7 of the Notes to Financial Statements. |
The accompanying notes are an integral part of these financial statements.
| 89 | (continued) |
| Ohio National Fund, Inc. | Balanced Portfolio (Continued) |
Schedule of Written Options Outstanding | June 30, 2015 (Unaudited) |
| Contracts* | Value | |||||
S&P 500 Index Call Option | ||||||
Expiration: August 2015, Exercise Price: $2,175.00 | 350 | $ | 115,150 | |||
|
|
| ||||
Total Written Options Outstanding (Premiums received $419,531) | 350 | $ | 115,150 | |||
|
|
| ||||
| * | 100 shares per contract. |
The accompanying notes are an integral part of these financial statements.
| 90 |
| Ohio National Fund, Inc. | Target VIP Portfolio |
Objective/Strategy
The Target VIP Portfolio seeks an above average total return by investing in the common stocks of companies which are identified by a model which applies separate uniquely specialized strategies.
Performance as of June 30, 2015
Average Annual Returns: | ||||
One year | 2.70% | |||
Five years | 17.02% | |||
Since inception (11/2/05) | 5.20% |
Past performance does not guarantee future results. The performance data quoted represents past performance and current returns may be lower or higher. Total return figures include change in share price and reinvestment of dividends and capital gains. The investment return and principal value will fluctuate so that an investor’s shares, when redeemed, may be worth more or less than the original cost. To obtain performance information up to the most recent month end, call toll-free 1-877-781-6392.
The Portfolio is not open to direct retail investment. Beneficial interest in shares is obtained solely by purchase of variable life insurance policies and variable annuity contracts. Actual performance results for variable annuity and variable universal life contracts will be lower due to contract charges. Consult your contract for applicable charges.
Comments
For the six-month period ended June 30, 2015, the Target VIP Portfolio returned 2.07% versus 1.94% for the current benchmark, the Russell 3000 Index.
U.S. equities posted modest gains over the reporting period. Economic data was sluggish to begin the year, but steadily gained momentum by period end. Harsh winter weather and a west coast port strike were blamed for generally weaker than expected first quarter growth. This, combined with the impact of the stronger dollar, led to muted earnings growth in the first quarter. The slow start to the year pushed out expectations for the first Federal Reserve rate hike. The push out of rate hikes was generally viewed in a positive light by equity investors. With employment data gradually strengthening, along with steadily improving economic data later in the first half of the year, the consensus forecast is now calling for rate hikes to begin this fall. Though rate hikes appear imminent, interest rates near historic lows and improving economic fundamentals should continue to support investors’ risk appetite and demand for equities.
The Portfolio had its annual rebalance in early January 2015. Though the selection process for the underlying strategies did not change, there were changes in the sector exposure of the Portfolio as a result of the rebalance. The rebalance resulted in additional exposure to the Industrials, Consumer Discretionary and Consumer Staples sectors. Industrials are now overweight, while the additional Consumer Discretionary exposure increased its overweight. Consumer Staples remains underweight. The sectors losing notable weight as a result of the rebalance were Financials and Energy. Both sectors are underweight in relation to the benchmark.(1)
The Health Care sector was the biggest contributor to relative performance, as stock selection drove performance in the sector. Gilead Sciences, Inc. and Insys Therapeutics, Inc. were among the top five contributors in the Portfolio for the period. Stock selection was also positive in the Consumer Staples and Energy sectors, led
by The Kroger Co. and Tesoro Corp., respectively. A large underweight in the Financials sector also contributed to relative performance, as the sector underperformed the broader market for the period.(1)
Stock selection in Information Technology resulted in the sector being the biggest detractor from relative performance. Micron Technology, Inc. and Intel Corp. were the two biggest detractors in the Portfolio over the period. Stock selection in the Industrials sector also weighed on relative performance. 3M Co. and United Continental Holdings, Inc. were among the Portfolio’s holdings in the sector that had a negative impact on performance. An overweight to Utilities also hurt the Portfolio, as the sector was the worst performer amid investors’ expectations of Federal Reserve rate hikes later in the year.(1)
The Portfolio’s best performers were Repligen Corp., Ellie Mae, Inc., Insys Therapeutics, Inc., AMN Healthcare Services, Inc. and Gentherm, Inc. The worst performers were Micron Technology, Inc., OraSure Technologies, Inc., Keurig Green Mountain, Inc., Avis Budget Group, Inc. and Zumiez, Inc. The Portfolio’s top contributors to performance were Apple, Inc., The Walt Disney Co., Gilead Sciences, Inc., Insys Therapeutics, Inc. and The Home Depot, Inc. The top detractors from performance were Micron Technology, Inc., Intel Corp., Yahoo! Inc., 3M Co. and United Continental Holdings, Inc.(1)
As we look to the second half of 2015, equities continue to offer an attractive risk/reward proposition relative to other asset classes in our opinion. The Greek situation in Europe and potential Federal Reserve rate hikes here at home are areas to keep an eye on as they could lead to near-term increases in market volatility. Taking a longer term view though, we view steady economic growth, historically low interest rates and strong corporate balance sheets as reasons to remain positive on equities. As always, we remain consistent in the application of the six strategies underlying the Portfolio. The result is a Portfolio with broad exposures across the size and sector spectrum, which we believe provides diversification along with upside potential.
| (1) | The Portfolio’s composition is subject to change. Holdings and weightings are as of June 30, 2015. |
Change in Value of $10,000 Investment
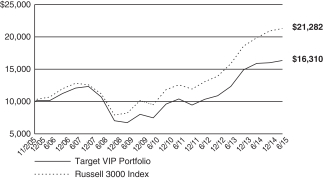
Hypothetical illustration based on past performance. Future performance will vary. The Portfolio’s returns reflect reinvested dividends. The Portfolio’s holdings may differ significantly from the securities in the index. The index is unmanaged and therefore does not reflect the cost of portfolio management and accounting.
The Russell 3000 Index measures the performance of the largest 3000 U.S. companies representing approximately 98% of the investable U.S. equity market. The Russell 3000 Index is constructed to provide a comprehensive, unbiased, and stable barometer of the broad market and is completely reconstituted annually to ensure new and growing equities are reflected. The index presented includes the effects of reinvested dividends.
| 91 | (continued) |
| Ohio National Fund, Inc. | Target VIP Portfolio (Continued) |
Portfolio Composition as of June 30, 2015 (1)
| % of Net Assets | ||||
Common Stocks (3) | 99.0 | |||
Money Market Funds and | 1.0 | |||
|
| |||
| 100.0 | ||||
|
|
Top 10 Portfolio Holdings as of June 30, 2015 (1) (2)
| % of Net Assets | ||||
1. Apple, Inc. | 8.0 | |||
2. Home Depot, Inc. / The | 5.2 | |||
3. 3M Co. | 4.3 | |||
4. Taiwan Semiconductor Manufacturing Co Ltd. – ADR | 4.1 | |||
5. Walt Disney Co. / The | 3.9 | |||
6. Boeing Co. / The | 3.4 | |||
7. AT&T, Inc. | 3.4 | |||
8. Gilead Sciences, Inc. | 3.2 | |||
9. Intel Corp. | 2.6 | |||
10. Amgen, Inc. | 2.2 |
| (1) | Composition of Portfolio subject to change. |
| (2) | Short-term investments have been excluded from the list of Top 10 Portfolio Holdings. |
| (3) | Sectors: |
| % of Net Assets | ||||
Information Technology | 20.0 | |||
Consumer Discretionary | 18.0 | |||
Health Care | 15.2 | |||
Industrials | 12.8 | |||
Telecommunication Services | 6.6 | |||
Financials | 6.6 | |||
Energy | 6.3 | |||
Consumer Staples | 5.6 | |||
Utilities | 4.2 | |||
Materials | 3.7 | |||
|
| |||
| 99.0 | ||||
|
|
| 92 |
| Ohio National Fund, Inc. | Target VIP Portfolio |
Schedule of Investments | June 30, 2015 (Unaudited) |
| Common Stocks – 99.0% | Shares | Value | ||||||||
CONSUMER DISCRETIONARY – 18.0% | ||||||||||
American Axle & Manufacturing Holdings, Inc. (Auto Components) | (a) | 3,798 | $ | 79,416 | ||||||
Delphi Automotive PLC (Auto Components) | 6,578 | 559,722 | ||||||||
Gentherm, Inc. (Auto Components) | (a) | 7,164 | 393,375 | |||||||
Magna International, Inc. (Auto Components) | 9,183 | 515,074 | ||||||||
Tata Motors Ltd. – ADR (Automobiles) | 11,943 | 411,675 | ||||||||
Core-Mark Holding Co., Inc. (Distributors) | 4,631 | 274,387 | ||||||||
BJ’s Restaurants, Inc. (Hotels, Restaurants & Leisure) | (a) | 5,170 | 250,486 | |||||||
Brinker International, Inc. (Hotels, Restaurants & Leisure) | 1,465 | 84,457 | ||||||||
Marriott International, Inc. Class A (Hotels, Restaurants & Leisure) | 1,799 | 133,828 | ||||||||
Popeye’s Louisiana Kitchen, Inc. (Hotels, Restaurants & Leisure) | (a) | 4,683 | 280,933 | |||||||
Universal Electronics, Inc. (Household Durables) | (a) | 3,143 | 156,647 | |||||||
Cablevision Systems Corp. Class A (Media) | 4,796 | 114,816 | ||||||||
Walt Disney Co. / The (Media) | 18,203 | 2,077,690 | ||||||||
Dillard’s, Inc. Class A (Multiline Retail) | 830 | 87,308 | ||||||||
Dollar Tree, Inc. (Multiline Retail) | (a) | 1,913 | 151,108 | |||||||
Bed Bath & Beyond, Inc. (Specialty Retail) | (a) | 2,929 | 202,042 | |||||||
Caleres, Inc. (Specialty Retail) | 2,674 | 84,980 | ||||||||
Cato Corp. / The Class A (Specialty Retail) | 5,215 | 202,133 | ||||||||
Home Depot, Inc. / The (Specialty Retail) | 24,832 | 2,759,580 | ||||||||
O’Reilly Automotive, Inc. (Specialty Retail) | (a) | 953 | 215,359 | |||||||
Outerwall, Inc. (Specialty Retail) | 1,154 | 87,831 | ||||||||
Ross Stores, Inc. (Specialty Retail) | 3,896 | 189,385 | ||||||||
Zumiez, Inc. (Specialty Retail) | (a) | 5,820 | 154,987 | |||||||
|
| |||||||||
| 9,467,219 | ||||||||||
|
| |||||||||
CONSUMER STAPLES – 5.6% | ||||||||||
Brown-Forman Corp. Class B (Beverages) | 1,003 | 100,481 | ||||||||
Dr Pepper Snapple Group, Inc. (Beverages) | 1,525 | 111,172 | ||||||||
Monster Beverage Corp. (Beverages) | (a) | 1,588 | 212,824 | |||||||
Kroger Co. / The (Food & Staples Retailing) | 10,826 | 784,993 | ||||||||
Keurig Green Mountain, Inc. (Food Products) | 1,546 | 118,470 | ||||||||
Sanderson Farms, Inc. (Food Products) | 993 | 74,634 | ||||||||
USANA Health Sciences, Inc. (Personal Products) | (a) | 2,470 | 337,550 | |||||||
Altria Group, Inc. (Tobacco) | 15,575 | 761,773 | ||||||||
Imperial Tobacco Group PLC – ADR (Tobacco) | 4,898 | 472,657 | ||||||||
|
| |||||||||
| 2,974,554 | ||||||||||
|
| |||||||||
ENERGY – 6.3% | ||||||||||
FMC Technologies, Inc. (Energy Equip. & Svs.) | (a) | 429 | 17,799 | |||||||
BP PLC – ADR (Oil, Gas & Consumable Fuels) | 11,235 | 448,951 | ||||||||
Eni SpA – ADR (Oil, Gas & Consumable Fuels) | 12,277 | 436,816 | ||||||||
Exxon Mobil Corp. (Oil, Gas & Consumable Fuels) | 7,622 | 634,150 | ||||||||
Hess Corp. (Oil, Gas & Consumable Fuels) | 542 | 36,249 | ||||||||
REX American Resources Corp. (Oil, Gas & Consumable Fuels) | (a) | 1,609 | 102,397 | |||||||
Royal Dutch Shell PLC Class B – ADR (Oil, Gas & Consumable Fuels) | 6,160 | 353,276 | ||||||||
Statoil ASA – ADR (Oil, Gas & Consumable Fuels) | 24,253 | 434,129 | ||||||||
Synergy Resources Corp. (Oil, Gas & Consumable Fuels) | (a) | 17,532 | 200,391 | |||||||
Tesoro Corp. (Oil, Gas & Consumable Fuels) | 2,795 | 235,926 | ||||||||
TOTAL SA – ADR (Oil, Gas & Consumable Fuels) | 8,365 | 411,307 | ||||||||
|
| |||||||||
| 3,311,391 | ||||||||||
|
| |||||||||
FINANCIALS – 6.6% | ||||||||||
HSBC Holdings PLC – ADR (Banks) | 9,091 | 407,368 | ||||||||
Standard Chartered PLC (Banks) | 30,122 | 490,085 | ||||||||
Swedbank AB – ADR (Banks) | 17,041 | 399,441 | ||||||||
HFF, Inc. Class A (Capital Markets) | 7,550 | 315,061 | ||||||||
Legg Mason, Inc. (Capital Markets) | 3,067 | 158,043 | ||||||||
Piper Jaffray Cos. (Capital Markets) | (a) | 3,226 | 140,783 | |||||||
Moody’s Corp. (Diversified Financial Svs.) | 5,588 | 603,280 | ||||||||
Allstate Corp. / The (Insurance) | 11,149 | 723,236 | ||||||||
United Insurance Holdings Corp. (Insurance) | 4,163 | 64,693 | ||||||||
Universal Insurance Holdings, Inc. (Insurance) | 6,784 | 164,173 | ||||||||
|
| |||||||||
| 3,466,163 | ||||||||||
|
| |||||||||
| Common Stocks (Continued) | Shares | Value | ||||||||
HEALTH CARE – 15.2% | ||||||||||
Amgen, Inc. (Biotechnology) | 7,591 | $ | 1,165,370 | |||||||
Gilead Sciences, Inc. (Biotechnology) | 14,374 | 1,682,908 | ||||||||
Insys Therapeutics, Inc. (Biotechnology) | (a) | 14,012 | 503,311 | |||||||
MiMedx Group, Inc. (Biotechnology) | (a) | 21,664 | 251,086 | |||||||
Repligen Corp. (Biotechnology) | (a) | 6,503 | 268,379 | |||||||
Abaxis, Inc. (Health Care Equip. & Supplies) | 4,481 | 230,682 | ||||||||
Edwards Lifesciences Corp. (Health Care Equip. & Supplies) | (a) | 1,234 | 175,759 | |||||||
Intuitive Surgical, Inc. (Health Care Equip. & Supplies) | (a) | 421 | 203,974 | |||||||
Natus Medical, Inc. (Health Care Equip. & Supplies) | (a) | 6,500 | 276,640 | |||||||
OraSure Technologies, Inc. (Health Care Equip. & Supplies) | (a) | 11,268 | 60,735 | |||||||
AMN Healthcare Services, Inc. (Health Care Providers & Svs.) | (a) | 9,308 | 294,040 | |||||||
HCA Holdings, Inc. (Health Care Providers & Svs.) | (a) | 9,610 | 871,819 | |||||||
Providence Service Corp. / The (Health Care Providers & Svs.) | (a) | 3,222 | 142,670 | |||||||
Albany Molecular Research, Inc. (Life Sciences Tools & Svs.) | (a) | 6,420 | 129,812 | |||||||
Depomed, Inc. (Pharmaceuticals) | (a) | 11,654 | 250,095 | |||||||
Eli Lilly & Co. (Pharmaceuticals) | 12,912 | 1,078,023 | ||||||||
GlaxoSmithKline PLC – ADR (Pharmaceuticals) | 10,070 | 419,416 | ||||||||
|
| |||||||||
| 8,004,719 | ||||||||||
|
| |||||||||
INDUSTRIALS – 12.8% | ||||||||||
Boeing Co. / The (Aerospace & Defense) | 13,076 | 1,813,903 | ||||||||
Huntington Ingalls Industries, Inc. (Aerospace & Defense) | 1,072 | 120,696 | ||||||||
Northrop Grumman Corp. (Aerospace & Defense) | 1,307 | 207,329 | ||||||||
TASER International, Inc. (Aerospace & Defense) | (a) | 10,410 | 346,757 | |||||||
C.H. Robinson Worldwide, Inc. (Air Freight & Logistics) | 2,091 | 130,457 | ||||||||
Echo Global Logistics, Inc. (Air Freight & Logistics) | (a) | 4,774 | 155,919 | |||||||
Alaska Air Group, Inc. (Airlines) | 2,925 | 188,458 | ||||||||
United Continental Holdings, Inc. (Airlines) | (a) | 8,044 | 426,412 | |||||||
ACCO Brands Corp. (Commercial Svs. & Supplies) | (a) | 22,536 | 175,105 | |||||||
3M Co. (Industrial Conglomerates) | 14,519 | 2,240,282 | ||||||||
Greenbrier Cos., Inc. / The (Machinery) | 7,143 | 334,650 | ||||||||
Avis Budget Group, Inc. (Road & Rail) | (a) | 2,322 | 102,354 | |||||||
Ryder System, Inc. (Road & Rail) | 1,173 | 102,485 | ||||||||
Saia, Inc. (Road & Rail) | (a) | 4,872 | 191,421 | |||||||
United Rentals, Inc. (Trading Companies & Distributors) | (a) | 2,237 | 196,006 | |||||||
|
| |||||||||
| 6,732,234 | ||||||||||
|
| |||||||||
INFORMATION TECHNOLOGY – 20.0% | ||||||||||
F5 Networks, Inc. (Communications Equip.) | (a) | 179 | 21,543 | |||||||
OSI Systems, Inc. (Electronic Equip., Instr. & Comp.) | (a) | 3,976 | 281,461 | |||||||
Sanmina Corp. (Electronic Equip., Instr. & Comp.) | (a) | 3,625 | 73,080 | |||||||
DHI Group, Inc. (Internet Software & Svs.) | (a) | 10,588 | 94,127 | |||||||
LogMeIn, Inc. (Internet Software & Svs.) | (a) | 4,847 | 312,583 | |||||||
Yahoo!, Inc. (Internet Software & Svs.) | (a) | 10,976 | 431,247 | |||||||
Intel Corp. (Semiconductors & Equip.) | 45,622 | 1,387,593 | ||||||||
Lam Research Corp. (Semiconductors & Equip.) | 1,079 | 87,777 | ||||||||
Micron Technology, Inc. (Semiconductors & Equip.) | (a) | 33,857 | 637,866 | |||||||
Taiwan Semiconductor Manufacturing Co Ltd. – ADR (Semiconductors & Equip.) | 95,983 | 2,179,774 | ||||||||
Ellie Mae, Inc. (Software) | (a) | 5,792 | 404,224 | |||||||
Qualys, Inc. (Software) | (a) | 6,845 | 276,196 | |||||||
Apple, Inc. (Tech. Hardware, Storage & Periph.) | 33,476 | 4,198,727 | ||||||||
Seagate Technology PLC (Tech. Hardware, Storage & Periph.) | 3,097 | 147,107 | ||||||||
|
| |||||||||
| 10,533,305 | ||||||||||
|
| |||||||||
MATERIALS – 3.7% | ||||||||||
Celanese Corp. (Chemicals) | 3,401 | 244,464 | ||||||||
Headwaters, Inc. (Construction Materials) | (a) | 14,396 | 262,295 | |||||||
Packaging Corp. of America (Containers & Packaging) | 2,176 | 135,978 | ||||||||
Anglo American PLC – ADR (Metals & Mining) | 46,738 | 338,383 | ||||||||
| 93 | (continued) |
| Ohio National Fund, Inc. | Target VIP Portfolio (Continued) |
Schedule of Investments | June 30, 2015 (Unaudited) |
| Common Stocks (Continued) | Shares | Value | ||||||||
MATERIALS (continued) | ||||||||||
BHP Billiton Ltd. – ADR (Metals & Mining) | 9,007 | $ | 366,675 | |||||||
Rio Tinto PLC – ADR (Metals & Mining) | 9,253 | 381,316 | ||||||||
South32 Ltd. – ADR (Metals & Mining) | (a) | 3,653 | 24,512 | |||||||
Neenah Paper, Inc. (Paper & Forest Products) | 3,325 | 196,042 | ||||||||
|
| |||||||||
| 1,949,665 | ||||||||||
|
| |||||||||
TELECOMMUNICATION SERVICES – 6.6% | ||||||||||
AT&T, Inc. (Diversified Telecom. Svs.) | 50,580 | 1,796,602 | ||||||||
Consolidated Communications Holdings, Inc. (Diversified Telecom. Svs.) | 10,056 | 211,277 | ||||||||
Iridium Communications, Inc. (Diversified Telecom. Svs.) | (a) | 19,013 | 172,828 | |||||||
Telenor ASA – ADR (Diversified Telecom. Svs.) | 7,057 | 462,974 | ||||||||
TeliaSonera AB – ADR (Diversified Telecom. Svs.) | 33,156 | 389,915 | ||||||||
Vodafone Group PLC – ADR (Wireless Telecom. Svs.) | 12,532 | 456,791 | ||||||||
|
| |||||||||
| 3,490,387 | ||||||||||
|
| |||||||||
UTILITIES – 4.2% | ||||||||||
Electricite de France SA – ADR (Electric Utilities) | 78,493 | 349,294 | ||||||||
Empire District Electric Co. / The (Electric Utilities) | 8,875 | 193,475 | ||||||||
Southern Co. / The (Electric Utilities) | 3,271 | 137,055 | ||||||||
| Common Stocks (Continued) | Shares | Value | ||||||||
UTILITIES (continued) | ||||||||||
SSE PLC – ADR (Electric Utilities) | 17,000 | $ | 410,720 | |||||||
GDF Suez – ADR (Multi-Utilities) | 18,314 | 341,098 | ||||||||
National Grid PLC – ADR (Multi-Utilities) | 6,074 | 392,198 | ||||||||
SCANA Corp. (Multi-Utilities) | 519 | 26,287 | ||||||||
Sempra Energy (Multi-Utilities) | 895 | 88,551 | ||||||||
American States Water Co. (Water Utilities) | 7,790 | 291,268 | ||||||||
|
| |||||||||
| 2,229,946 | ||||||||||
|
| |||||||||
Total Common Stocks (Cost $49,323,993) | $ | 52,159,583 | ||||||||
|
| |||||||||
| Money Market Funds – 0.9% | Shares | Value | ||||||||
Fidelity Institutional Money Market Funds | 467,000 | $ | 467,000 | |||||||
|
| |||||||||
Total Money Market Funds (Cost $467,000) | $ | 467,000 | ||||||||
|
| |||||||||
Total Investments – 99.9% (Cost $49,790,993) | (b) | $ | 52,626,583 | |||||||
Other Assets in Excess of Liabilities – 0.1% | 67,008 | |||||||||
|
| |||||||||
Net Assets – 100.0% | $ | 52,693,591 | ||||||||
|
| |||||||||
Percentages are stated as a percent of net assets.
Abbreviations:
ADR: American Depositary Receipts
Footnotes:
| (a) | Non-income producing security. |
| (b) | Represents cost for financial reporting purposes, which may differ from cost basis for federal income tax purposes. See also Note 7 of the Notes to Financial Statements. |
The accompanying notes are an integral part of these financial statements.
| 94 |
| Ohio National Fund, Inc. | Bristol Growth Portfolio |
Objective/Strategy
The Bristol Growth Portfolio seeks long-term growth of capital by investing primarily in common stocks of the 1,000 largest publicly traded U.S. companies in terms of market capitalization.
Performance as of June 30, 2015
Average Annual Returns: | ||||
One year | 11.52% | |||
Five years | 17.21% | |||
Since inception (5/1/07) | 7.23% |
Past performance does not guarantee future results. The performance data quoted represents past performance and current returns may be lower or higher. Total return figures include change in share price and reinvestment of dividends and capital gains. The investment return and principal value will fluctuate so that an investor’s shares, when redeemed, may be worth more or less than the original cost. To obtain performance information up to the most recent month end, call toll-free 1-877-781-6392.
The Portfolio is not open to direct retail investment. Beneficial interest in shares is obtained solely by purchase of variable life insurance policies and variable annuity contracts. Actual performance results for variable annuity and variable universal life contracts will be lower due to contract charges. Consult your contract for applicable charges.
Comments
For the six-month period ended June 30, 2015, the Bristol Growth Portfolio returned 5.72% versus 3.96% for the current benchmark, the Russell 1000 Growth Index.
The year began with many thinking macroeconomic fundamentals had firmed amidst global monetary easing. While the U.S. Federal Reserve ended its historic bond-buying stimulus program, the European Central Bank continued its own stimulus measures and the Japanese Central Bank continued efforts to create growth and inflation. The end of the Federal Reserve’s quantitative easing introduced new controversy, as investors shifted to debating the timing of potential interest rate hikes. Economic data points that traditionally would have been seen as positive indicators began to raise fears that yields could move higher sooner than expected. Meanwhile, Greece reappeared in the headlines, as its position within the European Union became more uncertain. A new Greek government was elected with a mandate to take a hard stance on its debt obligations, while the European Troika refused to renegotiate. Domestically, the turmoil in the North American energy sector continued to work its way through the system, with a lack of consensus about the length and depth of the downturn. These uncertainties were compounded by fear of the potential return of Iranian oil to global markets.
The outperformance for the period was driven primarily by the 477 basis point outperformance in Health Care, most of which resulted from positive stock selection rather than the sector’s overweight. Industrials and Financials also benefited from positive stock selection, but weakness in Information Technology names detracted on a relative basis.(1)
The Portfolio’s best performers for the reporting period were Intercept Pharmaceuticals, Inc., Pharmacyclics, Inc., Humana, Inc., Clovis Oncology, Inc. and Amazon.com, Inc. The Portfolio’s worst performers were PVH Corp., VeriFone Systems, Inc., Intel Corp., Yahoo!, Inc. and The Procter & Gamble Co. The top contributors to performance were Clovis Oncology, Inc., Pharmacyclics, Inc., Inter-
cept Pharmaceuticals, Inc., Apple, Inc. and Amazon.com, Inc. The top detractors from performance were PVH Corp., Intel Corp., Yahoo!, Inc., Microsoft Corp., and The Procter & Gamble Co.(1)
The top contributor to the Portfolio’s performance, at 124 basis points, was Clovis Oncology, Inc. due to mediocre results from its main competitor Astra Zeneca, as well as positive data on its ovarian cancer drug. Pharmacyclics, Inc. contributed 115 basis points as its new cancer drug expectations were raised and the company was eventually purchased. Intercept Pharmaceuticals, Inc. contributed 104 basis points due to positive results from its NASH drug as well as the failings of competing drugs. Apple, Inc. added 70 basis points due to strong iPhone sales. Amazon.com, Inc. added 60 basis points, as near term profitability for the company improved and improved trends in the Prime business provide greater visibility for the company’s long term profitability outlook.(1)
Detractors from Portfolio performance during the reporting period included PVH Corp., detracting 42 basis points due to currency translation impact from the weak Euro. Intel Corp. detracted 38 basis points and Microsoft Corp. detracted 26 basis points due to weak PC sales. Yahoo!, Inc. detracted 29 basis points due to concerns regarding its ability to spinoff Alibaba in a tax efficient manner. The Procter & Gamble Co. detracted 24 basis points due to weak organic sales growth and currency translation impact.(1)
For the balance of the year, we remain optimistic. While concerns regarding China and Greece have made their way into the headlines again, the risks to both regions should be contained. The Chinese government still has many levers to pull to stimulate its economy and Greece should have a minimal impact on the European economy even if it exits the European Union. The corporate profit picture looks positive though slightly below historical trendline and the market seems well prepared for an increase in interest rates as the Federal Reserve tries to normalize. With valuations being “fair” at this point, we believe our continued focus on companies with a strong competitive position and ability to gain market share will help benefit our performance going forward.
| The Portfolio’s composition is subject to change. Holdings and weightings are as of June 30, 2015. |
Change in Value of $10,000 Investment
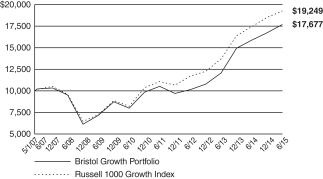
Hypothetical illustration based on past performance. Future performance will vary. The Portfolio’s returns reflect reinvested dividends. The Portfolio’s holdings may differ significantly from the securities in the index. The index is unmanaged and therefore does not reflect the cost of portfolio management and accounting.
The Russell 1000 Growth Index is a market-capitalization weighted index of those firms in the Russell 1000 Index with higher price-to-book ratios and higher forecasted growth values. The Russell 1000 Index measures the performance of the large-cap segment of the U.S. equity universe. The index presented herein includes the effects of requested dividends.
| 95 | (continued) |
| Ohio National Fund, Inc. | Bristol Growth Portfolio (Continued) |
Portfolio Composition as of June 30, 2015 (1)
| % of Net Assets | ||||
Common Stocks (3) | 99.0 | |||
Money Market Funds and | 1.0 | |||
|
| |||
| 100.0 | ||||
|
|
Top 10 Portfolio Holdings as of June 30, 2015 (1) (2)
| % of Net Assets | ||||
1. Apple, Inc. | 4.3 | |||
2. Microsoft Corp. | 3.8 | |||
3. Thermo Fisher Scientific, Inc. | 2.6 | |||
4. Honeywell International, Inc. | 2.6 | |||
5. Amgen, Inc. | 2.5 | |||
6. Oracle Corp. | 2.4 | |||
7. St. Jude Medical, Inc. | 2.4 | |||
8. Prudential Financial, Inc. | 2.3 | |||
9. Danaher Corp. | 2.2 | |||
10. Bank of America Corp. | 2.2 |
| (1) | Composition of Portfolio subject to change. |
| (2) | Short-term investments have been excluded from the list of Top 10 Portfolio Holdings. |
| (3) | Sectors: |
| % of Net Assets | ||||
Information Technology | 25.5 | |||
Consumer Discretionary | 20.2 | |||
Health Care | 17.8 | |||
Industrials | 11.6 | |||
Consumer Staples | 7.6 | |||
Financials | 6.5 | |||
Materials | 4.6 | |||
Energy | 4.1 | |||
Telecommunication Services | 1.1 | |||
|
| |||
| 99.0 | ||||
|
|
| 96 |
| Ohio National Fund, Inc. | Bristol Growth Portfolio |
Schedule of Investments | June 30, 2015 (Unaudited) |
| Common Stocks – 99.0% | Shares | Value | ||||||||
CONSUMER DISCRETIONARY – 20.2% | ||||||||||
Johnson Controls, Inc. (Auto Components) | 50,796 | $ | 2,515,926 | |||||||
Chipotle Mexican Grill, Inc. (Hotels, Restaurants & Leisure) | (a) | 3,362 | 2,033,976 | |||||||
Jarden Corp. (Household Durables) | (a) | 49,696 | 2,571,768 | |||||||
Amazon.com, Inc. (Internet & Catalog Retail) | (a) | 5,909 | 2,565,038 | |||||||
CBS Corp. Class B (Media) | 44,147 | 2,450,158 | ||||||||
Twenty-First Century Fox, Inc. Class A (Media) | 38,734 | 1,260,598 | ||||||||
Viacom, Inc. Class B (Media) | 37,796 | 2,443,133 | ||||||||
Walt Disney Co. / The (Media) | 23,825 | 2,719,386 | ||||||||
Lowe’s Cos., Inc. (Specialty Retail) | 37,279 | 2,496,575 | ||||||||
Tiffany & Co. (Specialty Retail) | 15,864 | 1,456,315 | ||||||||
PVH Corp. (Textiles, Apparel & Luxury Goods) | 22,093 | 2,545,114 | ||||||||
|
| |||||||||
| 25,057,987 | ||||||||||
|
| |||||||||
CONSUMER STAPLES – 7.6% | ||||||||||
Coca-Cola Co. / The (Beverages) | 55,912 | 2,193,428 | ||||||||
Tyson Foods, Inc. Class A (Food Products) | 59,156 | 2,521,820 | ||||||||
Colgate-Palmolive Co. (Household Products) | 38,275 | 2,503,568 | ||||||||
Procter & Gamble Co. / The (Household Products) | 27,982 | 2,189,312 | ||||||||
|
| |||||||||
| 9,408,128 | ||||||||||
|
| |||||||||
ENERGY – 4.1% | ||||||||||
Anadarko Petroleum Corp. (Oil, Gas & Consumable Fuels) | 31,568 | 2,464,198 | ||||||||
Devon Energy Corp. (Oil, Gas & Consumable Fuels) | 34,640 | 2,060,734 | ||||||||
Newfield Exploration Co. (Oil, Gas & Consumable Fuels) | (a) | 16,729 | 604,251 | |||||||
|
| |||||||||
| 5,129,183 | ||||||||||
|
| |||||||||
FINANCIALS – 6.5% | ||||||||||
Bank of America Corp. (Banks) | 161,231 | 2,744,152 | ||||||||
Hartford Financial Services Group, Inc. / The (Insurance) | 60,476 | 2,513,987 | ||||||||
Prudential Financial, Inc. (Insurance) | 32,134 | 2,812,368 | ||||||||
|
| |||||||||
| 8,070,507 | ||||||||||
|
| |||||||||
HEALTH CARE – 17.8% | ||||||||||
Amgen, Inc. (Biotechnology) | 20,007 | 3,071,475 | ||||||||
Celgene Corp. (Biotechnology) | (a) | 13,556 | 1,568,904 | |||||||
Receptos, Inc. (Biotechnology) | (a) | 11,331 | 2,153,457 | |||||||
St. Jude Medical, Inc. (Health Care Equip. & Supplies) | 39,991 | 2,922,142 | ||||||||
Aetna, Inc. (Health Care Providers & Svs.) | 14,519 | 1,850,592 | ||||||||
HCA Holdings, Inc. (Health Care Providers & Svs.) | (a) | 26,626 | 2,415,511 | |||||||
Thermo Fisher Scientific, Inc. (Life Sciences Tools & Svs.) | 25,262 | 3,277,997 | ||||||||
Allergan PLC (Pharmaceuticals) | (a) | 8,380 | 2,542,995 | |||||||
Mylan NV (Pharmaceuticals) | (a) | 34,448 | 2,337,641 | |||||||
|
| |||||||||
| 22,140,714 | ||||||||||
|
| |||||||||
| Common Stocks (Continued) | Shares | Value | ||||||||
INDUSTRIALS – 11.6% | ||||||||||
Honeywell International, Inc. (Aerospace & Defense) | 31,245 | $ | 3,186,053 | |||||||
Lockheed Martin Corp. (Aerospace & Defense) | 13,430 | 2,496,637 | ||||||||
United Technologies Corp. (Aerospace & Defense) | 10,767 | 1,194,383 | ||||||||
FedEx Corp. (Air Freight & Logistics) | 13,986 | 2,383,214 | ||||||||
Danaher Corp. (Industrial Conglomerates) | 32,093 | 2,746,840 | ||||||||
Xylem, Inc. (Machinery) | 66,166 | 2,452,774 | ||||||||
|
| |||||||||
| 14,459,901 | ||||||||||
|
| |||||||||
INFORMATION TECHNOLOGY – 25.5% | ||||||||||
Facebook, Inc. Class A (Internet Software & Svs.) | (a) | 28,909 | 2,479,380 | |||||||
Google, Inc. Class A (Internet Software & Svs.) | (a) | 4,335 | 2,341,073 | |||||||
Google, Inc. Class C (Internet Software & Svs.) | (a) | 4,223 | 2,198,114 | |||||||
MasterCard, Inc. Class A (IT Svs.) | 28,397 | 2,654,552 | ||||||||
Visa, Inc. (IT Svs.) | 37,316 | 2,505,769 | ||||||||
Avago Technologies Ltd. (Semiconductors & Equip.) | 18,450 | 2,452,558 | ||||||||
Intel Corp. (Semiconductors & Equip.) | 74,707 | 2,272,213 | ||||||||
Microsoft Corp. (Software) | 106,885 | 4,718,973 | ||||||||
Oracle Corp. (Software) | 74,511 | 3,002,793 | ||||||||
Apple, Inc. (Tech. Hardware, Storage & Periph.) | 42,400 | 5,318,020 | ||||||||
Hewlett-Packard Co. (Tech. Hardware, Storage & Periph.) | 57,471 | 1,724,705 | ||||||||
|
| |||||||||
| 31,668,150 | ||||||||||
|
| |||||||||
MATERIALS – 4.6% | ||||||||||
Dow Chemical Co. / The (Chemicals) | 38,362 | 1,962,984 | ||||||||
Huntsman Corp. (Chemicals) | 113,848 | 2,512,625 | ||||||||
Monsanto Co. (Chemicals) | 11,173 | 1,190,930 | ||||||||
|
| |||||||||
| 5,666,539 | ||||||||||
|
| |||||||||
TELECOMMUNICATION SERVICES – 1.1% | ||||||||||
Verizon Communications, Inc. (Diversified Telecom. Svs.) | 30,173 | 1,406,363 | ||||||||
|
| |||||||||
Total Common Stocks (Cost $114,001,826) | $ | 123,007,472 | ||||||||
|
| |||||||||
| Money Market Funds – 0.5% | Shares | Value | ||||||||
Fidelity Institutional Money Market Funds | 649,000 | $ | 649,000 | |||||||
|
| |||||||||
Total Money Market Funds (Cost $649,000) | $ | 649,000 | ||||||||
|
| |||||||||
Total Investments – 99.5% (Cost $114,650,826) | (b) | $ | 123,656,472 | |||||||
Other Assets in Excess of Liabilities – 0.5% | 590,793 | |||||||||
|
| |||||||||
Net Assets – 100.0% | $ | 124,247,265 | ||||||||
|
| |||||||||
Percentages are stated as a percent of net assets.
Footnotes:
| (a) | Non-income producing security. |
| (b) | Represents cost for financial reporting purposes, which may differ from cost basis for federal income tax purposes. See also Note 7 of the Notes to Financial Statements. |
The accompanying notes are an integral part of these financial statements.
| 97 |
| Ohio National Fund, Inc. | Risk Managed Balanced Portfolio |
Objective/Strategy
The Risk Managed Balanced Portfolio seeks long-term capital growth, consistent with preservation of capital and balanced by current income. The Portfolio invests in a balanced portfolio of equity and fixed-income securities (the “Balanced Component”) and a risk management portfolio intended to enhance the risk adjusted return of the Portfolio (the “Risk Managed Component”).
Performance as of June 30, 2015
Average Annual Total Return: | ||||
One year | 4.47% | |||
Since inception (5/1/14) | 6.49% |
Comments
For the six-month period ended June 30, 2015, the Risk Managed Balanced Portfolio returned -0.65% versus 0.73% for the current benchmark, which is comprised of 55% S&P 500 Index and 45% Barclays Capital U.S. Aggregate Bond Index.
Stocks gained slowly over most of the period, but illustrated weakness toward the end on account of factors emanating from Greece and China. After weathering weak first quarter economic and jobs growth, stocks were later aided by favorable data that indicated the factors contributing to the winter slowdown were indeed transitory. Crude oil prices reset within a higher trading band and the dollar stabilized after its recent strong period of appreciation. Both developments were highlighted by the Federal Reserve’s (“Fed”) June statement, in which it said a potential increase of the Fed Funds rate during the latter part of the year would be “appropriate.” Fixed income markets rallied during the winter, given the weak U.S. data. They largely retreated over the spring, influenced by a combination of improving U.S. data and lingering uncertainty about the path of global monetary policy. Low rates in Europe and geopolitical concerns kept yield-curve steepening in check, however.
The Balanced Component, sub-advised by Janus Capital Management LLC, seeks to provide consistent returns over time by allocating across the spectrum of fixed income and equity securities. For the six-month period, the Balanced Component slightly under-performed the Balanced Index, a blended benchmark of the S&P 500 Index (55%) and the Barclays Capital U.S. Aggregate Bond Index (45%), by .45%.
The equity-to-fixed-income allocation, which may vary with market conditions, ended the period with an equity weighting of roughly 57%, with the remainder in fixed income. The current level reflects our view that on a risk-adjusted basis, equities represent greater opportunity for returns at this juncture.(1)
The Balanced Component’s equity sleeve underperformed its benchmark, the S&P 500 Index. Holdings within the Industrials and Consumer Discretionary sectors detracted most from relative performance. Airline carrier United Continental Holdings, Inc. weighed on performance. Shares declined due to concerns about industry pricing. Our outlook for the stock remains favorable at current valuations. The company is beginning to realize meaningful synergies from its Continental merger and is remaining disciplined on capacity. It also has taken constructive measures with stock buybacks and reducing debt.(1)
Similar to other railroad companies, Union Pacific Corp. has suffered year-to-date volume declines from the slowdown in the oil market and related lower transportation needs. Coal and agriculture
industry demands have also been softer. We remain positive on the stock. The company continues to benefit from its large, profitable intermodal freight business. Fundamentals remain attractive, and the company continues to demonstrate a firm commitment to returning capital to shareholders with a healthy dividend yield and stock buybacks.(1)
Diversified materials company E.I. du Pont de Nemours & Co. was another detractor, as the company defeated an activist investor’s proxy fight to win seats on its board. Shares sold off on concerns that there is now less pressure for aggressive cost reductions or to break up the company to unlock unrealized potential value. We believe the price weakness provided an attractive entry point for the stock. The company has introduced new board members that we expect will maintain a sharp focus on capturing current untapped gains from its businesses. The company also has been affected by softness in the agriculture cycle, a sector where we see a number of interesting developments, such as ongoing consolidation. Such consolidation could enhance the value E.I. du Pont de Nemours & Co.’s Pioneer business, a leading developer and supplier of plant genetics to farmers. The stock’s dividend yield also remains attractive.(1)
Contributing to relative performance during the quarter was our stock selections in Financials and Materials. LyondellBasell Industries NV was the largest individual contributor, which aided our Materials holdings. Prices for many of the petrochemicals the company produces are tied to oil prices, which had weighed on the stock at the end of 2014. However, prices for the feedstocks LyondellBasell Industries NV uses to create ethylene and some of its other chemicals have also declined, leading to better profit margins than the market initially expected. The bounce back in oil prices during the period also allowed chemical producers to raise ethylene prices, which was further supportive for margins. In addition, concerns around the recent CEO transition began to dissipate, with current management continuing to demonstrate its commitment to returning shareholder capital through an increased dividend and stock buybacks.(1)
Aetna, Inc., a diversified health care benefits company, was also a top contributor. A Supreme Court ruling that keeps federally established health care exchanges intact lifted managed care stocks broadly. Acquisition rumors among managed care companies also point to an upcoming round of consolidation in the industry, and anticipation of this wave of consolidation has been favorable for managed care stocks. We believe the company is well positioned for growth in the post-Affordable Care Act reform environment.(1)
The Blackstone Group LP was another top contributor, which boosted our Financials holdings. The stock was up after reporting earnings that exceeded expectations, driven by a strong quarter for The Blackstone Group LP’s private equity business and by strong inflows for some of its other asset management products. We continue to like the company. We think the company is a best-in-class alternatives manager, and also like the company for its high dividend yield.(1)
The fixed income sleeve outperformed its benchmark, the Barclays Capital U.S. Aggregate Bond Index. Our corporate credit allocation was a key a driver of outperformance. Yield curve positioning within investment-grade contributed as our defensive move into higher-quality names proved timely. The positive contribution attributed to our high-yield security selection is, in our view, the result of our rigorous, fundamental investment process that analyzes not only companies, but also specific securities, identifying the instruments that have the most robust protections for fixed income investors.
| 98 | (continued) |
| Ohio National Fund, Inc. | Risk Managed Balanced Portfolio (Continued) |
While we remain overweight corporate credit relative to the benchmark, our allocation to the segment is close to the lowest point it has been since the financial crisis. On a sector basis, banking, brokerage, asset managers and exchanges were relative contributors.
Two financial companies that contributed to relative performance were E*TRADE Financial Corp. and Ally Financial, Inc. Ally Financial, Inc. has many attributes that we find attractive. The company has streamlined itself into a pure play on auto financing, a sector that, we believe, has tailwinds as U.S. employment and consumption improves. The company has an asset-light business model, reliant upon its online banking channel to grow its substantial deposit base. We find that Ally Financial, Inc. has been able to retain these deposits at a greater rate than many expected possible with online accounts. Ally Financial, Inc.’s management is moving to pay down its highest-cost debt.(1)
Certain credits also weighed on relative results. Chesapeake Energy Corp., a leading producer of natural gas, has a leadership team that manages its balance sheet like an investment grade company. With its ample liquidity and a large asset base, Chesapeake Energy Corp., in our view, is well-positioned to attain a ratings upgrade.(1)
On an asset class basis, our U.S. Treasury allocation was a relative contributor. During the period, we increased the position to better reflect our defensive stance. This move was engineered through a reduction of our duration contribution from Treasuries, with our holdings being markedly shorter than those of the benchmark. As a result, Treasury yield curve positioning contributed to performance given the period’s steepening curve.(1)
The Portfolio’s Risk Managed Component, sub-advised by AnchorPath Financial LLC, a sleeve of derivatives and cash equivalents, seeks to limit the downside risk of the Portfolio. Under normal circumstances, the Risk Managed Component will represent approximately 20% of the Portfolio. The allocation from this target over this period ranged between 18.7% and 22.4%, and ended the period representing approximately 19.0% of the Portfolio. (1)
The Portfolio returns are enhanced on a risk-adjusted basis when the aggregate Portfolio achieves lower volatility with similar returns, or higher returns at similar volatility compared to a benchmark. For the period, however, the Risk Managed Component increased the annualized volatility of the aggregate Portfolio by 0.3%. The component also decreased the cumulative return of the Portfolio by 0.9% as compared to the Balanced Component of the Portfolio. Over this period, when the Balanced Component experienced lower realized drawdowns and relatively flat performance, the Risk Managed Balanced Portfolio’s risk adjusted returns were not enhanced. Most of the underperformance of the Risk Managed Component was attributed to losses on index-based option positions that declined in value as the implied volatility related to those options declined.(1)
Many of the reasons that we remain cautious in our approach to fixed income are the same that cause us to favor equities. The Fed has reiterated its commitment to growth. As a consequence, the initiation of rate hikes would infer an expanding economy conducive for stocks. High-yield spreads, which are still tight by historical standards, limit the upside of those securities, which further supports the rationale for favoring those companies’ stocks at present.
We believe stock valuations remain relatively attractive in the context of the current market environment. Global economic growth continues to strengthen, with steady, if slow, gains in the U.S. and positive signals finally emerging from Europe, issues in Greece notwithstanding. China also seems to be navigating its economic
slowdown reasonably well, without any recent material deterioration.
The U.S. labor market continues to gain on the employment front, with indications that companies are beginning to increase wages as well. The housing market is improving, and consumer spending continues to increase with strong demand for automobiles and other big-ticket items – all further evidence that the economy is on stable footing. Against this backdrop, it seems likely the Fed will begin raising interest rates later this year. This would be a positive signal that the economy is once again normalizing and should be supportive for stocks, though any dramatic, unexpected rate jump would probably prove to be disruptive short term.
Multiple factors have the potential to impact the fixed income environment; chief among them remains the timing and pace of the Fed’s rate hikes. Data suggest that the central bank is achieving its dual mandate. Strong gains in payrolls have resumed and wage growth has shown signs of accelerating. Rates have yet to rise, as the Fed has made clear its objective of achieving sustainable growth. With economic expansion comes jobs, and after that, wage-driven inflation. A strong jobs market, according to the Fed, should help push inflation back toward its target of 2%.
The dollar remains one of our wild cards. Deterioration in the Greece dispute or a deceleration in non-U.S. economies could send investors fleeing back toward dollar-denominated assets, forcing a resumption in the currency’s march upward. In a nod to this scenario, the Fed has acknowledged that international developments are being considered as it charts its path forward.
We are mindful that we are nearing the end of a credit cycle. Merger and acquisition activity, share buybacks, and debt issuance are up. As a result, our credit allocation is near the lowest since the financial crisis, while still being overweight versus the benchmark. Utilizing our fundamental security-level approach, we are concentrating our holdings in the highest-quality companies whose management teams have maintained balance sheet discipline.
We are also concerned with the potential for sustained periods of elevated market volatility, which we consider suppressed by continued fixed income inflows. Alarmingly low levels of liquidity are a serious risk factor, in our view. Should an illiquidity event occur, we want to be a provider of liquidity. Accordingly, we have lowered the overall duration of the portfolio, especially as a percentage of the benchmark. Treasuries are the tool we utilize to toggle duration. Shorter-dated government securities act as a cash cushion for our portfolios, allowing us to better weather storms and opportunistically make attractive investments caused by market dislocations.
Over the past quarter, we have dramatically reduced risks in the fixed income sleeve of the Balanced Component and expect to maintain this defensive posture as the aforementioned risk factors play out. We have not seen such a confluence of potentially adverse forces for several years. Our binding principle of capital preservation is of utmost importance as we navigate the choppy waters ahead.(1)
| (1) | The Portfolio’s composition is subject to change. Holdings and weightings are as of June 30, 2015. |
| 99 | (continued) |
| Ohio National Fund, Inc. | Risk Managed Balanced Portfolio (Continued) |
Change in Value of $10,000 Investment
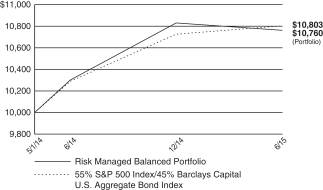
The S&P 500 index is a capitalization-weighted index designed to measure performance of the broad domestic economy through changes in the aggregate market value of 500 stocks representing all major industries. The index includes the effects of reinvested dividends.
The Barclays Capital U.S. Aggregate Bond Index measures returns of U.S. investment grade bonds market, which includes investment grade U.S. Government bonds, high quality corporate bonds, mortgage pass-through securities, and asset-backed securities publicly offered for sale in the U.S. The index’s securities must have at least one year remaining to maturity; they must also be denominated in U.S. dollars and must be fixed rate, nonconvertible, and taxable.
Portfolio Composition as of June 30, 2015 (1)
| % of Net Assets | ||||
Common Stocks (3) | 42.6 | |||
U.S. Treasury Obligations | 15.5 | |||
Corporate Bonds (3) | 11.5 | |||
U.S. Government Agency Mortgage-Backed Securities | 6.2 | |||
Purchased Options | 5.6 | |||
Master Limited Partnerships (3) | 2.8 | |||
Asset-Backed / Mortgage-Backed Securities (3) | 1.6 | |||
Preferred Stocks (3) | 0.5 | |||
Preferred Stock Depository Receipts (3) | 0.5 | |||
Trust Preferred Securities (3) | 0.2 | |||
Money Market Funds | 13.0 | |||
|
| |||
| 100.0 | ||||
|
|
Top 10 Portfolio Holdings as of June 30, 2015 (1) (2)
| % of Net Assets | ||||
1. Apple, Inc. | 2.5 | |||
2. MasterCard, Inc. Class A | 2.2 | |||
3. U.S. Treasury Note | 1.9 | |||
4. Blackstone Group LP / The | 1.8 | |||
5. U.S. Treasury Note | 1.7 | |||
6. AbbVie, Inc. | 1.6 | |||
7. NIKE, Inc. Class B | 1.6 | |||
8. Microsoft Corp. | 1.5 | |||
9. Bristol-Myers Squibb Co. | 1.4 | |||
10. U.S. Treasury Note | 1.4 |
| (1) | Composition of Portfolio subject to change. |
| (2) | Short-term investments have been excluded from the list of Top 10 Portfolio Holdings. |
| (3) | Sectors (combined): |
| % of Net Assets | ||||
Financials | 12.8 | |||
Information Technology | 10.9 | |||
Health Care | 10.8 | |||
Consumer Discretionary | 8.5 | |||
Industrials | 6.4 | |||
Energy | 3.8 | |||
Materials | 3.7 | |||
Consumer Staples | 2.4 | |||
Telecommunication Services | 0.3 | |||
Utilities | 0.1 | |||
|
| |||
| 59.7 | ||||
|
|
| 100 |
| Ohio National Fund, Inc. | Risk Managed Balanced Portfolio |
Schedule of Investments | June 30, 2015 (Unaudited) |
| Common Stocks – 42.6% | Shares | Value | ||||||||||||
CONSUMER DISCRETIONARY – 6.7% |
| |||||||||||||
General Motors Co. (Automobiles) | 18,551 | $ | 618,305 | |||||||||||
Las Vegas Sands Corp. (Hotels, Restaurants & Leisure) | 13,570 | 713,375 | ||||||||||||
Six Flags Entertainment Corp. (Hotels, Restaurants & Leisure) | 4,507 | 202,139 | ||||||||||||
Starwood Hotels & Resorts Worldwide, Inc. (Hotels, Restaurants & Leisure) | 4,989 | 404,558 | ||||||||||||
Priceline Group, Inc. / The (Internet & Catalog Retail) | (a) | 560 | 644,767 | |||||||||||
Mattel, Inc. (Leisure Products) | 10,134 | 260,342 | ||||||||||||
Home Depot, Inc. / The (Specialty Retail) | 8,767 | 974,277 | ||||||||||||
NIKE, Inc. Class B (Textiles, Apparel & Luxury Goods) | 10,727 | 1,158,731 | ||||||||||||
|
| |||||||||||||
| 4,976,494 | ||||||||||||||
|
| |||||||||||||
CONSUMER STAPLES – 2.1% | ||||||||||||||
Diageo PLC (Beverages) | (c) | 5,954 | 172,426 | |||||||||||
Hershey Co. / The (Food Products) | 4,165 | 369,977 | ||||||||||||
Altria Group, Inc. (Tobacco) | 11,310 | 553,172 | ||||||||||||
Philip Morris International, Inc. (Tobacco) | 6,090 | 488,235 | ||||||||||||
|
| |||||||||||||
| 1,583,810 | ||||||||||||||
|
| |||||||||||||
ENERGY – 1.1% | ||||||||||||||
Chevron Corp. (Oil, Gas & Consumable Fuels) | 5,714 | 551,230 | ||||||||||||
Marathon Oil Corp. (Oil, Gas & Consumable Fuels) | 11,233 | 298,124 | ||||||||||||
|
| |||||||||||||
| 849,354 | ||||||||||||||
|
| |||||||||||||
FINANCIALS – 4.6% | ||||||||||||||
JPMorgan Chase & Co. (Banks) | 8,840 | 598,998 | ||||||||||||
U.S. Bancorp (Banks) | 20,167 | 875,248 | ||||||||||||
TD Ameritrade Holding Corp. (Capital Markets) | 10,044 | 369,820 | ||||||||||||
American Express Co. (Consumer Finance) | 6,821 | 530,128 | ||||||||||||
CME Group, Inc. (Diversified Financial Svs.) | 4,144 | 385,641 | ||||||||||||
Prudential PLC (Insurance) | (c) | 21,558 | 519,535 | |||||||||||
Outfront Media, Inc. (Real Estate Investment Trusts) | 5,966 | 150,582 | ||||||||||||
|
| |||||||||||||
| 3,429,952 | ||||||||||||||
|
| |||||||||||||
HEALTH CARE – 9.7% | ||||||||||||||
Amgen, Inc. (Biotechnology) | 5,954 | 914,058 | ||||||||||||
Regeneron Pharmaceuticals, Inc. (Biotechnology) | (a) | 908 | 463,198 | |||||||||||
Aetna, Inc. (Health Care Providers & Svs.) | 5,052 | 643,928 | ||||||||||||
AbbVie, Inc. (Pharmaceuticals) | 17,614 | 1,183,485 | ||||||||||||
Allergan PLC (Pharmaceuticals) | (a) | 3,216 | 975,927 | |||||||||||
Bristol-Myers Squibb Co. (Pharmaceuticals) | 16,131 | 1,073,357 | ||||||||||||
Eli Lilly & Co. (Pharmaceuticals) | 8,145 | 680,026 | ||||||||||||
Endo International PLC (Pharmaceuticals) | (a) | 9,214 | 733,895 | |||||||||||
Merck & Co., Inc. (Pharmaceuticals) | 10,319 | 587,461 | ||||||||||||
|
| |||||||||||||
| 7,255,335 | ||||||||||||||
|
| |||||||||||||
INDUSTRIALS – 5.5% | ||||||||||||||
Boeing Co. / The (Aerospace & Defense) | 6,971 | 967,017 | ||||||||||||
Honeywell International, Inc. (Aerospace & Defense) | 7,207 | 734,898 | ||||||||||||
United Continental Holdings, Inc. (Airlines) | (a) | 10,448 | 553,848 | |||||||||||
3M Co. (Industrial Conglomerates) | 2,762 | 426,177 | ||||||||||||
Dover Corp. (Machinery) | �� | 4,214 | 295,739 | |||||||||||
Towers Watson & Co. Class A (Professional Svs.) | 1,681 | 211,470 | ||||||||||||
Union Pacific Corp. (Road & Rail) | 9,490 | 905,061 | ||||||||||||
|
| |||||||||||||
| 4,094,210 | ||||||||||||||
|
| |||||||||||||
INFORMATION TECHNOLOGY – 10.0% | ||||||||||||||
TE Connectivity Ltd. (Electronic Equip., Instr. & Comp.) | 9,490 | 610,207 | ||||||||||||
Google, Inc. Class C (Internet Software & Svs.) | (a) | 1,755 | 913,495 | |||||||||||
Yahoo!, Inc. (Internet Software & Svs.) | (a) | 10,865 | 426,886 | |||||||||||
Automatic Data Processing, Inc. (IT Svs.) | 3,202 | 256,896 | ||||||||||||
MasterCard, Inc. Class A (IT Svs.) | 17,361 | 1,622,906 | ||||||||||||
NXP Semiconductors NV (Semiconductors & Equip.) | (a) | 3,517 | 345,369 | |||||||||||
Microsoft Corp. (Software) | 25,035 | 1,105,295 | ||||||||||||
Apple, Inc. (Tech. Hardware, Storage & Periph.) | 15,098 | 1,893,667 | ||||||||||||
Seagate Technology PLC (Tech. Hardware, Storage & Periph.) | 6,645 | 315,638 | ||||||||||||
|
| |||||||||||||
| 7,490,359 | ||||||||||||||
|
| |||||||||||||
MATERIALS – 2.7% | ||||||||||||||
E.I. du Pont de Nemours & Co. (Chemicals) | 16,241 | 1,038,612 | ||||||||||||
LyondellBasell Industries NV Class A (Chemicals) | 9,692 | 1,003,316 | ||||||||||||
|
| |||||||||||||
| 2,041,928 | ||||||||||||||
|
| |||||||||||||
| 101 | (continued) |
| Ohio National Fund, Inc. | Risk Managed Balanced Portfolio (Continued) |
Schedule of Investments | June 30, 2015 (Unaudited) |
| Common Stocks (Continued) | Shares | Value | ||||||||||||
TELECOMMUNICATION SERVICES – 0.2% | ||||||||||||||
Verizon Communications, Inc. (Diversified Telecom. Svs.) | 2,271 | $ | 105,851 | |||||||||||
|
| |||||||||||||
Total Common Stocks (Cost $31,602,964) | $ | 31,827,293 | ||||||||||||
|
| |||||||||||||
| Corporate Bonds – 11.5% | Rate | Maturity | Face Amount | Value | ||||||||||
CONSUMER DISCRETIONARY – 1.0% | ||||||||||||||
ZF North America Capital, Inc. (Auto Components) | (b) | 4.750% | 04/29/2025 | $ | 150,000 | $ | 145,500 | |||||||
General Motors Co. (Automobiles) | 6.250% | 10/02/2043 | 9,000 | 10,021 | ||||||||||
General Motors Co. (Automobiles) | 4.875% | 10/02/2023 | 183,000 | 192,685 | ||||||||||
General Motors Co. (Automobiles) | 3.500% | 10/02/2018 | 42,000 | 43,365 | ||||||||||
1011778 BC ULC / New Red Finance, Inc. (Hotels, Restaurants & Leisure) | (b) | 4.625% | 01/15/2022 | 61,000 | 60,085 | |||||||||
Brinker International, Inc. (Hotels, Restaurants & Leisure) | 3.875% | 05/15/2023 | 71,000 | 69,140 | ||||||||||
PPL WEM Holdings Ltd. (Hotels, Restaurants & Leisure) | (b) | 5.375% | 05/01/2021 | 43,000 | 47,518 | |||||||||
PPL WEM Holdings Ltd. (Hotels, Restaurants & Leisure) | (b) | 3.900% | 05/01/2016 | 33,000 | 33,658 | |||||||||
Wynn Las Vegas LLC / Wynn Las Vegas Capital Corp. (Hotels, Restaurants & Leisure) | (b) | 4.250% | 05/30/2023 | 16,000 | 14,720 | |||||||||
D.R. Horton, Inc. (Household Durables) | 4.750% | 05/15/2017 | 27,000 | 28,012 | ||||||||||
MDC Holdings, Inc. (Household Durables) | 5.500% | 01/15/2024 | 38,000 | 37,335 | ||||||||||
Toll Brothers Finance Corp. (Household Durables) | 5.875% | 02/15/2022 | 25,000 | 26,812 | ||||||||||
UBM PLC (Media) | (b) | 5.750% | 11/03/2020 | 31,000 | 33,422 | |||||||||
Macy’s Retail Holdings, Inc. (Multiline Retail) | 5.900% | 12/01/2016 | 25,000 | 26,633 | ||||||||||
|
| |||||||||||||
| 768,906 | ||||||||||||||
|
| |||||||||||||
CONSUMER STAPLES – 0.3% | ||||||||||||||
Kraft Heinz Foods Co. (Food Products) | (b) | 3.500% | 07/15/2022 | 30,000 | 30,109 | |||||||||
Kraft Heinz Foods Co. (Food Products) | (b) | 2.800% | 07/02/2020 | 35,000 | 34,995 | |||||||||
Wm. Wrigley Jr. Co. (Food Products) | (b) | 3.375% | 10/21/2020 | 49,000 | 50,445 | |||||||||
Wm. Wrigley Jr. Co. (Food Products) | (b) | 2.400% | 10/21/2018 | 116,000 | 117,580 | |||||||||
|
| |||||||||||||
| 233,129 | ||||||||||||||
|
| |||||||||||||
ENERGY – 1.7% | ||||||||||||||
Forum Energy Technologies, Inc. (Energy Equip. & Svs.) | 6.250% | 10/01/2021 | 24,000 | 23,760 | ||||||||||
Helmerich & Payne International Drilling Co. (Energy Equip. & Svs.) | (b) | 4.650% | 03/15/2025 | 52,000 | 53,602 | |||||||||
Oceaneering International, Inc. (Energy Equip. & Svs.) | 4.650% | 11/15/2024 | 90,000 | 89,790 | ||||||||||
Chesapeake Energy Corp. (Oil, Gas & Consumable Fuels) | 5.375% | 06/15/2021 | 37,000 | 33,485 | ||||||||||
Chesapeake Energy Corp. (Oil, Gas & Consumable Fuels) | 4.875% | 04/15/2022 | 61,000 | 53,070 | ||||||||||
Chevron Corp. (Oil, Gas & Consumable Fuels) | 1.345% | 11/15/2017 | 27,000 | 27,105 | ||||||||||
Cimarex Energy Co. (Oil, Gas & Consumable Fuels) | 5.875% | 05/01/2022 | 140,000 | 149,800 | ||||||||||
Cimarex Energy Co. (Oil, Gas & Consumable Fuels) | 4.375% | 06/01/2024 | 80,000 | 79,357 | ||||||||||
DCP Midstream Operating LP (Oil, Gas & Consumable Fuels) | 5.600% | 04/01/2044 | 11,000 | 9,780 | ||||||||||
DCP Midstream Operating LP (Oil, Gas & Consumable Fuels) | 3.875% | 03/15/2023 | 46,000 | 42,448 | ||||||||||
DCP Midstream Operating LP (Oil, Gas & Consumable Fuels) | 4.950% | 04/01/2022 | 75,000 | 73,898 | ||||||||||
Devon Energy Corp. (Oil, Gas & Consumable Fuels) | 2.250% | 12/15/2018 | 46,000 | 46,097 | ||||||||||
Energy Transfer Partners LP (Oil, Gas & Consumable Fuels) | 4.150% | 10/01/2020 | 31,000 | 31,832 | ||||||||||
EnLink Midstream Partners LP (Oil, Gas & Consumable Fuels) | 4.400% | 04/01/2024 | 48,000 | 48,065 | ||||||||||
EnLink Midstream Partners LP (Oil, Gas & Consumable Fuels) | 5.600% | 04/01/2044 | 35,000 | 33,895 | ||||||||||
Kinder Morgan Energy Partners LP (Oil, Gas & Consumable Fuels) | 5.000% | 10/01/2021 | 58,000 | 61,310 | ||||||||||
Kinder Morgan Energy Partners LP (Oil, Gas & Consumable Fuels) | 4.300% | 05/01/2024 | 33,000 | 32,521 | ||||||||||
Kinder Morgan, Inc. (Oil, Gas & Consumable Fuels) | 7.750% | 01/15/2032 | 24,000 | 27,442 | ||||||||||
Motiva Enterprises LLC (Oil, Gas & Consumable Fuels) | (b) | 5.750% | 01/15/2020 | 26,000 | 28,565 | |||||||||
NGL Energy Partners LP / NGL Energy Finance Corp. (Oil, Gas & Consumable Fuels) | 5.125% | 07/15/2019 | 35,000 | 34,912 | ||||||||||
Phillips 66 Partners LP (Oil, Gas & Consumable Fuels) | 3.605% | 02/15/2025 | 16,000 | 15,035 | ||||||||||
Plains All American Pipeline LP / PAA Finance Corp. (Oil, Gas & Consumable Fuels) | 3.950% | 09/15/2015 | 71,000 | 71,402 | ||||||||||
Spectra Energy Partners LP (Oil, Gas & Consumable Fuels) | 4.750% | 03/15/2024 | 53,000 | 56,173 | ||||||||||
Targa Resources Partners LP / Targa Resources Partners Finance Corp. (Oil, Gas & Consumable Fuels) | (b) | 4.125% | 11/15/2019 | 35,000 | 34,650 | |||||||||
Western Gas Partners LP (Oil, Gas & Consumable Fuels) | 5.375% | 06/01/2021 | 93,000 | 100,288 | ||||||||||
|
| |||||||||||||
| 1,258,282 | ||||||||||||||
|
| |||||||||||||
FINANCIALS – 4.4% | ||||||||||||||
CIT Group, Inc. (Banks) | (b) | 5.500% | 02/15/2019 | 99,000 | 103,207 | |||||||||
CIT Group, Inc. (Banks) | 4.250% | 08/15/2017 | 102,000 | 103,530 | ||||||||||
Royal Bank of Scotland Group PLC (Banks) | 6.100% | 06/10/2023 | 76,000 | 80,710 | ||||||||||
Royal Bank of Scotland Group PLC (Banks) | 6.000% | 12/19/2023 | 117,000 | 123,740 | ||||||||||
Royal Bank of Scotland Group PLC (Banks) | 5.125% | 05/28/2024 | 129,000 | 128,671 | ||||||||||
Royal Bank of Scotland Group PLC (Banks) | 2.550% | 09/18/2015 | 107,000 | 107,299 | ||||||||||
Santander UK PLC (Banks) | (b) | 5.000% | 11/07/2023 | 256,000 | 261,625 | |||||||||
SVB Financial Group (Banks) | 5.375% | 09/15/2020 | 33,000 | 36,740 | ||||||||||
Ameriprise Financial, Inc. (Capital Markets) | (d) | 7.518% | 06/01/2066 | 122,000 | 122,000 | |||||||||
Carlyle Holdings Finance LLC (Capital Markets) | (b) | 3.875% | 02/01/2023 | 25,000 | 25,236 | |||||||||
Charles Schwab Corp. / The (Capital Markets) | 3.000% | 03/10/2025 | 28,000 | 27,421 | ||||||||||
E*TRADE Financial Corp. (Capital Markets) | 5.375% | 11/15/2022 | 66,000 | 67,650 | ||||||||||
| 102 | (continued) |
| Ohio National Fund, Inc. | Risk Managed Balanced Portfolio (Continued) |
Schedule of Investments | June 30, 2015 (Unaudited) |
| Corporate Bonds (Continued) | Rate | Maturity | Face Amount | Value | ||||||||||
FINANCIALS (continued) | ||||||||||||||
E*TRADE Financial Corp. (Capital Markets) | 4.625% | 09/15/2023 | $ | 89,000 | $ | 87,442 | ||||||||
Goldman Sachs Group, Inc. / The (Capital Markets) | 5.625% | 01/15/2017 | 31,000 | 32,823 | ||||||||||
Lazard Group LLC (Capital Markets) | 4.250% | 11/14/2020 | 72,000 | 75,634 | ||||||||||
Neuberger Berman Group LLC / Neuberger Berman Finance Corp. (Capital Markets) | (b) | 5.875% | 03/15/2022 | 137,000 | 146,419 | |||||||||
Neuberger Berman Group LLC / Neuberger Berman Finance Corp. (Capital Markets) | (b) | 4.875% | 04/15/2045 | 57,000 | 51,503 | |||||||||
Raymond James Financial, Inc. (Capital Markets) | 5.625% | 04/01/2024 | 127,000 | 141,089 | ||||||||||
Raymond James Financial, Inc. (Capital Markets) | 4.250% | 04/15/2016 | 77,000 | 78,920 | ||||||||||
Stifel Financial Corp. (Capital Markets) | 4.250% | 07/18/2024 | 40,000 | 39,467 | ||||||||||
TD Ameritrade Holding Corp. (Capital Markets) | 3.625% | 04/01/2025 | 116,000 | 117,626 | ||||||||||
TD Ameritrade Holding Corp. (Capital Markets) | 2.950% | 04/01/2022 | 40,000 | 39,623 | ||||||||||
Ally Financial, Inc. (Consumer Finance) | 8.000% | 12/31/2018 | 13,000 | 14,511 | ||||||||||
Ally Financial, Inc. (Consumer Finance) | 4.125% | 03/30/2020 | 51,000 | 50,904 | ||||||||||
Ally Financial, Inc. (Consumer Finance) | 4.625% | 05/19/2022 | 43,000 | 42,462 | ||||||||||
American Express Co. (Consumer Finance) | (d) | 6.800% | 09/01/2066 | 65,000 | 66,878 | |||||||||
Discover Financial Services (Consumer Finance) | 3.950% | 11/06/2024 | 12,000 | 11,643 | ||||||||||
Discover Financial Services (Consumer Finance) | 3.750% | 03/04/2025 | 60,000 | 57,203 | ||||||||||
Synchrony Financial (Consumer Finance) | 3.000% | 08/15/2019 | 59,000 | 59,376 | ||||||||||
GE Capital Trust I (Diversified Financial Svs.) | (d) | 6.375% | 11/15/2067 | 133,000 | 142,044 | |||||||||
General Electric Capital Corp. (Diversified Financial Svs.) | (d) | 6.375% | 11/15/2067 | 57,000 | 61,275 | |||||||||
LeasePlan Corp. NV (Diversified Financial Svs.) | (b) | 2.500% | 05/16/2018 | 241,000 | 241,230 | |||||||||
Voya Financial, Inc. (Diversified Financial Svs.) | (d) | 5.650% | 05/15/2053 | 24,000 | 24,480 | |||||||||
CNO Financial Group, Inc. (Insurance) | 4.500% | 05/30/2020 | 12,000 | 12,180 | ||||||||||
CNO Financial Group, Inc. (Insurance) | 5.250% | 05/30/2025 | 33,000 | 33,535 | ||||||||||
Primerica, Inc. (Insurance) | 4.750% | 07/15/2022 | 66,000 | 70,335 | ||||||||||
Alexandria Real Estate Equities, Inc. (Real Estate Investment Trusts) | 4.600% | 04/01/2022 | 63,000 | 66,308 | ||||||||||
Alexandria Real Estate Equities, Inc. (Real Estate Investment Trusts) | 2.750% | 01/15/2020 | 51,000 | 50,408 | ||||||||||
Alexandria Real Estate Equities, Inc. (Real Estate Investment Trusts) | 4.500% | 07/30/2029 | 49,000 | 48,997 | ||||||||||
Retail Opportunity Investments Partnership LP (Real Estate Investment Trusts) | 4.000% | 12/15/2024 | 10,000 | 9,880 | ||||||||||
Retail Opportunity Investments Partnership LP (Real Estate Investment Trusts) | 5.000% | 12/15/2023 | 22,000 | 23,054 | ||||||||||
Senior Housing Properties Trust (Real Estate Investment Trusts) | 6.750% | 12/15/2021 | 29,000 | 32,985 | ||||||||||
SL Green Realty Corp. (Real Estate Investment Trusts) | 7.750% | 03/15/2020 | 35,000 | 41,667 | ||||||||||
SL Green Realty Corp. (Real Estate Investment Trusts) | 5.000% | 08/15/2018 | 55,000 | 58,856 | ||||||||||
Jones Lang LaSalle, Inc. (Real Estate Mgmt. & Development) | 4.400% | 11/15/2022 | 30,000 | 30,735 | ||||||||||
Kennedy-Wilson, Inc. (Real Estate Mgmt. & Development) | 5.875% | 04/01/2024 | 60,000 | 59,700 | ||||||||||
|
| |||||||||||||
| 3,309,021 | ||||||||||||||
|
| |||||||||||||
HEALTH CARE – 1.1% | ||||||||||||||
Becton Dickinson and Co. (Health Care Equip. & Supplies) | 1.800% | 12/15/2017 | 31,000 | 30,998 | ||||||||||
Zimmer Biomet Holdings, Inc. (Health Care Equip. & Supplies) | 2.700% | 04/01/2020 | 47,000 | 46,717 | ||||||||||
Zimmer Biomet Holdings, Inc. (Health Care Equip. & Supplies) | 3.550% | 04/01/2025 | 88,000 | 85,170 | ||||||||||
Zimmer Biomet Holdings, Inc. (Health Care Equip. & Supplies) | 3.150% | 04/01/2022 | 55,000 | 54,050 | ||||||||||
Fresenius Medical Care U.S. Finance II, Inc. (Health Care Providers & Svs.) | (b) | 5.875% | 01/31/2022 | 49,000 | 52,185 | |||||||||
HCA, Inc. (Health Care Providers & Svs.) | 3.750% | 03/15/2019 | 25,000 | 25,187 | ||||||||||
Laboratory Corp. of America Holdings (Health Care Providers & Svs.) | 3.200% | 02/01/2022 | 57,000 | 56,134 | ||||||||||
Laboratory Corp. of America Holdings (Health Care Providers & Svs.) | 3.600% | 02/01/2025 | 57,000 | 54,325 | ||||||||||
Omnicare, Inc. (Health Care Providers & Svs.) | 4.750% | 12/01/2022 | 23,000 | 24,380 | ||||||||||
Omnicare, Inc. (Health Care Providers & Svs.) | 5.000% | 12/01/2024 | 19,000 | 20,425 | ||||||||||
Life Technologies Corp. (Life Sciences Tools & Svs.) | 6.000% | 03/01/2020 | 34,000 | 38,214 | ||||||||||
Thermo Fisher Scientific, Inc. (Life Sciences Tools & Svs.) | 3.300% | 02/15/2022 | 19,000 | 18,755 | ||||||||||
Actavis Funding SCS (Pharmaceuticals) | 4.850% | 06/15/2044 | 16,000 | 15,382 | ||||||||||
Actavis Funding SCS (Pharmaceuticals) | 3.850% | 06/15/2024 | 14,000 | 13,812 | ||||||||||
Actavis Funding SCS (Pharmaceuticals) | 2.450% | 06/15/2019 | 5,000 | 4,976 | ||||||||||
Actavis Funding SCS (Pharmaceuticals) | 4.750% | 03/15/2045 | 25,000 | 23,697 | ||||||||||
Actavis Funding SCS (Pharmaceuticals) | 4.550% | 03/15/2035 | 37,000 | 35,074 | ||||||||||
Actavis Funding SCS (Pharmaceuticals) | 3.000% | 03/12/2020 | 85,000 | 85,231 | ||||||||||
Actavis Funding SCS (Pharmaceuticals) | 3.800% | 03/15/2025 | 88,000 | 86,313 | ||||||||||
VRX Escrow Corp. (Pharmaceuticals) | (b) | 6.125% | 04/15/2025 | 21,000 | 21,630 | |||||||||
VRX Escrow Corp. (Pharmaceuticals) | (b) | 5.875% | 05/15/2023 | 21,000 | 21,499 | |||||||||
|
| |||||||||||||
| 814,154 | ||||||||||||||
|
| |||||||||||||
INDUSTRIALS – 0.9% | ||||||||||||||
Exelis, Inc. (Aerospace & Defense) | 5.550% | 10/01/2021 | 18,000 | 19,785 | ||||||||||
Exelis, Inc. (Aerospace & Defense) | 4.250% | 10/01/2016 | 15,000 | 15,479 | ||||||||||
Southwest Airlines Co. (Airlines) | 5.125% | 03/01/2017 | 36,000 | 38,194 | ||||||||||
Owens Corning (Building Products) | 4.200% | 12/01/2024 | 22,000 | 21,563 | ||||||||||
CNH Industrial Capital LLC (Machinery) | 3.625% | 04/15/2018 | 25,000 | 25,000 | ||||||||||
Verisk Analytics, Inc. (Professional Svs.) | 5.800% | 05/01/2021 | 170,000 | 191,079 | ||||||||||
Verisk Analytics, Inc. (Professional Svs.) | 4.125% | 09/12/2022 | 24,000 | 24,409 | ||||||||||
Verisk Analytics, Inc. (Professional Svs.) | 4.875% | 01/15/2019 | 22,000 | 23,503 | ||||||||||
| 103 | (continued) |
| Ohio National Fund, Inc. | Risk Managed Balanced Portfolio (Continued) |
Schedule of Investments | June 30, 2015 (Unaudited) |
| Corporate Bonds (Continued) | Rate | Maturity | Face Amount | Value | ||||||||||
INDUSTRIALS (continued) | ||||||||||||||
Verisk Analytics, Inc. (Professional Svs.) | 4.000% | 06/15/2025 | $ | 104,000 | $ | 101,733 | ||||||||
Verisk Analytics, Inc. (Professional Svs.) | 5.500% | 06/15/2045 | 57,000 | 55,870 | ||||||||||
J.B. Hunt Transport Services, Inc. (Road & Rail) | 3.375% | 09/15/2015 | 42,000 | 42,211 | ||||||||||
Penske Truck Leasing Co. LP / PTL Finance Corp. (Road & Rail) | (b) | 3.375% | 03/15/2018 | 37,000 | 38,115 | |||||||||
Penske Truck Leasing Co. LP / PTL Finance Corp. (Road & Rail) | (b) | 4.250% | 01/17/2023 | 63,000 | 63,768 | |||||||||
Penske Truck Leasing Co. LP / PTL Finance Corp. (Road & Rail) | (b) | 2.500% | 06/15/2019 | 27,000 | 26,723 | |||||||||
|
| |||||||||||||
| 687,432 | ||||||||||||||
|
| |||||||||||||
INFORMATION TECHNOLOGY – 0.9% | ||||||||||||||
Harris Corp. (Communications Equip.) | 3.832% | 04/27/2025 | 20,000 | 19,412 | ||||||||||
Harris Corp. (Communications Equip.) | 5.054% | 04/27/2045 | 26,000 | 24,684 | ||||||||||
Seagate HDD Cayman (Computers & Peripherals) | (b) | 4.750% | 01/01/2025 | 196,000 | 194,737 | |||||||||
Seagate HDD Cayman (Computers & Peripherals) | 4.750% | 06/01/2023 | 28,000 | 28,497 | ||||||||||
Seagate HDD Cayman (Computers & Peripherals) | (b) | 5.750% | 12/01/2034 | 55,000 | 54,008 | |||||||||
Seagate HDD Cayman (Computers & Peripherals) | (b) | 4.875% | 06/01/2027 | 51,000 | 49,492 | |||||||||
FLIR Systems, Inc. (Electronic Equip., Instr. & Comp.) | 3.750% | 09/01/2016 | 24,000 | 24,600 | ||||||||||
Molex Electronic Technologies, LLC (Electronic Equip., Instr. & Comp.) | (b) | 2.878% | 04/15/2020 | 22,000 | 21,644 | |||||||||
Molex Electronic Technologies, LLC (Electronic Equip., Instr. & Comp.) | (b) | 3.900% | 04/15/2025 | 72,000 | 69,659 | |||||||||
Trimble Navigation Ltd. (Electronic Equip., Instr. & Comp.) | 4.750% | 12/01/2024 | 42,000 | 41,997 | ||||||||||
Fidelity National Information Services, Inc. (IT Svs.) | 5.000% | 03/15/2022 | 9,000 | 9,498 | ||||||||||
Fiserv, Inc. (IT Svs.) | 3.125% | 10/01/2015 | 32,000 | 32,170 | ||||||||||
Autodesk, Inc. (Software) | 3.600% | 12/15/2022 | 33,000 | 32,786 | ||||||||||
Cadence Design Systems, Inc. (Software) | 4.375% | 10/15/2024 | 76,000 | 76,137 | ||||||||||
|
| |||||||||||||
| 679,321 | ||||||||||||||
|
| |||||||||||||
MATERIALS – 1.0% | ||||||||||||||
Albemarle Corp. (Chemicals) | 5.450% | 12/01/2044 | 52,000 | 51,870 | ||||||||||
Albemarle Corp. (Chemicals) | 4.150% | 12/01/2024 | 63,000 | 62,705 | ||||||||||
Ashland, Inc. (Chemicals) | 3.875% | 04/15/2018 | 28,000 | 28,770 | ||||||||||
Ashland, Inc. (Chemicals) | 6.875% | 05/15/2043 | 45,000 | 45,675 | ||||||||||
LyondellBasell Industries NV (Chemicals) | 4.625% | 02/26/2055 | 78,000 | 68,420 | ||||||||||
Rockwood Specialties Group, Inc. (Chemicals) | 4.625% | 10/15/2020 | 87,000 | 90,589 | ||||||||||
Hanson Ltd. (Construction Materials) | 6.125% | 08/15/2016 | 34,000 | 35,411 | ||||||||||
Martin Marietta Materials, Inc. (Construction Materials) | 4.250% | 07/02/2024 | 27,000 | 27,295 | ||||||||||
Vulcan Materials Co. (Construction Materials) | 7.000% | 06/15/2018 | 40,000 | 45,200 | ||||||||||
Vulcan Materials Co. (Construction Materials) | 7.500% | 06/15/2021 | 18,000 | 20,700 | ||||||||||
Vulcan Materials Co. (Construction Materials) | 4.500% | 04/01/2025 | 89,000 | 88,777 | ||||||||||
Reliance Steel & Aluminum Co. (Metals & Mining) | 4.500% | 04/15/2023 | 60,000 | 58,953 | ||||||||||
Georgia-Pacific LLC (Paper & Forest Products) | (b) | 3.163% | 11/15/2021 | 54,000 | 54,597 | |||||||||
Georgia-Pacific LLC (Paper & Forest Products) | (b) | 3.600% | 03/01/2025 | 83,000 | 82,060 | |||||||||
|
| |||||||||||||
| 761,022 | ||||||||||||||
|
| |||||||||||||
TELECOMMUNICATION SERVICES – 0.1% | ||||||||||||||
Sprint Corp. (Wireless Telecom. Svs.) | 7.250% | 09/15/2021 | 59,000 | 58,078 | ||||||||||
|
| |||||||||||||
UTILITIES – 0.1% | ||||||||||||||
IPALCO Enterprises, Inc. (Electric Utilities) | 5.000% | 05/01/2018 | 34,000 | 35,870 | ||||||||||
|
| |||||||||||||
Total Corporate Bonds (Cost $8,789,806) | $ | 8,605,215 | ||||||||||||
|
| |||||||||||||
| Preferred Stocks – 0.5% | Rate | Quantity | Value | |||||||||||
FINANCIALS – 0.5% | ||||||||||||||
Zions Bancorporation (Banks) | (e) | 5.800% | 38,000 | $ | 36,148 | |||||||||
Charles Schwab Corp. Series A / The (Capital Markets) | (e) | 7.000% | 59,000 | 68,497 | ||||||||||
Ally Financial, Inc. (Consumer Finance) | (b) | 7.000% | 45 | 45,696 | ||||||||||
General Electric Capital Corp. (Diversified Financial Svs.) | (e) | 7.125% | 100,000 | 115,375 | ||||||||||
General Electric Capital Corp. (Diversified Financial Svs.) | (e) | 6.250% | 100,000 | 109,375 | ||||||||||
General Electric Capital Corp. (Diversified Financial Svs.) | 4.700% | 239 | 5,808 | |||||||||||
|
| |||||||||||||
| 380,899 | ||||||||||||||
|
| |||||||||||||
HEALTH CARE – 0.0% | ||||||||||||||
Allergan PLC (Pharmaceuticals) | 5.500% | 11 | 11,468 | |||||||||||
|
| |||||||||||||
Total Preferred Stocks (Cost $393,649) | $ | 392,367 | ||||||||||||
|
| |||||||||||||
| 104 | (continued) |
| Ohio National Fund, Inc. | Risk Managed Balanced Portfolio (Continued) |
Schedule of Investments | June 30, 2015 (Unaudited) |
| Trust Preferred Securities – 0.2% | Rate | Quantity | Value | |||||||||||
FINANCIALS – 0.2% | ||||||||||||||
Citigroup Capital XIII (Banks) | (e) | 7.875% | 1,600 | $ | 41,536 | |||||||||
Goldman Sachs Capital I (Capital Markets) | 6.345% | 99,000 | 114,516 | |||||||||||
Morgan Stanley Capital Trust III (Capital Markets) | 6.250% | 323 | 8,246 | |||||||||||
Morgan Stanley Capital Trust IV (Capital Markets) | 6.250% | 73 | 1,857 | |||||||||||
Morgan Stanley Capital Trust V (Capital Markets) | 5.750% | 23 | 581 | |||||||||||
Morgan Stanley Capital Trust VIII (Capital Markets) | 6.450% | 13 | 330 | |||||||||||
|
| |||||||||||||
Total Trust Preferred Securities (Cost $170,357) | $ | 167,066 | ||||||||||||
|
| |||||||||||||
| Preferred Stock Depository Receipts – 0.5% | Rate | Shares | Value | |||||||||||
FINANCIALS – 0.5% | ||||||||||||||
Bank of America Corp. (Banks) | (f) | 8.000% | 59,000 | $ | 62,245 | |||||||||
Citigroup, Inc. (Banks) | (f) | 5.800% | 22,000 | 22,055 | ||||||||||
Wells Fargo & Co. (Banks) | (h) | 6.625% | 2,500 | 69,000 | ||||||||||
Morgan Stanley (Capital Markets) | (f) | 5.550% | 45,000 | 44,674 | ||||||||||
Morgan Stanley (Capital Markets) | (h) | 7.125% | 1,650 | 46,117 | ||||||||||
Morgan Stanley (Capital Markets) | (h) | 6.875% | 1,200 | 32,016 | ||||||||||
Discover Financial Services (Consumer Finance) | (g) | 6.500% | 2,625 | 66,859 | ||||||||||
|
| |||||||||||||
Total Preferred Stock Depository Receipts (Cost $346,884) | $ | 342,966 | ||||||||||||
|
| |||||||||||||
| Master Limited Partnerships – 2.8% | Shares | Value | ||||||||||||
ENERGY – 1.0% | ||||||||||||||
Enterprise Products Partners LP (Oil, Gas & Consumable Fuels) | 25,188 | $ | 752,869 | |||||||||||
|
| |||||||||||||
FINANCIALS – 1.8% | ||||||||||||||
Blackstone Group LP / The (Capital Markets) | 32,995 | 1,348,506 | ||||||||||||
|
| |||||||||||||
Total Master Limited Partnerships (Cost $2,020,401) | $ | 2,101,375 | ||||||||||||
|
| |||||||||||||
| Asset-Backed / Mortgage-Backed Securities – 1.6% | Rate | Maturity | Face Amount | Value | ||||||||||
CONSUMER DISCRETIONARY – 0.8% | ||||||||||||||
Applebee’s Funding LLC / IHOP Funding LLC 2014-1 A2 | (b) | 4.277% | 09/05/2044 | $ | 7,000 | $ | 7,089 | |||||||
CKE Restaurant Holdings, Inc. 2013-1A A2 | (b) | 4.474% | 03/20/2043 | 48,313 | 49,021 | |||||||||
DB Master Finance LLC 2015-1A A2I | (b) | 3.262% | 02/20/2045 | 49,875 | 50,034 | |||||||||
Hilton U.S.A. Trust 2013-HLT EFX | (b) | 5.609% | 11/05/2030 | 150,000 | 151,949 | |||||||||
Hilton U.S.A. Trust 2013-HLT DFX | (b) | 4.407% | 11/05/2030 | 250,000 | 252,036 | |||||||||
Wendys Funding LLC 2015-1A A2I | (b) | 3.371% | 06/15/2045 | 85,000 | 84,793 | |||||||||
|
| |||||||||||||
| 594,922 | ||||||||||||||
|
| |||||||||||||
FINANCIALS – 0.8% | ||||||||||||||
AmeriCredit Automobile Receivables Trust 2012-4 D | 2.680% | 10/09/2018 | 100,000 | 101,850 | ||||||||||
AmeriCredit Automobile Receivables Trust 2012-4 E | (b) | 3.820% | 02/10/2020 | 145,000 | 148,646 | |||||||||
AmeriCredit Automobile Receivables Trust 2015-2 D | 3.000% | 06/08/2021 | 20,000 | 20,020 | ||||||||||
Banc of America Commercial Mortgage Trust 2006-6 AJ | 5.421% | 10/10/2045 | 120,000 | 123,630 | ||||||||||
COMM 2007-C9 Mortgage Trust AJ | 5.650% | 12/10/2049 | 10,000 | 10,447 | ||||||||||
GCCFC Commercial Mortgage Trust 2007-GG11 AM | 5.867% | 12/10/2049 | 50,000 | 53,624 | ||||||||||
GAHR Commericial Mortgage Trust 2015-NRF DFX | (b) | 3.495% | 12/15/2019 | 10,000 | 9,789 | |||||||||
LB-UBS Commercial Mortgage Trust 2007-C2 AM | 5.493% | 02/15/2040 | 10,000 | 10,488 | ||||||||||
Santander Drive Auto Receivables Trust 2015-1 D | 3.240% | 04/15/2021 | 16,000 | 16,080 | ||||||||||
Wachovia Bank Commercial Mortgage Trust Series 2007-C30 AM | 5.383% | 12/15/2043 | 57,681 | 60,607 | ||||||||||
Wachovia Bank Commercial Mortgage Trust Series 2007-C31 AJ | 5.660% | 04/15/2047 | 40,000 | 41,022 | ||||||||||
Wachovia Bank Commercial Mortgage Trust Series 2007-C33 AJ | 6.150% | 02/15/2051 | 25,621 | 26,484 | ||||||||||
|
| |||||||||||||
| 622,687 | ||||||||||||||
|
| |||||||||||||
Total Asset-Backed / Mortgage-Backed Securities (Cost $1,227,895) | $ | 1,217,609 | ||||||||||||
|
| |||||||||||||
| U.S. Treasury Obligations – 15.5% | Rate | Maturity | Face Amount | Value | ||||||||||
U.S. Treasury Note | 0.375% | 05/31/2016 | $ | 118,000 | $ | 118,074 | ||||||||
U.S. Treasury Note | 0.500% | 06/30/2016 | 861,000 | 862,278 | ||||||||||
U.S. Treasury Note | 0.625% | 07/15/2016 | 1,066,000 | 1,068,748 | ||||||||||
U.S. Treasury Note | 0.625% | 12/31/2016 | 772,000 | 773,327 | ||||||||||
U.S. Treasury Note | 0.500% | 01/31/2017 | 845,000 | 844,406 | ||||||||||
U.S. Treasury Note | 0.875% | 02/28/2017 | 4,000 | 4,020 | ||||||||||
U.S. Treasury Note | 0.500% | 04/30/2017 | 350,000 | 349,289 | ||||||||||
U.S. Treasury Note | 0.625% | 05/31/2017 | 59,000 | 58,968 | ||||||||||
U.S. Treasury Note | 0.875% | 07/15/2017 | 8,000 | 8,031 | ||||||||||
U.S. Treasury Note | 1.000% | 09/15/2017 | 1,000 | 1,006 | ||||||||||
U.S. Treasury Note | 0.875% | 10/15/2017 | 2,000 | 2,004 | ||||||||||
| 105 | (continued) |
| Ohio National Fund, Inc. | Risk Managed Balanced Portfolio (Continued) |
Schedule of Investments | June 30, 2015 (Unaudited) |
| U.S. Treasury Obligations (Continued) | Rate | Maturity | Face Amount | Value | ||||||||||
U.S. Treasury Note | 1.000% | 12/15/2017 | $ | 354,000 | $ | 355,327 | ||||||||
U.S. Treasury Note | 0.875% | 01/31/2018 | 6,000 | 5,999 | ||||||||||
U.S. Treasury Note | 1.375% | 07/31/2018 | 316,000 | 318,962 | ||||||||||
U.S. Treasury Note | 1.500% | 08/31/2018 | 374,000 | 378,617 | ||||||||||
U.S. Treasury Note | 1.375% | 09/30/2018 | 1,247,000 | 1,256,450 | ||||||||||
U.S. Treasury Note | 1.250% | 10/31/2018 | 246,000 | 246,673 | ||||||||||
U.S. Treasury Note | 1.625% | 07/31/2019 | 213,000 | 214,697 | ||||||||||
U.S. Treasury Note | 1.750% | 09/30/2019 | 190,000 | 192,123 | ||||||||||
U.S. Treasury Note | 1.500% | 10/31/2019 | 282,000 | 281,912 | ||||||||||
U.S. Treasury Note | 1.500% | 11/30/2019 | 344,000 | 343,785 | ||||||||||
U.S. Treasury Note | 1.625% | 12/31/2019 | 292,000 | 292,935 | ||||||||||
U.S. Treasury Note | 1.375% | 03/31/2020 | 8,000 | 7,915 | ||||||||||
U.S. Treasury Note | 2.125% | 09/30/2021 | 153,000 | 154,386 | ||||||||||
U.S. Treasury Note | 2.125% | 12/31/2021 | 215,000 | 216,478 | ||||||||||
U.S. Treasury Note | 1.750% | 05/15/2023 | 65,000 | 62,806 | ||||||||||
U.S. Treasury Note | 2.500% | 08/15/2023 | 242,000 | 246,935 | ||||||||||
U.S. Treasury Note | 2.750% | 11/15/2023 | 336,000 | 348,889 | ||||||||||
U.S. Treasury Note | 2.500% | 05/15/2024 | 174,000 | 176,746 | ||||||||||
U.S. Treasury Note | 2.375% | 08/15/2024 | 44,000 | 44,172 | ||||||||||
U.S. Treasury Note | (j) | 2.250% | 11/15/2024 | 1,425,000 | 1,413,868 | |||||||||
U.S. Treasury Note | 2.000% | 02/15/2025 | 31,000 | 30,075 | ||||||||||
U.S. Treasury Note | 2.125% | 05/15/2025 | 361,000 | 353,864 | ||||||||||
U.S. Treasury Note | 3.750% | 11/15/2043 | 225,000 | 251,894 | ||||||||||
U.S. Treasury Note | 3.625% | 02/15/2044 | 50,000 | 54,727 | ||||||||||
U.S. Treasury Note | 3.375% | 05/15/2044 | 43,000 | 44,952 | ||||||||||
U.S. Treasury Note | 3.000% | 05/15/2045 | 184,000 | 179,457 | ||||||||||
|
| |||||||||||||
Total U.S. Treasury Obligations (Cost $11,602,741) | $ | 11,564,795 | ||||||||||||
|
| |||||||||||||
| U.S. Government Agency Mortgage-Backed Securities – 6.2% | Rate | Maturity | Face Amount | Value | ||||||||||
Fannie Mae Pool | 4.000% | 06/01/2029 | $ | 7,463 | $ | 8,024 | ||||||||
Fannie Mae Pool | 4.000% | 09/01/2029 | 253,778 | 272,844 | ||||||||||
Fannie Mae Pool | 3.500% | 10/01/2029 | 29,326 | 30,884 | ||||||||||
Fannie Mae Pool | 4.000% | 04/01/2034 | 23,428 | 25,250 | ||||||||||
Fannie Mae Pool | 5.500% | 04/01/2040 | 335,893 | 378,725 | ||||||||||
Fannie Mae Pool | 5.500% | 05/01/2041 | 8,425 | 9,455 | ||||||||||
Fannie Mae Pool | 5.500% | 07/01/2041 | 46,221 | 51,903 | ||||||||||
Fannie Mae Pool | 4.000% | 06/01/2042 | 16,664 | 17,759 | ||||||||||
Fannie Mae Pool | 3.500% | 07/01/2042 | 39,729 | 41,047 | ||||||||||
Fannie Mae Pool | 4.000% | 07/01/2042 | 127,995 | 136,393 | ||||||||||
Fannie Mae Pool | 4.000% | 08/01/2042 | 7,613 | 8,113 | ||||||||||
Fannie Mae Pool | 4.000% | 09/01/2042 | 9,348 | 9,965 | ||||||||||
Fannie Mae Pool | 4.000% | 12/01/2042 | 6,485 | 6,926 | ||||||||||
Fannie Mae Pool | 3.500% | 01/01/2043 | 44,074 | 45,404 | ||||||||||
Fannie Mae Pool | 3.500% | 02/01/2043 | 68,506 | 70,576 | ||||||||||
Fannie Mae Pool | 3.500% | 02/01/2043 | 43,575 | 44,889 | ||||||||||
Fannie Mae Pool | 4.500% | 03/01/2043 | 214,154 | 235,300 | ||||||||||
Fannie Mae Pool | 4.000% | 08/01/2043 | 23,423 | 24,969 | ||||||||||
Fannie Mae Pool | 3.500% | 04/01/2044 | 7,320 | 7,562 | ||||||||||
Fannie Mae Pool | 3.500% | 05/01/2044 | 52,501 | 54,342 | ||||||||||
Fannie Mae Pool | 4.500% | 05/01/2044 | 331,415 | 365,107 | ||||||||||
Fannie Mae Pool | 4.000% | 06/01/2044 | 179,767 | 191,610 | ||||||||||
Fannie Mae Pool | 4.000% | 07/01/2044 | 53,003 | 56,739 | ||||||||||
Fannie Mae Pool | 5.000% | 07/01/2044 | 258,560 | 291,893 | ||||||||||
Fannie Mae Pool | 4.000% | 08/01/2044 | 33,425 | 35,782 | ||||||||||
Fannie Mae Pool | 4.500% | 08/01/2044 | 77,994 | 85,933 | ||||||||||
Fannie Mae Pool | 4.500% | 10/01/2044 | 49,446 | 54,392 | ||||||||||
Fannie Mae Pool | 4.500% | 10/01/2044 | 58,986 | 64,995 | ||||||||||
Fannie Mae Pool | 3.500% | 02/01/2045 | 54,570 | 56,212 | ||||||||||
Fannie Mae Pool | 4.500% | 03/01/2045 | 90,706 | 99,778 | ||||||||||
Fannie Mae Pool | 4.500% | 05/01/2045 | 170,841 | 188,957 | ||||||||||
Freddie Mac Gold Pool | 3.500% | 07/01/2029 | 89,187 | 93,965 | ||||||||||
Freddie Mac Gold Pool | 3.500% | 09/01/2029 | 382,337 | 402,882 | ||||||||||
Freddie Mac Gold Pool | 5.500% | 08/01/2041 | 153,311 | 176,032 | ||||||||||
Freddie Mac Gold Pool | 3.500% | 02/01/2044 | 19,965 | 20,567 | ||||||||||
Freddie Mac Gold Pool | 4.000% | 08/01/2044 | 92,678 | 98,861 | ||||||||||
Ginnie Mae I Pool | 5.000% | 01/15/2040 | 294,428 | 326,840 | ||||||||||
Ginnie Mae I Pool | 5.000% | 05/15/2040 | 130,453 | 146,982 | ||||||||||
Ginnie Mae I Pool | 5.000% | 06/15/2044 | 44,540 | 50,477 | ||||||||||
| 106 | (continued) |
| Ohio National Fund, Inc. | Risk Managed Balanced Portfolio (Continued) |
Schedule of Investments | June 30, 2015 (Unaudited) |
| U.S. Government Agency Mortgage-Backed Securities (Continued) | Rate | Maturity | Face Amount | Value | ||||||||||
Ginnie Mae I Pool | 5.000% | 06/15/2044 | $ | 89,879 | $ | 101,763 | ||||||||
Ginnie Mae I Pool | 4.000% | 04/15/2045 | 162,496 | 175,621 | ||||||||||
Ginnie Mae II Pool | 5.500% | 11/20/2037 | 6,451 | 7,220 | ||||||||||
Ginnie Mae II Pool | 5.500% | 05/20/2042 | 9,399 | 10,700 | ||||||||||
|
| |||||||||||||
Total U.S. Government Agency Mortgage-Backed Securities (Cost $4,584,651) | $ | 4,583,638 | ||||||||||||
|
| |||||||||||||
| Purchased Options – 5.6% | Contracts (i) | Value | ||||||||||||
SPDR S&P 500 ETF Trust Put Option | 99 | $ | 139,986 | |||||||||||
SPDR S&P 500 ETF Trust Put Option | 152 | 242,972 | ||||||||||||
SPDR S&P 500 ETF Trust Put Option | 116 | 207,988 | ||||||||||||
SPDR S&P 500 ETF Trust Put Option | 140 | 285,530 | ||||||||||||
SPDR S&P 500 ETF Trust Put Option | 155 | 349,370 | ||||||||||||
SPDR S&P 500 ETF Trust Put Option | 134 | 328,702 | ||||||||||||
SPDR S&P 500 ETF Trust Put Option | 190 | 509,010 | ||||||||||||
SPDR S&P 500 ETF Trust Put Option | 40 | 117,380 | ||||||||||||
SPDR S&P 500 ETF Trust Put Option | �� | 20 | 62,820 | |||||||||||
SPDR S&P 500 ETF Trust Call Option | 51 | 130,050 | ||||||||||||
SPDR S&P 500 ETF Trust Call Option | 94 | 208,022 | ||||||||||||
SPDR S&P 500 ETF Trust Call Option | 152 | 288,648 | ||||||||||||
SPDR S&P 500 ETF Trust Call Option | 116 | 185,716 | ||||||||||||
SPDR S&P 500 ETF Trust Call Option | 140 | 185,500 | ||||||||||||
SPDR S&P 500 ETF Trust Call Option | 155 | 166,005 | ||||||||||||
SPDR S&P 500 ETF Trust Call Option | 134 | 294,398 | ||||||||||||
SPDR S&P 500 ETF Trust Call Option | 190 | 368,600 | ||||||||||||
SPDR S&P 500 ETF Trust Call Option | 40 | 67,820 | ||||||||||||
SPDR S&P 500 ETF Trust Call Option | 40 | 58,800 | ||||||||||||
|
| |||||||||||||
Total Purchased Options (Cost $4,634,119) | $ | 4,197,317 | ||||||||||||
|
| |||||||||||||
| Money Market Funds – 14.6% | Shares | Value | ||||||||||||
Fidelity Institutional Money Market Funds Money Market Portfolio – Class I | 6,000,000 | $ | 6,000,000 | |||||||||||
Short-Term Investments Trust – STIC Prime Portfolio | 4,879,000 | 4,879,000 | ||||||||||||
|
| |||||||||||||
Total Money Market Funds (Cost $10,879,000) | $ | 10,879,000 | ||||||||||||
|
| |||||||||||||
Total Investments – 101.6% (Cost $76,252,467) | (k) | $ | 75,878,641 | |||||||||||
Liabilities in Excess of Other Assets – (1.6)% | (l) | (1,204,405) | ||||||||||||
|
| |||||||||||||
Net Assets – 100.0% | $ | 74,674,236 | ||||||||||||
|
| |||||||||||||
Percentages are stated as a percent of net assets.
Footnotes:
| (a) | Non-income producing security. |
| (b) | Security exempt from registration under Regulation D of the Securities Act of 1933. These securities may be resold in transactions exempt from registration, normally to qualified buyers under Rule 144A. At June 30, 2015, the value of these securities totaled $3,063,239, or 4.1% of the Portfolio’s net assets. These securities were deemed liquid pursuant to procedures approved by the Board of Directors. |
| (c) | Security traded on a foreign exchange has been valued at an estimate of fair value that is different than the local market close price. These fair value estimates are determined by an independent fair valuation service that has been approved by the Board. These securities represent $691,961, or 0.9% of the Portfolio’s net |
| 107 | (continued) |
| Ohio National Fund, Inc. | Risk Managed Balanced Portfolio (Continued) |
Schedule of Investments | June 30, 2015 (Unaudited) |
| assets. Other Portfolio securities are not subjected to fair value procedures because they are traded on domestic or foreign exchanges that have close times that are consistent with the U.S. market close, normally 4:00 pm Eastern Time. |
| (d) | Security is a variable rate instrument in which the coupon rate is fixed until a later specified date, then is adjusted quarterly in concert with U.S. LIBOR. Interest rates stated are those in effect at June 30, 2015. |
| (e) | Security is a variable rate preferred stock or trust preferred security in which the dividend rate is fixed until a later specified date, then is adjusted quarterly in concert with U.S. LIBOR. Dividend rates stated are those in effect at June 30, 2015. |
| (f) | Security is a depository receipt in which each share represents a 1/25th interest in a share of the corresponding perpetual non-cumulative variable rate preferred stock. The dividend rate is fixed until a later specified date, then is adjusted quarterly in concert with U.S. LIBOR. Dividend rates stated are those in effect at June 30, 2015. |
| (g) | Security is a depository receipt in which each share represents a 1/40th interest in a share of the corresponding perpetual non-cumulative fixed rate preferred stock. |
| (h) | Security is a depository receipt in which each share represents a 1/1,000th interest in a share of the corresponding perpetual non-cumulative variable rate preferred stock. The dividend rate is fixed until a later specified date, then is adjusted quarterly in concert with U.S. LIBOR. Dividend rates stated are those in effect at June 30, 2015. |
| (i) | 100 shares per contract. |
| (j) | Security is fully or partially pledged as collateral for futures contracts outstanding at June 30, 2015. |
| (k) | Represents cost for financial reporting purposes, which may differ from cost basis for federal income tax purposes. See also Note 7 of the Notes to Financial Statements. |
| (l) | Includes $196,095 of cash pledged as collateral for the following futures contracts outstanding at June 30, 2015: |
Type | Description | Expiration | Number of Contracts | Contract at Value | Initial Contract Amount | Unrealized Appreciation (Depreciation) | Variation Margin Receivable (Payable) | |||||||||||||||
Long | S&P 500 E-mini | September 18, 2015 | 113 | $11,607,360 | $ | 11,783,380 | $ | (176,020 | ) | $ | — | |||||||||||
Long | 10-Year U.S. Treasury Note | September 21, 2015 | 313 | $39,491,797 | $ | 39,738,083 | $ | (246,286 | ) | $ | — | |||||||||||
|
|
|
| |||||||||||||||||||
| $ | (422,306 | ) | $ | — | ||||||||||||||||||
|
|
|
| |||||||||||||||||||
The accompanying notes are an integral part of these financial statements.
| 108 |
| Ohio National Fund, Inc. |
| June 30, 2015 (Unaudited) |
| Equity Portfolio | Money Market Portfolio | Bond Portfolio | Omni Portfolio | International Portfolio | Capital Appreciation Portfolio | International Small-Mid Company Portfolio | Aggressive Growth | |||||||||||||||||||||||||
Assets: | ||||||||||||||||||||||||||||||||
Investments in securities, at value* | $ | 520,127,213 | $ | 141,496,772 | $ | 156,797,862 | $ | 50,499,822 | $ | 173,980,700 | $ | 447,830,388 | $ | 87,393,899 | $ | 46,511,773 | ||||||||||||||||
Cash | 955 | 55,946,701 | 277 | 2,424 | 1,541,689 | 23 | — | 253 | ||||||||||||||||||||||||
Foreign currencies, at value** | — | — | — | — | 1,343 | — | 281 | — | ||||||||||||||||||||||||
Receivable for securities sold | 1,645,657 | — | — | 456,775 | 633,363 | 6,681,686 | 334,688 | 133,504 | ||||||||||||||||||||||||
Due from adviser | — | 29,024 | — | — | — | — | — | — | ||||||||||||||||||||||||
Receivable for fund shares sold | 93,497 | 994,787 | 1,124,954 | 45,431 | 685,830 | 425,173 | 175,247 | 63,736 | ||||||||||||||||||||||||
Dividends and accrued interest receivable | 487,687 | 1,552 | 1,542,536 | 160,039 | 132,721 | 323,910 | 92,021 | 13,942 | ||||||||||||||||||||||||
Foreign tax reclaim receivable | 13,620 | — | — | — | 176,556 | 26,908 | 25,940 | 4,102 | ||||||||||||||||||||||||
Variation margin receivable on futures contracts | — | — | — | — | 144,205 | — | — | — | ||||||||||||||||||||||||
Prepaid expenses and other assets | 4,621 | 1,451 | 1,193 | 302 | 1,280 | 4,710 | 525 | 298 | ||||||||||||||||||||||||
|
|
|
|
|
|
|
|
|
|
|
|
|
|
|
| |||||||||||||||||
Total assets | 522,373,250 | 198,470,287 | 159,466,822 | 51,164,793 | 177,297,687 | 455,292,798 | 88,022,601 | 46,727,608 | ||||||||||||||||||||||||
|
|
|
|
|
|
|
|
|
|
|
|
|
|
|
| |||||||||||||||||
Liabilities: | ||||||||||||||||||||||||||||||||
Payable for securities purchased | 5,479,112 | — | — | 461,274 | 326,305 | 10,806,565 | 852,349 | — | ||||||||||||||||||||||||
Payable for fund shares redeemed | 1,954,157 | 1,216,712 | 141,084 | 71,851 | 35,562 | 753,296 | 24,952 | 40,589 | ||||||||||||||||||||||||
Payable for investment management services | 329,908 | 40,249 | 73,580 | 25,283 | 122,481 | 280,440 | 71,459 | 30,884 | ||||||||||||||||||||||||
Accrued custody expense | 3,336 | 1,702 | 1,136 | 1,317 | 40,511 | 3,596 | 26,844 | 849 | ||||||||||||||||||||||||
Accrued professional fees | 6,441 | 7,849 | 6,960 | 6,554 | 7,212 | 6,440 | 6,737 | 6,573 | ||||||||||||||||||||||||
Accrued accounting fees | 15,790 | 6,725 | 8,702 | 4,659 | 15,293 | 13,911 | 8,079 | 2,279 | ||||||||||||||||||||||||
Accrued printing and filing fees | 14,612 | 6,240 | 4,645 | 1,517 | 5,441 | 12,112 | 2,541 | 1,574 | ||||||||||||||||||||||||
Withholding tax payable | — | — | — | — | 44,063 | — | 5,969 | 314 | ||||||||||||||||||||||||
Unrealized depreciation on foreign currency contracts | — | — | — | — | 271,805 | — | 335,828 | — | ||||||||||||||||||||||||
|
|
|
|
|
|
|
|
|
|
|
|
|
|
|
| |||||||||||||||||
Total liabilities | 7,803,356 | 1,279,477 | 236,107 | 572,455 | 868,673 | 11,876,360 | 1,334,758 | 83,062 | ||||||||||||||||||||||||
|
|
|
|
|
|
|
|
|
|
|
|
|
|
|
| |||||||||||||||||
Net assets | $ | 514,569,894 | $ | 197,190,810 | $ | 159,230,715 | $ | 50,592,338 | $ | 176,429,014 | $ | 443,416,438 | $ | 86,687,843 | $ | 46,644,546 | ||||||||||||||||
|
|
|
|
|
|
|
|
|
|
|
|
|
|
|
| |||||||||||||||||
Net assets consist of: | ||||||||||||||||||||||||||||||||
Par value, $1 per share | $ | 15,273,671 | $ | 19,719,094 | $ | 10,235,537 | $ | 2,003,329 | $ | 13,299,206 | $ | 12,601,440 | $ | 2,773,922 | $ | 3,173,759 | ||||||||||||||||
Paid-in capital in excess of par value | 477,408,609 | 177,471,716 | 147,824,994 | 37,866,369 | 209,716,356 | 355,805,519 | 61,819,956 | 25,020,384 | ||||||||||||||||||||||||
Accumulated net realized gain (loss) on investments | (21,852,110 | ) | — | (8,856,516 | ) | 8,865,605 | (67,520,598 | ) | 45,458,526 | 4,416,617 | 11,488,957 | |||||||||||||||||||||
Net unrealized appreciation (depreciation) on: | ||||||||||||||||||||||||||||||||
Investments | 41,695,212 | — | 2,168,510 | 1,533,953 | 15,763,192 | 27,433,382 | 17,564,195 | 6,974,784 | ||||||||||||||||||||||||
Foreign currency contracts | — | — | — | — | (271,805 | ) | — | (335,828 | ) | — | ||||||||||||||||||||||
Futures contracts | — | — | — | — | (722,349 | ) | — | — | — | |||||||||||||||||||||||
Other foreign currency related transactions | — | — | — | — | (9,005 | ) | (2,160 | ) | (4,560 | ) | (55 | ) | ||||||||||||||||||||
Undistributed net investment income (loss) | 2,044,512 | — | 7,858,190 | 323,082 | 6,174,017 | 2,119,731 | 453,541 | (13,283 | ) | |||||||||||||||||||||||
|
|
|
|
|
|
|
|
|
|
|
|
|
|
|
| |||||||||||||||||
Net assets | $ | 514,569,894 | $ | 197,190,810 | $ | 159,230,715 | $ | 50,592,338 | $ | 176,429,014 | $ | 443,416,438 | $ | 86,687,843 | $ | 46,644,546 | ||||||||||||||||
|
|
|
|
|
|
|
|
|
|
|
|
|
|
|
| |||||||||||||||||
* Investments in securities, at cost | $ | 478,432,001 | $ | 141,496,772 | $ | 154,629,352 | $ | 48,965,869 | $ | 158,217,508 | $ | 420,397,006 | $ | 69,829,704 | $ | 39,536,989 | ||||||||||||||||
|
|
|
|
|
|
|
|
|
|
|
|
|
|
|
| |||||||||||||||||
** Foreign currencies, at cost | $ | — | $ | — | $ | — | $ | — | $ | 983 | $ | — | $ | 390 | $ | — | ||||||||||||||||
|
|
|
|
|
|
|
|
|
|
|
|
|
|
|
| |||||||||||||||||
Shares outstanding | 15,273,671 | 19,719,094 | 10,235,537 | 2,003,329 | 13,299,206 | 12,601,440 | 2,773,922 | 3,173,759 | ||||||||||||||||||||||||
|
|
|
|
|
|
|
|
|
|
|
|
|
|
|
| |||||||||||||||||
Authorized Fund shares allocated to Portfolio | 25,000,000 | 55,000,000 | 30,000,000 | 10,000,000 | 30,000,000 | 25,000,000 | 7,000,000 | 7,000,000 | ||||||||||||||||||||||||
|
|
|
|
|
|
|
|
|
|
|
|
|
|
|
| |||||||||||||||||
Net asset value per share | $ | 33.69 | $ | 10.00 | $ | 15.56 | $ | 25.25 | $ | 13.27 | $ | 35.19 | $ | 31.25 | $ | 14.70 | ||||||||||||||||
|
|
|
|
|
|
|
|
|
|
|
|
|
|
|
| |||||||||||||||||
The accompanying notes are an integral part of these financial statements.
| 109 |
| Ohio National Fund, Inc. |
Statements of Assets and Liabilities | June 30, 2015 (Unaudited) |
| Small Cap Growth Portfolio | Mid Cap Opportunity Portfolio | S&P 500® Index Portfolio | Strategic Value Portfolio | High Income Bond Portfolio | Capital Growth Portfolio | Nasdaq-100® Portfolio | Bristol Portfolio | |||||||||||||||||||||||||
Assets: | ||||||||||||||||||||||||||||||||
Investments in securities, at value* | $ | 226,897,571 | $ | 89,614,852 | $ | 408,241,148 | $ | 328,266,868 | $ | 222,857,887 | $ | 75,892,389 | $ | 129,508,627 | $ | 231,404,890 | ||||||||||||||||
Cash | 10,287 | 408 | 1,666,703 | 576 | 164 | 824 | 776,480 | 14,716 | ||||||||||||||||||||||||
Receivable for securities sold | 575,213 | 772,665 | 64,749 | — | 75,540 | 617,970 | — | 8,609,342 | ||||||||||||||||||||||||
Receivable for fund shares sold | 61,301 | 8,724 | 195,331 | 2,352,421 | 44,167 | 32,872 | 29,556 | 28,509 | ||||||||||||||||||||||||
Dividends and accrued interest receivable | 43,426 | 29,802 | 527,659 | 1,976,162 | 3,664,638 | 14,292 | 59,261 | 262,336 | ||||||||||||||||||||||||
Foreign tax reclaim receivable | 2,081 | — | 3,263 | 66,468 | — | — | — | — | ||||||||||||||||||||||||
Prepaid expenses and other assets | 1,913 | 621 | 2,862 | 2,391 | 1,716 | 540 | 912 | 1,702 | ||||||||||||||||||||||||
|
|
|
|
|
|
|
|
|
|
|
|
|
|
|
| |||||||||||||||||
Total assets | 227,591,792 | 90,427,072 | 410,701,715 | 332,664,886 | 226,644,112 | 76,558,887 | 130,374,836 | 240,321,495 | ||||||||||||||||||||||||
|
|
|
|
|
|
|
|
|
|
|
|
|
|
|
| |||||||||||||||||
Liabilities: | ||||||||||||||||||||||||||||||||
Payable for securities purchased | 1,361,932 | 1,514,295 | 675,139 | 2,693,912 | 919,502 | 392,770 | 453,990 | 2,437,161 | ||||||||||||||||||||||||
Payable for fund shares redeemed | 2,604,015 | 30,052 | 133,455 | 64,509 | 790,770 | 47,007 | 368,103 | 5,266,730 | ||||||||||||||||||||||||
Payable for investment management services | 146,439 | 63,149 | 121,078 | 195,468 | 131,009 | 56,943 | 42,006 | 147,537 | ||||||||||||||||||||||||
Accrued custody expense | 3,107 | 1,428 | 5,660 | 3,655 | 1,909 | 930 | 1,331 | 2,337 | ||||||||||||||||||||||||
Accrued professional fees | 6,440 | 6,760 | 7,468 | 10,652 | 8,379 | 10,793 | 6,686 | 7,444 | ||||||||||||||||||||||||
Accrued accounting fees | 7,864 | 3,843 | 16,573 | 10,815 | 22,636 | 3,721 | 5,245 | 7,682 | ||||||||||||||||||||||||
Accrued printing and filing fees | 6,681 | 2,811 | 10,927 | 11,004 | 8,654 | 2,540 | 3,849 | 8,007 | ||||||||||||||||||||||||
Withholding tax payable | — | — | 704 | 76,399 | — | — | — | — | ||||||||||||||||||||||||
|
|
|
|
|
|
|
|
|
|
|
|
|
|
|
| |||||||||||||||||
Total liabilities | 4,136,478 | 1,622,338 | 971,004 | 3,066,414 | 1,882,859 | 514,704 | 881,210 | 7,876,898 | ||||||||||||||||||||||||
|
|
|
|
|
|
|
|
|
|
|
|
|
|
|
| |||||||||||||||||
Net assets | $ | 223,455,314 | $ | 88,804,734 | $ | 409,730,711 | $ | 329,598,472 | $ | 224,761,253 | $ | 76,044,183 | $ | 129,493,626 | $ | 232,444,597 | ||||||||||||||||
|
|
|
|
|
|
|
|
|
|
|
|
|
|
|
| |||||||||||||||||
Net assets consist of: | ||||||||||||||||||||||||||||||||
Par value, $1 per share | $ | 8,260,901 | $ | 2,766,694 | $ | 18,493,864 | $ | 23,770,147 | $ | 13,462,036 | $ | 1,728,144 | $ | 11,430,365 | $ | 10,508,369 | ||||||||||||||||
Paid-in capital in excess of par value | 161,697,280 | 69,005,121 | 243,129,488 | 237,496,728 | 183,286,058 | 45,670,289 | 60,978,140 | 141,736,001 | ||||||||||||||||||||||||
Accumulated net realized gain on investments | 22,164,846 | 3,415,302 | 5,999,777 | 43,080,112 | 7,268,678 | 10,789,322 | 5,725,153 | 68,187,657 | ||||||||||||||||||||||||
Net unrealized appreciation (depreciation) on: |
| |||||||||||||||||||||||||||||||
Investments | 31,526,265 | 13,744,454 | 137,852,186 | 16,479,087 | (2,474,214 | ) | 18,104,103 | 50,683,763 | 11,209,150 | |||||||||||||||||||||||
Foreign currency related transactions | 42 | — | — | (3,794 | ) | — | — | — | — | |||||||||||||||||||||||
Undistributed net investment income (loss) | (194,020 | ) | (126,837 | ) | 4,255,396 | 8,776,192 | 23,218,695 | (247,675 | ) | 676,205 | 803,420 | |||||||||||||||||||||
|
|
|
|
|
|
|
|
|
|
|
|
|
|
|
| |||||||||||||||||
Net assets | $ | 223,455,314 | $ | 88,804,734 | $ | 409,730,711 | $ | 329,598,472 | $ | 224,761,253 | $ | 76,044,183 | $ | 129,493,626 | $ | 232,444,597 | ||||||||||||||||
|
|
|
|
|
|
|
|
|
|
|
|
|
|
|
| |||||||||||||||||
* Investments in securities, at cost | $ | 195,371,306 | $ | 75,870,398 | $ | 270,388,962 | $ | 311,787,781 | $ | 225,332,101 | $ | 57,788,286 | $ | 78,824,864 | $ | 220,195,740 | ||||||||||||||||
|
|
|
|
|
|
|
|
|
|
|
|
|
|
|
| |||||||||||||||||
Shares outstanding | 8,260,901 | 2,766,694 | 18,493,864 | 23,770,147 | 13,462,036 | 1,728,144 | 11,430,365 | 10,508,369 | ||||||||||||||||||||||||
|
|
|
|
|
|
|
|
|
|
|
|
|
|
|
| |||||||||||||||||
Authorized Fund shares allocated to Portfolio | 15,000,000 | 6,000,000 | 35,000,000 | 65,000,000 | 35,000,000 | 5,000,000 | 25,000,000 | 40,000,000 | ||||||||||||||||||||||||
|
|
|
|
|
|
|
|
|
|
|
|
|
|
|
| |||||||||||||||||
Net asset value per share | $ | 27.05 | $ | 32.10 | $ | 22.15 | $ | 13.87 | $ | 16.70 | $ | 44.00 | $ | 11.33 | $ | 22.12 | ||||||||||||||||
|
|
|
|
|
|
|
|
|
|
|
|
|
|
|
| |||||||||||||||||
The accompanying notes are an integral part of these financial statements.
| 110 |
| Ohio National Fund, Inc. |
Statements of Assets and Liabilities | June 30, 2015 (Unaudited) |
Bryton Growth Portfolio | Balanced Portfolio | Target VIP Portfolio | Bristol Growth Portfolio | Risk Managed Balanced Portfolio | ||||||||||||||||
Assets: | ||||||||||||||||||||
Investments in securities, at value* | $ | 182,211,960 | $ | 889,226,145 | $ | 52,626,583 | $ | 123,656,472 | $ | 75,878,641 | ||||||||||
Cash | 391 | 382,029 | 72 | 7,627 | 282,020 | |||||||||||||||
Receivable for securities sold | 6,189,058 | 10,398,676 | — | 2,814,843 | 133,926 | |||||||||||||||
Receivable for fund shares sold | 45,761 | 527,020 | 36,165 | 5,144 | 359,716 | |||||||||||||||
Dividends and accrued interest receivable | 42,432 | 3,669,707 | 133,581 | 120,910 | 170,081 | |||||||||||||||
Foreign tax reclaim receivable | — | — | 4,284 | — | — | |||||||||||||||
Prepaid expenses and other assets | 1,345 | 8,729 | 396 | 910 | 332 | |||||||||||||||
|
|
|
|
|
|
|
|
|
| |||||||||||
Total assets | 188,490,947 | 904,212,306 | 52,801,081 | 126,605,906 | 76,824,716 | |||||||||||||||
|
|
|
|
|
|
|
|
|
| |||||||||||
Liabilities: | ||||||||||||||||||||
Options written, at value** | — | 115,150 | — | — | — | |||||||||||||||
Payable for securities purchased | 4,869,337 | 19,700,211 | — | 955,481 | 2,050,688 | |||||||||||||||
Payable for fund shares redeemed | 2,933,494 | 2,514,286 | 49,537 | 1,303,081 | 10,737 | |||||||||||||||
Payable for investment management services | 122,271 | 429,356 | 26,596 | 81,949 | 52,604 | |||||||||||||||
Accrued custody expense | 3,561 | 5,689 | 2,775 | 1,523 | 6,203 | |||||||||||||||
Accrued professional fees | 7,207 | �� | 6,441 | 8,595 | 6,966 | 13,929 | ||||||||||||||
Accrued accounting fees | 6,091 | 27,363 | 3,352 | 4,640 | 13,725 | |||||||||||||||
Accrued printing and filing fees | 6,663 | 22,635 | 1,822 | 5,001 | 2,594 | |||||||||||||||
Withholding tax payable | — | — | 14,813 | — | — | |||||||||||||||
|
|
|
|
|
|
|
|
|
| |||||||||||
Total liabilities | 7,948,624 | 22,821,131 | 107,490 | 2,358,641 | 2,150,480 | |||||||||||||||
|
|
|
|
|
|
|
|
|
| |||||||||||
Net assets | $ | 180,542,323 | $ | 881,391,175 | $ | 52,693,591 | $ | 124,247,265 | $ | 74,674,236 | ||||||||||
|
|
|
|
|
|
|
|
|
| |||||||||||
Net assets consist of: | ||||||||||||||||||||
Par value, $1 per share | $ | 7,963,790 | $ | 45,176,209 | $ | 3,562,918 | $ | 7,147,373 | $ | 6,938,332 | ||||||||||
Paid-in capital in excess of par value | 122,559,958 | 769,898,750 | 49,513,494 | 77,081,014 | 66,677,792 | |||||||||||||||
Accumulated net realized gain (loss) on investments | 39,618,481 | 25,281,829 | (3,795,660 | ) | 30,661,622 | 1,608,992 | ||||||||||||||
Net unrealized appreciation (depreciation) on: | ||||||||||||||||||||
Investments | 10,887,272 | 33,563,854 | 2,835,590 | 9,005,646 | (373,826 | ) | ||||||||||||||
Futures contracts | — | — | — | — | (422,306 | ) | ||||||||||||||
Written options | — | 304,381 | — | — | — | |||||||||||||||
Undistributed net investment income (loss) | (487,178 | ) | 7,166,152 | 577,249 | 351,610 | 245,252 | ||||||||||||||
|
|
|
|
|
|
|
|
|
| |||||||||||
Net assets | $ | 180,542,323 | $ | 881,391,175 | $ | 52,693,591 | $ | 124,247,265 | $ | 74,674,236 | ||||||||||
|
|
|
|
|
|
|
|
|
| |||||||||||
* Investments in securities, at cost | $ | 171,324,688 | $ | 855,662,291 | $ | 49,790,993 | $ | 114,650,826 | $ | 76,252,467 | ||||||||||
|
|
|
|
|
|
|
|
|
| |||||||||||
** Premiums received on options written | $ | — | $ | 419,531 | $ | — | $ | — | $ | — | ||||||||||
|
|
|
|
|
|
|
|
|
| |||||||||||
Shares outstanding | 7,963,790 | 45,176,209 | 3,562,918 | 7,147,373 | 6,938,332 | |||||||||||||||
|
|
|
|
|
|
|
|
|
| |||||||||||
Authorized Fund shares allocated to Portfolio | 30,000,000 | 55,000,000 | 10,000,000 | 25,000,000 | 15,000,000 | |||||||||||||||
|
|
|
|
|
|
|
|
|
| |||||||||||
Net asset value per share | $ | 22.67 | $ | 19.51 | $ | 14.79 | $ | 17.38 | $ | 10.76 | ||||||||||
|
|
|
|
|
|
|
|
|
| |||||||||||
The accompanying notes are an integral part of these financial statements.
| 111 |
| Ohio National Fund, Inc. |
| For the Six-Month Period Ended June 30, 2015 (Unaudited) |
| Equity Portfolio | Money Market Portfolio | Bond Portfolio | Omni Portfolio | International Portfolio | Capital Appreciation Portfolio | International Small-Mid Company Portfolio | Aggressive Growth Portfolio | |||||||||||||||||||||||||
Investment income: | ||||||||||||||||||||||||||||||||
Interest | $ | — | $ | 45,496 | $ | 3,315,244 | $ | 195,119 | $ | — | $ | — | $ | — | $ | 190 | ||||||||||||||||
Dividends, net of taxes withheld* | 3,742,303 | 7,407 | 951 | 237,039 | 2,807,093 | 3,870,026 | 727,603 | 181,897 | ||||||||||||||||||||||||
|
|
|
|
|
|
|
|
|
|
|
|
|
|
|
| |||||||||||||||||
Total investment income | 3,742,303 | 52,903 | 3,316,195 | 432,158 | 2,807,093 | 3,870,026 | 727,603 | 182,087 | ||||||||||||||||||||||||
|
|
|
|
|
|
|
|
|
|
|
|
|
|
|
| |||||||||||||||||
Expenses: | ||||||||||||||||||||||||||||||||
Management fees | 1,969,233 | 270,420 | 456,811 | 129,113 | 739,600 | 1,686,218 | 384,900 | 169,210 | ||||||||||||||||||||||||
Custodian fees | 9,991 | 5,113 | 3,323 | 3,973 | 82,829 | 10,802 | 49,841 | 3,147 | ||||||||||||||||||||||||
Directors’ fees | 27,200 | 10,238 | 8,507 | 2,421 | 9,540 | 23,681 | 4,172 | 2,274 | ||||||||||||||||||||||||
Professional fees | 10,669 | 10,091 | 8,856 | 7,218 | 9,281 | 9,481 | 7,745 | 7,232 | ||||||||||||||||||||||||
Accounting fees | 43,663 | 22,244 | 27,191 | 13,889 | 31,880 | 38,280 | 15,733 | 7,020 | ||||||||||||||||||||||||
Printing and filing fees | 14,953 | 7,371 | 4,937 | 1,744 | 5,609 | 12,184 | 2,804 | 1,601 | ||||||||||||||||||||||||
Compliance expense | 4,381 | 4,381 | 4,381 | 4,381 | 4,381 | 4,381 | 4,381 | 4,381 | ||||||||||||||||||||||||
Other | 3,734 | 1,602 | 1,140 | 500 | 3,972 | 2,733 | 983 | 505 | ||||||||||||||||||||||||
|
|
|
|
|
|
|
|
|
|
|
|
|
|
|
| |||||||||||||||||
Total expenses | 2,083,824 | 331,460 | 515,146 | 163,239 | 887,092 | 1,787,760 | 470,559 | 195,370 | ||||||||||||||||||||||||
|
|
|
|
|
|
|
|
|
|
|
|
|
|
|
| |||||||||||||||||
Less expenses reduced or reimbursed by adviser | — | (278,557 | ) | — | — | — | — | — | — | |||||||||||||||||||||||
|
|
|
|
|
|
|
|
|
|
|
|
|
|
|
| |||||||||||||||||
Net expenses | 2,083,824 | 52,903 | 515,146 | 163,239 | 887,092 | 1,787,760 | 470,559 | 195,370 | ||||||||||||||||||||||||
|
|
|
|
|
|
|
|
|
|
|
|
|
|
|
| |||||||||||||||||
Net investment income (loss) | 1,658,479 | — | 2,801,049 | 268,919 | 1,920,001 | 2,082,266 | 257,044 | (13,283 | ) | |||||||||||||||||||||||
|
|
|
|
|
|
|
|
|
|
|
|
|
|
|
| |||||||||||||||||
Realized/unrealized gain (loss) on investments, futures contracts, foreign currency contracts, and other foreign currency related transactions: | ||||||||||||||||||||||||||||||||
Net realized gain (loss) on: | ||||||||||||||||||||||||||||||||
Investments | 26,293,793 | — | 1,201,148 | 2,822,628 | (5,960,930 | ) | 25,605,992 | 3,233,983 | 3,385,831 | |||||||||||||||||||||||
Futures contracts | — | — | — | — | 809,872 | — | — | — | ||||||||||||||||||||||||
Foreign currency contracts | — | — | — | — | 3,738,359 | — | 584,647 | — | ||||||||||||||||||||||||
Other foreign currency related transactions | — | — | — | — | 136,523 | (13,967 | ) | (59,906 | ) | 130 | ||||||||||||||||||||||
Change in unrealized appreciation/depreciation on: | ||||||||||||||||||||||||||||||||
Investments | (23,903,318 | ) | — | (4,994,203 | ) | (1,443,481 | ) | 11,344,109 | (9,479,167 | ) | 5,996,437 | (599,867 | ) | |||||||||||||||||||
Futures contracts | — | — | — | — | (677,047 | ) | — | — | — | |||||||||||||||||||||||
Foreign currency contracts | — | — | — | — | (1,496,303 | ) | — | (335,973 | ) | — | ||||||||||||||||||||||
Other foreign currency related transactions | — | — | — | — | 38,182 | (1,023 | ) | (788 | ) | 177 | ||||||||||||||||||||||
|
|
|
|
|
|
|
|
|
|
|
|
|
|
|
| |||||||||||||||||
Net realized/unrealized gain (loss) on investments, futures contracts, foreign currency contracts, and other foreign currency related transactions | 2,390,475 | — | (3,793,055 | ) | 1,379,147 | 7,932,765 | 16,111,835 | 9,418,400 | 2,786,271 | |||||||||||||||||||||||
|
|
|
|
|
|
|
|
|
|
|
|
|
|
|
| |||||||||||||||||
Change in net assets from operations | $ | 4,048,954 | $ | — | $ | (992,006 | ) | $ | 1,648,066 | $ | 9,852,766 | $ | 18,194,101 | $ | 9,675,444 | $ | 2,772,988 | |||||||||||||||
|
|
|
|
|
|
|
|
|
|
|
|
|
|
|
| |||||||||||||||||
* Taxes withheld | $ | — | $ | — | $ | — | $ | — | $ | 469,067 | $ | 164,918 | $ | 66,671 | $ | 3,407 | ||||||||||||||||
|
|
|
|
|
|
|
|
|
|
|
|
|
|
|
| |||||||||||||||||
The accompanying notes are an integral part of these financial statements.
| 112 |
| Ohio National Fund, Inc. |
Statements of Operations | For the Six-Month Period Ended June 30, 2015 (Unaudited) |
| Small Cap Growth Portfolio | Mid Cap Opportunity Portfolio | S&P 500® Index Portfolio | Strategic Value Portfolio | High Income Bond Portfolio | Capital Growth Portfolio | Nasdaq-100® Index Portfolio | Bristol Portfolio | |||||||||||||||||||||||||
Investment income: | ||||||||||||||||||||||||||||||||
Interest | $ | 446 | $ | — | $ | — | $ | — | $ | 7,366,814 | $ | — | $ | — | $ | — | ||||||||||||||||
Dividends, net of taxes withheld* | 759,109 | 283,208 | 4,208,189 | 7,239,485 | 2,828 | 123,406 | 813,628 | 1,649,395 | ||||||||||||||||||||||||
|
|
|
|
|
|
|
|
|
|
|
|
|
|
|
| |||||||||||||||||
Total investment income | 759,555 | 283,208 | 4,208,189 | 7,239,485 | 7,369,642 | 123,406 | 813,628 | 1,649,395 | ||||||||||||||||||||||||
|
|
|
|
|
|
|
|
|
|
|
|
|
|
|
| |||||||||||||||||
Expenses: | ||||||||||||||||||||||||||||||||
Management fees | 851,592 | 372,686 | 718,015 | 1,199,047 | 795,897 | 338,273 | 248,145 | 875,733 | ||||||||||||||||||||||||
Custodian fees | 10,320 | 4,484 | 16,864 | 14,790 | 5,690 | 2,651 | 4,527 | 7,114 | ||||||||||||||||||||||||
Directors’ fees | 11,511 | 4,625 | 21,457 | 17,344 | 11,934 | 3,972 | 6,784 | 12,515 | ||||||||||||||||||||||||
Professional fees | 8,425 | 7,884 | 11,677 | 13,129 | 10,955 | 11,792 | 8,214 | 10,073 | ||||||||||||||||||||||||
Accounting fees | 22,883 | 11,839 | 50,340 | 35,329 | 70,031 | 11,857 | 15,850 | 24,478 | ||||||||||||||||||||||||
Printing and filing fees | 6,987 | 3,030 | 11,126 | 11,025 | 8,724 | 2,548 | 3,906 | 8,197 | ||||||||||||||||||||||||
Compliance expense | 4,381 | 4,381 | 4,381 | 4,381 | 4,381 | 4,381 | 4,381 | 4,381 | ||||||||||||||||||||||||
Other | 1,656 | 1,116 | 4,612 | 5,169 | 2,036 | 997 | 1,429 | 3,077 | ||||||||||||||||||||||||
|
|
|
|
|
|
|
|
|
|
|
|
|
|
|
| |||||||||||||||||
Total expenses | 917,755 | 410,045 | 838,472 | 1,300,214 | 909,648 | 376,471 | 293,236 | 945,568 | ||||||||||||||||||||||||
|
|
|
|
|
|
|
|
|
|
|
|
|
|
|
| |||||||||||||||||
Net investment income (loss) | (158,200 | ) | (126,837 | ) | 3,369,717 | 5,939,271 | 6,459,994 | (253,065 | ) | 520,392 | 703,827 | |||||||||||||||||||||
|
|
|
|
|
|
|
|
|
|
|
|
|
|
|
| |||||||||||||||||
Realized/unrealized gain (loss) on investments and foreign currency related transactions: | ||||||||||||||||||||||||||||||||
Net realized gain (loss) on: | ||||||||||||||||||||||||||||||||
Investments | 7,305,396 | 4,417,400 | 4,389,702 | 5,883,740 | (956,361 | ) | 2,303,808 | 2,043,729 | 24,592,630 | |||||||||||||||||||||||
Foreign currency related transactions | (84 | ) | — | — | (54,130 | ) | — | — | — | — | ||||||||||||||||||||||
Change in unrealized appreciation/depreciation on: | ||||||||||||||||||||||||||||||||
Investments | 9,384,962 | (2,637,709 | ) | (3,569,532 | ) | (12,856,890 | ) | (288,789 | ) | 3,328,376 | 2,551,923 | (10,210,247 | ) | |||||||||||||||||||
Foreign currency related transactions | 42 | — | — | 10,558 | — | — | — | — | ||||||||||||||||||||||||
|
|
|
|
|
|
|
|
|
|
|
|
|
|
|
| |||||||||||||||||
Net realized/unrealized gain (loss) on investments and foreign currency related transactions | 16,690,316 | 1,779,691 | 820,170 | (7,016,722 | ) | (1,245,150 | ) | 5,632,184 | 4,595,652 | 14,382,383 | ||||||||||||||||||||||
|
|
|
|
|
|
|
|
|
|
|
|
|
|
|
| |||||||||||||||||
Change in net assets from operations | $ | 16,532,116 | $ | 1,652,854 | $ | 4,189,887 | $ | (1,077,451 | ) | $ | 5,214,844 | $ | 5,379,119 | $ | 5,116,044 | $ | 15,086,210 | |||||||||||||||
|
|
|
|
|
|
|
|
|
|
|
|
|
|
|
| |||||||||||||||||
* Taxes withheld | $ | 7,800 | $ | — | $ | 318 | $ | 229,152 | $ | — | $ | — | $ | — | $ | — | ||||||||||||||||
|
|
|
|
|
|
|
|
|
|
|
|
|
|
|
| |||||||||||||||||
The accompanying notes are an integral part of these financial statements.
| 113 |
| Ohio National Fund, Inc. |
Statements of Operations | For the Six-Month Period Ended June 30, 2015 (Unaudited) |
| Bryton Growth Portfolio | Balanced Portfolio | Target VIP Portfolio | Bristol Growth Portfolio | Risk Managed Balanced Portfolio | ||||||||||||||||
Investment income: | ||||||||||||||||||||
Interest | $ | — | $ | 4,426,925 | $ | — | $ | — | $ | 229,942 | ||||||||||
Dividends, net of taxes withheld** | 304,690 | 4,041,726 | 690,067 | 833,374 | 258,749 | |||||||||||||||
|
|
|
|
|
|
|
|
|
| |||||||||||
Total investment income | 304,690 | 8,468,651 | 690,067 | 833,374 | 488,691 | |||||||||||||||
|
|
|
|
|
|
|
|
|
| |||||||||||
Expenses: | ||||||||||||||||||||
Management fees | 730,063 | 2,530,707 | 164,536 | 491,308 | 239,727 | |||||||||||||||
Custodian fees | 9,823 | 17,047 | 16,964 | 4,621 | 21,756 | |||||||||||||||
Directors’ fees | 9,649 | 45,191 | 2,871 | 6,682 | 2,992 | |||||||||||||||
Professional fees | 9,313 | 12,207 | 11,226 | 8,486 | 14,695 | |||||||||||||||
Accounting fees | 19,777 | 74,815 | 10,432 | 14,688 | 37,969 | |||||||||||||||
Printing and filing fees | 6,697 | 22,960 | 1,821 | 4,991 | 2,903 | |||||||||||||||
Compliance expense | 4,381 | 4,381 | 4,381 | 4,381 | 4,380 | |||||||||||||||
Other | 2,165 | 5,546 | 715 | 1,641 | 437 | |||||||||||||||
|
|
|
|
|
|
|
|
|
| |||||||||||
Total expenses | 791,868 | 2,712,854 | 212,946 | 536,798 | 324,859 | |||||||||||||||
|
|
|
|
|
|
|
|
|
| |||||||||||
Less expenses reduced or reimbursed by adviser | — | — | — | — | — | |||||||||||||||
|
|
|
|
|
|
|
|
|
| |||||||||||
Net expenses | 791,868 | 2,712,854 | 212,946 | 536,798 | 324,859 | |||||||||||||||
|
|
|
|
|
|
|
|
|
| |||||||||||
Net investment income (loss) | (487,178 | ) | 5,755,797 | 477,121 | 296,576 | 163,832 | ||||||||||||||
|
|
|
|
|
|
|
|
|
| |||||||||||
Realized/unrealized gain (loss) on investments, foreign currency related transactions, and written options: | ||||||||||||||||||||
Net realized gain (loss) on: | ||||||||||||||||||||
Investments | 19,511,620 | 9,731,129 | 2,655,266 | 10,927,788 | (22,137 | ) | ||||||||||||||
Futures contracts | — | — | — | — | 463,685 | |||||||||||||||
Foreign currency related transactions | — | — | — | — | 125 | |||||||||||||||
Written options | — | 2,781,568 | — | — | — | |||||||||||||||
Change in unrealized appreciation/depreciation on: | ||||||||||||||||||||
Investments | (124,617 | ) | 5,916,741 | (1,921,742 | ) | (4,184,925 | ) | (1,170,465 | ) | |||||||||||
Futures contracts | — | — | — | — | (565,292 | ) | ||||||||||||||
Foreign currency related transactions | — | — | — | — | — | |||||||||||||||
Written options | — | (104,907 | ) | — | — | — | ||||||||||||||
|
|
|
|
|
|
|
|
|
| |||||||||||
Net realized/unrealized gain (loss) on investments, foreign currency related transactions, and written options | 19,387,003 | 18,324,531 | 733,524 | 6,742,863 | (1,294,084 | ) | ||||||||||||||
|
|
|
|
|
|
|
|
|
| |||||||||||
Change in net assets from operations | $ | 18,899,825 | $ | 24,080,328 | $ | 1,210,645 | $ | 7,039,439 | $ | (1,130,252 | ) | |||||||||
|
|
|
|
|
|
|
|
|
| |||||||||||
* Taxes withheld | $ | — | $ | 12,902 | $ | 39,734 | $ | — | $ | 868 | ||||||||||
|
|
|
|
|
|
|
|
|
| |||||||||||
The accompanying notes are an integral part of these financial statements.
| 114 |
| Ohio National Fund, Inc. |
| Equity Portfolio | Money Market Portfolio | Bond Portfolio | Omni Portfolio | |||||||||||||||||||||||||||||
| Six-Month Period Ended June 30, 2015 (Unaudited) | Year Ended December 31, 2014 | Six-Month Period Ended June 30, 2015 (Unaudited) | Year Ended December 31, 2014 | Six-Month Period Ended June 30, 2015 (Unaudited) | Year Ended December 31, 2014 | Six-Month Period Ended June 30, 2015 (Unaudited) | Year Ended December 31, 2014 | |||||||||||||||||||||||||
Increase (Decrease) in net assets: | ||||||||||||||||||||||||||||||||
Operations: | ||||||||||||||||||||||||||||||||
Net investment income | $ | 1,658,479 | $ | 2,046,357 | $ | — | $ | — | $ | 2,801,049 | $ | 5,057,141 | $ | 268,919 | $ | 395,534 | ||||||||||||||||
Net realized gain on investments and foreign currency related transactions | 26,293,793 | 33,346,801 | — | — | 1,201,148 | 1,319,586 | 2,822,628 | 6,306,647 | ||||||||||||||||||||||||
Change in unrealized appreciation/depreciation on investments | (23,903,318 | ) | 6,063,115 | — | — | (4,994,203 | ) | 2,254,423 | (1,443,481 | ) | (2,442,237 | ) | ||||||||||||||||||||
|
|
|
|
|
|
|
|
|
|
|
|
|
|
|
| |||||||||||||||||
Change in net assets from operations | 4,048,954 | 41,456,273 | — | — | (992,006 | ) | 8,631,150 | 1,648,066 | 4,259,944 | |||||||||||||||||||||||
|
|
|
|
|
|
|
|
|
|
|
|
|
|
|
| |||||||||||||||||
Distributions to shareholders: | ||||||||||||||||||||||||||||||||
Distributions from net investment income | — | (1,660,324 | ) | — | — | — | — | — | (341,371 | ) | ||||||||||||||||||||||
|
|
|
|
|
|
|
|
|
|
|
|
|
|
|
| |||||||||||||||||
Capital transactions: | ||||||||||||||||||||||||||||||||
Received from shares sold | 33,562,867 | 315,246,386 | 64,944,891 | 192,184,015 | 22,549,121 | 46,735,844 | 16,846,602 | 2,915,916 | ||||||||||||||||||||||||
Received from dividends reinvested | — | 1,660,324 | — | — | — | — | — | 341,371 | ||||||||||||||||||||||||
Paid for shares redeemed | (41,777,343 | ) | (59,401,285 | ) | (69,766,768 | ) | (251,269,999 | ) | (20,990,226 | ) | (48,280,931 | ) | (5,098,912 | ) | (7,867,809 | ) | ||||||||||||||||
|
|
|
|
|
|
|
|
|
|
|
|
|
|
|
| |||||||||||||||||
Change in net assets from capital transactions | (8,214,476 | ) | 257,505,425 | (4,821,877 | ) | (59,085,984 | ) | 1,558,895 | (1,545,087 | ) | 11,747,690 | (4,610,522 | ) | |||||||||||||||||||
|
|
|
|
|
|
|
|
|
|
|
|
|
|
|
| |||||||||||||||||
Change in net assets | (4,165,522 | ) | 297,301,374 | (4,821,877 | ) | (59,085,984 | ) | 566,889 | 7,086,063 | 13,395,756 | (691,949 | ) | ||||||||||||||||||||
Net assets: | ||||||||||||||||||||||||||||||||
Beginning of period | 518,735,416 | 221,434,042 | 202,012,687 | 261,098,671 | 158,663,826 | 151,577,763 | 37,196,582 | 37,888,531 | ||||||||||||||||||||||||
|
|
|
|
|
|
|
|
|
|
|
|
|
|
|
| |||||||||||||||||
End of period | $ | 514,569,894 | $ | 518,735,416 | $ | 197,190,810 | $ | 202,012,687 | $ | 159,230,715 | $ | 158,663,826 | $ | 50,592,338 | $ | 37,196,582 | ||||||||||||||||
|
|
|
|
|
|
|
|
|
|
|
|
|
|
|
| |||||||||||||||||
Undistributed net investment income | $ | 2,044,512 | $ | 386,033 | $ | — | $ | — | $ | 7,858,190 | $ | 5,057,141 | $ | 323,082 | $ | 54,163 | ||||||||||||||||
|
|
|
|
|
|
|
|
|
|
|
|
|
|
|
| |||||||||||||||||
The accompanying notes are an integral part of these financial statements.
| 115 |
| Ohio National Fund, Inc. |
Statements of Changes in Net Assets |
| International Portfolio | Capital Appreciation Portfolio | International Small-Mid Company Portfolio | Aggressive Growth Portfolio | |||||||||||||||||||||||||||||
| Six-Month Period Ended June 30, 2015 (Unaudited) | Year Ended December 31, 2014 | Six-Month Period Ended June 30, 2015 (Unaudited) | Year Ended December 31, 2014 | Six-Month Period Ended June 30, 2015 (Unaudited) | Year Ended December 31, 2014 | Six-Month Period Ended June 30, 2015 (Unaudited) | Year Ended December 31, 2014 | |||||||||||||||||||||||||
Increase (Decrease) in net assets: | ||||||||||||||||||||||||||||||||
Operations: | ||||||||||||||||||||||||||||||||
Net investment income (loss) | $ | 1,920,001 | $ | 2,572,757 | $ | 2,082,266 | $ | 1,213,441 | $ | 257,044 | $ | 277,179 | $ | (13,283 | ) | $ | (87,987 | ) | ||||||||||||||
Net realized gain (loss) on investments, futures contracts, foreign currency contracts, and other foreign currency related transactions | (1,276,176 | ) | 19,582,968 | 25,592,025 | 20,173,243 | 3,758,724 | 5,598,075 | 3,385,961 | 8,194,676 | |||||||||||||||||||||||
Change in unrealized appreciation/depreciation on investments, futures contracts, foreign currency contracts, and other foreign currency related transactions | 9,208,941 | (39,577,450 | ) | (9,480,190 | ) | (1,239,649 | ) | 5,659,676 | (12,565,288 | ) | (599,690 | ) | (4,579,372 | ) | ||||||||||||||||||
|
|
|
|
|
|
|
|
|
|
|
|
|
|
|
| |||||||||||||||||
Change in net assets from operations | 9,852,766 | (17,421,725 | ) | 18,194,101 | 20,147,035 | 9,675,444 | (6,690,034 | ) | 2,772,988 | 3,527,317 | ||||||||||||||||||||||
|
|
|
|
|
|
|
|
|
|
|
|
|
|
|
| |||||||||||||||||
Distributions to shareholders: | ||||||||||||||||||||||||||||||||
Distributions from net investment income | — | — | — | (1,165,844 | ) | — | — | — | — | |||||||||||||||||||||||
|
|
|
|
|
|
|
|
|
|
|
|
|
|
|
| |||||||||||||||||
Capital transactions: | ||||||||||||||||||||||||||||||||
Received from shares sold | 10,621,673 | 30,187,407 | 13,387,515 | 331,391,049 | 18,998,869 | 13,115,148 | 9,514,968 | 7,560,703 | ||||||||||||||||||||||||
Received from dividends reinvested | — | — | — | 1,165,844 | — | — | — | — | ||||||||||||||||||||||||
Paid for shares redeemed | (18,415,817 | ) | (27,822,330 | ) | (37,579,225 | ) | (40,131,679 | ) | (9,540,836 | ) | (15,853,656 | ) | (5,568,679 | ) | (10,565,748 | ) | ||||||||||||||||
|
|
|
|
|
|
|
|
|
|
|
|
|
|
|
| |||||||||||||||||
Change in net assets from capital transactions | (7,794,144 | ) | 2,365,077 | (24,191,710 | ) | 292,425,214 | 9,458,033 | (2,738,508 | ) | 3,946,289 | (3,005,045 | ) | ||||||||||||||||||||
|
|
|
|
|
|
|
|
|
|
|
|
|
|
|
| |||||||||||||||||
Change in net assets | 2,058,622 | (15,056,648 | ) | (5,997,609 | ) | 311,406,405 | 19,133,477 | (9,428,542 | ) | 6,719,277 | 522,272 | |||||||||||||||||||||
Net assets: | ||||||||||||||||||||||||||||||||
Beginning of period | 174,370,392 | 189,427,040 | 449,414,047 | 138,007,642 | 67,554,366 | 76,982,908 | 39,925,269 | 39,402,997 | ||||||||||||||||||||||||
|
|
|
|
|
|
|
|
|
|
|
|
|
|
|
| |||||||||||||||||
End of period | $ | 176,429,014 | $ | 174,370,392 | $ | 443,416,438 | $ | 449,414,047 | $ | 86,687,843 | $ | 67,554,366 | $ | 46,644,546 | $ | 39,925,269 | ||||||||||||||||
|
|
|
|
|
|
|
|
|
|
|
|
|
|
|
| |||||||||||||||||
Undistributed net investment income (loss) | $ | 6,174,017 | $ | 4,254,016 | $ | 2,119,731 | $ | 37,465 | $ | 453,541 | $ | 196,497 | $ | (13,283 | ) | $ | — | |||||||||||||||
|
|
|
|
|
|
|
|
|
|
|
|
|
|
|
| |||||||||||||||||
The accompanying notes are an integral part of these financial statements.
| 116 |
| Ohio National Fund, Inc. |
Statements of Changes in Net Assets |
| Small Cap Growth Portfolio | Mid Cap Opportunity Portfolio | S&P 500® Index Portfolio | Strategic Value Portfolio | |||||||||||||||||||||||||||||
| Six-Month Period Ended June 30, 2015 (Unaudited) | Year Ended December 31, 2014 | Six-Month Period Ended June 30, 2015 (Unaudited) | Year Ended December 31, 2014 | Six-Month Period Ended June 30, 2015 (Unaudited) | Year Ended December 31, 2014 | Six-Month Period Ended June 30, 2015 (Unaudited) | Year Ended December 31, 2014 | |||||||||||||||||||||||||
Increase (Decrease) in net assets: | ||||||||||||||||||||||||||||||||
Operations: | ||||||||||||||||||||||||||||||||
Net investment income (loss) | $ | (158,200 | ) | $ | (394,361 | ) | $ | (126,837 | ) | $ | (151,221 | ) | $ | 3,369,717 | $ | 5,637,059 | $ | 5,939,271 | $ | 20,943,847 | ||||||||||||
Net realized gain on investments and foreign currency related transactions | 7,305,312 | 15,523,432 | 4,417,400 | 15,149,638 | 4,389,702 | 3,675,264 | 5,829,610 | 36,941,062 | ||||||||||||||||||||||||
Change in unrealized appreciation/depreciation on investments and foreign currency related transactions | 9,385,004 | 7,521,125 | (2,637,709 | ) | (5,886,389 | ) | (3,569,532 | ) | 33,949,693 | (12,846,332 | ) | (11,438,100 | ) | |||||||||||||||||||
|
|
|
|
|
|
|
|
|
|
|
|
|
|
|
| |||||||||||||||||
Change in net assets from operations | 16,532,116 | 22,650,196 | 1,652,854 | 9,112,028 | 4,189,887 | 43,262,016 | (1,077,451 | ) | 46,446,809 | |||||||||||||||||||||||
|
|
|
|
|
|
|
|
|
|
|
|
|
|
|
| |||||||||||||||||
Distributions to shareholders: | ||||||||||||||||||||||||||||||||
Distributions from net investment income | — | — | — | — | — | (4,671,250 | ) | — | (17,815,244 | ) | ||||||||||||||||||||||
|
|
|
|
|
|
|
|
|
|
|
|
|
|
|
| |||||||||||||||||
Capital transactions: | ||||||||||||||||||||||||||||||||
Received from shares sold | 21,794,079 | 130,344,816 | 8,819,561 | 14,483,197 | 55,751,183 | 111,526,771 | 24,255,128 | 42,389,840 | ||||||||||||||||||||||||
Received from dividends reinvested | — | — | — | — | — | 4,671,250 | — | 17,815,244 | ||||||||||||||||||||||||
Paid for shares redeemed | (27,014,801 | ) | (50,387,901 | ) | (8,339,685 | ) | (19,935,180 | ) | (38,414,496 | ) | (81,517,679 | ) | (26,190,110 | ) | (153,890,559 | ) | ||||||||||||||||
|
|
|
|
|
|
|
|
|
|
|
|
|
|
|
| |||||||||||||||||
Change in net assets from capital transactions | (5,220,722 | ) | 79,956,915 | 479,876 | (5,451,983 | ) | 17,336,687 | 34,680,342 | (1,934,982 | ) | (93,685,475 | ) | ||||||||||||||||||||
|
|
|
|
|
|
|
|
|
|
|
|
|
|
|
| |||||||||||||||||
Change in net assets | 11,311,394 | 102,607,111 | 2,132,730 | 3,660,045 | 21,526,574 | 73,271,108 | (3,012,433 | ) | (65,053,910 | ) | ||||||||||||||||||||||
Net assets: | ||||||||||||||||||||||||||||||||
Beginning of period | 212,143,920 | 109,536,809 | 86,672,004 | 83,011,959 | 388,204,137 | 314,933,029 | 332,610,905 | 397,664,815 | ||||||||||||||||||||||||
|
|
|
|
|
|
|
|
|
|
|
|
|
|
|
| |||||||||||||||||
End of period | $ | 223,455,314 | $ | 212,143,920 | $ | 88,804,734 | $ | 86,672,004 | $ | 409,730,711 | $ | 388,204,137 | $ | 329,598,472 | $ | 332,610,905 | ||||||||||||||||
|
|
|
|
|
|
|
|
|
|
|
|
|
|
|
| |||||||||||||||||
Undistributed net investment income (loss) | $ | (194,020 | ) | $ | (35,820 | ) | $ | (126,837 | ) | $ | — | $ | 4,255,396 | $ | 885,679 | $ | 8,776,192 | $ | 2,817,246 | |||||||||||||
|
|
|
|
|
|
|
|
|
|
|
|
|
|
|
| |||||||||||||||||
The accompanying notes are an integral part of these financial statements.
| 117 |
| Ohio National Fund, Inc. |
Statements of Changes in Net Assets |
| High Income Bond Portfolio | Capital Growth Portfolio | Nasdaq-100® Index Portfolio | Bristol Portfolio | |||||||||||||||||||||||||||||
| Six-Month Period Ended June 30, 2015 (Unaudited) | Year Ended December 31, 2014 | Six-Month Period Ended June 30, 2015 (Unaudited) | Year Ended December 31, 2014 | Six-Month Period Ended June 30, 2015 (Unaudited) | Year Ended December 31, 2014 | Six-Month Period Ended June 30, 2015 (Unaudited) | Year Ended December 31, 2014 | |||||||||||||||||||||||||
Increase (Decrease) in net assets: | ||||||||||||||||||||||||||||||||
Operations: | ||||||||||||||||||||||||||||||||
Net investment income (loss) | $ | 6,459,994 | $ | 16,751,342 | $ | (253,065 | ) | $ | (349,357 | ) | $ | 520,392 | $ | 1,307,307 | $ | 703,827 | $ | 994,675 | ||||||||||||||
Net realized gain (loss) on investments and foreign currency related transactions | (956,361 | ) | 8,225,039 | 2,303,808 | 8,907,401 | 2,043,729 | 4,311,375 | 24,592,630 | 45,974,586 | |||||||||||||||||||||||
Change in unrealized appreciation/depreciation on investments and foreign currency related transactions | (288,789 | ) | (16,353,341 | ) | 3,328,376 | (6,915,894 | ) | 2,551,923 | 12,616,165 | (10,210,247 | ) | (16,492,459 | ) | |||||||||||||||||||
|
|
|
|
|
|
|
|
|
|
|
|
|
|
|
| |||||||||||||||||
Change in net assets from operations | 5,214,844 | 8,623,040 | 5,379,119 | 1,642,150 | 5,116,044 | 18,234,847 | 15,086,210 | 30,476,802 | ||||||||||||||||||||||||
|
|
|
|
|
|
|
|
|
|
|
|
|
|
|
| |||||||||||||||||
Distributions to shareholders: | ||||||||||||||||||||||||||||||||
Distributions from net investment income | — | — | — | — | — | (1,151,494 | ) | — | (895,082 | ) | ||||||||||||||||||||||
|
|
|
|
|
|
|
|
|
|
|
|
|
|
|
| |||||||||||||||||
Capital transactions: | ||||||||||||||||||||||||||||||||
Received from shares sold | 13,131,374 | 45,515,603 | 5,637,870 | 16,459,619 | 24,833,045 | 43,549,332 | 10,088,080 | 17,018,019 | ||||||||||||||||||||||||
Received from dividends reinvested | — | — | — | — | — | 1,151,494 | — | 895,082 | ||||||||||||||||||||||||
Paid for shares redeemed | (23,685,416 | ) | (131,923,035 | ) | (10,463,951 | ) | (23,042,984 | ) | (22,141,532 | ) | (35,945,696 | ) | (24,746,275 | ) | (47,019,709 | ) | ||||||||||||||||
|
|
|
|
|
|
|
|
|
|
|
|
|
|
|
| |||||||||||||||||
Change in net assets from capital transactions | (10,554,042 | ) | (86,407,432 | ) | (4,826,081 | ) | (6,583,365 | ) | 2,691,513 | 8,755,130 | (14,658,195 | ) | (29,106,608 | ) | ||||||||||||||||||
|
|
|
|
|
|
|
|
|
|
|
|
|
|
|
| |||||||||||||||||
Change in net assets | (5,339,198 | ) | (77,784,392 | ) | 553,038 | (4,941,215 | ) | 7,807,557 | 25,838,483 | 428,015 | 475,112 | |||||||||||||||||||||
Net assets: | ||||||||||||||||||||||||||||||||
Beginning of period | 230,100,451 | 307,884,843 | 75,491,145 | 80,432,360 | 121,686,069 | 95,847,586 | 232,016,582 | 231,541,470 | ||||||||||||||||||||||||
|
|
|
|
|
|
|
|
|
|
|
|
|
|
|
| |||||||||||||||||
End of period | $ | 224,761,253 | $ | 230,100,451 | $ | 76,044,183 | $ | 75,491,145 | $ | 129,493,626 | $ | 121,686,069 | $ | 232,444,597 | $ | 232,016,582 | ||||||||||||||||
|
|
|
|
|
|
|
|
|
|
|
|
|
|
|
| |||||||||||||||||
Undistributed net investment income (loss) | $ | 23,218,695 | $ | 16,758,701 | $ | (247,675 | ) | $ | 5,390 | $ | 676,205 | $ | 155,813 | $ | 803,420 | $ | 99,593 | |||||||||||||||
|
|
|
|
|
|
|
|
|
|
|
|
|
|
|
| |||||||||||||||||
The accompanying notes are an integral part of these financial statements.
| 118 |
| Ohio National Fund, Inc. |
Statements of Changes in Net Assets |
| Bryton Growth Portfolio | Balanced Portfolio | Target VIP Portfolio | Bristol Growth Portfolio | |||||||||||||||||||||||||||||
| Six-Month Period Ended June 30, 2015 (Unaudited) | Year Ended December 31, 2014 | Six-Month Period Ended June 30, 2015 (Unaudited) | Year Ended December 31, 2014 | Six-Month Period Ended June 30, 2015 (Unaudited) | Year Ended December 31, 2014 | Six-Month Period Ended June 30, 2015 (Unaudited) | Year Ended December 31, 2014 | |||||||||||||||||||||||||
Increase (Decrease) in net assets: | ||||||||||||||||||||||||||||||||
Operations: | ||||||||||||||||||||||||||||||||
Net investment income (loss) | $ | (487,178 | ) | $ | (818,246 | ) | $ | 5,755,797 | $ | 7,584,554 | $ | 477,121 | $ | 954,277 | $ | 296,576 | $ | 425,637 | ||||||||||||||
Net realized gain on investments, foreign currency related transactions, and written options | 19,511,620 | 22,063,567 | 12,512,697 | 15,476,691 | 2,655,266 | 6,802,148 | 10,927,788 | 20,039,564 | ||||||||||||||||||||||||
Change in unrealized appreciation/depreciation on investments, foreign currency related transactions, and written options | (124,617 | ) | (9,867,313 | ) | 5,811,834 | 8,993,866 | (1,921,742 | ) | (3,839,788 | ) | (4,184,925 | ) | (6,250,848 | ) | ||||||||||||||||||
|
|
|
|
|
|
|
|
|
|
|
|
|
|
|
| |||||||||||||||||
Change in net assets from operations | 18,899,825 | 11,378,008 | 24,080,328 | 32,055,111 | 1,210,645 | 3,916,637 | 7,039,439 | 14,214,353 | ||||||||||||||||||||||||
|
|
|
|
|
|
|
|
|
|
|
|
|
|
|
| |||||||||||||||||
Distributions to shareholders: | ||||||||||||||||||||||||||||||||
Distributions from net investment income | — | — | — | (6,075,617 | ) | — | (854,149 | ) | — | (370,603 | ) | |||||||||||||||||||||
|
|
|
|
|
|
|
|
|
|
|
|
|
|
|
| |||||||||||||||||
Capital transactions: | ||||||||||||||||||||||||||||||||
Received from shares sold | 7,500,740 | 30,786,203 | 79,904,371 | 624,661,369 | 2,121,420 | 6,144,750 | 4,709,837 | 10,802,580 | ||||||||||||||||||||||||
Received from dividends reinvested | — | — | — | 6,075,617 | — | 854,149 | — | 370,603 | ||||||||||||||||||||||||
Paid for shares redeemed | (24,944,178 | ) | (43,857,130 | ) | (55,727,163 | ) | (72,643,183 | ) | (5,780,383 | ) | (8,637,548 | ) | (11,555,318 | ) | (23,225,588 | ) | ||||||||||||||||
|
|
|
|
|
|
|
|
|
|
|
|
|
|
|
| |||||||||||||||||
Change in net assets from capital transactions | (17,443,438 | ) | (13,070,927 | ) | 24,177,208 | 558,093,803 | (3,658,963 | ) | (1,638,649 | ) | (6,845,481 | ) | (12,052,405 | ) | ||||||||||||||||||
|
|
|
|
|
|
|
|
|
|
|
|
|
|
|
| |||||||||||||||||
Change in net assets | 1,456,387 | (1,692,919 | ) | 48,257,536 | 584,073,297 | (2,448,318 | ) | 1,423,839 | 193,958 | 1,791,345 | ||||||||||||||||||||||
Net assets: | ||||||||||||||||||||||||||||||||
Beginning of period | 179,085,936 | 180,778,855 | 833,133,639 | 249,060,342 | 55,141,909 | 53,718,070 | 124,053,307 | 122,261,962 | ||||||||||||||||||||||||
|
|
|
|
|
|
|
|
|
|
|
|
|
|
|
| |||||||||||||||||
End of period | $ | 180,542,323 | $ | 179,085,936 | $ | 881,391,175 | $ | 833,133,639 | $ | 52,693,591 | $ | 55,141,909 | $ | 124,247,265 | $ | 124,053,307 | ||||||||||||||||
|
|
|
|
|
|
|
|
|
|
|
|
|
|
|
| |||||||||||||||||
Undistributed net investment income (loss) | $ | (487,178 | ) | $ | — | $ | 7,166,152 | $ | 1,410,355 | $ | 577,249 | $ | 100,128 | $ | 351,610 | $ | 55,034 | |||||||||||||||
|
|
|
|
|
|
|
|
|
|
|
|
|
|
|
| |||||||||||||||||
The accompanying notes are an integral part of these financial statements.
| 119 |
| Ohio National Fund, Inc. |
Statements of Changes in Net Assets |
| Risk Managed Balanced Portfolio | ||||||||
| Six-Month Period Ended June 30, 2015 (Unaudited) | Period from May 1, 2014* to December 31, 2014 | |||||||
Increase (Decrease) in net assets: | ||||||||
Operations: | ||||||||
Net investment income | $ | 163,832 | $ | 81,427 | ||||
Net realized gain on investments, futures contracts, and foreign currency related transactions | 441,673 | 1,167,312 | ||||||
Change in unrealized appreciation/depreciation on investments, futures contracts, and foreign currency related transactions | (1,735,757 | ) | 939,625 | |||||
|
|
|
| |||||
Change in net assets from operations | (1,130,252 | ) | 2,188,364 | |||||
|
|
|
| |||||
Capital transactions: | ||||||||
Received from shares sold | 48,604,016 | 54,419,880 | ||||||
Paid for shares redeemed | (6,606,221 | ) | (22,801,551 | ) | ||||
|
|
|
| |||||
Change in net assets from capital transactions | 41,997,795 | 31,618,329 | ||||||
|
|
|
| |||||
Change in net assets | 40,867,543 | 33,806,693 | ||||||
Net assets: | ||||||||
Beginning of period | 33,806,693 | — | ||||||
|
|
|
| |||||
End of period | $ | 74,674,236 | $ | 33,806,693 | ||||
|
|
|
| |||||
Undistributed net investment income | $ | 245,252 | $ | 81,420 | ||||
|
|
|
| |||||
| * | Represents date of inception and commencement of operations. |
The accompanying notes are an integral part of these financial statements.
| 120 |
| Ohio National Fund, Inc. |
| Equity Portfolio | Money Market Portfolio | |||||||||||||||||||||||||||||||||||||||
| Six-Month Period Ended June 30, 2015 (Unaudited) | Years Ended December 31, | Six-Month Period Ended June 30, 2015 (Unaudited) | Years Ended December 31, | |||||||||||||||||||||||||||||||||||||
| 2014 | 2013 | 2012 | 2011 | 2014 | 2013 | 2012 | 2011 | |||||||||||||||||||||||||||||||||
Selected per-share data: | ||||||||||||||||||||||||||||||||||||||||
Net asset value, beginning of period | $ | 33.44 | $ | 29.41 | $ | 21.54 | $ | 18.88 | $ | 19.72 | $ | 10.00 | $ | 10.00 | $ | 10.00 | $ | 10.00 | $ | 10.00 | ||||||||||||||||||||
Operations: | ||||||||||||||||||||||||||||||||||||||||
Net investment income | 0.11 | 0.12 | 0.27 | 0.35 | 0.21 | — | — | — | — | — | ||||||||||||||||||||||||||||||
Net realized and unrealized gain (loss) on investments and foreign currency related transactions | 0.14 | 4.02 | 7.84 | 2.61 | (0.88 | ) | — | — | — | — | — | |||||||||||||||||||||||||||||
|
|
|
|
|
|
|
|
|
|
|
|
|
|
|
|
|
|
|
| |||||||||||||||||||||
Total from operations | 0.25 | 4.14 | 8.11 | 2.96 | (0.67 | ) | — | — | — | — | — | |||||||||||||||||||||||||||||
|
|
|
|
|
|
|
|
|
|
|
|
|
|
|
|
|
|
|
| |||||||||||||||||||||
Distributions: | ||||||||||||||||||||||||||||||||||||||||
Distributions from net investment income | — | (0.11 | ) | (0.24 | ) | (0.30 | ) | (0.17 | ) | — | — | — | — | — | ||||||||||||||||||||||||||
|
|
|
|
|
|
|
|
|
|
|
|
|
|
|
|
|
|
|
| |||||||||||||||||||||
Net asset value, end of period | $ | 33.69 | $ | 33.44 | $ | 29.41 | $ | 21.54 | $ | 18.88 | $ | 10.00 | $ | 10.00 | $ | 10.00 | $ | 10.00 | $ | 10.00 | ||||||||||||||||||||
|
|
|
|
|
|
|
|
|
|
|
|
|
|
|
|
|
|
|
| |||||||||||||||||||||
Total return | 0.75 | % (b) | 14.07 | % | 37.69 | % | 15.69 | % | –3.38 | % | 0.00 | % (b) | 0.00 | % | 0.00 | % | 0.00 | % | 0.00 | % | ||||||||||||||||||||
Ratios and supplemental data: | ||||||||||||||||||||||||||||||||||||||||
Net assets at end of period (in millions) | $ | 514.6 | $ | 518.7 | $ | 221.4 | $ | 186.5 | $ | 187.9 | $ | 197.2 | $ | 202.0 | $ | 261.1 | $ | 258.6 | $ | 286.2 | ||||||||||||||||||||
Ratios to average net assets: | ||||||||||||||||||||||||||||||||||||||||
Ratios net of expenses reduced or reimbursed by adviser: | ||||||||||||||||||||||||||||||||||||||||
Expenses | 0.80 | % (a) | 0.83 | % | 0.87 | % | 0.89 | % | 0.87 | % | 0.05 | % (a) | 0.04 | % | 0.06 | % | 0.09 | % | 0.11 | % | ||||||||||||||||||||
Net investment income | 0.64 | % (a) | 0.69 | % | 0.98 | % | 1.55 | % | 1.00 | % | 0.00 | % (a) | 0.00 | % | 0.00 | % | 0.00 | % | 0.00 | % | ||||||||||||||||||||
Ratios assuming no expenses reduced or reimbursed by adviser: | ||||||||||||||||||||||||||||||||||||||||
Expenses | 0.80 | % (a) | 0.83 | % | 0.87 | % | 0.89 | % | 0.87 | % | 0.34 | % (a) | 0.33 | % | 0.34 | % | 0.35 | % | 0.34 | % | ||||||||||||||||||||
Net investment income (loss) | 0.64 | % (a) | 0.69 | % | 0.98 | % | 1.55 | % | 1.00 | % | –0.29 | % (a) | –0.29 | % | –0.28 | % | –0.26 | % | –0.23 | % | ||||||||||||||||||||
Portfolio turnover rate | 22 | % | 46 | % | 43 | % | 48 | % | 54 | % | 0 | % | 0 | % | 0 | % | 0 | % | 0 | % | ||||||||||||||||||||
| (a) | Annualized. |
| (b) | Not annualized. |
The accompanying notes are an integral part of these financial statements.
| 121 |
| Ohio National Fund, Inc. |
Financial Highlights |
| Bond Portfolio | Omni Portfolio | |||||||||||||||||||||||||||||||||||||||
| Six-Month Period Ended June 30, 2015 (Unaudited) | Years Ended December 31, | Six-Month Period Ended June 30, 2015 (Unaudited) | Years Ended December 31, | |||||||||||||||||||||||||||||||||||||
| 2014 | 2013 | 2012 | 2011 | 2014 | 2013 | 2012 | 2011 | |||||||||||||||||||||||||||||||||
Selected per-share data: | ||||||||||||||||||||||||||||||||||||||||
Net asset value, beginning of period | $ | 15.65 | $ | 14.78 | $ | 15.07 | $ | 14.05 | $ | 13.21 | $ | 24.15 | $ | 21.74 | $ | 16.82 | $ | 15.21 | $ | 16.08 | ||||||||||||||||||||
Operations: | ||||||||||||||||||||||||||||||||||||||||
Net investment income | 0.27 | 0.50 | 0.56 | 0.51 | 0.48 | 0.13 | 0.26 | 0.24 | 0.26 | 0.25 | ||||||||||||||||||||||||||||||
Net realized and unrealized gain (loss) on investments and foreign currency related transactions | (0.36 | ) | 0.37 | (0.85 | ) | 0.51 | 0.36 | 0.97 | 2.37 | 4.89 | 1.57 | (0.91 | ) | |||||||||||||||||||||||||||
|
|
|
|
|
|
|
|
|
|
|
|
|
|
|
|
|
|
|
| |||||||||||||||||||||
Total from operations | (0.09 | ) | 0.87 | (0.29 | ) | 1.02 | 0.84 | 1.10 | 2.63 | 5.13 | 1.83 | (0.66 | ) | |||||||||||||||||||||||||||
|
|
|
|
|
|
|
|
|
|
|
|
|
|
|
|
|
|
|
| |||||||||||||||||||||
Distributions: | ||||||||||||||||||||||||||||||||||||||||
Distributions from net investment income | — | — | — | — | — | — | (0.22 | ) | (0.21 | ) | (0.22 | ) | (0.21 | ) | ||||||||||||||||||||||||||
|
|
|
|
|
|
|
|
|
|
|
|
|
|
|
|
|
|
|
| |||||||||||||||||||||
Net asset value, end of period | $ | 15.56 | $ | 15.65 | $ | 14.78 | $ | 15.07 | $ | 14.05 | $ | 25.25 | $ | 24.15 | $ | 21.74 | $ | 16.82 | $ | 15.21 | ||||||||||||||||||||
|
|
|
|
|
|
|
|
|
|
|
|
|
|
|
|
|
|
|
| |||||||||||||||||||||
Total return | –0.58 | % (b) | 5.89 | % | –1.92 | % | 7.26 | % | 6.36 | % | 4.55 | % (b) | 12.12 | % | 30.53 | % | 12.04 | % | –4.12 | % | ||||||||||||||||||||
Ratios and supplemental data: | ||||||||||||||||||||||||||||||||||||||||
Net assets at end of period (in millions) | $ | 159.2 | $ | 158.7 | $ | 151.6 | $ | 172.2 | $ | 162.0 | $ | 50.6 | $ | 37.2 | $ | 37.9 | $ | 33.2 | $ | 34.7 | ||||||||||||||||||||
Ratios to average net assets: | ||||||||||||||||||||||||||||||||||||||||
Expenses | 0.63 | % (a) | 0.64 | % | 0.66 | % | 0.66 | % | 0.66 | % | 0.76 | % (a) | 0.77 | % | 0.79 | % | 0.81 | % | 0.77 | % | ||||||||||||||||||||
Net investment income | 3.44 | % (a) | 3.34 | % | 3.34 | % | 3.41 | % | 3.70 | % | 1.25 | % (a) | 1.06 | % | 1.17 | % | 1.49 | % | 1.40 | % | ||||||||||||||||||||
Portfolio turnover rate | 44 | % | 35 | % | 15 | % | 18 | % | 15 | % | 100 | % | 198 | % | 210 | % | 179 | % | 147 | % | ||||||||||||||||||||
| (a) | Annualized. |
| (b) | Not annualized. |
The accompanying notes are an integral part of these financial statements.
| 122 |
| Ohio National Fund, Inc. |
Financial Highlights |
| International Portfolio | Capital Appreciation Portfolio | |||||||||||||||||||||||||||||||||||||||
| Six-Month Period Ended June 30, 2015 (Unaudited) | Years Ended December 31, | Six-Month Period Ended June 30, 2015 (Unaudited) | Years Ended December 31, | |||||||||||||||||||||||||||||||||||||
| 2014 | 2013 | 2012 | 2011 | 2014 | 2013 | 2012 | 2011 | |||||||||||||||||||||||||||||||||
Selected per-share data: | ||||||||||||||||||||||||||||||||||||||||
Net asset value, beginning of period | $ | 12.55 | $ | 13.85 | $ | 12.41 | $ | 10.32 | $ | 12.20 | $ | 33.82 | $ | 31.24 | $ | 23.32 | $ | 19.95 | $ | 20.37 | ||||||||||||||||||||
Operations: | ||||||||||||||||||||||||||||||||||||||||
Net investment income | 0.16 | 0.18 | 0.23 | 0.20 | 0.17 | 0.17 | 0.08 | 0.13 | 0.15 | 0.09 | ||||||||||||||||||||||||||||||
Net realized and unrealized gain (loss) on investments, futures contracts, foreign currency contracts, and other foreign currency related transactions | 0.56 | (1.48 | ) | 1.21 | 1.89 | (2.05 | ) | 1.20 | 2.59 | 7.91 | 3.36 | (0.43 | ) | |||||||||||||||||||||||||||
|
|
|
|
|
|
|
|
|
|
|
|
|
|
|
|
|
|
|
| |||||||||||||||||||||
Total from operations | 0.72 | (1.30 | ) | 1.44 | 2.09 | (1.88 | ) | 1.37 | 2.67 | 8.04 | 3.51 | (0.34 | ) | |||||||||||||||||||||||||||
|
|
|
|
|
|
|
|
|
|
|
|
|
|
|
|
|
|
|
| |||||||||||||||||||||
Distributions: | ||||||||||||||||||||||||||||||||||||||||
Distributions from net investment income | — | — | — | — | — | — | (0.09 | ) | (0.12 | ) | (0.14 | ) | (0.08 | ) | ||||||||||||||||||||||||||
|
|
|
|
|
|
|
|
|
|
|
|
|
|
|
|
|
|
|
| |||||||||||||||||||||
Net asset value, end of period | $ | 13.27 | $ | 12.55 | $ | 13.85 | $ | 12.41 | $ | 10.32 | $ | 35.19 | $ | 33.82 | $ | 31.24 | $ | 23.32 | $ | 19.95 | ||||||||||||||||||||
|
|
|
|
|
|
|
|
|
|
|
|
|
|
|
|
|
|
|
| |||||||||||||||||||||
Total return | 5.74 | % (b) | –9.39 | % | 11.60 | % | 20.25 | % | –15.41 | % | 4.05 | % (b) | 8.54 | % | 34.51 | % | 17.59 | % | –1.65 | % | ||||||||||||||||||||
Ratios and supplemental data: | ||||||||||||||||||||||||||||||||||||||||
Net assets at end of period (in millions) | $ | 176.4 | $ | 174.4 | $ | 189.4 | $ | 180.3 | $ | 172.8 | $ | 443.4 | $ | 449.4 | $ | 138.0 | $ | 115.7 | $ | 114.7 | ||||||||||||||||||||
Ratios to average net assets: | ||||||||||||||||||||||||||||||||||||||||
Ratios net of expenses reduced or reimbursed by adviser: | ||||||||||||||||||||||||||||||||||||||||
Expenses | 0.99 | % (a) | 0.84 | % | 0.75 | % | 1.02 | % | 1.02 | % | 0.79 | % (a) | 0.83 | % | 0.88 | % | 0.90 | % | 0.88 | % | ||||||||||||||||||||
Net investment income | 2.15 | % (a) | 1.43 | % | 1.52 | % | 1.65 | % | 1.41 | % | 0.93 | % (a) | 0.56 | % | 0.45 | % | 0.66 | % | 0.41 | % | ||||||||||||||||||||
Ratios assuming no expenses reduced or reimbursed by adviser: | ||||||||||||||||||||||||||||||||||||||||
Expenses | 0.99 | % (a) | 1.00 | % | 1.01 | % | 1.02 | % | 1.02 | % | 0.79 | % (a) | 0.83 | % | 0.88 | % | 0.90 | % | 0.88 | % | ||||||||||||||||||||
Net investment income | 2.15 | % (a) | 1.27 | % | 1.26 | % | 1.65 | % | 1.41 | % | 0.93 | % (a) | 0.56 | % | 0.45 | % | 0.66 | % | 0.41 | % | ||||||||||||||||||||
Portfolio turnover rate | 45 | % | 95 | % | 53 | % | 61 | % | 58 | % | 31 | % | 67 | % | 49 | % | 39 | % | 61 | % | ||||||||||||||||||||
| (a) | Annualized. |
| (b) | Not annualized. |
The accompanying notes are an integral part of these financial statements.
| 123 |
| Ohio National Fund, Inc. |
Financial Highlights |
| International Small-Mid Company Portfolio | Aggressive Growth Portfolio | |||||||||||||||||||||||||||||||||||||||
| Six-Month Period Ended June 30, 2015 (Unaudited) | Years Ended December 31, | Six-Month Period Ended June 30, 2015 (Unaudited) | Years Ended December 31, | |||||||||||||||||||||||||||||||||||||
| 2014 | 2013 | 2012 | 2011 | 2014 | 2013 | 2012 | 2011 | |||||||||||||||||||||||||||||||||
Selected per-share data: | ||||||||||||||||||||||||||||||||||||||||
Net asset value, beginning of period | $ | 27.39 | $ | 30.03 | $ | 23.52 | $ | 19.17 | $ | 23.24 | $ | 13.70 | $ | 12.50 | $ | 9.51 | $ | 7.74 | $ | 8.17 | ||||||||||||||||||||
Operations: | ||||||||||||||||||||||||||||||||||||||||
Net investment income (loss) | 0.08 | 0.12 | 0.12 | 0.17 | 0.26 | — | (0.03 | ) | (0.02 | ) | 0.03 | — | ||||||||||||||||||||||||||||
Net realized and unrealized gain (loss) on investments and foreign currency related transactions | 3.78 | (2.76 | ) | 6.39 | 4.18 | (4.33 | ) | 1.00 | 1.23 | 3.01 | 1.74 | (0.43 | ) | |||||||||||||||||||||||||||
|
|
|
|
|
|
|
|
|
|
|
|
|
|
|
|
|
|
|
| |||||||||||||||||||||
Total from operations | 3.86 | (2.64 | ) | 6.51 | 4.35 | (4.07 | ) | 1.00 | 1.20 | 2.99 | 1.77 | (0.43 | ) | |||||||||||||||||||||||||||
|
|
|
|
|
|
|
|
|
|
|
|
|
|
|
|
|
|
|
| |||||||||||||||||||||
Net asset value, end of period | $ | 31.25 | $ | 27.39 | $ | 30.03 | $ | 23.52 | $ | 19.17 | $ | 14.70 | $ | 13.70 | $ | 12.50 | $ | 9.51 | $ | 7.74 | ||||||||||||||||||||
|
|
|
|
|
|
|
|
|
|
|
|
|
|
|
|
|
|
|
| |||||||||||||||||||||
Total return | 14.09 | % (b) | –8.79 | % | 27.68 | % | 22.69 | % | –17.51 | % | 7.30 | % (b) | 9.60 | % | 31.44 | % | 22.87 | % | –5.26 | % | ||||||||||||||||||||
Ratios and supplemental data: | ||||||||||||||||||||||||||||||||||||||||
Net assets at end of period (in millions) | $ | 86.7 | $ | 67.6 | $ | 77.0 | $ | 64.5 | $ | 57.5 | $ | 46.6 | $ | 39.9 | $ | 39.4 | $ | 33.1 | $ | 25.8 | ||||||||||||||||||||
Ratios to average net assets: | ||||||||||||||||||||||||||||||||||||||||
Expenses | 1.22 | % (a) | 1.18 | % | 1.19 | % | 1.21 | % | 1.20 | % | 0.92 | % (a) | 0.94 | % | 0.97 | % | 0.99 | % | 1.04 | % | ||||||||||||||||||||
Net investment income (loss) | 0.67 | % (a) | 0.38 | % | 0.40 | % | 0.64 | % | 1.07 | % | –0.06 | % (a) | –0.23 | % | –0.25 | % | 0.34 | % | 0.02 | % | ||||||||||||||||||||
Portfolio turnover rate | 25 | % | 65 | % | 51 | % | 55 | % | 67 | % | 31 | % | 55 | % | 60 | % | 17 | % | 47 | % | ||||||||||||||||||||
| (a) | Annualized. |
| (b) | Not annualized. |
The accompanying notes are an integral part of these financial statements.
| 124 |
| Ohio National Fund, Inc. |
Financial Highlights |
| Small Cap Growth Portfolio | Mid Cap Opportunity Portfolio | |||||||||||||||||||||||||||||||||||||||
| Six-Month Period Ended June 30, 2015 (Unaudited) | Years Ended December 31, | Six-Month Period Ended June 30, 2015 (Unaudited) | Years Ended December 31, | |||||||||||||||||||||||||||||||||||||
| 2014 | 2013 | 2012 | 2011 | 2014 | 2013 | 2012 | 2011 | |||||||||||||||||||||||||||||||||
Selected per-share data: | ||||||||||||||||||||||||||||||||||||||||
Net asset value, beginning of period | $ | 25.07 | $ | 22.65 | $ | 15.59 | $ | 13.21 | $ | 12.86 | $ | 31.49 | $ | 28.24 | $ | 21.32 | $ | 17.81 | $ | 18.43 | ||||||||||||||||||||
Operations: | ||||||||||||||||||||||||||||||||||||||||
Net investment income (loss) | (0.02 | ) | (0.05 | ) | (0.03 | ) | (0.03 | ) | (0.08 | ) | (0.05 | ) | (0.05 | ) | (0.07 | ) | (0.02 | ) | (0.06 | ) | ||||||||||||||||||||
Net realized and unrealized gain (loss) on investments and foreign currency related transactions | 2.00 | 2.47 | 7.09 | 2.41 | 0.43 | 0.66 | 3.30 | 6.99 | 3.53 | (0.56 | ) | |||||||||||||||||||||||||||||
|
|
|
|
|
|
|
|
|
|
|
|
|
|
|
|
|
|
|
| |||||||||||||||||||||
Total from operations | 1.98 | 2.42 | 7.06 | 2.38 | 0.35 | 0.61 | 3.25 | 6.92 | 3.51 | (0.62 | ) | |||||||||||||||||||||||||||||
|
|
|
|
|
|
|
|
|
|
|
|
|
|
|
|
|
|
|
| |||||||||||||||||||||
Distributions: | ||||||||||||||||||||||||||||||||||||||||
Distributions from net investment income | — | — | — | — | — | — | — | — | — | — | ||||||||||||||||||||||||||||||
|
|
|
|
|
|
|
|
|
|
|
|
|
|
|
|
|
|
|
| |||||||||||||||||||||
Net asset value, end of period | $ | 27.05 | $ | 25.07 | $ | 22.65 | $ | 15.59 | $ | 13.21 | $ | 32.10 | $ | 31.49 | $ | 28.24 | $ | 21.32 | $ | 17.81 | ||||||||||||||||||||
|
|
|
|
|
|
|
|
|
|
|
|
|
|
|
|
|
|
|
| |||||||||||||||||||||
Total return | 7.90 | % (b) | 10.68 | % | 45.29 | % | 18.02 | % | 2.72 | % | 1.94 | % (b) | 11.51 | % | 32.46 | % | 19.71 | % | –3.36 | % | ||||||||||||||||||||
Ratios and supplemental data: | ||||||||||||||||||||||||||||||||||||||||
Net assets at end of period (in millions) | $ | 223.5 | $ | 212.1 | $ | 109.5 | $ | 35.0 | $ | 31.5 | $ | 88.8 | $ | 86.7 | $ | 83.0 | $ | 67.1 | $ | 61.1 | ||||||||||||||||||||
Ratios to average net assets: | ||||||||||||||||||||||||||||||||||||||||
Expenses | 0.85 | % (a) | 0.89 | % | 1.04 | % | 1.10 | % | 1.08 | % | 0.94 | % (a) | 0.94 | % | 0.96 | % | 0.98 | % | 0.96 | % | ||||||||||||||||||||
Net investment income (loss) | –0.15 | % (a) | –0.31 | % | –0.29 | % | –0.20 | % | –0.60 | % | –0.29 | % (a) | –0.18 | % | –0.28 | % | –0.09 | % | –0.29 | % | ||||||||||||||||||||
Portfolio turnover rate | 16 | % | 58% | 69 | % (c) | 65 | % | 58 | % | 31 | % | 61 | % | 44 | % | 45 | % | 51 | % | |||||||||||||||||||||
| (a) | Annualized. |
| (b) | Not annualized. |
| (c) | The cost of purchases and proceeds from sales of securities that were incurred to realign the Portfolio’s holdings subsequent to the December 20, 2013 reorganization are excluded from the 2013 portfolio turnover rate calculation. If such amounts had not been excluded, the portfolio turnover rate would have been 146%. |
The accompanying notes are an integral part of these financial statements.
| 125 |
| Ohio National Fund, Inc. |
Financial Highlights |
| S&P 500® Index Portfolio | Strategic Value Portfolio | |||||||||||||||||||||||||||||||||||||||
| Six-Month Period Ended June 30, 2015 (Unaudited) | Years Ended December 31, | Six-Month Period Ended June 30, 2015 (Unaudited) | Years Ended December 31, | |||||||||||||||||||||||||||||||||||||
| 2014 | 2013 | 2012 | 2011 | 2014 | 2013 | 2012 | 2011 | |||||||||||||||||||||||||||||||||
Selected per-share data: | ||||||||||||||||||||||||||||||||||||||||
Net asset value, beginning of period | $ | 21.93 | $ | 19.63 | $ | 15.08 | $ | 13.25 | $ | 13.21 | $ | 13.92 | $ | 13.09 | $ | 11.09 | $ | 10.50 | $ | 9.36 | ||||||||||||||||||||
Operations: | ||||||||||||||||||||||||||||||||||||||||
Net investment income | 0.18 | 0.32 | 0.26 | 0.26 | 0.22 | 0.25 | 0.93 | 0.35 | 0.13 | 0.33 | ||||||||||||||||||||||||||||||
Net realized and unrealized gain (loss) on investments and foreign currency related transactions | 0.04 | 2.25 | 4.52 | 1.78 | 0.01 | (0.30 | ) | 0.68 | 1.97 | 0.63 | 0.98 | |||||||||||||||||||||||||||||
|
|
|
|
|
|
|
|
|
|
|
|
|
|
|
|
|
|
|
| |||||||||||||||||||||
Total from operations | 0.22 | 2.57 | 4.78 | 2.04 | 0.23 | (0.05 | ) | 1.61 | 2.32 | 0.76 | 1.31 | |||||||||||||||||||||||||||||
|
|
|
|
|
|
|
|
|
|
|
|
|
|
|
|
|
|
|
| |||||||||||||||||||||
Distributions: | ||||||||||||||||||||||||||||||||||||||||
Distributions from net investment income | — | (0.27 | ) | (0.23 | ) | (0.21 | ) | (0.19 | ) | — | (0.78 | ) | (0.32 | ) | (0.17 | ) | (0.17 | ) | ||||||||||||||||||||||
|
|
|
|
|
|
|
|
|
|
|
|
|
|
|
|
|
|
|
| |||||||||||||||||||||
Net asset value, end of period | $ | 22.15 | $ | 21.93 | $ | 19.63 | $ | 15.08 | $ | 13.25 | $ | 13.87 | $ | 13.92 | $ | 13.09 | $ | 11.09 | $ | 10.50 | ||||||||||||||||||||
|
|
|
|
|
|
|
|
|
|
|
|
|
|
|
|
|
|
|
| |||||||||||||||||||||
Total return | 1.00 | % (b) | 13.11 | % | 31.74 | % | 15.40 | % | 1.77 | % | –0.36 | % (b) | 12.41 | % | 21.00 | % | 7.21 | % | 14.03 | % | ||||||||||||||||||||
Ratios and supplemental data: | ||||||||||||||||||||||||||||||||||||||||
Net assets at end of period (in millions) | $ | 409.7 | $ | 388.2 | $ | 314.9 | $ | 207.8 | $ | 170.7 | $ | 329.6 | $ | 332.6 | $ | 397.7 | $ | 268.2 | $ | 42.0 | ||||||||||||||||||||
Ratios to average net assets: | ||||||||||||||||||||||||||||||||||||||||
Expenses | 0.41 | % (a) | 0.43 | % | 0.45 | % | 0.48 | % | 0.47 | % | 0.78 | % (a) | 0.78 | % | 0.79 | % | 0.82 | % | 0.96 | % | ||||||||||||||||||||
Net investment income | 1.66 | % (a) | 1.64 | % | 1.68 | % | 1.87 | % | 1.62 | % | 3.54 | % (a) | 5.37 | % | 3.58 | % | 3.84 | % | 4.07 | % | ||||||||||||||||||||
Portfolio turnover rate | 7 | % | 11 | % | 15 | % | 7 | % | 9 | % | 8 | % | 22 | % | 22 | % | 30 | % | 19 | % | ||||||||||||||||||||
| (a) | Annualized. |
| (b) | Not annualized. |
The accompanying notes are an integral part of these financial statements.
| 126 |
| Ohio National Fund, Inc. |
Financial Highlights |
| High Income Bond Portfolio | Capital Growth Portfolio | |||||||||||||||||||||||||||||||||||||||
| Six-Month Period Ended June 30, 2015 (Unaudited) | Years Ended December 31, | Six-Month Period Ended June 30, 2015 (Unaudited) | Years Ended December 31, | |||||||||||||||||||||||||||||||||||||
| 2014 | 2013 | 2012 | 2011 | 2014 | 2013 | 2012 | 2011 | |||||||||||||||||||||||||||||||||
Selected per-share data: | ||||||||||||||||||||||||||||||||||||||||
Net asset value, beginning of period | $ | 16.32 | $ | 15.88 | $ | 14.83 | $ | 12.97 | $ | 12.31 | $ | 41.01 | $ | 40.03 | $ | 30.73 | $ | 27.00 | $ | 27.68 | ||||||||||||||||||||
Operations: | ||||||||||||||||||||||||||||||||||||||||
Net investment income (loss) | 0.54 | 1.57 | 1.10 | 0.99 | 1.08 | (0.15 | ) | (0.19 | ) | (0.15 | ) | (0.03 | ) | (0.19 | ) | |||||||||||||||||||||||||
Net realized and unrealized gain (loss) on investments and foreign currency related transactions | (0.16 | ) | (1.13 | ) | (0.05 | ) | 0.87 | (0.42 | ) | 3.14 | 1.17 | 9.45 | 3.76 | (0.49 | ) | |||||||||||||||||||||||||
|
|
|
|
|
|
|
|
|
|
|
|
|
|
|
|
|
|
|
| |||||||||||||||||||||
Total from operations | 0.38 | 0.44 | 1.05 | 1.86 | 0.66 | 2.99 | 0.98 | 9.30 | 3.73 | (0.68 | ) | |||||||||||||||||||||||||||||
|
|
|
|
|
|
|
|
|
|
|
|
|
|
|
|
|
|
|
| |||||||||||||||||||||
Net asset value, end of period | $ | 16.70 | $ | 16.32 | $ | 15.88 | $ | 14.83 | $ | 12.97 | $ | 44.00 | $ | 41.01 | $ | 40.03 | $ | 30.73 | $ | 27.00 | ||||||||||||||||||||
|
|
|
|
|
|
|
|
|
|
|
|
|
|
|
|
|
|
|
| |||||||||||||||||||||
Total return | 2.33 | % (b) | 2.77 | % | 7.08 | % | 14.34 | % | 5.36 | % | 7.29 | % (b) | 2.45 | % | 30.26 | % | 13.81 | % | –2.46 | % | ||||||||||||||||||||
Ratios and supplemental data: | ||||||||||||||||||||||||||||||||||||||||
Net assets at end of period (in millions) | $ | 224.8 | $ | 230.1 | $ | 307.9 | $ | 311.9 | $ | 267.5 | $ | 76.0 | $ | 75.5 | $ | 80.4 | $ | 55.1 | $ | 51.1 | ||||||||||||||||||||
Ratios to average net assets: | ||||||||||||||||||||||||||||||||||||||||
Expenses | 0.80 | % (a) | 0.77 | % | 0.77 | % | 0.79 | % | 0.78 | % | 1.00 | % (a) | 1.00 | % | 1.01 | % | 1.04 | % | 1.02 | % | ||||||||||||||||||||
Net investment income (loss) | 5.66 | % (a) | 5.73 | % | 6.36 | % | 7.17 | % | 7.69 | % | –0.67 | % (a) | –0.45 | % | –0.44 | % | –0.10 | % | –0.64 | % | ||||||||||||||||||||
Portfolio turnover rate | 16 | % | 33 | % | 29 | % | 35 | % | 35 | % | 17 | % | 44 | % | 42 | % | 42 | % | 44 | % | ||||||||||||||||||||
| (a) | Annualized. |
| (b) | Not annualized. |
The accompanying notes are an integral part of these financial statements.
| 127 |
| Ohio National Fund, Inc. |
Financial Highlights |
| Nasdaq-100® Index Portfolio | Bristol Portfolio | |||||||||||||||||||||||||||||||||||||||
| Six-Month Period Ended June 30, 2015 (Unaudited) | Years Ended December 31, | Six-Month Period Ended June 30, 2015 (Unaudited) | Years Ended December 31, | |||||||||||||||||||||||||||||||||||||
| 2014 | 2013 | 2012 | 2011 | 2014 | 2013 | 2012 | 2011 | |||||||||||||||||||||||||||||||||
Selected per-share data: | ||||||||||||||||||||||||||||||||||||||||
Net asset value, beginning of period | $ | 10.88 | $ | 9.25 | $ | 6.85 | $ | 5.85 | $ | 5.69 | $ | 20.75 | $ | 18.29 | $ | 13.01 | $ | 11.56 | $ | 12.51 | ||||||||||||||||||||
Operations: | ||||||||||||||||||||||||||||||||||||||||
Net investment income | 0.05 | 0.12 | 0.07 | 0.06 | 0.02 | 0.07 | 0.09 | 0.09 | 0.09 | 0.06 | ||||||||||||||||||||||||||||||
Net realized and unrealized gain (loss) on investments | 0.40 | 1.62 | 2.39 | 0.99 | 0.16 | 1.30 | 2.45 | 5.27 | 1.43 | (0.95 | ) | |||||||||||||||||||||||||||||
|
|
|
|
|
|
|
|
|
|
|
|
|
|
|
|
|
|
|
| |||||||||||||||||||||
Total from operations | 0.45 | 1.74 | 2.46 | 1.05 | 0.18 | 1.37 | 2.54 | 5.36 | 1.52 | (0.89 | ) | |||||||||||||||||||||||||||||
|
|
|
|
|
|
|
|
|
|
|
|
|
|
|
|
|
|
|
| |||||||||||||||||||||
Distributions: | ||||||||||||||||||||||||||||||||||||||||
Distributions from net investment income | — | (0.11 | ) | (0.06 | ) | (0.05 | ) | (0.02 | ) | — | (0.08 | ) | (0.08 | ) | �� | (0.07 | ) | (0.06 | ) | |||||||||||||||||||||
|
|
|
|
|
|
|
|
|
|
|
|
|
|
|
|
|
|
|
| |||||||||||||||||||||
Net asset value, end of period | $ | 11.33 | $ | 10.88 | $ | 9.25 | $ | 6.85 | $ | 5.85 | $ | 22.12 | $ | 20.75 | $ | 18.29 | $ | 13.01 | $ | 11.56 | ||||||||||||||||||||
|
|
|
|
|
|
|
|
|
|
|
|
|
|
|
|
|
|
|
| |||||||||||||||||||||
Total return | 4.14 | % (b) | 18.77 | % | 35.98 | % | 17.88 | % | 3.19 | % | 6.60 | % (b) | 13.88 | % | 41.21 | % | 13.19 | % | –7.16 | % | ||||||||||||||||||||
Ratios and supplemental data: | ||||||||||||||||||||||||||||||||||||||||
Net assets at end of period (in millions) | $ | 129.5 | $ | 121.7 | $ | 95.8 | $ | 68.5 | $ | 55.5 | $ | 232.4 | $ | 232.0 | $ | 231.5 | $ | 204.9 | $ | 192.7 | ||||||||||||||||||||
Ratios to average net assets: | ||||||||||||||||||||||||||||||||||||||||
Expenses | 0.46 | % (a) | 0.48 | % | 0.51 | % | 0.53 | % | 0.52 | % | 0.80 | % (a) | 0.81 | % | 0.82 | % | 0.85 | % | 0.84 | % | ||||||||||||||||||||
Net investment income | 0.82 | % (a) | 1.23 | % | 0.94 | % | 0.98 | % | 0.41 | % | 0.60 | % (a) | 0.42 | % | 0.51 | % | 0.68 | % | 0.52 | % | ||||||||||||||||||||
Portfolio turnover rate | 9 | % | 23 | % | 43 | % | 25 | % | 44 | % | 123 | % | 239 | % | 269 | % | 244 | % | 198 | % | ||||||||||||||||||||
| (a) | Annualized. |
| (b) | Not annualized. |
The accompanying notes are an integral part of these financial statements.
| 128 |
| Ohio National Fund, Inc. |
Financial Highlights |
| Bryton Growth Portfolio | Balanced Portfolio | |||||||||||||||||||||||||||||||||||||||
| Six-Month Period Ended June 30, 2015 (Unaudited) | Years Ended December 31, | Six-Month Period Ended June 30, 2015 (Unaudited) | Years Ended December 31, | |||||||||||||||||||||||||||||||||||||
| 2014 | 2013 | 2012 | 2011 | 2014 | 2013 | 2012 | 2011 | |||||||||||||||||||||||||||||||||
Selected per-share data: | ||||||||||||||||||||||||||||||||||||||||
Net asset value, beginning of period | $ | 20.47 | $ | 19.28 | $ | 13.70 | $ | 12.31 | $ | 13.57 | $ | 18.96 | $ | 18.02 | $ | 15.76 | $ | 13.91 | $ | 13.87 | ||||||||||||||||||||
Operations: | ||||||||||||||||||||||||||||||||||||||||
Net investment income (loss) | (0.06 | ) | (0.09 | ) | (0.11 | ) | (0.07 | ) | (0.08 | ) | 0.13 | 0.16 | 0.08 | 0.10 | 0.31 | |||||||||||||||||||||||||
Net realized and unrealized gain (loss) on investments, foreign currency related transactions, and written options | 2.26 | 1.28 | 5.69 | 1.46 | (1.18 | ) | 0.42 | 0.92 | 2.32 | 1.75 | (0.00 | ) | ||||||||||||||||||||||||||||
|
|
|
|
|
|
|
|
|
|
|
|
|
|
|
|
|
|
|
| |||||||||||||||||||||
Total from operations | 2.20 | 1.19 | 5.58 | 1.39 | (1.26 | ) | 0.55 | 1.08 | 2.40 | 1.85 | 0.31 | |||||||||||||||||||||||||||||
|
|
|
|
|
|
|
|
|
|
|
|
|
|
|
|
|
|
|
| |||||||||||||||||||||
Distributions: | ||||||||||||||||||||||||||||||||||||||||
Distributions from net investment income | — | — | — | — | — | — | (0.14 | ) | (0.14 | ) | — | (0.27 | ) | |||||||||||||||||||||||||||
|
|
|
|
|
|
|
|
|
|
|
|
|
|
|
|
|
|
|
| |||||||||||||||||||||
Net asset value, end of period | $ | 22.67 | $ | 20.47 | $ | 19.28 | $ | 13.70 | $ | 12.31 | $ | 19.51 | $ | 18.96 | $ | 18.02 | $ | 15.76 | $ | 13.91 | ||||||||||||||||||||
|
|
|
|
|
|
|
|
|
|
|
|
|
|
|
|
|
|
|
| |||||||||||||||||||||
Total return | 10.75 | % (b) | 6.17 | % | 40.73 | % | 11.29 | % | –9.29 | % | 2.90 | % (b) | 5.99 | % | 15.26 | % | 13.30 | % | 2.29 | % | ||||||||||||||||||||
Ratios and supplemental data: | ||||||||||||||||||||||||||||||||||||||||
Net assets at end of period (in millions) | $ | 180.5 | $ | 179.1 | $ | 180.8 | $ | 157.7 | $ | 155.4 | $ | 881.4 | $ | 833.1 | $ | 249.1 | $ | 77.1 | $ | 17.1 | ||||||||||||||||||||
Ratios to average net assets: | ||||||||||||||||||||||||||||||||||||||||
Ratios net of expenses reduced or reimbursed by adviser: | ||||||||||||||||||||||||||||||||||||||||
Expenses | 0.87 | % (a) | 0.88 | % | 0.89 | % | 0.93 | % | 0.91 | % | 0.63 | % (a) | 0.64 | % | 0.75 | % | 0.86 | % | 0.94 | % | ||||||||||||||||||||
Net investment income (loss) | –0.54 | % (a) | –0.45 | % | –0.59 | % | –0.57 | % | –0.67 | % | 1.34 | % (a) | 1.80 | % | 1.45 | % | 1.90 | % | 2.33 | % | ||||||||||||||||||||
Ratios assuming no expenses reduced or reimbursed by adviser: | ||||||||||||||||||||||||||||||||||||||||
Expenses | 0.87 | % (a) | 0.88 | % | 0.89 | % | 0.93 | % | 0.91 | % | 0.63 | % (a) | 0.68 | % | 0.75 | % | 0.86 | % | 0.94 | % | ||||||||||||||||||||
Net investment income (loss) | –0.54 | % (a) | –0.45 | % | –0.59 | % | –0.57 | % | –0.67 | % | 1.34 | % (a) | 1.76 | % | 1.45 | % | 1.90 | % | 2.33 | % | ||||||||||||||||||||
Portfolio turnover rate | 82 | % | 178 | % | 185 | % | 152 | % | 156 | % | 45 | % | 94 | % | 82 | % (c) | 60 | % | 47 | % | ||||||||||||||||||||
| (a) | Annualized. |
| (b) | Not annualized. |
| (c) | The cost of purchases and proceeds from sales of securities that were incurred to realign the Portfolio’s holdings subsequent to the December 20, 2013 reorganization are excluded from the 2013 portfolio turnover rate calculation. If such amounts had not been excluded, the portfolio turnover rate would have been 89%. |
The accompanying notes are an integral part of these financial statements.
| 129 |
| Ohio National Fund, Inc. |
Financial Highlights |
| Target VIP Portfolio | Bristol Growth Portfolio | |||||||||||||||||||||||||||||||||||||||
| Six-Month Period Ended June 30, 2015 (Unaudited) | Years Ended December 31, | Six-Month Period Ended June 30, 2015 (Unaudited) | Years Ended December 31, | |||||||||||||||||||||||||||||||||||||
| 2014 | 2013 | 2012 | 2011 | 2014 | 2013 | 2012 | 2011 | |||||||||||||||||||||||||||||||||
Selected per-share data: | ||||||||||||||||||||||||||||||||||||||||
Net asset value, beginning of period | $ | 14.49 | $ | 13.70 | $ | 10.10 | $ | 8.89 | $ | 9.11 | $ | 16.44 | $ | 14.72 | $ | 10.66 | $ | 9.63 | $ | 9.84 | ||||||||||||||||||||
Operations: | ||||||||||||||||||||||||||||||||||||||||
Net investment income | 0.14 | 0.25 | 0.09 | 0.18 | 0.10 | 0.04 | 0.06 | 0.06 | 0.06 | 0.04 | ||||||||||||||||||||||||||||||
Net realized and unrealized gain (loss) on investments and foreign currency related transactions | 0.16 | 0.77 | 3.61 | 1.17 | (0.23 | ) | 0.90 | 1.71 | 4.05 | 1.02 | (0.21 | ) | ||||||||||||||||||||||||||||
|
|
|
|
|
|
|
|
|
|
|
|
|
|
|
|
|
|
|
| |||||||||||||||||||||
Total from operations | 0.30 | 1.02 | 3.70 | 1.35 | (0.13 | ) | 0.94 | 1.77 | 4.11 | 1.08 | (0.17 | ) | ||||||||||||||||||||||||||||
|
|
|
|
|
|
|
|
|
|
|
|
|
|
|
|
|
|
|
| |||||||||||||||||||||
Distributions: | ||||||||||||||||||||||||||||||||||||||||
Distributions from net investment income | — | (0.23 | ) | (0.10 | ) | (0.14 | ) | (0.09 | ) | — | (0.05 | ) | (0.05 | ) | (0.05 | ) | (0.04 | ) | ||||||||||||||||||||||
|
|
|
|
|
|
|
|
|
|
|
|
|
|
|
|
|
|
|
| |||||||||||||||||||||
Net asset value, end of period | $ | 14.79 | $ | 14.49 | $ | 13.70 | $ | 10.10 | $ | 8.89 | $ | 17.38 | $ | 16.44 | $ | 14.72 | $ | 10.66 | $ | 9.63 | ||||||||||||||||||||
|
|
|
|
|
|
|
|
|
|
|
|
|
|
|
|
|
|
|
| |||||||||||||||||||||
Total return | 2.07 | % (b) | 7.44 | % | 36.71 | % | 15.24 | % | –1.41 | % | 5.72 | % (b) | 12.01 | % | 38.62 | % | 11.20 | % | –1.77 | % | ||||||||||||||||||||
Ratios and supplemental data: | ||||||||||||||||||||||||||||||||||||||||
Net assets at end of period (in millions) | $ | 52.7 | $ | 55.1 | $ | 53.7 | $ | 21.2 | $ | 20.5 | $ | 124.2 | $ | 124.1 | $ | 122.3 | $ | 108.0 | $ | 99.9 | ||||||||||||||||||||
Ratios to average net assets: | ||||||||||||||||||||||||||||||||||||||||
Expenses | 0.78 | % (a) | 0.77 | % | 0.82 | % | 0.87 | % | 0.84 | % | 0.85 | % (a) | 0.86 | % | 0.88 | % | 0.92 | % | 0.90 | % | ||||||||||||||||||||
Net investment income | 1.74 | % (a) | 1.77 | % | 0.92 | % | 1.73 | % | 1.07 | % | 0.47 | % (a) | 0.34 | % | 0.42 | % | 0.57 | % | 0.41 | % | ||||||||||||||||||||
Portfolio turnover rate | 68 | % | 79 | % | 57 | % (c) | 70 | % | 79 | % | 95 | % | 192 | % | 237 | % | 229 | % | 187 | % | ||||||||||||||||||||
| (a) | Annualized. |
| (b) | Not annualized. |
| (c) | The cost of purchases and proceeds from sales of securities that were incurred to realign the Portfolio’s holdings subsequent to the December 20, 2013 reorganization are excluded from the 2013 portfolio turnover rate calculation. If such amounts had not been excluded, the portfolio turnover rate would have been 138%. |
The accompanying notes are an integral part of these financial statements.
| 130 |
| Ohio National Fund, Inc. |
Financial Highlights |
| Risk Managed Balanced Portfolio | ||||||||
| Six-Month Period Ended June 30, 2015 (Unaudited) | Period from May 1, 2014* to December 31, 2014 | |||||||
Selected per-share data: | ||||||||
Net asset value, beginning of period | $ | 10.83 | $ | 10.00 | ||||
Operations: | ||||||||
Net investment income | 0.01 | 0.03 | ||||||
Net realized and unrealized gain (loss) on investments, futures contracts, and foreign currency related transactions | (0.08 | ) | 0.80 | |||||
|
|
|
| |||||
Total from operations | (0.07 | ) | 0.83 | |||||
|
|
|
| |||||
Net asset value, end of period | $ | 10.76 | $ | 10.83 | ||||
|
|
|
| |||||
Total return | –0.65 | % (b) | 8.30 | % (b) | ||||
Ratios and supplemental data: | ||||||||
Net assets at end of period (in millions) | $ | 74.7 | $ | 33.8 | ||||
Ratios to average net assets: | ||||||||
Expenses | 1.22 | % (a) | 1.43 | % (a) | ||||
Net investment income | 0.61 | % (a) | 0.43 | % (a) | ||||
Portfolio turnover rate | 35 | % | 94 | % | ||||
| (a) | Annualized. |
| (b) | Not annualized. |
| * | Represents date of inception and commencement of operations. |
The accompanying notes are an integral part of these financial statements.
| 131 |
| Ohio National Fund, Inc. |
| June 30, 2015 (Unaudited) |
| (1) | Organization |
Ohio National Fund, Inc. (the “Fund”) is a Maryland corporation registered under the Investment Company Act of 1940, as amended (the “40 Act”). The fund is an open-end investment company and follows accounting and reporting guidance under Financial Accounting Standards Board (“FASB”) Accounting Standards Codification (“ASC”) Topic 946, “Financial Services-Investment Companies”. The Fund consists of twenty-one separate investment portfolios (the “Portfolios”) that seek the following objectives and strategies:
| ¢ | Equity Portfolio — Long-term growth of capital by investing at least 80% of its assets in equity securities. |
| ¢ | Money Market Portfolio — Maximum current income consistent with preservation of principal and liquidity by investing in high quality money market instruments. |
| ¢ | Bond Portfolio — High level of income and opportunity for capital appreciation consistent with preservation of capital by investing primarily in intermediate-term and long-term fixed income securities. |
| ¢ | Omni Portfolio — High level of long-term total return consistent with preservation of capital by investing in stocks, bonds, and money market instruments. |
| ¢ | International Portfolio — Long term growth of capital by investing at least 80% of its assets in securities of foreign companies. |
| ¢ | Capital Appreciation Portfolio — Long-term capital growth by investing primarily in equity and equity related securities of established companies with either current or emerging earnings growth not fully appreciated or recognized by the market. |
| ¢ | International Small-Mid Company Portfolio — Long-term growth of capital by investing at least 80% of its assets in equity securities of foreign small and mid-cap companies. |
| ¢ | Aggressive Growth Portfolio — Long-term capital growth by investing primarily in domestic and foreign equity securities selected for growth potential. |
| ¢ | Small Cap Growth Portfolio — Long-term capital appreciation by investing at least 80% of its net assets in stocks of small companies. |
| ¢ | Mid Cap Opportunity Portfolio — Long-term total return by investing at least 80% of its net assets in equity securities of mid-cap companies, primarily those that are strategically positioned for long-term growth. |
| ¢ | S&P 500® Index Portfolio — Total return that approximates the total return of the Standard & Poor’s 500® Index, at a risk level consistent with that of the Standard & Poor’s 500® Index. |
| ¢ | Strategic Value Portfolio — Growth of capital and income by investing primarily in high dividend yielding common stocks with dividend growth potential. |
| ¢ | High Income Bond Portfolio — High current income by investing at least 80% of its net assets in lower rated corporate debt obligations commonly referred to as “junk bonds”. The Portfolio’s investments are generally rated Ba or lower by Moody’s, or BB or lower by Standard & Poor’s or Fitch. |
| ¢ | Capital Growth Portfolio — Long-term capital appreciation by investing primarily in an actively managed portfolio of equity securities of small cap growth companies. |
| ¢ | Nasdaq-100® Index Portfolio — Long-term growth of capital by investing primarily in stocks that are included in the Nasdaq-100® Index. Unlike the other Portfolios of the Fund, the Nasdaq-100® Index Portfolio is a non-diversified portfolio for purposes of Section 5(b) of the 40 Act. |
| ¢ | Bristol Portfolio — Long-term growth of capital by investing primarily in common stocks of the 1,000 largest publicly traded U.S. companies in terms of market capitalization. |
| ¢ | Bryton Growth Portfolio — Long-term growth of capital by investing primarily in common stocks of growth-oriented U.S. companies smaller than the 500 largest publicly traded U.S. companies in terms of market capitalization. |
| ¢ | Balanced Portfolio — Capital appreciation and income by investing normally up to 75% of its assets in equity securities of domestic and foreign securities of any market capitalization while maintaining a minimum of 25% of its assets in fixed income securities. |
| 132 | (continued) |
| Ohio National Fund, Inc. |
Notes to Financial Statements (Continued) | June 30, 2015 (Unaudited) |
| ¢ | Target VIP Portfolio — Above average total return by investing in the common stocks of companies which are identified by a model that applies separate uniquely specialized strategies. |
| ¢ | Bristol Growth Portfolio — Long-term growth of capital by investing primarily in common stocks of the 1,000 largest publicly traded U.S. companies in terms of market capitalization. |
| ¢ | Risk Managed Balanced Portfolio — Long-term capital growth, consistent with preservation of capital and balanced by current income. The Portfolio invests in a balanced portfolio of equity and fixed-income securities and a risk management portfolio intended to enhance the risk adjusted return of the Portfolio. |
Additional detail regarding portfolio-specific objectives, policies, and investment strategies is provided in the prospectus and Statement of Additional Information of Ohio National Fund, Inc. There are no assurances that these objectives will be met. Each Portfolio, except the Nasdaq-100® Index Portfolio, is classified as diversified for purposes of Section 5(b) of the 40 Act.
At present, the Fund sells its shares only to separate accounts of The Ohio National Life Insurance Company (“ONLIC”), Ohio National Life Assurance Corporation (“ONLAC”), and National Security Life and Annuity Company (“NSLA”) to support certain benefits under variable contracts issued by those entities. In the future, Fund shares may be used for other purposes but, unless there is a change in applicable law, they will not be sold directly to the public.
Interest in each Portfolio is represented by a separate class of the Fund’s capital stock, par value $1. Each share of a Portfolio participates equally in the Portfolio’s dividends, distributions, net assets, and voting matters.
The Fund is authorized to issue 550 million of its capital shares. These authorized shares have been allocated to specific Portfolios of the Fund as follows:
Portfolio | Authorized Shares | |||
Equity | 25,000,000 | |||
Money Market | 55,000,000 | |||
Bond | 30,000,000 | |||
Omni | 10,000,000 | |||
International | 30,000,000 | |||
Capital Appreciation | 25,000,000 | |||
International Small-Mid Company | 7,000,000 | |||
Aggressive Growth | 7,000,000 | |||
Small Cap Growth | 15,000,000 | |||
Mid Cap Opportunity | 6,000,000 | |||
S&P 500® Index | 35,000,000 | |||
Portfolio | Authorized Shares | |||
Strategic Value | 65,000,000 | |||
High Income Bond | 35,000,000 | |||
Capital Growth | 5,000,000 | |||
Nasdaq-100® Index | 25,000,000 | |||
Bristol | 40,000,000 | |||
Bryton Growth | 30,000,000 | |||
Balanced | 55,000,000 | |||
Target VIP | 10,000,000 | |||
Bristol Growth | 25,000,000 | |||
Risk Managed Balanced | 15,000,000 | |||
The Fund’s Board of Directors (the ��Board”) periodically reallocates authorized shares among the Portfolios of the Fund and may authorize additional shares as deemed necessary.
Under the Fund’s organizational documents, its Officers and Directors are indemnified against certain liabilities arising out of the performance of their duties to the Fund. In addition, in the normal course of business, the Fund enters into contracts with its vendors and others that provide for general indemnifications. The Fund’s maximum exposure under these arrangements is unknown as this would involve future claims that may be made against the Fund. However, based on experience, the risk of loss to the Fund is expected to be remote.
| (2) | Significant Accounting Policies |
The following is a summary of significant accounting policies followed by the Fund in preparation of its Schedules of Investments:
Use of Estimates
The preparation of Schedules of Investments in conformity with U.S. generally accepted accounting principles (“U.S. GAAP”) requires management to make estimates and assumptions that affect the reported amounts of assets and liabilities and disclosure of contingent assets and liabilities at the date of the financial statements and the reported amounts of increases and decreases in net assets from operations during the reporting period. Actual results could differ from those estimates.
| 133 | (continued) |
| Ohio National Fund, Inc. |
Notes to Financial Statements (Continued) | June 30, 2015 (Unaudited) |
Security Valuation
Investments are valued using pricing procedures approved by the Board.
Various investments in the Money Market Portfolio are valued at amortized cost in accordance with Rule 2a-7 of the 40 Act. In all Portfolios of the Fund, fixed income instruments that mature in sixty days or less, and of sufficient credit quality, are valued at amortized cost. Amortized cost valuation involves valuing a security at its cost initially and thereafter amortizing to maturity any discounts or premiums on the level-yield method, regardless of the impact of fluctuating market interest rates on the value of the security. In these instances, amortized cost approximates fair value.
Investments, other than those securities aforementioned, are valued as follows:
Domestic equity securities that are traded on U.S. exchanges, other than Nasdaq Stock Market, are valued at the last trade price reported by the primary exchange of each security (4:00 pm Eastern Time for normal trading sessions). Domestic equity securities that are listed on the Nasdaq Stock Market are valued at the Nasdaq Official Closing Price (“NOCP”). Over-the-counter domestic equity securities are valued at the last trade price reported daily as of 4:00 pm Eastern Time (normal trading sessions). Over-the-counter traded ADRs may also be valued at an evaluated price based on the value of the underlying securities. If a domestic equity security is not traded on a particular day, the mean between the bid and ask prices reported at 4:00 pm Eastern Time (normal trading sessions) by the primary exchange will generally be used for valuation purposes. The principal sources for market quotations are independent pricing services that have been approved by the Board.
Fixed income securities that have a remaining maturity exceeding sixty days are generally valued at the bid price reported at 4:00 pm Eastern Time (normal trading sessions), as provided by independent pricing services approved by the Board.
Shares of open-end mutual funds are valued at each fund’s last calculated net asset value per share.
Restricted securities, illiquid securities, or other investments for which market quotations or other observable market inputs are not readily available are valued at an estimate of value using methods determined in good faith by the Fund’s Pricing Committee under the supervision of the Board.
Foreign equity securities are initially priced at the reported close price of the exchange on which a security is primarily traded. Securities not traded on a particular day are valued at the mean between the last reported bid and ask quotes at daily close, or the last sale price when appropriate. The principal sources for market quotations are independent pricing services that have been approved by the Board.
Equity securities that are primarily traded on foreign exchanges, other than those with close times that are consistent with the normal 4:00 pm Eastern Time close of U.S. equity markets, are further subjected to fair valuation pricing procedures provided by an independent fair valuation service. The service provides data that can be used to estimate the price of a foreign issue that would prevail in a liquid market given market information available daily at 4:00 pm Eastern Time (normal trading sessions). Multiple factors may be considered in performing this valuation, including an issue’s local close price, relevant general and sector indices, currency fluctuations, and pricing of related depository receipts, exchange traded funds, and futures. The pricing procedures are performed for each individual security for which there is a fairly large degree of certainty that the local close price is not the liquid market price at the time of U.S. market close. The procedures are performed each day there is a change in a consistently used market index from the time of local close to the U.S. market close. Backtesting analysis is performed on a quarterly basis to monitor the effectiveness of these procedures. The testing is reviewed by management of the Fund as well as the Fund’s Board. Prior results have indicated that these procedures have been effective in reaching valuation objectives.
The differences between the aggregate cost and values of investments are reflected as unrealized appreciation or unrealized depreciation.
Pricing inputs used in the Fund’s determination of its investment values are categorized according to a three-tier hierarchy framework. The hierarchy is summarized in three broad levels:
| Level 1: | Quoted prices in active markets for identical securities. |
| Level 2: | Other significant observable inputs, including quoted prices for similar securities, interest rates, prepayment speeds, credit risk, etc. |
| Level 3: | Significant unobservable inputs, including the Fund’s own assumptions used to determine the value of securities. |
| 134 | (continued) |
| Ohio National Fund, Inc. |
Notes to Financial Statements (Continued) | June 30, 2015 (Unaudited) |
The following is a summary of the inputs used in valuing each of the Portfolio’s assets (liabilities) at value as of June 30, 2015:
Portfolio | Financial Instrument Type | Level 1 | Level 2 | Level 3 | ||||||||||
Equity | Common Stocks** | $ | 501,425,847 | $ | — | $ | — | |||||||
| Master Limited Partnerships** | 7,879,366 | — | — | |||||||||||
| Money Market Funds | 10,822,000 | — | — | |||||||||||
|
|
|
|
|
| |||||||||
| $ | 520,127,213 | $ | — | $ | — | |||||||||
|
|
|
|
|
| |||||||||
Money Market* | Commercial Paper** | $ | — | $ | 106,496,865 | $ | — | |||||||
| U.S. Government Agency Issues | — | 7,999,907 | — | |||||||||||
| Money Market Funds | 27,000,000 | — | — | |||||||||||
|
|
|
|
|
| |||||||||
| $ | 27,000,000 | $ | 114,496,772 | $ | — | |||||||||
|
|
|
|
|
| |||||||||
Bond | Corporate Bonds** | $ | — | $ | 154,729,862 | $ | — | |||||||
| Asset-Backed Securities** | — | 882,000 | — | |||||||||||
| Money Market Funds | 1,186,000 | — | — | |||||||||||
|
|
|
|
|
| |||||||||
| $ | 1,186,000 | $ | 155,611,862 | $ | — | |||||||||
|
|
|
|
|
| |||||||||
Omni | Common Stocks** | $ | 38,298,168 | $ | — | $ | — | |||||||
| Corporate Bonds** | — | 10,320,076 | — | |||||||||||
| Asset-Backed Securities** | — | 98,000 | — | |||||||||||
| U.S. Treasury Obligations | — | 1,243,578 | — | |||||||||||
| Money Market Funds | 540,000 | — | — | |||||||||||
|
|
|
|
|
| |||||||||
| $ | 38,838,168 | $ | 11,661,654 | $ | — | |||||||||
|
|
|
|
|
| |||||||||
International | Common Stocks** | $ | 10,175,903 | $ | 139,262,011 | $ | — | |||||||
| Preferred Stocks** | — | 1,032,387 | — | |||||||||||
| Money Market Funds | 23,510,399 | — | — | |||||||||||
|
|
|
|
|
| |||||||||
| $ | 33,686,302 | $ | 140,294,398 | $ | — | |||||||||
|
|
|
|
|
| |||||||||
| Foreign currency contracts | $ | (271,805 | ) | $ | — | $ | — | |||||||
|
|
|
|
|
| |||||||||
| Futures contracts | $ | (722,349 | ) | $ | — | $ | — | |||||||
|
|
|
|
|
| |||||||||
Capital Appreciation | Common Stocks** | $ | 427,755,967 | $ | 7,256,421 | $ | — | |||||||
| Money Market Funds | 12,818,000 | — | — | |||||||||||
|
|
|
|
|
| |||||||||
| $ | 440,573,967 | $ | 7,256,421 | $ | — | |||||||||
|
|
|
|
|
| |||||||||
International Small-Mid Company | Common Stocks** | $ | 15,706,154 | $ | 69,063,317 | $ | — | |||||||
| Exchange Traded Funds | 403,609 | — | — | |||||||||||
| Rights** | — | 9 | — | |||||||||||
| Money Market Funds | 2,220,810 | — | — | |||||||||||
|
|
|
|
|
| |||||||||
| $ | 18,330,573 | $ | 69,063,326 | $ | — | |||||||||
|
|
|
|
|
| |||||||||
| Foreign currency contracts | $ | (335,828 | ) | $ | — | $ | — | |||||||
|
|
|
|
|
| |||||||||
Aggressive Growth | Common Stocks** | $ | 45,037,773 | $ | — | $ | — | |||||||
| Money Market Funds | 1,474,000 | — | — | |||||||||||
|
|
|
|
|
| |||||||||
| $ | 46,511,773 | $ | — | $ | — | |||||||||
|
|
|
|
|
| |||||||||
Small Cap Growth | Common Stocks** | $ | 217,688,332 | $ | 4,011,857 | $ | — | |||||||
| Master Limited Partnerships** | 1,693,382 | — | — | |||||||||||
| Money Market Funds | 3,504,000 | — | — | |||||||||||
|
|
|
|
|
| |||||||||
| $ | 222,885,714 | $ | 4,011,857 | $ | — | |||||||||
|
|
|
|
|
| |||||||||
Mid Cap Opportunity | Common Stocks** | $ | 88,184,852 | $ | — | $ | — | |||||||
| Money Market Funds | 1,430,000 | — | — | |||||||||||
|
|
|
|
|
| |||||||||
| $ | 89,614,852 | $ | — | $ | — | |||||||||
|
|
|
|
|
| |||||||||
| 135 | (continued) |
| Ohio National Fund, Inc. |
Notes to Financial Statements (Continued) | June 30, 2015 (Unaudited) |
Portfolio | Financial Instrument Type | Level 1 | Level 2 | Level 3 | ||||||||||
S&P 500® Index | Common Stocks** | $ | 391,747,417 | $ | — | $ | — | |||||||
| Exchange Traded Funds | 16,493,731 | — | — | |||||||||||
|
|
|
|
|
| |||||||||
| $ | 408,241,148 | $ | — | $ | — | |||||||||
|
|
|
|
|
| |||||||||
Strategic Value | Common Stocks** | $ | 253,610,907 | $ | 68,015,961 | $ | — | |||||||
| Money Market Funds | 6,640,000 | — | — | |||||||||||
|
|
|
|
|
| |||||||||
| $ | 260,250,907 | $ | 68,015,961 | $ | — | |||||||||
|
|
|
|
|
| |||||||||
High Income Bond | Corporate Bonds** | $ | — | $ | 219,529,537 | $ | — | |||||||
| Common Stocks** | — | — | 11,350 | |||||||||||
| Money Market Funds | 3,317,000 | — | — | |||||||||||
|
|
|
|
|
| |||||||||
| $ | 3,317,000 | $ | 219,529,537 | $ | 11,350 | |||||||||
|
|
|
|
|
| |||||||||
Capital Growth | Common Stocks** | $ | 75,332,695 | $ | — | $ | — | |||||||
| Master Limited Partnerships** | 441,694 | — | — | |||||||||||
| Money Market Funds | 118,000 | — | — | |||||||||||
|
|
|
|
|
| |||||||||
| $ | 75,892,389 | $ | — | $ | — | |||||||||
|
|
|
|
|
| |||||||||
Nasdaq-100® Index | Common Stocks** | $ | 125,721,026 | $ | — | $ | — | |||||||
| Exchange Traded Funds | 3,787,601 | — | — | |||||||||||
|
|
|
|
|
| |||||||||
| $ | 129,508,627 | $ | — | $ | — | |||||||||
|
|
|
|
|
| |||||||||
Bristol | Common Stocks** | $ | 230,698,890 | $ | — | $ | — | |||||||
| Money Market Funds | 706,000 | — | — | |||||||||||
|
|
|
|
|
| |||||||||
| $ | 231,404,890 | $ | — | $ | — | |||||||||
|
|
|
|
|
| |||||||||
Bryton Growth | Common Stocks** | $ | 177,306,960 | $ | — | $ | — | |||||||
| Money Market Funds | 4,905,000 | — | — | |||||||||||
|
|
|
|
|
| |||||||||
| $ | 182,211,960 | $ | — | $ | — | |||||||||
|
|
|
|
|
| |||||||||
Balanced | Common Stocks** | $ | 476,654,103 | $ | — | $ | — | |||||||
| Corporate Bonds** | — | 196,308,925 | — | |||||||||||
| Municipal Bonds | — | 3,558,720 | — | |||||||||||
| Preferred Stocks** | 5,699,419 | 7,528,255 | — | |||||||||||
| Trust Preferred Securities** | 9,690,518 | 24,399,878 | — | |||||||||||
| Asset-Backed / Mortgage-Backed Securities** | — | 20,121,650 | — | |||||||||||
| U.S. Treasury Obligations | — | 84,800,461 | — | |||||||||||
| Closed-End Mutual Funds | 26,161,216 | — | — | |||||||||||
| Exchange Traded Funds | 8,234,000 | — | — | |||||||||||
| Purchased Options | 5,805,000 | — | — | |||||||||||
| Money Market Funds | 20,264,000 | — | — | |||||||||||
|
|
|
|
|
| |||||||||
| $ | 552,508,256 | $ | 336,717,889 | $ | — | |||||||||
|
|
|
|
|
| |||||||||
| Written Options | $ | (115,150 | ) | $ | — | $ | — | |||||||
|
|
|
|
|
| |||||||||
Target VIP | Common Stocks** | $ | 52,159,583 | $ | — | $ | — | |||||||
| Money Market Funds | 467,000 | — | — | |||||||||||
|
|
|
|
|
| |||||||||
| $ | 52,626,583 | $ | — | $ | — | |||||||||
|
|
|
|
|
| |||||||||
Bristol Growth | Common Stocks** | $ | 123,007,472 | $ | — | $ | — | |||||||
| Money Market Funds | 649,000 | — | — | |||||||||||
|
|
|
|
|
| |||||||||
| $ | 123,656,472 | $ | — | $ | — | |||||||||
|
|
|
|
|
| |||||||||
| 136 | (continued) |
| Ohio National Fund, Inc. |
Notes to Financial Statements (Continued) | June 30, 2015 (Unaudited) |
Portfolio | Financial Instrument Type | Level 1 | Level 2 | Level 3 | ||||||||||
Risk Managed Balanced | Common Stocks** | $ | 31,135,332 | $ | 691,961 | $ | — | |||||||
| Corporate Bonds** | — | 8,605,215 | — | |||||||||||
| Preferred Stocks** | 17,276 | 375,091 | — | |||||||||||
| Trust Preferred Securities** | 52,550 | 114,516 | — | |||||||||||
| Preferred Stock Depository Receipts** | 213,992 | 128,974 | — | |||||||||||
| Master Limited Partnerships** | 2,101,375 | — | — | |||||||||||
| Asset-Backed / Mortgage-Backed Securities** | — | 1,217,609 | — | |||||||||||
| U.S. Treasury Obligations | — | 11,564,795 | — | |||||||||||
| U.S. Government Agency Mortgage-Backed Securities | — | 4,583,638 | — | |||||||||||
| Purchased Options | 2,619,909 | 1,577,408 | — | |||||||||||
| Money Market Funds | 10,879,000 | — | — | |||||||||||
|
|
|
|
|
| |||||||||
| $ | 47,019,434 | $ | 28,859,207 | $ | — | |||||||||
|
|
|
|
|
| |||||||||
| Futures contracts | $ | (422,306 | ) | $ | — | $ | — | |||||||
|
|
|
|
|
| |||||||||
| * | At June 30, 2015, the Money Market Portfolio’s investments, with the exception of money market funds, were valued using amortized cost, in accordance with rules under the 40 Act. Amortized cost approximates the current fair value of a security, but since the value is not obtained from a quoted price in an active market, such securities are considered to be valued using Level 2 inputs. |
| ** | For detailed industry descriptions, see the accompanying Schedules of Investments. |
As stated above, the value assigned to the Fund’s foreign securities will, in most cases, not be the quoted or published prices of the investments on their respective primary markets or exchanges. Securities that are priced using fair value estimates are categorized as Level 2 in the fair value hierarchy, whereas securities that do not meet the established criteria are categorized as Level 1. The valuation of a foreign security from one valuation period to the next may result in a transfer between Levels 1 and 2 if the degree of certainty that the local close price is not the liquid market price at the time of U.S. market close is not similar for both periods. The Fund’s policy is to recognize transfers between fair value hierarchy levels at the reporting period end.
In the International Portfolio, there was a transfer of a security from Level 2 pricing at December 31, 2014, to Level 1 at June 30, 2015. This security was that Portfolio’s holding of Cerved Information Solutions SpA common stock. The fair valuation service provider reported that this security did not meet the minimum predictability threshold to be fair valued at June 30, 2015 and was not fair valued in the current period, whereas in the prior period, the security met the threshold to be fair valued. The value of this holding was $933,097 and $533,906 at June 30, 2015 and December 31, 2014, respectively.
In the International Small-Mid Company Portfolio, there was a transfer of a security from Level 2 pricing at December 31, 2014, to Level 1 at June 30, 2015. This security was that Portfolio’s holding of MorphoSys AG common stock. The fair valuation service provider reported that this security did not meet the minimum predictability threshold to be fair valued at June 30, 2015 and was not fair valued in the current period, whereas in the prior period, the security met the threshold to be fair valued. The value of this holding was $115,628 and $475,286 at June 30, 2015 and December 31, 2014, respectively.
| 137 | (continued) |
| Ohio National Fund, Inc. |
Notes to Financial Statements (Continued) | June 30, 2015 (Unaudited) |
Below is a reconciliation that details the activity of securities in Level 3 during the six-month period ended June 30, 2015:
| High Income Bond | ||||
Beginning Balance – January 1, 2015 | $ | 5,799 | ||
Total gains or losses (realized/unrealized): | ||||
Included in earnings (or changes in net assets) | 5,551 | |||
Issuances | — | |||
Settlements | — | |||
Transfers out of Level 3 (due to availability of acitve market quotations or significant observable market inputs) | — | |||
Transfers into Level 3 (due to lack of active market quotations or significant observable inputs) | — | |||
|
| |||
Ending Balance – June 30, 2015 | $ | 11,350 | ||
|
| |||
The amount of total gains or losses for the period included in earnings (or changes in net assets) | $ | 5,551 | ||
|
| |||
The following table present additional information about valuation techniques and inputs used for investments that are measured at fair value and categorized within Level 3 at June 30, 2015:
Instrument | Valuation Technique Used | Unobservable inputs | Input Values | |||||
Lone Pine Common Stock | Value of claim on the enterprise value of underlying company | Net enterprise value (in thousands) | $ | 181,770 | ||||
Share class claim on value | 25 | % | ||||||
| # of share class total shares (in thousands) | 24,990 | |||||||
Foreign Securities and Currency
The books and records of all the Portfolios are maintained in U.S. dollars. All investments and cash quoted in foreign currencies are valued daily in U.S. dollars on the basis of the foreign currency exchange rates provided by an independent source. These exchange rates are currently determined daily, at 4:00 pm Eastern Time for normal trading sessions. Purchases and sales of foreign-denominated investments are recorded at rates of exchange prevailing on the respective dates of such transactions.
The Fund may not fully isolate that portion of the results of operations resulting from changes in foreign exchange rates from fluctuations arising from changes in market prices on foreign currency-denominated investments. For the portion that is isolated, amounts are reflected in the Statements of Operations as other foreign currency related transactions. However, for tax purposes, the Fund does fully isolate the effect of fluctuations in foreign exchange rates when determining the gain or loss upon sale or maturity of such investments to the extent required by federal income tax regulations.
All Portfolios of the Fund may invest in securities of foreign issuers. Securities of foreign issuers that are purchased by the Money Market Portfolio are limited to 50% of that Portfolio’s assets and must be denominated in U.S. dollars and held in custody in the United States of America. The International and International Small-Mid Company Portfolios may be invested entirely in foreign securities. Investments in securities of foreign issuers, including investments in foreign companies through the use of depositary receipts, carry certain risks not ordinarily associated with investments in securities of domestic issuers. Such risks include future political and economic developments, and the possible imposition of exchange controls or other foreign governmental laws and restrictions. In addition, with respect to certain countries, there is the possibility of expropriation of assets, confiscatory taxation, political or social instability, or diplomatic developments that could adversely affect capital investment within those countries.
Restricted and Illiquid Securities
Restricted securities are those securities purchased through a private offering and cannot be resold to the general public without prior registration under the Securities Act of 1933 (“the 1933 Act”) or pursuant to the resale limitations provided by Rule 144A under the 1933 Act, or an exemption from the registration requirements of the 1933 Act. 144A securities are issued by corporations without registration in reliance on 1933 Act provisions allowing for the private resale of unregistered securities to qualified institutional buyers. Section 4(a)(2) commercial paper is issued pursuant to Section 4(a)(2) of the 1933 Act which exempts an issue from registration. This paper may be used to finance non-current transactions, such as acquisitions, stock
| 138 | (continued) |
| Ohio National Fund, Inc. |
Notes to Financial Statements (Continued) | June 30, 2015 (Unaudited) |
repurchase programs, and other long-term assets. Investments by a portfolio in Rule 144A and Section 4(a)(2) securities could have the effect of decreasing the liquidity of a Portfolio during any period in which qualified institutional investors were no longer interested in purchasing these securities.
Typically, the restricted securities noted above are not considered illiquid. The criteria used to determine if a restricted security is illiquid includes frequency of trades and quotes, available dealers willing to make transactions, availability of market makers in the security, and the nature of the security and its trades. The Money Market, Bond, and Omni Portfolios may invest up to 10% of their respective assets in illiquid securities. Each of the other Portfolios of the Fund may invest up to 15% of its net assets in illiquid securities.
Investment Transactions and Related Income
For financial reporting purposes, investment transactions are accounted for on a trade date basis. For purposes of executing separate account shareholder transactions in the normal course of business, however, the Fund’s investment transactions are recorded no later than the first calculation on the first business day following the trade date in accordance with Rule 2a-4 of the 40 Act. Accordingly, differences between the net asset values for financial reporting and for executing separate account shareholder transactions may arise.
Dividend income is recognized on the ex-dividend date, except in the case of those Portfolios holding foreign securities, in which dividends are recorded as soon after the ex-dividend date as the Fund’s information agents become aware of such dividends. Interest income is accrued daily as earned and includes the amortization of premium and accretion of discount. Net realized gain or loss on investments and foreign exchange transactions are determined using the specific identification method.
Distributions to Shareholders and Federal Taxes
Net investment income of the Money Market Portfolio is declared and paid daily as a dividend to shareholders immediately before the computation of the net asset value of Money Market Portfolio shares. Dividends are automatically reinvested in additional Money Market Portfolio shares at the net asset value immediately following such computation. Distributions arising from net investment income and net capital gains from the remaining Portfolios are declared and paid to shareholders periodically as required for each of the Portfolios to continue to qualify as a regulated investment company pursuant to Subchapter M of the Internal Revenue Code. The Fund, excluding the Money Market Portfolio, may also fully or partially satisfy its distribution requirements by using consent dividends rather than cash dividends if consent dividends are authorized, these amounts will become taxable to the shareholders as if they were paid in cash. The Fund has the intent to continue to comply with tax provisions pertaining to regulated investment companies and make distributions of taxable income, whether by cash or consent dividends, sufficient to relieve it from substantially all federal income and excise taxes. As such, no provisions for federal income or excise taxes have been recorded.
The character of income and realized capital gains distributions are determined in accordance with federal income tax regulations and may differ from net investment income and realized gains for financial reporting purposes. These “book/tax” differences are either considered temporary or permanent in nature. To the extent these differences are permanent in nature they are reclassified within the composition of net assets; temporary differences do not require such reclassification. Distributions to shareholders that exceed taxable income and net taxable realized gains are reported as return of capital distributions.
The Fund’s management and its tax agent, U.S. Bancorp Fund Services, LLC, perform an affirmative evaluation of tax positions taken or expected to be taken in the course of preparing the Fund’s tax returns to determine whether it is more-likely-than-not (i.e. greater than 50-percent) that each tax position will be sustained upon examination by a taxing authority based on the technical merits of the position. A tax position that meets the more-likely-than-not recognition threshold is measured to determine the amount of benefit to recognize in the Schedules of Investments. Differences between tax positions taken in a tax return and amounts recognized in the Schedules of Investments will generally result in an increase in a liability for taxes payable (or a reduction of a tax refund receivable), including the recognition of any related interest and penalties as an operating expense. Implementation of the evaluation included a review of tax positions taken in tax years that remain subject to examination by all major tax jurisdictions, including federal tax and the state of Maryland (i.e., the last four tax year ends and the interim tax period since then). The determination has been made that there are no uncertain tax positions that would require the Portfolios to record a tax liability and, therefore, there is no impact to the Portfolios’ Schedules of Investments.
| 139 | (continued) |
| Ohio National Fund, Inc. |
Notes to Financial Statements (Continued) | June 30, 2015 (Unaudited) |
Expense Allocation
Expenses directly attributable to a Portfolio are charged to that Portfolio. Expenses that cannot be directly attributed to a Portfolio are allocated among all the benefited Portfolios on a basis of relative net assets or other appropriate method.
Foreign Withholding Taxes
Certain Portfolios in the Fund may be subject to taxes imposed by countries in which they invest with respect to their investments in issuers existing or operating in such countries. Such taxes are generally withheld based on income earned. These Portfolios accrue such taxes as the related income is earned.
Subsequent Events
In its meeting on May 21, 2015, the Board determined, due to the continued poor performance of the Capital Growth Portfolio, to replace Eagle Asset Management, Inc. (“Eagle”) as the sub-adviser for the Portfolio. Accordingly, the Board approved the continuance of the sub-advisory agreement with Eagle only until such time as a replacement sub-adviser could take over management of the Portfolio. In its meeting on August 13, 2015, the Board, including a majority of the Directors who are not “interested persons” of the Fund, approved a sub-advisory agreement with ClearBridge, LLC to become the sub-adviser of the Portfolio. It is anticipated that the change in sub-adviser will be effective on September 25, 2015. Upon the change in sub-adviser, the name of the Portfolio will become “ClearBridge Small Cap Portfolio” and the new sub-adviser will begin managing the Portfolio using a different investment strategy that will be described in a revised prospectus for the Portfolio.
Management has evaluated events and transactions through the date the financial statements were issued, for purposes of recognition or disclosure in these financial statements, and there are no other subsequent events to report.
| (3) | Related Party and Other Transactions |
The Fund has an Investment Advisory Agreement with Ohio National Investments, Inc. (“ONI”), a wholly-owned subsidiary of ONLIC. Under the terms of this agreement, ONI provides portfolio management and investment advice to the Fund and administers its operations, subject to the supervision of the Fund’s Board. This agreement is renewed annually upon the approval by the Board. As compensation for its services, ONI receives advisory fees from the Fund calculated on the basis of each Portfolio’s average daily net assets and the following current schedule of Board-approved annualized fee breakpoints.
Equity |
0.79% of first $200 million 0.74% of next $800 million 0.70% over $1 billion |
Bond |
0.60% of first $100 million 0.50% of next $150 million 0.45% of next $250 million 0.40% of next $500 million 0.30% of next $1 billion 0.25% over $2 billion |
International |
0.85% of first $100 million 0.80% of next $100 million 0.70% over $200 million |
International Small-Mid Company |
1.00% of first $100 million 0.90% of next $100 million 0.85% over $200 million |
Small Cap Growth |
0.80% of first $150 million 0.75% of next $150 million 0.70% of next $300 million 0.65% over $600 million |
Money Market |
0.30% of first $100 million1 0.25% of next $150 million 0.23% of next $250 million 0.20% of next $500 million 0.15% over $1 billion |
Omni |
0.60% of first $100 million 0.50% of next $150 million 0.45% of next $250 million 0.40% of next $500 million 0.30% of next $1 billion 0.25% over $2 billion |
Capital Appreciation |
0.80% of first $100 million 0.75% of next $300 million 0.65% of next $600 million 0.60% over $1 billion |
Aggressive Growth |
0.80% of first $100 million 0.75% of next $400 million 0.70% over $500 million |
| 140 | (continued) |
| Ohio National Fund, Inc. |
Notes to Financial Statements (Continued) | June 30, 2015 (Unaudited) |
S&P 500® Index |
0.40% of first $100 million 0.35% of next $150 million 0.33% over $250 million |
High Income Bond |
0.75% of first $75 million 0.70% of next $75 million 0.65% of next $75 million 0.60% over $225 million |
Nasdaq-100® Index |
0.40% of first $100 million 0.35% of next $150 million 0.33% over $250 million |
Bryton Growth |
0.85% of first $100 million 0.75% of next $400 million 0.70% over $500 million |
Target VIP |
0.60% of first $100 million 0.55% of next $400 million 0.50% over $500 million |
Risk Managed Balanced |
0.90% of first $500 million 0.75% over $500 million |
Mid Cap Opportunity |
0.85% of first $100 million 0.80% of next $100 million 0.75% of next $300 million 0.70% over $500 million |
Strategic Value |
0.75% of first $100 million 0.70% of next $400 million 0.65% over $500 million |
Capital Growth |
0.90% of first $100 million 0.85% of next $100 million 0.80% of next $300 million 0.75% over $500 million |
Bristol |
0.80% of first $100 million 0.70% of next $400 million 0.65% over $500 million |
Balanced |
0.65% of first $200 million 0.60% of next $300 million 0.55% over $500 million |
Bristol Growth |
0.80% of first $100 million 0.70% of next $400 million 0.65% over $500 million |
| 1 | For the six-month period ended June 30, 2015, ONI waived advisory fees in excess of an annualized rate of 0.25% of the first $100 million of average daily net assets in the Money Market Portfolio. Waivers related to the Money Market Portfolio are voluntary and are not subject to recoupment in subsequent periods. The amount of the waiver for the six-month period ended June 30, 2015 was $25,000. If ONI did not agree to waive these fees, the total expenses incurred by the Money Market Portfolio for the six-month period ended June 30, 2015 would have been higher than the net expenses reflected in the Statements of Operations. |
Under the Investment Advisory Agreement, the Fund authorizes ONI to retain sub-advisers (“the Sub-Advisers”) for the Equity, Omni, International, Capital Appreciation, International Small-Mid Company, Aggressive Growth, Small Cap Growth, Mid Cap Opportunity, Strategic Value, High Income Bond, Capital Growth, Bristol, Bryton Growth, Balanced, Target VIP, Bristol Growth, and Risk Managed Balanced Portfolios subject to the approval of the Board. ONI has entered into sub-advisory agreements with ClearBridge, LLC (formerly Legg Mason Capital Management, Inc.) (“ClearBridge”), Suffolk Capital Management, LLC (“Suffolk”), Federated Global Investment Management Corp. (“Federated Global”), Jennison Associates LLC (“Jennison”), Janus Capital Management LLC (“Janus”), Goldman Sachs Asset Management, L.P. (“Goldman Sachs”), Federated Equity Management Company of Pennsylvania (“Federated Equity”), Federated Investment Management Company (“Federated Investment”), Eagle Asset Management, Inc. (“Eagle”), ICON Advisers, Inc. (“ICON”), First Trust Advisors L.P. (“First Trust”), and AnchorPath Financial, LLC (“AnchorPath”), to manage the investment of those Portfolios’ assets, subject to the supervision of ONI. As compensation for their services, the Sub-Advisers receive from ONI a sub-advisory fee calculated on the basis of each of the aforementioned Portfolio’s average daily net assets and the following current Board-approved schedule of annualized fee breakpoints.
Equity (ClearBridge) |
0.40% of first $200 million 0.38% over $200 million |
International (Federated Global) |
0.40% of first $200 million 0.35% over $200 million |
Omni (Suffolk) |
0.30% of first $100 million 0.25% of next $150 million 0.225% of next $250 million 0.20% of next $500 million 0.15% of next $1 billion 0.125% over $2 billion |
| 141 | (continued) |
| Ohio National Fund, Inc. |
Notes to Financial Statements (Continued) | June 30, 2015 (Unaudited) |
Capital Appreciation (Jennison) |
0.75% of first $10 million 0.50% of next $30 million 0.35% of next $25 million 0.25% of next $335 million 0.22% of next $600 million 0.20% over $1 billion |
Small Cap Growth (Janus) |
0.55% of first $150 million 0.45% over $150 million |
Strategic Value (Federated Equity) |
0.50% of first $35 million 0.35% of next $65 million 0.25% over $100 million |
Capital Growth (Eagle) |
0.59% of first $100 million 0.55% of next $100 million 0.50% over $200 million |
Bristol (Suffolk) |
0.45% of first $100 million 0.40% of next $400 million 0.35% over $500 million |
Balanced (ICON) |
0.40% of first $200 million 0.35% of next $300 million 0.30% over $500 million |
Bristol Growth (Suffolk) |
0.45% of first $100 million 0.40% of next $400 million 0.35% over $500 million |
International Small-Mid Company (Federated Global) |
0.75% of first $100 million 0.65% over $100 million |
Aggressive Growth (Janus) |
0.55% of first $100 million 0.50% of next $400 million 0.45% over $500 million |
Mid Cap Opportunity (Goldman Sachs) |
0.60% of first $100 million 0.55% of next $100 million 0.50% over $200 million |
High Income Bond (Federated Investment) |
0.50% of first $30 million 0.40% of next $20 million 0.30% of next $25 million 0.25% over $75 million |
Bryton Growth (Suffolk) |
0.50% of first $100 million 0.45% of next $400 million 0.40% over $500 million |
Target VIP (First Trust) |
0.35% of first $500 million 0.25% over $500 million |
Risk Managed Balanced (Janus) |
0.35% of first $500 million 0.25% over $500 million |
Risk Managed Balanced (AnchorPath) |
0.20% of first $500 million 0.15% over $500 million |
Suffolk, the sub-adviser for the Omni, Bristol, Bryton Growth, and Bristol Growth Portfolios has an affiliation with ONI. Ohio National Financial Services, Inc. (ONFS) owns 100% of ONLIC, the parent company of ONI, and also owns 84.7% of the voting securities of Suffolk. There were no Fund liabilities payable to Suffolk at June 30, 2015 and fees paid to Suffolk are an expense of ONI, not of the Fund.
Pursuant to a service agreement among ONI, ONLIC, and the Fund, ONLIC has agreed to provide personnel and facilities to ONI on a cost-reimbursement basis. These personnel members include officers of the Fund. ONLIC also provides clerical and administrative services and such supplies and equipment as may be reasonably required in order for ONI to properly perform its advisory function pursuant to the Investment Advisory Agreement. ONLIC further performs duties to fulfill the transfer agent function on behalf of the Fund. Performance of these duties by ONLIC and availability of facilities, personnel, supplies, and equipment does not represent an expense to the Fund in excess of the advisory fees paid to ONI.
Pursuant to the Investment Advisory Agreement between ONI and the Fund, if the total expenses applicable to any Portfolio during any calendar quarter (excluding taxes, brokerage commissions, interest expense and management fees) exceed 1%, on an annualized basis, evaluated quarterly, of such Portfolio’s average daily net asset value, ONI will reimburse the Portfolio for such excess expenses. There were no expense reimbursements associated with this agreement during the six-month period ended June 30, 2015.
During the six-month period ended June 30, 2015, ONI voluntarily reimbursed the amount of daily gross expenses of the Money Market Portfolio in excess of daily income earned by the Portfolio. The amount reimbursed to the Portfolio for the six-month period ended June 30, 2015 was $ 253,557, of which $29,024 was receivable from ONI at June 30, 2015. This reimbursement is not subject to recoupment in subsequent periods. The total amount noted as “Less expenses reduced or reimbursed by adviser” for this Portfolio on the Statements of Operations also includes a waiver of advisory fees. For the six-month period ended June 30, 2015, ONI waived advisory fees in excess of an annualized rate of 0.25% of the first $100 million of average daily net assets in the Money Market Portfolio. Waivers related to the Money Market Portfolio are voluntary and are not subject to recoupment in subsequent periods. The amount of the waiver for the six-month period ended June 30, 2015 was $25,000. If ONI did not agree to
| 142 | (continued) |
| Ohio National Fund, Inc. |
Notes to Financial Statements (Continued) | June 30, 2015 (Unaudited) |
waive these fees, the total expenses incurred by the Money Market Portfolio for the six-month period ended June 30, 2015 would have been higher than the net expenses reflected in the Statements of Operations.
The Investment Advisory Agreement allows for a portion of the expenses related to the Fund’s Chief Compliance Officer and staff to be incurred by the Fund and paid from the Fund to the Fund’s adviser, ONI. Pursuant to the service agreement among ONI, ONLIC, and the Fund, ONLIC has provided the personnel, services, and equipment necessary for the execution of the Fund’s regulation-mandated compliance function and ONI has reimbursed ONLIC for costs allocated to the Fund. For the six-month period ended June 30, 2015, the Fund incurred compliance expenses totaling $92,000, which is allocated to the Portfolios by equal dollar amounts. Expenses incurred by the Portfolios are reflected on the Statements of Operations as “Compliance expense”.
Each director of the Board is compensated based on an annual retainer fee of $90,000, paid quarterly. The Board chair receives an additional quarterly retainer fee of $3,750, the lead independent director of the Board receives an additional quarterly retainer fee of $3,125, and the Audit Committee chair receives an additional quarterly retainer fee of $1,250; each paid quarterly. For the six-month period ended June 30, 2015, directors’ compensation and reimbursement of director expenses by the Portfolios of the Fund totaled $245,560.
U.S. Bancorp Fund Services, LLC, 615 East Michigan Street, Milwaukee, Wisconsin, serves as the accounting agent for all but the International and International Small-Mid Company Portfolios. U.S. Bank Institutional Trust & Custody, 425 Walnut Street, Cincinnati, Ohio serves as the custodian for all but the International and International Small-Mid Company Portfolios. The accounting agent and custodian for the International and International Small-Mid Company Portfolios is State Street Bank-Kansas City, 801 Pennsylvania Ave., Kansas City, Missouri. For assets held outside the United States, U.S. Bank and State Street Bank-Kansas City enter into sub-custodial agreements, subject to approval by the Board.
| (4) | Capital Share Transactions |
Capital share transactions for the six-month period ended June 30, 2015, and the year ended December 31, 2014, respectively, were as follows:
| Equity | Money Market | Bond | ||||||||||||||||||||||
| Six-Month Period ended 6/30/2015 | Year Ended 12/31/2014 | Six-Month Period ended 6/30/2015 | Year Ended 12/31/2014 | Six-Month Period ended 6/30/2015 | Year Ended 12/31/2014 | |||||||||||||||||||
Capital shares issued on sales | 994,813 | 9,807,995 | 6,494,490 | 19,218,401 | 1,420,290 | 3,030,585 | ||||||||||||||||||
Capital shares issued on reinvested dividends | — | 50,620 | — | — | — | — | ||||||||||||||||||
Capital shares redeemed | (1,235,086 | ) | (1,872,987 | ) | (6,976,677 | ) | (25,127,000 | ) | (1,324,526 | ) | (3,149,736 | ) | ||||||||||||
|
|
|
|
|
|
|
|
|
|
|
| |||||||||||||
Net increase/(decrease) | (240,273 | ) | 7,985,628 | (482,187 | ) | (5,908,599 | ) | 95,764 | (119,151 | ) | ||||||||||||||
|
|
|
|
|
|
|
|
|
|
|
| |||||||||||||
| Omni | International | Capital Appreciation | ||||||||||||||||||||||
| Six-Month Period ended 6/30/2015 | Year Ended 12/31/2014 | Six-Month Period ended 6/30/2015 | Year Ended 12/31/2014 | Six-Month Period ended 6/30/2015 | Year Ended 12/31/2014 | |||||||||||||||||||
Capital shares issued on sales | 668,319 | 127,023 | 793,660 | 2,302,342 | 382,464 | 10,054,175 | ||||||||||||||||||
Capital shares issued on reinvested dividends | — | 14,307 | — | — | — | 35,371 | ||||||||||||||||||
Capital shares redeemed | (204,913 | ) | (344,229 | ) | (1,384,358 | ) | (2,089,021 | ) | (1,070,797 | ) | (1,217,063 | ) | ||||||||||||
|
|
|
|
|
|
|
|
|
|
|
| |||||||||||||
Net increase/(decrease) | 463,406 | (202,899 | ) | (590,698 | ) | 213,321 | (688,333 | ) | 8,872,483 | |||||||||||||||
|
|
|
|
|
|
|
|
|
|
|
| |||||||||||||
| International Small-Mid Company | Aggressive Growth | Small Cap Growth | ||||||||||||||||||||||
| Six-Month Period ended 6/30/2015 | Year Ended 12/31/2014 | Six-Month Period ended 6/30/2015 | Year Ended 12/31/2014 | Six-Month Period ended 6/30/2015 | Year Ended 12/31/2014 | |||||||||||||||||||
Capital shares issued on sales | 625,125 | 451,579 | 648,169 | 596,695 | 836,003 | 5,798,430 | ||||||||||||||||||
Capital shares issued on reinvested dividends | — | — | — | — | — | — | ||||||||||||||||||
Capital shares redeemed | (317,156 | ) | (549,074 | ) | (388,149 | ) | (835,040 | ) | (1,036,873 | ) | (2,173,789 | ) | ||||||||||||
|
|
|
|
|
|
|
|
|
|
|
| |||||||||||||
Net increase/(decrease) | 307,969 | (97,495 | ) | 260,020 | (238,345 | ) | (200,870 | ) | 3,624,641 | |||||||||||||||
|
|
|
|
|
|
|
|
|
|
|
| |||||||||||||
| 143 | (continued) |
| Ohio National Fund, Inc. |
Notes to Financial Statements (Continued) | June 30, 2015 (Unaudited) |
| Mid Cap Opportunity | S&P 500® Index | Strategic Value | ||||||||||||||||||||||
| Six-Month Period ended 6/30/2015 | Year Ended 12/31/2014 | Six-Month Period ended 6/30/2015 | Year Ended 12/31/2014 | Six-Month Period ended 6/30/2015 | Year Ended 12/31/2014 | |||||||||||||||||||
Capital shares issued on sales | 275,669 | 492,242 | 2,517,349 | 5,393,429 | 1,722,706 | 2,994,850 | ||||||||||||||||||
Capital shares issued on reinvested dividends | — | — | — | 216,562 | — | 1,295,654 | ||||||||||||||||||
Capital shares redeemed | (261,697 | ) | (679,451 | ) | (1,723,482 | ) | (3,957,420 | ) | (1,846,578 | ) | (10,775,289 | ) | ||||||||||||
|
|
|
|
|
|
|
|
|
|
|
| |||||||||||||
Net increase/(decrease) | 13,972 | (187,209 | ) | 793,867 | 1,652,571 | (123,872 | ) | (6,484,785 | ) | |||||||||||||||
|
|
|
|
|
|
|
|
|
|
|
| |||||||||||||
| High Income Bond | Capital Growth | Nasdaq-100® Index | ||||||||||||||||||||||
| Six-Month Period ended 6/30/2015 | Year Ended 12/31/2014 | Six-Month Period ended 6/30/2015 | Year Ended 12/31/2014 | Six-Month Period ended 6/30/2015 | Year Ended 12/31/2014 | |||||||||||||||||||
Capital shares issued on sales | 786,385 | 2,776,857 | 134,219 | 416,020 | 2,209,299 | 4,349,282 | ||||||||||||||||||
Capital shares issued on reinvested dividends | — | — | — | — | — | 106,128 | ||||||||||||||||||
Capital shares redeemed | (1,420,492 | ) | (8,064,822 | ) | (246,826 | ) | (584,328 | ) | (1,967,686 | ) | (3,627,481 | ) | ||||||||||||
|
|
|
|
|
|
|
|
|
|
|
| |||||||||||||
Net increase/(decrease) | (634,107 | ) | (5,287,965 | ) | (112,607 | ) | (168,308 | ) | 241,613 | 827,929 | ||||||||||||||
|
|
|
|
|
|
|
|
|
|
|
| |||||||||||||
| Bristol | Bryton Growth | Balanced | ||||||||||||||||||||||
| Six-Month Period ended 6/30/2015 | Year Ended 12/31/2014 | Six-Month Period ended 6/30/2015 | Year Ended 12/31/2014 | Six-Month Period ended 6/30/2015 | Year Ended 12/31/2014 | |||||||||||||||||||
Capital shares issued on sales | 464,799 | 885,795 | 348,044 | 1,556,041 | 4,105,838 | 33,697,189 | ||||||||||||||||||
Capital shares issued on reinvested dividends | — | 43,834 | — | — | — | 325,770 | ||||||||||||||||||
Capital shares redeemed | (1,136,866 | ) | (2,406,623 | ) | (1,132,343 | ) | (2,185,467 | ) | (2,865,306 | ) | (3,910,873 | ) | ||||||||||||
|
|
|
|
|
|
|
|
|
|
|
| |||||||||||||
Net increase/(decrease) | (672,067 | ) | (1,476,994 | ) | (784,299 | ) | (629,426 | ) | 1,240,532 | 30,112,086 | ||||||||||||||
|
|
|
|
|
| �� |
|
|
|
|
| |||||||||||||
| Target VIP | Bristol Growth | Risk Managed Balanced | ||||||||||||||||||||||
| Six-Month Period ended 6/30/2015 | Year Ended 12/31/2014 | Six-Month Period ended 6/30/2015 | Year Ended 12/31/2014 | Six-Month Period ended 6/30/2015 | Period from 5/1/2014* to 12/31/2014 | |||||||||||||||||||
Capital shares issued on sales | 142,875 | 435,011 | 272,149 | 703,568 | 4,419,358 | 5,294,469 | ||||||||||||||||||
Capital shares issued on reinvested dividends | — | 59,398 | — | 22,849 | — | — | ||||||||||||||||||
Capital shares redeemed | (386,366 | ) | (609,589 | ) | (670,702 | ) | (1,488,214 | ) | (601,759 | ) | (2,173,736 | ) | ||||||||||||
|
|
|
|
|
|
|
|
|
|
|
| |||||||||||||
Net increase/(decrease) | (243,491 | ) | (115,180 | ) | (398,553 | ) | (761,797 | ) | 3,817,599 | 3,120,733 | ||||||||||||||
|
|
|
|
|
|
|
|
|
|
|
| |||||||||||||
| * | Date of commencement of operations |
| (5) | Investment Transactions |
Cost of purchases and proceeds from sales of investments (excluding short-term and government securities) for the six-month period ended June 30, 2015 were as follows:
| Equity | Bond | Omni | International | Capital Appreciation | ||||||||||||||||
Cost of purchases | $ | 112,725,460 | $ | 57,443,914 | $ | 51,978,151 | $ | 63,314,085 | $ | 134,955,265 | ||||||||||
Proceeds from sales | $ | 117,376,737 | $ | 50,804,710 | $ | 40,834,200 | $ | 72,624,834 | $ | 154,770,738 | ||||||||||
| International Small-Mid Company | Aggressive Growth | Small Cap Growth | Mid Cap Opportunity | S&P 500® Index | ||||||||||||||||
Cost of purchases | $ | 31,429,775 | $ | 16,314,573 | $ | 35,096,199 | $ | 27,836,676 | $ | 48,331,501 | ||||||||||
Proceeds from sales | $ | 18,719,983 | $ | 12,731,606 | $ | 38,198,884 | $ | 26,559,067 | $ | 27,611,311 | ||||||||||
| Strategic Value | High Income Bond | Capital Growth | Nasdaq-100® Index | Bristol | ||||||||||||||||
Cost of purchases | $ | 30,653,145 | $ | 36,428,964 | $ | 12,384,983 | $ | 14,987,575 | $ | 288,307,669 | ||||||||||
Proceeds from sales | $ | 26,202,287 | $ | 38,071,953 | $ | 17,380,054 | $ | 11,815,555 | $ | 301,791,938 | ||||||||||
| 144 | (continued) |
| Ohio National Fund, Inc. |
Notes to Financial Statements (Continued) | June 30, 2015 (Unaudited) |
| Bryton Growth | Balanced | Target VIP | Bristol Growth | Risk Managed Balanced | ||||||||||||||||
Cost of purchases | $ | 145,180,272 | $ | 363,416,688 | $ | 36,501,013 | $ | 118,049,139 | $ | 35,969,182 | ||||||||||
Proceeds from sales | $ | 164,703,496 | $ | 348,044,202 | $ | 39,328,839 | $ | 124,229,615 | $ | 6,291,612 | ||||||||||
Cost of purchases and proceeds from sales of government securities for the six-month period ended June 30, 2015 were as follows:
| Bond | Omni | Balanced | Risk Managed Balanced | |||||||||||||
Cost of purchases | $ | 20,346,882 | $ | 2,841,695 | $ | 41,831,298 | $ | 17,692,850 | ||||||||
Proceeds from sales | $ | 20,266,298 | $ | 1,984,746 | $ | 20,777,618 | $ | 9,652,079 | ||||||||
| (6) | Financial Instruments |
The Fund’s Portfolios, other than the Money Market Portfolio, may trade in financial instruments with off-balance sheet risk for hedging purposes or, otherwise, in accordance with stated investing objectives. These financial instruments may include options, futures, and foreign currency contracts that may involve, to a varying degree, elements of risk in excess of the amounts recognized on financial statements.
Options
A Portfolio may buy and write (i.e., sell) call and put options. In writing call options, the Portfolio gives the purchaser of the call option the right to purchase the underlying securities from the Portfolio at a specified “exercise” price at any time prior to the expiration of the option, normally within nine months. A Portfolio writes a covered call option when it owns the underlying securities and an uncovered call option when it does not. In purchasing put options, a Portfolio pays the seller of the put option a premium for the right of the Portfolio to sell the underlying securities to the seller at a specified exercise price prior to the expiration of the option. When a Portfolio sells a put option, it has the obligation to buy, and the purchaser of the put the right to sell, the underlying security at the exercise price during the option period. Whenever a Portfolio has a written covered call option outstanding, the underlying securities will be segregated by the Custodian and held in an escrow account to assure that such securities will be delivered to the option holder if the option is exercised. While the underlying securities are subject to the option, the Portfolio remains the record owner of the securities, entitling it to receive dividends and to exercise any voting rights. Whenever a Portfolio has a written uncovered call option outstanding, it will segregate with the Custodian cash or liquid assets that, when added to the amounts deposited with the broker as margin, equal to the market value of the securities underlying the call option (but not less than the exercise price of the call option). To cover a written put option, the Portfolio writing the option deposits cash or liquid securities in a segregated account at the Custodian. In order to terminate its position as the writer or the purchaser of an option, the Portfolio may enter into a “closing” transaction, which is the purchase (if the Portfolio has written the option) or sale (if the Portfolio is the purchaser of the option) of an option on the same underlying securities and having the same exercise price and expiration date as the option previously written or purchased by the Portfolio.
When a Portfolio writes a put or call option, an amount equal to the premium received is included on the Statement of Assets and Liabilities as a liability. The amount of the liability is subsequently marked-to-market to reflect the current market value of the option. Such liability is subject to off balance sheet risks to the extent of any future increases in market value of the written options. If an option expires on its stipulated expiration date or if the Portfolio enters into a closing purchase transaction, a gain or loss is realized. If a written call option on an individual security is exercised, a gain or loss is realized for the sale of the underlying security, and the proceeds from the sale are increased by the premium originally received. If a written call option on a securities index is exercised, a gain or loss is realized as determined by the premium originally received, the exercise price and the market value of the index. If a written put option on an individual security is exercised, the cost of the security acquired is decreased by the premium originally received. When a Portfolio purchases a put or call option, an amount equal to the premium paid is included on the Portfolio’s Statement of Assets and Liabilities as an investment, and is subsequently marked-to-market to reflect the current market value of the option. If an option expires on the stipulated expiration date or if the Portfolio enters into a closing sale transaction, a gain or loss is realized. If a Portfolio exercises a call option on an individual security, the cost of the security acquired is increased by the premium paid for the call. If the Portfolio exercises a put option on an individual security, a gain or loss is realized from the sale of the underlying security, and the proceeds from such a sale are decreased by the premium originally paid. If the Portfolio exercises a put option on a security index, a gain or loss is realized as determined by the premium originally paid, the exercise price and the market value of the index.
| 145 | (continued) |
| Ohio National Fund, Inc. |
Notes to Financial Statements (Continued) | June 30, 2015 (Unaudited) |
The Balanced Portfolio wrote call options and purchased put options associated with the S&P 500 Index during the six-month period ended June 30, 2015 . These instruments were used by the Portfolio to provide a hedge against equity price risk. During a period in which the prices of the Portfolio’s common stocks may decline, these instruments are designed to increase in value, thus providing price accumulation gains that partially offset the price accumulation losses of the common stocks in the Portfolio.
The Balanced Portfolio’s written call options are collateralized by cash and/or securities held with the Portfolio’s prime broker and in segregated accounts at the Portfolio’s custodian. Such collateral holdings are restricted from use. The cash collateral or borrowings from the prime broker, if necessary, are included on the Statement of Assets and Liabilities. The securities pledged as collateral are noted as such on the Portfolio’s Schedules of Investments. Written and purchased options are non-income producing securities.
The number of option contracts written and the premiums received by the Balanced Portfolio for the six-month period ended June 30, 2015 as follows:
| Number of Contracts | Premiums Received | |||||||
Options outstanding, beginning of period | 800 | $ | 1,432,788 | |||||
Options written | 3,400 | 3,602,894 | ||||||
Options exercised | — | — | ||||||
Options expired | — | — | ||||||
Options closed | (3,850 | ) | (4,616,151 | ) | ||||
|
|
|
| |||||
Options outstanding, end of period | 350 | $ | 419,531 | |||||
|
|
|
| |||||
Transactions involving purchased options by the Balanced Portfolio for the six-month period ended June 30, 2015 were: Cost of purchases: $11.1 million, Proceeds from sales: $2.9 million, Expirations: $4.9 million.
The Risk Managed Balanced Portfolio also purchased call and put options associated with the S&P 500 Index during the six-month period ended June 30, 2015. These instruments were used by the Portfolio to provide for the Portfolio’s stated risk management strategy. Transactions involving purchased options by the Risk Managed Balanced Portfolio for the six-month period ended June 30, 2105 were: Cost of purchases: $2.8 million, Proceeds from sales: $0.5 million.
Futures Contracts
A Portfolio may buy or sell two kinds of financial futures contracts: stock index futures contracts and interest rate futures contracts. Stock index futures contracts are contracts developed by and traded on national commodity exchanges whereby the buyer will, on a specified future date, pay or receive a final cash payment equal to the difference between the actual value of the stock index on the last day of the contract and the value of the stock index established by the contract multiplied by the specific dollar amount set by the exchange. Futures contracts may be based on broad-based stock indexes such as the S&P 500 Index or on narrow-based stock indexes. A particular index will be selected according to the Adviser’s investment strategy for the particular Portfolio. An interest rate futures contract is an agreement whereby one party agrees to sell and another party agrees to purchase a specified amount of a specified financial instrument (debt security) at a specified price at a specified date, time and place. Although interest rate futures contracts typically require actual future delivery of and payment for financial instruments, the contracts are usually closed out before the delivery date. A public market exists in interest rate futures contracts covering primarily the following financial instruments: U.S. Treasury bonds; U.S. Treasury notes; Government National Mortgage Association (GNMA) modified pass-through mortgage-backed securities; three-month U.S. Treasury bills; 90-day commercial paper; bank certificates of deposit; and Eurodollar certificates of deposit. U.S. futures contracts are traded on exchanges which have been designated “contract markets” by the Commodities Futures Trading Commission (“CFTC”) and must be executed through a futures commission merchant (“FCM”), or brokerage firm, which is a member of the relevant contract market. It is expected that futures contracts trading in additional financial instruments will be authorized.
The Fund, on behalf of each Portfolio, has filed with the National Futures Association, a notice claiming an exclusion from the definition of the term “commodity pool operator” under the Commodity Exchange Act, as amended, and the rules of the CFTC promulgated thereunder, with respect to each Portfolio’s operation. Accordingly, the Portfolios are not subject to registration or regulation as a commodity pool operator.
| 146 | (continued) |
| Ohio National Fund, Inc. |
Notes to Financial Statements (Continued) | June 30, 2015 (Unaudited) |
The buyer or seller of a futures contract is not required to deliver or pay for the underlying instrument unless the contract is held until the delivery date. However, both the buyer and seller are required to deposit “initial margin” for the benefit of the broker when the contract is entered into. Initial margin deposits are equal to a percentage of the contract’s value, as set by the exchange on which the contract is traded, and are similar to good faith deposits or performance bonds.
Unlike margin extended by a securities broker, initial margin payments do not constitute purchasing securities on margin for purposes of a Portfolio’s investment limitations. A Portfolio, its futures commission merchant and the Custodian retain control of the initial margin until the contract is liquidated. If the value of either party’s position declines, that party will be required to make additional “variation margin” payments to settle the change in value on a daily basis. The party that has a gain may be entitled to receive all or a portion of this amount. In the event of the bankruptcy of the FCM that holds margin on behalf of a Portfolio, the Portfolio may be entitled to return of margin owed to the Portfolio only in proportion to the amount received by the FCM’s other customers. ONI and the Sub-Advisers will attempt to minimize this risk by carefully monitoring the creditworthiness of the FCMs with which the Portfolios do business. In addition to the margin restrictions discussed above, transactions in futures contracts and options on futures contracts may involve the segregation of funds pursuant to requirements imposed by the SEC. Under those requirements, where a Portfolio has a long position in a futures contract or sells a put option, it will be required to establish a segregated account (not with an FCM or broker) containing cash or certain liquid assets equal to the purchase price of the contract or the exercise price of the option (less any margin on deposit). For a short position in futures contacts held by a Portfolio or call options sold by a Portfolio, those requirements mandate the establishment of a segregated account (not with a futures commission merchant or broker) containing cash or certain liquid assets that, when added to the amounts deposited as margin, equal the market value of the instruments underlying the futures contracts or call options. However, segregation of assets is not required if a Portfolio “covers” its position.
At June 30, 2015, there were outstanding futures contracts in the International Portfolio. Details of these contracts are as follows:
Type | Description | Expiration | Number of Contracts | Contract at | Initial Contract Amount | Unrealized Appreciation (Depreciation) | Variation Margin Receivable (Payable) | |||||||||||||||
Long | JPX Nikkei Index 400 Future | September 10, 2015 | 211 | $ 2,536,965 | $ | 2,602,430 | $ | (65,465 | ) | $ | 13,718 | |||||||||||
Long | DAX Index Future | September 18, 2015 | 17 | 5,212,632 | 5,354,349 | (141,717 | ) | (44,905 | ) | |||||||||||||
Long | Hang Seng China Enterprises (HSCE) Index Future | July 30, 2015 | 112 | 9,337,487 | 9,821,230 | (483,743 | ) | 196,411 | ||||||||||||||
Long | OMX Stockholm 30 Index Future | July 17, 2015 | 100 | 1,859,804 | 1,891,228 | (31,424 | ) | (21,019 | ) | |||||||||||||
|
|
|
|
|
|
| ||||||||||||||||
| $18,946,890 | $ | 19,669,239 | $ | (722,349 | ) | $ | 144,205 | |||||||||||||||
|
|
|
|
|
|
| ||||||||||||||||
A portion of the International Portfolio’s securities and cash holdings, as noted on the Portfolio’s Schedule of Investments, were pledged at June 30, 2015 as collateral for these contracts.
These futures contracts were executed for the purpose of increasing exposure to an attractive equities market, beyond that evidenced by the Portfolio’s investment in common stocks, while maintaining a significant cash balance that could be used for potentially higher-than-average shareholder transactions. There were other index futures contracts that were executed and closed in the International Portfolio during the six-month period ended June 30, 2015. Those contracts were executed for similar purposes as the contracts outstanding at June 30, 2015. For the six-month period ended June 30, 2015, the notional values of futures contracts opened and closed prior to contract settlement date by the International Portfolio were $67.8 million and $56.2 million, respectively.
| 147 | (continued) |
| Ohio National Fund, Inc. |
Notes to Financial Statements (Continued) | June 30, 2015 (Unaudited) |
At June 30, 2015, there were also outstanding futures contracts in the Risk Managed Balanced Portfolio. Details of these contracts are as follows:
Type | Description | Expiration | Number of Contracts | Contract at | Initial Contract Amount | Unrealized Appreciation (Depreciation) | Variation Margin Receivable (Payable) | |||||||||||||||
Long | S&P 500 E-mini Future | September 18, 2015 | 113 | $11,607,360 | $ | 11,783,380 | $ | (176,020 | ) | $ | — | |||||||||||
Long | 10-Year U.S. Treasury Note Future | September 21, 2015 | 313 | $39,491,797 | $ | 39,738,083 | $ | (246,286 | ) | $ | — | |||||||||||
|
|
|
|
|
|
| ||||||||||||||||
| $51,099,157 | $ | 51,521,463 | $ | (422,306 | ) | $ | — | |||||||||||||||
|
|
|
|
|
|
| ||||||||||||||||
A portion of Risk Managed Balanced Portfolio’s securities and cash holdings, as noted on the Portfolio’s Schedule of Investments, was pledged at June 30, 2015 as collateral for these contracts. These futures contracts were used by the Portfolio to provide for the Portfolio’s stated risk management strategy. There were other index futures contracts that were executed and closed in the Risk Managed Balanced Portfolio during the six-month period ended June 30, 2015. Those contracts were executed for similar purposes as the contracts outstanding at June 30, 2015. For the six-month period ended June 30, 2015, the notional values of futures contracts opened and closed prior to contract settlement date by the Risk Managed Balanced Portfolio were $104.9 million and $76.1 million, respectively.
Foreign Currency Contracts
In order to hedge against changes in the exchange rates of foreign currencies in relation to the U.S. dollar, each Portfolio, other than the Money Market Portfolio, may engage in forward foreign currency contracts, foreign currency options and foreign currency futures contracts in connection with the purchase, sale or ownership of a specific security. The International Portfolio, International Small-Mid Company Portfolio, Strategic Value Portfolio and High Income Bond Portfolio may engage in non-hedging related transactions to implement their investment strategies.
The Portfolios generally conduct their foreign currency exchange transactions on a spot (i.e., cash) basis at the spot rate prevailing in the foreign exchange currency market. When a Portfolio purchases or sells a security denominated in or exposed to a foreign currency, it may enter into a forward foreign currency contract (“forward contract”) for the purchase or sale, for a fixed amount of dollars, of the amount of currency involved in the underlying security transaction. A forward contract involves an obligation to purchase or sell a specific currency at a future date, which may be any fixed number of days from the date of the contract agreed upon by the parties, at a price set at the time of the contract. In this manner, a Portfolio may obtain protection against a possible loss resulting from an adverse change in the relationship between the U.S. dollar and the foreign currency during the period between the date the security is purchased or sold and the date upon which payment is made or received. Although such contracts tend to minimize the risk of loss due to the decline in the value of the hedged currency, at the same time they tend to limit any potential gain which might result should the value of such currency increase.
Forward contracts are traded in the interbank market conducted directly between currency traders (usually large commercial banks) and their customers. Generally a forward contract has no deposit requirement, and no commissions are charged. Although foreign exchange dealers do not charge a fee for conversion, they do realize a profit based on the difference between the prices at which they buy and sell various currencies. When the Portfolio manager believes that the currency of a particular foreign country may suffer a substantial decline against the U.S. dollar, a Portfolio may enter into a forward contract to sell, for a fixed amount of dollars, the amount of foreign currency approximating the value of some or all of that Portfolio’s securities denominated in or exposed to such foreign currency. No Portfolio will enter into such forward contracts or maintain a net exposure to such contracts where the consummation of the contracts would obligate the Portfolio to deliver an amount of foreign currency in excess of the value of its assets denominated in or exposed to that currency. At the consummation of a forward contract for delivery by a Portfolio of a foreign currency, the Portfolio may either make delivery of the foreign currency or terminate its contractual obligation to deliver the foreign currency by purchasing an offsetting contract obligating it to purchase, at the same maturity date, the same amount of the foreign currency. If the Portfolio chooses to make delivery of the foreign currency, it may be required to obtain such currency through the sale of its securities denominated in such currency or through conversion of other Portfolio assets into such currency. It is impossible to forecast the market value of Portfolio securities at the expiration of the forward contract. Accordingly, it may be necessary for the Portfolio to purchase additional foreign currency on
| 148 | (continued) |
| Ohio National Fund, Inc. |
Notes to Financial Statements (Continued) | June 30, 2015 (Unaudited) |
the spot market (and bear the expense of such purchase) if the market value of the security is less than the amount of foreign currency the Portfolio is obligated to deliver, and if a decision is made to sell the security and make delivery of the foreign currency. Conversely, it may be necessary for the Portfolio to sell on the spot market some of the foreign currency received on the sale of its hedged security if the security’s market value exceeds the amount of foreign currency the Portfolio is obligated to deliver.
If the Portfolio retains the hedged security and engages in an offsetting transaction, it will incur a gain or loss to the extent that there has been movement in spot or forward contract prices. If a Portfolio engages in an offsetting transaction, it may subsequently enter into a new forward contract to sell the foreign currency. Should forward prices decline during the period between the Portfolio’s entering into a forward contract for the sale of a foreign currency and the date it enters into an offsetting contract for the purchase of the foreign currency, the Portfolio will realize a gain to the extent the price of the currency it has agreed to sell exceeds the price of the currency it has agreed to purchase. Should forward prices increase, the Portfolio will suffer a loss to the extent the price of the currency it has agreed to purchase exceeds the price of the currency it has agreed to sell.
Buyers and sellers of foreign currency options and futures contracts are subject to the same risks previously described with respect to options and futures generally. In addition, settlement of currency options and futures contracts with respect to most currencies must occur at a bank located in the issuing nation. The ability to establish and close out positions on such options is subject to the maintenance of a liquid market that may not always be available. Currency rates may fluctuate based on political considerations and governmental actions as opposed to purely economic factors.
Predicting the movements of foreign currency in relation to the U.S. dollar is difficult and requires different skills than those necessary to predict movements in the securities market. There is no assurance that the use of foreign currency hedging transactions can successfully protect a Portfolio against loss resulting from the movements of foreign currency in relation to the U.S. dollar. In addition, it must be remembered that these methods of protecting the value of a Portfolio’s securities against a decline in the value of a currency does not eliminate fluctuations in the underlying prices of the securities. It simply establishes a rate of exchange which can be achieved at some future point in time. Additionally, although such contracts tend to minimize the risk of loss due to the decline in the value of the hedged currency, at the same time they tend to limit any potential gain which might result should the value of such currency increase.
Foreign currency contracts were executed in the International and International Small-Mid Company Portfolios in order to mitigate the effect that exchange rate volatility had on the valuation of the Portfolios’ investments that were either significantly under-weighted or over-weighted in relation to the Portfolios’ respective benchmark indices. The International Portfolio was under-weighted in equity investments within Russia and Switzerland and, therefore, executed contracts to buy the Russian Ruble and Swiss Franc in order to mitigate the effect that volatility in those exchange rates (in relation to the U.S. dollar) might otherwise have on relative performance. Likewise, the International Portfolio was over-weighted in equity investments within Japan and member states of the European Union and, therefore, executed contracts to sell the Japanese Yen and the Euro in order to mitigate the effect that volatility in those exchange rates might otherwise have on relative performance. The International Small-Mid Company Portfolio was also over-weighted in equity investments within the member states of the European Union and, therefore, executed contracts to sell the Euro in order to mitigate the effect that volatility in that exchange rate might otherwise have on relative performance.
The Portfolios entered into other foreign currency contracts during the period for similar benchmark performance hedging purposes. The Portfolios also entered into contracts that were the inverse of previously executed contracts to effectively exit prior contracts earlier than stated contract delivery dates, as investment over-weights or under-weights were reduced, or as previously executed contracts resulted in an attractive return to the Portfolios. For the six-month period ended June 30, 2015, the notional value of foreign currency contracts executed by the International Portfolio were approximately $113.5 million for currencies bought and approximately $117.5 million for currencies sold. For the six-month period ended June 30, 2015, the notional value of foreign currency contracts executed by the International Small-Mid Company Portfolio were approximately $9.4 million for currencies bought and approximately $10.0 million for currencies sold.
| 149 | (continued) |
| Ohio National Fund, Inc. |
Notes to Financial Statements (Continued) | June 30, 2015 (Unaudited) |
The values and financial statement effects of derivative instruments that were not accounted for as hedging instruments as of, and for the six-month period ended June 30, 2015, were as follows:
Portfolio | Instrument | Primary Risk Type | Value- Asset Derivatives | Value- Liability Derivatives | Location on Statements of Assets and Liabilities | |||||||||||
International | Contracts to buy foreign currencies | Currency exchange rate | $ | 11,143,716 | $ | (10,989,204 | ) | (1 | ) | |||||||
|
|
|
| |||||||||||||
Contracts to sell foreign currencies | Currency exchange rate | $ | 55,049,300 | $ | (55,475,617 | ) | (1 | ) | ||||||||
|
|
|
| |||||||||||||
Futures contracts | Equity price | $ | 18,946,890 | $ | (19,669,239 | ) | (2 | ) | ||||||||
|
|
|
| |||||||||||||
International Small-Mid Company | Contracts to sell foreign currencies | Currency exchange rate | $ | 8,217,845 | $ | (8,553,673 | ) | (1 | ) | |||||||
|
|
|
| |||||||||||||
Balanced | Purchased options | Equity price | $ | 5,805,000 | $ | — | (3 | ) | ||||||||
|
|
|
| |||||||||||||
Written options | Equity price | $ | — | $ | (115,150 | ) | (4 | ) | ||||||||
|
|
|
| |||||||||||||
Risk Managed Balanced | Purchased options | Equity price | $ | 4,197,317 | $ | — | (3 | ) | ||||||||
|
|
|
| |||||||||||||
Futures contracts | Equity price | $ | 51,099,157 | $ | (51,521,463 | ) | (2 | ) | ||||||||
|
|
|
| |||||||||||||
| (1) | Net unrealized appreciation(depreciation) on foreign currency contacts |
| (2) | Net unrealized appreciation(depreciation) on futures contracts |
| (3) | Investments in securities, at value |
| (4) | Options written, at value |
Portfolio | Instrument | Risk Type | Realized Gain (Loss) on Derivatives Recognized in Income | Change in Unrealized Appreciation/ Depreciation on Derivatives Recognized in Income | Location on Statements of Operations | |||||||||||
International | Foreign currency contracts | Currency exchange rate | $ | 3,738,359 | $ | (1,496,303 | ) | (1 | ), (2) | |||||||
|
|
|
| |||||||||||||
Futures contracts | Equity price | $ | 809,872 | $ | (677,047 | ) | (3 | ), (4) | ||||||||
|
|
|
| |||||||||||||
International Small-Mid Company | Foreign currency contracts | Currency exchange rate | $ | 584,647 | $ | (335,973 | ) | (1 | ), (2) | |||||||
|
|
|
| |||||||||||||
Balanced | Purchased options | Equity price | $ | (6,019,568 | ) | $ | 1,278,138 | (5 | ), (6) | |||||||
|
|
|
| |||||||||||||
Written options | Equity price | $ | 2,781,568 | $ | (104,907 | ) | (7 | ), (8) | ||||||||
|
|
|
| |||||||||||||
Risk Managed Balanced | Futures contracts | Equity price | $ | 463,685 | $ | (422,306 | ) | (3 | ), (4) | |||||||
|
|
|
| |||||||||||||
Purchased options | Equity price | $ | (13,466 | ) | $ | (630,778 | ) | (5 | ), (6) | |||||||
|
|
|
| |||||||||||||
| (1) | Net realized gain (loss) on foreign currency contracts |
| (2) | Change in unrealized appreciation/depreciation on foreign currency contracts |
| (3) | Net realized gain (loss) on futures contracts |
| (4) | Change in unrealized appreciation/depreciation on futures contracts |
| (5) | Net realized gain (loss) on investments |
| (6) | Change in unrealized appreciation/depreciation on investments |
| (7) | Net realized gain (loss) on written options |
| (8) | Change in unrealized appreciation/depreciation on written options |
| 150 | (continued) |
| Ohio National Fund, Inc. |
Notes to Financial Statements (Continued) | June 30, 2015 (Unaudited) |
The Portfolios may enter into International Swaps and Derivatives Association, Inc. Master Agreements (“ISDA Master Agreement”) or similar agreements with their derivative contract counterparties whereby the Portfolios may, under certain circumstances, offset with the counterparty certain derivative financial instruments’ payables and/or receivables and create one single net payment. Under certain of the ISDA Master Agreements in place at June 30, 2015, the Portfolios are subject to master netting agreements (“MNA”) that allows for amounts owed between each Portfolio and the counterparty to their transactions to be netted. The party that has the larger payable pays the excess of the larger amount over the smaller amount to the other party. The MNAs do not apply to amounts owed to or from different counterparties; further, certain of the MNAs limit offsetting for forward foreign currency contracts to amounts owed in the same currency and on the same exchange date.
For financial reporting purposes, the Portfolios offset derivative assets and liabilities that are subject to netting arrangements in the Statement of Assets and Liabilities. At June 30, 2015, there were no outstanding derivative transactions that were subject to netting arrangements.
| (7) | Federal Income Tax Information |
At December 31, 2014, the components of accumulated earnings (deficit) on a tax basis were as follows:
Portfolio | Undistributed Ordinary Income | Undistributed Long-Term Capital Gains (Losses) | Accumulated Earnings | Accumulated Capital and Other Losses | Unrealized Appreciation (Depreciation)(1) | Total Accumulated Earnings (Deficit) | ||||||||||||||||||
Equity | $ | 386,033 | $ | — | $ | 386,033 | $ | (47,738,305 | ) | $ | 65,190,932 | $ | 17,838,660 | |||||||||||
Money Market | — | — | — | — | — | — | ||||||||||||||||||
Bond | 5,057,141 | — | 5,057,141 | (10,057,664 | ) | 7,162,713 | 2,162,190 | |||||||||||||||||
Omni | 3,414,759 | 2,836,013 | 6,250,772 | — | 2,823,802 | 9,074,574 | ||||||||||||||||||
International | 5,661,713 | — | 5,661,713 | (66,063,445 | ) | 3,962,418 | (56,439,314 | ) | ||||||||||||||||
Capital Appreciation | 37,465 | 21,377,238 | 21,414,703 | — | 35,400,675 | 56,815,378 | ||||||||||||||||||
International Small-Mid Company | 196,497 | 663,392 | 859,889 | — | 11,558,632 | 12,418,521 | ||||||||||||||||||
Aggressive Growth | 757,233 | 7,625,484 | 8,382,717 | — | 7,294,698 | 15,677,415 | ||||||||||||||||||
Small Cap Growth | 6,796,985 | 8,271,301 | 15,068,286 | — | 21,896,731 | 36,965,017 | ||||||||||||||||||
Mid Cap Opportunity | — | — | — | (908,099 | ) | 16,288,164 | 15,380,065 | |||||||||||||||||
S&P 500® Index | 2,502,607 | 2,916,947 | 5,419,554 | — | 138,497,918 | 143,917,472 | ||||||||||||||||||
Strategic Value | 9,115,067 | 31,089,467 | 40,204,534 | — | 29,204,514 | 69,409,048 | ||||||||||||||||||
High Income Bond | 16,913,403 | 8,062,933 | 24,976,336 | — | (2,178,021 | ) | 22,798,315 | |||||||||||||||||
Capital Growth | 64,168 | 8,492,117 | 8,556,285 | — | 14,710,346 | 23,266,631 | ||||||||||||||||||
Nasdaq-100® Index | 642,404 | 3,719,174 | 4,361,578 | — | 47,607,499 | 51,969,077 | ||||||||||||||||||
Bristol | 25,104,654 | 19,779,477 | 44,884,131 | — | 20,229,886 | 65,114,017 | ||||||||||||||||||
Bryton Growth | 13,803,912 | 7,047,022 | 20,850,934 | — | 10,267,816 | 31,118,750 | ||||||||||||||||||
Balanced | 7,409,393 | 7,100,698 | 14,510,091 | — | 27,725,797 | 42,235,888 | ||||||||||||||||||
Target VIP | 100,128 | — | 100,128 | (6,201,457 | ) | 4,507,863 | (1,593,466 | ) | ||||||||||||||||
Bristol Growth | 9,673,590 | 10,640,279 | 20,313,869 | — | 12,665,570 | 32,979,439 | ||||||||||||||||||
Risk Managed Balanced | 1,039,871 | 527,944 | 1,567,815 | — | 620,549 | 2,188,364 | ||||||||||||||||||
| (1) | The differences between book-basis and tax-basis unrealized appreciation/(depreciation) are attributed primarliy to tax deferral of losses on wash sales and the realization for tax purposes of unrealized gains/(losses) on certain instruments. |
| 151 | (continued) |
| Ohio National Fund, Inc. |
Notes to Financial Statements (Continued) | June 30, 2015 (Unaudited) |
For Federal income tax purposes, the following Portfolios had capital loss carryforwards as of December 31, 2014 that are available to offset future realized gains, if any:
| Total Loss Carryforward | Expiration | |||||||||||||||||||||||
Portfolio | 2016 | 2017 | 2018 | No Expiration Short Term | No Expiration Long Term | |||||||||||||||||||
Equity | $ | 47,738,305 | $ | — | $ | 44,720,565 | $ | 3,017,740 | $ | — | $ | — | ||||||||||||
Bond | 10,057,664 | 534,910 | 9,522,754 | — | — | — | ||||||||||||||||||
International | 66,063,445 | 271,315 | 65,792,130 | — | — | — | ||||||||||||||||||
Mid Cap Opportunity | 908,099 | — | 908,099 | — | — | — | ||||||||||||||||||
Target VIP | 6,201,457 | 6,201,457 | — | — | — | — | ||||||||||||||||||
The tax characteristics of distributions paid to shareholders for the year ended December 31, 2014 were as follows:
Portfolio | Ordinary Income | Net Long-Term Capital Gains | Total Distribution Paid | |||||||||
Equity | $ | 1,660,324 | $ | — | | $ | 1,660,324 | |||||
Omni | 341,371 | | — | | 341,371 | |||||||
Capital Appreciation | 1,165,844 | | — | | 1,165,844 | |||||||
S&P 500® Index | 4,671,250 | — | 4,671,250 | |||||||||
Strategic Value | 17,815,244 | | — | | 17,815,244 | |||||||
Nasdaq-100® Index | 1,151,494 | | — | | 1,151,494 | |||||||
Bristol | 895,082 | | — | | 895,082 | |||||||
Balanced | 6,075,617 | — | 6,075,617 | |||||||||
Target VIP | 854,149 | | — | | 854,149 | |||||||
Bristol Growth | 370,603 | | — | | 370,603 | |||||||
There were no distributions paid to shareholders during the six-month period ended June 30, 2015.
| 152 | (continued) |
Ohio National Fund, Inc.
Notes to Financial Statements (Continued) | June 30, 2015 (Unaudited) |
During the year ended December 31, 2014, the Fund recorded classifications within the composition of net assets for permanent book/tax differences. These classifications were as follows:
| Equity | Money Market | Bond | Omni | International | Capital Appreciation | International Small-Mid Company | Aggressive Growth | Small Cap Growth | Mid Cap Opportunity | |||||||||||||||||||||||||||||||
Consent distributions | ||||||||||||||||||||||||||||||||||||||||
Paid in capital in excess of par value | $ | 195,315 | $ | — | $ | 5,136,321 | $ | 1,439,909 | $ | 4,327,327 | $ | 2,511,660 | $ | 196,447 | $ | 4,354,957 | $ | 14,770,686 | $ | — | ||||||||||||||||||||
Undistributed net investment income | (195,315 | ) | — | (5,136,321 | ) | (47,856 | ) | (4,327,327 | ) | (38,483 | ) | (196,447 | ) | — | — | — | ||||||||||||||||||||||||
Accumulated net realized gain (loss) on investments | — | — | — | (1,392,053 | ) | — | (2,473,177 | ) | — | (4,354,957 | ) | (14,770,686 | ) | — | ||||||||||||||||||||||||||
Undistributed net investment losses | ||||||||||||||||||||||||||||||||||||||||
Paid in capital in excess of par value | — | — | — | — | — | — | — | — | — | (151,406 | ) | |||||||||||||||||||||||||||||
Undistributed net investment income | — | — | — | — | — | — | — | 88,136 | 408,849 | 151,200 | ||||||||||||||||||||||||||||||
Accumulated net realized gain (loss) on investments | — | — | — | — | — | — | — | (88,136 | ) | (408,849 | ) | 206 | ||||||||||||||||||||||||||||
Foreign currency related reclassifications | ||||||||||||||||||||||||||||||||||||||||
Undistributed net investment income | — | — | — | — | 2,945,364 | (10,132 | ) | (80,682 | ) | (149 | ) | (1,029 | ) | 21 | ||||||||||||||||||||||||||
Accumulated net realized gain (loss) on investments | — | — | — | — | (2,945,364 | ) | 10,132 | 80,682 | 149 | 1,029 | (21 | ) | ||||||||||||||||||||||||||||
Reclassifications for partnership sales/basis | ||||||||||||||||||||||||||||||||||||||||
Undistributed net investment income | — | — | — | — | — | — | — | — | (32,200 | ) | — | |||||||||||||||||||||||||||||
Accumulated net realized gain (loss) on investments | — | — | — | — | — | — | — | — | 32,200 | — | ||||||||||||||||||||||||||||||
Other permanent differences | ||||||||||||||||||||||||||||||||||||||||
Paid in capital in excess of par value | — | — | — | — | — | — | — | — | (52 | ) | — | |||||||||||||||||||||||||||||
Undistributed net investment income | — | — | — | — | — | — | — | — | 51 | — | ||||||||||||||||||||||||||||||
Accumulated net realized gain (loss) on investments | — | — | — | — | — | — | — | — | 1 | — | ||||||||||||||||||||||||||||||
| 153 | (continued) |
Ohio National Fund, Inc.
Notes to Financial Statements (Continued) | June 30, 2015 (Unaudited) |
| S&P 500® Index | Strategic Value | High Income Bond | Capital Growth | Nasdaq-100® Index | Bristol | Bryton Growth | Balanced | Target VIP | Bristol Growth | Risk Managed Balanced | ||||||||||||||||||||||||||||||||||
Consent distributions | ||||||||||||||||||||||||||||||||||||||||||||
Paid in capital in excess of par value | $ | 3,436,824 | $ | 5,416,348 | $ | 23,033,792 | $ | 5,342,907 | $ | 5,443,659 | $ | 49,458,063 | $ | 38,069,479 | $ | 5,188,610 | $ | 67,221 | $ | 23,554,720 | $ | — | ||||||||||||||||||||||
Undistributed net investment income | (584,268 | ) | (1,480,210 | ) | (19,555,535 | ) | — | (93,015 | ) | (89,796 | ) | — | (320,182 | ) | (25,680 | ) | (21,733 | ) | — | |||||||||||||||||||||||||
Accumulated net realized gain (loss) on investments | (2,852,556 | ) | (3,936,138 | ) | (3,478,257 | ) | (5,342,907 | ) | (5,350,644 | ) | (49,368,267 | ) | (38,069,479 | ) | (4,868,428 | ) | (41,541 | ) | (23,532,987 | ) | — | |||||||||||||||||||||||
Undistributed net investment losses | ||||||||||||||||||||||||||||||||||||||||||||
Paid in capital in excess of par value | — | — | — | 51,425 | — | — | — | — | — | — | — | |||||||||||||||||||||||||||||||||
Undistributed net investment income | — | — | — | 286,348 | — | — | 818,246 | — | — | — | — | |||||||||||||||||||||||||||||||||
Accumulated net realized gain (loss) on investments | — | — | — | (337,773 | ) | — | — | (818,246 | ) | — | — | — | — | |||||||||||||||||||||||||||||||
Foreign currency related reclassifications | ||||||||||||||||||||||||||||||||||||||||||||
Paid in capital in excess of par value | — | — | — | — | — | — | — | — | — | — | — | |||||||||||||||||||||||||||||||||
Undistributed net investment income | — | (169,864 | ) | — | — | — | — | — | (655 | ) | — | — | (48 | ) | ||||||||||||||||||||||||||||||
Accumulated net realized gain (loss) on investments | — | 169,864 | — | — | — | — | — | 655 | — | — | 48 | |||||||||||||||||||||||||||||||||
Real estate investment trust (REIT) reclassifications | ||||||||||||||||||||||||||||||||||||||||||||
Undistributed net investment income | (93,694 | ) | (229,774 | ) | — | (3,826 | ) | — | — | — | (97,927 | ) | — | — | 41 | |||||||||||||||||||||||||||||
Accumulated net realized gain (loss) on investments | 93,694 | 229,774 | — | 3,826 | — | — | — | 97,927 | — | — | (41 | ) | ||||||||||||||||||||||||||||||||
Passive Foreign Investment Company (PFIC) reclassifications | ||||||||||||||||||||||||||||||||||||||||||||
Undistributed net investment income | — | — | — | 22,081 | — | — | — | — | — | — | — | |||||||||||||||||||||||||||||||||
Accumulated net realized gain (loss) on investments | — | — | — | (22,081 | ) | — | — | — | — | — | — | — | ||||||||||||||||||||||||||||||||
Reclassifications for partnership sales/basis | ||||||||||||||||||||||||||||||||||||||||||||
Undistributed net investment income | — | — | — | 50,144 | — | — | — | 35,123 | — | — | — | |||||||||||||||||||||||||||||||||
Accumulated net realized gain (loss) on investments | — | — | — | (50,144 | ) | — | — | — | (35,123 | ) | — | — | — | |||||||||||||||||||||||||||||||
Other permanent differences | ||||||||||||||||||||||||||||||||||||||||||||
Paid in capital in excess of par value | — | — | — | — | — | — | — | (14 | ) | — | — | — | ||||||||||||||||||||||||||||||||
Undistributed net investment income | (47 | ) | — | — | — | — | — | — | (1 | ) | — | — | — | |||||||||||||||||||||||||||||||
Accumulated net realized gain (loss) on investments | 47 | — | — | — | — | — | — | 15 | — | — | — | |||||||||||||||||||||||||||||||||
| 154 | (continued) |
| Ohio National Fund, Inc. |
Notes to Financial Statements (Continued) | June 30, 2015 (Unaudited) |
The cost basis for Federal income tax purposes may differ from the cost basis for financial reporting purposes. The table below details the unrealized appreciation (depreciation) and aggregate cost of securities at June 30, 2015 for Federal income tax purposes.
| Equity | Bond | Omni | International | Capital Appreciation | International Small-Mid Company | |||||||||||||||||||
Gross unrealized: | ||||||||||||||||||||||||
Appreciation | $ | 68,949,096 | $ | 4,908,054 | $ | 2,576,398 | $ | 20,880,293 | $ | 45,606,754 | $ | 20,115,112 | ||||||||||||
Depreciation | (27,709,594 | ) | (2,739,544 | ) | (1,196,077 | ) | (5,388,788 | ) | (19,663,298 | ) | (2,552,789 | ) | ||||||||||||
|
|
|
|
|
|
|
|
|
|
|
| |||||||||||||
Net unrealized appreciation (depreciation) | $ | 41,239,502 | $ | 2,168,510 | $ | 1,380,321 | $ | 15,491,505 | $ | 25,943,456 | $ | 17,562,323 | ||||||||||||
|
|
|
|
|
|
|
|
|
|
|
| |||||||||||||
Aggregate cost of securities: | $ | 478,887,711 | $ | 154,629,352 | $ | 49,119,502 | $ | 158,489,195 | $ | 421,886,931 | $ | 69,831,576 | ||||||||||||
|
|
|
|
|
|
|
|
|
|
|
| |||||||||||||
| Aggressive Growth | Small Cap Growth | Mid Cap Opportunity | S&P 500® Index | Strategic Value | High Income Bond | |||||||||||||||||||
Gross unrealized: | ||||||||||||||||||||||||
Appreciation | $ | 7,487,835 | $ | 40,959,783 | $ | 16,071,373 | $ | 143,362,723 | $ | 31,581,670 | $ | 3,828,744 | ||||||||||||
Depreciation | (527,025 | ) | (9,678,090 | ) | (2,420,918 | ) | (8,441,572 | ) | (15,180,129 | ) | (6,295,554 | ) | ||||||||||||
|
|
|
|
|
|
|
|
|
|
|
| |||||||||||||
Net unrealized appreciation (depreciation) | $ | 6,960,810 | $ | 31,281,693 | $ | 13,650,455 | $ | 134,921,151 | $ | 16,401,541 | $ | (2,466,810 | ) | |||||||||||
|
|
|
|
|
|
|
|
|
|
|
| |||||||||||||
Aggregate cost of securities: | $ | 39,550,964 | $ | 195,503,380 | $ | 75,964,396 | $ | 273,319,996 | $ | 311,865,327 | $ | 225,324,698 | ||||||||||||
|
|
|
|
|
|
|
|
|
|
|
| |||||||||||||
| Capital Growth | Nasdaq-100® Index | Bristol | Bryton Growth | Balanced | Target VIP | |||||||||||||||||||
Gross unrealized: | ||||||||||||||||||||||||
Appreciation | $ | 21,070,960 | $ | 51,778,883 | $ | 16,140,252 | $ | 20,115,317 | $ | 54,050,331 | $ | 6,003,751 | ||||||||||||
Depreciation | (3,032,238 | ) | (1,619,461 | ) | (6,120,613 | ) | (9,972,118 | ) | (20,501,172 | ) | (3,498,765 | ) | ||||||||||||
|
|
|
|
|
|
|
|
|
|
|
| |||||||||||||
Net unrealized appreciation (depreciation) | $ | 18,038,722 | $ | 50,159,422 | $ | 10,019,639 | $ | 10,143,199 | $ | 33,549,159 | $ | 2,504,986 | ||||||||||||
|
|
|
|
|
|
|
|
|
|
|
| |||||||||||||
Aggregate cost of securities: | $ | 57,853,667 | $ | 79,349,205 | $ | 221,385,251 | $ | 172,068,761 | $ | 855,676,987 | $ | 50,121,597 | ||||||||||||
|
|
|
|
|
|
|
|
|
|
|
| |||||||||||||
| Bristol Growth | Risk Managed Balanced | |||||||||||||||||||||||
Gross unrealized: | ||||||||||||||||||||||||
Appreciation | $ | 11,599,320 | $ | 1,553,867 | ||||||||||||||||||||
Depreciation | (2,843,143 | ) | (2,452,694 | ) | ||||||||||||||||||||
|
|
|
| |||||||||||||||||||||
Net unrealized appreciation (depreciation) | $ | 8,756,177 | $ | (898,827 | ) | |||||||||||||||||||
|
|
|
| |||||||||||||||||||||
Aggregate cost of securities: | $ | 114,900,295 | $ | 76,777,468 | ||||||||||||||||||||
|
|
|
| |||||||||||||||||||||
| (8) | Legal Matters |
Effective December 20, 2013, the assets and liabilities of the Target Equity/Income Portfolio were acquired and assumed by the Target VIP Portfolio in exchange for shares of the Target VIP Portfolio (“the reorganization”).
In December 2007, prior to the reorganization, the Target Equity/Income Portfolio, as a shareholder of Lyondell Chemical Company (“Lyondell”), participated in a cash out merger of Lyondell in which it received $48 per share of consideration (the “Merger”). Lyondell later filed for bankruptcy and two entities created by the Lyondell bankruptcy plan of reorganization have initiated lawsuits seeking to recover, or clawback, proceeds received by shareholders in the December 2007 merger based on fraudulent transfer claims.
The first action, Edward S. Weisfelner, as Trustee of the LB Creditor Trust v. Morgan Stanley & Co., Inc., et. al., was initiated on October 22, 2010 (the “Creditor Trust Action”), in the Supreme Court of the State of New York in the County of New York but has
| 155 | (continued) |
| Ohio National Fund, Inc. |
Notes to Financial Statements (Continued) | June 30, 2015 (Unaudited) |
subsequently been removed to the U.S. Bankruptcy Court for the Southern District of New York. The second action, Edward S. Weisfelner, as Trustee of the LB Litigation Trust v. Holmes TTEE, et. al., was initiated on December 23, 2010 (the “Litigation Trust Action”), in the U.S. Bankruptcy Court for the Southern District of New York. Both actions attempt to recover the proceeds paid out to the holders of Lyondell shares at the time of the 2007 merger. The value of the proceeds to the fund totaled $1,772,400.
On January 4, 2012, the Fund was named in a second amended complaint in the Creditor Trust Action. On April 9, 2014, plaintiffs filed a third amended complaint. In response, on July 30, 2014, the defendant group, including the Fund, filed an omnibus motion to dismiss. The outcome of these proceedings on the Portfolio cannot be predicted.
As a result of the aforementioned reorganization involving the Target Equity/Income Portfolio, any future claims that may result from these complaints will be assumed by the Target VIP Portfolio as the Survivor Portfolio. Management of the Fund continues to assess the cases and has not yet determined the potential effect, if any, on the net asset value of the Target VIP Portfolio.
Also, in December 2007, the S&P 500® Index and Strategic Value Portfolios, shareholders of the Tribune Company, participated in a similar cash out merger in which shareholders received $34 per share of consideration. The value of the proceeds received by the S&P 500® Index and Strategic Value Portfolios, was $37,910 and $384,200, respectively. The company subsequently filed for bankruptcy and several legal complaints have been initiated by groups of Tribune Company creditors seeking to recover, or clawback, proceeds received by shareholders based on fraudulent transfer claims (the “Tribune Bankruptcy”).
The first action, Official Committee of Unsecured Creditors of Tribune Company v. FitzSimons, et. al. (“FitzSimons”) was initiated on November 1, 2010 in the U.S. Bankruptcy Court for the District of Delaware. As a result of these proceedings, the Court agreed to allow individual creditors to file similar complaints in U.S. state courts. The Fund is specifically named in a complaint in the U.S. District Court, Southern District of Ohio, Western Division, Deutsche Bank Trust Company Americas, et. al. v. American Electric Power, et. al., that was initiated in June of 2011. The Fund, along with the Strategic Value Portfolio, is also named in a similar complaint in the U.S. District Court, Eastern District of Pennsylvania, Deutsche Bank Trust Company Americas, et. al. v. Ametek Inc. Employees Master Retirement Trust, et. al. These Tribune litigation actions have been consolidated into a single Multidistrict Litigation (“MDL”) in the U.S. District Court, Southern District of New York. Pursuant to a Court order dated September 7, 2012, certain defendants in the MDL, including the Fund, filed a motion to dismiss on November 6, 2012. The Court granted the motion to dismiss on September 23, 2013. Pending an appeal, only the actual fraudulent transfer claims as alleged in FitzSimons remain. The outcome of these proceedings on the two Portfolios of the Fund cannot be predicted. Management of the Fund continues to assess litigation matters and any offers of settlement.
| 156 |
| Ohio National Fund, Inc. |
| June 30, 2015 (Unaudited) |
| (1) | Expense Disclosure |
An individual may not buy or own membership interests of the Fund directly. An individual acquires an indirect interest in the Fund by purchasing a variable annuity contract or variable insurance policy and allocating premiums or purchase payments to Fund Portfolios available through the separate accounts of ONLIC, ONLAC, and NSLA. Separate accounts of these entities are the shareholders of the Fund.
As a shareholder of the Fund, a separate account incurs ongoing costs, including management fees and other Fund expenses. This example is intended to help a policy/contract owner understand ongoing costs (in dollars) associated with the underlying investment in the Fund’s Portfolios by the separate account shareholder and to compare these costs with the ongoing costs associated with investing in other mutual funds.
The example is based on an investment of $1,000 invested at July 1, 2014 and held through December 31, 2014.
Actual Expenses
The table below provides information about investment values and actual expenses associated with each Portfolio of the Fund. The information below, together with the amount of an underlying investment, can be used to estimate expenses paid over the period. An estimate can be obtained by simply dividing an underlying investment value by $1,000 (for example, an $8,600 investment value divided by $1,000 = 8.6), then multiplying the result by the number in the table under the heading entitled “Expenses Paid During Period”.
Portfolio | Beginning Investment Value 1/1/2015 | Ending Investment Value 6/30/2015 | Expense Paid During Period* 1/1/2015 – 6/30/2015 | Expense Ratio During Period 1/1/2015 – 6/30/2015 (Annualized) | ||||||||||||
Equity | $ | 1,000.00 | $ | 1,007.50 | $ | 3.98 | 0.80 | % | ||||||||
Money Market | 1,000.00 | 1,000.00 | 0.25 | 0.05 | % | |||||||||||
Bond | 1,000.00 | 994.20 | 3.12 | 0.63 | % | |||||||||||
Omni | 1,000.00 | 1,045.50 | 3.85 | 0.76 | % | |||||||||||
International | 1,000.00 | 1,057.40 | 5.05 | 0.99 | % | |||||||||||
Capital Appreciation | 1,000.00 | 1,040.50 | 4.00 | 0.79 | % | |||||||||||
International Small-Mid Company | 1,000.00 | 1,140.90 | 6.48 | 1.22 | % | |||||||||||
Aggressive Growth | 1,000.00 | 1,073.00 | 4.73 | 0.92 | % | |||||||||||
Small Cap Growth | 1,000.00 | 1,079.00 | 4.38 | 0.85 | % | |||||||||||
Mid Cap Opportunity | 1,000.00 | 1,019.40 | 4.71 | 0.94 | % | |||||||||||
S&P 500® Index | 1,000.00 | 1,010.00 | 2.04 | 0.41 | % | |||||||||||
Strategic Value | 1,000.00 | 996.40 | 3.86 | 0.78 | % | |||||||||||
High Income Bond | 1,000.00 | 1,023.30 | 4.01 | 0.80 | % | |||||||||||
Capital Growth | 1,000.00 | 1,072.90 | 5.14 | 1.00 | % | |||||||||||
Nasdaq-100® Index | 1,000.00 | 1,041.40 | 2.33 | 0.46 | % | |||||||||||
Bristol | 1,000.00 | 1,066.00 | 4.10 | 0.80 | % | |||||||||||
Bryton Growth | 1,000.00 | 1,107.50 | 4.55 | 0.87 | % | |||||||||||
Balanced | 1,000.00 | 1,029.00 | 3.17 | 0.63 | % | |||||||||||
Target VIP | 1,000.00 | 1,020.70 | 3.91 | 0.78 | % | |||||||||||
Bristol Growth | 1,000.00 | 1,057.20 | 4.34 | 0.85 | % | |||||||||||
Risk Managed Balanced | 1,000.00 | 993.50 | 6.03 | 1.22 | % | |||||||||||
| 157 | (continued) |
| Ohio National Fund, Inc. |
Additional Information (Continued) | June 30, 2015 (Unaudited) |
Hypothetical Example for Comparison Purposes
The table below provides information about hypothetical investment values and hypothetical expenses based on each respective Portfolio’s actual expense ratio and an assumed rate of return of 5% per year before expenses, which is not an actual return. The hypothetical investment values and expenses may not be used to estimate the actual ending investment balance or expenses actually paid for the period by the shareholders. A policy/contract holder may use this information to compare this 5% hypothetical example with the 5% hypothetical examples that appear in the shareholder reports of other funds.
Portfolio | Beginning Investment Value 1/1/2015 | Ending Investment Value 6/30/2015 | Expense Paid During Period* 1/1/2015 – 6/30/2015 | Expense Ratio During Period 1/1/2015 – 6/30/2015 (Annualized) | ||||||||||||
Equity | $ | 1,000.00 | $ | 1,020.83 | $ | 4.01 | 0.80 | % | ||||||||
Money Market | 1,000.00 | 1,024.55 | 0.25 | 0.05 | % | |||||||||||
Bond | 1,000.00 | 1,021.67 | 3.16 | 0.63 | % | |||||||||||
Omni | 1,000.00 | 1,021.03 | 3.81 | 0.76 | % | |||||||||||
International | 1,000.00 | 1,019.89 | 4.96 | 0.99 | % | |||||||||||
Capital Appreciation | 1,000.00 | 1,020.88 | 3.96 | 0.79 | % | |||||||||||
International Small-Mid Company | 1,000.00 | 1,018.74 | 6.11 | 1.22 | % | |||||||||||
Aggressive Growth | 1,000.00 | 1,020.23 | 4.61 | 0.92 | % | |||||||||||
Small Cap Growth | 1,000.00 | 1,020.58 | 4.26 | 0.85 | % | |||||||||||
Mid Cap Opportunity | 1,000.00 | 1,020.13 | 4.71 | 0.94 | % | |||||||||||
S&P 500® Index | 1,000.00 | 1,022.76 | 2.06 | 0.41 | % | |||||||||||
Strategic Value | 1,000.00 | 1,020.93 | 3.91 | 0.78 | % | |||||||||||
High Income Bond | 1,000.00 | 1,020.83 | 4.01 | 0.80 | % | |||||||||||
Capital Growth | 1,000.00 | 1,019.84 | 5.01 | 1.00 | % | |||||||||||
Nasdaq-100® Index | 1,000.00 | 1,022.51 | 2.31 | 0.46 | % | |||||||||||
Bristol | 1,000.00 | 1,020.83 | 4.01 | 0.80 | % | |||||||||||
Bryton Growth | 1,000.00 | 1,020.48 | 4.36 | 0.87 | % | |||||||||||
Balanced | 1,000.00 | 1,021.67 | 3.16 | 0.63 | % | |||||||||||
Target VIP | 1,000.00 | 1,020.93 | 3.91 | 0.78 | % | |||||||||||
Bristol Growth | 1,000.00 | 1,020.58 | 4.26 | 0.85 | % | |||||||||||
Risk Managed Balanced | 1,000.00 | 1,018.74 | 6.11 | 1.22 | % | |||||||||||
| * | Expenses are equal to the average account value times the Fund’s annualized expense ratio multiplied by the number of days in the most recent fiscal half-year (181 days) divided by the number of days in the fiscal year (365 days). Please note that the expenses shown in these tables are meant to highlight ongoing Fund costs only and do not reflect any contract-level expenses or Fund transactional costs, such as sales charges (loads) or exchange fees (if any). Therefore, these tables are useful in comparing ongoing fund costs only, and will not fully assist a policy/contract owner in determining the relative total expenses of different funds. In addition, if transactional costs were included, costs may have been higher for these Portfolios as well as for a fund being compared. |
| 158 |
| Ohio National Fund, Inc. |
| June 30, 2015 (Unaudited) |
Name and Address | Age | Position(s) with the Fund | Term of Office | Number of Portfolios Served as Director | Principal Occupation(s) and Other Directorships During Past Five Years | |||||||
Independent Directors | ||||||||||||
George M. Vredeveld One Financial Way Cincinnati, Ohio | 72 | Lead Independent Director, Member of Audit and Independent Directors Committees | Indefinite; Since March 1996 | 21 | Professor Emeritus, Finance: University of Cincinnati (January 2014 to present); Research Fellow and Member of Academic Council: Varna Free University, Varna, Bulgaria (2012 to present); Alpaugh Professor of Economics: Lindner College of Business, University of Cincinnati (2004-2013); Founder/President: Economics Center at the University of Cincinnati (1977-2012). | |||||||
John I. Von Lehman One Financial Way Cincinnati, Ohio | 62 | Director, Chairman of Audit Committee and Member of Independent Directors Committee | Indefinite; Since August 2007 | 21 | Executive Vice President, CFO, Secretary, and Director: The Midland Company (1988-2007); Director, Audit Committee and Corporate Governance Committee Member: American Financial Group, Inc.; Finance Committee: Life Enriching Communities; Investment Committee: Xavier University Foundation. | |||||||
Madeleine W. Ludlow One Financial Way Cincinnati, Ohio | 60 | Director, Member of Audit and Independent Directors Committees | Indefinite; Since April 2012 | 21 | Founder/Managing Director: West Capital Partners LLC (2010-present), Ludlow Ward Capital Advisors LLC (2005-2009); Director, ALLETE, Inc. (2004-present). | |||||||
Geoffrey Keenan One Financial Way Cincinnati, Ohio | 56 | Director, Member of Audit and Independent Directors Committees | Indefinite; Since January 2015 | 21 | Executive Vice President and Chief Operating Officer of Gateway Investments Advisers, LLC (1995-2013) | |||||||
Interested Director | ||||||||||||
John J. Palmer One Financial Way Cincinnati, Ohio | 75 | Chairman and Director | Indefinite; Since July 1997 | 21 | Insurance industry consultant (April 2010 to present), Director: NSLA; President: Ohio National Fund, Inc. (1997-2010); Director and Vice Chairman: ONLIC (1997-2010); President and CEO: NSLA (2002-2010), Director: ONI and various affiliated companies (1997-2010), Tucson Symphony Orchestra, and Pima Canyon Estates Homeowners’ Association. | |||||||
Officers | ||||||||||||
Christopher A. Carlson One Financial Way Cincinnati, Ohio | 56 | President | Indefinite; Since March 2000 | Vice Chairman and Chief Investment Officer: ONLIC; President and Director: ONI; Chief Investment Officer: NSLA; Officer and Director of various other Ohio National-affiliated companies. | ||||||||
Thomas A. Barefield One Financial Way Cincinnati, Ohio | 62 | Vice President | Indefinite; Since February 1998 | Vice Chairman and Chief Distribution Officer: ONLIC; Director and Vice President — Marketing: NSLA; Director: ONI; Senior Vice President: Ohio National Equities, Inc.; Recent graduate of class XXIX of Leadership Cincinnati. | ||||||||
R. Todd Brockman One Financial Way Cincinnati, Ohio | 46 | Treasurer | Indefinite; Since August 2004 | Vice President, Mutual Funds: ONLIC and NSLA; Treasurer: ONI. | ||||||||
Kimberly A. Plante One Financial Way Cincinnati, Ohio | 41 | Secretary | Indefinite; Since March 2005 | Senior Associate Counsel: ONLIC; Secretary: ONI; Officer of various other Ohio National-affiliated companies. | ||||||||
Julie T. Thomas One Financial Way Cincinnati, Ohio | 52 | Chief Compliance Officer | Indefinite; Since June 2013 | Vice President: ONLIC; Chief Compliance Officer: ONI, Suffolk, and other Ohio National-affiliated companies. | ||||||||
| 159 | (continued) |
| Ohio National Fund, Inc. |
Information about Directors and Officers (Continued) | June 30, 2015 (Unaudited) |
Name and Address | Age | Position(s) with the Fund | Term of Office | Number of Portfolios Served as Director | Principal Occupation(s) and Other Directorships During Past Five Years | |||||||
Catherine E. Gehr One Financial Way Cincinnati, Ohio | 43 | Assistant Treasurer | Indefinite; Since March 2005 | Manager, Mutual Fund Operations: ONLIC; Assistant Treasurer: ONI. | ||||||||
Emily Bae One Financial Way Cincinnati, Ohio | 30 | Assistant Secretary | Indefinite; Since May 2013 | Assistant Secretary: ONI; Assistant Counsel: ONLIC. Prior to May 2013, was Counsel with Goodyear Tire & Rubber Company. | ||||||||
| 160 |

Item 2. Code Of Ethics.
As of the end of the period covered by this report, Ohio National Fund, Inc. (the “Fund”) has adopted a code of ethics that applies to the Fund’s principal executive officer and principal financial officer. There were no substantive amendments or waivers to the Code of Ethics during the period covered by this report.
A copy of this Code of Ethics is filed as Exhibit EX-99.CODE to this Form N-CSR and is also available, without charge, upon request, by calling 877-781-6392 toll free.
Item 3. Audit Committee Financial Expert.
The Fund’s Board of Directors has determined that the Fund has an audit committee financial expert serving on its Audit Committee. The Audit Committee financial expert is Mr. John I. VonLehman. Mr. VonLehman is independent for purposes of Item 3 of Form N-CSR.
Item 4. Principal Accountant Fees And Services.
The aggregate fees for each of the last two fiscal years for professional services rendered by the principal accountant for the audit of the Fund’s annual financial statements or services that are normally provided by the accountant in connection with statutory and regulatory filings or engagements for those fiscal years are listed below.
(a) Audit Fees.
Audits of the Portfolios for the year ended.
Fiscal year ended December 31, 2014: $267,750
Fiscal year ended December 31, 2013: $248,333
Consent on N-1A Annual Registration Statement filed with the SEC.
Fiscal year ended December 31, 2014: $5,000
Fiscal year ended December 31, 2013: $5,000
Merger related audit testwork.
Fiscal year ended December 31, 2013: $5,000
(b) Audit-Related Fees.
Consent on N-14 Filing filed with the SEC.
Fiscal year ended December 31, 2013: $6,000
Professional services rendered in connection with the consent on the Fund’s N-14 merger filing (paid by the Fund’s adviser (ONI)
(c) Tax Fees. None.
(d) All Other Fees. None.
(e)(1) Audit Committee Pre-Approval Policies and Procedures:
The Fund’s Audit Committee has adopted an Audit Committee Charter that requires that the Audit Committee oversee the quality and appropriateness of the accounting methods used in the preparation of the Fund’s financial statements, and the independent audit thereof; approve the selection and compensation of the independent auditors; and pre-approve the performance, by the independent auditors, of non-audit services for the Fund, its investment adviser, or any affiliated entity controlling, controlled by or under common control with the investment adviser that provides ongoing services to the Fund.
| (e)(2) | Services Approved Pursuant to Paragraph (c)(7)(i)(C) of Rule 2-01 of Regulation S-X: |
During the fiscal years ended December 31, 2014 and 2013, there were no non-audit services provided by the Fund’s principal accountant that would have required pre-approval by the Fund’s Audit Committee. The audit related fees aforementioned were pre-approved by the Fund’s Audit Committee, although not required by paragraph (c) (7) (ii) of Regulation S-X as the audit-related fees were less than five percent of the total amount of revenues paid to the Fund’s principal accountant.
| (f) | Not applicable. |
| (g) | There were no non-audit services provided by the Fund’s principal accountant, other than items disclosed in item (b) above, in which a fee was billed to the Fund, the Fund’s adviser, and any entity controlling, controlled by, or under common control with the adviser that provides ongoing services to the registrant for the last two fiscal years. |
| (h) | Not applicable, as there were no non-audit services performed by the Fund’s principal accountant that were rendered to the Fund, the Fund’s adviser, or any entity controlling, controlled by, or under common control with the adviser that provided ongoing services to the registrant that were not pre-approved for the last two fiscal years. |
Item 5. Audit Committee Of Listed Registrants.
Not applicable.
Item 6. Schedule of Investments.
Not applicable.
Item 7. Disclosure Of Proxy Voting Policies And Procedures For Closed-End Management Investment Companies.
Not Applicable.
Item 8. Portfolio Managers of Closed-End Management Investment Companies.
Not Applicable.
Item 9. Purchases of Equity Securities by Closed-End Management Investment Company and Affiliated Purchasers.
Not Applicable.
Item 10. Submission of Matters to a Vote of Security Holders.
There were no material changes to the procedures by which shareholders may recommend nominees to the Fund’s Board of Directors.
Item 11. Controls and Procedures.
| (a) | The Fund’s principal executive officer and principal financial officer have concluded, based on their evaluation conducted as of a date within 90 days of the filing of this report, that the Fund’s disclosure controls and procedures are adequately designed and are operating effectively to ensure (i) that material information relating to the Fund, including its consolidated subsidiaries, is made known to them by others within those entities, particularly during the period in which this report is being prepared; and (ii) that information required to be disclosed by the Fund on Form N-CSR is recorded, processed, summarized and reported within the time periods specified in the Securities and Exchange Commission’s rules and forms. |
| (b) | There were no changes in the Fund’s internal control over financial reporting that occurred during the second fiscal quarter of the period covered by this report that have materially affected, or are reasonably likely to materially affect, the Fund’s internal control over financial reporting. |
Item 12. Exhibits.
| (a)(1) | The Fund’s Code of Ethics pursuant to Item 2 of Form N-CSR is filed and attached hereto as EX-99.CODE. |
| (a)(2) | A separate certification for each principal executive officer and principal financial officer of the Fund as required by Rule 30a-2(a) under the Investment Company Act of 1940 (17 CFR 270.30a-2(a)) is attached hereto as |
The certifications required by Section 906 of the Sarbanes-Oxley Act of 2002 are attached hereto as EX-99.906CERT.
SIGNATURES
Pursuant to the requirements of the Securities Exchange Act of 1934 and the Investment Company Act of 1940, the registrant has duly caused this report to be signed on its behalf by the undersigned, thereunto duly authorized.
Ohio National Fund, Inc.
| By: | /s/ Christopher A. Carlson | |
| Christopher A. Carlson | ||
| President | ||
| (Principal Executive Officer) | ||
| September 8, 2015 |
Pursuant to the requirements of the Securities Exchange Act of 1934 and the Investment Company Act of 1940, this report has been signed below by the following persons on behalf of the registrant and in the capacities and on the dates indicated.
Ohio National Fund, Inc.
| By: | /s/ Christopher A. Carlson | |
| Christopher A. Carlson | ||
| President | ||
| (Principal Executive Officer) | ||
| September 8, 2015 | ||
| By: | /s/ R. Todd Brockman | |
| R. Todd Brockman | ||
| Treasurer | ||
| (Principal Financial Officer) | ||
| September 8, 2015 | ||