UNITED STATES
SECURITIES AND EXCHANGE COMMISSION
Washington, D.C. 20549
FORM N-CSR
CERTIFIED SHAREHOLDER REPORT OF REGISTERED
MANAGEMENT INVESTMENT COMPANIES
Investment Company Act file number 811-03015
Ohio National Fund, Inc.
(Exact name of registrant as specified in charter)
One Financial Way, Cincinnati, Ohio
| 45242
| |
| (Address of principal executive offices) | (Zip code) |
CT Corporation 300 E. Lombard St. Suite 1400 Baltimore, MD 21202
(Name and address of agent for service)
Registrant’s telephone number, including area code: 513-794-6971
Date of fiscal year end: December 31
Date of reporting period: June 30, 2017
Form N-CSR is to be used by management investment companies to file reports with the Commission not later than 10 days after the transmission to stockholders of any report that is required to be transmitted to stockholders under Rule 30e-1 under the Investment Company Act of 1940 (17 CFR 270.30e-1). The Commission may use the information provided on Form N-CSR in its regulatory, disclosure review, inspection, and policymaking roles.
A registrant is required to disclose the information specified by Form N-CSR, and the Commission will make this information public. A registrant is not required to respond to the collection of information contained in Form N-CSR unless the Form displays a currently valid Office of Management and Budget (“OMB”) control number. Please direct comments concerning the accuracy of the information collection burden estimate and any suggestions for reducing the burden to Secretary, Securities and Exchange Commission, 450 Fifth Street, NW, Washington, DC 20549-0609. The OMB has reviewed this collection of information under the clearance requirements of 44 U.S.C. § 3507.
| Item 1. | Reports To Stockholders. |
OHIO NATIONAL FUND, INC.
TABLE OF CONTENTS
| 1 | ||||
| 3 | ||||
| 4 | ||||
| 7 | ||||
| 12 | ||||
| 19 | ||||
ON International Equity Portfolio (formerly the International Portfolio) | 23 | |||
ON Foreign Portfolio (formerly the International Small-Mid Company Portfolio) | 29 | |||
| 36 | ||||
| 39 | ||||
| 44 | ||||
| 47 | ||||
| 55 | ||||
| 58 | ||||
| 69 | ||||
| 73 | ||||
| 77 | ||||
| 80 | ||||
| 83 | ||||
| 90 | ||||
| 97 | ||||
| 100 | ||||
| 114 | ||||
| 117 | ||||
| 120 | ||||
| 123 | ||||
| 126 | ||||
| 129 | ||||
| 132 | ||||
| 135 | ||||
| 141 | ||||
| 147 | ||||
| 167 | ||||
| 174 | ||||
Message |  |
Dear Investor:
The first half of 2017 has proven to be one of the best for investors since 2013. Consider the following:
| • | Equities have risen in six months to generate returns that took almost twelve months to earn in 2016. |
| • | Bonds have performed favorably, contributing both capital appreciation from lower rates and coupon return. |
| • | The VIX® Index®, a measure of equity volatility considered by analysts to be a gauge of investor fear, is trading at its lowest level in a decade. This low level is causing concern among analysts about investor complacency. |
| • | A U.S. balanced fund composite (60 percent Dow Jones U.S. Total Stock Market Index and 40 percent Bloomberg Barclays U.S. Aggregate Bond Index) returned 6.4 percent in the first six months of 2017. |
While we do not expect returns to continue at such a lofty pace, we remain cautiously optimistic. Fundamentals are solid, with moderately rising economic activity, a strengthening labor market and expansion in both household spending and business fixed investment. Additionally, corporate profits were very strong in Q2 2017, with 73 percent of filings meeting or beating expectations. Meanwhile, inflation remains muted. Globally, the economy is also on track for strengthening.
One of the more visible threats to stability is the political landscape in the U.S. and around the world. Economically,
a primary threat is the ability of the central banks to engineer a soft landing from quantitative easing strategies employed across the globe.
On this last point, rapid growth in asset values has led to much speculation about the role that liquidity injected by central banks around the world has played in boosting asset prices, and how these asset prices might adjust if central banks begin to retract their easy money policies. In the U.S., the Federal Reserve has scaled back its new bond purchase policy, restricting it to just reinvestment of principal. Furthermore, it is evaluating a strategy for unwinding its balance sheet. While such adjustments and their impact on the markets are difficult to judge, we believe portfolio diversification should serve investors well when corrections vary between markets and asset types.
Equity Markets
Large caps fared the best among broad-based indices in the U.S., with mid caps and small caps producing much more modest returns. However, it has been a breakout year for international developed market stocks and emerging markets. This is a turnaround from last year, when these international markets lagged. Strong local currency returns in foreign markets were further boosted by a weak U.S. Dollar, down 7.0 percent against a basket of currencies. Again, this is a reversal from the prior year, when the strengthened U.S. dollar hurt international returns that were translated into U.S. dollars. In addition to the success of international and emerging markets, another key theme has been the success of growth stocks, which far
| 1 |
outpaced value stocks. A summary of returns for key equity benchmarks is presented below:
| Index | 6/30/17 YTD U.S. (price and dividend) | |||
S&P 500® | 9.3 | % | ||
S&P 500 Value | 4.9 | % | ||
S&P 500 Growth | 13.3 | % | ||
S&P MidCap 400® | 6.0 | % | ||
S&P SmallCap 600® | 2.7 | % | ||
FTSE All World ex-US | 14.0 | % | ||
FTSE Emerging Markets | 14.6 | % | ||
Fixed Income Markets
Bond returns, though a fair bit less than equity returns, are approaching what fixed income portfolios realized for the full year of 2016. The Bloomberg Barclays US Aggregate Bond Index had a year-to-date total return of 2.3 percent at the end of the second quarter, compared to 2.6 percent for the full year of 2016. Though the Fed has increased rates twice so far in the first half of 2017, the effect remains primarily in the short end of the curve. With inflation in check, the long end of the yield curve has shown little momentum for moving higher. As a result, fixed income yields in diversified portfolios, which tend to invest in medium to long securities, have actually fallen.
Within bonds, the corporate credit segment has performed best, driven by better corporate profits and an improving global economy. Within the Bloomberg Barclays US Aggregate Bond Index, Corporates returned 3.8 percent, vs. Treasuries at 1.9 percent. Longer duration bonds outperformed shorter duration bonds, and lower quality bonds outperformed higher quality bonds. For example, BBB corporates returned 4.4 percent, vs. AA rated corporates at 2.6 percent.
The focus for the remainder of 2017 is on actions the Fed may take to slow its purchases of government securities
and the effect this might have on the markets and interest rates. The Federal Open Market Committee emphasized its plan for gradual adjustments.
The Ohio National Fund, Inc.
The Portfolios offered through the Ohio National Fund, Inc. performed well in the first six months of 2017, with 13 of 17 actively managed Portfolios beating their benchmarks. Another five newly formed Portfolios, with four months of history each, performed in line with their benchmarks. The returns of the three index Portfolios, before expenses, were very close to those of their respective indices. We are very pleased with the performance of our fund family.
Looking Ahead
We are optimistic about investor prospects for the remainder of the year. While we do not advocate chasing recent winners, we believe that staying the course in well diversified portfolios will serve investors well over the long term. There are many positive developments, with global growth, in particular, continuing to move in a favorable direction. There are some risks that could grow, including the global political landscape, as well as possible actions of central bankers, which we will carefully monitor.
Thank you for entrusting your assets to the Ohio National Fund, Inc. We look forward to continuing to serve your financial needs.
Sincerely,

Michael J. DeWeirdt, CFA, FRM
President
| 2 |
Directors and Officers of Ohio National Fund, Inc.
John J. Palmer, Director
Madeleine W. Ludlow, Director
George M. Vredeveld, Director
Geoffrey Keenan, Director
Lawrence L. Grypp, Director
Michael J. DeWeirdt, President
Paul J. Gerard, Vice President
R. Todd Brockman, Treasurer
Kimberly A. Plante, Secretary
Keith Dwyer, Chief Compliance Officer
Emily Bae, Assistant Secretary
Daniel P. Leming, Assistant Treasurer
The Statement of Additional Information of Ohio National Fund, Inc. (the “Fund”) includes additional information about the Fund’s Board of Directors (the “Board”) and is available at http://www.ohionationalfund.com or upon request, without charge, by calling 877-781-6392 (toll-free).
A description of the policies and procedures that the Fund uses in voting proxies relating to Fund securities, as well as information regarding how the Fund voted proxies during the most recent twelve-month period ended June 30, is available without charge, upon request, by calling 877-781-6392 (toll-free) and on the Securities and Exchange Commission (the “Commission”) website at http://www.sec.gov.
The Fund has filed its Schedules of Investments as of March 31 and September 30 with the Commission, as required, on Form N-Q. Form N-Q is required to be filed with the Commission for the first and third quarters of each fiscal year within sixty days after the end of each period and is available on the Commission website upon acceptance of each submission. The Fund’s Forms N-Q may be reviewed and copied at the Commission’s Public Reference Room in Washington, DC. Information about the Public Reference Room is available by calling 1-800-SEC-0330 (toll-free).
This report and the financial statements contained herein are submitted for the general information of the shareholders of the Fund. This report is not authorized for distribution to prospective investors in the Fund unless preceded or accompanied by an effective prospectus of Ohio National Fund, Inc. For a prospectus containing more complete information, including charges and expenses, please contact Ohio National Investments, Inc., One Financial Way, Cincinnati, OH 45242, telephone 877-781-6392 (toll-free).
| 3 |
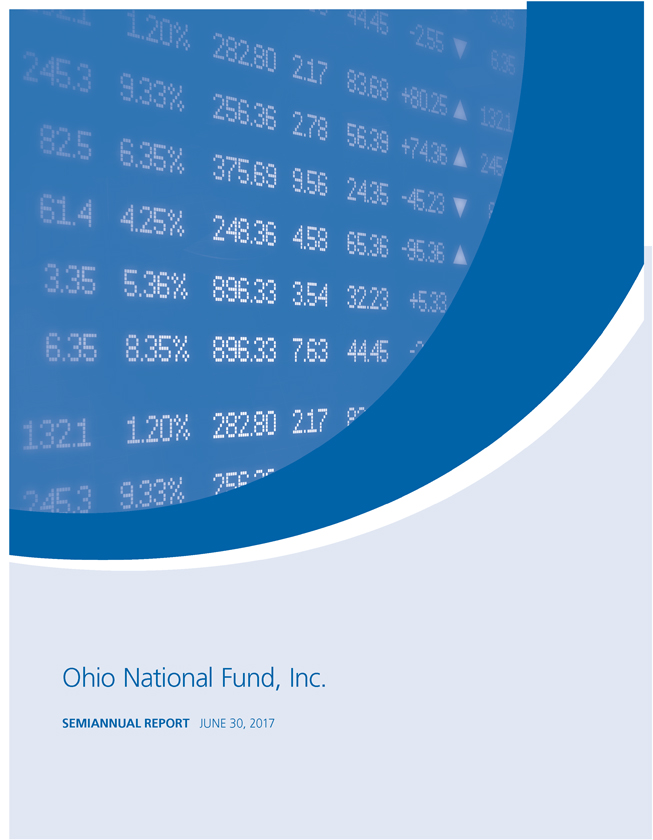
| Ohio National Fund, Inc. | Equity Portfolio |
Objective/Strategy
The Equity Portfolio seeks long-term growth of capital by investing at least 80% of its assets in equity securities.
Performance as of June 30, 2017
Average Annual returns | ||||
One year | 19.89% | |||
Five years | 14.61% | |||
Ten years | 2.15% |
Past performance does not guarantee future results. The performance data quoted represents past performance and current returns may be lower or higher. Total return figures include change in share price and reinvestment of dividends and capital gains. The investment return and principal value will fluctuate so that an investor’s shares, when redeemed, may be worth more or less than the original cost. To obtain performance information up to the most recent month end, call toll-free 1-877-781-6392.
The Portfolio is not open to direct retail investment. Beneficial interest in shares is obtained solely by purchase of variable life insurance policies and variable annuity contracts. Actual performance results for variable annuity and variable universal life contracts will be lower due to contract charges. Consult your contract for applicable charges.
Total expense ratio is 0.82% per the Fund’s prospectus dated May 1, 2017. Additional information pertaining to the Fund’s expense ratio as of June 30, 2017 can be found in the Portfolio’s Financial Highlights.
Comments from Sub-Adviser
Q. How did the Portfolio perform in comparison to its benchmark during the reporting period?
A. For the six-month period ended June 30, 2017, the Equity Portfolio returned 6.73% versus 9.34% for its benchmark, the S&P 500 Index.
Q. Were there specific market conditions, investment strategies, or techniques that materially affected the Portfolio’s benchmark-relative performance during the reporting period?
A. Given our valuation-driven investment process, we believe that good relative and absolute returns come from finding stocks where realized results can exceed expectations. The lack of broad investing opportunities has created a needle-in-the-haystack market, but that is a great opportunity for truly active managers, like us, to prove our worth. We are underweight Information Technology, particularly those included in the “FAANG stock” grouping (Facebook, Inc., Amazon.com, Inc., Apple, Inc., Netflix, Inc., and Alphabet, Inc.), and underweight the also-loved “bond-proxy” stocks in Telecommunication Services and Consumer Staples that have benefitted from record-low interest rates. The narrative in favor of deflation and extrapolation of low rates well into the future is back in full force, after a brief respite, as the election-induced hopes of reflation have melted away. During the middle of the second quarter, when capital really flooded into FAANG stocks and bond proxies, our relative performance suffered, but we were able to recover much of this relative drop later in the quarter. However, we still own some Information Technology stocks where we believe innovation can extend scaling advantages, and where business values remain above rising prices.(1)
Q. How did sector selection and security selection each impact the Portfolio’s performance relative to its benchmark?
A. Stock selection was the key factor for the Portfolio’s underperformance, but was partially offset by sector allocation effects.
Stock selection in the Health Care, Energy and Information Technology (“IT”) sectors detracted the most from relative performance. The Portfolio’s underweight to the IT sector also detracted from returns. Meanwhile, stock selection in the Real Estate sector contributed to relative performance, as did an underweight to the Telecommunication Services (“Telecom”) sector.(1)
Q. Were there any factors that impacted the benchmark’s performance more significantly than the Portfolio’s performance?
A. The Portfolio’s underweight allocation in the Telecom sector contributed strongly to relative performance, as the sector underperformed the broader benchmark. The benchmark benefited from larger weights in Consumer Staples and Information Technology stocks, which delivered stronger performance in the benchmark than in the Portfolio.(1)
Q. Which holdings contributed the most to, and detracted the most from, the Portfolio’s benchmark-relative performance?
A. Oracle Corp., Realogy Holdings Corp., and PulteGroup, Inc. contributed the most to relative performance.(1)
Shares of Oracle Corp., which provides products and services for the corporate Information Technology ecosystems, continued its rise in the second quarter, as the company has shown progress in successfully managing its cloud transition. The company has shifted business to the cloud at a rate similar to Microsoft, at a similar point in its transition cycle, and at a faster rate than Adobe Systems, Inc., which is perhaps the most successful example of a software provider transitioning to cloud delivery.(1)
Realogy Holdings Corp., the largest residential real estate brokerage company in the country, was a major contributor to performance in the first half. Existing home sales hit their fastest pace on an annualized basis during the spring and the housing market has remained solid since then. Housing strength has buoyed Realogy Holdings Corp., which has moved higher following two consecutive quarters of better than expected results.(1)
Leading homebuilding company PulteGroup, Inc. was a top performing stock on a combination of factors affecting the industry, including broader enthusiasm about the economy, resilient housing data and flat-to-declining Treasury yields. The latter factor may help mortgage rates stabilize, which could buoy new home sales. In addition, pent up demand for housing continues to be a theme, as more millennials enter the work force and save up for a home.(1)
Synchrony Financial, Apache Corp., and Devon Energy Corp. detracted the most from relative performance.(1)
Consumer lender Synchrony Financial underperformed the market during the second quarter after lowering credit guidance and on investor worries about a retail-industry slowdown (Synchrony Financial manages credit cards for department stores and other retail outlets). Synchrony Financial may also have been negatively impacted by the market’s declining expectations of tax reform being implemented this year, as the company would be a major beneficiary of corporate tax cuts and reform.(1)
Apache Corp. shares were a leading detractor, as the price of oil declined about 20% during the period and the company reported weaker than expected earnings results. The market may also be concerned about the oil-gas mix from Apache’s Alpine High field. Apache Corp. has begun drilling deeper in the region first to prove out the field, but deeper regions tend to have a higher gas mix, which the market dislikes.(1)
| 4 | (continued) |
| Ohio National Fund, Inc. | Equity Portfolio (Continued) |
Devon Energy Corp. traded down in the second quarter on broader commodity price decreases and expectations for larger United States crude inventories for the foreseeable future. The company itself continues to improve operationally, and asset sales have helped reduce leverage, and thus alleviate some of the market’s concerns of financial distress.(1)
| (1) | The Portfolio’s composition is subject to change. Holdings and weightings are as of June 30, 2017. |
Change in Value of $10,000 Investment
Hypothetical illustration based on past performance. Future performance will vary. The Portfolio’s returns reflect reinvested dividends. The Portfolio’s holdings may differ significantly from the securities in the index. The index is unmanaged and therefore does not reflect the cost of portfolio management and accounting.
The S&P 500 Index is a capitalization-weighted index designed to measure performance of the broad domestic economy through changes in the aggregate market value of 500 stocks representing all major industries. The index presented includes the effects of reinvested dividends.
Portfolio Composition as of June 30, 2017 (1)
| % of Net Assets | ||||
Common Stocks (4) | 98.9 | |||
Closed-End Mutual Funds | 1.0 | |||
Money Market Funds | 0.1 | |||
|
| |||
| 100.0 | ||||
|
|
Top 10 Portfolio Holdings as of June 30, 2017 (1) (2) (3)
| % of Net Assets | ||||
1. Alphabet, Inc. Class C | 4.6 | |||
2. Oracle Corp. | 4.0 | |||
3. Wells Fargo & Co. | 3.5 | |||
4. Microsoft Corp. | 3.5 | |||
5. Synchrony Financial | 3.4 | |||
6. Citigroup, Inc. | 3.4 | |||
7. Allergan PLC | 3.3 | |||
8. Realogy Holdings Corp. | 3.1 | |||
9. Amazon.com, Inc. | 3.1 | |||
10. MetLife, Inc. | 2.8 |
| (1) | Composition of Portfolio subject to change. |
| (2) | Short-term investments have been excluded from the list of Top 10 Portfolio Holdings. |
| (3) | Top 10 Portfolio Holdings is presented at an individual security level. Total investment exposure by issuer may be higher. |
| (4) | Sectors (Common Stocks): |
| % of Net Assets | ||||
Financials | 18.5 | |||
Consumer Discretionary | 16.8 | |||
Information Technology | 16.4 | |||
Health Care | 16.2 | |||
Industrials | 9.6 | |||
Energy | 7.3 | |||
Utilities | 6.6 | |||
Real Estate | 4.9 | |||
Materials | 1.7 | |||
Consumer Staples | 0.9 | |||
|
| |||
| 98.9 | ||||
|
|
| 5 |
| Ohio National Fund, Inc. | Equity Portfolio |
Schedule of Investments | June 30, 2017 (Unaudited) |
| Common Stocks – 98.9% | Shares | Value | ||||||||
| CONSUMER DISCRETIONARY – 16.8% | ||||||||||
Adient PLC (Auto Components) | 141,652 | $ | 9,261,208 | |||||||
ServiceMaster Global Holdings, Inc. (Diversified Consumer Svs.) | (a) | 109,342 | 4,285,113 | |||||||
Norwegian Cruise Line Holdings Ltd. (Hotels, Restaurants & Leisure) | (a) | 146,400 | 7,948,056 | |||||||
PulteGroup, Inc. (Household Durables) | 442,967 | 10,865,980 | ||||||||
Amazon.com, Inc. (Internet & Direct Marketing Retail) | (a) | 18,070 | 17,491,760 | |||||||
CBS Corp. Class B (Media) | 104,721 | 6,679,105 | ||||||||
AutoZone, Inc. (Specialty Retail) | (a) | 18,040 | 10,291,098 | |||||||
Lowe’s Cos., Inc. (Specialty Retail) | 135,500 | 10,505,315 | ||||||||
Signet Jewelers Ltd. (Specialty Retail) | 96,882 | 6,126,818 | ||||||||
Hanesbrands, Inc. (Textiles, Apparel & Luxury Goods) | 258,416 | 5,984,915 | ||||||||
Ralph Lauren Corp. (Textiles, Apparel & Luxury Goods) | 77,840 | 5,744,592 | ||||||||
|
| |||||||||
| 95,183,960 | ||||||||||
|
| |||||||||
| CONSUMER STAPLES – 0.9% | ||||||||||
Molson Coors Brewing Co. Class B (Beverages) | 60,890 | 5,257,243 | ||||||||
|
| |||||||||
| ENERGY – 7.3% | ||||||||||
Apache Corp. (Oil, Gas & Consumable Fuels) | 217,161 | 10,408,527 | ||||||||
Cabot Oil & Gas Corp. (Oil, Gas & Consumable Fuels) | 250,910 | 6,292,823 | ||||||||
CONSOL Energy, Inc. (Oil, Gas & Consumable Fuels) | (a) | 422,270 | 6,308,714 | |||||||
Devon Energy Corp. (Oil, Gas & Consumable Fuels) | 216,760 | 6,929,817 | ||||||||
Pioneer Natural Resources Co. (Oil, Gas & Consumable Fuels) | 72,047 | 11,497,260 | ||||||||
|
| |||||||||
| 41,437,141 | ||||||||||
|
| |||||||||
| FINANCIALS – 18.5% | ||||||||||
Citigroup, Inc. (Banks) | 285,912 | 19,121,795 | ||||||||
Wells Fargo & Co. (Banks) | 363,220 | 20,126,020 | ||||||||
Ameriprise Financial, Inc. (Capital Markets) | 69,725 | 8,875,295 | ||||||||
Intercontinental Exchange, Inc. (Capital Markets) | 189,812 | 12,512,407 | ||||||||
Synchrony Financial (Consumer Finance) | 649,690 | 19,373,756 | ||||||||
Hartford Financial Services Group, Inc. / The (Insurance) | 172,080 | 9,046,246 | ||||||||
MetLife, Inc. (Insurance) | 292,925 | 16,093,299 | ||||||||
|
| |||||||||
| 105,148,818 | ||||||||||
|
| |||||||||
| HEALTH CARE – 16.2% | ||||||||||
Alexion Pharmaceuticals, Inc. (Biotechnology) | (a) | 129,001 | 15,695,552 | |||||||
Biogen, Inc. (Biotechnology) | (a) | 36,270 | 9,842,227 | |||||||
Celgene Corp. (Biotechnology) | (a) | 121,820 | 15,820,763 | |||||||
UnitedHealth Group, Inc. (Health Care Providers & Svs.) | 58,244 | 10,799,603 | ||||||||
Allergan PLC (Pharmaceuticals) | 78,060 | 18,975,605 | ||||||||
Bristol-Myers Squibb Co. (Pharmaceuticals) | 164,680 | 9,175,970 | ||||||||
Mylan NV (Pharmaceuticals) | (a) | 296,209 | 11,498,833 | |||||||
|
| |||||||||
| 91,808,553 | ||||||||||
|
| |||||||||
| Common Stocks (Continued) | Shares | Value | ||||||||
| INDUSTRIALS – 9.6% | ||||||||||
TransDigm Group, Inc. (Aerospace & Defense) | 35,220 | $ | 9,469,601 | |||||||
C.H. Robinson Worldwide, Inc. (Air Freight & Logistics) | 114,340 | 7,852,871 | ||||||||
United Continental Holdings, Inc. (Airlines) | (a) | 192,540 | 14,488,635 | |||||||
Johnson Controls International PLC (Building Products) | 268,990 | 11,663,406 | ||||||||
Stericycle, Inc. (Commercial Svs. & Supplies) | (a) | 140,810 | 10,746,619 | |||||||
|
| |||||||||
| 54,221,132 | ||||||||||
|
| |||||||||
| INFORMATION TECHNOLOGY – 16.4% | ||||||||||
Cisco Systems, Inc. (Communications Equip.) | 438,546 | 13,726,490 | ||||||||
Alphabet, Inc. Class C (Internet Software & Svs.) | (a) | 28,664 | 26,047,837 | |||||||
QUALCOMM, Inc. (Semiconductors & Equip.) | 195,160 | 10,776,735 | ||||||||
Microsoft Corp. (Software) | 288,220 | 19,867,005 | ||||||||
Oracle Corp. (Software) | 451,559 | 22,641,168 | ||||||||
|
| |||||||||
| 93,059,235 | ||||||||||
|
| |||||||||
| MATERIALS – 1.7% | ||||||||||
Royal Gold, Inc. (Metals & Mining) | 119,763 | 9,361,874 | ||||||||
|
| |||||||||
| REAL ESTATE – 4.9% | ||||||||||
American Homes 4 Rent (Equity Real Estate Investment Trusts) | 444,490 | 10,032,139 | ||||||||
Realogy Holdings Corp. (Real Estate Mgmt. & Development) | 546,890 | 17,746,581 | ||||||||
|
| |||||||||
| 27,778,720 | ||||||||||
|
| |||||||||
| UTILITIES – 6.6% | ||||||||||
Exelon Corp. (Electric Utilities) | 375,870 | 13,557,631 | ||||||||
AES Corp. (Ind. Power & Renewable Elec.) | 946,617 | 10,516,915 | ||||||||
Calpine Corp. (Ind. Power & Renewable Elec.) | (a) | 969,870 | 13,122,341 | |||||||
|
| |||||||||
| 37,196,887 | ||||||||||
|
| |||||||||
Total Common Stocks (Cost $495,194,676) | $ | 560,453,563 | ||||||||
|
| |||||||||
| Closed-End Mutual Funds – 1.0% | Shares | Value | ||||||||
Altaba, Inc. | (a) | 105,506 | $ | 5,747,967 | ||||||
|
| |||||||||
Total Closed-End Mutual Funds (Cost $3,631,356) | $ | 5,747,967 | ||||||||
|
| |||||||||
| Money Market Funds – 0.7% | Shares | Value | ||||||||
State Street Institutional U.S. Government Money Market Fund Institutional Class | 3,924,509 | $ | 3,924,509 | |||||||
|
| |||||||||
Total Money Market Funds (Cost $3,924,509) | $ | 3,924,509 | ||||||||
|
| |||||||||
Total Investments – 100.6% (Cost $502,750,541) | (b) | $ | 570,126,039 | |||||||
Liabilities in Excess of Other Assets – (0.6)% | (3,120,317) | |||||||||
|
| |||||||||
Net Assets – 100.0% | $ | 567,005,722 | ||||||||
|
| |||||||||
Percentages are stated as a percent of net assets.
Footnotes:
| (a) | Non-income producing security. |
| (b) | Represents cost for financial reporting purposes, which may differ from cost basis for federal income tax purposes. See also Note 7 of the Notes to Financial Statements. |
The accompanying notes are an integral part of these financial statements.
| 6 |
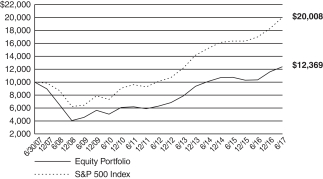
| Ohio National Fund, Inc. | Bond Portfolio |
Objective/Strategy
The Bond Portfolio seeks to obtain a high level of income and opportunity for capital appreciation consistent with preservation of capital by investing primarily in intermediate-term and long-term fixed income securities.
Performance as of June 30, 2017
Average Annual returns | ||||
One year | 2.57% | |||
Five years | 3.30% | |||
Ten years | 4.39% |
Past performance does not guarantee future results. The performance data quoted represents past performance and current returns may be lower or higher. Total return figures include change in share price and reinvestment of dividends and capital gains. The investment return and principal value will fluctuate so that an investor’s shares, when redeemed, may be worth more or less than the original cost. To obtain performance information up to the most recent month end, call toll-free 1-877-781-6392.
The Portfolio is not open to direct retail investment. Beneficial interest in shares is obtained solely by purchase of variable life insurance policies and variable annuity contracts. Actual performance results for variable annuity and variable universal life contracts will be lower due to contract charges. Consult your contract for applicable charges.
Total expense ratio is 0.65% per the Fund’s prospectus dated May 1, 2017. Additional information pertaining to the Fund’s expense ratio as of June 30, 2017 can be found in the Portfolio’s Financial Highlights.
Comments from Adviser
Q. How did the Portfolio perform in comparison to its benchmark during the reporting period?
A. For the six-month period ended June 30, 2017, the Bond Portfolio returned 3.69% versus 3.88% for its benchmark, the BofA Merrill Lynch U.S. Corporate Master Index.
Q. Were there specific market conditions, investment strategies, or techniques that materially affected the Portfolio’s benchmark-relative performance during the reporting period?
A. Long-term interest rates declined slightly, while the Federal Reserve increased short term rates, causing the yield curve to flatten. In this environment, longer duration bonds outperformed shorter duration bonds, in general. Corporate credit spreads tightened modestly based on strong demand from domestic and foreign buyers, as well as improving corporate profits. Lower quality bonds outperformed higher quality bonds during the period, as investors continue to pursue higher-yielding assets. From an investment strategy perspective, the Portfolio was positioned with a slightly lower duration and slightly lower credit quality than the benchmark.(1)
While neither of the above factors materially affected the Portfolio’s performance compared to the benchmark, the Portfolio’s shorter duration slightly detracted from performance. Conversely, the Portfolio’s lower credit quality compared to the benchmark slightly added to performance.(1)
Q. How did sector selection and security selection each impact the Portfolio’s performance relative to its benchmark?
A. The Portfolio was overweight the Energy sector versus the benchmark and underweight the Consumer Staples and Financials sectors during the period. Other sector weightings, versus the
benchmark, were not significant. In terms of performance attribution, no sector added or detracted from performance by more than 0.20% compared to the benchmark. The Portfolio’s Financials and Telecommunications Services sectors performed the best, while the Portfolio’s Utilities sector performed the worst, versus the benchmark. In each case, security selection within the sector accounted for the majority of the sector performance versus the benchmark, rather than the sector weighting.(1)
Q. Were there any factors that impacted the benchmark’s performance more significantly than the Portfolio’s performance?
A. The benchmark does not include cash in its performance calculation, while the Portfolio maintains a cash balance due to inflows and outflows from shareholder participants. Cash benefits the Portfolio’s return relative to the benchmark when returns are negative during a period, and creates a drag on performance, relative to the benchmark, during a period of positive performance. During the period, returns were positive in the Portfolio, so cash was a detractor to performance of the Portfolio, relative to the benchmark. In addition, the benchmark does not have fund expenses in its performance calculation.(1)
Q. Which holdings contributed the most to, and detracted the most from, the Portfolio’s benchmark-relative performance?
A. The top three contributors to the Portfolio’s performance relative to the benchmark were Viacom, Inc. 4.850% due 12/15/2034, Williams Partners LP 5.400% due 03/04/2044 and Marathon Petroleum Corp. 4.750% due 09/15/2044. Each of these bonds are longer duration bonds that performed well with the decline in longer term interest rates and experienced spread tightening during the period. The top three detractors to the Portfolio’s performance relative to the benchmark were Noble Holding International Ltd. 7.700% due 04/01/2025, Coach, Inc. 4.125% due 07/15/2027, and Lloyds Banking Group PLC 3.750% due 01/11/2027. Noble Corp PLC and Lloyds Banking Group PLC experienced spread widening during the period they were held in the Portfolio. The decline in Coach Inc. was due to a rise in interest rates during the time it was held in the Portfolio.(1)
Q. Were there any significant changes to the Portfolio’s management team, investments strategy, or selection process during the reporting period?
A. Effective May 1, 2017, Gary Rodmaker of Ohio National Investments, Inc., the adviser to the Portfolio, became the Portfolio’s sole portfolio manager. Previously, Phillip Byrde of Ohio National Investments, Inc. was a co-portfolio manager. There were no significant changes to the investment strategy or security selection process during the reporting period.
| (1) | The Portfolio’s composition is subject to change. Holdings and weightings are as of June 30, 2017. |
| 7 | (continued) |
| Ohio National Fund, Inc. | Bond Portfolio (Continued) |
Change in Value of $10,000 Investment
Hypothetical illustration based on past performance. Future performance will vary. The Portfolio’s returns reflect reinvested dividends. The Portfolio’s holdings may differ significantly from the securities in the index. The index is unmanaged and therefore does not reflect the cost of portfolio management and accounting.
The BofA Merrill Lynch U.S. Corporate Master Index tracks the performance of all U.S. dollar-denominated, investment grade corporate public debt issued in the U.S. domestic bond market. Qualifying bonds must have an investment grade rating (based on an average of Moody’s, S&P, and Fitch). In addition, qualifying securities must have at least one year remaining term to maturity, a fixed coupon schedule, and a minimum amount outstanding of $250 million.
Portfolio Composition as of June 30, 2017 (1)
| % of Net Assets | ||||
Corporate Bonds (4) | 97.3 | |||
Asset-Backed Securities (4) | 0.6 | |||
Money Market Funds and Other Net Assets | 2.1 | |||
|
| |||
| 100.0 | ||||
|
|
Top 10 Portfolio Holdings as of June 30, 2017 (1) (2) (3)
| % of Net Assets | ||||
1. ONEOK, Inc. | 1.8 | |||
2. Enable Midstream Partners LP | 1.6 | |||
3. Suntory Holdings Ltd. | 1.6 | |||
4. Jefferies Group LLC | 1.1 | |||
5. Crown Castle International Corp. | 1.1 | |||
6. Teachers Insurance & Annuity Association of America | 1.1 | |||
7. Westpac Banking Corp. | 1.1 | |||
8. Fifth Third Bancorp | 1.1 | |||
9. Coach, Inc. | 1.1 | |||
10. JPMorgan Chase & Co. | 1.1 |
| (1) | Composition of Portfolio subject to change. |
| (2) | Short-term investments have been excluded from the list of Top 10 Portfolio Holdings. |
| (3) | Top 10 Portfolio Holdings is presented at an individual security level. Total investment exposure by issuer may be higher. |
| (4) | Sectors (Corporate Bonds, Asset-Backed Securities): |
| % of Net Assets | ||||
Financials | 23.1 | |||
Energy | 18.0 | |||
Consumer Discretionary | 10.4 | |||
Utilities | 9.2 | |||
Real Estate | 7.7 | |||
Industrials | 7.6 | |||
Information Technology | 6.6 | |||
Consumer Staples | 5.7 | |||
Health Care | 4.7 | |||
Materials | 3.7 | |||
Telecommunication Services | 2.6 | |||
|
| |||
| 97.9 | ||||
|
|
| 8 |
| Ohio National Fund, Inc. | Bond Portfolio |
Schedule of Investments | June 30, 2017 (Unaudited) |
| Corporate Bonds – 97.3% | Rate | Maturity | Face Amount | Value | ||||||||||||
| CONSUMER DISCRETIONARY – 9.2% | ||||||||||||||||
Magna International, Inc. (Auto Components) | 3.625% | 06/15/2024 | $ | 1,000,000 | $ | 1,026,854 | ||||||||||
General Motors Co. (Automobiles) | 5.000% | 04/01/2035 | 900,000 | 903,097 | ||||||||||||
Wyndham Worldwide Corp. (Hotels, Restaurants & Leisure) | 4.150% | 04/01/2024 | 900,000 | 924,196 | ||||||||||||
Newell Brands, Inc. (Household Durables) | 3.150% | 04/01/2021 | 900,000 | 921,303 | ||||||||||||
Expedia, Inc. (Internet & Direct Marketing Retail) | 5.000% | 02/15/2026 | 1,000,000 | 1,095,056 | ||||||||||||
21st Century Fox America, Inc. (Media) | 4.500% | 02/15/2021 | 1,250,000 | 1,339,386 | ||||||||||||
Comcast Corp. (Media) | 4.250% | 01/15/2033 | 750,000 | 800,136 | ||||||||||||
Discovery Communications, LLC (Media) | 4.375% | 06/15/2021 | 1,000,000 | 1,055,396 | ||||||||||||
Discovery Communications, LLC (Media) | 3.300% | 05/15/2022 | 275,000 | 276,001 | ||||||||||||
Time Warner Cable, LLC (Media) | 6.550% | 05/01/2037 | 850,000 | 1,016,059 | ||||||||||||
Viacom, Inc. (Media) | 4.850% | 12/15/2034 | 1,500,000 | 1,492,314 | ||||||||||||
Viacom, Inc. (Media) | 3.450% | 10/04/2026 | 900,000 | 869,034 | ||||||||||||
Kohl’s Corp. (Multiline Retail) | 4.000% | 11/01/2021 | 925,000 | 947,270 | ||||||||||||
Home Depot, Inc. / The (Specialty Retail) | 2.125% | 09/15/2026 | 800,000 | 747,967 | ||||||||||||
Coach, Inc. (Textiles, Apparel & Luxury Goods) | 4.125% | 07/15/2027 | 1,800,000 | 1,781,896 | ||||||||||||
|
| |||||||||||||||
| 15,195,965 | ||||||||||||||||
|
| |||||||||||||||
| CONSUMER STAPLES – 5.7% | ||||||||||||||||
Anheuser-Busch InBev Finance, Inc. (Beverages) | 4.700% | 02/01/2036 | 900,000 | 994,277 | ||||||||||||
Anheuser-Busch InBev Finance, Inc. (Beverages) | 4.900% | 02/01/2046 | 1,000,000 | 1,130,232 | ||||||||||||
Suntory Holdings Ltd. (Beverages) | (a) | 2.550% | 06/28/2022 | 2,700,000 | 2,683,214 | |||||||||||
Costco Wholesale Corp. (Food & Staples Retailing) | 3.000% | 05/18/2027 | 900,000 | 897,681 | ||||||||||||
Mead Johnson Nutrition Co. (Food Products) | 3.000% | 11/15/2020 | 900,000 | 923,110 | ||||||||||||
Imperial Brands Finance PLC (Tobacco) | (a) | 3.750% | 07/21/2022 | 1,400,000 | 1,457,429 | |||||||||||
Philip Morris International, Inc. (Tobacco) | 4.125% | 05/17/2021 | 1,250,000 | 1,332,266 | ||||||||||||
|
| |||||||||||||||
| 9,418,209 | ||||||||||||||||
|
| |||||||||||||||
| ENERGY – 18.0% | ||||||||||||||||
Halliburton Co. (Energy Equip. & Svs.) | 4.850% | 11/15/2035 | 900,000 | 963,229 | ||||||||||||
Noble Holding International Ltd. (Energy Equip. & Svs.) | 5.750% | 03/16/2018 | 900,000 | 905,454 | ||||||||||||
Noble Holding International Ltd. (Energy Equip. & Svs.) | 7.700% | 04/01/2025 | 1,000,000 | 767,500 | ||||||||||||
Transocean, Inc. (Energy Equip. & Svs.) | (a) | 9.000% | 07/15/2023 | 1,000,000 | 1,037,500 | |||||||||||
BP Capital Markets PLC (Oil, Gas & Consumable Fuels) | 3.017% | 01/16/2027 | 900,000 | 875,713 | ||||||||||||
Buckeye Partners LP (Oil, Gas & Consumable Fuels) | 4.875% | 02/01/2021 | 1,000,000 | 1,058,553 | ||||||||||||
Canadian Natural Resources Ltd. (Oil, Gas & Consumable Fuels) | 4.950% | 06/01/2047 | 900,000 | 914,656 | ||||||||||||
Chevron Corp. (Oil, Gas & Consumable Fuels) | 2.895% | 03/03/2024 | 900,000 | 908,292 | ||||||||||||
Columbia Pipeline Group, Inc. (Oil, Gas & Consumable Fuels) | 4.500% | 06/01/2025 | 900,000 | 958,122 | ||||||||||||
Enable Midstream Partners LP (Oil, Gas & Consumable Fuels) | 4.400% | 03/15/2027 | 2,700,000 | 2,709,998 | ||||||||||||
Exxon Mobil Corp. (Oil, Gas & Consumable Fuels) | 4.114% | 03/01/2046 | 900,000 | 950,829 | ||||||||||||
Kinder Morgan Energy Partners LP (Oil, Gas & Consumable Fuels) | 4.150% | 03/01/2022 | 1,000,000 | 1,041,754 | ||||||||||||
Kinder Morgan, Inc. (Oil, Gas & Consumable Fuels) | 5.300% | 12/01/2034 | 1,000,000 | 1,030,664 | ||||||||||||
Marathon Oil Corp. (Oil, Gas & Consumable Fuels) | 3.850% | 06/01/2025 | 850,000 | 829,772 | ||||||||||||
Marathon Petroleum Corp. (Oil, Gas & Consumable Fuels) | 4.750% | 09/15/2044 | 1,000,000 | 951,297 | ||||||||||||
Murphy Oil Corp. (Oil, Gas & Consumable Fuels) | 4.700% | 12/01/2022 | 1,400,000 | 1,351,700 | ||||||||||||
ONEOK, Inc. (Oil, Gas & Consumable Fuels) | 6.000% | 06/15/2035 | 2,690,000 | 2,895,247 | ||||||||||||
Phillips 66 (Oil, Gas & Consumable Fuels) | (a)(b) | QL + 75 | 04/15/2020 | 900,000 | 901,810 | |||||||||||
Plains All American Pipeline LP / PAA Finance Corp. (Oil, Gas & Consumable Fuels) | 2.850% | 01/31/2023 | 1,000,000 | 969,988 | ||||||||||||
Plains All American Pipeline LP / PAA Finance Corp. (Oil, Gas & Consumable Fuels) | 4.650% | 10/15/2025 | 900,000 | 922,573 | ||||||||||||
Shell International Finance BV (Oil, Gas & Consumable Fuels) | 4.000% | 05/10/2046 | 900,000 | 890,482 | ||||||||||||
Southwestern Energy Co. (Oil, Gas & Consumable Fuels) | 5.800% | 01/23/2020 | 900,000 | 922,050 | ||||||||||||
Spectra Energy Capital, LLC (Oil, Gas & Consumable Fuels) | 3.300% | 03/15/2023 | 1,425,000 | 1,430,154 | ||||||||||||
TransCanada PipeLines Ltd. (Oil, Gas & Consumable Fuels) | 2.500% | 08/01/2022 | 1,425,000 | 1,423,071 | ||||||||||||
Williams Partners LP (Oil, Gas & Consumable Fuels) | 3.750% | 06/15/2027 | 1,000,000 | 989,932 | ||||||||||||
Williams Partners LP (Oil, Gas & Consumable Fuels) | 5.400% | 03/04/2044 | 1,000,000 | 1,057,534 | ||||||||||||
|
| |||||||||||||||
| 29,657,874 | ||||||||||||||||
|
| |||||||||||||||
| FINANCIALS – 23.1% | ||||||||||||||||
Bank of America Corp. (Banks) | 3.875% | 08/01/2025 | 850,000 | 879,415 | ||||||||||||
Bank of America Corp. (Banks) | (b) | 4.244% | 04/24/2038 | 1,000,000 | 1,041,089 | |||||||||||
Branch Banking & Trust Co. (Banks) | 3.625% | 09/16/2025 | 1,180,000 | 1,227,383 | ||||||||||||
Citigroup, Inc. (Banks) | 4.400% | 06/10/2025 | 900,000 | 937,234 | ||||||||||||
Citigroup, Inc. (Banks) | 3.700% | 01/12/2026 | 1,000,000 | 1,011,488 | ||||||||||||
Fifth Third Bancorp (Banks) | 4.500% | 06/01/2018 | 1,750,000 | 1,791,667 | ||||||||||||
JPMorgan Chase & Co. (Banks) | 3.625% | 12/01/2027 | 1,800,000 | 1,781,775 | ||||||||||||
SunTrust Banks, Inc. (Banks) | 2.500% | 05/01/2019 | 1,400,000 | 1,413,181 | ||||||||||||
Wells Fargo & Co. (Banks) | 3.000% | 04/22/2026 | 900,000 | 879,078 | ||||||||||||
Wells Fargo & Co. (Banks) | 4.650% | 11/04/2044 | 1,000,000 | 1,051,755 | ||||||||||||
Westpac Banking Corp. (Banks) | (b) | 4.322% | 11/23/2031 | 1,800,000 | 1,845,061 | |||||||||||
E*TRADE Financial Corp. (Capital Markets) | 4.625% | 09/15/2023 | 900,000 | 936,000 | ||||||||||||
Goldman Sachs Group, Inc. / The (Capital Markets) | 3.750% | 05/22/2025 | 1,400,000 | 1,433,713 | ||||||||||||
| 9 | (continued) |
| Ohio National Fund, Inc. | Bond Portfolio (Continued) |
Schedule of Investments | June 30, 2017 (Unaudited) |
| Corporate Bonds(Continued) | Rate | Maturity | Face Amount | Value | ||||||||||||
| FINANCIALS (continued) | ||||||||||||||||
Intercontinental Exchange, Inc. (Capital Markets) | 2.750% | 12/01/2020 | $ | 900,000 | $ | 916,761 | ||||||||||
Intercontinental Exchange, Inc. (Capital Markets) | 3.750% | 12/01/2025 | 1,000,000 | 1,046,220 | ||||||||||||
Morgan Stanley (Capital Markets) | 3.750% | 02/25/2023 | 1,250,000 | 1,299,744 | ||||||||||||
Morgan Stanley (Capital Markets) | 3.950% | 04/23/2027 | 1,000,000 | 1,006,393 | ||||||||||||
Nasdaq, Inc. (Capital Markets) | 3.850% | 06/30/2026 | 900,000 | 913,283 | ||||||||||||
Northern Trust Corp. (Capital Markets) | 3.450% | 11/04/2020 | 1,000,000 | 1,042,304 | ||||||||||||
Capital One Financial Corp. (Consumer Finance) | 2.450% | 04/24/2019 | 925,000 | 929,979 | ||||||||||||
Ford Motor Credit Co., LLC (Consumer Finance) | 3.157% | 08/04/2020 | 1,400,000 | 1,426,590 | ||||||||||||
General Motors Financial Co., Inc. (Consumer Finance) | 3.200% | 07/06/2021 | 900,000 | 910,032 | ||||||||||||
General Motors Financial Co., Inc. (Consumer Finance) | 4.350% | 01/17/2027 | 1,000,000 | 1,012,411 | ||||||||||||
Synchrony Financial (Consumer Finance) | 4.250% | 08/15/2024 | 900,000 | 919,338 | ||||||||||||
Berkshire Hathaway, Inc. (Diversified Financial Svs.) | 3.125% | 03/15/2026 | 900,000 | 910,214 | ||||||||||||
Jefferies Group LLC (Diversified Financial Svs.) | 4.850% | 01/15/2027 | 1,800,000 | 1,880,327 | ||||||||||||
Aflac, Inc. (Insurance) | 3.625% | 06/15/2023 | 1,425,000 | 1,497,507 | ||||||||||||
Allstate Corp. / The (Insurance) | 5.200% | 01/15/2042 | 500,000 | 555,734 | ||||||||||||
American International Group, Inc. (Insurance) | 3.875% | 01/15/2035 | 1,400,000 | 1,358,581 | ||||||||||||
Marsh & McLennan Cos., Inc. (Insurance) | 3.500% | 06/03/2024 | 1,400,000 | 1,444,514 | ||||||||||||
Progressive Corp. / The (Insurance) | 2.450% | 01/15/2027 | 900,000 | 853,544 | ||||||||||||
Teachers Insurance & Annuity Association of America (Insurance) | (a) | 4.270% | 05/15/2047 | 1,800,000 | 1,845,412 | |||||||||||
|
| |||||||||||||||
| 37,997,727 | ||||||||||||||||
|
| |||||||||||||||
| HEALTH CARE – 4.7% | ||||||||||||||||
AbbVie, Inc. (Biotechnology) | 2.900% | 11/06/2022 | 1,425,000 | 1,438,227 | ||||||||||||
Amgen, Inc. (Biotechnology) | 4.100% | 06/15/2021 | 1,000,000 | 1,060,571 | ||||||||||||
Baxalta, Inc. (Biotechnology) | 4.000% | 06/23/2025 | 1,400,000 | 1,460,347 | ||||||||||||
Celgene Corp. (Biotechnology) | 3.875% | 08/15/2025 | 1,350,000 | 1,410,001 | ||||||||||||
Laboratory Corp. of America Holdings (Health Care Providers & Svs.) | 3.750% | 08/23/2022 | 425,000 | 441,606 | ||||||||||||
Quest Diagnostics, Inc. (Health Care Providers & Svs.) | 2.700% | 04/01/2019 | 1,000,000 | 1,011,732 | ||||||||||||
Pfizer, Inc. (Pharmaceuticals) | 3.000% | 12/15/2026 | 900,000 | 902,609 | ||||||||||||
|
| |||||||||||||||
| 7,725,093 | ||||||||||||||||
|
| |||||||||||||||
| INDUSTRIALS – 7.0% | ||||||||||||||||
BAE Systems Holdings, Inc. (Aerospace & Defense) | (a) | 6.375% | 06/01/2019 | 750,000 | 807,739 | |||||||||||
Lockheed Martin Corp. (Aerospace & Defense) | 3.350% | 09/15/2021 | 1,000,000 | 1,040,101 | ||||||||||||
Lockheed Martin Corp. (Aerospace & Defense) | 3.600% | 03/01/2035 | 1,000,000 | 987,813 | ||||||||||||
Raytheon Co. (Aerospace & Defense) | 4.400% | 02/15/2020 | 1,250,000 | 1,329,084 | ||||||||||||
FedEx Corp. (Air Freight & Logistics) | 4.900% | 01/15/2034 | 1,425,000 | 1,587,781 | ||||||||||||
Illinois Tool Works, Inc. (Machinery) | 3.375% | 09/15/2021 | 500,000 | 520,184 | ||||||||||||
Parker-Hannifin Corp. (Machinery) | 4.200% | 11/21/2034 | 1,400,000 | 1,491,231 | ||||||||||||
Burlington Northern Santa Fe, LLC (Road & Rail) | 4.550% | 09/01/2044 | 900,000 | 999,020 | ||||||||||||
Norfolk Southern Corp. (Road & Rail) | 3.000% | 04/01/2022 | 600,000 | 613,303 | ||||||||||||
Union Pacific Corp. (Road & Rail) | 3.250% | 08/15/2025 | 1,000,000 | 1,027,883 | ||||||||||||
Aircastle Ltd. (Trading Companies & Distributors) | 4.125% | 05/01/2024 | 1,000,000 | 1,016,250 | ||||||||||||
|
| |||||||||||||||
| 11,420,389 | ||||||||||||||||
|
| |||||||||||||||
| INFORMATION TECHNOLOGY – 6.6% | ||||||||||||||||
Dell International, LLC / EMC Corp. (Computers & Peripherals) | (a) | 5.450% | 06/15/2023 | 900,000 | 976,531 | |||||||||||
Intel Corp. (Semiconductors & Equip.) | 4.000% | 12/15/2032 | 1,500,000 | 1,582,831 | ||||||||||||
KLA-Tencor Corp. (Semiconductors & Equip.) | 3.375% | 11/01/2019 | 900,000 | 925,395 | ||||||||||||
Microsoft Corp. (Software) | 4.450% | 11/03/2045 | 900,000 | 1,002,867 | ||||||||||||
Microsoft Corp. (Software) | 4.100% | 02/06/2037 | 900,000 | 970,558 | ||||||||||||
Oracle Corp. (Software) | 4.300% | 07/08/2034 | 1,500,000 | 1,629,237 | ||||||||||||
Apple, Inc. (Tech. Hardware, Storage & Periph.) | 2.500% | 02/09/2025 | 1,000,000 | 978,124 | ||||||||||||
Apple, Inc. (Tech. Hardware, Storage & Periph.) | 3.350% | 02/09/2027 | 900,000 | 921,531 | ||||||||||||
Hewlett Packard Enterprise Co. (Tech. Hardware, Storage & Periph.) | 4.900% | 10/15/2025 | 850,000 | 891,216 | ||||||||||||
Seagate HDD Cayman (Tech. Hardware, Storage & Periph.) | (a) | 4.875% | 03/01/2024 | 900,000 | 915,377 | |||||||||||
|
| |||||||||||||||
| 10,793,667 | ||||||||||||||||
|
| |||||||||||||||
| MATERIALS – 3.7% | ||||||||||||||||
Airgas, Inc. (Chemicals) | 3.050% | 08/01/2020 | 900,000 | 922,194 | ||||||||||||
CF Industries, Inc. (Chemicals) | (a) | 3.400% | 12/01/2021 | 900,000 | 909,841 | |||||||||||
Dow Chemical Co. / The (Chemicals) | 4.250% | 10/01/2034 | 1,400,000 | 1,445,317 | ||||||||||||
FMC Corp. (Chemicals) | 3.950% | 02/01/2022 | 1,000,000 | 1,037,089 | ||||||||||||
Packaging Corp. of America (Containers & Packaging) | 4.500% | 11/01/2023 | 675,000 | 724,159 | ||||||||||||
Anglo American Capital PLC (Metals & Mining) | (a) | 3.750% | 04/10/2022 | 1,000,000 | 1,005,000 | |||||||||||
|
| |||||||||||||||
| 6,043,600 | ||||||||||||||||
|
| |||||||||||||||
| 10 | (continued) |
| Ohio National Fund, Inc. | Bond Portfolio (Continued) |
Schedule of Investments | June 30, 2017 (Unaudited) |
| Corporate Bonds (Continued) | Rate | Maturity | Face Amount | Value | ||||||||||||
| REAL ESTATE – 7.7% | ||||||||||||||||
Alexandria Real Estate Equities, Inc. (Equity Real Estate Investment Trusts) | 3.950% | 01/15/2028 | $ | 900,000 | $ | 915,296 | ||||||||||
Boston Properties LP (Equity Real Estate Investment Trusts) | 3.125% | 09/01/2023 | 925,000 | 936,324 | ||||||||||||
Camden Property Trust (Equity Real Estate Investment Trusts) | 4.250% | 01/15/2024 | 900,000 | 942,852 | ||||||||||||
Crown Castle International Corp. (Equity Real Estate Investment Trusts) | 4.000% | 03/01/2027 | 1,800,000 | 1,852,900 | ||||||||||||
Federal Realty Investment Trust (Equity Real Estate Investment Trusts) | 3.000% | 08/01/2022 | 1,425,000 | 1,435,354 | ||||||||||||
HCP, Inc. (Equity Real Estate Investment Trusts) | 4.000% | 06/01/2025 | 1,500,000 | 1,536,657 | ||||||||||||
Healthcare Realty Trust, Inc. (Equity Real Estate Investment Trusts) | 3.875% | 05/01/2025 | 1,400,000 | 1,411,295 | ||||||||||||
Hospitality Properties Trust (Equity Real Estate Investment Trusts) | 4.250% | 02/15/2021 | 1,000,000 | 1,042,657 | ||||||||||||
Simon Property Group LP (Equity Real Estate Investment Trusts) | 3.750% | 02/01/2024 | 1,475,000 | 1,535,779 | ||||||||||||
Welltower, Inc. (Equity Real Estate Investment Trusts) | 4.250% | 04/01/2026 | 1,000,000 | 1,045,793 | ||||||||||||
|
| |||||||||||||||
| 12,654,907 | ||||||||||||||||
|
| |||||||||||||||
| TELECOMMUNICATION SERVICES – 2.6% | ||||||||||||||||
AT&T, Inc. (Diversified Telecom. Svs.) | 3.400% | 05/15/2025 | 900,000 | 884,861 | ||||||||||||
AT&T, Inc. (Diversified Telecom. Svs.) | 4.125% | 02/17/2026 | 1,000,000 | 1,025,365 | ||||||||||||
Verizon Communications, Inc. (Diversified Telecom. Svs.) | 4.600% | 04/01/2021 | 1,250,000 | 1,340,424 | ||||||||||||
Verizon Communications, Inc. (Diversified Telecom. Svs.) | 3.850% | 11/01/2042 | 425,000 | 371,061 | ||||||||||||
Rogers Communications, Inc. (Wireless Telecom. Svs.) | 3.000% | 03/15/2023 | 700,000 | 704,107 | ||||||||||||
|
| |||||||||||||||
| 4,325,818 | ||||||||||||||||
|
| |||||||||||||||
| UTILITIES – 9.0% | ||||||||||||||||
AEP Transmission Co., LLC (Electric Utilities) | 4.000% | 12/01/2046 | 900,000 | 931,217 | ||||||||||||
Appalachian Power Co. (Electric Utilities) | 4.600% | 03/30/2021 | 1,000,000 | 1,073,748 | ||||||||||||
Commonwealth Edison Co. (Electric Utilities) | 4.350% | 11/15/2045 | 900,000 | 971,499 | ||||||||||||
DTE Electric Co. (Electric Utilities) | 3.375% | 03/01/2025 | 1,000,000 | 1,032,477 | ||||||||||||
Duke Energy Corp. (Electric Utilities) | 3.750% | 09/01/2046 | 900,000 | 856,285 | ||||||||||||
Duke Energy Florida, LLC (Electric Utilities) | 4.550% | 04/01/2020 | 500,000 | 533,219 | ||||||||||||
ITC Holdings Corp. (Electric Utilities) | 3.650% | 06/15/2024 | 500,000 | 508,989 | ||||||||||||
LG&E & KU Energy, LLC (Electric Utilities) | 4.375% | 10/01/2021 | 1,000,000 | 1,062,889 | ||||||||||||
NextEra Energy Capital Holdings, Inc. (Electric Utilities) | 1.649% | 09/01/2018 | 900,000 | 897,302 | ||||||||||||
South Carolina Electric & Gas Co. (Electric Utilities) | 4.350% | 02/01/2042 | 1,000,000 | 1,008,671 | ||||||||||||
Xcel Energy, Inc. (Electric Utilities) | 4.700% | 05/15/2020 | 1,000,000 | 1,058,545 | ||||||||||||
Southern Co. Gas Capital Corp. (Gas Utilities) | 5.250% | 08/15/2019 | 1,000,000 | 1,060,022 | ||||||||||||
Southwest Gas Corp. (Gas Utilities) | 3.875% | 04/01/2022 | 1,250,000 | 1,291,019 | ||||||||||||
Avista Corp. (Multi-Utilities) | 5.950% | 06/01/2018 | 1,000,000 | 1,037,931 | ||||||||||||
American Water Capital Corp. (Water Utilities) | 4.300% | 12/01/2042 | 1,400,000 | 1,513,486 | ||||||||||||
|
| |||||||||||||||
| 14,837,299 | ||||||||||||||||
|
| |||||||||||||||
Total Corporate Bonds (Cost $155,562,857) | $ | 160,070,548 | ||||||||||||||
|
| |||||||||||||||
| Asset-Backed Securities – 0.6% | Rate | Maturity | Face Amount | Value | ||||||||||||
| INDUSTRIALS – 0.6% | ||||||||||||||||
American Airlines 2015-1 Class B Pass Through Trust (Airlines) | 3.700% | 05/01/2023 | $ | 939,838 | $ | 930,439 | ||||||||||
|
| |||||||||||||||
Total Asset-Backed Securities (Cost $938,775) | $ | 930,439 | ||||||||||||||
|
| |||||||||||||||
| Money Market Funds – 1.2% | Shares | Value | ||||||||||||||
State Street Institutional U.S. Government Money Market Fund Institutional Class | 1,912,862 | $ | 1,912,862 | |||||||||||||
|
| |||||||||||||||
Total Money Market Funds (Cost $1,912,862) | $ | 1,912,862 | ||||||||||||||
|
| |||||||||||||||
Total Investments – 99.1% (Cost $158,414,494) | (c) | $ | 162,913,849 | |||||||||||||
Other Assets in Excess of Liabilities – 0.9% | 1,533,456 | |||||||||||||||
|
| |||||||||||||||
Net Assets – 100.0% | $ | 164,447,305 | ||||||||||||||
|
| |||||||||||||||
Percentages are stated as a percent of net assets.
Footnotes:
| (a) | Security exempt from registration under Regulation D of the Securities Act of 1933. These securities may be resold in transactions exempt from registration, normally to qualified buyers under Rule 144A. At June 30, 2017, the value of these securities totaled $12,539,853, or 7.6% of the Portfolio’s net assets. These securities were deemed liquid pursuant to procedures approved by the Board of Directors. |
| (b) | Security is a variable rate instrument in which the coupon or dividend rate is fixed until a later specified date, then is adjusted periodically. Rates stated are those in effect at June 30, 2017. |
| (c) | Represents cost for financial reporting purposes, which may differ from cost basis for federal income tax purposes. See also Note 7 of the Notes to Financial Statements. |
The accompanying notes are an integral part of these financial statements.
| 11 |
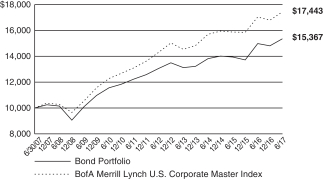
| Ohio National Fund, Inc. | Omni Portfolio |
Objective/Strategy
The Omni Portfolio seeks a high level of long-term total return consistent with preservation of capital by investing in stocks, bonds, and money market instruments.
Performance as of June 30, 2017
Average Annual returns | ||||
One year | 17.99% | |||
Five years | 14.33% | |||
Ten years | 7.32% |
Past performance does not guarantee future results. The performance data quoted represents past performance and current returns may be lower or higher. Total return figures include change in share price and reinvestment of dividends and capital gains. The investment return and principal value will fluctuate so that an investor’s shares, when redeemed, may be worth more or less than the original cost. To obtain performance information up to the most recent month end, call toll-free 1-877-781-6392.
The Portfolio is not open to direct retail investment. Beneficial interest in shares is obtained solely by purchase of variable life insurance policies and variable annuity contracts. Actual performance results for variable annuity and variable universal life contracts will be lower due to contract charges. Consult your contract for applicable charges.
Total expense ratio is 0.80% per the Fund’s prospectus dated May 1, 2017. Additional information pertaining to the Fund’s expense ratio as of June 30, 2017 can be found in the Portfolio’s Financial Highlights.
Comments from Sub-Adviser/Adviser
Q. How did the Portfolio perform in comparison to its benchmark during the reporting period?
A. For the six-month period ended June 30, 2017, the Omni Portfolio returned 9.36% versus 7.68% for its benchmark, which is comprised of 70% S&P 500 Index and 30% BofA Merrill Lynch U.S. Corporate Master Index.
Q. Were there specific market conditions, investment strategies, or techniques that materially affected the Portfolio’s benchmark-relative performance during the reporting period?
A. At the half-way point of the year, the economy continues to churn ahead; perhaps, not at the speed our President desires, or promised, but at least in a positive direction. As the economy moves along steadily, under the watchful eye of the Federal Reserve, the market anticipated the progress of the federal government in implementing some of the broader promises leading up to the election.
Health care affects a large portion of the economy. At this point, major changes do not appear to be expected. If there is no new health care plan and subsequent major tax overhaul, there is a significant chance the market will react negatively. While one could argue that tax cut expectations have been reduced, there is clearly the hope that some major changes occur, even if it is a tax holiday to repatriate overseas earnings.
Q. How did sector selection and security selection each impact the Portfolio’s performance relative to its benchmark?
A. The Portfolio’s outperformance was due principally to stock selection in Consumer Discretionary and Information Technology, as well as an underweight in Energy. In addition, the Portfolio’s asset allocation to stocks was slightly higher than the benchmark, which
added to performance. Detractors from relative return were led by stock selection in Consumer Staples and Financials.(1)
The fixed income portion of the Portfolio slightly underperformed the fixed income portion of the benchmark. Lower quality bonds outperformed higher quality bonds during the period, as investors continue to reach for yield. The Portfolio’s U.S. Treasury Obligations detracted from relative performance, as bond spreads tightened during the period.(1)
Q. Were there any factors that impacted the benchmark’s performance more significantly than the Portfolio’s performance?
A. The benchmark does not include cash in its performance calculation, while the portfolio maintains a cash balance due to inflows and outflows from shareholder participants. Cash benefits the Portfolio’s return relative to the benchmark when returns are negative during a period, and creates a drag on performance, relative to the benchmark during a period of positive performance. During the period, returns were positive in the Portfolio, so cash was a detractor to performance of the Portfolio, relative to the benchmark. In addition, the benchmark does not have mutual fund expenses in its performance calculation.(1)
Q. Which holdings contributed the most to, and detracted the most from, the Portfolio’s benchmark-relative performance?
A. Among the Portfolio’s Information Technology holdings, DXC Technology Co. generated 71 basis points of relative contribution during the six-month period and was able to beat analyst earnings estimates on stronger margins and continued progress towards its merger synergies with Hewlett Packard Enterprise Co. Delphi Automotive Plc contributed 56 basis points on positive earnings results and the spinoff of its powertrain division. Alnylam Pharmaceuticals, Inc. added 50 basis points, benefitting from a competitor’s release that helped confirm the efficacy of the Alnylam Pharmaceuticals’ drug for familial amyloidotic polyneuropathy (FAP).(1)
The key detractor was IMAX Corp., which detracted 55 basis points of relative contribution during the six-month period while struggling from a slew of negative revisions, as the outlook for the summer movie slate worsened. We finally exited the position when it appeared that China was getting closer to saturation of IMAX theatres sooner than expected, and the revenue per theatre might be secularly challenged. Devon Energy Corp. cost the Portfolio 38 basis points, as it continued to contend with the consistently deteriorating outlook for oil prices. Even as the Organization of the Petroleum Exporting Countries (“OPEC”) struggles to maintain a cap on its own production levels, United States production has managed to stay resilient, pushing oil prices lower even as company specific results continue to trend positively. AECOM, which detracted 22 basis points, was expected to be a major beneficiary of a bipartisan infrastructure spending bill, but so far it seems expectations for any explicit plan to be released and implemented keep getting delayed.(1)
On the fixed income portion of the Portfolio, longer duration bonds performed the best. Specifically, Williams Partners LP 5.400% due 03/04/2044, Time Warner Cable, LLC 6.550% due 05/01/2037 and Microsoft Corp. 4.100% due 02/06/2037 contributed to relative performance. Each of these bonds are longer duration bonds that performed well with the decline in longer term interest rates and experienced spread tightening during the period. The largest detractors from performance were Coach, Inc. 4.125% due 07/15/2027, Lloyds Banking Group PLC 3.750% due 01/11/2027, and
| 12 | (continued) |
| Ohio National Fund, Inc. | Omni Portfolio (Continued) |
AEP Transmission Co., LLC 4.000% due 12/01/2046. Lloyds Banking Group PLC and A&P Transmission Co. experienced spread widening during the time held in the Portfolio. The decline in Coach was due to a rise in interest rates during the time it was held in the Portfolio.(1)
Q. Were there any significant changes to the Portfolio’s management team, investments strategy, or selection process during the reporting period?
A. Effective May 1, 2017, Gary Rodmaker of Ohio National Investments, Inc., the adviser to the Portfolio, became the Portfolio’s portfolio manager of the fixed income portion of the Portfolio. Previously, Phillip Byrde of Ohio National Investments, Inc. was the portfolio manager of the fixed income portion. There were no significant changes to the investment strategy or security selection process during the reporting period.
| (1) | The Portfolio’s composition is subject to change. Holdings and weightings are as of June 30, 2017. |
Change in Value of $10,000 Investment
Hypothetical illustration based on past performance. Future performance will vary. The Portfolio’s returns reflect reinvested dividends. The Portfolio’s holdings may differ significantly from the securities in the index. The index is unmanaged and therefore does not reflect the cost of portfolio management and accounting.
The S&P 500 Index is a capitalization-weighted index designed to measure performance of the broad domestic market through changes in the aggregate market value of 500 stocks representing all major industries. The index presented includes the effects of reinvested dividends.
The BofA Merrill Lynch U.S. Corporate Master Index tracks the performance of all U.S. dollar-denominated, investment grade corporate public debt issued in the U.S. domestic bond market. Qualifying bonds must have an investment grade rating (based on an average of Moody’s, S&P, and Fitch). In addition, qualifying securities must have at least one year remaining term to maturity, a fixed coupon schedule, and a minimum amount outstanding of $250 million.
| 13 | (continued) |
| Ohio National Fund, Inc. | Omni Portfolio (Continued) |
Portfolio Composition as of June 30, 2017 (1)
| % of Net Assets | ||||
Common Stocks (4) | 77.1 | |||
Corporate Bonds (4) | 20.0 | |||
Asset-Backed Securities (4) | 0.1 | |||
U.S. Treasury Obligations | 1.8 | |||
Money Market Funds and | 1.0 | |||
|
| |||
| 100.0 | ||||
|
|
Top 10 Portfolio Holdings as of June 30, 2017 (1) (2) (3)
| % of Net Assets | ||||
1. Apple, Inc. | 2.8 | |||
2. Amazon.com, Inc. | 2.5 | |||
3. Alphabet, Inc. Class C | 2.3 | |||
4. Facebook, Inc. Class A | 2.1 | |||
5. Citigroup, Inc. | 2.0 | |||
6. JPMorgan Chase & Co. | 2.0 | |||
7. Bank of America Corp. | 2.0 | |||
8. Goldman Sachs Group, Inc. / The | 1.9 | |||
9. Microsoft Corp. | 1.9 | |||
10. Humana, Inc. | 1.6 |
| (1) | Composition of Portfolio subject to change. |
| (2) | Short-term investments have been excluded from the list of Top 10 Portfolio Holdings. |
| (3) | Top 10 Portfolio Holdings is presented at an individual security level. Total investment exposure by issuer may be higher. |
| (4) | Sectors (Common Stocks, Corporate Bonds, Asset-Backed Securities): |
| % of Net Assets | ||||
Information Technology | 25.1 | |||
Consumer Discretionary | 16.9 | |||
Financials | 15.8 | |||
Industrials | 12.3 | |||
Health Care | 11.1 | |||
Energy | 5.1 | |||
Consumer Staples | 4.2 | |||
Materials | 2.2 | |||
Telecommunication Services | 1.6 | |||
Utilities | 1.5 | |||
Real Estate | 1.4 | |||
|
| |||
| 97.2 | ||||
|
|
| 14 |
| Ohio National Fund, Inc. | Omni Portfolio |
Schedule of Investments | June 30, 2017 (Unaudited) |
| Common Stocks – 77.1% | Shares | Value | ||||||||
| CONSUMER DISCRETIONARY – 14.7% | ||||||||||
McDonald’s Corp. (Hotels, Restaurants & Leisure) | 6,267 | $ | 959,854 | |||||||
MGM Resorts International (Hotels, Restaurants & Leisure) | 27,462 | 859,286 | ||||||||
Royal Caribbean Cruises Ltd. (Hotels, Restaurants & Leisure) | 4,239 | 463,026 | ||||||||
D.R. Horton, Inc. (Household Durables) | 28,324 | 979,161 | ||||||||
Newell Brands, Inc. (Household Durables) | 17,101 | 916,956 | ||||||||
Amazon.com, Inc. (Internet & Direct Marketing Retail) | (a) | 1,620 | 1,568,160 | |||||||
CBS Corp. Class B (Media) | 14,830 | 945,857 | ||||||||
Time Warner, Inc. (Media) | 4,896 | 491,607 | ||||||||
Coach, Inc. (Textiles, Apparel & Luxury Goods) | 20,552 | 972,932 | ||||||||
PVH Corp. (Textiles, Apparel & Luxury Goods) | 8,526 | 976,227 | ||||||||
|
| |||||||||
| 9,133,066 | ||||||||||
|
| |||||||||
| CONSUMER STAPLES – 2.9% | ||||||||||
Kraft Heinz Co. / The (Food Products) | 10,160 | 870,102 | ||||||||
Philip Morris International, Inc. (Tobacco) | 7,964 | 935,372 | ||||||||
|
| |||||||||
| 1,805,474 | ||||||||||
|
| |||||||||
| ENERGY – 1.5% | ||||||||||
Devon Energy Corp. (Oil, Gas & Consumable Fuels) | 13,163 | 420,821 | ||||||||
Pioneer Natural Resources Co. (Oil, Gas & Consumable Fuels) | 3,202 | 510,975 | ||||||||
|
| |||||||||
| 931,796 | ||||||||||
|
| |||||||||
| FINANCIALS – 10.2% | ||||||||||
Bank of America Corp. (Banks) | 51,211 | 1,242,379 | ||||||||
Citigroup, Inc. (Banks) | 18,958 | 1,267,911 | ||||||||
JPMorgan Chase & Co. (Banks) | 13,780 | 1,259,492 | ||||||||
KeyCorp (Banks) | 51,500 | 965,110 | ||||||||
Goldman Sachs Group, Inc. / The (Capital Markets) | 5,309 | 1,178,067 | ||||||||
Morgan Stanley (Capital Markets) | 10,547 | 469,974 | ||||||||
|
| |||||||||
| 6,382,933 | ||||||||||
|
| |||||||||
| HEALTH CARE – 10.3% | ||||||||||
Alnylam Pharmaceuticals, Inc. (Biotechnology) | (a) | 8,272 | 659,775 | |||||||
Celgene Corp. (Biotechnology) | (a) | 3,711 | 481,948 | |||||||
Medtronic PLC (Health Care Equip. & Supplies) | 4,845 | 429,994 | ||||||||
Envision Healthcare Corp. (Health Care Providers & Svs.) | (a) | 14,340 | 898,688 | |||||||
Humana, Inc. (Health Care Providers & Svs.) | 4,081 | 981,970 | ||||||||
UnitedHealth Group, Inc. (Health Care Providers & Svs.) | 3,109 | 576,471 | ||||||||
Thermo Fisher Scientific, Inc. (Life Sciences Tools & Svs.) | 5,503 | 960,108 | ||||||||
Aerie Pharmaceuticals, Inc. (Pharmaceuticals) | (a) | 8,928 | 469,166 | |||||||
AstraZeneca PLC – ADR (Pharmaceuticals) | 27,664 | 943,066 | ||||||||
|
| |||||||||
| 6,401,186 | ||||||||||
|
| |||||||||
| INDUSTRIALS – 11.3% | ||||||||||
Raytheon Co. (Aerospace & Defense) | 6,063 | 979,053 | ||||||||
FedEx Corp. (Air Freight & Logistics) | 4,507 | 979,506 | ||||||||
Delta Air Lines, Inc. (Airlines) | 18,062 | 970,652 | ||||||||
AECOM (Construction & Engineering) | (a) | 27,310 | 882,932 | |||||||
Snap-on, Inc. (Machinery) | 5,090 | 804,220 | ||||||||
Wabtec Corp. (Machinery) | 6,911 | 632,357 | ||||||||
Xylem, Inc. (Machinery) | 15,984 | 885,993 | ||||||||
Union Pacific Corp. (Road & Rail) | 8,458 | 921,161 | ||||||||
|
| |||||||||
| 7,055,874 | ||||||||||
|
| |||||||||
| INFORMATION TECHNOLOGY – 23.5% | ||||||||||
Trimble, Inc. (Electronic Equip., Instr. & Comp.) | (a) | 26,783 | 955,350 | |||||||
CommScope Holding Co., Inc. (Communications Equip.) | (a) | 25,313 | 962,653 | |||||||
Alibaba Group Holding Ltd. – ADR (Internet Software & Svs.) | (a) | 3,366 | 474,269 | |||||||
Alphabet, Inc. Class A (Internet Software & Svs.) | (a) | 256 | 237,998 | |||||||
Alphabet, Inc. Class C (Internet Software & Svs.) | (a) | 1,549 | 1,407,623 | |||||||
Facebook, Inc. Class A (Internet Software & Svs.) | (a) | 8,495 | 1,282,575 | |||||||
DXC Technology Co. (IT Svs.) | 12,428 | 953,476 | ||||||||
ASML Holding NV (Semiconductors & Equip.) | 7,127 | 928,719 | ||||||||
Broadcom Ltd. (Semiconductors & Equip.) | 3,981 | 927,772 | ||||||||
Cavium, Inc. (Semiconductors & Equip.) | (a) | 11,954 | 742,702 | |||||||
Marvell Technology Group Ltd. (Semiconductors & Equip.) | 54,819 | 905,610 | ||||||||
Adobe Systems, Inc. (Software) | (a) | 6,700 | 947,648 | |||||||
Microsoft Corp. (Software) | 17,090 | 1,178,014 | ||||||||
| 15 | (continued) |
| Ohio National Fund, Inc. | Omni Portfolio (Continued) |
Schedule of Investments | June 30, 2017 (Unaudited) |
| Common Stocks (Continued) | Shares | Value | ||||||||
| INFORMATION TECHNOLOGY (continued) | ||||||||||
Oracle Corp. (Software) | 18,936 | $ | 949,451 | |||||||
Apple, Inc. (Tech. Hardware, Storage & Periph.) | 12,338 | 1,776,919 | ||||||||
|
| |||||||||
| 14,630,779 | ||||||||||
|
| |||||||||
| MATERIALS – 1.5% | ||||||||||
Dow Chemical Co. / The (Chemicals) | 15,272 | 963,205 | ||||||||
|
| |||||||||
| TELECOMMUNICATION SERVICES – 1.2% | ||||||||||
T-Mobile U.S., Inc. (Wireless Telecom. Svs.) | (a) | 12,840 | 778,361 | |||||||
|
| |||||||||
Total Common Stocks (Cost $42,684,496) | $ | 48,082,674 | ||||||||
|
| |||||||||
| Corporate Bonds – 20.0% | Rate | Maturity | Face Amount | Value | ||||||||||||
| CONSUMER DISCRETIONARY – 2.2% | ||||||||||||||||
General Motors Co. (Automobiles) | 5.000% | 04/01/2035 | $ | 100,000 | $ | 100,344 | ||||||||||
Wyndham Worldwide Corp. (Hotels, Restaurants & Leisure) | 4.150% | 04/01/2024 | 100,000 | 102,688 | ||||||||||||
Newell Brands, Inc. (Household Durables) | 3.150% | 04/01/2021 | 100,000 | 102,367 | ||||||||||||
21st Century Fox America, Inc. (Media) | 4.500% | 02/15/2021 | 100,000 | 107,151 | ||||||||||||
Comcast Corp. (Media) | 5.875% | 02/15/2018 | 75,000 | 76,971 | ||||||||||||
Discovery Communications, LLC (Media) | 3.300% | 05/15/2022 | 75,000 | 75,273 | ||||||||||||
Time Warner Cable, LLC (Media) | 6.550% | 05/01/2037 | 150,000 | 179,304 | ||||||||||||
Viacom, Inc. (Media) | 4.250% | 09/01/2023 | 75,000 | 78,284 | ||||||||||||
Viacom, Inc. (Media) | 3.450% | 10/04/2026 | 100,000 | 96,559 | ||||||||||||
Kohl’s Corp. (Multiline Retail) | 4.000% | 11/01/2021 | 75,000 | 76,806 | ||||||||||||
Home Depot, Inc. / The (Specialty Retail) | 2.125% | 09/15/2026 | 200,000 | 186,992 | ||||||||||||
Coach, Inc. (Textiles, Apparel & Luxury Goods) | 4.125% | 07/15/2027 | 200,000 | 197,988 | ||||||||||||
|
| |||||||||||||||
| 1,380,727 | ||||||||||||||||
|
| |||||||||||||||
CONSUMER STAPLES – 1.3% | ||||||||||||||||
Anheuser-Busch InBev Finance, Inc. (Beverages) | 4.700% | 02/01/2036 | 100,000 | 110,475 | ||||||||||||
Suntory Holdings Ltd. (Beverages) | (b) | 2.550% | 06/28/2022 | 300,000 | 298,135 | |||||||||||
Costco Wholesale Corp. (Food & Staples Retailing) | 3.000% | 05/18/2027 | 100,000 | 99,742 | ||||||||||||
Mead Johnson Nutrition Co. (Food Products) | 3.000% | 11/15/2020 | 100,000 | 102,568 | ||||||||||||
Imperial Brands Finance PLC (Tobacco) | (b) | 3.750% | 07/21/2022 | 100,000 | 104,102 | |||||||||||
Philip Morris International, Inc. (Tobacco) | 3.375% | 08/11/2025 | 100,000 | 102,453 | ||||||||||||
|
| |||||||||||||||
| 817,475 | ||||||||||||||||
|
| |||||||||||||||
ENERGY – 3.6% | ||||||||||||||||
Halliburton Co. (Energy Equip. & Svs.) | 4.850% | 11/15/2035 | 100,000 | 107,026 | ||||||||||||
Noble Holding International Ltd. (Energy Equip. & Svs.) | 5.750% | 03/16/2018 | 100,000 | 100,606 | ||||||||||||
BP Capital Markets PLC (Oil, Gas & Consumable Fuels) | 3.017% | 01/16/2027 | 100,000 | 97,301 | ||||||||||||
Canadian Natural Resources Ltd. (Oil, Gas & Consumable Fuels) | 4.950% | 06/01/2047 | 100,000 | 101,628 | ||||||||||||
Chevron Corp. (Oil, Gas & Consumable Fuels) | 2.895% | 03/03/2024 | 100,000 | 100,921 | ||||||||||||
Columbia Pipeline Group, Inc. (Oil, Gas & Consumable Fuels) | 4.500% | 06/01/2025 | 100,000 | 106,458 | ||||||||||||
Enable Midstream Partners LP (Oil, Gas & Consumable Fuels) | 4.400% | 03/15/2027 | 300,000 | 301,111 | ||||||||||||
EOG Resources, Inc. (Oil, Gas & Consumable Fuels) | 3.150% | 04/01/2025 | 100,000 | 98,353 | ||||||||||||
Exxon Mobil Corp. (Oil, Gas & Consumable Fuels) | 4.114% | 03/01/2046 | 100,000 | 105,648 | ||||||||||||
Kinder Morgan Energy Partners LP (Oil, Gas & Consumable Fuels) | 4.150% | 03/01/2022 | 75,000 | 78,132 | ||||||||||||
Magellan Midstream Partners LP (Oil, Gas & Consumable Fuels) | 6.400% | 07/15/2018 | 150,000 | 156,710 | ||||||||||||
Marathon Oil Corp. (Oil, Gas & Consumable Fuels) | 3.850% | 06/01/2025 | 150,000 | 146,430 | ||||||||||||
Murphy Oil Corp. (Oil, Gas & Consumable Fuels) | 4.700% | 12/01/2022 | 100,000 | 96,550 | ||||||||||||
Phillips 66 (Oil, Gas & Consumable Fuels) | (b)(c) | QL + 75 | 04/15/2020 | 100,000 | 100,201 | |||||||||||
Plains All American Pipeline LP / PAA Finance Corp. (Oil, Gas & Consumable Fuels) | 4.650% | 10/15/2025 | 100,000 | 102,508 | ||||||||||||
Shell International Finance BV (Oil, Gas & Consumable Fuels) | 4.000% | 05/10/2046 | 100,000 | 98,942 | ||||||||||||
Southwestern Energy Co. (Oil, Gas & Consumable Fuels) | 5.800% | 01/23/2020 | 100,000 | 102,450 | ||||||||||||
Spectra Energy Capital LLC (Oil, Gas & Consumable Fuels) | 3.300% | 03/15/2023 | 75,000 | 75,271 | ||||||||||||
TransCanada PipeLines Ltd. (Oil, Gas & Consumable Fuels) | 2.500% | 08/01/2022 | 75,000 | 74,898 | ||||||||||||
Williams Partners LP (Oil, Gas & Consumable Fuels) | 5.400% | 03/04/2044 | 100,000 | 105,753 | ||||||||||||
|
| |||||||||||||||
| 2,256,897 | ||||||||||||||||
|
| |||||||||||||||
FINANCIALS – 5.6% | ||||||||||||||||
Bank of America Corp. (Banks) | 3.875% | 08/01/2025 | 150,000 | 155,191 | ||||||||||||
Branch Banking & Trust Co. (Banks) | 3.625% | 09/16/2025 | 100,000 | 104,016 | ||||||||||||
Citigroup, Inc. (Banks) | 4.400% | 06/10/2025 | 100,000 | 104,137 | ||||||||||||
Comerica, Inc. (Banks) | 3.800% | 07/22/2026 | 100,000 | 101,134 | ||||||||||||
JPMorgan Chase & Co. (Banks) | 3.250% | 09/23/2022 | 100,000 | 102,470 | ||||||||||||
JPMorgan Chase & Co. (Banks) | 3.625% | 12/01/2027 | 200,000 | 197,975 | ||||||||||||
KeyBank NA (Banks) | 5.700% | 11/01/2017 | 150,000 | 151,935 | ||||||||||||
SunTrust Banks, Inc. (Banks) | 2.500% | 05/01/2019 | 100,000 | 100,942 | ||||||||||||
Wells Fargo & Co. (Banks) | 3.000% | 04/22/2026 | 100,000 | 97,675 | ||||||||||||
| 16 | (continued) |
| Ohio National Fund, Inc. | Omni Portfolio (Continued) |
Schedule of Investments | June 30, 2017 (Unaudited) |
| Corporate Bonds(Continued) | Rate | Maturity | Face Amount | Value | ||||||||||||
| CONSUMER DISCRETIONARY (continued) | ||||||||||||||||
Wells Fargo & Co. (Banks) | 3.500% | 03/08/2022 | $ | 75,000 | $ | 77,906 | ||||||||||
Westpac Banking Corp. (Banks) | (c) | 4.322% | 11/23/2031 | 200,000 | 205,007 | |||||||||||
E*TRADE Financial Corp. (Capital Markets) | 4.625% | 09/15/2023 | 100,000 | 104,000 | ||||||||||||
Goldman Sachs Group, Inc. / The (Capital Markets) | 3.750% | 05/22/2025 | 100,000 | 102,408 | ||||||||||||
Intercontinental Exchange, Inc. (Capital Markets) | 2.750% | 12/01/2020 | 100,000 | 101,862 | ||||||||||||
Mellon Funding Corp. (Capital Markets) | 5.500% | 11/15/2018 | 100,000 | 104,899 | ||||||||||||
Morgan Stanley (Capital Markets) | 3.750% | 02/25/2023 | 75,000 | 77,985 | ||||||||||||
Morgan Stanley (Capital Markets) | 3.950% | 04/23/2027 | 100,000 | 100,639 | ||||||||||||
Nasdaq, Inc. (Capital Markets) | 3.850% | 06/30/2026 | 100,000 | 101,476 | ||||||||||||
Northern Trust Corp. (Capital Markets) | 3.950% | 10/30/2025 | 75,000 | 79,408 | ||||||||||||
Capital One Financial Corp. (Consumer Finance) | 2.450% | 04/24/2019 | 75,000 | 75,404 | ||||||||||||
Ford Motor Credit Co., LLC (Consumer Finance) | 3.157% | 08/04/2020 | 100,000 | 101,899 | ||||||||||||
General Motors Financial Co., Inc. (Consumer Finance) | 3.200% | 07/06/2021 | 100,000 | 101,115 | ||||||||||||
Synchrony Financial (Consumer Finance) | 4.250% | 08/15/2024 | 100,000 | 102,149 | ||||||||||||
Berkshire Hathaway, Inc. (Diversified Financial Svs.) | 3.125% | 03/15/2026 | 100,000 | 101,135 | ||||||||||||
Jefferies Group, LLC (Diversified Financial Svs.) | 4.850% | 01/15/2027 | 200,000 | 208,925 | ||||||||||||
Aflac, Inc. (Insurance) | 3.625% | 06/15/2023 | 75,000 | 78,816 | ||||||||||||
American International Group, Inc. (Insurance) | 3.875% | 01/15/2035 | 100,000 | 97,042 | ||||||||||||
Marsh & McLennan Cos., Inc. (Insurance) | 3.500% | 06/03/2024 | 100,000 | 103,180 | ||||||||||||
Progressive Corp. / The (Insurance) | 2.450% | 01/15/2027 | 100,000 | 94,838 | ||||||||||||
Teachers Insurance & Annuity Association of America (Insurance) | (b) | 4.270% | 05/15/2047 | 200,000 | 205,046 | |||||||||||
|
| |||||||||||||||
| 3,440,614 | ||||||||||||||||
|
| |||||||||||||||
HEALTH CARE – 0.8% | ||||||||||||||||
AbbVie, Inc. (Biotechnology) | 2.900% | 11/06/2022 | 75,000 | 75,696 | ||||||||||||
Baxalta, Inc. (Biotechnology) | 4.000% | 06/23/2025 | 100,000 | 104,311 | ||||||||||||
Celgene Corp. (Biotechnology) | 3.875% | 08/15/2025 | 150,000 | 156,667 | ||||||||||||
Laboratory Corp. of America Holdings (Health Care Providers & Svs.) | 3.750% | 08/23/2022 | 75,000 | 77,931 | ||||||||||||
Pfizer, Inc. (Pharmaceuticals) | 3.000% | 12/15/2026 | 100,000 | 100,290 | ||||||||||||
|
| |||||||||||||||
| 514,895 | ||||||||||||||||
|
| |||||||||||||||
INDUSTRIALS – 0.9% | ||||||||||||||||
Lockheed Martin Corp. (Aerospace & Defense) | 3.600% | 03/01/2035 | 100,000 | 98,781 | ||||||||||||
FedEx Corp. (Air Freight & Logistics) | 4.900% | 01/15/2034 | 75,000 | 83,567 | ||||||||||||
Parker-Hannifin Corp. (Machinery) | 4.200% | 11/21/2034 | 100,000 | 106,517 | ||||||||||||
Burlington Northern Santa Fe, LLC (Road & Rail) | 4.550% | 09/01/2044 | 100,000 | 111,002 | ||||||||||||
Norfolk Southern Corp. (Road & Rail) | 3.000% | 04/01/2022 | 75,000 | 76,663 | ||||||||||||
Union Pacific Corp. (Road & Rail) | 3.250% | 08/15/2025 | 100,000 | 102,788 | ||||||||||||
|
| |||||||||||||||
| 579,318 | ||||||||||||||||
|
| |||||||||||||||
INFORMATION TECHNOLOGY – 1.6% | ||||||||||||||||
Dell International, LLC / EMC Corp. (Computers & Peripherals) | (b) | 5.450% | 06/15/2023 | 100,000 | 108,503 | |||||||||||
KLA-Tencor Corp. (Semiconductors & Equip.) | 3.375% | 11/01/2019 | 100,000 | 102,822 | ||||||||||||
Microsoft Corp. (Software) | 4.450% | 11/03/2045 | 100,000 | 111,430 | ||||||||||||
Microsoft Corp. (Software) | 4.100% | 02/06/2037 | 100,000 | 107,840 | ||||||||||||
Oracle Corp. (Software) | 4.300% | 07/08/2034 | 100,000 | 108,616 | ||||||||||||
Apple, Inc. (Tech. Hardware, Storage & Periph.) | 2.500% | 02/09/2025 | 100,000 | 97,812 | ||||||||||||
Apple, Inc. (Tech. Hardware, Storage & Periph.) | 3.350% | 02/09/2027 | 100,000 | 102,392 | ||||||||||||
Hewlett Packard Enterprise Co. (Tech. Hardware, Storage & Periph.) | 4.900% | 10/15/2025 | 150,000 | 157,274 | ||||||||||||
Seagate HDD Cayman (Tech. Hardware, Storage & Periph.) | (b) | 4.875% | 03/01/2024 | 100,000 | 101,709 | |||||||||||
|
| |||||||||||||||
| 998,398 | ||||||||||||||||
|
| |||||||||||||||
MATERIALS – 0.7% | ||||||||||||||||
Airgas, Inc. (Chemicals) | 3.050% | 08/01/2020 | 100,000 | 102,466 | ||||||||||||
CF Industries, Inc. (Chemicals) | 3.450% | 06/01/2023 | 75,000 | 70,875 | ||||||||||||
CF Industries, Inc. (Chemicals) | (b) | 3.400% | 12/01/2021 | 100,000 | 101,094 | |||||||||||
Dow Chemical Co. / The (Chemicals) | 4.250% | 10/01/2034 | 100,000 | 103,237 | ||||||||||||
Packaging Corp. of America (Containers & Packaging) | 4.500% | 11/01/2023 | 75,000 | 80,462 | ||||||||||||
|
| |||||||||||||||
| 458,134 | ||||||||||||||||
|
| |||||||||||||||
REAL ESTATE – 1.4% | ||||||||||||||||
Alexandria Real Estate Equities, Inc. (Equity Real Estate Investment Trusts) | 3.950% | 01/15/2028 | 100,000 | 101,700 | ||||||||||||
Boston Properties LP (Equity Real Estate Investment Trusts) | 3.125% | 09/01/2023 | 75,000 | 75,918 | ||||||||||||
Camden Property Trust (Equity Real Estate Investment Trusts) | 4.250% | 01/15/2024 | 100,000 | 104,761 | ||||||||||||
Crown Castle International Corp. (Equity Real Estate Investment Trusts) | 4.000% | 03/01/2027 | 200,000 | 205,878 | ||||||||||||
Federal Realty Investment Trust (Equity Real Estate Investment Trusts) | 3.000% | 08/01/2022 | 75,000 | 75,545 | ||||||||||||
HCP, Inc. (Equity Real Estate Investment Trusts) | 4.000% | 06/01/2025 | 100,000 | 102,444 | ||||||||||||
Healthcare Realty Trust, Inc. (Equity Real Estate Investment Trusts) | 3.875% | 05/01/2025 | 100,000 | 100,807 | ||||||||||||
Simon Property Group LP (Equity Real Estate Investment Trusts) | 3.750% | 02/01/2024 | 75,000 | 78,091 | ||||||||||||
|
| |||||||||||||||
| 845,144 | ||||||||||||||||
|
| |||||||||||||||
| 17 | (continued) |
| Ohio National Fund, Inc. | Omni Portfolio (Continued) |
Schedule of Investments | June 30, 2017 (Unaudited) |
| Corporate Bonds (Continued) | Rate | Maturity | Face Amount | Value | ||||||||||||
| TELECOMMUNICATION SERVICES – 0.4% | ||||||||||||||||
AT&T, Inc. (Diversified Telecom. Svs.) | 3.400% | 05/15/2025 | $ | 100,000 | $ | 98,318 | ||||||||||
Verizon Communications, Inc. (Diversified Telecom. Svs.) | 3.850% | 11/01/2042 | 75,000 | 65,481 | ||||||||||||
Rogers Communications, Inc. (Wireless Telecom. Svs.) | 3.000% | 03/15/2023 | 75,000 | 75,440 | ||||||||||||
|
| |||||||||||||||
| 239,239 | ||||||||||||||||
|
| |||||||||||||||
UTILITIES – 1.5% | ||||||||||||||||
AEP Transmission Co., LLC (Electric Utilities) | 4.000% | 12/01/2046 | 100,000 | 103,469 | ||||||||||||
Commonwealth Edison Co. (Electric Utilities) | 4.350% | 11/15/2045 | 100,000 | 107,944 | ||||||||||||
Duke Energy Corp. (Electric Utilities) | 3.750% | 09/01/2046 | 100,000 | 95,143 | ||||||||||||
Fortis, Inc. (Electric Utilities) | 3.055% | 10/04/2026 | 100,000 | 96,499 | ||||||||||||
NextEra Energy Capital Holdings, Inc. (Electric Utilities) | 1.649% | 09/01/2018 | 100,000 | 99,700 | ||||||||||||
Pennsylvania Electric Co. (Electric Utilities) | 6.050% | 09/01/2017 | 150,000 | 150,964 | ||||||||||||
South Carolina Electric & Gas Co. (Electric Utilities) | 4.350% | 02/01/2042 | 75,000 | 75,650 | ||||||||||||
Southwest Gas Corp. (Gas Utilities) | 3.875% | 04/01/2022 | 75,000 | 77,461 | ||||||||||||
American Water Capital Corp. (Water Utilities) | 4.300% | 12/01/2042 | 100,000 | 108,106 | ||||||||||||
|
| |||||||||||||||
| 914,936 | ||||||||||||||||
|
| |||||||||||||||
Total Corporate Bonds (Cost $12,151,785) | $ | 12,445,777 | ||||||||||||||
|
| |||||||||||||||
| Asset-Backed Securities – 0.1% | Rate | Maturity | Face Amount | Value | ||||||||||||
| INDUSTRIALS – 0.1% | ||||||||||||||||
American Airlines 2015-1 Class B Pass Through Trust (Airlines) | 3.700% | 05/01/2023 | $ | 80,673 | $ | 79,866 | ||||||||||
|
| |||||||||||||||
Total Asset-Backed Securities (Cost $80,673) | $ | 79,866 | ||||||||||||||
|
| |||||||||||||||
| U.S. Treasury Obligations – 1.8% | Rate | Maturity | Face Amount | Value | ||||||||||||
U.S. Treasury Note | 1.500% | 11/30/2019 | $ | 400,000 | $ | 400,375 | ||||||||||
U.S. Treasury Note | 1.500% | 03/31/2023 | 400,000 | 388,984 | ||||||||||||
U.S. Treasury Note | 1.750% | 05/15/2022 | 300,000 | 298,324 | ||||||||||||
|
| |||||||||||||||
Total U.S. Treasury Obligations (Cost $1,116,108) | $ | 1,087,683 | ||||||||||||||
|
| |||||||||||||||
| Money Market Funds – 0.7% | Shares | Value | ||||||||||||||
State Street Institutional U.S. Government Money Market Fund Institutional Class | 445,138 | $ | 445,138 | |||||||||||||
|
| |||||||||||||||
Total Money Market Funds (Cost $445,138) | $ | 445,138 | ||||||||||||||
|
| |||||||||||||||
Total Investments – 99.7% (Cost $56,478,200) | (d) | $ | 62,141,138 | |||||||||||||
Other Assets in Excess of Liabilities – 0.3% | 210,307 | |||||||||||||||
|
| |||||||||||||||
Net Assets – 100.0% | $ | 62,351,445 | ||||||||||||||
|
| |||||||||||||||
Percentages are stated as a percent of net assets.
Abbreviations:
| ADR: | American Depositary Receipts |
Footnotes:
| (a) | Non-income producing security. |
| (b) | Security exempt from registration under Regulation D of the Securities Act of 1933. These securities may be resold in transactions exempt from registration, normally to qualified buyers under Rule 144A. At June 30, 2017, the value of these securities totaled $1,018,790, or 1.6% of the Portfolio’s net assets. These securities were deemed liquid pursuant to procedures approved by the Board of Directors. |
| (c) | Security is a variable rate instrument in which the coupon or dividend rate is fixed until a later specified date, then is adjusted periodically. Rates stated are those in effect at June 30, 2017. |
| (d) | Represents cost for financial reporting purposes, which may differ from cost basis for federal income tax purposes. See also Note 7 of the Notes to Financial Statements. |
The accompanying notes are an integral part of these financial statements.
| 18 |
| Ohio National Fund, Inc. | Capital Appreciation Portfolio |
Objective/Strategy
The Capital Appreciation Portfolio seeks long-term growth of capital by investing primarily in equity and equity related securities of established companies with either current or emerging earnings growth not fully appreciated or recognized by the market.
Performance as of June 30, 2017
Average Annual returns | ||||
One year | 19.92% | |||
Five years | 13.62% | |||
Ten years | 6.52% |
Past performance does not guarantee future results. The performance data quoted represents past performance and current returns may be lower or higher. Total return figures include change in share price and reinvestment of dividends and capital gains. The investment return and principal value will fluctuate so that an investor’s shares, when redeemed, may be worth more or less than the original cost. To obtain performance information up to the most recent month end, call toll-free 1-877-781-6392.
The Portfolio is not open to direct retail investment. Beneficial interest in shares is obtained solely by purchase of variable life insurance policies and variable annuity contracts. Actual performance results for variable annuity and variable universal life contracts will be lower due to contract charges. Consult your contract for applicable charges.
Total expense ratio is 0.83% per the Fund’s prospectus dated May 1, 2017. Additional information pertaining to the Fund’s expense ratio as of June 30, 2017 can be found in the Portfolio’s Financial Highlights.
Comments from Sub-Adviser
Q. How did the Portfolio perform in comparison to its benchmark during the reporting period?
A. For the six-month period ended June 30, 2017, the Capital Appreciation Portfolio returned 5.23% versus 9.34% for its benchmark, the S&P 500 Index.
Q. Were there specific market conditions, investment strategies, or techniques that materially affected the Portfolio’s benchmark-relative performance during the reporting period?
A. Equity market gains so far this year have been supported by earnings growth and margin expansion across many industries. In the S&P 500 Index, there was significant sector disparity, with Information Technology, Health Care, and Consumer Discretionary advancing double digits and Energy and Telecommunication Services each falling by more than 10%. In addition, large caps outperformed small caps and growth significantly outperformed value across capitalizations. This is sharp contrast to the market dynamics in 2016, when small cap value led and large cap growth lagged. While the Portfolio utilizes a “go anywhere” strategy, our reward versus risk discipline typically drives us away from areas of the market where valuations are stretched and towards smaller and mid cap names where we often find more misunderstood and/or mispriced securities. As a result, the Portfolio is currently underweight large cap growth and overweight small/midcap.(1)
Q. How did sector selection and security selection each impact the Portfolio’s performance relative to its benchmark?
A. The Energy sector was partly responsible for the underperformance, as both stock selection and an overweight stance detracted. In retrospect, we overestimated the extent to which the Organization of the Petroleum Exporting Counties’ (“OPEC’s”)
decision to cut production would lift prices. In addition, the market’s responsiveness to weekly data point fluctuations that failed to meet its expectations, combined with negative news headlines and the likelihood of producers hedging their 2018 production, drove increased volatility and West Texas Intermediate (WTI) oil prices to their lows during the second quarter. This volatility seemed to have a significant negative effect on many of our holdings. We have been trimming the Portfolio’s exposure to the sector, but still have conviction that the Portfolio’s holdings represent unique franchises that are well positioned when inventories start to fall.(1)
Within Health Care and Information Technology, relative results were also negatively impacted by stock selection and underweight positions. These results were derived from company-specific events more than from a consistent theme. Conversely, security selection in Materials and Real Estate contributed to relative performance.(1)
Q. Which holdings contributed the most to, and detracted the most from, the Portfolio’s benchmark-relative performance?
A. Coach Inc. announced an acquisition of Kate Spade, which we believe fits well in the company’s strategic plans. Coach Inc.’s brand transformation continues to drive differentiation and relevance amidst a highly competitive environment in North America. Coach, Inc.’s management continues to execute on its long-term turnaround strategy. With the current repositioning of the business gaining momentum, as well as the growth in international markets and its Stuart Weitzman line, we find the reward to risk ratio very attractive.(1)
Live Nation Entertainment, Inc. started off the year on a high note as both concerts and ticketing were well above expectations. We think the outlook remains very favorable. Many growth drivers like the secondary market, international expansion, and share gains are in place and the core business generates strong cash flow.(1)
Veeva Systems, a provider of industry cloud software and data solutions for the life sciences industry, reported financial results that easily beat market expectations, driven by growth in its vault product. We believe the growth potential for Veeva is still attractive; however, the Portfolio eliminated the position due to a narrowing risk/reward ratio after very strong share price performance.(1)
The Portfolio’s largest detractors from relative return were all from the Energy sector.(1)
Patterson-UTI Energy, Inc. has a strong high-spec land rig and pressure pumping (fracking) business, along with a management team that has executed well through the downturn. Their high-spec rig fleet will be in demand and garner higher rig-day rates as shale basin production likely increases throughout 2017 and 2018.(1)
Halliburton Co. should continue to execute on its preeminent position as the leading integrated provider of oil field services. The potential for increasing incremental margins in pressure pumping and completions still remains. We believe the stock’s recent pull back is just a function of timing, as the company signaled that it will be protecting its market share as activity picks up throughout 2017.(1)
Noble Energy, Inc. is attractively valued, given its prospects for growth in the Middle East, efficient use of capital and prudent cost management. We favor the company for its highly visible stream of production growth due to a combination of strong international and United States assets, along with a clean balance sheet. The recent sanctioning of the Leviathan gas project in offshore Mediterranean will be a huge cash flow generator as the company sells natural gas to markets in Israel, Egypt and Jordan. Noble Energy, Inc. is one of
| 19 | (continued) |
| Ohio National Fund, Inc. | Capital Appreciation Portfolio (Continued) |
the cheapest major independent producers in the oil, gas, and consumable fuels industry on a sum-of-the-parts and cash flow-multiple basis.(1)
| (1) | The Portfolio’s composition is subject to change. Holdings and weightings are as of June 30, 2017. |
Change in Value of $10,000 Investment
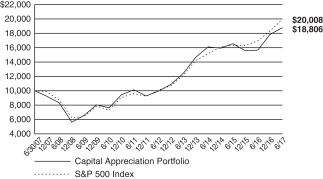
Hypothetical illustration based on past performance. Future performance will vary. The Portfolio’s returns reflect reinvested dividends. The Portfolio’s holdings may differ significantly from the securities in the index. The index is unmanaged and therefore does not reflect the cost of portfolio management and accounting.
The S&P 500 Index is a capitalization-weighted index designed to measure performance of the broad domestic economy through changes in the aggregate market value of 500 stocks representing all major industries. The index presented includes the effects of reinvested dividends.
Portfolio Composition as of June 30, 2017 (1)
| % of Net Assets | ||||
Common Stocks (4) | 98.9 | |||
Money Market Funds | ||||
Less Net Liabilities | 1.1 | |||
|
| |||
| 100.0 | ||||
|
| |||
Top 10 Portfolio Holdings as of June 30, 2017 (1) (2) (3)
| % of Net Assets | ||||
1. Apple, Inc. | 2.4 | |||
2. Goldman Sachs Group, Inc. / The | 2.3 | |||
3. MetLife, Inc. | 2.1 | |||
4. Coach, Inc. | 2.0 | |||
5. Bank of America Corp. | 2.0 | |||
6. PNC Financial Services Group, Inc. / The | 1.9 | |||
7. JPMorgan Chase & Co. | 1.9 | |||
8. Microsoft Corp. | 1.9 | |||
9. MGM Resorts International | 1.9 | |||
10. Mondelez International, Inc. Class A | 1.8 |
| (1) | Composition of Portfolio subject to change. |
| (2) | Short-term investments have been excluded from the list of Top 10 Portfolio Holdings. |
| (3) | Top 10 Portfolio Holdings is presented at an individual security level. Total investment exposure by issuer may be higher. |
| (4) | Sectors (Common Stocks): |
| % of Net Assets | ||||
Information Technology | 23.5 | |||
Consumer Discretionary | 22.6 | |||
Financials | 14.3 | |||
Health Care | 12.2 | |||
Industrials | 9.8 | |||
Energy | 6.3 | |||
Materials | 4.5 | |||
Consumer Staples | 3.1 | |||
Utilities | 1.4 | |||
Real Estate | 1.2 | |||
|
| |||
| 98.9 | ||||
|
|
| 20 |
| Ohio National Fund, Inc. | Capital Appreciation Portfolio |
Schedule of Investments | June 30, 2017 (Unaudited) |
| Common Stocks – 98.9% | Shares | Value | ||||||||
| CONSUMER DISCRETIONARY – 22.6% | ||||||||||
Houghton Mifflin Harcourt Co. (Diversified Consumer Svs.) | (a) | 125,010 | $ | 1,537,623 | ||||||
Laureate Education, Inc. Class A (Diversified Consumer Svs.) | (a) | 85,200 | 1,493,556 | |||||||
Carnival Corp. (Hotels, Restaurants & Leisure) | 45,561 | 2,987,435 | ||||||||
Hyatt Hotels Corp. Class A (Hotels, Restaurants & Leisure) | (a) | 60,868 | 3,421,390 | |||||||
MGM Resorts International (Hotels, Restaurants & Leisure) | 112,220 | 3,511,364 | ||||||||
Playa Hotels & Resorts NV (Hotels, Restaurants & Leisure) | (a) | 223,835 | 2,674,828 | |||||||
SeaWorld Entertainment, Inc. (Hotels, Restaurants & Leisure) | 116,229 | 1,891,046 | ||||||||
Wendy’s Co. / The (Hotels, Restaurants & Leisure) | 137,347 | 2,130,252 | ||||||||
CalAtlantic Group, Inc. (Household Durables) | 70,020 | 2,475,207 | ||||||||
Toll Brothers, Inc. (Household Durables) | 49,155 | 1,942,114 | ||||||||
Comcast Corp. Class A (Media) | 75,634 | 2,943,675 | ||||||||
Liberty Global PLC Class C (Media) | (a) | 38,510 | 1,200,742 | |||||||
Live Nation Entertainment, Inc. (Media) | (a) | 97,022 | 3,381,217 | |||||||
Twenty-First Century Fox, Inc. Class A (Media) | 94,437 | 2,676,345 | ||||||||
Viacom, Inc. Class B (Media) | 94,299 | 3,165,617 | ||||||||
Target Corp. (Multiline Retail) | 31,536 | 1,649,017 | ||||||||
Coach, Inc. (Textiles, Apparel & Luxury Goods) | 80,939 | 3,831,652 | ||||||||
|
| |||||||||
| 42,913,080 | ||||||||||
|
| |||||||||
| CONSUMER STAPLES – 3.1% | ||||||||||
Conagra Brands, Inc. (Food Products) | 45,341 | 1,621,394 | ||||||||
Mondelez International, Inc. Class A (Food Products) | 80,164 | 3,462,283 | ||||||||
Turning Point Brands, Inc. (Tobacco) | (a) | 52,504 | 805,411 | |||||||
|
| |||||||||
| 5,889,088 | ||||||||||
|
| |||||||||
| ENERGY – 6.3% | ||||||||||
Halliburton Co. (Energy Equip. & Svs.) | 52,129 | 2,226,430 | ||||||||
Patterson-UTI Energy, Inc. (Energy Equip. & Svs.) | 74,905 | 1,512,332 | ||||||||
ProPetro Holding Corp. (Energy Equip. & Svs.) | (a) | 90,084 | 1,257,573 | |||||||
Arch Coal, Inc. (Oil, Gas & Consumable Fuels) | 13,242 | 904,429 | ||||||||
Continental Resources, Inc. (Oil, Gas & Consumable Fuels) | (a) | 30,730 | 993,501 | |||||||
Noble Energy, Inc. (Oil, Gas & Consumable Fuels) | 79,820 | 2,258,906 | ||||||||
Royal Dutch Shell PLC Class A – ADR (Oil, Gas & Consumable Fuels) | 52,221 | 2,777,635 | ||||||||
|
| |||||||||
| 11,930,806 | ||||||||||
|
| |||||||||
| FINANCIALS – 14.3% | ||||||||||
Bank of America Corp. (Banks) | 153,071 | 3,713,502 | ||||||||
BB&T Corp. (Banks) | 42,591 | 1,934,057 | ||||||||
Citigroup, Inc. (Banks) | 29,630 | 1,981,654 | ||||||||
JPMorgan Chase & Co. (Banks) | 39,687 | 3,627,392 | ||||||||
PNC Financial Services Group, Inc. / The (Banks) | 29,562 | 3,691,407 | ||||||||
Goldman Sachs Group, Inc. / The (Capital Markets) | 19,308 | 4,284,445 | ||||||||
Morgan Stanley (Capital Markets) | 54,041 | 2,408,067 | ||||||||
TPG Pace Holdings Corp. (Capital Markets) | (a) | 135,330 | 1,388,486 | |||||||
MetLife, Inc. (Insurance) | 74,414 | 4,088,305 | ||||||||
|
| |||||||||
| 27,117,315 | ||||||||||
|
| |||||||||
| HEALTH CARE – 12.2% | ||||||||||
Biogen, Inc. (Biotechnology) | (a) | 8,521 | 2,312,259 | |||||||
BioMarin Pharmaceutical, Inc. (Biotechnology) | (a) | 30,044 | 2,728,596 | |||||||
Shire PLC – ADR (Biotechnology) | 15,343 | 2,535,738 | ||||||||
Cigna Corp. (Health Care Providers & Svs.) | 20,406 | 3,415,760 | ||||||||
Allergan PLC (Pharmaceuticals) | 12,384 | 3,010,427 | ||||||||
| Common Stocks (Continued) | Shares | Value | ||||||||
| HEALTH CARE (continued) | ||||||||||
Bristol-Myers Squibb Co. (Pharmaceuticals) | 50,161 | $ | 2,794,971 | |||||||
Merck & Co., Inc. (Pharmaceuticals) | 36,320 | 2,327,749 | ||||||||
Mylan NV (Pharmaceuticals) | (a) | 38,490 | 1,494,182 | |||||||
Pfizer, Inc. (Pharmaceuticals) | 72,402 | 2,431,983 | ||||||||
|
| |||||||||
| 23,051,665 | ||||||||||
|
| |||||||||
| INDUSTRIALS – 9.8% | ||||||||||
Orbital ATK, Inc. (Aerospace & Defense) | 19,666 | 1,934,348 | ||||||||
United Technologies Corp. (Aerospace & Defense) | 19,693 | 2,404,712 | ||||||||
Mobile Mini, Inc. (Commercial Svs. & Supplies) | 46,841 | 1,398,204 | ||||||||
Eaton Corp. PLC (Electrical Equip.) | 19,665 | 1,530,527 | ||||||||
General Electric Co. (Industrial Conglomerates) | 65,353 | 1,765,185 | ||||||||
Ryder System, Inc. (Road & Rail) | 19,013 | 1,368,556 | ||||||||
Schneider National, Inc. Class B (Road & Rail) | 100,162 | 2,240,624 | ||||||||
Union Pacific Corp. (Road & Rail) | 25,827 | 2,812,819 | ||||||||
Univar, Inc. (Trading Companies & Distributors) | (a) | 106,805 | 3,118,706 | |||||||
|
| |||||||||
| 18,573,681 | ||||||||||
|
| |||||||||
| INFORMATION TECHNOLOGY – 23.5% | ||||||||||
Infinera Corp. (Communications Equip.) | (a) | 198,294 | 2,115,797 | |||||||
Juniper Networks, Inc. (Communications Equip.) | 75,240 | 2,097,691 | ||||||||
Benchmark Electronics, Inc. (Electronic Equip., Instr. & Comp.) | (a) | 63,226 | 2,042,200 | |||||||
FLIR Systems, Inc. (Electronic Equip., Instr. & Comp.) | 53,373 | 1,849,908 | ||||||||
National Instruments Corp. (Electronic Equip., Instr. & Comp.) | 54,211 | 2,180,366 | ||||||||
Alphabet, Inc. Class C (Internet Software & Svs.) | (a) | 3,657 | 3,323,226 | |||||||
CSRA, Inc. (IT Svs.) | 67,447 | 2,141,442 | ||||||||
Cavium, Inc. (Semiconductors & Equip.) | (a) | 26,400 | 1,640,232 | |||||||
Versum Materials, Inc. (Semiconductors & Equip.) | 78,266 | 2,543,645 | ||||||||
Fortinet, Inc. (Software) | (a) | 57,909 | 2,168,113 | |||||||
Guidewire Software, Inc. (Software) | (a) | 32,117 | 2,206,759 | |||||||
Microsoft Corp. (Software) | 51,723 | 3,565,266 | ||||||||
Oracle Corp. (Software) | 63,757 | 3,196,776 | ||||||||
PTC, Inc. (Software) | (a) | 42,191 | 2,325,568 | |||||||
Verint Systems, Inc. (Software) | (a) | 61,704 | 2,511,353 | |||||||
Apple, Inc. (Tech. Hardware, Storage & Periph.) | 31,058 | 4,472,973 | ||||||||
BlackBerry Ltd. (Tech. Hardware, Storage & Periph.) | (a) | 106,570 | 1,064,634 | |||||||
Diebold Nixdorf, Inc. (Tech. Hardware, Storage & Periph.) | 114,281 | 3,199,868 | ||||||||
|
| |||||||||
| 44,645,817 | ||||||||||
|
| |||||||||
| MATERIALS – 4.5% | ||||||||||
Monsanto Co. (Chemicals) | 11,291 | 1,336,403 | ||||||||
Sealed Air Corp. (Containers & Packaging) | 41,899 | 1,875,399 | ||||||||
Constellium NV Class A (Metals & Mining) | (a) | 102,903 | 710,031 | |||||||
Rio Tinto PLC – ADR (Metals & Mining) | 46,069 | 1,949,179 | ||||||||
United States Steel Corp. (Metals & Mining) | 64,281 | 1,423,181 | ||||||||
Warrior Met Coal, Inc. (Metals & Mining) | 69,738 | 1,194,612 | ||||||||
|
| |||||||||
| 8,488,805 | ||||||||||
|
| |||||||||
| REAL ESTATE – 1.2% | ||||||||||
CoreCivic, Inc. (Equity Real Estate Investment Trusts) | 82,103 | 2,264,401 | ||||||||
|
| |||||||||
| UTILITIES – 1.4% | ||||||||||
PG&E Corp. (Electric Utilities) | 40,233 | 2,670,264 | ||||||||
|
| |||||||||
Total Common Stocks (Cost $165,065,879) | $ | 187,544,922 | ||||||||
|
| |||||||||
| 21 | (continued) |
| Ohio National Fund, Inc. | Capital Appreciation Portfolio (Continued) |
Schedule of Investments | June 30, 2017 (Unaudited) |
| Money Market Funds – 1.5% | Shares | Value | ||||||||
State Street Institutional U.S. Government Money Market Fund Institutional Class | 2,763,199 | $ | 2,763,199 | |||||||
|
| |||||||||
Total Money Market Funds (Cost $2,763,199) | $ | 2,763,199 | ||||||||
|
| |||||||||
Total Investments – 100.4% (Cost $167,829,078) | (b) | $ | 190,308,121 | |||||||
Liabilities in Excess of Other Assets – (0.4)% | (664,991) | |||||||||
|
| |||||||||
Net Assets – 100.0% | $ | 189,643,130 | ||||||||
|
| |||||||||
Percentages are stated as a percent of net assets.
Abbreviations:
ADR: American Depositary Receipts
Footnotes:
| (a) | Non-income producing security. |
| (b) | Represents cost for financial reporting purposes, which may differ from cost basis for federal income tax purposes. See also Note 7 of the Notes to Financial Statements. |
The accompanying notes are an integral part of these financial statements.
| 22 |
| Ohio National Fund, Inc. | ON International Equity Portfolio (formerly the International Portfolio) |
Objective/Strategy
The ON International Equity Portfolio (formerly the International Portfolio) seeks long-term growth of capital by investing at least 80% of its assets in securities of foreign companies.
Performance as of June 30, 2017
Average Annual returns | ||||
One year | 19.46% | |||
Five years | 4.73% | |||
Ten years | -0.06% |
Past performance does not guarantee future results. The performance data quoted represents past performance and current returns may be lower or higher. Total return figures include change in share price and reinvestment of dividends and capital gains. The investment return and principal value will fluctuate so that an investor’s shares, when redeemed, may be worth more or less than the original cost. To obtain performance information up to the most recent month end, call toll-free 1-877-781-6392.
The Portfolio is not open to direct retail investment. Beneficial interest in shares is obtained solely by purchase of variable life insurance policies and variable annuity contracts. Actual performance results for variable annuity and variable universal life contracts will be lower due to contract charges. Consult your contract for applicable charges.
Total expense ratio is 1.02% per the Fund’s prospectus dated May 1, 2017. Additional information pertaining to the Fund’s expense ratio as of June 30, 2017 can be found in the Portfolio’s Financial Highlights.
Comments from Sub-Advisers
Q. How did the Portfolio perform in comparison to its benchmark during the reporting period?
A. For the six-month period ended June 30, 2017, the ON International Equity Portfolio (formerly the International Portfolio) returned 16.15% versus 13.81% for its current benchmark, the MSCI EAFE Index (Net – USD), and 14.10% for its former benchmark, the MSCI All Country World Ex-USA Index (Net – USD).
For the period from January 1, 2017 to April 30, 2017 (the “first four-month period”), the Portfolio was known as the International Portfolio, was sub-advised by Federated Global Investment Management Corp. (“Federated Global”), and utilized the MSCI All Country World Ex-USA Index (Net – USD) as its benchmark. During the first four-month period, the Portfolio returned 12.95% versus 10.17% for the MSCI All Country World Ex-USA Index (Net – USD).
For the period from May 1, 2017 to June 30, 2017 (the “latter two-month period”), the Portfolio was sub-advised by Lazard Asset Management, LLC (“Lazard”). During this period, the Portfolio was managed with the strategy of investing primarily in equity securities, principally common stocks, of relatively large non-US companies with market capitalization in the range of companies included in the MSCI EAFE Index (Net – USD) that the Lazard portfolio managers believe are undervalued based on their evaluation of a company’s earnings, cash flow or asset values. During the latter two-month period, the Portfolio returned 2.83% versus 3.49% for its current benchmark.
Q. Were there specific market conditions, investment strategies, or techniques that materially affected the Portfolio’s benchmark-relative performance during the reporting period?
A. Federated Global: During the first four-month period, global equity market performance was broadly positive. Faster global growth
outside the U.S. and an improved price inflation outlook led to a continue
d broad market rally. Global economic indicators, such as the Global Manufacturing PMI, rose significantly, hitting a three year high in February due to pronounced improvements in both developed and emerging markets growth expectations. Two key allocations that contributed to performance during the period were overweight positions to emerging markets (EM) and the Euro Area. As measured by the MSCI Emerging Markets Index (Net – USD), Emerging Markets strongly led the period, rising 13.88%. The Euro Area, as measured by the MSCI Euro (Net – USD) index, outperformed most non-U.S. equity indices, climbing 12.81%. Developed non-U.S. markets, as measured by the MSCI EAFE Index (Net – USD), climbed 9.97%, exceeding the return of the MSCI USA Index (Net – USD).
There were several key geopolitical risks that affected performance during the first four-month period, including the following: (1) UK’s Article 50 notification, i.e. “Brexit,” where the Portfolio maintained an underweight to the U.K.; (2) the new U.S. Presidential administration; (3) currency and commodity volatility coupled with U.S. dollar volatility; (4) the trajectory for U.S. growth and debate over the timing and size of Federal reserve tightening, (5) diminishing concerns about China’s economy and signs of stabilization in the global growth outlook, and (6) geopolitical risks events, including the French election outcome that boosted returns in the Euro Area, where the Portfolio maintained an overweight.(1)
Lazard: The Portfolio aims to outperform its benchmark by approximately 200 to 300 basis points over a full market cycle (typically three to five years) with a consistent pattern of performance. Historically, the strategy has added more value versus the benchmark when markets are fundamentally driven in both down markets and moderately rising markets as opposed to low-quality-led rapidly rising markets. Overall, the Lazard portfolio management team remains confident in continuing to focus on stock selection and seeking to find stocks with sustainably high or improving returns trading at attractive valuations.
Q. How did sector selection and security selection each impact the Portfolio’s performance relative to its benchmark?
A. Federated Global: Top contributors for the first four-month period were overweight positions in Sweden and Denmark, driven by both stock and country selection. The third top contributor was an underweight to United Kingdom, where stock and country selection both assisted. Top detractors were the Portfolio’s underweight positions in France, China, and Mexico.(1)
For the first four-month period, sector allocation contributed 0.77% to relative performance. This compares to a contribution to relative performance of 2.25% from stock selection within sectors. Stock selection within Industrials and Financials were the biggest sector contributors. The largest sector detractor was stock selection within Utilities.(1)
Lazard: The largest contributor for the latter two-month period was stock selection within the Real Estate sector. The primary detractor was stock selection within Consumer Staples, followed by both weighting and stock selection in Health Care and stock selection within Telecommunication Services.(1)
| 23 | (continued) |
| Ohio National Fund, Inc. | ON International Equity Portfolio (formerly the International Portfolio) (Continued) |
Q. Were there any factors that impacted the benchmark’s performance more significantly than the Portfolio’s performance?
A. Federated Global: The Portfolio’s allocation to European equities was the most significant contributor to performance during the first four-month period, where both stock selection and country allocation were positive. Within Europe, the decision to overweight northern Europe, including Sweden, Denmark, Austria and the Netherlands, and underweighting the United Kingdom contributed positively to performance. The Portfolio did not have any stocks in France, which detracted from performance; however, the overall overweight allocation to the Euro Area benefited performance.(1)
Lazard: The Portfolio’s performance during the latter two-month period was achieved against a backdrop in which the drivers of equity performance shifted, as investors focused more on individual company fundamentals rather than on macroeconomic trends. Between June 2016 and January 2017, investors bid up lower-quality equities as global growth strengthened, central banks mostly remained accommodative, and United States initiatives on taxes, regulations, and fiscal spending seemed imminent, raising expectations for improving global growth. During the second quarter of 2017, however, investors began to notice the widening gap between stock prices and actual earnings in some cyclical sectors. Higher quality stocks in this environment outperformed those of lower quality, though by a small margin. While the strategy’s relative performance has improved since January 2017, as the market has re-focused on company fundamentals, the latter two-month measurement period has resulted in a short-term modest underperformance relative to the new benchmark.(1)
Q. Which holdings contributed the most to, and detracted the most from, the Portfolio’s benchmark-relative performance?
A. Federated Global: The top three contributors for the first four-month period were Vestas Wind Systems A/S (29 basis points), Volvo AB (28 basis points) and Disco Corp. (24 basis points). The period’s European area economic recovery was a key positive contributor for the Industrial companies in the Portfolio. European industrials outperformed in the period, including Vestas Wind Systems A/S, which had a strong order intake during the period, and Volvo AB, which also saw positive growth in order demand in both Europe and in China due to robust construction activity. As in the United States, Information Technology companies had a strong performance during the period, and Disco Corp., specifically, had favorable demand from 3D NAND applications and a positive product mix.(1)
The top three detractors were Statoil ASA (-20 basis points), Deutsche Telekom AG (-15 basis points), and Hennes & Maurtiz AB (-14 basis points). Despite the ongoing economic recovery in Europe, oil prices slid during the reporting period, which negatively impacted Statoil ASA.(1)
Lazard: Stock selection in the Consumer Staples sector detracted from relative returns during the latter two-month period, as shares of Dutch global supermarket operator Ahold Delhaize (which was sold during the quarter) fell on the news that Amazon.com, Inc. would be buying United States supermarket chain Whole Foods Market, Inc. This acquisition increases uncertainty about the size of the profit pool for the United States grocery industry, as Amazon.com, Inc. focuses on lower prices in order to build loyalty at the expense of profits. Stock selection in the Health Care sector also hurt relative returns as British global specialty pharmaceutical
manufacturer Shire PLC underperformed. The company offers an attractive mix of treatments for rare diseases. This gives it critical pricing power, which is increasingly challenging to find in global pharmaceuticals. We believe the market remains skeptical about the company’s ability to integrate Baxalta and pay down the debt incurred to fund the acquisition. The company’s fundamentals remain strong and the valuations are very attractive in our view. We continue to own a significant position in the stock. In the Telecommunication Services sector, shares of British phone and broadband company BT Group PLC declined on a weaker outlook and a lowered dividend growth target. Lastly, low exposure to the strong performing Utilities sector was dilutive to relative returns.(1)
In contrast, shares of Japanese real estate developer Daiwa House Industry Co. Ltd. performed well on an increased dividend, and as results highlighted strong growth in commercial facilities and logistics. Stock selection in the Financials sector also helped relative returns, as shares of Italian bank UniCredit SpA beat expectations in all business lines. Elsewhere, shares of United Kingdom-based health insurance exchange provider Aon PLC rose on results that highlighted better than expected organic growth, as well as on the announcement of a new plan to reduce costs. Within the Industrials sector, shares of Irish discount airline Ryanair Holdings PLC - ADR rose on strong results and on the announcement of a new stock buyback program. Lastly, low exposure to Asia ex-Japan, which underperformed the market, was beneficial to relative returns.(1)
Q. How did the Portfolio’s use of derivative instruments and initial public offerings (IPOs), if any, impact performance?
A. The Portfolio used equity index futures during the first four-month period to assist in managing country weights and cash in the Portfolio. The Portfolio chose equity index futures that were liquid and were related to equity markets that were viewed as attractive. The net effect of equity index futures was minimal during the first four-month period; a slight detraction of 2 basis points. No derivative instruments or IPOs were used during the latter two-month period.
| (1) | The Portfolio’s composition is subject to change. Holdings and weightings are as of June 30, 2017. |
| 24 | (continued) |
| Ohio National Fund, Inc. | ON International Equity Portfolio (formerly the International Portfolio) (Continued) |
Change in Value of $10,000 Investment
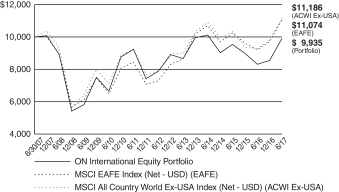
Hypothetical illustration based on past performance. Future performance will vary. The Portfolio’s returns reflect reinvested dividends. The Portfolio’s holdings may differ significantly from the securities in the index. The index is unmanaged and therefore does not reflect the cost of portfolio management and accounting.
The Portfolio’s benchmark was changed from MSCI All Country World Ex-USA Index (Net-USD) to MSCI EAFE Index (Net-USD) effective May 1, 2017. The change in the benchmark was made because the MSCI EAFE Index (Net-USD) better reflects the style of the strategy utilized by the current sub-adviser.
The MSCI EAFE Index (Net-USD) is a free-float-adjusted market-capitalization-weighted index that is designed to measure the equity market performance of 21 developed markets, including countries in Europe, Australasia and the Far East, excluding the U.S. and Canada. The returns for the MSCI EAFE Index (Net-USD) include the effects of reinvested dividends, net of taxes, and adjustment to U.S. Dollar denomination.
The MSCI All Country World Ex-USA Index (Net-USD) is a free float adjusted market capitalization weighted index that is designed to measure the equity market performance of developed and emerging markets. The MSCI All Country World Index consists of 23 developed and 24 emerging market country indices and excludes the impact of the United States. The returns for the MSCI All Country World Ex-USA Index (Net-USD) include the effects of reinvested dividends, net of taxes, and adjustment to U.S. Dollar denomination.
Portfolio Composition as of June 30, 2017 (1)
| % of Net Assets | ||||
Common Stocks (4) (5) | 98.8 | |||
Money Market Funds | ||||
Less Net Liabilities | 1.2 | |||
|
| |||
| 100.0 | ||||
|
|
Top 10 Portfolio Holdings as of June 30, 2017 (1) (2) (3)
| % of Net Assets | ||||
1. Prudential PLC | 3.5 | |||
2. Novartis AG | 3.2 | |||
3. British American Tobacco PLC | 3.1 | |||
4. Daiwa House Industry Co. Ltd. | 3.1 | |||
5. Valeo SA | 2.7 | |||
6. Shire PLC | 2.7 | |||
7. SAP SE | 2.7 | |||
8. Royal Dutch Shell PLC | 2.5 | |||
9. Vinci SA | 2.4 | |||
10. Aon PLC | 2.2 |
| (1) | Composition of Portfolio subject to change. |
| (2) | Short-term investments have been excluded from the list of Top 10 Portfolio Holdings. |
| (3) | Top 10 Portfolio Holdings is presented at an individual security level. Total investment exposure by issuer may be higher. |
| (4) | Top 10 Country Weightings (Common Stocks): |
| % of Net Assets | ||||
United Kingdom | 18.7 | |||
Japan | 17.8 | |||
France | 11.8 | |||
Switzerland | 6.3 | |||
Netherlands | 5.3 | |||
Canada | 4.4 | |||
Sweden | 4.0 | |||
Ireland | 3.6 | |||
Germany | 3.6 | |||
Australia | 3.1 |
| 25 | (continued) |
| Ohio National Fund, Inc. | ON International Equity Portfolio (formerly the International Portfolio) (Continued) |
| (5) | Sectors (Common Stocks): |
| % of Net Assets | ||||
Industrials | 19.3 | |||
Financials | 19.2 | |||
Consumer Discretionary | 13.6 | |||
Consumer Staples | 11.9 | |||
Health Care | 9.2 | |||
Energy | 7.0 | |||
Information Technology | 6.3 | |||
Telecommunication Services | 4.4 | |||
Materials | 3.8 | |||
Real Estate | 3.1 | |||
Utilities | 1.0 | |||
|
| |||
| 98.8 | ||||
|
|
| 26 |
| Ohio National Fund, Inc. | ON International Equity Portfolio (formerly the International Portfolio) |
Schedule of Investments | June 30, 2017 (Unaudited) |
| Common Stocks – 98.8% | Shares | Value | ||||||||
| United Kingdom – 18.7% | ||||||||||
Aon PLC | 25,800 | $ | 3,430,110 | |||||||
British American Tobacco PLC | (c) | 70,645 | 4,813,954 | |||||||
BT Group PLC | (c) | 343,077 | 1,319,213 | |||||||
ConvaTec Group PLC | (a)(b)(d) | 415,550 | 1,727,616 | |||||||
Diageo PLC | (c) | 78,283 | 2,313,399 | |||||||
Howden Joinery Group PLC | (c) | 209,635 | 1,112,070 | |||||||
Informa PLC | (c) | 182,853 | 1,594,913 | |||||||
Provident Financial PLC | (c) | 21,879 | 693,928 | |||||||
Prudential PLC | (c) | 232,147 | 5,328,645 | |||||||
RELX PLC | (c) | 148,663 | 3,213,646 | |||||||
Unilever PLC | (c) | 58,982 | 3,191,980 | |||||||
|
| |||||||||
| 28,739,474 | ||||||||||
|
| |||||||||
| Japan – 17.8% | ||||||||||
ABC-Mart, Inc. | (c) | 25,300 | 1,490,984 | |||||||
Daiwa House Industry Co. Ltd. | (c) | 137,200 | 4,695,749 | |||||||
Don Quijote Holdings Co. Ltd. | (c) | 88,400 | 3,358,741 | |||||||
Hoshizaki Corp. | (c) | 13,000 | 1,179,500 | |||||||
Isuzu Motors Ltd. | (c) | 184,800 | 2,294,729 | |||||||
Kao Corp. | (c) | 27,110 | 1,611,914 | |||||||
KDDI Corp. | (c) | 76,000 | 2,010,019 | |||||||
Makita Corp. | (c) | 62,300 | 2,307,219 | |||||||
Seven & I Holdings Co. Ltd. | (c) | 36,200 | 1,493,773 | |||||||
Sony Corp. | (c) | 83,300 | 3,177,374 | |||||||
Sumitomo Mitsui Financial Group, Inc. | (c) | 66,900 | 2,612,073 | |||||||
United Arrows Ltd. | (c) | 32,000 | 1,039,529 | |||||||
|
| |||||||||
| 27,271,604 | ||||||||||
|
| |||||||||
| France – 11.8% | ||||||||||
Air Liquide SA | (c) | 22,165 | 2,739,503 | |||||||
Airbus SE | (c) | 15,815 | 1,305,140 | |||||||
Capgemini SE | (c) | 32,639 | 3,371,688 | |||||||
Cie Generale des Etablissements Michelin | (c) | 21,508 | 2,862,584 | |||||||
Valeo SA | (c) | 61,848 | 4,161,063 | |||||||
Vinci SA | (c) | 42,273 | 3,605,949 | |||||||
|
| |||||||||
| 18,045,927 | ||||||||||
|
| |||||||||
| Switzerland – 6.3% | ||||||||||
Julius Baer Group Ltd. | (c) | 29,349 | 1,550,691 | |||||||
Novartis AG | (c) | 58,255 | 4,865,842 | |||||||
Wolseley PLC | (c) | 52,310 | 3,210,667 | |||||||
|
| |||||||||
| 9,627,200 | ||||||||||
|
| |||||||||
| Netherlands – 5.3% | ||||||||||
Koninklijke KPN NV | (c) | 395,963 | 1,267,304 | |||||||
Royal Dutch Shell PLC | (c) | 144,755 | 3,845,952 | |||||||
Wolters Kluwer NV | (c) | 70,560 | 2,984,189 | |||||||
|
| |||||||||
| 8,097,445 | ||||||||||
|
| |||||||||
| Canada – 4.4% | ||||||||||
Bank of Montreal | 51 | 3,745 | ||||||||
Canadian National Railway Co. | 26,800 | 2,174,503 | ||||||||
National Bank of Canada | 47,144 | 1,982,389 | ||||||||
Suncor Energy, Inc. | 88,300 | 2,579,956 | ||||||||
|
| |||||||||
| 6,740,593 | ||||||||||
|
| |||||||||
| Sweden – 4.0% | ||||||||||
Assa Abloy AB | (c) | 148,529 | 3,273,796 | |||||||
Nordea Bank AB | (c) | 226,388 | 2,883,374 | |||||||
|
| |||||||||
| 6,157,170 | ||||||||||
|
| |||||||||
| Ireland – 3.6% | ||||||||||
Medtronic PLC | 38,090 | 3,380,487 | ||||||||
Ryanair Holdings PLC – ADR | (a) | 19,500 | 2,098,395 | |||||||
|
| |||||||||
| 5,478,882 | ||||||||||
|
| |||||||||
| Common Stocks (Continued) | Shares | Value | ||||||||
| Germany – 3.6% | ||||||||||
Deutsche Post AG | (c) | 35,933 | $ | 1,348,862 | ||||||
SAP SE | (c) | 39,322 | 4,115,886 | |||||||
|
| |||||||||
| 5,464,748 | ||||||||||
|
| |||||||||
| Australia – 3.1% | ||||||||||
BHP Billiton PLC | (c) | 205,337 | 3,145,906 | |||||||
Caltex Australia Ltd. | (c) | 64,404 | 1,563,940 | |||||||
|
| |||||||||
| 4,709,846 | ||||||||||
|
| |||||||||
| United States – 2.7% | ||||||||||
Shire PLC | (c) | 75,029 | 4,137,018 | |||||||
|
| |||||||||
| Belgium – 2.6% | ||||||||||
Anheuser-Busch InBev SA/NV | (c) | 25,839 | 2,853,878 | |||||||
KBC Group NV | (c) | 15,831 | 1,200,290 | |||||||
|
| |||||||||
| 4,054,168 | ||||||||||
|
| |||||||||
| Norway – 2.5% | ||||||||||
Statoil ASA | (c) | 99,297 | 1,646,557 | |||||||
Telenor ASA | (c) | 128,039 | 2,124,198 | |||||||
|
| |||||||||
| 3,770,755 | ||||||||||
|
| |||||||||
| Denmark – 2.4% | ||||||||||
AP Moller – Maersk A/S | (c) | 875 | 1,761,823 | |||||||
Carlsberg A/S | (c) | 18,281 | 1,953,605 | |||||||
|
| |||||||||
| 3,715,428 | ||||||||||
|
| |||||||||
| Italy – 1.6% | ||||||||||
UniCredit SpA | (a)(c) | 129,450 | 2,424,758 | |||||||
|
| |||||||||
| Singapore – 1.5% | ||||||||||
DBS Group Holdings Ltd. | (c) | 155,900 | 2,346,415 | |||||||
|
| |||||||||
| Finland – 1.5% | ||||||||||
Sampo Oyj | (c) | 45,588 | 2,338,920 | |||||||
|
| |||||||||
| Taiwan – 1.4% | ||||||||||
Taiwan Semiconductor Manufacturing Co. Ltd. – ADR | 62,800 | 2,195,488 | ||||||||
|
| |||||||||
| Luxembourg – 1.3% | ||||||||||
RTL Group SA | (c) | 12,917 | 975,867 | |||||||
Tenaris SA | (c) | 70,054 | 1,093,804 | |||||||
|
| |||||||||
| 2,069,671 | ||||||||||
|
| |||||||||
| Brazil – 1.0% | ||||||||||
BB Seguridade Participacoes SA | 183,300 | 1,585,181 | ||||||||
|
| |||||||||
| Spain – 1.0% | ||||||||||
Red Electrica Corp. SA | (c) | 71,574 | 1,497,357 | |||||||
|
| |||||||||
| Turkey – 0.7% | ||||||||||
Turkiye Garanti Bankasi AS | (c) | 409,226 | 1,139,022 | |||||||
|
| |||||||||
Total Common Stocks (Cost $147,852,995) | $ | 151,607,070 | ||||||||
|
| |||||||||
| Money Market Funds – 3.4% | Shares | Value | ||||||||
State Street Institutional U.S. Government Money Market Fund Institutional Class | 5,184,380 | $ | 5,184,380 | |||||||
|
| |||||||||
Total Money Market Funds (Cost $5,184,380) | $ | 5,184,380 | ||||||||
|
| |||||||||
Total Investments – 102.2% (Cost $153,037,375) | (e) | $ | 156,791,450 | |||||||
Other Liabilities in Excess of Assets – (2.2)% | (3,358,673) | |||||||||
|
| |||||||||
Net Assets – 100.0% | $ | 153,432,777 | ||||||||
|
| |||||||||
| 27 | (continued) |
| Ohio National Fund, Inc. | ON International Equity Portfolio (formerly the International Portfolio) (Continued) |
Schedule of Investments | June 30, 2017 (Unaudited) |
Percentages are stated as a percent of net assets.
Abbreviations:
ADR: American Depositary Receipts
Footnotes:
| (a) | Non-income producing security. |
| (b) | Security exempt from registration under Regulation D of the Securities Act of 1933. These securities may be resold in transactions exempt from registration, normally to qualified buyers under Rule 144A. At June 30, 2017, the value of these securities totaled $1,727,616, or 1.1% of the Portfolio’s net assets. These securities were deemed liquid pursuant to procedures approved by the Board of Directors. |
| (c) | Security traded on a foreign exchange has been valued at an estimate of fair value that is different than the local market close price. These fair value estimates are determined by an independent fair valuation service that has been approved by the Board. These securities represent $130,449,200, or 85.0% of the Portfolio’s net assets. |
| (d) | As discussed in Note 2 of the Notes to Financial Statements, not all investments that are traded on a foreign exchange are valued at an estimate that is different from the local close price. In some instances, the independent fair valuation service uses a stock’s local close price because the service’s measure of predictability related to their valuation model of a stock is below a chosen threshold. These securities represent $1,727,616, or 1.1% of the Portfolio’s net assets. |
Other Portfolio securities are not subjected to fair valuation procedures because they are traded on domestic or foreign exchanges that have close times that are consistent with the U.S. market close, normally 4:00 pm Eastern Time.
| (e) | Represents cost for financial reporting purposes, which may differ from cost basis for federal income tax purposes. See also Note 7 of the Notes to Financial Statements. |
The accompanying notes are an integral part of these financial statements.
| 28 |
| Ohio National Fund, Inc. | ON Foreign Portfolio (formerly the International Small-Mid Company Portfolio) |
Objective/Strategy
The ON Foreign Portfolio (formerly the International Small-Mid Company Portfolio) seeks long-term growth of capital by investing at least 80% of its assets in foreign securities.
Performance as of June 30, 2017
Average Annual returns | ||||
One year | 17.90% | |||
Five years | 8.54% | |||
Ten years | 1.48% |
Past performance does not guarantee future results. The performance data quoted represents past performance and current returns may be lower or higher. Total return figures include change in share price and reinvestment of dividends and capital gains. The investment return and principal value will fluctuate so that an investor’s shares, when redeemed, may be worth more or less than the original cost. To obtain performance information up to the most recent month end, call toll-free 1-877-781-6392.
The Portfolio is not open to direct retail investment. Beneficial interest in shares is obtained solely by purchase of variable life insurance policies and variable annuity contracts. Actual performance results for variable annuity and variable universal life contracts will be lower due to contract charges. Consult your contract for applicable charges.
Total expense ratio is 1.09% per the Fund’s prospectus dated May 1, 2017. Additional information pertaining to the Fund’s expense ratio as of June 30, 2017 can be found in the Portfolio’s Financial Highlights.
Comments from Sub-Advisers
Q. How did the Portfolio perform in comparison to its benchmark during the reporting period?
A. For the six-month period ended June 30, 2017, the ON Foreign Portfolio (formerly the International Small-Mid Company Portfolio) returned 14.54% versus 14.10% for its new benchmark, the MSCI All Country World Ex-USA Index (Net - USD), and 15.38% for its former benchmark, the MSCI ACWI Ex USA SMID Cap Index (Net - USD).
For the period from January 1, 2017 to April 30, 2017 (the “first four-month period”), the Portfolio was known as the International Small-Mid Company Portfolio, was sub-advised by Federated Global Investment Management Corp. (“Federated Global”), and utilized the MSCI ACWI Ex USA SMID Cap Index (Net - USD) as its benchmark. During the first four-month period, the Portfolio returned 12.77% versus 11.70% for the MSCI ACWI Ex USA SMID Cap Index (Net - USD).
For the period from May 1, 2017 to June 30, 2017 (the “latter two-month period”), the Portfolio was sub-advised by Templeton Global Advisors Limited (“Templeton”). During this period, the Portfolio was managed with the strategy of investing in common stock and other equity securities of companies located outside the United States, including those in emerging markets, without respect to a company’s capitalization. Previously, the investments made were primarily in small- and mid-capitalization companies within the total market capitalization of stocks included in the Portfolio’s previous benchmark. With the restriction on company capitalization lifted, the new benchmark became the MSCI All Country World ex-USA Index (Net - USD). During the latter two-month period period, the Portfolio returned 1.57% versus 3.57% for its new benchmark.
Q. Were there specific market conditions, investment strategies, or techniques that materially affected the Portfolio’s benchmark-relative performance during the reporting period?
A. Federated Global: The outperformance during the first four-month period can almost entirely be attributed to positive stock selection, which accounted for roughly 97% of the outperformance.(1)
Given the uncertain international outlook, where markets are being impacted more and more by central bank policies and geopolitical activities, the Federated Global team made the decision to reduce some of the larger sector and country exposures from the prior year. The idea was to have stock selection be the largest driver of the Portfolio’s performance, and that is evidenced in this result.(1)
Templeton: Although stocks sustained upward momentum through the bulk of the latter two-month period, market leadership reverted to defensive, growth-oriented issues following the cyclical value rally of 2016. The market’s increasingly defensive posture was consistent with mixed global economic and political news flow. Investors focused primarily on positive factors, which included resilient corporate earnings, receding political anxiety and a gathering economic recovery in Europe. The period opened with a reduction in political uncertainty in Europe after pro-European centrist candidate Emmanuel Macron defeated his right-wing nationalist opponent in the French presidential election. A subsequent victory in parliamentary elections gave his upstart En Marche party a decisive majority and mandate to pursue market-friendly structural reforms in France. Europe’s other main election during the period, a snap election called by United Kingdom (“U.K.”) Prime Minister Theresa May in a bid to consolidate her leadership ahead of Brexit negotiations, backfired drastically, with Ms. May’s Conservative Party losing its parliamentary majority and cobbling together an uneasy coalition with the Democratic Unionist Party of Northern Ireland. European economic indicators continued to suggest a firming regional recovery, with gross domestic product growth accelerating, the purchasing managers’ index hitting a six-year high and unemployment falling to its lowest level since the global financial crisis. The United States (“U.S.”) Federal Reserve raised its target interest rate in June for the third time in the past six months and set out a plan to gradually shrink its balance sheet despite low inflation and mixed economic data. Longer maturity interest rates failed to respond, and the flattening yield curve suggested to us the market remained cautious about the U.S. economic outlook. Lack of legislative progress on President Trump’s pro-growth reform agenda and continued political tensions and distractions underscored such caution, contributing to the International Monetary Fund’s decision to downgrade its U.S. growth forecasts. In Asia, independent credit ratings agency Moody’s Investors Service surprised investors by downgrading China’s sovereign credit rating. Moody’s analysts noted that the Chinese government was proceeding too slowly with reforms to rebalance the country’s economy and reduce debt, to which the government responded that Moody’s underestimates its commitment to reform. Also in the region, the Japanese government upgraded its assessment of the country’s economy amid stronger investment and consumer spending, North Korea continued with provocative missile tests, and South Koreans elected a new president who advocated a softer approach to its northern neighbors. Elsewhere, Brazil again descended into crisis after tapes were released alleging to show the president, who has promised to snuff out corruption, endorsing the payment of hush money to a politician serving jail time. Oil declined during the period, as concerns about excess supply overshadowed an agreement by the Organization of the Petroleum Exporting Countries (“OPEC”) to extend production cuts.
| 29 | (continued) |
| Ohio National Fund, Inc. | ON Foreign Portfolio (formerly the International Small-Mid Company Portfolio) (Continued) |
Anomalous market conditions have also contributed to recent performance headwinds for Templeton and other active managers. We believe monetary policy has never been so loose and experimental, artificially depressing the price of money and skewing the risk-free rate (and therefore the assets that are priced off of it). Global debt levels have never been so high, generating a flood of liquidity that has saturated many financial assets. Political tensions remain elevated, and policymakers may struggle to turn pro-growth campaign promises into actual legislation. Meanwhile, we believe stocks have become commoditized into “factor buckets,” and are thought of today not as ownership stakes in long-term, cash-generating businesses, but instead as high-or-low-beta, high-or-low-quality, defensive-or-aggressive, risk-on-or-off, etc. In our opinion, these are all unusual conditions that create additional challenges for fundamentally oriented security analysts. Yet, it is our belief that all of these trends are temporary, as price eventually converges with value over time and a healthy market needs investors with the ability to facilitate price discovery. After a long, fallow period for active value investors, we were encouraged by 2016’s value rally and, despite the more recent pull-back, anticipate a supportive environment for value investing over our long-term horizon.
Q. How did sector selection and security selection each impact the Portfolio’s performance relative to its benchmark?
A. Federated Global: The most significant sector-level results for the first four-month period were:
| • | Stock selection in Industrials added 93 basis points. |
| • | Stock selection in Health Care added 84 basis points. |
| • | Stock selection in Financials added 38 basis points. |
| • | Stock selection in Telecommunications Services added 36 basis points.(1) |
Templeton: Overall, the Portfolio’s performance relative to its new benchmark, the MSCI All Country World ex-USA Index (Net - USD), benefited from stock selection during the latter two-month period, although support from stock-picking was offset by unfavorable sector allocations.(1)
Energy was the Portfolio’s most significant detractor, accounting for most of the Portfolio’s sector-level underperformance. In this case, both stock-specific weakness and an unfavorable overweighting detracted during a period when oil briefly fell into bear market territory amid the worst start to a year for the commodity since 1997. Nevertheless, we believe the current pessimism in oil markets is misplaced, and we view near-term concerns about rising North America supply as overblown in the context of our long-term investment outlook. The rise in U.S. inventories is partially a seasonal event, and we expect some drawdown of stockpiles in the second half of 2017, countering the perception of a supply glut. In any event, more comprehensive data on global inventories paint the picture of a much tighter market than the one suggested by U.S. data. We could also begin to see falling output from North American shale fields if sustained low prices discourage investment in future production. Financial speculation has further pressured oil, with net positioning in futures markets revealing one of the highest levels of short trades on record, a potential contrarian indicator. We also observe that geopolitical relations among the world’s largest oil producers are mostly stable, with compliance to OPEC production cuts above 100% and Russia apparently making good on its pledge to constrain output in line with OPEC. Finally, the world’s largest oil producer, Saudi Arabia, is preparing to conduct an initial public
offering (IPO) of one of the world’s most valuable companies, Saudi Arabian Oil (commonly known as Saudi Aramco). Riyadh, the capital of Saudi Arabia, seems to hope to maximize proceeds from this historic IPO, and has every incentive to wish for a more buoyant price environment. With oil stocks, on average, trading near their lowest relative price-to-book levels in the last 90 years, we continue to find what we consider compelling contrarian bargains in this sector.(1)
In Health Care, stock selection weighed on relative performance, but the Portfolio’s overweighted position positively contributed to relative performance, as the sector recovered from oversold conditions prompted by election-cycle political rhetoric in the U.S., a major market for most drugmakers. Our analysis indicates that the defensive growth prospects of the entire health care sector remain materially undervalued amid excessive political concerns, and we continue to find sufficient bottom-up bargains to justify an overweighted allocation. Within the sector, we continue to favor innovative companies we feel have portfolios of high-margin, long-duration products that are facing little competition or demonstrable advantages over existing therapies.(1)
Turning to contributors, stock selection and an underweight in Financials boosted relative performance. Sector outperformance during the latter two-month period was led by European and Asian lenders, which offered more exposure to tailwinds associated with the French election outcome than the headwinds stemming from doubts about the viability of the global reflation trade. We are encouraged by the continued progress in the European banking sector more generally, where earnings revisions have returned to a positive trajectory, regulatory capital has been largely rebuilt and the bulk of post-crisis re-regulation efforts are now complete. As economic data have picked up and risky political events been favorably resolved, demand for credit has increased. Indeed, private loan growth is steadily rising in Europe, with favorable implications for bank earnings. Yet, it is our belief little of this good news has made it into the price of European bank shares, which continue to look undervalued to us based on price-to-earnings ratio, price-to-book value and dividend yields, both relative to their own history and to their U.S. peers. In Asia, South Korean banks rallied strongly amid signs that a new government would deliver fiscal stimulus, reform the rigid corporate chaebol (large, mostly family-owned conglomerates) structure and normalize economic ties with China. Prospects for improving corporate governance and political stability have combined with rising interest rates and genuine economic growth to benefit the banking sector in emerging Asia, more generally.(1)
Stock selection also drove outperformance in the Telecommunication Services, Industrials and Consumer Discretionary sectors.(1)
For the latter two-month period, the U.S. dollar rose in value relative to many currencies in which the Portfolio’s investments were traded. As a result, performance was negatively affected by securities with non-U.S. currency exposure.(1)
Q. Which holdings contributed the most to, and detracted the most from, the Portfolio’s benchmark-relative performance?
A. Federated Global: The top three contributors during the first four-month period were as follows:
Ipsen SA, which added 75 basis points, provided mid-term guidance through 2020 that was above market expectations. In addition to better visibility, growth continues to accelerate in its high margin oncology drug.(1)
| 30 | (continued) |
| Ohio National Fund, Inc. | ON Foreign Portfolio (formerly the International Small-Mid Company Portfolio) (Continued) |
Rheinmetall AG supplied 53 basis points on expectations of an increase to the German Defense budget that has led to upgraded growth expectations for Rheinmetall’s Defense division. Their other division, automotive, continues to report better than expected profit margins.(1)
Nexteer Automotive Group Ltd., an electric power steering company, contributed 38 basis points by successfully diversifying away from its United States customer base and increasing penetration into the Chinese auto market. They also teamed up with Continental in developing advanced driver assistance systems (ADAS) products.(1)
The top three detractors were as follows:
Precision Drilling Corp detracted 23 basis points. The company is a Canadian oilfield driller with high leverage, which makes it a high beta play on the price of oil. The pullback in oil, along with declining United States rig count expectations for the second half of 2017, led to a rotation out of Precision Drilling.(1)
Mando Corp, which subtracted 20 basis points, is a Korean auto parts company. The Company has large exposure to the Hyundai automotive group, which is caught up in a political firestorm between China and South Korea over the U.S. deployment of defense missiles in Korea. To reduce exposure to Hyundia and Kia China auto sales, Mando has successfully carried out more sales to Chinese Original Equipment Manufacturers (OEMs).(1)
Whitecap Resources, Inc. deducted 18 basis points. Similar to Precision Drilling Corp, WhiteCap is a Canadian exploration and production company that has been impacted by lower oil prices and sector rotation.(1)
Templeton: The top three contributors for the latter two-month period were as follows:
Korea Investment Holdings Co. Ltd. - The company’s shares rose over the period amid signs that a new government in South Korea would deliver fiscal stimulus, reform the rigid corporate chaebol structure (large, mostly family-owned conglomerates) and normalize economic ties with China. Specific to the company, a swing to profitability in the first quarter of 2017 and expectations of continued earnings improvements led to an upgrade cycle among Wall Street analysts. The company continues to benefit from stronger affiliate income from investment banking, trading and asset management, which have helped offset a structural decline in brokerage commissions and lower net interest income attributable to falling interest rates. Although the stock remains a hold with additional upside potential, we are monitoring the position closely for profit-taking opportunities after strong share price performance.(1)
Standard Chartered PLC - Shares rallied after the company’s chief executive officer said the firm was preparing to pay the first dividend in more than two years following a significant strengthening of its financial position. Indeed, under new CEO Bill Winters, Standard Chartered PLC has been aggressive in de-risking its balance sheet and controlling costs, resulting in a more resilient and conservatively managed bank. Such measures have come at the expense of near-term revenue and profitability, and the stock consequently remains exceedingly cheap based on price-to-tangible book value, in our analysis. For patient investors, we continue to believe Standard Chartered PLC represents excellent long-term value given its prudent restructuring initiatives and attractive market position in emerging markets with high gross domestic product growth rates.(1)
SoftBank Group Corp. - Shares of the Japanese mobile operator and technology conglomerate rose to the highest levels in nearly two decades after the firm’s majority-owned U.S. telecommunications subsidiary, Sprint Corp., reported better-than-expected sales and subscriber growth. The higher share price also reflected rising optimism that Softbank Group Corp. may be able to execute a long-desired merger between Sprint Corp. and another major U.S. mobile operator, T-Mobile U.S., under a new Republican administration. Elsewhere at SoftBank Group Corp., the core Japanese telecommunications business is providing strong, stable free cash flow; Chinese technology subsidiary Alibaba Group Holding Ltd. continues to realize outsized growth; and the newly acquired U.K. semiconductor manufacturer ARM Holdings plc, while expensive and value-destructive in the near term, in our view, offers another exciting long-term growth driver. SoftBank Group Corp.’s stock remains excessively cheap on a sum-of-the-parts basis, in our analysis.(1)
The top three detractors were as follows:
Petrofac Limited - Shares of U.K. based oilfield services firm Petrofac Limited declined sharply after the U.K.’s Serious Fraud Office (“SFO”) launched an investigation into bribery allegations related to the firm’s past relationship with controversial Monaco-based consultancy Unaoil. While we had been constructive on the stock given its healthy pipeline of outstanding bids, strategic refocus on core assets, and prudent balance sheet deleveraging, the escalating fraud investigation seems to us a thesis changer. Over the past three years, nearly all of the SFO’s investigations have led to charges being filed. Of particular concern, the executives currently running Petrofac Limited also ran the company when the alleged improprieties occurred. Any legal action against these individuals could materially impact Petrofac Limited’s ability to win new business, without which the company’s financial situation is tenuous. A change in circumstances requires a reassessment of the new reality, and we decided to liquidate our stake in Petrofac Limited given the rising risk profile.(1)
Eldorado Gold Corp. (“Eldorado”) - The company’s shares fell due to a weaker gold price and a few company-specific developments, including lower production from its flagship Kisladag mine in Turkey, a seemingly fully priced mine acquisition in Canada and news that the Greek Ministry of Energy and Environment had initiated arbitration proceedings against Eldorado’s Greek subsidiary to ensure compliance with local permits. We believe the lower production from Kisladag is temporary and merely delays - not impairs - the economics of the mine; we view the Canadian acquisition as something that could add value to the company given major tax synergies and significant exploration optionality in this attractive jurisdiction; and we believe the Greek proceedings are politically motivated and unlikely to derail the development efforts of the largest foreign investor in a country experiencing a debt crisis. More generally, Eldorado features a strong balance sheet and remains one of the cheapest, lowest-cost, longest-life, and highest-growth gold miners in the world.(1)
UCB S.A. - Shares of the Belgian biotechnology firm slumped after a U.S. study of an osteoporosis drug it is developing in partnership with Amgen, Inc. raised concerns about heart safety that could delay the drug’s approval in the U.S. Although such news is disappointing, with the pipeline discounted, we still have good exposure to the potential success of “lower risk,” newly launched drugs. Moreover, with the threat of generic competition fading for UCB S.A. and evidence of an improved product mix in its future drug portfolio, we believe market confidence should return, supporting the share price.(1)
| 31 | (continued) |
| Ohio National Fund, Inc. | ON Foreign Portfolio (formerly the International Small-Mid Company Portfolio) (Continued) |
Q. How did the Portfolio’s use of derivative instruments and initial public offerings (IPOs), if any, impact performance?
A. Federated Global: During the first four-month period, the Portfolio bought a short euro forward contract to partially mitigate the large overweight to the Euro currency. As the euro currency appreciated during the period, the currency contract detracted 7 basis points from performance.(1)
The Portfolio participated in four IPO’s during the period. Those IPO’s generated a positive contribution of 10 basis points to performance. Below is a breakdown of each IPO’s contribution:
| • | Canada Goose Holdings Inc., 39.75% base return, 4 basis points contribution, |
| • | Galenica Sante Ag, 12.50% base return, 3 basis points contribution, |
| • | X-Fab Silicon Foundries SE, 2.43% base return, 2 basis points contribution, |
| • | Keane Group Inc., 15.20% base return, 1 basis points contribution.(1) |
Templeton Global: No derivatives were used, nor were there IPOs that impacted performance during the latter two-month period.(1)
| (1) | The Portfolio’s composition is subject to change. Holdings and weightings are as of June 30, 2017. |
Change in Value of $10,000 Investment
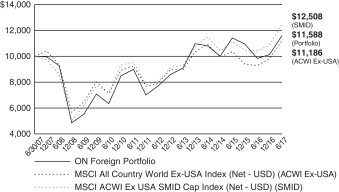
Hypothetical illustration based on past performance. Future performance will vary. The Portfolio’s returns reflect reinvested dividends. The Portfolio’s holdings may differ significantly from the securities in the index. The index is unmanaged and therefore does not reflect the cost of portfolio management and accounting.
The Portfolio’s benchmark was changed from MSCI ACWI Ex USA SMID Cap Index (Net-USD) to MSCI All Country World Ex-USA Index (Net-USD) effective May 1, 2017. The change in the benchmark was made because the MSCI All Country World Ex-USA Index (Net-USD) better reflects the style of the strategy utilized by the current sub-adviser.
The MSCI All Country World Ex-USA Index (Net-USD) is a free float-adjusted market capitalization weighted index that is designed to measure the equity market performance of developed and emerging markets. The MSCI All Country World Index (ACWI) consists of 23 developed and 24 emerging market country indices and excludes the impact of the United States. The returns for the MSCI ACWI ex USA Index (Net-USD) include the effects of reinvested dividends, net of taxes, and adjustment to U.S. Dollar denomination.
The MSCI ACWI Ex USA SMID Cap Index captures mid and small cap representation across 22 of 23 developed market countries (excluding the U.S.) and 23 emerging markets countries. With over 5,000 constituents, the index covers approximately 28% of the free float-adjusted market capitalization in each country. The returns presented for this index include the effects of reinvested dividends, net of taxes, and adjustment to U.S dollar denomination.
| 32 | (continued) |
| Ohio National Fund, Inc. | ON Foreign Portfolio (formerly the International Small-Mid Company Portfolio) (Continued) |
Portfolio Composition as of June 30, 2017 (1)
| % of Net Assets | ||||
Common Stocks (4) (5) | 95.0 | |||
Money Market Funds | ||||
Less Net Liabilities | 5.0 | |||
|
| |||
| 100.0 | ||||
|
|
Top 10 Portfolio Holdings as of June 30, 2017 (1) (2) (3)
| % of Net Assets | ||||
1. Samsung Electronics Co. Ltd. | 3.7 | |||
2. SoftBank Group Corp. | 2.7 | |||
3. BP PLC | 2.6 | |||
4. Royal Dutch Shell PLC | 2.3 | |||
5. Roche Holding AG | 2.3 | |||
6. Baidu, Inc. – ADR | 2.3 | |||
7. Teva Pharmaceutical Industries Ltd. – ADR | 2.2 | |||
8. Standard Chartered PLC | 2.2 | |||
9. Hana Financial Group, Inc. | 2.1 | |||
10. Sanofi | 2.1 |
| (1) | Composition of Portfolio subject to change. |
| (2) | Short-term investments have been excluded from the list of Top 10 Portfolio Holdings. |
| (3) | Top 10 Portfolio Holdings is presented at an individual security level. Total investment exposure by issuer may be higher. |
| (4) | Top 10 Country Weightings (Common Stocks): |
| % of Net Assets | ||||
United Kingdom | 15.9 | |||
South Korea | 10.0 | |||
Japan | 10.0 | |||
France | 8.1 | |||
Netherlands | 7.5 | |||
China | 6.9 | |||
Germany | 6.5 | |||
Canada | 6.2 | |||
Switzerland | 4.1 | |||
Taiwan | 3.2 |
| (5) | Sectors (Common Stocks): |
| % of Net Assets | ||||
Financials | 22.5 | |||
Health Care | 16.5 | |||
Energy | 12.9 | |||
Information Technology | 10.9 | |||
Telecommunication Services | 8.9 | |||
Industrials | 7.5 | |||
Consumer Discretionary | 7.0 | |||
Materials | 6.8 | |||
Consumer Staples | 2.0 | |||
|
| |||
| 95.0 | ||||
|
|
| 33 |
| Ohio National Fund, Inc. | ON Foreign Portfolio (formerly the International Small-Mid Company Portfolio) |
Schedule of Investments | June 30, 2017 (Unaudited) |
| Common Stocks – 95.0% | Shares | Value | ||||||||
| United Kingdom – 15.9% | ||||||||||
Aviva PLC | (c) | 133,720 | $ | 917,234 | ||||||
BAE Systems PLC | (c) | 138,240 | 1,141,209 | |||||||
Barclays PLC | (c) | 319,800 | 845,798 | |||||||
BP PLC | (c) | 358,270 | 2,067,996 | |||||||
Capita PLC | (c) | 47,485 | 427,911 | |||||||
Cobham PLC | (c) | 322,840 | 545,198 | |||||||
HSBC Holdings PLC | (c) | 153,530 | 1,425,060 | |||||||
Johnson Matthey PLC | (c) | 17,600 | 658,708 | |||||||
Kingfisher PLC | (c) | 211,720 | 829,288 | |||||||
Rolls-Royce Holdings PLC | (c) | 42,650 | 494,681 | |||||||
SIG PLC | (d) | 368,740 | 713,674 | |||||||
Standard Chartered PLC | (a)(c) | 171,100 | 1,732,936 | |||||||
Vodafone Group PLC | (c) | 233,940 | 664,378 | |||||||
|
| |||||||||
| 12,464,071 | ||||||||||
|
| |||||||||
| South Korea – 10.0% | ||||||||||
Dongbu Insurance Co. Ltd. | (c) | 9,026 | 536,397 | |||||||
Hana Financial Group, Inc. | (c) | 42,130 | 1,663,819 | |||||||
Hyundai Mobis Co. Ltd. | (c) | 4,623 | 1,010,642 | |||||||
KB Financial Group, Inc. | (c) | 18,220 | 919,932 | |||||||
Korea Investment Holdings Co. Ltd. | (c) | 13,799 | 845,571 | |||||||
Samsung Electronics Co. Ltd. | (c) | 1,375 | 2,863,878 | |||||||
|
| |||||||||
| 7,840,239 | ||||||||||
|
| |||||||||
| Japan – 10.0% | ||||||||||
Astellas Pharma, Inc. | (c) | 67,300 | 824,875 | |||||||
Inpex Corp. | (c) | 61,700 | 595,742 | |||||||
Kirin Holdings Co. Ltd. | (c) | 38,500 | 785,346 | |||||||
Panasonic Corp. | (c) | 65,300 | 889,729 | |||||||
SoftBank Group Corp. | (c) | 26,400 | 2,146,059 | |||||||
Sumitomo Metal Mining Co. Ltd. | (c) | 47,000 | 628,206 | |||||||
Sumitomo Rubber Industries Ltd. | (c) | 51,300 | 868,792 | |||||||
Suntory Beverage & Food Ltd. | (c) | 16,700 | 776,230 | |||||||
Taiheiyo Cement Corp. | (c) | 78,200 | 285,980 | |||||||
|
| |||||||||
| 7,800,959 | ||||||||||
|
| |||||||||
| France – 8.1% | ||||||||||
AXA SA | (c) | 35,720 | 978,133 | |||||||
BNP Paribas SA | (c) | 21,430 | 1,542,803 | |||||||
Cie Generale des Etablissements Michelin | (c) | 4,288 | 570,707 | |||||||
Sanofi | (c) | 17,220 | 1,650,019 | |||||||
TOTAL SA | (c) | 31,640 | 1,570,830 | |||||||
|
| |||||||||
| 6,312,492 | ||||||||||
|
| |||||||||
| Netherlands – 7.5% | ||||||||||
Aegon NV | (c) | 270,070 | 1,382,193 | |||||||
Flow Traders | (b)(c) | 15,070 | 415,862 | |||||||
ING Groep NV | (c) | 56,650 | 977,935 | |||||||
QIAGEN NV | (c) | 37,960 | 1,263,071 | |||||||
Royal Dutch Shell PLC | (c) | 68,270 | 1,832,803 | |||||||
|
| |||||||||
| 5,871,864 | ||||||||||
|
| |||||||||
| China – 6.9% | ||||||||||
Baidu, Inc. – ADR | (a) | 10,010 | 1,790,389 | |||||||
China Life Insurance Co. Ltd. | (c) | 249,000 | 760,958 | |||||||
China Telecom Corp. Ltd. | (c) | 2,000,000 | 949,726 | |||||||
Shandong Weigao Group Medical Polymer Co. Ltd. | (c) | 660,000 | 517,788 | |||||||
Sinopec Engineering Group Co. Ltd. | (c) | 800,500 | 721,189 | |||||||
Sinopharm Group Co. Ltd. | (c) | 155,200 | 701,179 | |||||||
|
| |||||||||
| 5,441,229 | ||||||||||
|
| |||||||||
| Germany – 6.5% | ||||||||||
Bayer AG | (c) | 10,130 | 1,312,950 | |||||||
Gerresheimer AG | (c) | 10,040 | 808,055 | |||||||
Merck KGaA | (c) | 8,080 | 977,669 | |||||||
MorphoSys AG | (a)(c) | 9,530 | 676,397 | |||||||
Siemens AG | (c) | 4,697 | 646,091 | |||||||
Telefonica Deutschland Holding AG | (c) | 129,160 | 645,928 | |||||||
|
| |||||||||
| 5,067,090 | ||||||||||
|
| |||||||||
| Common Stocks (Continued) | Shares | Value | ||||||||
| Canada – 6.2% | ||||||||||
Alamos Gold, Inc. | 119,339 | $ | 856,854 | |||||||
Barrick Gold Corp. | 57,440 | 913,870 | ||||||||
Eldorado Gold Corp. | 273,534 | 725,599 | ||||||||
Ensign Energy Services, Inc. | 80,800 | 431,789 | ||||||||
Husky Energy, Inc. | (a) | 47,600 | 540,308 | |||||||
Precision Drilling Corp. | (a) | 194,000 | 662,724 | |||||||
Suncor Energy, Inc. | 25,700 | 750,905 | ||||||||
|
| |||||||||
| 4,882,049 | ||||||||||
|
| |||||||||
| Switzerland – 4.1% | ||||||||||
GAM Holding AG | (c) | 38,820 | 521,928 | |||||||
Roche Holding AG | (c) | 7,040 | 1,798,824 | |||||||
UBS Group AG | (c) | 53,480 | 909,475 | |||||||
|
| |||||||||
| 3,230,227 | ||||||||||
|
| |||||||||
| Taiwan – 3.2% | ||||||||||
Catcher Technology Co. Ltd. | (c) | 93,000 | 1,108,414 | |||||||
Quanta Computer, Inc. | (c) | 283,000 | 669,441 | |||||||
Taiwan Semiconductor Manufacturing Co. Ltd. | (c) | 107,000 | 731,047 | |||||||
|
| |||||||||
| 2,508,902 | ||||||||||
|
| |||||||||
| Singapore – 2.9% | ||||||||||
Singapore Telecommunications Ltd. | (c) | 378,900 | 1,070,137 | |||||||
United Overseas Bank Ltd. | (c) | 70,200 | 1,178,562 | |||||||
|
| |||||||||
| 2,248,699 | ||||||||||
|
| |||||||||
| United States – 2.5% | ||||||||||
Oracle Corp. | 28,160 | 1,411,942 | ||||||||
Tahoe Resources, Inc. | 65,500 | 564,690 | ||||||||
|
| |||||||||
| 1,976,632 | ||||||||||
|
| |||||||||
| Hong Kong – 2.3% | ||||||||||
China Mobile Ltd. | (c) | 64,500 | 683,816 | |||||||
CK Hutchison Holdings Ltd. | (c) | 92,000 | 1,154,558 | |||||||
|
| |||||||||
| 1,838,374 | ||||||||||
|
| |||||||||
| Israel – 2.2% | ||||||||||
Teva Pharmaceutical Industries Ltd. – ADR | 52,980 | 1,759,996 | ||||||||
|
| |||||||||
| Norway – 1.9% | ||||||||||
Telenor ASA | (c) | 48,960 | 812,258 | |||||||
Yara International ASA | (c) | 17,660 | 664,056 | |||||||
|
| |||||||||
| 1,476,314 | ||||||||||
|
| |||||||||
| Italy – 1.5% | ||||||||||
Eni SpA | (c) | 79,167 | 1,189,711 | |||||||
|
| |||||||||
| New Zealand – 1.0% | ||||||||||
SKY Network Television Ltd. | (c) | 317,198 | 802,042 | |||||||
|
| |||||||||
| Sweden – 0.9% | ||||||||||
Getinge AB | (c) | 34,850 | 682,581 | |||||||
|
| |||||||||
| Thailand – 0.7% | ||||||||||
Kasikornbank PCL | (c) | 18,100 | 105,669 | |||||||
PTT Exploration & Production PCL | (c) | 183,600 | 465,626 | |||||||
|
| |||||||||
| 571,295 | ||||||||||
|
| |||||||||
| Luxembourg – 0.7% | ||||||||||
SES SA | (c) | 23,210 | 543,738 | |||||||
|
| |||||||||
Total Common Stocks (Cost $73,685,995) | $ | 74,508,504 | ||||||||
|
| |||||||||
| Money Market Funds – 5.9% | Shares | Value | ||||||||
State Street Institutional U.S. Government Money Market Fund Institutional Class | 4,609,669 | $ | 4,609,669 | |||||||
|
| |||||||||
Total Money Market Funds (Cost $4,609,669) | $ | 4,609,669 | ||||||||
|
| |||||||||
Total Investments – 100.9% (Cost $78,295,664) | (e) | $ | 79,118,173 | |||||||
Liabilities in Excess of Other Assets – (0.9)% | (674,228) | |||||||||
|
| |||||||||
Net Assets – 100.0% | $ | 78,443,945 | ||||||||
|
| |||||||||
| 34 | (continued) |
| Ohio National Fund, Inc. | ON Foreign Portfolio (formerly the International Small-Mid Company Portfolio) (Continued) |
Schedule of Investments | June 30, 2017 (Unaudited) |
Percentages are stated as a percent of net assets.
Abbreviations:
ADR: American Depositary Receipts
Footnotes:
| (a) | Non-income producing security. |
| (b) | Security exempt from registration under Regulation D of the Securities Act of 1933. These securities may be resold in transactions exempt from registration, normally to qualified buyers under Rule 144A. At June 30, 2017, the value of these securities totaled $415,862, or 0.5% of the Portfolio’s net assets. These securities were deemed liquid pursuant to procedures approved by the Board of Directors. |
| (c) | Security traded on a foreign exchange has been valued at an estimate of fair value that is different than the local market close price. These fair value estimates are determined by an independent fair valuation service that has been approved by the Board. These securities represent $63,385,764, or 80.8% of the Portfolio’s net assets. |
| (d) | As discussed in Note 2 of the Notes to Financial Statements, not all investments that are traded on a foreign exchange are valued at an estimate that is different from the local close price. In some instances, the independent fair valuation service uses a stock’s local close price because the service’s measure of predictability related to their valuation model of a stock is below a chosen threshold. These securities represent $713,674, or 0.9% of the Portfolio’s net assets. |
Other Portfolio securities are not subjected to fair valuation procedures because they are traded on domestic or foreign exchanges that have close times that are consistent with the U.S. market close, normally 4:00 pm Eastern Time.
| (e) | Represents cost for financial reporting purposes, which may differ from cost basis for federal income tax purposes. See also Note 7 of the Notes to Financial Statements. |
The accompanying notes are an integral part of these financial statements.
| 35 |
| Ohio National Fund, Inc. | Aggressive Growth Portfolio |
Objective/Strategy
The Aggressive Growth Portfolio seeks long-term capital growth by investing primarily in domestic and foreign equity securities selected for growth potential.
Performance as of June 30, 2017
Average Annual returns | ||||
One year | 23.41% | |||
Five years | 15.40% | |||
Ten years | 8.54% |
Past performance does not guarantee future results. The performance data quoted represents past performance and current returns may be lower or higher. Total return figures include change in share price and reinvestment of dividends and capital gains. The investment return and principal value will fluctuate so that an investor’s shares, when redeemed, may be worth more or less than the original cost. To obtain performance information up to the most recent month end, call toll-free 1-877-781-6392.
The Portfolio is not open to direct retail investment. Beneficial interest in shares is obtained solely by purchase of variable life insurance policies and variable annuity contracts. Actual performance results for variable annuity and variable universal life contracts will be lower due to contract charges. Consult your contract for applicable charges.
Total expense ratio is 0.95% per the Fund’s prospectus dated May 1, 2017. Additional information pertaining to the Fund’s expense ratio as of June 30, 2017 can be found in the Portfolio’s Financial Highlights.
Comments from Sub-Adviser
Q. How did the Portfolio perform in comparison to its benchmark during the reporting period?
A. For the six-month period ended June 30, 2017, the Aggressive Growth Portfolio returned 17.87% versus 13.99% for its benchmark, the Russell 1000 Growth Index.
Q. Were there specific market conditions, investment strategies, or techniques that materially affected the Portfolio’s benchmark-relative performance during the reporting period?
A. Many of the Portfolio’s holdings have benefitted from some of the most powerful secular growth themes in today’s economy: the shift from offline to online spending, the switch of enterprise software from on-premises data centers to the cloud, a proliferation of connected devices in the home and business, and a growing global middle class, to name a few. These themes may be well known, but they remain nascent in their development. We believe the Portfolio’s companies are still in the early innings of realizing their earnings potential as these themes push forward. We remain confident in their ability to grow earnings and welcome an environment where that growth is the key determinant of stock price appreciation.(1)
Q. How did sector selection and security selection each impact the Portfolio’s performance relative to its benchmark?
A. Stock selection in the Information Technology and Health Care sectors were large drivers of the Portfolio’s outperformance. Stock selection in the Financials and Materials sectors detracted from relative results.
Q. Which holdings contributed the most to, and detracted the most from, the Portfolio’s benchmark-relative performance?
A. Due to the concentrated nature of the Portfolio, a few individual securities can have a large impact on performance. The largest
contributors to performance included Activision Blizzard, Inc. (“Activision”), CSX Corp. (“CSX”) and Adobe Systems, Inc. The largest detractors included Tractor Supply Co., General Electric Co., and SPS Commerce, Inc.(1)
Activision’s stock has appreciated as the market has begun to recognize that the company’s digital transition enables a more durable cash flow stream and new avenues to monetize its franchises. We believe the trend toward digital gaming is a powerful tailwind for Activision. As gaming moves from physical game cartridges toward digital platforms, it reduces costs for Activision and makes it less reliant on the release of a new gaming console to drive game sales. Digital gaming also gives the company the ability to sell digital items to gamers in real-time. We also like that Activision has a number of popular game franchises, which makes the company less dependent on any single franchise and creates a loyal and receptive audience when a franchise launches a new release. We also believe Activision can improve monetization of games that it acquired from King Digital by inserting advertisements into those games for the first time. Finally, we believe the company has an opportunity to monetize viewership of its games through eSports.(1)
CSX was another large contributor to performance. The stock was up after an announcement that a new CEO with a history of improving operations at railroad companies was taking the helm at the company. We had long believed that CSX’s operating underperformance relative to other railroad companies left room for improvement, and believe better results will follow the new leadership. We believe a large rail network such as CSX’s is a valuable asset that would be hard, if not impossible, for other transportation and logistics companies to replicate. Railways also have a significant cost advantage over the trucking industry. As CSX focuses on improving its service and reliability to customers, we believe it will continue to drive more shippers to use the railway instead of trucking services.(1)
Adobe Systems, Inc. was the third largest contributor. We believe the company is poised to grow profitability as its digital media business moves from a perpetual license-based business model to a subscription-based business model. We also believe Adobe’s digital marketing business, which helps advertisers create digital content, is well positioned for the transition in advertising spending toward digital advertising platforms.(1)
Tractor Supply Co. was our largest detractor. Tractor Supply Co. provides a number of farming materials, targeting hobbyist farmers and outdoor enthusiasts. We believe the company has better buying power than subscale regional players it competes against. Much of the materials it sells have a high weight to value factor, meaning they are not as easy to ship. This insulates Tractor Supply Co. from ecommerce disruption more than many other retailers. The stock has been down due to disappointing comparative sales that have led to negative earnings revisions.(1)
General Electric, Co. (“GE”) was the second largest detractor. We have been disappointed in GE’s cash flow conversion from its industrial businesses, and sold the position during the period.(1)
SPS Commerce, Inc., which sells supply chain management software, also dragged on returns and was sold during the period.(1)
| (1) | The Portfolio’s composition is subject to change. Holdings and weightings are as of June 30, 2017. |
| 36 | (continued) |
| Ohio National Fund, Inc. | Aggressive Growth Portfolio (Continued) |
Change in Value of $10,000 Investment
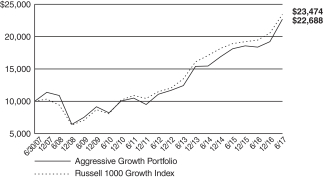
Hypothetical illustration based on past performance. Future performance will vary. The Portfolio’s returns reflect reinvested dividends. The Portfolio’s holdings may differ significantly from the securities in the index. The index is unmanaged and therefore does not reflect the cost of portfolio management and accounting.
The Russell 1000 Growth Index is a market-capitalization weighted index of those firms in the Russell 1000 Index with higher price-to-book ratios and higher forecasted growth values. The Russell 1000 Index measures the performance of the large-cap segment of the U.S. equity universe. The index presented includes the effects of reinvested dividends.
Portfolio Composition as of June 30, 2017 (1)
| % of Net Assets | ||||
Common Stocks (4) | 96.8 | |||
Money Market Funds | ||||
Less Net Liabilities | 3.2 | |||
|
| |||
| 100.0 | ||||
|
|
Top 10 Portfolio Holdings as of June 30, 2017 (1) (2) (3)
| % of Net Assets | ||||||
| 1. | Alphabet, Inc. Class C | 5.6 | ||||
| 2. | Microsoft Corp. | 5.2 | ||||
| 3. | Activision Blizzard, Inc. | 4.4 | ||||
| 4. | Mastercard, Inc. Class A | 4.2 | ||||
| 5. | Amazon.com, Inc. | 4.1 | ||||
| 6. | Allergan PLC | 3.7 | ||||
| 7. | CSX Corp. | 3.4 | ||||
| 8. | Facebook, Inc. Class A | 3.4 | ||||
| 9. | Cooper Cos., Inc. / The | 3.3 | ||||
| 10. | TD Ameritrade Holding Corp. | 3.3 |
| (1) | Composition of Portfolio subject to change. |
| (2) | Short-term investments have been excluded from the list of Top 10 Portfolio Holdings. |
| (3) | Top 10 Portfolio Holdings is presented at an individual security level. Total investment exposure by issuer may be higher. |
| (4) | Sectors (Common Stocks): |
| % of Net Assets | ||||
Information Technology | 40.2 | |||
Health Care | 25.3 | |||
Consumer Discretionary | 15.1 | |||
Financials | 8.4 | |||
Industrials | 3.4 | |||
Materials | 1.8 | |||
Real Estate | 1.6 | |||
Consumer Staples | 1.0 | |||
|
| |||
| 96.8 | ||||
|
|
| 37 |
| Ohio National Fund, Inc. | Aggressive Growth Portfolio |
Schedule of Investments | June 30, 2017 (Unaudited) |
| Common Stocks – 96.8% | Shares | Value | ||||||||
| CONSUMER DISCRETIONARY – 15.1% | ||||||||||
Delphi Automotive PLC (Auto Components) | 13,811 | $ | 1,210,534 | |||||||
Tesla Motors, Inc. (Automobiles) | (a) | 778 | 281,332 | |||||||
Royal Caribbean Cruises Ltd. (Hotels, Restaurants & Leisure) | 7,947 | 868,051 | ||||||||
Starbucks Corp. (Hotels, Restaurants & Leisure) | 13,248 | 772,491 | ||||||||
Amazon.com, Inc. (Internet & Direct Marketing Retail) | (a) | 2,375 | 2,299,000 | |||||||
Ctrip.com International Ltd. – ADR (Internet & Direct Marketing Retail) | (a) | 13,847 | 745,799 | |||||||
MakeMyTrip Ltd. (Internet & Direct Marketing Retail) | (a) | 15,435 | 517,844 | |||||||
Tractor Supply Co. (Specialty Retail) | 10,418 | 564,760 | ||||||||
NIKE, Inc. Class B (Textiles, Apparel & Luxury Goods) | 21,649 | 1,277,291 | ||||||||
|
| |||||||||
| 8,537,102 | ||||||||||
|
| |||||||||
CONSUMER STAPLES – 1.0% | ||||||||||
Costco Wholesale Corp. (Food & Staples Retailing) | 3,631 | 580,706 | ||||||||
|
| |||||||||
FINANCIALS – 8.4% | ||||||||||
SVB Financial Group (Banks) | (a) | 7,421 | 1,304,538 | |||||||
Intercontinental Exchange, Inc. (Capital Markets) | 23,493 | 1,548,659 | ||||||||
TD Ameritrade Holding Corp. (Capital Markets) | 43,504 | 1,870,237 | ||||||||
|
| |||||||||
| 4,723,434 | ||||||||||
|
| |||||||||
HEALTH CARE – 25.3% | ||||||||||
Celgene Corp. (Biotechnology) | (a) | 5,549 | 720,649 | |||||||
DBV Technologies SA – ADR (Biotechnology) | (a) | 8,731 | 311,784 | |||||||
Regeneron Pharmaceuticals, Inc. (Biotechnology) | (a) | 3,684 | 1,809,360 | |||||||
Boston Scientific Corp. (Health Care Equip. & Supplies) | (a) | 62,483 | 1,732,029 | |||||||
Cooper Cos., Inc. / The (Health Care Equip. & Supplies) | 7,882 | 1,887,108 | ||||||||
DexCom, Inc. (Health Care Equip. & Supplies) | (a) | 7,280 | 532,532 | |||||||
ICU Medical, Inc. (Health Care Equip. & Supplies) | (a) | 5,259 | 907,178 | |||||||
Intuitive Surgical, Inc. (Health Care Equip. & Supplies) | (a) | 927 | 867,088 | |||||||
Humana, Inc. (Health Care Providers & Svs.) | 3,818 | 918,687 | ||||||||
athenahealth, Inc. (Health Care Technology) | (a) | 6,767 | 951,102 | |||||||
Allergan PLC (Pharmaceuticals) | 8,511 | 2,068,939 | ||||||||
Zoetis, Inc. (Pharmaceuticals) | 25,138 | 1,568,108 | ||||||||
|
| |||||||||
| 14,274,564 | ||||||||||
|
| |||||||||
| Common Stocks (Continued) | Shares | Value | ||||||||
INDUSTRIALS – 3.4% | ||||||||||
CSX Corp. (Road & Rail) | 35,724 | $ | 1,949,101 | |||||||
|
| |||||||||
INFORMATION TECHNOLOGY – 40.2% | ||||||||||
Harris Corp. (Communications Equip.) | 10,528 | 1,148,394 | ||||||||
Alphabet, Inc. Class C (Internet Software & Svs.) | (a) | 3,497 | 3,177,829 | |||||||
CoStar Group, Inc. (Internet Software & Svs.) | (a) | 4,561 | 1,202,280 | |||||||
Facebook, Inc. Class A (Internet Software & Svs.) | (a) | 12,767 | 1,927,562 | |||||||
Trade Desk, Inc. / The Class A (Internet Software & Svs.) | (a) | 19,968 | 1,000,596 | |||||||
Mastercard, Inc. Class A (IT Svs.) | 19,425 | 2,359,166 | ||||||||
WEX, Inc. (IT Svs.) | (a) | 9,543 | 995,049 | |||||||
ASML Holding NV (Semiconductors & Equip.) | 6,283 | 818,738 | ||||||||
Activision Blizzard, Inc. (Software) | 43,313 | 2,493,529 | ||||||||
Adobe Systems, Inc. (Software) | (a) | 10,998 | 1,555,557 | |||||||
Microsoft Corp. (Software) | 42,281 | 2,914,429 | ||||||||
Salesforce.com, Inc. (Software) | (a) | 19,640 | 1,700,824 | |||||||
Tyler Technologies, Inc. (Software) | (a) | 3,416 | 600,089 | |||||||
Ultimate Software Group, Inc. / The (Software) | (a) | 4,053 | 851,374 | |||||||
|
| |||||||||
| 22,745,416 | ||||||||||
|
| |||||||||
| MATERIALS – 1.8% | ||||||||||
Vulcan Materials Co. (Construction Materials) | 7,973 | 1,010,020 | ||||||||
|
| |||||||||
| REAL ESTATE – 1.6% | ||||||||||
Crown Castle International Corp. (Equity Real Estate Investment Trusts) | 9,168 | 918,450 | ||||||||
|
| |||||||||
Total Common Stocks (Cost $42,921,645) | $ | 54,738,793 | ||||||||
|
| |||||||||
| Money Market Funds – 3.3% | Shares | Value | ||||||||
State Street Institutional U.S. Government Money Market Fund Institutional Class | 1,833,179 | $ | 1,833,179 | |||||||
|
| |||||||||
Total Money Market Funds (Cost $1,833,179) | $ | 1,833,179 | ||||||||
|
| |||||||||
Total Investments – 100.1% (Cost $44,754,824) | (b) | $ | 56,571,972 | |||||||
Liabilities in Excess of Other Assets – (0.1)% | (42,247) | |||||||||
|
| |||||||||
Net Assets – 100.0% | $ | 56,529,725 | ||||||||
|
| |||||||||
Percentages are stated as a percent of net assets.
Abbreviations:
ADR: American Depositary Receipts
Footnotes:
| (a) | Non-income producing security. |
| (b) | Represents cost for financial reporting purposes, which may differ from cost basis for federal income tax purposes. See also Note 7 of the Notes to Financial Statements. |
The accompanying notes are an integral part of these financial statements.
| 38 |
| Ohio National Fund, Inc. | Small Cap Growth Portfolio |
Objective/Strategy
The Small Cap Growth Portfolio seeks long-term capital appreciation by investing at least 80% of its net assets in stocks of small capitalization companies.
Performance as of June 30, 2017
Average Annual returns | ||||
One year | 20.66% | |||
Five years | 15.09% | |||
Ten years | 9.17% |
Past performance does not guarantee future results. The performance data quoted represents past performance and current returns may be lower or higher. Total return figures include change in share price and reinvestment of dividends and capital gains. The investment return and principal value will fluctuate so that an investor’s shares, when redeemed, may be worth more or less than the original cost. To obtain performance information up to the most recent month end, call toll-free 1-877-781-6392.
The Portfolio is not open to direct retail investment. Beneficial interest in shares is obtained solely by purchase of variable life insurance policies and variable annuity contracts. Actual performance results for variable annuity and variable universal life contracts will be lower due to contract charges. Consult your contract for applicable charges.
Total expense ratio is 0.86% per the Fund’s prospectus dated May 1, 2017. Additional information pertaining to the Fund’s expense ratio as of June 30, 2017 can be found in the Portfolio’s Financial Highlights.
Comments from Sub-Adviser
Q. How did the Portfolio perform in comparison to its benchmark during the reporting period?
A. For the six-month period ended June 30, 2017, the Small Cap Growth Portfolio returned 13.45% versus 9.97% for its benchmark, the Russell 2000 Growth Index.
Q. Were there specific market conditions, investment strategies, or techniques that materially affected the Portfolio’s benchmark-relative performance during the reporting period?
A. We categorize the market environment since the November presidential election as one long on hope and short on pragmatism. It’s not that there aren’t reasons to be positive: the U.S. economy looks healthier than at any point since before the financial crisis, corporate earnings are improving and the number of fundamentally positive meetings we’ve had with management teams is higher than we’ve seen in years. That optimism, however, is reflected in valuations … and then some.
Small cap stock valuations are well above their long-term averages. The stock price for many small cap companies already reflects a rosy scenario of tax cuts and regulatory rollbacks from the Trump administration. These benefits seem to us to be far from certain. A prolonged battle to reform the health insurance market - a core tenet of the President and the controlling party in the House and Senate - shows that drastic reform is hard to come by, if it comes at all.
Geopolitical risk, meanwhile, seems lost on the market. Despite elevated tensions with Russia and North Korea and the threat of upending free-trade pacts, the Chicago Board Options Exchange Volatility Index (“VIX”) has barely budged from a historically low level.
Our outlook for stocks and the broader business environment is a little more grounded. We think the economy will remain healthy, but
aren’t betting on tax reform or a major infrastructure spending initiative any time in 2017. If that proves correct, stocks will likely have to adjust. We don’t expect a major downturn in markets, but expect a lower return environment going forward, with the possibility for a negative surprise within small-cap stocks greater than the possibility for a positive one.
Q. How did sector selection and security selection each impact the Portfolio’s performance relative to its benchmark?
A. At the sector level, stock selection in the Information Technology and Industrials sectors were large contributors to the Portfolio’s outperformance. Stock selection in the Health Care and Consumer Discretionary sectors detracted from relative results.(1)
We have taken a high-quality approach to investing in small cap stocks, focusing on companies we believe have more predictable, growing revenue streams. The companies we favor typically generate a high return on invested capital or demonstrate a proven ability to expand profit margins. These companies are often defined by sustainable competitive advantages such as high barriers to entry in their respective industry or a differentiated product or service that gives them pricing power, helping the company grow in a variety of market and economic environments. The current market environment favored our investment style, as higher quality stocks returned to favor.(1)
Q. Were there any factors that impacted the benchmark’s performance more significantly than the Portfolio’s performance?
A. U.S. small cap stocks gained ground in the six-month period, but a stylistic change in market tone favored a new set of market leaders. Over the six-month period, companies with more established earnings profiles generally outperformed the smaller companies and more cyclical stocks that had enjoyed stronger returns in the first few months after the November election. Health Care and Information Technology were among the top performing sectors within the Russell 2000 Growth Index during the period, while the Energy and Consumer Staples sectors lagged. Energy stocks fell as oil prices dipped during the second quarter.(1)
Q. Which holdings contributed the most to, and detracted the most from, the Portfolio’s benchmark-relative performance?
A. The top contributors to performance were as follows:
Puma Biotechnology, Inc.: The development-stage biotechnology company develops novel therapeutics for the treatment of various forms of cancer. Puma focuses on in-licensing drug candidates that are undergoing or have already completed initial clinical testing and then seeks to further develop those drug candidates for commercial use. We like the potential for one of the company’s lead drugs, Neratinib, to treat a subset of women with breast cancer.(1)
Cadence Design Systems, Inc.: Cadence sells its electronic design automation software to customers who use it to design semiconductors and electronic systems. We believe the company’s semiconductor design software is becoming increasingly important as semiconductors grow more complex. As one of only two companies specializing in this market segment, Cadence should be able to increase pricing and profits. We also appreciate the company’s intellectual property licensing business, which we believe is a high-margin, high-growth operation.(1)
SS&C Technologies Holdings, Inc. (“SS&C”): The company is a global provider of investment and financial software-enabled
| 39 | (continued) |
| Ohio National Fund, Inc. | Small Cap Growth Portfolio (Continued) |
services and is focused exclusively on the global financial services industry. We like SS&C because the majority of its revenue comes from recurring sources such as subscription services or software maintenance, where client retention has remained high.(1)
The top detractors from performance were as follows:
Sally Beauty Holdings, Inc.: The company is a retailer of hair and beauty products. We think the company is uniquely positioned with a broader and higher-quality product lineup than mass retailers, but which sell at attractive price points relative to salons.(1)
National CineMedia, Inc.: The company provides pre-feature advertising in movie theaters. We sold the position during the period to pursue better growth opportunities in the Portfolio.(1)
Biglari Holdings, Inc.: The company owns or has ownership stakes in a number of companies including Steak ‘n Shake and Cracker Barrel restaurants, Maxim magazine and First Guard Insurance, among others. We see the opportunity for the company to improve earnings as it turns around profitability at Maxim, expands margins at Steak ‘n Shake as it sells franchising rights to more of its stores and as the company potentially disposes of some of its less profitable businesses.(1)
Q. How did the Portfolio’s use of derivative instruments and initial public offerings (IPOs), if any, impact performance?
A. The Portfolio participated in four Initial Public Offerings (IPOs) over the period, which had a favorable impact on performance. Floor & Decor Holdings, Inc. and MuleSoft, Inc. each contributed 3 basis points, Canada Goose Holdings, Inc. contributed 2 basis points, and Yext, Inc. contributed 1 basis point to performance during the period. The Portfolio did not use derivatives during the period.(1)
| (1) | The Portfolio’s composition is subject to change. Holdings and weightings are as of June 30, 2017. |
Change in Value of $10,000 Investment
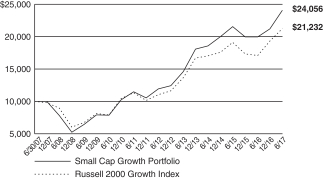
Hypothetical illustration based on past performance. Future performance will vary. The Portfolio’s returns reflect reinvested dividends. The Portfolio’s holdings may differ significantly from the securities in the index. The index is unmanaged and therefore does not reflect the cost of portfolio management and accounting.
The Russell 2000 Growth Index measures the performance of the small-cap growth segment of the U.S. equity universe. It includes the Russell 2000 Index companies with higher price-to-value ratios and higher forecasted growth values. The Russell 2000 Index includes the 2000 firms from the Russell 3000 Index with the smallest market capitalizations. The Russell 3000 Index represents 98% of the investable U.S. equity markets. The index presented includes the effects of reinvested dividends.
| 40 | (continued) |
| Ohio National Fund, Inc. | Small Cap Growth Portfolio (Continued) |
Portfolio Composition as of June 30, 2017 (1)
| % of Net Assets | ||||
Common Stocks (4) | 96.6 | |||
Master Limited Partnerships (4) | 2.4 | |||
U.S. Government Agency Issues | 1.4 | |||
Money Market Funds | (0.4 | ) | ||
|
| |||
| 100.0 | ||||
|
|
Top 10 Portfolio Holdings as of June 30, 2017 (1) (2) (3)
| % of Net Assets | ||||||
| 1. | Broadridge Financial Solutions, Inc. | 2.3 | ||||
| 2. | Nice Ltd. – ADR | 2.2 | ||||
| 3. | SS&C Technologies Holdings, Inc. | 2.1 | ||||
| 4. | Blackbaud, Inc. | 2.1 | ||||
| 5. | Cadence Design Systems, Inc. | 2.0 | ||||
| 6. | STERIS PLC | 1.9 | ||||
| 7. | HEICO Corp. Class A | 1.9 | ||||
| 8. | ServiceMaster Global Holdings, Inc. | 1.9 | ||||
| 9. | Sensient Technologies Corp. | 1.8 | ||||
| 10. | Euronet Worldwide, Inc. | 1.8 |
| (1) | Composition of Portfolio subject to change. |
| (2) | Short-term investments have been excluded from the list of Top 10 Portfolio Holdings. |
| (3) | Top 10 Portfolio Holdings is presented at an individual security level. Total investment exposure by issuer may be higher. |
| (4) | Sectors (Common Stocks, Master Limited Partnerships): |
| % of Net Assets | ||||
Information Technology | 34.1 | |||
Health Care | 20.8 | |||
Industrials | 13.8 | |||
Consumer Discretionary | 11.0 | |||
Financials | 8.1 | |||
Materials | 5.0 | |||
Real Estate | 2.8 | |||
Consumer Staples | 2.3 | |||
Energy | 1.1 | |||
|
| |||
| 99.0 | ||||
|
|
| 41 |
| Ohio National Fund, Inc. | Small Cap Growth Portfolio |
Schedule of Investments | June 30, 2017 (Unaudited) |
| Common Stocks – 96.6% | Shares | Value | ||||||||
| CONSUMER DISCRETIONARY – 9.7% | ||||||||||
Gentherm, Inc. (Auto Components) | (a) | 34,297 | $ | 1,330,724 | ||||||
Visteon Corp. (Auto Components) | (a) | 8,985 | 917,009 | |||||||
ServiceMaster Global Holdings, Inc. (Diversified Consumer Svs.) | (a) | 117,523 | 4,605,726 | |||||||
Biglari Holdings, Inc. (Hotels, Restaurants & Leisure) | (a) | 7,442 | 2,974,865 | |||||||
Domino’s Pizza Group PLC (Hotels, Restaurants & Leisure) | (b) | 388,472 | 1,486,822 | |||||||
Dunkin’ Brands Group, Inc. (Hotels, Restaurants & Leisure) | 46,408 | 2,558,009 | ||||||||
Playa Hotels & Resorts NV (Hotels, Restaurants & Leisure) | (a) | 93,385 | 1,115,951 | |||||||
MakeMyTrip Ltd. (Internet & Direct Marketing Retail) | (a) | 45,599 | 1,529,846 | |||||||
Manchester United PLC Class A (Media) | 75,977 | 1,234,626 | ||||||||
Sally Beauty Holdings, Inc. (Specialty Retail) | (a) | 140,144 | 2,837,916 | |||||||
Williams-Sonoma, Inc. (Specialty Retail) | 27,142 | 1,316,387 | ||||||||
Carter’s, Inc. (Textiles, Apparel & Luxury Goods) | 24,041 | 2,138,447 | ||||||||
|
| |||||||||
| 24,046,328 | ||||||||||
|
| |||||||||
CONSUMER STAPLES – 2.3% | ||||||||||
Britvic PLC (Beverages) | (b) | 69,459 | 626,047 | |||||||
Casey’s General Stores, Inc. (Food & Staples Retailing) | 8,882 | 951,351 | ||||||||
Amplify Snack Brands, Inc. (Food Products) | (a) | 84,748 | 816,971 | |||||||
Ontex Group NV (Personal Products) | (b) | 89,193 | 3,168,657 | |||||||
|
| |||||||||
| 5,563,026 | ||||||||||
|
| |||||||||
FINANCIALS – 8.1% | ||||||||||
Bank of the Ozarks, Inc. (Banks) | 3,674 | 172,200 | ||||||||
Texas Capital Bancshares, Inc. (Banks) | (a) | 16,299 | 1,261,543 | |||||||
Financial Engines, Inc. (Capital Markets) | 63,445 | 2,322,087 | ||||||||
LPL Financial Holdings, Inc. (Capital Markets) | 68,097 | 2,891,399 | ||||||||
MSCI, Inc. (Capital Markets) | 36,188 | 3,727,002 | ||||||||
WisdomTree Investments, Inc. (Capital Markets) | 124,305 | 1,264,182 | ||||||||
SLM Corp. (Consumer Finance) | (a) | 153,399 | 1,764,089 | |||||||
Cision Ltd. (Diversified Financial Svs.) | (a) | 149,278 | 1,536,071 | |||||||
Kingstone Cos., Inc. (Insurance) | 100,000 | 1,530,000 | ||||||||
RLI Corp. (Insurance) | 31,067 | 1,696,879 | ||||||||
LendingTree, Inc. (Thrifts & Mortgage Finance) | (a) | 11,453 | 1,972,207 | |||||||
|
| |||||||||
| 20,137,659 | ||||||||||
|
| |||||||||
| HEALTH CARE – 20.8% | ||||||||||
ACADIA Pharmaceuticals, Inc. (Biotechnology) | (a) | 49,837 | 1,389,954 | |||||||
Axovant Sciences Ltd. (Biotechnology) | (a) | 22,232 | 515,560 | |||||||
DBV Technologies SA – ADR (Biotechnology) | (a) | 37,345 | 1,333,590 | |||||||
Eagle Pharmaceuticals, Inc. (Biotechnology) | (a) | 34,317 | 2,707,268 | |||||||
Ironwood Pharmaceuticals, Inc. (Biotechnology) | (a) | 102,889 | 1,942,544 | |||||||
Knight Therapeutics, Inc. (Biotechnology) | (a) | 206,998 | 1,642,512 | |||||||
Ligand Pharmaceuticals, Inc. (Biotechnology) | (a) | 19,584 | 2,377,498 | |||||||
Neurocrine Biosciences, Inc. (Biotechnology) | (a) | 22,012 | 1,012,552 | |||||||
Puma Biotechnology, Inc. (Biotechnology) | (a) | 26,813 | 2,343,456 | |||||||
AngioDynamics, Inc. (Health Care Equip. & Supplies) | (a) | 71,065 | 1,151,964 | |||||||
Atrion Corp. (Health Care Equip. & Supplies) | 1,667 | 1,072,381 | ||||||||
Globus Medical, Inc. (Health Care Equip. & Supplies) | (a) | 44,837 | 1,486,347 | |||||||
ICU Medical, Inc. (Health Care Equip. & Supplies) | (a) | 15,564 | 2,684,790 | |||||||
Novadaq Technologies, Inc. (Health Care Equip. & Supplies) | (a) | 21,576 | 252,871 | |||||||
STERIS PLC (Health Care Equip. & Supplies) | 58,450 | 4,763,675 | ||||||||
Trinity Biotech PLC – ADR (Health Care Equip. & Supplies) | (a) | 104,778 | 628,668 | |||||||
Wright Medical Group NV (Health Care Equip. & Supplies) | (a) | 57,753 | 1,587,630 | |||||||
Capital Senior Living Corp. (Health Care Providers & Svs.) | (a) | 78,273 | 1,190,532 | |||||||
Diplomat Pharmacy, Inc. (Health Care Providers & Svs.) | (a) | 50,238 | 743,522 | |||||||
HealthEquity, Inc. (Health Care Providers & Svs.) | (a) | 37,958 | 1,891,447 | |||||||
| Common Stocks (Continued) | Shares | Value | ||||||||
| HEALTH CARE (continued) | ||||||||||
athenahealth, Inc. (Health Care Technology) | (a) | 18,387 | $ | 2,584,293 | ||||||
HealthStream, Inc. (Health Care Technology) | (a) | 66,147 | 1,740,989 | |||||||
Medidata Solutions, Inc. (Health Care Technology) | (a) | 9,421 | 736,722 | |||||||
Bio-Techne Corp. (Life Sciences Tools & Svs.) | 19,254 | 2,262,345 | ||||||||
NeoGenomics, Inc. (Life Sciences Tools & Svs.) | (a) | 168,263 | 1,507,636 | |||||||
Aratana Therapeutics, Inc. (Pharmaceuticals) | (a) | 131,189 | 948,496 | |||||||
Catalent, Inc. (Pharmaceuticals) | (a) | 121,801 | 4,275,215 | |||||||
GW Pharmaceuticals PLC – ADR (Pharmaceuticals) | (a) | 12,365 | 1,239,591 | |||||||
Prestige Brands Holdings, Inc. (Pharmaceuticals) | (a) | 47,610 | 2,514,284 | |||||||
Teligent, Inc. (Pharmaceuticals) | (a) | 123,292 | 1,128,122 | |||||||
|
| |||||||||
| 51,656,454 | ||||||||||
|
| |||||||||
INDUSTRIALS – 13.8% | ||||||||||
HEICO Corp. Class A (Aerospace & Defense) | 76,145 | 4,724,797 | ||||||||
Echo Global Logistics, Inc. (Air Freight & Logistics) | (a) | 53,258 | 1,059,834 | |||||||
A.O. Smith Corp. (Building Products) | 46,914 | 2,642,666 | ||||||||
CSW Industrials, Inc. (Building Products) | (a) | 65,322 | 2,524,695 | |||||||
EnerSys (Electrical Equip.) | 28,251 | 2,046,785 | ||||||||
ITT, Inc. (Machinery) | 52,447 | 2,107,320 | ||||||||
Kennametal, Inc. (Machinery) | 43,183 | 1,615,908 | ||||||||
Nordson Corp. (Machinery) | 20,602 | 2,499,435 | ||||||||
Proto Labs, Inc. (Machinery) | (a) | 16,965 | 1,140,896 | |||||||
Rexnord Corp. (Machinery) | (a) | 132,581 | 3,082,508 | |||||||
Standex International Corp. (Machinery) | 20,992 | 1,903,974 | ||||||||
Wabtec Corp. (Machinery) | 18,952 | 1,734,108 | ||||||||
Advisory Board Co. / The (Professional Svs.) | (a) | 38,549 | 1,985,274 | |||||||
AMERCO (Road & Rail) | 4,709 | 1,723,777 | ||||||||
Old Dominion Freight Line, Inc. (Road & Rail) | 28,334 | 2,698,530 | ||||||||
SiteOne Landscape Supply, Inc. (Trading Companies & Distributors) | (a) | 15,065 | 784,284 | |||||||
|
| |||||||||
| 34,274,791 | ||||||||||
|
| |||||||||
| INFORMATION TECHNOLOGY – 34.1% | ||||||||||
Belden, Inc. (Electronic Equip., Instr. & Comp.) | 55,508 | 4,186,968 | ||||||||
CTS Corp. (Electronic Equip., Instr. & Comp.) | 134,103 | 2,896,625 | ||||||||
National Instruments Corp. (Electronic Equip., Instr. & Comp.) | 42,964 | 1,728,012 | ||||||||
OSI Systems, Inc. (Electronic Equip., Instr. & Comp.) | (a) | 30,519 | 2,293,503 | |||||||
Alarm.com Holdings, Inc. (Internet Software & Svs.) | (a) | 49,697 | 1,870,098 | |||||||
ChannelAdvisor Corp. (Internet Software & Svs.) | (a) | 98,409 | 1,136,624 | |||||||
Cimpress NV (Internet Software & Svs.) | (a) | 23,624 | 2,233,177 | |||||||
CoStar Group, Inc. (Internet Software & Svs.) | (a) | 10,143 | 2,673,695 | |||||||
Envestnet, Inc. (Internet Software & Svs.) | (a) | 66,665 | 2,639,934 | |||||||
Instructure, Inc. (Internet Software & Svs.) | (a) | 53,240 | 1,570,580 | |||||||
J2 Global, Inc. (Internet Software & Svs.) | 43,486 | 3,700,224 | ||||||||
Trade Desk, Inc. / The Class A (Internet Software & Svs.) | (a) | 29,765 | 1,491,524 | |||||||
Yext, Inc. (Internet Software & Svs.) | (a) | 97,455 | 1,299,075 | |||||||
Zillow Group, Inc. (Internet Software & Svs.) | (a) | 44,564 | 2,176,506 | |||||||
Broadridge Financial Solutions, Inc. (IT Svs.) | 75,759 | 5,724,350 | ||||||||
Euronet Worldwide, Inc. (IT Svs.) | (a) | 49,942 | 4,363,433 | |||||||
MAXIMUS, Inc. (IT Svs.) | 41,455 | 2,596,327 | ||||||||
WEX, Inc. (IT Svs.) | (a) | 32,337 | 3,371,779 | |||||||
ON Semiconductor Corp. (Semiconductors & Equip.) | (a) | 279,884 | 3,929,571 | |||||||
SolarEdge Technologies, Inc. (Semiconductors & Equip.) | (a) | 48,485 | 969,700 | |||||||
Blackbaud, Inc. (Software) | 60,272 | 5,168,324 | ||||||||
Cadence Design Systems, Inc. (Software) | (a) | 147,799 | 4,949,788 | |||||||
Descartes Systems Group, Inc. / The (Software) | (a) | 90,079 | 2,191,543 | |||||||
Everbridge, Inc. (Software) | (a) | 23,921 | 582,716 | |||||||
Guidewire Software, Inc. (Software) | (a) | 24,556 | 1,687,243 | |||||||
Nice Ltd. – ADR (Software) | 70,356 | 5,538,424 | ||||||||
Paylocity Holding Corp. (Software) | (a) | 48,869 | 2,207,901 | |||||||
RealPage, Inc. (Software) | (a) | 45,067 | 1,620,159 | |||||||
SS&C Technologies Holdings, Inc. (Software) | 137,181 | 5,269,122 | ||||||||
| 42 | (continued) |
| Ohio National Fund, Inc. | Small Cap Growth Portfolio (Continued) |
Schedule of Investments | June 30, 2017 (Unaudited) |
| Common Stocks (Continued) | Shares | Value | ||||||||
| INFORMATION TECHNOLOGY (continued) | ||||||||||
Tyler Technologies, Inc. (Software) | (a) | 13,771 | $ | 2,419,152 | ||||||
|
| |||||||||
| 84,486,077 | ||||||||||
|
| |||||||||
| MATERIALS – 5.0% | ||||||||||
H.B. Fuller Co. (Chemicals) | 28,729 | 1,468,339 | ||||||||
Sensient Technologies Corp. (Chemicals) | 56,184 | 4,524,497 | ||||||||
Valvoline, Inc. (Chemicals) | 112,051 | 2,657,850 | ||||||||
Summit Materials, Inc. Class A (Construction Materials) | (a) | 72,655 | 2,097,550 | |||||||
Winpak Ltd. (Containers & Packaging) | 36,843 | 1,654,071 | ||||||||
|
| |||||||||
| 12,402,307 | ||||||||||
|
| |||||||||
| REAL ESTATE – 2.8% | ||||||||||
Condor Hospitality Trust, Inc. (Equity Real Estate Investment Trusts) | 95,745 | 1,026,386 | ||||||||
Easterly Government Properties, Inc. (Equity Real Estate Investment Trusts) | 82,078 | 1,719,534 | ||||||||
Physicians Realty Trust (Equity Real Estate Investment Trusts) | 68,223 | 1,374,011 | ||||||||
Jones Lang LaSalle, Inc. (Real Estate Mgmt. & Development) | 13,534 | 1,691,750 | ||||||||
St. Joe Co. / The (Real Estate Mgmt. & Development) | (a) | 61,731 | 1,157,457 | |||||||
|
| |||||||||
| 6,969,138 | ||||||||||
|
| |||||||||
Total Common Stocks (Cost $187,665,877) | $ | 239,535,780 | ||||||||
|
| |||||||||
| Master Limited Partnerships – 2.4% | Shares | Value | ||||||||
| CONSUMER DISCRETIONARY – 1.3% | ||||||||||
Cedar Fair LP (Hotels, Restaurants & Leisure) | 45,633 | $ | 3,290,139 | |||||||
|
| |||||||||
ENERGY – 1.1% | ||||||||||
DCP Midstream Partners LP (Oil, Gas & Consumable Fuels) | 76,167 | 2,576,730 | ||||||||
|
| |||||||||
Total Master Limited Partnerships (Cost $5,330,913) | $ | 5,866,869 | ||||||||
|
| |||||||||
| U.S. Government Agency Issues – 1.4% | Rate | Maturity | Face Amount | Value | ||||||||||||||
Federal Home Loan Bank | 0.650% | 07/03/2017 | $ | 3,600,000 | $ | 3,599,870 | ||||||||||||
|
| |||||||||||||||||
Total U.S. Government Agency Issues (Cost $3,599,870) | $ | 3,599,870 | ||||||||||||||||
|
| |||||||||||||||||
| Money Market Funds – 0.3% | Shares | Value | ||||||||||||||
State Street Institutional U.S. Government Money Market Fund Institutional Class | 681,953 | $ | 681,953 | |||||||||||||
|
| |||||||||||||||
Total Money Market Funds (Cost $681,953) | $ | 681,953 | ||||||||||||||
|
| |||||||||||||||
Total Investments – 100.7% (Cost $197,278,613) | (c) | $ | 249,684,472 | |||||||||||||
Liabilities in Excess of Other Assets – (0.7)% | (1,729,575) | |||||||||||||||
|
| |||||||||||||||
Net Assets – 100.0% | $ | 247,954,897 | ||||||||||||||
|
| |||||||||||||||
Percentages are stated as a percent of net assets.
Abbreviations:
ADR: American Depositary Receipts
Footnotes:
| (a) | Non-income producing security. |
| (b) | Security traded on a foreign exchange has been valued at an estimate of fair value that is different than the local market close price. These fair value estimates are determined by an independent fair valuation service that has been approved by the Board. These securities represent $5,281,526, or 2.1% of the Portfolio’s net assets. |
Other Portfolio securities are not subjected to fair value procedures because they are traded on domestic or foreign exchanges that have close times that are consistent with the U.S. market close, normally 4:00 pm Eastern Time.
| (c) | Represents cost for financial reporting purposes, which may differ from cost basis for federal income tax purposes. See also Note 7 of the Notes to Financial Statements. |
The accompanying notes are an integral part of these financial statements.
| 43 |
| Ohio National Fund, Inc. | Mid Cap Opportunity Portfolio |
Objective/Strategy
The Mid Cap Opportunity Portfolio seeks long-term total return by investing at least 80% of its net assets in equity securities of mid-cap companies, primarily those that are strategically positioned for long-term growth.
Performance as of June 30, 2017
Average Annual Returns | ||||
One year | 14.07% | |||
Five years | 11.87% | |||
Ten years | 4.77% |
Past performance does not guarantee future results. The performance data quoted represents past performance and current returns may be lower or higher. Total return figures include change in share price and reinvestment of dividends and capital gains. The investment return and principal value will fluctuate so that an investor’s shares, when redeemed, may be worth more or less than the original cost. To obtain performance information up to the most recent month end, call toll-free 1-877-781-6392.
The Portfolio is not open to direct retail investment. Beneficial interest in shares is obtained solely by purchase of variable life insurance policies and variable annuity contracts. Actual performance results for variable annuity and variable universal life contracts will be lower due to contract charges. Consult your contract for applicable charges.
Total expense ratio is 0.98% per the Fund’s prospectus dated May 1, 2017. Additional information pertaining to the Fund’s expense ratio as of June 30, 2017 can be found in the Portfolio’s Financial Highlights.
Comments from Sub-Adviser
Q. How did the Portfolio perform in comparison to its benchmark during the reporting period?
A. For the six-month period ended June 30, 2017, the Mid Cap Opportunity Portfolio returned 14.82% versus 11.40% for its benchmark, the Russell Midcap Growth Index.
Q. Were there specific market conditions, investment strategies, or techniques that materially affected the Portfolio’s benchmark-relative performance during the reporting period?
A. Stock selection was the primary driver of the Portfolio’s outperformance during the period. The Portfolio benefitted from a reversal in some securities that underperformed in 2016, as well as from mergers and acquisition activity that positively impacted some of the Portfolio’s holdings.(1)
Q. How did sector selection and security selection each impact the Portfolio’s performance relative to its benchmark?
A. Stock selection within the Consumer Discretionary and Industrials sectors contributed the most to the Portfolio’s relative outperformance. Stock selection within the Information Technology and Financials sectors detracted most from relative returns. Sector allocation did not have a significant impact on the Portfolio’s relative performance.(1)
Q. Which holdings contributed the most to, and detracted the most from, the Portfolio’s benchmark-relative performance?
A. Panera Bread Co. Class A (“Panera”) was a top contributor to relative returns during the period. In this time, the company reported strong fourth quarter results, with earnings ahead of market estimates driven by better than expected operating margins. The company also announced record new store sales volume and 2017
guidance that was ahead of market expectations. Later in the period, the company’s share price rose sharply as it was announced that JAB Holding Company would be purchasing the fast casual restaurant chain. The premium paid for Panera was a positive recognition of Panera’s previous investments to improve efficiencies and grow margins. Following strong year-to-date performance and a potential shift in leadership, we felt it prudent to exit the position and look for opportunities elsewhere.(1)
Advance Auto Parts, Inc. was a top detractor from relative returns during the period. Throughout the period, the stock had been weak, as a combination of concerns around increased competition within the auto part industry and weaker than expected earnings weighed on the company. The company announced first quarter earnings during the period that were lower than market estimates, causing the stock to fall even further. Despite the weakness, the comparable same store sales growth trends are moving in the right direction and we believe the company could greatly benefit from planned internal improvements to increase its margin structure. Overall, Advance Auto Parts, Inc. is an attractively valued business that has a compelling earnings growth opportunity over the long-term.(1)
Q. How did the Portfolio’s use of derivative instruments and initial public offerings (IPOs), if any, impact performance?
A. The Portfolio did not utilize derivatives during the period.
The Portfolio participated in two IPOs during the period: Snap, Inc. and Altice USA, Inc. The Portfolio’s position in Snap, Inc. contributed 3 basis points to relative performance during the period, while the Portfolio’s position in Altice USA, Inc. contributed 2 basis points to relative performance.
| (1) | The Portfolio’s composition is subject to change. Holdings and weightings are as of June 30, 2017. |
Change in Value of $10,000 Investment
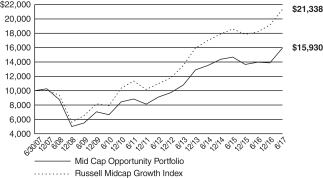
Hypothetical illustration based on past performance. Future performance will vary. The Portfolio’s returns reflect reinvested dividends. The Portfolio’s holdings may differ significantly from the securities in the index. The index is unmanaged and therefore does not reflect the cost of portfolio management and accounting.
The Russell Midcap Growth Index is a subset of the Russell Midcap Index, which measures the performance of the 800 smallest companies in the Russell 1000 Index. The Russell Midcap Growth Index measures the performance of those stocks of the Russell Midcap Index with higher price-to-book ratios and higher relative forecasted growth rates. The index presented includes the effects of reinvested dividends.
| 44 | (continued) |
| Ohio National Fund, Inc. | Mid Cap Opportunity Portfolio (Continued) |
Portfolio Composition as of June 30, 2017 (1)
| % of Net Assets | ||||
Common Stocks (4) | 97.9 | |||
Money Market Funds | 2.1 | |||
|
| |||
| 100.0 | ||||
|
|
Top 10 Portfolio Holdings as of June 30, 2017 (1) (2) (3)
| % of Net Assets | ||||||
| 1. | Amphenol Corp. Class A | 3.0 | ||||
| 2. | Xylem, Inc. | 2.9 | ||||
| 3. | Roper Technologies, Inc. | 2.8 | ||||
| 4. | Edwards Lifesciences Corp. | 2.5 | ||||
| 5. | Northern Trust Corp. | 2.4 | ||||
| 6. | Middleby Corp. / The | 2.4 | ||||
| 7. | Mettler-Toledo International, Inc. | 2.2 | ||||
| 8. | Zoetis, Inc. | 2.2 | ||||
| 9. | Ross Stores, Inc. | 2.2 | ||||
| 10. | Intercontinental Exchange, Inc. | 2.1 |
| (1) | Composition of Portfolio subject to change. |
| (2) | Short-term investments have been excluded from the list of Top 10 Portfolio Holdings. |
| (3) | Top 10 Portfolio Holdings is presented at an individual security level. Total investment exposure by issuer may be higher. |
| (4) | Sectors (Common Stocks): |
| % of Net Assets | ||||
Information Technology | 24.1 | |||
Industrials | 17.1 | |||
Health Care | 15.6 | |||
Consumer Discretionary | 15.2 | |||
Financials | 10.5 | |||
Materials | 6.0 | |||
Consumer Staples | 4.7 | |||
Real Estate | 2.7 | |||
Energy | 2.0 | |||
|
| |||
| 97.9 | ||||
|
|
| 45 |
| Ohio National Fund, Inc. | Mid Cap Opportunity Portfolio |
Schedule of Investments | June 30, 2017 (Unaudited) |
| Common Stocks – 97.9% | Shares | Value | ||||||||
| CONSUMER DISCRETIONARY – 15.2% | ||||||||||
Delphi Automotive PLC (Auto Components) | 4,518 | $ | 396,003 | |||||||
Dunkin’ Brands Group, Inc. (Hotels, Restaurants & Leisure) | 12,890 | 710,497 | ||||||||
Yum! Brands, Inc. (Hotels, Restaurants & Leisure) | 10,296 | 759,433 | ||||||||
Newell Brands, Inc. (Household Durables) | 28,362 | 1,520,770 | ||||||||
Expedia, Inc. (Internet & Direct Marketing Retail) | 10,281 | 1,531,355 | ||||||||
Altice U.S.A., Inc. (Media) | (a) | 4,269 | 137,889 | |||||||
CBS Corp. Class B (Media) | 12,004 | 765,615 | ||||||||
Advance Auto Parts, Inc. (Specialty Retail) | 6,145 | 716,446 | ||||||||
Five Below, Inc. (Specialty Retail) | (a) | 13,357 | 659,435 | |||||||
O’Reilly Automotive, Inc. (Specialty Retail) | (a) | 2,075 | 453,885 | |||||||
Ross Stores, Inc. (Specialty Retail) | 28,809 | 1,663,144 | ||||||||
Ulta Beauty, Inc. (Specialty Retail) | (a) | 3,894 | 1,118,902 | |||||||
PVH Corp. (Textiles, Apparel & Luxury Goods) | 8,373 | 958,709 | ||||||||
|
| |||||||||
| 11,392,083 | ||||||||||
|
| |||||||||
| CONSUMER STAPLES – 4.7% | ||||||||||
Molson Coors Brewing Co. Class B (Beverages) | 5,460 | 471,416 | ||||||||
Monster Beverage Corp. (Beverages) | (a) | 18,640 | 926,035 | |||||||
Blue Buffalo Pet Products, Inc. (Food Products) | (a) | 30,593 | 697,826 | |||||||
Hershey Co. / The (Food Products) | 8,793 | 944,104 | ||||||||
Snyder’s-Lance, Inc. (Food Products) | 12,687 | 439,224 | ||||||||
|
| |||||||||
| 3,478,605 | ||||||||||
|
| |||||||||
| ENERGY – 2.0% | ||||||||||
Dril-Quip, Inc. (Energy Equip. & Svs.) | (a) | 4,346 | 212,085 | |||||||
Concho Resources, Inc. (Oil, Gas & Consumable Fuels) | (a) | 5,460 | 663,554 | |||||||
Diamondback Energy, Inc. (Oil, Gas & Consumable Fuels) | (a) | 6,745 | 599,023 | |||||||
|
| |||||||||
| 1,474,662 | ||||||||||
|
| |||||||||
| FINANCIALS – 10.5% | ||||||||||
Eagle Bancorp, Inc. (Banks) | (a) | 16,753 | 1,060,465 | |||||||
First Republic Bank (Banks) | 10,273 | 1,028,327 | ||||||||
SunTrust Banks, Inc. (Banks) | 14,136 | 801,794 | ||||||||
Affiliated Managers Group, Inc. (Capital Markets) | 4,658 | 772,576 | ||||||||
Intercontinental Exchange, Inc. (Capital Markets) | 23,794 | 1,568,500 | ||||||||
Lazard Ltd. Class A (Capital Markets) | 18,521 | 858,078 | ||||||||
Northern Trust Corp. (Capital Markets) | 18,435 | 1,792,066 | ||||||||
|
| |||||||||
| 7,881,806 | ||||||||||
|
| |||||||||
| HEALTH CARE – 15.6% | ||||||||||
ACADIA Pharmaceuticals, Inc. (Biotechnology) | (a) | 10,927 | 304,754 | |||||||
Alkermes PLC (Biotechnology) | (a) | 15,507 | 898,941 | |||||||
Exelixis, Inc. (Biotechnology) | (a) | 17,049 | 419,917 | |||||||
Incyte Corp. (Biotechnology) | (a) | 7,823 | 984,994 | |||||||
Neurocrine Biosciences, Inc. (Biotechnology) | (a) | 7,610 | 350,060 | |||||||
Vertex Pharmaceuticals, Inc. (Biotechnology) | (a) | 3,708 | 477,850 | |||||||
Edwards Lifesciences Corp. (Health Care Equip. & Supplies) | (a) | 15,772 | 1,864,881 | |||||||
Nevro Corp. (Health Care Equip. & Supplies) | (a) | 7,617 | 566,933 | |||||||
Agilent Technologies, Inc. (Life Sciences Tools & Svs.) | 21,309 | 1,263,837 | ||||||||
Illumina, Inc. (Life Sciences Tools & Svs.) | (a) | 6,892 | 1,195,900 | |||||||
Mettler-Toledo International, Inc. (Life Sciences Tools & Svs.) | (a) | 2,851 | 1,677,928 | |||||||
Zoetis, Inc. (Pharmaceuticals) | 26,706 | 1,665,920 | ||||||||
|
| |||||||||
| 11,671,915 | ||||||||||
|
| |||||||||
| INDUSTRIALS – 17.1% | ||||||||||
L3 Technologies, Inc. (Aerospace & Defense) | 5,530 | 923,952 | ||||||||
| Common Stocks – 97.9% | Shares | Value | ||||||||
| INDUSTRIALS (continued) | ||||||||||
Fortune Brands Home & Security, Inc. (Building Products) | 12,649 | $ | 825,221 | |||||||
Hubbell, Inc. (Electrical Equip.) | 4,993 | 565,058 | ||||||||
Sensata Technologies Holding NV (Electrical Equip.) | (a) | 27,057 | 1,155,875 | |||||||
Roper Technologies, Inc. (Industrial Conglomerates) | 9,090 | 2,104,608 | ||||||||
Fortive Corp. (Machinery) | 18,918 | 1,198,455 | ||||||||
IDEX Corp. (Machinery) | 6,332 | 715,579 | ||||||||
John Bean Technologies Corp. (Machinery) | 5,888 | 577,024 | ||||||||
Middleby Corp. / The (Machinery) | (a) | 14,710 | 1,787,412 | |||||||
WABCO Holdings, Inc. (Machinery) | (a) | 6,332 | 807,393 | |||||||
Xylem, Inc. (Machinery) | 38,809 | 2,151,183 | ||||||||
|
| |||||||||
| 12,811,760 | ||||||||||
|
| |||||||||
| INFORMATION TECHNOLOGY – 24.1% | ||||||||||
Amphenol Corp. Class A (Electronic Equip., Instr. & Comp.) | 30,048 | 2,218,143 | ||||||||
GoDaddy, Inc. Class A (Internet Software & Svs.) | (a) | 19,136 | 811,749 | |||||||
Black Knight Financial Services, Inc. Class A (IT Svs.) | (a) | 34,168 | 1,399,180 | |||||||
Fiserv, Inc. (IT Svs.) | (a) | 11,846 | 1,449,240 | |||||||
Global Payments, Inc. (IT Svs.) | 14,436 | 1,303,860 | ||||||||
Total System Services, Inc. (IT Svs.) | 22,051 | 1,284,471 | ||||||||
Analog Devices, Inc. (Semiconductors & Equip.) | 16,513 | 1,284,711 | ||||||||
Lam Research Corp. (Semiconductors & Equip.) | 7,347 | 1,039,086 | ||||||||
Qorvo, Inc. (Semiconductors & Equip.) | (a) | 5,390 | 341,295 | |||||||
Xilinx, Inc. (Semiconductors & Equip.) | 15,132 | 973,290 | ||||||||
Autodesk, Inc. (Software) | (a) | 8,575 | 864,531 | |||||||
Electronic Arts, Inc. (Software) | (a) | 8,094 | 855,698 | |||||||
Intuit, Inc. (Software) | 10,818 | 1,436,739 | ||||||||
Red Hat, Inc. (Software) | (a) | 10,312 | 987,374 | |||||||
ServiceNow, Inc. (Software) | (a) | 6,963 | 738,078 | |||||||
Splunk, Inc. (Software) | (a) | 8,479 | 482,370 | |||||||
Tyler Technologies, Inc. (Software) | (a) | 3,201 | 562,320 | |||||||
|
| |||||||||
| 18,032,135 | ||||||||||
|
| |||||||||
| MATERIALS – 6.0% | ||||||||||
Ashland Global Holdings, Inc. (Chemicals) | 6,519 | 429,667 | ||||||||
RPM International, Inc. (Chemicals) | 23,934 | 1,305,600 | ||||||||
Sherwin-Williams Co. / The (Chemicals) | 1,800 | 631,728 | ||||||||
Valvoline, Inc. (Chemicals) | 38,482 | 912,793 | ||||||||
Avery Dennison Corp. (Containers & Packaging) | 14,082 | 1,244,426 | ||||||||
|
| |||||||||
| 4,524,214 | ||||||||||
|
| |||||||||
| REAL ESTATE – 2.7% | ||||||||||
Equinix, Inc. (Equity Real Estate Investment Trusts) | 2,060 | 884,070 | ||||||||
SBA Communications Corp. (Equity Real Estate Investment Trusts) | (a) | 8,233 | 1,110,632 | |||||||
|
| |||||||||
| 1,994,702 | ||||||||||
|
| |||||||||
Total Common Stocks (Cost $60,664,340) | $ | 73,261,882 | ||||||||
|
| |||||||||
| Money Market Funds – 2.2% | Shares | Value | ||||||||
State Street Institutional U.S. Government Money Market Fund Institutional Class | 1,606,763 | $ | 1,606,763 | |||||||
|
| |||||||||
Total Money Market Funds (Cost $1,606,763) | $ | 1,606,763 | ||||||||
|
| |||||||||
Total Investments – 100.1% | (b) | $ | 74,868,645 | |||||||
Liabilities in Excess of Other | (56,101) | |||||||||
|
| |||||||||
Net Assets – 100.0% | $ | 74,812,544 | ||||||||
|
| |||||||||
Percentages are stated as a percent of net assets.
Footnotes:
| (a) | Non-income producing security. |
| (b) | Represents cost for financial reporting purposes, which may differ from cost basis for federal income tax purposes. See also Note 7 of the Notes to Financial Statements. |
| 46 |
The accompanying notes are an integral part of these financial statements.
| Ohio National Fund, Inc. | S&P 500® Index Portfolio |
Objective/Strategy
The S&P 500® Index Portfolio seeks total return approximating that of the Standard & Poor’s 500® Index (S&P 500® Index), including reinvestment of dividends, at a risk level consistent with that of the S&P 500® Index by investing more than 80% of its net assets in the securities included in the S&P 500® Index.
Performance as of June 30, 2017
Average Annual returns | ||||
One year | 17.43% | |||
Five years | 14.09% | |||
Ten years | 6.68% |
Past performance does not guarantee future results. The performance data quoted represents past performance and current returns may be lower or higher. Total return figures include change in share price and reinvestment of dividends and capital gains. The investment return and principal value will fluctuate so that an investor’s shares, when redeemed, may be worth more or less than the original cost. To obtain performance information up to the most recent month end, call toll-free 1-877-781-6392.
The Portfolio is not open to direct retail investment. Beneficial interest in shares is obtained solely by purchase of variable life insurance policies and variable annuity contracts. Actual performance results for variable annuity and variable universal life contracts will be lower due to contract charges. Consult your contract for applicable charges.
Total expense ratio is 0.42% per the Fund’s prospectus dated May 1, 2017. Additional information pertaining to the Fund’s expense ratio as of June 30, 2017 can be found in the Portfolio’s Financial Highlights.
Comments
Q. How did the Portfolio perform in comparison to its benchmark during the reporting period?
A. For the six-month period ended June 30, 2017, the S&P 500® Index Portfolio returned 9.13% versus 9.34% for the benchmark, S&P 500® Index.
Q. Were there specific market conditions, investment strategies, or techniques that materially affected the Portfolio’s benchmark-relative performance during the reporting period?
A. The Portfolio intends to approximate the underlying return of the S&P 500® Index. There were no material market events or changes in strategy that impacted the Portfolio’s relative return for the period.(1)
Q. How did sector selection and security selection each impact the Portfolio’s performance relative to its benchmark?
A. The Portfolio is managed on a risk-controlled basis and is constructed to closely replicate its benchmark index. The expected sources of performance variance include the impact of trading daily cash flows, including trading commissions, and the operating expenses of the Portfolio.
The best performing sectors for the Portfolio and benchmark were Information Technology, Health Care, and Consumer Discretionary, while Energy and Telecommunications Services were the key laggards.(1)
Q. Which holdings contributed the most to, and detracted the most from, the Portfolio’s benchmark-relative performance?
A. The largest contributors to the Portfolio and benchmark returns for the period were Apple, Inc., Amazon.com, Inc., and Facebook,
Inc. Class A. The largest detractors from the Portfolio and benchmark returns for the period were General Electric Co., Exxon Mobil Corp., and Verizon Communications, Inc.(1)
Q. How did the Portfolio’s use of derivative instruments and initial public offerings (IPOs), if any, impact performance?
A. The Portfolio uses S&P 500® Index futures contracts primarily to equitize open dividend receivables, as well as to manage day-to-day cash flows to ensure that the Portfolio is fully invested. The futures did not meaningfully impact performance due to their index characteristics and size in relation to Portfolio net assets.(1)
| (1) | The Portfolio’s composition is subject to change. Holdings and weightings are as of June 30, 2017. |
Change in Value of $10,000 Investment
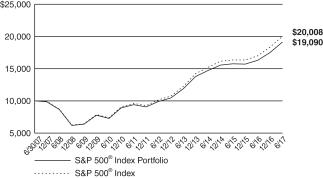
Hypothetical illustration based on past performance. Future performance will vary. The Portfolio’s returns reflect reinvested dividends. The Portfolio’s holdings may differ significantly from the securities in the index. The index is unmanaged and therefore does not reflect the cost of portfolio management and accounting. Investors cannot invest directly in an index, although they can invest in its underlying securities or funds.
The S&P 500® Index is a capitalization-weighted index designed to measure performance of the broad domestic economy through changes in the aggregate market value of 500 stocks representing all major industries. The index presented includes the effects of reinvested dividends.
The S&P 500® Index is a product of S&P Dow Jones Indices LLC or its affiliates (“SPDJI”), and has been licensed for use by Ohio National Investments, Inc. (“ONI”) Standard & Poor’s® and S&P® are registered trademarks of Standard & Poor’s Financial Services LLC (“S&P”); Dow Jones® is a registered trademark of Dow Jones Trademark Holdings LLC (“Dow Jones”); and these trademarks have been licensed for use by SPDJI and sublicensed for certain purposes by ONI. The S&P 500® Index Portfolio of Ohio National Fund, Inc. is not sponsored, endorsed, sold or promoted by SPDJI, Dow Jones, S&P, their respective affiliates, and none of such parties make any representation regarding the advisability of investing in such product(s) nor do they have any liability for any errors, omissions, or interruptions of the S&P 500® Index.
| 47 | (continued) |
| Ohio National Fund, Inc. | S&P 500® Index Portfolio (Continued) |
Portfolio Composition as of June 30, 2017 (1)
| % of Net Assets | ||||
Common Stocks (4) | 99.8 | |||
Money Market Funds and | 0.2 | |||
|
| |||
| 100.0 | ||||
|
|
Top 10 Portfolio Holdings as of June 30, 2017 (1) (2) (3)
| % of Net Assets | ||||||
| 1. | Apple, Inc. | 3.6 | ||||
| 2. | Microsoft Corp. | 2.6 | ||||
| 3. | Amazon.com, Inc. | 1.8 | ||||
| 4. | Facebook, Inc. Class A | 1.7 | ||||
| 5. | Johnson & Johnson | 1.7 | ||||
| 6. | Exxon Mobil Corp. | 1.6 | ||||
| 7. | JPMorgan Chase & Co. | 1.6 | ||||
| 8. | Berkshire Hathaway, Inc. Class B | 1.5 | ||||
| 9. | Alphabet, Inc. Class A | 1.3 | ||||
| 10. | Alphabet, Inc. Class C | 1.3 |
| (1) | Composition of Portfolio subject to change. |
| (2) | Short-term investments have been excluded from the list of Top 10 Portfolio Holdings. |
| (3) | Top 10 Portfolio Holdings is presented at an individual security level. Total investment exposure by issuer may be higher. |
| (4) | Sectors (Common Stocks): |
| % of Net Assets | ||||
Information Technology | 22.2 | |||
Financials | 14.5 | |||
Health Care | 14.5 | |||
Consumer Discretionary | 12.3 | |||
Industrials | 10.3 | |||
Consumer Staples | 9.0 | |||
Energy | 6.0 | |||
Utilities | 3.2 | |||
Real Estate | 2.9 | |||
Materials | 2.8 | |||
Telecommunication Services | 2.1 | |||
|
| |||
| 99.8 | ||||
|
|
| 48 |
| Ohio National Fund, Inc. | S&P 500® Index Portfolio |
Schedule of Investments | June 30, 2017 (Unaudited) |
| Common Stocks – 99.8% | Shares | Value | ||||||||
| CONSUMER DISCRETIONARY – 12.3% | ||||||||||
BorgWarner, Inc. (Auto Components) | 8,651 | $ | 366,456 | |||||||
Delphi Automotive PLC (Auto Components) | 11,624 | 1,018,844 | ||||||||
Goodyear Tire & Rubber Co. / The (Auto Components) | 10,926 | 381,973 | ||||||||
Ford Motor Co. (Automobiles) | 169,700 | 1,898,943 | ||||||||
General Motors Co. (Automobiles) | 59,584 | 2,081,269 | ||||||||
Harley-Davidson, Inc. (Automobiles) | 7,595 | 410,282 | ||||||||
Genuine Parts Co. (Distributors) | 6,395 | 593,200 | ||||||||
LKQ Corp. (Distributors) | (a) | 13,376 | 440,739 | |||||||
H&R Block, Inc. (Diversified Consumer Svs.) | 8,989 | 277,850 | ||||||||
Carnival Corp. (Hotels, Restaurants & Leisure) | 18,161 | 1,190,817 | ||||||||
Chipotle Mexican Grill, Inc. (Hotels, Restaurants & Leisure) | (a) | 1,244 | 517,628 | |||||||
Darden Restaurants, Inc. (Hotels, Restaurants & Leisure) | 5,395 | 487,924 | ||||||||
Hilton Worldwide Holdings, Inc. (Hotels, Restaurants & Leisure) | 8,890 | 549,847 | ||||||||
Marriott International, Inc. Class A (Hotels, Restaurants & Leisure) | 13,480 | 1,352,179 | ||||||||
McDonald’s Corp. (Hotels, Restaurants & Leisure) | 35,365 | 5,416,503 | ||||||||
Royal Caribbean Cruises Ltd. (Hotels, Restaurants & Leisure) | 7,279 | 795,085 | ||||||||
Starbucks Corp. (Hotels, Restaurants & Leisure) | 62,831 | 3,663,676 | ||||||||
Wyndham Worldwide Corp. (Hotels, Restaurants & Leisure) | 4,528 | 454,656 | ||||||||
Wynn Resorts Ltd. (Hotels, Restaurants & Leisure) | 3,464 | 464,592 | ||||||||
Yum! Brands, Inc. (Hotels, Restaurants & Leisure) | 14,354 | 1,058,751 | ||||||||
D.R. Horton, Inc. (Household Durables) | 14,829 | 512,639 | ||||||||
Garmin Ltd. (Household Durables) | 4,976 | 253,925 | ||||||||
Leggett & Platt, Inc. (Household Durables) | 5,741 | 301,575 | ||||||||
Lennar Corp. Class A (Household Durables) | 8,816 | 470,069 | ||||||||
Mohawk Industries, Inc. (Household Durables) | (a) | 2,741 | 662,472 | |||||||
Newell Brands, Inc. (Household Durables) | 20,961 | 1,123,929 | ||||||||
PulteGroup, Inc. (Household Durables) | 12,321 | 302,234 | ||||||||
Whirlpool Corp. (Household Durables) | 3,209 | 614,909 | ||||||||
Amazon.com, Inc. (Internet & Direct Marketing Retail) | (a) | 17,213 | 16,662,184 | |||||||
Expedia, Inc. (Internet & Direct Marketing Retail) | 5,275 | 785,711 | ||||||||
Netflix, Inc. (Internet & Direct Marketing Retail) | (a) | 18,701 | 2,794,116 | |||||||
Priceline Group, Inc. / The (Internet & Direct Marketing Retail) | (a) | 2,133 | 3,989,819 | |||||||
TripAdvisor, Inc. (Internet & Direct Marketing Retail) | (a) | 4,792 | 183,054 | |||||||
Hasbro, Inc. (Leisure Products) | 4,881 | 544,280 | ||||||||
Mattel, Inc. (Leisure Products) | 14,863 | 320,000 | ||||||||
CBS Corp. Class B (Media) | 15,983 | 1,019,396 | ||||||||
Charter Communications, Inc. Class A (Media) | (a) | 9,358 | 3,152,242 | |||||||
Comcast Corp. Class A (Media) | 205,345 | 7,992,027 | ||||||||
Discovery Communications, Inc. Class A (Media) | (a) | 6,668 | 172,234 | |||||||
Discovery Communications, Inc. Class C (Media) | (a) | 9,151 | 230,697 | |||||||
DISH Network Corp. Class A (Media) | (a) | 9,870 | 619,441 | |||||||
Interpublic Group of Cos., Inc. / The (Media) | 17,143 | 421,718 | ||||||||
News Corp. Class A (Media) | 16,582 | 227,173 | ||||||||
News Corp. Class B (Media) | 5,197 | 73,538 | ||||||||
Omnicom Group, Inc. (Media) | 10,098 | 837,124 | ||||||||
Scripps Networks Interactive, Inc. Class A (Media) | 4,161 | 284,238 | ||||||||
Time Warner, Inc. (Media) | 33,649 | 3,378,696 | ||||||||
Twenty-First Century Fox, Inc. Class A (Media) | 45,660 | 1,294,004 | ||||||||
Twenty-First Century Fox, Inc. Class B (Media) | 21,134 | 589,005 | ||||||||
Viacom, Inc. Class B (Media) | 15,286 | 513,151 | ||||||||
Walt Disney Co. / The (Media) | 63,119 | 6,706,394 | ||||||||
Dollar General Corp. (Multiline Retail) | 10,946 | 789,097 | ||||||||
Dollar Tree, Inc. (Multiline Retail) | (a) | 10,270 | 718,078 | |||||||
Kohl’s Corp. (Multiline Retail) | 7,397 | 286,042 | ||||||||
Macy’s, Inc. (Multiline Retail) | 13,212 | 307,047 | ||||||||
Nordstrom, Inc. (Multiline Retail) | 4,827 | 230,875 | ||||||||
Target Corp. (Multiline Retail) | 23,938 | 1,251,718 | ||||||||
Advance Auto Parts, Inc. (Specialty Retail) | 3,204 | 373,554 | ||||||||
AutoNation, Inc. (Specialty Retail) | (a) | 2,856 | 120,409 | |||||||
| Common Stocks (Continued) | Shares | Value | ||||||||
| CONSUMER DISCRETIONARY (continued) | ||||||||||
AutoZone, Inc. (Specialty Retail) | (a) | 1,222 | $ | 697,102 | ||||||
Bed Bath & Beyond, Inc. (Specialty Retail) | 6,298 | 191,459 | ||||||||
Best Buy Co., Inc. (Specialty Retail) | 11,512 | 659,983 | ||||||||
CarMax, Inc. (Specialty Retail) | (a) | 8,036 | 506,750 | |||||||
Foot Locker, Inc. (Specialty Retail) | 5,694 | 280,600 | ||||||||
Gap, Inc. / The (Specialty Retail) | 9,551 | 210,027 | ||||||||
Home Depot, Inc. / The (Specialty Retail) | 51,873 | 7,957,318 | ||||||||
L Brands, Inc. (Specialty Retail) | 10,454 | 563,366 | ||||||||
Lowe’s Cos., Inc. (Specialty Retail) | 37,230 | 2,886,442 | ||||||||
O’Reilly Automotive, Inc. (Specialty Retail) | (a) | 3,949 | 863,804 | |||||||
Ross Stores, Inc. (Specialty Retail) | 17,009 | 981,930 | ||||||||
Signet Jewelers Ltd. (Specialty Retail) | 2,968 | 187,696 | ||||||||
Staples, Inc. (Specialty Retail) | 28,340 | 285,384 | ||||||||
Tiffany & Co. (Specialty Retail) | 4,651 | 436,589 | ||||||||
TJX Cos., Inc. / The (Specialty Retail) | 27,911 | 2,014,337 | ||||||||
Tractor Supply Co. (Specialty Retail) | 5,578 | 302,383 | ||||||||
Ulta Salon Cosmetics & Fragrance, Inc. (Specialty Retail) | (a) | 2,530 | 726,970 | |||||||
Coach, Inc. (Textiles, Apparel & Luxury Goods) | 12,198 | 577,453 | ||||||||
Hanesbrands, Inc. (Textiles, Apparel & Luxury Goods) | 15,800 | 365,928 | ||||||||
Michael Kors Holdings Ltd. (Textiles, Apparel & Luxury Goods) | (a) | 6,762 | 245,123 | |||||||
NIKE, Inc. Class B (Textiles, Apparel & Luxury Goods) | 57,500 | 3,392,500 | ||||||||
PVH Corp. (Textiles, Apparel & Luxury Goods) | 3,385 | 387,583 | ||||||||
Ralph Lauren Corp. (Textiles, Apparel & Luxury Goods) | 2,391 | 176,456 | ||||||||
Under Armour, Inc. Class A (Textiles, Apparel & Luxury Goods) | (a) | 8,022 | 174,559 | |||||||
Under Armour, Inc. Class C (Textiles, Apparel & Luxury Goods) | (a) | 7,989 | 161,058 | |||||||
V.F. Corp. (Textiles, Apparel & Luxury Goods) | 13,900 | 800,640 | ||||||||
|
| |||||||||
| 110,563,468 | ||||||||||
|
| |||||||||
| CONSUMER STAPLES – 9.0% | ||||||||||
Brown-Forman Corp. Class B (Beverages) | 7,675 | 373,005 | ||||||||
Coca-Cola Co. / The (Beverages) | 166,842 | 7,482,864 | ||||||||
Constellation Brands, Inc. Class A (Beverages) | 7,439 | 1,441,157 | ||||||||
Dr Pepper Snapple Group, Inc. (Beverages) | 7,975 | 726,602 | ||||||||
Molson Coors Brewing Co. Class B (Beverages) | 8,012 | 691,756 | ||||||||
Monster Beverage Corp. (Beverages) | (a) | 17,492 | 869,003 | |||||||
PepsiCo, Inc. (Beverages) | 61,981 | 7,158,186 | ||||||||
Costco Wholesale Corp. (Food & Staples Retailing) | 19,030 | 3,043,468 | ||||||||
CVS Health Corp. (Food & Staples Retailing) | 44,204 | 3,556,654 | ||||||||
Kroger Co. / The (Food & Staples Retailing) | 39,596 | 923,379 | ||||||||
Sysco Corp. (Food & Staples Retailing) | 21,364 | 1,075,250 | ||||||||
Walgreens Boots Alliance, Inc. (Food & Staples Retailing) | 37,052 | 2,901,542 | ||||||||
Wal-Mart Stores, Inc. (Food & Staples Retailing) | 64,089 | 4,850,256 | ||||||||
Whole Foods Market, Inc. (Food & Staples Retailing) | 13,866 | 583,897 | ||||||||
Archer-Daniels-Midland Co. (Food Products) | 24,760 | 1,024,569 | ||||||||
Campbell Soup Co. (Food Products) | 8,320 | 433,888 | ||||||||
Conagra Brands, Inc. (Food Products) | 17,539 | 627,195 | ||||||||
General Mills, Inc. (Food Products) | 24,997 | 1,384,834 | ||||||||
Hershey Co. / The (Food Products) | 6,074 | 652,165 | ||||||||
Hormel Foods Corp. (Food Products) | 11,704 | 399,223 | ||||||||
J.M. Smucker Co. / The (Food Products) | 5,051 | 597,685 | ||||||||
Kellogg Co. (Food Products) | 10,944 | 760,170 | ||||||||
Kraft Heinz Co. / The (Food Products) | 25,887 | 2,216,963 | ||||||||
McCormick & Co., Inc. (Food Products) | 4,913 | 479,067 | ||||||||
Mondelez International, Inc. Class A (Food Products) | 65,832 | 2,843,284 | ||||||||
Tyson Foods, Inc. Class A (Food Products) | 12,504 | 783,126 | ||||||||
Church & Dwight Co., Inc. (Household Products) | 10,815 | 561,082 | ||||||||
Clorox Co. / The (Household Products) | 5,588 | 744,545 | ||||||||
Colgate-Palmolive Co. (Household Products) | 38,325 | 2,841,032 | ||||||||
Kimberly-Clark Corp. (Household Products) | 15,400 | 1,988,294 | ||||||||
| 49 | (continued) |
| Ohio National Fund, Inc. | S&P 500® Index Portfolio (Continued) |
Schedule of Investments | June 30, 2017 (Unaudited) |
| Common Stocks (Continued) | Shares | Value | ||||||||
| CONSUMER STAPLES (continued) | ||||||||||
Procter & Gamble Co. / The (Household Products) | 110,971 | $ | 9,671,123 | |||||||
Coty, Inc. Class A (Personal Products) | 20,437 | 383,398 | ||||||||
Estee Lauder Cos., Inc. / The Class A (Personal Products) | 9,713 | 932,254 | ||||||||
Altria Group, Inc. (Tobacco) | 83,811 | 6,241,405 | ||||||||
Philip Morris International, Inc. (Tobacco) | 67,389 | 7,914,838 | ||||||||
Reynolds American, Inc. (Tobacco) | 35,904 | 2,335,196 | ||||||||
|
| |||||||||
| 81,492,355 | ||||||||||
|
| |||||||||
| ENERGY – 6.0% | ||||||||||
Baker Hughes, Inc. (Energy Equip. & Svs.) | 18,461 | 1,006,309 | ||||||||
Halliburton Co. (Energy Equip. & Svs.) | 37,656 | 1,608,288 | ||||||||
Helmerich & Payne, Inc. (Energy Equip. & Svs.) | 4,711 | 255,996 | ||||||||
National Oilwell Varco, Inc. (Energy Equip. & Svs.) | 16,489 | 543,148 | ||||||||
Schlumberger Ltd. (Energy Equip. & Svs.) | 60,287 | 3,969,296 | ||||||||
TechnipFMC PLC (Energy Equip. & Svs.) | (a) | 20,245 | 550,664 | |||||||
Transocean Ltd. (Energy Equip. & Svs.) | (a) | 16,967 | 139,638 | |||||||
Anadarko Petroleum Corp. (Oil, Gas & Consumable Fuels) | 24,312 | 1,102,306 | ||||||||
Apache Corp. (Oil, Gas & Consumable Fuels) | 16,504 | 791,037 | ||||||||
Cabot Oil & Gas Corp. (Oil, Gas & Consumable Fuels) | 20,198 | 506,566 | ||||||||
Chesapeake Energy Corp. (Oil, Gas & Consumable Fuels) | (a) | 33,096 | 164,487 | |||||||
Chevron Corp. (Oil, Gas & Consumable Fuels) | 82,202 | 8,576,135 | ||||||||
Cimarex Energy Co. (Oil, Gas & Consumable Fuels) | 4,127 | 387,979 | ||||||||
Concho Resources, Inc. (Oil, Gas & Consumable Fuels) | (a) | 6,429 | 781,316 | |||||||
ConocoPhillips (Oil, Gas & Consumable Fuels) | 53,676 | 2,359,597 | ||||||||
Devon Energy Corp. (Oil, Gas & | 22,809 | 729,204 | ||||||||
EOG Resources, Inc. (Oil, Gas & Consumable Fuels) | 25,047 | 2,267,254 | ||||||||
EQT Corp. (Oil, Gas & Consumable Fuels) | 7,520 | 440,597 | ||||||||
Exxon Mobil Corp. (Oil, Gas & Consumable Fuels) | 183,849 | 14,842,130 | ||||||||
Hess Corp. (Oil, Gas & Consumable Fuels) | 11,725 | 514,376 | ||||||||
Kinder Morgan, Inc. (Oil, Gas & Consumable Fuels) | 83,302 | 1,596,066 | ||||||||
Marathon Oil Corp. (Oil, Gas & Consumable Fuels) | 36,880 | 437,028 | ||||||||
Marathon Petroleum Corp. (Oil, Gas & Consumable Fuels) | 22,507 | 1,177,791 | ||||||||
Murphy Oil Corp. (Oil, Gas & Consumable Fuels) | 7,037 | 180,358 | ||||||||
Newfield Exploration Co. (Oil, Gas & Consumable Fuels) | (a) | 8,643 | 245,980 | |||||||
Noble Energy, Inc. (Oil, Gas & Consumable Fuels) | 19,750 | 558,925 | ||||||||
Occidental Petroleum Corp. (Oil, Gas & Consumable Fuels) | 33,174 | 1,986,127 | ||||||||
ONEOK, Inc. (Oil, Gas & Consumable Fuels) | 16,483 | 859,753 | ||||||||
Phillips 66 (Oil, Gas & Consumable Fuels) | 19,034 | 1,573,921 | ||||||||
Pioneer Natural Resources Co. (Oil, Gas & Consumable Fuels) | 7,380 | 1,177,700 | ||||||||
Range Resources Corp. (Oil, Gas & Consumable Fuels) | 8,164 | 189,160 | ||||||||
Tesoro Corp. (Oil, Gas & Consumable Fuels) | 6,557 | 613,735 | ||||||||
Valero Energy Corp. (Oil, Gas & Consumable Fuels) | 19,405 | 1,309,061 | ||||||||
Williams Cos., Inc. / The (Oil, Gas & Consumable Fuels) | 35,851 | 1,085,568 | ||||||||
|
| |||||||||
| 54,527,496 | ||||||||||
|
| |||||||||
| FINANCIALS – 14.5% | ||||||||||
Bank of America Corp. (Banks) | 431,798 | 10,475,419 | ||||||||
BB&T Corp. (Banks) | 35,204 | 1,598,614 | ||||||||
Citigroup, Inc. (Banks) | 119,460 | 7,989,485 | ||||||||
Citizens Financial Group, Inc. (Banks) | 21,978 | 784,175 | ||||||||
Comerica, Inc. (Banks) | 7,677 | 562,263 | ||||||||
Fifth Third Bancorp (Banks) | 32,553 | 845,076 | ||||||||
Huntington Bancshares, Inc. (Banks) | 47,169 | 637,725 | ||||||||
JPMorgan Chase & Co. (Banks) | 154,151 | 14,089,401 | ||||||||
KeyCorp (Banks) | 47,559 | 891,256 | ||||||||
M&T Bank Corp. (Banks) | 6,676 | 1,081,178 | ||||||||
People’s United Financial, Inc. (Banks) | 14,940 | 263,840 | ||||||||
PNC Financial Services Group, Inc. / The (Banks) | 20,996 | 2,621,771 | ||||||||
Regions Financial Corp. (Banks) | 52,152 | 763,505 | ||||||||
| Common Stocks (Continued) | Shares | Value | ||||||||
| FINANCIALS (continued) | ||||||||||
SunTrust Banks, Inc. (Banks) | 20,977 | $ | 1,189,815 | |||||||
U.S. Bancorp (Banks) | 68,735 | 3,568,721 | ||||||||
Wells Fargo & Co. (Banks) | 195,144 | 10,812,929 | ||||||||
Zions Bancorporation (Banks) | 8,792 | 386,057 | ||||||||
Affiliated Managers Group, Inc. (Capital Markets) | 2,456 | 407,352 | ||||||||
Ameriprise Financial, Inc. (Capital Markets) | 6,615 | 842,023 | ||||||||
Bank of New York Mellon Corp. / The (Capital Markets) | 45,119 | 2,301,971 | ||||||||
BlackRock, Inc. (Capital Markets) | 5,260 | 2,221,877 | ||||||||
CBOE Holdings, Inc. (Capital Markets) | 3,986 | 364,320 | ||||||||
Charles Schwab Corp. / The (Capital Markets) | 52,795 | 2,268,073 | ||||||||
CME Group, Inc. (Capital Markets) | 14,743 | 1,846,413 | ||||||||
E*TRADE Financial Corp. (Capital Markets) | (a) | 11,918 | 453,242 | |||||||
Franklin Resources, Inc. (Capital Markets) | 14,856 | 665,400 | ||||||||
Goldman Sachs Group, Inc. / The (Capital Markets) | 15,884 | 3,524,660 | ||||||||
Intercontinental Exchange, Inc. (Capital Markets) | 25,689 | 1,693,419 | ||||||||
Invesco Ltd. (Capital Markets) | 17,653 | 621,209 | ||||||||
Moody’s Corp. (Capital Markets) | 7,221 | 878,651 | ||||||||
Morgan Stanley (Capital Markets) | 61,800 | 2,753,808 | ||||||||
Nasdaq, Inc. (Capital Markets) | 4,945 | 353,518 | ||||||||
Northern Trust Corp. (Capital Markets) | 9,364 | 910,274 | ||||||||
Raymond James Financial, Inc. (Capital Markets) | 5,561 | 446,103 | ||||||||
S&P Global, Inc. (Capital Markets) | 11,186 | 1,633,044 | ||||||||
State Street Corp. (Capital Markets) | 15,345 | 1,376,907 | ||||||||
T. Rowe Price Group, Inc. (Capital Markets) | 10,468 | 776,830 | ||||||||
American Express Co. (Consumer Finance) | 32,575 | 2,744,118 | ||||||||
Capital One Financial Corp. (Consumer Finance) | 20,955 | 1,731,302 | ||||||||
Discover Financial Services (Consumer Finance) | 16,496 | 1,025,886 | ||||||||
Navient Corp. (Consumer Finance) | 12,363 | 205,844 | ||||||||
Synchrony Financial (Consumer Finance) | 33,420 | 996,584 | ||||||||
Berkshire Hathaway, Inc. Class B (Diversified Financial Svs.) | (a) | 82,416 | 13,958,798 | |||||||
Leucadia National Corp. (Diversified | 14,051 | 367,574 | ||||||||
Aflac, Inc. (Insurance) | 17,219 | 1,337,572 | ||||||||
Allstate Corp. / The (Insurance) | 15,816 | 1,398,767 | ||||||||
American International Group, Inc. (Insurance) | 38,159 | 2,385,701 | ||||||||
Aon PLC (Insurance) | 11,371 | 1,511,774 | ||||||||
Arthur J. Gallagher & Co. (Insurance) | 7,787 | 445,806 | ||||||||
Assurant, Inc. (Insurance) | 2,377 | 246,471 | ||||||||
Chubb Ltd. (Insurance) | 20,259 | 2,945,253 | ||||||||
Cincinnati Financial Corp. (Insurance) | 6,503 | 471,142 | ||||||||
Everest Re Group Ltd. (Insurance) | 1,782 | 453,679 | ||||||||
Hartford Financial Services Group, Inc. / The (Insurance) | 15,939 | 837,913 | ||||||||
Lincoln National Corp. (Insurance) | 9,731 | 657,621 | ||||||||
Loews Corp. (Insurance) | 11,980 | 560,784 | ||||||||
Marsh & McLennan Cos., Inc. (Insurance) | 22,360 | 1,743,186 | ||||||||
MetLife, Inc. (Insurance) | 46,879 | 2,575,532 | ||||||||
Principal Financial Group, Inc. (Insurance) | 11,630 | 745,134 | ||||||||
Progressive Corp. / The (Insurance) | 25,205 | 1,111,288 | ||||||||
Prudential Financial, Inc. (Insurance) | 18,614 | 2,012,918 | ||||||||
Torchmark Corp. (Insurance) | 4,721 | 361,157 | ||||||||
Travelers Cos., Inc. / The (Insurance) | 12,123 | 1,533,923 | ||||||||
Unum Group (Insurance) | 9,902 | 461,730 | ||||||||
Willis Towers Watson PLC (Insurance) | 5,513 | 801,921 | ||||||||
XL Group Ltd. (Insurance) | 11,344 | 496,867 | ||||||||
|
| |||||||||
| 131,026,569 | ||||||||||
|
| |||||||||
| HEALTH CARE – 14.5% | ||||||||||
AbbVie, Inc. (Biotechnology) | 69,055 | 5,007,178 | ||||||||
Alexion Pharmaceuticals, Inc. (Biotechnology) | (a) | 9,743 | 1,185,431 | |||||||
Amgen, Inc. (Biotechnology) | 31,929 | 5,499,132 | ||||||||
Biogen, Inc. (Biotechnology) | (a) | 9,268 | 2,514,964 | |||||||
Celgene Corp. (Biotechnology) | (a) | 33,879 | 4,399,866 | |||||||
Gilead Sciences, Inc. (Biotechnology) | 56,697 | 4,013,014 | ||||||||
Incyte Corp. (Biotechnology) | (a) | 7,374 | 928,460 | |||||||
Regeneron Pharmaceuticals, Inc. (Biotechnology) | (a) | 3,306 | 1,623,709 | |||||||
Vertex Pharmaceuticals, Inc. (Biotechnology) | (a) | 10,807 | 1,392,698 | |||||||
Abbott Laboratories (Health Care Equip. & Supplies) | 75,291 | 3,659,896 | ||||||||
| 50 | (continued) |
| Ohio National Fund, Inc. | S&P 500® Index Portfolio (Continued) |
Schedule of Investments | June 30, 2017 (Unaudited) |
| Common Stocks (Continued) | Shares | Value | ||||||||
| HEALTH CARE (continued) | ||||||||||
Align Technology, Inc. (Health Care Equip. & Supplies) | (a) | 3,276 | $ | 491,793 | ||||||
Baxter International, Inc. (Health Care Equip. & Supplies) | 21,163 | 1,281,208 | ||||||||
Becton Dickinson and Co. (Health Care Equip. & Supplies) | 9,865 | 1,924,760 | ||||||||
Boston Scientific Corp. (Health Care Equip. & Supplies) | (a) | 59,416 | 1,647,012 | |||||||
Cooper Cos., Inc. / The (Health Care Equip. & Supplies) | 2,120 | 507,570 | ||||||||
C.R. Bard, Inc. (Health Care Equip. & Supplies) | 3,142 | 993,218 | ||||||||
Danaher Corp. (Health Care Equip. & Supplies) | 26,503 | 2,236,588 | ||||||||
DENTSPLY SIRONA, Inc. (Health Care Equip. & Supplies) | 9,946 | 644,899 | ||||||||
Edwards Lifesciences Corp. (Health Care Equip. & Supplies) | (a) | 9,103 | 1,076,339 | |||||||
Hologic, Inc. (Health Care Equip. & Supplies) | (a) | 12,149 | 551,322 | |||||||
IDEXX Laboratories, Inc. (Health Care Equip. & Supplies) | (a) | 3,824 | 617,270 | |||||||
Intuitive Surgical, Inc. (Health Care Equip. & Supplies) | (a) | 1,598 | 1,494,721 | |||||||
Medtronic PLC (Health Care Equip. & Supplies) | 59,394 | 5,271,218 | ||||||||
Stryker Corp. (Health Care Equip. & Supplies) | 13,460 | 1,867,979 | ||||||||
Varian Medical Systems, Inc. (Health Care Equip. & Supplies) | (a) | 3,988 | 411,522 | |||||||
Zimmer Biomet Holdings, Inc. (Health Care Equip. & Supplies) | 8,731 | 1,121,060 | ||||||||
Aetna, Inc. (Health Care Providers & Svs.) | 14,392 | 2,185,137 | ||||||||
AmerisourceBergen Corp. (Health Care Providers & Svs.) | 7,200 | 680,616 | ||||||||
Anthem, Inc. (Health Care Providers & Svs.) | 11,497 | 2,162,931 | ||||||||
Cardinal Health, Inc. (Health Care | 13,706 | 1,067,972 | ||||||||
Centene Corp. (Health Care Providers & Svs.) | (a) | 7,475 | 597,103 | |||||||
Cigna Corp. (Health Care Providers & Svs.) | 11,108 | 1,859,368 | ||||||||
DaVita, Inc. (Health Care Providers & Svs.) | (a) | 6,755 | 437,454 | |||||||
Envision Healthcare Corp. (Health Care Providers & Svs.) | (a) | 5,096 | 319,366 | |||||||
Express Scripts Holding Co. (Health Care Providers & Svs.) | (a) | 25,752 | 1,644,008 | |||||||
HCA Healthcare, Inc. (Health Care Providers & Svs.) | (a) | 12,417 | 1,082,762 | |||||||
Henry Schein, Inc. (Health Care Providers & Svs.) | (a) | 3,442 | 629,955 | |||||||
Humana, Inc. (Health Care Providers & Svs.) | 6,262 | 1,506,762 | ||||||||
Laboratory Corp. of America Holdings (Health Care Providers & Svs.) | (a) | 4,439 | 684,227 | |||||||
McKesson Corp. (Health Care Providers & Svs.) | 9,151 | 1,505,706 | ||||||||
Patterson Cos., Inc. (Health Care Providers & Svs.) | 3,540 | 166,203 | ||||||||
Quest Diagnostics, Inc. (Health Care Providers & Svs.) | 5,937 | 659,957 | ||||||||
UnitedHealth Group, Inc. (Health Care Providers & Svs.) | 41,812 | 7,752,781 | ||||||||
Universal Health Services, Inc. Class B (Health Care Providers & Svs.) | 3,879 | 473,548 | ||||||||
Cerner Corp. (Health Care Technology) | (a) | 12,756 | 847,891 | |||||||
Agilent Technologies, Inc. (Life Sciences Tools & Svs.) | 13,984 | 829,391 | ||||||||
Illumina, Inc. (Life Sciences Tools & Svs.) | (a) | 6,335 | 1,099,249 | |||||||
Mettler-Toledo International, Inc. (Life Sciences Tools & Svs.) | (a) | 1,120 | 659,165 | |||||||
PerkinElmer, Inc. (Life Sciences Tools & Svs.) | 4,774 | 325,300 | ||||||||
Thermo Fisher Scientific, Inc. (Life Sciences Tools & Svs.) | 16,974 | 2,961,454 | ||||||||
Waters Corp. (Life Sciences Tools & Svs.) | (a) | 3,473 | 638,476 | |||||||
Allergan PLC (Pharmaceuticals) | 14,573 | 3,542,551 | ||||||||
Bristol-Myers Squibb Co. (Pharmaceuticals) | 71,480 | 3,982,866 | ||||||||
Eli Lilly & Co. (Pharmaceuticals) | 42,129 | 3,467,217 | ||||||||
Johnson & Johnson (Pharmaceuticals) | 116,881 | 15,462,188 | ||||||||
Mallinckrodt PLC (Pharmaceuticals) | (a) | 4,310 | 193,131 | |||||||
Merck & Co., Inc. (Pharmaceuticals) | 118,675 | 7,605,881 | ||||||||
| Common Stocks (Continued) | Shares | Value | ||||||||
| HEALTH CARE (continued) | ||||||||||
Mylan NV (Pharmaceuticals) | (a) | 20,000 | $ | 776,400 | ||||||
Perrigo Co. PLC (Pharmaceuticals) | 6,221 | 469,810 | ||||||||
Pfizer, Inc. (Pharmaceuticals) | 258,936 | 8,697,660 | ||||||||
Zoetis, Inc. (Pharmaceuticals) | 21,295 | 1,328,382 | ||||||||
|
| |||||||||
| 130,665,695 | ||||||||||
|
| |||||||||
| INDUSTRIALS – 10.3% | ||||||||||
Arconic, Inc. (Aerospace & Defense) | 19,124 | 433,159 | ||||||||
Boeing Co. / The (Aerospace & Defense) | 24,355 | 4,816,201 | ||||||||
General Dynamics Corp. (Aerospace & Defense) | 12,304 | 2,437,422 | ||||||||
L3 Technologies, Inc. (Aerospace & Defense) | 3,379 | 564,563 | ||||||||
Lockheed Martin Corp. (Aerospace & Defense) | 10,800 | 2,998,188 | ||||||||
Northrop Grumman Corp. (Aerospace & Defense) | 7,574 | 1,944,322 | ||||||||
Raytheon Co. (Aerospace & Defense) | 12,629 | 2,039,331 | ||||||||
Rockwell Collins, Inc. (Aerospace & Defense) | 7,046 | 740,394 | ||||||||
Textron, Inc. (Aerospace & Defense) | 11,615 | 547,067 | ||||||||
TransDigm Group, Inc. (Aerospace & Defense) | 2,122 | 570,542 | ||||||||
United Technologies Corp. (Aerospace & Defense) | 32,331 | 3,947,938 | ||||||||
C.H. Robinson Worldwide, Inc. (Air Freight & Logistics) | 6,111 | 419,703 | ||||||||
Expeditors International of Washington, Inc. (Air Freight & Logistics) | 7,818 | 441,561 | ||||||||
FedEx Corp. (Air Freight & Logistics) | 10,673 | 2,319,563 | ||||||||
United Parcel Service, Inc. Class B (Air Freight & Logistics) | 29,885 | 3,304,982 | ||||||||
Alaska Air Group, Inc. (Airlines) | 5,363 | 481,383 | ||||||||
American Airlines Group, Inc. (Airlines) | 21,373 | 1,075,489 | ||||||||
Delta Air Lines, Inc. (Airlines) | 31,936 | 1,716,241 | ||||||||
Southwest Airlines Co. (Airlines) | 26,235 | 1,630,243 | ||||||||
United Continental Holdings, Inc. (Airlines) | (a) | 12,226 | 920,007 | |||||||
Allegion PLC (Building Products) | 4,135 | 335,431 | ||||||||
Fortune Brands Home & Security, Inc. (Building Products) | 6,676 | 435,542 | ||||||||
Johnson Controls International plc (Building Products) | 40,704 | 1,764,925 | ||||||||
Masco Corp. (Building Products) | 13,877 | 530,240 | ||||||||
Cintas Corp. (Commercial Svs. & Supplies) | 3,747 | 472,272 | ||||||||
Republic Services, Inc. (Commercial Svs. & Supplies) | 9,973 | 635,579 | ||||||||
Stericycle, Inc. (Commercial Svs. & Supplies) | (a) | 3,700 | 282,384 | |||||||
Waste Management, Inc. (Commercial Svs. & Supplies) | 17,636 | 1,293,601 | ||||||||
Fluor Corp. (Construction & Engineering) | 6,065 | 277,656 | ||||||||
Jacobs Engineering Group, Inc. (Construction & Engineering) | 5,225 | 284,188 | ||||||||
Quanta Services, Inc. (Construction & Engineering) | (a) | 6,426 | 211,544 | |||||||
Acuity Brands, Inc. (Electrical Equip.) | 1,913 | 388,875 | ||||||||
AMETEK, Inc. (Electrical Equip.) | 9,984 | 604,731 | ||||||||
Eaton Corp. PLC (Electrical Equip.) | 19,408 | 1,510,525 | ||||||||
Emerson Electric Co. (Electrical Equip.) | 27,963 | 1,667,154 | ||||||||
Rockwell Automation, Inc. (Electrical Equip.) | 5,590 | 905,356 | ||||||||
3M Co. (Industrial Conglomerates) | 25,929 | 5,398,159 | ||||||||
General Electric Co. (Industrial Conglomerates) | 377,858 | 10,205,945 | ||||||||
Honeywell International, Inc. (Industrial Conglomerates) | 33,077 | 4,408,833 | ||||||||
Roper Technologies, Inc. (Industrial Conglomerates) | 4,427 | 1,024,983 | ||||||||
Caterpillar, Inc. (Machinery) | 25,563 | 2,747,000 | ||||||||
Cummins, Inc. (Machinery) | 6,705 | 1,087,685 | ||||||||
Deere & Co. (Machinery) | 12,768 | 1,577,997 | ||||||||
Dover Corp. (Machinery) | 6,754 | 541,806 | ||||||||
Flowserve Corp. (Machinery) | 5,667 | 263,119 | ||||||||
Fortive Corp. (Machinery) | 13,083 | 828,808 | ||||||||
Illinois Tool Works, Inc. (Machinery) | 13,490 | 1,932,443 | ||||||||
Ingersoll-Rand PLC (Machinery) | 11,108 | 1,015,160 | ||||||||
PACCAR, Inc. (Machinery) | 15,242 | 1,006,582 | ||||||||
Parker-Hannifin Corp. (Machinery) | 5,779 | 923,600 | ||||||||
Pentair PLC (Machinery) | 7,275 | 484,079 | ||||||||
Snap-on, Inc. (Machinery) | 2,514 | 397,212 | ||||||||
| 51 | (continued) |
| Ohio National Fund, Inc. | S&P 500® Index Portfolio (Continued) |
Schedule of Investments | June 30, 2017 (Unaudited) |
| Common Stocks (Continued) | Shares | Value | ||||||||
| INDUSTRIALS (continued) | ||||||||||
Stanley Black & Decker, Inc. (Machinery) | 6,637 | $ | 934,025 | |||||||
Xylem, Inc. (Machinery) | 7,798 | 432,243 | ||||||||
Equifax, Inc. (Professional Svs.) | 5,216 | 716,783 | ||||||||
IHS Markit Ltd. (Professional Svs.) | (a) | 13,770 | 606,431 | |||||||
Nielsen Holdings PLC (Professional Svs.) | 14,573 | 563,392 | ||||||||
Robert Half International, Inc. (Professional Svs.) | 5,518 | 264,478 | ||||||||
Verisk Analytics, Inc. (Professional Svs.) | (a) | 6,672 | 562,917 | |||||||
CSX Corp. (Road & Rail) | 40,034 | 2,184,255 | ||||||||
J.B. Hunt Transport Services, Inc. (Road & Rail) | 3,722 | 340,116 | ||||||||
Kansas City Southern (Road & Rail) | 4,603 | 481,704 | ||||||||
Norfolk Southern Corp. (Road & Rail) | 12,573 | 1,530,134 | ||||||||
Union Pacific Corp. (Road & Rail) | 35,034 | 3,815,553 | ||||||||
Fastenal Co. (Trading Companies & Distributors) | 12,551 | 546,345 | ||||||||
United Rentals, Inc. (Trading Companies & Distributors) | (a) | 3,667 | 413,308 | |||||||
W.W. Grainger, Inc. (Trading Companies & Distributors) | 2,331 | 420,815 | ||||||||
|
| |||||||||
| 92,604,212 | ||||||||||
|
| |||||||||
| INFORMATION TECHNOLOGY – 22.2% | ||||||||||
Cisco Systems, Inc. (Communications Equip.) | 216,945 | 6,790,379 | ||||||||
F5 Networks, Inc. (Communications Equip.) | (a) | 2,807 | 356,657 | |||||||
Harris Corp. (Communications Equip.) | 5,290 | 577,033 | ||||||||
Juniper Networks, Inc. (Communications Equip.) | 16,579 | 462,223 | ||||||||
Motorola Solutions, Inc. (Communications Equip.) | 7,093 | 615,247 | ||||||||
Amphenol Corp. Class A (Electronic Equip., Instr. & Comp.) | 13,260 | 978,853 | ||||||||
Corning, Inc. (Electronic Equip., Instr. & Comp.) | 39,928 | 1,199,836 | ||||||||
FLIR Systems, Inc. (Electronic Equip., Instr. & Comp.) | 5,921 | 205,222 | ||||||||
TE Connectivity Ltd. (Electronic Equip., Instr. & Comp.) | 15,404 | 1,211,987 | ||||||||
Akamai Technologies, Inc. (Internet Software & Svs.) | (a) | 7,502 | 373,675 | |||||||
Alphabet, Inc. Class A (Internet Software & Svs.) | (a) | 12,914 | 12,005,888 | |||||||
Alphabet, Inc. Class C (Internet Software & Svs.) | (a) | 12,947 | 11,765,327 | |||||||
eBay, Inc. (Internet Software & Svs.) | (a) | 43,674 | 1,525,096 | |||||||
Facebook, Inc. Class A (Internet Software & Svs.) | (a) | 102,559 | 15,484,358 | |||||||
VeriSign, Inc. (Internet Software & Svs.) | (a) | 3,830 | 356,037 | |||||||
Accenture PLC Class A (IT Svs.) | 26,905 | 3,327,610 | ||||||||
Alliance Data Systems Corp. (IT Svs.) | 2,416 | 620,163 | ||||||||
Automatic Data Processing, Inc. (IT Svs.) | 19,412 | 1,988,954 | ||||||||
Cognizant Technology Solutions Corp. Class A (IT Svs.) | 25,556 | 1,696,918 | ||||||||
CSRA, Inc. (IT Svs.) | 6,304 | 200,152 | ||||||||
DXC Technology Co. (IT Svs.) | 12,284 | 942,428 | ||||||||
Fidelity National Information Services, | 14,344 | 1,224,978 | ||||||||
Fiserv, Inc. (IT Svs.) | (a) | 9,215 | 1,127,363 | |||||||
Gartner, Inc. (IT Svs.) | (a) | 3,924 | 484,653 | |||||||
Global Payments, Inc. (IT Svs.) | 6,616 | 597,557 | ||||||||
International Business Machines Corp. (IT Svs.) | 37,095 | 5,706,324 | ||||||||
Mastercard, Inc. Class A (IT Svs.) | 40,698 | 4,942,772 | ||||||||
Paychex, Inc. (IT Svs.) | 13,873 | 789,929 | ||||||||
PayPal Holdings, Inc. (IT Svs.) | (a) | 48,472 | 2,601,492 | |||||||
Total System Services, Inc. (IT Svs.) | 7,186 | 418,585 | ||||||||
Visa, Inc. (IT Svs.) | 80,106 | 7,512,341 | ||||||||
Western Union Co. / The (IT Svs.) | 20,447 | 389,515 | ||||||||
Advanced Micro Devices, Inc. (Semiconductors & Equip.) | (a) | 33,622 | 419,603 | |||||||
Analog Devices, Inc. (Semiconductors & Equip.) | 15,924 | 1,238,887 | ||||||||
Applied Materials, Inc. (Semiconductors & Equip.) | 46,627 | 1,926,161 | ||||||||
Broadcom Ltd. (Semiconductors & Equip.) | 17,415 | 4,058,566 | ||||||||
Intel Corp. (Semiconductors & Equip.) | 204,316 | 6,893,622 | ||||||||
KLA-Tencor Corp. (Semiconductors & Equip.) | 6,802 | 622,451 | ||||||||
Lam Research Corp. (Semiconductors & Equip.) | 6,999 | 989,869 | ||||||||
Microchip Technology, Inc. (Semiconductors & Equip.) | 9,953 | 768,173 | ||||||||
Micron Technology, Inc. (Semiconductors & Equip.) | (a) | 45,121 | 1,347,313 | |||||||
| Common Stocks (Continued) | Shares | Value | ||||||||
| INFORMATION TECHNOLOGY (continued) | ||||||||||
NVIDIA Corp. (Semiconductors & Equip.) | 25,816 | $ | 3,731,961 | |||||||
Qorvo, Inc. (Semiconductors & Equip.) | (a) | 5,515 | 349,210 | |||||||
QUALCOMM, Inc. (Semiconductors & Equip.) | 64,104 | 3,539,823 | ||||||||
Skyworks Solutions, Inc. (Semiconductors & Equip.) | 8,006 | 768,176 | ||||||||
Texas Instruments, Inc. (Semiconductors & Equip.) | 43,229 | 3,325,607 | ||||||||
Xilinx, Inc. (Semiconductors & Equip.) | 10,763 | 692,276 | ||||||||
Activision Blizzard, Inc. (Software) | 30,084 | 1,731,936 | ||||||||
Adobe Systems, Inc. (Software) | (a) | 21,464 | 3,035,868 | |||||||
ANSYS, Inc. (Software) | (a) | 3,710 | 451,433 | |||||||
Autodesk, Inc. (Software) | (a) | 8,415 | 848,400 | |||||||
CA, Inc. (Software) | 13,596 | 468,654 | ||||||||
Citrix Systems, Inc. (Software) | (a) | 6,558 | 521,886 | |||||||
Electronic Arts, Inc. (Software) | (a) | 13,452 | 1,422,145 | |||||||
Intuit, Inc. (Software) | 10,561 | 1,402,606 | ||||||||
Microsoft Corp. (Software) | 334,982 | 23,090,309 | ||||||||
Oracle Corp. (Software) | 130,327 | 6,534,596 | ||||||||
Red Hat, Inc. (Software) | (a) | 7,715 | 738,711 | |||||||
salesforce.com, Inc. (Software) | (a) | 29,012 | 2,512,439 | |||||||
Symantec Corp. (Software) | 26,391 | 745,546 | ||||||||
Synopsys, Inc. (Software) | (a) | 6,522 | 475,649 | |||||||
Apple, Inc. (Tech. Hardware, Storage & Periph.) | 226,221 | 32,580,348 | ||||||||
Hewlett Packard Enterprise Co. (Tech. Hardware, Storage & Periph.) | 72,234 | 1,198,362 | ||||||||
HP, Inc. (Tech. Hardware, Storage & Periph.) | 73,038 | 1,276,704 | ||||||||
NetApp, Inc. (Tech. Hardware, Storage & Periph.) | 11,756 | 470,828 | ||||||||
Seagate Technology PLC (Tech. Hardware, Storage & Periph.) | 12,886 | 499,333 | ||||||||
Western Digital Corp. (Tech. Hardware, Storage & Periph.) | 12,637 | 1,119,638 | ||||||||
Xerox Corp. (Tech. Hardware, Storage & Periph.) | 9,262 | 266,097 | ||||||||
|
| |||||||||
| 200,542,738 | ||||||||||
|
| |||||||||
| MATERIALS – 2.8% | ||||||||||
Air Products & Chemicals, Inc. (Chemicals) | 9,447 | 1,351,488 | ||||||||
Albemarle Corp. (Chemicals) | 4,805 | 507,120 | ||||||||
CF Industries Holdings, Inc. (Chemicals) | 10,115 | 282,815 | ||||||||
Dow Chemical Co. / The (Chemicals) | 48,767 | 3,075,735 | ||||||||
Eastman Chemical Co. (Chemicals) | 6,327 | 531,405 | ||||||||
Ecolab, Inc. (Chemicals) | 11,326 | 1,503,527 | ||||||||
E.I. du Pont de Nemours & Co. (Chemicals) | 37,619 | 3,036,230 | ||||||||
FMC Corp. (Chemicals) | 5,814 | 424,713 | ||||||||
International Flavors & Fragrances, Inc. (Chemicals) | 3,426 | 462,510 | ||||||||
LyondellBasell Industries NV Class A (Chemicals) | 14,331 | 1,209,393 | ||||||||
Monsanto Co. (Chemicals) | 19,039 | 2,253,456 | ||||||||
Mosaic Co. / The (Chemicals) | 15,230 | 347,701 | ||||||||
PPG Industries, Inc. (Chemicals) | 11,116 | 1,222,315 | ||||||||
Praxair, Inc. (Chemicals) | 12,403 | 1,644,018 | ||||||||
Sherwin-Williams Co. / The (Chemicals) | 3,515 | 1,233,624 | ||||||||
Martin Marietta Materials, Inc. (Construction Materials) | 2,717 | 604,750 | ||||||||
Vulcan Materials Co. (Construction Materials) | 5,734 | 726,383 | ||||||||
Avery Dennison Corp. (Containers & Packaging) | 3,842 | 339,518 | ||||||||
Ball Corp. (Containers & Packaging) | 15,191 | 641,212 | ||||||||
International Paper Co. (Containers & Packaging) | 17,915 | 1,014,168 | ||||||||
Sealed Air Corp. (Containers & Packaging) | 8,496 | 380,281 | ||||||||
WestRock Co. (Containers & Packaging) | 10,895 | 617,311 | ||||||||
Freeport-McMoRan, Inc. (Metals & Mining) | (a) | 57,753 | 693,614 | |||||||
Newmont Mining Corp. (Metals & Mining) | 23,136 | 749,375 | ||||||||
Nucor Corp. (Metals & Mining) | 13,843 | 801,094 | ||||||||
|
| |||||||||
| 25,653,756 | ||||||||||
|
| |||||||||
| REAL ESTATE – 2.9% | ||||||||||
Alexandria Real Estate Equities, Inc. (Equity Real Estate Investment Trusts) | 3,952 | 476,097 | ||||||||
American Tower Corp. (Equity Real Estate Investment Trusts) | 18,441 | 2,440,113 | ||||||||
| 52 | (continued) |
| Ohio National Fund, Inc. | S&P 500® Index Portfolio (Continued) |
Schedule of Investments | June 30, 2017 (Unaudited) |
| Common Stocks (Continued) | Shares | Value | ||||||||
| REAL ESTATE (continued) | ||||||||||
Apartment Investment & Management Co. Class A (Equity Real Estate Investment Trusts) | 6,813 | $ | 292,755 | |||||||
AvalonBay Communities, Inc. (Equity Real Estate Investment Trusts) | 5,978 | 1,148,792 | ||||||||
Boston Properties, Inc. (Equity Real Estate Investment Trusts) | 6,676 | 821,282 | ||||||||
Crown Castle International Corp. (Equity Real Estate Investment Trusts) | 15,885 | 1,591,359 | ||||||||
Digital Realty Trust, Inc. (Equity Real Estate Investment Trusts) | 6,932 | 782,969 | ||||||||
Equinix, Inc. (Equity Real Estate Investment Trusts) | 3,380 | 1,450,561 | ||||||||
Equity Residential (Equity Real Estate Investment Trusts) | 15,930 | 1,048,672 | ||||||||
Essex Property Trust, Inc. (Equity Real Estate Investment Trusts) | 2,846 | 732,190 | ||||||||
Extra Space Storage, Inc. (Equity Real Estate Investment Trusts) | 5,463 | 426,114 | ||||||||
Federal Realty Investment Trust (Equity Real Estate Investment Trusts) | 3,134 | 396,106 | ||||||||
GGP, Inc. (Equity Real Estate Investment Trusts) | 25,272 | 595,408 | ||||||||
HCP, Inc. (Equity Real Estate Investment Trusts) | 20,331 | 649,779 | ||||||||
Host Hotels & Resorts, Inc. (Equity Real Estate Investment Trusts) | 32,096 | 586,394 | ||||||||
Iron Mountain, Inc. (Equity Real Estate Investment Trusts) | 10,657 | 366,175 | ||||||||
Kimco Realty Corp. (Equity Real Estate Investment Trusts) | 18,473 | 338,980 | ||||||||
Macerich Co. / The (Equity Real Estate Investment Trusts) | 5,167 | 299,996 | ||||||||
Mid-America Apartment Communities, Inc. (Equity Real Estate Investment Trusts) | 4,928 | 519,313 | ||||||||
Prologis, Inc. (Equity Real Estate | 23,010 | 1,349,306 | ||||||||
Public Storage (Equity Real Estate Investment Trusts) | 6,487 | 1,352,734 | ||||||||
Realty Income Corp. (Equity Real Estate Investment Trusts) | 11,848 | 653,773 | ||||||||
Regency Centers Corp. (Equity Real Estate Investment Trusts) | 6,346 | 397,513 | ||||||||
Simon Property Group, Inc. (Equity Real Estate Investment Trusts) | 13,546 | 2,191,201 | ||||||||
SL Green Realty Corp. (Equity Real Estate Investment Trusts) | 4,418 | 467,424 | ||||||||
UDR, Inc. (Equity Real Estate Investment Trusts) | 11,602 | 452,130 | ||||||||
Ventas, Inc. (Equity Real Estate Investment Trusts) | 15,397 | 1,069,784 | ||||||||
Vornado Realty Trust (Equity Real Estate Investment Trusts) | 7,474 | 701,809 | ||||||||
Welltower, Inc. (Equity Real Estate Investment Trusts) | 15,887 | 1,189,142 | ||||||||
Weyerhaeuser Co. (Equity Real Estate Investment Trusts) | 32,598 | 1,092,033 | ||||||||
CBRE Group, Inc. (Real Estate Mgmt. & Development) | (a) | 13,047 | 474,911 | |||||||
|
| |||||||||
| 26,354,815 | ||||||||||
|
| |||||||||
| Common Stocks (Continued) | Shares | Value | ||||||||
| TELECOMMUNICATION SERVICES – 2.1% | ||||||||||
AT&T, Inc. (Diversified Telecom. Svs.) | 266,753 | $ | 10,064,591 | |||||||
CenturyLink, Inc. (Diversified Telecom. Svs.) | 23,812 | 568,631 | ||||||||
Level 3 Communications, Inc. (Diversified Telecom. Svs.) | (a) | 12,701 | 753,169 | |||||||
Verizon Communications, Inc. (Diversified Telecom. Svs.) | 176,998 | 7,904,731 | ||||||||
|
| |||||||||
| 19,291,122 | ||||||||||
|
| |||||||||
| UTILITIES – 3.2% | ||||||||||
Alliant Energy Corp. (Electric Utilities) | 9,885 | 397,080 | ||||||||
American Electric Power Co., Inc. (Electric Utilities) | 21,335 | 1,482,142 | ||||||||
Duke Energy Corp. (Electric Utilities) | 30,367 | 2,538,378 | ||||||||
Edison International (Electric Utilities) | 14,136 | 1,105,294 | ||||||||
Entergy Corp. (Electric Utilities) | 7,787 | 597,808 | ||||||||
Eversource Energy (Electric Utilities) | 13,749 | 834,702 | ||||||||
Exelon Corp. (Electric Utilities) | 40,182 | 1,449,365 | ||||||||
FirstEnergy Corp. (Electric Utilities) | 19,253 | 561,417 | ||||||||
NextEra Energy, Inc. (Electric Utilities) | 20,313 | 2,846,461 | ||||||||
PG&E Corp. (Electric Utilities) | 22,155 | 1,470,427 | ||||||||
Pinnacle West Capital Corp. (Electric Utilities) | 4,840 | 412,174 | ||||||||
PPL Corp. (Electric Utilities) | 29,642 | 1,145,960 | ||||||||
Southern Co. / The (Electric Utilities) | 43,154 | 2,066,214 | ||||||||
Xcel Energy, Inc. (Electric Utilities) | 22,031 | 1,010,782 | ||||||||
AES Corp. (Ind. Power & Renewable Elec.) | 28,642 | 318,213 | ||||||||
NRG Energy, Inc. (Ind. Power & Renewable Elec.) | 13,714 | 236,155 | ||||||||
Ameren Corp. (Multi-Utilities) | 10,528 | 575,566 | ||||||||
CenterPoint Energy, Inc. (Multi-Utilities) | 18,699 | 511,979 | ||||||||
CMS Energy Corp. (Multi-Utilities) | 12,168 | 562,770 | ||||||||
Consolidated Edison, Inc. (Multi-Utilities) | 13,250 | 1,070,865 | ||||||||
Dominion Energy, Inc. (Multi-Utilities) | 27,291 | 2,091,309 | ||||||||
DTE Energy Co. (Multi-Utilities) | 7,783 | 823,364 | ||||||||
NiSource, Inc. (Multi-Utilities) | 14,034 | 355,902 | ||||||||
Public Service Enterprise Group, Inc. (Multi-Utilities) | 21,949 | 944,027 | ||||||||
SCANA Corp. (Multi-Utilities) | 6,201 | 415,529 | ||||||||
Sempra Energy (Multi-Utilities) | 10,883 | 1,227,058 | ||||||||
WEC Energy Group, Inc. (Multi-Utilities) | 13,693 | 840,476 | ||||||||
American Water Works Co., Inc. (Water Utilities) | 7,732 | 602,709 | ||||||||
|
| |||||||||
| 28,494,126 | ||||||||||
|
| |||||||||
Total Common Stocks (Cost $669,880,140) | $ | 901,216,352 | ||||||||
|
| |||||||||
| Money Market Funds – 0.2% | Shares | Value | ||||||||
State Street Institutional U.S. Government Money Market Fund Institutional Class | 1,469,235 | $ | 1,469,235 | |||||||
|
| |||||||||
Total Money Market Funds (Cost $1,469,235) | $ | 1,469,235 | ||||||||
|
| |||||||||
Total Investments – 100.0% (Cost $671,349,375) | (b) | $ | 902,685,587 | |||||||
Other Assets in Excess of Liabilities – 0.0% | (c) | 383,794 | ||||||||
|
| |||||||||
Net Assets – 100.0% | $ | 903,069,381 | ||||||||
|
| |||||||||
Percentages are stated as a percent of net assets.
Footnotes:
| (a) | Non-income producing security. |
| (b) | Represents cost for financial reporting purposes, which may differ from cost basis for federal income tax purposes. See also Note 7 of the Notes to Financial Statements. |
| (c) | Includes $105,865 of cash pledged as collateral for the futures contracts outstanding at June 30, 2017. See also the following Schedule of Open Futures Contracts. |
The accompanying notes are an integral part of these financial statements.
| 53 |
| Ohio National Fund, Inc. | S&P 500® Index Portfolio (Continued) |
Schedule of Open Futures Contracts | June 30, 2017 (Unaudited) |
Description | Number of Contracts | Expiration Date | Notional Amount | Value | Unrealized Appreciation (Depreciation) | |||||||||
CME E-mini S&P 500 Index – Long | 15 | September 15, 2017 | $ | 1,827,778 | $1,815,675 | $ | (12,103 | ) | ||||||
|
|
|
|
| ||||||||||
The accompanying notes are an integral part of these financial statements.
| 54 |
| Ohio National Fund, Inc. | Strategic Value Portfolio |
Objective/Strategy
The Strategic Value Portfolio seeks growth of capital and income by investing primarily in high dividend yielding, undervalued stocks with dividend growth potential.
Performance as of June 30, 2017
Average Annual returns | ||||
One year | 3.75% | |||
Five years | 11.60% | |||
Ten years | 5.16% |
Past performance does not guarantee future results. The performance data quoted represents past performance and current returns may be lower or higher. Total return figures include change in share price and reinvestment of dividends and capital gains. The investment return and principal value will fluctuate so that an investor’s shares, when redeemed, may be worth more or less than the original cost. To obtain performance information up to the most recent month end, call toll-free 1-877-781-6392.
The Portfolio is not open to direct retail investment. Beneficial interest in shares is obtained solely by purchase of variable life insurance policies and variable annuity contracts. Actual performance results for variable annuity and variable universal life contracts will be lower due to contract charges. Consult your contract for applicable charges.
Total expense ratio is 0.78% per the Fund’s prospectus dated May 1, 2017. Additional information pertaining to the Fund’s expense ratio as of June 30, 2017 can be found in the Portfolio’s Financial Highlights.
Comments from Sub-Adviser
Q. How did the Portfolio perform in comparison to its benchmark during the reporting period?
A. For the six-month period ended June 30, 2017, the Strategic Value Portfolio returned 8.27% versus 6.09% for its benchmark, the Dow Jones U.S. Select Dividend Index (“DJSDI”).
Q. Were there specific market conditions, investment strategies, or techniques that materially affected the Portfolio’s benchmark-relative performance during the reporting period?
A. The overall market displayed a preference for “risk-on” characteristics in the first half of the year, as low yield and high beta themes dominated investor predilection. Although investor preferences did not favor a high-quality dividend approach, the Portfolio still provided an attractive return. In the Portfolio’s favor, large market cap outperformed small market cap in the period. The strategy benefited accordingly, as its mega/large cap tilt contributed to relative performance versus the mid-cap tilted DJSDI.(1)
Regardless of market conditions, the Portfolio remained committed to its objectives of delivering high dividend income and moderate dividend growth to investors, as it ended the period with a gross weighted average dividend yield of 4.1%. This yield surpassed not only that of the S&P 500 Index, with its 2.0% yield, and the 10 year U.S. Treasury Note, but also the 3.6% yield of the DJSDI. Complementing the Portfolio’s high yield, many of the Portfolio’s holdings raised their dividend in the first half of the year. The most notable increases came courtesy of PepsiCo, Inc., Ventas, Inc., Realty Income Corp., The Coca-Cola Co. and Digital Realty Trust, Inc.(1)
Q. How did sector selection and security selection each impact the Portfolio’s performance relative to its benchmark?
A. During the period, the Portfolio’s top contributors to its outperformance were an overweight and positive stock selection in Health Care, as the Portfolio’s overweight in pharmaceuticals names
generated an 18.1% return, while the lighter exposure in the DJSDI posted a 10.3% return. The Portfolio’s pharmaceutical names benefitted from the Senate’s health care bill, which if passed, is viewed as potentially positive for pharmaceutical companies, as various fees and taxes assessed to the industry could be eliminated. The Portfolio also heavily benefited from its notable overweight to Consumer Staples and its underweight to Financials.(1)
The primary detractor, from a sector perspective, was the Portfolio’s overweight to Telecommunication Services Of note, AT&T, Inc. and Verizon Communications, Inc. posted declines of 9.2% and 14.2%, respectively, when their stock prices were negatively affected by recent competitive pressures within the United States wireless market. Additionally, the DJSDI benefitted from the strong performance in Utilities stocks (+8.9%), where it had a near 30% exposure. This large concentration significantly exceeds the weighting of the Portfolio in the sector, detracting from relative performance. Relative performance was further hampered by the Portfolio’s pronounced relative underweight in Industrials and its zero exposure to Materials; sectors that afford little reliable dividend yield and dividend growth opportunity.(1)
Q. Were there any factors that impacted the benchmark’s performance more significantly than the Portfolio’s performance?
A. Utilities had a larger impact on the benchmark’s overall total return due to its outsized average weight in the benchmark. Further, the DJSDI captures both regulated and unregulated (commodity-linked) utility companies. The Portfolio’s exposure focuses on regulated utilities, where we have better visibility into the expectations of future dividends and dividend growth, but may have less variability in returns. The Portfolio’s regulated utilities tend to have lower standard deviations, indicating that they typically go down less during periods of declining commodity pricing or periods of market distress but may also go up less during periods of broad market advances. Further, market cap preferences can also notably affect relative performance, as the Portfolio’s mega-cap tilt versus the benchmark’s mid-cap tilt can cause significant dispersion in returns.(1)
Q. Which holdings contributed the most to, and detracted the most from, the Portfolio’s benchmark-relative performance?
A. The top three relative contributors were as follows:
Sanofi (+21.6% return, +75 basis points total effect) - Shares of Sanofi moved higher after reporting strong first quarter results driven by their vaccines and Genzyme/Specialty Care Segment.(1)
Vodafone Group PLC - ADR (+22.1% return, +61 basis points total effect) - Vodafone shares gained after reporting strong operating results for fiscal year 2017 and gave solid earnings before interest, taxes, depreciation, and amortization (“EBITDA”) and free cash flow guidance for fiscal year 2018.(1)
Philip Morris International, Inc. (+30.7% return, +57 basis points total effect) - Phillip Morris continues to benefit from heightened expectations of its new product, iQOS.(1)
The top three relative detractors were as follows:
Verizon Communications, Inc. (“Verizon”) (-14.4% return, -100 basis points total effect) - Verizon’s stock price was negatively affected by the recent competitive pressures with the United States wireless market. (1)
AT&T, Inc. (-9.2% return, -57 basis points total effect) - AT&T, Inc.’s stock price was negatively affected by the recent competitive pressures with the United States wireless market.(1)
| 55 | (continued) |
| Ohio National Fund, Inc. | Strategic Value Portfolio (Continued) |
Exxon Mobil Corp. (-8.9% return, -43 basis points total effect) - The Energy sector was down as crude oil prices declined. Energy was the second greatest laggard in the S&P 500 Index.(1)
| (1) | The Portfolio’s composition is subject to change. Holdings and weightings are as of June 30, 2017. |
Change in Value of $10,000 Investment
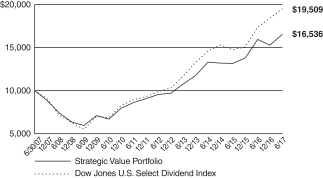
Hypothetical illustration based on past performance. Future performance will vary. The Portfolio’s returns reflect reinvested dividends. The Portfolio’s holdings may differ significantly from the securities in the index. The index is unmanaged and therefore does not reflect the cost of portfolio management and accounting.
The Dow Jones U.S. Select Dividend Index is comprised of all dividend-paying companies in the Dow Jones U.S. Index that have a non-negative historical five-year dividend-per-share growth rate, a five-year average dividend to earnings-per-share ratio of less than or equal to 60%, paid dividends in each of the previous five years, and a three-month average daily trading volume of 200,000 shares. Current index components are included in the universe regardless of their dividend payout ratio or trading volume. The Dow Jones U.S. Index aims to consistently represent the top 95% of U.S. companies based on float-adjusted market capitalization, excluding non common issues and illiquid stocks. The index presented includes the effects of reinvested dividends.
Portfolio Composition as of June 30, 2017 (1)
| % of Net Assets | ||||
Common Stocks (4) | 97.2 | |||
Money Market Funds and | 2.8 | |||
|
| |||
| 100.0 | ||||
|
|
Top 10 Portfolio Holdings as of June 30, 2017 (1) (2) (3)
| % of Net Assets | ||||||
| 1. | AbbVie, Inc. | 4.8 | ||||
| 2. | Philip Morris International, Inc. | 4.8 | ||||
| 3. | Vodafone Group PLC – ADR | 4.6 | ||||
| 4. | Altria Group, Inc. | 4.6 | ||||
| 5. | AT&T, Inc. | 4.6 | ||||
| 6. | Verizon Communications, Inc. | 4.5 | ||||
| 7. | Coca-Cola Co. / The | 4.2 | ||||
| 8. | BCE, Inc. | 4.2 | ||||
| 9. | Duke Energy Corp. | 3.9 | ||||
| 10. | Sanofi | 3.9 |
| (1) | Composition of Portfolio subject to change. |
| (2) | Short-term investments have been excluded from the list of Top 10 Portfolio Holdings. |
| (3) | Top 10 Portfolio Holdings is presented at an individual security level. Total investment exposure by issuer may be higher. |
| (4) | Sectors (Common Stocks): |
| % of Net Assets | ||||
Consumer Staples | 18.7 | |||
Telecommunication Services | 17.8 | |||
Utilities | 17.7 | |||
Health Care | 17.0 | |||
Energy | 11.7 | |||
Real Estate | 9.5 | |||
Consumer Discretionary | 2.1 | |||
Financials | 1.6 | |||
Information Technology | 0.6 | |||
Industrials | 0.5 | |||
|
| |||
| 97.2 | ||||
|
|
| 56 |
| Ohio National Fund, Inc. | Strategic Value Portfolio |
Schedule of Investments | June 30, 2017 (Unaudited) |
| Common Stocks – 97.2% | Shares | Value | ||||||||
| CONSUMER DISCRETIONARY – 2.1% | ||||||||||
McDonald’s Corp. (Hotels, Restaurants & Leisure) | 81,775 | $ | 12,524,659 | |||||||
|
| |||||||||
| CONSUMER STAPLES – 18.7% | ||||||||||
Coca-Cola Co. / The (Beverages) | 550,950 | 24,710,107 | ||||||||
PepsiCo, Inc. (Beverages) | 26,650 | 3,077,809 | ||||||||
General Mills, Inc. (Food Products) | 83,675 | 4,635,595 | ||||||||
Kimberly-Clark Corp. (Household Products) | 76,600 | 9,889,826 | ||||||||
Procter & Gamble Co. / The (Household Products) | 141,740 | 12,352,641 | ||||||||
Altria Group, Inc. (Tobacco) | 366,345 | 27,281,712 | ||||||||
Philip Morris International, Inc. (Tobacco) | 239,920 | 28,178,604 | ||||||||
|
| |||||||||
| 110,126,294 | ||||||||||
|
| |||||||||
| ENERGY – 11.7% | ||||||||||
BP PLC (Oil, Gas & Consumable Fuels) | (a) | 1,949,425 | 11,252,416 | |||||||
Chevron Corp. (Oil, Gas & Consumable Fuels) | 152,655 | 15,926,496 | ||||||||
Exxon Mobil Corp. (Oil, Gas & Consumable Fuels) | 204,150 | 16,481,029 | ||||||||
Occidental Petroleum Corp. (Oil, Gas & Consumable Fuels) | 216,200 | 12,943,894 | ||||||||
TOTAL SA (Oil, Gas & Consumable Fuels) | (a) | 242,975 | 12,062,973 | |||||||
|
| |||||||||
| 68,666,808 | ||||||||||
|
| |||||||||
| FINANCIALS – 1.6% | ||||||||||
Muenchener Rueckversicherungs-Gesellschaft AG in Muenchen (Insurance) | (a) | 47,625 | 9,637,047 | |||||||
|
| |||||||||
| HEALTH CARE – 17.0% | ||||||||||
AbbVie, Inc. (Biotechnology) | 389,525 | 28,244,458 | ||||||||
AstraZeneca PLC (Pharmaceuticals) | (a) | 214,230 | 14,349,879 | |||||||
GlaxoSmithKline PLC (Pharmaceuticals) | (a) | 744,706 | 15,852,742 | |||||||
Merck & Co., Inc. (Pharmaceuticals) | 294,300 | 18,861,687 | ||||||||
Sanofi (Pharmaceuticals) | (a) | 241,136 | 23,105,628 | |||||||
|
| |||||||||
| 100,414,394 | ||||||||||
|
| |||||||||
| INDUSTRIALS – 0.5% | ||||||||||
United Parcel Service, Inc. Class B (Air Freight & Logistics) | 27,550 | 3,046,755 | ||||||||
|
| |||||||||
| INFORMATION TECHNOLOGY – 0.6% | ||||||||||
Paychex, Inc. (IT Svs.) | 60,450 | 3,442,023 | ||||||||
|
| |||||||||
| REAL ESTATE – 9.5% | ||||||||||
Crown Castle International Corp. (Equity Real Estate Investment Trusts) | 211,925 | 21,230,646 | ||||||||
Digital Realty Trust, Inc. (Equity Real Estate Investment Trusts) | 49,670 | 5,610,226 | ||||||||
National Retail Properties, Inc. (Equity Real Estate Investment Trusts) | 116,000 | 4,535,600 | ||||||||
| Common Stocks (Continued) | Shares | Value | ||||||||
| REAL ESTATE (continued) | ||||||||||
Omega Healthcare Investors, Inc. (Equity Real Estate Investment Trusts) | 101,550 | $ | 3,353,181 | |||||||
Realty Income Corp. (Equity Real Estate Investment Trusts) | 73,800 | 4,072,284 | ||||||||
Ventas, Inc. (Equity Real Estate Investment Trusts) | 159,330 | 11,070,248 | ||||||||
Welltower, Inc. (Equity Real Estate Investment Trusts) | 78,800 | 5,898,180 | ||||||||
|
| |||||||||
| 55,770,365 | ||||||||||
|
| |||||||||
| TELECOMMUNICATION SERVICES – 17.8% | ||||||||||
AT&T, Inc. (Diversified Telecom. Svs.) | 716,348 | 27,027,810 | ||||||||
BCE, Inc. (Diversified Telecom. Svs.) | 544,505 | 24,521,200 | ||||||||
Verizon Communications, Inc. (Diversified Telecom. Svs.) | 587,476 | 26,236,678 | ||||||||
Vodafone Group PLC – ADR (Wireless Telecom. Svs.) | 950,868 | 27,318,438 | ||||||||
|
| |||||||||
| 105,104,126 | ||||||||||
|
| |||||||||
| UTILITIES – 17.7% | ||||||||||
American Electric Power Co., Inc. (Electric Utilities) | 85,425 | 5,934,475 | ||||||||
Duke Energy Corp. (Electric Utilities) | 276,931 | 23,148,662 | ||||||||
PPL Corp. (Electric Utilities) | 434,925 | 16,814,201 | ||||||||
Southern Co. / The (Electric Utilities) | 181,860 | 8,707,457 | ||||||||
Consolidated Edison, Inc. (Multi-Utilities) | 65,000 | 5,253,300 | ||||||||
Dominion Energy, Inc. (Multi-Utilities) | 244,425 | 18,730,288 | ||||||||
National Grid PLC (Multi-Utilities) | (a) | 1,455,850 | 18,038,680 | |||||||
Public Service Enterprise Group, Inc. (Multi-Utilities) | 172,100 | 7,402,021 | ||||||||
|
| |||||||||
| 104,029,084 | ||||||||||
|
| |||||||||
Total Common Stocks (Cost $540,544,143) | $ | 572,761,555 | ||||||||
|
| |||||||||
| Money Market Funds – 1.5% | Shares | Value | ||||||||
State Street Institutional U.S. Government Money Market Fund Institutional Class | 8,623,132 | $ | 8,623,132 | |||||||
|
| |||||||||
Total Money Market Funds (Cost $8,623,132) | $ | 8,623,132 | ||||||||
|
| |||||||||
Total Investments – 98.7% (Cost $549,167,275) | (b) | $ | 581,384,687 | |||||||
Other Assets in Excess of Liabilities – 1.3% | 7,914,615 | |||||||||
|
| |||||||||
Net Assets – 100.0% | $ | 589,299,302 | ||||||||
|
| |||||||||
Percentages are stated as a percent of net assets.
Abbreviations:
ADR: American Depositary Receipts
Footnotes:
| (a) | Security traded on a foreign exchange has been valued at an estimate of fair value that is different than the local market close price. These fair value estimates are determined by an independent fair valuation service that has been approved by the Board. These securities represent $104,299,365, or 17.7% of the Portfolio’s net assets. |
| Other Portfolio securities are not subjected to fair value procedures because they are traded on domestic or foreign exchanges that have close times that are consistent with the U.S. market close, normally 4:00 pm Eastern Time. |
| (b) | Represents cost for financial reporting purposes, which may differ from cost basis for federal income tax purposes. See also Note 7 of the Notes to Financial Statements. |
The accompanying notes are an integral part of these financial statements.
| 57 |
| Ohio National Fund, Inc. | High Income Bond Portfolio |
Objective/Strategy
The High Income Bond Portfolio seeks high current income by investing at least 80% of its net assets in lower rated corporate debt obligations commonly referred to as “junk bonds”. The Portfolio’s investments are generally rated Ba or lower by Moody’s, or BB or lower by Standard & Poor’s or Fitch.
Performance as of June 30, 2017
Average Annual returns | ||||
One year | 11.36% | |||
Five years | 6.40% | |||
Ten years | 7.04% |
Past performance does not guarantee future results. The performance data quoted represents past performance and current returns may be lower or higher. Total return figures include change in share price and reinvestment of dividends and capital gains. The investment return and principal value will fluctuate so that an investor’s shares, when redeemed, may be worth more or less than the original cost. To obtain performance information up to the most recent month end, call toll-free 1-877-781-6392.
The Portfolio is not open to direct retail investment. Beneficial interest in shares is obtained solely by purchase of variable life insurance policies and variable annuity contracts. Actual performance results for variable annuity and variable universal life contracts will be lower due to contract charges. Consult your contract for applicable charges.
Total expense ratio is 0.81% per the Fund’s prospectus dated May 1, 2017. Additional information pertaining to the Fund’s expense ratio as of June 30, 2017 can be found in the Portfolio’s Financial Highlights.
Comments from Sub-Adviser
Q. How did the Portfolio perform in comparison to its benchmark during the reporting period?
A. For the six-month period ended June 30, 2017, the High Income Bond Portfolio returned 5.03% versus 4.92% for its benchmark, the Bloomberg Barclays U.S. Corporate High Yield 2% Issuer Capped Index (“BBHY2%ICI”).
Q. Were there specific market conditions, investment strategies, or techniques that materially affected the Portfolio’s benchmark-relative performance during the reporting period?
A. The high yield market generated attractive relative and absolute returns during the six-month period ended June 30, 2017. The market continued to be fueled by a high level of confidence that the domestic economy continues on a path of solid, but unspectacular, growth. While acrimony between the political left and right continues, business leaders seem to be focused on a more benign regulatory environment, as well as the potential for tax relief. Consumers continue to be encouraged by high levels of employment, low levels of inflation, low intermediate term interest rates (despite the Federal Reserve’s modest increase in the Federal Fund’s rate) and increasing net worth. Foreign economies are also performing well. Equity prices, a proxy for corporate valuations, moved higher during the period while high yield default activity remained modest. While a swoon in oil prices in June briefly brought back memories of 2015 for high yield investors, stabilization in the mid 40’s for this volatile commodity limited the damage to oil-related sectors. The overall impact of these factors can be seen in the decline in the yield spread between the Credit Suisse High Yield Bond Index and Treasury securities with comparable maturities, which tightened during the period.(1)
Q. How did sector selection and security selection each impact the Portfolio’s performance relative to its benchmark?
A. The Portfolio’s outperformance was led by its overweight to the strong performing health care sector and its underweight to the poor performing oil field services and independent energy sectors. The Portfolio also benefitted from strong security selection in the cable & satellite, wireless, packaging and independent energy industry sectors. The Portfolio was negatively impacted by security selection in the transportation services and midstream sectors.(1)
Q. Were there any factors that impacted the benchmark’s performance more significantly than the Portfolio’s performance?
A. Within the high-yield market, major industry sectors that substantially outperformed the overall BBHY2%ICI included: pharmaceuticals, banking, health care, cable & satellite and chemicals. Major industry sectors that substantially underperformed the overall BBHY2%ICI included: independent energy, oil field services, retail, other industrials and consumer products. From a quality ratings perspective, the CCC-rated sector generated the best returns, followed by BB and B-rated sectors.(1)
Q. Which holdings contributed the most to, and detracted the most from, the Portfolio’s benchmark-relative performance?
A. Specific Portfolio holdings that substantially outperformed the BBHY2%ICI included: Intelsat Jackson Holdings SA, which moved substantially higher in price as a result of a merger/restructuring proposal by a company affiliated with Softbank and stabilizing fundamental performance, Ortho-Clinical Diagnostics, Inc./Ortho-Clinical Diagnostics SA, which moved higher on improving financial performance, and CHS / Community Health Systems, Inc., which moved higher on the strength of asset sales and better sentiment in the health care space.(1)
Specific holdings that substantially underperformed the BBHY2%ICI included: PetSmart, Inc., which underperformed on negative sentiment in the retail sector and online competition, FGI Operating Co. LLC / FGI Finance, Inc., which underperformed as firearms sales slumped, and Northern Oil and Gas, Inc., which moved lower due to weakening oil prices.(1)
| (1) | The Portfolio’s composition is subject to change. Holdings and weightings are as of June 30, 2017. |
| 58 | (continued) |
| Ohio National Fund, Inc. | High Income Bond Portfolio (Continued) |
Change in Value of $10,000 Investment
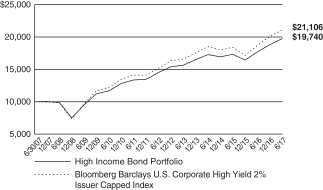
Hypothetical illustration based on past performance. Future performance will vary. All returns reflect reinvested dividends. The Portfolio’s holdings may differ significantly from the securities in the index. The index is unmanaged and therefore does not reflect the cost of Portfolio management or trading. Neither the Portfolio nor the index is open to direct investment.
The Bloomberg Barclays U.S. Corporate High Yield 2% Issuer Capped Index is the 2% Issuer Cap component of the Bloomberg Barclays U.S. Corporate High Yield Bond Index. The Bloomberg Barclays U.S. Corporate High Yield Bond Index is an unmanaged index that includes all fixed income securities having a maximum quality rating of Ba1/BB+/BB+, a minimum amount outstanding of $150 million, and a least 1 year to maturity. The 2% Issuer Cap component limits the exposure of each issuer to 2% of the total market value and distributes any excess market value index–wide on a pro–rata basis. The index is presented on a total return basis.
Portfolio Composition as of June 30, 2017 (1)
| % of Net Assets | ||||
Corporate Bonds (4) | 94.6 | |||
Exchange Traded Funds | 1.5 | |||
Money Market Funds and | 3.9 | |||
|
| |||
| 100.0 | ||||
|
|
Top 10 Portfolio Holdings as of June 30, 2017 (1) (2) (3)
| % of Net Assets | ||||
1. Ortho-Clinical Diagnostics, Inc. / Ortho-Clinical Diagnostics SA 6.625%, 05/15/2022 | 0.8 | |||
2. Jaguar Holding Co. II / Pharmaceutical Product Development LLC 6.375%, 08/01/2023 | 0.8 | |||
3. iShares iBoxx $ High Yield Corporate Bond ETF | 0.8 | |||
4. SPDR Bloomberg Barclays High Yield Bond ETF | 0.8 | |||
5. Platform Specialty Products Corp. 6.500%, 02/01/2022 | 0.7 | |||
6. Sprint Corp. | 0.7 | |||
7. MPH Acquisition Holdings LLC 7.125%, 06/01/2024 | 0.7 | |||
8. First Data Corp. | 0.6 | |||
9. Post Holdings, Inc. | 0.6 | |||
10. Ally Financial, Inc. | 0.6 |
| (1) | Composition of Portfolio subject to change. |
| (2) | Short-term investments have been excluded from the list of Top 10 Portfolio Holdings. |
| (3) | Top 10 Portfolio Holdings is presented at an individual security level. Total investment exposure by issuer may be higher. |
| (4) | Sectors (Corporate Bonds): |
| % of Net Assets | ||||
Consumer Discretionary | 24.5 | |||
Health Care | 14.4 | |||
Energy | 11.7 | |||
Information Technology | 10.8 | |||
Materials | 10.6 | |||
Industrials | 7.4 | |||
Telecommunication Services | 4.3 | |||
Financials | 4.2 | |||
Utilities | 3.4 | |||
Consumer Staples | 3.0 | |||
Real Estate | 0.3 | |||
|
| |||
| 94.6 | ||||
|
|
| 59 |
| Ohio National Fund, Inc. | High Income Bond Portfolio |
Schedule of Investments | June 30, 2017 (Unaudited) |
| Corporate Bonds – 94.6% | Rate | Maturity | Face Amount | Value | ||||||||||
| CONSUMER DISCRETIONARY – 24.5% | ||||||||||||||
Adient Global Holdings Ltd. (Auto Components) | (a) | 4.875% | 08/15/2026 | $ | 950,000 | $ | 952,375 | |||||||
American Axle & Manufacturing, Inc. (Auto Components) | 6.625% | 10/15/2022 | 125,000 | 128,125 | ||||||||||
American Axle & Manufacturing, Inc. (Auto Components) | (a) | 6.500% | 04/01/2027 | 625,000 | 607,812 | |||||||||
Cooper-Standard Automotive, Inc. (Auto Components) | (a) | 5.625% | 11/15/2026 | 200,000 | 200,750 | |||||||||
Dana Financing Luxembourg Sarl (Auto Components) | (a) | 6.500% | 06/01/2026 | 800,000 | 851,500 | |||||||||
Dana Financing Luxembourg Sarl (Auto Components) | (a) | 5.750% | 04/15/2025 | 175,000 | 181,125 | |||||||||
Gates Global LLC / Gates Global Co. (Auto Components) | (a) | 6.000% | 07/15/2022 | 1,550,000 | 1,553,875 | |||||||||
Goodyear Tire & Rubber Co. / The (Auto Components) | 5.125% | 11/15/2023 | 300,000 | 314,250 | ||||||||||
Goodyear Tire & Rubber Co. / The (Auto Components) | 5.000% | 05/31/2026 | 200,000 | 207,000 | ||||||||||
Goodyear Tire & Rubber Co. / The (Auto Components) | 4.875% | 03/15/2027 | 325,000 | 329,875 | ||||||||||
IHO Verwaltung GmbH (Auto Components) | (a)(b) | 4.750%, 5.500% PIK | 09/15/2026 | 1,075,000 | 1,087,094 | |||||||||
J.B. Poindexter & Co., Inc. (Auto Components) | (a) | 9.000% | 04/01/2022 | 475,000 | 498,156 | |||||||||
Omega U.S. Sub, LLC (Auto Components) | (a) | 8.750% | 07/15/2023 | 775,000 | 819,562 | |||||||||
Tenneco, Inc. (Auto Components) | 5.000% | 07/15/2026 | 100,000 | 101,125 | ||||||||||
ZF North America Capital, Inc. (Auto Components) | (a) | 4.750% | 04/29/2025 | 475,000 | 501,125 | |||||||||
ServiceMaster Co. LLC / The (Diversified Consumer Svs.) | 7.450% | 08/15/2027 | 300,000 | 327,750 | ||||||||||
ServiceMaster Co. LLC / The (Diversified Consumer Svs.) | 7.100% | 03/01/2018 | 450,000 | 461,250 | ||||||||||
ServiceMaster Co. LLC / The (Diversified Consumer Svs.) | (a) | 5.125% | 11/15/2024 | 700,000 | 724,500 | |||||||||
1011778 B.C. ULC / New Red Finance, Inc. (Hotels, Restaurants & Leisure) | (a) | 6.000% | 04/01/2022 | 1,175,000 | 1,217,594 | |||||||||
1011778 B.C. ULC / New Red Finance, Inc. (Hotels, Restaurants & Leisure) | (a) | 4.250% | 05/15/2024 | 250,000 | 248,422 | |||||||||
Aramark Services, Inc. (Hotels, Restaurants & Leisure) | 5.125% | 01/15/2024 | 550,000 | 578,187 | ||||||||||
Aramark Services, Inc. (Hotels, Restaurants & Leisure) | 4.750% | 06/01/2026 | 375,000 | 389,062 | ||||||||||
Aramark Services, Inc. (Hotels, Restaurants & Leisure) | (a) | 5.000% | 04/01/2025 | 300,000 | 316,875 | |||||||||
Boyd Gaming Corp. (Hotels, Restaurants & Leisure) | 6.875% | 05/15/2023 | 525,000 | 561,750 | ||||||||||
Boyd Gaming Corp. (Hotels, Restaurants & Leisure) | 6.375% | 04/01/2026 | 650,000 | 702,812 | ||||||||||
Cedar Fair LP / Canada’s Wonderland Co. / Magnum Management Corp. (Hotels, Restaurants & Leisure) | (a) | 5.375% | 04/15/2027 | 100,000 | 105,750 | |||||||||
Cedar Fair LP / Canada’s Wonderland Co. / Magnum Management Corp. (Hotels, Restaurants & Leisure) | 5.375% | 06/01/2024 | 375,000 | 391,875 | ||||||||||
Chester Downs & Marina LLC (Hotels, Restaurants & Leisure) | (a) | 9.250% | 02/01/2020 | 900,000 | 927,000 | |||||||||
Eagle II Acquisition Co. LLC (Hotels, Restaurants & Leisure) | (a) | 6.000% | 04/01/2025 | 325,000 | 344,500 | |||||||||
GLP Capital LP / GLP Financing II, Inc. (Hotels, Restaurants & Leisure) | 5.375% | 11/01/2023 | 300,000 | 326,250 | ||||||||||
GLP Capital LP / GLP Financing II, Inc. (Hotels, Restaurants & Leisure) | 5.375% | 04/15/2026 | 125,000 | 136,536 | ||||||||||
Hilton Domestic Operations (Hotels, Restaurants & Leisure) | (a) | 4.250% | 09/01/2024 | 250,000 | 253,437 | |||||||||
Hilton Worldwide Finance LLC / Hilton Worldwide Finance Corp. (Hotels, Restaurants & Leisure) | (a) | 4.625% | 04/01/2025 | 375,000 | 386,719 | |||||||||
KFC Holding Co. / Pizza Hut Holdings LLC / Taco Bell of America LLC (Hotels, Restaurants & Leisure) | (a) | 5.000% | 06/01/2024 | 150,000 | 156,375 | |||||||||
KFC Holding Co. / Pizza Hut Holdings LLC / Taco Bell of America LLC (Hotels, Restaurants & Leisure) | (a) | 5.250% | 06/01/2026 | 300,000 | 315,750 | |||||||||
KFC Holding Co. / Pizza Hut Holdings LLC / Taco Bell of America LLC (Hotels, Restaurants & Leisure) | (a) | 4.750% | 06/01/2027 | 650,000 | 663,812 | |||||||||
KIRS Midco 3 PLC (Hotels, Restaurants & Leisure) | (a) | 8.625% | 07/15/2023 | 850,000 | 860,625 | |||||||||
MGM Growth Properties Operating Partnership LP / MGP Finance Co-Issuer, Inc. (Hotels, Restaurants & Leisure) | 5.625% | 05/01/2024 | 50,000 | 54,500 | ||||||||||
MGM Resorts International (Hotels, Restaurants & Leisure) | 7.750% | 03/15/2022 | 750,000 | 880,312 | ||||||||||
MGM Resorts International (Hotels, Restaurants & Leisure) | 6.750% | 10/01/2020 | 150,000 | 166,185 | ||||||||||
MGM Resorts International (Hotels, Restaurants & Leisure) | 4.625% | 09/01/2026 | 1,575,000 | 1,590,750 | ||||||||||
Mohegan Tribal Gaming Authority (Hotels, Restaurants & Leisure) | (a) | 7.875% | 10/15/2024 | 925,000 | 962,000 | |||||||||
Penn National Gaming, Inc. (Hotels, Restaurants & Leisure) | (a) | 5.625% | 01/15/2027 | 375,000 | 382,031 | |||||||||
Pinnacle Entertainment, Inc. (Hotels, Restaurants & Leisure) | (a) | 5.625% | 05/01/2024 | 1,075,000 | 1,118,000 | |||||||||
Rivers Pittsburgh Borrower LP / Rivers Pittsburgh Finance Corp. (Hotels, Restaurants & Leisure) | (a) | 6.125% | 08/15/2021 | 900,000 | 913,500 | |||||||||
Seminole Hard Rock Entertainment, Inc. / Seminole Hard Rock International LLC (Hotels, Restaurants & Leisure) | (a) | 5.875% | 05/15/2021 | 1,400,000 | 1,407,000 | |||||||||
Seminole Indian Tribe of Florida (Hotels, Restaurants & Leisure) | (a) | 7.804% | 10/01/2020 | 520,000 | 525,200 | |||||||||
Six Flags Entertainment Corp. (Hotels, Restaurants & Leisure) | (a) | 4.875% | 07/31/2024 | 350,000 | 352,142 | |||||||||
Six Flags Entertainment Corp. (Hotels, Restaurants & Leisure) | (a) | 5.500% | 04/15/2027 | 1,050,000 | 1,081,500 | |||||||||
Station Casinos LLC (Hotels, Restaurants & Leisure) | 7.500% | 03/01/2021 | 313,000 | 325,520 | ||||||||||
Sugarhouse HSP Gaming Prop. Mezz LP / Sugarhouse HSP Gaming Finance Corp. (Hotels, Restaurants & Leisure) | (a) | 5.875% | 05/15/2025 | 350,000 | 341,250 | |||||||||
Wynn Las Vegas LLC / Wynn Las Vegas Capital Corp. (Hotels, Restaurants & Leisure) | (a) | 5.250% | 05/15/2027 | 225,000 | 230,484 | |||||||||
RSI Home Products, Inc. (Household Durables) | (a) | 6.500% | 03/15/2023 | 975,000 | 1,026,187 | |||||||||
FGI Operating Co. LLC / FGI Finance, Inc. (Acquired 04/12/2012 through 11/04/2013, Cost $809,102) (Leisure Products) | (c) | 7.875% | 05/01/2020 | 800,000 | 536,000 | |||||||||
Acosta, Inc. (Media) | (a) | 7.750% | 10/01/2022 | 1,275,000 | 965,812 | |||||||||
Altice SA (Media) | (a) | 7.625% | 02/15/2025 | 1,425,000 | 1,567,500 | |||||||||
Altice U.S. Finance I Corp. (Media) | (a) | 5.375% | 07/15/2023 | 375,000 | 390,234 | |||||||||
Altice U.S. Finance II Corp. (Media) | (a) | 7.750% | 07/15/2025 | 1,175,000 | 1,298,375 | |||||||||
| 60 | (continued) |
| Ohio National Fund, Inc. | High Income Bond Portfolio (Continued) |
Schedule of Investments | June 30, 2017 (Unaudited) |
| Corporate Bonds (Continued) | Rate | Maturity | Face Amount | Value | ||||||||||
| CONSUMER DISCRETIONARY (continued) | ||||||||||||||
AMC Entertainment Holdings, Inc. (Media) | (a) | 5.875% | 11/15/2026 | $ | 300,000 | $ | 313,125 | |||||||
AMC Entertainment Holdings, Inc. (Media) | (a) | 6.125% | 05/15/2027 | 200,000 | 211,062 | |||||||||
AMC Networks, Inc. (Media) | 5.000% | 04/01/2024 | 800,000 | 819,000 | ||||||||||
Cablevision Systems Corp. (Media) | 5.875% | 09/15/2022 | 1,200,000 | 1,261,500 | ||||||||||
CBS Radio, Inc. (Media) | (a) | 7.250% | 11/01/2024 | 600,000 | 618,000 | |||||||||
CCO Holdings LLC / CCO Holdings Capital Corp. (Media) | 5.125% | 02/15/2023 | 150,000 | 154,781 | ||||||||||
CCO Holdings LLC / CCO Holdings Capital Corp. (Media) | 5.750% | 09/01/2023 | 325,000 | 338,812 | ||||||||||
CCO Holdings LLC / CCO Holdings Capital Corp. (Media) | 5.750% | 01/15/2024 | 1,275,000 | 1,343,531 | ||||||||||
CCO Holdings LLC / CCO Holdings Capital Corp. (Media) | (a) | 5.375% | 05/01/2025 | 175,000 | 186,375 | |||||||||
CCO Holdings LLC / CCO Holdings Capital Corp. (Media) | (a) | 5.875% | 05/01/2027 | 150,000 | 160,312 | |||||||||
CCO Holdings LLC / CCO Holdings Capital Corp. (Media) | (a) | 5.125% | 05/01/2027 | 1,625,000 | 1,661,562 | |||||||||
Cequel Communications Holdings I LLC / Cequel Capital Corp. (Media) | (a) | 5.125% | 12/15/2021 | 750,000 | 763,125 | |||||||||
Cequel Communications Holdings I LLC / Cequel Capital Corp. (Media) | (a) | 5.125% | 12/15/2021 | 100,000 | 101,843 | |||||||||
Clear Channel International BV (Media) | (a) | 8.750% | 12/15/2020 | 50,000 | 53,000 | |||||||||
Clear Channel Worldwide Holdings, Inc. (Media) | 6.500% | 11/15/2022 | 275,000 | 280,500 | ||||||||||
Clear Channel Worldwide Holdings, Inc. (Media) | 6.500% | 11/15/2022 | 725,000 | 745,082 | ||||||||||
CSC Holdings LLC (Media) | 5.250% | 06/01/2024 | 250,000 | 255,025 | ||||||||||
CSC Holdings LLC (Media) | (a) | 5.500% | 04/15/2027 | 650,000 | 687,375 | |||||||||
DISH DBS Corp. (Media) | 5.875% | 07/15/2022 | 1,325,000 | 1,424,375 | ||||||||||
DISH DBS Corp. (Media) | 5.875% | 11/15/2024 | 375,000 | 400,114 | ||||||||||
DISH DBS Corp. (Media) | 7.750% | 07/01/2026 | 550,000 | 651,750 | ||||||||||
EMI Music Publishing Group North America Holdings, Inc. (Media) | (a) | 7.625% | 06/15/2024 | 875,000 | 973,437 | |||||||||
E.W. Scripps Company / The (Media) | (a) | 5.125% | 05/15/2025 | 175,000 | 180,250 | |||||||||
Gannett Co., Inc. (Media) | (a) | 5.500% | 09/15/2024 | 225,000 | 231,750 | |||||||||
Gray Television, Inc. (Media) | (a) | 5.875% | 07/15/2026 | 825,000 | 841,500 | |||||||||
Gray Television, Inc. (Media) | (a) | 5.125% | 10/15/2024 | 250,000 | 252,500 | |||||||||
iHeartCommunications, Inc. (Media) | 9.000% | 03/01/2021 | 700,000 | 525,000 | ||||||||||
Intelsat Jackson Holdings SA (Media) | 7.500% | 04/01/2021 | 1,525,000 | 1,406,812 | ||||||||||
Intelsat Jackson Holdings SA (Media) | 5.500% | 08/01/2023 | 550,000 | 455,125 | ||||||||||
Intelsat Jackson Holdings SA (Media) | (a) | 8.000% | 02/15/2024 | 675,000 | 727,312 | |||||||||
Intelsat Jackson Holdings SA (Media) | (a) | 9.750% | 07/15/2025 | 350,000 | 349,562 | |||||||||
Lamar Media Corp. (Media) | 5.375% | 01/15/2024 | 275,000 | 287,375 | ||||||||||
LIN Television Corp. (Media) | 5.875% | 11/15/2022 | 350,000 | 366,625 | ||||||||||
Live Nation Entertainment, Inc. (Media) | (a) | 4.875% | 11/01/2024 | 250,000 | 253,750 | |||||||||
Lynx II Corp. (Media) | (a) | 6.375% | 04/15/2023 | 475,000 | 498,750 | |||||||||
Nexstar Broadcasting, Inc. (Media) | (a) | 6.125% | 02/15/2022 | 475,000 | 496,969 | |||||||||
Nexstar Escrow Corp. (Media) | (a) | 5.625% | 08/01/2024 | 1,025,000 | 1,037,812 | |||||||||
Nielsen Finance LLC / Nielsen Finance Co. (Media) | (a) | 5.000% | 04/15/2022 | 1,250,000 | 1,296,875 | |||||||||
Outfront Media Capital LLC / Outfront Media Capital Corp. (Media) | 5.250% | 02/15/2022 | 300,000 | 310,875 | ||||||||||
Outfront Media Capital LLC / Outfront Media Capital Corp. (Media) | 5.625% | 02/15/2024 | 300,000 | 313,125 | ||||||||||
Radio One, Inc. (Media) | (a) | 9.250% | 02/15/2020 | 650,000 | 624,000 | |||||||||
Radio One, Inc. (Media) | (a) | 7.375% | 04/15/2022 | 625,000 | 646,875 | |||||||||
Regal Entertainment Group (Media) | 5.750% | 02/01/2025 | 550,000 | 567,875 | ||||||||||
Regal Entertainment Group (Media) | 5.750% | 03/15/2022 | 100,000 | 104,500 | ||||||||||
Sinclair Television Group, Inc. (Media) | (a) | 5.625% | 08/01/2024 | 875,000 | 897,969 | |||||||||
Sinclair Television Group, Inc. (Media) | (a) | 5.875% | 03/15/2026 | 750,000 | 766,875 | |||||||||
Sinclair Television Group, Inc. (Media) | (a) | 5.125% | 02/15/2027 | 250,000 | 241,875 | |||||||||
Sirius XM Radio, Inc. (Media) | (a) | 4.625% | 05/15/2023 | 1,175,000 | 1,208,781 | |||||||||
Sirius XM Radio, Inc. (Media) | (a) | 6.000% | 07/15/2024 | 275,000 | 292,187 | |||||||||
Sirius XM Radio, Inc. (Media) | (a) | 5.375% | 04/15/2025 | 150,000 | 155,062 | |||||||||
Sirius XM Radio, Inc. (Media) | (a) | 5.375% | 07/15/2026 | 725,000 | 750,375 | |||||||||
Sirius XM Radio, Inc. (Media) | (a) | 5.000% | 08/01/2027 | 200,000 | 201,500 | |||||||||
TEGNA, Inc. (Media) | 6.375% | 10/15/2023 | 700,000 | 738,500 | ||||||||||
Tribune Media Co. (Media) | 5.875% | 07/15/2022 | 1,375,000 | 1,440,312 | ||||||||||
Unitymedia KabelBW GmbH (Media) | (a) | 6.125% | 01/15/2025 | 975,000 | 1,045,687 | |||||||||
Unitymedia Hessen GmbH & Co. KG / Unitymedia NRW GmbH (Media) | (a) | 5.500% | 01/15/2023 | 427,500 | 443,531 | |||||||||
Unitymedia Hessen GmbH & Co. KG / Unitymedia NRW GmbH (Media) | (a) | 5.000% | 01/15/2025 | 200,000 | 209,500 | |||||||||
Virgin Media Finance PLC (Media) | (a) | 6.000% | 10/15/2024 | 800,000 | 848,000 | |||||||||
Virgin Media Finance PLC (Media) | (a) | 5.750% | 01/15/2025 | 400,000 | 415,000 | |||||||||
Virgin Media Secured Finance PLC (Media) | (a) | 5.250% | 01/15/2026 | 425,000 | 442,344 | |||||||||
Virgin Media Secured Finance PLC (Media) | (a) | 5.500% | 08/15/2026 | 200,000 | 209,500 | |||||||||
WMG Acquisition Corp. (Media) | (a) | 5.000% | 08/01/2023 | 75,000 | 76,875 | |||||||||
WMG Acquisition Corp. (Media) | (a) | 4.875% | 11/01/2024 | 200,000 | 204,000 | |||||||||
Ziggo Bond Finance BV (Media) | (a) | 6.000% | 01/15/2027 | 775,000 | 783,719 | |||||||||
Ziggo Secured Finance BV (Media) | (a) | 5.500% | 01/15/2027 | 925,000 | 944,656 | |||||||||
Argos Merger Sub, Inc. (Specialty Retail) | (a) | 7.125% | 03/15/2023 | 1,600,000 | 1,424,000 | |||||||||
Michaels Stores, Inc. (Specialty Retail) | (a) | 5.875% | 12/15/2020 | 1,275,000 | 1,305,281 | |||||||||
Party City Holdings, Inc. (Specialty Retail) | (a) | 6.125% | 08/15/2023 | 975,000 | 1,009,125 | |||||||||
PetSmart, Inc. (Specialty Retail) | (a) | 8.875% | 06/01/2025 | 325,000 | 300,170 | |||||||||
| 61 | (continued) |
| Ohio National Fund, Inc. | High Income Bond Portfolio (Continued) |
Schedule of Investments | June 30, 2017 (Unaudited) |
| Corporate Bonds (Continued) | Rate | Maturity | Face Amount | Value | ||||||||||
| CONSUMER DISCRETIONARY (continued) | ||||||||||||||
Sally Holdings LLC / Sally Capital, Inc. (Specialty Retail) | 5.625% | 12/01/2025 | $ | 600,000 | $ | 614,250 | ||||||||
Hanesbrands, Inc. (Textiles, Apparel & Luxury Goods) | (a) | 4.875% | 05/15/2026 | 475,000 | 482,125 | |||||||||
Springs Industries, Inc. (Textiles, Apparel & Luxury Goods) | 6.250% | 06/01/2021 | 455,000 | 469,219 | ||||||||||
|
| |||||||||||||
| 77,944,383 | ||||||||||||||
|
| |||||||||||||
| CONSUMER STAPLES – 3.0% | ||||||||||||||
Albertsons Cos., LLC / Safeway, Inc. / New Albertson’s, Inc. / Albertson’s, LLC (Food & Staples Retailing) | (a) | 6.625% | 06/15/2024 | 1,025,000 | 1,017,312 | |||||||||
Albertsons Cos., LLC / Safeway, Inc. / New Albertson’s, Inc. / Albertson’s, LLC (Food & Staples Retailing) | (a) | 5.750% | 03/15/2025 | 525,000 | 488,250 | |||||||||
Performance Food Group, Inc. (Food & Staples Retailing) | (a) | 5.500% | 06/01/2024 | 75,000 | 77,437 | |||||||||
Rite Aid Corp. (Food & Staples Retailing) | (a) | 6.125% | 04/01/2023 | 550,000 | 541,062 | |||||||||
U.S. Foods, Inc. (Food & Staples Retailing) | (a) | 5.875% | 06/15/2024 | 1,550,000 | 1,608,125 | |||||||||
Hearthside Group Holdings LLC / Hearthside Finance Co. (Food Products) | (a) | 6.500% | 05/01/2022 | 850,000 | 845,750 | |||||||||
Lamb Weston Holdings, Inc. (Food Products) | (a) | 4.875% | 11/01/2026 | 500,000 | 518,125 | |||||||||
Pinnacle Foods Finance LLC / Pinnacle Foods Finance Corp. (Food Products) | 5.875% | 01/15/2024 | 250,000 | 266,875 | ||||||||||
Post Holdings, Inc. (Food Products) | (a) | 6.000% | 12/15/2022 | 100,000 | 106,000 | |||||||||
Post Holdings, Inc. (Food Products) | (a) | 5.000% | 08/15/2026 | 2,000,000 | 1,995,000 | |||||||||
Spectrum Brands, Inc. (Household Products) | 6.125% | 12/15/2024 | 175,000 | 187,469 | ||||||||||
Spectrum Brands, Inc. (Household Products) | 5.750% | 07/15/2025 | 400,000 | 429,040 | ||||||||||
First Quality Finance Co., Inc. (Personal Products) | (a) | 4.625% | 05/15/2021 | 1,450,000 | 1,462,687 | |||||||||
First Quality Finance Co., Inc. (Personal Products) | (a) | 5.000% | 07/01/2025 | 100,000 | 102,000 | |||||||||
|
| |||||||||||||
| 9,645,132 | ||||||||||||||
|
| |||||||||||||
| ENERGY – 11.7% | ||||||||||||||
Precision Drilling Corp. (Energy Equip. & Svs.) | (a) | 7.750% | 12/15/2023 | 425,000 | 418,625 | |||||||||
Weatherford International, LLC (Energy Equip. & Svs.) | 6.800% | 06/15/2037 | 500,000 | 427,500 | ||||||||||
Weatherford International Ltd. (Energy Equip. & Svs.) | 7.000% | 03/15/2038 | 425,000 | 363,375 | ||||||||||
Weatherford International Ltd. (Energy Equip. & Svs.) | 8.250% | 06/15/2023 | 500,000 | 500,000 | ||||||||||
Weatherford International Ltd. (Energy Equip. & Svs.) | (a) | 9.875% | 02/15/2024 | 75,000 | 78,375 | |||||||||
Alliance Resource Operating Partners LP / Alliance Resource Finance Corp. (Oil, Gas & Consumable Fuels) | (a) | 7.500% | 05/01/2025 | 625,000 | 657,031 | |||||||||
Antero Midstream Partners LP / Antero Midstream Finance Corp. (Oil, Gas & Consumable Fuels) | (a) | 5.375% | 09/15/2024 | 900,000 | 920,250 | |||||||||
Antero Resources Corp. (Oil, Gas & Consumable Fuels) | 5.125% | 12/01/2022 | 200,000 | 200,436 | ||||||||||
Antero Resources Corp. (Oil, Gas & Consumable Fuels) | (a) | 5.000% | 03/01/2025 | 1,050,000 | 1,018,500 | |||||||||
Ascent Resources Utica Holdings LLC / ARU Finance Corp. (Oil, Gas & Consumable Fuels) | (a) | 10.000% | 04/01/2022 | 575,000 | 575,000 | |||||||||
Callon Petroleum Co. (Oil, Gas & Consumable Fuels) | 6.125% | 10/01/2024 | 339,000 | 344,932 | ||||||||||
Callon Petroleum Co. (Oil, Gas & Consumable Fuels) | (a) | 6.125% | 10/01/2024 | 275,000 | 279,812 | |||||||||
Carrizo Oil & Gas, Inc. (Oil, Gas & Consumable Fuels) | 7.500% | 09/15/2020 | 875,000 | 890,312 | ||||||||||
Carrizo Oil & Gas, Inc. (Oil, Gas & Consumable Fuels) | 6.250% | 04/15/2023 | 100,000 | 96,250 | ||||||||||
Carrizo Oil & Gas, Inc. (Oil, Gas & Consumable Fuels) | 8.250% | 07/15/2025 | 300,000 | 305,250 | ||||||||||
Cheniere Corpus Christi Holdings, LLC (Oil, Gas & Consumable Fuels) | 5.875% | 03/31/2025 | 475,000 | 506,469 | ||||||||||
Cheniere Corpus Christi Holdings, LLC (Oil, Gas & Consumable Fuels) | 7.000% | 06/30/2024 | 550,000 | 613,250 | ||||||||||
Cheniere Corpus Christi Holdings, LLC (Oil, Gas & Consumable Fuels) | (a) | 5.125% | 06/30/2027 | 225,000 | 230,625 | |||||||||
Chesapeake Energy Corp. (Oil, Gas & Consumable Fuels) | 5.375% | 06/15/2021 | 525,000 | 490,875 | ||||||||||
Chesapeake Energy Corp. (Oil, Gas & Consumable Fuels) | 5.750% | 03/15/2023 | 50,000 | 45,375 | ||||||||||
Chesapeake Energy Corp. (Oil, Gas & Consumable Fuels) | (a) | 8.000% | 12/15/2022 | 456,000 | 482,220 | |||||||||
Chesapeake Energy Corp. (Oil, Gas & Consumable Fuels) | (a) | 8.000% | 01/15/2025 | 175,000 | 173,250 | |||||||||
Chesapeake Energy Corp. (Oil, Gas & Consumable Fuels) | (a) | 8.000% | 06/15/2027 | 750,000 | 736,875 | |||||||||
Continental Resources, Inc. (Oil, Gas & Consumable Fuels) | 4.500% | 04/15/2023 | 775,000 | 740,125 | ||||||||||
CrownRock LP / CrownRock Finance, Inc. (Oil, Gas & Consumable Fuels) | (a) | 7.125% | 04/15/2021 | 150,000 | 154,125 | |||||||||
CrownRock LP / CrownRock Finance, Inc. (Oil, Gas & Consumable Fuels) | (a) | 7.750% | 02/15/2023 | 175,000 | 184,625 | |||||||||
CVR Refining LLC / Coffeyville Finance, Inc. (Oil, Gas & Consumable Fuels) | 6.500% | 11/01/2022 | 1,175,000 | 1,183,812 | ||||||||||
Diamondback Energy, Inc. (Oil, Gas & Consumable Fuels) | (a) | 4.750% | 11/01/2024 | 275,000 | 273,625 | |||||||||
Energy Transfer Equity LP (Oil, Gas & Consumable Fuels) | 5.875% | 01/15/2024 | 1,275,000 | 1,351,500 | ||||||||||
Enviva Partners LP / Enviva Partners Finance Corp. (Oil, Gas & Consumable Fuels) | (a) | 8.500% | 11/01/2021 | 1,000,000 | 1,067,500 | |||||||||
EP Energy LLC / Everest Acquisition Finance, Inc. (Oil, Gas & Consumable Fuels) | 6.375% | 06/15/2023 | 150,000 | 88,125 | ||||||||||
EP Energy LLC / Everest Acquisition Finance, Inc. (Oil, Gas & Consumable Fuels) | (a) | 8.000% | 11/29/2024 | 500,000 | 498,750 | |||||||||
Gulfport Energy Corp. (Oil, Gas & Consumable Fuels) | 6.625% | 05/01/2023 | 275,000 | 275,687 | ||||||||||
Gulfport Energy Corp. (Oil, Gas & Consumable Fuels) | (a) | 6.000% | 10/15/2024 | 450,000 | 437,625 | |||||||||
Gulfport Energy Corp. (Oil, Gas & Consumable Fuels) | (a) | 6.375% | 05/15/2025 | 275,000 | 270,875 | |||||||||
Hiland Partners LP / Hiland Partners Finance Corp. (Oil, Gas & Consumable Fuels) | (a) | 5.500% | 05/15/2022 | 250,000 | 261,115 | |||||||||
Holly Energy Partners LP / Holly Energy Finance Corp. (Oil, Gas & Consumable Fuels) | (a) | 6.000% | 08/01/2024 | 875,000 | 910,000 | |||||||||
Laredo Petroleum, Inc. (Oil, Gas & Consumable Fuels) | 7.375% | 05/01/2022 | 150,000 | 151,500 | ||||||||||
Laredo Petroleum, Inc. (Oil, Gas & Consumable Fuels) | 5.625% | 01/15/2022 | 275,000 | 266,750 | ||||||||||
Laredo Petroleum, Inc. (Oil, Gas & Consumable Fuels) | 6.250% | 03/15/2023 | 475,000 | 471,437 | ||||||||||
MPLX LP (Oil, Gas & Consumable Fuels) | 5.500% | 02/15/2023 | 600,000 | 616,062 | ||||||||||
Northern Oil and Gas, Inc. (Acquired 05/08/2013 through 10/05/2016, Cost $928,727) (Oil, Gas & Consumable Fuels) | (c) | 8.000% | 06/01/2020 | 975,000 | 682,500 | |||||||||
| 62 | (continued) |
| Ohio National Fund, Inc. | High Income Bond Portfolio (Continued) |
Schedule of Investments | June 30, 2017 (Unaudited) |
| Corporate Bonds (Continued) | Rate | Maturity | Face Amount | Value | ||||||||||
| ENERGY (continued) | ||||||||||||||
NuStar Logistics LP (Oil, Gas & Consumable Fuels) | 5.625% | 04/28/2027 | $ | 475,000 | $ | 498,750 | ||||||||
Oasis Petroleum, Inc. (Oil, Gas & Consumable Fuels) | 6.875% | 03/15/2022 | 900,000 | 873,000 | ||||||||||
Parsley Energy LLC / Parsley Finance Corp. (Oil, Gas & Consumable Fuels) | (a) | 6.250% | 06/01/2024 | 100,000 | 105,000 | |||||||||
Parsley Energy LLC / Parsley Finance Corp. (Oil, Gas & Consumable Fuels) | (a) | 5.375% | 01/15/2025 | 175,000 | 176,312 | |||||||||
Parsley Energy LLC / Parsley Finance Corp. (Oil, Gas & Consumable Fuels) | (a) | 5.250% | 08/15/2025 | 175,000 | 174,562 | |||||||||
PDC Energy, Inc. (Oil, Gas & Consumable Fuels) | 7.750% | 10/15/2022 | 100,000 | 103,750 | ||||||||||
PDC Energy, Inc. (Oil, Gas & Consumable Fuels) | (a) | 6.125% | 09/15/2024 | 350,000 | 355,250 | |||||||||
Peabody Securities Finance Corp. (Oil, Gas & Consumable Fuels) | (a) | 6.000% | 03/31/2022 | 125,000 | 124,062 | |||||||||
Peabody Securities Finance Corp. (Oil, Gas & Consumable Fuels) | (a) | 6.375% | 03/31/2025 | 475,000 | 467,875 | |||||||||
QEP Resources, Inc. (Oil, Gas & Consumable Fuels) | 6.875% | 03/01/2021 | 450,000 | 466,875 | ||||||||||
QEP Resources, Inc. (Oil, Gas & Consumable Fuels) | 5.250% | 05/01/2023 | 125,000 | 118,125 | ||||||||||
Range Resources Corp. (Oil, Gas & Consumable Fuels) | 4.875% | 05/15/2025 | 600,000 | 570,000 | ||||||||||
Rice Energy, Inc. (Oil, Gas & Consumable Fuels) | 6.250% | 05/01/2022 | 500,000 | 522,500 | ||||||||||
RSP Permian, Inc. (Oil, Gas & Consumable Fuels) | 6.625% | 10/01/2022 | 325,000 | 337,187 | ||||||||||
RSP Permian, Inc. (Oil, Gas & Consumable Fuels) | (a) | 5.250% | 01/15/2025 | 350,000 | 350,437 | |||||||||
Sabine Pass Liquefaction, LLC (Oil, Gas & Consumable Fuels) | 5.625% | 04/15/2023 | 700,000 | 778,028 | ||||||||||
Sabine Pass Liquefaction, LLC (Oil, Gas & Consumable Fuels) | 5.625% | 03/01/2025 | 225,000 | 248,443 | ||||||||||
SM Energy Co. (Oil, Gas & Consumable Fuels) | 5.000% | 01/15/2024 | 375,000 | 331,875 | ||||||||||
SM Energy Co. (Oil, Gas & Consumable Fuels) | 6.750% | 09/15/2026 | 325,000 | 310,271 | ||||||||||
Southwestern Energy Co. (Oil, Gas & Consumable Fuels) | 4.100% | 03/15/2022 | 1,225,000 | 1,141,547 | ||||||||||
Summit Midstream Holdings LLC / Summit Midstream Finance Corp. (Oil, Gas & Consumable Fuels) | 5.500% | 08/15/2022 | 1,400,000 | 1,398,250 | ||||||||||
Summit Midstream Holdings LLC / Summit Midstream Finance Corp. (Oil, Gas & Consumable Fuels) | 5.750% | 04/15/2025 | 350,000 | 351,750 | ||||||||||
Targa Resources Partners LP / Targa Resources Partners Finance Corp. (Oil, Gas & Consumable Fuels) | 5.250% | 05/01/2023 | 150,000 | 153,750 | ||||||||||
Targa Resources Partners LP / Targa Resources Partners Finance Corp. (Oil, Gas & Consumable Fuels) | (a) | 5.375% | 02/01/2027 | 1,000,000 | 1,035,000 | |||||||||
Tesoro Corp. (Oil, Gas & Consumable Fuels) | 5.125% | 04/01/2024 | 425,000 | 449,437 | ||||||||||
Tesoro Corp. (Oil, Gas & Consumable Fuels) | (a) | 5.125% | 12/15/2026 | 250,000 | 271,900 | |||||||||
Tesoro Logistics LP / Tesoro Logistics Finance Corp. (Oil, Gas & Consumable Fuels) | 5.875% | 10/01/2020 | 725,000 | 740,406 | ||||||||||
Tesoro Logistics LP / Tesoro Logistics Finance Corp. (Oil, Gas & Consumable Fuels) | 6.125% | 10/15/2021 | 325,000 | 338,000 | ||||||||||
Tesoro Logistics LP / Tesoro Logistics Finance Corp. (Oil, Gas & Consumable Fuels) | 5.500% | 10/15/2019 | 50,000 | 52,750 | ||||||||||
Tesoro Logistics LP / Tesoro Logistics Finance Corp. (Oil, Gas & Consumable Fuels) | 6.250% | 10/15/2022 | 75,000 | 79,687 | ||||||||||
Tesoro Logistics LP / Tesoro Logistics Finance Corp. (Oil, Gas & Consumable Fuels) | 6.375% | 05/01/2024 | 150,000 | 162,375 | ||||||||||
Tesoro Logistics LP / Tesoro Logistics Finance Corp. (Oil, Gas & Consumable Fuels) | 5.250% | 01/15/2025 | 650,000 | 682,500 | ||||||||||
Ultra Resources, Inc. (Oil, Gas & Consumable Fuels) | (a) | 6.875% | 04/15/2022 | 150,000 | 148,875 | |||||||||
Ultra Resources, Inc. (Oil, Gas & Consumable Fuels) | (a) | 7.125% | 04/15/2025 | 300,000 | 295,875 | |||||||||
Western Refining Logistics LP / WNRL Finance Corp. (Oil, Gas & Consumable Fuels) | 7.500% | 02/15/2023 | 900,000 | 969,750 | ||||||||||
Whiting Petroleum Corp. (Oil, Gas & Consumable Fuels) | 6.250% | 04/01/2023 | 1,075,000 | 986,312 | ||||||||||
Williams Cos., Inc. / The (Oil, Gas & Consumable Fuels) | 4.550% | 06/24/2024 | 250,000 | 256,875 | ||||||||||
WPX Energy, Inc. (Oil, Gas & Consumable Fuels) | 6.000% | 01/15/2022 | 450,000 | 445,500 | ||||||||||
WPX Energy, Inc. (Oil, Gas & Consumable Fuels) | 5.250% | 09/15/2024 | 50,000 | 47,500 | ||||||||||
WPX Energy, Inc. (Oil, Gas & Consumable Fuels) | 8.250% | 08/01/2023 | 200,000 | 217,000 | ||||||||||
|
| |||||||||||||
| 37,377,666 | ||||||||||||||
|
| |||||||||||||
| FINANCIALS – 4.2% | ||||||||||||||
MSCI, Inc. (Capital Markets) | (a) | 5.250% | 11/15/2024 | 150,000 | 159,000 | |||||||||
MSCI, Inc. (Capital Markets) | (a) | 5.750% | 08/15/2025 | 325,000 | 352,014 | |||||||||
Ally Financial, Inc. (Consumer Finance) | 4.125% | 03/30/2020 | 875,000 | 899,062 | ||||||||||
Ally Financial, Inc. (Consumer Finance) | 4.625% | 03/30/2025 | 400,000 | 409,672 | ||||||||||
Ally Financial, Inc. (Consumer Finance) | 4.625% | 05/19/2022 | 250,000 | 260,000 | ||||||||||
Ally Financial, Inc. (Consumer Finance) | 5.750% | 11/20/2025 | 1,850,000 | 1,947,125 | ||||||||||
Navient Corp. (Consumer Finance) | 5.875% | 10/25/2024 | 975,000 | 992,355 | ||||||||||
Navient Corp. (Consumer Finance) | 7.250% | 09/25/2023 | 275,000 | 294,937 | ||||||||||
Navient Corp. (Consumer Finance) | 5.500% | 01/25/2023 | 325,000 | 330,281 | ||||||||||
Navient Corp. (Consumer Finance) | 6.125% | 03/25/2024 | 775,000 | 798,250 | ||||||||||
Alpha 3 BV / Alpha US Bidco, Inc. (Diversified Financial Svs.) | (a) | 6.250% | 02/01/2025 | 725,000 | 745,844 | |||||||||
BCD Acquisition, Inc. (Diversified Financial Svs.) | (a) | 9.625% | 09/15/2023 | 625,000 | 675,000 | |||||||||
HUB International Ltd. (Insurance) | (a) | 7.875% | 10/01/2021 | 1,575,000 | 1,641,937 | |||||||||
NFP Corp. (Insurance) | (a) | 6.875% | 07/15/2025 | 825,000 | 833,250 | |||||||||
USIS Merger Sub, Inc. (Insurance) | (a) | 6.875% | 05/01/2025 | 975,000 | 992,063 | |||||||||
Quicken Loans, Inc. (Thrifts & Mortgage Finance) | (a) | 5.750% | 05/01/2025 | 1,825,000 | 1,884,313 | |||||||||
|
| |||||||||||||
| 13,215,103 | ||||||||||||||
| �� |
|
| ||||||||||||
| HEALTH CARE – 14.4% | ||||||||||||||
Ortho-Clinical Diagnostics, Inc. / Ortho-Clinical Diagnostics SA (Health Care Equip. & Supplies) | (a) | 6.625% | 05/15/2022 | 2,750,000 | 2,626,250 | |||||||||
Sterigenics-Nordion Holdings LLC (Health Care Equip. & Supplies) | (a) | 6.500% | 05/15/2023 | 900,000 | 927,000 | |||||||||
Sterigenics-Nordion Topco LLC (Health Care Equip. & Supplies) | (a)(b) | 8.125%, 8.875% PIK | 11/01/2021 | 1,400,000 | 1,435,000 | |||||||||
| 63 | (continued) |
| Ohio National Fund, Inc. | High Income Bond Portfolio (Continued) |
Schedule of Investments | June 30, 2017 (Unaudited) |
| Corporate Bonds (Continued) | Rate | Maturity | Face Amount | Value | ||||||||||
| HEALTH CARE (continued) | ||||||||||||||
Teleflex, Inc. (Health Care Equip. & Supplies) | 5.250% | 06/15/2024 | $ | 275,000 | $ | 284,625 | ||||||||
Teleflex, Inc. (Health Care Equip. & Supplies) | 4.875% | 06/01/2026 | 100,000 | 102,250 | ||||||||||
Acadia Healthcare Co., Inc. (Health Care Providers & Svs.) | 5.625% | 02/15/2023 | 1,350,000 | 1,396,406 | ||||||||||
Acadia Healthcare Co., Inc. (Health Care Providers & Svs.) | 6.500% | 03/01/2024 | 625,000 | 667,188 | ||||||||||
Air Medical Merger Sub Corp. (Health Care Providers & Svs.) | (a) | 6.375% | 05/15/2023 | 1,200,000 | 1,137,000 | |||||||||
CHS / Community Health Systems, Inc. (Health Care Providers & Svs.) | 5.125% | 08/01/2021 | 300,000 | 303,750 | ||||||||||
CHS / Community Health Systems, Inc. (Health Care Providers & Svs.) | 6.875% | 02/01/2022 | 1,350,000 | 1,179,563 | ||||||||||
CHS / Community Health Systems, Inc. (Health Care Providers & Svs.) | 6.250% | 03/31/2023 | 650,000 | 671,028 | ||||||||||
DaVita, Inc. (Health Care Providers & Svs.) | 5.125% | 07/15/2024 | 175,000 | 177,625 | ||||||||||
DaVita, Inc. (Health Care Providers & Svs.) | 5.000% | 05/01/2025 | 475,000 | 476,188 | ||||||||||
Eagle Holding Co. II, LLC (Health Care Providers & Svs.) | (a)(b) | 7.625%, 8.375% PIK | 05/15/2022 | 325,000 | 334,344 | |||||||||
Envision Healthcare Corp. (Health Care Providers & Svs.) | 5.625% | 07/15/2022 | 375,000 | 388,594 | ||||||||||
Envision Healthcare Corp. (Health Care Providers & Svs.) | (a) | 5.125% | 07/01/2022 | 925,000 | 949,281 | |||||||||
Envision Healthcare Corp. (Health Care Providers & Svs.) | (a) | 6.250% | 12/01/2024 | 900,000 | 960,750 | |||||||||
HCA, Inc. (Health Care Providers & Svs.) | 5.000% | 03/15/2024 | 1,600,000 | 1,694,000 | ||||||||||
HCA, Inc. (Health Care Providers & Svs.) | 5.250% | 04/15/2025 | 1,775,000 | 1,908,125 | ||||||||||
HCA, Inc. (Health Care Providers & Svs.) | 5.375% | 02/01/2025 | 1,200,000 | 1,265,760 | ||||||||||
HCA, Inc. (Health Care Providers & Svs.) | 5.875% | 02/15/2026 | 1,425,000 | 1,539,000 | ||||||||||
HCA, Inc. (Health Care Providers & Svs.) | 5.875% | 05/01/2023 | 275,000 | 299,406 | ||||||||||
IASIS Healthcare LLC / IASIS Capital Corp. (Health Care Providers & Svs.) | 8.375% | 05/15/2019 | 775,000 | 778,875 | ||||||||||
Jaguar Holding Co. II / Pharmaceutical Product Development LLC (Health Care Providers & Svs.) | (a) | 6.375% | 08/01/2023 | 2,425,000 | 2,555,344 | |||||||||
LifePoint Health, Inc. (Health Care Providers & Svs.) | 5.500% | 12/01/2021 | 250,000 | 258,750 | ||||||||||
LifePoint Health, Inc. (Health Care Providers & Svs.) | 5.875% | 12/01/2023 | 75,000 | 79,125 | ||||||||||
LifePoint Health, Inc. (Health Care Providers & Svs.) | 5.375% | 05/01/2024 | 850,000 | 879,750 | ||||||||||
MEDNAX, Inc. (Health Care Providers & Svs.) | (a) | 5.250% | 12/01/2023 | 125,000 | 128,750 | |||||||||
MPH Acquisition Holdings LLC (Health Care Providers & Svs.) | (a) | 7.125% | 06/01/2024 | 2,075,000 | 2,212,469 | |||||||||
Surgery Center Holdings, Inc. (Health Care Providers & Svs.) | (a) | 6.750% | 07/01/2025 | 775,000 | 784,688 | |||||||||
Team Health Holdings, Inc. (Health Care Providers & Svs.) | (a) | 6.375% | 02/01/2025 | 1,700,000 | 1,649,000 | |||||||||
Tenet Healthcare Corp. (Health Care Providers & Svs.) | 4.500% | 04/01/2021 | 350,000 | 355,688 | ||||||||||
Tenet Healthcare Corp. (Health Care Providers & Svs.) | 4.375% | 10/01/2021 | 250,000 | 253,750 | ||||||||||
Tenet Healthcare Corp. (Health Care Providers & Svs.) | 6.750% | 06/15/2023 | 1,700,000 | 1,700,000 | ||||||||||
Tenet Healthcare Corp. (Health Care Providers & Svs.) | (a) | 7.500% | 01/01/2022 | 225,000 | 244,080 | |||||||||
Tenet Healthcare Corp. (Health Care Providers & Svs.) | (a) | 4.625% | 07/15/2024 | 155,000 | 155,194 | |||||||||
THC Escrow Corp. III (Health Care Providers & Svs.) | (a) | 4.625% | 07/15/2024 | 195,000 | 195,527 | |||||||||
THC Escrow Corp. III (Health Care Providers & Svs.) | (a) | 5.125% | 05/01/2025 | 750,000 | 752,813 | |||||||||
THC Escrow Corp. III (Health Care Providers & Svs.) | (a) | 7.000% | 08/01/2025 | 225,000 | 224,156 | |||||||||
Vizient, Inc. (Health Care Providers & Svs.) | (a) | 10.375% | 03/01/2024 | 1,075,000 | 1,236,250 | |||||||||
Quintiles IMS Health, Inc. (Health Care Technology) | (a) | 5.000% | 10/15/2026 | 325,000 | 335,156 | |||||||||
Endo Finance LLC / Endo Ltd. / Endo Finco, Inc. (Pharmaceuticals) | (a) | 6.000% | 02/01/2025 | 1,125,000 | 916,875 | |||||||||
Endo Finance LLC / Endo Ltd. / Endo Finco, Inc. (Pharmaceuticals) | (a) | 6.000% | 07/15/2023 | 475,000 | 399,238 | |||||||||
Mallinckrodt International Finance SA (Pharmaceuticals) | 4.750% | 04/15/2023 | 475,000 | 404,938 | ||||||||||
Mallinckrodt International Finance SA / Mallinckrodt CB LLC (Pharmaceuticals) | (a) | 5.500% | 04/15/2025 | 700,000 | 612,500 | |||||||||
Mallinckrodt International Finance SA / Mallinckrodt CB LLC (Pharmaceuticals) | (a) | 5.625% | 10/15/2023 | 1,350,000 | 1,231,875 | |||||||||
Prestige Brands, Inc. (Pharmaceuticals) | (a) | 5.375% | 12/15/2021 | 1,100,000 | 1,134,375 | |||||||||
Prestige Brands, Inc. (Pharmaceuticals) | (a) | 6.375% | 03/01/2024 | 1,000,000 | 1,068,750 | |||||||||
Valeant Pharmaceuticals International, Inc. (Pharmaceuticals) | (a) | 7.250% | 07/15/2022 | 675,000 | 634,500 | |||||||||
VRX Escrow Corp. (Pharmaceuticals) | (a) | 5.875% | 05/15/2023 | 825,000 | 707,438 | |||||||||
VRX Escrow Corp. (Pharmaceuticals) | (a) | 6.125% | 04/15/2025 | 2,075,000 | 1,755,969 | |||||||||
Valeant Pharmaceuticals International, Inc. (Pharmaceuticals) | (a) | 5.625% | 12/01/2021 | 100,000 | 90,250 | |||||||||
Valeant Pharmaceuticals International, Inc. (Pharmaceuticals) | (a) | 5.500% | 03/01/2023 | 350,000 | 297,059 | |||||||||
Valeant Pharmaceuticals International, Inc. (Pharmaceuticals) | (a) | 6.500% | 03/15/2022 | 125,000 | 131,094 | |||||||||
Valeant Pharmaceuticals International, Inc. (Pharmaceuticals) | (a) | 7.000% | 03/15/2024 | 350,000 | 367,938 | |||||||||
VPII Escrow Corp. (Pharmaceuticals) | (a) | 7.500% | 07/15/2021 | 750,000 | 726,563 | |||||||||
|
| |||||||||||||
| 45,981,860 | ||||||||||||||
|
| |||||||||||||
| INDUSTRIALS – 7.4% | ||||||||||||||
Silver II Borrower / Silver II U.S. Holdings LLC (Aerospace & Defense) | (a) | 7.750% | 12/15/2020 | 325,000 | 325,000 | |||||||||
Engility Corp. (Aerospace & Defense) | 8.875% | 09/01/2024 | 600,000 | 651,750 | ||||||||||
TransDigm, Inc. (Aerospace & Defense) | 5.500% | 10/15/2020 | 275,000 | 279,125 | ||||||||||
TransDigm, Inc. (Aerospace & Defense) | 6.000% | 07/15/2022 | 550,000 | 566,500 | ||||||||||
TransDigm, Inc. (Aerospace & Defense) | 6.500% | 07/15/2024 | 775,000 | 800,188 | ||||||||||
TransDigm, Inc. (Aerospace & Defense) | 6.500% | 05/15/2025 | 250,000 | 254,375 | ||||||||||
TransDigm, Inc. (Aerospace & Defense) | 6.375% | 06/15/2026 | 850,000 | 862,750 | ||||||||||
Allegion PLC (Building Products) | 5.875% | 09/15/2023 | 100,000 | 107,500 | ||||||||||
Allegion U.S. Holding Co., Inc. (Building Products) | 5.750% | 10/01/2021 | 325,000 | 337,188 | ||||||||||
Building Materials Corp. of America (Building Products) | (a) | 6.000% | 10/15/2025 | 475,000 | 508,250 | |||||||||
Hillman Group, Inc. / The (Building Products) | (a) | 6.375% | 07/15/2022 | 1,500,000 | 1,440,000 | |||||||||
Masonite International Corp. (Building Products) | (a) | 5.625% | 03/15/2023 | 275,000 | 287,375 | |||||||||
NCI Building Systems, Inc. (Building Products) | (a) | 8.250% | 01/15/2023 | 375,000 | 405,469 | |||||||||
| 64 | (continued) |
| Ohio National Fund, Inc. | High Income Bond Portfolio (Continued) |
Schedule of Investments | June 30, 2017 (Unaudited) |
| Corporate Bonds (Continued) | Rate | Maturity | Face Amount | Value | ||||||||||
| INDUSTRIALS (continued) | ||||||||||||||
Ply Gem Industries, Inc. (Building Products) | 6.500% | 02/01/2022 | $ | 900,000 | $ | 942,678 | ||||||||
GW Honos Security Corp. (Commercial Svs. & Supplies) | (a) | 8.750% | 05/15/2025 | 325,000 | 340,031 | |||||||||
KAR Auction Services, Inc. (Commercial Svs. & Supplies) | (a) | 5.125% | 06/01/2025 | 575,000 | 585,781 | |||||||||
Multi-Color Corp. (Commercial Svs. & Supplies) | (a) | 6.125% | 12/01/2022 | 950,000 | 997,500 | |||||||||
Ritchie Bros Auctioneers, Inc. (Commercial Svs. & Supplies) | (a) | 5.375% | 01/15/2025 | 225,000 | 234,563 | |||||||||
Southern Graphics, Inc. (Commercial Svs. & Supplies) | (a) | 8.375% | 10/15/2020 | 1,025,000 | 1,042,938 | |||||||||
Tervita Escrow Corp. (Commercial Svs. & Supplies) | (a) | 7.625% | 12/01/2021 | 600,000 | 604,500 | |||||||||
Sensata Technologies BV (Electrical Equip.) | (a) | 5.625% | 11/01/2024 | 225,000 | 241,313 | |||||||||
Sensata Technologies BV (Electrical Equip.) | (a) | 5.000% | 10/01/2025 | 100,000 | 104,580 | |||||||||
Sensata Technologies UK Financing Co. PLC (Electrical Equip.) | (a) | 6.250% | 02/15/2026 | 225,000 | 245,250 | |||||||||
Allison Transmission, Inc. (Machinery) | (a) | 5.000% | 10/01/2024 | 250,000 | 256,250 | |||||||||
Schaeffler Finance BV (Machinery) | (a) | 4.750% | 05/15/2023 | 275,000 | 283,250 | |||||||||
Nielsen Co. Luxembourg SARL / The (Professional Svs.) | (a) | 5.500% | 10/01/2021 | 625,000 | 646,875 | |||||||||
Nielsen Co. Luxembourg SARL / The (Professional Svs.) | (a) | 5.000% | 02/01/2025 | 300,000 | 307,500 | |||||||||
Tempo Acquisition, LLC / Tempo Acquisition Finance Corp. (Professional Svs.) | (a) | 6.750% | 06/01/2025 | 625,000 | 639,063 | |||||||||
Avis Budget Car Rental, LLC / Avis Budget Finance, Inc. (Road & Rail) | 5.500% | 04/01/2023 | 125,000 | 124,219 | ||||||||||
Avis Budget Car Rental, LLC / Avis Budget Finance, Inc. (Road & Rail) | (a) | 5.250% | 03/15/2025 | 775,000 | 729,469 | |||||||||
Avis Budget Car Rental, LLC / Avis Budget Finance, Inc. (Road & Rail) | (a) | 6.375% | 04/01/2024 | 700,000 | 698,250 | |||||||||
Hertz Corp. / The (Road & Rail) | 6.250% | 10/15/2022 | 600,000 | 523,500 | ||||||||||
Hertz Corp. / The (Road & Rail) | (a) | 5.500% | 10/15/2024 | 1,175,000 | 963,500 | |||||||||
Hertz Corp. / The (Road & Rail) | (a) | 7.625% | 06/01/2022 | 450,000 | 448,920 | |||||||||
American Builders & Contractors Supply Co., Inc. (Trading Companies & Distributors) | (a) | 5.625% | 04/15/2021 | 340,000 | 349,775 | |||||||||
American Builders & Contractors Supply Co., Inc. (Trading Companies & Distributors) | (a) | 5.750% | 12/15/2023 | 50,000 | 52,875 | |||||||||
HD Supply, Inc. (Trading Companies & Distributors) | (a) | 5.250% | 12/15/2021 | 200,000 | 209,875 | |||||||||
HD Supply, Inc. (Trading Companies & Distributors) | (a) | 5.750% | 04/15/2024 | 525,000 | 557,813 | |||||||||
Park Aerospace Holdings Ltd. (Trading Companies & Distributors) | (a) | 5.250% | 08/15/2022 | 175,000 | 182,931 | |||||||||
Park Aerospace Holdings Ltd. (Trading Companies & Distributors) | (a) | 5.500% | 02/15/2024 | 1,625,000 | 1,697,313 | |||||||||
United Rentals North America, Inc. (Trading Companies & Distributors) | 4.625% | 07/15/2023 | 225,000 | 233,606 | ||||||||||
United Rentals North America, Inc. (Trading Companies & Distributors) | 5.500% | 07/15/2025 | 300,000 | 314,250 | ||||||||||
United Rentals North America, Inc. (Trading Companies & Distributors) | 5.875% | 09/15/2026 | 325,000 | 346,125 | ||||||||||
United Rentals North America, Inc. (Trading Companies & Distributors) | 5.500% | 05/15/2027 | 350,000 | 360,500 | ||||||||||
WESCO Distribution, Inc. (Trading Companies & Distributors) | 5.375% | 12/15/2021 | 425,000 | 441,469 | ||||||||||
WESCO Distribution, Inc. (Trading Companies & Distributors) | 5.375% | 06/15/2024 | 1,050,000 | 1,095,938 | ||||||||||
|
| |||||||||||||
| 23,627,870 | ||||||||||||||
|
| |||||||||||||
| INFORMATION TECHNOLOGY – 10.8% | ||||||||||||||
CommScope Technologies Finance LLC (Communications Equip.) | (a) | 6.000% | 06/15/2025 | 325,000 | 346,938 | |||||||||
CommScope Technologies LLC (Communications Equip.) | (a) | 5.000% | 03/15/2027 | 150,000 | 149,625 | |||||||||
CommScope, Inc. (Communications Equip.) | (a) | 5.500% | 06/15/2024 | 525,000 | 546,494 | |||||||||
Riverbed Technology, Inc. (Communications Equip.) | (a) | 8.875% | 03/01/2023 | 1,025,000 | 1,041,656 | |||||||||
Diamond 1 Finance Corp. / Diamond 2 Finance Corp. (Computers & Peripherals) | (a) | 7.125% | 06/15/2024 | 1,375,000 | 1,511,514 | |||||||||
Anixter, Inc. (Electronic Equip., Instr. & Comp.) | 5.500% | 03/01/2023 | 325,000 | 347,344 | ||||||||||
Belden, Inc. (Electronic Equip., Instr. & Comp.) | (a) | 5.500% | 09/01/2022 | 725,000 | 746,750 | |||||||||
Belden, Inc. (Electronic Equip., Instr. & Comp.) | (a) | 5.250% | 07/15/2024 | 950,000 | 983,250 | |||||||||
CDW LLC / CDW Finance Corp. (Electronic Equip., Instr. & Comp.) | 5.500% | 12/01/2024 | 575,000 | 621,897 | ||||||||||
CDW LLC / CDW Finance Corp. (Electronic Equip., Instr. & Comp.) | 5.000% | 09/01/2023 | 550,000 | 572,688 | ||||||||||
CDW LLC / CDW Finance Corp. (Electronic Equip., Instr. & Comp.) | 5.000% | 09/01/2025 | 100,000 | 103,750 | ||||||||||
Cleaver-Brooks, Inc. (Electronic Equip., Instr. & Comp.) | (a) | 8.750% | 12/15/2019 | 225,000 | 232,031 | |||||||||
Zebra Technologies Corp. (Electronic Equip., Instr. & Comp.) | 7.250% | 10/15/2022 | 1,225,000 | 1,301,563 | ||||||||||
Match Group, Inc. (Internet Software & Svs.) | 6.750% | 12/15/2022 | 1,100,000 | 1,144,000 | ||||||||||
Match Group, Inc. (Internet Software & Svs.) | 6.375% | 06/01/2024 | 50,000 | 54,375 | ||||||||||
Inception Merger Sub, Inc. / Rackspace Hosting, Inc. (Internet Software & Svs.) | (a) | 8.625% | 11/15/2024 | 1,550,000 | 1,650,750 | |||||||||
VeriSign, Inc. (Internet Software & Svs.) | 4.625% | 05/01/2023 | 200,000 | 205,000 | ||||||||||
VeriSign, Inc. (Internet Software & Svs.) | 5.250% | 04/01/2025 | 125,000 | 133,438 | ||||||||||
VeriSign, Inc. (Internet Software & Svs.) | (a) | 4.750% | 07/15/2027 | 200,000 | 202,250 | |||||||||
First Data Corp. (IT Svs.) | (a) | 5.375% | 08/15/2023 | 550,000 | 574,750 | |||||||||
First Data Corp. (IT Svs.) | (a) | 7.000% | 12/01/2023 | 875,000 | 934,063 | |||||||||
First Data Corp. (IT Svs.) | (a) | 5.000% | 01/15/2024 | 800,000 | 822,744 | |||||||||
First Data Corp. (IT Svs.) | (a) | 5.750% | 01/15/2024 | 1,925,000 | 1,999,594 | |||||||||
Gartner, Inc. (IT Svs.) | (a) | 5.125% | 04/01/2025 | 350,000 | 367,644 | |||||||||
Sabre GLBL, Inc. (IT Svs.) | (a) | 5.375% | 04/15/2023 | 450,000 | 469,125 | |||||||||
Entegris, Inc. (Semiconductors & Equip.) | (a) | 6.000% | 04/01/2022 | 925,000 | 967,781 | |||||||||
Micron Technology, Inc. (Semiconductors & Equip.) | (a) | 5.250% | 08/01/2023 | 400,000 | 415,400 | |||||||||
Microsemi Corp. (Semiconductors & Equip.) | (a) | 9.125% | 04/15/2023 | 196,000 | 224,420 | |||||||||
Qorvo, Inc. (Semiconductors & Equip.) | 7.000% | 12/01/2025 | 425,000 | 482,375 | ||||||||||
Versum Materials, Inc. (Semiconductors & Equip.) | (a) | 5.500% | 09/30/2024 | 700,000 | 735,875 | |||||||||
BMC Software Finance, Inc. (Software) | (a) | 8.125% | 07/15/2021 | 1,525,000 | 1,578,863 | |||||||||
Ensemble S Merger Sub, Inc. (Software) | (a) | 9.000% | 09/30/2023 | 1,025,000 | 1,066,000 | |||||||||
Infor Software Parent LLC / Infor Software Parent, Inc. (Software) | (a)(b) | 7.125%, 7.875% PIK | 05/01/2021 | 1,750,000 | 1,802,500 | |||||||||
| 65 | (continued) |
| Ohio National Fund, Inc. | High Income Bond Portfolio (Continued) |
Schedule of Investments | June 30, 2017 (Unaudited) |
| Corporate Bonds (Continued) | Rate | Maturity | Face Amount | Value | ||||||||||
| INFORMATION TECHNOLOGY (continued) | ||||||||||||||
Infor U.S., Inc. (Software) | 6.500% | 05/15/2022 | $ | 1,675,000 | $ | 1,733,625 | ||||||||
Italics Merger Sub, Inc. (Software) | (a) | 7.125% | 07/15/2023 | 1,350,000 | 1,374,057 | |||||||||
JDA Escrow LLC / JDA Bond Finance, Inc. (Software) | (a) | 7.375% | 10/15/2024 | 1,050,000 | 1,092,000 | |||||||||
Nuance Communications, Inc. (Software) | (a) | 5.375% | 08/15/2020 | 364,000 | 369,915 | |||||||||
Nuance Communications, Inc. (Software) | (a) | 5.625% | 12/15/2026 | 975,000 | 1,040,813 | |||||||||
Nuance Communications, Inc. (Software) | 6.000% | 07/01/2024 | 500,000 | 532,500 | ||||||||||
PTC, Inc. (Software) | 6.000% | 05/15/2024 | 125,000 | 135,313 | ||||||||||
Solera LLC / Solera Finance, Inc. (Software) | (a) | 10.500% | 03/01/2024 | 1,375,000 | 1,579,531 | |||||||||
SS&C Technologies Holdings, Inc. (Software) | 5.875% | 07/15/2023 | 450,000 | 479,345 | ||||||||||
Symantec Corp. (Software) | (a) | 5.000% | 04/15/2025 | 475,000 | 497,116 | |||||||||
NCR Corp. (Tech. Hardware, Storage & Periph.) | 4.625% | 02/15/2021 | 475,000 | 484,500 | ||||||||||
NCR Corp. (Tech. Hardware, Storage & Periph.) | 5.000% | 07/15/2022 | 450,000 | 459,000 | ||||||||||
NCR Corp. (Tech. Hardware, Storage & Periph.) | 6.375% | 12/15/2023 | 225,000 | 241,313 | ||||||||||
|
| |||||||||||||
| 34,355,475 | ||||||||||||||
|
| |||||||||||||
| MATERIALS – 10.6% | ||||||||||||||
Eco Services Operations LLC / Eco Finance Corp. (Chemicals) | (a) | 8.500% | 11/01/2022 | 325,000 | 340,438 | |||||||||
Hexion, Inc. (Chemicals) | 6.625% | 04/15/2020 | 1,050,000 | 958,125 | ||||||||||
Huntsman International LLC (Chemicals) | 4.875% | 11/15/2020 | 450,000 | 472,500 | ||||||||||
Koppers, Inc. (Chemicals) | (a) | 6.000% | 02/15/2025 | 400,000 | 425,000 | |||||||||
Platform Specialty Products Corp. (Chemicals) | (a) | 6.500% | 02/01/2022 | 2,300,000 | 2,374,750 | |||||||||
Platform Specialty Products Corp. (Chemicals) | (a) | 10.375% | 05/01/2021 | 150,000 | 165,938 | |||||||||
PQ Corp. (Chemicals) | (a) | 6.750% | 11/15/2022 | 450,000 | 483,750 | |||||||||
The Scotts Miracle-Gro Co. (Chemicals) | 5.250% | 12/15/2026 | 50,000 | 52,375 | ||||||||||
Valvoline, Inc. (Chemicals) | (a) | 5.500% | 07/15/2024 | 100,000 | 105,750 | |||||||||
W.R. Grace & Co. (Chemicals) | (a) | 5.625% | 10/01/2024 | 200,000 | 213,750 | |||||||||
Standard Industries, Inc. (Construction Materials) | (a) | 5.000% | 02/15/2027 | 1,200,000 | 1,224,000 | |||||||||
ARD Finance SA (Containers & Packaging) | (b) | 7.125%, 7.875% PIK | 09/15/2023 | 1,250,000 | 1,334,250 | |||||||||
Ardagh Packaging Finance PLC / Ardagh Holdings U.S.A., Inc. (Containers & Packaging) | (a) | 6.000% | 06/30/2021 | 150,000 | 155,250 | |||||||||
Ardagh Packaging Finance PLC / Ardagh Holdings U.S.A., Inc. (Containers & Packaging) | (a) | 4.625% | 05/15/2023 | 200,000 | 204,918 | |||||||||
Ardagh Packaging Finance PLC / Ardagh Holdings U.S.A., Inc. (Containers & Packaging) | (a) | 7.250% | 05/15/2024 | 1,625,000 | 1,777,344 | |||||||||
Ardagh Packaging Finance PLC / Ardagh Holdings U.S.A., Inc. (Containers & Packaging) | (a) | 6.000% | 02/15/2025 | 400,000 | 420,000 | |||||||||
Ball Corp. (Containers & Packaging) | 5.250% | 07/01/2025 | 125,000 | 137,969 | ||||||||||
Berry Plastics Corp. (Containers & Packaging) | 5.500% | 05/15/2022 | 1,325,000 | 1,379,656 | ||||||||||
Berry Plastics Corp. (Containers & Packaging) | 5.125% | 07/15/2023 | 1,025,000 | 1,067,281 | ||||||||||
Berry Plastics Corp. (Containers & Packaging) | 6.000% | 10/15/2022 | 75,000 | 79,969 | ||||||||||
BWAY Holding Co. (Containers & Packaging) | (a) | 5.500% | 04/15/2024 | 900,000 | 919,125 | |||||||||
BWAY Holding Co. (Containers & Packaging) | (a) | 7.250% | 04/15/2025 | 1,825,000 | 1,852,375 | |||||||||
Crown Americas LLC / Crown Americas Capital Corp. V (Containers & Packaging) | (a) | 4.250% | 09/30/2026 | 100,000 | 99,750 | |||||||||
Flex Acquisition Co., Inc. (Containers & Packaging) | (a) | 6.875% | 01/15/2025 | 1,450,000 | 1,508,000 | |||||||||
Owens-Brockway Glass Container, Inc. (Containers & Packaging) | (a) | 5.875% | 08/15/2023 | 225,000 | 248,063 | |||||||||
Owens-Brockway Glass Container, Inc. (Containers & Packaging) | (a) | 6.375% | 08/15/2025 | 800,000 | 898,000 | |||||||||
Owens-Brockway Glass Container, Inc. (Containers & Packaging) | (a) | 5.375% | 01/15/2025 | 325,000 | 346,531 | |||||||||
Pactiv LLC (Containers & Packaging) | 7.950% | 12/15/2025 | 225,000 | 252,000 | ||||||||||
Reynolds Group Issuer, Inc. / Reynolds Group Issuer LLC (Containers & Packaging) | 5.750% | 10/15/2020 | 1,325,000 | 1,355,926 | ||||||||||
Reynolds Group Issuer, Inc. / Reynolds Group Issuer LLC (Containers & Packaging) | (a) | 7.000% | 07/15/2024 | 1,350,000 | 1,448,165 | |||||||||
Sealed Air Corp. (Containers & Packaging) | (a) | 4.875% | 12/01/2022 | 225,000 | 239,625 | |||||||||
Sealed Air Corp. (Containers & Packaging) | (a) | 5.125% | 12/01/2024 | 350,000 | 375,375 | |||||||||
Sealed Air Corp. (Containers & Packaging) | (a) | 5.500% | 09/15/2025 | 400,000 | 437,000 | |||||||||
Signode Industrial Group Lux SA / Signode Industrial Group U.S., Inc. (Containers & Packaging) | (a) | 6.375% | 05/01/2022 | 1,625,000 | 1,698,125 | |||||||||
ArcelorMittal (Metals & Mining) | 6.125% | 06/01/2025 | 350,000 | 392,000 | ||||||||||
Coeur Mining, Inc. (Metals & Mining) | (a) | 5.875% | 06/01/2024 | 550,000 | 533,500 | |||||||||
Compass Minerals International, Inc. (Metals & Mining) | (a) | 4.875% | 07/15/2024 | 1,000,000 | 985,000 | |||||||||
Freeport-McMoRan, Inc. (Metals & Mining) | 3.875% | 03/15/2023 | 1,175,000 | 1,092,750 | ||||||||||
Freeport-McMoRan, Inc. (Metals & Mining) | 5.400% | 11/14/2034 | 1,350,000 | 1,204,875 | ||||||||||
Hudbay Minerals, Inc. (Metals & Mining) | (a) | 7.250% | 01/15/2023 | 225,000 | 232,031 | |||||||||
Hudbay Minerals, Inc. (Metals & Mining) | (a) | 7.625% | 01/15/2025 | 400,000 | 419,000 | |||||||||
Steel Dynamics, Inc. (Metals & Mining) | 5.250% | 04/15/2023 | 125,000 | 129,844 | ||||||||||
Steel Dynamics, Inc. (Metals & Mining) | 5.125% | 10/01/2021 | 200,000 | 205,396 | ||||||||||
Steel Dynamics, Inc. (Metals & Mining) | 5.500% | 10/01/2024 | 350,000 | 371,875 | ||||||||||
Steel Dynamics, Inc. (Metals & Mining) | 5.000% | 12/15/2026 | 325,000 | 333,531 | ||||||||||
Teck Resources Ltd. (Metals & Mining) | 6.125% | 10/01/2035 | 775,000 | 807,938 | ||||||||||
Teck Resources Ltd. (Metals & Mining) | 6.000% | 08/15/2040 | 175,000 | 175,875 | ||||||||||
Teck Resources Ltd. (Metals & Mining) | (a) | 8.500% | 06/01/2024 | 450,000 | 519,750 | |||||||||
Clearwater Paper Corp. (Paper & Forest Products) | 4.500% | 02/01/2023 | 650,000 | 640,250 | ||||||||||
Clearwater Paper Corp. (Paper & Forest Products) | (a) | 5.375% | 02/01/2025 | 600,000 | 595,500 | |||||||||
|
| |||||||||||||
| 33,690,188 | ||||||||||||||
|
| |||||||||||||
| 66 | (continued) |
| Ohio National Fund, Inc. | High Income Bond Portfolio (Continued) |
Schedule of Investments | June 30, 2017 (Unaudited) |
| Corporate Bonds (Continued) | Rate | Maturity | Face Amount | Value | ||||||||||||
| REAL ESTATE – 0.3% | ||||||||||||||||
RHP Hotel Properties LP / RHP Finance Corp. (Equity Real Estate Investment Trusts) | 5.000% | 04/15/2023 | $ | 100,000 | $ | 102,250 | ||||||||||
Hub Holdings, LLC / Hub Holdings Finance, Inc. (Real Estate Mgmt. & Development) | (a)(b) | 8.125%, 8.875% PIK | 07/15/2019 | 975,000 | 977,438 | |||||||||||
|
| |||||||||||||||
| 1,079,688 | ||||||||||||||||
|
| |||||||||||||||
| TELECOMMUNICATION SERVICES – 4.3% | ||||||||||||||||
Level 3 Financing, Inc. (Diversified Telecom. Svs.) | 5.375% | 05/01/2025 | 350,000 | 368,375 | ||||||||||||
Neptune Finco Corp. (Diversified Telecom. Svs.) | (a) | 10.875% | 10/15/2025 | 350,000 | 421,313 | |||||||||||
Neptune Finco Corp. (Diversified Telecom. Svs.) | (a) | 6.625% | 10/15/2025 | 300,000 | 330,030 | |||||||||||
Neptune Finco Corp. (Diversified Telecom. Svs.) | (a) | 10.125% | 01/15/2023 | 300,000 | 348,000 | |||||||||||
Numericable-SFR SA (Diversified Telecom. Svs.) | (a) | 7.375% | 05/01/2026 | 1,400,000 | 1,519,000 | |||||||||||
Numericable Group SA (Diversified Telecom. Svs.) | (a) | 6.000% | 05/15/2022 | 425,000 | 444,656 | |||||||||||
Numericable Group SA (Diversified Telecom. Svs.) | (a) | 6.250% | 05/15/2024 | 400,000 | 422,500 | |||||||||||
Digicel Group Ltd. (Wireless Telecom. Svs.) | (a) | 8.250% | 09/30/2020 | 975,000 | 911,528 | |||||||||||
Sprint Capital Corp. (Wireless Telecom. Svs.) | 6.875% | 11/15/2028 | 700,000 | 778,099 | ||||||||||||
Sprint Nextel Corp. (Wireless Telecom. Svs.) | (a) | 7.000% | 03/01/2020 | 350,000 | 384,125 | |||||||||||
Sprint Communications, Inc. (Wireless Telecom. Svs.) | 6.000% | 11/15/2022 | 825,000 | 874,500 | ||||||||||||
Sprint Corp. (Wireless Telecom. Svs.) | 7.875% | 09/15/2023 | 975,000 | 1,121,250 | ||||||||||||
Sprint Corp. (Wireless Telecom. Svs.) | 7.125% | 06/15/2024 | 325,000 | 361,563 | ||||||||||||
Sprint Corp. (Wireless Telecom. Svs.) | 7.625% | 02/15/2025 | 1,950,000 | 2,244,938 | ||||||||||||
T-Mobile U.S.A., Inc. (Wireless Telecom. Svs.) | 6.125% | 01/15/2022 | 200,000 | 210,188 | ||||||||||||
T-Mobile U.S.A., Inc. (Wireless Telecom. Svs.) | 6.500% | 01/15/2024 | 625,000 | 671,875 | ||||||||||||
T-Mobile U.S.A., Inc. (Wireless Telecom. Svs.) | 6.625% | 04/01/2023 | 450,000 | 476,190 | ||||||||||||
T-Mobile U.S.A., Inc. (Wireless Telecom. Svs.) | 6.000% | 03/01/2023 | 150,000 | 158,765 | ||||||||||||
T-Mobile U.S.A., Inc. (Wireless Telecom. Svs.) | 6.375% | 03/01/2025 | 225,000 | 243,281 | ||||||||||||
T-Mobile U.S.A., Inc. (Wireless Telecom. Svs.) | 6.500% | 01/15/2026 | 325,000 | 358,719 | ||||||||||||
T-Mobile U.S.A., Inc. (Wireless Telecom. Svs.) | 5.125% | 04/15/2025 | 775,000 | 813,750 | ||||||||||||
T-Mobile U.S.A., Inc. (Wireless Telecom. Svs.) | 5.375% | 04/15/2027 | 200,000 | 214,500 | ||||||||||||
|
| |||||||||||||||
| 13,677,145 | ||||||||||||||||
|
| |||||||||||||||
| UTILITIES – 3.4% | ||||||||||||||||
AmeriGas Partners LP / AmeriGas Finance Corp. (Gas Utilities) | 5.625% | 05/20/2024 | 250,000 | 258,125 | ||||||||||||
AmeriGas Partners LP / AmeriGas Finance Corp. (Gas Utilities) | 5.875% | 08/20/2026 | 1,200,000 | 1,230,000 | ||||||||||||
AmeriGas Partners LP / AmeriGas Finance Corp. (Gas Utilities) | 5.500% | 05/20/2025 | 275,000 | 279,125 | ||||||||||||
AmeriGas Partners LP / AmeriGas Finance Corp. (Gas Utilities) | 5.750% | 05/20/2027 | 200,000 | 203,000 | ||||||||||||
Ferrellgas LP / Ferrellgas Finance Corp. (Gas Utilities) | 6.500% | 05/01/2021 | 450,000 | 425,250 | ||||||||||||
Ferrellgas LP / Ferrellgas Finance Corp. (Gas Utilities) | 6.750% | 01/15/2022 | 500,000 | 471,250 | ||||||||||||
Ferrellgas LP / Ferrellgas Finance Corp. (Gas Utilities) | 6.750% | 06/15/2023 | 725,000 | 674,250 | ||||||||||||
Suburban Propane Partners LP / Suburban Energy Finance Corp. (Gas Utilities) | 5.500% | 06/01/2024 | 1,150,000 | 1,144,250 | ||||||||||||
Suburban Propane Partners LP / Suburban Energy Finance Corp. (Gas Utilities) | 5.875% | 03/01/2027 | 475,000 | 472,625 | ||||||||||||
Calpine Corp. (Ind. Power & Renewable Elec.) | 5.750% | 01/15/2025 | 2,025,000 | 1,898,438 | ||||||||||||
NRG Energy, Inc. (Ind. Power & Renewable Elec.) | 6.625% | 03/15/2023 | 75,000 | 77,063 | ||||||||||||
NRG Energy, Inc. (Ind. Power & Renewable Elec.) | 6.250% | 05/01/2024 | 975,000 | 984,750 | ||||||||||||
NRG Energy, Inc. (Ind. Power & Renewable Elec.) | 7.250% | 05/15/2026 | 1,075,000 | 1,112,625 | ||||||||||||
NRG Energy, Inc. (Ind. Power & Renewable Elec.) | 6.625% | 01/15/2027 | 250,000 | 250,313 | ||||||||||||
TerraForm Power Operating, LLC (Ind. Power & Renewable Elec.) | (a) | 6.375% | 02/01/2023 | 1,125,000 | 1,170,000 | |||||||||||
TerraForm Power Operating, LLC (Ind. Power & Renewable Elec.) | (a) | 6.625% | 06/15/2025 | 150,000 | 159,375 | |||||||||||
|
| |||||||||||||||
| 10,810,439 | ||||||||||||||||
|
| |||||||||||||||
Total Corporate Bonds (Cost $294,712,468) | $ | 301,404,949 | ||||||||||||||
|
| |||||||||||||||
| Exchange Traded Funds – 1.5% | Shares | Value | ||||||||||||||
iShares iBoxx $ High Yield Corporate Bond ETF | 27,310 | $ | 2,413,931 | |||||||||||||
SPDR Bloomberg Barclays High Yield Bond ETF | 64,852 | 2,412,494 | ||||||||||||||
|
| |||||||||||||||
Total Exchange Traded Funds (Cost $4,747,992) | $ | 4,826,425 | ||||||||||||||
|
| |||||||||||||||
| Money Market Funds – 3.0% | Shares | Value | ||||||||||||||
State Street Institutional U.S. Government Money Market Fund Institutional Class | 9,575,705 | $ | 9,575,705 | |||||||||||||
|
| |||||||||||||||
Total Money Market Funds (Cost $9,575,705) | $ | 9,575,705 | ||||||||||||||
|
| |||||||||||||||
Total Investments – 99.1% (Cost $309,036,165) | (d) | $ | 315,807,079 | |||||||||||||
Other Assets in Excess of Liabilities – 0.9% | 2,802,221 | |||||||||||||||
|
| |||||||||||||||
Net Assets – 100.0% | $ | 318,609,300 | ||||||||||||||
|
| |||||||||||||||
Percentages are stated as a percent of net assets.
Abbreviations:
PIK: Payment-in-Kind
| 67 | (continued) |
| Ohio National Fund, Inc. | High Income Bond Portfolio (Continued) |
Schedule of Investments | June 30, 2017 (Unaudited) |
Footnotes:
| (a) | Security exempt from registration under Regulation D of the Securities Act of 1933. These securities may be resold in transactions exempt from registration, normally to qualified buyers under Rule 144A. At June 30, 2017, the value of these securities totaled $181,301,228, or 56.9% of the Portfolio’s net assets. Unless also noted with (c), as defined below, these securities were deemed liquid pursuant to procedures approved by the Board of Directors. |
| (b) | Issuer of the security has the option to make coupon payments in cash or in additional par value of this bond (Payment-in-Kind). |
| (c) | Represents a security deemed to be illiquid. At June 30, 2017, the value of illiquid securities in the Portfolio totaled $1,218,500, or 0.4% of the Portfolio’s net assets. |
| (d) | Represents cost for financial reporting purposes, which may differ from cost basis for federal income tax purposes. See also Note 7 of the Notes to Financial Statements. |
The accompanying notes are an integral part of these financial statements.
| 68 |
| Ohio National Fund, Inc. | ClearBridge Small Cap Portfolio |
Objective/Strategy
The ClearBridge Small Cap Portfolio seeks long-term capital appreciation by investing at least 80% of its net assets in common stocks and other equity securities of small capitalization companies or in other investments that the portfolio managers believe have similar economic characteristics.
Performance as of June 30, 2017
Average Annual returns | ||||
One year | 25.71% | |||
Five years | 14.05% | |||
Ten years | 8.29% |
Past performance does not guarantee future results. The performance data quoted represents past performance and current returns may be lower or higher. Total return figures include change in share price and reinvestment of dividends and capital gains. The investment return and principal value will fluctuate so that an investor’s shares, when redeemed, may be worth more or less than the original cost. To obtain performance information up to the most recent month end, call toll-free 1-877-781-6392.
The Portfolio is not open to direct retail investment. Beneficial interest in shares is obtained solely by purchase of variable life insurance policies and variable annuity contracts. Actual performance results for variable annuity and variable universal life contracts will be lower due to contract charges. Consult your contract for applicable charges.
Total expense ratio is 1.24% per the Fund’s prospectus dated May 1, 2017. Additional information pertaining to the Fund’s expense ratio as of June 30, 2017 can be found in the Portfolio’s Financial Highlights.
Comments from Sub-Adviser
Q. How did the Portfolio perform in comparison to its benchmark during the reporting period?
A. For the six-month period ended June 30, 2017, the ClearBridge Small Cap Portfolio returned 6.54% versus 4.99% for its benchmark, the Russell 2000 Index.
Q. Were there specific market conditions, investment strategies, or techniques that materially affected the Portfolio’s benchmark-relative performance during the reporting period?
A. There were no unusual conditions, investment strategies, or techniques that materially affected the Portfolio’s relative performance to the benchmark during the reporting period. We continue to monitor valuations and opportunities in the market so that we can position the Portfolio optimally from a risk-return perspective.(1)
Q. How did sector selection and security selection each impact the Portfolio’s performance relative to its benchmark?
A. Stock selection contributed to the Portfolio’s outperformance, partially offset by sector allocation effects. Stock selection in the Information Technology, Real Estate and Health Care sectors contributed the most to relative performance. Meanwhile, stock selection in the Materials sector and an underweight to the Health Care sector detracted from relative returns. The Portfolio’s cash position also detracted somewhat from relative performance.(1)
Q. Were there any factors that impacted the benchmark’s performance more significantly than the Portfolio’s performance?
A. The Portfolio has been underweight in a few of the primary areas that did well in both the first and second quarters; specifically, the
biotechnology industry, and “bond proxy” stock areas such as the Telecommunication Services and Utilities sectors. While the Portfolio is underweight Health Care, positive stock selection effects in the sector contributed to relative performance.(1)
Q. Which holdings contributed the most to, and detracted the most from, the Portfolio’s benchmark-relative performance?
A. Triton International Ltd., the largest lessor of shipping containers globally, was a top contributor in the second quarter. Triton’s stock rose due to improving demand for containers while supply remained constrained, as well as the potential for steel trade barriers implemented by the Trump administration, which would likely increase steel prices. The company benefits from higher steel prices in realizing higher scrap and residual value.(1)
Shares of 2U, Inc. were also a key contributor during the period. 2U partners with leading universities to offer online graduate degrees that are equivalent to on-campus degrees. Its contracts run for 10 years or more, but it loses money in the development stage of a program, so the lifetime profitability of each contract win is masked. As it increases the number of programs it launches, 2U creates more value in the long-term. Recognition of this approach by investors helped lift the stock.(1)
Shares of Akorn, Inc., a generic pharmaceuticals manufacturer, rose sharply in April after the company announced it had agreed to be acquired by Fresenius Kabi, a German drug and medical device supplier. The deal is expected to close in early 2018.(1)
Smart Sand, Inc., a provider of silica sand used as proppant for shale oil extraction, declined during the second quarter, as oil prices slid and as the market expects oil prices to be contained for some time. Nevertheless, sand pricing rose, and volumes have been strong, as the U.S. rig count has continued to rise and sand intensity has increased.(1)
Clearwater Paper Corp., which makes private-label hygienic paper and bleached paperboard products, declined following another earnings miss due to higher than expected costs. Clearwater has invested heavily in recent years to improve the quality of its products and to reduce systemic costs with new equipment and Information Technology systems. Our investment case has been that those investments would increase market share and generate incremental returns above the cost of capital. We still think that case is persuasive, but projects have cost more and taken longer than we expected.(1)
Extraction Oil & Gas, Inc. is an exploration and production company with primary assets in the U.S. Rocky Mountains region. The stock was pressured by a decline in crude oil prices during the period as well as negative sentiment related to a fatal gas well explosion in an area in close proximity to its Colorado operations. Despite recent stock weakness, the company reported results in May that topped forecasts, is confident in hitting or exceeding guidance provided for the rest of 2017 and has said that its 2018 growth plans are on track.(1)
Q. How did the Portfolio’s use of derivative instruments and initial public offerings (IPOs), if any, impact performance?
A. The Portfolio did not use derivatives during the period. The Portfolio invested in three IPOs: Foundation Building Materials, Inc., Cadence Bancorporation and REV Group, Inc. Foundation Building Materials has declined 11.48%, detracting from absolute performance by 11 basis points during the period. Shares of Cadence Bancorporation increased 3.88% following the IPO through the end of
| 69 | (continued) |
| Ohio National Fund, Inc. | ClearBridge Small Cap Portfolio (Continued) |
the period, contributing 3 basis points to the Portfolio’s absolute performance. The Portfolio’s investment in REV Group contributed 16 basis points to absolute returns.
| (1) | The Portfolio’s composition is subject to change. Holdings and weightings are as of June 30, 2017. |
Change in Value of $10,000 Investment
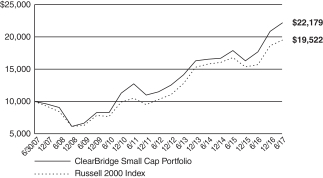
Hypothetical illustration based on past performance. Future performance will vary. The Portfolio’s returns reflect reinvested dividends. The Portfolio’s holdings may differ significantly from the securities in the index. The index is unmanaged and therefore does not reflect the cost of portfolio management and accounting.
The Russell 2000 Index measures the performance of the small-cap segment of the U.S equity universe. The Russell 2000 Index includes the 2000 firms from the Russell 3000 Index with the smallest market capitalizations. The Russell 3000 Index represents 98% of the investable U.S. equity market. The index presented includes the effects of reinvested dividends.
Portfolio Composition as of June 30, 2017 (1)
| % of Net Assets | ||||
Common Stocks (4) | 99.3 | |||
Money Market Funds | ||||
Less Net Liabilities | 0.7 | |||
|
| |||
| 100.0 | ||||
|
|
Top 10 Portfolio Holdings as of June 30, 2017 (1) (2) (3)
| % of Net Assets | ||||
1. Service Corp. International | 2.3 | |||
2. Gray Television, Inc. | 2.3 | |||
3. HealthEquity, Inc. | 2.2 | |||
4. LegacyTexas Financial Group, Inc. | 2.0 | |||
5. 2U, Inc. | 1.9 | |||
6. Murphy U.S.A., Inc. | 1.9 | |||
7. Web.com Group, Inc. | 1.9 | |||
8. Washington Federal, Inc. | 1.9 | |||
9. Q2 Holdings, Inc. | 1.9 | |||
10. First Interstate BancSystem, Inc. Class A | 1.9 |
| (1) | Composition of Portfolio subject to change. |
| (2) | Short-term investments have been excluded from the list of Top 10 Portfolio Holdings. |
| (3) | Top 10 Portfolio Holdings is presented at an individual security level. Total investment exposure by issuer may be higher. |
| (4) | Sectors (Common Stocks): |
| % of Net Assets | ||||
Financials | 22.4 | |||
Information Technology | 19.0 | |||
Industrials | 14.1 | |||
Consumer Discretionary | 13.7 | |||
Health Care | 12.4 | |||
Real Estate | 7.2 | |||
Consumer Staples | 3.4 | |||
Energy | 2.8 | |||
Materials | 2.5 | |||
Utilities | 1.8 | |||
|
| |||
| 99.3 | ||||
|
|
| 70 |
| Ohio National Fund, Inc. | ClearBridge Small Cap Portfolio |
Schedule of Investments | June 30, 2017 (Unaudited) |
| Common Stocks – 99.3% | Shares | Value | ||||||||
| CONSUMER DISCRETIONARY – 13.7% | ||||||||||
Gentex Corp. (Auto Components) | 173,800 | $ | 3,296,986 | |||||||
Horizon Global Corp. (Auto Components) | (a) | 204,610 | 2,938,200 | |||||||
Service Corp. International (Diversified Consumer Svs.) | 192,830 | 6,450,163 | ||||||||
Chuy’s Holdings, Inc. (Hotels, Restaurants & Leisure) | (a) | 111,260 | 2,603,484 | |||||||
Planet Fitness, Inc. Class A (Hotels, Restaurants & Leisure) | 194,540 | 4,540,564 | ||||||||
Gray Television, Inc. (Media) | (a) | 468,110 | 6,413,107 | |||||||
Aaron’s, Inc. (Specialty Retail) | 94,560 | 3,678,384 | ||||||||
Monro Muffler Brake, Inc. (Specialty Retail) | 73,800 | 3,081,150 | ||||||||
Murphy U.S.A., Inc. (Specialty Retail) | (a) | 73,600 | 5,454,496 | |||||||
|
| |||||||||
| 38,456,534 | ||||||||||
|
| |||||||||
| CONSUMER STAPLES – 3.4% | ||||||||||
Sprouts Farmers Market, Inc. (Food & Staples Retailing) | (a) | 200,000 | 4,534,000 | |||||||
United Natural Foods, Inc. (Food & Staples Retailing) | (a) | 84,060 | 3,085,002 | |||||||
Inter Parfums, Inc. (Personal Products) | 52,700 | 1,931,455 | ||||||||
|
| |||||||||
| 9,550,457 | ||||||||||
|
| |||||||||
| ENERGY – 2.8% | ||||||||||
Smart Sand, Inc. (Energy Equip. & Svs.) | (a) | 276,480 | 2,463,437 | |||||||
Extraction Oil & Gas, Inc. (Oil, Gas & Consumable Fuels) | (a) | 186,840 | 2,512,998 | |||||||
Sanchez Energy Corp. (Oil, Gas & Consumable Fuels) | (a) | 387,620 | 2,783,112 | |||||||
|
| |||||||||
| 7,759,547 | ||||||||||
|
| |||||||||
| FINANCIALS – 22.4% | ||||||||||
Cadence BanCorp (Banks) | (a) | 180,270 | 3,944,308 | |||||||
First Interstate BancSystem, Inc. Class A (Banks) | 140,100 | 5,211,720 | ||||||||
LegacyTexas Financial Group, Inc. (Banks) | 144,290 | 5,501,778 | ||||||||
Popular, Inc. (Banks) | 92,680 | 3,865,683 | ||||||||
TriState Capital Holdings, Inc. (Banks) | (a) | 96,810 | 2,439,612 | |||||||
Main Street Capital Corp. (Capital Markets) | 55,320 | 2,127,607 | ||||||||
PennantPark Investment Corp. (Capital Markets) | 212,382 | 1,569,503 | ||||||||
Triangle Capital Corp. (Capital Markets) | 185,099 | 3,261,444 | ||||||||
OneMain Holdings, Inc. (Consumer Finance) | (a) | 179,720 | 4,419,315 | |||||||
PRA Group, Inc. (Consumer Finance) | (a) | 101,127 | 3,832,713 | |||||||
Assured Guaranty Ltd. (Insurance) | 97,270 | 4,060,050 | ||||||||
Kinsale Capital Group, Inc. (Insurance) | 97,800 | 3,648,918 | ||||||||
ProAssurance Corp. (Insurance) | 54,510 | 3,314,208 | ||||||||
Beneficial Bancorp, Inc. (Thrifts & Mortgage Finance) | 205,990 | 3,089,850 | ||||||||
NMI Holdings, Inc. Class A (Thrifts & Mortgage Finance) | (a) | 313,914 | 3,594,315 | |||||||
Radian Group, Inc. (Thrifts & Mortgage Finance) | 214,900 | 3,513,615 | ||||||||
Washington Federal, Inc. (Thrifts & Mortgage Finance) | 162,440 | 5,393,008 | ||||||||
|
| |||||||||
| 62,787,647 | ||||||||||
|
| |||||||||
| HEALTH CARE – 12.4% | ||||||||||
Amarin Corp. PLC – ADR (Biotechnology) | (a) | 1,027,370 | 4,140,301 | |||||||
Ironwood Pharmaceuticals, Inc. (Biotechnology) | (a) | 163,720 | 3,091,034 | |||||||
Keryx Biopharmaceuticals, Inc. (Biotechnology) | (a) | 367,220 | 2,655,001 | |||||||
Lexicon Pharmaceuticals, Inc. (Biotechnology) | (a) | 200,680 | 3,301,186 | |||||||
Ligand Pharmaceuticals, Inc. (Biotechnology) | (a) | 34,110 | 4,140,954 | |||||||
Quotient Ltd. (Health Care Equip. & Supplies) | (a) | 384,000 | 2,826,240 | |||||||
HealthEquity, Inc. (Health Care Providers & Svs.) | (a) | 124,810 | 6,219,282 | |||||||
HealthSouth Corp. (Health Care Providers & Svs.) | 78,940 | 3,820,696 | ||||||||
INC Research Holdings, Inc. Class A (Life Sciences Tools & Svs.) | (a) | 38,440 | 2,248,740 | |||||||
Medpace Holdings, Inc. (Life Sciences Tools & Svs.) | (a) | 84,140 | 2,440,060 | |||||||
|
| |||||||||
| 34,883,494 | ||||||||||
|
| |||||||||
| Common Stocks (Continued) | Shares | Value | ||||||||
| INDUSTRIALS – 14.1% | ||||||||||
HEICO Corp. (Aerospace & Defense) | 59,162 | $ | 4,250,198 | |||||||
Allegiant Travel Co. (Airlines) | 17,740 | 2,405,544 | ||||||||
Continental Building Products, Inc. (Building Products) | (a) | 127,000 | 2,959,100 | |||||||
CIRCOR International, Inc. (Machinery) | 40,190 | 2,386,482 | ||||||||
REV Group, Inc. (Machinery) | 122,100 | 3,379,728 | ||||||||
Matson, Inc. (Marine) | 80,450 | 2,416,718 | ||||||||
ICF International, Inc. (Professional Svs.) | (a) | 74,650 | 3,516,015 | |||||||
Landstar System, Inc. (Road & Rail) | 28,491 | 2,438,830 | ||||||||
Marten Transport Ltd. (Road & Rail) | 104,860 | 2,873,164 | ||||||||
Foundation Building Materials, Inc. (Trading Companies & Distributors) | (a) | 197,360 | 2,538,050 | |||||||
GATX Corp. (Trading Companies & Distributors) | 54,000 | 3,470,580 | ||||||||
Rush Enterprises, Inc. Class A (Trading Companies & Distributors) | (a) | 85,250 | 3,169,595 | |||||||
Triton International Ltd. (Trading Companies & Distributors) | 111,430 | 3,726,219 | ||||||||
|
| |||||||||
| 39,530,223 | ||||||||||
|
| |||||||||
| INFORMATION TECHNOLOGY – 19.0% | ||||||||||
Methode Electronics, Inc. (Electronic Equip., Instr. & Comp.) | 112,430 | 4,632,116 | ||||||||
MTS Systems Corp. (Electronic Equip., Instr. & Comp.) | 56,340 | 2,918,412 | ||||||||
2U, Inc. (Internet Software & Svs.) | (a) | 116,260 | 5,454,919 | |||||||
Bankrate, Inc. (Internet Software & Svs.) | (a) | 390,137 | 5,013,260 | |||||||
Q2 Holdings, Inc. (Internet Software & Svs.) | (a) | 143,160 | 5,289,762 | |||||||
Web.com Group, Inc. (Internet Software & Svs.) | (a) | 214,360 | 5,423,308 | |||||||
WebMD Health Corp. (Internet Software & Svs.) | (a) | 82,110 | 4,815,751 | |||||||
EVERTEC, Inc. (IT Svs.) | 194,680 | 3,367,964 | ||||||||
WNS Holdings Ltd. – ADR (IT Svs.) | (a) | 128,140 | 4,402,890 | |||||||
Semtech Corp. (Semiconductors & Equip.) | (a) | 106,980 | 3,824,535 | |||||||
Veeco Instruments, Inc. (Semiconductors & Equip.) | (a) | 112,130 | 3,122,820 | |||||||
Manhattan Associates, Inc. (Software) | (a) | 51,678 | 2,483,645 | |||||||
RingCentral, Inc. Class A (Software) | (a) | 68,630 | 2,508,426 | |||||||
|
| |||||||||
| 53,257,808 | ||||||||||
|
| |||||||||
| MATERIALS – 2.5% | ||||||||||
Balchem Corp. (Chemicals) | 43,080 | 3,347,747 | ||||||||
Clearwater Paper Corp. (Paper & Forest Products) | (a) | 78,110 | 3,651,642 | |||||||
|
| |||||||||
| 6,999,389 | ||||||||||
|
| |||||||||
| REAL ESTATE – 7.2% | ||||||||||
American Homes 4 Rent (Equity Real Estate Investment Trusts) | 150,170 | 3,389,337 | ||||||||
Lexington Realty Trust (Equity Real Estate Investment Trusts) | 235,440 | 2,333,210 | ||||||||
Potlatch Corp. (Equity Real Estate Investment Trusts) | 59,820 | 2,733,774 | ||||||||
STORE Capital Corp. (Equity Real Estate Investment Trusts) | 160,350 | 3,599,858 | ||||||||
Summit Hotel Properties, Inc. (Equity Real Estate Investment Trusts) | 190,150 | 3,546,298 | ||||||||
Realogy Holdings Corp. (Real Estate Mgmt. & Development) | 137,960 | 4,476,803 | ||||||||
|
| |||||||||
| 20,079,280 | ||||||||||
|
| |||||||||
| UTILITIES – 1.8% | ||||||||||
PNM Resources, Inc. (Electric Utilities) | 129,440 | 4,951,080 | ||||||||
|
| |||||||||
Total Common Stocks (Cost $244,649,348) | $ | 278,255,459 | ||||||||
|
| |||||||||
| Money Market Funds – 3.9% | Shares | Value | ||||||||
State Street Institutional U.S. Government Money Market Fund Institutional Class | 10,906,206 | $ | 10,906,206 | |||||||
|
| |||||||||
Total Money Market Funds | $ | 10,906,206 | ||||||||
|
| |||||||||
Total Investments – 103.2% | (b) | $ | 289,161,665 | |||||||
Liabilities in Excess of Other | (8,900,000) | |||||||||
|
| |||||||||
Net Assets – 100.0% | $ | 280,261,665 | ||||||||
|
| |||||||||
| 71 | (continued) |
| Ohio National Fund, Inc. | ClearBridge Small Cap Portfolio (Continued) |
Schedule of Investments | June 30, 2017 (Unaudited) |
Percentages are stated as a percent of net assets.
Abbreviations:
ADR: American Depositary Receipts
Footnotes:
| (a) | Non-income producing security. |
| (b) | Represents cost for financial reporting purposes, which may differ from cost basis for federal income tax purposes. See also Note 7 of the Notes to Financial Statements. |
The accompanying notes are an integral part of these financial statements.
| 72 |
| Ohio National Fund, Inc. | Nasdaq-100® Index Portfolio |
Objective/Strategy
The Nasdaq-100® Index Portfolio seeks long-term growth of capital by investing more than 80% of its net assets in the common stocks that are included in the Nasdaq-100® Index. Unlike the other Portfolios of the Fund, the Nasdaq-100® Index Portfolio is a non-diversified portfolio for purposes of Section 5(b) of the Investment Company Act of 1940, as amended.
Performance as of June 30, 2017
Average Annual returns | ||||
One year | 28.80% | |||
Five years | 17.52% | |||
Ten years | 11.84% |
Past performance does not guarantee future results. The performance data quoted represents past performance and current returns may be lower or higher. Total return figures include change in share price and reinvestment of dividends and capital gains. The investment return and principal value will fluctuate so that an investor’s shares, when redeemed, may be worth more or less than the original cost. To obtain performance information up to the most recent month end, call toll-free 1-877-781-6392.
The Portfolio is not open to direct retail investment. Beneficial interest in shares is obtained solely by purchase of variable life insurance policies and variable annuity contracts. Actual performance results for variable annuity and variable universal life contracts will be lower due to contract charges. Consult your contract for applicable charges.
Total expense ratio is 0.48% per the Fund’s prospectus dated May 1, 2017. Additional information pertaining to the Fund’s expense ratio as of June 30, 2017 can be found in the Portfolio’s Financial Highlights.
Comments from Sub-Adviser
Q. How did the Portfolio perform in comparison to its benchmark during the reporting period?
A. For the six-month period ended June 30, 2017, the Nasdaq-100® Index Portfolio returned 16.52% versus 16.78% for its benchmark, the Nasdaq-100® Index.
Q. Were there specific market conditions, investment strategies, or techniques that materially affected the Portfolio’s benchmark-relative performance during the reporting period?
A. The Portfolio intends to approximate the underlying return of the Nasdaq-100® Index. There were no material market events or changes in strategy that impacted the Portfolio’s relative return for the period.(1)
Q. How did sector selection and security selection each impact the Portfolio’s performance relative to its benchmark?
A. The Portfolio is managed on a risk-controlled basis and is constructed to closely replicate its benchmark index. The expected sources of performance variance include the impact of trading daily cash flows, including trading commissions, and the operating expenses of the Portfolio.
Consumer Discretionary, Information Technology, and Industrials were the best performing sectors in the Portfolio and benchmark for the six-month period ended June 30, 2017, while Consumer Staples was the key laggard.(1)
Q. Which holdings contributed the most to, and detracted the most from, the Portfolio’s benchmark-relative performance?
A. The largest contributors to the Portfolio and benchmark returns for the period were Apple, Inc., Amazon.com, Inc., and Facebook, Inc. Class A. The largest detractors from the Portfolio and benchmark returns for the period were QUALCOMM, Inc., Intel Corp., and O’Reilly Automotive Inc.(1)
Q. How did the Portfolio’s use of derivative instruments and initial public offerings (IPOs), if any, impact performance?
A. The Portfolio uses Nasdaq-100® Index futures contracts primarily to equitize open dividend receivables, as well as to manage day-to-day cash flows to ensure the Portfolio is fully invested. The futures did not meaningfully impact performance due to their index characteristics and size in relation to Portfolio net assets.(1)
| (1) | The Portfolio’s composition is subject to change. Holdings and weightings are as of June 30, 2017. |
Change in Value of $10,000 Investment
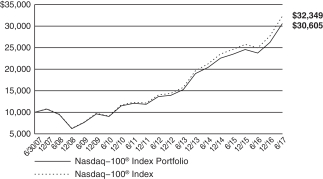
Hypothetical illustration based on past performance. Future performance will vary. The Portfolio’s returns reflect reinvested dividends. The Portfolio’s holdings may differ significantly from the securities in the index. The index is unmanaged and therefore does not reflect the cost of portfolio management and accounting. Investors cannot invest in an index. Although they can invest in its underlying securities or funds.
The Nasdaq-100® Index is a modified capitalization-weighted index of the 100 largest domestic and international non-financial companies listed on the NASDAQ Stock Market. The index presented includes the effects of reinvested dividends.
The Nasdaq-100®, Nasdaq-100 Index®, and Nasdaq® are registered trademarks of The NASDAQ OMX Group, Inc. (which with its affiliates is referred to as “NASDAQ OMX”). Ohio National Investments, Inc. has licensed these marks for the Portfolio’s use. NASDAQ OMX has not passed on the Portfolio’s legality or suitability. NASDAQ OMX does not sponsor, endorse, sell or promote the Portfolio. NASDAQ OMX MAKES NO WARRANTIES AND BEARS NO LIABILITY WITH RESPECT TO THE PORTFOLIO.
| 73 | (continued) |
| Ohio National Fund, Inc. | Nasdaq-100® Index Portfolio (Continued) |
Portfolio Composition as of June 30, 2017 (1)
| % of Net Assets | ||||
Common Stocks (4) | 98.8 | |||
Money Market Funds | ||||
Less Net Liabilities | 1.2 | |||
|
| |||
| 100.0 | ||||
|
|
Top 10 Portfolio Holdings as of June 30, 2017 (1) (2) (3)
| % of Net Assets | ||||
1. Apple, Inc. | 11.5 | |||
2. Microsoft Corp. | 8.1 | |||
3. Amazon.com, Inc. | 7.1 | |||
4. Facebook, Inc. Class A | 5.5 | |||
5. Alphabet, Inc. Class C | 4.8 | |||
6. Alphabet, Inc. Class A | 4.2 | |||
7. Comcast Corp. Class A | 2.8 | |||
8. Intel Corp. | 2.4 | |||
9. Cisco Systems, Inc. | 2.4 | |||
10. Amgen, Inc. | 1.9 |
| (1) | Composition of Portfolio subject to change. |
| (2) | Short-term investments have been excluded from the list of Top 10 Portfolio Holdings. |
| (3) | Top 10 Portfolio Holdings is presented at an individual security level. Total investment exposure by issuer may be higher. |
| (4) | Sectors (Common Stocks): |
| % of Net Assets | ||||
Information Technology | 56.8 | |||
Consumer Discretionary | 22.1 | |||
Health Care | 11.3 | |||
Consumer Staples | 5.4 | |||
Industrials | 2.2 | |||
Telecommunication Services | 1.0 | |||
|
| |||
| 98.8 | ||||
|
|
| 74 |
| Ohio National Fund, Inc. | Nasdaq-100® Index Portfolio |
Schedule of Investments | June 30, 2017 (Unaudited) |
| Common Stocks – 98.8% | Shares | Value | ||||||||
| CONSUMER DISCRETIONARY – 22.1% | ||||||||||
Tesla Motors, Inc. (Automobiles) | (a) | 4,845 | $ | 1,752,000 | ||||||
Marriott International, Inc. Class A (Hotels, Restaurants & Leisure) | 11,175 | 1,120,964 | ||||||||
Norwegian Cruise Line Holdings Ltd. (Hotels, Restaurants & Leisure) | (a) | 6,722 | 364,937 | |||||||
Starbucks Corp. (Hotels, Restaurants & Leisure) | 42,711 | 2,490,478 | ||||||||
Wynn Resorts Ltd. (Hotels, Restaurants & Leisure) | 3,019 | 404,908 | ||||||||
Amazon.com, Inc. (Internet & Direct Marketing Retail) | (a) | 14,098 | 13,646,864 | |||||||
Ctrip.com International Ltd. – ADR (Internet & Direct Marketing Retail) | (a) | 13,143 | 707,882 | |||||||
Expedia, Inc. (Internet & Direct Marketing Retail) | 4,075 | 606,971 | ||||||||
JD.com, Inc. – ADR (Internet & Direct Marketing Retail) | (a) | 27,051 | 1,060,940 | |||||||
Liberty Interactive Corp. QVC Group Class A (Internet & Direct Marketing Retail) | (a) | 12,432 | 305,081 | |||||||
Liberty Ventures (Internet & Direct Marketing Retail) | (a) | 2,395 | 125,235 | |||||||
Netflix, Inc. (Internet & Direct Marketing Retail) | (a) | 12,712 | 1,899,300 | |||||||
Priceline Group, Inc. / The (Internet & Direct Marketing Retail) | (a) | 1,449 | 2,710,384 | |||||||
Hasbro, Inc. (Leisure Products) | 3,687 | 411,137 | ||||||||
Mattel, Inc. (Leisure Products) | 10,103 | 217,518 | ||||||||
Charter Communications, Inc. Class A (Media) | (a) | 7,891 | 2,658,083 | |||||||
Comcast Corp. Class A (Media) | 139,612 | 5,433,699 | ||||||||
Discovery Communications, Inc. Class A (Media) | (a) | 4,535 | 117,139 | |||||||
Discovery Communications, Inc. Class C (Media) | (a) | 6,615 | 166,764 | |||||||
DISH Network Corp. Class A (Media) | (a) | 6,709 | 421,057 | |||||||
Liberty Global PLC Class A (Media) | (a) | 6,995 | 224,679 | |||||||
Liberty Global PLC Class C (Media) | (a) | 17,963 | 560,086 | |||||||
Liberty Global PLC LiLAC Class A (Media) | (a) | 1,463 | 31,850 | |||||||
Liberty Global PLC LiLAC Class C (Media) | (a) | 3,560 | 76,220 | |||||||
Sirius XM Holdings, Inc. (Media) | 137,592 | 752,628 | ||||||||
Twenty-First Century Fox, Inc. Class A (Media) | 31,038 | 879,617 | ||||||||
Twenty-First Century Fox, Inc. Class B (Media) | 23,552 | 656,394 | ||||||||
Viacom, Inc. Class B (Media) | 10,391 | 348,826 | ||||||||
Dollar Tree, Inc. (Multiline Retail) | (a) | 6,981 | 488,112 | |||||||
O’Reilly Automotive, Inc. (Specialty Retail) | (a) | 2,684 | 587,098 | |||||||
Ross Stores, Inc. (Specialty Retail) | 11,562 | 667,474 | ||||||||
Tractor Supply Co. (Specialty Retail) | 3,792 | 205,564 | ||||||||
Ulta Salon Cosmetics & Fragrance, Inc. (Specialty Retail) | (a) | 1,833 | 526,694 | |||||||
|
| |||||||||
| 42,626,583 | ||||||||||
|
| |||||||||
| CONSUMER STAPLES – 5.4% | ||||||||||
Monster Beverage Corp. (Beverages) | (a) | 16,747 | 831,991 | |||||||
Costco Wholesale Corp. (Food & Staples Retailing) | 12,946 | 2,070,454 | ||||||||
Walgreens Boots Alliance, Inc. (Food & Staples Retailing) | 31,882 | 2,496,679 | ||||||||
Kraft Heinz Co. / The (Food Products) | 35,913 | 3,075,589 | ||||||||
Mondelez International, Inc. Class A (Food Products) | 44,751 | 1,932,796 | ||||||||
|
| |||||||||
| 10,407,509 | ||||||||||
|
| |||||||||
| HEALTH CARE – 11.3% | ||||||||||
Alexion Pharmaceuticals, Inc. (Biotechnology) | (a) | 6,623 | 805,820 | |||||||
Amgen, Inc. (Biotechnology) | 21,690 | 3,735,669 | ||||||||
Biogen, Inc. (Biotechnology) | (a) | 6,256 | 1,697,628 | |||||||
BioMarin Pharmaceutical, Inc. (Biotechnology) | (a) | 5,146 | 467,360 | |||||||
Celgene Corp. (Biotechnology) | (a) | 23,030 | 2,990,906 | |||||||
Gilead Sciences, Inc. (Biotechnology) | 38,541 | 2,727,932 | ||||||||
Incyte Corp. (Biotechnology) | (a) | 6,040 | 760,496 | |||||||
Regeneron Pharmaceuticals, Inc. (Biotechnology) | (a) | 3,079 | 1,512,220 | |||||||
Shire PLC – ADR (Biotechnology) | 2,310 | 381,774 | ||||||||
Vertex Pharmaceuticals, Inc. (Biotechnology) | (a) | 7,346 | 946,679 | |||||||
DENTSPLY SIRONA, Inc. (Health Care Equip. & Supplies) | 6,761 | 438,383 | ||||||||
Hologic, Inc. (Health Care Equip. & Supplies) | (a) | 8,259 | 374,793 | |||||||
IDEXX Laboratories, Inc. (Health Care Equip. & Supplies) | (a) | 2,599 | 419,531 | |||||||
| Common Stocks (Continued) | Shares | Value | ||||||||
| HEALTH CARE (continued) | ||||||||||
Intuitive Surgical, Inc. (Health Care Equip. & Supplies) | (a) | 1,087 | $ | 1,016,747 | ||||||
Express Scripts Holding Co. (Health Care Providers & Svs.) | (a) | 17,506 | 1,117,583 | |||||||
Henry Schein, Inc. (Health Care Providers & Svs.) | (a) | 2,340 | 428,267 | |||||||
Cerner Corp. (Health Care Technology) | (a) | 9,746 | 647,817 | |||||||
Illumina, Inc. (Life Sciences Tools & Svs.) | (a) | 4,306 | 747,177 | |||||||
Mylan NV (Pharmaceuticals) | (a) | 15,808 | 613,667 | |||||||
|
| |||||||||
| 21,830,449 | ||||||||||
|
| |||||||||
| INDUSTRIALS – 2.2% | ||||||||||
American Airlines Group, Inc. (Airlines) | 14,529 | 731,099 | ||||||||
Cintas Corp. (Commercial Svs. & Supplies) | 3,106 | 391,480 | ||||||||
PACCAR, Inc. (Machinery) | 10,361 | 684,240 | ||||||||
Verisk Analytics, Inc. (Professional Svs.) | (a) | 4,877 | 411,473 | |||||||
CSX Corp. (Road & Rail) | 27,212 | 1,484,687 | ||||||||
J.B. Hunt Transport Services, Inc. (Road & Rail) | 3,244 | 296,437 | ||||||||
Fastenal Co. (Trading Companies & Distributors) | 8,532 | 371,398 | ||||||||
|
| |||||||||
| 4,370,814 | ||||||||||
|
| |||||||||
| INFORMATION TECHNOLOGY – 56.8% | ||||||||||
Cisco Systems, Inc. (Communications Equip.) | 147,473 | 4,615,905 | ||||||||
Akamai Technologies, Inc. (Internet Software & Svs.) | (a) | 5,099 | 253,981 | |||||||
Alphabet, Inc. Class A (Internet Software & Svs.) | (a) | 8,778 | 8,160,731 | |||||||
Alphabet, Inc. Class C (Internet Software & Svs.) | (a) | 10,234 | 9,299,943 | |||||||
Baidu, Inc. – ADR (Internet Software & Svs.) | (a) | 8,146 | 1,456,994 | |||||||
eBay, Inc. (Internet Software & Svs.) | (a) | 31,923 | 1,114,751 | |||||||
Facebook, Inc. Class A (Internet Software & Svs.) | (a) | 69,748 | 10,530,553 | |||||||
MercadoLibre, Inc. (Internet Software & Svs.) | 1,302 | 326,646 | ||||||||
NetEase, Inc. – ADR (Internet Software & Svs.) | 2,248 | 675,816 | ||||||||
Automatic Data Processing, Inc. (IT Svs.) | 13,196 | 1,352,062 | ||||||||
Cognizant Technology Solutions Corp. Class A (IT Svs.) | 17,372 | 1,153,501 | ||||||||
Fiserv, Inc. (IT Svs.) | (a) | 6,264 | 766,338 | |||||||
Paychex, Inc. (IT Svs.) | 10,596 | 603,336 | ||||||||
PayPal Holdings, Inc. (IT Svs.) | (a) | 35,430 | 1,901,528 | |||||||
Analog Devices, Inc. (Semiconductors & Equip.) | 10,825 | 842,185 | ||||||||
Applied Materials, Inc. (Semiconductors & Equip.) | 31,696 | 1,309,362 | ||||||||
Broadcom Ltd. (Semiconductors & Equip.) | 11,838 | 2,758,846 | ||||||||
Intel Corp. (Semiconductors & Equip.) | 138,889 | 4,686,115 | ||||||||
KLA-Tencor Corp. (Semiconductors & Equip.) | 4,624 | 423,142 | ||||||||
Lam Research Corp. (Semiconductors & Equip.) | 4,758 | 672,924 | ||||||||
Maxim Integrated Products, Inc. (Semiconductors & Equip.) | 8,333 | 374,152 | ||||||||
Microchip Technology, Inc. (Semiconductors & Equip.) | 6,766 | 522,200 | ||||||||
Micron Technology, Inc. (Semiconductors & Equip.) | (a) | 32,630 | 974,332 | |||||||
NVIDIA Corp. (Semiconductors & Equip.) | 17,549 | 2,536,883 | ||||||||
QUALCOMM, Inc. (Semiconductors & Equip.) | 43,576 | 2,406,267 | ||||||||
Skyworks Solutions, Inc. (Semiconductors & Equip.) | 5,442 | 522,160 | ||||||||
Texas Instruments, Inc. (Semiconductors & Equip.) | 29,386 | 2,260,665 | ||||||||
Xilinx, Inc. (Semiconductors & Equip.) | 7,316 | 470,565 | ||||||||
Activision Blizzard, Inc. (Software) | 22,229 | 1,279,724 | ||||||||
Adobe Systems, Inc. (Software) | (a) | 14,591 | 2,063,751 | |||||||
Autodesk, Inc. (Software) | (a) | 6,500 | 655,330 | |||||||
CA, Inc. (Software) | 12,323 | 424,774 | ||||||||
Check Point Software Technologies Ltd. (Software) | (a) | 4,895 | 533,947 | |||||||
Citrix Systems, Inc. (Software) | (a) | 4,458 | 354,768 | |||||||
Electronic Arts, Inc. (Software) | (a) | 9,144 | 966,704 | |||||||
Intuit, Inc. (Software) | 7,557 | 1,003,645 | ||||||||
Microsoft Corp. (Software) | 227,712 | 15,696,188 | ||||||||
Symantec Corp. (Software) | 17,940 | 506,805 | ||||||||
Apple, Inc. (Tech. Hardware, Storage & Periph.) | 153,779 | 22,147,252 | ||||||||
Seagate Technology PLC (Tech. Hardware, Storage & Periph.) | 8,749 | 339,024 | ||||||||
| 75 | (continued) |
| Ohio National Fund, Inc. | Nasdaq-100® Index Portfolio (Continued) |
Schedule of Investments | June 30, 2017 (Unaudited) |
| Common Stocks (Continued) | Shares | Value | ||||||||
| INFORMATION TECHNOLOGY (continued) | ||||||||||
Western Digital Corp. (Tech. Hardware, Storage & Periph.) | 8,590 | $ | 761,074 | |||||||
|
| |||||||||
| 109,704,869 | ||||||||||
|
| |||||||||
| TELECOMMUNICATION SERVICES – 1.0% | ||||||||||
T-Mobile U.S., Inc. (Wireless Telecom. Svs.) | (a) | 24,505 | 1,485,493 | |||||||
Vodafone Group PLC – ADR (Wireless Telecom. Svs.) | 12,839 | 368,864 | ||||||||
|
| |||||||||
| 1,854,357 | ||||||||||
|
| |||||||||
Total Common Stocks (Cost $110,967,012) | $ | 190,794,581 | ||||||||
|
| |||||||||
| Money Market Funds – 2.3% | Shares | Value | ||||||||
State Street Institutional U.S. Government Money Market Fund Institutional Class | 4,528,792 | $ | 4,528,792 | |||||||
|
| |||||||||
Total Money Market Funds (Cost $4,528,792) | $ | 4,528,792 | ||||||||
|
| |||||||||
Total Investments – 101.1% (Cost $115,495,804) | (b) | $ | 195,323,373 | |||||||
Liabilities in Excess of Other Assets – (1.1)% | (c) | (2,225,616) | ||||||||
|
| |||||||||
Net Assets – 100.0% | $ | 193,097,757 | ||||||||
|
| |||||||||
Percentages are stated as a percent of net assets.
Abbreviations:
ADR: American Depositary Receipts
Footnotes:
| (a) | Non-income producing security. |
| (b) | Represents cost for financial reporting purposes, which may differ from cost basis for federal income tax purposes. See also Note 7 of the Notes to Financial Statements. |
| (c) | Includes $154,157 of cash pledged as collateral for the futures contracts outstanding at June 30, 2017. See also the following Schedule of Open Futures Contracts. |
The accompanying notes are an integral part of these financial statements.
Schedule of Open Futures Contracts | June 30, 2017 (Unaudited) |
Description | Number of Contracts | Expiration Date | Notional Amount | Value | Unrealized Appreciation (Depreciation) | |||||||||
CME E-mini Nasdaq-100 Index – Long | 23 | September 15, 2017 | $ | 2,624,780 | $2,600,265 | $ | (24,515 | ) | ||||||
|
|
|
|
| ||||||||||
The accompanying notes are an integral part of these financial statements.
| 76 |
| Ohio National Fund, Inc. | Bristol Portfolio |
Objective/Strategy
The Bristol Portfolio seeks long-term growth of capital by investing primarily in common stocks of the 1,000 largest publicly traded U.S. companies in terms of market capitalization.
Performance as of June 30, 2017
Average Annual returns | ||||
One year | 24.02% | |||
Five years | 17.96% | |||
Ten years | 7.22% |
Past performance does not guarantee future results. The performance data quoted represents past performance and current returns may be lower or higher. Total return figures include change in share price and reinvestment of dividends and capital gains. The investment return and principal value will fluctuate so that an investor’s shares, when redeemed, may be worth more or less than the original cost. To obtain performance information up to the most recent month end, call toll-free 1-877-781-6392.
The Portfolio is not open to direct retail investment. Beneficial interest in shares is obtained solely by purchase of variable life insurance policies and variable annuity contracts. Actual performance results for variable annuity and variable universal life contracts will be lower due to contract charges. Consult your contract for applicable charges.
Total expense ratio is 0.83% per the Fund’s prospectus dated May 1, 2017. Additional information pertaining to the Fund’s expense ratio as of June 30, 2017 can be found in the Portfolio’s Financial Highlights.
Comments from Sub-Adviser
Q. How did the Portfolio perform in comparison to its benchmark during the reporting period?
A. For the six-month period ended June 30, 2017, the Bristol Portfolio returned 11.12% versus 9.34% for its benchmark, the S&P 500 Index.
Q. Were there specific market conditions, investment strategies, or techniques that materially affected the Portfolio’s benchmark-relative performance during the reporting period?
A. At the half-way point of the year, the economy continues to churn ahead; perhaps, not at the speed our President desires, or promised, but at least in a positive direction. As the economy moves along steadily, under the watchful eye of the Federal Reserve, the market anticipated the progress of the federal government in implementing some of the broader promises leading up to the election.
Health care affects a large portion of the economy. At this point, major changes do not appear to be expected. If there is no new health care plan and subsequent major tax overhaul, there is a significant chance the market will react negatively. While one could argue that tax cut expectations have been reduced, there is clearly the hope that some major changes occur, even if it is a tax holiday to repatriate overseas earnings.
Q. How did sector selection and security selection each impact the Portfolio’s performance relative to its benchmark?
A. Positive stock selection in Information Technology and Consumer Discretionary were the strongest factors, leading to the Portfolio’s outperformance for the period. The Portfolio’s relative underweight to Energy, overweight to Information Technology, and selections in Industrials and Telecommunication Services also contributed. Key detractors to relative return were stock selections in Financials and Consumer Staples. (1)
Q. Which holdings contributed the most to, and detracted the most from, the Portfolio’s benchmark-relative performance?
A. Among the Portfolio’s Information Technology holdings, DXC Technology Co. generated 71 basis points of relative contribution and was able to beat analyst earnings estimates on stronger margins and continued progress towards its merger synergies with Hewlett Packard Enterprise Co. Delphi Automotive Plc contributed 51 basis points on positive earnings results and the spinoff of its powertrain division. Alnylam Pharmaceuticals, Inc. added 50 basis points benefitting from a competitor’s release which helped confirm the efficacy of the Alnylam Pharmaceuticals’ drug for familial amyloidotic polyneuropathy (FAP). (1)
The key detractor was IMAX Corp., which detracted 55 basis points of relative contribution while struggling from a slew of negative revisions, as the outlook for the summer movie slate worsened. We finally exited the position when it appeared that China was getting closer to saturation of IMAX theatres sooner than expected, and the revenue per theatre might be secularly challenged. Devon Energy Corp. cost the Portfolio 38 basis points, as it continued to contend with the consistently deteriorating outlook for oil prices. Even as the Organization of the Petroleum Exporting Countries (“OPEC”) struggles to maintain a cap on its own production levels, United States production has managed to stay resilient, pushing oil prices lower even as company specific results continue to trend positively. AECOM, which detracted 22 basis points, was expected to be a major beneficiary of a bipartisan infrastructure spending bill, but so far it seems expectations for any explicit plan to be released and implemented keep getting delayed.(1)
| (1) | The Portfolio’s composition is subject to change. Holdings and weightings are as of June 30, 2017. |
| 77 | (continued) |
| Ohio National Fund, Inc. | Bristol Portfolio (Continued) |
Change in Value of $10,000 Investment
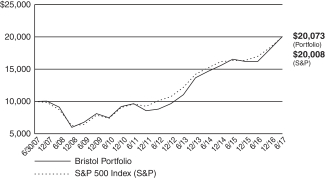
Hypothetical illustration based on past performance. Future performance will vary. The Portfolio’s returns reflect reinvested dividends. The Portfolio’s holdings may differ significantly from the securities in the index. The index is unmanaged and therefore does not reflect the cost of portfolio management and accounting.
The S&P 500 Index is a capitalization-weighted index designed to measure performance of the broad domestic economy through changes in the aggregate market value of 500 stocks representing all major industries. The index presented includes the effects of reinvested dividends.
Portfolio Composition as of June 30, 2017 (1)
| % of Net Assets | ||||
Common Stocks (4) | 99.7 | |||
Money Market Funds | 0.3 | |||
|
| |||
| 100.0 | ||||
|
|
Top 10 Portfolio Holdings as of June 30, 2017 (1) (2) (3)
| % of Net Assets | ||||
1. Apple, Inc. | 3.8 | |||
2. Amazon.com, Inc. | 3.3 | |||
3. Alphabet, Inc. Class C | 3.3 | |||
4. Facebook, Inc. Class A | 2.8 | |||
5. Citigroup, Inc. | 2.6 | |||
6. JPMorgan Chase & Co. | 2.6 | |||
7. Microsoft Corp. | 2.6 | |||
8. Goldman Sachs Group, Inc. / The | 2.5 | |||
9. Bank of America Corp. | 2.5 | |||
10. CBS Corp. Class B | 2.0 |
| (1) | Composition of Portfolio subject to change. |
| (2) | Short-term investments have been excluded from the list of Top 10 Portfolio Holdings. |
| (3) | Top 10 Portfolio Holdings is presented at an individual security level. Total investment exposure by issuer may be higher. |
| (4) | Sectors (Common Stocks): |
| % of Net Assets | ||||
Information Technology | 30.8 | |||
Consumer Discretionary | 19.0 | |||
Industrials | 13.8 | |||
Health Care | 13.5 | |||
Financials | 13.2 | |||
Consumer Staples | 3.8 | |||
Energy | 2.0 | |||
Materials | 2.0 | |||
Telecommunication Services | 1.6 | |||
|
| |||
| 99.7 | ||||
|
|
| 78 |
| Ohio National Fund, Inc. | Bristol Portfolio |
Schedule of Investments | June 30, 2017 (Unaudited) |
| Common Stocks – 99.7% | Shares | Value | ||||||||
| CONSUMER DISCRETIONARY – 19.0% | ||||||||||
McDonald’s Corp. (Hotels, Restaurants & Leisure) | 28,240 | $ | 4,325,238 | |||||||
MGM Resorts International (Hotels, Restaurants & Leisure) | 123,565 | 3,866,349 | ||||||||
Royal Caribbean Cruises Ltd. (Hotels, Restaurants & Leisure) | 19,096 | 2,085,856 | ||||||||
D.R. Horton, Inc. (Household Durables) | 127,427 | 4,405,151 | ||||||||
Newell Brands, Inc. (Household Durables) | 71,295 | 3,822,838 | ||||||||
Amazon.com, Inc. (Internet & Direct Marketing Retail) | (a) | 7,494 | 7,254,192 | |||||||
CBS Corp. Class B (Media) | 69,504 | 4,432,965 | ||||||||
Time Warner, Inc. (Media) | 22,450 | 2,254,205 | ||||||||
Coach, Inc. (Textiles, Apparel & Luxury Goods) | 92,395 | 4,373,979 | ||||||||
PVH Corp. (Textiles, Apparel & Luxury Goods) | 38,329 | 4,388,671 | ||||||||
|
| |||||||||
| 41,209,444 | ||||||||||
|
| |||||||||
| CONSUMER STAPLES – 3.8% | ||||||||||
Kraft Heinz Co. / The (Food Products) | 47,489 | 4,066,958 | ||||||||
Philip Morris International, Inc. (Tobacco) | 35,886 | 4,214,811 | ||||||||
|
| |||||||||
| 8,281,769 | ||||||||||
|
| |||||||||
| ENERGY – 2.0% | ||||||||||
Devon Energy Corp. (Oil, Gas & Consumable Fuels) | 60,118 | 1,921,972 | ||||||||
Pioneer Natural Resources Co. (Oil, Gas & Consumable Fuels) | 15,747 | 2,512,906 | ||||||||
|
| |||||||||
| 4,434,878 | ||||||||||
|
| |||||||||
| FINANCIALS – 13.2% | ||||||||||
Bank of America Corp. (Banks) | 222,251 | 5,391,809 | ||||||||
Citigroup, Inc. (Banks) | 84,854 | 5,675,036 | ||||||||
JPMorgan Chase & Co. (Banks) | 61,672 | 5,636,821 | ||||||||
KeyCorp (Banks) | 231,340 | 4,335,312 | ||||||||
Goldman Sachs Group, Inc. / The (Capital Markets) | 24,331 | 5,399,049 | ||||||||
Morgan Stanley (Capital Markets) | 47,447 | 2,114,238 | ||||||||
|
| |||||||||
| 28,552,265 | ||||||||||
|
| |||||||||
| HEALTH CARE – 13.5% | ||||||||||
Alnylam Pharmaceuticals, Inc. (Biotechnology) | (a) | 37,181 | 2,965,557 | |||||||
Celgene Corp. (Biotechnology) | (a) | 16,664 | 2,164,154 | |||||||
Medtronic PLC (Health Care Equip. & Supplies) | 23,777 | 2,110,209 | ||||||||
Envision Healthcare Corp. (Health Care Providers & Svs.) | (a) | 66,685 | 4,179,149 | |||||||
Humana, Inc. (Health Care Providers & Svs.) | 18,367 | 4,419,468 | ||||||||
UnitedHealth Group, Inc. (Health Care Providers & Svs.) | 13,921 | 2,581,232 | ||||||||
Thermo Fisher Scientific, Inc. (Life Sciences Tools & Svs.) | 24,766 | 4,320,924 | ||||||||
Aerie Pharmaceuticals, Inc. (Pharmaceuticals) | (a) | 41,023 | 2,155,759 | |||||||
AstraZeneca PLC – ADR (Pharmaceuticals) | 124,469 | 4,243,148 | ||||||||
|
| |||||||||
| 29,139,600 | ||||||||||
|
| |||||||||
| Common Stocks (Continued) | Shares | Value | ||||||||
| INDUSTRIALS – 13.8% | ||||||||||
Raytheon Co. (Aerospace & Defense) | 26,882 | $ | 4,340,905 | |||||||
FedEx Corp. (Air Freight & Logistics) | 20,256 | 4,402,236 | ||||||||
Delta Air Lines, Inc. (Airlines) | 51,050 | 2,743,427 | ||||||||
AECOM (Construction & Engineering) | (a) | 125,067 | 4,043,416 | |||||||
Snap-on, Inc. (Machinery) | 22,443 | 3,545,994 | ||||||||
Wabtec Corp. (Machinery) | 29,910 | 2,736,765 | ||||||||
Xylem, Inc. (Machinery) | 70,991 | 3,935,031 | ||||||||
Union Pacific Corp. (Road & Rail) | 38,029 | 4,141,738 | ||||||||
|
| |||||||||
| 29,889,512 | ||||||||||
|
| |||||||||
| INFORMATION TECHNOLOGY – 30.8% | ||||||||||
CommScope Holding Co., Inc. (Communications Equip.) | (a) | 114,452 | 4,352,610 | |||||||
Trimble, Inc. (Electronic Equip., Instr. & Comp.) | (a) | 119,906 | 4,277,047 | |||||||
Alibaba Group Holding Ltd. – ADR (Internet Software & Svs.) | (a) | 15,125 | 2,131,113 | |||||||
Alphabet, Inc. Class A (Internet Software & Svs.) | (a) | 693 | 644,268 | |||||||
Alphabet, Inc. Class C (Internet Software & Svs.) | (a) | 7,864 | 7,146,253 | |||||||
Facebook, Inc. Class A (Internet Software & Svs.) | (a) | 39,524 | 5,967,334 | |||||||
DXC Technology Co. (IT Svs.) | 55,873 | 4,286,577 | ||||||||
ASML Holding NV (Semiconductors & Equip.) | 32,627 | 4,251,624 | ||||||||
Broadcom Ltd. (Semiconductors & Equip.) | 17,984 | 4,191,171 | ||||||||
Cavium, Inc. (Semiconductors & Equip.) | (a) | 49,049 | 3,047,414 | |||||||
Marvell Technology Group Ltd. (Semiconductors & Equip.) | 246,938 | 4,079,416 | ||||||||
Adobe Systems, Inc. (Software) | (a) | 30,151 | 4,264,557 | |||||||
Microsoft Corp. (Software) | 81,417 | 5,612,074 | ||||||||
Oracle Corp. (Software) | 85,339 | 4,278,897 | ||||||||
Apple, Inc. (Tech. Hardware, Storage & Periph.) | 56,997 | 8,208,708 | ||||||||
|
| |||||||||
| 66,739,063 | ||||||||||
|
| |||||||||
| MATERIALS – 2.0% | ||||||||||
Dow Chemical Co. / The (Chemicals) | 67,487 | 4,256,405 | ||||||||
|
| |||||||||
| TELECOMMUNICATION SERVICES – 1.6% | ||||||||||
T-Mobile U.S., Inc. (Wireless Telecom. Svs.) | (a) | 58,233 | 3,530,084 | |||||||
|
| |||||||||
Total Common Stocks (Cost $192,878,496) | $ | 216,033,020 | ||||||||
|
| |||||||||
| Money Market Funds – 0.4% | Shares | Value | ||||||||
State Street Institutional U.S. Government Money Market Fund Institutional Class | 770,084 | $ | 770,084 | |||||||
|
| |||||||||
Total Money Market Funds (Cost $770,084) | $ | 770,084 | ||||||||
|
| |||||||||
Total Investments – 100.1% (Cost $193,648,580) | (b) | $ | 216,803,104 | |||||||
Liabilities in Excess of Other Assets – (0.1)% | (222,944) | |||||||||
|
| |||||||||
Net Assets – 100.0% | $ | 216,580,160 | ||||||||
|
| |||||||||
Percentages are stated as a percent of net assets.
Abbreviations:
ADR: American Depositary Receipts
Footnotes:
| (a) | Non-income producing security. |
| (b) | Represents cost for financial reporting purposes, which may differ from cost basis for federal income tax purposes. See also Note 7 of the Notes to Financial Statements. |
The accompanying notes are an integral part of these financial statements.
| 79 |
| Ohio National Fund, Inc. | Bryton Growth Portfolio |
Objective/Strategy
The Bryton Growth Portfolio seeks long-term growth of capital by investing primarily in common stocks of growth-oriented U.S. companies smaller than the 500 largest publicly traded U.S. companies in terms of market capitalization.
Performance as of June 30, 2017
Average Annual returns | ||||
One year | 22.28% | |||
Five years | 11.34% | |||
Ten years | 5.26% |
Past performance does not guarantee future results. The performance data quoted represents past performance and current returns may be lower or higher. Total return figures include change in share price and reinvestment of dividends and capital gains. The investment return and principal value will fluctuate so that an investor’s shares, when redeemed, may be worth more, or less than the original cost. To obtain performance information up to the most recent month end, call toll-free 1-877-781-6392.
The Portfolio is not open to direct retail investment. Beneficial interest in shares is obtained solely by purchase of variable life insurance policies and variable annuity contracts. Actual performance results for variable annuity and variable universal life contracts will be lower due to contract charges. Consult your contract for applicable charges.
Total expense ratio is 0.92% per the Fund’s prospectus dated May 1, 2017. Additional information pertaining to the Fund’s expense ratio as of June 30, 2017 can be found in the Portfolio’s Financial Highlights.
Comments from Sub-Adviser
Q. How did the Portfolio perform in comparison to its benchmark during the reporting period?
A. For the six-month period ended June 30, 2017, the Bryton Growth Portfolio returned 10.64% versus 9.97% for its benchmark, the Russell 2000 Growth Index.
Q. Were there specific market conditions, investment strategies, or techniques that materially affected the Portfolio’s benchmark-relative performance during the reporting period?
A. At the half-way point of the year, the economy continues to churn ahead; perhaps, not at the speed our President desires, or promised, but at least in a positive direction. As the economy moves along steadily, under the watchful eye of the Federal Reserve, the market anticipated the progress of the federal government in implementing some of the broader promises leading up to the election.
Health care affects a large portion of the economy. At this point, major changes do not appear to be expected. If there is no new health care plan and subsequent major tax overhaul, there is a significant chance the market will react negatively. While one could argue that tax cut expectations have been reduced, there is clearly the hope that some major changes occur, even if it is a tax holiday to repatriate overseas earnings.
Q. How did sector selection and security selection each impact the Portfolio’s performance relative to its benchmark?
A. Leading the Portfolio’s outperformance were positive stock selections in Health Care, Consumer Staples, and Industrials. An underweight to Consumer Discretionary and an overweight to Information Technology also contributed. Top detractors were stock
selections within Consumer Discretionary and Information Technology, as well as overweights to Energy and Consumer Staples.(1)
Q. Which holdings contributed the most to, and detracted the most from, the Portfolio’s benchmark-relative performance?
A. The Portfolio had a number of successes within Health Care that helped drive strong performance during the period. AxoGen, Inc. contributed 107 basis points of relative contribution and continued to successfully ramp up its nerve repair product, the AxoGuard Nerve Connector. Mazor Robotics, Ltd. added 92 basis points on strong sales and orders for its robotic spine surgery device, driven by a partnership with Medtronic PLC that was initiated in 2016. Additionally, there is speculation that Medtronic PLC would be interested in acquiring the company outright. Sage Therapeutics, Inc. showed positive early stage clinical trial data and added another 76 basis points of contribution.(1)
Callon Petroleum Co. detracted 48 basis points of relative contribution as it continued to struggle from the deteriorating outlook for oil prices. Even as the Organization of the Petroleum Exporting Countries (“OPEC”) struggles to maintain a cap on its own production levels, United States production has managed to stay resilient, pushing oil prices lower even as company specific results continue to trend positively. IMAX Corp. detracted 45 basis points while struggling from a slew of negative revisions, as the outlook for the summer movie slate worsened. We finally exited the position when it appeared that China was getting closer to saturation of IMAX theatres sooner than expected, and the revenue per theatre might be secularly challenged. Inphi Corp. reported a strong first quarter, but delivered a weaker than expected guidance for the second quarter, impacted by inventory correction stemming from delayed optical builds in China, causing a loss of 38 basis points.(1)
| (1) | The Portfolio’s composition is subject to change. Holdings and weightings are as of June 30, 2017. |
| 80 | (continued) |
| Ohio National Fund, Inc. | Bryton Growth Portfolio (Continued) |
Change in Value of $10,000 Investment
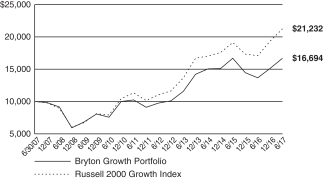
Hypothetical illustration based on past performance. Future performance will vary. The Portfolio’s returns reflect reinvested dividends. The Portfolio’s holdings may differ significantly from the securities in the index. The index is unmanaged and therefore does not reflect the cost of portfolio management and accounting.
The Russell 2000 Growth Index measures the performance of the small-cap growth segment of the U.S. equity universe. It includes the Russell 2000 Index companies with higher price-to-value ratios and higher forecasted growth values. The Russell 2000 Index includes the 2000 firms from the Russell 3000 Index with the smallest market capitalizations. The Russell 3000 Index represents 98% of the investable U.S. equity market. The index presented includes the effects of reinvested dividends.
Portfolio Composition as of June 30, 2017 (1)
| % of Net Assets | ||||
Common Stocks (4) | 99.4 | |||
Money Market Funds | ||||
Less Net Liabilities | 0.6 | |||
|
| |||
| 100.0 | ||||
|
|
Top 10 Portfolio Holdings as of June 30, 2017 (1) (2) (3)
| % of Net Assets | ||||
1. Mueller Water Products, Inc. Class A | 2.1 | |||
2. E.L.F. Beauty, Inc. | 2.1 | |||
3. Home BancShares, Inc. | 2.0 | |||
4. Prestige Brands Holdings, Inc. | 2.0 | |||
5. Healthcare Services Group, Inc. | 2.0 | |||
6. Revance Therapeutics, Inc. | 1.9 | |||
7. PolyOne Corp. | 1.9 | |||
8. Fair Isaac Corp. | 1.9 | |||
9. MGP Ingredients, Inc. | 1.9 | |||
10. Semtech Corp. | 1.9 |
| (1) | Composition of Portfolio subject to change. |
| (2) | Short-term investments have been excluded from the list of Top 10 Portfolio Holdings. |
| (3) | Top 10 Portfolio Holdings is presented at an individual security level. Total investment exposure by issuer may be higher. |
| (4) | Sectors (Common Stocks): |
| % of Net Assets | ||||
Information Technology | 33.3 | |||
Health Care | 23.2 | |||
Industrials | 20.7 | |||
Consumer Staples | 7.4 | |||
Consumer Discretionary | 5.7 | |||
Financials | 5.5 | |||
Materials | 1.9 | |||
Energy | 1.0 | |||
Real Estate | 0.7 | |||
|
| |||
| 99.4 | ||||
|
|
| 81 |
| Ohio National Fund, Inc. | Bryton Growth Portfolio |
Schedule of Investments | June 30, 2017 (Unaudited) |
| Common Stocks – 99.4% | Shares | Value | ||||||||
| CONSUMER DISCRETIONARY – 5.7% | ||||||||||
Superior Industries International, Inc. (Auto Components) | 70,473 | $ | 1,448,220 | |||||||
Tenneco, Inc. (Auto Components) | 17,326 | 1,001,963 | ||||||||
Carrols Restaurant Group, Inc. (Hotels, Restaurants & Leisure) | (a) | 101,062 | 1,238,009 | |||||||
ClubCorp Holdings, Inc. (Hotels, Restaurants & Leisure) | 137,579 | 1,802,285 | ||||||||
|
| |||||||||
| 5,490,477 | ||||||||||
|
| |||||||||
| CONSUMER STAPLES – 7.4% | ||||||||||
MGP Ingredients, Inc. (Beverages) | 35,763 | 1,829,993 | ||||||||
J&J Snack Foods Corp. (Food Products) | 12,013 | 1,586,557 | ||||||||
Nomad Foods Ltd. (Food Products) | (a) | 121,409 | 1,713,081 | |||||||
E.L.F. Beauty, Inc. (Personal Products) | (a) | 72,405 | 1,970,140 | |||||||
|
| |||||||||
| 7,099,771 | ||||||||||
|
| |||||||||
| ENERGY – 1.0% | ||||||||||
Callon Petroleum Co. (Oil, Gas & Consumable Fuels) | (a) | 92,946 | 986,157 | |||||||
|
| |||||||||
| FINANCIALS – 5.5% | ||||||||||
Ameris Bancorp (Banks) | 32,063 | 1,545,437 | ||||||||
Home BancShares, Inc. (Banks) | 78,507 | 1,954,824 | ||||||||
Evercore Partners, Inc. Class A (Capital Markets) | 24,409 | 1,720,834 | ||||||||
|
| |||||||||
| 5,221,095 | ||||||||||
|
| |||||||||
| HEALTH CARE – 23.2% | ||||||||||
Ligand Pharmaceuticals, Inc. (Biotechnology) | (a) | 13,677 | 1,660,388 | |||||||
Loxo Oncology, Inc. (Biotechnology) | (a) | 12,958 | 1,039,102 | |||||||
Sage Therapeutics, Inc. (Biotechnology) | (a) | 20,334 | 1,619,400 | |||||||
AxoGen, Inc. (Health Care Equip. & Supplies) | (a) | 88,862 | 1,488,439 | |||||||
K2M Group Holdings, Inc. (Health Care Equip. & Supplies) | (a) | 32,054 | 780,835 | |||||||
Neogen Corp. (Health Care Equip. & Supplies) | (a) | 23,343 | 1,613,235 | |||||||
Penumbra, Inc. (Health Care Equip. & Supplies) | (a) | 18,076 | 1,586,169 | |||||||
NeoGenomics, Inc. (Life Sciences Tools & Svs.) | (a) | 199,569 | 1,788,138 | |||||||
Aclaris Therapeutics, Inc. (Pharmaceuticals) | (a) | 54,244 | 1,471,097 | |||||||
Aerie Pharmaceuticals, Inc. (Pharmaceuticals) | (a) | 23,162 | 1,217,163 | |||||||
Pacira Pharmaceuticals, Inc. (Pharmaceuticals) | (a) | 32,360 | 1,543,572 | |||||||
Paratek Pharmaceuticals, Inc. (Pharmaceuticals) | (a) | 53,866 | 1,298,171 | |||||||
Prestige Brands Holdings, Inc. (Pharmaceuticals) | (a) | 36,319 | 1,918,006 | |||||||
Revance Therapeutics, Inc. (Pharmaceuticals) | (a) | 70,095 | 1,850,508 | |||||||
Teligent, Inc. (Pharmaceuticals) | (a) | 151,570 | 1,386,865 | |||||||
|
| |||||||||
| 22,261,088 | ||||||||||
|
| |||||||||
| INDUSTRIALS – 20.7% | ||||||||||
Aerojet Rocketdyne Holdings, Inc. (Aerospace & Defense) | (a) | 82,599 | 1,718,059 | |||||||
Axon Enterprise, Inc. (Aerospace & Defense) | (a) | 64,394 | 1,618,865 | |||||||
Cubic Corp. (Aerospace & Defense) | 14,782 | 684,407 | ||||||||
Casella Waste Systems, Inc. Class A (Commercial Svs. & Supplies) | (a) | 55,402 | 909,147 | |||||||
Healthcare Services Group, Inc. (Commercial Svs. & Supplies) | 40,769 | 1,909,212 | ||||||||
Tetra Tech, Inc. (Commercial Svs. & Supplies) | 31,577 | 1,444,648 | ||||||||
Aegion Corp. (Construction & Engineering) | (a) | 64,633 | 1,414,170 | |||||||
Dycom Industries, Inc. (Construction & Engineering) | (a) | 18,614 | 1,666,325 | |||||||
| Common Stocks (Continued) | Shares | Value | ||||||||
| INDUSTRIALS (continued) | ||||||||||
Mueller Water Products, Inc. Class A (Machinery) | 169,072 | $ | 1,974,761 | |||||||
Navistar International Corp. (Machinery) | (a) | 55,889 | 1,465,968 | |||||||
Rexnord Corp. (Machinery) | (a) | 61,631 | 1,432,921 | |||||||
Mistras Group, Inc. (Professional Svs.) | (a) | 82,248 | 1,806,989 | |||||||
Univar, Inc. (Trading Companies & Distributors) | (a) | 61,859 | 1,806,283 | |||||||
|
| |||||||||
| 19,851,755 | ||||||||||
|
| |||||||||
| INFORMATION TECHNOLOGY – 33.3% | ||||||||||
Belden, Inc. (Electronic Equip., Instr. & Comp.) | 19,009 | 1,433,849 | ||||||||
Fabrinet (Electronic Equip., Instr. & Comp.) | (a) | 35,286 | 1,505,301 | |||||||
FARO Technologies, Inc. (Electronic Equip., Instr. & Comp.) | (a) | 40,484 | 1,530,295 | |||||||
Infinera Corp. (Communications Equip.) | (a) | 84,449 | 901,071 | |||||||
Radware Ltd. (Communications Equip.) | (a) | 96,252 | 1,688,260 | |||||||
Viavi Solutions, Inc. (Communications Equip.) | (a) | 153,191 | 1,613,101 | |||||||
Cornerstone OnDemand, Inc. (Internet Software & Svs.) | (a) | 40,751 | 1,456,848 | |||||||
Cavium, Inc. (Semiconductors & Equip.) | (a) | 26,513 | 1,647,253 | |||||||
FormFactor, Inc. (Semiconductors & Equip.) | (a) | 92,687 | 1,149,319 | |||||||
Inphi Corp. (Semiconductors & Equip.) | (a) | 48,692 | 1,670,136 | |||||||
Integrated Device Technology, Inc. (Semiconductors & Equip.) | (a) | 69,789 | 1,799,858 | |||||||
Microsemi Corp. (Semiconductors & Equip.) | (a) | 33,651 | 1,574,867 | |||||||
Power Integrations, Inc. (Semiconductors & Equip.) | 20,321 | 1,481,401 | ||||||||
Semtech Corp. (Semiconductors & Equip.) | (a) | 50,740 | 1,813,955 | |||||||
Silicon Motion Technology Corp. – ADR (Semiconductors & Equip.) | 31,506 | 1,519,534 | ||||||||
Callidus Software, Inc. (Software) | (a) | 63,852 | 1,545,218 | |||||||
CommVault Systems, Inc. (Software) | (a) | 25,788 | 1,455,733 | |||||||
Fair Isaac Corp. (Software) | 13,162 | 1,834,914 | ||||||||
Telenav, Inc. (Software) | (a) | 137,266 | 1,111,855 | |||||||
Zendesk, Inc. (Software) | (a) | 57,808 | 1,605,906 | |||||||
Electronics For Imaging, Inc. (Tech. Hardware, Storage & Periph.) | (a) | 34,041 | 1,612,863 | |||||||
|
| |||||||||
| 31,951,537 | ||||||||||
|
| |||||||||
| MATERIALS – 1.9% | ||||||||||
PolyOne Corp. (Chemicals) | 47,722 | 1,848,750 | ||||||||
|
| |||||||||
| REAL ESTATE – 0.7% | ||||||||||
Rexford Industrial Realty, Inc. (Equity Real Estate Investment Trusts) | 25,279 | 693,656 | ||||||||
|
| |||||||||
Total Common Stocks (Cost $87,638,189) | $ | 95,404,286 | ||||||||
|
| |||||||||
| Money Market Funds – 1.9% | Shares | Value | ||||||||
State Street Institutional U.S. Government Money Market Fund Institutional Class | 1,846,433 | $ | 1,846,433 | |||||||
|
| |||||||||
Total Money Market Funds (Cost $1,846,433) | $ | 1,846,433 | ||||||||
|
| |||||||||
Total Investments – 101.3% (Cost $89,484,622) | (b) | $ | 97,250,719 | |||||||
Liabilities in Excess of Other Assets – (1.3)% | (1,212,665) | |||||||||
|
| |||||||||
Net Assets – 100.0% | $ | 96,038,054 | ||||||||
|
| |||||||||
Percentages are stated as a percent of net assets.
Abbreviations:
ADR: American Depositary Receipts
Footnotes:
| (a) | Non-income producing security. |
| (b) | Represents cost for financial reporting purposes, which may differ from cost basis for federal income tax purposes. See also Note 7 of the Notes to Financial Statements. |
The accompanying notes are an integral part of these financial statements.
| 82 |
| Ohio National Fund, Inc. | Balanced Portfolio |
Objective/Strategy
The Balanced Portfolio seeks capital appreciation and income by investing normally up to 75% of its total assets in equity securities of domestic and foreign companies of any market capitalization while maintaining a minimum of 25% of its total assets in fixed income securities.
Performance as of June 30, 2017
Average Annual returns | ||||
One year | 10.85% | |||
Five years | 7.41% | |||
Ten years | 5.11% |
Past performance does not guarantee future results. The performance data quoted represents past performance and current returns may be lower or higher. Total return figures include change in share price and reinvestment of dividends and capital gains. The investment return and principal value will fluctuate so that an investor’s shares, when redeemed, may be worth more or less than the original cost. To obtain performance information up to the most recent month end, call toll-free 1-877-781-6392.
The Portfolio is not open to direct retail investment. Beneficial interest in shares is obtained solely by purchase of variable life insurance policies and variable annuity contracts. Actual performance results for variable annuity and variable universal life contracts will be lower due to contract charges. Consult your contract for applicable charges.
Total expense ratio is 0.74% per the Fund’s prospectus dated May 1, 2017. Additional information pertaining to the Fund’s expense ratio as of June 30, 2017 can be found in the Portfolio’s Financial Highlights.
Comments from Sub-Adviser
Q. How did the Portfolio perform in comparison to its benchmark during the reporting period?
A. For the six-month period ended June 30, 2017, the Balanced Portfolio returned 6.45% versus 6.35% for its benchmark, which is comprised of 60% S&P Composite 1500 Index and 40% Bloomberg Barclays U.S. Universal Index.
Q. Were there specific market conditions, investment strategies, or techniques that materially affected the Portfolio’s benchmark-relative performance during the reporting period?
A. Entering 2017, our equity valuation model viewed the overall broad domestic market as trading approximately 4% above our estimate of fair value. Given our valuation model’s estimate for the market, the Portfolio maintained an underweight position in equities relative to the benchmark during the six-month period. While the Portfolio was underweight equities relative to the blended benchmark, security selection within the equity portion of the Portfolio led to a positive overall net effect from an attribution standpoint. The Portfolio also had a larger than normal cash balance during the period, which ended up being a drag on performance due to positive market returns.(1)
The fixed income portion of the Portfolio had positive overall performance, even while the bond market traded in a relatively narrow range. We continued our focus on credit spread risk, with a particular focus on shorter duration. The Portfolio’s fixed income volatility remained relatively low, resulting in positive risk-adjusted returns. The Portfolio’s use of closed-end fund arbitrage continued to be rewarded, as a number of these positions converted to open-end funds or liquidated, capturing the original discount to net asset value at which they had been acquired. This strategy has been a consistent contributor to relative return. Given our positioning, we
tend to expect underperformance when rates fall aggressively and relative outperformance when rates rise.(1)
Q. How did sector selection and security selection each impact the Portfolio’s performance relative to its benchmark?
A. Focusing on the equity portion of the Portfolio, the largest sector contributor to relative performance over the course of the period was the Information Technology sector, as strong stock selection produced positive total effect. Other sectors that contributed positively to relative performance included the Health Care, Telecommunication Services, and Real Estate sectors. Positions in Financials, Consumer Staples, and Consumer Discretionary detracted from relative performance over the period.(1)
The fixed income portion of the Portfolio did not significantly impact relative performance.(1)
Q. Were there any factors that impacted the benchmark’s performance more significantly than the Portfolio’s performance?
A. During the first half of 2017, the Portfolio was underweight equities relative to the benchmark and had a significant cash position. While the cash position was a drag on performance during a time when many equity markets registered all-time highs, the Portfolio still managed to slightly outperform the benchmark.(1)
Q. Which holdings contributed the most to, and detracted the most from, the Portfolio’s benchmark-relative performance?
A. The three best benchmark-relative contributors were Broadcom Ltd., IPG Photonics Corp., and Jazz Pharmaceuticals PLC. Both Broadcom Ltd. & IPG Photonics Corp. were beneficiaries of the strong rally in the Information Technology sector. Jazz Pharmaceuticals PLC is a specialty pharmaceutical company that saw a strong rebound in the first half of 2017 after having a tough second half of 2016. We continue to believe the company could provide further upside, as valuations remain attractive.(1)
The three stocks that detracted the most from benchmark-relative performance were Discover Financial Services, Cimarex Energy Co., and Signature Bank. Discover Financial Services fell by over 13% during the first half of the year as earnings disappointed relative to the rest of the peer group. Cimarex Energy Co. is a mid-cap energy company in the oil & gas exploration & production industry. Oil price pressure weighed heavy on this commodity-exposed company, resulting in a sell-off of over 32% in the stock. After a strong fourth quarter of 2016, Signature Bank fell by about 3.5% over the course of the period. While the absolute losses were relatively small, the large overweight position in the name resulted in performance drawdown for the Portfolio.(1)
Q. How did the Portfolio’s use of derivative instruments and initial public offerings (IPOs), if any, impact performance?
A. The Portfolio utilized both written calls and purchased puts during the period. The use of these options detracted 0.34% due to the constantly grinding upward market and low overall volatility environment.(1)
| (1) | The Portfolio’s composition is subject to change. Holdings and weightings are as of June 30, 2017. |
| 83 | (continued) |
| Ohio National Fund, Inc. | Balanced Portfolio (Continued) |
Change in Value of $10,000 Investment
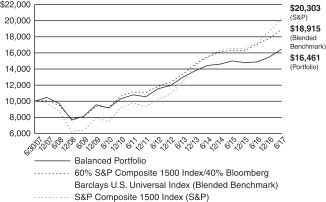
Hypothetical illustration based on past performance. Future performance will vary. The Portfolio’s returns reflect reinvested dividends. The Portfolio’s holdings may differ significantly from the securities in the index. The index is unmanaged and therefore does not reflect the cost of portfolio management and accounting.
The S&P Composite 1500 Index is a broad-based capitalization-weighted index of 1500 U.S. companies and is comprised of the S&P MidCap 400, S&P 500, and the S&P SmallCap 600. It is designed for investors seeking to replicate to the performance of the U.S. equity market or benchmark against a representative universe of tradable stocks. The index presented includes the effects of reinvested dividends.
The Bloomberg Barclays U.S. Universal Index represents the union of the U.S. Aggregate Index, U.S. Corporate High Yield Index. Investment Grade 144A Index, Eurodollar Index, U.S. Emerging Markets Index, and the non-ERISA portion of the Commercial Mortgage-Backed Securities (CMBS) Index. The index covers USD-denominated, taxable bonds that are rated either investment grade or high-yield.
Portfolio Composition as of June 30, 2017 (1)
| % of Net Assets | ||||
Common Stocks (4) | 46.1 | |||
Corporate Bonds (4) | 24.5 | |||
Preferred Securities (4) | 2.3 | |||
Asset-Backed / Mortgage-Backed Securities (4) | 0.9 | |||
U.S. Treasury Obligations | 12.8 | |||
Closed-End Mutual Funds | 6.6 | |||
Exchange Traded Funds | 1.5 | |||
Purchased Options | 0.2 | |||
Money Market Funds | ||||
Less Net Liabilities | 5.1 | |||
|
| |||
| 100.0 | ||||
|
|
Top 10 Portfolio Holdings as of June 30, 2017 (1) (2) (3)
| % of Net Assets | ||||
1. U.S. Treasury Note | 3.0 | |||
2. U.S. Treasury Note | 3.0 | |||
3. U.S. Treasury Note | 2.9 | |||
4. U.S. Treasury Note | 2.0 | |||
5. Prudential Financial, Inc. | 1.4 | |||
6. Discover Financial Services | 1.4 | |||
7. Sirius XM Radio, Inc. | 1.2 | |||
8. Berkshire Hathaway, Inc. Class B | 1.2 | |||
9. Berkshire Hathaway, Inc. 2.750%, 03/15/2023 | 1.2 | |||
10. Broadcom Ltd. | 1.2 |
| (1) | Composition of Portfolio subject to change. |
| (2) | Short-term investments have been excluded from the list of Top 10 Portfolio Holdings. |
| (3) | Top 10 Portfolio Holdings is presented at an individual security level. Total investment exposure by issuer may be higher. |
| (4) | Sectors (Common Stocks, Corporate Bonds, Preferred Securities, Asset-Backed / Mortgage-Backed Securities): |
| % of Net Assets | ||||
Financials | 17.5 | |||
Information Technology | 11.8 | |||
Consumer Discretionary | 11.7 | |||
Health Care | 8.5 | |||
Industrials | 7.2 | |||
Energy | 5.9 | |||
Consumer Staples | 4.3 | |||
Materials | 2.7 | |||
Real Estate | 1.6 | |||
Utilities | 1.5 | |||
Telecommunication Services | 1.1 | |||
|
| |||
| 73.8 | ||||
|
|
| 84 |
| Ohio National Fund, Inc. | Balanced Portfolio |
Schedule of Investments | June 30, 2017 (Unaudited) |
| Common Stocks – 46.1% | Shares | Value | ||||||||
| CONSUMER DISCRETIONARY – 7.7% | ||||||||||
Goodyear Tire & Rubber Co. / The (Auto Components) | 145,000 | $ | 5,069,200 | |||||||
Magna International, Inc. (Auto Components) | 120,000 | 5,559,600 | ||||||||
McDonald’s Corp. (Hotels, Restaurants & Leisure) | 7,000 | 1,072,120 | ||||||||
Royal Caribbean Cruises Ltd. (Hotels, Restaurants & Leisure) | 15,000 | 1,638,450 | ||||||||
Wyndham Worldwide Corp. (Hotels, Restaurants & Leisure) | 65,000 | 6,526,650 | ||||||||
Newell Brands, Inc. (Household Durables) | 145,000 | 7,774,900 | ||||||||
Whirlpool Corp. (Household Durables) | 13,000 | 2,491,060 | ||||||||
Brunswick Corp. (Leisure Products) | 142,000 | 8,907,660 | ||||||||
CBS Corp. Class B (Media) | 49,704 | 3,170,121 | ||||||||
Comcast Corp. Class A (Media) | 62,088 | 2,416,465 | ||||||||
Time Warner, Inc. (Media) | 51,000 | 5,120,910 | ||||||||
Twenty-First Century Fox, Inc. Class A (Media) | 165,000 | 4,676,100 | ||||||||
Walt Disney Co. / The (Media) | 50,000 | 5,312,500 | ||||||||
AutoZone, Inc. (Specialty Retail) | (a) | 4,000 | 2,281,840 | |||||||
Lowe’s Cos., Inc. (Specialty Retail) | 45,000 | 3,488,850 | ||||||||
O’Reilly Automotive, Inc. (Specialty Retail) | (a) | 19,000 | 4,156,060 | |||||||
NIKE, Inc. Class B (Textiles, Apparel & Luxury Goods) | 115,000 | 6,785,000 | ||||||||
|
| |||||||||
| 76,447,486 | ||||||||||
|
| |||||||||
| CONSUMER STAPLES – 2.7% | ||||||||||
Constellation Brands, Inc. Class A (Beverages) | 15,000 | 2,905,950 | ||||||||
Molson Coors Brewing Co. Class B (Beverages) | 15,000 | 1,295,100 | ||||||||
Monster Beverage Corp. (Beverages) | (a) | 50,000 | 2,484,000 | |||||||
CVS Health Corp. (Food & Staples Retailing) | 80,000 | 6,436,800 | ||||||||
Walgreens Boots Alliance, Inc. (Food & Staples Retailing) | 75,000 | 5,873,250 | ||||||||
Tyson Foods, Inc. Class A (Food Products) | 125,000 | 7,828,750 | ||||||||
|
| |||||||||
| 26,823,850 | ||||||||||
|
| |||||||||
| ENERGY – 2.9% | ||||||||||
Schlumberger Ltd. (Energy Equip. & Svs.) | 70,000 | 4,608,800 | ||||||||
U.S. Silica Holdings, Inc. (Energy Equip. & Svs.) | 125,000 | 4,436,250 | ||||||||
Cimarex Energy Co. (Oil, Gas & Consumable Fuels) | 57,000 | 5,358,570 | ||||||||
Diamondback Energy, Inc. (Oil, Gas & Consumable Fuels) | (a) | 65,000 | 5,772,650 | |||||||
Marathon Petroleum Corp. (Oil, Gas & Consumable Fuels) | 40,000 | 2,093,200 | ||||||||
Range Resources Corp. (Oil, Gas & Consumable Fuels) | 75,000 | 1,737,750 | ||||||||
SRC Energy, Inc. (Oil, Gas & Consumable Fuels) | (a) | 750,000 | 5,047,500 | |||||||
|
| |||||||||
| 29,054,720 | ||||||||||
|
| |||||||||
| FINANCIALS – 7.1% | ||||||||||
Bank of America Corp. (Banks) | 190,000 | 4,609,400 | ||||||||
KeyCorp (Banks) | 250,000 | 4,685,000 | ||||||||
Signature Bank (Banks) | (a) | 63,270 | 9,081,143 | |||||||
SVB Financial Group (Banks) | (a) | 15,000 | 2,636,850 | |||||||
Goldman Sachs Group, Inc. / The (Capital Markets) | 34,000 | 7,544,600 | ||||||||
Invesco Ltd. (Capital Markets) | 62,900 | 2,213,451 | ||||||||
Discover Financial Services (Consumer Finance) | 222,080 | 13,811,155 | ||||||||
Berkshire Hathaway, Inc. Class B (Diversified Financial Svs.) | (a) | 73,000 | 12,364,010 | |||||||
American International Group, Inc. (Insurance) | 70,000 | 4,376,400 | ||||||||
Lincoln National Corp. (Insurance) | 75,000 | 5,068,500 | ||||||||
XL Group Ltd. (Insurance) | 100,000 | 4,380,000 | ||||||||
|
| |||||||||
| 70,770,509 | ||||||||||
|
| |||||||||
| HEALTH CARE – 7.6% | ||||||||||
AbbVie, Inc. (Biotechnology) | 15,000 | 1,087,650 | ||||||||
Celgene Corp. (Biotechnology) | (a) | 46,000 | 5,974,020 | |||||||
China Biologic Products, Inc. (Biotechnology) | (a) | 15,000 | 1,696,500 | |||||||
Ligand Pharmaceuticals, Inc. (Biotechnology) | (a) | 15,000 | 1,821,000 | |||||||
Shire PLC – ADR (Biotechnology) | 27,000 | 4,462,290 | ||||||||
Boston Scientific Corp. (Health Care Equip. & Supplies) | (a) | 200,000 | 5,544,000 | |||||||
Edwards Lifesciences Corp. (Health Care Equip. & Supplies) | (a) | 55,000 | 6,503,200 | |||||||
Teleflex, Inc. (Health Care Equip. & Supplies) | 10,000 | 2,077,600 | ||||||||
Zimmer Biomet Holdings, Inc. (Health Care Equip. & Supplies) | 17,000 | 2,182,800 | ||||||||
Aetna, Inc. (Health Care Providers & Svs.) | 25,000 | 3,795,750 | ||||||||
Cigna Corp. (Health Care Providers & Svs.) | 18,000 | 3,013,020 | ||||||||
HCA Healthcare, Inc. (Health Care Providers & Svs.) | (a) | 60,000 | 5,232,000 | |||||||
Thermo Fisher Scientific, Inc. (Life Sciences Tools & Svs.) | 30,000 | 5,234,100 | ||||||||
Allergan PLC (Pharmaceuticals) | 43,700 | 10,623,033 | ||||||||
Eli Lilly & Co. (Pharmaceuticals) | 30,000 | 2,469,000 | ||||||||
Jazz Pharmaceuticals PLC (Pharmaceuticals) | (a) | 45,000 | 6,997,500 | |||||||
Mallinckrodt PLC (Pharmaceuticals) | (a) | 45,000 | 2,016,450 | |||||||
| 85 | (continued) |
| Ohio National Fund, Inc. | Balanced Portfolio (Continued) |
Schedule of Investments | June 30, 2017 (Unaudited) |
| Common Stocks (Continued) | Shares | Value | ||||||||
| HEALTH CARE (continued) | ||||||||||
Pfizer, Inc. (Pharmaceuticals) | 70,000 | $ | 2,351,300 | |||||||
Roche Holding AG – ADR (Pharmaceuticals) | 75,000 | 2,385,000 | ||||||||
|
| |||||||||
| 75,466,213 | ||||||||||
|
| |||||||||
| INDUSTRIALS – 4.6% | ||||||||||
Boeing Co. / The (Aerospace & Defense) | 10,000 | 1,977,500 | ||||||||
Orbital ATK, Inc. (Aerospace & Defense) | 69,915 | 6,876,840 | ||||||||
Rockwell Collins, Inc. (Aerospace & Defense) | 13,954 | 1,466,286 | ||||||||
Spirit AeroSystems Holdings, Inc. Class A (Aerospace & Defense) | 125,000 | 7,242,500 | ||||||||
Delta Air Lines, Inc. (Airlines) | 45,000 | 2,418,300 | ||||||||
Southwest Airlines Co. (Airlines) | 60,000 | 3,728,400 | ||||||||
Johnson Controls International PLC (Building Products) | 170,000 | 7,371,200 | ||||||||
Masco Corp. (Building Products) | 125,000 | 4,776,250 | ||||||||
Deluxe Corp. (Commercial Svs. & Supplies) | 30,000 | 2,076,600 | ||||||||
Allison Transmission Holdings, Inc. (Machinery) | 65,000 | 2,438,150 | ||||||||
Snap-on, Inc. (Machinery) | 15,000 | 2,370,000 | ||||||||
Air Lease Corp. (Trading Companies & Distributors) | 63,775 | 2,382,634 | ||||||||
|
| |||||||||
| 45,124,660 | ||||||||||
|
| |||||||||
| INFORMATION TECHNOLOGY – 9.8% | ||||||||||
Fabrinet (Electronic Equip., Instr. & Comp.) | (a) | 160,000 | 6,825,600 | |||||||
IPG Photonics Corp. (Electronic Equip., Instr. & Comp.) | (a) | 42,172 | 6,119,157 | |||||||
TE Connectivity Ltd. (Electronic Equip., Instr. & Comp.) | 90,000 | 7,081,200 | ||||||||
Alphabet, Inc. Class C (Internet Software & Svs.) | (a) | 11,776 | 10,701,205 | |||||||
Facebook, Inc. Class A (Internet Software & Svs.) | (a) | 55,000 | 8,303,900 | |||||||
LogMeIn, Inc. (Internet Software & Svs.) | 40,000 | 4,180,000 | ||||||||
Cognizant Technology Solutions Corp. Class A (IT Svs.) | 40,000 | 2,656,000 | ||||||||
MasterCard, Inc. Class A (IT Svs.) | 91,600 | 11,124,820 | ||||||||
Visa, Inc. (IT Svs.) | 111,400 | 10,447,092 | ||||||||
Broadcom Ltd. (Semiconductors & Equip.) | 50,000 | 11,652,500 | ||||||||
Skyworks Solutions, Inc. (Semiconductors & Equip.) | 30,000 | 2,878,500 | ||||||||
Activision Blizzard, Inc. (Software) | 20,000 | 1,151,400 | ||||||||
CDK Global, Inc. (Software) | 100,000 | 6,206,000 | ||||||||
Electronic Arts, Inc. (Software) | (a) | 10,000 | 1,057,200 | |||||||
Apple, Inc. (Tech. Hardware, Storage & Periph.) | 38,910 | 5,603,818 | ||||||||
Xerox Corp. (Tech. Hardware, Storage & Periph.) | 37,500 | 1,077,375 | ||||||||
|
| |||||||||
| 97,065,767 | ||||||||||
|
| |||||||||
| MATERIALS – 1.9% | ||||||||||
LyondellBasell Industries NV Class A (Chemicals) | 50,000 | 4,219,500 | ||||||||
Martin Marietta Materials, Inc. (Construction Materials) | 12,000 | 2,670,960 | ||||||||
Graphic Packaging Holding Co. (Containers & Packaging) | 500,000 | 6,890,000 | ||||||||
Cia de Minas Buenaventura SAA – ADR (Metals & Mining) | 400,000 | 4,600,000 | ||||||||
|
| |||||||||
| 18,380,460 | ||||||||||
|
| |||||||||
| REAL ESTATE – 0.4% | ||||||||||
CBRE Group, Inc. (Real Estate Mgmt. & Development) | (a) | 105,000 | 3,822,000 | |||||||
|
| |||||||||
| TELECOMMUNICATION SERVICES – 0.3% | ||||||||||
T-Mobile U.S., Inc. (Wireless Telecom. Svs.) | (a) | 45,000 | 2,727,900 | |||||||
|
| |||||||||
| UTILITIES – 1.1% | ||||||||||
NextEra Energy, Inc. (Electric Utilities) | 25,000 | 3,503,250 | ||||||||
CMS Energy Corp. (Multi-Utilities) | 51,300 | 2,372,625 | ||||||||
Sempra Energy (Multi-Utilities) | 45,000 | 5,073,750 | ||||||||
|
| |||||||||
| 10,949,625 | ||||||||||
|
| |||||||||
Total Common Stocks (Cost $396,117,946) | $ | 456,633,190 | ||||||||
|
| |||||||||
| Corporate Bonds – 24.5% | Rate | Maturity | Face Amount | Value | ||||||||||||
| CONSUMER DISCRETIONARY – 4.0% | ||||||||||||||||
Lear Corp. (Auto Components) | 5.250% | 01/15/2025 | $ | 2,775,000 | $ | 2,936,369 | ||||||||||
OneBeacon U.S. Holdings, Inc. (Hotels, Restaurants & Leisure) | 4.600% | 11/09/2022 | 1,245,000 | 1,278,876 | ||||||||||||
Mattamy Group Corp. (Household Durables) | (b) | 6.500% | 11/15/2020 | 1,625,000 | 1,657,500 | |||||||||||
CBRE Services, Inc. (Media) | 5.000% | 03/15/2023 | 919,000 | 957,484 | ||||||||||||
Lee Enterprises, Inc. (Media) | (b) | 9.500% | 03/15/2022 | 3,680,000 | 3,790,400 | |||||||||||
Sirius XM Radio, Inc. (Media) | (b) | 5.250% | 08/15/2022 | 12,050,000 | 12,372,458 | |||||||||||
CST Brands, Inc. (Specialty Retail) | 5.000% | 05/01/2023 | 4,000,000 | 4,200,800 | ||||||||||||
Penske Automotive Group, Inc. (Specialty Retail) | 5.750% | 10/01/2022 | 965,000 | 996,363 | ||||||||||||
Reliance Intermediate Holdings LP (Specialty Retail) | (b) | 6.500% | 04/01/2023 | 6,982,000 | 7,470,740 | |||||||||||
| 86 | (continued) |
| Ohio National Fund, Inc. | Balanced Portfolio (Continued) |
Schedule of Investments | June 30, 2017 (Unaudited) |
| Corporate Bonds (Continued) | Rate | Maturity | Face Amount | Value | ||||||||||||
| CONSUMER DISCRETIONARY (continued) | ||||||||||||||||
Sally Holdings LLC / Sally Capital, Inc. (Specialty Retail) | 5.750% | 06/01/2022 | $ | 3,000,000 | $ | 3,086,250 | ||||||||||
William Carter Co. / The (Textiles, Apparel & Luxury Goods) | 5.250% | 08/15/2021 | 695,000 | 714,981 | ||||||||||||
|
| |||||||||||||||
| 39,462,221 | ||||||||||||||||
|
| |||||||||||||||
| CONSUMER STAPLES – 1.6% | ||||||||||||||||
Kraft Heinz Foods Co. (Food Products) | (b) | 4.875% | 02/15/2025 | 10,359,000 | 11,103,035 | |||||||||||
HRG Group, Inc. (Household Products) | 7.875% | 07/15/2019 | 2,300,000 | 2,357,500 | ||||||||||||
Altria Group, Inc. (Tobacco) | 9.250% | 08/06/2019 | 2,179,000 | 2,501,527 | ||||||||||||
|
| |||||||||||||||
| 15,962,062 | ||||||||||||||||
|
| |||||||||||||||
| ENERGY – 3.0% | ||||||||||||||||
MPLX LP (Oil, Gas & Consumable Fuels) | 5.500% | 02/15/2023 | 9,215,000 | 9,461,686 | ||||||||||||
Overseas Shipholding Group, Inc. (Acquired 07/13/2016 through 10/13/2016, Cost $4,702,063) | (d) | 8.125% | 03/30/2018 | 4,630,000 | 4,768,900 | |||||||||||
Regency Energy Partners LP / Regency Energy Finance Corp. (Oil, Gas & Consumable Fuels) | 5.500% | 04/15/2023 | 2,525,000 | 2,613,375 | ||||||||||||
Tesoro Corp. (Oil, Gas & Consumable Fuels) | 4.250% | 10/01/2017 | 4,700,000 | 4,711,750 | ||||||||||||
Williams Partners LP / ACMP Finance Corp. (Oil, Gas & Consumable Fuels) | 4.875% | 05/15/2023 | 7,700,000 | 7,989,674 | ||||||||||||
|
| |||||||||||||||
| 29,545,385 | ||||||||||||||||
|
| |||||||||||||||
| FINANCIALS – 7.9% | ||||||||||||||||
Citigroup, Inc. (Banks) | 6.875% | 06/01/2025 | 2,250,000 | 2,707,938 | ||||||||||||
RBC U.S.A. Holdco Corp. (Banks) | 5.250% | 09/15/2020 | 1,500,000 | 1,629,833 | ||||||||||||
E*TRADE Financial Corp. (Capital Markets) | 5.375% | 11/15/2022 | 5,599,000 | 5,885,635 | ||||||||||||
GFI Group, Inc. (Capital Markets) | 8.375% | 07/19/2018 | 3,850,000 | 4,061,750 | ||||||||||||
Raymond James Financial, Inc. (Capital Markets) | 5.625% | 04/01/2024 | 6,500,000 | 7,396,734 | ||||||||||||
Credit Acceptance Corp. (Consumer Finance) | 6.125% | 02/15/2021 | 2,500,000 | 2,562,500 | ||||||||||||
Berkshire Hathaway, Inc. (Diversified Financial Svs.) | 2.750% | 03/15/2023 | 11,550,000 | 11,701,536 | ||||||||||||
International Lease Finance Corp. (Diversified Financial Svs.) | 5.875% | 08/15/2022 | 4,256,000 | 4,804,317 | ||||||||||||
NewStar Financial, Inc. (Diversified Financial Svs.) | 7.250% | 05/01/2020 | 2,000,000 | 2,047,500 | ||||||||||||
SAFG Retirement Services, Inc. (Diversified Financial Svs.) | 8.125% | 04/28/2023 | 7,600,000 | 9,536,222 | ||||||||||||
Alleghany Corp. (Insurance) | 5.625% | 09/15/2020 | 1,000,000 | 1,096,489 | ||||||||||||
American Equity Investment Life Holding Co. (Insurance) | 6.625% | 07/15/2021 | 2,000,000 | 2,068,848 | ||||||||||||
ProAssurance Corp. (Insurance) | 5.300% | 11/15/2023 | 5,063,000 | 5,558,723 | ||||||||||||
Prudential Financial, Inc. (Insurance) | (c) | 8.875% | 06/15/2038 | 13,437,000 | 14,280,978 | |||||||||||
Radian Group, Inc. (Thrifts & Mortgage Finance) | 5.500% | 06/01/2019 | 3,250,000 | 3,412,500 | ||||||||||||
|
| |||||||||||||||
| 78,751,503 | ||||||||||||||||
|
| |||||||||||||||
| HEALTH CARE – 0.9% | ||||||||||||||||
Abbott Laboratories (Health Care Equip. & Supplies) | 3.875% | 09/15/2025 | 3,250,000 | 3,343,018 | ||||||||||||
Centene Corp. (Health Care Providers & Svs.) | 5.625% | 02/15/2021 | 510,000 | 531,675 | ||||||||||||
Molina Healthcare, Inc. (Health Care Providers & Svs.) | 5.375% | 11/15/2022 | 3,500,000 | 3,705,625 | ||||||||||||
Universal Health Services, Inc. (Health Care Providers & Svs.) | (b) | 4.750% | 08/01/2022 | 1,000,000 | 1,033,750 | |||||||||||
|
| |||||||||||||||
| 8,614,068 | ||||||||||||||||
|
| |||||||||||||||
| INDUSTRIALS – 2.5% | ||||||||||||||||
Spirit AeroSystems, Inc. (Aerospace & Defense) | 5.250% | 03/15/2022 | 11,120,000 | 11,538,012 | ||||||||||||
Allegion PLC (Building Products) | 5.875% | 09/15/2023 | 625,000 | 671,875 | ||||||||||||
Allegion U.S. Holding Co., Inc. (Building Products) | 5.750% | 10/01/2021 | 3,733,000 | 3,872,987 | ||||||||||||
Covanta Holding Corp. (Commercial Svs. & Supplies) | 6.375% | 10/01/2022 | 169,000 | 174,070 | ||||||||||||
AECOM (Construction & Engineering) | 5.750% | 10/15/2022 | 3,700,000 | 3,871,125 | ||||||||||||
EnPro Industries, Inc. (Machinery) | 5.875% | 09/15/2022 | 470,000 | 489,975 | ||||||||||||
Aircastle Ltd. (Trading Companies & Distributors) | 5.000% | 04/01/2023 | 4,400,000 | 4,697,000 | ||||||||||||
|
| |||||||||||||||
| 25,315,044 | ||||||||||||||||
|
| |||||||||||||||
| INFORMATION TECHNOLOGY – 2.0% | ||||||||||||||||
Corning, Inc. (Electronic Equip., Instr. & Comp.) | 7.250% | 08/15/2036 | 3,197,000 | 3,925,197 | ||||||||||||
Amkor Technology, Inc. (Semiconductors & Equip.) | 6.375% | 10/01/2022 | 3,500,000 | 3,644,375 | ||||||||||||
Micron Technology, Inc. (Semiconductors & Equip.) | 7.500% | 09/15/2023 | 4,550,000 | 5,090,085 | ||||||||||||
NXP BV / NXP Funding LLC (Semiconductors & Equip.) | (b) | 4.625% | 06/01/2023 | 6,315,000 | 6,812,306 | |||||||||||
|
| |||||||||||||||
| 19,471,963 | ||||||||||||||||
|
| |||||||||||||||
| MATERIALS – 0.8% | ||||||||||||||||
Chemtura Corp. (Chemicals) | 5.750% | 07/15/2021 | 3,400,000 | 3,502,000 | ||||||||||||
FMG Resources Pty. Ltd. (Metals & Mining) | (b) | 9.750% | 03/01/2022 | 3,500,000 | 3,985,625 | |||||||||||
|
| |||||||||||||||
| 7,487,625 | ||||||||||||||||
|
| |||||||||||||||
| REAL ESTATE – 0.6% | ||||||||||||||||
Select Income REIT (Equity Real Estate Investment Trusts) | 4.500% | 02/01/2025 | 4,850,000 | 4,857,513 | ||||||||||||
Greystar Real Estate Partners LLC (Real Estate Mgmt. & Development) | (b) | 8.250% | 12/01/2022 | 890,000 | 958,975 | |||||||||||
|
| |||||||||||||||
| 5,816,488 | ||||||||||||||||
|
| |||||||||||||||
| 87 | (continued) |
| Ohio National Fund, Inc. | Balanced Portfolio (Continued) |
Schedule of Investments | June 30, 2017 (Unaudited) |
| Corporate Bonds (Continued) | Rate | Maturity | Face Amount | Value | ||||||||||||
| TELECOMMUNICATION SERVICES – 0.8% | ||||||||||||||||
Level 3 Communications, Inc. (Diversified Telecom. Svs.) | 5.750% | 12/01/2022 | $ | 258,000 | $ | 267,675 | ||||||||||
Clearwire Communications LLC / Clearwire Finance, Inc. (Wireless Telecom. Svs.) | (b) | 8.250% | 12/01/2040 | 7,650,000 | 7,841,250 | |||||||||||
|
| |||||||||||||||
| 8,108,925 | ||||||||||||||||
|
| |||||||||||||||
| UTILITIES – 0.4% | ||||||||||||||||
DPL, Inc. (Electric Utilities) | 6.750% | 10/01/2019 | 4,000,000 | 4,180,000 | ||||||||||||
|
| |||||||||||||||
Total Corporate Bonds (Cost $242,875,153) | $ | 242,715,284 | ||||||||||||||
|
| |||||||||||||||
| Preferred Securities – 2.3% | Rate | Quantity | Value | |||||||||||||
| FINANCIALS – 1.7% | ||||||||||||||||
JPMorgan Chase & Co. (Banks) | 5.450% | 42,536 | $ | 1,101,257 | ||||||||||||
JPMorgan Chase & Co. DR (Banks) | 6.125% | 52,500 | 1,414,875 | |||||||||||||
JPMorgan Chase & Co. (Banks) | 6.150% | 9,443 | 258,833 | |||||||||||||
Wells Fargo & Co. DR (Banks) | 8.000% | 269,946 | 6,994,301 | |||||||||||||
Wells Fargo & Co. DR (Banks) | 6.000% | 56,254 | 1,486,793 | |||||||||||||
Argo Group U.S., Inc. (Insurance) | 6.500% | 13,830 | 350,037 | |||||||||||||
Maiden Holdings North America Ltd. (Insurance) | 7.750% | 181,274 | 4,874,458 | |||||||||||||
Protective Life Corp. (Insurance) | 6.250% | 3,536 | 89,708 | |||||||||||||
Protective Life Corp. (Insurance) | 6.000% | 28,510 | 721,873 | |||||||||||||
|
| |||||||||||||||
| 17,292,135 | ||||||||||||||||
|
| |||||||||||||||
| REAL ESTATE – 0.6% | ||||||||||||||||
Gramercy Property Trust (Acquired 08/27/2014 through 04/05/2017, Cost $5,380,162) | (d) | 7.125% | 208,051 | 5,617,377 | ||||||||||||
|
| |||||||||||||||
Total Preferred Securities (Cost $22,703,952) | $ | 22,909,512 | ||||||||||||||
|
| |||||||||||||||
| Asset-Backed / Mortgage-Backed Securities – 0.9% | Rate | Maturity | Face Amount | Value | ||||||||||||
| FINANCIALS – 0.8% | ||||||||||||||||
New Residential Mortgage Loan Trust 2016-3A Class B3C | (b)(d) | 4.000% | 09/25/2056 | $ | 7,922,002 | $ | 7,732,310 | |||||||||
|
| |||||||||||||||
| 7,732,310 | ||||||||||||||||
|
| |||||||||||||||
| INDUSTRIALS – 0.1% | ||||||||||||||||
UAL 2007-1 Class B Pass Through Trust | 7.336% | 07/02/2019 | 924,837 | 980,327 | ||||||||||||
|
| |||||||||||||||
Total Asset-Backed / Mortgage-Backed Securities (Cost $9,002,918) | $ | 8,712,637 | ||||||||||||||
|
| |||||||||||||||
| U.S. Treasury Obligations – 12.8% | Rate | Maturity | Face Amount | Value | ||||||||||||
U.S. Treasury Note | 1.000% | 09/15/2017 | $ | 10,000,000 | $ | 9,998,530 | ||||||||||
U.S. Treasury Note | 1.875% | 01/31/2022 | 19,500,000 | 19,522,854 | ||||||||||||
U.S. Treasury Note | 1.875% | 05/31/2022 | 30,000,000 | 29,995,320 | ||||||||||||
U.S. Treasury Note | 1.625% | 02/15/2026 | 30,000,000 | 28,508,190 | ||||||||||||
U.S. Treasury Note | 1.500% | 08/15/2026 | 10,000,000 | 9,355,470 | ||||||||||||
U.S. Treasury Note | 2.250% | 02/15/2027 | 30,000,000 | 29,866,410 | ||||||||||||
|
| |||||||||||||||
Total U.S. Treasury Obligations (Cost $128,446,375) | $ | 127,246,774 | ||||||||||||||
|
| |||||||||||||||
| Closed-End Mutual Funds – 6.6% | Shares | Value | ||||||||||||||
Aberdeen Emerging Markets Smaller Co. Opportunities Fund, Inc. | 10,147 | $ | 139,927 | |||||||||||||
Alpine Total Dynamic Dividend Fund | 210,719 | 1,831,148 | ||||||||||||||
Asia Pacific Fund, Inc. / The | 131,541 | 1,699,510 | ||||||||||||||
BlackRock Defined Opportunity Credit Trust | 225,251 | 2,236,742 | ||||||||||||||
BlackRock Enhanced Government Fund, Inc. | 187,031 | 2,489,383 | ||||||||||||||
BlackRock Income Trust, Inc. | 811,862 | 5,171,561 | ||||||||||||||
China Fund, Inc. / The | 2,266 | 42,352 | ||||||||||||||
Cushing Renaissance Fund / The | 116,764 | 2,042,202 | ||||||||||||||
Delaware Investments Dividend & Income Fund, Inc. | 147,831 | 1,546,312 | ||||||||||||||
Deutsche Global High Income Fund, Inc. | 192,573 | 1,677,311 | ||||||||||||||
Deutsche High Income Opportunities Fund, Inc. | 63,935 | 951,353 | ||||||||||||||
Deutsche Multi-Market Income Trust | 645,668 | 5,681,878 | ||||||||||||||
Deutsche Strategic Income Trust | 122,406 | 1,516,610 | ||||||||||||||
Eaton Vance High Income 2021 Target Term Trust | 458,835 | 4,638,822 | ||||||||||||||
Federated Premier Intermediate Municipal Income Fund | 53,556 | 731,575 | ||||||||||||||
First Trust Mortgage Income Fund | 79,080 | 1,122,145 | ||||||||||||||
Invesco High Income Trust II | 15,134 | 225,799 | ||||||||||||||
JPMorgan China Region Fund, Inc. | 89,958 | 1,805,457 | ||||||||||||||
Korea Equity Fund, Inc. | 209,386 | 1,474,077 | ||||||||||||||
Lazard Global Total Return and Income Fund, Inc. | 15,154 | 247,768 | ||||||||||||||
Lazard World Dividend & Income Fund, Inc. | 14,353 | 158,170 | ||||||||||||||
| 88 | (continued) |
| Ohio National Fund, Inc. | Balanced Portfolio (Continued) |
Schedule of Investments | June 30, 2017 (Unaudited) |
| Closed-End Mutual Funds (Continued) | Shares | Value | ||||||||||||||
Madison Covered Call & Equity Strategy Fund | 452,321 | $ | 3,541,673 | |||||||||||||
Madison Strategic Sector Premium Fund | 167,646 | 2,018,458 | ||||||||||||||
MFS Investment Grade Municipal Trust | 281,084 | 2,850,192 | ||||||||||||||
Morgan Stanley Emerging Markets Fund, Inc. | 19,037 | 307,448 | ||||||||||||||
Morgan Stanley Income Securities, Inc. | 244,555 | 4,455,792 | ||||||||||||||
Nuveen High Income December 2018 Target Term Fund | 362,964 | 3,651,418 | ||||||||||||||
Nuveen High Income December 2019 Target Term Fund | 240,021 | 2,448,214 | ||||||||||||||
Nuveen Mortgage Opportunity Term Fund 2 | 32,349 | 795,462 | ||||||||||||||
Pacholder High Yield Fund, Inc. | 386,911 | 3,079,812 | ||||||||||||||
Swiss Helvetia Fund, Inc. / The | 260,163 | 3,304,070 | ||||||||||||||
Virtus Total Return Fund, Inc. | 168,402 | 2,061,241 | ||||||||||||||
|
| |||||||||||||||
Total Closed-End Mutual Funds (Cost $64,908,522) | $ | 65,943,882 | ||||||||||||||
|
| |||||||||||||||
| Exchange Traded Funds – 1.5% | Shares | Value | ||||||||||||||
iShares Currency Hedged MSCI Eurozone ETF | 180,000 | $ | 5,275,800 | |||||||||||||
iShares Europe ETF | 110,000 | 4,875,200 | ||||||||||||||
SPDR S&P 500 ETF Trust | 19,152 | 4,630,954 | ||||||||||||||
|
| |||||||||||||||
Total Exchange Traded Funds (Cost $13,291,474) | $ | 14,781,954 | ||||||||||||||
|
| |||||||||||||||
| Purchased Options – 0.2% | Expiration | Exercise Price | Contracts(e) | Value | ||||||||||||
S&P 500 Index Put Option | September 2017 | $2,000.00 | 800 | $ | 252,000 | |||||||||||
S&P 500 Index Put Option | September 2017 | $2,200.00 | 800 | 700,000 | ||||||||||||
S&P 500 Index Put Option | October 2017 | $2,300.00 | 300 | 840,000 | ||||||||||||
|
| |||||||||||||||
Total Purchased Options (Cost $3,886,685) | $ | 1,792,000 | ||||||||||||||
|
| |||||||||||||||
| Money Market Funds – 7.2% | Shares | Value | ||||||||||||||
State Street Institutional U.S. Government Money Market Fund | 71,561,701 | $ | 71,561,701 | |||||||||||||
|
| |||||||||||||||
Total Money Market Funds (Cost $71,561,701) | $ | 71,561,701 | ||||||||||||||
|
| |||||||||||||||
Total Investments – 102.1% (Cost $952,794,726) | (f) | $ | 1,012,296,934 | |||||||||||||
Liabilities in Excess of Other Assets – (2.1)% | (20,896,006) | |||||||||||||||
|
| |||||||||||||||
Net Assets – 100.0% | $ | 991,400,928 | ||||||||||||||
|
| |||||||||||||||
Percentages are stated as a percent of net assets.
Abbreviations:
| ADR: | American Depositary Receipts |
| DR: | Depository Receipt |
Footnotes:
| (a) | Non-income producing security. |
| (b) | Security exempt from registration under Regulation D of the Securities Act of 1933. These securities may be resold in transactions exempt from registration, normally to qualified buyers under Rule 144A. At June 30, 2017, the value of these securities totaled $64,758,349, or 6.5% of the Portfolio’s net assets. Unless also noted with (d), as defined below, these securities were deemed liquid pursuant to procedures approved by the Board of Directors. |
| (c) | Security is a variable rate instrument in which the coupon or dividend rate is fixed until a later specified date, then is adjusted periodically. Rates stated are those in effect at June 30, 2017. |
| (d) | Represents a security deemed to be illiquid. At June 30, 2017, the value of illiquid securities in the Portfolio totaled $18,118,587, or 1.8% of the Portfolio’s net assets. |
| (e) | 100 shares per contract. |
| (f) | Represents cost for financial reporting purposes, which may differ from cost basis for federal income tax purposes. See also Note 7 of the Notes to Financial Statements. |
The accompanying notes are an integral part of these financial statements.
| 89 |
| Ohio National Fund, Inc. | S&P MidCap 400® Index Portfolio |
Objective/Strategy
The S&P MidCap 400® Index Portfolio seeks total return approximating that of the Standard & Poor’s MidCap 400® Index (S&P MidCap 400® Index), including reinvestment of dividends, at a risk level consistent with that of the S&P MidCap 400® Index by investing more than 80% of its net assets in the securities in the S&P MidCap 400® Index.
Performance as of June 30, 2017
Average Annual returns | ||||
One year | 15.13% | |||
Five years | 11.68% | |||
Ten years | 4.03% |
Past performance does not guarantee future results. The performance data quoted represents past performance and current returns may be lower or higher. Total return figures include change in share price and reinvestment of dividends and capital gains. The investment return and principal value will fluctuate so that an investor’s shares, when redeemed, may be worth more or less than the original cost. To obtain performance information up to the most recent month end, call toll-free 1-877-781-6392.
The Portfolio is not open to direct retail investment. Beneficial interest in shares is obtained solely by purchase of variable life insurance policies and variable annuity contracts. Actual performance results for variable annuity and variable universal life contracts will be lower due to contract charges. Consult your contract for applicable charges.
Total expense ratio is 0.79% per the Fund’s prospectus dated May 1, 2017. Additional information pertaining to the Fund’s expense ratio as of June 30, 2017 can be found in the Portfolio’s Financial Highlights.
Comments from Sub-Adviser
Q. How did the Portfolio perform in comparison to its benchmark during the reporting period?
A. For the six-month period ended June 30, 2017, the S&P MidCap 400® Index Portfolio returned 5.69% versus 5.99% for the benchmark, the S&P MidCap 400® Index.
Q. Were there specific market conditions, investment strategies, or techniques that materially affected the Portfolio’s benchmark-relative performance during the reporting period?
A. The Portfolio intends to approximate the underlying return of the S&P MidCap 400® Index. There were no material market events or changes in strategy that impacted the Portfolio’s relative return for the period.(1)
Q. How did sector selection and security selection each impact the Portfolio’s performance relative to its benchmark?
A. The Portfolio is managed on a risk-controlled basis and is constructed to closely replicate its benchmark index. The expected sources of performance variance include the impact of trading daily cash flows, including trading commissions, and the operating expenses of the Portfolio.
Information Technology, Health Care and Industrials were the top contributing sectors in the Portfolio and benchmark for the period, while Energy was the key laggard.(1)
Q. Which holdings contributed the most to, and detracted the most from, the Portfolio’s benchmark-relative performance?
A. The largest contributors to the Portfolio and benchmark returns for the period were Align Technology, Inc., The Chemours Co., and Packaging Corp. of America. The largest detractors from the Portfolio and benchmark returns for the period were Nabors Industries Ltd., QEP Resources, Inc., and United States Steel Corp.(1)
Q. How did the Portfolio’s use of derivative instruments and initial public offerings (IPOs), if any, impact performance?
A. The Portfolio uses S&P MidCap 400® Index futures contracts primarily to equitize open dividend receivables, as well as to manage day-to-day cash flows to ensure the Portfolio is fully invested. The futures did not meaningfully impact performance due to their index characteristics and size in relation to Portfolio net assets.(1)
| (1) | The Portfolio’s composition is subject to change. Holdings and weightings are as of June 30, 2017. |
Change in Value of $10,000 Investment
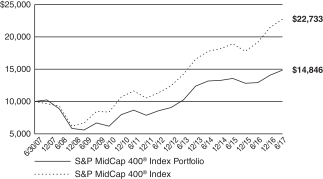
Hypothetical illustration based on past performance. Future performance will vary. The Portfolio’s returns reflect reinvested dividends. The Portfolio’s holdings may differ significantly from the securities in the index. The index is unmanaged and therefore does not reflect the cost of portfolio management and accounting.
The S&P MidCap 400® Index is a capitalization-weighted index of 400 common stocks representing all major industries in the mid-range of the U.S. stock market. The index presented includes the effects of reinvested dividends.
Prior to December 16, 2016, the Portfolio was known as the Target VIP Portfolio. The strategy of the Target VIP Portfolio was to seek above average total return by investing in common stocks of companies which were identified by a model that applied separate uniquely specialized strategies.
The S&P MidCap 400® Index is a product of S&P Dow Jones Indices LLC or its affiliates (“SPDJI”), and has been licensed for use by Ohio National Investments, Inc. (“ONI”) Standard & Poor’s® and S&P® are registered trademarks of Standard & Poor’s Financial Services LLC (“S&P”); Dow Jones® is a registered trademark of Dow Jones Trademark Holdings LLC (“Dow Jones”); and these trademarks have been licensed for use by SPDJI and sublicensed for certain purposes by ONI. The S&P MidCap 400® Index Portfolio of Ohio National Fund, Inc. is not sponsored, endorsed, sold or promoted by SPDJI, Dow Jones, S&P, their respective affiliates, and none of such parties make any representation regarding the advisability of investing in such product(s) nor do they have any liability for any errors, omissions, or interruptions of the S&P MidCap 400® Index.
| 90 | (continued) |
| Ohio National Fund, Inc. | S&P MidCap 400® Index Portfolio (Continued) |
Portfolio Composition as of June 30, 2017 (1)
| % of Net Assets | ||||||
Common Stocks (4) | 98.2 | |||||
Money Market Funds | 1.8 | |||||
|
| |||||
| 100.0 | ||||||
|
| |||||
Top 10 Portfolio Holdings as of June 30, 2017 (1) (2) (3)
| % of Net Assets | ||||||
| 1. | ResMed, Inc. | 0.7 | ||||
| 2. | Packaging Corp. of America | 0.6 | ||||
| 3. | Domino’s Pizza, Inc. | 0.6 | ||||
| 4. | Duke Realty Corp. | 0.6 | ||||
| 5. | Cadence Design Systems, Inc. | 0.6 | ||||
| 6. | Teleflex, Inc. | 0.6 | ||||
| 7. | MSCI, Inc. | 0.6 | ||||
| 8. | SVB Financial Group | 0.5 | ||||
| 9. | Alleghany Corp. | 0.5 | ||||
| 10. | Trimble, Inc. | 0.5 |
| (1) | Composition of Portfolio subject to change. |
| (2) | Short-term investments have been excluded from the list of Top 10 Portfolio Holdings. |
| (3) | Top 10 Portfolio Holdings is presented at an individual security level. Total investment exposure by issuer may be higher. |
| (4) | Sectors (Common Stocks): |
| % of Net Assets | ||||
Information Technology | 17.5 | |||
Financials | 16.1 | |||
Industrials | 14.8 | |||
Consumer Discretionary | 11.5 | |||
Real Estate | 9.7 | |||
Health Care | 9.0 | |||
Materials | 7.5 | |||
Utilities | 5.4 | |||
Consumer Staples | 3.6 | |||
Energy | 2.9 | |||
Telecommunication Services | 0.2 | |||
|
| |||
| 98.2 | ||||
|
|
| 91 |
| Ohio National Fund, Inc. | S&P MidCap 400® Index Portfolio |
Schedule of Investments | June 30, 2017 (Unaudited) |
| Common Stocks – 98.2% | Shares | Value | ||||||
| CONSUMER DISCRETIONARY – 11.5% | ||||||||
Cooper Tire & Rubber Co. (Auto Components) | 1,783 | $ 64,366 | ||||||
Dana, Inc. (Auto Components) | 4,868 | 108,702 | ||||||
Gentex Corp. (Auto Components) | 9,733 | 184,635 | ||||||
Thor Industries, Inc. (Automobiles) | 1,611 | 168,382 | ||||||
Pool Corp. (Distributors) | 1,396 | 164,128 | ||||||
Adtalem Global Education, Inc. (Diversified Consumer Svs.) | 1,919 | 72,826 | ||||||
Graham Holdings Co. Class B (Diversified Consumer Svs.) | 157 | 94,145 | ||||||
Service Corp. International (Diversified Consumer Svs.) | 6,332 | 211,805 | ||||||
Sotheby’s (Diversified Consumer Svs.) | (a) | 1,543 | 82,813 | |||||
Brinker International, Inc. (Hotels, Restaurants & Leisure) | 1,650 | 62,865 | ||||||
Buffalo Wild Wings, Inc. (Hotels, Restaurants & Leisure) | (a) | 544 | 68,925 | |||||
Cheesecake Factory, Inc. / The (Hotels, Restaurants & Leisure) | 1,503 | 75,601 | ||||||
Churchill Downs, Inc. (Hotels, Restaurants & Leisure) | 417 | 76,436 | ||||||
Cracker Barrel Old Country Store, Inc. (Hotels, Restaurants & Leisure) | 814 | 136,141 | ||||||
Domino’s Pizza, Inc. (Hotels, Restaurants & Leisure) | 1,624 | 343,525 | ||||||
Dunkin’ Brands Group, Inc. (Hotels, Restaurants & Leisure) | 3,115 | 171,699 | ||||||
International Speedway Corp. Class A (Hotels, Restaurants & Leisure) | 859 | 32,255 | ||||||
Jack in the Box, Inc. (Hotels, Restaurants & Leisure) | 991 | 97,613 | ||||||
Panera Bread Co. Class A (Hotels, Restaurants & Leisure) | (a) | 719 | 226,226 | |||||
Papa John’s International, Inc. (Hotels, Restaurants & Leisure) | 892 | 64,010 | ||||||
Texas Roadhouse, Inc. (Hotels, Restaurants & Leisure) | 2,173 | 110,714 | ||||||
Wendy’s Co. / The (Hotels, Restaurants & Leisure) | 6,449 | 100,024 | ||||||
CalAtlantic Group, Inc. (Household Durables) | 2,611 | 92,299 | ||||||
Helen of Troy Ltd. (Household Durables) | (a) | 912 | 85,819 | |||||
KB Home (Household Durables) | 2,806 | 67,260 | ||||||
NVR, Inc. (Household Durables) | (a) | 118 | 284,452 | |||||
Tempur Sealy International, Inc. (Household Durables) | (a) | 1,579 | 84,303 | |||||
Toll Brothers, Inc. (Household Durables) | 4,985 | 196,957 | ||||||
TRI Pointe Group, Inc. (Household Durables) | (a) | 5,373 | 70,870 | |||||
Tupperware Brands Corp. (Household Durables) | 1,708 | 119,953 | ||||||
HSN, Inc. (Internet & Direct Marketing Retail) | 1,088 | 34,707 | ||||||
Brunswick Corp. (Leisure Products) | 3,007 | 188,629 | ||||||
Polaris Industries, Inc. (Leisure Products) | 1,973 | 181,970 | ||||||
AMC Networks, Inc. Class A (Media) | (a) | 1,869 | 99,823 | |||||
Cable One, Inc. (Media) | 159 | 113,033 | ||||||
Cinemark Holdings, Inc. (Media) | 3,566 | 138,539 | ||||||
John Wiley & Sons, Inc. Class A (Media) | 1,508 | 79,547 | ||||||
Live Nation Entertainment, Inc. (Media) | (a) | 4,494 | 156,616 | |||||
Meredith Corp. (Media) | 1,235 | 73,421 | ||||||
New York Times Co. / The Class A (Media) | 4,111 | 72,765 | ||||||
TEGNA, Inc. (Media) | 7,231 | 104,199 | ||||||
Big Lots, Inc. (Multiline Retail) | 1,517 | 73,271 | ||||||
Dillard’s, Inc. Class A (Multiline Retail) | 730 | 42,114 | ||||||
Aaron’s, Inc. (Specialty Retail) | 2,124 | 82,624 | ||||||
American Eagle Outfitters, Inc. (Specialty Retail) | 5,582 | 67,263 | ||||||
Cabela’s, Inc. (Specialty Retail) | (a) | 1,742 | 103,510 | |||||
Chico’s FAS, Inc. (Specialty Retail) | 4,378 | 41,241 | ||||||
Dick’s Sporting Goods, Inc. (Specialty Retail) | 2,957 | 117,777 | ||||||
GameStop Corp. Class A (Specialty Retail) | 3,417 | 73,841 | ||||||
Michaels Cos., Inc. / The (Specialty Retail) | (a) | 3,570 | 66,116 | |||||
Murphy U.S.A., Inc. (Specialty Retail) | (a) | 1,166 | 86,412 | |||||
Office Depot, Inc. (Specialty Retail) | 17,410 | 98,192 | ||||||
Sally Beauty Holdings, Inc. (Specialty Retail) | (a) | 4,636 | 93,879 | |||||
| Common Stocks (Continued) | Shares | Value | ||||||
| CONSUMER DISCRETIONARY (continued) | ||||||||
Urban Outfitters, Inc. (Specialty Retail) | (a) | 2,986 | $ 55,360 | |||||
Williams-Sonoma, Inc. (Specialty Retail) | 2,688 | 130,368 | ||||||
Carter’s, Inc. (Textiles, Apparel & Luxury Goods) | 1,638 | 145,700 | ||||||
Deckers Outdoor Corp. (Textiles, Apparel & Luxury Goods) | (a) | 1,078 | 73,584 | |||||
Kate Spade & Co. (Textiles, Apparel & Luxury Goods) | (a) | 4,320 | 79,877 | |||||
Skechers U.S.A., Inc. Class A (Textiles, Apparel & Luxury Goods) | (a) | 4,506 | 132,927 | |||||
| ||||||||
| 6,527,054 | ||||||||
| ||||||||
| CONSUMER STAPLES – 3.6% | ||||||||
Boston Beer Co., Inc. / The Class A (Beverages) | (a) | 315 | 41,627 | |||||
Casey’s General Stores, Inc. (Food & Staples Retailing) | 1,324 | 141,814 | ||||||
Sprouts Farmers Market, Inc. (Food & Staples Retailing) | (a) | 4,353 | 98,682 | |||||
United Natural Foods, Inc. (Food & Staples Retailing) | (a) | 1,708 | 62,684 | |||||
Dean Foods Co. (Food Products) | 3,062 | 52,054 | ||||||
Flowers Foods, Inc. (Food Products) | 6,200 | 107,322 | ||||||
Hain Celestial Group, Inc. / The (Food Products) | (a) | 3,483 | 135,210 | |||||
Ingredion, Inc. (Food Products) | 2,414 | 287,773 | ||||||
Lamb Weston Holdings, Inc. (Food Products) | 4,674 | 205,843 | ||||||
Lancaster Colony Corp. (Food Products) | 656 | 80,439 | ||||||
Post Holdings, Inc. (Food Products) | (a) | 2,242 | 174,091 | |||||
Snyder’s-Lance, Inc. (Food Products) | 2,895 | 100,225 | ||||||
Tootsie Roll Industries, Inc. (Food Products) | 592 | 20,631 | ||||||
TreeHouse Foods, Inc. (Food Products) | (a) | 1,917 | 156,600 | |||||
Energizer Holdings, Inc. (Household Products) | 2,082 | 99,978 | ||||||
Avon Products, Inc. (Personal Products) | (a) | 14,810 | 56,278 | |||||
Edgewell Personal Care Co. (Personal Products) | (a) | 1,934 | 147,023 | |||||
Nu Skin Enterprises, Inc. (Personal Products) | 1,672 | 105,068 | ||||||
| ||||||||
| 2,073,342 | ||||||||
| ||||||||
| ENERGY – 2.9% | ||||||||
Diamond Offshore Drilling, Inc. (Energy Equip. & Svs.) | (a) | 2,129 | 23,057 | |||||
Dril-Quip, Inc. (Energy Equip. & Svs.) | (a) | 1,277 | 62,318 | |||||
Ensco PLC Class A (Energy Equip. & Svs.) | 10,248 | 52,880 | ||||||
Nabors Industries Ltd. (Energy Equip. & Svs.) | 9,637 | 78,445 | ||||||
Oceaneering International, Inc. (Energy Equip. & Svs.) | 3,288 | 75,098 | ||||||
Oil States International, Inc. (Energy Equip. & Svs.) | (a) | 1,746 | 47,404 | |||||
Patterson-UTI Energy, Inc. (Energy Equip. & Svs.) | 5,604 | 113,145 | ||||||
Rowan Cos. Plc Class A (Energy Equip. & Svs.) | (a) | 4,261 | 43,633 | |||||
Superior Energy Services, Inc. (Energy Equip. & Svs.) | (a) | 5,157 | 53,787 | |||||
CONSOL Energy, Inc. (Oil, Gas & Consumable Fuels) | (a) | 5,974 | 89,252 | |||||
Energen Corp. (Oil, Gas & Consumable Fuels) | (a) | 3,276 | 161,736 | |||||
Gulfport Energy Corp. (Oil, Gas & Consumable Fuels) | (a) | 5,374 | 79,266 | |||||
HollyFrontier Corp. (Oil, Gas & Consumable Fuels) | 5,991 | 164,573 | ||||||
Matador Resources Co. (Oil, Gas & Consumable Fuels) | (a) | 3,146 | 67,230 | |||||
PBF Energy, Inc. Class A (Oil, Gas & Consumable Fuels) | 3,699 | 82,340 | ||||||
QEP Resources, Inc. (Oil, Gas & Consumable Fuels) | (a) | 8,113 | 81,941 | |||||
SM Energy Co. (Oil, Gas & Consumable Fuels) | 3,302 | 54,582 | ||||||
Southwestern Energy Co. (Oil, Gas & Consumable Fuels) | (a) | 17,049 | 103,658 | |||||
World Fuel Services Corp. (Oil, Gas & Consumable Fuels) | 2,333 | 89,704 | ||||||
WPX Energy, Inc. (Oil, Gas & Consumable Fuels) | (a) | 13,441 | 129,840 | |||||
| ||||||||
| 1,653,889 | ||||||||
| ||||||||
| FINANCIALS – 16.1% | ||||||||
Associated Banc-Corp. (Banks) | 5,125 | 129,150 | ||||||
BancorpSouth, Inc. (Banks) | 2,824 | 86,132 | ||||||
| 92 | (continued) |
| Ohio National Fund, Inc. | S&P MidCap 400® Index Portfolio (Continued) |
Schedule of Investments | June 30, 2017 (Unaudited) |
| Common Stocks (Continued) | Shares | Value | ||||||
| FINANCIALS (continued) | ||||||||
Bank of Hawaii Corp. (Banks) | 1,437 | $ 119,228 | ||||||
Bank of the Ozarks, Inc. (Banks) | 4,107 | 192,495 | ||||||
Canadian Imperial Bank of Commerce (Banks) | 1 | 15 | ||||||
Cathay General Bancorp (Banks) | 2,526 | 95,862 | ||||||
Chemical Financial Corp. (Banks) | 2,395 | 115,942 | ||||||
Commerce Bancshares, Inc. (Banks) | 2,955 | 167,933 | ||||||
Cullen / Frost Bankers, Inc. (Banks) | 1,924 | 180,683 | ||||||
East West Bancorp, Inc. (Banks) | 4,880 | 285,870 | ||||||
First Horizon National Corp. (Banks) | 7,869 | 137,078 | ||||||
FNB Corp. (Banks) | 10,958 | 155,165 | ||||||
Fulton Financial Corp. (Banks) | 5,884 | 111,796 | ||||||
Hancock Holding Co. (Banks) | 2,843 | 139,307 | ||||||
Home BancShares, Inc. (Banks) | 4,249 | 105,800 | ||||||
International Bancshares Corp. (Banks) | 1,959 | 68,663 | ||||||
MB Financial, Inc. (Banks) | 2,400 | 105,696 | ||||||
PacWest Bancorp (Banks) | 4,051 | 189,182 | ||||||
Pinnacle Financial Partners, Inc. (Banks) | 2,439 | 153,169 | ||||||
Prosperity Bancshares, Inc. (Banks) | 2,358 | 151,478 | ||||||
Signature Bank (Banks) | (a) | 1,812 | 260,076 | |||||
SVB Financial Group (Banks) | (a) | 1,773 | 311,676 | |||||
Synovus Financial Corp. (Banks) | 4,140 | 183,154 | ||||||
TCF Financial Corp. (Banks) | 5,765 | 91,894 | ||||||
Texas Capital Bancshares, Inc. (Banks) | (a) | 1,668 | 129,103 | |||||
Trustmark Corp. (Banks) | 2,282 | 73,389 | ||||||
UMB Financial Corp. (Banks) | 1,477 | 110,568 | ||||||
Umpqua Holdings Corp. (Banks) | 7,420 | 136,231 | ||||||
United Bankshares, Inc. (Banks) | 3,530 | 138,376 | ||||||
Valley National Bancorp (Banks) | 8,882 | 104,896 | ||||||
Webster Financial Corp. (Banks) | 3,123 | 163,083 | ||||||
Wintrust Financial Corp. (Banks) | 1,873 | 143,172 | ||||||
Eaton Vance Corp. (Capital Markets) | 3,868 | 183,034 | ||||||
FactSet Research Systems, Inc. (Capital Markets) | 1,328 | 220,687 | ||||||
Federated Investors, Inc. Class B (Capital Markets) | 3,124 | 88,253 | ||||||
Janus Henderson Group PLC (Capital Markets) | (a) | 6,093 | 201,739 | |||||
Legg Mason, Inc. (Capital Markets) | 2,887 | 110,168 | ||||||
MarketAxess Holdings, Inc. (Capital Markets) | 1,266 | 254,593 | ||||||
MSCI, Inc. (Capital Markets) | 3,056 | 314,737 | ||||||
SEI Investments Co. (Capital Markets) | 4,504 | 242,225 | ||||||
Stifel Financial Corp. (Capital Markets) | (a) | 2,306 | 106,030 | |||||
SLM Corp. (Consumer Finance) | (a) | 14,510 | 166,865 | |||||
Alleghany Corp. (Insurance) | (a) | 521 | 309,891 | |||||
American Financial Group, Inc. (Insurance) | 2,486 | 247,034 | ||||||
Aspen Insurance Holdings Ltd. (Insurance) | 2,021 | 100,747 | ||||||
Brown & Brown, Inc. (Insurance) | 3,890 | 167,542 | ||||||
CNO Financial Group, Inc. (Insurance) | 5,801 | 121,125 | ||||||
First American Financial Corp. (Insurance) | 3,712 | 165,889 | ||||||
Genworth Financial, Inc. Class A (Insurance) | (a) | 16,813 | 63,385 | |||||
Hanover Insurance Group, Inc. / The (Insurance) | 1,436 | 127,273 | ||||||
Kemper Corp. (Insurance) | 1,642 | 63,381 | ||||||
Mercury General Corp. (Insurance) | 1,229 | 66,366 | ||||||
Old Republic International Corp. (Insurance) | 8,257 | 161,259 | ||||||
Primerica, Inc. (Insurance) | 1,532 | 116,049 | ||||||
Reinsurance Group of America, Inc. (Insurance) | 2,176 | 279,377 | ||||||
RenaissanceRe Holdings Ltd. (Insurance) | 1,371 | 190,638 | ||||||
WR Berkley Corp. (Insurance) | 3,273 | 226,393 | ||||||
New York Community Bancorp, Inc. (Thrifts & Mortgage Finance) | 16,518 | 216,881 | ||||||
Washington Federal, Inc. (Thrifts & Mortgage Finance) | 3,010 | 99,932 | ||||||
| ||||||||
| 9,147,755 | ||||||||
| ||||||||
| HEALTH CARE – 9.0% | ||||||||
Bioverativ, Inc. (Biotechnology) | (a) | 3,645 | 219,320 | |||||
United Therapeutics Corp. (Biotechnology) | (a) | 1,518 | 196,930 | |||||
ABIOMED, Inc. (Health Care Equip. & Supplies) | (a) | 1,373 | 196,751 | |||||
| Common Stocks (Continued) | Shares | Value | ||||||
| HEALTH CARE (continued) | ||||||||
Globus Medical, Inc. (Health Care Equip. & Supplies) | (a) | 2,429 | $ 80,521 | |||||
Halyard Health, Inc. (Health Care Equip. & Supplies) | (a) | 1,572 | 61,748 | |||||
Hill-Rom Holdings, Inc. (Health Care Equip. & Supplies) | 2,029 | 161,529 | ||||||
LivaNova PLC (Health Care Equip. & Supplies) | (a) | 1,460 | 89,367 | |||||
Masimo Corp. (Health Care Equip. & Supplies) | (a) | 1,531 | 139,597 | |||||
NuVasive, Inc. (Health Care Equip. & Supplies) | (a) | 1,705 | 131,149 | |||||
ResMed, Inc. (Health Care Equip. & Supplies) | 4,789 | 372,919 | ||||||
STERIS PLC (Health Care Equip. & Supplies) | 2,861 | 233,171 | ||||||
Teleflex, Inc. (Health Care Equip. & Supplies) | 1,521 | 316,003 | ||||||
West Pharmaceutical Services, Inc. (Health Care Equip. & Supplies) | 2,477 | 234,126 | ||||||
Acadia Healthcare Co., Inc. (Health Care Providers & Svs.) | (a) | 2,573 | 127,055 | |||||
HealthSouth Corp. (Health Care Providers & Svs.) | 3,017 | 146,023 | ||||||
LifePoint Health, Inc. (Health Care Providers & Svs.) | (a) | 1,373 | 92,197 | |||||
MEDNAX, Inc. (Health Care Providers & Svs.) | (a) | 3,142 | 189,683 | |||||
Molina Healthcare, Inc. (Health Care Providers & Svs.) | (a) | 1,439 | 99,550 | |||||
Owens & Minor, Inc. (Health Care Providers & Svs.) | 2,064 | 66,440 | ||||||
Tenet Healthcare Corp. (Health Care Providers & Svs.) | (a) | 2,709 | 52,392 | |||||
VCA, Inc. (Health Care Providers & Svs.) | (a) | 2,741 | 253,022 | |||||
WellCare Health Plans, Inc. (Health Care Providers & Svs.) | (a) | 1,503 | 269,879 | |||||
Allscripts Healthcare Solutions, Inc. (Health Care Technology) | (a) | 6,116 | 78,040 | |||||
Medidata Solutions, Inc. (Health Care Technology) | (a) | 1,874 | 146,547 | |||||
Bio-Rad Laboratories, Inc. Class A (Life Sciences Tools & Svs.) | (a) | 705 | 159,549 | |||||
Bio-Techne Corp. (Life Sciences Tools & Svs.) | 1,268 | 148,990 | ||||||
Charles River Laboratories International, Inc. (Life Sciences Tools & Svs.) | (a) | 1,603 | 162,143 | |||||
INC Research Holdings, Inc. Class A (Life Sciences Tools & Svs.) | (a) | 1,821 | 106,528 | |||||
PAREXEL International Corp. (Life Sciences Tools & Svs.) | (a) | 1,708 | 148,442 | |||||
Akorn, Inc. (Pharmaceuticals) | (a) | 2,934 | 98,406 | |||||
Catalent, Inc. (Pharmaceuticals) | (a) | 4,212 | 147,841 | |||||
Endo International PLC (Pharmaceuticals) | (a) | 6,685 | 74,671 | |||||
Prestige Brands Holdings, Inc. (Pharmaceuticals) | (a) | 1,783 | 94,160 | |||||
| ||||||||
| 5,094,689 | ||||||||
| ||||||||
| INDUSTRIALS – 14.8% | ||||||||
Curtiss-Wright Corp. (Aerospace & Defense) | 1,491 | 136,844 | ||||||
Esterline Technologies Corp. (Aerospace & Defense) | (a) | 1,003 | 95,084 | |||||
Huntington Ingalls Industries, Inc. (Aerospace & Defense) | 1,555 | 289,479 | ||||||
KLX, Inc. (Aerospace & Defense) | (a) | 1,754 | 87,700 | |||||
Orbital ATK, Inc. (Aerospace & Defense) | 1,943 | 191,113 | ||||||
Teledyne Technologies, Inc. (Aerospace & Defense) | (a) | 1,188 | 151,648 | |||||
JetBlue Airways Corp. (Airlines) | (a) | 11,259 | 257,043 | |||||
A.O. Smith Corp. (Building Products) | 4,978 | 280,411 | ||||||
Lennox International, Inc. (Building Products) | 1,298 | 238,365 | ||||||
Clean Harbors, Inc. (Commercial Svs. & Supplies) | (a) | 1,765 | 98,540 | |||||
Copart, Inc. (Commercial Svs. & Supplies) | (a) | 6,910 | 219,669 | |||||
Deluxe Corp. (Commercial Svs. & Supplies) | 1,648 | 114,075 | ||||||
Herman Miller, Inc. (Commercial Svs. & Supplies) | 2,016 | 61,286 | ||||||
| 93 | (continued) |
| Ohio National Fund, Inc. | S&P MidCap 400® Index Portfolio (Continued) |
Schedule of Investments | June 30, 2017 (Unaudited) |
| Common Stocks (Continued) | Shares | Value | ||||||
| INDUSTRIALS (continued) | ||||||||
HNI Corp. (Commercial Svs. & Supplies) | 1,486 | $ 59,247 | ||||||
MSA Safety, Inc. (Commercial Svs. & Supplies) | 1,060 | 86,040 | ||||||
Pitney Bowes, Inc. (Commercial Svs. & Supplies) | 6,279 | 94,813 | ||||||
Rollins, Inc. (Commercial Svs. & Supplies) | 3,229 | 131,453 | ||||||
AECOM (Construction & Engineering) | (a) | 5,245 | 169,571 | |||||
Dycom Industries, Inc. (Construction & Engineering) | (a) | 1,049 | 93,906 | |||||
EMCOR Group, Inc. (Construction & Engineering) | 2,005 | 131,087 | ||||||
Granite Construction, Inc. (Construction & Engineering) | 1,344 | 64,835 | ||||||
KBR, Inc. (Construction & Engineering) | 4,829 | 73,497 | ||||||
Valmont Industries, Inc. (Construction & Engineering) | 761 | 113,846 | ||||||
EnerSys (Electrical Equip.) | 1,465 | 106,139 | ||||||
Hubbell, Inc. (Electrical Equip.) | 1,723 | 194,992 | ||||||
Regal Beloit Corp. (Electrical Equip.) | 1,511 | 123,222 | ||||||
Carlisle Cos., Inc. (Industrial Conglomerates) | 2,176 | 207,590 | ||||||
AGCO Corp. (Machinery) | 2,247 | 151,425 | ||||||
Crane Co. (Machinery) | 1,702 | 135,105 | ||||||
Donaldson Co., Inc. (Machinery) | 4,449 | 202,607 | ||||||
Graco, Inc. (Machinery) | 1,869 | 204,244 | ||||||
IDEX Corp. (Machinery) | 2,580 | 291,566 | ||||||
ITT, Inc. (Machinery) | 2,989 | 120,098 | ||||||
Kennametal, Inc. (Machinery) | 2,711 | 101,446 | ||||||
Lincoln Electric Holdings, Inc. (Machinery) | 2,095 | 192,929 | ||||||
Nordson Corp. (Machinery) | 1,805 | 218,983 | ||||||
Oshkosh Corp. (Machinery) | 2,519 | 173,509 | ||||||
Terex Corp. (Machinery) | 3,286 | 123,225 | ||||||
Timken Co. / The (Machinery) | 2,363 | 109,289 | ||||||
Toro Co. / The (Machinery) | 3,639 | 252,146 | ||||||
Trinity Industries, Inc. (Machinery) | 5,123 | 143,598 | ||||||
Wabtec Corp. (Machinery) | 2,918 | 266,997 | ||||||
Woodward, Inc. (Machinery) | 1,856 | 125,428 | ||||||
Kirby Corp. (Marine) | (a) | 1,818 | 121,533 | |||||
Dun & Bradstreet Corp. / The (Professional Svs.) | 1,242 | 134,322 | ||||||
FTI Consulting, Inc. (Professional Svs.) | (a) | 1,392 | 48,664 | |||||
ManpowerGroup, Inc. (Professional Svs.) | 2,267 | 253,111 | ||||||
Avis Budget Group, Inc. (Road & Rail) | (a) | 2,840 | 77,447 | |||||
Genesee & Wyoming, Inc. Class A (Road & Rail) | (a) | 2,074 | 141,841 | |||||
Landstar System, Inc. (Road & Rail) | 1,413 | 120,953 | ||||||
Old Dominion Freight Line, Inc. (Road & Rail) | 2,340 | 222,862 | ||||||
Ryder System, Inc. (Road & Rail) | 1,804 | 129,852 | ||||||
Werner Enterprises, Inc. (Road & Rail) | 1,523 | 44,700 | ||||||
GATX Corp. (Trading Companies & Distributors) | 1,327 | 85,286 | ||||||
MSC Industrial Direct Co., Inc. Class A (Trading Companies & Distributors) | 1,519 | 130,573 | ||||||
NOW, Inc. (Trading Companies & Distributors) | (a) | 3,629 | 58,354 | |||||
Watsco, Inc. (Trading Companies & Distributors) | 1,028 | 158,518 | ||||||
| ||||||||
| 8,412,106 | ||||||||
| ||||||||
| INFORMATION TECHNOLOGY – 17.5% | ||||||||
Arrow Electronics, Inc. (Electronic Equip., Instr. & Comp.) | (a) | 3,005 | 235,652 | |||||
Avnet, Inc. (Electronic Equip., Instr. & Comp.) | 4,208 | 163,607 | ||||||
Belden, Inc. (Electronic Equip., Instr. & Comp.) | 1,423 | 107,337 | ||||||
Cognex Corp. (Electronic Equip., Instr. & Comp.) | 2,926 | 248,417 | ||||||
Coherent, Inc. (Electronic Equip., Instr. & Comp.) | (a) | 831 | 186,967 | |||||
IPG Photonics Corp. (Electronic Equip., Instr. & Comp.) | (a) | 1,269 | 184,132 | |||||
Jabil Circuit, Inc. (Electronic Equip., Instr. & Comp.) | 6,165 | 179,956 | ||||||
Keysight Technologies, Inc. (Electronic Equip., Instr. & Comp.) | (a) | 6,240 | 242,923 | |||||
Knowles Corp. (Electronic Equip., Instr. & Comp.) | (a) | 3,006 | 50,861 | |||||
Littelfuse, Inc. (Electronic Equip., Instr. & Comp.) | 764 | 126,060 | ||||||
National Instruments Corp. (Electronic Equip., Instr. & Comp.) | 3,606 | 145,033 | ||||||
| Common Stocks (Continued) | Shares | Value | ||||||
| INFORMATION TECHNOLOGY (continued) | ||||||||
SYNNEX Corp. (Electronic Equip., Instr. & Comp.) | 981 | $ 117,681 | ||||||
Tech Data Corp. (Electronic Equip., Instr. & Comp.) | (a) | 1,168 | 117,968 | |||||
Trimble, Inc. (Electronic Equip., Instr. & Comp.) | (a) | 8,540 | 304,622 | |||||
VeriFone Systems, Inc. (Electronic Equip., Instr. & Comp.) | (a) | 3,760 | 68,056 | |||||
Vishay Intertechnology, Inc. (Electronic Equip., Instr. & Comp.) | 4,516 | 74,966 | ||||||
Zebra Technologies Corp. Class A (Electronic Equip., Instr. & Comp.) | (a) | 1,784 | 179,328 | |||||
ARRIS International PLC (Communications Equip.) | (a) | 6,343 | 177,731 | |||||
Brocade Communications Systems, Inc. (Communications Equip.) | 13,854 | 174,699 | ||||||
Ciena Corp. (Communications Equip.) | (a) | 4,772 | 119,395 | |||||
InterDigital, Inc. (Communications Equip.) | 1,167 | 90,209 | ||||||
NetScout Systems, Inc. (Communications Equip.) | (a) | 3,088 | 106,227 | |||||
Plantronics, Inc. (Communications Equip.) | 1,127 | 58,953 | ||||||
ViaSat, Inc. (Communications Equip.) | (a) | 1,784 | 118,101 | |||||
Cars.com, Inc. (Internet Software & Svs.) | (a) | 2,409 | 64,152 | |||||
J2 Global, Inc. (Internet Software & Svs.) | 1,622 | 138,016 | ||||||
LogMeIn, Inc. (Internet Software & Svs.) | 1,773 | 185,278 | ||||||
WebMD Health Corp. (Internet Software & Svs.) | (a) | 1,271 | 74,544 | |||||
Acxiom Corp. (IT Svs.) | (a) | 2,644 | 68,691 | |||||
Broadridge Financial Solutions, Inc. (IT Svs.) | 3,973 | 300,200 | ||||||
Convergys Corp. (IT Svs.) | 3,171 | 75,406 | ||||||
CoreLogic, Inc. (IT Svs.) | (a) | 2,852 | 123,720 | |||||
DST Systems, Inc. (IT Svs.) | 2,080 | 128,336 | ||||||
Jack Henry & Associates, Inc. (IT Svs.) | 2,627 | 272,866 | ||||||
Leidos Holdings, Inc. (IT Svs.) | 4,849 | 250,645 | ||||||
MAXIMUS, Inc. (IT Svs.) | 2,182 | 136,659 | ||||||
NeuStar, Inc. Class A (IT Svs.) | (a) | 1,876 | 62,565 | |||||
Sabre Corp. (IT Svs.) | 6,927 | 150,801 | ||||||
Science Applications International Corp. (IT Svs.) | 1,471 | 102,117 | ||||||
Teradata Corp. (IT Svs.) | (a) | 4,407 | 129,962 | |||||
WEX, Inc. (IT Svs.) | (a) | 1,300 | 135,551 | |||||
Cirrus Logic, Inc. (Semiconductors & Equip.) | (a) | 2,168 | 135,977 | |||||
Cree, Inc. (Semiconductors & Equip.) | (a) | 3,275 | 80,729 | |||||
Cypress Semiconductor Corp. (Semiconductors & Equip.) | 11,089 | 151,365 | ||||||
First Solar, Inc. (Semiconductors & Equip.) | (a) | 2,633 | 105,004 | |||||
Integrated Device Technology, Inc. (Semiconductors & Equip.) | (a) | 4,479 | 115,513 | |||||
Microsemi Corp. (Semiconductors & Equip.) | (a) | 3,912 | 183,082 | |||||
Monolithic Power Systems, Inc. (Semiconductors & Equip.) | 1,278 | 123,199 | ||||||
Silicon Laboratories, Inc. (Semiconductors & Equip.) | (a) | 1,425 | 97,399 | |||||
Synaptics, Inc. (Semiconductors & Equip.) | (a) | 1,161 | 60,035 | |||||
Teradyne, Inc. (Semiconductors & Equip.) | 6,733 | 202,192 | ||||||
Versum Materials, Inc. (Semiconductors & Equip.) | 3,657 | 118,852 | ||||||
ACI Worldwide, Inc. (Software) | (a) | 3,974 | 88,898 | |||||
Blackbaud, Inc. (Software) | 1,616 | 138,572 | ||||||
Cadence Design Systems, Inc. (Software) | (a) | 9,440 | 316,146 | |||||
CDK Global, Inc. (Software) | 4,908 | 304,590 | ||||||
CommVault Systems, Inc. (Software) | (a) | 1,407 | 79,425 | |||||
Fair Isaac Corp. (Software) | 1,044 | 145,544 | ||||||
Fortinet, Inc. (Software) | (a) | 5,028 | 188,248 | |||||
Manhattan Associates, Inc. (Software) | (a) | 2,347 | 112,797 | |||||
PTC, Inc. (Software) | (a) | 3,906 | 215,299 | |||||
Take-Two Interactive Software, Inc. (Software) | (a) | 3,507 | 257,344 | |||||
Tyler Technologies, Inc. (Software) | (a) | 1,136 | 199,561 | |||||
Ultimate Software Group, Inc. / The (Software) | (a) | 1,005 | 211,110 | |||||
3D Systems Corp. (Tech. Hardware, Storage & Periph.) | (a) | 3,640 | 68,068 | |||||
| 94 | (continued) |
| Ohio National Fund, Inc. | S&P MidCap 400® Index Portfolio (Continued) |
Schedule of Investments | June 30, 2017 (Unaudited) |
| Common Stocks (Continued) | Shares | Value | ||||||
| INFORMATION TECHNOLOGY (continued) | ||||||||
Diebold Nixdorf, Inc. (Tech. Hardware, Storage & Periph.) | 2,544 | $ 71,232 | ||||||
NCR Corp. (Tech. Hardware, Storage & Periph.) | (a) | 4,080 | 166,627 | |||||
| ||||||||
| 9,915,198 | ||||||||
| ||||||||
| MATERIALS – 7.5% | ||||||||
Ashland Global Holdings, Inc. (Chemicals) | 2,097 | 138,213 | ||||||
Cabot Corp. (Chemicals) | 2,105 | 112,470 | ||||||
Chemours Co. / The (Chemicals) | 6,226 | 236,090 | ||||||
Minerals Technologies, Inc. (Chemicals) | 1,195 | 87,474 | ||||||
NewMarket Corp. (Chemicals) | 312 | 143,670 | ||||||
Olin Corp. (Chemicals) | 5,584 | 169,084 | ||||||
PolyOne Corp. (Chemicals) | 2,755 | 106,729 | ||||||
RPM International, Inc. (Chemicals) | 4,517 | 246,402 | ||||||
Scotts Miracle-Gro Co. / The Class A (Chemicals) | 1,484 | 132,759 | ||||||
Sensient Technologies Corp. (Chemicals) | 1,496 | 120,473 | ||||||
Valvoline, Inc. (Chemicals) | 6,884 | 163,288 | ||||||
Eagle Materials, Inc. (Construction Materials) | 1,635 | 151,107 | ||||||
AptarGroup, Inc. (Containers & Packaging) | 2,101 | 182,493 | ||||||
Bemis Co., Inc. (Containers & Packaging) | 3,096 | 143,190 | ||||||
Greif, Inc. Class A (Containers & Packaging) | 870 | 48,529 | ||||||
Owens-Illinois, Inc. (Containers & Packaging) | (a) | 5,481 | 131,106 | |||||
Packaging Corp. of America (Containers & Packaging) | 3,181 | 354,332 | ||||||
Silgan Holdings, Inc. (Containers & Packaging) | 2,527 | 80,308 | ||||||
Sonoco Products Co. (Containers & Packaging) | 3,347 | 172,103 | ||||||
Allegheny Technologies, Inc. (Metals & Mining) | 3,666 | 62,359 | ||||||
Carpenter Technology Corp. (Metals & Mining) | 1,575 | 58,952 | ||||||
Commercial Metals Co. (Metals & Mining) | 3,901 | 75,796 | ||||||
Compass Minerals International, Inc. (Metals & Mining) | 1,139 | 74,377 | ||||||
Reliance Steel & Aluminum Co. (Metals & Mining) | 2,471 | 179,914 | ||||||
Royal Gold, Inc. (Metals & Mining) | 2,201 | 172,052 | ||||||
Steel Dynamics, Inc. (Metals & Mining) | 8,167 | 292,460 | ||||||
United States Steel Corp. (Metals & Mining) | 5,878 | 130,139 | ||||||
Worthington Industries, Inc. (Metals & Mining) | 1,480 | 74,326 | ||||||
Domtar Corp. (Paper & Forest Products) | 2,110 | 81,066 | ||||||
Louisiana-Pacific Corp. (Paper & Forest Products) | (a) | 4,871 | 117,440 | |||||
| ||||||||
| 4,238,701 | ||||||||
| ||||||||
| REAL ESTATE – 9.7% | ||||||||
American Campus Communities, Inc. (Equity Real Estate Investment Trusts) | 4,524 | 213,985 | ||||||
Camden Property Trust (Equity Real Estate Investment Trusts) | 2,956 | 252,768 | ||||||
Care Capital Properties, Inc. (Equity Real Estate Investment Trusts) | 2,833 | 75,641 | ||||||
CoreCivic, Inc. (Equity Real Estate Investment Trusts) | 3,977 | 109,686 | ||||||
Corporate Office Properties Trust (Equity Real Estate Investment Trusts) | 3,349 | 117,315 | ||||||
Cousins Properties, Inc. (Equity Real Estate Investment Trusts) | 14,112 | 124,044 | ||||||
CyrusOne, Inc. (Equity Real Estate Investment Trusts) | 2,629 | 146,567 | ||||||
DCT Industrial Trust, Inc. (Equity Real Estate Investment Trusts) | 3,095 | 165,397 | ||||||
Douglas Emmett, Inc. (Equity Real Estate Investment Trusts) | 4,962 | 189,598 | ||||||
Duke Realty Corp. (Equity Real Estate Investment Trusts) | 11,982 | 334,897 | ||||||
Education Realty Trust, Inc. (Equity Real Estate Investment Trusts) | 2,477 | 95,984 | ||||||
EPR Properties (Equity Real Estate Investment Trusts) | 2,168 | 155,814 | ||||||
First Industrial Realty Trust, Inc. (Equity Real Estate Investment Trusts) | 3,952 | 113,106 | ||||||
| Common Stocks (Continued) | Shares | Value | ||||||
| REAL ESTATE (continued) | ||||||||
GEO Group, Inc. / The (Equity Real Estate Investment Trusts) | 4,187 | $ 123,810 | ||||||
Healthcare Realty Trust, Inc. (Equity Real Estate Investment Trusts) | 3,924 | 134,005 | ||||||
Highwoods Properties, Inc. (Equity Real Estate Investment Trusts) | 3,435 | 174,189 | ||||||
Hospitality Properties Trust (Equity Real Estate Investment Trusts) | 5,553 | 161,870 | ||||||
Kilroy Realty Corp. (Equity Real Estate Investment Trusts) | 3,315 | 249,122 | ||||||
Lamar Advertising Co. Class A (Equity Real Estate Investment Trusts) | 2,813 | 206,952 | ||||||
LaSalle Hotel Properties (Equity Real Estate Investment Trusts) | 3,812 | 113,598 | ||||||
Liberty Property Trust (Equity Real Estate Investment Trusts) | 4,971 | 202,369 | ||||||
Life Storage, Inc. (Equity Real Estate Investment Trusts) | 1,573 | 116,559 | ||||||
Mack-Cali Realty Corp. (Equity Real Estate Investment Trusts) | 3,049 | 82,750 | ||||||
Medical Properties Trust, Inc. (Equity Real Estate Investment Trusts) | 12,303 | 158,340 | ||||||
National Retail Properties, Inc. (Equity Real Estate Investment Trusts) | 5,040 | 197,064 | ||||||
Omega Healthcare Investors, Inc. (Equity Real Estate Investment Trusts) | 6,644 | 219,385 | ||||||
Potlatch Corp. (Equity Real Estate Investment Trusts) | 1,368 | 62,518 | ||||||
Quality Care Properties, Inc. (Equity Real Estate Investment Trusts) | (a) | 3,155 | 57,768 | |||||
Rayonier, Inc. (Equity Real Estate Investment Trusts) | 4,337 | 124,775 | ||||||
Senior Housing Properties Trust (Equity Real Estate Investment Trusts) | 8,026 | 164,051 | ||||||
Tanger Factory Outlet Centers, Inc. (Equity Real Estate Investment Trusts) | 3,252 | 84,487 | ||||||
Taubman Centers, Inc. (Equity Real Estate Investment Trusts) | 2,054 | 122,316 | ||||||
Uniti Group, Inc. (Equity Real Estate Investment Trusts) | (a) | 5,316 | 133,644 | |||||
Urban Edge Properties (Equity Real Estate Investment Trusts) | 3,357 | 79,662 | ||||||
Washington Prime Group, Inc. (Equity Real Estate Investment Trusts) | 6,255 | 52,354 | ||||||
Weingarten Realty Investors (Equity Real Estate Investment Trusts) | 3,996 | 120,280 | ||||||
Alexander & Baldwin, Inc. (Real Estate Mgmt. & Development) | 1,557 | 64,429 | ||||||
Jones Lang LaSalle, Inc. (Real Estate Mgmt. & Development) | 1,525 | 190,625 | ||||||
| ||||||||
| 5,491,724 | ||||||||
| ||||||||
| TELECOMMUNICATION SERVICES – 0.2% | ||||||||
Frontier Communications Corp. (Diversified Telecom. Svs.) | 39,628 | 45,968 | ||||||
Telephone & Data Systems, Inc. (Wireless Telecom. Svs.) | 3,163 | 87,773 | ||||||
| ||||||||
| 133,741 | ||||||||
| ||||||||
| UTILITIES – 5.4% | ||||||||
Great Plains Energy, Inc. (Electric Utilities) | 7,284 | 213,276 | ||||||
Hawaiian Electric Industries, Inc. (Electric Utilities) | 3,661 | 118,543 | ||||||
IDACORP, Inc. (Electric Utilities) | 1,703 | 145,351 | ||||||
OGE Energy Corp. (Electric Utilities) | 6,740 | 234,485 | ||||||
PNM Resources, Inc. (Electric Utilities) | 2,682 | 102,587 | ||||||
Westar Energy, Inc. (Electric Utilities) | 4,793 | 254,125 | ||||||
Atmos Energy Corp. (Gas Utilities) | 3,553 | 294,721 | ||||||
National Fuel Gas Co. (Gas Utilities) | 2,875 | 160,540 | ||||||
New Jersey Resources Corp. (Gas Utilities) | 2,917 | 115,805 | ||||||
| 95 | (continued) |
| Ohio National Fund, Inc. | S&P MidCap 400® Index Portfolio (Continued) |
Schedule of Investments | June 30, 2017 (Unaudited) |
| Common Stocks (Continued) | Shares | Value | ||||||
| UTILITIES (continued) | ||||||||
ONE Gas, Inc. (Gas Utilities) | 1,767 | $ 123,354 | ||||||
Southwest Gas Holdings, Inc. (Gas Utilities) | 1,602 | 117,042 | ||||||
UGI Corp. (Gas Utilities) | 5,846 | 283,005 | ||||||
WGL Holdings, Inc. (Gas Utilities) | 1,722 | 143,666 | ||||||
Black Hills Corp. (Multi-Utilities) | 1,808 | 121,986 | ||||||
MDU Resources Group, Inc. (Multi-Utilities) | 6,571 | 172,160 | ||||||
NorthWestern Corp. (Multi-Utilities) | 1,631 | 99,524 | ||||||
Vectren Corp. (Multi-Utilities) | 2,805 | 163,924 | ||||||
Aqua America, Inc. (Water Utilities) | 5,985 | 199,300 | ||||||
| ||||||||
| 3,063,394 | ||||||||
| ||||||||
Total Common Stocks (Cost $54,381,353) | $55,751,593 | |||||||
| ||||||||
| Money Market Funds – 2.1% | Shares | Value | ||||||
State Street Institutional U.S. Government Money Market Fund Institutional Class | 1,215,336 | $ 1,215,336 | ||||||
| ||||||||
Total Money Market Funds | $ 1,215,336 | |||||||
| ||||||||
Total Investments – 100.3% | (b) | $56,966,929 | ||||||
Liabilities in Excess of Other | (c) | (160,673) | ||||||
| ||||||||
Net Assets – 100.0% | $56,806,256 | |||||||
| ||||||||
Percentages are stated as a percent of net assets.
Footnotes:
| (a) | Non-income producing security. |
| (b) | Represents cost for financial reporting purposes, which may differ from cost basis for federal income tax purposes. See also Note 7 of the Notes to Financial Statements. |
| (c) | Includes $105,627 of cash pledged as collateral for the futures contracts outstanding at June 30, 2017. See also the following Schedule of Open Futures Contracts. |
The accompanying notes are an integral part of these financial statements.
Schedule of Open Futures Contracts | June 30, 2017 (Unaudited) |
Description | Number of Contracts | Expiration Date | Notional Amount | Value | Unrealized Appreciation (Depreciation) | |||||||||
CME E-mini S&P MidCap 400 Index – Long | 6 | September 15, 2017 | $ | 1,051,627 | $1,047,661 | $ | (3,966 | ) | ||||||
|
|
|
|
| ||||||||||
The accompanying notes are an integral part of these financial statements.
| 96 |
| Ohio National Fund, Inc. | Bristol Growth Portfolio |
Objective/Strategy
The Bristol Growth Portfolio seeks long-term growth of capital by investing primarily in common stocks of the 1,000 largest publicly traded U.S. companies in terms of market capitalization.
Performance as of June 30, 2017
Average Annual returns | ||||
One year | 19.68% | |||
Five years | 16.43% | |||
Ten years | 7.80% |
Past performance does not guarantee future results. The performance data quoted represents past performance and current returns may be lower or higher. Total return figures include change in share price and reinvestment of dividends and capital gains. The investment return and principal value will fluctuate so that an investor’s shares, when redeemed, may be worth more or less than the original cost. To obtain performance information up to the most recent month end, call toll-free 1-877-781-6392.
The Portfolio is not open to direct retail investment. Beneficial interest in shares is obtained solely by purchase of variable life insurance policies and variable annuity contracts. Actual performance results for variable annuity and variable universal life contracts will be lower due to contract charges. Consult your contract for applicable charges.
Total expense ratio is 0.89% per the Fund’s prospectus dated May 1, 2017. Additional information pertaining to the Fund’s expense ratio as of June 30, 2017 can be found in the Portfolio’s Financial Highlights.
Comments from Sub-Adviser
Q. How did the Portfolio perform in comparison to its benchmark during the reporting period?
A. For the six-month period ended June 30, 2017, the Bristol Growth Portfolio returned 13.78% versus 13.99% for its benchmark, the Russell 1000 Growth Index.
Q. Were there specific market conditions, investment strategies, or techniques that materially affected the Portfolio’s benchmark-relative performance during the reporting period?
A. At the half-way point of the year, the economy continues to churn ahead; perhaps, not at the speed our President desires, or promised, but at least in a positive direction. As the economy moves along steadily, under the watchful eye of the Federal Reserve, the market anticipated the progress of the federal government in implementing some of the broader promises leading up to the election.
Health care affects a large portion of the economy. At this point, major changes do not appear to be expected. If there is no new health care plan and subsequent major tax overhaul, there is a significant chance the market will react negatively. While one could argue that tax cut expectations have been reduced, there is clearly the hope that some major changes occur, even if it is a tax holiday to repatriate overseas earnings.
Q. How did sector selection and security selection each impact the Portfolio’s performance relative to its benchmark?
A. The Portfolio slightly underperformed the benchmark during the period. Selections in Financials and Consumer Staples, as well as an underweight to Health Care and overweight to Telecommunication Services were key detractors. Key contributors to relative performance were stock selection within the Consumer Discretionary, Information Technology, and Telecommunication Services, as well as underweights to Consumer Staples and Real Estate.(1)
Q. Which holdings contributed the most to, and detracted the most from, the Portfolio’s benchmark-relative performance?
A. Among the Portfolio’s Information Technology holdings, DXC Technology Co. generated 68 basis points of relative contribution and was able to beat analyst earnings estimates on stronger margins and continued progress towards its merger synergies with Hewlett Packard Enterprise Co. Oracle Corp. added 57 basis points as it continued to show positive earnings reports as well as confidence in the transition into software as a service (“SaaS”). Delphi Automotive PLC contributed 54 basis points on positive earnings results along with the spinoff of its powertrain division.(1)
The key detractor was IMAX Corp., which detracted 55 basis points of relative contribution while struggling from a slew of negative revisions, as the outlook for the summer movie slate worsened. We finally exited the position when it appeared that China was getting closer to saturation of IMAX theatres sooner than expected, and the revenue per theatre might be secularly challenged. Apple, Inc., detracting 36 basis points, cost the Portfolio due to its underweight relative to the benchmark. AECOM, which detracted 23 basis points, was expected to be a major beneficiary of a bipartisan infrastructure spending bill, but so far it seems like expectations for any explicit plan to be released and implemented keeps getting delayed.(1)
| (1) | The Portfolio’s composition is subject to change. Holdings and weightings are as of June 30, 2017. |
| 97 | (continued) |
| Ohio National Fund, Inc. | Bristol Growth Portfolio (Continued) |
Change in Value of $10,000 Investment
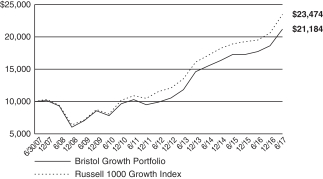
Hypothetical illustration based on past performance. Future performance will vary. The Portfolio’s returns reflect reinvested dividends. The Portfolio’s holdings may differ significantly from the securities in the index. The index is unmanaged and therefore does not reflect the cost of portfolio management and accounting.
The Russell 1000 Growth Index is a market-capitalization weighted index of those firms in the Russell 1000 Index with higher price-to-book ratios and higher forecasted growth values. The Russell 1000 Index measures the performance of the large-cap segment of the U.S. equity universe. The index presented includes the effects of requested dividends.
Portfolio Composition as of June 30, 2017 (1)
| % of Net Assets | ||||
Common Stocks (4) | 98.8 | |||
Money Market Funds and | 1.2 | |||
|
| |||
| 100.0 | ||||
|
|
Top 10 Portfolio Holdings as of June 30, 2017 (1) (2) (3)
| % of Net Assets | ||||||
| 1. | Amazon.com, Inc. | 4.7 | ||||
| 2. | Apple, Inc. | 4.4 | ||||
| 3. | Alphabet, Inc. Class C | 4.0 | ||||
| 4. | Microsoft Corp. | 3.9 | ||||
| 5. | Facebook, Inc. Class A | 3.6 | ||||
| 6. | Alphabet, Inc. Class A | 2.5 | ||||
| 7. | PVH Corp. | 2.2 | ||||
| 8. | Visa, Inc. | 2.1 | ||||
| 9. | Coach, Inc. | 2.1 | ||||
| 10. | Goldman Sachs Group, Inc. / The | 2.1 |
| (1) | Composition of Portfolio subject to change. |
| (2) | Short-term investments have been excluded from the list of Top 10 Portfolio Holdings. |
| (3) | Top 10 Portfolio Holdings is presented at an individual security level. Total investment exposure by issuer may be higher. |
| (4) | Sectors (Common Stocks): |
| % of Net Assets | ||||
Information Technology | 38.8 | |||
Consumer Discretionary | 20.5 | |||
Health Care | 14.9 | |||
Industrials | 13.7 | |||
Consumer Staples | 3.8 | |||
Financials | 3.6 | |||
Materials | 1.9 | |||
Telecommunication Services | 1.6 | |||
|
| |||
| 98.8 | ||||
|
|
| 98 |
| Ohio National Fund, Inc. | Bristol Growth Portfolio |
Schedule of Investments | June 30, 2017 (Unaudited) |
| Common Stocks – 98.8% | Shares | Value | ||||||||
| CONSUMER DISCRETIONARY – 20.5% | ||||||||||
McDonald’s Corp. (Hotels, Restaurants & Leisure) | 16,199 | $ | 2,481,039 | |||||||
MGM Resorts International (Hotels, Restaurants & Leisure) | 70,324 | 2,200,438 | ||||||||
Royal Caribbean Cruises Ltd. (Hotels, Restaurants & Leisure) | 11,073 | 1,209,504 | ||||||||
D.R. Horton, Inc. (Household Durables) | 72,511 | 2,506,705 | ||||||||
Newell Brands, Inc. (Household Durables) | 44,973 | 2,411,452 | ||||||||
Amazon.com, Inc. (Internet & Direct Marketing Retail) | (a) | 5,966 | 5,775,088 | |||||||
CBS Corp. Class B (Media) | 35,413 | 2,258,641 | ||||||||
Time Warner, Inc. (Media) | 12,636 | 1,268,781 | ||||||||
Coach, Inc. (Textiles, Apparel & Luxury Goods) | 53,854 | 2,549,448 | ||||||||
PVH Corp. (Textiles, Apparel & Luxury Goods) | 23,376 | 2,676,552 | ||||||||
|
| |||||||||
| 25,337,648 | ||||||||||
|
| |||||||||
| CONSUMER STAPLES – 3.8% | ||||||||||
Kraft Heinz Co. / The (Food Products) | 27,144 | 2,324,612 | ||||||||
Philip Morris International, Inc. (Tobacco) | 20,586 | 2,417,826 | ||||||||
|
| |||||||||
| 4,742,438 | ||||||||||
|
| |||||||||
| FINANCIALS – 3.6% | ||||||||||
Citigroup, Inc. (Banks) | 28,667 | 1,917,249 | ||||||||
Goldman Sachs Group, Inc. / The (Capital Markets) | 11,463 | 2,543,640 | ||||||||
|
| |||||||||
| 4,460,889 | ||||||||||
|
| |||||||||
| HEALTH CARE – 14.9% | ||||||||||
Alnylam Pharmaceuticals, Inc. (Biotechnology) | (a) | 21,249 | 1,694,820 | |||||||
Celgene Corp. (Biotechnology) | (a) | 9,464 | 1,229,090 | |||||||
Medtronic PLC (Health Care Equip. & Supplies) | 27,569 | 2,446,749 | ||||||||
Envision Healthcare Corp. (Health Care Providers & Svs.) | (a) | 38,239 | 2,396,438 | |||||||
Humana, Inc. (Health Care Providers & Svs.) | 10,485 | 2,522,901 | ||||||||
UnitedHealth Group, Inc. (Health Care Providers & Svs.) | 11,294 | 2,094,134 | ||||||||
Thermo Fisher Scientific, Inc. (Life Sciences Tools & Svs.) | 14,138 | 2,466,657 | ||||||||
Aerie Pharmaceuticals, Inc. (Pharmaceuticals) | (a) | 23,751 | 1,248,115 | |||||||
AstraZeneca PLC – ADR (Pharmaceuticals) | 69,026 | 2,353,096 | ||||||||
|
| |||||||||
| 18,452,000 | ||||||||||
|
| |||||||||
| INDUSTRIALS – 13.7% | ||||||||||
Raytheon Co. (Aerospace & Defense) | 14,509 | 2,342,913 | ||||||||
FedEx Corp. (Air Freight & Logistics) | 11,593 | 2,519,507 | ||||||||
Delta Air Lines, Inc. (Airlines) | 23,306 | 1,252,464 | ||||||||
AECOM (Construction & Engineering) | (a) | 71,359 | 2,307,036 | |||||||
Snap-on, Inc. (Machinery) | 13,655 | 2,157,490 | ||||||||
Wabtec Corp. (Machinery) | 17,263 | 1,579,565 | ||||||||
| Common Stocks (Continued) | Shares | Value | ||||||||
| INDUSTRIALS (continued) | ||||||||||
Xylem, Inc. (Machinery) | 42,853 | $ | 2,375,342 | |||||||
Union Pacific Corp. (Road & Rail) | 21,780 | 2,372,060 | ||||||||
|
| |||||||||
| 16,906,377 | ||||||||||
|
| |||||||||
| INFORMATION TECHNOLOGY – 38.8% | ||||||||||
CommScope Holding Co., Inc. (Communications Equip.) | (a) | 63,085 | 2,399,123 | |||||||
Trimble, Inc. (Electronic Equip., Instr. & Comp.) | (a) | 68,805 | 2,454,274 | |||||||
Alibaba Group Holding Ltd. – ADR (Internet Software & Svs.) | (a) | 8,606 | 1,212,585 | |||||||
Alphabet, Inc. Class A (Internet Software & Svs.) | (a) | 3,291 | 3,059,577 | |||||||
Alphabet, Inc. Class C (Internet Software & Svs.) | (a) | 5,400 | 4,907,142 | |||||||
Facebook, Inc. Class A (Internet Software & Svs.) | (a) | 29,626 | 4,472,934 | |||||||
DXC Technology Co. (IT Svs.) | 31,144 | 2,389,368 | ||||||||
Visa, Inc. (IT Svs.) | 27,318 | 2,561,882 | ||||||||
ASML Holding NV (Semiconductors & Equip.) | 18,730 | 2,440,706 | ||||||||
Broadcom Ltd. (Semiconductors & Equip.) | 10,192 | 2,375,246 | ||||||||
Cavium, Inc. (Semiconductors & Equip.) | (a) | 27,109 | 1,684,282 | |||||||
Marvell Technology Group Ltd. (Semiconductors & Equip.) | 141,790 | 2,342,371 | ||||||||
NVIDIA Corp. (Semiconductors & Equip.) | 4,091 | 591,395 | ||||||||
Adobe Systems, Inc. (Software) | (a) | 17,212 | 2,434,465 | |||||||
Microsoft Corp. (Software) | 70,683 | 4,872,179 | ||||||||
Oracle Corp. (Software) | 48,732 | 2,443,422 | ||||||||
Apple, Inc. (Tech. Hardware, Storage & Periph.) | 37,994 | 5,471,896 | ||||||||
|
| |||||||||
| 48,112,847 | ||||||||||
|
| |||||||||
| MATERIALS – 1.9% | ||||||||||
E.I. du Pont de Nemours & Co. (Chemicals) | 29,810 | 2,405,965 | ||||||||
|
| |||||||||
| TELECOMMUNICATION SERVICES – 1.6% | ||||||||||
T-Mobile U.S., Inc. (Wireless Telecom. Svs.) | (a) | 33,468 | 2,028,830 | |||||||
|
| |||||||||
Total Common Stocks (Cost $105,565,650) | $ | 122,446,994 | ||||||||
|
| |||||||||
| Money Market Funds – 0.8% | Shares | Value | ||||||||
State Street Institutional U.S. Government Money Market Fund Institutional Class | 983,256 | $ | 983,256 | |||||||
|
| |||||||||
Total Money Market Funds (Cost $983,256) | $ | 983,256 | ||||||||
|
| |||||||||
Total Investments – 99.6% (Cost $106,548,906) | (b) | $ | 123,430,250 | |||||||
Other Assets in Excess of Liabilities – 0.4% | 492,210 | |||||||||
|
| |||||||||
Net Assets – 100.0% | $ | 123,922,460 | ||||||||
|
| |||||||||
Percentages are stated as a percent of net assets.
Abbreviations:
ADR: American Depositary Receipts
Footnotes:
| (a) | Non-income producing security. |
| (b) | Represents cost for financial reporting purposes, which may differ from cost basis for federal income tax purposes. See also Note 7 of the Notes to Financial Statements. |
The accompanying notes are an integral part of these financial statements.
| 99 |
| Ohio National Fund, Inc. | Risk Managed Balanced Portfolio |
Objective/Strategy
The Risk Managed Balanced Portfolio seeks long-term capital growth, consistent with preservation of capital and balanced by current income. The Portfolio invests in a balanced portfolio of equity and fixed-income securities (the “Balanced Component”) and a risk management portfolio intended to enhance the risk adjusted return of the Portfolio (the “Risk Management Component”).
Performance as of June 30, 2017
Average Annual returns | ||||
One year | 9.35% | |||
Since inception (5/1/14) | 5.82% |
Past performance does not guarantee future results. The performance data quoted represents past performance and current returns may be lower or higher. Total return figures include change in share price and reinvestment of dividends and capital gains. The investment return and principal value will fluctuate so that an investor’s shares, when redeemed, may be worth more or less than the original cost. To obtain performance information up to the most recent month end, call toll-free 1-877-781-6392.
The Portfolio is not open to direct retail investment. Beneficial interest in shares is obtained solely by purchase of variable life insurance policies and variable annuity contracts. Actual performance results for variable annuity and variable universal life contracts will be lower due to contract charges. Consult your contract for applicable charges.
Total expense ratio is 1.04% per the Fund’s prospectus dated May 1, 2017. Additional information pertaining to the Fund’s expense ratio as of June 30, 2017 can be found in the Portfolio’s Financial Highlights.
Comments from Sub-Advisers
Q. How did the Portfolio perform in comparison to its benchmark during the reporting period?
A. For the six-month period ended June 30, 2017, the Risk Managed Balanced Portfolio returned 7.87% versus 6.12% for its benchmark, which is comprised of 55% S&P 500 Index and 45% Bloomberg Barclays U.S. Aggregate Bond Index.
Q. Were there specific market conditions, investment strategies, or techniques that materially affected the Portfolio’s benchmark-relative performance during the reporting period?
A. Equity markets started the year off strong. The Trump administration’s pro-growth fiscal platform continued to inspire optimism around the potential for greater economic expansion. U.S. economic data confirmed that the economy was already on the right track. Consumer and business confidence surveys registered multi-year highs. The labor market strengthened and key inflation measures rose. This backdrop supported the Federal Reserve’s decision to implement its first interest rate increase of the year in March. However, Washington’s general lack of progress on reform initiatives caused investors to begin reassessing the reflation trade. Downward pressure on the price of crude oil amid a ramp-up in U.S. production created further uncertainty on the inflation front.
Stocks continued gaining ground in the latter half of the period, with several equity benchmarks achieving record highs. Risk assets were supported by the strong first quarter earnings season in which nearly all sectors exceeded consensus sales and earnings estimates. Economic data, however, turned decidedly weaker. Specifically, core inflation, as measured by the Consumer Price Index, receded to 1.7% in May, the lowest reading since June 2015. Tepid economic data aside, the Federal Reserve raised its benchmark rate
by another 25 basis points in June and Chairwoman Janet Yellen indicated that the economy was likely healthy enough to withstand additional increases.
The U.S. yield curve flattened during the period. Short-term yields rose on Fed-driven volatility and intermediate and longer dated yields rallied as investors expressed renewed concern over the economic outlook. Corporate credit spreads, on both investment grade and high yield, finished tighter, spurred in part by the successful corporate earnings season.
Q. How did sector selection and security selection each impact the Portfolio’s performance relative to its benchmark?
A. The Balanced Component of the Portfolio, sub-advised by Janus Capital Management LLC, seeks to provide consistent returns over time by allocating across the spectrum of fixed income and equity securities. Its equity-to-fixed-income allocation ended the period approximately 63% equity, 36% fixed income and a small allocation to cash. We had increased our equity allocation to the top end of our range intra-period, but our concern over high multiples led us to trim some of our more volatile positions. Our equity allocation may vary based on market conditions, and currently reflects our view that on a risk-adjusted basis, equities present more attractive opportunities relative to fixed income.(1)
The Balanced Component’s equity portion outperformed its benchmark, the S&P 500 Index. Favorable stock selection made Industrials the equity portion’s strongest-contributing sector relative to the S&P 500 Index. Energy was the second-strongest-contributing sector, primarily due to the underweight allocation in the poor-performing sector. Strong stock selection in the Consumer Discretionary sector resulted in a relative contribution as well.(1)
Financials was the weakest-contributing sector in the equity portion relative to the S&P 500 Index, followed by Consumer Staples and Materials; all largely due to stock selection rather than sector allocation.(1)
The Balanced Component’s fixed income portion also outperformed its benchmark, the Bloomberg Barclays U.S. Aggregate Bond Index. However, as the period progressed, we grew increasingly concerned with the potential for an economic slowdown. We are simultaneously wary of how far spreads have tightened. As such, we reduced exposure to sectors that we believe are exhibiting poor fundamentals, particularly those that we believe will look to engage in merger and acquisition (M&A) activity. We increased emphasis on non-cyclical names with the ability to generate sustainable free cash flow even in an economic downturn. While we added back duration year to date, our U.S. Treasuries exposure remains relatively low, in the context of our historical range. Our belief that the pace of inflation would slow led us to close our position in Treasury Inflation-Protected Securities (TIPS) early in the period. Duration in the fixed income portion, at June 30, 2017, was 103% of that of the fixed income benchmark.(1)
Outperformance in the fixed income portion was driven by our investment-grade corporate credit exposure. Our overweight allocation benefited results as spreads tightened, and our security selection was particularly strong. Our emphasis on owning securities in the lowest tier of investment-grade ratings also aided relative results, as “riskier” assets performed well during the period. For similar reasons, an out-of-index allocation to high yield contributed positively to performance. However, with long-term rates rallying, our limited exposure to long duration corporate bonds partially offset these gains. Our continued focus on securities that provide
| 100 | (continued) |
| Ohio National Fund, Inc. | Risk Managed Balanced Portfolio (Continued) |
greater spread carry than the index further supported results. Carry is a measure of excess income generated by the Portfolio’s holdings.(1)
On a credit sector basis, relative contributors included banking and brokerage, asset managers and exchanges. Financials generally benefited from the prospect of a more relaxed regulatory environment under the Trump administration and rising interest rates, which help pad net interest income. Our overweight allocations in both sectors proved beneficial. Within banking, security selection further aided outperformance, largely due to preferred exposure and bank hybrids, which behave akin to high-yield corporate credit.(1)
Two financial related issuers, Neuberger Berman Group LLC / Neuberger Berman Finance Corp. (“Neuberger Berman”) and Raymond James Financial, Inc. (“Raymond James”), were among the top individual corporate credit contributors on a relative basis. Neuberger Berman benefited from solid first quarter earnings results and increased liquidity in the name after the company issued a bond in the first quarter. Although we continue to like the company’s conservative management team and its commitment to reducing leverage, our target valuation was realized and we trimmed our position. In regards to Raymond James, we like the stability of the company’s business model and appreciate the management team’s conservative approach to the balance sheet. S&P upgraded the company’s credit rating during the period and the asset manager is under review for an upgrade at Moody’s.(1)
Information Technology also aided performance. Global growth and the anticipation of greater capital investment lifted the sector for much of the period. Additionally, spread compression across a number of our overweight positions, including Seagate HDD Cayman (“Seagate”), supported relative results. Seagate has reported stronger more stable results over the past few quarters amid robust storage demand for personal computers and enterprise infrastructure.(1)
Relative detractors included our positioning in electric utilities and independent energy. Electric utilities weighed on results largely due to our yield curve positioning. Our shorter dated exposure in the sector did not benefit from the decline in long-term rates. We actively reduced our exposure to independent energy over the period, but our overweight allocation was impacted by the volatility in the price of crude oil. No individual corporate issuer materially detracted from relative performance.(1)
On an asset class basis, our positioning in U.S. Treasury obligations was a strong relative contributor, primarily due to yield curve positioning. Our overweight allocation in the long bond proved beneficial as long-term rates declined. Government related debt, which includes government agency debt as well as debt issued by state-owned firms, detracted. This was due to our significant underweight allocation in the asset class. We did not own securities of certain Mexico-domiciled issuers that performed well over the period.(1)
Q. How did the Risk Management Component impact the Portfolio’s performance during the period?
A. The Portfolio’s Risk Management Component, sub-advised by AnchorPath Financial LLC, is a sleeve of derivatives and cash equivalents that seeks to enhance the risk-adjusted return of the Portfolio. Under normal circumstances, the Risk Management Component will represent approximately 20% of the Portfolio. Over the period, this allocation ranged between 18.4% and 20.3%(1)
The Portfolio’s performance is enhanced on a risk-adjusted basis when the aggregate Portfolio achieves lower volatility with similar returns, or higher returns at similar volatility than the Balanced Component alone. Over the period, which was a low volatility environment, as compared to the Balanced Component, the Portfolio’s realized volatility was slightly higher by 0.1%. The aggregate Portfolio also produced a slightly lower period return than the Balanced Component over the period, by 0.39%. Due to the similar volatility and lower return achieved, the risk-adjusted return of the Risk Managed Balanced Portfolio was not enhanced during this period, as compared to the Balanced Component. The slight under-performance produced by the Risk Management Component was attributable to losses on index-based options resulting from the time decay of premium value and to declines in market implied volatility, which was significantly offset by gains on Treasury future positions.(1)
Q. Which holdings contributed the most to, and detracted the most from, the Portfolio’s benchmark-relative performance?
A. The Boeing Co. led contributors during the period. Global air traffic continues to grow, which results in more wear and tear on jets and faster replacement of planes – providing a favorable backdrop for the company’s commercial airline business. Additionally, the debut of its 737 MAX narrow-body aircraft was well received by investors. Positive tailwinds for the defense sector, which accounts for roughly 30% to 40% of Boeing’s business, also boosted the stock during the period. We like Boeing’s ability to generate free cash flow, which its management often returns to shareholders. We also appreciate the recent dividend increase.(1)
CSX Corp. was another large contributor to performance. Positive sentiment surrounded the railroad company’s successively improving operations efficiency metrics. We anticipate that recently appointed CEO Hunter Harrison will continue to implement operational changes and further improve upon efficiency gains at an accelerated pace. Overall rail volume remains generally positive, and we believe industry fundamentals provide a favorable backdrop for revenues. As CSX Corp. focuses on improving its service and reliability to customers, we also believe it will continue to drive more shippers to use the railway instead of trucking services.(1)
Software company Adobe Systems, Inc. also contributed to performance. Our investment thesis was validated as the company’s shift from a licensed-software model to a recurring revenue, subscription-based model continued to accelerate. We appreciate the higher predictability of earnings and cash flow associated with the new approach. Additionally, Omniture, the company’s online marketing tool, had better-than-expected growth during the period.(1)
Synchrony Financial was the largest detractor. The stock of this private label credit card issuer fell amid general weakness in retail during the period and heightened loss provisions. Given Synchrony’s strong recent growth, increased loss provisions were widely expected, but the reported increase exceeded expectations and hurt credibility among investors. We trimmed our position during the period, but we continue to believe that the company provides a valuable service to retailers.(1)
The Kroger Co. was another top detractor. To help offset competitive threats and new entrants in certain markets, the grocer had aggressively lowered prices. This change, combined with the fact that the national grocery-store chain had a larger-than-expected LIFO charge as food price deflation turned to inflation during the
| 101 | (continued) |
| Ohio National Fund, Inc. | Risk Managed Balanced Portfolio (Continued) |
quarter, ultimately lowered the company’s earnings guidance. Late in the period, Amazon.com Inc.’s announced acquisition of Whole Foods Market, Inc. sent supermarkets’ stocks down across the board. We believe the capital investments that The Kroger Co. is making in new and existing stores, as well as in its supply chain, will eventually lead to higher free cash flow per share. However, we are concerned about the increased competition from a number of players and are closely monitoring the stock.(1)
Mattel, Inc. also weighed on performance. Early in the year, the toy company named former Google executive Margaret Georgiadis as the new CEO. The stock was negatively impacted by a series of decisions made by new management, including reducing the dividend, increasing investment in technology and lowering revenue guidance for 2017. While these decisions hurt the stock price in the short term, we believe the company’s management is taking the right steps to improve the business over the long-term. We also like Mattel, Inc.’s brand lineup, which leaves the company well-positioned in a healthy industry.(1)
Q. How did the Portfolio’s use of derivative instruments and initial public offerings (IPOs), if any, impact performance?
A. The Risk Management Component contributed 1.3% to the absolute return of the aggregate Portfolio during the period, primarily based on the use of derivative instruments. U.S. Treasury futures added roughly 1% to the aggregate absolute Portfolio return, due to the decline in 10-Year Treasury rates during the period. Purchased index options detracted 0.3% in absolute return due to time decay in premium value and lower volatility during the period. Finally, equity futures added 0.6% during the period, correlating with the rising value of the S&P 500 Index.(1)
| (1) | The Portfolio’s composition is subject to change. Holdings and weightings are as of June 30, 2017. |
Change in Value of $10,000 Investment
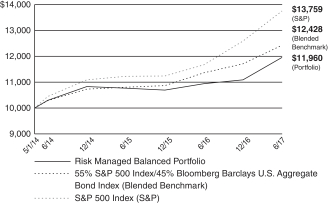
The S&P 500 index is a capitalization-weighted index designed to measure performance of the broad domestic economy through changes in the aggregate market value of 500 stocks representing all major industries. The index includes the effects of reinvested dividends.
The Bloomberg Barclays U.S. Aggregate Bond Index measures returns of U.S. investment grade bonds market, which includes investment grade U.S. Government bonds, high quality corporate bonds, mortgage pass-through securities, and asset-backed securities publicly offered for sale in the U.S. The index’s securities must have at least one year remaining to maturity; they must also be denominated in U.S. dollars and must be fixed rate, nonconvertible, and taxable.
| 102 | (continued) |
| Ohio National Fund, Inc. | Risk Managed Balanced Portfolio (Continued) |
Portfolio Composition as of June 30, 2017 (1)
| % of Net Assets | ||||
Common Stocks (4) | 50.3 | |||
Corporate Bonds (4) | 13.7 | |||
Preferred Securities (4) | 0.5 | |||
Master Limited Partnerships (4) | 0.6 | |||
Asset-Backed / Mortgage-Backed Securities (4) | 2.0 | |||
U.S. Treasury Obligations | 6.6 | |||
U.S. Government Agency Mortgage-Backed Securities | 6.8 | |||
Purchased Options | 6.0 | |||
Money Market Funds | 13.5 | |||
|
| |||
| 100.0 | ||||
|
|
Top 10 Portfolio Holdings as of June 30, 2017 (1) (2) (3)
| % of Net Assets | ||||
1. Microsoft Corp. | 2.7 | |||
2. Boeing Co. / The | 2.5 | |||
3. MasterCard, Inc. Class A | 2.2 | |||
4. Altria Group, Inc. | 2.0 | |||
5. Alphabet, Inc. Class C | 1.8 | |||
6. CME Group, Inc. | 1.5 | |||
7. Amgen, Inc. | 1.5 | |||
8. Adobe Systems, Inc. | 1.4 | |||
9. Apple, Inc. | 1.4 | |||
10. Honeywell International, Inc. | 1.4 |
| (1) | Composition of Portfolio subject to change. |
| (2) | Short-term investments have been excluded from the list of Top 10 Portfolio Holdings. |
| (3) | Top 10 Portfolio Holdings is presented at an individual security level. Total investment exposure by issuer may be higher. |
| (4) | Sectors (Common Stocks, Corporate Bonds, Preferred Securities, Master Limited Partnerships, Asset-Backed / Mortgage-Backed Securities): |
| % of Net Assets | ||||
Information Technology | 13.2 | |||
Consumer Discretionary | 11.2 | |||
Financials | 10.1 | |||
Health Care | 8.4 | |||
Industrials | 8.1 | |||
Consumer Staples | 7.4 | |||
Real Estate | 3.1 | |||
Materials | 2.5 | |||
Energy | 2.2 | |||
Utilities | 0.5 | |||
Telecommunication Services | 0.4 | |||
|
| |||
| 67.1 | ||||
|
|
| 103 |
| Ohio National Fund, Inc. | Risk Managed Balanced Portfolio |
Schedule of Investments | June 30, 2017 (Unaudited) |
| Common Stocks – 50.3% | Shares | Value | ||||||||
| CONSUMER DISCRETIONARY – 9.1% | ||||||||||
General Motors Co. (Automobiles) | 80,919 | $ | 2,826,501 | |||||||
McDonald’s Corp. (Hotels, Restaurants & Leisure) | 10,757 | 1,647,542 | ||||||||
Norwegian Cruise Line Holdings Ltd. (Hotels, Restaurants & Leisure) | (a) | 20,462 | 1,110,882 | |||||||
Six Flags Entertainment Corp. (Hotels, Restaurants & Leisure) | 17,541 | 1,045,619 | ||||||||
Starbucks Corp. (Hotels, Restaurants & Leisure) | 37,742 | 2,200,736 | ||||||||
Priceline Group, Inc. / The (Internet & Direct Marketing Retail) | (a) | 2,351 | 4,397,593 | |||||||
Hasbro, Inc. (Leisure Products) | 14,590 | 1,626,931 | ||||||||
Mattel, Inc. (Leisure Products) | 42,758 | 920,580 | ||||||||
Comcast Corp. Class A (Media) | 113,530 | 4,418,588 | ||||||||
Madison Square Garden Co. / The (Media) | (a) | 3,507 | 690,528 | |||||||
Time Warner, Inc. (Media) | 4,720 | 473,935 | ||||||||
Home Depot, Inc. / The (Specialty Retail) | 24,352 | 3,735,597 | ||||||||
NIKE, Inc. Class B (Textiles, Apparel & Luxury Goods) | 74,130 | 4,373,670 | ||||||||
|
| |||||||||
| 29,468,702 | ||||||||||
|
| |||||||||
| CONSUMER STAPLES – 5.8% | ||||||||||
Costco Wholesale Corp. (Food & Staples Retailing) | 24,973 | 3,993,932 | ||||||||
Kroger Co. / The (Food & Staples Retailing) | 66,167 | 1,543,014 | ||||||||
Sysco Corp. (Food & Staples Retailing) | 33,851 | 1,703,721 | ||||||||
Hershey Co. / The (Food Products) | 16,486 | 1,770,102 | ||||||||
Kimberly-Clark Corp. (Household Products) | 15,496 | 2,000,689 | ||||||||
Estee Lauder Cos., Inc. / The Class A (Personal Products) | 15,231 | 1,461,871 | ||||||||
Altria Group, Inc. (Tobacco) | 85,437 | 6,362,493 | ||||||||
|
| |||||||||
| 18,835,822 | ||||||||||
|
| |||||||||
| ENERGY – 0.8% | ||||||||||
Suncor Energy, Inc. (Oil, Gas & Consumable Fuels) | 86,513 | 2,526,180 | ||||||||
|
| |||||||||
| FINANCIALS – 4.7% | ||||||||||
U.S. Bancorp (Banks) | 81,969 | 4,255,830 | ||||||||
CME Group, Inc. (Capital Markets) | 39,098 | 4,896,634 | ||||||||
Morgan Stanley (Capital Markets) | 5,785 | 257,780 | ||||||||
TD Ameritrade Holding Corp. (Capital Markets) | 62,363 | 2,680,985 | ||||||||
Synchrony Financial (Consumer Finance) | 82,647 | 2,464,534 | ||||||||
Progressive Corp. / The (Insurance) | 12,136 | 535,076 | ||||||||
|
| |||||||||
| 15,090,839 | ||||||||||
|
| |||||||||
| HEALTH CARE – 6.9% | ||||||||||
AbbVie, Inc. (Biotechnology) | 25,044 | 1,815,940 | ||||||||
Amgen, Inc. (Biotechnology) | 28,127 | 4,844,313 | ||||||||
Abbott Laboratories (Health Care Equip. & Supplies) | 48,997 | 2,381,744 | ||||||||
Medtronic PLC (Health Care Equip. & Supplies) | 43,165 | 3,830,894 | ||||||||
Aetna, Inc. (Health Care Providers & Svs.) | 16,591 | 2,519,012 | ||||||||
Allergan PLC (Pharmaceuticals) | 14,369 | 3,492,960 | ||||||||
Bristol-Myers Squibb Co. (Pharmaceuticals) | 46,596 | 2,596,329 | ||||||||
Eli Lilly & Co. (Pharmaceuticals) | 9,625 | 792,137 | ||||||||
|
| |||||||||
| 22,273,329 | ||||||||||
|
| |||||||||
| INDUSTRIALS – 7.3% | ||||||||||
Boeing Co. / The (Aerospace & Defense) | 40,391 | 7,987,320 | ||||||||
General Dynamics Corp. (Aerospace & Defense) | 12,659 | 2,507,748 | ||||||||
Northrop Grumman Corp. (Aerospace & Defense) | 11,554 | 2,966,027 | ||||||||
United Parcel Service, Inc. Class B (Air Freight & Logistics) | 15,601 | 1,725,315 | ||||||||
Honeywell International, Inc. (Industrial Conglomerates) | 33,428 | 4,455,618 | ||||||||
CSX Corp. (Road & Rail) | 71,800 | 3,917,408 | ||||||||
|
| |||||||||
| 23,559,436 | ||||||||||
|
| |||||||||
| INFORMATION TECHNOLOGY – 12.0% | ||||||||||
Alphabet, Inc. Class C (Internet Software & Svs.) | (a) | 6,406 | 5,821,324 | |||||||
Accenture PLC Class A (IT Svs.) | 17,855 | 2,208,306 | ||||||||
Automatic Data Processing, Inc. (IT Svs.) | 13,887 | 1,422,862 | ||||||||
MasterCard, Inc. Class A (IT Svs.) | 58,019 | 7,046,408 | ||||||||
Intel Corp. (Semiconductors & Equip.) | 80,962 | 2,731,658 | ||||||||
Lam Research Corp. (Semiconductors & Equip.) | 11,652 | 1,647,942 | ||||||||
Adobe Systems, Inc. (Software) | (a) | 32,858 | 4,647,436 | |||||||
Microsoft Corp. (Software) | 125,559 | 8,654,782 | ||||||||
Apple, Inc. (Tech. Hardware, Storage & Periph.) | 30,948 | 4,457,131 | ||||||||
|
| |||||||||
| 38,637,849 | ||||||||||
|
| |||||||||
| 104 | (continued) |
| Ohio National Fund, Inc. | Risk Managed Balanced Portfolio (Continued) |
Schedule of Investments | June 30, 2017 (Unaudited) |
| Common Stocks (Continued) | Shares | Value | ||||||||||||
| MATERIALS – 1.5% | ||||||||||||||
LyondellBasell Industries NV Class A (Chemicals) | 47,211 | $ | 3,984,136 | |||||||||||
Vulcan Materials Co. (Construction Materials) | 6,300 | 798,084 | ||||||||||||
|
| |||||||||||||
| 4,782,220 | ||||||||||||||
|
| |||||||||||||
| REAL ESTATE – 2.2% | ||||||||||||||
Colony NorthStar, Inc. Class A (Equity Real Estate Investment Trusts) | 97,452 | 1,373,099 | ||||||||||||
Colony Starwood Homes (Equity Real Estate Investment Trusts) | 20,930 | 718,108 | ||||||||||||
Crown Castle International Corp. (Equity Real Estate Investment Trusts) | 12,333 | 1,235,520 | ||||||||||||
MGM Growth Properties, LLC Class A (Equity Real Estate Investment Trusts) | 29,011 | 846,831 | ||||||||||||
Outfront Media, Inc. (Equity Real Estate Investment Trusts) | 40,183 | 929,031 | ||||||||||||
CBRE Group, Inc. (Real Estate Mgmt. & Development) | (a) | 56,640 | 2,061,696 | |||||||||||
|
| |||||||||||||
| 7,164,285 | ||||||||||||||
|
| |||||||||||||
Total Common Stocks (Cost $140,453,698) | $ | 162,338,662 | ||||||||||||
|
| |||||||||||||
| Corporate Bonds – 13.7% | Rate | Maturity | Face Amount | Value | ||||||||||
| CONSUMER DISCRETIONARY – 1.4% | ||||||||||||||
Ford Motor Co. (Automobiles) | 4.346% | 12/08/2026 | $ | 228,000 | $ | 234,809 | ||||||||
General Motors Co. (Automobiles) | 4.875% | 10/02/2023 | 187,000 | 200,376 | ||||||||||
1011778 B.C. ULC / New Red Finance, Inc. (Hotels, Restaurants & Leisure) | (b) | 4.625% | 01/15/2022 | 320,000 | 328,000 | |||||||||
1011778 B.C. ULC / New Red Finance Inc. (Hotels, Restaurants & Leisure) | (b) | 4.250% | 05/15/2024 | 238,000 | 236,498 | |||||||||
Hilton Worldwide Finance LLC / Hilton Worldwide Finance Corp. (Hotels, Restaurants & Leisure) | (b) | 4.625% | 04/01/2025 | 420,000 | 433,125 | |||||||||
MGM Growth Properties Operating Partnership LP / MGP Finance Co-Issuer, Inc. (Hotels, Restaurants & Leisure) | 5.625% | 05/01/2024 | 108,000 | 117,720 | ||||||||||
Wynn Las Vegas LLC / Wynn Las Vegas Capital Corp. (Hotels, Restaurants & Leisure) | (b) | 5.250% | 05/15/2027 | 97,000 | 99,364 | |||||||||
D.R. Horton, Inc. (Household Durables) | 3.750% | 03/01/2019 | 231,000 | 236,314 | ||||||||||
MDC Holdings, Inc. (Household Durables) | 5.500% | 01/15/2024 | 53,000 | 56,047 | ||||||||||
Newell Brands, Inc. (Household Durables) | 3.150% | 04/01/2021 | 71,000 | 72,681 | ||||||||||
Newell Brands, Inc. (Household Durables) | 3.850% | 04/01/2023 | 81,000 | 85,034 | ||||||||||
Newell Brands, Inc. (Household Durables) | 4.200% | 04/01/2026 | 433,000 | 459,797 | ||||||||||
Newell Brands, Inc. (Household Durables) | 5.000% | 11/15/2023 | 98,000 | 104,864 | ||||||||||
Toll Brothers Finance Corp. (Household Durables) | 5.875% | 02/15/2022 | 133,000 | 147,298 | ||||||||||
Toll Brothers Finance Corp. (Household Durables) | 4.375% | 04/15/2023 | 63,000 | 65,174 | ||||||||||
CCO Holdings, LLC / CCO Holdings Capital Corp. (Media) | 5.250% | 03/15/2021 | 160,000 | 164,400 | ||||||||||
CCO Holdings, LLC / CCO Holdings Capital Corp. (Media) | (b) | 5.125% | 05/01/2027 | 438,000 | 447,855 | |||||||||
Charter Communications Operating LLC / Charter Communications Operating Capital Corp. (Media) | 4.908% | 07/23/2025 | 254,000 | 274,425 | ||||||||||
Comcast Corp. (Media) | 3.400% | 07/15/2046 | 25,000 | 22,801 | ||||||||||
Comcast Corp. (Media) | 2.350% | 01/15/2027 | 176,000 | 165,209 | ||||||||||
Comcast Corp. (Media) | 3.300% | 02/01/2027 | 107,000 | 108,326 | ||||||||||
Cox Communications, Inc. (Media) | (b) | 3.350% | 09/15/2026 | 257,000 | 252,386 | |||||||||
NBCUniversal Media, LLC (Media) | 4.450% | 01/15/2043 | 47,000 | 49,967 | ||||||||||
Time Warner, Inc. (Media) | 3.600% | 07/15/2025 | 157,000 | 157,622 | ||||||||||
UBM PLC (Media) | (b) | 5.750% | 11/03/2020 | 100,000 | 105,264 | |||||||||
Coach, Inc. (Textiles, Apparel & Luxury Goods) | 3.000% | 07/15/2022 | 81,000 | 79,854 | ||||||||||
Coach, Inc. (Textiles, Apparel & Luxury Goods) | 4.125% | 07/15/2027 | 81,000 | 80,185 | ||||||||||
|
| |||||||||||||
| 4,785,395 | ||||||||||||||
|
| |||||||||||||
| CONSUMER STAPLES – 1.6% | ||||||||||||||
Anheuser-Busch InBev Finance, Inc. (Beverages) | 2.650% | 02/01/2021 | 91,000 | 92,212 | ||||||||||
Anheuser-Busch InBev Finance, Inc. (Beverages) | 3.300% | 02/01/2023 | 515,000 | 530,246 | ||||||||||
Anheuser-Busch InBev Finance, Inc. (Beverages) | 3.650% | 02/01/2026 | 687,000 | 707,863 | ||||||||||
Constellation Brands, Inc. (Beverages) | 4.250% | 05/01/2023 | 231,000 | 245,889 | ||||||||||
Constellation Brands, Inc. (Beverages) | 4.750% | 12/01/2025 | 28,000 | 30,672 | ||||||||||
Constellation Brands, Inc. (Beverages) | 3.700% | 12/06/2026 | 169,000 | 172,181 | ||||||||||
Molson Coors Brewing Co. (Beverages) | 3.000% | 07/15/2026 | 328,000 | 315,518 | ||||||||||
Molson Coors Brewing Co. (Beverages) | 4.200% | 07/15/2046 | 87,000 | 85,382 | ||||||||||
CVS Health Corp. (Food & Staples Retailing) | 2.800% | 07/20/2020 | 522,000 | 531,406 | ||||||||||
CVS Health Corp. (Food & Staples Retailing) | 4.750% | 12/01/2022 | 111,000 | 121,652 | ||||||||||
CVS Health Corp. (Food & Staples Retailing) | 5.000% | 12/01/2024 | 155,000 | 171,707 | ||||||||||
Sysco Corp. (Food & Staples Retailing) | 2.500% | 07/15/2021 | 67,000 | 67,176 | ||||||||||
Sysco Corp. (Food & Staples Retailing) | 3.300% | 07/15/2026 | 166,000 | 164,700 | ||||||||||
Sysco Corp. (Food & Staples Retailing) | 3.250% | 07/15/2027 | 91,000 | 89,528 | ||||||||||
Walgreens Boots Alliance, Inc. (Food & Staples Retailing) | 3.450% | 06/01/2026 | 191,000 | 190,616 | ||||||||||
Walgreens Boots Alliance, Inc. (Food & Staples Retailing) | 4.650% | 06/01/2046 | 31,000 | 32,493 | ||||||||||
Danone S.A. (Food Products) | (b) | 2.077% | 11/02/2021 | 447,000 | 440,936 | |||||||||
Wm. Wrigley Jr. Co. (Food Products) | (b) | 3.375% | 10/21/2020 | 119,000 | 122,824 | |||||||||
Wm. Wrigley Jr. Co. (Food Products) | (b) | 2.400% | 10/21/2018 | 447,000 | 450,028 | |||||||||
Reckitt Benckiser Treasury Services PLC (Household Products) | (b) | 2.375% | 06/24/2022 | 200,000 | 198,671 | |||||||||
| 105 | (continued) |
| Ohio National Fund, Inc. | Risk Managed Balanced Portfolio (Continued) |
Schedule of Investments | June 30, 2017 (Unaudited) |
| Corporate Bonds(Continued) | Rate | Maturity | Face Amount | Value | ||||||||||
| CONSUMER STAPLES (continued) | ||||||||||||||
Reckitt Benckiser Treasury Services PLC (Household Products) | (b) | 2.750% | 06/26/2024 | $ | 200,000 | $ | 198,070 | |||||||
Reckitt Benckiser Treasury Services PLC (Household Products) | (b) | 3.000% | 06/26/2027 | 234,000 | 230,647 | |||||||||
|
| |||||||||||||
| 5,190,417 | ||||||||||||||
|
| |||||||||||||
| ENERGY – 1.4% | ||||||||||||||
Diamond Offshore Drilling, Inc. (Energy Equip. & Svs.) | 5.875% | 05/01/2019 | 34,000 | 34,935 | ||||||||||
Helmerich & Payne International Drilling Co. (Energy Equip. & Svs.) | 4.650% | 03/15/2025 | 173,000 | 181,429 | ||||||||||
Oceaneering International, Inc. (Energy Equip. & Svs.) | 4.650% | 11/15/2024 | 225,000 | 221,913 | ||||||||||
Antero Resources Corp. (Oil, Gas & Consumable Fuels) | 5.375% | 11/01/2021 | 272,000 | 274,720 | ||||||||||
Canadian Natural Resources Ltd. (Oil, Gas & Consumable Fuels) | 5.900% | 02/01/2018 | 78,000 | 79,792 | ||||||||||
Canadian Natural Resources Ltd. (Oil, Gas & Consumable Fuels) | 2.950% | 01/15/2023 | 83,000 | 82,328 | ||||||||||
Cenovus Energy, Inc. (Oil, Gas & Consumable Fuels) | 5.700% | 10/15/2019 | 6,000 | 6,332 | ||||||||||
Columbia Pipeline Group, Inc. (Oil, Gas & Consumable Fuels) | 4.500% | 06/01/2025 | 92,000 | 97,941 | ||||||||||
ConocoPhillips Co. (Oil, Gas & Consumable Fuels) | 4.950% | 03/15/2026 | 225,000 | 250,610 | ||||||||||
Enbridge Energy Partners LP (Oil, Gas & Consumable Fuels) | 5.875% | 10/15/2025 | 144,000 | 164,286 | ||||||||||
Energy Transfer Equity LP (Oil, Gas & Consumable Fuels) | 5.875% | 01/15/2024 | 117,000 | 124,020 | ||||||||||
Energy Transfer Equity LP (Oil, Gas & Consumable Fuels) | 5.500% | 06/01/2027 | 225,000 | 232,875 | ||||||||||
Energy Transfer Partners LP (Oil, Gas & Consumable Fuels) | 4.150% | 10/01/2020 | 120,000 | 124,623 | ||||||||||
Energy Transfer Partners LP (Oil, Gas & Consumable Fuels) | 4.750% | 01/15/2026 | 63,000 | 65,546 | ||||||||||
Hiland Partners Holdings, LLC / Hiland Partners Finance Corp. (Oil, Gas & Consumable Fuels) | (b) | 5.500% | 05/15/2022 | 101,000 | 105,491 | |||||||||
Kinder Morgan Energy Partners LP (Oil, Gas & Consumable Fuels) | 5.000% | 10/01/2021 | 280,000 | 300,696 | ||||||||||
Kinder Morgan Energy Partners LP (Oil, Gas & Consumable Fuels) | 3.950% | 09/01/2022 | 147,000 | 151,862 | ||||||||||
Motiva Enterprises LLC (Oil, Gas & Consumable Fuels) | (b) | 5.750% | 01/15/2020 | 159,000 | 170,149 | |||||||||
NuStar Logistics LP (Oil, Gas & Consumable Fuels) | 5.625% | 04/28/2027 | 152,000 | 159,600 | ||||||||||
Phillips 66 Partners LP (Oil, Gas & Consumable Fuels) | 3.605% | 02/15/2025 | 112,000 | 110,918 | ||||||||||
Regency Energy Partners LP / Regency Energy Finance Corp. (Oil, Gas & Consumable Fuels) | 5.875% | 03/01/2022 | 153,000 | 168,526 | ||||||||||
Sabine Pass Liquefaction, LLC (Oil, Gas & Consumable Fuels) | 5.000% | 03/15/2027 | 248,000 | 264,015 | ||||||||||
SM Energy Co. (Oil, Gas & Consumable Fuels) | 6.500% | 01/01/2023 | 13,000 | 12,382 | ||||||||||
TC PipeLines LP (Oil, Gas & Consumable Fuels) | 3.900% | 05/25/2027 | 172,000 | 171,641 | ||||||||||
Tesoro Logistics LP / Tesoro Logistics Finance Corp. (Oil, Gas & Consumable Fuels) | 5.250% | 01/15/2025 | 64,000 | 67,200 | ||||||||||
Western Gas Partners LP (Oil, Gas & Consumable Fuels) | 5.375% | 06/01/2021 | 279,000 | 299,490 | ||||||||||
Williams Cos., Inc. / The (Oil, Gas & Consumable Fuels) | 3.700% | 01/15/2023 | 68,000 | 66,980 | ||||||||||
Williams Partners LP (Oil, Gas & Consumable Fuels) | 3.750% | 06/15/2027 | 289,000 | 286,090 | ||||||||||
Williams Partners LP / ACMP Finance Corp. (Oil, Gas & Consumable Fuels) | 4.875% | 05/15/2023 | 168,000 | 174,320 | ||||||||||
Williams Partners LP / ACMP Finance Corp. (Oil, Gas & Consumable Fuels) | 4.875% | 03/15/2024 | 15,000 | 15,719 | ||||||||||
|
| |||||||||||||
| 4,466,429 | ||||||||||||||
|
| |||||||||||||
| FINANCIALS – 3.1% | ||||||||||||||
Bank of America Corp. (Banks) | 2.503% | 10/21/2022 | 525,000 | 518,225 | ||||||||||
Bank of America Corp. (Banks) | 4.183% | 11/25/2027 | 245,000 | 249,211 | ||||||||||
Bank of America Corp. (Banks) | (c) | 4.244% | 04/24/2038 | 350,000 | 364,381 | |||||||||
Citigroup, Inc. (Banks) | (c) | QL + 143 | 09/01/2023 | 245,000 | 249,550 | |||||||||
Citigroup, Inc. (Banks) | (c) | 3.887% | 01/10/2028 | 413,000 | 419,761 | |||||||||
Citizens Financial Group, Inc. (Banks) | 4.350% | 08/01/2025 | 38,000 | 39,425 | ||||||||||
Citizens Financial Group, Inc. (Banks) | 4.300% | 12/03/2025 | 327,000 | 340,964 | ||||||||||
Citizens Financial Group, Inc. (Banks) | 3.750% | 07/01/2024 | 47,000 | 46,760 | ||||||||||
JPMorgan Chase & Co. (Banks) | 2.295% | 08/15/2021 | 319,000 | 317,113 | ||||||||||
JPMorgan Chase & Co. (Banks) | 3.375% | 05/01/2023 | 341,000 | 345,987 | ||||||||||
JPMorgan Chase & Co. (Banks) | 3.875% | 09/10/2024 | 86,000 | 88,737 | ||||||||||
JPMorgan Chase & Co. (Banks) | (c) | 3.782% | 02/01/2028 | 344,000 | 351,817 | |||||||||
Santander U.K. PLC (Banks) | (b) | 5.000% | 11/07/2023 | 790,000 | 846,894 | |||||||||
SVB Financial Group (Banks) | 5.375% | 09/15/2020 | 139,000 | 151,270 | ||||||||||
U.S. Bancorp (Banks) | 2.375% | 07/22/2026 | 258,000 | 243,172 | ||||||||||
Wells Fargo & Co. (Banks) | 3.000% | 04/22/2026 | 98,000 | 95,722 | ||||||||||
Carlyle Holdings Finance LLC (Capital Markets) | (b) | 3.875% | 02/01/2023 | 130,000 | 133,475 | |||||||||
CBOE Holdings, Inc. (Capital Markets) | 3.650% | 01/12/2027 | 188,000 | 189,637 | ||||||||||
Charles Schwab Corp. / The (Capital Markets) | 3.000% | 03/10/2025 | 117,000 | 117,022 | ||||||||||
E*TRADE Financial Corp. (Capital Markets) | 5.375% | 11/15/2022 | 272,000 | 285,925 | ||||||||||
E*TRADE Financial Corp. (Capital Markets) | 4.625% | 09/15/2023 | 403,000 | 419,120 | ||||||||||
Goldman Sachs Group, Inc. / The (Capital Markets) | 3.000% | 04/26/2022 | 323,000 | 325,986 | ||||||||||
Goldman Sachs Group, Inc. / The (Capital Markets) | (c) | 3.691% | 06/05/2028 | 264,000 | 265,077 | |||||||||
Goldman Sachs Group, Inc. / The (Capital Markets) | 3.750% | 02/25/2026 | 326,000 | 331,982 | ||||||||||
Lazard Group LLC (Capital Markets) | 4.250% | 11/14/2020 | 222,000 | 234,193 | ||||||||||
Morgan Stanley (Capital Markets) | 2.625% | 11/17/2021 | 361,000 | 360,431 | ||||||||||
Morgan Stanley (Capital Markets) | 3.950% | 04/23/2027 | 236,000 | 237,509 | ||||||||||
Neuberger Berman Group LLC / Neuberger Berman Finance Corp. (Capital Markets) | (b) | 4.875% | 04/15/2045 | 122,000 | 118,575 | |||||||||
Raymond James Financial, Inc. (Capital Markets) | 3.625% | 09/15/2026 | 81,000 | 81,082 | ||||||||||
Raymond James Financial, Inc. (Capital Markets) | 4.950% | 07/15/2046 | 218,000 | 236,909 | ||||||||||
Scottrade Financial Services, Inc. (Capital Markets) | (b) | 6.125% | 07/11/2021 | 54,000 | 61,315 | |||||||||
| 106 | (continued) |
| Ohio National Fund, Inc. | Risk Managed Balanced Portfolio (Continued) |
Schedule of Investments | June 30, 2017 (Unaudited) |
| Corporate Bonds(Continued) | Rate | Maturity | Face Amount | Value | ||||||||||
| FINANCIALS (continued) | ||||||||||||||
TD Ameritrade Holding Corp. (Capital Markets) | 3.625% | 04/01/2025 | $ | 82,000 | $ | 84,855 | ||||||||
TD Ameritrade Holding Corp. (Capital Markets) | 2.950% | 04/01/2022 | 146,000 | 149,385 | ||||||||||
Ally Financial, Inc. (Consumer Finance) | 8.000% | 12/31/2018 | 92,000 | 99,245 | ||||||||||
Discover Financial Services (Consumer Finance) | 3.950% | 11/06/2024 | 184,000 | 186,865 | ||||||||||
Discover Financial Services (Consumer Finance) | 3.750% | 03/04/2025 | 254,000 | 250,992 | ||||||||||
General Motors Financial Co., Inc. (Consumer Finance) | 3.950% | 04/13/2024 | 488,000 | 494,808 | ||||||||||
Synchrony Financial (Consumer Finance) | 3.000% | 08/15/2019 | 76,000 | 77,075 | ||||||||||
Synchrony Financial (Consumer Finance) | 4.500% | 07/23/2025 | 228,000 | 234,484 | ||||||||||
Berkshire Hathaway, Inc. (Diversified Financial Svs.) | 3.125% | 03/15/2026 | 44,000 | 44,499 | ||||||||||
LeasePlan Corp. NV (Diversified Financial Svs.) | (b) | 2.500% | 05/16/2018 | 352,000 | 352,945 | |||||||||
|
| |||||||||||||
| 10,042,380 | ||||||||||||||
|
| |||||||||||||
| HEALTH CARE – 1.5% | ||||||||||||||
Shire Acquisitions Investments Ireland DAC (Biotechnology) | 2.400% | 09/23/2021 | 157,000 | 155,154 | ||||||||||
Shire Acquisitions Investments Ireland DAC (Biotechnology) | 2.875% | 09/23/2023 | 210,000 | 208,117 | ||||||||||
Shire Acquisitions Investments Ireland DAC (Biotechnology) | 3.200% | 09/23/2026 | 210,000 | 205,371 | ||||||||||
Abbott Laboratories (Health Care Equip. & Supplies) | 3.750% | 11/30/2026 | 61,000 | 62,276 | ||||||||||
Abbott Laboratories (Health Care Equip. & Supplies) | 3.875% | 09/15/2025 | 38,000 | 39,088 | ||||||||||
Becton Dickinson and Co. (Health Care Equip. & Supplies) | 2.894% | 06/06/2022 | 123,000 | 123,153 | ||||||||||
Becton Dickinson and Co. (Health Care Equip. & Supplies) | 3.363% | 06/06/2024 | 274,000 | 274,530 | ||||||||||
Becton Dickinson and Co. (Health Care Equip. & Supplies) | 3.700% | 06/06/2027 | 194,000 | 194,304 | ||||||||||
Becton Dickinson and Co. (Health Care Equip. & Supplies) | 4.669% | 06/06/2047 | 64,000 | 65,922 | ||||||||||
Aetna, Inc. (Health Care Providers & Svs.) | 2.800% | 06/15/2023 | 117,000 | 116,781 | ||||||||||
Cardinal Health, Inc. (Health Care Providers & Svs.) | 2.616% | 06/15/2022 | 126,000 | 126,102 | ||||||||||
Cardinal Health, Inc. (Health Care Providers & Svs.) | 3.079% | 06/15/2024 | 82,000 | 82,176 | ||||||||||
Cardinal Health, Inc. (Health Care Providers & Svs.) | 3.410% | 06/15/2027 | 162,000 | 161,308 | ||||||||||
Centene Corp. (Health Care Providers & Svs.) | 4.750% | 05/15/2022 | 14,000 | 14,613 | ||||||||||
Centene Corp. (Health Care Providers & Svs.) | 6.125% | 02/15/2024 | 34,000 | 36,760 | ||||||||||
Centene Corp. (Health Care Providers & Svs.) | 4.750% | 01/15/2025 | 40,000 | 41,100 | ||||||||||
Cigna Corp. (Health Care Providers & Svs.) | 3.250% | 04/15/2025 | 460,000 | 461,834 | ||||||||||
Express Scripts Holding Co. (Health Care Providers & Svs.) | 3.500% | 06/15/2024 | 86,000 | 86,729 | ||||||||||
Express Scripts Holding Co. (Health Care Providers & Svs.) | 4.500% | 02/25/2026 | 219,000 | 232,120 | ||||||||||
Express Scripts Holding Co. (Health Care Providers & Svs.) | 3.400% | 03/01/2027 | 102,000 | 98,453 | ||||||||||
HCA, Inc. (Health Care Providers & Svs.) | 3.750% | 03/15/2019 | 166,000 | 169,320 | ||||||||||
HCA, Inc. (Health Care Providers & Svs.) | 5.000% | 03/15/2024 | 71,000 | 75,171 | ||||||||||
HCA, Inc. (Health Care Providers & Svs.) | 5.375% | 02/01/2025 | 64,000 | 67,507 | ||||||||||
HCA, Inc. (Health Care Providers & Svs.) | 5.875% | 02/15/2026 | 125,000 | 135,000 | ||||||||||
HCA, Inc. (Health Care Providers & Svs.) | 5.875% | 05/01/2023 | 59,000 | 64,236 | ||||||||||
Tenet Healthcare Corp. (Health Care Providers & Svs.) | (b) | 4.625% | 07/15/2024 | 71,000 | 71,089 | |||||||||
THC Escrow Corp. III (Health Care Providers & Svs.) | (b) | 4.625% | 07/15/2024 | 88,000 | 88,238 | |||||||||
Universal Health Services, Inc. (Health Care Providers & Svs.) | (b) | 4.750% | 08/01/2022 | 159,000 | 164,366 | |||||||||
WellCare Health Plans, Inc. (Health Care Providers & Svs.) | 5.250% | 04/01/2025 | 156,000 | 163,410 | ||||||||||
Life Technologies Corp. (Life Sciences Tools & Svs.) | 6.000% | 03/01/2020 | 180,000 | 196,159 | ||||||||||
Allergan Funding SCS (Pharmaceuticals) | 3.000% | 03/12/2020 | 471,000 | 481,264 | ||||||||||
Teva Pharmaceutical Finance Netherlands III B.V. (Pharmaceuticals) | 3.150% | 10/01/2026 | 248,000 | 235,545 | ||||||||||
|
| |||||||||||||
| 4,697,196 | ||||||||||||||
|
| |||||||||||||
| INDUSTRIALS – 0.7% | ||||||||||||||
Arconic, Inc. (Aerospace & Defense) | 5.125% | 10/01/2024 | 31,000 | 32,163 | ||||||||||
Rockwell Collins, Inc. (Aerospace & Defense) | 3.200% | 03/15/2024 | 105,000 | 106,407 | ||||||||||
Rockwell Collins, Inc. (Aerospace & Defense) | 3.500% | 03/15/2027 | 180,000 | 182,546 | ||||||||||
FedEx Corp. (Air Freight & Logistics) | 3.900% | 02/01/2035 | 22,000 | 21,861 | ||||||||||
FedEx Corp. (Air Freight & Logistics) | 4.400% | 01/15/2047 | 9,000 | 9,270 | ||||||||||
Masco Corp. (Building Products) | 3.500% | 04/01/2021 | 127,000 | 130,496 | ||||||||||
Masco Corp. (Building Products) | 4.375% | 04/01/2026 | 22,000 | 23,467 | ||||||||||
Owens Corning (Building Products) | 4.200% | 12/01/2024 | 141,000 | 147,652 | ||||||||||
Owens Corning (Building Products) | 3.400% | 08/15/2026 | 58,000 | 57,142 | ||||||||||
Cintas Corp. No. 2 (Commercial Svs. & Supplies) | 4.300% | 06/01/2021 | 45,000 | 47,946 | ||||||||||
CNH Industrial Capital LLC (Machinery) | 3.625% | 04/15/2018 | 174,000 | 175,531 | ||||||||||
IHS Markit Ltd. (Professional Svs.) | (b) | 5.000% | 11/01/2022 | 24,000 | 25,905 | |||||||||
IHS Markit Ltd. (Professional Svs.) | (b) | 4.750% | 02/15/2025 | 90,000 | 96,638 | |||||||||
Verisk Analytics, Inc. (Professional Svs.) | 5.800% | 05/01/2021 | 211,000 | 234,581 | ||||||||||
Verisk Analytics, Inc. (Professional Svs.) | 4.875% | 01/15/2019 | 76,000 | 79,141 | ||||||||||
Verisk Analytics, Inc. (Professional Svs.) | 4.125% | 09/12/2022 | 184,000 | 193,882 | ||||||||||
Verisk Analytics, Inc. (Professional Svs.) | 5.500% | 06/15/2045 | 222,000 | 246,963 | ||||||||||
Penske Truck Leasing Co. LP / PTL Finance Corp. (Road & Rail) | (b) | 3.375% | 03/15/2018 | 228,000 | 230,576 | |||||||||
Penske Truck Leasing Co. LP / PTL Finance Corp. (Road & Rail) | (b) | 2.500% | 06/15/2019 | 59,000 | 59,302 | |||||||||
Park Aerospace Holdings Ltd. (Trading Companies & Distributors) | (b) | 5.250% | 08/15/2022 | 77,000 | 80,490 | |||||||||
Park Aerospace Holdings Ltd. (Trading Companies & Distributors) | (b) | 5.500% | 02/15/2024 | 200,000 | 208,900 | |||||||||
|
| |||||||||||||
| 2,390,859 | ||||||||||||||
|
| |||||||||||||
| 107 | (continued) |
| Ohio National Fund, Inc. | Risk Managed Balanced Portfolio (Continued) |
Schedule of Investments | June 30, 2017 (Unaudited) |
| Corporate Bonds (Continued) | Rate | Maturity | Face Amount | Value | ||||||||||||
| INFORMATION TECHNOLOGY – 1.2% | ||||||||||||||||
Trimble Navigation Ltd. (Electronic Equip., Instr. & Comp.) | 4.750% | 12/01/2024 | $ | 249,000 | $ | 265,906 | ||||||||||
Fidelity National Information Services, Inc. (IT Svs.) | 3.625% | 10/15/2020 | 145,000 | 151,881 | ||||||||||||
Fidelity National Information Services, Inc. (IT Svs.) | 4.500% | 10/15/2022 | 179,000 | 194,474 | ||||||||||||
Fidelity National Information Services, Inc. (IT Svs.) | 3.000% | 08/15/2026 | 224,000 | 216,925 | ||||||||||||
First Data Corp. (IT Svs.) | (b) | 7.000% | 12/01/2023 | 191,000 | 203,893 | |||||||||||
Total System Services, Inc. (IT Svs.) | 4.800% | 04/01/2026 | 451,000 | 490,980 | ||||||||||||
Total System Services, Inc. (IT Svs.) | 3.800% | 04/01/2021 | 124,000 | 129,119 | ||||||||||||
Broadcom Corp. / Broadcom Cayman Finance Ltd. (Semiconductors & Equip.) | (b) | 3.625% | 01/15/2024 | 173,000 | 176,936 | |||||||||||
Broadcom Corp. / Broadcom Cayman Finance Ltd. (Semiconductors & Equip.) | (b) | 3.875% | 01/15/2027 | 444,000 | 455,991 | |||||||||||
NXP BV / NXP Funding LLC (Semiconductors & Equip.) | (b) | 4.125% | 06/01/2021 | 242,000 | 254,826 | |||||||||||
NXP BV / NXP Funding LLC (Semiconductors & Equip.) | (b) | 3.875% | 09/01/2022 | 269,000 | 280,096 | |||||||||||
TSMC Global Ltd. (Semiconductors & Equip.) | (b) | 1.625% | 04/03/2018 | 440,000 | 439,119 | |||||||||||
Cadence Design Systems, Inc. (Software) | 4.375% | 10/15/2024 | 224,000 | 232,693 | ||||||||||||
Seagate HDD Cayman (Tech. Hardware, Storage & Periph.) | 4.750% | 01/01/2025 | 310,000 | 311,507 | ||||||||||||
Seagate HDD Cayman (Tech. Hardware, Storage & Periph.) | 5.750% | 12/01/2034 | 64,000 | 64,154 | ||||||||||||
Seagate HDD Cayman (Tech. Hardware, Storage & Periph.) | 4.875% | 06/01/2027 | 22,000 | 21,973 | ||||||||||||
|
| |||||||||||||||
| 3,890,473 | ||||||||||||||||
|
| |||||||||||||||
| MATERIALS – 1.0% | ||||||||||||||||
CF Industries, Inc. (Chemicals) | 6.875% | 05/01/2018 | 465,000 | 483,019 | ||||||||||||
CF Industries, Inc. (Chemicals) | (b) | 4.500% | 12/01/2026 | 232,000 | 238,556 | |||||||||||
PPL Capital Funding, Inc. (Chemicals) | 3.100% | 05/15/2026 | 266,000 | 260,358 | ||||||||||||
Sherwin-Williams Co. / The (Chemicals) | 2.750% | 06/01/2022 | 72,000 | 71,949 | ||||||||||||
Sherwin-Williams Co. / The (Chemicals) | 3.125% | 06/01/2024 | 46,000 | 46,221 | ||||||||||||
Sherwin-Williams Co. / The (Chemicals) | 3.450% | 06/01/2027 | 131,000 | 131,933 | ||||||||||||
Sherwin-Williams Co. / The (Chemicals) | 4.500% | 06/01/2047 | 61,000 | 64,011 | ||||||||||||
Eagle Materials, Inc. (Construction Materials) | 4.500% | 08/01/2026 | 18,000 | 18,405 | ||||||||||||
Martin Marietta Materials, Inc. (Construction Materials) | 4.250% | 07/02/2024 | 95,000 | 99,705 | ||||||||||||
Vulcan Materials Co. (Construction Materials) | 7.000% | 06/15/2018 | 139,000 | 145,548 | ||||||||||||
Vulcan Materials Co. (Construction Materials) | 7.500% | 06/15/2021 | 91,000 | 107,386 | ||||||||||||
Vulcan Materials Co. (Construction Materials) | 4.500% | 04/01/2025 | 223,000 | 238,160 | ||||||||||||
Ball Corp. (Containers & Packaging) | 4.375% | 12/15/2020 | 172,000 | 180,600 | ||||||||||||
Anglo American Capital PLC (Metals & Mining) | (b) | 4.750% | 04/10/2027 | 200,000 | 205,460 | |||||||||||
FMG Resources August 2006 Pty. Ltd. (Metals & Mining) | (b) | 4.750% | 05/15/2022 | 147,000 | 147,551 | |||||||||||
FMG Resources August 2006 Pty. Ltd. (Metals & Mining) | (b) | 5.125% | 05/15/2024 | 49,000 | 49,000 | |||||||||||
Freeport-McMoRan, Inc. (Metals & Mining) | 3.100% | 03/15/2020 | 70,000 | 68,512 | ||||||||||||
Reliance Steel & Aluminum Co. (Metals & Mining) | 4.500% | 04/15/2023 | 116,000 | 122,518 | ||||||||||||
Steel Dynamics, Inc. (Metals & Mining) | 5.000% | 12/15/2026 | 19,000 | 19,499 | ||||||||||||
Teck Resources Ltd. (Metals & Mining) | (b) | 8.500% | 06/01/2024 | 175,000 | 202,125 | |||||||||||
Georgia-Pacific LLC (Paper & Forest Products) | (b) | 3.163% | 11/15/2021 | 99,000 | 101,090 | |||||||||||
Georgia-Pacific LLC (Paper & Forest Products) | (b) | 3.600% | 03/01/2025 | 372,000 | 383,577 | |||||||||||
|
| |||||||||||||||
| 3,385,183 | ||||||||||||||||
|
| |||||||||||||||
| REAL ESTATE – 0.9% | ||||||||||||||||
Alexandria Real Estate Equities, Inc. (Equity Real Estate Investment Trusts) | 4.600% | 04/01/2022 | 257,000 | 274,608 | ||||||||||||
Alexandria Real Estate Equities, Inc. (Equity Real Estate Investment Trusts) | 2.750% | 01/15/2020 | 140,000 | 140,952 | ||||||||||||
Alexandria Real Estate Equities, Inc. (Equity Real Estate Investment Trusts) | 4.500% | 07/30/2029 | 190,000 | 201,426 | ||||||||||||
American Tower Corp. (Equity Real Estate Investment Trusts) | 3.500% | 01/31/2023 | 45,000 | 46,145 | ||||||||||||
American Tower Corp. (Equity Real Estate Investment Trusts) | 3.450% | 09/15/2021 | 24,000 | 24,747 | ||||||||||||
American Tower Corp. (Equity Real Estate Investment Trusts) | 3.300% | 02/15/2021 | 249,000 | 255,484 | ||||||||||||
American Tower Corp. (Equity Real Estate Investment Trusts) | 4.400% | 02/15/2026 | 155,000 | 162,496 | ||||||||||||
American Tower Corp. (Equity Real Estate Investment Trusts) | 3.375% | 10/15/2026 | 293,000 | 286,699 | ||||||||||||
Crown Castle International Corp. (Equity Real Estate Investment Trusts) | 5.250% | 01/15/2023 | 205,000 | 227,694 | ||||||||||||
Post Apartment Homes LP (Equity Real Estate Investment Trusts) | 4.750% | 10/15/2017 | 46,000 | 46,041 | ||||||||||||
Senior Housing Properties Trust (Equity Real Estate Investment Trusts) | 6.750% | 12/15/2021 | 61,000 | 68,030 | ||||||||||||
SL Green Realty Corp. (Equity Real Estate Investment Trusts) | 7.750% | 03/15/2020 | 237,000 | 265,346 | ||||||||||||
SL Green Realty Corp. (Equity Real Estate Investment Trusts) | 5.000% | 08/15/2018 | 85,000 | 87,240 | ||||||||||||
Jones Lang LaSalle, Inc. (Real Estate Mgmt. & Development) | 4.400% | 11/15/2022 | 197,000 | 207,411 | ||||||||||||
Kennedy-Wilson, Inc. (Real Estate Mgmt. & Development) | 5.875% | 04/01/2024 | 554,000 | 571,312 | ||||||||||||
|
| |||||||||||||||
| 2,865,631 | ||||||||||||||||
|
| |||||||||||||||
| TELECOMMUNICATION SERVICES – 0.4% | ||||||||||||||||
AT&T, Inc. (Diversified Telecom. Svs.) | 3.400% | 05/15/2025 | 39,000 | 38,344 | ||||||||||||
AT&T, Inc. (Diversified Telecom. Svs.) | 4.250% | 03/01/2027 | 183,000 | 189,201 | ||||||||||||
AT&T, Inc. (Diversified Telecom. Svs.) | 5.250% | 03/01/2037 | 239,000 | 254,900 | ||||||||||||
Verizon Communications, Inc. (Diversified Telecom. Svs.) | 4.125% | 08/15/2046 | 103,000 | 91,800 | ||||||||||||
Verizon Communications, Inc. (Diversified Telecom. Svs.) | 2.625% | 08/15/2026 | 508,000 | 468,439 | ||||||||||||
Verizon Communications, Inc. (Diversified Telecom. Svs.) | (b) | 2.946% | 03/15/2022 | 87,000 | 87,595 | |||||||||||
|
| |||||||||||||||
| 1,130,279 | ||||||||||||||||
|
| |||||||||||||||
| 108 | (continued) |
| Ohio National Fund, Inc. | Risk Managed Balanced Portfolio (Continued) |
Schedule of Investments | June 30, 2017 (Unaudited) |
| Corporate Bonds (Continued) | Rate | Maturity | Face Amount | Value | ||||||||||||
| UTILITIES – 0.5% | ||||||||||||||||
Duke Energy Corp. (Electric Utilities) | 1.800% | 09/01/2021 | $ | 90,000 | $ | 87,847 | ||||||||||
Duke Energy Corp. (Electric Utilities) | 2.650% | 09/01/2026 | 134,000 | 127,278 | ||||||||||||
IPALCO Enterprises, Inc. (Electric Utilities) | 5.000% | 05/01/2018 | 121,000 | 122,966 | ||||||||||||
PPL WEM Holdings Ltd. (Electric Utilities) | (b) | 5.375% | 05/01/2021 | 203,000 | 219,032 | |||||||||||
Southern Co. / The (Electric Utilities) | 2.350% | 07/01/2021 | 365,000 | 362,306 | ||||||||||||
Southern Co. / The (Electric Utilities) | 2.950% | 07/01/2023 | 192,000 | 190,743 | ||||||||||||
Southern Co. / The (Electric Utilities) | 3.250% | 07/01/2026 | 365,000 | 357,102 | ||||||||||||
Dominion Energy, Inc. (Multi-Utilities) | 2.000% | 08/15/2021 | 27,000 | 26,479 | ||||||||||||
Dominion Energy, Inc. (Multi-Utilities) | 2.850% | 08/15/2026 | 44,000 | 41,948 | ||||||||||||
|
| |||||||||||||||
| 1,535,701 | ||||||||||||||||
|
| |||||||||||||||
Total Corporate Bonds (Cost $43,924,808) | $ | 44,379,943 | ||||||||||||||
|
| |||||||||||||||
| Preferred Securities – 0.5% | Rate | Quantity | Value | |||||||||||||
| FINANCIALS – 0.4% | ||||||||||||||||
Citigroup Capital XIII (Banks) | (c) | QL + 637 | 1,316 | $ | 34,190 | |||||||||||
Wells Fargo & Co. DR (Banks) | (c) | 5.875% | 165,000 | 181,825 | ||||||||||||
Charles Schwab Corp. Series A / The (Capital Markets) | (c) | 7.000% | 225,000 | 259,312 | ||||||||||||
Charles Schwab Corp. Series E / The DR (Capital Markets) | (c) | 4.625% | 38,000 | 38,807 | ||||||||||||
E*TRADE Financial Corp. (Capital Markets) | (c) | 5.875% | 37,000 | 39,220 | ||||||||||||
Goldman Sachs Capital I (Capital Markets) | 6.345% | 458,000 | 565,027 | |||||||||||||
Morgan Stanley DR (Capital Markets) | (c) | 6.875% | 1,528 | 44,755 | ||||||||||||
Discover Financial Services (Consumer Finance) | 6.500% | 9,502 | 244,962 | |||||||||||||
|
| |||||||||||||||
| 1,408,098 | �� | |||||||||||||||
|
| |||||||||||||||
| INDUSTRIALS – 0.1% | ||||||||||||||||
General Electric Co. (Industrial Conglomerates) | (c) | 5.000% | 318,000 | 337,525 | ||||||||||||
General Electric Co. (Industrial Conglomerates) | 4.700% | 404 | 10,306 | |||||||||||||
|
| |||||||||||||||
| 347,831 | ||||||||||||||||
|
| |||||||||||||||
Total Preferred Securities (Cost $1,702,444) | $ | 1,755,929 | ||||||||||||||
|
| |||||||||||||||
| Master Limited Partnerships – 0.6% | Shares | Value | ||||||||||||||
| FINANCIALS – 0.6% | ||||||||||||||||
Blackstone Group LP / The (Capital Markets) | 55,119 | $ | 1,838,219 | |||||||||||||
|
| |||||||||||||||
Total Master Limited Partnerships (Cost $1,566,398) | $ | 1,838,219 | ||||||||||||||
|
| |||||||||||||||
| Asset-Backed / Mortgage-Backed Securities – 2.0% | Rate | Maturity | Face Amount | Value | ||||||||||||
| CONSUMER DISCRETIONARY – 0.7% | ||||||||||||||||
Applebee’s Funding LLC / IHOP Funding LLC 2014-1 A2 | (b) | 4.277% | 09/05/2044 | $ | 7,000 | $ | 6,890 | |||||||||
CKE Restaurant Holdings, Inc. 2013-1A A2 | (b) | 4.474% | 03/20/2043 | 845,425 | 843,738 | |||||||||||
Coinstar Funding LLC Series 2017-1 A2 | (b) | 5.216% | 04/25/2047 | 199,000 | 202,175 | |||||||||||
Cosmopolitan Hotel Trust 2016-COSMO B | (b) | 3.259% | 11/15/2033 | 42,000 | 42,316 | |||||||||||
Cosmopolitan Hotel Trust 2016-COSMO D | (b) | 4.659% | 11/15/2033 | 56,000 | 56,698 | |||||||||||
Cosmopolitan Hotel Trust 2016-COSMO E | (b) | 5.809% | 11/15/2033 | 82,000 | 83,309 | |||||||||||
Domino’s Pizza Master Issuer LLC 2012-1A A2 | (b) | 5.216% | 01/25/2042 | 164,712 | 164,791 | |||||||||||
Domino’s Pizza Master Issuer LLC 2015-1A A2I | (b) | 3.484% | 10/25/2045 | 122,450 | 123,666 | |||||||||||
Domino’s Pizza Master Issuer LLC 2017-1A A2II | (b) | 3.082% | 07/25/2047 | 50,000 | 49,758 | |||||||||||
Domino’s Pizza Master Issuer LLC 2017-1A A23 | (b) | 4.118% | 07/25/2047 | 210,000 | 209,869 | |||||||||||
Jimmy Johns Funding LLC 2017-1A A2II | (b) | 4.846% | 07/30/2047 | 158,000 | 158,000 | |||||||||||
Taco Bell Funding, LLC 2016-1A A2I | (b) | 3.832% | 05/25/2046 | 132,003 | 134,948 | |||||||||||
Wendys Funding LLC 2015-1A A2I | (b) | 3.371% | 06/15/2045 | 168,990 | 170,440 | |||||||||||
|
| |||||||||||||||
| 2,246,598 | ||||||||||||||||
|
| |||||||||||||||
| FINANCIALS – 1.3% | ||||||||||||||||
American Tower Trust I 13 1A | (b) | 1.551% | 03/15/2018 | 83,000 | 82,832 | |||||||||||
AmeriCredit Automobile Receivables Trust 2016-1 D | 3.590% | 02/08/2022 | 81,000 | 82,711 | ||||||||||||
AmeriCredit Automobile Receivables Trust 2015-2 D | 3.000% | 06/08/2021 | 20,000 | 20,194 | ||||||||||||
AmeriCredit Automobile Receivables Trust 2015-3 D | 3.340% | 08/08/2021 | 383,000 | 388,388 | ||||||||||||
AmeriCredit Automobile Receivables Trust 2016-2 D | 3.650% | 05/09/2022 | 63,000 | 64,346 | ||||||||||||
BAMLL Commercial Mortgage Securities Trust 2014-FL1 | (b) | 6.659% | 12/15/2031 | 200,000 | 189,975 | |||||||||||
Banc of America Commercial Mortgage Trust 2007-3 AJ | 5.874% | 06/10/2049 | 139,774 | 140,488 | ||||||||||||
GCCFC Commercial Mortgage Trust 2007-GG11 AM | 5.867% | 12/10/2049 | 25,000 | 25,067 | ||||||||||||
Fannie Mae Connecticut Avenue Securities 2014-C04 1M2 | 6.116% | 11/25/2024 | 436,541 | 498,881 | ||||||||||||
Freddie Mac Structured Agency Credit Risk Debt Notes 2014-DN1 M3 | 5.716% | 02/25/2024 | 315,000 | 367,796 | ||||||||||||
GS Mortgage Securities Trust 2014-GSFL E | (b) | 7.109% | 07/15/2031 | 100,000 | 100,055 | |||||||||||
GSCCRE Commercial Mortgage Trust 2015-HULA E | (b) | 5.527% | 08/15/2032 | 133,000 | 133,664 | |||||||||||
J.P. Morgan Chase Commercial Mortgage Securities Trust 2016-WIKI C | (b) | 3.554% | 10/05/2031 | 26,000 | 26,548 | |||||||||||
| 109 | (continued) |
| Ohio National Fund, Inc. | Risk Managed Balanced Portfolio (Continued) |
Schedule of Investments | June 30, 2017 (Unaudited) |
| Asset-Backed / Mortgage-Backed Securities (Continued) | Rate | Maturity | Face Amount | Value | ||||||||||||
| FINANCIALS (continued) | ||||||||||||||||
J.P. Morgan Chase Commercial Mortgage Securities Trust 2016-WIKI D | (b) | 4.143% | 10/05/2031 | $ | 40,000 | $ | 40,663 | |||||||||
J.P. Morgan Chase Commercial Mortgage Securities Trust 2010-C2 E | (b) | 5.724% | 11/15/2043 | 100,000 | 102,422 | |||||||||||
J.P. Morgan Chase Commercial Mortgage Securities Trust 2015-SGP B | (b) | 3.909% | 07/15/2036 | 150,000 | 150,935 | |||||||||||
J.P. Morgan Chase Commercial Mortgage Securities Trust 2015-SGP D | (b) | 5.659% | 07/15/2036 | 100,000 | 100,997 | |||||||||||
J.P. Morgan Chase Commercial Mortgage Securities Trust 2015-UES E | (b) | 3.742% | 09/05/2032 | 44,000 | 43,704 | |||||||||||
LB-UBS Commercial Mortgage Trust 2006-C1 AJ | 5.276% | 02/15/2041 | 133,325 | 133,382 | ||||||||||||
LB-UBS Commercial Mortgage Trust 2007-C7 AJ | 6.500% | 09/15/2045 | 43,782 | 44,293 | ||||||||||||
LB-UBS Commercial Mortgage Trust 2008-C1 AM | 6.296% | 04/15/2041 | 249,000 | 246,775 | ||||||||||||
OSCAR US Funding Trust V 2016-2A A3 | (b) | 2.730% | 12/15/2020 | 40,000 | 40,028 | |||||||||||
OSCAR US Funding Trust V 2016-2A A4 | (b) | 2.990% | 12/15/2023 | 40,000 | 39,848 | |||||||||||
Palisades Center Trust 2016-PLSD D | (b) | 4.737% | 04/13/2033 | 38,000 | 38,300 | |||||||||||
Santander Drive Auto Receivables Trust 2015-1 D | 3.240% | 04/15/2021 | 341,000 | 345,699 | ||||||||||||
Santander Drive Auto Receivables Trust 2015-4 D | 3.530% | 08/16/2021 | 53,000 | 54,057 | ||||||||||||
Wachovia Bank Commercial Mortgage Trust Series 2007-C30 AJ | 5.413% | 12/15/2043 | 88,220 | 89,349 | ||||||||||||
Wachovia Bank Commercial Mortgage Trust Series 2007-C31 AJ | 5.660% | 04/15/2047 | 94,443 | 96,437 | ||||||||||||
Wachovia Bank Commercial Mortgage Trust Series 2007-C33 AJ | 6.174% | 02/15/2051 | 103,940 | 105,794 | ||||||||||||
Wachovia Bank Commercial Mortgage Trust Series 2007-C34 AJ | 6.271% | 05/15/2046 | 33,843 | 33,867 | ||||||||||||
Wells Fargo Commercial Mortgage Trust 2014-TISH WTS1 | (b) | 3.409% | 02/15/2027 | 212,000 | 217,436 | |||||||||||
|
| |||||||||||||||
| 4,044,931 | ||||||||||||||||
|
| |||||||||||||||
Total Asset-Backed / Mortgage-Backed Securities (Cost $6,286,621) | $ | 6,291,529 | ||||||||||||||
|
| |||||||||||||||
| U.S. Treasury Obligations – 6.6% | Rate | Maturity | Face Amount | Value | ||||||||||||
U.S. Treasury Note | 1.250% | 04/30/2019 | $ | 78,000 | $ | 77,811 | ||||||||||
U.S. Treasury Note | 1.250% | 05/31/2019 | 1,948,000 | 1,943,358 | ||||||||||||
U.S. Treasury Note | 1.000% | 11/15/2019 | 1,189,000 | 1,176,460 | ||||||||||||
U.S. Treasury Note | 1.500% | 04/15/2020 | 14,000 | 13,990 | ||||||||||||
U.S. Treasury Note | 1.500% | 05/15/2020 | 74,000 | 73,913 | ||||||||||||
U.S. Treasury Note | 1.500% | 06/15/2020 | 85,000 | 84,874 | ||||||||||||
U.S. Treasury Note | 1.250% | 10/31/2021 | 1,207,000 | 1,178,806 | ||||||||||||
U.S. Treasury Note | 1.875% | 02/28/2022 | 293,000 | 293,321 | ||||||||||||
U.S. Treasury Note | 1.875% | 03/31/2022 | 178,000 | 178,097 | ||||||||||||
U.S. Treasury Note | 1.750% | 05/31/2022 | 3,153,000 | 3,134,155 | ||||||||||||
U.S. Treasury Note | 2.000% | 05/31/2024 | 1,103,000 | 1,093,823 | ||||||||||||
U.S. Treasury Note | (f) | 2.250% | 11/15/2024 | 1,865,000 | 1,874,907 | |||||||||||
U.S. Treasury Note | 2.000% | 02/15/2025 | 81,000 | 79,870 | ||||||||||||
U.S. Treasury Note | 2.000% | 11/15/2026 | 1,349,000 | 1,315,538 | ||||||||||||
U.S. Treasury Note | 2.250% | 02/15/2027 | 2,136,000 | 2,126,488 | ||||||||||||
U.S. Treasury Note | 2.375% | 05/15/2027 | 1,162,000 | 1,169,489 | ||||||||||||
U.S. Treasury Note | 2.250% | 08/15/2046 | 1,993,000 | 1,757,888 | ||||||||||||
U.S. Treasury Note | 2.875% | 11/15/2046 | 2,931,000 | 2,952,182 | ||||||||||||
U.S. Treasury Note | 3.000% | 02/15/2047 | 898,000 | 927,956 | ||||||||||||
|
| |||||||||||||||
Total U.S. Treasury Obligations (Cost $21,346,868) | $ | 21,452,926 | ||||||||||||||
|
| |||||||||||||||
| U.S. Government Agency Mortgage-Backed Securities – 6.8% | Rate | Maturity | Face Amount | Value | ||||||||||||
Fannie Mae Pool | 4.000% | 09/01/2029 | $ | 198,379 | $ | 210,359 | ||||||||||
Fannie Mae Pool | 3.500% | 05/01/2033 | 314,042 | 326,625 | ||||||||||||
Fannie Mae Pool | 4.000% | 04/01/2034 | 19,040 | 20,200 | ||||||||||||
Fannie Mae Pool | 5.500% | 04/01/2040 | 191,442 | 212,808 | ||||||||||||
Fannie Mae Pool | 4.500% | 01/01/2041 | 82,072 | 89,633 | ||||||||||||
Fannie Mae Pool | 5.500% | 05/01/2041 | 4,897 | 5,452 | ||||||||||||
Fannie Mae Pool | 5.500% | 06/01/2041 | 27,403 | 30,846 | ||||||||||||
Fannie Mae Pool | 5.500% | 07/01/2041 | 26,658 | 29,605 | ||||||||||||
Fannie Mae Pool | 4.500% | 11/01/2041 | 241,976 | 264,170 | ||||||||||||
Fannie Mae Pool | 5.500% | 02/01/2042 | 110,994 | 123,504 | ||||||||||||
Fannie Mae Pool | 4.000% | 06/01/2042 | 13,265 | 14,063 | ||||||||||||
Fannie Mae Pool | 4.000% | 07/01/2042 | 93,618 | 99,231 | ||||||||||||
Fannie Mae Pool | 4.500% | 08/01/2042 | 376,534 | 410,372 | ||||||||||||
Fannie Mae Pool | 4.000% | 08/01/2042 | 5,782 | 6,128 | ||||||||||||
Fannie Mae Pool | 4.000% | 09/01/2042 | 7,153 | 7,581 | ||||||||||||
Fannie Mae Pool | 4.500% | 11/01/2042 | 28,801 | 31,260 | ||||||||||||
Fannie Mae Pool | 3.500% | 01/01/2043 | 33,512 | 34,576 | ||||||||||||
Fannie Mae Pool | 3.500% | 02/01/2043 | 53,220 | 54,916 | ||||||||||||
Fannie Mae Pool | 3.500% | 02/01/2043 | 35,310 | 36,435 | ||||||||||||
Fannie Mae Pool | 4.500% | 03/01/2043 | 170,688 | 186,051 | ||||||||||||
Fannie Mae Pool | 4.000% | 08/01/2043 | 19,487 | 20,658 | ||||||||||||
Fannie Mae Pool | 3.500% | 04/01/2044 | 5,603 | 5,792 | ||||||||||||
Fannie Mae Pool | 5.500% | 05/01/2044 | 77,707 | 86,478 | ||||||||||||
| 110 | (continued) |
| Ohio National Fund, Inc. | Risk Managed Balanced Portfolio (Continued) |
Schedule of Investments | June 30, 2017 (Unaudited) |
| U.S. Government Agency Mortgage-Backed Securities (Continued) | Rate | Maturity | Face Amount | Value | ||||||||||||
Fannie Mae Pool | 4.000% | 06/01/2044 | $ | 147,350 | $ | 156,197 | ||||||||||
Fannie Mae Pool | 5.000% | 07/01/2044 | 201,514 | 225,117 | ||||||||||||
Fannie Mae Pool | 4.000% | 07/01/2044 | 41,358 | 44,159 | ||||||||||||
Fannie Mae Pool | 4.500% | 08/01/2044 | 60,803 | 66,635 | ||||||||||||
Fannie Mae Pool | 4.000% | 08/01/2044 | 26,358 | 28,144 | ||||||||||||
Fannie Mae Pool | 4.500% | 10/01/2044 | 38,488 | 42,061 | ||||||||||||
Fannie Mae Pool | 4.500% | 10/01/2044 | 1,057,188 | 1,158,539 | ||||||||||||
Fannie Mae Pool | 4.500% | 10/01/2044 | 46,233 | 50,659 | ||||||||||||
Fannie Mae Pool | 3.500% | 02/01/2045 | 44,582 | 46,006 | ||||||||||||
Fannie Mae Pool | 4.500% | 03/01/2045 | 66,129 | 72,275 | ||||||||||||
Fannie Mae Pool | 4.500% | 05/01/2045 | 117,540 | 128,783 | ||||||||||||
Fannie Mae Pool | 4.500% | 05/01/2045 | 137,804 | 150,987 | ||||||||||||
Fannie Mae Pool | 4.000% | 05/01/2045 | 62,574 | 66,833 | ||||||||||||
Fannie Mae Pool | 4.500% | 06/01/2045 | 150,636 | 164,089 | ||||||||||||
Fannie Mae Pool | 4.500% | 09/01/2045 | 819,071 | 895,276 | ||||||||||||
Fannie Mae Pool | 4.000% | 10/01/2045 | 435,978 | 462,999 | ||||||||||||
Fannie Mae Pool | 4.500% | 10/01/2045 | 312,514 | 340,935 | ||||||||||||
Fannie Mae Pool | 4.000% | 12/01/2045 | 78,593 | 83,934 | ||||||||||||
Fannie Mae Pool | 4.000% | 01/01/2046 | 88,065 | 93,814 | ||||||||||||
Fannie Mae Pool | 3.500% | 01/01/2046 | 212,817 | 220,002 | ||||||||||||
Fannie Mae Pool | 3.500% | 01/01/2046 | 212,157 | 219,329 | ||||||||||||
Fannie Mae Pool | 4.500% | 02/01/2046 | 163,439 | 179,082 | ||||||||||||
Fannie Mae Pool | 4.500% | 02/01/2046 | 68,925 | 75,346 | ||||||||||||
Fannie Mae Pool | 4.000% | 04/01/2046 | 116,572 | 124,125 | ||||||||||||
Fannie Mae Pool | 4.500% | 04/01/2046 | 109,003 | 119,971 | ||||||||||||
Fannie Mae Pool | 4.000% | 05/01/2046 | 137,234 | 146,200 | ||||||||||||
Fannie Mae Pool | 4.000% | 06/01/2046 | 96,414 | 102,713 | ||||||||||||
Fannie Mae Pool | 4.500% | 07/01/2046 | 479,190 | 525,086 | ||||||||||||
Fannie Mae Pool | 4.500% | 07/01/2046 | 87,070 | 95,188 | ||||||||||||
Fannie Mae Pool | 3.500% | 07/01/2046 | 249,004 | 257,130 | ||||||||||||
Fannie Mae Pool | 4.500% | 07/01/2046 | 176,288 | 191,118 | ||||||||||||
Fannie Mae Pool | 3.500% | 07/01/2046 | 250,208 | 258,371 | ||||||||||||
Fannie Mae Pool | 3.500% | 08/01/2046 | 735,179 | 756,819 | ||||||||||||
Fannie Mae Pool | 4.000% | 08/01/2046 | 12,472 | 13,240 | ||||||||||||
Fannie Mae Pool | 4.000% | 08/01/2046 | 12,844 | 13,642 | ||||||||||||
Fannie Mae Pool | 4.000% | 08/01/2046 | 10,955 | 11,636 | ||||||||||||
Fannie Mae Pool | 4.000% | 08/01/2046 | 8,821 | 9,369 | ||||||||||||
Fannie Mae Pool | 4.500% | 09/01/2046 | 111,170 | 121,847 | ||||||||||||
Fannie Mae Pool | 4.000% | 10/01/2046 | 104,987 | 111,422 | ||||||||||||
Fannie Mae Pool | 4.500% | 11/01/2046 | 149,867 | 163,056 | ||||||||||||
Fannie Mae Pool | 4.500% | 11/01/2046 | 26,035 | 28,471 | ||||||||||||
Fannie Mae Pool | 4.500% | 12/01/2046 | 97,308 | 105,161 | ||||||||||||
Fannie Mae Pool | 4.000% | 01/01/2047 | 67,291 | 72,016 | ||||||||||||
Fannie Mae Pool | 4.500% | 02/01/2047 | 499,553 | 541,580 | ||||||||||||
Fannie Mae Pool | 4.000% | 02/01/2047 | 154,767 | 165,024 | ||||||||||||
Fannie Mae Pool | 4.000% | 03/01/2047 | 16,708 | 17,750 | ||||||||||||
Fannie Mae Pool | 4.000% | 03/01/2047 | 4,498 | 4,777 | ||||||||||||
Fannie Mae Pool | 4.000% | 03/01/2047 | 4,471 | 4,751 | ||||||||||||
Fannie Mae Pool | 4.000% | 03/01/2047 | 9,541 | 10,127 | ||||||||||||
Fannie Mae Pool | 4.000% | 04/01/2047 | 77,745 | 83,092 | ||||||||||||
Fannie Mae Pool | 4.000% | 04/01/2047 | 17,552 | 18,649 | ||||||||||||
Fannie Mae Pool | 4.000% | 04/01/2047 | 21,768 | 23,105 | ||||||||||||
Fannie Mae Pool | 4.000% | 04/01/2047 | 16,285 | 17,285 | ||||||||||||
Fannie Mae Pool | 4.000% | 04/01/2047 | 15,442 | 16,391 | ||||||||||||
Fannie Mae Pool | 4.000% | 04/01/2047 | 17,242 | 18,301 | ||||||||||||
Fannie Mae Pool | 4.500% | 04/01/2047 | 411,309 | 449,786 | ||||||||||||
Fannie Mae Pool | 4.000% | 05/01/2047 | 18,336 | 19,482 | ||||||||||||
Fannie Mae Pool | 4.000% | 05/01/2047 | 14,333 | 15,229 | ||||||||||||
Fannie Mae Pool | 4.000% | 05/01/2047 | 23,205 | 24,631 | ||||||||||||
Fannie Mae Pool | 4.500% | 05/01/2047 | 30,607 | 33,353 | ||||||||||||
Fannie Mae Pool | 4.500% | 05/01/2047 | 25,206 | 27,429 | ||||||||||||
Fannie Mae Pool | 4.500% | 05/01/2047 | 24,727 | 26,923 | ||||||||||||
Fannie Mae Pool | 4.500% | 05/01/2047 | 18,715 | 20,394 | ||||||||||||
Fannie Mae Pool | 4.500% | 05/01/2047 | 15,164 | 16,501 | ||||||||||||
Fannie Mae Pool | 4.500% | 05/01/2047 | 17,329 | 18,868 | ||||||||||||
Fannie Mae Pool | 4.500% | 05/01/2047 | 16,554 | 18,004 | ||||||||||||
Fannie Mae Pool | 4.500% | 05/01/2047 | 15,965 | 17,363 | ||||||||||||
Fannie Mae Pool | 4.000% | 05/01/2047 | 5,999 | 6,371 | ||||||||||||
Fannie Mae Pool | 4.500% | 05/01/2047 | 8,501 | 9,240 | ||||||||||||
Fannie Mae Pool | 4.500% | 05/01/2047 | 5,584 | 6,085 | ||||||||||||
| 111 | (continued) |
| Ohio National Fund, Inc. | Risk Managed Balanced Portfolio (Continued) |
Schedule of Investments | June 30, 2017 (Unaudited) |
| U.S. Government Agency Mortgage-Backed Securities (Continued) | Rate | Maturity | Face Amount | Value | ||||||||||||
Fannie Mae Pool | 4.500% | 05/01/2047 | $ | 6,157 | $ | 6,710 | ||||||||||
Fannie Mae Pool | 3.500% | 06/01/2047 | 12,017 | 12,397 | ||||||||||||
Fannie Mae Pool | 4.000% | 06/01/2047 | 69,387 | 73,649 | ||||||||||||
Fannie Mae Pool | 4.000% | 06/01/2047 | 26,084 | 27,763 | ||||||||||||
Fannie Mae Pool | 4.000% | 06/01/2047 | 37,773 | 40,058 | ||||||||||||
Fannie Mae Pool | 4.000% | 06/01/2047 | 33,141 | 35,212 | ||||||||||||
Fannie Mae Pool | 4.500% | 06/01/2047 | 10,697 | 11,657 | ||||||||||||
Fannie Mae Pool | 4.000% | 06/01/2047 | 11,858 | 12,604 | ||||||||||||
Fannie Mae Pool | 4.000% | 06/01/2047 | 34,105 | 36,221 | ||||||||||||
Fannie Mae Pool | 4.500% | 06/01/2047 | 16,236 | 17,493 | ||||||||||||
Fannie Mae Pool | 3.500% | 05/01/2056 | 388,408 | 399,251 | ||||||||||||
Freddie Mac Gold Pool | 3.500% | 07/01/2029 | 69,214 | 72,224 | ||||||||||||
Freddie Mac Gold Pool | 3.500% | 09/01/2029 | 330,207 | 344,589 | ||||||||||||
Freddie Mac Gold Pool | 8.000% | 04/01/2032 | 20,587 | 25,228 | ||||||||||||
Freddie Mac Gold Pool | 5.500% | 08/01/2041 | 105,856 | 120,898 | ||||||||||||
Freddie Mac Gold Pool | 5.500% | 08/01/2041 | 285,931 | 322,880 | ||||||||||||
Freddie Mac Gold Pool | 5.000% | 03/01/2042 | 201,154 | 222,754 | ||||||||||||
Freddie Mac Gold Pool | 3.500% | 02/01/2044 | 16,307 | 16,807 | ||||||||||||
Freddie Mac Gold Pool | 4.500% | 05/01/2044 | 151,751 | 164,339 | ||||||||||||
Freddie Mac Gold Pool | 5.000% | 07/01/2044 | 499,305 | 550,944 | ||||||||||||
Freddie Mac Gold Pool | 4.000% | 08/01/2044 | 69,505 | 74,113 | ||||||||||||
Freddie Mac Gold Pool | 4.500% | 06/01/2045 | 97,863 | 107,166 | ||||||||||||
Freddie Mac Gold Pool | 4.500% | 10/01/2045 | 920,871 | 1,005,727 | ||||||||||||
Freddie Mac Gold Pool | 4.500% | 02/01/2046 | 848,331 | 928,930 | ||||||||||||
Freddie Mac Gold Pool | 4.500% | 02/01/2046 | 77,419 | 84,557 | ||||||||||||
Freddie Mac Gold Pool | 4.500% | 05/01/2046 | 707,474 | 774,693 | ||||||||||||
Freddie Mac Gold Pool | 4.500% | 06/01/2046 | 251,296 | 271,679 | ||||||||||||
Freddie Mac Gold Pool | 3.500% | 07/01/2046 | 496,739 | 514,198 | ||||||||||||
Ginnie Mae I Pool | 7.500% | 08/15/2033 | 41,534 | 48,511 | ||||||||||||
Ginnie Mae I Pool | 5.000% | 01/15/2040 | 179,650 | 196,564 | ||||||||||||
Ginnie Mae I Pool | 5.000% | 05/15/2040 | 113,573 | 126,221 | ||||||||||||
Ginnie Mae I Pool | 4.500% | 05/15/2041 | 72,303 | 81,065 | ||||||||||||
Ginnie Mae I Pool | 4.500% | 05/15/2044 | 21,501 | 23,571 | ||||||||||||
Ginnie Mae I Pool | 5.000% | 06/15/2044 | 57,018 | 63,457 | ||||||||||||
Ginnie Mae I Pool | 5.000% | 06/15/2044 | 31,657 | 35,251 | ||||||||||||
Ginnie Mae I Pool | 5.000% | 07/15/2044 | 24,998 | 27,786 | ||||||||||||
Ginnie Mae I Pool | 4.000% | 01/15/2045 | 341,052 | 361,277 | ||||||||||||
Ginnie Mae I Pool | 4.000% | 03/15/2045 | 918,713 | 974,159 | ||||||||||||
Ginnie Mae I Pool | 4.000% | 04/15/2045 | 141,341 | 152,071 | ||||||||||||
Ginnie Mae I Pool | 4.000% | 07/15/2046 | 215,610 | 230,436 | ||||||||||||
Ginnie Mae I Pool | 4.500% | 08/15/2046 | 551,574 | 604,504 | ||||||||||||
Ginnie Mae II Pool | 5.000% | 12/20/2044 | 307,475 | 344,854 | ||||||||||||
Ginnie Mae II Pool | 5.000% | 09/20/2045 | 72,362 | 81,378 | ||||||||||||
Ginnie Mae II Pool | 4.000% | 10/20/2045 | 215,120 | 229,788 | ||||||||||||
|
| |||||||||||||||
Total U.S. Government Agency Mortgage-Backed Securities (Cost $22,229,403) | $ | 21,990,650 | ||||||||||||||
|
| |||||||||||||||
| Purchased Options – 6.0% | Expiration | Exercise Price | Contracts (d) | Value | ||||||||||||
S&P 500 Index Call Option | December 2018 | $2,200.00 | 41 | $ | 1,296,830 | |||||||||||
S&P 500 Index Call Option | December 2018 | $2,250.00 | 10 | 276,200 | ||||||||||||
S&P 500 Index Call Option | December 2018 | $2,300.00 | 20 | 484,600 | ||||||||||||
S&P 500 Index Call Option | December 2018 | $2,350.00 | 5 | 105,100 | ||||||||||||
S&P 500 Index Call Option | December 2019 | $2,300.00 | 38 | 1,151,780 | ||||||||||||
S&P 500 Index Call Option | December 2019 | $2,350.00 | 92 | 2,518,040 | ||||||||||||
S&P 500 Index Call Option | December 2019 | $2,400.00 | 65 | 1,635,400 | ||||||||||||
S&P 500 Index Put Option | December 2018 | $2,200.00 | 41 | 420,455 | ||||||||||||
S&P 500 Index Put Option | December 2018 | $2,250.00 | 10 | 115,800 | ||||||||||||
S&P 500 Index Put Option | December 2018 | $2,300.00 | 20 | 261,000 | ||||||||||||
S&P 500 Index Put Option | December 2018 | $2,350.00 | 5 | 73,500 | ||||||||||||
S&P 500 Index Put Option | December 2019 | $2,300.00 | 38 | 733,780 | ||||||||||||
S&P 500 Index Put Option | December 2019 | $2,350.00 | 92 | 1,944,880 | ||||||||||||
S&P 500 Index Put Option | December 2019 | $2,400.00 | 65 | 1,497,600 | ||||||||||||
SPDR S&P 500 ETF Trust Call Option | December 2018 | $210.00 | 400 | 1,564,000 | ||||||||||||
SPDR S&P 500 ETF Trust Call Option | December 2018 | $215.00 | 187 | 650,760 | ||||||||||||
SPDR S&P 500 ETF Trust Call Option | December 2018 | $220.00 | 120 | 372,840 | ||||||||||||
SPDR S&P 500 ETF Trust Call Option | December 2018 | $225.00 | 222 | 610,278 | ||||||||||||
SPDR S&P 500 ETF Trust Call Option | December 2018 | $230.00 | 239 | 575,512 | ||||||||||||
SPDR S&P 500 ETF Trust Call Option | December 2018 | $235.00 | 28 | 58,324 | ||||||||||||
SPDR S&P 500 ETF Trust Call Option | December 2018 | $240.00 | 50 | 88,750 | ||||||||||||
SPDR S&P 500 ETF Trust Call Option | December 2019 | $230.00 | 101 | 303,505 | ||||||||||||
| 112 | (continued) |
| Ohio National Fund, Inc. | Risk Managed Balanced Portfolio (Continued) |
Schedule of Investments | June 30, 2017 (Unaudited) |
| Purchased Options (Continued) | Expiration | Exercise Price | Contracts (d) | Value | ||||||||||||
SPDR S&P 500 ETF Trust Call Option | December 2019 | $235.00 | 115 | $ | 305,670 | |||||||||||
SPDR S&P 500 ETF Trust Call Option | December 2019 | $240.00 | 109 | 259,420 | ||||||||||||
SPDR S&P 500 ETF Trust Put Option | December 2018 | $210.00 | 400 | 330,800 | ||||||||||||
SPDR S&P 500 ETF Trust Put Option | December 2018 | $215.00 | 187 | 174,284 | ||||||||||||
SPDR S&P 500 ETF Trust Put Option | December 2018 | $220.00 | 120 | 126,480 | ||||||||||||
SPDR S&P 500 ETF Trust Put Option | December 2018 | $225.00 | 222 | 265,734 | ||||||||||||
SPDR S&P 500 ETF Trust Put Option | December 2018 | $230.00 | 239 | 318,109 | ||||||||||||
SPDR S&P 500 ETF Trust Put Option | December 2018 | $235.00 | 28 | 42,504 | ||||||||||||
SPDR S&P 500 ETF Trust Put Option | December 2018 | $240.00 | 50 | 85,050 | ||||||||||||
SPDR S&P 500 ETF Trust Put Option | December 2019 | $230.00 | 101 | 198,566 | ||||||||||||
SPDR S&P 500 ETF Trust Put Option | December 2019 | $235.00 | 115 | 248,285 | ||||||||||||
SPDR S&P 500 ETF Trust Put Option | December 2019 | $240.00 | 109 | 255,169 | ||||||||||||
|
| |||||||||||||||
Total Purchased Options (Cost $20,264,789) | $ | 19,349,005 | ||||||||||||||
|
| |||||||||||||||
| Money Market Funds – 13.4% | Shares | Value | ||||||||||||||
| State Street Institutional Liquid Reserves Fund Institutional Class | 34,977,906 | $ | 34,981,404 | |||||||||||||
| State Street Institutional U.S. Government Money Market Fund Institutional Class | 8,337,682 | 8,337,682 | ||||||||||||||
|
| |||||||||||||||
Total Money Market Funds (Cost $43,319,086) | $ | 43,319,086 | ||||||||||||||
|
| |||||||||||||||
Total Investments – 99.9% (Cost $301,094,115) | (e) | $ | 322,715,949 | |||||||||||||
Other Assets in Excess of Liabilities – 0.1% | (f) | 411,931 | ||||||||||||||
|
| |||||||||||||||
Net Assets – 100.0% | $ | 323,127,880 | ||||||||||||||
|
| |||||||||||||||
Percentages are stated as a percent of net assets.
Abbreviations:
QL: Quarterly U.S. LIBOR Rate, 1.299% on 6/30/2017
DR: Depository Receipt
Footnotes:
| (a) | Non-income producing security. |
| (b) | Security exempt from registration under Regulation D of the Securities Act of 1933. These securities may be resold in transactions exempt from registration, normally to qualified buyers under Rule 144A. At June 30, 2017, the value of these securities totaled $13,356,868, or 4.1% of the Portfolio’s net assets. These securities were deemed liquid pursuant to procedures approved by the Board of Directors. |
| (c) | Security is a variable rate instrument in which the coupon or dividend rate is fixed until a later specified date, then is adjusted periodically. Rates stated are those in effect at June 30, 2017. |
| (d) | 100 shares per contract. |
| (e) | Represents cost for financial reporting purposes, which may differ from cost basis for federal income tax purposes. See also Note 7 of the Notes to Financial Statements. |
| (f) | Security is fully or partially pledged, in addition to $741,628 of the Portfolio’s cash holdings, as collateral for the futures contracts outstanding at June 30, 2017. See also the following Schedule of Open Futures Contracts. |
The accompanying notes are an integral part of these financial statements.
Schedule of Open Futures Contracts | June 30, 2017 (Unaudited) |
Description | Number of Contracts | Expiration Date | Notional Amount | Value | Unrealized Appreciation (Depreciation) | |||||||||||
CME E-mini S&P 500 Index – Long | 256 | September 15, 2017 | $ | 31,062,954 | $ | 30,987,520 | $ | (75,434 | ) | |||||||
10-Year U.S. Treasury Note – Long | 1,400 | September 20, 2017 | 176,087,349 | 175,743,751 | (343,598 | ) | ||||||||||
U.S. Treasury Long Bond – Long | 28 | September 20, 2017 | 4,266,579 | 4,303,250 | 36,671 | |||||||||||
|
|
|
|
|
| |||||||||||
| $ | 211,416,882 | $ | 211,034,521 | $ | (382,361 | ) | ||||||||||
|
|
|
|
|
| |||||||||||
The accompanying notes are an integral part of these financial statements.
| 113 |
| Ohio National Fund, Inc. | ON Conservative Model Portfolio |
Objective/Strategy
The Portfolio is a fund of funds that seeks current income and preservation of capital. Under normal circumstances, the Portfolio intends to have investment exposure to various asset classes within the following target asset allocation ranges: U.S. Equity 0-25%, International Equity 0-10%, and Fixed Income 65-90%.
Performance as of June 30, 2017
Average Annual returns | ||||
Since inception (3/1/17) | 2.30% |
Past performance does not guarantee future results. The performance data quoted represents past performance and current returns may be lower or higher. Total return figures include change in share price and reinvestment of dividends and capital gains. The investment return and principal value will fluctuate so that an investor’s shares, when redeemed, may be worth more or less than the original cost. To obtain performance information up to the most recent month end, call toll-free 1-877-781-6392.
The Portfolio is not open to direct retail investment. Beneficial interest in shares is obtained solely by purchase of variable life insurance policies and variable annuity contracts. Actual performance results for variable annuity and variable universal life contracts will be lower due to contract charges. Consult your contract for applicable charges.
Total expense ratio is estimated to be 1.00% per the Fund’s prospectus dated March 1, 2017. Additional information pertaining to the Fund’s expense ratio as of June 30, 2017 can be found in the Portfolio’s Financial Highlights. The Portfolio’s expense ratio included in the Financial Highlights does not include Acquired Fund Fees and Expenses (AFFE), which is a major component of the expense ratio that is required to be presented in the Fund’s prospectus.
Comments from Adviser
Q. How did the Portfolio perform in comparison to its benchmark during the reporting period?
A. For the period from March 1, 2017 (inception) to June 30, 2017, the ON Conservative Model Portfolio returned 2.30% versus 2.07% for its benchmark, the Morningstar® Conservative Target Risk Index.
Q. Were there specific market conditions, investment strategies, or techniques that materially affected the Portfolio’s benchmark-relative performance during the reporting period?
A. During the first half of 2017, the equity markets provided strong positive returns, both domestically and internationally. Large cap stocks generally outperformed mid cap and small cap stocks, and foreign stocks generally outperformed domestic stocks. Finally, growth stocks generally outperformed value stocks during the period.
Fixed income markets also provided positive returns for the period. Long-term interest rates declined modestly, while the Federal Reserve increased short term interest rates slightly. In this environment, longer duration bonds outperformed shorter duration bonds. Corporate credit spreads tightened, and lower quality bonds outperformed higher quality bonds during the period. In this environment, corporate bonds and high yield bonds generally outperformed other sectors of the bond market.
Q. How did asset class allocation impact the Portfolio’s performance relative to its benchmark?
A. The Portfolio invests in mutual funds, comprised mostly of fixed income funds, but also some equity funds. The asset allocation between fixed income funds and equity funds was roughly in-line with the benchmark. On the equity side, the Portfolio’s allocation to large cap domestic equity and international equity funds aided performance during the period. Fixed income funds generally underperformed equity funds during the period. Within the fixed income asset class, high yield and core plus funds outperformed inflation protected and short duration funds, which detracted from performance relative to the benchmark.(1)
Q. Which holdings contributed the most to, and detracted the most from, the Portfolio’s benchmark-relative performance?
A. The top three performing funds in the Portfolio were the Lazard International Equity Class R6, the Templeton Foreign Class R6, and the Strategic Value Portfolio. The top three funds that detracted from performance versus the benchmark were the PIMCO Real Return Institutional, the PIMCO Low Duration Institutional, and the PIMCO Total Return Institutional.(1)
| (1) | The Portfolio’s composition is subject to change. Holdings and weightings are as of June 30, 2017. |
Change in Value of $10,000 Investment
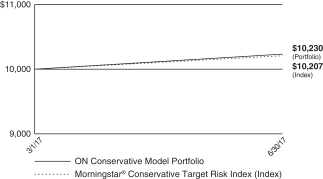
Hypothetical illustration based on past performance. Future performance will vary. The Portfolio’s returns reflect reinvested dividends. The Portfolio’s holdings may differ significantly from the securities in the index. The index is unmanaged and therefore does not reflect the cost of portfolio management and accounting.
The Morningstar® Target Risk Index Family is a series of Morningstar Indexes that provide exposure to a broad array of asset classes using Morningstar asset allocation methodology. The index family provides global equity market risk levels that are scaled to fit five equity market risk profiles: aggressive, moderately aggressive, moderate, moderately conservative, and conservative. The five levels of global equity exposure are set at 95%, 80%, 60%, 40%, and 20%, respectively.
| 114 | (continued) |
| Ohio National Fund, Inc. | ON Conservative Model Portfolio (Continued) |
Portfolio Composition as of June 30, 2017 (1)
| % of Net Assets | ||||
Open-End Mutual Funds | 100.0 | |||
|
| |||
| 100.0 | ||||
|
|
Top 10 Portfolio Holdings as of June 30, 2017 (1) (2) (3)
| % of Net Assets | ||||
1. Western Asset Core Plus Bond IS | 24.0 | |||
2. PIMCO Total Return Institutional | 19.0 | |||
3. PIMCO Real Return Institutional | 17.0 | |||
4. PIMCO Low Duration Institutional | 9.0 | |||
5. Ohio National Fund, Inc. – Balanced Portfolio | 7.0 | |||
6. Ohio National Fund, Inc. – High Income Bond Portfolio | 7.0 | |||
7. Ohio National Fund, Inc. – Strategic Value Portfolio | 7.0 | |||
8. Ohio National Fund, Inc. – S&P 500® Index Portfolio | 6.0 | |||
9. Lazard International Equity Class R6 | 2.0 | |||
10. Templeton Foreign Class R6 | 2.0 |
| (1) | Composition of Portfolio subject to change. |
| (2) | Short-term investments have been excluded from the list of Top 10 Portfolio Holdings. |
| (3) | Top 10 Portfolio Holdings is presented at an individual security level. Total investment exposure by issuer may be higher. |
| 115 |
| Ohio National Fund, Inc. | ON Conservative Model Portfolio |
Schedule of Investments in Unaffiliated Issuers | June 30, 2017 (Unaudited) |
| Open-End Mutual Funds – 69.1% | Shares | Value | ||||||||
PIMCO Low Duration Institutional | 966,825 | $ | 9,523,226 | |||||||
PIMCO Real Return Institutional | 1,647,479 | 18,023,425 | ||||||||
PIMCO Total Return Institutional | 1,966,859 | 20,120,970 | ||||||||
Western Asset Core Plus Bond IS | 2,158,564 | 25,427,885 | ||||||||
|
| |||||||||
Total Open-End Mutual Funds | $ | 73,095,506 | ||||||||
|
| |||||||||
Total Investments in Securities of Unaffiliated Issuers – 69.1% (Cost $72,344,073) | (a) | $ | 73,095,506 | |||||||
Total Investments in Affiliates – 30.9% (Cost $31,821,499) (see schedule below) | (a) | 32,752,812 | ||||||||
Liabilities in Excess of Other Assets – 0.0% | (24,984) | |||||||||
|
| |||||||||
Net Assets – 100.0% | $ | 105,823,334 | ||||||||
|
| |||||||||
Percentages are stated as a percent of net assets.
Footnotes:
| (a) | Represents cost for financial reporting purposes, which may differ from cost basis for federal income tax purposes. See also Note 7 of the Notes to Financial Statements. |
The accompanying notes are an integral part of these financial statements.
Schedule of Investments in Affiliates | June 30, 2017 (Unaudited) |
Affiliate | Value at March 1, 2017 (Inception) | Cost of Purchases | Proceeds from Sales | Net Realized Gain (Loss) | Change in Unrealized Appreciation (Depreciation) | Income Distributions | Capital Gain Distributions | Shares at June 30, 2017 | Value at June 30, 2017 | |||||||||||||||||||||||||||||||
Open-End Mutual Funds – 30.9% | ||||||||||||||||||||||||||||||||||||||||
Lazard International Equity Class R6 | (b | ) | $ | — | $ | 2,203,056 | $ | 262,222 | $ | 11,687 | $ | 160,564 | $ | — | $ | — | 116,423 | $ | 2,113,085 | |||||||||||||||||||||
Ohio National Fund, Inc. – Balanced Portfolio | (a | )(b) | — | 7,780,213 | 529,651 | 3,970 | 141,264 | — | — | 349,848 | 7,395,796 | |||||||||||||||||||||||||||||
Ohio National Fund, Inc. – High Income Bond Portfolio | (a | )(b) | — | 7,702,440 | 443,477 | 2,129 | 134,704 | — | — | 389,048 | 7,395,796 | |||||||||||||||||||||||||||||
Ohio National Fund, Inc. – Strategic Value Portfolio | (a | )(b) | — | 7,761,050 | 626,945 | 13,433 | 248,258 | — | — | 437,880 | 7,395,796 | |||||||||||||||||||||||||||||
Ohio National Fund, Inc. – S&P 500® Index Portfolio | (a | )(b) | — | 6,703,283 | 505,063 | 4,020 | 137,014 | — | — | 238,857 | 6,339,254 | |||||||||||||||||||||||||||||
Templeton Foreign Class R6 | (b | ) | — | 2,227,414 | 231,197 | 7,359 | 109,509 | — | — | 276,220 | 2,113,085 | |||||||||||||||||||||||||||||
|
|
|
|
|
|
|
|
|
| |||||||||||||||||||||||||||||||
Total Open-End Mutual Funds | $ | 42,598 | $ | 931,313 | $ | — | $ | — | $ | 32,752,812 | ||||||||||||||||||||||||||||||
|
|
|
|
|
|
|
|
|
| |||||||||||||||||||||||||||||||
Percentages are stated as a percent of net assets.
Footnotes:
| (a) | Non-income producing security. |
| (b) | Pursuant to Section 2(a)(3) of the Investment Company Act of 1940, the investment meets the definition of “affiliated person,” as the Portfolio directly or indirectly owns, controls, or holds with power to vote 5 percent or more of the outstanding voting securities of the holding. |
The accompanying notes are an integral part of these financial statements.
| 116 |
| Ohio National Fund, Inc. | ON Moderately Conservative Model Portfolio |
Objective/Strategy
The Portfolio is a fund of funds that seeks current income and moderate growth of capital with a greater emphasis on current income. Under normal circumstances, the Portfolio intends to have investment exposure to various asset classes within the following target asset allocation ranges: U.S. Equity 20-40%, International Equity 5-20%, and Fixed Income 30-70%.
Performance as of June 30, 2017
Average Annual returns | ||||
Since inception (3/1/17) | 2.60% |
Past performance does not guarantee future results. The performance data quoted represents past performance and current returns may be lower or higher. Total return figures include change in share price and reinvestment of dividends and capital gains. The investment return and principal value will fluctuate so that an investor’s shares, when redeemed, may be worth more or less than the original cost. To obtain performance information up to the most recent month end, call toll-free 1-877-781-6392.
The Portfolio is not open to direct retail investment. Beneficial interest in shares is obtained solely by purchase of variable life insurance policies and variable annuity contracts. Actual performance results for variable annuity and variable universal life contracts will be lower due to contract charges. Consult your contract for applicable charges.
Total expense ratio is estimated to be 1.02% per the Fund’s prospectus dated March 1, 2017. Additional information pertaining to the Fund’s expense ratio as of June 30, 2017 can be found in the Portfolio’s Financial Highlights. The Portfolio’s expense ratio included in the Financial Highlights does not include Acquired Fund Fees and Expenses (AFFE), which is a major component of the expense ratio that is required to be presented in the Fund’s prospectus.
Comments from Adviser
Q. How did the Portfolio perform in comparison to its benchmark during the reporting period?
A. For the period from March 1, 2017 (inception) to June 30, 2017, the ON Moderately Conservative Model Portfolio returned 2.60% versus 2.42% for its benchmark, the Morningstar® Moderately Conservative Target Risk Index.
Q. Were there specific market conditions, investment strategies, or techniques that materially affected the Portfolio’s benchmark-relative performance during the reporting period?
A. During the first half of 2017, the equity markets provided strong positive returns, both domestically and internationally. Large cap stocks generally outperformed mid cap and small cap stocks, and foreign stocks generally outperformed domestic stocks. Finally, growth stocks generally outperformed value stocks during the period.
Fixed income markets also provided positive returns for the period. Long-term interest rates declined modestly, while the Federal Reserve increased short term interest rates slightly. In this environment, longer duration bonds outperformed shorter duration bonds. Corporate credit spreads tightened, and lower quality bonds outperformed higher quality bonds during the period. In this environment, corporate bonds and high yield bonds generally outperformed other sectors of the bond market.
Q. How did asset class allocation impact the Portfolio’s performance relative to its benchmark?
A. The Portfolio invests in mutual funds, comprised mostly of fixed income funds, but also equity funds. The asset allocation between fixed income funds and equity funds was roughly in-line with the benchmark. On the equity side, the Portfolio’s allocation to large cap domestic equity, as well as international equity funds aided performance during the period. The Portfolio’s investment in real estate funds detracted from performance. Fixed income funds generally underperformed equity funds during the period. Within the fixed income asset class, high yield and core plus funds outperformed inflation protected and short duration funds, which detracted from performance relative to the benchmark.(1)
Q. Which holdings contributed the most to, and detracted the most from, the Portfolio’s benchmark-relative performance?
A. The top three performing funds in the Portfolio were the Lazard International Equity Class R6, the Templeton Foreign Class R6, and the Bristol Growth Portfolio. The top three funds that detracted from performance versus the benchmark were the PIMCO Real Return Institutional, the PIMCO Low Duration Institutional, and the Fidelity Advisor® Mid Cap II Class I.(1)
| (1) | The Portfolio’s composition is subject to change. Holdings and weightings are as of June 30, 2017. |
Change in Value of $10,000 Investment
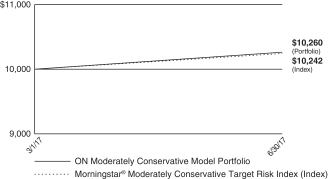
Hypothetical illustration based on past performance. Future performance will vary. The Portfolio’s returns reflect reinvested dividends. The Portfolio’s holdings may differ significantly from the securities in the index. The index is unmanaged and therefore does not reflect the cost of portfolio management and accounting.
The Morningstar® Target Risk Index Family is a series of Morningstar Indexes that provide exposure to a broad array of asset classes using Morningstar asset allocation methodology. The index family provides global equity market risk levels that are scaled to fit five equity market risk profiles: aggressive, moderately aggressive, moderate, moderately conservative, and conservative. The five levels of global equity exposure are set at 95%, 80%, 60%, 40%, and 20%, respectively.
| 117 | (continued) |
| Ohio National Fund, Inc. | ON Moderately Conservative Model Portfolio (Continued) |
Portfolio Composition as of June 30, 2017 (1)
| % of Net Assets | ||||
Open-End Mutual Funds | ||||
Less Net Liabilities | 100.0 | |||
|
| |||
| 100.0 | ||||
|
|
Top 10 Portfolio Holdings as of June 30, 2017 (1) (2) (3)
| % of Net Assets | ||||
1. Western Asset Core Plus Bond IS | 19.0 | |||
2. PIMCO Total Return Institutional | 15.0 | |||
3. PIMCO Real Return Institutional | 11.0 | |||
4. Ohio National Fund, Inc. – Strategic Value Portfolio | 8.0 | |||
5. Ohio National Fund, Inc. – Balanced Portfolio | 7.0 | |||
6. Ohio National Fund, Inc. – Equity Portfolio | 7.0 | |||
7. PIMCO Low Duration Institutional | 6.0 | |||
8. Lazard International Equity Class R6 | 6.0 | |||
9. Ohio National Fund, Inc. – High Income Bond Portfolio | 6.0 | |||
10. Ohio National Fund, Inc. – S&P 500® Index Portfolio | 5.0 |
| (1) | Composition of Portfolio subject to change. |
| (2) | Short-term investments have been excluded from the list of Top 10 Portfolio Holdings. |
| (3) | Top 10 Portfolio Holdings is presented at an individual security level. Total investment exposure by issuer may be higher. |
| 118 |
| Ohio National Fund, Inc. | ON Moderately Conservative Model Portfolio |
Schedule of Investments in Unaffiliated Issuers | June 30, 2017 (Unaudited) |
| Open-End Mutual Funds – 51.1% | Shares | Value | ||||||||
PIMCO Low Duration Institutional | 2,052,788 | $ | 20,219,964 | |||||||
PIMCO Real Return Institutional | 3,395,066 | 37,142,018 | ||||||||
PIMCO Total Return Institutional | 4,945,351 | 50,590,945 | ||||||||
Western Asset Core Plus Bond IS | 5,442,438 | 64,111,915 | ||||||||
|
| |||||||||
Total Open-End Mutual Funds | $ | 172,064,842 | ||||||||
|
| |||||||||
Total Investments in Securities of Unaffiliated Issuers – 51.1% (Cost $170,051,672) | (a) | $ | 172,064,842 | |||||||
Total Investments in Affiliates – 48.9% (Cost $159,787,309) (see schedule below) | (a) | 164,881,709 | ||||||||
Liabilities in Excess of Other Assets – 0.0% | (87,506) | |||||||||
|
| |||||||||
Net Assets – 100.0% | $ | 336,859,045 | ||||||||
|
| |||||||||
Percentages are stated as a percent of net assets.
Footnotes:
| (a) | Represents cost for financial reporting purposes, which may differ from cost basis for federal income tax purposes. See also Note 7 of the Notes to Financial Statements. |
The accompanying notes are an integral part of these financial statements.
Schedule of Investments in Affiliates | June 30, 2017 (Unaudited) |
Affiliate | Value at March 1, 2017 (Inception) | Cost of Purchases | Proceeds from Sales | Net Realized Gain (Loss) | Change in Unrealized Appreciation (Depreciation) | Income Distributions | Capital Gain Distributions | Shares at June 30, 2017 | Value at June 30, 2017 | |||||||||||||||||||||||||||||||
Open-End Mutual Funds – 48.9% | ||||||||||||||||||||||||||||||||||||||||
Fidelity Advisor® Mid Cap II Class I | (b | ) | $ | — | $ | 6,880,090 | $ | 327,571 | $ | 4,790 | $ | 172,557 | $ | — | $ | — | 324,019 | $ | 6,729,866 | |||||||||||||||||||||
Fidelity Advisor® Real Estate I | (b | ) | — | 7,247,241 | 553,408 | 2,047 | 33,986 | 12,472 | — | 292,222 | 6,729,866 | |||||||||||||||||||||||||||||
Lazard International Equity Class R6 | (b | ) | — | 20,512,313 | 1,997,218 | 107,172 | 1,567,330 | — | — | 1,112,374 | 20,189,597 | |||||||||||||||||||||||||||||
Ohio National Fund, Inc. – Equity Portfolio | (a | )(b) | — | 24,335,643 | 968,278 | (311 | ) | 187,476 | — | — | 611,488 | 23,554,530 | ||||||||||||||||||||||||||||
Ohio National Fund, Inc. – Bristol Growth Portfolio | (a | )(b) | — | 6,856,179 | 459,804 | 15,614 | 317,877 | — | — | 317,147 | 6,729,866 | |||||||||||||||||||||||||||||
Ohio National Fund, Inc. – Balanced Portfolio | (a | )(b) | — | 23,853,663 | 762,442 | 7,984 | 455,325 | — | — | 1,114,216 | 23,554,530 | |||||||||||||||||||||||||||||
Ohio National Fund, Inc. – High Income Bond Portfolio | (a | )(b) | — | 20,517,825 | 705,763 | 5,630 | 371,905 | — | — | 1,062,051 | 20,189,597 | |||||||||||||||||||||||||||||
Ohio National Fund, Inc. – Strategic Value Portfolio | (a | )(b) | — | 27,639,413 | 1,676,454 | 45,834 | 910,669 | — | — | 1,593,811 | 26,919,462 | |||||||||||||||||||||||||||||
Ohio National Fund, Inc. – S&P 500® Index Portfolio | (a | )(b) | — | 17,160,651 | 707,358 | 9,901 | 361,470 | — | — | 633,936 | 16,824,664 | |||||||||||||||||||||||||||||
Templeton Foreign Class R6 | (b | ) | — | 13,723,875 | 1,017,503 | 37,554 | 715,805 | — | — | 1,759,442 | 13,459,731 | |||||||||||||||||||||||||||||
|
|
|
|
|
|
|
|
|
| |||||||||||||||||||||||||||||||
Total Open-End Mutual Funds | $ | 236,215 | $ | 5,094,400 | $ | 12,472 | $ | — | $ | 164,881,709 | ||||||||||||||||||||||||||||||
|
|
|
|
|
|
|
|
|
| |||||||||||||||||||||||||||||||
Percentages are stated as a percent of net assets.
Footnotes:
| (a) | Non-income producing security. |
| (b) | Pursuant to Section 2(a)(3) of the Investment Company Act of 1940, the investment meets the definition of “affiliated person,” as the Portfolio directly or indirectly owns, controls, or holds with power to vote 5 percent or more of the outstanding voting securities of the holding. |
The accompanying notes are an integral part of these financial statements.
| 119 |
| Ohio National Fund, Inc. | ON Balanced Model Portfolio |
Objective/Strategy
The Portfolio is a fund of funds that seeks a balance between growth of capital and current income with a greater emphasis on growth of capital. Under normal circumstances, the Portfolio intends to have investment exposure to various asset classes within the following target asset allocation ranges: U.S. Equity 25-50%, International Equity 10-25%, and Fixed Income 25-50%.
Performance as of June 30, 2017
Average Annual returns | ||||
Since inception (3/1/17) | 2.70% |
Past performance does not guarantee future results. The performance data quoted represents past performance and current returns may be lower or higher. Total return figures include change in share price and reinvestment of dividends and capital gains. The investment return and principal value will fluctuate so that an investor’s shares, when redeemed, may be worth more or less than the original cost. To obtain performance information up to the most recent month end, call toll-free 1-877-781-6392.
The Portfolio is not open to direct retail investment. Beneficial interest in shares is obtained solely by purchase of variable life insurance policies and variable annuity contracts. Actual performance results for variable annuity and variable universal life contracts will be lower due to contract charges. Consult your contract for applicable charges.
Total expense ratio is estimated to be 1.09% per the Fund’s prospectus dated March 1, 2017. Additional information pertaining to the Fund’s expense ratio as of June 30, 2017 can be found in the Portfolio’s Financial Highlights. The Portfolio’s expense ratio included in the Financial Highlights does not include Acquired Fund Fees and Expenses (AFFE), which is a major component of the expense ratio that is required to be presented in the Fund’s prospectus.
Comments from Adviser
Q. How did the Portfolio perform in comparison to its benchmark during the reporting period?
A. For the period from March 1, 2017 (inception) to June 30, 2017, the ON Balanced Model Portfolio returned 2.70% versus 2.69% for its benchmark, the Morningstar® Moderate Target Risk Index.
Q. Were there specific market conditions, investment strategies, or techniques that materially affected the Portfolio’s benchmark-relative performance during the reporting period?
A. During the first half of 2017, the equity markets provided strong positive returns, both domestically and internationally. Large cap stocks generally outperformed mid cap and small cap stocks, and foreign stocks generally outperformed domestic stocks. Finally, growth stocks generally outperformed value stocks during the period.
Fixed income markets also provided positive returns for the period. Long-term interest rates declined modestly, while the Federal Reserve increased short term interest rates slightly. In this environment, longer duration bonds outperformed shorter duration bonds. Corporate credit spreads tightened, and lower quality bonds outperformed higher quality bonds during the period. In this environment, corporate bonds and high yield bonds generally outperformed other sectors of the bond market.
Q. How did asset class allocation impact the Portfolio’s performance relative to its benchmark?
A. The Portfolio invests in mutual funds, comprised of fixed income funds and equity funds. The asset allocation between fixed income funds and equity funds was roughly in-line with the benchmark. On the equity side, the Portfolio’s allocation to large cap and small cap domestic equity, as well as international equity funds aided performance during the period. The Portfolio’s allocation to capital appreciation funds detracted from performance. Fixed income funds generally underperformed equity funds during the period. Within the fixed income asset class, high yield and core plus funds outperformed inflation protected and short duration funds, which detracted from performance relative to the benchmark.(1)
Q. Which holdings contributed the most to, and detracted the most from, the Portfolio’s benchmark-relative performance?
A. The top three performing funds in the Portfolio were the Lazard International Equity Class R6, the Bristol Portfolio and the ClearBridge Small Cap Portfolio. The top three funds that detracted from performance versus the benchmark were the PIMCO Real Return Institutional, the Capital Appreciation Portfolio, and the PIMCO Low Duration Institutional.(1)
| (1) | The Portfolio’s composition is subject to change. Holdings and weightings are as of June 30, 2017. |
Change in Value of $10,000 Investment
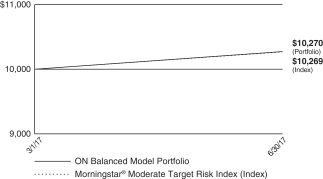
Hypothetical illustration based on past performance. Future performance will vary. The Portfolio’s returns reflect reinvested dividends. The Portfolio’s holdings may differ significantly from the securities in the index. The index is unmanaged and therefore does not reflect the cost of portfolio management and accounting.
The Morningstar® Target Risk Index Family is a series of Morningstar Indexes that provide exposure to a broad array of asset classes using Morningstar asset allocation methodology. The index family provides global equity market risk levels that are scaled to fit five equity market risk profiles: aggressive, moderately aggressive, moderate, moderately conservative, and conservative. The five levels of global equity exposure are set at 95%, 80%, 60%, 40%, and 20%, respectively.
| 120 | (continued) |
| Ohio National Fund, Inc. | ON Balanced Model Portfolio (Continued) |
Portfolio Composition as of June 30, 2017 (1)
| % of Net Assets | ||||
Open-End Mutual Funds | 100.0 | |||
|
| |||
| 100.0 | ||||
|
|
Top 10 Portfolio Holdings as of June 30, 2017 (1) (2) (3)
| % of Net Assets | ||||
1. PIMCO Total Return Institutional | 12.0 | |||
2. Lazard International Equity Class R6 | 9.0 | |||
3. Ohio National Fund, Inc. – Balanced Portfolio | 9.0 | |||
4. PIMCO Real Return Institutional | 8.0 | |||
5. Ohio National Fund, Inc. – Strategic Value Portfolio | 8.0 | |||
6. Templeton Foreign Class R6 | 7.0 | |||
7. Western Asset Core Plus Bond IS | 6.0 | |||
8. Ohio National Fund, Inc. – Equity Portfolio | 6.0 | |||
9. PIMCO Low Duration Institutional | 5.0 | |||
10. Ohio National Fund, Inc. – High Income Bond Portfolio | 5.0 |
| (1) | Composition of Portfolio subject to change. |
| (2) | Short-term investments have been excluded from the list of Top 10 Portfolio Holdings. |
| (3) | Top 10 Portfolio Holdings is presented at an individual security level. Total investment exposure by issuer may be higher. |
| 121 |
| Ohio National Fund, Inc. | ON Balanced Model Portfolio |
Schedule of Investments in Unaffiliated Issuers | June 30, 2017 (Unaudited) |
| Open-End Mutual Funds – 34.1% | Shares | Value | ||||||||
Lazard Emerging Markets Equity Class R6 | 2,588,111 | $ | 46,586,007 | |||||||
PIMCO Low Duration Institutional | 7,894,388 | 77,759,718 | ||||||||
PIMCO Real Return Institutional | 11,394,623 | 124,657,173 | ||||||||
PIMCO Total Return Institutional | 18,257,545 | 186,774,690 | ||||||||
Western Asset Core Plus Bond IS | 7,931,327 | 93,431,033 | ||||||||
|
| |||||||||
Total Open-End Mutual Funds | $ | 529,208,621 | ||||||||
|
| |||||||||
Total Investments in Securities of Unaffiliated Issuers – 34.1% (Cost $520,071,878) | (a) | $ | 529,208,621 | |||||||
Total Investments in Affiliates – 65.9% (Cost $986,269,501) (see schedule below) | (a) | 1,024,892,154 | ||||||||
Liabilities in Excess of Other Assets – 0.0% | (344,796) | |||||||||
|
| |||||||||
Net Assets – 100.0% | $ | 1,553,755,979 | ||||||||
|
| |||||||||
Percentages are stated as a percent of net assets.
Footnotes:
| (a) | Represents cost for financial reporting purposes, which may differ from cost basis for federal income tax purposes. See also Note 7 of the Notes to Financial Statements. |
The accompanying notes are an integral part of these financial statements.
Schedule of Investments in Affiliates | June 30, 2017 (Unaudited) |
Affiliate | Value at March 1, 2017 (Inception) | Cost of Purchases | Proceeds from Sales | Net Realized Gain (Loss) | Change in Unrealized Appreciation (Depreciation) | Income Distributions | Capital Gain Distributions | Shares at June 30, 2017 | Value at June 30, 2017 | |||||||||||||||||||||||||||||||
Open-End Mutual Funds – 65.9% | ||||||||||||||||||||||||||||||||||||||||
Fidelity Advisor® Mid Cap II Class I | (b | ) | $ | — | $ | 47,492,784 | $ | 2,632,042 | $ | 64,087 | $ | 1,661,178 | $ | — | $ | — | 2,242,947 | $ | 46,586,007 | |||||||||||||||||||||
Fidelity Advisor® Real Estate Class I | (b | ) | — | 32,740,892 | 3,185,010 | 137,381 | 1,364,075 | 57,631 | — | 1,348,560 | 31,057,338 | |||||||||||||||||||||||||||||
Goldman Sachs Large Cap Value Institutional | (b | ) | — | 63,166,817 | 31,624,374 | (771,849 | ) | 286,744 | — | — | 1,752,671 | 31,057,338 | ||||||||||||||||||||||||||||
Lazard International Equity Class R6 | (b | ) | — | 140,902,642 | 13,374,705 | 808,926 | 11,421,158 | — | — | 7,700,166 | 139,758,021 | |||||||||||||||||||||||||||||
Ohio National Fund, Inc. – Equity Portfolio | (a | )(b) | — | 95,983,515 | 4,142,007 | 12,550 | 1,317,956 | — | — | 2,418,796 | 93,172,014 | |||||||||||||||||||||||||||||
Ohio National Fund, Inc. – Capital Appreciation Portfolio | (a | )(b) | — | 47,869,845 | 1,444,452 | 6,245 | 154,369 | — | — | 1,174,338 | 46,586,007 | |||||||||||||||||||||||||||||
Ohio National Fund, Inc. – Balanced Portfolio | (a | )(b) | — | 140,843,773 | 4,320,584 | 63,637 | 3,171,195 | — | — | 6,611,070 | 139,758,021 | |||||||||||||||||||||||||||||
Ohio National Fund, Inc. – Bristol Portfolio | (a | )(b) | — | 47,603,012 | 2,855,452 | 77,293 | 1,761,154 | — | — | 1,745,448 | 46,586,007 | |||||||||||||||||||||||||||||
Ohio National Fund, Inc. – ClearBridge Small Cap Portfolio | (a | )(b) | — | 63,950,934 | 5,023,010 | 161,416 | 3,025,336 | — | — | 1,138,465 | 62,114,676 | |||||||||||||||||||||||||||||
Ohio National Fund, Inc. – High Income Bond Portfolio | (a | )(b) | — | 77,923,125 | 2,830,058 | 58,829 | 2,491,449 | — | — | 4,084,342 | 77,643,345 | |||||||||||||||||||||||||||||
Ohio National Fund, Inc. – Strategic Value Portfolio | (a | )(b) | — | 125,029,372 | 5,032,289 | 189,976 | 4,042,293 | — | — | 7,355,201 | 124,229,352 | |||||||||||||||||||||||||||||
Ohio National Fund, Inc. – S&P 500® Index Portfolio | (a | )(b) | — | 79,413,999 | 3,831,552 | 69,241 | 1,991,657 | — | — | 2,925,522 | 77,643,345 | |||||||||||||||||||||||||||||
Templeton Foreign Class R6 | (b | ) | — | 109,773,929 | 7,335,758 | 328,423 | 5,934,089 | — | — | 14,209,240 | 108,700,683 | |||||||||||||||||||||||||||||
|
|
|
|
|
|
|
|
|
| |||||||||||||||||||||||||||||||
Total Open-End Mutual Funds | $ | 1,206,155 | $ | 38,622,653 | $ | 57,631 | $ | — | $ | 1,024,892,154 | ||||||||||||||||||||||||||||||
|
|
|
|
|
|
|
|
|
| |||||||||||||||||||||||||||||||
Percentages are stated as a percent of net assets.
Footnotes:
| (a) | Non-income producing security. |
| (b) | Pursuant to Section 2(a)(3) of the Investment Company Act of 1940, the investment meets the definition of “affiliated person,” as the Portfolio directly or indirectly owns, controls, or holds with power to vote 5 percent or more of the outstanding voting securities of the holding. |
The accompanying notes are an integral part of these financial statements.
| 122 |
| Ohio National Fund, Inc. | ON Moderate Growth Model Portfolio |
Objective/Strategy
The Portfolio is a fund of funds that seeks growth of capital and moderate current income with a greater emphasis on growth of capital. Under normal circumstances, the Portfolio intends to have investment exposure to various asset classes within the following target asset allocation ranges: U.S. Equity 40-60%, International Equity 15-35%, and Fixed Income 10-30%.
Performance as of June 30, 2017
Average Annual returns | ||||
Since inception (3/1/17) | 3.50% |
Past performance does not guarantee future results. The performance data quoted represents past performance and current returns may be lower or higher. Total return figures include change in share price and reinvestment of dividends and capital gains. The investment return and principal value will fluctuate so that an investor’s shares, when redeemed, may be worth more or less than the original cost. To obtain performance information up to the most recent month end, call toll-free 1-877-781-6392.
The Portfolio is not open to direct retail investment. Beneficial interest in shares is obtained solely by purchase of variable life insurance policies and variable annuity contracts. Actual performance results for variable annuity and variable universal life contracts will be lower due to contract charges. Consult your contract for applicable charges.
Total expense ratio is estimated to be 1.14% per the Fund’s prospectus dated March 1, 2017. Additional information pertaining to the Fund’s expense ratio as of June 30, 2017 can be found in the Portfolio’s Financial Highlights. The Portfolio’s expense ratio included in the Financial Highlights does not include Acquired Fund Fees and Expenses (AFFE), which is a major component of the expense ratio that is required to be presented in the Fund’s prospectus.
Comments from Adviser
Q. How did the Portfolio perform in comparison to its benchmark during the reporting period?
A. For the period from March 1, 2017 (inception) to June 30, 2017, the ON Moderate Growth Model Portfolio returned 3.50% versus 3.23% for its benchmark, the Morningstar® Moderately Aggressive Target Risk Index.
Q. Were there specific market conditions, investment strategies, or techniques that materially affected the Portfolio’s benchmark-relative performance during the reporting period?
A. During the first half of 2017, the equity markets provided strong positive returns, both domestically and internationally. Large cap stocks generally outperformed mid cap and small cap stocks, and foreign stocks generally outperformed domestic stocks. Finally, growth stocks generally outperformed value stocks during the period.
Fixed income markets also provided positive returns for the period. Long-term interest rates declined modestly, while the Federal Reserve increased short term interest rates slightly. In this environment, longer duration bonds outperformed shorter duration bonds. Corporate credit spreads tightened, and lower quality bonds outperformed higher quality bonds during the period. In this environment, corporate bonds and high yield bonds generally outperformed other sectors of the bond market.
Q. How did asset class allocation impact the Portfolio’s performance relative to its benchmark?
A. The Portfolio invests in mutual funds, comprised mostly of equity funds, but also of fixed income funds. The asset allocation between fixed income funds and equity funds was roughly in-line with the benchmark. On the equity side, the Portfolio’s allocation to large cap and small cap domestic equity, as well as international equity funds aided performance during the period. The Portfolio’s allocation to large cap value funds and real estate funds detracted from performance. Fixed income funds generally underperformed equity funds during the period. Within the fixed income asset class, high yield and core plus funds outperformed inflation protected funds, which detracted from performance relative to the benchmark.(1)
Q. Which holdings contributed the most to, and detracted the most from, the Portfolio’s benchmark-relative performance?
A. The top three performing funds in the Portfolio were the Small Cap Growth Portfolio, the Lazard International Equity Class R6, and the Bristol Growth Portfolio. The top three funds that detracted from performance versus the benchmark were the PIMCO Real Return Institutional, the Goldman Sachs Large Cap Value Institutional, and the Fidelity Advisor® Real Estate Class I.(1)
| (1) | The Portfolio’s composition is subject to change. Holdings and weightings are as of June 30, 2017. |
Change in Value of $10,000 Investment
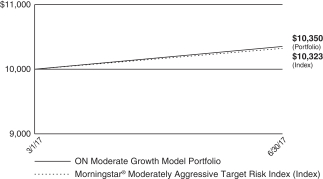
Hypothetical illustration based on past performance. Future performance will vary. The Portfolio’s returns reflect reinvested dividends. The Portfolio’s holdings may differ significantly from the securities in the index. The index is unmanaged and therefore does not reflect the cost of portfolio management and accounting.
The Morningstar® Target Risk Index Family is a series of Morningstar Indexes that provide exposure to a broad array of asset classes using Morningstar asset allocation methodology. The index family provides global equity market risk levels that are scaled to fit five equity market risk profiles: aggressive, moderately aggressive, moderate, moderately conservative, and conservative. The five levels of global equity exposure are set at 95%, 80%, 60%, 40%, and 20%, respectively.
| 123 | (continued) |
| Ohio National Fund, Inc. | ON Moderate Growth Model Portfolio (Continued) |
Portfolio Composition as of June 30, 2017 (1)
| % of Net Assets | ||||
Open-End Mutual Funds | 100.0 | |||
|
| |||
| 100.0 | ||||
|
|
Top 10 Portfolio Holdings as of June 30, 2017 (1) (2) (3)
| % of Net Assets | ||||
1. Western Asset Core Plus Bond IS | 12.0 | |||
2. Lazard International Equity Class R6 | 11.0 | |||
3. Ohio National Fund, Inc. – Strategic Value Portfolio | 10.0 | |||
4. Templeton Foreign Class R6 | 10.0 | |||
5. Ohio National Fund, Inc. – Balanced Portfolio | 8.0 | |||
6. Ohio National Fund, Inc. – Equity Portfolio | 8.0 | |||
7. Ohio National Fund, Inc. – S&P 500® Index Portfolio | 7.0 | |||
8. Fidelity Advisor® Mid Cap II Class I | 4.0 | |||
9. Lazard Emerging Markets Equity Class R6 | 4.0 | |||
10. Ohio National Fund, Inc. – Small Cap Growth Portfolio | 4.0 |
| (1) | Composition of Portfolio subject to change. |
| (2) | Short-term investments have been excluded from the list of Top 10 Portfolio Holdings. |
| (3) | Top 10 Portfolio Holdings is presented at an individual security level. Total investment exposure by issuer may be higher. |
| 124 |
| Ohio National Fund, Inc. | ON Moderate Growth Model Portfolio |
Schedule of Investments in Unaffiliated Issuers | June 30, 2017 (Unaudited) |
| Open-End Mutual Funds – 19.0% | Shares | Value | ||||||||
Lazard Emerging Markets Equity Class R6 | 5,733,839 | $ | 103,209,103 | |||||||
PIMCO Real Return Institutional | 7,099,725 | 77,670,988 | ||||||||
Western Asset Core Plus Bond IS | 26,356,874 | 310,483,972 | ||||||||
|
| |||||||||
Total Open-End Mutual Funds | $ | 491,364,063 | ||||||||
|
| |||||||||
Total Investments in Securities of Unaffiliated Issuers – 19.0% (Cost $482,810,673) | (a) | $ | 491,364,063 | |||||||
Total Investments in Affiliates – 81.0% (Cost $2,023,958,172) (see schedule below) | (a) | 2,089,984,335 | ||||||||
Liabilities in Excess of Other Assets – 0.0% | (513,736) | |||||||||
|
| |||||||||
Net Assets – 100.0% | $ | 2,580,834,662 | ||||||||
|
| |||||||||
Percentages are stated as a percent of net assets.
Footnotes:
| (a) | Represents cost for financial reporting purposes, which may differ from cost basis for federal income tax purposes. See also Note 7 of the Notes to Financial Statements. |
The accompanying notes are an integral part of these financial statements.
Schedule of Investments in Affiliates | June 30, 2017 (Unaudited) |
Affiliate | Value at March 1, 2017 (Inception) | Cost of Purchases | Proceeds from Sales | Net Realized Gain (Loss) | Change in Unrealized Appreciation (Depreciation) | Income Distributions | Capital Gain Distributions | Shares at June 30, 2017 | Value at June 30, 2017 | |||||||||||||||||||||||||||||||
Open-End Mutual Funds – 81.0% | ||||||||||||||||||||||||||||||||||||||||
Fidelity Advisor® Mid Cap II Class I | (b | ) | $ | — | $ | 104,918,139 | $ | 4,682,518 | $ | 76,400 | $ | 2,897,082 | $ | — | $ | — | 4,969,143 | $ | 103,209,103 | |||||||||||||||||||||
Fidelity Advisor® Real Estate Class I | (b | ) | — | 53,724,256 | 3,400,964 | 69,859 | 1,211,401 | 95,335 | — | 2,240,753 | 51,604,552 | |||||||||||||||||||||||||||||
Goldman Sachs Large Cap Value Institutional | (b | ) | — | 129,882,696 | 51,779,482 | (1,313,358 | ) | 616,971 | — | — | 4,368,331 | 77,406,827 | ||||||||||||||||||||||||||||
Lazard International Equity Class R6 | (b | ) | — | 286,582,226 | 20,875,761 | 880,083 | 17,238,485 | — | — | 15,637,743 | 283,825,033 | |||||||||||||||||||||||||||||
Ohio National Fund, Inc. – Equity Portfolio | (a | )(b) | — | 210,258,849 | 6,570,896 | 39,618 | 2,690,635 | — | — | 5,358,728 | 206,418,206 | |||||||||||||||||||||||||||||
Ohio National Fund, Inc. – Bristol Growth Portfolio | (a | )(b) | — | 78,427,063 | 4,607,191 | 139,787 | 3,447,168 | — | — | 3,647,824 | 77,406,827 | |||||||||||||||||||||||||||||
Ohio National Fund, Inc. – Balanced Portfolio | (a | )(b) | — | 207,142,550 | 4,962,806 | 40,793 | 4,197,669 | — | — | 9,764,343 | 206,418,206 | |||||||||||||||||||||||||||||
Ohio National Fund, Inc. – Bryton Growth Portfolio | (a | )(b) | — | 53,006,521 | 3,924,622 | 111,258 | 2,411,394 | — | — | 2,276,337 | 51,604,551 | |||||||||||||||||||||||||||||
Ohio National Fund, Inc. – Bristol Portfolio | (a | )(b) | — | 78,612,292 | 3,861,512 | 73,188 | 2,582,859 | — | — | 2,900,218 | 77,406,827 | |||||||||||||||||||||||||||||
Ohio National Fund, Inc. – ClearBridge Small Cap Portfolio | (a | )(b) | — | 79,819,709 | 4,547,595 | 56,951 | 2,077,762 | — | — | 1,418,747 | 77,406,827 | |||||||||||||||||||||||||||||
Ohio National Fund, Inc. – High Income Bond Portfolio | (a | )(b) | — | 77,673,879 | 2,577,020 | 30,436 | 2,279,532 | — | — | 4,071,900 | 77,406,827 | |||||||||||||||||||||||||||||
Ohio National Fund, Inc. – Strategic Value Portfolio | (a | )(b) | — | 258,867,412 | 7,733,814 | 178,792 | 6,710,368 | — | — | 15,276,658 | 258,022,758 | |||||||||||||||||||||||||||||
Ohio National Fund, Inc. – S&P 500® Index Portfolio | (a | )(b) | — | 182,945,972 | 6,577,600 | 85,005 | 4,162,553 | — | — | 6,805,423 | 180,615,930 | |||||||||||||||||||||||||||||
Ohio National Fund, Inc. – Small Cap Growth Portfolio | (a | )(b) | — | 104,495,372 | 7,396,669 | 267,383 | 5,843,017 | — | — | 3,418,652 | 103,209,103 | |||||||||||||||||||||||||||||
Templeton Foreign Class R6 | (b | ) | — | 262,513,958 | 12,502,474 | 352,007 | 7,659,267 | — | — | 33,728,465 | 258,022,758 | |||||||||||||||||||||||||||||
|
|
|
|
|
|
|
|
|
| |||||||||||||||||||||||||||||||
Total Open-End Mutual Funds | $ | 1,088,202 | $ | 66,026,163 | $ | 95,335 | $ | — | $ | 2,089,984,335 | ||||||||||||||||||||||||||||||
|
|
|
|
|
|
|
|
|
| |||||||||||||||||||||||||||||||
Percentages are stated as a percent of net assets.
Footnotes:
| (a) | Non-income producing security. |
| (b) | Pursuant to Section 2(a)(3) of the Investment Company Act of 1940, the investment meets the definition of “affiliated person,” as the Portfolio directly or indirectly owns, controls, or holds with power to vote 5 percent or more of the outstanding voting securities of the holding. |
The accompanying notes are an integral part of these financial statements.
| 125 |
| Ohio National Fund, Inc. | ON Growth Model Portfolio |
Objective/Strategy
The Portfolio is a fund of funds that seeks growth of capital and some current income. Under normal circumstances, the Portfolio intends to have investment exposure to various asset classes within the following target asset allocation ranges: U.S. Equity 50-80%, International Equity 15-45%, and Fixed Income 0-15%.
Performance as of June 30, 2017
Average Annual returns | ||||
Since inception | 3.60% |
Past performance does not guarantee future results. The performance data quoted represents past performance and current returns may be lower or higher. Total return figures include change in share price and reinvestment of dividends and capital gains. The investment return and principal value will fluctuate so that an investor’s shares, when redeemed, may be worth more or less than the original cost. To obtain performance information up to the most recent month end, call toll-free 1-877-781-6392.
The Portfolio is not open to direct retail investment. Beneficial interest in shares is obtained solely by purchase of variable life insurance policies and variable annuity contracts. Actual performance results for variable annuity and variable universal life contracts will be lower due to contract charges. Consult your contract for applicable charges.
Total expense ratio is estimated to be 1.21% per the Fund’s prospectus dated March 1, 2017. Additional information pertaining to the Fund’s expense ratio as of June 30, 2017 can be found in the Portfolio’s Financial Highlights. The Portfolio’s expense ratio included in the Financial Highlights does not include Acquired Fund Fees and Expenses (AFFE), which is a major component of the expense ratio that is required to be presented in the Fund’s prospectus.
Comments from Adviser
Q. How did the Portfolio perform in comparison to its benchmark during the reporting period?
A. For the period from March 1, 2017 (inception) to June 30, 2017, the ON Growth Model Portfolio returned 3.60% versus 3.51% for its benchmark, the Morningstar® Aggressive Target Risk Index.
Q. Were there specific market conditions, investment strategies, or techniques that materially affected the Portfolio’s benchmark-relative performance during the reporting period?
A. During the first half of 2017, the equity markets provided strong positive returns, both domestically and internationally. Large cap stocks generally outperformed mid cap and small cap stocks, and foreign stocks generally outperformed domestic stocks. Finally, growth stocks generally outperformed value stocks during the period.
Fixed income markets also provided positive returns for the period. Long-term interest rates declined modestly, while the Federal Reserve increased short term interest rates slightly. In this environment, longer duration bonds outperformed shorter duration bonds. Corporate credit spreads tightened, and lower quality bonds outperformed higher quality bonds during the period. In this environment, corporate bonds and high yield bonds generally outperformed other sectors of the bond market.
Q. How did asset class allocation impact the Portfolio’s performance relative to its benchmark?
A. The Portfolio invests in mutual funds, comprised mostly of equity funds, but also of fixed income funds. The asset allocation between fixed income funds and equity funds was roughly in-line with the benchmark. On the equity side, the Portfolio’s allocation to large cap and small cap domestic equity, as well as international equity funds aided performance during the period. The Portfolio’s allocation to large cap value funds and capital appreciation funds detracted from performance. Fixed income funds generally underperformed equity funds during the period. Within the fixed income asset class, high yield funds outperformed inflation protected funds, which detracted from performance relative to the benchmark.(1)
Q. Which holdings contributed the most to, and detracted the most from, the Portfolio’s benchmark-relative performance?
A. The top three performing funds in the Portfolio were the Small Cap Growth Portfolio, the Lazard International Equity Class R6, and the Bristol Growth Portfolio. The top three funds that detracted from performance versus the benchmark were the PIMCO Real Return Institutional, the Capital Appreciation Portfolio, and the Goldman Sachs Large Cap Value Institutional.(1)
| (1) | The Portfolio’s composition is subject to change. Holdings and weightings are as of June 30, 2017. |
Change in Value of $10,000 Investment
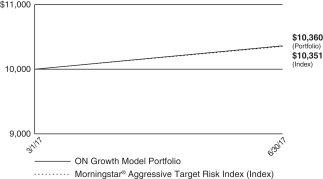
Hypothetical illustration based on past performance. Future performance will vary. The Portfolio’s returns reflect reinvested dividends. The Portfolio’s holdings may differ significantly from the securities in the index. The index is unmanaged and therefore does not reflect the cost of portfolio management and accounting.
The Morningstar® Target Risk Index Family is a series of Morningstar Indexes that provide exposure to a broad array of asset classes using Morningstar asset allocation methodology. The index family provides global equity market risk levels that are scaled to fit five equity market risk profiles: aggressive, moderately aggressive, moderate, moderately conservative, and conservative. The five levels of global equity exposure are set at 95%, 80%, 60%, 40%, and 20%, respectively.
| 126 | (continued) |
| Ohio National Fund, Inc. | ON Growth Model Portfolio (Continued) |
Portfolio Composition as of June 30, 2017 (1)
| % of Net Assets | ||||||
Open-End Mutual Funds | 100.0 | |||||
|
| |||||
| 100.0 | ||||||
|
| |||||
Top 10 Portfolio Holdings as of June 30, 2017 (1) (2) (3)
| % of Net Assets | ||||||
| 1. | Lazard International Equity Class R6 | 13.0 | ||||
| 2. | Templeton Foreign Class R6 | 12.0 | ||||
| 3. | Ohio National Fund, Inc. – Strategic Value Portfolio | 11.0 | ||||
| 4. | Ohio National Fund, Inc. – Equity Portfolio | 8.0 | ||||
| 5. | Ohio National Fund, Inc. – Balanced Portfolio | 7.0 | ||||
| 6. | Ohio National Fund, Inc. – S&P 500® Index Portfolio | 7.0 | ||||
| 7. | Lazard Emerging Markets Equity Class R6 | 5.0 | ||||
| 8. | Ohio National Fund, Inc. – ClearBridge Small Cap Portfolio | 5.0 | ||||
| 9. | Ohio National Fund, Inc. – Small Cap Growth Portfolio | 5.0 | ||||
| 10. | Fidelity Advisor® Mid Cap II Class I | 4.0 |
| (1) | Composition of Portfolio subject to change. |
| (2) | Short-term investments have been excluded from the list of Top 10 Portfolio Holdings. |
| (3) | Top 10 Portfolio Holdings is presented at an individual security level. Total investment exposure by issuer may be higher. |
| 127 |
| Ohio National Fund, Inc. | ON Growth Model Portfolio |
Schedule of Investments | June 30, 2017 (Unaudited) |
| Open-End Mutual Funds – 7.0% | Shares | Value | ||||||||
Lazard Emerging Markets Equity Class R6 | 1,446,690 | $ | 26,040,428 | |||||||
PIMCO Real Return Institutional | 955,372 | 10,451,771 | ||||||||
|
| |||||||||
Total Open-End Mutual Funds | $ | 36,492,199 | ||||||||
|
| |||||||||
Total Investments in Securities of Unaffiliated Issuers – 7.0% (Cost $35,700,864) | (a) | $ | 36,492,199 | |||||||
Total Investments in Affiliates – 93.0% (Cost $467,278,230) (see schedule below) | (a) | 484,351,956 | ||||||||
Liabilities in Excess of Other Assets – 0.0% | (105,191) | |||||||||
|
| |||||||||
Net Assets – 100.0% | $ | 520,738,964 | ||||||||
|
| |||||||||
Percentages are stated as a percent of net assets.
Footnotes:
| (a) | Represents cost for financial reporting purposes, which may differ from cost basis for federal income tax purposes. See also Note 7 of the Notes to Financial Statements. |
The accompanying notes are an integral part of these financial statements.
Schedule of Investments in Affiliates | June 30, 2017 (Unaudited) |
Affiliate | Value at March 1, 2017 (Inception) | Cost of Purchases | Proceeds from Sales | Net Realized Gain (Loss) | Change in Unrealized Appreciation (Depreciation) | Income Distributions | Capital Gain Distributions | Shares at June 30, 2017 | Value at June 30, 2017 | |||||||||||||||||||||||||||||||
Open-End Mutual Funds – 93.0% | ||||||||||||||||||||||||||||||||||||||||
Fidelity Advisor® Mid Cap II Class I | (b | ) | $ | — | $ | 20,792,335 | $ | 508,085 | $ | 6,446 | $ | 541,646 | $ | — | $ | — | 1,003,002 | $ | 20,832,342 | |||||||||||||||||||||
Fidelity Advisor® Real Estate Class I | (b | ) | — | 10,842,279 | 479,404 | 2,074 | 51,222 | 19,032 | — | 452,287 | 10,416,171 | |||||||||||||||||||||||||||||
Goldman Sachs Large Cap Value Institutional | (b | ) | — | 26,052,738 | 10,188,057 | (306,865 | ) | 66,441 | — | — | 881,730 | 15,624,257 | ||||||||||||||||||||||||||||
Lazard International Equity Class R6 | (b | ) | — | 67,317,390 | 5,070,378 | 263,745 | 5,194,355 | — | — | 3,730,309 | 67,705,112 | |||||||||||||||||||||||||||||
Ohio National Fund, Inc. – Equity Portfolio | (a | )(b) | — | 42,356,481 | 1,045,513 | 2,251 | 351,465 | — | — | 1,081,638 | 41,664,684 | |||||||||||||||||||||||||||||
Ohio National Fund, Inc. – Capital Appreciation Portfolio | (a | )(b) | — | 21,211,232 | 234,162 | (2,026 | ) | (142,702 | ) | — | — | 525,141 | 20,832,342 | |||||||||||||||||||||||||||
Ohio National Fund, Inc. – Bristol Growth Portfolio | (a | )(b) | — | 15,513,712 | 647,960 | 21,607 | 736,898 | — | — | 736,299 | 15,624,257 | |||||||||||||||||||||||||||||
Ohio National Fund, Inc. – Balanced Portfolio | (a | )(b) | — | 36,194,764 | 442,583 | 1,813 | 702,605 | — | — | 1,724,532 | 36,456,599 | |||||||||||||||||||||||||||||
Ohio National Fund, Inc. – Bryton Growth Portfolio | (a | )(b) | — | 10,568,888 | 803,840 | 26,420 | 624,703 | — | — | 459,469 | 10,416,171 | |||||||||||||||||||||||||||||
Ohio National Fund, Inc. – Bristol Portfolio | (a | )(b) | — | 20,772,474 | 617,489 | 10,048 | 667,309 | — | — | 780,530 | 20,832,342 | |||||||||||||||||||||||||||||
Ohio National Fund, Inc. – ClearBridge Small Cap Portfolio | (a | )(b) | — | 26,512,377 | 1,153,532 | 10,572 | 671,011 | — | — | 477,281 | 26,040,428 | |||||||||||||||||||||||||||||
Ohio National Fund, Inc. – High Income Bond Portfolio | (a | )(b) | — | 15,664,018 | 327,737 | 1,380 | 286,596 | — | — | 821,897 | 15,624,257 | |||||||||||||||||||||||||||||
Ohio National Fund, Inc. – Strategic Value Portfolio | (a | )(b) | — | 57,120,431 | 1,576,847 | 46,475 | 1,698,882 | — | — | 3,391,885 | 57,288,941 | |||||||||||||||||||||||||||||
Ohio National Fund, Inc. – S&P 500® Index Portfolio | (a | )(b) | — | 36,445,132 | 783,472 | 9,031 | 785,908 | — | — | 1,373,647 | 36,456,599 | |||||||||||||||||||||||||||||
Ohio National Fund, Inc. – Small Cap Growth Portfolio | (a | )(b) | — | 25,844,092 | 1,449,358 | 51,792 | 1,593,902 | — | — | 862,551 | 26,040,428 | |||||||||||||||||||||||||||||
Templeton Foreign Class R6 | (b | ) | — | 62,870,408 | 3,785,166 | 168,299 | 3,243,485 | — | — | 8,169,546 | 62,497,026 | |||||||||||||||||||||||||||||
|
|
|
|
|
|
|
|
|
| |||||||||||||||||||||||||||||||
Total Open-End Mutual Funds | $ | 313,062 | $ | 17,073,726 | $ | 19,032 | $ | — | $ | 484,351,956 | ||||||||||||||||||||||||||||||
|
|
|
|
|
|
|
|
|
| |||||||||||||||||||||||||||||||
Percentages are stated as a percent of net assets.
Footnotes:
| (a) | Non-income producing security. |
| (b) | Pursuant to Section 2(a)(3) of the Investment Company Act of 1940, the investment meets the definition of “affiliated person,” as the Portfolio directly or indirectly owns, controls, or holds with power to vote 5 percent or more of the outstanding voting securities of the holding. |
The accompanying notes are an integral part of these financial statements.
| 128 |
Ohio National Fund, Inc.
| Statements of Assets and Liabilities | June 30, 2017 (Unaudited) |
| ON | ||||||||||||||||||||||||||||||||||||
| Capital | International | Aggressive | Small Cap | Mid Cap | ||||||||||||||||||||||||||||||||
| Equity | Bond | Omni | Appreciation | Equity | ON Foreign | Growth | Growth | Opportunity | ||||||||||||||||||||||||||||
| Portfolio | Portfolio | Portfolio | Portfolio | Portfolio | Portfolio | Portfolio | Portfolio | Portfolio | ||||||||||||||||||||||||||||
Assets: | ||||||||||||||||||||||||||||||||||||
Investments in securities of unaffiliated issuers, at value* | $ | 570,126,039 | $ | 162,913,849 | $ | 62,141,138 | $ | 190,308,121 | $ | 156,791,450 | $ | 79,118,173 | $ | 56,571,972 | $ | 249,684,472 | $ | 74,868,645 | ||||||||||||||||||
Cash | — | — | 327,008 | — | — | — | — | — | 10,247 | |||||||||||||||||||||||||||
Foreign currencies, at value** | — | — | — | — | 462,741 | 3,471 | — | 15,264 | — | |||||||||||||||||||||||||||
Receivable for securities sold | 1,093,961 | — | 1,396,216 | 1,008,492 | — | — | 370,605 | 1,284,245 | 988,005 | |||||||||||||||||||||||||||
Receivable for fund shares sold | 647,607 | 174,145 | 35,054 | 877,816 | 60,704 | 50,083 | 9,557 | 39,842 | 13,056 | |||||||||||||||||||||||||||
Dividends and accrued interest receivable | 204,463 | 1,526,536 | 170,966 | 173,635 | 182,542 | 174,980 | 20,053 | 96,911 | 21,864 | |||||||||||||||||||||||||||
Foreign tax reclaim receivable | — | — | — | 47,944 | 542,286 | 66,569 | 2,264 | 17,043 | — | |||||||||||||||||||||||||||
Prepaid expenses and other assets | 6,706 | 1,811 | 1,744 | 2,293 | 1,687 | 793 | 596 | 2,687 | 824 | |||||||||||||||||||||||||||
|
|
|
|
|
|
|
|
|
|
|
|
|
|
|
|
|
| |||||||||||||||||||
Total assets | 572,078,776 | 164,616,341 | 64,072,126 | 192,418,301 | 158,041,410 | 79,414,069 | 56,975,047 | 251,140,464 | 75,902,641 | |||||||||||||||||||||||||||
|
|
|
|
|
|
|
|
|
|
|
|
|
|
|
|
|
| |||||||||||||||||||
Liabilities: | ||||||||||||||||||||||||||||||||||||
Payable for securities purchased | — | — | 1,585,872 | 2,444,649 | 730,128 | 853,929 | 298,652 | 1,483,470 | 943,074 | |||||||||||||||||||||||||||
Payable for fund shares redeemed | 4,686,466 | 74,125 | 88,118 | 191,290 | 3,697,438 | 32,371 | 96,179 | 1,519,475 | 80,167 | |||||||||||||||||||||||||||
Payable for investment management services | 354,207 | 75,813 | 30,781 | 121,379 | 108,448 | 44,737 | 37,944 | 159,728 | 52,873 | |||||||||||||||||||||||||||
Accrued custody expense | 2,634 | 1,126 | 2,002 | 1,525 | 25,384 | 9,866 | 1,113 | 4,079 | 1,765 | |||||||||||||||||||||||||||
Accrued professional fees | 5,904 | 5,519 | 5,420 | 5,543 | 5,514 | 5,436 | 5,415 | 5,597 | 5,433 | |||||||||||||||||||||||||||
Accrued accounting fees | 12,530 | 6,972 | 4,484 | 4,964 | 8,048 | 5,548 | 2,079 | 6,414 | 2,600 | |||||||||||||||||||||||||||
Accrued printing and filing fees | 6,193 | 1,799 | 681 | 2,056 | 1,713 | 847 | 634 | 2,711 | 819 | |||||||||||||||||||||||||||
Other fees payable | 5,120 | 3,682 | 3,323 | 3,765 | 3,635 | 3,358 | 3,306 | 3,966 | 3,366 | |||||||||||||||||||||||||||
Withholding tax payable | — | — | — | — | 28,325 | 14,032 | — | 127 | — | |||||||||||||||||||||||||||
|
|
|
|
|
|
|
|
|
|
|
|
|
|
|
|
|
| |||||||||||||||||||
Total liabilities | 5,073,054 | 169,036 | 1,720,681 | 2,775,171 | 4,608,633 | 970,124 | 445,322 | 3,185,567 | 1,090,097 | |||||||||||||||||||||||||||
|
|
|
|
|
|
|
|
|
|
|
|
|
|
|
|
|
| |||||||||||||||||||
Net assets | $ | 567,005,722 | $ | 164,447,305 | $ | 62,351,445 | $ | 189,643,130 | $ | 153,432,777 | $ | 78,443,945 | $ | 56,529,725 | $ | 247,954,897 | $ | 74,812,544 | ||||||||||||||||||
|
|
|
|
|
|
|
|
|
|
|
|
|
|
|
|
|
| |||||||||||||||||||
Net assets consist of: | ||||||||||||||||||||||||||||||||||||
Par value, $1 per share | $ | 14,718,899 | $ | 9,588,271 | $ | 2,117,016 | $ | 4,780,008 | $ | 11,113,755 | $ | 2,470,320 | $ | 3,071,457 | $ | 8,213,958 | $ | 2,145,298 | ||||||||||||||||||
Paid in capital in excess of par value | 449,133,804 | 148,494,443 | 49,866,949 | 147,822,779 | 192,354,909 | 61,295,326 | 35,248,400 | 178,196,235 | 55,370,341 | |||||||||||||||||||||||||||
Accumulated net realized gain (loss) on investments | 28,201,062 | (6,185,682 | ) | 3,848,247 | 9,557,810 | (55,321,315 | ) | 12,809,924 | 6,368,362 | 9,369,723 | 4,767,747 | |||||||||||||||||||||||||
Net unrealized appreciation (depreciation) on: | ||||||||||||||||||||||||||||||||||||
Investments | 67,375,498 | 4,499,355 | 5,662,938 | 22,479,043 | 3,754,075 | 822,509 | 11,817,148 | 52,405,859 | 12,597,542 | |||||||||||||||||||||||||||
Foreign currency related transactions | — | — | — | (414 | ) | 2,022 | 348 | (72 | ) | 405 | — | |||||||||||||||||||||||||
Undistributed net investment income (loss) | 7,576,459 | 8,050,918 | 856,295 | 5,003,904 | 1,529,331 | 1,045,518 | 24,430 | (231,283 | ) | (68,384 | ) | |||||||||||||||||||||||||
|
|
|
|
|
|
|
|
|
|
|
|
|
|
|
|
|
| |||||||||||||||||||
Net assets | $ | 567,005,722 | $ | 164,447,305 | $ | 62,351,445 | $ | 189,643,130 | $ | 153,432,777 | $ | 78,443,945 | $ | 56,529,725 | $ | 247,954,897 | $ | 74,812,544 | ||||||||||||||||||
|
|
|
|
|
|
|
|
|
|
|
|
|
|
|
|
|
| |||||||||||||||||||
*Investments in securities of unaffiliated issuers, at cost | $ | 502,750,541 | $ | 158,414,494 | $ | 56,478,200 | $ | 167,829,078 | $ | 153,037,375 | $ | 78,295,664 | $ | 44,754,824 | $ | 197,278,613 | $ | 62,271,103 | ||||||||||||||||||
|
|
|
|
|
|
|
|
|
|
|
|
|
|
|
|
|
| |||||||||||||||||||
**Foreign currencies, at cost | $ | — | $ | — | $ | — | $ | — | $ | 466,406 | $ | 3,709 | $ | — | $ | 15,100 | $ | — | ||||||||||||||||||
|
|
|
|
|
|
|
|
|
|
|
|
|
|
|
|
|
| |||||||||||||||||||
Shares outstanding | 14,718,899 | 9,588,271 | 2,117,016 | 4,780,008 | 11,113,755 | 2,470,320 | 3,071,457 | 8,213,958 | 2,145,298 | |||||||||||||||||||||||||||
|
|
|
|
|
|
|
|
|
|
|
|
|
|
|
|
|
| |||||||||||||||||||
Authorized Fund shares allocated to Portfolio | 35,000,000 | 30,000,000 | 15,000,000 | 25,000,000 | 90,000,000 | 32,000,000 | 24,000,000 | 30,000,000 | 21,000,000 | |||||||||||||||||||||||||||
|
|
|
|
|
|
|
|
|
|
|
|
|
|
|
|
|
| |||||||||||||||||||
Net asset value per share | $ | 38.52 | $ | 17.15 | $ | 29.45 | $ | 39.67 | $ | 13.81 | $ | 31.75 | $ | 18.40 | $ | 30.19 | $ | 34.87 | ||||||||||||||||||
|
|
|
|
|
|
|
|
|
|
|
|
|
|
|
|
|
| |||||||||||||||||||
The accompanying notes are an integral part of these financial statements.
129
Ohio National Fund, Inc.
| Statements of Assets and Liabilities | June 30, 2017 (Unaudited) |
| S&P | ||||||||||||||||||||||||||||||||||||
| S&P 500® | Strategic | High Income | ClearBridge | Nasdaq-100® | Bryton | MidCap 400® | ||||||||||||||||||||||||||||||
| Index | Value | Bond | Small Cap | Index | Bristol | Growth | Balanced | Index | ||||||||||||||||||||||||||||
| Portfolio | Portfolio | Portfolio | Portfolio | Portfolio | Portfolio | Portfolio | Portfolio | Portfolio | ||||||||||||||||||||||||||||
Assets: | ||||||||||||||||||||||||||||||||||||
Investments in securities of unaffiliated issuers, at value* | $ | 902,685,587 | $ | 581,384,687 | $ | 315,807,079 | $ | 289,161,665 | $ | 195,323,373 | $ | 216,803,104 | $ | 97,250,719 | $ | 1,012,296,934 | $ | 56,966,929 | ||||||||||||||||||
Cash | — | — | — | — | — | — | 135,717 | 3,078,593 | — | |||||||||||||||||||||||||||
Cash subject to usage restrictions | 105,865 | — | — | — | 154,157 | — | — | — | 105,627 | |||||||||||||||||||||||||||
Receivable for securities sold | — | — | 606,362 | — | — | 5,535,771 | 3,129,698 | 539,606 | 3,635 | |||||||||||||||||||||||||||
Receivable for fund shares sold | 669,671 | 4,817,939 | 88,275 | 27,187 | 116,821 | 30,271 | 17,559 | 354,342 | 21,812 | |||||||||||||||||||||||||||
Dividends and accrued interest receivable | 899,255 | 3,292,999 | 4,891,401 | 221,623 | 64,852 | 211,857 | 21,487 | 4,440,696 | 59,054 | |||||||||||||||||||||||||||
Foreign tax reclaim receivable | — | 389,919 | 918 | — | — | — | — | — | 14,137 | |||||||||||||||||||||||||||
Prepaid expenses and other assets | 9,723 | 5,525 | 3,492 | 3,000 | 1,912 | 6,064 | 2,784 | 11,294 | 557 | |||||||||||||||||||||||||||
|
|
|
|
|
|
|
|
|
|
|
|
|
|
|
|
|
| |||||||||||||||||||
Total assets | 904,370,101 | 589,891,069 | 321,397,527 | 289,413,475 | 195,661,115 | 222,587,067 | 100,557,964 | 1,020,721,465 | 57,171,751 | |||||||||||||||||||||||||||
|
|
|
|
|
|
|
|
|
|
|
|
|
|
|
|
|
| |||||||||||||||||||
Liabilities: | ||||||||||||||||||||||||||||||||||||
Cash overdraft | 7,607 | — | — | — | 24,479 | — | — | — | 3,999 | |||||||||||||||||||||||||||
Payable for securities purchased | 382,222 | — | 1,928,842 | 6,096,110 | 1,965,345 | 4,937,738 | 3,324,980 | 26,875,304 | 290,512 | |||||||||||||||||||||||||||
Payable for fund shares redeemed | 604,875 | 168,047 | 651,007 | 2,839,248 | 492,263 | 917,807 | 1,111,717 | 1,914,409 | 28,954 | |||||||||||||||||||||||||||
Payable for investment management services | 254,750 | 342,461 | 175,945 | 192,887 | 60,753 | 132,044 | 67,472 | 479,084 | 18,278 | |||||||||||||||||||||||||||
Accrued custody expense | 8,125 | 7,670 | 2,303 | 1,812 | 4,182 | 2,397 | 2,943 | 5,643 | 11,092 | |||||||||||||||||||||||||||
Accrued professional fees | 6,236 | 5,920 | 5,669 | 5,628 | 5,551 | 5,564 | 5,452 | 6,322 | 5,413 | |||||||||||||||||||||||||||
Accrued accounting fees | 20,817 | 11,195 | 16,779 | 6,743 | 4,883 | 5,176 | 2,891 | 22,431 | 3,358 | |||||||||||||||||||||||||||
Accrued printing and filing fees | 9,877 | 6,448 | 3,463 | 3,011 | 2,148 | 2,374 | 1,047 | 10,811 | 612 | |||||||||||||||||||||||||||
Other fees payable | 6,211 | 4,836 | 4,219 | 4,054 | 3,754 | 3,807 | 3,408 | 6,533 | 3,277 | |||||||||||||||||||||||||||
Withholding tax payable | — | 45,190 | — | 2,317 | — | — | — | — | — | |||||||||||||||||||||||||||
|
|
|
|
|
|
|
|
|
|
|
|
|
|
|
|
|
| |||||||||||||||||||
Total liabilities | 1,300,720 | 591,767 | 2,788,227 | 9,151,810 | 2,563,358 | 6,006,907 | 4,519,910 | 29,320,537 | 365,495 | |||||||||||||||||||||||||||
|
|
|
|
|
|
|
|
|
|
|
|
|
|
|
|
|
| |||||||||||||||||||
Net assets | $ | 903,069,381 | $ | 589,299,302 | $ | 318,609,300 | $ | 280,261,665 | $ | 193,097,757 | $ | 216,580,160 | $ | 96,038,054 | $ | 991,400,928 | $ | 56,806,256 | ||||||||||||||||||
|
|
|
|
|
|
|
|
|
|
|
|
|
|
|
|
|
| |||||||||||||||||||
Net assets consist of: | ||||||||||||||||||||||||||||||||||||
Par value, $1 per share | $ | 34,022,940 | $ | 34,893,023 | $ | 16,763,854 | $ | 5,136,769 | $ | 13,163,070 | $ | 8,114,888 | $ | 4,236,463 | $ | 46,899,547 | $ | 3,553,763 | ||||||||||||||||||
Paid in capital in excess of par value | 603,487,244 | 458,351,765 | 279,472,789 | 218,990,286 | 90,206,142 | 158,797,415 | 90,224,810 | 844,750,792 | 50,386,739 | |||||||||||||||||||||||||||
Accumulated net realized gain (loss) on investments | 17,669,363 | 41,036,073 | (5,208,596 | ) | 21,121,094 | 8,021,192 | 25,020,006 | (5,909,297 | ) | 13,141,437 | 719,847 | |||||||||||||||||||||||||
Net unrealized appreciation (depreciation) on: | ||||||||||||||||||||||||||||||||||||
Investments | 231,336,212 | 32,217,412 | 6,770,914 | 33,606,111 | 79,827,569 | 23,154,524 | 7,766,097 | 59,502,208 | 1,370,240 | |||||||||||||||||||||||||||
Futures contracts | (12,103 | ) | — | — | — | (24,515 | ) | — | — | — | (3,966 | ) | ||||||||||||||||||||||||
Foreign currency related transactions | — | 23,921 | — | — | — | — | — | — | — | |||||||||||||||||||||||||||
Undistributed net investment income (loss) | 16,565,725 | 22,777,108 | 20,810,339 | 1,407,405 | 1,904,299 | 1,493,327 | (280,019 | ) | 27,106,944 | 779,633 | ||||||||||||||||||||||||||
|
|
|
|
|
|
|
|
|
|
|
|
|
|
|
|
|
| |||||||||||||||||||
Net assets | $ | 903,069,381 | $ | 589,299,302 | $ | 318,609,300 | $ | 280,261,665 | $ | 193,097,757 | $ | 216,580,160 | $ | 96,038,054 | $ | 991,400,928 | $ | 56,806,256 | ||||||||||||||||||
|
|
|
|
|
|
|
|
|
|
|
|
|
|
|
|
|
| |||||||||||||||||||
*Investments in securities of unaffiliated issuers, at cost | $ | 671,349,375 | $ | 549,167,275 | $ | 309,036,165 | $ | 255,555,554 | $ | 115,495,804 | $ | 193,648,580 | $ | 89,484,622 | $ | 952,794,726 | $ | 55,596,689 | ||||||||||||||||||
|
|
|
|
|
|
|
|
|
|
|
|
|
|
|
|
|
| |||||||||||||||||||
Shares outstanding | 34,022,940 | 34,893,023 | 16,763,854 | 5,136,769 | 13,163,070 | 8,114,888 | 4,236,463 | 46,899,547 | 3,553,763 | |||||||||||||||||||||||||||
|
|
|
|
|
|
|
|
|
|
|
|
|
|
|
|
|
| |||||||||||||||||||
Authorized Fund shares allocated to Portfolio | 90,000,000 | 75,000,000 | 45,000,000 | 15,000,000 | 50,000,000 | 23,000,000 | 15,000,000 | 90,000,000 | 30,000,000 | |||||||||||||||||||||||||||
|
|
|
|
|
|
|
|
|
|
|
|
|
|
|
|
|
| |||||||||||||||||||
Net asset value per share | $ | 26.54 | $ | 16.89 | $ | 19.01 | $ | 54.56 | $ | 14.67 | $ | 26.69 | $ | 22.67 | $ | 21.14 | $ | 15.98 | ||||||||||||||||||
|
|
|
|
|
|
|
|
|
|
|
|
|
|
|
|
|
| |||||||||||||||||||
The accompanying notes are an integral part of these financial statements.
130
Ohio National Fund, Inc.
| Statements of Assets and Liabilities | June 30, 2017 (Unaudited) |
| ON | ON Moderately | |||||||||||||||||||||||||||
| Bristol | Risk Managed | Conservative | Conservative | ON Balanced | ON Moderate | ON | ||||||||||||||||||||||
| Growth | Balanced | Model | Model | Model | Growth Model | Growth Model | ||||||||||||||||||||||
| Portfolio | Portfolio | Portfolio | Portfolio | Portfolio | Portfolio | Portfolio | ||||||||||||||||||||||
Assets: | ||||||||||||||||||||||||||||
Investments in securities of unaffiliated issuers, at value* | $ | 123,430,250 | $ | 322,715,949 | $ | 73,095,506 | $ | 172,064,842 | $ | 529,208,621 | $ | 491,364,063 | $ | 36,492,199 | ||||||||||||||
Investments in affiliates, at value** | — | — | 32,752,812 | 164,881,709 | 1,024,892,154 | 2,089,984,335 | 484,351,956 | |||||||||||||||||||||
Cash subject to usage restrictions | — | 741,628 | — | — | — | — | — | |||||||||||||||||||||
Receivable for securities sold | 2,947,717 | 2,425,668 | 497,585 | 1,079,202 | 3,416,786 | 10,054,289 | 1,633,974 | |||||||||||||||||||||
Receivable for fund shares sold | 402,636 | 150,957 | — | 943 | 88,447 | 741,485 | 68,040 | |||||||||||||||||||||
Dividends and accrued interest receivable | 106,076 | 818,690 | 194,080 | 453,255 | 1,233,833 | 1,121,194 | 35,600 | |||||||||||||||||||||
Prepaid expenses and other assets | 3,540 | 3,224 | 1,834 | 3,101 | 13,474 | 21,633 | 4,476 | |||||||||||||||||||||
|
|
|
|
|
|
|
|
|
|
|
|
|
| |||||||||||||||
Total assets | 126,890,219 | 326,856,116 | 106,541,817 | 338,483,052 | 1,558,853,315 | 2,593,286,999 | 522,586,245 | |||||||||||||||||||||
|
|
|
|
|
|
|
|
|
|
|
|
|
| |||||||||||||||
Liabilities: | ||||||||||||||||||||||||||||
Cash overdraft | — | 147,590 | — | — | — | — | — | |||||||||||||||||||||
Payable for securities purchased | 2,801,711 | 2,822,100 | 351,893 | 952,192 | 4,375,320 | 11,372,683 | 1,686,480 | |||||||||||||||||||||
Payable for fund shares redeemed | 70,614 | 475,014 | 339,777 | 581,221 | 363,790 | 543,915 | 51,134 | |||||||||||||||||||||
Payable for investment management services | 79,618 | 240,869 | 9,816 | 69,666 | 318,157 | 479,612 | 85,579 | |||||||||||||||||||||
Accrued custody expense | 2,067 | 9,938 | 1,808 | 2,178 | 2,628 | 3,038 | 2,603 | |||||||||||||||||||||
Accrued professional fees | 5,480 | 5,673 | 5,371 | 5,597 | 6,776 | 7,760 | 5,766 | |||||||||||||||||||||
Accrued accounting fees | 3,403 | 19,330 | 3,913 | 3,913 | 3,913 | 3,913 | 3,913 | |||||||||||||||||||||
Accrued printing and filing fees | 1,357 | 3,553 | 1,159 | 3,681 | 16,934 | 28,076 | 5,650 | |||||||||||||||||||||
Other fees payable | 3,509 | 4,169 | 4,746 | 5,559 | 9,818 | 13,340 | 6,156 | |||||||||||||||||||||
|
|
|
|
|
|
|
|
|
|
|
|
|
| |||||||||||||||
Total liabilities | 2,967,759 | 3,728,236 | 718,483 | 1,624,007 | 5,097,336 | 12,452,337 | 1,847,281 | |||||||||||||||||||||
|
|
|
|
|
|
|
|
|
|
|
|
|
| |||||||||||||||
Net assets | $ | 123,922,460 | $ | 323,127,880 | $ | 105,823,334 | $ | 336,859,045 | $ | 1,553,755,979 | $ | 2,580,834,662 | $ | 520,738,964 | ||||||||||||||
|
|
|
|
|
|
|
|
|
|
|
|
|
| |||||||||||||||
Net assets consist of: | ||||||||||||||||||||||||||||
Par value, $1 per share | �� | $ | 5,840,912 | $ | 27,084,711 | $ | 10,344,789 | $ | 32,817,674 | $ | 151,299,796 | $ | 249,444,645 | $ | 50,285,919 | |||||||||||||
Paid in capital in excess of par value | 85,301,150 | 266,584,859 | 93,100,785 | 295,222,330 | 1,349,906,274 | 2,253,824,356 | 452,499,134 | |||||||||||||||||||||
Accumulated net realized gain on investments | 15,312,075 | 3,920,380 | 72,598 | 307,941 | 1,576,581 | 1,306,478 | 357,491 | |||||||||||||||||||||
Net unrealized appreciation (depreciation) on: | ||||||||||||||||||||||||||||
Investments | 16,881,344 | 21,621,834 | 1,682,746 | 7,107,570 | 47,759,396 | 74,579,553 | 17,865,061 | |||||||||||||||||||||
Futures contracts | — | (382,361 | ) | — | — | — | — | — | ||||||||||||||||||||
Undistributed net investment income (loss) | 586,979 | 4,298,457 | 622,416 | 1,403,530 | 3,213,932 | 1,679,630 | (268,641 | ) | ||||||||||||||||||||
|
|
|
|
|
|
|
|
|
|
|
|
|
| |||||||||||||||
Net assets | $ | 123,922,460 | $ | 323,127,880 | $ | 105,823,334 | $ | 336,859,045 | $ | 1,553,755,979 | $ | 2,580,834,662 | $ | 520,738,964 | ||||||||||||||
|
|
|
|
|
|
|
|
|
|
|
|
|
| |||||||||||||||
*Investments in securities of unaffiliated issuers, at cost | $ | 106,548,906 | $ | 301,094,115 | $ | 72,344,073 | $ | 170,051,672 | $ | 520,071,878 | $ | 482,810,673 | $ | 35,700,864 | ||||||||||||||
|
|
|
|
|
|
|
|
|
|
|
|
|
| |||||||||||||||
**Investments in affiliates, at cost | $ | — | $ | — | $ | 31,821,499 | $ | 159,787,309 | $ | 986,269,501 | $ | 2,023,958,172 | $ | 467,278,230 | ||||||||||||||
|
|
|
|
|
|
|
|
|
|
|
|
|
| |||||||||||||||
Shares outstanding | 5,840,912 | 27,084,711 | 10,344,789 | 32,817,674 | 151,299,796 | 249,444,645 | 50,285,919 | |||||||||||||||||||||
|
|
|
|
|
|
|
|
|
|
|
|
|
| |||||||||||||||
Authorized Fund shares allocated to Portfolio | 30,000,000 | 85,000,000 | 30,000,000 | 70,000,000 | 200,000,000 | 300,000,000 | 100,000,000 | |||||||||||||||||||||
|
|
|
|
|
|
|
|
|
|
|
|
|
| |||||||||||||||
Net asset value per share | $ | 21.22 | $ | 11.93 | $ | 10.23 | $ | 10.26 | $ | 10.27 | $ | 10.35 | $ | 10.36 | ||||||||||||||
|
|
|
|
|
|
|
|
|
|
|
|
|
| |||||||||||||||
The accompanying notes are an integral part of these financial statements.
131
Ohio National Fund, Inc.
| Statements of Operations | For the Six-Month Period Ended June 30, 2017 (Unaudited) |
| ON | ||||||||||||||||||||||||||||||||||||
| Capital | International | Aggressive | Small Cap | Mid Cap | ||||||||||||||||||||||||||||||||
| Equity | Bond | Omni | Appreciation | Equity | ON Foreign | Growth | Growth | Opportunity | ||||||||||||||||||||||||||||
| Portfolio | Portfolio | Portfolio | Portfolio | Portfolio | Portfolio | Portfolio | Portfolio | Portfolio | ||||||||||||||||||||||||||||
Investment income: | ||||||||||||||||||||||||||||||||||||
Interest | $ | — | $ | 3,198,943 | $ | 246,812 | $ | — | $ | 936 | $ | — | $ | 1,165 | $ | 5,044 | $ | — | ||||||||||||||||||
Dividends from unaffiliated issuers, net of taxes withheld* | 4,317,115 | 7,727 | 293,259 | 1,429,474 | 2,467,743 | 967,087 | 278,701 | 1,034,445 | 289,052 | |||||||||||||||||||||||||||
|
|
|
|
|
|
|
|
|
|
|
|
|
|
|
|
|
| |||||||||||||||||||
Total investment income | 4,317,115 | 3,206,670 | 540,071 | 1,429,474 | 2,468,679 | 967,087 | 279,866 | 1,039,489 | 289,052 | |||||||||||||||||||||||||||
|
|
|
|
|
|
|
|
|
|
|
|
|
|
|
|
|
| |||||||||||||||||||
Expenses: | ||||||||||||||||||||||||||||||||||||
Management fees | 2,143,892 | 452,640 | 180,361 | 737,622 | 636,690 | 343,620 | 215,086 | 941,970 | 312,674 | |||||||||||||||||||||||||||
Custodian fees | 7,912 | 3,333 | 6,007 | 4,578 | 75,855 | 39,434 | 3,617 | 13,062 | 4,626 | |||||||||||||||||||||||||||
Directors’ fees | 19,846 | 5,754 | 2,134 | 6,629 | 5,494 | 2,667 | 1,903 | 8,475 | 2,611 | |||||||||||||||||||||||||||
Professional fees | 20,285 | 12,398 | 10,447 | 12,988 | 12,234 | 10,679 | 10,312 | 13,945 | 10,709 | |||||||||||||||||||||||||||
Accounting fees | 37,973 | 20,836 | 13,429 | 15,048 | 24,551 | 16,594 | 6,175 | 19,331 | 7,782 | |||||||||||||||||||||||||||
Administration fees | 9,640 | 9,356 | 9,338 | 9,455 | 9,299 | 9,272 | 9,346 | 9,435 | 9,334 | |||||||||||||||||||||||||||
Printing and filing fees | 8,959 | 2,751 | 2,370 | 3,079 | 3,405 | 1,879 | 1,005 | 3,978 | 1,281 | |||||||||||||||||||||||||||
Compliance expense | 6,933 | 6,933 | 6,933 | 6,933 | 6,933 | 6,933 | 6,933 | 6,933 | 6,933 | |||||||||||||||||||||||||||
Other | 10,438 | 2,415 | 1,112 | 5,931 | 3,694 | 1,990 | 1,059 | 4,744 | 1,486 | |||||||||||||||||||||||||||
|
|
|
|
|
|
|
|
|
|
|
|
|
|
|
|
|
| |||||||||||||||||||
Total expenses | 2,265,878 | 516,416 | 232,131 | 802,263 | 778,155 | 433,068 | 255,436 | 1,021,873 | 357,436 | |||||||||||||||||||||||||||
|
|
|
|
|
|
|
|
|
|
|
|
|
|
|
|
|
| |||||||||||||||||||
Net investment income (loss) | 2,051,237 | 2,690,254 | 307,940 | 627,211 | 1,690,524 | 534,019 | 24,430 | 17,616 | (68,384 | ) | ||||||||||||||||||||||||||
|
|
|
|
|
|
|
|
|
|
|
|
|
|
|
|
|
| |||||||||||||||||||
Realized/unrealized gain on investments, futures contracts, foreign currency contracts, and other foreign currency related transactions: | ||||||||||||||||||||||||||||||||||||
Net realized gain (loss) on: | ||||||||||||||||||||||||||||||||||||
Investments in securities of unaffiliated issuers | 16,847,312 | 462,043 | 4,364,681 | 7,096,527 | 19,799,309 | 11,928,247 | 2,804,429 | 4,970,618 | 5,299,237 | |||||||||||||||||||||||||||
Futures contracts | — | — | — | — | 773,873 | — | — | — | — | |||||||||||||||||||||||||||
Foreign currency contracts | — | — | — | — | — | (24,837 | ) | — | — | — | ||||||||||||||||||||||||||
Other foreign currency related transactions | — | — | — | — | (194,379 | ) | 101,959 | — | 309 | — | ||||||||||||||||||||||||||
Change in unrealized appreciation/depreciation on: | ||||||||||||||||||||||||||||||||||||
Investments in securities of unaffiliated issuers | 18,530,979 | 2,746,388 | 718,271 | 2,145,940 | 855,049 | (2,802,431 | ) | 5,990,679 | 25,647,736 | 4,923,156 | ||||||||||||||||||||||||||
Futures contracts | — | — | — | — | (61,320 | ) | — | — | — | — | ||||||||||||||||||||||||||
Foreign currency related transactions | — | — | — | 3,758 | 25,233 | 11,835 | 132 | 1,327 | — | |||||||||||||||||||||||||||
|
|
|
|
|
|
|
|
|
|
|
|
|
|
|
|
|
| |||||||||||||||||||
Net realized/unrealized gain on investments, futures contracts, foreign currency contracts, and other foreign currency related transactions | 35,378,291 | 3,208,431 | 5,082,952 | 9,246,225 | 21,197,765 | 9,214,773 | 8,795,240 | 30,619,990 | 10,222,393 | |||||||||||||||||||||||||||
|
|
|
|
|
|
|
|
|
|
|
|
|
|
|
|
|
| |||||||||||||||||||
Change in net assets from operations | $ | 37,429,528 | $ | 5,898,685 | $ | 5,390,892 | $ | 9,873,436 | $ | 22,888,289 | $ | 9,748,792 | $ | 8,819,670 | $ | 30,637,606 | $ | 10,154,009 | ||||||||||||||||||
|
|
|
|
|
|
|
|
|
|
|
|
|
|
|
|
|
| |||||||||||||||||||
*Taxes withheld | $ | — | $ | — | $ | 1,398 | $ | 7,240 | $ | 370,480 | $ | 103,929 | $ | 840 | $ | 10,142 | $ | — | ||||||||||||||||||
|
|
|
|
|
|
|
|
|
|
|
|
|
|
|
|
|
| |||||||||||||||||||
The accompanying notes are an integral part of these financial statements.
132
Ohio National Fund, Inc.
| Statements of Operations | For the Six-Month Period Ended June 30, 2017 (Unaudited) |
| S&P | ||||||||||||||||||||||||||||||||||||
| S&P 500® | Strategic | High Income | ClearBridge | Nasdaq-100® | Bryton | MidCap 400® | ||||||||||||||||||||||||||||||
| Index | Value | Bond | Small Cap | Index | Bristol | Growth | Balanced | Index | ||||||||||||||||||||||||||||
| Portfolio | Portfolio | Portfolio | Portfolio | Portfolio | Portfolio | Portfolio | Portfolio | Portfolio | ||||||||||||||||||||||||||||
Investment income: | ||||||||||||||||||||||||||||||||||||
Interest | $ | 193 | $ | — | $ | 9,261,525 | $ | — | $ | 71 | $ | — | $ | — | $ | 6,533,431 | $ | 16 | ||||||||||||||||||
Dividends from unaffiliated issuers, net of taxes withheld* | 8,986,736 | 13,552,140 | 207,752 | 1,529,557 | 1,142,475 | 1,307,627 | 176,638 | 6,763,253 | 401,509 | |||||||||||||||||||||||||||
|
|
|
|
|
|
|
|
|
|
|
|
|
|
|
|
|
| |||||||||||||||||||
Total investment income | 8,986,929 | 13,552,140 | 9,469,277 | 1,529,557 | 1,142,546 | 1,307,627 | 176,638 | 13,296,684 | 401,525 | |||||||||||||||||||||||||||
|
|
|
|
|
|
|
|
|
|
|
|
|
|
|
|
|
| |||||||||||||||||||
Expenses: | ||||||||||||||||||||||||||||||||||||
Management fees | 1,494,917 | 1,805,786 | 1,054,907 | 1,140,190 | 338,883 | 780,035 | 401,794 | 2,844,644 | 103,031 | |||||||||||||||||||||||||||
Custodian fees | 28,105 | 21,879 | 6,783 | 8,056 | 12,785 | 8,297 | 9,534 | 19,387 | 37,019 | |||||||||||||||||||||||||||
Directors’ fees | 31,134 | 17,411 | 11,188 | 9,665 | 6,533 | 7,322 | 3,308 | 34,588 | 1,845 | |||||||||||||||||||||||||||
Professional fees | 26,087 | 18,801 | 15,389 | 14,629 | 12,753 | 13,317 | 11,114 | 28,113 | 11,212 | |||||||||||||||||||||||||||
Accounting fees | 62,440 | 33,619 | 50,448 | 20,281 | 14,351 | 15,590 | 8,712 | 67,234 | 10,600 | |||||||||||||||||||||||||||
Administration fees | 9,486 | 9,409 | 9,374 | 9,339 | 9,316 | 9,323 | 9,301 | 9,559 | 9,265 | |||||||||||||||||||||||||||
Printing and filing fees | 9,276 | 9,187 | 5,194 | 4,495 | 1,650 | 13,236 | 3,450 | 15,553 | 1,919 | |||||||||||||||||||||||||||
Compliance expense | 6,933 | 6,933 | 6,933 | 6,934 | 6,933 | 6,933 | 6,933 | 6,933 | 6,933 | |||||||||||||||||||||||||||
Other | 13,623 | 8,528 | 4,263 | 3,859 | 3,116 | 4,263 | 2,511 | 19,235 | 944 | |||||||||||||||||||||||||||
|
|
|
|
|
|
|
|
|
|
|
|
|
|
|
|
|
| |||||||||||||||||||
Total expenses | 1,682,001 | 1,931,553 | 1,164,479 | 1,217,448 | 406,320 | 858,316 | 456,657 | 3,045,246 | 182,768 | |||||||||||||||||||||||||||
|
|
|
|
|
|
|
|
|
|
|
|
|
|
|
|
|
| |||||||||||||||||||
Net investment income (loss) | 7,304,928 | 11,620,587 | 8,304,798 | 312,109 | 736,226 | 449,311 | (280,019 | ) | 10,251,438 | 218,757 | ||||||||||||||||||||||||||
|
|
|
|
|
|
|
|
|
|
|
|
|
|
|
|
|
| |||||||||||||||||||
Realized/unrealized gain on investments, futures contracts, foreign currency related transactions, and written options: | ||||||||||||||||||||||||||||||||||||
Net realized gain (loss) on: | ||||||||||||||||||||||||||||||||||||
Investments in securities of unaffiliated issuers | 12,813,202 | 14,801,243 | 1,183,905 | 11,760,744 | 4,769,237 | 23,176,353 | 3,885,509 | 8,512,139 | 683,414 | |||||||||||||||||||||||||||
Futures contracts | 1,068,651 | — | — | — | 267,053 | — | — | — | 29,172 | |||||||||||||||||||||||||||
Foreign currency related transactions | — | (97,568 | ) | — | — | — | — | — | — | — | ||||||||||||||||||||||||||
Written options | — | — | — | — | — | — | — | 412,834 | — | |||||||||||||||||||||||||||
Change in unrealized appreciation/depreciation on: | ||||||||||||||||||||||||||||||||||||
Investments in securities of unaffiliated issuers | 55,185,040 | 13,903,008 | 5,903,905 | 5,451,770 | 20,646,072 | (1,475,334 | ) | 6,096,784 | 41,718,597 | 1,759,973 | ||||||||||||||||||||||||||
Futures contracts | 99,156 | — | — | — | (9,154 | ) | — | — | — | 2,867 | ||||||||||||||||||||||||||
Foreign currency related transactions | — | 38,840 | — | — | — | — | — | — | — | |||||||||||||||||||||||||||
Written options | — | — | — | — | — | — | — | (259,478 | ) | — | ||||||||||||||||||||||||||
|
|
|
|
|
|
|
|
|
|
|
|
|
|
|
|
|
| |||||||||||||||||||
Net realized/unrealized gain on investments, futures contracts, foreign currency related transactions, and written options | 69,166,049 | 28,645,523 | 7,087,810 | 17,212,514 | 25,673,208 | 21,701,019 | 9,982,293 | 50,384,092 | 2,475,426 | |||||||||||||||||||||||||||
|
|
|
|
|
|
|
|
|
|
|
|
|
|
|
|
|
| |||||||||||||||||||
Change in net assets from operations | $ | 76,470,977 | $ | 40,266,110 | $ | 15,392,608 | $ | 17,524,623 | $ | 26,409,434 | $ | 22,150,330 | $ | 9,702,274 | $ | 60,635,530 | $ | 2,694,183 | ||||||||||||||||||
|
|
|
|
|
|
|
|
|
|
|
|
|
|
|
|
|
| |||||||||||||||||||
*Taxes withheld | $ | — | $ | 337,512 | $ | — | $ | 4,549 | $ | — | $ | 6,253 | $ | — | $ | 21,094 | $ | 9 | ||||||||||||||||||
|
|
|
|
|
|
|
|
|
|
|
|
|
|
|
|
|
| |||||||||||||||||||
The accompanying notes are an integral part of these financial statements.
133
Ohio National Fund, Inc.
| Statements of Operations | For the Six-Month Period Ended June 30, 2017 (Unaudited) |
| ON | ON Moderately | |||||||||||||||||||||||||||
| Bristol | Risk Managed | Conservative | Conservative | ON Balanced | ON Moderate | ON | ||||||||||||||||||||||
| Growth | Balanced | Model | Model | Model | Growth Model | Growth Model | ||||||||||||||||||||||
| Portfolio | Portfolio | Portfolio** | Portfolio** | Portfolio** | Portfolio** | Portfolio** | ||||||||||||||||||||||
Investment income: | ||||||||||||||||||||||||||||
Interest | $ | — | $ | 1,468,161 | $ | — | $ | — | $ | — | $ | — | $ | — | ||||||||||||||
Dividends from unaffiliated issuers, net of taxes withheld* | 696,861 | 2,037,052 | 723,907 | 1,710,994 | 4,461,296 | 3,544,597 | 125,412 | |||||||||||||||||||||
Dividends from affililiates | — | — | — | 12,472 | 57,631 | 95,335 | 19,032 | |||||||||||||||||||||
|
|
|
|
|
|
|
|
|
|
|
|
|
| |||||||||||||||
Total investment income | 696,861 | 3,505,213 | 723,907 | 1,723,466 | 4,518,927 | 3,639,932 | 144,444 | |||||||||||||||||||||
|
|
|
|
|
|
|
|
|
|
|
|
|
| |||||||||||||||
Expenses: | ||||||||||||||||||||||||||||
Management fees | 478,412 | 1,344,076 | 133,828 | 428,856 | 1,867,291 | 2,882,655 | 650,826 | |||||||||||||||||||||
Custodian fees | 6,764 | 27,474 | 3,617 | 4,357 | 5,257 | 6,077 | 5,207 | |||||||||||||||||||||
Directors’ fees | 4,309 | 10,808 | 3,685 | 11,849 | 54,847 | 89,785 | 17,864 | |||||||||||||||||||||
Professional fees | 11,655 | 15,069 | 7,077 | 9,992 | 25,370 | 38,067 | 12,156 | |||||||||||||||||||||
Accounting fees | 10,227 | 57,170 | 7,827 | 7,827 | 7,827 | 7,827 | 7,827 | |||||||||||||||||||||
Administration fees | 9,290 | 9,329 | 8,750 | 8,750 | 8,750 | 8,750 | 8,750 | |||||||||||||||||||||
Printing and filing fees | 4,423 | 5,271 | 3,158 | 5,655 | 23,848 | 38,710 | 8,264 | |||||||||||||||||||||
Compliance expense | 6,933 | 6,933 | 4,267 | 4,267 | 4,267 | 4,266 | 4,267 | |||||||||||||||||||||
Other | 2,401 | 5,067 | 719 | 2,332 | 10,868 | 17,891 | 3,522 | |||||||||||||||||||||
|
|
|
|
|
|
|
|
|
|
|
|
|
| |||||||||||||||
Total expenses | 534,414 | 1,481,197 | 172,928 | 483,885 | 2,008,325 | 3,094,028 | 718,683 | |||||||||||||||||||||
|
|
|
|
|
|
|
|
|
|
|
|
|
| |||||||||||||||
Less expenses reduced or reimbursed by advisor | — | — | (71,437 | ) | (163,949 | ) | (703,330 | ) | (1,133,726 | ) | (305,598 | ) | ||||||||||||||||
|
|
|
|
|
|
|
|
|
|
|
|
|
| |||||||||||||||
Net expenses | 534,414 | 1,481,197 | 101,491 | 319,936 | 1,304,995 | 1,960,302 | 413,085 | |||||||||||||||||||||
|
|
|
|
|
|
|
|
|
|
|
|
|
| |||||||||||||||
Net investment income (loss) | 162,447 | 2,024,016 | 622,416 | 1,403,530 | 3,213,932 | 1,679,630 | (268,641 | ) | ||||||||||||||||||||
|
|
|
|
|
|
|
|
|
|
|
|
|
| |||||||||||||||
Realized/unrealized gain on investments, futures contracts, and foreign currency related transactions: | ||||||||||||||||||||||||||||
Net realized gain (loss) on: | ||||||||||||||||||||||||||||
Investments in securities of unaffiliated issuers | 12,004,786 | 2,275,101 | 30,000 | 71,726 | 370,426 | 218,276 | 44,429 | |||||||||||||||||||||
Investments in affiliates | — | — | 42,598 | 236,215 | 1,206,155 | 1,088,202 | 313,062 | |||||||||||||||||||||
Futures contracts | — | 3,990,768 | — | — | — | — | — | |||||||||||||||||||||
Foreign currency related transactions | — | 78 | — | — | — | — | — | |||||||||||||||||||||
Change in unrealized appreciation/depreciation on: | ||||||||||||||||||||||||||||
Investments in securities of unaffiliated issuers | 3,783,114 | 13,520,069 | 751,433 | 2,013,170 | 9,136,743 | 8,553,390 | 791,335 | |||||||||||||||||||||
Investments in affiliates | — | — | 931,313 | 5,094,400 | 38,622,653 | 66,026,163 | 17,073,726 | |||||||||||||||||||||
Futures contracts | — | 547,476 | — | — | — | — | — | |||||||||||||||||||||
|
|
|
|
|
|
|
|
|
|
|
|
|
| |||||||||||||||
Net realized/unrealized gain on investments, futures contracts, and foreign currency related transactions | 15,787,900 | 20,333,492 | 1,755,344 | 7,415,511 | 49,335,977 | 75,886,031 | 18,222,552 | |||||||||||||||||||||
|
|
|
|
|
|
|
|
|
|
|
|
|
| |||||||||||||||
Change in net assets from operations | $ | 15,950,347 | $ | 22,357,508 | $ | 2,377,760 | $ | 8,819,041 | $ | 52,549,909 | $ | 77,565,661 | $ | 17,953,911 | ||||||||||||||
|
|
|
|
|
|
|
|
|
|
|
|
|
| |||||||||||||||
*Taxes withheld | $ | 3,691 | $ | 1,649 | $ | — | $ | — | $ | — | $ | — | $ | — | ||||||||||||||
|
|
|
|
|
|
|
|
|
|
|
|
|
| |||||||||||||||
** For the period from March 1, 2017 (inception) to June 30, 2017 (Unaudited)
The accompanying notes are an integral part of these financial statements.
134
Ohio National Fund, Inc.
| Statements of Changes in Net Assets |
| Equity | Bond | Omni | Capital Appreciation | |||||||||||||||||||||||||||||||||||||
| Portfolio | Portfolio | Portfolio | Portfolio | |||||||||||||||||||||||||||||||||||||
| Six-Month Period | Year Ended | Six-Month Period | Year Ended | Six-Month Period | Year Ended | Six-Month Period | Year Ended | |||||||||||||||||||||||||||||||||
| Ended June 30, | December 31, | Ended June 30, | December 31, | Ended June 30, | December 31, | Ended June 30, | December 31, | |||||||||||||||||||||||||||||||||
| 2017 (Unaudited) | 2016 | 2017 (Unaudited) | 2016 | 2017 (Unaudited) | 2016 | 2017 (Unaudited) | 2016 | |||||||||||||||||||||||||||||||||
Increase (Decrease) in net assets: | ||||||||||||||||||||||||||||||||||||||||
Operations: | ||||||||||||||||||||||||||||||||||||||||
Net investment income | $ | 2,051,237 | $ | 5,567,497 | $ | 2,690,254 | $ | 5,360,664 | $ | 307,940 | $ | 548,355 | $ | 627,211 | $ | 4,370,483 | ||||||||||||||||||||||||
Net realized gain on investments and foreign currency related transactions | 16,847,312 | 13,905,247 | 462,043 | 1,222,360 | 4,364,681 | 102,741 | 7,096,527 | 3,967,555 | ||||||||||||||||||||||||||||||||
Change in unrealized appreciation on investments and foreign currency related transactions | 18,530,979 | 45,292,838 | 2,746,388 | 5,678,977 | 718,271 | 4,237,353 | 2,149,698 | 29,929,870 | ||||||||||||||||||||||||||||||||
|
|
|
|
|
|
|
|
|
|
|
|
|
|
|
| |||||||||||||||||||||||||
Change in net assets from operations | 37,429,528 | 64,765,582 | 5,898,685 | 12,262,001 | 5,390,892 | 4,888,449 | 9,873,436 | 38,267,908 | ||||||||||||||||||||||||||||||||
|
|
|
|
|
|
|
|
|
|
|
|
|
|
|
| |||||||||||||||||||||||||
Capital transactions: | ||||||||||||||||||||||||||||||||||||||||
Received from shares sold | 394,188,965 | 74,625,434 | 30,037,557 | 43,120,961 | 4,568,224 | 22,508,648 | 77,179,798 | 26,186,350 | ||||||||||||||||||||||||||||||||
Paid for shares redeemed | (446,426,877 | ) | (92,865,870 | ) | (30,191,797 | ) | (50,720,513 | ) | (5,493,184 | ) | (18,210,716 | ) | (93,118,103 | ) | (299,174,418 | ) | ||||||||||||||||||||||||
|
|
|
|
|
|
|
|
|
|
|
|
|
|
|
| |||||||||||||||||||||||||
Change in net assets from capital transactions | (52,237,912 | ) | (18,240,436 | ) | (154,240 | ) | (7,599,552 | ) | (924,960 | ) | 4,297,932 | (15,938,305 | ) | (272,988,068 | ) | |||||||||||||||||||||||||
|
|
|
|
|
|
|
|
|
|
|
|
|
|
|
| |||||||||||||||||||||||||
Change in net assets | (14,808,384 | ) | 46,525,146 | 5,744,445 | 4,662,449 | 4,465,932 | 9,186,381 | (6,064,869 | ) | (234,720,160 | ) | |||||||||||||||||||||||||||||
Net assets: | ||||||||||||||||||||||||||||||||||||||||
Beginning of period | 581,814,106 | 535,288,960 | 158,702,860 | 154,040,411 | 57,885,513 | 48,699,132 | 195,707,999 | 430,428,159 | ||||||||||||||||||||||||||||||||
|
|
|
|
|
|
|
|
|
|
|
|
|
|
|
| |||||||||||||||||||||||||
End of period | $ | 567,005,722 | $ | 581,814,106 | $ | 164,447,305 | $ | 158,702,860 | $ | 62,351,445 | $ | 57,885,513 | $ | 189,643,130 | $ | 195,707,999 | ||||||||||||||||||||||||
|
|
|
|
|
|
|
|
|
|
|
|
|
|
|
| |||||||||||||||||||||||||
Undistributed net investment income | $ | 7,576,459 | $ | 5,525,222 | $ | 8,050,918 | $ | 5,360,664 | $ | 856,295 | $ | 548,355 | $ | 5,003,904 | $ | 4,376,693 | ||||||||||||||||||||||||
|
|
|
|
|
|
|
|
|
|
|
|
|
|
|
| |||||||||||||||||||||||||
The accompanying notes are an integral part of these financial statements.
135
Ohio National Fund, Inc.
| Statements of Changes in Net Assets |
| ON International Equity | ON Foreign | Aggressive Growth | Small Cap Growth | |||||||||||||||||||||||||||||||||||||
| Portfolio | Portfolio | Portfolio | Portfolio | |||||||||||||||||||||||||||||||||||||
| Six-Month Period | Year Ended | Six-Month Period | Year Ended | Six-Month Period | Year Ended | Six-Month Period | Year Ended | |||||||||||||||||||||||||||||||||
| Ended June 30, | December 31, | Ended June 30, | December 31, | Ended June 30, | December 31, | Ended June 30, | December 31, | |||||||||||||||||||||||||||||||||
| 2017 (Unaudited) | 2016 | 2017 (Unaudited) | 2016 | 2017 (Unaudited) | 2016 | 2017 (Unaudited) | 2016 | |||||||||||||||||||||||||||||||||
Increase (Decrease) in net assets: | ||||||||||||||||||||||||||||||||||||||||
Operations: | ||||||||||||||||||||||||||||||||||||||||
Net investment income (loss) | $ | 1,690,524 | $ | 2,311,311 | $ | 534,019 | $ | 611,684 | $ | 24,430 | $ | (48,739 | ) | $ | 17,616 | $ | 94,462 | |||||||||||||||||||||||
Net realized gain (loss) on investments, futures contracts, foreign currency contracts, and other foreign currency related transactions | 20,378,803 | (2,908,384 | ) | 12,005,369 | 1,355,648 | 2,804,429 | 3,612,672 | 4,970,927 | 4,425,258 | |||||||||||||||||||||||||||||||
Change in unrealized appreciation/depreciation on investments, futures contracts, foreign currency contracts, and other foreign currency related transactions | 818,962 | (7,063,923 | ) | (2,790,596 | ) | (7,904,384 | ) | 5,990,811 | (1,590,805 | ) | 25,649,063 | 9,943,195 | ||||||||||||||||||||||||||||
|
|
|
|
|
|
|
|
|
|
|
|
|
|
|
| |||||||||||||||||||||||||
Change in net assets from operations | 22,888,289 | (7,660,996 | ) | 9,748,792 | (5,937,052 | ) | 8,819,670 | 1,973,128 | 30,637,606 | 14,462,915 | ||||||||||||||||||||||||||||||
|
|
|
|
|
|
|
|
|
|
|
|
|
|
|
| |||||||||||||||||||||||||
Capital transactions: | ||||||||||||||||||||||||||||||||||||||||
Received from shares sold | 10,796,917 | 18,416,529 | 15,247,053 | 15,529,970 | 5,870,719 | 17,503,430 | 150,796,324 | 35,048,894 | ||||||||||||||||||||||||||||||||
Paid for shares redeemed | (21,777,338 | ) | (28,208,183 | ) | (13,224,890 | ) | (21,246,851 | ) | (8,026,398 | ) | (20,962,621 | ) | (165,785,939 | ) | (55,439,909 | ) | ||||||||||||||||||||||||
|
|
|
|
|
|
|
|
|
|
|
|
|
|
|
| |||||||||||||||||||||||||
Change in net assets from capital transactions | (10,980,421 | ) | (9,791,654 | ) | 2,022,163 | (5,716,881 | ) | (2,155,679 | ) | (3,459,191 | ) | (14,989,615 | ) | (20,391,015 | ) | |||||||||||||||||||||||||
|
|
|
|
|
|
|
|
|
|
|
|
|
|
|
| |||||||||||||||||||||||||
Change in net assets | 11,907,868 | (17,452,650 | ) | 11,770,955 | (11,653,933 | ) | 6,663,991 | (1,486,063 | ) | 15,647,991 | (5,928,100 | ) | ||||||||||||||||||||||||||||
Net assets: | ||||||||||||||||||||||||||||||||||||||||
Beginning of period | 141,524,909 | 158,977,559 | 66,672,990 | 78,326,923 | 49,865,734 | 51,351,797 | 232,306,906 | 238,235,006 | ||||||||||||||||||||||||||||||||
|
|
|
|
|
|
|
|
|
|
|
|
|
|
|
| |||||||||||||||||||||||||
End of period | $ | 153,432,777 | $ | 141,524,909 | $ | 78,443,945 | $ | 66,672,990 | $ | 56,529,725 | $ | 49,865,734 | $ | 247,954,897 | $ | 232,306,906 | ||||||||||||||||||||||||
|
|
|
|
|
|
|
|
|
|
|
|
|
|
|
| |||||||||||||||||||||||||
Undistributed net investment income (loss) | $ | 1,529,331 | $ | (161,193 | ) | $ | 1,045,518 | $ | 511,499 | $ | 24,430 | $ | — | $ | (231,283 | ) | $ | (248,899 | ) | |||||||||||||||||||||
|
|
|
|
|
|
|
|
|
|
|
|
|
|
|
| |||||||||||||||||||||||||
The accompanying notes are an integral part of these financial statements.
136
Ohio National Fund, Inc.
| Statements of Changes in Net Assets |
| Mid Cap Opportunity | S&P 500® Index | Strategic Value | High Income Bond | |||||||||||||||||||||||||||||||||||||
| Portfolio | Portfolio | Portfolio | Portfolio | |||||||||||||||||||||||||||||||||||||
| Six-Month Period | Year Ended | Six-Month Period | Year Ended | Six-Month Period | Year Ended | Six-Month Period | Year Ended | |||||||||||||||||||||||||||||||||
| Ended June 30, | December 31, | Ended June 30, | December 31, | Ended June 30, | December 31, | Ended June 30, | December 31, | |||||||||||||||||||||||||||||||||
| 2017 (Unaudited) | 2016 | 2017 (Unaudited) | 2016 | 2017 (Unaudited) | 2016 | 2017 (Unaudited) | 2016 | |||||||||||||||||||||||||||||||||
Increase (Decrease) in net assets: | ||||||||||||||||||||||||||||||||||||||||
Operations: | ||||||||||||||||||||||||||||||||||||||||
Net investment income (loss) | $ | (68,384 | ) | $ | (215,629 | ) | $ | 7,304,928 | $ | 9,504,257 | $ | 11,620,587 | $ | 11,653,440 | $ | 8,304,798 | $ | 12,498,039 | ||||||||||||||||||||||
Net realized gain (loss) on investments, futures contracts, and foreign currency related transactions | 5,299,237 | (338,817 | ) | 13,881,853 | 7,146,352 | 14,703,675 | 25,978,158 | 1,183,905 | (5,416,854 | ) | ||||||||||||||||||||||||||||||
Change in unrealized appreciation/depreciation on investments, futures contracts, and foreign currency related transactions | 4,923,156 | 1,686,385 | 55,284,196 | 44,613,505 | 13,941,848 | (5,901,300 | ) | 5,903,905 | 20,481,746 | |||||||||||||||||||||||||||||||
|
|
|
|
|
|
|
|
|
|
|
|
|
|
|
| |||||||||||||||||||||||||
Change in net assets from operations | 10,154,009 | 1,131,939 | 76,470,977 | 61,264,114 | 40,266,110 | 31,730,298 | 15,392,608 | 27,562,931 | ||||||||||||||||||||||||||||||||
|
|
|
|
|
|
|
|
|
|
|
|
|
|
|
| |||||||||||||||||||||||||
Capital transactions: | ||||||||||||||||||||||||||||||||||||||||
Received from shares sold | 3,892,646 | 11,015,154 | 414,490,211 | 481,935,063 | 496,677,473 | 230,579,093 | 217,907,731 | 145,585,402 | ||||||||||||||||||||||||||||||||
Paid for shares redeemed | (9,432,369 | ) | (20,652,206 | ) | (430,531,203 | ) | (111,283,422 | ) | (423,165,557 | ) | (96,596,881 | ) | (228,448,507 | ) | (53,611,878 | ) | ||||||||||||||||||||||||
|
|
|
|
|
|
|
|
|
|
|
|
|
|
|
| |||||||||||||||||||||||||
Change in net assets from capital transactions | (5,539,723 | ) | (9,637,052 | ) | (16,040,992 | ) | 370,651,641 | 73,511,916 | 133,982,212 | (10,540,776 | ) | 91,973,524 | ||||||||||||||||||||||||||||
|
|
|
|
|
|
|
|
|
|
|
|
|
|
|
| |||||||||||||||||||||||||
Change in net assets | 4,614,286 | (8,505,113 | ) | 60,429,985 | 431,915,755 | 113,778,026 | 165,712,510 | 4,851,832 | 119,536,455 | |||||||||||||||||||||||||||||||
Net assets: | ||||||||||||||||||||||||||||||||||||||||
Beginning of period | 70,198,258 | 78,703,371 | 842,639,396 | 410,723,641 | 475,521,276 | 309,808,766 | 313,757,468 | 194,221,013 | ||||||||||||||||||||||||||||||||
|
|
|
|
|
|
|
|
|
|
|
|
|
|
|
| |||||||||||||||||||||||||
End of period | $ | 74,812,544 | $ | 70,198,258 | $ | 903,069,381 | $ | 842,639,396 | $ | 589,299,302 | $ | 475,521,276 | $ | 318,609,300 | $ | 313,757,468 | ||||||||||||||||||||||||
|
|
|
|
|
|
|
|
|
|
|
|
|
|
|
| |||||||||||||||||||||||||
Undistributed net investment income (loss) | $ | (68,384 | ) | $ | — | $ | 16,565,725 | $ | 9,260,797 | $ | 22,777,108 | $ | 11,156,521 | $ | 20,810,339 | $ | 12,505,541 | |||||||||||||||||||||||
|
|
|
|
|
|
|
|
|
|
|
|
|
|
|
| |||||||||||||||||||||||||
The accompanying notes are an integral part of these financial statements.
137
Ohio National Fund, Inc.
| Statements of Changes in Net Assets |
| ClearBridge Small Cap | Nasdaq-100® Index | Bristol | Bryton Growth | |||||||||||||||||||||||||||||||||||||
| Portfolio | Portfolio | Portfolio | Portfolio | |||||||||||||||||||||||||||||||||||||
| Six-Month Period | Year Ended | Six-Month Period | Year Ended | Six-Month Period | Year Ended | Six-Month Period | Year Ended | |||||||||||||||||||||||||||||||||
| Ended June 30, | December 31, | Ended June 30, | December 31, | Ended June 30, | December 31, | Ended June 30, | December 31, | |||||||||||||||||||||||||||||||||
| 2017 (Unaudited) | 2016 | 2017 (Unaudited) | 2016 | 2017 (Unaudited) | 2016 | 2017 (Unaudited) | 2016 | |||||||||||||||||||||||||||||||||
Increase (Decrease) in net assets: | ||||||||||||||||||||||||||||||||||||||||
Operations: | ||||||||||||||||||||||||||||||||||||||||
Net investment income (loss) | $ | 312,109 | $ | 1,201,809 | $ | 736,226 | $ | 1,168,073 | $ | 449,311 | $ | 1,044,015 | $ | (280,019 | ) | $ | (860,516 | ) | ||||||||||||||||||||||
Net realized gain (loss) on investments and futures contracts | 11,760,744 | 9,259,292 | 5,036,290 | 3,504,093 | 23,176,353 | 5,891,996 | 3,885,509 | (7,638,999 | ) | |||||||||||||||||||||||||||||||
Change in unrealized appreciation/depreciation on investments and futures contracts | 5,451,770 | 27,407,702 | 20,636,918 | 4,693,663 | (1,475,334 | ) | 16,891,694 | 6,096,784 | 15,613,273 | |||||||||||||||||||||||||||||||
|
|
|
|
|
|
|
|
|
|
|
|
|
|
|
| |||||||||||||||||||||||||
Change in net assets from operations | 17,524,623 | 37,868,803 | 26,409,434 | 9,365,829 | 22,150,330 | 23,827,705 | 9,702,274 | 7,113,758 | ||||||||||||||||||||||||||||||||
|
|
|
|
|
|
|
|
|
|
|
|
|
|
|
| |||||||||||||||||||||||||
Capital transactions: | ||||||||||||||||||||||||||||||||||||||||
Received from shares sold | 199,186,060 | 176,227,241 | 38,390,151 | 62,657,502 | 172,542,191 | 17,790,000 | 73,335,944 | 23,716,928 | ||||||||||||||||||||||||||||||||
Paid for shares redeemed | (212,163,084 | ) | (32,385,445 | ) | (27,758,261 | ) | (54,533,803 | ) | (186,036,506 | ) | (52,376,277 | ) | (81,587,537 | ) | (98,411,908 | ) | ||||||||||||||||||||||||
|
|
|
|
|
|
|
|
|
|
|
|
|
|
|
| |||||||||||||||||||||||||
Change in net assets from capital transactions | (12,977,024 | ) | 143,841,796 | 10,631,890 | 8,123,699 | (13,494,315 | ) | (34,586,277 | ) | (8,251,593 | ) | (74,694,980 | ) | |||||||||||||||||||||||||||
|
|
|
|
|
|
|
|
|
|
|
|
|
|
|
| |||||||||||||||||||||||||
Change in net assets | 4,547,599 | 181,710,599 | 37,041,324 | 17,489,528 | 8,656,015 | (10,758,572 | ) | 1,450,681 | (67,581,222 | ) | ||||||||||||||||||||||||||||||
Net assets: | ||||||||||||||||||||||||||||||||||||||||
Beginning of period | 275,714,066 | 94,003,467 | 156,056,433 | 138,566,905 | 207,924,145 | 218,682,717 | 94,587,373 | 162,168,595 | ||||||||||||||||||||||||||||||||
|
|
|
|
|
|
|
|
|
|
|
|
|
|
|
| |||||||||||||||||||||||||
End of period | $ | 280,261,665 | $ | 275,714,066 | $ | 193,097,757 | $ | 156,056,433 | $ | 216,580,160 | $ | 207,924,145 | $ | 96,038,054 | $ | 94,587,373 | ||||||||||||||||||||||||
|
|
|
|
|
|
|
|
|
|
|
|
|
|
|
| |||||||||||||||||||||||||
Undistributed net investment income (loss) | $ | 1,407,405 | $ | 1,095,296 | $ | 1,904,299 | $ | 1,168,073 | $ | 1,493,327 | $ | 1,044,016 | $ | (280,019 | ) | $ | — | |||||||||||||||||||||||
|
|
|
|
|
|
|
|
|
|
|
|
|
|
|
| |||||||||||||||||||||||||
The accompanying notes are an integral part of these financial statements.
138
Ohio National Fund, Inc.
| Statements of Changes in Net Assets |
| S&P | ||||||||||||||||||||||||||||||||
| Balanced | MidCap 400® Index | Bristol Growth | Risk Managed Balanced | |||||||||||||||||||||||||||||
| Portfolio | Portfolio | Portfolio | Portfolio | |||||||||||||||||||||||||||||
| Six-Month Period | Year Ended | Six-Month Period | Year Ended | Six-Month Period | Year Ended | Six-Month Period | Year Ended | |||||||||||||||||||||||||
| Ended June 30, | December 31, | Ended June 30, | December 31, | Ended June 30, | December 31, | Ended June 30, | December 31, | |||||||||||||||||||||||||
| 2017 (Unaudited) | 2016 | 2017 (Unaudited) | 2016 | 2017 (Unaudited) | 2016 | 2017 (Unaudited) | 2016 | |||||||||||||||||||||||||
Increase (Decrease) in net assets: | ||||||||||||||||||||||||||||||||
Operations: | ||||||||||||||||||||||||||||||||
Net investment income | $ | 10,251,438 | $ | 18,594,618 | $ | 218,757 | $ | 542,920 | $ | 162,447 | $ | 424,532 | $ | 2,024,016 | $ | 2,324,310 | ||||||||||||||||
Net realized gain on investments, futures contracts, foreign currency related transactions, and written options | 8,924,973 | 1,778,556 | 712,586 | 3,365,004 | 12,004,786 | 4,713,343 | 6,265,947 | 149,292 | ||||||||||||||||||||||||
Change in unrealized appreciation/depreciation on investments, futures contracts, foreign currency related transactions, and written options | 41,459,119 | 22,371,779 | 1,762,840 | (31,624 | ) | 3,783,114 | 3,610,910 | 14,067,545 | 5,432,477 | |||||||||||||||||||||||
|
|
|
|
|
|
|
|
|
|
|
|
|
|
|
| |||||||||||||||||
Change in net assets from operations | 60,635,530 | 42,744,953 | 2,694,183 | 3,876,300 | 15,950,347 | 8,748,785 | 22,357,508 | 7,906,079 | ||||||||||||||||||||||||
|
|
|
|
|
|
|
|
|
|
|
|
|
|
|
| |||||||||||||||||
Capital transactions: | ||||||||||||||||||||||||||||||||
Received from shares sold | 470,760,852 | 178,836,349 | 24,374,408 | 5,426,998 | 115,927,986 | 13,636,740 | 58,082,783 | 145,512,489 | ||||||||||||||||||||||||
Paid for shares redeemed | (492,087,409 | ) | (134,411,384 | ) | (18,151,573 | ) | (7,686,316 | ) | (125,513,979 | ) | (21,052,560 | ) | (29,393,999 | ) | (35,661,000 | ) | ||||||||||||||||
|
|
|
|
|
|
|
|
|
|
|
|
|
|
|
| |||||||||||||||||
Change in net assets from capital transactions | (21,326,557 | ) | 44,424,965 | 6,222,835 | (2,259,318 | ) | (9,585,993 | ) | (7,415,820 | ) | 28,688,784 | 109,851,489 | ||||||||||||||||||||
|
|
|
|
|
|
|
|
|
|
|
|
|
|
|
| |||||||||||||||||
Change in net assets | 39,308,973 | 87,169,918 | 8,917,018 | 1,616,982 | 6,364,354 | 1,332,965 | 51,046,292 | 117,757,568 | ||||||||||||||||||||||||
Net assets: | ||||||||||||||||||||||||||||||||
Beginning of period | 952,091,955 | 864,922,037 | 47,889,238 | 46,272,256 | 117,558,106 | 116,225,141 | 272,081,588 | 154,324,020 | ||||||||||||||||||||||||
|
|
|
|
|
|
|
|
|
|
|
|
|
|
|
| |||||||||||||||||
End of period | $ | 991,400,928 | $ | 952,091,955 | $ | 56,806,256 | $ | 47,889,238 | $ | 123,922,460 | $ | 117,558,106 | $ | 323,127,880 | $ | 272,081,588 | ||||||||||||||||
|
|
|
|
|
|
|
|
|
|
|
|
|
|
|
| |||||||||||||||||
Undistributed net investment income | $ | 27,106,944 | $ | 16,855,506 | $ | 779,633 | $ | 560,876 | $ | 586,979 | $ | 424,532 | $ | 4,298,457 | $ | 2,274,441 | ||||||||||||||||
|
|
|
|
|
|
|
|
|
|
|
|
|
|
|
| |||||||||||||||||
The accompanying notes are an integral part of these financial statements.
139
Ohio National Fund, Inc.
| Statements of Changes in Net Assets |
| ON | ON Moderately | |||||||||||||||||||
| Conservative | Conservative | ON Balanced | ON Moderate | ON | ||||||||||||||||
| Model | Model | Model | Growth Model | Growth Model | ||||||||||||||||
| Portfolio | Portfolio | Portfolio | Portfolio | Portfolio | ||||||||||||||||
| Period from | Period from | Period from | Period from | Period from | ||||||||||||||||
| March 1, 2017 | March 1, 2017 | March 1, 2017 | March 1, 2017 | March 1, 2017 | ||||||||||||||||
| (inception) to | (inception) to | (inception) to | (inception) to | (inception) to | ||||||||||||||||
| June 30, | June 30, | June 30, | June 30, | June 30, | ||||||||||||||||
| 2017 (Unaudited) | 2017 (Unaudited) | 2017 (Unaudited) | 2017 (Unaudited) | 2017 (Unaudited) | ||||||||||||||||
Increase (Decrease) in net assets: | ||||||||||||||||||||
Operations: | ||||||||||||||||||||
Net investment income (loss) | $ | 622,416 | $ | 1,403,530 | $ | 3,213,932 | $ | 1,679,630 | $ | (268,641 | ) | |||||||||
Net realized gain on investments | 72,598 | 307,941 | 1,576,581 | 1,306,478 | 357,491 | |||||||||||||||
Change in unrealized appreciation on investments | 1,682,746 | 7,107,570 | 47,759,396 | 74,579,553 | 17,865,061 | |||||||||||||||
|
|
|
|
|
|
|
|
|
| |||||||||||
Change in net assets from operations | 2,377,760 | 8,819,041 | 52,549,909 | 77,565,661 | 17,953,911 | |||||||||||||||
|
|
|
|
|
|
|
|
|
| |||||||||||
Capital transactions: | ||||||||||||||||||||
Received from shares sold | 111,662,464 | 347,449,331 | 1,575,820,420 | 2,612,393,375 | 525,631,321 | |||||||||||||||
Paid for shares redeemed | (8,216,890 | ) | (19,409,327 | ) | (74,614,350 | ) | (109,124,374 | ) | (22,846,268 | ) | ||||||||||
|
|
|
|
|
|
|
|
|
| |||||||||||
Change in net assets from capital transactions | 103,445,574 | 328,040,004 | 1,501,206,070 | 2,503,269,001 | 502,785,053 | |||||||||||||||
|
|
|
|
|
|
|
|
|
| |||||||||||
Change in net assets | 105,823,334 | 336,859,045 | 1,553,755,979 | 2,580,834,662 | 520,738,964 | |||||||||||||||
Net assets: | ||||||||||||||||||||
Beginning of period | — | — | — | — | — | |||||||||||||||
|
|
|
|
|
|
|
|
|
| |||||||||||
End of period | $ | 105,823,334 | $ | 336,859,045 | $ | 1,553,755,979 | $ | 2,580,834,662 | $ | 520,738,964 | ||||||||||
|
|
|
|
|
|
|
|
|
| |||||||||||
Undistributed net investment income (loss) | $ | 622,416 | $ | 1,403,530 | $ | 3,213,932 | $ | 1,679,630 | $ | (268,641 | ) | |||||||||
|
|
|
|
|
|
|
|
|
| |||||||||||
The accompanying notes are an integral part of these financial statements.
140
Ohio National Fund, Inc.
| Financial Highlights |
| Selected per-share data | Ratios and supplemental data | |||||||||||||||||||||||||||||||||||||||||||||||
| Operations | Distributions | Ratios to average net assets | ||||||||||||||||||||||||||||||||||||||||||||||
| Ratios assuming | ||||||||||||||||||||||||||||||||||||||||||||||||
| no expenses | ||||||||||||||||||||||||||||||||||||||||||||||||
| Ratios net of expenses | reduced or | |||||||||||||||||||||||||||||||||||||||||||||||
| reduced or | reimbursed by | |||||||||||||||||||||||||||||||||||||||||||||||
| reimbursed by adviser | adviser | |||||||||||||||||||||||||||||||||||||||||||||||
| Net realized and | ||||||||||||||||||||||||||||||||||||||||||||||||
| unrealized gain | ||||||||||||||||||||||||||||||||||||||||||||||||
| (loss) on | ||||||||||||||||||||||||||||||||||||||||||||||||
| investments | Distributions | |||||||||||||||||||||||||||||||||||||||||||||||
| Net asset value, | and foreign | from net | Net asset value, | Net assets at end | Portfolio | |||||||||||||||||||||||||||||||||||||||||||
| beginning of year | Net investment | currency related | Total from | investment | end of year or | of year or period | Net investment | turnover | ||||||||||||||||||||||||||||||||||||||||
| or period | income | transactions | operations | income | period | Total Return | (in millions) | Expenses | income | Expenses | rate | |||||||||||||||||||||||||||||||||||||
|
| |||||||||||||||||||||||||||||||||||||||||||||||
Equity Portfolio | ||||||||||||||||||||||||||||||||||||||||||||||||
Six-Month Period Ended June 30, 2017+ | $36.09 | 0.17 | 2.26 | 2.43 | — | $38.52 | 6.73%* | $567.0 | 0.80%** | 0.72%** | 0.80%** | 20%* | ||||||||||||||||||||||||||||||||||||
Year ended December 31, 2016 | $32.02 | 0.35 | 3.72 | 4.07 | — | $36.09 | 12.71% | $581.8 | 0.82% | 1.05% | 0.82% | 47% | ||||||||||||||||||||||||||||||||||||
Year ended December 31, 2015 | $33.44 | 0.21 | (1.44) | (1.23) | (0.19) | $32.02 | -3.69% | $535.3 | 0.81% | 0.69% | 0.81% | 47% | ||||||||||||||||||||||||||||||||||||
Year ended December 31, 2014 | $29.41 | 0.12 | 4.02 | 4.14 | (0.11) | $33.44 | 14.07% | $518.7 | 0.83% | 0.69% | 0.83% | 46% | ||||||||||||||||||||||||||||||||||||
Year ended December 31, 2013 | $21.54 | 0.27 | 7.84 | 8.11 | (0.24) | $29.41 | 37.69% | $221.4 | 0.87% | 0.98% | 0.87% | 43% | ||||||||||||||||||||||||||||||||||||
Bond Portfolio | ||||||||||||||||||||||||||||||||||||||||||||||||
Six-Month Period Ended June 30, 2017+ | $16.54 | 0.28 | 0.33 | 0.61 | — | $17.15 | 3.69%* | $164.4 | 0.64%** | 3.34%** | 0.64%** | 44%* | ||||||||||||||||||||||||||||||||||||
Year ended December 31, 2016 | $15.33 | 0.59 | 0.62 | 1.21 | — | $16.54 | 7.89% | $158.7 | 0.65% | 3.33% | 0.65% | 88% | ||||||||||||||||||||||||||||||||||||
Year ended December 31, 2015 | $15.65 | 0.56 | (0.88) | (0.32) | — | $15.33 | -2.04% | $154.0 | 0.64% | 3.46% | 0.64% | 93% | ||||||||||||||||||||||||||||||||||||
Year ended December 31, 2014 | $14.78 | 0.50 | 0.37 | 0.87 | — | $15.65 | 5.89% | $158.7 | 0.64% | 3.34% | 0.64% | 35% | ||||||||||||||||||||||||||||||||||||
Year ended December 31, 2013 | $15.07 | 0.56 | (0.85) | (0.29) | — | $14.78 | -1.92% | $151.6 | 0.66% | 3.34% | 0.66% | 15% | ||||||||||||||||||||||||||||||||||||
Omni Portfolio | ||||||||||||||||||||||||||||||||||||||||||||||||
Six-Month Period Ended June 30, 2017+ | $26.93 | 0.15 | 2.37 | 2.52 | — | $29.45 | 9.36%* | $ 62.4 | 0.77%** | 1.02%** | 0.77%** | 86%* | ||||||||||||||||||||||||||||||||||||
Year ended December 31, 2016 | $24.43 | 0.25 | 2.25 | 2.50 | — | $26.93 | 10.23% | $ 57.9 | 0.80% | 1.09% | 0.80% | 194% | ||||||||||||||||||||||||||||||||||||
Year ended December 31, 2015 | $24.15 | 0.28 | 0.24 | 0.52 | (0.24) | $24.43 | 2.15% | $ 48.7 | 0.77% | 1.23% | 0.77% | 186% | ||||||||||||||||||||||||||||||||||||
Year ended December 31, 2014 | $21.74 | 0.26 | 2.37 | 2.63 | (0.22) | $24.15 | 12.12% | $ 37.2 | 0.77% | 1.06% | 0.77% | 198% | ||||||||||||||||||||||||||||||||||||
Year ended December 31, 2013 | $16.82 | 0.24 | 4.89 | 5.13 | (0.21) | $21.74 | 30.53% | $ 37.9 | 0.79% | 1.17% | 0.79% | 210% | ||||||||||||||||||||||||||||||||||||
Capital Appreciation Portfolio | ||||||||||||||||||||||||||||||||||||||||||||||||
Six-Month Period Ended June 30, 2017+ | $37.70 | 0.20 | 1.77 | 1.97 | — | $39.67 | 5.23%* | $189.6 | 0.84%** | 0.66%** | 0.84%** | 25%* | ||||||||||||||||||||||||||||||||||||
Year ended December 31, 2016 | $32.88 | 0.91 | 3.91 | 4.82 | — | $37.70 | 14.66% | $195.7 | 0.82% | 1.21% | 0.82% | 55% | ||||||||||||||||||||||||||||||||||||
Year ended December 31, 2015 | $33.82 | 0.29 | (0.98) | (0.69) | (0.25) | $32.88 | -2.05% | $430.4 | 0.80% | 0.86% | 0.80% | 69% | ||||||||||||||||||||||||||||||||||||
Year ended December 31, 2014 | $31.24 | 0.08 | 2.59 | 2.67 | (0.09) | $33.82 | 8.54% | $449.4 | 0.83% | 0.56% | 0.83% | 67% | ||||||||||||||||||||||||||||||||||||
Year ended December 31, 2013 | $23.32 | 0.13 | 7.91 | 8.04 | (0.12) | $31.24 | 34.51% | $138.0 | 0.88% | 0.45% | 0.88% | 49% | ||||||||||||||||||||||||||||||||||||
| + | Unaudited |
| * | Not annualized |
| ** | Annualized |
The accompanying notes are an integral part of these financial statements.
141
Ohio National Fund, Inc.
| Financial Highlights |
| Selected per-share data | Ratios and supplemental data | ||||||||||||||||||||||||||||||||||||||||||||||||||||||
| Operations | Ratios to average net assets | ||||||||||||||||||||||||||||||||||||||||||||||||||||||
| Ratios assuming no | |||||||||||||||||||||||||||||||||||||||||||||||||||||||
| Ratios net of expenses | expenses reduced | ||||||||||||||||||||||||||||||||||||||||||||||||||||||
| reduced or | or reimbursed by | ||||||||||||||||||||||||||||||||||||||||||||||||||||||
| reimbursed by adviser | adviser | ||||||||||||||||||||||||||||||||||||||||||||||||||||||
| Net realized and | |||||||||||||||||||||||||||||||||||||||||||||||||||||||
| unrealized | |||||||||||||||||||||||||||||||||||||||||||||||||||||||
| gain (loss) on | |||||||||||||||||||||||||||||||||||||||||||||||||||||||
| investments, | |||||||||||||||||||||||||||||||||||||||||||||||||||||||
| futures contracts, | |||||||||||||||||||||||||||||||||||||||||||||||||||||||
| foreign | |||||||||||||||||||||||||||||||||||||||||||||||||||||||
| currency contracts, | |||||||||||||||||||||||||||||||||||||||||||||||||||||||
| Net asset value, | and other foreign | Net asset value, | Net assets at end | Portfolio | |||||||||||||||||||||||||||||||||||||||||||||||||||
| beginning of | Net investment | currency related | Total from | end of year or | of year or period | Net investment | turnover | ||||||||||||||||||||||||||||||||||||||||||||||||
| year or period | income (loss) | transactions | operations | period | Total Return | (in millions) | Expenses | income (loss) | Expenses | rate | |||||||||||||||||||||||||||||||||||||||||||||
ON International Equity Portfolio | |||||||||||||||||||||||||||||||||||||||||||||||||||||||
Six-Month Period Ended June 30, 2017+ | $11.89 | 0.15 | 1.77 | 1.92 | $13.81 | 16.15 | %* | $153.4 | 1.02 | %** | 2.21 | %** | 1.02 | %** | 124 | %(a),* | |||||||||||||||||||||||||||||||||||||||
Year ended December 31, 2016 | $12.50 | 0.22 | (0.83 | ) | (0.61 | ) | $11.89 | -4.88 | % | $141.5 | 1.02 | % | 1.57 | % | 1.02 | % | 69 | % | |||||||||||||||||||||||||||||||||||||
Year ended December 31, 2015 | $12.55 | 0.19 | (0.24 | ) | (0.05 | ) | $12.50 | -0.40 | %(b) | $159.0 | 1.00 | % | 1.21 | % | 1.00 | % | 72 | % | |||||||||||||||||||||||||||||||||||||
Year ended December 31, 2014 | $13.85 | 0.18 | (1.48 | ) | (1.30 | ) | $12.55 | -9.39 | % | $174.4 | 0.84 | % | 1.43 | % | 1.00 | % | 95 | % | |||||||||||||||||||||||||||||||||||||
Year ended December 31, 2013 | $12.41 | 0.23 | 1.21 | 1.44 | $13.85 | 11.60 | % | $189.4 | 0.75 | % | 1.52 | % | 1.01 | % | 53 | % | |||||||||||||||||||||||||||||||||||||||
ON Foreign Portfolio | |||||||||||||||||||||||||||||||||||||||||||||||||||||||
Six-Month Period Ended June 30, 2017+ | $27.72 | 0.21 | 3.82 | 4.03 | $31.75 | 14.54 | %* | $ 78.4 | 1.19 | %** | 1.47 | %** | 1.19 | %** | 121 | %(a),* | |||||||||||||||||||||||||||||||||||||||
Year ended December 31, 2016 | $29.98 | 0.26 | (2.52 | ) | (2.26 | ) | $27.72 | -7.54 | % | $ 66.7 | 1.24 | % | 0.89 | % | 1.24 | % | 51 | % | |||||||||||||||||||||||||||||||||||||
Year ended December 31, 2015 | $27.39 | 0.03 | 2.56 | 2.59 | $29.98 | 9.46 | %(b) | $ 78.3 | 1.23 | % | 0.12 | % | 1.23 | % | 58 | % | |||||||||||||||||||||||||||||||||||||||
Year ended December 31, 2014 | $30.03 | 0.12 | (2.76 | ) | (2.64 | ) | $27.39 | -8.79 | % | $ 67.6 | 1.18 | % | 0.38 | % | 1.18 | % | 65 | % | |||||||||||||||||||||||||||||||||||||
Year ended December 31, 2013 | $23.52 | 0.12 | 6.39 | 6.51 | $30.03 | 27.68 | % | $ 77.0 | 1.19 | % | 0.40 | % | 1.19 | % | 51 | % | |||||||||||||||||||||||||||||||||||||||
Aggressive Growth Portfolio | |||||||||||||||||||||||||||||||||||||||||||||||||||||||
Six-Month Period Ended June 30, 2017+ | $15.61 | 0.01 | 2.78 | 2.79 | $18.40 | 17.87 | %* | $ 56.5 | 0.95 | %** | 0.09 | %** | 0.95 | %** | 28 | %* | |||||||||||||||||||||||||||||||||||||||
Year ended December 31, 2016 | $15.09 | (0.02 | ) | 0.54 | 0.52 | $15.61 | 3.45 | % | $ 49.9 | 0.95 | % | -0.09 | % | 0.95 | % | 63 | % | ||||||||||||||||||||||||||||||||||||||
Year ended December 31, 2015 | $13.70 | (0.01 | ) | 1.40 | 1.39 | $15.09 | 10.15 | % | $ 51.4 | 0.93 | % | -0.10 | % | 0.93 | % | 60 | % | ||||||||||||||||||||||||||||||||||||||
Year ended December 31, 2014 | $12.50 | (0.03 | ) | 1.23 | 1.20 | $13.70 | 9.60 | % | $ 39.9 | 0.94 | % | -0.23 | % | 0.94 | % | 55 | % | ||||||||||||||||||||||||||||||||||||||
Year ended December 31, 2013 | $ 9.51 | (0.02 | ) | 3.01 | 2.99 | $12.50 | 31.44 | % | $ 39.4 | 0.97 | % | -0.25 | % | 0.97 | % | 60 | % | ||||||||||||||||||||||||||||||||||||||
Small Cap Growth Portfolio | |||||||||||||||||||||||||||||||||||||||||||||||||||||||
Six-Month Period Ended June 30, 2017+ | $26.61 | — | 3.58 | 3.58 | $30.19 | 13.45 | %* | $248.0 | 0.85 | %** | 0.01 | %** | 0.85 | %** | 10 | %* | |||||||||||||||||||||||||||||||||||||||
Year ended December 31, 2016 | $25.01 | 0.01 | 1.59 | 1.60 | $26.61 | 6.40 | % | $232.3 | 0.86 | % | 0.04 | % | 0.86 | % | 25 | % | |||||||||||||||||||||||||||||||||||||||
Year ended December 31, 2015 | $25.07 | (0.03 | ) | (0.03 | ) | (0.06 | ) | $25.01 | -0.24 | %(b) | $238.2 | 0.85 | % | -0.12 | % | 0.85 | % | 37 | % | ||||||||||||||||||||||||||||||||||||
Year ended December 31, 2014 | $22.65 | (0.05 | ) | 2.47 | 2.42 | $25.07 | 10.64 | % | $212.1 | 0.89 | % | -0.31 | % | 0.89 | % | 58 | % | ||||||||||||||||||||||||||||||||||||||
Year ended December 31, 2013 | $15.59 | (0.03 | ) | 7.09 | 7.06 | $22.65 | 45.29 | % | $109.5 | 1.04 | % | -0.29 | % | 1.04 | % | 69 | %(c) | ||||||||||||||||||||||||||||||||||||||
| + | Unaudited |
| * | Not annualized |
| ** | Annualized |
| (a) | Effective May 1, 2017, the sub-adviser to the Portfolio changed from Federated Global Investment Management Corp. to Lazard Asset Management LLC for the ON International Equity Portfolio and to Templeton Global Advisors Limited for the ON Foreign Portfolio. Costs of purchases and proceeds from sales of portfolio securities associated with the change in the sub-adviser contributed to a higher portfolio turnover rate for the six-month period ended June 30, 2017 as compared to prior years. |
| (b) | Initial Public Offering (IPO) investments had a significant impact on the total return in this period and such performance may be difficult to repeat. |
| (c) | The cost of purchases and proceeds from sales of securities that were incurred to realign the Portfolio’s holdings subsequent to the December 20, 2013 reorganization are excluded from the 2013 portfolio turnover rate calculation. If such amounts had not been excluded, the portfolio turnover rate would have been 146%. |
The accompanying notes are an integral part of these financial statements.
142
Ohio National Fund, Inc.
| Financial Highlights |
| Selected per-share data | Ratios and supplemental data | |||||||||||||||||||||||||||||||||||||||||||||||||||||||||||
| Operations | Distributions | Ratios to average net assets | ||||||||||||||||||||||||||||||||||||||||||||||||||||||||||
| Ratios assuming | ||||||||||||||||||||||||||||||||||||||||||||||||||||||||||||
| no expenses | ||||||||||||||||||||||||||||||||||||||||||||||||||||||||||||
| Ratios net of expenses | reduced or | |||||||||||||||||||||||||||||||||||||||||||||||||||||||||||
| reduced or | reimbursed by | |||||||||||||||||||||||||||||||||||||||||||||||||||||||||||
| reimbursed by adviser | adviser | |||||||||||||||||||||||||||||||||||||||||||||||||||||||||||
| Net realized and | ||||||||||||||||||||||||||||||||||||||||||||||||||||||||||||
| unrealized gain | ||||||||||||||||||||||||||||||||||||||||||||||||||||||||||||
| (loss) on | ||||||||||||||||||||||||||||||||||||||||||||||||||||||||||||
| investments, | ||||||||||||||||||||||||||||||||||||||||||||||||||||||||||||
| �� | futures | Distributions | ||||||||||||||||||||||||||||||||||||||||||||||||||||||||||
| Net asset value, | contracts, foreign | from net | Net asset value, | Net assets at end | Portfolio | |||||||||||||||||||||||||||||||||||||||||||||||||||||||
| beginning of | Net investment | currency related | Total from | investment | end of year or | of year or period | Net investment | turnover | ||||||||||||||||||||||||||||||||||||||||||||||||||||
| year or period | income (loss) | transactions | operations | income | period | Total Return | (in millions) | Expenses | income (loss) | Expenses | rate | |||||||||||||||||||||||||||||||||||||||||||||||||
Mid Cap Opportunity Portfolio | ||||||||||||||||||||||||||||||||||||||||||||||||||||||||||||
Six-Month Period Ended June 30, 2017+ | $30.37 | (0.03 | ) | 4.53 | 4.50 | — | $34.87 | 14.82 | %* | $ 74.8 | 0.97 | %** | -0.19 | %** | 0.97 | %** | 32 | %* | ||||||||||||||||||||||||||||||||||||||||||
Year ended December 31, 2016 | $29.90 | (0.09 | ) | 0.56 | 0.47 | — | $30.37 | 1.57 | % | $ 70.2 | 0.98 | % | -0.29 | % | 0.98 | % | 61 | % | ||||||||||||||||||||||||||||||||||||||||||
Year ended December 31, 2015 | $31.49 | (0.07 | ) | (1.52 | ) | (1.59 | ) | — | $29.90 | -5.05 | %(a) | $ 78.7 | 0.94 | % | -0.21 | % | 0.94 | % | 59 | % | ||||||||||||||||||||||||||||||||||||||||
Year ended December 31, 2014 | $28.24 | (0.05 | ) | 3.30 | 3.25 | — | $31.49 | 11.51 | % | $ 86.7 | 0.94 | % | -0.18 | % | 0.94 | % | 61 | % | ||||||||||||||||||||||||||||||||||||||||||
Year ended December 31, 2013 | $21.32 | (0.07 | ) | 6.99 | 6.92 | — | $28.24 | 32.46 | % | $ 83.0 | 0.96 | % | -0.28 | % | 0.96 | % | 44 | % | ||||||||||||||||||||||||||||||||||||||||||
S&P 500® Index Portfolio | ||||||||||||||||||||||||||||||||||||||||||||||||||||||||||||
Six-Month Period Ended June 30, 2017+ | $24.32 | 0.22 | 2.00 | 2.22 | — | $26.54 | 9.13 | %* | $903.1 | 0.38 | %** | 1.67 | %** | 0.38 | %** | 4 | %* | |||||||||||||||||||||||||||||||||||||||||||
Year ended December 31, 2016 | $21.82 | 0.25 | 2.25 | 2.50 | — | $24.32 | 11.46 | % | $842.6 | 0.42 | % | 1.84 | % | 0.42 | % | 8 | % | |||||||||||||||||||||||||||||||||||||||||||
Year ended December 31, 2015 | $21.93 | 0.37 | (0.17 | ) | 0.20 | (0.31 | ) | $21.82 | 0.91 | % | $410.7 | 0.41 | % | 1.72 | % | 0.41 | % | 14 | % | |||||||||||||||||||||||||||||||||||||||||
Year ended December 31, 2014 | $19.63 | 0.32 | 2.25 | 2.57 | (0.27 | ) | $21.93 | 13.11 | % | $388.2 | 0.43 | % | 1.64 | % | 0.43 | % | 11 | % | ||||||||||||||||||||||||||||||||||||||||||
Year ended December 31, 2013 | $15.08 | 0.26 | 4.52 | 4.78 | (0.23 | ) | $19.63 | 31.74 | % | $314.9 | 0.45 | % | 1.68 | % | 0.45 | % | 15 | % | ||||||||||||||||||||||||||||||||||||||||||
Strategic Value Portfolio | ||||||||||||||||||||||||||||||||||||||||||||||||||||||||||||
Six-Month Period Ended June 30, 2017+ | $15.60 | 0.29 | 1.00 | 1.29 | — | $16.89 | 8.27 | %* | $589.3 | 0.76 | %** | 4.55 | %** | 0.76 | %** | 14 | %* | |||||||||||||||||||||||||||||||||||||||||||
Year ended December 31, 2016 | $14.07 | 0.36 | 1.17 | 1.53 | — | $15.60 | 10.87 | % | $475.5 | 0.78 | % | 3.19 | % | 0.78 | % | 32 | % | |||||||||||||||||||||||||||||||||||||||||||
Year ended December 31, 2015 | $13.92 | 0.53 | 0.06 | 0.59 | (0.44 | ) | $14.07 | 4.26 | % | $309.8 | 0.78 | % | 3.47 | % | 0.78 | % | 13 | % | ||||||||||||||||||||||||||||||||||||||||||
Year ended December 31, 2014 | $13.09 | 0.93 | 0.68 | 1.61 | (0.78 | ) | $13.92 | 12.41 | % | $332.6 | 0.78 | % | 5.37 | % | 0.78 | % | 22 | % | ||||||||||||||||||||||||||||||||||||||||||
Year ended December 31, 2013 | $11.09 | 0.35 | 1.97 | 2.32 | (0.32 | ) | $13.09 | 21.00 | % | $397.7 | 0.79 | % | 3.58 | % | 0.79 | % | 22 | % | ||||||||||||||||||||||||||||||||||||||||||
High Income Bond Portfolio | ||||||||||||||||||||||||||||||||||||||||||||||||||||||||||||
Six-Month Period Ended June 30, 2017+ | $18.10 | 0.52 | 0.39 | 0.91 | — | $19.01 | 5.03 | %* | $318.6 | 0.74 | %** | 5.28 | %** | 0.74 | %** | 17 | %* | |||||||||||||||||||||||||||||||||||||||||||
Year ended December 31, 2016 | $15.82 | 0.43 | 1.85 | 2.28 | — | $18.10 | 14.41 | % | $313.8 | 0.80 | % | 5.56 | % | 0.80 | % | 30 | % | |||||||||||||||||||||||||||||||||||||||||||
Year ended December 31, 2015 | $16.32 | 1.18 | (1.68 | ) | (0.50 | ) | — | $15.82 | -3.06 | % | $194.2 | 0.80 | % | 5.65 | % | 0.80 | % | 29 | % | |||||||||||||||||||||||||||||||||||||||||
Year ended December 31, 2014 | $15.88 | 1.57 | (1.13 | ) | 0.44 | — | $16.32 | 2.77 | % | $230.1 | 0.77 | % | 5.73 | % | 0.77 | % | 33 | % | ||||||||||||||||||||||||||||||||||||||||||
Year ended December 31, 2013 | $14.83 | 1.10 | (0.05 | ) | 1.05 | — | $15.88 | 7.08 | % | $307.9 | 0.77 | % | 6.36 | % | 0.77 | % | 29 | % | ||||||||||||||||||||||||||||||||||||||||||
| + | Unaudited |
| * | Not annualized |
| ** | Annualized |
| (a) | Initial Public Offering (IPO) investments had a significant impact on the total return in this period and such performance may be difficult to repeat. |
The accompanying notes are an integral part of these financial statements.
143
Ohio National Fund, Inc.
| Financial Highlights |
| Selected per-share data | Ratios and supplemental data | |||||||||||||||||||||||||||||||||||||||||||||||||||||||||||
| Operations | Distributions | Ratios to average net assets | ||||||||||||||||||||||||||||||||||||||||||||||||||||||||||
| Ratios assuming | ||||||||||||||||||||||||||||||||||||||||||||||||||||||||||||
| no expenses | ||||||||||||||||||||||||||||||||||||||||||||||||||||||||||||
| Ratios net of expenses | reduced or | |||||||||||||||||||||||||||||||||||||||||||||||||||||||||||
| reduced or | reimbursed by | |||||||||||||||||||||||||||||||||||||||||||||||||||||||||||
| reimbursed by adviser | adviser | |||||||||||||||||||||||||||||||||||||||||||||||||||||||||||
| Net realized and | ||||||||||||||||||||||||||||||||||||||||||||||||||||||||||||
| unrealized gain | ||||||||||||||||||||||||||||||||||||||||||||||||||||||||||||
| (loss) on | Distributions | |||||||||||||||||||||||||||||||||||||||||||||||||||||||||||
| Net asset value, | investments and | from net | Net asset value, | Net assets at end | Portfolio | |||||||||||||||||||||||||||||||||||||||||||||||||||||||
| beginning of year | Net investment | futures | Total from | investment | end of year or | of year or period | Net investment | turnover | ||||||||||||||||||||||||||||||||||||||||||||||||||||
| or period | income (loss) | contracts | operations | income | period | Total Return | (in millions) | Expenses | income (loss) | Expenses | rate | |||||||||||||||||||||||||||||||||||||||||||||||||
ClearBridge Small Cap Portfolio | ||||||||||||||||||||||||||||||||||||||||||||||||||||||||||||
Six-Month Period Ended June 30, 2017+ | $51.21 | 0.07 | 3.28 | 3.35 | — | $54.56 | 6.54 | %* | $280.3 | 0.89 | %** | 0.23 | %** | 0.89 | %** | 23 | %* | |||||||||||||||||||||||||||||||||||||||||||
Year ended December 31, 2016 | $40.00 | 0.22 | 10.99 | 11.21 | — | $51.21 | 28.03 | % | $275.7 | 0.93 | % | 0.92 | % | 0.93 | % | 51 | % | |||||||||||||||||||||||||||||||||||||||||||
Year ended December 31, 2015 | $41.01 | (0.10 | ) | (0.91 | ) | (1.01 | ) | — | $40.00 | -2.46 | % | $ 94.0 | 1.01 | % | -0.29 | % | 1.01 | % | 126 | %(a) | ||||||||||||||||||||||||||||||||||||||||
Year ended December 31, 2014 | $40.03 | (0.19 | ) | 1.17 | 0.98 | — | $41.01 | 2.45 | % | $ 75.5 | 1.00 | % | -0.45 | % | 1.00 | % | 44 | % | ||||||||||||||||||||||||||||||||||||||||||
Year ended December 31, 2013 | $30.73 | (0.15 | ) | 9.45 | 9.30 | — | $40.03 | 30.26 | % | $ 80.4 | 1.01 | % | -0.44 | % | 1.01 | % | 42 | % | ||||||||||||||||||||||||||||||||||||||||||
Nasdaq-100® Index Portfolio | ||||||||||||||||||||||||||||||||||||||||||||||||||||||||||||
Six-Month Period Ended June 30, 2017+ | $12.59 | 0.05 | 2.03 | 2.08 | — | $14.67 | 16.52 | %* | $193.1 | 0.45 | %** | 0.82 | %** | 0.45 | %** | 5 | %* | |||||||||||||||||||||||||||||||||||||||||||
Year ended December 31, 2016 | $11.80 | 0.09 | 0.70 | 0.79 | — | $12.59 | 6.69 | % | $156.1 | 0.48 | % | 0.84 | % | 0.48 | % | 13 | % | |||||||||||||||||||||||||||||||||||||||||||
Year ended December 31, 2015 | $10.88 | 0.09 | 0.91 | 1.00 | (0.08 | ) | $11.80 | 9.14 | % | $138.6 | 0.46 | % | 0.79 | % | 0.46 | % | 19 | % | ||||||||||||||||||||||||||||||||||||||||||
Year ended December 31, 2014 | $9.25 | 0.12 | 1.62 | 1.74 | (0.11 | ) | $10.88 | 18.77 | % | $121.7 | 0.48 | % | 1.23 | % | 0.48 | % | 23 | % | ||||||||||||||||||||||||||||||||||||||||||
Year ended December 31, 2013 | $6.85 | 0.07 | 2.39 | 2.46 | (0.06 | ) | $ 9.25 | 35.98 | % | $ 95.8 | 0.51 | % | 0.94 | % | 0.51 | % | 43 | % | ||||||||||||||||||||||||||||||||||||||||||
Bristol Portfolio | ||||||||||||||||||||||||||||||||||||||||||||||||||||||||||||
Six-Month Period Ended June 30, 2017+ | $24.02 | 0.06 | 2.61 | 2.67 | — | $26.69 | 11.12 | %* | $216.6 | 0.82 | %** | 0.43 | %** | 0.82 | %** | 103 | %* | |||||||||||||||||||||||||||||||||||||||||||
Year ended December 31, 2016 | $21.49 | 0.12 | 2.41 | 2.53 | — | $24.02 | 11.77 | % | $207.9 | 0.83 | % | 0.49 | % | 0.83 | % | 223 | % | |||||||||||||||||||||||||||||||||||||||||||
Year ended December 31, 2015 | $20.75 | 0.12 | 0.73 | 0.85 | (0.11 | ) | $21.49 | 4.08 | % | $218.7 | 0.81 | % | 0.55 | % | 0.81 | % | 228 | % | ||||||||||||||||||||||||||||||||||||||||||
Year ended December 31, 2014 | $18.29 | 0.09 | 2.45 | 2.54 | (0.08 | ) | $20.75 | 13.88 | % | $232.0 | 0.81 | % | 0.42 | % | 0.81 | % | 239 | % | ||||||||||||||||||||||||||||||||||||||||||
Year ended December 31, 2013 | $13.01 | 0.09 | 5.27 | 5.36 | (0.08 | ) | $18.29 | 41.21 | % | $231.5 | 0.82 | % | 0.51 | % | 0.82 | % | 269 | % | ||||||||||||||||||||||||||||||||||||||||||
Bryton Growth Portfolio | ||||||||||||||||||||||||||||||||||||||||||||||||||||||||||||
Six-Month Period Ended June 30, 2017+ | $20.49 | (0.07 | ) | 2.25 | 2.18 | — | $22.67 | 10.64 | %* | $ 96.0 | 0.97 | %** | -0.59 | %** | 0.97 | %** | 101 | %* | ||||||||||||||||||||||||||||||||||||||||||
Year ended December 31, 2016 | $19.60 | (0.19 | ) | 1.08 | 0.89 | — | $20.49 | 4.54 | % | $ 94.6 | 0.92 | % | -0.62 | % | 0.92 | % | 188 | % | ||||||||||||||||||||||||||||||||||||||||||
Year ended December 31, 2015 | $20.47 | (0.11 | ) | (0.76 | ) | (0.87 | ) | — | $19.60 | -4.25 | % | $162.2 | 0.88 | % | -0.53 | % | 0.88 | % | 169 | % | ||||||||||||||||||||||||||||||||||||||||
Year ended December 31, 2014 | $19.28 | (0.09 | ) | 1.28 | 1.19 | — | $20.47 | 6.17 | % | $179.1 | 0.88 | % | -0.45 | % | 0.88 | % | 178 | % | ||||||||||||||||||||||||||||||||||||||||||
Year ended December 31, 2013 | $13.70 | (0.11 | ) | 5.69 | 5.58 | — | $19.28 | 40.73 | % | $180.8 | 0.89 | % | -0.59 | % | 0.89 | % | 185 | % | ||||||||||||||||||||||||||||||||||||||||||
| + | Unaudited |
| * | Not annualized |
| ** | Annualized |
| (a) | Effective September 25, 2015, the sub-adviser changed from Eagle Asset Management, Inc. to ClearBridge, LLC. Costs of purchases and proceeds from sales of portfolio securities associated with the change in the sub-adviser contributed to a higher portfolio turnover rate for the year ended December 31, 2015 as compared to prior years. |
The accompanying notes are an integral part of these financial statements.
144
Ohio National Fund, Inc.
| Financial Highlights |
| Selected per-share data | Ratios and supplemental data | |||||||||||||||||||||||||||||||||||||||||||||||||||||||||||
| Operations | Distributions | Ratios to average net assets | ||||||||||||||||||||||||||||||||||||||||||||||||||||||||||
| Ratios assuming | ||||||||||||||||||||||||||||||||||||||||||||||||||||||||||||
| no expenses | ||||||||||||||||||||||||||||||||||||||||||||||||||||||||||||
| Ratios net of expenses | reduced or | |||||||||||||||||||||||||||||||||||||||||||||||||||||||||||
| reduced or | reimbursed by | �� | ||||||||||||||||||||||||||||||||||||||||||||||||||||||||||
| reimbursed by adviser | adviser | |||||||||||||||||||||||||||||||||||||||||||||||||||||||||||
| Net realized and | ||||||||||||||||||||||||||||||||||||||||||||||||||||||||||||
| unrealized gain (loss) on | ||||||||||||||||||||||||||||||||||||||||||||||||||||||||||||
| investments, futures | ||||||||||||||||||||||||||||||||||||||||||||||||||||||||||||
| contracts, foreign | Distributions | |||||||||||||||||||||||||||||||||||||||||||||||||||||||||||
| Net asset value, | currency related | from net | Net asset value, | Net assets at end | Portfolio | |||||||||||||||||||||||||||||||||||||||||||||||||||||||
| beginning of | Net investment | transactions, and written | Total from | investment | end of year or | of year or period | Net investment | turnover | ||||||||||||||||||||||||||||||||||||||||||||||||||||
| year or period | income | options | operations | income | period | Total Return | (in millions) | Expenses | income | Expenses | rate | |||||||||||||||||||||||||||||||||||||||||||||||||
Balanced Portfolio | ||||||||||||||||||||||||||||||||||||||||||||||||||||||||||||
Six-Month Period Ended June 30, 2017+ | $19.86 | 0.23 | 1.05 | 1.28 | — | $21.14 | 6.45 | %* | $991.4 | 0.63 | %** | 2.11 | %** | 0.63 | %** | 48 | %* | |||||||||||||||||||||||||||||||||||||||||||
Year ended December 31, 2016 | $18.99 | 0.39 | 0.48 | 0.87 | — | $19.86 | 4.58 | % | $952.1 | 0.64 | % | 2.05 | % | 0.64 | % | 99 | % | |||||||||||||||||||||||||||||||||||||||||||
Year ended December 31, 2015 | $18.96 | 0.30 | (0.02 | ) | 0.28 | (0.25 | ) | $18.99 | 1.47 | % | $864.9 | 0.64 | % | 1.58 | % | 0.64 | % | 92 | % | |||||||||||||||||||||||||||||||||||||||||
Year ended December 31, 2014 | $18.02 | 0.16 | 0.92 | 1.08 | (0.14 | ) | $18.96 | 5.99 | % | $833.1 | 0.64 | % | 1.80 | % | 0.68 | % | 94 | % | ||||||||||||||||||||||||||||||||||||||||||
Year ended December 31, 2013 | $15.76 | 0.08 | 2.32 | 2.40 | (0.14 | ) | $18.02 | 15.26 | % | $249.1 | 0.75 | % | 1.45 | % | 0.75 | % | 82 | %(a) | ||||||||||||||||||||||||||||||||||||||||||
S&P MidCap 400® Index Portfolio | ||||||||||||||||||||||||||||||||||||||||||||||||||||||||||||
Six-Month Period Ended June 30, 2017+ | $15.12 | 0.04 | 0.82 | 0.86 | — | $15.98 | 5.69 | %* | $ 56.8 | 0.71 | %** | 0.85 | %** | 0.71 | %** | 31 | %* | |||||||||||||||||||||||||||||||||||||||||||
Year ended December 31, 2016 | $13.81 | 0.17 | 1.14 | 1.31 | — | $15.12 | 9.49 | % | $ 47.9 | 0.79 | % | 1.24 | % | 0.79 | % | 179 | %(b) | |||||||||||||||||||||||||||||||||||||||||||
Year ended December 31, 2015 | $14.49 | 0.25 | (0.72 | ) | (0.47 | ) | (0.21 | ) | $13.81 | -3.24 | % | $ 46.3 | 0.77 | % | 1.54 | % | 0.77 | % | 72 | % | ||||||||||||||||||||||||||||||||||||||||
Year ended December 31, 2014 | $13.70 | 0.25 | 0.77 | 1.02 | (0.23 | ) | $14.49 | 7.44 | % | $ 55.1 | 0.77 | % | 1.77 | % | 0.77 | % | 79 | % | ||||||||||||||||||||||||||||||||||||||||||
Year ended December 31, 2013 | $10.10 | 0.09 | 3.61 | 3.70 | (0.10 | ) | $13.70 | 36.71 | % | $ 53.7 | 0.82 | % | 0.92 | % | 0.82 | % | 57 | %(a) | ||||||||||||||||||||||||||||||||||||||||||
Bristol Growth Portfolio | ||||||||||||||||||||||||||||||||||||||||||||||||||||||||||||
Six-Month Period Ended June 30, 2017+ | $18.65 | 0.03 | 2.54 | 2.57 | — | $21.22 | 13.78 | %* | $123.9 | 0.87 | %** | 0.27 | %** | 0.87 | %** | 102 | %* | |||||||||||||||||||||||||||||||||||||||||||
Year ended December 31, 2016 | $17.31 | 0.07 | 1.27 | 1.34 | — | $18.65 | 7.74 | % | $117.6 | 0.89 | % | 0.36 | % | 0.89 | % | 162 | % | |||||||||||||||||||||||||||||||||||||||||||
Year ended December 31, 2015 | $16.44 | 0.08 | 0.86 | 0.94 | (0.07 | ) | $17.31 | 5.72 | % | $116.2 | 0.86 | % | 0.43 | % | 0.86 | % | 168 | % | ||||||||||||||||||||||||||||||||||||||||||
Year ended December 31, 2014 | $14.72 | 0.06 | 1.71 | 1.77 | (0.05 | ) | $16.44 | 12.01 | % | $124.1 | 0.86 | % | 0.34 | % | 0.86 | % | 192 | % | ||||||||||||||||||||||||||||||||||||||||||
Year ended December 31, 2013 | $10.66 | 0.06 | 4.05 | 4.11 | (0.05 | ) | $14.72 | 38.62 | % | $122.3 | 0.88 | % | 0.42 | % | 0.88 | % | 237 | % | ||||||||||||||||||||||||||||||||||||||||||
Risk Managed Balanced Portfolio | ||||||||||||||||||||||||||||||||||||||||||||||||||||||||||||
Six-Month Period Ended June 30, 2017+ | $11.06 | 0.07 | 0.80 | 0.87 | — | $11.93 | 7.87 | %* | $323.1 | 0.99 | %** | 1.36 | %** | 0.99 | %** | 29 | %* | |||||||||||||||||||||||||||||||||||||||||||
Year ended December 31, 2016 | $10.66 | 0.09 | 0.31 | 0.40 | — | $11.06 | 3.75 | % | $272.1 | 1.03 | % | 1.09 | % | 1.03 | % | 78 | % | |||||||||||||||||||||||||||||||||||||||||||
Year ended December 31, 2015 | $10.83 | 0.03 | (0.17 | ) | (0.14 | ) | (0.03 | ) | $10.66 | -1.32 | % | $154.3 | 1.11 | % | 0.81 | % | 1.11 | % | 71 | % | ||||||||||||||||||||||||||||||||||||||||
Period From May 1, 2014 (inception)*** to June 30, 2014 | $10.00 | 0.03 | 0.80 | 0.83 | — | $10.83 | 8.30 | %* | $ 33.8 | 1.43 | %** | 0.43 | %** | 1.43 | %** | 94 | %* | |||||||||||||||||||||||||||||||||||||||||||
| + | Unaudited |
| * | Not annualized |
| ** | Annualized |
| *** | Represents date of inception and commencement of operations. |
| (a) | The cost of purchases and proceeds from sales of securities that were incurred to realign the Portfolio’s holdings subsequent to the December 20, 2013 reorganization are excluded from the 2013 portfolio turnover rate calculation. If such amounts had not been excluded, the portfolio turnover rate would have been 89% and 138% for the Balanced and the S&P MidCap 400® Index Portfolios, respectively. |
| (b) | Effective December 16, 2016, the sub-adviser to the Portfolio changed from First Trust Advisors L.P. to Geode Capital Management, LLC. Costs of purchases and proceeds from sales of portfolio securities associated with the change in the sub-adviser contributed to a higher portfolio turnover rate for the year ended December 31, 2016 as compared to prior years. |
The accompanying notes are an integral part of these financial statements.
145
Ohio National Fund, Inc.
| Financial Highlights |
| Selected per-share data | Ratios and supplemental data | ||||||||||||||||||||||||||||||||||||||||||||||||||||||
| Operations | Ratios to average net assets | ||||||||||||||||||||||||||||||||||||||||||||||||||||||
| Ratios assuming no | |||||||||||||||||||||||||||||||||||||||||||||||||||||||
| Ratios net of expenses | expenses reduced | ||||||||||||||||||||||||||||||||||||||||||||||||||||||
| reduced or | or reimbursed by | ||||||||||||||||||||||||||||||||||||||||||||||||||||||
| reimbursed by adviser | adviser | ||||||||||||||||||||||||||||||||||||||||||||||||||||||
| Net realized and | |||||||||||||||||||||||||||||||||||||||||||||||||||||||
| Net asset value, | unrealized | Net asset value, | Net assets at end | Portfolio | |||||||||||||||||||||||||||||||||||||||||||||||||||
| beginning of | Net investment | gain on | Total from | end of year or | of year or period | Net investment | turnover | ||||||||||||||||||||||||||||||||||||||||||||||||
| year or period | income (loss) | investments | operations | period | Total Return | (in millions) | Expenses | income (loss) | Expenses | rate | |||||||||||||||||||||||||||||||||||||||||||||
ON Conservative Model Portfolio | |||||||||||||||||||||||||||||||||||||||||||||||||||||||
Period From March 1, 2017 (inception)*** to June 30, 2017+ | $10.00 | 0.06 | 0.17 | 0.23 | $10.23 | 2.30%* | $105.8 | 0.30%**,† | 1.85%**,† | 0.51%**,† | 10%* | ||||||||||||||||||||||||||||||||||||||||||||
ON Moderately Conservative Model Portfolio | |||||||||||||||||||||||||||||||||||||||||||||||||||||||
Period From March 1, 2017 (inception)*** to June 30, 2017+ | $10.00 | 0.04 | 0.22 | 0.26 | $10.26 | 2.60%* | $336.9 | 0.30%**,† | 1.30%**,† | 0.45%**,† | 7%* | ||||||||||||||||||||||||||||||||||||||||||||
ON Balanced Model Portfolio | |||||||||||||||||||||||||||||||||||||||||||||||||||||||
Period From March 1, 2017 (inception)*** to June 30, 2017+ | $10.00 | 0.02 | 0.25 | 0.27 | $10.27 | 2.70%* | $1,553.8 | 0.28%**,† | 0.68%**,† | 0.43%**,† | 10%* | ||||||||||||||||||||||||||||||||||||||||||||
ON Moderate Growth Model Portfolio | |||||||||||||||||||||||||||||||||||||||||||||||||||||||
Period From March 1, 2017 (inception)*** to June 30, 2017+ | $10.00 | 0.01 | 0.34 | 0.35 | $10.35 | 3.50%* | $2,580.8 | 0.27%**,† | 0.23%**,† | 0.43%**,† | 10%* | ||||||||||||||||||||||||||||||||||||||||||||
ON Growth Model Portfolio | |||||||||||||||||||||||||||||||||||||||||||||||||||||||
Period From March 1, 2017 (inception)*** to June 30, 2017+ | $10.00 | (0.01) | 0.37 | 0.36 | $10.36 | 3.60%* | $520.7 | 0.25%**,† | -0.16%**,† | 0.44%**,† | 9%* | ||||||||||||||||||||||||||||||||||||||||||||
| + | Unaudited |
| * | Not annualized |
| ** | Annualized |
| *** | Represents date of inception and commencement of operations. |
| † | The ratios presented only reflect the direct income and expenses for the Portfolio, and do not include the indirect expenses related to the underlying funds in which the Portfolio invests. |
The accompanying notes are an integral part of these financial statements.
146
Ohio National Fund, Inc.
| Notes to Financial Statements | June 30, 2017 (Unaudited) |
(1) Organization
Ohio National Fund, Inc. (the “Fund”) is a Maryland corporation registered under the Investment Company Act of 1940, as amended (the “40 Act” ). The Fund is an open-end investment company and follows accounting and reporting guidance under Financial Accounting Standards Board (“FASB”) Accounting Standards Codification (“ASC”) Topic 946, “Financial Services-Investment Companies”. The Fund consists of twenty-five separate investment portfolios (the “Portfolios”) that seek the following objectives and strategies:
| ⬛ | Equity Portfolio – Long-term growth of capital by investing at least 80% of its assets in equity securities. |
| ⬛ | Bond Portfolio – High level of income and opportunity for capital appreciation consistent with preservation of capital by investing primarily in intermediate-term and long-term fixed income securities. |
| ⬛ | Omni Portfolio – High level of long-term total return consistent with preservation of capital by investing in stocks, bonds, and money market instruments. |
| ⬛ | Capital Appreciation Portfolio – Long-term growth of capital by investing primarily in equity and equity related securities of established companies with either current or emerging earnings growth not fully appreciated or recognized by the market. |
| ⬛ | ON International Equity Portfolio (formerly the International Portfolio) – Long-term growth of capital by investing at least 80% of its assets in securities of foreign companies. On May 1, 2017, the name, strategy, benchmark, and sub-adviser to this Portfolio were changed. Additional information is included within Note 3. |
| ⬛ | ON Foreign Portfolio (formerly the International Small-Mid Company Portfolio) – Long-term growth of capital by investing at least 80% of its assets in foreign securities. On May 1, 2017, the name, strategy, benchmark, and sub-adviser to this Portfolio were changed. Additional information is included within Note 3. |
| ⬛ | Aggressive Growth Portfolio – Long-term capital growth by investing primarily in domestic and foreign equity securities selected for growth potential. |
| ⬛ | Small Cap Growth Portfolio – Long-term capital appreciation by investing at least 80% of its net assets in stocks of small capitalization companies. |
| ⬛ | Mid Cap Opportunity Portfolio – Long-term total return by investing at least 80% of its net assets in equity securities of mid-cap companies, primarily those that are strategically positioned for long-term growth. |
| ⬛ | S&P 500® Index Portfolio – Total return approximating that of the Standard & Poor’s 500® Index (S&P 500® Index), including reinvestment of dividends, at a risk level consistent with that of the S&P 500® Index by investing more than 80% of its net assets in securities making up the S&P 500® Index. |
| ⬛ | Strategic Value Portfolio – Growth of capital and income by investing primarily in high dividend yielding common stocks with dividend growth potential. |
| ⬛ | High Income Bond Portfolio – High current income by investing at least 80% of its net assets in lower rated corporate debt obligations commonly referred to as “junk bonds”. The Portfolio’s investments are generally rated Ba or lower by Moody’s, or BB or lower by Standard & Poor’s or Fitch. |
| ⬛ | ClearBridge Small Cap Portfolio – Long-term capital appreciation by investing at least 80% of its net assets in common stocks and other equity securities of small capitalization companies or in other investments that the portfolio managers believe have similar economic characteristics. |
| ⬛ | Nasdaq-100® Index Portfolio – Long-term growth of capital by investing primarily in stocks that are included in the Nasdaq-100® Index. Unlike the other Portfolios of the Fund, the Nasdaq-100® Index Portfolio is a non-diversified portfolio for purposes of Section 5(b) of the 40 Act. |
| ⬛ | Bristol Portfolio – Long-term growth of capital by investing primarily in common stocks of the 1,000 largest publicly traded U.S. companies in terms of market capitalization. |
| ⬛ | Bryton Growth Portfolio – Long-term growth of capital by investing primarily in common stocks of growth-oriented U.S. companies smaller than the 500 largest publicly traded U.S. companies in terms of market capitalization. |
| ⬛ | Balanced Portfolio – Capital appreciation and income by investing normally up to 75% of its total assets in equity securities of domestic and foreign companies of any market capitalization while maintaining a minimum of 25% of its total assets in fixed income securities. |
| 147 | (continued) |
Ohio National Fund, Inc.
| Notes to Financial Statements (Continued) | June 30, 2017 (Unaudited) |
| ⬛ | S&P MidCap 400® Index Portfolio – Total return approximating that of the Standard & Poor’s MidCap 400® Index (S&P MidCap 400® Index), including reinvestment of dividends, at a risk level consistent with that of the S&P MidCap 400® Index by investing more than 80% of its net assets in the securities in the S&P MidCap 400® Index. |
| ⬛ | Bristol Growth Portfolio – Long-term growth of capital by investing primarily in common stocks of the 1,000 largest publicly traded U.S. companies in terms of market capitalization. |
| ⬛ | Risk Managed Balanced Portfolio – Long-term capital growth, consistent with preservation of capital and balanced by current income. The Portfolio invests in a balanced portfolio of equity and fixed-income securities and a risk management portfolio intended to enhance the risk adjusted return of the Portfolio. |
| ⬛ | ON Conservative Model Portfolio – Commenced operations on March 1, 2017 - The Portfolio is a fund of funds that seeks current income and preservation of capital. Under normal circumstances, the Portfolio intends to have investment exposure to various asset classes within the following target asset allocation ranges: U.S. Equity 0-25%, International Equity 0-10%, and Fixed Income 65-90%. |
| ⬛ | ON Moderately Conservative Model Portfolio – Commenced operations on March 1, 2017 - The Portfolio is a fund of funds that seeks current income and moderate growth of capital with a greater emphasis on current income. Under normal circumstances, the Portfolio intends to have investment exposure to various asset classes within the following target asset allocation ranges: U.S. Equity 20-40%, International Equity 5-20%, and Fixed Income 30-70%. |
| ⬛ | ON Balanced Model Portfolio – Commenced operations on March 1, 2017 - The Portfolio is a fund of funds that seeks a balance between growth of capital and current income with a greater emphasis on growth of capital. Under normal circumstances, the Portfolio intends to have investment exposure to various asset classes within the following target asset allocation ranges: U.S. Equity 25-50%, International Equity 10-25%, and Fixed Income 25-50%. |
| ⬛ | ON Moderate Growth Model Portfolio – Commenced operations on March 1, 2017 - The Portfolio is a fund of funds that seeks growth of capital and moderate current income with a greater emphasis on growth of capital. Under normal circumstances, the Portfolio intends to have investment exposure to various asset classes within the following target asset allocation ranges: U.S. Equity 40-60%, International Equity 15-35%, and Fixed Income 10-30%. |
| ⬛ | ON Growth Model Portfolio – Commenced operations on March 1, 2017 - The Portfolio is a fund of funds that seeks growth of capital and some current income. Under normal circumstances, the Portfolio intends to have investment exposure to various asset classes within the following target asset allocation ranges: U.S. Equity 50-80%, International Equity 15-45%, and Fixed Income 0-15%. |
Additional detail regarding portfolio-specific objectives, policies, and investment strategies is provided in the prospectus and Statement of Additional Information of Ohio National Fund, Inc. There are no assurances that these objectives will be met. Each Portfolio, except the Nasdaq-100® Index Portfolio, is classified as diversified for purposes of Section 5(b) of the 40 Act.
At present, the Fund issues its shares to separate accounts of The Ohio National Life Insurance Company (“ONLIC”), Ohio National Life Assurance Corporation (“ONLAC”), and National Security Life and Annuity Company (“NSLA”) to support certain benefits under variable contracts issued by those entities, as well as for purchases by other Portfolios of the Fund. In the future, Fund shares may be used for other purposes but, unless there is a change in applicable law, they will not be sold directly to the public.
Interest in each Portfolio is represented by a separate class of the Fund’s capital stock, par value $1. Each share of a Portfolio participates equally in the Portfolio’s dividends, distributions, net assets, and voting matters.
The Fund is authorized to issue 1.55 billion of its capital shares. These authorized shares have been allocated to specific Portfolios of the Fund as follows:
Portfolio | Authorized Shares | |
Equity | 35,000,000 | |
Bond | 30,000,000 | |
Omni | 15,000,000 | |
Capital Appreciation | 25,000,000 | |
ON International Equity | 90,000,000 | |
ON Foreign | 32,000,000 | |
Aggressive Growth | 24,000,000 | |
Small Cap Growth | 30,000,000 | |
Mid Cap Opportunity | 21,000,000 |
Portfolio | Authorized Shares | |
S&P 500® Index | 90,000,000 | |
Strategic Value | 75,000,000 | |
High Income Bond | 45,000,000 | |
ClearBridge Small Cap | 15,000,000 | |
Nasdaq-100® Index | 50,000,000 | |
Bristol | 23,000,000 | |
Bryton Growth | 15,000,000 | |
Balanced | 90,000,000 | |
S&P MidCap 400® Index | 30,000,000 |
| 148 | (continued) |
Ohio National Fund, Inc.
| Notes to Financial Statements (Continued) | June 30, 2017 (Unaudited) |
Portfolio | Authorized Shares | |
Bristol Growth | 30,000,000 | |
Risk Managed Balanced | 85,000,000 | |
ON Conservative Model | 30,000,000 | |
ON Moderately Conservative Model | 70,000,000 |
Portfolio | Authorized Shares | |
ON Balanced Model | 200,000,000 | |
ON Moderate Growth Model | 300,000,000 | |
ON Growth Model | 100,000,000 |
The Fund’s Board of Directors (the “Board”) periodically reallocates authorized shares among the Portfolios of the Fund and may authorize additional shares as deemed necessary.
Under the Fund’s organizational documents, its Officers and Directors are indemnified against certain liabilities arising out of the performance of their duties to the Fund. In addition, in the normal course of business, the Fund enters into contracts with its vendors and others that provide for general indemnifications. The Fund’s maximum exposure under these arrangements is unknown as this would involve future claims that may be made against the Fund. However, based on experience, the risk of loss to the Fund is expected to be remote.
(2) Significant Accounting Policies
The following is a summary of significant accounting policies followed by the Fund in preparation of its financial statements:
Use of Estimates
The preparation of financial statements in conformity with U.S. generally accepted accounting principles (“U.S. GAAP”) requires management to make estimates and assumptions that affect the reported amounts of assets and liabilities and disclosure of contingent assets and liabilities at the date of the financial statements and the reported amounts of increases and decreases in net assets from operations during the reporting period. Actual results could differ from those estimates.
Security Valuation
Investments are valued using pricing procedures approved by the Board.
Fixed income instruments that mature in sixty days or less, and of sufficient credit quality, are valued at amortized cost. Amortized cost valuation involves valuing a security at its cost initially and thereafter amortizing to maturity any discounts or premiums on the level-yield method, regardless of the impact of fluctuating market interest rates on the value of the security. In these instances, amortized cost approximates fair value.
Investments, other than those securities aforementioned, are valued as follows:
Domestic equity securities that are traded on U.S. exchanges, other than Nasdaq Stock Market, are valued at the last trade price reported by the primary exchange of each security (4:00 pm Eastern Time for normal trading sessions). Domestic equity securities that are listed on the Nasdaq Stock Market are valued at the Nasdaq Official Closing Price (“NOCP”). Over-the-counter domestic equity securities are valued at the last trade price reported daily as of 4:00 pm Eastern Time (normal trading sessions). Over-the-counter traded ADRs may also be valued at an evaluated price based on the value of the underlying securities. If a domestic equity security is not traded on a particular day, the mean between the bid and ask prices reported at 4:00 pm Eastern Time (normal trading sessions) by the primary exchange will generally be used for valuation purposes. The principal sources for market quotations are independent pricing services that have been approved by the Board.
Fixed income securities that have a remaining maturity exceeding sixty days are generally valued at the bid price reported at 4:00 pm Eastern Time (normal trading sessions), as provided by independent pricing services approved by the Board. The last trade or last evaluated bid may be used if an evaluated bid price is not available.
U.S exchange-traded options are valued at the composite basis last sale price as reported to a Board-approved independent pricing service by the OPRA (Options Price Reporting Authority) at 4:15 pm Eastern Time (normal trading sessions). If there are no reported trades for a trading session, the evaluated composite-basis bid price will generally be used for valuation purposes.
Shares of open-end mutual funds are valued at each fund’s last calculated net asset value per share.
Shares of closed-end mutual funds that are traded on U.S. exchanges are valued similarly to other domestic equity securities, typically at the last trade price reported by the primary exchange of each fund (4:00 pm Eastern Time for normal trading sessions).
Restricted securities, illiquid securities, or other investments for which market quotations or other observable market inputs are not readily available are valued at an estimate of value using methods determined in good faith by the Fund’s Pricing Committee under the supervision of the Board.
| 149 | (continued) |
Ohio National Fund, Inc.
| Notes to Financial Statements (Continued) | June 30, 2017 (Unaudited) |
Foreign equity securities are initially priced at the reported close price of the exchange on which a security is primarily traded. Securities not traded on a particular day are valued at the mean between the last reported bid and ask quotes at daily close, or the last sale price when appropriate. The principal sources for market quotations are independent pricing services that have been approved by the Board.
Equity securities that are primarily traded on foreign exchanges, other than those with close times that are consistent with the normal 4:00 pm Eastern Time close of U.S. equity markets, are further subjected to fair valuation pricing procedures provided by an independent fair valuation service. The service provides data that can be used to estimate the price of a foreign issue that would prevail in a liquid market given market information available daily at 4:00 pm Eastern Time (normal trading sessions). Multiple factors may be considered in performing this valuation, including an issue’s local close price, relevant general and sector indices, currency fluctuations, and pricing of related depository receipts, exchange traded funds, and futures. The pricing procedures are performed for each individual security for which there is a fairly large degree of certainty that the local close price is not the liquid market price at the time of U.S. market close. The procedures are performed each day there is a change in a consistently used market index from the time of local close to the U.S. market close. Backtesting analysis is performed on a quarterly basis to monitor the effectiveness of these procedures. The testing is reviewed by management of the Fund as well as the Fund’s Board. Prior results have indicated that these procedures have been effective in reaching valuation objectives.
The differences between the aggregate cost and values of investments are reflected as unrealized appreciation or unrealized depreciation.
Pricing inputs used in the Fund’s determination of its investment values are categorized according to a three-tier hierarchy framework. The hierarchy is summarized in three broad levels:
| Level 1: | Quoted prices in active markets for identical securities. | |
| Level 2: | Other significant observable inputs, including quoted prices for similar securities, interest rates, prepayment speeds, credit risk, etc. | |
| Level 3: | Significant unobservable inputs, including the Fund’s own assumptions used to determine the value of securities. | |
The following is a summary of the inputs used in valuing each of the Portfolio’s assets (liabilities) at value as of June 30, 2017:
Portfolio | Financial Instrument Type | Level 1 | Level 2 | Level 3 | ||||||||||
Equity | Common Stocks** | $ | 560,453,563 | $ | — | $ | — | |||||||
Closed-End Mutual Funds | 5,747,967 | — | — | |||||||||||
Money Market Funds | 3,924,509 | — | — | |||||||||||
|
|
|
|
|
| |||||||||
| $ | 570,126,039 | $ | — | $ | — | |||||||||
|
|
|
|
|
| |||||||||
Bond | Corporate Bonds** | $ | — | $ | 160,070,548 | $ | — | |||||||
Asset-Backed Securities** | — | 930,439 | — | |||||||||||
Money Market Funds | 1,912,862 | — | — | |||||||||||
|
|
|
|
|
| |||||||||
| $ | 1,912,862 | $ | 161,000,987 | $ | — | |||||||||
|
|
|
|
|
| |||||||||
Omni | Common Stocks** | $ | 48,082,674 | $ | — | $ | — | |||||||
Corporate Bonds** | — | 12,445,777 | — | |||||||||||
Asset-Backed Securities** | — | 79,866 | — | |||||||||||
U.S. Treasury Obligations | — | 1,087,683 | — | |||||||||||
Money Market Funds | 445,138 | — | — | |||||||||||
|
|
|
|
|
| |||||||||
| $ | 48,527,812 | $ | 13,613,326 | $ | — | |||||||||
|
|
|
|
|
| |||||||||
Capital Appreciation | Common Stocks** | $ | 187,544,922 | $ | — | $ | — | |||||||
Money Market Funds | 2,763,199 | — | — | |||||||||||
|
|
|
|
|
| |||||||||
| $ | 190,308,121 | $ | — | $ | — | |||||||||
|
|
|
|
|
| |||||||||
ON International Equity | Common Stocks** | $ | 17,727,760 | $ | 133,879,310 | $ | — | |||||||
Money Market Funds | 5,184,380 | — | — | |||||||||||
|
|
|
|
|
| |||||||||
| $ | 22,912,140 | $ | 133,879,310 | $ | — | |||||||||
|
|
|
|
|
| |||||||||
ON Foreign | Common Stocks** | $ | 11,122,740 | $ | 63,385,764 | $ | — | |||||||
Money Market Funds | 4,609,669 | — | — | |||||||||||
|
|
|
|
|
| |||||||||
| $ | 15,732,409 | $ | 63,385,764 | $ | — | |||||||||
|
|
|
|
|
| |||||||||
| 150 | (continued) |
Ohio National Fund, Inc.
| Notes to Financial Statements (Continued) | June 30, 2017 (Unaudited) |
Portfolio | Financial Instrument Type | Level 1 | Level 2 | Level 3 | ||||||||||
Aggressive Growth | Common Stocks** | $ | 54,738,793 | $ | — | $ | — | |||||||
Money Market Funds | 1,833,179 | — | — | |||||||||||
|
|
|
|
|
| |||||||||
| $ | 56,571,972 | $ | — | $ | — | |||||||||
|
|
|
|
|
| |||||||||
Small Cap Growth | Common Stocks** | $ | 234,254,254 | $ | 5,281,526 | $ | — | |||||||
Master Limited Partnerships** | 5,866,869 | — | — | |||||||||||
U.S. Government Agency Issues | — | 3,599,870 | — | |||||||||||
Money Market Funds | 681,953 | — | — | |||||||||||
|
|
|
|
|
| |||||||||
| $ | 240,803,076 | $ | 8,881,396 | $ | — | |||||||||
|
|
|
|
|
| |||||||||
Mid Cap Opportunity | Common Stocks** | $ | 73,261,882 | $ | — | $ | — | |||||||
Money Market Funds | 1,606,763 | — | — | |||||||||||
|
|
|
|
|
| |||||||||
| $ | 74,868,645 | $ | — | $ | — | |||||||||
|
|
|
|
|
| |||||||||
S&P 500® Index . | Common Stocks** | $ | 901,216,352 | $ | — | $ | — | |||||||
Money Market Funds | 1,469,235 | — | — | |||||||||||
|
|
|
|
|
| |||||||||
| $ | 902,685,587 | $ | — | $ | — | |||||||||
|
|
|
|
|
| |||||||||
Futures Contracts | $ | (12,103 | ) | $ | — | $ | — | |||||||
|
|
|
|
|
| |||||||||
Strategic Value | Common Stocks** | $ | 468,462,190 | $ | 104,299,365 | $ | — | |||||||
Money Market Funds | 8,623,132 | — | — | |||||||||||
|
|
|
|
|
| |||||||||
| $ | 477,085,322 | $ | 104,299,365 | $ | — | |||||||||
|
|
|
|
|
| |||||||||
High Income Bond | Corporate Bonds** | $ | — | $ | 301,404,949 | $ | — | |||||||
Exchange Traded Funds | 4,826,425 | — | — | |||||||||||
Money Market Funds | 9,575,705 | — | — | |||||||||||
|
|
|
|
|
| |||||||||
| $ | 14,402,130 | $ | 301,404,949 | $ | — | |||||||||
|
|
|
|
|
| |||||||||
ClearBridge Small Cap | Common Stocks** | $ | 278,255,459 | $ | — | $ | — | |||||||
Money Market Funds | 10,906,206 | — | — | |||||||||||
|
|
|
|
|
| |||||||||
| $ | 289,161,665 | $ | — | $ | — | |||||||||
|
|
|
|
|
| |||||||||
Nasdaq-100® Index | Common Stocks** | $ | 190,794,581 | $ | — | $ | — | |||||||
Money Market Funds | 4,528,792 | — | — | |||||||||||
|
|
|
|
|
| |||||||||
| $ | 195,323,373 | $ | — | $ | — | |||||||||
|
|
|
|
|
| |||||||||
Futures Contracts | $ | (24,515 | ) | $ | — | $ | — | |||||||
|
|
|
|
|
| |||||||||
Bristol | Common Stocks** | $ | 216,033,020 | $ | — | $ | — | |||||||
Money Market Funds | 770,084 | — | — | |||||||||||
|
|
|
|
|
| |||||||||
| $ | 216,803,104 | $ | — | $ | — | |||||||||
|
|
|
|
|
| |||||||||
Bryton Growth | Common Stocks** | $ | 95,404,286 | $ | — | $ | — | |||||||
Money Market Funds | 1,846,433 | — | — | |||||||||||
|
|
|
|
|
| |||||||||
| $ | 97,250,719 | $ | — | $ | — | |||||||||
|
|
|
|
|
| |||||||||
Balanced | Common Stocks** | $ | 456,633,190 | $ | — | $ | — | |||||||
Corporate Bonds** | — | 242,715,284 | — | |||||||||||
Preferred Securities** | 22,909,512 | — | — | |||||||||||
| Asset-Backed / Mortgage-Backed Securities** | — | 8,712,637 | — | |||||||||||
U.S. Treasury Obligations | — | 127,246,774 | — | |||||||||||
Closed-End Mutual Funds | 65,943,882 | — | — | |||||||||||
Exchange Traded Funds | 14,781,954 | — | — | |||||||||||
Purchased Options | 1,792,000 | — | — | |||||||||||
Money Market Funds | 71,561,701 | — | — | |||||||||||
|
|
|
|
|
| |||||||||
| $ | 633,622,239 | $ | 378,674,695 | $ | — | |||||||||
|
|
|
|
|
| |||||||||
| 151 | (continued) |
Ohio National Fund, Inc.
| Notes to Financial Statements (Continued) | June 30, 2017 (Unaudited) |
Portfolio | Financial Instrument Type | Level 1 | Level 2 | Level 3 | ||||||||||
S&P MidCap 400® Index | Common Stocks** | $ | 55,751,593 | $ | — | $ | — | |||||||
| Money Market Funds | 1,215,336 | — | — | |||||||||||
|
|
|
|
|
| |||||||||
| $ | 56,966,929 | $ | — | $ | — | |||||||||
|
|
|
|
|
| |||||||||
| Futures Contracts | $ | (3,966 | ) | $ | — | $ | — | |||||||
|
|
|
|
|
| |||||||||
Bristol Growth | Common Stocks** | $ | 122,446,994 | $ | — | $ | — | |||||||
| Money Market Funds | 983,256 | — | — | |||||||||||
|
|
|
|
|
| |||||||||
| $ | 123,430,250 | $ | — | $ | — | |||||||||
|
|
|
|
|
| |||||||||
Risk Managed Balanced | Common Stocks** | $ | 162,338,662 | $ | — | $ | — | |||||||
| Corporate Bonds** | — | 44,379,943 | — | |||||||||||
| Preferred Securities** | 334,213 | 1,421,716 | — | |||||||||||
| Master Limited Partnerships** | 1,838,219 | — | — | |||||||||||
| Asset-Backed / Mortgage-Backed Securities** | — | 6,291,529 | — | |||||||||||
| U.S. Treasury Obligations | — | 21,452,926 | — | |||||||||||
| U.S. Government Agency | ||||||||||||||
| Mortgage-Backed Securities | — | 21,990,650 | — | |||||||||||
| Purchased Options | 8,265,552 | 11,083,453 | — | |||||||||||
| Money Market Funds | 43,319,086 | — | — | |||||||||||
|
|
|
|
|
| |||||||||
| $ | 216,095,732 | $ | 106,620,217 | $ | — | |||||||||
|
|
|
|
|
| |||||||||
| Futures Contracts | $ | (382,361 | ) | $ | — | $ | — | |||||||
|
|
|
|
|
| |||||||||
ON Conservative Model | Open-End Mutual Funds | $ | 105,848,318 | $ | — | $ | — | |||||||
|
|
|
|
|
| |||||||||
ON Moderately Conservative Model | Open-End Mutual Funds | $ | 336,946,551 | $ | — | $ | — | |||||||
|
|
|
|
|
| |||||||||
ON Balanced Model | Open-End Mutual Funds | $ | 1,554,100,775 | $ | — | $ | — | |||||||
|
|
|
|
|
| |||||||||
ON Moderate Growth Model | Open-End Mutual Funds | $ | 2,581,348,398 | $ | — | $ | — | |||||||
|
|
|
|
|
| |||||||||
ON Growth Model | Open-End Mutual Funds | $ | 520,844,155 | $ | — | $ | — | |||||||
|
|
|
|
|
| |||||||||
|
** For detailed industry descriptions, see the accompanying Schedules of Investments.
As stated above, the value assigned to the Fund’s foreign securities will, in most cases, not be the quoted or published prices of the investments on their respective primary markets or exchanges. Securities that are priced using fair value estimates are categorized as Level 2 in the fair value hierarchy, whereas securities that do not meet the established criteria are categorized as Level 1. The valuation of a foreign security from one valuation period to the next may result in a transfer between Levels 1 and 2 if the degree of certainty that the local close price is not the liquid market price at the time of U.S. market close is not similar for both periods. The Fund’s policy is to recognize transfers between fair value hierarchy levels at the reporting period end.
For the six-month period ended June 30, 2017, there were no transfers of securities between Level 1 and Level 2, nor any transfers of securities into or out of Level 3.
Foreign Securities and Currency
The books and records of all the Portfolios are maintained in U.S. dollars. All investments and cash quoted in foreign currencies are valued daily in U.S. dollars on the basis of the foreign currency exchange rates provided by an independent source. These exchange rates are currently determined daily, at 4:00 pm Eastern Time for normal trading sessions. Purchases and sales of foreign-denominated investments are recorded at rates of exchange prevailing on the respective dates of such transactions.
The Fund may not fully isolate that portion of the results of operations resulting from changes in foreign exchange rates from fluctuations arising from changes in market prices on foreign currency-denominated investments. For the portion that is isolated, amounts are reflected in the Statements of Operations as other foreign currency related transactions. However, for tax purposes, the Fund does fully isolate the effect of fluctuations in foreign exchange rates when determining the gain or loss upon sale or maturity of such investments to the extent required by federal income tax regulations.
| 152 | (continued) |
Ohio National Fund, Inc.
| Notes to Financial Statements (Continued) | June 30, 2017 (Unaudited) |
All Portfolios of the Fund may invest in securities of foreign issuers. The ON International Equity and ON Foreign Portfolios may be invested entirely in foreign securities. Investments in securities of foreign issuers, including investments in foreign companies through the use of depositary receipts, carry certain risks not ordinarily associated with investments in securities of domestic issuers. Such risks include future political and economic developments, and the possible imposition of exchange controls or other foreign governmental laws and restrictions. In addition, with respect to certain countries, there is the possibility of expropriation of assets, confiscatory taxation, political or social instability, or diplomatic developments that could adversely affect capital investment within those countries.
Restricted and Illiquid Securities
Restricted securities are those securities purchased through a private offering and cannot be resold to the general public without prior registration under the Securities Act of 1933 (“the 1933 Act”) or pursuant to the resale limitations provided by Rule 144A under the 1933 Act, or an exemption from the registration requirements of the 1933 Act. 144A securities are issued by corporations without registration in reliance on 1933 Act provisions allowing for the private resale of unregistered securities to qualified institutional buyers. Section 4(a)(2) commercial paper is issued pursuant to Section 4(a)(2) of the 1933 Act which exempts an issue from registration. This paper may be used to finance non-current transactions, such as acquisitions, stock repurchase programs, and other long-term assets. Investments by a portfolio in Rule 144A and Section 4(a)(2) securities could have the effect of decreasing the liquidity of a Portfolio during any period in which qualified institutional investors were no longer interested in purchasing these securities.
Typically, the restricted securities noted above are not considered illiquid. The criteria used to determine if a restricted security is illiquid includes frequency of trades and quotes, available dealers willing to make transactions, availability of market makers in the security, and the nature of the security and its trades. The Bond and Omni Portfolios may invest up to 10% of their respective assets in illiquid securities. Each of the other Portfolios of the Fund may invest up to 15% of its net assets in illiquid securities.
Investment Transactions and Related Income
For financial reporting purposes, investment transactions are accounted for on a trade date basis. For purposes of executing separate account shareholder transactions in the normal course of business, however, the Fund’s investment transactions are recorded no later than the first calculation on the first business day following the trade date in accordance with Rule 2a-4 of the 40 Act. Accordingly, differences between the net asset values for financial reporting and for executing separate account shareholder transactions may arise.
Dividend income is recognized on the ex-dividend date, except in the case of those Portfolios holding foreign securities, in which dividends are recorded as soon after the ex-dividend date as the Fund’s information agents become aware of such dividends. Interest income is accrued daily as earned and includes the amortization of premium and accretion of discount. Net realized gain or loss on investments and foreign exchange transactions are determined using the specific identification method.
Distributions to Shareholders and Federal Taxes
Distributions arising from net investment income and net capital gains from the Portfolios are declared and paid to shareholders periodically, as required for each of the Portfolios to continue to qualify as a regulated investment company pursuant to Subchapter M of the Internal Revenue Code. The Fund fully or partially satisfies its distribution requirements by using consent dividends rather than cash distributions. The consent dividends, when authorized, become taxable to the shareholders as if they were paid in cash. The Fund has the intent to continue to comply with tax provisions pertaining to regulated investment companies and make distributions of taxable income, whether by cash or consent dividends, sufficient to relieve it from substantially all federal income and excise taxes. As such, no provisions for federal income or excise taxes have been recorded.
The character of income and realized capital gains distributions are determined in accordance with federal income tax regulations and may differ from net investment income and realized gains for financial reporting purposes. These “book/tax” differences are either considered temporary or permanent in nature. To the extent these differences are permanent in nature they are reclassified within the composition of net assets; temporary differences do not require such reclassification. Distributions to shareholders that exceed taxable income and net taxable realized gains are reported as return of capital distributions.
The Fund’s management and its tax agent perform an affirmative evaluation of tax positions taken or expected to be taken in the course of preparing the Fund’s tax returns to determine whether it is more-likely-than-not (i.e. greater than 50-percent) that each tax position will be sustained upon examination by a taxing authority based on the technical merits of the position. A tax position that meets the more-likely-than-not recognition threshold is measured to determine the amount of benefit to recognize in the Schedules of Investments. Differences between tax positions taken in a tax return and amounts recognized in the Schedules of Investments
| 153 | (continued) |
Ohio National Fund, Inc.
| Notes to Financial Statements (Continued) | June 30, 2017 (Unaudited) |
will generally result in an increase in a liability for taxes payable (or a reduction of a tax refund receivable), including the recognition of any related interest and penalties as an operating expense. Implementation of the evaluation included a review of tax positions taken in tax years that remain subject to examination by all major tax jurisdictions, including federal tax and the state of Maryland (i.e., the last four tax year ends and the interim tax period since then). The determination has been made that there are no uncertain tax positions that would require the Portfolios to record a tax liability and, therefore, there is no impact to the Portfolios’ Schedules of Investments.
Expense Allocation
Expenses directly attributable to a Portfolio are charged to that Portfolio. Expenses that cannot be directly attributed to a Portfolio are allocated among all the benefited Portfolios on a basis of relative net assets or other appropriate method.
Foreign Withholding Taxes
Certain Portfolios in the Fund may be subject to taxes imposed by countries in which they invest with respect to their investments in issuers existing or operating in such countries. Such taxes are generally withheld based on income earned. These Portfolios accrue such taxes as the related income is earned.
Investment Company Modernization
In October 2016, the Securities and Exchange Commission (SEC) released its Final Rules on Investment Company Reporting Modernization (the “Rules”). The Rules, which introduce two new regulatory reporting forms for investment companies – Form N-Port and Form N-CEN – also contain amendments to Regulation S-X that require standardized, enhanced disclosures about derivatives in investment company financial statements, as well as other amendments. The Fund has early-adopted the enhanced disclosures regarding derivatives and investments in affiliates, which had no effect on the Fund’s net assets or results of operations. The Fund’s management is currently evaluating the impact of the new regulatory forms on the Fund’s financial statements.
Subsequent Events
Management has evaluated events and transactions through the date the financial statements were issued, for purposes of recognition or disclosure in these financial statements, and there are no subsequent events to report.
(3) Related Party and Other Transactions
The Fund has an Investment Advisory Agreement with Ohio National Investments, Inc. (“ONI”), a wholly-owned subsidiary of ONLIC. Under the terms of this agreement, ONI provides portfolio management and investment advice to the Fund and administers its operations, subject to the supervision of the Fund’s Board. This agreement is renewed annually upon the approval by the Board. As compensation for its services, ONI receives advisory fees from the Fund calculated on the basis of each Portfolio’s average daily net assets and the following current schedule of Board-approved annualized fee breakpoints.
Equity | Omni | ON Foreign2 | ||
0.79% of first $200 million | 0.60% of first $100 million | 0.85% of first $100 million | ||
0.74% of next $800 million | 0.50% of next $150 million | 0.80% of next $100 million | ||
0.70% over $1 billion | 0.45% of next $250 million | 0.70% of next $800 million | ||
Bond | 0.40% of next $500 million | 0.67% over $1 billion | ||
0.60% of first $100 million | 0.30% of next $1 billion | Aggressive Growth | ||
0.50% of next $150 million | 0.25% over $2 billion | 0.80% of first $100 million | ||
0.45% of next $250 million | Capital Appreciation | 0.75% of next $400 million | ||
0.40% of next $500 million | 0.80% of first $100 million | 0.70% over $500 million | ||
0.30% of next $1 billion | 0.75% of next $300 million | Small Cap Growth | ||
0.25% over $2 billion | 0.65% of next $600 million | 0.80% of first $150 million | ||
0.60% over $1 billion | 0.75% of next $150 million | |||
ON International Equity1 | 0.70% of next $300 million | |||
0.85% of first $100 million | 0.65% over $600 million | |||
0.80% of next $100 million | ||||
0.70% of next $800 million | ||||
0.67% over $1 billion |
| 154 | (continued) |
Ohio National Fund, Inc.
| Notes to Financial Statements (Continued) | June 30, 2017 (Unaudited) |
Mid Cap Opportunity | Nasdaq-100® Index | Bristol Growth | ||
0.85% of first $100 million | 0.40% of first $100 million | 0.80% of first $100 million | ||
0.80% of next $100 million | 0.35% of next $150 million | 0.70% of next $400 million | ||
0.75% of next $300 million | 0.33% over $250 million | 0.65% over $500 million | ||
0.70% over $500 million | Bristol | Risk Managed Balanced | ||
S&P 500® Index | 0.80% of first $100 million | 0.90% of first $500 million | ||
0.40% of first $100 million | 0.70% of next $400 million | 0.75% over $500 million | ||
0.35% of next $150 million | 0.65% over $500 million | ON Conservative Model3 | ||
0.33% over $250 million | Bryton Growth | 0.40% of all net assets | ||
Strategic Value | 0.85% of first $100 million | ON Moderately Conservative Model3 | ||
0.75% of first $100 million | 0.75% of next $400 million | 0.40% of all net assets | ||
0.70% of next $400 million | 0.70% over $500 million | ON Balanced Model3 | ||
0.65% over $500 million | Balanced | 0.40% of all net assets | ||
High Income Bond | 0.65% of first $200 million | ON Moderate Growth Model3 | ||
0.75% of first $75 million | 0.60% of next $300 million | 0.40% of all net assets | ||
0.70% of next $75 million | 0.55% over $500 million | ON Growth Model3 | ||
0.65% of next $75 million | S&P MidCap 400® Index | 0.40% of all net assets | ||
0.60% over $225 million | 0.40% of first $100 million | |||
ClearBridge Small Cap | 0.35% of next $150 million | |||
0.85% of first $200 million | 0.33% over $250 million | |||
0.80% of next $300 million | ||||
0.75% over $500 million |
| 1 | At a meeting held on March 15, 2017, the Board, including a majority of the Directors who are not “interested persons” of the Fund, approved the replacement of the investment strategy and sub-adviser to the International Portfolio. |
Effective May 1, 2017, Lazard Asset Management, LLC replaced the Portfolio’s previous sub-adviser, Federated Global Investment Management Corp. In conjunction with the change in sub-adviser and investment strategy, the name of the Portfolio was changed from International Portfolio to ON International Equity Portfolio. Also, the Board approved a revision to the Portfolio’s advisory fee schedule shown above, also effective May 1, 2017. Previously, the advisory fee breakpoints, based on the Portfolio’s daily net assets, were:
0.85% of first $100 million
0.80% of next $100 million
0.70% over $200 million
| 2 | At a meeting held on March 15, 2017, the Board, including a majority of the Directors who are not “interested persons” of the Fund, approved the replacement of the investment strategy and sub-adviser to the International Small-Mid Company Portfolio. |
Effective May 1, 2017, Templeton Global Advisors Limited replaced the Portfolio’s previous sub-adviser, Federated Global Investment Management Corp. In conjunction with the change in sub-adviser and investment strategy, the name of the Portfolio was changed from International Small-Mid Company Portfolio to ON Foreign Portfolio. Also, the Board approved a revision to the Portfolio’s advisory fee schedule shown above, also effective May 1, 2017. Previously, the advisory fee breakpoints, based on the Portfolio’s daily net assets, were:
1.00% of first $100 million
0.90% of next $100 million
0.85% over $200 million
| 3 | ONI has contractually agreed to make payments (by waiving management fees and/or reimbursing expenses) to the Fund to the extent that the annual ordinary operating expenses of the five new Model Portfolios, exclusive of certain expenses, exceed the following percentages of the average daily net assets (the “Fee Waiver Agreement.”) |
ON Conservative Model | 0.82 | % | ||||
ON Moderately Conservative Model | 0.87 | % | ||||
ON Balanced Model | 0.94 | % | ||||
ON Moderate Growth Model | 0.99 | % | ||||
ON Growth Model | 1.03 | % |
For purposes of calculating the expenses subject to the Fee Waiver Agreement, the annual operating expenses are those as presented in the Fund’s prospectus. The prospectus presentation of Fund expenses includes Acquired Fund Fees and Expenses (“AFFE”), which is a calculation of the indirect costs associated with the Portfolios’ underlying investments in other investment companies. The Fee Waiver Agreement will continue at least through April 30, 2018. The Fee Waiver
| 155 | (continued) |
Ohio National Fund, Inc.
| Notes to Financial Statements (Continued) | June 30, 2017 (Unaudited) |
Agreement may only be terminated with the consent of the Board of Directors. Under the Fee Waiver Agreement, ONI is entitled to reimbursement of the excess expense payments paid by it in the three years following the date the particular expense payment occurred, but only if such reimbursement can be achieved without exceeding the applicable annual expense limitation in effect at the time of the expense payment or the reimbursement.
For the period from the Model Portfolios’ inception date, March 1, 2017, to June 30, 2017, ONI waived investment advisory fees or reimbursed the expenses of the Model Portfolios as follows:
Portfolio | ||||||
ON Conservative Model | $ | 71,437 | ||||
ON Moderately Conservative Model | 163,949 | |||||
ON Balanced Model | 703,330 | |||||
ON Moderate Growth Model | 1,133,726 | |||||
ON Growth Model | 305,598 |
Under the Investment Advisory Agreement, the Fund authorizes ONI to retain sub-advisers (“the Sub-Advisers”) for all Portfolios of the Fund, with the exception of the Bond Portfolio and the five new “Model” Portfolios, subject to the approval of the Board. ONI has entered into sub-advisory agreements with ClearBridge, LLC (“ClearBridge”), Suffolk Capital Management, LLC (“Suffolk”), Lazard Asset Management, LLC (“Lazard”), Templeton Global Advisors Limited (“Templeton”), Jennison Associates LLC (“Jennison”), Janus Capital Management LLC (“Janus”), Goldman Sachs Asset Management, L.P. (“Goldman Sachs”), Geode Capital Management, LLC (“Geode”), Federated Equity Management Company of Pennsylvania (“Federated Equity”), Federated Investment Management Company (“Federated Investment”), ICON Advisers, Inc. (“ICON”), and AnchorPath Financial, LLC (“AnchorPath”) to manage the investment of those Portfolios’ assets, subject to the supervision of ONI.
As compensation for their services, the Sub-Advisers receive from ONI a sub-advisory fee calculated on the basis of each of the aforementioned Portfolio’s average daily net assets and the following current Board-approved schedule of annualized fee breakpoints.
Equity (ClearBridge) | Small Cap Growth (Janus) | Bristol (Suffolk) | ||
0.40% of first $200 million | 0.55% of first $150 million | 0.45% of first $100 million | ||
0.38% over $200 million | 0.45% over $150 million | 0.40% of next $400 million | ||
Omni (Suffolk) | Mid Cap Opportunity (Goldman Sachs) | 0.35% over $500 million | ||
0.30% of first $100 million | 0.60% of first $100 million | Bryton Growth (Suffolk) | ||
0.25% of next $150 million | 0.55% of next $100 million | 0.50% of first $100 million | ||
0.225% of next $250 million | 0.50% over $200 million | 0.45% of next $400 million | ||
0.20% of next $500 million | S&P 500®Index (Geode)6 | 0.40% over $500 million | ||
0.15% of next $1 billion | 0.025% of first $100 million | Balanced (ICON) | ||
0.125% over 2 billion | 0.020% of next $150 million | 0.40% of first $200 million | ||
Capital Appreciation (Jennison) | 0.015% over $250 million | 0.35% of next $300 million | ||
0.75% of first $10 million | Strategic Value (Federated Equity) | 0.30% over $500 million | ||
0.50% of next $30 million | 0.50% of first $35 million | S&P MidCap 400®Index (Geode)6 | ||
0.35% of next $25 million | 0.35% of next $65 million | 0.039% of first $100 million | ||
0.25% of next $335 million | 0.25% over $100 million | 0.038% of next $150 million | ||
0.22% of next $600 million | High Income Bond (Federated Investment) | 0.037% of next $250 million | ||
0.20% over $1 billion | 0.50% of first $30 million | 0.036% of next $500 million | ||
ON International Equity (Lazard)4 | 0.40% of next $20 million | 0.035% over $1 billion | ||
0.40% on first $500 Million | 0.30% of next $25 million | Bristol Growth (Suffolk) | ||
0.35% on next $500 Million | 0.25% over $75 million | 0.45% of first $100 million | ||
0.32% over $1 Billion | ClearBridge Small Cap (ClearBridge) | 0.40% of next $400 million | ||
ON Foreign (Templeton)5 | 0.55% of first $200 million | 0.35% over $500 million | ||
0.43% on first $500 Million | 0.50% over $200 million | Risk Managed Balanced (Janus) | ||
0.38% on next $500 Million | Nasdaq-100®Index (Geode)6 | 0.35% of first $500 million | ||
0.35% over $1 Billion | 0.05% of first $100 million | 0.25% over $500 million | ||
Aggressive Growth (Janus) | 0.04% of next $150 million | Risk Managed Balanced (AnchorPath) | ||
0.55% of first $100 million | 0.03% over $250 million | 0.20% of first $500 million | ||
0.50% of next $400 million | 0.15% over $500 million | |||
0.45% over $500 million |
| 156 | (continued) |
Ohio National Fund, Inc.
| Notes to Financial Statements (Continued) | June 30, 2017 (Unaudited) |
| 4 | At a meeting held on March 15, 2017, the Board, including a majority of the Directors who are not “interested persons” of the Fund, approved the replacement of the investment strategy and sub-adviser to the International Portfolio. |
Effective May 1, 2017, Lazard Asset Management, LLC replaced the Portfolio’s previous sub-adviser, Federated Global Investment Management Corp. In conjunction with the change in sub-adviser and investment strategy, the name of the Portfolio was changed from International Portfolio to ON International Equity Portfolio. Also, the Board approved a revision to the Portfolio’s sub-advisory fee schedule shown above, also effective at May 1, 2017. Previously, the sub-advisory fee breakpoints, based on the Portfolio’s daily net assets, were:
0.40% of first $200 Million
0.35% over $200 Million
| 5 | At a meeting held on March 15, 2017, the Board, including a majority of the Directors who are not “interested persons” of the Fund, approved the replacement of the investment strategy and sub-adviser to the International Small-Mid Company Portfolio. |
Effective May 1, 2017, Templeton Global Advisors Limited replaced the Portfolio’s previous sub-adviser, Federated Global Investment Management Corp. In conjunction with the change in sub-adviser and investment strategy, the name of the Portfolio was changed from International Small-Mid Company Portfolio to ON Foreign Portfolio. Also, the Board approved a revision to the Portfolio’s sub-advisory fee schedule shown above, also effective at May 1, 2017. Previously, the sub-advisory fee breakpoints, based on the Portfolio’s daily net assets, were:
0.75% of first $100 Million
0.65% over $100 Million
| 6 | The sub-advisory fees for the three Portfolios sub-advised by Geode could be impacted by an agreed-upon minimum aggregate per annum fee of $150,000. For the six-month period ended June 30, 2017, the minimum aggregate fee had no impact on the sub-advisory fees that were calculated based on the fee schedules indicated above. |
Prior to December 30, 2016, Suffolk, the sub-adviser to the Omni, Bristol, Bryton Growth, and Bristol Growth Portfolios had an affiliation with ONI. Ohio National Financial Services, Inc. (ONFS) owns 100% of ONLIC, the parent company of ONI, and, until December 30, 2016, also owned 84.698% of the voting interests of Suffolk. On December 30, 2016, a Purchase and Sale Agreement was executed for the purpose of transferring ONLIC’s ownership interests to a Suffolk employee ownership group. There were no Fund liabilities payable to Suffolk at June 30, 2017, as sub-advisory fees are accrued and paid by ONI rather than the Fund.
Pursuant to a service agreement among ONI, ONLIC, and the Fund, ONLIC has agreed to provide personnel and facilities to ONI on a cost-reimbursement basis. These personnel members include officers of the Fund. ONLIC also provides clerical and administrative services and such supplies and equipment as may be reasonably required in order for ONI to properly perform its advisory function pursuant to the Investment Advisory Agreement. ONLIC further performs duties to fulfill the transfer agent function on behalf of the Fund. Performance of these duties by ONLIC and availability of facilities, personnel, supplies, and equipment does not represent an expense to the Fund in excess of the advisory fees paid to ONI.
Pursuant to the Investment Advisory Agreement between ONI and the Fund, if the total expenses applicable to any Portfolio during any calendar quarter (excluding taxes, brokerage commissions, interest expense and management fees) exceed 1%, on an annualized basis, evaluated quarterly, of such Portfolio’s average daily net asset value, ONI will reimburse the Portfolio for such excess expenses. There were no expense reimbursements associated with this agreement during the six-month period ended June 30, 2017.
The Investment Advisory Agreement allows for a portion of the expenses related to the Fund’s Chief Compliance Officer and staff to be incurred by the Fund and paid from the Fund to the Fund’s adviser, ONI. Pursuant to the service agreement among ONI, ONLIC, and the Fund, ONLIC has provided the personnel, services, and equipment necessary for the execution of the Fund’s regulation-mandated compliance function and ONI has reimbursed ONLIC for costs allocated to the Fund. For the six-month period ended June 30, 2017, the Fund incurred compliance expenses totaling $159,995, which is allocated to the Portfolios by equal dollar amounts. Expenses incurred by the Portfolios are reflected on the Statements of Operations as “Compliance expense”.
Each director of the Board is compensated based on an annual retainer fee of $140,000, paid quarterly. The Board chair receives an additional quarterly retainer fee of $3,750, the lead independent director of the Board receives an additional quarterly retainer fee of $3,125, and the Audit Committee chair receives an additional quarterly retainer fee of $1,250; each paid quarterly. For the six-month period ended June 30, 2017, directors’ compensation and reimbursement of director expenses by the Portfolios of the Fund totaled $371,654.
The accounting agent and custodian for the Fund is State Street Bank (Kansas City, MO and Boston, MA). For assets held outside of the United States, State Street Bank utilizes a foreign sub-custodian network that is subject to oversight and periodic approval of the Board.
| 157 | (continued) |
Ohio National Fund, Inc.
| Notes to Financial Statements (Continued) | June 30, 2017 (Unaudited) |
(4) Capital Share Transactions
Capital share transactions for the six-month period ended June 30, 2017, and the year ended December 31, 2016, respectively, were as follows:
| Equity | Bond | Omni | ||||||||||||||||||||||
| Six-Month | Six-Month | Six-Month | ||||||||||||||||||||||
| Period Ended | Year Ended | Period Ended | Year Ended | Period Ended | Year Ended | |||||||||||||||||||
| 6/30/2017 | 12/31/2016 | 6/30/2017 | 12/31/2016 | 6/30/2017 | 12/31/2016 | |||||||||||||||||||
Capital shares issued on sales | 10,367,261 | 2,230,233 | 1,772,275 | 2,653,292 | 160,389 | 907,980 | ||||||||||||||||||
Capital shares redeemed | (11,769,656 | ) | (2,826,282 | ) | (1,778,190 | ) | (3,109,602 | ) | (193,079 | ) | (751,330 | ) | ||||||||||||
|
|
|
|
|
|
|
|
|
|
|
| |||||||||||||
Net increase/(decrease) | (1,402,395 | ) | (596,049 | ) | (5,915 | ) | (456,310 | ) | (32,690 | ) | 156,650 | |||||||||||||
|
|
|
|
|
|
|
|
|
|
|
| |||||||||||||
| Capital Appreciation | ON International Equity | ON Foreign | ||||||||||||||||||||||
| Six-Month | Six-Month | Six-Month | ||||||||||||||||||||||
| Period Ended | Year Ended | Period Ended | Year Ended | Period Ended | Year Ended | |||||||||||||||||||
| 6/30/2017 | 12/31/2016 | 6/30/2017 | 12/31/2016 | 6/30/2017 | 12/31/2016 | |||||||||||||||||||
Capital shares issued on sales | 1,948,652 | 792,089 | 860,196 | 1,559,945 | 493,995 | 550,491 | ||||||||||||||||||
Capital shares redeemed | (2,359,186 | ) | (8,694,235 | ) | (1,653,758 | ) | (2,369,033 | ) | (429,000 | ) | (757,661 | ) | ||||||||||||
|
|
|
|
|
|
|
|
|
|
|
| |||||||||||||
Net increase/(decrease) | (410,534 | ) | (7,902,146 | ) | (793,562 | ) | (809,088 | ) | 64,995 | (207,170 | ) | |||||||||||||
|
|
|
|
|
|
|
|
|
|
|
| |||||||||||||
| Aggressive Growth | Small Cap Growth | Mid Cap Opportunity | ||||||||||||||||||||||
| Six-Month | Six-Month | Six-Month | ||||||||||||||||||||||
| Period Ended | Year Ended | Period Ended | Year Ended | Period Ended | Year Ended | |||||||||||||||||||
| 6/30/2017 | 12/31/2016 | 6/30/2017 | 12/31/2016 | 6/30/2017 | 12/31/2016 | |||||||||||||||||||
Capital shares issued on sales | 344,006 | 1,176,118 | 5,295,221 | 1,410,206 | 119,079 | 367,577 | ||||||||||||||||||
Capital shares redeemed | (466,506 | ) | (1,385,111 | ) | (5,810,004 | ) | (2,206,610 | ) | (285,186 | ) | (688,315 | ) | ||||||||||||
|
|
|
|
|
|
|
|
|
|
|
| |||||||||||||
Net increase/(decrease) | (122,500 | ) | (208,993 | ) | (514,783 | ) | (796,404 | ) | (166,107 | ) | (320,738 | ) | ||||||||||||
|
|
|
|
|
|
|
|
|
|
|
| |||||||||||||
| S&P 500® Index | Strategic Value | High Income Bond | ||||||||||||||||||||||
| Six-Month | Six-Month | Six-Month | ||||||||||||||||||||||
| Period Ended | Year Ended | Period Ended | Year Ended | Period Ended | Year Ended | |||||||||||||||||||
| 6/30/2017 | 12/31/2016 | 6/30/2017 | 12/31/2016 | 6/30/2017 | 12/31/2016 | |||||||||||||||||||
Capital shares issued on sales | 15,998,220 | 20,751,886 | 30,315,917 | 14,744,875 | 11,777,434 | 8,187,969 | ||||||||||||||||||
Capital shares redeemed | (16,623,998 | ) | (4,923,612 | ) | (25,906,013 | ) | (6,274,225 | ) | (12,343,667 | ) | (3,137,431 | ) | ||||||||||||
|
|
|
|
|
|
|
|
|
|
|
| |||||||||||||
Net increase/(decrease) | (625,778 | ) | 15,828,274 | 4,409,904 | 8,470,650 | (566,233 | ) | 5,050,538 | ||||||||||||||||
|
|
|
|
|
|
|
|
|
|
|
| |||||||||||||
| ClearBridge Small Cap | Nasdaq-100® Index | Bristol | ||||||||||||||||||||||
| Six-Month | Six-Month | Six-Month | ||||||||||||||||||||||
| Period Ended | Year Ended | Period Ended | Year Ended | Period Ended | Year Ended | |||||||||||||||||||
| 6/30/2017 | 12/31/2016 | 6/30/2017 | 12/31/2016 | 6/30/2017 | 12/31/2016 | |||||||||||||||||||
Capital shares issued on sales | 3,780,518 | 3,777,046 | 2,718,671 | 5,283,661 | 6,676,498 | 828,739 | ||||||||||||||||||
Capital shares redeemed | (4,027,213 | ) | (743,571 | ) | (1,952,620 | ) | (4,629,245 | ) | (7,218,466 | ) | (2,348,472 | ) | ||||||||||||
|
|
|
|
|
|
|
|
|
|
|
| |||||||||||||
Net increase/(decrease) | (246,695 | ) | 3,033,475 | 766,051 | 654,416 | (541,968 | ) | (1,519,733 | ) | |||||||||||||||
|
|
|
|
|
|
|
|
|
|
|
| |||||||||||||
| Bryton Growth | Balanced | S&P MidCap 400® Index | ||||||||||||||||||||||
| Six-Month | Six-Month | Six-Month | ||||||||||||||||||||||
| Period Ended | Year Ended | Period Ended | Year Ended | Period Ended | Year Ended | |||||||||||||||||||
| 6/30/2017 | 12/31/2016 | 6/30/2017 | 12/31/2016 | 6/30/2017 | 12/31/2016 | |||||||||||||||||||
Capital shares issued on sales | 3,387,094 | 1,339,282 | 22,753,971 | 9,384,539 | 1,528,206 | 370,339 | ||||||||||||||||||
Capital shares redeemed | (3,766,576 | ) | (4,999,127 | ) | (23,788,714 | ) | (6,988,391 | ) | (1,140,883 | ) | (554,988 | ) | ||||||||||||
|
|
|
|
|
|
|
|
|
|
|
| |||||||||||||
Net increase/(decrease) | (379,482 | ) | (3,659,845 | ) | (1,034,743 | ) | 2,396,148 | 387,323 | (184,649 | ) | ||||||||||||||
|
|
|
|
|
|
|
|
|
|
|
| |||||||||||||
| 158 | (continued) |
Ohio National Fund, Inc.
| Notes to Financial Statements (Continued) | June 30, 2017 (Unaudited) |
| Bristol Growth | Risk Managed Balanced | |||||||||||||||||||||
| Six-Month | Six-Month | |||||||||||||||||||||
| Period Ended | Year Ended | Period Ended | Year Ended | |||||||||||||||||||
| 6/30/2017 | 12/31/2016 | 6/30/2017 | 12/31/2016 | |||||||||||||||||||
Capital shares issued on sales | 5,704,967 | 766,504 | 5,008,165 | 13,411,958 | ||||||||||||||||||
Capital shares redeemed | (6,168,578 | ) | (1,174,726 | ) | (2,526,548 | ) | (3,282,546 | ) | ||||||||||||||
|
|
|
|
|
|
|
| |||||||||||||||
Net increase/(decrease) | (463,611 | ) | (408,222 | ) | 2,481,617 | 10,129,412 | ||||||||||||||||
|
|
|
|
|
|
|
| |||||||||||||||
| ON | ON Moderately | |||||||||||||||||||||
| Conservative | Conservative | ON Balanced | ON Moderate | ON Growth | ||||||||||||||||||
| Model | Model | Model | Growth Model | Model | ||||||||||||||||||
| Period from | Period from | Period from | Period from | Period from | ||||||||||||||||||
| March 1, 2017 | March 1, 2017 | March 1, 2017 | March 1, 2017 | March 1, 2017 | ||||||||||||||||||
| (inception) to | (inception) to | (inception) to | (inception) to | (inception) to | ||||||||||||||||||
| 6/30/2017 | 6/30/2017 | 6/30/2017 | 6/30/2017 | 6/30/2017 | ||||||||||||||||||
Capital shares issued on sales | 11,158,622 | 34,733,554 | 158,659,763 | 260,184,928 | 52,536,045 | |||||||||||||||||
Capital shares redeemed | (813,833 | ) | (1,915,880 | ) | (7,359,967 | ) | (10,740,283 | ) | (2,250,126 | ) | ||||||||||||
|
|
|
|
|
|
|
|
|
| |||||||||||||
Net increase/(decrease) | 10,344,789 | 32,817,674 | 151,299,796 | 249,444,645 | 50,285,919 | |||||||||||||||||
|
|
|
|
|
|
|
|
|
| |||||||||||||
(5) Investment Transactions
Cost of purchases and proceeds from sales of investments (excluding short-term and government securities) for the six-month period ended June 30, 2017 were as follows:
| Capital | ON International | ||||||||||||||||||||||||
| Equity | Bond | Omni | Appreciation | Equity | |||||||||||||||||||||
Cost of purchases | $ | 115,090,387 | $ | 69,637,105 | $ | 51,224,800 | $ | 45,896,310 | $ | 179,058,921 | |||||||||||||||
Proceeds from sales | $ | 140,818,366 | $ | 62,668,808 | $ | 51,006,935 | $ | 50,389,238 | $ | 181,113,622 | |||||||||||||||
| ON Foreign | Aggressive Growth | Small Cap Growth | Mid Cap Opportunity | S&P 500® Index | |||||||||||||||||||||
Cost of purchases | $ | 86,108,530 | $ | 14,626,785 | $ | 23,285,194 | $ | 23,559,697 | $ | 32,531,098 | |||||||||||||||
Proceeds from sales | $ | 83,562,131 | $ | 17,603,679 | $ | 36,581,489 | $ | 28,723,189 | $ | 32,230,387 | |||||||||||||||
| Strategic Value | High Income Bond | ClearBridge Small Cap | Nasdaq-100® Index | Bristol | |||||||||||||||||||||
Cost of purchases | $ | 152,238,698 | $ | 51,546,482 | $ | 70,506,315 | $ | 19,019,629 | $ | 215,644,082 | |||||||||||||||
Proceeds from sales | $ | 73,425,865 | $ | 54,869,904 | $ | 61,370,048 | $ | 9,049,276 | $ | 228,449,627 | |||||||||||||||
| Bryton Growth | Balanced | S&P MidCap 400® Index | Bristol Growth | Risk Managed Balanced | |||||||||||||||||||||
Cost of purchases | $ | 95,189,089 | $ | 369,561,271 | $ | 22,428,569 | $ | 125,118,549 | $ | 73,514,392 | |||||||||||||||
Proceeds from sales | $ | 103,179,684 | $ | 419,365,477 | $ | 16,072,272 | $ | 135,494,918 | $ | 45,372,083 | |||||||||||||||
| ON Conservative Model | ON Moderately Conservative Model | ON Balanced Model | ON Moderate Growth Model | ON Growth Model | |||||||||||||||||||||
Cost of purchases | $ | 110,977,983 | $ | 346,002,363 | $ | 1,609,599,092 | $ | 2,669,000,430 | $ | 533,256,490 | |||||||||||||||
Proceeds from sales | $ | 6,885,009 | $ | 16,471,324 | $ | 104,834,294 | $ | 163,538,063 | $ | 30,634,887 | |||||||||||||||
| 159 | (continued) |
Ohio National Fund, Inc.
| Notes to Financial Statements (Continued) | June 30, 2017 (Unaudited) |
Cost of purchases and proceeds from sales of government securities for the six-month period ended June 30, 2017 were as follows:
| Risk Managed | ||||||||||||||||
| Bond | Omni | Balanced | Balanced | |||||||||||||
Cost of purchases | $ | 3,918,047 | $ | — | $ | 69,937,852 | $ | 35,152,447 | ||||||||
Proceeds from sales | $ | 8,357,910 | $ | 482,133 | $ | — | $ | 30,762,608 | ||||||||
(6) Financial Instruments
The Fund’s Portfolios may trade in financial instruments with off-balance sheet risk for hedging purposes or, otherwise, in accordance with stated investing objectives. These financial instruments may include options, futures, and foreign currency contracts that may involve, to a varying degree, elements of risk in excess of the amounts recognized on financial statements.
Options
A Portfolio may buy and write (i.e., sell) call and put options. In writing call options, the Portfolio gives the purchaser of the call option the right to purchase the underlying securities from the Portfolio at a specified “exercise” price at any time prior to the expiration of the option, normally within nine months. A Portfolio writes a covered call option when it owns the underlying securities and an uncovered call option when it does not. In purchasing put options, a Portfolio pays the seller of the put option a premium for the right of the Portfolio to sell the underlying securities to the seller at a specified exercise price prior to the expiration of the option. When a Portfolio sells a put option, it has the obligation to buy, and the purchaser of the put the right to sell, the underlying security at the exercise price during the option period. Whenever a Portfolio has a written covered call option outstanding, the underlying securities will be segregated by the Custodian and held in an escrow account to assure that such securities will be delivered to the option holder if the option is exercised. While the underlying securities are subject to the option, the Portfolio remains the record owner of the securities, entitling it to receive dividends and to exercise any voting rights. Whenever a Portfolio has a written uncovered call option outstanding, it will segregate with the Custodian cash or liquid assets that, when added to the amounts deposited with the broker as margin, equal to the market value of the securities underlying the call option (but not less than the exercise price of the call option). To cover a written put option, the Portfolio writing the option deposits cash or liquid securities in a segregated account at the Custodian. In order to terminate its position as the writer or the purchaser of an option, the Portfolio may enter into a “closing” transaction, which is the purchase (if the Portfolio has written the option) or sale (if the Portfolio is the purchaser of the option) of an option on the same underlying securities and having the same exercise price and expiration date as the option previously written or purchased by the Portfolio.
When a Portfolio writes a put or call option, an amount equal to the premium received is included on the Statement of Assets and Liabilities as a liability. The amount of the liability is subsequently marked-to-market to reflect the current market value of the option. Such liability is subject to off balance sheet risks to the extent of any future increases in market value of the written options. If an option expires on its stipulated expiration date or if the Portfolio enters into a closing purchase transaction, a gain or loss is realized. If a written call option on an individual security is exercised, a gain or loss is realized for the sale of the underlying security, and the proceeds from the sale are increased by the premium originally received. If a written call option on a securities index is exercised, a gain or loss is realized as determined by the premium originally received, the exercise price and the market value of the index. If a written put option on an individual security is exercised, the cost of the security acquired is decreased by the premium originally received. When a Portfolio purchases a put or call option, an amount equal to the premium paid is included on the Portfolio’s Statement of Assets and Liabilities as an investment, and is subsequently marked-to-market to reflect the current market value of the option. If an option expires on the stipulated expiration date or if the Portfolio enters into a closing sale transaction, a gain or loss is realized. If a Portfolio exercises a call option on an individual security, the cost of the security acquired is increased by the premium paid for the call. If the Portfolio exercises a put option on an individual security, a gain or loss is realized from the sale of the underlying security, and the proceeds from such a sale are decreased by the premium originally paid. If the Portfolio exercises a put option on a security index, a gain or loss is realized as determined by the premium originally paid, the exercise price and the market value of the index.
The Balanced Portfolio held written options and purchased put options during the six-month period ended June 30, 2017. These instruments were used by the Portfolio to provide a hedge against equity price risk. During a period in which the prices of the Portfolio’s common stocks may decline, these instruments are designed to increase in value, thus providing price accumulation gains that partially offset the price accumulation losses of the common stocks in the Portfolio.
The Balanced Portfolio’s written call options, if any, are collateralized by cash and/or securities held by the Portfolio’s custodian under an Escrow Deposit Agreement between the custodian and the Options Clearing Corporation (“OCC”). Such collateral holdings are restricted from trading. The cash collateral or borrowings, if necessary, are included on the Statement of Assets and Liabilities.
| 160 | (continued) |
Ohio National Fund, Inc.
| Notes to Financial Statements (Continued) | June 30, 2017 (Unaudited) |
Written and purchased options are non-income producing securities.
The number of option contracts written and the premiums received by the Balanced Portfolio for the six-month period ended June 30, 2017 were as follows:
| Number of | Premiums | |||||||||
| Contracts | Received | |||||||||
Options outstanding, beginning of period | 400 | $ | 559,478 | |||||||
Options written during period | — | — | ||||||||
Options exercised during period | — | — | ||||||||
Options expired during period | — | — | ||||||||
Options closed during period | (400 | ) | (559,478 | ) | ||||||
|
|
|
| |||||||
Options outstanding, end of period | — | — | ||||||||
|
|
|
| |||||||
Transactions involving purchased options by the Balanced Portfolio for the six-month period ended June 30, 2017 were: Cost of purchases: $2.9 million, Expirations: $5.3 million.
The Risk Managed Balanced Portfolio also purchased call and put options associated with the S&P 500 Index or related exchange traded fund during the six-month period ended June 30, 2017. These instruments were used by the Risk Management Component of the Portfolio to provide for the Portfolio’s stated risk management strategy. Transactions involving purchased options by the Risk Managed Balanced Portfolio for the six-month period ended June 30, 2017 were: Cost of purchases: $12.8 million, Proceeds from sales: $11.6 million, Expirations: $0.5 million.
Futures Contracts
A Portfolio may buy or sell two kinds of financial futures contracts: stock index futures contracts and interest rate futures contracts. Stock index futures contracts are contracts developed by and traded on national commodity exchanges whereby the buyer will, on a specified future date, pay or receive a final cash payment equal to the difference between the actual value of the stock index on the last day of the contract and the value of the stock index established by the contract multiplied by the specific dollar amount set by the exchange. Futures contracts may be based on broad-based stock indexes such as the S&P 500 Index or on narrow-based stock indices. A particular index will be selected according to the Adviser’s investment strategy for the particular Portfolio. An interest rate futures contract is an agreement whereby one party agrees to sell and another party agrees to purchase a specified amount of a specified financial instrument (debt security) at a specified price at a specified date, time and place. Although interest rate futures contracts typically require actual future delivery of and payment for financial instruments, the contracts are usually closed out before the delivery date. A public market exists in interest rate futures contracts covering primarily the following financial instruments: U.S. Treasury bonds; U.S. Treasury notes; Government National Mortgage Association (GNMA) modified pass-through mortgage-backed securities; three-month U.S. Treasury bills; 90-day commercial paper; bank certificates of deposit; and Eurodollar certificates of deposit. U.S. futures contracts are traded on exchanges which have been designated “contract markets” by the Commodities Futures Trading Commission (“CFTC”) and must be executed through a futures commission merchant (“FCM”), or brokerage firm, which is a member of the relevant contract market. It is expected that futures contracts trading in additional financial instruments will be authorized.
The Fund, on behalf of each Portfolio, has filed with the National Futures Association, a notice claiming an exclusion from the definition of the term “commodity pool operator” under the Commodity Exchange Act, as amended, and the rules of the CFTC promulgated thereunder, with respect to each Portfolio’s operation. Accordingly, the Portfolios are not subject to registration or regulation as a commodity pool operator.
The buyer or seller of a futures contract is not required to deliver or pay for the underlying instrument unless the contract is held until the delivery date. However, both the buyer and seller are required to deposit “initial margin” for the benefit of the broker when the contract is entered into. Initial margin deposits are equal to a percentage of the contract’s value, as set by the exchange on which the contract is traded, and are similar to good faith deposits or performance bonds.
Unlike margin extended by a securities broker, initial margin payments do not constitute purchasing securities on margin for purposes of a Portfolio’s investment limitations. A Portfolio, its futures commission merchant and the Custodian retain control of the initial margin until the contract is liquidated. If the value of either party’s position declines, the party on the side of the declining position will be required to make additional “variation margin” payments to settle the change in value on a daily basis. The party that has a gain may be entitled to receive all or a portion of this amount. In the event of the bankruptcy of the FCM that holds margin on behalf of a Portfolio, the Portfolio may be entitled to return of margin owed to the Portfolio only in proportion to the amount received by the FCM’s other customers. ONI and the Sub-Advisers will attempt to minimize this risk by carefully monitoring the
| 161 | (continued) |
Ohio National Fund, Inc.
| Notes to Financial Statements (Continued) | June 30, 2017 (Unaudited) |
creditworthiness of the FCMs with which the Portfolios do business. In addition to the margin restrictions discussed above, transactions in futures contracts and options on futures contracts may involve the segregation of funds pursuant to requirements imposed by the SEC. Under those requirements, where a Portfolio has a long position in a futures contract or sells a put option, it will be required to establish a segregated account (not with an FCM or broker) containing cash or certain liquid assets equal to the purchase price of the contract or the exercise price of the option (less any margin on deposit). For a short position in futures contacts held by a Portfolio or call options sold by a Portfolio, those requirements mandate the establishment of a segregated account (not with a futures commission merchant or broker) containing cash or certain liquid assets that, when added to the amounts deposited as margin, equal the market value of the instruments underlying the futures contracts or call options. However, segregation of assets is not required if a Portfolio “covers” its position.
Portions of the S&P 500® Index, Nasdaq-100® Index, and S&P MidCap 400® Index Portfolios’ cash holdings, as noted on those Portfolios’ Schedules of Investments, were pledged at June 30, 2017 as collateral for futures contracts. These futures contracts were used by the Portfolios for the purpose of gaining equity exposure for cash and cash equivalents, thereby seeking to lessen a performance difference between the Portfolios and their respective benchmark indices. There were other index futures contracts that were executed and closed in the Portfolios during the six-month period ended June 30, 2017. Those contracts were executed for similar purposes as the contracts outstanding at June 30, 2017. For the six-month period ended June 30, 2017, the notional values of futures contracts opened and closed prior to contract settlement date by the S&P 500® Index Portfolio were $46.9 million and $54.0 million, respectively. For the six-month period ended June 30, 2017, the notional values of futures contracts opened and closed prior to contract settlement date by the Nasdaq-100® Index Portfolio were $26.3 million and $24.6 million, respectively. For the six-month period ended June 30, 2017, the notional values of futures contracts opened and closed prior to contract settlement date by the S&P MidCap 400® Index Portfolio were $4.3 million and $4.1 million, respectively.
Portions of the Risk Managed Balanced Portfolio’s securities and cash holdings, as noted on the Portfolio’s Schedule of Investments, were pledged at June 30, 2017 as collateral for futures contracts. These futures contracts were used by the Portfolio to provide for the Portfolio’s stated risk management strategy. There were other index futures contracts that were executed and closed in the Risk Managed Balanced Portfolio during the six-month period ended June 30, 2017. Those contracts were executed for similar purposes as the contracts outstanding at June 30, 2017. For the six-month period ended June 30, 2017, the notional values of futures contracts opened and closed prior to contract settlement date by the Portfolio were $436.0 million and $411.7 million, respectively.
Although there were no futures contracts in the ON International Equity Portfolio at June 30, 2017, there were index futures contracts that were executed and closed in that Portfolio during the six-month period ended June 30, 2017. Those contracts were executed for the purpose of increasing exposure to an attractive equities market, beyond that evidenced by the Portfolio’s investment in common stocks, while maintaining a significant cash balance that could be used for potentially higher-than-average shareholder transactions. For the six-month period ended June 30, 2017, the notional values of futures contracts opened and closed prior to contract settlement date by the Portfolio were $17.5 million and $25.4 million, respectively.
Foreign Currency Contracts
In order to hedge against changes in the exchange rates of foreign currencies in relation to the U.S. dollar, each Portfolio may engage in forward foreign currency contracts, foreign currency options and foreign currency futures contracts in connection with the purchase, sale or ownership of a specific security. The ON International Equity, ON Foreign, Strategic Value and High Income Bond Portfolios may engage in non-hedging related transactions to implement their investment strategies.
The Portfolios generally conduct their foreign currency exchange transactions on a spot (i.e., cash) basis at the spot rate prevailing in the foreign exchange currency market. When a Portfolio purchases or sells a security denominated in or exposed to a foreign currency, it may enter into a forward foreign currency contract (“forward contract”) for the purchase or sale, for a fixed amount of dollars, of the amount of currency involved in the underlying security transaction. A forward contract involves an obligation to purchase or sell a specific currency at a future date, which may be any fixed number of days from the date of the contract agreed upon by the parties, at a price set at the time of the contract. In this manner, a Portfolio may obtain protection against a possible loss resulting from an adverse change in the relationship between the U.S. dollar and the foreign currency during the period between the date the security is purchased or sold and the date upon which payment is made or received. Although such contracts tend to minimize the risk of loss due to the decline in the value of the hedged currency, at the same time they tend to limit any potential gain which might result should the value of such currency increase.
Forward contracts are traded in the interbank market conducted directly between currency traders (usually large commercial banks) and their customers. Generally, a forward contract has no deposit requirement, and no commissions are charged. Although foreign exchange dealers do not charge a fee for conversion, they do realize a profit based on the difference between the prices at which they buy and sell various currencies. When the Portfolio manager believes that the currency of a particular foreign country may suffer a substantial decline against the U.S. dollar, a Portfolio may enter into a forward contract to sell, for a fixed amount of
| 162 | (continued) |
Ohio National Fund, Inc.
| Notes to Financial Statements (Continued) | June 30, 2017 (Unaudited) |
dollars, the amount of foreign currency approximating the value of some or all of that Portfolio’s securities denominated in or exposed to such foreign currency. No Portfolio will enter into such forward contracts or maintain a net exposure to such contracts where the consummation of the contracts would obligate the Portfolio to deliver an amount of foreign currency in excess of the value of its assets denominated in or exposed to that currency. At the consummation of a forward contract for delivery by a Portfolio of a foreign currency, the Portfolio may either make delivery of the foreign currency or terminate its contractual obligation to deliver the foreign currency by purchasing an offsetting contract obligating it to purchase, at the same maturity date, the same amount of the foreign currency. If the Portfolio chooses to make delivery of the foreign currency, it may be required to obtain such currency through the sale of its securities denominated in such currency or through conversion of other Portfolio assets into such currency. It is impossible to forecast the market value of Portfolio securities at the expiration of the forward contract. Accordingly, it may be necessary for the Portfolio to purchase additional foreign currency on the spot market (and bear the expense of such purchase) if the market value of the security is less than the amount of foreign currency the Portfolio is obligated to deliver, and if a decision is made to sell the security and make delivery of the foreign currency. Conversely, it may be necessary for the Portfolio to sell on the spot market some of the foreign currency received on the sale of its hedged security if the security’s market value exceeds the amount of foreign currency the Portfolio is obligated to deliver.
If the Portfolio retains the hedged security and engages in an offsetting transaction, it will incur a gain or loss to the extent that there has been movement in spot or forward contract prices. If a Portfolio engages in an offsetting transaction, it may subsequently enter into a new forward contract to sell the foreign currency. Should forward prices decline during the period between the Portfolio’s entering into a forward contract for the sale of a foreign currency and the date it enters into an offsetting contract for the purchase of the foreign currency, the Portfolio will realize a gain to the extent the price of the currency it has agreed to sell exceeds the price of the currency it has agreed to purchase. Should forward prices increase, the Portfolio will suffer a loss to the extent the price of the currency it has agreed to purchase exceeds the price of the currency it has agreed to sell.
Buyers and sellers of foreign currency options and futures contracts are subject to the same risks previously described with respect to options and futures generally. In addition, settlement of currency options and futures contracts with respect to most currencies must occur at a bank located in the issuing nation. The ability to establish and close out positions on such options is subject to the maintenance of a liquid market that may not always be available. Currency rates may fluctuate based on political considerations and governmental actions as opposed to purely economic factors.
Predicting the movements of foreign currency in relation to the U.S. dollar is difficult and requires different skills than those necessary to predict movements in the securities market. There is no assurance that the use of foreign currency hedging transactions can successfully protect a Portfolio against loss resulting from the movements of foreign currency in relation to the U.S. dollar. In addition, it must be remembered that these methods of protecting the value of a Portfolio’s securities against a decline in the value of a currency does not eliminate fluctuations in the underlying prices of the securities. It simply establishes a rate of exchange which can be achieved at some future point in time. Additionally, although such contracts tend to minimize the risk of loss due to the decline in the value of the hedged currency, at the same time they tend to limit any potential gain which might result should the value of such currency increase.
Although there were no foreign currency contracts in the Portfolios at June 30, 2017, the ON Foreign Portfolio entered into foreign currency contracts during the six-month period ended June 30, 2017 in order to mitigate the effect that exchange rate volatility had on the valuation of the Portfolio’s investments that were either significantly under-weighted or over-weighted in relation to the Portfolio’s benchmark index. For the six-month period ended June 30, 2017, the notional value of foreign currency contracts executed by the ON Foreign Portfolio were approximately $3.3 million for currencies bought and approximately $3.3 million for currencies sold.
| 163 | (continued) |
Ohio National Fund, Inc.
| Notes to Financial Statements (Continued) | June 30, 2017 (Unaudited) |
The values and financial statement effects of derivative instruments that were not accounted for as hedging instruments as of, and for the six-month period ended June 30, 2017, were as follows:
| Location on | ||||||||||||||
| Value- | Value- | Statements of | ||||||||||||
| Asset | Liability | Assets and | ||||||||||||
Portfolio | Instrument | Primary Risk Type | Derivatives | Derivatives | Liabilities | |||||||||
S&P 500® Index | Futures contracts | Equity price | $ | 1,815,675 | $ | (1,827,778 | ) | (1) | ||||||
|
|
|
| |||||||||||
Nasdaq-100® Index | Futures contracts | Equity price | $ | 2,600,265 | $ | (2,624,780 | ) | (1) | ||||||
|
|
|
| |||||||||||
Balanced | Purchased options | Equity price | $ | 1,792,000 | $ | — | (2) | |||||||
|
|
|
| |||||||||||
S&P MidCap 400® Index | Futures contracts | Equity price | $ | 1,047,661 | $ | (1,051,627 | ) | (1) | ||||||
|
|
|
| |||||||||||
Risk Managed Balanced | Purchased options | Equity price | $ | 19,349,005 | $ | — | (2) | |||||||
|
|
|
| |||||||||||
| Futures contracts | Equity price | $ | 211,034,521 | $ | (211,416,882 | ) | (1) | |||||||
|
|
|
| |||||||||||
|
| (1) | Net unrealized appreciation/(depreciation) on futures contracts. The amounts represent the cumulative appreciation/(depreciation) of these futures contracts as reported in the Schedules of Open Futures Contracts. Only the current day’s variation margin, if any, is reported within the Statements of Assets and Liabilities as Variation margin receivable or payable on futures contracts. |
| (2) | Investments in securities, at value. |
Change in Unrealized | ||||||||||||||||||||
| Realized Gain | Appreciation/ | |||||||||||||||||||
| (Loss) on | Depreciation on | |||||||||||||||||||
| Derivatives | Derivatives | Location on | ||||||||||||||||||
| Recognized in | Recognized in | Statements | ||||||||||||||||||
Portfolio | Instrument | Risk Type | Income | Income | of Operations | |||||||||||||||
ON International Equity | Futures contracts | Equity price | $ | 773,873 | $ | (61,320 | ) | (3),(4) | ||||||||||||
|
|
|
| |||||||||||||||||
ON Foreign | Foreign currency contracts | Currency exchange rate | $ | (24,837 | ) | $ | — | (1),(2) | ||||||||||||
|
|
|
| |||||||||||||||||
S&P 500® Index | Futures contracts | Equity price | $ | 1,068,651 | $ | 99,156 | (3),(4) | |||||||||||||
|
|
|
| |||||||||||||||||
Nasdaq-100® Index | Futures contracts | Equity price | $ | 267,053 | $ | (9,154 | ) | (3),(4) | ||||||||||||
|
|
|
| |||||||||||||||||
Balanced | Purchased options | Equity price | $ | (5,343,582 | ) | $ | 2,164,526 | (5),(6) | ||||||||||||
|
|
|
| |||||||||||||||||
| Written options | Equity price | $ | 412,834 | $ | (259,478 | ) | (7),(8) | |||||||||||||
|
|
|
| |||||||||||||||||
S&P MidCap 400® Index | Futures contracts | Equity price | $ | 29,172 | $ | 2,867 | (3),(4) | |||||||||||||
|
|
|
| |||||||||||||||||
Risk Managed Balanced | Futures contracts | Equity price | $ | 3,990,768 | $ | 547,476 | (3),(4) | |||||||||||||
|
|
|
| |||||||||||||||||
| Purchased options | Equity price | $ | (469,705 | ) | $ | (233,113 | ) | (5),(6) | ||||||||||||
|
|
|
| |||||||||||||||||
|
| (1) | Net realized gain (loss) on foreign currency contracts. |
| (2) | Change in unrealized appreciation/(depreciation) on foreign currency contracts. |
| (3) | Net realized gain (loss) on futures contracts. |
| (4) | Change in unrealized appreciation/(depreciation) on futures contracts. |
| (5) | Net realized gain (loss) on investments. |
| (6) | Change in unrealized appreciation/(depreciation) on investments. |
| (7) | Net realized gain (loss) on written options. |
| (8) | Change in unrealized appreciation/(depreciation) on written options. |
The Portfolios may enter into International Swaps and Derivatives Association, Inc. Master Agreements (“ISDA Master Agreement”) or similar agreements with their derivative contract counterparties whereby the Portfolios may, under certain circumstances, offset with the counterparty certain derivative financial instruments’ payables and/or receivables and create one single net payment. For financial reporting purposes, the Portfolios offset derivative assets and liabilities that are subject to netting arrangements in the Statement of Assets and Liabilities. At June 30, 2017, there were no outstanding derivative transactions that were subject to netting arrangements.
| 164 | (continued) |
Ohio National Fund, Inc.
| Notes to Financial Statements (Continued) | June 30, 2017 (Unaudited) |
(7) Federal Income Tax Information
The cost basis for Federal income tax purposes may differ from the cost basis for financial reporting purposes. The table below details the unrealized appreciation (depreciation) and aggregate cost of securities at June 30, 2017 for Federal income tax purposes.
| Capital | ON International | |||||||||||||||||||||||
| Equity | Bond | Omni | Appreciation | Equity | ON Foreign | |||||||||||||||||||
Gross unrealized: | ||||||||||||||||||||||||
Appreciation | $ | 87,495,090 | $ | 5,277,621 | $ | 6,332,213 | $ | 28,064,667 | $ | 7,469,126 | $ | 3,378,737 | ||||||||||||
Depreciation | (21,485,157 | ) | (778,266 | ) | (1,404,183 | ) | (6,513,396 | ) | (4,221,073 | ) | (2,850,081 | ) | ||||||||||||
|
|
|
|
|
|
|
|
|
|
|
| |||||||||||||
Net unrealized appreciation | $ | 66,009,933 | $ | 4,499,355 | $ | 4,928,030 | $ | 21,551,271 | $ | 3,248,053 | $ | 528,656 | ||||||||||||
|
|
|
|
|
|
|
|
|
|
|
| |||||||||||||
Aggregate cost of securities: | $ | 504,116,106 | $ | 158,414,494 | $ | 57,213,108 | $ | 168,756,850 | $ | 153,543,398 | $ | 78,589,517 | ||||||||||||
|
|
|
|
|
|
|
|
|
|
|
| |||||||||||||
| Aggressive Growth | Small Cap Growth | Mid Cap Opportunity | S&P 500® Index | Strategic Value | High Income Bond | |||||||||||||||||||
Gross unrealized: | ||||||||||||||||||||||||
Appreciation | $ | 12,069,731 | $ | 57,808,707 | $ | 13,691,507 | $ | 240,869,315 | $ | 50,967,374 | $ | 10,247,008 | ||||||||||||
Depreciation | (348,963 | ) | (5,838,775 | ) | (1,438,772 | ) | (13,690,443 | ) | (18,873,760 | ) | (3,499,690 | ) | ||||||||||||
|
|
|
|
|
|
|
|
|
|
|
| |||||||||||||
Net unrealized appreciation | $ | 11,720,768 | $ | 51,969,932 | $ | 12,252,735 | $ | 227,178,872 | $ | 32,093,614 | $ | 6,747,318 | ||||||||||||
|
|
|
|
|
|
|
|
|
|
|
| |||||||||||||
Aggregate cost of securities: | $ | 44,851,204 | $ | 197,714,540 | $ | 62,615,910 | $ | 675,494,612 | $ | 549,291,073 | $ | 309,059,761 | ||||||||||||
|
|
|
|
|
|
|
|
|
|
|
| |||||||||||||
| ClearBridge Small Cap | Nasdaq-100® Index | Bristol | Bryton Growth | Balanced | S&P MidCap 400® Index | |||||||||||||||||||
Gross unrealized: | ||||||||||||||||||||||||
Appreciation | $ | 43,810,737 | $ | 81,647,895 | $ | 25,647,737 | $ | 9,245,401 | $ | 74,950,508 | $ | 3,352,002 | ||||||||||||
Depreciation | (10,520,971 | ) | (2,521,942 | ) | (6,536,350 | ) | (3,331,516 | ) | (15,316,939 | ) | (1,985,300 | ) | ||||||||||||
|
|
|
|
|
|
|
|
|
|
|
| |||||||||||||
Net unrealized appreciation | $ | 33,289,766 | $ | 79,125,953 | $ | 19,111,387 | $ | 5,913,885 | $ | 59,633,569 | $ | 1,366,702 | ||||||||||||
|
|
|
|
|
|
|
|
|
|
|
| |||||||||||||
Aggregate cost of securities: | $ | 255,871,899 | $ | 116,172,905 | $ | 197,691,717 | $ | 91,336,834 | $ | 952,663,365 | $ | 55,596,261 | ||||||||||||
|
|
|
|
|
|
|
|
|
|
|
| |||||||||||||
| Bristol Growth | Risk Managed Balanced | ON Conservative Model | ON Moderately Conservative Model | ON Balanced Model | ON Moderate Growth Model | |||||||||||||||||||
Gross unrealized: | ||||||||||||||||||||||||
Appreciation | $ | 17,893,997 | $ | 27,492,300 | $ | 1,832,758 | $ | 7,407,969 | $ | 47,759,396 | $ | 75,003,249 | ||||||||||||
Depreciation | (2,290,349 | ) | (7,096,119 | ) | (150,012 | ) | (300,399 | ) | — | (423,696 | ) | |||||||||||||
|
|
|
|
|
|
|
|
|
|
|
| |||||||||||||
Net unrealized appreciation | $ | 15,603,648 | $ | 20,396,181 | $ | 1,682,746 | $ | 7,107,570 | $ | 47,759,396 | $ | 74,579,553 | ||||||||||||
|
|
|
|
|
|
|
|
|
|
|
| |||||||||||||
Aggregate cost of securities: | $ | 107,826,602 | $ | 301,937,407 | $ | 104,165,572 | $ | 329,838,981 | $ | 1,506,341,379 | $ | 2,506,768,845 | ||||||||||||
|
|
|
|
|
|
|
|
|
|
|
| |||||||||||||
| ON Growth Model | ||||||||||||||||||||||||
Gross unrealized: | ||||||||||||||||||||||||
Appreciation. | $ | 18,093,131 | ||||||||||||||||||||||
Depreciation. | (228,070 | ) | ||||||||||||||||||||||
|
| |||||||||||||||||||||||
Net unrealized appreciation | $ | 17,865,061 | ||||||||||||||||||||||
|
| |||||||||||||||||||||||
Aggregate cost of securities: | $ | 502,979,094 | ||||||||||||||||||||||
|
| |||||||||||||||||||||||
(8) Legal Matters
Effective December 20, 2013, the assets and liabilities of the Target Equity/Income Portfolio were acquired and assumed by the S&P MidCap 400® Index Portfolio (formerly the Target VIP Portfolio) in exchange for shares of the S&P MidCap 400® Index Portfolio (the “Reorganization”).
| 165 | (continued) |
Ohio National Fund, Inc.
| Notes to Financial Statements (Continued) | June 30, 2017 (Unaudited) |
In December 2007, prior to the reorganization, the Target Equity/Income Portfolio, as a shareholder of Lyondell Chemical Company (“Lyondell”), participated in a cash out merger of Lyondell in which it received $48 per share of consideration (the “Merger”). Lyondell later filed for bankruptcy and two entities created by the Lyondell bankruptcy plan of reorganization have initiated lawsuits seeking to recover, or clawback, proceeds received by shareholders in the December 2007 merger based on fraudulent transfer claims.
The first action, Edward S. Weisfelner, as Trustee of the LB Creditor Trust v. Morgan Stanley & Co., Inc., et. al., was initiated on October 22, 2010 (the “Creditor Trust Action”), in the Supreme Court of the State of New York in the County of New York but has subsequently been removed to the U.S. Bankruptcy Court for the Southern District of New York. The second action, Edward S. Weisfelner, as Trustee of the LB Litigation Trust v. Holmes TTEE, et. al., was initiated on December 23, 2010 (the “Litigation Trust Action”), in the U.S. Bankruptcy Court for the Southern District of New York. Both actions attempt to recover the proceeds paid out to the holders of Lyondell shares at the time of the 2007 merger. The value of the proceeds to the Portfolio totaled $1,772,400.
On January 4, 2012, the Fund was named in a second amended complaint in the Creditor Trust Action. On April 9, 2014, plaintiffs filed a third amended complaint. In response, on July 30, 2014, the defendant group, including the Fund, filed an omnibus motion to dismiss. The outcome of these proceedings on the Portfolio cannot be predicted.
As a result of the aforementioned reorganization involving the Target Equity/Income Portfolio, any future claims that may result from these complaints will be assumed by the S&P MidCap 400® Index Portfolio as the Survivor Portfolio. Management of the Fund continues to assess the cases and has not yet determined the potential effect, if any, on the net asset value of the S&P MidCap 400® Index Portfolio.
Also, in December 2007, the S&P 500® Index and Strategic Value Portfolios, shareholders of the Tribune Company, participated in a similar cash out merger in which shareholders received $34 per share of consideration. The value of the proceeds received by the S&P 500® Index and Strategic Value Portfolios was $37,910 and $384,200, respectively. The company subsequently filed for bankruptcy and several legal complaints have been initiated by groups of Tribune Company creditors seeking to recover, or clawback, proceeds received by shareholders based on fraudulent transfer claims (the “Tribune Bankruptcy”).
The first action, Official Committee of Unsecured Creditors of Tribune Company v. FitzSimons, et. al. (“FitzSimons”) was initiated on November 1, 2010 in the U.S. Bankruptcy Court for the District of Delaware. As a result of these proceedings, the Court agreed to allow individual creditors to file similar complaints in U.S. state courts. The Fund is specifically named in a complaint in the U.S. District Court, Southern District of Ohio, Western Division, Deutsche Bank Trust Company Americas, et. al. v. American Electric Power, et. al., that was initiated in June of 2011. The Fund, along with the Strategic Value Portfolio, is also named in a similar complaint in the U.S. District Court, Eastern District of Pennsylvania, Deutsche Bank Trust Company Americas, et. al. v. Ametek Inc. Employees Master Retirement Trust, et. al. These Tribune litigation actions have been consolidated into a single Multidistrict Litigation (“MDL”) in the U.S. District Court, Southern District of New York. Thereafter, certain defendants in the MDL, including the Fund, filed various motions to dismiss. On September 23, 2013, the Court granted the motion to dismiss the individual creditors’ state-law fraudulent conveyance claim. Subsequently, on January 6, 2017, the Court granted the motion to dismiss the Trustee’s actual fraudulent conveyance claim. With pending appeals, the outcome of these proceedings on the two Portfolios of the Fund cannot be predicted. Management of the Fund continues to assess litigation matters and any offers of settlement.
| 166 |
Ohio National Fund, Inc.
| Additional Information (Unaudited) | June 30, 2017 |
(1) Review and Approval of Advisory and Sub-advisory Agreements
At a meeting held on February 10, 2017, the Board of Directors, including a majority of the Directors who are not “interested persons” of the Fund (the “Independent Directors”), approved an amendment to the advisory agreement (the “Advisory Agreement”) between Ohio National Investments, Inc. (the “Adviser”) and the Ohio National Fund, Inc. (the “Fund”) for the purpose of adding the Conservative Model Portfolio (the “Conservative Model”), Moderately Conservative Model Portfolio (the “Moderately Conservative Model”), Balanced Model Portfolio (the “Balanced Model”), Moderate Growth Model Portfolio (the “Moderate Growth Model”), and Growth Model Portfolio (the “Growth Model”) (collectively, the “Portfolios”) to the portfolios managed by the Adviser under the Advisory Agreement. The Directors noted their familiarity with the Advisory Agreement and with the Adviser.
The Directors noted that the Adviser is responsible for monitoring the investment performance and other responsibilities of the various Sub-Advisers that have day-to-day responsibility for the decisions made for certain of the Fund’s investment portfolios (each, a “Portfolio”). They also noted that the Adviser reports to the Fund’s Board on its analysis of each Sub-Adviser’s performance at the regular meetings of the Board, which are held at least quarterly. Where warranted, the Adviser will add or remove a particular Portfolio from a watchlist that it maintains. Watchlist criteria include, for example: (a) Portfolio performance over various time periods; (b) Portfolio risk issues, such as changes in key personnel involved with Portfolio management or changes in investment philosophy or process; and (c) organizational risk issues, such as regulatory, compliance or legal concerns, or changes in the ownership of the Sub-Adviser.
The Directors noted that the Adviser will have day-to-day responsibility for the management of each Portfolio as well as the compliance and administrative oversight responsibilities to the Portfolios, including collection and/or preparation of certain certifications required by the conditions of the Securities and Exchange Commission order (the “Order”) granted to the Fund, which, in summary, permits the Portfolios to operate as “Funds of Funds” and to invest in other investment companies in excess of the limits of Section 12(d)(1). They also noted that the Adviser will report to the Board on its analysis of each Portfolio’s performance at the regular meetings of the Board, which are held at least quarterly.
In considering the amendment to the Advisory Agreement, the Board requested and reviewed a significant amount of information relating to each Portfolio, including the following: (1) detail of the mix of underlying funds expected to be held in each model Portfolio; (2) historical weighted average returns that each model Portfolio would have realized had it been invested in the same mix of underlying funds over the relevant period (the “Hypothetical Performance”), as compared to the performance of the model Portfolio’s proposed benchmark “Benchmark Performance”); (3) performance data of the underlying funds expected to be held by the Portfolios; (4) comparative advisory fee and expense ratio information for a peer group of funds, as well as advisory fee and expense ratio peer comparison charts showing where each Portfolio’s proposed advisory fee and estimated expense ratio were located in the dispersion of its peer funds’ advisory fees and expense ratios; (5) comparative data regarding the expense ratio of each Portfolio as compared to its peer group; and (6) other information regarding the nature, extent and quality of services anticipated to be provided by the Adviser.
The Directors, including all of the Independent Directors, were assisted by experienced independent legal counsel throughout the contract review process. The Independent Directors discussed the proposed amendment in private session with such counsel at which no representatives of management or the Adviser were present. The Directors, including all of the Independent Directors, relied upon the advice of independent legal counsel and their own business judgment in determining the material factors to be considered in evaluating adding the portfolios to the Advisory Agreement and the weight to be given to each such factor. The conclusions reached by the Directors were based on a comprehensive evaluation of all of the information provided and were not the result of any one factor. Moreover, each Director may have afforded different weight to the various factors in reaching his or her conclusions with respect to approving the amendment to the Advisory Agreement.
Nature, Extent and Quality of Services
The Board evaluated the nature, extent and quality of the advisory services anticipated to be provided to the Portfolios by the Adviser. As part of its review, the Board reviewed information regarding the Adviser’s operations, procedures and personnel. The Directors took into account information they received during the previous year at Board meetings in connection with the Adviser’s service to other portfolios of the Fund and through periodic reports regarding the Adviser’s performance of its duties to such other portfolios. The Directors considered the capabilities and resources that the Adviser has dedicated to performing services on behalf of the Fund and its portfolios, as well as the quality of the Adviser’s administrative and other services, including the Adviser’s support to contract owners. The Directors also considered the quality of the compliance programs of the Adviser and its responsiveness to inquiries and requests from the Board.
The Directors determined that, in light of the Portfolios’ fund-of-funds structure, the Adviser would be performing significant services to each Portfolio that are in addition to, rather than duplicative of, services provided under the advisory contracts of the underlying funds. In making this determination, they noted, in particular, the representations of representatives of the Adviser that
| 167 | (continued) |
Ohio National Fund, Inc.
| Additional Information (Unaudited) (Continued) | June 30, 2017 |
the Adviser would perform regular reviews of each Portfolio and its underlying funds, focusing on the asset class make-up of the Portfolio, the percentages invested in each underlying fund, and each underlying fund’s performance against its benchmark, in order to make sure that the Portfolio is diversified, has the appropriate asset mix and is performing well. They also noted that the Adviser expects to periodically change the mix of the underlying funds as a result of its reviews.
The Directors also reviewed the conditions of the Order, and noted that the Adviser would bear significant responsibility and administrative burden in the monitoring and reporting required by the Order’s conditions. They also reviewed and approved the Adviser’s proposed compliance procedures relating to the Order, noting that they were familiar with the Adviser’s other compliance policies and procedures. It was the Directors’ conclusion that overall, they were satisfied with the nature, extent and quality of services anticipated to be provided to each Portfolio by the Adviser.
Investment Performance
Representatives of the Adviser reviewed with the Directors a performance analysis of the underlying funds anticipated to be held by each Portfolio at inception, comparing each underlying fund’s performance to that of its respective index. The Directors also reviewed a report of the Hypothetical Performance for each Portfolio over the one, three, five and ten year annualized periods based on the anticipated mix of underlying funds. They considered that the Hypothetical Performance information provided reflects outperformance relative to the Benchmark Performance over all periods shown for the Conservative Model, and over the three- and five-year periods for the Moderately Conservative Model, Balanced Model, and Moderately Aggressive Model. They noted that, although the Hypothetical Performance reflects underperformance for the Aggressive Model over all periods, the longer term returns, particularly the 5-year return, are in line with the Benchmark Performance. It was the Directors’ conclusion that the Adviser would be able to provide returns for each Portfolio consistent with their expectations.
Fees and Expenses
The Board reviewed charts showing, for each Portfolio, how the Portfolio’s advisory fee compared to the advisory fees of the funds in its peer group. The charts showed the number of funds in the peer group within each defined range of advisory fees, and the range that included the Portfolio. While the Board noted that the proposed advisory fee for each Portfolio appeared to be higher than the peer group median, they considered that the proposed advisory fees were well within the range of fees charged by peer funds. The Directors discussed the Portfolios’ estimated expense ratios (excluding acquired fund fees and expenses), noting that, although each appeared to be at or higher than the peer group median, the estimated expense ratios were well within the range of fees charged by peer funds. The Board concluded that the proposed advisory fees were reasonable.
Profitability and Economies of Scale
In considering the potential profitability of the Advisor in connection with its relationship with the Portfolios, they noted that the Adviser will waive fees otherwise payable to it in connection with the investment by a Portfolio in an underlying fund. The Directors further considered the statement of a representative of the Adviser that in analyzing its profitability for the Fund’s portfolios, the Adviser does not necessarily account for all of its costs in providing services to the Fund, including services outside the investment advisory function (such as Fund operations and legal functions), including those additional services required to maintain compliance with the Order. The Directors agreed that any projection of profit with respect to a Portfolio would be purely speculative at this time, as the Portfolios have not yet commenced operations. Accordingly, the profitability of the Adviser in connection with its relationship with the Portfolios was not a material factor in the Board’s deliberations. The Directors recognized that a Portfolio would likely realize economies of scale as the Portfolio’s net assets increase over time, but similarly noted that because the Portfolios had not yet commenced operations, discussions of economies of scale were premature. The Board concluded that the potential realization of economies of scale by the Portfolios from the Advisory Agreement with the Adviser should not be a material factor in the Board’s deliberations.
After consideration of the foregoing, the Board reached the following conclusions regarding the proposed Advisory Agreement with respect to each Portfolio, in addition to the conclusions set forth above: (a) the Adviser possesses the capability and resources to perform the duties required of it under the Advisory Agreement; (b) the investment philosophy, strategies and techniques of the Adviser are appropriate for pursuing the applicable Portfolio’s investment objective; (c) the Adviser is likely to execute its investment philosophy, strategies and techniques consistently over time; and (d) the Adviser maintains appropriate compliance programs. Based on all of the above-mentioned factors and their related conclusions, with no single factor or conclusion being determinative and with each Director not necessarily attributing the same weight to each factor, the Directors unanimously approved the amendment to the Advisory Agreement to add the Portfolios.
| 168 | (continued) |
Ohio National Fund, Inc.
| Additional Information (Unaudited) (Continued) | June 30, 2017 |
At a meeting held on March 15, 2017, the Board of Directors, including a majority of the Directors who are not “interested persons” of the Fund (the “Independent Directors”), approved a sub-advisory agreement between Ohio National Investments, Inc. (the “Adviser”) and Lazard Asset Management LLC (“Lazard”) with respect to the ON International Equity Portfolio (formerly the International Portfolio) (the “Lazard Sub-Advisory Agreement”) and a subadvisory agreement between the Adviser and Templeton Global Advisors Limited (“Templeton”; collectively with Lazard the “Sub-Advisers”) with respect to the ON Foreign Portfolio (formerly the International Small-Mid Company Portfolio) (the “Templeton Sub-Advisory Agreement”; collectively with the Lazard Sub-Advisory Agreement, the “Sub-Advisory Agreements”). The Directors noted that at their November 17, 2016 meeting, they had determined to replace Federated Global as sub-adviser to each of the International Portfolio and the International Small-Mid Company Portfolio upon the identification and approval of a new sub-adviser for each Portfolio. During the November meeting, they met with representatives of Lazard and Templeton and authorized the Adviser to proceed with the steps necessary to engage the Sub- Advisers.
In considering the approval of the Sub-Advisory Agreements, the Board requested and reviewed a significant amount of information relating to each Portfolio, including the following: (1) proposed advisory and sub-advisory fee information, including a comparison to existing fees for the Portfolio; (2) comparative advisory fee and expense ratio information for a peer group of funds, as well as advisory fee and sub-advisory fee peer comparison charts showing where each Portfolio’s proposed advisory fee and sub-advisory fee were located in the dispersion of its peer funds’ advisory fees and sub-advisory fees; (3) performance data for each of Lazard and Templeton of funds employing similar strategies to that of the respective Portfolio; (4) estimated Adviser profitability information; and (5) other information regarding the nature, extent and quality of services anticipated to be provided by each Sub-Adviser.
The Directors, including all of the Independent Directors, were assisted by experienced independent legal counsel throughout the contract review process. The Independent Directors discussed the proposed Sub-Advisory Agreement in private session with such counsel at which no representatives of management or the Adviser or either Sub-Adviser were present. The Directors, including all of the Independent Directors, relied upon the advice of independent legal counsel and their own business judgment in determining the material factors to be considered in evaluating each Sub-Advisory Agreement and the weight to be given to each such factor. The conclusions reached by the Directors were based on a comprehensive evaluation of all of the information provided and were not the result of any one factor. Moreover, each Director may have afforded different weight to the various factors in reaching his or her conclusions with respect to each Sub-Advisory Agreement.
Nature, Extent and Quality of Services
The Board evaluated the nature, extent and quality of the advisory services anticipated to be provided by each of Lazard and Templeton. As part of its review, the Board reviewed information regarding each Sub-Adviser’s operations, procedures and personnel. The Directors considered the capabilities and resources that each Sub-Adviser is expected to dedicate to performing services on behalf of the Portfolio, as well as the quality of its administrative and other services. The Directors also considered the quality of the compliance programs of the Sub- Advisers, and reviewed information on each Sub-Adviser’s portfolio management and brokerage practices, including any soft dollar benefits received. It was the Directors’ conclusion that overall, they were satisfied with the nature, extent and quality of services anticipated to be provided to each Portfolio by the respective Sub-Adviser.
Investment Performance
With respect to the ON International Equity Portfolio, the Board considered the performance of Lazard International Equity Open, which utilizes a strategy similar to that of the Portfolio, relative to that of its Morningstar peer group and benchmark. The Directors noted the poor relative performance for the year ended January 31, 2017, and asked for an explanation why the Adviser was recommending Lazard as sub-adviser for the Portfolio. Representative of the Adviser indicated that the Adviser is looking for a sub-adviser that has a repeatable process that can be successful. They indicated that Lazard has been managing the style effectively, noting that even with the bad year in 2016, its 5-year performance is in the 41st percentile of its peer group. They explained that the problem in 2016 was the company mix (Lazard was not in financials and energy, which performed well), and that the performance was also hurt by the Fund’s country allocation and currency. Based on this explanation, the Directors concluded that Lazard has the ability to manage the Portfolio effectively going forward.
With respect to the ON Foreign Portfolio, the Board considered the performance of Templeton Foreign Fund (Advisor Class), which utilizes a strategy similar to that of the Portfolio, relative to that of its Morningstar peer group and benchmark. The Directors noted that it had outperformed its peer group average for the year to date, 1-, 3- and 5-year periods ended January 31, 2017, noting in particular that the Templeton Foreign Fund ranked in the top 3% for the 1-year period and the top 14% for the 5-year period. Based on this performance, The Directors concluded that Templeton had the ability to manage the Portfolio effectively going forward.
| 169 | (continued) |
Ohio National Fund, Inc.
| Additional Information (Unaudited) (Continued) | June 30, 2017 |
Fees and Expenses, Profitability, and Economies of Scale
The Board reviewed charts showing, for each Portfolio, how the Portfolio’s proposed advisory and sub-advisory fees compared to the advisory and sub-advisory fees of the funds in its peer group. The charts showed the number of funds in the peer group within each defined range of advisory fees or sub-advisory fees, and the range that included the Portfolio. The Directors also noted that the Adviser, and not the Portfolios, is responsible for paying sub-advisory fees to the Sub-Advisers. The Board also considered the reasonableness of the proposed sub-advisory fees to be paid by the Adviser to each Sub-Adviser. The Directors relied on the ability of the Adviser to negotiate the terms of each sub-advisory agreement, including the sub-advisory fee, at arm’s length, noting that the Adviser is not affiliated with either Sub-Adviser.
With respect to the ON International Equity Portfolio, the Directors noted that the proposed advisory and sub-advisory fees were unchanged from the current fees, except that the Adviser had negotiated additional breakpoints in the Lazard Sub-Advisory Agreement that would be passed through to shareholders through additional breakpoints in the advisory fee. As to the ON Foreign Portfolio, the Directors noted that that the proposed advisory and sub-advisory fees were lower than the current fees.
The Directors remarked that because the sub-advisory fees were paid by the Adviser and not by a Portfolio, the Adviser was incentivized to negotiate a favorable fee. Accordingly, the cost of services provided by each Sub-Adviser and the profitability of the Sub-Adviser in connection with its relationship with the applicable Portfolio were not material factors in the Board’s deliberations. For similar reasons, the Board concluded that the potential realization of economies of scale by the Portfolios from the sub-advisory arrangements with the Sub-Advisers should not be a material factor in its deliberations.
After consideration of the foregoing, the Board reached the following conclusions regarding the proposed Sub-Advisory Agreements, in addition to the conclusions set forth above: (a) the Sub-Advisers possess the capability and resources to perform the duties required of them under the Sub-Advisory Agreements; (b) the investment philosophy, strategies and techniques of each Adviser are appropriate for pursuing the applicable Portfolio’s investment objective; (c) each Sub-Adviser is likely to execute its investment philosophy, strategies and techniques consistently over time; and (d) the Sub-Advisers maintain appropriate compliance programs. Based on all of the above-mentioned factors and their related conclusions, with no single factor or conclusion being determinative and with each Director not necessarily attributing the same weight to each factor, the Directors unanimously approved the Sub-Advisory Agreements.
Also, at the meeting held on March 15, 2017, the Board of Directors, including a majority of the Independent Directors, approved new Sub-Advisory Agreements between the Adviser and Janus Capital Management, LLC (“Janus”) with respect to the Aggressive Growth, Small Cap Growth and Risk Managed Balanced (as to the Balanced component) Portfolios (collectively, the “Janus Sub-Advisory Agreements”). They noted that they were being asked to approve the new Janus Sub-Advisory Agreements due to a change of control at Janus as a result of its parent’s upcoming merger with Henderson Group plc (“Henderson”).
In considering the approval of the Janus Sub-Advisory Agreements, the Directors noted that they had approved the current sub-advisory agreements with Janus at their November 17, 2016 Board meeting. They also discussed with representatives of the Adviser a memorandum provided by Janus that indicated that the material terms of the Janus Sub-Advisory Agreements were identical to the material terms of the current Janus sub-advisory agreements and that adoption of the Janus Sub-Advisory Agreements would not result in any increase in fees or expenses borne by shareholders.
The Directors indicated, therefore, that their primary consideration for the purpose of approving the new Janus Sub-Advisory Agreements was to determine whether the anticipated quality of services to be provided by Janus to the Portfolios would in any way be negatively impacted as a result of the merger. In this regard, the Directors noted that they had received assurances from Janus that the quality of services that Janus provides to the Portfolios would not be materially impacted by the merger, except that Janus would gain the strength of a broader and deeper investment management team through the combined resources of Janus and Henderson. The Directors also noted that Janus would retain the same investment policies, key personnel and other support systems as under the current Janus sub-advisory agreements. Based on these representations, the Directors indicated that they were convinced that the merger would not have a negative impact on Janus’ ability to provide effective services as sub-adviser to each Portfolio. The Board then turned to its review of updated information relating to each Portfolio, including the following: (1) performance data for each Portfolio for various time periods, including year to-date through January 31, 2017, (2) comparative performance, advisory fee and expense ratio information for a peer group of funds in the respective Portfolio’s Morningstar category (a “Morningstar Peer Group” or “peer group”), as well as management fee peer comparison charts showing where each Portfolio’s sub-advisory fee was located in the dispersion of its peer funds’ sub-advisory fees; (3) comparable performance information for each Portfolio’s relevant benchmark index or indices; (4) comparative data regarding the expense ratio of each Portfolio, as compared to its Morningstar Peer Group; (5) profitability analyses for Janus with respect to each Portfolio; and (6) other information regarding the nature, extent and quality of services provided by Janus.
| 170 | (continued) |
Ohio National Fund, Inc.
| Additional Information (Unaudited) (Continued) | June 30, 2017 |
The Directors, including all of the Independent Directors, were assisted by experienced independent legal counsel throughout the contract review process. The Independent Directors discussed the proposed Janus Sub-Advisory Agreements in private session with such counsel at which no representatives of management or the Adviser or Janus were present. The Directors, including all of the Independent Directors, relied upon the advice of independent legal counsel and their own business judgment in determining the material factors to be considered in evaluating each Janus Sub-Advisory Agreement and the weight to be given to each such factor. The conclusions reached by the Directors were based on a comprehensive evaluation of all of the information provided and were not the result of any one factor. Moreover, each Director may have afforded different weight to the various factors in reaching his or her conclusions with respect to each Janus Sub-Advisory Agreement.
Nature, Extent and Quality of Services
The Board evaluated the nature, extent and quality of the advisory services provided by Janus. Because of the relatively brief time since their last review of the sub-advisory agreements with Janus, the Directors revisited and confirmed their deliberations from their November 17, 2016 meeting. The Directors took into account information they received during the previous year at Board meetings in connection with Janus’ service to the Portfolios. They considered that the change of control at Janus was not expected to result in any change that would negatively impact the services provided to the Portfolios, and that the nature, extent, and quality of services to be provided would be at least as good as those provided under the current agreements. It was the Directors’ conclusion that overall, they continued to be satisfied with the nature, extent and quality of services anticipated to be provided to each Portfolio by Janus.
Investment Performance
Representatives of the Adviser reviewed with the Directors the Aggressive Growth, Small Cap Growth, and Risk Managed Balanced Portfolios’ performance year-to-date and for the 1-, 3- and 5-year periods ended January 31, 2017, as compared to the Portfolio’s Morningstar Peer Group and benchmarks. The Directors agreed that the Aggressive Growth Portfolio continues to have strong performance, noting the Portfolio performed in the top 18% or higher, relative to its Peer Group, over every period shown. As to the Small Gap Growth Portfolio, the Directors noted the improved year-to-date returns, and acknowledged that Janus had rebounded from a challenging period as shown in the 1-year returns. They considered the longer term performance of the Portfolio, noting that the Portfolio is in the top 9% for the 5-year period. Turning to the “balanced” component of the Risk Managed Balanced Portfolio, the Directors noted that Janus had again shown significantly improved performance for the year-to-date period relative to that of the 1-year period. They noted that Janus contributed significantly to the Portfolio’s strong recent performance, and that for the recent 3 month period, the Janus component of the Risk Managed Balanced Portfolio ranked in the top 8% relative to peers. Overall, the Board concluded that the Portfolios’ performance was acceptable.
Fees and Expenses
The Board reviewed the advisory fee paid to Janus for each Portfolio and reviewed charts showing, for each Portfolio, how the Portfolios’ sub-advisory fees compared to the fees of the funds in its peer group. The Directors also noted that the Adviser, and not the Portfolios, is responsible for paying sub-advisory fees to Janus. The Board also considered the reasonableness of the sub-advisory fees paid by the Adviser to Janus. The Directors relied on the ability of the Adviser to negotiate the terms of each sub-advisory agreement, including the sub-advisory fee, at arm’s-length, noting that the Adviser is not affiliated with Janus. With respect to the Janus Sub- Advisory Agreements, the Directors noted that there were no changes proposed to the existing sub-advisory fees and, as they had at the November 17, 2016 meeting, concluded that the sub-advisory fees were reasonable.
Profitability and Economies of Scale
The Directors reviewed the profitability analysis provided by Janus with respect to each Portfolio it sub-advises. They noted that Janus realized a profit in connection with its relationship with each Portfolio, but agreed that the profit was not excessive in terms of percentage of revenue or actual dollars. They further noted that because the sub-advisory fees were paid by the Adviser and not by a Portfolio, the Adviser was incentivized to negotiate a favorable fee. Accordingly, the cost of services provided by the Sub-Adviser and the profitability of the Sub-Adviser in connection with its relationship with the applicable Portfolio were not material factors in the Board’s deliberations. For similar reasons, the Board concluded that the potential realization of economies of scale by the Portfolios from the sub-advisory arrangements with the Sub-Adviser should not be a material factor in its deliberations.
After consideration of the foregoing, the Board reached the following conclusions regarding the proposed Janus Sub-Advisory Agreements with respect to each Portfolio, in addition to the conclusions set forth above: (a) Janus possesses the capability and resources to perform the duties required of it under the Janus Sub-Advisory Agreements; (b) the investment philosophy, strategies and techniques of Janus are appropriate for pursuing the applicable Portfolio’s investment objective; (c) Janus is likely to execute its
| 171 | (continued) |
Ohio National Fund, Inc.
| Additional Information (Unaudited) (Continued) | June 30, 2017 |
investment philosophy, strategies and techniques consistently over time; and (d) Janus maintains appropriate compliance programs. Based on all of the above-mentioned factors and their related conclusions, with no single factor or conclusion being determinative and with each Director not necessarily attributing the same weight to each factor, the Directors unanimously approved the Janus Sub-Advisory Agreements.
(2) Expense Disclosure
An individual may not buy or own membership interests of the Fund directly. An individual acquires an indirect interest in the Fund by purchasing a variable annuity contract or variable insurance policy and allocating premiums or purchase payments to Fund Portfolios available through the separate accounts of ONLIC, ONLAC, and NSLA. Separate accounts of these entities are the shareholders of the Fund.
As a shareholder of the Fund, a separate account incurs ongoing costs, including management fees and other Fund expenses. This example is intended to help a policy/contract owner understand ongoing costs (in dollars) associated with the underlying investment in the Fund’s Portfolios by the separate account shareholder and to compare these costs with the ongoing costs associated with investing in other mutual funds.
The example is based on an investment of $1,000 invested at January 1, 2017 and held through June 30, 2017.
Actual Expenses
The table below provides information about investment values and actual expenses associated with each Portfolio of the Fund. The information below, together with the amount of an underlying investment, can be used to estimate expenses paid over the period. An estimate can be obtained by simply dividing an underlying investment value by $1,000 (for example, an $8,600 investment value divided by $1,000 = 8.6), then multiplying the result by the number in the table under the heading entitled “Expenses Paid During Period”.
| Beginning | Ending | Expense Ratio | ||||||||
| Investment | Investment | Expenses Paid | During Period | |||||||
| Value | Value | During Period* | 1/1/2017 – 6/30/2017 | |||||||
Portfolio | 1/1/2017 | 6/30/2017 | 1/1/2017 – 6/30/2017 | (Annualized) | ||||||
Equity | $ | 1,000.00 | $1,067.30 | $4.10 | 0.80% | |||||
Bond | 1,000.00 | $1,036.90 | $3.23 | 0.64% | ||||||
Omni | 1,000.00 | $1,093.60 | $4.00 | 0.77% | ||||||
Capital Appreciation | 1,000.00 | $1,052.30 | $4.27 | 0.84% | ||||||
ON International Equity | 1,000.00 | $1,161.50 | $5.47 | 1.02% | ||||||
ON Foreign | 1,000.00 | $1,145.40 | $6.33 | 1.19% | ||||||
Aggressive Growth | 1,000.00 | $1,178.70 | $5.13 | 0.95% | ||||||
Small Cap Growth | 1,000.00 | $1,134.50 | $4.50 | 0.85% | ||||||
Mid Cap Opportunity | 1,000.00 | $1,148.20 | $5.17 | 0.97% | ||||||
S&P 500® Index | 1,000.00 | $1,091.30 | $1.97 | 0.38% | ||||||
Strategic Value | 1,000.00 | $1,082.70 | $3.92 | 0.76% | ||||||
High Income Bond | 1,000.00 | $1,050.30 | $3.76 | 0.74% | ||||||
ClearBridge Small Cap | 1,000.00 | $1,065.40 | $4.56 | 0.89% | ||||||
Nasdaq-100® Index | 1,000.00 | $1,165.20 | $2.42 | 0.45% | ||||||
Bristol | 1,000.00 | $1,111.20 | $4.29 | 0.82% | ||||||
Bryton Growth | 1,000.00 | $1,106.40 | $5.07 | 0.97% | ||||||
Balanced | 1,000.00 | $1,064.50 | $3.22 | 0.63% | ||||||
S&P MidCap 400® Index | 1,000.00 | $1,056.90 | $3.62 | 0.71% | ||||||
Bristol Growth | 1,000.00 | $1,137.80 | $4.61 | 0.87% | ||||||
Risk Managed Balanced | 1,000.00 | $1,078.70 | $5.10 | 0.99% | ||||||
ON Conservative Model | 1,000.00 | $1,023.00 | $0.68 | 0.20% | ||||||
ON Moderately Conservative Model | 1,000.00 | $1,026.00 | $0.68 | 0.20% | ||||||
ON Balanced Model | 1,000.00 | $1,027.00 | $0.64 | 0.19% | ||||||
ON Moderate Growth Model | 1,000.00 | $1,035.00 | $0.61 | 0.18% | ||||||
ON Growth Model | 1,000.00 | $1,036.00 | $0.58 | 0.17% | ||||||
| 172 | (continued) |
Ohio National Fund, Inc.
| Additional Information (Unaudited) (Continued) | June 30, 2017 |
Hypothetical Example for Comparison Purposes
The table below provides information about hypothetical investment values and hypothetical expenses based on each respective Portfolio’s actual expense ratio and an assumed rate of return of 5% per year before expenses, which is not an actual return. The hypothetical investment values and expenses may not be used to estimate the actual ending investment balance or expenses actually paid for the period by the shareholders. A policy/contract holder may use this information to compare this 5% hypothetical example with the 5% hypothetical examples that appear in the shareholder reports of other funds.
| Beginning | Ending | Expense Ratio | ||||||||
| Investment | Investment | Expenses Paid | During Period | |||||||
| Value | Value | During Period* | 1/1/2017 – 6/30/2017 | |||||||
Portfolio | 1/1/2017 | 6/30/2017 | 1/1/2017 – 6/30/2017 | (Annualized) | ||||||
Equity | $ | 1,000.00 | $1,020.83 | $4.01 | 0.80% | |||||
Bond | 1,000.00 | $1,021.62 | $3.21 | 0.64% | ||||||
Omni | 1,000.00 | $1,020.98 | $3.86 | 0.77% | ||||||
Capital Appreciation | 1,000.00 | $1,020.63 | $4.21 | 0.84% | ||||||
ON International Equity | 1,000.00 | $1,019.74 | $5.11 | 1.02% | ||||||
ON Foreign | 1,000.00 | $1,018.89 | $5.96 | 1.19% | ||||||
Aggressive Growth | 1,000.00 | $1,020.08 | $4.76 | 0.95% | ||||||
Small Cap Growth | 1,000.00 | $1,020.58 | $4.26 | 0.85% | ||||||
Mid Cap Opportunity | 1,000.00 | $1,019.98 | $4.86 | 0.97% | ||||||
S&P 500® Index | 1,000.00 | $1,022.91 | $1.91 | 0.38% | ||||||
Strategic Value | 1,000.00 | $1,021.03 | $3.81 | 0.76% | ||||||
High Income Bond | 1,000.00 | $1,021.12 | $3.71 | 0.74% | ||||||
ClearBridge Small Cap | 1,000.00 | $1,020.38 | $4.46 | 0.89% | ||||||
Nasdaq-100® Index | 1,000.00 | $1,022.56 | $2.26 | 0.45% | ||||||
Bristol | 1,000.00 | $1,020.73 | $4.11 | 0.82% | ||||||
Bryton Growth | 1,000.00 | $1,019.98 | $4.86 | 0.97% | ||||||
Balanced | 1,000.00 | $1,021.67 | $3.16 | 0.63% | ||||||
S&P MidCap 400® Index | 1,000.00 | $1,021.27 | $3.56 | 0.71% | ||||||
Bristol Growth | 1,000.00 | $1,020.48 | $4.36 | 0.87% | ||||||
Risk Managed Balanced | 1,000.00 | $1,019.89 | $4.96 | 0.99% | ||||||
ON Conservative Model | 1,000.00 | $1,023.80 | $1.00 | 0.20% | ||||||
ON Moderately Conservative Model | 1,000.00 | $1,023.80 | $1.00 | 0.20% | ||||||
ON Balanced Model | 1,000.00 | $1,023.85 | $0.95 | 0.19% | ||||||
ON Moderate Growth Model | 1,000.00 | $1,023.90 | $0.90 | 0.18% | ||||||
ON Growth Model | 1,000.00 | $1,023.95 | $0.85 | 0.17% | ||||||
|
| * | Expenses are equal to the average account value times the Fund’s annualized expense ratio multiplied by the number of days in the most recent fiscal half-year period (181 days) divided by the number of days in the fiscal year (365 days). Please note that the expenses shown in these tables are meant to highlight ongoing Fund costs only and do not reflect any contract-level expenses or Fund transactional costs, such as sales charges (loads) or exchange fees (if any). Therefore, these tables are useful in comparing ongoing fund costs only, and will not fully assist a policy/contract owner in determining the relative total expenses of different funds. In addition, if transactional costs were included, costs may have been higher for these Portfolios as well as for a fund being compared. |
| 173 |
Ohio National Fund, Inc.
| Information about Directors and Officers (Unaudited) | June 30, 2017 |
| Term of Office and Length of | Number of Portfolios in the Fund to be | Principal Occupation(s) During Past Five Years | ||||||||
Name and Address | Age | Position(s) with the Fund | Time Served | Overseen by Director | and Other Directorships | |||||
Independent Directors | ||||||||||
George M. Vredeveld One Financial Way Cincinnati, Ohio | 74 | Lead Independent Director, Member of Audit and Independent Directors Committees | Indefinite; Since March 1996 | 25 | Professor Emeritus, Finance: University of Cincinnati (January 2014-present); Research Fellow and Member of Academic Council: Varna Free University, Varna, Bulgaria (2012-present); Alpaugh Professor of Economics: Lindner College of Business, University of Cincinnati (2004-2013); Founder/President: Economics Center at the University of Cincinnati (1977-2012). | |||||
Madeleine W. Ludlow One Financial Way Cincinnati, Ohio | 62 | Director, Chairman of Audit Committee and Member of Independent Directors Committee | Indefinite; Since April 2012 | 25 | Founder/Managing Director: West Capital Partners LLC (2010-present), Ludlow Ward Capital Advisors LLC (2005-2009); Director: ALLETE, Inc. | |||||
Geoffrey Keenan One Financial Way Cincinnati, Ohio | 58 | Director, Member of Audit and Independent Directors Committees | Indefinite; Since January 2015 | 25 | Executive Vice President and Chief Operating Officer: Gateway Investment Advisers, LLC (1995-2013). | |||||
Lawrence L. Grypp One Financial Way Cincinnati, Ohio | 68 | Director, Member of Audit and Independent Directors Committees | Indefinite; Since December 2016 | 25 | President: Goering Center for Family and Private Business (2008-present). | |||||
| Interested Director | ||||||||||
John J. Palmer One Financial Way Cincinnati, Ohio | 77 | Chairman and Director | Indefinite; Since July 1997 | 25 | Insurance industry consultant (April 2010-present), President: Ohio National Fund, Inc. (1997-2010); Director and Vice Chairman: ONLIC (1997-2010); President and CEO: NSLA (2002-2010); Director: NSLA. | |||||
| Officers | ||||||||||
Michael J. DeWeirdt One Financial Way Cincinnati, Ohio | 58 | President | Indefinite; Since March 2017 | Senior Vice President and Head of Annuities SBU: ONLIC (January 2016-present); Senior Vice PResident, Chief Risk Officer: ONLIC (September 2015-December 2015); Senior Vice President, Capital and Financial Risk Management: ONLIC (December 2012-September 2015); Founder: Chatfield Financial Group (January 2012-December 2012) | ||||||
Paul J. Gerard One Financial Way Cincinnati, Ohio | 57 | Vice President | Indefinite; Since March 2016 | Senior Vice President and Chief Investment Officer: ONLIC and NSLA (January 2016-present); Senior Vice President, Investments: ONLIC (July 2012-December 2015); Vice President, Investments: ONLIC (February 2009-June 2012). | ||||||
R. Todd Brockman One Financial Way Cincinnati, Ohio | 48 | Treasurer | Indefinite; Since August 2004 | Vice President, Mutual Funds: ONLIC and NSLA (February 2014-present); Second Vice President, Mutual Fund Operations: ONLIC and NSLA (January 2007-February 2014); Treasurer: ONI. | ||||||
| 174 | (continued) |
Ohio National Fund, Inc.
| Information about Directors and Officers (Unaudited) (Continued) | June 30, 2017 |
Term of Office and Length of | Number of Portfolios in the Fund to be | Principal Occupation(s) During Past Five Years | ||||||||
Name and Address | Age | Position(s) with the Fund | Time Served | Overseen by Director | and Other Directorships | |||||
Kimberly A. Plante One Financial Way Cincinnati, Ohio | 43 | Secretary | Indefinite; Since March 2005 | Second Vice President and Counsel: ONLIC (January 2016-present); Senior Associate Counsel: ONLIC (January 2011-January 2016); Secretary: ONI; Officer of various other Ohio National-affiliated companies. | ||||||
Keith Dwyer One Financial Way Cincinnati, Ohio | 44 | Chief Compliance Officer | Indefinite; Since August 2016 | Second Vice President, Fund Compliance: ONLIC (August 2016-present); Director, Fund Compliance: ONLIC (January 2015-August 2016); Administrator, Fund Compliance: ONLIC (January2014-January 2015); Compliance Analyst (September 2009-September 2011 and April 2013- January 2014); Chief Compliance Officer: ONI, Fiduciary Capital Management (“FCM”) and other Ohio National-affiliated companies (August 2016- present); Chief Compliance Officer: Suffolk (August 2016-December 2016); Interim Chief Compliance Officer: ONI, Suffolk, FCM and other Ohio National-affiliated companies (November 2015-August 2016). | ||||||
Emily Bae One Financial Way Cincinnati, Ohio | 32 | Assistant Secretary | Indefinite; Since May 2013 | Sr. Assistant Counsel and Privacy Officer: ONLIC (January 2016-present); Assistant Counsel: ONLIC (April 2013-January 2016); Assistant Secretary: ONI (April 2013-present); Counsel: Goodyear Tire & Rubber Company (January 2012-April 2013). | ||||||
Daniel P. Leming One Financial Way Cincinnati, Ohio | 32 | Assistant Treasurer | Indefinite; Since March 2016 | Assistant Director, Fund Operations and Analysis: ONLIC (December 2016-present); Manager, Fund Operations and Analysis: ONLIC (February 2016- December 2016); Senior Mutual Fund Reporting & Operations Analyst: ONLIC (May 2012-Februrary 2016). | ||||||
| 175 |
Ohio National Fund, Inc.
Post Office Box 371
Cincinnati, Ohio 45201
Form 1325 Rev. 8-17
| Item 2. | Code Of Ethics. |
Not applicable for semiannual reports.
| Item 3. | Audit Committee Financial Expert. |
Not applicable for semiannual reports.
| Item 4. | Principal Accountant Fees And Services. |
Not applicable for semiannual reports.
| Item 5. | Audit Committee Of Listed Registrants. |
Not applicable for semiannual reports.
| Item 6. | Schedule of Investments. |
Schedules are included as part of the report to shareholders filed under Item 1 of this Form.
| Item 7. | Disclosure Of Proxy Voting Policies And Procedures For Closed-End Management Investment Companies. |
Not applicable for open-end investment companies.
| Item 8. | Portfolio Managers of Closed-End Management Investment Companies. |
Not applicable for open-end investment companies.
| Item 9. | Purchases of Equity Securities by Closed-End Management Investment Company and Affiliated Purchasers. |
Not applicable for open-end investment companies.
| Item 10. | Submission of Matters to a Vote of Security Holders. |
There were no material changes to the procedures by which shareholders may recommend nominees to the Fund’s Board of Directors.
| Item 11. | Controls and Procedures. |
| (a) | The Fund’s principal executive officer and principal financial officer have concluded, based on their evaluation conducted as of a date within 90 days of the filing of this report, that the Fund’s disclosure controls and procedures are adequately designed and are operating effectively to ensure (i) that material information relating to the Fund, including its consolidated subsidiaries, is made known to them by others within those entities, particularly during the period in which this report is being prepared; and (ii) that information required to be disclosed by the Fund on Form N-CSR is recorded, processed, summarized and reported within the time periods specified in the Securities and Exchange Commission’s rules and forms. |
| (b) | There were no changes in the Fund’s internal control over financial reporting that occurred during the second fiscal quarter of the period covered by this report that have materially affected, or are reasonably likely to materially affect, the Fund’s internal control over financial reporting. |
| Item 12. | Exhibits. |
| (a)(1) | Not applicable for semiannual reports. |
| (a)(2) | A separate certification for each principal executive officer and principal financial officer of the Fund as required by Rule 30a-2(a) under the Investment Company Act of 1940 (17 CFR 270.30a-2(a)) is attached hereto as EX-99.CERT. |
| (a)(3) | None. |
| (b) | The certifications required by Section 906 of the Sarbanes-Oxley Act of 2002 are attached hereto as EX-99.906CERT. |
SIGNATURES
Pursuant to the requirements of the Securities Exchange Act of 1934 and the Investment Company Act of 1940, the registrant has duly caused this report to be signed on its behalf by the undersigned, thereunto duly authorized.
Ohio National Fund, Inc.
By: | /s/ Michael J. DeWeirdt | |
Michael J. DeWeirdt | ||
President | ||
(Principal Executive Officer) | ||
September 8, 2017 |
Pursuant to the requirements of the Securities Exchange Act of 1934 and the Investment Company Act of 1940, this report has been signed below by the following persons on behalf of the registrant and in the capacities and on the dates indicated.
Ohio National Fund, Inc.
By: | /s/ Michael J. DeWeirdt | |
Michael J. DeWeirdt | ||
President | ||
(Principal Executive Officer) | ||
September 8, 2017 |
By: | /s/ R. Todd Brockman | |
R. Todd Brockman | ||
Treasurer | ||
(Principal Financial Officer) | ||
September 8, 2017 |