UNITED STATES
SECURITIES AND EXCHANGE COMMISSION
Washington, D.C. 20549
FORM N-CSR
CERTIFIED SHAREHOLDER REPORT OF REGISTERED
MANAGEMENT INVESTMENT COMPANIES
Investment Company Act file number 811-03015
Ohio National Fund, Inc.
| (Exact name of registrant as specified in charter) | ||||||||||
One Financial Way, Cincinnati, Ohio
| 45242
| |||||||||
| (Address of principal executive offices) | (Zip code) | |||||||||
| CT Corporation 300 E. Lombard St. Suite 1400 Baltimore, MD 21202 | ||||||||||
(Name and address of agent for service)
Registrant’s telephone number, including area code: 513-794-6971
Date of fiscal year end: December 31
Date of reporting period: June 30, 2020
Item 1. Reports To Stockholders.


| Index | 06/30/20 YTD U.S. Dollar Total Return (price and dividend) | |
| S&P 500® | -3.1% | |
| Russell 1000® Growth | +9.8% | |
| Russell 1000® Value | -16.3% | |
| S&P MidCap 400® | -12.8% | |
| Russell 2000® Small Cap | -13.0% | |
| MSCI All Country World Ex-USA (Net – USD) | -11.0% | |
| MSCI Emerging Market | -9.7% |
| Index | 06/30/20 YTD U.S. Dollar Total Return (price and interest) | |
| Bloomberg Barclays U.S. Aggregate | 6.1% | |
| Bloomberg Barclays U.S. Treasury | 8.7% | |
| Bloomberg Barclays Securitized | 3.6% | |
| Bloomberg Barclays Corporate | 5.0% | |
| Bloomberg Barclays U.S. Corporate High Yield | -3.8% |
| Ohio National Fund, Inc. | ON Bond Portfolio (Unaudited) |
| Average Annual returns | |
| One year | 8.00% |
| Five years | 5.46% |
| Ten years | 4.62% |
| (1) | The Portfolio’s composition is subject to change. Holdings and weightings are as of June 30, 2020. |

| Ohio National Fund, Inc. | ON Bond Portfolio (Unaudited) (Continued) |
| Portfolio Composition as of June 30, 2020 (1) | |
| % of Net Assets | |
| Corporate Bonds (4) | 93.5 |
| Asset-Backed Securities (4) | 2.0 |
| U.S. Treasury Obligations | 1.6 |
| Money Market Funds and Other Net Assets | 2.9 |
| 100.0 | |
| Top 10 Portfolio Holdings as of June 30, 2020 (1) (2) (3) | ||
| % of Net Assets | ||
| 1. | Campbell Soup Co. 4.150%, 03/15/2028 | 1.7 |
| 2. | U.S. Treasury Note 1.500%, 02/15/2030 | 1.6 |
| 3. | Lear Corp. 4.250%, 05/15/2029 | 1.5 |
| 4. | AbbVie, Inc. 4.250%, 11/21/2049 | 1.3 |
| 5. | Comcast Corp. 3.250%, 11/01/2039 | 1.2 |
| 6. | Keurig Dr Pepper, Inc. 3.430%, 06/15/2027 | 1.2 |
| 7. | Kinross Gold Corp. 4.500%, 07/15/2027 | 1.2 |
| 8. | Mosaic Co. / The 4.050%, 11/15/2027 | 1.1 |
| 9. | Hasbro, Inc. 3.900%, 11/19/2029 | 1.1 |
| 10. | Bank of Montreal 3.803%, 12/15/2032 | 1.1 |
| (1) | Composition of Portfolio subject to change. | |
| (2) | Short-term investments have been excluded from the list of Top 10 Portfolio Holdings. | |
| (3) | Top 10 Portfolio Holdings is presented at an individual security level. Total investment exposure by issuer may be higher. | |
| (4) | Sectors (Corporate Bonds, Asset-Backed Securities): | |
| % of Net Assets | |
| Financials | 27.5 |
| Industrials | 11.6 |
| Energy | 10.3 |
| Materials | 8.5 |
| Utilities | 8.4 |
| Consumer Staples | 8.3 |
| Communication Services | 6.7 |
| Consumer Discretionary | 5.1 |
| Health Care | 4.2 |
| Real Estate | 3.5 |
| Information Technology | 1.4 |
| 95.5 |
| Ohio National Fund, Inc. | ON Bond Portfolio |
| Schedule of Investments | June 30, 2020 (Unaudited) |
| Corporate Bonds–93.5% | Rate | Maturity | Face Amount | Value | |
| Communication Services–6.7% | |||||
AT&T, Inc. (Diversified Telecom. Svs.) | QL + 118 | 06/12/2024 | $2,000,000 | $ 2,003,958 | |
AT&T, Inc. (Diversified Telecom. Svs.) | 3.400% | 05/15/2025 | 1,000,000 | 1,099,556 | |
AT&T, Inc. (Diversified Telecom. Svs.) | 4.900% | 08/15/2037 | 1,000,000 | 1,197,851 | |
Comcast Corp. (Media) | 3.250% | 11/01/2039 | 3,000,000 | 3,328,295 | |
Lamar Media Corp. (Media) | (a) | 4.875% | 01/15/2029 | 1,200,000 | 1,206,000 |
Rogers Communications, Inc. (Wireless Telecom. Svs.) | 3.700% | 11/15/2049 | 2,100,000 | 2,310,980 | |
Time Warner Cable LLC (Media) | 6.550% | 05/01/2037 | 850,000 | 1,117,913 | |
T-Mobile U.S.A., Inc. (Wireless Telecom. Svs.) | (a) | 3.875% | 04/15/2030 | 1,800,000 | 2,006,226 |
Verizon Communications, Inc. (Diversified Telecom. Svs.) | 4.500% | 08/10/2033 | 1,000,000 | 1,245,283 | |
Verizon Communications, Inc. (Diversified Telecom. Svs.) | 4.400% | 11/01/2034 | 1,500,000 | 1,863,894 | |
Walt Disney Co. / The (Entertainment) | 3.600% | 01/13/2051 | 1,000,000 | 1,111,937 | |
| 18,491,893 | |||||
| Consumer Discretionary–5.1% | |||||
Amazon.com, Inc. (Internet & Direct Marketing Retail) | 3.875% | 08/22/2037 | 1,000,000 | 1,237,829 | |
Aptiv PLC (Auto Components) | 4.350% | 03/15/2029 | 1,000,000 | 1,071,014 | |
Expedia Group, Inc. (Internet & Direct Marketing Retail) | 5.000% | 02/15/2026 | 1,500,000 | 1,543,860 | |
Hasbro, Inc. (Leisure Products) | 3.900% | 11/19/2029 | 3,000,000 | 3,123,360 | |
Lear Corp. (Auto Components) | 4.250% | 05/15/2029 | 4,000,000 | 4,104,752 | |
Magna International, Inc. (Auto Components) | 3.625% | 06/15/2024 | 1,000,000 | 1,088,344 | |
MDC Holdings, Inc. (Household Durables) | 3.850% | 01/15/2030 | 2,000,000 | 1,910,000 | |
| 14,079,159 | |||||
| Consumer Staples–8.3% | |||||
Anheuser-Busch Cos. LLC / Anheuser-Busch InBev Worldwide, Inc. (Beverages) | 4.700% | 02/01/2036 | 2,000,000 | 2,357,857 | |
Anheuser-Busch Cos. LLC / Anheuser-Busch InBev Worldwide, Inc. (Beverages) | 4.900% | 02/01/2046 | 1,000,000 | 1,223,131 | |
Anheuser-Busch InBev Worldwide, Inc. (Beverages) | 4.600% | 04/15/2048 | 2,000,000 | 2,334,820 | |
B.A.T. Capital Corp. (Tobacco) | 3.215% | 09/06/2026 | 1,000,000 | 1,073,469 | |
B.A.T. Capital Corp. (Tobacco) | 4.700% | 04/02/2027 | 2,000,000 | 2,285,504 | |
Campbell Soup Co. (Food Products) | 4.150% | 03/15/2028 | 4,000,000 | 4,603,909 | |
Costco Wholesale Corp. (Food & Staples Retailing) | 1.750% | 04/20/2032 | 1,200,000 | 1,218,215 | |
Hershey Co. / The (Food Products) | 1.700% | 06/01/2030 | 1,800,000 | 1,848,739 | |
Keurig Dr Pepper, Inc. (Beverages) | 3.430% | 06/15/2027 | 3,000,000 | 3,307,728 | |
Philip Morris International, Inc. (Tobacco) | 3.375% | 08/15/2029 | 2,500,000 | 2,841,991 | |
| 23,095,363 | |||||
| Energy–10.3% | |||||
Baker Hughes, a GE Co. LLC / Baker Hughes Co-Obligor, Inc. (Energy Equip. & Svs.) | 4.080% | 12/15/2047 | 2,000,000 | 2,079,422 | |
BP Capital Markets America, Inc. (Oil, Gas & Consumable Fuels) | 3.017% | 01/16/2027 | 1,000,000 | 1,082,625 | |
Chevron Corp. (Oil, Gas & Consumable Fuels) | 2.895% | 03/03/2024 | 900,000 | 968,560 | |
Chevron Corp. (Oil, Gas & Consumable Fuels) | 2.236% | 05/11/2030 | 1,800,000 | 1,884,210 | |
Concho Resources, Inc. (Oil, Gas & Consumable Fuels) | 3.750% | 10/01/2027 | 2,000,000 | 2,132,509 | |
Energy Transfer Operating LP (Oil, Gas & Consumable Fuels) | 4.950% | 06/15/2028 | 2,000,000 | 2,147,393 | |
Exxon Mobil Corp. (Oil, Gas & Consumable Fuels) | 4.114% | 03/01/2046 | 900,000 | 1,090,690 | |
Exxon Mobil Corp. (Oil, Gas & Consumable Fuels) | 3.452% | 04/15/2051 | 1,200,000 | 1,331,599 | |
Halliburton Co. (Energy Equip. & Svs.) | 4.850% | 11/15/2035 | 900,000 | 946,563 | |
Kinder Morgan, Inc. (Oil, Gas & Consumable Fuels) | 5.300% | 12/01/2034 | 1,000,000 | 1,163,000 | |
Marathon Oil Corp. (Oil, Gas & Consumable Fuels) | 3.850% | 06/01/2025 | 850,000 | 856,836 | |
Marathon Petroleum Corp. (Oil, Gas & Consumable Fuels) | 4.750% | 09/15/2044 | 1,000,000 | 1,044,064 | |
ONEOK, Inc. (Oil, Gas & Consumable Fuels) | 5.850% | 01/15/2026 | 1,200,000 | 1,370,291 | |
ONEOK, Inc. (Oil, Gas & Consumable Fuels) | 6.000% | 06/15/2035 | 1,000,000 | 1,114,844 | |
Peabody Energy Corp. (Oil, Gas & Consumable Fuels) | (a) | 6.000% | 03/31/2022 | 1,800,000 | 1,170,000 |
Sabine Pass Liquefaction LLC (Oil, Gas & Consumable Fuels) | (a) | 4.500% | 05/15/2030 | 600,000 | 662,507 |
Shell International Finance BV (Oil, Gas & Consumable Fuels) | 4.000% | 05/10/2046 | 1,000,000 | 1,180,509 | |
Tennessee Gas Pipeline Co. LLC (Oil, Gas & Consumable Fuels) | (a) | 2.900% | 03/01/2030 | 1,000,000 | 1,024,602 |
Texas Eastern Transmission LP (Oil, Gas & Consumable Fuels) | (a) | 4.150% | 01/15/2048 | 1,000,000 | 1,088,752 |
Transocean Pontus Ltd. (Energy Equip. & Svs.) | (a) | 6.125% | 08/01/2025 | 1,043,750 | 908,063 |
Williams Cos., Inc. / The (Oil, Gas & Consumable Fuels) | 3.350% | 08/15/2022 | 1,000,000 | 1,039,438 | |
Williams Cos., Inc. / The (Oil, Gas & Consumable Fuels) | 3.750% | 06/15/2027 | 1,000,000 | 1,066,660 | |
Williams Cos., Inc. / The (Oil, Gas & Consumable Fuels) | 5.400% | 03/04/2044 | 1,000,000 | 1,111,455 | |
| 28,464,592 | |||||
| Financials–27.5% | |||||
AerCap Ireland Capital DAC / AerCap Global Aviation Trust (Diversified Financial Svs.) | 3.300% | 01/23/2023 | 2,000,000 | 1,963,721 | |
American Express Co. (Consumer Finance) | QL + 75 | 08/03/2023 | 1,000,000 | 999,113 | |
American International Group, Inc. (Insurance) | 3.875% | 01/15/2035 | 2,500,000 | 2,864,594 | |
Bank of America Corp. (Banks) | 3.875% | 08/01/2025 | 1,000,000 | 1,132,232 | |
Bank of America Corp. (Rate is fixed until 01/23/2025, at which point, the rate becomes QL + 81) (Banks) | (b) | 3.366% | 01/23/2026 | 2,000,000 | 2,184,387 |
| Ohio National Fund, Inc. | ON Bond Portfolio (Continued) |
| Schedule of Investments | June 30, 2020 (Unaudited) |
| Corporate Bonds (Continued) | Rate | Maturity | Face Amount | Value | |
| Financials (continued) | |||||
Bank of America Corp. (Rate is fixed until 04/24/2037, at which point, the rate becomes QL + 181) (Banks) | (b) | 4.244% | 04/24/2038 | $1,000,000 | $ 1,225,072 |
Bank of Montreal (Rate is fixed until 12/15/2027, at which point, the rate becomes USSW5 + 143) (Banks) | (b) | 3.803% | 12/15/2032 | 2,800,000 | 3,013,668 |
Berkshire Hathaway, Inc. (Diversified Financial Svs.) | 3.125% | 03/15/2026 | 900,000 | 1,008,237 | |
BlackRock, Inc. (Capital Markets) | 2.400% | 04/30/2030 | 1,000,000 | 1,079,032 | |
Capital One Bank U.S.A. N.A. (Rate is fixed until 01/28/2025, at which point, the rate becomes SOFR + 91) (Consumer Finance) | (b) | 2.280% | 01/28/2026 | 1,500,000 | 1,522,247 |
Citigroup, Inc. (Banks) | 4.400% | 06/10/2025 | 2,000,000 | 2,239,719 | |
Citigroup, Inc. (Banks) | 3.700% | 01/12/2026 | 1,000,000 | 1,116,813 | |
Citigroup, Inc. (Banks) | 4.450% | 09/29/2027 | 2,000,000 | 2,279,192 | |
Deutsche Bank AG (Capital Markets) | 2.700% | 07/13/2020 | 2,000,000 | 2,000,420 | |
Discover Bank (Rate is fixed until 08/09/2023, at which point, the rate becomes USSW5 + 173) (Banks) | (b) | 4.682% | 08/09/2028 | 2,000,000 | 2,019,000 |
E*TRADE Financial Corp. (Capital Markets) | 2.950% | 08/24/2022 | 1,800,000 | 1,875,111 | |
Ford Motor Credit Co. LLC (Consumer Finance) | 3.157% | 08/04/2020 | 1,400,000 | 1,391,530 | |
Ford Motor Credit Co. LLC (Consumer Finance) | QL + 88 | 10/12/2021 | 2,000,000 | 1,897,796 | |
General Motors Financial Co., Inc. (Consumer Finance) | 3.200% | 07/06/2021 | 2,000,000 | 2,023,059 | |
General Motors Financial Co., Inc. (Consumer Finance) | QL + 99 | 01/05/2023 | 2,000,000 | 1,927,697 | |
Goldman Sachs Group, Inc. / The (Capital Markets) | 3.750% | 05/22/2025 | 2,000,000 | 2,215,951 | |
Goldman Sachs Group, Inc. / The (Rate is fixed until 04/23/2028, at which point, the rate becomes QL + 116) (Capital Markets) | (b) | 3.814% | 04/23/2029 | 2,000,000 | 2,260,463 |
Intercontinental Exchange, Inc. (Capital Markets) | 3.750% | 12/01/2025 | 1,000,000 | 1,139,433 | |
Jefferies Group LLC / Jefferies Group Capital Finance, Inc. (Diversified Financial Svs.) | 4.850% | 01/15/2027 | 1,800,000 | 1,982,134 | |
JPMorgan Chase & Co. (Banks) | 3.625% | 12/01/2027 | 2,000,000 | 2,210,247 | |
JPMorgan Chase & Co. (Rate is fixed until 05/13/2030, at which point, the rate becomes SOFR + 252) (Banks) | (b) | 2.956% | 05/13/2031 | 2,000,000 | 2,126,757 |
Marsh & McLennan Cos., Inc. (Insurance) | 3.500% | 06/03/2024 | 1,400,000 | 1,530,343 | |
Morgan Stanley (Capital Markets) | QL + 140 | 10/24/2023 | 1,260,000 | 1,273,152 | |
Morgan Stanley (Capital Markets) | 3.950% | 04/23/2027 | 1,000,000 | 1,125,542 | |
Morgan Stanley (Rate is fixed until 01/23/2029, at which point, the rate becomes QL + 163) (Capital Markets) | (b) | 4.431% | 01/23/2030 | 2,000,000 | 2,382,358 |
Nasdaq, Inc. (Capital Markets) | 3.850% | 06/30/2026 | 2,000,000 | 2,241,853 | |
PNC Bank N.A. (Banks) | 2.700% | 10/22/2029 | 2,500,000 | 2,664,184 | |
Synchrony Financial (Consumer Finance) | 4.250% | 08/15/2024 | 1,000,000 | 1,051,685 | |
Synchrony Financial (Consumer Finance) | 5.150% | 03/19/2029 | 2,000,000 | 2,254,444 | |
TD Ameritrade Holding Corp. (Capital Markets) | 3.300% | 04/01/2027 | 2,000,000 | 2,239,350 | |
Teachers Insurance & Annuity Association of America (Insurance) | (a) | 4.270% | 05/15/2047 | 900,000 | 1,067,790 |
Truist Bank (Banks) | 3.625% | 09/16/2025 | 1,000,000 | 1,114,129 | |
Wells Fargo & Co. (Banks) | 3.000% | 04/22/2026 | 1,000,000 | 1,092,002 | |
Wells Fargo & Co. (Rate is fixed until 10/30/2029, at which point, the rate becomes QL + 117) (Banks) | (b) | 2.879% | 10/30/2030 | 2,000,000 | 2,137,369 |
Wells Fargo & Co. (Rate is fixed until 04/30/2040, at which point, the rate becomes SOFR + 253) (Banks) | (b) | 3.068% | 04/30/2041 | 1,200,000 | 1,248,633 |
Wells Fargo & Co. (Banks) | 4.650% | 11/04/2044 | 1,000,000 | 1,238,639 | |
Westpac Banking Corp. (Rate is fixed until 02/04/2025, at which point, the rate becomes H15T5Y + 135) (Banks) | (b) | 2.894% | 02/04/2030 | 1,500,000 | 1,525,547 |
Westpac Banking Corp. (Rate is fixed until 11/23/2026, at which point, the rate becomes USISDA05 + 224) (Banks) | (b) | 4.322% | 11/23/2031 | 1,800,000 | 1,997,351 |
| 75,881,996 | |||||
| Health Care–4.2% | |||||
AbbVie, Inc. (Biotechnology) | (a) | 3.200% | 11/21/2029 | 1,000,000 | 1,112,099 |
AbbVie, Inc. (Biotechnology) | (a) | 4.250% | 11/21/2049 | 3,000,000 | 3,596,135 |
Bristol-Myers Squibb Co. (Pharmaceuticals) | (a) | 3.875% | 08/15/2025 | 2,000,000 | 2,275,169 |
HCA, Inc. (Health Care Providers & Svs.) | 5.250% | 06/15/2026 | 1,000,000 | 1,151,010 | |
Quest Diagnostics, Inc. (Health Care Providers & Svs.) | 2.950% | 06/30/2030 | 2,000,000 | 2,128,379 | |
Quest Diagnostics, Inc. (Health Care Providers & Svs.) | 2.800% | 06/30/2031 | 1,200,000 | 1,258,839 | |
| 11,521,631 | |||||
| Industrials–9.6% | |||||
Air Lease Corp. (Trading Companies & Distributors) | 2.250% | 01/15/2023 | 2,000,000 | 1,969,954 | |
Air Lease Corp. (Trading Companies & Distributors) | 2.300% | 02/01/2025 | 2,000,000 | 1,905,946 | |
Aircastle Ltd. (Trading Companies & Distributors) | 4.125% | 05/01/2024 | 2,000,000 | 1,890,288 | |
Boeing Co. / The (Aerospace & Defense) | 3.200% | 03/01/2029 | 3,000,000 | 2,967,261 | |
Burlington Northern Santa Fe LLC (Road & Rail) | 4.550% | 09/01/2044 | 900,000 | 1,182,408 | |
FedEx Corp. (Air Freight & Logistics) | 3.800% | 05/15/2025 | 1,300,000 | 1,445,058 | |
FedEx Corp. (Air Freight & Logistics) | 4.900% | 01/15/2034 | 2,000,000 | 2,418,531 | |
Lockheed Martin Corp. (Aerospace & Defense) | 1.850% | 06/15/2030 | 1,200,000 | 1,229,698 | |
Lockheed Martin Corp. (Aerospace & Defense) | 3.600% | 03/01/2035 | 1,000,000 | 1,200,162 | |
Lockheed Martin Corp. (Aerospace & Defense) | 2.800% | 06/15/2050 | 600,000 | 632,866 |
| Ohio National Fund, Inc. | ON Bond Portfolio (Continued) |
| Schedule of Investments | June 30, 2020 (Unaudited) |
| Corporate Bonds (Continued) | Rate | Maturity | Face Amount | Value | |
| Industrials (continued) | |||||
Northrop Grumman Corp. (Aerospace & Defense) | 2.930% | 01/15/2025 | $2,500,000 | $ 2,700,783 | |
Parker-Hannifin Corp. (Machinery) | 4.200% | 11/21/2034 | 1,400,000 | 1,676,485 | |
Union Pacific Corp. (Road & Rail) | 3.250% | 08/15/2025 | 1,000,000 | 1,108,839 | |
United Rentals North America, Inc. (Trading Companies & Distributors) | 5.250% | 01/15/2030 | 2,000,000 | 2,065,000 | |
Waste Connections, Inc. (Commercial Svs. & Supplies) | 4.250% | 12/01/2028 | 1,800,000 | 2,127,751 | |
| 26,521,030 | |||||
| Information Technology–1.4% | |||||
Hewlett Packard Enterprise Co. (Tech. Hardware, Storage & Periph.) | 4.900% | 10/15/2025 | 850,000 | 983,116 | |
Microsoft Corp. (Software) | 4.100% | 02/06/2037 | 565,000 | 728,779 | |
Microsoft Corp. (Software) | 2.525% | 06/01/2050 | 1,235,000 | 1,277,867 | |
Seagate HDD Cayman (Tech. Hardware, Storage & Periph.) | 4.875% | 03/01/2024 | 900,000 | 964,661 | |
| 3,954,423 | |||||
| Materials–8.5% | |||||
Anglo American Capital PLC (Metals & Mining) | (a) | 4.750% | 04/10/2027 | 1,000,000 | 1,112,827 |
Anglo American Capital PLC (Metals & Mining) | (a) | 4.000% | 09/11/2027 | 900,000 | 962,037 |
Dow Chemical Co. / The (Chemicals) | 4.250% | 10/01/2034 | 2,000,000 | 2,230,122 | |
DuPont de Nemours, Inc. (Chemicals) | 2.169% | 05/01/2023 | 2,000,000 | 2,037,500 | |
Kinross Gold Corp. (Metals & Mining) | 4.500% | 07/15/2027 | 3,000,000 | 3,275,686 | |
Mosaic Co. / The (Chemicals) | 4.050% | 11/15/2027 | 3,000,000 | 3,185,377 | |
Nutrien Ltd. (Chemicals) | 4.200% | 04/01/2029 | 1,900,000 | 2,204,423 | |
RPM International, Inc. (Chemicals) | 4.250% | 01/15/2048 | 3,000,000 | 2,951,231 | |
Steel Dynamics, Inc. (Metals & Mining) | 2.800% | 12/15/2024 | 1,200,000 | 1,248,857 | |
Steel Dynamics, Inc. (Metals & Mining) | 3.250% | 01/15/2031 | 1,200,000 | 1,219,535 | |
Syngenta Finance N.V. (Chemicals) | (a) | 5.182% | 04/24/2028 | 1,000,000 | 1,066,505 |
Yamana Gold, Inc. (Metals & Mining) | 4.625% | 12/15/2027 | 2,000,000 | 2,106,378 | |
| 23,600,478 | |||||
| Real Estate–3.5% | |||||
Alexandria Real Estate Equities, Inc. (Equity REIT) | 3.950% | 01/15/2028 | 1,000,000 | 1,140,574 | |
Federal Realty Investment Trust (Equity REIT) | 3.250% | 07/15/2027 | 2,000,000 | 2,093,515 | |
Healthcare Realty Trust, Inc. (Equity REIT) | 3.875% | 05/01/2025 | 1,400,000 | 1,487,206 | |
Healthcare Realty Trust, Inc. (Equity REIT) | 3.625% | 01/15/2028 | 1,000,000 | 1,053,006 | |
Healthpeak Properties, Inc. (Equity REIT) | 4.000% | 06/01/2025 | 1,500,000 | 1,661,264 | |
Welltower, Inc. (Equity REIT) | 4.250% | 04/01/2026 | 1,000,000 | 1,120,648 | |
Welltower, Inc. (Equity REIT) | 2.700% | 02/15/2027 | 1,000,000 | 1,039,048 | |
| 9,595,261 | |||||
| Utilities–8.4% | |||||
AEP Transmission Co. LLC (Electric Utilities) | 4.000% | 12/01/2046 | 1,000,000 | 1,200,290 | |
AEP Transmission Co. LLC (Electric Utilities) | 3.750% | 12/01/2047 | 1,351,000 | 1,549,393 | |
Ameren Corp. (Multi-Utilities) | 3.500% | 01/15/2031 | 2,000,000 | 2,235,693 | |
American Water Capital Corp. (Water Utilities) | 4.300% | 12/01/2042 | 1,400,000 | 1,716,615 | |
Berkshire Hathaway Energy Co. (Multi-Utilities) | 3.250% | 04/15/2028 | 1,900,000 | 2,148,360 | |
Commonwealth Edison Co. (Electric Utilities) | 4.350% | 11/15/2045 | 2,000,000 | 2,541,173 | |
Connecticut Light & Power Co. / The (Electric Utilities) | 4.000% | 04/01/2048 | 1,000,000 | 1,219,210 | |
Duke Energy Corp. (Electric Utilities) | 3.750% | 09/01/2046 | 1,000,000 | 1,132,409 | |
Eversource Energy (Electric Utilities) | 3.300% | 01/15/2028 | 1,000,000 | 1,099,331 | |
FirstEnergy Transmission LLC (Electric Utilities) | (a) | 4.550% | 04/01/2049 | 1,800,000 | 2,186,240 |
Florida Power & Light Co. (Electric Utilities) | 3.150% | 10/01/2049 | 2,000,000 | 2,273,165 | |
Jersey Central Power & Light Co. (Electric Utilities) | (a) | 4.300% | 01/15/2026 | 900,000 | 1,040,663 |
Public Service Electric & Gas Co. (Multi-Utilities) | 3.600% | 12/01/2047 | 1,500,000 | 1,736,270 | |
Southwest Gas Corp. (Gas Utilities) | 3.875% | 04/01/2022 | 1,000,000 | 1,039,166 | |
| 23,117,978 | |||||
Total Corporate Bonds (Cost $238,858,083) | $258,323,804 |
| Asset-Backed Securities–2.0% | Rate | Maturity | Face Amount | Value | |
| Industrials–2.0% | |||||
Air Canada 2017-1 Class B Pass Through Trust | (a) | 3.700% | 01/15/2026 | $2,132,937 | $ 1,688,329 |
American Airlines 2015-1 Class B Pass Through Trust | 3.700% | 05/01/2023 | 2,670,227 | 1,765,918 | |
United Airlines 2016-1 Class B Pass Through Trust | 3.650% | 01/07/2026 | 1,491,667 | 1,100,701 | |
United Airlines 2019-2 Class AA Pass Through Trust | 2.700% | 05/01/2032 | 1,000,000 | 902,872 | |
Total Asset-Backed Securities (Cost $7,296,888) | $ 5,457,820 |
| Ohio National Fund, Inc. | ON Bond Portfolio (Continued) |
| Schedule of Investments | June 30, 2020 (Unaudited) |
| U.S. Treasury Obligations–1.6% | Rate | Maturity | Face Amount | Value | |
U.S. Treasury Note | 1.500% | 02/15/2030 | $4,000,000 | $ 4,323,593 | |
Total U.S. Treasury Obligations (Cost $4,313,167) | $ 4,323,593 |
| Money Market Funds–1.2% | Shares | Value | |
State Street Institutional Liquid Reserves Fund Institutional Class, 0.346% | (c) | 3,442,769 | $ 3,444,147 |
Total Money Market Funds (Cost $3,444,254) | $ 3,444,147 | ||
Total Investments – 98.3% (Cost $253,912,392) | (d) | $271,549,364 | |
Other Assets in Excess of Liabilities – 1.7% | 4,626,303 | ||
| Net Assets – 100.0% | $276,175,667 |
Percentages are stated as a percent of net assets. |
| Abbreviations: | ||
| H15T5Y: | U.S. Treasury Yield Curve Rate T-Note Constant Maturity 5 Year, 0.290% at 06/30/2020 | |
| QL: | Quarterly U.S. LIBOR Rate, 0.302% at 06/30/2020 | |
| SOFR: | Secured Overnight Financing Rate, 0.100% at 06/30/2020 | |
| USISDA05: | USD ICE Swap Rate 11:00am NY 5 Year, 0.310% at 06/30/2020 | |
| USSW5: | USD Swap Semi 30/360 5 Year, 0.326% at 06/30/2020 | |
| Footnotes: | ||
| (a) | Security exempt from registration under Regulation D of the Securities Act of 1933. These securities may be resold in transactions exempt from registration, normally to qualified buyers under Rule 144A. At June 30, 2020, the value of these securities totaled $24,173,944, or 8.8% of the Portfolio’s net assets. | |
| (b) | Security is a fixed-then-variable rate instrument in which the coupon or dividend rate is fixed until a later specified date, then is adjusted periodically. Rates stated, including interest rate caps and floors, if any, are those in effect at June 30, 2020. | |
| (c) | Rate represents the seven-day yield at June 30, 2020. | |
| (d) | Represents cost for financial reporting purposes, which may differ from cost basis for federal income tax purposes. See also Note 8 of the Notes to Financial Statements. | |
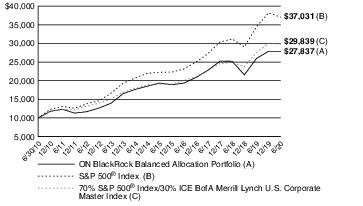
| Ohio National Fund, Inc. | ON BlackRock Balanced Allocation Portfolio (Unaudited) |
| Average Annual returns | |
| One year | 7.30% |
| Five years | 7.53% |
| Ten years | 10.78% |
| (1) | The Portfolio’s composition is subject to change. Holdings and weightings are as of June 30, 2020. |
| Ohio National Fund, Inc. | ON BlackRock Balanced Allocation Portfolio (Unaudited) (Continued) |
| Portfolio Composition as of June 30, 2020 (1) | |
| % of Net Assets | |
| Common Stocks (4) | 66.4 |
| Corporate Bonds (4) | 30.3 |
| U.S. Treasury Obligations | 1.3 |
| Asset-Backed Securities (4) | 0.2 |
| Rights (4) | 0.0 |
| Money Market Funds Less Net Liabilities | 1.8 |
| 100.0 | |
| Top 10 Portfolio Holdings as of June 30, 2020 (1) (2) (3) | ||
| % of Net Assets | ||
| 1. | Microsoft Corp. | 4.7 |
| 2. | Amazon.com, Inc. | 3.7 |
| 3. | Apple, Inc. | 3.6 |
| 4. | Alphabet, Inc. Class A | 1.6 |
| 5. | Home Depot, Inc. / The | 1.2 |
| 6. | Cisco Systems, Inc. | 1.2 |
| 7. | Berkshire Hathaway, Inc. Class B | 1.2 |
| 8. | NVIDIA Corp. | 1.1 |
| 9. | Intel Corp. | 1.1 |
| 10. | U.S. Treasury Note 1.500%, 02/15/2030 | 1.1 |
| (1) | Composition of Portfolio subject to change. | |
| (2) | Short-term investments have been excluded from the list of Top 10 Portfolio Holdings. | |
| (3) | Top 10 Portfolio Holdings is presented at an individual security level. Total investment exposure by issuer may be higher. | |
| (4) | Sectors (Common Stocks, Corporate Bonds, Asset-Backed Securities, Rights): | |
| % of Net Assets | |
| Information Technology | 19.6 |
| Financials | 15.2 |
| Health Care | 11.9 |
| Communication Services | 9.1 |
| Consumer Discretionary | 8.9 |
| Industrials | 7.9 |
| Consumer Staples | 7.4 |
| Utilities | 6.5 |
| Energy | 4.6 |
| Materials | 3.3 |
| Real Estate | 2.5 |
| 96.9 |
| Ohio National Fund, Inc. | ON BlackRock Balanced Allocation Portfolio |
| Schedule of Investments | June 30, 2020 (Unaudited) |
| Common Stocks–66.4% | Shares | Value | |
| Communication Services–6.8% | |||
Activision Blizzard, Inc. (Entertainment) | 2,681 | $ 203,488 | |
Alphabet, Inc. Class A (Interactive Media & Svs.) | (a) | 5,601 | 7,942,498 |
Alphabet, Inc. Class C (Interactive Media & Svs.) | (a) | 3,794 | 5,363,236 |
Altice U.S.A., Inc. Class A (Media) | (a) | 3,146 | 70,911 |
AMC Networks, Inc. Class A (Media) | (a) | 2,548 | 59,598 |
AT&T, Inc. (Diversified Telecom. Svs.) | 82,451 | 2,492,494 | |
Cable One, Inc. (Media) | 42 | 74,544 | |
CenturyLink, Inc. (Diversified Telecom. Svs.) | 16,799 | 168,494 | |
Charter Communications, Inc. Class A (Media) | (a) | 24 | 12,241 |
Comcast Corp. Class A (Media) | 46,095 | 1,796,783 | |
Discovery, Inc. Class A (Media) | (a) | 9,782 | 206,400 |
Electronic Arts, Inc. (Entertainment) | (a) | 2,534 | 334,615 |
Facebook, Inc. Class A (Interactive Media & Svs.) | (a) | 23,372 | 5,307,080 |
Interpublic Group of Cos., Inc. / The (Media) | 64,408 | 1,105,241 | |
Netflix, Inc. (Entertainment) | (a) | 5,711 | 2,598,733 |
Sirius XM Holdings, Inc. (Media) | 287,278 | 1,686,322 | |
TEGNA, Inc. (Media) | 2,684 | 29,900 | |
Telephone & Data Systems, Inc. (Wireless Telecom. Svs.) | 23,259 | 462,389 | |
Twitter, Inc. (Interactive Media & Svs.) | (a) | 26,910 | 801,649 |
United States Cellular Corp. (Wireless Telecom. Svs.) | (a) | 14,743 | 455,116 |
Verizon Communications, Inc. (Diversified Telecom. Svs.) | 45,050 | 2,483,606 | |
ViacomCBS, Inc. Class B (Media) | 3,662 | 85,398 | |
Walt Disney Co. / The (Entertainment) | 3,506 | 390,954 | |
Zynga, Inc. Class A (Entertainment) | (a) | 10,061 | 95,982 |
| 34,227,672 | |||
| Consumer Discretionary–7.4% | |||
Amazon.com, Inc. (Internet & Direct Marketing Retail) | (a) | 6,773 | 18,685,488 |
Best Buy Co., Inc. (Specialty Retail) | 6,890 | 601,290 | |
Boyd Gaming Corp. (Hotels, Restaurants & Leisure) | 5,864 | 122,558 | |
Bright Horizons Family Solutions, Inc. (Diversified Consumer Svs.) | (a) | 352 | 41,254 |
Carnival Corp. (Hotels, Restaurants & Leisure) | 2,692 | 44,203 | |
Choice Hotels International, Inc. (Hotels, Restaurants & Leisure) | 1,712 | 135,077 | |
Darden Restaurants, Inc. (Hotels, Restaurants & Leisure) | 11,659 | 883,402 | |
Domino's Pizza, Inc. (Hotels, Restaurants & Leisure) | 1,088 | 401,951 | |
Extended Stay America, Inc. (Hotels, Restaurants & Leisure) | 4,186 | 46,841 | |
Graham Holdings Co. Class B (Diversified Consumer Svs.) | 263 | 90,122 | |
H&R Block, Inc. (Diversified Consumer Svs.) | 35,353 | 504,841 | |
Harley-Davidson, Inc. (Automobiles) | 2,204 | 52,389 | |
Home Depot, Inc. / The (Specialty Retail) | 24,030 | 6,019,755 | |
Las Vegas Sands Corp. (Hotels, Restaurants & Leisure) | 3,663 | 166,813 | |
Levi Strauss & Co. Class A (Textiles, Apparel & Luxury Goods) | 3,148 | 42,183 | |
Lowe's Cos., Inc. (Specialty Retail) | 20,696 | 2,796,444 | |
McDonald's Corp. (Hotels, Restaurants & Leisure) | 8,952 | 1,651,376 | |
NIKE, Inc. Class B (Textiles, Apparel & Luxury Goods) | 18,894 | 1,852,557 | |
Norwegian Cruise Line Holdings Ltd. (Hotels, Restaurants & Leisure) | (a) | 7,452 | 122,436 |
Penn National Gaming, Inc. (Hotels, Restaurants & Leisure) | (a) | 2,780 | 84,901 |
Royal Caribbean Cruises Ltd. (Hotels, Restaurants & Leisure) | 3,787 | 190,486 | |
Target Corp. (Multiline Retail) | 5,368 | 643,784 | |
Texas Roadhouse, Inc. (Hotels, Restaurants & Leisure) | 5,351 | 281,302 | |
TJX Cos., Inc. / The (Specialty Retail) | 9,348 | 472,635 | |
V.F. Corp. (Textiles, Apparel & Luxury Goods) | 7,110 | 433,283 | |
Wyndham Destinations, Inc. (Hotels, Restaurants & Leisure) | 3,958 | 111,537 | |
Wyndham Hotels & Resorts, Inc. (Hotels, Restaurants & Leisure) | 3,628 | 154,625 | |
Yum! Brands, Inc. (Hotels, Restaurants & Leisure) | 7,681 | 667,556 | |
| 37,301,089 | |||
| Consumer Staples–4.7% | |||
Altria Group, Inc. (Tobacco) | 2,755 | 108,134 | |
Brown-Forman Corp. Class B (Beverages) | 1,990 | 126,683 | |
Clorox Co. / The (Household Products) | 5,429 | 1,190,960 | |
Coca-Cola Co. / The (Beverages) | 36,261 | 1,620,141 | |
Coca-Cola European Partners PLC (Beverages) | 9,273 | 350,148 | |
Colgate-Palmolive Co. (Household Products) | 17,388 | 1,273,845 | |
Costco Wholesale Corp. (Food & Staples Retailing) | 17,414 | 5,280,099 | |
General Mills, Inc. (Food Products) | 37,524 | 2,313,355 | |
Hershey Co. / The (Food Products) | 16,786 | 2,175,801 | |
Keurig Dr Pepper, Inc. (Beverages) | 1,170 | 33,228 | |
Lancaster Colony Corp. (Food Products) | 535 | 82,920 |
| Ohio National Fund, Inc. | ON BlackRock Balanced Allocation Portfolio (Continued) |
| Schedule of Investments | June 30, 2020 (Unaudited) |
| Common Stocks (Continued) | Shares | Value | |
| Consumer Staples (continued) | |||
McCormick & Co., Inc. (Food Products) | 872 | $ 156,445 | |
Mondelez International, Inc. Class A (Food Products) | 7,122 | 364,148 | |
PepsiCo, Inc. (Beverages) | 33,596 | 4,443,407 | |
Procter & Gamble Co. / The (Household Products) | 35,572 | 4,253,344 | |
| 23,772,658 | |||
| Energy–1.6% | |||
Baker Hughes Co. (Energy Equip. & Svs.) | 16,465 | 253,396 | |
ChampionX Corp. (Energy Equip. & Svs.) | (a) | 22,987 | 224,353 |
Chevron Corp. (Oil, Gas & Consumable Fuels) | 13,602 | 1,213,707 | |
ConocoPhillips (Oil, Gas & Consumable Fuels) | 14,517 | 610,004 | |
Continental Resources, Inc. (Oil, Gas & Consumable Fuels) | 25,295 | 443,421 | |
EOG Resources, Inc. (Oil, Gas & Consumable Fuels) | 21,805 | 1,104,641 | |
Exxon Mobil Corp. (Oil, Gas & Consumable Fuels) | 28,212 | 1,261,641 | |
Marathon Oil Corp. (Oil, Gas & Consumable Fuels) | 99,746 | 610,446 | |
National Oilwell Varco, Inc. (Energy Equip. & Svs.) | 2,153 | 26,374 | |
ONEOK, Inc. (Oil, Gas & Consumable Fuels) | 3,180 | 105,640 | |
PDC Energy, Inc. (Oil, Gas & Consumable Fuels) | (a) | 13,954 | 173,588 |
Phillips 66 (Oil, Gas & Consumable Fuels) | 9,948 | 715,261 | |
Schlumberger Ltd. (Energy Equip. & Svs.) | 21,341 | 392,461 | |
TechnipFMC PLC (Energy Equip. & Svs.) | 22,139 | 151,431 | |
Valero Energy Corp. (Oil, Gas & Consumable Fuels) | 5,506 | 323,863 | |
Williams Cos., Inc. / The (Oil, Gas & Consumable Fuels) | 7,108 | 135,194 | |
| 7,745,421 | |||
| Financials–7.0% | |||
Aflac, Inc. (Insurance) | 11,865 | 427,496 | |
Allstate Corp. / The (Insurance) | 957 | 92,819 | |
Ally Financial, Inc. (Consumer Finance) | 34,632 | 686,753 | |
American Express Co. (Consumer Finance) | 9,933 | 945,622 | |
Ameriprise Financial, Inc. (Capital Markets) | 3,503 | 525,590 | |
Bank of America Corp. (Banks) | 101,708 | 2,415,565 | |
Bank of New York Mellon Corp. / The (Capital Markets) | 15,120 | 584,388 | |
Berkshire Hathaway, Inc. Class B (Diversified Financial Svs.) | (a) | 32,663 | 5,830,672 |
Brown & Brown, Inc. (Insurance) | 2,216 | 90,324 | |
CBOE Global Markets, Inc. (Capital Markets) | 1,800 | 167,904 | |
Charles Schwab Corp. / The (Capital Markets) | 41,220 | 1,390,763 | |
Cincinnati Financial Corp. (Insurance) | 28,914 | 1,851,363 | |
Citizens Financial Group, Inc. (Banks) | 17,417 | 439,605 | |
CME Group, Inc. (Capital Markets) | 6,822 | 1,108,848 | |
Cullen / Frost Bankers, Inc. (Banks) | 9,619 | 718,636 | |
E*TRADE Financial Corp. (Capital Markets) | 976 | 48,536 | |
FactSet Research Systems, Inc. (Capital Markets) | 1,845 | 606,027 | |
First American Financial Corp. (Insurance) | 3,443 | 165,333 | |
First Horizon National Corp. (Banks) | 3,321 | 33,077 | |
Franklin Resources, Inc. (Capital Markets) | 8,031 | 168,410 | |
Globe Life, Inc. (Insurance) | 6,496 | 482,198 | |
Hanover Insurance Group, Inc. / The (Insurance) | 800 | 81,064 | |
Intercontinental Exchange, Inc. (Capital Markets) | 8,122 | 743,975 | |
Invesco Ltd. (Capital Markets) | 6,668 | 71,748 | |
JPMorgan Chase & Co. (Banks) | 44,379 | 4,174,289 | |
Marsh & McLennan Cos., Inc. (Insurance) | 8,978 | 963,968 | |
MGIC Investment Corp. (Thrifts & Mortgage Finance) | 2,584 | 21,163 | |
Moody's Corp. (Capital Markets) | 1,036 | 284,620 | |
Northern Trust Corp. (Capital Markets) | 2,416 | 191,685 | |
Progressive Corp. / The (Insurance) | 1,031 | 82,593 | |
Prudential Financial, Inc. (Insurance) | 26,951 | 1,641,316 | |
Reinsurance Group of America, Inc. (Insurance) | 377 | 29,572 | |
S&P Global, Inc. (Capital Markets) | 9,411 | 3,100,736 | |
State Street Corp. (Capital Markets) | 2,618 | 166,374 | |
T. Rowe Price Group, Inc. (Capital Markets) | 3,824 | 472,264 | |
Unum Group (Insurance) | 7,585 | 125,835 | |
Wells Fargo & Co. (Banks) | 144,923 | 3,710,029 | |
Willis Towers Watson PLC (Insurance) | 1,670 | 328,907 | |
Zions Bancorp N.A. (Banks) | 1,760 | 59,840 | |
| 35,029,907 | |||
| Health Care–9.6% | |||
Abbott Laboratories (Health Care Equip. & Supplies) | 24,487 | 2,238,846 | |
AbbVie, Inc. (Biotechnology) | 48,394 | 4,751,323 |
| Ohio National Fund, Inc. | ON BlackRock Balanced Allocation Portfolio (Continued) |
| Schedule of Investments | June 30, 2020 (Unaudited) |
| Common Stocks (Continued) | Shares | Value | |
| Health Care (continued) | |||
Amgen, Inc. (Biotechnology) | 11,670 | $ 2,752,486 | |
Anthem, Inc. (Health Care Providers & Svs.) | 6,040 | 1,588,399 | |
Biogen, Inc. (Biotechnology) | (a) | 2,375 | 635,431 |
Bristol-Myers Squibb Co. (Pharmaceuticals) | 28,107 | 1,652,692 | |
Cardinal Health, Inc. (Health Care Providers & Svs.) | 4,564 | 238,195 | |
Cigna Corp. (Health Care Providers & Svs.) | 2,601 | 488,078 | |
CVS Health Corp. (Health Care Providers & Svs.) | 32,118 | 2,086,707 | |
Danaher Corp. (Health Care Equip. & Supplies) | 2,525 | 446,496 | |
Edwards Lifesciences Corp. (Health Care Equip. & Supplies) | (a) | 36,116 | 2,495,977 |
Elanco Animal Health, Inc. (Pharmaceuticals) | (a) | 10,311 | 221,171 |
Eli Lilly & Co. (Pharmaceuticals) | 7,919 | 1,300,141 | |
Envista Holdings Corp. (Health Care Equip. & Supplies) | (a) | 4,516 | 95,242 |
Gilead Sciences, Inc. (Biotechnology) | 42,660 | 3,282,260 | |
Globus Medical, Inc. Class A (Health Care Equip. & Supplies) | (a) | 680 | 32,443 |
HCA Healthcare, Inc. (Health Care Providers & Svs.) | 2,063 | 200,235 | |
IDEXX Laboratories, Inc. (Health Care Equip. & Supplies) | (a) | 2,925 | 965,718 |
Johnson & Johnson (Pharmaceuticals) | 24,132 | 3,393,683 | |
Laboratory Corp. of America Holdings (Health Care Providers & Svs.) | (a) | 962 | 159,798 |
McKesson Corp. (Health Care Providers & Svs.) | 6,578 | 1,009,197 | |
Medtronic PLC (Health Care Equip. & Supplies) | 14,673 | 1,345,514 | |
Merck & Co., Inc. (Pharmaceuticals) | 57,973 | 4,483,052 | |
Pfizer, Inc. (Pharmaceuticals) | 63,174 | 2,065,790 | |
Quest Diagnostics, Inc. (Health Care Providers & Svs.) | 2,273 | 259,031 | |
Regeneron Pharmaceuticals, Inc. (Biotechnology) | (a) | 1,329 | 828,831 |
Sage Therapeutics, Inc. (Biotechnology) | (a) | 2,456 | 102,121 |
STERIS PLC (Health Care Equip. & Supplies) | 291 | 44,651 | |
Stryker Corp. (Health Care Equip. & Supplies) | 7,388 | 1,331,244 | |
Teladoc Health, Inc. (Health Care Technology) | (a) | 1,645 | 313,932 |
Thermo Fisher Scientific, Inc. (Life Sciences Tools & Svs.) | 963 | 348,933 | |
UnitedHealth Group, Inc. (Health Care Providers & Svs.) | 16,782 | 4,949,851 | |
Veeva Systems, Inc. Class A (Health Care Technology) | (a) | 1,053 | 246,844 |
West Pharmaceutical Services, Inc. (Health Care Equip. & Supplies) | 520 | 118,128 | |
Zoetis, Inc. (Pharmaceuticals) | 12,125 | 1,661,610 | |
| 48,134,050 | |||
| Industrials–5.4% | |||
3M Co. (Industrial Conglomerates) | 3,940 | 614,601 | |
Advanced Drainage Systems, Inc. (Building Products) | 906 | 44,756 | |
AGCO Corp. (Machinery) | 3,811 | 211,358 | |
Allegion PLC (Building Products) | 20,869 | 2,133,229 | |
AMERCO (Road & Rail) | 863 | 260,790 | |
AMETEK, Inc. (Electrical Equip.) | 1,152 | 102,954 | |
Boeing Co. / The (Aerospace & Defense) | 1,348 | 247,088 | |
Canadian Pacific Railway Ltd. (Road & Rail) | 591 | 150,906 | |
Carlisle Cos., Inc. (Industrial Conglomerates) | 1,144 | 136,903 | |
Cintas Corp. (Commercial Svs. & Supplies) | 2,022 | 538,580 | |
CSX Corp. (Road & Rail) | 9,136 | 637,145 | |
Curtiss-Wright Corp. (Aerospace & Defense) | 477 | 42,587 | |
Deere & Co. (Machinery) | 6,031 | 947,772 | |
Delta Air Lines, Inc. (Airlines) | 21,227 | 595,417 | |
EMCOR Group, Inc. (Construction & Engineering) | 7,653 | 506,169 | |
Fastenal Co. (Trading Companies & Distributors) | 4,834 | 207,089 | |
FedEx Corp. (Air Freight & Logistics) | 332 | 46,553 | |
GATX Corp. (Trading Companies & Distributors) | 11,127 | 678,525 | |
Generac Holdings, Inc. (Electrical Equip.) | (a) | 1,763 | 214,963 |
General Dynamics Corp. (Aerospace & Defense) | 2,483 | 371,109 | |
General Electric Co. (Industrial Conglomerates) | 23,703 | 161,892 | |
HEICO Corp. (Aerospace & Defense) | 1,572 | 156,650 | |
Honeywell International, Inc. (Industrial Conglomerates) | 19,939 | 2,882,980 | |
Hubbell, Inc. (Electrical Equip.) | 8,489 | 1,064,181 | |
Illinois Tool Works, Inc. (Machinery) | 11,859 | 2,073,546 | |
L3Harris Technologies, Inc. (Aerospace & Defense) | 5,222 | 886,017 | |
Lockheed Martin Corp. (Aerospace & Defense) | 3,409 | 1,244,012 | |
Lyft, Inc. Class A (Road & Rail) | (a) | 1,043 | 34,429 |
MasTec, Inc. (Construction & Engineering) | (a) | 10,666 | 478,583 |
Mercury Systems, Inc. (Aerospace & Defense) | (a) | 509 | 40,038 |
Norfolk Southern Corp. (Road & Rail) | 227 | 39,854 | |
Northrop Grumman Corp. (Aerospace & Defense) | 3,586 | 1,102,480 | |
Oshkosh Corp. (Machinery) | 13,978 | 1,001,104 |
| Ohio National Fund, Inc. | ON BlackRock Balanced Allocation Portfolio (Continued) |
| Schedule of Investments | June 30, 2020 (Unaudited) |
| Common Stocks (Continued) | Shares | Value | |
| Industrials (continued) | |||
PACCAR, Inc. (Machinery) | 6,417 | $ 480,312 | |
Quanta Services, Inc. (Construction & Engineering) | 1,590 | 62,376 | |
Resideo Technologies, Inc. (Building Products) | (a) | 5,722 | 67,062 |
Robert Half International, Inc. (Professional Svs.) | 14,401 | 760,805 | |
Roper Technologies, Inc. (Industrial Conglomerates) | 943 | 366,129 | |
Snap-on, Inc. (Machinery) | 3,121 | 432,290 | |
Southwest Airlines Co. (Airlines) | 10,563 | 361,043 | |
Spirit AeroSystems Holdings, Inc. Class A (Aerospace & Defense) | 2,032 | 48,646 | |
Teledyne Technologies, Inc. (Aerospace & Defense) | (a) | 115 | 35,759 |
Toro Co. / The (Machinery) | 1,953 | 129,562 | |
Trex Co., Inc. (Building Products) | (a) | 351 | 45,655 |
Union Pacific Corp. (Road & Rail) | 8,970 | 1,516,558 | |
United Parcel Service, Inc. Class B (Air Freight & Logistics) | 13,055 | 1,451,455 | |
W.W. Grainger, Inc. (Trading Companies & Distributors) | 1,171 | 367,881 | |
WESCO International, Inc. (Trading Companies & Distributors) | (a) | 1,081 | 37,954 |
Xylem, Inc. (Machinery) | 12,320 | 800,307 | |
| 26,818,054 | |||
| Information Technology–18.6% | |||
Accenture PLC Class A (IT Svs.) | 1,851 | 397,447 | |
Adobe, Inc. (Software) | (a) | 6,919 | 3,011,910 |
Amdocs Ltd. (IT Svs.) | 1,016 | 61,854 | |
Analog Devices, Inc. (Semiconductors & Equip.) | 468 | 57,395 | |
Apple, Inc. (Tech. Hardware, Storage & Periph.) | 49,076 | 17,902,925 | |
Applied Materials, Inc. (Semiconductors & Equip.) | 38,497 | 2,327,144 | |
Atlassian Corp. PLC Class A (Software) | (a) | 1,848 | 333,139 |
Automatic Data Processing, Inc. (IT Svs.) | 21,475 | 3,197,413 | |
Avnet, Inc. (Electronic Equip., Instr. & Comp.) | 13,502 | 376,503 | |
Cirrus Logic, Inc. (Semiconductors & Equip.) | (a) | 9,296 | 574,307 |
Cisco Systems, Inc. (Communications Equip.) | 126,326 | 5,891,845 | |
Citrix Systems, Inc. (Software) | 3,879 | 573,743 | |
Cloudflare, Inc. Class A (Software) | (a) | 9,516 | 342,100 |
Cognizant Technology Solutions Corp. Class A (IT Svs.) | 2,063 | 117,220 | |
DocuSign, Inc. (Software) | (a) | 2,076 | 357,508 |
DXC Technology Co. (IT Svs.) | 2,323 | 38,329 | |
Fiserv, Inc. (IT Svs.) | (a) | 16,236 | 1,584,958 |
HP, Inc. (Tech. Hardware, Storage & Periph.) | 19,204 | 334,726 | |
Intel Corp. (Semiconductors & Equip.) | 94,373 | 5,646,337 | |
Intuit, Inc. (Software) | 7,054 | 2,089,324 | |
Lam Research Corp. (Semiconductors & Equip.) | 992 | 320,872 | |
Mastercard, Inc. Class A (IT Svs.) | 8,364 | 2,473,235 | |
Microsoft Corp. (Software) | 116,428 | 23,694,262 | |
Motorola Solutions, Inc. (Communications Equip.) | 246 | 34,472 | |
National Instruments Corp. (Electronic Equip., Instr. & Comp.) | 18,872 | 730,535 | |
NetApp, Inc. (Tech. Hardware, Storage & Periph.) | 8,140 | 361,172 | |
NVIDIA Corp. (Semiconductors & Equip.) | 14,901 | 5,661,039 | |
Paychex, Inc. (IT Svs.) | 19,099 | 1,446,749 | |
PayPal Holdings, Inc. (IT Svs.) | (a) | 25,736 | 4,483,983 |
RingCentral, Inc. Class A (Software) | (a) | 1,309 | 373,078 |
salesforce.com, Inc. (Software) | (a) | 4,717 | 883,636 |
ServiceNow, Inc. (Software) | (a) | 151 | 61,164 |
Skyworks Solutions, Inc. (Semiconductors & Equip.) | 1,286 | 164,428 | |
Slack Technologies, Inc. Class A (Software) | (a) | 9,896 | 307,667 |
Smartsheet, Inc. Class A (Software) | (a) | 6,144 | 312,852 |
TE Connectivity Ltd. (Electronic Equip., Instr. & Comp.) | 609 | 49,664 | |
Texas Instruments, Inc. (Semiconductors & Equip.) | 11,160 | 1,416,985 | |
Visa, Inc. (IT Svs.) | 20,030 | 3,869,195 | |
VMware, Inc. Class A (Software) | (a) | 3,120 | 483,163 |
Xilinx, Inc. (Semiconductors & Equip.) | 1,349 | 132,728 | |
Zoom Video Communications, Inc. Class A (Software) | (a) | 1,279 | 324,278 |
Zscaler, Inc. (Software) | (a) | 3,186 | 348,867 |
| 93,150,151 | |||
| Materials–1.6% | |||
Air Products & Chemicals, Inc. (Chemicals) | 2,251 | 543,527 | |
Alcoa Corp. (Metals & Mining) | (a) | 26,441 | 297,197 |
Domtar Corp. (Paper & Forest Products) | 16,250 | 343,038 | |
DuPont de Nemours, Inc. (Chemicals) | 1,070 | 56,849 | |
Ecolab, Inc. (Chemicals) | 15,863 | 3,155,944 | |
FMC Corp. (Chemicals) | 1,028 | 102,409 |
| Ohio National Fund, Inc. | ON BlackRock Balanced Allocation Portfolio (Continued) |
| Schedule of Investments | June 30, 2020 (Unaudited) |
| Common Stocks (Continued) | Shares | Value | |
| Materials (continued) | |||
Freeport-McMoRan, Inc. (Metals & Mining) | 7,442 | $ 86,104 | |
Linde PLC (Chemicals) | 3,345 | 709,508 | |
Mosaic Co. / The (Chemicals) | 30,254 | 378,478 | |
PPG Industries, Inc. (Chemicals) | 6,600 | 699,996 | |
Reliance Steel & Aluminum Co. (Metals & Mining) | 5,381 | 510,818 | |
Sherwin-Williams Co. / The (Chemicals) | 1,359 | 785,298 | |
Steel Dynamics, Inc. (Metals & Mining) | 1,827 | 47,666 | |
Westrock Co. (Containers & Packaging) | 4,928 | 139,265 | |
| 7,856,097 | |||
| Real Estate–1.6% | |||
Alexandria Real Estate Equities, Inc. (Equity REIT) | 1,204 | 195,349 | |
American Tower Corp. (Equity REIT) | 6,018 | 1,555,894 | |
AvalonBay Communities, Inc. (Equity REIT) | 2,614 | 404,229 | |
Boston Properties, Inc. (Equity REIT) | 14,882 | 1,345,035 | |
Camden Property Trust (Equity REIT) | 1,277 | 116,488 | |
Douglas Emmett, Inc. (Equity REIT) | 3,570 | 109,456 | |
Equity Residential (Equity REIT) | 22,452 | 1,320,627 | |
Federal Realty Investment Trust (Equity REIT) | 636 | 54,193 | |
Host Hotels & Resorts, Inc. (Equity REIT) | 26,566 | 286,647 | |
Macerich Co. / The (Equity REIT) | 6,280 | 56,332 | |
Park Hotels & Resorts, Inc. (Equity REIT) | 19,836 | 196,178 | |
Prologis, Inc. (Equity REIT) | 18,716 | 1,746,764 | |
QTS Realty Trust, Inc. Class A (Equity REIT) | 1,062 | 68,064 | |
Realty Income Corp. (Equity REIT) | 7,322 | 435,659 | |
| 7,890,915 | |||
| Utilities–2.1% | |||
Alliant Energy Corp. (Electric Utilities) | 9,503 | 454,624 | |
Ameren Corp. (Multi-Utilities) | 14,295 | 1,005,796 | |
American Water Works Co., Inc. (Water Utilities) | 9,723 | 1,250,961 | |
Avangrid, Inc. (Electric Utilities) | 1,424 | 59,780 | |
CMS Energy Corp. (Multi-Utilities) | 10,927 | 638,355 | |
Consolidated Edison, Inc. (Multi-Utilities) | 6,719 | 483,298 | |
Eversource Energy (Electric Utilities) | 13,158 | 1,095,667 | |
Exelon Corp. (Electric Utilities) | 8,009 | 290,647 | |
IDACORP, Inc. (Electric Utilities) | 3,265 | 285,263 | |
NextEra Energy, Inc. (Electric Utilities) | 15,505 | 3,723,836 | |
Pinnacle West Capital Corp. (Electric Utilities) | 5,060 | 370,847 | |
Public Service Enterprise Group, Inc. (Multi-Utilities) | 2,056 | 101,073 | |
Southwest Gas Holdings, Inc. (Gas Utilities) | 1,641 | 113,311 | |
UGI Corp. (Gas Utilities) | 5,199 | 165,328 | |
Xcel Energy, Inc. (Electric Utilities) | 10,697 | 668,562 | |
| 10,707,348 | |||
Total Common Stocks (Cost $306,672,318) | $332,633,362 |
| Corporate Bonds–30.3% | Rate | Maturity | Face Amount | Value | |
| Communication Services–2.3% | |||||
AT&T, Inc. (Diversified Telecom. Svs.) | 3.400% | 05/15/2025 | $1,000,000 | $ 1,099,556 | |
AT&T, Inc. (Diversified Telecom. Svs.) | 4.900% | 08/15/2037 | 1,000,000 | 1,197,851 | |
Comcast Corp. (Media) | 3.250% | 11/01/2039 | 2,000,000 | 2,218,863 | |
Lamar Media Corp. (Media) | (b) | 4.875% | 01/15/2029 | 800,000 | 804,000 |
Rogers Communications, Inc. (Wireless Telecom. Svs.) | 3.700% | 11/15/2049 | 1,400,000 | 1,540,653 | |
Time Warner Cable LLC (Media) | 6.550% | 05/01/2037 | 150,000 | 197,279 | |
T-Mobile U.S.A., Inc. (Wireless Telecom. Svs.) | (b) | 3.875% | 04/15/2030 | 1,200,000 | 1,337,484 |
Verizon Communications, Inc. (Diversified Telecom. Svs.) | 4.500% | 08/10/2033 | 1,000,000 | 1,245,283 | |
Verizon Communications, Inc. (Diversified Telecom. Svs.) | 4.400% | 11/01/2034 | 1,000,000 | 1,242,596 | |
Walt Disney Co. / The (Entertainment) | 3.600% | 01/13/2051 | 750,000 | 833,953 | |
| 11,717,518 | |||||
| Consumer Discretionary–1.5% | |||||
Amazon.com, Inc. (Internet & Direct Marketing Retail) | 3.875% | 08/22/2037 | 1,000,000 | 1,237,829 | |
Aptiv PLC (Auto Components) | 4.350% | 03/15/2029 | 150,000 | 160,652 | |
Booking Holdings, Inc. (Internet & Direct Marketing Retail) | 3.550% | 03/15/2028 | 200,000 | 218,436 | |
Expedia Group, Inc. (Internet & Direct Marketing Retail) | 3.250% | 02/15/2030 | 1,000,000 | 931,974 | |
Hasbro, Inc. (Leisure Products) | 3.900% | 11/19/2029 | 2,000,000 | 2,082,240 |
| Ohio National Fund, Inc. | ON BlackRock Balanced Allocation Portfolio (Continued) |
| Schedule of Investments | June 30, 2020 (Unaudited) |
| Corporate Bonds (Continued) | Rate | Maturity | Face Amount | Value | |
| Consumer Discretionary (continued) | |||||
Lear Corp. (Auto Components) | 3.500% | 05/30/2030 | $1,000,000 | $ 999,228 | |
Target Corp. (Multiline Retail) | 2.350% | 02/15/2030 | 2,000,000 | 2,138,237 | |
| 7,768,596 | |||||
| Consumer Staples–2.7% | |||||
Anheuser-Busch Cos. LLC / Anheuser-Busch InBev Worldwide, Inc. (Beverages) | 4.700% | 02/01/2036 | 2,000,000 | 2,357,857 | |
B.A.T. Capital Corp. (Tobacco) | 3.215% | 09/06/2026 | 1,000,000 | 1,073,469 | |
B.A.T. Capital Corp. (Tobacco) | 4.700% | 04/02/2027 | 1,000,000 | 1,142,752 | |
Campbell Soup Co. (Food Products) | 4.150% | 03/15/2028 | 2,000,000 | 2,301,954 | |
Costco Wholesale Corp. (Food & Staples Retailing) | 1.750% | 04/20/2032 | 800,000 | 812,144 | |
Diageo Capital PLC (Beverages) | 2.375% | 10/24/2029 | 2,000,000 | 2,134,635 | |
Hershey Co. / The (Food Products) | 1.700% | 06/01/2030 | 1,200,000 | 1,232,493 | |
Keurig Dr Pepper, Inc. (Beverages) | 3.430% | 06/15/2027 | 1,000,000 | 1,102,576 | |
Philip Morris International, Inc. (Tobacco) | 3.375% | 08/15/2029 | 1,000,000 | 1,136,796 | |
| 13,294,676 | |||||
| Energy–3.0% | |||||
Baker Hughes, a GE Co. LLC / Baker Hughes Co-Obligor, Inc. (Energy Equip. & Svs.) | 3.337% | 12/15/2027 | 1,000,000 | 1,065,273 | |
BP Capital Markets America, Inc. (Oil, Gas & Consumable Fuels) | 3.017% | 01/16/2027 | 1,000,000 | 1,082,625 | |
Chevron Corp. (Oil, Gas & Consumable Fuels) | 2.895% | 03/03/2024 | 100,000 | 107,618 | |
Chevron Corp. (Oil, Gas & Consumable Fuels) | 2.236% | 05/11/2030 | 1,200,000 | 1,256,140 | |
Concho Resources, Inc. (Oil, Gas & Consumable Fuels) | 3.750% | 10/01/2027 | 1,000,000 | 1,066,254 | |
Energy Transfer Operating LP (Oil, Gas & Consumable Fuels) | 4.950% | 06/15/2028 | 1,000,000 | 1,073,697 | |
EOG Resources, Inc. (Oil, Gas & Consumable Fuels) | 3.150% | 04/01/2025 | 100,000 | 109,942 | |
Exxon Mobil Corp. (Oil, Gas & Consumable Fuels) | 4.114% | 03/01/2046 | 100,000 | 121,188 | |
Exxon Mobil Corp. (Oil, Gas & Consumable Fuels) | 3.452% | 04/15/2051 | 800,000 | 887,733 | |
Halliburton Co. (Energy Equip. & Svs.) | 4.850% | 11/15/2035 | 100,000 | 105,174 | |
Kinder Morgan, Inc. (Oil, Gas & Consumable Fuels) | 5.300% | 12/01/2034 | 1,000,000 | 1,163,000 | |
Marathon Oil Corp. (Oil, Gas & Consumable Fuels) | 3.850% | 06/01/2025 | 150,000 | 151,206 | |
MPLX LP (Oil, Gas & Consumable Fuels) | 6.375% | 05/01/2024 | 1,000,000 | 1,032,523 | |
ONEOK, Inc. (Oil, Gas & Consumable Fuels) | 5.850% | 01/15/2026 | 800,000 | 913,527 | |
Peabody Energy Corp. (Oil, Gas & Consumable Fuels) | (b) | 6.000% | 03/31/2022 | 200,000 | 130,000 |
Sabine Pass Liquefaction LLC (Oil, Gas & Consumable Fuels) | (b) | 4.500% | 05/15/2030 | 400,000 | 441,671 |
Shell International Finance BV (Oil, Gas & Consumable Fuels) | 4.000% | 05/10/2046 | 1,500,000 | 1,770,763 | |
Tennessee Gas Pipeline Co. LLC (Oil, Gas & Consumable Fuels) | (b) | 2.900% | 03/01/2030 | 1,000,000 | 1,024,602 |
Williams Cos., Inc. / The (Oil, Gas & Consumable Fuels) | 3.350% | 08/15/2022 | 109,000 | 113,299 | |
Williams Cos., Inc. / The (Oil, Gas & Consumable Fuels) | 3.750% | 06/15/2027 | 1,000,000 | 1,066,660 | |
Williams Cos., Inc. / The (Oil, Gas & Consumable Fuels) | 5.400% | 03/04/2044 | 100,000 | 111,145 | |
| 14,794,040 | |||||
| Financials–8.2% | |||||
AerCap Ireland Capital DAC / AerCap Global Aviation Trust (Diversified Financial Svs.) | 3.300% | 01/23/2023 | 1,000,000 | 981,860 | |
AerCap Ireland Capital DAC / AerCap Global Aviation Trust (Diversified Financial Svs.) | 4.875% | 01/16/2024 | 1,000,000 | 993,398 | |
American International Group, Inc. (Insurance) | 3.875% | 01/15/2035 | 150,000 | 171,876 | |
Bank of America Corp. (Banks) | 3.875% | 08/01/2025 | 1,000,000 | 1,132,232 | |
Bank of Montreal (Rate is fixed until 12/15/2027, at which point, the rate becomes USSW5 + 143) (Banks) | (c) | 3.803% | 12/15/2032 | 200,000 | 215,262 |
Bank of New York Mellon Corp. / The (Capital Markets) | 3.300% | 08/23/2029 | 200,000 | 224,870 | |
Berkshire Hathaway, Inc. (Diversified Financial Svs.) | 3.125% | 03/15/2026 | 100,000 | 112,026 | |
BlackRock, Inc. (Capital Markets) | 2.400% | 04/30/2030 | 2,000,000 | 2,158,064 | |
Capital One Bank U.S.A. N.A. (Rate is fixed until 01/28/2025, at which point, the rate becomes SOFR + 91) (Consumer Finance) | (c) | 2.280% | 01/28/2026 | 1,000,000 | 1,014,831 |
Citigroup, Inc. (Rate is fixed until 07/24/2027, at which point, the rate becomes QL + 139) (Banks) | (c) | 3.668% | 07/24/2028 | 1,000,000 | 1,114,734 |
Citigroup, Inc. (Rate is fixed until 11/05/2029, at which point, the rate becomes SOFR + 142) (Banks) | (c) | 2.976% | 11/05/2030 | 1,000,000 | 1,063,960 |
Deutsche Bank AG (Capital Markets) | 2.700% | 07/13/2020 | 200,000 | 200,042 | |
Discover Bank (Banks) | 2.450% | 09/12/2024 | 1,000,000 | 1,048,760 | |
Discover Bank (Rate is fixed until 08/09/2023, at which point, the rate becomes USSW5 + 173) (Banks) | (c) | 4.682% | 08/09/2028 | 250,000 | 252,375 |
E*TRADE Financial Corp. (Capital Markets) | 2.950% | 08/24/2022 | 200,000 | 208,346 | |
Ford Motor Credit Co. LLC (Consumer Finance) | 3.157% | 08/04/2020 | 100,000 | 99,395 | |
Ford Motor Credit Co. LLC (Consumer Finance) | 3.087% | 01/09/2023 | 2,000,000 | 1,901,240 | |
General Motors Financial Co., Inc. (Consumer Finance) | 4.200% | 03/01/2021 | 1,500,000 | 1,519,945 | |
General Motors Financial Co., Inc. (Consumer Finance) | 3.200% | 07/06/2021 | 100,000 | 101,153 | |
Goldman Sachs Group, Inc. / The (Capital Markets) | 3.750% | 05/22/2025 | 1,000,000 | 1,107,976 | |
Goldman Sachs Group, Inc. / The (Rate is fixed until 06/05/2027, at which point, the rate becomes QL + 151) (Capital Markets) | (c) | 3.691% | 06/05/2028 | 1,000,000 | 1,120,013 |
Jefferies Group LLC / Jefferies Group Capital Finance, Inc. (Diversified Financial Svs.) | 4.850% | 01/15/2027 | 200,000 | 220,237 | |
JPMorgan Chase & Co. (Banks) | 3.625% | 12/01/2027 | 1,000,000 | 1,105,123 | |
JPMorgan Chase & Co. (Rate is fixed until 05/13/2030, at which point, the rate becomes SOFR + 252) (Banks) | (c) | 2.956% | 05/13/2031 | 1,000,000 | 1,063,379 |
| Ohio National Fund, Inc. | ON BlackRock Balanced Allocation Portfolio (Continued) |
| Schedule of Investments | June 30, 2020 (Unaudited) |
| Corporate Bonds (Continued) | Rate | Maturity | Face Amount | Value | |
| Financials (continued) | |||||
Marsh & McLennan Cos., Inc. (Insurance) | 3.500% | 06/03/2024 | $ 100,000 | $ 109,310 | |
Morgan Stanley (Capital Markets) | 3.950% | 04/23/2027 | 1,000,000 | 1,125,542 | |
Morgan Stanley (Rate is fixed until 01/22/2030, at which point, the rate becomes SOFR + 114) (Capital Markets) | (c) | 2.699% | 01/22/2031 | 3,000,000 | 3,186,414 |
Nasdaq, Inc. (Capital Markets) | 3.850% | 06/30/2026 | 1,000,000 | 1,120,926 | |
Northern Trust Corp. (Capital Markets) | 3.950% | 10/30/2025 | 200,000 | 230,766 | |
PNC Bank N.A. (Banks) | 4.050% | 07/26/2028 | 1,950,000 | 2,285,538 | |
Principal Financial Group, Inc. (Insurance) | QL + 304 | 05/15/2055 | 4,250,000 | 3,808,850 | |
S&P Global, Inc. (Capital Markets) | 4.000% | 06/15/2025 | 150,000 | 172,041 | |
Synchrony Financial (Consumer Finance) | 4.250% | 08/15/2024 | 1,000,000 | 1,051,685 | |
TD Ameritrade Holding Corp. (Capital Markets) | 3.300% | 04/01/2027 | 1,000,000 | 1,119,675 | |
Teachers Insurance & Annuity Association of America (Insurance) | (b) | 4.270% | 05/15/2047 | 100,000 | 118,643 |
Truist Bank (Rate is fixed until 09/17/2024, at which point, the rate becomes H15T5Y + 115) (Banks) | (c) | 2.636% | 09/17/2029 | 3,000,000 | 3,010,487 |
Volkswagen Group of America Finance LLC (Consumer Finance) | (b) | 4.625% | 11/13/2025 | 200,000 | 227,379 |
Wells Fargo & Co. (Banks) | 3.000% | 04/22/2026 | 1,500,000 | 1,638,003 | |
Wells Fargo & Co. (Rate is fixed until 04/30/2040, at which point, the rate becomes SOFR + 253) (Banks) | (c) | 3.068% | 04/30/2041 | 800,000 | 832,422 |
Westpac Banking Corp. (Rate is fixed until 02/04/2025, at which point, the rate becomes H15T5Y + 135) (Banks) | (c) | 2.894% | 02/04/2030 | 1,500,000 | 1,525,547 |
Westpac Banking Corp. (Rate is fixed until 11/23/2026, at which point, the rate becomes USISDA05 + 224) (Banks) | (c) | 4.322% | 11/23/2031 | 200,000 | 221,928 |
| 40,916,253 | |||||
| Health Care–2.3% | |||||
AbbVie, Inc. (Biotechnology) | (b) | 3.200% | 11/21/2029 | 1,000,000 | 1,112,099 |
AbbVie, Inc. (Biotechnology) | (b) | 4.250% | 11/21/2049 | 2,000,000 | 2,397,423 |
Bristol-Myers Squibb Co. (Pharmaceuticals) | (b) | 3.875% | 08/15/2025 | 150,000 | 170,638 |
CVS Health Corp. (Health Care Providers & Svs.) | 4.100% | 03/25/2025 | 2,250,000 | 2,543,446 | |
HCA, Inc. (Health Care Providers & Svs.) | 5.250% | 06/15/2026 | 2,000,000 | 2,302,020 | |
Quest Diagnostics, Inc. (Health Care Providers & Svs.) | 2.800% | 06/30/2031 | 800,000 | 839,226 | |
UnitedHealth Group, Inc. (Health Care Providers & Svs.) | 3.875% | 12/15/2028 | 2,000,000 | 2,394,286 | |
| 11,759,138 | |||||
| Industrials–2.3% | |||||
Air Lease Corp. (Trading Companies & Distributors) | 2.250% | 01/15/2023 | 1,000,000 | 984,977 | |
Air Lease Corp. (Trading Companies & Distributors) | 2.300% | 02/01/2025 | 2,000,000 | 1,905,946 | |
Boeing Co. / The (Aerospace & Defense) | 3.200% | 03/01/2029 | 1,500,000 | 1,483,630 | |
Burlington Northern Santa Fe LLC (Road & Rail) | 4.550% | 09/01/2044 | 100,000 | ���131,379 | |
FedEx Corp. (Air Freight & Logistics) | 3.800% | 05/15/2025 | 700,000 | 778,108 | |
FedEx Corp. (Air Freight & Logistics) | 4.900% | 01/15/2034 | 1,000,000 | 1,209,266 | |
Lockheed Martin Corp. (Aerospace & Defense) | 1.850% | 06/15/2030 | 800,000 | 819,798 | |
Lockheed Martin Corp. (Aerospace & Defense) | 3.600% | 03/01/2035 | 100,000 | 120,016 | |
Lockheed Martin Corp. (Aerospace & Defense) | 2.800% | 06/15/2050 | 400,000 | 421,911 | |
Northrop Grumman Corp. (Aerospace & Defense) | 2.930% | 01/15/2025 | 100,000 | 108,031 | |
Parker-Hannifin Corp. (Machinery) | 4.200% | 11/21/2034 | 100,000 | 119,749 | |
Union Pacific Corp. (Road & Rail) | 3.250% | 08/15/2025 | 100,000 | 110,884 | |
United Rentals North America, Inc. (Trading Companies & Distributors) | 4.875% | 01/15/2028 | 1,000,000 | 1,025,000 | |
United Rentals North America, Inc. (Trading Companies & Distributors) | 5.250% | 01/15/2030 | 100,000 | 103,250 | |
Waste Connections, Inc. (Commercial Svs. & Supplies) | 4.250% | 12/01/2028 | 200,000 | 236,417 | |
Waste Connections, Inc. (Commercial Svs. & Supplies) | 2.600% | 02/01/2030 | 2,000,000 | 2,109,810 | |
| 11,668,172 | |||||
| Information Technology–1.0% | |||||
Apple, Inc. (Tech. Hardware, Storage & Periph.) | 2.200% | 09/11/2029 | 2,000,000 | 2,147,441 | |
Hewlett Packard Enterprise Co. (Tech. Hardware, Storage & Periph.) | 4.900% | 10/15/2025 | 150,000 | 173,491 | |
Microsoft Corp. (Software) | 4.100% | 02/06/2037 | 63,000 | 81,262 | |
Microsoft Corp. (Software) | 2.525% | 06/01/2050 | 137,000 | 141,755 | |
Oracle Corp. (Software) | 4.300% | 07/08/2034 | 2,100,000 | 2,603,478 | |
Seagate HDD Cayman (Tech. Hardware, Storage & Periph.) | 4.875% | 03/01/2024 | 100,000 | 107,185 | |
| 5,254,612 | |||||
| Materials–1.7% | |||||
Anglo American Capital PLC (Metals & Mining) | (b) | 4.000% | 09/11/2027 | 100,000 | 106,893 |
Dow Chemical Co. / The (Chemicals) | 4.250% | 10/01/2034 | 2,000,000 | 2,230,122 | |
DuPont de Nemours, Inc. (Chemicals) | 2.169% | 05/01/2023 | 1,000,000 | 1,018,750 | |
Kinross Gold Corp. (Metals & Mining) | 4.500% | 07/15/2027 | 1,000,000 | 1,091,895 | |
Mosaic Co. / The (Chemicals) | 4.050% | 11/15/2027 | 1,000,000 | 1,061,793 | |
Nutrien Ltd. (Chemicals) | 4.200% | 04/01/2029 | 100,000 | 116,022 | |
Steel Dynamics, Inc. (Metals & Mining) | 2.800% | 12/15/2024 | 800,000 | 832,571 |
| Ohio National Fund, Inc. | ON BlackRock Balanced Allocation Portfolio (Continued) |
| Schedule of Investments | June 30, 2020 (Unaudited) |
| Corporate Bonds (Continued) | Rate | Maturity | Face Amount | Value | |
| Materials (continued) | |||||
Steel Dynamics, Inc. (Metals & Mining) | 3.250% | 01/15/2031 | $ 800,000 | $ 813,023 | |
Yamana Gold, Inc. (Metals & Mining) | 4.625% | 12/15/2027 | 1,000,000 | 1,053,189 | |
| 8,324,258 | |||||
| Real Estate–0.9% | |||||
Alexandria Real Estate Equities, Inc. (Equity REIT) | 3.950% | 01/15/2028 | 1,000,000 | 1,140,574 | |
American Tower Corp. (Equity REIT) | 2.750% | 01/15/2027 | 2,000,000 | 2,147,583 | |
Healthcare Realty Trust, Inc. (Equity REIT) | 3.875% | 05/01/2025 | 100,000 | 106,229 | |
Healthpeak Properties, Inc. (Equity REIT) | 4.000% | 06/01/2025 | 100,000 | 110,751 | |
Welltower, Inc. (Equity REIT) | 2.700% | 02/15/2027 | 1,000,000 | 1,039,048 | |
| 4,544,185 | |||||
| Utilities–4.4% | |||||
AEP Transmission Co. LLC (Electric Utilities) | 4.000% | 12/01/2046 | 1,000,000 | 1,200,290 | |
AEP Transmission Co. LLC (Electric Utilities) | 3.750% | 12/01/2047 | 1,000,000 | 1,146,849 | |
Alabama Power Co. (Electric Utilities) | 3.450% | 10/01/2049 | 2,000,000 | 2,219,904 | |
Ameren Corp. (Multi-Utilities) | 2.500% | 09/15/2024 | 1,000,000 | 1,059,645 | |
Ameren Corp. (Multi-Utilities) | 3.500% | 01/15/2031 | 1,000,000 | 1,117,846 | |
American Water Capital Corp. (Water Utilities) | 4.300% | 12/01/2042 | 100,000 | 122,615 | |
Berkshire Hathaway Energy Co. (Multi-Utilities) | 3.250% | 04/15/2028 | 100,000 | 113,072 | |
Black Hills Corp. (Multi-Utilities) | 3.050% | 10/15/2029 | 2,500,000 | 2,644,469 | |
Commonwealth Edison Co. (Electric Utilities) | 4.350% | 11/15/2045 | 1,000,000 | 1,270,586 | |
Connecticut Light & Power Co. / The (Electric Utilities) | 4.000% | 04/01/2048 | 1,000,000 | 1,219,210 | |
Consolidated Edison Co. of New York, Inc. (Multi-Utilities) | 3.850% | 06/15/2046 | 2,000,000 | 2,299,045 | |
Duke Energy Corp. (Electric Utilities) | 3.750% | 09/01/2046 | 1,500,000 | 1,698,613 | |
Duke Energy Indiana LLC (Electric Utilities) | 3.250% | 10/01/2049 | 1,000,000 | 1,108,050 | |
FirstEnergy Transmission LLC (Electric Utilities) | (b) | 4.550% | 04/01/2049 | 200,000 | 242,916 |
Florida Power & Light Co. (Electric Utilities) | 3.150% | 10/01/2049 | 2,000,000 | 2,273,165 | |
Jersey Central Power & Light Co. (Electric Utilities) | (b) | 4.300% | 01/15/2026 | 100,000 | 115,629 |
Oncor Electric Delivery Co. LLC (Electric Utilities) | 3.100% | 09/15/2049 | 1,000,000 | 1,101,953 | |
Public Service Electric & Gas Co. (Multi-Utilities) | 3.600% | 12/01/2047 | 1,000,000 | 1,157,513 | |
| 22,111,370 | |||||
Total Corporate Bonds (Cost $144,407,769) | $152,152,818 |
| U.S. Treasury Obligations–1.3% | Rate | Maturity | Face Amount | Value | |
U.S. Treasury Note | 3.000% | 10/31/2025 | $1,000,000 | $ 1,140,938 | |
U.S. Treasury Note | 1.500% | 02/15/2030 | 5,000,000 | 5,404,492 | |
Total U.S. Treasury Obligations (Cost $6,450,401) | $ 6,545,430 |
| Asset-Backed Securities–0.2% | Rate | Maturity | Face Amount | Value | |
| Industrials–0.2% | |||||
American Airlines 2015-1 Class B Pass Through Trust | 3.700% | 05/01/2023 | $ 111,259 | $ 73,580 | |
United Airlines 2016-1 Class B Pass Through Trust | 3.650% | 01/07/2026 | 165,741 | 122,300 | |
United Airlines 2019-2 Class AA Pass Through Trust | 2.700% | 05/01/2032 | 1,000,000 | 902,872 | |
Total Asset-Backed Securities (Cost $1,277,019) | $ 1,098,752 |
| Rights –0.0% | Quantity | Value | |
| Health Care–0.0% | |||
Bristol-Myers Squibb Co. (Pharmaceuticals) | (a) | 10,603 | $ 37,959 |
Total Rights (Cost $22,584) | $ 37,959 |
| Money Market Funds–1.8% | Shares | Value | |
State Street Institutional Liquid Reserves Fund Institutional Class, 0.346% | (d) | 9,043,171 | $ 9,046,789 |
Total Money Market Funds (Cost $9,046,889) | $ 9,046,789 | ||
Total Investments – 100.0% (Cost $467,876,980) | (e) | $501,515,110 | |
Liabilities in Excess of Other Assets – (0.0)% | (f) | (196,753) | |
| Net Assets – 100.0% | $501,318,357 |
| Ohio National Fund, Inc. | ON BlackRock Balanced Allocation Portfolio (Continued) |
| Schedule of Investments | June 30, 2020 (Unaudited) |
Percentages are stated as a percent of net assets. |
| Abbreviations: | ||
| H15T5Y: | U.S. Treasury Yield Curve Rate T-Note Constant Maturity 5 Year, 0.290% at 06/30/2020 | |
| QL: | Quarterly U.S. LIBOR Rate, 0.302% at 06/30/2020 | |
| SOFR: | Secured Overnight Financing Rate, 0.100% at 06/30/2020 | |
| USISDA05: | USD ICE Swap Rate 11:00am NY 5 Year, 0.310% at 06/30/2020 | |
| USSW5: | USD Swap Semi 30/360 5 Year, 0.326% at 06/30/2020 | |
| Footnotes: | ||
| (a) | Non-income producing security. | |
| (b) | Security exempt from registration under Regulation D of the Securities Act of 1933. These securities may be resold in transactions exempt from registration, normally to qualified buyers under Rule 144A. At June 30, 2020, the value of these securities totaled $8,229,377, or 1.6% of the Portfolio’s net assets. | |
| (c) | Security is a fixed-then-variable rate instrument in which the coupon or dividend rate is fixed until a later specified date, then is adjusted periodically. Rates stated, including interest rate caps and floors, if any, are those in effect at June 30, 2020. | |
| (d) | Rate represents the seven-day yield at June 30, 2020. | |
| (e) | Represents cost for financial reporting purposes, which may differ from cost basis for federal income tax purposes. See also Note 8 of the Notes to Financial Statements. | |
| (f) | Includes $828,000 of cash pledged as collateral for the futures contracts outstanding at June 30, 2020. See also the following Schedule of Open Futures Contracts. | |
| Schedule of Open Futures Contracts | June 30, 2020 (Unaudited) |
| Description | Number of contracts | Expiration Date | Notional Amount | Value | Unrealized Appreciation (Depreciation) | Variation Margin Receivable (Payable) | ||||||
| CME E-mini S&P 500 Index - Long | 69 | September 18, 2020 | $10,455,562 | $10,661,190 | $205,628 | $146,626 |
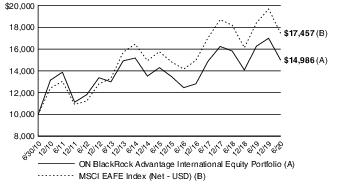
| Ohio National Fund, Inc. | ON BlackRock Advantage International Equity Portfolio (Unaudited) |
| Average Annual returns | |
| One year | -7.90% |
| Five years | 0.94% |
| Ten years | 4.13% |
| (1) | The Portfolio’s composition is subject to change. Holdings and weightings are as of June 30, 2020. |
| Ohio National Fund, Inc. | ON BlackRock Advantage International Equity Portfolio (Unaudited) (Continued) |
| Ohio National Fund, Inc. | ON BlackRock Advantage International Equity Portfolio (Unaudited) (Continued) |
| Portfolio Composition as of June 30, 2020 (1) | |
| % of Net Assets | |
| Common Stocks (4) (5) | 98.2 |
| Preferred Securities (4) (5) | 0.3 |
| Rights (4) (5) | 0.0 |
| Money Market Funds and Other Net Assets | 1.5 |
| 100.0 | |
| Top 10 Portfolio Holdings as of June 30, 2020 (1) (2) (3) | ||
| % of Net Assets | ||
| 1. | Nestle SA | 3.3 |
| 2. | Roche Holding AG | 2.2 |
| 3. | Novartis AG | 1.6 |
| 4. | Siemens AG | 1.5 |
| 5. | L'Oreal SA | 1.4 |
| 6. | ASML Holding N.V. | 1.3 |
| 7. | AstraZeneca PLC | 1.3 |
| 8. | SAP SE | 1.2 |
| 9. | Deutsche Boerse AG | 1.1 |
| 10. | LVMH Moet Hennessy Louis Vuitton SE | 1.1 |
| (1) | Composition of Portfolio subject to change. | |
| (2) | Short-term investments have been excluded from the list of Top 10 Portfolio Holdings. | |
| (3) | Top 10 Portfolio Holdings is presented at an individual security level. Total investment exposure by issuer may be higher. | |
| (4) | Top 10 Country Weightings (Common Stocks, Preferred Securities, Rights): | |
| % of Net Assets | |
| Japan | 25.1 |
| United Kingdom | 12.3 |
| France | 11.8 |
| Switzerland | 11.4 |
| Germany | 8.4 |
| Netherlands | 6.2 |
| Australia | 5.9 |
| Sweden | 3.7 |
| Hong Kong | 2.9 |
| Italy | 2.4 |
| (5) | Sectors (Common Stocks, Preferred Securities, Rights): |
| % of Net Assets | |
| Health Care | 16.0 |
| Financials | 14.1 |
| Industrials | 13.5 |
| Consumer Staples | 11.7 |
| Consumer Discretionary | 11.5 |
| Information Technology | 9.0 |
| Materials | 7.4 |
| Communication Services | 6.9 |
| Real Estate | 3.0 |
| Utilities | 2.8 |
| Energy | 2.6 |
| 98.5 |
| Ohio National Fund, Inc. | ON BlackRock Advantage International Equity Portfolio |
| Schedule of Investments | June 30, 2020 (Unaudited) |
| Common Stocks–98.2% | Shares | Value | |
| Japan–25.1% | |||
ABC-Mart, Inc. (Consumer Discretionary) | (a) | 1,000 | $ 58,663 |
Advantest Corp. (Information Technology) | (a) | 6,800 | 388,079 |
Aeon Co. Ltd. (Consumer Staples) | (a) | 4,700 | 109,343 |
AEON Financial Service Co. Ltd. (Financials) | (a) | 4,200 | 46,065 |
Aeon Mall Co. Ltd. (Real Estate) | (a) | 1,300 | 17,275 |
Alfresa Holdings Corp. (Health Care) | (a) | 38,600 | 809,108 |
Alps Alpine Co. Ltd. (Information Technology) | (a) | 25,000 | 322,231 |
Amada Co. Ltd. (Industrials) | (a) | 76,700 | 628,009 |
Anritsu Corp. (Information Technology) | (a) | 20,100 | 477,520 |
Asahi Group Holdings Ltd. (Consumer Staples) | (a) | 10,700 | 375,808 |
Asahi Kasei Corp. (Materials) | (a) | 66,000 | 540,262 |
Astellas Pharma, Inc. (Health Care) | (a) | 61,600 | 1,028,693 |
Benesse Holdings, Inc. (Consumer Discretionary) | (a) | 800 | 21,456 |
Bridgestone Corp. (Consumer Discretionary) | (a) | 27,500 | 887,574 |
Canon Marketing Japan, Inc. (Information Technology) | (a) | 900 | 18,404 |
Canon, Inc. (Information Technology) | (a) | 95,200 | 1,899,052 |
Central Japan Railway Co. (Industrials) | (a) | 9,800 | 1,515,650 |
Chugai Pharmaceutical Co. Ltd. (Health Care) | (a) | 31,500 | 1,686,508 |
COMSYS Holdings Corp. (Industrials) | (a) | 7,500 | 222,413 |
CyberAgent, Inc. (Communication Services) | (a) | 3,400 | 167,122 |
Dai-ichi Life Holdings, Inc. (Financials) | (a) | 181,200 | 2,168,964 |
Daiichi Sankyo Co. Ltd. (Health Care) | (a) | 24,600 | 2,012,074 |
Daikin Industries Ltd. (Industrials) | (a) | 8,000 | 1,294,400 |
Daito Trust Construction Co. Ltd. (Real Estate) | (a) | 6,400 | 589,833 |
Daiwa House Industry Co. Ltd. (Real Estate) | (a) | 44,819 | 1,058,395 |
Daiwa Securities Group, Inc. (Financials) | (a) | 3,900 | 16,383 |
Denso Corp. (Consumer Discretionary) | (a) | 89,200 | 3,498,160 |
Dentsu Group, Inc. (Communication Services) | (a) | 15,100 | 358,196 |
DIC Corp. (Materials) | (a) | 48,100 | 1,210,710 |
Dip Corp. (Communication Services) | (a) | 15,500 | 314,853 |
Disco Corp. (Information Technology) | (a) | 1,100 | 268,277 |
East Japan Railway Co. (Industrials) | (a) | 32,400 | 2,245,166 |
Eisai Co. Ltd. (Health Care) | (a) | 10,500 | 834,213 |
Electric Power Development Co. Ltd. (Utilities) | (a) | 23,600 | 447,373 |
ENEOS Holdings, Inc. (Energy) | (a) | 182,200 | 649,463 |
FamilyMart Co. Ltd. (Consumer Staples) | (a) | 32,600 | 559,673 |
FANUC Corp. (Industrials) | (a) | 8,200 | 1,470,013 |
Fast Retailing Co. Ltd. (Consumer Discretionary) | (a) | 1,400 | 804,680 |
Fuji Media Holdings, Inc. (Communication Services) | (a) | 85,800 | 829,428 |
Fuji Seal International, Inc. (Materials) | (a) | 3,100 | 60,329 |
FUJIFILM Holdings Corp. (Information Technology) | (a) | 21,500 | 920,236 |
Glory Ltd. (Industrials) | (a) | 6,500 | 148,268 |
Hakuhodo DY Holdings, Inc. (Communication Services) | (a) | 2,200 | 26,257 |
Hirose Electric Co. Ltd. (Information Technology) | (a) | 700 | 76,866 |
Hitachi Transport System Ltd. (Industrials) | (a) | 2,100 | 56,164 |
Honda Motor Co. Ltd. (Consumer Discretionary) | (a) | 6,100 | 156,121 |
Horiba Ltd. (Information Technology) | (a) | 1,100 | 58,195 |
Hoshizaki Corp. (Industrials) | (a) | 1,300 | 111,424 |
House Foods Group, Inc. (Consumer Staples) | (a) | 1,800 | 58,182 |
Hulic Co. Ltd. (Real Estate) | (a) | 4,900 | 46,261 |
Isuzu Motors Ltd. (Consumer Discretionary) | (a) | 30,100 | 273,529 |
ITOCHU Corp. (Industrials) | (a) | 9,500 | 205,559 |
Izumi Co. Ltd. (Consumer Discretionary) | (a) | 22,800 | 722,755 |
J Front Retailing Co. Ltd. (Consumer Discretionary) | (a) | 3,000 | 20,071 |
Japan Exchange Group, Inc. (Financials) | (a) | 14,500 | 335,819 |
Japan Post Holdings Co. Ltd. (Financials) | (a) | 68,700 | 490,290 |
Japan Retail Fund Investment Corp. (Real Estate) | (a) | 24 | 30,019 |
Japan Tobacco, Inc. (Consumer Staples) | (a) | 33,100 | 614,758 |
JTEKT Corp. (Consumer Discretionary) | (a) | 32,700 | 255,328 |
Justsystems Corp. (Information Technology) | (a) | 400 | 28,444 |
Kajima Corp. (Industrials) | (a) | 83,200 | 994,810 |
Kakaku.com, Inc. (Communication Services) | (a) | 5,700 | 145,203 |
Kaneka Corp. (Materials) | (a) | 22,300 | 580,383 |
| Common Stocks (Continued) | Shares | Value | |
| Japan (continued) | |||
Kao Corp. (Consumer Staples) | (a) | 41,510 | $ 3,294,143 |
Kawasaki Heavy Industries Ltd. (Industrials) | (a) | 8,600 | 124,215 |
KDDI Corp. (Communication Services) | (a) | 113,100 | 3,374,581 |
Keyence Corp. (Information Technology) | (a) | 11,100 | 4,651,583 |
Kikkoman Corp. (Consumer Staples) | (a) | 500 | 24,149 |
Kobayashi Pharmaceutical Co. Ltd. (Consumer Staples) | (a) | 900 | 79,132 |
Koito Manufacturing Co. Ltd. (Consumer Discretionary) | (a) | 3,400 | 137,563 |
Komatsu Ltd. (Industrials) | (a) | 12,200 | 249,862 |
Konami Holdings Corp. (Communication Services) | (a) | 12,000 | 400,426 |
Konica Minolta, Inc. (Information Technology) | (a) | 329,400 | 1,145,529 |
Kose Corp. (Consumer Staples) | (a) | 1,000 | 121,047 |
Kubota Corp. (Industrials) | (a) | 10,300 | 154,075 |
Kyocera Corp. (Information Technology) | (a) | 15,200 | 829,685 |
Kyowa Exeo Corp. (Industrials) | (a) | 3,400 | 81,630 |
Kyushu Electric Power Co., Inc. (Utilities) | (a) | 11,000 | 92,193 |
M3, Inc. (Health Care) | (a) | 9,100 | 386,578 |
Marubeni Corp. (Industrials) | (a) | 38,800 | 176,245 |
Maruha Nichiro Corp. (Consumer Staples) | (a) | 3,700 | 75,779 |
Mitsubishi Chemical Holdings Corp. (Materials) | (a) | 114,700 | 668,892 |
Mitsubishi Estate Co. Ltd. (Real Estate) | (a) | 1,600 | 23,843 |
Mitsubishi Materials Corp. (Materials) | (a) | 47,800 | 1,009,320 |
Mitsubishi UFJ Lease & Finance Co. Ltd. (Financials) | (a) | 8,000 | 38,175 |
Mitsui & Co. Ltd. (Industrials) | (a) | 8,900 | 131,868 |
Mitsui Chemicals, Inc. (Materials) | (a) | 7,500 | 156,871 |
MonotaRO Co. Ltd. (Industrials) | (a) | 7,500 | 301,338 |
Murata Manufacturing Co. Ltd. (Information Technology) | (a) | 43,200 | 2,546,574 |
Nankai Electric Railway Co. Ltd. (Industrials) | (a) | 800 | 18,321 |
Nexon Co. Ltd. (Communication Services) | (a) | 13,700 | 309,023 |
NGK Spark Plug Co. Ltd. (Consumer Discretionary) | (a) | 2,400 | 34,495 |
Nidec Corp. (Industrials) | (a) | 5,600 | 377,265 |
Nifco, Inc. (Consumer Discretionary) | (a) | 2,700 | 57,762 |
Nihon Kohden Corp. (Health Care) | (a) | 7,000 | 235,273 |
Nikon Corp. (Consumer Discretionary) | (a) | 68,300 | 573,605 |
Nintendo Co. Ltd. (Communication Services) | (a) | 6,300 | 2,816,532 |
Nippon Electric Glass Co. Ltd. (Information Technology) | (a) | 9,700 | 152,370 |
Nippon Shinyaku Co. Ltd. (Health Care) | (a) | 3,000 | 244,868 |
Nippon Shokubai Co. Ltd. (Materials) | (a) | 9,800 | 513,690 |
Nippon Telegraph & Telephone Corp. (Communication Services) | (a) | 35,000 | 815,480 |
Nippon Television Holdings, Inc. (Communication Services) | (a) | 10,300 | 111,559 |
Nishi-Nippon Railroad Co. Ltd. (Industrials) | (a) | 600 | 16,281 |
Nisshin Seifun Group, Inc. (Consumer Staples) | (a) | 2,000 | 29,863 |
Nitori Holdings Co. Ltd. (Consumer Discretionary) | (a) | 13,000 | 2,548,896 |
Nitto Denko Corp. (Materials) | (a) | 14,600 | 827,676 |
Nomura Real Estate Master Fund, Inc. (Real Estate) | (a) | 110 | 131,747 |
Nomura Research Institute Ltd. (Information Technology) | (a) | 5,800 | 158,414 |
NTT Data Corp. (Information Technology) | (a) | 1,800 | 20,125 |
NTT DOCOMO, Inc. (Communication Services) | (a) | 53,600 | 1,422,973 |
Obic Co. Ltd. (Information Technology) | (a) | 800 | 140,991 |
Odakyu Electric Railway Co. Ltd. (Industrials) | (a) | 1,900 | 46,660 |
Omron Corp. (Information Technology) | (a) | 9,600 | 642,991 |
Oracle Corp. Japan (Information Technology) | (a) | 2,100 | 249,086 |
Oriental Land Co. Ltd. (Consumer Discretionary) | (a) | 2,100 | 277,507 |
Otsuka Holdings Co. Ltd. (Health Care) | (a) | 2,200 | 95,880 |
Penta-Ocean Construction Co. Ltd. (Industrials) | (a) | 400 | 2,160 |
PeptiDream, Inc. (Health Care) | (a)(b) | 3,100 | 142,834 |
Pola Orbis Holdings, Inc. (Consumer Staples) | (a) | 80,400 | 1,403,668 |
Rakuten, Inc. (Consumer Discretionary) | (a) | 9,700 | 85,680 |
| Ohio National Fund, Inc. | ON BlackRock Advantage International Equity Portfolio (Continued) |
| Schedule of Investments | June 30, 2020 (Unaudited) |
| Common Stocks (Continued) | Shares | Value | |
| Japan (continued) | |||
Recruit Holdings Co. Ltd. (Industrials) | (a) | 46,500 | $ 1,599,143 |
Resona Holdings, Inc. (Financials) | (a) | 145,500 | 497,885 |
Rohm Co. Ltd. (Information Technology) | (a) | 4,600 | 305,860 |
Ryohin Keikaku Co. Ltd. (Consumer Discretionary) | (a) | 25,200 | 358,433 |
Sanwa Holdings Corp. (Industrials) | (a) | 70,200 | 630,859 |
SCSK Corp. (Information Technology) | (a) | 1,500 | 73,387 |
Secom Co. Ltd. (Industrials) | (a) | 4,600 | 403,616 |
Sega Sammy Holdings, Inc. (Consumer Discretionary) | (a) | 6,900 | 82,712 |
Seiko Epson Corp. (Information Technology) | (a) | 51,000 | 584,240 |
Sekisui House Ltd. (Consumer Discretionary) | (a) | 34,200 | 652,952 |
Seria Co. Ltd. (Consumer Discretionary) | (a) | 700 | 24,967 |
Seven & I Holdings Co. Ltd. (Consumer Staples) | (a) | 36,800 | 1,203,858 |
Seven Bank Ltd. (Financials) | (a) | 12,600 | 34,534 |
Shimamura Co. Ltd. (Consumer Discretionary) | (a) | 600 | 40,639 |
Shin-Etsu Chemical Co. Ltd. (Materials) | (a) | 9,800 | 1,150,143 |
Shionogi & Co. Ltd. (Health Care) | (a) | 15,300 | 959,820 |
SKY Perfect JSAT Holdings, Inc. (Communication Services) | (a) | 6,000 | 22,304 |
SMC Corp. (Industrials) | (a) | 200 | 102,784 |
SMS Co. Ltd. (Industrials) | (a) | 800 | 18,003 |
Softbank Corp. (Communication Services) | (a) | 107,100 | 1,365,122 |
SoftBank Group Corp. (Communication Services) | (a) | 60,100 | 3,030,702 |
Sohgo Security Services Co. Ltd. (Industrials) | (a) | 500 | 23,347 |
Sony Corp. (Consumer Discretionary) | (a) | 57,100 | 3,941,620 |
Sumitomo Chemical Co. Ltd. (Materials) | (a) | 140,400 | 422,435 |
Sumitomo Heavy Industries Ltd. (Industrials) | (a) | 32,300 | 706,435 |
Sumitomo Mitsui Financial Group, Inc. (Financials) | (a) | 119,700 | 3,378,148 |
Sumitomo Mitsui Trust Holdings, Inc. (Financials) | (a) | 27,600 | 777,778 |
Suntory Beverage & Food Ltd. (Consumer Staples) | (a) | 40,200 | 1,568,533 |
Sysmex Corp. (Health Care) | (a) | 10,900 | 836,702 |
T&D Holdings, Inc. (Financials) | (a) | 10,100 | 86,751 |
Takeda Pharmaceutical Co. Ltd. (Health Care) | (a) | 81,802 | 2,938,977 |
Teijin Ltd. (Materials) | (a) | 33,200 | 528,598 |
Terumo Corp. (Health Care) | (a) | 3,600 | 137,026 |
Tokio Marine Holdings, Inc. (Financials) | (a) | 17,200 | 752,896 |
Tokyo Broadcasting System Holdings, Inc. (Communication Services) | (a) | 1,900 | 30,393 |
Tokyo Electron Ltd. (Information Technology) | (a) | 9,900 | 2,442,763 |
Topcon Corp. (Information Technology) | (a) | 27,300 | 220,819 |
Toray Industries, Inc. (Materials) | (a) | 31,900 | 150,569 |
Toyo Seikan Group Holdings Ltd. (Materials) | (a) | 4,500 | 50,748 |
Toyota Motor Corp. (Consumer Discretionary) | (a) | 33,300 | 2,094,039 |
Toyota Tsusho Corp. (Industrials) | (a) | 3,200 | 81,604 |
Trend Micro, Inc. (Information Technology) | (a) | 15,100 | 843,855 |
Ube Industries Ltd. (Materials) | (a) | 22,800 | 392,948 |
Ulvac, Inc. (Information Technology) | (a) | 1,900 | 55,160 |
Unicharm Corp. (Consumer Staples) | (a) | 26,200 | 1,074,527 |
West Japan Railway Co. (Industrials) | (a) | 7,800 | 437,494 |
Yamaha Corp. (Consumer Discretionary) | (a) | 4,200 | 198,093 |
Yamaha Motor Co. Ltd. (Consumer Discretionary) | (a) | 25,600 | 403,199 |
Yaskawa Electric Corp. (Industrials) | (a) | 10,000 | 347,631 |
Yokogawa Electric Corp. (Information Technology) | (a) | 41,100 | 643,983 |
Z Holdings Corp. (Communication Services) | (a) | 217,000 | 1,064,976 |
ZOZO, Inc. (Consumer Discretionary) | (a) | 6,800 | 151,587 |
| 112,969,328 | |||
| United Kingdom–12.3% | |||
Ashmore Group PLC (Financials) | (a) | 38,390 | 198,225 |
AstraZeneca PLC (Health Care) | (a) | 54,903 | 5,713,997 |
Auto Trader Group PLC (Communication Services) | (a) | 68,926 | 448,760 |
AVEVA Group PLC (Information Technology) | (a) | 6,250 | 316,895 |
BAE Systems PLC (Industrials) | (a) | 124,826 | 746,392 |
| Common Stocks (Continued) | Shares | Value | |
| United Kingdom (continued) | |||
Barratt Developments PLC (Consumer Discretionary) | (a) | 52,944 | $ 325,401 |
Bellway PLC (Consumer Discretionary) | (a) | 4,390 | 138,269 |
Berkeley Group Holdings PLC (Consumer Discretionary) | (a) | 25,134 | 1,294,406 |
BP PLC (Energy) | (a) | 309,754 | 1,186,680 |
British American Tobacco PLC (Consumer Staples) | (a) | 93,334 | 3,579,622 |
BT Group PLC (Communication Services) | (a) | 492,617 | 696,683 |
Cineworld Group PLC (Communication Services) | (a) | 173,055 | 129,913 |
Compass Group PLC (Consumer Discretionary) | (a) | 74,399 | 1,023,616 |
Croda International PLC (Materials) | (a) | 6,461 | 419,647 |
Diageo PLC (Consumer Staples) | (a) | 111,948 | 3,720,854 |
Dialog Semiconductor PLC (Information Technology) | (a)(b) | 4,302 | 196,639 |
easyJet PLC (Industrials) | (a) | 55,186 | 465,898 |
Ferguson PLC (Industrials) | (a) | 12,305 | 1,006,137 |
GlaxoSmithKline PLC (Health Care) | (a) | 210,870 | 4,259,508 |
Great Portland Estates PLC (Real Estate) | (a) | 1,776 | 13,914 |
Greggs PLC (Consumer Discretionary) | (a) | 933 | 18,712 |
HomeServe PLC (Industrials) | (a) | 20,376 | 329,418 |
Howden Joinery Group PLC (Industrials) | (a) | 175,618 | 1,202,311 |
HSBC Holdings PLC (Financials) | (a) | 625,473 | 2,906,940 |
IG Group Holdings PLC (Financials) | (a) | 25,704 | 259,562 |
Informa PLC (Communication Services) | (a) | 362,446 | 2,095,570 |
John Wood Group PLC (Energy) | (a) | 54,507 | 130,696 |
Johnson Matthey PLC (Materials) | (a) | 4,523 | 117,797 |
Jupiter Fund Management PLC (Financials) | (a) | 6,189 | 19,624 |
Legal & General Group PLC (Financials) | (a) | 6,241 | 17,015 |
Lloyds Banking Group PLC (Financials) | (a) | 1,364,952 | 526,543 |
London Stock Exchange Group PLC (Financials) | (a) | 15,369 | 1,598,302 |
M&G PLC (Financials) | (a) | 20,839 | 43,271 |
Marks & Spencer Group PLC (Consumer Discretionary) | (a) | 75,037 | 92,015 |
Meggitt PLC (Industrials) | (a) | 98,545 | 358,936 |
Micro Focus International PLC (Information Technology) | (a) | 42,241 | 225,358 |
Moneysupermarket.com Group PLC (Consumer Discretionary) | (a) | 319,360 | 1,281,080 |
National Grid PLC (Utilities) | (a) | 7,608 | 92,821 |
Prudential PLC (Financials) | (a) | 137,235 | 2,067,865 |
Reckitt Benckiser Group PLC (Consumer Staples) | (a) | 294 | 27,048 |
Redrow PLC (Consumer Discretionary) | (a) | 3,904 | 20,820 |
RELX PLC (Industrials) | (a) | 77,026 | 1,782,825 |
Rightmove PLC (Communication Services) | (a) | 195,095 | 1,318,753 |
Rio Tinto Ltd. (Materials) | (a) | 13,708 | 938,636 |
Rio Tinto PLC (Materials) | (a) | 18,004 | 1,013,203 |
Rolls-Royce Holdings PLC (Industrials) | (a) | 24,771 | 87,457 |
Royal Bank of Scotland Group PLC (Financials) | (a) | 446,074 | 669,666 |
RSA Insurance Group PLC (Financials) | (a) | 27,610 | 139,829 |
Sage Group PLC / The (Information Technology) | (a) | 7,434 | 61,709 |
Schroders PLC (Financials) | (a) | 5,875 | 214,424 |
Smith & Nephew PLC (Health Care) | (a) | 72,322 | 1,347,622 |
Smiths Group PLC (Industrials) | (a) | 26,462 | 462,606 |
Spirax-Sarco Engineering PLC (Industrials) | (a) | 1,793 | 220,736 |
SSE PLC (Utilities) | (a) | 6,718 | 113,757 |
Standard Chartered PLC (Financials) | (a) | 175,433 | 950,987 |
Tesco PLC (Consumer Staples) | (a) | 264,974 | 745,283 |
Unilever N.V. (Consumer Staples) | (a) | 33,396 | 1,780,598 |
Unilever PLC (Consumer Staples) | (a) | 44,541 | 2,402,590 |
Vistry Group PLC (Consumer Discretionary) | (a) | 4,399 | 38,748 |
Vodafone Group PLC (Communication Services) | (a) | 1,138,843 | 1,810,485 |
Wm Morrison Supermarkets PLC (Consumer Staples) | (a) | 17,300 | 40,754 |
| 55,453,828 | |||
| France–11.8% | |||
Aeroports de Paris (Industrials) | (a) | 411 | 42,432 |
| Ohio National Fund, Inc. | ON BlackRock Advantage International Equity Portfolio (Continued) |
| Schedule of Investments | June 30, 2020 (Unaudited) |
| Common Stocks (Continued) | Shares | Value | |
| France (continued) | |||
Airbus SE (Industrials) | (a)(b) | 9,951 | $ 713,027 |
Alstom SA (Industrials) | (a) | 4,985 | 232,305 |
Amundi SA (Financials) | (a)(b) | 5,186 | 407,689 |
AXA SA (Financials) | (a) | 87,877 | 1,849,188 |
BNP Paribas SA (Financials) | (a)(b) | 12,508 | 499,745 |
Bouygues SA (Industrials) | (a)(b) | 3,176 | 108,792 |
Bureau Veritas SA (Industrials) | (a)(b) | 23,618 | 500,925 |
Carrefour SA (Consumer Staples) | (a) | 17,411 | 270,010 |
Christian Dior SE (Consumer Discretionary) | (a) | 533 | 226,777 |
Cie de Saint-Gobain (Industrials) | (a)(b) | 7,048 | 254,298 |
Cie Plastic Omnium SA (Consumer Discretionary) | (a) | 876 | 17,946 |
CNP Assurances (Financials) | (a)(b) | 45,537 | 528,158 |
Credit Agricole SA (Financials) | (a)(b) | 59,138 | 561,555 |
Danone SA (Consumer Staples) | (a)(b) | 18,777 | 1,303,371 |
Dassault Systemes SE (Information Technology) | (a) | 13,195 | 2,290,558 |
Edenred (Industrials) | (a) | 4,318 | 189,379 |
Engie SA (Utilities) | (a)(b) | 133,796 | 1,659,328 |
EssilorLuxottica SA (Consumer Discretionary) | (a)(b) | 12,139 | 1,561,176 |
Eutelsat Communications SA (Communication Services) | (a) | 31,310 | 289,628 |
Gecina SA (Real Estate) | (a) | 4,126 | 509,590 |
Hermes International (Consumer Discretionary) | (a) | 1,585 | 1,330,778 |
Kering SA (Consumer Discretionary) | (a) | 3,074 | 1,680,614 |
Legrand SA (Industrials) | (a) | 4,438 | 337,210 |
L'Oreal SA (Consumer Staples) | (a) | 20,027 | 6,463,641 |
LVMH Moet Hennessy Louis Vuitton SE (Consumer Discretionary) | (a) | 11,073 | 4,888,674 |
Natixis SA (Financials) | (a)(b) | 60,432 | 159,392 |
Orange SA (Communication Services) | (a) | 33,365 | 398,977 |
Pernod Ricard SA (Consumer Staples) | (a) | 13,581 | 2,138,550 |
Peugeot SA (Consumer Discretionary) | (a)(b) | 80,241 | 1,315,882 |
Publicis Groupe SA (Communication Services) | (a) | 4,018 | 130,525 |
Renault SA (Consumer Discretionary) | (a)(b) | 23,194 | 593,618 |
Rexel SA (Industrials) | (a)(b) | 147,090 | 1,685,818 |
Safran SA (Industrials) | (a)(b) | 10,868 | 1,093,226 |
Sanofi (Health Care) | (a) | 38,092 | 3,884,796 |
Sartorius Stedim Biotech (Health Care) | (a) | 1,152 | 292,075 |
Schneider Electric SE (Industrials) | (a) | 25,578 | 2,845,210 |
SCOR SE (Financials) | (a)(b) | 5,709 | 157,673 |
Societe Generale SA (Financials) | (a)(b) | 181,556 | 3,035,558 |
Sodexo SA (Consumer Discretionary) | (a) | 14,477 | 981,655 |
Teleperformance (Industrials) | (a) | 1,867 | 475,491 |
TOTAL SA (Energy) | (a) | 81,016 | 3,123,848 |
Ubisoft Entertainment SA (Communication Services) | (a)(b) | 8,857 | 733,452 |
Unibail-Rodamco-Westfield (Real Estate) | (a) | 14,545 | 819,854 |
Wendel SE (Financials) | (a) | 334 | 31,876 |
Worldline SA (Information Technology) | (a)(b) | 6,548 | 570,916 |
| 53,185,186 | |||
| Switzerland–11.4% | |||
Alcon, Inc. (Health Care) | (a)(b) | 19,823 | 1,139,014 |
Baloise Holding AG (Financials) | (a) | 4,661 | 702,182 |
Barry Callebaut AG (Consumer Staples) | (a) | 552 | 1,053,678 |
Belimo Holding AG (Industrials) | (a) | 40 | 296,029 |
Bucher Industries AG (Industrials) | (a) | 99 | 28,596 |
Chocoladefabriken Lindt & Spruengli AG (Consumer Staples) | (a) | 18 | 148,668 |
Chocoladefabriken Lindt & Spruengli AG (Consumer Staples) | (a) | 1 | 86,257 |
Coca-Cola HBC AG (Consumer Staples) | (a) | 23,259 | 582,245 |
Credit Suisse Group AG (Financials) | (a) | 59,132 | 615,261 |
Geberit AG (Industrials) | (a) | 4,180 | 2,097,255 |
Givaudan SA (Materials) | (a) | 1,181 | 4,414,539 |
Logitech International SA (Information Technology) | (a) | 968 | 63,432 |
Lonza Group AG (Health Care) | (a) | 1,063 | 563,068 |
Nestle SA (Consumer Staples) | (a) | 134,645 | 14,928,175 |
| Common Stocks (Continued) | Shares | Value | |
| Switzerland (continued) | |||
Novartis AG (Health Care) | (a) | 84,360 | $ 7,349,529 |
Roche Holding AG (Health Care) | (a) | 28,179 | 9,762,602 |
Sika AG (Materials) | (a) | 24,747 | 4,770,536 |
Sonova Holding AG (Health Care) | (a) | 1 | 200 |
Swiss Re AG (Financials) | (a) | 18,857 | 1,462,068 |
Swisscom AG (Communication Services) | (a) | 1,186 | 621,940 |
Tecan Group AG (Health Care) | (a) | 398 | 141,055 |
Vifor Pharma AG (Health Care) | (a) | 3,477 | 526,024 |
| 51,352,353 | |||
| Germany–8.1% | |||
adidas AG (Consumer Discretionary) | (a)(b) | 12,464 | 3,286,153 |
Allianz SE (Financials) | (a) | 999 | 204,138 |
BASF SE (Materials) | (a) | 2,697 | 151,489 |
Bayer AG (Health Care) | (a) | 21,587 | 1,600,103 |
Beiersdorf AG (Consumer Staples) | (a) | 7,148 | 812,829 |
Carl Zeiss Meditec AG (Health Care) | (a)(b) | 5,591 | 544,408 |
Continental AG (Consumer Discretionary) | (a)(b) | 1,083 | 106,471 |
Covestro AG (Materials) | (a)(b) | 2,512 | 95,678 |
Delivery Hero SE (Consumer Discretionary) | (a)(b) | 8,540 | 877,632 |
Deutsche Boerse AG (Financials) | (a) | 27,699 | 5,012,874 |
Deutsche Post AG (Industrials) | (a)(b) | 34,269 | 1,258,352 |
Duerr AG (Industrials) | (a) | 822 | 21,457 |
DWS Group GmbH & Co. KGaA (Financials) | (a) | 2,833 | 103,226 |
E.ON SE (Utilities) | (a) | 151,435 | 1,709,349 |
Freenet AG (Communication Services) | (a) | 4,182 | 67,158 |
GRENKE AG (Financials) | (a)(b) | 809 | 62,755 |
Hella GmbH & Co. KGaA (Consumer Discretionary) | (a) | 4,714 | 193,645 |
HelloFresh SE (Consumer Discretionary) | (a)(b) | 6,043 | 323,269 |
HOCHTIEF AG (Industrials) | (a) | 19,694 | 1,752,359 |
Infineon Technologies AG (Information Technology) | (a) | 4,116 | 96,447 |
LEG Immobilien AG (Real Estate) | (a)(b) | 453 | 57,457 |
Merck KGaA (Health Care) | (a) | 35,188 | 4,097,565 |
Nemetschek SE (Information Technology) | (a) | 6,478 | 445,118 |
Rational AG (Industrials) | (a) | 135 | 75,652 |
SAP SE (Information Technology) | (a) | 38,552 | 5,389,161 |
Siemens AG (Industrials) | (a) | 56,628 | 6,678,542 |
Symrise AG (Materials) | (a) | 5,541 | 647,447 |
Vonovia SE (Real Estate) | (a) | 13,396 | 818,804 |
| 36,489,538 | |||
| Netherlands–6.2% | |||
ABN AMRO Bank N.V. (Financials) | (a) | 127,505 | 1,097,262 |
Adyen N.V. (Information Technology) | (b)(c) | 34 | 49,487 |
Akzo Nobel N.V. (Materials) | (a) | 16,377 | 1,471,319 |
ASML Holding N.V. (Information Technology) | (a) | 15,625 | 5,715,826 |
ASR Nederland N.V. (Financials) | (a) | 2,050 | 63,073 |
BE Semiconductor Industries N.V. (Information Technology) | (a) | 5,050 | 223,915 |
Euronext N.V. (Financials) | (a) | 4,373 | 440,161 |
EXOR N.V. (Financials) | (a) | 9,241 | 530,408 |
Heineken N.V. (Consumer Staples) | (c) | 76 | 7,007 |
ING Groep N.V. (Financials) | (a) | 94,156 | 656,352 |
Just Eat Takeaway.com N.V. (Consumer Discretionary) | (a)(b) | 14,961 | 1,563,797 |
Koninklijke DSM N.V. (Materials) | (a) | 11,490 | 1,595,018 |
Koninklijke KPN N.V. (Communication Services) | (a) | 120,409 | 320,278 |
Koninklijke Philips N.V. (Health Care) | (a)(b) | 102,086 | 4,769,244 |
Prosus N.V. (Consumer Discretionary) | (a)(b) | 24,161 | 2,252,709 |
Royal Dutch Shell PLC Class A (Energy) | (a) | 181,482 | 2,905,757 |
Royal Dutch Shell PLC Class B (Energy) | (a) | 122,759 | 1,861,063 |
Wolters Kluwer N.V. (Industrials) | (c) | 30,703 | 2,398,079 |
| 27,920,755 | |||
| Australia–5.9% | |||
Afterpay Ltd. (Information Technology) | (a)(b) | 5,559 | 240,080 |
ALS Ltd. (Industrials) | (a) | 8,530 | 38,950 |
Alumina Ltd. (Materials) | (a) | 33,363 | 38,027 |
| Ohio National Fund, Inc. | ON BlackRock Advantage International Equity Portfolio (Continued) |
| Schedule of Investments | June 30, 2020 (Unaudited) |
| Common Stocks (Continued) | Shares | Value | |
| Australia (continued) | |||
Ansell Ltd. (Health Care) | (a) | 1,104 | $ 28,064 |
APA Group (Utilities) | (a) | 53,924 | 416,958 |
Appen Ltd. (Information Technology) | (a) | 1,053 | 25,002 |
Aristocrat Leisure Ltd. (Consumer Discretionary) | (a) | 120,238 | 2,153,041 |
ASX Ltd. (Financials) | (a) | 6,814 | 405,013 |
Atlas Arteria Ltd. (Industrials) | (a) | 87,215 | 402,759 |
Aurizon Holdings Ltd. (Industrials) | (a) | 78,954 | 268,671 |
AusNet Services (Utilities) | (a) | 43,353 | 50,089 |
Australia & New Zealand Banking Group Ltd. (Financials) | (a) | 45,927 | 595,910 |
Bendigo & Adelaide Bank Ltd. (Financials) | (a) | 180,336 | 880,702 |
BHP Group Ltd. (Materials) | (a) | 153,313 | 3,817,170 |
BHP Group PLC (Materials) | (a) | 39,467 | 807,616 |
Brambles Ltd. (Industrials) | (a) | 162,496 | 1,232,108 |
carsales.com Ltd. (Communication Services) | (a) | 2,464 | 30,501 |
Challenger Ltd. (Financials) | (a) | 7,263 | 22,492 |
Cochlear Ltd. (Health Care) | (a) | 2,032 | 266,779 |
Commonwealth Bank of Australia (Financials) | (a) | 59,051 | 2,851,828 |
CSL Ltd. (Health Care) | (a) | 20,014 | 3,980,565 |
Evolution Mining Ltd. (Materials) | (a) | 5,198 | 20,649 |
Fortescue Metals Group Ltd. (Materials) | (a) | 29,764 | 289,356 |
Goodman Group (Real Estate) | (a) | 47,370 | 488,774 |
GPT Group / The (Real Estate) | (a) | 221,311 | 642,933 |
Harvey Norman Holdings Ltd. (Consumer Discretionary) | (a) | 75,180 | 184,814 |
IDP Education Ltd. (Consumer Discretionary) | (a) | 4,169 | 45,182 |
IGO Ltd. (Materials) | (a) | 91,184 | 311,126 |
Insurance Australia Group Ltd. (Financials) | (a) | 39,255 | 157,544 |
Lendlease Group (Real Estate) | (a) | 11,208 | 96,873 |
Macquarie Group Ltd. (Financials) | (a) | 7,218 | 599,037 |
Magellan Financial Group Ltd. (Financials) | (a) | 4,524 | 184,740 |
Metcash Ltd. (Consumer Staples) | (a) | 22,814 | 43,045 |
Mineral Resources Ltd. (Materials) | (a) | 8,743 | 129,462 |
Mirvac Group (Real Estate) | (a) | 577,467 | 872,323 |
NEXTDC Ltd. (Information Technology) | (a)(b) | 6,866 | 47,226 |
Northern Star Resources Ltd. (Materials) | (a) | 14,052 | 132,525 |
Nufarm Ltd. (Materials) | (a)(b) | 7,149 | 20,310 |
OZ Minerals Ltd. (Materials) | (a) | 25,425 | 195,354 |
Perpetual Ltd. (Financials) | (a) | 10,572 | 218,629 |
Scentre Group (Real Estate) | (a) | 66,492 | 100,944 |
Sonic Healthcare Ltd. (Health Care) | (a) | 25,886 | 546,629 |
Spark Infrastructure Group (Utilities) | (a) | 76,952 | 114,932 |
Stockland (Real Estate) | (a) | 94,965 | 220,205 |
Sydney Airport (Industrials) | (a) | 33,180 | 130,948 |
Tabcorp Holdings Ltd. (Consumer Discretionary) | (a) | 218,297 | 514,887 |
Technology One Ltd. (Information Technology) | (a) | 11,174 | 68,478 |
Transurban Group (Industrials) | (a) | 87,939 | 862,393 |
Treasury Wine Estates Ltd. (Consumer Staples) | (a) | 24,262 | 176,527 |
Vicinity Centres (Real Estate) | (a) | 437,705 | 438,714 |
Vocus Group Ltd. (Communication Services) | (a)(b) | 11,580 | 23,795 |
WiseTech Global Ltd. (Information Technology) | (a) | 5,141 | 69,547 |
Woodside Petroleum Ltd. (Energy) | (a) | 2,586 | 39,081 |
Worley Ltd. (Energy) | (a) | 8,988 | 54,996 |
| 26,594,303 | |||
| Sweden–3.7% | |||
Alfa Laval AB (Industrials) | (a)(b) | 6,789 | 149,767 |
Assa Abloy AB Class B (Industrials) | (a) | 108,554 | 2,221,827 |
Atlas Copco AB (Industrials) | (a) | 27,588 | 1,025,115 |
Atlas Copco AB (Industrials) | (a) | 727 | 30,960 |
Boliden AB (Materials) | (a) | 11,872 | 272,301 |
Castellum AB (Real Estate) | (a) | 24,697 | 462,771 |
Dometic Group AB (Consumer Discretionary) | (a)(b) | 12,182 | 110,088 |
Elekta AB (Health Care) | (a) | 103,294 | 962,222 |
EQT AB (Financials) | (a) | 9,697 | 174,846 |
Evolution Gaming Group AB (Consumer Discretionary) | (a) | 4,952 | 294,127 |
Fabege AB (Real Estate) | (a) | 168,554 | 1,982,294 |
Fastighets AB Balder (Real Estate) | (a)(b) | 759 | 29,040 |
| Common Stocks (Continued) | Shares | Value | |
| Sweden (continued) | |||
Hexagon AB (Information Technology) | (a)(b) | 8,963 | $ 526,357 |
Hufvudstaden AB (Real Estate) | (a) | 34,568 | 430,934 |
Indutrade AB (Industrials) | (a)(b) | 2,732 | 108,356 |
Investor AB (Financials) | (a) | 6,775 | 359,399 |
Kinnevik AB Class B (Financials) | (a) | 33,094 | 873,592 |
L E Lundbergforetagen AB (Financials) | (a)(b) | 31,705 | 1,445,231 |
Lifco AB (Industrials) | (a) | 2,243 | 143,027 |
Lundin Energy AB (Energy) | (a) | 12,200 | 297,749 |
Saab AB Class B (Industrials) | (a)(b) | 8,131 | 204,367 |
Skanska AB (Industrials) | (a)(b) | 19,792 | 404,059 |
Svenska Cellulosa AB SCA Class B (Materials) | (a)(b) | 8,621 | 103,117 |
Swedbank AB (Financials) | (a)(b) | 79,190 | 1,016,869 |
Swedish Match AB (Consumer Staples) | (a) | 11,642 | 821,409 |
Telefonaktiebolaget LM Ericsson (Information Technology) | (a) | 85,982 | 797,015 |
Telia Co. AB (Communication Services) | (a) | 376,639 | 1,409,082 |
| 16,655,921 | |||
| Hong Kong–2.9% | |||
AIA Group Ltd. (Financials) | (a) | 445,400 | 4,167,875 |
BOC Hong Kong Holdings Ltd. (Financials) | (a) | 220,000 | 704,416 |
Champion REIT (Real Estate) | (a) | 265,000 | 138,418 |
CK Asset Holdings Ltd. (Real Estate) | (a) | 100 | 600 |
CK Infrastructure Holdings Ltd. (Utilities) | (a) | 19,000 | 98,216 |
CLP Holdings Ltd. (Utilities) | (a) | 215,000 | 2,111,565 |
Hang Seng Bank Ltd. (Financials) | (a) | 5,500 | 92,632 |
Henderson Land Development Co. Ltd. (Real Estate) | (a) | 30,000 | 114,411 |
HKT Trust & HKT Ltd. (Communication Services) | (a) | 290,000 | 425,566 |
Hong Kong & China Gas Co. Ltd. (Utilities) | (a) | 255,150 | 396,546 |
Hong Kong Exchanges & Clearing Ltd. (Financials) | (a) | 32,500 | 1,384,230 |
Hysan Development Co. Ltd. (Real Estate) | (a) | 16,000 | 51,652 |
Link REIT (Real Estate) | (a) | 173,100 | 1,421,179 |
MTR Corp. Ltd. (Industrials) | (a) | 26,000 | 135,219 |
NWS Holdings Ltd. (Industrials) | (a) | 386,000 | 335,761 |
Sun Hung Kai Properties Ltd. (Real Estate) | (a) | 6,500 | 83,039 |
Swire Pacific Ltd. Class A (Real Estate) | (a) | 81,700 | 434,217 |
Swire Properties Ltd. (Real Estate) | (a) | 320,800 | 819,057 |
Techtronic Industries Co. Ltd. (Industrials) | (a) | 18,000 | 178,102 |
Xinyi Glass Holdings Ltd. (Consumer Discretionary) | (a) | 22,000 | 27,151 |
| 13,119,852 | |||
| Italy–2.4% | |||
Amplifon SpA (Health Care) | (a)(b) | 15,336 | 409,701 |
Anima Holding SpA (Financials) | (a) | 3,647 | 15,753 |
Assicurazioni Generali SpA (Financials) | (a) | 156,757 | 2,381,179 |
Atlantia SpA (Industrials) | (a)(b) | 1,240 | 20,057 |
Banca Mediolanum SpA (Financials) | (a) | 10,341 | 74,421 |
Enel SpA (Utilities) | (a) | 213,642 | 1,847,670 |
Ferrari N.V. (Consumer Discretionary) | (a) | 13,968 | 2,392,651 |
Interpump Group SpA (Industrials) | (a) | 2,710 | 80,796 |
Intesa Sanpaolo SpA (Financials) | (a)(b) | 275,202 | 528,853 |
Iren SpA (Utilities) | (a) | 7,350 | 18,252 |
Italgas SpA (Utilities) | (a) | 114,092 | 663,974 |
Mediobanca Banca di Credito Finanziario SpA (Financials) | (a) | 193,484 | 1,397,204 |
Terna Rete Elettrica Nazionale SpA (Utilities) | (a) | 108,424 | 747,860 |
| 10,578,371 | |||
| Spain–1.8% | |||
Acerinox SA (Materials) | (a)(b) | 7,319 | 59,505 |
Amadeus IT Group SA (Information Technology) | (a) | 8,731 | 458,396 |
Banco Bilbao Vizcaya Argentaria SA (Financials) | (a) | 606,273 | 2,087,376 |
Banco Santander SA (Financials) | (a)(b) | 771,936 | 1,888,510 |
EDP Renovaveis SA (Utilities) | (c) | 1,259 | 17,398 |
Grifols SA (Health Care) | (a) | 24,673 | 750,257 |
Industria de Diseno Textil SA (Consumer Discretionary) | (a) | 36,766 | 975,529 |
| Ohio National Fund, Inc. | ON BlackRock Advantage International Equity Portfolio (Continued) |
| Schedule of Investments | June 30, 2020 (Unaudited) |
| Common Stocks (Continued) | Shares | Value | |
| Spain (continued) | |||
Naturgy Energy Group SA (Utilities) | (a) | 51,255 | $ 956,875 |
Repsol SA (Energy) | (a) | 34,580 | 305,548 |
Siemens Gamesa Renewable Energy SA (Industrials) | (a)(b) | 2,774 | 49,391 |
Telefonica SA (Communication Services) | (a) | 86,301 | 412,758 |
| 7,961,543 | |||
| Denmark–1.6% | |||
Chr Hansen Holding A/S (Materials) | (a) | 11,252 | 1,160,593 |
DSV PANALPINA A/S (Industrials) | (a) | 2,212 | 271,711 |
Genmab A/S (Health Care) | (a)(b) | 2,197 | 740,813 |
H Lundbeck A/S (Health Care) | (a) | 8,887 | 335,790 |
Novo Nordisk A/S Class B (Health Care) | (a) | 57,713 | 3,759,871 |
Orsted A/S (Utilities) | (c) | 9,031 | 1,042,190 |
Royal Unibrew A/S (Consumer Staples) | (a)(b) | 277 | 23,091 |
Tryg A/S (Financials) | (a) | 663 | 19,263 |
| 7,353,322 | |||
| Finland–1.4% | |||
Elisa Oyj (Communication Services) | (a) | 2,377 | 144,644 |
Kesko Oyj (Consumer Staples) | (a) | 17,481 | 299,228 |
Kone Oyj Class B (Industrials) | (a) | 19,611 | 1,352,559 |
Konecranes Oyj (Industrials) | (a) | 2,310 | 52,418 |
Nokia Oyj (Information Technology) | (a) | 418,124 | 1,827,145 |
Sampo Oyj (Financials) | (a) | 4,254 | 146,634 |
UPM-Kymmene Oyj (Materials) | (a) | 32,332 | 936,486 |
Valmet Oyj (Industrials) | (a) | 9,512 | 249,308 |
Wartsila OYJ Abp (Industrials) | (a) | 144,717 | 1,200,437 |
| 6,208,859 | |||
| Ireland–1.1% | |||
AIB Group PLC (Financials) | (a)(b) | 13,753 | 17,365 |
Bank of Ireland Group PLC (Financials) | (a)(b) | 39,321 | 81,022 |
DCC PLC (Industrials) | (a) | 2,780 | 231,973 |
Experian PLC (Industrials) | (a) | 131,726 | 4,623,432 |
Kerry Group PLC Class A (Consumer Staples) | (a) | 366 | 45,467 |
| 4,999,259 | |||
| Norway–0.5% | |||
Gjensidige Forsikring ASA (Financials) | (a)(b) | 30,353 | 560,807 |
Schibsted ASA (Communication Services) | (a)(b) | 744 | 17,574 |
Telenor ASA (Communication Services) | (a) | 121,555 | 1,774,808 |
| 2,353,189 | |||
| Singapore–0.4% | |||
Ascendas Real Estate Investment Trust (Real Estate) | (a) | 39,200 | 89,941 |
DBS Group Holdings Ltd. (Financials) | (a) | 13,020 | 195,910 |
Oversea-Chinese Banking Corp. Ltd. (Financials) | (a) | 111,400 | 726,081 |
Singapore Telecommunications Ltd. (Communication Services) | (a) | 437,600 | 778,446 |
United Overseas Bank Ltd. (Financials) | (a) | 10,400 | 151,963 |
| 1,942,341 | |||
| Belgium–0.4% | |||
Anheuser-Busch InBev SA / N.V. (Consumer Staples) | (a) | 7,007 | 345,420 |
Cofinimmo SA (Real Estate) | (a) | 538 | 74,193 |
Colruyt SA (Consumer Staples) | (a) | 1,262 | 69,359 |
Galapagos N.V. (Health Care) | (a)(b) | 1,427 | 281,658 |
Groupe Bruxelles Lambert SA (Financials) | (a) | 9,621 | 805,855 |
| 1,576,485 | |||
| Luxembourg–0.3% | |||
ArcelorMittal SA (Materials) | (a)(b) | 87,406 | 925,792 |
Aroundtown SA (Real Estate) | (a)(b) | 40,117 | 229,943 |
RTL Group SA (Communication Services) | (a)(b) | 6,289 | 201,768 |
Tenaris SA (Energy) | (a) | 9,210 | 59,852 |
| 1,417,355 |
| Common Stocks (Continued) | Shares | Value | |
| New Zealand–0.3% | |||
a2 Milk Co. Ltd. (Consumer Staples) | (a)(b) | 15,016 | $ 194,665 |
a2 Milk Co. Ltd. (Consumer Staples) | (a)(b) | 5,214 | 68,250 |
Fisher & Paykel Healthcare Corp. Ltd. (Health Care) | (a) | 32,124 | 740,034 |
Xero Ltd. (Information Technology) | (a)(b) | 5,113 | 321,174 |
| 1,324,123 | |||
| Macao–0.2% | |||
Sands China Ltd. (Consumer Discretionary) | (a) | 224,800 | 885,540 |
| Portugal–0.1% | |||
Galp Energia SGPS SA (Energy) | (a) | 56,577 | 656,292 |
| Austria–0.1% | |||
ams AG (Information Technology) | (a)(b) | 5,810 | 86,619 |
OMV AG (Energy) | (a)(b) | 7,616 | 256,993 |
| 343,612 | |||
| Isle of Man–0.1% | |||
GVC Holdings PLC (Consumer Discretionary) | (a) | 32,912 | 301,668 |
| United States–0.1% | |||
Barco N.V. (Information Technology) | (a)(b) | 1,364 | 240,864 |
Sims Ltd. (Materials) | (a) | 3,378 | 18,775 |
| 259,639 | |||
| Israel–0.0% | |||
Bank Hapoalim BM (Financials) | (a) | 8,962 | 53,576 |
Bank Leumi Le-Israel BM (Financials) | (a) | 3,413 | 17,161 |
Delek Group Ltd. (Energy) | (a) | 753 | 18,111 |
Nice Ltd. (Information Technology) | (a)(b) | 92 | 17,342 |
Shapir Engineering and Industry Ltd. (Industrials) | (a)(b) | 3,632 | 22,105 |
| 128,295 | |||
| China–0.0% | |||
Sinopec Engineering Group Co. Ltd. (Industrials) | (a) | 400 | 172 |
Total Common Stocks (Cost $443,606,400) | $442,031,129 |
| Preferred Securities–0.3% | Rate | Quantity | Value | |
| Germany–0.3% | ||||
Sartorius AG (Health Care) | (a) | 0.123% (d) | 3,145 | $ 1,038,001 |
Total Preferred Securities (Cost $1,049,344) | $ 1,038,001 |
| Rights –0.0% | Shares | Value | |
| Spain–0.0% | |||
Repsol SA (Energy) | (b)(c) | 115,740 | $ 56,344 |
Telefonica SA (Communication Services) | (b)(c) | 121,710 | 23,943 |
| 80,287 | |||
Total Rights (Cost $90,876) | $ 80,287 |
| Money Market Funds–1.4% | Shares | Value | |
State Street Institutional Liquid Reserves Fund Institutional Class, 0.346% | (e) | 6,421,878 | $ 6,424,447 |
Total Money Market Funds (Cost $6,424,529) | $ 6,424,447 | ||
Total Investments – 99.9% (Cost $451,171,149) | (f) | $449,573,864 | |
Other Assets in Excess of Liabilities – 0.1% | (g) | 528,812 | |
| Net Assets – 100.0% | $450,102,676 |
| Ohio National Fund, Inc. | ON BlackRock Advantage International Equity Portfolio (Continued) |
| Schedule of Investments | June 30, 2020 (Unaudited) |
Percentages are stated as a percent of net assets. |
| Footnotes: | ||
| (a) | Security traded on a foreign exchange has been valued at an estimate of fair value that is different than the local market close price. These fair value estimates are determined by an independent fair valuation service that has been approved by the Board. These securities represent $439,554,969 or 97.7% of the Portfolio’s net assets. | |
| (b) | Non-income producing security. | |
| (c) | As discussed in Note 2 of the Notes to Financial Statements, not all investments that are traded on a foreign exchange are valued at an estimate that is different from the local close price. In some instances, the independent fair valuation service uses a stock’s local close price because the service’s measure of predictability related to their valuation model of a stock is below a chosen threshold. These securities represent $3,594,448 or 0.8% of the Portfolio’s net assets. Other Portfolio securities are not subjected to fair valuation procedures because they are traded on domestic or foreign exchanges that have close times that are consistent with the U.S. market close, normally 4:00 pm Eastern Time. | |
| (d) | Represents twelve-month dividend yield. | |
| (e) | Rate represents the seven-day yield at June 30, 2020. | |
| (f) | Represents cost for financial reporting purposes, which may differ from cost basis for federal income tax purposes. See also Note 8 of the Notes to Financial Statements. | |
| (g) | Includes $987,360 of cash pledged as collateral for the futures contracts outstanding at June 30, 2020. See also the following Schedule of Open Futures Contracts. | |
| Schedule of Open Futures Contracts | June 30, 2020 (Unaudited) |
| Description | Number of contracts | Expiration Date | Notional Amount | Value | Unrealized Appreciation (Depreciation) | Variation Margin Receivable (Payable) | ||||||
| MSCI EAFE Index - Long | 102 | September 18, 2020 | $9,045,920 | $9,069,840 | $23,920 | $(22,340) |
| Ohio National Fund, Inc. | ON Janus Henderson Forty Portfolio (Unaudited) |
| Average Annual returns | |
| One year | 20.50% |
| Five years | 16.13% |
| Ten years | 16.63% |
| (1) | The Portfolio’s composition is subject to change. Holdings and weightings are as of June 30, 2020. |

| Ohio National Fund, Inc. | ON Janus Henderson Forty Portfolio (Unaudited) (Continued) |
| Portfolio Composition as of June 30, 2020 (1) | |
| % of Net Assets | |
| Common Stocks (4) | 99.6 |
| Rights (4) | 0.0 |
| Money Market Funds Less Net Liabilities | 0.4 |
| 100.0 | |
| Top 10 Portfolio Holdings as of June 30, 2020 (1) (2) (3) | ||
| % of Net Assets | ||
| 1. | Microsoft Corp. | 8.8 |
| 2. | Amazon.com, Inc. | 8.4 |
| 3. | Apple, Inc. | 5.9 |
| 4. | Mastercard, Inc. Class A | 5.5 |
| 5. | Alphabet, Inc. Class C | 4.0 |
| 6. | salesforce.com, Inc. | 3.7 |
| 7. | Boston Scientific Corp. | 3.3 |
| 8. | Adobe, Inc. | 3.1 |
| 9. | American Tower Corp. | 3.0 |
| 10. | T-Mobile U.S., Inc. | 2.9 |
| (1) | Composition of Portfolio subject to change. | |
| (2) | Short-term investments have been excluded from the list of Top 10 Portfolio Holdings. | |
| (3) | Top 10 Portfolio Holdings is presented at an individual security level. Total investment exposure by issuer may be higher. | |
| (4) | Sectors (Common Stocks, Rights): | |
| % of Net Assets | |
| Information Technology | 39.8 |
| Consumer Discretionary | 17.7 |
| Communication Services | 16.9 |
| Health Care | 14.6 |
| Industrials | 4.4 |
| Real Estate | 3.0 |
| Materials | 1.7 |
| Financials | 1.5 |
| 99.6 |
| Ohio National Fund, Inc. | ON Janus Henderson Forty Portfolio |
| Schedule of Investments | June 30, 2020 (Unaudited) |
| Common Stocks–99.6% | Shares | Value | |
| Communication Services–16.9% | |||
Alphabet, Inc. Class C (Interactive Media & Svs.) | (a) | 5,216 | $ 7,373,390 |
Facebook, Inc. Class A (Interactive Media & Svs.) | (a) | 20,684 | 4,696,716 |
GCI Liberty, Inc. Class A (Diversified Telecom. Svs.) | (a) | 56,374 | 4,009,319 |
Match Group, Inc. (Interactive Media & Svs.) | (a) | 22,523 | 2,411,087 |
Netflix, Inc. (Entertainment) | (a) | 11,451 | 5,210,663 |
T-Mobile U.S., Inc. (Wireless Telecom. Svs.) | (a) | 50,611 | 5,271,135 |
Walt Disney Co. / The (Entertainment) | 21,092 | 2,351,969 | |
| 31,324,279 | |||
| Consumer Discretionary–17.7% | |||
Amazon.com, Inc. (Internet & Direct Marketing Retail) | (a) | 5,628 | 15,526,639 |
Chewy, Inc. Class A (Internet & Direct Marketing Retail) | (a) | 34,600 | 1,546,274 |
Home Depot, Inc. / The (Specialty Retail) | 20,315 | 5,089,110 | |
Lululemon Athletica, Inc. (Textiles, Apparel & Luxury Goods) | (a) | 4,601 | 1,435,558 |
LVMH Moet Hennessy Louis Vuitton SE (Textiles, Apparel & Luxury Goods) | (b) | 6,564 | 2,897,973 |
NIKE, Inc. Class B (Textiles, Apparel & Luxury Goods) | 31,656 | 3,103,871 | |
ServiceMaster Global Holdings, Inc. (Diversified Consumer Svs.) | (a) | 88,619 | 3,162,812 |
| 32,762,237 | |||
| Financials–1.5% | |||
Markel Corp. (Insurance) | (a) | 2,981 | 2,751,970 |
| Health Care–14.6% | |||
Boston Scientific Corp. (Health Care Equip. & Supplies) | (a) | 175,813 | 6,172,794 |
Cooper Cos., Inc. / The (Health Care Equip. & Supplies) | 12,907 | 3,660,942 | |
Danaher Corp. (Health Care Equip. & Supplies) | 27,675 | 4,893,770 | |
Elanco Animal Health, Inc. (Pharmaceuticals) | (a) | 108,609 | 2,329,663 |
Globus Medical, Inc. Class A (Health Care Equip. & Supplies) | (a) | 38,909 | 1,856,348 |
ICU Medical, Inc. (Health Care Equip. & Supplies) | (a) | 10,923 | 2,013,218 |
Intuitive Surgical, Inc. (Health Care Equip. & Supplies) | (a) | 5,967 | 3,400,176 |
Neurocrine Biosciences, Inc. (Biotechnology) | (a) | 22,600 | 2,757,200 |
| 27,084,111 | |||
| Industrials–4.4% | |||
CoStar Group, Inc. (Professional Svs.) | (a) | 5,758 | 4,092,038 |
L3Harris Technologies, Inc. (Aerospace & Defense) | 23,704 | 4,021,858 | |
| 8,113,896 |
| Common Stocks (Continued) | Shares | Value | |
| Information Technology–39.8% | |||
Adobe, Inc. (Software) | (a) | 13,005 | $ 5,661,207 |
Apple, Inc. (Tech. Hardware, Storage & Periph.) | 29,761 | 10,856,813 | |
ASML Holding N.V. (Semiconductors & Equip.) | 12,320 | 4,534,130 | |
Atlassian Corp. PLC Class A (Software) | (a) | 10,774 | 1,942,229 |
Avalara, Inc. (Software) | (a) | 17,914 | 2,384,174 |
Cognex Corp. (Electronic Equip., Instr. & Comp.) | 23,377 | 1,396,074 | |
Lam Research Corp. (Semiconductors & Equip.) | 5,908 | 1,911,002 | |
Mastercard, Inc. Class A (IT Svs.) | 34,613 | 10,235,064 | |
Microchip Technology, Inc. (Semiconductors & Equip.) | 15,184 | 1,599,027 | |
Microsoft Corp. (Software) | 80,405 | 16,363,222 | |
NVIDIA Corp. (Semiconductors & Equip.) | 8,732 | 3,317,374 | |
salesforce.com, Inc. (Software) | (a) | 36,730 | 6,880,631 |
Texas Instruments, Inc. (Semiconductors & Equip.) | 34,667 | 4,401,669 | |
Twilio, Inc. Class A (IT Svs.) | (a) | 10,006 | 2,195,516 |
| 73,678,132 | |||
| Materials–1.7% | |||
Sherwin-Williams Co. / The (Chemicals) | 5,266 | 3,042,958 | |
| Real Estate–3.0% | |||
American Tower Corp. (Equity REIT) | 21,663 | 5,600,752 | |
Total Common Stocks (Cost $135,024,843) | $184,358,335 |
| Rights –0.0% | Quantity | Value | |
| Communication Services–0.0% | |||
T-Mobile U.S., Inc. (Wireless Telecom. Svs.) | (a) | 38,340 | $ 6,441 |
Total Rights (Cost $14,186) | $ 6,441 |
| Money Market Funds–2.2% | Shares | Value | |
State Street Institutional Liquid Reserves Fund Institutional Class, 0.346% | (c) | 3,996,483 | $ 3,998,081 |
Total Money Market Funds (Cost $3,998,315) | $ 3,998,081 | ||
Total Investments – 101.8% (Cost $139,037,344) | (d) | $188,362,857 | |
Liabilities in Excess of Other Assets – (1.8)% | (3,246,640) | ||
| Net Assets – 100.0% | $185,116,217 |
Percentages are stated as a percent of net assets. |
| Footnotes: | ||
| (a) | Non-income producing security. | |
| (b) | Security traded on a foreign exchange has been valued at an estimate of fair value that is different than the local market close price. These fair value estimates are determined by an independent fair valuation service that has been approved by the Board. These securities represent $2,897,973 or 1.6% of the Portfolio’s net assets. | |
| (c) | Rate represents the seven-day yield at June 30, 2020. | |
| (d) | Represents cost for financial reporting purposes, which may differ from cost basis for federal income tax purposes. See also Note 8 of the Notes to Financial Statements. | |
| Ohio National Fund, Inc. | ON Janus Henderson Venture Portfolio (Unaudited) |
| Average Annual returns | |
| One year | -0.38% |
| Five years | 7.15% |
| Ten years | 14.48% |
| (1) | The Portfolio’s composition is subject to change. Holdings and weightings are as of June 30, 2020. |
| Ohio National Fund, Inc. | ON Janus Henderson Venture Portfolio (Unaudited) (Continued) |

| Portfolio Composition as of June 30, 2020 (1) | |
| % of Net Assets | |
| Common Stocks (4) | 97.9 |
| Master Limited Partnerships (4) | 0.3 |
| Rights (4) | 0.1 |
| Money Market Funds Less Net Liabilities | 1.7 |
| 100.0 | |
| Top 10 Portfolio Holdings as of June 30, 2020 (1) (2) (3) | ||
| % of Net Assets | ||
| 1. | Catalent, Inc. | 3.4 |
| 2. | Nice Ltd. – ADR | 2.9 |
| 3. | Descartes Systems Group, Inc. / The | 1.9 |
| 4. | Clarivate Analytics PLC | 1.9 |
| 5. | SS&C Technologies Holdings, Inc. | 1.8 |
| 6. | Paylocity Holding Corp. | 1.6 |
| 7. | Broadridge Financial Solutions, Inc. | 1.5 |
| 8. | Redfin Corp. | 1.5 |
| 9. | ServiceMaster Global Holdings, Inc. | 1.4 |
| 10. | Trade Desk, Inc. / The Class A | 1.4 |
| (1) | Composition of Portfolio subject to change. | |
| (2) | Short-term investments have been excluded from the list of Top 10 Portfolio Holdings. | |
| (3) | Top 10 Portfolio Holdings is presented at an individual security level. Total investment exposure by issuer may be higher. | |
| (4) | Sectors (Common Stocks, Master Limited Partnerships, Rights): | |
| % of Net Assets | |
| Information Technology | 33.4 |
| Health Care | 27.7 |
| Industrials | 14.5 |
| Consumer Discretionary | 8.4 |
| Materials | 4.2 |
| Financials | 4.1 |
| Real Estate | 3.0 |
| Consumer Staples | 1.9 |
| Communication Services | 1.1 |
| 98.3 |
| Ohio National Fund, Inc. | ON Janus Henderson Venture Portfolio |
| Schedule of Investments | June 30, 2020 (Unaudited) |
| Common Stocks–97.9% | Shares | Value | |
| Communication Services–1.1% | |||
Manchester United PLC Class A (Entertainment) | 48,896 | $ 774,024 | |
Vonage Holdings Corp. (Diversified Telecom. Svs.) | (a) | 90,973 | 915,188 |
| 1,689,212 | |||
| Consumer Discretionary–8.1% | |||
Carter's, Inc. (Textiles, Apparel & Luxury Goods) | 9,846 | 794,572 | |
Dunkin' Brands Group, Inc. (Hotels, Restaurants & Leisure) | 16,743 | 1,092,146 | |
frontdoor, Inc. (Diversified Consumer Svs.) | (a) | 33,141 | 1,469,141 |
K12, Inc. (Diversified Consumer Svs.) | (a) | 49,904 | 1,359,385 |
Lovesac Co. / The (Household Durables) | (a) | 45,273 | 1,187,511 |
Monarch Casino & Resort, Inc. (Hotels, Restaurants & Leisure) | (a) | 14,330 | 488,366 |
ServiceMaster Global Holdings, Inc. (Diversified Consumer Svs.) | (a) | 62,185 | 2,219,383 |
Thor Industries, Inc. (Automobiles) | 14,702 | 1,566,204 | |
Visteon Corp. (Auto Components) | (a) | 13,521 | 926,188 |
Vroom, Inc. (Specialty Retail) | (a) | 11,358 | 592,206 |
Williams-Sonoma, Inc. (Specialty Retail) | 15,056 | 1,234,743 | |
| 12,929,845 | |||
| Consumer Staples–1.9% | |||
BellRing Brands, Inc. Class A (Personal Products) | (a) | 34,972 | 697,342 |
Casey's General Stores, Inc. (Food & Staples Retailing) | 5,718 | 854,955 | |
Hain Celestial Group, Inc. / The (Food Products) | (a) | 21,633 | 681,656 |
Ontex Group N.V. (Personal Products) | (a)(b) | 52,691 | 774,519 |
| 3,008,472 | |||
| Energy–0.0% | |||
Solaris Oilfield Infrastructure, Inc. Class A (Energy Equip. & Svs.) | 8,475 | 62,885 | |
| Financials–4.1% | |||
Assetmark Financial Holdings, Inc. (Capital Markets) | (a) | 28,572 | 779,730 |
Kearny Financial Corp. (Thrifts & Mortgage Finance) | 61,605 | 503,929 | |
LendingTree, Inc. (Consumer Finance) | (a) | 3,877 | 1,122,508 |
LPL Financial Holdings, Inc. (Capital Markets) | 27,952 | 2,191,436 | |
RLI Corp. (Insurance) | 17,729 | 1,455,551 | |
UMB Financial Corp. (Banks) | 8,584 | 442,505 | |
| 6,495,659 | |||
| Health Care–27.6% | |||
AngioDynamics, Inc. (Health Care Equip. & Supplies) | (a) | 17,892 | 181,962 |
Arcturus Therapeutics Holdings, Inc. (Biotechnology) | (a) | 5,665 | 264,782 |
Ascendis Pharma A/S – ADR (Biotechnology) | (a) | 5,241 | 775,144 |
Axogen, Inc. (Health Care Equip. & Supplies) | (a) | 58,517 | 540,697 |
Bio-Techne Corp. (Life Sciences Tools & Svs.) | 8,193 | 2,163,525 | |
Bridgebio Pharma, Inc. (Biotechnology) | (a) | 19,334 | 630,482 |
Catalent, Inc. (Pharmaceuticals) | (a) | 74,508 | 5,461,436 |
Codexis, Inc. (Life Sciences Tools & Svs.) | (a) | 61,909 | 705,763 |
CryoPort, Inc. (Health Care Equip. & Supplies) | (a) | 58,352 | 1,765,148 |
Deciphera Pharmaceuticals, Inc. (Biotechnology) | (a) | 15,103 | 901,951 |
Eagle Pharmaceuticals, Inc. (Biotechnology) | (a) | 24,733 | 1,186,689 |
FibroGen, Inc. (Biotechnology) | (a) | 26,667 | 1,080,813 |
Glaukos Corp. (Health Care Equip. & Supplies) | (a) | 11,964 | 459,657 |
Global Blood Therapeutics, Inc. (Biotechnology) | (a) | 14,452 | 912,355 |
Globus Medical, Inc. Class A (Health Care Equip. & Supplies) | (a) | 33,244 | 1,586,071 |
| Common Stocks (Continued) | Shares | Value | |
| Health Care (continued) | |||
GW Pharmaceuticals PLC – ADR (Pharmaceuticals) | (a) | 7,717 | $ 947,030 |
HealthEquity, Inc. (Health Care Providers & Svs.) | (a) | 14,880 | 873,010 |
Heron Therapeutics, Inc. (Biotechnology) | (a) | 29,275 | 430,635 |
Heska Corp. (Health Care Equip. & Supplies) | (a) | 8,016 | 746,851 |
ICON PLC (Life Sciences Tools & Svs.) | (a) | 6,132 | 1,032,997 |
ICU Medical, Inc. (Health Care Equip. & Supplies) | (a) | 7,417 | 1,367,027 |
Immunomedics, Inc. (Biotechnology) | (a) | 8,251 | 292,415 |
Insmed, Inc. (Biotechnology) | (a) | 46,524 | 1,281,271 |
Integra LifeSciences Holdings Corp. (Health Care Equip. & Supplies) | (a) | 29,428 | 1,382,822 |
Knight Therapeutics, Inc. (Pharmaceuticals) | (a) | 99,844 | 516,282 |
Ligand Pharmaceuticals, Inc. (Biotechnology) | (a) | 17,843 | 1,995,740 |
Mirati Therapeutics, Inc. (Biotechnology) | (a) | 11,004 | 1,256,327 |
MyoKardia, Inc. (Pharmaceuticals) | (a) | 12,939 | 1,250,166 |
Myovant Sciences Ltd. (Biotechnology) | (a) | 35,630 | 734,691 |
NeoGenomics, Inc. (Life Sciences Tools & Svs.) | (a) | 59,577 | 1,845,695 |
Neurocrine Biosciences, Inc. (Biotechnology) | (a) | 14,925 | 1,820,850 |
Orchard Therapeutics PLC – ADR (Biotechnology) | (a) | 49,044 | 294,264 |
Phathom Pharmaceuticals, Inc. (Pharmaceuticals) | (a) | 15,502 | 510,171 |
Prestige Consumer Healthcare, Inc. (Pharmaceuticals) | (a) | 29,113 | 1,093,484 |
PTC Therapeutics, Inc. (Biotechnology) | (a) | 17,209 | 873,185 |
Rhythm Pharmaceuticals, Inc. (Biotechnology) | (a) | 34,522 | 769,841 |
STERIS PLC (Health Care Equip. & Supplies) | 13,240 | 2,031,546 | |
Surmodics, Inc. (Health Care Equip. & Supplies) | (a) | 17,723 | 766,342 |
Vaxcyte, Inc. (Pharmaceuticals) | (a) | 23,700 | 749,157 |
Zogenix, Inc. (Pharmaceuticals) | (a) | 20,571 | 555,623 |
| 44,033,897 | |||
| Industrials–14.5% | |||
Alamo Group, Inc. (Machinery) | 7,426 | 762,205 | |
AMERCO (Road & Rail) | 2,884 | 871,516 | |
Brady Corp. Class A (Commercial Svs. & Supplies) | 36,259 | 1,697,646 | |
Cimpress PLC (Commercial Svs. & Supplies) | (a) | 7,570 | 577,894 |
Clarivate Analytics PLC (Professional Svs.) | (a) | 133,094 | 2,971,989 |
Construction Partners, Inc. Class A (Construction & Engineering) | (a) | 46,058 | 817,990 |
CSW Industrials, Inc. (Building Products) | 30,781 | 2,127,275 | |
EnerSys (Electrical Equip.) | 18,515 | 1,191,996 | |
Gates Industrial Corp. PLC (Machinery) | (a) | 101,356 | 1,041,940 |
HEICO Corp. Class A (Aerospace & Defense) | 11,285 | 916,793 | |
ITT, Inc. (Machinery) | 31,188 | 1,831,983 | |
Kornit Digital Ltd. (Machinery) | (a) | 37,118 | 1,981,359 |
Nordson Corp. (Machinery) | 9,371 | 1,777,772 | |
Proto Labs, Inc. (Machinery) | (a) | 4,472 | 502,966 |
Rexnord Corp. (Machinery) | 70,129 | 2,044,260 | |
Standex International Corp. (Machinery) | 19,056 | 1,096,673 | |
TrueBlue, Inc. (Professional Svs.) | (a) | 26,159 | 399,448 |
Westinghouse Air Brake Technologies Corp. (Machinery) | 8,943 | 514,848 | |
| 23,126,553 | |||
| Information Technology–33.4% | |||
Altair Engineering, Inc. Class A (Software) | (a) | 31,944 | 1,269,774 |
Belden, Inc. (Electronic Equip., Instr. & Comp.) | 24,658 | 802,618 | |
Blackbaud, Inc. (Software) | 33,758 | 1,926,907 | |
Broadridge Financial Solutions, Inc. (IT Svs.) | 19,301 | 2,435,593 | |
Cadence Design Systems, Inc. (Software) | (a) | 12,611 | 1,210,152 |
ChannelAdvisor Corp. (Software) | (a) | 93,438 | 1,480,058 |
| Ohio National Fund, Inc. | ON Janus Henderson Venture Portfolio (Continued) |
| Schedule of Investments | June 30, 2020 (Unaudited) |
| Common Stocks (Continued) | Shares | Value | |
| Information Technology (continued) | |||
Descartes Systems Group, Inc. / The (Software) | (a) | 59,065 | $ 3,118,141 |
Envestnet, Inc. (Software) | (a) | 24,108 | 1,772,902 |
Euronet Worldwide, Inc. (IT Svs.) | (a) | 20,307 | 1,945,817 |
Everbridge, Inc. (Software) | (a) | 11,001 | 1,522,098 |
GTY Technology Holdings, Inc. (Software) | (a) | 100,574 | 418,891 |
Guidewire Software, Inc. (Software) | (a) | 10,621 | 1,177,338 |
Intelligent Systems Corp. (Software) | (a) | 15,619 | 532,295 |
J2 Global, Inc. (Software) | (a) | 33,279 | 2,103,566 |
LivePerson, Inc. (Software) | (a) | 43,126 | 1,786,710 |
Medallia, Inc. (Software) | (a) | 35,712 | 901,371 |
National Instruments Corp. (Electronic Equip., Instr. & Comp.) | 16,914 | 654,741 | |
Nice Ltd. – ADR (Software) | (a) | 24,191 | 4,577,905 |
Novanta, Inc. (Electronic Equip., Instr. & Comp.) | (a) | 13,188 | 1,408,083 |
ON Semiconductor Corp. (Semiconductors & Equip.) | (a) | 86,058 | 1,705,669 |
OSI Systems, Inc. (Electronic Equip., Instr. & Comp.) | (a) | 18,729 | 1,397,933 |
Paylocity Holding Corp. (Software) | (a) | 17,297 | 2,523,459 |
RealPage, Inc. (Software) | (a) | 33,280 | 2,163,533 |
Repay Holdings Corp. (IT Svs.) | (a) | 37,181 | 915,768 |
Rogers Corp. (Electronic Equip., Instr. & Comp.) | (a) | 8,913 | 1,110,560 |
Sailpoint Technologies Holdings, Inc. (Software) | (a) | 54,232 | 1,435,521 |
Shift4 Payments, Inc. Class A (IT Svs.) | (a) | 4,923 | 174,766 |
SS&C Technologies Holdings, Inc. (Software) | 50,910 | 2,875,397 | |
Trade Desk, Inc. / The Class A (Software) | (a) | 5,407 | 2,197,945 |
Tyler Technologies, Inc. (Software) | (a) | 4,851 | 1,682,715 |
WEX, Inc. (IT Svs.) | (a) | 6,327 | 1,044,018 |
WNS Holdings Ltd. – ADR (IT Svs.) | (a) | 32,236 | 1,772,335 |
Yext, Inc. (Software) | (a) | 66,344 | 1,101,974 |
| 53,146,553 | |||
| Materials–4.2% | |||
Chase Corp. (Chemicals) | 7,224 | 740,460 | |
H.B. Fuller Co. (Chemicals) | 19,039 | 849,139 |
| Common Stocks (Continued) | Shares | Value | |
| Materials (continued) | |||
Neenah, Inc. (Paper & Forest Products) | 5,679 | $ 280,883 | |
Sealed Air Corp. (Containers & Packaging) | 24,662 | 810,147 | |
Sensient Technologies Corp. (Chemicals) | 39,655 | 2,068,405 | |
Valvoline, Inc. (Chemicals) | 104,326 | 2,016,622 | |
| 6,765,656 | |||
| Real Estate–3.0% | |||
Easterly Government Properties, Inc. (Equity REIT) | 48,675 | 1,125,366 | |
FirstService Corp. (Real Estate Mgmt. & Development) | 12,215 | 1,230,661 | |
Redfin Corp. (Real Estate Mgmt. & Development) | (a) | 58,031 | 2,432,079 |
| 4,788,106 | |||
Total Common Stocks (Cost $118,517,825) | $156,046,838 |
| Master Limited Partnerships–0.3% | Shares | Value | |
| Consumer Discretionary–0.3% | |||
Cedar Fair LP (Hotels, Restaurants & Leisure) | 15,866 | $ 436,315 | |
Total Master Limited Partnerships (Cost $756,990) | $ 436,315 |
| Rights –0.1% | Quantity | Value | |
| Health Care–0.1% | |||
Bristol-Myers Squibb Co. (Pharmaceuticals) | (a) | 52,920 | $ 189,453 |
Total Rights (Cost $182,352) | $ 189,453 |
| Money Market Funds–2.5% | Shares | Value | |
State Street Institutional Liquid Reserves Fund Institutional Class, 0.346% | (c) | 4,037,621 | $ 4,039,236 |
Total Money Market Funds (Cost $4,039,117) | $ 4,039,236 | ||
Total Investments – 100.8% (Cost $123,496,284) | (d) | $160,711,842 | |
Liabilities in Excess of Other Assets – (0.8)% | (1,329,655) | ||
| Net Assets – 100.0% | $159,382,187 |
Percentages are stated as a percent of net assets. |
| Abbreviations: | ||
| ADR: | American Depositary Receipts | |
| Footnotes: | ||
| (a) | Non-income producing security. | |
| (b) | Security traded on a foreign exchange has been valued at an estimate of fair value that is different than the local market close price. These fair value estimates are determined by an independent fair valuation service that has been approved by the Board. These securities represent $774,519 or 0.5% of the Portfolio’s net assets. Other Portfolio securities are not subjected to fair value procedures because they are traded on domestic or foreign exchanges that have close times that are consistent with the U.S. market close, normally 4:00 pm Eastern Time. | |
| (c) | Rate represents the seven-day yield at June 30, 2020. | |
| (d) | Represents cost for financial reporting purposes, which may differ from cost basis for federal income tax purposes. See also Note 8 of the Notes to Financial Statements. | |
| Ohio National Fund, Inc. | ON Janus Henderson Enterprise Portfolio (Unaudited) |
| Average Annual returns | |
| One year | -1.29% |
| Five years | 7.83% |
| Ten years | 12.35% |
| (1) | The Portfolio’s composition is subject to change. Holdings and weightings are as of June 30, 2020. |
| Ohio National Fund, Inc. | ON Janus Henderson Enterprise Portfolio (Unaudited) (Continued) |

| Portfolio Composition as of June 30, 2020 (1) | |
| % of Net Assets | |
| Common Stocks (4) | 97.1 |
| Money Market Funds and Other Net Assets | 2.9 |
| 100.0 | |
| Top 10 Portfolio Holdings as of June 30, 2020 (1) (2) (3) | ||
| % of Net Assets | ||
| 1. | Constellation Software, Inc. | 3.5 |
| 2. | Microchip Technology, Inc. | 3.1 |
| 3. | Aon PLC Class A | 2.6 |
| 4. | PerkinElmer, Inc. | 2.3 |
| 5. | LPL Financial Holdings, Inc. | 2.3 |
| 6. | SS&C Technologies Holdings, Inc. | 2.3 |
| 7. | Nice Ltd. – ADR | 2.3 |
| 8. | Global Payments, Inc. | 2.2 |
| 9. | Broadridge Financial Solutions, Inc. | 2.2 |
| 10. | KLA-Tencor Corp. | 2.1 |
| (1) | Composition of Portfolio subject to change. | |
| (2) | Short-term investments have been excluded from the list of Top 10 Portfolio Holdings. | |
| (3) | Top 10 Portfolio Holdings is presented at an individual security level. Total investment exposure by issuer may be higher. | |
| (4) | Sectors (Common Stocks): | |
| % of Net Assets | |
| Information Technology | 37.9 |
| Industrials | 17.2 |
| Health Care | 16.8 |
| Financials | 11.8 |
| Consumer Discretionary | 7.5 |
| Real Estate | 3.8 |
| Materials | 1.1 |
| Utilities | 0.6 |
| Communication Services | 0.4 |
| 97.1 |
| Ohio National Fund, Inc. | ON Janus Henderson Enterprise Portfolio |
| Schedule of Investments | June 30, 2020 (Unaudited) |
| Common Stocks–97.1% | Shares | Value | |
| Communication Services–0.4% | |||
Liberty Media Corp. - Liberty Formula One Class C (Entertainment) | (a) | 12,810 | $ 406,205 |
| Consumer Discretionary–7.5% | |||
Aramark (Hotels, Restaurants & Leisure) | 24,328 | 549,083 | |
CarMax, Inc. (Specialty Retail) | (a) | 15,752 | 1,410,592 |
Dunkin' Brands Group, Inc. (Hotels, Restaurants & Leisure) | 19,517 | 1,273,094 | |
frontdoor, Inc. (Diversified Consumer Svs.) | (a) | 12,024 | 533,024 |
Gildan Activewear, Inc. (Textiles, Apparel & Luxury Goods) | 43,433 | 672,777 | |
ServiceMaster Global Holdings, Inc. (Diversified Consumer Svs.) | (a) | 24,055 | 858,523 |
Visteon Corp. (Auto Components) | (a) | 6,495 | 444,907 |
Wayfair, Inc. Class A (Internet & Direct Marketing Retail) | (a) | 7,199 | 1,422,594 |
| 7,164,594 | |||
| Financials–11.8% | |||
Aon PLC Class A (Insurance) | 12,779 | 2,461,235 | |
CBOE Global Markets, Inc. (Capital Markets) | 7,219 | 673,388 | |
Intact Financial Corp. (Insurance) | 16,128 | 1,534,987 | |
LPL Financial Holdings, Inc. (Capital Markets) | 28,364 | 2,223,738 | |
MSCI, Inc. (Capital Markets) | 1,658 | 553,474 | |
SVB Financial Group (Banks) | (a) | 2,866 | 617,709 |
TD Ameritrade Holding Corp. (Capital Markets) | 15,898 | 578,369 | |
W.R. Berkley Corp. (Insurance) | 25,548 | 1,463,645 | |
Willis Towers Watson PLC (Insurance) | 5,808 | 1,143,886 | |
| 11,250,431 | |||
| Health Care–16.8% | |||
Ascendis Pharma A/S – ADR (Biotechnology) | (a) | 1,650 | 244,035 |
Boston Scientific Corp. (Health Care Equip. & Supplies) | (a) | 51,156 | 1,796,087 |
Catalent, Inc. (Pharmaceuticals) | (a) | 22,563 | 1,653,868 |
Cooper Cos., Inc. / The (Health Care Equip. & Supplies) | 5,856 | 1,660,996 | |
DENTSPLY SIRONA, Inc. (Health Care Equip. & Supplies) | 15,605 | 687,556 | |
Elanco Animal Health, Inc. (Pharmaceuticals) | (a) | 28,764 | 616,988 |
ICU Medical, Inc. (Health Care Equip. & Supplies) | (a) | 3,378 | 622,599 |
IQVIA Holdings, Inc. (Life Sciences Tools & Svs.) | (a) | 9,967 | 1,414,118 |
Neurocrine Biosciences, Inc. (Biotechnology) | (a) | 4,184 | 510,448 |
PerkinElmer, Inc. (Life Sciences Tools & Svs.) | 22,758 | 2,232,332 | |
PRA Health Sciences, Inc. (Life Sciences Tools & Svs.) | (a) | 7,274 | 707,688 |
Royalty Pharma PLC Class A (Pharmaceuticals) | (a) | 13,677 | 664,018 |
Sarepta Therapeutics, Inc. (Biotechnology) | (a) | 3,943 | 632,221 |
Teleflex, Inc. (Health Care Equip. & Supplies) | 2,832 | 1,030,791 | |
Varian Medical Systems, Inc. (Health Care Equip. & Supplies) | (a) | 5,108 | 625,832 |
Waters Corp. (Life Sciences Tools & Svs.) | (a) | 5,304 | 956,842 |
| 16,056,419 | |||
| Industrials–17.2% | |||
Carlisle Cos., Inc. (Industrial Conglomerates) | 4,859 | 581,477 | |
Cimpress PLC (Commercial Svs. & Supplies) | (a) | 11,394 | 869,818 |
CoStar Group, Inc. (Professional Svs.) | (a) | 1,865 | 1,325,400 |
Edenred (Commercial Svs. & Supplies) | (b) | 16,527 | 724,843 |
Ferguson PLC (Trading Companies & Distributors) | (b) | 8,698 | 711,205 |
HEICO Corp. Class A (Aerospace & Defense) | 2,519 | 204,644 | |
IHS Markit Ltd. (Professional Svs.) | 10,552 | 796,676 | |
Ingersoll Rand, Inc. (Machinery) | (a) | 23,756 | 668,019 |
L3Harris Technologies, Inc. (Aerospace & Defense) | 7,499 | 1,272,355 |
| Common Stocks (Continued) | Shares | Value | |
| Industrials (continued) | |||
Middleby Corp. / The (Machinery) | (a) | 5,898 | $ 465,588 |
Rexnord Corp. (Machinery) | 36,608 | 1,067,123 | |
Ritchie Bros Auctioneers, Inc. (Commercial Svs. & Supplies) | 31,579 | 1,290,002 | |
Ryanair Holdings PLC – ADR (Airlines) | (a) | 10,721 | 711,231 |
Sensata Technologies Holding PLC (Electrical Equip.) | (a) | 49,378 | 1,838,343 |
Teledyne Technologies, Inc. (Aerospace & Defense) | (a) | 3,873 | 1,204,309 |
Verisk Analytics, Inc. (Professional Svs.) | 10,085 | 1,716,467 | |
Westinghouse Air Brake Technologies Corp. (Machinery) | 16,931 | 974,718 | |
| 16,422,218 | |||
| Information Technology–37.9% | |||
Amdocs Ltd. (IT Svs.) | 28,149 | 1,713,711 | |
Atlassian Corp. PLC Class A (Software) | (a) | 7,939 | 1,431,164 |
Broadridge Financial Solutions, Inc. (IT Svs.) | 16,240 | 2,049,326 | |
Ceridian HCM Holding, Inc. (Software) | (a) | 9,256 | 733,723 |
Constellation Software, Inc. (Software) | 2,940 | 3,319,606 | |
Dolby Laboratories, Inc. Class A (Electronic Equip., Instr. & Comp.) | 15,746 | 1,037,189 | |
Dynatrace, Inc. (Software) | (a) | 9,927 | 403,036 |
Euronet Worldwide, Inc. (IT Svs.) | (a) | 4,496 | 430,807 |
Fidelity National Information Services, Inc. (IT Svs.) | 12,426 | 1,666,202 | |
Flex Ltd. (Electronic Equip., Instr. & Comp.) | (a) | 88,860 | 910,815 |
Global Payments, Inc. (IT Svs.) | 12,174 | 2,064,954 | |
GoDaddy, Inc. Class A (IT Svs.) | (a) | 26,962 | 1,977,123 |
KLA-Tencor Corp. (Semiconductors & Equip.) | 10,354 | 2,013,646 | |
Lam Research Corp. (Semiconductors & Equip.) | 4,703 | 1,521,232 | |
Microchip Technology, Inc. (Semiconductors & Equip.) | 28,274 | 2,977,535 | |
National Instruments Corp. (Electronic Equip., Instr. & Comp.) | 36,332 | 1,406,412 | |
Nice Ltd. – ADR (Software) | (a) | 11,612 | 2,197,455 |
ON Semiconductor Corp. (Semiconductors & Equip.) | (a) | 70,984 | 1,406,903 |
SS&C Technologies Holdings, Inc. (Software) | 38,967 | 2,200,856 | |
TE Connectivity Ltd. (Electronic Equip., Instr. & Comp.) | 22,654 | 1,847,434 | |
WEX, Inc. (IT Svs.) | (a) | 11,730 | 1,935,567 |
Xilinx, Inc. (Semiconductors & Equip.) | 10,050 | 988,819 | |
| 36,233,515 | |||
| Materials–1.1% | |||
Sealed Air Corp. (Containers & Packaging) | 31,283 | 1,027,646 | |
| Real Estate–3.8% | |||
Crown Castle International Corp. (Equity REIT) | 11,097 | 1,857,083 | |
Lamar Advertising Co. Class A (Equity REIT) | 26,336 | 1,758,191 | |
| 3,615,274 | |||
| Utilities–0.6% | |||
Alliant Energy Corp. (Electric Utilities) | 12,802 | 612,448 | |
Total Common Stocks (Cost $83,450,150) | $92,788,750 |
| Money Market Funds–2.8% | Shares | Value | |
State Street Institutional Liquid Reserves Fund Institutional Class, 0.346% | (c) | 2,671,090 | $ 2,672,159 |
Total Money Market Funds (Cost $2,671,621) | $ 2,672,159 | ||
Total Investments – 99.9% (Cost $86,121,771) | (d) | $95,460,909 | |
Other Assets in Excess of Liabilities – 0.1% | 68,421 | ||
| Net Assets – 100.0% | $95,529,330 |
| Ohio National Fund, Inc. | ON Janus Henderson Enterprise Portfolio (Continued) |
| Schedule of Investments | June 30, 2020 (Unaudited) |
Percentages are stated as a percent of net assets. |
| Abbreviations: | ||
| ADR: | American Depositary Receipts | |
| Footnotes: | ||
| (a) | Non-income producing security. | |
| (b) | Security traded on a foreign exchange has been valued at an estimate of fair value that is different than the local market close price. These fair value estimates are determined by an independent fair valuation service that has been approved by the Board. These securities represent $1,436,048 or 1.5% of the Portfolio’s net assets. | |
| (c) | Rate represents the seven-day yield at June 30, 2020. | |
| (d) | Represents cost for financial reporting purposes, which may differ from cost basis for federal income tax purposes. See also Note 8 of the Notes to Financial Statements. | |
| Ohio National Fund, Inc. | ON S&P 500® Index Portfolio (Unaudited) |
| Average Annual returns | |
| One year | 7.13% |
| Five years | 10.28% |
| Ten years | 13.48% |
| (1) | The Portfolio’s composition is subject to change. Holdings and weightings are as of June 30, 2020. |
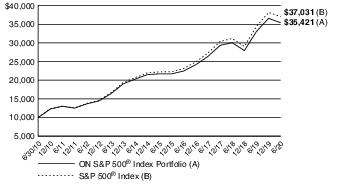
| Ohio National Fund, Inc. | ON S&P 500® Index Portfolio (Unaudited) (Continued) |
| Portfolio Composition as of June 30, 2020 (1) | |
| % of Net Assets | |
| Common Stocks (4) | 99.7 |
| Rights (4) | 0.0 |
| Money Market Funds Less Net Liabilities | 0.3 |
| 100.0 | |
| Top 10 Portfolio Holdings as of June 30, 2020 (1) (2) (3) | ||
| % of Net Assets | ||
| 1. | Microsoft Corp. | 6.0 |
| 2. | Apple, Inc. | 5.8 |
| 3. | Amazon.com, Inc. | 4.5 |
| 4. | Facebook, Inc. Class A | 2.1 |
| 5. | Alphabet, Inc. Class A | 1.7 |
| 6. | Alphabet, Inc. Class C | 1.6 |
| 7. | Johnson & Johnson | 1.4 |
| 8. | Berkshire Hathaway, Inc. Class B | 1.3 |
| 9. | Visa, Inc. | 1.3 |
| 10. | Procter & Gamble Co. / The | 1.2 |
| (1) | Composition of Portfolio subject to change. | |
| (2) | Short-term investments have been excluded from the list of Top 10 Portfolio Holdings. | |
| (3) | Top 10 Portfolio Holdings is presented at an individual security level. Total investment exposure by issuer may be higher. | |
| (4) | Sectors (Common Stocks, Rights): | |
| % of Net Assets | |
| Information Technology | 27.4 |
| Health Care | 14.6 |
| Consumer Discretionary | 10.8 |
| Communication Services | 10.8 |
| Financials | 10.0 |
| Industrials | 8.0 |
| Consumer Staples | 6.9 |
| Utilities | 3.1 |
| Real Estate | 2.8 |
| Energy | 2.8 |
| Materials | 2.5 |
| 99.7 |
| Ohio National Fund, Inc. | ON S&P 500® Index Portfolio |
| Schedule of Investments | June 30, 2020 (Unaudited) |
| Common Stocks–99.7% | Shares | Value | |
| Communication Services–10.8% | |||
Activision Blizzard, Inc. (Entertainment) | 32,790 | $ 2,488,761 | |
Alphabet, Inc. Class A (Interactive Media & Svs.) | (a) | 12,799 | 18,149,622 |
Alphabet, Inc. Class C (Interactive Media & Svs.) | (a) | 12,418 | 17,554,209 |
AT&T, Inc. (Diversified Telecom. Svs.) | 303,232 | 9,166,703 | |
CenturyLink, Inc. (Diversified Telecom. Svs.) | 42,170 | 422,965 | |
Charter Communications, Inc. Class A (Media) | (a) | 6,413 | 3,270,887 |
Comcast Corp. Class A (Media) | 193,834 | 7,555,649 | |
Discovery, Inc. Class A (Media) | (a) | 6,897 | 145,527 |
Discovery, Inc. Class C (Media) | (a) | 13,436 | 258,777 |
DISH Network Corp. Class A (Media) | (a) | 10,983 | 379,023 |
Electronic Arts, Inc. (Entertainment) | (a) | 12,286 | 1,622,366 |
Facebook, Inc. Class A (Interactive Media & Svs.) | (a) | 102,336 | 23,237,436 |
Fox Corp. Class A (Media) | 14,552 | 390,285 | |
Fox Corp. Class B (Media) | 6,880 | 184,659 | |
Interpublic Group of Cos., Inc. / The (Media) | 16,623 | 285,251 | |
Live Nation Entertainment, Inc. (Entertainment) | (a) | 6,067 | 268,950 |
Netflix, Inc. (Entertainment) | (a) | 18,717 | 8,516,984 |
News Corp. Class A (Media) | 16,312 | 193,460 | |
News Corp. Class B (Media) | 5,274 | 63,024 | |
Omnicom Group, Inc. (Media) | 9,136 | 498,826 | |
Take-Two Interactive Software, Inc. (Entertainment) | (a) | 4,831 | 674,263 |
T-Mobile U.S., Inc. (Wireless Telecom. Svs.) | (a) | 24,249 | 2,525,533 |
Twitter, Inc. (Interactive Media & Svs.) | (a) | 33,353 | 993,586 |
Verizon Communications, Inc. (Diversified Telecom. Svs.) | 176,101 | 9,708,448 | |
ViacomCBS, Inc. Class B (Media) | 22,895 | 533,912 | |
Walt Disney Co. / The (Entertainment) | 76,871 | 8,571,885 | |
| 117,660,991 | |||
| Consumer Discretionary–10.8% | |||
Advance Auto Parts, Inc. (Specialty Retail) | 2,951 | 420,370 | |
Amazon.com, Inc. (Internet & Direct Marketing Retail) | (a) | 17,831 | 49,192,519 |
Aptiv PLC (Auto Components) | 11,385 | 887,119 | |
AutoZone, Inc. (Specialty Retail) | (a) | 992 | 1,119,095 |
Best Buy Co., Inc. (Specialty Retail) | 9,652 | 842,330 | |
Booking Holdings, Inc. (Internet & Direct Marketing Retail) | (a) | 1,742 | 2,773,856 |
BorgWarner, Inc. (Auto Components) | 8,893 | 313,923 | |
CarMax, Inc. (Specialty Retail) | (a) | 6,918 | 619,507 |
Carnival Corp. (Hotels, Restaurants & Leisure) | 20,220 | 332,012 | |
Chipotle Mexican Grill, Inc. (Hotels, Restaurants & Leisure) | (a) | 1,091 | 1,148,125 |
D.R. Horton, Inc. (Household Durables) | 14,110 | 782,400 | |
Darden Restaurants, Inc. (Hotels, Restaurants & Leisure) | 5,501 | 416,811 | |
Dollar General Corp. (Multiline Retail) | 10,713 | 2,040,934 | |
Dollar Tree, Inc. (Multiline Retail) | (a) | 10,079 | 934,122 |
Domino's Pizza, Inc. (Hotels, Restaurants & Leisure) | 1,671 | 617,334 | |
eBay, Inc. (Internet & Direct Marketing Retail) | 28,109 | 1,474,317 | |
Expedia Group, Inc. (Internet & Direct Marketing Retail) | 5,785 | 475,527 | |
Ford Motor Co. (Automobiles) | 166,239 | 1,010,733 | |
Gap, Inc. / The (Specialty Retail) | 9,075 | 114,527 | |
Garmin Ltd. (Household Durables) | 6,203 | 604,793 | |
General Motors Co. (Automobiles) | 53,551 | 1,354,840 | |
Genuine Parts Co. (Distributors) | 6,141 | 534,021 | |
H&R Block, Inc. (Diversified Consumer Svs.) | 8,085 | 115,454 | |
Hanesbrands, Inc. (Textiles, Apparel & Luxury Goods) | 14,599 | 164,823 | |
Hasbro, Inc. (Leisure Products) | 5,394 | 404,280 | |
Hilton Worldwide Holdings, Inc. (Hotels, Restaurants & Leisure) | 11,771 | 864,580 | |
Home Depot, Inc. / The (Specialty Retail) | 45,775 | 11,467,095 | |
Kohl's Corp. (Multiline Retail) | 6,744 | 140,073 | |
L Brands, Inc. (Specialty Retail) | 10,023 | 150,044 |
| Common Stocks (Continued) | Shares | Value | |
| Consumer Discretionary (continued) | |||
Las Vegas Sands Corp. (Hotels, Restaurants & Leisure) | 14,284 | $ 650,493 | |
Leggett & Platt, Inc. (Household Durables) | 5,628 | 197,824 | |
Lennar Corp. Class A (Household Durables) | 11,649 | 717,811 | |
LKQ Corp. (Distributors) | (a) | 12,956 | 339,447 |
Lowe's Cos., Inc. (Specialty Retail) | 32,134 | 4,341,946 | |
Marriott International, Inc. Class A (Hotels, Restaurants & Leisure) | 11,434 | 980,237 | |
McDonald's Corp. (Hotels, Restaurants & Leisure) | 31,647 | 5,837,922 | |
MGM Resorts International (Hotels, Restaurants & Leisure) | 21,048 | 353,606 | |
Mohawk Industries, Inc. (Household Durables) | (a) | 2,523 | 256,740 |
Newell Brands, Inc. (Household Durables) | 16,342 | 259,511 | |
NIKE, Inc. Class B (Textiles, Apparel & Luxury Goods) | 52,779 | 5,174,981 | |
Norwegian Cruise Line Holdings Ltd. (Hotels, Restaurants & Leisure) | (a) | 10,943 | 179,793 |
NVR, Inc. (Household Durables) | (a) | 146 | 475,778 |
O'Reilly Automotive, Inc. (Specialty Retail) | (a) | 3,158 | 1,331,634 |
PulteGroup, Inc. (Household Durables) | 10,751 | 365,857 | |
PVH Corp. (Textiles, Apparel & Luxury Goods) | 3,023 | 145,255 | |
Ralph Lauren Corp. (Textiles, Apparel & Luxury Goods) | 2,034 | 147,506 | |
Ross Stores, Inc. (Specialty Retail) | 15,120 | 1,288,829 | |
Royal Caribbean Cruises Ltd. (Hotels, Restaurants & Leisure) | 7,333 | 368,850 | |
Starbucks Corp. (Hotels, Restaurants & Leisure) | 49,717 | 3,658,674 | |
Tapestry, Inc. (Textiles, Apparel & Luxury Goods) | 11,565 | 153,583 | |
Target Corp. (Multiline Retail) | 21,281 | 2,552,230 | |
Tiffany & Co. (Specialty Retail) | 4,665 | 568,850 | |
TJX Cos., Inc. / The (Specialty Retail) | 50,991 | 2,578,105 | |
Tractor Supply Co. (Specialty Retail) | 4,901 | 645,903 | |
Ulta Beauty, Inc. (Specialty Retail) | (a) | 2,397 | 487,598 |
Under Armour, Inc. Class A (Textiles, Apparel & Luxury Goods) | (a) | 8,009 | 78,008 |
Under Armour, Inc. Class C (Textiles, Apparel & Luxury Goods) | (a) | 8,446 | 74,663 |
V.F. Corp. (Textiles, Apparel & Luxury Goods) | 13,611 | 829,454 | |
Whirlpool Corp. (Household Durables) | 2,655 | 343,902 | |
Wynn Resorts Ltd. (Hotels, Restaurants & Leisure) | 4,144 | 308,687 | |
Yum! Brands, Inc. (Hotels, Restaurants & Leisure) | 12,790 | 1,111,579 | |
| 118,120,820 | |||
| Consumer Staples–6.9% | |||
Altria Group, Inc. (Tobacco) | 79,085 | 3,104,086 | |
Archer-Daniels-Midland Co. (Food Products) | 23,650 | 943,635 | |
Brown-Forman Corp. Class B (Beverages) | 7,797 | 496,357 | |
Campbell Soup Co. (Food Products) | 7,236 | 359,123 | |
Church & Dwight Co., Inc. (Household Products) | 10,498 | 811,495 | |
Clorox Co. / The (Household Products) | 5,321 | 1,167,268 | |
Coca-Cola Co. / The (Beverages) | 164,503 | 7,349,994 | |
Colgate-Palmolive Co. (Household Products) | 36,448 | 2,670,180 | |
Conagra Brands, Inc. (Food Products) | 20,738 | 729,355 | |
Constellation Brands, Inc. Class A (Beverages) | 7,145 | 1,250,018 | |
Costco Wholesale Corp. (Food & Staples Retailing) | 18,791 | 5,697,619 | |
Coty, Inc. Class A (Personal Products) | 12,689 | 56,720 | |
Estee Lauder Cos., Inc. / The Class A (Personal Products) | 9,566 | 1,804,913 | |
General Mills, Inc. (Food Products) | 25,794 | 1,590,200 | |
Hershey Co. / The (Food Products) | 6,259 | 811,292 | |
Hormel Foods Corp. (Food Products) | 11,966 | 577,599 | |
J.M. Smucker Co. / The (Food Products) | 4,837 | 511,803 | |
Kellogg Co. (Food Products) | 10,613 | 701,095 | |
Kimberly-Clark Corp. (Household Products) | 14,491 | 2,048,303 |
| Ohio National Fund, Inc. | ON S&P 500® Index Portfolio (Continued) |
| Schedule of Investments | June 30, 2020 (Unaudited) |
| Common Stocks (Continued) | Shares | Value | |
| Consumer Staples (continued) | |||
Kraft Heinz Co. / The (Food Products) | 26,575 | $ 847,477 | |
Kroger Co. / The (Food & Staples Retailing) | 33,424 | 1,131,402 | |
Lamb Weston Holdings, Inc. (Food Products) | 6,225 | 397,964 | |
McCormick & Co., Inc. (Food Products) | 5,255 | 942,799 | |
Molson Coors Beverage Co. Class B (Beverages) | 8,035 | 276,083 | |
Mondelez International, Inc. Class A (Food Products) | 60,761 | 3,106,710 | |
Monster Beverage Corp. (Beverages) | (a) | 15,900 | 1,102,188 |
PepsiCo, Inc. (Beverages) | 59,045 | 7,809,292 | |
Philip Morris International, Inc. (Tobacco) | 66,268 | 4,642,736 | |
Procter & Gamble Co. / The (Household Products) | 105,363 | 12,598,254 | |
Sysco Corp. (Food & Staples Retailing) | 21,611 | 1,181,257 | |
Tyson Foods, Inc. Class A (Food Products) | 12,508 | 746,853 | |
Walgreens Boots Alliance, Inc. (Food & Staples Retailing) | 31,348 | 1,328,842 | |
Walmart, Inc. (Food & Staples Retailing) | 60,263 | 7,218,302 | |
| 76,011,214 | |||
| Energy–2.8% | |||
Apache Corp. (Oil, Gas & Consumable Fuels) | 16,080 | 217,080 | |
Baker Hughes Co. (Energy Equip. & Svs.) | 27,974 | 430,520 | |
Cabot Oil & Gas Corp. (Oil, Gas & Consumable Fuels) | 17,103 | 293,830 | |
Chevron Corp. (Oil, Gas & Consumable Fuels) | 79,460 | 7,090,216 | |
Concho Resources, Inc. (Oil, Gas & Consumable Fuels) | 8,399 | 432,548 | |
ConocoPhillips (Oil, Gas & Consumable Fuels) | 45,649 | 1,918,171 | |
Devon Energy Corp. (Oil, Gas & Consumable Fuels) | 16,462 | 186,679 | |
Diamondback Energy, Inc. (Oil, Gas & Consumable Fuels) | 6,730 | 281,449 | |
EOG Resources, Inc. (Oil, Gas & Consumable Fuels) | 24,757 | 1,254,190 | |
Exxon Mobil Corp. (Oil, Gas & Consumable Fuels) | 179,957 | 8,047,677 | |
Halliburton Co. (Energy Equip. & Svs.) | 37,462 | 486,257 | |
Hess Corp. (Oil, Gas & Consumable Fuels) | 11,148 | 577,578 | |
HollyFrontier Corp. (Oil, Gas & Consumable Fuels) | 6,265 | 182,938 | |
Kinder Morgan, Inc. (Oil, Gas & Consumable Fuels) | 82,724 | 1,254,923 | |
Marathon Oil Corp. (Oil, Gas & Consumable Fuels) | 33,211 | 203,251 | |
Marathon Petroleum Corp. (Oil, Gas & Consumable Fuels) | 27,638 | 1,033,108 | |
National Oilwell Varco, Inc. (Energy Equip. & Svs.) | 16,419 | 201,133 | |
Noble Energy, Inc. (Oil, Gas & Consumable Fuels) | 20,325 | 182,112 | |
Occidental Petroleum Corp. (Oil, Gas & Consumable Fuels) | 38,423 | 703,141 | |
ONEOK, Inc. (Oil, Gas & Consumable Fuels) | 18,638 | 619,154 | |
Phillips 66 (Oil, Gas & Consumable Fuels) | 18,578 | 1,335,758 | |
Pioneer Natural Resources Co. (Oil, Gas & Consumable Fuels) | 6,995 | 683,411 | |
Schlumberger Ltd. (Energy Equip. & Svs.) | 58,985 | 1,084,734 | |
TechnipFMC PLC (Energy Equip. & Svs.) | 18,207 | 124,536 | |
Valero Energy Corp. (Oil, Gas & Consumable Fuels) | 17,319 | 1,018,704 | |
Williams Cos., Inc. / The (Oil, Gas & Consumable Fuels) | 51,572 | 980,899 | |
| 30,823,997 | |||
| Financials–10.0% | |||
Aflac, Inc. (Insurance) | 30,500 | 1,098,915 | |
Allstate Corp. / The (Insurance) | 13,365 | 1,296,271 | |
American Express Co. (Consumer Finance) | 28,105 | 2,675,596 | |
American International Group, Inc. (Insurance) | 36,673 | 1,143,464 | |
Ameriprise Financial, Inc. (Capital Markets) | 5,194 | 779,308 |
| Common Stocks (Continued) | Shares | Value | |
| Financials (continued) | |||
Aon PLC Class A (Insurance) | 9,835 | $ 1,894,221 | |
Arthur J. Gallagher & Co. (Insurance) | 8,050 | 784,795 | |
Assurant, Inc. (Insurance) | 2,548 | 263,183 | |
Bank of America Corp. (Banks) | 332,277 | 7,891,579 | |
Bank of New York Mellon Corp. / The (Capital Markets) | 34,292 | 1,325,386 | |
Berkshire Hathaway, Inc. Class B (Diversified Financial Svs.) | (a) | 82,740 | 14,769,917 |
BlackRock, Inc. (Capital Markets) | 6,566 | 3,572,495 | |
Capital One Financial Corp. (Consumer Finance) | 19,370 | 1,212,368 | |
CBOE Global Markets, Inc. (Capital Markets) | 4,678 | 436,364 | |
Charles Schwab Corp. / The (Capital Markets) | 48,772 | 1,645,567 | |
Chubb Ltd. (Insurance) | 19,212 | 2,432,623 | |
Cincinnati Financial Corp. (Insurance) | 6,389 | 409,088 | |
Citigroup, Inc. (Banks) | 88,600 | 4,527,460 | |
Citizens Financial Group, Inc. (Banks) | 18,217 | 459,797 | |
CME Group, Inc. (Capital Markets) | 15,263 | 2,480,848 | |
Comerica, Inc. (Banks) | 5,935 | 226,124 | |
Discover Financial Services (Consumer Finance) | 12,983 | 650,319 | |
E*TRADE Financial Corp. (Capital Markets) | 9,391 | 467,014 | |
Everest Re Group Ltd. (Insurance) | 1,708 | 352,190 | |
Fifth Third Bancorp (Banks) | 30,176 | 581,793 | |
First Republic Bank (Banks) | 7,284 | 772,031 | |
Franklin Resources, Inc. (Capital Markets) | 11,871 | 248,935 | |
Globe Life, Inc. (Insurance) | 4,184 | 310,578 | |
Goldman Sachs Group, Inc. / The (Capital Markets) | 13,175 | 2,603,644 | |
Hartford Financial Services Group, Inc. / The (Insurance) | 15,291 | 589,468 | |
Huntington Bancshares, Inc. (Banks) | 43,052 | 388,975 | |
Intercontinental Exchange, Inc. (Capital Markets) | 23,294 | 2,133,730 | |
Invesco Ltd. (Capital Markets) | 16,064 | 172,849 | |
JPMorgan Chase & Co. (Banks) | 129,673 | 12,197,042 | |
KeyCorp (Banks) | 41,650 | 507,297 | |
Lincoln National Corp. (Insurance) | 8,208 | 301,972 | |
Loews Corp. (Insurance) | 10,335 | 354,387 | |
M&T Bank Corp. (Banks) | 5,480 | 569,756 | |
MarketAxess Holdings, Inc. (Capital Markets) | 1,610 | 806,481 | |
Marsh & McLennan Cos., Inc. (Insurance) | 21,714 | 2,331,432 | |
MetLife, Inc. (Insurance) | 32,794 | 1,197,637 | |
Moody's Corp. (Capital Markets) | 6,864 | 1,885,747 | |
Morgan Stanley (Capital Markets) | 50,975 | 2,462,093 | |
MSCI, Inc. (Capital Markets) | 3,618 | 1,207,761 | |
Nasdaq, Inc. (Capital Markets) | 4,871 | 581,938 | |
Northern Trust Corp. (Capital Markets) | 8,827 | 700,334 | |
People's United Financial, Inc. (Banks) | 18,140 | 209,880 | |
PNC Financial Services Group, Inc. / The (Banks) | 18,051 | 1,899,146 | |
Principal Financial Group, Inc. (Insurance) | 10,874 | 451,706 | |
Progressive Corp. / The (Insurance) | 24,910 | 1,995,540 | |
Prudential Financial, Inc. (Insurance) | 16,777 | 1,021,719 | |
Raymond James Financial, Inc. (Capital Markets) | 5,185 | 356,884 | |
Regions Financial Corp. (Banks) | 40,741 | 453,040 | |
S&P Global, Inc. (Capital Markets) | 10,253 | 3,378,158 | |
State Street Corp. (Capital Markets) | 14,958 | 950,581 | |
SVB Financial Group (Banks) | (a) | 2,193 | 472,657 |
Synchrony Financial (Consumer Finance) | 22,925 | 508,018 | |
T. Rowe Price Group, Inc. (Capital Markets) | 9,682 | 1,195,727 | |
Travelers Cos., Inc. / The (Insurance) | 10,753 | 1,226,380 | |
Truist Financial Corp. (Banks) | 57,342 | 2,153,192 | |
U.S. Bancorp (Banks) | 58,329 | 2,147,674 | |
Unum Group (Insurance) | 8,810 | 146,158 | |
W.R. Berkley Corp. (Insurance) | 6,036 | 345,802 | |
Wells Fargo & Co. (Banks) | 158,779 | 4,064,742 |
| Ohio National Fund, Inc. | ON S&P 500® Index Portfolio (Continued) |
| Schedule of Investments | June 30, 2020 (Unaudited) |
| Common Stocks (Continued) | Shares | Value | |
| Financials (continued) | |||
Willis Towers Watson PLC (Insurance) | 5,475 | $ 1,078,301 | |
Zions Bancorp N.A. (Banks) | 7,000 | 238,000 | |
| 109,994,077 | |||
| Health Care–14.6% | |||
Abbott Laboratories (Health Care Equip. & Supplies) | 75,276 | 6,882,485 | |
AbbVie, Inc. (Biotechnology) | 75,002 | 7,363,696 | |
ABIOMED, Inc. (Health Care Equip. & Supplies) | (a) | 1,902 | 459,447 |
Agilent Technologies, Inc. (Life Sciences Tools & Svs.) | 13,130 | 1,160,298 | |
Alexion Pharmaceuticals, Inc. (Biotechnology) | (a) | 9,399 | 1,054,944 |
Align Technology, Inc. (Health Care Equip. & Supplies) | (a) | 3,042 | 834,846 |
AmerisourceBergen Corp. (Health Care Providers & Svs.) | 6,341 | 638,983 | |
Amgen, Inc. (Biotechnology) | 25,035 | 5,904,755 | |
Anthem, Inc. (Health Care Providers & Svs.) | 10,729 | 2,821,512 | |
Baxter International, Inc. (Health Care Equip. & Supplies) | 21,650 | 1,864,065 | |
Becton Dickinson and Co. (Health Care Equip. & Supplies) | 12,548 | 3,002,360 | |
Biogen, Inc. (Biotechnology) | (a) | 6,945 | 1,858,135 |
Bio-Rad Laboratories, Inc. Class A (Life Sciences Tools & Svs.) | (a) | 913 | 412,210 |
Boston Scientific Corp. (Health Care Equip. & Supplies) | (a) | 60,802 | 2,134,758 |
Bristol-Myers Squibb Co. (Pharmaceuticals) | 96,292 | 5,661,970 | |
Cardinal Health, Inc. (Health Care Providers & Svs.) | 12,430 | 648,722 | |
Centene Corp. (Health Care Providers & Svs.) | (a) | 24,643 | 1,566,063 |
Cerner Corp. (Health Care Technology) | 12,930 | 886,352 | |
Cigna Corp. (Health Care Providers & Svs.) | 15,702 | 2,946,480 | |
Cooper Cos., Inc. / The (Health Care Equip. & Supplies) | 2,092 | 593,375 | |
CVS Health Corp. (Health Care Providers & Svs.) | 55,620 | 3,613,631 | |
Danaher Corp. (Health Care Equip. & Supplies) | 26,778 | 4,735,154 | |
DaVita, Inc. (Health Care Providers & Svs.) | (a) | 3,644 | 288,386 |
DENTSPLY SIRONA, Inc. (Health Care Equip. & Supplies) | 9,358 | 412,313 | |
DexCom, Inc. (Health Care Equip. & Supplies) | (a) | 3,928 | 1,592,411 |
Edwards Lifesciences Corp. (Health Care Equip. & Supplies) | (a) | 26,370 | 1,822,431 |
Eli Lilly & Co. (Pharmaceuticals) | 35,841 | 5,884,375 | |
Gilead Sciences, Inc. (Biotechnology) | 53,369 | 4,106,211 | |
HCA Healthcare, Inc. (Health Care Providers & Svs.) | 11,195 | 1,086,587 | |
Henry Schein, Inc. (Health Care Providers & Svs.) | (a) | 6,057 | 353,668 |
Hologic, Inc. (Health Care Equip. & Supplies) | (a) | 11,031 | 628,767 |
Humana, Inc. (Health Care Providers & Svs.) | 5,626 | 2,181,482 | |
IDEXX Laboratories, Inc. (Health Care Equip. & Supplies) | (a) | 3,613 | 1,192,868 |
Illumina, Inc. (Life Sciences Tools & Svs.) | (a) | 6,256 | 2,316,910 |
Incyte Corp. (Biotechnology) | (a) | 7,660 | 796,410 |
Intuitive Surgical, Inc. (Health Care Equip. & Supplies) | (a) | 4,963 | 2,828,066 |
IQVIA Holdings, Inc. (Life Sciences Tools & Svs.) | (a) | 7,551 | 1,071,336 |
Johnson & Johnson (Pharmaceuticals) | 112,125 | 15,768,139 | |
Laboratory Corp. of America Holdings (Health Care Providers & Svs.) | (a) | 4,152 | 689,689 |
McKesson Corp. (Health Care Providers & Svs.) | 6,880 | 1,055,530 | |
Medtronic PLC (Health Care Equip. & Supplies) | 57,073 | 5,233,594 | |
Merck & Co., Inc. (Pharmaceuticals) | 107,424 | 8,307,098 | |
Mettler-Toledo International, Inc. (Life Sciences Tools & Svs.) | (a) | 1,015 | 817,633 |
Mylan N.V. (Pharmaceuticals) | (a) | 22,079 | 355,030 |
| Common Stocks (Continued) | Shares | Value | |
| Health Care (continued) | |||
PerkinElmer, Inc. (Life Sciences Tools & Svs.) | 4,761 | $ 467,006 | |
Perrigo Co. PLC (Pharmaceuticals) | 5,779 | 319,405 | |
Pfizer, Inc. (Pharmaceuticals) | 236,412 | 7,730,672 | |
Quest Diagnostics, Inc. (Health Care Providers & Svs.) | 5,688 | 648,204 | |
Regeneron Pharmaceuticals, Inc. (Biotechnology) | (a) | 4,293 | 2,677,329 |
ResMed, Inc. (Health Care Equip. & Supplies) | 6,154 | 1,181,568 | |
STERIS PLC (Health Care Equip. & Supplies) | 3,631 | 557,141 | |
Stryker Corp. (Health Care Equip. & Supplies) | 13,719 | 2,472,027 | |
Teleflex, Inc. (Health Care Equip. & Supplies) | 1,983 | 721,772 | |
Thermo Fisher Scientific, Inc. (Life Sciences Tools & Svs.) | 16,809 | 6,090,573 | |
UnitedHealth Group, Inc. (Health Care Providers & Svs.) | 40,361 | 11,904,477 | |
Universal Health Services, Inc. Class B (Health Care Providers & Svs.) | 3,318 | 308,209 | |
Varian Medical Systems, Inc. (Health Care Equip. & Supplies) | (a) | 3,880 | 475,378 |
Vertex Pharmaceuticals, Inc. (Biotechnology) | (a) | 11,035 | 3,203,571 |
Waters Corp. (Life Sciences Tools & Svs.) | (a) | 2,644 | 476,978 |
West Pharmaceutical Services, Inc. (Health Care Equip. & Supplies) | 3,141 | 713,541 | |
Zimmer Biomet Holdings, Inc. (Health Care Equip. & Supplies) | 8,791 | 1,049,294 | |
Zoetis, Inc. (Pharmaceuticals) | 20,213 | 2,769,990 | |
| 159,600,310 | |||
| Industrials–8.0% | |||
3M Co. (Industrial Conglomerates) | 24,478 | 3,818,323 | |
A.O. Smith Corp. (Building Products) | 5,769 | 271,835 | |
Alaska Air Group, Inc. (Airlines) | 5,141 | 186,413 | |
Allegion PLC (Building Products) | 3,939 | 402,645 | |
American Airlines Group, Inc. (Airlines) | 21,229 | 277,463 | |
AMETEK, Inc. (Electrical Equip.) | 9,748 | 871,179 | |
Boeing Co. / The (Aerospace & Defense) | 22,817 | 4,182,356 | |
C.H. Robinson Worldwide, Inc. (Air Freight & Logistics) | 5,746 | 454,279 | |
Carrier Global Corp. (Building Products) | 34,544 | 767,568 | |
Caterpillar, Inc. (Machinery) | 23,035 | 2,913,927 | |
Cintas Corp. (Commercial Svs. & Supplies) | 3,581 | 953,835 | |
Copart, Inc. (Commercial Svs. & Supplies) | (a) | 8,763 | 729,695 |
CSX Corp. (Road & Rail) | 32,566 | 2,271,153 | |
Cummins, Inc. (Machinery) | 6,274 | 1,087,033 | |
Deere & Co. (Machinery) | 13,316 | 2,092,609 | |
Delta Air Lines, Inc. (Airlines) | 24,204 | 678,922 | |
Dover Corp. (Machinery) | 6,113 | 590,271 | |
Eaton Corp. PLC (Electrical Equip.) | 17,027 | 1,489,522 | |
Emerson Electric Co. (Electrical Equip.) | 25,432 | 1,577,547 | |
Equifax, Inc. (Professional Svs.) | 5,155 | 886,041 | |
Expeditors International of Washington, Inc. (Air Freight & Logistics) | 7,106 | 540,340 | |
Fastenal Co. (Trading Companies & Distributors) | 24,410 | 1,045,724 | |
FedEx Corp. (Air Freight & Logistics) | 10,226 | 1,433,890 | |
Flowserve Corp. (Machinery) | 5,560 | 158,571 | |
Fortive Corp. (Machinery) | 12,591 | 851,907 | |
Fortune Brands Home & Security, Inc. (Building Products) | 5,964 | 381,279 | |
General Dynamics Corp. (Aerospace & Defense) | 9,887 | 1,477,711 | |
General Electric Co. (Industrial Conglomerates) | 372,295 | 2,542,775 | |
Honeywell International, Inc. (Industrial Conglomerates) | 29,871 | 4,319,048 | |
Howmet Aerospace, Inc. (Aerospace & Defense) | 16,239 | 257,388 | |
Huntington Ingalls Industries, Inc. (Aerospace & Defense) | 1,725 | 300,995 | |
IDEX Corp. (Machinery) | 3,218 | 508,573 | |
IHS Markit Ltd. (Professional Svs.) | 16,961 | 1,280,556 |
| Ohio National Fund, Inc. | ON S&P 500® Index Portfolio (Continued) |
| Schedule of Investments | June 30, 2020 (Unaudited) |
| Common Stocks (Continued) | Shares | Value | |
| Industrials (continued) | |||
Illinois Tool Works, Inc. (Machinery) | 12,235 | $ 2,139,290 | |
Ingersoll Rand, Inc. (Machinery) | (a) | 14,701 | 413,392 |
J.B. Hunt Transport Services, Inc. (Road & Rail) | 3,605 | 433,826 | |
Jacobs Engineering Group, Inc. (Construction & Engineering) | 5,563 | 471,742 | |
Johnson Controls International PLC (Building Products) | 31,619 | 1,079,473 | |
Kansas City Southern (Road & Rail) | 4,059 | 605,968 | |
L3Harris Technologies, Inc. (Aerospace & Defense) | 9,185 | 1,558,419 | |
Lockheed Martin Corp. (Aerospace & Defense) | 10,502 | 3,832,390 | |
Masco Corp. (Building Products) | 11,266 | 565,666 | |
Nielsen Holdings PLC (Professional Svs.) | 15,233 | 226,362 | |
Norfolk Southern Corp. (Road & Rail) | 10,900 | 1,913,713 | |
Northrop Grumman Corp. (Aerospace & Defense) | 6,597 | 2,028,182 | |
Old Dominion Freight Line, Inc. (Road & Rail) | 4,001 | 678,530 | |
Otis Worldwide Corp. (Machinery) | 17,302 | 983,792 | |
PACCAR, Inc. (Machinery) | 14,711 | 1,101,118 | |
Parker-Hannifin Corp. (Machinery) | 5,464 | 1,001,387 | |
Pentair PLC (Machinery) | 7,027 | 266,956 | |
Quanta Services, Inc. (Construction & Engineering) | 5,871 | 230,319 | |
Raytheon Technologies Corp. (Aerospace & Defense) | 62,595 | 3,857,104 | |
Republic Services, Inc. (Commercial Svs. & Supplies) | 8,964 | 735,496 | |
Robert Half International, Inc. (Professional Svs.) | 4,892 | 258,444 | |
Rockwell Automation, Inc. (Electrical Equip.) | 4,924 | 1,048,812 | |
Rollins, Inc. (Commercial Svs. & Supplies) | 6,042 | 256,120 | |
Roper Technologies, Inc. (Industrial Conglomerates) | 4,442 | 1,724,651 | |
Snap-on, Inc. (Machinery) | 2,307 | 319,543 | |
Southwest Airlines Co. (Airlines) | 22,883 | 782,141 | |
Stanley Black & Decker, Inc. (Machinery) | 6,547 | 912,521 | |
Teledyne Technologies, Inc. (Aerospace & Defense) | (a) | 1,567 | 487,259 |
Textron, Inc. (Aerospace & Defense) | 9,752 | 320,938 | |
Trane Technologies PLC (Building Products) | 10,174 | 905,283 | |
TransDigm Group, Inc. (Aerospace & Defense) | 2,137 | 944,661 | |
Union Pacific Corp. (Road & Rail) | 28,875 | 4,881,896 | |
United Airlines Holdings, Inc. (Airlines) | (a) | 10,702 | 370,396 |
United Parcel Service, Inc. Class B (Air Freight & Logistics) | 29,961 | 3,331,064 | |
United Rentals, Inc. (Trading Companies & Distributors) | (a) | 3,079 | 458,894 |
Verisk Analytics, Inc. (Professional Svs.) | 6,900 | 1,174,380 | |
W.W. Grainger, Inc. (Trading Companies & Distributors) | 1,848 | 580,568 | |
Waste Management, Inc. (Commercial Svs. & Supplies) | 16,519 | 1,749,527 | |
Westinghouse Air Brake Technologies Corp. (Machinery) | 7,689 | 442,656 | |
Xylem, Inc. (Machinery) | 7,688 | 499,412 | |
| 87,173,664 | |||
| Information Technology–27.4% | |||
Accenture PLC Class A (IT Svs.) | 27,114 | 5,821,918 | |
Adobe, Inc. (Software) | (a) | 20,505 | 8,926,032 |
Advanced Micro Devices, Inc. (Semiconductors & Equip.) | (a) | 49,846 | 2,622,398 |
Akamai Technologies, Inc. (IT Svs.) | (a) | 6,883 | 737,100 |
Amphenol Corp. Class A (Electronic Equip., Instr. & Comp.) | 12,572 | 1,204,523 | |
Analog Devices, Inc. (Semiconductors & Equip.) | 15,683 | 1,923,363 | |
ANSYS, Inc. (Software) | (a) | 3,653 | 1,065,690 |
| Common Stocks (Continued) | Shares | Value | |
| Information Technology (continued) | |||
Apple, Inc. (Tech. Hardware, Storage & Periph.) | 173,392 | $ 63,253,402 | |
Applied Materials, Inc. (Semiconductors & Equip.) | 39,013 | 2,358,336 | |
Arista Networks, Inc. (Communications Equip.) | (a) | 2,290 | 480,969 |
Autodesk, Inc. (Software) | (a) | 9,329 | 2,231,404 |
Automatic Data Processing, Inc. (IT Svs.) | 18,296 | 2,724,091 | |
Broadcom, Inc. (Semiconductors & Equip.) | 17,016 | 5,370,420 | |
Broadridge Financial Solutions, Inc. (IT Svs.) | 4,874 | 615,050 | |
Cadence Design Systems, Inc. (Software) | (a) | 11,882 | 1,140,197 |
CDW Corp. (Electronic Equip., Instr. & Comp.) | 6,081 | 706,491 | |
Cisco Systems, Inc. (Communications Equip.) | 180,487 | 8,417,914 | |
Citrix Systems, Inc. (Software) | 4,956 | 733,042 | |
Cognizant Technology Solutions Corp. Class A (IT Svs.) | 22,999 | 1,306,803 | |
Corning, Inc. (Electronic Equip., Instr. & Comp.) | 32,228 | 834,705 | |
DXC Technology Co. (IT Svs.) | 10,757 | 177,491 | |
F5 Networks, Inc. (Communications Equip.) | (a) | 2,593 | 361,672 |
Fidelity National Information Services, Inc. (IT Svs.) | 26,298 | 3,526,299 | |
Fiserv, Inc. (IT Svs.) | (a) | 23,938 | 2,336,828 |
FleetCor Technologies, Inc. (IT Svs.) | (a) | 3,560 | 895,447 |
FLIR Systems, Inc. (Electronic Equip., Instr. & Comp.) | 5,563 | 225,691 | |
Fortinet, Inc. (Software) | (a) | 5,695 | 781,753 |
Gartner, Inc. (IT Svs.) | (a) | 3,783 | 458,991 |
Global Payments, Inc. (IT Svs.) | 12,733 | 2,159,771 | |
Hewlett Packard Enterprise Co. (Tech. Hardware, Storage & Periph.) | 54,871 | 533,895 | |
HP, Inc. (Tech. Hardware, Storage & Periph.) | 60,783 | 1,059,448 | |
Intel Corp. (Semiconductors & Equip.) | 180,199 | 10,781,306 | |
International Business Machines Corp. (IT Svs.) | 37,791 | 4,564,019 | |
Intuit, Inc. (Software) | 11,099 | 3,287,413 | |
IPG Photonics Corp. (Electronic Equip., Instr. & Comp.) | (a) | 1,507 | 241,708 |
Jack Henry & Associates, Inc. (IT Svs.) | 3,272 | 602,146 | |
Juniper Networks, Inc. (Communications Equip.) | 14,027 | 320,657 | |
Keysight Technologies, Inc. (Electronic Equip., Instr. & Comp.) | (a) | 7,957 | 801,906 |
KLA-Tencor Corp. (Semiconductors & Equip.) | 6,597 | 1,282,985 | |
Lam Research Corp. (Semiconductors & Equip.) | 6,179 | 1,998,659 | |
Leidos Holdings, Inc. (IT Svs.) | 5,706 | 534,481 | |
Mastercard, Inc. Class A (IT Svs.) | 37,617 | 11,123,347 | |
Maxim Integrated Products, Inc. (Semiconductors & Equip.) | 11,386 | 690,105 | |
Microchip Technology, Inc. (Semiconductors & Equip.) | 10,430 | 1,098,383 | |
Micron Technology, Inc. (Semiconductors & Equip.) | (a) | 47,343 | 2,439,111 |
Microsoft Corp. (Software) | 322,742 | 65,681,224 | |
Motorola Solutions, Inc. (Communications Equip.) | 7,247 | 1,015,522 | |
NetApp, Inc. (Tech. Hardware, Storage & Periph.) | 9,451 | 419,341 | |
NortonLifeLock, Inc. (Software) | 23,151 | 459,084 | |
NVIDIA Corp. (Semiconductors & Equip.) | 26,180 | 9,946,044 | |
Oracle Corp. (Software) | 88,580 | 4,895,817 | |
Paychex, Inc. (IT Svs.) | 13,566 | 1,027,624 | |
Paycom Software, Inc. (Software) | (a) | 2,045 | 633,398 |
PayPal Holdings, Inc. (IT Svs.) | (a) | 49,973 | 8,706,796 |
Qorvo, Inc. (Semiconductors & Equip.) | (a) | 4,870 | 538,281 |
QUALCOMM, Inc. (Semiconductors & Equip.) | 47,878 | 4,366,952 | |
salesforce.com, Inc. (Software) | (a) | 38,346 | 7,183,356 |
Seagate Technology PLC (Tech. Hardware, Storage & Periph.) | 9,648 | 467,060 | |
ServiceNow, Inc. (Software) | (a) | 8,116 | 3,287,467 |
Skyworks Solutions, Inc. (Semiconductors & Equip.) | 7,088 | 906,272 |
| Ohio National Fund, Inc. | ON S&P 500® Index Portfolio (Continued) |
| Schedule of Investments | June 30, 2020 (Unaudited) |
| Common Stocks (Continued) | Shares | Value | |
| Information Technology (continued) | |||
Synopsys, Inc. (Software) | (a) | 6,416 | $ 1,251,120 |
TE Connectivity Ltd. (Electronic Equip., Instr. & Comp.) | 14,030 | 1,144,146 | |
Texas Instruments, Inc. (Semiconductors & Equip.) | 39,064 | 4,959,956 | |
Tyler Technologies, Inc. (Software) | (a) | 1,699 | 589,349 |
VeriSign, Inc. (IT Svs.) | (a) | 4,319 | 893,299 |
Visa, Inc. (IT Svs.) | 71,807 | 13,870,958 | |
Western Digital Corp. (Tech. Hardware, Storage & Periph.) | 12,801 | 565,164 | |
Western Union Co. / The (IT Svs.) | 17,562 | 379,690 | |
Xerox Holdings Corp. (Tech. Hardware, Storage & Periph.) | 7,722 | 118,069 | |
Xilinx, Inc. (Semiconductors & Equip.) | 10,332 | 1,016,565 | |
Zebra Technologies Corp. Class A (Electronic Equip., Instr. & Comp.) | (a) | 2,264 | 579,471 |
| 299,659,385 | |||
| Materials–2.5% | |||
Air Products & Chemicals, Inc. (Chemicals) | 9,399 | 2,269,483 | |
Albemarle Corp. (Chemicals) | 4,518 | 348,835 | |
Amcor PLC (Containers & Packaging) | 67,253 | 686,653 | |
Avery Dennison Corp. (Containers & Packaging) | 3,558 | 405,932 | |
Ball Corp. (Containers & Packaging) | 13,890 | 965,216 | |
Celanese Corp. (Chemicals) | 5,037 | 434,895 | |
CF Industries Holdings, Inc. (Chemicals) | 9,057 | 254,864 | |
Corteva, Inc. (Chemicals) | 31,769 | 851,092 | |
Dow, Inc. (Chemicals) | 31,508 | 1,284,266 | |
DuPont de Nemours, Inc. (Chemicals) | 31,232 | 1,659,356 | |
Eastman Chemical Co. (Chemicals) | 5,758 | 400,987 | |
Ecolab, Inc. (Chemicals) | 10,525 | 2,093,949 | |
FMC Corp. (Chemicals) | 5,499 | 547,810 | |
Freeport-McMoRan, Inc. (Metals & Mining) | 61,927 | 716,495 | |
International Flavors & Fragrances, Inc. (Chemicals) | 4,538 | 555,724 | |
International Paper Co. (Containers & Packaging) | 16,782 | 590,894 | |
Linde PLC (Chemicals) | 22,352 | 4,741,083 | |
LyondellBasell Industries N.V. Class A (Chemicals) | 10,971 | 721,014 | |
Martin Marietta Materials, Inc. (Construction Materials) | 2,653 | 548,030 | |
Mosaic Co. / The (Chemicals) | 14,998 | 187,625 | |
Newmont Corp. (Metals & Mining) | 34,151 | 2,108,483 | |
Nucor Corp. (Metals & Mining) | 12,832 | 531,373 | |
Packaging Corp. of America (Containers & Packaging) | 4,006 | 399,799 | |
PPG Industries, Inc. (Chemicals) | 10,041 | 1,064,948 | |
Sealed Air Corp. (Containers & Packaging) | 6,638 | 218,058 | |
Sherwin-Williams Co. / The (Chemicals) | 3,439 | 1,987,226 | |
Vulcan Materials Co. (Construction Materials) | 5,632 | 652,467 | |
Westrock Co. (Containers & Packaging) | 10,926 | 308,769 | |
| 27,535,326 | |||
| Real Estate–2.8% | |||
Alexandria Real Estate Equities, Inc. (Equity REIT) | 5,359 | 869,498 | |
American Tower Corp. (Equity REIT) | 18,870 | 4,878,650 | |
Apartment Investment & Management Co. Class A (Equity REIT) | 6,284 | 236,530 | |
AvalonBay Communities, Inc. (Equity REIT) | 5,975 | 923,974 | |
Boston Properties, Inc. (Equity REIT) | 6,162 | 556,921 | |
CBRE Group, Inc. Class A (Real Estate Mgmt. & Development) | (a) | 14,310 | 647,098 |
Crown Castle International Corp. (Equity REIT) | 17,742 | 2,969,124 | |
Digital Realty Trust, Inc. (Equity REIT) | 11,422 | 1,623,180 | |
Duke Realty Corp. (Equity REIT) | 15,602 | 552,155 | |
Equinix, Inc. (Equity REIT) | 3,769 | 2,646,969 | |
Equity Residential (Equity REIT) | 14,846 | 873,242 | |
Essex Property Trust, Inc. (Equity REIT) | 2,776 | 636,176 |
| Common Stocks (Continued) | Shares | Value | |
| Real Estate (continued) | |||
Extra Space Storage, Inc. (Equity REIT) | 5,470 | $ 505,264 | |
Federal Realty Investment Trust (Equity REIT) | 2,965 | 252,648 | |
Healthpeak Properties, Inc. (Equity REIT) | 22,973 | 633,136 | |
Host Hotels & Resorts, Inc. (Equity REIT) | 30,089 | 324,660 | |
Iron Mountain, Inc. (Equity REIT) | 12,280 | 320,508 | |
Kimco Realty Corp. (Equity REIT) | 18,444 | 236,821 | |
Mid-America Apartment Communities, Inc. (Equity REIT) | 4,879 | 559,475 | |
Prologis, Inc. (Equity REIT) | 31,451 | 2,935,322 | |
Public Storage (Equity REIT) | 6,392 | 1,226,561 | |
Realty Income Corp. (Equity REIT) | 14,577 | 867,331 | |
Regency Centers Corp. (Equity REIT) | 7,253 | 332,840 | |
SBA Communications Corp. (Equity REIT) | 4,751 | 1,415,418 | |
Simon Property Group, Inc. (Equity REIT) | 13,007 | 889,419 | |
SL Green Realty Corp. (Equity REIT) | 3,261 | 160,735 | |
UDR, Inc. (Equity REIT) | 12,582 | 470,315 | |
Ventas, Inc. (Equity REIT) | 15,928 | 583,283 | |
Vornado Realty Trust (Equity REIT) | 6,762 | 258,376 | |
Welltower, Inc. (Equity REIT) | 17,727 | 917,372 | |
Weyerhaeuser Co. (Equity REIT) | 31,714 | 712,296 | |
| 31,015,297 | |||
| Utilities–3.1% | |||
AES Corp. (Ind. Power & Renewable Elec.) | 28,396 | 411,458 | |
Alliant Energy Corp. (Electric Utilities) | 10,661 | 510,022 | |
Ameren Corp. (Multi-Utilities) | 10,471 | 736,740 | |
American Electric Power Co., Inc. (Electric Utilities) | 21,104 | 1,680,723 | |
American Water Works Co., Inc. (Water Utilities) | 7,690 | 989,395 | |
Atmos Energy Corp. (Gas Utilities) | 5,224 | 520,206 | |
CenterPoint Energy, Inc. (Multi-Utilities) | 23,256 | 434,190 | |
CMS Energy Corp. (Multi-Utilities) | 12,224 | 714,126 | |
Consolidated Edison, Inc. (Multi-Utilities) | 14,198 | 1,021,262 | |
Dominion Energy, Inc. (Multi-Utilities) | 35,741 | 2,901,454 | |
DTE Energy Co. (Multi-Utilities) | 8,178 | 879,135 | |
Duke Energy Corp. (Electric Utilities) | 31,302 | 2,500,717 | |
Edison International (Electric Utilities) | 16,051 | 871,730 | |
Entergy Corp. (Electric Utilities) | 8,494 | 796,822 | |
Evergy, Inc. (Electric Utilities) | 9,657 | 572,564 | |
Eversource Energy (Electric Utilities) | 14,311 | 1,191,677 | |
Exelon Corp. (Electric Utilities) | 41,476 | 1,505,164 | |
FirstEnergy Corp. (Electric Utilities) | 23,009 | 892,289 | |
NextEra Energy, Inc. (Electric Utilities) | 20,836 | 5,004,182 | |
NiSource, Inc. (Multi-Utilities) | 16,342 | 371,617 | |
NRG Energy, Inc. (Ind. Power & Renewable Elec.) | 10,418 | 339,210 | |
Pinnacle West Capital Corp. (Electric Utilities) | 4,763 | 349,080 | |
PPL Corp. (Electric Utilities) | 32,629 | 843,133 | |
Public Service Enterprise Group, Inc. (Multi-Utilities) | 21,510 | 1,057,432 | |
Sempra Energy (Multi-Utilities) | 12,453 | 1,459,865 | |
Southern Co. / The (Electric Utilities) | 44,967 | 2,331,539 | |
WEC Energy Group, Inc. (Multi-Utilities) | 13,416 | 1,175,912 | |
Xcel Energy, Inc. (Electric Utilities) | 22,348 | 1,396,750 | |
| 33,458,394 | |||
Total Common Stocks (Cost $869,469,442) | $1,091,053,475 |
| Rights –0.0% | Quantity | Value | |
| Communication Services–0.0% | |||
T-Mobile U.S., Inc. (Wireless Telecom. Svs.) | (a) | 819 | $ 138 |
Total Rights (Cost $303) | $ 138 |
| Ohio National Fund, Inc. | ON S&P 500® Index Portfolio (Continued) |
| Schedule of Investments | June 30, 2020 (Unaudited) |
| Money Market Funds–0.4% | Shares | Value | |
State Street Institutional Liquid Reserves Fund Institutional Class, 0.346% | (b) | 4,253,646 | $ 4,255,347 |
Total Money Market Funds (Cost $4,255,347) | $ 4,255,347 | ||
Total Investments – 100.1% (Cost $873,725,092) | (c) | $1,095,308,960 | |
Liabilities in Excess of Other Assets – (0.1)% | (d) | (1,077,142) | |
| Net Assets – 100.0% | $1,094,231,818 |
Percentages are stated as a percent of net assets. |
| Footnotes: | ||
| (a) | Non-income producing security. | |
| (b) | Rate represents the seven-day yield at June 30, 2020. | |
| (c) | Represents cost for financial reporting purposes, which may differ from cost basis for federal income tax purposes. See also Note 8 of the Notes to Financial Statements. | |
| (d) | Includes $492,000 of cash pledged as collateral for the futures contracts outstanding at June 30, 2020. See also the following Schedule of Open Futures Contracts. | |
| Schedule of Open Futures Contracts | June 30, 2020 (Unaudited) |
| Description | Number of contracts | Expiration Date | Notional Amount | Value | Unrealized Appreciation (Depreciation) | Variation Margin Receivable (Payable) | ||||||
| CME E-mini S&P 500 Index - Long | 41 | September 18, 2020 | $6,223,714 | $6,334,910 | $111,196 | $83,986 |
| Ohio National Fund, Inc. | ON BlackRock Advantage Large Cap Value Portfolio (Unaudited) |
| Average Annual returns | |
| One year | -7.91% |
| Five years | 4.34% |
| Ten years | 9.32% |
| (1) | The Portfolio’s composition is subject to change. Holdings and weightings are as of June 30, 2020. |
| Ohio National Fund, Inc. | ON BlackRock Advantage Large Cap Value Portfolio (Unaudited) (Continued) |
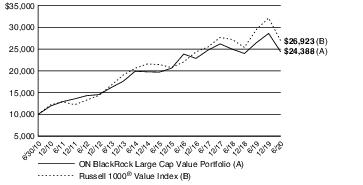
| Portfolio Composition as of June 30, 2020 (1) | |
| % of Net Assets | |
| Common Stocks (4) | 94.5 |
| Money Market Funds and Other Net Assets | 5.5 |
| 100.0 | |
| Top 10 Portfolio Holdings as of June 30, 2020 (1) (2) (3) | ||
| % of Net Assets | ||
| 1. | Berkshire Hathaway, Inc. Class B | 2.9 |
| 2. | Intel Corp. | 2.5 |
| 3. | JPMorgan Chase & Co. | 2.2 |
| 4. | Johnson & Johnson | 2.0 |
| 5. | Home Depot, Inc. / The | 1.7 |
| 6. | AT&T, Inc. | 1.7 |
| 7. | Wells Fargo & Co. | 1.6 |
| 8. | Verizon Communications, Inc. | 1.5 |
| 9. | Procter & Gamble Co. / The | 1.4 |
| 10. | Bank of America Corp. | 1.4 |
| (1) | Composition of Portfolio subject to change. | |
| (2) | Short-term investments have been excluded from the list of Top 10 Portfolio Holdings. | |
| (3) | Top 10 Portfolio Holdings is presented at an individual security level. Total investment exposure by issuer may be higher. | |
| (4) | Sectors (Common Stocks): | |
| % of Net Assets | |
| Financials | 18.4 |
| Health Care | 13.6 |
| Industrials | 10.7 |
| Information Technology | 10.0 |
| Consumer Staples | 7.9 |
| Communication Services | 7.9 |
| Consumer Discretionary | 7.1 |
| Utilities | 6.2 |
| Energy | 4.4 |
| Materials | 4.3 |
| Real Estate | 4.0 |
| 94.5 |
| Ohio National Fund, Inc. | ON BlackRock Advantage Large Cap Value Portfolio |
| Schedule of Investments | June 30, 2020 (Unaudited) |
| Common Stocks–94.5% | Shares | Value | |
| Communication Services–7.9% | |||
Activision Blizzard, Inc. (Entertainment) | 9,348 | $ 709,513 | |
Alphabet, Inc. Class A (Interactive Media & Svs.) | (a) | 752 | 1,066,374 |
Alphabet, Inc. Class C (Interactive Media & Svs.) | (a) | 1,250 | 1,767,012 |
AT&T, Inc. (Diversified Telecom. Svs.) | 157,073 | 4,748,317 | |
Cable One, Inc. (Media) | 22 | 39,047 | |
CenturyLink, Inc. (Diversified Telecom. Svs.) | 34,292 | 343,949 | |
Comcast Corp. Class A (Media) | 64,825 | 2,526,878 | |
Discovery, Inc. Class A (Media) | (a) | 28,222 | 595,484 |
Discovery, Inc. Class C (Media) | (a) | 3,247 | 62,537 |
Electronic Arts, Inc. (Entertainment) | (a) | 276 | 36,446 |
Interpublic Group of Cos., Inc. / The (Media) | 19,189 | 329,283 | |
Nexstar Media Group, Inc. Class A (Media) | 1,348 | 112,814 | |
Sirius XM Holdings, Inc. (Media) | 203,994 | 1,197,445 | |
TEGNA, Inc. (Media) | 4,214 | 46,944 | |
Telephone & Data Systems, Inc. (Wireless Telecom. Svs.) | 4,903 | 97,472 | |
Twitter, Inc. (Interactive Media & Svs.) | (a) | 18,748 | 558,503 |
United States Cellular Corp. (Wireless Telecom. Svs.) | (a) | 6,452 | 199,173 |
Verizon Communications, Inc. (Diversified Telecom. Svs.) | 77,668 | 4,281,837 | |
ViacomCBS, Inc. Class B (Media) | 9,053 | 211,116 | |
Vodafone Group PLC – ADR (Wireless Telecom. Svs.) | 25,235 | 402,246 | |
Walt Disney Co. / The (Entertainment) | 25,597 | 2,854,321 | |
| 22,186,711 | |||
| Consumer Discretionary–7.1% | |||
Amazon.com, Inc. (Internet & Direct Marketing Retail) | (a) | 827 | 2,281,544 |
Aptiv PLC (Auto Components) | 7,651 | 596,166 | |
Best Buy Co., Inc. (Specialty Retail) | 7,478 | 652,605 | |
Boyd Gaming Corp. (Hotels, Restaurants & Leisure) | 4,374 | 91,417 | |
Bright Horizons Family Solutions, Inc. (Diversified Consumer Svs.) | (a) | 565 | 66,218 |
Carnival Corp. (Hotels, Restaurants & Leisure) | 6,524 | 107,124 | |
Chipotle Mexican Grill, Inc. (Hotels, Restaurants & Leisure) | (a) | 261 | 274,666 |
Choice Hotels International, Inc. (Hotels, Restaurants & Leisure) | 2,063 | 162,771 | |
D.R. Horton, Inc. (Household Durables) | 9,939 | 551,118 | |
Darden Restaurants, Inc. (Hotels, Restaurants & Leisure) | 11,660 | 883,478 | |
Domino's Pizza, Inc. (Hotels, Restaurants & Leisure) | 256 | 94,577 | |
Extended Stay America, Inc. (Hotels, Restaurants & Leisure) | 27,327 | 305,789 | |
Ford Motor Co. (Automobiles) | 8,606 | 52,324 | |
General Motors Co. (Automobiles) | 2,666 | 67,450 | |
Goodyear Tire & Rubber Co. / The (Auto Components) | 33,496 | 299,622 | |
Graham Holdings Co. Class B (Diversified Consumer Svs.) | 747 | 255,974 | |
H&R Block, Inc. (Diversified Consumer Svs.) | 42,828 | 611,584 | |
Harley-Davidson, Inc. (Automobiles) | 9,242 | 219,682 | |
Helen of Troy Ltd. (Household Durables) | (a) | 274 | 51,665 |
Hilton Grand Vacations, Inc. (Hotels, Restaurants & Leisure) | (a) | 4,800 | 93,840 |
Home Depot, Inc. / The (Specialty Retail) | 19,370 | 4,852,379 | |
Las Vegas Sands Corp. (Hotels, Restaurants & Leisure) | 3,196 | 145,546 | |
Leggett & Platt, Inc. (Household Durables) | 1,061 | 37,294 | |
Levi Strauss & Co. Class A (Textiles, Apparel & Luxury Goods) | 2,876 | 38,538 | |
Lowe's Cos., Inc. (Specialty Retail) | 6,009 | 811,936 |
| Common Stocks (Continued) | Shares | Value | |
| Consumer Discretionary (continued) | |||
Marriott Vacations Worldwide Corp. (Hotels, Restaurants & Leisure) | 1,183 | $ 97,254 | |
McDonald's Corp. (Hotels, Restaurants & Leisure) | 10,274 | 1,895,245 | |
MGM Resorts International (Hotels, Restaurants & Leisure) | 10,491 | 176,249 | |
NIKE, Inc. Class B (Textiles, Apparel & Luxury Goods) | 1,004 | 98,442 | |
Norwegian Cruise Line Holdings Ltd. (Hotels, Restaurants & Leisure) | (a) | 4,796 | 78,798 |
Penn National Gaming, Inc. (Hotels, Restaurants & Leisure) | (a) | 4,109 | 125,489 |
Planet Fitness, Inc. Class A (Hotels, Restaurants & Leisure) | (a) | 1,756 | 106,361 |
Ralph Lauren Corp. (Textiles, Apparel & Luxury Goods) | 895 | 64,905 | |
Royal Caribbean Cruises Ltd. (Hotels, Restaurants & Leisure) | 2,360 | 118,708 | |
Service Corp. International (Diversified Consumer Svs.) | 1,614 | 62,768 | |
Target Corp. (Multiline Retail) | 11,763 | 1,410,737 | |
Texas Roadhouse, Inc. (Hotels, Restaurants & Leisure) | 7,888 | 414,672 | |
TJX Cos., Inc. / The (Specialty Retail) | 1,901 | 96,115 | |
V.F. Corp. (Textiles, Apparel & Luxury Goods) | 9,882 | 602,209 | |
Vail Resorts, Inc. (Hotels, Restaurants & Leisure) | 453 | 82,514 | |
Wyndham Destinations, Inc. (Hotels, Restaurants & Leisure) | 7,650 | 215,577 | |
Wyndham Hotels & Resorts, Inc. (Hotels, Restaurants & Leisure) | 5,808 | 247,537 | |
Yum! Brands, Inc. (Hotels, Restaurants & Leisure) | 4,615 | 401,090 | |
| 19,899,977 | |||
| Consumer Staples–7.9% | |||
Altria Group, Inc. (Tobacco) | 3,186 | 125,050 | |
Brown-Forman Corp. Class B (Beverages) | 3,453 | 219,818 | |
Campbell Soup Co. (Food Products) | 2,994 | 148,592 | |
Church & Dwight Co., Inc. (Household Products) | 548 | 42,360 | |
Clorox Co. / The (Household Products) | 5,326 | 1,168,365 | |
Coca-Cola Co. / The (Beverages) | 26,326 | 1,176,246 | |
Coca-Cola European Partners PLC (Beverages) | 9,578 | 361,665 | |
Colgate-Palmolive Co. (Household Products) | 15,099 | 1,106,153 | |
Constellation Brands, Inc. Class A (Beverages) | 1,034 | 180,898 | |
Costco Wholesale Corp. (Food & Staples Retailing) | 6,915 | 2,096,697 | |
General Mills, Inc. (Food Products) | 46,732 | 2,881,028 | |
Hershey Co. / The (Food Products) | 14,478 | 1,876,638 | |
J.M. Smucker Co. / The (Food Products) | 4,454 | 471,278 | |
Keurig Dr Pepper, Inc. (Beverages) | 8,703 | 247,165 | |
Lamb Weston Holdings, Inc. (Food Products) | 3,292 | 210,458 | |
McCormick & Co., Inc. (Food Products) | 3,116 | 559,042 | |
Molson Coors Beverage Co. Class B (Beverages) | 9,684 | 332,742 | |
Mondelez International, Inc. Class A (Food Products) | 18,492 | 945,496 | |
PepsiCo, Inc. (Beverages) | 17,879 | 2,364,676 | |
Performance Food Group Co. (Food & Staples Retailing) | (a) | 1,877 | 54,696 |
Philip Morris International, Inc. (Tobacco) | 693 | 48,552 | |
Procter & Gamble Co. / The (Household Products) | 33,665 | 4,025,324 | |
U.S. Foods Holding Corp. (Food & Staples Retailing) | (a) | 1,891 | 37,290 |
| Ohio National Fund, Inc. | ON BlackRock Advantage Large Cap Value Portfolio (Continued) |
| Schedule of Investments | June 30, 2020 (Unaudited) |
| Common Stocks (Continued) | Shares | Value | |
| Consumer Staples (continued) | |||
Walgreens Boots Alliance, Inc. (Food & Staples Retailing) | 699 | $ 29,631 | |
Walmart, Inc. (Food & Staples Retailing) | 12,933 | 1,549,115 | |
| 22,258,975 | |||
| Energy–4.4% | |||
Baker Hughes Co. (Energy Equip. & Svs.) | 25,291 | 389,229 | |
ChampionX Corp. (Energy Equip. & Svs.) | (a) | 23,467 | 229,038 |
Chevron Corp. (Oil, Gas & Consumable Fuels) | 28,375 | 2,531,901 | |
Concho Resources, Inc. (Oil, Gas & Consumable Fuels) | 2,858 | 147,187 | |
ConocoPhillips (Oil, Gas & Consumable Fuels) | 23,029 | 967,679 | |
Continental Resources, Inc. (Oil, Gas & Consumable Fuels) | 30,895 | 541,589 | |
Devon Energy Corp. (Oil, Gas & Consumable Fuels) | 25,585 | 290,134 | |
EOG Resources, Inc. (Oil, Gas & Consumable Fuels) | 25,120 | 1,272,579 | |
Exxon Mobil Corp. (Oil, Gas & Consumable Fuels) | 39,942 | 1,786,206 | |
Halliburton Co. (Energy Equip. & Svs.) | 5,899 | 76,569 | |
Hess Corp. (Oil, Gas & Consumable Fuels) | 635 | 32,899 | |
Kinder Morgan, Inc. (Oil, Gas & Consumable Fuels) | 2,158 | 32,737 | |
Marathon Oil Corp. (Oil, Gas & Consumable Fuels) | 121,826 | 745,575 | |
Marathon Petroleum Corp. (Oil, Gas & Consumable Fuels) | 3,472 | 129,783 | |
National Oilwell Varco, Inc. (Energy Equip. & Svs.) | 14,169 | 173,570 | |
ONEOK, Inc. (Oil, Gas & Consumable Fuels) | 5,985 | 198,822 | |
PBF Energy, Inc. Class A (Oil, Gas & Consumable Fuels) | 4,862 | 49,787 | |
Phillips 66 (Oil, Gas & Consumable Fuels) | 10,025 | 720,798 | |
Schlumberger Ltd. (Energy Equip. & Svs.) | 31,150 | 572,849 | |
TechnipFMC PLC (Energy Equip. & Svs.) | 26,730 | 182,833 | |
Valero Energy Corp. (Oil, Gas & Consumable Fuels) | 13,462 | 791,835 | |
Williams Cos., Inc. / The (Oil, Gas & Consumable Fuels) | 33,173 | 630,950 | |
| 12,494,549 | |||
| Financials–18.4% | |||
Affiliated Managers Group, Inc. (Capital Markets) | 4,553 | 339,472 | |
Aflac, Inc. (Insurance) | 11,958 | 430,847 | |
Alleghany Corp. (Insurance) | 153 | 74,838 | |
Allstate Corp. / The (Insurance) | 4,372 | 424,040 | |
Ally Financial, Inc. (Consumer Finance) | 44,463 | 881,701 | |
American Express Co. (Consumer Finance) | 7,204 | 685,821 | |
American International Group, Inc. (Insurance) | 6,514 | 203,107 | |
American National Insurance Co. (Insurance) | (a) | 1,915 | 138,014 |
Ameriprise Financial, Inc. (Capital Markets) | 4,587 | 688,233 | |
Arch Capital Group Ltd. (Insurance) | (a) | 6,032 | 172,817 |
Bank of America Corp. (Banks) | 169,161 | 4,017,574 | |
Bank of New York Mellon Corp. / The (Capital Markets) | 23,820 | 920,643 | |
Bank OZK (Banks) | 2,821 | 66,209 | |
Berkshire Hathaway, Inc. Class B (Diversified Financial Svs.) | (a) | 44,921 | 8,018,848 |
Brown & Brown, Inc. (Insurance) | 9,818 | 400,182 | |
CBOE Global Markets, Inc. (Capital Markets) | 2,425 | 226,204 | |
Charles Schwab Corp. / The (Capital Markets) | 29,132 | 982,914 | |
Cincinnati Financial Corp. (Insurance) | 29,978 | 1,919,491 | |
CIT Group, Inc. (Banks) | 1,420 | 29,437 | |
Citigroup, Inc. (Banks) | 24,738 | 1,264,112 | |
Citizens Financial Group, Inc. (Banks) | 26,307 | 663,989 | |
CME Group, Inc. (Capital Markets) | 10,502 | 1,706,995 | |
Comerica, Inc. (Banks) | 4,591 | 174,917 | |
Commerce Bancshares, Inc. (Banks) | 2,189 | 130,180 |
| Common Stocks (Continued) | Shares | Value | |
| Financials (continued) | |||
Cullen / Frost Bankers, Inc. (Banks) | 10,646 | $ 795,363 | |
Discover Financial Services (Consumer Finance) | 3,703 | 185,483 | |
E*TRADE Financial Corp. (Capital Markets) | 4,071 | 202,451 | |
FactSet Research Systems, Inc. (Capital Markets) | 1,395 | 458,216 | |
First American Financial Corp. (Insurance) | 6,933 | 332,923 | |
First Horizon National Corp. (Banks) | 4,076 | 40,597 | |
Franklin Resources, Inc. (Capital Markets) | 12,806 | 268,542 | |
Globe Life, Inc. (Insurance) | 8,087 | 600,298 | |
Hanover Insurance Group, Inc. / The (Insurance) | 791 | 80,152 | |
Hartford Financial Services Group, Inc. / The (Insurance) | 7,155 | 275,825 | |
Intercontinental Exchange, Inc. (Capital Markets) | 7,999 | 732,708 | |
Invesco Ltd. (Capital Markets) | 61,646 | 663,311 | |
JPMorgan Chase & Co. (Banks) | 65,822 | 6,191,217 | |
LendingTree, Inc. (Consumer Finance) | (a) | 230 | 66,592 |
Lincoln National Corp. (Insurance) | 1,771 | 65,155 | |
Marsh & McLennan Cos., Inc. (Insurance) | 7,238 | 777,144 | |
MetLife, Inc. (Insurance) | 11,545 | 421,623 | |
MGIC Investment Corp. (Thrifts & Mortgage Finance) | 15,229 | 124,725 | |
Morgan Stanley (Capital Markets) | 9,694 | 468,220 | |
Northern Trust Corp. (Capital Markets) | 6,199 | 491,829 | |
PacWest Bancorp (Banks) | 6,985 | 137,674 | |
Pinnacle Financial Partners, Inc. (Banks) | 3,077 | 129,203 | |
PNC Financial Services Group, Inc. / The (Banks) | 6,343 | 667,347 | |
Principal Financial Group, Inc. (Insurance) | 2,394 | 99,447 | |
Progressive Corp. / The (Insurance) | 3,469 | 277,902 | |
Prudential Financial, Inc. (Insurance) | 37,524 | 2,285,212 | |
Regions Financial Corp. (Banks) | 85,549 | 951,305 | |
Reinsurance Group of America, Inc. (Insurance) | 4,171 | 327,173 | |
S&P Global, Inc. (Capital Markets) | 2,704 | 890,914 | |
State Street Corp. (Capital Markets) | 8,436 | 536,108 | |
Synchrony Financial (Consumer Finance) | 7,665 | 169,856 | |
Synovus Financial Corp. (Banks) | 1,702 | 34,942 | |
T. Rowe Price Group, Inc. (Capital Markets) | 5,631 | 695,428 | |
TD Ameritrade Holding Corp. (Capital Markets) | 777 | 28,267 | |
Travelers Cos., Inc. / The (Insurance) | 1,853 | 211,335 | |
U.S. Bancorp (Banks) | 22,595 | 831,948 | |
Unum Group (Insurance) | 4,377 | 72,614 | |
W.R. Berkley Corp. (Insurance) | 2,703 | 154,855 | |
Webster Financial Corp. (Banks) | 1,849 | 52,900 | |
Wells Fargo & Co. (Banks) | 171,360 | 4,386,816 | |
Willis Towers Watson PLC (Insurance) | 2,571 | 506,358 | |
Wintrust Financial Corp. (Banks) | 2,713 | 118,341 | |
Zions Bancorp N.A. (Banks) | 13,495 | 458,830 | |
| 51,827,734 | |||
| Health Care–13.6% | |||
Abbott Laboratories (Health Care Equip. & Supplies) | 26,302 | 2,404,792 | |
AbbVie, Inc. (Biotechnology) | 26,444 | 2,596,272 | |
Agilent Technologies, Inc. (Life Sciences Tools & Svs.) | 1,442 | 127,430 | |
Amgen, Inc. (Biotechnology) | 3,775 | 890,371 | |
AMN Healthcare Services, Inc. (Health Care Providers & Svs.) | (a) | 1,109 | 50,171 |
Anthem, Inc. (Health Care Providers & Svs.) | 4,569 | 1,201,556 | |
Biogen, Inc. (Biotechnology) | (a) | 2,037 | 544,999 |
Bluebird Bio, Inc. (Biotechnology) | (a) | 946 | 57,744 |
Bristol-Myers Squibb Co. (Pharmaceuticals) | 19,363 | 1,138,544 | |
Cardinal Health, Inc. (Health Care Providers & Svs.) | 8,896 | 464,282 | |
Cigna Corp. (Health Care Providers & Svs.) | 6,061 | 1,137,347 |
| Ohio National Fund, Inc. | ON BlackRock Advantage Large Cap Value Portfolio (Continued) |
| Schedule of Investments | June 30, 2020 (Unaudited) |
| Common Stocks (Continued) | Shares | Value | |
| Health Care (continued) | |||
Covetrus, Inc. (Health Care Providers & Svs.) | (a) | 1,567 | $ 28,034 |
CVS Health Corp. (Health Care Providers & Svs.) | 44,595 | 2,897,337 | |
Danaher Corp. (Health Care Equip. & Supplies) | 7,662 | 1,354,871 | |
DENTSPLY SIRONA, Inc. (Health Care Equip. & Supplies) | 1,105 | 48,686 | |
Edwards Lifesciences Corp. (Health Care Equip. & Supplies) | (a) | 15,359 | 1,061,460 |
Elanco Animal Health, Inc. (Pharmaceuticals) | (a) | 10,551 | 226,319 |
Envista Holdings Corp. (Health Care Equip. & Supplies) | (a) | 2,401 | 50,637 |
Gilead Sciences, Inc. (Biotechnology) | 44,645 | 3,434,986 | |
HCA Healthcare, Inc. (Health Care Providers & Svs.) | 2,988 | 290,015 | |
Hologic, Inc. (Health Care Equip. & Supplies) | (a) | 6,288 | 358,416 |
Humana, Inc. (Health Care Providers & Svs.) | 505 | 195,814 | |
IDEXX Laboratories, Inc. (Health Care Equip. & Supplies) | (a) | 706 | 233,093 |
Johnson & Johnson (Pharmaceuticals) | 40,176 | 5,649,951 | |
Laboratory Corp. of America Holdings (Health Care Providers & Svs.) | (a) | 1,761 | 292,520 |
McKesson Corp. (Health Care Providers & Svs.) | 6,011 | 922,208 | |
Medtronic PLC (Health Care Equip. & Supplies) | 24,374 | 2,235,096 | |
Merck & Co., Inc. (Pharmaceuticals) | 20,533 | 1,587,817 | |
Mylan N.V. (Pharmaceuticals) | (a) | 13,473 | 216,646 |
Pfizer, Inc. (Pharmaceuticals) | 116,040 | 3,794,508 | |
Quest Diagnostics, Inc. (Health Care Providers & Svs.) | 2,432 | 277,151 | |
Regeneron Pharmaceuticals, Inc. (Biotechnology) | (a) | 679 | 423,458 |
Sage Therapeutics, Inc. (Biotechnology) | (a) | 2,021 | 84,033 |
STERIS PLC (Health Care Equip. & Supplies) | 2,315 | 355,214 | |
Stryker Corp. (Health Care Equip. & Supplies) | 938 | 169,018 | |
Teladoc Health, Inc. (Health Care Technology) | (a) | 1,452 | 277,100 |
UnitedHealth Group, Inc. (Health Care Providers & Svs.) | 2,824 | 832,939 | |
West Pharmaceutical Services, Inc. (Health Care Equip. & Supplies) | 1,082 | 245,798 | |
Zoetis, Inc. (Pharmaceuticals) | 1,335 | 182,948 | |
| 38,339,581 | |||
| Industrials–10.7% | |||
3M Co. (Industrial Conglomerates) | 1,577 | 245,996 | |
Advanced Drainage Systems, Inc. (Building Products) | 2,323 | 114,756 | |
AGCO Corp. (Machinery) | 17,558 | 973,767 | |
Alaska Air Group, Inc. (Airlines) | 3,999 | 145,004 | |
Allegion PLC (Building Products) | 18,249 | 1,865,413 | |
AMERCO (Road & Rail) | 1,058 | 319,717 | |
Axon Enterprise, Inc. (Aerospace & Defense) | (a) | 821 | 80,565 |
Boeing Co. / The (Aerospace & Defense) | 5,078 | 930,797 | |
Carlisle Cos., Inc. (Industrial Conglomerates) | 2,314 | 276,916 | |
Caterpillar, Inc. (Machinery) | 5,245 | 663,492 | |
Cintas Corp. (Commercial Svs. & Supplies) | 1,095 | 291,664 | |
Colfax Corp. (Machinery) | (a) | 2,022 | 56,414 |
CSX Corp. (Road & Rail) | 11,254 | 784,854 | |
Curtiss-Wright Corp. (Aerospace & Defense) | 6,107 | 545,233 | |
Deere & Co. (Machinery) | 7,900 | 1,241,485 | |
Delta Air Lines, Inc. (Airlines) | 21,690 | 608,404 | |
EMCOR Group, Inc. (Construction & Engineering) | 5,053 | 334,205 | |
Fastenal Co. (Trading Companies & Distributors) | 1,097 | 46,995 | |
FedEx Corp. (Air Freight & Logistics) | 3,176 | 445,339 | |
Fortive Corp. (Machinery) | 5,268 | 356,433 | |
GATX Corp. (Trading Companies & Distributors) | 9,059 | 552,418 | |
Generac Holdings, Inc. (Electrical Equip.) | (a) | 1,809 | 220,571 |
| Common Stocks (Continued) | Shares | Value | |
| Industrials (continued) | |||
General Dynamics Corp. (Aerospace & Defense) | 9,137 | $ 1,365,616 | |
General Electric Co. (Industrial Conglomerates) | 110,898 | 757,433 | |
Graco, Inc. (Machinery) | 732 | 35,129 | |
HEICO Corp. (Aerospace & Defense) | 337 | 33,582 | |
Hexcel Corp. (Aerospace & Defense) | 5,178 | 234,149 | |
Honeywell International, Inc. (Industrial Conglomerates) | 15,995 | 2,312,717 | |
Hubbell, Inc. (Electrical Equip.) | 15,670 | 1,964,391 | |
IDEX Corp. (Machinery) | 623 | 98,459 | |
IHS Markit Ltd. (Professional Svs.) | 3,646 | 275,273 | |
Illinois Tool Works, Inc. (Machinery) | 6,199 | 1,083,895 | |
L3Harris Technologies, Inc. (Aerospace & Defense) | 3,549 | 602,159 | |
Landstar System, Inc. (Road & Rail) | 3,993 | 448,454 | |
Lyft, Inc. Class A (Road & Rail) | (a) | 5,755 | 189,973 |
MasTec, Inc. (Construction & Engineering) | (a) | 6,779 | 304,174 |
Mercury Systems, Inc. (Aerospace & Defense) | (a) | 2,080 | 163,613 |
Middleby Corp. / The (Machinery) | (a) | 751 | 59,284 |
Norfolk Southern Corp. (Road & Rail) | 6,340 | 1,113,114 | |
Northrop Grumman Corp. (Aerospace & Defense) | 692 | 212,748 | |
Oshkosh Corp. (Machinery) | 9,742 | 697,722 | |
Otis Worldwide Corp. (Machinery) | 3,453 | 196,338 | |
Owens Corning (Building Products) | 5,233 | 291,792 | |
PACCAR, Inc. (Machinery) | 11,127 | 832,856 | |
Quanta Services, Inc. (Construction & Engineering) | 3,603 | 141,346 | |
Raytheon Technologies Corp. (Aerospace & Defense) | 5,256 | 323,875 | |
Republic Services, Inc. (Commercial Svs. & Supplies) | 718 | 58,912 | |
Robert Half International, Inc. (Professional Svs.) | 849 | 44,853 | |
Roper Technologies, Inc. (Industrial Conglomerates) | 2,070 | 803,698 | |
SiteOne Landscape Supply, Inc. (Trading Companies & Distributors) | (a) | 1,046 | 119,213 |
Snap-on, Inc. (Machinery) | 8,587 | 1,189,385 | |
Southwest Airlines Co. (Airlines) | 12,665 | 432,890 | |
Spirit AeroSystems Holdings, Inc. Class A (Aerospace & Defense) | 6,490 | 155,371 | |
Stanley Black & Decker, Inc. (Machinery) | 1,803 | 251,302 | |
Teledyne Technologies, Inc. (Aerospace & Defense) | (a) | 1,736 | 539,809 |
Toro Co. / The (Machinery) | 2,026 | 134,405 | |
Trane Technologies PLC (Building Products) | 2,752 | 244,873 | |
Trex Co., Inc. (Building Products) | (a) | 557 | 72,449 |
Uber Technologies, Inc. (Road & Rail) | (a) | 4,520 | 140,482 |
Union Pacific Corp. (Road & Rail) | 1,753 | 296,380 | |
United Parcel Service, Inc. Class B (Air Freight & Logistics) | 284 | 31,575 | |
W.W. Grainger, Inc. (Trading Companies & Distributors) | 438 | 137,602 | |
WESCO International, Inc. (Trading Companies & Distributors) | (a) | 2,639 | 92,655 |
Xylem, Inc. (Machinery) | 9,570 | 621,667 | |
| 30,206,051 | |||
| Information Technology–10.0% | |||
Alliance Data Systems Corp. (IT Svs.) | 694 | 31,313 | |
Analog Devices, Inc. (Semiconductors & Equip.) | 3,480 | 426,787 | |
Applied Materials, Inc. (Semiconductors & Equip.) | 28,271 | 1,708,982 | |
Atlassian Corp. PLC Class A (Software) | (a) | 1,475 | 265,898 |
Automatic Data Processing, Inc. (IT Svs.) | 8,432 | 1,255,441 | |
Avnet, Inc. (Electronic Equip., Instr. & Comp.) | 34,679 | 967,024 |
| Ohio National Fund, Inc. | ON BlackRock Advantage Large Cap Value Portfolio (Continued) |
| Schedule of Investments | June 30, 2020 (Unaudited) |
| Common Stocks (Continued) | Shares | Value | |
| Information Technology (continued) | |||
Ciena Corp. (Communications Equip.) | (a) | 2,525 | $ 136,754 |
Cirrus Logic, Inc. (Semiconductors & Equip.) | (a) | 2,336 | 144,318 |
Cisco Systems, Inc. (Communications Equip.) | 82,467 | 3,846,261 | |
Citrix Systems, Inc. (Software) | 3,562 | 526,855 | |
Cloudflare, Inc. Class A (Software) | (a) | 7,595 | 273,040 |
Cognizant Technology Solutions Corp. Class A (IT Svs.) | 4,295 | 244,042 | |
DocuSign, Inc. (Software) | (a) | 1,530 | 263,481 |
DXC Technology Co. (IT Svs.) | 7,823 | 129,080 | |
Fiserv, Inc. (IT Svs.) | (a) | 10,868 | 1,060,934 |
Hewlett Packard Enterprise Co. (Tech. Hardware, Storage & Periph.) | 5,626 | 54,741 | |
HP, Inc. (Tech. Hardware, Storage & Periph.) | 30,923 | 538,988 | |
Intel Corp. (Semiconductors & Equip.) | 116,899 | 6,994,067 | |
Intuit, Inc. (Software) | 311 | 92,115 | |
Lam Research Corp. (Semiconductors & Equip.) | 807 | 261,032 | |
Leidos Holdings, Inc. (IT Svs.) | 607 | 56,858 | |
Marvell Technology Group Ltd. (Semiconductors & Equip.) | 997 | 34,955 | |
Maxim Integrated Products, Inc. (Semiconductors & Equip.) | 1,387 | 84,066 | |
Microsoft Corp. (Software) | 11,229 | 2,285,214 | |
Motorola Solutions, Inc. (Communications Equip.) | 801 | 112,244 | |
National Instruments Corp. (Electronic Equip., Instr. & Comp.) | 6,754 | 261,447 | |
NetApp, Inc. (Tech. Hardware, Storage & Periph.) | 3,652 | 162,039 | |
NVIDIA Corp. (Semiconductors & Equip.) | 3,186 | 1,210,393 | |
Paychex, Inc. (IT Svs.) | 2,065 | 156,424 | |
PayPal Holdings, Inc. (IT Svs.) | (a) | 7,018 | 1,222,746 |
Perspecta, Inc. (IT Svs.) | 1,810 | 42,046 | |
RingCentral, Inc. Class A (Software) | (a) | 966 | 275,320 |
Silicon Laboratories, Inc. (Semiconductors & Equip.) | (a) | 742 | 74,400 |
Skyworks Solutions, Inc. (Semiconductors & Equip.) | 909 | 116,225 | |
Slack Technologies, Inc. Class A (Software) | (a) | 8,451 | 262,742 |
Smartsheet, Inc. Class A (Software) | (a) | 5,051 | 257,197 |
ViaSat, Inc. (Communications Equip.) | (a) | 865 | 33,190 |
Visa, Inc. (IT Svs.) | 7,658 | 1,479,296 | |
VMware, Inc. Class A (Software) | (a) | 856 | 132,560 |
Xerox Holdings Corp. (Tech. Hardware, Storage & Periph.) | 2,945 | 45,029 | |
Xilinx, Inc. (Semiconductors & Equip.) | 410 | 40,340 | |
Zoom Video Communications, Inc. Class A (Software) | (a) | 1,017 | 257,850 |
Zscaler, Inc. (Software) | (a) | 2,565 | 280,868 |
| 28,104,602 | |||
| Materials–4.3% | |||
Air Products & Chemicals, Inc. (Chemicals) | 2,045 | 493,786 | |
Alcoa Corp. (Metals & Mining) | (a) | 53,227 | 598,271 |
AptarGroup, Inc. (Containers & Packaging) | 3,110 | 348,258 | |
Chemours Co. / The (Chemicals) | 3,741 | 57,424 | |
Corteva, Inc. (Chemicals) | 3,849 | 103,115 | |
Domtar Corp. (Paper & Forest Products) | 21,705 | 458,192 | |
Dow, Inc. (Chemicals) | 5,421 | 220,960 | |
DuPont de Nemours, Inc. (Chemicals) | 13,020 | 691,753 | |
Ecolab, Inc. (Chemicals) | 10,433 | 2,075,645 | |
FMC Corp. (Chemicals) | 6,201 | 617,744 | |
Freeport-McMoRan, Inc. (Metals & Mining) | 10,411 | 120,455 | |
International Paper Co. (Containers & Packaging) | 12,605 | 443,822 | |
Linde PLC (Chemicals) | 7,828 | 1,660,397 | |
LyondellBasell Industries N.V. Class A (Chemicals) | 11,284 | 741,584 |
| Common Stocks (Continued) | Shares | Value | |
| Materials (continued) | |||
Martin Marietta Materials, Inc. (Construction Materials) | 144 | $ 29,746 | |
Mosaic Co. / The (Chemicals) | 60,460 | 756,355 | |
Newmont Corp. (Metals & Mining) | 4,932 | 304,502 | |
PPG Industries, Inc. (Chemicals) | 10,452 | 1,108,539 | |
Reliance Steel & Aluminum Co. (Metals & Mining) | 7,899 | 749,852 | |
Sonoco Products Co. (Containers & Packaging) | 821 | 42,930 | |
Southern Copper Corp. (Metals & Mining) | 2,654 | 105,550 | |
Steel Dynamics, Inc. (Metals & Mining) | 5,251 | 136,999 | |
Westrock Co. (Containers & Packaging) | 2,944 | 83,197 | |
| 11,949,076 | |||
| Real Estate–4.0% | |||
Alexandria Real Estate Equities, Inc. (Equity REIT) | 1,089 | 176,690 | |
American Campus Communities, Inc. (Equity REIT) | 3,020 | 105,579 | |
AvalonBay Communities, Inc. (Equity REIT) | 4,917 | 760,365 | |
Boston Properties, Inc. (Equity REIT) | 12,393 | 1,120,079 | |
Camden Property Trust (Equity REIT) | 5,228 | 476,898 | |
CBRE Group, Inc. Class A (Real Estate Mgmt. & Development) | (a) | 2,629 | 118,884 |
Douglas Emmett, Inc. (Equity REIT) | 7,901 | 242,245 | |
Equity Residential (Equity REIT) | 30,472 | 1,792,363 | |
Essex Property Trust, Inc. (Equity REIT) | 807 | 184,940 | |
Federal Realty Investment Trust (Equity REIT) | 2,735 | 233,049 | |
Healthpeak Properties, Inc. (Equity REIT) | 1,648 | 45,419 | |
Host Hotels & Resorts, Inc. (Equity REIT) | 52,707 | 568,709 | |
Kilroy Realty Corp. (Equity REIT) | 1,026 | 60,226 | |
Life Storage, Inc. (Equity REIT) | 704 | 66,845 | |
Macerich Co. / The (Equity REIT) | 9,821 | 88,095 | |
National Retail Properties, Inc. (Equity REIT) | 27,136 | 962,785 | |
Park Hotels & Resorts, Inc. (Equity REIT) | 32,506 | 321,484 | |
Prologis, Inc. (Equity REIT) | 25,233 | 2,354,996 | |
QTS Realty Trust, Inc. Class A (Equity REIT) | 681 | 43,645 | |
Realty Income Corp. (Equity REIT) | 17,876 | 1,063,622 | |
Regency Centers Corp. (Equity REIT) | 2,363 | 108,438 | |
RLJ Lodging Trust (Equity REIT) | 14,201 | 134,058 | |
UDR, Inc. (Equity REIT) | 4,255 | 159,052 | |
Welltower, Inc. (Equity REIT) | 2,832 | 146,556 | |
| 11,335,022 | |||
| Utilities–6.2% | |||
Alliant Energy Corp. (Electric Utilities) | 4,775 | 228,436 | |
Ameren Corp. (Multi-Utilities) | 29,855 | 2,100,598 | |
American Water Works Co., Inc. (Water Utilities) | 5,443 | 700,296 | |
Atmos Energy Corp. (Gas Utilities) | 4,358 | 433,970 | |
Avangrid, Inc. (Electric Utilities) | 4,003 | 168,046 | |
CMS Energy Corp. (Multi-Utilities) | 25,218 | 1,473,236 | |
Consolidated Edison, Inc. (Multi-Utilities) | 8,121 | 584,144 | |
DTE Energy Co. (Multi-Utilities) | 8,181 | 879,457 | |
Duke Energy Corp. (Electric Utilities) | 5,124 | 409,356 | |
Eversource Energy (Electric Utilities) | 17,271 | 1,438,156 | |
Exelon Corp. (Electric Utilities) | 18,206 | 660,696 | |
IDACORP, Inc. (Electric Utilities) | 6,553 | 572,536 | |
NextEra Energy, Inc. (Electric Utilities) | 16,028 | 3,849,445 | |
Pinnacle West Capital Corp. (Electric Utilities) | 22,164 | 1,624,400 | |
Public Service Enterprise Group, Inc. (Multi-Utilities) | 10,147 | 498,826 | |
UGI Corp. (Gas Utilities) | 7,493 | 238,277 | |
Xcel Energy, Inc. (Electric Utilities) | 24,350 | 1,521,875 | |
| 17,381,750 | |||
Total Common Stocks (Cost $289,155,461) | $265,984,028 |
| Ohio National Fund, Inc. | ON BlackRock Advantage Large Cap Value Portfolio (Continued) |
| Schedule of Investments | June 30, 2020 (Unaudited) |
| Money Market Funds–2.7% | Shares | Value | |
State Street Institutional Liquid Reserves Fund Institutional Class, 0.346% | (b) | 7,658,983 | $ 7,662,046 |
Total Money Market Funds (Cost $7,662,193) | $ 7,662,046 | ||
Total Investments – 97.2% (Cost $296,817,654) | (c) | $273,646,074 | |
Other Assets in Excess of Liabilities – 2.8% | (d) | 7,823,765 | |
| Net Assets – 100.0% | $281,469,839 |
Percentages are stated as a percent of net assets. |
| Abbreviations: | ||
| ADR: | American Depositary Receipts | |
| Footnotes: | ||
| (a) | Non-income producing security. | |
| (b) | Rate represents the seven-day yield at June 30, 2020. | |
| (c) | Represents cost for financial reporting purposes, which may differ from cost basis for federal income tax purposes. See also Note 8 of the Notes to Financial Statements. | |
| (d) | Includes $805,200 of cash pledged as collateral for the futures contracts outstanding at June 30, 2020. See also the following Schedule of Open Futures Contracts. | |
| Schedule of Open Futures Contracts | June 30, 2020 (Unaudited) |
| Description | Number of contracts | Expiration Date | Notional Amount | Value | Unrealized Appreciation (Depreciation) | Variation Margin Receivable (Payable) | ||||||
| CME E-mini S&P 500 Index - Long | 61 | September 18, 2020 | $9,227,402 | $9,425,110 | $197,709 | $127,854 |
| Ohio National Fund, Inc. | ON Federated High Income Bond Portfolio (Unaudited) |
| Average Annual returns | |
| One year | 0.48% |
| Five years | 4.47% |
| Ten years | 6.33% |
| (1) | The Portfolio’s composition is subject to change. Holdings and weightings are as of June 30, 2020. |
| Ohio National Fund, Inc. | ON Federated High Income Bond Portfolio (Unaudited) (Continued) |
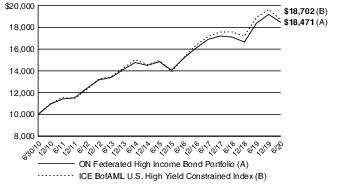
| Portfolio Composition as of June 30, 2020 (1) | |
| % of Net Assets | |
| Corporate Bonds (4) | 95.0 |
| Common Stocks (4) | 0.1 |
| Money Market Funds and Other Net Assets | 4.9 |
| 100.0 | |
| Top 10 Portfolio Holdings as of June 30, 2020 (1) (2) (3) | ||
| % of Net Assets | ||
| 1. | HUB International Ltd. 7.000%, 05/01/2026 | 1.2 |
| 2. | CCO Holdings LLC / CCO Holdings Capital Corp. 4.750%, 03/01/2030 | 1.1 |
| 3. | 1011778 B.C. ULC / New Red Finance, Inc. 5.000%, 10/15/2025 | 0.9 |
| 4. | Allied Universal Holdco LLC / Allied Universal Finance Corp. 9.750%, 07/15/2027 | 0.9 |
| 5. | Tempo Acquisition LLC / Tempo Acquisition Finance Corp. 6.750%, 06/01/2025 | 0.9 |
| 6. | Altice France SA 7.375%, 05/01/2026 | 0.8 |
| 7. | Clarios Global LP / Clarios U.S. Finance Co. 8.500%, 05/15/2027 | 0.8 |
| 8. | Sprint Corp. 7.625%, 02/15/2025 | 0.7 |
| 9. | Standard Industries, Inc. 5.000%, 02/15/2027 | 0.7 |
| 10. | ARD Finance SA 6.500%,7.250% PIK, 06/30/2027 | 0.7 |
| (1) | Composition of Portfolio subject to change. | |
| (2) | Short-term investments have been excluded from the list of Top 10 Portfolio Holdings. | |
| (3) | Top 10 Portfolio Holdings is presented at an individual security level. Total investment exposure by issuer may be higher. | |
| (4) | Sectors (Common Stocks, Corporate Bonds): | |
| % of Net Assets | |
| Communication Services | 17.9 |
| Health Care | 13.5 |
| Energy | 12.8 |
| Consumer Discretionary | 11.0 |
| Industrials | 10.8 |
| Materials | 9.7 |
| Financials | 8.7 |
| Utilities | 4.0 |
| Information Technology | 3.2 |
| Consumer Staples | 3.1 |
| Real Estate | 0.4 |
| 95.1 |
| Ohio National Fund, Inc. | ON Federated High Income Bond Portfolio |
| Schedule of Investments | June 30, 2020 (Unaudited) |
| Corporate Bonds–95.0% | Rate | Maturity | Face Amount | Value | |
| Communication Services–17.9% | |||||
Altice France SA (Diversified Telecom. Svs.) | (a) | 7.375% | 05/01/2026 | $1,275,000 | $ 1,331,023 |
AMC Networks, Inc. (Media) | 5.000% | 04/01/2024 | 600,000 | 594,000 | |
AMC Networks, Inc. (Media) | 4.750% | 08/01/2025 | 225,000 | 221,063 | |
CCO Holdings LLC / CCO Holdings Capital Corp. (Media) | (a) | 5.875% | 05/01/2027 | 900,000 | 939,105 |
CCO Holdings LLC / CCO Holdings Capital Corp. (Media) | (a) | 5.000% | 02/01/2028 | 650,000 | 671,125 |
CCO Holdings LLC / CCO Holdings Capital Corp. (Media) | (a) | 5.375% | 06/01/2029 | 175,000 | 184,625 |
CCO Holdings LLC / CCO Holdings Capital Corp. (Media) | (a) | 4.750% | 03/01/2030 | 1,750,000 | 1,790,582 |
CCO Holdings LLC / CCO Holdings Capital Corp. (Media) | (a) | 4.500% | 08/15/2030 | 250,000 | 255,125 |
CSC Holdings LLC (Media) | (a) | 5.375% | 07/15/2023 | 375,000 | 380,325 |
CSC Holdings LLC (Media) | 5.250% | 06/01/2024 | 375,000 | 398,201 | |
CSC Holdings LLC (Media) | (a) | 7.750% | 07/15/2025 | 525,000 | 545,948 |
CSC Holdings LLC (Media) | (a) | 6.625% | 10/15/2025 | 300,000 | 311,625 |
CSC Holdings LLC (Media) | (a) | 5.500% | 04/15/2027 | 1,100,000 | 1,144,550 |
CSC Holdings LLC (Media) | (a) | 7.500% | 04/01/2028 | 550,000 | 600,188 |
CSC Holdings LLC (Media) | (a) | 5.750% | 01/15/2030 | 200,000 | 208,898 |
CSC Holdings LLC (Media) | (a) | 4.125% | 12/01/2030 | 200,000 | 198,262 |
CSC Holdings LLC (Media) | (a) | 4.625% | 12/01/2030 | 300,000 | 291,408 |
Cumulus Media New Holdings, Inc. (Media) | (a) | 6.750% | 07/01/2026 | 100,000 | 92,375 |
Diamond Sports Group LLC / Diamond Sports Finance Co. (Media) | (a) | 5.375% | 08/15/2026 | 400,000 | 289,936 |
Diamond Sports Group LLC / Diamond Sports Finance Co. (Media) | (a) | 6.625% | 08/15/2027 | 525,000 | 281,400 |
DISH DBS Corp. (Media) | 5.875% | 11/15/2024 | 250,000 | 248,518 | |
DISH DBS Corp. (Media) | 7.750% | 07/01/2026 | 825,000 | 874,591 | |
Dolya Holdco 18 DAC (Media) | (a) | 5.000% | 07/15/2028 | 500,000 | 493,600 |
Entercom Media Corp. (Media) | (a) | 7.250% | 11/01/2024 | 575,000 | 500,250 |
Entercom Media Corp. (Media) | (a) | 6.500% | 05/01/2027 | 400,000 | 359,000 |
Gray Television, Inc. (Media) | (a) | 5.875% | 07/15/2026 | 750,000 | 747,187 |
iHeartCommunications, Inc. (Media) | 6.375% | 05/01/2026 | 41,769 | 41,351 | |
iHeartCommunications, Inc. (Media) | 8.375% | 05/01/2027 | 950,707 | 871,199 | |
iHeartCommunications, Inc. (Media) | (a) | 5.250% | 08/15/2027 | 200,000 | 191,500 |
iHeartCommunications, Inc. (Media) | (a) | 4.750% | 01/15/2028 | 100,000 | 92,250 |
Intelsat Jackson Holdings SA (Acquired 05/15/2018, Cost $259,500) (Diversified Telecom. Svs.) | (b) | 5.500% | 08/01/2023 | 300,000 | 170,910 |
Intelsat Jackson Holdings SA (Acquired 09/06/2018 through 10/02/2018, Cost $326,688) (Diversified Telecom. Svs.) | (a)(b) | 8.500% | 10/15/2024 | 325,000 | 195,406 |
Intelsat Jackson Holdings SA (Acquired 06/19/2017, Cost $350,000) (Diversified Telecom. Svs.) | (a)(b) | 9.750% | 07/15/2025 | 350,000 | 215,005 |
Lamar Media Corp. (Media) | (a) | 4.875% | 01/15/2029 | 125,000 | 125,625 |
Match Group, Inc. (Interactive Media & Svs.) | (a) | 5.000% | 12/15/2027 | 450,000 | 468,248 |
Match Group, Inc. (Interactive Media & Svs.) | (a) | 4.625% | 06/01/2028 | 75,000 | 75,836 |
Match Group, Inc. (Interactive Media & Svs.) | (a) | 4.125% | 08/01/2030 | 425,000 | 416,101 |
Nexstar Broadcasting, Inc. (Media) | (a) | 5.625% | 08/01/2024 | 950,000 | 957,125 |
Nexstar Broadcasting, Inc. (Media) | (a) | 5.625% | 07/15/2027 | 300,000 | 300,018 |
Rackspace Hosting, Inc. (Interactive Media & Svs.) | (a) | 8.625% | 11/15/2024 | 875,000 | 890,750 |
Scripps Escrow, Inc. (Media) | (a) | 5.875% | 07/15/2027 | 400,000 | 379,000 |
Sinclair Television Group, Inc. (Media) | (a) | 5.625% | 08/01/2024 | 525,000 | 504,000 |
Sinclair Television Group, Inc. (Media) | (a) | 5.875% | 03/15/2026 | 400,000 | 394,000 |
Sinclair Television Group, Inc. (Media) | (a) | 5.125% | 02/15/2027 | 75,000 | 68,250 |
Sirius XM Radio, Inc. (Media) | (a) | 3.875% | 08/01/2022 | 125,000 | 125,781 |
Sirius XM Radio, Inc. (Media) | (a) | 4.625% | 05/15/2023 | 425,000 | 427,338 |
Sirius XM Radio, Inc. (Media) | (a) | 5.375% | 04/15/2025 | 75,000 | 77,025 |
Sirius XM Radio, Inc. (Media) | (a) | 5.375% | 07/15/2026 | 725,000 | 748,736 |
Sirius XM Radio, Inc. (Media) | (a) | 5.000% | 08/01/2027 | 75,000 | 76,937 |
Sirius XM Radio, Inc. (Media) | (a) | 4.125% | 07/01/2030 | 475,000 | 468,569 |
Sprint Capital Corp. (Wireless Telecom. Svs.) | 6.875% | 11/15/2028 | 625,000 | 761,687 | |
Sprint Corp. (Wireless Telecom. Svs.) | 7.625% | 02/15/2025 | 1,100,000 | 1,269,125 | |
TEGNA, Inc. (Media) | (a) | 4.625% | 03/15/2028 | 300,000 | 276,000 |
TEGNA, Inc. (Media) | (a) | 5.000% | 09/15/2029 | 625,000 | 588,875 |
Telenet Finance Luxembourg Notes SARL (Media) | (a) | 5.500% | 03/01/2028 | 800,000 | 834,000 |
Terrier Media Buyer, Inc. (Media) | (a) | 8.875% | 12/15/2027 | 875,000 | 838,906 |
T-Mobile U.S.A., Inc. (Wireless Telecom. Svs.) | 6.500% | 01/15/2024 | 325,000 | 332,053 | |
T-Mobile U.S.A., Inc. (Wireless Telecom. Svs.) | 6.375% | 03/01/2025 | 125,000 | 128,438 | |
T-Mobile U.S.A., Inc. (Wireless Telecom. Svs.) | 5.125% | 04/15/2025 | 675,000 | 690,187 | |
T-Mobile U.S.A., Inc. (Wireless Telecom. Svs.) | 6.500% | 01/15/2026 | 325,000 | 339,583 | |
Virgin Media Finance PLC (Media) | (a) | 5.000% | 07/15/2030 | 200,000 | 195,270 |
Virgin Media Secured Finance PLC (Media) | (a) | 4.500% | 08/15/2030 | 200,000 | 200,125 |
WMG Acquisition Corp. (Entertainment) | (a) | 3.875% | 07/15/2030 | 125,000 | 126,256 |
Ziggo B.V. (Diversified Telecom. Svs.) | (a) | 5.500% | 01/15/2027 | 539,000 | 547,780 |
Ziggo Bond Co. B.V. (Diversified Telecom. Svs.) | (a) | 6.000% | 01/15/2027 | 625,000 | 634,375 |
| 29,996,530 | |||||
| Consumer Discretionary–11.0% | |||||
1011778 B.C. ULC / New Red Finance, Inc. (Hotels, Restaurants & Leisure) | (a) | 5.000% | 10/15/2025 | 1,600,000 | 1,592,000 |
Adient Global Holdings Ltd. (Auto Components) | (a) | 4.875% | 08/15/2026 | 675,000 | 556,875 |
| Ohio National Fund, Inc. | ON Federated High Income Bond Portfolio (Continued) |
| Schedule of Investments | June 30, 2020 (Unaudited) |
| Corporate Bonds (Continued) | Rate | Maturity | Face Amount | Value | |
| Consumer Discretionary (continued) | |||||
Adient U.S. LLC (Auto Components) | (a) | 9.000% | 04/15/2025 | $ 25,000 | $ 26,930 |
Adient U.S. LLC (Auto Components) | (a) | 7.000% | 05/15/2026 | 75,000 | 77,625 |
American Axle & Manufacturing, Inc. (Auto Components) | 6.500% | 04/01/2027 | 600,000 | 582,372 | |
Aramark Services, Inc. (Hotels, Restaurants & Leisure) | (a) | 5.000% | 04/01/2025 | 175,000 | 172,375 |
Aramark Services, Inc. (Hotels, Restaurants & Leisure) | (a) | 6.375% | 05/01/2025 | 275,000 | 283,973 |
Aramark Services, Inc. (Hotels, Restaurants & Leisure) | 4.750% | 06/01/2026 | 375,000 | 360,937 | |
Aramark Services, Inc. (Hotels, Restaurants & Leisure) | (a) | 5.000% | 02/01/2028 | 475,000 | 451,250 |
Boyd Gaming Corp. (Hotels, Restaurants & Leisure) | (a) | 8.625% | 06/01/2025 | 50,000 | 52,250 |
Boyd Gaming Corp. (Hotels, Restaurants & Leisure) | 6.375% | 04/01/2026 | 525,000 | 498,750 | |
Boyd Gaming Corp. (Hotels, Restaurants & Leisure) | 6.000% | 08/15/2026 | 175,000 | 162,750 | |
Boyd Gaming Corp. (Hotels, Restaurants & Leisure) | (a) | 4.750% | 12/01/2027 | 75,000 | 64,364 |
Caesars Resort Collection LLC / CRC Finco, Inc. (Hotels, Restaurants & Leisure) | (a) | 5.250% | 10/15/2025 | 175,000 | 152,250 |
Clarios Global LP / Clarios U.S. Finance Co. (Auto Components) | (a) | 6.250% | 05/15/2026 | 125,000 | 128,906 |
Clarios Global LP / Clarios U.S. Finance Co. (Auto Components) | (a) | 8.500% | 05/15/2027 | 1,300,000 | 1,306,435 |
Colt Merger Sub, Inc. (Hotels, Restaurants & Leisure) | (a) | 5.750% | 07/01/2025 | 50,000 | 50,250 |
Colt Merger Sub, Inc. (Hotels, Restaurants & Leisure) | (a) | 6.250% | 07/01/2025 | 325,000 | 322,465 |
Colt Merger Sub, Inc. (Hotels, Restaurants & Leisure) | (a) | 8.125% | 07/01/2027 | 350,000 | 340,375 |
Dana Financing Luxembourg SARL (Auto Components) | (a) | 6.500% | 06/01/2026 | 725,000 | 750,375 |
Dana, Inc. (Auto Components) | 5.375% | 11/15/2027 | 100,000 | 99,250 | |
Eldorado Resorts, Inc. (Hotels, Restaurants & Leisure) | 6.000% | 04/01/2025 | 500,000 | 520,520 | |
Eldorado Resorts, Inc. (Hotels, Restaurants & Leisure) | 6.000% | 09/15/2026 | 200,000 | 216,064 | |
Gates Global LLC / Gates Corp. (Auto Components) | (a) | 6.250% | 01/15/2026 | 825,000 | 817,088 |
Goodyear Tire & Rubber Co. / The (Auto Components) | 5.000% | 05/31/2026 | 175,000 | 163,013 | |
Goodyear Tire & Rubber Co. / The (Auto Components) | 4.875% | 03/15/2027 | 200,000 | 183,200 | |
Hilton Domestic Operating Co., Inc. (Hotels, Restaurants & Leisure) | (a) | 5.375% | 05/01/2025 | 25,000 | 24,906 |
Hilton Domestic Operating Co., Inc. (Hotels, Restaurants & Leisure) | 5.125% | 05/01/2026 | 525,000 | 522,706 | |
Hilton Domestic Operating Co., Inc. (Hotels, Restaurants & Leisure) | (a) | 5.750% | 05/01/2028 | 25,000 | 25,250 |
Hilton Domestic Operating Co., Inc. (Hotels, Restaurants & Leisure) | 4.875% | 01/15/2030 | 150,000 | 147,750 | |
IHO Verwaltungs GmbH (Auto Components) | (a)(c) | 4.750%, 5.500% PIK | 09/15/2026 | 550,000 | 539,000 |
IHO Verwaltungs GmbH (Auto Components) | (a)(c) | 6.000%, 6.750% PIK | 05/15/2027 | 400,000 | 406,500 |
J.B. Poindexter & Co., Inc. (Auto Components) | (a) | 7.125% | 04/15/2026 | 475,000 | 479,750 |
KFC Holding Co. / Pizza Hut Holdings LLC / Taco Bell of America LLC (Hotels, Restaurants & Leisure) | (a) | 5.250% | 06/01/2026 | 300,000 | 307,500 |
KFC Holding Co. / Pizza Hut Holdings LLC / Taco Bell of America LLC (Hotels, Restaurants & Leisure) | (a) | 4.750% | 06/01/2027 | 525,000 | 538,125 |
MGM Growth Properties Operating Partnership LP / MGP Finance Co-Issuer, Inc. (Hotels, Restaurants & Leisure) | (a) | 4.625% | 06/15/2025 | 100,000 | 98,008 |
MGM Resorts International (Hotels, Restaurants & Leisure) | 6.750% | 05/01/2025 | 400,000 | 396,032 | |
MGM Resorts International (Hotels, Restaurants & Leisure) | 4.625% | 09/01/2026 | 823,000 | 748,930 | |
Michaels Stores, Inc. (Specialty Retail) | (a) | 8.000% | 07/15/2027 | 400,000 | 347,648 |
Mohegan Gaming & Entertainment (Hotels, Restaurants & Leisure) | (a) | 7.875% | 10/15/2024 | 600,000 | 498,000 |
Newell Brands, Inc. (Household Durables) | 4.875% | 06/01/2025 | 100,000 | 104,728 | |
Party City Holdings, Inc. (Specialty Retail) | (a) | 6.125% | 08/15/2023 | 625,000 | 134,375 |
Party City Holdings, Inc. (Specialty Retail) | (a) | 6.625% | 08/01/2026 | 600,000 | 129,000 |
Six Flags Entertainment Corp. (Hotels, Restaurants & Leisure) | (a) | 5.500% | 04/15/2027 | 750,000 | 670,312 |
Six Flags Theme Parks, Inc. (Hotels, Restaurants & Leisure) | (a) | 7.000% | 07/01/2025 | 50,000 | 51,688 |
Stars Group Holdings B.V. / Stars Group U.S. Co-Borrower LLC (Hotels, Restaurants & Leisure) | (a) | 7.000% | 07/15/2026 | 925,000 | 975,061 |
Station Casinos LLC (Hotels, Restaurants & Leisure) | (a) | 5.000% | 10/01/2025 | 775,000 | 682,000 |
Station Casinos LLC (Hotels, Restaurants & Leisure) | (a) | 4.500% | 02/15/2028 | 75,000 | 63,000 |
VOC Escrow Ltd. (Hotels, Restaurants & Leisure) | (a) | 5.000% | 02/15/2028 | 325,000 | 241,312 |
William Carter Co. / The (Textiles, Apparel & Luxury Goods) | (a) | 5.500% | 05/15/2025 | 75,000 | 77,344 |
William Carter Co. / The (Textiles, Apparel & Luxury Goods) | (a) | 5.625% | 03/15/2027 | 75,000 | 77,250 |
Wyndham Hotels & Resorts, Inc. (Hotels, Restaurants & Leisure) | (a) | 5.375% | 04/15/2026 | 200,000 | 192,500 |
Yum! Brands, Inc. (Hotels, Restaurants & Leisure) | (a) | 7.750% | 04/01/2025 | 50,000 | 53,938 |
Yum! Brands, Inc. (Hotels, Restaurants & Leisure) | (a) | 4.750% | 01/15/2030 | 75,000 | 76,125 |
| 18,541,380 | |||||
| Consumer Staples–3.1% | |||||
Albertsons Cos., Inc. / Safeway, Inc. / New Albertsons LP / Albertsons LLC (Food & Staples Retailing) | 6.625% | 06/15/2024 | 750,000 | 768,750 | |
Albertsons Cos., Inc. / Safeway, Inc. / New Albertsons LP / Albertsons LLC (Food & Staples Retailing) | 5.750% | 03/15/2025 | 725,000 | 740,863 | |
Albertsons Cos., Inc. / Safeway, Inc. / New Albertsons LP / Albertsons LLC (Food & Staples Retailing) | (a) | 5.875% | 02/15/2028 | 100,000 | 103,177 |
Edgewell Personal Care Co. (Personal Products) | (a) | 5.500% | 06/01/2028 | 200,000 | 205,750 |
Energizer Holdings, Inc. (Household Products) | (a) | 5.500% | 06/15/2025 | 125,000 | 127,026 |
Energizer Holdings, Inc. (Household Products) | (a) | 6.375% | 07/15/2026 | 175,000 | 180,943 |
Energizer Holdings, Inc. (Household Products) | (a) | 7.750% | 01/15/2027 | 150,000 | 159,940 |
Energizer Holdings, Inc. (Household Products) | (a) | 4.750% | 06/15/2028 | 150,000 | 147,146 |
Kraft Heinz Foods Co. (Food Products) | 4.375% | 06/01/2046 | 425,000 | 417,662 | |
Lamb Weston Holdings, Inc. (Food Products) | (a) | 4.875% | 05/15/2028 | 100,000 | 105,951 |
| Ohio National Fund, Inc. | ON Federated High Income Bond Portfolio (Continued) |
| Schedule of Investments | June 30, 2020 (Unaudited) |
| Corporate Bonds (Continued) | Rate | Maturity | Face Amount | Value | |
| Consumer Staples (continued) | |||||
Post Holdings, Inc. (Food Products) | (a) | 5.000% | 08/15/2026 | $ 975,000 | $ 978,656 |
Post Holdings, Inc. (Food Products) | (a) | 5.750% | 03/01/2027 | 550,000 | 569,250 |
U.S. Foods, Inc. (Food & Staples Retailing) | (a) | 5.875% | 06/15/2024 | 725,000 | 688,750 |
| 5,193,864 | |||||
| Energy–12.8% | |||||
Antero Midstream Partners LP / Antero Midstream Finance Corp. (Oil, Gas & Consumable Fuels) | 5.375% | 09/15/2024 | 575,000 | 489,894 | |
Antero Midstream Partners LP / Antero Midstream Finance Corp. (Oil, Gas & Consumable Fuels) | (a) | 5.750% | 03/01/2027 | 225,000 | 177,750 |
Antero Midstream Partners LP / Antero Midstream Finance Corp. (Oil, Gas & Consumable Fuels) | (a) | 5.750% | 01/15/2028 | 625,000 | 493,750 |
Antero Resources Corp. (Oil, Gas & Consumable Fuels) | 5.625% | 06/01/2023 | 400,000 | 256,000 | |
Archrock Partners LP / Archrock Partners Finance Corp. (Oil, Gas & Consumable Fuels) | (a) | 6.875% | 04/01/2027 | 625,000 | 588,750 |
Archrock Partners LP / Archrock Partners Finance Corp. (Oil, Gas & Consumable Fuels) | (a) | 6.250% | 04/01/2028 | 125,000 | 114,413 |
Ascent Resources Utica Holdings LLC / ARU Finance Corp. (Oil, Gas & Consumable Fuels) | (a) | 10.000% | 04/01/2022 | 200,000 | 170,500 |
Ascent Resources Utica Holdings LLC / ARU Finance Corp. (Oil, Gas & Consumable Fuels) | (a) | 7.000% | 11/01/2026 | 225,000 | 144,000 |
Berry Petroleum Co. LLC (Oil, Gas & Consumable Fuels) | (a) | 7.000% | 02/15/2026 | 325,000 | 263,250 |
Buckeye Partners LP (Oil, Gas & Consumable Fuels) | (a) | 4.125% | 03/01/2025 | 175,000 | 167,872 |
Buckeye Partners LP (Oil, Gas & Consumable Fuels) | (a) | 4.500% | 03/01/2028 | 400,000 | 376,000 |
Callon Petroleum Co. (Oil, Gas & Consumable Fuels) | 6.125% | 10/01/2024 | 425,000 | 144,500 | |
Callon Petroleum Co. (Oil, Gas & Consumable Fuels) | 8.250% | 07/15/2025 | 450,000 | 157,500 | |
Callon Petroleum Co. (Oil, Gas & Consumable Fuels) | 6.375% | 07/01/2026 | 225,000 | 74,250 | |
Centennial Resource Production LLC (Oil, Gas & Consumable Fuels) | (a) | 6.875% | 04/01/2027 | 350,000 | 185,500 |
Cheniere Energy Partners LP (Oil, Gas & Consumable Fuels) | 5.250% | 10/01/2025 | 900,000 | 897,030 | |
Cheniere Energy, Inc. (Oil, Gas & Consumable Fuels) | 4.500% | 10/01/2029 | 125,000 | 121,875 | |
Chesapeake Energy Corp. (Acquired 12/06/2016 through 09/17/2018, Cost $1,076,753) (Oil, Gas & Consumable Fuels) | (a)(b) | 11.500% | 01/01/2025 | 752,000 | 78,960 |
CNX Midstream Partners LP / CNX Midstream Finance Corp. (Oil, Gas & Consumable Fuels) | (a) | 6.500% | 03/15/2026 | 725,000 | 667,000 |
Continental Resources, Inc. (Oil, Gas & Consumable Fuels) | 4.375% | 01/15/2028 | 225,000 | 198,049 | |
CrownRock LP / CrownRock Finance, Inc. (Oil, Gas & Consumable Fuels) | (a) | 5.625% | 10/15/2025 | 600,000 | 537,750 |
Endeavor Energy Resources LP / EER Finance, Inc. (Oil, Gas & Consumable Fuels) | (a) | 6.625% | 07/15/2025 | 200,000 | 201,564 |
Endeavor Energy Resources LP / EER Finance, Inc. (Oil, Gas & Consumable Fuels) | (a) | 5.750% | 01/30/2028 | 150,000 | 144,000 |
Enviva Partners LP / Enviva Partners Finance Corp. (Oil, Gas & Consumable Fuels) | (a) | 6.500% | 01/15/2026 | 900,000 | 936,000 |
EP Energy LLC / Everest Acquisition Finance, Inc. (Acquired 11/17/2016 through 07/27/2018, Cost $548,719) (Oil, Gas & Consumable Fuels) | (a)(b) | 8.000% | 11/29/2024 | 550,000 | 11,000 |
EQM Midstream Partners LP (Oil, Gas & Consumable Fuels) | 4.750% | 07/15/2023 | 175,000 | 176,531 | |
EQM Midstream Partners LP (Oil, Gas & Consumable Fuels) | (a) | 6.000% | 07/01/2025 | 225,000 | 227,250 |
EQM Midstream Partners LP (Oil, Gas & Consumable Fuels) | (a) | 6.500% | 07/01/2027 | 325,000 | 332,907 |
EQM Midstream Partners LP (Oil, Gas & Consumable Fuels) | 5.500% | 07/15/2028 | 300,000 | 285,750 | |
EQT Corp. (Oil, Gas & Consumable Fuels) | 4.875% | 11/15/2021 | 100,000 | 97,970 | |
EQT Corp. (Oil, Gas & Consumable Fuels) | 6.125% | 02/01/2025 | 400,000 | 398,608 | |
EQT Corp. (Oil, Gas & Consumable Fuels) | 7.000% | 02/01/2030 | 50,000 | 51,502 | |
Gulfport Energy Corp. (Oil, Gas & Consumable Fuels) | 6.000% | 10/15/2024 | 75,000 | 38,250 | |
Gulfport Energy Corp. (Oil, Gas & Consumable Fuels) | 6.375% | 05/15/2025 | 275,000 | 137,171 | |
Gulfport Energy Corp. (Oil, Gas & Consumable Fuels) | 6.375% | 01/15/2026 | 125,000 | 60,156 | |
Hess Midstream Operations LP (Oil, Gas & Consumable Fuels) | (a) | 5.125% | 06/15/2028 | 300,000 | 288,726 |
Holly Energy Partners LP / Holly Energy Finance Corp. (Oil, Gas & Consumable Fuels) | (a) | 5.000% | 02/01/2028 | 225,000 | 214,312 |
Jagged Peak Energy LLC (Oil, Gas & Consumable Fuels) | 5.875% | 05/01/2026 | 300,000 | 291,000 | |
Nabors Industries Ltd. (Energy Equip. & Svs.) | (a) | 7.250% | 01/15/2026 | 75,000 | 46,125 |
Nabors Industries Ltd. (Energy Equip. & Svs.) | (a) | 7.500% | 01/15/2028 | 75,000 | 46,125 |
NuStar Logistics LP (Oil, Gas & Consumable Fuels) | 5.625% | 04/28/2027 | 875,000 | 845,731 | |
Oasis Petroleum, Inc. (Oil, Gas & Consumable Fuels) | 6.875% | 03/15/2022 | 625,000 | 103,125 | |
Oasis Petroleum, Inc. (Oil, Gas & Consumable Fuels) | (a) | 6.250% | 05/01/2026 | 75,000 | 12,375 |
Occidental Petroleum Corp. (Oil, Gas & Consumable Fuels) | 2.900% | 08/15/2024 | 300,000 | 256,500 | |
Occidental Petroleum Corp. (Oil, Gas & Consumable Fuels) | 3.500% | 06/15/2025 | 275,000 | 232,375 | |
Occidental Petroleum Corp. (Oil, Gas & Consumable Fuels) | 8.000% | 07/15/2025 | 175,000 | 175,656 | |
Occidental Petroleum Corp. (Oil, Gas & Consumable Fuels) | 8.875% | 07/15/2030 | 425,000 | 424,469 | |
Occidental Petroleum Corp. (Oil, Gas & Consumable Fuels) | 6.450% | 09/15/2036 | 325,000 | 278,171 | |
Occidental Petroleum Corp. (Oil, Gas & Consumable Fuels) | 4.300% | 08/15/2039 | 125,000 | 86,214 | |
Occidental Petroleum Corp. (Oil, Gas & Consumable Fuels) | 4.100% | 02/15/2047 | 150,000 | 101,063 | |
Occidental Petroleum Corp. (Oil, Gas & Consumable Fuels) | 4.400% | 08/15/2049 | 150,000 | 104,282 | |
Parsley Energy LLC / Parsley Finance Corp. (Oil, Gas & Consumable Fuels) | (a) | 5.250% | 08/15/2025 | 75,000 | 72,026 |
Parsley Energy LLC / Parsley Finance Corp. (Oil, Gas & Consumable Fuels) | (a) | 5.625% | 10/15/2027 | 100,000 | 98,500 |
PDC Energy, Inc. (Oil, Gas & Consumable Fuels) | 6.125% | 09/15/2024 | 200,000 | 186,000 | |
PDC Energy, Inc. (Oil, Gas & Consumable Fuels) | 5.750% | 05/15/2026 | 200,000 | 182,000 | |
Precision Drilling Corp. (Energy Equip. & Svs.) | 7.750% | 12/15/2023 | 350,000 | 239,750 | |
Precision Drilling Corp. (Energy Equip. & Svs.) | (a) | 7.125% | 01/15/2026 | 100,000 | 61,000 |
QEP Resources, Inc. (Oil, Gas & Consumable Fuels) | 5.250% | 05/01/2023 | 75,000 | 49,500 | |
QEP Resources, Inc. (Oil, Gas & Consumable Fuels) | 5.625% | 03/01/2026 | 400,000 | 254,000 | |
Range Resources Corp. (Oil, Gas & Consumable Fuels) | 4.875% | 05/15/2025 | 500,000 | 375,175 |
| Ohio National Fund, Inc. | ON Federated High Income Bond Portfolio (Continued) |
| Schedule of Investments | June 30, 2020 (Unaudited) |
| Corporate Bonds (Continued) | Rate | Maturity | Face Amount | Value | |
| Energy (continued) | |||||
SESI LLC (Energy Equip. & Svs.) | 7.125% | 12/15/2021 | $ 100,000 | $ 34,500 | |
SESI LLC (Energy Equip. & Svs.) | 7.750% | 09/15/2024 | 825,000 | 301,125 | |
Shelf Drilling Holdings Ltd. (Oil, Gas & Consumable Fuels) | (a) | 8.250% | 02/15/2025 | 500,000 | 225,000 |
SM Energy Co. (Oil, Gas & Consumable Fuels) | 5.000% | 01/15/2024 | 175,000 | 94,500 | |
SM Energy Co. (Oil, Gas & Consumable Fuels) | 5.625% | 06/01/2025 | 100,000 | 53,000 | |
SM Energy Co. (Oil, Gas & Consumable Fuels) | 6.750% | 09/15/2026 | 350,000 | 176,008 | |
SM Energy Co. (Oil, Gas & Consumable Fuels) | 6.625% | 01/15/2027 | 25,000 | 12,250 | |
Summit Midstream Holdings LLC / Summit Midstream Finance Corp. (Oil, Gas & Consumable Fuels) | 5.500% | 08/15/2022 | 825,000 | 544,500 | |
Summit Midstream Holdings LLC / Summit Midstream Finance Corp. (Oil, Gas & Consumable Fuels) | 5.750% | 04/15/2025 | 250,000 | 140,000 | |
Sunoco LP / Sunoco Finance Corp. (Oil, Gas & Consumable Fuels) | 5.500% | 02/15/2026 | 75,000 | 72,750 | |
Sunoco LP / Sunoco Finance Corp. (Oil, Gas & Consumable Fuels) | 5.875% | 03/15/2028 | 350,000 | 347,431 | |
Targa Resources Partners LP / Targa Resources Partners Finance Corp. (Oil, Gas & Consumable Fuels) | 5.250% | 05/01/2023 | 150,000 | 147,719 | |
Targa Resources Partners LP / Targa Resources Partners Finance Corp. (Oil, Gas & Consumable Fuels) | 5.875% | 04/15/2026 | 150,000 | 148,500 | |
Targa Resources Partners LP / Targa Resources Partners Finance Corp. (Oil, Gas & Consumable Fuels) | 5.375% | 02/01/2027 | 700,000 | 675,500 | |
Targa Resources Partners LP / Targa Resources Partners Finance Corp. (Oil, Gas & Consumable Fuels) | 6.500% | 07/15/2027 | 25,000 | 25,063 | |
Targa Resources Partners LP / Targa Resources Partners Finance Corp. (Oil, Gas & Consumable Fuels) | 5.000% | 01/15/2028 | 525,000 | 493,699 | |
Targa Resources Partners LP / Targa Resources Partners Finance Corp. (Oil, Gas & Consumable Fuels) | (a) | 5.500% | 03/01/2030 | 475,000 | 458,669 |
Tervita Corp. (Energy Equip. & Svs.) | (a) | 7.625% | 12/01/2021 | 450,000 | 353,250 |
TransMontaigne Partners LP / TLP Finance Corp. (Oil, Gas & Consumable Fuels) | 6.125% | 02/15/2026 | 225,000 | 217,125 | |
U.S.A. Compression Partners LP / U.S.A. Compression Finance Corp. (Energy Equip. & Svs.) | 6.875% | 09/01/2027 | 100,000 | 94,980 | |
U.S.A. Compression Partners LP / U.S.A. Compression Finance Corp. (Energy Equip. & Svs.) | 6.875% | 04/01/2026 | 775,000 | 748,844 | |
Ultra Resources, Inc. (Acquired 05/02/2017 through 07/18/2017, Cost $200,000) (Oil, Gas & Consumable Fuels) | (a)(b) | 7.125% | 04/15/2025 | 200,000 | 500 |
Western Midstream Operating LP (Oil, Gas & Consumable Fuels) | 4.000% | 07/01/2022 | 100,000 | 99,680 | |
Western Midstream Operating LP (Oil, Gas & Consumable Fuels) | 4.650% | 07/01/2026 | 50,000 | 47,890 | |
Western Midstream Operating LP (Oil, Gas & Consumable Fuels) | 4.500% | 03/01/2028 | 175,000 | 164,500 | |
Western Midstream Operating LP (Oil, Gas & Consumable Fuels) | 4.050% | 02/01/2030 | 150,000 | 144,366 | |
Western Midstream Operating LP (Oil, Gas & Consumable Fuels) | 5.450% | 04/01/2044 | 75,000 | 62,460 | |
Western Midstream Operating LP (Oil, Gas & Consumable Fuels) | 5.300% | 03/01/2048 | 750,000 | 608,437 | |
Western Midstream Operating LP (Oil, Gas & Consumable Fuels) | 5.500% | 08/15/2048 | 100,000 | 81,000 | |
Whiting Petroleum Corp. (Acquired 06/10/2016 through 01/12/2017, Cost $410,406) (Oil, Gas & Consumable Fuels) | (b) | 6.250% | 04/01/2023 | 425,000 | 73,844 |
Whiting Petroleum Corp. (Acquired 12/12/2017 through 10/16/2018, Cost $326,875) (Oil, Gas & Consumable Fuels) | (b) | 6.625% | 01/15/2026 | 325,000 | 57,688 |
WPX Energy, Inc. (Oil, Gas & Consumable Fuels) | 5.750% | 06/01/2026 | 75,000 | 72,750 | |
WPX Energy, Inc. (Oil, Gas & Consumable Fuels) | 5.250% | 10/15/2027 | 200,000 | 186,837 | |
WPX Energy, Inc. (Oil, Gas & Consumable Fuels) | 5.875% | 06/15/2028 | 25,000 | 23,938 | |
WPX Energy, Inc. (Oil, Gas & Consumable Fuels) | 4.500% | 01/15/2030 | 125,000 | 110,451 | |
| 21,526,206 | |||||
| Financials–8.7% | |||||
Alliant Holdings Intermediate LLC / Alliant Holdings Co-Issuer (Insurance) | (a) | 6.750% | 10/15/2027 | 625,000 | 622,887 |
AmWINS Group, Inc. (Insurance) | (a) | 7.750% | 07/01/2026 | 900,000 | 945,000 |
Ardonagh Midco 2 PLC (Insurance) | (a) | 11.500%, 12.750% PIK | 01/15/2027 | 300,000 | 301,500 |
Ardonagh Midco 3 PLC (Insurance) | (a) | 8.625% | 07/15/2023 | 225,000 | 235,013 |
AssuredPartners, Inc. (Insurance) | (a) | 7.000% | 08/15/2025 | 675,000 | 675,000 |
Atotech Alpha 2 B.V. (Diversified Financial Svs.) | (a)(c) | 8.750%, 9.500% PIK | 06/01/2023 | 250,000 | 249,375 |
Atotech Alpha 3 B.V. / Alpha U.S. Bidco, Inc. (Diversified Financial Svs.) | (a) | 6.250% | 02/01/2025 | 575,000 | 566,375 |
Ford Motor Credit Co. LLC (Consumer Finance) | 3.336% | 03/18/2021 | 325,000 | 321,656 | |
Ford Motor Credit Co. LLC (Consumer Finance) | 3.813% | 10/12/2021 | 300,000 | 295,890 | |
Ford Motor Credit Co. LLC (Consumer Finance) | 3.096% | 05/04/2023 | 400,000 | 379,080 | |
Ford Motor Credit Co. LLC (Consumer Finance) | 4.063% | 11/01/2024 | 375,000 | 357,581 | |
Ford Motor Credit Co. LLC (Consumer Finance) | 5.125% | 06/16/2025 | 200,000 | 200,456 | |
Ford Motor Credit Co. LLC (Consumer Finance) | 4.389% | 01/08/2026 | 225,000 | 213,328 | |
Ford Motor Credit Co. LLC (Consumer Finance) | 4.271% | 01/09/2027 | 450,000 | 420,750 | |
Ford Motor Credit Co. LLC (Consumer Finance) | 5.113% | 05/03/2029 | 300,000 | 292,614 | |
GTCR AP Finance, Inc. (Insurance) | (a) | 8.000% | 05/15/2027 | 275,000 | 283,077 |
HUB International Ltd. (Insurance) | (a) | 7.000% | 05/01/2026 | 2,075,000 | 2,075,000 |
Navient Corp. (Consumer Finance) | 6.125% | 03/25/2024 | 175,000 | 166,250 | |
Navient Corp. (Consumer Finance) | 5.875% | 10/25/2024 | 775,000 | 728,019 | |
Navient Corp. (Consumer Finance) | 6.750% | 06/25/2025 | 175,000 | 167,344 | |
Navient Corp. (Consumer Finance) | 6.750% | 06/15/2026 | 125,000 | 116,250 | |
Navient Corp. (Consumer Finance) | 5.000% | 03/15/2027 | 50,000 | 42,000 |
| Ohio National Fund, Inc. | ON Federated High Income Bond Portfolio (Continued) |
| Schedule of Investments | June 30, 2020 (Unaudited) |
| Corporate Bonds (Continued) | Rate | Maturity | Face Amount | Value | |
| Financials (continued) | |||||
NFP Corp. (Insurance) | (a) | 7.000% | 05/15/2025 | $ 50,000 | $ 52,500 |
NFP Corp. (Insurance) | (a) | 6.875% | 07/15/2025 | 1,025,000 | 983,600 |
NFP Corp. (Insurance) | (a) | 8.000% | 07/15/2025 | 100,000 | 97,750 |
Quicken Loans LLC (Thrifts & Mortgage Finance) | (a) | 5.750% | 05/01/2025 | 1,075,000 | 1,098,962 |
Quicken Loans LLC (Thrifts & Mortgage Finance) | (a) | 5.250% | 01/15/2028 | 375,000 | 390,000 |
Refinitiv U.S. Holdings, Inc. (Capital Markets) | (a) | 6.250% | 05/15/2026 | 200,000 | 212,000 |
Refinitiv U.S. Holdings, Inc. (Capital Markets) | (a) | 8.250% | 11/15/2026 | 975,000 | 1,055,896 |
USI, Inc. (Insurance) | (a) | 6.875% | 05/01/2025 | 1,050,000 | 1,059,187 |
| 14,604,340 | |||||
| Health Care–13.5% | |||||
Acadia Healthcare Co., Inc. (Health Care Providers & Svs.) | 5.625% | 02/15/2023 | 750,000 | 750,262 | |
Acadia Healthcare Co., Inc. (Health Care Providers & Svs.) | 6.500% | 03/01/2024 | 400,000 | 407,072 | |
Acadia Healthcare Co., Inc. (Health Care Providers & Svs.) | (a) | 5.500% | 07/01/2028 | 25,000 | 25,063 |
Air Medical Group Holdings, Inc. (Health Care Providers & Svs.) | (a) | 6.375% | 05/15/2023 | 725,000 | 667,000 |
Avantor, Inc. (Health Care Equip. & Supplies) | (a) | 6.000% | 10/01/2024 | 125,000 | 130,625 |
Avantor, Inc. (Health Care Equip. & Supplies) | (a) | 9.000% | 10/01/2025 | 975,000 | 1,050,562 |
Bausch Health Americas, Inc. (Pharmaceuticals) | (a) | 8.500% | 01/31/2027 | 525,000 | 557,156 |
Bausch Health Cos., Inc. (Pharmaceuticals) | (a) | 5.500% | 03/01/2023 | 53,000 | 52,680 |
Bausch Health Cos., Inc. (Pharmaceuticals) | (a) | 5.875% | 05/15/2023 | 39,000 | 38,903 |
Bausch Health Cos., Inc. (Pharmaceuticals) | (a) | 7.000% | 03/15/2024 | 225,000 | 233,438 |
Bausch Health Cos., Inc. (Pharmaceuticals) | (a) | 6.125% | 04/15/2025 | 1,050,000 | 1,064,983 |
Bausch Health Cos., Inc. (Pharmaceuticals) | (a) | 5.500% | 11/01/2025 | 200,000 | 204,412 |
Bausch Health Cos., Inc. (Pharmaceuticals) | (a) | 9.000% | 12/15/2025 | 425,000 | 457,814 |
Bausch Health Cos., Inc. (Pharmaceuticals) | (a) | 5.750% | 08/15/2027 | 175,000 | 185,500 |
Bausch Health Cos., Inc. (Pharmaceuticals) | (a) | 5.000% | 01/30/2028 | 175,000 | 164,761 |
Bausch Health Cos., Inc. (Pharmaceuticals) | (a) | 7.250% | 05/30/2029 | 525,000 | 550,793 |
Centene Corp. (Health Care Providers & Svs.) | 4.750% | 01/15/2025 | 325,000 | 332,693 | |
Centene Corp. (Health Care Providers & Svs.) | (a) | 5.375% | 06/01/2026 | 425,000 | 440,580 |
Centene Corp. (Health Care Providers & Svs.) | (a) | 5.375% | 08/15/2026 | 225,000 | 234,047 |
Centene Corp. (Health Care Providers & Svs.) | 4.250% | 12/15/2027 | 725,000 | 748,135 | |
Centene Corp. (Health Care Providers & Svs.) | 4.625% | 12/15/2029 | 425,000 | 449,977 | |
Centene Corp. (Health Care Providers & Svs.) | 3.375% | 02/15/2030 | 50,000 | 50,486 | |
Charles River Laboratories International, Inc. (Life Sciences Tools & Svs.) | (a) | 5.500% | 04/01/2026 | 225,000 | 234,000 |
CHS / Community Health Systems, Inc. (Health Care Providers & Svs.) | 6.250% | 03/31/2023 | 775,000 | 730,019 | |
CHS / Community Health Systems, Inc. (Health Care Providers & Svs.) | (a) | 8.625% | 01/15/2024 | 50,000 | 48,894 |
CHS / Community Health Systems, Inc. (Health Care Providers & Svs.) | (a) | 6.625% | 02/15/2025 | 100,000 | 94,000 |
CHS / Community Health Systems, Inc. (Health Care Providers & Svs.) | (a) | 8.000% | 03/15/2026 | 200,000 | 189,040 |
Endo Dac / Endo Finance LLC / Endo Finco, Inc. (Pharmaceuticals) | (a) | 9.500% | 07/31/2027 | 361,000 | 381,830 |
Endo Dac / Endo Finance LLC / Endo Finco, Inc. (Pharmaceuticals) | (a) | 6.000% | 06/30/2028 | 552,000 | 356,040 |
HCA, Inc. (Health Care Providers & Svs.) | 5.375% | 02/01/2025 | 900,000 | 964,125 | |
HCA, Inc. (Health Care Providers & Svs.) | 5.875% | 02/15/2026 | 325,000 | 356,688 | |
HCA, Inc. (Health Care Providers & Svs.) | 5.375% | 09/01/2026 | 100,000 | 108,875 | |
HCA, Inc. (Health Care Providers & Svs.) | 5.625% | 09/01/2028 | 425,000 | 474,049 | |
HCA, Inc. (Health Care Providers & Svs.) | 3.500% | 09/01/2030 | 500,000 | 481,469 | |
IQVIA, Inc. (Life Sciences Tools & Svs.) | (a) | 5.000% | 10/15/2026 | 300,000 | 308,610 |
IQVIA, Inc. (Life Sciences Tools & Svs.) | (a) | 5.000% | 05/15/2027 | 300,000 | 306,882 |
Jaguar Holding Co. II / PPD Development LP (Health Care Providers & Svs.) | (a) | 4.625% | 06/15/2025 | 275,000 | 279,868 |
Jaguar Holding Co. II / PPD Development LP (Health Care Providers & Svs.) | (a) | 5.000% | 06/15/2028 | 200,000 | 204,750 |
LifePoint Health, Inc. (Health Care Providers & Svs.) | (a) | 6.750% | 04/15/2025 | 200,000 | 206,500 |
LifePoint Health, Inc. (Health Care Providers & Svs.) | (a) | 4.375% | 02/15/2027 | 125,000 | 118,125 |
Mallinckrodt International Finance SA / Mallinckrodt CB LLC (Pharmaceuticals) | (a) | 5.625% | 10/15/2023 | 1,275,000 | 248,625 |
Mallinckrodt International Finance SA / Mallinckrodt CB LLC (Pharmaceuticals) | (a) | 5.500% | 04/15/2025 | 400,000 | 66,000 |
MEDNAX, Inc. (Health Care Providers & Svs.) | (a) | 6.250% | 01/15/2027 | 325,000 | 325,000 |
MPH Acquisition Holdings LLC (Health Care Providers & Svs.) | (a) | 7.125% | 06/01/2024 | 1,250,000 | 1,162,500 |
Par Pharmaceutical, Inc. (Pharmaceuticals) | (a) | 7.500% | 04/01/2027 | 75,000 | 76,965 |
Polaris Intermediate Corp. (Health Care Providers & Svs.) | (a)(c) | 8.500%, 9.250% PIK | 12/01/2022 | 375,000 | 330,000 |
Prestige Brands, Inc. (Pharmaceuticals) | (a) | 6.375% | 03/01/2024 | 1,150,000 | 1,184,500 |
RegionalCare Hospital Partners Holdings, Inc. / LifePoint Health, Inc. (Health Care Providers & Svs.) | (a) | 9.750% | 12/01/2026 | 650,000 | 663,000 |
Team Health Holdings, Inc. (Health Care Providers & Svs.) | (a) | 6.375% | 02/01/2025 | 975,000 | 565,500 |
Teleflex, Inc. (Health Care Equip. & Supplies) | 4.625% | 11/15/2027 | 175,000 | 185,012 | |
Teleflex, Inc. (Health Care Equip. & Supplies) | (a) | 4.250% | 06/01/2028 | 25,000 | 25,625 |
Tenet Healthcare Corp. (Health Care Providers & Svs.) | 6.750% | 06/15/2023 | 450,000 | 446,625 | |
Tenet Healthcare Corp. (Health Care Providers & Svs.) | 4.625% | 07/15/2024 | 125,000 | 122,491 | |
Tenet Healthcare Corp. (Health Care Providers & Svs.) | (a) | 7.500% | 04/01/2025 | 50,000 | 53,125 |
Tenet Healthcare Corp. (Health Care Providers & Svs.) | 5.125% | 05/01/2025 | 525,000 | 506,735 | |
Tenet Healthcare Corp. (Health Care Providers & Svs.) | 7.000% | 08/01/2025 | 375,000 | 367,534 | |
Tenet Healthcare Corp. (Health Care Providers & Svs.) | (a) | 4.875% | 01/01/2026 | 300,000 | 293,838 |
Tenet Healthcare Corp. (Health Care Providers & Svs.) | (a) | 5.125% | 11/01/2027 | 425,000 | 419,347 |
| Ohio National Fund, Inc. | ON Federated High Income Bond Portfolio (Continued) |
| Schedule of Investments | June 30, 2020 (Unaudited) |
| Corporate Bonds (Continued) | Rate | Maturity | Face Amount | Value | |
| Health Care (continued) | |||||
Vizient, Inc. (Health Care Providers & Svs.) | (a) | 6.250% | 05/15/2027 | $ 125,000 | $ 130,938 |
West Street Merger Sub, Inc. (Life Sciences Tools & Svs.) | (a) | 6.375% | 09/01/2025 | 925,000 | 894,937 |
| 22,709,003 | |||||
| Industrials–10.8% | |||||
Allied Universal Holdco LLC / Allied Universal Finance Corp. (Commercial Svs. & Supplies) | (a) | 6.625% | 07/15/2026 | 150,000 | 157,500 |
Allied Universal Holdco LLC / Allied Universal Finance Corp. (Commercial Svs. & Supplies) | (a) | 9.750% | 07/15/2027 | 1,400,000 | 1,475,250 |
American Builders & Contractors Supply Co., Inc. (Trading Companies & Distributors) | (a) | 5.875% | 05/15/2026 | 975,000 | 965,250 |
American Builders & Contractors Supply Co., Inc. (Trading Companies & Distributors) | (a) | 4.000% | 01/15/2028 | 50,000 | 48,589 |
Brink's Co. / The (Commercial Svs. & Supplies) | (a) | 5.500% | 07/15/2025 | 75,000 | 76,390 |
Core & Main LP (Commercial Svs. & Supplies) | (a) | 6.125% | 08/15/2025 | 850,000 | 847,152 |
Cornerstone Building Brands, Inc. (Building Products) | (a) | 8.000% | 04/15/2026 | 700,000 | 705,250 |
Dun & Bradstreet Corp. / The (Professional Svs.) | (a) | 6.875% | 08/15/2026 | 225,000 | 238,500 |
Dun & Bradstreet Corp. / The (Professional Svs.) | (a) | 10.250% | 02/15/2027 | 1,025,000 | 1,137,750 |
Garda World Security Corp. (Commercial Svs. & Supplies) | (a) | 4.625% | 02/15/2027 | 175,000 | 172,375 |
Garda World Security Corp. (Commercial Svs. & Supplies) | (a) | 9.500% | 11/01/2027 | 1,103,000 | 1,166,422 |
Nielsen Co. Luxembourg SARL / The (Professional Svs.) | (a) | 5.000% | 02/01/2025 | 150,000 | 149,234 |
Nielsen Finance LLC / Nielsen Finance Co. (Professional Svs.) | (a) | 5.000% | 04/15/2022 | 550,000 | 548,460 |
Park Aerospace Holdings Ltd. (Trading Companies & Distributors) | (a) | 5.500% | 02/15/2024 | 675,000 | 617,516 |
Sensata Technologies U.K. Financing Co. PLC (Electrical Equip.) | (a) | 6.250% | 02/15/2026 | 200,000 | 207,500 |
Sensata Technologies, Inc. (Electrical Equip.) | (a) | 4.375% | 02/15/2030 | 225,000 | 222,750 |
Standard Industries, Inc. (Building Products) | (a) | 6.000% | 10/15/2025 | 150,000 | 154,391 |
Standard Industries, Inc. (Building Products) | (a) | 5.000% | 02/15/2027 | 1,200,000 | 1,215,000 |
Stena International SA (Transportation Infrastructure) | (a) | 6.125% | 02/01/2025 | 275,000 | 262,625 |
Tempo Acquisition LLC / Tempo Acquisition Finance Corp. (Professional Svs.) | (a) | 6.750% | 06/01/2025 | 1,425,000 | 1,442,812 |
TransDigm U.K. Holdings PLC (Aerospace & Defense) | 6.875% | 05/15/2026 | 275,000 | 255,750 | |
TransDigm, Inc. (Aerospace & Defense) | 6.500% | 07/15/2024 | 325,000 | 312,744 | |
TransDigm, Inc. (Aerospace & Defense) | 6.500% | 05/15/2025 | 350,000 | 327,282 | |
TransDigm, Inc. (Aerospace & Defense) | (a) | 6.250% | 03/15/2026 | 575,000 | 574,641 |
TransDigm, Inc. (Aerospace & Defense) | 6.375% | 06/15/2026 | 850,000 | 775,625 | |
TransDigm, Inc. (Aerospace & Defense) | 5.500% | 11/15/2027 | 100,000 | 87,294 | |
Trident TPI Holdings, Inc. (Machinery) | (a) | 9.250% | 08/01/2024 | 175,000 | 179,375 |
Trident TPI Holdings, Inc. (Machinery) | (a) | 6.625% | 11/01/2025 | 700,000 | 665,000 |
United Rentals North America, Inc. (Trading Companies & Distributors) | 5.875% | 09/15/2026 | 100,000 | 104,800 | |
United Rentals North America, Inc. (Trading Companies & Distributors) | 6.500% | 12/15/2026 | 250,000 | 262,500 | |
United Rentals North America, Inc. (Trading Companies & Distributors) | 5.500% | 05/15/2027 | 125,000 | 128,750 | |
United Rentals North America, Inc. (Trading Companies & Distributors) | 3.875% | 11/15/2027 | 100,000 | 99,750 | |
United Rentals North America, Inc. (Trading Companies & Distributors) | 4.875% | 01/15/2028 | 425,000 | 435,625 | |
United Rentals North America, Inc. (Trading Companies & Distributors) | 5.250% | 01/15/2030 | 100,000 | 103,250 | |
Vertical Holdco GmbH (Building Products) | (a) | 7.625% | 07/15/2028 | 200,000 | 200,000 |
Vertical U.S. Newco, Inc. (Building Products) | (a) | 5.250% | 07/15/2027 | 325,000 | 325,000 |
Watco Cos. LLC / Watco Finance Corp. (Road & Rail) | (a) | 6.500% | 06/15/2027 | 275,000 | 281,760 |
WESCO Distribution, Inc. (Trading Companies & Distributors) | 5.375% | 12/15/2021 | 350,000 | 350,350 | |
WESCO Distribution, Inc. (Trading Companies & Distributors) | 5.375% | 06/15/2024 | 550,000 | 547,365 | |
WESCO Distribution, Inc. (Trading Companies & Distributors) | (a) | 7.125% | 06/15/2025 | 100,000 | 105,470 |
WESCO Distribution, Inc. (Trading Companies & Distributors) | (a) | 7.250% | 06/15/2028 | 225,000 | 237,278 |
| 18,170,325 | |||||
| Information Technology–3.2% | |||||
ams AG (Semiconductors & Equip.) | (a) | 7.000% | 07/31/2025 | 275,000 | 272,250 |
Banff Merger Sub, Inc. (IT Svs.) | (a) | 9.750% | 09/01/2026 | 150,000 | 150,937 |
Dell International LLC / EMC Corp. (Computers & Peripherals) | (a) | 7.125% | 06/15/2024 | 950,000 | 984,141 |
Fair Isaac Corp. (Software) | (a) | 4.000% | 06/15/2028 | 75,000 | 75,188 |
Gartner, Inc. (IT Svs.) | (a) | 5.125% | 04/01/2025 | 200,000 | 204,810 |
Gartner, Inc. (IT Svs.) | (a) | 4.500% | 07/01/2028 | 50,000 | 50,585 |
Go Daddy Operating Co. LLC / GD Finance Co., Inc. (IT Svs.) | (a) | 5.250% | 12/01/2027 | 150,000 | 152,625 |
NCR Corp. (Tech. Hardware, Storage & Periph.) | 6.375% | 12/15/2023 | 225,000 | 228,656 | |
NCR Corp. (Tech. Hardware, Storage & Periph.) | (a) | 8.125% | 04/15/2025 | 25,000 | 26,500 |
NCR Corp. (Tech. Hardware, Storage & Periph.) | (a) | 5.750% | 09/01/2027 | 275,000 | 275,000 |
Nuance Communications, Inc. (Software) | 5.625% | 12/15/2026 | 150,000 | 156,000 | |
PTC, Inc. (Software) | (a) | 4.000% | 02/15/2028 | 125,000 | 124,070 |
Qorvo, Inc. (Semiconductors & Equip.) | (a) | 4.375% | 10/15/2029 | 250,000 | 256,020 |
RP Crown Parent LLC (Software) | (a) | 7.375% | 10/15/2024 | 1,025,000 | 1,022,437 |
Science Applications International Corp. (IT Svs.) | (a) | 4.875% | 04/01/2028 | 25,000 | 24,922 |
Sophia LP / Sophia Finance, Inc. (Software) | (a) | 9.000% | 09/30/2023 | 225,000 | 227,250 |
SS&C Technologies, Inc. (Software) | (a) | 5.500% | 09/30/2027 | 775,000 | 789,252 |
TTM Technologies, Inc. (Electronic Equip., Instr. & Comp.) | (a) | 5.625% | 10/01/2025 | 400,000 | 396,752 |
| 5,417,395 | |||||
| Materials–9.6% | |||||
ARD Finance SA (Containers & Packaging) | (a)(c) | 6.500%, 7.250% PIK | 06/30/2027 | 1,200,000 | 1,187,250 |
| Ohio National Fund, Inc. | ON Federated High Income Bond Portfolio (Continued) |
| Schedule of Investments | June 30, 2020 (Unaudited) |
| Corporate Bonds (Continued) | Rate | Maturity | Face Amount | Value | |
| Materials (continued) | |||||
Ardagh Packaging Finance PLC / Ardagh Holdings U.S.A., Inc. (Containers & Packaging) | (a) | 6.000% | 02/15/2025 | $ 250,000 | $ 255,938 |
Ardagh Packaging Finance PLC / Ardagh Holdings U.S.A., Inc. (Containers & Packaging) | (a) | 5.250% | 08/15/2027 | 275,000 | 269,946 |
Ardagh Packaging Finance PLC / Ardagh Holdings U.S.A., Inc. (Containers & Packaging) | (a) | 5.250% | 08/15/2027 | 200,000 | 196,324 |
Axalta Coating Systems LLC / Axalta Coating Systems Dutch Holding B BV (Chemicals) | (a) | 4.750% | 06/15/2027 | 150,000 | 150,780 |
Berry Global, Inc. (Containers & Packaging) | 5.500% | 05/15/2022 | 269,000 | 269,404 | |
Berry Global, Inc. (Containers & Packaging) | 6.000% | 10/15/2022 | 37,000 | 37,093 | |
Berry Global, Inc. (Containers & Packaging) | (a) | 4.875% | 07/15/2026 | 325,000 | 329,875 |
Berry Global, Inc. (Containers & Packaging) | (a) | 5.625% | 07/15/2027 | 275,000 | 282,562 |
Clearwater Paper Corp. (Paper & Forest Products) | (a) | 5.375% | 02/01/2025 | 775,000 | 780,812 |
Coeur Mining, Inc. (Metals & Mining) | 5.875% | 06/01/2024 | 500,000 | 480,000 | |
Compass Minerals International, Inc. (Metals & Mining) | (a) | 4.875% | 07/15/2024 | 900,000 | 902,250 |
Compass Minerals International, Inc. (Metals & Mining) | (a) | 6.750% | 12/01/2027 | 200,000 | 210,000 |
Crown Americas LLC / Crown Americas Capital Corp. VI (Containers & Packaging) | 4.750% | 02/01/2026 | 275,000 | 280,233 | |
Element Solutions, Inc. (Chemicals) | (a) | 5.875% | 12/01/2025 | 450,000 | 454,359 |
Flex Acquisition Co., Inc. (Containers & Packaging) | (a) | 6.875% | 01/15/2025 | 1,150,000 | 1,109,750 |
Flex Acquisition Co., Inc. (Containers & Packaging) | (a) | 7.875% | 07/15/2026 | 750,000 | 727,500 |
Freeport-McMoRan, Inc. (Metals & Mining) | 5.000% | 09/01/2027 | 225,000 | 226,055 | |
Freeport-McMoRan, Inc. (Metals & Mining) | 4.125% | 03/01/2028 | 175,000 | 169,750 | |
Freeport-McMoRan, Inc. (Metals & Mining) | 5.250% | 09/01/2029 | 125,000 | 128,181 | |
Freeport-McMoRan, Inc. (Metals & Mining) | 4.250% | 03/01/2030 | 150,000 | 145,500 | |
Freeport-McMoRan, Inc. (Metals & Mining) | 5.400% | 11/14/2034 | 450,000 | 444,797 | |
Graphic Packaging International LLC (Containers & Packaging) | (a) | 4.750% | 07/15/2027 | 150,000 | 158,250 |
Graphic Packaging International LLC (Containers & Packaging) | (a) | 3.500% | 03/15/2028 | 100,000 | 99,220 |
Hexion, Inc. (Chemicals) | (a) | 7.875% | 07/15/2027 | 475,000 | 432,250 |
Hudbay Minerals, Inc. (Metals & Mining) | (a) | 7.250% | 01/15/2023 | 150,000 | 147,750 |
Hudbay Minerals, Inc. (Metals & Mining) | (a) | 7.625% | 01/15/2025 | 450,000 | 430,875 |
Illuminate Buyer LLC / Illuminate Holdings IV, Inc. (Chemicals) | (a) | 9.000% | 07/01/2028 | 50,000 | 52,125 |
Koppers, Inc. (Chemicals) | (a) | 6.000% | 02/15/2025 | 900,000 | 875,250 |
Mauser Packaging Solutions Holding Co. (Containers & Packaging) | (a) | 5.500% | 04/15/2024 | 300,000 | 294,656 |
Mauser Packaging Solutions Holding Co. (Containers & Packaging) | (a) | 7.250% | 04/15/2025 | 1,250,000 | 1,133,462 |
Nouryon Holding B.V. (Chemicals) | (a) | 8.000% | 10/01/2026 | 800,000 | 818,952 |
Owens-Brockway Glass Container, Inc. (Containers & Packaging) | (a) | 5.875% | 08/15/2023 | 225,000 | 232,313 |
Owens-Brockway Glass Container, Inc. (Containers & Packaging) | (a) | 5.375% | 01/15/2025 | 175,000 | 176,750 |
Owens-Brockway Glass Container, Inc. (Containers & Packaging) | (a) | 6.375% | 08/15/2025 | 600,000 | 634,500 |
Owens-Brockway Glass Container, Inc. (Containers & Packaging) | (a) | 6.625% | 05/13/2027 | 50,000 | 52,000 |
PQ Corp. (Chemicals) | (a) | 5.750% | 12/15/2025 | 125,000 | 125,938 |
Reynolds Group Issuer, Inc. / Reynolds Group Issuer LLC / Reynolds Group Issuer (Containers & Packaging) | (a) | 7.000% | 07/15/2024 | 475,000 | 476,335 |
Sealed Air Corp. (Containers & Packaging) | (a) | 4.000% | 12/01/2027 | 175,000 | 175,000 |
Trivium Packaging Finance B.V. (Containers & Packaging) | (a) | 8.500% | 08/15/2027 | 350,000 | 374,062 |
Trivium Packaging Finance BV (Containers & Packaging) | (a) | 5.500% | 08/15/2026 | 200,000 | 201,750 |
W.R. Grace & Co-Conn (Chemicals) | (a) | 4.875% | 06/15/2027 | 175,000 | 177,280 |
| 16,107,077 | |||||
| Real Estate–0.4% | |||||
Cushman & Wakefield U.S. Borrower LLC (Real Estate Mgmt. & Development) | (a) | 6.750% | 05/15/2028 | 200,000 | 208,500 |
VICI Properties LP / VICI Note Co., Inc. (Equity REIT) | (a) | 3.500% | 02/15/2025 | 25,000 | 23,500 |
VICI Properties LP / VICI Note Co., Inc. (Equity REIT) | (a) | 4.250% | 12/01/2026 | 225,000 | 215,908 |
VICI Properties LP / VICI Note Co., Inc. (Equity REIT) | (a) | 3.750% | 02/15/2027 | 50,000 | 47,000 |
VICI Properties LP / VICI Note Co., Inc. (Equity REIT) | (a) | 4.625% | 12/01/2029 | 175,000 | 170,625 |
| 665,533 | |||||
| Utilities–4.0% | |||||
AmeriGas Partners LP / AmeriGas Finance Corp. (Gas Utilities) | 5.875% | 08/20/2026 | 800,000 | 844,000 | |
AmeriGas Partners LP / AmeriGas Finance Corp. (Gas Utilities) | 5.750% | 05/20/2027 | 100,000 | 105,750 | |
Calpine Corp. (Ind. Power & Renewable Elec.) | 5.750% | 01/15/2025 | 675,000 | 681,608 | |
Calpine Corp. (Ind. Power & Renewable Elec.) | (a) | 5.250% | 06/01/2026 | 150,000 | 151,457 |
Calpine Corp. (Ind. Power & Renewable Elec.) | (a) | 4.500% | 02/15/2028 | 350,000 | 343,000 |
DPL, Inc. (Electric Utilities) | (a) | 4.125% | 07/01/2025 | 75,000 | 75,021 |
Ferrellgas LP / Ferrellgas Finance Corp. (Gas Utilities) | 6.750% | 01/15/2022 | 225,000 | 189,000 | |
Ferrellgas LP / Ferrellgas Finance Corp. (Gas Utilities) | 6.750% | 06/15/2023 | 150,000 | 123,750 | |
NRG Energy, Inc. (Electric Utilities) | 7.250% | 05/15/2026 | 750,000 | 791,250 | |
NRG Energy, Inc. (Electric Utilities) | 6.625% | 01/15/2027 | 250,000 | 261,250 | |
Suburban Propane Partners LP / Suburban Energy Finance Corp. (Gas Utilities) | 5.500% | 06/01/2024 | 425,000 | 420,750 | |
Suburban Propane Partners LP / Suburban Energy Finance Corp. (Gas Utilities) | 5.875% | 03/01/2027 | 600,000 | 594,000 | |
TerraForm Power Operating LLC (Ind. Power & Renewable Elec.) | (a) | 5.000% | 01/31/2028 | 1,125,000 | 1,175,625 |
Vistra Operations Co. LLC (Ind. Power & Renewable Elec.) | (a) | 5.500% | 09/01/2026 | 225,000 | 230,207 |
| Ohio National Fund, Inc. | ON Federated High Income Bond Portfolio (Continued) |
| Schedule of Investments | June 30, 2020 (Unaudited) |
| Corporate Bonds (Continued) | Rate | Maturity | Face Amount | Value | |
| Utilities (continued) | |||||
Vistra Operations Co. LLC (Ind. Power & Renewable Elec.) | (a) | 5.625% | 02/15/2027 | $ 400,000 | $ 410,792 |
Vistra Operations Co. LLC (Ind. Power & Renewable Elec.) | (a) | 5.000% | 07/31/2027 | 375,000 | 381,281 |
| 6,778,741 | |||||
Total Corporate Bonds (Cost $169,698,080) | $159,710,394 |
| Common Stocks–0.1% | Shares | Value | |
| Communication Services–0.0% | |||
iHeartMedia, Inc. Class A (Media) | (d) | 7,387 | $ 61,681 |
| Materials–0.1% | |||
Hexion Holdings Corp. Class B (Chemicals) | (d) | 10,888 | 73,494 |
Total Common Stocks (Cost $498,022) | $ 135,175 |
| Money Market Funds–4.2% | Shares | Value | |
State Street Institutional Liquid Reserves Fund Institutional Class, 0.346% | (e) | 7,084,720 | $ 7,087,554 |
Total Money Market Funds (Cost $7,088,113) | $ 7,087,554 | ||
Total Investments – 99.3% (Cost $177,284,215) | (f) | $166,933,123 | |
Other Assets in Excess of Liabilities – 0.7% | 1,158,360 | ||
| Net Assets – 100.0% | $168,091,483 |
Percentages are stated as a percent of net assets. |
| Abbreviations: | ||
| PIK: | Payment-in-Kind | |
| Footnotes: | ||
| (a) | Security exempt from registration under Regulation D of the Securities Act of 1933. These securities may be resold in transactions exempt from registration, normally to qualified buyers under Rule 144A. At June 30, 2020, the value of these securities totaled $110,752,252, or 65.9% of the Portfolio’s net assets. | |
| (b) | Represents a security that is in default and deemed to be non-income producing. | |
| (c) | Issuer of the security has the option to make coupon payments in cash or in additional par value of this bond (Payment-in-Kind). | |
| (d) | Non-income producing security. | |
| (e) | Rate represents the seven-day yield at June 30, 2020. | |
| (f) | Represents cost for financial reporting purposes, which may differ from cost basis for federal income tax purposes. See also Note 8 of the Notes to Financial Statements. | |
| Ohio National Fund, Inc. | ON Nasdaq-100® Index Portfolio (Unaudited) |
| Average Annual returns | |
| One year | 33.22% |
| Five years | 19.03% |
| Ten years | 20.06% |
| (1) | The Portfolio’s composition is subject to change. Holdings and weightings are as of June 30, 2020. |

| Ohio National Fund, Inc. | ON Nasdaq-100® Index Portfolio (Unaudited) (Continued) |
| Portfolio Composition as of June 30, 2020 (1) | |
| % of Net Assets | |
| Common Stocks (4) | 101.4 |
| Rights (4) | 0.0 |
| Less Net Liabilities | (1.4) |
| 100.0 | |
| Top 10 Portfolio Holdings as of June 30, 2020 (1) (2) (3) | ||
| % of Net Assets | ||
| 1. | Apple, Inc. | 12.2 |
| 2. | Microsoft Corp. | 11.9 |
| 3. | Amazon.com, Inc. | 10.7 |
| 4. | Facebook, Inc. Class A | 4.2 |
| 5. | Alphabet, Inc. Class A | 3.8 |
| 6. | Alphabet, Inc. Class C | 3.7 |
| 7. | Intel Corp. | 2.5 |
| 8. | NVIDIA Corp. | 2.3 |
| 9. | Adobe, Inc. | 2.1 |
| 10. | PayPal Holdings, Inc. | 2.0 |
| (1) | Composition of Portfolio subject to change. | |
| (2) | Short-term investments have been excluded from the list of Top 10 Portfolio Holdings. | |
| (3) | Top 10 Portfolio Holdings is presented at an individual security level. Total investment exposure by issuer may be higher. | |
| (4) | Sectors (Common Stocks, Rights): | |
| % of Net Assets | |
| Information Technology | 49.0 |
| Communication Services | 20.0 |
| Consumer Discretionary | 17.3 |
| Health Care | 7.4 |
| Consumer Staples | 5.0 |
| Industrials | 2.0 |
| Utilities | 0.7 |
| 101.4 |
| Ohio National Fund, Inc. | ON Nasdaq-100® Index Portfolio |
| Schedule of Investments | June 30, 2020 (Unaudited) |
| Common Stocks–101.4% | Shares | Value | |
| Communication Services–20.0% | |||
Activision Blizzard, Inc. (Entertainment) | 26,643 | $ 2,022,204 | |
Alphabet, Inc. Class A (Interactive Media & Svs.) | (a) | 9,319 | 13,214,808 |
Alphabet, Inc. Class C (Interactive Media & Svs.) | (a) | 9,125 | 12,899,191 |
Baidu, Inc. – ADR (Interactive Media & Svs.) | (a) | 9,510 | 1,140,154 |
Charter Communications, Inc. Class A (Media) | (a) | 7,140 | 3,641,686 |
Comcast Corp. Class A (Media) | 157,519 | 6,140,091 | |
Electronic Arts, Inc. (Entertainment) | (a) | 9,983 | 1,318,255 |
Facebook, Inc. Class A (Interactive Media & Svs.) | (a) | 65,181 | 14,800,650 |
Fox Corp. Class A (Media) | 11,922 | 319,748 | |
Fox Corp. Class B (Media) | 8,972 | 240,808 | |
Liberty Global PLC Class A (Media) | (a) | 6,342 | 138,636 |
Liberty Global PLC Class C (Media) | (a) | 14,127 | 303,872 |
NetEase, Inc. – ADR (Entertainment) | 2,562 | 1,100,071 | |
Netflix, Inc. (Entertainment) | (a) | 15,208 | 6,920,248 |
Sirius XM Holdings, Inc. (Media) | 151,138 | 887,180 | |
Take-Two Interactive Software, Inc. (Entertainment) | (a) | 3,944 | 550,464 |
T-Mobile U.S., Inc. (Wireless Telecom. Svs.) | (a) | 42,731 | 4,450,434 |
| 70,088,500 | |||
| Consumer Discretionary–17.3% | |||
Amazon.com, Inc. (Internet & Direct Marketing Retail) | (a) | 13,520 | 37,299,246 |
Booking Holdings, Inc. (Internet & Direct Marketing Retail) | (a) | 1,416 | 2,254,753 |
Dollar Tree, Inc. (Multiline Retail) | (a) | 8,223 | 762,108 |
eBay, Inc. (Internet & Direct Marketing Retail) | 24,302 | 1,274,640 | |
Expedia Group, Inc. (Internet & Direct Marketing Retail) | 4,661 | 383,134 | |
JD.com, Inc. – ADR (Internet & Direct Marketing Retail) | (a) | 32,100 | 1,931,778 |
Lululemon Athletica, Inc. (Textiles, Apparel & Luxury Goods) | (a) | 4,300 | 1,341,643 |
Marriott International, Inc. Class A (Hotels, Restaurants & Leisure) | 11,198 | 960,004 | |
MercadoLibre, Inc. (Internet & Direct Marketing Retail) | (a) | 1,719 | 1,694,539 |
O'Reilly Automotive, Inc. (Specialty Retail) | (a) | 2,566 | 1,082,005 |
Ross Stores, Inc. (Specialty Retail) | 12,282 | 1,046,918 | |
Starbucks Corp. (Hotels, Restaurants & Leisure) | 40,424 | 2,974,802 | |
Tesla, Inc. (Automobiles) | (a) | 6,410 | 6,921,582 |
Trip.com Group Ltd. – ADR (Internet & Direct Marketing Retail) | (a) | 18,043 | 467,675 |
Ulta Beauty, Inc. (Specialty Retail) | (a) | 1,938 | 394,228 |
| 60,789,055 | |||
| Consumer Staples–5.0% | |||
Costco Wholesale Corp. (Food & Staples Retailing) | 15,265 | 4,628,501 | |
Kraft Heinz Co. / The (Food Products) | 42,267 | 1,347,894 | |
Mondelez International, Inc. Class A (Food Products) | 49,345 | 2,523,010 | |
Monster Beverage Corp. (Beverages) | (a) | 18,206 | 1,262,040 |
PepsiCo, Inc. (Beverages) | 47,974 | 6,345,041 | |
Walgreens Boots Alliance, Inc. (Food & Staples Retailing) | 30,341 | 1,286,155 | |
| 17,392,641 | |||
| Health Care–7.4% | |||
Alexion Pharmaceuticals, Inc. (Biotechnology) | (a) | 7,623 | 855,606 |
Align Technology, Inc. (Health Care Equip. & Supplies) | (a) | 2,729 | 748,947 |
Amgen, Inc. (Biotechnology) | 20,338 | 4,796,921 | |
Biogen, Inc. (Biotechnology) | (a) | 5,643 | 1,509,785 |
BioMarin Pharmaceutical, Inc. (Biotechnology) | (a) | 6,268 | 773,095 |
| Common Stocks (Continued) | Shares | Value | |
| Health Care (continued) | |||
Cerner Corp. (Health Care Technology) | 10,546 | $ 722,928 | |
DexCom, Inc. (Health Care Equip. & Supplies) | (a) | 3,193 | 1,294,442 |
Gilead Sciences, Inc. (Biotechnology) | 43,372 | 3,337,042 | |
IDEXX Laboratories, Inc. (Health Care Equip. & Supplies) | (a) | 2,934 | 968,689 |
Illumina, Inc. (Life Sciences Tools & Svs.) | (a) | 5,083 | 1,882,489 |
Incyte Corp. (Biotechnology) | (a) | 7,536 | 783,518 |
Intuitive Surgical, Inc. (Health Care Equip. & Supplies) | (a) | 4,034 | 2,298,694 |
Regeneron Pharmaceuticals, Inc. (Biotechnology) | (a) | 3,487 | 2,174,668 |
Seattle Genetics, Inc. (Biotechnology) | (a) | 5,981 | 1,016,291 |
Vertex Pharmaceuticals, Inc. (Biotechnology) | (a) | 8,961 | 2,601,468 |
| 25,764,583 | |||
| Industrials–2.0% | |||
Cintas Corp. (Commercial Svs. & Supplies) | 3,594 | 957,298 | |
Copart, Inc. (Commercial Svs. & Supplies) | (a) | 8,132 | 677,152 |
CoStar Group, Inc. (Professional Svs.) | (a) | 1,348 | 957,983 |
CSX Corp. (Road & Rail) | 26,487 | 1,847,203 | |
Fastenal Co. (Trading Companies & Distributors) | 19,860 | 850,802 | |
PACCAR, Inc. (Machinery) | 11,934 | 893,260 | |
Verisk Analytics, Inc. (Professional Svs.) | 5,603 | 953,631 | |
| 7,137,329 | |||
| Information Technology–49.0% | |||
Adobe, Inc. (Software) | (a) | 16,658 | 7,251,394 |
Advanced Micro Devices, Inc. (Semiconductors & Equip.) | (a) | 40,499 | 2,130,652 |
Analog Devices, Inc. (Semiconductors & Equip.) | 12,742 | 1,562,679 | |
ANSYS, Inc. (Software) | (a) | 2,954 | 861,770 |
Apple, Inc. (Tech. Hardware, Storage & Periph.) | 117,490 | 42,860,352 | |
Applied Materials, Inc. (Semiconductors & Equip.) | 31,701 | 1,916,325 | |
ASML Holding N.V. (Semiconductors & Equip.) | 2,656 | 977,488 | |
Autodesk, Inc. (Software) | (a) | 7,580 | 1,813,060 |
Automatic Data Processing, Inc. (IT Svs.) | 14,871 | 2,214,143 | |
Broadcom, Inc. (Semiconductors & Equip.) | 13,826 | 4,363,624 | |
Cadence Design Systems, Inc. (Software) | (a) | 9,640 | 925,054 |
CDW Corp. (Electronic Equip., Instr. & Comp.) | 4,925 | 572,187 | |
Check Point Software Technologies Ltd. (Software) | (a) | 4,937 | 530,382 |
Cisco Systems, Inc. (Communications Equip.) | 146,005 | 6,809,673 | |
Citrix Systems, Inc. (Software) | 4,275 | 632,315 | |
Cognizant Technology Solutions Corp. Class A (IT Svs.) | 18,684 | 1,061,625 | |
DocuSign, Inc. (Software) | (a) | 6,331 | 1,090,262 |
Fiserv, Inc. (IT Svs.) | (a) | 23,162 | 2,261,074 |
Intel Corp. (Semiconductors & Equip.) | 146,388 | 8,758,394 | |
Intuit, Inc. (Software) | 9,019 | 2,671,338 | |
KLA-Tencor Corp. (Semiconductors & Equip.) | 5,358 | 1,042,024 | |
Lam Research Corp. (Semiconductors & Equip.) | 5,022 | 1,624,416 | |
Maxim Integrated Products, Inc. (Semiconductors & Equip.) | 9,227 | 559,248 | |
Microchip Technology, Inc. (Semiconductors & Equip.) | 8,468 | 891,765 | |
Micron Technology, Inc. (Semiconductors & Equip.) | (a) | 38,475 | 1,982,232 |
Microsoft Corp. (Software) | 205,559 | 41,833,312 | |
NetApp, Inc. (Tech. Hardware, Storage & Periph.) | 7,605 | 337,434 | |
NVIDIA Corp. (Semiconductors & Equip.) | 21,264 | 8,078,406 | |
NXP Semiconductors N.V. (Semiconductors & Equip.) | 9,646 | 1,100,030 | |
Paychex, Inc. (IT Svs.) | 12,385 | 938,164 |
| Ohio National Fund, Inc. | ON Nasdaq-100® Index Portfolio (Continued) |
| Schedule of Investments | June 30, 2020 (Unaudited) |
| Common Stocks (Continued) | Shares | Value | |
| Information Technology (continued) | |||
PayPal Holdings, Inc. (IT Svs.) | (a) | 40,600 | $ 7,073,738 |
QUALCOMM, Inc. (Semiconductors & Equip.) | 38,898 | 3,547,887 | |
Skyworks Solutions, Inc. (Semiconductors & Equip.) | 5,781 | 739,159 | |
Splunk, Inc. (Software) | (a) | 5,491 | 1,091,062 |
Synopsys, Inc. (Software) | (a) | 5,210 | 1,015,950 |
Texas Instruments, Inc. (Semiconductors & Equip.) | 31,727 | 4,028,377 | |
VeriSign, Inc. (IT Svs.) | (a) | 4,005 | 828,354 |
Western Digital Corp. (Tech. Hardware, Storage & Periph.) | 10,330 | 456,070 | |
Workday, Inc. Class A (Software) | (a) | 6,017 | 1,127,345 |
Xilinx, Inc. (Semiconductors & Equip.) | 8,429 | 829,329 | |
Zoom Video Communications, Inc. Class A (Software) | (a) | 5,794 | 1,469,011 |
| 171,857,104 |
| Common Stocks (Continued) | Shares | Value | |
| Utilities–0.7% | |||
Exelon Corp. (Electric Utilities) | 33,692 | $ 1,222,683 | |
Xcel Energy, Inc. (Electric Utilities) | 18,162 | 1,135,125 | |
| 2,357,808 | |||
Total Common Stocks (Cost $237,658,580) | $355,387,020 |
| Rights –0.0% | Quantity | Value | |
| Communication Services–0.0% | |||
T-Mobile U.S., Inc. (Wireless Telecom. Svs.) | (a) | 2,150 | $ 361 |
Total Rights (Cost $795) | $ 361 | ||
Total Investments – 101.4% (Cost $237,659,375) | (b) | $355,387,381 | |
Liabilities in Excess of Other Assets – (1.4)% | (c) | (4,845,188) | |
| Net Assets – 100.0% | $350,542,193 |
Percentages are stated as a percent of net assets. |
| Abbreviations: | ||
| ADR: | American Depositary Receipts | |
| Footnotes: | ||
| (a) | Non-income producing security. | |
| (b) | Represents cost for financial reporting purposes, which may differ from cost basis for federal income tax purposes. See also Note 8 of the Notes to Financial Statements. | |
| (c) | Includes $135,000 of cash pledged as collateral for the futures contracts outstanding at June 30, 2020. See also the following Schedule of Open Futures Contracts. | |
| Schedule of Open Futures Contracts | June 30, 2020 (Unaudited) |
| Description | Number of contracts | Expiration Date | Notional Amount | Value | Unrealized Appreciation (Depreciation) | Variation Margin Receivable (Payable) | ||||||
| CME E-mini Nasdaq-100 Index - Long | 9 | September 18, 2020 | $1,787,425 | $1,826,505 | $39,080 | $31,320 |
| Ohio National Fund, Inc. | ON BlackRock Advantage Large Cap Core Portfolio (Unaudited) |
| Average Annual returns | |
| One year | 5.62% |
| Five years | 7.91% |
| Ten years | 12.50% |
| (1) | The Portfolio’s composition is subject to change. Holdings and weightings are as of June 30, 2020. |

| Ohio National Fund, Inc. | ON BlackRock Advantage Large Cap Core Portfolio (Unaudited) (Continued) |
| Portfolio Composition as of June 30, 2020 (1) | |
| % of Net Assets | |
| Common Stocks (4) | 97.9 |
| Rights (4) | 0.0 |
| Money Market Funds Less Net Liabilities | 2.1 |
| 100.0 | |
| Top 10 Portfolio Holdings as of June 30, 2020 (1) (2) (3) | ||
| % of Net Assets | ||
| 1. | Microsoft Corp. | 7.0 |
| 2. | Amazon.com, Inc. | 5.5 |
| 3. | Apple, Inc. | 5.2 |
| 4. | Alphabet, Inc. Class A | 2.3 |
| 5. | Home Depot, Inc. / The | 1.8 |
| 6. | Berkshire Hathaway, Inc. Class B | 1.7 |
| 7. | Cisco Systems, Inc. | 1.7 |
| 8. | NVIDIA Corp. | 1.7 |
| 9. | Intel Corp. | 1.7 |
| 10. | Alphabet, Inc. Class C | 1.6 |
| (1) | Composition of Portfolio subject to change. | |
| (2) | Short-term investments have been excluded from the list of Top 10 Portfolio Holdings. | |
| (3) | Top 10 Portfolio Holdings is presented at an individual security level. Total investment exposure by issuer may be higher. | |
| (4) | Sectors (Common Stocks, Rights): | |
| % of Net Assets | |
| Information Technology | 27.4 |
| Health Care | 14.2 |
| Consumer Discretionary | 11.0 |
| Financials | 10.3 |
| Communication Services | 10.1 |
| Industrials | 7.8 |
| Consumer Staples | 7.0 |
| Utilities | 3.1 |
| Materials | 2.4 |
| Real Estate | 2.3 |
| Energy | 2.3 |
| 97.9 |
| Ohio National Fund, Inc. | ON BlackRock Advantage Large Cap Core Portfolio |
| Schedule of Investments | June 30, 2020 (Unaudited) |
| Common Stocks–97.9% | Shares | Value | |
| Communication Services–10.1% | |||
Activision Blizzard, Inc. (Entertainment) | 3,911 | $ 296,845 | |
Alphabet, Inc. Class A (Interactive Media & Svs.) | (a) | 6,312 | 8,950,732 |
Alphabet, Inc. Class C (Interactive Media & Svs.) | (a) | 4,264 | 6,027,633 |
Altice U.S.A., Inc. Class A (Media) | (a) | 4,338 | 97,779 |
AMC Networks, Inc. Class A (Media) | (a) | 2,894 | 67,691 |
AT&T, Inc. (Diversified Telecom. Svs.) | 93,176 | 2,816,711 | |
Cable One, Inc. (Media) | 23 | 40,822 | |
CenturyLink, Inc. (Diversified Telecom. Svs.) | 20,913 | 209,757 | |
Charter Communications, Inc. Class A (Media) | (a) | 27 | 13,771 |
Comcast Corp. Class A (Media) | 50,855 | 1,982,328 | |
Discovery, Inc. Class A (Media) | (a) | 11,512 | 242,903 |
Electronic Arts, Inc. (Entertainment) | (a) | 2,936 | 387,699 |
Facebook, Inc. Class A (Interactive Media & Svs.) | (a) | 26,371 | 5,988,063 |
Interpublic Group of Cos., Inc. / The (Media) | 66,182 | 1,135,683 | |
Netflix, Inc. (Entertainment) | (a) | 6,397 | 2,910,891 |
Sirius XM Holdings, Inc. (Media) | 323,686 | 1,900,037 | |
TEGNA, Inc. (Media) | 3,080 | 34,311 | |
Telephone & Data Systems, Inc. (Wireless Telecom. Svs.) | 26,971 | 536,184 | |
Twitter, Inc. (Interactive Media & Svs.) | (a) | 30,860 | 919,319 |
United States Cellular Corp. (Wireless Telecom. Svs.) | (a) | 18,337 | 566,063 |
Verizon Communications, Inc. (Diversified Telecom. Svs.) | 48,164 | 2,655,281 | |
ViacomCBS, Inc. Class A (Media) | 2,614 | 66,918 | |
ViacomCBS, Inc. Class B (Media) | 4,260 | 99,343 | |
Walt Disney Co. / The (Entertainment) | 4,385 | 488,971 | |
Zynga, Inc. Class A (Entertainment) | (a) | 10,332 | 98,567 |
| 38,534,302 | |||
| Consumer Discretionary–11.0% | |||
Amazon.com, Inc. (Internet & Direct Marketing Retail) | (a) | 7,614 | 21,005,656 |
Best Buy Co., Inc. (Specialty Retail) | 7,626 | 665,521 | |
Boyd Gaming Corp. (Hotels, Restaurants & Leisure) | 6,178 | 129,120 | |
Bright Horizons Family Solutions, Inc. (Diversified Consumer Svs.) | (a) | 346 | 40,551 |
Carnival Corp. (Hotels, Restaurants & Leisure) | 2,940 | 48,275 | |
Choice Hotels International, Inc. (Hotels, Restaurants & Leisure) | 1,788 | 141,073 | |
Darden Restaurants, Inc. (Hotels, Restaurants & Leisure) | 12,791 | 969,174 | |
Domino's Pizza, Inc. (Hotels, Restaurants & Leisure) | 1,252 | 462,539 | |
Extended Stay America, Inc. (Hotels, Restaurants & Leisure) | 5,812 | 65,036 | |
Graham Holdings Co. Class B (Diversified Consumer Svs.) | 271 | 92,864 | |
H&R Block, Inc. (Diversified Consumer Svs.) | 36,786 | 525,304 | |
Harley-Davidson, Inc. (Automobiles) | 2,360 | 56,097 | |
Home Depot, Inc. / The (Specialty Retail) | 26,963 | 6,754,501 | |
Las Vegas Sands Corp. (Hotels, Restaurants & Leisure) | 1,767 | 80,469 | |
Levi Strauss & Co. Class A (Textiles, Apparel & Luxury Goods) | 3,241 | 43,429 | |
Lowe's Cos., Inc. (Specialty Retail) | 23,158 | 3,129,109 | |
McDonald's Corp. (Hotels, Restaurants & Leisure) | 10,119 | 1,866,652 | |
Melco Resorts & Entertainment Ltd. – ADR (Hotels, Restaurants & Leisure) | 8,957 | 139,013 | |
NIKE, Inc. Class B (Textiles, Apparel & Luxury Goods) | 21,736 | 2,131,215 |
| Common Stocks (Continued) | Shares | Value | |
| Consumer Discretionary (continued) | |||
Norwegian Cruise Line Holdings Ltd. (Hotels, Restaurants & Leisure) | (a) | 8,470 | $ 139,162 |
Penn National Gaming, Inc. (Hotels, Restaurants & Leisure) | (a) | 3,036 | 92,720 |
Royal Caribbean Cruises Ltd. (Hotels, Restaurants & Leisure) | 4,396 | 221,119 | |
Target Corp. (Multiline Retail) | 6,753 | 809,887 | |
Texas Roadhouse, Inc. (Hotels, Restaurants & Leisure) | 5,865 | 308,323 | |
TJX Cos., Inc. / The (Specialty Retail) | 9,637 | 487,247 | |
V.F. Corp. (Textiles, Apparel & Luxury Goods) | 7,485 | 456,136 | |
Wyndham Destinations, Inc. (Hotels, Restaurants & Leisure) | 2,969 | 83,666 | |
Wyndham Hotels & Resorts, Inc. (Hotels, Restaurants & Leisure) | 5,257 | 224,053 | |
Yum! Brands, Inc. (Hotels, Restaurants & Leisure) | 8,635 | 750,468 | |
| 41,918,379 | |||
| Consumer Staples–7.0% | |||
Altria Group, Inc. (Tobacco) | 2,711 | 106,407 | |
Anheuser-Busch InBev SA / N.V. – ADR (Beverages) | 1,423 | 70,154 | |
Brown-Forman Corp. Class B (Beverages) | 2,287 | 145,590 | |
Clorox Co. / The (Household Products) | 6,351 | 1,393,219 | |
Coca-Cola Co. / The (Beverages) | 41,279 | 1,844,346 | |
Coca-Cola European Partners PLC (Beverages) | 9,263 | 349,771 | |
Colgate-Palmolive Co. (Household Products) | 19,321 | 1,415,456 | |
Costco Wholesale Corp. (Food & Staples Retailing) | 19,671 | 5,964,444 | |
General Mills, Inc. (Food Products) | 42,671 | 2,630,667 | |
Hershey Co. / The (Food Products) | 18,734 | 2,428,301 | |
Keurig Dr Pepper, Inc. (Beverages) | 1,522 | 43,225 | |
Lancaster Colony Corp. (Food Products) | 617 | 95,629 | |
McCormick & Co., Inc. (Food Products) | 987 | 177,078 | |
Mondelez International, Inc. Class A (Food Products) | 7,360 | 376,317 | |
PepsiCo, Inc. (Beverages) | 37,464 | 4,954,988 | |
Procter & Gamble Co. / The (Household Products) | 40,115 | 4,796,550 | |
| 26,792,142 | |||
| Energy–2.3% | |||
Baker Hughes Co. (Energy Equip. & Svs.) | 15,980 | 245,932 | |
ChampionX Corp. (Energy Equip. & Svs.) | (a) | 25,251 | 246,450 |
Chevron Corp. (Oil, Gas & Consumable Fuels) | 15,800 | 1,409,834 | |
ConocoPhillips (Oil, Gas & Consumable Fuels) | 17,841 | 749,679 | |
Continental Resources, Inc. (Oil, Gas & Consumable Fuels) | 28,861 | 505,933 | |
EOG Resources, Inc. (Oil, Gas & Consumable Fuels) | 25,905 | 1,312,347 | |
Exxon Mobil Corp. (Oil, Gas & Consumable Fuels) | 33,227 | 1,485,912 | |
Marathon Oil Corp. (Oil, Gas & Consumable Fuels) | 101,495 | 621,149 | |
National Oilwell Varco, Inc. (Energy Equip. & Svs.) | 3,179 | 38,943 | |
ONEOK, Inc. (Oil, Gas & Consumable Fuels) | 3,221 | 107,002 | |
Phillips 66 (Oil, Gas & Consumable Fuels) | 11,047 | 794,279 | |
Schlumberger Ltd. (Energy Equip. & Svs.) | 26,862 | 493,992 | |
TechnipFMC PLC (Energy Equip. & Svs.) | 27,152 | 185,720 | |
Valero Energy Corp. (Oil, Gas & Consumable Fuels) | 5,701 | 335,333 | |
Williams Cos., Inc. / The (Oil, Gas & Consumable Fuels) | 8,663 | 164,770 | |
| 8,697,275 |
| Ohio National Fund, Inc. | ON BlackRock Advantage Large Cap Core Portfolio (Continued) |
| Schedule of Investments | June 30, 2020 (Unaudited) |
| Common Stocks (Continued) | Shares | Value | |
| Financials–10.3% | |||
Aflac, Inc. (Insurance) | 10,374 | $ 373,775 | |
Allstate Corp. / The (Insurance) | 1,064 | 103,197 | |
Ally Financial, Inc. (Consumer Finance) | 38,884 | 771,070 | |
American Express Co. (Consumer Finance) | 11,467 | 1,091,658 | |
Ameriprise Financial, Inc. (Capital Markets) | 3,679 | 551,997 | |
Bank of America Corp. (Banks) | 114,117 | 2,710,279 | |
Bank of New York Mellon Corp. / The (Capital Markets) | 15,709 | 607,153 | |
Berkshire Hathaway, Inc. Class B (Diversified Financial Svs.) | (a) | 37,138 | 6,629,504 |
Brown & Brown, Inc. (Insurance) | 2,358 | 96,112 | |
CBOE Global Markets, Inc. (Capital Markets) | 2,012 | 187,679 | |
Charles Schwab Corp. / The (Capital Markets) | 46,196 | 1,558,653 | |
Cincinnati Financial Corp. (Insurance) | 32,399 | 2,074,508 | |
Citizens Financial Group, Inc. (Banks) | 15,249 | 384,885 | |
CME Group, Inc. (Capital Markets) | 7,696 | 1,250,908 | |
Comerica, Inc. (Banks) | 332 | 12,649 | |
Cullen / Frost Bankers, Inc. (Banks) | 10,943 | 817,552 | |
E*TRADE Financial Corp. (Capital Markets) | 1,285 | 63,903 | |
FactSet Research Systems, Inc. (Capital Markets) | 2,207 | 724,933 | |
First American Financial Corp. (Insurance) | 3,911 | 187,806 | |
First Horizon National Corp. (Banks) | 22,621 | 225,305 | |
Franklin Resources, Inc. (Capital Markets) | 8,811 | 184,767 | |
Globe Life, Inc. (Insurance) | 6,938 | 515,008 | |
Hanover Insurance Group, Inc. / The (Insurance) | 867 | 87,853 | |
Intercontinental Exchange, Inc. (Capital Markets) | 9,608 | 880,093 | |
Invesco Ltd. (Capital Markets) | 4,631 | 49,830 | |
JPMorgan Chase & Co. (Banks) | 49,302 | 4,637,346 | |
Marsh & McLennan Cos., Inc. (Insurance) | 9,926 | 1,065,755 | |
MGIC Investment Corp. (Thrifts & Mortgage Finance) | 10,680 | 87,469 | |
Moody's Corp. (Capital Markets) | 1,078 | 296,159 | |
Northern Trust Corp. (Capital Markets) | 2,831 | 224,612 | |
Progressive Corp. / The (Insurance) | 1,233 | 98,776 | |
Prudential Financial, Inc. (Insurance) | 27,416 | 1,669,634 | |
Reinsurance Group of America, Inc. (Insurance) | 775 | 60,791 | |
S&P Global, Inc. (Capital Markets) | 10,635 | 3,504,020 | |
State Street Corp. (Capital Markets) | 2,573 | 163,514 | |
T. Rowe Price Group, Inc. (Capital Markets) | 4,256 | 525,616 | |
Unum Group (Insurance) | 23,809 | 394,991 | |
Wells Fargo & Co. (Banks) | 159,999 | 4,095,974 | |
Willis Towers Watson PLC (Insurance) | 1,869 | 368,100 | |
Zions Bancorp N.A. (Banks) | 1,844 | 62,696 | |
| 39,396,530 | |||
| Health Care–14.2% | |||
Abbott Laboratories (Health Care Equip. & Supplies) | 27,550 | 2,518,897 | |
AbbVie, Inc. (Biotechnology) | 53,840 | 5,286,011 | |
Agilent Technologies, Inc. (Life Sciences Tools & Svs.) | 560 | 49,487 | |
Amgen, Inc. (Biotechnology) | 12,993 | 3,064,529 | |
Anthem, Inc. (Health Care Providers & Svs.) | 6,996 | 1,839,808 | |
Biogen, Inc. (Biotechnology) | (a) | 2,677 | 716,231 |
Bristol-Myers Squibb Co. (Pharmaceuticals) | 31,618 | 1,859,138 | |
Cardinal Health, Inc. (Health Care Providers & Svs.) | 5,633 | 293,986 | |
Cigna Corp. (Health Care Providers & Svs.) | 3,153 | 591,660 | |
CVS Health Corp. (Health Care Providers & Svs.) | 34,771 | 2,259,072 | |
Danaher Corp. (Health Care Equip. & Supplies) | 3,014 | 532,966 | |
Edwards Lifesciences Corp. (Health Care Equip. & Supplies) | (a) | 40,441 | 2,794,878 |
| Common Stocks (Continued) | Shares | Value | |
| Health Care (continued) | |||
Elanco Animal Health, Inc. (Pharmaceuticals) | (a) | 11,967 | $ 256,692 |
Eli Lilly & Co. (Pharmaceuticals) | 8,826 | 1,449,053 | |
Envista Holdings Corp. (Health Care Equip. & Supplies) | (a) | 3,553 | 74,933 |
Gilead Sciences, Inc. (Biotechnology) | 47,887 | 3,684,426 | |
HCA Healthcare, Inc. (Health Care Providers & Svs.) | 2,410 | 233,915 | |
Hologic, Inc. (Health Care Equip. & Supplies) | (a) | 1,664 | 94,848 |
IDEXX Laboratories, Inc. (Health Care Equip. & Supplies) | (a) | 2,863 | 945,248 |
Intuitive Surgical, Inc. (Health Care Equip. & Supplies) | (a) | 86 | 49,005 |
Johnson & Johnson (Pharmaceuticals) | 27,187 | 3,823,308 | |
Laboratory Corp. of America Holdings (Health Care Providers & Svs.) | (a) | 1,118 | 185,711 |
McKesson Corp. (Health Care Providers & Svs.) | 7,071 | 1,084,833 | |
Medtronic PLC (Health Care Equip. & Supplies) | 16,066 | 1,473,252 | |
Merck & Co., Inc. (Pharmaceuticals) | 66,799 | 5,165,567 | |
Pfizer, Inc. (Pharmaceuticals) | 72,563 | 2,372,810 | |
Quest Diagnostics, Inc. (Health Care Providers & Svs.) | 2,661 | 303,248 | |
Regeneron Pharmaceuticals, Inc. (Biotechnology) | (a) | 1,473 | 918,636 |
Sage Therapeutics, Inc. (Biotechnology) | (a) | 3,192 | 132,723 |
STERIS PLC (Health Care Equip. & Supplies) | 307 | 47,106 | |
Stryker Corp. (Health Care Equip. & Supplies) | 8,257 | 1,487,829 | |
Teladoc Health, Inc. (Health Care Technology) | (a) | 2,000 | 381,680 |
Thermo Fisher Scientific, Inc. (Life Sciences Tools & Svs.) | 1,007 | 364,876 | |
UnitedHealth Group, Inc. (Health Care Providers & Svs.) | 18,530 | 5,465,424 | |
Veeva Systems, Inc. Class A (Health Care Technology) | (a) | 1,417 | 332,173 |
West Pharmaceutical Services, Inc. (Health Care Equip. & Supplies) | 649 | 147,433 | |
Zoetis, Inc. (Pharmaceuticals) | 13,601 | 1,863,881 | |
| 54,145,273 | |||
| Industrials–7.8% | |||
3M Co. (Industrial Conglomerates) | 4,462 | 696,027 | |
Advanced Drainage Systems, Inc. (Building Products) | 967 | 47,770 | |
AGCO Corp. (Machinery) | 4,357 | 241,639 | |
Allegion PLC (Building Products) | 22,961 | 2,347,073 | |
AMERCO (Road & Rail) | 936 | 282,850 | |
AMETEK, Inc. (Electrical Equip.) | 1,230 | 109,925 | |
Beacon Roofing Supply, Inc. (Trading Companies & Distributors) | (a) | 2,067 | 54,507 |
Boeing Co. / The (Aerospace & Defense) | 1,422 | 260,653 | |
Carlisle Cos., Inc. (Industrial Conglomerates) | 905 | 108,301 | |
Cintas Corp. (Commercial Svs. & Supplies) | 2,217 | 590,520 | |
CSX Corp. (Road & Rail) | 11,239 | 783,808 | |
Curtiss-Wright Corp. (Aerospace & Defense) | 910 | 81,245 | |
Deere & Co. (Machinery) | 6,807 | 1,069,720 | |
Delta Air Lines, Inc. (Airlines) | 23,437 | 657,408 | |
EMCOR Group, Inc. (Construction & Engineering) | 8,393 | 555,113 | |
Fastenal Co. (Trading Companies & Distributors) | 5,243 | 224,610 | |
FedEx Corp. (Air Freight & Logistics) | 769 | 107,829 |
| Ohio National Fund, Inc. | ON BlackRock Advantage Large Cap Core Portfolio (Continued) |
| Schedule of Investments | June 30, 2020 (Unaudited) |
| Common Stocks (Continued) | Shares | Value | |
| Industrials (continued) | |||
GATX Corp. (Trading Companies & Distributors) | 13,928 | $ 849,329 | |
Generac Holdings, Inc. (Electrical Equip.) | (a) | 1,714 | 208,988 |
General Dynamics Corp. (Aerospace & Defense) | 2,548 | 380,824 | |
General Electric Co. (Industrial Conglomerates) | 27,658 | 188,904 | |
HEICO Corp. (Aerospace & Defense) | 2,595 | 258,592 | |
Honeywell International, Inc. (Industrial Conglomerates) | 22,378 | 3,235,635 | |
Hubbell, Inc. (Electrical Equip.) | 10,162 | 1,273,908 | |
Illinois Tool Works, Inc. (Machinery) | 13,050 | 2,281,793 | |
L3Harris Technologies, Inc. (Aerospace & Defense) | 5,710 | 968,816 | |
Lockheed Martin Corp. (Aerospace & Defense) | 3,724 | 1,358,962 | |
MasTec, Inc. (Construction & Engineering) | (a) | 11,520 | 516,902 |
Mercury Systems, Inc. (Aerospace & Defense) | (a) | 485 | 38,150 |
Norfolk Southern Corp. (Road & Rail) | 1,384 | 242,989 | |
Northrop Grumman Corp. (Aerospace & Defense) | 3,977 | 1,222,689 | |
Oshkosh Corp. (Machinery) | 14,317 | 1,025,384 | |
PACCAR, Inc. (Machinery) | 7,717 | 577,617 | |
Quanta Services, Inc. (Construction & Engineering) | 1,484 | 58,217 | |
Robert Half International, Inc. (Professional Svs.) | 16,273 | 859,703 | |
Roper Technologies, Inc. (Industrial Conglomerates) | 1,300 | 504,738 | |
Snap-on, Inc. (Machinery) | 3,869 | 535,895 | |
Southwest Airlines Co. (Airlines) | 11,740 | 401,273 | |
Spirit AeroSystems Holdings, Inc. Class A (Aerospace & Defense) | 2,001 | 47,904 | |
Teledyne Technologies, Inc. (Aerospace & Defense) | (a) | 142 | 44,155 |
Toro Co. / The (Machinery) | 1,890 | 125,383 | |
Trex Co., Inc. (Building Products) | (a) | 437 | 56,841 |
Union Pacific Corp. (Road & Rail) | 9,580 | 1,619,691 | |
United Parcel Service, Inc. Class B (Air Freight & Logistics) | 14,673 | 1,631,344 | |
W.W. Grainger, Inc. (Trading Companies & Distributors) | 1,011 | 317,616 | |
Xylem, Inc. (Machinery) | 13,721 | 891,316 | |
| 29,942,556 | |||
| Information Technology–27.4% | |||
Accenture PLC Class A (IT Svs.) | 2,165 | 464,869 | |
Adobe, Inc. (Software) | (a) | 7,660 | 3,334,475 |
Analog Devices, Inc. (Semiconductors & Equip.) | 450 | 55,188 | |
Apple, Inc. (Tech. Hardware, Storage & Periph.) | 54,650 | 19,936,320 | |
Applied Materials, Inc. (Semiconductors & Equip.) | 43,019 | 2,600,499 | |
Atlassian Corp. PLC Class A (Software) | (a) | 2,239 | 403,625 |
Automatic Data Processing, Inc. (IT Svs.) | 24,002 | 3,573,658 | |
Avnet, Inc. (Electronic Equip., Instr. & Comp.) | 11,684 | 325,808 | |
Cirrus Logic, Inc. (Semiconductors & Equip.) | (a) | 9,792 | 604,950 |
Cisco Systems, Inc. (Communications Equip.) | 141,730 | 6,610,287 | |
Citrix Systems, Inc. (Software) | 4,294 | 635,126 | |
Cloudflare, Inc. Class A (Software) | (a) | 10,664 | 383,371 |
Cognizant Technology Solutions Corp. Class A (IT Svs.) | 3,260 | 185,233 | |
DocuSign, Inc. (Software) | (a) | 2,311 | 397,977 |
DXC Technology Co. (IT Svs.) | 2,208 | 36,432 | |
Fiserv, Inc. (IT Svs.) | (a) | 17,835 | 1,741,053 |
| Common Stocks (Continued) | Shares | Value | |
| Information Technology (continued) | |||
HP, Inc. (Tech. Hardware, Storage & Periph.) | 21,665 | $ 377,621 | |
Intel Corp. (Semiconductors & Equip.) | 105,868 | 6,334,082 | |
Intuit, Inc. (Software) | 7,774 | 2,302,581 | |
Lam Research Corp. (Semiconductors & Equip.) | 1,142 | 369,391 | |
Mastercard, Inc. Class A (IT Svs.) | 9,378 | 2,773,075 | |
Microsoft Corp. (Software) | 131,225 | 26,705,600 | |
Motorola Solutions, Inc. (Communications Equip.) | 1,052 | 147,417 | |
National Instruments Corp. (Electronic Equip., Instr. & Comp.) | 19,604 | 758,871 | |
NetApp, Inc. (Tech. Hardware, Storage & Periph.) | 10,063 | 446,495 | |
NVIDIA Corp. (Semiconductors & Equip.) | 16,792 | 6,379,449 | |
Paychex, Inc. (IT Svs.) | 22,504 | 1,704,678 | |
PayPal Holdings, Inc. (IT Svs.) | (a) | 28,950 | 5,043,958 |
RingCentral, Inc. Class A (Software) | (a) | 1,446 | 412,124 |
salesforce.com, Inc. (Software) | (a) | 5,682 | 1,064,409 |
ServiceNow, Inc. (Software) | (a) | 198 | 80,202 |
Skyworks Solutions, Inc. (Semiconductors & Equip.) | 1,582 | 202,274 | |
Slack Technologies, Inc. Class A (Software) | (a) | 11,090 | 344,788 |
Smartsheet, Inc. Class A (Software) | (a) | 6,915 | 352,112 |
TE Connectivity Ltd. (Electronic Equip., Instr. & Comp.) | 683 | 55,699 | |
Texas Instruments, Inc. (Semiconductors & Equip.) | 12,816 | 1,627,247 | |
Visa, Inc. (IT Svs.) | 22,780 | 4,400,413 | |
VMware, Inc. Class A (Software) | (a) | 3,504 | 542,629 |
Xilinx, Inc. (Semiconductors & Equip.) | 1,774 | 174,544 | |
Zoom Video Communications, Inc. Class A (Software) | (a) | 1,554 | 394,001 |
Zscaler, Inc. (Software) | (a) | 3,529 | 386,425 |
| 104,668,956 | |||
| Materials–2.4% | |||
Air Products & Chemicals, Inc. (Chemicals) | 2,435 | 587,955 | |
Alcoa Corp. (Metals & Mining) | (a) | 29,001 | 325,971 |
Domtar Corp. (Paper & Forest Products) | 19,337 | 408,204 | |
DuPont de Nemours, Inc. (Chemicals) | 1,533 | 81,448 | |
Ecolab, Inc. (Chemicals) | 17,889 | 3,559,017 | |
FMC Corp. (Chemicals) | 1,209 | 120,441 | |
Freeport-McMoRan, Inc. (Metals & Mining) | 4,590 | 53,106 | |
Linde PLC (Chemicals) | 4,057 | 860,530 | |
Mosaic Co. / The (Chemicals) | 32,728 | 409,427 | |
PPG Industries, Inc. (Chemicals) | 7,636 | 809,874 | |
Reliance Steel & Aluminum Co. (Metals & Mining) | 5,644 | 535,785 | |
Sherwin-Williams Co. / The (Chemicals) | 1,578 | 911,848 | |
Steel Dynamics, Inc. (Metals & Mining) | 2,589 | 67,547 | |
Summit Materials, Inc. Class A (Construction Materials) | (a) | 13,083 | 210,375 |
Westrock Co. (Containers & Packaging) | 4,446 | 125,644 | |
| 9,067,172 | |||
| Real Estate–2.3% | |||
Alexandria Real Estate Equities, Inc. (Equity REIT) | 1,495 | 242,564 | |
American Tower Corp. (Equity REIT) | 6,704 | 1,733,252 | |
AvalonBay Communities, Inc. (Equity REIT) | 2,933 | 453,559 | |
Boston Properties, Inc. (Equity REIT) | 18,281 | 1,652,237 | |
Camden Property Trust (Equity REIT) | 1,377 | 125,610 | |
Douglas Emmett, Inc. (Equity REIT) | 4,084 | 125,215 | |
Equity Residential (Equity REIT) | 24,776 | 1,457,324 | |
Federal Realty Investment Trust (Equity REIT) | 728 | 62,033 | |
Host Hotels & Resorts, Inc. (Equity REIT) | 29,393 | 317,150 | |
Macerich Co. / The (Equity REIT) | 5,843 | 52,412 | |
Park Hotels & Resorts, Inc. (Equity REIT) | 21,581 | 213,436 | |
Prologis, Inc. (Equity REIT) | 21,059 | 1,965,437 |
| Ohio National Fund, Inc. | ON BlackRock Advantage Large Cap Core Portfolio (Continued) |
| Schedule of Investments | June 30, 2020 (Unaudited) |
| Common Stocks (Continued) | Shares | Value | |
| Real Estate (continued) | |||
QTS Realty Trust, Inc. Class A (Equity REIT) | 1,411 | $ 90,431 | |
Realty Income Corp. (Equity REIT) | 7,870 | 468,265 | |
| 8,958,925 | |||
| Utilities–3.1% | |||
Alliant Energy Corp. (Electric Utilities) | 9,600 | 459,264 | |
Ameren Corp. (Multi-Utilities) | 16,630 | 1,170,087 | |
American Water Works Co., Inc. (Water Utilities) | 5,142 | 661,570 | |
Avangrid, Inc. (Electric Utilities) | 1,555 | 65,279 | |
CMS Energy Corp. (Multi-Utilities) | 12,993 | 759,051 | |
Consolidated Edison, Inc. (Multi-Utilities) | 8,299 | 596,947 | |
Eversource Energy (Electric Utilities) | 14,618 | 1,217,241 | |
Exelon Corp. (Electric Utilities) | 6,272 | 227,611 | |
IDACORP, Inc. (Electric Utilities) | 3,221 | 281,419 | |
NextEra Energy, Inc. (Electric Utilities) | 17,583 | 4,222,909 | |
Pinnacle West Capital Corp. (Electric Utilities) | 5,340 | 391,368 | |
Public Service Enterprise Group, Inc. (Multi-Utilities) | 3,175 | 156,083 | |
Southwest Gas Holdings, Inc. (Gas Utilities) | 2,266 | 156,467 |
| Common Stocks (Continued) | Shares | Value | |
| Utilities (continued) | |||
UGI Corp. (Gas Utilities) | 5,856 | $ 186,221 | |
Xcel Energy, Inc. (Electric Utilities) | 20,600 | 1,287,500 | |
| 11,839,017 | |||
Total Common Stocks (Cost $346,241,643) | $373,960,527 |
| Rights –0.0% | Quantity | Value | |
| Health Care–0.0% | |||
Bristol-Myers Squibb Co. (Pharmaceuticals) | (a) | 11,619 | $ 41,596 |
Total Rights (Cost $24,749) | $ 41,596 |
| Money Market Funds–2.8% | Shares | Value | |
State Street Institutional Liquid Reserves Fund Institutional Class, 0.346% | (b) | 10,746,593 | $ 10,750,891 |
Total Money Market Funds (Cost $10,750,592) | $ 10,750,891 | ||
Total Investments – 100.7% (Cost $357,016,984) | (c) | $384,753,014 | |
Liabilities in Excess of Other Assets – (0.7)% | (d) | (2,676,868) | |
| Net Assets – 100.0% | $382,076,146 |
Percentages are stated as a percent of net assets. |
| Abbreviations: | ||
| ADR: | American Depositary Receipts | |
| Footnotes: | ||
| (a) | Non-income producing security. | |
| (b) | Rate represents the seven-day yield at June 30, 2020. | |
| (c) | Represents cost for financial reporting purposes, which may differ from cost basis for federal income tax purposes. See also Note 8 of the Notes to Financial Statements. | |
| (d) | Includes $984,000 of cash pledged as collateral for the futures contracts outstanding at June 30, 2020. See also the following Schedule of Open Futures Contracts. | |
| Schedule of Open Futures Contracts | June 30, 2020 (Unaudited) |
| Description | Number of contracts | Expiration Date | Notional Amount | Value | Unrealized Appreciation (Depreciation) | Variation Margin Receivable (Payable) | ||||||
| CME E-mini S&P 500 Index - Long | 82 | September 18, 2020 | $12,405,456 | $12,669,820 | $264,364 | $172,480 |
| Ohio National Fund, Inc. | ON BlackRock Advantage Small Cap Growth Portfolio (Unaudited) |
| Average Annual returns | |
| One year | 5.19% |
| Five years | 6.15% |
| Ten years | 11.53% |
| (1) | The Portfolio’s composition is subject to change. Holdings and weightings are as of June 30, 2020. |
| Ohio National Fund, Inc. | ON BlackRock Advantage Small Cap Growth Portfolio (Unaudited) (Continued) |

| Portfolio Composition as of June 30, 2020 (1) | |
| % of Net Assets | |
| Common Stocks (4) | 99.3 |
| Rights (4) | 0.0 |
| Money Market Funds Less Net Liabilities | 0.7 |
| 100.0 | |
| Top 10 Portfolio Holdings as of June 30, 2020 (1) (2) (3) | ||
| % of Net Assets | ||
| 1. | QTS Realty Trust, Inc. Class A | 1.0 |
| 2. | Qualys, Inc. | 0.9 |
| 3. | LCI Industries | 0.7 |
| 4. | Rapid7, Inc. | 0.7 |
| 5. | Generac Holdings, Inc. | 0.7 |
| 6. | SPS Commerce, Inc. | 0.7 |
| 7. | Ultragenyx Pharmaceutical, Inc. | 0.7 |
| 8. | First Industrial Realty Trust, Inc. | 0.6 |
| 9. | ESCO Technologies, Inc. | 0.6 |
| 10. | Cirrus Logic, Inc. | 0.6 |
| (1) | Composition of Portfolio subject to change. | |
| (2) | Short-term investments have been excluded from the list of Top 10 Portfolio Holdings. | |
| (3) | Top 10 Portfolio Holdings is presented at an individual security level. Total investment exposure by issuer may be higher. | |
| (4) | Sectors (Common Stocks, Rights): | |
| % of Net Assets | |
| Health Care | 33.7 |
| Information Technology | 19.8 |
| Industrials | 14.6 |
| Consumer Discretionary | 12.8 |
| Financials | 4.4 |
| Real Estate | 3.6 |
| Consumer Staples | 3.5 |
| Communication Services | 2.7 |
| Materials | 2.7 |
| Utilities | 1.4 |
| Energy | 0.1 |
| 99.3 |
| Ohio National Fund, Inc. | ON BlackRock Advantage Small Cap Growth Portfolio |
| Schedule of Investments | June 30, 2020 (Unaudited) |
| Common Stocks–99.3% | Shares | Value | |
| Communication Services–2.7% | |||
Bandwidth, Inc. Class A (Diversified Telecom. Svs.) | (a) | 1,795 | $ 227,965 |
Cardlytics, Inc. (Media) | (a) | 3,274 | 229,115 |
Cargurus, Inc. (Interactive Media & Svs.) | (a) | 24,595 | 623,483 |
Cogent Communications Holdings, Inc. (Diversified Telecom. Svs.) | 9,628 | 744,822 | |
EverQuote, Inc. Class A (Interactive Media & Svs.) | (a) | 3,933 | 228,743 |
Glu Mobile, Inc. (Entertainment) | (a) | 19,352 | 179,393 |
IDT Corp. Class B (Diversified Telecom. Svs.) | (a) | 8,567 | 55,943 |
IMAX Corp. (Entertainment) | (a) | 18,381 | 206,051 |
MSG Networks, Inc. Class A (Media) | (a) | 12,114 | 120,534 |
Ooma, Inc. (Diversified Telecom. Svs.) | (a) | 7,140 | 117,667 |
QuinStreet, Inc. (Interactive Media & Svs.) | (a) | 18,861 | 197,286 |
Shenandoah Telecommunications Co. (Wireless Telecom. Svs.) | 7,200 | 354,888 | |
TechTarget, Inc. (Media) | (a) | 12,214 | 366,787 |
TrueCar, Inc. (Interactive Media & Svs.) | (a) | 22,630 | 58,386 |
Vonage Holdings Corp. (Diversified Telecom. Svs.) | (a) | 22,155 | 222,879 |
Yelp, Inc. (Interactive Media & Svs.) | (a) | 14,817 | 342,717 |
ZoomInfo Technologies, Inc. Class A (Interactive Media & Svs.) | (a) | 12,174 | 621,239 |
| 4,897,898 | |||
| Consumer Discretionary–12.8% | |||
1-800-Flowers.com, Inc. Class A (Internet & Direct Marketing Retail) | (a) | 18,251 | 365,385 |
Aaron's, Inc. (Specialty Retail) | 5,983 | 271,628 | |
America's Car-Mart, Inc. (Specialty Retail) | (a) | 1,448 | 127,236 |
Asbury Automotive Group, Inc. (Specialty Retail) | (a) | 6,256 | 483,776 |
Big Lots, Inc. (Multiline Retail) | 8,980 | 377,160 | |
BJ's Restaurants, Inc. (Hotels, Restaurants & Leisure) | 9,908 | 207,473 | |
Boyd Gaming Corp. (Hotels, Restaurants & Leisure) | 7,489 | 156,520 | |
Brinker International, Inc. (Hotels, Restaurants & Leisure) | 8,754 | 210,096 | |
Camping World Holdings, Inc. Class A (Specialty Retail) | 7,443 | 202,152 | |
Cheesecake Factory, Inc. / The (Hotels, Restaurants & Leisure) | 15,994 | 366,582 | |
Chegg, Inc. (Diversified Consumer Svs.) | (a) | 9,714 | 653,364 |
Children's Place, Inc. / The (Specialty Retail) | 2,809 | 105,113 | |
Churchill Downs, Inc. (Hotels, Restaurants & Leisure) | 7,779 | 1,035,774 | |
Chuy's Holdings, Inc. (Hotels, Restaurants & Leisure) | (a) | 6,554 | 97,524 |
Core-Mark Holding Co., Inc. (Distributors) | 11,254 | 280,844 | |
Cracker Barrel Old Country Store, Inc. (Hotels, Restaurants & Leisure) | 3,781 | 419,351 | |
Crocs, Inc. (Textiles, Apparel & Luxury Goods) | (a) | 20,230 | 744,869 |
Dave & Buster's Entertainment, Inc. (Hotels, Restaurants & Leisure) | 5,909 | 78,767 | |
Deckers Outdoor Corp. (Textiles, Apparel & Luxury Goods) | (a) | 3,628 | 712,503 |
Denny's Corp. (Hotels, Restaurants & Leisure) | (a) | 16,339 | 165,024 |
Dorman Products, Inc. (Auto Components) | (a) | 316 | 21,194 |
Eldorado Resorts, Inc. (Hotels, Restaurants & Leisure) | (a) | 15,144 | 606,669 |
Everi Holdings, Inc. (Hotels, Restaurants & Leisure) | (a) | 9,639 | 49,737 |
Fox Factory Holding Corp. (Auto Components) | (a) | 7,074 | 584,383 |
Helen of Troy Ltd. (Household Durables) | (a) | 4,192 | 790,443 |
Hilton Grand Vacations, Inc. (Hotels, Restaurants & Leisure) | (a) | 20,714 | 404,959 |
iRobot Corp. (Household Durables) | (a) | 4,160 | 349,024 |
La-Z-Boy, Inc. (Household Durables) | 3,634 | 98,336 |
| Common Stocks (Continued) | Shares | Value | |
| Consumer Discretionary (continued) | |||
LCI Industries (Auto Components) | 11,519 | $ 1,324,455 | |
LGI Homes, Inc. (Household Durables) | (a) | 3,370 | 296,661 |
Lithia Motors, Inc. Class A (Specialty Retail) | 2,249 | 340,341 | |
Malibu Boats, Inc. Class A (Leisure Products) | (a) | 4,616 | 239,801 |
MarineMax, Inc. (Specialty Retail) | (a) | 10,934 | 244,812 |
MDC Holdings, Inc. (Household Durables) | 28,948 | 1,033,444 | |
Monro, Inc. (Specialty Retail) | 2,556 | 140,427 | |
National Vision Holdings, Inc. (Specialty Retail) | (a) | 10,506 | 320,643 |
Overstock.com, Inc. (Internet & Direct Marketing Retail) | (a) | 8,093 | 230,084 |
Oxford Industries, Inc. (Textiles, Apparel & Luxury Goods) | 7,286 | 320,657 | |
Papa John's International, Inc. (Hotels, Restaurants & Leisure) | 2,625 | 208,451 | |
Penn National Gaming, Inc. (Hotels, Restaurants & Leisure) | (a) | 16,343 | 499,115 |
Planet Fitness, Inc. Class A (Hotels, Restaurants & Leisure) | (a) | 1,700 | 102,969 |
RealReal, Inc. / The (Internet & Direct Marketing Retail) | (a) | 7,735 | 98,931 |
Red Rock Resorts, Inc. Class A (Hotels, Restaurants & Leisure) | 9,427 | 102,849 | |
RH (Specialty Retail) | (a) | 3,851 | 958,514 |
Ruth's Hospitality Group, Inc. (Hotels, Restaurants & Leisure) | 5,627 | 45,916 | |
Scientific Games Corp. (Hotels, Restaurants & Leisure) | (a) | 13,632 | 210,751 |
Shake Shack, Inc. Class A (Hotels, Restaurants & Leisure) | (a) | 2,545 | 134,834 |
Shutterstock, Inc. (Internet & Direct Marketing Retail) | 8,208 | 287,034 | |
Sleep Number Corp. (Specialty Retail) | (a) | 3,682 | 153,318 |
Sonic Automotive, Inc. Class A (Specialty Retail) | 4,241 | 135,330 | |
Sonos, Inc. (Household Durables) | (a) | 4,175 | 61,080 |
Stamps.com, Inc. (Internet & Direct Marketing Retail) | (a) | 2,420 | 444,530 |
Standard Motor Products, Inc. (Auto Components) | 2,770 | 114,124 | |
Steven Madden Ltd. (Textiles, Apparel & Luxury Goods) | 32,442 | 800,993 | |
Stitch Fix, Inc. Class A (Internet & Direct Marketing Retail) | (a) | 5,611 | 139,938 |
Strategic Education, Inc. (Diversified Consumer Svs.) | 4,989 | 766,560 | |
Texas Roadhouse, Inc. (Hotels, Restaurants & Leisure) | 19,134 | 1,005,874 | |
TopBuild Corp. (Household Durables) | (a) | 3,312 | 376,806 |
Visteon Corp. (Auto Components) | (a) | 7,000 | 479,500 |
W.W. International, Inc. (Diversified Consumer Svs.) | (a) | 5,389 | 136,773 |
Wingstop, Inc. (Hotels, Restaurants & Leisure) | 7,068 | 982,240 | |
YETI Holdings, Inc. (Leisure Products) | (a) | 9,324 | 398,414 |
| 23,102,055 | |||
| Consumer Staples–3.5% | |||
BJ's Wholesale Club Holdings, Inc. (Food & Staples Retailing) | (a) | 10,478 | 390,515 |
Boston Beer Co., Inc. / The Class A (Beverages) | (a) | 1,086 | 582,802 |
Calavo Growers, Inc. (Food Products) | 13,288 | 835,948 | |
Freshpet, Inc. (Food Products) | (a) | 12,162 | 1,017,473 |
J & J Snack Foods Corp. (Food Products) | 7,425 | 943,940 | |
John B Sanfilippo & Son, Inc. (Food Products) | 4,559 | 389,019 | |
Lancaster Colony Corp. (Food Products) | 3,619 | 560,909 | |
Medifast, Inc. (Personal Products) | 1,944 | 269,769 | |
National Beverage Corp. (Beverages) | (a) | 5,284 | 322,430 |
| Ohio National Fund, Inc. | ON BlackRock Advantage Small Cap Growth Portfolio (Continued) |
| Schedule of Investments | June 30, 2020 (Unaudited) |
| Common Stocks (Continued) | Shares | Value | |
| Consumer Staples (continued) | |||
Performance Food Group Co. (Food & Staples Retailing) | (a) | 9,654 | $ 281,318 |
Sprouts Farmers Market, Inc. (Food & Staples Retailing) | (a) | 8,800 | 225,192 |
USANA Health Sciences, Inc. (Personal Products) | (a) | 907 | 66,601 |
Vector Group Ltd. (Tobacco) | 16,507 | 166,060 | |
WD-40 Co. (Household Products) | 1,642 | 325,609 | |
| 6,377,585 | |||
| Energy–0.1% | |||
Evolution Petroleum Corp. (Oil, Gas & Consumable Fuels) | 31,209 | 87,385 | |
Smart Sand, Inc. (Energy Equip. & Svs.) | (a) | 47,289 | 49,654 |
| 137,039 | |||
| Financials–4.4% | |||
Ares Management Corp. Class A (Capital Markets) | 8,848 | 351,266 | |
Artisan Partners Asset Management, Inc. Class A (Capital Markets) | 11,808 | 383,760 | |
BancFirst Corp. (Banks) | 6,497 | 263,583 | |
BankFinancial Corp. (Banks) | 5,622 | 47,225 | |
Cohen & Steers, Inc. (Capital Markets) | 3,246 | 220,890 | |
eHealth, Inc. (Insurance) | (a) | 4,530 | 445,027 |
Federated Hermes, Inc. (Capital Markets) | 14,038 | 332,701 | |
FedNat Holding Co. (Insurance) | 4,051 | 44,845 | |
First Financial Bankshares, Inc. (Banks) | 22,230 | 642,225 | |
First Savings Financial Group, Inc. (Banks) | 2,205 | 95,543 | |
FirstCash, Inc. (Consumer Finance) | 14,155 | 955,179 | |
Focus Financial Partners, Inc. Class A (Capital Markets) | (a) | 3,789 | 125,226 |
Green Dot Corp. Class A (Consumer Finance) | (a) | 3,595 | 176,443 |
Hamilton Lane, Inc. Class A (Capital Markets) | 7,226 | 486,816 | |
Houlihan Lokey, Inc. (Capital Markets) | 4,003 | 222,727 | |
Kinsale Capital Group, Inc. (Insurance) | 4,045 | 627,824 | |
LendingTree, Inc. (Consumer Finance) | (a) | 184 | 53,273 |
Main Street Capital Corp. (Capital Markets) | 110 | 3,424 | |
Moelis & Co. Class A (Capital Markets) | 10,504 | 327,305 | |
National General Holdings Corp. (Insurance) | 12,012 | 259,579 | |
Pacific Mercantile Bancorp (Banks) | (a) | 18,854 | 69,006 |
Palomar Holdings, Inc. (Insurance) | (a) | 2,397 | 205,567 |
Republic First Bancorp, Inc. (Banks) | (a) | 50,682 | 123,664 |
Riverview Bancorp, Inc. (Thrifts & Mortgage Finance) | 1,100 | 6,215 | |
RLI Corp. (Insurance) | 6,739 | 553,272 | |
TriState Capital Holdings, Inc. (Banks) | (a) | 15,182 | 238,509 |
Trupanion, Inc. (Insurance) | (a) | 7,113 | 303,654 |
United Insurance Holdings Corp. (Insurance) | 12,756 | 99,752 | |
Virtus Investment Partners, Inc. (Capital Markets) | 1,764 | 205,135 | |
WisdomTree Investments, Inc. (Capital Markets) | 44,364 | 153,943 | |
| 8,023,578 | |||
| Health Care–33.7% | |||
ACADIA Pharmaceuticals, Inc. (Biotechnology) | (a) | 7,081 | 343,216 |
Acceleron Pharma, Inc. (Biotechnology) | (a) | 3,487 | 332,206 |
Adverum Biotechnologies, Inc. (Biotechnology) | (a) | 6,755 | 141,044 |
Aerie Pharmaceuticals, Inc. (Pharmaceuticals) | (a) | 7,377 | 108,885 |
Agenus, Inc. (Biotechnology) | (a) | 98,406 | 386,736 |
Aimmune Therapeutics, Inc. (Biotechnology) | (a) | 5,844 | 97,653 |
Akcea Therapeutics, Inc. (Biotechnology) | (a) | 2,274 | 31,154 |
Akebia Therapeutics, Inc. (Biotechnology) | (a) | 25,418 | 345,176 |
Alector, Inc. (Biotechnology) | (a) | 13,964 | 341,280 |
Allakos, Inc. (Biotechnology) | (a) | 1,389 | 99,814 |
Allogene Therapeutics, Inc. (Biotechnology) | (a) | 8,727 | 373,690 |
Amarin Corp. PLC – ADR (Biotechnology) | (a) | 17,101 | 118,339 |
| Common Stocks (Continued) | Shares | Value | |
| Health Care (continued) | |||
Amedisys, Inc. (Health Care Providers & Svs.) | (a) | 1,883 | $ 373,851 |
Amicus Therapeutics, Inc. (Biotechnology) | (a) | 35,768 | 539,381 |
AMN Healthcare Services, Inc. (Health Care Providers & Svs.) | (a) | 10,297 | 465,836 |
Amneal Pharmaceuticals, Inc. (Pharmaceuticals) | (a) | 61,351 | 292,031 |
Amphastar Pharmaceuticals, Inc. (Pharmaceuticals) | (a) | 32,280 | 725,009 |
Apellis Pharmaceuticals, Inc. (Biotechnology) | (a) | 9,947 | 324,869 |
Aptinyx, Inc. (Biotechnology) | (a) | 28,141 | 117,348 |
Arcturus Therapeutics Holdings, Inc. (Biotechnology) | (a) | 2,547 | 119,047 |
Arcus Biosciences, Inc. (Biotechnology) | (a) | 8,758 | 216,673 |
Arena Pharmaceuticals, Inc. (Biotechnology) | (a) | 2,752 | 173,238 |
Arrowhead Pharmaceuticals, Inc. (Biotechnology) | (a) | 19,362 | 836,245 |
Arvinas, Inc. (Pharmaceuticals) | (a) | 2,154 | 72,245 |
Atara Biotherapeutics, Inc. (Biotechnology) | (a) | 5,726 | 83,428 |
Athenex, Inc. (Biotechnology) | (a) | 11,735 | 161,474 |
Athersys, Inc. (Biotechnology) | (a) | 60,257 | 166,309 |
AtriCure, Inc. (Health Care Equip. & Supplies) | (a) | 7,974 | 358,431 |
Atrion Corp. (Health Care Equip. & Supplies) | 225 | 143,327 | |
Axsome Therapeutics, Inc. (Pharmaceuticals) | (a) | 1,920 | 157,978 |
Beam Therapeutics, Inc. (Biotechnology) | (a) | 5,710 | 159,880 |
BioCryst Pharmaceuticals, Inc. (Biotechnology) | (a) | 72,492 | 345,424 |
BioDelivery Sciences International, Inc. (Pharmaceuticals) | (a) | 18,702 | 81,541 |
Biohaven Pharmaceutical Holding Co. Ltd. (Biotechnology) | (a) | 5,560 | 406,492 |
BioTelemetry, Inc. (Health Care Providers & Svs.) | (a) | 8,597 | 388,498 |
Blueprint Medicines Corp. (Biotechnology) | (a) | 11,779 | 918,762 |
Bridgebio Pharma, Inc. (Biotechnology) | (a) | 16,735 | 545,728 |
Calithera Biosciences, Inc. (Biotechnology) | (a) | 20,802 | 109,835 |
Cara Therapeutics, Inc. (Pharmaceuticals) | (a) | 8,301 | 141,947 |
Cardiovascular Systems, Inc. (Health Care Equip. & Supplies) | (a) | 12,158 | 383,585 |
CareDx, Inc. (Biotechnology) | (a) | 6,031 | 213,678 |
Castle Biosciences, Inc. (Biotechnology) | (a) | 4,170 | 157,167 |
Castlight Health, Inc. Class B (Health Care Technology) | (a) | 39,467 | 32,758 |
Cerus Corp. (Health Care Equip. & Supplies) | (a) | 20,887 | 137,854 |
ChemoCentryx, Inc. (Biotechnology) | (a) | 4,239 | 243,912 |
Coherus Biosciences, Inc. (Biotechnology) | (a) | 22,584 | 403,350 |
CONMED Corp. (Health Care Equip. & Supplies) | 1,278 | 92,003 | |
Corcept Therapeutics, Inc. (Pharmaceuticals) | (a) | 30,175 | 507,543 |
CorVel Corp. (Health Care Providers & Svs.) | (a) | 2,208 | 156,525 |
Crinetics Pharmaceuticals, Inc. (Biotechnology) | (a) | 2,601 | 45,570 |
Cue Biopharma, Inc. (Biotechnology) | (a) | 9,963 | 244,193 |
Cytokinetics, Inc. (Biotechnology) | (a) | 11,213 | 264,290 |
CytomX Therapeutics, Inc. (Biotechnology) | (a) | 19,385 | 161,477 |
Deciphera Pharmaceuticals, Inc. (Biotechnology) | (a) | 6,692 | 399,646 |
Denali Therapeutics, Inc. (Biotechnology) | (a) | 8,753 | 211,648 |
Dynavax Technologies Corp. (Biotechnology) | (a) | 27,338 | 242,488 |
Eagle Pharmaceuticals, Inc. (Biotechnology) | (a) | 4,790 | 229,824 |
Editas Medicine, Inc. (Biotechnology) | (a) | 14,883 | 440,239 |
Emergent BioSolutions, Inc. (Biotechnology) | (a) | 13,121 | 1,037,609 |
Enanta Pharmaceuticals, Inc. (Biotechnology) | (a) | 8,707 | 437,178 |
Ensign Group, Inc. / The (Health Care Providers & Svs.) | 13,589 | 568,700 | |
Epizyme, Inc. (Biotechnology) | (a) | 9,867 | 158,464 |
Evolent Health, Inc. Class A (Health Care Technology) | (a) | 15,103 | 107,533 |
Exact Sciences Corp. (Biotechnology) | (a) | 2,070 | 179,966 |
Fate Therapeutics, Inc. (Biotechnology) | (a) | 14,554 | 499,348 |
| Ohio National Fund, Inc. | ON BlackRock Advantage Small Cap Growth Portfolio (Continued) |
| Schedule of Investments | June 30, 2020 (Unaudited) |
| Common Stocks (Continued) | Shares | Value | |
| Health Care (continued) | |||
FibroGen, Inc. (Biotechnology) | (a) | 19,905 | $ 806,750 |
Flexion Therapeutics, Inc. (Biotechnology) | (a) | 10,954 | 144,045 |
GenMark Diagnostics, Inc. (Health Care Equip. & Supplies) | (a) | 8,558 | 125,888 |
Glaukos Corp. (Health Care Equip. & Supplies) | (a) | 7,877 | 302,634 |
Global Blood Therapeutics, Inc. (Biotechnology) | (a) | 4,625 | 291,976 |
Globus Medical, Inc. Class A (Health Care Equip. & Supplies) | (a) | 20,318 | 969,372 |
Gossamer Bio, Inc. (Biotechnology) | (a) | 4,355 | 56,615 |
Haemonetics Corp. (Health Care Equip. & Supplies) | (a) | 10,256 | 918,527 |
Halozyme Therapeutics, Inc. (Biotechnology) | (a) | 38,359 | 1,028,405 |
Harpoon Therapeutics, Inc. (Biotechnology) | (a) | 16,708 | 277,353 |
Health Catalyst, Inc. (Health Care Technology) | (a) | 3,982 | 116,155 |
HealthEquity, Inc. (Health Care Providers & Svs.) | (a) | 15,080 | 884,744 |
Heron Therapeutics, Inc. (Biotechnology) | (a) | 15,285 | 224,842 |
HMS Holdings Corp. (Health Care Technology) | (a) | 10,720 | 347,221 |
Immunomedics, Inc. (Biotechnology) | (a) | 6,755 | 239,397 |
Innoviva, Inc. (Pharmaceuticals) | (a) | 32,438 | 453,483 |
Inogen, Inc. (Health Care Equip. & Supplies) | (a) | 5,863 | 208,254 |
Inovalon Holdings, Inc. Class A (Health Care Technology) | (a) | 25,733 | 495,618 |
Inovio Pharmaceuticals, Inc. (Biotechnology) | (a) | 16,686 | 449,688 |
Insmed, Inc. (Biotechnology) | (a) | 12,645 | 348,243 |
Inspire Medical Systems, Inc. (Health Care Technology) | (a) | 5,651 | 491,750 |
Integer Holdings Corp. (Health Care Equip. & Supplies) | (a) | 6,797 | 496,521 |
Intellia Therapeutics, Inc. (Biotechnology) | (a) | 22,238 | 467,443 |
Intercept Pharmaceuticals, Inc. (Biotechnology) | (a) | 7,405 | 354,774 |
Intersect ENT, Inc. (Pharmaceuticals) | (a) | 19,785 | 267,889 |
Intra-Cellular Therapies, Inc. (Pharmaceuticals) | (a) | 6,743 | 173,093 |
Invitae Corp. (Biotechnology) | (a) | 17,835 | 540,222 |
Iovance Biotherapeutics, Inc. (Biotechnology) | (a) | 11,991 | 329,153 |
iRadimed Corp. (Health Care Equip. & Supplies) | (a) | 4,808 | 111,594 |
iRhythm Technologies, Inc. (Health Care Equip. & Supplies) | (a) | 4,803 | 556,620 |
Ironwood Pharmaceuticals, Inc. (Biotechnology) | (a) | 54,433 | 561,749 |
Joint Corp. / The (Health Care Providers & Svs.) | (a) | 5,943 | 90,750 |
KalVista Pharmaceuticals, Inc. (Biotechnology) | (a) | 3,078 | 37,244 |
Karuna Therapeutics, Inc. (Biotechnology) | (a) | 1,354 | 150,917 |
Karyopharm Therapeutics, Inc. (Biotechnology) | (a) | 9,483 | 179,608 |
Kodiak Sciences, Inc. (Biotechnology) | (a) | 3,585 | 194,020 |
LeMaitre Vascular, Inc. (Health Care Equip. & Supplies) | 4,666 | 123,182 | |
LHC Group, Inc. (Health Care Providers & Svs.) | (a) | 5,017 | 874,563 |
Ligand Pharmaceuticals, Inc. (Biotechnology) | (a) | 3,964 | 443,373 |
LivaNova PLC (Health Care Equip. & Supplies) | (a) | 5,246 | 252,490 |
Livongo Health, Inc. (Health Care Technology) | (a) | 3,781 | 284,293 |
Luminex Corp. (Life Sciences Tools & Svs.) | 8,482 | 275,919 | |
MacroGenics, Inc. (Biotechnology) | (a) | 8,789 | 245,389 |
Magellan Health, Inc. (Health Care Providers & Svs.) | (a) | 1,791 | 130,707 |
Medpace Holdings, Inc. (Life Sciences Tools & Svs.) | (a) | 7,746 | 720,533 |
MeiraGTx Holdings PLC (Biotechnology) | (a) | 1,192 | 14,924 |
Merit Medical Systems, Inc. (Health Care Equip. & Supplies) | (a) | 10,544 | 481,334 |
Mirati Therapeutics, Inc. (Biotechnology) | (a) | 5,261 | 600,648 |
| Common Stocks (Continued) | Shares | Value | |
| Health Care (continued) | |||
Momenta Pharmaceuticals, Inc. (Biotechnology) | (a) | 21,889 | $ 728,247 |
Morphic Holding, Inc. (Biotechnology) | (a) | 4,121 | 111,473 |
MyoKardia, Inc. (Pharmaceuticals) | (a) | 5,683 | 549,091 |
NanoString Technologies, Inc. (Life Sciences Tools & Svs.) | (a) | 7,675 | 225,261 |
Natera, Inc. (Biotechnology) | (a) | 11,505 | 573,639 |
Neogen Corp. (Health Care Equip. & Supplies) | (a) | 6,358 | 493,381 |
NeoGenomics, Inc. (Life Sciences Tools & Svs.) | (a) | 27,009 | 836,739 |
Nevro Corp. (Health Care Equip. & Supplies) | (a) | 5,473 | 653,859 |
NextGen Healthcare, Inc. (Health Care Technology) | (a) | 15,479 | 169,959 |
NGM Biopharmaceuticals, Inc. (Pharmaceuticals) | (a) | 19,905 | 392,925 |
Novavax, Inc. (Biotechnology) | (a) | 3,700 | 308,395 |
Novocure Ltd. (Health Care Equip. & Supplies) | (a) | 12,355 | 732,651 |
NuVasive, Inc. (Health Care Equip. & Supplies) | (a) | 5,319 | 296,056 |
Omeros Corp. (Pharmaceuticals) | (a) | 9,141 | 134,556 |
Omnicell, Inc. (Health Care Technology) | (a) | 10,729 | 757,682 |
OraSure Technologies, Inc. (Health Care Equip. & Supplies) | (a) | 10,372 | 120,626 |
Pacific Biosciences of California, Inc. (Life Sciences Tools & Svs.) | (a) | 22,046 | 76,059 |
Pacira BioSciences, Inc. (Pharmaceuticals) | (a) | 15,329 | 804,313 |
PetIQ, Inc. (Health Care Providers & Svs.) | (a) | 5,324 | 185,488 |
Phreesia, Inc. (Health Care Technology) | (a) | 22,415 | 633,896 |
Portola Pharmaceuticals, Inc. (Biotechnology) | (a) | 13,296 | 239,195 |
Prestige Consumer Healthcare, Inc. (Pharmaceuticals) | (a) | 1,373 | 51,570 |
Prevail Therapeutics, Inc. (Biotechnology) | (a) | 7,921 | 118,023 |
Principia Biopharma, Inc. (Biotechnology) | (a) | 4,886 | 292,134 |
Protagonist Therapeutics, Inc. (Biotechnology) | (a) | 6,477 | 114,384 |
PTC Therapeutics, Inc. (Biotechnology) | (a) | 10,031 | 508,973 |
Puma Biotechnology, Inc. (Biotechnology) | (a) | 19,032 | 198,504 |
Quidel Corp. (Health Care Equip. & Supplies) | (a) | 1,199 | 268,264 |
Quotient Ltd. (Health Care Equip. & Supplies) | (a) | 50,862 | 376,379 |
Radius Health, Inc. (Biotechnology) | (a) | 13,550 | 184,686 |
Reata Pharmaceuticals, Inc. Class A (Pharmaceuticals) | (a) | 1,043 | 162,729 |
REGENXBIO, Inc. (Biotechnology) | (a) | 13,058 | 480,926 |
Repligen Corp. (Life Sciences Tools & Svs.) | (a) | 3,103 | 383,562 |
Replimune Group, Inc. (Biotechnology) | (a) | 13,279 | 329,983 |
Retrophin, Inc. (Biotechnology) | (a) | 29,913 | 610,524 |
Rigel Pharmaceuticals, Inc. (Biotechnology) | (a) | 173,402 | 317,326 |
Sage Therapeutics, Inc. (Biotechnology) | (a) | 361 | 15,010 |
Sangamo Therapeutics, Inc. (Biotechnology) | (a) | 47,433 | 425,000 |
Select Medical Holdings Corp. (Health Care Providers & Svs.) | (a) | 26,126 | 384,836 |
Seres Therapeutics, Inc. (Biotechnology) | (a) | 46,448 | 221,092 |
Shockwave Medical, Inc. (Health Care Equip. & Supplies) | (a) | 5,712 | 270,577 |
SI-BONE, Inc. (Health Care Equip. & Supplies) | (a) | 8,320 | 132,621 |
Silk Road Medical, Inc. (Health Care Equip. & Supplies) | (a) | 9,097 | 381,073 |
Spectrum Pharmaceuticals, Inc. (Biotechnology) | (a) | 42,197 | 142,626 |
Supernus Pharmaceuticals, Inc. (Pharmaceuticals) | (a) | 23,504 | 558,220 |
Syndax Pharmaceuticals, Inc. (Biotechnology) | (a) | 9,608 | 142,391 |
Tactile Systems Technology, Inc. (Health Care Equip. & Supplies) | (a) | 6,107 | 253,013 |
Tandem Diabetes Care, Inc. (Health Care Equip. & Supplies) | (a) | 4,566 | 451,669 |
Teladoc Health, Inc. (Health Care Technology) | (a) | 4,833 | 922,330 |
Tenet Healthcare Corp. (Health Care Providers & Svs.) | (a) | 11,742 | 212,648 |
TG Therapeutics, Inc. (Biotechnology) | (a) | 6,001 | 116,899 |
TherapeuticsMD, Inc. (Pharmaceuticals) | (a) | 28,331 | 35,414 |
| Ohio National Fund, Inc. | ON BlackRock Advantage Small Cap Growth Portfolio (Continued) |
| Schedule of Investments | June 30, 2020 (Unaudited) |
| Common Stocks (Continued) | Shares | Value | |
| Health Care (continued) | |||
Theravance Biopharma, Inc. (Pharmaceuticals) | (a) | 18,256 | $ 383,193 |
Translate Bio, Inc. (Biotechnology) | (a) | 7,110 | 127,411 |
TransMedics Group, Inc. (Health Care Equip. & Supplies) | (a) | 11,168 | 200,131 |
Tricida, Inc. (Pharmaceuticals) | (a) | 6,117 | 168,095 |
Turning Point Therapeutics, Inc. (Biotechnology) | (a) | 4,223 | 272,764 |
U.S. Physical Therapy, Inc. (Health Care Providers & Svs.) | 9,256 | 749,921 | |
Ultragenyx Pharmaceutical, Inc. (Biotechnology) | (a) | 15,166 | 1,186,285 |
UNITY Biotechnology, Inc. (Biotechnology) | (a) | 7,381 | 64,067 |
Vanda Pharmaceuticals, Inc. (Biotechnology) | (a) | 15,755 | 180,237 |
Vapotherm, Inc. (Health Care Equip. & Supplies) | (a) | 4,145 | 169,904 |
Veracyte, Inc. (Biotechnology) | (a) | 19,226 | 497,953 |
Vericel Corp. (Biotechnology) | (a) | 14,818 | 204,785 |
Vir Biotechnology, Inc. (Biotechnology) | (a) | 12,844 | 526,219 |
Vocera Communications, Inc. (Health Care Technology) | (a) | 20,173 | 427,668 |
Xencor, Inc. (Biotechnology) | (a) | 14,313 | 463,598 |
Zogenix, Inc. (Pharmaceuticals) | (a) | 10,967 | 296,219 |
| 60,845,807 | |||
| Industrials–14.6% | |||
AAON, Inc. (Building Products) | 3,625 | 196,801 | |
Advanced Drainage Systems, Inc. (Building Products) | 18,102 | 894,239 | |
Aerojet Rocketdyne Holdings, Inc. (Aerospace & Defense) | (a) | 11,696 | 463,629 |
Allegiant Travel Co. (Airlines) | 714 | 77,976 | |
American Woodmark Corp. (Building Products) | (a) | 2,152 | 162,799 |
Applied Industrial Technologies, Inc. (Trading Companies & Distributors) | 15,636 | 975,530 | |
ASGN, Inc. (Professional Svs.) | (a) | 10,705 | 713,809 |
Astronics Corp. (Aerospace & Defense) | (a) | 10,351 | 109,307 |
Atkore International Group, Inc. (Electrical Equip.) | (a) | 17,409 | 476,136 |
Avis Budget Group, Inc. (Road & Rail) | (a) | 4,884 | 111,795 |
Blue Bird Corp. (Machinery) | (a) | 25,254 | 378,557 |
BMC Stock Holdings, Inc. (Trading Companies & Distributors) | (a) | 3,904 | 98,147 |
Brink's Co. / The (Commercial Svs. & Supplies) | 2,563 | 116,642 | |
Builders FirstSource, Inc. (Building Products) | (a) | 30,891 | 639,444 |
Cimpress PLC (Commercial Svs. & Supplies) | (a) | 1,571 | 119,930 |
Comfort Systems U.S.A., Inc. (Construction & Engineering) | 23,662 | 964,226 | |
Covenant Transportation Group, Inc. Class A (Road & Rail) | (a) | 6,504 | 93,853 |
CRA International, Inc. (Professional Svs.) | 3,417 | 134,972 | |
Dycom Industries, Inc. (Construction & Engineering) | (a) | 3,460 | 141,479 |
EMCOR Group, Inc. (Construction & Engineering) | 10,856 | 718,016 | |
ESCO Technologies, Inc. (Machinery) | 13,882 | 1,173,445 | |
Evoqua Water Technologies Corp. (Machinery) | (a) | 30,410 | 565,626 |
Exponent, Inc. (Professional Svs.) | 8,061 | 652,377 | |
Federal Signal Corp. (Machinery) | 9,136 | 271,613 | |
Forrester Research, Inc. (Professional Svs.) | (a) | 4,676 | 149,819 |
Forward Air Corp. (Air Freight & Logistics) | 4,710 | 234,652 | |
Foundation Building Materials, Inc. (Trading Companies & Distributors) | (a) | 29,419 | 459,231 |
Franklin Covey Co. (Professional Svs.) | (a) | 25,526 | 546,256 |
Franklin Electric Co., Inc. (Machinery) | 3,026 | 158,926 | |
Generac Holdings, Inc. (Electrical Equip.) | (a) | 10,258 | 1,250,758 |
H&E Equipment Services, Inc. (Trading Companies & Distributors) | 8,101 | 149,706 |
| Common Stocks (Continued) | Shares | Value | |
| Industrials (continued) | |||
Healthcare Services Group, Inc. (Commercial Svs. & Supplies) | 7,343 | $ 179,610 | |
Herc Holdings, Inc. (Trading Companies & Distributors) | (a) | 8,104 | 249,036 |
Hillenbrand, Inc. (Machinery) | 8,789 | 237,918 | |
Hub Group, Inc. Class A (Air Freight & Logistics) | (a) | 1,237 | 59,203 |
ICF International, Inc. (Professional Svs.) | 6,114 | 396,371 | |
Insperity, Inc. (Professional Svs.) | 8,823 | 571,113 | |
John Bean Technologies Corp. (Machinery) | 6,901 | 593,624 | |
Kforce, Inc. (Professional Svs.) | 20,786 | 607,990 | |
Landstar System, Inc. (Road & Rail) | 4,643 | 521,455 | |
Marten Transport Ltd. (Road & Rail) | 33,039 | 831,261 | |
MasTec, Inc. (Construction & Engineering) | (a) | 8,500 | 381,395 |
McGrath RentCorp (Commercial Svs. & Supplies) | 18,463 | 997,187 | |
Mercury Systems, Inc. (Aerospace & Defense) | (a) | 4,737 | 372,612 |
Miller Industries, Inc. (Machinery) | 4,975 | 148,106 | |
Mobile Mini, Inc. (Commercial Svs. & Supplies) | 6,776 | 199,892 | |
Moog, Inc. Class A (Aerospace & Defense) | 7,642 | 404,873 | |
MSA Safety, Inc. (Commercial Svs. & Supplies) | 3,417 | 391,041 | |
MYR Group, Inc. (Construction & Engineering) | (a) | 3,819 | 121,864 |
Plug Power, Inc. (Electrical Equip.) | (a) | 31,097 | 255,306 |
Proto Labs, Inc. (Machinery) | (a) | 3,095 | 348,095 |
Radiant Logistics, Inc. (Air Freight & Logistics) | (a) | 10,231 | 40,208 |
RBC Bearings, Inc. (Machinery) | (a) | 3,439 | 460,964 |
Saia, Inc. (Road & Rail) | (a) | 4,361 | 484,856 |
SiteOne Landscape Supply, Inc. (Trading Companies & Distributors) | (a) | 7,969 | 908,227 |
SPX Corp. (Machinery) | (a) | 10,707 | 440,593 |
Steelcase, Inc. Class A (Commercial Svs. & Supplies) | 41,726 | 503,216 | |
Sunrun, Inc. (Electrical Equip.) | (a) | 7,372 | 145,376 |
Tetra Tech, Inc. (Commercial Svs. & Supplies) | 4,713 | 372,893 | |
Trex Co., Inc. (Building Products) | (a) | 7,500 | 975,525 |
TriNet Group, Inc. (Professional Svs.) | (a) | 8,922 | 543,707 |
Wabash National Corp. (Machinery) | 6,850 | 72,747 | |
Watts Water Technologies, Inc. Class A (Machinery) | 2,884 | 233,604 | |
Welbilt, Inc. (Machinery) | (a) | 16,471 | 100,308 |
| 26,349,872 | |||
| Information Technology–19.8% | |||
2U, Inc. (Software) | (a) | 6,390 | 242,564 |
8x8, Inc. (Software) | (a) | 48,416 | 774,656 |
A10 Networks, Inc. (Software) | (a) | 29,254 | 199,220 |
Acacia Communications, Inc. (Communications Equip.) | (a) | 2,144 | 144,055 |
ACI Worldwide, Inc. (Software) | (a) | 8,367 | 225,825 |
Advanced Energy Industries, Inc. (Semiconductors & Equip.) | (a) | 14,259 | 966,618 |
Alarm.com Holdings, Inc. (Software) | (a) | 9,945 | 644,536 |
Altair Engineering, Inc. Class A (Software) | (a) | 13,812 | 549,027 |
Ambarella, Inc. (Semiconductors & Equip.) | (a) | 12,170 | 557,386 |
Appfolio, Inc. Class A (Software) | (a) | 3,576 | 581,851 |
Appian Corp. (Software) | (a) | 4,629 | 237,236 |
Axcelis Technologies, Inc. (Semiconductors & Equip.) | (a) | 5,093 | 141,840 |
Benefitfocus, Inc. (Software) | (a) | 46,998 | 505,699 |
Blackbaud, Inc. (Software) | 8,225 | 469,483 | |
Blackline, Inc. (Software) | (a) | 4,928 | 408,581 |
Bottomline Technologies DE, Inc. (Software) | (a) | 16,326 | 828,871 |
Box, Inc. Class A (Software) | (a) | 50,599 | 1,050,435 |
Brooks Automation, Inc. (Semiconductors & Equip.) | 11,731 | 518,979 | |
Cabot Microelectronics Corp. (Semiconductors & Equip.) | 1,492 | 208,194 |
| Ohio National Fund, Inc. | ON BlackRock Advantage Small Cap Growth Portfolio (Continued) |
| Schedule of Investments | June 30, 2020 (Unaudited) |
| Common Stocks (Continued) | Shares | Value | |
| Information Technology (continued) | |||
Calix, Inc. (Communications Equip.) | (a) | 10,788 | $ 160,741 |
Ciena Corp. (Communications Equip.) | (a) | 7,097 | 384,374 |
Cirrus Logic, Inc. (Semiconductors & Equip.) | (a) | 18,268 | 1,128,597 |
CommVault Systems, Inc. (Software) | (a) | 12,478 | 482,899 |
Cornerstone OnDemand, Inc. (Software) | (a) | 3,013 | 116,181 |
CSG Systems International, Inc. (IT Svs.) | 21,756 | 900,481 | |
ePlus, Inc. (Electronic Equip., Instr. & Comp.) | (a) | 9,034 | 638,523 |
Everbridge, Inc. (Software) | (a) | 3,900 | 539,604 |
Fabrinet (Electronic Equip., Instr. & Comp.) | (a) | 2,340 | 146,063 |
FARO Technologies, Inc. (Electronic Equip., Instr. & Comp.) | (a) | 3,903 | 209,201 |
Fitbit, Inc. Class A (Electronic Equip., Instr. & Comp.) | (a) | 77,290 | 499,293 |
Five9, Inc. (Software) | (a) | 9,260 | 1,024,804 |
FormFactor, Inc. (Semiconductors & Equip.) | (a) | 15,727 | 461,273 |
Grid Dynamics Holdings, Inc. (IT Svs.) | (a) | 23,044 | 159,004 |
Hackett Group, Inc. / The (IT Svs.) | 8,456 | 114,494 | |
II-VI, Inc. (Electronic Equip., Instr. & Comp.) | (a) | 5,929 | 279,967 |
Inphi Corp. (Semiconductors & Equip.) | (a) | 4,782 | 561,885 |
InterDigital, Inc. (Communications Equip.) | 4,105 | 232,466 | |
International Money Express, Inc. (IT Svs.) | (a) | 18,136 | 225,975 |
J2 Global, Inc. (Software) | (a) | 3,575 | 225,976 |
KBR, Inc. (IT Svs.) | 8,608 | 194,110 | |
Lattice Semiconductor Corp. (Semiconductors & Equip.) | (a) | 7,339 | 208,354 |
LivePerson, Inc. (Software) | (a) | 10,243 | 424,368 |
LiveRamp Holdings, Inc. (IT Svs.) | (a) | 3,579 | 152,000 |
ManTech International Corp. Class A (IT Svs.) | 7,747 | 530,592 | |
MAXIMUS, Inc. (IT Svs.) | 7,728 | 544,438 | |
MaxLinear, Inc. (Semiconductors & Equip.) | (a) | 9,509 | 204,063 |
Model N, Inc. (Software) | (a) | 13,608 | 473,014 |
Novanta, Inc. (Electronic Equip., Instr. & Comp.) | (a) | 2,308 | 246,425 |
OSI Systems, Inc. (Electronic Equip., Instr. & Comp.) | (a) | 14,090 | 1,051,678 |
Paylocity Holding Corp. (Software) | (a) | 3,278 | 478,227 |
PC Connection, Inc. (Electronic Equip., Instr. & Comp.) | 10,698 | 495,959 | |
Perficient, Inc. (IT Svs.) | (a) | 5,004 | 179,043 |
Ping Identity Holding Corp. (Software) | (a) | 9,910 | 318,012 |
Power Integrations, Inc. (Semiconductors & Equip.) | 8,251 | 974,691 | |
Progress Software Corp. (Software) | 5,584 | 216,380 | |
PROS Holdings, Inc. (Software) | (a) | 7,486 | 332,603 |
Q2 Holdings, Inc. (Software) | (a) | 3,489 | 299,321 |
Qualys, Inc. (Software) | (a) | 15,355 | 1,597,227 |
Radware Ltd. (Communications Equip.) | (a) | 5,120 | 120,781 |
Rambus, Inc. (Semiconductors & Equip.) | (a) | 28,213 | 428,838 |
Rapid7, Inc. (Software) | (a) | 25,258 | 1,288,663 |
RingCentral, Inc. Class A (Software) | (a) | 2,814 | 802,018 |
Rogers Corp. (Electronic Equip., Instr. & Comp.) | (a) | 1,493 | 186,028 |
Semtech Corp. (Semiconductors & Equip.) | (a) | 10,264 | 535,986 |
Silicon Laboratories, Inc. (Semiconductors & Equip.) | (a) | 2,882 | 288,978 |
Silicon Motion Technology Corp. – ADR (Semiconductors & Equip.) | 1,921 | 93,687 | |
SPS Commerce, Inc. (Software) | (a) | 16,387 | 1,230,991 |
SVMK, Inc. (Software) | (a) | 6,437 | 151,527 |
Synaptics, Inc. (Semiconductors & Equip.) | (a) | 7,027 | 422,463 |
Tower Semiconductor Ltd. (Semiconductors & Equip.) | (a) | 33,370 | 637,033 |
Varonis Systems, Inc. (Software) | (a) | 5,369 | 475,049 |
Verint Systems, Inc. (Software) | (a) | 2,645 | 119,501 |
Verra Mobility Corp. (IT Svs.) | (a) | 37,926 | 389,879 |
Virtusa Corp. (IT Svs.) | (a) | 4,151 | 134,783 |
| Common Stocks (Continued) | Shares | Value | |
| Information Technology (continued) | |||
WNS Holdings Ltd. – ADR (IT Svs.) | (a) | 10,183 | $ 559,861 |
Workiva, Inc. (Software) | (a) | 6,526 | 349,076 |
Yext, Inc. (Software) | (a) | 52,186 | 866,810 |
| 35,749,314 | |||
| Materials–2.7% | |||
Balchem Corp. (Chemicals) | 7,943 | 753,473 | |
Boise Cascade Co. (Paper & Forest Products) | 25,760 | 968,834 | |
Ingevity Corp. (Chemicals) | (a) | 9,229 | 485,169 |
Innospec, Inc. (Chemicals) | 2,599 | 200,773 | |
Materion Corp. (Metals & Mining) | 11,211 | 689,364 | |
Novagold Resources, Inc. (Metals & Mining) | (a) | 61,094 | 560,843 |
PolyOne Corp. (Chemicals) | 13,865 | 363,679 | |
Silgan Holdings, Inc. (Containers & Packaging) | 12,779 | 413,912 | |
Trinseo SA (Chemicals) | 6,602 | 146,300 | |
Venator Materials PLC (Chemicals) | (a) | 146,203 | 261,703 |
| 4,844,050 | |||
| Real Estate–3.6% | |||
DiamondRock Hospitality Co. (Equity REIT) | 11,964 | 66,161 | |
EastGroup Properties, Inc. (Equity REIT) | 7,103 | 842,487 | |
First Industrial Realty Trust, Inc. (Equity REIT) | 30,556 | 1,174,573 | |
Four Corners Property Trust, Inc. (Equity REIT) | 20,146 | 491,562 | |
NexPoint Residential Trust, Inc. (Equity REIT) | 12,451 | 440,143 | |
Plymouth Industrial REIT, Inc. (Equity REIT) | 12,071 | 154,509 | |
QTS Realty Trust, Inc. Class A (Equity REIT) | 26,930 | 1,725,944 | |
Redfin Corp. (Real Estate Mgmt. & Development) | (a) | 10,587 | 443,701 |
RMR Group, Inc. / The Class A (Real Estate Mgmt. & Development) | 8,260 | ��� 243,422 | |
Ryman Hospitality Properties, Inc. (Equity REIT) | 9,435 | 326,451 | |
Summit Hotel Properties, Inc. (Equity REIT) | 57,442 | 340,631 | |
Uniti Group, Inc. (Equity REIT) | 34,710 | 324,538 | |
| 6,574,122 | |||
| Utilities–1.4% | |||
American States Water Co. (Water Utilities) | 10,577 | 831,669 | |
California Water Service Group (Water Utilities) | 5,469 | 260,871 | |
New Jersey Resources Corp. (Gas Utilities) | 17,180 | 560,927 | |
Northwest Natural Holding Co. (Gas Utilities) | 2,915 | 162,628 | |
NorthWestern Corp. (Multi-Utilities) | 6,954 | 379,132 | |
Ormat Technologies, Inc. (Ind. Power & Renewable Elec.) | 2,615 | 166,026 | |
SJW Group (Water Utilities) | 2,033 | 126,270 | |
Southwest Gas Holdings, Inc. (Gas Utilities) | 1,577 | 108,892 | |
| 2,596,415 | |||
Total Common Stocks (Cost $172,491,446) | $179,497,735 |
| Rights –0.0% | Quantity | Value | |
| Health Care–0.0% | |||
Alder BioPharmaceuticals, Inc. CVR (Pharmaceuticals) | 14,631 | $ 12,875 | |
Total Rights (Cost $12,876) | $ 12,875 |
| Money Market Funds–2.9% | Shares | Value | |
State Street Institutional Liquid Reserves Fund Institutional Class, 0.346% | (b) | 5,296,550 | $ 5,298,669 |
Total Money Market Funds (Cost $5,299,024) | $ 5,298,669 | ||
Total Investments – 102.2% (Cost $177,803,346) | (c) | $184,809,279 | |
Liabilities in Excess of Other Assets – (2.2)% | (d) | (3,992,519) | |
| Net Assets – 100.0% | $180,816,760 |
| Ohio National Fund, Inc. | ON BlackRock Advantage Small Cap Growth Portfolio (Continued) |
| Schedule of Investments | June 30, 2020 (Unaudited) |
Percentages are stated as a percent of net assets. |
| Abbreviations: | ||
| ADR: | American Depositary Receipts | |
| Footnotes: | ||
| (a) | Non-income producing security. | |
| (b) | Rate represents the seven-day yield at June 30, 2020. | |
| (c) | Represents cost for financial reporting purposes, which may differ from cost basis for federal income tax purposes. See also Note 8 of the Notes to Financial Statements. | |
| (d) | Includes $544,000 of cash pledged as collateral for the futures contracts outstanding at June 30, 2020. See also the following Schedule of Open Futures Contracts. | |
| Schedule of Open Futures Contracts | June 30, 2020 (Unaudited) |
| Description | Number of contracts | Expiration Date | Notional Amount | Value | Unrealized Appreciation (Depreciation) | Variation Margin Receivable (Payable) | ||||||
| CME E-mini Russell 2000 Index - Long | 85 | September 18, 2020 | $5,894,444 | $6,109,800 | $215,356 | $60,069 |
| Ohio National Fund, Inc. | ON S&P MidCap 400® Index Portfolio (Unaudited) |
| Average Annual returns | |
| One year | -7.02% |
| Five years | 3.03% |
| Ten years | 9.80% |
| (1) | The Portfolio’s composition is subject to change. Holdings and weightings are as of June 30, 2020. |
| Ohio National Fund, Inc. | ON S&P MidCap 400® Index Portfolio (Unaudited) (Continued) |

| Portfolio Composition as of June 30, 2020 (1) | |
| % of Net Assets | |
| Common Stocks (4) | 99.5 |
| Money Market Funds Less Net Liabilities | 0.5 |
| 100.0 | |
| Top 10 Portfolio Holdings as of June 30, 2020 (1) (2) (3) | ||
| % of Net Assets | ||
| 1. | Teradyne, Inc. | 0.9 |
| 2. | Etsy, Inc. | 0.8 |
| 3. | FactSet Research Systems, Inc. | 0.8 |
| 4. | Fair Isaac Corp. | 0.8 |
| 5. | Catalent, Inc. | 0.7 |
| 6. | Masimo Corp. | 0.7 |
| 7. | Pool Corp. | 0.7 |
| 8. | Trimble, Inc. | 0.7 |
| 9. | Molina Healthcare, Inc. | 0.7 |
| 10. | Cognex Corp. | 0.6 |
| (1) | Composition of Portfolio subject to change. | |
| (2) | Short-term investments have been excluded from the list of Top 10 Portfolio Holdings. | |
| (3) | Top 10 Portfolio Holdings is presented at an individual security level. Total investment exposure by issuer may be higher. | |
| (4) | Sectors (Common Stocks): | |
| % of Net Assets | |
| Information Technology | 16.5 |
| Industrials | 15.6 |
| Financials | 15.0 |
| Consumer Discretionary | 14.4 |
| Health Care | 11.1 |
| Real Estate | 9.9 |
| Materials | 6.0 |
| Utilities | 4.1 |
| Consumer Staples | 3.7 |
| Communication Services | 1.8 |
| Energy | 1.4 |
| 99.5 |
| Ohio National Fund, Inc. | ON S&P MidCap 400® Index Portfolio |
| Schedule of Investments | June 30, 2020 (Unaudited) |
| Common Stocks–99.5% | Shares | Value | |
| Communication Services–1.8% | |||
AMC Networks, Inc. Class A (Media) | (a) | 9,628 | $ 225,199 |
Cable One, Inc. (Media) | 1,255 | 2,227,437 | |
Cinemark Holdings, Inc. (Entertainment) | 25,468 | 294,155 | |
John Wiley & Sons, Inc. Class A (Media) | 10,392 | 405,288 | |
New York Times Co. / The Class A (Media) | 34,424 | 1,446,841 | |
TEGNA, Inc. (Media) | 52,218 | 581,709 | |
Telephone & Data Systems, Inc. (Wireless Telecom. Svs.) | 23,345 | 464,099 | |
TripAdvisor, Inc. (Interactive Media & Svs.) | 24,035 | 456,905 | |
World Wrestling Entertainment, Inc. Class A (Entertainment) | 11,054 | 480,296 | |
Yelp, Inc. (Interactive Media & Svs.) | (a) | 15,580 | 360,365 |
| 6,942,294 | |||
| Consumer Discretionary–14.4% | |||
Aaron's, Inc. (Specialty Retail) | 16,097 | 730,804 | |
Adient PLC (Auto Components) | (a) | 20,788 | 341,339 |
Adtalem Global Education, Inc. (Diversified Consumer Svs.) | (a) | 12,346 | 384,578 |
American Eagle Outfitters, Inc. (Specialty Retail) | 37,095 | 404,335 | |
AutoNation, Inc. (Specialty Retail) | (a) | 13,741 | 516,387 |
Boyd Gaming Corp. (Hotels, Restaurants & Leisure) | 19,143 | 400,089 | |
Brunswick Corp. (Leisure Products) | 18,866 | 1,207,613 | |
Caesars Entertainment Corp. (Hotels, Restaurants & Leisure) | (a) | 133,813 | 1,623,152 |
Carter's, Inc. (Textiles, Apparel & Luxury Goods) | 10,404 | 839,603 | |
Choice Hotels International, Inc. (Hotels, Restaurants & Leisure) | 7,523 | 593,565 | |
Churchill Downs, Inc. (Hotels, Restaurants & Leisure) | 8,366 | 1,113,933 | |
Columbia Sportswear Co. (Textiles, Apparel & Luxury Goods) | 6,781 | 546,413 | |
Cracker Barrel Old Country Store, Inc. (Hotels, Restaurants & Leisure) | 5,663 | 628,083 | |
Dana, Inc. (Auto Components) | 34,440 | 419,824 | |
Deckers Outdoor Corp. (Textiles, Apparel & Luxury Goods) | (a) | 6,679 | 1,311,689 |
Delphi Technologies PLC (Auto Components) | (a) | 20,531 | 291,746 |
Dick's Sporting Goods, Inc. (Specialty Retail) | 15,552 | 641,676 | |
Dunkin' Brands Group, Inc. (Hotels, Restaurants & Leisure) | 19,584 | 1,277,464 | |
Eldorado Resorts, Inc. (Hotels, Restaurants & Leisure) | (a) | 19,892 | 796,874 |
Etsy, Inc. (Internet & Direct Marketing Retail) | (a) | 28,312 | 3,007,584 |
Five Below, Inc. (Specialty Retail) | (a) | 13,297 | 1,421,582 |
Foot Locker, Inc. (Specialty Retail) | 24,830 | 724,043 | |
Gentex Corp. (Auto Components) | 58,420 | 1,505,483 | |
Goodyear Tire & Rubber Co. / The (Auto Components) | 55,612 | 497,449 | |
Graham Holdings Co. Class B (Diversified Consumer Svs.) | 1,017 | 348,495 | |
Grand Canyon Education, Inc. (Diversified Consumer Svs.) | (a) | 11,298 | 1,022,808 |
Grubhub, Inc. (Internet & Direct Marketing Retail) | (a) | 21,938 | 1,542,241 |
Harley-Davidson, Inc. (Automobiles) | 36,546 | 868,698 | |
Helen of Troy Ltd. (Household Durables) | (a) | 6,016 | 1,134,377 |
Jack in the Box, Inc. (Hotels, Restaurants & Leisure) | 5,403 | 400,308 | |
KB Home (Household Durables) | 20,762 | 636,978 | |
Lear Corp. (Auto Components) | 13,013 | 1,418,677 | |
Marriott Vacations Worldwide Corp. (Hotels, Restaurants & Leisure) | 8,717 | 716,625 | |
Mattel, Inc. (Leisure Products) | (a) | 82,771 | 800,396 |
Murphy U.S.A., Inc. (Specialty Retail) | (a) | 6,543 | 736,676 |
Nordstrom, Inc. (Multiline Retail) | 25,825 | 400,029 |
| Common Stocks (Continued) | Shares | Value | |
| Consumer Discretionary (continued) | |||
Ollie's Bargain Outlet Holdings, Inc. (Multiline Retail) | (a) | 13,490 | $ 1,317,298 |
Papa John's International, Inc. (Hotels, Restaurants & Leisure) | 5,314 | 421,985 | |
Penn National Gaming, Inc. (Hotels, Restaurants & Leisure) | (a) | 30,852 | 942,220 |
Polaris, Inc. (Leisure Products) | 13,734 | 1,271,082 | |
Pool Corp. (Distributors) | 9,526 | 2,589,834 | |
RH (Specialty Retail) | (a) | 3,960 | 985,644 |
Sally Beauty Holdings, Inc. (Specialty Retail) | (a) | 26,867 | 336,643 |
Scientific Games Corp. (Hotels, Restaurants & Leisure) | (a) | 13,146 | 203,237 |
Service Corp. International (Diversified Consumer Svs.) | 42,511 | 1,653,253 | |
Six Flags Entertainment Corp. (Hotels, Restaurants & Leisure) | 18,768 | 360,533 | |
Skechers U.S.A., Inc. Class A (Textiles, Apparel & Luxury Goods) | (a) | 32,512 | 1,020,227 |
Strategic Education, Inc. (Diversified Consumer Svs.) | 5,296 | 813,730 | |
Taylor Morrison Home Corp. (Household Durables) | (a) | 30,936 | 596,755 |
Tempur Sealy International, Inc. (Household Durables) | (a) | 10,331 | 743,315 |
Texas Roadhouse, Inc. (Hotels, Restaurants & Leisure) | 15,538 | 816,833 | |
Thor Industries, Inc. (Automobiles) | 13,170 | 1,403,000 | |
Toll Brothers, Inc. (Household Durables) | 27,581 | 898,865 | |
TopBuild Corp. (Household Durables) | (a) | 7,900 | 898,783 |
TRI Pointe Group, Inc. (Household Durables) | (a) | 31,059 | 456,257 |
Urban Outfitters, Inc. (Specialty Retail) | (a) | 16,731 | 254,646 |
Visteon Corp. (Auto Components) | (a) | 6,634 | 454,429 |
W.W. International, Inc. (Diversified Consumer Svs.) | (a) | 11,080 | 281,210 |
Wendy's Co. / The (Hotels, Restaurants & Leisure) | 42,499 | 925,628 | |
Williams-Sonoma, Inc. (Specialty Retail) | 18,552 | 1,521,450 | |
Wyndham Destinations, Inc. (Hotels, Restaurants & Leisure) | 20,349 | 573,435 | |
Wyndham Hotels & Resorts, Inc. (Hotels, Restaurants & Leisure) | 22,220 | 947,016 | |
| 53,938,924 | |||
| Consumer Staples–3.7% | |||
BJ's Wholesale Club Holdings, Inc. (Food & Staples Retailing) | (a) | 29,457 | 1,097,862 |
Boston Beer Co., Inc. / The Class A (Beverages) | (a) | 2,303 | 1,235,905 |
Casey's General Stores, Inc. (Food & Staples Retailing) | 8,775 | 1,312,038 | |
Darling Ingredients, Inc. (Food Products) | (a) | 39,147 | 963,799 |
Edgewell Personal Care Co. (Personal Products) | (a) | 12,953 | 403,615 |
Energizer Holdings, Inc. (Household Products) | 15,192 | 721,468 | |
Flowers Foods, Inc. (Food Products) | 45,966 | 1,027,800 | |
Grocery Outlet Holding Corp. (Food & Staples Retailing) | (a) | 15,172 | 619,018 |
Hain Celestial Group, Inc. / The (Food Products) | (a) | 18,725 | 590,025 |
Ingredion, Inc. (Food Products) | 15,974 | 1,325,842 | |
Lancaster Colony Corp. (Food Products) | 4,723 | 732,018 | |
Nu Skin Enterprises, Inc. Class A (Personal Products) | 12,383 | 473,402 | |
Pilgrim's Pride Corp. (Food Products) | (a) | 12,408 | 209,571 |
Post Holdings, Inc. (Food Products) | (a) | 15,287 | 1,339,447 |
Sanderson Farms, Inc. (Food Products) | 4,722 | 547,233 | |
Sprouts Farmers Market, Inc. (Food & Staples Retailing) | (a) | 28,145 | 720,230 |
| Ohio National Fund, Inc. | ON S&P MidCap 400® Index Portfolio (Continued) |
| Schedule of Investments | June 30, 2020 (Unaudited) |
| Common Stocks (Continued) | Shares | Value | |
| Consumer Staples (continued) | |||
Tootsie Roll Industries, Inc. (Food Products) | 4,096 | $ 140,370 | |
TreeHouse Foods, Inc. (Food Products) | (a) | 13,464 | 589,723 |
| 14,049,366 | |||
| Energy–1.4% | |||
Antero Midstream Corp. (Oil, Gas & Consumable Fuels) | 66,979 | 341,593 | |
ChampionX Corp. (Energy Equip. & Svs.) | (a) | 44,313 | 432,495 |
Cimarex Energy Co. (Oil, Gas & Consumable Fuels) | 24,314 | 668,392 | |
CNX Resources Corp. (Oil, Gas & Consumable Fuels) | (a) | 44,594 | 385,738 |
EQT Corp. (Oil, Gas & Consumable Fuels) | 61,021 | 726,150 | |
Equitrans Midstream Corp. (Oil, Gas & Consumable Fuels) | 96,913 | 805,347 | |
Murphy Oil Corp. (Oil, Gas & Consumable Fuels) | 34,847 | 480,889 | |
PBF Energy, Inc. Class A (Oil, Gas & Consumable Fuels) | 24,264 | 248,463 | |
Transocean Ltd. (Energy Equip. & Svs.) | (a) | 137,290 | 251,241 |
World Fuel Services Corp. (Oil, Gas & Consumable Fuels) | 15,087 | 388,641 | |
WPX Energy, Inc. (Oil, Gas & Consumable Fuels) | (a) | 97,225 | 620,295 |
| 5,349,244 | |||
| Financials–15.0% | |||
Affiliated Managers Group, Inc. (Capital Markets) | 11,266 | 839,993 | |
Alleghany Corp. (Insurance) | 3,414 | 1,669,924 | |
American Financial Group, Inc. (Insurance) | 17,798 | 1,129,461 | |
Associated Banc-Corp. (Banks) | 36,678 | 501,755 | |
BancorpSouth Bank (Banks) | 23,205 | 527,682 | |
Bank of Hawaii Corp. (Banks) | 9,546 | 586,220 | |
Bank OZK (Banks) | 28,792 | 675,748 | |
Brighthouse Financial, Inc. (Insurance) | (a) | 22,350 | 621,777 |
Brown & Brown, Inc. (Insurance) | 56,093 | 2,286,351 | |
Cathay General Bancorp (Banks) | 18,044 | 474,557 | |
CIT Group, Inc. (Banks) | 23,480 | 486,740 | |
CNO Financial Group, Inc. (Insurance) | 34,288 | 533,864 | |
Commerce Bancshares, Inc. (Banks) | 23,939 | 1,423,652 | |
Cullen / Frost Bankers, Inc. (Banks) | 13,575 | 1,014,188 | |
East West Bancorp, Inc. (Banks) | 33,765 | 1,223,644 | |
Eaton Vance Corp. (Capital Markets) | 27,209 | 1,050,267 | |
Essent Group Ltd. (Thrifts & Mortgage Finance) | 26,407 | 957,782 | |
Evercore, Inc. Class A (Capital Markets) | 9,675 | 570,051 | |
FactSet Research Systems, Inc. (Capital Markets) | 9,034 | 2,967,398 | |
Federated Hermes, Inc. (Capital Markets) | 22,883 | 542,327 | |
First American Financial Corp. (Insurance) | 26,579 | 1,276,324 | |
First Financial Bankshares, Inc. (Banks) | 33,893 | 979,169 | |
First Horizon National Corp. (Banks) | 74,504 | 742,060 | |
FirstCash, Inc. (Consumer Finance) | 9,886 | 667,107 | |
FNB Corp. (Banks) | 77,241 | 579,307 | |
Fulton Financial Corp. (Banks) | 38,571 | 406,153 | |
Genworth Financial, Inc. Class A (Insurance) | (a) | 120,092 | 277,412 |
Glacier Bancorp, Inc. (Banks) | 21,162 | 746,807 | |
Hancock Whitney Corp. (Banks) | 20,563 | 435,936 | |
Hanover Insurance Group, Inc. / The (Insurance) | 9,068 | 918,860 | |
Home BancShares, Inc. (Banks) | 36,643 | 563,569 | |
Interactive Brokers Group, Inc. Class A (Capital Markets) | 18,295 | 764,182 | |
International Bancshares Corp. (Banks) | 13,274 | 425,033 | |
Janus Henderson Group PLC (Capital Markets) | 36,593 | 774,308 | |
Jefferies Financial Group, Inc. (Diversified Financial Svs.) | 53,854 | 837,430 | |
Kemper Corp. (Insurance) | 14,645 | 1,062,055 | |
Legg Mason, Inc. (Capital Markets) | 19,961 | 993,060 |
| Common Stocks (Continued) | Shares | Value | |
| Financials (continued) | |||
LendingTree, Inc. (Consumer Finance) | (a) | 1,839 | $ 532,446 |
Mercury General Corp. (Insurance) | 6,492 | 264,549 | |
Navient Corp. (Consumer Finance) | 40,586 | 285,320 | |
New York Community Bancorp, Inc. (Thrifts & Mortgage Finance) | 110,585 | 1,127,967 | |
Old Republic International Corp. (Insurance) | 68,092 | 1,110,580 | |
PacWest Bancorp (Banks) | 27,800 | 547,938 | |
Pinnacle Financial Partners, Inc. (Banks) | 17,020 | 714,670 | |
Primerica, Inc. (Insurance) | 9,720 | 1,133,352 | |
Prosperity Bancshares, Inc. (Banks) | 22,084 | 1,311,348 | |
Reinsurance Group of America, Inc. (Insurance) | 16,177 | 1,268,924 | |
RenaissanceRe Holdings Ltd. (Insurance) | 11,999 | 2,052,189 | |
RLI Corp. (Insurance) | 9,535 | 782,823 | |
SEI Investments Co. (Capital Markets) | 29,633 | 1,629,222 | |
Selective Insurance Group, Inc. (Insurance) | 14,247 | 751,387 | |
Signature Bank (Banks) | 12,781 | 1,366,544 | |
SLM Corp. (Consumer Finance) | 89,503 | 629,206 | |
Sterling Bancorp (Banks) | 46,430 | 544,160 | |
Stifel Financial Corp. (Capital Markets) | 16,353 | 775,623 | |
Synovus Financial Corp. (Banks) | 35,166 | 721,958 | |
TCF Financial Corp. (Banks) | 36,264 | 1,066,887 | |
Texas Capital Bancshares, Inc. (Banks) | (a) | 12,018 | 370,996 |
Trustmark Corp. (Banks) | 15,105 | 370,375 | |
UMB Financial Corp. (Banks) | 10,112 | 521,274 | |
Umpqua Holdings Corp. (Banks) | 52,603 | 559,696 | |
United Bankshares, Inc. (Banks) | 30,348 | 839,426 | |
Valley National Bancorp (Banks) | 93,526 | 731,373 | |
Washington Federal, Inc. (Thrifts & Mortgage Finance) | 18,064 | 484,838 | |
Webster Financial Corp. (Banks) | 21,529 | 615,945 | |
Wintrust Financial Corp. (Banks) | 13,744 | 599,513 | |
| 56,242,682 | |||
| Health Care–11.1% | |||
Acadia Healthcare Co., Inc. (Health Care Providers & Svs.) | (a) | 21,227 | 533,222 |
Amedisys, Inc. (Health Care Providers & Svs.) | (a) | 7,724 | 1,533,523 |
Arrowhead Pharmaceuticals, Inc. (Biotechnology) | (a) | 24,296 | 1,049,344 |
Avanos Medical, Inc. (Health Care Equip. & Supplies) | (a) | 11,360 | 333,870 |
Bio-Techne Corp. (Life Sciences Tools & Svs.) | 9,118 | 2,407,790 | |
Cantel Medical Corp. (Health Care Equip. & Supplies) | 8,841 | 391,038 | |
Catalent, Inc. (Pharmaceuticals) | (a) | 38,802 | 2,844,187 |
Charles River Laboratories International, Inc. (Life Sciences Tools & Svs.) | (a) | 11,805 | 2,058,202 |
Chemed Corp. (Health Care Providers & Svs.) | 3,786 | 1,707,751 | |
Encompass Health Corp. (Health Care Providers & Svs.) | 23,712 | 1,468,484 | |
Exelixis, Inc. (Biotechnology) | (a) | 73,158 | 1,736,771 |
Globus Medical, Inc. Class A (Health Care Equip. & Supplies) | (a) | 18,052 | 861,261 |
Haemonetics Corp. (Health Care Equip. & Supplies) | (a) | 12,021 | 1,076,601 |
HealthEquity, Inc. (Health Care Providers & Svs.) | (a) | 17,048 | 1,000,206 |
Hill-Rom Holdings, Inc. (Health Care Equip. & Supplies) | 15,878 | 1,743,087 | |
ICU Medical, Inc. (Health Care Equip. & Supplies) | (a) | 4,622 | 851,881 |
Integra LifeSciences Holdings Corp. (Health Care Equip. & Supplies) | (a) | 16,795 | 789,197 |
LHC Group, Inc. (Health Care Providers & Svs.) | (a) | 7,079 | 1,234,011 |
Ligand Pharmaceuticals, Inc. (Biotechnology) | (a) | 3,829 | 428,274 |
LivaNova PLC (Health Care Equip. & Supplies) | (a) | 11,595 | 558,067 |
Masimo Corp. (Health Care Equip. & Supplies) | (a) | 11,876 | 2,707,609 |
MEDNAX, Inc. (Health Care Providers & Svs.) | (a) | 20,344 | 347,882 |
| Ohio National Fund, Inc. | ON S&P MidCap 400® Index Portfolio (Continued) |
| Schedule of Investments | June 30, 2020 (Unaudited) |
| Common Stocks (Continued) | Shares | Value | |
| Health Care (continued) | |||
Molina Healthcare, Inc. (Health Care Providers & Svs.) | (a) | 14,123 | $ 2,513,612 |
Nektar Therapeutics (Pharmaceuticals) | (a) | 42,485 | 983,953 |
NuVasive, Inc. (Health Care Equip. & Supplies) | (a) | 12,229 | 680,666 |
Patterson Cos., Inc. (Health Care Providers & Svs.) | 20,603 | 453,266 | |
Penumbra, Inc. (Health Care Equip. & Supplies) | (a) | 7,887 | 1,410,353 |
PRA Health Sciences, Inc. (Life Sciences Tools & Svs.) | (a) | 15,178 | 1,476,668 |
Prestige Consumer Healthcare, Inc. (Pharmaceuticals) | (a) | 11,930 | 448,091 |
Quidel Corp. (Health Care Equip. & Supplies) | (a) | 9,118 | 2,040,061 |
Repligen Corp. (Life Sciences Tools & Svs.) | (a) | 11,230 | 1,388,140 |
Syneos Health, Inc. (Life Sciences Tools & Svs.) | (a) | 14,911 | 868,566 |
Tenet Healthcare Corp. (Health Care Providers & Svs.) | (a) | 24,982 | 452,424 |
United Therapeutics Corp. (Biotechnology) | (a) | 10,499 | 1,270,379 |
| 41,648,437 | |||
| Industrials–15.6% | |||
Acuity Brands, Inc. (Electrical Equip.) | 9,455 | 905,222 | |
AECOM (Construction & Engineering) | (a) | 38,196 | 1,435,406 |
AGCO Corp. (Machinery) | 14,831 | 822,527 | |
ASGN, Inc. (Professional Svs.) | (a) | 12,532 | 835,634 |
Avis Budget Group, Inc. (Road & Rail) | (a) | 12,737 | 291,550 |
Axon Enterprise, Inc. (Aerospace & Defense) | (a) | 14,988 | 1,470,772 |
Brink's Co. / The (Commercial Svs. & Supplies) | 12,054 | 548,578 | |
Carlisle Cos., Inc. (Industrial Conglomerates) | 13,102 | 1,567,916 | |
Clean Harbors, Inc. (Commercial Svs. & Supplies) | (a) | 12,204 | 731,996 |
Colfax Corp. (Machinery) | (a) | 20,059 | 559,646 |
Crane Co. (Machinery) | 11,768 | 699,725 | |
Curtiss-Wright Corp. (Aerospace & Defense) | 9,937 | 887,175 | |
Deluxe Corp. (Commercial Svs. & Supplies) | 9,954 | 234,317 | |
Donaldson Co., Inc. (Machinery) | 30,091 | 1,399,833 | |
Dycom Industries, Inc. (Construction & Engineering) | (a) | 7,526 | 307,738 |
EMCOR Group, Inc. (Construction & Engineering) | 13,089 | 865,706 | |
EnerSys (Electrical Equip.) | 10,134 | 652,427 | |
Fluor Corp. (Construction & Engineering) | 33,528 | 405,018 | |
FTI Consulting, Inc. (Professional Svs.) | (a) | 8,851 | 1,013,882 |
GATX Corp. (Trading Companies & Distributors) | 8,316 | 507,110 | |
Generac Holdings, Inc. (Electrical Equip.) | (a) | 14,953 | 1,823,219 |
Graco, Inc. (Machinery) | 39,739 | 1,907,075 | |
Healthcare Services Group, Inc. (Commercial Svs. & Supplies) | 17,746 | 434,067 | |
Herman Miller, Inc. (Commercial Svs. & Supplies) | 14,007 | 330,705 | |
Hexcel Corp. (Aerospace & Defense) | 19,918 | 900,692 | |
HNI Corp. (Commercial Svs. & Supplies) | 10,178 | 311,141 | |
Hubbell, Inc. (Electrical Equip.) | 12,930 | 1,620,905 | |
Insperity, Inc. (Professional Svs.) | 8,703 | 563,345 | |
ITT, Inc. (Machinery) | 20,571 | 1,208,341 | |
JetBlue Airways Corp. (Airlines) | (a) | 64,259 | 700,423 |
KAR Auction Services, Inc. (Commercial Svs. & Supplies) | 30,828 | 424,193 | |
Kennametal, Inc. (Machinery) | 19,791 | 568,200 | |
Kirby Corp. (Marine) | (a) | 14,313 | 766,604 |
Knight-Swift Transportation Holdings, Inc. (Road & Rail) | 29,195 | 1,217,723 | |
Landstar System, Inc. (Road & Rail) | 9,162 | 1,028,984 | |
Lennox International, Inc. (Building Products) | 8,303 | 1,934,516 | |
Lincoln Electric Holdings, Inc. (Machinery) | 14,156 | 1,192,501 | |
ManpowerGroup, Inc. (Professional Svs.) | 13,854 | 952,463 | |
MasTec, Inc. (Construction & Engineering) | (a) | 13,908 | 624,052 |
| Common Stocks (Continued) | Shares | Value | |
| Industrials (continued) | |||
Mercury Systems, Inc. (Aerospace & Defense) | (a) | 13,265 | $ 1,043,425 |
Middleby Corp. / The (Machinery) | (a) | 13,273 | 1,047,771 |
MSA Safety, Inc. (Commercial Svs. & Supplies) | 8,528 | 975,944 | |
MSC Industrial Direct Co., Inc. Class A (Trading Companies & Distributors) | 10,829 | 788,460 | |
Nordson Corp. (Machinery) | 12,246 | 2,323,189 | |
nVent Electric PLC (Electrical Equip.) | 37,303 | 698,685 | |
Oshkosh Corp. (Machinery) | 16,226 | 1,162,106 | |
Owens Corning (Building Products) | 25,734 | 1,434,928 | |
Regal Beloit Corp. (Electrical Equip.) | 9,671 | 844,472 | |
Ryder System, Inc. (Road & Rail) | 12,822 | 480,953 | |
Stericycle, Inc. (Commercial Svs. & Supplies) | (a) | 21,799 | 1,220,308 |
Terex Corp. (Machinery) | 15,161 | 284,572 | |
Tetra Tech, Inc. (Commercial Svs. & Supplies) | 12,896 | 1,020,332 | |
Timken Co. / The (Machinery) | 16,131 | 733,799 | |
Toro Co. / The (Machinery) | 25,565 | 1,695,982 | |
Trex Co., Inc. (Building Products) | (a) | 13,801 | 1,795,096 |
Trinity Industries, Inc. (Machinery) | 22,498 | 478,982 | |
Univar Solutions, Inc. (Trading Companies & Distributors) | (a) | 33,073 | 557,611 |
Valmont Industries, Inc. (Construction & Engineering) | 5,098 | 579,235 | |
Watsco, Inc. (Trading Companies & Distributors) | 7,814 | 1,388,548 | |
Werner Enterprises, Inc. (Road & Rail) | 13,671 | 595,099 | |
Woodward, Inc. (Machinery) | 13,535 | 1,049,639 | |
XPO Logistics, Inc. (Air Freight & Logistics) | (a) | 21,738 | 1,679,261 |
| 58,529,724 | |||
| Information Technology–16.5% | |||
ACI Worldwide, Inc. (Software) | (a) | 27,662 | 746,597 |
Alliance Data Systems Corp. (IT Svs.) | 10,116 | 456,434 | |
Arrow Electronics, Inc. (Electronic Equip., Instr. & Comp.) | (a) | 18,761 | 1,288,693 |
Avnet, Inc. (Electronic Equip., Instr. & Comp.) | 23,583 | 657,612 | |
Belden, Inc. (Electronic Equip., Instr. & Comp.) | 9,093 | 295,977 | |
Blackbaud, Inc. (Software) | 11,820 | 674,686 | |
Cabot Microelectronics Corp. (Semiconductors & Equip.) | 6,936 | 967,850 | |
CACI International, Inc. Class A (IT Svs.) | (a) | 5,984 | 1,297,810 |
CDK Global, Inc. (Software) | 28,971 | 1,199,979 | |
Ceridian HCM Holding, Inc. (Software) | (a) | 24,216 | 1,919,602 |
Ciena Corp. (Communications Equip.) | (a) | 36,646 | 1,984,747 |
Cirrus Logic, Inc. (Semiconductors & Equip.) | (a) | 13,924 | 860,225 |
Cognex Corp. (Electronic Equip., Instr. & Comp.) | 40,956 | 2,445,892 | |
Coherent, Inc. (Electronic Equip., Instr. & Comp.) | (a) | 5,784 | 757,588 |
CommVault Systems, Inc. (Software) | (a) | 10,124 | 391,799 |
CoreLogic, Inc. (IT Svs.) | 18,958 | 1,274,357 | |
Cree, Inc. (Semiconductors & Equip.) | (a) | 25,804 | 1,527,339 |
Enphase Energy, Inc. (Semiconductors & Equip.) | (a) | 19,416 | 923,619 |
Fair Isaac Corp. (Software) | (a) | 6,919 | 2,892,419 |
First Solar, Inc. (Semiconductors & Equip.) | (a) | 18,198 | 900,801 |
II-VI, Inc. (Electronic Equip., Instr. & Comp.) | (a) | 20,917 | 987,701 |
InterDigital, Inc. (Communications Equip.) | 7,332 | 415,211 | |
J2 Global, Inc. (Software) | (a) | 10,813 | 683,490 |
Jabil, Inc. (Electronic Equip., Instr. & Comp.) | 32,754 | 1,050,748 | |
KBR, Inc. (IT Svs.) | 33,951 | 765,595 | |
Littelfuse, Inc. (Electronic Equip., Instr. & Comp.) | 5,794 | 988,630 | |
LiveRamp Holdings, Inc. (IT Svs.) | (a) | 15,568 | 661,173 |
LogMeIn, Inc. (Software) | 11,642 | 986,892 | |
Lumentum Holdings, Inc. (Communications Equip.) | (a) | 17,867 | 1,454,910 |
Manhattan Associates, Inc. (Software) | (a) | 15,147 | 1,426,847 |
MAXIMUS, Inc. (IT Svs.) | 14,637 | 1,031,177 |
| Ohio National Fund, Inc. | ON S&P MidCap 400® Index Portfolio (Continued) |
| Schedule of Investments | June 30, 2020 (Unaudited) |
| Common Stocks (Continued) | Shares | Value | |
| Information Technology (continued) | |||
MKS Instruments, Inc. (Semiconductors & Equip.) | 13,090 | $ 1,482,312 | |
Monolithic Power Systems, Inc. (Semiconductors & Equip.) | 9,924 | 2,351,988 | |
National Instruments Corp. (Electronic Equip., Instr. & Comp.) | 28,018 | 1,084,577 | |
NCR Corp. (Tech. Hardware, Storage & Periph.) | (a) | 30,511 | 528,451 |
NetScout Systems, Inc. (Communications Equip.) | (a) | 15,143 | 387,055 |
Paylocity Holding Corp. (Software) | (a) | 8,579 | 1,251,590 |
Perspecta, Inc. (IT Svs.) | 32,567 | 756,531 | |
PTC, Inc. (Software) | (a) | 24,837 | 1,932,070 |
Qualys, Inc. (Software) | (a) | 7,991 | 831,224 |
Sabre Corp. (IT Svs.) | 65,759 | 530,018 | |
Science Applications International Corp. (IT Svs.) | 11,786 | 915,537 | |
Semtech Corp. (Semiconductors & Equip.) | (a) | 15,533 | 811,133 |
Silicon Laboratories, Inc. (Semiconductors & Equip.) | (a) | 10,431 | 1,045,916 |
SolarEdge Technologies, Inc. (Semiconductors & Equip.) | (a) | 11,839 | 1,643,016 |
Synaptics, Inc. (Semiconductors & Equip.) | (a) | 8,119 | 488,114 |
SYNNEX Corp. (Electronic Equip., Instr. & Comp.) | 9,831 | 1,177,459 | |
Teradata Corp. (Software) | (a) | 25,888 | 538,470 |
Teradyne, Inc. (Semiconductors & Equip.) | 39,542 | 3,341,695 | |
Trimble, Inc. (Electronic Equip., Instr. & Comp.) | (a) | 59,580 | 2,573,260 |
Universal Display Corp. (Semiconductors & Equip.) | 10,113 | 1,513,107 | |
ViaSat, Inc. (Communications Equip.) | (a) | 13,941 | 534,916 |
Vishay Intertechnology, Inc. (Electronic Equip., Instr. & Comp.) | 31,626 | 482,929 | |
WEX, Inc. (IT Svs.) | (a) | 10,381 | 1,712,969 |
| 61,830,737 | |||
| Materials–6.0% | |||
Allegheny Technologies, Inc. (Metals & Mining) | (a) | 30,118 | 306,902 |
AptarGroup, Inc. (Containers & Packaging) | 15,306 | 1,713,966 | |
Ashland Global Holdings, Inc. (Chemicals) | 14,431 | 997,182 | |
Cabot Corp. (Chemicals) | 13,499 | 500,138 | |
Carpenter Technology Corp. (Metals & Mining) | 11,435 | 277,642 | |
Chemours Co. / The (Chemicals) | 39,233 | 602,227 | |
Commercial Metals Co. (Metals & Mining) | 28,429 | 579,952 | |
Compass Minerals International, Inc. (Metals & Mining) | 8,066 | 393,217 | |
Domtar Corp. (Paper & Forest Products) | 13,117 | 276,900 | |
Eagle Materials, Inc. (Construction Materials) | 9,915 | 696,231 | |
Greif, Inc. Class A (Containers & Packaging) | 6,342 | 218,228 | |
Ingevity Corp. (Chemicals) | (a) | 9,837 | 517,131 |
Louisiana-Pacific Corp. (Paper & Forest Products) | 26,781 | 686,933 | |
Minerals Technologies, Inc. (Chemicals) | 8,127 | 381,400 | |
NewMarket Corp. (Chemicals) | 1,722 | 689,627 | |
O-I Glass, Inc. (Containers & Packaging) | 37,268 | 334,667 | |
Olin Corp. (Chemicals) | 37,647 | 432,564 | |
PolyOne Corp. (Chemicals) | 21,818 | 572,286 | |
Reliance Steel & Aluminum Co. (Metals & Mining) | 15,187 | ���1,441,702 | |
Royal Gold, Inc. (Metals & Mining) | 15,645 | 1,944,986 | |
RPM International, Inc. (Chemicals) | 30,888 | 2,318,453 | |
Scotts Miracle-Gro Co. / The (Chemicals) | 9,392 | 1,262,942 | |
Sensient Technologies Corp. (Chemicals) | 10,113 | 527,494 | |
Silgan Holdings, Inc. (Containers & Packaging) | 18,498 | 599,150 | |
Sonoco Products Co. (Containers & Packaging) | 23,922 | 1,250,881 | |
Steel Dynamics, Inc. (Metals & Mining) | 50,188 | 1,309,405 | |
United States Steel Corp. (Metals & Mining) | 52,639 | 380,054 |
| Common Stocks (Continued) | Shares | Value | |
| Materials (continued) | |||
Valvoline, Inc. (Chemicals) | 44,134 | $ 853,110 | |
Worthington Industries, Inc. (Metals & Mining) | 8,756 | 326,599 | |
| 22,391,969 | |||
| Real Estate–9.9% | |||
American Campus Communities, Inc. (Equity REIT) | 32,801 | 1,146,723 | |
Brixmor Property Group, Inc. (Equity REIT) | 70,758 | 907,118 | |
Camden Property Trust (Equity REIT) | 23,230 | 2,119,041 | |
CoreCivic, Inc. (Equity REIT) | 28,422 | 266,030 | |
CoreSite Realty Corp. (Equity REIT) | 9,607 | 1,163,023 | |
Corporate Office Properties Trust (Equity REIT) | 26,761 | 678,124 | |
Cousins Properties, Inc. (Equity REIT) | 35,469 | 1,058,040 | |
CyrusOne, Inc. (Equity REIT) | 27,482 | 1,999,316 | |
Douglas Emmett, Inc. (Equity REIT) | 39,303 | 1,205,030 | |
EastGroup Properties, Inc. (Equity REIT) | 9,327 | 1,106,276 | |
EPR Properties (Equity REIT) | 18,520 | 613,568 | |
First Industrial Realty Trust, Inc. (Equity REIT) | 30,319 | 1,165,462 | |
GEO Group, Inc. / The (Equity REIT) | 28,980 | 342,833 | |
Healthcare Realty Trust, Inc. (Equity REIT) | 32,202 | 943,197 | |
Highwoods Properties, Inc. (Equity REIT) | 24,791 | 925,448 | |
Hudson Pacific Properties, Inc. (Equity REIT) | 36,576 | 920,252 | |
JBG SMITH Properties (Equity REIT) | 28,072 | 830,089 | |
Jones Lang LaSalle, Inc. (Real Estate Mgmt. & Development) | 12,313 | 1,273,903 | |
Kilroy Realty Corp. (Equity REIT) | 25,263 | 1,482,938 | |
Lamar Advertising Co. Class A (Equity REIT) | 20,600 | 1,375,256 | |
Life Storage, Inc. (Equity REIT) | 11,201 | 1,063,535 | |
Macerich Co. / The (Equity REIT) | 27,593 | 247,509 | |
Mack-Cali Realty Corp. (Equity REIT) | 21,595 | 330,188 | |
Medical Properties Trust, Inc. (Equity REIT) | 126,045 | 2,369,646 | |
National Retail Properties, Inc. (Equity REIT) | 41,033 | 1,455,851 | |
Omega Healthcare Investors, Inc. (Equity REIT) | 54,137 | 1,609,493 | |
Park Hotels & Resorts, Inc. (Equity REIT) | 56,287 | 556,678 | |
Pebblebrook Hotel Trust (Equity REIT) | 31,261 | 427,025 | |
Physicians Realty Trust (Equity REIT) | 48,339 | 846,899 | |
PotlatchDeltic Corp. (Equity REIT) | 15,978 | 607,643 | |
PS Business Parks, Inc. (Equity REIT) | 4,783 | 633,269 | |
Rayonier, Inc. (Equity REIT) | 33,039 | 819,037 | |
Sabra Health Care REIT, Inc. (Equity REIT) | 48,956 | 706,435 | |
Service Properties Trust (Equity REIT) | 39,132 | 277,446 | |
Spirit Realty Capital, Inc. (Equity REIT) | 24,556 | 856,022 | |
STORE Capital Corp. (Equity REIT) | 53,070 | 1,263,597 | |
Taubman Centers, Inc. (Equity REIT) | 14,703 | 555,185 | |
Urban Edge Properties (Equity REIT) | 26,325 | 312,478 | |
Weingarten Realty Investors (Equity REIT) | 28,753 | 544,294 | |
| 37,003,897 | |||
| Utilities–4.1% | |||
ALLETE, Inc. (Electric Utilities) | 12,352 | 674,543 | |
Black Hills Corp. (Multi-Utilities) | 14,965 | 847,917 | |
Essential Utilities, Inc. (Water Utilities) | 53,167 | 2,245,774 | |
Hawaiian Electric Industries, Inc. (Electric Utilities) | 26,046 | 939,219 | |
IDACORP, Inc. (Electric Utilities) | 12,048 | 1,052,634 | |
MDU Resources Group, Inc. (Multi-Utilities) | 47,874 | 1,061,845 | |
National Fuel Gas Co. (Gas Utilities) | 21,554 | 903,759 | |
New Jersey Resources Corp. (Gas Utilities) | 22,847 | 745,955 | |
NorthWestern Corp. (Multi-Utilities) | 12,038 | 656,312 | |
OGE Energy Corp. (Electric Utilities) | 47,740 | 1,449,386 | |
ONE Gas, Inc. (Gas Utilities) | 12,616 | 972,063 | |
PNM Resources, Inc. (Electric Utilities) | 18,996 | 730,206 | |
Southwest Gas Holdings, Inc. (Gas Utilities) | 13,148 | 907,869 | |
Spire, Inc. (Gas Utilities) | 12,217 | 802,779 | |
UGI Corp. (Gas Utilities) | 49,684 | 1,579,951 | |
| 15,570,212 | |||
Total Common Stocks (Cost $390,281,904) | $373,497,486 |
| Ohio National Fund, Inc. | ON S&P MidCap 400® Index Portfolio (Continued) |
| Schedule of Investments | June 30, 2020 (Unaudited) |
| Money Market Funds–0.5% | Shares | Value | |
State Street Institutional Liquid Reserves Fund Institutional Class, 0.346% | (b) | 2,014,441 | $ 2,015,247 |
Total Money Market Funds (Cost $2,015,247) | $ 2,015,247 | ||
Total Investments – 100.0% (Cost $392,297,151) | (c) | $375,512,733 | |
Liabilities in Excess of Other Assets – (0.0)% | (d) | (155,724) | |
| Net Assets – 100.0% | $375,357,009 |
Percentages are stated as a percent of net assets. |
| Footnotes: | ||
| (a) | Non-income producing security. | |
| (b) | Rate represents the seven-day yield at June 30, 2020. | |
| (c) | Represents cost for financial reporting purposes, which may differ from cost basis for federal income tax purposes. See also Note 8 of the Notes to Financial Statements. | |
| (d) | Includes $285,000 of cash pledged as collateral for the futures contracts outstanding at June 30, 2020. See also the following Schedule of Open Futures Contracts. | |
| Schedule of Open Futures Contracts | June 30, 2020 (Unaudited) |
| Description | Number of contracts | Expiration Date | Notional Amount | Value | Unrealized Appreciation (Depreciation) | Variation Margin Receivable (Payable) | ||||||
| CME E-mini S&P MidCap 400 Index - Long | 19 | September 18, 2020 | $3,328,065 | $3,380,290 | $52,225 | $44,080 |
| Ohio National Fund, Inc. | ON BlackRock Advantage Large Cap Growth Portfolio (Unaudited) |
| Average Annual returns | |
| One year | 19.32% |
| Five years | 12.31% |
| Ten years | 14.73% |
| (1) | The Portfolio’s composition is subject to change. Holdings and weightings are as of June 30, 2020. |
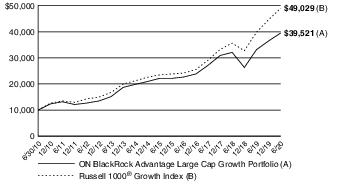
| Ohio National Fund, Inc. | ON BlackRock Advantage Large Cap Growth Portfolio (Unaudited) (Continued) |
| Portfolio Composition as of June 30, 2020 (1) | |
| % of Net Assets | |
| Common Stocks (4) | 98.8 |
| Rights (4) | 0.0 |
| Money Market Funds Less Net Liabilities | 1.2 |
| 100.0 | |
| Top 10 Portfolio Holdings as of June 30, 2020 (1) (2) (3) | ||
| % of Net Assets | ||
| 1. | Microsoft Corp. | 8.4 |
| 2. | Amazon.com, Inc. | 8.2 |
| 3. | Apple, Inc. | 8.1 |
| 4. | Facebook, Inc. Class A | 2.9 |
| 5. | Alphabet, Inc. Class C | 2.9 |
| 6. | NVIDIA Corp. | 2.6 |
| 7. | Adobe, Inc. | 2.3 |
| 8. | Alphabet, Inc. Class A | 2.0 |
| 9. | UnitedHealth Group, Inc. | 2.0 |
| 10. | PayPal Holdings, Inc. | 1.9 |
| (1) | Composition of Portfolio subject to change. | |
| (2) | Short-term investments have been excluded from the list of Top 10 Portfolio Holdings. | |
| (3) | Top 10 Portfolio Holdings is presented at an individual security level. Total investment exposure by issuer may be higher. | |
| (4) | Sectors (Common Stocks, Rights): | |
| % of Net Assets | |
| Information Technology | 42.9 |
| Health Care | 15.2 |
| Consumer Discretionary | 14.8 |
| Communication Services | 11.1 |
| Industrials | 5.0 |
| Consumer Staples | 4.6 |
| Financials | 2.3 |
| Real Estate | 1.6 |
| Materials | 1.0 |
| Utilities | 0.3 |
| 98.8 |
| Ohio National Fund, Inc. | ON BlackRock Advantage Large Cap Growth Portfolio |
| Schedule of Investments | June 30, 2020 (Unaudited) |
| Common Stocks–98.8% | Shares | Value | |
| Communication Services–11.1% | |||
Activision Blizzard, Inc. (Entertainment) | 2,569 | $ 194,987 | |
Alphabet, Inc. Class A (Interactive Media & Svs.) | (a) | 1,450 | 2,056,172 |
Alphabet, Inc. Class C (Interactive Media & Svs.) | (a) | 2,060 | 2,912,037 |
Cable One, Inc. (Media) | 56 | 99,392 | |
Charter Communications, Inc. Class A (Media) | (a) | 341 | 173,924 |
Comcast Corp. Class A (Media) | 5,085 | 198,213 | |
Electronic Arts, Inc. (Entertainment) | (a) | 981 | 129,541 |
Facebook, Inc. Class A (Interactive Media & Svs.) | (a) | 13,074 | 2,968,713 |
Netflix, Inc. (Entertainment) | (a) | 2,702 | 1,229,518 |
Pinterest, Inc. Class A (Interactive Media & Svs.) | (a) | 1,179 | 26,138 |
Sirius XM Holdings, Inc. (Media) | 108,649 | 637,770 | |
Twitter, Inc. (Interactive Media & Svs.) | (a) | 8,092 | 241,061 |
United States Cellular Corp. (Wireless Telecom. Svs.) | (a) | 4,518 | 139,471 |
Zynga, Inc. Class A (Entertainment) | (a) | 26,975 | 257,341 |
| 11,264,278 | |||
| Consumer Discretionary–14.8% | |||
Amazon.com, Inc. (Internet & Direct Marketing Retail) | (a) | 3,018 | 8,326,119 |
Best Buy Co., Inc. (Specialty Retail) | 1,256 | 109,611 | |
Boyd Gaming Corp. (Hotels, Restaurants & Leisure) | 2,463 | 51,477 | |
Bright Horizons Family Solutions, Inc. (Diversified Consumer Svs.) | (a) | 412 | 48,286 |
Chipotle Mexican Grill, Inc. (Hotels, Restaurants & Leisure) | (a) | 238 | 250,462 |
Darden Restaurants, Inc. (Hotels, Restaurants & Leisure) | 276 | 20,912 | |
Dollar General Corp. (Multiline Retail) | 1,271 | 242,138 | |
Domino's Pizza, Inc. (Hotels, Restaurants & Leisure) | 618 | 228,314 | |
eBay, Inc. (Internet & Direct Marketing Retail) | 1,446 | 75,843 | |
Etsy, Inc. (Internet & Direct Marketing Retail) | (a) | 1,308 | 138,949 |
H&R Block, Inc. (Diversified Consumer Svs.) | 6,468 | 92,363 | |
Home Depot, Inc. / The (Specialty Retail) | 5,668 | 1,419,891 | |
Levi Strauss & Co. Class A (Textiles, Apparel & Luxury Goods) | 1,277 | 17,112 | |
Lowe's Cos., Inc. (Specialty Retail) | 6,600 | 891,792 | |
Lululemon Athletica, Inc. (Textiles, Apparel & Luxury Goods) | (a) | 1,225 | 382,212 |
NIKE, Inc. Class B (Textiles, Apparel & Luxury Goods) | 8,185 | 802,539 | |
Pool Corp. (Distributors) | 141 | 38,334 | |
Ross Stores, Inc. (Specialty Retail) | 246 | 20,969 | |
Tesla, Inc. (Automobiles) | (a) | 875 | 944,834 |
Texas Roadhouse, Inc. (Hotels, Restaurants & Leisure) | 2,750 | 144,567 | |
TJX Cos., Inc. / The (Specialty Retail) | 3,962 | 200,319 | |
V.F. Corp. (Textiles, Apparel & Luxury Goods) | 513 | 31,262 | |
Vail Resorts, Inc. (Hotels, Restaurants & Leisure) | 383 | 69,763 | |
Wayfair, Inc. Class A (Internet & Direct Marketing Retail) | (a) | 237 | 46,833 |
Yum! Brands, Inc. (Hotels, Restaurants & Leisure) | 4,492 | 390,400 | |
| 14,985,301 | |||
| Consumer Staples–4.6% | |||
Brown-Forman Corp. Class B (Beverages) | 500 | 31,830 | |
Church & Dwight Co., Inc. (Household Products) | 580 | 44,834 | |
Clorox Co. / The (Household Products) | 2,527 | 554,348 | |
Coca-Cola European Partners PLC (Beverages) | 2,126 | 80,278 |
| Common Stocks (Continued) | Shares | Value | |
| Consumer Staples (continued) | |||
Colgate-Palmolive Co. (Household Products) | 296 | $ 21,685 | |
Costco Wholesale Corp. (Food & Staples Retailing) | 5,485 | 1,663,107 | |
General Mills, Inc. (Food Products) | 7,562 | 466,197 | |
Hershey Co. / The (Food Products) | 4,318 | 559,699 | |
PepsiCo, Inc. (Beverages) | 9,161 | 1,211,634 | |
Procter & Gamble Co. / The (Household Products) | 513 | 61,339 | |
Sanderson Farms, Inc. (Food Products) | 139 | 16,109 | |
| 4,711,060 | |||
| Financials–2.3% | |||
American Express Co. (Consumer Finance) | 601 | 57,215 | |
Brown & Brown, Inc. (Insurance) | 1,384 | 56,412 | |
Charles Schwab Corp. / The (Capital Markets) | 8,950 | 301,973 | |
CME Group, Inc. (Capital Markets) | 543 | 88,259 | |
Cullen / Frost Bankers, Inc. (Banks) | 1,295 | 96,749 | |
FactSet Research Systems, Inc. (Capital Markets) | 1,017 | 334,054 | |
First American Financial Corp. (Insurance) | 742 | 35,631 | |
Intercontinental Exchange, Inc. (Capital Markets) | 624 | 57,158 | |
LendingTree, Inc. (Consumer Finance) | (a) | 93 | 26,926 |
Marsh & McLennan Cos., Inc. (Insurance) | 2,656 | 285,175 | |
Moody's Corp. (Capital Markets) | 33 | 9,066 | |
S&P Global, Inc. (Capital Markets) | 3,014 | 993,053 | |
T. Rowe Price Group, Inc. (Capital Markets) | 123 | 15,191 | |
| 2,356,862 | |||
| Health Care–15.2% | |||
Abbott Laboratories (Health Care Equip. & Supplies) | 2,997 | 274,016 | |
AbbVie, Inc. (Biotechnology) | 15,738 | 1,545,157 | |
Agilent Technologies, Inc. (Life Sciences Tools & Svs.) | 1,539 | 136,001 | |
Alkermes PLC (Biotechnology) | (a) | 1,481 | 28,739 |
AmerisourceBergen Corp. (Health Care Providers & Svs.) | 210 | 21,162 | |
Amgen, Inc. (Biotechnology) | 4,811 | 1,134,723 | |
Anthem, Inc. (Health Care Providers & Svs.) | 1,353 | 355,812 | |
Arena Pharmaceuticals, Inc. (Biotechnology) | (a) | 1,416 | 89,137 |
Biogen, Inc. (Biotechnology) | (a) | 246 | 65,817 |
Bristol-Myers Squibb Co. (Pharmaceuticals) | 5,487 | 322,636 | |
Cardinal Health, Inc. (Health Care Providers & Svs.) | 613 | 31,993 | |
CVS Health Corp. (Health Care Providers & Svs.) | 573 | 37,228 | |
DexCom, Inc. (Health Care Equip. & Supplies) | (a) | 1,193 | 483,642 |
Edwards Lifesciences Corp. (Health Care Equip. & Supplies) | (a) | 11,978 | 827,800 |
Elanco Animal Health, Inc. (Pharmaceuticals) | (a) | 3,285 | 70,463 |
Eli Lilly & Co. (Pharmaceuticals) | 4,464 | 732,900 | |
Gilead Sciences, Inc. (Biotechnology) | 7,944 | 611,211 | |
HCA Healthcare, Inc. (Health Care Providers & Svs.) | 587 | 56,974 | |
Hologic, Inc. (Health Care Equip. & Supplies) | (a) | 428 | 24,396 |
IDEXX Laboratories, Inc. (Health Care Equip. & Supplies) | (a) | 1,673 | 552,358 |
Intuitive Surgical, Inc. (Health Care Equip. & Supplies) | (a) | 164 | 93,452 |
McKesson Corp. (Health Care Providers & Svs.) | 1,738 | 266,644 | |
Merck & Co., Inc. (Pharmaceuticals) | 20,370 | 1,575,212 | |
Mettler-Toledo International, Inc. (Life Sciences Tools & Svs.) | (a) | 129 | 103,916 |
Moderna, Inc. (Biotechnology) | (a) | 1,843 | 118,339 |
Regeneron Pharmaceuticals, Inc. (Biotechnology) | (a) | 862 | 537,586 |
ResMed, Inc. (Health Care Equip. & Supplies) | 330 | 63,360 |
| Ohio National Fund, Inc. | ON BlackRock Advantage Large Cap Growth Portfolio (Continued) |
| Schedule of Investments | June 30, 2020 (Unaudited) |
| Common Stocks (Continued) | Shares | Value | |
| Health Care (continued) | |||
Stryker Corp. (Health Care Equip. & Supplies) | 2,559 | $ 461,106 | |
Teladoc Health, Inc. (Health Care Technology) | (a) | 954 | 182,061 |
Thermo Fisher Scientific, Inc. (Life Sciences Tools & Svs.) | 471 | 170,662 | |
UnitedHealth Group, Inc. (Health Care Providers & Svs.) | 6,835 | 2,015,983 | |
Veeva Systems, Inc. Class A (Health Care Technology) | (a) | 2,525 | 591,911 |
Vertex Pharmaceuticals, Inc. (Biotechnology) | (a) | 3,130 | 908,670 |
Waters Corp. (Life Sciences Tools & Svs.) | (a) | 108 | 19,483 |
West Pharmaceutical Services, Inc. (Health Care Equip. & Supplies) | 878 | 199,455 | |
Zoetis, Inc. (Pharmaceuticals) | 5,552 | 760,846 | |
| 15,470,851 | |||
| Industrials–5.0% | |||
Advanced Drainage Systems, Inc. (Building Products) | 722 | 35,667 | |
Allegion PLC (Building Products) | 3,963 | 405,098 | |
C.H. Robinson Worldwide, Inc. (Air Freight & Logistics) | 464 | 36,684 | |
Carlisle Cos., Inc. (Industrial Conglomerates) | 248 | 29,678 | |
Cintas Corp. (Commercial Svs. & Supplies) | 856 | 228,004 | |
Copart, Inc. (Commercial Svs. & Supplies) | (a) | 1,137 | 94,678 |
CSX Corp. (Road & Rail) | 836 | 58,303 | |
EMCOR Group, Inc. (Construction & Engineering) | 4,805 | 317,803 | |
Expeditors International of Washington, Inc. (Air Freight & Logistics) | 441 | 33,534 | |
Fastenal Co. (Trading Companies & Distributors) | 308 | 13,195 | |
Generac Holdings, Inc. (Electrical Equip.) | (a) | 610 | 74,377 |
HEICO Corp. (Aerospace & Defense) | 640 | 63,776 | |
Honeywell International, Inc. (Industrial Conglomerates) | 840 | 121,456 | |
Hubbell, Inc. (Electrical Equip.) | 2,927 | 366,929 | |
IHS Markit Ltd. (Professional Svs.) | 1,126 | 85,013 | |
Illinois Tool Works, Inc. (Machinery) | 2,063 | 360,715 | |
L3Harris Technologies, Inc. (Aerospace & Defense) | 1,051 | 178,323 | |
Lockheed Martin Corp. (Aerospace & Defense) | 1,064 | 388,275 | |
Northrop Grumman Corp. (Aerospace & Defense) | 959 | 294,835 | |
Robert Half International, Inc. (Professional Svs.) | 4,076 | 215,335 | |
Roper Technologies, Inc. (Industrial Conglomerates) | 144 | 55,909 | |
SiteOne Landscape Supply, Inc. (Trading Companies & Distributors) | (a) | 419 | 47,753 |
Teledyne Technologies, Inc. (Aerospace & Defense) | (a) | 341 | 106,034 |
Toro Co. / The (Machinery) | 1,141 | 75,694 | |
Trex Co., Inc. (Building Products) | (a) | 344 | 44,744 |
Union Pacific Corp. (Road & Rail) | 3,702 | 625,897 | |
United Parcel Service, Inc. Class B (Air Freight & Logistics) | 2,695 | 299,630 | |
W.W. Grainger, Inc. (Trading Companies & Distributors) | 566 | 177,814 | |
Xylem, Inc. (Machinery) | 3,802 | 246,978 | |
| 5,082,131 | |||
| Information Technology–42.9% | |||
Accenture PLC Class A (IT Svs.) | 2,234 | 479,684 | |
Adobe, Inc. (Software) | (a) | 5,245 | 2,283,201 |
Advanced Micro Devices, Inc. (Semiconductors & Equip.) | (a) | 8,530 | 448,763 |
Alteryx, Inc. Class A (Software) | (a) | 650 | 106,782 |
Amphenol Corp. Class A (Electronic Equip., Instr. & Comp.) | 2,149 | 205,896 |
| Common Stocks (Continued) | Shares | Value | |
| Information Technology (continued) | |||
Analog Devices, Inc. (Semiconductors & Equip.) | 331 | $ 40,594 | |
Appfolio, Inc. Class A (Software) | (a) | 443 | 72,081 |
Apple, Inc. (Tech. Hardware, Storage & Periph.) | 22,610 | 8,248,128 | |
Applied Materials, Inc. (Semiconductors & Equip.) | 8,745 | 528,635 | |
Atlassian Corp. PLC Class A (Software) | (a) | 1,685 | 303,755 |
Autodesk, Inc. (Software) | (a) | 959 | 229,383 |
Automatic Data Processing, Inc. (IT Svs.) | 7,381 | 1,098,957 | |
Avnet, Inc. (Electronic Equip., Instr. & Comp.) | 4,569 | 127,407 | |
Broadridge Financial Solutions, Inc. (IT Svs.) | 233 | 29,402 | |
Cadence Design Systems, Inc. (Software) | (a) | 3,722 | 357,163 |
CDW Corp. (Electronic Equip., Instr. & Comp.) | 682 | 79,235 | |
Ciena Corp. (Communications Equip.) | (a) | 1,846 | 99,979 |
Cirrus Logic, Inc. (Semiconductors & Equip.) | (a) | 2,129 | 131,530 |
Cisco Systems, Inc. (Communications Equip.) | 23,444 | 1,093,428 | |
Citrix Systems, Inc. (Software) | 1,318 | 194,945 | |
Cloudflare, Inc. Class A (Software) | (a) | 3,525 | 126,724 |
Cognex Corp. (Electronic Equip., Instr. & Comp.) | 2,081 | 124,277 | |
DocuSign, Inc. (Software) | (a) | 1,804 | 310,667 |
Dolby Laboratories, Inc. Class A (Electronic Equip., Instr. & Comp.) | 2,447 | 161,184 | |
Fiserv, Inc. (IT Svs.) | (a) | 4,693 | 458,131 |
Fortinet, Inc. (Software) | (a) | 150 | 20,590 |
HP, Inc. (Tech. Hardware, Storage & Periph.) | 486 | 8,471 | |
HubSpot, Inc. (Software) | (a) | 602 | 135,059 |
Intel Corp. (Semiconductors & Equip.) | 4,460 | 266,842 | |
Intuit, Inc. (Software) | 2,804 | 830,517 | |
Jack Henry & Associates, Inc. (IT Svs.) | 828 | 152,377 | |
Lam Research Corp. (Semiconductors & Equip.) | 1,362 | 440,552 | |
Mastercard, Inc. Class A (IT Svs.) | 6,281 | 1,857,292 | |
Maxim Integrated Products, Inc. (Semiconductors & Equip.) | 921 | 55,822 | |
Microsoft Corp. (Software) | 41,937 | 8,534,599 | |
Monolithic Power Systems, Inc. (Semiconductors & Equip.) | 149 | 35,313 | |
Motorola Solutions, Inc. (Communications Equip.) | 1,824 | 255,597 | |
National Instruments Corp. (Electronic Equip., Instr. & Comp.) | 2,937 | 113,691 | |
NetApp, Inc. (Tech. Hardware, Storage & Periph.) | 5,849 | 259,520 | |
New Relic, Inc. (Software) | (a) | 1,883 | 129,739 |
NVIDIA Corp. (Semiconductors & Equip.) | 6,905 | 2,623,279 | |
Paychex, Inc. (IT Svs.) | 3,378 | 255,883 | |
Paycom Software, Inc. (Software) | (a) | 45 | 13,938 |
Paylocity Holding Corp. (Software) | (a) | 384 | 56,022 |
PayPal Holdings, Inc. (IT Svs.) | (a) | 11,325 | 1,973,155 |
Qualys, Inc. (Software) | (a) | 908 | 94,450 |
RingCentral, Inc. Class A (Software) | (a) | 1,089 | 310,376 |
salesforce.com, Inc. (Software) | (a) | 5,814 | 1,089,137 |
Seagate Technology PLC (Tech. Hardware, Storage & Periph.) | 683 | 33,064 | |
ServiceNow, Inc. (Software) | (a) | 2,671 | 1,081,915 |
Slack Technologies, Inc. Class A (Software) | (a) | 5,617 | 174,633 |
Smartsheet, Inc. Class A (Software) | (a) | 2,567 | 130,712 |
Square, Inc. Class A (IT Svs.) | (a) | 544 | 57,087 |
Synopsys, Inc. (Software) | (a) | 538 | 104,910 |
Teradata Corp. (Software) | (a) | 1,070 | 22,256 |
Texas Instruments, Inc. (Semiconductors & Equip.) | 5,498 | 698,081 | |
Trimble, Inc. (Electronic Equip., Instr. & Comp.) | (a) | 728 | 31,442 |
Twilio, Inc. Class A (IT Svs.) | (a) | 311 | 68,240 |
VeriSign, Inc. (IT Svs.) | (a) | 229 | 47,364 |
Visa, Inc. (IT Svs.) | 9,836 | 1,900,020 | |
VMware, Inc. Class A (Software) | (a) | 1,559 | 241,427 |
| Ohio National Fund, Inc. | ON BlackRock Advantage Large Cap Growth Portfolio (Continued) |
| Schedule of Investments | June 30, 2020 (Unaudited) |
| Common Stocks (Continued) | Shares | Value | |
| Information Technology (continued) | |||
Workday, Inc. Class A (Software) | (a) | 1,929 | $ 361,417 |
Xilinx, Inc. (Semiconductors & Equip.) | 944 | 92,880 | |
Zebra Technologies Corp. Class A (Electronic Equip., Instr. & Comp.) | (a) | 1,522 | 389,556 |
Zendesk, Inc. (Software) | (a) | 385 | 34,084 |
Zoom Video Communications, Inc. Class A (Software) | (a) | 4,225 | 1,071,206 |
Zscaler, Inc. (Software) | (a) | 1,346 | 147,387 |
| 43,539,833 | |||
| Materials–1.0% | |||
Ecolab, Inc. (Chemicals) | 3,798 | 755,612 | |
PPG Industries, Inc. (Chemicals) | 215 | 22,803 | |
Reliance Steel & Aluminum Co. (Metals & Mining) | 131 | 12,436 | |
Sherwin-Williams Co. / The (Chemicals) | 388 | 224,206 | |
| 1,015,057 | |||
| Real Estate–1.6% | |||
American Tower Corp. (Equity REIT) | 2,726 | 704,780 | |
AvalonBay Communities, Inc. (Equity REIT) | 634 | 98,042 | |
Boston Properties, Inc. (Equity REIT) | 1,402 | 126,713 | |
Camden Property Trust (Equity REIT) | 190 | 17,332 | |
Douglas Emmett, Inc. (Equity REIT) | 591 | 18,120 | |
Equity Residential (Equity REIT) | 3,790 | 222,928 | |
Prologis, Inc. (Equity REIT) | 1,619 | 151,101 | |
QTS Realty Trust, Inc. Class A (Equity REIT) | 386 | 24,739 |
| Common Stocks (Continued) | Shares | Value | |
| Real Estate (continued) | |||
Realty Income Corp. (Equity REIT) | 1,541 | $ 91,689 | |
SBA Communications Corp. (Equity REIT) | 369 | 109,932 | |
| 1,565,376 | |||
| Utilities–0.3% | |||
CMS Energy Corp. (Multi-Utilities) | 1,097 | 64,087 | |
IDACORP, Inc. (Electric Utilities) | 112 | 9,785 | |
NextEra Energy, Inc. (Electric Utilities) | 829 | 199,101 | |
| 272,973 | |||
Total Common Stocks (Cost $83,771,799) | $100,263,722 |
| Rights –0.0% | Quantity | Value | |
| Health Care–0.0% | |||
Bristol-Myers Squibb Co. (Pharmaceuticals) | (a) | 5,350 | $ 19,153 |
Total Rights (Cost $11,396) | $ 19,153 |
| Money Market Funds–5.7% | Shares | Value | |
State Street Institutional Liquid Reserves Fund Institutional Class, 0.346% | (b) | 5,797,808 | $ 5,800,127 |
Total Money Market Funds (Cost $5,800,653) | $ 5,800,127 | ||
Total Investments – 104.5% (Cost $89,583,848) | (c) | $106,083,002 | |
Liabilities in Excess of Other Assets – (4.5)% | (d) | (4,541,877) | |
| Net Assets – 100.0% | $101,541,125 |
Percentages are stated as a percent of net assets. |
| Footnotes: | ||
| (a) | Non-income producing security. | |
| (b) | Rate represents the seven-day yield at June 30, 2020. | |
| (c) | Represents cost for financial reporting purposes, which may differ from cost basis for federal income tax purposes. See also Note 8 of the Notes to Financial Statements. | |
| (d) | Includes $276,000 of cash pledged as collateral for the futures contracts outstanding at June 30, 2020. See also the following Schedule of Open Futures Contracts. | |
| Schedule of Open Futures Contracts | June 30, 2020 (Unaudited) |
| Description | Number of contracts | Expiration Date | Notional Amount | Value | Unrealized Appreciation (Depreciation) | Variation Margin Receivable (Payable) | ||||||
| CME E-mini S&P 500 Index - Long | 23 | September 18, 2020 | $3,487,505 | $3,553,730 | $66,225 | $26,075 |
| Ohio National Fund, Inc. | ON Risk Managed Balanced Portfolio (Unaudited) |
| Average Annual returns | |
| One year | 16.17% |
| Five years | 9.93% |
| Since inception (5/1/14) | 9.27% |
| Ohio National Fund, Inc. | ON Risk Managed Balanced Portfolio (Unaudited) (Continued) |
| (1) | The Portfolio’s composition is subject to change. Holdings and weightings are as of June 30, 2020. |
| Ohio National Fund, Inc. | ON Risk Managed Balanced Portfolio (Unaudited) (Continued) |

| Portfolio Composition as of June 30, 2020 (1) | |
| % of Net Assets | |
| Common Stocks (4) | 48.9 |
| Corporate Bonds (4) | 19.5 |
| U.S. Treasury Obligations | 7.4 |
| Purchased Options | 7.2 |
| Asset-Backed / Mortgage-Backed Securities (4) | 4.5 |
| U.S. Government Agency Mortgage-Backed Securities | 3.2 |
| Preferred Securities (4) | 0.7 |
| Sovereign Issues | 0.2 |
| Money Market Funds Less Net Liabilities | 8.4 |
| 100.0 | |
| Top 10 Portfolio Holdings as of June 30, 2020 (1) (2) (3) | ||
| % of Net Assets | ||
| 1. | Microsoft Corp. | 3.6 |
| 2. | Alphabet, Inc. Class C | 2.5 |
| 3. | Amazon.com, Inc. | 2.0 |
| 4. | U.S. Treasury Note 0.375%, 03/31/2022 | 2.0 |
| 5. | U.S. Treasury Note 0.500%, 03/31/2025 | 1.9 |
| 6. | UnitedHealth Group, Inc. | 1.8 |
| 7. | Facebook, Inc. Class A | 1.7 |
| 8. | Visa, Inc. | 1.6 |
| 9. | Monster Beverage Corp. | 1.1 |
| 10. | Home Depot, Inc. / The | 1.1 |
| (1) | Composition of Portfolio subject to change. | |
| (2) | Short-term investments have been excluded from the list of Top 10 Portfolio Holdings. | |
| (3) | Top 10 Portfolio Holdings is presented at an individual security level. Total investment exposure by issuer may be higher. | |
| (4) | Sectors (Common Stocks, Corporate Bonds, Preferred Securities, Asset-Backed / Mortgage Backed Securities): | |
| % of Net Assets | |
| Information Technology | 17.4 |
| Health Care | 11.7 |
| Financials | 10.9 |
| Consumer Discretionary | 8.6 |
| Communication Services | 7.6 |
| Consumer Staples | 6.3 |
| Industrials | 6.0 |
| Utilities | 2.4 |
| Materials | 1.0 |
| Energy | 1.0 |
| Real Estate | 0.7 |
| 73.6 |
| Ohio National Fund, Inc. | ON Risk Managed Balanced Portfolio |
| Schedule of Investments | June 30, 2020 (Unaudited) |
| Common Stocks–48.9% | Shares | Value | |
| Communication Services–5.5% | |||
Alphabet, Inc. Class C (Interactive Media & Svs.) | (a) | 6,886 | $ 9,734,118 |
Comcast Corp. Class A (Media) | 24,747 | 964,638 | |
Electronic Arts, Inc. (Entertainment) | (a) | 18,360 | 2,424,438 |
Facebook, Inc. Class A (Interactive Media & Svs.) | (a) | 28,580 | 6,489,661 |
Take-Two Interactive Software, Inc. (Entertainment) | (a) | 4,903 | 684,312 |
Verizon Communications, Inc. (Diversified Telecom. Svs.) | 21,580 | 1,189,705 | |
| 21,486,872 | |||
| Consumer Discretionary–6.5% | |||
Amazon.com, Inc. (Internet & Direct Marketing Retail) | (a) | 2,865 | 7,904,019 |
AutoZone, Inc. (Specialty Retail) | (a) | 1,400 | 1,579,368 |
Booking Holdings, Inc. (Internet & Direct Marketing Retail) | (a) | 240 | 382,162 |
Burlington Stores, Inc. (Specialty Retail) | (a) | 4,180 | 823,167 |
Deckers Outdoor Corp. (Textiles, Apparel & Luxury Goods) | (a) | 3,550 | 697,185 |
Dollar General Corp. (Multiline Retail) | 8,286 | 1,578,566 | |
Domino's Pizza, Inc. (Hotels, Restaurants & Leisure) | 2,860 | 1,056,598 | |
Etsy, Inc. (Internet & Direct Marketing Retail) | (a) | 4,360 | 463,163 |
Home Depot, Inc. / The (Specialty Retail) | 16,639 | 4,168,236 | |
McDonald's Corp. (Hotels, Restaurants & Leisure) | 6,131 | 1,130,986 | |
NIKE, Inc. Class B (Textiles, Apparel & Luxury Goods) | 27,488 | 2,695,198 | |
O'Reilly Automotive, Inc. (Specialty Retail) | (a) | 1,630 | 687,322 |
Ross Stores, Inc. (Specialty Retail) | 2,890 | 246,344 | |
TJX Cos., Inc. / The (Specialty Retail) | 33,420 | 1,689,715 | |
Ulta Beauty, Inc. (Specialty Retail) | (a) | 1,810 | 368,190 |
| 25,470,219 | |||
| Consumer Staples–3.9% | |||
British American Tobacco PLC – ADR (Tobacco) | 34,630 | 1,344,337 | |
Coca-Cola Co. / The (Beverages) | 15,770 | 704,604 | |
Colgate-Palmolive Co. (Household Products) | 6,040 | 442,490 | |
Costco Wholesale Corp. (Food & Staples Retailing) | 5,845 | 1,772,262 | |
Monster Beverage Corp. (Beverages) | (a) | 63,155 | 4,377,904 |
PepsiCo, Inc. (Beverages) | 6,700 | 886,142 | |
Philip Morris International, Inc. (Tobacco) | 21,310 | 1,492,979 | |
Procter & Gamble Co. / The (Household Products) | 16,399 | 1,960,828 | |
Sysco Corp. (Food & Staples Retailing) | 3,974 | 217,219 | |
Walmart, Inc. (Food & Staples Retailing) | 18,470 | 2,212,337 | |
| 15,411,102 | |||
| Energy–0.1% | |||
Royal Dutch Shell PLC Class B – ADR (Oil, Gas & Consumable Fuels) | 6,860 | 208,887 | |
| Financials–2.0% | |||
American Financial Group, Inc. (Insurance) | 5,430 | 344,588 | |
CME Group, Inc. (Capital Markets) | 3,340 | 542,884 | |
Essent Group Ltd. (Thrifts & Mortgage Finance) | 15,320 | 555,656 | |
Everest Re Group Ltd. (Insurance) | 4,500 | 927,900 | |
Intercontinental Exchange, Inc. (Capital Markets) | 7,070 | 647,612 | |
JPMorgan Chase & Co. (Banks) | 8,960 | 842,778 | |
PNC Financial Services Group, Inc. / The (Banks) | 3,880 | 408,215 | |
Progressive Corp. / The (Insurance) | 11,162 | 894,188 | |
RenaissanceRe Holdings Ltd. (Insurance) | 6,770 | 1,157,873 | |
S&P Global, Inc. (Capital Markets) | 4,380 | 1,443,122 | |
| 7,764,816 | |||
| Health Care–10.1% | |||
ABIOMED, Inc. (Health Care Equip. & Supplies) | (a) | 1,812 | 437,707 |
Align Technology, Inc. (Health Care Equip. & Supplies) | (a) | 5,250 | 1,440,810 |
Anthem, Inc. (Health Care Providers & Svs.) | 4,350 | 1,143,963 | |
Bristol-Myers Squibb Co. (Pharmaceuticals) | 22,816 | 1,341,581 | |
DaVita, Inc. (Health Care Providers & Svs.) | (a) | 7,970 | 630,746 |
Edwards Lifesciences Corp. (Health Care Equip. & Supplies) | (a) | 33,750 | 2,332,462 |
Eli Lilly & Co. (Pharmaceuticals) | 5,511 | 904,796 | |
IDEXX Laboratories, Inc. (Health Care Equip. & Supplies) | (a) | 4,050 | 1,337,148 |
Illumina, Inc. (Life Sciences Tools & Svs.) | (a) | 5,490 | 2,033,221 |
Intuitive Surgical, Inc. (Health Care Equip. & Supplies) | (a) | 6,240 | 3,555,739 |
Johnson & Johnson (Pharmaceuticals) | 11,710 | 1,646,777 | |
Medtronic PLC (Health Care Equip. & Supplies) | 4,241 | 388,900 | |
Merck & Co., Inc. (Pharmaceuticals) | 23,833 | 1,843,006 | |
Mettler-Toledo International, Inc. (Life Sciences Tools & Svs.) | (a) | 500 | 402,775 |
| Ohio National Fund, Inc. | ON Risk Managed Balanced Portfolio (Continued) |
| Schedule of Investments | June 30, 2020 (Unaudited) |
| Common Stocks (Continued) | Shares | Value | |
| Health Care (continued) | |||
Regeneron Pharmaceuticals, Inc. (Biotechnology) | (a) | 3,460 | $ 2,157,829 |
Roche Holding AG – ADR (Pharmaceuticals) | 26,060 | 1,130,483 | |
Stryker Corp. (Health Care Equip. & Supplies) | 5,080 | 915,365 | |
UnitedHealth Group, Inc. (Health Care Providers & Svs.) | 23,576 | 6,953,741 | |
Veeva Systems, Inc. Class A (Health Care Technology) | (a) | 4,740 | 1,111,151 |
Vertex Pharmaceuticals, Inc. (Biotechnology) | (a) | 12,850 | 3,730,483 |
Zoetis, Inc. (Pharmaceuticals) | 29,290 | 4,013,902 | |
| 39,452,585 | |||
| Industrials–3.7% | |||
Allegion PLC (Building Products) | 13,880 | 1,418,813 | |
AMETEK, Inc. (Electrical Equip.) | 5,070 | 453,106 | |
C.H. Robinson Worldwide, Inc. (Air Freight & Logistics) | 14,280 | 1,128,977 | |
Copart, Inc. (Commercial Svs. & Supplies) | (a) | 16,252 | 1,353,304 |
IDEX Corp. (Machinery) | 2,490 | 393,520 | |
L3Harris Technologies, Inc. (Aerospace & Defense) | 9,250 | 1,569,447 | |
Lockheed Martin Corp. (Aerospace & Defense) | 4,760 | 1,737,019 | |
Masco Corp. (Building Products) | 19,680 | 988,133 | |
Northrop Grumman Corp. (Aerospace & Defense) | 1,340 | 411,970 | |
RELX PLC – ADR (Professional Svs.) | 48,010 | 1,131,115 | |
Republic Services, Inc. (Commercial Svs. & Supplies) | 5,420 | 444,711 | |
Roper Technologies, Inc. (Industrial Conglomerates) | 4,780 | 1,855,883 | |
Verisk Analytics, Inc. (Professional Svs.) | 9,780 | 1,664,556 | |
| 14,550,554 | |||
| Information Technology–15.2% | |||
Adobe, Inc. (Software) | (a) | 5,138 | 2,236,623 |
Amdocs Ltd. (IT Svs.) | 12,140 | 739,083 | |
Amphenol Corp. Class A (Electronic Equip., Instr. & Comp.) | 4,830 | 462,762 | |
ANSYS, Inc. (Software) | (a) | 870 | 253,805 |
Apple, Inc. (Tech. Hardware, Storage & Periph.) | 8,936 | 3,259,853 | |
Arista Networks, Inc. (Communications Equip.) | (a) | 4,210 | 884,226 |
ASML Holding N.V. (Semiconductors & Equip.) | 3,130 | 1,151,934 | |
Automatic Data Processing, Inc. (IT Svs.) | 10,950 | 1,630,346 | |
Booz Allen Hamilton Holding Corp. (IT Svs.) | 13,110 | 1,019,827 | |
CDW Corp. (Electronic Equip., Instr. & Comp.) | 5,750 | 668,035 | |
Check Point Software Technologies Ltd. (Software) | (a) | 12,280 | 1,319,240 |
Citrix Systems, Inc. (Software) | 9,360 | 1,384,438 | |
Cognex Corp. (Electronic Equip., Instr. & Comp.) | 6,700 | 400,124 | |
Euronet Worldwide, Inc. (IT Svs.) | (a) | 4,440 | 425,441 |
Fidelity National Information Services, Inc. (IT Svs.) | 8,260 | 1,107,583 | |
Fortinet, Inc. (Software) | (a) | 1,012 | 138,917 |
Genpact Ltd. (IT Svs.) | 23,620 | 862,602 | |
IPG Photonics Corp. (Electronic Equip., Instr. & Comp.) | (a) | 4,010 | 643,164 |
Mastercard, Inc. Class A (IT Svs.) | 2,284 | 675,379 | |
Microsoft Corp. (Software) | 70,193 | 14,284,977 | |
Motorola Solutions, Inc. (Communications Equip.) | 10,930 | 1,531,621 | |
Nice Ltd. – ADR (Software) | (a) | 5,110 | 967,016 |
NortonLifeLock, Inc. (Software) | 21,930 | 434,872 | |
Nuance Communications, Inc. (Software) | (a) | 46,980 | 1,188,829 |
NVIDIA Corp. (Semiconductors & Equip.) | 2,946 | 1,119,215 | |
Oracle Corp. (Software) | 36,500 | 2,017,355 | |
Paychex, Inc. (IT Svs.) | 9,670 | 732,503 | |
Paycom Software, Inc. (Software) | (a) | 2,060 | 638,044 |
PayPal Holdings, Inc. (IT Svs.) | (a) | 21,260 | 3,704,130 |
QUALCOMM, Inc. (Semiconductors & Equip.) | 10,716 | 977,406 | |
Slack Technologies, Inc. Class A (Software) | (a) | 16,670 | 518,270 |
Splunk, Inc. (Software) | (a) | 2,210 | 439,127 |
Texas Instruments, Inc. (Semiconductors & Equip.) | 14,144 | 1,795,864 | |
Tyler Technologies, Inc. (Software) | (a) | 2,250 | 780,480 |
Visa, Inc. (IT Svs.) | 33,320 | 6,436,424 | |
Xilinx, Inc. (Semiconductors & Equip.) | 25,300 | 2,489,267 | |
| 59,318,782 | |||
| Materials–0.6% | |||
Sealed Air Corp. (Containers & Packaging) | 14,050 | 461,543 | |
Sherwin-Williams Co. / The (Chemicals) | 3,370 | 1,947,354 | |
| 2,408,897 |
| Ohio National Fund, Inc. | ON Risk Managed Balanced Portfolio (Continued) |
| Schedule of Investments | June 30, 2020 (Unaudited) |
| Common Stocks (Continued) | Shares | Value | |
| Real Estate–0.2% | |||
CubeSmart (Equity REIT) | 13,950 | $ 376,511 | |
Mid-America Apartment Communities, Inc. (Equity REIT) | 1,920 | 220,166 | |
Sun Communities, Inc. (Equity REIT) | 1,840 | 249,651 | |
| 846,328 | |||
| Utilities–1.1% | |||
Ameren Corp. (Multi-Utilities) | 18,470 | 1,299,549 | |
American Electric Power Co., Inc. (Electric Utilities) | 19,080 | 1,519,531 | |
FirstEnergy Corp. (Electric Utilities) | 10,700 | 414,946 | |
NextEra Energy, Inc. (Electric Utilities) | 4,790 | 1,150,415 | |
| 4,384,441 | |||
Total Common Stocks (Cost $157,783,417) | $191,303,483 |
| Corporate Bonds–19.5% | Rate | Maturity | Face Amount | Value | |
| Communication Services–2.1% | |||||
AT&T, Inc. (Diversified Telecom. Svs.) | 3.600% | 07/15/2025 | $ 112,000 | $ 124,391 | |
AT&T, Inc. (Diversified Telecom. Svs.) | 5.250% | 03/01/2037 | 24,000 | 29,667 | |
AT&T, Inc. (Diversified Telecom. Svs.) | 4.850% | 03/01/2039 | 158,000 | 190,510 | |
AT&T, Inc. (Diversified Telecom. Svs.) | 4.750% | 05/15/2046 | 105,000 | 124,341 | |
AT&T, Inc. (Diversified Telecom. Svs.) | 4.500% | 03/09/2048 | 207,000 | 242,904 | |
CenturyLink, Inc. (Diversified Telecom. Svs.) | 6.450% | 06/15/2021 | 124,000 | 126,815 | |
CenturyLink, Inc. (Diversified Telecom. Svs.) | 5.800% | 03/15/2022 | 102,000 | 104,805 | |
Charter Communications Operating LLC / Charter Communications Operating Capital (Media) | 5.050% | 03/30/2029 | 519,000 | 612,207 | |
Charter Communications Operating LLC / Charter Communications Operating Capital (Media) | 2.800% | 04/01/2031 | 502,000 | 508,641 | |
Charter Communications Operating LLC / Charter Communications Operating Capital (Media) | 6.484% | 10/23/2045 | 62,000 | 82,376 | |
Charter Communications Operating LLC / Charter Communications Operating Capital (Media) | 5.375% | 05/01/2047 | 49,000 | 57,839 | |
Charter Communications Operating LLC / Charter Communications Operating Capital (Media) | 4.800% | 03/01/2050 | 265,000 | 300,352 | |
Charter Communications Operating LLC / Charter Communications Operating Capital (Media) | 3.700% | 04/01/2051 | 548,000 | 533,072 | |
Comcast Corp. (Media) | 3.100% | 04/01/2025 | 80,000 | 87,877 | |
Comcast Corp. (Media) | 3.150% | 03/01/2026 | 146,000 | 163,366 | |
Comcast Corp. (Media) | 3.300% | 04/01/2027 | 218,000 | 245,052 | |
Comcast Corp. (Media) | 4.150% | 10/15/2028 | 123,000 | 147,974 | |
Comcast Corp. (Media) | 2.650% | 02/01/2030 | 113,000 | 122,865 | |
Comcast Corp. (Media) | 3.400% | 04/01/2030 | 218,000 | 248,245 | |
Comcast Corp. (Media) | 4.250% | 10/15/2030 | 205,000 | 250,989 | |
Comcast Corp. (Media) | 4.600% | 10/15/2038 | 122,000 | 155,366 | |
Comcast Corp. (Media) | 3.750% | 04/01/2040 | 87,000 | 102,335 | |
Comcast Corp. (Media) | 4.950% | 10/15/2058 | 111,000 | 157,797 | |
Level 3 Financing, Inc. (Diversified Telecom. Svs.) | (b) | 3.875% | 11/15/2029 | 309,000 | 325,785 |
Tencent Holdings Ltd. (Interactive Media & Svs.) | (b) | 1.810% | 01/26/2026 | 201,000 | 203,255 |
Tencent Holdings Ltd. (Interactive Media & Svs.) | (b) | 3.240% | 06/03/2050 | 201,000 | 201,352 |
T-Mobile U.S.A., Inc. (Wireless Telecom. Svs.) | 6.375% | 03/01/2025 | 300,000 | 308,250 | |
T-Mobile U.S.A., Inc. (Wireless Telecom. Svs.) | (b) | 3.500% | 04/15/2025 | 264,000 | 287,765 |
T-Mobile U.S.A., Inc. (Wireless Telecom. Svs.) | (b) | 3.750% | 04/15/2027 | 673,000 | 746,694 |
T-Mobile U.S.A., Inc. (Wireless Telecom. Svs.) | (b) | 3.875% | 04/15/2030 | 226,000 | 251,893 |
T-Mobile U.S.A., Inc. (Wireless Telecom. Svs.) | (b) | 4.375% | 04/15/2040 | 78,000 | 90,224 |
T-Mobile U.S.A., Inc. (Wireless Telecom. Svs.) | (b) | 4.500% | 04/15/2050 | 91,000 | 107,193 |
Verizon Communications, Inc. (Diversified Telecom. Svs.) | 2.625% | 08/15/2026 | 149,000 | 162,119 | |
Verizon Communications, Inc. (Diversified Telecom. Svs.) | 3.000% | 03/22/2027 | 128,000 | 141,971 | |
Verizon Communications, Inc. (Diversified Telecom. Svs.) | 3.150% | 03/22/2030 | 108,000 | 122,075 | |
Verizon Communications, Inc. (Diversified Telecom. Svs.) | 4.862% | 08/21/2046 | 93,000 | 126,424 | |
Verizon Communications, Inc. (Diversified Telecom. Svs.) | 4.522% | 09/15/2048 | 69,000 | 91,181 | |
Verizon Communications, Inc. (Diversified Telecom. Svs.) | 4.000% | 03/22/2050 | 77,000 | 96,935 | |
Weibo Corp. (Interactive Media & Svs.) | 3.375% | 07/08/2030 | 207,000 | 205,628 | |
| 8,188,530 | |||||
| Consumer Discretionary–2.1% | |||||
Aramark Services, Inc. (Hotels, Restaurants & Leisure) | (b) | 6.375% | 05/01/2025 | 474,000 | 489,467 |
AutoNation, Inc. (Specialty Retail) | 4.750% | 06/01/2030 | 229,000 | 248,097 | |
AutoZone, Inc. (Specialty Retail) | 3.750% | 04/18/2029 | 303,000 | 344,262 | |
Booking Holdings, Inc. (Internet & Direct Marketing Retail) | 4.500% | 04/13/2027 | 336,000 | 385,715 | |
Booking Holdings, Inc. (Internet & Direct Marketing Retail) | 4.625% | 04/13/2030 | 234,000 | 273,666 | |
Choice Hotels International, Inc. (Hotels, Restaurants & Leisure) | 3.700% | 12/01/2029 | 255,000 | 255,451 | |
Dollar General Corp. (Multiline Retail) | 3.500% | 04/03/2030 | 187,000 | 209,466 | |
Dollar General Corp. (Multiline Retail) | 4.125% | 04/03/2050 | 181,000 | 215,990 | |
General Motors Co. (Automobiles) | 6.125% | 10/01/2025 | 79,000 | 88,781 | |
General Motors Co. (Automobiles) | 4.200% | 10/01/2027 | 94,000 | 95,765 | |
General Motors Co. (Automobiles) | 6.800% | 10/01/2027 | 107,000 | 124,668 |
| Ohio National Fund, Inc. | ON Risk Managed Balanced Portfolio (Continued) |
| Schedule of Investments | June 30, 2020 (Unaudited) |
| Corporate Bonds (Continued) | Rate | Maturity | Face Amount | Value | |
| Consumer Discretionary (continued) | |||||
General Motors Co. (Automobiles) | 5.000% | 10/01/2028 | $ 269,000 | $ 285,669 | |
General Motors Co. (Automobiles) | 5.400% | 04/01/2048 | 90,000 | 88,951 | |
Hasbro, Inc. (Leisure Products) | 3.000% | 11/19/2024 | 145,000 | 151,837 | |
Hasbro, Inc. (Leisure Products) | 3.550% | 11/19/2026 | 193,000 | 203,950 | |
Hasbro, Inc. (Leisure Products) | 3.900% | 11/19/2029 | 519,000 | 540,341 | |
Lowe's Cos., Inc. (Specialty Retail) | 4.000% | 04/15/2025 | 308,000 | 351,449 | |
Lowe's Cos., Inc. (Specialty Retail) | 4.500% | 04/15/2030 | 318,000 | 390,031 | |
Lowe's Cos., Inc. (Specialty Retail) | 5.000% | 04/15/2040 | 162,000 | 210,457 | |
Lowe's Cos., Inc. (Specialty Retail) | 5.125% | 04/15/2050 | 222,000 | 306,443 | |
Marriott International, Inc. (Hotels, Restaurants & Leisure) | 5.750% | 05/01/2025 | 361,000 | 393,425 | |
McDonald's Corp. (Hotels, Restaurants & Leisure) | 3.500% | 07/01/2027 | 272,000 | 308,799 | |
McDonald's Corp. (Hotels, Restaurants & Leisure) | 2.625% | 09/01/2029 | 294,000 | 314,721 | |
McDonald's Corp. (Hotels, Restaurants & Leisure) | 3.625% | 09/01/2049 | 90,000 | 99,741 | |
MGM Growth Properties Operating Partnership LP / MGP Finance Co-Issuer, Inc. (Hotels, Restaurants & Leisure) | (b) | 4.625% | 06/15/2025 | 196,000 | 192,096 |
MGM Resorts International (Hotels, Restaurants & Leisure) | 7.750% | 03/15/2022 | 44,000 | 44,757 | |
NIKE, Inc. (Textiles, Apparel & Luxury Goods) | 2.400% | 03/27/2025 | 98,000 | 105,394 | |
NIKE, Inc. (Textiles, Apparel & Luxury Goods) | 2.750% | 03/27/2027 | 152,000 | 166,837 | |
NIKE, Inc. (Textiles, Apparel & Luxury Goods) | 3.250% | 03/27/2040 | 114,000 | 128,436 | |
NIKE, Inc. (Textiles, Apparel & Luxury Goods) | 3.375% | 03/27/2050 | 74,000 | 84,844 | |
Nordstrom, Inc. (Multiline Retail) | 4.375% | 04/01/2030 | 274,000 | 214,927 | |
O'Reilly Automotive, Inc. (Specialty Retail) | 3.600% | 09/01/2027 | 6,000 | 6,742 | |
O'Reilly Automotive, Inc. (Specialty Retail) | 4.350% | 06/01/2028 | 47,000 | 54,787 | |
O'Reilly Automotive, Inc. (Specialty Retail) | 3.900% | 06/01/2029 | 232,000 | 267,126 | |
Ralph Lauren Corp. (Textiles, Apparel & Luxury Goods) | 2.950% | 06/15/2030 | 97,000 | 100,129 | |
Royal Caribbean Cruises Ltd. (Hotels, Restaurants & Leisure) | (b) | 10.875% | 06/01/2023 | 136,000 | 139,748 |
Royal Caribbean Cruises Ltd. (Hotels, Restaurants & Leisure) | (b) | 11.500% | 06/01/2025 | 240,000 | 250,181 |
Starbucks Corp. (Hotels, Restaurants & Leisure) | 4.450% | 08/15/2049 | 180,000 | 217,426 | |
| 8,350,572 | |||||
| Consumer Staples–2.4% | |||||
Alimentation Couche-Tard, Inc. (Food & Staples Retailing) | (b) | 2.950% | 01/25/2030 | 77,000 | 79,819 |
Altria Group, Inc. (Tobacco) | 4.800% | 02/14/2029 | 106,000 | 123,564 | |
Anheuser-Busch Cos. LLC / Anheuser-Busch InBev Worldwide, Inc. (Beverages) | 4.900% | 02/01/2046 | 268,000 | 327,799 | |
Anheuser-Busch InBev Worldwide, Inc. (Beverages) | 4.150% | 01/23/2025 | 512,000 | 580,976 | |
Anheuser-Busch InBev Worldwide, Inc. (Beverages) | 3.500% | 06/01/2030 | 570,000 | 640,774 | |
Anheuser-Busch InBev Worldwide, Inc. (Beverages) | 4.350% | 06/01/2040 | 190,000 | 216,368 | |
Anheuser-Busch InBev Worldwide, Inc. (Beverages) | 4.500% | 06/01/2050 | 192,000 | 228,939 | |
Anheuser-Busch InBev Worldwide, Inc. (Beverages) | 4.750% | 04/15/2058 | 162,000 | 195,543 | |
Anheuser-Busch InBev Worldwide, Inc. (Beverages) | 4.600% | 06/01/2060 | 136,000 | 162,578 | |
Campbell Soup Co. (Food Products) | 3.950% | 03/15/2025 | 113,000 | 127,034 | |
Cargill, Inc. (Food Products) | (b) | 1.375% | 07/23/2023 | 77,000 | 78,329 |
Cargill, Inc. (Food Products) | (b) | 2.125% | 04/23/2030 | 113,000 | 118,425 |
Coca-Cola Co. / The (Beverages) | 2.950% | 03/25/2025 | 122,000 | 134,435 | |
Coca-Cola Co. / The (Beverages) | 3.375% | 03/25/2027 | 263,000 | 301,555 | |
Coca-Cola Co. / The (Beverages) | 3.450% | 03/25/2030 | 182,000 | 214,097 | |
Coca-Cola Co. / The (Beverages) | 4.200% | 03/25/2050 | 197,000 | 258,608 | |
Coca-Cola Femsa S.A.B de C.V. (Beverages) | 2.750% | 01/22/2030 | 154,000 | 162,866 | |
Estee Lauder Cos., Inc. / The (Personal Products) | 2.600% | 04/15/2030 | 412,000 | 449,299 | |
Fomento Economico Mexicano S.A.B de C.V. (Beverages) | 3.500% | 01/16/2050 | 182,000 | 187,771 | |
General Mills, Inc. (Food Products) | 4.200% | 04/17/2028 | 281,000 | 331,135 | |
General Mills, Inc. (Food Products) | 2.875% | 04/15/2030 | 86,000 | 93,497 | |
J.M. Smucker Co. / The (Food Products) | 2.375% | 03/15/2030 | 165,000 | 168,426 | |
J.M. Smucker Co. / The (Food Products) | 3.550% | 03/15/2050 | 77,000 | 79,411 | |
JBS U.S.A. LUX SA / JBS U.S.A. Finance, Inc. (Food Products) | (b) | 6.750% | 02/15/2028 | 76,000 | 80,276 |
Keurig Dr Pepper, Inc. (Beverages) | 4.597% | 05/25/2028 | 277,000 | 332,182 | |
Keurig Dr Pepper, Inc. (Beverages) | 3.200% | 05/01/2030 | 57,000 | 63,057 | |
Keurig Dr Pepper, Inc. (Beverages) | 3.800% | 05/01/2050 | 130,000 | 148,299 | |
Kimberly-Clark de Mexico S.A.B de C.V. (Household Products) | (b) | 2.431% | 07/01/2031 | 274,000 | 275,233 |
Mars, Inc. (Food Products) | (b) | 2.700% | 04/01/2025 | 113,000 | 120,950 |
Mars, Inc. (Food Products) | (b) | 3.200% | 04/01/2030 | 28,000 | 31,873 |
Mars, Inc. (Food Products) | (b) | 4.200% | 04/01/2059 | 23,000 | 29,489 |
Mondelez International Holdings Netherlands BV (Food Products) | (b) | 2.250% | 09/19/2024 | 249,000 | 261,950 |
Mondelez International, Inc. (Food Products) | 2.125% | 04/13/2023 | 83,000 | 85,966 | |
Mondelez International, Inc. (Food Products) | 2.750% | 04/13/2030 | 41,000 | 44,222 | |
PepsiCo, Inc. (Beverages) | 2.250% | 03/19/2025 | 187,000 | 200,028 | |
PepsiCo, Inc. (Beverages) | 2.625% | 03/19/2027 | 58,000 | 63,393 | |
PepsiCo, Inc. (Beverages) | 3.625% | 03/19/2050 | 155,000 | 188,493 | |
PepsiCo, Inc. (Beverages) | 3.875% | 03/19/2060 | 47,000 | 59,840 |
| Ohio National Fund, Inc. | ON Risk Managed Balanced Portfolio (Continued) |
| Schedule of Investments | June 30, 2020 (Unaudited) |
| Corporate Bonds (Continued) | Rate | Maturity | Face Amount | Value | |
| Consumer Staples (continued) | |||||
Procter & Gamble Co. / The (Household Products) | 2.450% | 03/25/2025 | $ 74,000 | $ 80,312 | |
Procter & Gamble Co. / The (Household Products) | 2.800% | 03/25/2027 | 119,000 | 132,565 | |
Procter & Gamble Co. / The (Household Products) | 3.000% | 03/25/2030 | 68,000 | 77,919 | |
Procter & Gamble Co. / The (Household Products) | 3.550% | 03/25/2040 | 136,000 | 164,016 | |
Procter & Gamble Co. / The (Household Products) | 3.600% | 03/25/2050 | 72,000 | 89,632 | |
Sysco Corp. (Food & Staples Retailing) | 2.500% | 07/15/2021 | 73,000 | 74,261 | |
Sysco Corp. (Food & Staples Retailing) | 5.650% | 04/01/2025 | 217,000 | 253,859 | |
Sysco Corp. (Food & Staples Retailing) | 2.400% | 02/15/2030 | 72,000 | 71,155 | |
Sysco Corp. (Food & Staples Retailing) | 5.950% | 04/01/2030 | 473,000 | 592,702 | |
Sysco Corp. (Food & Staples Retailing) | 6.600% | 04/01/2040 | 270,000 | 365,442 | |
Sysco Corp. (Food & Staples Retailing) | 6.600% | 04/01/2050 | 334,000 | 458,824 | |
| 9,607,186 | |||||
| Energy–0.9% | |||||
Cheniere Corpus Christi Holdings LLC (Oil, Gas & Consumable Fuels) | (b) | 3.700% | 11/15/2029 | 557,000 | 570,341 |
Energy Transfer Operating LP (Oil, Gas & Consumable Fuels) | 5.875% | 01/15/2024 | 127,000 | 142,039 | |
Energy Transfer Operating LP (Oil, Gas & Consumable Fuels) | 5.500% | 06/01/2027 | 98,000 | 109,297 | |
Energy Transfer Operating LP (Oil, Gas & Consumable Fuels) | 4.950% | 06/15/2028 | 25,000 | 26,843 | |
Hess Corp. (Oil, Gas & Consumable Fuels) | 4.300% | 04/01/2027 | 258,000 | 267,018 | |
Hess Midstream Operations LP (Oil, Gas & Consumable Fuels) | (b) | 5.125% | 06/15/2028 | 381,000 | 366,682 |
HollyFrontier Corp. (Oil, Gas & Consumable Fuels) | 5.875% | 04/01/2026 | 242,000 | 267,507 | |
Kinder Morgan, Inc. (Oil, Gas & Consumable Fuels) | 4.300% | 03/01/2028 | 69,000 | 78,184 | |
NGPL PipeCo LLC (Oil, Gas & Consumable Fuels) | (b) | 4.375% | 08/15/2022 | 189,000 | 194,938 |
ONEOK, Inc. (Oil, Gas & Consumable Fuels) | 5.850% | 01/15/2026 | 306,000 | 349,424 | |
Plains All American Pipeline LP (Oil, Gas & Consumable Fuels) | 4.650% | 10/15/2025 | 241,000 | 257,363 | |
TransCanada PipeLines Ltd. (Oil, Gas & Consumable Fuels) | 4.100% | 04/15/2030 | 413,000 | 470,234 | |
WPX Energy, Inc. (Oil, Gas & Consumable Fuels) | 4.500% | 01/15/2030 | 442,000 | 390,556 | |
| 3,490,426 | |||||
| Financials–3.8% | |||||
AerCap Ireland Capital DAC / AerCap Global Aviation Trust (Diversified Financial Svs.) | 4.125% | 07/03/2023 | 160,000 | 156,452 | |
AerCap Ireland Capital DAC / AerCap Global Aviation Trust (Diversified Financial Svs.) | 6.500% | 07/15/2025 | 271,000 | 283,908 | |
Alleghany Corp. (Insurance) | 3.625% | 05/15/2030 | 291,000 | 308,718 | |
Aviation Capital Group LLC (Diversified Financial Svs.) | (b) | 2.875% | 01/20/2022 | 25,000 | 23,893 |
Aviation Capital Group LLC (Diversified Financial Svs.) | (b) | 3.875% | 05/01/2023 | 102,000 | 97,042 |
Aviation Capital Group LLC (Diversified Financial Svs.) | (b) | 4.125% | 08/01/2025 | 3,000 | 2,701 |
Aviation Capital Group LLC (Diversified Financial Svs.) | (b) | 4.875% | 10/01/2025 | 46,000 | 42,137 |
Aviation Capital Group LLC (Diversified Financial Svs.) | (b) | 3.500% | 11/01/2027 | 32,000 | 26,376 |
Banco de Credito del Peru (Rate is fixed until 07/01/2025, at which point, the rate becomes H15T5Y + 300) (Banks) | (b)(c) | 3.125% | 07/01/2030 | 202,000 | 200,283 |
Bank of America Corp. (Rate is fixed until 04/24/2027, at which point, the rate becomes QL + 151) (Banks) | (c) | 3.705% | 04/24/2028 | 501,000 | 566,214 |
Bank of America Corp. (Rate is fixed until 03/05/2028, at which point, the rate becomes QL + 107) (Banks) | (c) | 3.970% | 03/05/2029 | 177,000 | 202,745 |
Bank of America Corp. (Rate is fixed until 04/29/2030, at which point, the rate becomes SOFR + 215) (Banks) | (c) | 2.592% | 04/29/2031 | 678,000 | 717,156 |
BNP Paribas SA (Rate is fixed until 11/19/2024, at which point, the rate becomes QL + 111) (Banks) | (b)(c) | 2.819% | 11/19/2025 | 306,000 | 320,470 |
BNP Paribas SA (Rate is fixed until 01/13/2030, at which point, the rate becomes SOFR + 151) (Banks) | (b)(c) | 3.052% | 01/13/2031 | 333,000 | 350,297 |
Capital One Financial Corp. (Consumer Finance) | 2.600% | 05/11/2023 | 349,000 | 364,445 | |
CBOE Global Markets, Inc. (Capital Markets) | 3.650% | 01/12/2027 | 165,000 | 185,383 | |
Charles Schwab Corp. / The (Capital Markets) | 4.625% | 03/22/2030 | 299,000 | 372,986 | |
Citigroup, Inc. (Rate is fixed until 01/10/2027, at which point, the rate becomes QL + 156) (Banks) | (c) | 3.887% | 01/10/2028 | 570,000 | 642,398 |
Citigroup, Inc. (Rate is fixed until 03/31/2030, at which point, the rate becomes SOFR + 391) (Banks) | (c) | 4.412% | 03/31/2031 | 380,000 | 449,421 |
Citizens Financial Group, Inc. (Banks) | 4.300% | 12/03/2025 | 114,000 | 127,557 | |
First Republic Bank (Banks) | 4.625% | 02/13/2047 | 100,000 | 120,001 | |
GE Capital Funding LLC (Diversified Financial Svs.) | (b) | 3.450% | 05/15/2025 | 539,000 | 564,707 |
General Motors Financial Co., Inc. (Consumer Finance) | 5.200% | 03/20/2023 | 154,000 | 164,772 | |
General Motors Financial Co., Inc. (Consumer Finance) | 4.350% | 04/09/2025 | 177,000 | 186,809 | |
General Motors Financial Co., Inc. (Consumer Finance) | 4.300% | 07/13/2025 | 54,000 | 56,268 | |
General Motors Financial Co., Inc. (Consumer Finance) | 4.350% | 01/17/2027 | 99,000 | 102,420 | |
Goldman Sachs Group, Inc. / The (Capital Markets) | 3.500% | 04/01/2025 | 1,525,000 | 1,672,174 | |
Harley-Davidson Financial Services, Inc. (Consumer Finance) | (b) | 3.350% | 06/08/2025 | 152,000 | 155,338 |
JPMorgan Chase & Co. (Rate is fixed until 04/22/2025, at which point, the rate becomes SOFR + 185) (Banks) | (c) | 2.083% | 04/22/2026 | 933,000 | 968,017 |
JPMorgan Chase & Co. (Rate is fixed until 01/29/2026, at which point, the rate becomes QL + 125) (Banks) | (c) | 3.960% | 01/29/2027 | 508,000 | 578,636 |
JPMorgan Chase & Co. (Rate is fixed until 02/01/2027, at which point, the rate becomes QL + 134) (Banks) | (c) | 3.782% | 02/01/2028 | 191,000 | 216,408 |
| Ohio National Fund, Inc. | ON Risk Managed Balanced Portfolio (Continued) |
| Schedule of Investments | June 30, 2020 (Unaudited) |
| Corporate Bonds (Continued) | Rate | Maturity | Face Amount | Value | |
| Financials (continued) | |||||
JPMorgan Chase & Co. (Rate is fixed until 12/05/2028, at which point, the rate becomes QL + 133) (Banks) | (c) | 4.452% | 12/05/2029 | $ 460,000 | $ 551,461 |
JPMorgan Chase & Co. (Rate is fixed until 10/15/2029, at which point, the rate becomes SOFR + 151) (Banks) | (c) | 2.739% | 10/15/2030 | 218,000 | 233,835 |
JPMorgan Chase & Co. (Rate is fixed until 03/24/2030, at which point, the rate becomes SOFR + 379) (Banks) | (c) | 4.493% | 03/24/2031 | 171,000 | 208,902 |
Morgan Stanley (Capital Markets) | 4.350% | 09/08/2026 | 251,000 | 289,439 | |
Morgan Stanley (Capital Markets) | 3.950% | 04/23/2027 | 396,000 | 445,715 | |
Morgan Stanley (Rate is fixed until 01/23/2029, at which point, the rate becomes QL + 163) (Capital Markets) | (c) | 4.431% | 01/23/2030 | 408,000 | 486,001 |
MSCI, Inc. (Capital Markets) | (b) | 4.000% | 11/15/2029 | 25,000 | 25,500 |
Raymond James Financial, Inc. (Capital Markets) | 4.650% | 04/01/2030 | 114,000 | 136,286 | |
Raymond James Financial, Inc. (Capital Markets) | 4.950% | 07/15/2046 | 185,000 | 223,709 | |
USAA Capital Corp. (Diversified Financial Svs.) | (b) | 2.125% | 05/01/2030 | 150,000 | 154,435 |
Volkswagen Group of America Finance LLC (Consumer Finance) | (b) | 2.900% | 05/13/2022 | 287,000 | 296,401 |
Wells Fargo & Co. (Rate is fixed until 02/11/2025, at which point, the rate becomes QL + 75) (Banks) | (c) | 2.164% | 02/11/2026 | 651,000 | 671,891 |
Wells Fargo & Co. (Rate is fixed until 10/30/2029, at which point, the rate becomes QL + 117) (Banks) | (c) | 2.879% | 10/30/2030 | 298,000 | 318,468 |
Wells Fargo & Co. (Rate is fixed until 04/04/2030, at which point, the rate becomes QL + 377) (Banks) | (c) | 4.478% | 04/04/2031 | 545,000 | 659,766 |
| 14,927,941 | |||||
| Health Care��1.6% | |||||
AbbVie, Inc. (Biotechnology) | (b) | 3.450% | 03/15/2022 | 292,000 | 303,362 |
AbbVie, Inc. (Biotechnology) | (b) | 3.250% | 10/01/2022 | 175,000 | 183,077 |
AbbVie, Inc. (Biotechnology) | (b) | 2.800% | 03/15/2023 | 14,000 | 14,527 |
AbbVie, Inc. (Biotechnology) | (b) | 2.600% | 11/21/2024 | 165,000 | 175,705 |
AbbVie, Inc. (Biotechnology) | (b) | 3.800% | 03/15/2025 | 210,000 | 234,158 |
Baxter International, Inc. (Health Care Equip. & Supplies) | (b) | 3.750% | 10/01/2025 | 273,000 | 311,037 |
Baxter International, Inc. (Health Care Equip. & Supplies) | (b) | 3.950% | 04/01/2030 | 238,000 | 282,177 |
Boston Scientific Corp. (Health Care Equip. & Supplies) | 3.750% | 03/01/2026 | 137,000 | 155,567 | |
Boston Scientific Corp. (Health Care Equip. & Supplies) | 4.000% | 03/01/2029 | 71,000 | 81,223 | |
Boston Scientific Corp. (Health Care Equip. & Supplies) | 4.700% | 03/01/2049 | 114,000 | 145,380 | |
Bristol-Myers Squibb Co. (Pharmaceuticals) | (b) | 3.400% | 07/26/2029 | 125,000 | 145,685 |
Centene Corp. (Health Care Providers & Svs.) | 4.750% | 05/15/2022 | 15,000 | 15,207 | |
Centene Corp. (Health Care Providers & Svs.) | (b) | 5.375% | 06/01/2026 | 371,000 | 384,601 |
Centene Corp. (Health Care Providers & Svs.) | 4.250% | 12/15/2027 | 326,000 | 336,403 | |
Centene Corp. (Health Care Providers & Svs.) | 4.625% | 12/15/2029 | 376,000 | 398,098 | |
Centene Corp. (Health Care Providers & Svs.) | 3.375% | 02/15/2030 | 212,000 | 214,059 | |
Cigna Corp. (Health Care Providers & Svs.) | 3.400% | 09/17/2021 | 47,000 | 48,589 | |
Cigna Corp. (Health Care Providers & Svs.) | 2.400% | 03/15/2030 | 114,000 | 118,274 | |
Cigna Corp. (Health Care Providers & Svs.) | 3.200% | 03/15/2040 | 52,000 | 55,066 | |
Cigna Corp. (Health Care Providers & Svs.) | 3.400% | 03/15/2050 | 78,000 | 84,029 | |
CVS Health Corp. (Health Care Providers & Svs.) | 4.100% | 03/25/2025 | 297,000 | 335,735 | |
CVS Health Corp. (Health Care Providers & Svs.) | 3.000% | 08/15/2026 | 33,000 | 36,081 | |
CVS Health Corp. (Health Care Providers & Svs.) | 4.300% | 03/25/2028 | 181,000 | 211,606 | |
CVS Health Corp. (Health Care Providers & Svs.) | 4.125% | 04/01/2040 | 141,000 | 166,298 | |
CVS Health Corp. (Health Care Providers & Svs.) | 5.050% | 03/25/2048 | 150,000 | 195,115 | |
CVS Health Corp. (Health Care Providers & Svs.) | 4.250% | 04/01/2050 | 70,000 | 84,198 | |
DH Europe Finance II SARL (Health Care Equip. & Supplies) | 2.200% | 11/15/2024 | 129,000 | 135,580 | |
DH Europe Finance II SARL (Health Care Equip. & Supplies) | 2.600% | 11/15/2029 | 71,000 | 75,541 | |
DH Europe Finance II SARL (Health Care Equip. & Supplies) | 3.400% | 11/15/2049 | 91,000 | 102,186 | |
HCA, Inc. (Health Care Providers & Svs.) | 5.375% | 02/01/2025 | 133,000 | 142,476 | |
HCA, Inc. (Health Care Providers & Svs.) | 5.875% | 02/15/2026 | 70,000 | 76,825 | |
HCA, Inc. (Health Care Providers & Svs.) | 5.375% | 09/01/2026 | 54,000 | 58,792 | |
HCA, Inc. (Health Care Providers & Svs.) | 5.625% | 09/01/2028 | 76,000 | 84,771 | |
HCA, Inc. (Health Care Providers & Svs.) | 5.875% | 02/01/2029 | 109,000 | 123,343 | |
HCA, Inc. (Health Care Providers & Svs.) | 3.500% | 09/01/2030 | 386,000 | 371,694 | |
Pfizer, Inc. (Pharmaceuticals) | 2.625% | 04/01/2030 | 80,000 | 88,009 | |
Thermo Fisher Scientific, Inc. (Life Sciences Tools & Svs.) | 4.497% | 03/25/2030 | 372,000 | 460,146 | |
| 6,434,620 | |||||
| Industrials–2.2% | |||||
Air Lease Corp. (Trading Companies & Distributors) | 3.875% | 07/03/2023 | 22,000 | 22,284 | |
Air Lease Corp. (Trading Companies & Distributors) | 4.250% | 02/01/2024 | 97,000 | 99,332 | |
Air Lease Corp. (Trading Companies & Distributors) | 3.750% | 06/01/2026 | 8,000 | 8,073 | |
Air Lease Corp. (Trading Companies & Distributors) | 3.000% | 02/01/2030 | 12,000 | 11,120 | |
BAE Systems PLC (Aerospace & Defense) | (b) | 3.400% | 04/15/2030 | 200,000 | 218,116 |
Boeing Co. / The (Aerospace & Defense) | 2.250% | 06/15/2026 | 35,000 | 33,833 | |
Boeing Co. / The (Aerospace & Defense) | 3.250% | 03/01/2028 | 44,000 | 43,836 |
| Ohio National Fund, Inc. | ON Risk Managed Balanced Portfolio (Continued) |
| Schedule of Investments | June 30, 2020 (Unaudited) |
| Corporate Bonds (Continued) | Rate | Maturity | Face Amount | Value | |
| Industrials (continued) | |||||
Boeing Co. / The (Aerospace & Defense) | 3.200% | 03/01/2029 | $ 250,000 | $ 247,272 | |
Boeing Co. / The (Aerospace & Defense) | 3.600% | 05/01/2034 | 290,000 | 274,038 | |
Carrier Global Corp. (Electrical Equip.) | (b) | 2.242% | 02/15/2025 | 145,000 | 148,666 |
Carrier Global Corp. (Electrical Equip.) | (b) | 2.493% | 02/15/2027 | 116,000 | 118,149 |
Empresa de Transporte de Pasajeros Metro SA (Road & Rail) | (b) | 3.650% | 05/07/2030 | 200,000 | 215,750 |
Equifax, Inc. (Professional Svs.) | 2.600% | 12/01/2024 | 423,000 | 447,360 | |
Equifax, Inc. (Professional Svs.) | 2.600% | 12/15/2025 | 147,000 | 156,588 | |
Equifax, Inc. (Professional Svs.) | 3.100% | 05/15/2030 | 240,000 | 255,118 | |
Experian Finance PLC (Professional Svs.) | (b) | 2.750% | 03/08/2030 | 637,000 | 678,736 |
General Dynamics Corp. (Aerospace & Defense) | 3.250% | 04/01/2025 | 205,000 | 227,350 | |
General Dynamics Corp. (Aerospace & Defense) | 3.500% | 04/01/2027 | 296,000 | 338,993 | |
General Dynamics Corp. (Aerospace & Defense) | 3.625% | 04/01/2030 | 241,000 | 282,129 | |
General Dynamics Corp. (Aerospace & Defense) | 4.250% | 04/01/2040 | 167,000 | 207,996 | |
General Dynamics Corp. (Aerospace & Defense) | 4.250% | 04/01/2050 | 58,000 | 75,338 | |
General Electric Co. (Industrial Conglomerates) | 3.450% | 05/01/2027 | 105,000 | 107,706 | |
General Electric Co. (Industrial Conglomerates) | 6.750% | 03/15/2032 | 129,000 | 157,935 | |
General Electric Co. (Industrial Conglomerates) | 4.250% | 05/01/2040 | 79,000 | 77,675 | |
General Electric Co. (Industrial Conglomerates) | 4.350% | 05/01/2050 | 138,000 | 136,764 | |
Huntington Ingalls Industries, Inc. (Aerospace & Defense) | (b) | 3.844% | 05/01/2025 | 205,000 | 222,594 |
Huntington Ingalls Industries, Inc. (Aerospace & Defense) | (b) | 5.000% | 11/15/2025 | 349,000 | 361,337 |
Huntington Ingalls Industries, Inc. (Aerospace & Defense) | (b) | 4.200% | 05/01/2030 | 366,000 | 407,735 |
IHS Markit Ltd. (Professional Svs.) | (b) | 5.000% | 11/01/2022 | 26,000 | 27,880 |
IHS Markit Ltd. (Professional Svs.) | (b) | 4.750% | 02/15/2025 | 215,000 | 240,800 |
Northrop Grumman Corp. (Aerospace & Defense) | 4.400% | 05/01/2030 | 205,000 | 248,460 | |
Northrop Grumman Corp. (Aerospace & Defense) | 5.150% | 05/01/2040 | 90,000 | 119,767 | |
Northrop Grumman Corp. (Aerospace & Defense) | 5.250% | 05/01/2050 | 115,000 | 165,368 | |
Otis Worldwide Corp. (Machinery) | (b) | 2.056% | 04/05/2025 | 170,000 | 178,157 |
United Parcel Service, Inc. (Air Freight & Logistics) | 3.900% | 04/01/2025 | 173,000 | 196,388 | |
United Parcel Service, Inc. (Air Freight & Logistics) | 4.450% | 04/01/2030 | 151,000 | 188,592 | |
United Parcel Service, Inc. (Air Freight & Logistics) | 5.200% | 04/01/2040 | 99,000 | 136,641 | |
United Parcel Service, Inc. (Air Freight & Logistics) | 5.300% | 04/01/2050 | 214,000 | 305,744 | |
Verisk Analytics, Inc. (Professional Svs.) | 5.500% | 06/15/2045 | 101,000 | 138,467 | |
Westinghouse Air Brake Technologies Corp. (Machinery) | 4.400% | 03/15/2024 | 189,000 | 200,367 | |
Westinghouse Air Brake Technologies Corp. (Machinery) | 3.200% | 06/15/2025 | 45,000 | 45,939 | |
Westinghouse Air Brake Technologies Corp. (Machinery) | 3.450% | 11/15/2026 | 66,000 | 67,939 | |
Westinghouse Air Brake Technologies Corp. (Machinery) | 4.950% | 09/15/2028 | 606,000 | 674,277 | |
| 8,516,609 | |||||
| Information Technology–2.2% | |||||
Analog Devices, Inc. (Semiconductors & Equip.) | 2.950% | 04/01/2025 | 157,000 | 170,108 | |
Broadcom, Inc. (Semiconductors & Equip.) | (b) | 4.700% | 04/15/2025 | 414,000 | 466,114 |
Broadcom, Inc. (Semiconductors & Equip.) | (b) | 4.150% | 11/15/2030 | 539,000 | 586,456 |
Broadridge Financial Solutions, Inc. (IT Svs.) | 2.900% | 12/01/2029 | 495,000 | 528,984 | |
Dell International LLC / EMC Corp. (Computers & Peripherals) | (b) | 5.875% | 06/15/2021 | 341,000 | 341,102 |
Global Payments, Inc. (IT Svs.) | 4.800% | 04/01/2026 | 185,000 | 216,920 | |
Global Payments, Inc. (IT Svs.) | 3.200% | 08/15/2029 | 75,000 | 80,325 | |
Infor, Inc. (Software) | (b) | 1.750% | 07/15/2025 | 106,000 | 106,443 |
Lam Research Corp. (Semiconductors & Equip.) | 4.000% | 03/15/2029 | 51,000 | 60,595 | |
Leidos, Inc. (IT Svs.) | (b) | 2.950% | 05/15/2023 | 156,000 | 162,505 |
Marvell Technology Group Ltd. (Semiconductors & Equip.) | 4.200% | 06/22/2023 | 108,000 | 116,052 | |
Marvell Technology Group Ltd. (Semiconductors & Equip.) | 4.875% | 06/22/2028 | 450,000 | 541,202 | |
Mastercard, Inc. (IT Svs.) | 3.300% | 03/26/2027 | 256,000 | 289,895 | |
Mastercard, Inc. (IT Svs.) | 3.350% | 03/26/2030 | 324,000 | 374,813 | |
Mastercard, Inc. (IT Svs.) | 3.850% | 03/26/2050 | 182,000 | 227,058 | |
Micron Technology, Inc. (Semiconductors & Equip.) | 2.497% | 04/24/2023 | 366,000 | 380,069 | |
Oracle Corp. (Software) | 2.500% | 04/01/2025 | 216,000 | 232,317 | |
Oracle Corp. (Software) | 2.800% | 04/01/2027 | 530,000 | 578,716 | |
PayPal Holdings, Inc. (IT Svs.) | 2.400% | 10/01/2024 | 139,000 | 147,530 | |
PayPal Holdings, Inc. (IT Svs.) | 2.650% | 10/01/2026 | 357,000 | 387,963 | |
PayPal Holdings, Inc. (IT Svs.) | 2.850% | 10/01/2029 | 240,000 | 262,625 | |
Trimble, Inc. (Electronic Equip., Instr. & Comp.) | 4.750% | 12/01/2024 | 270,000 | 293,736 | |
Trimble, Inc. (Electronic Equip., Instr. & Comp.) | 4.900% | 06/15/2028 | 544,000 | 624,326 | |
Visa, Inc. (IT Svs.) | 1.900% | 04/15/2027 | 452,000 | 472,408 | |
Visa, Inc. (IT Svs.) | 2.050% | 04/15/2030 | 220,000 | 230,606 | |
Visa, Inc. (IT Svs.) | 2.700% | 04/15/2040 | 95,000 | 101,773 | |
VMware, Inc. (Software) | 4.500% | 05/15/2025 | 261,000 | 285,558 | |
VMware, Inc. (Software) | 4.650% | 05/15/2027 | 293,000 | 324,045 | |
| 8,590,244 |
| Ohio National Fund, Inc. | ON Risk Managed Balanced Portfolio (Continued) |
| Schedule of Investments | June 30, 2020 (Unaudited) |
| Corporate Bonds (Continued) | Rate | Maturity | Face Amount | Value | |
| Materials–0.4% | |||||
Avery Dennison Corp. (Containers & Packaging) | 2.650% | 04/30/2030 | $ 299,000 | $ 306,383 | |
Cemex S.A.B de C.V. (Construction Materials) | (b) | 7.375% | 06/05/2027 | 200,000 | 203,200 |
Ecolab, Inc. (Chemicals) | 4.800% | 03/24/2030 | 135,000 | 171,156 | |
Georgia-Pacific LLC (Paper & Forest Products) | (b) | 3.163% | 11/15/2021 | 99,000 | 101,772 |
Indonesia Asahan Aluminium Persero PT (Metals & Mining) | (b) | 4.750% | 05/15/2025 | 240,000 | 256,173 |
Reliance Steel & Aluminum Co. (Metals & Mining) | 4.500% | 04/15/2023 | 116,000 | 124,593 | |
Steel Dynamics, Inc. (Metals & Mining) | 5.500% | 10/01/2024 | 227,000 | 233,243 | |
| 1,396,520 | |||||
| Real Estate–0.5% | |||||
Alexandria Real Estate Equities, Inc. (Equity REIT) | 4.900% | 12/15/2030 | 275,000 | 342,434 | |
Camden Property Trust (Equity REIT) | 2.800% | 05/15/2030 | 342,000 | 369,458 | |
Crown Castle International Corp. (Equity REIT) | 3.650% | 09/01/2027 | 133,000 | 148,134 | |
Crown Castle International Corp. (Equity REIT) | 4.300% | 02/15/2029 | 154,000 | 178,676 | |
Crown Castle International Corp. (Equity REIT) | 3.100% | 11/15/2029 | 279,000 | 299,017 | |
Crown Castle International Corp. (Equity REIT) | 3.300% | 07/01/2030 | 67,000 | 73,151 | |
Crown Castle International Corp. (Equity REIT) | 4.150% | 07/01/2050 | 69,000 | 79,310 | |
Equinix, Inc. (Equity REIT) | 2.625% | 11/18/2024 | 123,000 | 130,948 | |
Equinix, Inc. (Equity REIT) | 2.900% | 11/18/2026 | 104,000 | 112,104 | |
Equinix, Inc. (Equity REIT) | 3.200% | 11/18/2029 | 233,000 | 252,917 | |
| 1,986,149 | |||||
| Utilities–1.3% | |||||
AEP Transmission Co. LLC (Electric Utilities) | 3.650% | 04/01/2050 | 162,000 | 186,974 | |
Ameren Corp. (Multi-Utilities) | 3.500% | 01/15/2031 | 669,000 | 747,839 | |
American Water Capital Corp. (Water Utilities) | 2.800% | 05/01/2030 | 211,000 | 229,414 | |
American Water Capital Corp. (Water Utilities) | 3.450% | 05/01/2050 | 252,000 | 283,125 | |
Berkshire Hathaway Energy Co. (Multi-Utilities) | (b) | 3.700% | 07/15/2030 | 265,000 | 309,968 |
Berkshire Hathaway Energy Co. (Multi-Utilities) | (b) | 4.250% | 10/15/2050 | 278,000 | 348,182 |
Dominion Energy, Inc. (Multi-Utilities) | 3.375% | 04/01/2030 | 340,000 | 376,119 | |
Kentucky Utilities Co. (Electric Utilities) | 3.300% | 06/01/2050 | 157,000 | 168,069 | |
NextEra Energy Capital Holdings, Inc. (Electric Utilities) | 2.750% | 05/01/2025 | 149,000 | 160,887 | |
NRG Energy, Inc. (Electric Utilities) | (b) | 3.750% | 06/15/2024 | 308,000 | 325,160 |
NRG Energy, Inc. (Electric Utilities) | 7.250% | 05/15/2026 | 273,000 | 288,015 | |
NRG Energy, Inc. (Electric Utilities) | 6.625% | 01/15/2027 | 274,000 | 286,330 | |
Oncor Electric Delivery Co. LLC (Electric Utilities) | 3.700% | 11/15/2028 | 194,000 | 227,697 | |
Oncor Electric Delivery Co. LLC (Electric Utilities) | 3.800% | 06/01/2049 | 257,000 | 311,004 | |
PPL WEM Ltd. / Western Power Distribution PLC (Ind. Power & Renewable Elec.) | (b) | 5.375% | 05/01/2021 | 203,000 | 207,932 |
Southern Co. / The (Electric Utilities) | 3.700% | 04/30/2030 | 508,000 | 579,792 | |
| 5,036,507 | |||||
Total Corporate Bonds (Cost $69,733,229) | $ 76,525,304 |
| U.S. Treasury Obligations–7.4% | Rate | Maturity | Face Amount | Value | |
U.S. Treasury Bill | 0.000% | 07/23/2020 | $ 300,000 | $ 299,979 | |
U.S. Treasury Bill | (d) | 0.000% | 09/24/2020 | 300,000 | 299,908 |
U.S. Treasury Note | 1.125% | 02/28/2022 | 558,600 | 567,481 | |
U.S. Treasury Note | 0.375% | 03/31/2022 | 7,718,600 | 7,746,339 | |
U.S. Treasury Note | 1.500% | 09/15/2022 | 626,000 | 644,511 | |
U.S. Treasury Note | (d) | 2.250% | 11/15/2024 | 1,865,000 | 2,027,532 |
U.S. Treasury Note | (d) | 0.500% | 03/31/2025 | 7,407,500 | 7,486,205 |
U.S. Treasury Note | 2.750% | 08/15/2042 | 2,224,300 | 2,851,014 | |
U.S. Treasury Note | 2.250% | 08/15/2049 | 3,171,800 | 3,812,603 | |
U.S. Treasury Note | 2.375% | 11/15/2049 | 338,600 | 417,999 | |
U.S. Treasury Note | 2.000% | 02/15/2050 | 1,700,100 | 1,945,950 | |
U.S. Treasury Note | 1.250% | 05/15/2050 | 800,000 | 768,031 | |
Total U.S. Treasury Obligations (Cost $27,680,685) | $ 28,867,552 |
| Purchased Options–7.2% | Notional Amount | Expiration | Exercise Price | Contracts (e) | Value | |
S&P 500 Index Call Option | $ 1,550,145 | December 2021 | $2,800 | 5 | $ 247,415 | |
S&P 500 Index Call Option | 9,300,870 | December 2021 | $2,850 | 30 | 1,379,880 | |
S&P 500 Index Call Option | 7,750,725 | December 2021 | $2,900 | 25 | 973,250 | |
S&P 500 Index Call Option | 7,130,667 | December 2021 | $3,000 | 23 | 751,870 | |
S&P 500 Index Call Option | 1,550,145 | December 2021 | $3,050 | 5 | 148,450 | |
S&P 500 Index Call Option | 3,100,290 | December 2021 | $3,100 | 10 | 267,900 | |
S&P 500 Index Call Option | 3,100,290 | December 2021 | $3,150 | 10 | 279,940 | |
S&P 500 Index Call Option | 1,550,145 | December 2021 | $3,200 | 5 | 123,175 | |
S&P 500 Index Call Option | 3,100,290 | December 2021 | $3,250 | 10 | 200,800 |
| Ohio National Fund, Inc. | ON Risk Managed Balanced Portfolio (Continued) |
| Schedule of Investments | June 30, 2020 (Unaudited) |
| Purchased Options (Continued) | Notional Amount | Expiration | Exercise Price | Contracts (e) | Value | |
S&P 500 Index Call Option | $ 1,550,145 | December 2021 | $3,300 | 5 | $ 102,500 | |
S&P 500 Index Call Option | 9,300,870 | December 2022 | $2,800 | 30 | 1,502,700 | |
S&P 500 Index Call Option | 6,200,580 | December 2022 | $2,900 | 20 | 962,620 | |
S&P 500 Index Call Option | 6,200,580 | December 2022 | $2,950 | 20 | 907,180 | |
S&P 500 Index Call Option | 13,021,218 | December 2022 | $3,000 | 42 | 1,607,340 | |
S&P 500 Index Call Option | 10,851,015 | December 2022 | $3,100 | 35 | 1,146,600 | |
S&P 500 Index Call Option | 4,650,435 | December 2022 | $3,200 | 15 | 415,650 | |
S&P 500 Index Put Option | 1,550,145 | December 2021 | $2,800 | 5 | 135,950 | |
S&P 500 Index Put Option | 9,300,870 | December 2021 | $2,850 | 30 | 709,200 | |
S&P 500 Index Put Option | 7,750,725 | December 2021 | $2,900 | 25 | 787,500 | |
S&P 500 Index Put Option | 7,130,667 | December 2021 | $3,000 | 23 | 804,333 | |
S&P 500 Index Put Option | 1,550,145 | December 2021 | $3,050 | 5 | 186,610 | |
S&P 500 Index Put Option | 3,100,290 | December 2021 | $3,100 | 10 | 331,000 | |
S&P 500 Index Put Option | 3,100,290 | December 2021 | $3,150 | 10 | 352,700 | |
S&P 500 Index Put Option | 1,550,145 | December 2021 | $3,200 | 5 | 187,700 | |
S&P 500 Index Put Option | 3,100,290 | December 2021 | $3,250 | 10 | 423,500 | |
S&P 500 Index Put Option | 4,650,435 | December 2021 | $3,300 | 15 | 672,150 | |
S&P 500 Index Put Option | 13,951,305 | December 2021 | $3,350 | 45 | 2,132,550 | |
S&P 500 Index Put Option | 9,300,870 | December 2022 | $2,800 | 30 | 1,077,300 | |
S&P 500 Index Put Option | 6,200,580 | December 2022 | $2,900 | 20 | 680,600 | |
S&P 500 Index Put Option | 6,200,580 | December 2022 | $2,950 | 20 | 836,640 | |
S&P 500 Index Put Option | 13,021,218 | December 2022 | $3,000 | 42 | 1,603,140 | |
S&P 500 Index Put Option | 10,851,015 | December 2022 | $3,100 | 35 | 1,491,700 | |
S&P 500 Index Put Option | 4,650,435 | December 2022 | $3,200 | 15 | 711,000 | |
SPDR S&P 500 ETF Trust Call Option | 1,541,800 | December 2021 | $280 | 50 | 253,850 | |
SPDR S&P 500 ETF Trust Call Option | 2,312,700 | December 2021 | $285 | 75 | 347,850 | |
SPDR S&P 500 ETF Trust Call Option | 2,621,060 | December 2021 | $290 | 85 | 377,910 | |
SPDR S&P 500 ETF Trust Call Option | 2,281,864 | December 2021 | $295 | 74 | 289,118 | |
SPDR S&P 500 ETF Trust Call Option | 6,167,200 | December 2021 | $300 | 200 | 758,200 | |
SPDR S&P 500 ETF Trust Call Option | 925,080 | December 2021 | $305 | 30 | 102,150 | |
SPDR S&P 500 ETF Trust Call Option | 925,080 | December 2021 | $310 | 30 | 94,350 | |
SPDR S&P 500 ETF Trust Put Option | 1,541,800 | December 2021 | $280 | 50 | 129,450 | |
SPDR S&P 500 ETF Trust Put Option | 2,312,700 | December 2021 | $285 | 75 | 206,400 | |
SPDR S&P 500 ETF Trust Put Option | 2,621,060 | December 2021 | $290 | 85 | 252,365 | |
SPDR S&P 500 ETF Trust Put Option | 2,281,864 | December 2021 | $295 | 74 | 244,200 | |
SPDR S&P 500 ETF Trust Put Option | 6,167,200 | December 2021 | $300 | 200 | 726,000 | |
SPDR S&P 500 ETF Trust Put Option | 925,080 | December 2021 | $305 | 30 | 112,170 | |
SPDR S&P 500 ETF Trust Put Option | 925,080 | December 2021 | $310 | 30 | 114,000 | |
Total Purchased Options (Cost $25,979,996) | $ 28,148,856 |
| Asset-Backed / Mortgage-Backed Securities–4.5% | Rate | Maturity | Face Amount | Value | |
| Consumer Discretionary–0.0% | |||||
Great Wolf Trust 2019-WOLF A | (b) | ML + 103 | 12/15/2036 | $ 64,000 | $ 61,461 |
Great Wolf Trust 2019-WOLF C | (b) | ML + 163 | 12/15/2036 | 79,000 | 73,067 |
| 134,528 | |||||
| Financials–4.5% | |||||
Apidos CLO XXXIII 2020-33A B | (b) | QL + 220 | 07/24/2031 | 300,000 | 299,730 |
Ballyrock CLO 2020-1A B | (b) | QL + 290 | 07/20/2030 | 300,000 | 300,000 |
Citigroup Commercial Mortgage Trust 2017-P8 AS | 3.789% | 09/15/2050 | 127,167 | 140,727 | |
COMM 2015-CR25 B | 4.690% | 08/10/2048 | 134,711 | 141,226 | |
COMM 2015-LC23 C | 4.800% | 10/10/2048 | 100,000 | 97,655 | |
Connecticut Avenue Securities Trust 2019-R02 1M2 | (b) | ML + 230 | 08/25/2031 | 88,894 | 87,557 |
Connecticut Avenue Securities Trust 2019-R03 1M2 | (b) | ML + 215 | 09/25/2031 | 238,978 | 235,982 |
Connecticut Avenue Securities Trust 2019-R04 2M2 | (b) | ML + 210 | 06/25/2039 | 66,851 | 64,898 |
Connecticut Avenue Securities Trust 2019-R05 1M2 | (b) | ML + 200 | 07/25/2039 | 314,652 | 307,755 |
Connecticut Avenue Securities Trust 2019-R07 1M2 | (b) | ML + 210 | 10/25/2039 | 333,999 | 323,752 |
Connecticut Avenue Securities Trust 2020-R01 1M1 | (b) | ML + 80 | 01/25/2040 | 76,882 | 76,445 |
Connecticut Avenue Securities Trust 2020-R02 2M2 | (b) | ML + 200 | 01/25/2040 | 360,000 | 340,813 |
Connecticut Avenue Securities Trust 2020-SBT1 1M2 | (b) | ML + 365 | 02/25/2040 | 255,000 | 238,409 |
Connecticut Avenue Securities Trust 2020-SBT1 2M2 | (b) | ML + 365 | 02/25/2040 | 270,000 | 259,215 |
DBUBS 2011-LC1A C | (b) | 5.876% | 11/10/2046 | 270,347 | 271,947 |
Fannie Mae Connecticut Avenue Securities 2014-C04 1M2 | ML + 490 | 11/25/2024 | 436,432 | 448,165 | |
Fannie Mae Connecticut Avenue Securities 2015-C02 1M2 | ML + 400 | 05/25/2025 | 55,717 | 56,221 | |
Fannie Mae Connecticut Avenue Securities 2015-C03 1M2 | ML + 500 | 07/25/2025 | 316,158 | 322,438 | |
Fannie Mae Connecticut Avenue Securities 2015-C03 2M2 | ML + 500 | 07/25/2025 | 82,471 | 84,229 | |
Fannie Mae Connecticut Avenue Securities 2015-C04 1M2 | ML + 570 | 04/25/2028 | 91,588 | 96,252 | |
Fannie Mae Connecticut Avenue Securities 2016-C01 1M2 | ML + 675 | 08/25/2028 | 154,531 | 161,936 |
| Ohio National Fund, Inc. | ON Risk Managed Balanced Portfolio (Continued) |
| Schedule of Investments | June 30, 2020 (Unaudited) |
| Asset-Backed / Mortgage-Backed Securities (Continued) | Rate | Maturity | Face Amount | Value | |
| Financials (continued) | |||||
Fannie Mae Connecticut Avenue Securities 2016-C03 2M2 | ML + 590 | 10/25/2028 | $ 170,014 | $ 176,724 | |
Fannie Mae Connecticut Avenue Securities 2016-C04 1M2 | ML + 425 | 01/25/2029 | 311,348 | 322,205 | |
Fannie Mae Connecticut Avenue Securities 2016-C07 2M2 | ML + 435 | 05/25/2029 | 126,021 | 130,365 | |
Fannie Mae Connecticut Avenue Securities 2017-C01 1M2 | ML + 355 | 07/25/2029 | 351,852 | 357,717 | |
Fannie Mae Connecticut Avenue Securities 2017-C03 1M1 | ML + 95 | 10/25/2029 | 4,108 | 4,104 | |
Fannie Mae Connecticut Avenue Securities 2017-C07 1B1 | ML + 400 | 05/25/2030 | 300,000 | 298,694 | |
Fannie Mae Connecticut Avenue Securities 2018-C05 1M2 | ML + 235 | 01/25/2031 | 96,013 | 93,874 | |
Fannie Mae Connecticut Avenue Securities 2018-C06 1M2 | ML + 200 | 03/25/2031 | 262,356 | 251,832 | |
Freddie Mac Stacr Remic Trust 2019-HQA4 M1 | (b) | ML + 77 | 11/25/2049 | 5,525 | 5,499 |
Freddie Mac Stacr Remic Trust 2020-DNA1 M1 | (b) | ML + 70 | 01/25/2050 | 27,577 | 27,518 |
Freddie Mac Stacr Remic Trust 2020-DNA1 M2 | (b) | ML + 170 | 01/25/2050 | 237,000 | 226,510 |
Freddie Mac STACR Remic Trust 2020-DNA2 M1 | (b) | ML + 75 | 02/25/2050 | 24,132 | 23,911 |
Freddie Mac STACR Trust 2019-DNA4 M2 | (b) | ML + 195 | 10/25/2049 | 114,570 | 112,289 |
Freddie Mac STACR Trust 2019-HQA2 M2 | (b) | ML + 205 | 04/25/2049 | 70,527 | 69,079 |
Freddie Mac Structured Agency Credit Risk Debt Notes 2015-DN1 M3 | ML + 415 | 01/25/2025 | 97,479 | 98,936 | |
Freddie Mac Structured Agency Credit Risk Debt Notes 2015-DNA1 M3 | ML + 330 | 10/25/2027 | 250,000 | 253,767 | |
Freddie Mac Structured Agency Credit Risk Debt Notes 2015-DNA2 M3 | ML + 390 | 12/25/2027 | 196,948 | 200,202 | |
Freddie Mac Structured Agency Credit Risk Debt Notes 2015-DNA3 M3 | ML + 470 | 04/25/2028 | 250,000 | 260,125 | |
Freddie Mac Structured Agency Credit Risk Debt Notes 2015-HQ1 M3 | ML + 380 | 03/25/2025 | 144,304 | 146,328 | |
Freddie Mac Structured Agency Credit Risk Debt Notes 2015-HQA1 M3 | ML + 470 | 03/25/2028 | 203,361 | 210,182 | |
Freddie Mac Structured Agency Credit Risk Debt Notes 2016-DNA1 M3 | ML + 555 | 07/25/2028 | 229,353 | 239,651 | |
Freddie Mac Structured Agency Credit Risk Debt Notes 2016-DNA4 M3 | ML + 380 | 03/25/2029 | 310,000 | 313,106 | |
Freddie Mac Structured Agency Credit Risk Debt Notes 2016-HQA2 M3 | ML + 515 | 11/25/2028 | 235,145 | 245,741 | |
Freddie Mac Structured Agency Credit Risk Debt Notes 2016-HQA4 M3 | ML + 390 | 04/25/2029 | 270,000 | 277,917 | |
Freddie Mac Structured Agency Credit Risk Debt Notes 2017-DNA1 M2 | ML + 325 | 07/25/2029 | 250,000 | 252,184 | |
Freddie Mac Structured Agency Credit Risk Debt Notes 2017-DNA2 M2 | ML + 345 | 10/25/2029 | 300,000 | 304,038 | |
Freddie Mac Structured Agency Credit Risk Debt Notes 2017-DNA3 M2 | ML + 250 | 03/25/2030 | 270,000 | 271,329 | |
Freddie Mac Structured Agency Credit Risk Debt Notes 2017-HQA1 M2 | ML + 355 | 08/25/2029 | 259,948 | 264,009 | |
Freddie Mac Structured Agency Credit Risk Debt Notes 2018-DNA1 M2 | ML + 180 | 07/25/2030 | 101,449 | 99,213 | |
GS Mortgage Securities Trust 2010-C2 D | (b) | 5.351% | 12/10/2043 | 270,000 | 266,060 |
GS Mortgage Securities Trust 2012-GCJ9 AS | 3.124% | 11/10/2045 | 287,514 | 292,855 | |
GS Mortgage Securities Trust 2016-GS3 A4 | 2.850% | 10/10/2049 | 270,000 | 288,124 | |
GS Mortgage Securities Trust 2017-GS7 A4 | 3.430% | 08/10/2050 | 270,000 | 301,404 | |
GS Mortgage Securities Trust 2018-GS9 A4 | 3.992% | 03/10/2051 | 153,543 | 175,257 | |
GS Mortgage Securities Trust 2019-GC38 A4 | 3.968% | 02/10/2052 | 250,000 | 289,822 | |
JP Morgan Chase Commercial Mortgage Securities Trust 2010-C2 A3 | (b) | 4.070% | 11/15/2043 | 120,155 | 120,031 |
JP Morgan Chase Commercial Mortgage Securities Trust 2012-LC9 A5 | 2.840% | 12/15/2047 | 214,692 | 219,983 | |
JP Morgan Chase Commercial Mortgage Securities Trust 2013-C10 B | 3.674% | 12/15/2047 | 300,000 | 301,237 | |
JPMBB Commercial Mortgage Securities Trust 2013-C15 AS | 4.420% | 11/15/2045 | 250,000 | 267,897 | |
JPMBB Commercial Mortgage Securities Trust 2014-C21 C | 4.813% | 08/15/2047 | 295,000 | 272,804 | |
JPMBB Commercial Mortgage Securities Trust 2015-C27 AS | 3.634% | 02/15/2048 | 130,694 | 136,666 | |
JPMBB Commercial Mortgage Securities Trust 2015-C31 B | 4.773% | 08/15/2048 | 300,000 | 316,765 | |
Magnetite XXVI Ltd. 2020-26A A | (b) | QL + 175 | 07/15/2030 | 401,052 | 400,028 |
Morgan Stanley Capital I Trust 2018-H3 AS | 4.429% | 07/15/2051 | 270,000 | 309,946 | |
Morgan Stanley Capital I Trust 2018-H4 A4 | 4.310% | 12/15/2051 | 250,000 | 296,998 | |
OCP CLO 2020-18A A | (b) | QL + 180 | 04/20/2030 | 250,000 | 249,869 |
SG Commercial Mortgage Securities Trust 2016-C5 A4 | 3.055% | 10/10/2048 | 250,000 | 263,614 | |
UBS Commercial Mortgage Trust 2018-C10 A3 | 4.048% | 05/15/2051 | 270,000 | 309,773 | |
Wells Fargo Commercial Mortgage Trust 2015-C28 A4 | 3.540% | 05/15/2048 | 250,000 | 272,281 | |
Wells Fargo Commercial Mortgage Trust 2015-C30 A3 | 3.411% | 09/15/2058 | 232,889 | 253,403 | |
Wells Fargo Commercial Mortgage Trust 2015-NXS3 A4 | 3.617% | 09/15/2057 | 270,000 | 295,055 | |
Wells Fargo Commercial Mortgage Trust 2016-C35 A3 | 2.674% | 07/15/2048 | 300,000 | 316,571 | |
Wells Fargo Commercial Mortgage Trust 2016-C35 B | 3.438% | 07/15/2048 | 270,000 | 263,432 | |
Wells Fargo Commercial Mortgage Trust 2017-C39 A5 | 3.418% | 09/15/2050 | 270,000 | 301,384 | |
Wells Fargo Commercial Mortgage Trust 2017-C41 A3 | 3.210% | 11/15/2050 | 270,000 | 293,021 | |
Wells Fargo Commercial Mortgage Trust 2018-C44 A4 | 3.948% | 05/15/2051 | 270,000 | 309,866 | |
WFRBS Commercial Mortgage Trust 2014-C24 AS | 3.931% | 11/15/2047 | 270,000 | 285,060 | |
| 17,561,607 | |||||
Total Asset-Backed / Mortgage-Backed Securities (Cost $17,468,314) | $ 17,696,135 |
| U.S. Government Agency Mortgage-Backed Securities–3.2% | Rate | Maturity | Face Amount | Value | |
Fannie Mae Pool FN AL5310 | 3.500% | 04/01/2044 | $ 3,671 | $ 4,049 | |
Fannie Mae Pool FN AL5887 | 4.500% | 10/01/2044 | 23,003 | 26,121 | |
Fannie Mae Pool FN AL6542 | 4.500% | 03/01/2045 | 35,895 | 40,765 | |
Fannie Mae Pool FN AL6620 | 4.500% | 08/01/2042 | 234,141 | 265,642 | |
Fannie Mae Pool FN AL6997 | 4.500% | 11/01/2042 | 17,131 | 19,202 |
| Ohio National Fund, Inc. | ON Risk Managed Balanced Portfolio (Continued) |
| Schedule of Investments | June 30, 2020 (Unaudited) |
| U.S. Government Agency Mortgage-Backed Securities (Continued) | Rate | Maturity | Face Amount | Value | |
Fannie Mae Pool FN AL8855 | 3.500% | 07/01/2046 | $ 15,311 | $ 16,643 | |
Fannie Mae Pool FN AS7168 | 3.500% | 05/01/2046 | 37,617 | 40,442 | |
Fannie Mae Pool FN AS7587 | 3.500% | 07/01/2046 | 171,790 | 187,781 | |
Fannie Mae Pool FN AS7822 | 3.500% | 08/01/2046 | 483,872 | 520,217 | |
Fannie Mae Pool FN AZ9203 | 3.000% | 10/01/2045 | 53,381 | 56,242 | |
Fannie Mae Pool FN BA2885 | 3.000% | 10/01/2045 | 94,335 | 99,392 | |
Fannie Mae Pool FN BA4752 | 3.000% | 01/01/2046 | 11,501 | 12,117 | |
Fannie Mae Pool FN BC1520 | 3.500% | 08/01/2046 | 296,772 | 319,063 | |
Fannie Mae Pool FN BC2468 | 3.000% | 03/01/2046 | 261,495 | 275,513 | |
Fannie Mae Pool FN BC2488 | 3.000% | 03/01/2046 | 366,518 | 386,167 | |
Fannie Mae Pool FN BC9077 | 3.500% | 12/01/2046 | 20,411 | 21,944 | |
Fannie Mae Pool FN BH1902 | 3.500% | 12/01/2047 | 19,213 | 21,316 | |
Fannie Mae Pool FN BH3892 | 3.500% | 08/01/2047 | 58,538 | 62,030 | |
Fannie Mae Pool FN BH6940 | 3.500% | 08/01/2047 | 43,964 | 47,211 | |
Fannie Mae Pool FN BJ1692 | 3.500% | 12/01/2047 | 95,175 | 102,380 | |
Fannie Mae Pool FN BJ1695 | 3.500% | 12/01/2047 | 17,012 | 18,452 | |
Fannie Mae Pool FN BJ4558 | 3.500% | 01/01/2048 | 68,434 | 73,774 | |
Fannie Mae Pool FN BJ4559 | 3.500% | 01/01/2048 | 27,479 | 29,731 | |
Fannie Mae Pool FN BJ4566 | 4.000% | 01/01/2048 | 234,970 | 255,744 | |
Fannie Mae Pool FN BJ4567 | 4.000% | 01/01/2048 | 393,834 | 427,598 | |
Fannie Mae Pool FN BJ5170 | 3.500% | 03/01/2048 | 13,432 | 14,625 | |
Fannie Mae Pool FN BK1964 | 4.000% | 03/01/2048 | 91,197 | 100,476 | |
Fannie Mae Pool FN BK1975 | 3.500% | 03/01/2048 | 44,717 | 48,423 | |
Fannie Mae Pool FN BK3211 | 4.500% | 03/01/2048 | 97,536 | 104,932 | |
Fannie Mae Pool FN BK4157 | 4.000% | 05/01/2048 | 184,319 | 195,109 | |
Fannie Mae Pool FN BM3282 | 3.500% | 12/01/2047 | 9,117 | 10,114 | |
Fannie Mae Pool FN BM3511 | 4.500% | 02/01/2046 | 152,935 | 170,004 | |
Fannie Mae Pool FN BM3912 | 3.000% | 03/01/2047 | 214,530 | 229,156 | |
Fannie Mae Pool FN BM4427 | 3.500% | 04/01/2048 | 153,171 | 164,568 | |
Fannie Mae Pool FN BM4735 | 3.500% | 04/01/2048 | 155,183 | 171,042 | |
Fannie Mae Pool FN BM4896 | 3.000% | 02/01/2047 | 1,598,045 | 1,710,738 | |
Fannie Mae Pool FN BM5138 | 3.500% | 11/01/2048 | 257,023 | 283,289 | |
Fannie Mae Pool FN BM5334 | 3.500% | 01/01/2049 | 92,892 | 99,723 | |
Fannie Mae Pool FN BN0012 | 4.500% | 08/01/2048 | 87,662 | 94,239 | |
Fannie Mae Pool FN BO3223 | 3.000% | 10/01/2034 | 64,838 | 68,718 | |
Fannie Mae Pool FN BO4725 | 2.500% | 11/01/2034 | 88,867 | 94,314 | |
Fannie Mae Pool FN BO5957 | 3.000% | 12/01/2034 | 10,662 | 11,366 | |
Fannie Mae Pool FN BO7717 | 3.000% | 11/01/2034 | 11,458 | 12,253 | |
Fannie Mae Pool FN CA0108 | 3.500% | 08/01/2047 | 32,592 | 36,160 | |
Fannie Mae Pool FN FM0029 | 3.000% | 09/01/2046 | 379,157 | 406,004 | |
Fannie Mae Pool FN FM1036 | 3.000% | 05/01/2043 | 254,049 | ���271,906 | |
Fannie Mae Pool FN MA3211 | 4.000% | 12/01/2047 | 150,313 | 160,226 | |
Fannie Mae Pool FN MA3239 | 4.000% | 01/01/2048 | 23,824 | 25,430 | |
Freddie Mac Gold Pool FG G60658 | 3.500% | 07/01/2046 | 331,347 | 365,638 | |
Freddie Mac Gold Pool FG G61360 | 3.500% | 03/01/2048 | 76,568 | 83,194 | |
Freddie Mac Gold Pool FG G61737 | 3.500% | 11/01/2048 | 364,058 | 394,014 | |
Freddie Mac Gold Pool FG Q54793 | 4.500% | 03/01/2048 | 89,417 | 95,979 | |
Freddie Mac Gold Pool FG Q55394 | 3.500% | 04/01/2048 | 26,771 | 29,086 | |
Freddie Mac Pool FR QN0783 | 3.000% | 10/01/2034 | 48,812 | 51,697 | |
Freddie Mac Pool FR QN0786 | 3.000% | 10/01/2034 | 117,238 | 124,580 | |
Freddie Mac Pool FR QN0951 | 2.500% | 11/01/2034 | 72,549 | 77,010 | |
Freddie Mac Pool FR SB0040 | 2.500% | 12/01/2033 | 471,856 | 495,074 | |
Freddie Mac Pool FR SB0116 | 2.500% | 11/01/2034 | 108,590 | 115,267 | |
Freddie Mac Pool FR ZA4718 | 3.000% | 10/01/2046 | 276,415 | 293,525 | |
Freddie Mac Pool FR ZK8962 | 3.000% | 09/01/2032 | 106,849 | 113,471 | |
Freddie Mac Pool FR ZK9009 | 3.000% | 10/01/2032 | 42,409 | 44,618 | |
Freddie Mac Pool FR ZK9163 | 3.000% | 01/01/2033 | 54,693 | 58,080 | |
Freddie Mac Pool FR ZM1434 | 3.500% | 07/01/2046 | 59,073 | 63,555 | |
Freddie Mac Pool FR ZM4821 | 3.500% | 11/01/2047 | 49,283 | 53,943 | |
Freddie Mac Pool FR ZM4939 | 3.500% | 11/01/2047 | 85,089 | 91,748 | |
Freddie Mac Pool FR ZM5102 | 3.500% | 12/01/2047 | 113,793 | 124,318 | |
Freddie Mac Pool FR ZM5228 | 3.500% | 12/01/2047 | 63,371 | 68,331 | |
Freddie Mac Pool FR ZM5705 | 3.500% | 02/01/2048 | 26,651 | 28,731 | |
Freddie Mac Pool FR ZM5707 | 3.500% | 02/01/2048 | 23,533 | 25,074 | |
Freddie Mac Pool FR ZM5945 | 4.000% | 03/01/2048 | 67,185 | 73,247 | |
Freddie Mac Pool FR ZM6220 | 4.000% | 04/01/2048 | 77,397 | 82,029 | |
Freddie Mac Pool FR ZM6276 | 4.000% | 04/01/2048 | 108,548 | 117,798 | |
Freddie Mac Pool FR ZM6427 | 4.000% | 05/01/2048 | 281,227 | 298,648 | |
Freddie Mac Pool FR ZN2165 | 4.500% | 12/01/2048 | 100,298 | 111,567 | |
Freddie Mac Pool FR ZS4598 | 3.000% | 01/01/2045 | 47,752 | 50,782 |
| Ohio National Fund, Inc. | ON Risk Managed Balanced Portfolio (Continued) |
| Schedule of Investments | June 30, 2020 (Unaudited) |
| U.S. Government Agency Mortgage-Backed Securities (Continued) | Rate | Maturity | Face Amount | Value | |
Freddie Mac Pool FR ZS7403 | 3.000% | 05/01/2031 | $ 309,501 | $ 329,835 | |
Freddie Mac Pool FR ZS9830 | 3.500% | 10/01/2046 | 404,786 | 435,190 | |
Freddie Mac Pool FR ZT0272 | 3.500% | 02/01/2047 | 243,409 | 262,765 | |
Freddie Mac Pool FR ZT0337 | 3.500% | 12/01/2044 | 40,155 | 43,420 | |
Freddie Mac Pool FR ZT0537 | 3.500% | 03/01/2048 | 288,991 | 315,645 | |
Freddie Mac Pool FR ZT1633 | 4.000% | 03/01/2047 | 20,094 | 21,809 | |
Total U.S. Government Agency Mortgage-Backed Securities (Cost $12,103,311) | $ 12,752,019 |
| Preferred Securities–0.7% | Rate | Quantity | Value | |
| Financials–0.6% | ||||
Bank of America Corp. DR (Rate is fixed until 09/05/2024, at which point, the rate becomes QL + 371) (Banks) | (c) | 6.250% | 286,000 | $ 296,030 |
Bank of America Corp. DR (Rate is fixed until 03/17/2025, at which point, the rate becomes QL + 390) (Banks) | (c) | 6.100% | 124,000 | 130,820 |
Bank of New York Mellon Corp. / The DR (Rate is fixed until 09/20/2025, at which point, the rate becomes H15T5Y + 436) (Capital Markets) | (c) | 4.700% | 128,000 | 133,120 |
Citigroup, Inc. DR (Rate is fixed until 01/30/2023, at which point, the rate becomes QL + 407) (Banks) | (c) | 5.950% | 217,000 | 214,820 |
Citigroup, Inc. DR (Rate is fixed until 05/15/2025, at which point, the rate becomes QL + 391) (Banks) | (c) | 5.950% | 142,000 | 141,006 |
Citigroup, Inc. DR (Rate is fixed until 02/15/2023, at which point, the rate becomes QL + 423) (Banks) | (c) | 5.900% | 27,000 | 26,848 |
Discover Financial Services (Rate is fixed until 09/23/2025, at which point, the rate becomes H15T5Y + 578) (Consumer Finance) | (c) | 6.125% | 404,000 | 414,383 |
Goldman Sachs Group, Inc. / The DR (Capital Markets) | QL + 392 | 470,000 | 430,849 | |
Truist Financial Corp. DR (Rate is fixed until 09/01/2030, at which point, the rate becomes H15T10Y + 435) (Banks) | (c) | 5.100% | 256,000 | 264,346 |
Wells Fargo & Co. DR (Rate is fixed until 06/15/2025, at which point, the rate becomes QL + 399) (Banks) | (c) | 5.875% | 292,000 | 303,496 |
| 2,355,718 | ||||
| Industrials–0.1% | ||||
General Electric Co. (Rate is fixed until 01/21/2021, at which point, the rate becomes QL + 333) (Industrial Conglomerates) | (c) | 5.000% | 336,000 | 263,794 |
Total Preferred Securities (Cost $2,726,627) | $ 2,619,512 |
| Sovereign Issues–0.2% | Rate | Maturity | Face Amount | Value | |
Brazilian Government International Bond | 2.875% | 06/06/2025 | $ 202,000 | $ 199,475 | |
Colombia Government International Bond | 3.125% | 04/15/2031 | 540,000 | 535,416 | |
Uruguay Government International Bond | 4.375% | 01/23/2031 | 58,061 | 67,859 | |
Total Sovereign Issues (Cost $806,192) | $ 802,750 |
| Money Market Funds–8.5% | Shares | Value | |
State Street Institutional Liquid Reserves Fund Institutional Class, 0.346% | (f) | 25,185,070 | $ 25,195,144 |
State Street Institutional U.S. Government Money Market Fund, 0.116% | (f) | 7,997,501 | 7,997,501 |
Total Money Market Funds (Cost $33,194,630) | $ 33,192,645 | ||
Total Investments – 100.1% (Cost $347,476,401) | (g) | $391,908,256 | |
| Liabilities in Excess of Other Assets – (0.1)% | (547,030) | ||
| Net Assets – 100.0% | $391,361,226 |
| Ohio National Fund, Inc. | ON Risk Managed Balanced Portfolio (Continued) |
| Schedule of Investments | June 30, 2020 (Unaudited) |
Percentages are stated as a percent of net assets. |
| Abbreviations: | ||
| ADR: | American Depositary Receipts | |
| CLO: | Collaterized Loan Obligation | |
| DR: | Depositary Receipt | |
| H15T10Y: | U.S. Treasury Yield Curve Rate T-Note Constant Maturity 10 Year, 0.660% at 06/30/2020 | |
| H15T5Y: | U.S. Treasury Yield Curve Rate T-Note Constant Maturity 5 Year, 0.290% at 06/30/2020 | |
| ML: | Monthly U.S. LIBOR Rate, 0.162% at 06/30/2020 | |
| QL: | Quarterly U.S. LIBOR Rate, 0.302% at 06/30/2020 | |
| SOFR: | Secured Overnight Financing Rate, 0.100% at 06/30/2020 | |
| Footnotes: | ||
| (a) | Non-income producing security. | |
| (b) | Security exempt from registration under Regulation D of the Securities Act of 1933. These securities may be resold in transactions exempt from registration, normally to qualified buyers under Rule 144A. At June 30, 2020, the value of these securities totaled $20,462,619, or 5.2% of the Portfolio’s net assets. | |
| (c) | Security is a fixed-then-variable rate instrument in which the coupon or dividend rate is fixed until a later specified date, then is adjusted periodically. Rates stated, including interest rate caps and floors, if any, are those in effect at June 30, 2020. | |
| (d) | Security is fully or partially pledged as collateral for the futures contracts outstanding at June 30, 2020. See also the following Schedule of Open Futures Contracts. | |
| (e) | 100 shares per contract. | |
| (f) | Rate represents the seven-day yield at June 30, 2020. | |
| (g) | Represents cost for financial reporting purposes, which may differ from cost basis for federal income tax purposes. See also Note 8 of the Notes to Financial Statements. | |
| Schedule of Open Futures Contracts | June 30, 2020 (Unaudited) |
| Description | Number of contracts | Expiration Date | Notional Amount | Value | Unrealized Appreciation (Depreciation) | Variation Margin Receivable (Payable) | ||||||
| CME E-mini S&P 500 Index - Long | 310 | September 18, 2020 | $ 47,425,829 | $ 47,898,100 | $472,271 | $ 673,074 | ||||||
| CBT U.S. Ultra Bond - Long | 3 | September 21, 2020 | 644,317 | 654,469 | 10,152 | (3,094) | ||||||
| CBT 10-Year U.S. Ultra Bond - Short | (37) | September 21, 2020 | (5,779,738) | (5,826,922) | (47,184) | 11,625 | ||||||
| CBT 10-Year U.S. Treasury Note - Long | 1,320 | September 21, 2020 | 183,237,962 | 183,706,875 | 468,913 | (206,250) | ||||||
| CBT U.S. Long Bond - Long | 53 | September 21, 2020 | 9,442,334 | 9,463,813 | 21,479 | (24,844) | ||||||
| CBT 2-Year U.S. Treasury Note - Long | 255 | September 30, 2020 | 56,297,309 | 56,311,172 | 13,863 | 2,814 | ||||||
| CBT 5-Year U.S. Treasury Note - Long | 7 | September 30, 2020 | 878,790 | 880,195 | 1,405 | (273) | ||||||
| $292,146,803 | $293,087,702 | $940,899 | $ 453,052 |
| Ohio National Fund, Inc. | ON Federated Core Plus Bond Portfolio (Unaudited) |
| Average Annual returns | |
| Since inception (5/1/20) | 1.80% |
| (1) | The Portfolio’s composition is subject to change. Holdings and weightings are as of June 30, 2020. |
| Ohio National Fund, Inc. | ON Federated Core Plus Bond Portfolio (Unaudited) (Continued) |
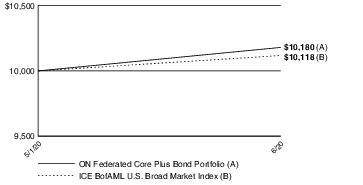
| Portfolio Composition as of June 30, 2020 (1) | |
| % of Net Assets | |
| Corporate Bonds (4) | 40.6 |
| U.S. Treasury Obligations | 25.6 |
| U.S. Government Agency Mortgage-Backed Securities | 18.5 |
| Investment Companies | 7.2 |
| Asset-Backed Securities (4) | 2.5 |
| Sovereign Issues | 0.5 |
| Money Market Funds and Other Net Assets | 5.1 |
| 100.0 | |
| Top 10 Portfolio Holdings as of June 30, 2020 (1) (2) (3) | ||
| % of Net Assets | ||
| 1. | U.S. Treasury Note 0.125%, 04/30/2022 | 9.2 |
| 2. | U.S. Treasury Note 0.375%, 04/30/2025 | 5.5 |
| 3. | U.S. Treasury Note 2.000%, 02/15/2050 | 4.0 |
| 4. | U.S. Treasury Note 0.250%, 04/15/2023 | 3.9 |
| 5. | Federated Hermes Core Trust - Emerging Markets Core Fund | 3.5 |
| 6. | Federated Hermes Core Trust III - Federated Project and Trade Finance Core Fund | 2.8 |
| 7. | Fannie Mae Pool FN FM2778 3.000%, 03/01/2050 | 2.1 |
| 8. | Fannie Mae Pool FN MA4020 3.000%, 05/01/2050 | 2.0 |
| 9. | Fannie Mae Pool FN CA5549 3.000%, 04/01/2050 | 2.0 |
| 10. | Fannie Mae Pool FN CA5348 3.500%, 03/01/2050 | 2.0 |
| (1) | Composition of Portfolio subject to change. | |
| (2) | Short-term investments have been excluded from the list of Top 10 Portfolio Holdings. | |
| (3) | Top 10 Portfolio Holdings is presented at an individual security level. Total investment exposure by issuer may be higher. | |
| (4) | Sectors (Corporate Bonds, Asset-Backed Securities): | |
| % of Net Assets | |
| Financials | 12.7 |
| Communication Services | 4.7 |
| Industrials | 4.7 |
| Health Care | 3.9 |
| Consumer Staples | 3.4 |
| Information Technology | 2.7 |
| Energy | 2.7 |
| Utilities | 2.6 |
| Consumer Discretionary | 2.2 |
| Real Estate | 1.9 |
| Materials | 1.6 |
| 43.1 |
| Ohio National Fund, Inc. | ON Federated Core Plus Bond Portfolio |
| Schedule of Investments | June 30, 2020 (Unaudited) |
| Corporate Bonds–40.6% | Rate | Maturity | Face Amount | Value | |
| Communication Services–4.7% | |||||
AMC Networks, Inc. (Media) | 5.000% | 04/01/2024 | $ 75,000 | $ 74,250 | |
America Movil S.A.B de C.V. (Wireless Telecom. Svs.) | 2.875% | 05/07/2030 | 200,000 | 211,110 | |
AT&T, Inc. (Diversified Telecom. Svs.) | 4.300% | 02/15/2030 | 175,000 | 204,454 | |
AT&T, Inc. (Diversified Telecom. Svs.) | 3.500% | 06/01/2041 | 150,000 | 157,527 | |
AT&T, Inc. (Diversified Telecom. Svs.) | 4.500% | 03/09/2048 | 550,000 | 645,397 | |
AT&T, Inc. (Diversified Telecom. Svs.) | 3.650% | 06/01/2051 | 150,000 | 156,478 | |
Bell Canada, Inc. (Diversified Telecom. Svs.) | 4.464% | 04/01/2048 | 250,000 | 316,175 | |
CCO Holdings LLC / CCO Holdings Capital Corp. (Media) | (a) | 5.500% | 05/01/2026 | 50,000 | 51,813 |
CCO Holdings LLC / CCO Holdings Capital Corp. (Media) | (a) | 4.500% | 08/15/2030 | 150,000 | 153,075 |
Charter Communications Operating LLC / Charter Communications Operating Capital (Media) | 2.800% | 04/01/2031 | 125,000 | 126,654 | |
Charter Communications Operating LLC / Charter Communications Operating Capital (Media) | 6.484% | 10/23/2045 | 225,000 | 298,945 | |
Comcast Corp. (Media) | 3.400% | 04/01/2030 | 225,000 | 256,216 | |
Comcast Corp. (Media) | 3.450% | 02/01/2050 | 500,000 | 566,716 | |
CSC Holdings LLC (Media) | (a) | 7.500% | 04/01/2028 | 250,000 | 272,812 |
Cumulus Media New Holdings, Inc. (Media) | (a) | 6.750% | 07/01/2026 | 25,000 | 23,094 |
Deutsche Telekom International Finance B.V. (Diversified Telecom. Svs.) | (a) | 3.600% | 01/19/2027 | 375,000 | 419,673 |
Discovery Communications LLC (Media) | 4.650% | 05/15/2050 | 250,000 | 283,512 | |
DISH DBS Corp. (Media) | 7.750% | 07/01/2026 | 50,000 | 53,005 | |
DISH DBS Corp. (Media) | (a) | 7.375% | 07/01/2028 | 25,000 | 24,844 |
Entercom Media Corp. (Media) | (a) | 7.250% | 11/01/2024 | 25,000 | 21,750 |
Entercom Media Corp. (Media) | (a) | 6.500% | 05/01/2027 | 25,000 | 22,438 |
Fox Corp. (Media) | 3.500% | 04/08/2030 | 100,000 | 111,643 | |
Fox Corp. (Media) | 5.576% | 01/25/2049 | 125,000 | 175,862 | |
Gray Television, Inc. (Media) | (a) | 5.875% | 07/15/2026 | 25,000 | 24,906 |
Grupo Televisa S.A.B (Media) | 5.000% | 05/13/2045 | 375,000 | 412,395 | |
iHeartCommunications, Inc. (Media) | 6.375% | 05/01/2026 | 50,000 | 49,500 | |
iHeartCommunications, Inc. (Media) | 8.375% | 05/01/2027 | 100,000 | 91,637 | |
Lamar Media Corp. (Media) | (a) | 4.875% | 01/15/2029 | 25,000 | 25,125 |
Match Group, Inc. (Interactive Media & Svs.) | (a) | 5.000% | 12/15/2027 | 25,000 | 26,014 |
Match Group, Inc. (Interactive Media & Svs.) | (a) | 4.625% | 06/01/2028 | 25,000 | 25,279 |
Match Group, Inc. (Interactive Media & Svs.) | (a) | 4.125% | 08/01/2030 | 25,000 | 24,477 |
Nexstar Broadcasting, Inc. (Media) | (a) | 5.625% | 08/01/2024 | 75,000 | 75,562 |
Nexstar Broadcasting, Inc. (Media) | (a) | 5.625% | 07/15/2027 | 50,000 | 50,003 |
Omnicom Group, Inc. (Media) | 4.200% | 06/01/2030 | 225,000 | 261,604 | |
Rackspace Hosting, Inc. (Interactive Media & Svs.) | (a) | 8.625% | 11/15/2024 | 100,000 | 101,800 |
Scripps Escrow, Inc. (Media) | (a) | 5.875% | 07/15/2027 | 75,000 | 71,062 |
Sinclair Television Group, Inc. (Media) | (a) | 5.875% | 03/15/2026 | 100,000 | 98,500 |
Sirius XM Radio, Inc. (Media) | (a) | 5.375% | 07/15/2026 | 50,000 | 51,637 |
Sirius XM Radio, Inc. (Media) | (a) | 5.500% | 07/01/2029 | 50,000 | 52,889 |
Sky Ltd. (Media) | (a) | 3.750% | 09/16/2024 | 200,000 | 222,704 |
Sprint Capital Corp. (Wireless Telecom. Svs.) | 6.875% | 11/15/2028 | 50,000 | 60,935 | |
Sprint Corp. (Wireless Telecom. Svs.) | 7.625% | 03/01/2026 | 100,000 | 118,037 | |
TEGNA, Inc. (Media) | (a) | 4.625% | 03/15/2028 | 50,000 | 46,000 |
TEGNA, Inc. (Media) | (a) | 5.000% | 09/15/2029 | 25,000 | 23,555 |
Telefonica Emisiones SA (Diversified Telecom. Svs.) | 4.895% | 03/06/2048 | 375,000 | 455,096 | |
Telenet Finance Luxembourg Notes SARL (Media) | (a) | 5.500% | 03/01/2028 | 200,000 | 208,500 |
Terrier Media Buyer, Inc. (Media) | (a) | 8.875% | 12/15/2027 | 50,000 | 47,938 |
T-Mobile U.S.A., Inc. (Wireless Telecom. Svs.) | 5.125% | 04/15/2025 | 75,000 | 76,687 | |
T-Mobile U.S.A., Inc. (Wireless Telecom. Svs.) | 4.500% | 02/01/2026 | 100,000 | 101,196 | |
T-Mobile U.S.A., Inc. (Wireless Telecom. Svs.) | (a) | 3.875% | 04/15/2030 | 250,000 | 278,642 |
T-Mobile U.S.A., Inc. (Wireless Telecom. Svs.) | (a) | 4.500% | 04/15/2050 | 125,000 | 147,244 |
Verizon Communications, Inc. (Diversified Telecom. Svs.) | 3.150% | 03/22/2030 | 175,000 | 197,807 | |
Verizon Communications, Inc. (Diversified Telecom. Svs.) | 4.000% | 03/22/2050 | 450,000 | 566,505 | |
ViacomCBS, Inc. (Media) | 4.950% | 01/15/2031 | 300,000 | 350,823 | |
Virgin Media Finance PLC (Media) | (a) | 5.000% | 07/15/2030 | 200,000 | 195,270 |
Vodafone Group PLC (Wireless Telecom. Svs.) | 4.125% | 05/30/2025 | 175,000 | 198,710 | |
Vodafone Group PLC (Wireless Telecom. Svs.) | 5.250% | 05/30/2048 | 225,000 | 296,048 | |
Walt Disney Co. / The (Entertainment) | 3.800% | 03/22/2030 | 125,000 | 145,944 | |
Walt Disney Co. / The (Entertainment) | 4.700% | 03/23/2050 | 175,000 | 228,207 | |
WMG Acquisition Corp. (Entertainment) | (a) | 3.875% | 07/15/2030 | 25,000 | 25,251 |
Ziggo B.V. (Diversified Telecom. Svs.) | (a) | 5.500% | 01/15/2027 | 200,000 | 203,258 |
| 10,264,190 | |||||
| Consumer Discretionary–2.2% | |||||
1011778 B.C. ULC / New Red Finance, Inc. (Hotels, Restaurants & Leisure) | (a) | 5.000% | 10/15/2025 | 175,000 | 174,125 |
Adient U.S. LLC (Auto Components) | (a) | 7.000% | 05/15/2026 | 50,000 | 51,750 |
Advance Auto Parts, Inc. (Specialty Retail) | (a) | 3.900% | 04/15/2030 | 375,000 | 401,087 |
Amazon.com, Inc. (Internet & Direct Marketing Retail) | 3.875% | 08/22/2037 | 300,000 | 371,349 | |
Aramark Services, Inc. (Hotels, Restaurants & Leisure) | (a) | 5.000% | 04/01/2025 | 75,000 | 73,875 |
| Ohio National Fund, Inc. | ON Federated Core Plus Bond Portfolio (Continued) |
| Schedule of Investments | June 30, 2020 (Unaudited) |
| Corporate Bonds (Continued) | Rate | Maturity | Face Amount | Value | |
| Consumer Discretionary (continued) | |||||
Aramark Services, Inc. (Hotels, Restaurants & Leisure) | (a) | 5.000% | 02/01/2028 | $ 75,000 | $ 71,250 |
AutoNation, Inc. (Specialty Retail) | 4.750% | 06/01/2030 | 110,000 | 119,173 | |
AutoZone, Inc. (Specialty Retail) | 4.000% | 04/15/2030 | 200,000 | 231,117 | |
Booking Holdings, Inc. (Internet & Direct Marketing Retail) | 4.625% | 04/13/2030 | 200,000 | 233,903 | |
Boyd Gaming Corp. (Hotels, Restaurants & Leisure) | (a) | 8.625% | 06/01/2025 | 25,000 | 26,125 |
Boyd Gaming Corp. (Hotels, Restaurants & Leisure) | (a) | 4.750% | 12/01/2027 | 75,000 | 64,363 |
Caesars Resort Collection LLC / CRC Finco, Inc. (Hotels, Restaurants & Leisure) | (a) | 5.250% | 10/15/2025 | 50,000 | 43,500 |
Clarios Global LP (Automobiles) | (a) | 6.750% | 05/15/2025 | 25,000 | 26,000 |
Clarios Global LP / Clarios U.S. Finance Co. (Auto Components) | (a) | 6.250% | 05/15/2026 | 25,000 | 25,781 |
Clarios Global LP / Clarios U.S. Finance Co. (Auto Components) | (a) | 8.500% | 05/15/2027 | 50,000 | 50,247 |
Colt Merger Sub, Inc. (Hotels, Restaurants & Leisure) | (a) | 6.250% | 07/01/2025 | 25,000 | 24,805 |
Colt Merger Sub, Inc. (Hotels, Restaurants & Leisure) | (a) | 8.125% | 07/01/2027 | 25,000 | 24,313 |
Daimler Finance North America LLC (Automobiles) | (a) | 3.350% | 02/22/2023 | 325,000 | 340,349 |
Dana Financing Luxembourg SARL (Auto Components) | (a) | 5.750% | 04/15/2025 | 50,000 | 50,750 |
Dana, Inc. (Auto Components) | 5.375% | 11/15/2027 | 25,000 | 24,813 | |
Dollar General Corp. (Multiline Retail) | 3.875% | 04/15/2027 | 375,000 | 431,115 | |
Dollar Tree, Inc. (Multiline Retail) | 3.700% | 05/15/2023 | 400,000 | 428,186 | |
Gates Global LLC / Gates Corp. (Auto Components) | (a) | 6.250% | 01/15/2026 | 50,000 | 49,520 |
General Motors Co. (Automobiles) | 6.125% | 10/01/2025 | 200,000 | 224,761 | |
Hilton Domestic Operating Co., Inc. (Hotels, Restaurants & Leisure) | 4.250% | 09/01/2024 | 50,000 | 48,510 | |
Home Depot, Inc. / The (Specialty Retail) | 2.700% | 04/15/2030 | 425,000 | 466,578 | |
J.B. Poindexter & Co., Inc. (Auto Components) | (a) | 7.125% | 04/15/2026 | 50,000 | 50,500 |
MGM Growth Properties Operating Partnership LP / MGP Finance Co-Issuer, Inc. (Hotels, Restaurants & Leisure) | (a) | 4.625% | 06/15/2025 | 25,000 | 24,502 |
MGM Resorts International (Hotels, Restaurants & Leisure) | 6.000% | 03/15/2023 | 50,000 | 50,500 | |
MGM Resorts International (Hotels, Restaurants & Leisure) | 6.750% | 05/01/2025 | 75,000 | 74,256 | |
Mohegan Gaming & Entertainment (Hotels, Restaurants & Leisure) | (a) | 7.875% | 10/15/2024 | 50,000 | 41,500 |
Newell Brands, Inc. (Household Durables) | 4.875% | 06/01/2025 | 25,000 | 26,182 | |
O'Reilly Automotive, Inc. (Specialty Retail) | 4.200% | 04/01/2030 | 200,000 | 234,156 | |
Six Flags Entertainment Corp. (Hotels, Restaurants & Leisure) | (a) | 5.500% | 04/15/2027 | 25,000 | 22,344 |
Six Flags Theme Parks, Inc. (Hotels, Restaurants & Leisure) | (a) | 7.000% | 07/01/2025 | 25,000 | 25,844 |
Stars Group Holdings B.V. / Stars Group U.S. Co-Borrower LLC (Hotels, Restaurants & Leisure) | (a) | 7.000% | 07/15/2026 | 75,000 | 79,059 |
Station Casinos LLC (Hotels, Restaurants & Leisure) | (a) | 5.000% | 10/01/2025 | 75,000 | 66,000 |
William Carter Co. / The (Textiles, Apparel & Luxury Goods) | (a) | 5.500% | 05/15/2025 | 25,000 | 25,781 |
| 4,797,969 | |||||
| Consumer Staples–3.4% | |||||
Albertsons Cos., Inc. / Safeway, Inc. / New Albertsons LP / Albertsons LLC (Food & Staples Retailing) | 5.750% | 03/15/2025 | 50,000 | 51,094 | |
Albertsons Cos., Inc. / Safeway, Inc. / New Albertsons LP / Albertsons LLC (Food & Staples Retailing) | (a) | 5.875% | 02/15/2028 | 100,000 | 103,177 |
Alimentation Couche-Tard, Inc. (Food & Staples Retailing) | (a) | 3.800% | 01/25/2050 | 200,000 | 207,239 |
Altria Group, Inc. (Tobacco) | 3.875% | 09/16/2046 | 300,000 | 299,074 | |
Anheuser-Busch InBev Worldwide, Inc. (Beverages) | 4.350% | 06/01/2040 | 200,000 | 227,755 | |
Anheuser-Busch InBev Worldwide, Inc. (Beverages) | 4.500% | 06/01/2050 | 500,000 | 596,195 | |
B.A.T. Capital Corp. (Tobacco) | 4.540% | 08/15/2047 | 350,000 | 380,978 | |
Campbell Soup Co. (Food Products) | 2.375% | 04/24/2030 | 250,000 | 258,877 | |
Clorox Co. / The (Household Products) | 1.800% | 05/15/2030 | 155,000 | 156,334 | |
Coca-Cola Femsa S.A.B de C.V. (Beverages) | 2.750% | 01/22/2030 | 250,000 | 264,393 | |
Constellation Brands, Inc. (Beverages) | 3.750% | 05/01/2050 | 200,000 | 217,223 | |
Edgewell Personal Care Co. (Personal Products) | (a) | 5.500% | 06/01/2028 | 25,000 | 25,719 |
Energizer Holdings, Inc. (Household Products) | (a) | 6.375% | 07/15/2026 | 25,000 | 25,849 |
Flowers Foods, Inc. (Food Products) | 3.500% | 10/01/2026 | 325,000 | 349,969 | |
General Mills, Inc. (Food Products) | 3.700% | 10/17/2023 | 150,000 | 163,206 | |
General Mills, Inc. (Food Products) | 2.875% | 04/15/2030 | 150,000 | 163,076 | |
Grupo Bimbo S.A.B de C.V. (Food Products) | (a) | 4.875% | 06/27/2044 | 325,000 | 363,255 |
Heineken N.V. (Beverages) | (a) | 3.500% | 01/29/2028 | 375,000 | 422,534 |
J.M. Smucker Co. / The (Food Products) | 3.500% | 03/15/2025 | 200,000 | 221,649 | |
Keurig Dr Pepper, Inc. (Beverages) | 4.417% | 05/25/2025 | 150,000 | 172,956 | |
Keurig Dr Pepper, Inc. (Beverages) | 3.200% | 05/01/2030 | 200,000 | 221,253 | |
Kroger Co. / The (Food & Staples Retailing) | 2.200% | 05/01/2030 | 200,000 | 207,964 | |
Kroger Co. / The (Food & Staples Retailing) | 3.950% | 01/15/2050 | 200,000 | 228,807 | |
McCormick & Co., Inc. (Food Products) | 2.500% | 04/15/2030 | 200,000 | 208,582 | |
Mondelez International, Inc. (Food Products) | 1.500% | 05/04/2025 | 175,000 | 178,350 | |
PepsiCo, Inc. (Beverages) | 2.750% | 03/19/2030 | 450,000 | 501,395 | |
Philip Morris International, Inc. (Tobacco) | 2.100% | 05/01/2030 | 250,000 | 257,533 | |
Post Holdings, Inc. (Food Products) | (a) | 5.750% | 03/01/2027 | 75,000 | 77,625 |
Post Holdings, Inc. (Food Products) | (a) | 4.625% | 04/15/2030 | 75,000 | 73,598 |
Reckitt Benckiser Treasury Services PLC (Household Products) | (a) | 3.000% | 06/26/2027 | 350,000 | 382,617 |
| Ohio National Fund, Inc. | ON Federated Core Plus Bond Portfolio (Continued) |
| Schedule of Investments | June 30, 2020 (Unaudited) |
| Corporate Bonds (Continued) | Rate | Maturity | Face Amount | Value | |
| Consumer Staples (continued) | |||||
Tyson Foods, Inc. (Food Products) | 3.550% | 06/02/2027 | $ 350,000 | $ 387,561 | |
U.S. Foods, Inc. (Food & Staples Retailing) | (a) | 5.875% | 06/15/2024 | 50,000 | 47,500 |
| 7,443,337 | |||||
| Energy–2.7% | |||||
Antero Midstream Partners LP / Antero Midstream Finance Corp. (Oil, Gas & Consumable Fuels) | (a) | 5.750% | 03/01/2027 | 100,000 | 79,000 |
Apache Corp. (Oil, Gas & Consumable Fuels) | 5.100% | 09/01/2040 | 50,000 | 41,066 | |
Ascent Resources Utica Holdings LLC / ARU Finance Corp. (Oil, Gas & Consumable Fuels) | (a) | 7.000% | 11/01/2026 | 50,000 | 32,000 |
BP Capital Markets America, Inc. (Oil, Gas & Consumable Fuels) | 3.194% | 04/06/2025 | 175,000 | 190,276 | |
BP Capital Markets America, Inc. (Oil, Gas & Consumable Fuels) | 3.588% | 04/14/2027 | 350,000 | 387,055 | |
Buckeye Partners LP (Oil, Gas & Consumable Fuels) | (a) | 4.125% | 03/01/2025 | 50,000 | 47,963 |
Canadian Natural Resources Ltd. (Oil, Gas & Consumable Fuels) | 2.050% | 07/15/2025 | 250,000 | 250,499 | |
Cheniere Energy Partners LP (Oil, Gas & Consumable Fuels) | 5.625% | 10/01/2026 | 25,000 | 24,755 | |
Cheniere Energy, Inc. (Oil, Gas & Consumable Fuels) | (b) | 4.500% | 10/01/2029 | 50,000 | 48,750 |
Chevron Corp. (Oil, Gas & Consumable Fuels) | 3.078% | 05/11/2050 | 225,000 | 238,735 | |
CNX Midstream Partners LP / CNX Midstream Finance Corp. (Oil, Gas & Consumable Fuels) | (a) | 6.500% | 03/15/2026 | 75,000 | 69,000 |
CrownRock LP / CrownRock Finance, Inc. (Oil, Gas & Consumable Fuels) | (a) | 5.625% | 10/15/2025 | 75,000 | 67,219 |
Enbridge Energy Partners LP (Oil, Gas & Consumable Fuels) | 5.500% | 09/15/2040 | 250,000 | 302,018 | |
Endeavor Energy Resources LP / EER Finance, Inc. (Oil, Gas & Consumable Fuels) | (a) | 6.625% | 07/15/2025 | 25,000 | 25,196 |
Energy Transfer Operating LP (Oil, Gas & Consumable Fuels) | 3.750% | 05/15/2030 | 400,000 | 395,258 | |
Enterprise Products Operating LLC (Oil, Gas & Consumable Fuels) | 3.950% | 02/15/2027 | 100,000 | 114,002 | |
Enterprise Products Operating LLC (Oil, Gas & Consumable Fuels) | 3.700% | 01/31/2051 | 200,000 | 207,930 | |
Enviva Partners LP / Enviva Partners Finance Corp. (Oil, Gas & Consumable Fuels) | (a) | 6.500% | 01/15/2026 | 75,000 | 78,000 |
EQM Midstream Partners LP (Oil, Gas & Consumable Fuels) | 5.500% | 07/15/2028 | 75,000 | 71,437 | |
EQT Corp. (Oil, Gas & Consumable Fuels) | 6.125% | 02/01/2025 | 50,000 | 49,826 | |
Exxon Mobil Corp. (Oil, Gas & Consumable Fuels) | 3.482% | 03/19/2030 | 500,000 | 569,359 | |
Hess Midstream Operations LP (Oil, Gas & Consumable Fuels) | (a) | 5.125% | 06/15/2028 | 25,000 | 24,061 |
Holly Energy Partners LP / Holly Energy Finance Corp. (Oil, Gas & Consumable Fuels) | (a) | 5.000% | 02/01/2028 | 25,000 | 23,813 |
Kinder Morgan, Inc. (Oil, Gas & Consumable Fuels) | 4.300% | 03/01/2028 | 300,000 | 339,931 | |
NuStar Logistics LP (Oil, Gas & Consumable Fuels) | 6.000% | 06/01/2026 | 50,000 | 49,000 | |
Occidental Petroleum Corp. (Oil, Gas & Consumable Fuels) | 2.900% | 08/15/2024 | 25,000 | 21,375 | |
Occidental Petroleum Corp. (Oil, Gas & Consumable Fuels) | 8.000% | 07/15/2025 | 25,000 | 25,094 | |
Occidental Petroleum Corp. (Oil, Gas & Consumable Fuels) | 8.875% | 07/15/2030 | 25,000 | 24,969 | |
Occidental Petroleum Corp. (Oil, Gas & Consumable Fuels) | 6.450% | 09/15/2036 | 75,000 | 64,193 | |
Occidental Petroleum Corp. (Oil, Gas & Consumable Fuels) | 4.400% | 04/15/2046 | 75,000 | 52,290 | |
Parsley Energy LLC / Parsley Finance Corp. (Oil, Gas & Consumable Fuels) | (a) | 5.625% | 10/15/2027 | 25,000 | 24,625 |
PDC Energy, Inc. (Oil, Gas & Consumable Fuels) | 6.125% | 09/15/2024 | 25,000 | 23,250 | |
PDC Energy, Inc. (Oil, Gas & Consumable Fuels) | 5.750% | 05/15/2026 | 25,000 | 22,750 | |
Phillips 66 (Oil, Gas & Consumable Fuels) | 3.850% | 04/09/2025 | 175,000 | 193,972 | |
Precision Drilling Corp. (Energy Equip. & Svs.) | 5.250% | 11/15/2024 | 25,000 | 16,700 | |
Shell International Finance B.V. (Oil, Gas & Consumable Fuels) | 2.375% | 04/06/2025 | 200,000 | 212,303 | |
Shell International Finance B.V. (Oil, Gas & Consumable Fuels) | 2.750% | 04/06/2030 | 250,000 | 270,988 | |
Suncor Energy, Inc. (Oil, Gas & Consumable Fuels) | 2.800% | 05/15/2023 | 290,000 | 302,883 | |
Targa Resources Partners LP / Targa Resources Partners Finance Corp. (Oil, Gas & Consumable Fuels) | 5.250% | 05/01/2023 | 100,000 | 98,479 | |
Targa Resources Partners LP / Targa Resources Partners Finance Corp. (Oil, Gas & Consumable Fuels) | 5.875% | 04/15/2026 | 100,000 | 99,000 | |
U.S.A. Compression Partners LP / U.S.A. Compression Finance Corp. (Energy Equip. & Svs.) | 6.875% | 04/01/2026 | 75,000 | 72,469 | |
Valero Energy Corp. (Oil, Gas & Consumable Fuels) | 4.350% | 06/01/2028 | 175,000 | 198,057 | |
Western Midstream Operating LP (Oil, Gas & Consumable Fuels) | 4.500% | 03/01/2028 | 50,000 | 47,000 | |
Western Midstream Operating LP (Oil, Gas & Consumable Fuels) | 5.300% | 03/01/2048 | 50,000 | 40,563 | |
Western Midstream Operating LP (Oil, Gas & Consumable Fuels) | 5.500% | 08/15/2048 | 25,000 | 20,250 | |
Williams Cos., Inc. / The (Oil, Gas & Consumable Fuels) | 3.750% | 06/15/2027 | 250,000 | 266,665 | |
WPX Energy, Inc. (Oil, Gas & Consumable Fuels) | 5.750% | 06/01/2026 | 25,000 | 24,250 | |
WPX Energy, Inc. (Oil, Gas & Consumable Fuels) | 4.500% | 01/15/2030 | 25,000 | 22,090 | |
| 5,870,364 | |||||
| Financials–10.2% | |||||
Aflac, Inc. (Insurance) | 3.625% | 06/15/2023 | 350,000 | 382,748 | |
Alliant Holdings Intermediate LLC / Alliant Holdings Co-Issuer (Insurance) | (a) | 6.750% | 10/15/2027 | 75,000 | 74,746 |
American Express Credit Corp. (Consumer Finance) | 3.300% | 05/03/2027 | 400,000 | 454,408 | |
American International Group, Inc. (Insurance) | 4.500% | 07/16/2044 | 250,000 | 291,139 | |
AmWINS Group, Inc. (Insurance) | (a) | 7.750% | 07/01/2026 | 50,000 | 52,500 |
AssuredPartners, Inc. (Insurance) | (a) | 7.000% | 08/15/2025 | 75,000 | 75,000 |
Bank of America Corp. (Banks) | 3.300% | 01/11/2023 | 550,000 | 585,684 | |
Bank of America Corp. (Rate is fixed until 02/13/2025, at which point, the rate becomes QL + 64) (Banks) | (c) | 2.015% | 02/13/2026 | 725,000 | 749,720 |
Bank of America Corp. (Rate is fixed until 04/29/2030, at which point, the rate becomes SOFR + 215) (Banks) | (c) | 2.592% | 04/29/2031 | 900,000 | 951,976 |
| Ohio National Fund, Inc. | ON Federated Core Plus Bond Portfolio (Continued) |
| Schedule of Investments | June 30, 2020 (Unaudited) |
| Corporate Bonds (Continued) | Rate | Maturity | Face Amount | Value | |
| Financials (continued) | |||||
Bank of New York Mellon Corp. / The (Capital Markets) | 2.200% | 08/16/2023 | $ 650,000 | $ 679,366 | |
BlackRock, Inc. (Capital Markets) | 1.900% | 01/28/2031 | 200,000 | 204,331 | |
Capital One Financial Corp. (Consumer Finance) | 3.900% | 01/29/2024 | 350,000 | 380,619 | |
Chubb INA Holdings, Inc. (Insurance) | 3.350% | 05/03/2026 | 200,000 | 228,048 | |
Citigroup, Inc. (Rate is fixed until 01/24/2022, at which point, the rate becomes QL + 72) (Banks) | (c) | 3.142% | 01/24/2023 | 550,000 | 568,822 |
Citigroup, Inc. (Rate is fixed until 04/24/2024, at which point, the rate becomes QL + 90) (Banks) | (c) | 3.352% | 04/24/2025 | 350,000 | 378,161 |
Citigroup, Inc. (Rate is fixed until 01/29/2030, at which point, the rate becomes SOFR + 115) (Banks) | (c) | 2.666% | 01/29/2031 | 725,000 | 752,375 |
Citizens Bank N.A. (Banks) | 3.750% | 02/18/2026 | 250,000 | 280,617 | |
Comerica, Inc. (Banks) | 3.800% | 07/22/2026 | 200,000 | 215,933 | |
Ford Motor Credit Co. LLC (Consumer Finance) | 5.113% | 05/03/2029 | 200,000 | 195,076 | |
General Motors Financial Co., Inc. (Consumer Finance) | 2.900% | 02/26/2025 | 400,000 | 398,405 | |
Goldman Sachs Group, Inc. / The (Rate is fixed until 10/31/2021, at which point, the rate becomes QL + 82) (Capital Markets) | (c) | 2.876% | 10/31/2022 | 375,000 | 384,467 |
Goldman Sachs Group, Inc. / The (Capital Markets) | 3.500% | 04/01/2025 | 375,000 | 411,190 | |
Goldman Sachs Group, Inc. / The (Capital Markets) | 3.800% | 03/15/2030 | 700,000 | 798,502 | |
GTCR AP Finance, Inc. (Insurance) | (a) | 8.000% | 05/15/2027 | 50,000 | 51,468 |
Hartford Financial Services Group, Inc. / The (Insurance) | 4.400% | 03/15/2048 | 200,000 | 240,974 | |
HSBC Holdings PLC (Banks) | 3.900% | 05/25/2026 | 900,000 | 999,193 | |
HUB International Ltd. (Insurance) | (a) | 7.000% | 05/01/2026 | 225,000 | 225,000 |
Huntington Bancshares, Inc. (Banks) | 2.550% | 02/04/2030 | 225,000 | 232,534 | |
John Deere Capital Corp. (Consumer Finance) | 3.450% | 03/07/2029 | 375,000 | 434,635 | |
JPMorgan Chase & Co. (Rate is fixed until 04/25/2022, at which point, the rate becomes QL + 94) (Banks) | (c) | 2.776% | 04/25/2023 | 350,000 | 362,367 |
JPMorgan Chase & Co. (Banks) | 3.125% | 01/23/2025 | 725,000 | 790,169 | |
JPMorgan Chase & Co. (Rate is fixed until 04/22/2030, at which point, the rate becomes SOFR + 204) (Banks) | (c) | 2.522% | 04/22/2031 | 900,000 | 950,499 |
Liberty Mutual Group, Inc. (Insurance) | (a) | 3.951% | 10/15/2050 | 225,000 | 237,645 |
Lincoln National Corp. (Insurance) | 4.000% | 09/01/2023 | 200,000 | 217,755 | |
Lincoln National Corp. (Insurance) | 3.050% | 01/15/2030 | 200,000 | 210,522 | |
M&T Bank Corp. (Banks) | 3.550% | 07/26/2023 | 375,000 | 406,750 | |
MetLife, Inc. (Insurance) | 4.050% | 03/01/2045 | 200,000 | 235,202 | |
Morgan Stanley (Capital Markets) | 4.100% | 05/22/2023 | 225,000 | 243,178 | |
Morgan Stanley (Capital Markets) | 6.250% | 08/09/2026 | 225,000 | 287,968 | |
Morgan Stanley (Rate is fixed until 01/24/2028, at which point, the rate becomes QL + 114) (Capital Markets) | (c) | 3.772% | 01/24/2029 | 700,000 | 796,796 |
Nationwide Mutual Insurance Co. (Insurance) | (a) | 4.350% | 04/30/2050 | 200,000 | 208,186 |
Navient Corp. (Consumer Finance) | 5.500% | 01/25/2023 | 50,000 | 47,938 | |
Navient Corp. (Consumer Finance) | 5.875% | 10/25/2024 | 50,000 | 46,969 | |
NFP Corp. (Insurance) | (a) | 7.000% | 05/15/2025 | 25,000 | 26,250 |
NFP Corp. (Insurance) | (a) | 6.875% | 07/15/2025 | 25,000 | 23,990 |
Northern Trust Corp. (Capital Markets) | 1.950% | 05/01/2030 | 175,000 | 179,889 | |
PNC Bank N.A. (Banks) | 3.250% | 01/22/2028 | 250,000 | 279,831 | |
Prudential Financial, Inc. (Insurance) | 3.700% | 03/13/2051 | 300,000 | 331,009 | |
Quicken Loans LLC (Thrifts & Mortgage Finance) | (a) | 5.750% | 05/01/2025 | 100,000 | 102,229 |
Quicken Loans LLC (Thrifts & Mortgage Finance) | (a) | 5.250% | 01/15/2028 | 25,000 | 26,000 |
Raymond James Financial, Inc. (Capital Markets) | 4.650% | 04/01/2030 | 200,000 | 239,098 | |
Refinitiv U.S. Holdings, Inc. (Capital Markets) | (a) | 8.250% | 11/15/2026 | 100,000 | 108,297 |
Regions Financial Corp. (Banks) | 2.250% | 05/18/2025 | 170,000 | 177,832 | |
Stifel Financial Corp. (Capital Markets) | 4.000% | 05/15/2030 | 200,000 | 211,791 | |
Toyota Motor Credit Corp. (Consumer Finance) | 2.700% | 01/11/2023 | 475,000 | 498,987 | |
Travelers Cos., Inc. / The (Insurance) | 2.550% | 04/27/2050 | 200,000 | 197,611 | |
Truist Bank (Banks) | 3.000% | 02/02/2023 | 700,000 | 740,114 | |
USI, Inc. (Insurance) | (a) | 6.875% | 05/01/2025 | 75,000 | 75,656 |
Volkswagen Group of America Finance LLC (Consumer Finance) | (a) | 4.250% | 11/13/2023 | 350,000 | 383,009 |
Wells Fargo & Co. (Banks) | 3.750% | 01/24/2024 | 350,000 | 382,427 | |
Wells Fargo & Co. (Banks) | 3.000% | 10/23/2026 | 550,000 | 599,856 | |
Wells Fargo & Co. (Rate is fixed until 02/11/2030, at which point, the rate becomes QL + 100) (Banks) | (c) | 2.572% | 02/11/2031 | 725,000 | 758,417 |
| 22,061,874 | |||||
| Health Care–3.9% | |||||
Abbott Laboratories (Health Care Equip. & Supplies) | 3.750% | 11/30/2026 | 225,000 | 261,782 | |
AbbVie, Inc. (Biotechnology) | (a) | 3.200% | 11/21/2029 | 225,000 | 250,222 |
AbbVie, Inc. (Biotechnology) | (a) | 4.250% | 11/21/2049 | 250,000 | 299,678 |
Acadia Healthcare Co., Inc. (Health Care Providers & Svs.) | 5.625% | 02/15/2023 | 25,000 | 25,009 | |
Acadia Healthcare Co., Inc. (Health Care Providers & Svs.) | 6.500% | 03/01/2024 | 75,000 | 76,326 | |
Acadia Healthcare Co., Inc. (Health Care Providers & Svs.) | (a) | 5.500% | 07/01/2028 | 25,000 | 25,063 |
Agilent Technologies, Inc. (Life Sciences Tools & Svs.) | 2.750% | 09/15/2029 | 100,000 | 108,665 |
| Ohio National Fund, Inc. | ON Federated Core Plus Bond Portfolio (Continued) |
| Schedule of Investments | June 30, 2020 (Unaudited) |
| Corporate Bonds (Continued) | Rate | Maturity | Face Amount | Value | |
| Health Care (continued) | |||||
Agilent Technologies, Inc. (Life Sciences Tools & Svs.) | 2.100% | 06/04/2030 | $ 110,000 | $ 112,783 | |
Air Medical Group Holdings, Inc. (Health Care Providers & Svs.) | (a) | 6.375% | 05/15/2023 | 50,000 | 46,000 |
Alcon Finance Corp. (Health Care Equip. & Supplies) | (a) | 2.600% | 05/27/2030 | 200,000 | 205,554 |
Amgen, Inc. (Biotechnology) | 2.450% | 02/21/2030 | 375,000 | 396,406 | |
AstraZeneca PLC (Pharmaceuticals) | 2.375% | 06/12/2022 | 125,000 | 129,437 | |
AstraZeneca PLC (Pharmaceuticals) | 3.125% | 06/12/2027 | 400,000 | 445,420 | |
Avantor, Inc. (Health Care Equip. & Supplies) | (a) | 9.000% | 10/01/2025 | 100,000 | 107,750 |
Bausch Health Americas, Inc. (Pharmaceuticals) | (a) | 8.500% | 01/31/2027 | 50,000 | 53,062 |
Bausch Health Cos., Inc. (Pharmaceuticals) | (a) | 6.125% | 04/15/2025 | 100,000 | 101,427 |
Bausch Health Cos., Inc. (Pharmaceuticals) | (a) | 5.500% | 11/01/2025 | 50,000 | 51,103 |
Bausch Health Cos., Inc. (Pharmaceuticals) | (a) | 5.000% | 01/30/2028 | 25,000 | 23,537 |
Bausch Health Cos., Inc. (Pharmaceuticals) | (a) | 6.250% | 02/15/2029 | 50,000 | 50,250 |
Bayer U.S. Finance LLC (Pharmaceuticals) | (a) | 3.375% | 10/08/2024 | 375,000 | 409,008 |
Becton Dickinson & Co. (Health Care Equip. & Supplies) | 3.700% | 06/06/2027 | 200,000 | 223,760 | |
Becton Dickinson & Co. (Health Care Equip. & Supplies) | 4.685% | 12/15/2044 | 200,000 | 246,193 | |
Biogen, Inc. (Biotechnology) | 3.150% | 05/01/2050 | 250,000 | 240,694 | |
Bristol-Myers Squibb Co. (Pharmaceuticals) | (a) | 3.900% | 02/20/2028 | 375,000 | 441,222 |
Bristol-Myers Squibb Co. (Pharmaceuticals) | (a) | 4.250% | 10/26/2049 | 100,000 | 132,773 |
Centene Corp. (Health Care Providers & Svs.) | 4.750% | 01/15/2025 | 50,000 | 51,183 | |
Centene Corp. (Health Care Providers & Svs.) | (a) | 5.250% | 04/01/2025 | 50,000 | 51,485 |
Centene Corp. (Health Care Providers & Svs.) | 4.250% | 12/15/2027 | 100,000 | 103,191 | |
CHS / Community Health Systems, Inc. (Health Care Providers & Svs.) | 6.250% | 03/31/2023 | 75,000 | 70,647 | |
CVS Health Corp. (Health Care Providers & Svs.) | 2.875% | 06/01/2026 | 200,000 | 216,546 | |
CVS Health Corp. (Health Care Providers & Svs.) | 3.750% | 04/01/2030 | 275,000 | 316,220 | |
CVS Health Corp. (Health Care Providers & Svs.) | 4.250% | 04/01/2050 | 225,000 | 270,636 | |
DENTSPLY SIRONA, Inc. (Health Care Equip. & Supplies) | 3.250% | 06/01/2030 | 110,000 | 115,247 | |
Eli Lilly and Co. (Pharmaceuticals) | 3.375% | 03/15/2029 | 375,000 | 433,843 | |
Endo Dac / Endo Finance LLC / Endo Finco, Inc. (Pharmaceuticals) | (a) | 9.500% | 07/31/2027 | 5,000 | 5,289 |
HCA, Inc. (Health Care Providers & Svs.) | 5.375% | 09/01/2026 | 100,000 | 108,875 | |
HCA, Inc. (Health Care Providers & Svs.) | 3.500% | 09/01/2030 | 50,000 | 48,147 | |
Jaguar Holding Co. II / PPD Development LP (Health Care Providers & Svs.) | (a) | 4.625% | 06/15/2025 | 25,000 | 25,443 |
Jaguar Holding Co. II / PPD Development LP (Health Care Providers & Svs.) | (a) | 5.000% | 06/15/2028 | 25,000 | 25,594 |
LifePoint Health, Inc. (Health Care Providers & Svs.) | (a) | 6.750% | 04/15/2025 | 50,000 | 51,625 |
Mallinckrodt International Finance SA / Mallinckrodt CB LLC (Pharmaceuticals) | (a) | 5.625% | 10/15/2023 | 50,000 | 9,750 |
MEDNAX, Inc. (Health Care Providers & Svs.) | (a) | 6.250% | 01/15/2027 | 25,000 | 25,000 |
Merck & Co., Inc. (Pharmaceuticals) | 3.400% | 03/07/2029 | 450,000 | 519,117 | |
MPH Acquisition Holdings LLC (Health Care Providers & Svs.) | (a) | 7.125% | 06/01/2024 | 75,000 | 69,750 |
Par Pharmaceutical, Inc. (Pharmaceuticals) | (a) | 7.500% | 04/01/2027 | 14,000 | 14,367 |
PerkinElmer, Inc. (Life Sciences Tools & Svs.) | 3.300% | 09/15/2029 | 200,000 | 214,314 | |
Polaris Intermediate Corp. (Health Care Providers & Svs.) | (a)(b) | 8.500%, 9.250% PIK | 12/01/2022 | 25,000 | 22,000 |
Prestige Brands, Inc. (Pharmaceuticals) | (a) | 6.375% | 03/01/2024 | 25,000 | 25,750 |
Prestige Brands, Inc. (Pharmaceuticals) | (a) | 5.125% | 01/15/2028 | 75,000 | 73,875 |
Stryker Corp. (Health Care Equip. & Supplies) | 3.500% | 03/15/2026 | 200,000 | 225,100 | |
Takeda Pharmaceutical Co. Ltd. (Pharmaceuticals) | 2.050% | 03/31/2030 | 200,000 | 197,958 | |
Teleflex, Inc. (Health Care Equip. & Supplies) | (a) | 4.250% | 06/01/2028 | 25,000 | 25,625 |
Tenet Healthcare Corp. (Health Care Providers & Svs.) | 6.750% | 06/15/2023 | 25,000 | 24,813 | |
Tenet Healthcare Corp. (Health Care Providers & Svs.) | 4.625% | 07/15/2024 | 50,000 | 48,996 | |
Tenet Healthcare Corp. (Health Care Providers & Svs.) | 5.125% | 05/01/2025 | 75,000 | 72,391 | |
Tenet Healthcare Corp. (Health Care Providers & Svs.) | 7.000% | 08/01/2025 | 25,000 | 24,502 | |
UnitedHealth Group, Inc. (Health Care Providers & Svs.) | 2.900% | 05/15/2050 | 120,000 | 127,784 | |
Vizient, Inc. (Health Care Providers & Svs.) | (a) | 6.250% | 05/15/2027 | 25,000 | 26,187 |
West Street Merger Sub, Inc. (Life Sciences Tools & Svs.) | (a) | 6.375% | 09/01/2025 | 75,000 | 72,562 |
Zoetis, Inc. (Pharmaceuticals) | 3.000% | 05/15/2050 | 300,000 | 308,408 | |
| 8,485,344 | |||||
| Industrials–4.7% | |||||
Airbus SE (Aerospace & Defense) | (a) | 3.150% | 04/10/2027 | 375,000 | 387,014 |
Allegion PLC (Building Products) | 3.500% | 10/01/2029 | 400,000 | 419,307 | |
Allied Universal Holdco LLC / Allied Universal Finance Corp. (Commercial Svs. & Supplies) | (a) | 9.750% | 07/15/2027 | 75,000 | 79,031 |
American Builders & Contractors Supply Co., Inc. (Trading Companies & Distributors) | (a) | 5.875% | 05/15/2026 | 25,000 | 24,750 |
American Builders & Contractors Supply Co., Inc. (Trading Companies & Distributors) | (a) | 4.000% | 01/15/2028 | 25,000 | 24,294 |
Boeing Co. / The (Aerospace & Defense) | 2.500% | 03/01/2025 | 200,000 | 199,512 | |
Boeing Co. / The (Aerospace & Defense) | 2.950% | 02/01/2030 | 225,000 | 219,724 | |
Boeing Co. / The (Aerospace & Defense) | 5.805% | 05/01/2050 | 300,000 | 353,971 | |
Brink's Co. / The (Commercial Svs. & Supplies) | (a) | 5.500% | 07/15/2025 | 25,000 | 25,463 |
Burlington Northern Santa Fe LLC (Road & Rail) | 3.000% | 04/01/2025 | 175,000 | 192,453 | |
Canadian Pacific Railway Co. (Road & Rail) | 2.050% | 03/05/2030 | 175,000 | 179,064 | |
CNH Industrial N.V. (Machinery) | 3.850% | 11/15/2027 | 375,000 | 395,152 | |
Core & Main LP (Commercial Svs. & Supplies) | (a) | 6.125% | 08/15/2025 | 50,000 | 49,832 |
| Ohio National Fund, Inc. | ON Federated Core Plus Bond Portfolio (Continued) |
| Schedule of Investments | June 30, 2020 (Unaudited) |
| Corporate Bonds (Continued) | Rate | Maturity | Face Amount | Value | |
| Industrials (continued) | |||||
Cornerstone Building Brands, Inc. (Building Products) | (a) | 8.000% | 04/15/2026 | $ 50,000 | $ 50,375 |
Dun & Bradstreet Corp. / The (Professional Svs.) | (a) | 10.250% | 02/15/2027 | 100,000 | 111,000 |
Equifax, Inc. (Professional Svs.) | 2.600% | 12/15/2025 | 350,000 | 372,828 | |
ERAC U.S.A. Finance LLC (Road & Rail) | (a) | 3.850% | 11/15/2024 | 350,000 | 368,537 |
Experian Finance PLC (Professional Svs.) | (a) | 4.250% | 02/01/2029 | 200,000 | 232,565 |
FedEx Corp. (Air Freight & Logistics) | 4.250% | 05/15/2030 | 100,000 | 114,187 | |
FedEx Corp. (Air Freight & Logistics) | 4.050% | 02/15/2048 | 200,000 | 205,463 | |
Garda World Security Corp. (Commercial Svs. & Supplies) | (a) | 4.625% | 02/15/2027 | 25,000 | 24,625 |
Garda World Security Corp. (Commercial Svs. & Supplies) | (a) | 9.500% | 11/01/2027 | 75,000 | 79,312 |
General Electric Co. (Industrial Conglomerates) | 3.625% | 05/01/2030 | 550,000 | 550,492 | |
Honeywell International, Inc. (Industrial Conglomerates) | 1.350% | 06/01/2025 | 65,000 | 66,748 | |
Honeywell International, Inc. (Industrial Conglomerates) | 2.800% | 06/01/2050 | 70,000 | 74,657 | |
Huntington Ingalls Industries, Inc. (Aerospace & Defense) | 3.483% | 12/01/2027 | 100,000 | 107,704 | |
IAA, Inc. (Commercial Svs. & Supplies) | (a) | 5.500% | 06/15/2027 | 25,000 | 25,845 |
IHS Markit Ltd. (Professional Svs.) | 4.750% | 08/01/2028 | 250,000 | 293,357 | |
Kansas City Southern (Road & Rail) | 3.500% | 05/01/2050 | 200,000 | 215,350 | |
KAR Auction Services, Inc. (Commercial Svs. & Supplies) | (a) | 5.125% | 06/01/2025 | 50,000 | 49,250 |
Lennox International, Inc. (Building Products) | 3.000% | 11/15/2023 | 375,000 | 386,833 | |
Lockheed Martin Corp. (Aerospace & Defense) | 2.900% | 03/01/2025 | 275,000 | 301,492 | |
Lockheed Martin Corp. (Aerospace & Defense) | 1.850% | 06/15/2030 | 100,000 | 102,475 | |
Masco Corp. (Building Products) | 3.500% | 11/15/2027 | 150,000 | 159,155 | |
Nielsen Finance LLC / Nielsen Finance Co. (Professional Svs.) | (a) | 5.000% | 04/15/2022 | 75,000 | 74,790 |
Northrop Grumman Corp. (Aerospace & Defense) | 3.250% | 01/15/2028 | 400,000 | 446,905 | |
Otis Worldwide Corp. (Machinery) | (a) | 2.565% | 02/15/2030 | 200,000 | 209,728 |
Penske Truck Leasing Co. LP / PTL Finance Corp. (Road & Rail) | (a) | 3.450% | 07/01/2024 | 350,000 | 370,267 |
Roper Technologies, Inc. (Industrial Conglomerates) | 2.800% | 12/15/2021 | 325,000 | 334,266 | |
Ryder System, Inc. (Road & Rail) | 3.400% | 03/01/2023 | 350,000 | 366,883 | |
Southwest Airlines Co. (Airlines) | 5.250% | 05/04/2025 | 175,000 | 184,604 | |
Standard Industries, Inc. (Building Products) | (a) | 6.000% | 10/15/2025 | 100,000 | 102,927 |
Standard Industries, Inc. (Building Products) | (a) | 5.000% | 02/15/2027 | 25,000 | 25,313 |
Tempo Acquisition LLC / Tempo Acquisition Finance Corp. (Professional Svs.) | (a) | 6.750% | 06/01/2025 | 100,000 | 101,250 |
Textron, Inc. (Aerospace & Defense) | 3.650% | 03/15/2027 | 300,000 | 310,703 | |
TransDigm, Inc. (Aerospace & Defense) | 6.500% | 05/15/2025 | 50,000 | 46,754 | |
TransDigm, Inc. (Aerospace & Defense) | (a) | 6.250% | 03/15/2026 | 75,000 | 74,953 |
TransDigm, Inc. (Aerospace & Defense) | 5.500% | 11/15/2027 | 75,000 | 65,470 | |
Trident TPI Holdings, Inc. (Machinery) | (a) | 9.250% | 08/01/2024 | 50,000 | 51,250 |
Union Pacific Corp. (Road & Rail) | 2.400% | 02/05/2030 | 275,000 | 293,934 | |
United Rentals North America, Inc. (Trading Companies & Distributors) | 6.500% | 12/15/2026 | 50,000 | 52,500 | |
United Rentals North America, Inc. (Trading Companies & Distributors) | 5.250% | 01/15/2030 | 50,000 | 51,625 | |
Verisk Analytics, Inc. (Professional Svs.) | 4.125% | 03/15/2029 | 200,000 | 233,630 | |
Watco Cos. LLC / Watco Finance Corp. (Road & Rail) | (a) | 6.500% | 06/15/2027 | 25,000 | 25,615 |
WESCO Distribution, Inc. (Trading Companies & Distributors) | (a) | 7.125% | 06/15/2025 | 25,000 | 26,368 |
WESCO Distribution, Inc. (Trading Companies & Distributors) | (a) | 7.250% | 06/15/2028 | 50,000 | 52,728 |
Westinghouse Air Brake Technologies Corp. (Machinery) | 3.200% | 06/15/2025 | 100,000 | 102,087 | |
Xylem, Inc. (Machinery) | 2.250% | 01/30/2031 | 155,000 | 155,934 | |
| 10,202,301 | |||||
| Information Technology–2.7% | |||||
Apple, Inc. (Tech. Hardware, Storage & Periph.) | 2.500% | 02/09/2022 | 250,000 | 258,464 | |
Apple, Inc. (Tech. Hardware, Storage & Periph.) | 2.900% | 09/12/2027 | 600,000 | 672,517 | |
BBVA U.S.A. (IT Svs.) | 3.875% | 04/10/2025 | 250,000 | 264,102 | |
Broadcom, Inc. (Semiconductors & Equip.) | (a) | 4.700% | 04/15/2025 | 360,000 | 405,316 |
Broadcom, Inc. (Semiconductors & Equip.) | (a) | 4.150% | 11/15/2030 | 100,000 | 108,804 |
CDW LLC / CDW Finance Corp. (Electronic Equip., Instr. & Comp.) | 5.000% | 09/01/2025 | 25,000 | 25,719 | |
CDW LLC / CDW Finance Corp. (Electronic Equip., Instr. & Comp.) | 4.250% | 04/01/2028 | 25,000 | 25,476 | |
Cisco Systems, Inc. (Communications Equip.) | 3.625% | 03/04/2024 | 250,000 | 279,102 | |
Dell International LLC / EMC Corp. (Computers & Peripherals) | (a) | 5.850% | 07/15/2025 | 350,000 | 402,094 |
Entegris, Inc. (Semiconductors & Equip.) | (a) | 4.625% | 02/10/2026 | 25,000 | 25,375 |
Fair Isaac Corp. (Software) | (a) | 4.000% | 06/15/2028 | 25,000 | 25,063 |
Fidelity National Information Services, Inc. (IT Svs.) | 3.750% | 05/21/2029 | 150,000 | 175,722 | |
Fiserv, Inc. (IT Svs.) | 3.800% | 10/01/2023 | 150,000 | 163,890 | |
Fiserv, Inc. (IT Svs.) | 3.500% | 07/01/2029 | 200,000 | 224,582 | |
Gartner, Inc. (IT Svs.) | (a) | 4.500% | 07/01/2028 | 25,000 | 25,293 |
Go Daddy Operating Co. LLC / GD Finance Co., Inc. (IT Svs.) | (a) | 5.250% | 12/01/2027 | 25,000 | 25,438 |
Lam Research Corp. (Semiconductors & Equip.) | 1.900% | 06/15/2030 | 175,000 | 178,831 | |
Leidos, Inc. (IT Svs.) | (a) | 3.625% | 05/15/2025 | 95,000 | 103,526 |
Leidos, Inc. (IT Svs.) | (a) | 4.375% | 05/15/2030 | 250,000 | 281,612 |
Micron Technology, Inc. (Semiconductors & Equip.) | 2.497% | 04/24/2023 | 200,000 | 207,688 | |
Microsoft Corp. (Software) | 2.375% | 05/01/2023 | 700,000 | 738,776 |
| Ohio National Fund, Inc. | ON Federated Core Plus Bond Portfolio (Continued) |
| Schedule of Investments | June 30, 2020 (Unaudited) |
| Corporate Bonds (Continued) | Rate | Maturity | Face Amount | Value | |
| Information Technology (continued) | |||||
NCR Corp. (Tech. Hardware, Storage & Periph.) | (a) | 8.125% | 04/15/2025 | $ 25,000 | $ 26,500 |
Nuance Communications, Inc. (Software) | 5.625% | 12/15/2026 | 25,000 | 26,000 | |
Oracle Corp. (Software) | 3.250% | 11/15/2027 | 400,000 | 448,702 | |
PTC, Inc. (Software) | (a) | 4.000% | 02/15/2028 | 25,000 | 24,814 |
Qorvo, Inc. (Semiconductors & Equip.) | (a) | 4.375% | 10/15/2029 | 25,000 | 25,602 |
RP Crown Parent LLC (Software) | (a) | 7.375% | 10/15/2024 | 50,000 | 49,875 |
Science Applications International Corp. (IT Svs.) | (a) | 4.875% | 04/01/2028 | 25,000 | 24,922 |
Sophia LP / Sophia Finance, Inc. (Software) | (a) | 9.000% | 09/30/2023 | 25,000 | 25,250 |
SS&C Technologies, Inc. (Software) | (a) | 5.500% | 09/30/2027 | 50,000 | 50,919 |
TTM Technologies, Inc. (Electronic Equip., Instr. & Comp.) | (a) | 5.625% | 10/01/2025 | 75,000 | 74,391 |
Visa, Inc. (IT Svs.) | 3.150% | 12/14/2025 | 150,000 | 167,345 | |
Visa, Inc. (IT Svs.) | 2.050% | 04/15/2030 | 325,000 | 340,668 | |
| 5,902,378 | |||||
| Materials–1.6% | |||||
Albemarle Corp. (Chemicals) | 4.150% | 12/01/2024 | 125,000 | 133,957 | |
Albemarle Corp. (Chemicals) | 5.450% | 12/01/2044 | 125,000 | 131,323 | |
ARD Finance SA (Containers & Packaging) | (a)(b) | 6.500%, 7.250% PIK | 06/30/2027 | 200,000 | 197,875 |
Berry Global, Inc. (Containers & Packaging) | (a) | 4.875% | 07/15/2026 | 50,000 | 50,750 |
Berry Global, Inc. (Containers & Packaging) | (a) | 5.625% | 07/15/2027 | 75,000 | 77,062 |
Carpenter Technology Corp. (Metals & Mining) | 4.450% | 03/01/2023 | 100,000 | 98,985 | |
Clearwater Paper Corp. (Paper & Forest Products) | 4.500% | 02/01/2023 | 50,000 | 49,750 | |
Compass Minerals International, Inc. (Metals & Mining) | (a) | 4.875% | 07/15/2024 | 50,000 | 50,125 |
Compass Minerals International, Inc. (Metals & Mining) | (a) | 6.750% | 12/01/2027 | 25,000 | 26,250 |
Element Solutions, Inc. (Chemicals) | (a) | 5.875% | 12/01/2025 | 25,000 | 25,242 |
Flex Acquisition Co., Inc. (Containers & Packaging) | (a) | 6.875% | 01/15/2025 | 100,000 | 96,500 |
Flex Acquisition Co., Inc. (Containers & Packaging) | (a) | 7.875% | 07/15/2026 | 50,000 | 48,500 |
Freeport-McMoRan, Inc. (Metals & Mining) | 5.000% | 09/01/2027 | 50,000 | 50,234 | |
Freeport-McMoRan, Inc. (Metals & Mining) | 5.400% | 11/14/2034 | 50,000 | 49,422 | |
Hexion, Inc. (Chemicals) | (a) | 7.875% | 07/15/2027 | 25,000 | 22,750 |
Hudbay Minerals, Inc. (Metals & Mining) | (a) | 7.625% | 01/15/2025 | 50,000 | 47,875 |
Illuminate Buyer LLC / Illuminate Holdings IV, Inc. (Chemicals) | (a) | 9.000% | 07/01/2028 | 25,000 | 26,062 |
Koppers, Inc. (Chemicals) | (a) | 6.000% | 02/15/2025 | 50,000 | 48,625 |
Mauser Packaging Solutions Holding Co. (Containers & Packaging) | (a) | 5.500% | 04/15/2024 | 25,000 | 24,555 |
Mauser Packaging Solutions Holding Co. (Containers & Packaging) | (a) | 7.250% | 04/15/2025 | 25,000 | 22,669 |
Owens-Brockway Glass Container, Inc. (Containers & Packaging) | (a) | 5.375% | 01/15/2025 | 50,000 | 50,500 |
Owens-Brockway Glass Container, Inc. (Containers & Packaging) | (a) | 6.625% | 05/13/2027 | 25,000 | 26,000 |
Packaging Corp. of America (Containers & Packaging) | 3.650% | 09/15/2024 | 400,000 | 436,346 | |
PPL Capital Funding, Inc. (Chemicals) | 3.100% | 05/15/2026 | 200,000 | 216,517 | |
PQ Corp. (Chemicals) | (a) | 5.750% | 12/15/2025 | 25,000 | 25,188 |
Reliance Steel & Aluminum Co. (Metals & Mining) | 4.500% | 04/15/2023 | 360,000 | 386,669 | |
RPM International, Inc. (Chemicals) | 4.550% | 03/01/2029 | 200,000 | 224,840 | |
Synovus Bank (Rate is fixed until 02/10/2022, at which point, the rate becomes SOFR + 95) (Chemicals) | (c) | 2.289% | 02/10/2023 | 250,000 | 253,110 |
Trivium Packaging Finance B.V. (Containers & Packaging) | (a) | 8.500% | 08/15/2027 | 200,000 | 213,750 |
W.R. Grace & Co-Conn (Chemicals) | (a) | 4.875% | 06/15/2027 | 25,000 | 25,326 |
WRKCo, Inc. (Containers & Packaging) | 4.000% | 03/15/2028 | 250,000 | 279,348 | |
| 3,416,105 | |||||
| Real Estate–1.9% | |||||
Alexandria Real Estate Equities, Inc. (Equity REIT) | 3.900% | 06/15/2023 | 200,000 | 216,352 | |
Alexandria Real Estate Equities, Inc. (Equity REIT) | 3.950% | 01/15/2028 | 200,000 | 228,115 | |
American Tower Corp. (Equity REIT) | 2.900% | 01/15/2030 | 200,000 | 213,418 | |
American Tower Corp. (Equity REIT) | 2.100% | 06/15/2030 | 200,000 | 200,416 | |
AvalonBay Communities, Inc. (Equity REIT) | 3.350% | 05/15/2027 | 375,000 | 418,181 | |
Boston Properties LP (Equity REIT) | 3.650% | 02/01/2026 | 200,000 | 221,521 | |
Camden Property Trust (Equity REIT) | 2.800% | 05/15/2030 | 200,000 | 216,057 | |
Crown Castle International Corp. (Equity REIT) | 3.300% | 07/01/2030 | 150,000 | 163,771 | |
Crown Castle International Corp. (Equity REIT) | 2.250% | 01/15/2031 | 105,000 | 105,758 | |
Cushman & Wakefield U.S. Borrower LLC (Real Estate Mgmt. & Development) | (a) | 6.750% | 05/15/2028 | 25,000 | 26,063 |
Mid-America Apartments LP (Equity REIT) | 4.000% | 11/15/2025 | 375,000 | 416,549 | |
Prologis LP (Equity REIT) | 2.250% | 04/15/2030 | 360,000 | 378,985 | |
Regency Centers LP (Equity REIT) | 2.950% | 09/15/2029 | 350,000 | 355,180 | |
UDR, Inc. (Equity REIT) | 3.500% | 01/15/2028 | 375,000 | 410,120 | |
VICI Properties LP / VICI Note Co., Inc. (Equity REIT) | (a) | 4.250% | 12/01/2026 | 50,000 | 47,979 |
Welltower, Inc. (Equity REIT) | 4.250% | 04/01/2026 | 175,000 | 196,113 | |
WP Carey, Inc. (Equity REIT) | 4.600% | 04/01/2024 | 175,000 | 186,296 | |
WP Carey, Inc. (Equity REIT) | 3.850% | 07/15/2029 | 175,000 | 181,933 | |
| 4,182,807 |
| Ohio National Fund, Inc. | ON Federated Core Plus Bond Portfolio (Continued) |
| Schedule of Investments | June 30, 2020 (Unaudited) |
| Corporate Bonds (Continued) | Rate | Maturity | Face Amount | Value | |
| Utilities–2.6% | |||||
American Electric Power Co., Inc. (Electric Utilities) | 3.200% | 11/13/2027 | $ 375,000 | $ 411,923 | |
AmeriGas Partners LP / AmeriGas Finance Corp. (Gas Utilities) | 5.500% | 05/20/2025 | 25,000 | 25,750 | |
AmeriGas Partners LP / AmeriGas Finance Corp. (Gas Utilities) | 5.750% | 05/20/2027 | 25,000 | 26,438 | |
Avangrid, Inc. (Electric Utilities) | 3.800% | 06/01/2029 | 275,000 | 319,324 | |
Berkshire Hathaway Energy Co. (Multi-Utilities) | (a) | 4.050% | 04/15/2025 | 250,000 | 284,571 |
Black Hills Corp. (Multi-Utilities) | 2.500% | 06/15/2030 | 120,000 | 122,583 | |
Calpine Corp. (Ind. Power & Renewable Elec.) | (a) | 5.250% | 06/01/2026 | 50,000 | 50,485 |
Calpine Corp. (Ind. Power & Renewable Elec.) | (a) | 5.125% | 03/15/2028 | 25,000 | 24,438 |
Dominion Energy Gas Holdings LLC (Multi-Utilities) | 3.900% | 11/15/2049 | 150,000 | 157,429 | |
Dominion Energy, Inc. (Multi-Utilities) | 3.375% | 04/01/2030 | 250,000 | 276,558 | |
DPL, Inc. (Electric Utilities) | (a) | 4.125% | 07/01/2025 | 25,000 | 25,007 |
Duke Energy Corp. (Electric Utilities) | 3.400% | 06/15/2029 | 550,000 | 618,206 | |
Emera U.S. Finance LP (Electric Utilities) | 3.550% | 06/15/2026 | 200,000 | 224,437 | |
Emera U.S. Finance LP (Electric Utilities) | 4.750% | 06/15/2046 | 200,000 | 237,050 | |
Eversource Energy (Electric Utilities) | 3.350% | 03/15/2026 | 220,000 | 238,130 | |
Exelon Corp. (Electric Utilities) | 4.050% | 04/15/2030 | 400,000 | 461,774 | |
FirstEnergy Corp. (Electric Utilities) | 2.650% | 03/01/2030 | 250,000 | 260,881 | |
National Fuel Gas Co. (Gas Utilities) | 5.500% | 01/15/2026 | 250,000 | 265,930 | |
NextEra Energy Capital Holdings, Inc. (Electric Utilities) | 3.550% | 05/01/2027 | 200,000 | 226,729 | |
NextEra Energy Capital Holdings, Inc. (Electric Utilities) | 2.250% | 06/01/2030 | 200,000 | 205,454 | |
NRG Energy, Inc. (Electric Utilities) | 5.750% | 01/15/2028 | 50,000 | 52,750 | |
Sempra Energy (Multi-Utilities) | 3.400% | 02/01/2028 | 400,000 | 439,475 | |
Southern Co. / The (Electric Utilities) | 3.700% | 04/30/2030 | 450,000 | 513,595 | |
Suburban Propane Partners LP / Suburban Energy Finance Corp. (Gas Utilities) | 5.750% | 03/01/2025 | 50,000 | 50,000 | |
TerraForm Power Operating LLC (Ind. Power & Renewable Elec.) | (a) | 5.000% | 01/31/2028 | 75,000 | 78,375 |
Vistra Operations Co. LLC (Ind. Power & Renewable Elec.) | (a) | 5.500% | 09/01/2026 | 50,000 | 51,157 |
| 5,648,449 | |||||
Total Corporate Bonds (Cost $85,362,917) | $ 88,275,118 |
| U.S. Treasury Obligations–25.6% | Rate | Maturity | Face Amount | Value | |
U.S. Treasury Note | 0.125% | 04/30/2022 | $20,000,000 | $ 19,985,938 | |
U.S. Treasury Note | 0.250% | 04/15/2023 | 8,500,000 | 8,518,594 | |
U.S. Treasury Note | 0.375% | 04/30/2025 | 12,000,000 | 12,054,375 | |
U.S. Treasury Note | (d) | 0.500% | 04/30/2027 | 3,900,000 | 3,906,094 |
U.S. Treasury Note | 1.500% | 02/15/2030 | 2,500,000 | 2,702,246 | |
U.S. Treasury Note | 2.000% | 02/15/2050 | 7,500,000 | 8,584,570 | |
Total U.S. Treasury Obligations (Cost $55,919,644) | $ 55,751,817 |
| U.S. Government Agency Mortgage-Backed Securities–18.5% | Rate | Maturity | Face Amount | Value | |
Fannie Mae Pool FN BK2355 | 2.500% | 04/01/2035 | $ 2,451,703 | $ 2,567,948 | |
Fannie Mae Pool FN BP1938 | 2.500% | 04/01/2050 | 2,484,033 | 2,590,764 | |
Fannie Mae Pool FN BP2797 | 2.500% | 05/01/2050 | 2,487,556 | 2,590,938 | |
Fannie Mae Pool FN BP4783 | 2.000% | 05/01/2035 | 1,492,346 | 1,544,231 | |
Fannie Mae Pool FN CA4819 | 4.000% | 12/01/2049 | 2,370,409 | 2,561,836 | |
Fannie Mae Pool FN CA5348 | 3.500% | 03/01/2050 | 4,116,079 | 4,386,366 | |
Fannie Mae Pool FN CA5549 | 3.000% | 04/01/2050 | 4,207,273 | 4,434,304 | |
Fannie Mae Pool FN FM2778 | 3.000% | 03/01/2050 | 4,209,053 | 4,459,537 | |
Fannie Mae Pool FN MA3865 | 3.000% | 12/01/2034 | 1,102,171 | 1,158,280 | |
Fannie Mae Pool FN MA3906 | 3.500% | 01/01/2050 | 2,539,634 | 2,669,562 | |
Fannie Mae Pool FN MA3939 | 3.500% | 02/01/2050 | 4,006,498 | 4,211,618 | |
Fannie Mae Pool FN MA4020 | 3.000% | 05/01/2050 | 4,214,516 | 4,440,455 | |
Freddie Mac Pool FR RA2310 | 4.000% | 03/01/2050 | 2,397,532 | 2,578,867 | |
Total U.S. Government Agency Mortgage-Backed Securities (Cost $40,323,256) | $ 40,194,706 |
| Investment Companies–7.2% | Shares | Value | |
Federated Hermes Core Trust - Emerging Markets Core Fund | (e)(f) | 785,711 | $ 7,660,678 |
Federated Hermes Core Trust - Federated Bank Loan Core Fund | (e)(f) | 225,989 | 2,063,277 |
Federated Hermes Core Trust III - Federated Project and Trade Finance Core Fund | (f)(g) | 692,042 | 6,062,283 |
Total Investment Companies (Cost $15,200,000) | $ 15,786,238 |
| Asset-Backed Securities–2.5% | Rate | Maturity | Face Amount | Value | |
| Financials–2.5% | |||||
CNH Equipment Trust 2020-A A3 | 1.160% | 06/16/2025 | $ 260,000 | $ 262,420 | |
Ford Credit Auto Owner Trust 2020-B B | 1.190% | 01/15/2026 | 500,000 | 500,726 | |
Freddie Mac Multifamily Structured Pass Through Certificates K108 A2 | 1.517% | 03/25/2030 | 400,000 | 416,110 | |
Freddie Mac Multifamily Structured Pass Through Certificates K109 A2 | 1.558% | 04/25/2030 | 400,000 | 417,580 |
| Ohio National Fund, Inc. | ON Federated Core Plus Bond Portfolio (Continued) |
| Schedule of Investments | June 30, 2020 (Unaudited) |
| Asset-Backed Securities (Continued) | Rate | Maturity | Face Amount | Value | |
| Financials (continued) | |||||
GM Financial Automobile Leasing Trust 2020-2 C | 2.560% | 07/22/2024 | $ 375,000 | $ 380,107 | |
HPEFS Equipment Trust 2020-2A C | (a) | 2.000% | 07/22/2030 | 525,000 | 524,895 |
HPEFS Equipment Trust 2020-2A D | (a) | 2.790% | 07/22/2030 | 750,000 | 749,880 |
MMAF Equipment Finance LLC 2020-A A5 | (a) | 1.560% | 10/09/2042 | 750,000 | 760,346 |
Toyota Auto Loan Extended Note Trust 2020-1A A | (a) | 1.350% | 05/25/2033 | 700,000 | 710,464 |
World Omni Auto Receivables Trust 2020-B B | 1.220% | 03/16/2026 | 750,000 | 751,254 | |
Total Asset-Backed Securities (Cost $5,433,689) | $ 5,473,782 |
| Sovereign Issues–0.5% | Rate | Maturity | Face Amount | Value | |
Colombia Government International Bond | 4.500% | 03/15/2029 | $ 375,000 | $ 411,210 | |
Mexico Government International Bond | 3.750% | 01/11/2028 | 350,000 | 364,224 | |
Republic of Poland Government International Bond | 4.000% | 01/22/2024 | 200,000 | 221,756 | |
Total Sovereign Issues (Cost $946,013) | $ 997,190 |
| Money Market Funds–0.7% | Shares | Value | |
State Street Institutional Liquid Reserves Fund Institutional Class, 0.346% | (h) | 1,580,324 | $ 1,580,956 |
Total Money Market Funds (Cost $1,580,975) | $ 1,580,956 | ||
Total Investments – 95.6% (Cost $204,766,494) | (i) | $208,059,807 | |
Other Assets in Excess of Liabilities – 4.4% | 9,536,105 | ||
| Net Assets – 100.0% | $217,595,912 |
Percentages are stated as a percent of net assets. |
| Abbreviations: | ||
| PIK: | Payment-in-Kind | |
| QL: | Quarterly U.S. LIBOR Rate, 0.302% at 06/30/2020 | |
| SOFR: | Secured Overnight Financing Rate, 0.100% at 06/30/2020 | |
| Footnotes: | ||
| (a) | Security exempt from registration under Regulation D of the Securities Act of 1933. These securities may be resold in transactions exempt from registration, normally to qualified buyers under Rule 144A. At June 30, 2020, the value of these securities totaled $20,230,542, or 9.3% of the Portfolio’s net assets. | |
| (b) | Issuer of the security has the option to make coupon payments in cash or in additional par value of this bond (Payment-in-Kind). | |
| (c) | Security is a fixed-then-variable rate instrument in which the coupon or dividend rate is fixed until a later specified date, then is adjusted periodically. Rates stated, including interest rate caps and floors, if any, are those in effect at June 30, 2020. | |
| (d) | Security is fully or partially pledged as collateral for the futures contracts outstanding at June 30, 2020. See also the following Schedule of Open Futures Contracts. | |
| (e) | Shares of this fund have not been registered and are issued in reliance on Section 4(a)(2) and Regulation D of the Securities Act of 1933. Investments in this fund may only be made by investment companies, insurance company separate accounts, common or commingled trust funds or similar organizations or entities that are “accredited investors” within the meaning of Regulation D of the 1933 Act. | |
| (f) | Represents a security deemed to be restricted. At June 30, 2020, the value of restricted securities in the Portfolio totaled $15,786,238, or 7.2% of the Portfolio’s net assets. | |
| (g) | Open-end extended payment fund. Beneficial interests in this fund are issued solely in private placement transactions which do not involve any “public offering” within the meaning of Section 4(a)(2) and Regulation D of the Securities Act of 1933. Investments in this fund may only be made by organizations or entities that are “accredited investors” within the meaning of Regulation D of the 1933 Act and that are also “qualified purchasers” as defined in Section 2(a)(51) of the Investment Company Act of 1940, as amended (“Eligible Investors”). This fund has adopted policies to limit the transfer of its shares, which may occur only pursuant to authorization by this fund's Board of Directors, and only to Eligible Investors.When a redeeming shareholder of this fund presents shares to the fund's transfer agent in proper order for redemption, the fund will have up to 31 days to make payment to the redeeming shareholder. The price of redeemed shares will be determined as of the closing net asset value of the fund 24 days after receipt of a shareholder redemption request or, if such date is a weekend or holiday, on the preceding business day. | |
| (h) | Rate represents the seven-day yield at June 30, 2020. | |
| (i) | Represents cost for financial reporting purposes, which may differ from cost basis for federal income tax purposes. See also Note 8 of the Notes to Financial Statements. | |
| Schedule of Open Futures Contracts | June 30, 2020 (Unaudited) |
| Description | Number of contracts | Expiration Date | Notional Amount | Value | Unrealized Appreciation (Depreciation) | Variation Margin Receivable (Payable) | ||||||
| CBT U.S. Ultra Bond - Short | (2) | September 21, 2020 | $ (430,933) | $ (436,313) | $ (5,380) | $2,063 | ||||||
| CBT 10-Year U.S. Ultra Bond - Short | (6) | September 21, 2020 | (938,799) | (944,906) | (6,107) | 1,500 | ||||||
| CBT 10-Year U.S. Treasury Note - Short | (25) | September 21, 2020 | (3,468,929) | (3,479,297) | (10,368) | 3,906 | ||||||
| CBT 2-Year U.S. Treasury Note - Long | 75 | September 30, 2020 | 16,555,833 | 16,561,875 | 6,042 | 1,172 | ||||||
| $11,717,172 | $11,701,359 | $(15,813) | $8,641 |
| Ohio National Fund, Inc. | ON Conservative Model Portfolio (Unaudited) |
| Average Annual returns | |
| One year | 5.49% |
| Since inception (3/1/17) | 4.90% |
| (1) | The Portfolio’s composition is subject to change. Holdings and weightings are as of June 30, 2020. |
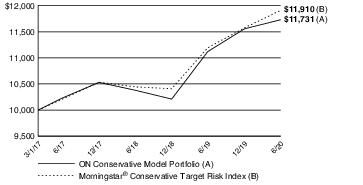
| Ohio National Fund, Inc. | ON Conservative Model Portfolio (Unaudited) (Continued) |
| Portfolio Composition as of June 30, 2020 (1) | |
| % of Net Assets | |
| Open-End Mutual Funds Less Net Liabilities | 100.0 |
| 100.0 | |
| Top 10 Portfolio Holdings as of June 30, 2020 (1) (2) (3) | ||
| % of Net Assets | ||
| 1. | PIMCO Total Return Institutional | 17.0 |
| 2. | Western Asset Core Plus Bond IS | 17.0 |
| 3. | ON Federated Core Plus Bond Portfolio | 12.0 |
| 4. | PIMCO Low Duration Institutional | 11.0 |
| 5. | ON S&P 500® Index Portfolio | 11.0 |
| 6. | ON Bond Portfolio | 10.0 |
| 7. | ON Federated High Income Bond Portfolio | 7.0 |
| 8. | PIMCO Real Return Institutional | 5.0 |
| 9. | ON BlackRock Advantage Large Cap Value Portfolio | 3.0 |
| 10. | DFA International Core Equity Portfolio Institutional | 2.0 |
| (1) | Composition of Portfolio subject to change. | |
| (2) | Short-term investments have been excluded from the list of Top 10 Portfolio Holdings. | |
| (3) | Top 10 Portfolio Holdings is presented at an individual security level. Total investment exposure by issuer may be higher. | |
| Ohio National Fund, Inc. | ON Conservative Model Portfolio |
| Schedule of Investments in Unaffiliated Issuers | June 30, 2020 (Unaudited) |
| Open-End Mutual Funds–52.1% | Shares | Value | |
DFA International Core Equity Portfolio Institutional | 137,178 | $ 1,610,469 | |
PIMCO Low Duration Institutional | 888,122 | 8,801,294 | |
PIMCO Real Return Institutional | 337,368 | 3,997,813 | |
PIMCO Total Return Institutional | 1,256,697 | 13,610,025 | |
Western Asset Core Plus Bond IS | 1,108,289 | 13,609,786 | |
Total Open-End Mutual Funds | $41,629,387 | ||
Total Investments in Securities of Unaffiliated Issuers – 52.1% (Cost $39,792,077) | (a) | $41,629,387 | |
| Total Investments in Affiliates – 47.9% (Cost $36,807,110) (see schedule below) | (a) | 38,350,701 | |
| Liabilities in Excess of Other Assets – 0.0% | (34,928) | ||
| Net Assets – 100.0% | $79,945,160 |
Percentages are stated as a percent of net assets. |
| Footnotes: | ||
| (a) | Represents cost for financial reporting purposes, which may differ from cost basis for federal income tax purposes. See also Note 8 of the Notes to Financial Statements. | |
| Schedule of Investments in Affiliates | June 30, 2020 (Unaudited) |
| Affiliate | Value at January 1, 2020 | Cost of Purchases | Proceeds from Sales | Net Realized Gain (Loss) | Change in Unrealized Appreciation (Depreciation) | Shares at June 30, 2020 | Value at June 30, 2020 | |||
| Open-End Mutual Funds – 47.9% | ||||||||||
ON BlackRock Advantage International Equity Portfolio | (a) | $1,500,256 | $ 472,166 | $ 230,900 | $(30,472) | $(113,104) | 116,809 | $ 1,597,946 | ||
ON BlackRock Advantage Large Cap Value Portfolio | (a) | 2,250,385 | 786,231 | 349,966 | (29,911) | (259,820) | 149,995 | 2,396,919 | ||
ON Bond Portfolio | (a) | 7,501,282 | 737,886 | 594,507 | 59,468 | 285,600 | 402,505 | 7,989,729 | ||
ON Federated Core Plus Bond Portfolio | (a) | — | 9,494,286 | 76,175 | 953 | 168,611 | 941,815 | 9,587,675 | ||
ON Federated High Income Bond Portfolio | (a) | 5,250,898 | 848,766 | 358,201 | 19,820 | (168,472) | 280,905 | 5,592,811 | ||
ON Janus Henderson Venture Portfolio | (a) | 750,128 | 261,942 | 216,526 | (28,684) | 32,113 | 24,516 | 798,973 | ||
ON S&P 500® Index Portfolio | (a) | 8,251,411 | 2,349,218 | 1,760,690 | 75,312 | (126,549) | 272,856 | 8,788,702 | ||
ON S&P MidCap 400® Index Portfolio | (a) | 1,500,256 | 612,743 | 382,741 | (23,844) | (108,468) | 95,286 | 1,597,946 | ||
Total Open-End Mutual Funds | $ 42,642 | $(290,089) | $38,350,701 |
Percentages are stated as a percent of net assets. |
| Footnotes: | ||
| (a) | Pursuant to Section 2(a)(3) of the Investment Company Act of 1940, the investment meets the definition of “affiliated person”, as the Portfolio directly or indirectly owns, controls, or holds with power to vote 5 percent or more of the outstanding voting securities of the holding at June 30, 2020. | |
| Ohio National Fund, Inc. | ON Moderately Conservative Model Portfolio (Unaudited) |
| Average Annual returns | |
| One year | 4.47% |
| Since inception (3/1/17) | 4.85% |
| (1) | The Portfolio’s composition is subject to change. Holdings and weightings are as of June 30, 2020. |

| Ohio National Fund, Inc. | ON Moderately Conservative Model Portfolio (Unaudited) (Continued) |
| Portfolio Composition as of June 30, 2020 (1) | |
| % of Net Assets | |
| Open-End Mutual Funds Less Net Liabilities | 100.0 |
| 100.0 | |
| Top 10 Portfolio Holdings as of June 30, 2020 (1) (2) (3) | ||
| % of Net Assets | ||
| 1. | Western Asset Core Plus Bond IS | 13.0 |
| 2. | PIMCO Total Return Institutional | 13.0 |
| 3. | ON S&P 500® Index Portfolio | 13.0 |
| 4. | ON Federated Core Plus Bond Portfolio | 10.0 |
| 5. | PIMCO Low Duration Institutional | 8.0 |
| 6. | ON Bond Portfolio | 7.0 |
| 7. | ON Federated High Income Bond Portfolio | 5.0 |
| 8. | ON S&P MidCap 400® Index Portfolio | 5.0 |
| 9. | ON BlackRock Advantage Large Cap Value Portfolio | 5.0 |
| 10. | ON BlackRock Advantage International Equity Portfolio | 4.5 |
| (1) | Composition of Portfolio subject to change. | |
| (2) | Short-term investments have been excluded from the list of Top 10 Portfolio Holdings. | |
| (3) | Top 10 Portfolio Holdings is presented at an individual security level. Total investment exposure by issuer may be higher. | |
| Ohio National Fund, Inc. | ON Moderately Conservative Model Portfolio |
| Schedule of Investments in Unaffiliated Issuers | June 30, 2020 (Unaudited) |
| Open-End Mutual Funds–42.6% | Shares | Value | |
DFA Emerging Markets Portfolio Institutional | 125,798 | $ 3,180,161 | |
DFA International Core Equity Portfolio Institutional | 543,114 | 6,376,163 | |
PIMCO Low Duration Institutional | 1,704,318 | 16,889,788 | |
PIMCO Real Return Institutional | 534,126 | 6,329,396 | |
PIMCO Total Return Institutional | 2,535,719 | 27,461,836 | |
Vanguard International Growth Fund Admiral Class | 18,252 | 2,108,277 | |
Western Asset Core Plus Bond IS | 2,236,325 | 27,462,074 | |
Total Open-End Mutual Funds | $ 89,807,695 | ||
Total Investments in Securities of Unaffiliated Issuers – 42.6% (Cost $86,231,757) | (a) | $ 89,807,695 | |
| Total Investments in Affiliates – 57.4% (Cost $116,746,090) (see schedule below) | (a) | 121,225,945 | |
| Liabilities in Excess of Other Assets – 0.0% | (74,068) | ||
| Net Assets – 100.0% | $210,959,572 |
Percentages are stated as a percent of net assets. |
| Footnotes: | ||
| (a) | Represents cost for financial reporting purposes, which may differ from cost basis for federal income tax purposes. See also Note 8 of the Notes to Financial Statements. | |
| Schedule of Investments in Affiliates | June 30, 2020 (Unaudited) |
| Affiliate | Value at January 1, 2020 | Cost of Purchases | Proceeds from Sales | Net Realized Gain (Loss) | Change in Unrealized Appreciation (Depreciation) | Income Distributions | Shares at June 30, 2020 | Value at June 30, 2020 | ||||
| Open-End Mutual Funds – 57.4% | ||||||||||||
Fidelity Advisor® Real Estate I | (a) | $ 2,230,299 | $ 396,614 | $ 232,692 | $ (19,288) | $ (266,656) | $3,982 | 112,262 | $ 2,108,277 | |||
ON BlackRock Advantage International Equity Portfolio | (a) | 10,036,345 | 1,458,929 | 891,902 | (115,650) | (1,000,474) | — | 693,512 | 9,487,248 | |||
ON BlackRock Advantage Large Cap Core Portfolio | (a) | 4,460,598 | 529,017 | 697,198 | 3,748 | (79,610) | — | 131,603 | 4,216,555 | |||
ON BlackRock Advantage Large Cap Value Portfolio | (a) | 11,151,494 | 1,846,864 | 921,376 | (27,100) | (1,508,496) | — | 659,661 | 10,541,386 | |||
ON Bond Portfolio | (a) | 15,612,092 | 187,330 | 1,619,537 | 149,515 | 428,541 | — | 743,473 | 14,757,941 | |||
ON Federated Core Plus Bond Portfolio | (a) | — | 21,040,092 | 321,998 | (1,180) | 365,859 | — | 2,070,999 | 21,082,773 | |||
ON Federated High Income Bond Portfolio | (a) | 13,381,793 | 253,681 | 2,484,995 | 38,190 | (647,282) | — | 529,452 | 10,541,387 | |||
ON Janus Henderson Enterprise Portfolio | (a) | 2,230,299 | 410,543 | 395,417 | 10,705 | (147,853) | — | 47,367 | 2,108,277 | |||
ON Janus Henderson Forty Portfolio | (a) | 2,230,299 | 188,674 | 524,073 | 68,045 | 145,332 | — | 73,690 | 2,108,277 | |||
ON Janus Henderson Venture Portfolio | (a) | 2,230,299 | 389,224 | 467,338 | (69,958) | 26,050 | — | 64,691 | 2,108,277 | |||
ON Nasdaq-100® Index Portfolio | (a) | 4,460,598 | 302,948 | 1,232,710 | 134,195 | 551,524 | — | 182,219 | 4,216,555 | |||
ON S&P 500® Index Portfolio | (a) | 28,993,885 | 3,439,647 | 4,378,780 | 152,183 | (799,330) | — | 850,904 | 27,407,605 | |||
ON S&P MidCap 400® Index Portfolio | (a) | 11,151,494 | 2,308,638 | 1,728,992 | (129,534) | (1,060,219) | — | 628,586 | 10,541,387 | |||
Total Open-End Mutual Funds | $ 193,871 | $(3,992,614) | $3,982 | $121,225,945 |
Percentages are stated as a percent of net assets. |
| Footnotes: | ||
| (a) | Pursuant to Section 2(a)(3) of the Investment Company Act of 1940, the investment meets the definition of “affiliated person”, as the Portfolio directly or indirectly owns, controls, or holds with power to vote 5 percent or more of the outstanding voting securities of the holding at June 30, 2020. | |
| Ohio National Fund, Inc. | ON Balanced Model Portfolio (Unaudited) |
| Average Annual returns | |
| One year | 3.20% |
| Since inception (3/1/17) | 4.55% |
| (1) | The Portfolio’s composition is subject to change. Holdings and weightings are as of June 30, 2020. |
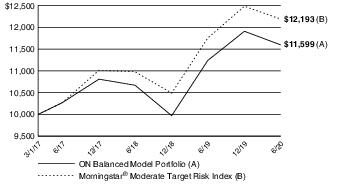
| Ohio National Fund, Inc. | ON Balanced Model Portfolio (Unaudited) (Continued) |
| Portfolio Composition as of June 30, 2020 (1) | |
| % of Net Assets | |
| Open-End Mutual Funds Less Net Liabilities | 100.0 |
| 100.0 | |
| Top 10 Portfolio Holdings as of June 30, 2020 (1) (2) (3) | ||
| % of Net Assets | ||
| 1. | ON S&P 500® Index Portfolio | 14.0 |
| 2. | Western Asset Core Plus Bond IS | 9.0 |
| 3. | ON S&P MidCap 400® Index Portfolio | 9.0 |
| 4. | PIMCO Total Return Institutional | 8.0 |
| 5. | ON BlackRock Advantage International Equity Portfolio | 8.0 |
| 6. | ON Federated Core Plus Bond Portfolio | 8.0 |
| 7. | PIMCO Low Duration Institutional | 6.0 |
| 8. | ON BlackRock Advantage Large Cap Value Portfolio | 6.0 |
| 9. | ON Bond Portfolio | 5.0 |
| 10. | DFA International Core Equity Portfolio Institutional | 4.0 |
| (1) | Composition of Portfolio subject to change. | |
| (2) | Short-term investments have been excluded from the list of Top 10 Portfolio Holdings. | |
| (3) | Top 10 Portfolio Holdings is presented at an individual security level. Total investment exposure by issuer may be higher. | |
| Ohio National Fund, Inc. | ON Balanced Model Portfolio |
| Schedule of Investments in Unaffiliated Issuers | June 30, 2020 (Unaudited) |
| Open-End Mutual Funds–34.1% | Shares | Value | |
DFA Emerging Markets Portfolio Institutional | 1,215,782 | $ 30,734,974 | |
DFA International Core Equity Portfolio Institutional | 3,499,244 | 41,081,120 | |
Lazard Emerging Markets Equity Class R6 | 701,153 | 10,187,755 | |
PIMCO Low Duration Institutional | 6,176,687 | 61,210,968 | |
PIMCO Total Return Institutional | 7,540,303 | 81,661,488 | |
Vanguard International Growth Fund Admiral Class | 264,594 | 30,563,265 | |
Western Asset Core Plus Bond IS | 7,481,257 | 91,869,832 | |
Total Open-End Mutual Funds | $ 347,309,402 | ||
Total Investments in Securities of Unaffiliated Issuers – 34.1% (Cost $340,367,341) | (a) | $ 347,309,402 | |
| Total Investments in Affiliates – 65.9% (Cost $648,253,776) (see schedule below) | (a) | 672,391,830 | |
| Liabilities in Excess of Other Assets – 0.0% | (321,557) | ||
| Net Assets – 100.0% | $1,019,379,675 |
Percentages are stated as a percent of net assets. |
| Footnotes: | ||
| (a) | Represents cost for financial reporting purposes, which may differ from cost basis for federal income tax purposes. See also Note 8 of the Notes to Financial Statements. | |
| Schedule of Investments in Affiliates | June 30, 2020 (Unaudited) |
| Affiliate | Value at January 1, 2020 | Cost of Purchases | Proceeds from Sales | Net Realized Gain (Loss) | Change in Unrealized Appreciation (Depreciation) | Income Distributions | Shares at June 30, 2020 | Value at June 30, 2020 | ||||
| Open-End Mutual Funds – 65.9% | ||||||||||||
Fidelity Advisor® Real Estate I | (a) | $ 11,089,585 | $ 1,264,256 | $ 715,498 | $ (1,842) | $ (1,448,746) | $18,926 | 542,479 | $ 10,187,755 | |||
ON BlackRock Advantage International Equity Portfolio | (a) | 83,171,885 | 11,342,679 | 3,940,757 | (410,644) | (8,661,123) | — | 5,957,752 | 81,502,040 | |||
ON BlackRock Advantage Large Cap Core Portfolio | (a) | 22,179,169 | 911,890 | 2,182,317 | 88,228 | (621,460) | — | 635,940 | 20,375,510 | |||
ON BlackRock Advantage Large Cap Growth Portfolio | (a) | 22,179,169 | 318,683 | 3,804,102 | 306,307 | 1,375,453 | — | 683,054 | 20,375,510 | |||
ON BlackRock Advantage Large Cap Value Portfolio | (a) | 66,537,508 | 6,988,293 | 2,966,063 | (74,574) | (9,358,634) | — | 3,825,190 | 61,126,530 | |||
ON BlackRock Advantage Small Cap Growth Portfolio | (a) | 22,179,169 | 2,401,074 | 3,746,153 | 308,135 | (766,715) | — | 672,237 | 20,375,510 | |||
ON Bond Portfolio | (a) | 55,447,923 | 1,466,537 | 7,923,169 | 674,811 | 1,272,673 | — | 2,566,185 | 50,938,775 | |||
ON Federated Core Plus Bond Portfolio | (a) | — | 80,718,709 | 609,387 | (1,083) | 1,393,801 | — | 8,006,094 | 81,502,040 | |||
ON Federated High Income Bond Portfolio | (a) | 44,358,339 | 253,670 | 11,811,601 | 371,830 | (2,608,973) | — | 1,535,071 | 30,563,265 | |||
ON Janus Henderson Enterprise Portfolio | (a) | 11,089,585 | 1,185,304 | 1,334,490 | 48,322 | (800,966) | — | 228,887 | 10,187,755 | |||
ON Janus Henderson Forty Portfolio | (a) | 22,179,169 | 192,963 | 3,920,394 | 527,597 | 1,396,175 | — | 712,181 | 20,375,510 | |||
ON Janus Henderson Venture Portfolio | (a) | — | 9,744,779 | 778,516 | 71,110 | 1,150,382 | — | 312,604 | 10,187,755 | |||
ON Nasdaq-100® Index Portfolio | (a) | 22,179,169 | 26,146 | 5,004,491 | 614,520 | 2,560,166 | — | 880,532 | 20,375,510 | |||
ON S&P 500® Index Portfolio | (a) | 155,254,185 | 6,500,743 | 14,578,911 | 2,219,194 | (6,766,641) | — | 4,428,084 | 142,628,570 | |||
ON S&P MidCap 400® Index Portfolio | (a) | 110,895,847 | 14,510,485 | 20,275,509 | (3,868,461) | (9,572,567) | — | 5,467,489 | 91,689,795 | |||
Total Open-End Mutual Funds | $ 873,450 | $(31,457,175) | $18,926 | $672,391,830 |
Percentages are stated as a percent of net assets. |
| Footnotes: | ||
| (a) | Pursuant to Section 2(a)(3) of the Investment Company Act of 1940, the investment meets the definition of “affiliated person”, as the Portfolio directly or indirectly owns, controls, or holds with power to vote 5 percent or more of the outstanding voting securities of the holding at June 30, 2020. | |
| Ohio National Fund, Inc. | ON Moderate Growth Model Portfolio (Unaudited) |
| Average Annual returns | |
| One year | 2.39% |
| Since inception (3/1/17) | 4.94% |
| (1) | The Portfolio’s composition is subject to change. Holdings and weightings are as of June 30, 2020. |

| Ohio National Fund, Inc. | ON Moderate Growth Model Portfolio (Unaudited) (Continued) |
| Portfolio Composition as of June 30, 2020 (1) | |
| % of Net Assets | |
| Open-End Mutual Funds Less Net Liabilities | 100.0 |
| 100.0 | |
| Top 10 Portfolio Holdings as of June 30, 2020 (1) (2) (3) | ||
| % of Net Assets | ||
| 1. | ON S&P 500® Index Portfolio | 17.0 |
| 2. | ON S&P MidCap 400® Index Portfolio | 10.0 |
| 3. | ON BlackRock Advantage International Equity Portfolio | 9.0 |
| 4. | Western Asset Core Plus Bond IS | 7.0 |
| 5. | ON BlackRock Advantage Large Cap Value Portfolio | 7.0 |
| 6. | DFA International Core Equity Portfolio Institutional | 6.0 |
| 7. | ON Federated Core Plus Bond Portfolio | 6.0 |
| 8. | ON BlackRock Advantage Large Cap Core Portfolio | 4.0 |
| 9. | ON Nasdaq-100® Index Portfolio | 4.0 |
| 10. | Vanguard International Growth Fund Admiral Class | 4.0 |
| (1) | Composition of Portfolio subject to change. | |
| (2) | Short-term investments have been excluded from the list of Top 10 Portfolio Holdings. | |
| (3) | Top 10 Portfolio Holdings is presented at an individual security level. Total investment exposure by issuer may be higher. | |
| Ohio National Fund, Inc. | ON Moderate Growth Model Portfolio |
| Schedule of Investments in Unaffiliated Issuers | June 30, 2020 (Unaudited) |
| Open-End Mutual Funds–23.6% | Shares | Value | |
DFA Emerging Markets Portfolio Institutional | 2,094,603 | $ 52,951,562 | |
DFA International Core Equity Portfolio Institutional | 9,042,758 | 106,161,980 | |
Lazard Emerging Markets Equity Class R6 | 1,208,025 | 17,552,603 | |
PIMCO Low Duration Institutional | 2,660,411 | 26,364,670 | |
PIMCO Total Return Institutional | 1,623,853 | 17,586,334 | |
Vanguard International Growth Fund Admiral Class | 607,830 | 70,210,412 | |
Western Asset Core Plus Bond IS | 10,024,910 | 123,105,903 | |
Total Open-End Mutual Funds | $ 413,933,464 | ||
Total Investments in Securities of Unaffiliated Issuers – 23.6% (Cost $422,234,563) | (a) | $ 413,933,464 | |
| Total Investments in Affiliates – 76.4% (Cost $1,284,182,251) (see schedule below) | (a) | 1,342,774,136 | |
| Liabilities in Excess of Other Assets – 0.0% | (674,612) | ||
| Net Assets – 100.0% | $1,756,032,988 |
Percentages are stated as a percent of net assets. |
| Footnotes: | ||
| (a) | Represents cost for financial reporting purposes, which may differ from cost basis for federal income tax purposes. See also Note 8 of the Notes to Financial Statements. | |
| Schedule of Investments in Affiliates | June 30, 2020 (Unaudited) |
| Affiliate | Value at January 1, 2020 | Cost of Purchases | Proceeds from Sales | Net Realized Gain (Loss) | Change in Unrealized Appreciation (Depreciation) | Income Distributions | Shares at June 30, 2020 | Value at June 30, 2020 | ||||
| Open-End Mutual Funds – 76.4% | ||||||||||||
Fidelity Advisor® Real Estate I | (a) | $ 19,613,949 | $ 1,829,923 | $ 1,316,445 | $ (31,463) | $ (2,543,361) | $32,624 | 934,643 | $ 17,552,603 | |||
ON BlackRock Advantage International Equity Portfolio | (a) | 196,139,490 | 5,443,074 | 18,973,930 | (3,481,094) | (21,154,112) | — | 11,547,765 | 157,973,428 | |||
ON BlackRock Advantage Large Cap Core Portfolio | (a) | 78,455,796 | 2,292 | 5,977,538 | 1,080,834 | (3,350,972) | — | 2,191,336 | 70,210,412 | |||
ON BlackRock Advantage Large Cap Growth Portfolio | (a) | 58,841,847 | 1,446 | 10,236,047 | 2,708,029 | 1,342,534 | — | 1,765,264 | 52,657,809 | |||
ON BlackRock Advantage Large Cap Value Portfolio | (a) | 137,297,643 | 8,879,962 | 3,448,824 | (108,469) | (19,752,090) | — | 7,688,875 | 122,868,222 | |||
ON BlackRock Advantage Small Cap Growth Portfolio | (a) | 58,841,847 | 3,460,673 | 7,975,129 | 600,720 | (2,270,302) | — | 1,737,308 | 52,657,809 | |||
ON Bond Portfolio | (a) | 68,648,821 | 3,651,281 | 13,126,565 | 1,023,482 | 1,237,092 | — | 3,094,917 | 61,434,111 | |||
ON Federated Core Plus Bond Portfolio | (a) | — | 104,643,714 | 1,100,855 | (1,587) | 1,774,347 | — | 10,345,346 | 105,315,619 | |||
ON Federated High Income Bond Portfolio | (a) | 39,227,898 | 2,266,074 | 4,842,596 | 202,456 | (1,748,626) | — | 1,763,195 | 35,105,206 | |||
ON Janus Henderson Enterprise Portfolio | (a) | 19,613,949 | 1,178,768 | 1,803,003 | 81,545 | (1,518,656) | — | 394,352 | 17,552,603 | |||
ON Janus Henderson Forty Portfolio | (a) | 78,455,796 | 1,311 | 14,456,250 | 1,554,634 | 4,654,921 | — | 2,454,051 | 70,210,412 | |||
ON Janus Henderson Venture Portfolio | (a) | 43,150,688 | 2,185,744 | 8,306,231 | 399,118 | (2,324,113) | — | 1,077,177 | 35,105,206 | |||
ON Nasdaq-100® Index Portfolio | (a) | 78,455,796 | 1,898 | 18,761,838 | 2,015,081 | 8,499,475 | — | 3,034,158 | 70,210,412 | |||
ON S&P 500® Index Portfolio | (a) | 333,437,132 | 101,228 | 23,714,867 | 4,150,757 | (15,579,997) | — | 9,264,025 | 298,394,253 | |||
ON S&P MidCap 400® Index Portfolio | (a) | 215,753,439 | 17,429,060 | 30,579,445 | (5,767,670) | (21,309,353) | — | 10,466,669 | 175,526,031 | |||
Total Open-End Mutual Funds | $ 4,426,373 | $(74,043,213) | $32,624 | $1,342,774,136 |
Percentages are stated as a percent of net assets. |
| Footnotes: | ||
| (a) | Pursuant to Section 2(a)(3) of the Investment Company Act of 1940, the investment meets the definition of “affiliated person”, as the Portfolio directly or indirectly owns, controls, or holds with power to vote 5 percent or more of the outstanding voting securities of the holding at June 30, 2020. | |
| Ohio National Fund, Inc. | ON Growth Model Portfolio (Unaudited) |
| Average Annual returns | |
| One year | 2.27% |
| Since inception (3/1/17) | 5.15% |
| (1) | The Portfolio’s composition is subject to change. Holdings and weightings are as of June 30, 2020. |
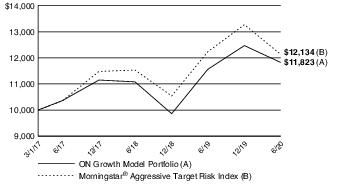
| Ohio National Fund, Inc. | ON Growth Model Portfolio (Unaudited) (Continued) |
| Portfolio Composition as of June 30, 2020 (1) | |
| % of Net Assets | |
| Open-End Mutual Funds Less Net Liabilities | 100.0 |
| 100.0 | |
| Top 10 Portfolio Holdings as of June 30, 2020 (1) (2) (3) | ||
| % of Net Assets | ||
| 1. | ON S&P 500® Index Portfolio | 17.0 |
| 2. | ON BlackRock Advantage International Equity Portfolio | 12.0 |
| 3. | ON S&P MidCap 400® Index Portfolio | 11.5 |
| 4. | DFA International Core Equity Portfolio Institutional | 7.0 |
| 5. | ON BlackRock Advantage Large Cap Value Portfolio | 7.0 |
| 6. | ON Nasdaq-100® Index Portfolio | 7.0 |
| 7. | ON BlackRock Advantage Large Cap Core Portfolio | 5.0 |
| 8. | ON Janus Henderson Forty Portfolio | 5.0 |
| 9. | Vanguard International Growth Fund Admiral Class | 5.0 |
| 10. | ON BlackRock Advantage Small Cap Growth Portfolio | 4.5 |
| (1) | Composition of Portfolio subject to change. | |
| (2) | Short-term investments have been excluded from the list of Top 10 Portfolio Holdings. | |
| (3) | Top 10 Portfolio Holdings is presented at an individual security level. Total investment exposure by issuer may be higher. | |
| Ohio National Fund, Inc. | ON Growth Model Portfolio |
| Schedule of Investments in Unaffiliated Issuers | June 30, 2020 (Unaudited) |
| Open-End Mutual Funds–20.1% | Shares | Value | |
DFA Emerging Markets Portfolio Institutional | 457,679 | $ 11,570,130 | |
DFA International Core Equity Portfolio Institutional | 2,305,079 | 27,061,621 | |
Lazard Emerging Markets Equity Class R6 | 527,946 | 7,671,061 | |
PIMCO Total Return Institutional | 354,842 | 3,842,932 | |
Vanguard International Growth Fund Admiral Class | 166,026 | 19,177,653 | |
Western Asset Core Plus Bond IS | 625,887 | 7,685,897 | |
Total Open-End Mutual Funds | $ 77,009,294 | ||
Total Investments in Securities of Unaffiliated Issuers – 20.1% (Cost $81,135,612) | (a) | $ 77,009,294 | |
| Total Investments in Affiliates – 79.9% (Cost $292,596,384) (see schedule below) | (a) | 306,842,449 | |
| Liabilities in Excess of Other Assets – 0.0% | (174,331) | ||
| Net Assets – 100.0% | $383,677,412 |
Percentages are stated as a percent of net assets. |
| Footnotes: | ||
| (a) | Represents cost for financial reporting purposes, which may differ from cost basis for federal income tax purposes. See also Note 8 of the Notes to Financial Statements. | |
| Schedule of Investments in Affiliates | June 30, 2020 (Unaudited) |
| Affiliate | Value at January 1, 2020 | Cost of Purchases | Proceeds from Sales | Net Realized Gain (Loss) | Change in Unrealized Appreciation (Depreciation) | Income Distributions | Shares at June 30, 2020 | Value at June 30, 2020 | ||||
| Open-End Mutual Funds – 79.9% | ||||||||||||
Fidelity Advisor® Real Estate I | (a) | $ 4,337,885 | $ 431,966 | $ 369,617 | $ (14,129) | $ (550,574) | $7,106 | 204,235 | $ 3,835,531 | |||
ON BlackRock Advantage International Equity Portfolio | (a) | 52,054,621 | 2,579,522 | 2,447,133 | (435,063) | (5,725,580) | — | 3,364,500 | 46,026,367 | |||
ON BlackRock Advantage Large Cap Core Portfolio | (a) | 21,689,425 | 29,426 | 1,882,201 | 315,625 | (974,622) | — | 598,553 | 19,177,653 | |||
ON BlackRock Advantage Large Cap Growth Portfolio | (a) | 13,013,655 | 37,311 | 2,398,489 | 617,752 | 236,363 | — | 385,739 | 11,506,592 | |||
ON BlackRock Advantage Large Cap Value Portfolio | (a) | 30,365,195 | 1,503,207 | 636,000 | 9,504 | (4,393,192) | — | 1,680,145 | 26,848,714 | |||
ON BlackRock Advantage Small Cap Growth Portfolio | (a) | 19,520,483 | 761,547 | 2,449,748 | 174,062 | (746,456) | — | 569,445 | 17,259,888 | |||
ON Bond Portfolio | (a) | 4,337,885 | 340,696 | 978,936 | 93,185 | 42,701 | — | 193,226 | 3,835,531 | |||
ON Federated High Income Bond Portfolio | (a) | 4,337,885 | 354,176 | 681,312 | 19,340 | (194,558) | — | 192,643 | 3,835,531 | |||
ON Janus Henderson Enterprise Portfolio | (a) | 4,337,885 | 208,487 | 389,346 | 25,345 | (346,840) | — | 86,172 | 3,835,531 | |||
ON Janus Henderson Forty Portfolio | (a) | 21,689,425 | 131,114 | 4,271,347 | 401,076 | 1,227,385 | — | 670,313 | 19,177,653 | |||
ON Janus Henderson Venture Portfolio | (a) | 17,351,540 | 561,481 | 1,929,756 | 170,211 | (811,354) | — | 470,762 | 15,342,122 | |||
ON Nasdaq-100® Index Portfolio | (a) | 30,365,195 | 152,234 | 7,584,586 | 758,556 | 3,157,315 | — | 1,160,273 | 26,848,714 | |||
ON S&P 500® Index Portfolio | (a) | 73,744,046 | 54,413 | 5,959,718 | 962,941 | (3,597,662) | — | 2,024,341 | 65,204,020 | |||
ON S&P MidCap 400® Index Portfolio | (a) | 52,054,621 | 3,424,264 | 5,018,738 | (807,526) | (5,544,019) | — | 2,630,209 | 44,108,602 | |||
Total Open-End Mutual Funds | $2,290,879 | $(18,221,093) | $7,106 | $306,842,449 |
Percentages are stated as a percent of net assets. |
| Footnotes: | ||
| (a) | Pursuant to Section 2(a)(3) of the Investment Company Act of 1940, the investment meets the definition of “affiliated person”, as the Portfolio directly or indirectly owns, controls, or holds with power to vote 5 percent or more of the outstanding voting securities of the holding at June 30, 2020. | |
| Statements of Assets and Liabilities | June 30, 2020 (Unaudited) |
| ON Bond Portfolio | ON BlackRock Balanced Allocation Portfolio | ON BlackRock Advantage International Equity Portfolio | ON Janus Henderson Forty Portfolio | ON Janus Henderson Venture Portfolio | ON Janus Henderson Enterprise Portfolio | ON S&P 500® Index Portfolio | |||||||
| Assets: | |||||||||||||
Investments in securities of unaffiliated issuers, at value* | $271,549,364 | $501,515,110 | $449,573,864 | $188,362,857 | $160,711,842 | $95,460,909 | $1,095,308,960 | ||||||
Cash | — | 283,273 | 64,418 | — | — | — | 1,132,823 | ||||||
Cash subject to usage restrictions | — | 828,000 | 987,360 | — | — | — | 492,000 | ||||||
Foreign currencies, at value** | — | — | 2,529,805 | — | — | 8,348 | — | ||||||
Receivable for securities sold | — | 8,483,913 | — | — | 1,600,410 | 279,819 | — | ||||||
Receivable for fund shares sold | 2,568,846 | 55,757 | 445,006 | 17,905 | 66,202 | 74,648 | 1,167,881 | ||||||
Receivable for variation margin on futures contracts | — | 146,626 | — | — | — | — | 83,986 | ||||||
Dividends and accrued interest receivable | 2,287,446 | 1,520,273 | 792,824 | 44,230 | 30,046 | 32,965 | 860,520 | ||||||
Foreign tax reclaim receivable | 9,323 | 27,160 | 852,846 | — | 14,841 | 2,503 | — | ||||||
Prepaid expenses and other assets | 3,359 | 6,133 | 5,108 | 2,156 | 1,770 | 1,159 | 13,589 | ||||||
Total assets | 276,418,338 | 512,866,245 | 455,251,231 | 188,427,148 | 162,425,111 | 95,860,351 | 1,099,059,759 | ||||||
| Liabilities: | |||||||||||||
Payable for securities purchased | — | 7,774,388 | — | — | 1,067,537 | 19,288 | 40,847 | ||||||
Payable for fund shares redeemed | 94,175 | 3,519,997 | 4,617,888 | 3,180,086 | 1,844,890 | 223,973 | 4,418,727 | ||||||
Payable for investment management services | 118,753 | 204,449 | 267,358 | 107,706 | 105,085 | 67,580 | 305,788 | ||||||
Payable for variation margin on futures contracts | — | — | 22,340 | — | — | — | — | ||||||
Accrued custody expense | 2,543 | 10,309 | 115,472 | 2,010 | 4,425 | 1,416 | 9,440 | ||||||
Accrued professional fees | 7,059 | 7,169 | 8,567 | 7,019 | 7,009 | 6,980 | 7,436 | ||||||
Accrued accounting fees | 8,818 | 16,527 | 34,095 | 4,354 | 4,500 | 3,144 | 21,142 | ||||||
Accrued printing and filing fees | 5,549 | 9,336 | 7,423 | 3,840 | 3,420 | 2,404 | 18,008 | ||||||
Other liabilities | 5,774 | 5,659 | 19,316 | 5,916 | 5,756 | 5,795 | 6,553 | ||||||
Withholding tax payable | — | 54 | 56,096 | — | 302 | 441 | — | ||||||
Total liabilities | 242,671 | 11,547,888 | 5,148,555 | 3,310,931 | 3,042,924 | 331,021 | 4,827,941 | ||||||
| Commitments and contingent liabilities (see Note 9 of Notes to Financial Statements) | |||||||||||||
Net assets | $276,175,667 | $501,318,357 | $450,102,676 | $185,116,217 | $159,382,187 | $95,529,330 | $1,094,231,818 | ||||||
| Net assets consist of: | |||||||||||||
Paid in capital | 251,523,034 | 452,707,768 | 503,042,139 | 127,508,226 | 117,365,709 | 84,644,561 | 826,776,185 | ||||||
Total distributable earnings | 24,652,633 | 48,610,589 | (52,939,463) | 57,607,991 | 42,016,478 | 10,884,769 | 267,455,633 | ||||||
Net assets | $276,175,667 | $501,318,357 | $450,102,676 | $185,116,217 | $159,382,187 | $95,529,330 | $1,094,231,818 | ||||||
*Investments in securities of unaffiliated issuers, at cost | $253,912,392 | $467,876,980 | $451,171,149 | $139,037,344 | $123,496,284 | $86,121,771 | $ 873,725,092 | ||||||
**Foreign currencies, at cost | $ — | $ — | $ 2,529,692 | $ — | $ — | $ 8,319 | $ — | ||||||
Shares outstanding, par value, $1 per share | 13,915,878 | 14,637,012 | 32,904,045 | 6,471,350 | 4,891,200 | 2,146,254 | 33,968,407 | ||||||
Authorized Fund shares allocated to Portfolio | 25,000,000 | 25,000,000 | 55,000,000 | 14,000,000 | 8,000,000 | 6,000,000 | 60,000,000 | ||||||
Net asset value per share | $ 19.85 | $ 34.25 | $ 13.68 | $ 28.61 | $ 32.59 | $ 44.51 | $ 32.21 |
| Statements of Assets and Liabilities | June 30, 2020 (Unaudited) |
| ON BlackRock Advantage Large Cap Value Portfolio | ON Federated High Income Bond Portfolio | ON Nasdaq-100® Index Portfolio | ON BlackRock Advantage Large Cap Core Portfolio | ON BlackRock Advantage Small Cap Growth Portfolio | ON S&P MidCap 400® Index Portfolio | ON BlackRock Advantage Large Cap Growth Portfolio | |||||||
| Assets: | |||||||||||||
Investments in securities of unaffiliated issuers, at value* | $273,646,074 | $166,933,123 | $355,387,381 | $384,753,014 | $184,809,279 | $375,512,733 | $106,083,002 | ||||||
Cash | 348,563 | — | 484,135 | 341,660 | 264,599 | 1,772,161 | 440,556 | ||||||
Cash subject to usage restrictions | 805,200 | — | 135,000 | 984,000 | 544,000 | 285,000 | 276,000 | ||||||
Foreign currencies, at value** | 444,545 | — | — | — | — | — | — | ||||||
Receivable for securities sold | 6,523,028 | 337,063 | 1,201,861 | 9,082,883 | 3,323,663 | — | 4,549,656 | ||||||
Receivable for fund shares sold | 6,074,219 | 1,215,318 | 306,056 | 194,574 | 40,708 | 345,296 | 1,167 | ||||||
Receivable for variation margin on futures contracts | 127,854 | — | 31,320 | 172,480 | 60,069 | 44,080 | 26,075 | ||||||
Dividends and accrued interest receivable | 319,103 | 2,757,541 | 83,556 | 293,979 | 75,620 | 385,498 | 50,549 | ||||||
Foreign tax reclaim receivable | 130,283 | — | — | 121 | — | 2,274 | — | ||||||
Prepaid expenses and other assets | 3,473 | 2,252 | 3,856 | 4,703 | 2,141 | 4,775 | 1,243 | ||||||
Total assets | 288,422,342 | 171,245,297 | 357,633,165 | 395,827,414 | 189,120,079 | 378,351,817 | 111,428,248 | ||||||
| Liabilities: | |||||||||||||
Payable for securities purchased | 6,664,940 | 2,977,812 | — | 8,928,930 | 3,403,022 | 882,762 | 7,478,489 | ||||||
Payable for fund shares redeemed | 98,100 | 46,191 | 6,952,409 | 4,582,190 | 4,758,137 | 1,962,320 | 2,328,169 | ||||||
Payable for investment management services | 154,432 | 99,585 | 102,994 | 203,056 | 115,668 | 111,570 | 55,390 | ||||||
Accrued custody expense | 9,175 | 1,472 | 8,969 | 8,155 | 4,437 | 9,728 | 6,279 | ||||||
Accrued professional fees | 7,063 | 7,013 | 7,093 | 7,112 | 7,020 | 7,110 | 6,982 | ||||||
Accrued accounting fees | 7,425 | 11,999 | 6,540 | 8,715 | 5,519 | 8,683 | 3,578 | ||||||
Accrued printing and filing fees | 5,273 | 4,043 | 6,456 | 6,878 | 3,823 | 6,778 | 2,509 | ||||||
Other liabilities | 6,095 | 5,699 | 5,962 | 6,111 | 5,693 | 5,857 | 5,727 | ||||||
Withholding tax payable | — | — | 549 | 121 | — | — | — | ||||||
Total liabilities | 6,952,503 | 3,153,814 | 7,090,972 | 13,751,268 | 8,303,319 | 2,994,808 | 9,887,123 | ||||||
| Commitments and contingent liabilities (see Note 9 of Notes to Financial Statements) | |||||||||||||
Net assets | $281,469,839 | $168,091,483 | $350,542,193 | $382,076,146 | $180,816,760 | $375,357,009 | $101,541,125 | ||||||
| Net assets consist of: | |||||||||||||
Paid in capital | 318,887,315 | 179,009,877 | 190,782,619 | 354,840,976 | 165,880,311 | 400,531,129 | 77,039,531 | ||||||
Total distributable earnings | (37,417,476) | (10,918,394) | 159,759,574 | 27,235,170 | 14,936,449 | (25,174,120) | 24,501,594 | ||||||
Net assets | $281,469,839 | $168,091,483 | $350,542,193 | $382,076,146 | $180,816,760 | $375,357,009 | $101,541,125 | ||||||
*Investments in securities of unaffiliated issuers, at cost | $296,817,654 | $177,284,215 | $237,659,375 | $357,016,984 | $177,803,346 | $392,297,151 | $ 89,583,848 | ||||||
**Foreign currencies, at cost | $ 465,856 | $ — | $ — | $ — | $ — | $ — | $ — | ||||||
Shares outstanding, par value, $1 per share | 17,617,296 | 8,443,844 | 15,148,177 | 11,925,062 | 5,964,851 | 22,381,038 | 3,404,560 | ||||||
Authorized Fund shares allocated to Portfolio | 30,000,000 | 15,000,000 | 30,000,000 | 20,000,000 | 10,000,000 | 40,000,000 | 7,000,000 | ||||||
Net asset value per share | $ 15.98 | $ 19.91 | $ 23.14 | $ 32.04 | $ 30.31 | $ 16.77 | $ 29.83 |
| Statements of Assets and Liabilities | June 30, 2020 (Unaudited) |
| ON Risk Managed Balanced Portfolio | ON Federated Core Plus Bond Portfolio | ON Conservative Model Portfolio | ON Moderately Conservative Model Portfolio | ON Balanced Model Portfolio | ON Moderate Growth Model Portfolio | ON Growth Model Portfolio | |||||||
| Assets: | |||||||||||||
Investments in securities of unaffiliated issuers, at value* | $391,908,256 | $208,059,807 | $41,629,387 | $ 89,807,695 | $ 347,309,402 | $ 413,933,464 | $ 77,009,294 | ||||||
Investments in affiliates, at value** | — | — | 38,350,701 | 121,225,945 | 672,391,830 | 1,342,774,136 | 306,842,449 | ||||||
Cash | 940,985 | 32,455 | — | — | — | — | — | ||||||
Receivable for securities sold | 4,995,586 | 1,259,321 | 112,439 | 1,683,842 | 11,103,636 | 17,568,098 | 2,645,020 | ||||||
Receivable for fund shares sold | 829,133 | 7,769,175 | 2 | 57 | 19,770 | 9,123 | — | ||||||
Receivable for variation margin on futures contracts | 453,052 | 8,641 | — | — | — | — | — | ||||||
Dividends and accrued interest receivable | 904,382 | 1,065,798 | 82,741 | 205,656 | 923,987 | 1,443,103 | 297,654 | ||||||
Prepaid expenses and other assets | 3,951 | — | 905 | 2,618 | 12,835 | 22,051 | 4,639 | ||||||
Total assets | 400,035,345 | 218,195,197 | 80,176,175 | 212,925,813 | 1,031,761,460 | 1,775,749,975 | 386,799,056 | ||||||
| Liabilities: | |||||||||||||
Payable for securities purchased | 6,859,240 | 472,209 | 187,064 | 1,847,852 | 11,636,766 | 18,818,099 | 2,716,703 | ||||||
Payable for fund shares redeemed | 1,477,676 | — | 8,118 | 41,703 | 410,627 | 202,225 | 225,971 | ||||||
Payable for investment management services | 282,759 | 94,108 | 15,205 | 52,585 | 296,639 | 647,107 | 152,270 | ||||||
Accrued custody expense | 13,357 | 2,939 | 1,840 | 3,055 | 3,203 | 2,970 | 2,814 | ||||||
Accrued professional fees | 7,115 | 7,031 | 6,350 | 6,410 | 6,778 | 7,111 | 6,488 | ||||||
Accrued accounting fees | 21,452 | 13,799 | 3,980 | 4,072 | 4,096 | 4,076 | 4,056 | ||||||
Accrued printing and filing fees | 6,961 | 4,330 | 2,174 | 4,219 | 16,772 | 28,109 | 6,840 | ||||||
Other liabilities | 5,452 | 4,869 | 6,284 | 6,345 | 6,904 | 7,290 | 6,502 | ||||||
Withholding tax payable | 107 | — | — | — | — | — | — | ||||||
Total liabilities | 8,674,119 | 599,285 | 231,015 | 1,966,241 | 12,381,785 | 19,716,987 | 3,121,644 | ||||||
Net assets | $391,361,226 | $217,595,912 | $79,945,160 | $210,959,572 | $1,019,379,675 | $1,756,032,988 | $383,677,412 | ||||||
| Net assets consist of: | |||||||||||||
Paid in capital | 294,615,378 | 213,784,086 | 76,913,427 | 209,816,959 | 1,036,498,372 | 1,839,670,003 | 408,237,945 | ||||||
Total distributable earnings | 96,745,848 | 3,811,826 | 3,031,733 | 1,142,613 | (17,118,697) | (83,637,015) | (24,560,533) | ||||||
Net assets | $391,361,226 | $217,595,912 | $79,945,160 | $210,959,572 | $1,019,379,675 | $1,756,032,988 | $383,677,412 | ||||||
*Investments in securities of unaffiliated issuers, at cost | $347,476,401 | $204,766,494 | $39,792,077 | $ 86,231,757 | $ 340,367,341 | $ 422,234,563 | $ 81,135,612 | ||||||
**Investments in affiliates, at cost | $ — | $ — | $36,807,110 | $116,746,090 | $ 648,253,776 | $1,284,182,251 | $292,596,384 | ||||||
Shares outstanding, par value, $1 per share | 24,789,312 | 21,364,354 | 7,022,307 | 18,633,038 | 91,156,258 | 157,990,347 | 33,886,629 | ||||||
Authorized Fund shares allocated to Portfolio | 45,000,000 | 90,000,000 | 10,000,000 | 30,000,000 | 150,000,000 | 260,000,000 | 60,000,000 | ||||||
Net asset value per share | $ 15.79 | $ 10.18 | $ 11.38 | $ 11.32 | $ 11.18 | $ 11.11 | $ 11.32 |
| Statements of Operations | For the Six-Month Period Ended June 30, 2020 (Unaudited) |
| ON Bond Portfolio | ON BlackRock Balanced Allocation Portfolio | ON BlackRock Advantage International Equity Portfolio | ON Janus Henderson Forty Portfolio | ON Janus Henderson Venture Portfolio | ON Janus Henderson Enterprise Portfolio | ON S&P 500® Index Portfolio | |||||||
| Investment income: | |||||||||||||
Interest | $4,835,311 | $ 2,453,273 | $ — | $ 2,702 | $ 1,686 | $ — | $ 4,843 | ||||||
Dividends from unaffiliated issuers, net of taxes withheld* | 17,815 | 3,267,876 | 6,334,199 | 585,368 | 360,602 | 459,981 | 11,027,460 | ||||||
Total investment income | 4,853,126 | 5,721,149 | 6,334,199 | 588,070 | 362,288 | 459,981 | 11,032,303 | ||||||
| Expenses: | |||||||||||||
Management fees | 727,922 | 1,229,781 | 1,489,970 | 637,926 | 601,026 | 405,469 | 1,837,298 | ||||||
Custodian fees | 8,110 | 28,794 | 239,220 | 8,471 | 12,846 | 4,162 | 38,088 | ||||||
Directors' fees | 13,739 | 24,854 | 20,331 | 8,964 | 7,173 | 4,643 | 53,542 | ||||||
Professional fees | 16,415 | 20,205 | 19,449 | 14,555 | 14,016 | 13,052 | 30,837 | ||||||
Accounting fees | 27,018 | 49,691 | 64,879 | 13,513 | 14,036 | 9,946 | 67,443 | ||||||
Administration fees | 16,861 | 16,146 | 28,206 | 16,635 | 16,239 | 16,053 | 20,536 | ||||||
Printing and filing fees | 9,314 | 14,571 | 13,964 | 6,675 | 5,977 | 4,801 | 25,002 | ||||||
Compliance expense | 5,979 | 5,979 | 5,978 | 5,978 | 5,978 | 5,978 | 5,978 | ||||||
Other | 3,460 | 7,499 | 16,595 | 2,988 | 2,561 | 1,661 | 18,625 | ||||||
Total expenses | 828,818 | 1,397,520 | 1,898,592 | 715,705 | 679,852 | 465,765 | 2,097,349 | ||||||
Net investment income (loss) | 4,024,308 | 4,323,629 | 4,435,607 | (127,635) | (317,564) | (5,784) | 8,934,954 | ||||||
| Realized/unrealized gain (loss) on investments, futures contracts, and foreign currency related transactions: | |||||||||||||
| Net realized gain (loss) on: | |||||||||||||
Investments in securities of unaffiliated issuers | 1,517,367 | 7,306,556 | (46,992,166) | 4,080,011 | 1,173,002 | 168,787 | 27,720,051 | ||||||
Futures contracts | — | 248,873 | (117,688) | — | — | — | (3,272) | ||||||
Foreign currency related transactions | — | (2) | (203,356) | 359 | (1,130) | 216 | — | ||||||
| Change in unrealized appreciation/depreciation on: | |||||||||||||
Investments in securities of unaffiliated issuers | 4,180,959 | (12,818,391) | (12,024,372) | 12,393,170 | (6,861,885) | (8,713,127) | (75,917,821) | ||||||
Futures contracts | — | 143,467 | 50,453 | — | — | — | 59,849 | ||||||
Foreign currency related transactions | — | (1) | (28,174) | (1) | 23 | (11) | — | ||||||
Net realized/unrealized gain (loss) on investments, futures contracts, and foreign currency related transactions | 5,698,326 | (5,119,498) | (59,315,303) | 16,473,539 | (5,689,990) | (8,544,135) | (48,141,193) | ||||||
Change in net assets from operations | $9,722,634 | $ (795,869) | $(54,879,696) | $16,345,904 | $(6,007,554) | $(8,549,919) | $(39,206,239) | ||||||
*Taxes withheld | $ — | $ 106 | $ 674,302 | $ 2,812 | $ 591 | $ 8,542 | $ — |
| Statements of Operations | For the Six-Month Period Ended June 30, 2020 (Unaudited) |
| ON BlackRock Advantage Large Cap Value Portfolio | ON Federated High Income Bond Portfolio | ON Nasdaq-100® Index Portfolio | ON BlackRock Advantage Large Cap Core Portfolio | ON BlackRock Advantage Small Cap Growth Portfolio | ON S&P MidCap 400® Index Portfolio | ON BlackRock Advantage Large Cap Growth Portfolio | |||||||
| Investment income: | |||||||||||||
Interest | $ — | $ 5,350,662 | $ 2,532 | $ — | $ — | $ 2,221 | $ — | ||||||
Dividends from unaffiliated issuers, net of taxes withheld* | 3,756,753 | 41,585 | 1,688,528 | 3,619,263 | 665,203 | 3,575,730 | 593,805 | ||||||
Total investment income | 3,756,753 | 5,392,247 | 1,691,060 | 3,619,263 | 665,203 | 3,577,951 | 593,805 | ||||||
| Expenses: | |||||||||||||
Management fees | 941,515 | 630,194 | 595,740 | 1,228,840 | 685,323 | 691,064 | 336,215 | ||||||
Custodian fees | 18,347 | 4,593 | 26,251 | 19,791 | 13,867 | 24,308 | 16,288 | ||||||
Directors' fees | 13,771 | 9,004 | 16,260 | 18,962 | 8,646 | 19,076 | 5,071 | ||||||
Professional fees | 18,016 | 14,579 | 17,193 | 21,882 | 14,527 | 18,361 | 13,160 | ||||||
Accounting fees | 22,871 | 36,611 | 20,768 | 26,066 | 16,912 | 27,847 | 10,704 | ||||||
Administration fees | 17,307 | 16,593 | 17,364 | 17,894 | 16,118 | 17,064 | 16,138 | ||||||
Printing and filing fees | 9,370 | 7,366 | 10,013 | 11,096 | 6,832 | 10,521 | 4,992 | ||||||
Compliance expense | 5,978 | 5,978 | 5,978 | 5,978 | 5,978 | 5,979 | 5,979 | ||||||
Other | 5,054 | 2,537 | 5,288 | 6,203 | 2,957 | 6,077 | 1,733 | ||||||
Total expenses | 1,052,229 | 727,455 | 714,855 | 1,356,712 | 771,160 | 820,297 | 410,280 | ||||||
Net investment income (loss) | 2,704,524 | 4,664,792 | 976,205 | 2,262,551 | (105,957) | 2,757,654 | 183,525 | ||||||
| Realized/unrealized gain (loss) on investments, futures contracts, and foreign currency related transactions: | |||||||||||||
| Net realized gain (loss) on: | |||||||||||||
Investments in securities of unaffiliated issuers | (18,883,649) | (2,003,058) | 24,729,802 | (745,706) | 8,465,188 | (10,938,597) | 6,471,479 | ||||||
Futures contracts | (84,824) | — | 48,044 | 65,371 | (523,181) | 404,046 | 27,853 | ||||||
Foreign currency related transactions | 6,595 | — | — | — | — | — | — | ||||||
| Change in unrealized appreciation/depreciation on: | |||||||||||||
Investments in securities of unaffiliated issuers | (30,059,455) | (10,998,186) | 26,220,081 | (14,246,599) | (14,503,415) | (47,635,986) | 1,114,992 | ||||||
Futures contracts | 109,588 | — | (41,213) | 185,175 | 187,484 | 5,902 | 48,191 | ||||||
Foreign currency related transactions | (31,785) | — | — | — | — | — | — | ||||||
Net realized/unrealized gain (loss) on investments, futures contracts, and foreign currency related transactions | (48,943,530) | (13,001,244) | 50,956,714 | (14,741,759) | (6,373,924) | (58,164,635) | 7,662,515 | ||||||
Change in net assets from operations | $(46,239,006) | $ (8,336,452) | $51,932,919 | $(12,479,208) | $ (6,479,881) | $(55,406,981) | $7,846,040 | ||||||
*Taxes withheld | $ — | $ — | $ 1,701 | $ 226 | $ — | $ 643 | $ — |
| Statements of Operations | For the Six-Month Period Ended June 30, 2020 (Unaudited) |
| ON Risk Managed Balanced Portfolio | ON Federated Core Plus Bond Portfolio** | ON Conservative Model Portfolio | ON Moderately Conservative Model Portfolio | ON Balanced Model Portfolio | ON Moderate Growth Model Portfolio | ON Growth Model Portfolio | |||||||
| Investment income: | |||||||||||||
Interest | $ 1,893,920 | $ 627,421 | $ — | $ — | $ — | $ — | $ — | ||||||
Dividends from unaffiliated issuers, net of taxes withheld* | 1,841,597 | 116,909 | 572,186 | 1,260,755 | 4,311,277 | 4,290,244 | 452,030 | ||||||
Dividends from affililiates | — | — | — | 3,982 | 18,926 | 32,624 | 7,106 | ||||||
Total investment income | 3,735,517 | 744,330 | 572,186 | 1,264,737 | 4,330,203 | 4,322,868 | 459,136 | ||||||
| Expenses: | |||||||||||||
Management fees | 1,737,773 | 186,887 | 150,602 | 419,180 | 2,015,688 | 3,476,248 | 757,853 | ||||||
Custodian fees | 43,669 | 2,944 | 8,032 | 12,115 | 13,411 | 12,537 | 11,986 | ||||||
Directors' fees | 16,795 | — | 3,677 | 10,467 | 49,976 | 86,025 | 18,696 | ||||||
Professional fees | 17,964 | 10,975 | 15,542 | 19,112 | 40,325 | 60,059 | 23,770 | ||||||
Accounting fees | 66,980 | 13,800 | 11,694 | 11,970 | 12,041 | 11,962 | 11,921 | ||||||
Administration fees | 15,258 | 3,961 | 15,171 | 15,291 | 18,357 | 20,920 | 16,384 | ||||||
Printing and filing fees | 12,649 | 5,018 | 4,657 | 7,366 | 23,513 | 37,454 | 10,380 | ||||||
Compliance expense | 5,978 | 1,980 | 5,978 | 5,978 | 5,978 | 5,978 | 5,978 | ||||||
Recoupment of previously reimbursed expenses | — | — | — | — | — | 128,881 | 45,728 | ||||||
Other | 6,251 | — | 994 | 2,937 | 14,451 | 24,949 | 5,313 | ||||||
Total expenses | 1,923,317 | 225,565 | 216,347 | 504,416 | 2,193,740 | 3,865,013 | 908,009 | ||||||
Less expenses reduced or reimbursed by advisor | — | — | (74,896) | (80,940) | (243,031) | (163,559) | (55,388) | ||||||
Net expenses | 1,923,317 | 225,565 | 141,451 | 423,476 | 1,950,709 | 3,701,454 | 852,621 | ||||||
Net investment income (loss) | 1,812,200 | 518,765 | 430,735 | 841,261 | 2,379,494 | 621,414 | (393,485) | ||||||
| Realized/unrealized gain on investments, futures contracts, and foreign currency related transactions: | |||||||||||||
| Net realized gain (loss) on: | |||||||||||||
Investments in securities of unaffiliated issuers | 22,942,670 | (47,412) | 451,337 | 1,047,847 | 3,428,519 | (2,229,754) | (1,015,659) | ||||||
Investments in affiliates | — | — | 42,642 | 193,871 | 873,450 | 4,426,373 | 2,290,879 | ||||||
Futures contracts | 18,247,322 | 62,973 | — | — | — | — | — | ||||||
Foreign currency related transactions | (1,354) | — | — | — | — | — | — | ||||||
| Change in unrealized appreciation/depreciation on: | |||||||||||||
Investments in securities of unaffiliated issuers | (21,663,059) | 3,293,313 | 786,364 | 659,263 | (5,414,342) | (20,645,606) | (5,625,216) | ||||||
Investments in affiliates | — | — | (290,089) | (3,992,614) | (31,457,175) | (74,043,213) | (18,221,093) | ||||||
Futures contracts | 2,738,166 | (15,813) | — | — | — | — | — | ||||||
Net realized/unrealized gain (loss) on investments, futures contracts, and foreign currency related transactions | 22,263,745 | 3,293,061 | 990,254 | (2,091,633) | (32,569,548) | (92,492,200) | (22,571,089) | ||||||
Change in net assets from operations | $ 24,075,945 | $3,811,826 | $1,420,989 | $(1,250,372) | $(30,190,054) | $(91,870,786) | $(22,964,574) | ||||||
*Taxes withheld | $ 3,563 | $ — | $ — | $ — | $ — | $ — | $ — |
| ** | For the period from May 1, 2020 (inception) to June 30, 2020 (Unaudited) |
| ON Bond Portfolio | ON BlackRock Balanced Allocation Portfolio | ON BlackRock Advantage International Equity Portfolio | ON Janus Henderson Forty Portfolio | ||||||||||||
| Six-Month Period | Year Ended | Six-Month Period | Year Ended | Six-Month Period | Year Ended | Six-Month Period | Year Ended | ||||||||
| Ended June 30, 2020 (Unaudited) | December 31, 2019 | Ended June 30, 2020 (Unaudited) | December 31, 2019 | Ended June 30, 2020 (Unaudited) | December 31, 2019 | Ended June 30, 2020 (Unaudited) | December 31, 2019 | ||||||||
| Increase (Decrease) in net assets: | |||||||||||||||
| Operations: | |||||||||||||||
Net investment income (loss) | $ 4,024,308 | $ 8,222,236 | $ 4,323,629 | $ 3,988,732 | $ 4,435,607 | $ 10,129,073 | $ (127,635) | $ (750) | |||||||
Net realized gain (loss) on investments, futures contracts, and foreign currency related transactions | 1,517,367 | 883,529 | 7,555,427 | 27,935,557 | (47,313,210) | 2,593,815 | 4,080,370 | 19,451,811 | |||||||
Change in unrealized appreciation/depreciation on investments, futures contracts, and foreign currency related transactions | 4,180,959 | 26,034,272 | (12,674,925) | 24,683,181 | (12,002,093) | 76,191,698 | 12,393,169 | 39,698,662 | |||||||
Change in net assets from operations | 9,722,634 | 35,140,037 | (795,869) | 56,607,470 | (54,879,696) | 88,914,586 | 16,345,904 | 59,149,723 | |||||||
| Distributions: | |||||||||||||||
Distributions to shareholders | — | (6,277,707) | — | (25,500,324) | — | (7,735,538) | — | (15,119,874) | |||||||
| Capital transactions: | |||||||||||||||
Received from shares sold | 24,828,360 | 61,748,018 | 22,966,530 | 18,470,860 | 29,088,789 | 14,258,974 | 5,542,676 | 47,877,936 | |||||||
Received from shares issued in reorganizations | — | — | — | 462,055,756 | 39,436,084 | — | — | — | |||||||
Received from dividends reinvested | — | 6,277,707 | — | 25,500,324 | — | 7,735,538 | — | 15,119,874 | |||||||
Paid for shares redeemed | (48,840,196) | (64,113,870) | (66,070,524) | (45,479,414) | (37,779,939) | (147,693,116) | (33,722,216) | (59,415,089) | |||||||
Change in net assets from capital transactions | (24,011,836) | 3,911,855 | (43,103,994) | 460,547,526 | 30,744,934 | (125,698,604) | (28,179,540) | 3,582,721 | |||||||
Change in net assets | (14,289,202) | 32,774,185 | (43,899,863) | 491,654,672 | (24,134,762) | (44,519,556) | (11,833,636) | 47,612,570 | |||||||
| Net assets: | |||||||||||||||
Beginning of period | 290,464,869 | 257,690,684 | 545,218,220 | 53,563,548 | 474,237,438 | 518,756,994 | 196,949,853 | 149,337,283 | |||||||
End of period | $276,175,667 | $290,464,869 | $501,318,357 | $545,218,220 | $450,102,676 | $ 474,237,438 | $185,116,217 | $196,949,853 | |||||||
| ON Janus Henderson Venture Portfolio | ON Janus Henderson Enterprise Portfolio | ON S&P 500® Index Portfolio | ON BlackRock Advantage Large Cap Value Portfolio | ||||||||||||
| Six-Month Period | Year Ended | Six-Month Period | Year Ended | Six-Month Period | Year Ended | Six-Month Period | Year Ended | ||||||||
| Ended June 30, 2020 (Unaudited) | December 31, 2019 | Ended June 30, 2020 (Unaudited) | December 31, 2019 | Ended June 30, 2020 (Unaudited) | December 31, 2019 | Ended June 30, 2020 (Unaudited) | December 31, 2019 | ||||||||
| Increase (Decrease) in net assets: | |||||||||||||||
| Operations: | |||||||||||||||
Net investment income (loss) | $ (317,564) | $ (617,975) | $ (5,784) | $ 104,349 | $ 8,934,954 | $ 19,153,257 | $ 2,704,524 | $ 12,565,407 | |||||||
Net realized gain (loss) on investments, futures contracts, and foreign currency related transactions | 1,171,872 | 28,909,298 | 169,003 | 6,551,294 | 27,716,779 | 110,239,780 | (18,961,878) | 1,661,543 | |||||||
Change in unrealized appreciation/depreciation on investments, futures contracts, and foreign currency related transactions | (6,861,862) | 23,375,489 | (8,713,138) | 26,933,721 | (75,857,972) | 188,588,412 | (29,981,652) | 42,240,920 | |||||||
Change in net assets from operations | (6,007,554) | 51,666,812 | (8,549,919) | 33,589,364 | (39,206,239) | 317,981,449 | (46,239,006) | 56,467,870 | |||||||
| Distributions: | |||||||||||||||
Distributions to shareholders | — | (24,504,430) | — | (5,240,352) | — | (112,068,403) | — | (12,498,626) | |||||||
| Capital transactions: | |||||||||||||||
Received from shares sold | 19,585,000 | 13,407,144 | 5,689,326 | 5,724,811 | 52,311,553 | 100,470,240 | 24,168,652 | 18,418,626 | |||||||
Received from dividends reinvested | — | 24,504,430 | — | 5,240,352 | — | 112,068,403 | — | 12,498,626 | |||||||
Paid for shares redeemed | (24,870,118) | (101,846,524) | (11,583,146) | (31,932,168) | (121,464,870) | (327,398,850) | (17,140,868) | (76,044,468) | |||||||
Change in net assets from capital transactions | (5,285,118) | (63,934,950) | (5,893,820) | (20,967,005) | (69,153,317) | (114,860,207) | 7,027,784 | (45,127,216) | |||||||
Change in net assets | (11,292,672) | (36,772,568) | (14,443,739) | 7,382,007 | (108,359,556) | 91,052,839 | (39,211,222) | (1,157,972) | |||||||
| Net assets: | |||||||||||||||
Beginning of period | 170,674,859 | 207,447,427 | 109,973,069 | 102,591,062 | 1,202,591,374 | 1,111,538,535 | 320,681,061 | 321,839,033 | |||||||
End of period | $159,382,187 | $ 170,674,859 | $ 95,529,330 | $109,973,069 | $1,094,231,818 | $1,202,591,374 | $281,469,839 | $320,681,061 | |||||||
| ON Federated High Income Bond Portfolio | ON Nasdaq-100® Index Portfolio | ON BlackRock Advantage Large Cap Core Portfolio | ON BlackRock Advantage Small Cap Growth Portfolio | ||||||||||||
| Six-Month Period | Year Ended | Six-Month Period | Year Ended | Six-Month Period | Year Ended | Six-Month Period | Year Ended | ||||||||
| Ended June 30, 2020 (Unaudited) | December 31, 2019 | Ended June 30, 2020 (Unaudited) | December 31, 2019 | Ended June 30, 2020 (Unaudited) | December 31, 2019 | Ended June 30, 2020 (Unaudited) | December 31, 2019 | ||||||||
| Increase (Decrease) in net assets: | |||||||||||||||
| Operations: | |||||||||||||||
Net investment income (loss) | $ 4,664,792 | $ 10,670,675 | $ 976,205 | $ 2,246,654 | $ 2,262,551 | $ 2,855,349 | $ (105,957) | $ 129,231 | |||||||
Net realized gain (loss) on investments, futures contracts, and foreign currency related transactions | (2,003,058) | (897,568) | 24,777,846 | 62,114,967 | (680,335) | (1,502,909) | 7,942,007 | 5,065,737 | |||||||
Change in unrealized appreciation/depreciation on investments, futures contracts, and foreign currency related transactions | (10,998,186) | 18,766,682 | 26,178,868 | 47,816,959 | (14,061,424) | 71,008,059 | (14,315,931) | 24,442,662 | |||||||
Change in net assets from operations | (8,336,452) | 28,539,789 | 51,932,919 | 112,178,580 | (12,479,208) | 72,360,499 | (6,479,881) | 29,637,630 | |||||||
| Distributions: | |||||||||||||||
Distributions to shareholders | — | (8,186,705) | — | (47,519,641) | — | (2,159,153) | — | (1,583,506) | |||||||
| Capital transactions: | |||||||||||||||
Received from shares sold | 9,335,601 | 18,147,369 | 27,066,834 | 32,049,119 | 6,520,455 | 7,056,986 | 10,473,639 | 67,085,654 | |||||||
Received from shares issued in reorganizations | — | — | — | — | — | 312,578,298 | — | 113,327,536 | |||||||
Received from dividends reinvested | — | 8,186,705 | — | 47,519,641 | — | 2,159,153 | — | 1,583,506 | |||||||
Paid for shares redeemed | (31,559,809) | (50,117,305) | (81,443,853) | (118,823,588) | (42,535,068) | (116,770,432) | (28,025,119) | (30,664,664) | |||||||
Change in net assets from capital transactions | (22,224,208) | (23,783,231) | (54,377,019) | (39,254,828) | (36,014,613) | 205,024,005 | (17,551,480) | 151,332,032 | |||||||
Change in net assets | (30,560,660) | (3,430,147) | (2,444,100) | 25,404,111 | (48,493,821) | 275,225,351 | (24,031,361) | 179,386,156 | |||||||
| Net assets: | |||||||||||||||
Beginning of period | 198,652,143 | 202,082,290 | 352,986,293 | 327,582,182 | 430,569,967 | 155,344,616 | 204,848,121 | 25,461,965 | |||||||
End of period | $168,091,483 | $198,652,143 | $350,542,193 | $ 352,986,293 | $382,076,146 | $ 430,569,967 | $180,816,760 | $204,848,121 | |||||||
| ON S&P MidCap 400® Index Portfolio | ON BlackRock Advantage Large Cap Growth Portfolio | ON Risk Managed Balanced Portfolio | ON Federated Core Plus Bond Portfolio | ||||||||||
| Six-Month Period | Year Ended | Six-Month Period | Year Ended | Six-Month Period | Year Ended | Period from May 1, 2020 (inception) to | |||||||
| Ended June 30, 2020 (Unaudited) | December 31, 2019 | Ended June 30, 2020 (Unaudited) | December 31, 2019 | Ended June 30, 2020 (Unaudited) | December 31, 2019 | June 30, 2020 (Unaudited) | |||||||
| Increase (Decrease) in net assets: | |||||||||||||
| Operations: | |||||||||||||
Net investment income | $ 2,757,654 | $ 4,965,409 | $ 183,525 | $ 651,541 | $ 1,812,200 | $ 5,282,953 | $ 518,765 | ||||||
Net realized gain (loss) on investments, futures contracts, and foreign currency related transactions | (10,534,551) | (352,101) | 6,499,332 | 5,623,259 | 41,188,638 | 40,521,258 | 15,561 | ||||||
Change in unrealized appreciation/depreciation on investments and futures contracts | (47,630,084) | 80,581,384 | 1,163,183 | 25,875,444 | (18,924,893) | 38,808,539 | 3,277,500 | ||||||
Change in net assets from operations | (55,406,981) | 85,194,692 | 7,846,040 | 32,150,244 | 24,075,945 | 84,612,750 | 3,811,826 | ||||||
| Distributions: | |||||||||||||
Distributions to shareholders | — | (3,723,816) | — | (3,920,333) | — | (33,102,023) | — | ||||||
| Capital transactions: | |||||||||||||
Received from shares sold | 43,375,306 | 147,897,604 | 1,281,723 | 27,125,358 | 19,449,342 | 46,090,331 | 215,892,501 | ||||||
Received from dividends reinvested | — | 3,723,816 | — | 3,920,333 | — | 33,102,023 | — | ||||||
Paid for shares redeemed | (63,550,574) | (88,790,895) | (20,778,797) | (33,558,151) | (55,771,038) | (74,163,800) | (2,108,415) | ||||||
Change in net assets from capital transactions | (20,175,268) | 62,830,525 | (19,497,074) | (2,512,460) | (36,321,696) | 5,028,554 | 213,784,086 | ||||||
Change in net assets | (75,582,249) | 144,301,401 | (11,651,034) | 25,717,451 | (12,245,751) | 56,539,281 | 217,595,912 | ||||||
| Net assets: | |||||||||||||
Beginning of period | 450,939,258 | 306,637,857 | 113,192,159 | 87,474,708 | 403,606,977 | 347,067,696 | — | ||||||
End of period | $375,357,009 | $450,939,258 | $101,541,125 | $113,192,159 | $391,361,226 | $403,606,977 | $217,595,912 | ||||||
| ON Conservative Model Portfolio | ON Moderately Conservative Model Portfolio | ON Balanced Model Portfolio | ON Moderate Growth Model Portfolio | ON Growth Model Portfolio | |||||||||||||||
| Six-Month Period | Year Ended | Six-Month Period | Year Ended | Six-Month Period | Year Ended | Six-Month Period | Year Ended | Six-Month Period | Year Ended | ||||||||||
| Ended June 30, 2020 (Unaudited) | December 31, 2019 | Ended June 30, 2020 (Unaudited) | December 31, 2019 | Ended June 30, 2020 (Unaudited) | December 31, 2019 | Ended June 30, 2020 (Unaudited) | December 31, 2019 | Ended June 30, 2020 (Unaudited) | December 31, 2019 | ||||||||||
| Increase (Decrease) in net assets: | |||||||||||||||||||
| Operations: | |||||||||||||||||||
Net investment income (loss) | $ 430,735 | $ 2,051,534 | $ 841,261 | $ 5,068,598 | $ 2,379,494 | $ 20,259,475 | $ 621,414 | $ 25,446,618 | $ (393,485) | $ 3,921,953 | |||||||||
Net realized gain on investments and capital gain distributions received from underlying mutual funds | 493,979 | 1,730,912 | 1,241,718 | 5,806,881 | 4,301,969 | 33,378,374 | 2,196,619 | 83,219,346 | 1,275,220 | 22,480,647 | |||||||||
Change in unrealized appreciation/depreciation on investments | 496,275 | 5,686,469 | (3,333,351) | 24,407,923 | (36,871,517) | 146,133,437 | (94,688,819) | 309,819,405 | (23,846,309) | 74,490,301 | |||||||||
Change in net assets from operations | 1,420,989 | 9,468,915 | (1,250,372) | 35,283,402 | (30,190,054) | 199,771,286 | (91,870,786) | 418,485,369 | (22,964,574) | 100,892,901 | |||||||||
| Distributions: | |||||||||||||||||||
Distributions to shareholders | — | (2,260,264) | — | (7,104,987) | — | (22,640,298) | — | (48,028,519) | — | (12,213,533) | |||||||||
Return of capital | — | — | — | (372,215) | — | (17,493,344) | — | (57,954,547) | — | (6,226,565) | |||||||||
Total distributions | — | (2,260,264) | — | (7,477,202) | — | (40,133,642) | — | (105,983,066) | — | (18,440,098) | |||||||||
| Capital transactions: | |||||||||||||||||||
Received from shares sold | 11,019,520 | 12,487,482 | 6,475,632 | 15,863,306 | 11,227,020 | 21,587,318 | 11,611,290 | 25,139,402 | 4,380,188 | 10,394,211 | |||||||||
Received from dividends reinvested | — | 2,260,264 | — | 7,477,202 | — | 40,133,642 | — | 105,983,066 | — | 18,440,098 | |||||||||
Paid for shares redeemed | (7,598,264) | (25,853,548) | (17,489,356) | (65,140,990) | (71,155,524) | (258,751,251) | (125,092,599) | (427,228,533) | (31,373,892) | (101,803,149) | |||||||||
Change in net assets from capital transactions | 3,421,256 | (11,105,802) | (11,013,724) | (41,800,482) | (59,928,504) | (197,030,291) | (113,481,309) | (296,106,065) | (26,993,704) | (72,968,840) | |||||||||
Change in net assets | 4,842,245 | (3,897,151) | (12,264,096) | (13,994,282) | (90,118,558) | (37,392,647) | (205,352,095) | 16,396,238 | (49,958,278) | 9,483,963 | |||||||||
| Net assets: | |||||||||||||||||||
Beginning of period | 75,102,915 | 79,000,066 | 223,223,668 | 237,217,950 | 1,109,498,233 | 1,146,890,880 | 1,961,385,083 | 1,944,988,845 | 433,635,690 | 424,151,727 | |||||||||
End of period | $79,945,160 | $ 75,102,915 | $210,959,572 | $223,223,668 | $1,019,379,675 | $1,109,498,233 | $1,756,032,988 | $1,961,385,083 | $383,677,412 | $ 433,635,690 | |||||||||
| Financial Highlights |
| Selected per-share data | Ratios and supplemental data | ||||||||||||
| Operations | Distributions | Ratios to average net assets | |||||||||||
| Ratios net of expenses reduced or reimbursed by adviser | Ratios assuming no expenses reduced or reimbursed by adviser | ||||||||||||
| Net asset value, beginning of year or period | Net investment income (loss) | Net realized and unrealized gain (loss) | Total from operations | Distributions to shareholders | Net asset value, end of year or period | Total Return# | Expenses | Net investment income (loss) | Expenses | Net assets, end of year or period (millions) | Portfolio turnover rate | ||
| ON Bond Portfolio | |||||||||||||
Six-Month Period Ended June 30, 2020+ | $19.10 | 0.30 | 0.45 | 0.75 | — | $19.85 | 3.93%* | 0.61% ** | 2.94%** | 0.61%** | $276.2 | 42% * | |
Year Ended December 31, 2019 | $17.02 | 0.55 | 1.96 | 2.51 | (0.43) | $19.10 | 14.73% | 0.60% | 3.19% | 0.60% | $290.5 | 60% | |
Year Ended December 31, 2018 | $17.56 | 0.64 | (1.18) | (0.54) | — | $17.02 | (3.08)% | 0.59% | 3.27% | 0.59% | $257.7 | 40% | |
Year Ended December 31, 2017 | $16.54 | 0.04 | 0.98 | 1.02 | — | $17.56 | 6.17% | 0.63% | 3.16% | 0.63% | $317.3 | 114% | |
Year Ended December 31, 2016 | $15.33 | 0.59 | 0.62 | 1.21 | — | $16.54 | 7.89% | 0.65% | 3.33% | 0.65% | $158.7 | 88% | |
| ON BlackRock Balanced Allocation Portfolio | |||||||||||||
Six-Month Period Ended June 30, 2020+ | $34.30 | 0.30 | (0.35) | (0.05) | — | $34.25 | (0.15)%* | 0.56%** | 1.72%** | 0.56%** | $501.3 | 67%* | |
Year Ended December 31, 2019 | $27.85 | 0.26 | 7.85 | 8.11 | (1.66) | $34.30 | 29.29% | 0.59% | 1.77% | 0.59% | $545.2 | 97% (a) | |
Year Ended December 31, 2018 | $32.60 | 0.40 | (5.15) | (4.75) | — | $27.85 | (14.57)% | 0.77% | 1.16% | 0.77% | $ 53.6 | 225% | |
Year Ended December 31, 2017 | $26.93 | 0.31 | 5.36 | 5.67 | — | $32.60 | 21.05% | 0.78% | 1.02% | 0.78% | $ 68.4 | 187% | |
Year Ended December 31, 2016 | $24.43 | 0.25 | 2.25 | 2.50 | — | $26.93 | 10.23% | 0.80% | 1.09% | 0.80% | $ 57.9 | 194% | |
| ON BlackRock Advantage International Equity Portfolio | |||||||||||||
Six-Month Period Ended June 30, 2020+ | $15.52 | 0.13 | (1.97) | (1.84) | — | $13.68 | (11.86)%* | 0.90%** | 2.11%** | 0.90%** | $450.1 | 106%* | |
Year Ended December 31, 2019 | $13.07 | 0.34 | 2.37 | 2.71 | (0.26) | $15.52 | 20.72% | 0.87% | 2.15% | 0.87% | $474.2 | 105% (b) | |
Year Ended December 31, 2018 | $15.08 | 0.23 | (2.24) | (2.01) | — | $13.07 | (13.33)% | 0.86% | 1.93% | 0.86% | $518.8 | 44% | |
Year Ended December 31, 2017 | $11.89 | 0.18 | 3.01 | 3.19 | — | $15.08 | 26.83% | 1.06% | 1.25% | 1.06% | $158.1 | 132% (c) | |
Year Ended December 31, 2016 | $12.50 | 0.22 | (0.83) | (0.61) | — | $11.89 | (4.88)% | 1.02% | 1.57% | 1.02% | $141.5 | 69% | |
| ON Janus Henderson Forty Portfolio | |||||||||||||
Six-Month Period Ended June 30, 2020+ | $26.06 | (0.02) | 2.57 | 2.55 | — | $28.61 | 9.79%* | 0.79%** | (0.14)%** | 0.79%** | $185.1 | 21%* | |
Year Ended December 31, 2019 | $20.97 | (—) (d) | 7.25 | 7.25 | (2.16) | $26.06 | 34.89% | 0.81% | (—)% (d) | 0.81% | $196.9 | 53% | |
Year Ended December 31, 2018 | $19.93 | (0.03) | 1.07 | 1.04 | — | $20.97 | 5.22% | 0.87% | (0.15)% | 0.87% | $149.3 | 48% | |
Year Ended December 31, 2017 | $15.61 | (0.03) | 4.35 | 4.32 | — | $19.93 | 27.67% | 0.96% | (0.15)% | 0.96% | $ 60.6 | 57% | |
Year Ended December 31, 2016 | $15.09 | (0.02) | 0.54 | 0.52 | — | $15.61 | 3.45% | 0.95% | (0.09)% | 0.95% | $ 49.9 | 63% | |
| + | Unaudited |
| * | Not annualized |
| ** | Annualized |
| (a) | The cost of purchases and proceeds from sales of Portfolio securities that were incurred to realign the Portfolio’s holdings subsequent to the August 23, 2019 reorganization are excluded from the portfolio turnover rate calculation. See Note 3 of the Notes to Financial Statements for further information regarding this reorganization. If such amounts had not been excluded, the portfolio turnover rate would have been 261%. Effective February 1, 2019, the sub-adviser for the equity portion of the ON BlackRock Balanced Allocation Portfolio changed from Suffolk Capital Management, LLC to BlackRock Investment Management, LLC ("BlackRock"). |
| (b) | Effective December 7, 2019, the sub-adviser to the ON ON BlackRock Advantage International Equity Portfolio changed from Lazard Asset Management LLC to BlackRock Investment Management, LLC. Costs of purchases and proceeds from sales of portfolio securities associated with the change in sub-advisers contributed to a higher portfolio turnover rate for the year ended December 31, 2019 as compared to prior years. |
| (c) | Effective May 1, 2017, the sub-adviser to the ON BlackRock Advantage International Equity Portfolio changed from Federated Global Investment Management Corp. to Lazard Asset Management LLC. Costs of purchases and proceeds from sales of portfolio securities associated with the change in the sub-adviser contributed to a higher portfolio turnover rate for the year ended December 31, 2017 as compared to prior years. |
| (d) | Less than $0.005 per share, or 0.005%. |
| Financial Highlights |
| Selected per-share data | Ratios and supplemental data | ||||||||||||
| Operations | Distributions | Ratios to average net assets | |||||||||||
| Ratios net of expenses reduced or reimbursed by adviser | Ratios assuming no expenses reduced or reimbursed by adviser | ||||||||||||
| Net asset value, beginning of year or period | Net investment income (loss) | Net realized and unrealized gain (loss) | Total from operations | Distributions to shareholders | Net asset value, end of year or period | Total Return# | Expenses | Net investment income (loss) | Expenses | Net assets, end of year or period (millions) | Portfolio turnover rate | ||
| ON Janus Henderson Venture Portfolio | |||||||||||||
Six-Month Period Ended June 30, 2020+ | $33.89 | (0.07) | (1.23) | (1.30) | — | $32.59 | (3.84)%* | 0.90% ** | (0.42)%** | 0.90%** | $ 159.4 | 13% * | |
Year Ended December 31, 2019 | $30.89 | (0.15) | 8.87 | 8.72 | (5.72) | $33.89 | 28.61% | 0.88% | (0.35)% | 0.88% | $ 170.7 | 17% | |
Year Ended December 31, 2018 | $32.99 | (0.10) | (2.00) | (2.10) | — | $30.89 | (6.37)% | 0.85% | (0.23)% | 0.85% | $ 207.4 | 33% | |
Year Ended December 31, 2017 | $26.61 | (0.06) | 6.44 | 6.38 | — | $32.99 | 23.98% | 0.85% | (0.19)% | 0.85% | $ 276.2 | 26% | |
Year Ended December 31, 2016 | $25.01 | 0.01 | 1.59 | 1.60 | — | $26.61 | 6.40% | 0.86% | 0.04% | 0.86% | $ 232.3 | 25% | |
| ON Janus Henderson Enterprise Portfolio | |||||||||||||
Six-Month Period Ended June 30, 2020+ | $48.53 | (—) (a) | (4.02) | (4.02) | — | $44.51 | (8.28)%* | 0.97%** | (0.01)%** | 0.97%** | $ 95.5 | 6%* | |
Year Ended December 31, 2019 | $37.36 | 0.05 | 13.54 | 13.59 | (2.42) | $48.53 | 36.57% | 0.96% | 0.10% | 0.96% | $ 110.0 | 10% | |
Year Ended December 31, 2018 | $38.60 | 0.02 | (1.26) | (1.24) | — | $37.36 | (3.21)% | 0.96% | 0.06% | 0.96% | $ 102.6 | 103% (b) | |
Year Ended December 31, 2017 | $30.37 | (0.09) | 8.32 | 8.23 | — | $38.60 | 27.10% | 0.98% | (0.24)% | 0.98% | $ 77.8 | 57% | |
Year Ended December 31, 2016 | $29.90 | (0.09) | 0.56 | 0.47 | — | $30.37 | 1.57% | 0.98% | (0.29)% | 0.98% | $ 70.2 | 61% | |
| ON S&P 500® Index Portfolio | |||||||||||||
Six-Month Period Ended June 30, 2020+ | $33.29 | 0.27 | (1.35) | (1.08) | — | $32.21 | (3.24)%* | 0.39%** | 1.65%** | 0.39%** | $1,094.2 | 3%* | |
Year Ended December 31, 2019 | $28.11 | 0.57 | 8.00 | 8.57 | (3.39) | $33.29 | 30.97% | 0.39% | 1.64% | 0.39% | $1,202.6 | 7% | |
Year Ended December 31, 2018 | $29.52 | 0.48 | (1.89) | (1.41) | — | $28.11 | (4.78)% | 0.38% | 1.58% | 0.38% | $1,111.5 | 18% | |
Year Ended December 31, 2017 | $24.32 | 0.37 | 4.83 | 5.20 | — | $29.52 | 21.38% | 0.38% | 1.65% | 0.38% | $1,144.2 | 8% | |
Year Ended December 31, 2016 | $21.82 | 0.25 | 2.25 | 2.50 | — | $24.32 | 11.46% | 0.42% | 1.84% | 0.42% | $ 842.6 | 8% | |
| ON BlackRock Advantage Large Cap Value Portfolio | |||||||||||||
Six-Month Period Ended June 30, 2020+ | $18.75 | 0.15 | (2.92) | (2.77) | — | $15.98 | (14.77)%* | 0.75%** | 1.92%** | 0.75%** | $ 281.5 | 76%* | |
Year Ended December 31, 2019 | $16.37 | 0.76 | 2.38 | 3.14 | (0.76) | $18.75 | 19.21% | 0.77% | 3.94% | 0.77% | $ 320.7 | 127% (c) | |
Year Ended December 31, 2018 | $17.88 | 0.87 | (2.38) | (1.51) | — | $16.37 | (8.45)% | 0.76% | 3.88% | 0.76% | $ 321.8 | 18% | |
Year Ended December 31, 2017 | $15.60 | 0.59 | 1.69 | 2.28 | — | $17.88 | 14.62% | 0.75% | 3.77% | 0.75% | $ 596.7 | 27% | |
Year Ended December 31, 2016 | $14.07 | 0.36 | 1.17 | 1.53 | — | $15.60 | 10.87% | 0.78% | 3.19% | 0.78% | $ 475.5 | 32% | |
| + | Unaudited |
| * | Not annualized |
| ** | Annualized |
| (a) | Less than $0.005 per share, or 0.005%. |
| (b) | Effective May 1, 2018, the sub-adviser changed from Goldman Sachs Asset Management, L.P. to Janus Capital Management LLC. Costs of purchases and proceeds from sales of portfolio securities associated with the change in the sub-adviser contributed to a higher portfolio turnover rate for the year ended December 31, 2018 as compared to prior years. |
| (c) | Effective December 7, 2019, the sub-adviser changed from Federated Equity Management Company of Pennsylvania to BlackRock Investment Management, LLC. Costs of purchases and proceeds from sales of portfolio securities associated with the change in the sub-adviser contributed to a higher portfolio turnover rate for the year ended December 31, 2019 as compared to prior years. |
| Financial Highlights |
| Selected per-share data | Ratios and supplemental data | ||||||||||||
| Operations | Distributions | Ratios to average net assets | |||||||||||
| Ratios net of expenses reduced or reimbursed by adviser | Ratios assuming no expenses reduced or reimbursed by adviser | ||||||||||||
| Net asset value, beginning of year or period | Net investment income (loss) | Net realized and unrealized gain (loss) | Total from operations | Distributions to shareholders | Net asset value, end of year or period | Total Return# | Expenses | Net investment income (loss) | Expenses | Net assets, end of year or period (millions) | Portfolio turnover rate | ||
| ON Federated High Income Bond Portfolio | |||||||||||||
Six-Month Period Ended June 30, 2020+ | $20.69 | 0.59 | (1.37) | (0.78) | — | $19.91 | (3.77)%* | 0.82% ** | 5.28%** | 0.82%** | $168.1 | 15% * | |
Year Ended December 31, 2019 | $18.73 | 1.14 | 1.70 | 2.84 | (0.88) | $20.69 | 15.29% | 0.80% | 5.34% | 0.80% | $198.7 | 23% | |
Year Ended December 31, 2018 | $19.36 | 1.41 | (2.04) | (0.63) | — | $18.73 | (3.25)% | 0.75% | 5.39% | 0.75% | $202.1 | 14% | |
Year Ended December 31, 2017 | $18.10 | 1.04 | 0.22 | 1.26 | — | $19.36 | 6.96% | 0.74% | 5.21% | 0.74% | $319.1 | 30% | |
Year Ended December 31, 2016 | $15.82 | 0.43 | 1.85 | 2.28 | — | $18.10 | 14.41% | 0.80% | 5.56% | 0.80% | $313.8 | 30% | |
| ON Nasdaq-100® Index Portfolio | |||||||||||||
Six-Month Period Ended June 30, 2020+ | $19.83 | 0.07 | 3.24 | 3.31 | — | $23.14 | 16.69%* | 0.43%** | 0.59%** | 0.43%** | $350.5 | 2%* | |
Year Ended December 31, 2019 | $16.60 | 0.14 | 6.15 | 6.29 | (3.06) | $19.83 | 38.86% | 0.42% | 0.66% | 0.42% | $353.0 | 8% | |
Year Ended December 31, 2018 | $16.67 | 0.12 | (0.19) | (0.07) | — | $16.60 | (0.42)% | 0.41% | 0.67% | 0.41% | $327.6 | 22% | |
Year Ended December 31, 2017 | $12.59 | 0.07 | 4.01 | 4.08 | — | $16.67 | 32.41% | 0.45% | 0.71% | 0.45% | $257.2 | 9% | |
Year Ended December 31, 2016 | $11.80 | 0.09 | 0.70 | 0.79 | — | $12.59 | 6.69% | 0.48% | 0.84% | 0.48% | $156.1 | 13% | |
| ON BlackRock Advantage Large Cap Core Portfolio | |||||||||||||
Six-Month Period Ended June 30, 2020+ | $32.95 | 0.19 | (1.10) | (0.91) | — | $32.04 | (2.76)%* | 0.71%** | 1.18%** | 0.71%** | $382.1 | 66%* | |
Year Ended December 31, 2019 | $24.79 | 0.22 | 8.10 | 8.32 | (0.16) | $32.95 | 33.60% | 0.74% | 1.28% | 0.74% | $430.6 | 152% (a) | |
Year Ended December 31, 2018 | $30.22 | 0.20 | (5.63) | (5.43) | — | $24.79 | (17.97)% | 0.82% | 0.63% | 0.82% | $155.3 | 272% | |
Year Ended December 31, 2017 | $24.02 | 0.16 | 6.04 | 6.20 | — | $30.22 | 25.81% | 0.82% | 0.47% | 0.82% | $223.7 | 220% | |
Year Ended December 31, 2016 | $21.49 | 0.12 | 2.41 | 2.53 | — | $24.02 | 11.77% | 0.83% | 0.49% | 0.83% | $207.9 | 223% | |
| ON BlackRock Advantage Small Cap Growth Portfolio | |||||||||||||
Six-Month Period Ended June 30, 2020+ | $31.42 | (0.02) | (1.09) | (1.11) | — | $30.31 | (3.53)%* | 0.86%** | (0.12)%** | 0.86%** | $180.8 | 49%* | |
Year Ended December 31, 2019 | $23.62 | 0.02 | 8.02 | 8.04 | (0.24) | $31.42 | 34.07% | 0.91% | 0.11% | 0.91% | $204.8 | 114% (a) | |
Year Ended December 31, 2018 | $24.91 | (0.26) | (1.03) | (1.29) | — | $23.62 | (5.18)% | 1.05% | (0.55)% | 1.05% | $ 25.5 | 201% | |
Year Ended December 31, 2017 | $20.49 | (0.21) | 4.63 | 4.42 | — | $24.91 | 21.57% | 0.98% | (0.55)% | 0.98% | $ 56.8 | 196% | |
Year Ended December 31, 2016 | $19.60 | (0.19) | 1.08 | 0.89 | — | $20.49 | 4.54% | 0.92% | (0.62)% | 0.92% | $ 94.6 | 188% | |
| + | Unaudited |
| * | Not annualized |
| ** | Annualized |
| (a) | The cost of purchases and proceeds from sales of Portfolio securities that were incurred to realign the Portfolios holdings subsequent to the August 23, 2019 reorganization are excluded from the portfolio turnover rate calculation. If such amounts had not been excluded, the portfolio turnover rates would have been 211% for the ON BlackRock Advantage Large Cap Core Portfolio and and 177% for the ON BlackRock Advantage Small Cap Growth Portolio. Effective February 1, 2019, the sub-adviser to the Portfolios changed from Suffolk Capital Management, LLC to BlackRock Investment Management, LLC. |
| Financial Highlights |
| Selected per-share data | Ratios and supplemental data | ||||||||||||
| Operations | Distributions | Ratios to average net assets | |||||||||||
| Ratios net of expenses reduced or reimbursed by adviser | Ratios assuming no expenses reduced or reimbursed by adviser | ||||||||||||
| Net asset value, beginning of year or period | Net investment income | Net realized and unrealized gain (loss) | Total from operations | Distributions to shareholders | Net asset value, end of year or period | Total Return# | Expenses | Net investment income | Expenses | Net assets, end of year or period (millions) | Portfolio turnover rate | ||
| ON S&P MidCap 400® Index Portfolio | |||||||||||||
Six-Month Period Ended June 30, 2020+ | $19.25 | 0.12 | (2.60) | (2.48) | — | $16.77 | (12.88)%* | 0.42% ** | 1.42%** | 0.42%** | $375.4 | 20% * | |
Year Ended December 31, 2019 | $15.46 | 0.21 | 3.74 | 3.95 | (0.16) | $19.25 | 25.58% | 0.44% | 1.37% | 0.44% | $450.9 | 39% | |
Year Ended December 31, 2018 | $17.46 | 0.10 | (2.10) | (2.00) | — | $15.46 | (11.45)% | 0.51% | 1.32% | 0.51% | $306.6 | 28% | |
Year Ended December 31, 2017 | $15.12 | 0.04 | 2.30 | 2.34 | — | $17.46 | 15.48% | 0.71% | 0.92% | 0.71% | $ 88.8 | 41% | |
Year Ended December 31, 2016 | $13.81 | 0.17 | 1.14 | 1.31 | — | $15.12 | 9.49% | 0.79% | 1.24% | 0.79% | $ 47.9 | 179% (a) | |
| ON BlackRock Advantage Large Cap Growth Portfolio | |||||||||||||
Six-Month Period Ended June 30, 2020+ | $27.54 | 0.06 | 2.23 | 2.29 | — | $29.83 | 8.32%* | 0.81%** | 0.36%** | 0.81%** | $101.5 | 68%* | |
Year Ended December 31, 2019 | $20.59 | 0.16 | 7.77 | 7.93 | (0.98) | $27.54 | 38.68% | 0.80% | 0.62% | 0.80% | $113.2 | 214% | |
Year Ended December 31, 2018 | $24.19 | 0.12 | (3.72) | (3.60) | — | $20.59 | (14.88)% | 0.88% | 0.43% | 0.88% | $ 87.5 | 269% | |
Year Ended December 31, 2017 | $18.65 | 0.07 | 5.47 | 5.54 | — | $24.19 | 29.71% | 0.88% | 0.24% | 0.88% | $128.0 | 218% | |
Year Ended December 31, 2016 | $17.31 | 0.07 | 1.27 | 1.34 | — | $18.65 | 7.74% | 0.89% | 0.36% | 0.89% | $117.6 | 162% | |
| ON Risk Managed Balanced Portfolio | |||||||||||||
Six-Month Period Ended June 30, 2020+ | $14.81 | 0.08 | 0.90 | 0.98 | — | $15.79 | 6.62%* | 0.99%** | 0.93%** | 0.99%** | $391.4 | 102%* (b), (c) | |
Year Ended December 31, 2019 | $12.91 | 0.21 | 3.01 | 3.22 | (1.32) | $14.81 | 25.16% | 0.99% | 1.39% | 0.99% | $403.6 | 105% (c) | |
Year Ended December 31, 2018 | $13.01 | 0.17 | (0.27) | (0.10) | — | $12.91 | (0.77)% | 0.99% | 1.27% | 0.99% | $347.1 | 131% (c) | |
Year Ended December 31, 2017 | $11.06 | 0.14 | 1.81 | 1.95 | — | $13.01 | 17.63% | 1.00% | 1.22% | 1.00% | $344.2 | 72% (c) | |
Year Ended December 31, 2016 | $10.66 | 0.09 | 0.31 | 0.40 | — | $11.06 | 3.75% | 1.03% | 1.09% | 1.03% | $272.1 | 78% | |
| ON Federated Core Plus Bond Portfolio | |||||||||||||
Period From May 1, 2020 (inception) to June 30, 2020+ | $10.00 | 0.02 | 0.16 | 0.18 | — | $10.18 | 1.80%* | 0.65%** | 1.50%** | 0.65%** | $217.6 | 7%* | |
| + | Unaudited |
| * | Not annualized |
| ** | Annualized |
| (a) | Effective December 16, 2016, the sub-adviser to the Portfolio changed from First Trust Advisors L.P. to Geode Capital Management, LLC. Costs of purchases and proceeds from sales of portfolio securities associated with the change in the sub-adviser contributed to a higher portfolio turnover rate for the year ended December 31, 2016 as compared to prior years. |
| (b) | Effective May 1, 2020, the sub-adviser(s) to the ON Risk Managed Balanced Portfolio changed from Janus Capital Management LLC and AnchorPath Financial, LLC to AllianceBerstein, L.P. Costs of purchases and proceeds from sales of portfolio securities associated with the change in the sub-adviser contributed to a higher portfolio turnover rate for the six-month period ended June 30, 2020 as compared to prior years. |
| (c) | The portfolio turnover calculation includes purchases and sales from mortgage dollar roll transactions. Without the effect of mortgage dollar roll transactions, the portfolio turnover rate would have been 89% for the six-month period ended June 30, 2020, 84% for the year ended December 31, 2019, 102% for the year ended December 31, 2018, and 63% for the year ended December 31, 2017 (see Note 2 of the Notes to Financial Statements). |
| Financial Highlights |
| Selected per-share data | Ratios and supplemental data | ||||||||||||||
| Operations | Distributions | Ratios to average net assets | |||||||||||||
| Ratios net of expenses reduced or reimbursed by adviser | Ratios assuming no expenses reduced or reimbursed by adviser | ||||||||||||||
| Net asset value, beginning of year or period | Net investment income (loss) | Net realized and unrealized gain (loss) | Total from operations | Distributions to shareholders | Return of capital | Total distributions | Net asset value, end of year or period | Total Return# | Expenses † | Net investment income (loss)† | Expenses † | Net assets, end of year or period (millions) | Portfolio turnover rate | ||
| ON Conservative Model Portfolio | |||||||||||||||
Six-Month Period Ended June 30, 2020+ | $11.21 | 0.06 | 0.11 | 0.17 | — | — | — | $11.38 | 1.52%* | 0.38% ** | 1.14%** | 0.57%** | $ 79.9 | 21% * | |
Year Ended December 31, 2019 | $10.21 | 0.31 | 1.04 | 1.35 | (0.35) | — | (0.35) | $11.21 | 13.18% | 0.26% | 2.70% | 0.55% | $ 75.1 | 23% | |
Year Ended December 31, 2018 | $10.53 | 0.20 | (0.52) | (0.32) | — | — | — | $10.21 | (3.04)% | 0.27% | 1.70% | 0.52% | $ 79.0 | 35% | |
Period From March 1, 2017 (inception) to June 30, 2017 | $10.00 | 0.16 | 0.37 | 0.53 | — | — | — | $10.53 | 5.30% | 0.25% ** | 1.71% ** | 0.51% ** | $ 99.7 | 29% * | |
| ON Moderately Conservative Model Portfolio | |||||||||||||||
Six-Month Period Ended June 30, 2020+ | $11.37 | 0.05 | (0.10) | (0.05) | — | — | — | $11.32 | (0.44)%* | 0.40%** | 0.80%** | 0.48%** | $ 211.0 | 18%* | |
Year Ended December 31, 2019 | $10.09 | 0.26 | 1.41 | 1.67 | (0.37) | (0.02) | (0.39) | $11.37 | 16.58% | 0.35% | 2.22% | 0.46% | $ 223.2 | 18% | |
Year Ended December 31, 2018 | $10.69 | 0.15 | (0.75) | (0.60) | — | — | — | $10.09 | (5.61)% | 0.28% | 1.26% | 0.45% | $ 237.2 | 38% | |
Period From March 1, 2017 (inception) to June 30, 2017 | $10.00 | 0.13 | 0.56 | 0.69 | — | — | — | $10.69 | 6.90% | 0.25% ** | 1.40% ** | 0.45% ** | $ 326.0 | 22% * | |
| ON Balanced Model Portfolio | |||||||||||||||
Six-Month Period Ended June 30, 2020+ | $11.48 | 0.03 | (0.33) | (0.30) | — | — | — | $11.18 | (2.61)%* | 0.39%** | 0.47%** | 0.44%** | $1,019.4 | 16%* | |
Year Ended December 31, 2019 | $ 9.97 | 0.21 | 1.73 | 1.94 | (0.24) | (0.19) | (0.43) | $11.48 | 19.46% | 0.36% | 1.82% | 0.43% | $1,109.5 | 22% | |
Year Ended December 31, 2018 | $10.81 | 0.09 | (0.93) | (0.84) | — | — | — | $ 9.97 | (7.77)% | 0.31% | 0.77% | 0.42% | $1,146.9 | 37% | |
Period From March 1, 2017 (inception) to June 30, 2017 | $10.00 | 0.09 | 0.72 | 0.81 | — | — | — | $10.81 | 8.10% | 0.25% ** | 1.01% ** | 0.42% ** | $1,562.6 | 25% * | |
| ON Moderate Growth Model Portfolio | |||||||||||||||
Six-Month Period Ended June 30, 2020+ | $11.63 | — (a) | (0.52) | (0.52) | — | — | — | $11.11 | (4.47)%* | 0.43%** | 0.07%** | 0.44%** | $1,756.0 | 11%* | |
Year Ended December 31, 2019 | $ 9.93 | 0.16 | 2.20 | 2.36 | (0.30) | (0.36) | (0.66) | $11.63 | 23.81% | 0.43% | 1.31% | 0.44% | $1,961.4 | 20% | |
Year Ended December 31, 2018 | $11.05 | 0.05 | (1.17) | (1.12) | — | — | — | $ 9.93 | (10.14)% | 0.35% | 0.42% | 0.42% | $1,945.0 | 49% | |
Period From March 1, 2017 (inception) to June 30, 2017 | $10.00 | 0.07 | 0.98 | 1.05 | — | — | — | $11.05 | 10.50% | 0.26% ** | 0.80% ** | 0.42% ** | $2,646.8 | 23% * | |
| ON Growth Model Portfolio | |||||||||||||||
Six-Month Period Ended June 30, 2020+ | $11.94 | (0.01) | (0.61) | (0.62) | — | — | — | $11.32 | (5.19)%* | 0.45%** | (0.21)%** | 0.48%** | $ 383.7 | 5%* | |
Year Ended December 31, 2019 | $ 9.86 | 0.11 | 2.50 | 2.61 | (0.35) | (0.18) | (0.53) | $11.94 | 26.47% | 0.45% | 0.92% | 0.47% | $ 433.6 | 18% | |
Year Ended December 31, 2018 | $11.15 | 0.02 | (1.31) | (1.29) | — | — | — | $ 9.86 | (11.57)% | 0.31% | 0.17% | 0.43% | $ 424.2 | 62% | |
Period From March 1, 2017 (inception) to June 30, 2017 | $10.00 | 0.05 | 1.10 | 1.15 | — | — | — | $11.15 | 11.50% | 0.25% ** | 0.51% ** | 0.43% ** | $ 543.8 | 24% * | |
| + | Unaudited |
| * | Not annualized |
| ** | Annualized |
| (a) | Less than $0.005 per share, or 0.005%. |
| Notes to Financial Statements | June 30, 2020 (Unaudited) |
| ■ | ON Bond Portfolio – High level of income and opportunity for capital appreciation consistent with preservation of capital by investing, under normal circumstances, at least 80% of its net assets in corporate debt securities. |
| ■ | ON BlackRock Balanced Allocation Portfolio – High level of long-term total return consistent with preservation of capital by investing in stocks, bonds, and money market instruments. |
| ■ | ON BlackRock Advantage International Equity Portfolio (formerly ON International Equity Portfolio) – Long-term growth of capital by investing, under normal circumstances, at least 80% of its net assets in non-U.S. equity securities and equity-like instruments of companies that are components of, or have characteristics similar to, the companies included in the MSCI EAFE Index (Net - USD) |
| ■ | ON Janus Henderson Forty Portfolio – Long-term capital growth by investing primarily in domestic and foreign equity securities selected for growth potential. |
| ■ | ON Janus Henderson Venture Portfolio – Long-term capital appreciation by investing, under normal circumstances, at least 80% of its net assets in stocks of small capitalization companies. |
| ■ | ON Janus Henderson Enterprise Portfolio – Long-term total return by investing, under normal circumstances, at least 50% of its net assets in equity securities of mid-cap companies, primarily those that are strategically positioned for long-term growth. |
| ■ | ON S&P 500® Index Portfolio – Total return approximating that of the Standard & Poor's 500® Index (S&P 500® Index), at a risk level consistent with that of the S&P 500® Index by investing, under normal circumstances, more than 80% of its net assets in securities included in the S&P 500® Index. |
| ■ | ON BlackRock Advantage Large Cap Value Portfolio – Growth of capital by investing, under normal circumstances, at least 80% of its net assets in stocks of large capitalization companies with market capitalizations at the time of investment that are within the range of market capitalizations of the companies in the Russell 1000® Value Index for the previous twelve months. |
| ■ | ON Federated High Income Bond Portfolio – High current income by investing, under normal circumstances, at least 80% of its net assets in lower rated corporate debt obligations commonly referred to as "junk bonds". The Portfolio's investments are generally rated BB or lower by Standard & Poor’s or Fitch, or Ba or lower by Moody's. |
| ■ | ON Nasdaq-100® Index Portfolio – Long-term growth of capital by investing, under normal circumstances, more than 80% of its net assets in the common stocks of companies that are included in the Nasdaq-100® Index. |
| ■ | ON BlackRock Advantage Large Cap Core Portfolio – Long-term growth of capital by investing, under normal circumstances, at least 80% of its net assets in common stocks of the 1,000 largest publicly traded U.S. companies in terms of market capitalization. |
| ■ | ON BlackRock Advantage Small Cap Growth Portfolio – Long-term growth of capital by investing, under normal circumstances, at least 80% of its net assets in stocks of companies with a market capitalization at the time of investment that is no greater than the largest market capitalization of a company in the Russell 2000® Index for the previous twelve months. |
| ■ | ON S&P MidCap 400® Index Portfolio – Total return approximating that of the Standard & Poor’s MidCap 400® Index (S&P MidCap 400® Index), including reinvestment of dividends, at a risk level consistent with that of the S&P MidCap 400® Index by investing, under normal circumstances, more than 80% of its net assets in the securities included in the S& P MidCap 400® Index. |
| ■ | ON BlackRock Advantage Large Cap Growth Portfolio – Long-term growth of capital by investing, under normal circumstances, at least 80% of its net assets in stocks of companies with market capitalizations at the time of investment that are within the range of market capitalizations of the companies in the Russell 1000® Growth Index for the previous twelve months. |
| ■ | ON Risk Managed Balanced Portfolio – Long-term capital growth, consistent with preservation of capital and balanced by current income. The Portfolio invests in a balanced portfolio of equity and fixed-income securities and a risk management portfolio intended to enhance the risk adjusted return of the Portfolio. |
| Notes to Financial Statements (Continued) | June 30, 2020 (Unaudited) |
| ■ | ON Federated Core Plus Bond Portfolio - Total return by investing at least 80% of its net assets in fixed-income investments, primarily U.S. dollar denominated, investment-grade, fixed income securities. Investment-grade, fixed income securities are rated in one of the four highest categories (BBB- or higher) by a nationally recognized statistical rating organization (“NRSRO”). |
| ■ | ON Conservative Model Portfolio* – Current income and preservation of capital by investing in underlying mutual funds. Under normal circumstances, the Portfolio intends to have investment exposure to various asset classes within the following target asset allocation ranges: U.S. Equity 0-25%, International Equity 0-10%, and Fixed Income 65-90%. |
| ■ | ON Moderately Conservative Model Portfolio* – Current income and moderate growth of capital with a greater emphasis on current income by investing in underlying mutual funds. Under normal circumstances, the Portfolio intends to have investment exposure to various asset classes within the following target asset allocation ranges: U.S. Equity 20-40%, International Equity 5-20%, and Fixed Income 30-70%. |
| ■ | ON Balanced Model Portfolio* – A balance between growth of capital and current income with a greater emphasis on growth of capital by investing in underlying mutual funds. Under normal circumstances, the Portfolio intends to have investment exposure to various asset classes within the following target asset allocation ranges: U.S. Equity 25-50%, International Equity 10-25%, and Fixed Income 25-50%. |
| ■ | ON Moderate Growth Model Portfolio* – Growth of capital and moderate current income with a greater emphasis on growth of capital by investing in underlying mutual funds. Under normal circumstances, the Portfolio intends to have investment exposure to various asset classes within the following target asset allocation ranges: U.S. Equity 40-60%, International Equity 15-35%, and Fixed Income 10-30%. |
| ■ | ON Growth Model Portfolio* – Growth of capital and some current income by investing in underlying mutual funds. Under normal circumstances, the Portfolio intends to have investment exposure to various asset classes within the following target asset allocation ranges: U.S. Equity 50-80%, International Equity 15-45%, and Fixed Income 0-15%. |
| * | Collectively, the "ON Model Portfolios". |
| Notes to Financial Statements (Continued) | June 30, 2020 (Unaudited) |
| Portfolio | Authorized Shares | Portfolio | Authorized Shares | |||
| ON Bond | 25,000,000 | ON BlackRock Advantage Large Cap Growth | 7,000,000 | |||
| ON BlackRock Balanced Allocation | 25,000,000 | ON Risk Managed Balanced | 45,000,000 | |||
| ON BlackRock Advantage International Equity | 55,000,000 | ON Federated Core Plus Bond | 90,000,000 | |||
| ON Janus Henderson Forty | 14,000,000 | ON Conservative Model | 10,000,000 | |||
| ON Janus Henderson Venture | 8,000,000 | ON Moderately Conservative Model | 30,000,000 | |||
| ON Janus Henderson Enterprise | 6,000,000 | ON Balanced Model | 150,000,000 | |||
| ON S&P 500® Index | 60,000,000 | ON Moderate Growth Model | 260,000,000 | |||
| ON BlackRock Advantage Large Cap Value | 30,000,000 | ON Growth Model | 60,000,000 | |||
| ON Federated High Income Bond | 15,000,000 | ON iShares Managed Risk Balanced* | 170,000,000 | |||
| ON Nasdaq-100® Index | 30,000,000 | ON iShares Managed Risk Moderate Growth* | 120,000,000 | |||
| ON BlackRock Advantage Large Cap Core | 20,000,000 | ON iShares Managed Risk Growth* | 100,000,000 | |||
| ON BlackRock Advantage Small Cap Growth | 10,000,000 | ON Janus Henderson U.S. Low Volatility* | 170,000,000 | |||
| ON S&P MidCap 400® Index | 40,000,000 |
| * | These Portfolios and their respective authorized shares have been approved, but the Portfolios are not yet in operation. |
| Notes to Financial Statements (Continued) | June 30, 2020 (Unaudited) |
| Notes to Financial Statements (Continued) | June 30, 2020 (Unaudited) |
| Level 1: | Quoted prices in active markets for identical securities. |
| Level 2: | Other significant observable inputs, including quoted prices for similar securities, interest rates, prepayment speeds, credit risk, etc. |
| Level 3: | Significant unobservable inputs, including the Fund’s own assumptions used to determine the value of securities. |
| Portfolio | Financial Instrument Type | Level 1 | Level 2 | Level 3 | ||||
ON Bond | Corporate Bonds** | $ — | $258,323,804 | $ — | ||||
| Asset-Backed Securities** | — | 5,457,820 | — | |||||
| U.S. Treasury Obligations | — | 4,323,593 | — | |||||
| Money Market Funds | 3,444,147 | — | — | |||||
| $ 3,444,147 | $268,105,217 | $ — | ||||||
ON BlackRock Balanced Allocation | Common Stocks** | $ 332,633,362 | $ — | $ — | ||||
| Corporate Bonds** | — | 152,152,818 | — | |||||
| U.S. Treasury Obligations | — | 6,545,430 | — | |||||
| Asset-Backed Securities** | — | 1,098,752 | — | |||||
| Rights** | 37,959 | — | — | |||||
| Money Market Funds | 9,046,789 | — | — | |||||
| $ 341,718,110 | $159,797,000 | $ — | ||||||
| Futures Contracts | $ 205,628 | $ — | $ — | |||||
ON BlackRock Advantage International Equity | Common Stocks** | $ 3,514,161 | $438,516,968 | $ — | ||||
| Preferred Securities** | — | 1,038,001 | — | |||||
| Rights** | 80,287 | — | — | |||||
| Money Market Funds | 6,424,447 | — | — | |||||
| $ 10,018,895 | $439,554,969 | $ — | ||||||
| Futures Contracts | $ 23,920 | $ — | $ — | |||||
ON Janus Henderson Forty | Common Stocks** | $ 181,460,362 | $ 2,897,973 | $ — | ||||
| Rights** | 6,441 | — | — | |||||
| Money Market Funds | 3,998,081 | — | — | |||||
| $ 185,464,884 | $ 2,897,973 | $ — | ||||||
ON Janus Henderson Venture | Common Stocks** | $ 155,272,319 | $ 774,519 | $ — | ||||
| Master Limited Partnerships** | 436,315 | — | — | |||||
| Rights** | 189,453 | — | — | |||||
| Money Market Funds | 4,039,236 | — | — | |||||
| $ 159,937,323 | $ 774,519 | $ — | ||||||
ON Janus Henderson Enterprise | Common Stocks** | $ 91,352,702 | $ 1,436,048 | $ — | ||||
| Money Market Funds | 2,672,159 | — | — | |||||
| $ 94,024,861 | $ 1,436,048 | $ — |
| Notes to Financial Statements (Continued) | June 30, 2020 (Unaudited) |
| Portfolio | Financial Instrument Type | Level 1 | Level 2 | Level 3 | ||||
ON S&P 500® Index | Common Stocks** | $1,091,053,475 | $ — | $ — | ||||
| Rights** | 138 | — | — | |||||
| Money Market Funds | 4,255,347 | — | — | |||||
| $1,095,308,960 | $ — | $ — | ||||||
| Futures Contracts | $ 111,196 | $ — | $ — | |||||
ON BlackRock Advantage Large Cap Value | Common Stocks** | $ 265,984,028 | $ — | $ — | ||||
| Money Market Funds | 7,662,046 | — | — | |||||
| $ 273,646,074 | $ — | $ — | ||||||
| Futures Contracts | $ 197,709 | $ — | $ — | |||||
ON Federated High Income Bond | Corporate Bonds** | $ — | $159,710,394 | $ — | ||||
| Common Stocks** | 135,175 | — | — | |||||
| Money Market Funds | 7,087,554 | — | — | |||||
| $ 7,222,729 | $159,710,394 | $ — | ||||||
ON Nasdaq-100® Index | Common Stocks** | $ 355,387,020 | $ — | $ — | ||||
| Rights** | 361 | — | — | |||||
| $ 355,387,381 | $ — | $ — | ||||||
| Futures Contracts | $ 39,080 | $ — | $ — | |||||
ON BlackRock Advantage Large Cap Core | Common Stocks** | $ 373,960,527 | $ — | $ — | ||||
| Rights** | 41,596 | — | — | |||||
| Money Market Funds | 10,750,891 | — | — | |||||
| $ 384,753,014 | $ — | $ — | ||||||
| Futures Contracts | $ 264,364 | $ — | $ — | |||||
ON BlackRock Advantage Small Cap Growth | Common Stocks** | $ 179,497,735 | $ — | $ — | ||||
| Rights** | — | 12,875 | — | |||||
| Money Market Funds | 5,298,669 | — | — | |||||
| $ 184,796,404 | $ 12,875 | $ — | ||||||
| Futures Contracts | $ 215,356 | $ — | $ — | |||||
ON S&P MidCap 400® Index | Common Stocks** | $ 373,497,486 | $ — | $ — | ||||
| Money Market Funds | 2,015,247 | — | — | |||||
| $ 375,512,733 | $ — | $ — | ||||||
| Futures Contracts | $ 52,225 | $ — | $ — | |||||
ON BlackRock Advantage Large Cap Growth | Common Stocks** | $ 100,263,722 | $ — | $ — | ||||
| Rights** | 19,153 | — | — | |||||
| Money Market Funds | 5,800,127 | — | — | |||||
| $ 106,083,002 | $ — | $ — | ||||||
| Futures Contracts | $ 66,225 | $ — | $ — |
| Notes to Financial Statements (Continued) | June 30, 2020 (Unaudited) |
| Portfolio | Financial Instrument Type | Level 1 | Level 2 | Level 3 | ||||
ON Risk Managed Balanced | Common Stocks** | $ 191,303,483 | $ — | $ — | ||||
| Corporate Bonds** | — | 76,525,304 | — | |||||
| U.S. Treasury Obligations | — | 28,867,552 | — | |||||
| Purchased Options | 11,503,206 | 16,645,650 | — | |||||
| Asset-Backed / Mortgage-Backed Securities** | — | 17,696,135 | — | |||||
| U.S. Government Agency Mortgage-Backed Securities | — | 12,752,019 | — | |||||
| Preferred Securities** | — | 2,619,512 | — | |||||
| Sovereign Issues | — | 802,750 | — | |||||
| Money Market Funds | 33,192,645 | — | — | |||||
| $ 235,999,334 | $155,908,922 | $ — | ||||||
| Futures Contracts | $ 940,899 | $ — | $ — | |||||
ON Federated Core Plus Bond | Corporate Bonds** | $ — | $ 88,275,118 | $ — | ||||
| U.S. Treasury Obligations | — | 55,751,817 | — | |||||
| U.S. Government Agency Mortgage-Backed Securities | — | 40,194,706 | — | |||||
| Investment Companies*** | 9,723,955 | — | — | |||||
| Asset-Backed Securities** | — | 5,473,782 | — | |||||
| Sovereign Issues | — | 997,190 | — | |||||
| Money Market Funds | 1,580,956 | — | — | |||||
| $ 11,304,911 | $190,692,613 | $ — | ||||||
| Futures Contracts | $ (15,813) | $ — | $ — | |||||
ON Conservative Model | Open-End Mutual Funds | $ 79,980,088 | $ — | $ — | ||||
ON Moderately Conservative Model | Open-End Mutual Funds | $ 211,033,640 | $ — | $ — | ||||
ON Balanced Model | Open-End Mutual Funds | $1,019,701,232 | $ — | $ — | ||||
ON Moderate Growth Model | Open-End Mutual Funds | $1,756,707,600 | $ — | $ — | ||||
ON Growth Model | Open-End Mutual Funds | $ 383,851,743 | $ — | $ — |
| ** | For detailed industry descriptions, see the accompanying Schedules of Investments. |
| *** | The value for shares of an investment company, totaling $6,062,283, was determined by using the net asset value per share practical expedient and, therefore, has not been included or categorized in the chart above. |
| Notes to Financial Statements (Continued) | June 30, 2020 (Unaudited) |
| Notes to Financial Statements (Continued) | June 30, 2020 (Unaudited) |
| Notes to Financial Statements (Continued) | June 30, 2020 (Unaudited) |
| Target Portfolio prior to the reorganization: | ON Foreign | |
Investment portfolio fair value | $ 38,933,135 | |
Investment portfolio cost | $ 40,686,429 | |
Unrealized portfolio appreciation (depreciation) | $ (1,753,294) | |
Net assets | $ 39,436,084 | |
Net asset value (per share, extended) | $ 25.5635 | |
Shares | 1,542,670 | |
| Survivor Portfolio prior to the reorganization: | ON BlackRock Advantage International Equity | |
Investment portfolio fair value | $403,881,706 | |
Investment portfolio cost | $413,036,626 | |
Unrealized portfolio appreciation (depreciation) | $ (9,154,920) | |
Net assets | $408,742,811 | |
Net asset value (per share, extended) | $ 13.2629 | |
Shares | 30,818,583 | |
| Survivor Portfolio subsequent to the reorganization: | ON BlackRock Advantage International Equity | |
Investment portfolio fair value | $442,814,841 | |
Investment portfolio cost | $453,723,055 | |
Unrealized portfolio appreciaton (depreciation) | $ (10,908,214) | |
Net assets | $448,178,895 | |
Net asset value (per share, extended) | $ 13.2629 | |
Shares | 33,791,993 |
| ON BlackRock Advantage International Equity | |
Net investment income | $ 4,826,239 |
Net realized/unrealized gains | (66,630,381) |
Change in net assets resulting from operations | $(61,804,142) |
| Notes to Financial Statements (Continued) | June 30, 2020 (Unaudited) |
| ON Bond |
| 0.60% of first $100 million |
| 0.50% of next $150 million |
| 0.45% of next $250 million |
| 0.40% of next $500 million |
| 0.30% of next $1 billion |
| 0.25% over $2 billion |
| ON BlackRock Balanced Allocation |
| 0.58% of first $100 million |
| 0.50% of next $150 million |
| 0.45% of next $250 million |
| 0.40% of next $500 million |
| 0.30% of next $1 billion |
| 0.25% over $2 billion |
| ON BlackRock Advantage International Equity |
| 0.72% of first $200 million |
| 0.70% of next $800 million |
| 0.66% over $1 billion |
| ON Janus Henderson Forty |
| 0.73% of first $100 million |
| 0.68% of next $400 million |
| 0.63% over $500 million |
| ON Janus Henderson Venture |
| 0.80% of first $150 million |
| 0.75% of next $150 million |
| 0.70% of next $300 million |
| 0.65% over $600 million |
| ON Janus Henderson Enterprise |
| 0.85% of first $100 million |
| 0.80% of next $100 million |
| 0.75% of next $300 million |
| 0.70% over $500 million |
| ON S&P 500® Index |
| 0.40% of first $100 million |
| 0.35% of next $150 million |
| 0.33% over $250 million |
| ON BlackRock Advantage Large Cap Value |
| 0.67% of first $500 million |
| 0.65% over $500 million |
| ON Federated High Income Bond |
| 0.75% of first $75 million |
| 0.70% of next $75 million |
| 0.65% of next $75 million |
| 0.60% over $225 million |
| ON Nasdaq-100® Index |
| 0.40% of first $100 million |
| 0.35% of next $150 million |
| 0.33% over $250 million |
| ON BlackRock Advantage Large Cap Core |
| 0.64% of first $500 million |
| 0.62% over $500 million |
| ON BlackRock Advantage Small Cap Growth |
| 0.78% of first $100 million |
| 0.75% of next $400 million |
| 0.70% over $500 million |
| ON S&P MidCap 400® Index |
| 0.40% of first $100 million |
| 0.35% of next $150 million |
| 0.33% over $250 million |
| ON BlackRock Advantage Large Cap Growth |
| 0.66% of first $500 million |
| 0.64% over $500 million |
| ON Risk Managed Balanced1 |
| 0.88% of first $500 million |
| 0.74% of next $1.3 billion |
| 0.72% over $1.8 billion |
| ON Federated Core Plus Bond |
| 0.56% of first $100 million |
| 0.54% of next $150 million |
| 0.50% of next $150 million |
| 0.45% of next $350 million |
| 0.43% over $750 million |
| ON Conservative Model |
| 0.40% of all net assets |
| ON Moderately Conservative Model |
| 0.40% of all net assets |
| ON Balanced Model |
| 0.40% of all net assets |
| ON Moderate Growth Model |
| 0.40% of all net assets |
| ON Growth Model |
| 0.40% of all net assets |
| 1 | At a meeting held on February 12, 2020, the Board, including a majority of the Directors who are not “interested persons” of the Fund (the "Independent Directors"), approved the replacement of the sub-advisers to the Portfolio. |
| Effective May 1, 2020, AllianceBerstein, L.P. (“AB”) replaced the Portfolio's previous sub-advisers, Janus Capital Management, LLC and AnchorPath Financial, LLC. The investment objective, name, and benchmark remained unchanged. In connection with this change in sub-adviser, the Board approved a revision to the Portfolio's advisory fee breakpoint schedule, also effective May 1, 2020. Previously, the advisory fee breakpoints, based on of the Portfolio's daily net assets were as follows: |
| ON Risk Managed Balanced |
| 0.90% of first $500 million |
| 0.75% over $500 million |
| Notes to Financial Statements (Continued) | June 30, 2020 (Unaudited) |
| ON BlackRock Advantage International Equity (BlackRock) |
| 0.32% of first $200 million |
| 0.30% over $200 million |
| ON Janus Henderson Forty (Janus) |
| 0.40% of first $100 million |
| 0.35% of next $400 million |
| 0.30% over $500 million |
| ON Janus Henderson Venture (Janus) |
| 0.55% of first $150 million |
| 0.45% over $150 million |
| ON Janus Henderson Enterprise (Janus) |
| 0.60% of first $100 million |
| 0.55% of next $100 million |
| 0.50% over $200 million |
| ON S&P 500® Index (Geode)3 |
| 0.01% of all net assets |
| ON Federated High Income Bond (Federated) |
| 0.50% of first $30 million |
| 0.40% of next $20 million |
| 0.30% of next $25 million |
| 0.25% over $75 million |
| ON Nasdaq-100® Index (Geode)3 |
| 0.05% of first $100 million |
| 0.04% of next $150 million |
| 0.03% over $250 million |
| ON BlackRock Advantage Small Cap Growth (BlackRock) |
| 0.40% of first $250 million |
| 0.35% over $250 million |
| ON S&P MidCap 400® Index (Geode)3 |
| 0.039% of first $100 million |
| 0.038% of next $150 million |
| 0.037% of next $250 million |
| 0.036% of next $500 million |
| 0.035% over $1 billion |
| ON Risk Managed Balanced (AB)2 |
| 0.50% of first $400 million |
| 0.40% of next $800 million |
| 0.30% over $1.2 billion |
| ON Federated Core Plus Bond (Federated) |
| 0.18% of first $100 million |
| 0.15% of next $150 million |
| 0.12% of next $150 million |
| 0.10% of next $350 million |
| 0.08% over $750 million |
| 2 | At a meeting held on February 12, 2020, the Board, including a majority of the Directors who are not “interested persons” of the Fund, approved the replacement of the sub-advisers to the Portfolio. |
| Effective May 1, 2020, AB replaced the Portfolio's previous sub-advisers, Janus and AnchorPath Financial, LLC. In conjunction with the change in sub-advisers, the Board approved a revision to the sub-advisory fee schedules shown above. Previously, the sub-advisory fee breakpoints, based on the Portfolio's daily net assets, were: |
| ON Risk Managed Balanced (Janus) | ON Risk Managed Balanced (AnchorPath) | |
| 0.35% of first $500 million | 0.20% of first $500 million | |
| 0.25% over $500 million | 0.15% over $500 million |
| 3 | The sub-advisory fees for the three Portfolios sub-advised by Geode could be impacted by an agreed-upon minimum aggregate per annum fee of $150,000. For the six-month period ended June 30, 2020, the minimum aggregate fee had no impact on the sub-advisory fees that were calculated based on the breakpoint schedule indicated above. |
| Notes to Financial Statements (Continued) | June 30, 2020 (Unaudited) |
| Portfolio | May 1, 2020 to April 30, 2021 | May 1, 2019 to April 30, 2020 | May 1, 2018 to April 30, 2019 | |||
ON Conservative Model | 1.00% | 0.92% | 0.87% | |||
ON Moderately Conservative Model | 1.00% | 1.00% | 0.92% | |||
ON Balanced Model | 1.00% | 1.00% | 0.99% | |||
ON Moderate Growth Model | 1.07% | 1.07% | 1.04% | |||
ON Growth Model | 1.14% | 1.14% | 1.08% |
| Portfolio | Six-Month Period Ended June 30, 2020 | Year Ended December 31, 2019 | ||
ON Conservative Model | $ 74,896 | $220,103 | ||
ON Moderately Conservative Model | 80,940 | 261,201 | ||
ON Balanced Model | 243,031 | 778,985 | ||
ON Moderate Growth Model | 163,559 | 253,374 | ||
ON Growth Model | 55,388 | 64,344 |
| Portfolio | Expires April 30, 2021 | Expires April 30, 2022 | Expires April 30, 2023 | Expires April 30, 2024 | Total | |||||
ON Conservative Model | $ 307,130 | $212,490 | $203,244 | $24,224 | $ 747,088 | |||||
ON Moderately Conservative Model | 752,636 | 376,793 | 198,007 | 31,977 | 1,359,413 | |||||
ON Balanced Model | 3,025,712 | 952,043 | 656,506 | 69,345 | 4,703,606 | |||||
ON Moderate Growth Model | 4,497,363 | 226,173 | 34,678 | — | 4,758,214 | |||||
ON Growth Model | 1,110,925 | 260,291 | 9,659 | — | 1,380,875 |
| Notes to Financial Statements (Continued) | June 30, 2020 (Unaudited) |
| ON Bond | ON BlackRock Balanced Allocation | ON BlackRock Advantage International Equity | |||||||||
| Six-Month Period Ended | Year Ended | Six-Month Period Ended | Year Ended | Six-Month Period Ended | Year Ended | ||||||
| June 30, 2020 (Unaudited) | December 31, 2019 | June 30, 2020 (Unaudited) | December 31, 2019 | June 30, 2020 (Unaudited) | December 31, 2019 | ||||||
Capital shares issued on sales | 1,295,699 | 3,240,589 | 731,264 | 545,146 | 2,257,447 | 974,536 | |||||
Capital shares issued in reorganizations | — | — | — | 14,014,746 | 2,973,410 | — | |||||
Capital shares issued on reinvested distributions | — | 329,020 | — | 763,025 | — | 500,682 | |||||
Capital shares redeemed | (2,589,935) | (3,498,040) | (1,988,574) | (1,351,971) | (2,875,521) | (10,613,337) | |||||
Net increase/(decrease) | (1,294,236) | 71,569 | (1,257,310) | 13,970,946 | 2,355,336 | (9,138,119) | |||||
| ON Janus Henderson Forty | ON Janus Henderson Venture | ON Janus Henderson Enterprise | |||||||||
| Six-Month Period Ended | Year Ended | Six-Month Period Ended | Year Ended | Six-Month Period Ended | Year Ended | ||||||
| June 30, 2020 (Unaudited) | December 31, 2019 | June 30, 2020 (Unaudited) | December 31, 2019 | June 30, 2020 (Unaudited) | December 31, 2019 | ||||||
Capital shares issued on sales | 212,802 | 2,255,356 | 680,207 | 381,735 | 143,320 | 126,984 | |||||
Capital shares issued in reorganizations | — | — | — | — | — | — | |||||
Capital shares issued on reinvested distributions | — | 598,807 | — | 737,419 | — | 111,426 | |||||
Capital shares redeemed | (1,299,907) | (2,417,355) | (825,499) | (2,797,597) | (263,216) | (717,906) | |||||
Net increase/(decrease) | (1,087,105) | 436,808 | (145,292) | (1,678,443) | (119,896) | (479,496) | |||||
| ON S&P 500® Index | ON BlackRock Advantage Large Cap Value | ON Federated High Income Bond | |||||||||
| Six-Month Period Ended | Year Ended | Six-Month Period Ended | Year Ended | Six-Month Period Ended | Year Ended | ||||||
| June 30, 2020 (Unaudited) | December 31, 2019 | June 30, 2020 (Unaudited) | December 31, 2019 | June 30, 2020 (Unaudited) | December 31, 2019 | ||||||
Capital shares issued on sales | 1,778,278 | 3,326,047 | 1,591,502 | 1,018,596 | 493,288 | 881,649 | |||||
Capital shares issued in reorganizations | — | — | — | — | — | — | |||||
Capital shares issued on reinvested distributions | — | 3,497,765 | — | 671,969 | — | 405,082 | |||||
Capital shares redeemed | (3,935,863) | (10,242,233) | (1,079,060) | (4,249,469) | (1,653,012) | (2,471,563) | |||||
Net increase/(decrease) | (2,157,585) | (3,418,421) | 512,442 | (2,558,904) | (1,159,724) | (1,184,832) | |||||
| Notes to Financial Statements (Continued) | June 30, 2020 (Unaudited) |
| ON Nasdaq-100® Index | ON BlackRock Advantage Large Cap Core | ON BlackRock Advantage Small Cap Growth | |||||||||
| Six-Month Period Ended | Year Ended | Six-Month Period Ended | Year Ended | Six-Month Period Ended | Year Ended | ||||||
| June 30, 2020 (Unaudited) | December 31, 2019 | June 30, 2020 (Unaudited) | December 31, 2019 | June 30, 2020 (Unaudited) | December 31, 2019 | ||||||
Capital shares issued on sales | 1,364,117 | 1,678,291 | 227,552 | 234,322 | 427,031 | 2,344,042 | |||||
Capital shares issued in reorganizations | — | — | — | 10,633,434 | — | 4,095,062 | |||||
Capital shares issued on reinvested distributions | — | 2,522,274 | — | 67,855 | — | 51,935 | |||||
Capital shares redeemed | (4,012,564) | (6,137,710) | (1,370,569) | (4,133,242) | (982,499) | (1,048,823) | |||||
Net increase/(decrease) | (2,648,447) | (1,937,145) | (1,143,017) | 6,802,369 | (555,468) | 5,442,216 | |||||
| ON S&P MidCap 400® Index | ON BlackRock Advantage Large Cap Growth | ON Risk Managed Balanced | |||||||||
| Six-Month Period Ended | Year Ended | Six-Month Period Ended | Year Ended | Six-Month Period Ended | Year Ended | ||||||
| June 30, 2020 (Unaudited) | December 31, 2019 | June 30, 2020 (Unaudited) | December 31, 2019 | June 30, 2020 (Unaudited) | December 31, 2019 | ||||||
Capital shares issued on sales | 2,961,983 | 8,405,131 | 48,012 | 1,070,137 | 1,292,341 | 3,173,323 | |||||
Capital shares issued in reorganizations | — | — | — | — | — | — | |||||
Capital shares issued on reinvested distributions | — | 199,776 | — | 147,937 | — | 2,279,753 | |||||
Capital shares redeemed | (4,004,572) | (5,020,228) | (753,846) | (1,355,693) | (3,747,351) | (5,091,874) | |||||
Net increase/(decrease) | (1,042,589) | 3,584,679 | (705,834) | (137,619) | (2,455,010) | 361,202 | |||||
| ON Federated Core Plus Bond | ON Conservative Model | ON Moderately Conservative Model | |||||||
| Period from May 1, 2020 (inception) to | Six-Month Period Ended | Year Ended | Six-Month Period Ended | Year Ended | |||||
| June 30, 2020 (Unaudited) | June 30, 2020 (Unaudited) | December 31, 2019 | June 30, 2020 (Unaudited) | December 31, 2019 | |||||
Capital shares issued on sales | 21,575,485 | 1,012,724 | 1,134,157 | 603,120 | 1,436,394 | ||||
Capital shares issued in reorganizations | — | — | — | — | — | ||||
Capital shares issued on reinvested distributions | — | — | 201,990 | — | 658,784 | ||||
Capital shares redeemed | (211,131) | (687,066) | (2,374,963) | (1,600,613) | (5,963,369) | ||||
Net increase/(decrease) | 21,364,354 | 325,658 | (1,038,816) | (997,493) | (3,868,191) | ||||
| ON Balanced Model | ON Moderate Growth Model | ON Growth Model | |||||||||
| Six-Month Period Ended | Year Ended | Six-Month Period Ended | Year Ended | Six-Month Period Ended | Year Ended | ||||||
| June 30, 2020 (Unaudited) | December 31, 2019 | June 30, 2020 (Unaudited) | December 31, 2019 | June 30, 2020 (Unaudited) | December 31, 2019 | ||||||
Capital shares issued on sales | 1,055,843 | 1,956,344 | 1,104,968 | 2,228,980 | 418,651 | 930,126 | |||||
Capital shares issued in reorganizations | — | — | — | — | — | — | |||||
Capital shares issued on reinvested distributions | — | 3,505,121 | — | 9,136,471 | — | 1,548,287 | |||||
Capital shares redeemed | (6,582,693) | (23,785,531) | (11,721,862) | (38,709,593) | (2,862,753) | (9,143,969) | |||||
Net increase/(decrease) | (5,526,850) | (18,324,066) | (10,616,894) | (27,344,142) | (2,444,102) | (6,665,556) | |||||
| Notes to Financial Statements (Continued) | June 30, 2020 (Unaudited) |
| ON Bond | ON BlackRock Balanced Allocation | ON BlackRock Advantage International Equity | ON Janus Henderson Forty | ON Janus Henderson Venture | |||||
Cost of purchases | $82,572,776 | $290,572,054 | $439,409,651 | $37,884,275 | $19,715,014 | ||||
Proceeds from sales | $91,099,562 | $336,446,267 | $439,235,786 | $64,221,819 | $24,129,361 |
| ON Janus Henderson Enterprise | ON S&P 500® Index | ON BlackRock Advantage Large Cap Value | ON Federated High Income Bond | ON Nasdaq-100® Index | |||||
Cost of purchases | $ 5,790,146 | $33,824,444 | $209,197,538 | $25,501,530 | $ 7,815,045 | ||||
Proceeds from sales | $12,491,216 | $94,315,846 | $208,666,097 | $41,646,263 | $53,883,814 |
| ON BlackRock Advantage Large Cap Core | ON BlackRock Advantage Small Cap Growth | ON S&P MidCap 400® Index | ON BlackRock Advantage Large Cap Growth | ON Risk Managed Balanced | |||||
Cost of purchases | $248,253,884 | $ 87,486,435 | $77,423,698 | $68,913,555 | $279,131,111 | ||||
Proceeds from sales | $287,617,935 | $105,082,683 | $92,850,528 | $88,864,976 | $255,570,178 |
| ON Federated Core Plus Bond | ON Conservative Model | ON Moderately Conservative Model | ON Balanced Model | ON Moderate Growth Model | |||||
Cost of purchases | $151,409,691 | $19,511,998 | $39,077,907 | $164,335,853 | $193,225,845 | ||||
Proceeds from sales | $ 4,960,655 | $15,659,924 | $49,256,955 | $221,907,931 | $306,106,824 |
| ON Growth Model | |
Cost of purchases | $20,793,480 |
Proceeds from sales | $48,178,067 |
| ON Bond | ON BlackRock Balanced Allocation | ON Risk Managed Balanced | ON Federated Core Plus Bond | ||||
Cost of purchases | $32,095,459 | $44,110,484 | $79,755,219 | $66,471,043 | |||
Proceeds from sales | $41,766,740 | $37,795,902 | $84,184,409 | $ 9,576,121 |
| Notes to Financial Statements (Continued) | June 30, 2020 (Unaudited) |
| Notes to Financial Statements (Continued) | June 30, 2020 (Unaudited) |
| Portfolio | Collateral Pledged | Futures Contracts Opened (in millions) | Futures Contracts Closed (in millions) | |||
ON BlackRock Balanced Allocation | Portions of cash holdings | $ 58.7 | $ 52.4 | |||
ON BlackRock Advantage International Equity | Portions of cash holdings | 76.4 | 77.0 | |||
ON S&P 500® Index | Portions of cash holdings | 56.2 | 54.7 | |||
ON BlackRock Advantage Large Cap Value | Portions of cash holdings | 49.3 | 45.5 | |||
ON Nasdaq-100® Index | Portions of cash holdings | 24.5 | 27.2 | |||
ON BlackRock Advantage Large Cap Core | Portions of cash holdings | 63.8 | 56.3 | |||
ON BlackRock Advantage Small Cap Growth | Portions of cash holdings | 42.3 | 39.6 | |||
ON S&P MidCap 400® Index | Portions of cash holdings | 18.0 | 19.4 | |||
ON BlackRock Advantage Large Cap Growth | Portions of cash holdings | 30.5 | 28.2 | |||
ON Risk Managed Balanced | Portions of securities | 1,102.5 | 1,081.5 | |||
ON Federated Core Plus Bond | Portions of securities | 19.7 | 7.9 |
| Portfolio | Instrument | Primary Risk Type | Value- Asset Derivatives | Value- Liability Derivatives | Location on Statements of Assets and Liabilities | |||||
ON BlackRock Balanced Allocation | Futures contracts | Equity price | $10,661,190 | $10,455,562 | (1) | |||||
ON BlackRock Advantage International Equity | Futures contracts | Equity price | 9,069,840 | 9,045,920 | (1) | |||||
ON S&P 500® Index | Futures contracts | Equity price | 6,334,910 | 6,223,714 | (1) | |||||
ON BlackRock Advantage Large Cap Value | Futures contracts | Equity price | 9,425,110 | 9,227,402 | (1) |
| Notes to Financial Statements (Continued) | June 30, 2020 (Unaudited) |
| Portfolio | Instrument | Primary Risk Type | Value- Asset Derivatives | Value- Liability Derivatives | Location on Statements of Assets and Liabilities | |||||
ON Nasdaq-100® Index | Futures contracts | Equity price | $ 1,826,505 | $ 1,787,425 | (1) | |||||
ON BlackRock Advantage Large Cap Core | Futures contracts | Equity price | 12,669,820 | 12,405,456 | (1) | |||||
ON BlackRock Advantage Small Cap Growth | Futures contracts | Equity price | 6,109,800 | 5,894,444 | (1) | |||||
ON S&P MidCap 400® Index | Futures contracts | Equity price | 3,380,290 | 3,328,065 | (1) | |||||
ON BlackRock Advantage Large Cap Growth | Futures contracts | Equity price | 3,553,730 | 3,487,505 | (1) | |||||
ON Risk Managed Balanced | Futures contracts | Equity price and interest rate | 293,087,702 | 292,146,803 | (1) | |||||
| Purchased options | Equity price | 28,148,856 | — | (2) | ||||||
ON Federated Core Plus Bond | Futures contracts | Interest rate | 11,701,359 | 11,717,172 | (1) |
| (1) | Total distributable earnings. The amounts represent the cumulative appreciation (depreciation) of these futures contracts as reported in the Statements of Assets and Liabilities. Only the current day’s variation margin, if any, is reported within the Statements of Assets and Liabilities as receivable (payable) for variation margin on futures contracts. Each Portfolio's Schedule of Open Futures Contracts details the values by futures contract type. |
| (2) | Investments in securities of unaffiliated issuers, at value. |
| Portfolio | Instrument | Primary Risk Type | Realized Gain (Loss) on Derivatives Recognized in Income | Change in Unrealized Appreciation/ Depreciation on Derivatives Recognized in Income | Location on Statements of Operations | |||||
ON BlackRock Balanced Allocation | Futures contracts | Equity price | $ 248,873 | $ 143,467 | (1),(2) | |||||
ON BlackRock Advantage International Equity | Futures contracts | Equity price | (117,688) | 50,453 | (1),(2) | |||||
ON S&P 500® Index | Futures contracts | Equity price | (3,272) | 59,849 | (1),(2) | |||||
ON BlackRock Advantage Large Cap Value | Futures contracts | Equity price | (84,824) | 109,588 | (1),(2) | |||||
ON Nasdaq-100® Index | Futures contracts | Equity price | 48,044 | (41,213) | (1),(2) | |||||
ON BlackRock Advantage Large Cap Core | Futures contracts | Equity price | 65,371 | 185,175 | (1),(2) | |||||
ON BlackRock Advantage Small Cap Growth | Futures contracts | Equity price | (523,181) | 187,484 | (1),(2) | |||||
ON S&P MidCap 400® Index | Futures contracts | Equity price | 404,046 | 5,902 | (1),(2) | |||||
ON BlackRock Advantage Large Cap Growth | Futures contracts | Equity price | 27,853 | 48,191 | (1),(2) | |||||
ON Risk Managed Balanced | Futures contracts | Equity price and interest rate | 18,247,322 | 2,738,166 | (1),(2) | |||||
| Purchased options | Equity price | 3,383,331 | (1,087,760) | (3),(4) | ||||||
ON Federated Core Plus Bond | Futures contracts | Interest rate | 62,973 | (15,813) | (1),(2) |
| (1) | Net realized gain (loss) on futures contracts. |
| (2) | Change in unrealized appreciation/depreciation on futures contracts. |
| (3) | Net realized gain (loss) on investments in securities of unaffiliated issuers. |
| (4) | Change in unrealized appreciation/depreciation on investments in securities of unaffiliated issuers. |
| Notes to Financial Statements (Continued) | June 30, 2020 (Unaudited) |
| ON Bond | ON BlackRock Balanced Allocation | ON BlackRock Advantage International Equity | ON Janus Henderson Forty | ON Janus Henderson Venture | ON Janus Henderson Enterprise | ||||||
| Gross unrealized: | |||||||||||
Appreciation | $ 20,955,443 | $ 51,642,919 | $ 31,533,944 | $ 51,133,430 | $ 46,991,130 | $16,350,269 | |||||
Depreciation | (3,345,853) | (18,261,746) | (33,568,461) | (1,882,166) | (9,650,463) | (7,030,069) | |||||
Net unrealized appreciation (depreciation) | $ 17,609,590 | $ 33,381,173 | $ (2,034,517) | $ 49,251,264 | $ 37,340,667 | $ 9,320,200 | |||||
Aggregate cost of investments: | $253,939,774 | $468,339,565 | $451,632,301 | $139,111,593 | $123,371,175 | $86,140,709 |
| ON S&P 500® Index | ON BlackRock Advantage Large Cap Value | ON Federated High Income Bond | ON Nasdaq-100® Index | ON BlackRock Advantage Large Cap Core | ON BlackRock Advantage Small Cap Growth | ||||||
| Gross unrealized: | |||||||||||
Appreciation | $304,862,449 | $ 10,648,784 | $ 3,282,778 | $124,352,991 | $ 47,426,116 | $ 24,175,561 | |||||
Depreciation | (90,820,092) | (36,398,667) | (13,729,904) | (7,374,474) | (21,168,295) | (19,349,789) | |||||
Net unrealized appreciation (depreciation) | $214,042,357 | $ (25,749,883) | $ (10,447,126) | $116,978,517 | $ 26,257,821 | $ 4,825,772 | |||||
Aggregate cost of investments: | $881,377,799 | $299,593,666 | $177,380,249 | $238,447,944 | $358,759,557 | $180,198,863 |
| ON S&P MidCap 400® Index | ON BlackRock Advantage Large Cap Growth | ON Risk Managed Balanced | ON Federated Core Plus Bond | ON Conservative Model | ON Moderately Conservative Model | ||||||
| Gross unrealized: | |||||||||||
Appreciation | $ 34,518,006 | $18,280,027 | $ 48,236,336 | $ 3,574,614 | $ 3,574,614 | $ 10,019,880 | |||||
Depreciation | (54,005,186) | (2,079,620) | (5,308,282) | (2,230,536) | (2,230,536) | (10,960,247) | |||||
Net unrealized appreciation (depreciation) | $ (19,487,180) | $16,200,407 | $ 42,928,054 | $ 1,344,078 | $ 1,344,078 | $ (940,367) | |||||
Aggregate cost of investments: | $395,052,138 | $89,948,820 | $349,921,101 | $78,636,010 | $78,636,010 | $211,974,007 |
| Notes to Financial Statements (Continued) | June 30, 2020 (Unaudited) |
| ON Balanced Model | ON Moderate Growth Model | ON Growth Model | |||
| Gross unrealized: | |||||
Appreciation | $ 51,515,631 | $ 105,814,429 | $ 25,310,424 | ||
Depreciation | (71,566,813) | (192,269,475) | (50,752,692) | ||
Net unrealized appreciation (depreciation) | $ (20,051,182) | $ (86,455,046) | $ (25,442,268) | ||
Aggregate cost of investments: | $1,039,752,414 | $1,843,162,646 | $409,294,011 |
| Notes to Financial Statements (Continued) | June 30, 2020 (Unaudited) |
| Election of Director - Christopher A. Carlson | Election of Director - Lawrence L. Grypp | Election of Director - Geoffrey Keenan | |||||||||
Shares voted for | 420,411,800 | 77.6% | 419,209,687 | 77.3% | 420,884,759 | 77.6% | |||||
Shares voted against | 10,109,627 | 1.9% | 11,311,740 | 2.1% | 9,636,668 | 1.8% | |||||
Shares abstaining | 111,404,487 | 20.5% | 111,404,487 | 20.6% | 111,404,487 | 20.6% | |||||
Shares not voted | 184,646 | 0.0% | 184,646 | 0.0% | 184,646 | 0.0% | |||||
Total shares on record date | 542,110,560 | 100.0% | 542,110,560 | 100.0% | 542,110,560 | 100.0% | |||||
| Additional Information | June 30, 2020 (Unaudited) |
| Additional Information (Continued) | June 30, 2020 (Unaudited) |
| Additional Information (Continued) | June 30, 2020 (Unaudited) |
| Portfolio | Beginning Investment Value 1/1/2020 | Ending Investment Value 6/30/2020 | Expenses Paid During Period* 1/1/2020 – 6/30/2020 | Expense Ratio During Period 1/1/2020 – 6/30/2020 (Annualized) | ||||
ON Bond | $1,000.00 | $1,039.30 | $3.09 | 0.61% | ||||
ON BlackRock Balanced Allocation | $1,000.00 | $ 998.50 | $2.78 | 0.56% | ||||
ON BlackRock Advantage International Equity | $1,000.00 | $ 881.40 | $4.21 | 0.90% | ||||
ON Janus Henderson Forty | $1,000.00 | $1,097.90 | $4.12 | 0.79% | ||||
ON Janus Henderson Venture | $1,000.00 | $ 961.60 | $4.39 | 0.90% | ||||
ON Janus Henderson Enterprise | $1,000.00 | $ 917.20 | $4.62 | 0.97% | ||||
ON S&P 500® Index | $1,000.00 | $ 967.60 | $1.91 | 0.39% | ||||
ON BlackRock Advantage Large Cap Value | $1,000.00 | $ 852.30 | $3.45 | 0.75% | ||||
ON Federated High Income Bond | $1,000.00 | $ 962.30 | $4.00 | 0.82% | ||||
ON Nasdaq-100® Index | $1,000.00 | $1,166.90 | $2.32 | 0.43% | ||||
ON BlackRock Advantage Large Cap Core | $1,000.00 | $ 972.40 | $3.48 | 0.71% | ||||
ON BlackRock Advantage Small Cap Growth | $1,000.00 | $ 964.70 | $4.20 | 0.86% | ||||
ON S&P MidCap 400® Index | $1,000.00 | $ 871.20 | $1.95 | 0.42% | ||||
ON BlackRock Advantage Large Cap Growth | $1,000.00 | $1,083.20 | $4.20 | 0.81% | ||||
ON Risk Managed Balanced | $1,000.00 | $1,066.20 | $5.09 | 0.99% | ||||
ON Federated Core Plus Bond | $1,000.00 | $1,018.00 | $1.10 | 0.22% | ||||
ON Conservative Model | $1,000.00 | $1,015.20 | $1.90 | 0.38% | ||||
ON Moderately Conservative Model | $1,000.00 | $ 995.60 | $1.98 | 0.40% | ||||
ON Balanced Model | $1,000.00 | $ 973.90 | $1.91 | 0.39% | ||||
ON Moderate Growth Model | $1,000.00 | $ 955.30 | $2.09 | 0.43% | ||||
ON Growth Model | $1,000.00 | $ 948.10 | $2.18 | 0.45% |
| Additional Information (Continued) | June 30, 2020 (Unaudited) |
| Portfolio | Beginning Investment Value 1/1/2020 | Ending Investment Value 6/30/2020 | Expenses Paid During Period* 1/1/2020 – 6/30/2020 | Expense Ratio During Period 1/1/2020 – 6/30/2020 (Annualized) | ||||
ON Bond | $1,000.00 | $1,021.83 | $3.07 | 0.61% | ||||
ON BlackRock Balanced Allocation | $1,000.00 | $1,022.08 | $2.82 | 0.56% | ||||
ON BlackRock Advantage International Equity | $1,000.00 | $1,020.39 | $4.52 | 0.90% | ||||
ON Janus Henderson Forty | $1,000.00 | $1,020.93 | $3.97 | 0.79% | ||||
ON Janus Henderson Venture | $1,000.00 | $1,020.39 | $4.52 | 0.90% | ||||
ON Janus Henderson Enterprise | $1,000.00 | $1,020.04 | $4.87 | 0.97% | ||||
ON S&P 500® Index | $1,000.00 | $1,022.92 | $1.96 | 0.39% | ||||
ON BlackRock Advantage Large Cap Value | $1,000.00 | $1,021.13 | $3.77 | 0.75% | ||||
ON Federated High Income Bond | $1,000.00 | $1,020.79 | $4.12 | 0.82% | ||||
ON Nasdaq-100® Index | $1,000.00 | $1,022.73 | $2.16 | 0.43% | ||||
ON BlackRock Advantage Large Cap Core | $1,000.00 | $1,021.33 | $3.57 | 0.71% | ||||
ON BlackRock Advantage Small Cap Growth | $1,000.00 | $1,020.59 | $4.32 | 0.86% | ||||
ON S&P MidCap 400® Index | $1,000.00 | $1,022.77 | $2.11 | 0.42% | ||||
ON BlackRock Advantage Large Cap Growth | $1,000.00 | $1,020.84 | $4.07 | 0.81% | ||||
ON Risk Managed Balanced | $1,000.00 | $1,019.94 | $4.97 | 0.99% | ||||
ON Federated Core Plus Bond | $1,000.00 | $1,023.77 | $1.11 | 0.22% | ||||
ON Conservative Model | $1,000.00 | $1,022.97 | $1.91 | 0.38% | ||||
ON Moderately Conservative Model | $1,000.00 | $1,022.87 | $2.01 | 0.40% | ||||
ON Balanced Model | $1,000.00 | $1,022.92 | $1.96 | 0.39% | ||||
ON Moderate Growth Model | $1,000.00 | $1,022.73 | $2.16 | 0.43% | ||||
ON Growth Model | $1,000.00 | $1,022.63 | $2.26 | 0.45% |
| * | Expenses are equal to the average account value times the Fund’s annualized expense ratio multiplied by the number of days in the most recent fiscal half-year (182 days) divided by the number of days in the fiscal year (366 days). Please note that the expenses shown in these tables are meant to highlight ongoing Fund costs only and do not reflect any contract-level expenses or Fund transactional costs, such as sales charges (loads) or exchange fees (if any). Therefore, these tables are useful in comparing ongoing fund costs only, and will not fully assist a policy/contract owner in determining the relative total expenses of different funds. In addition, if transactional costs were included, costs may have been higher for these Portfolios as well as for a fund being compared. |
| Information about Directors and Officers | June 30, 2020 (Unaudited) |
| Name and Address | Age | Position(s) with the Fund | Term of Office and Length of Time Served | Number of Portfolios in the Fund to be Overseen by Director | Principal Occupation(s) During Past Five Years and Other Directorships | |||||
| Independent Directors | ||||||||||
| George M. Vredeveld One Financial Way Cincinnati, Ohio | 77 | Director, Member of Audit and Independent Directors Committees | Indefinite; Since March 1996 | 21 | Professor Emeritus, Finance: University of Cincinnati (January 2014 - present); Honorary Consul; Republic of Bulgaria (2019 - present); Alpaugh Professor of Economics: Lindner College of Business, University of Cincinnati (2004 - 2013); Founder/President: Economics Center at the University of Cincinnati (1977 - 2012). | |||||
| Madeleine W. Ludlow One Financial Way Cincinnati, Ohio | 65 | Director, Chairman of Audit Committee and Member of Independent Directors Committee | Indefinite; Since April 2012 | 21 | Founder/Managing Director: West Capital Partners LLC (2010 - present), Ludlow Ward Capital Advisors LLC (2005 - 2009); Director: ALLETE, Inc. | |||||
| Geoffrey Keenan One Financial Way Cincinnati, Ohio | 61 | Chairman and Director, Member of Audit and Independent Directors Committees | Indefinite; Since January 2015 | 21 | Executive Vice President and Chief Operating Officer: Gateway Investment Advisers, LLC (1995 - 2013). | |||||
| Lawrence L. Grypp One Financial Way Cincinnati, Ohio | 71 | Director, Member of Audit and Independent Directors Committees | Indefinite; Since December 2016 | 21 | Senior Business Advisor and Board Member: Goering Center for Family and Private Business (January 2018 - Present); President: Goering Center for Family and Private Business (August 2008 - December 2017). | |||||
| Interested Director | ||||||||||
| Christopher A. Carlson One Financial Way Cincinnati, Ohio | 61 | Service as a Director began July 1, 2020 | Indefinite; Since July 2020 | 21 | President/Vice Chairman and other positions: Ohio National Financial Services and subsidiaries (June 1993 - December 2018); President: Ohio National Fund, Inc. (March 2010 - May 2016). | |||||
| Officers | ||||||||||
| Michael J. DeWeirdt One Financial Way Cincinnati, Ohio | 61 | President | Indefinite; Since March 2017 | Senior Vice President and Chief Product Officer: ONLIC (September 2018 - Present); President: NSLAC (May 2016 - Present); Senior Vice President and Head of Annuities SBU: ONLIC (January 2016 - September 2018); Senior Vice President, Chief Risk Officer: ONLIC (September 2015 - December 2015); Senior Vice President, Capital and Financial Risk Management: ONLIC (December 2012 - September 2015). | ||||||
| Paul J. Gerard One Financial Way Cincinnati, Ohio | 60 | Vice President | Indefinite; Since March 2016 | Senior Vice President and Chief Investment Officer: ONLIC and NSLA (January 2016 - present); Senior Vice President, Investments: ONLIC (July 2012 - December 2015). |
| Information about Directors and Officers (Continued) | June 30, 2020 (Unaudited) |
| Name and Address | Age | Position(s) with the Fund | Term of Office and Length of Time Served | Number of Portfolios in the Fund to be Overseen by Director | Principal Occupation(s) During Past Five Years and Other Directorships | |||||
| R. Todd Brockman One Financial Way Cincinnati, Ohio | 51 | Treasurer | Indefinite; Since August 2004 | Vice President, Mutual Funds: ONLIC and NSLA (February 2014 - present); Treasurer: ONI. | ||||||
| Kimberly A. Plante One Financial Way Cincinnati, Ohio | 46 | Secretary | Indefinite; Since March 2005 | Vice President and Counsel: ONLIC (November 2017 - present); Second Vice President and Counsel: ONLIC (January 2016 - November 2017); Senior Associate Counsel: ONLIC (January 2011 - January 2016); Secretary: ONI; Officer of various other Ohio National-affiliated companies. | ||||||
| Keith Dwyer One Financial Way Cincinnati, Ohio | 47 | Chief Compliance Officer | Indefinite; Since August 2016 | Second Vice President, Fund Compliance: ONLIC (August 2016 - present); Director, Fund Compliance: ONLIC (January 2015 - August 2016); Administrator, Fund Compliance: ONLIC (January 2014 - January 2015); Chief Compliance Officer: ONI and other Ohio National-affiliated companies (August 2016 - present); Chief Compliance Officer: Fiduciary Capital Management ("FCM") (August 2016 - December 2017); Chief Compliance Officer: Suffolk Capital Management, LLC ("Suffolk") (August 2016 - December 2016); Interim Chief Compliance Officer: ONI, Suffolk, FCM and other Ohio National-affiliated companies (November 2015 - August 2016). | ||||||
| Daniel P. Leming One Financial Way Cincinnati, Ohio | 35 | Assistant Treasurer | Indefinite; Since March 2016 | Director, Fund Operations and Analysis: ONLIC (July 2018 - present); Assistant Director, Fund Operations and Analysis: ONLIC (December 2016 - June 2018); Manager, Fund Operations and Analysis: ONLIC (February 2016 - December 2016); Sr. Mutual Fund Reporting & Operations Analyst: ONLIC (May 2012 - February 2016). |
PAID
Item 2. Code Of Ethics.
Not applicable for semiannual reports.
Item 3. Audit Committee Financial Expert.
Not applicable for semiannual reports.
Item 4. Principal Accountant Fees And Services.
Not applicable for semiannual reports.
Item 5. Audit Committee Of Listed Registrants.
Not applicable for semiannual reports.
Item 6. Investments.
Not applicable, as the schedules are included as part of the report to shareholders filed under Item 1.
Item 7. Disclosure Of Proxy Voting Policies And Procedures For Closed-End Management Investment Companies.
Not applicable for open-end investment companies.
Item 8. Portfolio Managers of Closed-End Management Investment Companies.
Not applicable for open-end investment companies.
Item 9. Purchases of Equity Securities by Closed-End Management Investment Company and Affiliated Purchasers.
Not applicable for open-end investment companies.
Item 10. Submission of Matters to a Vote of Security Holders.
There were no material changes to the procedures by which shareholders may recommend nominees to the Fund’s Board of Directors.
Item 11. Controls and Procedures.
(a) The Fund’s principal executive officer and principal financial officer have concluded, based on their evaluation conducted as of a date within the most recent fiscal half-year of the filing of this report, that the Fund’s disclosure controls and procedures are adequately designed and are operating effectively to ensure (i) that material information relating to the Fund, including its consolidated subsidiaries, is made known to them by others within those entities, particularly during the period in which this report is being prepared; and (ii) that information required to be disclosed by the Fund on Form N-CSR is recorded, processed, summarized and reported within the time periods specified in the Securities and Exchange Commission’s rules and forms.
(b) There were no changes in the Fund’s internal control over financial reporting that occurred during the most recent fiscal half-year covered by this report that have materially affected, or are reasonably likely to materially affect, the Fund’s internal control over financial reporting.
Item 12. Disclosure of Securities Lending Activities for Closed-End Management Investment Companies.
Not Applicable.
Item 13. Exhibits.
(a)(1) Not applicable for semiannual reports.
(a)(3) Certification pursuant to Section 906 of the Sarbanes-Oxley Act.
SIGNATURES
Pursuant to the requirements of the Securities Exchange Act of 1934 and the Investment Company Act of 1940, the registrant has duly caused this report to be signed on its behalf by the undersigned, thereunto duly authorized.
Ohio National Fund, Inc.
| By: | /s/ Michael J. DeWeirdt | |
| Michael J. DeWeirdt | ||
| President | ||
| (Principal Executive Officer) | ||
| September 1, 2020 | ||
Pursuant to the requirements of the Securities Exchange Act of 1934 and the Investment Company Act of 1940, this report has been signed below by the following persons on behalf of the registrant and in the capacities and on the dates indicated.
Ohio National Fund, Inc.
| By | /s/ Michael J. DeWeirdt | |
| Michael J. DeWeirdt | ||
| President | ||
| (Principal Executive Officer) | ||
| September 1, 2020 | ||
| By: | /s/ R. Todd Brockman | |
| R. Todd Brockman | ||
| Treasurer | ||
| (Principal Financial Officer) | ||
| September 1, 2020 | ||