UNITED STATES
SECURITIES AND EXCHANGE COMMISSION
Washington, D.C. 20549
FORM N-CSR
CERTIFIED SHAREHOLDER REPORT OF REGISTERED
MANAGEMENT INVESTMENT COMPANIES
Investment Company Act file number 811-03015
Ohio National Fund, Inc.
(Exact name of registrant as specified in charter)
One Financial Way, Cincinnati, Ohio
| 45242
| |
| (Address of principal executive offices) | (Zip Code) | |
CT Corporation 300 E. Lombard St., Suite 1400 Baltimore, MD 21202
(Name and address of agent for service)
Registrant’s telephone number, including area code: 513-794-6971
Date of fiscal year end: December 31
Date of reporting period: December 31, 2022
Item 1. Reports To Stockholders.
(a)

| 1 | ||||
| 4 | ||||
| 10 | ||||
| 18 | ||||
| 25 | ||||
| 28 | ||||
| 35 | ||||
| 43 | ||||
| 51 | ||||
| 56 | ||||
| 66 | ||||
| 70 | ||||
| 74 | ||||
| 80 | ||||
| 87 | ||||
| 91 | ||||
| 110 | ||||
ON U.S. Low Volatility Portfolio (formerly ON Janus Henderson U.S. Low Volatility Portfolio) | 124 | |||
| 128 | ||||
| 132 | ||||
| 135 | ||||
| 137 | ||||
| 139 | ||||
| 142 | ||||
| 145 | ||||
| 148 | ||||
| 151 | ||||
| 154 | ||||
| 157 | ||||
| 163 | ||||
| 169 | ||||
| 193 | ||||
| 195 | ||||
| 206 | ||||
Jeffery A. Bley Jr., CRCP President, Ohio National Fund, Inc. |

Dear Investor:
As we reflect on 2022, we saw the economy experience a year with record inflation, substantial geopolitical turbulence, higher interest rates, continued supply chain disruptions and the possibility of global recession. From a financial market perspective, it was also a decidedly difficult year. Financial markets experienced substantial headwinds that resulted in poor performance, with many asset classes declining by double digits. Both stock and bond indices experienced significant declines, a relatively rare occurrence.
Inflation and the response by the Federal Reserve, or “The Fed,” dominated the global economy this year. By mid-year 2022, the U.S. inflation rate hit 9.1%, the highest reading in four decades. In response to rising inflation, the Fed raised interest rates aggressively throughout the year. Central banks worldwide are doing the same, to various degrees. Notably, the Fed is prioritizing the fight against inflation above economic growth. It is willing to cause a recession if that is what is required to curb inflation. As we moved through the year, the Fed’s actions on interest rates seemed to be effective. By year-end 2022, the inflation rate was 6.5%. However, domestic GDP growth stood at only 1.9% percent at the end of the third quarter of 2022, which was the consequence of the Fed’s actions.
From a geopolitical standpoint, we witnessed Russia invade its neighbor, Ukraine, and in response, the western world has ostracized Russia economically, financially, and politically. The downstream impacts are being felt worldwide in the energy, agricultural, and broader financial markets and resulting in a paradigm shift that will last decades. While energy prices decreased as we moved through the second half of 2022, supply challenges persisted in Europe.
Throughout the year, China’s Zero COVID policy continued to hamper its economic growth. As we moved later into the year, widespread unrest persuaded China’s leadership to abandon the strict policies. However, China’s low vaccination rates and little natural immunity are causing widespread infections. This will continue to impact supply chains throughout the world given China’s position as the “world’s manufacturer.” However, as of the end of 2022, we have begun to see improvements in global supply chains.
Equity Markets
Equity markets declined substantially during 2022. Within the domestic equity market, the S&P 500®, S&P MidCap 400® and Russell 2000® indices all posted negative returns, ranging from -13.06% to -20.44%, with mid-cap indices outperforming both large and small-cap indices. Value stocks outperformed growth stocks by a wide margin during the year, which is a reversal from a multi-year trend. The S&P 500® Value Index returned -5.22%, while the S&P 500® Growth Index returned -29.41%. Within foreign equity markets, international indices of developed countries outperformed emerging market indices.
1
A summary of returns for key equity benchmarks for 2022 is presented below:
2022 U.S. Dollar Total Return | ||||
Index | (price and dividend) | |||
S&P 500® | -18.11% | |||
S&P 500® Growth | -29.41% | |||
S&P 500® Value | -5.22% | |||
S&P MidCap 400® | -13.06% | |||
Russell 2000® | -20.44% | |||
MSCI All Country World Ex-USA (Net) | 16.00% | |||
MSCI Emerging Markets (Net) | -20.09% | |||
Fixed Income Markets
Fixed-income markets experienced significant negative returns during 2022. The Fed raised the Fed Funds rate aggressively in 2022 to curb inflation, and has indicated that it will continue to raise the Fed Funds rate until inflation is under control. Interest rates increased across the curve during the year in response to the Fed’s policy to aggressively combat inflation. Short-term interest rates increased more than long-term interest rates, which caused the Treasury curve to invert from two years to ten years during most of the year. Historically, an inverted yield curve has preceded a recession. Corporate credit spreads also widened during the period, as credit markets are pricing in additional stress in the future. As bond prices react negatively to rising interest rates, these factors combined to create substantial negative returns for fixed-income investors in 2022.
The Bloomberg U.S. Aggregate Bond Index posted a total return of -13.01% in 2022. Lower-quality indices, like the Bloomberg U.S. Corporate Bond Index and the Bloomberg U.S. Corporate High Yield Bond Index, provided total returns of -15.76% and -11.19%, respectively. The Bloomberg U.S. Securitized Index, a higher quality, shorter duration index, provided a return of -11.67% for the period. The table below illustrates the returns of the various indices.
| 2022 U.S. Dollar Total | ||||
| Return | ||||
Index | (price and interest) | |||
Bloomberg U.S. Aggregate Bond | -13.01% | |||
Bloomberg U.S. Treasury | -12.46% | |||
Bloomberg U.S. Securitized | -11.67% | |||
Bloomberg U.S. Corporate Bond | -15.76% | |||
Bloomberg U.S. Corporate High Yield Bond | -11.19% | |||
The Ohio National Fund, Inc.
The Ohio National Fund continues to offer a wide array of investment options that can be used to build a diversified portfolio. During 2022, eight of the twenty actively managed Portfolios beat their respective peer groups. In addition, before expenses, the returns of the three index Portfolios performed in line with their respective indices during the period. During the year, two new portfolios were launched: the ON iShares Managed Risk Moderate Growth and ON iShares Managed Risk Growth.
2
Looking Ahead
Undoubtedly, 2023 will be eventful, but we hope it offers some economic clarity. Inflation has begun to tick down, which is a hopeful sign. The Fed is expected to continue its restrictive posture, and short-term interest rates are expected to increase incrementally moving forward. Prices are still high, and economic growth is slowing, further indicating a possible recession in 2023. We believe it is more likely than not that we will experience a recession. However, while unlikely, a “soft landing” is possible.
Inflation and geopolitical events will continue to pressure the market. But financial markets are forward-looking, discounting mechanisms. Much of the above has been discounted during the year, as evidenced by the negative returns for the period. Performance in 2023 will likely be driven by changing expectations around interest rates, inflation, earnings, and the depth/length of a potential recession.
Thank you for entrusting your assets with Ohio National Fund, Inc. We look forward to serving your financial needs in the years ahead.
3
| ON Bond Portfolio (Unaudited) |
| Objective/Strategy |
The ON Bond Portfolio seeks a high level of income and opportunity for capital appreciation consistent with preservation of capital by investing, under normal circumstances, at least 80% of its net assets in corporate debt securities.
| Performance as of December 31, 2022 | ||
Average Annual returns | ||||
One year | -15.19% | |||
Five years | 0.36% | |||
Ten years | 1.72% | |||
Past performance does not guarantee future results. The performance data quoted represents past performance and current returns may be lower or higher. Total return figures include change in share price and reinvestment of dividends and capital gains. The investment return and principal value will fluctuate so that an investor’s shares, when redeemed, may be worth more or less than the original cost. To obtain performance information up to the most recent month end, call toll-free 1-877-781-6392.
The Portfolio is not open to direct retail investment. Beneficial interest in the Portfolio’s shares is obtained either through an allocation to the Portfolio as an investment vehicle within variable life insurance policies or annuity contracts, or as an underlying investment by the ON Model Portfolios. Actual performance results for variable annuity and variable universal life contracts will be lower due to contract charges. Consult your contract for applicable charges.
Total expense ratio is 0.59% per the Fund’s prospectus dated April 29, 2022. Additional information pertaining to the Portfolio’s expense ratio as of December 31, 2022 can be found in the Portfolio’s Financial Highlights.
| Comments from Adviser |
Q. How did the Portfolio perform in comparison to its benchmark during the reporting period?
A. For the year ended December 31, 2022, the Portfolio returned -15.19% versus -15.45% for its benchmark, the ICE BofA U.S. Corporate Index.
Q. Were there specific market conditions, investment strategies, or techniques that materially affected the Portfolio’s benchmark-relative performance during the reporting period?
A. Fixed income markets registered negative returns in 2022. The Federal Reserve (the “Fed”) raised the Fed Funds rate aggressively in 2022 in an attempt to curb inflation. Furthermore, the Fed has indicated that it will continue to raise the Fed Funds rate, and hold it at a high level, until inflation declines to its target level of 2%. Interest rates increased across the entire yield curve, but short-term interest rates increased by a larger amount than long-term rates. Even so, shorter duration bonds outperformed longer duration bonds for the year. The yield curve inverted between the 2-year and 10-year Treasury rate near the middle of the year and remained inverted by 55 basis points at year-end. Historically, an inverted yield curve can be a harbinger of a pending recession. Credit spreads widened during the year, and lower quality bonds generally underperformed higher quality bonds.
From an investment strategy perspective, the Portfolio was positioned with a slightly shorter duration than the benchmark throughout the year, which enhanced performance. In terms of bond quality, the Portfolio was slightly overweight lower rated bonds, which detracted from performance. (1)
Q. How did sector allocation and security selection each impact the Portfolio’s performance relative to its benchmark?
A. Sector allocation provided positive relative performance for the Portfolio in 2022. The overweight to U.S. Treasuries and Consumer Discretionary sectors enhanced performance. Allocations to Materials and Financials detracted from performance. From a quality perspective, the underweight allocation to A-rated bonds and overweight to BBB-rated and BB-rated bonds detracted from performance slightly. Security selection provided a small amount of positive relative performance. Security selection within the Financials and Materials provided positive relative performance, offsetting the allocation underperformance in these sectors. Similarly, security selection within the BBB-rated sector provided positive relative performance, offsetting the underperformance caused by the allocation to the BBB-rated sector. (1)
Q. Which securities contributed the most to, and detracted the most from, the Portfolio’s benchmark-relative performance?
A. The top three contributors to the Portfolio’s performance relative to the benchmark were Truist Financial Corp. 6.123% due 10/28/2033, Morgan Stanley 6.296% due 10/18/2028, and American Airlines 2015-1 Class B Pass Through Trust 3.700% due 05/01/2023. The top three detractors from the Portfolio’s performance relative to the benchmark were Charter Communications Operating LLC / Charter Communications Operating Capital 3.700% due 04/01/2051, The Home Depot, Inc. 2.375% due 3/15/2051, and Lowe’s Cos., Inc. 3.000% due 10/15/2050. Each of these bonds are longer duration bonds, which performed poorly due to rising interest rates. (1)
| (1) | The Portfolio’s composition is subject to change. Holdings and weightings are as of December 31, 2022. |
| Change in Value of $10,000 Investment |
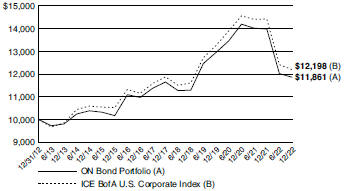
Hypothetical illustration based on past performance. Future performance will vary. The Portfolio’s returns reflect reinvested dividends. The Portfolio’s holdings may differ significantly from the securities in the index. The index is unmanaged and therefore does not reflect the cost of portfolio management and accounting.
The ICE BofA U.S. Corporate Index tracks the performance of all U.S. dollar-denominated, investment grade corporate public debt issued in the U.S. domestic bond market. Qualifying bonds must have an investment grade rating (based on an average of Moody’s, S&P, and Fitch). In addition, qualifying securities must have at least one year remaining term to maturity, a fixed coupon schedule, and a minimum amount outstanding of $250 million.
Past performance is no guarantee of future results. Redemption of fund shares could have tax implications unique to each shareholder.
| 4 | (continued) |
Ohio National Fund, Inc. | ON Bond Portfolio (Unaudited) (Continued) |
| Portfolio Composition as of December 31, 2022 (1) | ||
| % of Net Assets | ||||
Corporate Bonds (4) | 83.5 | |||
U.S. Treasury Obligations | 9.9 | |||
Asset-Backed Securities (4) | 2.6 | |||
Other Net Assets | 4.0 | |||
|
| |||
| 100.0 | ||||
|
| |||
| Top 10 Portfolio Holdings as of December 31, 2022 (1) (2) (3) | ||||
| % of Net Assets | ||||||
| 1. | U.S. Treasury Note 4.500%, 11/15/2025 | 5.4 | ||||
| 2. | U.S. Treasury Note 4.500%, 11/30/2024 | 2.3 | ||||
| 3. | U.S. Treasury Note 3.000%, 08/15/2052 | 2.2 | ||||
| 4. | Lear Corp. 4.250%, 05/15/2029 | 1.6 | ||||
| 5. | Kinross Gold Corp. 4.500%, 07/15/2027 | 1.3 | ||||
| 6. | Mosaic Co. / The 4.050%, 11/15/2027 | 1.3 | ||||
| 7. | Hasbro, Inc. 3.900%, 11/19/2029 | 1.2 | ||||
| 8. | Boeing Co. / The 3.200%, 03/01/2029 | 1.2 | ||||
| 9. | Ares Capital Corp. 3.200%, 11/15/2031 | 1.2 | ||||
| 10. | AbbVie, Inc. 4.250%, 11/21/2049 | 1.1 | ||||
| (1) | Composition of Portfolio subject to change. |
| (2) | Short-term investments have been excluded from the list of Top 10 Portfolio Holdings. |
| (3) | Top 10 Portfolio Holdings is presented at an individual security level. Total investment exposure by issuer may be higher. |
| (4) | Sectors (Corporate Bonds, Asset-Backed Securities): |
| % of Net Assets | ||||
Financials | 24.3 | |||
Industrials | 11.9 | |||
Consumer Discretionary | 8.2 | |||
Consumer Staples | 8.1 | |||
Energy | 7.2 | |||
Utilities | 7.1 | |||
Materials | 6.9 | |||
Communication Services | 4.2 | |||
Health Care | 3.8 | |||
Real Estate | 2.8 | |||
Information Technology | 1.6 | |||
|
| |||
| 86.1 | ||||
|
| |||
| 5 |
Ohio National Fund, Inc. | ON Bond Portfolio | |
| Schedule of Investments | December 31, 2022 | |
| Corporate Bonds – 83.5% | Rate | Maturity | Face Amount | Value | ||||||||||||||||
COMMUNICATION SERVICES – 4.2% | ||||||||||||||||||||
AT&T, Inc. (Diversified Telecom. Svs.) | 4.900% | 08/15/2037 | $ | 1,000,000 | $ | 919,099 | ||||||||||||||
Charter Communications Operating LLC / Charter Communications Operating Capital (Media) | 3.700% | 04/01/2051 | 1,000,000 | 608,068 | ||||||||||||||||
Comcast Corp. (Media) | 3.250% | 11/01/2039 | 3,000,000 | 2,337,110 | ||||||||||||||||
Time Warner Cable LLC (Media) | 6.550% | 05/01/2037 | 2,000,000 | 1,904,122 | ||||||||||||||||
T-Mobile U.S.A., Inc. (Wireless Telecom. Svs.) | 3.875% | 04/15/2030 | 1,800,000 | 1,630,466 | ||||||||||||||||
Verizon Communications, Inc. (Diversified Telecom. Svs.) | 4.400% | 11/01/2034 | 1,500,000 | 1,377,382 | ||||||||||||||||
Verizon Communications, Inc. (Diversified Telecom. Svs.) | 2.875% | 11/20/2050 | 1,000,000 | 626,959 | ||||||||||||||||
|
| |||||||||||||||||||
| 9,403,206 | ||||||||||||||||||||
|
| |||||||||||||||||||
CONSUMER DISCRETIONARY – 8.2% | ||||||||||||||||||||
Amazon.com, Inc. (Internet & Direct Marketing Retail) | 3.875% | 08/22/2037 | 1,000,000 | 885,920 | ||||||||||||||||
Aptiv PLC (Auto Components) | 4.350% | 03/15/2029 | 1,000,000 | 922,501 | ||||||||||||||||
Aptiv PLC / Aptiv Corp. (Auto Components) | 3.250% | 03/01/2032 | 2,000,000 | 1,635,919 | ||||||||||||||||
Best Buy Co., Inc. (Specialty Retail) | 1.950% | 10/01/2030 | 3,000,000 | 2,373,727 | ||||||||||||||||
Expedia Group, Inc. (Hotels, Restaurants & Leisure) | 4.625% | 08/01/2027 | 1,000,000 | 959,353 | ||||||||||||||||
Hasbro, Inc. (Leisure Products) | 3.900% | 11/19/2029 | 3,000,000 | 2,666,053 | ||||||||||||||||
Home Depot, Inc. / The (Specialty Retail) | 2.375% | 03/15/2051 | 2,000,000 | 1,193,133 | ||||||||||||||||
Lear Corp. (Auto Components) | 4.250% | 05/15/2029 | 4,000,000 | 3,592,173 | ||||||||||||||||
Lowe’s Cos., Inc. (Specialty Retail) | 3.000% | 10/15/2050 | 2,000,000 | 1,272,278 | ||||||||||||||||
M.D.C. Holdings, Inc. (Household Durables) | 3.850% | 01/15/2030 | 2,000,000 | 1,628,043 | ||||||||||||||||
Magna International, Inc. (Auto Components) | 3.625% | 06/15/2024 | 1,000,000 | 977,409 | ||||||||||||||||
|
| |||||||||||||||||||
| 18,106,509 | ||||||||||||||||||||
|
| |||||||||||||||||||
CONSUMER STAPLES – 8.1% | ||||||||||||||||||||
Anheuser-Busch Cos. LLC / Anheuser-Busch InBev Worldwide, Inc. (Beverages) | 4.900% | 02/01/2046 | 1,000,000 | 909,075 | ||||||||||||||||
Anheuser-Busch Cos. LLC / Anheuser-Busch InBev Worldwide, Inc. (Beverages) | 4.700% | 02/01/2036 | 2,000,000 | 1,888,886 | ||||||||||||||||
Anheuser-Busch InBev Worldwide, Inc. (Beverages) | 4.600% | 04/15/2048 | 2,000,000 | 1,737,903 | ||||||||||||||||
B.A.T. Capital Corp. (Tobacco) | 3.215% | 09/06/2026 | 1,000,000 | 922,527 | ||||||||||||||||
B.A.T. Capital Corp. (Tobacco) | 4.700% | 04/02/2027 | 2,000,000 | 1,917,182 | ||||||||||||||||
Coca-Cola Co. / The (Beverages) | 3.000% | 03/05/2051 | 1,000,000 | 727,125 | ||||||||||||||||
Coca-Cola Co. / The (Beverages) | 2.500% | 03/15/2051 | 1,000,000 | 647,000 | ||||||||||||||||
Hershey Co. / The (Food Products) | 1.700% | 06/01/2030 | 1,800,000 | 1,441,334 | ||||||||||||||||
JBS U.S.A. LUX SA / JBS U.S.A. Food Co. / JBS U.S.A. Finance, Inc. (Food Products) | (a) | 5.750% | 04/01/2033 | 1,200,000 | 1,144,536 | |||||||||||||||
Kimberly-Clark Corp. (Household Products) | 1.050% | 09/15/2027 | 2,000,000 | 1,705,440 | ||||||||||||||||
Kraft Heinz Foods Co. (Food Products) | 4.625% | 10/01/2039 | 1,200,000 | 1,052,679 | ||||||||||||||||
Philip Morris International, Inc. (Tobacco) | 3.375% | 08/15/2029 | 2,500,000 | 2,251,115 | ||||||||||||||||
Smithfield Foods, Inc. (Food Products) | (a) | 3.000% | 10/15/2030 | 2,000,000 | 1,522,786 | |||||||||||||||
|
| |||||||||||||||||||
| 17,867,588 | ||||||||||||||||||||
|
| |||||||||||||||||||
ENERGY – 7.2% | ||||||||||||||||||||
Baker Hughes Holdings LLC / Baker Hughes Co-Obligor, Inc. (Energy Equip. & Svs.) | 4.080% | 12/15/2047 | 2,000,000 | 1,559,937 | ||||||||||||||||
BP Capital Markets America, Inc. (Oil, Gas & Consumable Fuels) | 3.017% | 01/16/2027 | 1,000,000 | 931,061 | ||||||||||||||||
BP Capital Markets America, Inc. (Oil, Gas & Consumable Fuels) | 1.749% | 08/10/2030 | 1,000,000 | 797,196 | ||||||||||||||||
Chevron Corp. (Oil, Gas & Consumable Fuels) | 2.236% | 05/11/2030 | 1,800,000 | 1,542,422 | ||||||||||||||||
Energy Transfer LP (Oil, Gas & Consumable Fuels) | 4.950% | 06/15/2028 | 2,000,000 | 1,933,971 | ||||||||||||||||
Halliburton Co. (Energy Equip. & Svs.) | 4.850% | 11/15/2035 | 1,000,000 | 925,114 | ||||||||||||||||
Kinder Morgan, Inc. (Oil, Gas & Consumable Fuels) | 5.300% | 12/01/2034 | 1,000,000 | 935,853 | ||||||||||||||||
Marathon Petroleum Corp. (Oil, Gas & Consumable Fuels) | 4.750% | 09/15/2044 | 1,000,000 | 834,998 | ||||||||||||||||
ONEOK, Inc. (Oil, Gas & Consumable Fuels) | 5.850% | 01/15/2026 | 1,200,000 | 1,214,371 | ||||||||||||||||
ONEOK, Inc. (Oil, Gas & Consumable Fuels) | 6.000% | 06/15/2035 | 1,000,000 | 959,957 | ||||||||||||||||
Shell International Finance B.V. (Oil, Gas & Consumable Fuels) | 4.000% | 05/10/2046 | 1,000,000 | 815,405 | ||||||||||||||||
Tennessee Gas Pipeline Co. LLC (Oil, Gas & Consumable Fuels) | (a) | 2.900% | 03/01/2030 | 1,000,000 | 837,595 | |||||||||||||||
Texas Eastern Transmission LP (Oil, Gas & Consumable Fuels) | (a) | 4.150% | 01/15/2048 | 1,000,000 | 801,898 | |||||||||||||||
Williams Cos., Inc. / The (Oil, Gas & Consumable Fuels) | 3.750% | 06/15/2027 | 1,000,000 | 941,253 | ||||||||||||||||
Williams Cos., Inc. / The (Oil, Gas & Consumable Fuels) | 5.400% | 03/04/2044 | 1,000,000 | 906,524 | ||||||||||||||||
|
| |||||||||||||||||||
| 15,937,555 | ||||||||||||||||||||
|
| |||||||||||||||||||
FINANCIALS – 24.3% | ||||||||||||||||||||
AerCap Ireland Capital DAC / AerCap Global Aviation Trust (Diversified Financial Svs.) | 3.300% | 01/30/2032 | 1,500,000 | 1,172,641 | ||||||||||||||||
American Express Co. (Rate is fixed until 08/03/2032, at which point, the rate becomes SOFR + 176) (Consumer Finance) | (b | ) | 4.420% | 08/03/2033 | 1,800,000 | 1,700,306 | ||||||||||||||
Ares Capital Corp. (Capital Markets) | 3.200% | 11/15/2031 | 3,500,000 | 2,568,475 | ||||||||||||||||
Bank of America Corp. (Banks) | 3.875% | 08/01/2025 | 1,000,000 | 973,392 | ||||||||||||||||
Bank of America Corp. (Rate is fixed until 03/08/2032, at which point, the rate becomes H15T5Y + 200) (Banks) | (b) | 3.846% | 03/08/2037 | 1,000,000 | 828,060 | |||||||||||||||
Bank of Montreal (Rate is fixed until 12/15/2027, at which point, the rate becomes USSW5 + 143) (Banks) | (b) | 3.803% | 12/15/2032 | 2,800,000 | 2,465,457 | |||||||||||||||
BlackRock, Inc. (Capital Markets) | 2.400% | 04/30/2030 | 1,000,000 | 854,593 | ||||||||||||||||
BlackRock, Inc. (Capital Markets) | 2.100% | 02/25/2032 | 2,000,000 | 1,609,194 | ||||||||||||||||
| 6 | (continued) |
Ohio National Fund, Inc. | ON Bond Portfolio (Continued) | |
| Schedule of Investments | December 31, 2022 | |
| Corporate Bonds (Continued) | Rate | Maturity | Face Amount | Value | ||||||||||||||||
FINANCIALS (continued) | ||||||||||||||||||||
Capital One Bank U.S.A. N.A. (Rate is fixed until 01/28/2025, at which point, the rate becomes SOFR + 91) (Consumer Finance) | (b) | 2.280% | 01/28/2026 | $ | 1,500,000 | $ | 1,400,921 | |||||||||||||
Charles Schwab Corp. / The (Capital Markets) | 3.300% | 04/01/2027 | 2,000,000 | 1,890,903 | ||||||||||||||||
Citigroup, Inc. (Banks) | 3.700% | 01/12/2026 | 1,000,000 | 961,921 | ||||||||||||||||
Citigroup, Inc. (Banks) | 4.450% | 09/29/2027 | 2,000,000 | 1,906,817 | ||||||||||||||||
Discover Bank (Rate is fixed until 08/09/2023, at which point, the rate becomes USSW5 + 173) (Banks) | (b) | 4.682% | 08/09/2028 | 2,000,000 | 1,919,560 | |||||||||||||||
General Motors Financial Co., Inc. (Consumer Finance) | QL + 99 | 01/05/2023 | 2,000,000 | 1,999,848 | ||||||||||||||||
Goldman Sachs Group, Inc. / The (Capital Markets) | 3.750% | 05/22/2025 | 2,000,000 | 1,934,312 | ||||||||||||||||
Intercontinental Exchange, Inc. (Capital Markets) | 3.750% | 12/01/2025 | 1,000,000 | 973,669 | ||||||||||||||||
Jefferies Group LLC / Jefferies Group Capital Finance, Inc. (Capital Markets) | 4.850% | 01/15/2027 | 1,800,000 | 1,777,218 | ||||||||||||||||
JPMorgan Chase & Co. (Banks) | 3.625% | 12/01/2027 | 2,000,000 | 1,848,914 | ||||||||||||||||
JPMorgan Chase & Co. (Rate is fixed until 05/13/2030, at which point, the rate becomes SOFR + 252) (Banks) | (b) | 2.956% | 05/13/2031 | 2,000,000 | 1,647,911 | |||||||||||||||
KeyCorp (Rate is fixed until 06/01/2032, at which point, the rate becomes SOFRINDX + 206) (Banks) | (b) | 4.789% | 06/01/2033 | 2,500,000 | 2,360,472 | |||||||||||||||
Marsh & McLennan Cos., Inc. (Insurance) | 3.500% | 06/03/2024 | 1,400,000 | 1,369,772 | ||||||||||||||||
Morgan Stanley (Capital Markets) | 3.950% | 04/23/2027 | 1,000,000 | 944,393 | ||||||||||||||||
Morgan Stanley (Rate is fixed until 10/18/2027, at which point, the rate becomes SOFR + 224) (Capital Markets) | (b) | 6.296% | 10/18/2028 | 2,000,000 | 2,064,609 | |||||||||||||||
PNC Bank N.A. (Banks) | 2.700% | 10/22/2029 | 2,500,000 | 2,109,503 | ||||||||||||||||
State Street Corp. (Capital Markets) | 2.200% | 03/03/2031 | 2,000,000 | 1,599,012 | ||||||||||||||||
Synchrony Financial (Consumer Finance) | 4.250% | 08/15/2024 | 1,000,000 | 977,036 | ||||||||||||||||
Synchrony Financial (Consumer Finance) | 5.150% | 03/19/2029 | 2,000,000 | 1,892,541 | ||||||||||||||||
Truist Financial Corp (Rate is fixed until 10/28/2032, at which point, the rate becomes SOFR + 230) (Banks) | (b) | 6.123% | 10/28/2033 | 1,000,000 | 1,052,102 | |||||||||||||||
U.S. Bancorp (Banks) | 1.375% | 07/22/2030 | 2,000,000 | 1,545,789 | ||||||||||||||||
Wells Fargo & Co. (Banks) | 3.000% | 04/22/2026 | 1,000,000 | 935,311 | ||||||||||||||||
Wells Fargo & Co. (Rate is fixed until 10/30/2029, at which point, the rate becomes TSFR3M + 143) (Banks) | (b) | 2.879% | 10/30/2030 | 2,000,000 | 1,698,809 | |||||||||||||||
Wells Fargo & Co. (Rate is fixed until 04/30/2040, at which point, the rate becomes SOFR + 253) (Banks) | (b) | 3.068% | 04/30/2041 | 1,200,000 | 855,949 | |||||||||||||||
Wells Fargo & Co. (Banks) | 4.650% | 11/04/2044 | 1,000,000 | 841,776 | ||||||||||||||||
Westpac Banking Corp. (Rate is fixed until 02/04/2025, at which point, the rate becomes H15T5Y + 135) (Banks) | (b) | 2.894% | 02/04/2030 | 1,500,000 | 1,375,172 | |||||||||||||||
Westpac Banking Corp. (Rate is fixed until 11/23/2026, at which point, the rate becomes USISDA05 + 224) (Banks) | (b) | 4.322% | 11/23/2031 | 1,800,000 | 1,694,088 | |||||||||||||||
|
| |||||||||||||||||||
| 53,750,446 | ||||||||||||||||||||
|
| |||||||||||||||||||
HEALTH CARE – 3.8% | ||||||||||||||||||||
AbbVie, Inc. (Biotechnology) | 3.200% | 11/21/2029 | 1,000,000 | 901,474 | ||||||||||||||||
AbbVie, Inc. (Biotechnology) | 4.250% | 11/21/2049 | 3,000,000 | 2,489,655 | ||||||||||||||||
HCA, Inc. (Health Care Providers & Svs.) | 5.250% | 06/15/2026 | 1,000,000 | 987,930 | ||||||||||||||||
Quest Diagnostics, Inc. (Health Care Providers & Svs.) | 2.950% | 06/30/2030 | 2,000,000 | 1,727,443 | ||||||||||||||||
Quest Diagnostics, Inc. (Health Care Providers & Svs.) | 2.800% | 06/30/2031 | 1,200,000 | 1,004,741 | ||||||||||||||||
Regeneron Pharmaceuticals, Inc. (Biotechnology) | 1.750% | 09/15/2030 | 1,800,000 | 1,390,262 | ||||||||||||||||
|
| |||||||||||||||||||
| 8,501,505 | ||||||||||||||||||||
|
| |||||||||||||||||||
INDUSTRIALS – 9.3% | ||||||||||||||||||||
Air Lease Corp. (Trading Companies & Distributors) | 2.250% | 01/15/2023 | 2,000,000 | 1,998,098 | ||||||||||||||||
Air Lease Corp. (Trading Companies & Distributors) | 2.300% | 02/01/2025 | 2,000,000 | 1,862,058 | ||||||||||||||||
BAE Systems PLC (Aerospace & Defense) | (a) | 1.900% | 02/15/2031 | 2,000,000 | 1,550,917 | |||||||||||||||
Boeing Co. / The (Aerospace & Defense) | 3.200% | 03/01/2029 | 3,000,000 | 2,630,670 | ||||||||||||||||
Burlington Northern Santa Fe LLC (Road & Rail) | 4.550% | 09/01/2044 | 900,000 | 813,683 | ||||||||||||||||
Canadian Pacific Railway Co. (Road & Rail) | 2.050% | 03/05/2030 | 1,300,000 | 1,065,348 | ||||||||||||||||
FedEx Corp. (Air Freight & Logistics) | 4.900% | 01/15/2034 | 2,000,000 | 1,890,065 | ||||||||||||||||
Lockheed Martin Corp. (Aerospace & Defense) | 1.850% | 06/15/2030 | 1,200,000 | 985,517 | ||||||||||||||||
Lockheed Martin Corp. (Aerospace & Defense) | 3.600% | 03/01/2035 | 1,000,000 | 887,578 | ||||||||||||||||
Northrop Grumman Corp. (Aerospace & Defense) | 2.930% | 01/15/2025 | 1,000,000 | 959,001 | ||||||||||||||||
Parker-Hannifin Corp. (Machinery) | 4.200% | 11/21/2034 | 1,400,000 | 1,261,240 | ||||||||||||||||
TTX Co. (Road & Rail) | (a) | 5.650% | 12/01/2052 | 2,000,000 | 2,009,704 | |||||||||||||||
Union Pacific Corp. (Road & Rail) | 3.250% | 08/15/2025 | 1,000,000 | 961,065 | ||||||||||||||||
Waste Connections, Inc. (Commercial Svs. & Supplies) | 4.250% | 12/01/2028 | 1,800,000 | 1,719,821 | ||||||||||||||||
|
| |||||||||||||||||||
| 20,594,765 | ||||||||||||||||||||
|
| |||||||||||||||||||
INFORMATION TECHNOLOGY – 1.6% | ||||||||||||||||||||
Broadcom, Inc. (Semiconductors & Equip.) | (a) | 2.600% | 02/15/2033 | 2,000,000 | 1,501,194 | |||||||||||||||
VMware, Inc. (Software) | 2.200% | 08/15/2031 | 2,800,000 | 2,124,819 | ||||||||||||||||
|
| |||||||||||||||||||
| 3,626,013 | ||||||||||||||||||||
|
| |||||||||||||||||||
| 7 | (continued) |
Ohio National Fund, Inc. | ON Bond Portfolio (Continued) | |
| Schedule of Investments | December 31, 2022 | |
| Corporate Bonds (Continued) | Rate | Maturity | Face Amount | Value | ||||||||||||||||
MATERIALS – 6.9% | ||||||||||||||||||||
Anglo American Capital PLC (Metals & Mining) | (a) | 4.750% | 04/10/2027 | $ | 1,000,000 | $ | 966,491 | |||||||||||||
Anglo American Capital PLC (Metals & Mining) | (a) | 4.000% | 09/11/2027 | 800,000 | 753,692 | |||||||||||||||
Dow Chemical Co. / The (Chemicals) | 4.250% | 10/01/2034 | 1,402,000 | 1,267,384 | ||||||||||||||||
Glencore Funding LLC (Metals & Mining) | (a) | 2.850% | 04/27/2031 | 2,000,000 | 1,636,650 | |||||||||||||||
Kinross Gold Corp. (Metals & Mining) | 4.500% | 07/15/2027 | 3,000,000 | 2,845,399 | ||||||||||||||||
Mosaic Co. / The (Chemicals) | 4.050% | 11/15/2027 | 3,000,000 | 2,824,743 | ||||||||||||||||
Nutrien Ltd. (Chemicals) | 4.200% | 04/01/2029 | 1,900,000 | 1,784,677 | ||||||||||||||||
RPM International, Inc. (Chemicals) | 4.250% | 01/15/2048 | 3,000,000 | 2,237,682 | ||||||||||||||||
Steel Dynamics, Inc. (Metals & Mining) | 3.250% | 01/15/2031 | 1,200,000 | 1,024,127 | ||||||||||||||||
|
| |||||||||||||||||||
| 15,340,845 | ||||||||||||||||||||
|
| |||||||||||||||||||
REAL ESTATE – 2.8% | ||||||||||||||||||||
Alexandria Real Estate Equities, Inc. (Equity REIT) | 3.950% | 01/15/2028 | 1,000,000 | 938,793 | ||||||||||||||||
Healthcare Realty Holdings LP (Equity REIT) | 3.875% | 05/01/2025 | 1,400,000 | 1,336,731 | ||||||||||||||||
Healthcare Realty Holdings LP (Equity REIT) | 3.625% | 01/15/2028 | 1,000,000 | 886,641 | ||||||||||||||||
VICI Properties LP / VICI Note Co., Inc. (Equity REIT) | (a) | 4.625% | 12/01/2029 | 1,300,000 | 1,183,000 | |||||||||||||||
Welltower, Inc. (Equity REIT) | 4.250% | 04/01/2026 | 1,000,000 | 966,996 | ||||||||||||||||
Welltower, Inc. (Equity REIT) | �� | 2.700% | 02/15/2027 | 1,000,000 | 900,547 | |||||||||||||||
|
| |||||||||||||||||||
| 6,212,708 | ||||||||||||||||||||
|
| |||||||||||||||||||
UTILITIES – 7.1% | ||||||||||||||||||||
AEP Transmission Co. LLC (Electric Utilities) | 4.000% | 12/01/2046 | 1,000,000 | 785,338 | ||||||||||||||||
AEP Transmission Co. LLC (Electric Utilities) | 3.750% | 12/01/2047 | 1,351,000 | 1,046,693 | ||||||||||||||||
Ameren Corp. (Multi-Utilities) | 3.500% | 01/15/2031 | 2,000,000 | 1,768,825 | ||||||||||||||||
American Water Capital Corp. (Water Utilities) | 4.300% | 12/01/2042 | 1,400,000 | 1,214,762 | ||||||||||||||||
Berkshire Hathaway Energy Co. (Multi-Utilities) | 3.250% | 04/15/2028 | 1,900,000 | 1,757,756 | ||||||||||||||||
Commonwealth Edison Co. (Electric Utilities) | 4.350% | 11/15/2045 | 2,000,000 | 1,706,209 | ||||||||||||||||
Connecticut Light & Power Co. / The (Electric Utilities) | 4.000% | 04/01/2048 | 1,000,000 | 834,276 | ||||||||||||||||
Duke Energy Corp. (Electric Utilities) | 3.750% | 09/01/2046 | 1,000,000 | 741,968 | ||||||||||||||||
Eversource Energy (Electric Utilities) | 3.300% | 01/15/2028 | 1,000,000 | 920,820 | ||||||||||||||||
FirstEnergy Transmission LLC (Electric Utilities) | (a) | 4.550% | 04/01/2049 | 1,800,000 | 1,456,467 | |||||||||||||||
Florida Power & Light Co. (Electric Utilities) | 3.150% | 10/01/2049 | 2,000,000 | 1,440,557 | ||||||||||||||||
Jersey Central Power & Light Co. (Electric Utilities) | (a) | 4.300% | 01/15/2026 | 900,000 | 869,271 | |||||||||||||||
Public Service Electric & Gas Co. (Multi-Utilities) | 3.600% | 12/01/2047 | 1,500,000 | 1,139,059 | ||||||||||||||||
|
| |||||||||||||||||||
| 15,682,001 | ||||||||||||||||||||
|
| |||||||||||||||||||
Total Corporate Bonds (Cost $213,081,506) | $ | 185,023,141 | ||||||||||||||||||
|
| |||||||||||||||||||
| U.S. Treasury Obligations – 9.9% | Rate | Maturity | Face Amount | Value | ||||||||||||||||
U.S. Treasury Note. | 4.500% | 11/30/2024 | $ | 5,000,000 | $ | 5,000,195 | ||||||||||||||
U.S. Treasury Note. | 4.500% | 11/15/2025 | 12,000,000 | 12,072,187 | ||||||||||||||||
U.S. Treasury Note. | 3.000% | 08/15/2052 | 6,000,000 | 4,943,438 | ||||||||||||||||
|
| |||||||||||||||||||
Total U.S. Treasury Obligations (Cost $22,475,596) | $ | 22,015,820 | ||||||||||||||||||
|
| |||||||||||||||||||
| Asset-Backed Securities – 2.6% | Rate | Maturity | Face Amount | Value | ||||||||||||||||
INDUSTRIALS – 2.6% | ||||||||||||||||||||
Air Canada 2017-1 Class B Pass Through Trust | (a) | 3.700% | 01/15/2026 | $ | 1,521,164 | $ | 1,386,582 | |||||||||||||
American Airlines 2015-1 Class B Pass Through Trust | 3.700% | 05/01/2023 | 349,104 | 345,316 | ||||||||||||||||
FedEx Corp. 2020-1 Class AA Pass Through Trust | 1.875% | 02/20/2034 | 2,679,164 | 2,195,764 | ||||||||||||||||
United Airlines 2016-1 Class B Pass Through Trust | 3.650% | 01/07/2026 | 1,106,250 | 1,000,916 | ||||||||||||||||
United Airlines 2019-2 Class AA Pass Through Trust | 2.700% | 05/01/2032 | 884,524 | 713,701 | ||||||||||||||||
|
| |||||||||||||||||||
Total Asset-Backed Securities (Cost $6,540,258) | $ | 5,642,279 | ||||||||||||||||||
|
| |||||||||||||||||||
Total Investments – 96.0% (Cost $242,097,360) | (c) | $ | 212,681,240 | |||||||||||||||||
Other Assets in Excess of Liabilities – 4.0% | 8,799,359 | |||||||||||||||||||
|
| |||||||||||||||||||
Net Assets – 100.0% | $ | 221,480,599 | ||||||||||||||||||
|
| |||||||||||||||||||
Percentages are stated as a percent of net assets.
| Abbreviations: | ||
H15T5Y: | U.S. Treasury Yield Curve Rate T-Note Constant Maturity 5 Year, 3.880% at 12/31/2022 | |
QL: | Quarterly U.S. LIBOR Rate, 4.767% at 12/31/2022 | |
SOFR: | Secured Overnight Financing Rate, 4.300% at 12/31/2022 | |
TSFR3M: | Quarterly CME Term SOFR, 4.587% at 12/31/2022 | |
USISDA05: | USD ICE Swap Rate 11:00am NY 5 Year, 4.045% at 12/31/2022 | |
USSW5: | USD Swap Semi 30/360 5 Year, 4.023% at 12/31/2022 |
| 8 |
Ohio National Fund, Inc. | ON Bond Portfolio (Continued) | |
| Schedule of Investments | December 31, 2022 | |
Footnotes:
| (a) | Security exempt from registration under Regulation D of the Securities Act of 1933. These securities may be resold in transactions exempt from registration, normally to qualified buyers under Rule 144A. At December 31, 2022, the value of these securities totaled $17,620,783, or 8.0% of the Portfolio’s net assets. |
| (b) | Security is a fixed-then-variable rate instrument in which the coupon or dividend rate is fixed until a later specified date, then is adjusted periodically. Rates stated, including interest rate caps and floors, if any, are those in effect at December 31, 2022. |
| (c) | Represents cost for financial reporting purposes, which may differ from cost basis for federal income tax purposes. See also Note 7 of the Notes to Financial Statements. |
The accompanying notes are an integral part of these financial statements.
| 9 |
| ON BlackRock Balanced Allocation Portfolio (Unaudited) |
| Objective/Strategy |
The ON BlackRock Balanced Allocation Portfolio seeks a high level of long-term total return consistent with preservation of capital by investing in stocks, bonds, and money market instruments.
| Performance as of December 31, 2022 |
Average Annual returns | ||||
One year | -18.41 | % | ||
Five years | 4.41 | % | ||
Ten years | 9.49 | % |
Past performance does not guarantee future results. The performance data quoted represents past performance and current returns may be lower or higher. Total return figures include change in share price and reinvestment of dividends and capital gains. The investment return and principal value will fluctuate so that an investor’s shares, when redeemed, may be worth more or less than the original cost. To obtain performance information up to the most recent month end, call toll-free 1-877-781-6392.
The Portfolio is not open to direct retail investment. Beneficial interest in the Portfolio’s shares is obtained either through an allocation to the Portfolio as an investment vehicle within variable life insurance policies or annuity contracts, or as an underlying investment by the ON Model Portfolios. Actual performance results for variable annuity and variable universal life contracts will be lower due to contract charges. Consult your contract for applicable charges.
Total expense ratio is 0.54% per the Fund’s prospectus dated April 29, 2022. Additional information pertaining to the Portfolio’s expense ratio as of December 31, 2022 can be found in the Portfolio’s Financial Highlights.
| Comments from Sub-Adviser/Adviser |
Q. How did the Portfolio perform in comparison to its benchmark during the reporting period?
A. For the year ended December 31, 2022, the Portfolio returned -18.41% versus -18.11% for its benchmark, the S&P 500® Index. The Portfolio’s secondary benchmark, which is comprised of 70% S&P 500® Index and 30% ICE BofA U.S. Corporate Index, returned -17.09% for the year ended December 31, 2022.
Q. Were there specific market conditions, investment strategies, or techniques that materially affected the Portfolio’s benchmark-relative performance during the reporting period?
A. The Portfolio’s equity sleeve underperformed the primary benchmark, while the fixed income sleeve underperformed the fixed income portion of the secondary benchmark but outperformed the primary benchmark. However, much of the equity sleeve’s underperformance was offset by the fixed income sleeve, as fixed income securities did not decline as much as the primary benchmark during the year.
In the equity sleeve, the Portfolio’s slight underperformance was primarily driven by weakness in the first quarter. Fundamental insights struggled in the first half of the year, driven by growth-related quality measures, with partial recovery in the second half of the year. Fundamental quality insights with a growth flavor, such as measures of company culture, founder involvement, and company benefits were the largest detractors, amid the market’s value style preference.
However, fundamental value insights were strong contributors amid the prevailing market style preference. Namely, insights evaluating company earnings yield, sales, and other financial statement metrics contributed. Defensive quality measures relating to stability, balance sheet quality, and internal financing also performed well against the broad market decline. (1)
As it relates to the fixed income sleeve of the Portfolio, interest rates rose significantly in 2022, as the Federal Reserve (the “Fed”) raised the Fed Funds rate aggressively in an attempt to curb inflation. Furthermore, the Fed has indicated that it will continue to raise the Fed Funds rate, and hold it at a high level, until inflation declines to its target level of 2%. Interest rates increased across the entire yield curve, but short-term interest rates increased by a larger amount than long-term rates. Even so, shorter duration bonds outperformed longer duration bonds for the year. The yield curve inverted between the 2-year and 10-year Treasury rate near the middle of the year and remained inverted by 55 basis points at year-end. Historically, an inverted yield curve can be a harbinger of a pending recession. Credit spreads widened during the year, and lower quality bonds generally underperformed higher quality bonds. From an investment strategy perspective, the Portfolio was positioned with a slightly shorter duration than the fixed income portion of the secondary benchmark throughout the year, which enhanced performance slightly. (1)
Q. How did sector allocation and security selection each impact the Portfolio’s performance relative to its benchmark?
A. For the equity sleeve, sector allocation decisions contributed to relative performance. An underweight position within Communication Services names contributed, as the sector underperformed due to its pro-growth orientation. Conversely, an underweight in the Energy sector in the latter part of the year was a key detractor. Security selection, however, had a more meaningful impact on underperformance, driven by negative selection within Consumer Staples and Information Technology.
For the fixed income sleeve, security selection was a positive contributor to the Portfolio’s fixed income performance relative to the fixed income portion of the secondary benchmark. Sector allocation was also a slight positive contributor to the Portfolio’s relative performance vs. the fixed income portion of the secondary benchmark. (1)
Q. Which securities contributed the most to, and detracted the most from, the Portfolio’s benchmark-relative performance?
A. In the equity sleeve, the Portfolio’s overweights in EOG Resources, Inc., a Texas-based Energy company, and oilfield services company Schlumberger Ltd. / N.V. were top contributors to relative performance. Both stocks benefitted from the broad Energy sector rally and the runup in commodities prices. In contrast, an overweight to EcoLab, Inc. was a key detractor from relative performance, as the stock struggled against supply chain challenges, as well as rising input costs. An early overweight to IDEXX Laboratories, Inc. was the top detractor, as the company missed its first quarter earnings estimates and lowered its forward guidance.
For the fixed income sleeve of the Portfolio, the top three contributors to the Portfolio’s performance relative to the fixed income portion of the secondary benchmark were Ford Motor Credit Co. LLC 3.087% due 01/09/2023, AerCap Ireland Capital DAC / AerCap Global Aviation Trust 3.300% due 1/23/2023, and Air Lease Corp 2.250% due 01/15/2023. Each of these bonds are shorter duration bonds. The top three detractors to the Portfolio’s relative performance were Lowe’s Cos., Inc. 3.000% due 10/15/2050, Verizon Communications, Inc. 2.875% due 11/20/2050, and Duke Energy Indiana LLC 3.250% due 10/01/2049. Each of these bonds are longer duration bonds.(1)
Q. How did the Portfolio’s use of derivative instruments and initial public offerings (IPOs), if any, impact performance?
A. Pursuant to the Portfolio’s investment strategy, futures contracts were used to prevent a cash drag on performance. The futures contracts detracted 19 basis points from the absolute return of the Portfolio for the year. The Portfolio did not participate in any IPOs during the year. (1)
| (1) | The Portfolio’s composition is subject to change. Holdings and weightings are as of December 31, 2022. |
| 10 | (continued) |
Ohio National Fund, Inc. | ON BlackRock Balanced Allocation Portfolio (Unaudited) (Continued) |
| Change in Value of $10,000 Investment |
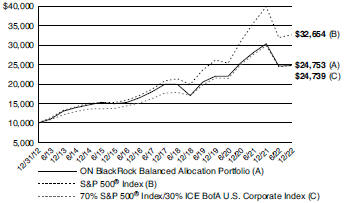
Hypothetical illustration based on past performance. Future performance will vary. The Portfolio’s returns reflect reinvested dividends. The Portfolio’s holdings may differ significantly from the securities in the index. The index is unmanaged and therefore does not reflect the cost of portfolio management and accounting.
The S&P 500® Index is a capitalization-weighted index designed to measure performance of the broad domestic market through changes in the aggregate market value of 500 stocks representing all major industries. The index presented includes the effects of reinvested dividends.
The ICE BofA U.S. Corporate Index tracks the performance of all U.S. dollar-denominated, investment grade corporate public debt issued in the U.S. domestic bond market. Qualifying bonds must have an investment grade rating (based on an average of Moody’s, S&P, and Fitch). In addition, qualifying securities must have at least one year remaining term to maturity, a fixed coupon schedule, and a minimum amount outstanding of $250 million.
Past performance is no guarantee of future results. Redemption of fund shares could have tax implications unique to each shareholder.
| Portfolio Composition as of December 31, 2022 (1) |
| % of Net Assets | ||||
Common Stocks (4) | 70.9 | |||
Corporate Bonds (4) | 26.7 | |||
U.S. Treasury Obligations | 0.8 | |||
Asset-Backed Securities (4) | 0.5 | |||
Other Net Assets | 1.1 | |||
|
| |||
| 100.0 | ||||
|
| |||
| Top 10 Portfolio Holdings as of December 31, 2022 (1) (2) (3) | ||||
| % of Net Assets | ||||||
1. | Microsoft Corp. | 4.4 | ||||
2. | Apple, Inc. | 4.1 | ||||
3. | Amazon.com, Inc. | 1.7 | ||||
4. | Alphabet, Inc. Class A | 1.5 | ||||
5. | PepsiCo, Inc. | 1.4 | ||||
6. | Exxon Mobil Corp. | 1.1 | ||||
7. | Alphabet, Inc. Class C | 1.1 | ||||
8. | Home Depot, Inc. / The | 1.0 | ||||
9. | Berkshire Hathaway, Inc. Class B | 1.0 | ||||
10. | American Express Co. | 1.0 | ||||
| (1) | Composition of Portfolio subject to change. |
| (2) | Short-term investments have been excluded from the list of Top 10 Portfolio Holdings. |
| (3) | Top 10 Portfolio Holdings is presented at an individual security level. Total investment exposure by issuer may be higher. |
| (4) | Sectors (Common Stocks, Corporate Bonds, Asset-Backed Securities): |
| % of Net Assets | ||||
Information Technology | 19.4 | |||
Financials | 15.1 | |||
Health Care | 13.5 | |||
Industrials | 9.3 | |||
Consumer Discretionary | 8.6 | |||
Consumer Staples | 8.3 | |||
Communication Services | 6.4 | |||
Energy | 6.3 | |||
Utilities | 4.5 | |||
Materials | 3.5 | |||
Real Estate | 3.2 | |||
|
| |||
| 98.1 | ||||
|
| |||
| 11 |
Ohio National Fund, Inc. | ON BlackRock Balanced Allocation Portfolio | |
| Schedule of Investments | December 31, 2022 | |
| Common Stocks – 70.9% | Shares | Value | ||||||||||
COMMUNICATION SERVICES – 5.0% | ||||||||||||
Alphabet, Inc. Class A (Interactive Media & Svs.) | (a | ) | 70,284 | $ | 6,201,157 | |||||||
Alphabet, Inc. Class C (Interactive Media & Svs.) | (a | ) | 50,718 | 4,500,208 | ||||||||
Comcast Corp. Class A (Media) | 69,157 | 2,418,420 | ||||||||||
Fox Corp. Class A (Media) | 100,169 | 3,042,133 | ||||||||||
Fox Corp. Class B (Media) | 1,535 | 43,671 | ||||||||||
Live Nation Entertainment, Inc. (Entertainment) | (a | ) | 5,023 | 350,304 | ||||||||
Meta Platforms, Inc. Class A (Interactive Media & Svs.) | (a | ) | 22,016 | 2,649,405 | ||||||||
Snap, Inc. Class A (Interactive Media & Svs.) | (a | ) | 43,990 | 393,711 | ||||||||
Verizon Communications, Inc. (Diversified Telecom. Svs.) | 26,366 | 1,038,820 | ||||||||||
Warner Bros Discovery, Inc. (Entertainment) | (a | ) | 13,645 | 129,355 | ||||||||
|
| |||||||||||
| 20,767,184 | ||||||||||||
|
| |||||||||||
CONSUMER DISCRETIONARY – 6.6% | ||||||||||||
Amazon.com, Inc. (Internet & Direct Marketing Retail) | (a | ) | 82,324 | 6,915,216 | ||||||||
AutoNation, Inc. (Specialty Retail) | (a | ) | 8,275 | 887,907 | ||||||||
Best Buy Co., Inc. (Specialty Retail) | 1,949 | 156,329 | ||||||||||
eBay, Inc. (Internet & Direct Marketing Retail) | 43,173 | 1,790,384 | ||||||||||
General Motors Co. (Automobiles) | 17,313 | 582,409 | ||||||||||
Home Depot, Inc. / The (Specialty Retail) | 13,685 | 4,322,544 | ||||||||||
Lear Corp. (Auto Components) | 2,698 | 334,606 | ||||||||||
Lowe’s Cos., Inc. (Specialty Retail) | 10,869 | 2,165,540 | ||||||||||
Lululemon Athletica, Inc. (Textiles, Apparel & Luxury Goods) | (a | ) | 4,096 | 1,312,276 | ||||||||
McDonald’s Corp. (Hotels, Restaurants & Leisure) | 3,149 | 829,856 | ||||||||||
Starbucks Corp. (Hotels, Restaurants & Leisure) | 4,538 | 450,170 | ||||||||||
Target Corp. (Multiline Retail) | 6,488 | 966,972 | ||||||||||
Tesla, Inc. (Automobiles) | (a | ) | 25,400 | 3,128,772 | ||||||||
Travel + Leisure Co. (Hotels, Restaurants & Leisure) | 44,055 | 1,603,602 | ||||||||||
Ulta Beauty, Inc. (Specialty Retail) | (a | ) | 2,140 | 1,003,810 | ||||||||
Whirlpool Corp. (Household Durables) | 2,674 | 378,264 | ||||||||||
Yum! Brands, Inc. (Hotels, Restaurants & Leisure) | 5,459 | 699,189 | ||||||||||
|
| |||||||||||
| 27,527,846 | ||||||||||||
|
| |||||||||||
CONSUMER STAPLES – 5.4% | ||||||||||||
Brown-Forman Corp. Class B (Beverages) | 19,334 | 1,269,857 | ||||||||||
Colgate-Palmolive Co. (Household Products) | 45,531 | 3,587,387 | ||||||||||
Costco Wholesale Corp. (Food & Staples Retailing) | 2,196 | 1,002,474 | ||||||||||
Hershey Co. / The (Food Products) | 9,829 | 2,276,102 | ||||||||||
Kroger Co. / The (Food & Staples Retailing) | 22,272 | 992,886 | ||||||||||
Mondelez International, Inc. Class A (Food Products) | 29,966 | 1,997,234 | ||||||||||
PepsiCo, Inc. (Beverages) | 31,821 | 5,748,782 | ||||||||||
Procter & Gamble Co. / The (Household Products) | 23,371 | 3,542,109 | ||||||||||
Tyson Foods, Inc. Class A (Food Products) | 14,718 | 916,195 | ||||||||||
Walmart, Inc. (Food & Staples Retailing) | 7,665 | 1,086,820 | ||||||||||
|
| |||||||||||
| 22,419,846 | ||||||||||||
|
| |||||||||||
ENERGY – 4.0% | ||||||||||||
Chevron Corp. (Oil, Gas & Consumable Fuels) | 22,337 | 4,009,268 | ||||||||||
EOG Resources, Inc. (Oil, Gas & Consumable Fuels) | 16,729 | 2,166,740 | ||||||||||
Exxon Mobil Corp. (Oil, Gas & Consumable Fuels) | 42,497 | 4,687,419 | ||||||||||
Halliburton Co. (Energy Equip. & Svs.) | 27,494 | 1,081,889 | ||||||||||
Marathon Oil Corp. (Oil, Gas & Consumable Fuels) | 24,027 | 650,411 | ||||||||||
Marathon Petroleum Corp. (Oil, Gas & Consumable Fuels) | 16,536 | 1,924,625 | ||||||||||
Schlumberger Ltd. / N.V. (Energy Equip. & Svs.) | 30,139 | 1,611,231 | ||||||||||
Valero Energy Corp. (Oil, Gas & Consumable Fuels) | 3,675 | 466,211 | ||||||||||
|
| |||||||||||
| 16,597,794 | ||||||||||||
|
| |||||||||||
FINANCIALS – 7.7% | ||||||||||||
American Express Co. (Consumer Finance) | 28,748 | 4,247,517 | ||||||||||
Bank of America Corp. (Banks) | 77,641 | 2,571,470 | ||||||||||
Bank of New York Mellon Corp. / The (Capital Markets) | 22,374 | 1,018,465 | ||||||||||
Berkshire Hathaway, Inc. Class B (Diversified Financial Svs.) | (a | ) | 13,966 | 4,314,097 | ||||||||
Capital One Financial Corp. (Consumer Finance) | 12,428 | 1,155,307 | ||||||||||
CME Group, Inc. (Capital Markets) | 7,736 | 1,300,886 | ||||||||||
Discover Financial Services (Consumer Finance) | 8,710 | 852,099 | ||||||||||
JPMorgan Chase & Co. (Banks) | 3,005 | 402,971 | ||||||||||
Marsh & McLennan Cos., Inc. (Insurance) | 21,481 | 3,554,676 | ||||||||||
MetLife, Inc. (Insurance) | 51,131 | 3,700,350 | ||||||||||
Travelers Cos., Inc. / The (Insurance) | 14,056 | 2,635,359 | ||||||||||
U.S. Bancorp (Banks) | 33,287 | 1,451,646 | ||||||||||
| 12 | (continued) |
Ohio National Fund, Inc. | ON BlackRock Balanced Allocation Portfolio (Continued) | |
| Schedule of Investments | December 31, 2022 | |
| Common Stocks (Continued) | Shares | Value | ||||||||||
FINANCIALS (continued) | ||||||||||||
Voya Financial, Inc. (Diversified Financial Svs.) | 45,915 | $ | 2,823,313 | |||||||||
Wells Fargo & Co. (Banks) | 57,144 | 2,359,476 | ||||||||||
|
| |||||||||||
| 32,387,632 | ||||||||||||
|
| |||||||||||
HEALTH CARE – 11.6% | ||||||||||||
Abbott Laboratories (Health Care Equip. & Supplies) | 15,135 | 1,661,672 | ||||||||||
AbbVie, Inc. (Biotechnology) | 8,363 | 1,351,544 | ||||||||||
Agilent Technologies, Inc. (Life Sciences Tools & Svs.) | 19,749 | 2,955,438 | ||||||||||
AmerisourceBergen Corp. (Health Care Providers & Svs.) | 7,591 | 1,257,905 | ||||||||||
Amgen, Inc. (Biotechnology) | 9,485 | 2,491,140 | ||||||||||
Becton Dickinson and Co. (Health Care Equip. & Supplies) | 11,650 | 2,962,595 | ||||||||||
Biogen, Inc. (Biotechnology) | (a | ) | 2,315 | 641,070 | ||||||||
Boston Scientific Corp. (Health Care Equip. & Supplies) | (a | ) | 45,966 | 2,126,847 | ||||||||
Bristol-Myers Squibb Co. (Pharmaceuticals) | 6,186 | 445,083 | ||||||||||
Cigna Corp. (Health Care Providers & Svs.) | 12,705 | 4,209,675 | ||||||||||
CVS Health Corp. (Health Care Providers & Svs.) | 15,590 | 1,452,832 | ||||||||||
Danaher Corp. (Life Sciences Tools & Svs.) | 11,890 | 3,155,844 | ||||||||||
Elevance Health, Inc. (Health Care Providers & Svs.) | 4,129 | 2,118,053 | ||||||||||
Eli Lilly & Co. (Pharmaceuticals) | 8,775 | 3,210,246 | ||||||||||
Gilead Sciences, Inc. (Biotechnology) | 7,304 | 627,048 | ||||||||||
Humana, Inc. (Health Care Providers & Svs.) | 806 | 412,825 | ||||||||||
Johnson & Johnson (Pharmaceuticals) | 20,791 | 3,672,730 | ||||||||||
Medtronic PLC (Health Care Equip. & Supplies) | 18,082 | 1,405,333 | ||||||||||
Merck & Co., Inc. (Pharmaceuticals) | 15,890 | 1,762,996 | ||||||||||
Pfizer, Inc. (Pharmaceuticals) | 47,204 | 2,418,733 | ||||||||||
Teladoc Health, Inc. (Health Care Technology) | (a | ) | 13,276 | 313,977 | ||||||||
Thermo Fisher Scientific, Inc. (Life Sciences Tools & Svs.) | 6,326 | 3,483,665 | ||||||||||
UnitedHealth Group, Inc. (Health Care Providers & Svs.) | 8,001 | 4,241,970 | ||||||||||
Veeva Systems, Inc. Class A (Health Care Technology) | (a | ) | 2,453 | 395,865 | ||||||||
|
| |||||||||||
| 48,775,086 | ||||||||||||
|
| |||||||||||
INDUSTRIALS – 6.5% | ||||||||||||
AECOM (Construction & Engineering) | 4,965 | 421,677 | ||||||||||
CSX Corp. (Road & Rail) | 35,624 | 1,103,632 | ||||||||||
Curtiss-Wright Corp. (Aerospace & Defense) | 5,808 | 969,878 | ||||||||||
Deere & Co. (Machinery) | 7,499 | 3,215,271 | ||||||||||
Eaton Corp. PLC (Electrical Equip.) | 8,314 | 1,304,882 | ||||||||||
General Dynamics Corp. (Aerospace & Defense) | 14,095 | 3,497,110 | ||||||||||
HEICO Corp. (Aerospace & Defense) | 4,184 | 642,830 | ||||||||||
Illinois Tool Works, Inc. (Machinery) | 10,447 | 2,301,474 | ||||||||||
Lockheed Martin Corp. (Aerospace & Defense) | 7,770 | 3,780,027 | ||||||||||
PACCAR, Inc. (Machinery) | 21,245 | 2,102,618 | ||||||||||
SiteOne Landscape Supply, Inc. (Trading Companies & Distributors) | (a | ) | 6,327 | 742,284 | ||||||||
Snap-on, Inc. (Machinery) | 4,927 | 1,125,770 | ||||||||||
Tetra Tech, Inc. (Commercial Svs. & Supplies) | 863 | 125,299 | ||||||||||
Timken Co. / The (Machinery) | 18,065 | 1,276,654 | ||||||||||
Union Pacific Corp. (Road & Rail) | 2,019 | 418,074 | ||||||||||
United Parcel Service, Inc. Class B (Air Freight & Logistics) | 10,491 | 1,823,755 | ||||||||||
W.W. Grainger, Inc. (Trading Companies & Distributors) | 1,602 | 891,113 | ||||||||||
Xylem, Inc. (Machinery) | 15,143 | 1,674,362 | ||||||||||
|
| |||||||||||
| 27,416,710 | ||||||||||||
|
| |||||||||||
INFORMATION TECHNOLOGY – 18.0% | ||||||||||||
Accenture PLC Class A (IT Svs.) | 3,322 | 886,442 | ||||||||||
Adobe, Inc. (Software) | (a | ) | 6,831 | 2,298,836 | ||||||||
Analog Devices, Inc. (Semiconductors & Equip.) | 25,680 | 4,212,290 | ||||||||||
Apple, Inc. (Tech. Hardware, Storage & Periph.) | 132,706 | 17,242,491 | ||||||||||
Applied Materials, Inc. (Semiconductors & Equip.) | 13,342 | 1,299,244 | ||||||||||
Automatic Data Processing, Inc. (IT Svs.) | 7,760 | 1,853,554 | ||||||||||
Cognizant Technology Solutions Corp. Class A (IT Svs.) | 22,503 | 1,286,947 | ||||||||||
Dell Technologies, Inc. Class C (Tech. Hardware, Storage & Periph.) | 15,116 | 607,965 | ||||||||||
Enphase Energy, Inc. (Semiconductors & Equip.) | (a | ) | 1,411 | 373,859 | ||||||||
Flex Ltd. (Electronic Equip., Instr. & Comp.) | (a | ) | 97,451 | 2,091,298 | ||||||||
Hewlett Packard Enterprise Co. (Tech. Hardware, Storage & Periph.) | 84,999 | 1,356,584 | ||||||||||
Intel Corp. (Semiconductors & Equip.) | 83,529 | 2,207,671 | ||||||||||
Intuit, Inc. (Software) | 2,324 | 904,547 | ||||||||||
Juniper Networks, Inc. (Communications Equip.) | 27,381 | 875,097 | ||||||||||
KLA Corp. (Semiconductors & Equip.) | 2,391 | 901,479 | ||||||||||
Lam Research Corp. (Semiconductors & Equip.) | 2,692 | 1,131,448 | ||||||||||
Mastercard, Inc. Class A (IT Svs.) | 8,637 | 3,003,344 | ||||||||||
| 13 | (continued) |
Ohio National Fund, Inc. | ON BlackRock Balanced Allocation Portfolio (Continued) | |
| Schedule of Investments | December 31, 2022 | |
| Common Stocks (Continued) | Shares | Value | ||||||||||
INFORMATION TECHNOLOGY (continued) | ||||||||||||
Microsoft Corp. (Software) | 76,074 | $ | 18,244,067 | |||||||||
NVIDIA Corp. (Semiconductors & Equip.) | 15,781 | 2,306,235 | ||||||||||
NXP Semiconductors N.V. (Semiconductors & Equip.) | 2,145 | 338,974 | ||||||||||
PayPal Holdings, Inc. (IT Svs.) | (a | ) | 19,399 | 1,381,597 | ||||||||
QUALCOMM, Inc. (Semiconductors & Equip.) | 10,269 | 1,128,974 | ||||||||||
Salesforce, Inc. (Software) | (a | ) | 17,461 | 2,315,154 | ||||||||
ServiceNow, Inc. (Software) | (a | ) | 4,433 | 1,721,201 | ||||||||
Silicon Laboratories, Inc. (Semiconductors & Equip.) | (a | ) | 6,970 | 945,620 | ||||||||
TE Connectivity Ltd. (Electronic Equip., Instr. & Comp.) | 2,766 | 317,537 | ||||||||||
Visa, Inc. (IT Svs.) | 15,391 | 3,197,634 | ||||||||||
Workday, Inc. Class A (Software) | (a | ) | 5,909 | 988,753 | ||||||||
|
| |||||||||||
| 75,418,842 | ||||||||||||
|
| |||||||||||
MATERIALS – 2.0% | ||||||||||||
Corteva, Inc. (Chemicals) | 28,270 | 1,661,710 | ||||||||||
Ecolab, Inc. (Chemicals) | 17,862 | 2,599,993 | ||||||||||
FMC Corp. (Chemicals) | 12,527 | 1,563,370 | ||||||||||
Linde PLC (Chemicals) | 4,482 | 1,461,939 | ||||||||||
Newmont Corp. (Metals & Mining) | 6,677 | 315,154 | ||||||||||
Steel Dynamics, Inc. (Metals & Mining) | 6,714 | 655,958 | ||||||||||
|
| |||||||||||
| 8,258,124 | ||||||||||||
|
| |||||||||||
REAL ESTATE – 2.2% | ||||||||||||
Crown Castle, Inc. (Equity REIT) | 2,738 | 371,382 | ||||||||||
Equity Residential (Equity REIT) | 29,324 | 1,730,116 | ||||||||||
Essex Property Trust, Inc. (Equity REIT) | 7,319 | 1,551,043 | ||||||||||
Prologis, Inc. (Equity REIT) | 21,529 | 2,426,964 | ||||||||||
Simon Property Group, Inc. (Equity REIT) | 26,967 | 3,168,083 | ||||||||||
|
| |||||||||||
| 9,247,588 | ||||||||||||
|
| |||||||||||
UTILITIES – 1.9% | ||||||||||||
CMS Energy Corp. (Multi-Utilities) | 33,525 | 2,123,138 | ||||||||||
DTE Energy Co. (Multi-Utilities) | 31,032 | 3,647,191 | ||||||||||
Evergy, Inc. (Electric Utilities) | 28,400 | 1,787,212 | ||||||||||
Vistra Corp. (Ind. Power & Renewable Elec.) | 19,206 | 445,579 | ||||||||||
| 8,003,120 | ||||||||||||
|
| |||||||||||
Total Common Stocks (Cost $306,856,341) | $ | 296,819,772 | ||||||||||
|
| |||||||||||
| Corporate Bonds – 26.7% | Rate | Maturity | Face Amount | Value | ||||||||||||||||
COMMUNICATION SERVICES – 1.4% | ||||||||||||||||||||
AT&T, Inc. (Diversified Telecom. Svs.) | 4.900 | % | 08/15/2037 | $1,000,000 | $ | 919,099 | ||||||||||||||
Comcast Corp. (Media) | 3.250 | % | 11/01/2039 | 2,000,000 | 1,558,073 | |||||||||||||||
Time Warner Cable LLC (Media) | 6.550 | % | 05/01/2037 | 1,000,000 | 952,061 | |||||||||||||||
T-Mobile U.S.A., Inc. (Wireless Telecom. Svs.) | 3.875 | % | 04/15/2030 | 1,200,000 | 1,086,978 | |||||||||||||||
Verizon Communications, Inc. (Diversified Telecom. Svs.) | 4.400 | % | 11/01/2034 | 1,000,000 | 918,255 | |||||||||||||||
Verizon Communications, Inc. (Diversified Telecom. Svs.) | 2.875 | % | 11/20/2050 | 1,000,000 | 626,959 | |||||||||||||||
|
| |||||||||||||||||||
| 6,061,425 | ||||||||||||||||||||
|
| |||||||||||||||||||
CONSUMER DISCRETIONARY – 2.0% | ||||||||||||||||||||
Amazon.com, Inc. (Internet & Direct Marketing Retail) | 3.875 | % | 08/22/2037 | 1,000,000 | 885,920 | |||||||||||||||
Best Buy Co., Inc. (Specialty Retail) | 1.950 | % | 10/01/2030 | 2,000,000 | 1,582,484 | |||||||||||||||
Expedia Group, Inc. (Hotels, Restaurants & Leisure) | 4.625 | % | 08/01/2027 | 1,000,000 | 959,353 | |||||||||||||||
Hasbro, Inc. (Leisure Products) | 3.900 | % | 11/19/2029 | 2,000,000 | 1,777,369 | |||||||||||||||
Lear Corp. (Auto Components) | 3.500 | % | 05/30/2030 | 1,000,000 | 840,071 | |||||||||||||||
Lowe’s Cos., Inc. (Specialty Retail) | 3.000 | % | 10/15/2050 | 1,000,000 | 636,139 | |||||||||||||||
Target Corp. (Multiline Retail) | 2.350 | % | 02/15/2030 | 2,000,000 | 1,697,680 | |||||||||||||||
|
| |||||||||||||||||||
| 8,379,016 | ||||||||||||||||||||
|
| |||||||||||||||||||
CONSUMER STAPLES – 2.9% | ||||||||||||||||||||
Anheuser-Busch Cos. LLC / Anheuser-Busch InBev Worldwide, Inc. (Beverages) | 4.700 | % | 02/01/2036 | 2,000,000 | 1,888,886 | |||||||||||||||
B.A.T. Capital Corp. (Tobacco) | 3.215 | % | 09/06/2026 | 1,000,000 | 922,527 | |||||||||||||||
B.A.T. Capital Corp. (Tobacco) | 4.700 | % | 04/02/2027 | 1,000,000 | 958,591 | |||||||||||||||
Campbell Soup Co. (Food Products) | 4.150 | % | 03/15/2028 | 2,000,000 | 1,909,949 | |||||||||||||||
Coca-Cola Co. / The (Beverages) | 3.000 | % | 03/05/2051 | 2,000,000 | 1,454,250 | |||||||||||||||
Diageo Capital PLC (Beverages) | 2.375 | % | 10/24/2029 | 2,000,000 | 1,706,190 | |||||||||||||||
Hershey Co. / The (Food Products) | 1.700 | % | 06/01/2030 | 1,200,000 | 960,889 | |||||||||||||||
JBS U.S.A. LUX SA / JBS U.S.A. Food Co. / JBS U.S.A. Finance, Inc. (Food Products) | (b | ) | 5.750 | % | 04/01/2033 | 800,000 | 763,024 | |||||||||||||
| 14 | (continued) |
Ohio National Fund, Inc. | ON BlackRock Balanced Allocation Portfolio (Continued) | |
| Schedule of Investments | December 31, 2022 | |
| Corporate Bonds (Continued) | Rate | Maturity | Face Amount | Value | ||||||||||||||||
CONSUMER STAPLES (continued) | ||||||||||||||||||||
Kraft Heinz Foods Co. (Food Products) | 4.625 | % | 10/01/2039 | $ 800,000 | $ | 701,786 | ||||||||||||||
Philip Morris International, Inc. (Tobacco) | 3.375 | % | 08/15/2029 | 1,000,000 | 900,446 | |||||||||||||||
|
| |||||||||||||||||||
| 12,166,538 | ||||||||||||||||||||
|
| |||||||||||||||||||
ENERGY – 2.3% | ||||||||||||||||||||
Baker Hughes Holdings LLC / Baker Hughes Co-Obligor, Inc. (Energy Equip. & Svs.) | 3.337 | % | 12/15/2027 | 1,000,000 | 923,704 | |||||||||||||||
BP Capital Markets America, Inc. (Oil, Gas & Consumable Fuels) | 3.017 | % | 01/16/2027 | 1,000,000 | 931,061 | |||||||||||||||
Chevron Corp. (Oil, Gas & Consumable Fuels) | 2.236 | % | 05/11/2030 | 1,200,000 | 1,028,281 | |||||||||||||||
Energy Transfer LP (Oil, Gas & Consumable Fuels) | 4.950 | % | 06/15/2028 | 1,000,000 | 966,985 | |||||||||||||||
Halliburton Co. (Energy Equip. & Svs.) | 4.850 | % | 11/15/2035 | 1,000,000 | 925,114 | |||||||||||||||
Kinder Morgan, Inc. (Oil, Gas & Consumable Fuels) | 5.300 | % | 12/01/2034 | 1,000,000 | 935,853 | |||||||||||||||
ONEOK, Inc. (Oil, Gas & Consumable Fuels) | 5.850 | % | 01/15/2026 | 800,000 | 809,581 | |||||||||||||||
Shell International Finance B.V. (Oil, Gas & Consumable Fuels) | 4.000 | % | 05/10/2046 | 1,500,000 | 1,223,108 | |||||||||||||||
Tennessee Gas Pipeline Co. LLC (Oil, Gas & Consumable Fuels) | (b | ) | 2.900 | % | 03/01/2030 | 1,000,000 | 837,595 | |||||||||||||
Williams Cos., Inc. / The (Oil, Gas & Consumable Fuels) | 3.750 | % | 06/15/2027 | 1,000,000 | 941,253 | |||||||||||||||
Williams Cos., Inc. / The (Oil, Gas & Consumable Fuels) | 5.400 | % | 03/04/2044 | 100,000 | 90,652 | |||||||||||||||
|
| |||||||||||||||||||
| 9,613,187 | ||||||||||||||||||||
|
| |||||||||||||||||||
FINANCIALS – 7.4% | ||||||||||||||||||||
AerCap Ireland Capital DAC / AerCap Global Aviation Trust (Diversified Financial Svs.) | 4.875 | % | 01/16/2024 | 1,000,000 | 990,460 | |||||||||||||||
AerCap Ireland Capital DAC / AerCap Global Aviation Trust (Diversified Financial Svs.) | 3.300 | % | 01/30/2032 | 1,000,000 | 781,761 | |||||||||||||||
American Express Co. (Rate is fixed until 08/03/2032, at which point, the rate becomes SOFR + 176) (Consumer Finance) | (c | ) | 4.420 | % | 08/03/2033 | 1,200,000 | 1,133,538 | |||||||||||||
Ares Capital Corp. (Capital Markets) | 3.200 | % | 11/15/2031 | 1,500,000 | 1,100,775 | |||||||||||||||
Bank of Montreal (Rate is fixed until 12/15/2027, at which point, the rate becomes USSW5 + 143) (Banks) | (c | ) | 3.803 | % | 12/15/2032 | 200,000 | 176,104 | |||||||||||||
BlackRock, Inc. (Capital Markets) | 2.100 | % | 02/25/2032 | 1,000,000 | 804,597 | |||||||||||||||
Capital One Bank U.S.A. N.A. (Rate is fixed until 01/28/2025, at which point, the rate becomes SOFR + 91) (Consumer Finance) | (c | ) | 2.280 | % | 01/28/2026 | 1,000,000 | 933,947 | |||||||||||||
Charles Schwab Corp. / The (Capital Markets) | 3.300 | % | 04/01/2027 | 1,000,000 | 945,452 | |||||||||||||||
Citigroup, Inc. (Banks) | 4.125 | % | 07/25/2028 | 1,000,000 | 930,747 | |||||||||||||||
Citigroup, Inc. (Rate is fixed until 11/05/2029, at which point, the rate becomes SOFR + 142) (Banks) | (c | ) | 2.976 | % | 11/05/2030 | 1,000,000 | 840,826 | |||||||||||||
Citigroup, Inc. (Rate is fixed until 05/01/2031, at which point, the rate becomes SOFR + 117) (Banks) | (c | ) | 2.561 | % | 05/01/2032 | 2,000,000 | 1,578,929 | |||||||||||||
Discover Bank (Banks) | 2.450 | % | 09/12/2024 | 1,000,000 | 945,890 | |||||||||||||||
Discover Bank (Rate is fixed until 08/09/2023, at which point, the rate becomes USSW5 + 173) (Banks) | (c | ) | 4.682 | % | 08/09/2028 | 250,000 | 239,945 | |||||||||||||
Ford Motor Credit Co. LLC (Consumer Finance) | 3.087 | % | 01/09/2023 | 2,000,000 | 1,998,126 | |||||||||||||||
General Motors Financial Co., Inc. (Consumer Finance) | 2.700 | % | 06/10/2031 | 3,000,000 | 2,298,526 | |||||||||||||||
Goldman Sachs Group, Inc. / The (Capital Markets) | 3.750 | % | 05/22/2025 | 1,000,000 | 967,156 | |||||||||||||||
JPMorgan Chase & Co. (Banks) | 3.625 | % | 12/01/2027 | 1,000,000 | 924,457 | |||||||||||||||
JPMorgan Chase & Co. (Rate is fixed until 05/13/2030, at which point, the rate becomes SOFR + 252) (Banks) | (c | ) | 2.956 | % | 05/13/2031 | 1,000,000 | 823,956 | |||||||||||||
Morgan Stanley (Capital Markets) | 3.950 | % | 04/23/2027 | 1,000,000 | 944,393 | |||||||||||||||
Morgan Stanley (Rate is fixed until 01/22/2030, at which point, the rate becomes SOFR + 114) (Capital Markets) | (c | ) | 2.699 | % | 01/22/2031 | 1,500,000 | 1,239,520 | |||||||||||||
PNC Bank N.A. (Banks) | 4.050 | % | 07/26/2028 | 1,950,000 | 1,834,788 | |||||||||||||||
State Street Corp. (Capital Markets) | 2.200 | % | 03/03/2031 | 1,000,000 | 799,506 | |||||||||||||||
Synchrony Financial (Consumer Finance) | 4.250 | % | 08/15/2024 | 1,000,000 | 977,036 | |||||||||||||||
Truist Bank (Rate is fixed until 09/17/2024, at which point, the rate becomes H15T5Y + 115) (Banks) | (c | ) | 2.636 | % | 09/17/2029 | 2,500,000 | 2,337,968 | |||||||||||||
U.S. Bancorp (Banks) | 1.375 | % | 07/22/2030 | 1,000,000 | 772,894 | |||||||||||||||
Wells Fargo & Co. (Banks) | 3.000 | % | 04/22/2026 | 1,500,000 | 1,402,966 | |||||||||||||||
Wells Fargo & Co. (Rate is fixed until 04/30/2040, at which point, the rate becomes SOFR + 253) (Banks) | (c | ) | 3.068 | % | 04/30/2041 | 800,000 | 570,632 | |||||||||||||
Westpac Banking Corp. (Rate is fixed until 02/04/2025, at which point, the rate becomes H15T5Y + 135) (Banks)(c) | 2.894 | % | 02/04/2030 | 1,500,000 | 1,375,172 | |||||||||||||||
Westpac Banking Corp. (Rate is fixed until 11/23/2026, at which point, the rate becomes USISDA05 + 224) (Banks)(c) | 4.322 | % | 11/23/2031 | 200,000 | 188,232 | |||||||||||||||
|
| |||||||||||||||||||
| 30,858,299 | ||||||||||||||||||||
|
| |||||||||||||||||||
HEALTH CARE – 1.9% | ||||||||||||||||||||
AbbVie, Inc. (Biotechnology) | 3.200 | % | 11/21/2029 | 1,000,000 | 901,474 | |||||||||||||||
AbbVie, Inc. (Biotechnology) | 4.250 | % | 11/21/2049 | 2,000,000 | 1,659,770 | |||||||||||||||
HCA, Inc. (Health Care Providers & Svs.) | 5.250 | % | 06/15/2026 | 2,000,000 | 1,975,859 | |||||||||||||||
Quest Diagnostics, Inc. (Health Care Providers & Svs.) | 2.800 | % | 06/30/2031 | 800,000 | 669,827 | |||||||||||||||
Regeneron Pharmaceuticals, Inc. (Biotechnology) | 1.750 | % | 09/15/2030 | 1,200,000 | 926,841 | |||||||||||||||
UnitedHealth Group, Inc. (Health Care Providers & Svs.) | 3.875 | % | 12/15/2028 | 2,000,000 | 1,907,449 | |||||||||||||||
| 8,041,220 | ||||||||||||||||||||
INDUSTRIALS – 2.3% | ||||||||||||||||||||
Air Lease Corp. (Trading Companies & Distributors) | 2.250 | % | 01/15/2023 | 1,000,000 | 999,049 | |||||||||||||||
| 15 | (continued) |
Ohio National Fund, Inc. | ON BlackRock Balanced Allocation Portfolio (Continued) | |
| Schedule of Investments | December 31, 2022 | |
| Corporate Bonds (Continued) | Rate | Maturity | Face Amount | Value | ||||||||||||||||
INDUSTRIALS (continued) | ||||||||||||||||||||
Air Lease Corp. (Trading Companies & Distributors) | 2.300 | % | 02/01/2025 | $2,000,000 | $ | 1,862,059 | ||||||||||||||
Boeing Co. / The (Aerospace & Defense) | 3.200 | % | 03/01/2029 | 1,500,000 | 1,315,335 | |||||||||||||||
Burlington Northern Santa Fe LLC (Road & Rail) | 4.550 | % | 09/01/2044 | 100,000 | 90,409 | |||||||||||||||
FedEx Corp. (Air Freight & Logistics) | 4.900 | % | 01/15/2034 | 1,000,000 | 945,032 | |||||||||||||||
Lockheed Martin Corp. (Aerospace & Defense) | 1.850 | % | 06/15/2030 | 800,000 | 657,011 | |||||||||||||||
TTX Co. (Road & Rail) | (b | ) | 5.650 | % | 12/01/2052 | 1,000,000 | 1,004,852 | |||||||||||||
United Rentals North America, Inc. (Trading Companies & Distributors) | 4.875 | % | 01/15/2028 | 1,000,000 | 947,650 | |||||||||||||||
Waste Connections, Inc. (Commercial Svs. & Supplies) | 2.600 | % | 02/01/2030 | 2,000,000 | 1,705,274 | |||||||||||||||
|
| |||||||||||||||||||
| 9,526,671 | ||||||||||||||||||||
|
| |||||||||||||||||||
INFORMATION TECHNOLOGY – 1.4% | ||||||||||||||||||||
Broadcom, Inc. (Semiconductors & Equip.) | (b | ) | 2.600 | % | 02/15/2033 | 1,000,000 | 750,597 | |||||||||||||
HP, Inc. (Tech. Hardware, Storage & Periph.) | 2.650 | % | 06/17/2031 | 3,000,000 | 2,337,248 | |||||||||||||||
Oracle Corp. (Software) | 4.300 | % | 07/08/2034 | 2,100,000 | 1,844,502 | |||||||||||||||
VMware, Inc. (Software) | 2.200 | % | 08/15/2031 | 1,200,000 | 910,637 | |||||||||||||||
|
| |||||||||||||||||||
| 5,842,984 | ||||||||||||||||||||
|
| |||||||||||||||||||
MATERIALS – 1.5% | ||||||||||||||||||||
Dow Chemical Co. / The (Chemicals) | 4.250 | % | 10/01/2034 | 1,402,000 | 1,267,385 | |||||||||||||||
Glencore Funding LLC (Metals & Mining) | (b | ) | 2.850 | % | 04/27/2031 | 3,000,000 | 2,454,975 | |||||||||||||
Kinross Gold Corp. (Metals & Mining) | 4.500 | % | 07/15/2027 | 1,000,000 | 948,466 | |||||||||||||||
Mosaic Co. / The (Chemicals) | 4.050 | % | 11/15/2027 | 1,000,000 | 941,581 | |||||||||||||||
Steel Dynamics, Inc. (Metals & Mining) | 3.250 | % | 01/15/2031 | 800,000 | 682,751 | |||||||||||||||
|
| |||||||||||||||||||
| 6,295,158 | ||||||||||||||||||||
|
| |||||||||||||||||||
REAL ESTATE – 1.0% | ||||||||||||||||||||
Alexandria Real Estate Equities, Inc. (Equity REIT) | 3.950 | % | 01/15/2028 | 1,000,000 | 938,793 | |||||||||||||||
American Tower Corp. (Equity REIT) | 2.750 | % | 01/15/2027 | 2,000,000 | 1,813,021 | |||||||||||||||
VICI Properties LP / VICI Note Co., Inc. (Equity REIT) | (b | ) | 4.625 | % | 12/01/2029 | 700,000 | 637,000 | |||||||||||||
Welltower, Inc. (Equity REIT) | 2.700 | % | 02/15/2027 | 1,000,000 | 900,547 | |||||||||||||||
|
| |||||||||||||||||||
| 4,289,361 | ||||||||||||||||||||
|
| |||||||||||||||||||
UTILITIES – 2.6% | ||||||||||||||||||||
AEP Transmission Co. LLC (Electric Utilities) | 4.000 | % | 12/01/2046 | 1,000,000 | 785,338 | |||||||||||||||
AEP Transmission Co. LLC (Electric Utilities) | 3.750 | % | 12/01/2047 | 1,000,000 | 774,754 | |||||||||||||||
Ameren Corp. (Multi-Utilities) | 2.500 | % | 09/15/2024 | 1,000,000 | 956,465 | |||||||||||||||
Ameren Corp. (Multi-Utilities) | 3.500 | % | 01/15/2031 | 1,000,000 | 884,413 | |||||||||||||||
American Water Capital Corp. (Water Utilities) | 4.300 | % | 12/01/2042 | 100,000 | 86,769 | |||||||||||||||
Black Hills Corp. (Multi-Utilities) | 3.050 | % | 10/15/2029 | 2,500,000 | 2,120,544 | |||||||||||||||
Commonwealth Edison Co. (Electric Utilities) | 4.350 | % | 11/15/2045 | 1,000,000 | 853,104 | |||||||||||||||
Connecticut Light & Power Co. / The (Electric Utilities) | 4.000 | % | 04/01/2048 | 1,000,000 | 834,276 | |||||||||||||||
Duke Energy Corp. (Electric Utilities) | 3.750 | % | 09/01/2046 | 1,500,000 | 1,112,951 | |||||||||||||||
Duke Energy Indiana LLC (Electric Utilities) | 3.250 | % | 10/01/2049 | 1,000,000 | 693,840 | |||||||||||||||
FirstEnergy Transmission LLC (Electric Utilities) | (b | ) | 4.550 | % | 04/01/2049 | 200,000 | 161,830 | |||||||||||||
Florida Power & Light Co. (Electric Utilities) | 3.150 | % | 10/01/2049 | 1,000,000 | 720,279 | |||||||||||||||
Public Service Electric & Gas Co. (Multi-Utilities) | 3.600 | % | 12/01/2047 | 1,000,000 | 759,373 | |||||||||||||||
|
| |||||||||||||||||||
| 10,743,936 | ||||||||||||||||||||
|
| |||||||||||||||||||
Total Corporate Bonds (Cost $131,886,326) | $ | 111,817,795 | ||||||||||||||||||
|
| |||||||||||||||||||
| U.S. Treasury Obligations – 0.8% | Rate | Maturity | Face Amount | Value | ||||||||||||||||
U.S. Treasury Note. | 1.875 | % | 02/15/2032 | $1,000,000 | $ | 848,320 | ||||||||||||||
U.S. Treasury Note. | 4.125 | % | 11/15/2032 | 2,500,000 | 2,551,172 | |||||||||||||||
|
| |||||||||||||||||||
Total U.S. Treasury Obligations (Cost $3,513,158) | $ | 3,399,492 | ||||||||||||||||||
|
| |||||||||||||||||||
| Asset-Backed Securities – 0.5% | Rate | Maturity | Face Amount | Value | ||||||||||||||||
INDUSTRIALS – 0.5% | ||||||||||||||||||||
FedEx Corp. 2020-1 Class AA Pass Through Trust | 1.875 | % | 02/20/2034 | $1,786,110 | $ | 1,463,842 | ||||||||||||||
United Airlines 2016-1 Class B Pass Through Trust | 3.650 | % | 01/07/2026 | 122,917 | 111,213 | |||||||||||||||
United Airlines 2019-2 Class AA Pass Through Trust | 2.700 | % | 05/01/2032 | 884,524 | 713,702 | |||||||||||||||
|
| |||||||||||||||||||
Total Asset-Backed Securities (Cost $2,793,551) | $ | 2,288,757 | ||||||||||||||||||
|
| |||||||||||||||||||
Total Investments – 98.9% (Cost $445,049,376) | (d | ) | $ | 414,325,816 | ||||||||||||||||
Other Assets in Excess of Liabilities – 1.1% | (e | ) | 4,404,739 | |||||||||||||||||
|
| |||||||||||||||||||
Net Assets – 100.0% | $ | 418,730,555 | ||||||||||||||||||
|
| |||||||||||||||||||
Percentages are stated as a percent of net assets.
| 16 | (continued) |
Ohio National Fund, Inc. | ON BlackRock Balanced Allocation Portfolio (Continued) | |
| Schedule of Investments | December 31, 2022 | |
Abbreviations: | ||
H15T5Y: | U.S. Treasury Yield Curve Rate T-Note Constant Maturity 5 Year, 3.880% at 12/31/2022 | |
SOFR: | Secured Overnight Financing Rate, 4.300% at 12/31/2022 | |
USISDA05: | USD ICE Swap Rate 11:00am NY 5 Year, 4.045% at 12/31/2022 | |
USSW5: | USD Swap Semi 30/360 5 Year, 4.023% at 12/31/2022 |
Footnotes:
| (a) | Non-income producing security. |
| (b) | Security exempt from registration under Regulation D of the Securities Act of 1933. These securities may be resold in transactions exempt from registration, normally to qualified buyers under Rule 144A. At December 31, 2022, the value of these securities totaled $6,609,873, or 1.6% of the Portfolio’s net assets. |
| (c) | Security is a fixed-then-variable rate instrument in which the coupon or dividend rate is fixed until a later specified date, then is adjusted periodically. Rates stated, including interest rate caps and floors, if any, are those in effect at December 31, 2022. |
| (d) | Represents cost for financial reporting purposes, which may differ from cost basis for federal income tax purposes. See also Note 7 of the Notes to Financial Statements. |
| (e) | Includes $243,800 of cash pledged as collateral for the futures contracts outstanding at December 31, 2022. See also the following Schedule of Open Futures Contracts. |
The accompanying notes are an integral part of these financial statements.
| Schedule of Open Futures Contracts | December 31, 2022 | |||||||||||
Description | Number of contracts | Expiration Date | Notional Amount | Value | Unrealized Appreciation (Depreciation) | Variation Margin Receivable (Payable) | ||||||
CME E-mini S&P 500 Index - Long | 23 | March 17, 2023 | $4,557,964 | $4,440,150 | $(117,814) | $(7,510) |
The accompanying notes are an integral part of these financial statements.
17
| ON BlackRock Advantage International Equity Portfolio (Unaudited) |
| Objective/Strategy |
The ON Blackrock Advantage International Equity Portfolio seeks long-term growth of capital by investing, under normal circumstances, at least 80% of its net assets in non-U.S. equity securities and equity-like instruments of companies that are components of, or have characteristics similar to, the companies included in the MSCI EAFE Index (Net - USD).
| Performance as of December 31, 2022 | ||||
| Average Annual returns | ||||
One year | -13.47 | % | ||
Five years | 1.86 | % | ||
Ten years | 2.91 | % |
Past performance does not guarantee future results. The performance data quoted represents past performance and current returns may be lower or higher. Total return figures include change in share price and reinvestment of dividends and capital gains. The investment return and principal value will fluctuate so that an investor’s shares, when redeemed, may be worth more or less than the original cost. To obtain performance information up to the most recent month end, call toll-free 1-877-781-6392.
The Portfolio is not open to direct retail investment. Beneficial interest in the Portfolio’s shares is obtained either through an allocation to the Portfolio as an investment vehicle within variable life insurance policies or annuity contracts, or as an underlying investment by the ON Model Portfolios. Actual performance results for variable annuity and variable universal life contracts will be lower due to contract charges. Consult your contract for applicable charges.
Total expense ratio is 0.89% per the Fund’s prospectus dated April 29, 2022. Additional information pertaining to the Portfolio’s expense ratio as of December 31, 2022 can be found in the Portfolio’s Financial Highlights.
| Comments from Sub-Adviser |
Q. How did the Portfolio perform in comparison to its benchmark during the reporting period?
A. For the year ended December 31, 2022, the Portfolio returned -13.47% versus -14.45% for its benchmark, the MSCI EAFE Index (Net – USD).
Q. Were there specific market conditions, investment strategies, or techniques that materially affected the Portfolio’s benchmark-relative performance during the reporting period?
A. Fundamental measures drove outperformance for the year. Contrarian quality insights, which question the sustainability of company growth, did best, with insights evaluating internal financing ability and return on assets driving gains. Traditional valuation measures tracking company sales, cash flow, and other financial statement metrics also contributed to gains amid the continued market style preference.
Sentiment measures also proved additive throughout the year, as these measures were able to correctly position the Portfolio as market themes shifted between rising interest rates and hopes for a dovish policy pivot. Trend-based measures evaluating company specific key performance indicators were able to help identify company’s beats and misses during earnings season. Additionally, an insight that captures company linkages was additive, as it correctly positioned the Portfolio around the broader China re-opening theme in the fourth quarter.
However, in what was ultimately a macro-led market for much of the year, select macro thematic insights struggled. Measures designed to evaluate industries likely to benefit from policy normalization and the evolving economic cycle proved overly defensive during the close of the period. This eroded the gains from macro insights earlier in the year. (1)
Q. How did country selection impact the Portfolio’s performance relative to its benchmark?
A. Country allocation decisions modestly contributed to relative returns. Underweight positions to Netherlands and Switzerland contributed the most to relative performance, as these countries underperformed the broader market. Conversely, underweight positions across Sweden and the United Kingdom detracted from relative performance, as they outperformed the broader market. Notably, however, security selection within Japan, Singapore, and Sweden had a much more meaningful positive impact to relative outperformance. (1)
Q. How did sector allocation and security selection each impact the Portfolio’s performance relative to its benchmark?
A. Sector allocation decisions contributed to relative returns. An overweight position to Energy names contributed to relative performance amid the market focus on commodities complexes. Conversely, an underweight across Financials detracted, as Financials performed well alongside the broader value rally at the start of 2022. Notably, however, security selection had a more meaningful positive impact, led by selection in Industrials, Consumer Staples, and Heath Care. (1)
Q. Which securities contributed the most to, and detracted the most from, the Portfolio’s benchmark-relative performance?
A. The Portfolio’s overweight position in Singapore-based Jardine Cycle & Carriage Ltd. was a top contributor to relative performance, as demand continued to grow for the company’s automotive brands amid broadening economic reopening. An overweight to Swedish Match AB, a tobacco company, contributed as investors sought traditional defensives amid the bearish market tone.
In contrast, an overweight to British industrial equipment rental company Ashtead Group PLC was a key detractor from relative performance, as the stock struggled amid supply disruptions, labor shortages and rising interest rates. Additionally, an overweight to Omron Corp. declined, as the electronics components supplier struggled amid concerns over supply chains and rising input costs. (1)
Q. How did the Portfolio’s use of derivative instruments and initial public offerings (IPOs), if any, impact performance?
A. Pursuant to the Portfolio’s investment strategy, futures contracts were used to prevent a cash drag on performance. The futures contracts detracted 41 basis points from the Portfolio’s absolute return for the year. (1)
| (1) | The Portfolio’s composition is subject to change. Holdings and weightings are as of December 31, 2022. |
| 18 | (continued) |
Ohio National Fund, Inc. | ON BlackRock Advantage International Equity Portfolio (Unaudited) (Continued) |
| Change in Value of $10,000 Investment | ||||
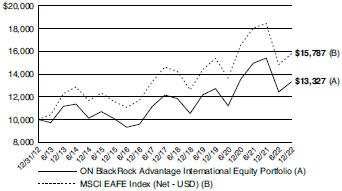
Hypothetical illustration based on past performance. Future performance will vary. The Portfolio’s returns reflect reinvested dividends. The Portfolio’s holdings may differ significantly from the securities in the index. The index is unmanaged and therefore does not reflect the cost of portfolio management and accounting.
The MSCI EAFE Index (Net-USD) is a free-float-adjusted market-capitalization weighted index that is designed to measure the equity market performance of 21 developed markets, including countries in Europe, Australasia and the Far East, excluding the U.S. and Canada. The returns for this index include the effects of reinvested dividends, net of taxes, and adjustment to U.S. Dollar denomination.
Past performance is no guarantee of future results. Redemption of fund shares could have tax implications unique to each shareholder.
| Portfolio Composition as of December 31, 2022 (1) | ||
| % of Net Assets | ||||
Common Stocks (4) (5) | 97.9 | |||
Preferred Securities (4) (5) | 0.6 | |||
Other Net Assets | 1.5 | |||
|
| |||
| 100.0 | ||||
|
| |||
| Top 10 Portfolio Holdings as of December 31, 2022 (1) (2) (3) | ||||
| % of Net Assets | ||||||
1. | Shell PLC | 2.3 | ||||
2. | Nestle SA | 2.2 | ||||
3. | BHP Group Ltd. | 1.9 | ||||
4. | Novo Nordisk A/S Class B | 1.8 | ||||
5. | Novartis AG | 1.8 | ||||
6. | AIA Group Ltd. | 1.7 | ||||
7. | Siemens AG | 1.6 | ||||
8. | SAP SE | 1.6 | ||||
9. | LVMH Moet Hennessy Louis Vuitton SE | 1.6 | ||||
10. | ASML Holding N.V. | 1.5 | ||||
| (1) | Composition of Portfolio subject to change. |
| (2) | Short-term investments have been excluded from the list of Top 10 Portfolio Holdings. |
| (3) | Top 10 Portfolio Holdings is presented at an individual security level. Total investment exposure by issuer may be higher. |
| (4) | Top 10 Country Weightings (Common Stocks, Preferred Securities): |
| % of Net Assets | ||||
Japan | 20.5 | |||
United Kingdom | 14.5 | |||
France | 12.3 | |||
Germany | 9.6 | |||
Switzerland | 8.6 | |||
Australia | 8.5 | |||
Netherlands | 4.3 | |||
Hong Kong | 3.8 | |||
Denmark | 3.7 | |||
Sweden | 2.2 | |||
| (5) | Sectors (Common Stocks, Preferred Securities): |
| % of Net Assets | ||||
Industrials | 17.3 | |||
Financials | 16.0 | |||
Health Care | 14.3 | |||
Consumer Staples | 10.5 | |||
Consumer Discretionary | 9.5 | |||
Information Technology | 8.0 | |||
Materials | 6.9 | |||
Energy | 6.0 | |||
Communication Services | 4.9 | |||
Utilities | 3.1 | |||
Real Estate | 2.0 | |||
|
| |||
| 98.5 | ||||
|
| |||
| 19 |
Ohio National Fund, Inc. | ON BlackRock Advantage International Equity Portfolio | |
| Schedule of Investments | December 31, 2022 | |
| Common Stocks – 97.9% | Shares | Value | ||||||||
JAPAN – 20.5% | ||||||||||
Acom Co. Ltd. (Financials) | (a) | 46,100 | $ | 110,327 | ||||||
Alfresa Holdings Corp. (Health Care) | (a) | 43,600 | 554,212 | |||||||
Amada Co. Ltd. (Industrials) | (a) | 269,800 | 2,101,027 | |||||||
Astellas Pharma, Inc. (Health Care) | (a) | 191,500 | 2,911,878 | |||||||
Benesse Holdings, Inc. (Consumer Discretionary) | (a) | 84,300 | 1,281,697 | |||||||
Central Japan Railway Co. (Industrials) | (a) | 5,500 | 675,288 | |||||||
Cosmos Pharmaceutical Corp. (Consumer Staples) | (a) | 1,400 | 142,245 | |||||||
Dai-ichi Life Holdings, Inc. (Financials) | (a) | 58,400 | 1,318,869 | |||||||
Daiichi Sankyo Co. Ltd. (Health Care) | (a) | 16,500 | 531,080 | |||||||
Daiwa House Industry Co. Ltd. (Real Estate) | (a) | 28,100 | 647,318 | |||||||
DMG Mori Co. Ltd. (Industrials) | (a) | 70,000 | 926,991 | |||||||
Ebara Corp. (Industrials) | (a) | 8,700 | 309,916 | |||||||
FANUC Corp. (Industrials) | (a) | 7,400 | 1,107,384 | |||||||
Fast Retailing Co. Ltd. (Consumer Discretionary) | (a) | 4,200 | 2,555,841 | |||||||
Fuji Media Holdings, Inc. (Communication Services) | (a) | 32,100 | 261,098 | |||||||
Hino Motors Ltd. (Industrials) | (a)(b) | 12,400 | 47,116 | |||||||
Hitachi Ltd. (Industrials) | (a) | 11,100 | 558,511 | |||||||
Honda Motor Co. Ltd. (Consumer Discretionary) | (a) | 88,100 | 2,009,474 | |||||||
Horiba Ltd. (Information Technology) | (a) | 3,300 | 143,064 | |||||||
Hoya Corp. (Health Care) | (a) | 6,200 | 593,827 | |||||||
Inpex Corp. (Energy) | (a) | 65,600 | 704,899 | |||||||
ITOCHU Corp. (Industrials) | (a) | 34,700 | 1,088,634 | |||||||
Itochu Techno-Solutions Corp. (Information Technology) | (a) | 12,800 | 296,906 | |||||||
Japan Post Bank Co. Ltd. (Financials) | (a) | 89,500 | 767,279 | |||||||
JGC Holdings Corp. (Industrials) | (a) | 10,100 | 128,027 | |||||||
Kajima Corp. (Industrials) | (a) | 5,300 | 61,678 | |||||||
Kakaku.com, Inc. (Communication Services) | (a) | 5,800 | 93,065 | |||||||
Kamigumi Co. Ltd. (Industrials) | (a) | 10,100 | 205,616 | |||||||
Kandenko Co. Ltd. (Industrials) | (a) | 15,300 | 99,921 | |||||||
KDDI Corp. (Communication Services) | (a) | 141,800 | 4,300,353 | |||||||
Kinden Corp. (Industrials) | (a) | 5,700 | 62,057 | |||||||
Kubota Corp. (Industrials) | (a) | 35,600 | 486,347 | |||||||
Lawson, Inc. (Consumer Staples) | (a) | 63,400 | 2,423,816 | |||||||
Lion Corp. (Consumer Staples) | (a) | 66,500 | 764,914 | |||||||
Medipal Holdings Corp. (Health Care) | (a) | 6,800 | 89,877 | |||||||
Mitsubishi Corp. (Industrials) | (a) | 111,400 | 3,616,576 | |||||||
Mitsubishi Electric Corp. (Industrials) | (a) | 3,000 | 29,727 | |||||||
Mitsubishi Estate Co. Ltd. (Real Estate) | (a) | 53,500 | 693,016 | |||||||
Mitsubishi Gas Chemical Co., Inc. (Materials) | (a) | 85,500 | 1,175,331 | |||||||
Mitsubishi Heavy Industries Ltd. (Industrials) | (a) | 4,400 | 173,873 | |||||||
Mitsubishi UFJ Financial Group, Inc. (Financials) | (a) | 426,900 | 2,865,956 | |||||||
Mitsui Fudosan Co. Ltd. (Real Estate) | (a) | 88,300 | 1,613,856 | |||||||
MS&AD Insurance Group Holdings, Inc. (Financials) | (a) | 29,300 | 936,716 | |||||||
Nabtesco Corp. (Industrials) | (a) | 4,700 | 119,213 | |||||||
NEC Corp. (Information Technology) | (a) | 35,000 | 1,227,423 | |||||||
Nippon Steel Corp. (Materials) | (a) | 31,700 | 550,031 | |||||||
Nippon Telegraph & Telephone Corp. (Communication Services) | (a) | 86,700 | 2,472,554 | |||||||
Nitto Denko Corp. (Materials) | (a) | 18,700 | 1,077,021 | |||||||
Nomura Real Estate Holdings, Inc. (Real Estate) | (a) | 4,100 | 87,669 | |||||||
Nomura Research Institute Ltd. (Information Technology) | (a) | 10,100 | 240,117 | |||||||
NSK Ltd. (Industrials) | (a) | 63,700 | 335,871 | |||||||
Obayashi Corp. (Industrials) | (a) | 4,700 | 35,502 | |||||||
Omron Corp. (Information Technology) | (a) | 37,200 | 1,797,794 | |||||||
Oracle Corp. (Information Technology) | (a) | 1,000 | 65,021 | |||||||
| Common Stocks (Continued) | Shares | Value | ||||||||
JAPAN (continued) | ||||||||||
Oriental Land Co. Ltd. (Consumer Discretionary) | (a) | 4,100 | $ | 596,649 | ||||||
Otsuka Corp. (Information Technology) | (a) | 5,100 | 160,754 | |||||||
Pola Orbis Holdings, Inc. (Consumer Staples) | (a) | 38,200 | 537,626 | |||||||
Recruit Holdings Co. Ltd. (Industrials) | (a) | 86,800 | 2,717,011 | |||||||
Ricoh Co. Ltd. (Information Technology) | (a) | 31,800 | 242,034 | |||||||
Santen Pharmaceutical Co. Ltd. (Health Care) | (a) | 107,500 | 875,955 | |||||||
SCSK Corp. (Information Technology) | (a) | 2,900 | 43,897 | |||||||
Sega Sammy Holdings, Inc. (Consumer Discretionary) | (a) | 46,300 | 699,105 | |||||||
Shimizu Corp. (Industrials) | (a) | 3,600 | 19,209 | |||||||
Shiseido Co. Ltd. (Consumer Staples) | (a) | 3,300 | 161,745 | |||||||
SMC Corp. (Industrials) | (a) | 600 | 250,532 | |||||||
SoftBank Corp. (Communication Services) | (a) | 69,900 | 790,825 | |||||||
SoftBank Group Corp. (Communication Services) | (a) | 29,700 | 1,256,100 | |||||||
Sohgo Security Services Co. Ltd. (Industrials) | (a) | 4,700 | 127,961 | |||||||
Sompo Holdings, Inc. (Financials) | (a) | 3,100 | 137,154 | |||||||
Sony Group Corp. (Consumer Discretionary) | (a) | 4,400 | 335,375 | |||||||
Sumitomo Chemical Co. Ltd. (Materials) | (a) | 502,400 | 1,801,417 | |||||||
Sumitomo Corp. (Industrials) | (a) | 70,900 | 1,178,577 | |||||||
Sumitomo Heavy Industries Ltd. (Industrials) | (a) | 700 | 13,975 | |||||||
Sundrug Co. Ltd. (Consumer Staples) | (a) | 5,300 | 157,498 | |||||||
Suzuki Motor Corp. (Consumer Discretionary) | (a) | 26,700 | 855,130 | |||||||
T&D Holdings, Inc. (Financials) | (a) | 37,400 | 535,371 | |||||||
Taisho Pharmaceutical Holdings Co. Ltd. (Health Care) | (a) | 1,600 | 70,379 | |||||||
Takeda Pharmaceutical Co. Ltd. (Health Care) | (a) | 92,700 | 2,896,566 | |||||||
Terumo Corp. (Health Care) | (a) | 19,500 | 552,836 | |||||||
Tokyo Electron Ltd. (Information Technology) | (a) | 1,200 | 352,594 | |||||||
Tokyo Tatemono Co. Ltd. (Real Estate) | (a) | 1,400 | 16,949 | |||||||
Toshiba Corp. (Industrials) | (a) | 9,500 | 330,118 | |||||||
TOTO Ltd. (Industrials) | (a) | 1,100 | 37,311 | |||||||
Toyota Industries Corp. (Industrials) | (a) | 2,700 | 146,679 | |||||||
Toyota Motor Corp. (Consumer Discretionary) | (a) | 61,100 | 833,559 | |||||||
Trend Micro, Inc. (Information Technology) | (a)(b) | 9,700 | 453,643 | |||||||
Tsuruha Holdings, Inc. (Consumer Staples) | (a) | 31,100 | 2,412,274 | |||||||
Yamada Holdings Co. Ltd. (Consumer Discretionary) | (a) | 259,600 | 921,518 | |||||||
Yaskawa Electric Corp. (Industrials) | (a) | 19,600 | 625,346 | |||||||
ZOZO, Inc. (Consumer Discretionary) | (a) | 5,700 | 140,766 | |||||||
|
| |||||||||
| 72,758,257 | ||||||||||
|
| |||||||||
UNITED KINGDOM – 14.5% | ||||||||||
Anglo American PLC (Materials) | (a) | 26,706 | 1,045,804 | |||||||
AstraZeneca PLC (Health Care) | (a) | 32,704 | 4,425,484 | |||||||
Auto Trader Group PLC (Communication Services) | (a) | 30,253 | 188,396 | |||||||
Barclays PLC (Financials) | (a) | 406,168 | 772,861 | |||||||
Bellway PLC (Consumer Discretionary) | (a) | 6,949 | 158,911 | |||||||
BP PLC (Energy) | (a) | 824,010 | 4,754,490 | |||||||
British American Tobacco PLC (Consumer Staples) | (a) | 107,433 | 4,249,851 | |||||||
BT Group PLC (Communication Services) | (a) | 1,120,254 | 1,512,650 | |||||||
Centrica PLC (Utilities) | (a) | 498,613 | 579,917 | |||||||
Croda International PLC (Materials) | (a) | 4,437 | 353,090 | |||||||
| 20 | (continued) |
Ohio National Fund, Inc. | ON BlackRock Advantage International Equity Portfolio (Continued) | |
| Schedule of Investments | December 31, 2022 | |
| Common Stocks (Continued) | Shares | Value | ||||||||
UNITED KINGDOM (continued) | ||||||||||
Diageo PLC (Consumer Staples) | (a) | 74,729 | $ | 3,271,027 | ||||||
GSK PLC (Health Care) | (a) | 272,353 | 4,707,141 | |||||||
Hargreaves Lansdown PLC (Financials) | (a) | 1,575 | 16,219 | |||||||
HSBC Holdings PLC (Financials) | (a) | 231,243 | 1,433,136 | |||||||
IG Group Holdings PLC (Financials) | (a) | 26,821 | 252,716 | |||||||
IMI PLC (Industrials) | (a) | 20,815 | 325,085 | |||||||
Intertek Group PLC (Industrials) | (a) | 48,438 | 2,356,615 | |||||||
Lloyds Banking Group PLC (Financials) | (a) | 1,912,728 | 1,043,800 | |||||||
National Grid PLC (Utilities) | (a) | 156,797 | 1,878,326 | |||||||
Reckitt Benckiser Group PLC (Consumer Staples) | (a) | 1,573 | 109,035 | |||||||
RELX PLC (Industrials) | (a) | 69,470 | 1,920,708 | |||||||
Rio Tinto PLC (Materials) | (a) | 10,263 | 722,351 | |||||||
Shell PLC (Energy) | (a) | 294,123 | 8,291,568 | |||||||
Smiths Group PLC (Industrials) | (a) | 22,855 | 438,635 | |||||||
Spectris PLC (Information Technology) | (a) | 21,778 | 788,943 | |||||||
Spirax-Sarco Engineering PLC (Industrials) | (a) | 3,018 | 385,491 | |||||||
SSE PLC (Utilities) | (a) | 61,341 | 1,261,596 | |||||||
Standard Chartered PLC (Financials) | (a) | 51,959 | 387,537 | |||||||
Tesco PLC (Consumer Staples) | (a) | 475,882 | 1,282,439 | |||||||
Travis Perkins PLC (Industrials) | (a) | 6,709 | 71,727 | |||||||
Unilever PLC (Consumer Staples) | (a) | 44,375 | 2,240,397 | |||||||
Vodafone Group PLC (Communication Services) | (a) | 76,247 | 77,217 | |||||||
|
| |||||||||
| 51,303,163 | ||||||||||
|
| |||||||||
FRANCE – 12.3% | ||||||||||
Air Liquide SA (Materials) | (a) | 1,218 | 172,877 | |||||||
Airbus SE (Industrials) | (a) | 11,395 | 1,354,893 | |||||||
Arkema SA (Materials) | (a) | 10,416 | 936,865 | |||||||
BNP Paribas SA (Financials) | (a) | 26,857 | 1,529,214 | |||||||
Capgemini SE (Information Technology) | (a) | 14,186 | 2,371,559 | |||||||
Covivio (Real Estate) | (a) | 986 | 58,527 | |||||||
Danone SA (Consumer Staples) | (a) | 376 | 19,817 | |||||||
Dassault Aviation SA (Industrials) | (a) | 1,378 | 233,699 | |||||||
Dassault Systemes SE (Information Technology) | (a) | 61,446 | 2,209,577 | |||||||
Engie SA (Utilities) | (a) | 141,276 | 2,021,104 | |||||||
Hermes International (Consumer Discretionary) | (a) | 1,752 | 2,711,836 | |||||||
Ipsen SA (Health Care) | (a) | 3,340 | 359,252 | |||||||
Klepierre SA (Real Estate) | (a) | 1,996 | 46,069 | |||||||
L’Oreal SA (Consumer Staples) | (a) | 8,404 | 3,009,452 | |||||||
LVMH Moet Hennessy Louis Vuitton SE (Consumer Discretionary) | (a) | 7,556 | 5,498,443 | |||||||
Pernod Ricard SA (Consumer Staples) | (a) | 12,979 | 2,553,260 | |||||||
Remy Cointreau SA (Consumer Staples) | (a) | 337 | 56,823 | |||||||
Rexel SA (Industrials) | (a) | 17,299 | 342,148 | |||||||
Safran SA (Industrials) | (a) | 24,455 | 3,063,082 | |||||||
Sanofi (Health Care) | (a) | 55,920 | 5,392,172 | |||||||
Schneider Electric SE (Industrials) | (a) | 17,981 | 2,525,154 | |||||||
Societe Generale SA (Financials) | (a) | 77,925 | 1,954,642 | |||||||
Teleperformance (Industrials) | (a) | 3,077 | 735,604 | |||||||
Thales SA (Industrials) | (a) | 6,635 | 847,746 | |||||||
TotalEnergies SE (Energy) | (a) | 33,171 | 2,082,248 | |||||||
Ubisoft Entertainment SA (Communication Services) | (a)(b) | 24,242 | 684,856 | |||||||
Vinci SA (Industrials) | (a) | 9,095 | 906,652 | |||||||
|
| |||||||||
| 43,677,571 | ||||||||||
|
| |||||||||
GERMANY – 9.0% | ||||||||||
adidas AG (Consumer Discretionary) | (a) | 8,038 | 1,089,360 | |||||||
Bayer AG (Health Care) | (a) | 15,643 | 805,146 | |||||||
Bayerische Motoren Werke AG (Consumer Discretionary) | (a) | 7,988 | 707,217 | |||||||
Carl Zeiss Meditec AG (Health Care) | (a) | 7,147 | 898,334 | |||||||
Daimler Truck Holding AG (Industrials) | (a)(b) | 6,890 | 211,810 | |||||||
Deutsche Boerse AG (Financials) | (a) | 4,613 | 794,313 | |||||||
Deutsche Post AG (Industrials) | (a) | 89,745 | 3,358,853 | |||||||
| Common Stocks (Continued) | Shares | Value | ||||||||
GERMANY (continued) | ||||||||||
Deutsche Telekom AG (Communication Services) | (a) | 68,914 | $ | 1,371,152 | ||||||
DWS Group GmbH & Co. KGaA (Financials) | (a) | 15,320 | 494,384 | |||||||
Evonik Industries AG (Materials) | (a) | 43,015 | 820,460 | |||||||
HOCHTIEF AG (Industrials) | (a) | 20,441 | 1,148,088 | |||||||
Infineon Technologies AG (Information Technology) | (a) | 37,935 | 1,152,916 | |||||||
K+SAG (Materials) | (a) | 16,078 | 316,960 | |||||||
Mercedes-Benz Group AG (Consumer Discretionary) | (a) | 52,577 | 3,438,266 | |||||||
Nemetschek SE (Information Technology) | (a) | 13,867 | 708,969 | |||||||
SAP SE (Information Technology) | (a) | 55,510 | 5,730,890 | |||||||
Scout24 SE (Communication Services) | (a) | 29,373 | 1,478,449 | |||||||
Siemens AG (Industrials) | (a) | 42,121 | 5,806,430 | |||||||
Siemens Energy AG (Industrials) | (a) | 12,106 | 227,304 | |||||||
Talanx AG (Financials) | (a) | 758 | 35,733 | |||||||
thyssenkrupp AG (Materials) | (a)(b) | 10,393 | 63,112 | |||||||
Volkswagen AG (Consumer Discretionary) | (a) | 1,834 | 287,710 | |||||||
Wacker Chemie AG (Materials) | (a) | 7,127 | 908,252 | |||||||
|
| |||||||||
| 31,854,108 | ||||||||||
|
| |||||||||
SWITZERLAND – 8.6% | ||||||||||
ABB Ltd. (Industrials) | (a) | 60,639 | 1,848,125 | |||||||
Chocoladefabriken Lindt & Spruengli AG (Consumer Staples) | (a) | 2 | 205,767 | |||||||
Chocoladefabriken Lindt & Spruengli AG NVS (Consumer Staples) | (a) | 172 | 1,752,687 | |||||||
Cie Financiere Richemont SA (Consumer Discretionary) | (a) | 7,348 | 952,741 | |||||||
Glencore PLC (Materials) | (a) | 50,126 | 334,272 | |||||||
Nestle SA (Consumer Staples) | (a) | 67,160 | 7,757,608 | |||||||
Novartis AG (Health Care) | (a) | 70,126 | 6,346,222 | |||||||
Roche Holding AG (Health Care) | (a) | 1,016 | 393,696 | |||||||
Roche Holding AG NVS (Health Care) | (a) | 12,270 | 3,855,692 | |||||||
STMicroelectronics N.V. (Information Technology) | (a) | 36,673 | 1,303,212 | |||||||
Swatch Group AG / The (Consumer Discretionary) | (a) | 3,856 | 1,095,955 | |||||||
Temenos AG (Information Technology) | (a) | 8,875 | 488,243 | |||||||
UBS Group AG (Financials) | (a) | 216,470 | 4,023,359 | |||||||
|
| |||||||||
| 30,357,579 | ||||||||||
|
| |||||||||
AUSTRALIA – 8.5% | ||||||||||
AGL Energy Ltd. (Utilities) | (a) | 53,447 | 292,574 | |||||||
Allkem Ltd. (Materials) | (a)(b) | 107,157 | 811,790 | |||||||
ANZ Group Holdings Ltd. (Financials) | (b)(c) | 47,253 | 761,194 | |||||||
Aristocrat Leisure Ltd. (Consumer Discretionary) | (a) | 125,991 | 2,596,146 | |||||||
BHP Group Ltd. (Materials) | (a) | 215,292 | 6,669,088 | |||||||
Charter Hall Group (Real Estate) | (a) | 8,433 | 68,407 | |||||||
Commonwealth Bank of Australia (Financials) | (a) | 7,679 | 533,343 | |||||||
CSL Ltd. (Health Care) | (a) | 10,832 | 2,112,176 | |||||||
Flight Centre Travel Group Ltd. (Consumer Discretionary) | (a)(b) | 70,318 | 688,192 | |||||||
Fortescue Metals Group Ltd. (Materials) | (a) | 40,762 | 569,737 | |||||||
GPT Group / The (Real Estate) | (a) | 17,261 | 49,229 | |||||||
Iluka Resources Ltd. (Materials) | (a) | 21,463 | 138,061 | |||||||
Insurance Australia Group Ltd. (Financials) | (a) | 28,606 | 91,959 | |||||||
Macquarie Group Ltd. (Financials) | (a) | 29,574 | 3,338,563 | |||||||
Medibank Pvt Ltd. (Financials) | (a) | 127,147 | 253,663 | |||||||
Mineral Resources Ltd. (Materials) | (a) | 4,954 | 259,869 | |||||||
National Australia Bank Ltd. (Financials) | (a) | 81,394 | 1,652,592 | |||||||
OZ Minerals Ltd. (Materials) | (a) | 14,706 | 277,196 | |||||||
| 21 | (continued) |
Ohio National Fund, Inc. | ON BlackRock Advantage International Equity Portfolio (Continued) | |
| Schedule of Investments | December 31, 2022 | |
| Common Stocks (Continued) | Shares | Value | ||||||||
AUSTRALIA (continued) | ||||||||||
Pilbara Minerals Ltd. (Materials) | (a)(b) | 23,199 | $ | 58,746 | ||||||
Qantas Airways Ltd. (Industrials) | (a)(b) | 23,471 | 95,004 | |||||||
QBE Insurance Group Ltd. (Financials) | (a) | 3,438 | 31,188 | |||||||
REA Group Ltd. (Communication Services) | (a) | 7,058 | 530,808 | |||||||
Rio Tinto Ltd. (Materials) | (a) | 2,762 | 217,992 | |||||||
Steadfast Group Ltd. (Financials) | (a) | 65,112 | 241,826 | |||||||
Stockland (Real Estate) | (a) | 30,809 | 75,878 | |||||||
Telstra Group Ltd. (Communication Services) | (a) | 658,342 | 1,780,447 | |||||||
Treasury Wine Estates Ltd. (Consumer Staples) | (a) | 18,626 | 172,075 | |||||||
Westpac Banking Corp. (Financials) | (a) | 249,919 | 3,956,595 | |||||||
Worley Ltd. (Energy) | (a) | 158,813 | 1,619,965 | |||||||
|
| |||||||||
| 29,944,303 | ||||||||||
|
| |||||||||
NETHERLANDS – 4.3% | ||||||||||
Aalberts N.V. (Industrials) | (a) | 1,601 | 62,363 | |||||||
ABN AMRO Bank N.V. (Financials) | (a) | 6,341 | 87,810 | |||||||
Adyen N.V. (Information Technology) | (a)(b) | 69 | 95,789 | |||||||
Argenx SE (Health Care) | (a)(b) | 880 | 330,357 | |||||||
ASML Holding N.V. (Information Technology) | (a) | 9,922 | 5,409,987 | |||||||
ASR Nederland N.V. (Financials) | (a) | 24,581 | 1,167,941 | |||||||
IMCD N.V. (Industrials) | (a) | 4,562 | 652,555 | |||||||
JDE Peet’s N.V. (Consumer Staples) | (a) | 2,959 | 85,588 | |||||||
Koninklijke DSM N.V. (Materials) | (a) | 7,139 | 876,630 | |||||||
Koninklijke Philips N.V. (Health Care) | (a) | 258,387 | 3,888,003 | |||||||
Koninklijke Vopak N.V. (Energy) | (a) | 856 | 25,463 | |||||||
NN Group N.V. (Financials) | (a) | 718 | 29,361 | |||||||
Randstad N.V. (Industrials) | (a) | 3,516 | 214,836 | |||||||
Signify N.V. (Industrials) | (a) | 3,734 | 125,696 | |||||||
Stellantis N.V. (Consumer Discretionary) | (a)(b) | 100,006 | 1,421,121 | |||||||
Wolters Kluwer N.V. (Industrials) | (a) | 7,867 | 823,165 | |||||||
|
| |||||||||
| 15,296,665 | ||||||||||
|
| |||||||||
HONG KONG – 3.8% | ||||||||||
AIA Group Ltd. (Financials) | (a) | 533,200 | 5,888,331 | |||||||
ASMPT Ltd. (Information Technology) | (a) | 54,400 | 386,359 | |||||||
Bank of East Asia Ltd. / The (Financials) | (a) | 22,600 | 27,321 | |||||||
BOC Hong Kong Holdings Ltd. (Financials) | (a) | 141,500 | 480,364 | |||||||
Budweiser Brewing Co. APAC Ltd. (Consumer Staples) | (a) | 37,700 | 117,850 | |||||||
CK Hutchison Holdings Ltd. (Industrials) | (a) | 61,500 | 368,437 | |||||||
CK Infrastructure Holdings Ltd. (Utilities) | (a) | 29,500 | 153,932 | |||||||
ESR Group Ltd. (Real Estate) | (a) | 27,600 | 57,699 | |||||||
Hang Lung Properties Ltd. (Real Estate) | (a) | 29,000 | 56,492 | |||||||
Hysan Development Co. Ltd. (Real Estate) | (a) | 42,000 | 136,014 | |||||||
Jardine Matheson Holdings Ltd. (Industrials) | (a) | 42,700 | 2,172,185 | |||||||
Kerry Properties Ltd. (Real Estate) | (a) | 262,500 | 569,478 | |||||||
Link REIT (Real Estate) | (a) | 3,300 | 24,147 | |||||||
Man Wah Holdings Ltd. (Consumer Discretionary) | (a) | 74,400 | 73,620 | |||||||
New World Development Co. Ltd. (Real Estate) | (a) | 417,000 | 1,169,758 | |||||||
Pacific Basin Shipping Ltd. (Industrials) | (a) | 46,000 | 15,497 | |||||||
Sino Land Co. Ltd. (Real Estate) | (a) | 74,000 | 92,299 | |||||||
SITC International Holdings Co. Ltd. (Industrials) | (a) | 17,000 | 37,679 | |||||||
Sun Hung Kai Properties Ltd. (Real Estate) | (a) | 53,000 | 723,946 | |||||||
Swire Properties Ltd. (Real Estate) | (a) | 317,200 | 803,434 | |||||||
| Common Stocks (Continued) | Shares | Value | ||||||||
HONG KONG (continued) | ||||||||||
WH Group Ltd. (Consumer Staples) | (a) | 41,000 | $ | 23,913 | ||||||
Wharf Holdings Ltd. / The (Real Estate) | (a) | 13,000 | 38,134 | |||||||
|
| |||||||||
| 13,416,889 | ||||||||||
|
| |||||||||
DENMARK – 3.7% | ||||||||||
AP Moller - Maersk A/S Class B (Industrials) | (a) | 742 | 1,661,044 | |||||||
AP Moller - Maersk A/S Class A (Industrials) | (a) | 236 | 520,111 | |||||||
Carlsberg A/S Class B (Consumer Staples) | (a) | 2,443 | 324,056 | |||||||
Coloplast A/S Class B (Health Care) | (a) | 1,639 | 192,013 | |||||||
Demant A/S (Health Care) | (a)(b) | 3,260 | 90,907 | |||||||
DSV A/S (Industrials) | (a) | 794 | 125,561 | |||||||
Genmab A/S (Health Care) | (a)(b) | 1,997 | 844,321 | |||||||
H. Lundbeck A/S (Health Care) | (a) | 58,088 | 217,525 | |||||||
Novo Nordisk A/S Class B (Health Care) | (a) | 46,898 | 6,369,478 | |||||||
Novozymes A/S (Materials) | (a) | 16,650 | 844,716 | |||||||
Pandora A/S (Consumer Discretionary) | (a) | 2,667 | 188,508 | |||||||
Tryg A/S (Financials) | (a) | 76,418 | 1,816,116 | |||||||
|
| |||||||||
| 13,194,356 | ||||||||||
|
| |||||||||
SWEDEN – 2.2% | ||||||||||
Boliden AB (Materials) | (a) | 11,216 | 421,297 | |||||||
EQT AB (Financials) | (a) | 6,023 | 127,960 | |||||||
Industrivarden AB Class C (Financials) | (a) | 79,772 | 1,935,465 | |||||||
Industrivarden AB Class A (Financials) | (a) | 19,521 | 474,810 | |||||||
Investor AB Class B (Financials) | (a) | 113,823 | 2,060,305 | |||||||
Investor AB Class A (Financials) | (a) | 12,476 | 232,112 | |||||||
Saab AB Class B (Industrials) | (a) | 48,739 | 1,920,684 | |||||||
Telefonaktiebolaget LM Ericsson Class B (Information Technology) | (a) | 70,592 | 413,628 | |||||||
Volvo AB Class B (Industrials) | (a) | 8,423 | 152,150 | |||||||
Volvo Car AB Class B (Consumer Discretionary) | (a)(b) | 6,204 | 28,249 | |||||||
|
| |||||||||
| 7,766,660 | ||||||||||
|
| |||||||||
ITALY – 1.8% | ||||||||||
A2A SpA (Utilities) | (a) | 104,688 | 139,577 | |||||||
Assicurazioni Generali SpA (Financials) | (a) | 26,905 | 478,438 | |||||||
Banca Monte dei Paschi di Siena SpA (Financials) | (a)(b) | 19,711 | 40,582 | |||||||
Buzzi Unicem SpA (Materials) | (a) | 4,727 | 91,090 | |||||||
Eni SpA (Energy) | (a) | 5,857 | 83,283 | |||||||
Intesa Sanpaolo SpA (Financials) | (a) | 261,586 | 579,520 | |||||||
Mediobanca Banca di Credito Finanziario SpA (Financials) | (a) | 64,335 | 618,199 | |||||||
Moncler SpA (Consumer Discretionary) | (a) | 1,055 | 56,059 | |||||||
Pirelli & C SpA (Consumer Discretionary) | (a) | 107,435 | 460,526 | |||||||
Poste Italiane SpA (Financials) | (a) | 62,346 | 608,277 | |||||||
PRADA SpA (Consumer Discretionary) | (a) | 38,500 | 216,132 | |||||||
Reply SpA (Information Technology) | (a) | 2,406 | 276,011 | |||||||
Snam SpA (Utilities) | (a) | 433,374 | 2,101,360 | |||||||
UniCredit SpA (Financials) | (a) | 46,892 | 665,376 | |||||||
UnipolSai Assicurazioni SpA (Financials) | (a) | 33,256 | 81,874 | |||||||
|
| |||||||||
| 6,496,304 | ||||||||||
|
| |||||||||
SPAIN – 1.8% | ||||||||||
Acciona SA (Utilities) | (a) | 8,647 | 1,591,321 | |||||||
Amadeus IT Group SA (Information Technology) | (a)(b) | 4,257 | 220,843 | |||||||
Banco Bilbao Vizcaya Argentaria SA (Financials) | (a) | 374,189 | 2,253,840 | |||||||
Banco Santander SA (Financials) | (a) | 187,787 | 561,504 | |||||||
| 22 | (continued) |
Ohio National Fund, Inc. | ON BlackRock Advantage International Equity Portfolio (Continued) | |
| Schedule of Investments | December 31, 2022 | |
| Common Stocks (Continued) | Shares | Value | ||||||||
SPAIN (continued) | ||||||||||
Bankinter SA (Financials) | (a) | 7,452 | $ | 49,925 | ||||||
Grifols SA (Health Care) | (a)(b) | 13,038 | 150,568 | |||||||
Iberdrola SA (Utilities) | (a) | 69,450 | 810,724 | |||||||
Mapfre SA (Financials) | (a) | 81,137 | 156,960 | |||||||
Repsol SA (Energy) | (a) | 33,837 | 538,584 | |||||||
|
| |||||||||
| 6,334,269 | ||||||||||
|
| |||||||||
NORWAY – 1.7% | ||||||||||
Aker BP ASA (Energy) | (a) | 24,712 | 768,120 | |||||||
DNB Bank ASA (Financials) | (a) | 135,942 | 2,684,869 | |||||||
Equinor ASA (Energy) | (a) | 59,351 | 2,133,089 | |||||||
Gjensidige Forsikring ASA (Financials) | (a) | 2,101 | 41,209 | |||||||
Kongsberg Gruppen ASA (Industrials) | (a) | 3,348 | 142,504 | |||||||
Var Energi ASA (Energy) | (a) | 108,508 | 374,607 | |||||||
|
| |||||||||
| 6,144,398 | ||||||||||
|
| |||||||||
BELGIUM – 1.6% | ||||||||||
Anheuser-Busch InBev SA / N.V. (Consumer Staples) | (a) | 58,383 | 3,516,463 | |||||||
KBC Group N.V. (Financials) | (a) | 23,802 | 1,532,498 | |||||||
Proximus SADP (Communication Services) | (a) | 2,328 | 22,477 | |||||||
Solvay SA (Materials) | (a) | 5,550 | 561,138 | |||||||
UCB SA (Health Care) | (a) | 1,987 | 156,563 | |||||||
|
| |||||||||
| 5,789,139 | ||||||||||
|
| |||||||||
SINGAPORE – 1.1% | ||||||||||
ComfortDelGro Corp. Ltd. (Industrials) | (a) | 51,100 | 46,929 | |||||||
Jardine Cycle & Carriage Ltd. (Industrials) | (a) | 113,200 | 2,417,016 | |||||||
Mapletree Pan Asia Commercial Trust (Real Estate) | (a) | 116,200 | 145,185 | |||||||
Oversea-Chinese Banking Corp. Ltd. (Financials) | (a) | 82,100 | 746,784 | |||||||
United Overseas Bank Ltd. (Financials) | (a) | 28,700 | 657,398 | |||||||
|
| |||||||||
| 4,013,312 | ||||||||||
|
| |||||||||
IRELAND – 0.8% | ||||||||||
AIB Group PLC (Financials) | (a) | 13,753 | 52,790 | |||||||
Experian PLC (Industrials) | (a) | 72,780 | 2,464,937 | |||||||
Kingspan Group PLC (Industrials) | (a) | 7,011 | 379,603 | |||||||
|
| |||||||||
| 2,897,330 | ||||||||||
|
| |||||||||
| Common Stocks (Continued) | Shares | Value | ||||||||
LUXEMBOURG – 0.6% | ||||||||||
ArcelorMittal SA (Materials) | (a) | 78,950 | $ | 2,082,870 | ||||||
|
| |||||||||
AUSTRIA – 0.5% | ||||||||||
ams-OSRAM AG (Information Technology) | (a)(b) | 51,788 | 379,431 | |||||||
ANDRITZ AG (Industrials) | (a) | 18,223 | 1,043,123 | |||||||
BAWAG Group AG (Financials) | (a) | 1,967 | 104,822 | |||||||
Erste Group Bank AG (Financials) | (a) | 8,368 | 267,736 | |||||||
|
| |||||||||
| 1,795,112 | ||||||||||
|
| |||||||||
FINLAND – 0.4% | ||||||||||
Nokia Oyj (Information Technology) | (a) | 308,973 | 1,435,395 | |||||||
|
| |||||||||
ISRAEL – 0.2% | ||||||||||
Alony Hetz Properties & Investments Ltd. (Real Estate) | (a) | 3,111 | 31,702 | |||||||
Bank Hapoalim BM (Financials) | (a) | 10,181 | 91,669 | |||||||
Bezeq The Israeli Telecommunication Corp. Ltd. (Communication Services) | (a) | 272,344 | 467,209 | |||||||
Teva Pharmaceutical Industries Ltd. (Health Care) | (a)(b) | 9,899 | 91,285 | |||||||
|
| |||||||||
| 681,865 | ||||||||||
|
| |||||||||
Total Common Stocks | ||||||||||
(Cost $344,839,979) | $ | 347,239,545 | ||||||||
|
| |||||||||
| Preferred Securities – 0.6% | Rate | Quantity | Value | |||||||||||||
GERMANY – 0.6% | ||||||||||||||||
FUCHS PETROLUB SE (Materials) | (a | ) | 3.146 | % (d) | 2,937 | $ | 102,661 | |||||||||
Volkswagen AG (Consumer Discretionary) | (a | ) | 22.866 | % (d) | 14,429 | 1,789,912 | ||||||||||
|
| |||||||||||||||
Total Preferred Securities (Cost $2,091,888) |
| $ | 1,892,573 | |||||||||||||
|
| |||||||||||||||
Total Investments – 98.5% (Cost $346,931,867) |
| (e) | $ | 349,132,118 | ||||||||||||
Other Assets in Excess of Liabilities – 1.5% |
| (f) | 5,439,423 | |||||||||||||
|
| |||||||||||||||
Net Assets – 100.0% | $ | 354,571,541 | ||||||||||||||
|
| |||||||||||||||
Percentages are stated as a percent of net assets.
Abbreviations:
NVS: Non Voting Shares
Footnotes:
| (a) | Security traded on a foreign exchange has been valued at an estimate of fair value that is different than the local market close price. These fair value estimates are determined by an independent fair valuation service that has been approved by the Board. These securities represent $348,370,924 or 98.3% of the Portfolio’s net assets. |
| (b) | Non-income producing security. |
| (c) | As discussed in Note 2 of the Notes to Financial Statements, not all investments that are traded on a foreign exchange are valued at an estimate that is different from the local close price. In some instances, the independent fair valuation service uses a stock’s local close price because the service’s measure of predictability related to their valuation model of a stock is below a chosen threshold. These securities represent $761,194 or 0.2% of the Portfolio’s net assets. Other Portfolio securities are not subjected to fair valuation procedures because they are traded on domestic or foreign exchanges that have close times that are consistent with the U.S. market close, normally 4:00 pm Eastern Time. |
| (d) | Represents twelve-month dividend yield. Rates are determined by actual distributions, which are impacted by factors unique to each preference share such as board authorization, distributable earnings, and preferred payout features compared to other classes of equity. |
| (e) | Represents cost for financial reporting purposes, which may differ from cost basis for federal income tax purposes. See also Note 7 of the Notes to Financial Statements. |
| (f) | Includes $263,693 of cash pledged as collateral for the futures contracts outstanding at December 31, 2022. See also the following Schedule of Open Futures Contracts. |
The accompanying notes are an integral part of these financial statements.
| 23 |
Ohio National Fund, Inc. | ON BlackRock Advantage International Equity Portfolio (Continued) | |
| Schedule of Open Futures Contracts | December 31, 2022 | |
Description | Number of contracts | Expiration Date | Notional Amount | Value | Unrealized Appreciation (Depreciation) | Variation Margin Receivable (Payable) | ||||||
MSCI EAFE Index - Long | 51 | March 17, 2023 | $5,162,383 | $4,970,970 | $(191,413) | $(48,273) | ||||||
The accompanying notes are an integral part of these financial statements.
| 24 |
| ON Janus Henderson Forty Portfolio (Unaudited) |
| Objective/Strategy |
The ON Janus Henderson Forty Portfolio seeks long-term capital growth by investing primarily in domestic and foreign equity securities selected for growth potential.
| Performance as of December 31, 2022 | ||||
Average Annual returns | ||||
One year | -33.92 | % | ||
Five years | 9.13 | % | ||
Ten years | 12.49 | % | ||
Past performance does not guarantee future results. The performance data quoted represents past performance and current returns may be lower or higher. Total return figures include change in share price and reinvestment of dividends and capital gains. The investment return and principal value will fluctuate so that an investor’s shares, when redeemed, may be worth more or less than the original cost. To obtain performance information up to the most recent month end, call toll-free 1-877-781-6392.
The Portfolio is not open to direct retail investment. Beneficial interest in the Portfolio’s shares is obtained either through an allocation to the Portfolio as an investment vehicle within variable life insurance policies or annuity contracts, or as an underlying investment by the ON Model Portfolios. Actual performance results for variable annuity and variable universal life contracts will be lower due to contract charges. Consult your contract for applicable charges.
Total expense ratio is 0.78% per the Fund’s prospectus dated April 29, 2022. Additional information pertaining to the Portfolio’s expense ratio as of December 31, 2022 can be found in the Portfolio’s Financial Highlights.
| Comments from Sub-Adviser |
Q. How did the Portfolio perform in comparison to its benchmark during the reporting period?
A. For the year ended December 31, 2022, the Portfolio returned -33.92% versus -29.14% for its benchmark, the Russell 1000® Growth Index.
Q. Were there specific market conditions, investment strategies, or techniques that materially affected the Portfolio’s benchmark-relative performance during the reporting period?
A. Due to the concentrated nature of the Portfolio, the Portfolio’s relative underperformance was due largely to the individual stocks in the Portfolio, rather than a market condition or investment strategy that worked against the Portfolio. (1)
Q. How did sector allocation and security selection each impact the Portfolio’s performance relative to its benchmark?
A. Stock selection was the main driver of underperformance, led by negative selection within Communication Services, Information Technology, and Consumer Staples. Stock selection in Industrials and Consumer Discretionary contributed to relative performance. Sector allocation also detracted from relative performance for the year due to underweights in Consumer Staples and Energy, and an overweight to Communication Services. An overweight to Industrials offset some of the sector allocation underperformance. (1)
Q. Which securities contributed the most to, and detracted the most from, the Portfolio’s benchmark-relative performance?
A. Social media operator Snap, Inc. Class A was the top detractor from relative performance. The company suffered earlier in the year, as it faced difficulty in measuring advertisers’ conversion rates due to Apple’s iOS privacy changes. Later, the company had a more difficult time than expected gaining market share amid a weakening environment for advertising revenue. We exited our position in the stock during the year.
Medical device company Align Technology, Inc., which designs, manufactures, and markets dentistry products such as Invisalign, was also among the top detractors. The company suffered on fears that demand for its clear aligner product may have been pulled forward more than previously expected during the pandemic, and that consumer spending on big-ticket items would decline as the macroeconomic outlook weakens. We exited our position in the stock during the year. Cloud-based customer engagement platform Twilio, Inc. Class A (“Twilio”) was the third largest detractor. At the onset of the COVID-19 pandemic, demand for Twilio’s core products grew swiftly as digital transformation efforts accelerated, but the stock subsequently suffered from difficult year-over-year comparisons, lowered growth expectations, and margins below expectations. High-growth stocks with expected cash flows far out into the future generally fell during the year, as interest rates rose significantly. We exited our position in the stock during the year.
Not holding benchmark position Tesla, Inc., which declined significantly during the year, was the top contributor to the Portfolio’s benchmark-relative performance. The second largest individual contributor to relative performance was agriculture and industrial equipment manufacturer Deere & Co (“Deere”). Deere reported strong volumes with a solid outlook for its 2023 order book during the year, as farmers continue to be supported by elevated agricultural commodity prices. Deere has also benefited from the market’s recognition that the company is transitioning from a cyclical, agricultural-based company to a technology-centric provider of precision agriculture products. (1)
Q. Were there any significant changes to the Portfolio’s management team, investment strategy, or selection process during the reporting period?
A. There were no material changes to the Portfolio’s management team, investment strategy, or selection process. Brian Recht, former Assistant Portfolio Manager for the Portfolio, was promoted to Co-Portfolio Manager during the year.
| (1) | The Portfolio’s composition is subject to change. Holdings and weightings are as of December 31, 2022. |
| Change in Value of $10,000 Investment |
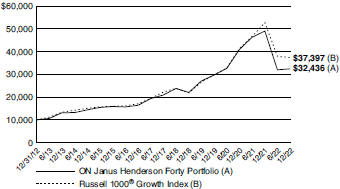
Hypothetical illustration based on past performance. Future performance will vary. The Portfolio’s returns reflect reinvested dividends. The Portfolio’s holdings may differ significantly from the securities in the index. The index is unmanaged and therefore does not reflect the cost of portfolio management and accounting.
The Russell 1000® Growth Index is a market-capitalization weighted index of those firms in the Russell 1000® Index with higher price-to-book ratios and higher forecasted growth values. The Russell 1000® Index measures the performance of the large-cap segment of the U.S. equity universe. The index presented includes the effects of reinvested dividends.
Past performance is no guarantee of future results. Redemption of fund shares could have tax implications unique to each shareholder.
| 25 | (continued) |
Ohio National Fund, Inc. | ON Janus Henderson Forty Portfolio (Unaudited)(Continued) |
| Portfolio Composition as of December 31, 2022 (1) | ||
| % of Net Assets | ||||
Common Stocks (4) | 98.7 | |||
Commercial Paper | 1.4 | |||
Less Net Liabilities | (0.1 | ) | ||
|
| |||
| 100.0 | ||||
|
| |||
| Top 10 Portfolio Holdings as of December 31, 2022 (1) (2) (3) | ||||
| % of Net Assets | ||||||
1. | Microsoft Corp. | 11.0 | ||||
2. | Mastercard, Inc. Class A | 7.0 | ||||
3. | Amazon.com, Inc. | 4.5 | ||||
4. | Apple, Inc. | 4.4 | ||||
5. | Deere & Co. | 4.1 | ||||
6. | AbbVie, Inc. | 3.7 | ||||
7. | Horizon Therapeutics PLC | 3.6 | ||||
8. | TJX Cos., Inc. / The | 3.5 | ||||
9. | CoStar Group, Inc. | 3.4 | ||||
10. | Howmet Aerospace, Inc. | 3.4 | ||||
| (1) | Composition of Portfolio subject to change. |
| (2) | Short-term investments have been excluded from the list of Top 10 Portfolio Holdings. |
| (3) | Top 10 Portfolio Holdings is presented at an individual security level. Total investment exposure by issuer may be higher. |
| (4) | Sectors (Common Stocks): |
| % of Net Assets | ||||
Information Technology | 37.6 | |||
Consumer Discretionary | 15.3 | |||
Industrials | 13.3 | |||
Health Care | 11.4 | |||
Materials | 6.8 | |||
Communication Services | 6.3 | |||
Financials | 4.2 | |||
Real Estate | 3.3 | |||
Consumer Staples | 0.5 | |||
|
| |||
| 98.7 | ||||
|
| |||
| 26 |
Ohio National Fund, Inc. | ON Janus Henderson Forty Portfolio | |
| Schedule of Investments | December 31, 2022 | |
| Common Stocks – 98.7% | Shares | Value | ||||||||||
COMMUNICATION SERVICES – 6.3% |
| |||||||||||
Alphabet, Inc. Class C (Interactive Media & Svs.) | (a) | 12,368 | $ | 1,097,413 | ||||||||
Match Group, Inc. (Interactive Media & Svs.) | (a) | 5,148 | 213,590 | |||||||||
Meta Platforms, Inc. Class A (Interactive Media & Svs.) | (a) | 12,098 | 1,455,873 | |||||||||
|
| |||||||||||
| 2,766,876 | ||||||||||||
|
| |||||||||||
CONSUMER DISCRETIONARY – 15.3% |
| |||||||||||
Amazon.com, Inc. (Internet & Direct Marketing Retail) | (a) | 23,614 | 1,983,576 | |||||||||
Booking Holdings, Inc. (Hotels, Restaurants & Leisure) | (a) | 560 | 1,128,557 | |||||||||
Caesars Entertainment, Inc. (Hotels, Restaurants & Leisure) | (a) | 10,481 | 436,010 | |||||||||
LVMH Moet Hennessy Louis Vuitton SE (Textiles, Apparel & Luxury Goods) | (b) | 1,184 | 861,588 | |||||||||
NIKE, Inc. Class B (Textiles, Apparel & Luxury Goods) | 5,441 | 636,651 | ||||||||||
Rivian Automotive, Inc. Class A (Automobiles) | (a) | 9,216 | 169,851 | |||||||||
TJX Cos., Inc. / The (Specialty Retail) | 19,232 | 1,530,867 | ||||||||||
|
| |||||||||||
| 6,747,100 | ||||||||||||
|
| |||||||||||
CONSUMER STAPLES – 0.5% |
| |||||||||||
Olaplex Holdings, Inc. (Personal Products) | (a) | 41,436 | 215,882 | |||||||||
|
| |||||||||||
FINANCIALS – 4.2% | ||||||||||||
Charles Schwab Corp. / The (Capital Markets) | 12,517 | 1,042,165 | ||||||||||
Cullen / Frost Bankers, Inc. (Banks) | 5,988 | 800,596 | ||||||||||
|
| |||||||||||
| 1,842,761 | ||||||||||||
|
| |||||||||||
HEALTH CARE – 11.4% | ||||||||||||
AbbVie, Inc. (Biotechnology) | 10,018 | 1,619,009 | ||||||||||
Danaher Corp. (Life Sciences Tools & Svs.) | 5,089 | 1,350,722 | ||||||||||
Dexcom, Inc. (Health Care Equip. & Supplies) | (a) | 3,902 | 441,863 | |||||||||
Horizon Therapeutics PLC (Biotechnology) | (a) | 14,103 | 1,604,921 | |||||||||
|
| |||||||||||
| 5,016,515 | ||||||||||||
|
| |||||||||||
INDUSTRIALS – 13.3% | ||||||||||||
Core & Main, Inc. Class A (Trading Companies & Distributors) | (a) | 56,258 | 1,086,342 | |||||||||
| Common Stocks (Continued) | Shares | Value | ||||||||||
INDUSTRIALS (continued) | ||||||||||||
CoStar Group, Inc. (Professional Svs.) | (a) | 19,506 | $ | 1,507,424 | ||||||||
Deere & Co. (Machinery) | 4,208 | 1,804,222 | ||||||||||
Howmet Aerospace, Inc. (Aerospace & Defense) | 37,767 | 1,488,397 | ||||||||||
|
| |||||||||||
| 5,886,385 | ||||||||||||
|
| |||||||||||
INFORMATION TECHNOLOGY – 37.6% |
| |||||||||||
Advanced Micro Devices, Inc. (Semiconductors & Equip.) | (a) | 20,803 | 1,347,410 | |||||||||
Apple, Inc. (Tech. Hardware, Storage & Periph.) | 14,998 | 1,948,690 | ||||||||||
ASML Holding N.V. (Semiconductors & Equip.) | 2,583 | 1,411,351 | ||||||||||
Atlassian Corp. Class A (Software) | (a) | 5,651 | 727,171 | |||||||||
Mastercard, Inc. Class A (IT Svs.) | 8,874 | 3,085,756 | ||||||||||
Microsoft Corp. (Software) | 20,290 | 4,865,948 | ||||||||||
NVIDIA Corp. (Semiconductors & Equip.) | 3,722 | 543,933 | ||||||||||
Texas Instruments, Inc. (Semiconductors & Equip.) | 7,938 | 1,311,516 | ||||||||||
Workday, Inc. Class A (Software) | (a) | 8,105 | 1,356,210 | |||||||||
|
| |||||||||||
| 16,597,985 | ||||||||||||
|
| |||||||||||
MATERIALS – 6.8% | ||||||||||||
Crown Holdings, Inc. (Containers & Packaging) . | 17,556 | 1,443,279 | ||||||||||
Freeport-McMoRan, Inc. (Metals & Mining) | 13,650 | 518,700 | ||||||||||
Sherwin-Williams Co. / The (Chemicals) | 4,448 | 1,055,644 | ||||||||||
|
| |||||||||||
| 3,017,623 | ||||||||||||
|
| |||||||||||
REAL ESTATE – 3.3% | ||||||||||||
American Tower Corp. (Equity REIT) | 6,899 | 1,461,622 | ||||||||||
|
| |||||||||||
Total Common Stocks | $ | 43,552,749 | ||||||||||
|
| |||||||||||
| Commercial Paper – 1.4% | Shares | Value | ||||||||||
Societe Generale SA, 3.992%, 01/03/2023 | 600,000 | $ | 599,867 | |||||||||
|
| |||||||||||
Total Commercial Paper |
| $ | 599,867 | |||||||||
|
| |||||||||||
Total Investments – 100.1% | (c | ) | $ | 44,152,616 | ||||||||
Liabilities in Excess of Other |
| (23,816 | ) | |||||||||
|
| |||||||||||
Net Assets – 100.0% | $ | 44,128,800 | ||||||||||
|
| |||||||||||
Percentages are stated as a percent of net assets.
Footnotes:
| (a) | Non-income producing security. |
| (b) | Security traded on a foreign exchange has been valued at an estimate of fair value that is different than the local market close price. These fair value estimates are determined by an independent fair valuation service that has been approved by the Board. These securities represent $861,588 or 2.0% of the Portfolio’s net assets. |
| (c) | Represents cost for financial reporting purposes, which may differ from cost basis for federal income tax purposes. See also Note 7 of the Notes to Financial Statements. |
The accompanying notes are an integral part of these financial statements.
| 27 |
| ON AB Small Cap Portfolio (Unaudited) |
| Objective/Strategy |
The ON AB Small Cap Portfolio seeks long-term growth of capital by investing, under normal circumstances, at least 80% of its net assets in equity securities of smaller capitalization companies with market capitalizations at the time of investment that fall within the lowest 20% of the total U.S. equity market capitalization (excluding companies with market capitalizations of less than $10 million).
| Performance as of December 31, 2022 | ||||
Average Annual returns | ||||
One year | -28.73% | |||
Five years | 4.47% | |||
Ten years | 10.17% |
Past performance does not guarantee future results. The performance data quoted represents past performance and current returns may be lower or higher. Total return figures include change in share price and reinvestment of dividends and capital gains. The investment return and principal value will fluctuate so that an investor’s shares, when redeemed, may be worth more or less than the original cost. To obtain performance information up to the most recent month end, call toll-free 1-877-781-6392.
The Portfolio is not open to direct retail investment. Beneficial interest in the Portfolio’s shares is obtained either through an allocation to the Portfolio as an investment vehicle within variable life insurance policies or annuity contracts, or as an underlying investment by the ON Model Portfolios. Actual performance results for variable annuity and variable universal life contracts will be lower due to contract charges. Consult your contract for applicable charges.
Total expense ratio is 0.83% per the Fund’s prospectus dated April 29, 2022. Additional information pertaining to the Portfolio’s expense ratio as of December 31, 2022 can be found in the Portfolio’s Financial Highlights.
| Comments from Sub-Adviser |
Q. How did the Portfolio perform in comparison to its benchmark during the reporting period?
A. For the year ended December 31, 2022, the Portfolio returned -28.73% versus -20.44% for its benchmark, the Russell 2000® Index.
Q. Were there specific market conditions, investment strategies, or techniques that materially affected the Portfolio’s benchmark-relative performance during the reporting period?
A. An unprecedented pace of interest rate hikes drove down asset valuations across the board, with high growth, small cap stocks being hit particularly hard. Given the Portfolio’s greater exposure to growth stocks than the benchmark, the Portfolio saw sharper declines than those of the benchmark. Additionally, record levels of correlation among high-growth stocks led to significant price movements (both up and down), regardless of company fundamentals, which meant the Portfolio was not rewarded for the quality companies it owned. (1)
Q. How did sector allocation and security selection each impact the Portfolio’s performance relative to its benchmark?
A. While sector allocation and security selection each detracted from relative performance, security selection was more significant to underperformance. Selection within Health Care was the primary driver of underperformance, followed by selection within Industrials and Financials. An underweight to Energy and an overweight to Information Technology also detracted. Underweights to Communication Services and Real Estate contributed slightly. (1)
Q. Which securities contributed the most to, and detracted the most from, the Portfolio’s benchmark-relative performance?
A. Matador Resources Co., ChampionX Corp. (“ChampionX”), and Silk Road Medical, Inc. were the largest individual contributors to relative performance. Matador Resources Co.’s shares outperformed mostly due to a positive oil price backdrop. Oil-field technology and chemistry supply company ChampionX contributed after releasing a strong third quarter earnings report. The company continues to execute on its ability to catch up on price/cost in its performance chemicals division, while experiencing continued growth in its other two divisions. Also, after having sufficiently paid down its debt, Champion will now return cash to its shareholders via a share buyback program. Silk Road Medical, Inc. contributed after the company received FDA approval for its TransCarotid Artery Revascularization (“TCAR”) label expansion to standard risk patients. Subsequently, Medicare announced expanded coverage to standard risk patients, providing an added boost to the stock.
R1 RCM, Inc., Trupanion, Inc., and Ranpak Holdings Corp. (“Ranpak”) were the largest individual detractors from relative performance. R1 RCM, Inc. was generally flat for most of the year, but reported third-quarter earnings that fell short on estimates for revenues and EBITDA, and significantly lowered its full-year guidance. The company’s CEO stepped down and the stock subsequently declined. Trupanion, Inc., a beneficiary of pandemic-era spending, declined as inflation weighed on consumer spending, despite positive longer-term trends in animal care. Ranpak detracted as the economic downturn in Europe and e-commerce weighed on its outlook. Additionally, the company has a Russian mill that supplies about 10% of its paper worldwide. The assumption is that Ranpak will eventually be unable to source from Russia, which could hurt its margins going forward. (1)
Q. Were there any significant changes to the Portfolio’s management team, investment strategy, or selection process during the reporting period?
A. Michael Doherty, Quantitative Analyst on AllianceBerstein L.P.’s ("AB") U.S. Small and SMID Growth team, retired effective June 30, 2022. Lucie Germain, who joined AB in December 2015, has assumed Michael’s role as the team’s quantitative analyst. Lucie previously served as a Senior Associate Portfolio Manager in the Institutional Equity Portfolio Management Group where she covered both U.S. Growth and Developed Market Strategic Core equity platforms.
| (1) | The Portfolio’s composition is subject to change. Holdings and weightings are as of December 31, 2022. |
| 28 | (continued) |
Ohio National Fund, Inc. | ON AB Small Cap Portfolio (Unaudited) (Continued) |
| Change in Value of $10,000 Investment | ||||
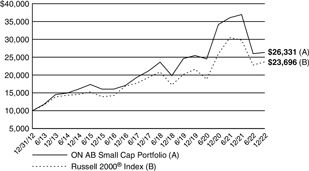
Hypothetical illustration based on past performance. Future performance will vary. The Portfolio’s returns reflect reinvested dividends. The Portfolio’s holdings may differ significantly from the securities in the index. The index is unmanaged and therefore does not reflect the cost of portfolio management and accounting.
The Russell 2000® Index measures the performance of the small-cap segment of the U.S. equity universe. The Russell 2000® Index includes the 2,000 firms from the Russell 3000® Index with the smallest market capitalizations. The Russell 3000® Index represents 98% of the investable U.S. equity market.
Past performance is no guarantee of future results. Redemption of fund shares could have tax implications unique to each shareholder.
| Portfolio Composition as of December 31, 2022 (1) | ||
| % of Net Assets | ||||
Common Stocks (4) | 98.7 | |||
Exchange Traded Funds | 0.4 | |||
Other Net Assets | 0.9 | |||
|
| |||
| 100.0 | ||||
|
| |||
| Top 10 Portfolio Holdings as of December 31, 2022 (1) (2) (3) | ||||
| % of Net Assets | ||||||
1. | Helmerich & Payne, Inc. | 1.1 | ||||
2. | SPS Commerce, Inc. | 1.0 | ||||
3. | ChampionX Corp. | 1.0 | ||||
4. | Texas Roadhouse, Inc. | 0.9 | ||||
5. | National Vision Holdings, Inc. | 0.9 | ||||
6. | Herc Holdings, Inc. | 0.9 | ||||
7. | Novanta, Inc. | 0.9 | ||||
8. | Chefs’ Warehouse, Inc. / The | 0.8 | ||||
9. | Hilton Grand Vacations, Inc. | 0.8 | ||||
10. | Saia, Inc. | 0.8 | ||||
| (1) | Composition of Portfolio subject to change. |
| (2) | Short-term investments have been excluded from the list of Top 10 Portfolio Holdings. |
| (3) | Top 10 Portfolio Holdings is presented at an individual security level. Total investment exposure by issuer may be higher. |
| (4) | Sectors (Common Stocks): |
| % of Net Assets | ||||
Industrials | 19.0 | |||
Information Technology | 18.1 | |||
Health Care | 15.0 | |||
Consumer Discretionary | 13.5 | |||
Financials | 13.1 | |||
Energy | 6.6 | |||
Consumer Staples | 4.4 | |||
Real Estate | 3.8 | |||
Materials | 3.1 | |||
Utilities | 1.2 | |||
Communication Services | 0.9 | |||
|
| |||
| 98.7 | ||||
|
| |||
| 29 |
Ohio National Fund, Inc. | ON AB Small Cap Portfolio | |
| Schedule of Investments | December 31, 2022 | |
| Common Stocks – 98.7% | Shares | Value | ||||||||||
COMMUNICATION SERVICES – 0.9% | ||||||||||||
AMC Networks, Inc. Class A (Media) | (a | ) | 3,530 | $ | 55,315 | |||||||
Cars.com, Inc. (Interactive Media & Svs.) | (a | ) | 5,115 | 70,434 | ||||||||
Cinemark Holdings, Inc. (Entertainment) | (a | ) | 9,019 | 78,104 | ||||||||
Cogent Communications Holdings, Inc. (Diversified Telecom. Svs.) | 3,530 | 201,492 | ||||||||||
EW Scripps Co. / The Class A (Media) | (a | ) | 8,220 | 108,422 | ||||||||
Gogo, Inc. (Wireless Telecom. Svs.) | (a | ) | 4,843 | 71,483 | ||||||||
Shutterstock, Inc. (Interactive Media & Svs.) | 2,040 | 107,549 | ||||||||||
TechTarget, Inc. (Media) | (a | ) | 2,320 | 102,219 | ||||||||
Telephone and Data Systems, Inc. (Wireless Telecom. Svs.) | 11,170 | 117,173 | ||||||||||
Yelp, Inc. (Interactive Media & Svs.) | (a | ) | 4,550 | 124,397 | ||||||||
|
| |||||||||||
| 1,036,588 | ||||||||||||
|
| |||||||||||
CONSUMER DISCRETIONARY – 13.5% | ||||||||||||
Academy Sports & Outdoors, Inc. (Specialty Retail) | 6,319 | 332,000 | ||||||||||
Adtalem Global Education, Inc. (Diversified Consumer Svs.) | (a | ) | 4,134 | 146,757 | ||||||||
American Axle & Manufacturing Holdings, Inc. (Auto Components) | (a | ) | 19,150 | 149,753 | ||||||||
American Eagle Outfitters, Inc. (Specialty Retail) | 10,150 | 141,694 | ||||||||||
Asbury Automotive Group, Inc. (Specialty Retail) | (a | ) | 1,826 | 327,311 | ||||||||
Bed Bath & Beyond, Inc. (Specialty Retail) | (a | ) | 8,785 | 22,050 | ||||||||
Bloomin’ Brands, Inc. (Hotels, Restaurants & Leisure) | 6,750 | 135,810 | ||||||||||
Boot Barn Holdings, Inc. (Specialty Retail) | (a | ) | 2,520 | 157,550 | ||||||||
Buckle, Inc. / The (Specialty Retail) | 948 | 42,992 | ||||||||||
Cavco Industries, Inc. (Household Durables) | (a | ) | 600 | 135,750 | ||||||||
Century Communities, Inc. (Household Durables) | 2,540 | 127,025 | ||||||||||
Cheesecake Factory, Inc. / The (Hotels, Restaurants & Leisure) | 3,690 | 117,010 | ||||||||||
Dave & Buster’s Entertainment, Inc. (Hotels, Restaurants & Leisure) | (a | ) | 3,360 | 119,078 | ||||||||
Designer Brands, Inc. Class A (Specialty Retail) | 10,040 | 98,191 | ||||||||||
Dine Brands Global, Inc. (Hotels, Restaurants & Leisure) | 1,840 | 118,864 | ||||||||||
Dorman Products, Inc. (Auto Components) | (a | ) | 2,510 | 202,984 | ||||||||
European Wax Center, Inc. Class A (Diversified Consumer Svs.) | 24,437 | 304,241 | ||||||||||
Five Below, Inc. (Specialty Retail) | (a | ) | 3,535 | 625,235 | ||||||||
Floor & Decor Holdings, Inc. Class A (Specialty Retail) | (a | ) | 366 | 25,485 | ||||||||
Fox Factory Holding Corp. (Auto Components) | (a | ) | 9,345 | 852,544 | ||||||||
Frontdoor, Inc. (Diversified Consumer Svs.) | (a | ) | 5,721 | 118,997 | ||||||||
Gentherm, Inc. (Auto Components) | (a | ) | 2,750 | 179,548 | ||||||||
Green Brick Partners, Inc. (Household Durables) | (a | ) | 3,212 | 77,827 | ||||||||
Group 1 Automotive, Inc. (Specialty Retail) | 1,410 | 254,322 | ||||||||||
Hilton Grand Vacations, Inc. (Hotels, Restaurants & Leisure) | (a | ) | 24,669 | 950,743 | ||||||||
Installed Building Products, Inc. (Household Durables) | 1,958 | 167,605 | ||||||||||
iRobot Corp. (Household Durables) | (a | ) | 2,450 | 117,919 | ||||||||
Jack in the Box, Inc. (Hotels, Restaurants & Leisure) | 1,400 | 95,522 | ||||||||||
Kontoor Brands, Inc. (Textiles, Apparel & Luxury Goods) | 3,960 | 158,360 | ||||||||||
La-Z-Boy, Inc. (Household Durables) | 4,820 | 109,992 | ||||||||||
LCI Industries (Auto Components) | 2,180 | 201,541 | ||||||||||
Leslie’s, Inc. (Specialty Retail) | (a | ) | 9,849 | 120,256 | ||||||||
LGI Homes, Inc. (Household Durables) | (a | ) | 1,930 | 178,718 | ||||||||
Life Time Group Holdings, Inc. (Hotels, Restaurants & Leisure) | (a | ) | 43,195 | 516,612 | ||||||||
Lithia Motors, Inc. (Specialty Retail) | 2,637 | 539,899 | ||||||||||
| Common Stocks (Continued) | Shares | Value | ||||||||||
CONSUMER DISCRETIONARY (continued) |
| |||||||||||
Lovesac Co. / The (Household Durables) | (a | ) | 11,718 | $ | 257,913 | |||||||
M.D.C. Holdings, Inc. (Household Durables) | 4,850 | 153,260 | ||||||||||
Meritage Homes Corp. (Household Durables) | (a | ) | 3,170 | 292,274 | ||||||||
Mister Car Wash, Inc. (Diversified Consumer Svs.) | (a | ) | 5,263 | 48,578 | ||||||||
Monarch Casino & Resort, Inc. (Hotels, Restaurants & Leisure) | (a | ) | 1,660 | 127,637 | ||||||||
National Vision Holdings, Inc. (Specialty Retail) | �� | (a | ) | 26,754 | 1,036,985 | |||||||
ODP Corp. / The (Specialty Retail) | (a | ) | 4,400 | 200,376 | ||||||||
Oxford Industries, Inc. (Textiles, Apparel & Luxury Goods) | 2,010 | 187,292 | ||||||||||
Patrick Industries, Inc. (Auto Components) | 1,980 | 119,988 | ||||||||||
Planet Fitness, Inc. Class A (Hotels, Restaurants & Leisure) | (a | ) | 11,295 | 890,046 | ||||||||
Shake Shack, Inc. Class A (Hotels, Restaurants & Leisure) | (a | ) | 3,100 | 128,743 | ||||||||
Signet Jewelers Ltd. (Specialty Retail) | 4,460 | 303,280 | ||||||||||
Six Flags Entertainment Corp. (Hotels, Restaurants & Leisure) | (a | ) | 5,473 | 127,247 | ||||||||
Skyline Champion Corp. (Household Durables) | (a | ) | 10,958 | 564,447 | ||||||||
Sleep Number Corp. (Specialty Retail) | (a | ) | 2,190 | 56,896 | ||||||||
Sonos, Inc. (Household Durables) | (a | ) | 9,149 | 154,618 | ||||||||
Steven Madden Ltd. (Textiles, Apparel & Luxury Goods) | 6,550 | 209,338 | ||||||||||
Strategic Education, Inc. (Diversified Consumer Svs.) | 2,073 | 162,357 | ||||||||||
Stride, Inc. (Diversified Consumer Svs.) | (a | ) | 2,963 | 92,683 | ||||||||
Sturm Ruger & Co., Inc. (Leisure Products) | 2,740 | 138,699 | ||||||||||
Texas Roadhouse, Inc. (Hotels, Restaurants & Leisure) | 11,648 | 1,059,386 | ||||||||||
Tri Pointe Homes, Inc. (Household Durables) | (a | ) | 7,833 | 145,616 | ||||||||
Vista Outdoor, Inc. (Leisure Products) | (a | ) | 5,450 | 132,817 | ||||||||
Wingstop, Inc. (Hotels, Restaurants & Leisure) | 4,412 | 607,179 | ||||||||||
Winnebago Industries, Inc. (Automobiles) | 2,890 | 152,303 | ||||||||||
Wolverine World Wide, Inc. (Textiles, Apparel & Luxury Goods) | 7,240 | 79,133 | ||||||||||
|
| |||||||||||
| 15,399,276 | ||||||||||||
|
| |||||||||||
CONSUMER STAPLES – 4.4% | ||||||||||||
Cal-Maine Foods, Inc. (Food Products) | 2,520 | 137,214 | ||||||||||
Central Garden & Pet Co. Class A (Household Products) | (a | ) | 3,610 | 129,238 | ||||||||
Chefs’ Warehouse, Inc. / The (Food & Staples Retailing) | (a | ) | 28,725 | 955,968 | ||||||||
Edgewell Personal Care Co. (Personal Products) | 4,650 | 179,211 | ||||||||||
elf Beauty, Inc. (Personal Products) | (a | ) | 3,300 | 182,490 | ||||||||
Fresh Del Monte Produce, Inc. (Food Products) | 6,300 | 164,997 | ||||||||||
Grocery Outlet Holding Corp. (Food & Staples Retailing) | (a | ) | 25,108 | 732,903 | ||||||||
Hain Celestial Group, Inc. / The (Food Products) | (a | ) | 5,981 | 96,773 | ||||||||
Hostess Brands, Inc. (Food Products) | (a | ) | 10,075 | 226,083 | ||||||||
J & J Snack Foods Corp. (Food Products) | 1,300 | 194,623 | ||||||||||
Medifast, Inc. (Personal Products) | 1,020 | 117,657 | ||||||||||
MGP Ingredients, Inc. (Beverages) | 1,020 | 108,508 | ||||||||||
National Beverage Corp. (Beverages) | (a | ) | 2,645 | 123,072 | ||||||||
Nu Skin Enterprises, Inc. Class A (Personal Products) | 3,254 | 137,189 | ||||||||||
PriceSmart, Inc. (Food & Staples Retailing) | 280 | 17,018 | ||||||||||
Simply Good Foods Co. / The (Food Products) | (a | ) | 7,200 | 273,816 | ||||||||
TreeHouse Foods, Inc. (Food Products) | (a | ) | 4,709 | 232,530 | ||||||||
United Natural Foods, Inc. (Food & Staples Retailing) | (a | ) | 4,820 | 186,582 | ||||||||
USANA Health Sciences, Inc. (Personal Products) | (a | ) | 1,970 | 104,804 | ||||||||
Vector Group Ltd. (Tobacco) | 13,620 | 161,533 | ||||||||||
| 30 | (continued) |
Ohio National Fund, Inc. | ON AB Small Cap Portfolio (Continued) | |
| Schedule of Investments | December 31, 2022 | |
| Common Stocks (Continued) | Shares | Value | ||||||||||
CONSUMER STAPLES (continued) | ||||||||||||
Vital Farms, Inc. (Food Products) | (a | ) | 21,050 | $ | 314,066 | |||||||
WD-40 Co. (Household Products) | 1,140 | 183,779 | ||||||||||
|
| |||||||||||
| 4,960,054 | ||||||||||||
|
| |||||||||||
ENERGY – 6.6% | ||||||||||||
Archrock, Inc. (Energy Equip. & Svs.) | 200 | 1,796 | ||||||||||
Callon Petroleum Co. (Oil, Gas & Consumable Fuels) | (a | ) | 4,750 | 176,178 | ||||||||
ChampionX Corp. (Energy Equip. & Svs.) | 37,366 | 1,083,240 | ||||||||||
Civitas Resources, Inc. (Oil, Gas & Consumable Fuels) | 3,439 | 199,221 | ||||||||||
CONSOL Energy, Inc. (Oil, Gas & Consumable Fuels) | 2,250 | 146,250 | ||||||||||
Core Laboratories N.V. (Energy Equip. & Svs.) | 7,290 | 147,768 | ||||||||||
DT Midstream, Inc. (Oil, Gas & Consumable Fuels) | 13,271 | 733,356 | ||||||||||
Green Plains, Inc. (Oil, Gas & Consumable Fuels) | (a | ) | 3,850 | 117,425 | ||||||||
Helmerich & Payne, Inc. (Energy Equip. & Svs.) | 24,151 | 1,197,165 | ||||||||||
Magnolia Oil & Gas Corp. Class A (Oil, Gas & Consumable Fuels) | 39,572 | 927,963 | ||||||||||
Matador Resources Co. (Oil, Gas & Consumable Fuels) | 16,486 | 943,659 | ||||||||||
Patterson-UTI Energy, Inc. (Energy Equip. & Svs.) | 15,640 | 263,378 | ||||||||||
RPC, Inc. (Energy Equip. & Svs.) | 15,490 | 137,706 | ||||||||||
SM Energy Co. (Oil, Gas & Consumable Fuels) | 8,360 | 291,179 | ||||||||||
Talos Energy, Inc. (Oil, Gas & Consumable Fuels) | (a | ) | 7,240 | 136,691 | ||||||||
TechnipFMC PLC (Energy Equip. & Svs.) | (a | ) | 64,895 | 791,070 | ||||||||
U.S. Silica Holdings, Inc. (Energy Equip. & Svs.) | (a | ) | 7,450 | 93,125 | ||||||||
World Fuel Services Corp. (Oil, Gas & Consumable Fuels) | 4,930 | 134,737 | ||||||||||
|
| |||||||||||
| 7,521,907 | ||||||||||||
|
| |||||||||||
FINANCIALS – 13.1% | ||||||||||||
American Equity Investment Life Holding Co. (Insurance) | 4,630 | 211,221 | ||||||||||
Ameris Bancorp (Banks) | 5,910 | 278,597 | ||||||||||
Apollo Commercial Real Estate Finance, Inc. (Mortgage REIT) | 11,680 | 125,677 | ||||||||||
Assured Guaranty Ltd. (Insurance) | 4,380 | 272,699 | ||||||||||
Axos Financial, Inc. (Thrifts & Mortgage Finance) | (a | ) | 4,330 | 165,493 | ||||||||
B. Riley Financial, Inc. (Capital Markets) | 2,670 | 91,314 | ||||||||||
BancFirst Corp. (Banks) | 1,300 | 114,634 | ||||||||||
BankUnited, Inc. (Banks) | 8,010 | 272,100 | ||||||||||
Banner Corp. (Banks) | 3,130 | 197,816 | ||||||||||
Bread Financial Holdings, Inc. (Consumer Finance) | 3,242 | 122,094 | ||||||||||
Brightsphere Investment Group, Inc. (Capital Markets) | 2,827 | 58,180 | ||||||||||
Brookline Bancorp, Inc. (Banks) | 11,040 | 156,216 | ||||||||||
Columbia Banking System, Inc. (Banks) | 6,120 | 184,396 | ||||||||||
Community Bank System, Inc. (Banks) | 4,580 | 288,311 | ||||||||||
Customers Bancorp, Inc. (Banks) | (a | ) | 2,500 | 70,850 | ||||||||
CVB Financial Corp. (Banks) | 10,890 | 280,417 | ||||||||||
Dime Community Bancshares, Inc. (Banks) | 5,370 | 170,927 | ||||||||||
Donnelley Financial Solutions, Inc. (Capital Markets) | (a | ) | 310 | 11,981 | ||||||||
Eagle Bancorp, Inc. (Banks) | 3,330 | 146,753 | ||||||||||
Employers Holdings, Inc. (Insurance) | 4,390 | 189,341 | ||||||||||
Encore Capital Group, Inc. (Consumer Finance) | (a | ) | 3,210 | 153,887 | ||||||||
First BanCorp (Banks) | 18,380 | 233,794 | ||||||||||
First Financial Bancorp (Banks) | 7,980 | 193,355 | ||||||||||
First Financial Bankshares, Inc. (Banks) | 22,478 | 773,243 | ||||||||||
First Hawaiian, Inc. (Banks) | 11,000 | 286,440 | ||||||||||
Genworth Financial, Inc. Class A (Insurance) | (a | ) | 48,010 | 253,973 | ||||||||
Horace Mann Educators Corp. (Insurance) | 3,110 | 116,221 | ||||||||||
| Common Stocks (Continued) | Shares | Value | ||||||||||
FINANCIALS (continued) | ||||||||||||
Houlihan Lokey, Inc. (Capital Markets) | 10,270 | $ | 895,133 | |||||||||
Independent Bank Corp. (Banks) | 3,783 | 319,399 | ||||||||||
Independent Bank Group, Inc. (Banks) | 3,060 | 183,845 | ||||||||||
James River Group Holdings Ltd. (Insurance) | 4,800 | 100,368 | ||||||||||
KKR Real Estate Finance Trust, Inc. (Mortgage REIT) | 8,420 | 117,543 | ||||||||||
Lakeland Financial Corp. (Banks) | 1,840 | 134,265 | ||||||||||
Mercury General Corp. (Insurance) | 357 | 12,209 | ||||||||||
Mr. Cooper Group, Inc. (Thrifts & Mortgage Finance) | (a | ) | 6,180 | 248,003 | ||||||||
National Bank Holdings Corp. Class A (Banks) | 4,450 | 187,211 | ||||||||||
NBT Bancorp, Inc. (Banks) | 2,870 | 124,615 | ||||||||||
New York Mortgage Trust, Inc. (Mortgage REIT) | 38,720 | 99,123 | ||||||||||
NMI Holdings, Inc. Class A (Thrifts & Mortgage Finance) | (a | ) | 7,570 | 158,213 | ||||||||
Northwest Bancshares, Inc. (Banks) | 9,360 | 130,853 | ||||||||||
P10, Inc. Class A (Capital Markets) | 25,258 | 269,503 | ||||||||||
Pacific Premier Bancorp, Inc. (Banks) | 8,070 | 254,689 | ||||||||||
Palomar Holdings, Inc. (Insurance) | (a | ) | 1,850 | 83,546 | ||||||||
Park National Corp. (Banks) | 1,420 | 199,865 | ||||||||||
Piper Sandler Cos. (Capital Markets) | 1,530 | 199,191 | ||||||||||
PRA Group, Inc. (Consumer Finance) | (a | ) | 4,720 | 159,442 | ||||||||
ProAssurance Corp. (Insurance) | 7,110 | 124,212 | ||||||||||
PROG Holdings, Inc. (Consumer Finance) | (a | ) | 4,081 | 68,928 | ||||||||
Provident Financial Services, Inc. (Thrifts & Mortgage Finance) | 7,540 | 161,054 | ||||||||||
Redwood Trust, Inc. (Mortgage REIT) | 16,000 | 108,160 | ||||||||||
Renasant Corp. (Banks) | 4,640 | 174,418 | ||||||||||
RLI Corp. (Insurance) | 902 | 118,405 | ||||||||||
Ryan Specialty Holdings, Inc. Class A (Insurance) | (a | ) | 16,433 | 682,134 | ||||||||
Seacoast Banking Corp. of Florida (Banks) | 4,890 | 152,519 | ||||||||||
ServisFirst Bancshares, Inc. (Banks) | 3,930 | 270,816 | ||||||||||
Simmons First National Corp. Class A (Banks) | 9,350 | 201,773 | ||||||||||
Southside Bancshares, Inc. (Banks) | 4,430 | 159,436 | ||||||||||
StepStone Group, Inc. Class A (Capital Markets) | 27,356 | 688,824 | ||||||||||
Stewart Information Services Corp. (Insurance) | 3,030 | 129,472 | ||||||||||
Stifel Financial Corp. (Capital Markets) | 12,629 | 737,155 | ||||||||||
StoneX Group, Inc. (Capital Markets) | (a | ) | 1,380 | 131,514 | ||||||||
Triumph Financial, Inc. (Banks) | (a | ) | 2,360 | 115,333 | ||||||||
Trupanion, Inc. (Insurance) | (a | ) | 10,778 | 512,278 | ||||||||
Trustmark Corp. (Banks) | 4,200 | 146,622 | ||||||||||
United Community Banks, Inc. (Banks) | 8,232 | 278,242 | ||||||||||
Virtus Investment Partners, Inc. (Capital Markets) | 650 | 124,436 | ||||||||||
Walker & Dunlop, Inc. (Thrifts & Mortgage Finance) | 2,560 | 200,909 | ||||||||||
Westamerica BanCorp (Banks) | 2,230 | 131,592 | ||||||||||
WSFS Financial Corp. (Thrifts & Mortgage Finance) | 5,151 | 233,546 | ||||||||||
|
| |||||||||||
| 14,948,724 | ||||||||||||
|
| |||||||||||
HEALTH CARE – 15.0% | ||||||||||||
AdaptHealth Corp. (Health Care Providers & Svs.) | (a | ) | 6,591 | 126,679 | ||||||||
ADC Therapeutics SA (Biotechnology) | (a | ) | 14,732 | 56,571 | ||||||||
AMN Healthcare Services, Inc. (Health Care Providers & Svs.) | (a | ) | 2,870 | 295,093 | ||||||||
Amphastar Pharmaceuticals, Inc. (Pharmaceuticals) | (a | ) | 3,480 | 97,510 | ||||||||
Apollo Medical Holdings, Inc. (Health Care Providers & Svs.) | (a | ) | 2,740 | 81,077 | ||||||||
Arrowhead Pharmaceuticals, Inc. (Biotechnology) | (a | ) | 12,695 | 514,909 | ||||||||
Ascendis Pharma A/S – ADR (Biotechnology) | (a | ) | 2,463 | 300,806 | ||||||||
AtriCure, Inc. (Health Care Equip. & Supplies) | (a | ) | 17,935 | 795,955 | ||||||||
Blueprint Medicines Corp. (Biotechnology) | (a | ) | 7,783 | 340,973 | ||||||||
| 31 | (continued) |
Ohio National Fund, Inc. | ON AB Small Cap Portfolio (Continued) | |
| Schedule of Investments | December 31, 2022 | |
| Common Stocks (Continued) | Shares | Value | ||||||||||
HEALTH CARE (continued) | ||||||||||||
Cardiovascular Systems, Inc. (Health Care Equip. & Supplies) | (a | ) | 4,410 | $ | 60,064 | |||||||
Catalyst Pharmaceuticals, Inc. (Biotechnology) | (a | ) | 6,422 | 119,449 | ||||||||
Coherus Biosciences, Inc. (Biotechnology) | (a | ) | 31,669 | 250,818 | ||||||||
CONMED Corp. (Health Care Equip. & Supplies) | 2,520 | 223,373 | ||||||||||
Corcept Therapeutics, Inc. (Pharmaceuticals) | (a | ) | 9,360 | 190,102 | ||||||||
CorVel Corp. (Health Care Providers & Svs.) | (a | ) | 840 | 122,077 | ||||||||
Cytokinetics, Inc. (Biotechnology) | (a | ) | 6,940 | 317,991 | ||||||||
Dynavax Technologies Corp. (Biotechnology) | (a | ) | 7,903 | 84,088 | ||||||||
Eagle Pharmaceuticals, Inc. (Biotechnology) | (a | ) | 4,065 | 118,820 | ||||||||
Embecta Corp. (Health Care Equip. & Supplies) | 4,021 | 101,691 | ||||||||||
Emergent BioSolutions, Inc. (Biotechnology) | (a | ) | 3,789 | 44,748 | ||||||||
Enhabit, Inc. (Health Care Providers & Svs.) | (a | ) | 3,459 | 45,520 | ||||||||
Ensign Group, Inc. / The (Health Care Providers & Svs.) | 4,350 | 411,553 | ||||||||||
Erasca, Inc. (Biotechnology) | (a | ) | 9,107 | 39,251 | ||||||||
Fulgent Genetics, Inc. (Health Care Providers & Svs.) | (a | ) | 2,310 | 68,792 | ||||||||
Glaukos Corp. (Health Care Equip. & Supplies) | (a | ) | 3,959 | 172,929 | ||||||||
Guardant Health, Inc. (Health Care Providers & Svs.) | (a | ) | 11,233 | 305,538 | ||||||||
Harmony Biosciences Holdings, Inc. (Pharmaceuticals) | (a | ) | 1,940 | 106,894 | ||||||||
Inari Medical, Inc. (Health Care Equip. & Supplies) | (a | ) | 10,897 | 692,613 | ||||||||
Insmed, Inc. (Biotechnology) | (a | ) | 18,577 | 371,168 | ||||||||
Integer Holdings Corp. (Health Care Equip. & Supplies) | (a | ) | 2,840 | 194,426 | ||||||||
Intellia Therapeutics, Inc. (Biotechnology) | (a | ) | 8,481 | 295,902 | ||||||||
Intra-Cellular Therapies, Inc. (Pharmaceuticals) | (a | ) | 10,427 | 551,797 | ||||||||
iRhythm Technologies, Inc. (Health Care Equip. & Supplies) | (a | ) | 6,062 | 567,828 | ||||||||
Ironwood Pharmaceuticals, Inc. (Biotechnology) | (a | ) | 10,510 | 130,219 | ||||||||
IVERIC bio, Inc. (Biotechnology) | (a | ) | 21,625 | 462,991 | ||||||||
Karuna Therapeutics, Inc. (Biotechnology) | (a | ) | 3,029 | 595,198 | ||||||||
Lantheus Holdings, Inc. (Health Care Equip. & Supplies) | (a | ) | 15,285 | 778,924 | ||||||||
Legend Biotech Corp. – ADR (Biotechnology) | (a | ) | 6,296 | 314,296 | ||||||||
Ligand Pharmaceuticals, Inc. (Pharmaceuticals) | (a | ) | 1,396 | 93,253 | ||||||||
Merit Medical Systems, Inc. (Health Care Equip. & Supplies) | (a | ) | 4,190 | 295,898 | ||||||||
Mesa Laboratories, Inc. (Health Care Equip. & Supplies) | 710 | 118,009 | ||||||||||
ModivCare, Inc. (Health Care Providers & Svs.) | (a | ) | 1,273 | 114,226 | ||||||||
Myriad Genetics, Inc. (Biotechnology) | (a | ) | 6,470 | 93,880 | ||||||||
Natera, Inc. (Biotechnology) | (a | ) | 10,928 | 438,978 | ||||||||
NeoGenomics, Inc. (Life Sciences Tools & Svs.) | (a | ) | 10,157 | 93,851 | ||||||||
NuVasive, Inc. (Health Care Equip. & Supplies) | (a | ) | 3,370 | 138,979 | ||||||||
Owens & Minor, Inc. (Health Care Providers & Svs.) | 6,400 | 124,992 | ||||||||||
Pacira BioSciences, Inc. (Pharmaceuticals) | (a | ) | 3,660 | 141,313 | ||||||||
Pediatrix Medical Group, Inc. (Health Care Providers & Svs.) | (a | ) | 7,430 | 110,410 | ||||||||
Prestige Consumer Healthcare, Inc. (Pharmaceuticals) | (a | ) | 4,080 | 255,408 | ||||||||
RadNet, Inc. (Health Care Providers & Svs.) | (a | ) | 7,950 | 149,698 | ||||||||
REGENXBIO, Inc. (Biotechnology) | (a | ) | 5,120 | 116,122 | ||||||||
Relay Therapeutics, Inc. (Biotechnology) | (a | ) | 12,697 | 189,693 | ||||||||
Repligen Corp. (Life Sciences Tools & Svs.) | (a | ) | 4,407 | 746,149 | ||||||||
Select Medical Holdings Corp. (Health Care Providers & Svs.) | 9,420 | 233,899 | ||||||||||
Silk Road Medical, Inc. (Health Care Equip. & Supplies) | (a | ) | 13,325 | 704,226 | ||||||||
| Common Stocks (Continued) | Shares | Value | ||||||||||
HEALTH CARE (continued) | ||||||||||||
Simulations Plus, Inc. (Health Care Technology) | 2,050 | $ | 74,969 | |||||||||
Supernus Pharmaceuticals, Inc. (Pharmaceuticals) | (a | ) | 5,118 | 182,559 | ||||||||
Surmodics, Inc. (Health Care Equip. & Supplies) | (a | ) | 3,320 | 113,278 | ||||||||
Treace Medical Concepts, Inc. (Health Care Equip. & Supplies) | (a | ) | 28,536 | 656,043 | ||||||||
Ultragenyx Pharmaceutical, Inc. (Biotechnology) | (a | ) | 6,005 | 278,212 | ||||||||
Veradigm, Inc. (Health Care Technology) | (a | ) | 11,420 | 201,449 | ||||||||
Vericel Corp. (Biotechnology) | (a | ) | 3,990 | 105,097 | ||||||||
Vir Biotechnology, Inc. (Biotechnology) | (a | ) | 16,334 | 413,414 | ||||||||
Viridian Therapeutics, Inc. (Biotechnology) | (a | ) | 8,567 | 250,242 | ||||||||
Zentalis Pharmaceuticals, Inc. (Biotechnology) | (a | ) | 11,792 | 237,491 | ||||||||
Zimvie, Inc. (Health Care Equip. & Supplies) | (a | ) | 1,510 | 14,103 | ||||||||
|
| |||||||||||
| 17,034,474 | ||||||||||||
|
| |||||||||||
INDUSTRIALS – 19.0% | ||||||||||||
3D Systems Corp. (Machinery) | (a | ) | 10,730 | 79,402 | ||||||||
AAON, Inc. (Building Products) | 3,530 | 265,880 | ||||||||||
AAR Corp. (Aerospace & Defense) | (a | ) | 4,420 | 198,458 | ||||||||
ABM Industries, Inc. (Commercial Svs. & Supplies) | 5,880 | 261,190 | ||||||||||
Aerojet Rocketdyne Holdings, Inc. (Aerospace & Defense) | (a | ) | 6,090 | 340,614 | ||||||||
AeroVironment, Inc. (Aerospace & Defense) | (a | ) | 1,930 | 165,324 | ||||||||
Albany International Corp. Class A (Machinery) | 2,590 | 255,348 | ||||||||||
Allegiant Travel Co. (Airlines) | (a | ) | 1,130 | 76,829 | ||||||||
Applied Industrial Technologies, Inc. (Trading Companies & Distributors) | 3,340 | 420,940 | ||||||||||
ArcBest Corp. (Road & Rail) | 2,440 | 170,898 | ||||||||||
Arcosa, Inc. (Construction & Engineering) | 4,130 | 224,424 | ||||||||||
Armstrong World Industries, Inc. (Building Products) | 6,334 | 434,449 | ||||||||||
Astec Industries, Inc. (Machinery) | 2,850 | 115,881 | ||||||||||
Atlas Air Worldwide Holdings, Inc. (Air Freight & Logistics) | (a | ) | 2,620 | 264,096 | ||||||||
Axon Enterprise, Inc. (Aerospace & Defense) | (a | ) | 3,828 | 635,180 | ||||||||
AZZ, Inc. (Electrical Equip.) | 3,380 | 135,876 | ||||||||||
Barnes Group, Inc. (Machinery) | 3,250 | 132,763 | ||||||||||
Boise Cascade Co. (Trading Companies & Distributors) | 3,460 | 237,598 | ||||||||||
Brady Corp. Class A (Commercial Svs. & Supplies) | 4,230 | 199,233 | ||||||||||
Comfort Systems U.S.A., Inc. (Construction & Engineering) | 7,142 | 821,901 | ||||||||||
Curtiss-Wright Corp. (Aerospace & Defense) | 4,365 | 728,911 | ||||||||||
Deluxe Corp. (Commercial Svs. & Supplies) | 5,150 | 87,447 | ||||||||||
Driven Brands Holdings, Inc. (Commercial Svs. & Supplies) | (a | ) | 28,427 | 776,341 | ||||||||
Encore Wire Corp. (Electrical Equip.) | 1,350 | 185,706 | ||||||||||
EnPro Industries, Inc. (Machinery) | 1,080 | 117,385 | ||||||||||
Esab Corp. (Machinery) | 14,101 | 661,619 | ||||||||||
ESCO Technologies, Inc. (Machinery) | 2,290 | 200,467 | ||||||||||
Exponent, Inc. (Professional Svs.) | 3,270 | 324,024 | ||||||||||
Federal Signal Corp. (Machinery) | 5,150 | 239,320 | ||||||||||
Forward Air Corp. (Air Freight & Logistics) | 2,420 | 253,834 | ||||||||||
Franklin Electric Co., Inc. (Machinery) | 3,280 | 261,580 | ||||||||||
FTI Consulting, Inc. (Professional Svs.) | (a | ) | 4,528 | 719,046 | ||||||||
GMS, Inc. (Trading Companies & Distributors) | (a | ) | 4,070 | 202,686 | ||||||||
Griffon Corp. (Building Products) | 3,260 | 116,675 | ||||||||||
Herc Holdings, Inc. (Trading Companies & Distributors) | 7,645 | 1,005,853 | ||||||||||
Hexcel Corp. (Aerospace & Defense) | 13,588 | 799,654 | ||||||||||
Hillenbrand, Inc. (Machinery) | 6,520 | 278,208 | ||||||||||
HNI Corp. (Commercial Svs. & Supplies) | 4,200 | 119,406 | ||||||||||
| 32 | (continued) |
Ohio National Fund, Inc. | ON AB Small Cap Portfolio (Continued) | |
| Schedule of Investments | December 31, 2022 | |
| Common Stocks (Continued) | Shares | Value | ||||||||||
INDUSTRIALS (continued) | ||||||||||||
Hub Group, Inc. Class A (Air Freight & Logistics) | (a | ) | 2,970 | $ | 236,085 | |||||||
Insperity, Inc. (Professional Svs.) | 7,661 | 870,290 | ||||||||||
ITT, Inc. (Machinery) | 10,139 | 822,273 | ||||||||||
John Bean Technologies Corp. (Machinery) | 2,745 | 250,701 | ||||||||||
KAR Auction Services, Inc. (Commercial Svs. & Supplies) | (a | ) | 9,404 | 122,722 | ||||||||
Korn Ferry (Professional Svs.) | 4,710 | 238,420 | ||||||||||
Lindsay Corp. (Machinery) | 1,070 | 174,249 | ||||||||||
Matson, Inc. (Marine) | 3,810 | 238,163 | ||||||||||
Middleby Corp. / The (Machinery) | (a | ) | 5,559 | 744,350 | ||||||||
MillerKnoll, Inc. (Commercial Svs. & Supplies) | 5,062 | 106,353 | ||||||||||
Moog, Inc. Class A (Aerospace & Defense) | 2,460 | 215,890 | ||||||||||
Mueller Industries, Inc. (Machinery) | 4,750 | 280,250 | ||||||||||
MYR Group, Inc. (Construction & Engineering) | (a | ) | 1,370 | 126,136 | ||||||||
NV5 Global, Inc. (Professional Svs.) | (a | ) | 779 | 103,077 | ||||||||
Pitney Bowes, Inc. (Commercial Svs. & Supplies) | 23,790 | 90,402 | ||||||||||
Resideo Technologies, Inc. (Building Products) | (a | ) | 12,440 | 204,638 | ||||||||
Saia, Inc. (Road & Rail) | (a | ) | 4,519 | 947,544 | ||||||||
Shoals Technologies Group, Inc. Class A (Electrical Equip.) | (a | ) | 27,316 | 673,886 | ||||||||
SiteOne Landscape Supply, Inc. (Trading Companies & Distributors) | (a | ) | 5,312 | 623,204 | ||||||||
SPX Technologies, Inc. (Machinery) | (a | ) | 3,807 | 249,930 | ||||||||
Sun Country Airlines Holdings, Inc. (Airlines) | (a | ) | 2,170 | 34,416 | ||||||||
Tetra Tech, Inc. (Commercial Svs. & Supplies) | 5,132 | 745,115 | ||||||||||
Trinity Industries, Inc. (Machinery) | 4,950 | 146,372 | ||||||||||
UFP Industries, Inc. (Building Products) | 5,290 | 419,232 | ||||||||||
UniFirst Corp. (Commercial Svs. & Supplies) | 1,270 | 245,097 | ||||||||||
Veritiv Corp. (Trading Companies & Distributors) | 1,060 | 129,013 | ||||||||||
|
| |||||||||||
| 21,552,254 | ||||||||||||
|
| |||||||||||
INFORMATION TECHNOLOGY – 18.1% |
| |||||||||||
A10 Networks, Inc. (Software) | 4,285 | 71,260 | ||||||||||
ADTRAN Holdings, Inc. (Communications Equip.) | 5,190 | 97,520 | ||||||||||
Advanced Energy Industries, Inc. (Electronic Equip., Instr. & Comp.) | 3,220 | 276,212 | ||||||||||
Alarm.com Holdings, Inc. (Software) | (a | ) | 3,760 | 186,045 | ||||||||
Allegro MicroSystems, Inc. (Semiconductors & Equip.) | (a | ) | 23,623 | 709,162 | ||||||||
Avid Technology, Inc. (Tech. Hardware, Storage & Periph.) | (a | ) | 2,377 | 63,204 | ||||||||
Axcelis Technologies, Inc. (Semiconductors & Equip.) | (a | ) | 2,350 | 186,496 | ||||||||
Badger Meter, Inc. (Electronic Equip., Instr. & Comp.) | 2,470 | 269,304 | ||||||||||
Blackline, Inc. (Software) | (a | ) | 10,374 | 697,859 | ||||||||
Braze, Inc. Class A (Software) | (a | ) | 16,226 | 442,645 | ||||||||
Cohu, Inc. (Semiconductors & Equip.) | (a | ) | 4,400 | 141,020 | ||||||||
Corsair Gaming, Inc. (Tech. Hardware, Storage & Periph.) | (a | ) | 9,060 | 122,944 | ||||||||
CSG Systems International, Inc. (IT Svs.) | 2,350 | 134,420 | ||||||||||
Digital Turbine, Inc. (Software) | (a | ) | 6,023 | 91,791 | ||||||||
DigitalOcean Holdings, Inc. (IT Svs.) | (a | ) | 14,139 | 360,120 | ||||||||
Diodes, Inc. (Semiconductors & Equip.) | (a | ) | 3,700 | 281,718 | ||||||||
Elastic N.V. (Software) | (a | ) | 6,947 | 357,770 | ||||||||
Enfusion, Inc. Class A (Software) | (a | ) | 9,422 | 91,111 | ||||||||
EVERTEC, Inc. (IT Svs.) | 5,340 | 172,909 | ||||||||||
Extreme Networks, Inc. (Communications Equip.) | (a | ) | 8,430 | 154,353 | ||||||||
Fabrinet (Electronic Equip., Instr. & Comp.) | (a | ) | 3,110 | 398,764 | ||||||||
FARO Technologies, Inc. (Electronic Equip., Instr. & Comp.) | (a | ) | 2,340 | 68,819 | ||||||||
Five9, Inc. (Software) | (a | ) | 9,504 | 644,941 | ||||||||
Flywire Corp. (IT Svs.) | (a | ) | 28,224 | 690,641 | ||||||||
FormFactor, Inc. (Semiconductors & Equip.) | (a | ) | 6,810 | 151,386 | ||||||||
| Common Stocks (Continued) | Shares | Value | ||||||||||
INFORMATION TECHNOLOGY (continued) |
| |||||||||||
Insight Enterprises, Inc. (Electronic Equip., Instr. & Comp.) | (a | ) | 3,010 | $ | 301,813 | |||||||
Instructure Holdings, Inc. (Software) | (a | ) | 19,537 | 457,947 | ||||||||
InterDigital, Inc. (Software) | 2,560 | 126,669 | ||||||||||
Itron, Inc. (Electronic Equip., Instr. & Comp.) | (a | ) | 3,750 | 189,938 | ||||||||
Knowles Corp. (Electronic Equip., Instr. & Comp.) | (a | ) | 8,500 | 139,570 | ||||||||
Kulicke & Soffa Industries, Inc. (Semiconductors & Equip.) | 5,310 | 235,021 | ||||||||||
Lattice Semiconductor Corp. (Semiconductors & Equip.) | (a | ) | 11,187 | 725,813 | ||||||||
Littelfuse, Inc. (Electronic Equip., Instr. & Comp.) | 3,019 | 664,784 | ||||||||||
LivePerson, Inc. (Software) | (a | ) | 5,529 | 56,064 | ||||||||
LiveRamp Holdings, Inc. (Software) | (a | ) | 4,660 | 109,230 | ||||||||
MACOM Technology Solutions Holdings, Inc. (Semiconductors & Equip.) | (a | ) | 14,886 | 937,520 | ||||||||
Manhattan Associates, Inc. (Software) | (a | ) | 6,584 | 799,298 | ||||||||
MaxLinear, Inc. (Semiconductors & Equip.) | (a | ) | 5,930 | 201,324 | ||||||||
Monday.com Ltd. (Software) | (a | ) | 4,171 | 508,862 | ||||||||
NetScout Systems, Inc. (Communications Equip.) | (a | ) | 5,976 | 194,280 | ||||||||
Novanta, Inc. (Electronic Equip., Instr. & Comp.) | (a | ) | 7,069 | 960,465 | ||||||||
Onto Innovation, Inc. (Semiconductors & Equip.) | (a | ) | 12,964 | 882,719 | ||||||||
OSI Systems, Inc. (Electronic Equip., Instr. & Comp.) | (a | ) | 60 | 4,771 | ||||||||
Payoneer Global, Inc. (IT Svs.) | (a | ) | 13,287 | 72,680 | ||||||||
PC Connection, Inc. (Electronic Equip., Instr. & Comp.) | 2,690 | 126,161 | ||||||||||
Perficient, Inc. (IT Svs.) | (a | ) | 2,710 | 189,239 | ||||||||
Plexus Corp. (Electronic Equip., Instr. & Comp.) | (a | ) | 2,500 | 257,325 | ||||||||
Progress Software Corp. (Software) | 3,160 | 159,422 | ||||||||||
Rambus, Inc. (Semiconductors & Equip.) | (a | ) | 9,360 | 335,275 | ||||||||
Rogers Corp. (Electronic Equip., Instr. & Comp.) | (a | ) | 1,630 | 194,524 | ||||||||
Sabre Corp. (IT Svs.) | (a | ) | 21,199 | 131,010 | ||||||||
Sanmina Corp. (Electronic Equip., Instr. & Comp.) | (a | ) | 3,720 | 213,119 | ||||||||
Semtech Corp. (Semiconductors & Equip.) | (a | ) | 4,100 | 117,629 | ||||||||
Shift4 Payments, Inc. Class A (IT Svs.) | (a | ) | 14,145 | 791,130 | ||||||||
Silicon Laboratories, Inc. (Semiconductors & Equip.) | (a | ) | 5,592 | 758,667 | ||||||||
Smartsheet, Inc. Class A (Software) | (a | ) | 15,745 | 619,723 | ||||||||
SPS Commerce, Inc. (Software) | (a | ) | 8,674 | 1,114,002 | ||||||||
TTEC Holdings, Inc. (IT Svs.) | 1,750 | 77,228 | ||||||||||
TTM Technologies, Inc. (Electronic Equip., Instr. & Comp.) | (a | ) | 11,850 | 178,698 | ||||||||
Ultra Clean Holdings, Inc. (Semiconductors & Equip.) | (a | ) | 1,621 | 53,736 | ||||||||
Unisys Corp. (IT Svs.) | (a | ) | 8,300 | 42,413 | ||||||||
Universal Display Corp. (Semiconductors & Equip.) | 5,405 | 583,956 | ||||||||||
Viavi Solutions, Inc. (Communications Equip.) | (a | ) | 19,550 | 205,470 | ||||||||
Xperi, Inc. (Software) | (a | ) | 3,460 | 29,791 | ||||||||
|
| |||||||||||
| 20,609,700 | ||||||||||||
|
| |||||||||||
MATERIALS – 3.1% | ||||||||||||
Arconic Corp. (Metals & Mining) | (a | ) | 8,080 | 170,973 | ||||||||
ATI, Inc. (Metals & Mining) | (a | ) | 10,700 | 319,502 | ||||||||
Balchem Corp. (Chemicals) | 2,790 | 340,687 | ||||||||||
Carpenter Technology Corp. (Metals & Mining) | 4,690 | 173,249 | ||||||||||
Compass Minerals International, Inc. (Metals & Mining) | 2,478 | 101,598 | ||||||||||
Element Solutions, Inc. (Chemicals) | 29,466 | 535,987 | ||||||||||
H.B. Fuller Co. (Chemicals) | 4,520 | 323,723 | ||||||||||
Innospec, Inc. (Chemicals) | 2,190 | 225,263 | ||||||||||
Livent Corp. (Chemicals) | (a | ) | 12,820 | 254,733 | ||||||||
| 33 | (continued) |
Ohio National Fund, Inc. | ON AB Small Cap Portfolio (Continued) |
| Schedule of Investments | December 31,2022 | |
| Common Stocks (Continued) | Shares | Value | ||||||||||
MATERIALS (continued) | ||||||||||||
Mativ Holdings, Inc. (Chemicals) | 3,890 | $ | 81,301 | |||||||||
Minerals Technologies, Inc. (Chemicals) | 2,160 | 131,155 | ||||||||||
O-I Glass, Inc. (Containers & Packaging) | (a | ) | 14,010 | 232,146 | ||||||||
Quaker Chemical Corp. (Chemicals) | 1,100 | 183,590 | ||||||||||
Stepan Co. (Chemicals) | 1,770 | 188,434 | ||||||||||
Sylvamo Corp. (Paper & Forest Products) | 2,426 | 117,879 | ||||||||||
Warrior Met Coal, Inc. (Metals & Mining) | 3,860 | 133,710 | ||||||||||
|
| |||||||||||
| 3,513,930 | ||||||||||||
|
| |||||||||||
REAL ESTATE – 3.8% | ||||||||||||
Agree Realty Corp. (Equity REIT) | 5,300 | 375,929 | ||||||||||
American Assets Trust, Inc. (Equity REIT) | 5,070 | 134,355 | ||||||||||
Brandywine Realty Trust (Equity REIT) | 14,450 | 88,868 | ||||||||||
CareTrust REIT, Inc. (Equity REIT) | 8,080 | 150,126 | ||||||||||
Community Healthcare Trust, Inc. (Equity REIT) . | 10 | 358 | ||||||||||
Cushman & Wakefield PLC (Real Estate Mgmt. & Development) | (a | ) | 10,490 | 130,705 | ||||||||
DiamondRock Hospitality Co. (Equity REIT) | 18,760 | 153,644 | ||||||||||
Douglas Elliman, Inc. (Real Estate Mgmt. & Development) | 6,810 | 27,717 | ||||||||||
Easterly Government Properties, Inc. (Equity REIT) | 6,200 | 88,474 | ||||||||||
Elme Communities (Equity REIT) | 7,650 | 136,170 | ||||||||||
Essential Properties Realty Trust, Inc. (Equity REIT) | 9,500 | 222,965 | ||||||||||
Four Corners Property Trust, Inc. (Equity REIT) . | 6,770 | 175,546 | ||||||||||
Getty Realty Corp. (Equity REIT) | 5,630 | 190,575 | ||||||||||
Global Net Lease, Inc. (Equity REIT) | 9,430 | 118,535 | ||||||||||
Innovative Industrial Properties, Inc. (Equity REIT) | 2,040 | 206,754 | ||||||||||
LTC Properties, Inc. (Equity REIT) | 60 | 2,132 | ||||||||||
LXP Industrial Trust (Equity REIT) | 23,230 | 232,765 | ||||||||||
Marcus & Millichap, Inc. (Real Estate Mgmt. & Development) | 2,590 | 89,226 | ||||||||||
NexPoint Residential Trust, Inc. (Equity REIT) | 1,600 | 69,632 | ||||||||||
Office Properties Income Trust (Equity REIT) | 6,400 | 85,440 | ||||||||||
| Common Stocks (Continued) | Shares | Value | ||||||||||
REAL ESTATE (continued) | ||||||||||||
Outfront Media, Inc. (Equity REIT) | 9,680 | $ | 160,494 | |||||||||
Retail Opportunity Investments Corp. (Equity REIT) | 10,100 | 151,803 | ||||||||||
Safehold, Inc. (Equity REIT) | 3,330 | 95,305 | ||||||||||
SITE Centers Corp. (Equity REIT) | 14,460 | 197,524 | ||||||||||
St. Joe Co. / The (Real Estate Mgmt. & Development) | 3,880 | 149,962 | ||||||||||
Sunstone Hotel Investors, Inc. (Equity REIT) | 15,043 | 145,315 | ||||||||||
Tanger Factory Outlet Centers, Inc. (Equity REIT) | 10,180 | 182,629 | ||||||||||
Uniti Group, Inc. (Equity REIT) | 20,270 | 112,093 | ||||||||||
Urban Edge Properties (Equity REIT) | 8,010 | 112,861 | ||||||||||
Veris Residential, Inc. (Equity REIT) | (a | ) | 10,860 | 173,000 | ||||||||
Xenia Hotels & Resorts, Inc. (Equity REIT) | 10,060 | 132,591 | ||||||||||
|
| |||||||||||
| 4,293,493 | ||||||||||||
|
| |||||||||||
UTILITIES – 1.2% | ||||||||||||
American States Water Co. (Water Utilities) | 3,140 | 290,607 | ||||||||||
Avista Corp. (Multi-Utilities) | 5,790 | 256,729 | ||||||||||
California Water Service Group | ||||||||||||
(Water Utilities) | 4,230 | 256,507 | ||||||||||
Chesapeake Utilities Corp. (Gas Utilities) | 1,500 | 177,270 | ||||||||||
SJW Group (Water Utilities) | 1,720 | 139,647 | ||||||||||
South Jersey Industries, Inc. (Gas Utilities) | 8,620 | 306,268 | ||||||||||
|
| |||||||||||
| 1,427,028 | ||||||||||||
|
| |||||||||||
Total Common Stocks | $ | 112,297,428 | ||||||||||
|
| |||||||||||
| Exchange Traded Funds – 0.4% | Shares | Value | ||||||||||
iShares Core S&P Small-Cap ETF | 4,497 | $ | 425,596 | |||||||||
|
| |||||||||||
Total Exchange Traded Funds |
| $ | 425,596 | |||||||||
|
| |||||||||||
Total Investments – 99.1% | (b | ) | $ | 112,723,024 | ||||||||
Other Assets in Excess of |
| 969,122 | ||||||||||
|
| |||||||||||
Net Assets – 100.0% | $ | 113,692,146 | ||||||||||
|
| |||||||||||
Percentages are stated as a percent of net assets.
Abbreviations:
ADR: American Depositary Receipts
Footnotes:
| (a) | Non-income producing security. |
| (b) | Represents cost for financial reporting purposes, which may differ from cost basis for federal income tax purposes. See also Note 7 of the Notes to Financial Statements. |
The accompanying notes are an integral part of these financial statements.
34
Ohio National Fund, Inc. | ON AB Mid Cap Core Portfolio (Unaudited) |
| Objective/Strategy |
The ON AB Mid Cap Core Portfolio seeks long-term growth of capital by investing, under normal circumstances, at least 80% of its net assets in equity securities of mid-capitalization companies with public stock market capitalization at the time of investment that are within the range of market capitalizations of the companies constituting the Russell Midcap® Index.
| Performance as of December 31, 2022 | ||||
Average Annual returns | ||||
One year | -23.31 | % | ||
Five years | 7.12 | % | ||
Ten years | 9.83 | % |
Past performance does not guarantee future results. The performance data quoted represents past performance and current returns may be lower or higher. Total return figures include change in share price and reinvestment of dividends and capital gains. The investment return and principal value will fluctuate so that an investor’s shares, when redeemed, may be worth more or less than the original cost. To obtain performance information up to the most recent month end, call toll-free 1-877-781-6392.
The Portfolio is not open to direct retail investment. Beneficial interest in the Portfolio’s shares is obtained either through an allocation to the Portfolio as an investment vehicle within variable life insurance policies or annuity contracts, or as an underlying investment by the ON Model Portfolios. Actual performance results for variable annuity and variable universal life contracts will be lower due to contract charges. Consult your contract for applicable charges.
Total expense ratio is 0.84% per the Fund’s prospectus dated April 29, 2022. Additional information pertaining to the Portfolio’s expense ratio as of December 31, 2022 can be found in the Portfolio’s Financial Highlights.
| Comments from Sub-Adviser |
Q. How did the Portfolio perform in comparison to its benchmark during the reporting period?
A. For the year ended December 31, 2022, the Portfolio returned -23.31% versus -17.32% for its benchmark, the Russell Midcap® Index.
Q. Were there specific market conditions, investment strategies, or techniques that materially affected the Portfolio’s benchmark-relative performance during the reporting period?
A. An unprecedented pace of interest rate hikes drove down asset valuations across the board, with high growth, smaller-cap stocks being hit particularly hard. Given the Portfolio’s greater exposure to growth stocks than the benchmark, the Portfolio saw sharper declines than those of the benchmark. Additionally, record levels of correlation among high-growth stocks led to significant price movements (both up and down), regardless of company fundamentals, which meant the Portfolio was not rewarded for the quality companies it owned. (1)
Q. How did sector allocation and security selection each impact the Portfolio’s performance relative to its benchmark?
A. Sector allocation and security selection each detracted from relative performance, with security selection being more significant to underperformance. Selection within Health Care was the primary driver of underperformance, followed by selection within Information Technology and Industrials. This detraction was slightly offset by positive selection within Communication Services and Materials. A slight underweight to Energy and overweight to Consumer Discretionary were detractors, while an underweight to the poorly performing Communication Services sector was beneficial to the Portfolio.(1)
Q. Which securities contributed the most to, and detracted the most from, the Portfolio’s benchmark-relative performance?
A. During the year, Matador Resources Co., LPL Financial Holdings, Inc. (“LPL”), and Acadia Healthcare Co., Inc. were the top contributors to relative performance. Matador Resources Co. shares outperformed mostly due to a positive oil price backdrop. LPL contributed, as the company continues to execute on its organic growth initiatives and should continue to benefit from the rising and sustainably higher interest rate environment. Acadia Healthcare Co., Inc., a behavioral healthcare provider, posted positive earnings results during the year, showing growth in patient days in residential care and the ability to outperform peers from a labor cost perspective.
Latham Group, Inc., R1 RCM, Inc., and Trex Co., Inc. detracted from relative performance for the year. Latham Group, Inc. detracted, as sharp interest rate hikes negatively impacted stocks leveraged to spending on home improvement. R1 RCM, Inc. was generally flat for most of the year, but reported third-quarter earnings that fell short on estimates for revenue and EBITDA and significantly lowered full-year guidance. The company’s CEO stepped down and the stock subsequently declined. Trex Co., Inc., a manufacturer of composite decking, executed well on building additional capacity to meet increasing demand for composite decks, but lack of transparency from management on the near-term outlook and higher inflation weighed on the company’s stock.(1)
Q. How did the Portfolio’s use of derivative instruments and initial public offerings (IPOs), if any, impact performance?
A. Pursuant to the Portfolio’s investment strategy, futures contracts were used to prevent a cash drag on performance. Futures contracts, in aggregate, detracted 2 basis points from the Portfolio’s absolute return for the year. The Portfolio did not participate in any IPOs during the period.(1)
Q. Were there any significant changes to the Portfolio’s management team, investment strategy, or selection process during the reporting period?
A. Michael Doherty, Quantitative Analyst on the U.S. Small and SMID Growth team, retired effective June 30, 2022. Lucie Germain, who joined AllianceBernstein L.P. in December 2015, has assumed Michael’s role as the team’s quantitative analyst. Lucie previously served as a Senior Associate Portfolio Manager in the Institutional Equity Portfolio Management Group where she covered both U.S. Growth and Developed Market Strategic Core equity platforms. There has been no change to the investment process or philosophy.
| (1) | The Portfolio’s composition is subject to change. Holdings and weightings are as of December 31, 2022. |
| 35 | (continued) |
Ohio National Fund, Inc. | ON AB Mid Cap Core Portfolio (Unaudited) (Continued) |
| Change in Value of $10,000 Investment | ||||||
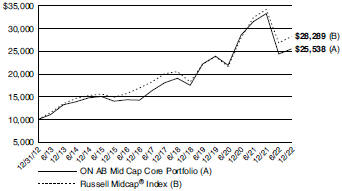
Hypothetical illustration based on past performance. Future performance will vary. The Portfolio’s returns reflect reinvested dividends. The Portfolio’s holdings may differ significantly from the securities in the index. The index is unmanaged and therefore does not reflect the cost of portfolio management and accounting.
The Russell Midcap® Index measures the performance of the mid-cap segment of the US equity universe. The Russell Midcap® Index is a subset of the Russell 1000® Index. It includes approximately 800 of the smallest securities based on a combination of their market cap and current index membership.
Past performance is no guarantee of future results. Redemption of fund shares could have tax implications unique to each shareholder.
| Portfolio Composition as of December 31, 2022 (1) | ||
| % of Net Assets | ||||
Common Stocks (4) | 98.8 | |||
Other Net Assets | 1.2 | |||
|
| |||
| 100.0 | ||||
|
| |||
| Top 10 Portfolio Holdings as of December 31, 2022 (1) (2) (3) | ||||
| % of Net Assets | ||||||||
| 1. | LPL Financial Holdings, Inc. | 0.7 | ||||||
| 2. | PTC, Inc. | 0.6 | ||||||
| 3. | AMETEK, Inc. | 0.6 | ||||||
| 4. | Carlisle Cos., Inc. | 0.6 | ||||||
| 5. | Planet Fitness, Inc. Class A | 0.6 | ||||||
| 6. | Dynatrace, Inc. | 0.6 | ||||||
| 7. | Howmet Aerospace, Inc. | 0.6 | ||||||
| 8. | Axon Enterprise, Inc. | 0.6 | ||||||
| 9. | First Citizens BancShares, Inc. Class A | 0.6 | ||||||
| 10. | Vail Resorts, Inc. | 0.6 | ||||||
| (1) | Composition of Portfolio subject to change. |
| (2) | Short-term investments have been excluded from the list of Top 10 Portfolio Holdings. |
| (3) | Top 10 Portfolio Holdings is presented at an individual security level. Total investment exposure by issuer may be higher. |
| (4) | Sectors (Common Stocks): |
| % of Net Assets | ||||
Industrials | 19.8 | |||
Information Technology | 16.5 | |||
Financials | 14.8 | |||
Consumer Discretionary | 13.2 | |||
Health Care | 11.4 | |||
Energy | 5.9 | |||
Real Estate | 5.1 | |||
Materials | 4.6 | |||
Utilities | 3.2 | |||
Consumer Staples | 2.6 | |||
Communication Services | 1.7 | |||
|
| |||
| 98.8 | ||||
|
| |||
| 36 |
Ohio National Fund, Inc. | ON AB Mid Cap Core Portfolio | |
| Schedule of Investments | December 31, 2022 | |
| Common Stocks – 98.8% | Shares | Value | ||||||||||
COMMUNICATION SERVICES – 1.7% | ||||||||||||
Criteo SA – ADR (Media) | (a | ) | 8,980 | $ | 234,019 | |||||||
Electronic Arts, Inc. (Entertainment) | 960 | 117,293 | ||||||||||
Fox Corp. Class A (Media) | 2,040 | 61,955 | ||||||||||
Interpublic Group of Cos., Inc. / The (Media) | 2,400 | 79,944 | ||||||||||
Liberty Broadband Corp. Class A (Media) | (a | ) | 480 | 36,408 | ||||||||
Liberty Broadband Corp. Class C (Media) | (a | ) | 660 | 50,338 | ||||||||
Liberty Media Corp. - Liberty Formula One Class C (Entertainment) | (a | ) | 1,385 | 82,795 | ||||||||
Lumen Technologies, Inc. (Diversified Telecom. Svs.) | 5,380 | 28,084 | ||||||||||
Match Group, Inc. (Interactive Media & Svs.) | (a | ) | 920 | 38,171 | ||||||||
Omnicom Group, Inc. (Media) | 930 | 75,860 | ||||||||||
Paramount Global Class B (Media) | 126 | 2,127 | ||||||||||
Pinterest, Inc. Class A (Interactive Media & Svs.) | (a | ) | 3,220 | 78,181 | ||||||||
ROBLOX Corp. Class A (Entertainment) | (a | ) | 1,750 | 49,805 | ||||||||
Sirius XM Holdings, Inc. (Media) | 10,060 | 58,750 | ||||||||||
Spotify Technology SA (Entertainment) | (a | ) | 550 | 43,422 | ||||||||
Take-Two Interactive Software, Inc. (Entertainment) | (a | ) | 470 | 48,941 | ||||||||
Trade Desk, Inc. / The Class A (Media) | (a | ) | 1,700 | 76,211 | ||||||||
Warner Bros Discovery, Inc. (Entertainment) | (a | ) | 7,731 | 73,290 | ||||||||
ZoomInfo Technologies, Inc. (Interactive Media & Svs.) | (a | ) | 1,570 | 47,273 | ||||||||
|
| |||||||||||
| 1,282,867 | ||||||||||||
|
| |||||||||||
CONSUMER DISCRETIONARY – 13.2% | ||||||||||||
ADT, Inc. (Diversified Consumer Svs.) | 29,366 | 266,350 | ||||||||||
Advance Auto Parts, Inc. (Specialty Retail) | 380 | 55,871 | ||||||||||
Aptiv PLC (Auto Components) | (a | ) | 1,100 | 102,443 | ||||||||
Aramark (Hotels, Restaurants & Leisure) | 1,962 | 81,109 | ||||||||||
AutoZone, Inc. (Specialty Retail) | (a | ) | 90 | 221,956 | ||||||||
Bath & Body Works, Inc. (Specialty Retail) | 5,150 | 217,021 | ||||||||||
Best Buy Co., Inc. (Specialty Retail) | 940 | 75,397 | ||||||||||
Burlington Stores, Inc. (Specialty Retail) | (a | ) | 1,670 | 338,609 | ||||||||
Caesars Entertainment, Inc. (Hotels, Restaurants & Leisure) | (a | ) | 770 | 32,032 | ||||||||
CarMax, Inc. (Specialty Retail) | (a | ) | 671 | 40,857 | ||||||||
Carnival Corp. (Hotels, Restaurants & Leisure) | (a | ) | 3,130 | 25,228 | ||||||||
Carter’s, Inc. (Textiles, Apparel & Luxury Goods) | 2,340 | 174,587 | ||||||||||
Carvana Co. (Specialty Retail) | (a | ) | 270 | 1,280 | ||||||||
Chipotle Mexican Grill, Inc. (Hotels, Restaurants & Leisure) | (a | ) | 110 | 152,624 | ||||||||
D.R. Horton, Inc. (Household Durables) | 1,350 | 120,339 | ||||||||||
Dana, Inc. (Auto Components) | 10,540 | 159,470 | ||||||||||
Darden Restaurants, Inc. (Hotels, Restaurants & Leisure) | 530 | 73,315 | ||||||||||
Dine Brands Global, Inc. (Hotels, Restaurants & Leisure) | 3,380 | 218,348 | ||||||||||
Dollar Tree, Inc. (Multiline Retail) | (a | ) | 970 | 137,197 | ||||||||
Domino’s Pizza, Inc. (Hotels, Restaurants & Leisure) | 180 | 62,352 | ||||||||||
DoorDash, Inc. Class A (Internet & Direct Marketing Retail) | (a | ) | 531 | 25,923 | ||||||||
DraftKings, Inc. Class A (Hotels, Restaurants & Leisure) | (a | ) | 3,400 | 38,726 | ||||||||
eBay, Inc. (Internet & Direct Marketing Retail) | 1,920 | 79,622 | ||||||||||
Etsy, Inc. (Internet & Direct Marketing Retail) | (a | ) | 484 | 57,974 | ||||||||
Expedia Group, Inc. (Hotels, Restaurants & Leisure) | (a | ) | 570 | 49,932 | ||||||||
Five Below, Inc. (Specialty Retail) | (a | ) | 2,302 | 407,155 | ||||||||
Garmin Ltd. (Household Durables) | 610 | 56,297 | ||||||||||
Gentex Corp. (Auto Components) | 2,170 | 59,176 | ||||||||||
Genuine Parts Co. (Distributors) | 610 | 105,841 | ||||||||||
Goodyear Tire & Rubber Co. / The (Auto Components) | (a | ) | 20,350 | 206,553 | ||||||||
Hasbro, Inc. (Leisure Products) | 770 | 46,978 | ||||||||||
Hilton Grand Vacations, Inc. (Hotels, Restaurants & Leisure) | (a | ) | 6,736 | 259,606 | ||||||||
Hilton Worldwide Holdings, Inc. (Hotels, Restaurants & Leisure) | 1,120 | 141,523 | ||||||||||
Hyatt Hotels Corp. Class A (Hotels, Restaurants & Leisure) | (a | ) | 690 | 62,411 | ||||||||
KB Home (Household Durables) | 6,440 | 205,114 | ||||||||||
| Common Stocks (Continued) | Shares | Value | ||||||||||
CONSUMER DISCRETIONARY (continued) |
| |||||||||||
Las Vegas Sands Corp. (Hotels, Restaurants & Leisure) | (a | ) | 1,670 | $ | 80,277 | |||||||
Lear Corp. (Auto Components) | 419 | 51,964 | ||||||||||
Lennar Corp. Class A (Household Durables) | 1,100 | 99,550 | ||||||||||
Lithia Motors, Inc. (Specialty Retail) | 1,230 | 251,830 | ||||||||||
LKQ Corp. (Distributors) | 1,630 | 87,058 | ||||||||||
Lululemon Athletica, Inc. (Textiles, Apparel & Luxury Goods) | (a | ) | 460 | 147,375 | ||||||||
MGM Resorts International (Hotels, Restaurants & Leisure) | 1,930 | 64,713 | ||||||||||
Mohawk Industries, Inc. (Household Durables) | (a | ) | 370 | 37,821 | ||||||||
National Vision Holdings, Inc. (Specialty Retail) | (a | ) | 9,890 | 383,336 | ||||||||
NVR, Inc. (Household Durables) | (a | ) | 74 | 341,331 | ||||||||
O’Reilly Automotive, Inc. (Specialty Retail) | (a | ) | 220 | 185,687 | ||||||||
Papa John’s International, Inc. (Hotels, Restaurants & Leisure) | 2,870 | 236,230 | ||||||||||
Planet Fitness, Inc. Class A (Hotels, Restaurants & Leisure) | (a | ) | 5,993 | 472,248 | ||||||||
Pool Corp. (Distributors) | 1,264 | 382,145 | ||||||||||
PulteGroup, Inc. (Household Durables) | 8,520 | 387,916 | ||||||||||
Ralph Lauren Corp. (Textiles, Apparel & Luxury Goods) | 3,460 | 365,618 | ||||||||||
RH (Specialty Retail) | (a | ) | 110 | 29,391 | ||||||||
Rivian Automotive, Inc. Class A (Automobiles) | (a | ) | 1,900 | 35,017 | ||||||||
Ross Stores, Inc. (Specialty Retail) | 1,180 | 136,963 | ||||||||||
Sally Beauty Holdings, Inc. (Specialty Retail) | (a | ) | 15,240 | 190,805 | ||||||||
Tapestry, Inc. (Textiles, Apparel & Luxury Goods) | 10,300 | 392,224 | ||||||||||
Taylor Morrison Home Corp. (Household Durables) | (a | ) | 5,936 | 180,158 | ||||||||
Tractor Supply Co. (Specialty Retail) | 470 | 105,736 | ||||||||||
Ulta Beauty, Inc. (Specialty Retail) | (a | ) | 230 | 107,886 | ||||||||
Under Armour, Inc. Class A (Textiles, Apparel & Luxury Goods) | (a | ) | 3,140 | 31,902 | ||||||||
V.F. Corp. (Textiles, Apparel & Luxury Goods) | 1,330 | 36,721 | ||||||||||
Vail Resorts, Inc. (Hotels, Restaurants & Leisure) | 1,852 | 441,424 | ||||||||||
Victoria’s Secret & Co. (Specialty Retail) | (a | ) | 386 | 13,811 | ||||||||
Williams-Sonoma, Inc. (Specialty Retail) | 2,250 | 258,570 | ||||||||||
Wingstop, Inc. (Hotels, Restaurants & Leisure) | 1,708 | 235,055 | ||||||||||
Yum! Brands, Inc. (Hotels, Restaurants & Leisure) | 1,150 | 147,292 | ||||||||||
|
| |||||||||||
| 10,277,270 | ||||||||||||
|
| |||||||||||
CONSUMER STAPLES – 2.6% | ||||||||||||
Boston Beer Co., Inc. / The Class A (Beverages) | (a | ) | 60 | 19,771 | ||||||||
Brown-Forman Corp. Class B (Beverages) | 1,000 | 65,680 | ||||||||||
Bunge Ltd. (Food Products) | 274 | 27,337 | ||||||||||
Campbell Soup Co. (Food Products) | 1,600 | 90,800 | ||||||||||
Church & Dwight Co., Inc. (Household Products) | 1,020 | 82,222 | ||||||||||
Clorox Co. / The (Household Products) | 510 | 71,568 | ||||||||||
Conagra Brands, Inc. (Food Products) | 2,060 | 79,722 | ||||||||||
Grocery Outlet Holding Corp. (Food & Staples Retailing) | (a | ) | 11,978 | 349,638 | ||||||||
Hain Celestial Group, Inc. / The (Food Products) | (a | ) | 11,770 | 190,439 | ||||||||
Hershey Co. / The (Food Products) | 600 | 138,942 | ||||||||||
Hormel Foods Corp. (Food Products) | 1,650 | 75,158 | ||||||||||
J.M. Smucker Co. / The (Food Products) | 580 | 91,907 | ||||||||||
Kellogg Co. (Food Products) | 1,220 | 86,913 | ||||||||||
Kroger Co. / The (Food & Staples Retailing) | 3,100 | 138,198 | ||||||||||
McCormick & Co., Inc. (Food Products) | 1,010 | 83,719 | ||||||||||
Nomad Foods Ltd. (Food Products) | (a | ) | 19,002 | 327,594 | ||||||||
Tyson Foods, Inc. Class A (Food Products) | 1,180 | 73,455 | ||||||||||
|
| |||||||||||
| 1,993,063 | ||||||||||||
|
| |||||||||||
ENERGY – 5.9% | ||||||||||||
APA Corp. (Oil, Gas & Consumable Fuels) | 1,270 | 59,284 | ||||||||||
Baker Hughes Co. (Energy Equip. & Svs.) | 3,800 | 112,214 | ||||||||||
Cactus, Inc. Class A (Energy Equip. & Svs.) | 6,300 | 316,638 | ||||||||||
Cameco Corp. (Oil, Gas & Consumable Fuels) | 9,970 | 226,020 | ||||||||||
Cheniere Energy, Inc. (Oil, Gas & Consumable Fuels) | 980 | 146,961 | ||||||||||
| 37 | (continued) |
Ohio National Fund, Inc. | ON AB Mid Cap Core Portfolio (Continued) | |
| Schedule of Investments | December 31, 2022 | |
| Common Stocks (Continued) | Shares | Value | ||||||||||
ENERGY (continued) | ||||||||||||
Chesapeake Energy Corp. (Oil, Gas & Consumable Fuels) | 690 | $ | 65,115 | |||||||||
Coterra Energy, Inc. (Oil, Gas & Consumable Fuels) | 2,820 | 69,287 | ||||||||||
Devon Energy Corp. (Oil, Gas & Consumable Fuels) | 2,370 | 145,779 | ||||||||||
Diamondback Energy, Inc. (Oil, Gas & Consumable Fuels) | 650 | 88,907 | ||||||||||
Halliburton Co. (Energy Equip. & Svs.) | 3,900 | 153,465 | ||||||||||
Helmerich & Payne, Inc. (Energy Equip. & Svs.) | 5,056 | 250,626 | ||||||||||
Hess Corp. (Oil, Gas & Consumable Fuels) | 1,130 | 160,257 | ||||||||||
HF Sinclair Corp. (Oil, Gas & Consumable Fuels) | 4,410 | 228,835 | ||||||||||
Magnolia Oil & Gas Corp. Class A (Oil, Gas & Consumable Fuels) | 11,761 | 275,795 | ||||||||||
Marathon Oil Corp. (Oil, Gas & Consumable Fuels) | 2,720 | 73,630 | ||||||||||
Matador Resources Co. (Oil, Gas & Consumable Fuels) | 5,418 | 310,126 | ||||||||||
NOV, Inc. (Energy Equip. & Svs.) | 9,144 | 191,018 | ||||||||||
ONEOK, Inc. (Oil, Gas & Consumable Fuels) | 1,810 | 118,917 | ||||||||||
Ovintiv, Inc. (Oil, Gas & Consumable Fuels) | 8,049 | 408,165 | ||||||||||
Patterson-UTI Energy, Inc. (Energy Equip. & Svs.) | 20,824 | 350,676 | ||||||||||
Phillips 66 (Oil, Gas & Consumable Fuels) | 1,700 | 176,936 | ||||||||||
Targa Resources Corp. (Oil, Gas & Consumable Fuels) | 5,703 | 419,171 | ||||||||||
Texas Pacific Land Corp. (Oil, Gas & Consumable Fuels) | 40 | 93,769 | ||||||||||
Williams Cos., Inc. / The (Oil, Gas & Consumable Fuels) | 5,010 | 164,829 | ||||||||||
|
| |||||||||||
| 4,606,420 | ||||||||||||
|
| |||||||||||
FINANCIALS – 14.8% | ||||||||||||
Aflac, Inc. (Insurance) | 2,600 | 187,044 | ||||||||||
AGNC Investment Corp. (Mortgage REIT) | 4,250 | 43,988 | ||||||||||
Allstate Corp. / The (Insurance) | 940 | 127,464 | ||||||||||
Ally Financial, Inc. (Consumer Finance) | 1,520 | 37,164 | ||||||||||
American Financial Group, Inc. (Insurance) | 2,350 | 322,608 | ||||||||||
Ameriprise Financial, Inc. (Capital Markets) | 480 | 149,458 | ||||||||||
Apollo Global Management, Inc. (Diversified Financial Svs.) | 1,322 | 84,330 | ||||||||||
Arch Capital Group Ltd. (Insurance) | (a | ) | 1,920 | 120,538 | ||||||||
Ares Management Corp. Class A (Capital Markets) | 5,189 | 355,135 | ||||||||||
Arthur J. Gallagher & Co. (Insurance) | 780 | 147,061 | ||||||||||
Bank of New York Mellon Corp. / The (Capital Markets) | 2,520 | 114,710 | ||||||||||
BankUnited, Inc. (Banks) | 5,880 | 199,744 | ||||||||||
Brown & Brown, Inc. (Insurance) | 1,430 | 81,467 | ||||||||||
Carlyle Group, Inc. / The (Capital Markets) | 1,790 | 53,414 | ||||||||||
CBOE Global Markets, Inc. (Capital Markets) | 2,494 | 312,922 | ||||||||||
Cincinnati Financial Corp. (Insurance) | 680 | 69,625 | ||||||||||
Citizens Financial Group, Inc. (Banks) | 1,740 | 68,504 | ||||||||||
Comerica, Inc. (Banks) | 6,251 | 417,879 | ||||||||||
Commerce Bancshares, Inc. (Banks) | 1,080 | 73,516 | ||||||||||
Discover Financial Services | ||||||||||||
(Consumer Finance) | 1,250 | 122,288 | ||||||||||
East West Bancorp, Inc. (Banks) | 1,000 | 65,900 | ||||||||||
Everest Re Group Ltd. (Insurance) | 740 | 245,140 | ||||||||||
F&G Annuities & Life, Inc. (Insurance) | (a | ) | 113 | 2,261 | ||||||||
FactSet Research Systems, Inc. (Capital Markets) | 230 | 92,278 | ||||||||||
Fidelity National Financial, Inc. (Insurance) | 1,670 | 62,825 | ||||||||||
Fifth Third Bancorp (Banks) | 2,900 | 95,149 | ||||||||||
First BanCorp (Banks) | 22,230 | 282,766 | ||||||||||
First Citizens BancShares, Inc. Class A (Banks) | 588 | 445,916 | ||||||||||
First Hawaiian, Inc. (Banks) | 12,514 | 325,865 | ||||||||||
First Horizon Corp. (Banks) | 2,360 | 57,820 | ||||||||||
First Republic Bank (Banks) | 710 | 86,542 | ||||||||||
Franklin Resources, Inc. (Capital Markets) | 2,540 | 67,005 | ||||||||||
Hanover Insurance Group, Inc. / The (Insurance) | 1,990 | 268,909 | ||||||||||
Hartford Financial Services Group, Inc. / The (Insurance) | 1,470 | 111,470 | ||||||||||
Huntington Bancshares, Inc. (Banks) | 4,980 | 70,218 | ||||||||||
| Common Stocks (Continued) | Shares | Value | ||||||||||
FINANCIALS (continued) | ||||||||||||
Invesco Ltd. (Capital Markets) | 2,820 | $ | 50,732 | |||||||||
Kemper Corp. (Insurance) | 4,210 | 207,132 | ||||||||||
KeyCorp (Banks) | 3,650 | 63,583 | ||||||||||
Kinsale Capital Group, Inc. (Insurance) | 1,469 | 384,173 | ||||||||||
KKR & Co., Inc. (Capital Markets) | 2,230 | 103,517 | ||||||||||
Loews Corp. (Insurance) | 1,370 | 79,912 | ||||||||||
LPL Financial Holdings, Inc. (Capital Markets) | 2,508 | 542,154 | ||||||||||
M&T Bank Corp. (Banks) | 520 | 75,431 | ||||||||||
Markel Corp. (Insurance) | (a | ) | 60 | 79,049 | ||||||||
Moelis & Co. Class A (Capital Markets) | 5,517 | 211,687 | ||||||||||
MSCI, Inc. (Capital Markets) | 329 | 153,041 | ||||||||||
Nasdaq, Inc. (Capital Markets) | 1,410 | 86,504 | ||||||||||
Northern Trust Corp. (Capital Markets) | 780 | 69,022 | ||||||||||
Pinnacle Financial Partners, Inc. (Banks) | 3,223 | 236,568 | ||||||||||
PJT Partners, Inc. Class A (Capital Markets) | 3,983 | 293,507 | ||||||||||
Principal Financial Group, Inc. (Insurance) | 1,190 | 99,865 | ||||||||||
Prudential Financial, Inc. (Insurance) | 1,630 | 162,120 | ||||||||||
Raymond James Financial, Inc. (Capital Markets) | 870 | 92,960 | ||||||||||
Regions Financial Corp. (Banks) | 3,530 | 76,107 | ||||||||||
Reinsurance Group of America, Inc. (Insurance) | 1,783 | 253,346 | ||||||||||
Rocket Cos., Inc. Class A (Thrifts & Mortgage Finance) | 5,490 | 38,430 | ||||||||||
Selective Insurance Group, Inc. (Insurance) | 2,750 | 243,677 | ||||||||||
State Street Corp. (Capital Markets) | 1,440 | 111,701 | ||||||||||
Stifel Financial Corp. (Capital Markets) | 5,150 | 300,605 | ||||||||||
Synchrony Financial (Consumer Finance) | 2,390 | 78,535 | ||||||||||
Synovus Financial Corp. (Banks) | 7,870 | 295,518 | ||||||||||
T. Rowe Price Group, Inc. (Capital Markets) | 920 | 100,335 | ||||||||||
Texas Capital Bancshares, Inc. (Banks) | (a | ) | 4,709 | 284,000 | ||||||||
Tradeweb Markets, Inc. Class A (Capital Markets) | 940 | 61,034 | ||||||||||
Trupanion, Inc. (Insurance) | (a | ) | 3,280 | 155,898 | ||||||||
Upstart Holdings, Inc. (Consumer Finance) | (a | ) | 166 | 2,195 | ||||||||
W.R. Berkley Corp. (Insurance) | 1,432 | 103,920 | ||||||||||
Webster Financial Corp. (Banks) | 4,260 | 201,668 | ||||||||||
Willis Towers Watson PLC (Insurance) | 530 | 129,627 | ||||||||||
Wintrust Financial Corp. (Banks) | 3,930 | 332,164 | ||||||||||
Zions Bancorp N.A. (Banks) | 8,360 | 410,978 | ||||||||||
|
| |||||||||||
| 11,539,618 | ||||||||||||
|
| |||||||||||
HEALTH CARE – 11.4% | ||||||||||||
Acadia Healthcare Co., Inc. (Health Care Providers & Svs.) | (a | ) | 3,770 | 310,346 | ||||||||
ADC Therapeutics SA (Biotechnology) | (a | ) | 5,870 | 22,541 | ||||||||
Agilent Technologies, Inc. (Life Sciences Tools & Svs.) | 1,260 | 188,559 | ||||||||||
Align Technology, Inc. (Health Care Equip. & Supplies) | (a | ) | 270 | 56,943 | ||||||||
Alnylam Pharmaceuticals, Inc. (Biotechnology) | (a | ) | 540 | 128,331 | ||||||||
AmerisourceBergen Corp. (Health Care Providers & Svs.) | 630 | 104,397 | ||||||||||
Arcus Biosciences, Inc. (Biotechnology) | (a | ) | 3,604 | 74,531 | ||||||||
Arrowhead Pharmaceuticals, Inc. (Biotechnology) | (a | ) | 4,263 | 172,907 | ||||||||
Ascendis Pharma A/S – ADR (Biotechnology) | (a | ) | 1,012 | 123,596 | ||||||||
AtriCure, Inc. (Health Care Equip. & Supplies) | (a | ) | 7,368 | 326,992 | ||||||||
Avantor, Inc. (Life Sciences Tools & Svs.) | (a | ) | 2,380 | 50,194 | ||||||||
Biogen, Inc. (Biotechnology) | (a | ) | 500 | 138,460 | ||||||||
BioMarin Pharmaceutical, Inc. (Biotechnology) | (a | ) | 640 | 66,234 | ||||||||
Bio-Rad Laboratories, Inc. Class A (Life | ||||||||||||
Sciences Tools & Svs.) | (a | ) | 120 | 50,459 | ||||||||
Blueprint Medicines Corp. (Biotechnology) | (a | ) | 2,668 | 116,885 | ||||||||
Cardinal Health, Inc. (Health Care Providers & Svs.) | 950 | 73,026 | ||||||||||
Catalent, Inc. (Pharmaceuticals) | (a | ) | 679 | 30,562 | ||||||||
Charles River Laboratories International, Inc. (Life Sciences Tools & Svs.) | (a | ) | 230 | 50,117 | ||||||||
Coherus Biosciences, Inc. (Biotechnology) | (a | ) | 12,199 | 96,616 | ||||||||
Cooper Cos., Inc. / The (Health Care Equip. & Supplies) | 201 | 66,465 | ||||||||||
DaVita, Inc. (Health Care Providers & Svs.) | (a | ) | 650 | 48,536 | ||||||||
DENTSPLY SIRONA, Inc. (Health Care Equip. & Supplies) | 1,134 | 36,107 | ||||||||||
| 38 | (continued) |
Ohio National Fund, Inc. | ON AB Mid Cap Core Portfolio (Continued) |
| Schedule of Investments | December 31,2022 | |
| Common Stocks (Continued) | Shares | Value | ||||||||
HEALTH CARE (continued) | ||||||||||
Dexcom, Inc. (Health Care Equip. & Supplies) | (a) | 1,480 | $ | 167,595 | ||||||
Envista Holdings Corp. (Health Care Equip. & Supplies) | (a) | 9,910 | 333,670 | |||||||
Erasca, Inc. (Biotechnology) | (a) | 3,715 | 16,012 | |||||||
Guardant Health, Inc. (Health Care Providers & Svs.) | (a) | 6,186 | 168,259 | |||||||
Hologic, Inc. (Health Care Equip. & Supplies) | (a) | 1,160 | 86,780 | |||||||
Horizon Therapeutics PLC (Biotechnology) | (a) | 810 | 92,178 | |||||||
ICON PLC (Life Sciences Tools & Svs.) | (a) | 1,249 | 242,618 | |||||||
ICU Medical, Inc. (Health Care Equip. & Supplies) | (a) | 274 | 43,150 | |||||||
IDEXX Laboratories, Inc. (Health Care Equip. & Supplies) | (a) | 350 | 142,786 | |||||||
Inari Medical, Inc. (Health Care Equip. & Supplies) | (a) | 4,252 | 270,257 | |||||||
Insulet Corp. (Health Care Equip. & Supplies) | (a) | 998 | 293,801 | |||||||
Integra LifeSciences Holdings Corp. (Health Care Equip. & Supplies) | (a) | 5,997 | 336,252 | |||||||
Intellia Therapeutics, Inc. (Biotechnology) | (a) | 3,026 | 105,577 | |||||||
Intra-Cellular Therapies, Inc. (Pharmaceuticals) | (a) | 3,448 | 182,468 | |||||||
IQVIA Holdings, Inc. (Life Sciences Tools & Svs.) | (a) | 780 | 159,814 | |||||||
iRhythm Technologies, Inc. (Health Care Equip. & Supplies) | (a) | 2,313 | 216,659 | |||||||
IVERIC bio, Inc. (Biotechnology) | (a) | 7,789 | 166,762 | |||||||
Karuna Therapeutics, Inc. (Biotechnology) | (a) | 979 | 192,373 | |||||||
Laboratory Corp. of America Holdings (Health Care Providers & Svs.) | 400 | 94,192 | ||||||||
Lantheus Holdings, Inc. (Health Care Equip. & Supplies) | (a) | 5,896 | 300,460 | |||||||
Legend Biotech Corp. – ADR (Biotechnology) | (a) | 2,570 | 128,294 | |||||||
Maravai LifeSciences Holdings, Inc. Class A (Life Sciences Tools & Svs.) | (a) | 1,960 | 28,048 | |||||||
Masimo Corp. (Health Care Equip. & Supplies) | (a) | 330 | 48,824 | |||||||
Mettler-Toledo International, Inc. (Life Sciences Tools & Svs.) | (a) | 90 | 130,090 | |||||||
Molina Healthcare, Inc. (Health Care Providers & Svs.) | (a) | 300 | 99,066 | |||||||
Neurocrine Biosciences, Inc. (Biotechnology) | (a) | 802 | 95,791 | |||||||
Oak Street Health, Inc. (Health Care Providers & Svs.) | (a) | 1,240 | 26,672 | |||||||
Pediatrix Medical Group, Inc. (Health Care Providers & Svs.) | (a) | 13,425 | 199,495 | |||||||
PerkinElmer, Inc. (Life Sciences Tools & Svs.) | 420 | 58,892 | ||||||||
QIAGEN N.V. (Life Sciences Tools & Svs.) | (a) | 1,580 | 78,795 | |||||||
Quest Diagnostics, Inc. (Health Care Providers & Svs.) | 580 | 90,735 | ||||||||
Repligen Corp. (Life Sciences Tools & Svs.) | (a) | 2,440 | 413,116 | |||||||
ResMed, Inc. (Health Care Equip. & Supplies) | 590 | 122,797 | ||||||||
Sarepta Therapeutics, Inc. (Biotechnology) | (a) | 838 | 108,588 | |||||||
Seagen, Inc. (Biotechnology) | (a) | 530 | 68,110 | |||||||
Silk Road Medical, Inc. (Health Care Equip. & Supplies) | (a) | 5,318 | 281,056 | |||||||
STERIS PLC (Health Care Equip. & Supplies) | 346 | 63,903 | ||||||||
Syneos Health, Inc. (Life Sciences Tools & Svs.) | (a) | 4,480 | 164,326 | |||||||
Ultragenyx Pharmaceutical, Inc. (Biotechnology) | (a) | 3,059 | 141,723 | |||||||
Universal Health Services, Inc. Class B (Health Care Providers & Svs.) | 510 | 71,854 | ||||||||
Veeva Systems, Inc. Class A (Health Care Technology) | (a) | 560 | 90,373 | |||||||
Viatris, Inc. (Pharmaceuticals) | 5,730 | 63,775 | ||||||||
Vir Biotechnology, Inc. (Biotechnology) | (a) | 4,547 | 115,085 | |||||||
Waters Corp. (Life Sciences Tools & Svs.) | (a) | 253 | 86,673 | |||||||
West Pharmaceutical Services, Inc. (Life Sciences Tools & Svs.) | 300 | 70,605 | ||||||||
Zimmer Biomet Holdings, Inc. (Health Care Equip. & Supplies) | 850 | 108,375 | ||||||||
|
| |||||||||
| 8,899,528 | ||||||||||
|
| |||||||||
INDUSTRIALS – 19.8% | ||||||||||
A.O. Smith Corp. (Building Products) | 1,130 | 64,681 | ||||||||
AECOM (Construction & Engineering) | 3,500 | 297,255 | ||||||||
| Common Stocks (Continued) | Shares | Value | ||||||||
INDUSTRIALS (continued) | ||||||||||
AGCO Corp. (Machinery) | 520 | $ | 72,119 | |||||||
Alaska Air Group, Inc. (Airlines) | (a) | 5,780 | 248,193 | |||||||
Allegion PLC (Building Products) | 570 | 59,998 | ||||||||
AMETEK, Inc. (Electrical Equip.) | 3,442 | 480,916 | ||||||||
Arcosa, Inc. (Construction & Engineering) | 5,082 | 276,156 | ||||||||
Armstrong World Industries, Inc. (Building Products) | 3,102 | 212,766 | ||||||||
Axon Enterprise, Inc. (Aerospace & Defense) | (a) | 2,717 | 450,832 | |||||||
Booz Allen Hamilton Holding Corp. (Professional Svs.) | 920 | 96,158 | ||||||||
C.H. Robinson Worldwide, Inc. (Air Freight & Logistics) | 790 | 72,332 | ||||||||
Carlisle Cos., Inc. (Building Products) | 2,029 | 478,134 | ||||||||
Carrier Global Corp. (Building Products) | 3,550 | 146,438 | ||||||||
Cintas Corp. (Commercial Svs. & Supplies) | 360 | 162,583 | ||||||||
Clarivate PLC (Professional Svs.) | (a) | 4,040 | 33,694 | |||||||
Copart, Inc. (Commercial Svs. & Supplies) | (a) | 1,688 | 102,782 | |||||||
CoStar Group, Inc. (Professional Svs.) | (a) | 1,620 | 125,194 | |||||||
Cummins, Inc. (Machinery) | 610 | 147,797 | ||||||||
Curtiss-Wright Corp. (Aerospace & Defense) | 1,953 | 326,132 | ||||||||
Delta Air Lines, Inc. (Airlines) | (a) | 2,620 | 86,093 | |||||||
Dover Corp. (Machinery) | 590 | 79,892 | ||||||||
Driven Brands Holdings, Inc. (Commercial Svs. & Supplies) | (a) | 13,402 | 366,009 | |||||||
Dycom Industries, Inc. (Construction & Engineering) | (a) | 2,900 | 271,440 | |||||||
Equifax, Inc. (Professional Svs.) | 490 | 95,236 | ||||||||
Expeditors International of Washington, Inc. (Air Freight & Logistics) | 570 | 59,234 | ||||||||
Fastenal Co. (Trading Companies & Distributors) | 2,350 | 111,202 | ||||||||
Fluor Corp. (Construction & Engineering) | (a) | 6,580 | 228,063 | |||||||
Fortive Corp. (Machinery) | 1,210 | 77,743 | ||||||||
FTI Consulting, Inc. (Professional Svs.) | (a) | 2,149 | 341,261 | |||||||
Generac Holdings, Inc. (Electrical Equip.) | (a) | 250 | 25,165 | |||||||
Graco, Inc. (Machinery) | 990 | 66,587 | ||||||||
HEICO Corp. Class A (Aerospace & Defense) | 600 | 71,910 | ||||||||
Herc Holdings, Inc. (Trading Companies & Distributors) | 2,370 | 311,821 | ||||||||
Hexcel Corp. (Aerospace & Defense) | 4,764 | 280,362 | ||||||||
Howmet Aerospace, Inc. (Aerospace & Defense) | 11,477 | 452,309 | ||||||||
Hubbell, Inc. (Electrical Equip.) | 400 | 93,872 | ||||||||
IDEX Corp. (Machinery) | 1,816 | 414,647 | ||||||||
Ingersoll Rand, Inc. (Machinery) | 8,162 | 426,465 | ||||||||
ITT, Inc. (Machinery) | 4,448 | 360,733 | ||||||||
J.B. Hunt Transport Services, Inc. (Road & Rail) | 450 | 78,462 | ||||||||
Jacobs Solutions, Inc. (Professional Svs.) | 573 | 68,800 | ||||||||
Knight-Swift Transportation Holdings, Inc. (Road & Rail) | 6,110 | 320,225 | ||||||||
Korn Ferry (Professional Svs.) | 2,810 | 142,242 | ||||||||
Leidos Holdings, Inc. (Professional Svs.) | 750 | 78,893 | ||||||||
Lennox International, Inc. (Building Products) | 230 | 55,023 | ||||||||
Lyft, Inc. Class A (Road & Rail) | (a) | 1,370 | 15,097 | |||||||
Masco Corp. (Building Products) | 1,190 | 55,537 | ||||||||
Masonite International Corp. (Building Products) | (a) | 2,840 | 228,932 | |||||||
Middleby Corp. / The (Machinery) | (a) | 2,485 | 332,742 | |||||||
Nordson Corp. (Machinery) | 360 | 85,579 | ||||||||
Old Dominion Freight Line, Inc. (Road & Rail) | 400 | 113,512 | ||||||||
Oshkosh Corp. (Machinery) | 2,220 | 195,782 | ||||||||
Otis Worldwide Corp. (Machinery) | 1,680 | 131,561 | ||||||||
Owens Corning (Building Products) | 790 | 67,387 | ||||||||
PACCAR, Inc. (Machinery) | 1,390 | 137,568 | ||||||||
Parker-Hannifin Corp. (Machinery) | 520 | 151,320 | ||||||||
Pentair PLC (Machinery) | 1,180 | 53,076 | ||||||||
Quanta Services, Inc. (Construction & Engineering) | 790 | 112,575 | ||||||||
Regal Rexnord Corp. (Electrical Equip.) | 2,600 | 311,948 | ||||||||
Republic Services, Inc. (Commercial Svs. & Supplies) | 860 | 110,931 | ||||||||
Robert Half International, Inc. (Professional Svs.) | 2,760 | 203,771 | ||||||||
Rockwell Automation, Inc. (Electrical Equip.) | 470 | 121,058 | ||||||||
Rollins, Inc. (Commercial Svs. & Supplies) | 2,040 | 74,542 | ||||||||
RXO, Inc. (Road & Rail) | (a) | 1,867 | 32,112 | |||||||
| 39 | (continued) |
Ohio National Fund, Inc. | ON AB Mid Cap Core Portfolio (Continued) |
| Schedule of Investments | December 31,2022 | |
| Common Stocks (Continued) | Shares | Value | ||||||||
INDUSTRIALS (continued) | ||||||||||
Sensata Technologies Holding PLC (Electrical Equip.) | 6,471 | $ | 261,299 | |||||||
Shoals Technologies Group, Inc. Class A (Electrical Equip.) | (a) | 10,672 | 263,278 | |||||||
SiteOne Landscape Supply, Inc. (Trading Companies & Distributors) | (a) | 2,781 | 326,267 | |||||||
Southwest Airlines Co. (Airlines) | (a) | 2,410 | 81,145 | |||||||
Spirit AeroSystems Holdings, Inc. Class A (Aerospace & Defense) | 10,130 | 299,848 | ||||||||
Stanley Black & Decker, Inc. (Machinery) | 630 | 47,326 | ||||||||
Star Bulk Carriers Corp. (Marine) | 10,210 | 196,338 | ||||||||
Tetra Tech, Inc. (Commercial Svs. & Supplies) | 2,511 | 364,572 | ||||||||
TFI International, Inc. (Road & Rail) | 3,104 | 311,145 | ||||||||
Timken Co. / The (Machinery) | 3,520 | 248,758 | ||||||||
Toro Co. / The (Machinery) | 670 | 75,844 | ||||||||
Trane Technologies PLC (Building Products) | 980 | 164,728 | ||||||||
TransDigm Group, Inc. (Aerospace & Defense) | 220 | 138,523 | ||||||||
TransUnion (Professional Svs.) | 780 | 44,265 | ||||||||
Trex Co., Inc. (Building Products) | (a) | 710 | 30,054 | |||||||
U-Haul Holding Co. (Road & Rail) | 100 | 6,019 | ||||||||
U-Haul Holding Co. NVS (Road & Rail) | 900 | 49,482 | ||||||||
United Rentals, Inc. (Trading Companies & Distributors) | (a) | 298 | 105,915 | |||||||
Verisk Analytics, Inc. (Professional Svs.) | 649 | 114,497 | ||||||||
Vertiv Holdings Co. (Electrical Equip.) | 24,130 | 329,616 | ||||||||
W.W. Grainger, Inc. (Trading Companies & Distributors) | 180 | 100,125 | ||||||||
Watsco, Inc. (Trading Companies & Distributors) | 260 | 64,844 | ||||||||
Westinghouse Air Brake Technologies Corp. (Machinery) | 930 | 92,823 | ||||||||
XPO, Inc. (Road & Rail) | (a) | 8,560 | 284,963 | |||||||
Xylem, Inc. (Machinery) | 730 | 80,716 | ||||||||
|
| |||||||||
| 15,435,269 | ||||||||||
|
| |||||||||
INFORMATION TECHNOLOGY – 16.5% |
| |||||||||
ACI Worldwide, Inc. (Software) | (a) | 10,710 | 246,330 | |||||||
Amdocs Ltd. (IT Svs.) | 1,000 | 90,900 | ||||||||
Amphenol Corp. Class A (Electronic Equip., Instr. & Comp.) | 2,390 | 181,975 | ||||||||
ANSYS, Inc. (Software) | (a) | 350 | 84,557 | |||||||
AppLovin Corp. Class A (Software) | (a) | 1,630 | 17,164 | |||||||
Arista Networks, Inc. (Communications Equip.) | (a) | 870 | 105,574 | |||||||
Aspen Technology, Inc. (Software) | (a) | 310 | 63,674 | |||||||
Avnet, Inc. (Electronic Equip., Instr. & Comp.) | 5,849 | 243,201 | ||||||||
Belden, Inc. (Electronic Equip., Instr. & Comp.) | 2,690 | 193,411 | ||||||||
Bill.com Holdings, Inc. (Software) | (a) | 490 | 53,390 | |||||||
Broadridge Financial Solutions, Inc. (IT Svs.) | 477 | 63,980 | ||||||||
Cadence Design Systems, Inc. (Software) | (a) | 1,130 | 181,523 | |||||||
CDW Corp. (Electronic Equip., Instr. & Comp.) | 590 | 105,362 | ||||||||
Ciena Corp. (Communications Equip.) | (a) | 4,618 | 235,426 | |||||||
Cloudflare, Inc. Class A (IT Svs.) | (a) | 900 | 40,689 | |||||||
CommVault Systems, Inc. (Software) | (a) | 4,320 | 271,469 | |||||||
Corning, Inc. (Electronic Equip., Instr. & Comp.) | 3,080 | 98,375 | ||||||||
Coupa Software, Inc. (Software) | (a) | 300 | 23,751 | |||||||
Crowdstrike Holdings, Inc. Class A (Software) | (a) | 727 | 76,546 | |||||||
Datadog, Inc. Class A (Software) | (a) | 924 | 67,914 | |||||||
DigitalOcean Holdings, Inc. (IT Svs.) | (a) | 5,280 | 134,482 | |||||||
DocuSign, Inc. (Software) | (a) | 740 | 41,011 | |||||||
Dropbox, Inc. Class A (Software) | (a) | 2,970 | 66,469 | |||||||
Dynatrace, Inc. (Software) | (a) | 12,143 | 465,077 | |||||||
Elastic N.V. (Software) | (a) | 630 | 32,445 | |||||||
Enphase Energy, Inc. (Semiconductors & Equip.) | (a) | 550 | 145,728 | |||||||
Entegris, Inc. (Semiconductors & Equip.) | 680 | 44,601 | ||||||||
EPAM Systems, Inc. (IT Svs.) | (a) | 220 | 72,103 | |||||||
Euronet Worldwide, Inc. (IT Svs.) | (a) | 536 | 50,588 | |||||||
Fair Isaac Corp. (Software) | (a) | 148 | 88,590 | |||||||
First Solar, Inc. (Semiconductors & Equip.) | (a) | 370 | 55,422 | |||||||
Five9, Inc. (Software) | (a) | 4,762 | 323,149 | |||||||
FleetCor Technologies, Inc. (IT Svs.) | (a) | 340 | 62,451 | |||||||
Flywire Corp. (IT Svs.) | (a) | 12,323 | 301,544 | |||||||
Fortinet, Inc. (Software) | (a) | 2,700 | 132,003 | |||||||
Freshworks, Inc. Class A (Software) | (a) | 15,518 | 228,270 | |||||||
Gartner, Inc. (IT Svs.) | (a) | 390 | 131,095 | |||||||
Gen Digital, Inc. (Software) | 14,150 | 303,234 | ||||||||
Genpact Ltd. (IT Svs.) | 4,840 | �� | 224,189 | |||||||
| Common Stocks (Continued) | Shares | Value | ||||||||
INFORMATION TECHNOLOGY (continued) |
| |||||||||
Global Payments, Inc. (IT Svs.) | 960 | $ | 95,347 | |||||||
GLOBALFOUNDRIES, Inc. (Semiconductors & Equip.) | (a) | 860 | 46,345 | |||||||
Hewlett Packard Enterprise Co. (Tech. Hardware, Storage & Periph.) | 5,300 | 84,588 | ||||||||
HP, Inc. (Tech. Hardware, Storage & Periph.) | 3,620 | 97,269 | ||||||||
HubSpot, Inc. (Software) | (a) | 949 | 274,384 | |||||||
Jack Henry & Associates, Inc. (IT Svs.) | 470 | 82,513 | ||||||||
Juniper Networks, Inc. (Communications Equip.) | 2,480 | 79,261 | ||||||||
Keysight Technologies, Inc. (Electronic Equip., Instr. & Comp.) | (a) | 760 | 130,013 | |||||||
Kulicke & Soffa Industries, Inc. (Semiconductors & Equip.) | 4,190 | 185,449 | ||||||||
Lattice Semiconductor Corp. (Semiconductors & Equip.) | (a) | 6,218 | 403,424 | |||||||
Littelfuse, Inc. (Electronic Equip., Instr. & Comp.) | 1,312 | 288,902 | ||||||||
Lumentum Holdings, Inc. (Communications Equip.) | (a) | 3,180 | 165,901 | |||||||
MACOM Technology Solutions Holdings, Inc. (Semiconductors & Equip.) | (a) | 5,704 | 359,238 | |||||||
Manhattan Associates, Inc. (Software) | (a) | 3,162 | 383,867 | |||||||
Microchip Technology, Inc. (Semiconductors & Equip.) | 2,046 | 143,731 | ||||||||
Monday.com Ltd. (Software) | (a) | 1,735 | 211,670 | |||||||
MongoDB, Inc. (IT Svs.) | (a) | 228 | 44,880 | |||||||
Monolithic Power Systems, Inc. | ||||||||||
(Semiconductors & Equip.) | 755 | 266,976 | ||||||||
Motorola Solutions, Inc. (Communications Equip.) | 700 | 180,397 | ||||||||
National Instruments Corp. (Electronic Equip., Instr. & Comp.) | 1,839 | 67,859 | ||||||||
Novanta, Inc. (Electronic Equip., Instr. & Comp.) | (a) | 2,739 | 372,148 | |||||||
ON Semiconductor Corp. (Semiconductors & Equip.) | (a) | 6,704 | 418,128 | |||||||
Palantir Technologies, Inc. Class A (Software) | (a) | 6,290 | 40,382 | |||||||
Paychex, Inc. (IT Svs.) | 1,320 | 152,539 | ||||||||
Paycom Software, Inc. (Software) | (a) | 200 | 62,062 | |||||||
PTC, Inc. (Software) | (a) | 4,145 | 497,566 | |||||||
Qorvo, Inc. (Semiconductors & Equip.) | (a) | 470 | 42,601 | |||||||
Shift4 Payments, Inc. Class A (IT Svs.) | (a) | 6,663 | 372,662 | |||||||
Skyworks Solutions, Inc. (Semiconductors & Equip.) | 680 | 61,968 | ||||||||
Smartsheet, Inc. Class A (Software) | (a) | 8,006 | 315,116 | |||||||
Splunk, Inc. (Software) | (a) | 660 | 56,819 | |||||||
SS&C Technologies Holdings, Inc. (IT Svs.) | 1,030 | 53,622 | ||||||||
Synaptics, Inc. (Semiconductors & Equip.) | (a) | 2,440 | 232,190 | |||||||
Synopsys, Inc. (Software) | (a) | 620 | 197,960 | |||||||
Teledyne Technologies, Inc. (Electronic Equip., Instr. & Comp.) | (a) | 175 | 69,984 | |||||||
Teradyne, Inc. (Semiconductors & Equip.) | 680 | 59,398 | ||||||||
Trimble, Inc. (Electronic Equip., Instr. & Comp.) | (a) | 1,020 | 51,571 | |||||||
Twilio, Inc. Class A (IT Svs.) | (a) | 620 | 30,355 | |||||||
Tyler Technologies, Inc. (Software) | (a) | 180 | 58,034 | |||||||
Ubiquiti, Inc. (Communications Equip.) | 200 | 54,706 | ||||||||
Unity Software, Inc. (Software) | (a) | 750 | 21,443 | |||||||
Universal Display Corp. (Semiconductors & Equip.) | 2,744 | 296,462 | ||||||||
VeriSign, Inc. (IT Svs.) | (a) | 410 | 84,230 | |||||||
Western Digital Corp. (Tech. Hardware, Storage & Periph.) | (a) | 1,250 | 39,438 | |||||||
Wix.com Ltd. (IT Svs.) | (a) | 250 | 19,208 | |||||||
Wolfspeed, Inc. (Semiconductors & Equip.) | (a) | 772 | 53,299 | |||||||
Zebra Technologies Corp. Class A (Electronic Equip., Instr. & Comp.) | (a) | 220 | 56,410 | |||||||
Zoom Video Communications, Inc. Class A (Software) | (a) | 870 | 58,934 | |||||||
Zscaler, Inc. (Software) | (a) | 370 | 41,403 | |||||||
|
| |||||||||
| 12,810,314 | ||||||||||
|
| |||||||||
MATERIALS – 4.6% | ||||||||||
Albemarle Corp. (Chemicals) | 470 | 101,924 | ||||||||
Alcoa Corp. (Metals & Mining) | 894 | 40,650 | ||||||||
Amcor PLC (Containers & Packaging) | 6,490 | 77,296 | ||||||||
| 40 | (continued) |
Ohio National Fund, Inc. | ON AB Mid Cap Core Portfolio (Continued) |
| Schedule of Investments | December 31,2022 | |
| Common Stocks (Continued) | Shares | Value | ||||||||
MATERIALS (continued) | ||||||||||
ATI, Inc. (Metals & Mining) | (a) | 9,680 | $ | 289,045 | ||||||
Avery Dennison Corp. (Containers & Packaging) | 360 | 65,160 | ||||||||
Ball Corp. (Containers & Packaging) | 1,300 | 66,482 | ||||||||
Berry Global Group, Inc. (Containers & Packaging) | 6,830 | 412,737 | ||||||||
Celanese Corp. (Chemicals) | 490 | 50,098 | ||||||||
CF Industries Holdings, Inc. (Chemicals) | 750 | 63,900 | ||||||||
Corteva, Inc. (Chemicals) | 3,080 | 181,043 | ||||||||
Crown Holdings, Inc. (Containers & Packaging) | 630 | 51,792 | ||||||||
DuPont de Nemours, Inc. (Chemicals) | 1,750 | 120,103 | ||||||||
Eastman Chemical Co. (Chemicals) | 660 | 53,750 | ||||||||
FMC Corp. (Chemicals) | 3,020 | 376,896 | ||||||||
Huntsman Corp. (Chemicals) | 10,590 | 291,013 | ||||||||
Innospec, Inc. (Chemicals) | 1,370 | 140,918 | ||||||||
International Flavors & Fragrances, Inc. (Chemicals) | 939 | 98,445 | ||||||||
International Paper Co. (Containers & Packaging) | 1,610 | 55,754 | ||||||||
LyondellBasell Industries N.V. Class A (Chemicals) | 1,050 | 87,182 | ||||||||
Martin Marietta Materials, Inc. (Construction Materials) | 250 | 84,493 | ||||||||
Mosaic Co. / The (Chemicals) | 1,320 | 57,908 | ||||||||
Nucor Corp. (Metals & Mining) | 1,230 | 162,126 | ||||||||
Packaging Corp. of America (Containers & Packaging) | 520 | 66,513 | ||||||||
PPG Industries, Inc. (Chemicals) | 970 | 121,968 | ||||||||
Reliance Steel & Aluminum Co. (Metals & Mining) | 880 | 178,147 | ||||||||
Sealed Air Corp. (Containers & Packaging) | 1,230 | 61,352 | ||||||||
Steel Dynamics, Inc. (Metals & Mining) | 662 | 64,677 | ||||||||
Vulcan Materials Co. (Construction Materials) | 540 | 94,560 | ||||||||
Westrock Co. (Containers & Packaging) | 1,370 | 48,169 | ||||||||
|
| |||||||||
| 3,564,101 | ||||||||||
|
| |||||||||
REAL ESTATE – 5.1% | ||||||||||
Alexandria Real Estate Equities, Inc. (Equity REIT) | 550 | 80,119 | ||||||||
American Homes 4 Rent Class A (Equity REIT) | 2,060 | 62,088 | ||||||||
Americold Realty Trust, Inc. (Equity REIT) | 1,890 | 53,506 | ||||||||
AvalonBay Communities, Inc. (Equity REIT) | 570 | 92,066 | ||||||||
Boston Properties, Inc. (Equity REIT) | 700 | 47,306 | ||||||||
Broadstone Net Lease, Inc. (Equity REIT) | 11,850 | 192,089 | ||||||||
Camden Property Trust (Equity REIT) | 2,360 | 264,037 | ||||||||
CBRE Group, Inc. Class A (Real Estate Mgmt. & Development) | (a) | 1,370 | 105,435 | |||||||
Cousins Properties, Inc. (Equity REIT) | 6,060 | 153,257 | ||||||||
CubeSmart (Equity REIT) | 7,070 | 284,568 | ||||||||
Equity LifeStyle Properties, Inc. (Equity REIT) | 1,100 | 71,060 | ||||||||
Equity Residential (Equity REIT) | 1,510 | 89,090 | ||||||||
Essex Property Trust, Inc. (Equity REIT) | 270 | 57,218 | ||||||||
Extra Space Storage, Inc. (Equity REIT) | 530 | 78,005 | ||||||||
Gaming and Leisure Properties, Inc. (Equity REIT) | 1,640 | 85,428 | ||||||||
Healthpeak Properties, Inc. (Equity REIT) | 2,220 | 55,655 | ||||||||
Host Hotels & Resorts, Inc. (Equity REIT) | 3,060 | 49,113 | ||||||||
| Common Stocks (Continued) | Shares | Value | ||||||||
REAL ESTATE (continued) | ||||||||||
Invitation Homes, Inc. (Equity REIT) | 2,300 | $ | 68,172 | |||||||
Iron Mountain, Inc. (Equity REIT) | 1,900 | 94,715 | ||||||||
Jones Lang LaSalle, Inc. (Real Estate Mgmt. & Development) | (a) | 410 | 65,342 | |||||||
Kimco Realty Corp. (Equity REIT) | 3,630 | 76,883 | ||||||||
Lamar Advertising Co. Class A (Equity REIT) | 767 | 72,405 | ||||||||
Medical Properties Trust, Inc. (Equity REIT) | 3,460 | 38,544 | ||||||||
Mid-America Apartment Communities, Inc. (Equity REIT) | 480 | 75,355 | ||||||||
Physicians Realty Trust (Equity REIT) | 18,120 | 262,196 | ||||||||
Realty Income Corp. (Equity REIT) | 2,650 | 168,090 | ||||||||
Regency Centers Corp. (Equity REIT) | 1,200 | 75,000 | ||||||||
SBA Communications Corp. (Equity REIT) | 420 | 117,730 | ||||||||
Simon Property Group, Inc. (Equity REIT) | 1,340 | 157,423 | ||||||||
STAG Industrial, Inc. (Equity REIT) | 6,670 | 215,508 | ||||||||
STORE Capital Corp. (Equity REIT) | 2,130 | 68,288 | ||||||||
Sun Communities, Inc. (Equity REIT) | 460 | 65,780 | ||||||||
UDR, Inc. (Equity REIT) | 1,640 | 63,517 | ||||||||
Ventas, Inc. (Equity REIT) | 1,530 | 68,927 | ||||||||
VICI Properties, Inc. (Equity REIT) | 3,360 | 108,864 | ||||||||
W.P. Carey, Inc. (Equity REIT) | 1,020 | 79,713 | ||||||||
Welltower, Inc. (Equity REIT) | 1,710 | 112,091 | ||||||||
Weyerhaeuser Co. (Equity REIT) | 3,060 | 94,860 | ||||||||
|
| |||||||||
| 3,969,443 | ||||||||||
|
| |||||||||
UTILITIES – 3.2% | ||||||||||
AES Corp. / The (Ind. Power & Renewable Elec.) | 2,310 | 66,436 | ||||||||
Ameren Corp. (Multi-Utilities) | 1,010 | 89,809 | ||||||||
American Water Works Co., Inc. (Water Utilities) | 750 | 114,315 | ||||||||
Atmos Energy Corp. (Gas Utilities) | 530 | 59,397 | ||||||||
Avangrid, Inc. (Electric Utilities) | 1,500 | 64,470 | ||||||||
CenterPoint Energy, Inc. (Multi-Utilities) | 2,070 | 62,079 | ||||||||
CMS Energy Corp. (Multi-Utilities) | 1,180 | 74,729 | ||||||||
Consolidated Edison, Inc. (Multi-Utilities) | 1,410 | 134,387 | ||||||||
Constellation Energy Corp. (Electric Utilities) | 1,120 | 96,555 | ||||||||
DTE Energy Co. (Multi-Utilities) | 790 | 92,849 | ||||||||
Edison International (Electric Utilities) | 1,470 | 93,521 | ||||||||
Entergy Corp. (Electric Utilities) | 830 | 93,375 | ||||||||
Essential Utilities, Inc. (Water Utilities) | 1,620 | 77,323 | ||||||||
Eversource Energy (Electric Utilities) | 1,400 | 117,376 | ||||||||
FirstEnergy Corp. (Electric Utilities) | 2,210 | 92,687 | ||||||||
IDACORP, Inc. (Electric Utilities) | 3,460 | 373,161 | ||||||||
PG&E Corp. (Electric Utilities) | (a) | 7,056 | 114,731 | |||||||
PPL Corp. (Electric Utilities) | 3,140 | 91,751 | ||||||||
Public Service Enterprise Group, Inc. (Multi-Utilities) | 2,070 | 126,829 | ||||||||
Southwest Gas Holdings, Inc. (Gas Utilities) | 2,711 | 167,757 | ||||||||
WEC Energy Group, Inc. (Multi-Utilities) | 1,290 | 120,950 | ||||||||
Xcel Energy, Inc. (Electric Utilities) | 2,150 | 150,737 | ||||||||
|
| |||||||||
| 2,475,224 | ||||||||||
|
| |||||||||
Total Common Stocks (Cost $85,731,466) | $ | 76,853,117 | ||||||||
|
| |||||||||
Total Investments – 98.8% (Cost $85,731,466) | (b) | $ | 76,853,117 | |||||||
Other Assets in Excess of Liabilities – 1.2% | (c) | 940,639 | ||||||||
|
| |||||||||
Net Assets – 100.0% | $ | 77,793,756 | ||||||||
|
| |||||||||
Percentages are stated as a percent of net assets.
Abbreviations:
| ADR: | American Depositary Receipts |
| NVS: | Non Voting Shares |
Footnotes:
| (a) | Non-income producing security. |
| (b) | Represents cost for financial reporting purposes, which may differ from cost basis for federal income tax purposes. See also Note 7 of the Notes to Financial Statements. |
| (c) | Includes $13,500 of cash pledged as collateral for the futures contracts outstanding at December 31, 2022. See also the following Schedule of Open Futures Contracts. |
The accompanying notes are an integral part of these financial statements.
| 41 |
Ohio National Fund, Inc. | ON AB Mid Cap Core Portfolio (Continued) |
| Schedule of Open Futures Contracts | December 31, 2022 | |
Description | Number of contracts | Expiration Date | Notional Amount | Value | Unrealized Appreciation (Depreciation) | Variation Margin Receivable (Payable) | ||||||
CME E-mini S&P MidCap 400 Index - Long | 1 | March 17, 2023 | $251,472 | $244,260 | $(7,212) | $(1,340) |
The accompanying notes are an integral part of these financial statements.
| 42 |
| ON S&P 500® Index Portfolio (Unaudited) |
| Objective/Strategy |
The ON S&P 500® Index Portfolio seeks total return approximating that of the Standard & Poor’s 500® Index (S&P 500® Index), at a risk level consistent with that of the S&P 500® Index by investing, under normal circumstances, more than 80% of its net assets in the common stocks and other securities of companies that are included in the S&P 500® Index.
| Performance as of December 31, 2022 | ||
Average Annual returns | ||||
One year | -18.42 | % | ||
Five years | 9.01 | % | ||
Ten years | 12.10 | % |
Past performance does not guarantee future results. The performance data quoted represents past performance and current returns may be lower or higher. Total return figures include change in share price and reinvestment of dividends and capital gains. The investment return and principal value will fluctuate so that an investor’s shares, when redeemed, may be worth more or less than the original cost. To obtain performance information up to the most recent month end, call toll-free 1-877-781-6392.
The Portfolio is not open to direct retail investment. Beneficial interest in the Portfolio’s shares is obtained either through an allocation to the Portfolio as an investment vehicle within variable life insurance policies or annuity contracts, or as an underlying investment by the ON Model Portfolios. Actual performance results for variable annuity and variable universal life contracts will be lower due to contract charges. Consult your contract for applicable charges.
Total expense ratio is 0.37% per the Fund’s prospectus dated April 29, 2022. Additional information pertaining to the Portfolio’s expense ratio as of December 31, 2022 can be found in the Portfolio’s Financial Highlights.
| Comments from Sub-Adviser |
Q. How did the Portfolio perform in comparison to its benchmark during the reporting period?
A. For the year ended December 31, 2022, the Portfolio returned -18.42% versus -18.11% for its benchmark, the S&P 500® Index.
Q. Were there specific market conditions, investment strategies, or techniques that materially affected the Portfolio’s benchmark-relative performance during the reporting period?
A. The Portfolio intends to track the underlying return of the S&P 500® Index. There were no material market events or changes in strategy during the year that materially impacted the Portfolio’s relative return. Sources of return variance were the Portfolio’s expenses and the cumulative impact of investing the day-to-day cash flows in the Portfolio.
Q. How did sector allocation and security selection each impact the Portfolio’s performance relative to its benchmark?
A. There was no impact from either sector allocation or stock selection that caused any significant performance variance between the Portfolio and its benchmark for the year. Information Technology, followed by Consumer Discretionary and Communication Services were the top detractors from performance. Energy and Utilities were the only sectors that contributed for the year. (1)
Q. Which securities contributed the most to, and detracted the most from, the Portfolio’s benchmark-relative performance?
A. Because the Portfolio weights its holdings to be similar to those utilized by the benchmark, there were no holdings that significantly contributed to, or detracted from, the Portfolio’s benchmark-relative performance for the year. Benchmark constituents that contributed the
most to Portfolio and benchmark returns were Exxon Mobil Corp., Chevron Corp., and Merck & Co., Inc. Amazon.com, Inc., Apple, Inc., and Microsoft Corp. were the leading detractors. (1)
Q. How did the Portfolio’s use of derivative instruments impact performance?
A. The Portfolio uses long CME E-mini S&P 500 Index futures contracts primarily to equitize open dividend receivables, as well as to manage day-to-day cash flows, to ensure the Portfolio is fully invested. Futures contracts, in aggregate, detracted 8 basis points from the Portfolio’s absolute return for the year. (1)
| (1) | The Portfolio’s composition is subject to change. Holdings and weightings are as of December 31, 2022. |
| Change in Value of $10,000 Investment |
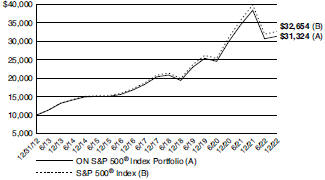
Hypothetical illustration based on past performance. Future performance will vary. The Portfolio’s returns reflect reinvested dividends. The Portfolio’s holdings may differ significantly from the securities in the index. The index is unmanaged and therefore does not reflect the cost of portfolio management and accounting. Investors cannot invest directly in an index, although they can invest in its underlying securities or funds.
The S&P 500® Index is a capitalization-weighted index designed to measure performance of the broad domestic economy through changes in the aggregate market value of 500 stocks representing all major industries. The index presented includes the effects of reinvested dividends.
Past performance is no guarantee of future results. Redemption of fund shares could have tax implications unique to each shareholder.
The S&P 500® Index is a product of S&P Dow Jones Indices LLC or its affiliates (“SPDJI”), and has been licensed for use by Ohio National Investments, Inc. (“ONI”). Standard & Poor’s® and S&P® are registered trademarks of Standard & Poor’s Financial Services LLC (“S&P”); Dow Jones® is a registered trademark of Dow Jones Trademark Holdings LLC (“Dow Jones”); and these trademarks have been licensed for use by SPDJI and sublicensed for certain purposes by ONI. The S&P 500® Index Portfolio of Ohio National Fund, Inc. is not sponsored, endorsed, sold or promoted by SPDJI, Dow Jones, S&P, their respective affiliates, and none of such parties make any representation regarding the advisability of investing in such product(s) nor do they have any liability for any errors, omissions, or interruptions of the S&P 500® Index.
| 43 | (continued) |
Ohio National Fund, Inc. | ON S&P 500® Index Portfolio (Unaudited) (Continued) |
| Portfolio Composition as of December 31, 2022 (1) | ||
| % of Net Assets | ||||
Common Stocks (4) | 98.5 | |||
U.S. Treasury Obligations | 0.0 | |||
Other Net Assets | 1.5 | |||
|
| |||
| 100.0 | ||||
|
| |||
| Top 10 Portfolio Holdings as of December 31, 2022 (1) (2) (3) | ||||
| % of Net Assets | ||||||||
| 1. | Apple, Inc. | 6.0 | ||||||
| 2. | Microsoft Corp. | 5.5 | ||||||
| 3. | Amazon.com, Inc. | 2.3 | ||||||
| 4. | Berkshire Hathaway, Inc. Class B | 1.7 | ||||||
| 5. | Alphabet, Inc. Class A | 1.6 | ||||||
| 6. | UnitedHealth Group, Inc. | 1.5 | ||||||
| 7. | Alphabet, Inc. Class C | 1.4 | ||||||
| 8. | Johnson & Johnson | 1.4 | ||||||
| 9. | Exxon Mobil Corp. | 1.4 | ||||||
| 10. | JPMorgan Chase & Co. | 1.2 | ||||||
| (1) | Composition of Portfolio subject to change. |
| (2) | Short-term investments have been excluded from the list of Top 10 Portfolio Holdings. |
| (3) | Top 10 Portfolio Holdings is presented at an individual security level. Total investment exposure by issuer may be higher. |
| (4) | Sectors (Common Stocks): |
| % of Net Assets | ||||
| Information Technology | 25.3 | |||
| Health Care | 15.6 | |||
| Financials | 11.5 | |||
| Consumer Discretionary | 9.6 | |||
| Industrials | 8.5 | |||
| Communication Services | 7.2 | |||
| Consumer Staples | 7.1 | |||
| Energy | 5.2 | |||
| Utilities | 3.1 | |||
| Materials | 2.7 | |||
| Real Estate | 2.7 | |||
|
| |||
| 98.5 | ||||
|
| |||
| 44 |
Ohio National Fund, Inc. | ON S&P 500® Index Portfolio | |
| Schedule of Investments | December 31, 2022 | |
| Common Stocks – 98.5% | Shares | Value | ||||||||
COMMUNICATION SERVICES – 7.2% | ||||||||||
Activision Blizzard, Inc. (Entertainment) | 22,338 | $ | 1,709,974 | |||||||
Alphabet, Inc. Class A (Interactive Media & Svs.) | (a) | 187,226 | 16,518,950 | |||||||
Alphabet, Inc. Class C (Interactive Media & Svs.) | (a) | 166,152 | 14,742,667 | |||||||
AT&T, Inc. (Diversified Telecom. Svs.) | 223,517 | 4,114,948 | ||||||||
Charter Communications, Inc. Class A (Media) | (a) | 3,368 | 1,142,089 | |||||||
Comcast Corp. Class A (Media) | 135,283 | 4,730,847 | ||||||||
DISH Network Corp. Class A (Media) | (a) | 7,905 | 110,986 | |||||||
Electronic Arts, Inc. (Entertainment) | 8,213 | 1,003,464 | ||||||||
Fox Corp. Class A (Media) | 9,338 | 283,595 | ||||||||
Fox Corp. Class B (Media) | 4,517 | 128,509 | ||||||||
Interpublic Group of Cos., Inc. / The (Media) | 12,206 | 406,582 | ||||||||
Live Nation Entertainment, Inc. (Entertainment) | (a) | 4,476 | 312,156 | |||||||
Lumen Technologies, Inc. (Diversified Telecom Svs.) | 29,487 | 153,922 | ||||||||
Match Group, Inc. (Interactive Media & Svs.) | (a) | 8,756 | 363,286 | |||||||
Meta Platforms, Inc. Class A (Interactive Media & Svs.) | (a) | 70,522 | 8,486,618 | |||||||
Netflix, Inc. (Entertainment) | (a) | 13,956 | 4,115,345 | |||||||
News Corp. Class A (Media) | 11,817 | 215,069 | ||||||||
News Corp. Class B (Media) | 3,846 | 70,920 | ||||||||
Omnicom Group, Inc. (Media) | 6,392 | 521,395 | ||||||||
Paramount Global Class B (Media) | 15,842 | 267,413 | ||||||||
Take-Two Interactive Software, Inc. (Entertainment) | (a) | 4,947 | 515,131 | |||||||
T-Mobile U.S., Inc. (Wireless Telecom. Svs.) | (a) | 18,727 | 2,621,780 | |||||||
Verizon Communications, Inc. (Diversified Telecom. Svs.) | 131,719 | 5,189,729 | ||||||||
Walt Disney Co. / The (Entertainment) | (a) | 57,170 | 4,966,930 | |||||||
Warner Bros Discovery, Inc. (Entertainment) | (a) | 69,424 | 658,140 | |||||||
|
| |||||||||
| 73,350,445 | ||||||||||
|
| |||||||||
CONSUMER DISCRETIONARY – 9.6% | ||||||||||
Advance Auto Parts, Inc. (Specialty Retail) | 1,899 | 279,210 | ||||||||
Amazon.com, Inc. (Internet & Direct Marketing Retail) | (a) | 278,347 | 23,381,148 | |||||||
Aptiv PLC (Auto Components) | (a) | 8,505 | 792,071 | |||||||
AutoZone, Inc. (Specialty Retail) | (a) | 595 | 1,467,377 | |||||||
Bath & Body Works, Inc. (Specialty Retail) | 7,167 | 302,017 | ||||||||
Best Buy Co., Inc. (Specialty Retail) | 6,312 | 506,285 | ||||||||
Booking Holdings, Inc. (Hotels, Restaurants & Leisure) | (a) | 1,216 | 2,450,580 | |||||||
BorgWarner, Inc. (Auto Components) | 7,301 | 293,865 | ||||||||
Caesars Entertainment, Inc. (Hotels, Restaurants & Leisure) | (a) | 6,764 | 281,382 | |||||||
CarMax, Inc. (Specialty Retail) | (a) | 4,942 | 300,918 | |||||||
Carnival Corp. (Hotels, Restaurants & Leisure) | (a) | 31,137 | 250,964 | |||||||
Chipotle Mexican Grill, Inc. (Hotels, Restaurants & Leisure) | (a) | 869 | 1,205,729 | |||||||
D.R. Horton, Inc. (Household Durables) | 9,793 | 872,948 | ||||||||
Darden Restaurants, Inc. (Hotels, Restaurants & Leisure) | 3,839 | 531,049 | ||||||||
Dollar General Corp. (Multiline Retail) | 7,070 | 1,740,987 | ||||||||
Dollar Tree, Inc. (Multiline Retail) | (a) | 6,590 | 932,090 | |||||||
Domino’s Pizza, Inc. (Hotels, Restaurants & Leisure) | 1,109 | 384,158 | ||||||||
eBay, Inc. (Internet & Direct Marketing Retail) | 17,012 | 705,488 | ||||||||
Etsy, Inc. (Internet & Direct Marketing Retail) | (a) | 3,941 | 472,053 | |||||||
Expedia Group, Inc. (Hotels, Restaurants & Leisure) | (a) | 4,718 | 413,297 | |||||||
Ford Motor Co. (Automobiles) | 123,864 | 1,440,538 | ||||||||
Garmin Ltd. (Household Durables) | 4,807 | 443,638 | ||||||||
General Motors Co. (Automobiles) | 44,555 | 1,498,830 | ||||||||
Genuine Parts Co. (Distributors) | 4,412 | 765,526 | ||||||||
Hasbro, Inc. (Leisure Products) | 4,050 | 247,090 | ||||||||
Hilton Worldwide Holdings, Inc. (Hotels, Restaurants & Leisure) | 8,470 | 1,070,269 | ||||||||
Home Depot, Inc. / The (Specialty Retail) | 32,112 | 10,142,896 | ||||||||
| Common Stocks (Continued) | Shares | Value | ||||||||
CONSUMER DISCRETIONARY (continued) |
| |||||||||
Las Vegas Sands Corp. (Hotels, Restaurants & Leisure) | (a) | 10,351 | $ | 497,573 | ||||||
Lennar Corp. Class A (Household Durables) | 7,986 | 722,733 | ||||||||
LKQ Corp. (Distributors) | 7,958 | 425,037 | ||||||||
Lowe’s Cos., Inc. (Specialty Retail) | 19,464 | 3,878,007 | ||||||||
Marriott International, Inc. Class A (Hotels, Restaurants & Leisure) | 8,431 | 1,255,292 | ||||||||
McDonald’s Corp. (Hotels, Restaurants & Leisure) | 22,974 | 6,054,338 | ||||||||
MGM Resorts International (Hotels, Restaurants & Leisure) | 9,971 | 334,328 | ||||||||
Mohawk Industries, Inc. (Household Durables) | (a) | 1,681 | 171,832 | |||||||
Newell Brands, Inc. (Household Durables) | 11,877 | 155,351 | ||||||||
NIKE, Inc. Class B (Textiles, Apparel & Luxury Goods) | 39,505 | 4,622,480 | ||||||||
Norwegian Cruise Line Holdings Ltd. (Hotels, Restaurants & Leisure) | (a) | 13,358 | 163,502 | |||||||
NVR, Inc. (Household Durables) | (a) | 94 | 433,583 | |||||||
O’Reilly Automotive, Inc. (Specialty Retail) | (a) | 1,962 | 1,655,987 | |||||||
Pool Corp. (Distributors) | 1,225 | 370,354 | ||||||||
PulteGroup, Inc. (Household Durables) | 7,143 | 325,221 | ||||||||
Ralph Lauren Corp. (Textiles, Apparel & Luxury Goods) | 1,286 | 135,892 | ||||||||
Ross Stores, Inc. (Specialty Retail) | 10,880 | 1,262,842 | ||||||||
Royal Caribbean Cruises Ltd. (Hotels, Restaurants & Leisure) | (a) | 6,904 | 341,265 | |||||||
Starbucks Corp. (Hotels, Restaurants & Leisure) | 35,993 | 3,570,506 | ||||||||
Tapestry, Inc. (Textiles, Apparel & Luxury Goods) | 7,550 | 287,504 | ||||||||
Target Corp. (Multiline Retail) | 14,438 | 2,151,839 | ||||||||
Tesla, Inc. (Automobiles) | (a) | 84,177 | 10,368,923 | |||||||
TJX Cos., Inc. / The (Specialty Retail) | 36,408 | 2,898,077 | ||||||||
Tractor Supply Co. (Specialty Retail) | 3,462 | 778,846 | ||||||||
Ulta Beauty, Inc. (Specialty Retail) | (a) | 1,606 | 753,326 | |||||||
V.F. Corp. (Textiles, Apparel & Luxury Goods) | 10,356 | 285,929 | ||||||||
Whirlpool Corp. (Household Durables) | 1,704 | 241,048 | ||||||||
Wynn Resorts Ltd. (Hotels, Restaurants & Leisure) | (a) | 3,242 | 267,368 | |||||||
Yum! Brands, Inc. (Hotels, Restaurants & Leisure) | 8,826 | 1,130,434 | ||||||||
|
| |||||||||
| 98,711,820 | ||||||||||
|
| |||||||||
CONSUMER STAPLES – 7.1% | ||||||||||
Altria Group, Inc. (Tobacco) | 56,247 | 2,571,050 | ||||||||
Archer-Daniels-Midland Co. (Food Products) | 17,225 | 1,599,341 | ||||||||
Brown-Forman Corp. Class B (Beverages) | 5,754 | 377,923 | ||||||||
Campbell Soup Co. (Food Products) | 6,264 | 355,482 | ||||||||
Church & Dwight Co., Inc. (Household Products) | 7,644 | 616,183 | ||||||||
Clorox Co. / The (Household Products) | 3,866 | 542,516 | ||||||||
Coca-Cola Co. / The (Beverages) | 122,050 | 7,763,600 | ||||||||
Colgate-Palmolive Co. (Household Products) | 26,180 | 2,062,722 | ||||||||
Conagra Brands, Inc. (Food Products) | 15,025 | 581,467 | ||||||||
Constellation Brands, Inc. Class A (Beverages) | 5,089 | 1,179,376 | ||||||||
Costco Wholesale Corp. (Food & Staples Retailing) | 13,880 | 6,336,220 | ||||||||
Estee Lauder Cos., Inc. / The Class A (Personal Products) | 7,256 | 1,800,286 | ||||||||
General Mills, Inc. (Food Products) | 18,623 | 1,561,539 | ||||||||
Hershey Co. / The (Food Products) | 4,617 | 1,069,159 | ||||||||
Hormel Foods Corp. (Food Products) | 9,112 | 415,052 | ||||||||
J.M. Smucker Co. / The (Food Products) | 3,338 | 528,939 | ||||||||
Kellogg Co. (Food Products) | 8,021 | 571,416 | ||||||||
Keurig Dr Pepper, Inc. (Beverages) | 26,668 | 950,981 | ||||||||
Kimberly-Clark Corp. (Household Products) | 10,590 | 1,437,592 | ||||||||
Kraft Heinz Co. / The (Food Products) | 24,917 | 1,014,371 | ||||||||
Kroger Co. / The (Food & Staples Retailing) | 20,448 | 911,572 | ||||||||
Lamb Weston Holdings, Inc. (Food Products) | 4,535 | 405,248 | ||||||||
McCormick & Co., Inc. (Food Products) | 7,861 | 651,598 | ||||||||
| 45 | (continued) |
Ohio National Fund, Inc. | ON S&P 500® Index Portfolio (Continued) | |
| Schedule of Investments | December 31, 2022 | |
| Common Stocks (Continued) | Shares | Value | ||||||||
CONSUMER STAPLES (continued) | ||||||||||
Molson Coors Beverage Co. Class B (Beverages) | 5,903 | $ | 304,123 | |||||||
Mondelez International, Inc. Class A (Food Products) | 42,840 | 2,855,286 | ||||||||
Monster Beverage Corp. (Beverages) | (a) | 11,942 | 1,212,471 | |||||||
PepsiCo, Inc. (Beverages) | 43,203 | 7,805,054 | ||||||||
Philip Morris International, Inc. (Tobacco) | 48,608 | 4,919,616 | ||||||||
Procter & Gamble Co. / The (Household Products) | 74,315 | 11,263,181 | ||||||||
Sysco Corp. (Food & Staples Retailing) | 15,909 | 1,216,243 | ||||||||
Tyson Foods, Inc. Class A (Food Products) | 9,078 | 565,106 | ||||||||
Walgreens Boots Alliance, Inc. (Food & Staples Retailing) | 22,530 | 841,721 | ||||||||
Walmart, Inc. (Food & Staples Retailing) | 44,260 | 6,275,625 | ||||||||
|
| |||||||||
| 72,562,059 | ||||||||||
|
| |||||||||
ENERGY – 5.2% | ||||||||||
APA Corp. (Oil, Gas & Consumable Fuels) | 10,082 | 470,628 | ||||||||
Baker Hughes Co. (Energy Equip. & Svs.) | 31,412 | 927,596 | ||||||||
Chevron Corp. (Oil, Gas & Consumable Fuels) | 55,792 | 10,014,106 | ||||||||
ConocoPhillips (Oil, Gas & Consumable Fuels) | 39,080 | 4,611,440 | ||||||||
Coterra Energy, Inc. (Oil, Gas & Consumable Fuels) | 24,760 | 608,353 | ||||||||
Devon Energy Corp. (Oil, Gas & Consumable Fuels) | 20,521 | 1,262,247 | ||||||||
Diamondback Energy, Inc. (Oil, Gas & Consumable Fuels) | 5,508 | 753,384 | ||||||||
EOG Resources, Inc. (Oil, Gas & Consumable Fuels) | 18,423 | 2,386,147 | ||||||||
EQT Corp. (Oil, Gas & Consumable Fuels) | 11,510 | 389,383 | ||||||||
Exxon Mobil Corp. (Oil, Gas & Consumable Fuels) | 129,159 | 14,246,238 | ||||||||
Halliburton Co. (Energy Equip. & Svs.) | 28,482 | 1,120,767 | ||||||||
Hess Corp. (Oil, Gas & Consumable Fuels) | 8,695 | 1,233,125 | ||||||||
Kinder Morgan, Inc. (Oil, Gas & Consumable Fuels) | 61,932 | 1,119,731 | ||||||||
Marathon Oil Corp. (Oil, Gas & Consumable Fuels) | 19,917 | 539,153 | ||||||||
Marathon Petroleum Corp. (Oil, Gas & Consumable Fuels) | 14,698 | 1,710,700 | ||||||||
Occidental Petroleum Corp. (Oil, Gas & Consumable Fuels) | 22,804 | 1,436,424 | ||||||||
ONEOK, Inc. (Oil, Gas & Consumable Fuels) | 14,020 | 921,114 | ||||||||
Phillips 66 (Oil, Gas & Consumable Fuels) | 14,824 | 1,542,882 | ||||||||
Pioneer Natural Resources Co. (Oil, Gas & Consumable Fuels) | 7,452 | 1,701,962 | ||||||||
Schlumberger Ltd. / N.V. (Energy Equip. & Svs.) | 44,474 | 2,377,580 | ||||||||
Targa Resources Corp. (Oil, Gas & Consumable Fuels) | 7,096 | 521,556 | ||||||||
Valero Energy Corp. (Oil, Gas & Consumable Fuels) | 12,091 | 1,533,864 | ||||||||
Williams Cos., Inc. / The (Oil, Gas & Consumable Fuels) | 38,204 | 1,256,912 | ||||||||
|
| |||||||||
| 52,685,292 | ||||||||||
|
| |||||||||
FINANCIALS – 11.5% | ||||||||||
Aflac, Inc. (Insurance) | 17,746 | 1,276,647 | ||||||||
Allstate Corp. / The (Insurance) | 8,317 | 1,127,785 | ||||||||
American Express Co. (Consumer Finance) | 18,760 | 2,771,790 | ||||||||
American International Group, Inc. (Insurance) | 23,303 | 1,473,682 | ||||||||
Ameriprise Financial, Inc. (Capital Markets) | 3,337 | 1,039,042 | ||||||||
Aon PLC Class A (Insurance) | 6,486 | 1,946,708 | ||||||||
Arch Capital Group Ltd. (Insurance) | (a) | 11,601 | 728,311 | |||||||
Arthur J. Gallagher & Co. (Insurance) | 6,612 | 1,246,626 | ||||||||
Assurant, Inc. (Insurance) | 1,654 | 206,849 | ||||||||
Bank of America Corp. (Banks) | 218,886 | 7,249,504 | ||||||||
Bank of New York Mellon Corp. / The (Capital Markets) | 23,095 | 1,051,284 | ||||||||
| Common Stocks (Continued) | Shares | Value | ||||||||
FINANCIALS (continued) | ||||||||||
Berkshire Hathaway, Inc. Class B (Diversified Financial Svs.) | (a) | 56,503 | $ | 17,453,777 | ||||||
BlackRock, Inc. (Capital Markets) | 4,708 | 3,336,230 | ||||||||
Brown & Brown, Inc. (Insurance) | 7,383 | 420,610 | ||||||||
Capital One Financial Corp. (Consumer Finance) | 11,986 | 1,114,219 | ||||||||
CBOE Global Markets, Inc. (Capital Markets) | 3,339 | 418,944 | ||||||||
Charles Schwab Corp. / The (Capital Markets) | 47,835 | 3,982,742 | ||||||||
Chubb Ltd. (Insurance) | 13,018 | 2,871,771 | ||||||||
Cincinnati Financial Corp. (Insurance) | 4,930 | 504,783 | ||||||||
Citigroup, Inc. (Banks) | 60,738 | 2,747,180 | ||||||||
Citizens Financial Group, Inc. (Banks) | 15,414 | 606,849 | ||||||||
CME Group, Inc. (Capital Markets) | 11,282 | 1,897,181 | ||||||||
Comerica, Inc. (Banks) | 4,104 | 274,352 | ||||||||
Discover Financial Services (Consumer Finance) | 8,576 | 838,990 | ||||||||
Everest Re Group Ltd. (Insurance) | 1,225 | 405,806 | ||||||||
FactSet Research Systems, Inc. (Capital Markets) | 1,194 | 479,045 | ||||||||
Fifth Third Bancorp (Banks) | 21,549 | 707,023 | ||||||||
First Republic Bank (Banks) | 5,737 | 699,283 | ||||||||
Franklin Resources, Inc. (Capital Markets) | 8,862 | 233,780 | ||||||||
Globe Life, Inc. (Insurance) | 2,821 | 340,072 | ||||||||
Goldman Sachs Group, Inc. / The (Capital Markets) | 10,619 | 3,646,352 | ||||||||
Hartford Financial Services Group, Inc. / The (Insurance) | 9,977 | 756,556 | ||||||||
Huntington Bancshares, Inc. (Banks) | 45,270 | 638,307 | ||||||||
Intercontinental Exchange, Inc. (Capital Markets) | 17,516 | 1,796,966 | ||||||||
Invesco Ltd. (Capital Markets) | 14,261 | 256,555 | ||||||||
JPMorgan Chase & Co. (Banks) | 91,989 | 12,335,725 | ||||||||
KeyCorp (Banks) | 29,247 | 509,483 | ||||||||
Lincoln National Corp. (Insurance) | 4,793 | 147,241 | ||||||||
Loews Corp. (Insurance) | 6,189 | 361,004 | ||||||||
M&T Bank Corp. (Banks) | 5,413 | 785,210 | ||||||||
MarketAxess Holdings, Inc. (Capital Markets) | 1,188 | 331,321 | ||||||||
Marsh & McLennan Cos., Inc. (Insurance) | 15,549 | 2,573,049 | ||||||||
MetLife, Inc. (Insurance) | 20,670 | 1,495,888 | ||||||||
Moody’s Corp. (Capital Markets) | 4,945 | 1,377,776 | ||||||||
Morgan Stanley (Capital Markets) | 41,339 | 3,514,642 | ||||||||
MSCI, Inc. (Capital Markets) | 2,512 | 1,168,507 | ||||||||
Nasdaq, Inc. (Capital Markets) | 10,644 | 653,009 | ||||||||
Northern Trust Corp. (Capital Markets) | 6,534 | 578,194 | ||||||||
PNC Financial Services Group, Inc. / The (Banks) | 12,648 | 1,997,625 | ||||||||
Principal Financial Group, Inc. (Insurance) | 7,136 | 598,853 | ||||||||
Progressive Corp. / The (Insurance) | 18,350 | 2,380,179 | ||||||||
Prudential Financial, Inc. (Insurance) | 11,540 | 1,147,768 | ||||||||
Raymond James Financial, Inc. (Capital Markets) | 6,057 | 647,190 | ||||||||
Regions Financial Corp. (Banks) | 29,335 | 632,463 | ||||||||
S&P Global, Inc. (Capital Markets) | 10,443 | 3,497,778 | ||||||||
Signature Bank (Banks) | 1,963 | 226,177 | ||||||||
State Street Corp. (Capital Markets) | 11,480 | 890,504 | ||||||||
SVB Financial Group (Banks) | (a) | 1,860 | 428,060 | |||||||
Synchrony Financial (Consumer Finance) | 14,096 | 463,195 | ||||||||
T. Rowe Price Group, Inc. (Capital Markets) | 7,005 | 763,965 | ||||||||
Travelers Cos., Inc. / The (Insurance) | 7,351 | 1,378,239 | ||||||||
Truist Financial Corp. (Banks) | 41,608 | 1,790,392 | ||||||||
U.S. Bancorp (Banks) | 42,405 | 1,849,282 | ||||||||
W.R. Berkley Corp. (Insurance) | 6,439 | 467,278 | ||||||||
Wells Fargo & Co. (Banks) | 119,500 | 4,934,155 | ||||||||
Willis Towers Watson PLC (Insurance) | 3,394 | 830,105 | ||||||||
Zions Bancorp N.A. (Banks) | 4,659 | 229,036 | ||||||||
|
| |||||||||
| 117,528,894 | ||||||||||
|
| |||||||||
HEALTH CARE – 15.6% | ||||||||||
Abbott Laboratories (Health Care Equip. & Supplies) | 54,700 | 6,005,513 | ||||||||
| 46 | (continued) |
Ohio National Fund, Inc. | ON S&P 500® Index Portfolio (Continued) | |
| Schedule of Investments | December 31, 2022 | |
| Common Stocks (Continued) | Shares | Value | ||||||||
HEALTH CARE (continued) | ||||||||||
AbbVie, Inc. (Biotechnology) | 55,460 | $ | 8,962,891 | |||||||
Agilent Technologies, Inc. (Life Sciences Tools & Svs.) | 9,283 | 1,389,201 | ||||||||
Align Technology, Inc. (Health Care Equip. & Supplies) | (a) | 2,287 | 482,328 | |||||||
AmerisourceBergen Corp. (Health Care Providers & Svs.) | 5,090 | 843,464 | ||||||||
Amgen, Inc. (Biotechnology) | 16,732 | 4,394,492 | ||||||||
Baxter International, Inc. (Health Care Equip. & Supplies) | 15,816 | 806,142 | ||||||||
Becton Dickinson and Co. (Health Care Equip. & Supplies) | 8,941 | 2,273,696 | ||||||||
Biogen, Inc. (Biotechnology) | (a) | 4,513 | 1,249,740 | |||||||
Bio-Rad Laboratories, Inc. Class A (Life Sciences Tools & Svs.) | (a) | 675 | 283,831 | |||||||
Bio-Techne Corp. (Life Sciences Tools & Svs.) | 4,938 | 409,261 | ||||||||
Boston Scientific Corp. (Health Care Equip. & Supplies) | (a) | 44,895 | 2,077,292 | |||||||
Bristol-Myers Squibb Co. (Pharmaceuticals) | 66,690 | 4,798,346 | ||||||||
Cardinal Health, Inc. (Health Care Providers & Svs.) | 8,218 | 631,718 | ||||||||
Catalent, Inc. (Pharmaceuticals) | (a) | 5,640 | 253,856 | |||||||
Centene Corp. (Health Care Providers & Svs.) | (a) | 17,755 | 1,456,088 | |||||||
Charles River Laboratories International, Inc. (Life Sciences Tools & Svs.) | (a) | 1,599 | 348,422 | |||||||
Cigna Corp. (Health Care Providers & Svs.) | 9,587 | 3,176,557 | ||||||||
Cooper Cos., Inc. / The (Health Care Equip. & Supplies) | 1,554 | 513,861 | ||||||||
CVS Health Corp. (Health Care Providers & Svs.) | 41,204 | 3,839,801 | ||||||||
Danaher Corp. (Life Sciences Tools & Svs.) | 20,546 | 5,453,319 | ||||||||
DaVita, Inc. (Health Care Providers & Svs.) | (a) | 1,718 | 128,283 | |||||||
DENTSPLY SIRONA, Inc. (Health Care Equip. & Supplies) | 6,721 | 213,997 | ||||||||
Dexcom, Inc. (Health Care Equip. & Supplies) | (a) | 12,111 | 1,371,450 | |||||||
Edwards Lifesciences Corp. (Health Care Equip. & Supplies) | (a) | 19,358 | 1,444,300 | |||||||
Elevance Health, Inc. (Health Care Providers & Svs.) | 7,488 | 3,841,119 | ||||||||
Eli Lilly & Co. (Pharmaceuticals) | 24,732 | 9,047,955 | ||||||||
Gilead Sciences, Inc. (Biotechnology) | 39,331 | 3,376,566 | ||||||||
HCA Healthcare, Inc. (Health Care Providers & Svs.) | 6,648 | 1,595,254 | ||||||||
Henry Schein, Inc. (Health Care Providers & Svs.) | (a) | 4,274 | 341,364 | |||||||
Hologic, Inc. (Health Care Equip. & Supplies) | (a) | 7,822 | 585,164 | |||||||
Humana, Inc. (Health Care Providers & Svs.) | 3,970 | 2,033,394 | ||||||||
IDEXX Laboratories, Inc. (Health Care Equip. & Supplies) | (a) | 2,600 | 1,060,696 | |||||||
Illumina, Inc. (Life Sciences Tools & Svs.) | (a) | 4,932 | 997,250 | |||||||
Incyte Corp. (Biotechnology) | (a) | 5,819 | 467,382 | |||||||
Intuitive Surgical, Inc. (Health Care Equip. & Supplies) | (a) | 11,080 | 2,940,078 | |||||||
IQVIA Holdings, Inc. (Life Sciences Tools & Svs.) | (a) | 5,826 | 1,193,689 | |||||||
Johnson & Johnson (Pharmaceuticals) | 81,991 | 14,483,710 | ||||||||
Laboratory Corp. of America Holdings (Health Care Providers & Svs.) | 2,777 | 653,928 | ||||||||
McKesson Corp. (Health Care Providers & Svs.) | 4,446 | 1,667,784 | ||||||||
Medtronic PLC (Health Care Equip. & Supplies) | 41,675 | 3,238,981 | ||||||||
Merck & Co., Inc. (Pharmaceuticals) | 79,508 | 8,821,413 | ||||||||
Mettler-Toledo International, Inc. (Life Sciences Tools & Svs.) | (a) | 699 | 1,010,370 | |||||||
Moderna, Inc. (Biotechnology) | (a) | 10,361 | 1,861,043 | |||||||
Molina Healthcare, Inc. (Health Care Providers & Svs.) | (a) | 1,831 | 604,633 | |||||||
Organon & Co. (Pharmaceuticals) | 8,013 | 223,803 | ||||||||
PerkinElmer, Inc. (Life Sciences Tools & Svs.) | 3,957 | 554,851 | ||||||||
| Common Stocks (Continued) | Shares | Value | ||||||||
HEALTH CARE (continued) | ||||||||||
Pfizer, Inc. (Pharmaceuticals) | 176,035 | $ | 9,020,033 | |||||||
Quest Diagnostics, Inc. (Health Care Providers & Svs.) | 3,569 | 558,334 | ||||||||
Regeneron Pharmaceuticals, Inc. (Biotechnology) | (a) | 3,358 | 2,422,763 | |||||||
ResMed, Inc. (Health Care Equip. & Supplies) | 4,598 | 956,982 | ||||||||
STERIS PLC (Health Care Equip. & Supplies) | 3,131 | 578,264 | ||||||||
Stryker Corp. (Health Care Equip. & Supplies) | 10,558 | 2,581,325 | ||||||||
Teleflex, Inc. (Health Care Equip. & Supplies) | 1,474 | 367,955 | ||||||||
Thermo Fisher Scientific, Inc. (Life Sciences Tools & Svs.) | 12,300 | 6,773,487 | ||||||||
UnitedHealth Group, Inc. (Health Care Providers & Svs.) | 29,301 | 15,534,804 | ||||||||
Universal Health Services, Inc. Class B (Health Care Providers & Svs.) | 2,016 | 284,034 | ||||||||
Vertex Pharmaceuticals, Inc. (Biotechnology) | (a) | 8,049 | 2,324,390 | |||||||
Viatris, Inc. (Pharmaceuticals) | 38,173 | 424,865 | ||||||||
Waters Corp. (Life Sciences Tools & Svs.) | (a) | 1,863 | 638,227 | |||||||
West Pharmaceutical Services, Inc. (Life Sciences Tools & Svs.) | 2,322 | 546,483 | ||||||||
Zimmer Biomet Holdings, Inc. (Health Care Equip. & Supplies) | 6,597 | 841,118 | ||||||||
Zoetis, Inc. (Pharmaceuticals) | 14,617 | 2,142,121 | ||||||||
|
| |||||||||
| 159,403,461 | ||||||||||
|
| |||||||||
INDUSTRIALS – 8.5% | ||||||||||
3M Co. (Industrial Conglomerates) | 17,336 | 2,078,933 | ||||||||
A.O. Smith Corp. (Building Products) | 3,971 | 227,300 | ||||||||
Alaska Air Group, Inc. (Airlines) | (a) | 3,955 | 169,828 | |||||||
Allegion PLC (Building Products) | 2,769 | 291,465 | ||||||||
American Airlines Group, Inc. (Airlines) | (a) | 20,432 | 259,895 | |||||||
AMETEK, Inc. (Electrical Equip.) | 7,205 | 1,006,683 | ||||||||
Boeing Co. / The (Aerospace & Defense) | (a) | 17,569 | 3,346,719 | |||||||
C.H. Robinson Worldwide, Inc. (Air Freight & Logistics) | 3,690 | 337,856 | ||||||||
Carrier Global Corp. (Building Products) | 26,254 | 1,082,978 | ||||||||
Caterpillar, Inc. (Machinery) | 16,321 | 3,909,859 | ||||||||
Cintas Corp. (Commercial Svs. & Supplies) | 2,705 | 1,221,632 | ||||||||
Copart, Inc. (Commercial Svs. & Supplies) | (a) | 13,435 | 818,057 | |||||||
CoStar Group, Inc. (Professional Svs.) | (a) | 12,752 | 985,475 | |||||||
CSX Corp. (Road & Rail) | 65,935 | 2,042,666 | ||||||||
Cummins, Inc. (Machinery) | 4,429 | 1,073,102 | ||||||||
Deere & Co. (Machinery) | 8,613 | 3,692,910 | ||||||||
Delta Air Lines, Inc. (Airlines) | (a) | 20,077 | 659,730 | |||||||
Dover Corp. (Machinery) | 4,401 | 595,939 | ||||||||
Eaton Corp. PLC (Electrical Equip.) | 12,474 | 1,957,794 | ||||||||
Emerson Electric Co. (Electrical Equip.) | 18,546 | 1,781,529 | ||||||||
Equifax, Inc. (Professional Svs.) | 3,844 | 747,120 | ||||||||
Expeditors International of Washington, Inc. (Air Freight & Logistics) | 4,989 | 518,457 | ||||||||
Fastenal Co. (Trading Companies & Distributors) | 17,939 | 848,874 | ||||||||
FedEx Corp. (Air Freight & Logistics) | 7,507 | 1,300,212 | ||||||||
Fortive Corp. (Machinery) | 11,102 | 713,304 | ||||||||
Generac Holdings, Inc. (Electrical Equip.) | (a) | 1,986 | 199,911 | |||||||
General Dynamics Corp. (Aerospace & Defense) | 7,059 | 1,751,409 | ||||||||
General Electric Co. (Industrial Conglomerates) | 34,241 | 2,869,053 | ||||||||
Honeywell International, Inc. (Industrial Conglomerates) | 21,084 | 4,518,301 | ||||||||
Howmet Aerospace, Inc. (Aerospace & Defense) | 11,511 | 453,649 | ||||||||
Huntington Ingalls Industries, Inc. (Aerospace & Defense) | 1,261 | 290,887 | ||||||||
IDEX Corp. (Machinery) | 2,365 | 540,000 | ||||||||
Illinois Tool Works, Inc. (Machinery) | 8,766 | 1,931,150 | ||||||||
Ingersoll Rand, Inc. (Machinery) | 12,696 | 663,366 | ||||||||
J.B. Hunt Transport Services, Inc. (Road & Rail) | 2,591 | 451,767 | ||||||||
| 47 | (continued) |
Ohio National Fund, Inc. | ON S&P 500® Index Portfolio (Continued) | |
| Schedule of Investments | December 31, 2022 | |
| Common Stocks (Continued) | Shares | Value | ||||||||
INDUSTRIALS (continued) | ||||||||||
Jacobs Solutions, Inc. (Professional Svs.) | 3,999 | $ | 480,160 | |||||||
Johnson Controls International PLC (Building Products) | 21,593 | 1,381,952 | ||||||||
L3Harris Technologies, Inc. (Aerospace & Defense) | 5,973 | 1,243,638 | ||||||||
Leidos Holdings, Inc. (Professional Svs.) | 4,307 | 453,053 | ||||||||
Lockheed Martin Corp. (Aerospace & Defense) | 7,315 | 3,558,674 | ||||||||
Masco Corp. (Building Products) | 7,071 | 330,004 | ||||||||
Nordson Corp. (Machinery) | 1,680 | 399,370 | ||||||||
Norfolk Southern Corp. (Road & Rail) | 7,261 | 1,789,256 | ||||||||
Northrop Grumman Corp. (Aerospace & Defense) | 4,533 | 2,473,250 | ||||||||
Old Dominion Freight Line, Inc. (Road & Rail) | 2,841 | 806,219 | ||||||||
Otis Worldwide Corp. (Machinery) | 13,061 | 1,022,807 | ||||||||
PACCAR, Inc. (Machinery) | 10,926 | 1,081,346 | ||||||||
Parker-Hannifin Corp. (Machinery) | 4,026 | 1,171,566 | ||||||||
Pentair PLC (Machinery) | 5,130 | 230,747 | ||||||||
Quanta Services, Inc. (Construction & Engineering) | 4,491 | 639,968 | ||||||||
Raytheon Technologies Corp. (Aerospace & Defense) | 46,127 | 4,655,137 | ||||||||
Republic Services, Inc. (Commercial Svs. & Supplies) | 6,452 | 832,243 | ||||||||
Robert Half International, Inc. (Professional Svs.) | 3,401 | 251,096 | ||||||||
Rockwell Automation, Inc. (Electrical Equip.) | 3,602 | 927,767 | ||||||||
Rollins, Inc. (Commercial Svs. & Supplies) | 7,313 | 267,217 | ||||||||
Snap-on, Inc. (Machinery) | 1,676 | 382,949 | ||||||||
Southwest Airlines Co. (Airlines) | (a) | 18,638 | 627,541 | |||||||
Stanley Black & Decker, Inc. (Machinery) | 4,644 | 348,857 | ||||||||
Textron, Inc. (Aerospace & Defense) | 6,528 | 462,182 | ||||||||
Trane Technologies PLC (Building Products) | 7,226 | 1,214,618 | ||||||||
TransDigm Group, Inc. (Aerospace & Defense) | 1,619 | 1,019,403 | ||||||||
Union Pacific Corp. (Road & Rail) | 19,281 | 3,992,517 | ||||||||
United Airlines Holdings, Inc. (Airlines) | (a) | 10,305 | 388,499 | |||||||
United Parcel Service, Inc. Class B (Air Freight & Logistics) | 22,899 | 3,980,762 | ||||||||
United Rentals, Inc. (Trading Companies & Distributors) | (a) | 2,167 | 770,195 | |||||||
Verisk Analytics, Inc. (Professional Svs.) | 4,901 | 864,634 | ||||||||
W.W. Grainger, Inc. (Trading Companies & Distributors) | 1,413 | 785,981 | ||||||||
Waste Management, Inc. (Commercial Svs. & Supplies) | 11,712 | 1,837,379 | ||||||||
Westinghouse Air Brake Technologies Corp. (Machinery) | 5,701 | 569,017 | ||||||||
Xylem, Inc. (Machinery) | 5,652 | 624,942 | ||||||||
|
| |||||||||
| 87,202,756 | ||||||||||
|
| |||||||||
INFORMATION TECHNOLOGY – 25.3% |
| |||||||||
Accenture PLC Class A (IT Svs.) | 19,757 | 5,271,958 | ||||||||
Adobe, Inc. (Software) | (a) | 14,580 | 4,906,607 | |||||||
Advanced Micro Devices, Inc. (Semiconductors & Equip.) | (a) | 50,564 | 3,275,030 | |||||||
Akamai Technologies, Inc. (IT Svs.) | (a) | 4,928 | 415,430 | |||||||
Amphenol Corp. Class A (Electronic Equip., Instr. & Comp.) | 18,670 | 1,421,534 | ||||||||
Analog Devices, Inc. (Semiconductors & Equip.) | 16,128 | 2,645,476 | ||||||||
ANSYS, Inc. (Software) | (a) | 2,732 | 660,024 | |||||||
Apple, Inc. (Tech. Hardware, Storage & Periph.) | 468,965 | 60,932,622 | ||||||||
Applied Materials, Inc. (Semiconductors & Equip.) | 26,977 | 2,627,020 | ||||||||
Arista Networks, Inc. (Communications Equip.) | (a) | 7,762 | 941,919 | |||||||
Autodesk, Inc. (Software) | (a) | 6,780 | 1,266,979 | |||||||
Automatic Data Processing, Inc. (IT Svs.) | 13,009 | 3,107,330 | ||||||||
Broadcom, Inc. (Semiconductors & Equip.) | 12,701 | 7,101,510 | ||||||||
Broadridge Financial Solutions, Inc. (IT Svs.) | 3,687 | 494,537 | ||||||||
Cadence Design Systems, Inc. (Software) | (a) | 8,603 | 1,381,986 | |||||||
| Common Stocks (Continued) | Shares | Value | ||||||||
INFORMATION TECHNOLOGY (continued) |
| |||||||||
CDW Corp. (Electronic Equip., Instr. & Comp.) | 4,249 | $ | 758,786 | |||||||
Ceridian HCM Holding, Inc. (Software) | (a) | 4,815 | 308,882 | |||||||
Cisco Systems, Inc. (Communications Equip.) | 128,773 | 6,134,746 | ||||||||
Cognizant Technology Solutions Corp. Class A (IT Svs.) | 16,091 | 920,244 | ||||||||
Corning, Inc. (Electronic Equip., Instr. & Comp.) | 23,904 | 763,494 | ||||||||
DXC Technology Co. (IT Svs.) | (a) | 7,204 | 190,906 | |||||||
Enphase Energy, Inc. (Semiconductors & Equip.) | (a) | 4,263 | 1,129,525 | |||||||
EPAM Systems, Inc. (IT Svs.) | (a) | 1,803 | 590,915 | |||||||
F5, Inc. (Communications Equip.) | (a) | 1,876 | 269,225 | |||||||
Fidelity National Information Services, Inc. (IT Svs.) | 18,608 | 1,262,553 | ||||||||
First Solar, Inc. (Semiconductors & Equip.) | (a) | 3,109 | 465,697 | |||||||
Fiserv, Inc. (IT Svs.) | (a) | 19,913 | 2,012,607 | |||||||
FleetCor Technologies, Inc. (IT Svs.) | (a) | 2,311 | 424,485 | |||||||
Fortinet, Inc. (Software) | (a) | 20,335 | 994,178 | |||||||
Gartner, Inc. (IT Svs.) | (a) | 2,484 | 834,972 | |||||||
Gen Digital, Inc. (Software) | 18,175 | 389,490 | ||||||||
Global Payments, Inc. (IT Svs.) | 8,478 | 842,035 | ||||||||
Hewlett Packard Enterprise Co. (Tech. Hardware, Storage & Periph.) | 40,391 | 644,640 | ||||||||
HP, Inc. (Tech. Hardware, Storage & Periph.) | 27,755 | 745,777 | ||||||||
Intel Corp. (Semiconductors & Equip.) | 129,422 | 3,420,623 | ||||||||
International Business Machines Corp. (IT Svs.) | 28,353 | 3,994,654 | ||||||||
Intuit, Inc. (Software) | 8,840 | 3,440,705 | ||||||||
Jack Henry & Associates, Inc. (IT Svs.) | 2,293 | 402,559 | ||||||||
Juniper Networks, Inc. (Communications Equip.) | 10,173 | 325,129 | ||||||||
Keysight Technologies, Inc. (Electronic Equip., Instr. & Comp.) | (a) | 5,596 | 957,308 | |||||||
KLA Corp. (Semiconductors & Equip.) | 4,443 | 1,675,144 | ||||||||
Lam Research Corp. (Semiconductors & Equip.) | 4,277 | 1,797,623 | ||||||||
Mastercard, Inc. Class A (IT Svs.) | 26,622 | 9,257,268 | ||||||||
Microchip Technology, Inc. (Semiconductors & Equip.) | 17,252 | 1,211,953 | ||||||||
Micron Technology, Inc. (Semiconductors & Equip.) | 34,093 | 1,703,968 | ||||||||
Microsoft Corp. (Software) | 233,783 | 56,065,839 | ||||||||
Monolithic Power Systems, Inc. (Semiconductors & Equip.) | 1,398 | 494,347 | ||||||||
Motorola Solutions, Inc. (Communications Equip.) | 5,243 | 1,351,174 | ||||||||
NetApp, Inc. (Tech. Hardware, Storage & Periph.) | 6,813 | 409,189 | ||||||||
NVIDIA Corp. (Semiconductors & Equip.) | 78,088 | 11,411,780 | ||||||||
NXP Semiconductors N.V. (Semiconductors & Equip.) | 8,125 | 1,283,994 | ||||||||
ON Semiconductor Corp. (Semiconductors & Equip.) | (a) | 13,594 | 847,858 | |||||||
Oracle Corp. (Software) | 48,196 | 3,939,541 | ||||||||
Paychex, Inc. (IT Svs.) | 10,057 | 1,162,187 | ||||||||
Paycom Software, Inc. (Software) | (a) | 1,519 | 471,361 | |||||||
PayPal Holdings, Inc. (IT Svs.) | (a) | 35,751 | 2,546,186 | |||||||
PTC, Inc. (Software) | (a) | 3,329 | 399,613 | |||||||
Qorvo, Inc. (Semiconductors & Equip.) | (a) | 3,189 | 289,051 | |||||||
QUALCOMM, Inc. (Semiconductors & Equip.) | 35,155 | 3,864,941 | ||||||||
Roper Technologies, Inc. (Software) | 3,326 | 1,437,131 | ||||||||
Salesforce, Inc. (Software) | (a) | 31,361 | 4,158,155 | |||||||
Seagate Technology Holdings PLC (Tech. Hardware, Storage & Periph.) | 6,044 | 317,975 | ||||||||
ServiceNow, Inc. (Software) | (a) | 6,335 | 2,459,690 | |||||||
Skyworks Solutions, Inc. (Semiconductors & Equip.) | 5,056 | 460,753 | ||||||||
SolarEdge Technologies, Inc. (Semiconductors & Equip.) | (a) | 1,750 | 495,723 | |||||||
Synopsys, Inc. (Software) | (a) | 4,796 | 1,531,315 | |||||||
TE Connectivity Ltd. (Electronic Equip., Instr. & Comp.) | 9,957 | 1,143,064 | ||||||||
| 48 | (continued) |
Ohio National Fund, Inc. | ON S&P 500® Index Portfolio (Continued) | |
| Schedule of Investments | December 31, 2022 | |
| Common Stocks (Continued) | Shares | Value | ||||||||
INFORMATION TECHNOLOGY (continued) |
| |||||||||
Teledyne Technologies, Inc. (Electronic Equip., Instr. & Comp.) | (a) | 1,470 | $ | 587,868 | ||||||
Teradyne, Inc. (Semiconductors & Equip.) | 4,880 | 426,268 | ||||||||
Texas Instruments, Inc. (Semiconductors & Equip.) | 28,461 | 4,702,326 | ||||||||
Trimble, Inc. (Electronic Equip., Instr. & Comp.) | (a) | 7,707 | 389,666 | |||||||
Tyler Technologies, Inc. (Software) | (a) | 1,308 | 421,712 | |||||||
VeriSign, Inc. (IT Svs.) | (a) | 2,897 | 595,160 | |||||||
Visa, Inc. (IT Svs.) | 51,276 | 10,653,102 | ||||||||
Western Digital Corp. (Tech. Hardware, Storage & Periph.) | (a) | 9,955 | 314,080 | |||||||
Zebra Technologies Corp. Class A (Electronic Equip., Instr. & Comp.) | (a) | 1,610 | 412,820 | |||||||
|
| |||||||||
| 259,363,922 | ||||||||||
|
| |||||||||
MATERIALS – 2.7% | ||||||||||
Air Products and Chemicals, Inc. (Chemicals) | 6,956 | 2,144,256 | ||||||||
Albemarle Corp. (Chemicals) | 3,677 | 797,394 | ||||||||
Amcor PLC (Containers & Packaging) | 46,641 | 555,494 | ||||||||
Avery Dennison Corp. (Containers & Packaging) | 2,532 | 458,292 | ||||||||
Ball Corp. (Containers & Packaging) | 9,852 | 503,831 | ||||||||
Celanese Corp. (Chemicals) | 3,128 | 319,807 | ||||||||
CF Industries Holdings, Inc. (Chemicals) | 6,146 | 523,639 | ||||||||
Corteva, Inc. (Chemicals) | 22,377 | 1,315,320 | ||||||||
Dow, Inc. (Chemicals) | 22,074 | 1,112,309 | ||||||||
DuPont de Nemours, Inc. (Chemicals) | 15,579 | 1,069,187 | ||||||||
Eastman Chemical Co. (Chemicals) | 3,738 | 304,423 | ||||||||
Ecolab, Inc. (Chemicals) | 7,778 | 1,132,166 | ||||||||
FMC Corp. (Chemicals) | 3,934 | 490,963 | ||||||||
Freeport-McMoRan, Inc. (Metals & Mining) | 44,820 | 1,703,160 | ||||||||
International Flavors & Fragrances, Inc. (Chemicals) | 8,009 | 839,664 | ||||||||
International Paper Co. (Containers & Packaging) | 11,126 | 385,293 | ||||||||
Linde PLC (Chemicals) | 15,505 | 5,057,421 | ||||||||
LyondellBasell Industries N.V. Class A (Chemicals) | 7,979 | 662,496 | ||||||||
Martin Marietta Materials, Inc. (Construction Materials) | 1,944 | 657,014 | ||||||||
Mosaic Co. / The (Chemicals) | 10,690 | 468,970 | ||||||||
Newmont Corp. (Metals & Mining) | 24,905 | 1,175,516 | ||||||||
Nucor Corp. (Metals & Mining) | 8,044 | 1,060,280 | ||||||||
Packaging Corp. of America (Containers & Packaging) | 2,913 | 372,602 | ||||||||
PPG Industries, Inc. (Chemicals) | 7,381 | 928,087 | ||||||||
Sealed Air Corp. (Containers & Packaging) | 4,493 | 224,111 | ||||||||
Sherwin-Williams Co. / The (Chemicals) | 7,396 | 1,755,293 | ||||||||
Steel Dynamics, Inc. (Metals & Mining) | 5,230 | 510,971 | ||||||||
Vulcan Materials Co. (Construction Materials) | 4,175 | 731,084 | ||||||||
Westrock Co. (Containers & Packaging) | 8,009 | 281,596 | ||||||||
|
| |||||||||
| 27,540,639 | ||||||||||
|
| |||||||||
REAL ESTATE – 2.7% | ||||||||||
Alexandria Real Estate Equities, Inc. (Equity REIT) | 4,680 | 681,736 | ||||||||
American Tower Corp. (Equity REIT) | 14,600 | 3,093,156 | ||||||||
AvalonBay Communities, Inc. (Equity REIT) | 4,396 | 710,042 | ||||||||
Boston Properties, Inc. (Equity REIT) | 4,482 | 302,894 | ||||||||
Camden Property Trust (Equity REIT) | 3,349 | 374,686 | ||||||||
CBRE Group, Inc. Class A (Real Estate Mgmt. & Development) | (a) | 9,903 | 762,135 | |||||||
Crown Castle, Inc. (Equity REIT) | 13,579 | 1,841,855 | ||||||||
Digital Realty Trust, Inc. (Equity REIT) | 9,018 | 904,235 | ||||||||
Equinix, Inc. (Equity REIT) | 2,902 | 1,900,897 | ||||||||
Equity Residential (Equity REIT) | 10,662 | 629,058 | ||||||||
Essex Property Trust, Inc. (Equity REIT) | 2,029 | 429,986 | ||||||||
Extra Space Storage, Inc. (Equity REIT) | 4,205 | 618,892 | ||||||||
Federal Realty Investment Trust (Equity REIT) | 2,286 | 230,977 | ||||||||
| Common Stocks (Continued) | Shares | Value | ||||||||
REAL ESTATE (continued) | ||||||||||
Healthpeak Properties, Inc. (Equity REIT) | 16,794 | $ | 421,026 | |||||||
Host Hotels & Resorts, Inc. (Equity REIT) | 22,493 | 361,013 | ||||||||
Invitation Homes, Inc. (Equity REIT) | 18,210 | 539,744 | ||||||||
Iron Mountain, Inc. (Equity REIT) | 9,073 | 452,289 | ||||||||
Kimco Realty Corp. (Equity REIT) | 19,360 | 410,045 | ||||||||
Mid-America Apartment Communities, Inc. (Equity REIT) | 3,619 | 568,147 | ||||||||
Prologis, Inc. (Equity REIT) | 28,948 | 3,263,308 | ||||||||
Public Storage (Equity REIT) | 4,957 | 1,388,902 | ||||||||
Realty Income Corp. (Equity REIT) | 19,665 | 1,247,351 | ||||||||
Regency Centers Corp. (Equity REIT) | 4,799 | 299,937 | ||||||||
SBA Communications Corp. (Equity REIT) | 3,384 | 948,569 | ||||||||
Simon Property Group, Inc. (Equity REIT) | 10,260 | 1,205,345 | ||||||||
UDR, Inc. (Equity REIT) | 9,604 | 371,963 | ||||||||
Ventas, Inc. (Equity REIT) | 12,530 | 564,476 | ||||||||
VICI Properties, Inc. (Equity REIT) | 30,229 | 979,420 | ||||||||
Vornado Realty Trust (Equity REIT) | 5,036 | 104,799 | ||||||||
Welltower, Inc. (Equity REIT) | 14,817 | 971,254 | ||||||||
Weyerhaeuser Co. (Equity REIT) | 23,121 | 716,751 | ||||||||
|
| |||||||||
| 27,294,888 | ||||||||||
|
| |||||||||
UTILITIES – 3.1% | ||||||||||
AES Corp. / The (Ind. Power & Renewable Elec.) | 20,934 | 602,062 | ||||||||
Alliant Energy Corp. (Electric Utilities) | 7,896 | 435,938 | ||||||||
Ameren Corp. (Multi-Utilities) | 8,118 | 721,852 | ||||||||
American Electric Power Co., Inc. (Electric Utilities) | 16,100 | 1,528,695 | ||||||||
American Water Works Co., Inc. (Water Utilities) | 5,716 | 871,233 | ||||||||
Atmos Energy Corp. (Gas Utilities) | 4,408 | 494,005 | ||||||||
CenterPoint Energy, Inc. (Multi-Utilities) | 19,727 | 591,613 | ||||||||
CMS Energy Corp. (Multi-Utilities) | 9,081 | 575,100 | ||||||||
Consolidated Edison, Inc. (Multi-Utilities) | 11,144 | 1,062,135 | ||||||||
Constellation Energy Corp. (Electric Utilities) | 10,259 | 884,428 | ||||||||
Dominion Energy, Inc. (Multi-Utilities) | 26,115 | 1,601,372 | ||||||||
DTE Energy Co. (Multi-Utilities) | 6,088 | 715,523 | ||||||||
Duke Energy Corp. (Electric Utilities) | 24,136 | 2,485,767 | ||||||||
Edison International (Electric Utilities) | 11,964 | 761,150 | ||||||||
Entergy Corp. (Electric Utilities) | 6,388 | 718,650 | ||||||||
Evergy, Inc. (Electric Utilities) | 7,229 | 454,921 | ||||||||
Eversource Energy (Electric Utilities) | 10,904 | 914,191 | ||||||||
Exelon Corp. (Electric Utilities) | 31,148 | 1,346,528 | ||||||||
FirstEnergy Corp. (Electric Utilities) | 17,047 | 714,951 | ||||||||
NextEra Energy, Inc. (Electric Utilities) | 62,315 | 5,209,534 | ||||||||
NiSource, Inc. (Multi-Utilities) | 12,747 | 349,523 | ||||||||
NRG Energy, Inc. (Electric Utilities) | 7,220 | 229,740 | ||||||||
PG&E Corp. (Electric Utilities) | (a) | 50,542 | 821,813 | |||||||
Pinnacle West Capital Corp. (Electric Utilities) | 3,556 | 270,398 | ||||||||
PPL Corp. (Electric Utilities) | 23,108 | 675,216 | ||||||||
Public Service Enterprise Group, Inc. (Multi-Utilities) | 15,655 | 959,182 | ||||||||
Sempra Energy (Multi-Utilities) | 9,849 | 1,522,064 | ||||||||
Southern Co. / The (Electric Utilities) | 34,123 | 2,436,723 | ||||||||
WEC Energy Group, Inc. (Multi-Utilities) | 9,910 | 929,162 | ||||||||
Xcel Energy, Inc. (Electric Utilities) | 17,141 | 1,201,755 | ||||||||
|
| |||||||||
| 32,085,224 | ||||||||||
|
| |||||||||
Total Common Stocks (Cost $720,715,494) |
| $ | 1,007,729,400 | |||||||
|
| |||||||||
| U.S. Treasury Obligations – 0.0% | Rate | Maturity | Face Amount | Value | ||||||||||||
U.S. Treasury Bill | (b) | 0.000 | % | 01/26/2023 | $200,000 | $ | 199,504 | |||||||||
|
| |||||||||||||||
Total U.S. Treasury Obligations | $ | 199,504 | ||||||||||||||
|
| |||||||||||||||
Total Investments – 98.5% |
| (c) | $ | 1,007,928,904 | ||||||||||||
Other Assets in Excess of |
| (b) | 15,651,466 | |||||||||||||
|
| |||||||||||||||
Net Assets – 100.0% |
| $ | 1,023,580,370 | |||||||||||||
|
| |||||||||||||||
| 49 | (continued) |
Ohio National Fund, Inc. | ON S&P 500® Index Portfolio (Continued) | |
| Schedule of Investments | December 31, 2022 | |
Percentages are stated as a percent of net assets.
Footnotes:
| (a) | Non-income producing security. |
| (b) | Security is fully pledged, in addition to $459,675 of the Portfolio’s cash holdings, as collateral for the futures contracts outstanding at December 31, 2022. See also the following Schedule of Open Futures Contracts. |
| (c) | Represents cost for financial reporting purposes, which may differ from cost basis for federal income tax purposes. See also Note 7 of the Notes to Financial Statements. |
The accompanying notes are an integral part of these financial statements.
| Schedule of Open Futures Contracts | December 31, 2022 | |||||||||||||||||||
Description | Number of | Expiration Date | Notional Amount | Value | Unrealized Appreciation (Depreciation) | Variation Margin Receivable (Payable) | ||||||
CME E-mini S&P 500 Index - Long | 62 | March 17, 2023 | $12,478,328 | $11,969,100 | $(509,228) | $(27,013) | ||||||
The accompanying notes are an integral part of these financial statements.
| 50 |
| ON BlackRock Advantage Large Cap Value Portfolio (Unaudited) |
| Objective/Strategy |
The ON BlackRock Advantage Large Cap Value Portfolio seeks growth of capital by investing under normal circumstances, at least 80% of its net assets in stocks of large capitalization companies with market capitalizations at the time of investment that are within the range of market capitalizations of the companies in the Russell 1000® Value Index for the previous twelve months.
| Performance as of December 31, 2022 | ||||
Average Annual returns | ||||
One year | -8.97 | % | ||
Five years | 5.25 | % | ||
Ten years | �� | 8.81 | % | |
Past performance does not guarantee future results. The performance data quoted represents past performance and current returns may be lower or higher. Total return figures include change in share price and reinvestment of dividends and capital gains. The investment return and principal value will fluctuate so that an investor’s shares, when redeemed, may be worth more or less than the original cost. To obtain performance information up to the most recent month end, call toll-free 1-877-781-6392.
The Portfolio is not open to direct retail investment. Beneficial interest in the Portfolio’s shares is obtained either through an allocation to the Portfolio as an investment vehicle within variable life insurance policies or annuity contracts, or as an underlying investment by the ON Model Portfolios. Actual performance results for variable annuity and variable universal life contracts will be lower due to contract charges. Consult your contract for applicable charges.
Total expense ratio is 0.73% per the Fund’s prospectus dated April 29, 2022. Additional information pertaining to the Portfolio’s expense ratio as of December 31, 2022 can be found in the Portfolio’s Financial Highlights.
| Comments from Sub-Adviser |
Q. How did the Portfolio perform in comparison to its benchmark during the reporting period?
A. For the year ended December 31, 2022, the Portfolio returned -8.97% versus -7.54% for its benchmark, the Russell 1000® Value Index.
Q. Were there specific market conditions, investment strategies, or techniques that materially affected the Portfolio’s benchmark-relative performance during the reporting period?
A. Portfolio underperformance was primarily driven by weakness in the first quarter. Fundamental insights struggled in the first half of the year, driven by growth-related quality measures, with partial recovery in the second half of the year. Fundamental quality insights with a growth flavor, such as measures of company culture, founder involvement, and company benefits, were large detractors amid the market’s value style preference. Nontraditional measures, such as environment-related measures that evaluate green patents and emissions levels underperformed as energy related firms outperformed their lower emissions counterparts.
However, fundamental value insights were strong contributors amid the prevailing market style preference. Namely, insights evaluating company earnings yield, sales, and other financial statement metrics contributed. Defensive quality measures also performed well with measures relating to stability, balance sheet quality, and internal financing ability contributing against the broad market decline. (1)
Q. How did sector allocation and security selection each impact the Portfolio’s performance relative to its benchmark?
A. Security selection was the main driver of underperformance, although sector allocation decisions also had a modest positive relative contribution. The largest drivers of underperformance were selections within Consumer Staples and Health Care. This detraction was somewhat offset by selection within Energy and an underweight to the underperforming Communication Services sector. (1)
Q. Which securities contributed the most to, and detracted the most from, the Portfolio’s benchmark-relative performance?
A. From a security standpoint, the Portfolio’s overweight position in EOG Resources, Inc., a Texas-based Energy company, was a top contributor to relative performance, as the company benefitted from the broader Energy rally and the runup in commodities prices. An underweight to The Walt Disney Co. also contributed, as disappointing results for the company’s streaming service throughout the year weighed on the stock price.
In contrast, an overweight to water purification company Ecolab, Inc. was a key detractor from relative performance, as the stock struggled against supply chain challenges, as well as rising input costs. Further hindering results was an underweight stance in ConocoPhillips, as the stock benefited from the runup in commodities prices across the Energy sector. (1)
Q. How did the Portfolio’s use of derivative instruments and initial public offerings (IPOs), if any, impact performance?
A. Pursuant to the Portfolio’s investment strategy, futures contracts were used to prevent a cash drag on performance. Futures contracts, in aggregate, detracted 23 basis points from the Portfolio’s absolute return for the year. The Portfolio also participated in two IPOs, which detracted 3 basis points from absolute return, in aggregate, led by a 3 basis point detraction from Bausch + Lomb Corp. (1)
| (1) | The Portfolio’s composition is subject to change. Holdings and weightings are as of December 31, 2022. |
| Change in Value of $10,000 Investment |
|
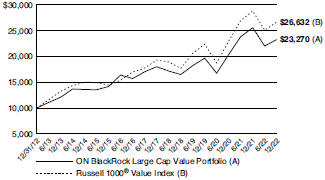
Hypothetical illustration based on past performance. Future performance will vary. The Portfolio’s returns reflect reinvested dividends. The Portfolio’s holdings may differ significantly from the securities in the index. The index is unmanaged and therefore does not reflect the cost of portfolio management and accounting.
The Russell 1000® Value Index measures the performance of the large-cap value segment of the U.S. equity universe. It includes those Russell 1000® Index companies with lower price-to-book ratios and lower expected and historical growth rates.
Past performance is no guarantee of future results. Redemption of fund shares could have tax implications unique to each shareholder.
| 51 | (continued) |
Ohio National Fund, Inc. | ON BlackRock Advantage Large Cap Value Portfolio (Unaudited) (Continued) |
| Portfolio Composition as of December 31, 2022 (1) | ||
| % of Net Assets | ||||
Common Stocks (4) | 99.1 | |||
Other Net Assets | 0.9 | |||
|
| |||
| 100.0 | ||||
|
| |||
| Top 10 Portfolio Holdings as of December 31, 2022 (1) (2) (3) | ||||
| % of Net Assets | ||||||
1. | Berkshire Hathaway, Inc. Class B | 2.6 | ||||
2. | Exxon Mobil Corp. | 2.5 | ||||
3. | Chevron Corp. | 2.4 | ||||
4. | Johnson & Johnson | 2.2 | ||||
5. | American Express Co. | 1.6 | ||||
6. | Cigna Corp. | 1.5 | ||||
7. | Pfizer, Inc. | 1.5 | ||||
8. | Procter & Gamble Co. / The | 1.5 | ||||
9. | Bank of America Corp. | 1.4 | ||||
10. | MetLife, Inc. | 1.4 | ||||
| (1) | Composition of Portfolio subject to change. |
| (2) | Short-term investments have been excluded from the list of Top 10 Portfolio Holdings. |
| (3) | Top 10 Portfolio Holdings is presented at an individual security level. Total investment exposure by issuer may be higher. |
| (4) | Sectors (Common Stocks): |
| % of Net Assets | ||||
Financials | 18.9 | |||
Health Care | 18.2 | |||
Industrials | 11.1 | |||
Energy | 8.9 | |||
Information Technology | 8.7 | |||
Consumer Staples | 8.2 | |||
Communication Services | 6.5 | |||
Real Estate | 5.0 | |||
Utilities | 4.9 | |||
Consumer Discretionary | 4.9 | |||
Materials | 3.8 | |||
|
| |||
| 99.1 | ||||
|
| |||
| 52 |
Ohio National Fund, Inc. | ON BlackRock Advantage Large Cap Value Portfolio |
| Schedule of Investments | December 31, 2022 | |
| Common Stocks – 99.1% | Shares | Value | ||||||||
COMMUNICATION SERVICES – 6.5% | ||||||||||
Alphabet, Inc. Class A (Interactive Media & Svs.) | (a) | 11,275 | $ | 994,793 | ||||||
Alphabet, Inc. Class C (Interactive Media & Svs.) | (a) | 7,769 | 689,343 | |||||||
AT&T, Inc. (Diversified Telecom. Svs.) | 71,721 | 1,320,384 | ||||||||
Comcast Corp. Class A (Media) | 73,972 | 2,586,801 | ||||||||
Fox Corp. Class A (Media) | 69,518 | 2,111,262 | ||||||||
Fox Corp. Class B (Media) | 1,530 | 43,528 | ||||||||
Liberty Global PLC Class A (Diversified Telecom. Svs.) | (a) | 15,105 | 285,938 | |||||||
Meta Platforms, Inc. Class A (Interactive Media & Svs.) | (a) | 19,809 | 2,383,815 | |||||||
Snap, Inc. Class A (Interactive Media & Svs.) | (a) | 25,365 | 227,017 | |||||||
United States Cellular Corp. (Wireless Telecom. Svs.) | (a) | 16,141 | 336,540 | |||||||
Verizon Communications, Inc. (Diversified Telecom. Svs.) | 37,835 | 1,490,699 | ||||||||
Walt Disney Co. / The (Entertainment) | (a) | 5,665 | 492,175 | |||||||
Warner Bros Discovery, Inc. (Entertainment) | (a) | 6,560 | 62,189 | |||||||
|
| |||||||||
| 13,024,484 | ||||||||||
|
| |||||||||
CONSUMER DISCRETIONARY – 4.9% | ||||||||||
AutoNation, Inc. (Specialty Retail) | (a) | 5,732 | 615,044 | |||||||
Best Buy Co., Inc. (Specialty Retail) | 2,684 | 215,284 | ||||||||
Domino’s Pizza, Inc. (Hotels, Restaurants & Leisure) | 1,080 | 374,112 | ||||||||
eBay, Inc. (Internet & Direct Marketing Retail) | 17,043 | 706,773 | ||||||||
General Motors Co. (Automobiles) | 22,435 | 754,713 | ||||||||
Home Depot, Inc. / The (Specialty Retail) | 5,082 | 1,605,201 | ||||||||
Lear Corp. (Auto Components) | 3,766 | 467,059 | ||||||||
Lennar Corp. Class A (Household Durables) | 8,503 | 769,521 | ||||||||
Lowe’s Cos., Inc. (Specialty Retail) | 3,681 | 733,402 | ||||||||
Lululemon Athletica, Inc. (Textiles, Apparel & Luxury Goods) | (a) | 1,833 | 587,257 | |||||||
McDonald’s Corp. (Hotels, Restaurants & Leisure) | 2,310 | 608,754 | ||||||||
Target Corp. (Multiline Retail) | 4,592 | 684,392 | ||||||||
Travel + Leisure Co. (Hotels, Restaurants & Leisure) | 26,260 | 955,864 | ||||||||
Under Armour, Inc. Class C (Textiles, Apparel & Luxury Goods) | (a) | 2,205 | 19,669 | |||||||
Whirlpool Corp. (Household Durables) | 4,307 | 609,268 | ||||||||
|
| |||||||||
| 9,706,313 | ||||||||||
|
| |||||||||
CONSUMER STAPLES – 8.2% | ||||||||||
Altria Group, Inc. (Tobacco) | 13,510 | 617,542 | ||||||||
Archer-Daniels-Midland Co. (Food Products) | 2,086 | 193,685 | ||||||||
Brown-Forman Corp. Class B (Beverages) | 17,360 | 1,140,205 | ||||||||
Bunge Ltd. (Food Products) | 5,313 | 530,078 | ||||||||
Colgate-Palmolive Co. (Household Products) | 22,520 | 1,774,351 | ||||||||
Hershey Co. / The (Food Products) | 4,463 | 1,033,497 | ||||||||
Kroger Co. / The (Food & Staples Retailing) | 21,479 | 957,534 | ||||||||
Mondelez International, Inc. Class A (Food Products) | 23,331 | 1,555,011 | ||||||||
PepsiCo, Inc. (Beverages) | 14,655 | 2,647,572 | ||||||||
Procter & Gamble Co. / The (Household Products) | 19,767 | 2,995,887 | ||||||||
Tyson Foods, Inc. Class A (Food Products) | 25,164 | 1,566,459 | ||||||||
Walmart, Inc. (Food & Staples Retailing) | 9,442 | 1,338,781 | ||||||||
|
| |||||||||
| 16,350,602 | ||||||||||
|
| |||||||||
ENERGY – 8.9% | ||||||||||
Chevron Corp. (Oil, Gas & Consumable Fuels) | 26,570 | 4,769,049 | ||||||||
EOG Resources, Inc. (Oil, Gas & Consumable Fuels) | 10,326 | 1,337,424 | ||||||||
Exxon Mobil Corp. (Oil, Gas & Consumable Fuels) | 45,735 | 5,044,571 | ||||||||
Halliburton Co. (Energy Equip. & Svs.) | 20,852 | 820,526 | ||||||||
Marathon Oil Corp. (Oil, Gas & Consumable Fuels) | 49,334 | 1,335,471 | ||||||||
| Common Stocks (Continued) | Shares | Value | ||||||||
ENERGY (continued) | ||||||||||
Marathon Petroleum Corp. (Oil, Gas & Consumable Fuels) | 13,711 | $ | 1,595,823 | |||||||
Phillips 66 (Oil, Gas & Consumable Fuels) | 6,376 | 663,614 | ||||||||
Schlumberger Ltd. / N.V. (Energy Equip. & Svs.) | 20,927 | 1,118,758 | ||||||||
Valero Energy Corp. (Oil, Gas & Consumable Fuels) | 4,297 | 545,118 | ||||||||
Williams Cos., Inc. / The (Oil, Gas & Consumable Fuels) | 13,366 | 439,741 | ||||||||
|
| |||||||||
| 17,670,095 | ||||||||||
|
| |||||||||
FINANCIALS – 18.9% | ||||||||||
Allstate Corp. / The (Insurance) | 6,027 | 817,261 | ||||||||
Ally Financial, Inc. (Consumer Finance) | 21,722 | 531,103 | ||||||||
American Express Co. (Consumer Finance) | 20,907 | 3,089,009 | ||||||||
Bank of America Corp. (Banks) | 81,719 | 2,706,533 | ||||||||
Bank of New York Mellon Corp. / The (Capital Markets) | 29,089 | 1,324,131 | ||||||||
Berkshire Hathaway, Inc. Class B (Diversified Financial Svs.) | (a) | 16,690 | 5,155,540 | |||||||
Capital One Financial Corp. (Consumer Finance) | 18,076 | 1,680,345 | ||||||||
Carlyle Group, Inc. / The (Capital Markets) | 11,095 | 331,075 | ||||||||
CBOE Global Markets, Inc. (Capital Markets) | 2,694 | 338,016 | ||||||||
Citigroup, Inc. (Banks) | 40,302 | 1,822,859 | ||||||||
CME Group, Inc. (Capital Markets) | 6,790 | 1,141,806 | ||||||||
Discover Financial Services (Consumer Finance) | 1,236 | 120,918 | ||||||||
Huntington Bancshares, Inc. (Banks) | 46,860 | 660,726 | ||||||||
Intercontinental Exchange, Inc. (Capital Markets) | 7,975 | 818,155 | ||||||||
JPMorgan Chase & Co. (Banks) | 16,200 | 2,172,420 | ||||||||
Marsh & McLennan Cos., Inc. (Insurance) | 10,999 | 1,820,114 | ||||||||
MetLife, Inc. (Insurance) | 37,291 | 2,698,750 | ||||||||
Pinnacle Financial Partners, Inc. (Banks) | 8,464 | 621,258 | ||||||||
PNC Financial Services Group, Inc. / The (Banks) | 2,490 | 393,271 | ||||||||
Regions Financial Corp. (Banks) | 61,417 | 1,324,151 | ||||||||
Synchrony Financial (Consumer Finance) | 7,988 | 262,486 | ||||||||
Travelers Cos., Inc. / The (Insurance) | 12,932 | 2,424,621 | ||||||||
Truist Financial Corp. (Banks) | 15,312 | 658,875 | ||||||||
U.S. Bancorp (Banks) | 19,597 | 854,625 | ||||||||
Voya Financial, Inc. (Diversified Financial Svs.) | 33,531 | 2,061,821 | ||||||||
Wells Fargo & Co. (Banks) | 42,285 | 1,745,948 | ||||||||
|
| |||||||||
| 37,575,817 | ||||||||||
|
| |||||||||
HEALTH CARE – 18.2% | ||||||||||
Abbott Laboratories (Health Care Equip. & Supplies) | 8,679 | 952,867 | ||||||||
Agilent Technologies, Inc. (Life Sciences Tools & Svs.) | 11,937 | 1,786,372 | ||||||||
AmerisourceBergen Corp. (Health Care Providers & Svs.) | 5,470 | 906,434 | ||||||||
Amgen, Inc. (Biotechnology) | 3,468 | 910,836 | ||||||||
Becton Dickinson and Co. (Health Care Equip. & Supplies) | 7,852 | 1,996,764 | ||||||||
Biogen, Inc. (Biotechnology) | (a) | 2,536 | 702,269 | |||||||
Boston Scientific Corp. (Health Care Equip. & Supplies) | (a) | 39,196 | 1,813,599 | |||||||
Bristol-Myers Squibb Co. (Pharmaceuticals) | 16,138 | 1,161,129 | ||||||||
Cigna Corp. (Health Care Providers & Svs.) | 9,268 | 3,070,859 | ||||||||
CVS Health Corp. (Health Care Providers & Svs.) | 20,486 | 1,909,090 | ||||||||
Danaher Corp. (Life Sciences Tools & Svs.) | 9,286 | 2,464,690 | ||||||||
Elevance Health, Inc. (Health Care Providers & Svs.) | 3,575 | 1,833,868 | ||||||||
Eli Lilly & Co. (Pharmaceuticals) | 1,252 | 458,032 | ||||||||
Exact Sciences Corp. (Biotechnology) | (a) | 5,653 | 279,880 | |||||||
Gilead Sciences, Inc. (Biotechnology) | 7,745 | 664,908 | ||||||||
IDEXX Laboratories, Inc. (Health Care Equip. & Supplies) | (a) | 1,196 | 487,920 | |||||||
| 53 | (continued) |
Ohio National Fund, Inc. | ON BlackRock Advantage Large Cap Value Portfolio (Continued) |
| Schedule of Investments | December 31, 2022 | |
| Common Stocks (Continued) | Shares | Value | ||||||||
HEALTH CARE (continued) | ||||||||||
Johnson & Johnson (Pharmaceuticals) | 24,883 | $ | 4,395,582 | |||||||
Medtronic PLC (Health Care Equip. & Supplies) | 19,756 | 1,535,436 | ||||||||
Merck & Co., Inc. (Pharmaceuticals) | 10,945 | 1,214,348 | ||||||||
Perrigo Co. PLC (Pharmaceuticals) | 14,628 | 498,669 | ||||||||
Pfizer, Inc. (Pharmaceuticals) | 59,722 | 3,060,155 | ||||||||
Syneos Health, Inc. (Life Sciences Tools & Svs.) | (a) | 13,056 | 478,894 | |||||||
Teladoc Health, Inc. (Health Care Technology) | (a) | 23,626 | 558,755 | |||||||
Thermo Fisher Scientific, Inc. (Life Sciences Tools & Svs.) | 4,870 | 2,681,860 | ||||||||
Veeva Systems, Inc. Class A (Health Care Technology) | (a) | 1,739 | 280,640 | |||||||
|
| |||||||||
| 36,103,856 | ||||||||||
|
| |||||||||
INDUSTRIALS – 11.1% | ||||||||||
AECOM (Construction & Engineering) | 4,809 | 408,428 | ||||||||
AMETEK, Inc. (Electrical Equip.) | 3,267 | 456,465 | ||||||||
CSX Corp. (Road & Rail) | 2,790 | 86,434 | ||||||||
Curtiss-Wright Corp. (Aerospace & Defense) | 8,007 | 1,337,089 | ||||||||
Deere & Co. (Machinery) | 3,269 | 1,401,616 | ||||||||
Eaton Corp. PLC (Electrical Equip.) | 13,970 | 2,192,592 | ||||||||
General Dynamics Corp. (Aerospace & Defense) | 9,956 | 2,470,183 | ||||||||
HEICO Corp. (Aerospace & Defense) | 5,417 | 832,268 | ||||||||
Honeywell International, Inc. (Industrial Conglomerates) | 4,850 | 1,039,355 | ||||||||
Illinois Tool Works, Inc. (Machinery) | 6,663 | 1,467,859 | ||||||||
JetBlue Airways Corp. (Airlines) | (a) | 1,558 | 10,096 | |||||||
KBR, Inc. (Professional Svs.) | 5,432 | 286,810 | ||||||||
Lockheed Martin Corp. (Aerospace & Defense) | 2,834 | 1,378,713 | ||||||||
Masterbrand, Inc. (Building Products) | (a) | 6,159 | 46,500 | |||||||
Northrop Grumman Corp. (Aerospace & Defense) | 1,258 | 686,377 | ||||||||
Owens Corning (Building Products) | 6,810 | 580,893 | ||||||||
PACCAR, Inc. (Machinery) | 15,211 | 1,505,433 | ||||||||
Ryder System, Inc. (Road & Rail) | 3,002 | 250,877 | ||||||||
Schneider National, Inc. Class B (Road & Rail) | 14,258 | 333,637 | ||||||||
SiteOne Landscape Supply, Inc. (Trading Companies & Distributors) | (a) | 5,110 | 599,505 | |||||||
Snap-on, Inc. (Machinery) | 5,365 | 1,225,849 | ||||||||
Stanley Black & Decker, Inc. (Machinery) | 3,864 | 290,264 | ||||||||
Tetra Tech, Inc. (Commercial Svs. & Supplies) . | 363 | 52,704 | ||||||||
Timken Co. / The (Machinery) | 15,783 | 1,115,385 | ||||||||
Uber Technologies, Inc. (Road & Rail) | (a) | 10,647 | 263,300 | |||||||
W.W. Grainger, Inc. (Trading Companies & Distributors) | 906 | 503,963 | ||||||||
Xylem, Inc. (Machinery) | 11,320 | 1,251,652 | ||||||||
|
| |||||||||
| 22,074,247 | ||||||||||
|
| |||||||||
INFORMATION TECHNOLOGY – 8.7% | ||||||||||
Adobe, Inc. (Software) | (a) | 1,564 | 526,333 | |||||||
Analog Devices, Inc. (Semiconductors & Equip.) | 15,721 | 2,578,716 | ||||||||
Automatic Data Processing, Inc. (IT Svs.) | 3,197 | 763,636 | ||||||||
Cognizant Technology Solutions Corp. Class A (IT Svs.) | 15,494 | 886,102 | ||||||||
Dell Technologies, Inc. Class C (Tech. Hardware, Storage & Periph.) | 11,216 | 451,108 | ||||||||
Fidelity National Information Services, Inc. (IT Svs.) | 7,485 | 507,857 | ||||||||
| Common Stocks (Continued) | Shares | Value | ||||||||
INFORMATION TECHNOLOGY (continued) |
| |||||||||
Flex Ltd. (Electronic Equip., Instr. & Comp.) | (a) | 52,592 | $ | 1,128,624 | ||||||
Hewlett Packard Enterprise Co. (Tech. Hardware, Storage & Periph.) | 77,167 | 1,231,585 | ||||||||
Intel Corp. (Semiconductors & Equip.) | 66,531 | 1,758,414 | ||||||||
Juniper Networks, Inc. (Communications Equip.) | 37,606 | 1,201,888 | ||||||||
Lam Research Corp. (Semiconductors & Equip.) | 791 | 332,457 | ||||||||
Microsoft Corp. (Software) | 4,265 | 1,022,832 | ||||||||
PayPal Holdings, Inc. (IT Svs.) | (a) | 17,091 | 1,217,221 | |||||||
Salesforce, Inc. (Software) | (a) | 12,036 | 1,595,853 | |||||||
ServiceNow, Inc. (Software) | (a) | 1,598 | 620,456 | |||||||
Silicon Laboratories, Inc. (Semiconductors & Equip.) | (a) | 6,220 | 843,867 | |||||||
TE Connectivity Ltd. (Electronic Equip., Instr. & Comp.) | 780 | 89,544 | ||||||||
Workday, Inc. Class A (Software) | (a) | 3,793 | 634,683 | |||||||
|
| |||||||||
| 17,391,176 | ||||||||||
|
| |||||||||
MATERIALS – 3.8% | ||||||||||
Corteva, Inc. (Chemicals) | 18,359 | 1,079,142 | ||||||||
Ecolab, Inc. (Chemicals) | 11,759 | 1,711,640 | ||||||||
FMC Corp. (Chemicals) | 10,353 | 1,292,054 | ||||||||
Linde PLC (Chemicals) | 5,628 | 1,835,741 | ||||||||
Newmont Corp. (Metals & Mining) | 14,659 | 691,905 | ||||||||
Reliance Steel & Aluminum Co. (Metals & Mining) | 1,584 | 320,665 | ||||||||
Steel Dynamics, Inc. (Metals & Mining) | 6,583 | 643,159 | ||||||||
|
| |||||||||
| 7,574,306 | ||||||||||
|
| |||||||||
REAL ESTATE – 5.0% | ||||||||||
Brixmor Property Group, Inc. (Equity REIT) | 4,630 | 104,962 | ||||||||
Crown Castle, Inc. (Equity REIT) | 2,247 | 304,783 | ||||||||
Equity LifeStyle Properties, Inc. (Equity REIT) | 8,880 | 573,648 | ||||||||
Equity Residential (Equity REIT) | 36,922 | 2,178,398 | ||||||||
Essex Property Trust, Inc. (Equity REIT) | 8,406 | 1,781,400 | ||||||||
Mid-America Apartment Communities, Inc. (Equity REIT) | 3,378 | 530,312 | ||||||||
Prologis, Inc. (Equity REIT) | 18,753 | 2,114,026 | ||||||||
Simon Property Group, Inc. (Equity REIT) | 19,801 | 2,326,221 | ||||||||
|
| |||||||||
| 9,913,750 | ||||||||||
|
| |||||||||
UTILITIES – 4.9% | ||||||||||
Black Hills Corp. (Multi-Utilities) | 4,632 | 325,815 | ||||||||
CMS Energy Corp. (Multi-Utilities) | 34,526 | 2,186,532 | ||||||||
DTE Energy Co. (Multi-Utilities) | 21,297 | 2,503,036 | ||||||||
Edison International (Electric Utilities) | 7,074 | 450,048 | ||||||||
Entergy Corp. (Electric Utilities) | 6,586 | 740,925 | ||||||||
Evergy, Inc. (Electric Utilities) | 17,358 | 1,092,339 | ||||||||
NextEra Energy, Inc. (Electric Utilities) | 11,064 | 924,950 | ||||||||
NRG Energy, Inc. (Electric Utilities) | 15,074 | 479,655 | ||||||||
Vistra Corp. (Ind. Power & Renewable Elec.) | 16,687 | 387,138 | ||||||||
Xcel Energy, Inc. (Electric Utilities) | 9,947 | 697,384 | ||||||||
|
| |||||||||
| 9,787,822 | ||||||||||
|
| |||||||||
Total Common Stocks (Cost $204,451,155) |
| $ | 197,172,468 | |||||||
|
| |||||||||
Total Investments – 99.1% (Cost $204,451,155) | (b) | $ | 197,172,468 | |||||||
Other Assets in Excess of Liabilities – 0.9% | (c) | 1,768,881 | ||||||||
|
| |||||||||
Net Assets – 100.0% | $ | 198,941,349 | ||||||||
|
| |||||||||
Percentages are stated as a percent of net assets.
| 54 | (continued) |
Ohio National Fund, Inc. | ON BlackRock Advantage Large Cap Value Portfolio (Continued) | |
| Schedule of Investments | December 31, 2022 | |
Footnotes:
| (a) | Non-income producing security. |
| (b) | Represents cost for financial reporting purposes, which may differ from cost basis for federal income tax purposes. See also Note 7 of the Notes to Financial Statements. |
| (c) | Includes $163,240 of cash pledged as collateral for the futures contracts outstanding at December 31, 2022. See also the following Schedule of Open Futures Contracts. |
The accompanying notes are an integral part of these financial statements.
| Schedule of Open Futures Contracts | December 31, 2022 | |||||||||||||||||||
Description | Number of contracts | Expiration Date | Notional Amount | Value | Unrealized Appreciation (Depreciation) | Variation Margin Receivable (Payable) | ||||||||
CME E-mini S&P 500 Index - Long | 14 | March 17, 2023 | $2,797,564 | $2,702,700 | $(94,864) | $(7,525) | ||||||||
The accompanying notes are an integral part of these financial statements.
| 55 |
| ON Federated High Income Bond Portfolio (Unaudited) |
| Objective/Strategy |
The ON Federated High Income Bond Portfolio seeks high current income by investing, under normal circumstances, at least 80% of its net assets in lower rated corporate debt obligations commonly referred to as “junk bonds”. The Portfolio’s investments are generally rated BB or lower by Standard & Poor’s or Fitch, or Ba or lower by Moody’s.
| Performance as of December 31, 2022 | ||||
Average Annual returns | ||||
One year | -11.43 | % | ||
Five years | 1.96 | % | ||
Ten years | 3.70 | % |
Past performance does not guarantee future results. The performance data quoted represents past performance and current returns may be lower or higher. Total return figures include change in share price and reinvestment of dividends and capital gains. The investment return and principal value will fluctuate so that an investor’s shares, when redeemed, may be worth more or less than the original cost. To obtain performance information up to the most recent month end, call toll-free 1-877-781-6392.
The Portfolio is not open to direct retail investment. Beneficial interest in the Portfolio’s shares is obtained either through an allocation to the Portfolio as an investment vehicle within variable life insurance policies or annuity contracts, or as an underlying investment by the ON Model Portfolios. Actual performance results for variable annuity and variable universal life contracts will be lower due to contract charges. Consult your contract for applicable charges.
Total expense ratio is 0.82% per the Fund’s prospectus dated April 29, 2022. Additional information pertaining to the Portfolio’s expense ratio as of December 31, 2022 can be found in the Portfolio’s Financial Highlights.
| Comments from Sub-Adviser |
Q. How did the Portfolio perform in comparison to its benchmark during the reporting period?
A. For the year ended December 31, 2022, the Portfolio returned -11.43% versus -11.21% for its benchmark, the ICE BofA U.S. High Yield Constrained Index.
Q. Were there specific market conditions, investment strategies, or techniques that materially affected the Portfolio’s benchmark-relative performance during the reporting period?
A. During the year, the 10-year U.S. Treasury started at 1.5%, peaked at 4.24% in October, and finished at 3.9%. Default rates and credit spreads for high yield securities climbed modestly higher. The overall impact of these factors can be illustrated by the change in credit spreads between the Credit Suisse High Yield Bond Index and U.S. Treasury securities with similar maturities which began the year at 355 basis points (“bps”), peaked in early July at 606 bps, and declined to end the year at 499 bps. The Portfolio began the year with a duration shorter than the benchmark. Given the substantial increase in the general interest rate level during the year, as well as the increase in credit spreads, the Portfolio’s shorter duration had a positive impact on relative performance particularly early in the year. (1)
Q. How did sector allocation and security selection each impact the Portfolio’s performance relative to its benchmark?
A. The Portfolio benefitted from its underweight to the poor performing retail sector, as well as security selection in the retail sector. The Portfolio also benefitted from both its overweight to the insurance sector and security selection in the sector. In addition, the Portfolio benefitted from its underweight to the poor performing telecommunications sector. Given the negative market returns for the year, the Portfolio also benefitted from its cash holdings throughout the year.
Detracting from relative performance was both the Portfolio’s overweight to, and selection within, the poor performing healthcare sector, driven mostly by selection within the pharmaceuticals subsector. The overweight to the poor performing media sector was also a detractor from performance. Security selection in the technology and electronics sector also detracted. (1)
Q. Which securities contributed the most to, and detracted the most from, the Portfolio’s benchmark-relative performance?
A. Contributors: Hub International Ltd. 7.000% due 05/01/2026 (“Hub International”): Hub International, a top five insurance broker with a large footprint in both the U.S. and Canada, continues to report strong, consistent earnings. USI, Inc. 6.875% due 05/01/2025 (“USI”): USI is a leading insurance broker in the U.S. focused on the middle market and continues to report strong, consistent earnings. Clarios Global LP / Clarios U.S. Finance Co. 8.500% due 05/15/2027 (“Clarios Global”): Clarios Global is a manufacturer of advanced, low-voltage batteries for vehicles and industrial products. The company has been very good about managing its balance sheet, using free cash flow to repay debt.
Detractors: Polar U.S. Borrower LLC / Schenectady International Group, Inc. 6.750% notes due 5/15/2026 (“Polar”): Polar is a global provider of performance additive, intermediates and active pharmaceutical ingredients used in the production of plastics, fuels, and lubricants, among other items. The company experienced weaker earnings in 2022 due to exposure to a weaker European market, as well as higher input costs due to inflation. The company has also been investing in capital expenditures in 2022, which has led to lower free cash flow. Audacy Capital 6.5% notes due 5/1/2027 and Audacy Capital Corp. 6.750% notes due 3/31/2029: Audacy is a U.S. radio company which reported weaker than expected earnings. Weaker earnings were accompanied by concerns around advertising revenue in a slowing economic environment. The company is taking steps to improve its cost structure and balance sheet. Given the weaker earnings and concerns around the outlook, the Portfolio reduced exposure to Audacy credit risk by exiting the Audacy Capital 6.5% notes due 5/1/2027. (1)
| (1) | The Portfolio’s composition is subject to change. Holdings and weightings are as of December 31, 2022. |
| Change in Value of $10,000 Investment |
|

Hypothetical illustration based on past performance. Future performance will vary. All returns reflect reinvested dividends. The Portfolio’s holdings may differ significantly from the securities in the index. The index is unmanaged and therefore does not reflect the cost of portfolio management and accounting.
The ICE BofA U.S. High Yield Constrained Index tracks the performance of below investment grade, but not in default, U.S. dollar denominated corporate bonds publicly issued in the U.S. domestic market, and includes issues with a credit rating of BBB or below, as rated by Moody’s and S&P.
Past performance is no guarantee of future results. Redemption of fund shares could have tax implications unique to each shareholder.
| 56 | (continued) |
Ohio National Fund, Inc. | ON Federated High Income Bond Portfolio (Unaudited) (Continued) |
| Portfolio Composition as of December 31, 2022 (1) | ||
| % of Net Assets | ||||
Corporate Bonds (4) | 96.8 | |||
Common Stocks (4) | 0.1 | |||
Rights (4) | 0.0 | |||
Other Net Assets | 3.1 | |||
|
| |||
| 100.0 | ||||
|
| |||
| Top 10 Portfolio Holdings as of December 31, 2022 (1) (2) (3) | ||||
| % of Net Assets | ||||||
1. | HUB International Ltd. 7.000%, 05/01/2026 | 1.5 | ||||
2. | CCO Holdings LLC / CCO Holdings Capital Corp. 4.750%, 03/01/2030 | 1.2 | ||||
3. | 1011778 B.C. ULC / New Red Finance, Inc. 4.000%, 10/15/2030 | 1.2 | ||||
4. | Clarios Global LP / Clarios U.S. Finance Co. 8.500%, 05/15/2027 | 1.0 | ||||
5. | BroadStreet Partners, Inc. 5.875%, 04/15/2029 | 0.9 | ||||
6. | Allied Universal Holdco LLC / Allied Universal Finance Corp. 9.750%, 07/15/2027 | 0.9 | ||||
7. | Clydesdale Acquisition Holdings, Inc. 8.750%, 04/15/2030 | 0.9 | ||||
8. | Garda World Security Corp. 9.500%, 11/01/2027 | 0.9 | ||||
9. | Standard Industries, Inc. 5.000%, 02/15/2027 | 0.8 | ||||
10. | NFP Corp. 6.875%, 08/15/2028 | 0.8 | ||||
| (1) | Composition of Portfolio subject to change. |
| (2) | Short-term investments have been excluded from the list of Top 10 Portfolio Holdings. |
| (3) | Top 10 Portfolio Holdings is presented at an individual security level. Total investment exposure by issuer may be higher. |
| (4) | Sectors (Common Stocks, Corporate Bonds, Rights): |
| % of Net Assets | ||||
Communication Services | 17.4 | |||
Energy | 14.1 | |||
Consumer Discretionary | 12.0 | |||
Financials | 11.2 | |||
Industrials | 10.6 | |||
Materials | 10.3 | |||
Health Care | 8.0 | |||
Information Technology | 6.7 | |||
Utilities | 3.2 | |||
Consumer Staples | 2.9 | |||
Real Estate | 0.5 | |||
|
| |||
| 96.9 | ||||
|
| |||
| 57 |
Ohio National Fund, Inc. | ON Federated High Income Bond Portfolio | |
| Schedule of Investments | December 31, 2022 | |
| Corporate Bonds – 96.8% | Rate | Maturity | Face Amount | Value | ||||||||||
COMMUNICATION SERVICES – 17.4% | ||||||||||||||
Audacy Capital Corp. (Media) | (a) | 6.750% | 03/31/2029 | $ | 350,000 | $ | 60,623 | |||||||
Cars.com, Inc. (Interactive Media & Svs.) | (a) | 6.375% | 11/01/2028 | 375,000 | 332,945 | |||||||||
CCO Holdings LLC / CCO Holdings Capital Corp. (Media) | (a) | 5.125% | 05/01/2027 | 200,000 | 186,414 | |||||||||
CCO Holdings LLC / CCO Holdings Capital Corp. (Media) | (a) | 5.000% | 02/01/2028 | 650,000 | 590,193 | |||||||||
CCO Holdings LLC / CCO Holdings Capital Corp. (Media) | (a) | 5.375% | 06/01/2029 | 125,000 | 113,034 | |||||||||
CCO Holdings LLC / CCO Holdings Capital Corp. (Media) | (a) | 4.750% | 03/01/2030 | 1,725,000 | 1,487,666 | |||||||||
CCO Holdings LLC / CCO Holdings Capital Corp. (Media) | (a) | 4.500% | 08/15/2030 | 250,000 | 206,539 | |||||||||
CCO Holdings LLC / CCO Holdings Capital Corp. (Media) | (a) | 4.250% | 01/15/2034 | 100,000 | 73,804 | |||||||||
CMG Media Corp. (Media) | (a) | 8.875% | 12/15/2027 | 950,000 | 715,065 | |||||||||
CSC Holdings LLC (Media) | 5.250% | 06/01/2024 | 375,000 | 349,131 | ||||||||||
CSC Holdings LLC (Media) | (a) | 5.500% | 04/15/2027 | 900,000 | 754,989 | |||||||||
CSC Holdings LLC (Media) | (a) | 7.500% | 04/01/2028 | 200,000 | 136,000 | |||||||||
CSC Holdings LLC (Media) | (a) | 4.125% | 12/01/2030 | 200,000 | 141,166 | |||||||||
CSC Holdings LLC (Media) | (a) | 4.625% | 12/01/2030 | 675,000 | 373,028 | |||||||||
CSC Holdings LLC (Media) | (a) | 3.375% | 02/15/2031 | 200,000 | 130,427 | |||||||||
CSC Holdings LLC (Media) | (a) | 4.500% | 11/15/2031 | 150,000 | 104,072 | |||||||||
Cumulus Media New Holdings, Inc. (Media) | (a) | 6.750% | 07/01/2026 | 356,000 | 299,040 | |||||||||
Directv Financing LLC / Directv Financing Co-Obligor, Inc. (Media) | (a) | 5.875% | 08/15/2027 | 400,000 | 357,864 | |||||||||
DISH DBS Corp. (Media) | (a) | 5.250% | 12/01/2026 | 450,000 | 379,051 | |||||||||
DISH DBS Corp. (Media) | 7.375% | 07/01/2028 | 100,000 | 70,750 | ||||||||||
DISH DBS Corp. (Media) | 5.125% | 06/01/2029 | 600,000 | 387,066 | ||||||||||
DISH Network Corp. (Media) | (a) | 11.750% | 11/15/2027 | 125,000 | 128,737 | |||||||||
Entegris Escrow Corp. (Media) | (a) | 5.950% | 06/15/2030 | 225,000 | 207,495 | |||||||||
Gray Escrow II, Inc. (Media) | (a) | 5.375% | 11/15/2031 | 175,000 | 126,114 | |||||||||
Gray Television, Inc. (Media) | (a) | 5.875% | 07/15/2026 | 750,000 | 668,190 | |||||||||
Gray Television, Inc. (Media) | (a) | 4.750% | 10/15/2030 | 75,000 | 54,252 | |||||||||
iHeartCommunications, Inc. (Media) | 6.375% | 05/01/2026 | 41,769 | 38,427 | ||||||||||
iHeartCommunications, Inc. (Media) | 8.375% | 05/01/2027 | 1,000,707 | 851,029 | ||||||||||
iHeartCommunications, Inc. (Media) | (a) | 5.250% | 08/15/2027 | 250,000 | 211,771 | |||||||||
iHeartCommunications, Inc. (Media) | (a) | 4.750% | 01/15/2028 | 100,000 | 81,434 | |||||||||
Lamar Media Corp. (Media) | 4.875% | 01/15/2029 | 150,000 | 137,727 | ||||||||||
Lamar Media Corp. (Media) | 3.625% | 01/15/2031 | 100,000 | 82,673 | ||||||||||
Match Group Holdings II LLC (Interactive Media & Svs.) | (a) | 5.000% | 12/15/2027 | 200,000 | 184,000 | |||||||||
Match Group Holdings II LLC (Interactive Media & Svs.) | (a) | 4.625% | 06/01/2028 | 75,000 | 66,860 | |||||||||
Match Group Holdings II LLC (Interactive Media & Svs.) | (a) | 4.125% | 08/01/2030 | 350,000 | 285,729 | |||||||||
Match Group Holdings II LLC (Interactive Media & Svs.) | (a) | 3.625% | 10/01/2031 | 150,000 | 115,030 | |||||||||
Midas OpCo Holdings LLC (Media) | (a) | 5.625% | 08/15/2029 | 1,000,000 | 824,580 | |||||||||
Millennium Escrow Corp. (Interactive Media & Svs.) | (a) | 6.625% | 08/01/2026 | 175,000 | 112,009 | |||||||||
News Corp. (Media) | (a) | 5.125% | 02/15/2032 | 75,000 | 68,250 | |||||||||
Nexstar Media, Inc. (Media) | (a) | 5.625% | 07/15/2027 | 300,000 | 275,207 | |||||||||
Nexstar Media, Inc. (Media) | (a) | 4.750% | 11/01/2028 | 750,000 | 648,750 | |||||||||
Outfront Media Capital LLC / Outfront Media Capital Corp. (Media) | (a) | 5.000% | 08/15/2027 | 50,000 | 45,012 | |||||||||
Outfront Media Capital LLC / Outfront Media Capital Corp. (Media) | (a) | 4.250% | 01/15/2029 | 100,000 | 82,973 | |||||||||
Outfront Media Capital LLC / Outfront Media Capital Corp. (Media) | (a) | 4.625% | 03/15/2030 | 225,000 | 186,148 | |||||||||
Rackspace Technology Global, Inc. (Interactive Media & Svs.) | (a) | 3.500% | 02/15/2028 | 350,000 | 203,392 | |||||||||
Rackspace Technology Global, Inc. (Interactive Media & Svs.) | (a) | 5.375% | 12/01/2028 | 375,000 | 163,448 | |||||||||
ROBLOX Corp. (Entertainment) | (a) | 3.875% | 05/01/2030 | 275,000 | 216,755 | |||||||||
Scripps Escrow II, Inc. (Media) | (a) | 3.875% | 01/15/2029 | 100,000 | 80,250 | |||||||||
Scripps Escrow II, Inc. (Media) | (a) | 5.375% | 01/15/2031 | 225,000 | 180,340 | |||||||||
Scripps Escrow, Inc. (Media) | (a) | 5.875% | 07/15/2027 | 350,000 | 312,375 | |||||||||
Sinclair Television Group, Inc. (Media) | (a) | 5.125% | 02/15/2027 | 125,000 | 101,952 | |||||||||
Sinclair Television Group, Inc. (Media) | (a) | 5.500% | 03/01/2030 | 525,000 | 367,096 | |||||||||
Sirius XM Radio, Inc. (Media) | (a) | 3.125% | 09/01/2026 | 225,000 | 199,786 | |||||||||
Sirius XM Radio, Inc. (Media) | (a) | 5.000% | 08/01/2027 | 75,000 | 69,327 | |||||||||
Sirius XM Radio, Inc. (Media) | (a) | 4.000% | 07/15/2028 | 175,000 | 152,302 | |||||||||
Sirius XM Radio, Inc. (Media) | (a) | 4.125% | 07/01/2030 | 475,000 | 391,975 | |||||||||
Sirius XM Radio, Inc. (Media) | (a) | 3.875% | 09/01/2031 | 550,000 | 429,093 | |||||||||
Sprint LLC (Wireless Telecom. Svs.) | 7.625% | 02/15/2025 | 300,000 | 309,700 | ||||||||||
TEGNA, Inc. (Media) | 5.000% | 09/15/2029 | 750,000 | 711,600 | ||||||||||
Telenet Finance Luxembourg Notes SARL (Media) | (a) | 5.500% | 03/01/2028 | 800,000 | 720,000 | |||||||||
T-Mobile U.S.A., Inc. (Wireless Telecom. Svs.) | 3.375% | 04/15/2029 | 450,000 | 396,346 | ||||||||||
Univision Communications, Inc. (Media) | (a) | 4.500% | 05/01/2029 | 275,000 | 229,971 | |||||||||
Univision Communications, Inc. (Media) | (a) | 7.375% | 06/30/2030 | 150,000 | 143,355 | |||||||||
UPC Broadband Finco B.V. (Media) | (a) | 4.875% | 07/15/2031 | 900,000 | 748,615 | |||||||||
Urban One, Inc. (Media) | (a) | 7.375% | 02/01/2028 | 400,000 | 338,124 | |||||||||
Virgin Media Finance PLC (Media) | (a) | 5.000% | 07/15/2030 | 200,000 | 160,412 | |||||||||
Virgin Media Secured Finance PLC (Media) | (a) | 4.500% | 08/15/2030 | 200,000 | 167,085 | |||||||||
Virgin Media Vendor Financing Notes IV DAC (Media) | (a) | 5.000% | 07/15/2028 | 575,000 | 502,612 | |||||||||
Vmed O2 U.K. Financing I PLC (Wireless Telecom. Svs.) | (a) | 4.250% | 01/31/2031 | 200,000 | 161,903 | |||||||||
Vmed O2 U.K. Financing I PLC (Wireless Telecom. Svs.) | (a) | 4.750% | 07/15/2031 | 400,000 | 324,940 | |||||||||
| 58 | (continued) |
Ohio National Fund, Inc. | ON Federated High Income Bond Portfolio (Continued) | |
| Schedule of Investments | December 31, 2022 | |
| Corporate Bonds – 96.8% | Rate | Maturity | Face Amount | Value | ||||||||||
COMMUNICATION SERVICES (continued) | ||||||||||||||
VZ Secured Financing B.V. (Media) | (a) | 5.000% | 01/15/2032 | $ | 550,000 | $ | 446,942 | |||||||
WMG Acquisition Corp. (Entertainment) | (a) | 3.750% | 12/01/2029 | 125,000 | 107,500 | |||||||||
WMG Acquisition Corp. (Entertainment) | (a) | 3.875% | 07/15/2030 | 75,000 | 64,601 | |||||||||
Ziggo Bond Co. B.V. (Diversified Telecom. Svs.) | (a) | 6.000% | 01/15/2027 | 425,000 | 395,428 | |||||||||
|
| |||||||||||||
| 21,528,489 | ||||||||||||||
|
| |||||||||||||
CONSUMER DISCRETIONARY – 12.0% | ||||||||||||||
1011778 B.C. ULC / New Red Finance, Inc. (Hotels, Restaurants & Leisure) | (a) | 4.000% | 10/15/2030 | 1,800,000 | 1,457,658 | |||||||||
Academy Ltd. (Specialty Retail) | (a) | 6.000% | 11/15/2027 | 300,000 | 287,211 | |||||||||
Adient Global Holdings Ltd. (Auto Components) | (a) | 4.875% | 08/15/2026 | 300,000 | 279,294 | |||||||||
Affinity Gaming (Hotels, Restaurants & Leisure) | (a) | 6.875% | 12/15/2027 | 400,000 | 339,136 | |||||||||
Aramark Services, Inc. (Hotels, Restaurants & Leisure) | (a) | 6.375% | 05/01/2025 | 425,000 | 419,777 | |||||||||
Aramark Services, Inc. (Hotels, Restaurants & Leisure) | (a) | 5.000% | 02/01/2028 | 100,000 | 93,294 | |||||||||
Asbury Automotive Group, Inc. (Specialty Retail) | (a) | 4.625% | 11/15/2029 | 300,000 | 252,792 | |||||||||
Asbury Automotive Group, Inc. (Specialty Retail) | (a) | 5.000% | 02/15/2032 | 200,000 | 164,540 | |||||||||
Boyd Gaming Corp. (Hotels, Restaurants & Leisure) | 4.750% | 12/01/2027 | 275,000 | 256,129 | ||||||||||
Boyd Gaming Corp. (Hotels, Restaurants & Leisure) | (a) | 4.750% | 06/15/2031 | 200,000 | 174,000 | |||||||||
Caesars Entertainment, Inc. (Hotels, Restaurants & Leisure) | (a) | 6.250% | 07/01/2025 | 325,000 | 315,795 | |||||||||
Caesars Entertainment, Inc. (Hotels, Restaurants & Leisure) | (a) | 8.125% | 07/01/2027 | 450,000 | 442,147 | |||||||||
Caesars Entertainment, Inc. (Hotels, Restaurants & Leisure) | (a) | 4.625% | 10/15/2029 | 250,000 | 203,452 | |||||||||
Caesars Resort Collection LLC / CRC Finco, Inc. (Hotels, Restaurants & Leisure) | (a) | 5.750% | 07/01/2025 | 225,000 | 220,254 | |||||||||
Clarios Global LP / Clarios U.S. Finance Co. (Auto Components) | (a) | 6.250% | 05/15/2026 | 112,000 | 109,480 | |||||||||
Clarios Global LP / Clarios U.S. Finance Co. (Auto Components) | (a) | 8.500% | 05/15/2027 | 1,200,000 | 1,171,796 | |||||||||
Dana, Inc. (Auto Components) | 4.250% | 09/01/2030 | 250,000 | 201,405 | ||||||||||
Dana, Inc. (Auto Components) | 4.500% | 02/15/2032 | 100,000 | 79,964 | ||||||||||
Dornoch Debt Merger Sub, Inc. (Auto Components) | (a) | 6.625% | 10/15/2029 | 625,000 | 438,473 | |||||||||
Garda World Security Corp. (Diversified Consumer Svs.) | (a) | 9.500% | 11/01/2027 | 1,103,000 | 1,062,317 | |||||||||
Gates Global LLC / Gates Corp. (Auto Components) | (a) | 6.250% | 01/15/2026 | 950,000 | 916,750 | |||||||||
Hilton Domestic Operating Co., Inc. (Hotels, Restaurants & Leisure) | (a) | 5.750% | 05/01/2028 | 50,000 | 48,500 | |||||||||
Hilton Domestic Operating Co., Inc. (Hotels, Restaurants & Leisure) | 4.875% | 01/15/2030 | 150,000 | 135,932 | ||||||||||
Hilton Domestic Operating Co., Inc. (Hotels, Restaurants & Leisure) | (a) | 3.625% | 02/15/2032 | 200,000 | 160,160 | |||||||||
IHO Verwaltungs GmbH (Auto Components) | (a)(b) | 4.750%, 5.500% PIK | 09/15/2026 | 400,000 | 346,145 | |||||||||
IHO Verwaltungs GmbH (Auto Components) | (a)(b) | 6.000%, 6.750% PIK | 05/15/2027 | 500,000 | 437,433 | |||||||||
KFC Holding Co. / Pizza Hut Holdings LLC / Taco Bell of America LLC (Hotels, Restaurants & Leisure) | (a) | 4.750% | 06/01/2027 | 525,000 | 504,000 | |||||||||
Kontoor Brands, Inc. (Textiles, Apparel & Luxury Goods) | (a) | 4.125% | 11/15/2029 | 100,000 | 81,611 | |||||||||
MGM Resorts International (Hotels, Restaurants & Leisure) | 4.625% | 09/01/2026 | 198,000 | 181,511 | ||||||||||
MGM Resorts International (Hotels, Restaurants & Leisure) | 4.750% | 10/15/2028 | 75,000 | 65,464 | ||||||||||
Midwest Gaming Borrower LLC / Midwest Gaming Finance Corp. (Hotels, Restaurants & Leisure) | (a) | 4.875% | 05/01/2029 | 200,000 | 170,173 | |||||||||
Mohegan Tribal Gaming Authority (Hotels, Restaurants & Leisure) | (a) | 8.000% | 02/01/2026 | 850,000 | 794,996 | |||||||||
Penn Entertainment, Inc. (Hotels, Restaurants & Leisure) | (a) | 5.625% | 01/15/2027 | 50,000 | 45,337 | |||||||||
Penn Entertainment, Inc. (Hotels, Restaurants & Leisure) | (a) | 4.125% | 07/01/2029 | 125,000 | 98,750 | |||||||||
Raptor Acquisition Corp. / Raptor Co-Issuer LLC (Hotels, Restaurants & Leisure) | (a) | 4.875% | 11/01/2026 | 50,000 | 44,420 | |||||||||
Real Hero Merger Sub 2, Inc. (Auto Components) | (a) | 6.250% | 02/01/2029 | 400,000 | 274,200 | |||||||||
Scientific Games Holdings LP / Scientific Games U.S. FinCo, Inc. (Hotels, Restaurants & Leisure) | (a) | 6.625% | 03/01/2030 | 400,000 | 337,880 | |||||||||
Scientific Games International, Inc. (Hotels, Restaurants & Leisure) | (a) | 8.625% | 07/01/2025 | 350,000 | 357,071 | |||||||||
Scientific Games International, Inc. (Hotels, Restaurants & Leisure) | (a) | 7.250% | 11/15/2029 | 250,000 | 240,000 | |||||||||
SeaWorld Parks & Entertainment, Inc. (Hotels, Restaurants & Leisure) | (a) | 5.250% | 08/15/2029 | 450,000 | 391,814 | |||||||||
Six Flags Entertainment Corp. (Hotels, Restaurants & Leisure) | (a) | 5.500% | 04/15/2027 | 275,000 | 247,679 | |||||||||
Six Flags Theme Parks, Inc. (Hotels, Restaurants & Leisure) | (a) | 7.000% | 07/01/2025 | 25,000 | 25,170 | |||||||||
Station Casinos LLC (Hotels, Restaurants & Leisure) | (a) | 4.500% | 02/15/2028 | 200,000 | 173,876 | |||||||||
Station Casinos LLC (Hotels, Restaurants & Leisure) | (a) | 4.625% | 12/01/2031 | 200,000 | 160,435 | |||||||||
William Carter Co. / The (Textiles, Apparel & Luxury Goods) | (a) | 5.625% | 03/15/2027 | 275,000 | 263,785 | |||||||||
Yum! Brands, Inc. (Hotels, Restaurants & Leisure) | (a) | 4.750% | 01/15/2030 | 75,000 | 68,813 | |||||||||
Yum! Brands, Inc. (Hotels, Restaurants & Leisure) | 4.625% | 01/31/2032 | 100,000 | 88,393 | ||||||||||
Yum! Brands, Inc. (Hotels, Restaurants & Leisure) | 5.375% | 04/01/2032 | 150,000 | 138,938 | ||||||||||
|
| |||||||||||||
| 14,768,150 | ||||||||||||||
|
| |||||||||||||
CONSUMER STAPLES – 2.9% | ||||||||||||||
Albertsons Cos., Inc. / Safeway, Inc. / New Albertsons LP / Albertsons LLC (Food & Staples Retailing) | (a) | 5.875% | 02/15/2028 | 100,000 | 95,068 | |||||||||
Albertsons Cos., Inc. / Safeway, Inc. / New Albertsons LP / Albertsons LLC (Food & Staples Retailing) | (a) | 3.500% | 03/15/2029 | 425,000 | 356,571 | |||||||||
BellRing Brands, Inc. (Personal Products) | (a) | 7.000% | 03/15/2030 | 550,000 | 529,237 | |||||||||
Edgewell Personal Care Co. (Personal Products) | (a) | 5.500% | 06/01/2028 | 175,000 | 163,665 | |||||||||
Edgewell Personal Care Co. (Personal Products) | (a) | 4.125% | 04/01/2029 | 200,000 | 170,496 | |||||||||
Energizer Holdings, Inc. (Household Products) | (a) | 6.500% | 12/31/2027 | 100,000 | 95,169 | |||||||||
Energizer Holdings, Inc. (Household Products) | (a) | 4.750% | 06/15/2028 | 150,000 | 129,990 | |||||||||
Energizer Holdings, Inc. (Household Products) | (a) | 4.375% | 03/31/2029 | 425,000 | 360,422 | |||||||||
| 59 | (continued) |
Ohio National Fund, Inc. | ON Federated High Income Bond Portfolio (Continued) | |
| Schedule of Investments | December 31, 2022 | |
| Corporate Bonds – 96.8% | Rate | Maturity | Face Amount | Value | ||||||||||
CONSUMER STAPLES (continued) | ||||||||||||||
Kraft Heinz Foods Co. (Food Products) | 4.375% | 06/01/2046 | $75,000 | $ | 60,945 | |||||||||
Performance Food Group, Inc. (Food & Staples Retailing) | (a) | 5.500% | 10/15/2027 | 150,000 | 141,475 | |||||||||
Performance Food Group, Inc. (Food & Staples Retailing) | (a) | 4.250% | 08/01/2029 | 250,000 | 216,655 | |||||||||
Post Holdings, Inc. (Food Products) | (a) | 5.750% | 03/01/2027 | 230,000 | 222,428 | |||||||||
Post Holdings, Inc. (Food Products) | (a) | 5.625% | 01/15/2028 | 500,000 | 470,673 | |||||||||
U.S. Foods, Inc. (Food & Staples Retailing) | (a) | 6.250% | 04/15/2025 | 100,000 | 98,953 | |||||||||
U.S. Foods, Inc. (Food & Staples Retailing) | (a) | 4.750% | 02/15/2029 | 350,000 | 310,772 | |||||||||
U.S. Foods, Inc. (Food & Staples Retailing) | (a) | 4.625% | 06/01/2030 | 175,000 | 154,108 | |||||||||
|
| |||||||||||||
| 3,576,627 | ||||||||||||||
|
| |||||||||||||
ENERGY – 14.1% | ||||||||||||||
Antero Midstream Partners LP / Antero Midstream Finance Corp. (Oil, Gas & Consumable Fuels) | (a) | 7.875% | 05/15/2026 | 125,000 | 126,533 | |||||||||
Antero Midstream Partners LP / Antero Midstream Finance Corp. (Oil, Gas & Consumable Fuels) | (a) | 5.750% | 03/01/2027 | 250,000 | 236,339 | |||||||||
Antero Midstream Partners LP / Antero Midstream Finance Corp. (Oil, Gas & Consumable Fuels) | (a) | 5.750% | 01/15/2028 | 625,000 | 579,756 | |||||||||
Antero Midstream Partners LP / Antero Midstream Finance Corp. (Oil, Gas & Consumable Fuels) | (a) | 5.375% | 06/15/2029 | 625,000 | 571,400 | |||||||||
Antero Resources Corp. (Oil, Gas & Consumable Fuels) | (a) | 7.625% | 02/01/2029 | 61,000 | 61,336 | |||||||||
Antero Resources Corp. (Oil, Gas & Consumable Fuels) | (a) | 5.375% | 03/01/2030 | 225,000 | 208,600 | |||||||||
Archrock Partners LP / Archrock Partners Finance Corp. (Oil, Gas & Consumable Fuels) | (a) | 6.875% | 04/01/2027 | 625,000 | 596,665 | |||||||||
Archrock Partners LP / Archrock Partners Finance Corp. (Oil, Gas & Consumable Fuels) | (a) | 6.250% | 04/01/2028 | 450,000 | 411,755 | |||||||||
Ascent Resources Utica Holdings LLC / ARU Finance Corp. (Oil, Gas & Consumable Fuels) | (a) | 7.000% | 11/01/2026 | 425,000 | 412,258 | |||||||||
Ascent Resources Utica Holdings LLC / ARU Finance Corp. (Oil, Gas & Consumable Fuels) | (a) | 8.250% | 12/31/2028 | 100,000 | 98,020 | |||||||||
Ascent Resources Utica Holdings LLC / ARU Finance Corp. (Oil, Gas & Consumable Fuels) | (a) | 5.875% | 06/30/2029 | 75,000 | 66,872 | |||||||||
Berry Petroleum Co. LLC (Oil, Gas & Consumable Fuels) | (a) | 7.000% | 02/15/2026 | 175,000 | 160,726 | |||||||||
Callon Petroleum Co. (Oil, Gas & Consumable Fuels) | 8.250% | 07/15/2025 | 150,000 | 149,250 | ||||||||||
Callon Petroleum Co. (Oil, Gas & Consumable Fuels) | 6.375% | 07/01/2026 | 125,000 | 116,506 | ||||||||||
Cheniere Energy Partners LP (Oil, Gas & Consumable Fuels) | 4.500% | 10/01/2029 | 100,000 | 89,922 | ||||||||||
Cheniere Energy Partners LP (Oil, Gas & Consumable Fuels) | 4.000% | 03/01/2031 | 325,000 | 276,692 | ||||||||||
Cheniere Energy Partners LP (Oil, Gas & Consumable Fuels) | 3.250% | 01/31/2032 | 150,000 | 119,206 | ||||||||||
Cheniere Energy, Inc. (Oil, Gas & Consumable Fuels) | 4.625% | 10/15/2028 | 175,000 | 158,177 | ||||||||||
Chesapeake Energy Corp. (Oil, Gas & Consumable Fuels) | (a) | 5.500% | 02/01/2026 | 50,000 | 48,249 | |||||||||
Chesapeake Energy Corp. (Oil, Gas & Consumable Fuels) | (a) | 5.875% | 02/01/2029 | 50,000 | 47,374 | |||||||||
Chord Energy Corp. (Oil, Gas & Consumable Fuels) | (a) | 6.375% | 06/01/2026 | 75,000 | 73,045 | |||||||||
CNX Midstream Partners LP (Oil, Gas & Consumable Fuels) | (a) | 4.750% | 04/15/2030 | 425,000 | 348,783 | |||||||||
Comstock Resources, Inc. (Oil, Gas & Consumable Fuels) | (a) | 6.750% | 03/01/2029 | 500,000 | 451,250 | |||||||||
Comstock Resources, Inc. (Oil, Gas & Consumable Fuels) | (a) | 5.875% | 01/15/2030 | 100,000 | 85,970 | |||||||||
Crestwood Midstream Partners LP / Crestwood Midstream Finance Corp. (Oil, Gas & Consumable Fuels) | (a) | 8.000% | 04/01/2029 | 300,000 | 298,526 | |||||||||
CrownRock LP / CrownRock Finance, Inc. (Oil, Gas & Consumable Fuels) | (a) | 5.625% | 10/15/2025 | 525,000 | 506,625 | |||||||||
CrownRock LP / CrownRock Finance, Inc. (Oil, Gas & Consumable Fuels) | (a) | 5.000% | 05/01/2029 | 50,000 | 44,926 | |||||||||
DT Midstream, Inc. (Oil, Gas & Consumable Fuels) | (a) | 4.375% | 06/15/2031 | 200,000 | 167,780 | |||||||||
Endeavor Energy Resources LP / EER Finance, Inc. (Oil, Gas & Consumable Fuels) | (a) | 5.750% | 01/30/2028 | 100,000 | 95,752 | |||||||||
Enviva Partners LP / Enviva Partners Finance Corp. (Oil, Gas & Consumable Fuels) | (a) | 6.500% | 01/15/2026 | 900,000 | 847,656 | |||||||||
EQM Midstream Partners LP (Oil, Gas & Consumable Fuels) | (a) | 7.500% | 06/01/2027 | 275,000 | 269,297 | |||||||||
EQM Midstream Partners LP (Oil, Gas & Consumable Fuels) | (a) | 6.500% | 07/01/2027 | 275,000 | 262,831 | |||||||||
EQM Midstream Partners LP (Oil, Gas & Consumable Fuels) | 5.500% | 07/15/2028 | 350,000 | 312,955 | ||||||||||
EQM Midstream Partners LP (Oil, Gas & Consumable Fuels) | (a) | 4.500% | 01/15/2029 | 100,000 | 83,993 | |||||||||
EQM Midstream Partners LP (Oil, Gas & Consumable Fuels) | (a) | 4.750% | 01/15/2031 | 675,000 | 551,812 | |||||||||
EQM Midstream Partners LP (Oil, Gas & Consumable Fuels) | 6.500% | 07/15/2048 | 75,000 | 56,218 | ||||||||||
Hess Midstream Operations LP (Oil, Gas & Consumable Fuels) | (a) | 5.125% | 06/15/2028 | 300,000 | 277,409 | |||||||||
Hess Midstream Operations LP (Oil, Gas & Consumable Fuels) | (a) | 4.250% | 02/15/2030 | 100,000 | 85,492 | |||||||||
Hess Midstream Operations LP (Oil, Gas & Consumable Fuels) | (a) | 5.500% | 10/15/2030 | 100,000 | 91,486 | |||||||||
Holly Energy Partners LP / Holly Energy Finance Corp. (Oil, Gas & Consumable Fuels) | (a) | 6.375% | 04/15/2027 | 175,000 | 171,936 | |||||||||
Holly Energy Partners LP / Holly Energy Finance Corp. (Oil, Gas & Consumable Fuels) | (a) | 5.000% | 02/01/2028 | 300,000 | 273,152 | |||||||||
Nabors Industries Ltd. (Energy Equip. & Svs.) | (a) | 7.250% | 01/15/2026 | 225,000 | 212,040 | |||||||||
Nabors Industries Ltd. (Energy Equip. & Svs.) | (a) | 7.500% | 01/15/2028 | 275,000 | 251,596 | |||||||||
Nabors Industries, Inc. (Oil, Gas & Consumable Fuels) | (a) | 7.375% | 05/15/2027 | 50,000 | 48,435 | |||||||||
NuStar Logistics LP (Oil, Gas & Consumable Fuels) | 5.625% | 04/28/2027 | 300,000 | 280,517 | ||||||||||
Occidental Petroleum Corp. (Oil, Gas & Consumable Fuels) | 5.875% | 09/01/2025 | 225,000 | 224,185 | ||||||||||
Occidental Petroleum Corp. (Oil, Gas & Consumable Fuels) | 8.875% | 07/15/2030 | 375,000 | 423,377 | ||||||||||
Occidental Petroleum Corp. (Oil, Gas & Consumable Fuels) | 6.625% | 09/01/2030 | 275,000 | 284,180 | ||||||||||
Occidental Petroleum Corp. (Oil, Gas & Consumable Fuels) | 6.450% | 09/15/2036 | 225,000 | 229,500 | ||||||||||
PDC Energy, Inc. (Oil, Gas & Consumable Fuels) | 5.750% | 05/15/2026 | 250,000 | 238,643 | ||||||||||
Permian Resources Operating LLC (Oil, Gas & Consumable Fuels) | (a) | 6.875% | 04/01/2027 | 350,000 | 329,783 | |||||||||
Precision Drilling Corp. (Energy Equip. & Svs.) | (a) | 7.125% | 01/15/2026 | 200,000 | 193,500 | |||||||||
Precision Drilling Corp. (Energy Equip. & Svs.) | (a) | 6.875% | 01/15/2029 | 175,000 | 162,926 | |||||||||
Range Resources Corp. (Oil, Gas & Consumable Fuels) | 4.875% | 05/15/2025 | 75,000 | 71,243 | ||||||||||
Range Resources Corp. (Oil, Gas & Consumable Fuels) | 8.250% | 01/15/2029 | 200,000 | 206,089 | ||||||||||
| 60 | (continued) |
Ohio National Fund, Inc. | ON Federated High Income Bond Portfolio (Continued) | |
| Schedule of Investments | December 31, 2022 | |
| Corporate Bonds – 96.8% | Rate | Maturity | Face Amount | Value | ||||||||||
ENERGY (continued) | ||||||||||||||
Range Resources Corp. (Oil, Gas & Consumable Fuels) | (a) | 4.750% | 02/15/2030 | $ | 125,000 | $ | 110,138 | |||||||
Rockcliff Energy II LLC (Oil, Gas & Consumable Fuels) | (a) | 5.500% | 10/15/2029 | 200,000 | 182,990 | |||||||||
SM Energy Co. (Oil, Gas & Consumable Fuels) | 6.750% | 09/15/2026 | 275,000 | 266,984 | ||||||||||
SM Energy Co. (Oil, Gas & Consumable Fuels) | 6.625% | 01/15/2027 | 25,000 | 24,081 | ||||||||||
SM Energy Co. (Oil, Gas & Consumable Fuels) | 6.500% | 07/15/2028 | 50,000 | 47,939 | ||||||||||
Southwestern Energy Co. (Oil, Gas & Consumable Fuels) | 8.375% | 09/15/2028 | 225,000 | 231,962 | ||||||||||
Southwestern Energy Co. (Oil, Gas & Consumable Fuels) | 5.375% | 03/15/2030 | 75,000 | 68,401 | ||||||||||
Southwestern Energy Co. (Oil, Gas & Consumable Fuels) | 4.750% | 02/01/2032 | 75,000 | 64,094 | ||||||||||
Tap Rock Resources LLC (Oil, Gas & Consumable Fuels) | (a) | 7.000% | 10/01/2026 | 325,000 | 302,282 | |||||||||
Targa Resources Partners LP / Targa Resources Partners Finance Corp. (Oil, Gas & Consumable Fuels) | 6.500% | 07/15/2027 | 25,000 | 25,159 | ||||||||||
Targa Resources Partners LP / Targa Resources Partners Finance Corp. (Oil, Gas & Consumable Fuels) | 5.000% | 01/15/2028 | 425,000 | 405,432 | ||||||||||
Targa Resources Partners LP / Targa Resources Partners Finance Corp. (Oil, Gas & Consumable Fuels) | 5.500% | 03/01/2030 | 475,000 | 446,937 | ||||||||||
Targa Resources Partners LP / Targa Resources Partners Finance Corp. (Oil, Gas & Consumable Fuels) | 4.875% | 02/01/2031 | 75,000 | 67,721 | ||||||||||
TransMontaigne Partners LP / TLP Finance Corp. (Oil, Gas & Consumable Fuels) | 6.125% | 02/15/2026 | 225,000 | 193,500 | ||||||||||
U.S.A. Compression Partners LP / U.S.A. Compression Finance Corp. (Energy Equip. & Svs.) | 6.875% | 04/01/2026 | 925,000 | 887,343 | ||||||||||
U.S.A. Compression Partners LP / U.S.A. Compression Finance Corp. (Energy Equip. & Svs.) | 6.875% | 09/01/2027 | 150,000 | 140,250 | ||||||||||
Western Midstream Operating LP (Oil, Gas & Consumable Fuels) | 4.650% | 07/01/2026 | 50,000 | 47,453 | ||||||||||
Western Midstream Operating LP (Oil, Gas & Consumable Fuels) | 4.500% | 03/01/2028 | 175,000 | 160,563 | ||||||||||
Western Midstream Operating LP (Oil, Gas & Consumable Fuels) | 4.750% | 08/15/2028 | 75,000 | 68,497 | ||||||||||
Western Midstream Operating LP (Oil, Gas & Consumable Fuels) | 5.450% | 04/01/2044 | 175,000 | 145,376 | ||||||||||
Western Midstream Operating LP (Oil, Gas & Consumable Fuels) | 5.300% | 03/01/2048 | 500,000 | 411,113 | ||||||||||
Western Midstream Operating LP (Oil, Gas & Consumable Fuels) | 5.500% | 08/15/2048 | 100,000 | 82,997 | ||||||||||
|
| |||||||||||||
| 17,429,756 | ||||||||||||||
|
| |||||||||||||
FINANCIALS – 11.2% | ||||||||||||||
AmWINS Group, Inc. (Insurance) | (a) | 4.875% | 06/30/2029 | 400,000 | 339,259 | |||||||||
Ardonagh Midco 2 PLC (Insurance) | (a)(b) | 11.500%, 12.750% PIK | 01/15/2027 | 500,000 | 475,000 | |||||||||
AssuredPartners, Inc. (Insurance) | (a) | 7.000% | 08/15/2025 | 675,000 | 652,781 | |||||||||
AssuredPartners, Inc. (Insurance) | (a) | 5.625% | 01/15/2029 | 200,000 | 164,607 | |||||||||
BroadStreet Partners, Inc. (Insurance) | (a) | 5.875% | 04/15/2029 | 1,350,000 | 1,148,960 | |||||||||
Ford Motor Credit Co. LLC (Consumer Finance) | 4.063% | 11/01/2024 | 375,000 | 360,027 | ||||||||||
Ford Motor Credit Co. LLC (Consumer Finance) | 5.125% | 06/16/2025 | 400,000 | 384,537 | ||||||||||
Ford Motor Credit Co. LLC (Consumer Finance) | 3.375% | 11/13/2025 | 575,000 | 519,807 | ||||||||||
Ford Motor Credit Co. LLC (Consumer Finance) | 4.389% | 01/08/2026 | 225,000 | 209,579 | ||||||||||
Ford Motor Credit Co. LLC (Consumer Finance) | 2.700% | 08/10/2026 | 200,000 | 173,680 | ||||||||||
Ford Motor Credit Co. LLC (Consumer Finance) | 4.271% | 01/09/2027 | 450,000 | 407,015 | ||||||||||
Ford Motor Credit Co. LLC (Consumer Finance) | 7.350% | 11/04/2027 | 225,000 | 230,558 | ||||||||||
Ford Motor Credit Co. LLC (Consumer Finance) | 5.113% | 05/03/2029 | 525,000 | 475,411 | ||||||||||
Ford Motor Credit Co. LLC (Consumer Finance) | 4.000% | 11/13/2030 | 275,000 | 225,731 | ||||||||||
GTCR AP Finance, Inc. (Insurance) | (a) | 8.000% | 05/15/2027 | 500,000 | 478,940 | |||||||||
HUB International Ltd. (Insurance) | (a) | 7.000% | 05/01/2026 | 1,950,000 | 1,909,030 | |||||||||
HUB International Ltd. (Insurance) | (a) | 5.625% | 12/01/2029 | 575,000 | 502,195 | |||||||||
Jones Deslauriers Insurance Management, Inc. (Insurance) | (a) | 10.500% | 12/15/2030 | 300,000 | 295,456 | |||||||||
Navient Corp. (Consumer Finance) | 6.750% | 06/25/2025 | 175,000 | 167,984 | ||||||||||
Navient Corp. (Consumer Finance) | 6.750% | 06/15/2026 | 200,000 | 189,557 | ||||||||||
Navient Corp. (Consumer Finance) | 5.500% | 03/15/2029 | 350,000 | 285,600 | ||||||||||
NFP Corp. (Insurance) | (a) | 6.875% | 08/15/2028 | 1,250,000 | 1,030,349 | |||||||||
NFP Corp. (Insurance) | (a) | 7.500% | 10/01/2030 | 375,000 | 352,644 | |||||||||
Rocket Mortgage LLC / Rocket Mortgage Co-Issuer, Inc. (Thrifts & Mortgage Finance) | (a) | 3.625% | 03/01/2029 | 200,000 | 158,488 | |||||||||
Rocket Mortgage LLC / Rocket Mortgage Co-Issuer, Inc. (Thrifts & Mortgage Finance) | (a) | 3.875% | 03/01/2031 | 350,000 | 267,146 | |||||||||
Rocket Mortgage LLC / Rocket Mortgage Co-Issuer, Inc. (Thrifts & Mortgage Finance) | (a) | 4.000% | 10/15/2033 | 400,000 | 298,744 | |||||||||
Ryan Specialty Group LLC (Insurance) | (a) | 4.375% | 02/01/2030 | 275,000 | 238,121 | |||||||||
United Wholesale Mortgage LLC (Thrifts & Mortgage Finance) | (a) | 5.500% | 11/15/2025 | 700,000 | 630,434 | |||||||||
United Wholesale Mortgage LLC (Thrifts & Mortgage Finance) | (a) | 5.750% | 06/15/2027 | 175,000 | 150,656 | |||||||||
United Wholesale Mortgage LLC (Thrifts & Mortgage Finance) | (a) | 5.500% | 04/15/2029 | 225,000 | 178,983 | |||||||||
USI, Inc. (Insurance) | (a) | 6.875% | 05/01/2025 | 1,025,000 | 987,428 | |||||||||
|
| |||||||||||||
| 13,888,707 | ||||||||||||||
|
| |||||||||||||
HEALTH CARE – 7.9% | ||||||||||||||
AdaptHealth LLC (Health Care Providers & Svs.) | (a) | 4.625% | 08/01/2029 | 250,000 | 209,312 | |||||||||
AdaptHealth LLC (Health Care Providers & Svs.) | (a) | 5.125% | 03/01/2030 | 325,000 | 276,669 | |||||||||
AHP Health Partners, Inc. (Health Care Providers & Svs.) | (a) | 5.750% | 07/15/2029 | 350,000 | 273,437 | |||||||||
Avantor Funding, Inc. (Health Care Equip. & Supplies) | (a) | 4.625% | 07/15/2028 | 575,000 | 522,468 | |||||||||
Avantor Funding, Inc. (Health Care Equip. & Supplies) | (a) | 3.875% | 11/01/2029 | 300,000 | 251,925 | |||||||||
Bausch Health Americas, Inc. (Pharmaceuticals) | (a) | 8.500% | 01/31/2027 | 400,000 | 209,260 | |||||||||
Bausch Health Cos., Inc. (Pharmaceuticals) | (a) | 6.125% | 02/01/2027 | 275,000 | 189,648 | |||||||||
Bausch Health Cos., Inc. (Pharmaceuticals) | (a) | 5.000% | 02/15/2029 | 175,000 | 83,868 | |||||||||
| 61 | (continued) |
Ohio National Fund, Inc. | ON Federated High Income Bond Portfolio (Continued) | |
| Schedule of Investments | December 31, 2022 | |
| Corporate Bonds – 96.8% | Rate | Maturity | Face Amount | Value | ||||||||||
HEALTH CARE (continued) | ||||||||||||||
Bausch Health Cos., Inc. (Pharmaceuticals) | (a) | 6.250% | 02/15/2029 | $ | 175,000 | $ | 84,252 | |||||||
Bausch Health Cos., Inc. (Pharmaceuticals) | (a) | 7.250% | 05/30/2029 | 575,000 | 277,610 | |||||||||
Catalent Pharma Solutions, Inc. (Pharmaceuticals) | (a) | 3.500% | 04/01/2030 | 150,000 | 118,439 | |||||||||
Centene Corp. (Health Care Providers & Svs.) | 4.250% | 12/15/2027 | 450,000 | 422,038 | ||||||||||
Centene Corp. (Health Care Providers & Svs.) | 4.625% | 12/15/2029 | 300,000 | 274,151 | ||||||||||
Centene Corp. (Health Care Providers & Svs.) | 3.375% | 02/15/2030 | 50,000 | 42,269 | ||||||||||
Centene Corp. (Health Care Providers & Svs.) | 2.625% | 08/01/2031 | 200,000 | 157,160 | ||||||||||
Charles River Laboratories International, Inc. (Life Sciences Tools & Svs.) | (a) | 3.750% | 03/15/2029 | 100,000 | 88,440 | |||||||||
Charles River Laboratories International, Inc. (Life Sciences Tools & Svs.) | (a) | 4.000% | 03/15/2031 | 100,000 | 86,500 | |||||||||
CHS / Community Health Systems, Inc. (Health Care Providers & Svs.) | (a) | 6.000% | 01/15/2029 | 50,000 | 41,824 | |||||||||
CHS / Community Health Systems, Inc. (Health Care Providers & Svs.) | (a) | 6.875% | 04/15/2029 | 300,000 | 154,189 | |||||||||
CHS / Community Health Systems, Inc. (Health Care Providers & Svs.) | (a) | 6.125% | 04/01/2030 | 150,000 | 74,277 | |||||||||
CHS / Community Health Systems, Inc. (Health Care Providers & Svs.) | (a) | 5.250% | 05/15/2030 | 225,000 | 169,658 | |||||||||
Embecta Corp. (Health Care Equip. & Supplies) | (a) | 5.000% | 02/15/2030 | 100,000 | 84,625 | |||||||||
Embecta Corp. (Health Care Equip. & Supplies) | (a) | 6.750% | 02/15/2030 | 250,000 | 225,625 | |||||||||
Garden Spinco Corp. (Health Care Equip. & Supplies) | (a) | 8.625% | 07/20/2030 | 100,000 | 106,000 | |||||||||
Global Medical Response, Inc. (Health Care Providers & Svs.) | (a) | 6.500% | 10/01/2025 | 250,000 | 178,928 | |||||||||
Grifols Escrow Issuer SA (Biotechnology) | (a) | 4.750% | 10/15/2028 | 200,000 | 172,694 | |||||||||
HCA, Inc. (Health Care Providers & Svs.) | 5.375% | 02/01/2025 | 225,000 | 224,728 | ||||||||||
HCA, Inc. (Health Care Providers & Svs.) | 3.500% | 09/01/2030 | 200,000 | 172,495 | ||||||||||
HealthEquity, Inc. (Health Care Providers & Svs.) | (a) | 4.500% | 10/01/2029 | 375,000 | 327,712 | |||||||||
IQVIA, Inc. (Health Care Technology) | (a) | 5.000% | 10/15/2026 | 300,000 | 286,455 | |||||||||
Legacy LifePoint Health LLC (Health Care Providers & Svs.) | (a) | 6.750% | 04/15/2025 | 150,000 | 141,164 | |||||||||
Legacy LifePoint Health LLC (Health Care Providers & Svs.) | (a) | 4.375% | 02/15/2027 | 125,000 | 105,728 | |||||||||
LifePoint Health, Inc. (Health Care Providers & Svs.) | (a) | 5.375% | 01/15/2029 | 25,000 | 14,128 | |||||||||
Mallinckrodt International Finance SA / Mallinckrodt CB LLC (Pharmaceuticals) | (a) | 10.000% | 06/15/2029 | 300,000 | 161,247 | |||||||||
Medline Borrower LP (Health Care Equip. & Supplies) | (a) | 3.875% | 04/01/2029 | 325,000 | 261,937 | |||||||||
Medline Borrower LP (Health Care Equip. & Supplies) | (a) | 5.250% | 10/01/2029 | 1,075,000 | 853,840 | |||||||||
MPH Acquisition Holdings LLC (Health Care Providers & Svs.) | (a) | 5.750% | 11/01/2028 | 275,000 | 182,878 | |||||||||
Organon & Co. / Organon Foreign Debt Co-Issuer B.V. (Pharmaceuticals) | (a) | 5.125% | 04/30/2031 | 450,000 | 389,646 | |||||||||
Pediatrix Medical Group, Inc. (Health Care Providers & Svs.) | (a) | 5.375% | 02/15/2030 | 225,000 | 195,518 | |||||||||
Prestige Brands, Inc. (Pharmaceuticals) | (a) | 3.750% | 04/01/2031 | 175,000 | 144,317 | |||||||||
RegionalCare Hospital Partners Holdings, Inc. / LifePoint Health, Inc. (Health Care Providers & Svs.) | (a) | 9.750% | 12/01/2026 | 200,000 | 160,942 | |||||||||
Syneos Health, Inc. (Life Sciences Tools & Svs.) | (a) | 3.625% | 01/15/2029 | 175,000 | 139,360 | |||||||||
Tenet Healthcare Corp. (Health Care Providers & Svs.) | 4.625% | 07/15/2024 | 51,000 | 49,738 | ||||||||||
Tenet Healthcare Corp. (Health Care Providers & Svs.) | (a) | 4.875% | 01/01/2026 | 300,000 | 283,693 | |||||||||
Tenet Healthcare Corp. (Health Care Providers & Svs.) | (a) | 6.250% | 02/01/2027 | 125,000 | 120,064 | |||||||||
Tenet Healthcare Corp. (Health Care Providers & Svs.) | (a) | 5.125% | 11/01/2027 | 400,000 | 372,096 | |||||||||
Tenet Healthcare Corp. (Health Care Providers & Svs.) | (a) | 6.125% | 10/01/2028 | 300,000 | 268,596 | |||||||||
Tenet Healthcare Corp. (Health Care Providers & Svs.) | (a) | 4.250% | 06/01/2029 | 150,000 | 129,945 | |||||||||
|
| |||||||||||||
| 9,761,493 | ||||||||||||||
|
| |||||||||||||
INDUSTRIALS – 10.6% | ||||||||||||||
Allied Universal Holdco LLC / Allied Universal Finance Corp. (Commercial Svs. & Supplies) | (a) | 6.625% | 07/15/2026 | 200,000 | 183,000 | |||||||||
Allied Universal Holdco LLC / Allied Universal Finance Corp. (Commercial Svs. & Supplies) | (a) | 9.750% | 07/15/2027 | 1,300,000 | 1,131,000 | |||||||||
American Airlines, Inc. / AAdvantage Loyalty IP Ltd. (Airlines) | (a) | 5.500% | 04/20/2026 | 175,000 | 168,288 | |||||||||
American Airlines, Inc. / AAdvantage Loyalty IP Ltd. (Airlines) | (a) | 5.750% | 04/20/2029 | 150,000 | 137,093 | |||||||||
American Builders & Contractors Supply Co., Inc. (Trading Companies & Distributors) | (a) | 4.000% | 01/15/2028 | 175,000 | 156,135 | |||||||||
BCPE Empire Holdings, Inc. (Commercial Svs. & Supplies) | (a) | 7.625% | 05/01/2027 | 850,000 | 762,263 | |||||||||
Brink’s Co. / The (Commercial Svs. & Supplies) | (a) | 5.500% | 07/15/2025 | 75,000 | 73,637 | |||||||||
Camelot Return Merger Sub, Inc. (Building Products) | (a) | 8.750% | 08/01/2028 | 175,000 | 160,585 | |||||||||
Clarivate Science Holdings Corp. (Professional Svs.) | (a) | 3.875% | 07/01/2028 | 75,000 | 64,980 | |||||||||
Clarivate Science Holdings Corp. (Professional Svs.) | (a) | 4.875% | 07/01/2029 | 400,000 | 340,140 | |||||||||
Cornerstone Building Brands, Inc. (Building Products) | (a) | 6.125% | 01/15/2029 | 200,000 | 140,848 | |||||||||
CP Atlas Buyer, Inc. (Building Products) | (a) | 7.000% | 12/01/2028 | 525,000 | 389,899 | |||||||||
Dun & Bradstreet Corp. / The (Professional Svs.) | (a) | 5.000% | 12/15/2029 | 300,000 | 256,729 | |||||||||
Foundation Building Materials, Inc. (Trading Companies & Distributors) | (a) | 6.000% | 03/01/2029 | 800,000 | 598,963 | |||||||||
Garda World Security Corp. (Commercial Svs. & Supplies) | (a) | 4.625% | 02/15/2027 | 175,000 | 154,521 | |||||||||
Garda World Security Corp. (Commercial Svs. & Supplies) | (a) | 6.000% | 06/01/2029 | 300,000 | 243,765 | |||||||||
GYP Holdings III Corp. (Building Products) | (a) | 4.625% | 05/01/2029 | 325,000 | 265,352 | |||||||||
H&E Equipment Services, Inc. (Trading Companies & Distributors) | (a) | 3.875% | 12/15/2028 | 300,000 | 255,537 | |||||||||
Interface, Inc. (Commercial Svs. & Supplies) | (a) | 5.500% | 12/01/2028 | 125,000 | 103,211 | |||||||||
KAR Auction Services, Inc. (Commercial Svs. & Supplies) | (a) | 5.125% | 06/01/2025 | 83,000 | 81,086 | |||||||||
Madison IAQ LLC (Commercial Svs. & Supplies) | (a) | 4.125% | 06/30/2028 | 50,000 | 41,812 | |||||||||
Madison IAQ LLC (Commercial Svs. & Supplies) | (a) | 5.875% | 06/30/2029 | 900,000 | 616,859 | |||||||||
MIWD Holdco II LLC / MIWD Finance Corp. (Building Products) | (a) | 5.500% | 02/01/2030 | 75,000 | 59,711 | |||||||||
Science Applications International Corp. (Professional Svs.) | (a) | 4.875% | 04/01/2028 | 75,000 | 69,375 | |||||||||
Sensata Technologies B.V. (Electrical Equip.) | (a) | 5.875% | 09/01/2030 | 200,000 | 189,545 | |||||||||
Sensata Technologies, Inc. (Electrical Equip.) | (a) | 4.375% | 02/15/2030 | 125,000 | 108,813 | |||||||||
Sensata Technologies, Inc. (Electrical Equip.) | (a) | 3.750% | 02/15/2031 | 25,000 | 20,566 | |||||||||
| 62 | (continued) |
Ohio National Fund, Inc. | ON Federated High Income Bond Portfolio (Continued) | |
| Schedule of Investments | December 31, 2022 | |
| Corporate Bonds – 96.8% | Rate | Maturity | Face Amount | Value | ||||||||||
INDUSTRIALS (continued) | ||||||||||||||
Solaris Midstream Holdings LLC (Commercial Svs. & Supplies) | (a) | 7.625% | 04/01/2026 | $ | 400,000 | $ | 397,852 | |||||||
SPX FLOW, Inc. (Machinery) | (a) | 8.750% | 04/01/2030 | 450,000 | 354,897 | |||||||||
Stena International SA (Transportation Infrastructure) | (a) | 6.125% | 02/01/2025 | 300,000 | 279,000 | |||||||||
TK Elevator Holdco GmbH (Building Products) | (a) | 7.625% | 07/15/2028 | 269,000 | 219,642 | |||||||||
TK Elevator U.S. Newco, Inc. (Building Products) | (a) | 5.250% | 07/15/2027 | 325,000 | 288,450 | |||||||||
TransDigm U.K. Holdings PLC (Aerospace & Defense) | 6.875% | 05/15/2026 | 275,000 | 268,541 | ||||||||||
TransDigm, Inc. (Aerospace & Defense) | (a) | 6.250% | 03/15/2026 | 600,000 | 591,714 | |||||||||
TransDigm, Inc. (Aerospace & Defense) | 6.375% | 06/15/2026 | 550,000 | 535,125 | ||||||||||
TransDigm, Inc. (Aerospace & Defense) | 5.500% | 11/15/2027 | 150,000 | 140,858 | ||||||||||
TransDigm, Inc. (Aerospace & Defense) | 4.625% | 01/15/2029 | 125,000 | 109,909 | ||||||||||
TransDigm, Inc. (Aerospace & Defense) | 4.875% | 05/01/2029 | 425,000 | 370,706 | ||||||||||
Trident TPI Holdings, Inc. (Machinery) | (a) | 9.250% | 08/01/2024 | 175,000 | 166,318 | |||||||||
Trident TPI Holdings, Inc. (Machinery) | (a) | 6.625% | 11/01/2025 | 700,000 | 606,642 | |||||||||
United Rentals North America, Inc. (Trading Companies & Distributors) | 5.500% | 05/15/2027 | 25,000 | 24,680 | ||||||||||
United Rentals North America, Inc. (Trading Companies & Distributors) | 4.875% | 01/15/2028 | 325,000 | 307,986 | ||||||||||
United Rentals North America, Inc. (Trading Companies & Distributors) | 5.250% | 01/15/2030 | 75,000 | 70,469 | ||||||||||
United Rentals North America, Inc. (Trading Companies & Distributors) | 3.875% | 02/15/2031 | 50,000 | 41,915 | ||||||||||
United Rentals North America, Inc. (Trading Companies & Distributors) | 3.750% | 01/15/2032 | 150,000 | 122,375 | ||||||||||
Watco Cos. LLC / Watco Finance Corp. (Road & Rail) | (a) | 6.500% | 06/15/2027 | 400,000 | 380,000 | |||||||||
WESCO Distribution, Inc. (Trading Companies & Distributors) | (a) | 7.125% | 06/15/2025 | 100,000 | 101,251 | |||||||||
WESCO Distribution, Inc. (Trading Companies & Distributors) | (a) | 7.250% | 06/15/2028 | 225,000 | 227,919 | |||||||||
White Cap Buyer LLC (Building Products) | (a) | 6.875% | 10/15/2028 | 425,000 | 367,629 | |||||||||
White Cap Parent LLC (Building Products) | (a)(b) | 8.250%, 9.000% PIK | 03/15/2026 | 325,000 | 280,959 | |||||||||
|
| |||||||||||||
| 13,028,550 | ||||||||||||||
|
| |||||||||||||
INFORMATION TECHNOLOGY – 6.7% | ||||||||||||||
AthenaHealth Group, Inc. (Software) | (a) | 6.500% | 02/15/2030 | 825,000 | 607,969 | |||||||||
Black Knight InfoServ LLC (IT Svs.) | (a) | 3.625% | 09/01/2028 | 275,000 | 238,563 | |||||||||
Boxer Parent Co., Inc. (Software) | (a) | 9.125% | 03/01/2026 | 325,000 | 306,610 | |||||||||
Central Parent, Inc. / CDK Global, Inc. (Software) | (a) | 7.250% | 06/15/2029 | 550,000 | 537,967 | |||||||||
Ciena Corp. (Communications Equip.) | (a) | 4.000% | 01/31/2030 | 75,000 | 66,008 | |||||||||
Cloud Software Group Holdings, Inc. (Software) | (a) | 6.500% | 03/31/2029 | 275,000 | 231,627 | |||||||||
Coherent Corp. (Electronic Equip., Instr. & Comp.) | (a) | 5.000% | 12/15/2029 | 475,000 | 409,654 | |||||||||
Condor Merger Sub, Inc. (Software) | (a) | 7.375% | 02/15/2030 | 1,175,000 | 944,736 | |||||||||
Consensus Cloud Solutions, Inc. (Software) | (a) | 6.500% | 10/15/2028 | 300,000 | 275,931 | |||||||||
Elastic N.V. (Software) | (a) | 4.125% | 07/15/2029 | 425,000 | 343,272 | |||||||||
Fair Isaac Corp. (Software) | (a) | 4.000% | 06/15/2028 | 125,000 | 113,438 | |||||||||
Gartner, Inc. (IT Svs.) | (a) | 4.500% | 07/01/2028 | 50,000 | 46,617 | |||||||||
Gartner, Inc. (IT Svs.) | (a) | 3.750% | 10/01/2030 | 125,000 | 107,746 | |||||||||
Go Daddy Operating Co. LLC / GD Finance Co., Inc. (IT Svs.) | (a) | 5.250% | 12/01/2027 | 350,000 | 331,261 | |||||||||
GoTo Group, Inc. (Software) | (a) | 5.500% | 09/01/2027 | 425,000 | 228,574 | |||||||||
Helios Software Holdings, Inc. / ION Corporate Solutions Finance SARL (Software) | (a) | 4.625% | 05/01/2028 | 375,000 | 284,991 | |||||||||
NCR Corp. (Software) | (a) | 5.000% | 10/01/2028 | 225,000 | 191,820 | |||||||||
NCR Corp. (Software) | (a) | 5.125% | 04/15/2029 | 50,000 | 41,816 | |||||||||
NCR Corp. (Software) | (a) | 6.125% | 09/01/2029 | 50,000 | 46,753 | |||||||||
NCR Corp. (Software) | (a) | 5.250% | 10/01/2030 | 325,000 | 268,125 | |||||||||
Open Text Corp. (Software) | (a) | 3.875% | 12/01/2029 | 350,000 | 281,466 | |||||||||
Rocket Software, Inc. (Software) | (a) | 6.500% | 02/15/2029 | 625,000 | 492,704 | |||||||||
Seagate HDD Cayman (Tech. Hardware, Storage & Periph.) | (a) | 9.625% | 12/01/2032 | 425,250 | 466,414 | |||||||||
SS&C Technologies, Inc. (Software) | (a) | 5.500% | 09/30/2027 | 600,000 | 561,838 | |||||||||
Synaptics, Inc. (Semiconductors & Equip.) | (a) | 4.000% | 06/15/2029 | 125,000 | 105,319 | |||||||||
TTM Technologies, Inc. (Electronic Equip., Instr. & Comp.) | (a) | 4.000% | 03/01/2029 | 450,000 | 385,895 | |||||||||
Veritas U.S., Inc. / Veritas Bermuda Ltd. (Software) | (a) | 7.500% | 09/01/2025 | 475,000 | 327,141 | |||||||||
Viavi Solutions, Inc. (Communications Equip.) | (a) | 3.750% | 10/01/2029 | 75,000 | 63,034 | |||||||||
|
| |||||||||||||
| 8,307,289 | ||||||||||||||
|
| |||||||||||||
MATERIALS – 10.3% | ||||||||||||||
ARD Finance SA (Containers & Packaging) | (a)(b) | 6.500%, 7.250% PIK | 06/30/2027 | 653,176 | 454,305 | |||||||||
Ardagh Metal Packaging Finance U.S.A. LLC / Ardagh Metal Packaging Finance PLC (Containers & Packaging) | (a) | 4.000% | 09/01/2029 | 475,000 | 376,451 | |||||||||
Ardagh Packaging Finance PLC / Ardagh Holdings U.S.A., Inc. (Containers & Packaging) | (a) | 5.250% | 08/15/2027 | 775,000 | 579,500 | |||||||||
Ardagh Packaging Finance PLC / Ardagh Holdings U.S.A., Inc. (Containers & Packaging) | (a) | 5.250% | 08/15/2027 | 275,000 | 205,629 | |||||||||
Axalta Coating Systems LLC (Chemicals) | (a) | 3.375% | 02/15/2029 | 150,000 | 123,775 | |||||||||
Axalta Coating Systems LLC / Axalta Coating Systems Dutch Holding B B.V. (Chemicals) | (a) | 4.750% | 06/15/2027 | 150,000 | 138,660 | |||||||||
Ball Corp. (Containers & Packaging) | 6.875% | 03/15/2028 | 25,000 | 25,679 | ||||||||||
Ball Corp. (Containers & Packaging) | 2.875% | 08/15/2030 | 325,000 | 259,389 | ||||||||||
Berry Global, Inc. (Containers & Packaging) | (a) | 5.625% | 07/15/2027 | 250,000 | 243,885 | |||||||||
Clearwater Paper Corp. (Paper & Forest Products) | (a) | 5.375% | 02/01/2025 | 575,000 | 558,694 | |||||||||
Cleveland-Cliffs, Inc. (Metals & Mining) | (a) | 4.875% | 03/01/2031 | 325,000 | 286,972 | |||||||||
Clydesdale Acquisition Holdings, Inc. (Containers & Packaging) | (a) | 8.750% | 04/15/2030 | 1,250,000 | 1,069,964 | |||||||||
Coeur Mining, Inc. (Metals & Mining) | (a) | 5.125% | 02/15/2029 | 325,000 | 253,639 | |||||||||
| 63 | (continued) |
Ohio National Fund, Inc. | ON Federated High Income Bond Portfolio (Continued) | |
| Schedule of Investments | December 31, 2022 | |
| Corporate Bonds – 96.8% | Rate | Maturity | Face Amount | Value | ||||||||||
MATERIALS (continued) | ||||||||||||||
Crown Americas LLC / Crown Americas Capital Corp. V (Containers & Packaging) | 4.250% | 09/30/2026 | $ | 50,000 | $ | 47,679 | ||||||||
Crown Americas LLC / Crown Americas Capital Corp. VI (Containers & Packaging) | 4.750% | 02/01/2026 | 275,000 | 266,956 | ||||||||||
Diamond BC B.V. (Chemicals) | (a) | 4.625% | 10/01/2029 | 750,000 | 601,875 | |||||||||
Element Solutions, Inc. (Chemicals) | (a) | 3.875% | 09/01/2028 | 300,000 | 255,000 | |||||||||
Graphic Packaging International LLC (Containers & Packaging) | (a) | 4.750% | 07/15/2027 | 150,000 | 141,188 | |||||||||
Graphic Packaging International LLC (Containers & Packaging) | (a) | 3.500% | 03/15/2028 | 100,000 | 87,031 | |||||||||
Graphic Packaging International LLC (Containers & Packaging) | (a) | 3.500% | 03/01/2029 | 100,000 | 85,203 | |||||||||
Graphic Packaging International LLC (Containers & Packaging) | (a) | 3.750% | 02/01/2030 | 25,000 | 21,250 | |||||||||
H.B. Fuller Co. (Chemicals) | 4.250% | 10/15/2028 | 125,000 | 110,625 | ||||||||||
Herens Holdco SARL (Chemicals) | (a) | 4.750% | 05/15/2028 | 500,000 | 373,705 | |||||||||
Koppers, Inc. (Chemicals) | (a) | 6.000% | 02/15/2025 | 725,000 | 688,750 | |||||||||
Mauser Packaging Solutions Holding Co. (Containers & Packaging) | (a) | 5.500% | 04/15/2024 | 300,000 | 291,704 | |||||||||
Mauser Packaging Solutions Holding Co. (Containers��& Packaging) | (a) | 7.250% | 04/15/2025 | 225,000 | 208,061 | |||||||||
OI European Group B.V. (Containers & Packaging) | (a) | 4.750% | 02/15/2030 | 300,000 | 262,710 | |||||||||
Olympus Water U.S. Holding Corp. (Chemicals) | (a) | 7.125% | 10/01/2027 | 200,000 | 190,500 | |||||||||
Olympus Water U.S. Holding Corp. (Chemicals) | (a) | 4.250% | 10/01/2028 | 200,000 | 162,371 | |||||||||
Olympus Water U.S. Holding Corp. (Chemicals) | (a) | 6.250% | 10/01/2029 | 400,000 | 303,682 | |||||||||
Owens-Brockway Glass Container, Inc. (Containers & Packaging) | (a) | 5.375% | 01/15/2025 | 175,000 | 167,895 | |||||||||
Owens-Brockway Glass Container, Inc. (Containers & Packaging) | (a) | 6.375% | 08/15/2025 | 450,000 | 440,951 | |||||||||
Owens-Brockway Glass Container, Inc. (Containers & Packaging) | (a) | 6.625% | 05/13/2027 | 38,000 | 36,868 | |||||||||
Polar U.S. Borrower LLC / Schenectady International Group, Inc. (Chemicals) | (a) | 6.750% | 05/15/2026 | 500,000 | 185,000 | |||||||||
Sealed Air Corp. (Containers & Packaging) | (a) | 4.000% | 12/01/2027 | 200,000 | 181,427 | |||||||||
Sealed Air Corp. (Containers & Packaging) | (a) | 5.000% | 04/15/2029 | 75,000 | 70,500 | |||||||||
SPCM SA (Chemicals) | (a) | 3.375% | 03/15/2030 | 200,000 | 161,000 | |||||||||
SRS Distribution, Inc. (Construction Materials) | (a) | 6.125% | 07/01/2029 | 200,000 | 161,704 | |||||||||
SRS Distribution, Inc. (Construction Materials) | (a) | 6.000% | 12/01/2029 | 625,000 | 497,408 | |||||||||
Standard Industries, Inc. (Construction Materials) | (a) | 5.000% | 02/15/2027 | 1,125,000 | 1,038,075 | |||||||||
Standard Industries, Inc. (Construction Materials) | (a) | 4.750% | 01/15/2028 | 25,000 | 22,497 | |||||||||
Trivium Packaging Finance B.V. (Containers & Packaging) | (a) | 5.500% | 08/15/2026 | 200,000 | 183,387 | |||||||||
Trivium Packaging Finance B.V. (Containers & Packaging) | (a) | 8.500% | 08/15/2027 | 675,000 | 619,329 | |||||||||
W.R. Grace Holdings LLC (Chemicals) | (a) | 4.875% | 06/15/2027 | 100,000 | 88,613 | |||||||||
W.R. Grace Holdings LLC (Chemicals) | (a) | 5.625% | 08/15/2029 | 250,000 | 201,818 | |||||||||
|
| |||||||||||||
| 12,731,304 | ||||||||||||||
|
| |||||||||||||
REAL ESTATE – 0.5% | ||||||||||||||
VICI Properties LP / VICI Note Co., Inc. (Equity REIT) | (a) | 4.625% | 06/15/2025 | 100,000 | 95,875 | |||||||||
VICI Properties LP / VICI Note Co., Inc. (Equity REIT) | (a) | 4.250% | 12/01/2026 | 175,000 | 163,262 | |||||||||
VICI Properties LP / VICI Note Co., Inc. (Equity REIT) | (a) | 3.875% | 02/15/2029 | 50,000 | 43,822 | |||||||||
VICI Properties LP / VICI Note Co., Inc. (Equity REIT) | (a) | 4.625% | 12/01/2029 | 225,000 | 204,750 | |||||||||
VICI Properties LP / VICI Note Co., Inc. (Equity REIT) | (a) | 4.125% | 08/15/2030 | 100,000 | 87,516 | |||||||||
|
| |||||||||||||
| 595,225 | ||||||||||||||
|
| |||||||||||||
UTILITIES – 3.2% | ||||||||||||||
AmeriGas Partners LP / AmeriGas Finance Corp. (Gas Utilities) | 5.875% | 08/20/2026 | 400,000 | 379,884 | ||||||||||
AmeriGas Partners LP / AmeriGas Finance Corp. (Gas Utilities) | 5.750% | 05/20/2027 | 100,000 | 92,937 | ||||||||||
Calpine Corp. (Ind. Power & Renewable Elec.) | (a) | 5.250% | 06/01/2026 | 50,000 | 47,626 | |||||||||
Calpine Corp. (Ind. Power & Renewable Elec.) | (a) | 4.500% | 02/15/2028 | 425,000 | 379,091 | |||||||||
Calpine Corp. (Ind. Power & Renewable Elec.) | (a) | 4.625% | 02/01/2029 | 150,000 | 128,708 | |||||||||
Calpine Corp. (Ind. Power & Renewable Elec.) | (a) | 5.000% | 02/01/2031 | 100,000 | 83,890 | |||||||||
Calpine Corp. (Ind. Power & Renewable Elec.) | (a) | 3.750% | 03/01/2031 | 300,000 | 241,547 | |||||||||
NRG Energy, Inc. (Electric Utilities) | 6.625% | 01/15/2027 | 76,000 | 75,358 | ||||||||||
NRG Energy, Inc. (Electric Utilities) | (a) | 3.375% | 02/15/2029 | 25,000 | 20,165 | |||||||||
NRG Energy, Inc. (Electric Utilities) | (a) | 3.625% | 02/15/2031 | 25,000 | 19,005 | |||||||||
NRG Energy, Inc. (Electric Utilities) | (a) | 3.875% | 02/15/2032 | 775,000 | 582,064 | |||||||||
Suburban Propane Partners LP / Suburban Energy Finance Corp. (Gas Utilities) | 5.875% | 03/01/2027 | 600,000 | 570,121 | ||||||||||
Suburban Propane Partners LP / Suburban Energy Finance Corp. (Gas Utilities) | (a) | 5.000% | 06/01/2031 | 125,000 | 106,248 | |||||||||
TerraForm Power Operating LLC (Ind. Power & Renewable Elec.) | (a) | 5.000% | 01/31/2028 | 750,000 | 674,992 | |||||||||
TransAlta Corp. (Ind. Power & Renewable Elec.) | 7.750% | 11/15/2029 | 25,000 | 25,532 | ||||||||||
Vistra Operations Co. LLC (Ind. Power & Renewable Elec.) | (a) | 5.500% | 09/01/2026 | 225,000 | 216,769 | |||||||||
Vistra Operations Co. LLC (Ind. Power & Renewable Elec.) | (a) | 5.000% | 07/31/2027 | 375,000 | 348,035 | |||||||||
|
| |||||||||||||
| 3,991,972 | ||||||||||||||
|
| |||||||||||||
Total Corporate Bonds (Cost $138,364,328) | $ | 119,607,562 | ||||||||||||
|
| |||||||||||||
| Common Stocks – 0.1% | Shares | Value | ||||||||
COMMUNICATION SERVICES – 0.0% | ||||||||||
iHeartMedia, Inc. Class A (Media) | (c) | 7,387 | $ | 45,282 | ||||||
|
| |||||||||
HEALTH CARE – 0.1% | ||||||||||
Mallinckrodt PLC (Pharmaceuticals) | (c) | 14,672 | 113,708 | |||||||
|
| |||||||||
Total Common Stocks (Cost $449,920) | $ | 158,990 | ||||||||
|
| |||||||||
| 64 | (continued) |
Ohio National Fund, Inc. | ON Federated High Income Bond Portfolio (Continued) | |
| Schedule of Investments | December 31, 2022 | |
| Rights – 0.0% | Quantity | Value | ||||||||
COMMUNICATION SERVICES – 0.0% | ||||||||||
Intelsat Jackson Holdings SA (Diversified Telecom. Svs.) | (c) | 591 | $ | 3,841 | ||||||
|
| |||||||||
Total Rights (Cost $0) | $ | 3,841 | ||||||||
|
| |||||||||
Total Investments – 96.9% (Cost $138,814,248) | (d) | $ | 119,770,393 | |||||||
Other Assets in Excess of Liabilities – 3.1% | 3,784,491 | |||||||||
|
| |||||||||
Net Assets – 100.0% | $ | 123,554,884 | ||||||||
|
| |||||||||
Percentages are stated as a percent of net assets.
Abbreviations:
| PIK: | Payment-in-Kind |
Footnotes:
| (a) | Security exempt from registration under Regulation D of the Securities Act of 1933. These securities may be resold in transactions exempt from registration, normally to qualified buyers under Rule 144A. At December 31, 2022, the value of these securities totaled $99,223,181, or 80.3% of the Portfolio’s net assets. |
| (b) | Issuer of the security has the option to make coupon payments in cash or in additional par value of this bond (Payment-in-Kind). |
| (c) | Non-income producing security. |
| (d) | Represents cost for financial reporting purposes, which may differ from cost basis for federal income tax purposes. See also Note 7 of the Notes to Financial Statements. |
The accompanying notes are an integral part of these financial statements.
| 65 |
| ON Nasdaq-100® Index Portfolio (Unaudited) |
| Objective/Strategy |
The ON Nasdaq-100® Index Portfolio seeks long-term growth of capital by investing, under normal circumstances, more than 80% of its net assets in the common stocks of companies that are included in the Nasdaq-100® Index.
| Performance as of December 31, 2022 | ||
Average Annual returns | ||||
One year | -32.57 | % | ||
Five years | 11.92 | % | ||
Ten years | 15.90 | % |
Past performance does not guarantee future results. The performance data quoted represents past performance and current returns may be lower or higher. Total return figures include change in share price and reinvestment of dividends and capital gains. The investment return and principal value will fluctuate so that an investor’s shares, when redeemed, may be worth more or less than the original cost. To obtain performance information up to the most recent month end, call toll-free 1-877-781-6392.
The Portfolio is not open to direct retail investment. Beneficial interest in the Portfolio’s shares is obtained either through an allocation to the Portfolio as an investment vehicle within variable life insurance policies or annuity contracts, or as an underlying investment by the ON Model Portfolios. Actual performance results for variable annuity and variable universal life contracts will be lower due to contract charges. Consult your contract for applicable charges.
Total expense ratio is 0.41% per the Fund’s prospectus dated April 29, 2022. Additional information pertaining to the Portfolio’s expense ratio as of December 31, 2022 can be found in the Portfolio’s Financial Highlights.
| Comments from Sub-Adviser |
Q. How did the Portfolio perform in comparison to its benchmark during the reporting period?
A. For the year ended December 31, 2022, the Portfolio returned -32.57% versus -32.38% for its benchmark, the Nasdaq-100® Index.
Q. Were there specific market conditions, investment strategies, or techniques that materially affected the Portfolio’s benchmark-relative performance during the reporting period?
A. The Portfolio intends to track the underlying return of the Nasdaq-100® Index. There were no material market events or changes in strategy during the year that materially impacted the Portfolio’s relative return. Sources of return variance were the Portfolio’s expenses and the cumulative impact of investing the day-to-day cash flows in the Portfolio.
Q. How did sector allocation and security selection each impact the Portfolio’s performance relative to its benchmark?
A. There was no impact from either sector allocation or stock selection that caused any significant performance variance between the Portfolio and its benchmark during the year. Information Technology, followed by Communication Services and Consumer Discretionary, were the top detractors from performance. The only sector that contributed for the year was Utilities. (1)
Q. Which securities contributed the most to, and detracted the most from, the Portfolio’s benchmark-relative performance?
A. Because the Portfolio weights its holdings to be similar to those utilized by the benchmark, there were no holdings that significantly contributed to, or detracted from, the Portfolio’s benchmark-relative performance for the year. Benchmark constituents that contributed the
most to Portfolio and benchmark returns were T-Mobile U.S., Inc., Amgen, Inc., and Gilead Sciences, Inc. Amazon.com, Inc., Apple, Inc., and Meta Platforms, Inc. Class A were leading detractors. (1)
Q. How did the Portfolio’s use of derivative instruments impact performance?
A. The Portfolio uses long CME E-mini Nasdaq-100 Index futures contracts primarily to equitize open dividend receivables, as well as to manage day-to-day cash flows, to ensure the Portfolio is fully invested. Futures contracts detracted 28 basis points, in aggregate, from the Portfolio’s absolute return for the year. (1)
| (1) | The Portfolio’s composition is subject to change. Holdings and weightings are as of December 31, 2022. |
| Change in Value of $10,000 Investment |
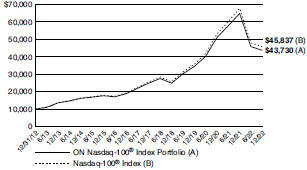
Hypothetical illustration based on past performance. Future performance will vary. The Portfolio’s returns reflect reinvested dividends. The Portfolio’s holdings may differ significantly from the securities in the index. The index is unmanaged and therefore does not reflect the cost of portfolio management and accounting.
The Nasdaq-100® Index is a modified capitalization-weighted index of the 100 largest domestic and international non-financial companies listed on the NASDAQ® Stock Market. The index presented includes the effects of reinvested dividends.
Past performance is no guarantee of future results. Redemption of fund shares could have tax implications unique to each shareholder.
The Nasdaq-100®, Nasdaq-100 Index®, and Nasdaq® are registered trademarks of The NASDAQ OMX Group, Inc. (which with its affiliates is referred to as “NASDAQ OMX”). Ohio National Investments, Inc. has licensed these marks for the Portfolio’s use. NASDAQ OMX has not passed on the Portfolio’s legality or suitability. NASDAQ OMX does not sponsor, endorse, sell or promote the Portfolio. NASDAQ OMX MAKES NO WARRANTIES AND BEARS NO LIABILITY WITH RESPECT TO THE PORTFOLIO.
| 66 | (continued) |
Ohio National Fund, Inc. | ON Nasdaq-100® Index Portfolio (Unaudited) (Continued) |
| Portfolio Composition as of December 31, 2022 (1) | ||
| % of Net Assets | ||||
Common Stocks (4) | 98.0 | |||
U.S. Treasury Obligations | 0.1 | |||
Other Net Assets | 1.9 | |||
|
| |||
| 100.0 | ||||
|
| |||
| Top 10 Portfolio Holdings as of December 31, 2022 (1) (2) (3) | ||||
| % of Net Assets | ||||||
1. | Microsoft Corp. | 12.4 | ||||
2. | Apple, Inc. | 11.5 | ||||
3. | Amazon.com, Inc. | 6.0 | ||||
4. | Alphabet, Inc. Class C | 3.8 | ||||
5. | Alphabet, Inc. Class A | 3.7 | ||||
6. | NVIDIA Corp. | 3.2 | ||||
7. | Tesla, Inc. | 2.7 | ||||
8. | Meta Platforms, Inc. Class A | 2.4 | ||||
9. | PepsiCo, Inc. | 2.2 | ||||
10. | Broadcom, Inc. | 2.0 | ||||
| (1) | Composition of Portfolio subject to change. |
| (2) | Short-term investments have been excluded from the list of Top 10 Portfolio Holdings. |
| (3) | Top 10 Portfolio Holdings is presented at an individual security level. Total investment exposure by issuer may be higher. |
| (4) | Sectors (Common Stocks): |
| % of Net Assets | ||||
Information Technology | 48.8 | |||
Communication Services | 15.7 | |||
Consumer Discretionary | 14.0 | |||
Health Care | 7.1 | |||
Consumer Staples | 6.6 | |||
Industrials | 3.9 | |||
Utilities | 1.4 | |||
Energy | 0.5 | |||
|
| |||
| 98.0 | ||||
|
| |||
| 67 |
Ohio National Fund, Inc. | ON Nasdaq-100® Index Portfolio | |
| Schedule of Investments | December 31, 2022 | |
| Common Stocks – 98.0% | Shares | Value | ||||||||
COMMUNICATION SERVICES – 15.7% | ||||||||||
Activision Blizzard, Inc. (Entertainment) | 14,676 | $ | 1,123,448 | |||||||
Alphabet, Inc. Class A (Interactive Media & Svs.) | (a) | 88,000 | 7,764,240 | |||||||
Alphabet, Inc. Class C (Interactive Media & Svs.) | (a) | 87,973 | 7,805,844 | |||||||
Charter Communications, Inc. Class A (Media) | (a) | 2,919 | 989,833 | |||||||
Comcast Corp. Class A (Media) | 80,897 | 2,828,968 | ||||||||
Electronic Arts, Inc. (Entertainment) | 5,177 | 632,526 | ||||||||
Meta Platforms, Inc. Class A (Interactive Media & Svs.) | (a) | 42,168 | 5,074,497 | |||||||
Netflix, Inc. (Entertainment) | (a) | 8,345 | 2,460,774 | |||||||
Sirius XM Holdings, Inc. (Media) | 72,938 | 425,958 | ||||||||
T-Mobile U.S., Inc. (Wireless Telecom. Svs.) | (a) | 23,331 | 3,266,340 | |||||||
Warner Bros Discovery, Inc. (Entertainment) | (a) | 45,538 | 431,700 | |||||||
|
| |||||||||
| 32,804,128 | ||||||||||
|
| |||||||||
CONSUMER DISCRETIONARY – 14.0% | ||||||||||
Airbnb, Inc. Class A (Hotels, Restaurants & Leisure) | (a) | 7,468 | 638,514 | |||||||
Amazon.com, Inc. (Internet & Direct Marketing Retail) | (a) | 147,465 | 12,387,060 | |||||||
Booking Holdings, Inc. (Hotels, Restaurants & Leisure) | (a) | 727 | 1,465,108 | |||||||
Dollar Tree, Inc. (Multiline Retail) | (a) | 4,148 | 586,693 | |||||||
eBay, Inc. (Internet & Direct Marketing Retail) | 10,176 | 421,999 | ||||||||
JD.com, Inc. – ADR (Internet & Direct Marketing Retail) | 9,110 | 511,344 | ||||||||
Lucid Group, Inc. (Automobiles) | (a) | 31,512 | 215,227 | |||||||
Lululemon Athletica, Inc. (Textiles, Apparel & Luxury Goods) | (a) | 2,294 | 734,952 | |||||||
Marriott International, Inc. Class A (Hotels, Restaurants & Leisure) | 5,936 | 883,811 | ||||||||
MercadoLibre, Inc. (Internet & Direct Marketing Retail) | (a) | 943 | 798,004 | |||||||
O’Reilly Automotive, Inc. (Specialty Retail) | (a) | 1,174 | 990,891 | |||||||
Pinduoduo, Inc. – ADR (Internet & Direct Marketing Retail) | (a) | 8,778 | 715,846 | |||||||
Rivian Automotive, Inc. Class A (Automobiles) | (a) | 17,123 | 315,577 | |||||||
Ross Stores, Inc. (Specialty Retail) | 6,508 | 755,384 | ||||||||
Starbucks Corp. (Hotels, Restaurants & Leisure) | 21,524 | 2,135,181 | ||||||||
Tesla, Inc. (Automobiles) | (a) | 45,645 | 5,622,551 | |||||||
|
| |||||||||
| 29,178,142 | ||||||||||
|
| |||||||||
CONSUMER STAPLES – 6.6% | ||||||||||
Costco Wholesale Corp. (Food & Staples Retailing) | 8,300 | 3,788,950 | ||||||||
Keurig Dr Pepper, Inc. (Beverages) | 26,558 | 947,058 | ||||||||
Kraft Heinz Co. / The (Food Products) | 22,970 | 935,109 | ||||||||
Mondelez International, Inc. Class A (Food Products) | 25,609 | 1,706,840 | ||||||||
Monster Beverage Corp. (Beverages) | (a) | 9,784 | 993,369 | |||||||
PepsiCo, Inc. (Beverages) | 25,835 | 4,667,351 | ||||||||
Walgreens Boots Alliance, Inc. (Food & Staples Retailing) | 16,217 | 605,867 | ||||||||
|
| |||||||||
| 13,644,544 | ||||||||||
|
| |||||||||
ENERGY – 0.5% | ||||||||||
Baker Hughes Co. (Energy Equip. & Svs.) | 18,780 | 554,573 | ||||||||
Diamondback Energy, Inc. (Oil, Gas & Consumable Fuels) | 3,300 | 451,374 | ||||||||
|
| |||||||||
| 1,005,947 | ||||||||||
|
| |||||||||
HEALTH CARE – 7.1% | ||||||||||
Align Technology, Inc. (Health Care Equip. & Supplies) | (a) | 1,465 | 308,969 | |||||||
Amgen, Inc. (Biotechnology) | 10,006 | 2,627,976 | ||||||||
AstraZeneca PLC – ADR (Pharmaceuticals) | 11,456 | 776,717 | ||||||||
Biogen, Inc. (Biotechnology) | (a) | 2,700 | 747,684 | |||||||
Dexcom, Inc. (Health Care Equip. & Supplies) | (a) | 7,243 | 820,197 | |||||||
| Common Stocks (Continued) | Shares | Value | ||||||||
HEALTH CARE (continued) | ||||||||||
Gilead Sciences, Inc. (Biotechnology) | 23,520 | $ | 2,019,192 | |||||||
IDEXX Laboratories, Inc. (Health Care Equip. & Supplies) | (a) | 1,553 | 633,562 | |||||||
Illumina, Inc. (Life Sciences Tools & Svs.) | (a) | 2,950 | 596,490 | |||||||
Intuitive Surgical, Inc. (Health Care Equip. & Supplies) | (a) | 6,627 | 1,758,474 | |||||||
Moderna, Inc. (Biotechnology) | (a) | 7,204 | 1,293,982 | |||||||
Regeneron Pharmaceuticals, Inc. (Biotechnology) | (a) | 2,008 | 1,448,752 | |||||||
Seagen, Inc. (Biotechnology) | (a) | 3,482 | 447,472 | |||||||
Vertex Pharmaceuticals, Inc. (Biotechnology) | (a) | 4,814 | 1,390,187 | |||||||
|
| |||||||||
| 14,869,654 | ||||||||||
|
| |||||||||
INDUSTRIALS – 3.9% | ||||||||||
Cintas Corp. (Commercial Svs. & Supplies) | 1,904 | 859,885 | ||||||||
Copart, Inc. (Commercial Svs. & Supplies) | (a) | 8,932 | 543,870 | |||||||
CoStar Group, Inc. (Professional Svs.) | (a) | 7,626 | 589,337 | |||||||
CSX Corp. (Road & Rail) | 39,425 | 1,221,387 | ||||||||
Fastenal Co. (Trading Companies & Distributors) | 10,741 | 508,264 | ||||||||
Honeywell International, Inc. (Industrial Conglomerates) | 12,608 | 2,701,894 | ||||||||
Old Dominion Freight Line, Inc. (Road & Rail) | 2,072 | 587,992 | ||||||||
PACCAR, Inc. (Machinery) | 6,522 | 645,482 | ||||||||
Verisk Analytics, Inc. (Professional Svs.) | 2,933 | 517,440 | ||||||||
|
| |||||||||
| 8,175,551 | ||||||||||
|
| |||||||||
INFORMATION TECHNOLOGY – 48.8% | ||||||||||
Adobe, Inc. (Software) | (a) | 8,718 | 2,933,869 | |||||||
Advanced Micro Devices, Inc. (Semiconductors & Equip.) | (a) | 30,236 | 1,958,386 | |||||||
Analog Devices, Inc. (Semiconductors & Equip.) | 9,551 | 1,566,651 | ||||||||
ANSYS, Inc. (Software) | (a) | 1,634 | 394,758 | |||||||
Apple, Inc. (Tech. Hardware, Storage & Periph.) | 184,950 | 24,030,553 | ||||||||
Applied Materials, Inc. (Semiconductors & Equip.) | 16,133 | 1,571,032 | ||||||||
ASML Holding N.V. (Semiconductors & Equip.) | 1,657 | 905,385 | ||||||||
Atlassian Corp. Class A (Software) | (a) | 2,781 | 357,859 | |||||||
Autodesk, Inc. (Software) | (a) | 4,048 | 756,450 | |||||||
Automatic Data Processing, Inc. (IT Svs.) | 7,779 | 1,858,092 | ||||||||
Broadcom, Inc. (Semiconductors & Equip.) | 7,595 | 4,246,592 | ||||||||
Cadence Design Systems, Inc. (Software) | (a) | 5,144 | 826,332 | |||||||
Cisco Systems, Inc. (Communications Equip.) | 77,037 | 3,670,043 | ||||||||
Cognizant Technology Solutions Corp. Class A (IT Svs.) | 9,637 | 551,140 | ||||||||
Crowdstrike Holdings, Inc. Class A (Software) | (a) | 4,093 | 430,952 | |||||||
Datadog, Inc. Class A (Software) | (a) | 5,477 | 402,559 | |||||||
Enphase Energy, Inc. (Semiconductors & Equip.) | (a) | 2,549 | 675,383 | |||||||
Fiserv, Inc. (IT Svs.) | (a) | 11,908 | 1,203,542 | |||||||
Fortinet, Inc. (Software) | (a) | 14,650 | 716,238 | |||||||
GLOBALFOUNDRIES, Inc. (Semiconductors & Equip.) | (a) | 10,222 | 550,864 | |||||||
Intel Corp. (Semiconductors & Equip.) | 77,391 | 2,045,444 | ||||||||
Intuit, Inc. (Software) | 5,268 | 2,050,411 | ||||||||
KLA Corp. (Semiconductors & Equip.) | 2,658 | 1,002,146 | ||||||||
Lam Research Corp. (Semiconductors & Equip.) | 2,557 | 1,074,707 | ||||||||
Marvell Technology, Inc. (Semiconductors & Equip.) | 15,988 | 592,195 | ||||||||
Microchip Technology, Inc. (Semiconductors & Equip.) | 10,314 | 724,558 | ||||||||
Micron Technology, Inc. (Semiconductors & Equip.) | 20,387 | 1,018,942 | ||||||||
Microsoft Corp. (Software) | 107,306 | 25,734,125 | ||||||||
NVIDIA Corp. (Semiconductors & Equip.) | 46,131 | 6,741,584 | ||||||||
NXP Semiconductors N.V. (Semiconductors & Equip.) | 4,859 | 767,868 | ||||||||
| 68 | (continued) |
Ohio National Fund, Inc. | ON Nasdaq-100® Index Portfolio (Continued) | |
| Schedule of Investments | December 31, 2022 | |
| Common Stocks (Continued) | Shares | Value | ||||||||
INFORMATION TECHNOLOGY (continued) | ||||||||||
Palo Alto Networks, Inc. (Software) | (a) | 5,670 | $ | 791,192 | ||||||
Paychex, Inc. (IT Svs.) | 6,758 | 780,954 | ||||||||
PayPal Holdings, Inc. (IT Svs.) | (a) | 21,378 | 1,522,541 | |||||||
QUALCOMM, Inc. (Semiconductors & Equip.) | 21,022 | 2,311,159 | ||||||||
Synopsys, Inc. (Software) | (a) | 2,868 | 915,724 | |||||||
Texas Instruments, Inc. (Semiconductors & Equip.) | 17,019 | 2,811,879 | ||||||||
Workday, Inc. Class A (Software) | (a) | 3,788 | 633,846 | |||||||
Zoom Video Communications, Inc. Class A (Software) | (a) | 4,607 | 312,078 | |||||||
Zscaler, Inc. (Software) | (a) | 2,704 | 302,578 | |||||||
|
| |||||||||
| 101,740,611 | ||||||||||
|
| |||||||||
UTILITIES – 1.4% | ||||||||||
American Electric Power Co., Inc. (Electric Utilities) | 9,636 | 914,938 | ||||||||
| Common Stocks (Continued) | Shares | Value | ||||||
UTILITIES (continued) | ||||||||
Constellation Energy Corp. (Electric Utilities) | 6,132 | $ | 528,640 | |||||
Exelon Corp. (Electric Utilities) | 18,635 | 805,591 | ||||||
Xcel Energy, Inc. (Electric Utilities) | 10,262 | 719,469 | ||||||
|
| |||||||
| 2,968,638 | ||||||||
|
| |||||||
Total Common Stocks (Cost $163,166,444) | $ | 204,387,215 | ||||||
|
| |||||||
U.S. Treasury Obligations –0.1% | Rate | Maturity | Face Amount | Value | ||||||||||||||
U.S. Treasury Bill | (b) | 0.000% | 01/26/2023 | $ | 100,000 | $ | 99,752 | |||||||||||
|
| |||||||||||||||||
Total U.S. Treasury Obligations (Cost $99,915) |
| $ | 99,752 | |||||||||||||||
|
| |||||||||||||||||
Total Investments – 98.1% |
| (c) | $ | 204,486,967 | ||||||||||||||
Other Assets in Excess of |
| (b) | 4,024,962 | |||||||||||||||
|
| |||||||||||||||||
Net Assets – 100.0% |
| $ | 208,511,929 | |||||||||||||||
|
| |||||||||||||||||
Percentages are stated as a percent of net assets.
Abbreviations:
ADR: American Depositary Receipts
Footnotes:
| (a) | Non-income producing security. |
| (b) | Security is fully pledged, in addition to $43,438 of the Portfolio’s cash holdings, as collateral for the futures contracts outstanding at December 31, 2022. See also the following Schedule of Open Futures Contracts. |
| (c) | Represents cost for financial reporting purposes, which may differ from cost basis for federal income tax purposes. See also Note 7 of the Notes to Financial Statements. |
The accompanying notes are an integral part of these financial statements.
| Schedule of Open Futures Contracts | December 31, 2022 | |||
Description | Number of contracts | Expiration Date | Notional Amount | Value | Unrealized Appreciation (Depreciation) | Variation Margin Receivable (Payable) | ||||||
CME E-mini Nasdaq-100 Index - Long | 9 | March 17, 2023 | $2,067,860 | $1,984,005 | $(83,855) | $(1,890) |
The accompanying notes are an integral part of these financial statements.
| 69 |
| ON BlackRock Advantage Large Cap Core Portfolio (Unaudited) |
| Objective/Strategy |
The ON BlackRock Advantage Large Cap Core Portfolio seeks long-term growth of capital by investing, under normal circumstances, at least 80% of its net assets in common stocks of the 1,000 largest publicly traded U.S. companies in terms of market capitalization.
| Performance as of December 31, 2022 |
Average Annual returns | ||||
One year | -19.56 | % | ||
Five years | 5.89 | % | ||
Ten years | 12.10 | % |
Past performance does not guarantee future results. The performance data quoted represents past performance and current returns may be lower or higher. Total return figures include change in share price and reinvestment of dividends and capital gains. The investment return and principal value will fluctuate so that an investor’s shares, when redeemed, may be worth more or less than the original cost. To obtain performance information up to the most recent month end, call toll-free 1-877-781-6392.
The Portfolio is not open to direct retail investment. Beneficial interest in the Portfolio’s shares is obtained either through an allocation to the Portfolio as an investment vehicle within variable life insurance policies or annuity contracts, or as an underlying investment by the ON Model Portfolios. Actual performance results for variable annuity and variable universal life contracts will be lower due to contract charges. Consult your contract for applicable charges.
Total expense ratio is 0.69% per the Fund’s prospectus dated April 29, 2022. Additional information pertaining to the Portfolio’s expense ratio as of December 31, 2022 can be found in the Portfolio’s Financial Highlights.
| Comments from Sub-Adviser |
Q. How did the Portfolio perform in comparison to its benchmark during the reporting period?
A. For the year ended December 31, 2022, the Portfolio returned -19.56% versus -18.11% for its benchmark, the S&P 500® Index.
Q. Were there specific market conditions, investment strategies, or techniques that materially affected the Portfolio’s benchmark-relative performance during the reporting period?
A. Portfolio underperformance was primarily driven by weakness in the first quarter. Fundamental insights struggled in the first half of the year, driven by growth-related quality measures, with partial recovery in the second half of the year. Fundamental quality insights with a growth flavor, such as measures of company culture, founder involvement, and company benefits, were a detractor amid the market’s value style preference. Nontraditional measures, such as environment-related measures that evaluate green patents and emissions levels underperformed as energy-related firms outperformed their lower emissions counterparts.
However, fundamental value insights were strong contributors, particularly in the first and fourth quarters, amid the prevailing market style preference. Namely, insights evaluating company earnings yield, sales, and other financial statement metrics contributed. Defensive quality measures also performed well with measures relating to stability, balance sheet quality, and internal financing ability contributing against the broad market decline. (1)
Q. How did sector allocation and security selection each impact the Portfolio’s performance relative to its benchmark?
A. Security selection drove the Portfolio’s underperformance, specifically within the Information Technology and Consumer Staples sectors. This detraction was partially offset by picks within the Energy
sector. Sector allocation decisions also offset some of the detraction from selection, notably with underweights to Communication Services and Consumer Discretionary. An overweight to Energy detracted slightly. (1)
Q. Which securities contributed the most to, and detracted the most from, the Portfolio’s benchmark-relative performance?
A. From a security standpoint, the Portfolio’s overweights to EOG Resources, Inc., a Texas-based Energy company, and oilfield services company Schlumberger Ltd. / N.V. were top contributors to relative performance for the year. The stocks benefitted from the broader energy rally and the runup in commodities prices.
In contrast, an overweight to EcoLab, Inc. was a key detractor from relative performance, as the stock struggled against supply chain challenges, as well as rising input costs. An early overweight to IDEXX Laboratories, Inc. detracted, as the company missed its first quarter earnings estimate and lowered its forward guidance. (1)
Q. How did the Portfolio’s use of derivative instruments and initial public offerings (IPOs), if any, impact performance?
A. Pursuant to the Portfolio’s investment strategy, futures contracts were used to prevent a cash drag on performance. Futures contracts detracted 24 basis points, in aggregate, from the Portfolio’s absolute return for the year. The Portfolio did not participate in any IPOs during the period. (1)
| (1) | The Portfolio’s composition is subject to change. Holdings and weightings are as of December 31, 2022. |
| Change in Value of $10,000 Investment |
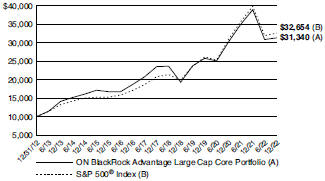
Hypothetical illustration based on past performance. Future performance will vary. The Portfolio’s returns reflect reinvested dividends. The Portfolio’s holdings may differ significantly from the securities in the index. The index is unmanaged and therefore does not reflect the cost of portfolio management and accounting.
The S&P 500® Index is a capitalization-weighted index designed to measure performance of the broad domestic economy through changes in the aggregate market value of 500 stocks representing all major industries. The index presented includes the effects of reinvested dividends.
Past performance is no guarantee of future results. Redemption of fund shares could have tax implications unique to each shareholder.
| 70 | (continued) |
Ohio National Fund, Inc. | ON BlackRock Advantage Large Cap Core Portfolio (Unaudited) (Continued) |
| Portfolio Composition as of December 31, 2022 (1) | ||
| % of Net Assets | ||||
Common Stocks (4) | 98.3 | |||
Other Net Assets | 1.7 | |||
|
| |||
| 100.0 | ||||
|
| |||
| Top 10 Portfolio Holdings as of December 31, 2022 (1) (2) (3) | ||||
| % of Net Assets | ||||||||
| 1. | Microsoft Corp. | 6.1 | ||||||
| 2. | Apple, Inc. | 5.8 | ||||||
| 3. | Amazon.com, Inc. | 2.3 | ||||||
| 4. | Alphabet, Inc. Class A | 2.1 | ||||||
| 5. | PepsiCo, Inc. | 1.9 | ||||||
| 6. | Exxon Mobil Corp. | 1.6 | ||||||
| 7. | Alphabet, Inc. Class C | 1.5 | ||||||
| 8. | Chevron Corp. | 1.4 | ||||||
| 9. | Cigna Corp. | 1.4 | ||||||
| 10. | UnitedHealth Group, Inc. | 1.4 | ||||||
| (1) | Composition of Portfolio subject to change. |
| (2) | Short-term investments have been excluded from the list of Top 10 Portfolio Holdings. |
| (3) | Top 10 Portfolio Holdings is presented at an individual security level. Total investment exposure by issuer may be higher. |
| (4) | Sectors (Common Stocks): |
| % of Net Assets | ||||
Information Technology | 25.1 | |||
Health Care | 15.9 | |||
Financials | 10.9 | |||
Consumer Discretionary | 9.2 | |||
Industrials | 8.8 | |||
Consumer Staples | 7.4 | |||
Communication Services | 6.9 | |||
Energy | 5.6 | |||
Real Estate | 3.1 | |||
Materials | 2.8 | |||
Utilities | 2.6 | |||
|
| |||
| 98.3 | ||||
|
| |||
| 71 |
Ohio National Fund, Inc. | ON BlackRock Advantage Large Cap Core Portfolio | |
| Schedule of Investments | December 31, 2022 | |
| Common Stocks – 98.3% | Shares | Value | ||||||||
COMMUNICATION SERVICES – 6.9% | ||||||||||
Alphabet, Inc. Class A (Interactive Media & Svs.) | (a) | 74,620 | $ | 6,583,723 | ||||||
Alphabet, Inc. Class C (Interactive Media & Svs.) | (a) | 52,672 | 4,673,587 | |||||||
Comcast Corp. Class A (Media) | 73,429 | 2,567,812 | ||||||||
Fox Corp. Class A (Media) | 106,543 | 3,235,711 | ||||||||
Fox Corp. Class B (Media) | 1,596 | 45,406 | ||||||||
Live Nation Entertainment, Inc. (Entertainment). | (a) | 4,302 | 300,021 | |||||||
Meta Platforms, Inc. Class A (Interactive Media & Svs.) | (a) | 23,181 | 2,789,602 | |||||||
Snap, Inc. Class A (Interactive Media & Svs.) | (a) | 48,314 | 432,410 | |||||||
Verizon Communications, Inc. (Diversified Telecom. Svs.) | 20,331 | 801,041 | ||||||||
Warner Bros Discovery, Inc. (Entertainment) | (a) | 13,992 | 132,644 | |||||||
|
| |||||||||
| 21,561,957 | ||||||||||
|
| |||||||||
CONSUMER DISCRETIONARY – 9.2% | ||||||||||
Amazon.com, Inc. (Internet & Direct Marketing Retail) | (a) | 84,590 | 7,105,560 | |||||||
AutoNation, Inc. (Specialty Retail) | (a) | 7,808 | 837,798 | |||||||
Best Buy Co., Inc. (Specialty Retail) | 2,176 | 174,537 | ||||||||
eBay, Inc. (Internet & Direct Marketing Retail) | 45,159 | 1,872,744 | ||||||||
Home Depot, Inc. / The (Specialty Retail) | 13,835 | 4,369,923 | ||||||||
Lear Corp. (Auto Components) | 5,683 | 704,806 | ||||||||
Lowe’s Cos., Inc. (Specialty Retail) | 11,002 | 2,192,038 | ||||||||
Lululemon Athletica, Inc. (Textiles, Apparel & Luxury Goods) | (a) | 4,866 | 1,558,969 | |||||||
McDonald’s Corp. (Hotels, Restaurants & Leisure) | 4,007 | 1,055,965 | ||||||||
Starbucks Corp. (Hotels, Restaurants & Leisure) | 4,634 | 459,693 | ||||||||
Target Corp. (Multiline Retail) | 5,744 | 856,086 | ||||||||
Tesla, Inc. (Automobiles) | (a) | 24,618 | 3,032,445 | |||||||
Travel + Leisure Co. (Hotels, Restaurants & Leisure) | 50,104 | 1,823,786 | ||||||||
Ulta Beauty, Inc. (Specialty Retail) | (a) | 3,434 | 1,610,786 | |||||||
Whirlpool Corp. (Household Durables) | 3,181 | 449,984 | ||||||||
Yum! Brands, Inc. (Hotels, Restaurants & Leisure) | 5,850 | 749,268 | ||||||||
|
| |||||||||
| 28,854,388 | ||||||||||
|
| |||||||||
CONSUMER STAPLES – 7.4% | ||||||||||
Brown-Forman Corp. Class B (Beverages) | 21,618 | 1,419,870 | ||||||||
Colgate-Palmolive Co. (Household Products) | 48,917 | 3,854,171 | ||||||||
Costco Wholesale Corp. (Food & Staples Retailing) | 2,592 | 1,183,248 | ||||||||
Hershey Co. / The (Food Products) | 9,037 | 2,092,698 | ||||||||
Kroger Co. / The (Food & Staples Retailing) | 21,234 | 946,612 | ||||||||
Mondelez International, Inc. Class A (Food Products) | 26,985 | 1,798,550 | ||||||||
PepsiCo, Inc. (Beverages) | 32,786 | 5,923,119 | ||||||||
Procter & Gamble Co. / The (Household Products) | 23,702 | 3,592,275 | ||||||||
Tyson Foods, Inc. Class A (Food Products) | 21,529 | 1,340,180 | ||||||||
Walmart, Inc. (Food & Staples Retailing) | 7,156 | 1,014,649 | ||||||||
|
| |||||||||
| 23,165,372 | ||||||||||
|
| |||||||||
ENERGY – 5.6% | ||||||||||
Chevron Corp. (Oil, Gas & Consumable Fuels) | 25,178 | 4,519,199 | ||||||||
EOG Resources, Inc. (Oil, Gas & Consumable Fuels) | 15,293 | 1,980,750 | ||||||||
Exxon Mobil Corp. (Oil, Gas & Consumable Fuels) | 45,866 | 5,059,020 | ||||||||
Halliburton Co. (Energy Equip. & Svs.) | 29,974 | 1,179,477 | ||||||||
Marathon Oil Corp. (Oil, Gas & Consumable Fuels) | 22,044 | 596,731 | ||||||||
Marathon Petroleum Corp. (Oil, Gas & Consumable Fuels) | 16,885 | 1,965,245 | ||||||||
| Common Stocks (Continued) | Shares | Value | ||||||||
ENERGY (continued) | ||||||||||
Schlumberger Ltd. / N.V. (Energy Equip. & Svs.) | 31,644 | $ | 1,691,688 | |||||||
Valero Energy Corp. (Oil, Gas & Consumable Fuels) | 3,759 | 476,867 | ||||||||
|
| |||||||||
| 17,468,977 | ||||||||||
|
| |||||||||
FINANCIALS – 10.9% | ||||||||||
American Express Co. (Consumer Finance) | 28,372 | 4,191,963 | ||||||||
Bank of America Corp. (Banks) | 82,167 | 2,721,371 | ||||||||
Bank of New York Mellon Corp. / The (Capital Markets) | 20,270 | 922,690 | ||||||||
Berkshire Hathaway, Inc. Class B (Diversified Financial Svs.) | (a) | 14,216 | 4,391,322 | |||||||
Capital One Financial Corp. (Consumer Finance) | 15,428 | 1,434,187 | ||||||||
CBOE Global Markets, Inc. (Capital Markets) | 3,310 | 415,306 | ||||||||
Citigroup, Inc. (Banks) | 6,989 | 316,113 | ||||||||
CME Group, Inc. (Capital Markets) | 7,917 | 1,331,323 | ||||||||
Discover Financial Services (Consumer Finance) | 9,080 | 888,296 | ||||||||
JPMorgan Chase & Co. (Banks) | 4,658 | 624,638 | ||||||||
Marsh & McLennan Cos., Inc. (Insurance) | 23,299 | 3,855,519 | ||||||||
MetLife, Inc. (Insurance) | 52,877 | 3,826,709 | ||||||||
Travelers Cos., Inc. / The (Insurance) | 15,259 | 2,860,910 | ||||||||
U.S. Bancorp (Banks) | 34,522 | 1,505,504 | ||||||||
Voya Financial, Inc. (Diversified Financial Svs.) | 44,835 | 2,756,904 | ||||||||
Wells Fargo & Co. (Banks) | 50,274 | 2,075,813 | ||||||||
|
| |||||||||
| 34,118,568 | ||||||||||
|
| |||||||||
HEALTH CARE – 15.9% | ||||||||||
Abbott Laboratories (Health Care Equip. & Supplies) | 16,536 | 1,815,487 | ||||||||
AbbVie, Inc. (Biotechnology) | 8,668 | 1,400,835 | ||||||||
Agilent Technologies, Inc. (Life Sciences Tools & Svs.) | 20,533 | 3,072,763 | ||||||||
AmerisourceBergen Corp. (Health Care Providers & Svs.) | 8,512 | 1,410,524 | ||||||||
Amgen, Inc. (Biotechnology) | 10,466 | 2,748,790 | ||||||||
Becton Dickinson and Co. (Health Care Equip. & Supplies) | 11,262 | 2,863,927 | ||||||||
Biogen, Inc. (Biotechnology) | (a) | 2,340 | 647,993 | |||||||
Boston Scientific Corp. (Health Care Equip. & Supplies) | (a) | 49,237 | 2,278,196 | |||||||
Bristol-Myers Squibb Co. (Pharmaceuticals) | 7,069 | 508,615 | ||||||||
Cigna Corp. (Health Care Providers & Svs.) | 13,459 | 4,459,505 | ||||||||
CVS Health Corp. (Health Care Providers & Svs.) | 15,419 | 1,436,897 | ||||||||
Danaher Corp. (Life Sciences Tools & Svs.) | 12,032 | 3,193,533 | ||||||||
Elevance Health, Inc. (Health Care Providers & Svs.) | 4,428 | 2,271,431 | ||||||||
Eli Lilly & Co. (Pharmaceuticals) | 8,918 | 3,262,561 | ||||||||
Gilead Sciences, Inc. (Biotechnology) | 6,266 | 537,936 | ||||||||
Johnson & Johnson (Pharmaceuticals) | 23,349 | 4,124,601 | ||||||||
Medtronic PLC (Health Care Equip. & Supplies) | 14,290 | 1,110,619 | ||||||||
Merck & Co., Inc. (Pharmaceuticals) | 15,216 | 1,688,215 | ||||||||
Pfizer, Inc. (Pharmaceuticals) | 48,593 | 2,489,905 | ||||||||
Teladoc Health, Inc. (Health Care Technology) | (a) | 17,134 | 405,219 | |||||||
Thermo Fisher Scientific, Inc. (Life Sciences Tools & Svs.) | 6,411 | 3,530,474 | ||||||||
UnitedHealth Group, Inc. (Health Care Providers & Svs.) | 8,411 | 4,459,344 | ||||||||
Veeva Systems, Inc. Class A (Health Care Technology) | (a) | 2,347 | 378,759 | |||||||
|
| |||||||||
| 50,096,129 | ||||||||||
|
| |||||||||
INDUSTRIALS – 8.8% | ||||||||||
CSX Corp. (Road & Rail) | 21,465 | 664,986 | ||||||||
Curtiss-Wright Corp. (Aerospace & Defense) | 8,193 | 1,368,149 | ||||||||
Deere & Co. (Machinery) | 7,883 | 3,379,915 | ||||||||
| 72 | (continued) |
Ohio National Fund, Inc. | ON BlackRock Advantage Large Cap Core Portfolio (Continued) | |
| Schedule of Investments | December 31, 2022 | |
| Common Stocks (Continued) | Shares | Value | ||||||||
INDUSTRIALS (continued) | ||||||||||
Eaton Corp. PLC (Electrical Equip.) | 8,882 | $ | 1,394,030 | |||||||
General Dynamics Corp. (Aerospace & Defense) | 13,819 | 3,428,632 | ||||||||
HEICO Corp. (Aerospace & Defense) | 4,628 | 711,046 | ||||||||
Honeywell International, Inc. (Industrial Conglomerates) | 3,950 | 846,485 | ||||||||
Illinois Tool Works, Inc. (Machinery) | 10,474 | 2,307,422 | ||||||||
Lockheed Martin Corp. (Aerospace & Defense) | 7,637 | 3,715,324 | ||||||||
PACCAR, Inc. (Machinery) | 22,668 | 2,243,452 | ||||||||
SiteOne Landscape Supply, Inc. (Trading Companies & Distributors) | (a) | 6,550 | 768,446 | |||||||
Snap-on, Inc. (Machinery) | 4,324 | 987,991 | ||||||||
Timken Co. / The (Machinery) | 17,467 | 1,234,393 | ||||||||
Union Pacific Corp. (Road & Rail) | 1,842 | 381,423 | ||||||||
United Parcel Service, Inc. Class B (Air Freight & Logistics) | 10,368 | 1,802,373 | ||||||||
W.W. Grainger, Inc. (Trading Companies & Distributors) | 1,512 | 841,050 | ||||||||
Xylem, Inc. (Machinery) | 14,958 | 1,653,906 | ||||||||
|
| |||||||||
| 27,729,023 | ||||||||||
|
| |||||||||
INFORMATION TECHNOLOGY – 25.1% |
| |||||||||
Accenture PLC Class A (IT Svs.) | 4,212 | 1,123,930 | ||||||||
Adobe, Inc. (Software) | (a) | 7,982 | 2,686,183 | |||||||
Advanced Micro Devices, Inc. (Semiconductors & Equip.) | (a) | 10,093 | 653,724 | |||||||
Analog Devices, Inc. (Semiconductors & Equip.) | 26,958 | 4,421,921 | ||||||||
Apple, Inc. (Tech. Hardware, Storage & Periph.) | 139,168 | 18,082,098 | ||||||||
Applied Materials, Inc. (Semiconductors & Equip.) | 19,014 | 1,851,583 | ||||||||
Automatic Data Processing, Inc. (IT Svs.) | 8,412 | 2,009,290 | ||||||||
Cognizant Technology Solutions Corp. Class A (IT Svs.) | 22,574 | 1,291,007 | ||||||||
Dell Technologies, Inc. Class C (Tech. Hardware, Storage & Periph.) | 16,821 | 676,541 | ||||||||
Enphase Energy, Inc. (Semiconductors & Equip.) | (a) | 1,064 | 281,917 | |||||||
Flex Ltd. (Electronic Equip., Instr. & Comp.) | (a) | 96,743 | 2,076,105 | |||||||
Hewlett Packard Enterprise Co. (Tech. Hardware, Storage & Periph.) | 89,567 | 1,429,489 | ||||||||
Intel Corp. (Semiconductors & Equip.) | 75,410 | 1,993,086 | ||||||||
Intuit, Inc. (Software) | 1,356 | 527,782 | ||||||||
Juniper Networks, Inc. (Communications Equip.) | 30,699 | 981,140 | ||||||||
KLA Corp. (Semiconductors & Equip.) | 2,212 | 833,990 | ||||||||
| Common Stocks (Continued) | Shares | Value | ||||||||
INFORMATION TECHNOLOGY (continued) | ||||||||||
Lam Research Corp. (Semiconductors & Equip.) | 1,790 | $ | 752,337 | |||||||
Mastercard, Inc. Class A (IT Svs.) | 8,168 | 2,840,259 | ||||||||
Microsoft Corp. (Software) | 79,239 | 19,003,097 | ||||||||
NVIDIA Corp. (Semiconductors & Equip.) | 15,270 | 2,231,558 | ||||||||
NXP Semiconductors N.V. (Semiconductors & Equip.) | 2,339 | 369,632 | ||||||||
PayPal Holdings, Inc. (IT Svs.) | (a) | 22,310 | 1,588,918 | |||||||
QUALCOMM, Inc. (Semiconductors & Equip.) | 10,655 | 1,171,411 | ||||||||
Salesforce, Inc. (Software) | (a) | 17,498 | 2,320,060 | |||||||
ServiceNow, Inc. (Software) | (a) | 4,681 | 1,817,492 | |||||||
Silicon Laboratories, Inc. (Semiconductors & Equip.) | (a) | 7,384 | 1,001,787 | |||||||
TE Connectivity Ltd. (Electronic Equip., Instr. & Comp.) | 2,404 | 275,979 | ||||||||
Visa, Inc. (IT Svs.) | 16,028 | 3,329,977 | ||||||||
Workday, Inc. Class A (Software) | (a) | 6,553 | 1,096,514 | |||||||
|
| |||||||||
| 78,718,807 | ||||||||||
|
| |||||||||
MATERIALS – 2.8% | ||||||||||
Corteva, Inc. (Chemicals) | 25,884 | 1,521,461 | ||||||||
Ecolab, Inc. (Chemicals) | 20,685 | 3,010,909 | ||||||||
FMC Corp. (Chemicals) | 12,328 | 1,538,534 | ||||||||
Linde PLC (Chemicals) | 5,158 | 1,682,436 | ||||||||
Newmont Corp. (Metals & Mining) | 6,733 | 317,798 | ||||||||
Steel Dynamics, Inc. (Metals & Mining) | 7,068 | 690,544 | ||||||||
|
| |||||||||
| 8,761,682 | ||||||||||
|
| |||||||||
REAL ESTATE – 3.1% | ||||||||||
Crown Castle, Inc. (Equity REIT) | 3,241 | 439,610 | ||||||||
Equity Residential (Equity REIT) | 28,548 | 1,684,332 | ||||||||
Essex Property Trust, Inc. (Equity REIT) | 8,324 | 1,764,022 | ||||||||
Prologis, Inc. (Equity REIT) | 23,281 | 2,624,467 | ||||||||
Simon Property Group, Inc. (Equity REIT) | 27,515 | 3,232,462 | ||||||||
|
| |||||||||
| 9,744,893 | ||||||||||
|
| |||||||||
UTILITIES – 2.6% | ||||||||||
CMS Energy Corp. (Multi-Utilities) | 34,895 | 2,209,900 | ||||||||
DTE Energy Co. (Multi-Utilities) | 31,120 | 3,657,534 | ||||||||
Evergy, Inc. (Electric Utilities) | 29,281 | 1,842,653 | ||||||||
Vistra Corp. (Ind. Power & Renewable Elec.) | 23,599 | 547,497 | ||||||||
|
| |||||||||
| 8,257,584 | ||||||||||
|
| |||||||||
Total Common Stocks (Cost $319,979,596) | $ | 308,477,380 | ||||||||
|
| |||||||||
Total Investments – 98.3% (Cost $319,979,596) | (b) | $ | 308,477,380 | |||||||
Other Assets in Excess of Liabilities – 1.7% | (c) | 5,320,659 | ||||||||
|
| |||||||||
Net Assets – 100.0% | $ | 313,798,039 | ||||||||
|
| |||||||||
Percentages are stated as a percent of net assets.
Footnotes:
| (a) | Non-income producing security. |
| (b) | Represents cost for financial reporting purposes, which may differ from cost basis for federal income tax purposes. See also Note 7 of the Notes to Financial Statements. |
| (c) | Includes $265,000 of cash pledged as collateral for the futures contracts outstanding at December 31, 2022. See also the following Schedule of Open Futures Contracts. |
The accompanying notes are an integral part of these financial statements.
| Schedule of Open Futures Contracts | December 31, 2022 | |||
Description | Number of contracts | Expiration Date | Notional Amount | Value | Unrealized Appreciation (Depreciation) | Variation Margin Receivable (Payable) | ||||||
CME E-mini S&P 500 Index - Long | 25 | March 17, 2023 | $4,967,337 | $4,826,250 | $(141,087) | $(13,438) |
The accompanying notes are an integral part of these financial statements.
| 73 |
| ON BlackRock Advantage Small Cap Growth Portfolio (Unaudited) |
| Objective/Strategy |
The ON BlackRock Advantage Small Cap Growth Portfolio seeks long-term growth of capital by investing, under normal circumstances, at least 80% of its net assets in stocks of small capitalization companies with a market capitalization at the time of investment that is no greater than the largest market capitalization of a company in the Russell 2000® Index for the previous twelve months.
| Performance as of December 31, 2022 |
Average Annual returns | ||||
One year | -26.12 | % | ||
Five years | 5.59 | % | ||
Ten years | 9.09 | % |
Past performance does not guarantee future results. The performance data quoted represents past performance and current returns may be lower or higher. Total return figures include change in share price and reinvestment of dividends and capital gains. The investment return and principal value will fluctuate so that an investor’s shares, when redeemed, may be worth more or less than the original cost. To obtain performance information up to the most recent month end, call toll-free 1-877-781-6392.
The Portfolio is not open to direct retail investment. Beneficial interest in the Portfolio’s shares is obtained either through an allocation to the Portfolio as an investment vehicle within variable life insurance policies or annuity contracts, or as an underlying investment by the ON Model Portfolios. Actual performance results for variable annuity and variable universal life contracts will be lower due to contract charges. Consult your contract for applicable charges.
Total expense ratio is 0.85% per the Fund’s prospectus dated April 29, 2022. Additional information pertaining to the Portfolio’s expense ratio as of December 31, 2022 can be found in the Portfolio’s Financial Highlights.
| Comments from Sub-Adviser |
Q. How did the Portfolio perform in comparison to its benchmark during the reporting period?
A. For the year ended December 31, 2022, the Portfolio returned -26.12% versus -26.36% for its benchmark, the Russell 2000® Growth Index.
Q. Were there specific market conditions, investment strategies, or techniques that materially affected the Portfolio’s benchmark-relative performance during the reporting period?
A. The Portfolio performed well amid the volatile market backdrop, leading to a slight outperformance that was bolstered by a particularly strong fourth quarter. Fundamental insights with a preference for attractively priced growth companies drove gains.
Traditional fundamental insights led positive performance for the year, as they benefitted from the market style preference. Traditional valuation metrics measuring company earnings yield, sales across valuations, and other financial statement metrics all contributed. Additionally, stability-related fundamental measures, such as insights with a preference for lower volatility stocks, performed well amid the broader risk-off market tone.
Sentiment-based measures also consistently contributed to performance, specifically through insights that identified sustained market trends which was reflected in persistent price returns. Elsewhere, insights evaluating management sentiment through conference call text helped to correctly position the Portfolio as the market grappled between competing themes of rate hikes and hopes for a dovish policy shift.
Conversely, fundamental quality insights with a growth flavor struggled as investor preference penalized growth in favor of relative valuation. Insights evaluating managerial quality, corporate culture, and founder involvement detracted. Nontraditional fundamental quality measures, specifically ESG insights, struggled as markets continued to focus on macro dynamics over company results. Particularly, environment-related insights, such as those that evaluate emissions levels, detracted from performance. (1)
Q. How did sector allocation and security selection each impact the Portfolio’s performance relative to its benchmark?
A. Allocation and selection decisions were each beneficial to Portfolio performance, with most of the outperformance coming within security selection, specifically within the Industrials and Energy sectors. These results were offset somewhat by selection within Materials and Health Care. While impacts from sector allocation were modest, the Portfolio benefitted from an overweight to Information Technology and an underweight to Financials. An underweight to Consumer Staples detracted. (1)
Q. Which securities contributed the most to, and detracted the most from, the Portfolio’s benchmark-relative performance?
A. From a security standpoint, the Portfolio’s overweight position in Applied Industrial Technologies, Inc. was a top contributor to relative performance for the year, as the stock benefitted from sustained demand for industrial products as supply chains continued to ease. An overweight to food retailer Lancaster Colony Corp. was also a top contributor amid market focus on consumer staples.
Hindering results was an overweight stance in Siteone Landscape Supply, Inc., as the stock struggled against supply chain challenges, as well as rising input costs. An overweight to Health Care stock Omnicell, Inc. was a key detractor, as the company dealt with rising costs of production. (1)
Q. How did the Portfolio’s use of derivative instruments and initial public offerings (IPOs), if any, impact performance?
A. Pursuant to the Portfolio’s investment strategy, futures contracts were used to prevent a cash drag on performance. Futures contracts detracted 43 basis points, in aggregate, from the Portfolio’s absolute return for the year. The Portfolio also participated in two IPOs, which detracted 3 basis points from absolute return, in aggregate, led by a 3 basis point detraction from Bausch + Lomb Corp. (1)
| (1) | The Portfolio’s composition is subject to change. Holdings and weightings are as of December 31, 2022. |
| 74 | (continued) |
Ohio National Fund, Inc. | ON BlackRock Advantage Small Cap Growth Portfolio (Unaudited) (Continued) |
| Change in Value of $10,000 Investment |
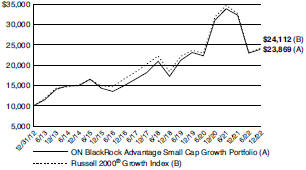
Hypothetical illustration based on past performance. Future performance will vary. The Portfolio’s returns reflect reinvested dividends. The Portfolio’s holdings may differ significantly from the securities in the index. The index is unmanaged and therefore does not reflect the cost of portfolio management and accounting.
The Russell 2000® Growth Index measures the performance of the small-cap growth segment of the U.S. equity universe. It includes the Russell 2000® Index companies with higher price-to-value ratios and higher forecasted growth values. The Russell 2000® Index includes the 2000 firms from the Russell 3000® Index with the smallest market capitalizations. The Russell 3000® Index represents 98% of the investable U.S. equity market. The index presented includes the effects of reinvested dividends.
Past performance is no guarantee of future results. Redemption of fund shares could have tax implications unique to each shareholder.
| Portfolio Composition as of December 31, 2022 (1) | ||
| % of Net Assets | ||||
Common Stocks (4) | 98.1 | |||
Rights (4) | 0.0 | |||
Other Net Assets | 1.9 | |||
|
| |||
| 100.0 | ||||
|
| |||
| Top 10 Portfolio Holdings as of December 31, 2022 (1) (2) (3) | ||||
| % of Net Assets | ||||||
1. | Applied Industrial Technologies, Inc. | 1.7 | ||||
2. | EMCOR Group, Inc. | 1.3 | ||||
3. | Franklin Electric Co., Inc. | 1.2 | ||||
4. | Chord Energy Corp. | 1.1 | ||||
5. | Silicon Laboratories, Inc. | 1.1 | ||||
6. | Insperity, Inc. | 1.1 | ||||
7. | Lancaster Colony Corp. | 1.0 | ||||
8. | Lattice Semiconductor Corp. | 0.9 | ||||
9. | Power Integrations, Inc. | 0.9 | ||||
10. | Iridium Communications, Inc. | 0.9 | ||||
| (1) | Composition of Portfolio subject to change. |
| (2) | Short-term investments have been excluded from the list of Top 10 Portfolio Holdings. |
| (3) | Top 10 Portfolio Holdings is presented at an individual security level. Total investment exposure by issuer may be higher. |
| (4) | Sectors (Common Stocks, Rights): |
| % of Net Assets | ||||
Health Care | 23.0 | |||
Information Technology | 19.9 | |||
Industrials | 18.7 | |||
Consumer Discretionary | 10.6 | |||
Energy | 7.4 | |||
Financials | 4.5 | |||
Consumer Staples | 3.9 | |||
Materials | 3.6 | |||
Utilities | 2.3 | |||
Communication Services | 2.2 | |||
Real Estate | 2.0 | |||
|
| |||
| 98.1 | ||||
|
| |||
| 75 |
Ohio National Fund, Inc. | ON BlackRock Advantage Small Cap Growth Portfolio | |
| Schedule of Investments | December 31, 2022 | |
| Common Stocks – 98.1% | Shares | Value | ||||||||
COMMUNICATION SERVICES – 2.2% | ||||||||||
Bandwidth, Inc. Class A (Diversified Telecom. Svs.) | (a) | 12,048 | $ | 276,502 | ||||||
Cargurus, Inc. (Interactive Media & Svs.) | (a) | 3,519 | 49,301 | |||||||
Cinemark Holdings, Inc. (Entertainment) | (a) | 22,619 | 195,881 | |||||||
Eventbrite, Inc. Class A (Interactive Media & Svs.) | (a) | 9,898 | 58,002 | |||||||
EverQuote, Inc. Class A (Interactive Media & Svs.) | (a) | 3,933 | 57,972 | |||||||
IDT Corp. Class B (Diversified Telecom. Svs.) | (a) | 8,567 | 241,332 | |||||||
Iridium Communications, Inc. (Diversified Telecom. Svs.) | (a) | 23,086 | 1,186,620 | |||||||
Ooma, Inc. (Diversified Telecom. Svs.) | (a) | 7,140 | 97,247 | |||||||
Shutterstock, Inc. (Interactive Media & Svs.) | 5,226 | 275,515 | ||||||||
Yelp, Inc. (Interactive Media & Svs.) | (a) | 3,270 | 89,402 | |||||||
Ziff Davis, Inc. (Interactive Media & Svs.) | (a) | 5,779 | 457,119 | |||||||
|
| |||||||||
| 2,984,893 | ||||||||||
|
| |||||||||
CONSUMER DISCRETIONARY – 10.6% | ||||||||||
1-800-Flowers.com, Inc. Class A (Internet & Direct Marketing Retail) | (a) | 25,190 | 240,816 | |||||||
2U, Inc. (Diversified Consumer Svs.) | (a) | 27,237 | 170,776 | |||||||
Accel Entertainment, Inc. (Hotels, Restaurants & Leisure) | (a) | 32,387 | 249,380 | |||||||
Asbury Automotive Group, Inc. (Specialty Retail) | (a) | 1,531 | 274,432 | |||||||
Boot Barn Holdings, Inc. (Specialty Retail) | (a) | 5,371 | 335,795 | |||||||
Chegg, Inc. (Diversified Consumer Svs.) | (a) | 9,955 | 251,563 | |||||||
Crocs, Inc. (Textiles, Apparel & Luxury Goods) | (a) | 7,805 | 846,296 | |||||||
Dave & Buster’s Entertainment, Inc. (Hotels, Restaurants & Leisure) | (a) | 3,650 | 129,356 | |||||||
Dillard’s, Inc. Class A (Multiline Retail) | 1,805 | 583,376 | ||||||||
Duolingo, Inc. (Diversified Consumer Svs.) | (a) | 1,719 | 122,273 | |||||||
Fox Factory Holding Corp. (Auto Components) | (a) | 5,638 | 514,355 | |||||||
GoPro, Inc. Class A (Household Durables) | (a) | 57,623 | 286,963 | |||||||
Hilton Grand Vacations, Inc. (Hotels, Restaurants & Leisure) | (a) | 17,716 | 682,775 | |||||||
International Game Technology PLC (Hotels, Restaurants & Leisure) | 25,259 | 572,874 | ||||||||
iRobot Corp. (Household Durables) | (a) | 2,737 | 131,732 | |||||||
LCI Industries (Auto Components) | 6,080 | 562,096 | ||||||||
M.D.C. Holdings, Inc. (Household Durables) | 18,277 | 577,553 | ||||||||
Malibu Boats, Inc. Class A (Leisure Products) | (a) | 7,654 | 407,958 | |||||||
MarineMax, Inc. (Specialty Retail) | (a) | 9,315 | 290,814 | |||||||
Murphy U.S.A., Inc. (Specialty Retail) | 3,888 | 1,086,852 | ||||||||
Overstock.com, Inc. (Internet & Direct Marketing Retail) | (a) | 12,750 | 246,840 | |||||||
Papa John’s International, Inc. (Hotels, Restaurants & Leisure) | 8,993 | 740,214 | ||||||||
Patrick Industries, Inc. (Auto Components) | 6,155 | 372,993 | ||||||||
RealReal, Inc. / The (Internet & Direct Marketing Retail) | (a) | 25,373 | 31,716 | |||||||
Rush Street Interactive, Inc. (Hotels, Restaurants & Leisure) | (a) | 10,070 | 36,151 | |||||||
Shake Shack, Inc. Class A (Hotels, Restaurants & Leisure) | (a) | 11,724 | 486,898 | |||||||
Signet Jewelers Ltd. (Specialty Retail) | 4,659 | 316,812 | ||||||||
Sonic Automotive, Inc. Class A (Specialty Retail) | 11,479 | 565,570 | ||||||||
Steven Madden Ltd. (Textiles, Apparel & Luxury Goods) | 6,292 | 201,092 | ||||||||
Stitch Fix, Inc. Class A (Internet & Direct Marketing Retail) | (a) | 14,615 | 45,453 | |||||||
Texas Roadhouse, Inc. (Hotels, Restaurants & Leisure) | 12,471 | 1,134,237 | ||||||||
Visteon Corp. (Auto Components) | (a) | 4,464 | 584,025 | |||||||
Wingstop, Inc. (Hotels, Restaurants & Leisure) | 6,959 | 957,698 | ||||||||
Winnebago Industries, Inc. (Automobiles) | 6,522 | 343,709 | ||||||||
|
| |||||||||
| 14,381,443 | ||||||||||
|
| |||||||||
| Common Stocks (Continued) | Shares | Value | ||||||||
CONSUMER STAPLES – 3.9% | ||||||||||
Andersons, Inc. / The (Food & Staples Retailing) | 13,948 | $ | 488,040 | |||||||
BellRing Brands, Inc. (Personal Products) | (a) | 11,298 | 289,681 | |||||||
Cal-Maine Foods, Inc. (Food Products) | 5,910 | 321,799 | ||||||||
Celsius Holdings, Inc. (Beverages) | (a) | 2,452 | 255,106 | |||||||
Central Garden & Pet Co. Class A (Household Products) | (a) | 9,778 | 350,052 | |||||||
Coca-Cola Consolidated, Inc. (Beverages) | 546 | 279,749 | ||||||||
elf Beauty, Inc. (Personal Products) | (a) | 3,513 | 194,269 | |||||||
Herbalife Nutrition Ltd. (Personal Products) | (a) | 16,841 | 250,594 | |||||||
Hostess Brands, Inc. (Food Products) | (a) | 17,404 | 390,546 | |||||||
Lancaster Colony Corp. (Food Products) | 7,002 | 1,381,495 | ||||||||
Medifast, Inc. (Personal Products) | 5,444 | 627,965 | ||||||||
Sprouts Farmers Market, Inc. (Food & Staples Retailing) | (a) | 3,892 | 125,984 | |||||||
Vital Farms, Inc. (Food Products) | (a) | 20,905 | 311,903 | |||||||
|
| |||||||||
| 5,267,183 | ||||||||||
|
| |||||||||
ENERGY – 7.4% | ||||||||||
Cactus, Inc. Class A (Energy Equip. & Svs.) | 6,749 | 339,205 | ||||||||
ChampionX Corp. (Energy Equip. & Svs.) | 12,609 | 365,535 | ||||||||
Chord Energy Corp. (Oil, Gas & Consumable Fuels) | 11,053 | 1,512,161 | ||||||||
Delek U.S. Holdings, Inc. (Oil, Gas & Consumable Fuels) | 15,414 | 416,178 | ||||||||
Denbury, Inc. (Oil, Gas & Consumable Fuels) | (a) | 3,933 | 342,250 | |||||||
Energy Fuels, Inc. (Oil, Gas & Consumable Fuels) | (a) | 14,224 | 88,331 | |||||||
Evolution Petroleum Corp. (Oil, Gas & Consumable Fuels) | 29,730 | 224,461 | ||||||||
Liberty Energy, Inc. (Energy Equip. & Svs.) | 44,614 | 714,270 | ||||||||
Magnolia Oil & Gas Corp. Class A (Oil, Gas & Consumable Fuels) | 11,374 | 266,720 | ||||||||
Matador Resources Co. (Oil, Gas & Consumable Fuels) | 14,881 | 851,788 | ||||||||
Murphy Oil Corp. (Oil, Gas & Consumable Fuels) | 8,632 | 371,262 | ||||||||
Nabors Industries Ltd. (Energy Equip. & Svs.) | (a) | 3,022 | 468,017 | |||||||
NexTier Oilfield Solutions, Inc. (Energy Equip. & Svs.) | (a) | 25,671 | 237,200 | |||||||
Oceaneering International, Inc. (Energy Equip. & Svs.) | (a) | 23,528 | 411,505 | |||||||
Ovintiv, Inc. (Oil, Gas & Consumable Fuels) | 12,120 | 614,605 | ||||||||
Patterson-UTI Energy, Inc. (Energy Equip. & Svs.) | 25,731 | 433,310 | ||||||||
PBF Energy, Inc. Class A (Oil, Gas & Consumable Fuels) | 8,027 | 327,341 | ||||||||
ProPetro Holding Corp. (Energy Equip. & Svs.) . | (a) | 15,350 | 159,180 | |||||||
Scorpio Tankers, Inc. (Oil, Gas & Consumable Fuels) | 4,584 | 246,482 | ||||||||
SM Energy Co. (Oil, Gas & Consumable Fuels) | 26,944 | 938,460 | ||||||||
Smart Sand, Inc. (Energy Equip. & Svs.) | (a) | 47,289 | 84,647 | |||||||
Valaris Ltd. (Energy Equip. & Svs.) | (a) | 7,916 | 535,280 | |||||||
|
| |||||||||
| 9,948,188 | ||||||||||
|
| |||||||||
FINANCIALS – 4.5% | ||||||||||
Artisan Partners Asset Management, Inc. Class A (Capital Markets) | 12,462 | 370,121 | ||||||||
Cohen & Steers, Inc. (Capital Markets) | 6,316 | 407,761 | ||||||||
Essent Group Ltd. (Thrifts & Mortgage Finance) | 19,608 | 762,359 | ||||||||
Federal Agricultural Mortgage Corp. Class C (Thrifts & Mortgage Finance) | 5,490 | 618,778 | ||||||||
First Financial Bankshares, Inc. (Banks) | 12,534 | 431,170 | ||||||||
Hamilton Lane, Inc. Class A (Capital Markets) | 10,125 | 646,785 | ||||||||
Houlihan Lokey, Inc. (Capital Markets) | 8,336 | 726,566 | ||||||||
Kinsale Capital Group, Inc. (Insurance) | 1,472 | 384,957 | ||||||||
Moelis & Co. Class A (Capital Markets) | 7,763 | 297,866 | ||||||||
| 76 | (continued) |
Ohio National Fund, Inc. | ON BlackRock Advantage Small Cap Growth Portfolio (Continued) | |
| Schedule of Investments | December 31, 2022 | |
| Common Stocks (Continued) | Shares | Value | ||||||||
FINANCIALS (continued) | ||||||||||
Open Lending Corp. Class A (Capital Markets) | (a) | 11,268 | $ | 76,059 | ||||||
RLI Corp. (Insurance) | 4,710 | 618,282 | ||||||||
Selectquote, Inc. (Insurance) | (a) | 8,673 | 5,827 | |||||||
Stifel Financial Corp. (Capital Markets) | 8,380 | 489,141 | ||||||||
Trupanion, Inc. (Insurance) | (a) | 5,319 | 252,812 | |||||||
|
| |||||||||
| 6,088,484 | ||||||||||
|
| |||||||||
HEALTH CARE – 23.0% | ||||||||||
ACADIA Pharmaceuticals, Inc. (Biotechnology) | (a) | 12,690 | 202,025 | |||||||
Aclaris Therapeutics, Inc. (Pharmaceuticals) | (a) | 7,879 | 124,094 | |||||||
Adaptive Biotechnologies Corp. (Life Sciences Tools & Svs.) | (a) | 22,888 | 174,864 | |||||||
Agenus, Inc. (Biotechnology) | (a) | 65,236 | 156,566 | |||||||
Alector, Inc. (Biotechnology) | (a) | 11,265 | 103,976 | |||||||
Alkermes PLC (Biotechnology) | (a) | 19,720 | 515,284 | |||||||
ALX Oncology Holdings, Inc. (Biotechnology) | (a) | 1,291 | 14,550 | |||||||
Amarin Corp. PLC – ADR (Biotechnology) | (a) | 17,101 | 20,692 | |||||||
American Well Corp. Class A (Health Care Technology) | (a) | 51,120 | 144,670 | |||||||
Amicus Therapeutics, Inc. (Biotechnology) | (a) | 34,993 | 427,265 | |||||||
AMN Healthcare Services, Inc. (Health Care Providers & Svs.) | (a) | 6,660 | 684,781 | |||||||
Amphastar Pharmaceuticals, Inc. (Pharmaceuticals) | (a) | 23,639 | 662,365 | |||||||
Apellis Pharmaceuticals, Inc. (Biotechnology) | (a) | 12,533 | 648,081 | |||||||
Applied Molecular Transport, Inc. (Biotechnology) | (a) | 2,404 | 1,010 | |||||||
Aptinyx, Inc. (Biotechnology) | (a) | 23,975 | 7,022 | |||||||
Arcutis Biotherapeutics, Inc. (Biotechnology) | (a) | 5,941 | 87,927 | |||||||
Arrowhead Pharmaceuticals, Inc. (Biotechnology) | (a) | 8,746 | 354,738 | |||||||
Arvinas, Inc. (Pharmaceuticals) | (a) | 3,865 | 132,222 | |||||||
Atara Biotherapeutics, Inc. (Biotechnology) | (a) | 26,563 | 87,127 | |||||||
Athenex, Inc. (Biotechnology) | (a) | 11,735 | 1,731 | |||||||
AtriCure, Inc. (Health Care Equip. & Supplies) | (a) | 7,974 | 353,886 | |||||||
Atrion Corp. (Health Care Equip. & Supplies) | 585 | 327,278 | ||||||||
Avidity Biosciences, Inc. (Biotechnology) | (a) | 5,306 | 117,740 | |||||||
Avrobio, Inc. (Biotechnology) | (a) | 9,661 | 6,887 | |||||||
Axonics, Inc. (Health Care Equip. & Supplies) | (a) | 6,527 | 408,133 | |||||||
Beam Therapeutics, Inc. (Biotechnology) | (a) | 4,803 | 187,845 | |||||||
Berkeley Lights, Inc. (Life Sciences Tools & Svs.) | (a) | 19,349 | 51,855 | |||||||
Beyondspring, Inc. (Biotechnology) | (a) | 5,417 | 10,184 | |||||||
Biohaven Ltd. (Biotechnology) | (a) | 2,278 | 31,619 | |||||||
Bionano Genomics, Inc. (Life Sciences Tools & Svs.) | (a) | 24,308 | 35,490 | |||||||
Blueprint Medicines Corp. (Biotechnology) | (a) | 11,921 | 522,259 | |||||||
Bridgebio Pharma, Inc. (Biotechnology) | (a) | 17,777 | 135,461 | |||||||
C4 Therapeutics, Inc. (Biotechnology) | (a) | 6,485 | 38,262 | |||||||
Cardiovascular Systems, Inc. (Health Care Equip. & Supplies) | (a) | 15,137 | 206,166 | |||||||
CareDx, Inc. (Biotechnology) | (a) | 4,195 | 47,865 | |||||||
Cerus Corp. (Health Care Equip. & Supplies) | (a) | 42,400 | 154,760 | |||||||
Codexis, Inc. (Life Sciences Tools & Svs.) | (a) | 17,805 | 82,971 | |||||||
Coherus Biosciences, Inc. (Biotechnology) | (a) | 29,534 | 233,909 | |||||||
Collegium Pharmaceutical, Inc. (Pharmaceuticals) | (a) | 15,250 | 353,800 | |||||||
Corcept Therapeutics, Inc. (Pharmaceuticals) | (a) | 34,077 | 692,104 | |||||||
Cytokinetics, Inc. (Biotechnology) | (a) | 3,206 | 146,899 | |||||||
Deciphera Pharmaceuticals, Inc. (Biotechnology) | (a) | 9,562 | 156,721 | |||||||
Denali Therapeutics, Inc. (Biotechnology) | (a) | 19,937 | 554,448 | |||||||
Editas Medicine, Inc. (Biotechnology) | (a) | 20,268 | 179,777 | |||||||
Enanta Pharmaceuticals, Inc. (Biotechnology) | (a) | 3,463 | 161,099 | |||||||
Ensign Group, Inc. / The (Health Care Providers & Svs.) | 11,622 | 1,099,557 | ||||||||
Evolent Health, Inc. Class A (Health Care Technology) | (a) | 24,450 | 686,556 | |||||||
| Common Stocks (Continued) | Shares | Value | ||||||||||
HEALTH CARE (continued) | ||||||||||||
Fate Therapeutics, Inc. (Biotechnology) | (a | ) | 35,418 | $ | 357,368 | |||||||
Foghorn Therapeutics, Inc. (Biotechnology) | (a | ) | 8,256 | 52,673 | ||||||||
Glaukos Corp. (Health Care Equip. & Supplies) | (a | ) | 2,764 | 120,732 | ||||||||
Haemonetics Corp. (Health Care Equip. & Supplies) | (a | ) | 7,098 | 558,258 | ||||||||
Halozyme Therapeutics, Inc. (Biotechnology) | (a | ) | 17,868 | 1,016,689 | ||||||||
Harmony Biosciences Holdings, Inc. (Pharmaceuticals) | (a | ) | 5,031 | 277,208 | ||||||||
Harpoon Therapeutics, Inc. (Biotechnology) | (a | ) | 849 | 616 | ||||||||
HealthEquity, Inc. (Health Care Providers & Svs.) | (a | ) | 11,939 | 735,920 | ||||||||
Heron Therapeutics, Inc. (Biotechnology) | (a | ) | 34,692 | 86,730 | ||||||||
Heska Corp. (Health Care Equip. & Supplies) | (a | ) | 3,015 | 187,412 | ||||||||
Insmed, Inc. (Biotechnology) | (a | ) | 22,842 | 456,383 | ||||||||
Inspire Medical Systems, Inc. (Health Care Equip. & Supplies) | (a | ) | 4,369 | 1,100,464 | ||||||||
Intellia Therapeutics, Inc. (Biotechnology) | (a | ) | 8,046 | 280,725 | ||||||||
Intercept Pharmaceuticals, Inc. (Biotechnology) | (a | ) | 6,783 | 83,906 | ||||||||
Intra-Cellular Therapies, Inc. (Pharmaceuticals) | (a | ) | 8,120 | 429,710 | ||||||||
Invitae Corp. (Health Care Providers & Svs.) | (a | ) | 17,449 | 32,455 | ||||||||
iRhythm Technologies, Inc. (Health Care Equip. & Supplies) | (a | ) | 1,936 | 181,345 | ||||||||
Ironwood Pharmaceuticals, Inc. (Biotechnology) | (a | ) | 39,694 | 491,809 | ||||||||
IVERIC bio, Inc. (Biotechnology) | (a | ) | 14,835 | 317,617 | ||||||||
Karuna Therapeutics, Inc. (Biotechnology) | (a | ) | 3,095 | 608,167 | ||||||||
Karyopharm Therapeutics, Inc. (Biotechnology) | (a | ) | 38,594 | 131,220 | ||||||||
Kiniksa Pharmaceuticals Ltd. Class A (Biotechnology) | (a | ) | 17,844 | 267,303 | ||||||||
Kymera Therapeutics, Inc. (Biotechnology) | (a | ) | 1,184 | 29,553 | ||||||||
Lantheus Holdings, Inc. (Health Care Equip. & Supplies) | (a | ) | 9,563 | 487,330 | ||||||||
LHC Group, Inc. (Health Care Providers & Svs.) | (a | ) | 3,489 | 564,136 | ||||||||
LivaNova PLC (Health Care Equip. & Supplies) | (a | ) | 1,609 | 89,364 | ||||||||
MacroGenics, Inc. (Biotechnology) | (a | ) | 3,552 | 23,834 | ||||||||
Madrigal Pharmaceuticals, Inc. (Biotechnology) | (a | ) | 1,490 | 432,472 | ||||||||
MannKind Corp. (Biotechnology) | (a | ) | 38,144 | 201,019 | ||||||||
Medpace Holdings, Inc. (Life Sciences Tools & Svs.) | (a | ) | 3,629 | 770,836 | ||||||||
Merit Medical Systems, Inc. (Health Care Equip. & Supplies) | (a | ) | 7,911 | 558,675 | ||||||||
Mirum Pharmaceuticals, Inc. (Biotechnology) | (a | ) | 7,949 | 155,006 | ||||||||
Neoleukin Therapeutics, Inc. (Biotechnology) | (a | ) | 9,004 | 4,583 | ||||||||
Nevro Corp. (Health Care Equip. & Supplies) | (a | ) | 3,665 | 145,134 | ||||||||
NGM Biopharmaceuticals, Inc. (Pharmaceuticals) | (a | ) | 9,360 | 46,987 | ||||||||
NuVasive, Inc. (Health Care Equip. & Supplies) | (a | ) | 4,359 | 179,765 | ||||||||
Omnicell, Inc. (Health Care Equip. & Supplies) | (a | ) | 9,174 | 462,553 | ||||||||
Option Care Health, Inc. (Health Care Providers & Svs.) | (a | ) | 36,691 | 1,104,032 | ||||||||
OraSure Technologies, Inc. (Health Care Equip. & Supplies) | (a | ) | 4,376 | 21,092 | ||||||||
Oyster Point Pharma, Inc. (Biotechnology) | (a | ) | 429 | 4,792 | ||||||||
Pacira BioSciences, Inc. (Pharmaceuticals) | (a | ) | 4,474 | 172,741 | ||||||||
Personalis, Inc. (Life Sciences Tools & Svs.) | (a | ) | 10,337 | 20,467 | ||||||||
Phreesia, Inc. (Health Care Technology) | (a | ) | 11,187 | 362,011 | ||||||||
Progyny, Inc. (Health Care Providers & Svs.) | (a | ) | 15,151 | 471,954 | ||||||||
Prometheus Biosciences, Inc. (Biotechnology) | (a | ) | 2,331 | 256,410 | ||||||||
PTC Therapeutics, Inc. (Biotechnology) | (a | ) | 13,616 | 519,723 | ||||||||
Recursion Pharmaceuticals, Inc. Class A (Biotechnology) | (a | ) | 7,184 | 55,389 | ||||||||
Relay Therapeutics, Inc. (Biotechnology) | (a | ) | 14,951 | 223,368 | ||||||||
Relmada Therapeutics, Inc. (Pharmaceuticals) | (a | ) | 5,208 | 18,176 | ||||||||
Revance Therapeutics, Inc. (Pharmaceuticals) | (a | ) | 8,096 | 149,452 | ||||||||
Rigel Pharmaceuticals, Inc. (Biotechnology) | (a | ) | 88,669 | 133,004 | ||||||||
| 77 | (continued) |
Ohio National Fund, Inc. | ON BlackRock Advantage Small Cap Growth Portfolio (Continued) | |
| Schedule of Investments | December 31, 2022 | |
| Common Stocks (Continued) | Shares | Value | ||||||||
HEALTH CARE (continued) | ||||||||||
Rocket Pharmaceuticals, Inc. (Biotechnology) | (a) | 2,755 | $ | 53,915 | ||||||
Sangamo Therapeutics, Inc. (Biotechnology) | (a) | 18,515 | 58,137 | |||||||
Seer, Inc. (Life Sciences Tools & Svs.) | (a) | 2,905 | 16,849 | |||||||
Select Medical Holdings Corp. (Health Care Providers & Svs.) | 14,667 | 364,182 | ||||||||
Seres Therapeutics, Inc. (Biotechnology) | (a) | 16,907 | 94,679 | |||||||
Shockwave Medical, Inc. (Health Care Equip. & Supplies) | (a) | 5,684 | 1,168,687 | |||||||
Silk Road Medical, Inc. (Health Care Equip. & Supplies) | (a) | 4,376 | 231,272 | |||||||
Sorrento Therapeutics, Inc. (Biotechnology) | (a) | 45,196 | 40,044 | |||||||
STAAR Surgical Co. (Health Care Equip. & Supplies) | (a) | 8,570 | 415,988 | |||||||
Sutro Biopharma, Inc. (Biotechnology) | (a) | 13,219 | 106,810 | |||||||
Tactile Systems Technology, Inc. (Health Care Equip. & Supplies) | (a) | 6,253 | 71,784 | |||||||
TG Therapeutics, Inc. (Biotechnology) | (a) | 15,198 | 179,792 | |||||||
Theravance Biopharma, Inc. (Pharmaceuticals) | (a) | 18,256 | 204,832 | |||||||
Twist Bioscience Corp. (Biotechnology) | (a) | 8,104 | 192,956 | |||||||
Vaxcyte, Inc. (Biotechnology) | (a) | 5,427 | 260,225 | |||||||
Veradigm, Inc. (Health Care Technology) | (a) | 13,436 | 237,011 | |||||||
Vericel Corp. (Biotechnology) | (a) | 5,321 | 140,155 | |||||||
Viemed Healthcare, Inc. (Health Care Providers & Svs.) | (a) | 11,958 | 90,402 | |||||||
Y-mAbs Therapeutics, Inc. (Biotechnology) | (a) | 4,746 | 23,160 | |||||||
Zentalis Pharmaceuticals, Inc. (Biotechnology) | (a) | 1,298 | 26,142 | |||||||
Zynex, Inc. (Health Care Equip. & Supplies) | (a) | 4,771 | 66,365 | |||||||
|
| |||||||||
| 31,016,476 | ||||||||||
|
| |||||||||
INDUSTRIALS – 18.7% | ||||||||||
Aerojet Rocketdyne Holdings, Inc. (Aerospace & Defense) | (a) | 10,831 | 605,778 | |||||||
Altra Industrial Motion Corp. (Machinery) | 4,106 | 245,334 | ||||||||
Ameresco, Inc. Class A (Construction & Engineering) | (a) | 5,464 | 312,213 | |||||||
Applied Industrial Technologies, Inc. (Trading Companies & Distributors) | 17,568 | 2,214,095 | ||||||||
ASGN, Inc. (Professional Svs.) | (a) | 4,144 | 337,653 | |||||||
Astec Industries, Inc. (Machinery) | 4,436 | 180,368 | ||||||||
Atkore, Inc. (Electrical Equip.) | (a) | 9,433 | 1,069,891 | |||||||
Bloom Energy Corp. Class A (Electrical Equip.) | (a) | 36,804 | 703,692 | |||||||
Chart Industries, Inc. (Machinery) | (a) | 4,433 | 510,815 | |||||||
Cimpress PLC (Commercial Svs. & Supplies) | (a) | 1,170 | 32,304 | |||||||
Comfort Systems U.S.A., Inc. (Construction & Engineering) | 1,618 | 186,199 | ||||||||
Dycom Industries, Inc. (Construction & Engineering) | (a) | 2,423 | 226,793 | |||||||
EMCOR Group, Inc. (Construction & Engineering) | 12,173 | 1,802,943 | ||||||||
Evoqua Water Technologies Corp. (Machinery) | (a) | 17,615 | 697,554 | |||||||
Fluor Corp. (Construction & Engineering) | (a) | 18,123 | 628,143 | |||||||
Franklin Covey Co. (Professional Svs.) | (a) | 19,851 | 928,431 | |||||||
Franklin Electric Co., Inc. (Machinery) | 20,468 | 1,632,323 | ||||||||
Herc Holdings, Inc. (Trading Companies & Distributors) | 842 | 110,782 | ||||||||
Hub Group, Inc. Class A (Air Freight & Logistics) | (a) | 9,119 | 724,869 | |||||||
Hyliion Holdings Corp. (Machinery) | (a) | 21,888 | 51,218 | |||||||
Insperity, Inc. (Professional Svs.) | 12,702 | 1,442,947 | ||||||||
JELD-WEN Holding, Inc. (Building Products) | (a) | 7,549 | 72,848 | |||||||
Kforce, Inc. (Professional Svs.) | 18,664 | 1,023,347 | ||||||||
Korn Ferry (Professional Svs.) | 18,261 | 924,372 | ||||||||
Manitowoc Co., Inc. / The (Machinery) | (a) | 2,982 | 27,315 | |||||||
Moog, Inc. Class A (Aerospace & Defense) | 3,564 | 312,777 | ||||||||
Radiant Logistics, Inc. (Air Freight & Logistics) | (a) | 10,231 | 52,076 | |||||||
Rush Enterprises, Inc. Class A (Trading Companies & Distributors) | 7,764 | 405,902 | ||||||||
Saia, Inc. (Road & Rail) | (a) | 4,809 | 1,008,351 | |||||||
| Common Stocks (Continued) | Shares | Value | ||||||||
INDUSTRIALS (continued) | ||||||||||
Shoals Technologies Group, Inc. Class A (Electrical Equip.) | (a) | 13,269 | $ | 327,346 | ||||||
Simpson Manufacturing Co., Inc. (Building Products) | 11,440 | 1,014,270 | ||||||||
SiteOne Landscape Supply, Inc. (Trading Companies & Distributors) | (a) | 5,575 | 654,059 | |||||||
SunPower Corp. (Electrical Equip.) | (a) | 32,263 | 581,702 | |||||||
Terex Corp. (Machinery) | 25,018 | 1,068,769 | ||||||||
Tetra Tech, Inc. (Commercial Svs. & Supplies) | 4,727 | 686,313 | ||||||||
UFP Industries, Inc. (Building Products) | 14,971 | 1,186,452 | ||||||||
Watts Water Technologies, Inc. Class A (Machinery) | 4,055 | 592,963 | ||||||||
Werner Enterprises, Inc. (Road & Rail) | 17,598 | 708,495 | ||||||||
|
| |||||||||
| 25,291,702 | ||||||||||
|
| |||||||||
INFORMATION TECHNOLOGY – 19.9% | ||||||||||
8x8, Inc. (Software) | (a) | 13,109 | 56,631 | |||||||
ACI Worldwide, Inc. (Software) | (a) | 22,258 | 511,934 | |||||||
Alarm.com Holdings, Inc. (Software) | (a) | 7,198 | 356,157 | |||||||
Altair Engineering, Inc. Class A (Software) | (a) | 14,660 | 666,590 | |||||||
Ambarella, Inc. (Semiconductors & Equip.) | (a) | 4,999 | 411,068 | |||||||
Amkor Technology, Inc. (Semiconductors & Equip.) | 9,172 | 219,945 | ||||||||
Appfolio, Inc. Class A (Software) | (a) | 2,156 | 227,199 | |||||||
Appian Corp. Class A (Software) | (a) | 6,661 | 216,882 | |||||||
Asana, Inc. Class A (Software) | (a) | 9,833 | 135,400 | |||||||
Avaya Holdings Corp. (Software) | (a) | 6,658 | 1,305 | |||||||
Axcelis Technologies, Inc. (Semiconductors & Equip.) | (a) | 3,820 | 303,155 | |||||||
BigCommerce Holdings, Inc. (IT Svs.) | (a) | 5,689 | 49,722 | |||||||
Blackline, Inc. (Software) | (a) | 6,296 | 423,532 | |||||||
Box, Inc. Class A (Software) | (a) | 30,486 | 949,029 | |||||||
Calix, Inc. (Communications Equip.) | (a) | 14,377 | 983,818 | |||||||
CSG Systems International, Inc. (IT Svs.) | 15,886 | 908,679 | ||||||||
Digital Turbine, Inc. (Software) | (a) | 13,930 | 212,293 | |||||||
DigitalOcean Holdings, Inc. (IT Svs.) | (a) | 4,907 | 124,981 | |||||||
Domo, Inc. Class B (Software) | (a) | 2,462 | 35,059 | |||||||
Envestnet, Inc. (Software) | (a) | 4,458 | 275,059 | |||||||
ePlus, Inc. (Electronic Equip., Instr. & Comp.) | (a) | 11,882 | 526,135 | |||||||
ExlService Holdings, Inc. (IT Svs.) | (a) | 2,229 | 377,659 | |||||||
Extreme Networks, Inc. (Communications Equip.) | (a) | 22,134 | 405,274 | |||||||
Flywire Corp. (IT Svs.) | (a) | 4,699 | 114,985 | |||||||
Hackett Group, Inc. / The (IT Svs.) | 6,448 | 131,346 | ||||||||
Ichor Holdings Ltd. (Semiconductors & Equip.) | (a) | 12,609 | 338,173 | |||||||
Insight Enterprises, Inc. (Electronic Equip., Instr. & Comp.) | (a) | 5,306 | 532,033 | |||||||
International Money Express, Inc. (IT Svs.) | (a) | 6,445 | 157,065 | |||||||
Kulicke & Soffa Industries, Inc. (Semiconductors & Equip.) | 7,518 | 332,747 | ||||||||
Lattice Semiconductor Corp. (Semiconductors & Equip.) | (a) | 19,115 | 1,240,181 | |||||||
Marqeta, Inc. Class A (IT Svs.) | (a) | 55,363 | 338,268 | |||||||
MaxLinear, Inc. (Semiconductors & Equip.) | (a) | 13,361 | 453,606 | |||||||
Model N, Inc. (Software) | (a) | 7,846 | 318,234 | |||||||
Momentive Global, Inc. (Software) | (a) | 15,542 | 108,794 | |||||||
NETGEAR, Inc. (Communications Equip.) | (a) | 9,191 | 166,449 | |||||||
OSI Systems, Inc. (Electronic Equip., Instr. & Comp.) | (a) | 11,328 | 900,803 | |||||||
PagerDuty, Inc. (Software) | (a) | 32,016 | 850,345 | |||||||
PC Connection, Inc. (Electronic Equip., Instr. & Comp.) | 12,511 | 586,766 | ||||||||
Perficient, Inc. (IT Svs.) | (a) | 6,636 | 463,392 | |||||||
Power Integrations, Inc. (Semiconductors & Equip.) | 17,185 | 1,232,508 | ||||||||
Progress Software Corp. (Software) | 16,369 | 825,816 | ||||||||
PROS Holdings, Inc. (Software) | (a) | 9,570 | 232,168 | |||||||
Q2 Holdings, Inc. (Software) | (a) | 10,094 | 271,226 | |||||||
Qualys, Inc. (Software) | (a) | 3,401 | 381,694 | |||||||
| 78 | (continued) |
Ohio National Fund, Inc. | ON BlackRock Advantage Small Cap Growth Portfolio (Continued) | |
| Schedule of Investments | December 31, 2022 | |
| Common Stocks (Continued) | Shares | Value | ||||||||
INFORMATION TECHNOLOGY (continued) |
| |||||||||
Rapid7, Inc. (Software) | (a) | 13,590 | $ | 461,788 | ||||||
Semtech Corp. (Semiconductors & Equip.) | (a) | 7,428 | 213,109 | |||||||
Silicon Laboratories, Inc. (Semiconductors & Equip.) | (a) | 10,650 | 1,444,885 | |||||||
Sprout Social, Inc. Class A (Software) | (a) | 10,567 | 596,613 | |||||||
SPS Commerce, Inc. (Software) | (a) | 4,067 | 522,325 | |||||||
StoneCo Ltd. Class A (IT Svs.) | (a) | 84,071 | 793,630 | |||||||
Super Micro Computer, Inc. (Tech. Hardware, Storage & Periph.) | (a) | 5,886 | 483,241 | |||||||
Synaptics, Inc. (Semiconductors & Equip.) | (a) | 5,081 | 483,508 | |||||||
Tenable Holdings, Inc. (Software) | (a) | 19,521 | 744,726 | |||||||
TTEC Holdings, Inc. (IT Svs.) | 6,055 | 267,207 | ||||||||
Ultra Clean Holdings, Inc. (Semiconductors & Equip.) | (a) | 8,538 | 283,035 | |||||||
Varonis Systems, Inc. (Software) | (a) | 30,100 | 720,594 | |||||||
Workiva, Inc. (Software) | (a) | 11,939 | 1,002,518 | |||||||
Yext, Inc. (Software) | (a) | 70,778 | 462,180 | |||||||
|
| |||||||||
| 26,833,464 | ||||||||||
|
| |||||||||
MATERIALS – 3.6% | ||||||||||
Avient Corp. (Chemicals) | 17,816 | 601,468 | ||||||||
Cabot Corp. (Chemicals) | 12,355 | 825,808 | ||||||||
Commercial Metals Co. (Metals & Mining) | 6,995 | 337,859 | ||||||||
Constellium SE (Metals & Mining) | (a) | 29,879 | 353,469 | |||||||
H.B. Fuller Co. (Chemicals) | 9,020 | 646,013 | ||||||||
Hawkins, Inc. (Chemicals) | 2,602 | 100,437 | ||||||||
Ingevity Corp. (Chemicals) | (a) | 4,255 | 299,722 | |||||||
Livent Corp. (Chemicals) | (a) | 29,382 | 583,821 | |||||||
Novagold Resources, Inc. (Metals & Mining) | (a) | 65,935 | 394,291 | |||||||
Quaker Chemical Corp. (Chemicals) | 1,818 | 303,424 | ||||||||
Schnitzer Steel Industries, Inc. Class A (Metals & Mining) | 7,765 | 237,997 | ||||||||
Stepan Co. (Chemicals) | 1,768 | 188,221 | ||||||||
Venator Materials PLC (Chemicals) | (a) | 55,792 | 30,122 | |||||||
|
| |||||||||
| 4,902,652 | ||||||||||
|
| |||||||||
REAL ESTATE – 2.0% | ||||||||||
Braemar Hotels & Resorts, Inc. (Equity REIT) | 51,306 | 210,868 | ||||||||
| Common Stocks (Continued) | Shares | Value | ||||||||
REAL ESTATE (continued) | ||||||||||
Broadstone Net Lease, Inc. (Equity REIT) | 2 | $ | 32 | |||||||
Corporate Office Properties Trust (Equity REIT) | 35,452 | 919,625 | ||||||||
Marcus & Millichap, Inc. (Real Estate Mgmt. & Development) | 10,682 | 367,995 | ||||||||
NexPoint Residential Trust, Inc. (Equity REIT) | 18,946 | 824,530 | ||||||||
Outfront Media, Inc. (Equity REIT) | 20,772 | 344,400 | ||||||||
Redfin Corp. (Real Estate Mgmt. & Development) | (a) | 4,977 | 21,102 | |||||||
|
| |||||||||
| 2,688,552 | ||||||||||
|
| |||||||||
UTILITIES – 2.3% | ||||||||||
Black Hills Corp. (Multi-Utilities) | 5,444 | 382,931 | ||||||||
Brookfield Infrastructure Corp. Class A (Gas Utilities) | 25,525 | 992,922 | ||||||||
Clearway Energy, Inc. Class A (Ind. Power & Renewable Elec.) | 5,330 | 159,474 | ||||||||
Clearway Energy, Inc. Class C (Ind. Power & Renewable Elec.) | 29,695 | 946,380 | ||||||||
Portland General Electric Co. (Electric Utilities) | 6,397 | 313,453 | ||||||||
Sunnova Energy International, Inc. (Ind. Power & Renewable Elec.) | (a) | 16,456 | 296,372 | |||||||
|
| |||||||||
| 3,091,532 | ||||||||||
|
| |||||||||
Total Common Stocks (Cost $159,156,836) |
| $ | 132,494,569 | |||||||
|
| |||||||||
| Rights – 0.0% | Quantity | Value | ||||||||
HEALTH CARE – 0.0% | ||||||||||
Flexion Therapeutics, Inc. CVR (Biotechnology) | 6,185 | $ | 3,835 | |||||||
Prevail Therapeutics, Inc. CVR (Biotechnology) | 2,231 | 1,115 | ||||||||
|
| |||||||||
Total Rights (Cost $4,950) | $ | 4,950 | ||||||||
|
| |||||||||
Total Investments – 98.1% | (b) | $ | 132,499,519 | |||||||
Other Assets in Excess of Liabilities – 1.9% | (c) | 2,501,675 | ||||||||
|
| |||||||||
Net Assets – 100.0% | $ | 135,001,194 | ||||||||
|
| |||||||||
Percentages are stated as a percent of net assets.
Abbreviations:
ADR: American Depositary Receipts
CVR: Contingent Value Right
Footnotes:
| (a) | Non-income producing security. |
| (b) | Represents cost for financial reporting purposes, which may differ from cost basis for federal income tax purposes. See also Note 7 of the Notes to Financial Statements. |
| (c) | Includes $139,200 of cash pledged as collateral for the futures contracts outstanding at December 31, 2022. See also the following Schedule of Open Futures Contracts. |
The accompanying notes are an integral part of these financial statements.
| Schedule of Open Futures Contracts | December 31, 2022 | |||
Description | Number of contracts | Expiration Date | Notional Amount | Value | Unrealized Appreciation (Depreciation) | Variation Margin Receivable (Payable) | ||||||
CME E-mini Russell 2000 Index - Long | 24 | March 17, 2023 | $2,178,499 | $2,125,080 | $(53,419) | $(7,440) |
The accompanying notes are an integral part of these financial statements.
| 79 |
| ON S&P MidCap 400® Index Portfolio (Unaudited) |
| Objective/Strategy |
The ON S&P MidCap 400® Index Portfolio seeks total return approximating that of the Standard & Poor’s MidCap 400® Index (S&P MidCap 400® Index), including reinvestment of dividends, at a risk level consistent with that of the S&P MidCap 400® Index by investing, under normal circumstances, more than 80% of its net assets in the common stocks and other securities included in the S&P MidCap 400® Index.
| Performance as of December 31, 2022 | ||||
Average Annual returns | ||||
One year | -13.40 | % | ||
Five years | 6.27 | % | ||
Ten years | 9.31 | % |
Past performance does not guarantee future results. The performance data quoted represents past performance and current returns may be lower or higher. Total return figures include change in share price and reinvestment of dividends and capital gains. The investment return and principal value will fluctuate so that an investor’s shares, when redeemed, may be worth more or less than the original cost. To obtain performance information up to the most recent month end, call toll-free 1-877-781-6392.
The Portfolio is not open to direct retail investment. Beneficial interest in the Portfolio’s shares is obtained either through an allocation to the Portfolio as an investment vehicle within variable life insurance policies or annuity contracts, or as an underlying investment by the ON Model Portfolios. Actual performance results for variable annuity and variable universal life contracts will be lower due to contract charges. Consult your contract for applicable charges.
Total expense ratio is 0.41% per the Fund’s prospectus dated April 29, 2022. Additional information pertaining to the Portfolio’s expense ratio as of December 31, 2022 can be found in the Portfolio’s Financial Highlights.
| Comments from Sub-Adviser |
Q. How did the Portfolio perform in comparison to its benchmark during the reporting period?
A. For the year ended December 31, 2022, the Portfolio returned -13.40% versus -13.06% for its benchmark, the S&P MidCap 400® Index.
Q. Were there specific market conditions, investment strategies, or techniques that materially affected the Portfolio’s benchmark-relative performance during the reporting period?
A. The Portfolio intends to track the underlying return of the S&P MidCap 400® Index. There were no material market events or changes in strategy during the year that materially impacted the Portfolio’s relative return. Sources of return variance were the Portfolio’s expenses and the cumulative impact of investing the day-to-day cash flows in the Portfolio.
Q. How did sector allocation and security selection each impact the Portfolio’s performance relative to its benchmark?
A. There was no impact from either sector allocation or stock selection that caused any significant performance variance between the Portfolio and its benchmark for the year. Consumer Discretionary, Information Technology and Real Estate were the top detractors from performance. The only sector that contributed for the period was Energy. (1)
Q. Which securities contributed the most to, and detracted the most from, the Portfolio’s benchmark-relative performance?
A. Because the Portfolio weights its holdings to be similar to those utilized by the benchmark, there were no holdings that significantly contributed to, or detracted from, the Portfolio’s benchmark-relative
performance. Benchmark constituents that contributed the most to Portfolio and benchmark returns were Steel Dynamics, Inc., First Solar, Inc., and EQT Corp. Trex Co., Inc., Synaptics, Inc., and Masimo Corp. were leading detractors. (1)
Q. How did the Portfolio’s use of derivative instruments impact performance?
A. The Portfolio uses long CME E-mini S&P MidCap 400 Index futures contracts primarily to equitize open dividend receivables, as well as to manage day-to-day cash flows, to ensure the Portfolio is fully invested. Futures contracts, in aggregate, detracted 5 basis points from the Portfolio’s absolute return for the year. (1)
| (1) | The Portfolio’s composition is subject to change. Holdings and weightings are as of December 31, 2022. |
| Change in Value of $10,000 Investment |
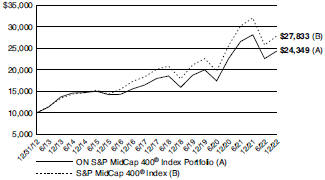
Hypothetical illustration based on past performance. Future performance will vary. The Portfolio’s returns reflect reinvested dividends. The Portfolio’s holdings may differ significantly from the securities in the index. The index is unmanaged and therefore does not reflect the cost of portfolio management and accounting.
The S&P MidCap 400® Index is a capitalization-weighted index of 400 common stocks representing all major industries in the mid-range of the U.S. stock market. The index presented includes the effects of reinvested dividends.
Past performance is no guarantee of future results. Redemption of fund shares could have tax implications unique to each shareholder.
Prior to December 16, 2016, the Portfolio was known as the Target VIP Portfolio. The strategy of the Target VIP Portfolio was to seek above average total return by investing in common stocks of companies which were identified by a model that applied separate uniquely specialized strategies.
The S&P MidCap 400® Index is a product of S&P Dow Jones Indices LLC or its affiliates (“SPDJI”), and has been licensed for use by Ohio National Investments, Inc. (“ONI”). Standard & Poor’s® and S&P® are registered trademarks of Standard & Poor’s Financial Services LLC (“S&P”); Dow Jones® is a registered trademark of Dow Jones Trademark Holdings LLC (“Dow Jones”); and these trademarks have been licensed for use by SPDJI and sublicensed for certain purposes by ONI. The S&P MidCap 400® Index Portfolio of Ohio National Fund, Inc. is not sponsored, endorsed, sold or promoted by SPDJI, Dow Jones, S&P, their respective affiliates, and none of such parties make any representation regarding the advisability of investing in such product(s) nor do they have any liability for any errors, omissions, or interruptions of the S&P MidCap 400® Index.
| 80 | (continued) |
Ohio National Fund, Inc. | ON S&P MidCap 400® Index Portfolio (Unaudited) (Continued) |
| Portfolio Composition as of December 31, 2022 (1) | ||
| % of Net Assets | ||||
Common Stocks (4) | 99.1 | |||
U.S. Treasury Obligations | 0.0 | |||
Other Net Assets | 0.9 | |||
|
| |||
| 100.0 | ||||
|
| |||
| Top 10 Portfolio Holdings as of December 31, 2022 (1) (2) (3) | ||||
| % of Net Assets | ||||||||
| 1. | Fair Isaac Corp. | 0.7 | ||||||
| 2. | First Horizon Corp. | 0.6 | ||||||
| 3. | United Therapeutics Corp. | 0.6 | ||||||
| 4. | Hubbell, Inc. | 0.6 | ||||||
| 5. | RPM International, Inc. | 0.6 | ||||||
| 6. | Carlisle Cos., Inc. | 0.6 | ||||||
| 7. | Reliance Steel & Aluminum Co. | 0.6 | ||||||
| 8. | AECOM | 0.6 | ||||||
| 9. | Toro Co. / The | 0.6 | ||||||
| 10. | Neurocrine Biosciences, Inc. | 0.5 | ||||||
| (1) | Composition of Portfolio subject to change. |
| (2) | Short-term investments have been excluded from the list of Top 10 Portfolio Holdings. |
| (3) | Top 10 Portfolio Holdings is presented at an individual security level. Total investment exposure by issuer may be higher. |
| (4) | Sectors (Common Stocks): |
| % of Net Assets | ||||
Industrials | 19.6 | |||
Financials | 15.0 | |||
Consumer Discretionary | 13.9 | |||
Information Technology | 12.0 | |||
Health Care | 10.1 | |||
Real Estate | 8.1 | |||
Materials | 6.5 | |||
Utilities | 4.0 | |||
Consumer Staples | 4.0 | |||
Energy | 3.9 | |||
Communication Services | 2.0 | |||
|
| |||
| 99.1 | ||||
|
| |||
| 81 |
Ohio National Fund, Inc. | ON S&P MidCap 400® Index Portfolio | |
| Schedule of Investments | December 31, 2022 | |
| Common Stocks – 99.1% | Shares | Value | ||||||||
COMMUNICATION SERVICES – 2.0% | ||||||||||
Cable One, Inc. (Media) | 860 | $ | 612,200 | |||||||
Frontier Communications Parent, Inc. (Diversified Telecom. Svs.) | (a) | 39,756 | 1,012,983 | |||||||
Iridium Communications, Inc. (Diversified Telecom. Svs.) | (a) | 22,405 | 1,151,617 | |||||||
John Wiley & Sons, Inc. Class A (Media) | 7,678 | 307,581 | ||||||||
New York Times Co. / The Class A (Media) | 29,330 | 952,052 | ||||||||
Nexstar Media Group, Inc. (Media) | 6,725 | 1,177,077 | ||||||||
TEGNA, Inc. (Media) | 39,794 | 843,235 | ||||||||
TripAdvisor, Inc. (Interactive Media & Svs.) | (a) | 18,683 | 335,920 | |||||||
World Wrestling Entertainment, Inc. Class A (Entertainment) | 7,723 | 529,180 | ||||||||
Ziff Davis, Inc. (Interactive Media & Svs.) | (a) | 8,416 | 665,705 | |||||||
|
| |||||||||
| 7,587,550 | ||||||||||
|
| |||||||||
CONSUMER DISCRETIONARY – 13.9% | ||||||||||
Adient PLC (Auto Components) | (a) | 16,906 | 586,469 | |||||||
AutoNation, Inc. (Specialty Retail) | (a) | 6,100 | 654,530 | |||||||
Boyd Gaming Corp. (Hotels, Restaurants & Leisure) | 14,146 | 771,381 | ||||||||
Brunswick Corp. (Leisure Products) | 12,929 | 931,922 | ||||||||
Capri Holdings Ltd. (Textiles, Apparel & Luxury Goods) | (a) | 22,969 | 1,316,583 | |||||||
Carter’s, Inc. (Textiles, Apparel & Luxury Goods) | 6,806 | 507,796 | ||||||||
Choice Hotels International, Inc. (Hotels, Restaurants & Leisure) | 4,942 | 556,667 | ||||||||
Churchill Downs, Inc. (Hotels, Restaurants & Leisure) | 5,869 | 1,240,883 | ||||||||
Columbia Sportswear Co. (Textiles, Apparel & Luxury Goods) | 6,315 | 553,068 | ||||||||
Cracker Barrel Old Country Store, Inc. (Hotels, Restaurants & Leisure) | 3,953 | 374,507 | ||||||||
Crocs, Inc. (Textiles, Apparel & Luxury Goods) | (a) | 11,011 | 1,193,923 | |||||||
Dana, Inc. (Auto Components) | 22,766 | 344,450 | ||||||||
Deckers Outdoor Corp. (Textiles, Apparel & Luxury Goods) | (a) | 4,720 | 1,884,035 | |||||||
Dick’s Sporting Goods, Inc. (Specialty Retail) | 9,915 | 1,192,675 | ||||||||
Five Below, Inc. (Specialty Retail) | (a) | 9,898 | 1,750,659 | |||||||
Foot Locker, Inc. (Specialty Retail) | 14,142 | 534,426 | ||||||||
Fox Factory Holding Corp. (Auto Components) | (a) | 7,537 | 687,601 | |||||||
GameStop Corp. Class A (Specialty Retail) | (a) | 45,074 | 832,066 | |||||||
Gap, Inc. / The (Specialty Retail) | 37,613 | 424,275 | ||||||||
Gentex Corp. (Auto Components) | 41,831 | 1,140,731 | ||||||||
Goodyear Tire & Rubber Co. / The (Auto Components) | (a) | 50,438 | 511,946 | |||||||
Graham Holdings Co. Class B (Diversified Consumer Svs.) | 683 | 412,675 | ||||||||
Grand Canyon Education, Inc. (Diversified Consumer Svs.) | (a) | 5,471 | 578,066 | |||||||
H&R Block, Inc. (Diversified Consumer Svs.) | 27,727 | 1,012,313 | ||||||||
Hanesbrands, Inc. (Textiles, Apparel & Luxury Goods) | 62,248 | 395,897 | ||||||||
Harley-Davidson, Inc. (Automobiles) | 23,722 | 986,835 | ||||||||
Helen of Troy Ltd. (Household Durables) | (a) | 4,277 | 474,362 | |||||||
KB Home (Household Durables) | 14,811 | 471,730 | ||||||||
Kohl’s Corp. (Multiline Retail) | 20,795 | 525,074 | ||||||||
Lear Corp. (Auto Components) | 10,543 | 1,307,543 | ||||||||
Leggett & Platt, Inc. (Household Durables) | 23,640 | 761,917 | ||||||||
Light & Wonder, Inc. (Hotels, Restaurants & Leisure) | (a) | 16,720 | 979,792 | |||||||
Lithia Motors, Inc. (Specialty Retail) | 4,879 | 998,926 | ||||||||
Macy’s, Inc. (Multiline Retail) | 48,317 | 997,746 | ||||||||
Marriott Vacations Worldwide Corp. (Hotels, Restaurants & Leisure) | 6,834 | 919,788 | ||||||||
Mattel, Inc. (Leisure Products) | (a) | 63,199 | 1,127,470 | |||||||
Murphy U.S.A., Inc. (Specialty Retail) | 3,707 | 1,036,255 | ||||||||
| Common Stocks (Continued) | Shares | Value | ||||||||||
CONSUMER DISCRETIONARY (continued) |
| |||||||||||
Nordstrom, Inc. (Multiline Retail) | 19,924 | $ | 321,573 | |||||||||
Ollie’s Bargain Outlet Holdings, Inc. (Multiline Retail) | (a | ) | 10,378 | 486,106 | ||||||||
Papa John’s International, Inc. (Hotels, Restaurants & Leisure) | 5,733 | 471,883 | ||||||||||
Penn Entertainment, Inc. (Hotels, Restaurants & Leisure) | (a | ) | 27,661 | 821,532 | ||||||||
Polaris, Inc. (Leisure Products) | 9,715 | 981,215 | ||||||||||
PVH Corp. (Textiles, Apparel & Luxury Goods) | 11,631 | 821,032 | ||||||||||
RH (Specialty Retail) | (a | ) | 3,427 | 915,660 | ||||||||
Service Corp. International (Diversified Consumer Svs.) | 27,431 | 1,896,579 | ||||||||||
Skechers U.S.A., Inc. Class A (Textiles, Apparel & Luxury Goods) | (a | ) | 23,908 | 1,002,941 | ||||||||
Taylor Morrison Home Corp. (Household Durables) | (a | ) | 19,320 | 586,362 | ||||||||
Tempur Sealy International, Inc. (Household Durables) | 30,522 | 1,047,820 | ||||||||||
Texas Roadhouse, Inc. (Hotels, Restaurants & Leisure) | 11,933 | 1,085,306 | ||||||||||
Thor Industries, Inc. (Automobiles) | 9,573 | 722,666 | ||||||||||
Toll Brothers, Inc. (Household Durables) | 18,794 | 938,196 | ||||||||||
TopBuild Corp. (Household Durables) | (a | ) | 5,701 | 892,150 | ||||||||
Topgolf Callaway Brands Corp. (Leisure Products) | (a | ) | 24,721 | 488,240 | ||||||||
Travel + Leisure Co. (Hotels, Restaurants & Leisure) | 14,493 | 527,545 | ||||||||||
Under Armour, Inc. Class A (Textiles, Apparel & Luxury Goods) | (a | ) | 33,446 | 339,811 | ||||||||
Under Armour, Inc. Class C (Textiles, Apparel & Luxury Goods) | (a | ) | 35,381 | 315,599 | ||||||||
Victoria’s Secret & Co. (Specialty Retail) | (a | ) | 14,487 | 518,345 | ||||||||
Visteon Corp. (Auto Components) | (a | ) | 5,019 | 656,636 | ||||||||
Wendy’s Co. / The (Hotels, Restaurants & Leisure) | 30,394 | 687,816 | ||||||||||
Williams-Sonoma, Inc. (Specialty Retail) | 11,896 | 1,367,088 | ||||||||||
Wingstop, Inc. (Hotels, Restaurants & Leisure) | 5,335 | 734,203 | ||||||||||
Wyndham Hotels & Resorts, Inc. (Hotels, Restaurants & Leisure) | 15,751 | 1,123,204 | ||||||||||
YETI Holdings, Inc. (Leisure Products) | (a | ) | 15,379 | 635,307 | ||||||||
|
| |||||||||||
| 51,361,797 | ||||||||||||
|
| |||||||||||
CONSUMER STAPLES – 4.0% | ||||||||||||
BellRing Brands, Inc. (Personal Products) | (a | ) | 24,153 | 619,283 | ||||||||
BJ’s Wholesale Club Holdings, Inc. (Food & Staples Retailing) | (a | ) | 24,086 | 1,593,530 | ||||||||
Boston Beer Co., Inc. / The Class A (Beverages) | (a | ) | 1,686 | 555,571 | ||||||||
Casey’s General Stores, Inc. (Food & Staples Retailing) | 6,643 | 1,490,357 | ||||||||||
Celsius Holdings, Inc. (Beverages) | (a | ) | 7,204 | 749,504 | ||||||||
Coca-Cola Consolidated, Inc. (Beverages) | 821 | 420,647 | ||||||||||
Coty, Inc. Class A (Personal Products) | (a | ) | 65,173 | 557,881 | ||||||||
Darling Ingredients, Inc. (Food Products) | (a | ) | 28,580 | 1,788,822 | ||||||||
Energizer Holdings, Inc. (Household Products) | 11,817 | 396,460 | ||||||||||
Flowers Foods, Inc. (Food Products) | 34,289 | 985,466 | ||||||||||
Grocery Outlet Holding Corp. (Food & Staples Retailing) | (a | ) | 15,785 | 460,764 | ||||||||
Ingredion, Inc. (Food Products) | 11,687 | 1,144,508 | ||||||||||
Lancaster Colony Corp. (Food Products) | 3,537 | 697,850 | ||||||||||
Performance Food Group Co. (Food & Staples Retailing) | (a | ) | 27,759 | 1,620,848 | ||||||||
Pilgrim’s Pride Corp. (Food Products) | (a | ) | 8,051 | 191,050 | ||||||||
Post Holdings, Inc. (Food Products) | (a | ) | 9,695 | 875,071 | ||||||||
Sprouts Farmers Market, Inc. (Food & Staples Retailing) | (a | ) | 18,875 | 610,984 | ||||||||
|
| |||||||||||
| 14,758,596 | ||||||||||||
|
| |||||||||||
| 82 | (continued) |
Ohio National Fund, Inc. | ON S&P MidCap 400® Index Portfolio (Continued) | |
| Schedule of Investments | December 31, 2022 | |
| Common Stocks (Continued) | Shares | Value | ||||||||
ENERGY – 3.9% | ||||||||||
Antero Midstream Corp. (Oil, Gas & Consumable Fuels) | 59,727 | $ | 644,454 | |||||||
Antero Resources Corp. (Oil, Gas & Consumable Fuels) | (a) | 49,243 | 1,526,041 | |||||||
ChampionX Corp. (Energy Equip. & Svs.) | 35,551 | 1,030,623 | ||||||||
CNX Resources Corp. (Oil, Gas & Consumable Fuels) | (a) | 32,184 | 541,979 | |||||||
DT Midstream, Inc. (Oil, Gas & Consumable Fuels) | 17,254 | 953,456 | ||||||||
Equitrans Midstream Corp. (Oil, Gas & Consumable Fuels) | 77,166 | 517,012 | ||||||||
HF Sinclair Corp. (Oil, Gas & Consumable Fuels) | 23,985 | 1,244,582 | ||||||||
Matador Resources Co. (Oil, Gas & Consumable Fuels) | 20,018 | 1,145,830 | ||||||||
Murphy Oil Corp. (Oil, Gas & Consumable Fuels) | 26,060 | 1,120,841 | ||||||||
NOV, Inc. (Energy Equip. & Svs.) | 70,049 | 1,463,324 | ||||||||
PBF Energy, Inc. Class A (Oil, Gas & Consumable Fuels) | 20,384 | 831,259 | ||||||||
PDC Energy, Inc. (Oil, Gas & Consumable Fuels) | 16,433 | 1,043,167 | ||||||||
Range Resources Corp. (Oil, Gas & Consumable Fuels) | 43,092 | 1,078,162 | ||||||||
Southwestern Energy Co. (Oil, Gas & Consumable Fuels) | (a) | 196,803 | 1,151,297 | |||||||
|
| |||||||||
| 14,292,027 | ||||||||||
|
| |||||||||
FINANCIALS – 15.0% | ||||||||||
Affiliated Managers Group, Inc. (Capital Markets) | 6,717 | 1,064,174 | ||||||||
American Financial Group, Inc. (Insurance) | 12,452 | 1,709,411 | ||||||||
Annaly Capital Management, Inc. (Mortgage REIT) | 83,439 | 1,758,894 | ||||||||
Associated Banc-Corp. (Banks) | 26,819 | 619,251 | ||||||||
Bank of Hawaii Corp. (Banks) | 7,123 | 552,460 | ||||||||
Bank OZK (Banks) | 19,712 | 789,663 | ||||||||
Brighthouse Financial, Inc. (Insurance) | (a) | 12,329 | 632,108 | |||||||
Cadence Bank (Banks) | 32,536 | 802,338 | ||||||||
Cathay General Bancorp (Banks) | 13,273 | 541,406 | ||||||||
CNO Financial Group, Inc. (Insurance) | 20,406 | 466,277 | ||||||||
Commerce Bancshares, Inc. (Banks) | 20,342 | 1,384,680 | ||||||||
Cullen / Frost Bankers, Inc. (Banks) | 11,467 | 1,533,138 | ||||||||
East West Bancorp, Inc. (Banks) | 25,134 | 1,656,331 | ||||||||
Essent Group Ltd. (Thrifts & Mortgage Finance) | 19,209 | 746,846 | ||||||||
Evercore, Inc. Class A (Capital Markets) | 6,383 | 696,258 | ||||||||
Federated Hermes, Inc. (Capital Markets) | 15,078 | 547,482 | ||||||||
First American Financial Corp. (Insurance) | 18,463 | 966,353 | ||||||||
First Financial Bankshares, Inc. (Banks) | 23,147 | 796,257 | ||||||||
First Horizon Corp. (Banks) | 95,703 | 2,344,723 | ||||||||
FirstCash Holdings, Inc. (Consumer Finance) | 6,692 | 581,602 | ||||||||
FNB Corp. (Banks) | 62,573 | 816,578 | ||||||||
Fulton Financial Corp. (Banks) | 29,882 | 502,914 | ||||||||
Glacier Bancorp, Inc. (Banks) | 19,753 | 976,193 | ||||||||
Hancock Whitney Corp. (Banks) | 15,284 | 739,593 | ||||||||
Hanover Insurance Group, Inc. / The (Insurance) | 6,343 | 857,130 | ||||||||
Home BancShares, Inc. (Banks) | 33,804 | 770,393 | ||||||||
Interactive Brokers Group, Inc. Class A (Capital Markets) | 18,344 | 1,327,188 | ||||||||
International Bancshares Corp. (Banks) | 9,433 | 431,654 | ||||||||
Janus Henderson Group PLC (Capital Markets) | 23,628 | 555,731 | ||||||||
Jefferies Financial Group, Inc. (Capital Markets) | 32,665 | 1,119,756 | ||||||||
Kemper Corp. (Insurance) | 11,392 | 560,486 | ||||||||
Kinsale Capital Group, Inc. (Insurance) | 3,843 | 1,005,021 | ||||||||
MGIC Investment Corp. (Thrifts & Mortgage Finance) | 52,976 | 688,688 | ||||||||
Navient Corp. (Consumer Finance) | 18,869 | 310,395 | ||||||||
| Common Stocks (Continued) | Shares | Value | ||||||||
FINANCIALS (continued) | ||||||||||
New York Community Bancorp, Inc. (Thrifts & Mortgage Finance) | 121,321 | $ | 1,043,361 | |||||||
Old National Bancorp (Banks) | 52,238 | 939,239 | ||||||||
Old Republic International Corp. (Insurance) | 50,475 | 1,218,971 | ||||||||
PacWest Bancorp (Banks) | 21,006 | 482,088 | ||||||||
Pinnacle Financial Partners, Inc. (Banks) | 13,634 | 1,000,736 | ||||||||
Primerica, Inc. (Insurance) | 6,580 | 933,176 | ||||||||
Prosperity Bancshares, Inc. (Banks) | 16,286 | 1,183,666 | ||||||||
Reinsurance Group of America, Inc. (Insurance) | 11,920 | 1,693,713 | ||||||||
RenaissanceRe Holdings Ltd. (Insurance) | 7,793 | 1,435,704 | ||||||||
RLI Corp. (Insurance) | 7,203 | 945,538 | ||||||||
SEI Investments Co. (Capital Markets) | 18,293 | 1,066,482 | ||||||||
Selective Insurance Group, Inc. (Insurance) | 10,750 | 952,557 | ||||||||
SLM Corp. (Consumer Finance) | 44,559 | 739,679 | ||||||||
Stifel Financial Corp. (Capital Markets) | 18,950 | 1,106,111 | ||||||||
Synovus Financial Corp. (Banks) | 25,940 | 974,047 | ||||||||
Texas Capital Bancshares, Inc. (Banks) | (a) | 8,898 | 536,638 | |||||||
UMB Financial Corp. (Banks) | 7,754 | 647,614 | ||||||||
Umpqua Holdings Corp. (Banks) | 38,712 | 691,009 | ||||||||
United Bankshares, Inc. (Banks) | 24,018 | 972,489 | ||||||||
Unum Group (Insurance) | 33,324 | 1,367,284 | ||||||||
Valley National Bancorp (Banks) | 74,952 | 847,707 | ||||||||
Voya Financial, Inc. (Diversified Financial Svs.) | 17,316 | 1,064,761 | ||||||||
Washington Federal, Inc. (Banks) | 11,654 | 390,992 | ||||||||
Webster Financial Corp. (Banks) | 31,031 | 1,469,007 | ||||||||
Wintrust Financial Corp. (Banks) | 10,837 | 915,943 | ||||||||
|
| |||||||||
| 55,469,884 | ||||||||||
|
| |||||||||
HEALTH CARE – 10.1% | ||||||||||
Acadia Healthcare Co., Inc. (Health Care Providers & Svs.) | (a) | 16,224 | 1,335,560 | |||||||
Amedisys, Inc. (Health Care Providers & Svs.) | (a) | 5,793 | 483,947 | |||||||
Arrowhead Pharmaceuticals, Inc. (Biotechnology) | (a) | 18,873 | 765,489 | |||||||
Azenta, Inc. (Life Sciences Tools & Svs.) | 13,377 | 778,809 | ||||||||
Bruker Corp. (Life Sciences Tools & Svs.) | 17,855 | 1,220,389 | ||||||||
Chemed Corp. (Health Care Providers & Svs.) | 2,652 | 1,353,660 | ||||||||
Encompass Health Corp. (Health Care Providers & Svs.) | 17,795 | 1,064,319 | ||||||||
Enovis Corp. (Health Care Equip. & Supplies) | (a) | 8,497 | 454,759 | |||||||
Envista Holdings Corp. (Health Care Equip. & Supplies) | (a) | 29,076 | 978,989 | |||||||
Exelixis, Inc. (Biotechnology) | (a) | 57,521 | 922,637 | |||||||
Globus Medical, Inc. Class A (Health Care Equip. & Supplies) | (a) | 13,805 | 1,025,297 | |||||||
Haemonetics Corp. (Health Care Equip. & Supplies) | (a) | 9,026 | 709,895 | |||||||
Halozyme Therapeutics, Inc. (Biotechnology) | (a) | 24,113 | 1,372,030 | |||||||
HealthEquity, Inc. (Health Care Providers & Svs.) | (a) | 15,075 | 929,223 | |||||||
ICU Medical, Inc. (Health Care Equip. & Supplies) | (a) | 3,592 | 565,668 | |||||||
Inari Medical, Inc. (Health Care Equip. & Supplies) | (a) | 8,610 | 547,252 | |||||||
Integra LifeSciences Holdings Corp. (Health Care Equip. & Supplies) | (a) | 12,958 | 726,555 | |||||||
Jazz Pharmaceuticals PLC (Pharmaceuticals) | (a) | 11,229 | 1,788,892 | |||||||
Lantheus Holdings, Inc. (Health Care Equip. & Supplies) | (a) | 12,275 | 625,534 | |||||||
LHC Group, Inc. (Health Care Providers & Svs.) | (a) | 5,534 | 894,792 | |||||||
LivaNova PLC (Health Care Equip. & Supplies) | (a) | 9,544 | 530,074 | |||||||
Masimo Corp. (Health Care Equip. & Supplies) | (a) | 8,624 | 1,275,921 | |||||||
Medpace Holdings, Inc. (Life Sciences Tools & Svs.) | (a) | 4,492 | 954,146 | |||||||
Neogen Corp. (Health Care Equip. & Supplies) | (a) | 38,536 | 586,903 | |||||||
Neurocrine Biosciences, Inc. (Biotechnology) | (a) | 17,144 | 2,047,679 | |||||||
Omnicell, Inc. (Health Care Equip. & Supplies) | (a) | 7,961 | 401,394 | |||||||
Option Care Health, Inc. (Health Care Providers & Svs.) | (a) | 27,571 | 829,611 | |||||||
| 83 | (continued) |
Ohio National Fund, Inc. | ON S&P MidCap 400® Index Portfolio (Continued) | |
| Schedule of Investments | December 31, 2022 | |
| Common Stocks (Continued) | Shares | Value | ||||||||
HEALTH CARE (continued) | ||||||||||
Patterson Cos., Inc. (Health Care Providers & Svs.) | 15,448 | $ | 433,007 | |||||||
Penumbra, Inc. (Health Care Equip. & Supplies) | (a) | 6,773 | 1,506,722 | |||||||
Perrigo Co. PLC (Pharmaceuticals) | 24,010 | 818,501 | ||||||||
Progyny, Inc. (Health Care Providers & Svs.) | (a) | 13,414 | 417,846 | |||||||
QuidelOrtho Corp. (Health Care Equip. & Supplies) | (a) | 9,540 | 817,292 | |||||||
R1 RCM, Inc. (Health Care Providers & Svs.) | (a) | 24,561 | 268,943 | |||||||
Repligen Corp. (Life Sciences Tools & Svs.) | (a) | 9,208 | 1,559,007 | |||||||
Shockwave Medical, Inc. (Health Care Equip. & Supplies) | (a) | 6,445 | 1,325,156 | |||||||
Sotera Health Co. (Life Sciences Tools & Svs.) | (a) | 17,551 | 146,200 | |||||||
STAAR Surgical Co. (Health Care Equip. & Supplies) | (a) | 8,596 | 417,250 | |||||||
Syneos Health, Inc. (Life Sciences Tools & Svs.) | (a) | 18,349 | 673,041 | |||||||
Tandem Diabetes Care, Inc. (Health Care Equip. & Supplies) | (a) | 11,465 | 515,352 | |||||||
Tenet Healthcare Corp. (Health Care Providers & Svs.) | (a) | 19,280 | 940,671 | |||||||
United Therapeutics Corp. (Biotechnology) | (a) | 8,128 | 2,260,316 | |||||||
|
| |||||||||
| 37,268,728 | ||||||||||
|
| |||||||||
INDUSTRIALS – 19.6% | ||||||||||
Acuity Brands, Inc. (Electrical Equip.) | 5,734 | 949,608 | ||||||||
AECOM (Construction & Engineering) | 24,902 | 2,114,927 | ||||||||
AGCO Corp. (Machinery) | 11,041 | 1,531,276 | ||||||||
ASGN, Inc. (Professional Svs.) | (a) | 8,898 | 725,009 | |||||||
Avis Budget Group, Inc. (Road & Rail) | (a) | 4,437 | 727,357 | |||||||
Axon Enterprise, Inc. (Aerospace & Defense) | (a) | 12,056 | 2,000,452 | |||||||
Brink’s Co. / The (Commercial Svs. & Supplies) | 8,283 | 444,880 | ||||||||
Builders FirstSource, Inc. (Building Products) | (a) | 26,246 | 1,702,840 | |||||||
CACI International, Inc. Class A (Professional Svs.) | (a) | 4,190 | 1,259,472 | |||||||
Carlisle Cos., Inc. (Building Products) | 9,223 | 2,173,400 | ||||||||
Chart Industries, Inc. (Machinery) | (a) | 7,453 | 858,809 | |||||||
Clean Harbors, Inc. (Commercial Svs. & Supplies) | (a) | 8,968 | 1,023,428 | |||||||
Crane Holdings Co. (Machinery) | 8,510 | 854,829 | ||||||||
Curtiss-Wright Corp. (Aerospace & Defense) | 6,832 | 1,140,876 | ||||||||
Donaldson Co., Inc. (Machinery) | 21,838 | 1,285,603 | ||||||||
Dycom Industries, Inc. (Construction & Engineering) | (a) | 5,265 | 492,804 | |||||||
EMCOR Group, Inc. (Construction & Engineering) | 8,498 | 1,258,639 | ||||||||
EnerSys (Electrical Equip.) | 7,280 | 537,555 | ||||||||
Esab Corp. (Machinery) | 9,213 | 432,274 | ||||||||
Flowserve Corp. (Machinery) | 23,307 | 715,059 | ||||||||
Fluor Corp. (Construction & Engineering) | (a) | 25,337 | 878,180 | |||||||
Fortune Brands Innovations, Inc. (Building Products) | 22,870 | 1,306,106 | ||||||||
FTI Consulting, Inc. (Professional Svs.) | (a) | 6,139 | 974,873 | |||||||
GATX Corp. (Trading Companies & Distributors) | 6,280 | 667,815 | ||||||||
Graco, Inc. (Machinery) | 30,052 | 2,021,298 | ||||||||
GXO Logistics, Inc. (Air Freight & Logistics) | (a) | 21,156 | 903,150 | |||||||
Hexcel Corp. (Aerospace & Defense) | 15,009 | 883,280 | ||||||||
Hubbell, Inc. (Electrical Equip.) | 9,577 | 2,247,530 | ||||||||
IAA, Inc. (Commercial Svs. & Supplies) | (a) | 23,853 | 954,120 | |||||||
Insperity, Inc. (Professional Svs.) | 6,358 | 722,269 | ||||||||
ITT, Inc. (Machinery) | 14,746 | 1,195,901 | ||||||||
JetBlue Airways Corp. (Airlines) | (a) | 57,761 | 374,291 | |||||||
KBR, Inc. (Professional Svs.) | 24,466 | 1,291,805 | ||||||||
Kennametal, Inc. (Machinery) | 14,418 | 346,897 | ||||||||
Kirby Corp. (Marine) | (a) | 10,683 | 687,451 | |||||||
Knight-Swift Transportation Holdings, Inc. (Road & Rail) | 28,660 | 1,502,071 | ||||||||
Landstar System, Inc. (Road & Rail) | 6,407 | 1,043,700 | ||||||||
Lennox International, Inc. (Building Products) | 5,751 | 1,375,812 | ||||||||
| Common Stocks (Continued) | Shares | Value | ||||||||
INDUSTRIALS (continued) | ||||||||||
Lincoln Electric Holdings, Inc. (Machinery) | 10,296 | $ | 1,487,669 | |||||||
ManpowerGroup, Inc. (Professional Svs.) | 9,015 | 750,138 | ||||||||
MasTec, Inc. (Construction & Engineering) | (a) | 10,514 | 897,160 | |||||||
MDU Resources Group, Inc. (Construction & Engineering) | 36,262 | 1,100,189 | ||||||||
Mercury Systems, Inc. (Aerospace & Defense) | (a) | 10,340 | 462,612 | |||||||
Middleby Corp. / The (Machinery) | (a) | 9,609 | 1,286,645 | |||||||
MSA Safety, Inc. (Commercial Svs. & Supplies) | 6,570 | 947,328 | ||||||||
MSC Industrial Direct Co., Inc. Class A (Trading Companies & Distributors) | 8,421 | 687,996 | ||||||||
nVent Electric PLC (Electrical Equip.) | 29,703 | 1,142,674 | ||||||||
Oshkosh Corp. (Machinery) | 11,661 | 1,028,384 | ||||||||
Owens Corning (Building Products) | 16,667 | 1,421,695 | ||||||||
Regal Rexnord Corp. (Electrical Equip.) | 11,804 | 1,416,244 | ||||||||
RXO, Inc. (Road & Rail) | (a) | 20,539 | 353,271 | |||||||
Ryder System, Inc. (Road & Rail) | 8,962 | 748,954 | ||||||||
Saia, Inc. (Road & Rail) | (a) | 4,719 | 989,480 | |||||||
Science Applications International Corp. (Professional Svs.) | 9,831 | 1,090,553 | ||||||||
Simpson Manufacturing Co., Inc. (Building Products) | 7,597 | 673,550 | ||||||||
Stericycle, Inc. (Commercial Svs. & Supplies) | (a) | 16,439 | 820,142 | |||||||
SunPower Corp. (Electrical Equip.) | (a) | 15,227 | 274,543 | |||||||
Sunrun, Inc. (Electrical Equip.) | (a) | 38,002 | 912,808 | |||||||
Terex Corp. (Machinery) | 12,018 | 513,409 | ||||||||
Tetra Tech, Inc. (Commercial Svs. & Supplies) | 9,451 | 1,372,191 | ||||||||
Timken Co. / The (Machinery) | 11,805 | 834,259 | ||||||||
Toro Co. / The (Machinery) | 18,582 | 2,103,482 | ||||||||
Trex Co., Inc. (Building Products) | (a) | 19,545 | 827,340 | |||||||
Univar Solutions, Inc. (Trading Companies & Distributors) | (a) | 29,098 | 925,316 | |||||||
Valmont Industries, Inc. (Construction & Engineering) | 3,804 | 1,257,869 | ||||||||
Vicor Corp. (Electrical Equip.) | (a) | 3,986 | 214,247 | |||||||
Watsco, Inc. (Trading Companies & Distributors) | 5,931 | 1,479,191 | ||||||||
Watts Water Technologies, Inc. Class A (Machinery) | 4,865 | 711,409 | ||||||||
Werner Enterprises, Inc. (Road & Rail) | 10,454 | 420,878 | ||||||||
Woodward, Inc. (Aerospace & Defense) | 10,729 | 1,036,529 | ||||||||
XPO, Inc. (Road & Rail) | (a) | 20,538 | 683,710 | |||||||
|
| |||||||||
| 72,477,511 | ||||||||||
|
| |||||||||
INFORMATION TECHNOLOGY – 12.0% |
| |||||||||
ACI Worldwide, Inc. (Software) | (a) | 20,035 | 460,805 | |||||||
Allegro MicroSystems, Inc. (Semiconductors & Equip.) | (a) | 11,599 | 348,202 | |||||||
Amkor Technology, Inc. (Semiconductors & Equip.) | 17,914 | 429,578 | ||||||||
Arrow Electronics, Inc. (Electronic Equip., Instr. & Comp.) | (a) | 10,969 | 1,147,028 | |||||||
Aspen Technology, Inc. (Software) | (a) | 5,179 | 1,063,767 | |||||||
Avnet, Inc. (Electronic Equip., Instr. & Comp.) | 16,322 | 678,669 | ||||||||
Belden, Inc. (Electronic Equip., Instr. & Comp.) | 7,634 | 548,885 | ||||||||
Blackbaud, Inc. (Software) | (a) | 7,952 | 468,055 | |||||||
Calix, Inc. (Communications Equip.) | (a) | 10,152 | 694,701 | |||||||
Ciena Corp. (Communications Equip.) | (a) | 26,416 | 1,346,688 | |||||||
Cirrus Logic, Inc. (Semiconductors & Equip.) | (a) | 9,820 | 731,394 | |||||||
Cognex Corp. (Electronic Equip., Instr. & Comp.) | 30,837 | 1,452,731 | ||||||||
Coherent Corp. (Electronic Equip., Instr. & Comp.) | (a) | 24,731 | 868,058 | |||||||
CommVault Systems, Inc. (Software) | (a) | 7,942 | 499,075 | |||||||
Concentrix Corp. (IT Svs.) | 7,565 | 1,007,355 | ||||||||
Dynatrace, Inc. (Software) | (a) | 35,929 | 1,376,081 | |||||||
Envestnet, Inc. (Software) | (a) | 9,864 | 608,609 | |||||||
Euronet Worldwide, Inc. (IT Svs.) | (a) | 8,401 | 792,886 | |||||||
ExlService Holdings, Inc. (IT Svs.) | (a) | 5,896 | 998,959 | |||||||
Fair Isaac Corp. (Software) | (a) | 4,454 | 2,666,075 | |||||||
| 84 | (continued) |
Ohio National Fund, Inc. | ON S&P MidCap 400® Index Portfolio (Continued) | |
| Schedule of Investments | December 31, 2022 | |
| Common Stocks (Continued) | Shares | Value | ||||||||
INFORMATION TECHNOLOGY (continued) |
| |||||||||
Genpact Ltd. (IT Svs.) | 30,063 | $ | 1,392,518 | |||||||
IPG Photonics Corp. (Electronic Equip., Instr. & Comp.) | (a) | 5,733 | 542,743 | |||||||
Jabil, Inc. (Electronic Equip., Instr. & Comp.) | 24,010 | 1,637,482 | ||||||||
Kyndryl Holdings, Inc. (IT Svs.) | (a) | 36,400 | 404,768 | |||||||
Lattice Semiconductor Corp. (Semiconductors & Equip.) | (a) | 24,441 | 1,585,732 | |||||||
Littelfuse, Inc. (Electronic Equip., Instr. & Comp.) | 4,415 | 972,183 | ||||||||
Lumentum Holdings, Inc. | ||||||||||
(Communications Equip.) | (a) | 12,161 | 634,439 | |||||||
MACOM Technology Solutions Holdings, Inc. (Semiconductors & Equip.) | (a) | 9,113 | 573,937 | |||||||
Manhattan Associates, Inc. (Software) | (a) | 11,137 | 1,352,032 | |||||||
Maximus, Inc. (IT Svs.) | 10,797 | 791,744 | ||||||||
MKS Instruments, Inc. (Semiconductors & Equip.) | 10,200 | 864,246 | ||||||||
National Instruments Corp. (Electronic Equip., Instr. & Comp.) | 23,284 | 859,180 | ||||||||
NCR Corp. (Software) | (a) | 24,499 | 573,522 | |||||||
Novanta, Inc. (Electronic Equip., Instr. & Comp.) | (a) | 6,364 | 864,677 | |||||||
Paylocity Holding Corp. (Software) | (a) | 7,346 | 1,427,034 | |||||||
Power Integrations, Inc. (Semiconductors & Equip.) | 10,201 | 731,616 | ||||||||
Qualys, Inc. (Software) | (a) | 6,164 | 691,786 | |||||||
Silicon Laboratories, Inc. (Semiconductors & Equip.) | (a) | 5,935 | 805,201 | |||||||
SiTime Corp. (Semiconductors & Equip.) | (a) | 2,867 | 291,344 | |||||||
Super Micro Computer, Inc. (Tech. Hardware, Storage & Periph.) | (a) | 8,210 | 674,041 | |||||||
Synaptics, Inc. (Semiconductors & Equip.) | (a) | 7,109 | 676,492 | |||||||
TD SYNNEX Corp. (Electronic Equip., Instr. & Comp.) | 7,500 | 710,325 | ||||||||
Teradata Corp. (Software) | (a) | 18,150 | 610,929 | |||||||
Universal Display Corp. (Semiconductors & Equip.) | 7,750 | 837,310 | ||||||||
Viasat, Inc. (Communications Equip.) | (a) | 13,478 | 426,579 | |||||||
Vishay Intertechnology, Inc. (Electronic Equip., Instr. & Comp.) | 23,052 | 497,232 | ||||||||
Vontier Corp. (Electronic Equip., Instr. & Comp.) | 28,174 | 544,603 | ||||||||
Western Union Co. / The (IT Svs.) | 68,860 | 948,202 | ||||||||
WEX, Inc. (IT Svs.) | (a) | 7,774 | 1,272,215 | |||||||
Wolfspeed, Inc. (Semiconductors & Equip.) | (a) | 22,151 | 1,529,305 | |||||||
Xerox Holdings Corp. (Tech. Hardware, Storage & Periph.) | 20,007 | 292,102 | ||||||||
|
| |||||||||
| 44,203,120 | ||||||||||
|
| |||||||||
MATERIALS – 6.5% | ||||||||||
Alcoa Corp. (Metals & Mining) | 31,552 | 1,434,669 | ||||||||
AptarGroup, Inc. (Containers & Packaging) | 11,641 | 1,280,277 | ||||||||
Ashland, Inc. (Chemicals) | 8,882 | 955,082 | ||||||||
Avient Corp. (Chemicals) | 15,242 | 514,570 | ||||||||
Cabot Corp. (Chemicals) | 10,030 | 670,405 | ||||||||
Chemours Co. / The (Chemicals) | 26,912 | 824,045 | ||||||||
Cleveland-Cliffs, Inc. (Metals & Mining) | (a) | 91,892 | 1,480,380 | |||||||
Commercial Metals Co. (Metals & Mining) | 20,927 | 1,010,774 | ||||||||
Eagle Materials, Inc. (Construction Materials) | 6,570 | 872,825 | ||||||||
Greif, Inc. Class A (Containers & Packaging) | 4,566 | 306,196 | ||||||||
Ingevity Corp. (Chemicals) | (a) | 6,264 | 441,236 | |||||||
Louisiana-Pacific Corp. (Paper & Forest Products) | 12,785 | 756,872 | ||||||||
MP Materials Corp. (Metals & Mining) | (a) | 16,462 | 399,697 | |||||||
NewMarket Corp. (Chemicals) | 1,215 | 377,999 | ||||||||
Olin Corp. (Chemicals) | 22,714 | 1,202,479 | ||||||||
Reliance Steel & Aluminum Co. (Metals & Mining) | 10,467 | 2,118,940 | ||||||||
| Common Stocks (Continued) | Shares | Value | ||||||||
MATERIALS (continued) | ||||||||||
Royal Gold, Inc. (Metals & Mining) | 11,707 | $ | 1,319,613 | |||||||
RPM International, Inc. (Chemicals) | 23,022 | 2,243,494 | ||||||||
Scotts Miracle-Gro Co. / The (Chemicals) | 7,218 | 350,723 | ||||||||
Sensient Technologies Corp. (Chemicals) | 7,495 | 546,535 | ||||||||
Silgan Holdings, Inc. (Containers & Packaging) | 14,920 | 773,453 | ||||||||
Sonoco Products Co. (Containers & Packaging) | 17,389 | 1,055,686 | ||||||||
United States Steel Corp. (Metals & Mining) | 41,779 | 1,046,564 | ||||||||
Valvoline, Inc. (Chemicals) | 31,567 | 1,030,663 | ||||||||
Westlake Corp. (Chemicals) | 6,147 | 630,313 | ||||||||
Worthington Industries, Inc. (Metals & Mining) | 5,407 | 268,782 | ||||||||
|
| |||||||||
| 23,912,272 | ||||||||||
|
| |||||||||
REAL ESTATE – 8.1% | ||||||||||
Apartment Income REIT Corp. (Equity REIT) | 26,739 | 917,415 | ||||||||
Brixmor Property Group, Inc. (Equity REIT) | 53,484 | 1,212,482 | ||||||||
Corporate Office Properties Trust (Equity REIT) | 20,051 | 520,123 | ||||||||
Cousins Properties, Inc. (Equity REIT) | 27,006 | 682,982 | ||||||||
CubeSmart (Equity REIT) | 40,048 | 1,611,932 | ||||||||
Douglas Emmett, Inc. (Equity REIT) | 31,344 | 491,474 | ||||||||
EastGroup Properties, Inc. (Equity REIT) | 7,770 | 1,150,426 | ||||||||
EPR Properties (Equity REIT) | 13,379 | 504,656 | ||||||||
First Industrial Realty Trust, Inc. (Equity REIT) | 23,564 | 1,137,199 | ||||||||
Healthcare Realty Trust, Inc. (Equity REIT) | 67,866 | 1,307,778 | ||||||||
Highwoods Properties, Inc. (Equity REIT) | 18,760 | 524,905 | ||||||||
Independence Realty Trust, Inc. (Equity REIT) | 39,916 | 672,984 | ||||||||
JBG SMITH Properties (Equity REIT) | 17,640 | 334,807 | ||||||||
Jones Lang LaSalle, Inc. (Real Estate Mgmt. & Development) | (a) | 8,464 | 1,348,908 | |||||||
Kilroy Realty Corp. (Equity REIT) | 18,758 | 725,372 | ||||||||
Kite Realty Group Trust (Equity REIT) | 39,072 | 822,466 | ||||||||
Lamar Advertising Co. Class A (Equity REIT) | 15,561 | 1,468,958 | ||||||||
Life Storage, Inc. (Equity REIT) | 15,157 | 1,492,964 | ||||||||
Macerich Co. / The (Equity REIT) | 38,301 | 431,269 | ||||||||
Medical Properties Trust, Inc. (Equity REIT) | 106,644 | 1,188,014 | ||||||||
National Retail Properties, Inc. (Equity REIT) | 31,877 | 1,458,692 | ||||||||
National Storage Affiliates Trust (Equity REIT) | 15,061 | 544,003 | ||||||||
Omega Healthcare Investors, Inc. (Equity REIT) | 41,764 | 1,167,304 | ||||||||
Park Hotels & Resorts, Inc. (Equity REIT) | 40,094 | 472,708 | ||||||||
Pebblebrook Hotel Trust (Equity REIT) | 23,460 | 314,129 | ||||||||
Physicians Realty Trust (Equity REIT) | 40,709 | 589,059 | ||||||||
PotlatchDeltic Corp. (Equity REIT) | 14,405 | 633,676 | ||||||||
Rayonier, Inc. (Equity REIT) | 26,112 | 860,652 | ||||||||
Rexford Industrial Realty, Inc. (Equity REIT) | 32,721 | 1,787,875 | ||||||||
Sabra Health Care REIT, Inc. (Equity REIT) | 41,189 | 511,979 | ||||||||
SL Green Realty Corp. (Equity REIT) | 11,469 | 386,735 | ||||||||
Spirit Realty Capital, Inc. (Equity REIT) | 24,907 | 994,537 | ||||||||
STORE Capital Corp. (Equity REIT) | 47,390 | 1,519,323 | ||||||||
|
| |||||||||
| 29,787,786 | ||||||||||
|
| |||||||||
UTILITIES – 4.0% | ||||||||||
ALLETE, Inc. (Electric Utilities) | 10,193 | 657,550 | ||||||||
Black Hills Corp. (Multi-Utilities) | 11,605 | 816,296 | ||||||||
Essential Utilities, Inc. (Water Utilities) | 42,562 | 2,031,484 | ||||||||
Hawaiian Electric Industries, Inc. (Electric Utilities) | 19,521 | 816,954 | ||||||||
IDACORP, Inc. (Electric Utilities) | 9,016 | 972,376 | ||||||||
National Fuel Gas Co. (Gas Utilities) | 16,313 | 1,032,613 | ||||||||
New Jersey Resources Corp. (Gas Utilities) | 17,161 | 851,529 | ||||||||
NorthWestern Corp. (Multi-Utilities) | 10,304 | 611,439 | ||||||||
OGE Energy Corp. (Electric Utilities) | 35,703 | 1,412,054 | ||||||||
ONE Gas, Inc. (Gas Utilities) | 9,656 | 731,152 | ||||||||
Ormat Technologies, Inc. (Ind. Power & Renewable Elec.) | 8,695 | 751,944 | ||||||||
PNM Resources, Inc. (Electric Utilities) | 15,309 | 746,926 | ||||||||
Portland General Electric Co. (Electric Utilities) | 15,919 | 780,031 | ||||||||
Southwest Gas Holdings, Inc. (Gas Utilities) | 11,003 | 680,866 | ||||||||
| 85 | (continued) |
Ohio National Fund, Inc. | ON S&P MidCap 400® Index Portfolio (Continued) | |
| Schedule of Investments | December 31, 2022 | |
| Common Stocks (Continued) | Shares | Value | ||||||
UTILITIES (continued) | ||||||||
Spire, Inc. (Gas Utilities) | 9,361 | $ | 644,598 | |||||
UGI Corp. (Gas Utilities) | 37,339 | 1,384,157 | ||||||
| 14,921,969 | ||||||||
|
| |||||||
Total Common Stocks (Cost $331,536,276) | $ | 366,041,240 | ||||||
|
| |||||||
U.S. Treasury Obligations –0.0% | Rate | Maturity | Face Amount | Value | ||||||||||||||
U.S. Treasury Bill | (b | ) | 0.000 | % | 01/26/2023 | $100,000 | $ | 99,752 | ||||||||||
|
| |||||||||||||||||
Total U.S. Treasury Obligations (Cost $99,915) | $ | 99,752 | ||||||||||||||||
|
| |||||||||||||||||
Total Investments – 99.1% |
| (c) | $ | 366,140,992 | ||||||||||||||
Other Assets in Excess of Liabilities – 0.9% |
| (b) | 3,339,770 | |||||||||||||||
|
| |||||||||||||||||
Net Assets – 100.0% | $ | 369,480,762 | ||||||||||||||||
|
| |||||||||||||||||
Percentages are stated as a percent of net assets.
Footnotes:
| (a) | Non-income producing security. |
| (b) | Security is fully pledged, in addition to $157,738 of the Portfolio’s cash holdings, as collateral for the futures contracts outstanding at December 31, 2022. See also the following Schedule of Open Futures Contracts. |
| (c) | Represents cost for financial reporting purposes, which may differ from cost basis for federal income tax purposes. See also Note 7 of the Notes to Financial Statements. |
The accompanying notes are an integral part of these financial statements.
| Schedule of Open Futures Contracts | December 31, 2022 | |||
Description | Number of contracts | Expiration Date | Notional Amount | Value | Unrealized Appreciation (Depreciation) | Variation Margin Receivable (Payable) | ||||||
CME E-mini S&P MidCap 400 Index - Long | 19 | March 17, 2023 | $4,710,372 | $4,640,940 | $(69,432) | $(25,460) |
The accompanying notes are an integral part of these financial statements.
86
Ohio National Fund, Inc. | ON BlackRock Advantage Large Cap Growth Portfolio (Unaudited) |
| Objective/Strategy |
The ON BlackRock Advantage Large Cap Growth Portfolio seeks long-term growth of capital by investing, under normal circumstances, at least 80% of its net assets in stocks of large capitalization companies with market capitalizations at the time of investment that are within the range of market capitalizations of the companies in the Russell 1000® Growth Index for the previous twelve months.
| Performance as of December 31, 2022 | ||
Average Annual returns | ||||
One year | -32.56 | % | ||
Five years | 6.20 | % | ||
Ten years | 11.98 | % |
Past performance does not guarantee future results. The performance data quoted represents past performance and current returns may be lower or higher. Total return figures include change in share price and reinvestment of dividends and capital gains. The investment return and principal value will fluctuate so that an investor’s shares, when redeemed, may be worth more or less than the original cost. To obtain performance information up to the most recent month end, call toll-free 1-877-781-6392.
The Portfolio is not open to direct retail investment. Beneficial interest in the Portfolio’s shares is obtained either through an allocation to the Portfolio as an investment vehicle within variable life insurance policies or annuity contracts, or as an underlying investment by the ON Model Portfolios. Actual performance results for variable annuity and variable universal life contracts will be lower due to contract charges. Consult your contract for applicable charges.
Total expense ratio is 0.78% per the Fund’s prospectus dated April 29, 2022. Additional information pertaining to the Portfolio’s expense ratio as of December 31, 2022 can be found in the Portfolio’s Financial Highlights.
| Comments from Sub-Adviser |
Q. How did the Portfolio perform in comparison to its benchmark during the reporting period?
A. For the year ended December 31, 2022, the Portfolio returned -32.56% versus -29.14% for its benchmark, the Russell 1000® Growth Index.
Q. Were there specific market conditions, investment strategies, or techniques that materially affected the Portfolio’s benchmark-relative performance during the reporting period?
A. The Portfolio’s underperformance was driven by fundamental quality and macro thematic insights. Fundamental insights struggled in the year, driven by growth-related quality measures. The largest detractors include measures of company culture, founder involvement, and company benefits. Nontraditional fundamental quality measures, specifically ESG insights, struggled, as markets continued to focus on macro dynamics over company results. Particularly, environment-related insights, such as those that evaluate green patents and emissions levels as energy related firms, outperformed their lower emissions counterparts.
However, other fundamental insights with a preference for attractively priced growth companies provided ballast. Namely, insights evaluating company earnings yield, sales, and other financial statement metrics did well. Defensive quality measures also performed well with measures relating to stability, balance sheet quality, and internal financing ability contributing, due to the market’s focus on company financial health. (1)
Q. How did sector allocation and security selection each impact the Portfolio’s performance relative to its benchmark?
A. Both sector allocation and selection negatively impacted the Portfolio’s relative performance, with allocation having a greater impact. Top detractors were selection within Health Care, Information Technology, and Consumer Staples, offset somewhat by strong selection within Communication Services. From a sector perspective, all allocation decisions were negative, led by underweights to Consumer Discretionary and Energy and an overweight to Utilities. (1)
Q. Which securities contributed the most to, and detracted the most from, the Portfolio’s benchmark-relative performance?
A. The Portfolio’s underweight position in Netflix, Inc. was the top contributor to relative performance for the year, as the stock struggled amid a stagnant user base. An overweight to EOG Resources, Inc. was also a top contributor, as oil and gas firms broadly benefited alongside the broader Energy sector.
In contrast, an underweight to biotech company AbbVie, Inc. was a key detractor from relative performance, as the stock benefitted from an earnings beat in the third quarter. Further hindering results was an underweight stance in Coca Cola Consolidated, Inc., as the market exhibited a preference for consumer durables. (1)
Q. How did the Portfolio’s use of derivative instruments and initial public offerings (IPOs), if any, impact performance?
A. Pursuant to the Portfolio’s investment strategy, futures contracts were used to prevent a cash drag on performance. Futures contracts detracted 49 basis points, in aggregate, from the Portfolio’s absolute return for the year. The Portfolio did not participate in any IPOs during the year. (1)
| (1) | The Portfolio’s composition is subject to change. Holdings and weightings are as of December 31, 2022. |
| Change in Value of $10,000 Investment |
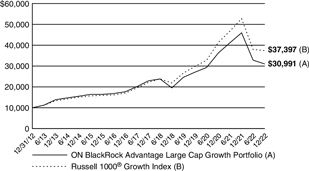
Hypothetical illustration based on past performance. Future performance will vary. The Portfolio’s returns reflect reinvested dividends. The Portfolio’s holdings may differ significantly from the securities in the index. The index is unmanaged and therefore does not reflect the cost of portfolio management and accounting.
The Russell 1000® Growth Index is a market-capitalization weighted index of those firms in the Russell 1000® Index with higher price-to-book ratios and higher forecasted growth values. The Russell 1000® Index measures the performance of the large-cap segment of the U.S. equity universe. The index presented includes the effects of reinvested dividends.
Past performance is no guarantee of future results. Redemption of fund shares could have tax implications unique to each shareholder.
| 87 | (continued) |
| Ohio National Fund, Inc. | ON BlackRock Advantage Large Cap Growth Portfolio (Unaudited) (Continued) |
| Portfolio Composition as of December 31, 2022 (1) | ||
| % of Net Assets | ||||
Common Stocks (4) | 98.2 | |||
Other Net Assets | 1.8 | |||
|
| |||
| 100.0 | ||||
|
| |||
| Top 10 Portfolio Holdings as of December 31, 2022 (1) (2) (3) | ||||
| % of Net Assets | ||||||||
| 1. | Apple, Inc. | 10.1 | ||||||
| 2. | Microsoft Corp. | 9.6 | ||||||
| 3. | Amazon.com, Inc. | 4.4 | ||||||
| 4. | UnitedHealth Group, Inc. | 2.9 | ||||||
| 5. | PepsiCo, Inc. | 2.5 | ||||||
| 6. | Alphabet, Inc. Class C | 2.4 | ||||||
| 7. | Alphabet, Inc. Class A | 2.2 | ||||||
| 8. | NVIDIA Corp. | 2.0 | ||||||
| 9. | Mastercard, Inc. Class A | 1.9 | ||||||
| 10. | Tesla, Inc. | 1.9 | ||||||
| (1) | Composition of Portfolio subject to change. |
| (2) | Short-term investments have been excluded from the list of Top 10 Portfolio Holdings. |
| (3) | Top 10 Portfolio Holdings is presented at an individual security level. Total investment exposure by issuer may be higher. |
| (4) | Sectors (Common Stocks): |
| % of Net Assets | ||||
Information Technology | 43.0 | |||
Health Care | 13.8 | |||
Consumer Discretionary | 13.4 | |||
Industrials | 7.4 | |||
Communication Services | 6.5 | |||
Consumer Staples | 6.1 | |||
Financials | 3.6 | |||
Energy | 1.6 | |||
Materials | 1.2 | |||
Real Estate | 1.1 | |||
Utilities | 0.5 | |||
|
| |||
| 98.2 | ||||
|
| |||
| 88 |
Ohio National Fund, Inc. | ON BlackRock Advantage Large Cap Growth Portfolio | |
| Schedule of Investments | December 31, 2022 | |
| Common Stocks – 98.2% | Shares | Value | ||||||||||
COMMUNICATION SERVICES – 6.5% |
| |||||||||||
Alphabet, Inc. Class A (Interactive Media & Svs.) | (a | ) | 95,048 | $ | 8,386,085 | |||||||
Alphabet, Inc. Class C (Interactive Media & Svs.) | (a | ) | 102,139 | 9,062,793 | ||||||||
Fox Corp. Class A (Media) | 79,899 | 2,426,533 | ||||||||||
Live Nation Entertainment, Inc. (Entertainment) | (a | ) | 18,608 | 1,297,722 | ||||||||
Match Group, Inc. (Interactive Media & Svs.) | (a | ) | 10,427 | 432,616 | ||||||||
Meta Platforms, Inc. Class A (Interactive Media & Svs.) | (a | ) | 13,857 | 1,667,551 | ||||||||
Snap, Inc. Class A (Interactive Media & Svs.) | (a | ) | 7,370 | 65,962 | ||||||||
Spotify Technology SA (Entertainment) | (a | ) | 13,741 | 1,084,852 | ||||||||
|
| |||||||||||
| 24,424,114 | ||||||||||||
|
| |||||||||||
CONSUMER DISCRETIONARY – 13.4% |
| |||||||||||
Amazon.com, Inc. (Internet & Direct Marketing Retail) | (a | ) | 197,540 | 16,593,360 | ||||||||
AutoZone, Inc. (Specialty Retail) | (a | ) | 751 | 1,852,101 | ||||||||
Best Buy Co., Inc. (Specialty Retail) | 6,845 | 549,038 | ||||||||||
Domino’s Pizza, Inc. (Hotels, Restaurants & Leisure) | 3,328 | 1,152,819 | ||||||||||
eBay, Inc. (Internet & Direct Marketing Retail) | 62,422 | 2,588,641 | ||||||||||
H&R Block, Inc. (Diversified Consumer Svs.) | 3,239 | 118,256 | ||||||||||
Home Depot, Inc. / The (Specialty Retail) | 17,372 | 5,487,120 | ||||||||||
Lowe’s Cos., Inc. (Specialty Retail) | 18,534 | 3,692,714 | ||||||||||
Lululemon Athletica, Inc. (Textiles, Apparel & Luxury Goods) | (a | ) | 8,700 | 2,787,306 | ||||||||
Marriott International, Inc. Class A (Hotels, Restaurants & Leisure) | 4,234 | 630,400 | ||||||||||
MercadoLibre, Inc. (Internet & Direct Marketing Retail) | (a | ) | 1,000 | 846,240 | ||||||||
NIKE, Inc. Class B (Textiles, Apparel & Luxury Goods) | 7,547 | 883,075 | ||||||||||
Starbucks Corp. (Hotels, Restaurants & Leisure) | 14,985 | 1,486,512 | ||||||||||
Target Corp. (Multiline Retail) | 8,151 | 1,214,825 | ||||||||||
Tesla, Inc. (Automobiles) | (a | ) | 58,668 | 7,226,724 | ||||||||
Travel + Leisure Co. (Hotels, Restaurants & Leisure) | 34,568 | 1,258,275 | ||||||||||
Ulta Beauty, Inc. (Specialty Retail) | (a | ) | 3,329 | 1,561,534 | ||||||||
Whirlpool Corp. (Household Durables) | 3,283 | 464,413 | ||||||||||
|
| |||||||||||
| 50,393,353 | ||||||||||||
|
| |||||||||||
CONSUMER STAPLES – 6.1% | ||||||||||||
Colgate-Palmolive Co. (Household Products) | 48,911 | 3,853,698 | ||||||||||
Costco Wholesale Corp. (Food & Staples Retailing) | 9,120 | 4,163,280 | ||||||||||
Hershey Co. / The (Food Products) | 16,216 | 3,755,139 | ||||||||||
PepsiCo, Inc. (Beverages) | 51,300 | 9,267,858 | ||||||||||
Procter & Gamble Co. / The (Household Products) | 11,068 | 1,677,466 | ||||||||||
|
| |||||||||||
| 22,717,441 | ||||||||||||
|
| |||||||||||
ENERGY – 1.6% | ||||||||||||
Chevron Corp. (Oil, Gas & Consumable Fuels) | 4,113 | 738,242 | ||||||||||
Devon Energy Corp. (Oil, Gas & Consumable Fuels) | 12,776 | 785,852 | ||||||||||
EOG Resources, Inc. (Oil, Gas & Consumable Fuels) | 10,047 | 1,301,287 | ||||||||||
Halliburton Co. (Energy Equip. & Svs.) | 15,789 | 621,297 | ||||||||||
Marathon Petroleum Corp. (Oil, Gas & Consumable Fuels) | 7,644 | 889,685 | ||||||||||
Ovintiv, Inc. (Oil, Gas & Consumable Fuels) | 16,050 | 813,896 | ||||||||||
Schlumberger Ltd. / N.V. (Energy Equip. & Svs.) | 2,326 | 124,348 | ||||||||||
Targa Resources Corp. (Oil, Gas & Consumable Fuels) | 8,850 | 650,475 | ||||||||||
|
| |||||||||||
| 5,925,082 | ||||||||||||
|
| |||||||||||
FINANCIALS – 3.6% | ||||||||||||
American Express Co. (Consumer Finance) | 30,092 | 4,446,093 | ||||||||||
Aon PLC Class A (Insurance) | 2,274 | 682,518 | ||||||||||
| Common Stocks (Continued) | Shares | Value | ||||||||||
FINANCIALS (continued) | ||||||||||||
CBOE Global Markets, Inc. (Capital Markets) | 5,626 | $ | 705,894 | |||||||||
Discover Financial Services (Consumer Finance) | 6,044 | 591,285 | ||||||||||
Marsh & McLennan Cos., Inc. (Insurance) | 37,326 | 6,176,707 | ||||||||||
MetLife, Inc. (Insurance) | 12,011 | 869,236 | ||||||||||
|
| |||||||||||
| 13,471,733 | ||||||||||||
|
| |||||||||||
HEALTH CARE – 13.8% | ||||||||||||
AbbVie, Inc. (Biotechnology) | 23,528 | 3,802,360 | ||||||||||
Agilent Technologies, Inc. (Life Sciences Tools & Svs.) | 22,830 | 3,416,509 | ||||||||||
AmerisourceBergen Corp. (Health Care Providers & Svs.) | 13,569 | 2,248,519 | ||||||||||
Amgen, Inc. (Biotechnology) | 10,813 | 2,839,926 | ||||||||||
Becton Dickinson and Co. (Health Care Equip. & Supplies) | 7,617 | 1,937,003 | ||||||||||
Blueprint Medicines Corp. (Biotechnology) | (a | ) | 1,395 | 61,115 | ||||||||
Cigna Corp. (Health Care Providers & Svs.) | 10,900 | 3,611,606 | ||||||||||
Danaher Corp. (Life Sciences Tools & Svs.) | 8,519 | 2,261,113 | ||||||||||
Edwards Lifesciences Corp. (Health Care Equip. & Supplies) | (a | ) | 30,016 | 2,239,494 | ||||||||
Elevance Health, Inc. (Health Care Providers & Svs.) | 1,555 | 797,668 | ||||||||||
Eli Lilly & Co. (Pharmaceuticals) | 17,818 | 6,518,537 | ||||||||||
Exact Sciences Corp. (Biotechnology) | (a | ) | 11,450 | 566,889 | ||||||||
Horizon Therapeutics PLC (Biotechnology) | (a | ) | 4,210 | 479,098 | ||||||||
IDEXX Laboratories, Inc. (Health Care Equip. & Supplies) | (a | ) | 380 | 155,025 | ||||||||
Medtronic PLC (Health Care Equip. & Supplies) | 14,373 | 1,117,070 | ||||||||||
Mettler-Toledo International, Inc. (Life Sciences Tools & Svs.) | (a | ) | 528 | 763,198 | ||||||||
Seagen, Inc. (Biotechnology) | (a | ) | 6,731 | 865,001 | ||||||||
Thermo Fisher Scientific, Inc. (Life Sciences Tools & Svs.) | 6,848 | 3,771,125 | ||||||||||
UnitedHealth Group, Inc. (Health Care Providers & Svs.) | 20,299 | 10,762,124 | ||||||||||
Veeva Systems, Inc. Class A (Health Care Technology) | (a | ) | 8,951 | 1,444,512 | ||||||||
Vertex Pharmaceuticals, Inc. (Biotechnology) | (a | ) | 4,355 | 1,257,637 | ||||||||
West Pharmaceutical Services, Inc. (Life Sciences Tools & Svs.) | 3,436 | 808,663 | ||||||||||
|
| |||||||||||
| 51,724,192 | ||||||||||||
|
| |||||||||||
INDUSTRIALS – 7.4% | ||||||||||||
Cintas Corp. (Commercial Svs. & Supplies) | 2,909 | 1,313,763 | ||||||||||
CSX Corp. (Road & Rail) | 43,382 | 1,343,974 | ||||||||||
Deere & Co. (Machinery) | 12,291 | 5,269,889 | ||||||||||
Eaton Corp. PLC (Electrical Equip.) | 3,565 | 559,527 | ||||||||||
Illinois Tool Works, Inc. (Machinery) | 5,643 | 1,243,153 | ||||||||||
Lockheed Martin Corp. (Aerospace & Defense) | 10,361 | 5,040,523 | ||||||||||
Otis Worldwide Corp. (Machinery) | 11,738 | 919,203 | ||||||||||
PACCAR, Inc. (Machinery) | 14,800 | 1,464,756 | ||||||||||
Tetra Tech, Inc. (Commercial Svs. & Supplies) | 864 | 125,444 | ||||||||||
Trane Technologies PLC (Building Products) | 3,062 | 514,692 | ||||||||||
Uber Technologies, Inc. (Road & Rail) | (a | ) | 84,891 | 2,099,354 | ||||||||
Union Pacific Corp. (Road & Rail) | 8,046 | 1,666,085 | ||||||||||
United Parcel Service, Inc. Class B (Air Freight & Logistics) | 11,993 | 2,084,863 | ||||||||||
W.W. Grainger, Inc. (Trading Companies & Distributors) | 3,444 | 1,915,725 | ||||||||||
Xylem, Inc. (Machinery) | 21,031 | 2,325,398 | ||||||||||
|
| |||||||||||
| 27,886,349 | ||||||||||||
|
| |||||||||||
INFORMATION TECHNOLOGY – 43.0% |
| |||||||||||
Accenture PLC Class A (IT Svs.) | 15,771 | 4,208,334 | ||||||||||
Adobe, Inc. (Software) | (a | ) | 14,677 | 4,939,251 | ||||||||
Advanced Micro Devices, Inc. (Semiconductors & Equip.) | (a | ) | 11,897 | 770,569 | ||||||||
| 89 | (continued) |
Ohio National Fund, Inc. | ON BlackRock Advantage Large Cap Growth Portfolio (Continued) |
| Schedule of Investments | December 31, 2022 | |||||
| Common Stocks (Continued) | Shares | Value | ||||||||||
INFORMATION TECHNOLOGY (continued) | ||||||||||||
Analog Devices, Inc. (Semiconductors & Equip.) | 26,832 | $ | 4,401,253 | |||||||||
Apple, Inc. (Tech. Hardware, Storage & Periph.) | 291,634 | 37,892,006 | ||||||||||
Autodesk, Inc. (Software) | (a | ) | 2,904 | 542,670 | ||||||||
Automatic Data Processing, Inc. (IT Svs.) | 10,829 | 2,586,615 | ||||||||||
Bill.com Holdings, Inc. (Software) | (a | ) | 5,239 | 570,841 | ||||||||
Cadence Design Systems, Inc. (Software) | (a | ) | 16,931 | 2,719,796 | ||||||||
CDW Corp. (Electronic Equip., Instr. & Comp.) | 13,666 | 2,440,474 | ||||||||||
Cognizant Technology Solutions Corp. Class A (IT Svs.) | 10,276 | 587,684 | ||||||||||
Crowdstrike Holdings, Inc. Class A (Software) | (a | ) | 5,634 | 593,204 | ||||||||
Dell Technologies, Inc. Class C (Tech. Hardware, Storage & Periph.) | 31,306 | 1,259,127 | ||||||||||
DocuSign, Inc. (Software) | (a | ) | 9,613 | 532,752 | ||||||||
Enphase Energy, Inc. (Semiconductors & Equip.) | (a | ) | 2,422 | 641,733 | ||||||||
Flex Ltd. (Electronic Equip., Instr. & Comp.) | (a | ) | 89,391 | 1,918,331 | ||||||||
Gartner, Inc. (IT Svs.) | (a | ) | 4,233 | 1,422,881 | ||||||||
Hewlett Packard Enterprise Co. (Tech. Hardware, Storage & Periph.) | 124,248 | 1,982,998 | ||||||||||
HubSpot, Inc. (Software) | (a | ) | 2,495 | 721,379 | ||||||||
Intuit, Inc. (Software) | 11,954 | 4,652,736 | ||||||||||
Jabil, Inc. (Electronic Equip., Instr. & Comp.) | 16,969 | 1,157,286 | ||||||||||
KLA Corp. (Semiconductors & Equip.) | 6,664 | 2,512,528 | ||||||||||
Lam Research Corp. (Semiconductors & Equip.) | 7,843 | 3,296,413 | ||||||||||
Lattice Semiconductor Corp. (Semiconductors & Equip.) | (a | ) | 12,175 | 789,914 | ||||||||
Manhattan Associates, Inc. (Software) | (a | ) | 172 | 20,881 | ||||||||
Mastercard, Inc. Class A (IT Svs.) | 21,004 | 7,303,721 | ||||||||||
Microsoft Corp. (Software) | 149,460 | 35,843,497 | ||||||||||
Monolithic Power Systems, Inc. (Semiconductors & Equip.) | 2,411 | 852,554 | ||||||||||
NVIDIA Corp. (Semiconductors & Equip.) | 50,248 | 7,343,243 | ||||||||||
NXP Semiconductors N.V. (Semiconductors & Equip.) | 6,357 | 1,004,597 | ||||||||||
Palo Alto Networks, Inc. (Software) | (a | ) | 7,829 | 1,092,459 | ||||||||
Paycom Software, Inc. (Software) | (a | ) | 3,755 | 1,165,214 | ||||||||
Paylocity Holding Corp. (Software) | (a | ) | 3,945 | 766,356 | ||||||||
| Common Stocks (Continued) | Shares | Value | ||||||||||
INFORMATION TECHNOLOGY (continued) | ||||||||||||
PayPal Holdings, Inc. (IT Svs.) | (a | ) | 28,015 | $ | 1,995,228 | |||||||
Pure Storage, Inc. Class A (Tech. Hardware, Storage & Periph.) | (a | ) | 34,036 | 910,803 | ||||||||
QUALCOMM, Inc. (Semiconductors & Equip.) | 22,032 | 2,422,198 | ||||||||||
Salesforce, Inc. (Software) | (a | ) | 12,987 | 1,721,946 | ||||||||
ServiceNow, Inc. (Software) | (a | ) | 8,589 | 3,334,851 | ||||||||
Splunk, Inc. (Software) | (a | ) | 1,050 | 90,394 | ||||||||
Synopsys, Inc. (Software) | (a | ) | 4,464 | 1,425,311 | ||||||||
TE Connectivity Ltd. (Electronic Equip., Instr. & Comp.) | 15,227 | 1,748,060 | ||||||||||
Texas Instruments, Inc. (Semiconductors & Equip.) | 7,211 | 1,191,401 | ||||||||||
Visa, Inc. (IT Svs.) | 26,427 | 5,490,473 | ||||||||||
Workday, Inc. Class A (Software) | (a | ) | 10,073 | 1,685,515 | ||||||||
Zscaler, Inc. (Software) | (a | ) | 5,532 | 619,031 | ||||||||
|
| |||||||||||
| 161,168,508 | ||||||||||||
|
| |||||||||||
MATERIALS – 1.2% | ||||||||||||
Corteva, Inc. (Chemicals) | 31,527 | 1,853,157 | ||||||||||
Ecolab, Inc. (Chemicals) | 13,213 | 1,923,284 | ||||||||||
Sherwin-Williams Co. / The (Chemicals) | 2,868 | 680,663 | ||||||||||
|
| |||||||||||
| 4,457,104 | ||||||||||||
|
| |||||||||||
REAL ESTATE – 1.1% | ||||||||||||
Equity Residential (Equity REIT) | 12,643 | 745,937 | ||||||||||
Essex Property Trust, Inc. (Equity REIT) | 2,310 | 489,535 | ||||||||||
Prologis, Inc. (Equity REIT) | 9,445 | 1,064,735 | ||||||||||
SBA Communications Corp. (Equity REIT) | 4,630 | 1,297,835 | ||||||||||
Simon Property Group, Inc. (Equity REIT) | 6,186 | 726,731 | ||||||||||
Zillow Group, Inc. Class A (Real Estate Mgmt. & Development) | (a | ) | 80 | 2,497 | ||||||||
|
| |||||||||||
| 4,327,270 | ||||||||||||
|
| |||||||||||
UTILITIES – 0.5% | ||||||||||||
DTE Energy Co. (Multi-Utilities) | 16,145 | 1,897,522 | ||||||||||
|
| |||||||||||
Total Common Stocks (Cost $375,906,456) | $ | 368,392,668 | ||||||||||
|
| |||||||||||
Total Investments – 98.2% | (b | ) | $ | 368,392,668 | ||||||||
Other Assets in Excess of Liabilities – 1.8% | (c | ) | 6,731,223 | |||||||||
|
| |||||||||||
Net Assets – 100.0% | $ | 375,123,891 | ||||||||||
|
| |||||||||||
Percentages are stated as a percent of net assets.
Footnotes:
| (a) | Non-income producing security. |
| (b) | Represents cost for financial reporting purposes, which may differ from cost basis for federal income tax purposes. See also Note 7 of the Notes to Financial Statements. |
| (c) | Includes $410,800 of cash pledged as collateral for the futures contracts outstanding at December 31, 2022. See also the following Schedule of Open Futures Contracts. |
The accompanying notes are an integral part of these financial statements.
| Schedule of Open Futures Contracts | December 31, 2022 | |||||||||||
Description | Number of contracts | Expiration Date | Notional Amount | Value | Unrealized Appreciation (Depreciation) | Variation Margin Receivable (Payable) | ||||||||||
CME E-mini Nasdaq-100 Index - Long | 26 | March 17, 2023 | $ | 6,071,580 | $ | 5,731,570 | $(340,010) | $(5,610) | ||||||||
The accompanying notes are an integral part of these financial statements.
| 90 |
| ON Risk Managed Balanced Portfolio (Unaudited) |
| Objective/Strategy |
The ON Risk Managed Balanced Portfolio seeks long-term capital growth, consistent with preservation of capital and balanced by current income. The Portfolio invests in a balanced portfolio of equity and fixed-income securities (the “Balanced Component”) and a risk management portfolio intended to enhance the risk adjusted return of the Portfolio (the “Risk Management Component”).
| Performance as of December 31, 2022 | ||
Average Annual returns | ||||
One year | -22.62 | % | ||
Five years | 6.20 | % | ||
Since inception (5/1/14) | 6.75 | % | ||
Past performance does not guarantee future results. The performance data quoted represents past performance and current returns may be lower or higher. Total return figures include change in share price and reinvestment of dividends and capital gains. The investment return and principal value will fluctuate so that an investor’s shares, when redeemed, may be worth more or less than the original cost. To obtain performance information up to the most recent month end, call toll-free 1-877-781-6392.
The Portfolio is not open to direct retail investment. Beneficial interest in the Portfolio’s shares is obtained either through an allocation to the Portfolio as an investment vehicle within variable life insurance policies or annuity contracts, or as an underlying investment by the ON Model Portfolios. Actual performance results for variable annuity and variable universal life contracts will be lower due to contract charges. Consult your contract for applicable charges.
Total expense ratio is 0.96% per the Fund’s prospectus dated April 29, 2022. Additional information pertaining to the Portfolio’s expense ratio as of December 31, 2022 can be found in the Portfolio’s Financial Highlights.
| Comments from Sub-Advisers |
Q. How did the Portfolio perform in comparison to its benchmark during the reporting period?
A. For the year ended December 31, 2022, the Portfolio returned -22.62% versus -18.11% for its benchmark, the S&P 500® Index. The Portfolio’s secondary benchmark, which is comprised of 55% S&P 500® Index/ 45% ICE BofA U.S. Broad Market Index, returned -15.58% for the year.
Q. Were there specific market conditions, investment strategies, or techniques that materially affected the Portfolio’s benchmark-relative performance during the reporting period?
A. The Portfolio posted negative performance for the year and underperformed the primary benchmark. The underperformance was limited, due mainly to the Portfolio’s allocation to fixed income during the year in which equities experienced significant underperformance.
The equity sleeve of the Balanced Component underperformed the primary benchmark. The underperformance was driven primarily by overweights to large cap growth stocks. This underperformance was slightly reduced by lower volatility and value equities within the Portfolio.
The fixed income sleeve of the Balanced Component underperformed the fixed income sleeve of the secondary benchmark, but outperformed the primary benchmark. (1)
Q. How did sector allocation and security selection each impact the Portfolio’s performance relative to its benchmark?
A. In the equity sleeve, security selection was the main driver of underperformance, specifically selection within Health Care and Consumer Staples. Sector positioning also detracted from performance, led by an underweight to Energy and an overweight to Information Technology.
In the fixed income sleeve, an overweight to emerging market corporates and an underweight to U.S. Treasuries (excluding derivatives) detracted. An underweight to mortgage pass-throughs and an overweight to investment grade corporate bonds contributed. Security selection in investment grade corporates detracted, while selection in emerging markets corporates was the main contributor and helped generate overall positive security selection for the fixed income sleeve. (1)
Q. How did the Risk Management Component impact the Portfolio’s performance during the period?
A. The Portfolio’s Risk Management Component is a sleeve of derivatives and cash equivalents that seeks to enhance the risk-adjusted return of the Portfolio. The Portfolio’s performance is enhanced on a risk-adjusted basis when the aggregate Portfolio achieves lower volatility with similar returns, or higher returns at similar volatility compared to a benchmark. The Portfolio’s return was 4.3% lower than the Balanced Component while the Portfolio’s annualized volatility was lower than the Balanced Component by approximately 3.0%, reducing overall risk. The Risk Management Component, however, did not enhance the Portfolio’s risk-adjusted return after reflecting these offsetting impacts.
The Risk Management Component’s relative underperformance was attributable to losses in the Treasury futures position, which were due to the rise in interest rates during the year and the declining value of options due to premium decay and lower implied volatilities. There was a gain due to the Portfolio having lower average equity exposure (compared to the Balanced Component), as the equity markets experienced a significant decline for the year. (1)
Q. Which securities contributed the most to, and detracted the most from, the Portfolio’s benchmark-relative performance?
A. In the equity sleeve, not holding benchmark position Tesla, Inc. was the largest contributor. Overweights to Health Care names Vertex Pharmaceuticals, Inc. and UnitedHealth Group, Inc. were also leading relative contributors. Underweights to Energy names Exxon Mobil Corp. and Chevron Corp., along with an overweight to Align Technology, Inc. were the largest detractors from performance.
In the fixed income sleeve, top contributors from an issuer perspective were Fannie Mae, Ginnie Mae, and an underweight to Russia, while selection in U.S. Treasury Notes, AT&T, Inc. and Charter Communications Operating LLC / Charter Communications Operating Capital Corp. were the main detractors. (1)
Q. How did the Portfolio’s use of derivative instruments impact overall Portfolio performance?
A. The Risk Management Component detracted 4.3% to the absolute return of the aggregate Portfolio during the year, primarily due to the use of derivative instruments. Long U.S. Treasury futures positions detracted, as interest rates rose during the year, and options positions detracted as a result of premium decay and lower implied volatilities. There was an offsetting gain due to short positions in equity index futures. (1)
Q. Were there any significant changes to the Portfolio’s management team, investment strategy, or security selection process during the reporting period?
| 91 | (continued) |
| Ohio National Fund, Inc. | ON Risk Managed Balanced Portfolio (Unaudited) (Continued) |
A. There were no personnel changes during 2022. Within the equity allocation, the U.S Systematic Value sleeve was added on May 23, 2022, to help balance out equity style risk.
| (1) | The Portfolio’s composition is subject to change. Holdings and weightings are as of December 31, 2022. |
| Change in Value of $10,000 Investment |
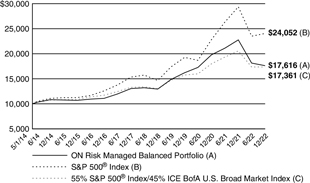
Hypothetical illustration based on past performance. Future performance will vary. The Portfolio’s returns reflect reinvested dividends. The Portfolio’s holdings may differ significantly from the securities in the index. The index is unmanaged and therefore does not reflect the cost of portfolio management and accounting.
The S&P 500® Index is a capitalization-weighted index designed to measure performance of the broad domestic economy through changes in the aggregate market value of 500 stocks representing all major industries. The index includes the effects of reinvested dividends.
The ICE BofA U.S. Broad Market Index measures the performance of U.S. dollar-denominated, investment grade debt securities, including U.S. Treasury notes and bonds, quasi-government securities, corporate securities, residential and commercial mortgage-backed securities and asset-backed securities. Securities are cap-weighted based on their amount outstanding times the market price plus accrued interest.
Past performance is no guarantee of future results. Redemption of fund shares could have tax implications unique to each shareholder.
| Portfolio Composition as of December 31, 2022 (1) | ||
| % of Net Assets | ||||
Common Stocks (4) | 50.1 | |||
Corporate Bonds (4) | 16.0 | |||
U.S. Treasury Obligations | 14.2 | |||
Asset-Backed / Mortgage-Backed Securities (4) | 6.3 | |||
Purchased Options | 5.7 | |||
U.S. Government Agency Mortgage-Backed Securities | 4.5 | |||
Preferred Securities (4) | 0.2 | |||
Sovereign Debt Issues | 0.1 | |||
Taxable Municipal Bonds | 0.0 | |||
Rights (4) | 0.0 | |||
Other Net Assets | 2.9 | |||
|
| |||
| 100.0 | ||||
|
| |||
| Top 10 Portfolio Holdings as of December 31, 2022 (1) (2) (3) | ||||
| % of Net Assets | ||||||
| 1. | Microsoft Corp. | 3.0 | ||||
| 2. | U.S. Treasury Note 1.875%, 02/15/2032 | 2.8 | ||||
| 3. | U.S. Treasury Note 3.875%, 11/30/2027 | 2.7 | ||||
| 4. | U.S. Treasury Note 2.750%, 07/31/2027 | 2.0 | ||||
| 5. | U.S. Treasury Note 3.250%, 05/15/2042 | 1.9 | ||||
| 6. | Alphabet, Inc. Class C | 1.6 | ||||
| 7. | UnitedHealth Group, Inc. | 1.6 | ||||
| 8. | Visa, Inc. | 1.4 | ||||
| 9. | U.S. Treasury Note 2.500%, 04/30/2024 | 1.2 | ||||
| 10. | S&P 500 Index Put Option, Expiration December 2024, Exercise price $4,300 | 1.2 | ||||
| (1) | Composition of Portfolio subject to change. |
| (2) | Short-term investments have been excluded from the list of Top 10 Portfolio Holdings. |
| (3) | Top 10 Portfolio Holdings is presented at an individual security level. Total investment exposure by issuer may be higher. |
| (4) | Sectors (Common Stocks, Corporate Bonds, Preferred Securities, Asset-Backed / Mortgage Backed Securities, Rights): |
| % of Net Assets | ||||
Information Technology | 17.0 | |||
Financials | 16.2 | |||
Health Care | 11.4 | |||
Consumer Discretionary | 6.1 | |||
Consumer Staples | 5.3 | |||
Industrials | 4.2 | |||
Energy | 3.9 | |||
Communication Services | 3.8 | |||
Utilities | 2.7 | |||
Materials | 1.1 | |||
Real Estate | 0.9 | |||
|
| |||
| 72.6 | ||||
|
| |||
| 92 |
Ohio National Fund, Inc. | ON Risk Managed Balanced Portfolio | |
| Schedule of Investments | December 31, 2022 | |
| Common Stocks – 50.1% | Shares | Value | ||||||||
| ||||||||||
COMMUNICATION SERVICES – 3.0% | ||||||||||
Alphabet, Inc. Class A (Interactive Media & Svs.) | (a) | 4,760 | $ | 419,975 | ||||||
Alphabet, Inc. Class C (Interactive Media & Svs.) | (a) | 204,723 | 18,165,072 | |||||||
AT&T, Inc. (Diversified Telecom. Svs.) | 96,718 | 1,780,578 | ||||||||
Charter Communications, Inc. Class A (Media) | (a) | 2,437 | 826,387 | |||||||
Comcast Corp. Class A (Media) | 67,864 | 2,373,204 | ||||||||
Electronic Arts, Inc. (Entertainment) | 24,947 | 3,048,024 | ||||||||
Lumen Technologies, Inc. (Diversified Telecom. Svs.) | 97,913 | 511,106 | ||||||||
Match Group, Inc. (Interactive Media & Svs.) | (a) | 14,561 | 604,136 | |||||||
Meta Platforms, Inc. Class A (Interactive Media & Svs.) | (a) | 19,152 | 2,304,752 | |||||||
Netflix, Inc. (Entertainment) | (a) | 5,020 | 1,480,297 | |||||||
Paramount Global Class B (Media) | 38,773 | 654,488 | ||||||||
Spotify Technology SA (Entertainment) | (a) | 7,966 | 628,916 | |||||||
Verizon Communications, Inc. (Diversified Telecom. Svs.) | 45,443 | 1,790,454 | ||||||||
|
| |||||||||
| 34,587,389 | ||||||||||
|
| |||||||||
CONSUMER DISCRETIONARY – 4.4% | ||||||||||
Advance Auto Parts, Inc. (Specialty Retail) | 4,117 | 605,322 | ||||||||
Amazon.com, Inc. (Internet & Direct Marketing Retail) | (a) | 94,280 | 7,919,520 | |||||||
AutoZone, Inc. (Specialty Retail) | (a) | 2,071 | 5,107,459 | |||||||
Best Buy Co., Inc. (Specialty Retail) | 10,279 | 824,479 | ||||||||
Booking Holdings, Inc. (Hotels, Restaurants & Leisure) | (a) | 927 | 1,868,165 | |||||||
BorgWarner, Inc. (Auto Components) | 20,122 | 809,910 | ||||||||
CarMax, Inc. (Specialty Retail) | (a) | 9,829 | 598,488 | |||||||
Chipotle Mexican Grill, Inc. (Hotels, Restaurants & Leisure) | (a) | 1,593 | 2,210,272 | |||||||
Dollar General Corp. (Multiline Retail) | 12,106 | 2,981,102 | ||||||||
Domino’s Pizza, Inc. (Hotels, Restaurants & Leisure) | 6,762 | 2,342,357 | ||||||||
Etsy, Inc. (Internet & Direct Marketing Retail) | (a) | 14,740 | 1,765,557 | |||||||
General Motors Co. (Automobiles) | 28,586 | 961,633 | ||||||||
Home Depot, Inc. / The (Specialty Retail) | 31,417 | 9,923,374 | ||||||||
Lennar Corp. Class A (Household Durables) | 9,622 | 870,791 | ||||||||
LKQ Corp. (Distributors) | 14,123 | 754,309 | ||||||||
NIKE, Inc. Class B (Textiles, Apparel & Luxury Goods) | 31,164 | 3,646,500 | ||||||||
O’Reilly Automotive, Inc. (Specialty Retail) | (a) | 3,012 | 2,542,218 | |||||||
PulteGroup, Inc. (Household Durables) | 16,648 | 757,983 | ||||||||
Tractor Supply Co. (Specialty Retail) | 8,614 | 1,937,892 | ||||||||
V.F. Corp. (Textiles, Apparel & Luxury Goods) | 21,864 | 603,665 | ||||||||
Williams-Sonoma, Inc. (Specialty Retail) | 5,173 | 594,481 | ||||||||
|
| |||||||||
| 49,625,477 | ||||||||||
|
| |||||||||
CONSUMER STAPLES – 4.0% | ||||||||||
Altria Group, Inc. (Tobacco) | 63,086 | 2,883,661 | ||||||||
BJ’s Wholesale Club Holdings, Inc. (Food & Staples Retailing) | (a) | 11,472 | 758,988 | |||||||
Coca-Cola Co. / The (Beverages) | 47,078 | 2,994,632 | ||||||||
Colgate-Palmolive Co. (Household Products) | 14,949 | 1,177,832 | ||||||||
Costco Wholesale Corp. (Food & Staples Retailing) | 18,682 | 8,528,333 | ||||||||
General Mills, Inc. (Food Products) | 26,343 | 2,208,861 | ||||||||
Keurig Dr Pepper, Inc. (Beverages) | 45,955 | 1,638,755 | ||||||||
Kimberly-Clark Corp. (Household Products) | 8,534 | 1,158,490 | ||||||||
Koninklijke Ahold Delhaize N.V. – ADR (Food & Staples Retailing) | 72,760 | 2,088,212 | ||||||||
Kroger Co. / The (Food & Staples Retailing) | 22,922 | 1,021,863 | ||||||||
Molson Coors Beverage Co. Class B (Beverages) | 17,824 | 918,292 | ||||||||
Monster Beverage Corp. (Beverages) | (a) | 79,451 | 8,066,660 | |||||||
Philip Morris International, Inc. (Tobacco) | 28,621 | 2,896,731 | ||||||||
Procter & Gamble Co. / The (Household Products) | 13,006 | 1,971,189 | ||||||||
Sysco Corp. (Food & Staples Retailing) | 12,538 | 958,530 | ||||||||
Tyson Foods, Inc. Class A (Food Products) | 14,118 | 878,846 | ||||||||
Walgreens Boots Alliance, Inc. (Food & Staples Retailing) | 30,512 | 1,139,928 | ||||||||
Walmart, Inc. (Food & Staples Retailing) | 26,972 | 3,824,360 | ||||||||
|
| |||||||||
| 45,114,163 | ||||||||||
|
| |||||||||
ENERGY – 1.9% | ||||||||||
APA Corp. (Oil, Gas & Consumable Fuels) | 23,424 | 1,093,432 | ||||||||
Baker Hughes Co. (Energy Equip. & Svs.) | 41,039 | 1,211,882 | ||||||||
Chesapeake Energy Corp. (Oil, Gas & Consumable Fuels) | 8,472 | 799,503 | ||||||||
Chevron Corp. (Oil, Gas & Consumable Fuels) | 2,801 | 502,752 | ||||||||
Coterra Energy, Inc. (Oil, Gas & Consumable Fuels) | 32,464 | 797,640 | ||||||||
Diamondback Energy, Inc. (Oil, Gas & Consumable Fuels) | 6,715 | 918,478 | ||||||||
Exxon Mobil Corp. (Oil, Gas & Consumable Fuels) | 12,904 | 1,423,311 | ||||||||
Halliburton Co. (Energy Equip. & Svs.) | 33,601 | 1,322,199 | ||||||||
| 93 | (continued) |
Ohio National Fund, Inc. | ON Risk Managed Balanced Portfolio (Continued) | |
| Schedule of Investments | December 31, 2022 | |
| Common Stocks (Continued) | Shares | Value | ||||||||
| ||||||||||
ENERGY (continued) | ||||||||||
HF Sinclair Corp. (Oil, Gas & Consumable Fuels) | 14,344 | $ | 744,310 | |||||||
Kinder Morgan, Inc. (Oil, Gas & Consumable Fuels) | 57,427 | 1,038,280 | ||||||||
Marathon Oil Corp. (Oil, Gas & Consumable Fuels) | 36,585 | 990,356 | ||||||||
Marathon Petroleum Corp. (Oil, Gas & Consumable Fuels) | 10,821 | 1,259,456 | ||||||||
Occidental Petroleum Corp. (Oil, Gas & Consumable Fuels) | 14,299 | 900,694 | ||||||||
Ovintiv, Inc. (Oil, Gas & Consumable Fuels) | 16,521 | 837,780 | ||||||||
Phillips 66 (Oil, Gas & Consumable Fuels) | 12,358 | 1,286,221 | ||||||||
Pioneer Natural Resources Co. (Oil, Gas & Consumable Fuels) | 4,395 | 1,003,774 | ||||||||
Schlumberger Ltd. / N.V. (Energy Equip. & Svs.) | 30,196 | 1,614,278 | ||||||||
Shell PLC – ADR (Oil, Gas & Consumable Fuels) | 47,634 | 2,712,756 | ||||||||
Valero Energy Corp. (Oil, Gas & Consumable Fuels) | 9,552 | 1,211,767 | ||||||||
|
| |||||||||
| 21,668,869 | ||||||||||
|
| |||||||||
FINANCIALS – 5.4% | ||||||||||
Ally Financial, Inc. (Consumer Finance) | 35,492 | 867,779 | ||||||||
American International Group, Inc. (Insurance) | 25,020 | 1,582,265 | ||||||||
Annaly Capital Management, Inc. (Mortgage REIT) | 57,057 | 1,202,762 | ||||||||
Bank of New York Mellon Corp. / The (Capital Markets) | 29,362 | 1,336,558 | ||||||||
Berkshire Hathaway, Inc. Class B (Diversified Financial Svs.) | (a) | 8,499 | 2,625,341 | |||||||
Capital One Financial Corp. (Consumer Finance) | 12,807 | 1,190,539 | ||||||||
CBOE Global Markets, Inc. (Capital Markets) | 8,844 | 1,109,657 | ||||||||
Citigroup, Inc. (Banks) | 36,286 | 1,641,216 | ||||||||
Citizens Financial Group, Inc. (Banks) | 30,480 | 1,199,998 | ||||||||
East West Bancorp, Inc. (Banks) | 14,810 | 975,979 | ||||||||
Everest Re Group Ltd. (Insurance) | 10,215 | 3,383,923 | ||||||||
F&G Annuities & Life, Inc. (Insurance) | (a) | 1,868 | 37,379 | |||||||
Fidelity National Financial, Inc. (Insurance) | 27,480 | 1,033,798 | ||||||||
Fifth Third Bancorp (Banks) | 33,906 | 1,112,456 | ||||||||
Goldman Sachs Group, Inc. / The (Capital Markets) | 5,577 | 1,915,030 | ||||||||
Houlihan Lokey, Inc. (Capital Markets) | 21,811 | 1,901,047 | ||||||||
Intercontinental Exchange, Inc. (Capital Markets) | 33,714 | 3,458,719 | ||||||||
JPMorgan Chase & Co. (Banks) | 57,399 | 7,697,206 | ||||||||
KeyCorp (Banks) | 64,517 | 1,123,886 | ||||||||
Lincoln National Corp. (Insurance) | 22,345 | 686,438 | ||||||||
Loews Corp. (Insurance) | 20,016 | 1,167,533 | ||||||||
MarketAxess Holdings, Inc. (Capital Markets) | 4,249 | 1,185,004 | ||||||||
Marsh & McLennan Cos., Inc. (Insurance) | 15,174 | 2,510,993 | ||||||||
MSCI, Inc. (Capital Markets) | 6,886 | 3,203,161 | ||||||||
Northern Trust Corp. (Capital Markets) | 12,309 | 1,089,223 | ||||||||
Progressive Corp. / The (Insurance) | 15,574 | 2,020,103 | ||||||||
Raymond James Financial, Inc. (Capital Markets) | 10,703 | 1,143,616 | ||||||||
Selective Insurance Group, Inc. (Insurance) | 11,515 | 1,020,344 | ||||||||
Signature Bank (Banks) | 6,563 | 756,189 | ||||||||
State Street Corp. (Capital Markets) | 17,884 | 1,387,262 | ||||||||
SVB Financial Group (Banks) | (a) | 3,001 | 690,650 | |||||||
Synchrony Financial (Consumer Finance) | 36,316 | 1,193,344 | ||||||||
T. Rowe Price Group, Inc. (Capital Markets) | 10,439 | 1,138,477 | ||||||||
Truist Financial Corp. (Banks) | 30,921 | 1,330,531 | ||||||||
U.S. Bancorp (Banks) | 32,710 | 1,426,483 | ||||||||
Willis Towers Watson PLC (Insurance) | 13,975 | 3,418,005 | ||||||||
Zions Bancorp N.A. (Banks) | 19,277 | 947,657 | ||||||||
|
| |||||||||
| 61,710,551 | ||||||||||
|
| |||||||||
HEALTH CARE – 10.8% | ||||||||||
Abbott Laboratories (Health Care Equip. & Supplies) | 20,469 | 2,247,292 | ||||||||
AbbVie, Inc. (Biotechnology) | 27,293 | 4,410,822 | ||||||||
Align Technology, Inc. (Health Care Equip. & Supplies) | (a) | 8,345 | 1,759,960 | |||||||
AmerisourceBergen Corp. (Health Care Providers & Svs.) | 6,794 | 1,125,834 | ||||||||
Avantor, Inc. (Life Sciences Tools & Svs.) | (a) | 46,139 | 973,072 | |||||||
Baxter International, Inc. (Health Care Equip. & Supplies) | 19,456 | 991,672 | ||||||||
Cardinal Health, Inc. (Health Care Providers & Svs.) | 15,049 | 1,156,817 | ||||||||
Centene Corp. (Health Care Providers & Svs.) | (a) | 47,226 | 3,873,004 | |||||||
Cigna Corp. (Health Care Providers & Svs.) | 5,086 | 1,685,195 | ||||||||
Cooper Cos., Inc. / The (Health Care Equip. & Supplies) | 3,656 | 1,208,930 | ||||||||
CVS Health Corp. (Health Care Providers & Svs.) | 45,456 | 4,236,045 | ||||||||
Edwards Lifesciences Corp. (Health Care Equip. & Supplies) | (a) | 74,706 | 5,573,815 | |||||||
Eli Lilly & Co. (Pharmaceuticals) | 7,643 | 2,796,115 | ||||||||
Genmab A/S – ADR (Biotechnology) | (a) | 23,840 | 1,010,339 | |||||||
HCA Healthcare, Inc. (Health Care Providers & Svs.) | 6,270 | 1,504,549 | ||||||||
Henry Schein, Inc. (Health Care Providers & Svs.) | (a) | 14,232 | 1,136,710 | |||||||
| 94 | (continued) |
Ohio National Fund, Inc. | ON Risk Managed Balanced Portfolio (Continued) | |
| Schedule of Investments | December 31, 2022 | |
| Common Stocks (Continued) | Shares | Value | ||||||||||
| ||||||||||||
HEALTH CARE (continued) | ||||||||||||
Hologic, Inc. (Health Care Equip. & Supplies) | (a | ) | 15,294 | $ | 1,144,144 | |||||||
IDEXX Laboratories, Inc. (Health Care Equip. & Supplies) | (a | ) | 14,797 | 6,036,584 | ||||||||
Illumina, Inc. (Life Sciences Tools & Svs.) | (a | ) | 4,410 | 891,702 | ||||||||
Incyte Corp. (Biotechnology) | (a | ) | 13,635 | 1,095,163 | ||||||||
Intuitive Surgical, Inc. (Health Care Equip. & Supplies) | (a | ) | 27,121 | 7,196,557 | ||||||||
Johnson & Johnson (Pharmaceuticals) | 25,831 | 4,563,046 | ||||||||||
Laboratory Corp. of America Holdings (Health Care Providers & Svs.) | 4,912 | 1,156,678 | ||||||||||
McKesson Corp. (Health Care Providers & Svs.) | 11,190 | 4,197,593 | ||||||||||
Medtronic PLC (Health Care Equip. & Supplies) | 20,513 | 1,594,270 | ||||||||||
Merck & Co., Inc. (Pharmaceuticals) | 49,873 | �� | 5,533,409 | |||||||||
Mettler-Toledo International, Inc. (Life Sciences Tools & Svs.) | (a | ) | 3,033 | 4,384,050 | ||||||||
Moderna, Inc. (Biotechnology) | (a | ) | 9,729 | 1,747,523 | ||||||||
Molina Healthcare, Inc. (Health Care Providers & Svs.) | (a | ) | 2,842 | 938,485 | ||||||||
Quest Diagnostics, Inc. (Health Care Providers & Svs.) | 7,995 | 1,250,738 | ||||||||||
Roche Holding AG – ADR (Pharmaceuticals) | 61,322 | 2,400,756 | ||||||||||
Teleflex, Inc. (Health Care Equip. & Supplies) | 4,667 | 1,165,023 | ||||||||||
Thermo Fisher Scientific, Inc. (Life Sciences Tools & Svs.) | 1,664 | 916,348 | ||||||||||
UnitedHealth Group, Inc. (Health Care Providers & Svs.) | 33,834 | 17,938,110 | ||||||||||
Veeva Systems, Inc. Class A (Health Care Technology) | (a | ) | 26,850 | 4,333,053 | ||||||||
Vertex Pharmaceuticals, Inc. (Biotechnology) | (a | ) | 30,246 | 8,734,440 | ||||||||
Viatris, Inc. (Pharmaceuticals) | 111,091 | 1,236,443 | ||||||||||
Waters Corp. (Life Sciences Tools & Svs.) | (a | ) | 3,377 | 1,156,893 | ||||||||
Zoetis, Inc. (Pharmaceuticals) | 53,899 | 7,898,898 | ||||||||||
|
| |||||||||||
| 123,200,077 | ||||||||||||
|
| |||||||||||
INDUSTRIALS – 3.0% | ||||||||||||
3M Co. (Industrial Conglomerates) | 9,733 | 1,167,181 | ||||||||||
AECOM (Construction & Engineering) | 17,007 | 1,444,405 | ||||||||||
AMETEK, Inc. (Electrical Equip.) | 16,758 | 2,341,428 | ||||||||||
Booz Allen Hamilton Holding Corp. (Professional Svs.) | 16,548 | 1,729,597 | ||||||||||
Builders FirstSource, Inc. (Building Products) | (a | ) | 11,632 | 754,684 | ||||||||
Carrier Global Corp. (Building Products) | 23,578 | 972,592 | ||||||||||
Copart, Inc. (Commercial Svs. & Supplies) | (a | ) | 71,789 | 4,371,232 | ||||||||
Emerson Electric Co. (Electrical Equip.) | 11,836 | 1,136,966 | ||||||||||
Expeditors International of Washington, Inc. (Air Freight & Logistics) | 7,953 | 826,476 | ||||||||||
FedEx Corp. (Air Freight & Logistics) | 5,918 | 1,024,998 | ||||||||||
Huntington Ingalls Industries, Inc. (Aerospace & Defense) | 3,040 | 701,267 | ||||||||||
IDEX Corp. (Machinery) | 9,755 | 2,227,359 | ||||||||||
J.B. Hunt Transport Services, Inc. (Road & Rail) | 4,204 | 733,009 | ||||||||||
Knight-Swift Transportation Holdings, Inc. (Road & Rail) | 32,411 | 1,698,661 | ||||||||||
L3Harris Technologies, Inc. (Aerospace & Defense) | 4,379 | 911,752 | ||||||||||
Leidos Holdings, Inc. (Professional Svs.) | 8,070 | 848,883 | ||||||||||
Lockheed Martin Corp. (Aerospace & Defense) | 9,448 | 4,596,358 | ||||||||||
Masco Corp. (Building Products) | 14,845 | 692,816 | ||||||||||
Otis Worldwide Corp. (Machinery) | 12,532 | 981,381 | ||||||||||
Owens Corning (Building Products) | 8,620 | 735,286 | ||||||||||
RELX PLC – ADR (Professional Svs.) | 34,994 | 970,034 | ||||||||||
Robert Half International, Inc. (Professional Svs.) | 8,416 | 621,353 | ||||||||||
Stanley Black & Decker, Inc. (Machinery) | 9,308 | 699,217 | ||||||||||
Textron, Inc. (Aerospace & Defense) | 12,166 | 861,353 | ||||||||||
Trex Co., Inc. (Building Products) | (a | ) | 17,519 | 741,579 | ||||||||
|
| |||||||||||
| 33,789,867 | ||||||||||||
|
| |||||||||||
INFORMATION TECHNOLOGY – 14.9% | ||||||||||||
Adobe, Inc. (Software) | (a | ) | 19,546 | 6,577,815 | ||||||||
Amdocs Ltd. (IT Svs.) | 24,336 | 2,212,142 | ||||||||||
Amphenol Corp. Class A (Electronic Equip., Instr. & Comp.) | 38,223 | 2,910,299 | ||||||||||
Apple, Inc. (Tech. Hardware, Storage & Periph.) | 59,757 | 7,764,227 | ||||||||||
Arista Networks, Inc. (Communications Equip.) | (a | ) | 41,348 | 5,017,580 | ||||||||
ASML Holding N.V. (Semiconductors & Equip.) | 3,996 | 2,183,414 | ||||||||||
Autodesk, Inc. (Software) | (a | ) | 11,516 | 2,151,995 | ||||||||
Automatic Data Processing, Inc. (IT Svs.) | 8,933 | 2,133,736 | ||||||||||
Broadcom, Inc. (Semiconductors & Equip.) | 8,999 | 5,031,611 | ||||||||||
Cadence Design Systems, Inc. (Software) | (a | ) | 10,590 | 1,701,178 | ||||||||
CDW Corp. (Electronic Equip., Instr. & Comp.) | 8,014 | 1,431,140 | ||||||||||
Cisco Systems, Inc. (Communications Equip.) | 40,899 | 1,948,428 | ||||||||||
Cognex Corp. (Electronic Equip., Instr. & Comp.) | 21,208 | 999,109 | ||||||||||
Dell Technologies, Inc. Class C (Tech. Hardware, Storage & Periph.) | 13,868 | 557,771 | ||||||||||
Entegris, Inc. (Semiconductors & Equip.) | 23,659 | 1,551,794 | ||||||||||
EPAM Systems, Inc. (IT Svs.) | (a | ) | 14,059 | 4,607,697 | ||||||||
| 95 | (continued) |
Ohio National Fund, Inc. | ON Risk Managed Balanced Portfolio (Continued) | |
| Schedule of Investments | December 31, 2022 | |
| Common Stocks (Continued) | Shares | Value | ||||||||||
| ||||||||||||
INFORMATION TECHNOLOGY (continued) | ||||||||||||
Fidelity National Information Services, Inc. (IT Svs.) | 44,126 | $ | 2,993,949 | |||||||||
Fortinet, Inc. (Software) | (a | ) | 129,243 | 6,318,690 | ||||||||
Gartner, Inc. (IT Svs.) | (a | ) | 1,672 | 562,026 | ||||||||
Gen Digital, Inc. (Software) | 162,545 | 3,483,339 | ||||||||||
Genpact Ltd. (IT Svs.) | 65,486 | 3,033,312 | ||||||||||
Global Payments, Inc. (IT Svs.) | 5,809 | 576,950 | ||||||||||
Hewlett Packard Enterprise Co. (Tech. Hardware, Storage & Periph.) | 43,800 | 699,048 | ||||||||||
HP, Inc. (Tech. Hardware, Storage & Periph.) | 21,728 | 583,831 | ||||||||||
Intel Corp. (Semiconductors & Equip.) | 45,737 | 1,208,829 | ||||||||||
Jabil, Inc. (Electronic Equip., Instr. & Comp.) | 7,576 | 516,683 | ||||||||||
KLA Corp. (Semiconductors & Equip.) | 3,399 | 1,281,525 | ||||||||||
Manhattan Associates, Inc. (Software) | (a | ) | 8,844 | 1,073,662 | ||||||||
Mastercard, Inc. Class A (IT Svs.) | 5,106 | 1,775,509 | ||||||||||
Micron Technology, Inc. (Semiconductors & Equip.) | 15,248 | 762,095 | ||||||||||
Microsoft Corp. (Software) | 140,467 | 33,686,796 | ||||||||||
Motorola Solutions, Inc. (Communications Equip.) | 11,417 | 2,942,275 | ||||||||||
NVIDIA Corp. (Semiconductors & Equip.) | 30,498 | 4,456,978 | ||||||||||
Oracle Corp. (Software) | 50,702 | 4,144,382 | ||||||||||
Paychex, Inc. (IT Svs.) | 26,361 | 3,046,277 | ||||||||||
Paycom Software, Inc. (Software) | (a | ) | 1,350 | 418,919 | ||||||||
PayPal Holdings, Inc. (IT Svs.) | (a | ) | 38,981 | 2,776,227 | ||||||||
PTC, Inc. (Software) | (a | ) | 13,164 | 1,580,207 | ||||||||
Qorvo, Inc. (Semiconductors & Equip.) | (a | ) | 5,932 | 537,676 | ||||||||
QUALCOMM, Inc. (Semiconductors & Equip.) | 58,844 | 6,469,309 | ||||||||||
Roper Technologies, Inc. (Software) | 9,722 | 4,200,779 | ||||||||||
ServiceNow, Inc. (Software) | (a | ) | 7,206 | 2,797,874 | ||||||||
Skyworks Solutions, Inc. (Semiconductors & Equip.) | 5,996 | 546,415 | ||||||||||
Synopsys, Inc. (Software) | (a | ) | 6,446 | 2,058,143 | ||||||||
Texas Instruments, Inc. (Semiconductors & Equip.) | 4,132 | 682,689 | ||||||||||
Tyler Technologies, Inc. (Software) | (a | ) | 7,068 | 2,278,794 | ||||||||
VeriSign, Inc. (IT Svs.) | (a | ) | 15,041 | 3,090,023 | ||||||||
Visa, Inc. (IT Svs.) | 77,248 | 16,049,045 | ||||||||||
VMware, Inc. Class A (Software) | (a | ) | 18,517 | 2,273,147 | ||||||||
Zebra Technologies Corp. Class A (Electronic Equip., Instr. & Comp.) | (a | ) | 5,415 | 1,388,460 | ||||||||
Zoom Video Communications, Inc. Class A (Software) | (a | ) | 6,809 | 461,242 | ||||||||
|
| |||||||||||
| 169,535,041 | ||||||||||||
|
| |||||||||||
MATERIALS – 0.7% | ||||||||||||
Celanese Corp. (Chemicals) | 6,120 | 625,709 | ||||||||||
Dow, Inc. (Chemicals) | 16,190 | 815,814 | ||||||||||
DuPont de Nemours, Inc. (Chemicals) | 13,203 | 906,122 | ||||||||||
Eastman Chemical Co. (Chemicals) | 7,670 | 624,645 | ||||||||||
International Paper Co. (Containers & Packaging) | 17,825 | 617,279 | ||||||||||
LyondellBasell Industries N.V. Class A (Chemicals) | 22,526 | 1,870,334 | ||||||||||
Sherwin-Williams Co. / The (Chemicals) | 10,472 | 2,485,320 | ||||||||||
Westrock Co. (Containers & Packaging) | 17,438 | 613,120 | ||||||||||
|
| |||||||||||
| 8,558,343 | ||||||||||||
|
| |||||||||||
REAL ESTATE – 0.4% | ||||||||||||
Boston Properties, Inc. (Equity REIT) | 8,236 | 556,589 | ||||||||||
Camden Property Trust (Equity REIT) | 5,166 | 577,972 | ||||||||||
Digital Realty Trust, Inc. (Equity REIT) | 7,429 | 744,906 | ||||||||||
Healthcare Realty Trust, Inc. (Equity REIT) | 28,276 | 544,879 | ||||||||||
Regency Centers Corp. (Equity REIT) | 11,126 | 695,375 | ||||||||||
Simon Property Group, Inc. (Equity REIT) | 7,530 | 884,624 | ||||||||||
Weyerhaeuser Co. (Equity REIT) | 24,041 | 745,271 | ||||||||||
|
| |||||||||||
| 4,749,616 | ||||||||||||
|
| |||||||||||
UTILITIES – 1.6% | ||||||||||||
American Electric Power Co., Inc. (Electric Utilities) | 32,077 | 3,045,711 | ||||||||||
CenterPoint Energy, Inc. (Multi-Utilities) | 76,995 | 2,309,080 | ||||||||||
Consolidated Edison, Inc. (Multi-Utilities) | 11,309 | 1,077,861 | ||||||||||
Constellation Energy Corp. (Electric Utilities) | 11,373 | 980,466 | ||||||||||
Duke Energy Corp. (Electric Utilities) | 13,649 | 1,405,711 | ||||||||||
Essential Utilities, Inc. (Water Utilities) | 19,775 | 943,861 | ||||||||||
Evergy, Inc. (Electric Utilities) | 14,220 | 894,865 | ||||||||||
Exelon Corp. (Electric Utilities) | 27,206 | 1,176,115 | ||||||||||
FirstEnergy Corp. (Electric Utilities) | 24,182 | 1,014,193 | ||||||||||
NextEra Energy, Inc. (Electric Utilities) | 15,344 | 1,282,758 | ||||||||||
NiSource, Inc. (Multi-Utilities) | 32,673 | 895,894 | ||||||||||
| 96 | (continued) |
Ohio National Fund, Inc. | ON Risk Managed Balanced Portfolio (Continued) | |
| Schedule of Investments | December 31, 2022 | |
| Common Stocks (Continued) | Shares | Value | ||||||
| ||||||||
UTILITIES (continued) | ||||||||
NRG Energy, Inc. (Electric Utilities) | 21,279 | $ | 677,098 | |||||
PPL Corp. (Electric Utilities) | 34,891 | 1,019,515 | ||||||
Xcel Energy, Inc. (Electric Utilities) | 27,509 | 1,928,656 | ||||||
|
| |||||||
| 18,651,784 | ||||||||
|
| |||||||
Total Common Stocks (Cost $558,477,264) | $ | 571,191,177 | ||||||
|
| |||||||
| Corporate Bonds – 16.0% | Rate | Maturity | Face Amount | Value | ||||||||||
| ||||||||||||||
COMMUNICATION SERVICES – 0.8% | ||||||||||||||
AT&T, Inc. (Diversified Telecom. Svs.) | 3.650% | 09/15/2059 | $ | 33,000 | $ | 22,088 | ||||||||
CCO Holdings LLC / CCO Holdings Capital Corp. (Media) | (b) | 4.500% | 08/15/2030 | 59,000 | 48,743 | |||||||||
CCO Holdings LLC / CCO Holdings Capital Corp. (Media) | (b) | 4.750% | 02/01/2032 | 102,000 | 82,691 | |||||||||
CCO Holdings LLC / CCO Holdings Capital Corp. (Media) | (b) | 4.500% | 06/01/2033 | 209,000 | 160,351 | |||||||||
Charter Communications Operating LLC / Charter Communications Operating Capital Corp. (Media) | 5.050% | 03/30/2029 | 519,000 | 488,295 | ||||||||||
Charter Communications Operating LLC / Charter Communications Operating Capital Corp. (Media) | 6.484% | 10/23/2045 | 62,000 | 55,910 | ||||||||||
Discovery Communications LLC (Media) | 5.200% | 09/20/2047 | 75,000 | 55,712 | ||||||||||
Discovery Communications LLC (Media) | 5.300% | 05/15/2049 | 35,000 | 26,463 | ||||||||||
DISH DBS Corp. (Media) | (b) | 5.250% | 12/01/2026 | 1,021,000 | 860,024 | |||||||||
DISH DBS Corp. (Media) | (b) | 5.750% | 12/01/2028 | 158,000 | 126,104 | |||||||||
Entegris Escrow Corp. (Media) | (b) | 4.750% | 04/15/2029 | 209,000 | 190,595 | |||||||||
Fox Corp. (Media) | 5.576% | 01/25/2049 | 1,068,000 | 952,860 | ||||||||||
Globo Comunicacao e Participacoes SA (Media) | 4.875% | 01/22/2030 | 794,000 | 664,981 | ||||||||||
Level 3 Financing, Inc. (Diversified Telecom. Svs.) | (b) | 3.875% | 11/15/2029 | 309,000 | 243,843 | |||||||||
Magallanes, Inc. (Media) | (b) | 4.279% | 03/15/2032 | 1,122,000 | 924,264 | |||||||||
Netflix, Inc. (Entertainment) | 5.875% | 11/15/2028 | 310,000 | 314,194 | ||||||||||
Tencent Holdings Ltd. (Interactive Media & Svs.) | (b) | 3.240% | 06/03/2050 | 201,000 | 127,056 | |||||||||
Time Warner Cable LLC (Media) | 7.300% | 07/01/2038 | 811,000 | 804,489 | ||||||||||
T-Mobile U.S.A., Inc. (Wireless Telecom. Svs.) | 2.625% | 04/15/2026 | 70,000 | 64,149 | ||||||||||
T-Mobile U.S.A., Inc. (Wireless Telecom. Svs.) | 2.625% | 02/15/2029 | 46,000 | 38,940 | ||||||||||
T-Mobile U.S.A., Inc. (Wireless Telecom. Svs.) | 3.375% | 04/15/2029 | 28,000 | 24,662 | ||||||||||
T-Mobile U.S.A., Inc. (Wireless Telecom. Svs.) | 3.875% | 04/15/2030 | 1,293,000 | 1,171,219 | ||||||||||
T-Mobile U.S.A., Inc. (Wireless Telecom. Svs.) | 2.550% | 02/15/2031 | 94,000 | 76,791 | ||||||||||
T-Mobile U.S.A., Inc. (Wireless Telecom. Svs.) | 2.875% | 02/15/2031 | 143,000 | 118,165 | ||||||||||
Verizon Communications, Inc. (Diversified Telecom. Svs.) | 3.150% | 03/22/2030 | 1,458,000 | 1,285,724 | ||||||||||
Weibo Corp. (Interactive Media & Svs.) | 3.375% | 07/08/2030 | 742,000 | 576,445 | ||||||||||
|
| |||||||||||||
| 9,504,758 | ||||||||||||||
|
| |||||||||||||
CONSUMER DISCRETIONARY – 1.7% | ||||||||||||||
Advance Auto Parts, Inc. (Specialty Retail) | 3.900% | 04/15/2030 | 1,335,000 | 1,169,776 | ||||||||||
Advance Auto Parts, Inc. (Specialty Retail) | 3.500% | 03/15/2032 | 3,000 | 2,461 | ||||||||||
Amazon.com, Inc. (Internet & Direct Marketing Retail) | 4.550% | 12/01/2027 | 1,021,000 | 1,017,615 | ||||||||||
AutoZone, Inc. (Specialty Retail) | 3.750% | 04/18/2029 | 303,000 | 279,403 | ||||||||||
AutoZone, Inc. (Specialty Retail) | 1.650% | 01/15/2031 | 1,010,000 | 783,603 | ||||||||||
Bath & Body Works, Inc. (Specialty Retail) | (b) | 6.625% | 10/01/2030 | 995,000 | 933,711 | |||||||||
Booking Holdings, Inc. (Hotels, Restaurants & Leisure) | 4.625% | 04/13/2030 | 1,302,000 | 1,257,443 | ||||||||||
Carnival Corp. (Hotels, Restaurants & Leisure) | (b) | 4.000% | 08/01/2028 | 237,000 | 193,252 | |||||||||
Cedar Fair LP / Canada’s Wonderland Co. / Magnum Management Corp. / Millennium Op (Hotels, Restaurants & Leisure) | 5.375% | 04/15/2027 | 1,000,000 | 955,000 | ||||||||||
Expedia Group, Inc. (Hotels, Restaurants & Leisure) | 4.625% | 08/01/2027 | 1,257,000 | 1,205,906 | ||||||||||
Ford Motor Co. (Automobiles) | 6.100% | 08/19/2032 | 441,000 | 407,201 | ||||||||||
General Motors Co. (Automobiles) | 6.125% | 10/01/2025 | 79,000 | 80,399 | ||||||||||
General Motors Co. (Automobiles) | 4.200% | 10/01/2027 | 94,000 | 88,391 | ||||||||||
General Motors Co. (Automobiles) | 6.800% | 10/01/2027 | 107,000 | 111,064 | ||||||||||
General Motors Co. (Automobiles) | 5.000% | 10/01/2028 | 269,000 | 257,630 | ||||||||||
GLP Capital LP / GLP Financing II, Inc. (Hotels, Restaurants & Leisure) | 3.250% | 01/15/2032 | 2,123,000 | 1,697,094 | ||||||||||
Jaguar Land Rover Automotive PLC (Automobiles) | (b) | 5.500% | 07/15/2029 | 1,227,000 | 868,969 | |||||||||
Las Vegas Sands Corp. (Hotels, Restaurants & Leisure) | 3.900% | 08/08/2029 | 1,829,000 | 1,540,865 | ||||||||||
Lowe’s Cos., Inc. (Specialty Retail) | 5.800% | 09/15/2062 | 640,000 | 612,583 | ||||||||||
Marriott International, Inc. (Hotels, Restaurants & Leisure) | 5.750% | 05/01/2025 | 1,264,000 | 1,274,897 | ||||||||||
Mattel, Inc. (Leisure Products) | (b) | 3.375% | 04/01/2026 | 128,000 | 117,684 | |||||||||
McDonald’s Corp. (Hotels, Restaurants & Leisure) | 3.500% | 07/01/2027 | 272,000 | 258,011 | ||||||||||
McDonald’s Corp. (Hotels, Restaurants & Leisure) | 2.625% | 09/01/2029 | 1,700,000 | 1,490,911 | ||||||||||
McDonald’s Corp. (Hotels, Restaurants & Leisure) | 3.625% | 09/01/2049 | 90,000 | 67,702 | ||||||||||
MDC Holdings, Inc. (Household Durables) | 6.000% | 01/15/2043 | 1,150,000 | 934,295 | ||||||||||
Nissan Motor Co. Ltd. (Automobiles) | (b) | 4.345% | 09/17/2027 | 430,000 | 389,901 | |||||||||
O’Reilly Automotive, Inc. (Specialty Retail) | 3.600% | 09/01/2027 | 6,000 | 5,655 | ||||||||||
O’Reilly Automotive, Inc. (Specialty Retail) | 4.350% | 06/01/2028 | 47,000 | 45,623 | ||||||||||
| 97 | (continued) |
Ohio National Fund, Inc. | ON Risk Managed Balanced Portfolio (Continued) | |
| Schedule of Investments | December 31, 2022 | |
| Corporate Bonds (Continued) | Rate | Maturity | Face Amount | Value | ||||||||||
| ||||||||||||||
CONSUMER DISCRETIONARY (continued) | ||||||||||||||
O’Reilly Automotive, Inc. (Specialty Retail) | 3.900% | 06/01/2029 | $ | 232,000 | $ | 215,987 | ||||||||
Prosus N.V. (Internet & Direct Marketing Retail) | (b) | 3.257% | 01/19/2027 | 629,000 | 562,299 | |||||||||
Prosus N.V. (Internet & Direct Marketing Retail) | (b) | 3.680% | 01/21/2030 | 216,000 | 179,592 | |||||||||
Ross Stores, Inc. (Specialty Retail) | 4.700% | 04/15/2027 | 280,000 | 275,467 | ||||||||||
Royal Caribbean Cruises Ltd. (Hotels, Restaurants & Leisure) | (b) | 8.250% | 01/15/2029 | 416,000 | 418,028 | |||||||||
Wynn Macau Ltd. (Hotels, Restaurants & Leisure) | (b) | 5.625% | 08/26/2028 | 292,000 | 249,394 | |||||||||
|
| |||||||||||||
| 19,947,812 | ||||||||||||||
|
| |||||||||||||
CONSUMER STAPLES – 1.3% | ||||||||||||||
Albertsons Cos., Inc. / Safeway, Inc. / New Albertsons LP / Albertsons LLC (Food & Staples Retailing) | (b) | 3.500% | 03/15/2029 | 156,000 | 130,882 | |||||||||
Albertsons Cos., Inc. / Safeway, Inc. / New Albertsons LP / Albertsons LLC (Food & Staples Retailing) | (b) | 4.875% | 02/15/2030 | 971,000 | 866,579 | |||||||||
Alimentation Couche-Tard, Inc. (Food & Staples Retailing) | (b) | 2.950% | 01/25/2030 | 77,000 | 65,254 | |||||||||
Altria Group, Inc. (Tobacco) | 4.800% | 02/14/2029 | 106,000 | 101,710 | ||||||||||
Altria Group, Inc. (Tobacco) | 3.400% | 05/06/2030 | 1,934,000 | 1,653,091 | ||||||||||
B.A.T. Capital Corp. (Tobacco) | 4.700% | 04/02/2027 | 180,000 | 172,546 | ||||||||||
B.A.T. Capital Corp. (Tobacco) | 2.259% | 03/25/2028 | 1,460,000 | 1,211,687 | ||||||||||
B.A.T. Capital Corp. (Tobacco) | 7.750% | 10/19/2032 | 189,000 | 203,284 | ||||||||||
Campbell Soup Co. (Food Products) | 3.950% | 03/15/2025 | 113,000 | 110,351 | ||||||||||
Cargill, Inc. (Food Products) | (b) | 1.375% | 07/23/2023 | 77,000 | 75,432 | |||||||||
Cargill, Inc. (Food Products) | (b) | 2.125% | 04/23/2030 | 1,301,000 | 1,071,211 | |||||||||
Coca-Cola Co. / The (Beverages) | 3.375% | 03/25/2027 | 1,376,000 | 1,319,626 | ||||||||||
Coca-Cola Co. / The (Beverages) | 3.450% | 03/25/2030 | 182,000 | 169,250 | ||||||||||
Estee Lauder Cos., Inc. / The (Personal Products) | 2.600% | 04/15/2030 | 412,000 | 354,070 | ||||||||||
Fomento Economico Mexicano S.A.B. de C.V. (Beverages) | 3.500% | 01/16/2050 | 182,000 | 127,638 | ||||||||||
J.M. Smucker Co. / The (Food Products) | 2.375% | 03/15/2030 | 165,000 | 136,681 | ||||||||||
MARB BondCo PLC (Food Products) | 3.950% | 01/29/2031 | 1,483,000 | 1,138,327 | ||||||||||
Mars, Inc. (Food Products) | (b) | 2.700% | 04/01/2025 | 113,000 | 107,570 | |||||||||
Mars, Inc. (Food Products) | (b) | 3.200% | 04/01/2030 | 28,000 | 25,010 | |||||||||
Mondelez International Holdings Netherlands B.V. (Food Products) | (b) | 2.250% | 09/19/2024 | 249,000 | 236,786 | |||||||||
Mondelez International, Inc. (Food Products) | 2.750% | 04/13/2030 | 19,000 | 16,377 | ||||||||||
Natura Cosmeticos SA (Personal Products) | 4.125% | 05/03/2028 | 563,000 | 459,414 | ||||||||||
Natura Cosmeticos SA (Personal Products) | (b) | 4.125% | 05/03/2028 | 230,000 | 187,682 | |||||||||
PepsiCo, Inc. (Beverages) | 2.250% | 03/19/2025 | 1,412,000 | 1,344,028 | ||||||||||
PepsiCo, Inc. (Beverages) | 2.625% | 03/19/2027 | 58,000 | 53,870 | ||||||||||
Philip Morris International, Inc. (Tobacco) | 5.000% | 11/17/2025 | 602,000 | 604,705 | ||||||||||
Philip Morris International, Inc. (Tobacco) | 5.625% | 11/17/2029 | 109,000 | 110,578 | ||||||||||
Pilgrim’s Pride Corp. (Food Products) | (b) | 5.875% | 09/30/2027 | 347,000 | 336,582 | |||||||||
Pilgrim’s Pride Corp. (Food Products) | (b) | 4.250% | 04/15/2031 | 1,000,000 | 850,555 | |||||||||
Procter & Gamble Co. / The (Household Products) | 3.000% | 03/25/2030 | 68,000 | 62,126 | ||||||||||
Sysco Corp. (Food & Staples Retailing) | 2.400% | 02/15/2030 | 72,000 | 59,846 | ||||||||||
Sysco Corp. (Food & Staples Retailing) | 5.950% | 04/01/2030 | 1,279,000 | 1,323,709 | ||||||||||
|
| |||||||||||||
| 14,686,457 | ||||||||||||||
|
| |||||||||||||
ENERGY – 2.0% | ||||||||||||||
Apache Corp. (Oil, Gas & Consumable Fuels) | 4.250% | 01/15/2030 | 1,000,000 | 884,907 | ||||||||||
BP Capital Markets America, Inc. (Oil, Gas & Consumable Fuels) | 2.939% | 06/04/2051 | 2,874,000 | 1,892,249 | ||||||||||
Canadian Natural Resources Ltd. (Oil, Gas & Consumable Fuels) | 5.850% | 02/01/2035 | 860,000 | 827,384 | ||||||||||
Cheniere Corpus Christi Holdings LLC (Oil, Gas & Consumable Fuels) | 3.700% | 11/15/2029 | 557,000 | 503,484 | ||||||||||
Continental Resources, Inc. (Oil, Gas & Consumable Fuels) | (b) | 5.750% | 01/15/2031 | 1,582,000 | 1,472,621 | |||||||||
Continental Resources, Inc. (Oil, Gas & Consumable Fuels) | (b) | 2.875% | 04/01/2032 | 218,000 | 161,470 | |||||||||
Devon Energy Corp. (Oil, Gas & Consumable Fuels) | 4.500% | 01/15/2030 | 1,733,000 | 1,613,412 | ||||||||||
Devon Energy Corp. (Oil, Gas & Consumable Fuels) | 5.600% | 07/15/2041 | 195,000 | 181,921 | ||||||||||
Diamondback Energy, Inc. (Oil, Gas & Consumable Fuels) | 6.250% | 03/15/2033 | 420,000 | 426,286 | ||||||||||
Enbridge Energy Partners LP (Oil, Gas & Consumable Fuels) | 7.375% | 10/15/2045 | 790,000 | 882,409 | ||||||||||
EQT Corp. (Oil, Gas & Consumable Fuels) | 7.000% | 02/01/2030 | 1,013,000 | 1,050,603 | ||||||||||
GNL Quintero SA (Oil, Gas & Consumable Fuels) | 4.634% | 07/31/2029 | 739,593 | 714,130 | ||||||||||
Hess Corp. (Oil, Gas & Consumable Fuels) | 4.300% | 04/01/2027 | 1,806,000 | 1,724,826 | ||||||||||
Kinder Morgan, Inc. (Oil, Gas & Consumable Fuels) | 4.300% | 03/01/2028 | 1,449,000 | 1,388,038 | ||||||||||
Marathon Oil Corp. (Oil, Gas & Consumable Fuels) | 6.800% | 03/15/2032 | 1,193,000 | 1,227,330 | ||||||||||
Marathon Petroleum Corp. (Oil, Gas & Consumable Fuels) | 6.500% | 03/01/2041 | 1,072,000 | 1,101,181 | ||||||||||
Oleoducto Central SA (Oil, Gas & Consumable Fuels) | (b) | 4.000% | 07/14/2027 | 410,000 | 361,701 | |||||||||
Oleoducto Central SA (Oil, Gas & Consumable Fuels) | 4.000% | 07/14/2027 | 356,000 | 314,062 | ||||||||||
ONEOK Partners LP (Oil, Gas & Consumable Fuels) | 6.125% | 02/01/2041 | 975,000 | 919,528 | ||||||||||
ONEOK, Inc. (Oil, Gas & Consumable Fuels) | 6.350% | 01/15/2031 | 127,000 | 129,025 | ||||||||||
ONEOK, Inc. (Oil, Gas & Consumable Fuels) | 6.100% | 11/15/2032 | 37,000 | 36,998 | ||||||||||
Ovintiv, Inc. (Oil, Gas & Consumable Fuels) | 7.375% | 11/01/2031 | 985,000 | 1,048,421 | ||||||||||
Plains All American Pipeline LP / PAA Finance Corp. (Oil, Gas & Consumable Fuels) | 3.550% | 12/15/2029 | 136,000 | 117,921 | ||||||||||
Suncor Energy, Inc. (Oil, Gas & Consumable Fuels) | 6.800% | 05/15/2038 | 1,561,000 | 1,635,166 | ||||||||||
| 98 | (continued) |
Ohio National Fund, Inc. | ON Risk Managed Balanced Portfolio (Continued) | |
| Schedule of Investments | December 31, 2022 | |
| Corporate Bonds (Continued) | Rate | Maturity | Face Amount | Value | ||||||||||
| ||||||||||||||
ENERGY (continued) | ||||||||||||||
Tengizchevroil Finance Co. International Ltd. (Oil, Gas & Consumable Fuels) | (b) | 3.250% | 08/15/2030 | $ | 487,000 | $ | 344,392 | |||||||
Var Energi ASA (Oil, Gas & Consumable Fuels) | (b) | 7.500% | 01/15/2028 | 636,000 | 647,831 | |||||||||
Var Energi ASA (Oil, Gas & Consumable Fuels) | (b) | 8.000% | 11/15/2032 | 784,000 | 809,651 | |||||||||
|
| |||||||||||||
| 22,416,947 | ||||||||||||||
|
| |||||||||||||
FINANCIALS – 4.5% | ||||||||||||||
AerCap Ireland Capital DAC / AerCap Global Aviation Trust (Diversified Financial Svs.) | 6.500% | 07/15/2025 | 271,000 | 274,598 | ||||||||||
AIB Group PLC (Rate is fixed until 10/14/2025, at which point, the rate becomes SOFR + 346) (Banks) | (b)(c) | 7.583% | 10/14/2026 | 1,611,000 | 1,640,322 | |||||||||
Alleghany Corp. (Insurance) | 3.625% | 05/15/2030 | 291,000 | 269,884 | ||||||||||
Argentum Netherlands B.V. for Swiss Re Ltd. (Rate is fixed until 08/15/2025, at which point, the rate becomes QL + 359) (Insurance) | (c) | 5.750% | 08/15/2050 | 1,500,000 | 1,428,750 | |||||||||
Aviation Capital Group LLC (Diversified Financial Svs.) | (b) | 4.375% | 01/30/2024 | 50,000 | 48,744 | |||||||||
Aviation Capital Group LLC (Diversified Financial Svs.) | (b) | 5.500% | 12/15/2024 | 148,000 | 145,371 | |||||||||
Aviation Capital Group LLC (Diversified Financial Svs.) | (b) | 4.125% | 08/01/2025 | 3,000 | 2,799 | |||||||||
Aviation Capital Group LLC (Diversified Financial Svs.) | (b) | 4.875% | 10/01/2025 | 57,000 | 53,712 | |||||||||
Aviation Capital Group LLC (Diversified Financial Svs.) | (b) | 1.950% | 01/30/2026 | 181,000 | 157,575 | |||||||||
Aviation Capital Group LLC (Diversified Financial Svs.) | (b) | 1.950% | 09/20/2026 | 2,008,000 | 1,701,100 | |||||||||
Aviation Capital Group LLC (Diversified Financial Svs.) | (b) | 3.500% | 11/01/2027 | 50,000 | 43,672 | |||||||||
Banco de Credito del Peru S.A. (Rate is fixed until 07/01/2025, at which point, the rate becomes H15T5Y + 300) (Banks) | (b)(c) | 3.125% | 07/01/2030 | 244,000 | 221,097 | |||||||||
Banco Santander SA (Rate is fixed until 03/24/2027, at which point, the rate becomes H15T1Y + 200) (Banks) | (c) | 4.175% | 03/24/2028 | 1,800,000 | 1,669,526 | |||||||||
Bank of America Corp. (Rate is fixed until 04/24/2027, at which point, the rate becomes QL + 151) (Banks) | (c) | 3.705% | 04/24/2028 | 501,000 | 463,622 | |||||||||
Bank of America Corp. (Rate is fixed until 04/27/2027, at which point, the rate becomes SOFR + 158) (Banks) | (c) | 4.376% | 04/27/2028 | 271,000 | 259,163 | |||||||||
Bank of America Corp. (Rate is fixed until 03/05/2028, at which point, the rate becomes QL + 107) (Banks) | (c) | 3.970% | 03/05/2029 | 177,000 | 163,322 | |||||||||
Bank of America Corp. (Rate is fixed until 04/29/2030, at which point, the rate becomes SOFR + 215) (Banks) | (c) | 2.592% | 04/29/2031 | 1,441,000 | 1,173,602 | |||||||||
Bank of Ireland Group PLC (Rate is fixed until 09/16/2025, at which point, the rate becomes H15T1Y + 265) (Banks) | (b)(c) | 6.253% | 09/16/2026 | 354,000 | 351,162 | |||||||||
Barclays PLC (Rate is fixed until 11/02/2027, at which point, the rate becomes H15T1Y + 330) (Banks) | (c) | 7.385% | 11/02/2028 | 889,000 | 926,630 | |||||||||
BNP Paribas SA (Rate is fixed until 02/25/2031, at which point, the rate becomes H15T5Y + 334) (Banks) | (c) | 4.625% | Perpetual | 877,000 | 677,571 | |||||||||
BNP Paribas SA (Rate is fixed until 11/19/2024, at which point, the rate becomes QL + 111) (Banks) | (b)(c) | 2.819% | 11/19/2025 | 2,170,000 | 2,055,594 | |||||||||
BNP Paribas SA (Rate is fixed until 01/13/2030, at which point, the rate becomes SOFR + 151) (Banks) | (b)(c) | 3.052% | 01/13/2031 | 333,000 | 272,908 | |||||||||
Capital One Financial Corp. (Rate is fixed until 05/10/2027, at which point, the rate becomes SOFR + 206) (Consumer Finance) | (c) | 4.927% | 05/10/2028 | 197,000 | 190,717 | |||||||||
Capital One Financial Corp. (Rate is fixed until 03/01/2029, at which point, the rate becomes SOFR + 179) (Consumer Finance) | (c) | 3.273% | 03/01/2030 | 1,651,000 | 1,411,555 | |||||||||
Citigroup, Inc. (Rate is fixed until 01/10/2027, at which point, the rate becomes QL + 156) (Banks) | (c) | 3.887% | 01/10/2028 | 1,538,000 | 1,437,212 | |||||||||
Citigroup, Inc. (Rate is fixed until 04/23/2028, at which point, the rate becomes QL + 119) (Banks) | (c) | 4.075% | 04/23/2029 | 212,000 | 195,075 | |||||||||
Citigroup, Inc. (Rate is fixed until 03/20/2029, at which point, the rate becomes QL + 134) (Banks) | (c) | 3.980% | 03/20/2030 | 145,000 | 130,773 | |||||||||
Citigroup, Inc. (Rate is fixed until 03/31/2030, at which point, the rate becomes SOFR + 391) (Banks) | (c) | 4.412% | 03/31/2031 | 380,000 | 348,953 | |||||||||
Cloverie PLC for Zurich Insurance Co. Ltd. (Rate is fixed until 06/24/2026, at which point, the rate becomes QL + 492) (Insurance) | (c) | 5.625% | 06/24/2046 | 1,116,000 | 1,088,100 | |||||||||
Cooperatieve Rabobank UA (Rate is fixed until 04/10/2024, at which point, the rate becomes USSW5 + 189) (Banks) | (c) | 4.000% | 04/10/2029 | 1,000,000 | 954,349 | |||||||||
Credit Suisse Group AG (Rate is fixed until 08/11/2027, at which point, the rate becomes H15T5Y + 489) (Capital Markets) | (c) | 5.250% | Perpetual | 641,000 | 417,087 | |||||||||
Credit Suisse Group AG (Rate is fixed until 06/05/2025, at which point, the rate becomes SOFR + 204) (Capital Markets) | (b)(c) | 2.193% | 06/05/2026 | 1,445,000 | 1,234,162 | |||||||||
Credit Suisse Group AG (Rate is fixed until 07/15/2025, at which point, the rate becomes SOFR + 334) (Capital Markets) | (b)(c) | 6.373% | 07/15/2026 | 753,000 | 706,953 | |||||||||
Danske Bank A/S (Rate is fixed until 04/01/2027, at which point, the rate becomes H15T1Y + 175) (Banks) | (b)(c) | 4.298% | 04/01/2028 | 1,829,000 | 1,681,807 | |||||||||
Deutsche Bank AG (Rate is fixed until 07/14/2025, at which point, the rate becomes SOFR + 319) (Banks) | (c) | 6.119% | 07/14/2026 | 256,000 | 254,287 | |||||||||
Deutsche Bank AG (Rate is fixed until 01/07/2027, at which point, the rate becomes SOFR + 132) (Banks) | (c) | 2.552% | 01/07/2028 | 204,000 | 173,409 | |||||||||
Federation des Caisses Desjardins du Quebec (Banks) | (b) | 4.550% | 08/23/2027 | 883,000 | 848,246 | |||||||||
General Motors Financial Co., Inc. (Consumer Finance) | 4.350% | 01/17/2027 | 99,000 | 94,069 | ||||||||||
General Motors Financial Co., Inc. (Consumer Finance) | 2.400% | 10/15/2028 | 1,366,000 | 1,132,695 | ||||||||||
| 99 | (continued) |
Ohio National Fund, Inc. | ON Risk Managed Balanced Portfolio (Continued) | |
| Schedule of Investments | December 31, 2022 | |
| Corporate Bonds (Continued) | Rate | Maturity | Face Amount | Value | ||||||||||
| ||||||||||||||
FINANCIALS (continued) | ||||||||||||||
General Motors Financial Co., Inc. (Consumer Finance) | 4.300% | 04/06/2029 | $ | 126,000 | $ | 112,859 | ||||||||
Goldman Sachs Group, Inc. / The (Rate is fixed until 04/22/2031, at which point, the rate becomes SOFR + 128) (Capital Markets) | (c) | 2.615% | 04/22/2032 | 2,059,000 | 1,642,034 | |||||||||
Goldman Sachs Group, Inc. / The (Rate is fixed until 07/21/2031, at which point, the rate becomes SOFR + 125) (Capital Markets) | (c) | 2.383% | 07/21/2032 | 103,000 | 79,919 | |||||||||
Harley-Davidson Financial Services, Inc. (Consumer Finance) | (b) | 3.050% | 02/14/2027 | 912,000 | 812,209 | |||||||||
HSBC Holdings PLC (Rate is fixed until 11/03/2025, at which point, the rate becomes SOFR + 303) (Banks) | (c) | 7.336% | 11/03/2026 | 1,649,000 | 1,715,078 | |||||||||
HSBC Holdings PLC (Rate is fixed until 08/11/2032, at which point, the rate becomes SOFR + 287) (Banks) | (c) | 5.402% | 08/11/2033 | 334,000 | 309,292 | |||||||||
ING Bank N.V. (Banks) | (b) | 5.800% | 09/25/2023 | 1,306,000 | 1,304,300 | |||||||||
ING Groep N.V. (Rate is fixed until 03/28/2027, at which point, the rate becomes SOFR + 183) (Banks) | (c) | 4.017% | 03/28/2028 | 209,000 | 195,432 | |||||||||
Intesa Sanpaolo SpA (Banks) | (b) | 7.000% | 11/21/2025 | 256,000 | 261,087 | |||||||||
JPMorgan Chase & Co. (Rate is fixed until 12/15/2024, at which point, the rate becomes SOFR + 107) (Banks) | (c) | 5.546% | 12/15/2025 | 1,242,000 | 1,242,022 | |||||||||
JPMorgan Chase & Co. (Rate is fixed until 12/05/2028, at which point, the rate becomes QL + 133) (Banks) | (c) | 4.452% | 12/05/2029 | 1,465,000 | 1,376,158 | |||||||||
JPMorgan Chase & Co. (Rate is fixed until 10/15/2029, at which point, the rate becomes SOFR + 151) (Banks) | (c) | 2.739% | 10/15/2030 | 218,000 | 182,818 | |||||||||
JPMorgan Chase & Co. (Rate is fixed until 03/24/2030, at which point, the rate becomes SOFR + 379) (Banks) | (c) | 4.493% | 03/24/2031 | 171,000 | 159,706 | |||||||||
JPMorgan Chase & Co. (Rate is fixed until 04/22/2031, at which point, the rate becomes SOFR + 125) (Banks) | (c) | 2.580% | 04/22/2032 | 458,000 | 366,876 | |||||||||
Lloyds Banking Group PLC (Rate is fixed until 11/15/2032, at which point, the rate becomes H15T1Y + 375) (Banks) | (c) | 7.953% | 11/15/2033 | 611,000 | 646,744 | |||||||||
Mizuho Financial Group, Inc. (Rate is fixed until 09/13/2029, at which point, the rate becomes SOFR + 157) (Banks) | (c) | 2.869% | 09/13/2030 | 1,261,000 | 1,054,527 | |||||||||
Morgan Stanley (Rate is fixed until 04/20/2027, at which point, the rate becomes SOFR + 161) (Capital Markets) | (c) | 4.210% | 04/20/2028 | 1,992,000 | 1,894,579 | |||||||||
Morgan Stanley (Rate is fixed until 10/18/2027, at which point, the rate becomes SOFR + 224) (Capital Markets) | (c) | 6.296% | 10/18/2028 | 79,000 | 81,552 | |||||||||
Nationwide Building Society (Thrifts & Mortgage Finance) | (b) | 4.000% | 09/14/2026 | 1,299,000 | 1,181,368 | |||||||||
Nationwide Building Society (Rate is fixed until 02/16/2027, at which point, the rate becomes SOFR + 129) (Thrifts & Mortgage Finance) | (b)(c) | 2.972% | 02/16/2028 | 368,000 | 323,471 | |||||||||
NatWest Group PLC (Rate is fixed until 11/10/2025, at which point, the rate becomes H15T1Y + 285) (Banks) | (c) | 7.472% | 11/10/2026 | 429,000 | 446,417 | |||||||||
Nomura Holdings, Inc. (Capital Markets) | 2.999% | 01/22/2032 | 1,330,000 | 1,043,459 | ||||||||||
S&P Global, Inc. (Capital Markets) | (b) | 4.750% | 08/01/2028 | 16,000 | 15,813 | |||||||||
S&P Global, Inc. (Capital Markets) | (b) | 4.250% | 05/01/2029 | 66,000 | 62,997 | |||||||||
Santander Holdings U.S.A., Inc. (Rate is fixed until 01/06/2027, at which point, the rate becomes SOFR + 125) (Banks) | (c) | 2.490% | 01/06/2028 | 1,365,000 | 1,171,146 | |||||||||
Santander U.K. Group Holdings PLC (Rate is fixed until 01/11/2027, at which point, the rate becomes SOFR + 122) (Banks) | (c) | 2.469% | 01/11/2028 | 1,374,000 | 1,173,340 | |||||||||
Societe Generale SA (Rate is fixed until 01/19/2027, at which point, the rate becomes H15T1Y + 130) (Banks) | (b)(c) | 2.797% | 01/19/2028 | 380,000 | 332,465 | |||||||||
Standard Chartered PLC (Rate is fixed until 11/16/2024, at which point, the rate becomes H15T1Y + 310) (Banks) | (b)(c) | 7.776% | 11/16/2025 | 274,000 | 282,192 | |||||||||
Standard Chartered PLC (Rate is fixed until 03/30/2025, at which point, the rate becomes H15T1Y + 165) (Banks) | (b)(c) | 3.971% | 03/30/2026 | 1,839,000 | 1,756,508 | |||||||||
Swedbank AB (Rate is fixed until 09/17/2024, at which point, the rate becomes H15T5Y + 413) (Banks) | (c) | 5.625% | Perpetual | 200,000 | 191,292 | |||||||||
Swiss Re Finance Luxembourg SA (Rate is fixed until 04/02/2029, at which point, the rate becomes H15T5Y + 358) (Insurance) | (c) | 5.000% | 04/02/2049 | 200,000 | 184,148 | |||||||||
Synchrony Financial (Consumer Finance) | 4.875% | 06/13/2025 | 696,000 | 678,154 | ||||||||||
Synchrony Financial (Consumer Finance) | 3.950% | 12/01/2027 | 720,000 | 642,131 | ||||||||||
UBS Group AG (Rate is fixed until 05/12/2025, at which point, the rate becomes H15T1Y + 155) (Capital Markets) | (b)(c) | 4.488% | 05/12/2026 | 267,000 | 260,956 | |||||||||
UniCredit SpA (Rate is fixed until 06/03/2031, at which point, the rate becomes H15T1Y + 155) (Banks) | (b)(c) | 3.127% | 06/03/2032 | 200,000 | 150,324 | |||||||||
Wells Fargo & Co. (Rate is fixed until 10/30/2029, at which point, the rate becomes TSFR3M + 143) (Banks) | (c) | 2.879% | 10/30/2030 | 298,000 | 253,123 | |||||||||
Wells Fargo & Co. (Rate is fixed until 04/04/2030, at which point, the rate becomes SOFR + 403) (Banks) | (c) | 4.478% | 04/04/2031 | 2,033,000 | 1,905,746 | |||||||||
|
| |||||||||||||
| 51,792,415 | ||||||||||||||
|
| |||||||||||||
HEALTH CARE – 0.6% | ||||||||||||||
AbbVie, Inc. (Biotechnology) | 2.800% | 03/15/2023 | 14,000 | 13,944 | ||||||||||
AbbVie, Inc. (Biotechnology) | 2.600% | 11/21/2024 | 165,000 | 157,849 | ||||||||||
| 100 | (continued) |
Ohio National Fund, Inc. | ON Risk Managed Balanced Portfolio (Continued) | |
| Schedule of Investments | December 31, 2022 | |
| Corporate Bonds (Continued) | Rate | Maturity | Face Amount | Value | ||||||||||
| ||||||||||||||
HEALTH CARE (continued) | ||||||||||||||
AbbVie, Inc. (Biotechnology) | 3.800% | 03/15/2025 | $ | 1,235,000 | $ | 1,203,643 | ||||||||
Amgen, Inc. (Biotechnology) | 3.350% | 02/22/2032 | 159,000 | 138,867 | ||||||||||
Bayer U.S. Finance II LLC (Pharmaceuticals) | (b) | 5.500% | 07/30/2035 | 879,000 | 840,512 | |||||||||
Bristol-Myers Squibb Co. (Pharmaceuticals) | 3.400% | 07/26/2029 | 624,000 | 577,476 | ||||||||||
Centene Corp. (Health Care Providers & Svs.) | 4.625% | 12/15/2029 | 376,000 | 343,602 | ||||||||||
Centene Corp. (Health Care Providers & Svs.) | 3.375% | 02/15/2030 | 212,000 | 179,218 | ||||||||||
Cigna Corp. (Health Care Providers & Svs.) | 2.400% | 03/15/2030 | 1,334,000 | 1,117,526 | ||||||||||
Cigna Corp. (Health Care Providers & Svs.) | 3.200% | 03/15/2040 | 52,000 | 39,231 | ||||||||||
Cigna Corp. (Health Care Providers & Svs.) | 3.400% | 03/15/2050 | 78,000 | 55,281 | ||||||||||
CVS Health Corp. (Health Care Providers & Svs.) | 3.000% | 08/15/2026 | 33,000 | 30,824 | ||||||||||
CVS Health Corp. (Health Care Providers & Svs.) | 4.300% | 03/25/2028 | 682,000 | 659,660 | ||||||||||
DH Europe Finance II SARL (Health Care Equip. & Supplies) | 2.200% | 11/15/2024 | 129,000 | 122,912 | ||||||||||
DH Europe Finance II SARL (Health Care Equip. & Supplies) | 2.600% | 11/15/2029 | 71,000 | 62,198 | ||||||||||
Medline Borrower LP (Health Care Equip. & Supplies) | (b) | 3.875% | 04/01/2029 | 240,000 | 193,430 | |||||||||
Pfizer, Inc. (Pharmaceuticals) | 2.625% | 04/01/2030 | 1,080,000 | 948,696 | ||||||||||
Zoetis, Inc. (Pharmaceuticals) | 5.400% | 11/14/2025 | 675,000 | 688,485 | ||||||||||
|
| |||||||||||||
| 7,373,354 | ||||||||||||||
|
| |||||||||||||
INDUSTRIALS – 1.0% | ||||||||||||||
Air Lease Corp. (Trading Companies & Distributors) | 2.875% | 01/15/2026 | 28,000 | 25,907 | ||||||||||
Air Lease Corp. (Trading Companies & Distributors) | 3.625% | 04/01/2027 | 15,000 | 13,667 | ||||||||||
Air Lease Corp. (Trading Companies & Distributors) | 2.100% | 09/01/2028 | 107,000 | 87,151 | ||||||||||
Air Lease Corp. (Trading Companies & Distributors) | 4.625% | 10/01/2028 | 883,000 | 825,906 | ||||||||||
Aircastle Ltd. (Trading Companies & Distributors) | 4.125% | 05/01/2024 | 58,000 | 56,066 | ||||||||||
Aircastle Ltd. (Trading Companies & Distributors) | (b) | 5.250% | 08/11/2025 | 1,269,000 | 1,220,445 | |||||||||
Aircastle Ltd. (Trading Companies & Distributors) | 4.250% | 06/15/2026 | 21,000 | 19,749 | ||||||||||
Aircastle Ltd. (Trading Companies & Distributors) | (b) | 2.850% | 01/26/2028 | 332,000 | 271,528 | |||||||||
BAE Systems PLC (Aerospace & Defense) | (b) | 3.400% | 04/15/2030 | 200,000 | 176,483 | |||||||||
Carrier Global Corp. (Building Products) | 2.242% | 02/15/2025 | 21,000 | 19,781 | ||||||||||
Carrier Global Corp. (Building Products) | 2.493% | 02/15/2027 | 26,000 | 23,437 | ||||||||||
CNH Industrial Capital LLC (Machinery) | 3.950% | 05/23/2025 | 205,000 | 198,855 | ||||||||||
Delta Air Lines, Inc. / SkyMiles IP Ltd. (Airlines) | (b) | 4.500% | 10/20/2025 | 859,058 | 838,081 | |||||||||
Delta Air Lines, Inc. / SkyMiles IP Ltd. (Airlines) | (b) | 4.750% | 10/20/2028 | 156,000 | 146,636 | |||||||||
Embraer Netherlands Finance B.V. (Aerospace & Defense) | (b) | 6.950% | 01/17/2028 | 647,000 | 647,000 | |||||||||
ENA Master Trust (Transportation Infrastructure) | (b) | 4.000% | 05/19/2048 | 203,000 | 142,097 | |||||||||
Equifax, Inc. (Professional Svs.) | 2.600% | 12/01/2024 | 1,138,000 | 1,084,725 | ||||||||||
Equifax, Inc. (Professional Svs.) | 2.600% | 12/15/2025 | 147,000 | 136,734 | ||||||||||
Equifax, Inc. (Professional Svs.) | 3.100% | 05/15/2030 | 240,000 | 201,923 | ||||||||||
Flowserve Corp. (Machinery) | 2.800% | 01/15/2032 | 1,801,000 | 1,349,030 | ||||||||||
General Dynamics Corp. (Aerospace & Defense) | 3.625% | 04/01/2030 | 1,205,000 | 1,119,846 | ||||||||||
Huntington Ingalls Industries, Inc. (Aerospace & Defense) | 3.844% | 05/01/2025 | 205,000 | 198,073 | ||||||||||
Parker-Hannifin Corp. (Machinery) | 4.500% | 09/15/2029 | 868,000 | 831,761 | ||||||||||
RELX Capital, Inc. (Professional Svs.) | 4.750% | 05/20/2032 | 65,000 | 62,457 | ||||||||||
Westinghouse Air Brake Technologies Corp. (Machinery) | 4.400% | 03/15/2024 | 1,125,000 | 1,106,667 | ||||||||||
Westinghouse Air Brake Technologies Corp. (Machinery) | 3.200% | 06/15/2025 | 45,000 | 42,365 | ||||||||||
|
| |||||||||||||
| 10,846,370 | ||||||||||||||
|
| |||||||||||||
INFORMATION TECHNOLOGY – 2.1% | ||||||||||||||
Apple, Inc. (Tech. Hardware, Storage & Periph.) | 1.250% | 08/20/2030 | 1,070,000 | 842,373 | ||||||||||
Apple, Inc. (Tech. Hardware, Storage & Periph.) | 4.100% | 08/08/2062 | 663,000 | 551,094 | ||||||||||
Broadcom, Inc. (Semiconductors & Equip.) | (b) | 4.000% | 04/15/2029 | 36,000 | 32,704 | |||||||||
Broadcom, Inc. (Semiconductors & Equip.) | 4.150% | 11/15/2030 | 1,143,000 | 1,024,302 | ||||||||||
Broadcom, Inc. (Semiconductors & Equip.) | (b) | 4.150% | 04/15/2032 | 123,000 | 107,976 | |||||||||
Broadcom, Inc. (Semiconductors & Equip.) | (b) | 4.926% | 05/15/2037 | 180,000 | 157,026 | |||||||||
CDW LLC / CDW Finance Corp. (Electronic Equip., Instr. & Comp.) | 4.250% | 04/01/2028 | 1,196,000 | 1,100,715 | ||||||||||
Global Payments, Inc. (IT Svs.) | 3.200% | 08/15/2029 | 75,000 | 63,754 | ||||||||||
Global Payments, Inc. (IT Svs.) | 5.400% | 08/15/2032 | 544,000 | 518,079 | ||||||||||
HP, Inc. (Tech. Hardware, Storage & Periph.) | 5.500% | 01/15/2033 | 1,119,000 | 1,051,242 | ||||||||||
Infor, Inc. (Software) | (b) | 1.750% | 07/15/2025 | 1,696,000 | 1,532,088 | |||||||||
Intel Corp. (Semiconductors & Equip.) | 5.050% | 08/05/2062 | 888,000 | 779,012 | ||||||||||
International Business Machines Corp. (IT Svs.) | 4.900% | 07/27/2052 | 862,000 | 783,417 | ||||||||||
Kyndryl Holdings, Inc. (IT Svs.) | 2.050% | 10/15/2026 | 2,046,000 | 1,669,315 | ||||||||||
Lam Research Corp. (Semiconductors & Equip.) | 4.000% | 03/15/2029 | 816,000 | 777,008 | ||||||||||
Mastercard, Inc. (IT Svs.) | 3.350% | 03/26/2030 | 1,713,000 | 1,570,600 | ||||||||||
Micron Technology, Inc. (Semiconductors & Equip.) | 6.750% | 11/01/2029 | 1,089,000 | 1,106,181 | ||||||||||
NXP B.V. / NXP Funding LLC (Semiconductors & Equip.) | 5.550% | 12/01/2028 | 125,000 | 124,832 | ||||||||||
Oracle Corp. (Software) | 2.950% | 04/01/2030 | 1,796,000 | 1,531,274 | ||||||||||
Oracle Corp. (Software) | 2.875% | 03/25/2031 | 225,000 | 186,554 | ||||||||||
Oracle Corp. (Software) | 3.900% | 05/15/2035 | 1,039,000 | 868,877 | ||||||||||
Oracle Corp. (Software) | 3.600% | 04/01/2040 | 134,000 | 98,304 | ||||||||||
| 101 | (continued) |
Ohio National Fund, Inc. | ON Risk Managed Balanced Portfolio (Continued) | |
| Schedule of Investments | December 31, 2022 | |
| Corporate Bonds (Continued) | Rate | Maturity | Face Amount | Value | ||||||||||
| ||||||||||||||
INFORMATION TECHNOLOGY (continued) | ||||||||||||||
Oracle Corp. (Software) | 5.375% | 07/15/2040 | $ | 43,000 | $ | 39,459 | ||||||||
Oracle Corp. (Software) | 3.650% | 03/25/2041 | 77,000 | 56,841 | ||||||||||
PayPal Holdings, Inc. (IT Svs.) | 2.850% | 10/01/2029 | 1,440,000 | 1,254,309 | ||||||||||
SK Hynix, Inc. (Semiconductors & Equip.) | (b) | 2.375% | 01/19/2031 | 304,000 | 222,882 | |||||||||
Skyworks Solutions, Inc. (Semiconductors & Equip.) | 3.000% | 06/01/2031 | 1,331,000 | 1,043,945 | ||||||||||
VeriSign, Inc. (IT Svs.) | 2.700% | 06/15/2031 | 1,408,000 | 1,146,698 | ||||||||||
Visa, Inc. (IT Svs.) | 1.900% | 04/15/2027 | 452,000 | 407,060 | ||||||||||
Visa, Inc. (IT Svs.) | 2.050% | 04/15/2030 | 220,000 | 185,900 | ||||||||||
VMware, Inc. (Software) | 4.500% | 05/15/2025 | 954,000 | 935,503 | ||||||||||
VMware, Inc. (Software) | 4.650% | 05/15/2027 | 293,000 | 283,598 | ||||||||||
Western Digital Corp. (Tech. Hardware, Storage & Periph.) | 2.850% | 02/01/2029 | 1,595,000 | 1,234,004 | ||||||||||
Workday, Inc. (Software) | 3.700% | 04/01/2029 | 42,000 | 38,533 | ||||||||||
Workday, Inc. (Software) | 3.800% | 04/01/2032 | 1,100,000 | 971,011 | ||||||||||
|
| |||||||||||||
| 24,296,470 | ||||||||||||||
|
| |||||||||||||
MATERIALS – 0.4% | ||||||||||||||
Anglo American Capital PLC (Metals & Mining) | (b) | 3.875% | 03/16/2029 | 355,000 | 318,714 | |||||||||
Celanese U.S. Holdings LLC (Chemicals) | 5.900% | 07/05/2024 | 869,000 | 868,720 | ||||||||||
CSN Resources SA (Metals & Mining) | 5.875% | 04/08/2032 | 787,000 | 657,675 | ||||||||||
Freeport Indonesia PT (Metals & Mining) | (b) | 4.763% | 04/14/2027 | 749,000 | 719,040 | |||||||||
Freeport Indonesia PT (Metals & Mining) | 4.763% | 04/14/2027 | 350,000 | 336,000 | ||||||||||
Nucor Corp. (Metals & Mining) | 4.300% | 05/23/2027 | 685,000 | 668,233 | ||||||||||
Stillwater Mining Co. (Metals & Mining) | (b) | 4.000% | 11/16/2026 | 300,000 | 263,250 | |||||||||
Suzano Austria GmbH (Paper & Forest Products) | 3.750% | 01/15/2031 | 56,000 | 46,980 | ||||||||||
Volcan Cia Minera S.A.A. (Metals & Mining) | (b) | 4.375% | 02/11/2026 | 31,000 | 26,708 | |||||||||
W.R. Grace Holdings LLC (Chemicals) | (b) | 4.875% | 06/15/2027 | 551,000 | 488,258 | |||||||||
|
| |||||||||||||
| 4,393,578 | ||||||||||||||
|
| |||||||||||||
REAL ESTATE – 0.5% | ||||||||||||||
American Tower Corp. (Equity REIT) | 3.650% | 03/15/2027 | 138,000 | 128,889 | ||||||||||
American Tower Corp. (Equity REIT) | 3.800% | 08/15/2029 | 1,455,000 | 1,319,937 | ||||||||||
American Tower Corp. (Equity REIT) | 4.050% | 03/15/2032 | 70,000 | 62,426 | ||||||||||
Camden Property Trust (Equity REIT) | 2.800% | 05/15/2030 | 1,197,000 | 1,029,933 | ||||||||||
Crown Castle, Inc. (Equity REIT) | 3.650% | 09/01/2027 | 133,000 | 123,535 | ||||||||||
Crown Castle, Inc. (Equity REIT) | 4.300% | 02/15/2029 | 154,000 | 145,428 | ||||||||||
Crown Castle, Inc. (Equity REIT) | 3.100% | 11/15/2029 | 279,000 | 243,189 | ||||||||||
Crown Castle, Inc. (Equity REIT) | 3.300% | 07/01/2030 | 67,000 | 58,611 | ||||||||||
Equinix, Inc. (Equity REIT) | 3.200% | 11/18/2029 | 1,689,000 | 1,470,142 | ||||||||||
Vornado Realty LP (Equity REIT) | 3.400% | 06/01/2031 | 1,326,000 | 985,910 | ||||||||||
|
| |||||||||||||
| 5,568,000 | ||||||||||||||
|
| |||||||||||||
UTILITIES – 1.1% | ||||||||||||||
AES Panama Generation Holdings SRL (Electric Utilities) | (b) | �� | 4.375% | 05/31/2030 | 285,000 | 247,579 | ||||||||
AES Panama Generation Holdings SRL (Electric Utilities) | 4.375% | 05/31/2030 | 241,000 | 209,357 | ||||||||||
Ameren Corp. (Multi-Utilities) | 3.500% | 01/15/2031 | 669,000 | 591,672 | ||||||||||
American Water Capital Corp. (Water Utilities) | 2.800% | 05/01/2030 | 1,002,000 | 866,364 | ||||||||||
Chile Electricity PEC SpA (Electric Utilities) | (b) | 0.000% | 01/25/2028 | 460,000 | 328,203 | |||||||||
Comision Federal de Electricidad (Electric Utilities) | (b) | 4.688% | 05/15/2029 | 221,000 | 195,459 | |||||||||
Comision Federal de Electricidad (Electric Utilities) | 3.348% | 02/09/2031 | 1,177,000 | 918,685 | ||||||||||
Comision Federal de Electricidad (Electric Utilities) | (b) | 3.348% | 02/09/2031 | 236,000 | 184,205 | |||||||||
Dominion Energy, Inc. (Multi-Utilities) | 3.375% | 04/01/2030 | 1,554,000 | 1,369,410 | ||||||||||
Duke Energy Carolinas NC Storm Funding LLC (Electric Utilities) | 2.617% | 07/01/2041 | 200,000 | 145,704 | ||||||||||
Enel Chile SA (Electric Utilities) | 4.875% | 06/12/2028 | 688,000 | 670,455 | ||||||||||
Enel Finance International N.V. (Electric Utilities) | (b) | 7.500% | 10/14/2032 | 800,000 | 845,414 | |||||||||
Engie Energia Chile SA (Electric Utilities) | 3.400% | 01/28/2030 | 673,000 | 549,499 | ||||||||||
NRG Energy, Inc. (Electric Utilities) | (b) | 3.750% | 06/15/2024 | 308,000 | 296,646 | |||||||||
Oncor Electric Delivery Co. LLC (Electric Utilities) | 3.700% | 11/15/2028 | 1,164,000 | 1,097,729 | ||||||||||
Pacific Gas and Electric Co. (Electric Utilities) | 4.400% | 03/01/2032 | 985,000 | 859,721 | ||||||||||
Public Service Enterprise Group, Inc. (Multi-Utilities) | 5.850% | 11/15/2027 | 786,000 | 808,830 | ||||||||||
Southern Co. / The (Electric Utilities) | 3.700% | 04/30/2030 | 2,032,000 | 1,833,927 | ||||||||||
|
| |||||||||||||
| 12,018,859 | ||||||||||||||
|
| |||||||||||||
Total Corporate Bonds (Cost $195,161,639) | $ | 182,845,020 | ||||||||||||
|
| |||||||||||||
| U.S. Treasury Obligations – 14.2% | Rate | Maturity | Face Amount | Value | ||||||||||
| ||||||||||||||
U.S. Treasury Note | 2.500% | 04/30/2024 | $ | 14,158,400 | $ | 13,755,771 | ||||||||
U.S. Treasury Note | 3.000% | 06/30/2024 | 2,293,600 | 2,238,679 | ||||||||||
U.S. Treasury Note | (d) | 2.250% | 11/15/2024 | 1,865,000 | 1,791,201 | |||||||||
U.S. Treasury Note | (d) | 0.500% | 03/31/2025 | 6,986,200 | 6,416,388 | |||||||||
U.S. Treasury Note | 2.750% | 07/31/2027 | 24,758,600 | 23,424,924 | ||||||||||
| 102 | (continued) |
Ohio National Fund, Inc. | ON Risk Managed Balanced Portfolio (Continued) | |
| Schedule of Investments | December 31, 2022 | |
| U.S. Treasury Obligations (Continued) | Rate | Maturity | Face Amount | Value | ||||||||||
| ||||||||||||||
U.S. Treasury Note | 4.125% | 10/31/2027 | $ | 2,729,700 | $ | 2,739,723 | ||||||||
U.S. Treasury Note | 3.875% | 11/30/2027 | 31,496,400 | 31,324,154 | ||||||||||
U.S. Treasury Note | 3.875% | 12/31/2027 | 1,803,600 | 1,793,173 | ||||||||||
U.S. Treasury Note | (d) | 1.875% | 02/15/2032 | 37,869,800 | 32,125,721 | |||||||||
U.S. Treasury Note | 4.125% | 11/15/2032 | 1,487,300 | 1,517,743 | ||||||||||
U.S. Treasury Note | 1.750% | 08/15/2041 | 2,584,800 | 1,768,872 | ||||||||||
U.S. Treasury Note | 2.000% | 11/15/2041 | 656,500 | 468,756 | ||||||||||
U.S. Treasury Note | 2.375% | 02/15/2042 | 268,200 | 204,775 | ||||||||||
U.S. Treasury Note | 3.250% | 05/15/2042 | 24,263,600 | 21,272,353 | ||||||||||
U.S. Treasury Note | (d) | 2.750% | 08/15/2042 | 2,036,600 | 1,637,474 | |||||||||
U.S. Treasury Note | 4.000% | 11/15/2042 | 2,942,700 | 2,881,087 | ||||||||||
U.S. Treasury Note | 2.250% | 08/15/2049 | 1,246,800 | 876,461 | ||||||||||
U.S. Treasury Note | 2.375% | 11/15/2049 | 338,600 | 244,718 | ||||||||||
U.S. Treasury Note | 1.875% | 02/15/2051 | 263,000 | 167,149 | ||||||||||
U.S. Treasury Note | 2.375% | 05/15/2051 | 338,200 | 242,632 | ||||||||||
U.S. Treasury Note | 2.000% | 08/15/2051 | 866,300 | 567,223 | ||||||||||
U.S. Treasury Note | (d) | 2.250% | 02/15/2052 | 16,994,700 | 11,817,955 | |||||||||
U.S. Treasury Note | 2.875% | 05/15/2052 | 1,371,700 | 1,099,075 | ||||||||||
U.S. Treasury Note | 4.000% | 11/15/2052 | 1,362,900 | 1,364,817 | ||||||||||
|
| |||||||||||||
Total U.S. Treasury Obligations (Cost $ 175,793,235) | $ | 161,740,824 | ||||||||||||
|
| |||||||||||||
| Asset-Backed / Mortgage-Backed Securities – 6.3% | Rate | Maturity | Face Amount | Value | ||||||||||
| ||||||||||||||
CONSUMER DISCRETIONARY – 0.0% | ||||||||||||||
Domino’s Pizza Master Issuer LLC 2021-1A A2I | (b) | 2.662% | 04/25/2051 | $ | 173,360 | $ | 144,180 | |||||||
Great Wolf Trust 2019-WOLF C | (b) | TSFR1M + 175 | 12/15/2036 | 79,000 | 75,422 | |||||||||
Hardee’s Funding LLC 2018-1A A23 | (b) | 5.710% | 06/20/2048 | 127,949 | 117,745 | |||||||||
Hardee’s Funding LLC 2020-1A A2 | (b) | 3.981% | 12/20/2050 | 132,340 | 113,331 | |||||||||
|
| |||||||||||||
| 450,678 | ||||||||||||||
|
| |||||||||||||
FINANCIALS – 6.2% | ||||||||||||||
AB Issuer LLC 2021-1 A2 | (b) | 3.734% | 07/30/2051 | 317,600 | 253,288 | |||||||||
ACM Auto Trust 2022-1A A | (b) | 3.230% | 04/20/2029 | 81,409 | 81,200 | |||||||||
Affirm Asset Securitization Trust 2021-Z1 A | (b) | 1.070% | 08/15/2025 | 85,497 | 83,088 | |||||||||
Affirm Asset Securitization Trust 2021-Z2 A | (b) | 1.170% | 11/16/2026 | 54,168 | 51,822 | |||||||||
AGL CLO 2021-12A D | (b) | QL + 285 | 07/20/2034 | 250,000 | 230,031 | |||||||||
AGL CLO 10 Ltd. 2021-10A A | (b) | QL + 113 | 04/15/2034 | 600,000 | 582,694 | |||||||||
American Credit Acceptance Receivables Trust 2022-3 A | (b) | 4.120% | 02/13/2026 | 960,772 | 953,972 | |||||||||
Amur Equipment Finance Receivables XI LLC 2022-2A A2 | (b) | 5.300% | 06/21/2028 | 464,000 | 458,878 | |||||||||
AREIT 2022-CRE6 A | (b) | SOFR30A + 125 | 01/16/2037 | 491,980 | 470,973 | |||||||||
Atalaya Equipment Leasing Trust 2021-1A C | (b) | 2.690% | 06/15/2028 | 300,000 | 280,223 | |||||||||
Avant Loans Funding Trust 2021-REV1 A | (b) | 1.210% | 07/15/2030 | 441,000 | 420,026 | |||||||||
Bain Capital Credit CLO 2021-4A D | (b) | QL + 310 | 10/20/2034 | 250,000 | 224,305 | |||||||||
Balboa Bay Loan Funding 2020-1A AR | (b) | QL + 112 | 01/20/2032 | 1,500,000 | 1,464,661 | |||||||||
Balboa Bay Loan Funding 2021-1A D | (b) | QL + 305 | 07/20/2034 | 307,948 | 272,868 | |||||||||
Ballyrock CLO 15 Ltd. 2021-1A C | (b) | QL + 310 | 04/15/2034 | 250,000 | 219,903 | |||||||||
Ballyrock CLO 16 Ltd. 2021-16A C | (b) | QL + 290 | 07/20/2034 | 250,000 | 231,250 | |||||||||
Ballyrock CLO 17 Ltd. 2021-17A A1A | (b) | QL + 115 | 10/20/2034 | 1,000,000 | 969,818 | |||||||||
Ballyrock CLO 17 Ltd. 2021-17A C | (b) | QL + 305 | 10/20/2034 | 250,000 | 217,734 | |||||||||
Battalion Clo 17 Ltd. 2021-17A A1 | (b) | QL + 126 | 03/09/2034 | 600,000 | 583,429 | |||||||||
BBCMS 2020-BID A | (b) | ML + 214 | 10/15/2037 | 301,000 | 290,494 | |||||||||
Bellemeade RE 2021-3A A2 | (b) | SOFR30A + 100 | 09/25/2031 | 286,223 | 271,221 | |||||||||
Bellemeade Re 2022-1 M1C | (b) | SOFR30A + 370 | 01/26/2032 | 327,948 | 273,869 | |||||||||
Bellemeade Re 2022-2 M1A | (b) | SOFR30A + 400 | 09/27/2032 | 959,476 | 942,349 | |||||||||
Bellemeade Re Ltd. 2021-1A M1C | (b) | SOFR30A + 295 | 03/25/2031 | 167,482 | 159,994 | |||||||||
BFLD Trust 2021-FPM A | (b) | ML + 160 | 06/15/2038 | 462,000 | 440,657 | |||||||||
Brex Commercial Charge Card Master Trust 2021-1 A | (b) | 2.090% | 07/15/2024 | 167,000 | 165,188 | |||||||||
BX Commercial Mortgage Trust 2019-IMC E | (b) | ML + 215 | 04/15/2034 | 320,787 | 299,915 | |||||||||
Cajun Global LLC 2021-1 A2 | (b) | 3.931% | 11/20/2051 | 61,070 | 51,721 | |||||||||
Carvana Auto Receivables Trust 2021-N3 C | 1.020% | 06/12/2028 | 120,785 | 116,746 | ||||||||||
Carvana Auto Receivables Trust 2021-N4 D | 2.300% | 09/11/2028 | 128,000 | 116,219 | ||||||||||
CIFC Funding 2020-4A A | (b) | QL + 132 | 01/15/2034 | 260,000 | 254,823 | |||||||||
CNH Equipment Trust 2022-C A2 | 5.420% | 07/15/2026 | 1,014,000 | 1,017,823 | ||||||||||
College Ave Student Loans 2021-C C | (b) | 3.060% | 07/26/2055 | 136,800 | 108,972 | |||||||||
COMM 2015-LC23 C | 4.554% | 10/10/2048 | 100,000 | 89,471 | ||||||||||
Connecticut Avenue Securities Trust 2019-R02 1M2 | (b) | ML + 230 | 08/25/2031 | 4,330 | 4,324 | |||||||||
Connecticut Avenue Securities Trust 2019-R03 1M2 | (b) | ML + 215 | 09/25/2031 | 13,289 | 13,256 | |||||||||
Connecticut Avenue Securities Trust 2019-R04 2B1 | (b) | ML + 525 | 06/25/2039 | 853,598 | 876,146 | |||||||||
Connecticut Avenue Securities Trust 2019-R06 2B1 | (b) | ML + 375 | 09/25/2039 | 1,000,000 | 980,244 | |||||||||
Connecticut Avenue Securities Trust 2019-R07 1M2 | (b) | ML + 210 | 10/25/2039 | 20,620 | 20,569 | |||||||||
Connecticut Avenue Securities Trust 2020-R02 2M2 | (b) | ML + 200 | 01/25/2040 | 103,532 | 101,969 | |||||||||
| 103 | (continued) |
Ohio National Fund, Inc. | ON Risk Managed Balanced Portfolio (Continued) | |
| Schedule of Investments | December 31, 2022 | |
| Asset-Backed / Mortgage-Backed Securities (Continued) | Rate | Maturity | Face Amount | Value | ||||||||||
| ||||||||||||||
FINANCIALS (continued) | ||||||||||||||
Connecticut Avenue Securities Trust 2020-SBT1 1M2 | (b) | ML + 365 | 02/25/2040 | $ | 255,000 | $ | 251,847 | |||||||
Connecticut Avenue Securities Trust 2020-SBT1 2M2 | (b) | ML + 365 | 02/25/2040 | 270,000 | 271,448 | |||||||||
Connecticut Avenue Securities Trust 2021-R01 1M2 | (b) | SOFR30A + 155 | 10/25/2041 | 462,831 | 451,055 | |||||||||
Connecticut Avenue Securities Trust 2021-R03 1M2 | (b) | SOFR30A + 165 | 12/25/2041 | 117,550 | 110,872 | |||||||||
Connecticut Avenue Securities Trust 2022-R01 1B1 | (b) | SOFR30A + 315 | 12/25/2041 | 305,277 | 286,540 | |||||||||
Connecticut Avenue Securities Trust 2022-R02 2M1 | (b) | SOFR30A + 120 | 01/25/2042 | 290,196 | 283,812 | |||||||||
Connecticut Avenue Securities Trust 2022-R02 2M2 | (b) | SOFR30A + 300 | 01/25/2042 | 960,000 | 904,543 | |||||||||
Connecticut Avenue Securities Trust 2022-R03 1M1 | (b) | SOFR30A + 210 | 03/25/2042 | 1,202,261 | 1,193,901 | |||||||||
Connecticut Avenue Securities Trust 2022-R03 1M2 | (b) | SOFR30A + 350 | 03/25/2042 | 253,631 | 256,806 | |||||||||
Connecticut Avenue Securities Trust 2022-R04 1M2 | (b) | SOFR30A + 310 | 03/25/2042 | 63,262 | 63,025 | |||||||||
Connecticut Avenue Securities Trust 2022-R05 2M2 | (b) | SOFR30A + 300 | 04/25/2042 | 599,367 | 580,189 | |||||||||
Connecticut Avenue Securities Trust 2022-R06 1M1 | (b) | SOFR30A + 275 | 05/25/2042 | 1,350,196 | 1,367,013 | |||||||||
Connecticut Avenue Securities Trust 2022-R07 1M1 | (b) | SOFR30A + 295 | 06/25/2042 | 1,147,906 | 1,158,042 | |||||||||
Connecticut Avenue Securities Trust 2022-R08 1M1 | (b) | SOFR30A + 255 | 07/25/2042 | 1,026,272 | 1,029,494 | |||||||||
CPS Auto Receivables Trust 2021-B C | (b) | 1.230% | 03/15/2027 | 234,000 | 227,147 | |||||||||
CPS Auto Receivables Trust 2021-C D | (b) | 1.690% | 06/15/2027 | 210,000 | 192,365 | |||||||||
CPS Auto Receivables Trust 2022-D A | (b) | 6.090% | 01/15/2027 | 1,012,433 | 1,013,268 | |||||||||
Dext ABS 2021-1 C | (b) | 2.290% | 09/15/2028 | 264,000 | 234,366 | |||||||||
Dext ABS 2021-1 D | (b) | 2.810% | 03/15/2029 | 133,000 | 115,732 | |||||||||
Diamond Issuer 2021-1A B | (b) | 2.701% | 11/20/2051 | 271,624 | 221,197 | |||||||||
Donlen Fleet Lease Funding 2021-2 C | (b) | 1.200% | 12/11/2034 | 460,000 | 429,615 | |||||||||
Dryden 78 CLO Ltd. 2020-78A A | (b) | QL + 118 | 04/17/2033 | 1,500,000 | 1,463,890 | |||||||||
Eagle RE 2021-2 M1B | (b) | SOFR30A + 205 | 04/25/2034 | 152,272 | 148,284 | |||||||||
Elmwood CLO IX Ltd. 2021-2A D | (b) | QL + 295 | 07/20/2034 | 250,000 | 233,815 | |||||||||
Exeter Automobile Receivables Trust 2022-6A A2 | 5.730% | 11/17/2025 | 1,018,000 | 1,019,160 | ||||||||||
Fannie Mae Connecticut Avenue Securities 2014-C04 1M2 | ML + 490 | 11/25/2024 | 156,948 | 161,033 | ||||||||||
Fannie Mae Connecticut Avenue Securities 2015-C02 1M2 | ML + 400 | 05/25/2025 | 15,941 | 16,021 | ||||||||||
Fannie Mae Connecticut Avenue Securities 2015-C03 1M2 | ML + 500 | 07/25/2025 | 87,123 | 88,423 | ||||||||||
Fannie Mae Connecticut Avenue Securities 2015-C04 1M2 | ML + 570 | 04/25/2028 | 52,924 | 55,827 | ||||||||||
Fannie Mae Connecticut Avenue Securities 2016-C01 1M2 | ML + 675 | 08/25/2028 | 60,677 | 63,350 | ||||||||||
Fannie Mae Connecticut Avenue Securities 2017-C07 1B1 | ML + 400 | 05/25/2030 | 300,000 | 307,461 | ||||||||||
Fannie Mae Connecticut Avenue Securities 2018-C05 1M2 | ML + 235 | 01/25/2031 | 697,978 | 699,583 | ||||||||||
Fannie Mae Connecticut Avenue Securities 2018-C06 1M2 | ML + 200 | 03/25/2031 | 152,458 | 150,545 | ||||||||||
Fannie Mae Connecticut Avenue Securities 2021-R02 2B1 | (b) | SOFR30A + 330 | 11/25/2041 | 211,036 | 194,748 | |||||||||
Fannie Mae Connecticut Avenue Securities 2021-R02 2M2 | (b) | SOFR30A + 200 | 11/25/2041 | 1,000,000 | 930,061 | |||||||||
FHF Trust 2021-2A A | (b) | 0.830% | 12/15/2026 | 79,000 | 75,100 | |||||||||
First Investors Auto Owner Trust 2022-2A A | (b) | 6.260% | 07/15/2027 | 860,956 | 859,949 | |||||||||
Flatiron CLO 2021-1A D | (b) | QL + 290 | 07/19/2034 | 250,000 | 233,165 | |||||||||
Ford Credit Auto Owner Trust 2021-1 D | (b) | 2.310% | 10/17/2033 | 230,000 | 199,934 | |||||||||
Freddie Mac Multifamily Structured Credit Risk 2021-MN1 M1 | (b) | SOFR30A + 200 | 01/25/2051 | 29,550 | 27,655 | |||||||||
Freddie Mac REMICS FHR 4981 HS | (e) | ML + 610 | 06/25/2050 | 721,395 | 69,600 | |||||||||
Freddie Mac REMICS FHR 5015 BI | (e) | 4.000% | 09/25/2050 | 515,428 | 96,322 | |||||||||
Freddie Mac Stacr Remic Trust 2020-DNA1 M2 | (b) | ML + 170 | 01/25/2050 | 44,446 | 44,308 | |||||||||
Freddie Mac STACR REMIC Trust 2020-DNA5 M2 | (b) | SOFR30A + 280 | 10/25/2050 | 94,570 | 95,314 | |||||||||
Freddie Mac STACR REMIC Trust 2020-DNA6 M2 | (b) | SOFR30A + 200 | 12/25/2050 | 1,306,419 | 1,297,367 | |||||||||
Freddie Mac STACR REMIC Trust 2021-DNA3 B1 | (b) | SOFR30A + 350 | 10/25/2033 | 278,276 | 257,380 | |||||||||
Freddie Mac STACR REMIC Trust 2021-DNA5 B1 | (b) | SOFR30A + 305 | 01/25/2034 | 1,000,000 | 913,269 | |||||||||
Freddie Mac STACR REMIC Trust 2021-DNA6 M2 | (b) | SOFR30A + 150 | 10/25/2041 | 393,665 | 373,970 | |||||||||
Freddie Mac STACR REMIC Trust 2021-DNA7 M2 | (b) | SOFR30A + 180 | 11/25/2041 | 986,480 | 926,484 | |||||||||
Freddie Mac STACR REMIC Trust 2021-HQA2 M1 | (b) | SOFR30A + 70 | 12/25/2033 | 514,874 | 510,814 | |||||||||
Freddie Mac STACR REMIC Trust 2021-HQA3 M2 | (b) | SOFR30A + 210 | 09/25/2041 | 1,000,000 | 880,225 | |||||||||
Freddie Mac STACR REMIC Trust 2021-HQA4 M2 | (b) | SOFR30A + 235 | 12/25/2041 | 1,046,349 | 923,406 | |||||||||
Freddie Mac STACR REMIC Trust 2022-DNA1 M1B | (b) | SOFR30A + 185 | 01/25/2042 | 1,600,000 | 1,518,194 | |||||||||
Freddie Mac STACR REMIC Trust 2022-DNA1 M2 | (b) | SOFR30A + 250 | 01/25/2042 | 394,327 | 356,171 | |||||||||
Freddie Mac STACR REMIC Trust 2022-DNA2 M2 | (b) | SOFR30A + 375 | 02/25/2042 | 295,064 | 277,491 | |||||||||
Freddie Mac STACR REMIC Trust 2022-DNA3 M1A | (b) | SOFR30A + 200 | 04/25/2042 | 1,160,138 | 1,154,337 | |||||||||
Freddie Mac STACR REMIC Trust 2022-DNA3 M1B | (b) | SOFR30A + 290 | 04/25/2042 | 1,600,000 | 1,581,013 | |||||||||
Freddie Mac STACR REMIC Trust 2022-DNA3 M2 | (b) | SOFR30A + 435 | 04/25/2042 | 200,000 | 192,070 | |||||||||
Freddie Mac STACR REMIC Trust 2022-DNA4 M1B | (b) | SOFR30A + 335 | 05/25/2042 | 1,621,038 | 1,629,643 | |||||||||
Freddie Mac STACR REMIC Trust 2022-DNA5 M1B | (b) | SOFR30A + 450 | 06/25/2042 | 1,331,433 | 1,392,076 | |||||||||
Freddie Mac STACR REMIC Trust 2022-DNA6 M1A | (b) | SOFR30A + 215 | 09/25/2042 | 441,094 | 441,363 | |||||||||
Freddie Mac STACR REMIC Trust 2022-DNA7 M1A | (b) | SOFR30A + 250 | 03/25/2052 | 1,135,622 | 1,139,417 | |||||||||
Freddie Mac STACR REMIC Trust 2022-HQA1 M1B | (b) | SOFR30A + 350 | 03/25/2042 | 65,368 | 64,816 | |||||||||
Freddie Mac STACR Trust 2018-DNA2 B1 | (b) | ML + 370 | 12/25/2030 | 1,000,000 | 1,001,554 | |||||||||
Freddie Mac STACR Trust 2019-DNA4 M2 | (b) | ML + 195 | 10/25/2049 | 8,249 | 8,249 | |||||||||
Freddie Mac Structured Agency Credit Risk Debt Notes 2022-HQA2 M1A | (b) | SOFR30A + 265 | 07/25/2042 | 466,297 | 468,607 | |||||||||
FREED ABS Trust 2021-2 C | (b) | 1.940% | 06/19/2028 | 460,000 | 446,547 | |||||||||
Galaxy 30 Clo Ltd. 2022-30A D | (b) | TSFR3M + 335 | 04/15/2035 | 400,000 | 358,834 | |||||||||
GCI Funding I LLC 2021-1 A | (b) | 2.380% | 06/18/2046 | 142,755 | 121,265 | |||||||||
| 104 | (continued) |
Ohio National Fund, Inc. | ON Risk Managed Balanced Portfolio (Continued) | |
| Schedule of Investments | December 31, 2022 | |
| Asset-Backed / Mortgage-Backed Securities (Continued) | Rate | Maturity | Face Amount | Value | ||||||||||
| ||||||||||||||
FINANCIALS (continued) | ||||||||||||||
Goldentree Loan Management U.S. Clo 7 Ltd. 2020-7A AR | (b) | QL + 107 | 04/20/2034 | $ | 250,000 | $ | 241,237 | |||||||
Hertz Vehicle Financing III LLC 2022-1A C | (b) | 2.630% | 06/25/2026 | 220,000 | 195,227 | |||||||||
HFX Funding Issuer 2017-1 | (b) | 3.652% | 03/15/2035 | 280,000 | 259,515 | |||||||||
Home RE 2021-2 M1B | (b) | SOFR30A + 160 | 01/25/2034 | 222,490 | 217,112 | |||||||||
Invesco CLO 2021-1A A1 | (b) | QL + 100 | 04/15/2034 | 1,700,000 | 1,645,664 | |||||||||
JP Morgan Chase Commercial Mortgage Securities Trust 2013-C10 B | 3.674% | 12/15/2047 | 300,000 | 291,115 | ||||||||||
JPMBB Commercial Mortgage Securities Trust 2013-C15 AS | 4.420% | 11/15/2045 | 250,000 | 245,553 | ||||||||||
JPMBB Commercial Mortgage Securities Trust 2014-C21 C | 4.644% | 08/15/2047 | 295,000 | 271,353 | ||||||||||
JPMBB Commercial Mortgage Securities Trust 2015-C27 AS | 3.634% | 02/15/2048 | 130,694 | 123,395 | ||||||||||
LAD Auto Receivables Trust 2021-1A C | (b) | 2.350% | 04/15/2027 | 406,000 | 369,436 | |||||||||
LAD Auto Receivables Trust 2022-1A A | (b) | 5.210% | 06/15/2027 | 712,421 | 701,010 | |||||||||
Morgan Stanley Capital I Trust 2018-H3 AS | 4.429% | 07/15/2051 | 270,000 | 248,689 | ||||||||||
MVW 2021-2A C | (b) | 2.230% | 05/20/2039 | 336,351 | 297,531 | |||||||||
Neighborly Issuer 2022-1A A2 | (b) | 3.695% | 01/30/2052 | 226,290 | 179,366 | |||||||||
Neighborly Issuer LLC 2021-1A A2 | (b) | 3.584% | 04/30/2051 | 124,728 | 99,802 | |||||||||
Nelnet Student Loan Trust 2021-BA B | (b) | 2.680% | 04/20/2062 | 100,000 | 79,442 | |||||||||
Nelnet Student Loan Trust 2021-DA C | (b) | 3.500% | 04/20/2062 | 100,000 | 77,970 | |||||||||
Neuberger Berman Loan Advisers Clo 2021-42A D | (b) | QL + 280 | 07/16/2035 | 301,613 | 272,822 | |||||||||
Neuberger Berman Loan Advisers Clo 43 Ltd. 2021-43A D | (b) | QL + 310 | 07/17/2035 | 250,000 | 219,101 | |||||||||
NMEF Funding 2022-B A2 | (b) | 6.070% | 06/15/2029 | 361,000 | 360,414 | |||||||||
Oaktown Re VII Ltd. 2021-2 M1A | (b) | SOFR30A + 160 | 04/25/2034 | 272,026 | 262,440 | |||||||||
OCP CLO 2020-18A AR | (b) | QL + 109 | 07/20/2032 | 322,000 | 314,156 | |||||||||
Octane Receivables Trust 2021-2A C | (b) | 2.530% | 05/21/2029 | 209,000 | 183,175 | |||||||||
OneMain Direct Auto Receivables Trust 2022-1A C | (b) | 5.310% | 06/14/2029 | 1,100,000 | 1,043,019 | |||||||||
PMT Credit Risk Transfer Trust 2019-2R A | (b) | ML + 275 | 05/27/2023 | 109,087 | 104,397 | |||||||||
Prestige Auto Receivables Trust 2022-1A A2 | (b) | 5.900% | 07/15/2025 | 988,000 | 987,719 | |||||||||
Rad CLO 11 Ltd. 2021-11A D | (b) | QL + 290 | 04/15/2034 | 250,000 | 216,773 | |||||||||
Regatta XX Funding Ltd. 2021-2A A | (b) | QL + 116 | 10/15/2034 | 450,431 | 436,024 | |||||||||
Regatta XXIV Funding Ltd. 2021-5A D | (b) | QL + 310 | 01/20/2035 | 450,000 | 406,097 | |||||||||
Research-Driven Pagaya Motor Asset Trust VII 2022-3A A | (b) | 5.380% | 11/25/2030 | 841,192 | 819,743 | |||||||||
Rockford Tower CLO 2021-1A D | (b) | QL + 300 | 07/20/2034 | 306,626 | 263,258 | |||||||||
Rockford Tower CLO 2021-2A A1 | (b) | QL + 116 | 07/20/2034 | 250,000 | 242,480 | |||||||||
Santander Bank Auto Credit-Linked Notes Series 2022-A B | (b) | 5.281% | 05/15/2032 | 625,217 | 610,380 | |||||||||
Santander Bank Auto Credit-Linked Notes Series 2022-B B | (b) | 5.721% | 08/16/2032 | 762,572 | 760,136 | |||||||||
Santander Bank Auto Credit-Linked Notes Series 2022-C B | (b) | 6.451% | 12/15/2032 | 998,144 | 998,289 | |||||||||
Santander Bank N.A. - SBCLN 2021-1A C | (b) | 3.268% | 12/15/2031 | 394,347 | 380,723 | |||||||||
SEB Funding LLC 2021-1A A2 | (b) | 4.969% | 01/30/2052 | 331,170 | 279,825 | |||||||||
SG Commercial Mortgage Securities Trust 2016-C5 A4 | 3.055% | 10/10/2048 | 250,000 | 230,227 | ||||||||||
Signal Peak CLO 2022-12A C | (b) | TSFR3M + 345 | 07/18/2034 | 1,115,000 | 1,080,298 | |||||||||
TICP CLO XV Ltd. 2020-15A A | (b) | QL + 128 | 04/20/2033 | 1,600,000 | 1,568,788 | |||||||||
Triangle Re 2021-3 M1B | (b) | SOFR30A + 290 | 02/25/2034 | 240,000 | 225,119 | |||||||||
United Auto Credit Securitization Trust 2022-2 A | (b) | 4.390% | 04/10/2025 | 598,023 | 595,185 | |||||||||
Upstart Securitization Trust 2021-3 B | (b) | 1.660% | 07/20/2031 | 210,000 | 195,278 | |||||||||
VASA Trust 2021-VASA A | (b) | ML + 90 | 07/15/2039 | 460,000 | 424,184 | |||||||||
Wells Fargo Commercial Mortgage Trust 2016-C35 B | 3.438% | 07/15/2048 | 270,000 | 226,340 | ||||||||||
WFRBS Commercial Mortgage Trust 2014-C24 AS | 3.931% | 11/15/2047 | 270,000 | 257,298 | ||||||||||
|
| |||||||||||||
| 70,263,625 | ||||||||||||||
|
| |||||||||||||
INDUSTRIALS – 0.1% | ||||||||||||||
Avis Budget Rental Car Funding AESOP LLC 2017-2A D | (b) | 4.560% | 03/20/2024 | 592,500 | 590,533 | |||||||||
|
| |||||||||||||
Total Asset-Backed / Mortgage-Backed Securities (Cost $73,043,007) | $ | 71,304,836 | ||||||||||||
|
| |||||||||||||
| Purchased Options – 5.7% | Notional Amount | Expiration | Exercise Price | Contracts (f) | Value | |||||||||||||
S&P 500 Index Call Option | $ | 42,618,450 | December 2024 | $4,000 | 111 | $ | 5,439,222 | |||||||||||
S&P 500 Index Call Option | 56,440,650 | December 2024 | 4,200 | 147 | 5,904,990 | |||||||||||||
S&P 500 Index Call Option | 95,987,500 | December 2024 | 4,300 | 250 | 9,044,250 | |||||||||||||
S&P 500 Index Call Option | 49,529,550 | December 2024 | 4,400 | 129 | 4,022,607 | |||||||||||||
S&P 500 Index Put Option | 54,520,900 | December 2024 | 4,000 | 142 | 6,406,472 | |||||||||||||
S&P 500 Index Put Option | 35,323,400 | December 2024 | 4,100 | 92 | 4,333,936 | |||||||||||||
S&P 500 Index Put Option | 65,655,450 | December 2024 | 4,200 | 171 | 8,835,570 | |||||||||||||
S&P 500 Index Put Option | 90,228,250 | December 2024 | 4,300 | 235 | 13,204,650 | |||||||||||||
S&P 500 Index Put Option | 49,529,550 | December 2024 | 4,400 | 129 | 8,084,430 | |||||||||||||
|
| |||||||||||||||||
Total Purchased Options (Cost $ 72,371,624) | $ | 65,276,127 | ||||||||||||||||
|
| |||||||||||||||||
| U.S. Government Agency Mortgage-Backed Securities – 4.5% | Rate | Maturity | Face Amount | Value | ||||||||||||||
Fannie Mae or Freddie Mac UMBS TBA | 2.000% | 01/15/2053 | $ | 1,523,097 | $ | 1,238,979 | ||||||||||||
| 105 | (continued) |
Ohio National Fund, Inc. | ON Risk Managed Balanced Portfolio (Continued) | |
| Schedule of Investments | December 31, 2022 | |
| U.S. Government Agency Mortgage-Backed Securities (Continued) | Rate | Maturity | Face Amount | Value | ||||||||||
Fannie Mae or Freddie Mac UMBS TBA | 2.500% | 01/15/2053 | $ | 15,030,022 | $ | 12,723,129 | ||||||||
Fannie Mae or Freddie Mac UMBS TBA | 3.000% | 01/15/2053 | 4,172,412 | 3,660,746 | ||||||||||
Fannie Mae or Freddie Mac UMBS TBA | 3.500% | 01/15/2053 | 6,605,359 | 5,999,666 | ||||||||||
Fannie Mae or Freddie Mac UMBS TBA | 4.000% | 01/15/2053 | 2,881,017 | 2,701,414 | ||||||||||
Fannie Mae or Freddie Mac UMBS TBA | 4.500% | 01/15/2053 | 2,854,498 | 2,746,759 | ||||||||||
Fannie Mae Pool FN AL5310 | 3.500% | 04/01/2044 | 2,167 | 2,026 | ||||||||||
Fannie Mae Pool FN AL5887 | 4.500% | 10/01/2044 | 12,831 | 12,667 | ||||||||||
Fannie Mae Pool FN AL6542 | 4.500% | 03/01/2045 | 19,639 | 19,388 | ||||||||||
Fannie Mae Pool FN AL6620 | 4.500% | 08/01/2042 | 120,725 | 118,485 | ||||||||||
Fannie Mae Pool FN AL6997 | 4.500% | 11/01/2042 | 8,812 | 8,735 | ||||||||||
Fannie Mae Pool FN AL8855 | 3.500% | 07/01/2046 | 7,502 | 6,969 | ||||||||||
Fannie Mae Pool FN AS7168 | 3.500% | 05/01/2046 | 15,521 | 14,411 | ||||||||||
Fannie Mae Pool FN AS7587 | 3.500% | 07/01/2046 | 90,231 | 83,810 | ||||||||||
Fannie Mae Pool FN AS7822 | 3.500% | 08/01/2046 | 173,510 | 161,017 | ||||||||||
Fannie Mae Pool FN AZ9203 | 3.000% | 10/01/2045 | 17,092 | 15,403 | ||||||||||
Fannie Mae Pool FN BA2885 | 3.000% | 10/01/2045 | 39,214 | 35,049 | ||||||||||
Fannie Mae Pool FN BA4752 | 3.000% | 01/01/2046 | 5,036 | 4,515 | ||||||||||
Fannie Mae Pool FN BC1520 | 3.500% | 08/01/2046 | 138,334 | 128,460 | ||||||||||
Fannie Mae Pool FN BC2468 | 3.000% | 03/01/2046 | 92,452 | 82,553 | ||||||||||
Fannie Mae Pool FN BC2488 | 3.000% | 03/01/2046 | 104,367 | 93,266 | ||||||||||
Fannie Mae Pool FN BC9077 | 3.500% | 12/01/2046 | 10,073 | 9,348 | ||||||||||
Fannie Mae Pool FN BH1902 | 3.500% | 12/01/2047 | 8,766 | 8,227 | ||||||||||
Fannie Mae Pool FN BH3892 | 3.500% | 08/01/2047 | 20,582 | 19,090 | ||||||||||
Fannie Mae Pool FN BH6940 | 3.500% | 08/01/2047 | 18,068 | 16,766 | ||||||||||
Fannie Mae Pool FN BJ1692 | 3.500% | 12/01/2047 | 43,604 | 40,825 | ||||||||||
Fannie Mae Pool FN BJ1695 | 3.500% | 12/01/2047 | 6,352 | 5,888 | ||||||||||
Fannie Mae Pool FN BJ4558 | 3.500% | 01/01/2048 | 32,009 | 29,968 | ||||||||||
Fannie Mae Pool FN BJ4559 | 3.500% | 01/01/2048 | 12,371 | 11,555 | ||||||||||
Fannie Mae Pool FN BJ4566 | 4.000% | 01/01/2048 | 105,893 | 102,205 | ||||||||||
Fannie Mae Pool FN BJ4567 | 4.000% | 01/01/2048 | 153,018 | 147,051 | ||||||||||
Fannie Mae Pool FN BJ5170 | 3.500% | 03/01/2048 | 8,596 | 8,067 | ||||||||||
Fannie Mae Pool FN BK1964 | 4.000% | 03/01/2048 | 31,565 | 30,466 | ||||||||||
Fannie Mae Pool FN BK1975 | 3.500% | 03/01/2048 | 20,009 | 18,734 | ||||||||||
Fannie Mae Pool FN BK3211 | 4.500% | 03/01/2048 | 35,449 | 34,752 | ||||||||||
Fannie Mae Pool FN BK4157 | 4.000% | 05/01/2048 | 42,746 | 40,825 | ||||||||||
Fannie Mae Pool FN BM3282 | 3.500% | 12/01/2047 | 5,547 | 5,203 | ||||||||||
Fannie Mae Pool FN BM3511 | 4.500% | 02/01/2046 | 70,583 | 69,971 | ||||||||||
Fannie Mae Pool FN BM3912 | 3.000% | 03/01/2047 | 110,909 | 99,375 | ||||||||||
Fannie Mae Pool FN BM4427 | 3.500% | 04/01/2048 | 64,627 | 59,901 | ||||||||||
Fannie Mae Pool FN BM4735 | 3.500% | 04/01/2048 | 78,729 | 73,713 | ||||||||||
Fannie Mae Pool FN BM4896 | 3.000% | 02/01/2047 | 730,793 | 665,004 | ||||||||||
Fannie Mae Pool FN BM5138 | 3.500% | 11/01/2048 | 144,442 | 135,239 | ||||||||||
Fannie Mae Pool FN BM5334 | 3.500% | 01/01/2049 | 33,813 | 31,318 | ||||||||||
Fannie Mae Pool FN BN0012 | 4.500% | 08/01/2048 | 20,065 | 19,592 | ||||||||||
Fannie Mae Pool FN BO3223 | 3.000% | 10/01/2034 | 26,719 | 25,072 | ||||||||||
Fannie Mae Pool FN BO4725 | 2.500% | 11/01/2034 | 43,729 | 40,265 | ||||||||||
Fannie Mae Pool FN BO5957 | 3.000% | 12/01/2034 | 5,603 | 5,259 | ||||||||||
Fannie Mae Pool FN BO7717 | 3.000% | 11/01/2034 | 5,559 | 5,217 | ||||||||||
Fannie Mae Pool FN BU1240 | 3.000% | 03/01/2052 | 1,044,060 | 920,937 | ||||||||||
Fannie Mae Pool FN BU1349 | 3.000% | 02/01/2052 | 825,897 | 729,051 | ||||||||||
Fannie Mae Pool FN BU8919 | 2.500% | 04/01/2052 | 683,587 | 582,256 | ||||||||||
Fannie Mae Pool FN BU8922 | 2.500% | 04/01/2052 | 651,818 | 554,589 | ||||||||||
Fannie Mae Pool FN CA0108 | 3.500% | 08/01/2047 | 19,030 | 17,859 | ||||||||||
Fannie Mae Pool FN CB1113 | 2.000% | 07/01/2051 | 1,092,818 | 891,353 | ||||||||||
Fannie Mae Pool FN CB2538 | 2.500% | 01/01/2052 | 699,008 | 595,879 | ||||||||||
Fannie Mae Pool FN CB3564 | 2.500% | 05/01/2052 | 569,936 | 485,900 | ||||||||||
Fannie Mae Pool FN CB3565 | 2.500% | 05/01/2052 | 457,769 | 389,777 | ||||||||||
Fannie Mae Pool FN FM0029 | 3.000% | 09/01/2046 | 183,739 | 167,198 | ||||||||||
Fannie Mae Pool FN FM1036 | 3.000% | 05/01/2043 | 93,216 | 84,828 | ||||||||||
Fannie Mae Pool FN FS0967 | 2.500% | 03/01/2052 | 760,214 | 648,118 | ||||||||||
Fannie Mae Pool FN MA3211 | 4.000% | 12/01/2047 | 42,522 | 40,670 | ||||||||||
Fannie Mae Pool FN MA3239 | 4.000% | 01/01/2048 | 6,862 | 6,546 | ||||||||||
Freddie Mac Gold Pool FG G60658 | 3.500% | 07/01/2046 | 179,209 | 169,226 | ||||||||||
Freddie Mac Gold Pool FG G61360 | 3.500% | 03/01/2048 | 38,266 | 35,498 | ||||||||||
Freddie Mac Gold Pool FG G61737 | 3.500% | 11/01/2048 | 153,740 | 142,684 | ||||||||||
Freddie Mac Gold Pool FG Q54793 | 4.500% | 03/01/2048 | 31,202 | 30,517 | ||||||||||
Freddie Mac Gold Pool FG Q55394 | 3.500% | 04/01/2048 | 12,053 | 11,184 | ||||||||||
Freddie Mac Pool FR QD8682 | 3.000% | 03/01/2052 | 682,798 | 602,440 | ||||||||||
Freddie Mac Pool FR QE0805 | 2.500% | 04/01/2052 | 638,378 | 543,551 | ||||||||||
Freddie Mac Pool FR QE0808 | 2.500% | 04/01/2052 | 681,279 | 579,761 | ||||||||||
| 106 | (continued) |
Ohio National Fund, Inc. | ON Risk Managed Balanced Portfolio (Continued) | |
| Schedule of Investments | December 31, 2022 | |
| U.S. Government Agency Mortgage-Backed Securities (Continued) | Rate | Maturity | Face Amount | Value | ||||||||||
| ||||||||||||||
Freddie Mac Pool FR QN0783 | 3.000% | 10/01/2034 | $ | 28,884 | $ | 27,113 | ||||||||
Freddie Mac Pool FR QN0786 | 3.000% | 10/01/2034 | 63,053 | 59,172 | ||||||||||
Freddie Mac Pool FR QN0951 | 2.500% | 11/01/2034 | 44,539 | 41,005 | ||||||||||
Freddie Mac Pool FR RA6963 | 2.000% | 03/01/2052 | 1,054,285 | 861,794 | ||||||||||
Freddie Mac Pool FR SB0040 | 2.500% | 12/01/2033 | 207,219 | 193,760 | ||||||||||
Freddie Mac Pool FR SB0116 | 2.500% | 11/01/2034 | 52,807 | 48,657 | ||||||||||
Freddie Mac Pool FR SD0932 | 2.500% | 04/01/2052 | 702,572 | 599,976 | ||||||||||
Freddie Mac Pool FR ZA4718 | 3.000% | 10/01/2046 | 133,547 | 119,521 | ||||||||||
Freddie Mac Pool FR ZK8962 | 3.000% | 09/01/2032 | 49,985 | 47,562 | ||||||||||
Freddie Mac Pool FR ZK9009 | 3.000% | 10/01/2032 | 18,572 | 17,645 | ||||||||||
Freddie Mac Pool FR ZK9163 | 3.000% | 01/01/2033 | 29,219 | 27,806 | ||||||||||
Freddie Mac Pool FR ZM1434 | 3.500% | 07/01/2046 | 21,862 | 20,385 | ||||||||||
Freddie Mac Pool FR ZM4821 | 3.500% | 11/01/2047 | 24,944 | 23,187 | ||||||||||
Freddie Mac Pool FR ZM4939 | 3.500% | 11/01/2047 | 45,951 | 43,021 | ||||||||||
Freddie Mac Pool FR ZM5102 | 3.500% | 12/01/2047 | 53,950 | 50,149 | ||||||||||
Freddie Mac Pool FR ZM5228 | 3.500% | 12/01/2047 | 31,247 | 29,255 | ||||||||||
Freddie Mac Pool FR ZM5705 | 3.500% | 02/01/2048 | 15,216 | 14,246 | ||||||||||
Freddie Mac Pool FR ZM5707 | 3.500% | 02/01/2048 | 9,739 | 9,053 | ||||||||||
Freddie Mac Pool FR ZM5945 | 4.000% | 03/01/2048 | 28,521 | 27,528 | ||||||||||
Freddie Mac Pool FR ZM6220 | 4.000% | 04/01/2048 | 13,484 | 12,857 | ||||||||||
Freddie Mac Pool FR ZM6276 | 4.000% | 04/01/2048 | 39,271 | 37,739 | ||||||||||
Freddie Mac Pool FR ZM6427 | 4.000% | 05/01/2048 | 89,965 | 85,795 | ||||||||||
Freddie Mac Pool FR ZN2165 | 4.500% | 12/01/2048 | 44,330 | 44,134 | ||||||||||
Freddie Mac Pool FR ZS4598 | 3.000% | 01/01/2045 | 16,956 | 15,279 | ||||||||||
Freddie Mac Pool FR ZS7403 | 3.000% | 05/01/2031 | 151,994 | 145,772 | ||||||||||
Freddie Mac Pool FR ZS9830 | 3.500% | 10/01/2046 | 176,945 | 164,328 | ||||||||||
Freddie Mac Pool FR ZT0272 | 3.500% | 02/01/2047 | 102,907 | 95,557 | ||||||||||
Freddie Mac Pool FR ZT0337 | 3.500% | 12/01/2044 | 17,643 | 16,505 | ||||||||||
Freddie Mac Pool FR ZT0537 | 3.500% | 03/01/2048 | 140,294 | 130,931 | ||||||||||
Freddie Mac Pool FR ZT1633 | 4.000% | 03/01/2047 | 8,967 | 8,589 | ||||||||||
Ginnie Mae II Jumbo TBA | 3.000% | 01/15/2053 | 1,154,251 | 1,027,493 | ||||||||||
Ginnie Mae II Jumbo TBA | 4.000% | 01/15/2053 | 2,802,682 | 2,651,610 | ||||||||||
Ginnie Mae II Jumbo TBA | 4.500% | 01/15/2053 | 4,324,000 | 4,193,902 | ||||||||||
|
| |||||||||||||
Total U.S. Government Agency Mortgage-Backed Securities (Cost $52,711,262) | $ | 50,737,491 | ||||||||||||
|
| |||||||||||||
| Preferred Securities – 0.2% | Rate | Quantity | Value | |||||||||||
| ||||||||||||||
FINANCIALS – 0.1% | ||||||||||||||
Charles Schwab Corp. / The DR (Rate is fixed until 06/01/2026, at which point, the rate becomes H15T5Y + 317) (Capital Markets) | (c) | 4.000% | 455,000 | $ | 394,713 | |||||||||
Citigroup, Inc. DR (Rate is fixed until 01/30/2023, at which point, the rate becomes QL + 407) (Banks) | (c) | 5.950% | 139,000 | 137,645 | ||||||||||
Citigroup, Inc. DR (Rate is fixed until 05/15/2025, at which point, the rate becomes QL + 391) (Banks) | (c) | 5.950% | 142,000 | 127,899 | ||||||||||
Citigroup, Inc. (Rate is fixed until 12/10/2025, at which point, the rate becomes H15T5Y + 360) (Banks) | (c) | 4.000% | 101,000 | 87,983 | ||||||||||
Citigroup, Inc. DR (Rate is fixed until 02/15/2023, at which point, the rate becomes QL + 423) (Banks) | (c) | 5.900% | 27,000 | 26,719 | ||||||||||
Discover Financial Services (Rate is fixed until 09/23/2025, at which point, the rate becomes H15T5Y + 578) (Consumer Finance) | (c) | 6.125% | 196,000 | 190,236 | ||||||||||
Fifth Third Bancorp DR (Rate is fixed until 09/30/2025, at which point, the rate becomes H15T5Y + 422) (Banks) | (c) | 4.500% | 76,000 | 70,605 | ||||||||||
Goldman Sachs Group, Inc. / The DR (Rate is fixed until 11/10/2026, at which point, the rate becomes H15T5Y + 295) (Capital Markets) | (c) | 4.125% | 120,000 | 99,888 | ||||||||||
Truist Financial Corp. DR (Rate is fixed until 09/01/2030, at which point, the rate becomes H15T10Y + 435) (Banks) | (c) | 5.100% | 256,000 | 236,800 | ||||||||||
|
| |||||||||||||
| 1,372,488 | ||||||||||||||
|
| |||||||||||||
INDUSTRIALS – 0.1% | ||||||||||||||
General Electric Co. (Industrial Conglomerates) | QL+333 | 336,000 | 330,101 | |||||||||||
|
| |||||||||||||
UTILITIES – 0.0% | ||||||||||||||
Vistra Corp. (Rate is fixed until 12/15/2026, at which point, the rate becomes H15T5Y + 574) (Ind. Power & Renewable Elec.) | (b)(c) | 7.000% | 107,000 | 97,363 | ||||||||||
|
| |||||||||||||
Total Preferred Securities (Cost $1,957,491) | $ | 1,799,952 | ||||||||||||
|
| |||||||||||||
| Sovereign Debt Issues – 0.1% | Rate | Maturity | Face Amount | Value | ||||||||||||||||
CDBL Funding 1 | 3.500 | % | 10/24/2027 | $ | 230,000 | $ | 212,073 | |||||||||||||
Colombia Government International Bond | 3.125 | % | 04/15/2031 | 1,176,000 | 872,844 | |||||||||||||||
Dominican Republic International Bond | (b | ) | 4.875 | % | 09/23/2032 | 250,000 | 207,515 | |||||||||||||
|
| |||||||||||||||||||
Total Sovereign Debt Issues (Cost $1,537,896) | $ | 1,292,432 | ||||||||||||||||||
|
| |||||||||||||||||||
| 107 | (continued) |
Ohio National Fund, Inc. | ON Risk Managed Balanced Portfolio (Continued) | |
| Schedule of Investments | December 31, 2022 | |
| Taxable Municipal Bonds – 0.0% | Rate | Maturity | Face Amount | Value | ||||||||||
Ochsner LSU Health System of North Louisiana | 2.510% | 05/15/2031 | $ | 230,000 | $ | 168,712 | ||||||||
Tobacco Settlement Finance Authority | 3.000% | 06/01/2035 | 72,016 | 64,627 | ||||||||||
University of California | 3.071% | 05/15/2051 | 310,000 | 207,406 | ||||||||||
|
| |||||||||||||
Total Taxable Municipal Bonds (Cost $610,968) | $ | 440,745 | ||||||||||||
|
| |||||||||||||
| Rights – 0.0% | Quantity | Value | ||||||||||||
HEALTH CARE – 0.0% | ||||||||||||||
ABIOMED, Inc. CVR (Health Care Technology) | 4,357 | $ | 0 | |||||||||||
|
| |||||||||||||
Total Rights (Cost $4,444) | $ | 0 | ||||||||||||
|
| |||||||||||||
Total Investments – 97.1% (Cost $1,131,668,830) | (g) | $ | 1,106,628,604 | |||||||||||
Other Assets in Excess of Liabilities – 2.9% | 32,584,905 | |||||||||||||
|
| |||||||||||||
Net Assets – 100.0% | $ | 1,139,213,509 | ||||||||||||
|
| |||||||||||||
Percentages are stated as a percent of net assets.
Abbreviations: | ||
ADR: | American Depositary Receipts | |
CLO: | Collaterized Loan Obligation | |
CVR: | Contingent Value Right | |
DR: | Depositary Receipt | |
H15T10Y: | U.S. Treasury Yield Curve Rate T-Note Constant Maturity 10 Year, 3.990% at 12/31/2022 | |
H15T1Y: | U.S. Treasury Yield Curve Rate T-Note Constant Maturity 1 Year, 4.730% at 12/31/2022 | |
H15T5Y: | U.S. Treasury Yield Curve Rate T-Note Constant Maturity 5 Year, 3.880% at 12/31/2022 | |
ML: | Monthly U.S. LIBOR Rate, 4.392% at 12/31/2022 | |
QL: | Quarterly U.S. LIBOR Rate, 4.767% at 12/31/2022 | |
SOFR: | Secured Overnight Financing Rate, 4.300% at 12/31/2022 | |
SOFR30A: | 30 Day Average Secured Overnight Financing Rate, 4.062% at 12/31/2022 | |
TSFR1M: | Monthly CME Term SOFR, 4.358% at 12/31/2022 | |
TSFR3M: | Quarterly CME Term SOFR, 4.587% at 12/31/2022 | |
UMBS TBA: | Uniform Mortgage-Backed Security To Be Announced (“TBA”); the securities backed by fixed rate mortgage loans that are delivered on a future settlement date could be issued by Fannie Mae, Freddie Mac, or a combination thereof. | |
USSW5: | USD Swap Semi 30/360 5 Year, 4.023% at 12/31/2022 |
Footnotes:
| (a) | Non-income producing security. |
| (b) | Security exempt from registration under Regulation D of the Securities Act of 1933. These securities may be resold in transactions exempt from registration, normally to qualified buyers under Rule 144A. At December 31, 2022, the value of these securities totaled $108,427,148, or 9.5% of the Portfolio’s net assets. |
| (c) | Security is a fixed-then-variable rate instrument in which the coupon or dividend rate is fixed until a later specified date, then is adjusted periodically. Rates stated, including interest rate caps and floors, if any, are those in effect at December 31, 2022. |
| (d) | Security is partially pledged as collateral for the futures contracts outstanding at December 31, 2022. The market value pledged totaled $22,320,336. See also the following Schedule of Open Futures Contracts. |
| (e) | Interest-only security |
| (f) | 100 shares per contract. |
| (g) | Represents cost for financial reporting purposes, which may differ from cost basis for federal income tax purposes. See also Note 7 of the Notes to Financial Statements. |
The accompanying notes are an integral part of these financial statements.
| Schedule of Open Futures Contracts | December 31, 2022 | |
Long Futures Contracts
Description | Number of contracts | Expiration Date | Notional Amount | Value | Unrealized Appreciation (Depreciation) | Variation Margin Receivable (Payable) | ||||||||||||||||||||||||||||||||||||||||||||
CME Micro E-mini S&P 500 Index - Long | 41 | March 17, 2023 | $ | 812,668 | $ | 791,505 | $ | (21,163 | ) | $ | (2,204 | ) | ||||||||||||||||||||||||||||||||||||||
CBT U.S. Long Bond - Long | 280 | March 22, 2023 | 35,417,217 | 35,096,250 | (320,967 | ) | (43,750 | ) | ||||||||||||||||||||||||||||||||||||||||||
CBT U.S. Ultra Bond - Long | 4 | March 22, 2023 | 548,561 | 537,250 | (11,311 | ) | (2,000 | ) | ||||||||||||||||||||||||||||||||||||||||||
CBT 10-Year U.S. Treasury Note - Long | 3,049 | March 22, 2023 | 344,717,552 | 342,393,172 | (2,324,380 | ) | (428,766 | ) | ||||||||||||||||||||||||||||||||||||||||||
CBT 2-Year U.S. Treasury Note - Long | 77 | March 31, 2023 | 15,772,462 | 15,791,016 | 18,554 | (12,031 | ) | |||||||||||||||||||||||||||||||||||||||||||
|
|
|
|
|
|
|
| |||||||||||||||||||||||||||||||||||||||||||
| $ | 397,268,460 | $ | 394,609,193 | $ | (2,659,267 | ) | $ | (488,751 | ) | |||||||||||||||||||||||||||||||||||||||||
|
|
|
|
|
|
|
| |||||||||||||||||||||||||||||||||||||||||||
| 108 |
Ohio National Fund, Inc. | ON Risk Managed Balanced Portfolio (Continued) | |
| Schedule of Open Futures Contracts | December 31, 2022 | |
Short Futures Contracts
Description | Number of contracts | Expiration Date | Notional Amount | Value | Unrealized Appreciation (Depreciation) | Variation Margin Receivable (Payable) | ||||||||||||||||||||||||||||||||||
CME E-mini S&P 500 Index - Short | 723 | March 17, 2023 | $ | (142,858,628 | ) | $ | (139,575,150 | ) | $ | 3,283,478 | $ | 388,613 | ||||||||||||||||||||||||||||
|
|
|
|
|
|
|
| |||||||||||||||||||||||||||||||||
Total Futures Contracts | $ | 254,409,832 | $ | 255,034,043 | $ | 624,211 | $ | (100,138 | ) | |||||||||||||||||||||||||||||||
|
|
|
|
|
|
|
| |||||||||||||||||||||||||||||||||
The accompanying notes are an integral part of these financial statements.
| 109 |
| ON Federated Core Plus Bond Portfolio (Unaudited) |
| Objective/Strategy |
The ON Federated Core Plus Bond Portfolio seeks to provide total return by investing at least 80% of its net assets in fixed-income investments, primarily U.S. dollar denominated, investment-grade, fixed income securities. Investment-grade, fixed income securities are rated in one of the four highest categories (BBB- or higher) by a nationally recognized statistical rating organization (“NRSRO”).
| Performance as of December 31, 2022 |
Average Annual returns
One year | -12.78 | % | ||
Since inception (5/1/20) | -3.81 | % |
Past performance does not guarantee future results. The performance data quoted represents past performance and current returns may be lower or higher. Total return figures include change in share price and reinvestment of dividends and capital gains. The investment return and principal value will fluctuate so that an investor’s shares, when redeemed, may be worth more or less than the original cost. To obtain performance information up to the most recent month end, call toll-free 1-877-781-6392.
The Portfolio is not open to direct retail investment. Beneficial interest in the Portfolio’s shares is obtained either through an allocation to the Portfolio as an investment vehicle within variable life insurance policies or annuity contracts, or as an underlying investment by the ON Model Portfolios. Actual performance results for variable annuity and variable universal life contracts will be lower due to contract charges. Consult your contract for applicable charges.
Total expense ratio is 0.58% per the Fund’s prospectus dated April 29, 2022. Additional information pertaining to the Portfolio’s expense ratio as of December 31, 2022 can be found in the Portfolio’s Financial Highlights.
| Comments from Sub-Adviser |
Q. How did the Portfolio perform in comparison to its benchmark during the reporting period?
A. For the year ended December 31, 2022, the Portfolio returned -12.78% versus -13.16% for its benchmark, the ICE BofA U.S. Broad Market Index.
Q. Were there specific market conditions, investment strategies, or techniques that materially affected the Portfolio’s benchmark-relative performance during the reporting period?
A. The Portfolio’s interest rate sensitivity (duration) and yield curve positioning were the primary drivers of its outperformance relative to the benchmark as a result of the significant increase in U.S. Treasury rates. The Portfolio’s average duration position was less than the benchmark’s duration. In addition, the Portfolio was positioned for shorter-term interest rates to increase more than longer-term rates. (1)
Q. How did sector allocation and security selection each impact the Portfolio’s performance relative to its benchmark?
A. The Portfolio was negatively affected by its sector allocation. During the year, credit spreads widened and the Portfolio’s allocation to the out-of-index bank loan and trade finance sectors and the resulting underweight to the U.S. Treasury sector detracted from performance relative to the benchmark. This negative impact more than offset the positive contribution from tactical overweights to the agency mortgage backed securities market during the year.
The Portfolio’s security selection during the year detracted from relative returns. Specifically, the Portfolio was negatively impacted by security selection in U.S. Treasury securities, healthcare, and media. The Portfolio was positively impacted by security selection in energy, agency MBS, basic industries, and foreign sovereign securities. (1)
Q. Which securities contributed the most to, and detracted the most from, the Portfolio’s benchmark-relative performance?
A. The top three contributors to the Portfolio’s outperformance during the year were short positions in the June, March, and September CBT U.S. Ultra Bond interest rate futures contracts. These positions were used to help manage the Portfolio’s interest rate risk and were the largest positive contributors in a rising interest rate environment.
Overweights to U.S. Treasury Note 2.875% due 5/15/2052, U.S. Treasury Note 2.250% due 2/15/2052 and U.S. Treasury Note 2.375% due 2/15/2042 were the largest detractors from relative performance due to the material increase in U.S. interest rates during the year. (1)
Q. How did the Portfolio’s use of derivative instruments and initial public offerings (IPOs), if any, impact performance?
A. U.S. interest rate futures were utilized to calibrate the Portfolio’s duration and yield curve positioning. The Portfolio’s average duration, which was less than the average duration of the benchmark, was a large positive contributor during the year, while the Portfolio’s yield curve positioning was also a positive contributor. In aggregate, futures contacts contributed approximately 72 basis points to the Portfolio’s absolute return for the year. (1)
| (1) | The Portfolio’s composition is subject to change. Holdings and weightings are as of December 31, 2022. |
| Change in Value of $10,000 Investment |
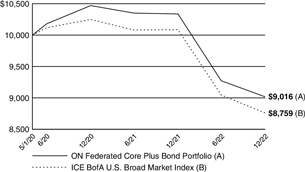
Hypothetical illustration based on past performance. Future performance will vary. The Portfolio’s returns reflect reinvested dividends. The Portfolio’s holdings may differ significantly from the securities in the index. The index is unmanaged and therefore does not reflect the cost of portfolio management and accounting.
The ICE BofA U.S. Broad Market Index measures the performance of U.S. dollar-denominated, investment grade debt securities, including U.S. Treasury notes and bonds, quasi-government securities, corporate securities, residential and commercial mortgage-backed securities and asset-backed securities. Securities are cap-weighted based on their amount outstanding times the market price plus accrued interest.
Past performance is no guarantee of future results. Redemption of fund shares could have tax implications unique to each shareholder.
| 110 | (continued) |
Ohio National Fund, Inc. | ON Federated Core Plus Bond Portfolio (Unaudited) (Continued) |
| Portfolio Composition as of December 31, 2022 (1) | ||
| % of Net Assets | ||||
U.S. Treasury Obligations | 46.1 | |||
Corporate Bonds (4) | 22.1 | |||
U.S. Government Agency Mortgage-Backed Securities | 20.0 | |||
Investment Companies | 6.3 | |||
Asset-Backed / Mortgage-Backed Securities (4) | 3.6 | |||
Sovereign Debt Issues | 0.3 | |||
Common Stocks (4) | 0.0 | |||
Other Net Assets | 1.6 | |||
|
| |||
| 100.0 | ||||
|
| |||
| Top 10 Portfolio Holdings as of December 31, 2022 (1) (2) (3) | ||||
| % of Net Assets | ||||||
| 1. | U.S. Treasury Note 3.875%, 11/30/2027 | 5.1 | ||||
| 2. | U.S. Treasury Note 2.875%, 05/15/2052 | 5.1 | ||||
| 3. | Federated Hermes Core Trust III - Federated Project and Trade Finance Core Fund | 3.4 | ||||
| 4. | U.S. Treasury Note 2.625%, 07/31/2029 | 3.0 | ||||
| 5. | U.S. Treasury Note 0.875%, 06/30/2026 | 2.9 | ||||
| 6. | Federated Hermes Core Trust - Emerging Markets Core Fund | 2.7 | ||||
| 7. | U.S. Treasury Note 4.125%, 11/15/2032 | 2.6 | ||||
| 8. | U.S. Treasury Note 2.250%, 03/31/2024 | 2.5 | ||||
| 9. | U.S. Treasury Note 1.875%, 02/15/2032 | 2.4 | ||||
| 10. | U.S. Treasury Note 2.750%, 04/30/2027 | 2.2 | ||||
| (1) | Composition of Portfolio subject to change. |
| (2) | Short-term investments have been excluded from the list of Top 10 Portfolio Holdings. |
| (3) | Top 10 Portfolio Holdings is presented at an individual security level. Total investment exposure by issuer may be higher. |
| (4) | Sectors (Common Stocks, Corporate Bonds, Asset-Backed / Mortgage Backed Securities): |
| % of Net Assets | ||||
Financials | 8.8 | |||
Industrials | 2.6 | |||
Communication Services | 2.2 | |||
Utilities | 2.0 | |||
Energy | 1.8 | |||
Health Care | 1.8 | |||
Information Technology | 1.8 | |||
Consumer Staples | 1.3 | |||
Consumer Discretionary | 1.2 | |||
Real Estate | 1.2 | |||
Materials | 1.0 | |||
|
| |||
| 25.7 | ||||
|
| |||
| 111 |
Ohio National Fund, Inc. | ON Federated Core Plus Bond Portfolio | |
| Schedule of Investments | December 31, 2022 | |
| U.S. Treasury Obligations – 46.1% | Rate | Maturity | Face Amount | Value | ||||||||||
U.S. Treasury Note | 0.125% | 04/30/2023 | $ | 1,500,000 | $ | 1,479,375 | ||||||||
U.S. Treasury Note | 0.125% | 06/30/2023 | 12,500,000 | 12,222,656 | ||||||||||
U.S. Treasury Note | 0.750% | 12/31/2023 | 7,250,000 | 6,969,165 | ||||||||||
U.S. Treasury Note | 2.250% | 03/31/2024 | 14,000,000 | 13,583,281 | ||||||||||
U.S. Treasury Note | 2.500% | 04/30/2024 | 8,400,000 | 8,161,125 | ||||||||||
U.S. Treasury Note | 0.250% | 05/15/2024 | 7,500,000 | 7,059,082 | ||||||||||
U.S. Treasury Note | 3.000% | 06/30/2024 | 5,000,000 | 4,880,273 | ||||||||||
U.S. Treasury Note | 3.000% | 07/31/2024 | 10,000,000 | 9,753,906 | ||||||||||
U.S. Treasury Note | 0.375% | 09/15/2024 | 6,000,000 | 5,591,953 | ||||||||||
U.S. Treasury Note | 4.500% | 11/30/2024 | 7,500,000 | 7,500,293 | ||||||||||
U.S. Treasury Note | 0.375% | 12/31/2025 | 3,000,000 | 2,681,133 | ||||||||||
U.S. Treasury Note | 0.875% | 06/30/2026 | 18,000,000 | 16,095,937 | ||||||||||
U.S. Treasury Note | 0.625% | 07/31/2026 | 2,400,000 | 2,120,719 | ||||||||||
U.S. Treasury Note | 1.500% | 01/31/2027 | 3,500,000 | 3,159,980 | ||||||||||
U.S. Treasury Note | 2.500% | 03/31/2027 | 5,900,000 | 5,536,551 | ||||||||||
U.S. Treasury Note | (a) | 0.500% | 04/30/2027 | 3,200,000 | 2,755,375 | |||||||||
U.S. Treasury Note | 2.750% | 04/30/2027 | 12,600,000 | 11,940,469 | ||||||||||
U.S. Treasury Note | 2.625% | 05/31/2027 | 1,500,000 | 1,413,926 | ||||||||||
U.S. Treasury Note | 3.875% | 11/30/2027 | 28,500,000 | 28,344,141 | ||||||||||
U.S. Treasury Note | 1.250% | 03/31/2028 | 575,000 | 499,756 | ||||||||||
U.S. Treasury Note | 1.500% | 11/30/2028 | 4,200,000 | 3,647,273 | ||||||||||
U.S. Treasury Note | 1.375% | 12/31/2028 | 3,650,000 | 3,148,125 | ||||||||||
U.S. Treasury Note | 2.375% | 03/31/2029 | 500,000 | 454,648 | ||||||||||
U.S. Treasury Note | 2.625% | 07/31/2029 | 18,000,000 | 16,574,766 | ||||||||||
U.S. Treasury Note | 3.875% | 11/30/2029 | 3,600,000 | 3,575,813 | ||||||||||
U.S. Treasury Note | 1.125% | 02/15/2031 | 405,000 | 330,091 | ||||||||||
U.S. Treasury Note | 1.875% | 02/15/2032 | 15,300,000 | 12,979,301 | ||||||||||
U.S. Treasury Note | 4.125% | 11/15/2032 | 13,850,000 | 14,133,492 | ||||||||||
U.S. Treasury Note | 1.375% | 11/15/2040 | 525,000 | 341,312 | ||||||||||
U.S. Treasury Note | 1.875% | 02/15/2041 | 180,000 | 127,223 | ||||||||||
U.S. Treasury Note | 2.375% | 02/15/2042 | 11,850,000 | 9,047,660 | ||||||||||
U.S. Treasury Note | 4.000% | 11/15/2042 | 1,600,000 | 1,566,500 | ||||||||||
U.S. Treasury Note | 2.000% | 02/15/2050 | 3,750,000 | 2,476,611 | ||||||||||
U.S. Treasury Note | 1.875% | 02/15/2051 | 3,940,000 | 2,504,055 | ||||||||||
U.S. Treasury Note | 2.875% | 05/15/2052 | 35,300,000 | 28,284,125 | ||||||||||
U.S. Treasury Note | 4.000% | 11/15/2052 | 2,800,000 | 2,803,938 | ||||||||||
|
| |||||||||||||
Total U.S. Treasury Obligations (Cost $275,599,979) | $ | 253,744,029 | ||||||||||||
|
| |||||||||||||
| Corporate Bonds – 22.1% | Rate | Maturity | Face Amount | Value | ||||||||||
COMMUNICATION SERVICES – 2.2% | ||||||||||||||
Alphabet, Inc. (Interactive Media & Svs.) | 2.050% | 08/15/2050 | $ | 650,000 | $ | 379,897 | ||||||||
America Movil S.A.B. de C.V. (Wireless Telecom. Svs.) | 2.875% | 05/07/2030 | 275,000 | 233,458 | ||||||||||
AT&T, Inc. (Diversified Telecom. Svs.) | 0.900% | 03/25/2024 | 550,000 | 522,291 | ||||||||||
AT&T, Inc. (Diversified Telecom. Svs.) | 1.700% | 03/25/2026 | 550,000 | 495,658 | ||||||||||
AT&T, Inc. (Diversified Telecom. Svs.) | 3.800% | 12/01/2057 | 1,870,000 | 1,290,175 | ||||||||||
Audacy Capital Corp. (Media) | (b) | 6.750% | 03/31/2029 | 75,000 | 12,991 | |||||||||
CCO Holdings LLC / CCO Holdings Capital Corp. (Media) | (b) | 5.000% | 02/01/2028 | 100,000 | 90,799 | |||||||||
CCO Holdings LLC / CCO Holdings Capital Corp. (Media) | (b) | 4.500% | 08/15/2030 | 125,000 | 103,269 | |||||||||
CCO Holdings LLC / CCO Holdings Capital Corp. (Media) | (b) | 4.250% | 02/01/2031 | 125,000 | 100,264 | |||||||||
CCO Holdings LLC / CCO Holdings Capital Corp. (Media) | (b) | 4.500% | 06/01/2033 | 75,000 | 57,542 | |||||||||
Charter Communications Operating LLC / Charter Communications Operating Capital Corp. (Media) | 6.484% | 10/23/2045 | 550,000 | 495,976 | ||||||||||
CMG Media Corp. (Media) | (b) | 8.875% | 12/15/2027 | 125,000 | 94,087 | |||||||||
Comcast Corp. (Media) | 3.450% | 02/01/2050 | 950,000 | 688,982 | ||||||||||
CSC Holdings LLC (Media) | (b) | 7.500% | 04/01/2028 | 200,000 | 136,000 | |||||||||
Cumulus Media New Holdings, Inc. (Media) | (b) | 6.750% | 07/01/2026 | 48,000 | 40,320 | |||||||||
Directv Financing LLC / Directv Financing Co-Obligor, Inc. (Media) | (b) | 5.875% | 08/15/2027 | 50,000 | 44,733 | |||||||||
DISH DBS Corp. (Media) | (b) | 5.250% | 12/01/2026 | 50,000 | 42,117 | |||||||||
DISH DBS Corp. (Media) | 7.375% | 07/01/2028 | 25,000 | 17,688 | ||||||||||
DISH DBS Corp. (Media) | 5.125% | 06/01/2029 | 75,000 | 48,383 | ||||||||||
DISH Network Corp. (Media) | (b) | 11.750% | 11/15/2027 | 25,000 | 25,748 | |||||||||
Entegris Escrow Corp. (Media) | (b) | 5.950% | 06/15/2030 | 25,000 | 23,055 | |||||||||
Gray Escrow II, Inc. (Media) | (b) | 5.375% | 11/15/2031 | 75,000 | 54,049 | |||||||||
Gray Television, Inc. (Media) | (b) | 4.750% | 10/15/2030 | 75,000 | 54,252 | |||||||||
Grupo Televisa S.A.B. (Media) | 5.000% | 05/13/2045 | 350,000 | 298,655 | ||||||||||
iHeartCommunications, Inc. (Media) | 6.375% | 05/01/2026 | 25,000 | 23,000 | ||||||||||
iHeartCommunications, Inc. (Media) | 8.375% | 05/01/2027 | 75,000 | 63,782 | ||||||||||
iHeartCommunications, Inc. (Media) | (b) | 5.250% | 08/15/2027 | 100,000 | 84,708 | |||||||||
Lamar Media Corp. (Media) | 4.875% | 01/15/2029 | 25,000 | 22,954 | ||||||||||
| 112 | (continued) |
Ohio National Fund, Inc. | ON Federated Core Plus Bond Portfolio (Continued) | |
| Schedule of Investments | December 31, 2022 | |
| Corporate Bonds (Continued) | Rate | Maturity | Face Amount | Value | ||||||||||
COMMUNICATION SERVICES (continued) | ||||||||||||||
Magallanes, Inc. (Media) | (b) | 4.279% | 03/15/2032 | $ | 450,000 | $ | 370,694 | |||||||
Magallanes, Inc. (Media) | (b) | 5.050% | 03/15/2042 | 470,000 | 359,589 | |||||||||
Match Group Holdings II LLC (Interactive Media & Svs.) | (b) | 5.000% | 12/15/2027 | 100,000 | 92,000 | |||||||||
Midas OpCo Holdings LLC (Media) | (b) | 5.625% | 08/15/2029 | 150,000 | 123,687 | |||||||||
Netflix, Inc. (Entertainment) | 4.875% | 04/15/2028 | 325,000 | 313,816 | ||||||||||
Nexstar Media, Inc. (Media) | (b) | 5.625% | 07/15/2027 | 150,000 | 137,604 | |||||||||
Outfront Media Capital LLC / Outfront Media Capital Corp. (Media) | (b) | 5.000% | 08/15/2027 | 25,000 | 22,506 | |||||||||
Outfront Media Capital LLC / Outfront Media Capital Corp. (Media) | (b) | 4.250% | 01/15/2029 | 50,000 | 41,487 | |||||||||
Paramount Global (Media) | 4.200% | 05/19/2032 | 525,000 | 429,696 | ||||||||||
Paramount Global (Media) | 4.900% | 08/15/2044 | 300,000 | 219,104 | ||||||||||
Rackspace Technology Global, Inc. (Interactive Media & Svs.) | (b) | 3.500% | 02/15/2028 | 25,000 | 14,528 | |||||||||
Rackspace Technology Global, Inc. (Interactive Media & Svs.) | (b) | 5.375% | 12/01/2028 | 100,000 | 43,586 | |||||||||
ROBLOX Corp. (Entertainment) | (b) | 3.875% | 05/01/2030 | 50,000 | 39,410 | |||||||||
Rogers Communications, Inc. (Wireless Telecom. Svs.) | (b) | 4.500% | 03/15/2042 | 465,000 | 379,006 | |||||||||
Scripps Escrow, Inc. (Media) | (b) | 5.875% | 07/15/2027 | 75,000 | 66,937 | |||||||||
Sinclair Television Group, Inc. (Media) | (b) | 5.125% | 02/15/2027 | 25,000 | 20,390 | |||||||||
Sinclair Television Group, Inc. (Media) | (b) | 5.500% | 03/01/2030 | 75,000 | 52,442 | |||||||||
Sirius XM Radio, Inc. (Media) | (b) | 3.875% | 09/01/2031 | 200,000 | 156,034 | |||||||||
Sky Ltd. (Media) | (b) | 3.750% | 09/16/2024 | 375,000 | 366,046 | |||||||||
Sprint LLC (Wireless Telecom. Svs.) | 7.625% | 03/01/2026 | 50,000 | 52,615 | ||||||||||
TEGNA, Inc. (Media) | (b) | 4.750% | 03/15/2026 | 25,000 | 24,241 | |||||||||
TEGNA, Inc. (Media) | 4.625% | 03/15/2028 | 25,000 | 23,743 | ||||||||||
TEGNA, Inc. (Media) | 5.000% | 09/15/2029 | 25,000 | 23,720 | ||||||||||
T-Mobile U.S.A., Inc. (Wireless Telecom. Svs.) | 4.750% | 02/01/2028 | 75,000 | 72,922 | ||||||||||
T-Mobile U.S.A., Inc. (Wireless Telecom. Svs.) | 3.375% | 04/15/2029 | 50,000 | 44,038 | ||||||||||
T-Mobile U.S.A., Inc. (Wireless Telecom. Svs.) | 3.500% | 04/15/2031 | 250,000 | 215,950 | ||||||||||
T-Mobile U.S.A., Inc. (Wireless Telecom. Svs.) | 3.300% | 02/15/2051 | 500,000 | 333,671 | ||||||||||
T-Mobile U.S.A., Inc. (Wireless Telecom. Svs.) | 5.650% | 01/15/2053 | 110,000 | 106,468 | ||||||||||
Univision Communications, Inc. (Media) | (b) | 7.375% | 06/30/2030 | 50,000 | 47,785 | |||||||||
UPC Broadband Finco B.V. (Media) | (b) | 4.875% | 07/15/2031 | 200,000 | 166,359 | |||||||||
Urban One, Inc. (Media) | (b) | 7.375% | 02/01/2028 | 50,000 | 42,266 | |||||||||
Verizon Communications, Inc. (Diversified Telecom. Svs.) | 4.000% | 03/22/2050 | 950,000 | 743,242 | ||||||||||
Virgin Media Finance PLC (Media) | (b) | 5.000% | 07/15/2030 | 200,000 | 160,412 | |||||||||
Vodafone Group PLC (Wireless Telecom. Svs.) | 4.125% | 05/30/2025 | 275,000 | 270,621 | ||||||||||
Vodafone Group PLC (Wireless Telecom. Svs.) | 5.250% | 05/30/2048 | 300,000 | 264,219 | ||||||||||
Walt Disney Co. / The (Entertainment) | 3.800% | 03/22/2030 | 125,000 | 116,503 | ||||||||||
Walt Disney Co. / The (Entertainment) | 4.700% | 03/23/2050 | 325,000 | 298,335 | ||||||||||
Walt Disney Co. / The (Entertainment) | 3.600% | 01/13/2051 | 350,000 | 266,503 | ||||||||||
|
| |||||||||||||
| 12,067,008 | ||||||||||||||
|
| |||||||||||||
CONSUMER DISCRETIONARY – 1.2% | ||||||||||||||
1011778 B.C. ULC / New Red Finance, Inc. (Hotels, Restaurants & Leisure) | (b) | 4.375% | 01/15/2028 | 50,000 | 44,770 | |||||||||
1011778 B.C. ULC / New Red Finance, Inc. (Hotels, Restaurants & Leisure) | (b) | 4.000% | 10/15/2030 | 175,000 | 141,717 | |||||||||
Academy Ltd. (Specialty Retail) | (b) | 6.000% | 11/15/2027 | 50,000 | 47,869 | |||||||||
Advance Auto Parts, Inc. (Specialty Retail) | 3.900% | 04/15/2030 | 675,000 | 591,460 | ||||||||||
Affinity Gaming (Hotels, Restaurants & Leisure) | (b) | 6.875% | 12/15/2027 | 75,000 | 63,588 | |||||||||
Amazon.com, Inc. (Internet & Direct Marketing Retail) | 3.875% | 08/22/2037 | 425,000 | 376,516 | ||||||||||
Amazon.com, Inc. (Internet & Direct Marketing Retail) | 2.500% | 06/03/2050 | 725,000 | 456,903 | ||||||||||
Aramark Services, Inc. (Hotels, Restaurants & Leisure) | (b) | 5.000% | 04/01/2025 | 25,000 | 24,395 | |||||||||
Aramark Services, Inc. (Hotels, Restaurants & Leisure) | (b) | 5.000% | 02/01/2028 | 50,000 | 46,647 | |||||||||
Asbury Automotive Group, Inc. (Specialty Retail) | (b) | 5.000% | 02/15/2032 | 50,000 | 41,135 | |||||||||
Boyd Gaming Corp. (Hotels, Restaurants & Leisure) | 4.750% | 12/01/2027 | 50,000 | 46,569 | ||||||||||
Caesars Entertainment, Inc. (Hotels, Restaurants & Leisure) | (b) | 8.125% | 07/01/2027 | 75,000 | 73,691 | |||||||||
Caesars Entertainment, Inc. (Hotels, Restaurants & Leisure) | (b) | 4.625% | 10/15/2029 | 50,000 | 40,691 | |||||||||
Caesars Resort Collection LLC / CRC Finco, Inc. (Hotels, Restaurants & Leisure) | (b) | 5.750% | 07/01/2025 | 50,000 | 48,945 | |||||||||
Clarios Global LP (Automobiles) | (b) | 6.750% | 05/15/2025 | 22,000 | 22,051 | |||||||||
Clarios Global LP / Clarios U.S. Finance Co. (Auto Components) | (b) | 8.500% | 05/15/2027 | 175,000 | 170,887 | |||||||||
Daimler Trucks Finance North America LLC (Automobiles) | (b) | 2.000% | 12/14/2026 | 340,000 | 299,572 | |||||||||
Daimler Trucks Finance North America LLC (Automobiles) | (b) | 2.375% | 12/14/2028 | 180,000 | 151,256 | |||||||||
Dana Financing Luxembourg SARL (Auto Components) | (b) | 5.750% | 04/15/2025 | 25,000 | 24,461 | |||||||||
Dana, Inc. (Auto Components) | 4.500% | 02/15/2032 | 50,000 | 39,982 | ||||||||||
Dollar General Corp. (Multiline Retail) | 3.875% | 04/15/2027 | 575,000 | 548,252 | ||||||||||
Dornoch Debt Merger Sub, Inc. (Auto Components) | (b) | 6.625% | 10/15/2029 | 125,000 | 87,695 | |||||||||
Garda World Security Corp. (Diversified Consumer Svs.) | (b) | 9.500% | 11/01/2027 | 175,000 | 168,545 | |||||||||
Gates Global LLC / Gates Corp. (Auto Components) | (b) | 6.250% | 01/15/2026 | 125,000 | 120,625 | |||||||||
General Motors Co. (Automobiles) | 6.125% | 10/01/2025 | 575,000 | 585,183 | ||||||||||
Hilton Domestic Operating Co., Inc. (Hotels, Restaurants & Leisure) | (b) | 3.625% | 02/15/2032 | 50,000 | 40,040 | |||||||||
Home Depot, Inc. / The (Specialty Retail) | 3.300% | 04/15/2040 | 950,000 | 756,392 | ||||||||||
IHO Verwaltungs GmbH (Auto Components) | (b)(c) | 6.000%, 6.750% PIK | 05/15/2027 | 200,000 | 174,973 | |||||||||
| 113 | (continued) |
Ohio National Fund, Inc. | ON Federated Core Plus Bond Portfolio (Continued) | |
| Schedule of Investments | December 31, 2022 | |
Corporate Bonds (Continued) | Rate | Maturity | Face Amount | Value | ||||||||||
CONSUMER DISCRETIONARY (continued) | ||||||||||||||
Mercedes-Benz Finance North America LLC (Automobiles) | (b) | 3.350% | 02/22/2023 | $ | 700,000 | $ | 697,402 | |||||||
Midwest Gaming Borrower LLC / Midwest Gaming Finance Corp. (Hotels, Restaurants & Leisure) | (b) | 4.875% | 05/01/2029 | 50,000 | 42,543 | |||||||||
Mohegan Tribal Gaming Authority (Hotels, Restaurants & Leisure) | (b) | 8.000% | 02/01/2026 | 150,000 | 140,293 | |||||||||
Penn Entertainment, Inc. (Hotels, Restaurants & Leisure) | (b) | 5.625% | 01/15/2027 | 25,000 | 22,669 | |||||||||
Penn Entertainment, Inc. (Hotels, Restaurants & Leisure) | (b) | 4.125% | 07/01/2029 | 25,000 | 19,750 | |||||||||
Raptor Acquisition Corp. / Raptor Co-Issuer LLC (Hotels, Restaurants & Leisure) | (b) | 4.875% | 11/01/2026 | 25,000 | 22,210 | |||||||||
Real Hero Merger Sub 2, Inc. (Auto Components) | (b) | 6.250% | 02/01/2029 | 50,000 | 34,275 | |||||||||
Scientific Games Holdings LP / Scientific Games U.S. FinCo, Inc. (Hotels, Restaurants & Leisure) | (b) | 6.625% | 03/01/2030 | 75,000 | 63,352 | |||||||||
Scientific Games International, Inc. (Hotels, Restaurants & Leisure) | (b) | 8.625% | 07/01/2025 | 50,000 | 51,010 | |||||||||
Scientific Games International, Inc. (Hotels, Restaurants & Leisure) | (b) | 7.250% | 11/15/2029 | 50,000 | 48,000 | |||||||||
SeaWorld Parks & Entertainment, Inc. (Hotels, Restaurants & Leisure) | (b) | 5.250% | 08/15/2029 | 50,000 | 43,535 | |||||||||
Six Flags Entertainment Corp. (Hotels, Restaurants & Leisure) | (b) | 5.500% | 04/15/2027 | 50,000 | 45,032 | |||||||||
Station Casinos LLC (Hotels, Restaurants & Leisure) | (b) | 4.500% | 02/15/2028 | 50,000 | 43,469 | |||||||||
Station Casinos LLC (Hotels, Restaurants & Leisure) | (b) | 4.625% | 12/01/2031 | 50,000 | 40,109 | |||||||||
William Carter Co. / The (Textiles, Apparel & Luxury Goods) | (b) | 5.625% | 03/15/2027 | 25,000 | 23,980 | |||||||||
Yum! Brands, Inc. (Hotels, Restaurants & Leisure) | 4.625% | 01/31/2032 | 75,000 | 66,295 | ||||||||||
|
| |||||||||||||
| 6,638,734 | ||||||||||||||
|
| |||||||||||||
CONSUMER STAPLES – 1.3% | ||||||||||||||
Albertsons Cos., Inc. / Safeway, Inc. / New Albertsons LP / Albertsons LLC (Food & Staples Retailing) | (b) | 5.875% | 02/15/2028 | 75,000 | 71,301 | |||||||||
Alimentation Couche-Tard, Inc. (Food & Staples Retailing) | (b) | 3.800% | 01/25/2050 | 625,000 | 438,893 | |||||||||
Altria Group, Inc. (Tobacco) | 3.875% | 09/16/2046 | 800,000 | 534,917 | ||||||||||
Anheuser-Busch InBev Worldwide, Inc. (Beverages) | 4.350% | 06/01/2040 | 300,000 | 263,624 | ||||||||||
B.A.T. Capital Corp. (Tobacco) | 4.540% | 08/15/2047 | 725,000 | 512,266 | ||||||||||
BellRing Brands, Inc. (Personal Products) | (b) | 7.000% | 03/15/2030 | 75,000 | 72,169 | |||||||||
Coca-Cola Europacific Partners PLC (Beverages) | (b) | 1.500% | 01/15/2027 | 600,000 | 518,926 | |||||||||
Coca-Cola Femsa S.A.B. de C.V. (Beverages) | 2.750% | 01/22/2030 | 750,000 | 645,938 | ||||||||||
Constellation Brands, Inc. (Beverages) | 3.750% | 05/01/2050 | 400,000 | 299,346 | ||||||||||
Edgewell Personal Care Co. (Personal Products) | (b) | 5.500% | 06/01/2028 | 25,000 | 23,381 | |||||||||
Edgewell Personal Care Co. (Personal Products) | (b) | 4.125% | 04/01/2029 | 25,000 | 21,312 | |||||||||
Energizer Holdings, Inc. (Household Products) | (b) | 6.500% | 12/31/2027 | 25,000 | 23,792 | |||||||||
Energizer Holdings, Inc. (Household Products) | (b) | 4.375% | 03/31/2029 | 75,000 | 63,604 | |||||||||
Flowers Foods, Inc. (Food Products) | 3.500% | 10/01/2026 | 675,000 | 631,825 | ||||||||||
Flowers Foods, Inc. (Food Products) | 2.400% | 03/15/2031 | 185,000 | 148,910 | ||||||||||
Grupo Bimbo S.A.B. de C.V. (Food Products) | (b) | 4.875% | 06/27/2044 | 925,000 | 799,408 | |||||||||
Keurig Dr Pepper, Inc. (Beverages) | 4.417% | 05/25/2025 | 36,000 | 35,592 | ||||||||||
Kraft Heinz Foods Co. (Food Products) | 4.375% | 06/01/2046 | 425,000 | 345,356 | ||||||||||
Kroger Co. / The (Food & Staples Retailing) | 3.950% | 01/15/2050 | 325,000 | 252,288 | ||||||||||
Performance Food Group, Inc. (Food & Staples Retailing) | (b) | 4.250% | 08/01/2029 | 50,000 | 43,331 | |||||||||
Philip Morris International, Inc. (Tobacco) | 3.875% | 08/21/2042 | 615,000 | 466,902 | ||||||||||
Post Holdings, Inc. (Food Products) | (b) | 5.750% | 03/01/2027 | 150,000 | 145,062 | |||||||||
Sysco Corp. (Food & Staples Retailing) | 4.450% | 03/15/2048 | 525,000 | 430,424 | ||||||||||
U.S. Foods, Inc. (Food & Staples Retailing) | (b) | 4.750% | 02/15/2029 | 50,000 | 44,396 | |||||||||
U.S. Foods, Inc. (Food & Staples Retailing) | (b) | 4.625% | 06/01/2030 | 75,000 | 66,046 | |||||||||
Unilever Capital Corp. (Personal Products) | 0.375% | 09/14/2023 | 100,000 | 96,782 | ||||||||||
|
| |||||||||||||
| 6,995,791 | ||||||||||||||
|
| |||||||||||||
ENERGY – 1.8% | ||||||||||||||
Antero Midstream Partners LP / Antero Midstream Finance Corp. (Oil, Gas & Consumable Fuels) | (b) | 7.875% | 05/15/2026 | 50,000 | 50,613 | |||||||||
Antero Midstream Partners LP / Antero Midstream Finance Corp. (Oil, Gas & Consumable Fuels) | (b) | 5.750% | 03/01/2027 | 25,000 | 23,634 | |||||||||
Antero Midstream Partners LP / Antero Midstream Finance Corp. (Oil, Gas & Consumable Fuels) | (b) | 5.750% | 01/15/2028 | 50,000 | 46,381 | |||||||||
Antero Midstream Partners LP / Antero Midstream Finance Corp. (Oil, Gas & Consumable Fuels) | (b) | 5.375% | 06/15/2029 | 75,000 | 68,568 | |||||||||
Antero Resources Corp. (Oil, Gas & Consumable Fuels) | (b) | 5.375% | 03/01/2030 | 50,000 | 46,356 | |||||||||
Archrock Partners LP / Archrock Partners Finance Corp. (Oil, Gas & Consumable Fuels) | (b) | 6.875% | 04/01/2027 | 75,000 | 71,600 | |||||||||
Archrock Partners LP / Archrock Partners Finance Corp. (Oil, Gas & Consumable Fuels) | (b) | 6.250% | 04/01/2028 | 50,000 | 45,751 | |||||||||
Ascent Resources Utica Holdings LLC / ARU Finance Corp. (Oil, Gas & Consumable Fuels) | (b) | 7.000% | 11/01/2026 | 25,000 | 24,250 | |||||||||
Ascent Resources Utica Holdings LLC / ARU Finance Corp. (Oil, Gas & Consumable Fuels) | (b) | 5.875% | 06/30/2029 | 100,000 | 89,163 | |||||||||
Boardwalk Pipelines LP (Oil, Gas & Consumable Fuels) | 3.400% | 02/15/2031 | 450,000 | 376,381 | ||||||||||
BP Capital Markets America, Inc. (Oil, Gas & Consumable Fuels) | 3.588% | 04/14/2027 | 725,000 | 690,566 | ||||||||||
Callon Petroleum Co. (Oil, Gas & Consumable Fuels) | (b) | 7.500% | 06/15/2030 | 25,000 | 22,875 | |||||||||
Canadian Natural Resources Ltd. (Oil, Gas & Consumable Fuels) | 2.050% | 07/15/2025 | 525,000 | 488,426 | ||||||||||
Cheniere Energy Partners LP (Oil, Gas & Consumable Fuels) | 4.500% | 10/01/2029 | 50,000 | 44,961 | ||||||||||
Cheniere Energy, Inc. (Oil, Gas & Consumable Fuels) | 4.625% | 10/15/2028 | 25,000 | 22,597 | ||||||||||
| 114 | (continued) |
Ohio National Fund, Inc. | ON Federated Core Plus Bond Portfolio (Continued) | |
| Schedule of Investments | December 31, 2022 | |
| Corporate Bonds (Continued) | Rate | Maturity | Face Amount | Value | ||||||||||
ENERGY (continued) | ||||||||||||||
Chevron Corp. (Oil, Gas & Consumable Fuels) | 3.078% | 05/11/2050 | $ | 475,000 | $ | 340,888 | ||||||||
CNX Midstream Partners LP (Oil, Gas & Consumable Fuels) | (b) | 4.750% | 04/15/2030 | 50,000 | 41,033 | |||||||||
Comstock Resources, Inc. (Oil, Gas & Consumable Fuels) | (b) | 6.750% | 03/01/2029 | 100,000 | 90,250 | |||||||||
Crestwood Midstream Partners LP / Crestwood Midstream Finance Corp. (Oil, Gas & Consumable Fuels) | (b) | 8.000% | 04/01/2029 | 50,000 | 49,754 | |||||||||
CrownRock LP / CrownRock Finance, Inc. (Oil, Gas & Consumable Fuels) | (b) | 5.625% | 10/15/2025 | 75,000 | 72,375 | |||||||||
Diamondback Energy, Inc. (Oil, Gas & Consumable Fuels) | 6.250% | 03/15/2033 | 390,000 | 395,837 | ||||||||||
DT Midstream, Inc. (Oil, Gas & Consumable Fuels) | (b) | 4.375% | 06/15/2031 | 50,000 | 41,945 | |||||||||
Eastern Gas Transmission & Storage, Inc. (Oil, Gas & Consumable Fuels) | 3.900% | 11/15/2049 | 150,000 | 105,947 | ||||||||||
Enbridge Energy Partners LP (Oil, Gas & Consumable Fuels) | 5.500% | 09/15/2040 | 700,000 | 654,208 | ||||||||||
Endeavor Energy Resources LP / EER Finance, Inc. (Oil, Gas & Consumable Fuels) | (b) | 5.750% | 01/30/2028 | 25,000 | 23,938 | |||||||||
Energy Transfer LP (Oil, Gas & Consumable Fuels) | 3.750% | 05/15/2030 | 500,000 | 440,843 | ||||||||||
Energy Transfer LP (Oil, Gas & Consumable Fuels) | 5.750% | 02/15/2033 | 150,000 | 146,754 | ||||||||||
EQM Midstream Partners LP (Oil, Gas & Consumable Fuels) | 5.500% | 07/15/2028 | 75,000 | 67,062 | ||||||||||
EQM Midstream Partners LP (Oil, Gas & Consumable Fuels) | (b) | 4.500% | 01/15/2029 | 50,000 | 41,996 | |||||||||
EQM Midstream Partners LP (Oil, Gas & Consumable Fuels) | (b) | 4.750% | 01/15/2031 | 50,000 | 40,875 | |||||||||
EQM Midstream Partners LP (Oil, Gas & Consumable Fuels) | 6.500% | 07/15/2048 | 75,000 | 56,218 | ||||||||||
Hess Corp. (Oil, Gas & Consumable Fuels) | 5.600% | 02/15/2041 | 580,000 | 548,256 | ||||||||||
Hess Midstream Operations LP (Oil, Gas & Consumable Fuels) | (b) | 5.125% | 06/15/2028 | 25,000 | 23,117 | |||||||||
Hess Midstream Operations LP (Oil, Gas & Consumable Fuels) | (b) | 4.250% | 02/15/2030 | 25,000 | 21,373 | |||||||||
Holly Energy Partners LP / Holly Energy Finance Corp. (Oil, Gas & Consumable Fuels) | (b) | 5.000% | 02/01/2028 | 75,000 | 68,288 | |||||||||
Kinder Morgan, Inc. (Oil, Gas & Consumable Fuels) | 3.250% | 08/01/2050 | 320,000 | 206,596 | ||||||||||
Marathon Petroleum Corp. (Oil, Gas & Consumable Fuels) | 4.750% | 09/15/2044 | 525,000 | 438,374 | ||||||||||
MPLX LP (Oil, Gas & Consumable Fuels) | 4.950% | 03/14/2052 | 525,000 | 428,843 | ||||||||||
Nabors Industries Ltd. (Energy Equip. & Svs.) | (b) | 7.250% | 01/15/2026 | 50,000 | 47,120 | |||||||||
Nabors Industries Ltd. (Energy Equip. & Svs.) | (b) | 7.500% | 01/15/2028 | 25,000 | 22,872 | |||||||||
NuStar Logistics LP (Oil, Gas & Consumable Fuels) | 6.375% | 10/01/2030 | 25,000 | 23,117 | ||||||||||
Occidental Petroleum Corp. (Oil, Gas & Consumable Fuels) | 6.450% | 09/15/2036 | 75,000 | 76,500 | ||||||||||
ONEOK, Inc. (Oil, Gas & Consumable Fuels) | 2.200% | 09/15/2025 | 150,000 | 137,814 | ||||||||||
ONEOK, Inc. (Oil, Gas & Consumable Fuels) | 4.500% | 03/15/2050 | 625,000 | 465,386 | ||||||||||
PDC Energy, Inc. (Oil, Gas & Consumable Fuels) | 5.750% | 05/15/2026 | 50,000 | 47,729 | ||||||||||
Permian Resources Operating LLC (Oil, Gas & Consumable Fuels) | (b) | 6.875% | 04/01/2027 | 50,000 | 47,112 | |||||||||
Phillips 66 (Oil, Gas & Consumable Fuels) | 0.900% | 02/15/2024 | 150,000 | 143,358 | ||||||||||
Phillips 66 (Oil, Gas & Consumable Fuels) | 3.850% | 04/09/2025 | 300,000 | 292,627 | ||||||||||
Phillips 66 (Oil, Gas & Consumable Fuels) | 4.875% | 11/15/2044 | 375,000 | 342,630 | ||||||||||
Precision Drilling Corp. (Energy Equip. & Svs.) | (b) | 6.875% | 01/15/2029 | 50,000 | 46,550 | |||||||||
Range Resources Corp. (Oil, Gas & Consumable Fuels) | 8.250% | 01/15/2029 | 50,000 | 51,522 | ||||||||||
Rockcliff Energy II LLC (Oil, Gas & Consumable Fuels) | (b) | 5.500% | 10/15/2029 | 25,000 | 22,874 | |||||||||
SM Energy Co. (Oil, Gas & Consumable Fuels) | 6.750% | 09/15/2026 | 50,000 | 48,542 | ||||||||||
SM Energy Co. (Oil, Gas & Consumable Fuels) | 6.500% | 07/15/2028 | 50,000 | 47,938 | ||||||||||
Southwestern Energy Co. (Oil, Gas & Consumable Fuels) | 5.375% | 03/15/2030 | 25,000 | 22,800 | ||||||||||
Tap Rock Resources LLC (Oil, Gas & Consumable Fuels) | (b) | 7.000% | 10/01/2026 | 50,000 | 46,505 | |||||||||
Targa Resources Corp. (Oil, Gas & Consumable Fuels) | 4.200% | 02/01/2033 | 430,000 | 369,956 | ||||||||||
U.S.A. Compression Partners LP / U.S.A. Compression Finance Corp. (Energy Equip. & Svs.) | 6.875% | 04/01/2026 | 150,000 | 143,893 | ||||||||||
Valero Energy Corp. (Oil, Gas & Consumable Fuels) | 4.350% | 06/01/2028 | 350,000 | 337,214 | ||||||||||
Western Midstream Operating LP (Oil, Gas & Consumable Fuels) | 4.300% | 02/01/2030 | 50,000 | 43,646 | ||||||||||
Western Midstream Operating LP (Oil, Gas & Consumable Fuels) | 5.300% | 03/01/2048 | 75,000 | 61,667 | ||||||||||
Western Midstream Operating LP (Oil, Gas & Consumable Fuels) | 5.500% | 08/15/2048 | 25,000 | 20,749 | ||||||||||
Williams Cos., Inc. / The (Oil, Gas & Consumable Fuels) | 3.750% | 06/15/2027 | 525,000 | 494,158 | ||||||||||
|
| |||||||||||||
| 9,861,171 | ||||||||||||||
|
| |||||||||||||
FINANCIALS – 5.2% | ||||||||||||||
AerCap Ireland Capital DAC / AerCap Global Aviation Trust (Diversified Financial Svs.) | 3.000% | 10/29/2028 | 165,000 | 138,233 | ||||||||||
AerCap Ireland Capital DAC / AerCap Global Aviation Trust (Diversified Financial Svs.) | 3.400% | 10/29/2033 | 350,000 | 265,368 | ||||||||||
American Express Co. (Consumer Finance) | 3.300% | 05/03/2027 | 825,000 | 771,240 | ||||||||||
AmWINS Group, Inc. (Insurance) | (b) | 4.875% | 06/30/2029 | 75,000 | 63,611 | |||||||||
Ardonagh Midco 2 PLC (Insurance) | (b)(c) | 11.500%, 12.750% PIK | 01/15/2027 | 200,000 | 190,000 | |||||||||
AssuredPartners, Inc. (Insurance) | (b) | 7.000% | 08/15/2025 | 25,000 | 24,177 | |||||||||
AssuredPartners, Inc. (Insurance) | (b) | 5.625% | 01/15/2029 | 100,000 | 82,303 | |||||||||
Bank of America Corp. (Rate is fixed until 02/13/2025, at which point, the rate becomes QL + 64) (Banks) | (d) | 2.015% | 02/13/2026 | 1,475,000 | 1,369,125 | |||||||||
Bank of America Corp. (Rate is fixed until 04/29/2030, at which point, the rate becomes SOFR + 215) (Banks) | (d) | 2.592% | 04/29/2031 | 1,900,000 | 1,547,428 | |||||||||
Bank of America Corp. (Rate is fixed until 07/22/2032, at which point, the rate becomes SOFR + 216) (Banks) | (d) | 5.015% | 07/22/2033 | 400,000 | 379,757 | |||||||||
Bank of New York Mellon Corp. / The (Capital Markets) | 2.200% | 08/16/2023 | 1,350,000 | 1,329,123 | ||||||||||
Bank of New York Mellon Corp. / The (Rate is fixed until 06/13/2027, at which point, the rate becomes SOFR + 115) (Capital Markets) | (d) | 3.992% | 06/13/2028 | 300,000 | 286,989 | |||||||||
BlackRock, Inc. (Capital Markets) | 1.900% | 01/28/2031 | 425,000 | 343,957 | ||||||||||
| 115 | (continued) |
Ohio National Fund, Inc. | ON Federated Core Plus Bond Portfolio (Continued) | |
| Schedule of Investments | December 31, 2022 | |
| Corporate Bonds (Continued) | Rate | Maturity | Face Amount | Value | ||||||||||
FINANCIALS (continued) | ||||||||||||||
BroadStreet Partners, Inc. (Insurance) | (b) | 5.875% | 04/15/2029 | $ | 200,000 | $ | 170,216 | |||||||
Chubb INA Holdings, Inc. (Insurance) | 3.350% | 05/03/2026 | 425,000 | 406,835 | ||||||||||
Citigroup, Inc. (Rate is fixed until 04/24/2024, at which point, the rate becomes QL + 90) (Banks) | (d) | 3.352% | 04/24/2025 | 725,000 | 703,017 | |||||||||
Citigroup, Inc. (Rate is fixed until 01/29/2030, at which point, the rate becomes SOFR + 115) (Banks) | (d) | 2.666% | 01/29/2031 | 1,600,000 | 1,312,293 | |||||||||
Citizens Bank N.A. (Banks) | 3.750% | 02/18/2026 | 475,000 | 455,267 | ||||||||||
Comerica, Inc. (Banks) | 3.800% | 07/22/2026 | 475,000 | 453,414 | ||||||||||
FNB Corp. (Banks) | 5.150% | 08/25/2025 | 320,000 | 316,189 | ||||||||||
Ford Motor Credit Co. LLC (Consumer Finance) | 7.350% | 11/04/2027 | 200,000 | 204,940 | ||||||||||
Ford Motor Credit Co. LLC (Consumer Finance) | 5.113% | 05/03/2029 | 375,000 | 339,579 | ||||||||||
General Motors Financial Co., Inc. (Consumer Finance) | 2.900% | 02/26/2025 | 675,000 | 639,330 | ||||||||||
General Motors Financial Co., Inc. (Consumer Finance) | 5.000% | 04/09/2027 | 260,000 | 251,854 | ||||||||||
Goldman Sachs Group, Inc. / The (Capital Markets) | 3.500% | 04/01/2025 | 775,000 | 745,273 | ||||||||||
Goldman Sachs Group, Inc. / The (Capital Markets) | 3.800% | 03/15/2030 | 1,400,000 | 1,258,564 | ||||||||||
Goldman Sachs Group, Inc. / The (Rate is fixed until 01/27/2031, at which point, the rate becomes SOFR + 109) (Capital Markets) | (d) | 1.992% | 01/27/2032 | 500,000 | 380,908 | |||||||||
GTCR AP Finance, Inc. (Insurance) | (b) | 8.000% | 05/15/2027 | 75,000 | 71,841 | |||||||||
HSBC Holdings PLC (Banks) | 3.900% | 05/25/2026 | 975,000 | 928,606 | ||||||||||
HUB International Ltd. (Insurance) | (b) | 5.625% | 12/01/2029 | 375,000 | 327,518 | |||||||||
Huntington Bancshares, Inc. (Rate is fixed until 08/04/2027, at which point, the rate becomes SOFR + 197) (Banks) | (d) | 4.443% | 08/04/2028 | 350,000 | 333,383 | |||||||||
Jefferies Financial Group, Inc. (Capital Markets) | 2.750% | 10/15/2032 | 305,000 | 229,364 | ||||||||||
John Deere Capital Corp. (Consumer Finance) | 3.450% | 03/07/2029 | 800,000 | 742,007 | ||||||||||
Jones Deslauriers Insurance Management, Inc. (Insurance) | (b) | 10.500% | 12/15/2030 | 50,000 | 49,243 | |||||||||
JPMorgan Chase & Co. (Banks) | 3.125% | 01/23/2025 | 525,000 | 506,686 | ||||||||||
JPMorgan Chase & Co. (Rate is fixed until 04/22/2030, at which point, the rate becomes SOFR + 204) (Banks) | (d) | 2.522% | 04/22/2031 | 900,000 | 736,458 | |||||||||
JPMorgan Chase & Co. (Rate is fixed until 11/19/2030, at which point, the rate becomes TSFR3M + 111) (Banks) | (d) | 1.764% | 11/19/2031 | 100,000 | 75,807 | |||||||||
JPMorgan Chase & Co. (Rate is fixed until 04/22/2031, at which point, the rate becomes SOFR + 125) (Banks) | (d) | 2.580% | 04/22/2032 | 100,000 | 80,104 | |||||||||
JPMorgan Chase & Co. (Rate is fixed until 01/25/2032, at which point, the rate becomes SOFR + 126) (Banks) | (d) | 2.963% | 01/25/2033 | 1,200,000 | 976,683 | |||||||||
JPMorgan Chase & Co. (Rate is fixed until 09/14/2032, at which point, the rate becomes SOFR + 258) (Banks) | (d) | 5.717% | 09/14/2033 | 300,000 | 292,816 | |||||||||
Lincoln National Corp. (Insurance) | 4.000% | 09/01/2023 | 300,000 | 297,640 | ||||||||||
M&T Bank Corp. (Banks) | 3.550% | 07/26/2023 | 575,000 | 570,756 | ||||||||||
Morgan Stanley (Capital Markets) | 4.100% | 05/22/2023 | 325,000 | 323,812 | ||||||||||
Morgan Stanley (Capital Markets) | 6.250% | 08/09/2026 | 475,000 | 496,030 | ||||||||||
Morgan Stanley (Rate is fixed until 01/24/2028, at which point, the rate becomes QL + 114) (Capital Markets) | (d) | 3.772% | 01/24/2029 | 750,000 | 686,816 | |||||||||
Morgan Stanley (Rate is fixed until 02/13/2031, at which point, the rate becomes SOFR + 103) (Capital Markets) | (d) | 1.794% | 02/13/2032 | 295,000 | 221,710 | |||||||||
Morgan Stanley (Rate is fixed until 04/28/2031, at which point, the rate becomes SOFR + 102) (Capital Markets) | (d) | 1.928% | 04/28/2032 | 250,000 | 188,632 | |||||||||
Morgan Stanley (Rate is fixed until 07/20/2032, at which point, the rate becomes SOFR + 208) (Capital Markets) | (d) | 4.889% | 07/20/2033 | 140,000 | 131,533 | |||||||||
Navient Corp. (Consumer Finance) | 4.875% | 03/15/2028 | 75,000 | 61,681 | ||||||||||
Navient Corp. (Consumer Finance) | 5.500% | 03/15/2029 | 50,000 | 40,800 | ||||||||||
NFP Corp. (Insurance) | (b) | 6.875% | 08/15/2028 | 175,000 | 144,249 | |||||||||
NFP Corp. (Insurance) | (b) | 7.500% | 10/01/2030 | 25,000 | 23,510 | |||||||||
Northern Trust Corp. (Capital Markets) | 6.125% | 11/02/2032 | 380,000 | 400,688 | ||||||||||
PNC Financial Services Group, Inc. / The (Rate is fixed until 06/06/2032, at which point, the rate becomes SOFRINDX + 185) (Banks) | (d) | 4.626% | 06/06/2033 | 630,000 | 582,005 | |||||||||
Prudential Financial, Inc. (Insurance) | 3.700% | 03/13/2051 | 575,000 | 438,765 | ||||||||||
Raymond James Financial, Inc. (Capital Markets) | 4.650% | 04/01/2030 | 100,000 | 96,283 | ||||||||||
Regions Financial Corp. (Banks) | 2.250% | 05/18/2025 | 345,000 | 322,406 | ||||||||||
Rocket Mortgage LLC / Rocket Mortgage Co-Issuer, Inc. (Thrifts & Mortgage Finance) | (b) | 2.875% | 10/15/2026 | 50,000 | 42,858 | |||||||||
Rocket Mortgage LLC / Rocket Mortgage Co-Issuer, Inc. (Thrifts & Mortgage Finance) | (b) | 3.625% | 03/01/2029 | 75,000 | 59,433 | |||||||||
Rocket Mortgage LLC / Rocket Mortgage Co-Issuer, Inc. (Thrifts & Mortgage Finance) | (b) | 4.000% | 10/15/2033 | 50,000 | 37,343 | |||||||||
Ryan Specialty Group LLC (Insurance) | (b) | 4.375% | 02/01/2030 | 50,000 | 43,295 | |||||||||
S&P Global, Inc. (Capital Markets) | (b) | 2.900% | 03/01/2032 | 240,000 | 204,709 | |||||||||
Stifel Financial Corp. (Capital Markets) | 4.000% | 05/15/2030 | 200,000 | 173,461 | ||||||||||
Toyota Motor Credit Corp. (Consumer Finance) | 3.950% | 06/30/2025 | 600,000 | 587,375 | ||||||||||
U.S. Bancorp (Rate is fixed until 07/22/2032, at which point, the rate becomes SOFR + 211) (Banks) | (d) | 4.967% | 07/22/2033 | 350,000 | 332,073 | |||||||||
United Wholesale Mortgage LLC (Thrifts & Mortgage Finance) | (b) | 5.500% | 11/15/2025 | 175,000 | 157,608 | |||||||||
USI, Inc. (Insurance) | (b) | 6.875% | 05/01/2025 | 200,000 | 192,669 | |||||||||
| 116 | (continued) |
Ohio National Fund, Inc. | ON Federated Core Plus Bond Portfolio (Continued) | |
| Schedule of Investments | December 31, 2022 | |
| Corporate Bonds (Continued) | Rate | Maturity | Face Amount | Value | ||||||||||
FINANCIALS (continued) | ||||||||||||||
Wells Fargo & Co. (Banks) | 3.750% | 01/24/2024 | $ | 750,000 | $ | 739,809 | ||||||||
Wells Fargo & Co. (Rate is fixed until 02/11/2030, at which point, the rate becomes SOFR + 126) (Banks) | (d) | 2.572% | 02/11/2031 | 1,550,000 | 1,283,503 | |||||||||
Wells Fargo & Co. (Rate is fixed until 07/25/2032, at which point, the rate becomes SOFR + 210) (Banks) | (d) | 4.897% | 07/25/2033 | 300,000 | 284,860 | |||||||||
|
| |||||||||||||
| 28,945,818 | ||||||||||||||
|
| |||||||||||||
HEALTH CARE – 1.8% | ||||||||||||||
Abbott Laboratories (Health Care Equip. & Supplies) | 3.750% | 11/30/2026 | 475,000 | 462,426 | ||||||||||
AdaptHealth LLC (Health Care Providers & Svs.) | (b) | 4.625% | 08/01/2029 | 25,000 | 20,931 | |||||||||
AdaptHealth LLC (Health Care Providers & Svs.) | (b) | 5.125% | 03/01/2030 | 75,000 | 63,847 | |||||||||
AHP Health Partners, Inc. (Health Care Providers & Svs.) | (b) | 5.750% | 07/15/2029 | 50,000 | 39,062 | |||||||||
Alcon Finance Corp. (Health Care Equip. & Supplies) | (b) | 2.600% | 05/27/2030 | 400,000 | 339,726 | |||||||||
Amgen, Inc. (Biotechnology) | 3.375% | 02/21/2050 | 500,000 | 347,575 | ||||||||||
AstraZeneca PLC (Pharmaceuticals) | 3.125% | 06/12/2027 | 610,000 | 572,779 | ||||||||||
AstraZeneca PLC (Pharmaceuticals) | 1.375% | 08/06/2030 | 225,000 | 177,756 | ||||||||||
Avantor Funding, Inc. (Health Care Equip. & Supplies) | (b) | 4.625% | 07/15/2028 | 75,000 | 68,148 | |||||||||
Avantor Funding, Inc. (Health Care Equip. & Supplies) | (b) | 3.875% | 11/01/2029 | 25,000 | 20,994 | |||||||||
Bausch Health Americas, Inc. (Pharmaceuticals) | (b) | 8.500% | 01/31/2027 | 50,000 | 26,157 | |||||||||
Bausch Health Cos., Inc. (Pharmaceuticals) | (b) | 6.125% | 02/01/2027 | 50,000 | 34,481 | |||||||||
Bausch Health Cos., Inc. (Pharmaceuticals) | (b) | 5.000% | 02/15/2029 | 50,000 | 23,962 | |||||||||
Bausch Health Cos., Inc. (Pharmaceuticals) | (b) | 6.250% | 02/15/2029 | 50,000 | 24,072 | |||||||||
Bayer U.S. Finance LLC (Pharmaceuticals) | (b) | 3.375% | 10/08/2024 | 775,000 | 748,891 | |||||||||
Becton Dickinson and Co. (Health Care Equip. & Supplies) | 4.685% | 12/15/2044 | 264,000 | 235,957 | ||||||||||
Becton Dickinson and Co. (Health Care Equip. & Supplies) | 3.794% | 05/20/2050 | 68,000 | 52,182 | ||||||||||
Biogen, Inc. (Biotechnology) | 3.150% | 05/01/2050 | 725,000 | 471,280 | ||||||||||
Bristol-Myers Squibb Co. (Pharmaceuticals) | 0.750% | 11/13/2025 | 245,000 | 220,152 | ||||||||||
Bristol-Myers Squibb Co. (Pharmaceuticals) | 3.900% | 02/20/2028 | 800,000 | 770,278 | ||||||||||
Bristol-Myers Squibb Co. (Pharmaceuticals) | 4.250% | 10/26/2049 | 200,000 | 171,868 | ||||||||||
Catalent Pharma Solutions, Inc. (Pharmaceuticals) | (b) | 3.500% | 04/01/2030 | 25,000 | 19,740 | |||||||||
Centene Corp. (Health Care Providers & Svs.) | 4.250% | 12/15/2027 | 200,000 | 187,573 | ||||||||||
CHS / Community Health Systems, Inc. (Health Care Providers & Svs.) | (b) | 5.625% | 03/15/2027 | 25,000 | 21,436 | |||||||||
CHS / Community Health Systems, Inc. (Health Care Providers & Svs.) | (b) | 6.125% | 04/01/2030 | 50,000 | 24,759 | |||||||||
CHS / Community Health Systems, Inc. (Health Care Providers & Svs.) | (b) | 5.250% | 05/15/2030 | 75,000 | 56,553 | |||||||||
CVS Health Corp. (Health Care Providers & Svs.) | 2.875% | 06/01/2026 | 425,000 | 396,728 | ||||||||||
CVS Health Corp. (Health Care Providers & Svs.) | 4.250% | 04/01/2050 | 450,000 | 358,162 | ||||||||||
Danaher Corp. (Life Sciences Tools & Svs.) | 2.600% | 10/01/2050 | 645,000 | 411,329 | ||||||||||
Embecta Corp. (Health Care Equip. & Supplies) | (b) | 6.750% | 02/15/2030 | 50,000 | 45,125 | |||||||||
Garden Spinco Corp. (Health Care Equip. & Supplies) | (b) | 8.625% | 07/20/2030 | 25,000 | 26,500 | |||||||||
GE HealthCare Technologies, Inc. (Health Care Equip. & Supplies) | (b) | 6.377% | 11/22/2052 | 105,000 | 111,522 | |||||||||
HCA, Inc. (Health Care Providers & Svs.) | 5.375% | 09/01/2026 | 75,000 | 74,166 | ||||||||||
HCA, Inc. (Health Care Providers & Svs.) | 3.500% | 07/15/2051 | 475,000 | 304,745 | ||||||||||
HealthEquity, Inc. (Health Care Providers & Svs.) | (b) | 4.500% | 10/01/2029 | 50,000 | 43,695 | |||||||||
Legacy LifePoint Health LLC (Health Care Providers & Svs.) | (b) | 6.750% | 04/15/2025 | 50,000 | 47,054 | |||||||||
LifePoint Health, Inc. (Health Care Providers & Svs.) | (b) | 5.375% | 01/15/2029 | 75,000 | 42,382 | |||||||||
Medline Borrower LP (Health Care Equip. & Supplies) | (b) | 3.875% | 04/01/2029 | 50,000 | 40,298 | |||||||||
Medline Borrower LP (Health Care Equip. & Supplies) | (b) | 5.250% | 10/01/2029 | 175,000 | 138,997 | |||||||||
MPH Acquisition Holdings LLC (Health Care Providers & Svs.) | (b) | 5.750% | 11/01/2028 | 50,000 | 33,251 | |||||||||
Pediatrix Medical Group, Inc. (Health Care Providers & Svs.) | (b) | 5.375% | 02/15/2030 | 50,000 | 43,448 | |||||||||
Prestige Brands, Inc. (Pharmaceuticals) | (b) | 5.125% | 01/15/2028 | 75,000 | 70,405 | |||||||||
Regeneron Pharmaceuticals, Inc. (Biotechnology) | 2.800% | 09/15/2050 | 702,000 | 435,387 | ||||||||||
Stryker Corp. (Health Care Equip. & Supplies) | 3.500% | 03/15/2026 | 450,000 | 431,907 | ||||||||||
Syneos Health, Inc. (Life Sciences Tools & Svs.) | (b) | 3.625% | 01/15/2029 | 50,000 | 39,817 | |||||||||
Takeda Pharmaceutical Co. Ltd. (Pharmaceuticals) | 2.050% | 03/31/2030 | 350,000 | 285,687 | ||||||||||
Takeda Pharmaceutical Co. Ltd. (Pharmaceuticals) | 3.025% | 07/09/2040 | 400,000 | 293,543 | ||||||||||
Tenet Healthcare Corp. (Health Care Providers & Svs.) | 4.625% | 07/15/2024 | 21,000 | 20,480 | ||||||||||
Tenet Healthcare Corp. (Health Care Providers & Svs.) | (b) | 4.875% | 01/01/2026 | 75,000 | 70,923 | |||||||||
Tenet Healthcare Corp. (Health Care Providers & Svs.) | (b) | 6.125% | 10/01/2028 | 75,000 | 67,149 | |||||||||
Tenet Healthcare Corp. (Health Care Providers & Svs.) | (b) | 4.250% | 06/01/2029 | 25,000 | 21,657 | |||||||||
Thermo Fisher Scientific, Inc. (Life Sciences Tools & Svs.) | 1.215% | 10/18/2024 | 350,000 | 328,479 | ||||||||||
Zoetis, Inc. (Pharmaceuticals) | 3.000% | 05/15/2050 | 625,000 | 422,189 | ||||||||||
|
| |||||||||||||
| 9,807,610 | ||||||||||||||
|
| |||||||||||||
INDUSTRIALS – 2.6% | ||||||||||||||
Air Lease Corp. (Trading Companies & Distributors) | 5.850% | 12/15/2027 | 470,000 | 469,466 | ||||||||||
Airbus SE (Aerospace & Defense) | (b) | 3.150% | 04/10/2027 | 800,000 | 743,122 | |||||||||
Allegion PLC (Building Products) | 3.500% | 10/01/2029 | 750,000 | 646,245 | ||||||||||
Allied Universal Holdco LLC / Allied Universal Finance Corp. (Commercial Svs. & Supplies) | (b) | 6.625% | 07/15/2026 | 25,000 | 22,875 | |||||||||
Allied Universal Holdco LLC / Allied Universal Finance Corp. (Commercial Svs. & Supplies) | (b) | 6.000% | 06/01/2029 | 200,000 | 145,152 | |||||||||
American Builders & Contractors Supply Co., Inc. (Trading Companies & Distributors) | (b) | 4.000% | 01/15/2028 | 25,000 | 22,305 | |||||||||
| 117 | (continued) |
Ohio National Fund, Inc. | ON Federated Core Plus Bond Portfolio (Continued) | |
| Schedule of Investments | December 31, 2022 | |
| Corporate Bonds (Continued) | Rate | Maturity | Face Amount | Value | ||||||||||
INDUSTRIALS (continued) | ||||||||||||||
BAE Systems PLC (Aerospace & Defense) | (b) | 3.000% | 09/15/2050 | $ | 500,000 | $ | 323,592 | |||||||
BCPE Empire Holdings, Inc. (Commercial Svs. & Supplies) | (b) | 7.625% | 05/01/2027 | 100,000 | 89,678 | |||||||||
Boeing Co. / The (Aerospace & Defense) | 2.196% | 02/04/2026 | 1,025,000 | 931,277 | ||||||||||
Boeing Co. / The (Aerospace & Defense) | 2.950% | 02/01/2030 | 225,000 | 190,558 | ||||||||||
Boeing Co. / The (Aerospace & Defense) | 5.805% | 05/01/2050 | 225,000 | 208,615 | ||||||||||
Burlington Northern Santa Fe LLC (Road & Rail) | 3.000% | 04/01/2025 | 475,000 | 456,820 | ||||||||||
Camelot Return Merger Sub, Inc. (Building Products) | (b) | 8.750% | 08/01/2028 | 25,000 | 22,941 | |||||||||
Canadian Pacific Railway Co. (Road & Rail) | 1.750% | 12/02/2026 | 90,000 | 80,202 | ||||||||||
Canadian Pacific Railway Co. (Road & Rail) | 2.050% | 03/05/2030 | 175,000 | 143,412 | ||||||||||
Canadian Pacific Railway Co. (Road & Rail) | 3.000% | 12/02/2041 | 75,000 | 56,542 | ||||||||||
Clarivate Science Holdings Corp. (Professional Svs.) | (b) | 4.875% | 07/01/2029 | 75,000 | 63,776 | |||||||||
CNH Industrial N.V. (Machinery) | 3.850% | 11/15/2027 | 525,000 | 491,740 | ||||||||||
Cornerstone Building Brands, Inc. (Building Products) | (b) | 6.125% | 01/15/2029 | 50,000 | 35,212 | |||||||||
CP Atlas Buyer, Inc. (Building Products) | (b) | 7.000% | 12/01/2028 | 50,000 | 37,133 | |||||||||
Dun & Bradstreet Corp. / The (Professional Svs.) | (b) | 5.000% | 12/15/2029 | 50,000 | 42,788 | |||||||||
Equifax, Inc. (Professional Svs.) | 2.600% | 12/15/2025 | 750,000 | 697,622 | ||||||||||
ERAC U.S.A. Finance LLC (Road & Rail) | (b) | 3.850% | 11/15/2024 | 650,000 | 628,032 | |||||||||
Experian Finance PLC (Professional Svs.) | (b) | 4.250% | 02/01/2029 | 350,000 | 322,886 | |||||||||
Foundation Building Materials, Inc. (Trading Companies & Distributors) | (b) | 6.000% | 03/01/2029 | 125,000 | 93,588 | |||||||||
Garda World Security Corp. (Commercial Svs. & Supplies) | (b) | 4.625% | 02/15/2027 | 50,000 | 44,149 | |||||||||
Garda World Security Corp. (Commercial Svs. & Supplies) | (b) | 6.000% | 06/01/2029 | 50,000 | 40,627 | |||||||||
General Dynamics Corp. (Aerospace & Defense) | 1.150% | 06/01/2026 | 670,000 | 594,857 | ||||||||||
GXO Logistics, Inc. (Air Freight & Logistics) | 2.650% | 07/15/2031 | 670,000 | 494,695 | ||||||||||
GYP Holdings III Corp. (Building Products) | (b) | 4.625% | 05/01/2029 | 75,000 | 61,235 | |||||||||
H&E Equipment Services, Inc. (Trading Companies & Distributors) | (b) | 3.875% | 12/15/2028 | 50,000 | 42,590 | |||||||||
Honeywell International, Inc. (Industrial Conglomerates) | 1.350% | 06/01/2025 | 390,000 | 360,532 | ||||||||||
Honeywell International, Inc. (Industrial Conglomerates) | 2.800% | 06/01/2050 | 270,000 | 191,874 | ||||||||||
Huntington Ingalls Industries, Inc. (Aerospace & Defense) | 3.483% | 12/01/2027 | 775,000 | 703,385 | ||||||||||
Kansas City Southern (Road & Rail) | 3.500% | 05/01/2050 | 675,000 | 480,213 | ||||||||||
Madison IAQ LLC (Commercial Svs. & Supplies) | (b) | 4.125% | 06/30/2028 | 25,000 | 20,906 | |||||||||
Madison IAQ LLC (Commercial Svs. & Supplies) | (b) | 5.875% | 06/30/2029 | 100,000 | 68,540 | |||||||||
Masco Corp. (Building Products) | 3.500% | 11/15/2027 | 350,000 | 324,188 | ||||||||||
MIWD Holdco II LLC / MIWD Finance Corp. (Building Products) | (b) | 5.500% | 02/01/2030 | 25,000 | 19,904 | |||||||||
Northrop Grumman Corp. (Aerospace & Defense) | 3.250% | 01/15/2028 | 825,000 | 760,856 | ||||||||||
Penske Truck Leasing Co. LP / PTL Finance Corp. (Road & Rail) | (b) | 3.450% | 07/01/2024 | 500,000 | 482,825 | |||||||||
Solaris Midstream Holdings LLC (Commercial Svs. & Supplies) | (b) | 7.625% | 04/01/2026 | 50,000 | 49,732 | |||||||||
SPX FLOW, Inc. (Machinery) | (b) | 8.750% | 04/01/2030 | 75,000 | 59,149 | |||||||||
Textron, Inc. (Aerospace & Defense) | 3.650% | 03/15/2027 | 600,000 | 559,333 | ||||||||||
TransDigm, Inc. (Aerospace & Defense) | (b) | 6.250% | 03/15/2026 | 75,000 | 73,964 | |||||||||
TransDigm, Inc. (Aerospace & Defense) | 5.500% | 11/15/2027 | 200,000 | 187,810 | ||||||||||
Trident TPI Holdings, Inc. (Machinery) | (b) | 9.250% | 08/01/2024 | 75,000 | 71,279 | |||||||||
Trident TPI Holdings, Inc. (Machinery) | (b) | 6.625% | 11/01/2025 | 50,000 | 43,332 | |||||||||
Union Pacific Corp. (Road & Rail) | 2.375% | 05/20/2031 | 385,000 | 324,133 | ||||||||||
United Rentals North America, Inc. (Trading Companies & Distributors) | 4.875% | 01/15/2028 | 75,000 | 71,074 | ||||||||||
United Rentals North America, Inc. (Trading Companies & Distributors) | 5.250% | 01/15/2030 | 25,000 | 23,490 | ||||||||||
United Rentals North America, Inc. (Trading Companies & Distributors) | 3.875% | 02/15/2031 | 25,000 | 20,957 | ||||||||||
Valmont Industries, Inc. (Construction & Engineering) | 5.000% | 10/01/2044 | 40,000 | 34,364 | ||||||||||
Verisk Analytics, Inc. (Professional Svs.) | 4.125% | 03/15/2029 | 600,000 | 561,679 | ||||||||||
Watco Cos. LLC / Watco Finance Corp. (Road & Rail) | (b) | 6.500% | 06/15/2027 | 50,000 | 47,500 | |||||||||
WESCO Distribution, Inc. (Trading Companies & Distributors) | (b) | 7.250% | 06/15/2028 | 100,000 | 101,297 | |||||||||
White Cap Buyer LLC (Building Products) | (b) | 6.875% | 10/15/2028 | 50,000 | 43,250 | |||||||||
White Cap Parent LLC (Building Products) | (b)(c) | 8.250%, 9.000% PIK | 03/15/2026 | 50,000 | 43,225 | |||||||||
Xylem, Inc. (Machinery) | 2.250% | 01/30/2031 | 455,000 | 369,096 | ||||||||||
|
| |||||||||||||
| 14,341,619 | ||||||||||||||
|
| |||||||||||||
INFORMATION TECHNOLOGY – 1.8% | ||||||||||||||
Apple, Inc. (Tech. Hardware, Storage & Periph.) | 2.900% | 09/12/2027 | 600,000 | 559,281 | ||||||||||
Apple, Inc. (Tech. Hardware, Storage & Periph.) | 2.375% | 02/08/2041 | 375,000 | 265,013 | ||||||||||
AthenaHealth Group, Inc. (Software) | (b) | 6.500% | 02/15/2030 | 150,000 | 110,540 | |||||||||
Boxer Parent Co., Inc. (Software) | (b) | 9.125% | 03/01/2026 | 50,000 | 47,171 | |||||||||
Broadcom, Inc. (Semiconductors & Equip.) | 4.150% | 11/15/2030 | 285,000 | 255,403 | ||||||||||
Broadcom, Inc. (Semiconductors & Equip.) | (b) | 3.419% | 04/15/2033 | 160,000 | 128,273 | |||||||||
Broadcom, Inc. (Semiconductors & Equip.) | (b) | 3.187% | 11/15/2036 | 15,000 | 10,774 | |||||||||
CDW LLC / CDW Finance Corp. (Electronic Equip., Instr. & Comp.) | 2.670% | 12/01/2026 | 480,000 | 426,153 | ||||||||||
Central Parent, Inc. / CDK Global, Inc. (Software) | (b) | 7.250% | 06/15/2029 | 75,000 | 73,359 | |||||||||
Cloud Software Group Holdings, Inc. (Software) | (b) | 6.500% | 03/31/2029 | 50,000 | 42,114 | |||||||||
Coherent Corp. (Electronic Equip., Instr. & Comp.) | (b) | 5.000% | 12/15/2029 | 75,000 | 64,682 | |||||||||
Condor Merger Sub, Inc. (Software) | (b) | 7.375% | 02/15/2030 | 150,000 | 120,605 | |||||||||
Consensus Cloud Solutions, Inc. (Software) | (b) | 6.500% | 10/15/2028 | 50,000 | 45,988 | |||||||||
| 118 | (continued) |
Ohio National Fund, Inc. | ON Federated Core Plus Bond Portfolio (Continued) | |
| Schedule of Investments | December 31, 2022 | |
| Corporate Bonds (Continued) | Rate | Maturity | Face Amount | Value | ||||||||||
INFORMATION TECHNOLOGY (continued) | ||||||||||||||
Elastic N.V. (Software) | (b) | 4.125% | 07/15/2029 | $ | 50,000 | $ | 40,385 | |||||||
Fidelity National Information Services, Inc. (IT Svs.) | 4.700% | 07/15/2027 | 300,000 | 292,679 | ||||||||||
Fidelity National Information Services, Inc. (IT Svs.) | 3.100% | 03/01/2041 | 305,000 | 210,056 | ||||||||||
Fiserv, Inc. (IT Svs.) | 3.800% | 10/01/2023 | 450,000 | 445,205 | ||||||||||
Fiserv, Inc. (IT Svs.) | 3.500% | 07/01/2029 | 425,000 | 382,890 | ||||||||||
Fortinet, Inc. (Software) | 1.000% | 03/15/2026 | 670,000 | 586,434 | ||||||||||
Go Daddy Operating Co. LLC / GD Finance Co., Inc. (IT Svs.) | (b) | 5.250% | 12/01/2027 | 50,000 | 47,323 | |||||||||
GoTo Group, Inc. (Software) | (b) | 5.500% | 09/01/2027 | 100,000 | 53,782 | |||||||||
Leidos, Inc. (IT Svs.) | 3.625% | 05/15/2025 | 220,000 | 211,259 | ||||||||||
Leidos, Inc. (IT Svs.) | 4.375% | 05/15/2030 | 525,000 | 473,424 | ||||||||||
Microsoft Corp. (Software) | 2.375% | 05/01/2023 | 1,200,000 | 1,191,427 | ||||||||||
NCR Corp. (Software) | (b) | 5.000% | 10/01/2028 | 25,000 | 21,313 | |||||||||
NCR Corp. (Software) | (b) | 5.250% | 10/01/2030 | 50,000 | 41,250 | |||||||||
Open Text Corp. (Software) | (b) | 3.875% | 12/01/2029 | 50,000 | 40,209 | |||||||||
Oracle Corp. (Software) | 6.250% | 11/09/2032 | 600,000 | 627,973 | ||||||||||
Oracle Corp. (Software) | 3.600% | 04/01/2050 | 500,000 | 336,633 | ||||||||||
PNC Bank N.A. (IT Svs.) | 3.875% | 04/10/2025 | 475,000 | 461,963 | ||||||||||
Rocket Software, Inc. (Software) | (b) | 6.500% | 02/15/2029 | 125,000 | 98,541 | |||||||||
Roper Technologies, Inc. (Software) | 1.000% | 09/15/2025 | 525,000 | 470,381 | ||||||||||
Seagate HDD Cayman (Tech. Hardware, Storage & Periph.) | (b) | 9.625% | 12/01/2032 | 39,000 | 42,775 | |||||||||
Skyworks Solutions, Inc. (Semiconductors & Equip.) | 1.800% | 06/01/2026 | 50,000 | 43,938 | ||||||||||
SS&C Technologies, Inc. (Software) | (b) | 5.500% | 09/30/2027 | 100,000 | 93,640 | |||||||||
TTM Technologies, Inc. (Electronic Equip., Instr. & Comp.) | (b) | 4.000% | 03/01/2029 | 75,000 | 64,316 | |||||||||
VeriSign, Inc. (IT Svs.) | 2.700% | 06/15/2031 | 660,000 | 537,515 | ||||||||||
Veritas U.S., Inc. / Veritas Bermuda Ltd. (Software) | (b) | 7.500% | 09/01/2025 | 50,000 | 34,436 | |||||||||
VMware, Inc. (Software) | 1.400% | 08/15/2026 | 240,000 | 209,224 | ||||||||||
VMware, Inc. (Software) | 2.200% | 08/15/2031 | 190,000 | 144,184 | ||||||||||
Vontier Corp. (Electronic Equip., Instr. & Comp.) | 1.800% | 04/01/2026 | 465,000 | 392,948 | ||||||||||
|
| |||||||||||||
| 9,745,459 | ||||||||||||||
|
| |||||||||||||
MATERIALS – 1.0% | ||||||||||||||
Albemarle Corp. (Chemicals) | 5.450% | 12/01/2044 | 275,000 | 248,500 | ||||||||||
Anglo American Capital PLC (Metals & Mining) | (b) | 2.875% | 03/17/2031 | 775,000 | 632,795 | |||||||||
Ardagh Packaging Finance PLC / Ardagh Holdings U.S.A., Inc. (Containers & Packaging) | (b) | 5.250% | 08/15/2027 | 200,000 | 149,549 | |||||||||
Ball Corp. (Containers & Packaging) | 6.875% | 03/15/2028 | 25,000 | 25,679 | ||||||||||
Ball Corp. (Containers & Packaging) | 3.125% | 09/15/2031 | 25,000 | 20,078 | ||||||||||
Clearwater Paper Corp. (Paper & Forest Products) | (b) | 4.750% | 08/15/2028 | 100,000 | 87,868 | |||||||||
Cleveland-Cliffs, Inc. (Metals & Mining) | (b) | 4.875% | 03/01/2031 | 50,000 | 44,150 | |||||||||
Clydesdale Acquisition Holdings, Inc. (Containers & Packaging) | (b) | 8.750% | 04/15/2030 | 275,000 | 235,392 | |||||||||
Coeur Mining, Inc. (Metals & Mining) | (b) | 5.125% | 02/15/2029 | 50,000 | 39,021 | |||||||||
Crown Americas LLC / Crown Americas Capital Corp. V (Containers & Packaging) | 4.250% | 09/30/2026 | 25,000 | 23,840 | ||||||||||
Diamond BC B.V. (Chemicals) | (b) | 4.625% | 10/01/2029 | 100,000 | 80,250 | |||||||||
Glencore Funding LLC (Metals & Mining) | (b) | 1.625% | 04/27/2026 | 400,000 | 352,437 | |||||||||
Glencore Funding LLC (Metals & Mining) | (b) | 3.375% | 09/23/2051 | 200,000 | 129,727 | |||||||||
Graphic Packaging International LLC (Containers & Packaging) | (b) | 3.500% | 03/01/2029 | 50,000 | 42,601 | |||||||||
International Flavors & Fragrances, Inc. (Chemicals) | (b) | 1.832% | 10/15/2027 | 450,000 | 377,671 | |||||||||
Koppers, Inc. (Chemicals) | (b) | 6.000% | 02/15/2025 | 75,000 | 71,250 | |||||||||
Mauser Packaging Solutions Holding Co. (Containers & Packaging) | (b) | 7.250% | 04/15/2025 | 50,000 | 46,236 | |||||||||
OI European Group B.V. (Containers & Packaging) | (b) | 4.750% | 02/15/2030 | 50,000 | 43,785 | |||||||||
Owens-Brockway Glass Container, Inc. (Containers & Packaging) | (b) | 5.375% | 01/15/2025 | 50,000 | 47,970 | |||||||||
Owens-Brockway Glass Container, Inc. (Containers & Packaging) | (b) | 6.625% | 05/13/2027 | 38,000 | 36,868 | |||||||||
Packaging Corp. of America (Containers & Packaging) | 3.650% | 09/15/2024 | 675,000 | 657,621 | ||||||||||
Polar U.S. Borrower LLC / Schenectady International Group, Inc. (Chemicals) | (b) | 6.750% | 05/15/2026 | 100,000 | 37,000 | |||||||||
Reliance Steel & Aluminum Co. (Metals & Mining) | 4.500% | 04/15/2023 | 760,000 | 759,867 | ||||||||||
RPM International, Inc. (Chemicals) | 4.550% | 03/01/2029 | 425,000 | 393,404 | ||||||||||
Sealed Air Corp. (Containers & Packaging) | (b) | 4.000% | 12/01/2027 | 50,000 | 45,357 | |||||||||
SRS Distribution, Inc. (Construction Materials) | (b) | 6.125% | 07/01/2029 | 25,000 | 20,213 | |||||||||
SRS Distribution, Inc. (Construction Materials) | (b) | 6.000% | 12/01/2029 | 100,000 | 79,585 | |||||||||
Standard Industries, Inc. (Construction Materials) | (b) | 5.000% | 02/15/2027 | 150,000 | 138,410 | |||||||||
Trivium Packaging Finance B.V. (Containers & Packaging) | (b) | 8.500% | 08/15/2027 | 225,000 | 206,443 | |||||||||
W.R. Grace Holdings LLC (Chemicals) | (b) | 4.875% | 06/15/2027 | 25,000 | 22,153 | |||||||||
W.R. Grace Holdings LLC (Chemicals) | (b) | 5.625% | 08/15/2029 | 50,000 | 40,364 | |||||||||
WRKCo, Inc. (Containers & Packaging) | 4.000% | 03/15/2028 | 525,000 | 488,543 | ||||||||||
|
| |||||||||||||
| 5,624,627 | ||||||||||||||
|
| |||||||||||||
REAL ESTATE – 1.2% | ||||||||||||||
Alexandria Real Estate Equities, Inc. (Equity REIT) | 1.875% | 02/01/2033 | 930,000 | 691,502 | ||||||||||
American Tower Corp. (Equity REIT) | 2.700% | 04/15/2031 | 450,000 | 366,279 | ||||||||||
AvalonBay Communities, Inc. (Equity REIT) | 3.350% | 05/15/2027 | 725,000 | 673,448 | ||||||||||
Boston Properties LP (Equity REIT) | 3.650% | 02/01/2026 | 650,000 | 616,129 | ||||||||||
| 119 | (continued) |
Ohio National Fund, Inc. | ON Federated Core Plus Bond Portfolio (Continued) | |
| Schedule of Investments | December 31, 2022 | |
| Corporate Bonds (Continued) | Rate | Maturity | Face Amount | Value | ||||||||||
REAL ESTATE (continued) | ||||||||||||||
Crown Castle, Inc. (Equity REIT) | 3.250% | 01/15/2051 | $ | 450,000 | $ | 292,578 | ||||||||
Healthcare Realty Holdings LP (Equity REIT) | 2.000% | 03/15/2031 | 525,000 | 397,443 | ||||||||||
KRC Interim Corp. (Equity REIT) | 2.700% | 10/01/2030 | 450,000 | 366,778 | ||||||||||
Mid-America Apartments LP (Equity REIT) | 4.000% | 11/15/2025 | 725,000 | 704,552 | ||||||||||
Piedmont Operating Partnership LP (Equity REIT) | 2.750% | 04/01/2032 | 300,000 | 209,977 | ||||||||||
Regency Centers LP (Equity REIT) | 2.950% | 09/15/2029 | 700,000 | 587,521 | ||||||||||
UDR, Inc. (Equity REIT) | 3.500% | 01/15/2028 | 725,000 | 658,704 | ||||||||||
VICI Properties LP / VICI Note Co., Inc. (Equity REIT) | (b) | 4.625% | 06/15/2025 | 75,000 | 71,906 | |||||||||
W.P. Carey, Inc. (Equity REIT) | 3.850% | 07/15/2029 | 350,000 | 314,395 | ||||||||||
Welltower, Inc. (Equity REIT) | 4.250% | 04/01/2026 | 475,000 | 459,323 | ||||||||||
|
| |||||||||||||
| 6,410,535 | ||||||||||||||
|
| |||||||||||||
UTILITIES – 2.0% | ||||||||||||||
Ameren Corp. (Multi-Utilities) | 1.750% | 03/15/2028 | 1,000,000 | 844,523 | ||||||||||
American Electric Power Co., Inc. (Electric Utilities) | 2.031% | 03/15/2024 | 335,000 | 323,002 | ||||||||||
AmeriGas Partners LP / AmeriGas Finance Corp. (Gas Utilities) | 5.500% | 05/20/2025 | 50,000 | 48,041 | ||||||||||
Black Hills Corp. (Multi-Utilities) | 2.500% | 06/15/2030 | 370,000 | 296,990 | ||||||||||
Calpine Corp. (Ind. Power & Renewable Elec.) | (b) | 5.000% | 02/01/2031 | 50,000 | 41,945 | |||||||||
Calpine Corp. (Ind. Power & Renewable Elec.) | (b) | 3.750% | 03/01/2031 | 25,000 | 20,129 | |||||||||
Dominion Energy, Inc. (Multi-Utilities) | 1.450% | 04/15/2026 | 670,000 | 596,476 | ||||||||||
Duke Energy Corp. (Electric Utilities) | 3.750% | 09/01/2046 | 650,000 | 482,279 | ||||||||||
Duke Energy Corp. (Electric Utilities) | 4.200% | 06/15/2049 | 725,000 | 572,151 | ||||||||||
Emera U.S. Finance LP (Electric Utilities) | 3.550% | 06/15/2026 | 400,000 | 374,680 | ||||||||||
Emera U.S. Finance LP (Electric Utilities) | 4.750% | 06/15/2046 | 400,000 | 308,622 | ||||||||||
Enel Finance International N.V. (Electric Utilities) | (b) | 2.250% | 07/12/2031 | 750,000 | 545,705 | |||||||||
Eversource Energy (Electric Utilities) | 3.350% | 03/15/2026 | 670,000 | 626,876 | ||||||||||
Exelon Corp. (Electric Utilities) | 4.050% | 04/15/2030 | 1,175,000 | 1,090,867 | ||||||||||
Exelon Corp. (Electric Utilities) | 4.100% | 03/15/2052 | 55,000 | 43,949 | ||||||||||
FirstEnergy Corp. (Electric Utilities) | 2.650% | 03/01/2030 | 250,000 | 203,835 | ||||||||||
National Fuel Gas Co. (Gas Utilities) | 5.500% | 01/15/2026 | 450,000 | 447,683 | ||||||||||
National Fuel Gas Co. (Gas Utilities) | 2.950% | 03/01/2031 | 270,000 | 211,586 | ||||||||||
NextEra Energy Capital Holdings, Inc. (Electric Utilities) | 3.550% | 05/01/2027 | 600,000 | 565,274 | ||||||||||
NextEra Energy Capital Holdings, Inc. (Electric Utilities) | 2.250% | 06/01/2030 | 600,000 | 493,409 | ||||||||||
NRG Energy, Inc. (Electric Utilities) | 5.750% | 01/15/2028 | 50,000 | 46,934 | ||||||||||
NRG Energy, Inc. (Electric Utilities) | (b) | 3.875% | 02/15/2032 | 25,000 | 18,776 | |||||||||
PPL Capital Funding, Inc. (Electric Utilities) | 3.100% | 05/15/2026 | 200,000 | 186,890 | ||||||||||
Puget Energy, Inc. (Electric Utilities) | 2.379% | 06/15/2028 | 685,000 | 582,849 | ||||||||||
Sempra Energy (Multi-Utilities) | 3.700% | 04/01/2029 | 590,000 | 537,774 | ||||||||||
Southern Co. / The (Rate is fixed until 01/15/2026, at which point, the rate becomes H15T5Y + 373) (Electric Utilities) | (d) | 4.000% | 01/15/2051 | 1,350,000 | 1,228,500 | |||||||||
Suburban Propane Partners LP / Suburban Energy Finance Corp. (Gas Utilities) | 5.875% | 03/01/2027 | 50,000 | 47,510 | ||||||||||
Suburban Propane Partners LP / Suburban Energy Finance Corp. (Gas Utilities) | (b) | 5.000% | 06/01/2031 | 25,000 | 21,250 | |||||||||
TerraForm Power Operating LLC (Ind. Power & Renewable Elec.) | (b) | 5.000% | 01/31/2028 | 75,000 | 67,499 | |||||||||
TransAlta Corp. (Ind. Power & Renewable Elec.) | 7.750% | 11/15/2029 | 25,000 | 25,532 | ||||||||||
Vistra Operations Co. LLC (Ind. Power & Renewable Elec.) | (b) | 5.500% | 09/01/2026 | 75,000 | 72,256 | |||||||||
WEC Energy Group, Inc. (Multi-Utilities) | 0.800% | 03/15/2024 | 220,000 | 208,426 | ||||||||||
WEC Energy Group, Inc. (Multi-Utilities) | 2.200% | 12/15/2028 | 190,000 | 160,816 | ||||||||||
|
| |||||||||||||
| 11,343,034 | ||||||||||||||
|
| |||||||||||||
Total Corporate Bonds (Cost $146,361,879) | $ | 121,781,406 | ||||||||||||
|
| |||||||||||||
| U.S. Government Agency Mortgage-Backed Securities – 20.0% | Rate | Maturity | Face Amount | Value | ||||||||||
Fannie Mae or Freddie Mac UMBS TBA | 4.000% | 01/15/2053 | $ | 1,250,000 | $ | 1,172,075 | ||||||||
Fannie Mae or Freddie Mac UMBS TBA | 4.500% | 01/15/2053 | 1,250,000 | 1,202,820 | ||||||||||
Fannie Mae Pool FN BM4333 | 3.500% | 12/01/2047 | 993,403 | 921,263 | ||||||||||
Fannie Mae Pool FN BN6715 | 4.000% | 06/01/2049 | 2,841,999 | 2,706,626 | ||||||||||
Fannie Mae Pool FN BP2797 | 2.500% | 05/01/2050 | 1,477,444 | 1,262,097 | ||||||||||
Fannie Mae Pool FN BP6700 | 2.500% | 09/01/2050 | 4,039,219 | 3,472,361 | ||||||||||
Fannie Mae Pool FN BP8188 | 2.000% | 09/01/2050 | 6,171,725 | 5,046,753 | ||||||||||
Fannie Mae Pool FN BQ4558 | 2.000% | 03/01/2051 | 2,115,890 | 1,727,265 | ||||||||||
Fannie Mae Pool FN BR1844 | 2.500% | 01/01/2051 | 1,208,465 | 1,026,818 | ||||||||||
Fannie Mae Pool FN BR4390 | 2.000% | 03/01/2051 | 3,607,153 | 2,945,875 | ||||||||||
Fannie Mae Pool FN BR9750 | 2.000% | 04/01/2051 | 3,621,566 | 2,956,438 | ||||||||||
Fannie Mae Pool FN BT7183 | 2.500% | 08/01/2051 | 1,626,071 | 1,380,461 | ||||||||||
Fannie Mae Pool FN BW7264 | 5.500% | 11/01/2052 | 2,970,244 | 2,978,216 | ||||||||||
Fannie Mae Pool FN BW7449 | 5.000% | 11/01/2052 | 998,841 | 985,027 | ||||||||||
Fannie Mae Pool FN CA4819 | 4.000% | 12/01/2049 | 989,268 | 939,593 | ||||||||||
Fannie Mae Pool FN CA5348 | 3.500% | 03/01/2050 | 1,578,918 | 1,448,965 | ||||||||||
Fannie Mae Pool FN CA5706 | 2.500% | 05/01/2050 | 1,939,932 | 1,656,365 | ||||||||||
Fannie Mae Pool FN CA6998 | 3.000% | 09/01/2050 | 2,973,905 | 2,627,847 | ||||||||||
| 120 | (continued) |
Ohio National Fund, Inc. | ON Federated Core Plus Bond Portfolio (Continued) | |
| Schedule of Investments | December 31, 2022 | |
| U.S. Government Agency Mortgage-Backed Securities (Continued) | Rate | Maturity | Face Amount | Value | ||||||||||
Fannie Mae Pool FN CA8118 | 2.000% | 12/01/2050 | $ | 1,808,494 | $ | 1,478,293 | ||||||||
Fannie Mae Pool FN CA9293 | 2.500% | 02/01/2051 | 2,434,361 | 2,068,131 | ||||||||||
Fannie Mae Pool FN CA9390 | 2.500% | 03/01/2051 | 5,464,858 | 4,629,123 | ||||||||||
Fannie Mae Pool FN CB3335 | 4.500% | 04/01/2052 | 4,826,409 | 4,730,788 | ||||||||||
Fannie Mae Pool FN FM2778 | 3.000% | 03/01/2050 | 2,154,671 | 1,910,519 | ||||||||||
Fannie Mae Pool FN FM3734 | 3.500% | 09/01/2049 | 1,163,357 | 1,081,653 | ||||||||||
Fannie Mae Pool FN FM3919 | 4.000% | 05/01/2049 | 718,383 | 691,203 | ||||||||||
Fannie Mae Pool FN FM4122 | 2.000% | 08/01/2050 | 6,281,055 | 5,157,237 | ||||||||||
Fannie Mae Pool FN FM4317 | 3.000% | 09/01/2050 | 2,833,439 | 2,500,459 | ||||||||||
Fannie Mae Pool FN FM4532 | 3.000% | 09/01/2050 | 3,224,888 | 2,838,262 | ||||||||||
Fannie Mae Pool FN FM6708 | 2.500% | 01/01/2051 | 3,523,024 | 2,993,476 | ||||||||||
Fannie Mae Pool FN FM7293 | 2.500% | 05/01/2051 | 1,263,891 | 1,074,307 | ||||||||||
Fannie Mae Pool FN FM7706 | 3.500% | 08/01/2050 | 3,175,866 | 2,924,214 | ||||||||||
Fannie Mae Pool FN FM8421 | 2.500% | 08/01/2051 | 2,162,821 | 1,836,315 | ||||||||||
Fannie Mae Pool FN MA4138 | 1.500% | 09/01/2050 | 4,278,632 | 3,305,724 | ||||||||||
Fannie Mae Pool FN MA4255 | 2.000% | 02/01/2051 | 1,638,466 | 1,337,340 | ||||||||||
Fannie Mae Pool FN MA4593 | 4.000% | 03/01/2052 | 881,658 | 827,040 | ||||||||||
Fannie Mae Pool FN MA4732 | 4.000% | 09/01/2052 | 1,983,338 | 1,860,445 | ||||||||||
Freddie Mac Pool FR QE6718 | 4.500% | 07/01/2052 | 997,635 | 960,278 | ||||||||||
Freddie Mac Pool FR QF1237 | 5.000% | 10/01/2052 | 4,379,802 | 4,319,232 | ||||||||||
Freddie Mac Pool FR RA3357 | 2.000% | 08/01/2050 | 1,191,510 | 974,780 | ||||||||||
Freddie Mac Pool FR RA3575 | 2.000% | 09/01/2050 | 5,850,678 | 4,783,019 | ||||||||||
Freddie Mac Pool FR RA5761 | 2.000% | 06/01/2051 | 2,350,719 | 1,918,161 | ||||||||||
Freddie Mac Pool FR SD0451 | 3.000% | 10/01/2050 | 1,708,800 | 1,507,922 | ||||||||||
Freddie Mac Pool FR SD0625 | 2.500% | 05/01/2051 | 2,120,028 | 1,800,153 | ||||||||||
Freddie Mac Pool FR SD0977 | 3.500% | 02/01/2052 | 5,807,221 | 5,315,693 | ||||||||||
Freddie Mac Pool FR SD7505 | 4.500% | 08/01/2049 | 761,084 | 750,875 | ||||||||||
Freddie Mac Pool FR SD8104 | 1.500% | 11/01/2050 | 2,086,113 | 1,611,694 | ||||||||||
Freddie Mac Pool FR SD8121 | 2.000% | 01/01/2051 | 1,617,526 | 1,322,355 | ||||||||||
Freddie Mac Pool FR SD8148 | 3.000% | 05/01/2051 | 3,026,935 | 2,660,294 | ||||||||||
Freddie Mac Pool FR SD8210 | 4.000% | 03/01/2052 | 841,292 | 789,689 | ||||||||||
Freddie Mac Pool FR ZT1257 | 3.000% | 01/01/2046 | 742,069 | 669,949 | ||||||||||
Ginnie Mae II Pool G2 MA6866 | 3.000% | 09/20/2050 | 1,402,113 | 1,258,376 | ||||||||||
|
| |||||||||||||
Total U.S. Government Agency Mortgage-Backed Securities (Cost $ 127,854,115) | $ | 110,343,864 | ||||||||||||
|
| |||||||||||||
| Investment Companies – 6.3% | Shares | Value | ||||||||||||
Federated Hermes Core Trust - Bank Loan Core Fund (Acquired 06/28/2021, Cost $746,662) | (e)(f) | 77,055 | $ | 667,295 | ||||||||||
Federated Hermes Core Trust - Emerging Markets Core Fund (Acquired 05/01/2020 through 12/13/2022, Cost $17,676,492) | (e)(f) | 1,891,251 | 15,016,536 | |||||||||||
Federated Hermes Core Trust III - Federated Project and Trade Finance Core Fund (Acquired 05/01/2020 through 06/28/2021, Cost $19,222,113) | (f)(g) | 2,176,961 | 18,852,485 | |||||||||||
|
| |||||||||||||
Total Investment Companies (Cost $37,645,267) | $ | 34,536,316 | ||||||||||||
|
| |||||||||||||
| Asset-Backed / Mortgage-Backed Securities – 3.6% | Rate | Maturity | Face Amount | Value | ||||||||||
FINANCIALS – 3.6% | ||||||||||||||
AmeriCredit Automobile Receivables Trust 2020-2 D | 2.130% | 03/18/2026 | $ | 180,000 | $ | 168,488 | ||||||||
AmeriCredit Automobile Receivables Trust 2020-3 D | 1.490% | 09/18/2026 | 175,000 | 161,693 | ||||||||||
BANK 2022-BNK40 A4 | 3.394% | 03/15/2064 | 660,000 | 579,965 | ||||||||||
Benchmark 2020-B19 A5 | 1.850% | 09/15/2053 | 1,150,000 | 922,100 | ||||||||||
Benchmark 2021-B26 A2 | 1.957% | 06/15/2054 | 520,000 | 465,531 | ||||||||||
Carmax Auto Owner Trust 2021-1 D | 1.280% | 07/15/2027 | 100,000 | 89,023 | ||||||||||
Chesapeake Funding II LLC 2020-1A D | (b) | 2.830% | 08/15/2032 | 150,000 | 145,205 | |||||||||
Ford Credit Auto Lease Trust 2020-B C | 1.700% | 02/15/2025 | 160,149 | 159,997 | ||||||||||
Ford Credit Floorplan Master Owner Trust A 2020-1 D | 2.120% | 09/15/2025 | 395,000 | 378,133 | ||||||||||
Freddie Mac Multifamily Structured Pass Through Certificates K108 A2 | 1.517% | 03/25/2030 | 400,000 | 327,841 | ||||||||||
Freddie Mac Multifamily Structured Pass Through Certificates K109 A2 | 1.558% | 04/25/2030 | 400,000 | 327,493 | ||||||||||
GM Financial Consumer Automobile Receivables Trust 2020-3 D | 1.910% | 09/16/2027 | 400,000 | 380,310 | ||||||||||
GS Mortgage-Backed Securities Trust 2022-PJ3 A4 | (b) | 2.500% | 08/25/2052 | 1,896,801 | 1,522,552 | |||||||||
Home Partners of America 2022-1 B | (b) | 4.330% | 04/17/2039 | 736,971 | 683,176 | |||||||||
HPEFS Equipment Trust 2020-2A D | (b) | 2.790% | 07/22/2030 | 750,000 | 742,270 | |||||||||
Invitation Homes 2018-SFR4 B | (b) | ML + 125 | 01/17/2038 | 2,999,862 | 2,949,315 | |||||||||
J.P. Morgan Mortgage Trust 2022-1 A2 | (b) | 3.000% | 07/25/2052 | 1,397,798 | 1,166,780 | |||||||||
JP Morgan Mortgage Trust 2022-2 A3 | (b) | 2.500% | 08/25/2052 | 1,884,043 | 1,512,312 | |||||||||
JP Morgan Mortgage Trust 2022-3 A3 | (b) | 2.500% | 08/25/2052 | 1,891,283 | 1,518,123 | |||||||||
MMAF Equipment Finance LLC 2020-A A5 | (b) | 1.560% | 10/09/2042 | 750,000 | 647,389 | |||||||||
Navient Private Education Refi Loan Trust 2020-FA A | (b) | 1.220% | 07/15/2069 | 167,251 | 148,461 | |||||||||
PFS Financing Corp. 2020-G B | (b) | 1.570% | 02/15/2026 | 310,000 | 293,584 | |||||||||
Progress Residential 2022-SFR1 E1 | (b) | 3.930% | 02/17/2041 | 900,000 | 700,428 | |||||||||
Progress Residential 2022-SFR2 D | 3.945% | 04/17/2027 | 1,000,000 | 869,111 | ||||||||||
Progress Residential 2022-SFR4 B | (b) | 4.788% | 05/17/2041 | 800,000 | 727,181 | |||||||||
| 121 | (continued) |
Ohio National Fund, Inc. | ON Federated Core Plus Bond Portfolio (Continued) | |
| Schedule of Investments | December 31, 2022 | |
| Asset-Backed / Mortgage-Backed Securities (Continued) | Rate | Maturity | Face Amount | Value | ||||||||||
FINANCIALS (continued) | ||||||||||||||
Santander Consumer Auto Receivables Trust 2020-BA D | (b) | 2.140% | 12/15/2026 | $ | 530,000 | $ | 504,651 | |||||||
Santander Drive Auto Receivables Trust 2020-3 D | 1.640% | 11/16/2026 | 750,000 | 719,036 | ||||||||||
Sierra Timeshare 2020-2A A | (b) | 1.330% | 07/20/2037 | 217,978 | 204,647 | |||||||||
SMB Private Education Loan Trust 2020-B A1A | (b) | 1.290% | 07/15/2053 | 416,854 | 367,739 | |||||||||
Tesla Auto Lease Trust 2020-A C | (b) | 1.680% | 02/20/2024 | 330,000 | 327,581 | |||||||||
Tesla Auto Lease Trust 2020-A D | (b) | 2.330% | 02/20/2024 | 100,000 | 98,933 | |||||||||
World Omni Select Auto Trust 2020-A D | 1.700% | 10/15/2026 | 250,000 | 233,161 | ||||||||||
|
| |||||||||||||
Total Asset-Backed / Mortgage-Backed Securities (Cost $ 22,465,802) | $ | 20,042,209 | ||||||||||||
|
| |||||||||||||
| Sovereign Debt Issues – 0.3% | Rate | Maturity | Face Amount | Value | ||||||||||
Mexico Government International Bond | 3.750% | 01/11/2028 | $ | 625,000 | $ | 589,863 | ||||||||
Mexico Government International Bond | 4.500% | 01/31/2050 | 775,000 | 588,362 | ||||||||||
Republic of Poland Government International Bond | 4.000% | 01/22/2024 | 600,000 | 591,660 | ||||||||||
|
| |||||||||||||
Total Sovereign Debt Issues (Cost $2,109,227) | $ | 1,769,885 | ||||||||||||
|
| |||||||||||||
| Common Stocks – 0.0% | Shares | Value | ||||||||||||
HEALTH CARE – 0.0% | ||||||||||||||
Mallinckrodt PLC (Pharmaceuticals) | (h) | 436 | $ | 3,379 | ||||||||||
|
| |||||||||||||
Total Common Stocks (Cost $8,073) | $ | 3,379 | ||||||||||||
|
| |||||||||||||
Total Investments – 98.4% (Cost $612,044,342) | (i) | $ | 542,221,088 | |||||||||||
Other Assets in Excess of Liabilities – 1.6% | 8,880,755 | |||||||||||||
|
| |||||||||||||
Net Assets – 100.0% | $ | 551,101,843 | ||||||||||||
|
| |||||||||||||
Percentages are stated as a percent of net assets.
Abbreviations: | ||
H15T5Y: | U.S. Treasury Yield Curve Rate T-Note Constant Maturity 5 Year, 3.880% at 12/31/2022 | |
ML: | Monthly U.S. LIBOR Rate, 4.392% at 12/31/2022 | |
PIK: | Payment-in-Kind | |
QL: | Quarterly U.S. LIBOR Rate, 4.767% at 12/31/2022 | |
SOFR: | Secured Overnight Financing Rate, 4.300% at 12/31/2022 | |
TSFR3M: | Quarterly CME Term SOFR, 4.587% at 12/31/2022 | |
UMBS TBA: | Uniform Mortgage-Backed Security To Be Announced ("TBA"); the securities backed by fixed rate mortgage loans that are delivered on a future settlement date could be issued by Fannie Mae, Freddie Mac, or a combination thereof. | |
Footnotes:
| (a) | Security is partially pledged as collateral for the futures contracts outstanding at December 31, 2022. The market value of securities pledged totaled $836,084. See also the following Schedule of Open Futures Contracts. |
| (b) | Security exempt from registration under Regulation D of the Securities Act of 1933. These securities may be resold in transactions exempt from registration, normally to qualified buyers under Rule 144A. At December 31, 2022, the value of these securities totaled $37,945,427, or 6.9% of the Portfolio’s net assets. |
| (c) | Issuer of the security has the option to make coupon payments in cash or in additional par value of this bond (Payment-in-Kind). |
| (d) | Security is a fixed-then-variable rate instrument in which the coupon or dividend rate is fixed until a later specified date, then is adjusted periodically. Rates stated, including interest rate caps and floors, if any, are those in effect at December 31, 2022. |
| (e) | Shares of this fund have not been registered and are issued in reliance on Section 4(a)(2) and Regulation D of the Securities Act of 1933. Investments in this fund may only be made by investment companies, insurance company separate accounts, common or commingled trust funds or similar organizations or entities that are “accredited investors” within the meaning of Regulation D of the 1933 Act. |
| (f) | Represents a security deemed to be restricted. At December 31, 2022, the value of restricted securities in the Portfolio totaled $34,536,316, or 6.3% of the Portfolio’s net assets. |
| (g) | Open-end extended payment fund. Beneficial interests in this fund are issued solely in private placement transactions which do not involve any “public offering” within the meaning of Section 4(a)(2) and Regulation D of the Securities Act of 1933. Investments in this fund may only be made by organizations or entities that are “accredited investors” within the meaning of Regulation D of the 1933 Act and that are also “qualified purchasers” as defined in Section 2(a)(51) of the Investment Company Act of 1940, as amended (“Eligible Investors”). This fund has adopted policies to limit the transfer of its shares, which may occur only pursuant to authorization by this fund’s Board of Directors, and only to Eligible Investors. When a redeeming shareholder of this fund presents shares to the fund’s transfer agent in proper order for redemption, the fund will have up to 31 days to make payment to the redeeming shareholder. The price of redeemed shares will be determined as of the closing net asset value of the fund 24 days after receipt of a shareholder redemption request or, if such date is a weekend or holiday, on the preceding business day. The fund’s NAV is calculated each day the NYSE is open. |
| (h) | Non-income producing security. |
| (i) | Represents cost for financial reporting purposes, which may differ from cost basis for federal income tax purposes. See also Note 7 of the Notes to Financial Statements. |
The accompanying notes are an integral part of these financial statements.
| 122 | (continued) |
Ohio National Fund, Inc. | ON Federated Core Plus Bond Portfolio (Continued) | |
| Schedule of Open Futures Contracts | December 31, 2022 | |
Long Futures Contracts
Description | Number of contracts | Expiration Date | Notional Amount | Value | Unrealized Appreciation (Depreciation) | Variation Margin Receivable (Payable) | ||||||||||||||||||||||||||||||||||||||||||||
CBT 10-Year U.S. Ultra Bond - Long | 84 | March 22, 2023 | $ | 10,026,708 | $ | 9,935,625 | $ | (91,083 | ) | $ | (5,250 | ) | ||||||||||||||||||||||||||||||||||||||
CBT 5-Year U.S. Treasury Note - Long | 135 | March 31, 2023 | 14,646,220 | 14,570,508 | (75,712 | ) | (11,601 | ) | ||||||||||||||||||||||||||||||||||||||||||
CBT 2-Year U.S. Treasury Note - Long | 272 | March 31, 2023 | 55,730,587 | 55,781,250 | 50,663 | (42,500 | ) | |||||||||||||||||||||||||||||||||||||||||||
|
|
|
|
|
|
|
| |||||||||||||||||||||||||||||||||||||||||||
| $ | 80,403,515 | $ | 80,287,383 | $ | (116,132 | ) | $ | (59,351 | ) | |||||||||||||||||||||||||||||||||||||||||
|
|
|
|
|
|
|
| |||||||||||||||||||||||||||||||||||||||||||
Short Futures Contracts
Description | Number of contracts | Expiration Date | Notional Amount | Value | Unrealized Appreciation (Depreciation) | Variation Margin Receivable (Payable) | ||||||||||||||||||||||||||||||||||||||||||||
CBT U.S. Ultra Bond - Short | 123 | March 22, 2023 | $ | (16,607,783 | ) | $ | (16,520,438 | ) | $ | 87,345 | $ | 61,500 | ||||||||||||||||||||||||||||||||||||||
|
|
|
|
|
|
|
| |||||||||||||||||||||||||||||||||||||||||||
Total Futures Contracts | $ | 63,795,732 | $ | 63,766,945 | $ | (28,787 | ) | $ | 2,149 | |||||||||||||||||||||||||||||||||||||||||
|
|
|
|
|
|
|
| |||||||||||||||||||||||||||||||||||||||||||
The accompanying notes are an integral part of these financial statements.
| 123 |
| ON U.S. Low Volatility Portfolio (Unaudited) |
| Objective/Strategy |
The ON U.S. Low Volatility Portfolio (formerly ON Janus Henderson U.S. Low Volatility Portfolio) seeks capital appreciation by investing, under normal circumstances, at least 80% of its net assets in U.S. common stocks of companies included in the S&P 500® Index. Those stocks are selected by a mathematical investment process which seeks to achieve returns similar to those of the S&P 500® Index over the long-term with lower absolute volatility.
| Performance as of December 31, 2022 |
Average Annual returns | ||||
One year | -7.33% | |||
Since inception (6/25/21) | 1.99% | |||
Past performance does not guarantee future results. The performance data quoted represents past performance and current returns may be lower or higher. Total return figures include change in share price and reinvestment of dividends and capital gains. The investment return and principal value will fluctuate so that an investor’s shares, when redeemed, may be worth more or less than the original cost. To obtain performance information up to the most recent month end, call toll-free 1-877-781-6392.
The Portfolio is not open to direct retail investment. Beneficial interest in the Portfolio’s shares is obtained either through an allocation to the Portfolio as an investment vehicle within variable life insurance policies or annuity contracts, or as an underlying investment by the ON Model Portfolios. Actual performance results for variable annuity and variable universal life contracts will be lower due to contract charges. Consult your contract for applicable charges.
Total expense ratio is 0.60% per the Fund’s prospectus, as revised by a supplement dated July 26, 2022. Additional information pertaining to the Portfolio’s expense ratio as of December 31, 2022 can be found in the Portfolio’s Financial Highlights.
| Comments from Sub-Adviser |
Q. How did the Portfolio perform in comparison to its benchmark during the reporting period?
A. For the year ended December 31, 2022, the Portfolio returned -7.33% versus -18.11% for its benchmark, the S&P 500® Index.
Effective August 20, 2022, Intech Investment Management LLC (“Intech”) replaced the Portfolio’s previous sub-adviser, Janus Capital Management, LLC (“Janus”). In conjunction with the change in sub-adviser, the name of the Portfolio was changed from ON Janus Henderson U.S. Low Volatility Portfolio to ON U.S. Low Volatility Portfolio. The Portfolio’s benchmark was unchanged, however.
For the period from January 1, 2022 to August 19, 2022 (the “first performance period”), the Portfolio returned -3.15% versus -10.39% for the S&P 500® Index.
For the period from August 20, 2022 to December 31, 2022, (the “latter performance period”), the Portfolio returned -4.32% versus -8.61% for the S&P 500® Index.
Q. Were there specific market conditions, investment strategies, or techniques that materially affected the Portfolio’s benchmark-relative performance during the reporting period?
A. Janus: For the first performance period, the Portfolio benefited from its overall defensive positioning amidst the heightened volatility experienced during the period. Specifically, an overweight to lower beta stocks, which strongly outperformed during the period, contributed to the Portfolio’s relative outperformance.
Intech: For the latter performance period, the Portfolio continued to benefit from its overall defensive positioning amidst the heightened volatility experienced during the period. Specifically, an overweight to lower beta stocks, which strongly outperformed during the period, contributed to relative performance during the period. (1)
Q. How did sector allocation and security selection each impact the Portfolio’s performance relative to its benchmark?
A. Janus: For the first performance period, selection and allocation each contributed to relative performance, with selection having a larger favorable impact. Selection was most impactful within the Information Technology and Communication Services sectors. From a sector perspective, the benchmark was led by the strong performance of the Energy sector, which gained over 45% during the first performance period. While not having an allocation to Energy was a headwind during the period, the Portfolio outperformed and benefited from average overweights to Consumer Staples, Health Care and Utilities.
Intech: While an average underweight to Energy was a headwind during the latter performance period as well, the Portfolio outperformed and benefited from average overweights to Consumer Staples, Information Technology, and Health Care. Selection was the main driver of the Portfolio’s relative performance, especially within the Consumer Discretionary and Health Care sectors. (1)
Q. Which securities contributed the most to, and detracted the most from, the Portfolio’s benchmark-relative performance?
A. Janus: The three largest contributors to the Portfolio’s relative performance during the first performance period were overweight positions in T-Mobile U.S.A., Inc., Eli Lilly & Co. and The Hershey Co. T-Mobile U.S.A. was aided by strong financial results and customer growth during the period. Eli Lilly & Co. benefited from Federal Drug Administration approvals of new drugs in its pipeline, as well as strong operating results. The Hershey Co. benefited from improved revenues and solid operating results during the period.
The three largest detractors from the Portfolio’s relative performance during the first performance period were not holding benchmark name Exxon Mobil Corp., as well as overweights to Verizon Communications, Inc. and Domino’s Pizza, Inc. Exxon Mobil Corp. outperformed the benchmark by a wide margin, primarily benefiting from rising oil prices during the period. Verizon Communications, Inc. underperformed amidst missed earnings and mixed financial results. Domino’s Pizza, Inc. underperformed, facing headwinds from shifts in consumer demands and spending in the current market environment.
Intech: The three largest contributors to the Portfolio’s relative performance during the latter performance period were underweight positions in Tesla, Inc. and Amazon.com, Inc., as well as an overweight to Gilead Sciences, Inc. Tesla, Inc. significantly underperformed the benchmark during the period, negatively impacted by rising interest rates, factory shut downs and missed revenue results. Gilead Sciences, Inc. outperformed the benchmark, largely benefiting from key regulatory wins and approvals for drugs. Amazon.com, Inc. underperformed the benchmark, facing headwinds from a slowdown in its core retail business, as consumers returned to shopping in stores.
The three largest detractors from the Portfolio’s relative performance were underweights to Exxon Mobil Corp., JPMorgan Chase & Co. and Chevron Corp. Exxon Mobil Corp. outperformed the benchmark by a wide margin, primarily benefiting from rising oil prices. JPMorgan Chase & Co. outperformed the benchmark, benefitting from rising interest rates during the year. Chevron Corp. outperformed the benchmark during the year, benefiting from rising oil prices. (1)
Q. Were there any significant changes to the Portfolio’s management team, investment strategy, or selection process during the reporting period?
| 124 | (continued) |
Ohio National Fund, Inc. | ON U.S. Low Volatility Portfolio (Unaudited) (Continued) |
A. Janus: In January 2022, Dr. Jian Tang was promoted to Portfolio Manager. He had full access to the Portfolio’s proprietary optimization methodology and is actively involved in identification and testing of ideas leading to enhancements, as well as new product development.
Intech: During the second half of the year, Intech hired Dr. Ryan Stever as Executive Vice President and Deputy Chief Investment Officer. Dr. Stever is an accomplished quantitative investment professional, bringing with him over two decades of research experience, including senior positions at BlackRock, Citadel, and Acadian Asset Management. He holds a PhD in finance and an undergraduate degree in economics and mathematics, complementing the mathematics and physics PhDs held by Intech’s investment team. He also brings deep experience from more traditional quantitative asset managers. While Dr. Stever’s hire strengthens Intech’s investment team and our commitment to continuous improvement, it does not signal a change to our investment approach. We expect Ryan’s complementary skills and experience to ensure more consistent and satisfying client outcomes.
| (1) | The Portfolio’s composition is subject to change. Holdings and weightings are as of December 31, 2022. |
| Change in Value of $10,000 Investment |
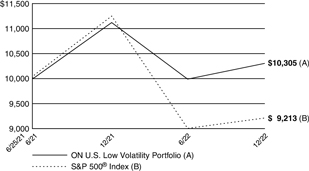
Hypothetical illustration based on past performance. Future performance will vary. The Portfolio’s returns reflect reinvested dividends. The Portfolio’s holdings may differ significantly from the securities in the index. The index is unmanaged and therefore does not reflect the cost of portfolio management and accounting.
The S&P 500® Index is a capitalization-weighted index designed to measure performance of the broad domestic economy through changes in the aggregate market value of 500 stocks representing all major industries. The index presented includes the effects of reinvested dividends.
Past performance is no guarantee of future results. Redemption of fund shares could have tax implications unique to each shareholder.
| Portfolio Composition as of December 31, 2022 (1) |
| % of Net Assets | ||||
Common Stocks (4) | 99.1 | |||
Other Net Assets | 0.9 | |||
|
| |||
| 100.0 | ||||
|
| |||
Top 10 Portfolio Holdings as of December 31, 2022 (1) (2) (3) |
| % of Net Assets | ||||||
1. | Apple, Inc. | 3.7 | ||||
2. | Walmart, Inc. | 3.3 | ||||
3. | Microsoft Corp. | 3.3 | ||||
4. | Johnson & Johnson | 3.1 | ||||
5. | Bristol-Myers Squibb Co. | 3.1 | ||||
6. | Gilead Sciences, Inc. | 3.0 | ||||
7. | Dollar General Corp. | 2.9 | ||||
8. | Verizon Communications, Inc. | 2.6 | ||||
9. | Merck & Co., Inc. | 2.5 | ||||
10. | AbbVie, Inc. | 2.3 | ||||
| (1) | Composition of Portfolio subject to change. |
| (2) | Short-term investments have been excluded from the list of Top 10 Portfolio Holdings. |
| (3) | Top 10 Portfolio Holdings is presented at an individual security level. Total investment exposure by issuer may be higher. |
| (4) | Sectors (Common Stocks): |
| % of Net Assets | ||||
Health Care | 22.7 | |||
Consumer Staples | 21.9 | |||
Information Technology | 13.5 | |||
Consumer Discretionary | 10.5 | |||
Industrials | 9.9 | |||
Communication Services | 7.8 | |||
Financials | 7.6 | |||
Utilities | 3.9 | |||
Real Estate | 0.9 | |||
Materials | 0.4 | |||
|
| |||
| 99.1 | ||||
|
| |||
| 125 |
Ohio National Fund, Inc. | ON U.S. Low Volatility Portfolio | |
| Schedule of Investments | December 31, 2022 | |
| Common Stocks – 99.1% | Shares | Value | ||||||||
COMMUNICATION SERVICES – 7.8% |
| |||||||||
Activision Blizzard, Inc. (Entertainment) | 137,818 | $ | 10,549,968 | |||||||
Alphabet, Inc. Class A (Interactive Media & Svs.) | (a) | 32,804 | 2,894,297 | |||||||
Alphabet, Inc. Class C (Interactive Media & Svs.) | (a) | 26,133 | 2,318,781 | |||||||
AT&T, Inc. (Diversified Telecom. Svs.) | 161,347 | 2,970,398 | ||||||||
Charter Communications, Inc. Class A (Media) | (a) | 6,425 | 2,178,718 | |||||||
Electronic Arts, Inc. (Entertainment) | 89,247 | 10,904,198 | ||||||||
Take-Two Interactive Software, Inc. (Entertainment) | (a) | 50,960 | 5,306,465 | |||||||
T-Mobile U.S., Inc. (Wireless Telecom. Svs.) | (a) | 9,377 | 1,312,780 | |||||||
Verizon Communications, Inc. (Diversified Telecom. Svs.) | 489,788 | 19,297,647 | ||||||||
|
| |||||||||
| 57,733,252 | ||||||||||
|
| |||||||||
CONSUMER DISCRETIONARY – 10.5% | ||||||||||
AutoZone, Inc. (Specialty Retail) | (a) | 4,294 | 10,589,777 | |||||||
Chipotle Mexican Grill, Inc. (Hotels, Restaurants & Leisure) | (a) | 5,473 | 7,593,733 | |||||||
Dollar General Corp. (Multiline Retail) | 86,576 | 21,319,340 | ||||||||
Dollar Tree, Inc. (Multiline Retail) | (a) | 45,549 | 6,442,451 | |||||||
Domino’s Pizza, Inc. (Hotels, Restaurants & Leisure) | 23,485 | 8,135,204 | ||||||||
Hilton Worldwide Holdings, Inc. (Hotels, Restaurants & Leisure) | 22,865 | 2,889,221 | ||||||||
McDonald’s Corp. (Hotels, Restaurants & Leisure) | 36,163 | 9,530,035 | ||||||||
O’Reilly Automotive, Inc. (Specialty Retail) | (a) | 6,678 | 5,636,432 | |||||||
Target Corp. (Multiline Retail) | 9,671 | 1,441,366 | ||||||||
Yum! Brands, Inc. (Hotels, Restaurants & Leisure) | 30,668 | 3,927,958 | ||||||||
|
| |||||||||
| 77,505,517 | ||||||||||
|
| |||||||||
CONSUMER STAPLES – 21.9% | ||||||||||
Altria Group, Inc. (Tobacco) | 48,836 | 2,232,294 | ||||||||
Brown-Forman Corp. Class B (Beverages) | 67,022 | 4,402,005 | ||||||||
Campbell Soup Co. (Food Products) | 49,508 | 2,809,579 | ||||||||
Church & Dwight Co., Inc. (Household Products) | 150,772 | 12,153,731 | ||||||||
Clorox Co. / The (Household Products) | 67,468 | 9,467,784 | ||||||||
Colgate-Palmolive Co. (Household Products) | 68,657 | 5,409,485 | ||||||||
Conagra Brands, Inc. (Food Products) | 223,096 | 8,633,815 | ||||||||
Costco Wholesale Corp. (Food & Staples Retailing) | 29,540 | 13,485,010 | ||||||||
General Mills, Inc. (Food Products) | 162,618 | 13,635,519 | ||||||||
Hershey Co. / The (Food Products) | 18,436 | 4,269,225 | ||||||||
Hormel Foods Corp. (Food Products) | 179,482 | 8,175,405 | ||||||||
J.M. Smucker Co. / The (Food Products) | 44,881 | 7,111,843 | ||||||||
Kellogg Co. (Food Products) | 134,049 | 9,549,651 | ||||||||
Kimberly-Clark Corp. (Household Products) | 46,629 | 6,329,887 | ||||||||
Kroger Co. / The (Food & Staples Retailing) | 311,286 | 13,877,130 | ||||||||
McCormick & Co., Inc. (Food Products) | 12,824 | 1,062,981 | ||||||||
Mondelez International, Inc. Class A (Food Products) | 30,565 | 2,037,157 | ||||||||
Monster Beverage Corp. (Beverages) | (a) | 31,732 | 3,221,750 | |||||||
PepsiCo, Inc. (Beverages) | 11,658 | 2,106,134 | ||||||||
Procter & Gamble Co. / The (Household Products) | 12,258 | 1,857,823 | ||||||||
Tyson Foods, Inc. Class A (Food Products) | 88,669 | 5,519,645 | ||||||||
Walmart, Inc. (Food & Staples Retailing) | 172,323 | 24,433,678 | ||||||||
|
| |||||||||
| 161,781,531 | ||||||||||
|
| |||||||||
FINANCIALS – 7.6% | ||||||||||
Aon PLC Class A (Insurance) | 12,029 | 3,610,384 | ||||||||
Arch Capital Group Ltd. (Insurance) | (a) | 35,873 | 2,252,107 | |||||||
Arthur J. Gallagher & Co. (Insurance) | 8,694 | 1,639,167 | ||||||||
Assurant, Inc. (Insurance) | 31,499 | 3,939,265 | ||||||||
Berkshire Hathaway, Inc. Class B (Diversified Financial Svs.) | (a) | 51,874 | 16,023,879 | |||||||
Brown & Brown, Inc. (Insurance) | 145,627 | 8,296,370 | ||||||||
| Common Stocks (continued) | Shares | Value | ||||||||||
FINANCIALS (continued) | ||||||||||||
CBOE Global Markets, Inc. (Capital Markets) | 23,797 | $ | 2,985,810 | |||||||||
FactSet Research Systems, Inc. (Capital Markets) | 12,659 | 5,078,917 | ||||||||||
Intercontinental Exchange, Inc. (Capital Markets) | 28,523 | 2,926,175 | ||||||||||
Loews Corp. (Insurance) | 36,343 | 2,119,887 | ||||||||||
Marsh & McLennan Cos., Inc. (Insurance) | 33,228 | 5,498,569 | ||||||||||
Moody’s Corp. (Capital Markets) | 2,816 | 784,594 | ||||||||||
Nasdaq, Inc. (Capital Markets) | 8,731 | 535,647 | ||||||||||
S&P Global, Inc. (Capital Markets) | 1,128 | 377,812 | ||||||||||
|
| |||||||||||
| 56,068,583 | ||||||||||||
|
| |||||||||||
HEALTH CARE – 22.7% | ||||||||||||
AbbVie, Inc. (Biotechnology) | 103,187 | 16,676,051 | ||||||||||
Baxter International, Inc. (Health Care Equip. & Supplies) | 102,971 | 5,248,432 | ||||||||||
Becton Dickinson and Co. (Health Care Equip. & Supplies) | 64,656 | 16,442,021 | ||||||||||
Biogen, Inc. (Biotechnology) | (a) | 1,704 | 471,872 | |||||||||
Boston Scientific Corp. (Health Care Equip. & Supplies) | (a) | 17,662 | 817,221 | |||||||||
Bristol-Myers Squibb Co. (Pharmaceuticals) | 314,845 | 22,653,098 | ||||||||||
Cooper Cos., Inc. / The (Health Care Equip. & Supplies) | 20,922 | 6,918,278 | ||||||||||
CVS Health Corp. (Health Care Providers & Svs.) | 4,569 | 425,785 | ||||||||||
Danaher Corp. (Life Sciences Tools & Svs.) | 2,091 | 554,993 | ||||||||||
DaVita, Inc. (Health Care Providers & Svs.) | (a) | 4,118 | 307,491 | |||||||||
Gilead Sciences, Inc. (Biotechnology) | 261,276 | 22,430,545 | ||||||||||
Henry Schein, Inc. (Health Care Providers & Svs.) | (a) | 32,265 | 2,577,006 | |||||||||
Hologic, Inc. (Health Care Equip. & Supplies) | (a) | 10,667 | 797,998 | |||||||||
Humana, Inc. (Health Care Providers & Svs.) | 2,348 | 1,202,622 | ||||||||||
Incyte Corp. (Biotechnology) | (a) | 43,017 | 3,455,125 | |||||||||
IQVIA Holdings, Inc. (Life Sciences Tools & Svs.) | (a) | 1,957 | 400,970 | |||||||||
Johnson & Johnson (Pharmaceuticals) | 130,860 | 23,116,419 | ||||||||||
Laboratory Corp. of America Holdings (Health Care Providers & Svs.) | 23,629 | 5,564,157 | ||||||||||
Merck & Co., Inc. (Pharmaceuticals) | 164,825 | 18,287,334 | ||||||||||
Mettler-Toledo International, Inc. (Life Sciences Tools & Svs.) | (a) | 165 | 238,499 | |||||||||
Pfizer, Inc. (Pharmaceuticals) | 145,033 | 7,431,491 | ||||||||||
Quest Diagnostics, Inc. (Health Care Providers & Svs.) | 37,210 | 5,821,132 | ||||||||||
Regeneron Pharmaceuticals, Inc. (Biotechnology) | (a) | 231 | 166,664 | |||||||||
STERIS PLC (Health Care Equip. & Supplies) | 2,266 | 418,507 | ||||||||||
Vertex Pharmaceuticals, Inc. (Biotechnology) . | (a) | 3,243 | 936,513 | |||||||||
Waters Corp. (Life Sciences Tools & Svs.) | (a) | 10,429 | 3,572,767 | |||||||||
West Pharmaceutical Services, Inc. (Life Sciences Tools & Svs.) | 608 | 143,093 | ||||||||||
Zoetis, Inc. (Pharmaceuticals) | 4,090 | 599,389 | ||||||||||
|
| |||||||||||
| 167,675,473 | ||||||||||||
|
| |||||||||||
INDUSTRIALS – 9.9% | ||||||||||||
AMETEK, Inc. (Electrical Equip.) | 46,325 | 6,472,529 | ||||||||||
C.H. Robinson Worldwide, Inc. (Air Freight & Logistics) | 73,314 | 6,712,630 | ||||||||||
Copart, Inc. (Commercial Svs. & Supplies) | (a) | 23,532 | 1,432,863 | |||||||||
Dover Corp. (Machinery) | 10,775 | 1,459,043 | ||||||||||
Expeditors International of Washington, Inc. (Air Freight & Logistics) | 51,310 | 5,332,135 | ||||||||||
Fortive Corp. (Machinery) | 41,002 | 2,634,379 | ||||||||||
IDEX Corp. (Machinery) | 22,861 | 5,219,852 | ||||||||||
J.B. Hunt Transport Services, Inc. (Road & Rail) | 1,134 | 197,724 | ||||||||||
Jacobs Solutions, Inc. (Professional Svs.) | 387 | 46,467 | ||||||||||
L3Harris Technologies, Inc. (Aerospace & Defense) | 3,248 | 676,266 | ||||||||||
| 126 | (continued) |
Ohio National Fund, Inc. | ON U.S. Low Volatility Portfolio (Continued) | |
| Schedule of Investments | December 31, 2022 | |
| Common Stocks (Continued) | Shares | Value | ||||||||||
INDUSTRIALS (continued) | ||||||||||||
Leidos Holdings, Inc. (Professional Svs.) | 30,039 | $ | 3,159,802 | |||||||||
Lockheed Martin Corp. (Aerospace & Defense) | 14,230 | 6,922,753 | ||||||||||
Nordson Corp. (Machinery) | 22,087 | 5,250,522 | ||||||||||
Northrop Grumman Corp. (Aerospace & Defense) | 6,138 | 3,348,954 | ||||||||||
Old Dominion Freight Line, Inc. (Road & Rail) | 2,956 | 838,854 | ||||||||||
Otis Worldwide Corp. (Machinery) | 6,224 | 487,401 | ||||||||||
Republic Services, Inc. (Commercial Svs. & Supplies) | 72,188 | 9,311,530 | ||||||||||
Verisk Analytics, Inc. (Professional Svs.) | 38,888 | 6,860,621 | ||||||||||
Waste Management, Inc. (Commercial Svs. & Supplies) | 41,444 | 6,501,735 | ||||||||||
|
| |||||||||||
| 72,866,060 | ||||||||||||
|
| |||||||||||
INFORMATION TECHNOLOGY – 13.5% | ||||||||||||
Accenture PLC Class A (IT Svs.) | 1,844 | 492,053 | ||||||||||
Akamai Technologies, Inc. (IT Svs.) | (a | ) | 75,939 | 6,401,658 | ||||||||
Amphenol Corp. Class A (Electronic Equip., Instr. & Comp.) | 7,167 | 545,695 | ||||||||||
Apple, Inc. (Tech. Hardware, Storage & Periph.) | 212,349 | 27,590,506 | ||||||||||
Broadridge Financial Solutions, Inc. (IT Svs.) | 23,503 | 3,152,457 | ||||||||||
Cognizant Technology Solutions Corp. Class A (IT Svs.) | 4,888 | 279,545 | ||||||||||
F5, Inc. (Communications Equip.) | (a | ) | 8,940 | 1,282,979 | ||||||||
Fiserv, Inc. (IT Svs.) | (a | ) | 16,631 | 1,680,895 | ||||||||
FleetCor Technologies, Inc. (IT Svs.) | (a | ) | 4,064 | 746,475 | ||||||||
Gartner, Inc. (IT Svs.) | (a | ) | 5,951 | 2,000,369 | ||||||||
Gen Digital, Inc. (Software) | 170,498 | 3,653,772 | ||||||||||
International Business Machines Corp. (IT Svs.) | 11,977 | 1,687,439 | ||||||||||
Jack Henry & Associates, Inc. (IT Svs.) | 19,669 | 3,453,090 | ||||||||||
Keysight Technologies, Inc. (Electronic Equip., Instr. & Comp.) | (a | ) | 9,977 | 1,706,765 | ||||||||
Microsoft Corp. (Software) | 101,610 | 24,368,110 | ||||||||||
Paychex, Inc. (IT Svs.) | 1,744 | 201,537 | ||||||||||
Roper Technologies, Inc. (Software) | 13,308 | 5,750,254 | ||||||||||
Teledyne Technologies, Inc. (Electronic Equip., Instr. & Comp.) | (a | ) | 5,738 | 2,294,684 | ||||||||
Tyler Technologies, Inc. (Software) | (a | ) | 3,014 | 971,744 | ||||||||
| Common Stocks (Continued) | Shares | Value | ||||||||||
INFORMATION TECHNOLOGY (continued) | ||||||||||||
VeriSign, Inc. (IT Svs.) | (a | ) | 49,888 | $ | 10,248,991 | |||||||
Zebra Technologies Corp. Class A (Electronic Equip., Instr. & Comp.) | (a | ) | 3,549 | 909,999 | ||||||||
|
| |||||||||||
| 99,419,017 | ||||||||||||
|
| |||||||||||
MATERIALS – 0.4% | ||||||||||||
Ball Corp. (Containers & Packaging) | 5,046 | 258,052 | ||||||||||
Newmont Corp. (Metals & Mining) | 34,178 | 1,613,202 | ||||||||||
Sherwin-Williams Co. / The (Chemicals) | 5,609 | 1,331,184 | ||||||||||
|
| |||||||||||
| 3,202,438 | ||||||||||||
|
| |||||||||||
REAL ESTATE – 0.9% | ||||||||||||
Camden Property Trust (Equity REIT) | 24,586 | 2,750,682 | ||||||||||
Extra Space Storage, Inc. (Equity REIT) | 3,816 | 561,639 | ||||||||||
Public Storage (Equity REIT) | 12,605 | 3,531,795 | ||||||||||
|
| |||||||||||
| 6,844,116 | ||||||||||||
|
| |||||||||||
UTILITIES – 3.9% | ||||||||||||
Alliant Energy Corp. (Electric Utilities) | 25,552 | 1,410,726 | ||||||||||
Ameren Corp. (Multi-Utilities) | 7,744 | 688,597 | ||||||||||
American Electric Power Co., Inc. (Electric Utilities) | 8,755 | 831,287 | ||||||||||
American Water Works Co., Inc. (Water Utilities) | 5,996 | 913,910 | ||||||||||
Atmos Energy Corp. (Gas Utilities) | 39,326 | 4,407,265 | ||||||||||
CMS Energy Corp. (Multi-Utilities) | 97,029 | 6,144,847 | ||||||||||
Consolidated Edison, Inc. (Multi-Utilities) | 69,241 | 6,599,360 | ||||||||||
Dominion Energy, Inc. (Multi-Utilities) | 2,675 | 164,031 | ||||||||||
DTE Energy Co. (Multi-Utilities) | 17,743 | 2,085,335 | ||||||||||
Duke Energy Corp. (Electric Utilities) | 16,591 | 1,708,707 | ||||||||||
Evergy, Inc. (Electric Utilities) | 13,052 | 821,362 | ||||||||||
NiSource, Inc. (Multi-Utilities) | 94,251 | 2,584,362 | ||||||||||
Southern Co. / The (Electric Utilities) | 4,775 | 340,983 | ||||||||||
|
| |||||||||||
| 28,700,772 | ||||||||||||
|
| |||||||||||
Total Common Stocks | $ | 731,796,759 | ||||||||||
|
| |||||||||||
Total Investments – 99.1% | (b | ) | $ | 731,796,759 | ||||||||
Other Assets in Excess of Liabilities –0.9% | 6,629,270 | |||||||||||
|
| |||||||||||
Net Assets – 100.0% | $ | 738,426,029 | ||||||||||
|
| |||||||||||
Percentages are stated as a percent of net assets.
Footnotes:
| (a) | Non-income producing security. |
| (b) | Represents cost for financial reporting purposes, which may differ from cost basis for federal income tax purposes. See also Note 7 of the Notes to Financial Statements. |
The accompanying notes are an integral part of these financial statements.
| 127 |
| ON AB Relative Value Portfolio (Unaudited) |
| Objective/Strategy |
The ON AB Relative Value Portfolio seeks long-term growth of capital by investing primarily in the equity securities of U.S. companies that the Portfolio’s sub-adviser believes are trading at attractive valuations and that have strong or improving business models.
| Performance as of December 31, 2022 | ||||
Average Annual returns | ||||
One year | -4.50% | |||
Since inception (12/2/21) | 0.43% | |||
Past performance does not guarantee future results. The performance data quoted represents past performance and current returns may be lower or higher. Total return figures include change in share price and reinvestment of dividends and capital gains. The investment return and principal value will fluctuate so that an investor’s shares, when redeemed, may be worth more or less than the original cost. To obtain performance information up to the most recent month end, call toll-free 1-877-781-6392.
The Portfolio is not open to direct retail investment. Beneficial interest in the Portfolio’s shares is obtained either through an allocation to the Portfolio as an investment vehicle within variable life insurance policies or annuity contracts, or as an underlying investment by the ON Model Portfolios. Actual performance results for variable annuity and variable universal life contracts will be lower due to contract charges. Consult your contract for applicable charges.
Total expense ratio is 0.78% per the Fund’s prospectus dated April 29, 2022. Additional information pertaining to the Portfolio’s expense ratio as of December 31, 2022 can be found in the Portfolio’s Financial Highlights.
| Comments from Sub-Adviser |
Q. How did the Portfolio perform in comparison to its benchmark during the reporting period?
A. For the year ended December 31, 2022, the Portfolio returned -4.50% versus -7.54% for its benchmark, the Russell 1000® Value Index.
Q. Were there specific market conditions, investment strategies, or techniques that materially affected the Portfolio’s benchmark-relative performance during the reporting period?
A. The Portfolio’s overweight to the earnings yield factor, underweight to the idiosyncratic volatility factor, and overweight to the profitability factor contributed to the Portfolio’s relative outperformance, while the Portfolio’s overweight to the beta factor, underweight to the leverage factor, and underweight to the dividend yield factor detracted from the Portfolio’s performance.(1)
Q. How did sector allocation and security selection each impact the Portfolio’s performance relative to its benchmark?
A. Security selection was the primary driver of the outperformance, while sector allocation detracted. Selection within Industrials, Consumer Discretionary, and Materials were the largest contributors to relative performance. From a sector allocation perspective, the Portfolio’s underweights to Communication Services, Real Estate, and Financials helped offset the detraction from an underweight to Energy and overweights to Consumer Discretionary and Information Technology. (1)
Q. Which securities contributed the most to, and detracted the most from, the Portfolio’s benchmark-relative performance?
A. Cigna Corp., a managed care company, was the top relative contributor for the year. The stock benefitted as membership growth and profitability remained strong throughout the year, while the company’s medical loss ratio came in better than expected. The company also continued to beat expectations and raise guidance throughout the year.
Amgen Inc., a biotechnology company, also contributed to relative performance. The stock benefitted from increasing optimism on the company’s pipeline, underpinned by an early-stage obesity drug, along with good fundamental performance of the base business. EOG Resources, Inc., an exploration and production company, was the third largest relative contributor. The company outperformed as oil pricing remained very strong, driven by favorable supply and demand dynamics, which were further exacerbated by the ongoing conflict in Ukraine and subsequent sanctions on Russia.
Exxon Mobil Corp., a leading integrated oil company that was not held in the Portfolio, was the largest detractor from relative performance for the year. The stock benefitted from favorable supply and demand dynamics, which supported a sharp increase in commodity prices. Additionally, the Russian invasion of Ukraine and subsequent sanctions drove further commodity price increases. Target Corp., a retailer, detracted from relative performance as the company was impacted by weakening consumer demand, driven by inflationary pressures and slowing economic growth. The company’s operating margins remain compressed due to higher input costs and discounting associated with excess inventory. CBRE Group Inc. Class A, a real estate services company, also detracted from relative performance. The stock underperformed during the year as rising interest rates pressured the real estate market. (1)
Q. Were there any significant changes to the Portfolio’s management team, investment strategy, or selection process during the reporting period?
A. During the performance period, there were four additions to the portfolio management team:
• Jerald Gooden joined the team as a generalist research associate.
• Alex Pizzirani, CFA rejoined AllianceBernstein L.P. and the portfolio management team as a research analyst focused on research and development, leveraging machine learning and data science.
• Ewa Przybylko, CFA joined the team as a research associate supporting co-CIO, Vinay Thapar, in covering the healthcare sector.
• Pradeep Ramani joined the team as a research analyst covering the technology sector.
| (1) | The Portfolio’s composition is subject to change. Holdings and weightings are as of December 31, 2022. |
| 128 | (continued) |
Ohio National Fund, Inc. | ON AB Relative Value Portfolio (Unaudited) (Continued) |
| Change in Value of $10,000 Investment |
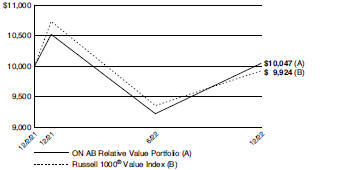
Hypothetical illustration based on past performance. Future performance will vary. The Portfolio’s returns reflect reinvested dividends. The Portfolio’s holdings may differ significantly from the securities in the index. The index is unmanaged and therefore does not reflect the cost of portfolio management and accounting.
The Russell 1000® Value Index measures the performance of the large-cap value segment of the U.S. equity universe. It includes those Russell 1000® Index companies with lower price-to-book ratios and lower expected and historical growth rates.
Past performance is no guarantee of future results. Redemption of fund shares could have tax implications unique to each shareholder.
| Portfolio Composition as of December 31, 2022 (1) | ||
| % of Net Assets | ||||
Common Stocks (4) | 96.5 | |||
Other Net Assets | 3.5 | |||
|
| |||
| 100.0 | ||||
|
| |||
Top 10 Portfolio Holdings as of December 31, 2022 (1) (2) (3) | ||||
| % of Net Assets | ||||||
1. | Philip Morris International, Inc. | 4.3 | ||||
2. | Elevance Health, Inc. | 4.2 | ||||
3. | Berkshire Hathaway, Inc. Class B | 3.8 | ||||
4. | Wells Fargo & Co. | 3.7 | ||||
5. | JPMorgan Chase & Co. | 3.5 | ||||
6. | Mastercard, Inc. Class A | 3.4 | ||||
7. | Roche Holding AG – ADR | 3.0 | ||||
8. | Amgen, Inc. | 2.9 | ||||
9. | Weyerhaeuser Co. | 2.5 | ||||
10. | Cigna Corp. | 2.4 | ||||
| (1) | Composition of Portfolio subject to change. |
| (2) | Short-term investments have been excluded from the list of Top 10 Portfolio Holdings. |
| (3) | Top 10 Portfolio Holdings is presented at an individual security level. Total investment exposure by issuer may be higher. |
| (4) | Sectors (Common Stocks): |
| % of Net Assets | ||||
Health Care | 19.9 | |||
Financials | 16.9 | |||
Information Technology | 16.1 | |||
Industrials | 14.7 | |||
Consumer Discretionary | 10.0 | |||
Energy | 5.2 | |||
Consumer Staples | 5.2 | |||
Real Estate | 3.4 | |||
Communication Services | 3.2 | |||
Materials | 1.3 | |||
Utilities | 0.6 | |||
|
| |||
| 96.5 | ||||
|
| |||
| 129 |
Ohio National Fund, Inc. | ON AB Relative Value Portfolio | |
Schedule of Investments | December 31, 2022 | |
| Common Stocks – 96.5% | Shares | Value | ||||||||||
| ||||||||||||
COMMUNICATION SERVICES – 3.2% | ||||||||||||
Alphabet, Inc. Class C (Interactive Media & Svs.) | (a | ) | 17,316 | $ | 1,536,449 | |||||||
Comcast Corp. Class A (Media) | 70,649 | 2,470,595 | ||||||||||
|
| |||||||||||
| 4,007,044 | ||||||||||||
|
| |||||||||||
CONSUMER DISCRETIONARY – 10.0% | ||||||||||||
AutoZone, Inc. (Specialty Retail) | (a | ) | 406 | 1,001,269 | ||||||||
Booking Holdings, Inc. (Hotels, Restaurants & Leisure) | (a | ) | 617 | 1,243,428 | ||||||||
BorgWarner, Inc. (Auto Components) | 27,499 | 1,106,835 | ||||||||||
Choice Hotels International, Inc. (Hotels, Restaurants & Leisure) | 9,079 | 1,022,658 | ||||||||||
D.R. Horton, Inc. (Household Durables) | 9,718 | 866,262 | ||||||||||
LKQ Corp. (Distributors) | 33,660 | 1,797,781 | ||||||||||
Lowe’s Cos., Inc. (Specialty Retail) | 9,811 | 1,954,744 | ||||||||||
Target Corp. (Multiline Retail) | 16,813 | 2,505,809 | ||||||||||
Ulta Beauty, Inc. (Specialty Retail) | (a | ) | 2,412 | 1,131,397 | ||||||||
|
| |||||||||||
| 12,630,183 | ||||||||||||
|
| |||||||||||
CONSUMER STAPLES – 5.2% | ||||||||||||
Kroger Co. / The (Food & Staples Retailing) | 24,810 | 1,106,030 | ||||||||||
Philip Morris International, Inc. (Tobacco) | 53,168 | 5,381,133 | ||||||||||
|
| |||||||||||
| 6,487,163 | ||||||||||||
|
| |||||||||||
ENERGY – 5.2% | ||||||||||||
Chevron Corp. (Oil, Gas & Consumable Fuels) | 5,291 | 949,682 | ||||||||||
ConocoPhillips (Oil, Gas & Consumable Fuels) | 6,565 | 774,670 | ||||||||||
EOG Resources, Inc. (Oil, Gas & Consumable Fuels) | 13,192 | 1,708,628 | ||||||||||
Helmerich & Payne, Inc. (Energy Equip. & Svs.) | 22,344 | 1,107,592 | ||||||||||
Phillips 66 (Oil, Gas & Consumable Fuels) | 19,282 | 2,006,870 | ||||||||||
|
| |||||||||||
| 6,547,442 | ||||||||||||
|
| |||||||||||
FINANCIALS – 16.9% | ||||||||||||
Axis Capital Holdings Ltd. (Insurance) | 17,951 | 972,406 | ||||||||||
Bank OZK (Banks) | 30,762 | 1,232,326 | ||||||||||
Berkshire Hathaway, Inc. Class B (Diversified Financial Svs.) | (a | ) | 15,655 | 4,835,830 | ||||||||
Goldman Sachs Group, Inc. / The (Capital Markets) | 4,738 | 1,626,934 | ||||||||||
Houlihan Lokey, Inc. (Capital Markets) | 11,078 | 965,558 | ||||||||||
JPMorgan Chase & Co. (Banks) | 33,004 | 4,425,836 | ||||||||||
MetLife, Inc. (Insurance) | 14,425 | 1,043,937 | ||||||||||
Nasdaq, Inc. (Capital Markets) | 16,165 | 991,723 | ||||||||||
Northern Trust Corp. (Capital Markets) | 5,389 | 476,873 | ||||||||||
Wells Fargo & Co. (Banks) | 113,375 | 4,681,254 | ||||||||||
|
| |||||||||||
| 21,252,677 | ||||||||||||
|
| |||||||||||
HEALTH CARE – 19.9% | ||||||||||||
Amgen, Inc. (Biotechnology) | 13,652 | 3,585,561 | ||||||||||
Cigna Corp. (Health Care Providers & Svs.) | 8,995 | 2,980,403 | ||||||||||
Elevance Health, Inc. (Health Care Providers & Svs.) | 10,225 | 5,245,118 | ||||||||||
Gilead Sciences, Inc. (Biotechnology) | 27,931 | 2,397,877 | ||||||||||
PerkinElmer, Inc. (Life Sciences Tools & Svs.) | 11,313 | 1,586,309 | ||||||||||
Pfizer, Inc. (Pharmaceuticals) | 19,038 | 975,507 | ||||||||||
Quest Diagnostics, Inc. (Health Care Providers & Svs.) | 12,512 | 1,957,377 | ||||||||||
Regeneron Pharmaceuticals, Inc. (Biotechnology) | (a | ) | 3,593 | 2,592,314 | ||||||||
Roche Holding AG – ADR (Pharmaceuticals) | 96,098 | 3,762,237 | ||||||||||
|
| |||||||||||
| 25,082,703 | ||||||||||||
|
| |||||||||||
INDUSTRIALS – 14.7% | ||||||||||||
Acuity Brands, Inc. (Electrical Equip.) | 4,059 | 672,211 | ||||||||||
Alaska Air Group, Inc. (Airlines) | (a | ) | 25,430 | 1,091,964 | ||||||||
Builders FirstSource, Inc. (Building Products) | (a | ) | 16,368 | 1,061,956 | ||||||||
| Common Stocks (Continued) | Shares | Value | ||||||||||
| ||||||||||||
INDUSTRIALS (continued) | ||||||||||||
Curtiss-Wright Corp. (Aerospace & Defense) | 5,136 | $ | 857,661 | |||||||||
EMCOR Group, Inc. (Construction & Engineering) | 5,787 | 857,113 | ||||||||||
Emerson Electric Co. (Electrical Equip.) | 18,188 | 1,747,139 | ||||||||||
Expeditors International of Washington, Inc. (Air Freight & Logistics) | 4,459 | 463,379 | ||||||||||
Knight-Swift Transportation Holdings, Inc. (Road & Rail) | 31,961 | 1,675,076 | ||||||||||
Middleby Corp. / The (Machinery) | (a | ) | 3,537 | 473,604 | ||||||||
MSC Industrial Direct Co., Inc. Class A (Trading Companies & Distributors) | 9,033 | �� | 737,996 | |||||||||
PACCAR, Inc. (Machinery) | 19,930 | 1,972,472 | ||||||||||
Raytheon Technologies Corp. (Aerospace & Defense) | 17,606 | 1,776,798 | ||||||||||
Robert Half International, Inc. (Professional Svs.) | 15,368 | 1,134,619 | ||||||||||
Southwest Airlines Co. (Airlines) | (a | ) | 39,723 | 1,337,473 | ||||||||
Textron, Inc. (Aerospace & Defense) | 25,685 | 1,818,498 | ||||||||||
Westinghouse Air Brake Technologies Corp. (Machinery) | 7,749 | 773,428 | ||||||||||
|
| |||||||||||
| 18,451,387 | ||||||||||||
|
| |||||||||||
INFORMATION TECHNOLOGY – 16.1% | ||||||||||||
Accenture PLC Class A (IT Svs.) | 4,146 | 1,106,319 | ||||||||||
Cisco Systems, Inc. (Communications Equip.) | 42,823 | 2,040,088 | ||||||||||
Cognizant Technology Solutions Corp. Class A (IT Svs.) | 10,958 | 626,688 | ||||||||||
FleetCor Technologies, Inc. (IT Svs.) | (a | ) | 8,052 | 1,478,991 | ||||||||
IPG Photonics Corp. (Electronic Equip., Instr. & Comp.) | (a | ) | 13,615 | 1,288,932 | ||||||||
Keysight Technologies, Inc. (Electronic Equip., Instr. & Comp.) | (a | ) | 9,944 | 1,701,120 | ||||||||
Littelfuse, Inc. (Electronic Equip., Instr. & Comp.) | 2,289 | 504,038 | ||||||||||
Mastercard, Inc. Class A (IT Svs.) | 12,340 | 4,290,988 | ||||||||||
Maximus, Inc. (IT Svs.) | 16,635 | 1,219,845 | ||||||||||
MKS Instruments, Inc. (Semiconductors & Equip.) | 12,970 | 1,098,948 | ||||||||||
NXP Semiconductors N.V. (Semiconductors & Equip.) | 6,683 | 1,056,114 | ||||||||||
PayPal Holdings, Inc. (IT Svs.) | (a | ) | 30,707 | 2,186,953 | ||||||||
Taiwan Semiconductor Manufacturing Co. Ltd. – ADR (Semiconductors & Equip.) | 14,950 | 1,113,625 | ||||||||||
Zebra Technologies Corp. Class A (Electronic Equip., Instr. & Comp.) | (a | ) | 2,097 | 537,692 | ||||||||
|
| |||||||||||
| 20,250,341 | ||||||||||||
|
| |||||||||||
MATERIALS – 1.3% | ||||||||||||
BHP Group Ltd. – ADR (Metals & Mining) | 9,603 | 595,866 | ||||||||||
Mosaic Co. / The (Chemicals) | 22,400 | 982,688 | ||||||||||
|
| |||||||||||
| 1,578,554 | ||||||||||||
|
| |||||||||||
REAL ESTATE – 3.4% | ||||||||||||
CBRE Group, Inc. Class A (Real Estate Mgmt. & Development) | (a | ) | 14,889 | 1,145,857 | ||||||||
Weyerhaeuser Co. (Equity REIT) | 101,103 | 3,134,193 | ||||||||||
|
| |||||||||||
| 4,280,050 | ||||||||||||
|
| |||||||||||
UTILITIES – 0.6% | ||||||||||||
IDACORP, Inc. (Electric Utilities) | 7,249 | 781,805 | ||||||||||
|
| |||||||||||
Total Common Stocks (Cost $120,667,622) | $ | 121,349,349 | ||||||||||
|
| |||||||||||
Total Investments – 96.5% | (b | ) | $ | 121,349,349 | ||||||||
Other Assets in Excess of Liabilities – 3.5% |
| 4,373,387 | ||||||||||
|
| |||||||||||
Net Assets – 100.0% | $ | 125,722,736 | ||||||||||
|
| |||||||||||
Percentages are stated as a percent of net assets.
| 130 | (continued) |
Ohio National Fund, Inc. | ON AB Relative Value Portfolio (Continued) | |
Schedule of Investments | December 31, 2022 | |
Abbreviations:
| ADR: | American Depositary Receipts |
Footnotes:
| (a) | Non-income producing security. |
| (b) | Represents cost for financial reporting purposes, which may differ from cost basis for federal income tax purposes. See also Note 7 of the Notes to Financial Statements. |
The accompanying notes are an integral part of these financial statements.
| 131 |
| ON iShares Managed Risk Balanced Portfolio (Unaudited) |
Objective/Strategy |
The ON iShares Managed Risk Balanced Portfolio seeks income and capital appreciation by investing in underlying exchange traded funds (“ETFs”) and futures. Under normal market conditions, through investments in the underlying funds and derivatives, the Portfolio invests a minimum of 25% of its assets in equity investments and a minimum of 25% of its assets in fixed income investments.
Performance as of December 31, 2022 |
| Average Annual returns | ||||
One year | -15.84 | % | ||
Since inception (6/25/21) | -9.38 | % |
Past performance does not guarantee future results. The performance data quoted represents past performance and current returns may be lower or higher. Total return figures include change in share price and reinvestment of dividends and capital gains. The investment return and principal value will fluctuate so that an investor’s shares, when redeemed, may be worth more or less than the original cost. To obtain performance information up to the most recent month end, call toll-free 1-877-781-6392.
The Portfolio is not open to direct retail investment. Beneficial interest in the Portfolio’s shares is obtained either through an allocation to the Portfolio as an investment vehicle within variable life insurance policies or annuity contracts, or as an underlying investment by the ON Model Portfolios. Actual performance results for variable annuity and variable universal life contracts will be lower due to contract charges. Consult your contract for applicable charges.
Total expense ratio is 0.69% per the Fund’s prospectus, as revised by a supplement dated October 14, 2022. Additional information pertaining to the Portfolio’s expense ratio as of December 31, 2022 can be found in the Portfolio’s Financial Highlights.
Comments from Sub-Adviser |
Q. How did the Portfolio perform in comparison to its benchmark during the reporting period?
A. For the year ended December 31, 2022, the Portfolio returned -15.84% versus -18.11% for its benchmark, the S&P 500® Index. The Portfolio’s secondary benchmark, which is comprised of 50% MSCI All Country World Index/50% ICE BofA U.S. Broad Market Index, returned -15.55% for the year ended December 31, 2022.
Q. Were there specific market conditions, investment strategies, or techniques that materially affected the Portfolio’s benchmark-relative performance during the reporting period?
A. The macro performance for the year was driven by stubborn inflation and a global wave of central bank tightening. Although there was a simultaneous drag on stock and bond returns, the Portfolio’s fixed income allocation benefited relative to the primary benchmark as bond markets did not see the same level of drawdowns. The perceived ‘transitory’ reopening inflation gave way to more persistent price increases. In fact, U.S. inflation remained at multi-decade highs for longer than policymakers expected, with pressures widespread across both goods and services.
The Bank of Japan stood nearly alone amongst developed market central banks, having not adjusted their policy rates. It was still engaged in yield curve control policy, despite persistent high inflation, before tweaking its yield curve control policy in the last weeks of December. This looser monetary policy over the majority of the year benefitted the Portfolio’s Japanese equity exposure relative to the Portfolio’s benchmark. (1)
Q. How did asset class allocation impact the Portfolio’s performance relative to its benchmark?
A. Over the year, the Portfolio was invested roughly 50% in equities and 50% in fixed income. Given the weak performance of equities over the year, the Portfolio’s fixed income exposure was a large contributor to relative performance. Other contributors included the Portfolio’s exposure to international developed equities, as those markets generally outperformed relative to U.S. equities. (1)
Q. How did country selection impact the Portfolio’s performance relative to its benchmark?
A. U.S. equities generally underperformed other developed equities during the year, but generally outperformed versus emerging market equities. Some of the country exposures that contributed to performance include the U.K. and Japan, while the Portfolio’s positioning in Sweden and Russia at the start of the year detracted from performance. (1)
Q. Which securities contributed the most to, and detracted the most from, the Portfolio’s benchmark-relative performance?
A. Relative to the primary benchmark, the best performing securities within the Portfolio for the year were iShares Core U.S. Aggregate Bond ETF, iShares Core MSCI EAFE ETF, and the CBT 5-Year U.S. Treasury Note Short Futures Contract expiring in June 2022. Fixed income markets and developed foreign equity markets performed well as compared to U.S. equities, while the aforementioned futures contract was held short and benefited from declining valuations in U.S. Treasuries. MSCI Emerging Markets Index - Long Future expiring in March 2022, MSCI EAFE Index - Long Future expiring in December 2022, and E-mini S&P 500 Index - Long Future expiring in March 2022 all detracted, as equity markets drew down during the periods when those positions were held. (1)
Q. How did the Portfolio’s use of derivative instruments and initial public offerings (IPOs), if any, impact performance?
A. Futures contracts detracted 175 basis points of absolute return for the Portfolio, in aggregate. The Portfolio did not participate in any IPOs during the year. (1)
| (1) | The Portfolio’s composition is subject to change. Holdings and weightings are as of December 31, 2022. |
| 132 | (continued) |
Ohio National Fund, Inc. | ON iShares Managed Risk Balanced Portfolio (Unaudited) (Continued) |
Change in Value of $10,000 Investment |
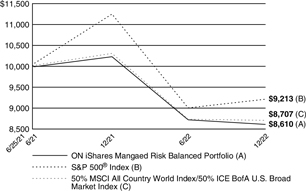
Hypothetical illustration based on past performance. Future performance will vary. The Portfolio’s returns reflect reinvested dividends. The Portfolio’s holdings may differ significantly from the securities in the index. The index is unmanaged and therefore does not reflect the cost of portfolio management and accounting.
The S&P 500® Index is a capitalization-weighted index designed to measure performance of the broad domestic economy through changes in the aggregate market value of 500 stocks representing all major industries. The index presented includes the effects of reinvested dividends.
The MSCI All Country World Index is a global free float-adjusted, market capitalization-weighted index that is designed to measure the equity market performance of large-cap and mid-cap stocks across many developed and emerging markets, and all eleven recognized GICS sectors. The index currently consists of 23 developed markets, including the United States, along with 27 emerging country markets. The returns presented for this index include the effects of reinvested dividends, net of taxes, and adjustment to U.S. Dollar denomination.
The ICE BofA U.S. Broad Market Index measures the performance of U.S. dollar-denominated, investment grade debt securities, including U.S. Treasury notes and bonds, quasi-government securities, corporate securities, residential and commercial mortgage-backed securities and asset-backed securities. Securities are cap-weighted based on their amount outstanding times the market price plus accrued interest.
Past performance is no guarantee of future results. Redemption of fund shares could have tax implications unique to each shareholder.
Portfolio Composition as of December 31, 2022 (1) |
| % of Net Assets | ||||
Exchange Traded Funds | 92.7 | |||
Other Net Assets | 7.3 | |||
|
| |||
| 100.0 | ||||
|
| |||
Top 10 Portfolio Holdings as of December 31, 2022 (1) (2) (3) |
| % of Net Assets | ||||||
| 1. | iShares Core U.S. Aggregate Bond ETF | 40.6 | ||||
| 2. | iShares Core S&P 500 ETF | 13.1 | ||||
| 3. | iShares Russell 1000 ETF | 10.9 | ||||
| 4. | BlackRock Ultra Short-Term Bond ETF | 10.8 | ||||
| 5. | iShares Core MSCI EAFE ETF | 5.5 | ||||
| 6. | iShares MSCI EAFE ETF | 4.3 | ||||
| 7. | iShares iBoxx $ Investment Grade Corporate Bond ETF | 3.2 | ||||
| 8. | iShares Core MSCI Emerging Markets ETF | 2.5 | ||||
| 9. | iShares MSCI Emerging Markets ETF | 1.8 | ||||
| (1) | Composition of Portfolio subject to change. |
| (2) | Short-term investments have been excluded from the list of Top 10 Portfolio Holdings. |
| (3) | Top 10 Portfolio Holdings is presented at an individual security level. Total investment exposure by issuer may be higher. |
| 133 |
Ohio National Fund, Inc. | ON iShares Managed Risk Balanced Portfolio |
Schedule of Investments | December 31, 2022 | |||
| Exchange Traded Funds – 92.7% | Shares | Value | ||||||||||
| ||||||||||||
BlackRock Ultra Short-Term Bond ETF | 1,323,411 | $ | 66,223,486 | |||||||||
iShares Core MSCI EAFE ETF | 545,475 | 33,623,079 | ||||||||||
iShares Core MSCI Emerging Markets ETF | 318,808 | 14,888,334 | ||||||||||
iShares Core S&P 500 ETF | 208,674 | 80,174,638 | ||||||||||
iShares Core U.S. Aggregate Bond ETF | 2,562,117 | 248,499,728 | ||||||||||
iShares iBoxx $ Investment Grade Corporate Bond ETF | 184,558 | 19,457,950 | ||||||||||
iShares MSCI EAFE ETF | 401,367 | 26,345,730 | ||||||||||
iShares MSCI Emerging Markets ETF | 295,805 | 11,211,009 | ||||||||||
iShares Russell 1000 ETF | 315,771 | 66,476,111 | ||||||||||
|
| |||||||||||
Total Exchange Traded Funds (Cost $586,050,309) | $ | 566,900,065 | ||||||||||
|
| |||||||||||
Total Investments – 92.7% (Cost $586,050,309) | (a | ) | $ | 566,900,065 | ||||||||
Other Assets in Excess of Liabilities – 7.3% | (b | ) | 44,735,804 | |||||||||
|
| |||||||||||
Net Assets – 100.0% | $ | 611,635,869 | ||||||||||
|
| |||||||||||
Percentages are stated as a percent of net assets.
Footnotes:
| (a) | Represents cost for financial reporting purposes, which may differ from cost basis for federal income tax purposes. See also Note 7 of the Notes to Financial Statements. |
| (b) | Includes $5,250,963 of cash pledged as collateral for the futures contracts outstanding at December 31, 2022. See also the following Schedule of Open Futures Contracts. |
The accompanying notes are an integral part of these financial statements.
Schedule of Open Futures Contracts | December 31, 2022 | |||
Long Futures Contracts
Description | Number of contracts | Expiration Date | Notional Amount | Value | Unrealized Appreciation (Depreciation) | Variation Margin Receivable | ||||||||||||||||||||||||||
CAD Currency Future - Long | 150 | March 14, 2023 | $ | 11,090,298 | $ | 11,088,000 | $ | (2,298 | ) | $ | 1,500 | |||||||||||||||||||||
MOD S&P TSX 60 Index - Long | 57 | March 16, 2023 | 10,201,041 | 9,849,970 | (351,071 | ) | (73,291 | ) | ||||||||||||||||||||||||
MSCI EAFE Index - Long | 134 | March 17, 2023 | 13,105,255 | 13,060,980 | (44,275 | ) | (85,800 | ) | ||||||||||||||||||||||||
CME E-mini S&P 500 Index - Long | 227 | March 17, 2023 | 44,404,144 | 43,822,350 | (581,794 | ) | (74,341 | ) | ||||||||||||||||||||||||
MSCI Emerging Markets Index - Long | 178 | March 17, 2023 | 8,698,384 | 8,538,660 | (159,724 | ) | (95,012 | ) | ||||||||||||||||||||||||
CBT 10-Year U.S. Treasury Note - Long | 343 | March 22, 2023 | 38,871,435 | 38,517,828 | (353,607 | ) | (37,749 | ) | ||||||||||||||||||||||||
|
|
|
|
|
|
|
| |||||||||||||||||||||||||
| $ | 126,370,557 | $ | 124,877,788 | $ | (1,492,769 | ) | $ | (364,693 | ) | |||||||||||||||||||||||
|
|
|
|
|
|
|
| |||||||||||||||||||||||||
Short Futures Contracts
Description | Number of contracts | Expiration Date | Notional Amount | Value | Unrealized | Variation Margin | ||||||||||||||||||||||||||
JPY Currency Future - Short | 13 | March 13, 2023 | $ | (1,213,764 | ) | $ | (1,252,388 | ) | $ | (38,624 | ) | $ | (17,956 | ) | ||||||||||||||||||
EUR Currency Future - Short | 3 | March 13, 2023 | (400,934 | ) | (403,275 | ) | (2,341 | ) | (806 | ) | ||||||||||||||||||||||
CBT U.S. Ultra Bond - Short | 45 | March 22, 2023 | (6,043,755 | ) | (6,044,063 | ) | (308 | ) | 22,500 | |||||||||||||||||||||||
|
|
|
|
|
|
|
| |||||||||||||||||||||||||
| $ | (7,658,453 | ) | $ | (7,699,726 | ) | $ | (41,273 | ) | $ | 3,738 | ||||||||||||||||||||||
|
|
|
|
|
|
|
| |||||||||||||||||||||||||
Total Futures Contracts | $ | 118,712,104 | $ | 117,178,062 | $ | (1,534,042 | ) | $ | (360,955 | ) | ||||||||||||||||||||||
|
|
|
|
|
|
|
| |||||||||||||||||||||||||
The accompanying notes are an integral part of these financial statements.
| 134 |
| ON iShares Managed Risk Moderate Growth Portfolio (Unaudited) |
| Objective/Strategy |
The ON iShares Managed Risk Moderate Growth Portfolio seeks income and capital appreciation by investing in underlying exchange traded funds (“ETFs”) and futures. Under normal market conditions, through investments in the underlying funds and derivatives, the Portfolio expects to allocate 65% of its assets in equity investments and 35% of its assets in fixed income investments. |
| Performance as of December 31, 2022 | ||||
| Average Annual returns | ||||
Since inception (10/14/22) | 5.90 | % | ||
Past performance does not guarantee future results. The performance data quoted represents past performance and current returns may be lower or higher. Total return figures include change in share price and reinvestment of dividends and capital gains. The investment return and principal value will fluctuate so that an investor’s shares, when redeemed, may be worth more or less than the original cost. To obtain performance information up to the most recent month end, call toll-free 1-877-781-6392.
The Portfolio is not open to direct retail investment. Beneficial interest in the Portfolio’s shares is obtained either through an allocation to the Portfolio as an investment vehicle within variable life insurance policies or annuity contracts, or as an underlying investment by the ON Model Portfolios. Actual performance results for variable annuity and variable universal life contracts will be lower due to contract charges. Consult your contract for applicable charges.
Total expense ratio is 0.68% per the Fund’s prospectus, as revised by a supplement dated October 14, 2022. Additional information pertaining to the Portfolio’s expense ratio as of December 31, 2022 can be found in the Portfolio’s Financial Highlights.
| (1) | The Portfolio’s composition is subject to change. Holdings and weightings are as of December 31, 2022. |
| Portfolio Composition as of December 31, 2022 (1) | ||
| % of Net Assets | ||||
Exchange Traded Funds | 88.4 | |||
Other Net Assets | 11.6 | |||
|
| |||
| 100.0 | ||||
|
| |||
Top 10 Portfolio Holdings as of December 31, 2022 (1) (2) (3) | ||||
| % of Net Assets | ||||||
| 1. | iShares Core U.S. Aggregate Bond ETF | 34.2 | ||||
| 2. | iShares Core S&P 500 ETF | 23.9 | ||||
| 3. | iShares Core MSCI EAFE ETF | 9.6 | ||||
| 4. | iShares Russell 1000 ETF | 9.5 | ||||
| 5. | iShares Core MSCI Emerging Markets ETF | 4.4 | ||||
| 6. | iShares MSCI EAFE ETF | 3.0 | ||||
| 7. | BlackRock Ultra Short-Term Bond ETF | 2.4 | ||||
| 8. | iShares MSCI Emerging Markets ETF | 1.4 | ||||
| (1) | Composition of Portfolio subject to change. |
| (2) | Short-term investments have been excluded from the list of Top 10 Portfolio Holdings. |
| (3) | Top 10 Portfolio Holdings is presented at an individual security level. Total investment exposure by issuer may be higher. |
| 135 |
Ohio National Fund, Inc. | ON iShares Managed Risk Moderate Growth Portfolio |
Schedule of Investments | December 31, 2022 | |||
| Exchange Traded Funds – 88.4% | Shares | Value | ||||||||||
BlackRock Ultra Short-Term Bond ETF | 235,963 | $ | 11,807,589 | |||||||||
iShares Core MSCI EAFE ETF | 766,707 | 47,259,819 | ||||||||||
iShares Core MSCI Emerging Markets ETF | 460,888 | 21,523,470 | ||||||||||
iShares Core S&P 500 ETF | 305,230 | 117,272,418 | ||||||||||
iShares Core U.S. Aggregate Bond ETF | 1,733,518 | 168,133,911 | ||||||||||
iShares MSCI EAFE ETF | 221,693 | 14,551,928 | ||||||||||
iShares MSCI Emerging Markets ETF | 178,231 | 6,754,955 | ||||||||||
iShares Russell 1000 ETF | 223,050 | 46,956,486 | ||||||||||
|
| |||||||||||
Total Exchange Traded Funds (Cost $411,737,385) | $ | 434,260,576 | ||||||||||
|
| |||||||||||
Total Investments – 88.4% (Cost $411,737,385) | (a | ) | $ | 434,260,576 | ||||||||
Other Assets in Excess of Liabilities – 11.6%. | (b | ) | 56,737,473 | |||||||||
|
| |||||||||||
Net Assets – 100.0% | $ | 490,998,049 | ||||||||||
|
| |||||||||||
Percentages are stated as a percent of net assets.
Footnotes:
| (a) | Represents cost for financial reporting purposes, which may differ from cost basis for federal income tax purposes. See also Note 7 of the Notes to Financial Statements. |
| (b) | Includes $4,271,385 of cash pledged as collateral for the futures contracts outstanding at December 31, 2022. See also the following Schedule of Open Futures Contracts. |
The accompanying notes are an integral part of these financial statements.
Schedule of Open Futures Contracts | December 31, 2022 | |||
Long Futures Contracts
Description | Number of contracts | Expiration Date | Notional Amount | Value | Unrealized Appreciation (Depreciation) | Variation Margin Receivable (Payable) | ||||||||||||||||||||||||||||||||
CAD Currency Future - Long | 92 | March 14, 2023 | $ | 6,802,049 | $ | 6,800,640 | $ | (1,409 | ) | $ | 920 | |||||||||||||||||||||||||||
MOD S&P TSX 60 Index - Long | 59 | March 16, 2023 | 10,558,972 | 10,195,583 | (363,389 | ) | (75,862 | ) | ||||||||||||||||||||||||||||||
MSCI EAFE Index - Long | 175 | March 17, 2023 | 17,358,666 | 17,057,250 | (301,416 | ) | (175,876 | ) | ||||||||||||||||||||||||||||||
CME E-mini S&P 500 Index - Long | 172 | March 17, 2023 | 34,193,503 | 33,204,600 | (988,903 | ) | (92,450 | ) | ||||||||||||||||||||||||||||||
MSCI Emerging Markets Index - Long | 163 | March 17, 2023 | 7,914,007 | 7,819,110 | (94,897 | ) | (96,487 | ) | ||||||||||||||||||||||||||||||
|
|
|
|
|
|
|
| |||||||||||||||||||||||||||||||
| $ | 76,827,197 | $ | 75,077,183 | $ | (1,750,014 | ) | $ | (439,755 | ) | |||||||||||||||||||||||||||||
|
|
|
|
|
|
|
| |||||||||||||||||||||||||||||||
Short Futures Contracts
Description | Number of contracts | Expiration Date | Notional Amount | Value | Unrealized Appreciation (Depreciation) | Variation Margin Receivable (Payable) | ||||||||||||||||||||||||||||||||
CBT U.S. Ultra Bond - Short | 35 | March 22, 2023 | $ | (4,700,698 | ) | $ | (4,700,938 | ) | $ | (240 | ) | $ | 17,500 | |||||||||||||||||||||||||
|
|
|
|
|
|
|
| |||||||||||||||||||||||||||||||
Total Futures Contracts | $ | 72,126,499 | $ | 70,376,245 | $ | (1,750,254 | ) | $ | (422,255 | ) | ||||||||||||||||||||||||||||
|
|
|
|
|
|
|
| |||||||||||||||||||||||||||||||
The accompanying notes are an integral part of these financial statements.
| 136 |
| ON iShares Managed Risk Growth Portfolio (Unaudited) |
| Objective/Strategy |
The ON iShares Managed Risk Growth Portfolio seeks income and capital appreciation by investing in underlying exchange traded funds (“ETFs”) and futures. Under normal market conditions, through investments in the underlying funds and derivatives, the Portfolio expects to allocate 85% of its assets in equity investments and 15% of its assets in fixed income investments. |
| Performance as of December 31, 2022 | ||||
| Average Annual returns | ||||
Since inception (10/14/22) | 6.00 | % | ||
Past performance does not guarantee future results. The performance data quoted represents past performance and current returns may be lower or higher. Total return figures include change in share price and reinvestment of dividends and capital gains. The investment return and principal value will fluctuate so that an investor’s shares, when redeemed, may be worth more or less than the original cost. To obtain performance information up to the most recent month end, call toll-free 1-877-781-6392.
The Portfolio is not open to direct retail investment. Beneficial interest in the Portfolio’s shares is obtained either through an allocation to the Portfolio as an investment vehicle within variable life insurance policies or annuity contracts, or as an underlying investment by the ON Model Portfolios. Actual performance results for variable annuity and variable universal life contracts will be lower due to contract charges. Consult your contract for applicable charges.
Total expense ratio is 0.68% per the Fund’s prospectus, as revised by a supplement dated October 14, 2022. Additional information pertaining to the Portfolio’s expense ratio as of December 31, 2022 can be found in the Portfolio’s Financial Highlights.
| (1) | The Portfolio’s composition is subject to change. Holdings and weightings are as of December 31, 2022. |
| Portfolio Composition as of December 31, 2022 (1) | ||
| % of Net Assets | ||||
Exchange Traded Funds | 90.3 | |||
Other Net Assets | 9.7 | |||
|
| |||
| 100.0 | ||||
|
| |||
| Top 10 Portfolio Holdings as of December 31, 2022 (1) (2) (3) | ||||
| % of Net Assets | ||||||
| 1. | iShares Core S&P 500 ETF | 37.8 | ||||
| 2. | iShares Core MSCI EAFE ETF | 15.6 | ||||
| 3. | iShares Core U.S. Aggregate Bond ETF | 14.4 | ||||
| 4. | iShares Russell 1000 ETF | 8.6 | ||||
| 5. | iShares Core MSCI Emerging Markets ETF | 6.7 | ||||
| 6. | BlackRock Ultra Short-Term Bond ETF | 3.4 | ||||
| 7. | iShares MSCI EAFE ETF | 2.6 | ||||
| 8. | iShares MSCI Emerging Markets ETF | 1.2 | ||||
| (1) | Composition of Portfolio subject to change. |
| (2) | Short-term investments have been excluded from the list of Top 10 Portfolio Holdings. |
| (3) | Top 10 Portfolio Holdings is presented at an individual security level. Total investment exposure by issuer may be higher. |
| 137 |
Ohio National Fund, Inc. | ON iShares Managed Risk Growth Portfolio |
Schedule of Investments | December 31, 2022 | |||
| Exchange Traded Funds – 90.3% | Shares | Value | ||||||||||
BlackRock Ultra Short-Term Bond ETF | 290,579 | $ | 14,540,573 | |||||||||
iShares Core MSCI EAFE ETF | 1,078,444 | 66,475,288 | ||||||||||
iShares Core MSCI Emerging Markets ETF | 611,134 | 28,539,958 | ||||||||||
iShares Core S&P 500 ETF | 419,468 | 161,163,800 | ||||||||||
iShares Core U.S. Aggregate Bond ETF | 634,156 | 61,506,790 | ||||||||||
iShares MSCI EAFE ETF | 165,815 | 10,884,097 | ||||||||||
iShares MSCI Emerging Markets ETF | 133,130 | 5,045,627 | ||||||||||
iShares Russell 1000 ETF | 175,028 | 36,846,895 | ||||||||||
|
| |||||||||||
Total Exchange Traded Funds (Cost $361,833,540) | $ | 385,003,028 | ||||||||||
|
| |||||||||||
Total Investments – 90.3% (Cost $361,833,540) | (a | ) | $ | 385,003,028 | ||||||||
Other Assets in Excess of Liabilities – 9.7% | (b | ) | 41,558,019 | |||||||||
|
| |||||||||||
Net Assets – 100.0% | $ | 426,561,047 | ||||||||||
|
| |||||||||||
Percentages are stated as a percent of net assets.
Footnotes:
| (a) | Represents cost for financial reporting purposes, which may differ from cost basis for federal income tax purposes. See also Note 7 of the Notes to Financial Statements. |
| (b) | Includes $3,091,344 of cash pledged as collateral for the futures contracts outstanding at December 31, 2022. See also the following Schedule of Open Futures Contracts. |
The accompanying notes are an integral part of these financial statements.
Schedule of Open Futures Contracts | December 31, 2022 | |||
Long Futures Contracts
Description | Number of contracts | Expiration Date | Notional Amount | Value | Unrealized Appreciation (Depreciation) | Variation Margin Receivable (Payable) | ||||||||||||||||||||||||||||||||
CAD Currency Future - Long | 157 | March 14, 2023 | $ | 11,607,845 | $ | 11,605,440 | $ | (2,405 | ) | $ | 1,570 | |||||||||||||||||||||||||||
MOD S&P TSX 60 Index - Long | 76 | March 16, 2023 | 13,601,391 | 13,133,294 | (468,097 | ) | 38,672 | |||||||||||||||||||||||||||||||
MSCI EAFE Index - Long | 45 | March 17, 2023 | 4,389,123 | 4,386,150 | (2,973 | ) | (45,227 | ) | ||||||||||||||||||||||||||||||
CME E-mini S&P 500 Index - Long | 119 | March 17, 2023 | 23,615,671 | 22,972,950 | (642,721 | ) | (63,963 | ) | ||||||||||||||||||||||||||||||
MSCI Emerging Markets Index - Long | 111 | March 17, 2023 | 5,409,321 | 5,324,670 | (84,651 | ) | (82,843 | ) | ||||||||||||||||||||||||||||||
|
|
|
|
|
|
|
| |||||||||||||||||||||||||||||||
| $ | 58,623,351 | $ | 57,422,504 | $ | (1,200,847 | ) | $ | (151,791 | ) | |||||||||||||||||||||||||||||
|
|
|
|
|
|
|
| |||||||||||||||||||||||||||||||
Short Futures Contracts
Description | Number of contracts | Expiration Date | Notional Amount | Value | Unrealized Appreciation (Depreciation) | Variation Margin Receivable (Payable) | ||||||||||||||||||||||||||||||||
CBT U.S. Ultra Bond - Short | 30 | March 22, 2023 | $ | (4,029,170 | ) | $ | (4,029,375 | ) | $ | (205 | ) | $ | 15,000 | |||||||||||||||||||||||||
|
|
|
|
|
|
|
| |||||||||||||||||||||||||||||||
Total Futures Contracts | $ | 54,594,181 | $ | 53,393,129 | $ | (1,201,052 | ) | $ | (136,791 | ) | ||||||||||||||||||||||||||||
|
|
|
|
|
|
|
| |||||||||||||||||||||||||||||||
The accompanying notes are an integral part of these financial statements.
| 138 |
| ON Moderately Conservative Model Portfolio (Unaudited) |
| Objective/Strategy |
The ON Moderately Conservative Model Portfolio is a fund of funds that seeks current income and moderate growth of capital with a greater emphasis on current income by investing in underlying mutual funds. Under normal circumstances, the Portfolio intends to have investment exposure to various asset classes within the following target asset allocation ranges: U.S. Equity 20-40%, International Equity 5-20%, and Fixed Income 30-70%.
| Performance as of December 31, 2022 | ||
| Average Annual returns | ||||
One year | -15.12 | % | ||
Five years | 2.35 | % | ||
Since inception (3/1/17) | 3.18 | % | ||
Past performance does not guarantee future results. The performance data quoted represents past performance and current returns may be lower or higher. Total return figures include change in share price and reinvestment of dividends and capital gains. The investment return and principal value will fluctuate so that an investor’s shares, when redeemed, may be worth more or less than the original cost. To obtain performance information up to the most recent month end, call toll-free 1-877-781-6392.
The Portfolio is not open to direct retail investment. Beneficial interest in the Portfolio’s shares is obtained either through an allocation to the Portfolio as an investment vehicle within variable life insurance policies or annuity contracts. Actual performance results for variable annuity and variable universal life contracts will be lower due to contract charges. Consult your contract for applicable charges.
Total gross expense ratio is estimated to be 1.02% per the Fund’s prospectus dated April 29, 2022. Additional information pertaining to the Portfolio’s expense ratio as of December 31, 2022 can be found in the Portfolio’s Financial Highlights. The Portfolio’s expense ratio included in the Financial Highlights does not include Acquired Fund Fees and Expenses (AFFE), which is a major component of the expense ratio that is required to be presented in the Fund’s prospectus. The Adviser has contractually agreed to make payments to the Fund to the extent necessary to maintain the Portfolio’s expense ratio (including AFFE, but excluding certain other expenses) at 1.00% through April 30, 2023.
| Comments from Adviser |
Q. How did the Portfolio perform in comparison to its benchmark during the reporting period?
A. For the year ended December 31, 2022, the Portfolio returned -15.12% versus -13.85% for its benchmark, the Morningstar® Moderately Conservative Target Risk Index.
Q. Were there specific market conditions, investment strategies, or techniques that materially affected the Portfolio’s benchmark-relative performance during the reporting period?
A. Equity markets declined substantially in 2022. Within the domestic market, value stocks outperformed growth stocks by a wide margin, although both value and growth indices were negative for the year. The Portfolio’s exposure to international and emerging market funds enhanced relative performance, while its exposure to growth funds detracted from relative performance. (1)
Fixed income markets also registered negative returns in 2022. The Federal Reserve (the “Fed”) raised the Fed Funds rate aggressively during the year in an attempt to curb inflation. Furthermore, the Fed has indicated that it will continue to raise the Fed Funds rate, and hold it at a high level, until inflation declines to its target level of 2%. Interest rates increased across the entire yield curve, but short-term interest rates increased by a larger amount than long-term rates. Even so, shorter duration bonds outperformed longer duration bonds for the year. The
yield curve inverted between the 2-year and 10-year Treasury rate near the middle of the year and remained inverted by 55 basis points at year-end. Historically, an inverted yield curve can be a harbinger of a pending recession. Credit spreads widened during the year, and lower quality bonds generally underperformed higher quality bonds. The Portfolio’s exposure to shorter duration bond funds enhanced relative performance, while its exposure to funds with longer duration and credit exposure detracted from relative performance. (1)
Q. How did asset class allocation impact the Portfolio’s performance relative to its benchmark?
A. The Portfolio invests in affiliated and unaffiliated mutual funds, comprised mostly of fixed income funds, but also some equity funds. The asset allocation between fixed income funds and equity funds was roughly in-line with the benchmark. On the equity side, the exposure to value funds, international funds, and emerging market funds benefited relative performance. The exposure to growth funds detracted from performance. On the fixed income side, the overweight allocation to funds with credit exposure detracted from relative performance, while the allocation to shorter duration bond funds enhanced relative performance. (1)
Q. Which securities contributed the most to, and detracted the most from, the Portfolio’s benchmark-relative performance?
A. The top three performing funds in the Portfolio were PIMCO Low Duration Institutional, ON AB Relative Value Portfolio, and ON Blackrock Advantage Large Cap Value Portfolio. PIMCO Low Duration Institutional benefited from its shorter duration, while the two equity funds benefited from their focus on value stocks. The top three funds that detracted from performance were ON Janus Henderson Forty Portfolio, ON Nasdaq-100® Index Portfolio, and ON Blackrock Advantage Large Cap Growth Portfolio. Each of these funds detracted from performance due to their exposure to growth stocks. ON Janus Henderson Forty Portfolio was eliminated from the Portfolio near the end of the year. (1)
Q. Were there any significant changes to the Portfolio’s management team, investment strategy, or selection process during the reporting period?
A. The asset allocation team was disbanded after the departure of Tara York. The ON Model Portfolios are now being managed by Gary Rodmaker, who was previously the leader of the asset allocation team. There were no changes to the investment strategy or selection process during the year.
| (1) | The Portfolio’s composition is subject to change. Holdings and weightings are as of December 31, 2022. |
| 139 | (continued) |
Ohio National Fund, Inc. | ON Moderately Conservative Model Portfolio (Unaudited) (Continued) |
Change in Value of $10,000 Investment |

Hypothetical illustration based on past performance. Future performance will vary. The Portfolio’s returns reflect reinvested dividends. The Portfolio’s holdings may differ significantly from the securities in the index. The index is unmanaged and therefore does not reflect the cost of portfolio management and accounting.
The Morningstar® Target Risk Index Family is a series of Morningstar Indexes that provide exposure to a broad array of asset classes using Morningstar asset allocation methodology. The index family provides global equity market risk levels that are scaled to fit five equity market risk profiles: aggressive, moderately aggressive, moderate, moderately conservative, and conservative. The five levels of global equity exposure are set at 95%, 80%, 60%, 40%, and 20%, respectively, and the Morningstar® Moderately Conservative Target Risk Index exposure is set at 40%.
Past performance is no guarantee of future results. Redemption of fund shares could have tax implications unique to each shareholder.
Portfolio Composition as of December 31, 2022 (1) | ||
| % of Net Assets | ||||
Open-End Mutual Funds | ||||
Less Net Liabilities | 100.0 | |||
|
| |||
| 100.0 | ||||
|
| |||
Top 10 Portfolio Holdings as of December 31, 2022 (1) (2) (3) | ||||
| % of Net Assets | ||||||
| 1. | ON Federated Core Plus Bond Portfolio | 15.0 | ||||
| 2. | ON S&P 500® Index Portfolio | 14.0 | ||||
| 3. | PIMCO Total Return Institutional | 13.1 | ||||
| 4. | PIMCO Low Duration Institutional | 12.0 | ||||
| 5. | ON Bond Portfolio | 8.0 | ||||
| 6. | Western Asset Core Plus Bond IS | 7.0 | ||||
| 7. | ON S&P MidCap 400® Index Portfolio | 7.0 | ||||
| 8. | ON Federated High Income Bond Portfolio | 5.0 | ||||
| 9. | ON BlackRock Advantage International Equity Portfolio | 4.0 | ||||
| 10. | ON BlackRock Advantage Large Cap Value Portfolio | 3.0 | ||||
| (1) | Composition of Portfolio subject to change. |
| (2) | Short-term investments have been excluded from the list of Top 10 Portfolio Holdings. |
| (3) | Top 10 Portfolio Holdings is presented at an individual security level. Total investment exposure by issuer may be higher. |
| 140 |
Ohio National Fund, Inc. | ON Moderately Conservative Model Portfolio |
Schedule of Investments in Unaffiliated Issuers |
|
December 31, 2022 |
|
| Open-End Mutual Funds – 37.1% | Shares | Value | ||||||
DFA Emerging Markets Portfolio Institutional | 84,596 | $ | 2,132,671 | |||||
DFA International Core Equity Portfolio Institutional | 473,576 | 6,398,012 | ||||||
PIMCO Low Duration Institutional | 2,822,713 | 25,686,685 | ||||||
PIMCO Total Return Institutional | 3,290,315 | 27,836,067 | ||||||
Vanguard International Growth Fund Admiral Class | 23,592 | 2,132,671 | ||||||
Western Asset Core Plus Bond IS | 1,601,604 | 14,991,016 | ||||||
|
| |||||||
Total Open-End Mutual Funds | $ | 79,177,122 | ||||||
|
| |||||||
Total Investments in Securities of Unaffiliated Issuers – 37.1% (Cost $90,312,572) | $ | 79,177,122 | ||||||
Total Investments in Affiliates – 62.9% (Cost $147,205,852) (see schedule below) | 134,358,252 | |||||||
Liabilities in Excess of Other Assets – 0.0% | (103,801 | ) | ||||||
|
| |||||||
Net Assets – 100.0% | $ | 213,431,573 | ||||||
|
| |||||||
Percentages are stated as a percent of net assets.
The accompanying notes are an integral part of these financial statements.
| Schedule of Investments in Affiliates | December 31, 2022 | |||
| Affiliate | Value at January 1, 2022 | Cost of Purchases | Proceeds from Sales | Net Realized Gain (Loss) | Change in Unrealized Appreciation (Depreciation) | Income Distributions | Capital Gain Distributions | Shares at December 31, 2022 | Value at December 31, 2022 | |||||||||||||||||||||||||||||||||||||||||||||||||||||||||||||||||||||||||
Open-End Mutual Funds – 62.9% | ||||||||||||||||||||||||||||||||||||||||||||||||||||||||||||||||||||||||||||||||||
Fidelity Advisor® Real Estate I | (a) | $2,815,609 | $ | 943,624 | $ | 565,095 | $ | 24,730 | $ | (1,086,197 | ) | $ | 21,857 | $ | 306,677 | 135,753 | $ | 2,132,671 | ||||||||||||||||||||||||||||||||||||||||||||||||||||||||||||||||
ON AB Mid Cap Core Portfolio | (a) | 2,815,609 | 1,579,801 | 564,157 | (8,037 | ) | (1,690,545 | ) | 5,357 | 1,058,876 | 84,764 | 2,132,671 | ||||||||||||||||||||||||||||||||||||||||||||||||||||||||||||||||||||||
ON AB Relative Value Portfolio | (a) | 2,815,609 | 234,911 | 804,162 | 5,398 | (119,085 | ) | 382 | 1,195 | 212,417 | 2,132,671 | |||||||||||||||||||||||||||||||||||||||||||||||||||||||||||||||||||||||
ON AB Small Cap Portfolio | (a) | 2,815,609 | 2,103,287 | 532,516 | (310,718 | ) | (1,942,991 | ) | 1,179 | 1,442,126 | 200,628 | 2,132,671 | ||||||||||||||||||||||||||||||||||||||||||||||||||||||||||||||||||||||
ON BlackRock Advantage International Equity Portfolio | (a) | 12,670,241 | 3,076,386 | 3,910,100 | (243,033 | ) | (3,062,811 | ) | 291,137 | 1,375,565 | 640,442 | 8,530,683 | ||||||||||||||||||||||||||||||||||||||||||||||||||||||||||||||||||||||
ON BlackRock Advantage Large Cap Core Portfolio | (a) | 5,631,218 | 1,941,060 | 986,513 | 12,495 | (2,332,919 | ) | 36,970 | 1,233,167 | 165,387 | 4,265,341 | |||||||||||||||||||||||||||||||||||||||||||||||||||||||||||||||||||||||
ON BlackRock Advantage Large Cap Value Portfolio | (a) | 11,262,436 | 3,067,716 | 4,873,641 | 324,063 | (3,382,562 | ) | 147,411 | 2,038,374 | 392,035 | 6,398,012 | |||||||||||||||||||||||||||||||||||||||||||||||||||||||||||||||||||||||
ON Bond Portfolio | (a) | 19,709,263 | 3,541,905 | 2,529,680 | (59,852 | ) | (3,600,271 | ) | 548,285 | 99,596 | 1,055,125 | 17,061,365 | ||||||||||||||||||||||||||||||||||||||||||||||||||||||||||||||||||||||
ON Federated Core Plus Bond Portfolio | (a) | 36,602,917 | 7,360,149 | 6,618,712 | (508,355 | ) | (4,845,939 | ) | 562,210 | 17,845 | 3,622,883 | 31,990,060 | ||||||||||||||||||||||||||||||||||||||||||||||||||||||||||||||||||||||
ON Federated High Income Bond Portfolio | (a) | 14,078,045 | 982,590 | 2,156,796 | 66,517 | (2,307,003 | ) | 679,159 | — | 593,398 | 10,663,353 | |||||||||||||||||||||||||||||||||||||||||||||||||||||||||||||||||||||||
ON Janus Henderson Forty Portfolio | (a) | 2,815,609 | 591,156 | 2,590,865 | (272,742 | ) | (543,158 | ) | — | — | — | — | ||||||||||||||||||||||||||||||||||||||||||||||||||||||||||||||||||||||
ON Nasdaq-100® Index Portfolio | (a) | 5,631,218 | 2,884,179 | 3,141,631 | (1,840,948 | ) | (1,400,147 | ) | 20,232 | 1,529,211 | 171,161 | 2,132,671 | ||||||||||||||||||||||||||||||||||||||||||||||||||||||||||||||||||||||
ON S&P 500® Index Portfolio | (a) | 36,602,917 | 11,049,945 | 7,011,103 | 1,480,707 | (12,265,077 | ) | 399,310 | 3,926,487 | 915,590 | 29,857,389 | |||||||||||||||||||||||||||||||||||||||||||||||||||||||||||||||||||||||
ON S&P MidCap 400® Index Portfolio | (a) | 14,078,045 | 8,310,686 | 3,663,945 | 704,320 | (4,500,412 | ) | 122,386 | 1,853,490 | 797,899 | 14,928,694 | |||||||||||||||||||||||||||||||||||||||||||||||||||||||||||||||||||||||
|
|
|
|
|
|
|
|
|
| |||||||||||||||||||||||||||||||||||||||||||||||||||||||||||||||||||||||||
Total Open-End Mutual Funds | $ | (625,455 | ) | $ | (43,079,117 | ) | $ | 2,835,875 | $ | 14,882,609 | $ | 134,358,252 | ||||||||||||||||||||||||||||||||||||||||||||||||||||||||||||||||||||||
|
|
|
|
|
|
|
|
|
| |||||||||||||||||||||||||||||||||||||||||||||||||||||||||||||||||||||||||
Percentages are stated as a percent of net assets.
Footnotes:
| (a) | Pursuant to Section 2(a)(3) of the Investment Company Act of 1940, the investment meets the definition of “affiliated person”, as the Portfolio directly or indirectly owns, controls, or holds with power to vote 5 percent or more of the outstanding voting securities of the holding at December 31, 2022. |
The accompanying notes are an integral part of these financial statements.
| 141 |
| ON Balanced Model Portfolio (Unaudited) |
| Objective/Strategy |
The ON Balanced Model Portfolio is a fund of funds that seeks a balance between growth of capital and current income with a greater emphasis on growth of capital by investing in underlying mutual funds. Under normal circumstances, the Portfolio intends to have investment exposure to various asset classes within the following target asset allocation ranges: U.S. Equity 25-50%, International Equity 10-25%, and Fixed Income 25-50%.
| Performance as of December 31, 2022 | ||||
Average Annual returns | ||||
One year | -15.75 | % | ||
Five years | 3.23 | % | ||
Since inception (3/1/17) | 4.14 | % | ||
Past performance does not guarantee future results. The performance data quoted represents past performance and current returns may be lower or higher. Total return figures include change in share price and reinvestment of dividends and capital gains. The investment return and principal value will fluctuate so that an investor’s shares, when redeemed, may be worth more or less than the original cost. To obtain performance information up to the most recent month end, call toll-free 1-877-781-6392.
The Portfolio is not open to direct retail investment. Beneficial interest in the Portfolio’s shares is obtained either through an allocation to the Portfolio as an investment vehicle within variable life insurance policies or annuity contracts. Actual performance results for variable annuity and variable universal life contracts will be lower due to contract charges. Consult your contract for applicable charges.
Total gross expense ratio is estimated to be 1.00% per the Fund’s prospectus dated April 29, 2022. Additional information pertaining to the Portfolio’s expense ratio as of December 31, 2022 can be found in the Portfolio’s Financial Highlights. The Portfolio’s expense ratio included in the Financial Highlights does not include Acquired Fund Fees and Expenses (AFFE), which is a major component of the expense ratio that is required to be presented in the Fund’s prospectus. The Adviser has contractually agreed to make payments to the Fund to the extent necessary to maintain the Portfolio’s expense ratio (including AFFE, but excluding certain other expenses) at 1.00% through April 30, 2023.
| Comments from Adviser |
Q. How did the Portfolio perform in comparison to its benchmark during the reporting period?
A. For the year ended December 31, 2022, the Portfolio returned -15.75% versus -14.77% for its benchmark, the Morningstar® Moderate Target Risk Index.
Q. Were there specific market conditions, investment strategies, or techniques that materially affected the Portfolio’s benchmark-relative performance during the reporting period?
A. Equity markets declined substantially in 2022. Within the domestic market, value stocks outperformed growth stocks by a wide margin, although both value and growth indices were negative for the year. The Portfolio’s exposure to international and emerging market funds enhanced relative performance, while its exposure to growth funds detracted from relative performance.
Fixed income markets also registered negative returns in 2022. The Federal Reserve (the “Fed”) raised the Fed Funds rate aggressively during the year in an attempt to curb inflation. Furthermore, the Fed has indicated that it will continue to raise the Fed Funds rate, and hold it at a high level, until inflation declines to its target level of 2%. Interest rates increased across the entire yield curve, but short-term interest rates increased by a larger amount than long-term rates. Even so, shorter duration bonds outperformed longer duration bonds for the year. The
yield curve inverted between the 2-year and 10-year Treasury rate near the middle of the year and remained inverted by 55 basis points at year-end. Historically, an inverted yield curve can be a harbinger of a pending recession. Credit spreads widened during the year, and lower quality bonds generally underperformed higher quality bonds. The Portfolio’s exposure to shorter duration bond funds enhanced relative performance, while its exposure to funds with longer duration and credit exposure detracted from relative performance. (1)
Q. How did asset class allocation impact the Portfolio’s performance relative to its benchmark?
A. The Portfolio invests in affiliated and unaffiliated mutual funds, comprised of fixed income and equity funds. The asset allocation between fixed income funds and equity funds was roughly in-line with the benchmark. On the equity side, the exposure to value funds, international funds, and emerging market funds benefited relative performance. The exposure to growth funds detracted from performance. On the fixed income side, the overweight allocation to funds with credit exposure detracted from relative performance, while the allocation to shorter duration bond funds enhanced relative performance. (1)
Q. Which securities contributed the most to, and detracted the most from, the Portfolio’s benchmark-relative performance?
A. The top three performing funds in the Portfolio were PIMCO Low Duration Institutional, ON AB Relative Value Portfolio, and ON Blackrock Advantage Large Cap Value Portfolio. PIMCO Low Duration Institutional benefited from its shorter duration, while the two equity funds benefited from their focus on value stocks. The top three funds that detracted from performance were ON Janus Henderson Forty Portfolio, ON Nasdaq-100® Index Portfolio, and ON Blackrock Advantage Large Cap Growth Portfolio. Each of these funds detracted from performance due to their exposure to growth stocks. ON Janus Henderson Forty Portfolio was eliminated from the Portfolio near the end of the year. (1)
Q. Were there any significant changes to the Portfolio’s management team, investment strategy, or selection process during the reporting period?
A. The asset allocation team was disbanded after the departure of Tara York. The ON Model Portfolios are now being managed by Gary Rodmaker, who was previously the leader of the asset allocation team. There were no changes to the investment strategy or selection process during the year.
| (1) | The Portfolio’s composition is subject to change. Holdings and weightings are as of December 31, 2022. |
| 142 | (continued) |
Ohio National Fund, Inc. | ON Balanced Model Portfolio (Unaudited) (Continued) |
| Change in Value of $10,000 Investment |
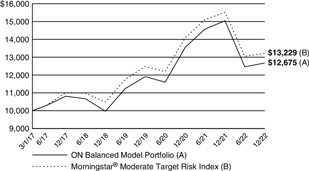
Hypothetical illustration based on past performance. Future performance will vary. The Portfolio’s returns reflect reinvested dividends. The Portfolio’s holdings may differ significantly from the securities in the index. The index is unmanaged and therefore does not reflect the cost of portfolio management and accounting.
The Morningstar® Target Risk Index Family is a series of Morningstar Indexes that provide exposure to a broad array of asset classes using Morningstar asset allocation methodology. The index family provides global equity market risk levels that are scaled to fit five equity market risk profiles: aggressive, moderately aggressive, moderate, moderately conservative, and conservative. The five levels of global equity exposure are set at 95%, 80%, 60%, 40%, and 20%, respectively, and the Morningstar® Moderate Target Risk Index exposure is set at 60%.
Past performance is no guarantee of future results. Redemption of fund shares could have tax implications unique to each shareholder.
| Portfolio Composition as of December 31, 2022 (1) | ||
| % of Net Assets | ||||
Open-End Mutual Funds | ||||
Less Net Liabilities | 100.0 | |||
|
| |||
| 100.0 | ||||
|
| |||
Top 10 Portfolio Holdings as of December 31, 2022 (1) (2) (3) | ||||
| % of Net Assets | ||||||
| 1. | ON S&P 500® Index Portfolio | 16.0 | ||||
| 2. | ON Federated Core Plus Bond Portfolio | 10.0 | ||||
| 3. | ON S&P MidCap 400® Index Portfolio | 10.0 | ||||
| 4. | PIMCO Total Return Institutional | 9.1 | ||||
| 5. | PIMCO Low Duration Institutional | 8.0 | ||||
| 6. | ON BlackRock Advantage International Equity Portfolio | 7.0 | ||||
| 7. | ON Bond Portfolio | 6.0 | ||||
| 8. | Western Asset Core Plus Bond IS | 5.0 | ||||
| 9. | DFA International Core Equity Portfolio Institutional | 5.0 | ||||
| 10. | ON BlackRock Advantage Large Cap Value Portfolio | 4.0 | ||||
| (1) | Composition of Portfolio subject to change. |
| (2) | Short-term investments have been excluded from the list of Top 10 Portfolio Holdings. |
| (3) | Top 10 Portfolio Holdings is presented at an individual security level. Total investment exposure by issuer may be higher. |
| 143 |
Ohio National Fund, Inc. | ON Balanced Model Portfolio |
| Schedule of Investments in Unaffiliated Issuers | December 31, 2022 | |||
| Open-End Mutual Funds – 31.1% | Shares | Value | ||||||
DFA Emerging Markets Portfolio Institutional | 624,830 | $ | 15,751,958 | |||||
DFA International Core Equity Portfolio Institutional | 2,914,870 | 39,379,896 | ||||||
PIMCO Low Duration Institutional | 6,949,050 | 63,236,357 | ||||||
PIMCO Total Return Institutional | 8,412,770 | 71,172,037 | ||||||
Vanguard International Growth Fund Admiral Class | 174,247 | 15,751,959 | ||||||
Western Asset Core Plus Bond IS | 4,224,166 | 39,538,192 | ||||||
|
| |||||||
Total Open-End Mutual Funds | $ | 244,830,399 | ||||||
|
| |||||||
Total Investments in Securities of Unaffiliated Issuers – 31.1% (Cost $277,465,604) | $ | 244,830,399 | ||||||
Total Investments in Affiliates – 68.9% (Cost $590,522,467) (see schedule below) | 543,442,563 | |||||||
Liabilities in Excess of Other Assets – 0.0% | (330,383 | ) | ||||||
|
| |||||||
Net Assets – 100.0% | $ | 787,942,579 | ||||||
|
| |||||||
Percentages are stated as a percent of net assets.
The accompanying notes are an integral part of these financial statements.
| Schedule of Investments in Affiliates | December 31, 2022 | |
| Affiliate | Value at January 1, 2022 | Cost of Purchases | Proceeds from Sales | Net Realized Gain (Loss) | Change in Unrealized Appreciation (Depreciation) | Income Distributions | Capital Gain Distributions | Shares at December 31, 2022 | Value at December 31, 2022 | |||||||||||||||||||||||||||||||||||||||||||||||||||||||||||||||||||||||||
Open-End Mutual Funds – 68.9% | ||||||||||||||||||||||||||||||||||||||||||||||||||||||||||||||||||||||||||||||||||
Fidelity Advisor® Real Estate I | (a) | $ | 10,924,811 | $ | 2,391,838 | $ | 1,435,240 | $ | 173,358 | $ | (4,178,788 | ) | $ | 80,797 | $ | 1,133,684 | 501,335 | $ | 7,875,979 | |||||||||||||||||||||||||||||||||||||||||||||||||||||||||||||||
ON AB Mid Cap Core Portfolio | (a) | 10,924,811 | 4,590,615 | 1,224,187 | (56,162 | ) | (6,359,098 | ) | 19,838 | 3,921,418 | 313,036 | 7,875,979 | ||||||||||||||||||||||||||||||||||||||||||||||||||||||||||||||||||||||
ON AB Relative Value Portfolio | (a) | 21,849,621 | 18,064,893 | 7,087,924 | (21,502 | ) | (1,301,171 | ) | 5,631 | 17,619 | 3,137,840 | 31,503,917 | ||||||||||||||||||||||||||||||||||||||||||||||||||||||||||||||||||||||
ON AB Small Cap Portfolio | (a) | 10,924,811 | 6,475,519 | 1,030,294 | (371,337 | ) | (8,122,720 | ) | 4,364 | 5,335,852 | 740,920 | 7,875,979 | ||||||||||||||||||||||||||||||||||||||||||||||||||||||||||||||||||||||
ON BlackRock Advantage International Equity Portfolio | (a) | 87,398,485 | 12,109,664 | 22,038,353 | (1,926,435 | ) | (20,411,507 | ) | 1,902,985 | 8,991,228 | 4,139,028 | 55,131,854 | ||||||||||||||||||||||||||||||||||||||||||||||||||||||||||||||||||||||
ON BlackRock Advantage Large Cap Core Portfolio | (a) | 21,849,621 | 5,444,940 | 2,799,794 | 284,896 | (9,027,705 | ) | 136,582 | 4,555,865 | 610,778 | 15,751,958 | |||||||||||||||||||||||||||||||||||||||||||||||||||||||||||||||||||||||
ON BlackRock Advantage Large Cap Growth Portfolio | (a) | 10,924,811 | 7,799,565 | 5,173,153 | 436,760 | (6,112,004 | ) | — | 2,901,929 | 1,198,779 | 7,875,979 | |||||||||||||||||||||||||||||||||||||||||||||||||||||||||||||||||||||||
ON BlackRock Advantage Large Cap Value Portfolio | (a) | 54,624,053 | 10,668,117 | 19,373,741 | 1,652,042 | (16,066,554 | ) | 679,409 | 9,394,777 | 1,930,387 | 31,503,917 | |||||||||||||||||||||||||||||||||||||||||||||||||||||||||||||||||||||||
ON BlackRock Advantage Small Cap Growth Portfolio | (a) | 21,849,621 | 7,539,746 | 2,310,743 | (219,757 | ) | (11,106,909 | ) | — | 5,666,415 | 851,918 | 15,751,958 | ||||||||||||||||||||||||||||||||||||||||||||||||||||||||||||||||||||||
ON Bond Portfolio | (a) | 54,624,053 | 12,106,401 | 9,495,416 | (186,512 | ) | (9,792,651 | ) | 1,434,705 | 260,615 | 2,922,441 | 47,255,875 | ||||||||||||||||||||||||||||||||||||||||||||||||||||||||||||||||||||||
ON Federated Core Plus Bond Portfolio | (a) | 87,398,485 | 23,772,858 | 19,922,156 | (1,541,867 | ) | (10,947,528 | ) | 1,235,159 | 39,205 | 8,919,569 | 78,759,792 | ||||||||||||||||||||||||||||||||||||||||||||||||||||||||||||||||||||||
ON Federated High Income Bond Portfolio | (a) | 32,774,432 | 1,989,039 | 6,037,674 | 278,464 | (5,376,323 | ) | 1,495,776 | — | 1,314,855 | 23,627,938 | |||||||||||||||||||||||||||||||||||||||||||||||||||||||||||||||||||||||
ON Janus Henderson Forty Portfolio | (a) | 10,924,811 | 4,902,645 | 9,332,274 | (3,092,146 | ) | (3,403,036 | ) | — | 3,884,948 | — | — | ||||||||||||||||||||||||||||||||||||||||||||||||||||||||||||||||||||||
ON Nasdaq-100® Index Portfolio | (a) | 21,849,621 | 5,173,614 | 10,395,045 | 1,769,694 | (10,521,905 | ) | 37,416 | 2,827,972 | 632,101 | 7,875,979 | |||||||||||||||||||||||||||||||||||||||||||||||||||||||||||||||||||||||
ON S&P 500® Index Portfolio | (a) | 163,872,158 | 28,598,987 | 21,477,865 | 4,832,125 | (49,809,738 | ) | 1,568,852 | 15,426,808 | 3,864,326 | 126,015,667 | |||||||||||||||||||||||||||||||||||||||||||||||||||||||||||||||||||||||
ON S&P MidCap 400® Index Portfolio | (a) | 98,323,295 | 24,085,668 | 18,016,736 | 4,300,925 | (29,933,360 | ) | 814,325 | 12,332,604 | 4,209,502 | 78,759,792 | |||||||||||||||||||||||||||||||||||||||||||||||||||||||||||||||||||||||
|
|
|
|
|
|
|
|
|
| |||||||||||||||||||||||||||||||||||||||||||||||||||||||||||||||||||||||||
Total Open-End Mutual Funds | $ | 6,312,546 | $ | (202,470,997 | ) | $ | 9,415,839 | $ | 76,690,939 | $ | 543,442,563 | |||||||||||||||||||||||||||||||||||||||||||||||||||||||||||||||||||||||
|
|
|
|
|
|
|
|
|
| |||||||||||||||||||||||||||||||||||||||||||||||||||||||||||||||||||||||||
Percentages are stated as a percent of net assets.
Footnotes:
| (a) | Pursuant to Section 2(a)(3) of the Investment Company Act of 1940, the investment meets the definition of “affiliated person”, as the Portfolio directly or indirectly owns, controls, or holds with power to vote 5 percent or more of the outstanding voting securities of the holding at December 31, 2022. |
The accompanying notes are an integral part of these financial statements.
| 144 |
| ON Moderate Growth Model Portfolio (Unaudited) |
| Objective/Strategy |
The ON Moderate Growth Model Portfolio is a fund of funds that seeks growth of capital and moderate current income with a greater emphasis on growth of capital by investing in underlying mutual funds. Under normal circumstances, the Portfolio intends to have investment exposure to various asset classes within the following target asset allocation ranges: U.S. Equity 40-60%, International Equity 15-35%, and Fixed Income 10-30%.
| Performance as of December 31, 2022 | ||||
Average Annual returns | ||||
One year | -17.17 | % | ||
Five years | 4.14 | % | ||
Since inception (3/1/17) | 5.32 | % |
Past performance does not guarantee future results. The performance data quoted represents past performance and current returns may be lower or higher. Total return figures include change in share price and reinvestment of dividends and capital gains. The investment return and principal value will fluctuate so that an investor’s shares, when redeemed, may be worth more or less than the original cost. To obtain performance information up to the most recent month end, call toll-free 1-877-781-6392.
The Portfolio is not open to direct retail investment. Beneficial interest in the Portfolio’s shares is obtained either through an allocation to the Portfolio as an investment vehicle within variable life insurance policies or annuity contracts.
Actual performance results for variable annuity and variable universal life contracts will be lower due to contract charges. Consult your contract for applicable charges.
Total gross expense ratio is estimated to be 0.99% per the Fund’s prospectus dated April 29, 2022. Additional information pertaining to the Portfolio’s expense ratio as of December 31, 2022 can be found in the Portfolio’s Financial Highlights. The Portfolio’s expense ratio included in the Financial Highlights does not include Acquired Fund Fees and Expenses (AFFE), which is a major component of the expense ratio that is required to be presented in the Fund’s prospectus. The Adviser has contractually agreed to make payments to the Fund to the extent necessary to maintain the Portfolio’s expense ratio (including AFFE, but excluding certain other expenses) at 1.07% through April 30, 2023.
| Comments from Adviser |
Q. How did the Portfolio perform in comparison to its benchmark during the reporting period?
A. For the year ended December 31, 2022, the Portfolio returned -17.17% versus -15.48% for its benchmark, the Morningstar® Moderately Aggressive Target Risk Index.
Q. Were there specific market conditions, investment strategies, or techniques that materially affected the Portfolio’s benchmark-relative performance during the reporting period?
A. Equity markets declined substantially in 2022. Within the domestic market, value stocks outperformed growth stocks by a wide margin, although both value and growth indices were negative for the year. The Portfolio’s exposure to international and emerging market funds enhanced relative performance, while its exposure to growth funds detracted from relative performance.
Fixed income markets also registered negative returns in 2022. The Federal Reserve (the “Fed”) raised the Fed Funds rate aggressively during the year in an attempt to curb inflation. Furthermore, the Fed has indicated that it will continue to raise the Fed Funds rate, and hold it at a high level, until inflation declines to its target level of 2%. Interest rates increased across the entire yield curve, but short-term interest rates increased by a larger amount than long-term rates. Even so, shorter duration bonds outperformed longer duration bonds for the year. The
yield curve inverted between the 2-year and 10-year Treasury rate near the middle of the year and remained inverted by 55 basis points at year-end. Historically, an inverted yield curve can be a harbinger of a pending recession. Credit spreads widened during the year, and lower quality bonds generally underperformed higher quality bonds. The Portfolio’s exposure to shorter duration bond funds enhanced relative performance, while its exposure to funds with longer duration and credit exposure detracted from relative performance. (1)
Q. How did asset class allocation impact the Portfolio’s performance relative to its benchmark?
A. The Portfolio invests in affiliated and unaffiliated mutual funds, comprised mostly of equity funds, but also some fixed income funds. The asset allocation between fixed income funds and equity funds was roughly in-line with the benchmark. On the equity side, the exposure to value funds, international funds, and emerging market funds benefited relative performance. The exposure to growth funds detracted from performance. On the fixed income side, the overweight allocation to funds with credit exposure detracted from relative performance, while the allocation to shorter duration bond funds enhanced relative performance. (1)
Q. Which securities contributed the most to, and detracted the most from, the Portfolio’s benchmark-relative performance?
A. The top three performing funds in the Portfolio were PIMCO Low Duration Institutional, ON AB Relative Value Portfolio, and ON Blackrock Advantage Large Cap Value Portfolio. PIMCO Low Duration Institutional benefited from its shorter duration, while the two equity funds benefited from their focus on value stocks. The top three funds that detracted from performance were ON Janus Henderson Forty Portfolio, ON Nasdaq-100® Index Portfolio, and ON Blackrock Advantage Large Cap Growth Portfolio. Each of these funds detracted from performance due to their exposure to growth stocks. ON Janus Henderson Forty Portfolio was eliminated from the Portfolio near the end of the year. (1)
Q. Were there any significant changes to the Portfolio’s management team, investment strategy, or selection process during the reporting period?
A. The asset allocation team was disbanded after the departure of Tara York. The ON Model Portfolios are now being managed by Gary Rodmaker, who was previously the leader of the asset allocation team. There were no changes to the investment strategy or selection process during the year.
| (1) | The Portfolio’s composition is subject to change. Holdings and weightings are as of December 31, 2022. |
| 145 | (continued) |
Ohio National Fund, Inc. | ON Moderate Growth Model Portfolio (Unaudited) (Continued) |
| Change in Value of $10,000 Investment |
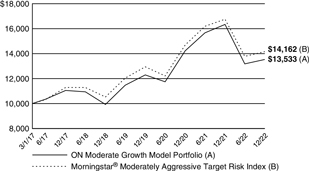
Hypothetical illustration based on past performance. Future performance will vary. The Portfolio’s returns reflect reinvested dividends. The Portfolio’s holdings may differ significantly from the securities in the index. The index is unmanaged and therefore does not reflect the cost of portfolio management and accounting.
The Morningstar® Target Risk Index Family is a series of Morningstar Indexes that provide exposure to a broad array of asset classes using Morningstar asset allocation methodology. The index family provides global equity market risk levels that are scaled to fit five equity market risk profiles: aggressive, moderately aggressive, moderate, moderately conservative, and conservative. The five levels of global equity exposure are set at 95%, 80%, 60%, 40%, and 20%, respectively, and the Morningstar® Moderately Aggressive Target Risk Index exposure is set at 80%.
Past performance is no guarantee of future results. Redemption of fund shares could have tax implications unique to each shareholder.
| Portfolio Composition as of December 31, 2022 (1) | ||
| % of Net Assets | ||||
Open-End Mutual Funds | ||||
Less Net Liabilities | 100.0 | |||
|
| |||
| 100.0 | ||||
|
| |||
Top 10 Portfolio Holdings as of December 31, 2022 (1) (2) (3) | ||||
| % of Net Assets | ||||||
| 1. | ON S&P 500® Index Portfolio | 19.0 | ||||
| 2. | ON S&P MidCap 400® Index Portfolio | 12.0 | ||||
| 3. | ON BlackRock Advantage International Equity Portfolio | 8.0 | ||||
| 4. | ON Federated Core Plus Bond Portfolio | 7.0 | ||||
| 5. | DFA International Core Equity Portfolio Institutional | 7.0 | ||||
| 6. | ON BlackRock Advantage Large Cap Value Portfolio | 6.0 | ||||
| 7. | PIMCO Total Return Institutional | 5.0 | ||||
| 8. | ON AB Relative Value Portfolio | 5.0 | ||||
| 9. | ON BlackRock Advantage Large Cap Core Portfolio | 4.0 | ||||
| 10. | ON Bond Portfolio | 4.0 | ||||
| (1) | Composition of Portfolio subject to change. |
| (2) | Short-term investments have been excluded from the list of Top 10 Portfolio Holdings. |
| (3) | Top 10 Portfolio Holdings is presented at an individual security level. Total investment exposure by issuer may be higher. |
| 146 |
Ohio National Fund, Inc. | ON Moderate Growth Model Portfolio |
| Schedule of Investments in Unaffiliated Issuers | December 31, 2022 | |||
| Open-End Mutual Funds – 22.0% | Shares | Value | ||||||
DFA Emerging Markets Portfolio Institutional | 1,146,449 | $ | 28,901,984 | |||||
DFA International Core Equity Portfolio Institutional | 7,487,561 | 101,156,942 | ||||||
PIMCO Low Duration Institutional | 4,781,088 | 43,507,897 | ||||||
PIMCO Total Return Institutional | 8,573,630 | 72,532,907 | ||||||
Vanguard International Growth Fund Admiral Class | 319,712 | 28,901,984 | ||||||
Western Asset Core Plus Bond IS | 4,648,988 | 43,514,532 | ||||||
|
| |||||||
Total Open-End Mutual Funds | $ | 318,516,246 | ||||||
|
| |||||||
Total Investments in Securities of Unaffiliated Issuers – 22.0% (Cost $354,765,741) | $ | 318,516,246 | ||||||
Total Investments in Affiliates – 78.0% (Cost $1,261,936,467) (see schedule below) | 1,127,177,369 | |||||||
Liabilities in Excess of Other Assets – 0.0% | (517,355 | ) | ||||||
|
| |||||||
Net Assets – 100.0% | $ | 1,445,176,260 | ||||||
|
| |||||||
Percentages are stated as a percent of net assets.
The accompanying notes are an integral part of these financial statements.
| Schedule of Investments in Affiliates | December 31, 2022 | |||
| Affiliate | Value at January 1, 2022 | Cost of Purchases | Proceeds from Sales | Net Realized Gain (Loss) | Change in Unrealized Appreciation (Depreciation) | Income Distributions | Capital Gain Distributions | Shares at December 31, 2022 | Value at December 31, 2022 | |||||||||||||||||||||||||||||||||||||||||||
Open-End Mutual Funds – 78.0% | ||||||||||||||||||||||||||||||||||||||||||||||||||||
Fidelity Advisor® Real Estate I | (a | ) | $ | 19,776,234 | $ | 4,351,193 | $ | 2,351,424$ | 342,854 | $ | (7,667,865 | ) | $ | 148,085 | $ | 2,077,826 | 919,859 | $ | 14,450,992 | |||||||||||||||||||||||||||||||||
ON AB Mid Cap Core Portfolio | (a | ) | 19,776,234 | 8,143,503 | 1,712,489 | (59,101 | ) | (11,697,155 | ) | 36,243 | 7,164,076 | 574,364 | 14,450,992 | |||||||||||||||||||||||||||||||||||||||
ON AB Relative Value Portfolio | (a | ) | 39,552,467 | 48,025,277 | 13,099,261 | (284,418 | ) | (1,939,106 | ) | 12,900 | 40,367 | 7,196,709 | 72,254,959 | |||||||||||||||||||||||||||||||||||||||
ON AB Small Cap Portfolio | (a | ) | 39,552,467 | 23,353,031 | 2,995,061 | (1,066,534 | ) | (29,941,919 | ) | 15,880 | 19,416,303 | 2,718,907 | 28,901,984 | |||||||||||||||||||||||||||||||||||||||
ON BlackRock Advantage International Equity Portfolio | (a | ) | 177,986,103 | 23,973,035 | 40,497,991 | (3,496,883 | ) | (42,356,329 | ) | 3,884,799 | 18,354,901 | 8,679,274 | 115,607,935 | |||||||||||||||||||||||||||||||||||||||
ON BlackRock Advantage Large Cap Core Portfolio | (a | ) | 79,104,935 | 18,280,598 | 7,522,981 | 1,310,781 | (33,369,365 | ) | 498,427 | 16,625,664 | 2,241,333 | 57,803,968 | ||||||||||||||||||||||||||||||||||||||||
ON BlackRock Advantage Large Cap Growth | ||||||||||||||||||||||||||||||||||||||||||||||||||||
Portfolio | (a | ) | 39,552,467 | 26,974,131 | 10,176,387 | 2,776,791 | (30,225,018 | ) | — | 15,861,837 | 4,399,084 | 28,901,984 | ||||||||||||||||||||||||||||||||||||||||
ON BlackRock Advantage Large Cap Value | ||||||||||||||||||||||||||||||||||||||||||||||||||||
Portfolio | (a | ) | 158,209,869 | 29,573,076 | 58,668,125 | 4,500,945 | (46,909,814 | ) | 1,991,218 | 27,534,296 | 5,312,865 | 86,705,951 | ||||||||||||||||||||||||||||||||||||||||
ON BlackRock Advantage Small Cap Growth Portfolio | (a | ) | 59,328,701 | 20,450,262 | 5,339,307 | (570,874 | ) | (30,515,806 | ) | — | 15,487,591 | 2,344,672 | 43,352,976 | |||||||||||||||||||||||||||||||||||||||
ON Bond Portfolio | (a | ) | 69,216,818 | 14,999,621 | 13,735,633 | (287,084 | ) | (12,389,754 | ) | 1,829,774 | 332,380 | 3,574,766 | 57,803,968 | |||||||||||||||||||||||||||||||||||||||
ON Federated Core Plus Bond Portfolio | (a | ) | 118,657,402 | 26,145,103 | 27,360,743 | (2,109,067 | ) | (14,175,752 | ) | 1,501,417 | 47,657 | 11,456,053 | 101,156,943 | |||||||||||||||||||||||||||||||||||||||
ON Federated High Income Bond Portfolio | (a | ) | 39,552,467 | 3,333,694 | 7,747,116 | 264,373 | (6,501,434 | ) | 1,823,015 | — | 1,608,346 | 28,901,984 | ||||||||||||||||||||||||||||||||||||||||
ON Janus Henderson Forty Portfolio | (a | ) | 39,552,467 | 10,983,405 | 32,950,255 | (6,150,630 | ) | (11,434,987 | ) | — | 7,081,369 | — | — | |||||||||||||||||||||||||||||||||||||||
ON Nasdaq-100® Index Portfolio | (a | ) | 59,328,701 | 17,228,093 | 19,931,930 | 3,297,638 | (31,020,518 | ) | 136,320 | 10,303,367 | 2,319,581 | 28,901,984 | ||||||||||||||||||||||||||||||||||||||||
ON S&P 500® Index Portfolio | (a | ) | 355,972,206 | 54,663,301 | 36,412,931 | 8,938,580 | (108,592,310 | ) | 3,443,488 | 33,860,445 | 8,419,775 | 274,568,846 | ||||||||||||||||||||||||||||||||||||||||
ON S&P MidCap 400® Index Portfolio | (a | ) | 197,762,337 | 59,982,972 | 31,430,230 | 7,014,687 | (59,917,863 | ) | 1,654,281 | 25,053,381 | 9,268,407 | 173,411,903 | ||||||||||||||||||||||||||||||||||||||||
|
|
|
|
|
|
|
|
|
| |||||||||||||||||||||||||||||||||||||||||||
Total Open-End Mutual Funds | $ | 14,422,058 | $ | (478,654,995 | ) | $ | 16,975,847 | $ | 199,241,460 | $ | 1,127,177,369 | |||||||||||||||||||||||||||||||||||||||||
|
|
|
|
|
|
|
|
|
| |||||||||||||||||||||||||||||||||||||||||||
Percentages are stated as a percent of net assets.
Footnotes:
| (a) | Pursuant to Section 2(a)(3) of the Investment Company Act of 1940, the investment meets the definition of “affiliated person”, as the Portfolio directly or indirectly owns, controls, or holds with power to vote 5 percent or more of the outstanding voting securities of the holding at December 31, 2022. |
The accompanying notes are an integral part of these financial statements.
| 147 |
| ON Growth Model Portfolio (Unaudited) |
Objective/Strategy |
The ON Growth Model Portfolio is a fund of funds that seeks growth of capital and some current income by investing in underlying mutual funds. Under normal circumstances, the Portfolio intends to have investment exposure to various asset classes within the following target asset allocation ranges: U.S. Equity 50-80%, International Equity 15-45%, and Fixed Income 0-15%.
Performance as of December 31, 2022 |
| Average Annual returns | ||||
One year | -18.29 | % | ||
Five years | 4.98 | % | ||
Since inception (3/1/17) | 6.21 | % |
Past performance does not guarantee future results. The performance data quoted represents past performance and current returns may be lower or higher. Total return figures include change in share price and reinvestment of dividends and capital gains. The investment return and principal value will fluctuate so that return an investor’s shares, when redeemed, may be worth more or less than the original cost. To obtain performance information up to the most recent month end, call toll-free 1-877-781-6392.
The Portfolio is not open to direct retail investment. Beneficial interest in the Portfolio’s shares is obtained either through an allocation to the Portfolio as an investment vehicle within variable life insurance policies or annuity contracts. Actual performance results for variable annuity and variable universal life contracts will be lower due to contract charges. Consult your contract for applicable charges.
Total gross expense ratio is estimated to be 1.03% per the Fund’s prospectus dated April 29, 2022. Additional information pertaining to the Portfolio’s expense ratio as of December 31, 2022 can be found in the Portfolio’s Financial Highlights. The Portfolio’s expense ratio included in the Financial Highlights does not include Acquired Fund Fees and Expenses (AFFE), which is a major component of the expense ratio that is required to be presented in the Fund’s prospectus. The Adviser has contractually agreed to make payments to the Fund to the extent necessary to maintain the Portfolio’s expense ratio (including AFFE, but excluding certain other expenses) at 1.14% through April 30, 2023.
Comments from Adviser |
Q. How did the Portfolio perform in comparison to its benchmark during the reporting period?
A. For the year ended December 31, 2022, the Portfolio returned -18.29% versus -15.93% for its benchmark, the Morningstar® Aggressive Target Risk Index.
Q. Were there specific market conditions, investment strategies, or techniques that materially affected the Portfolio’s benchmark-relative performance during the reporting period?
A. Equity markets declined substantially in 2022. Within the domestic market, value stocks outperformed growth stocks by a wide margin, although both value and growth indices were negative for the year. The Portfolio’s exposure to international and emerging market funds enhanced relative performance, while its exposure to growth funds detracted from relative performance.
Fixed income markets also registered negative returns in 2022. The Federal Reserve (the “Fed”) raised the Fed Funds rate aggressively during the year in an attempt to curb inflation. Furthermore, the Fed has indicated that it will continue to raise the Fed Funds rate, and hold it at a high level, until inflation declines to its target level of 2%. Interest rates increased across the entire yield curve, but short-term interest rates increased by a larger amount than long-term rates. Even so, shorter duration bonds outperformed longer duration bonds for the year. The yield curve inverted between the 2-year and 10-year Treasury rate near
the middle of the year and remained inverted by 55 basis points at year-end. Historically, an inverted yield curve can be a harbinger of a pending recession. Credit spreads widened during the year, and lower quality bonds generally underperformed higher quality bonds. The Portfolio’s exposure to shorter duration bond funds enhanced relative performance, while its exposure to funds with longer duration and credit exposure detracted from relative performance. (1)
Q. How did asset class allocation impact the Portfolio’s performance relative to its benchmark?
A. The Portfolio invests in affiliated and unaffiliated mutual funds, comprised mostly of equity funds, but also a small amount of fixed income funds. The asset allocation between fixed income funds and equity funds was roughly in-line with the benchmark. On the equity side, the exposure to value funds, international funds, and emerging market funds benefited relative performance. The exposure to growth funds detracted from performance. On the fixed income side, the overweight allocation to funds with credit exposure detracted from relative performance. (1)
Q. Which securities contributed the most to, and detracted the most from, the Portfolio’s benchmark-relative performance?
A. The top three performing funds in the Portfolio were PIMCO Low Duration Institutional, ON AB Relative Value Portfolio, and ON Blackrock Advantage Large Cap Value portfolio. PIMCO Low Duration Institutional benefited from its shorter duration, while the two equity funds benefited from their focus on value stocks. The top three funds that detracted from performance were ON Janus Henderson Forty Portfolio, ON Nasdaq-100® Index Portfolio, and ON Blackrock Advantage Large Cap Growth Portfolio. Each of these funds detracted from performance due to their exposure to growth stocks. ON Janus Henderson Forty portfolio was eliminated from the Portfolio near the end of the year. (1)
Q. Were there any significant changes to the Portfolio’s management team, investment strategy, or selection process during the reporting period?
A. The asset allocation team was disbanded after the departure of Tara York. The ON Model Portfolios are now being managed by Gary Rodmaker, who was previously the leader of the asset allocation team. There were no changes to the investment strategy or selection process during the year.
| (1) | The Portfolio’s composition is subject to change. Holdings and weightings are as of December 31, 2022. |
| 148 | (continued) |
Ohio National Fund, Inc. | ON Growth Model Portfolio (Unaudited) (Continued) |
Change in Value of $10,000 Investment |
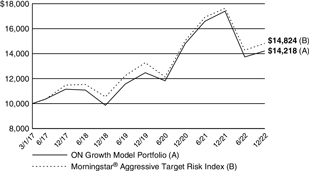
Hypothetical illustration based on past performance. Future performance will vary. The Portfolio’s returns reflect reinvested dividends. The Portfolio’s holdings may differ significantly from the securities in the index. The index is unmanaged and therefore does not reflect the cost of portfolio management and accounting.
The Morningstar® Target Risk Index Family is a series of Morningstar Indexes that provide exposure to a broad array of asset classes using Morningstar asset allocation methodology. The index family provides global equity market risk levels that are scaled to fit five equity market risk profiles: aggressive, moderately aggressive, moderate, moderately conservative, and conservative. The five levels of global equity exposure are set at 95%, 80%, 60%, 40%, and 20%, respectively, and the Morningstar® Aggressive Target Risk Index exposure is set at 95%.
Past performance is no guarantee of future results. Redemption of fund shares could have tax implications unique to each shareholder.
Portfolio Composition as of December 31, 2022 (1) | ||||
| % of Net Assets | ||||
Open-End Mutual Funds | ||||
Less Net Liabilities | 100.0 | |||
|
| |||
| 100.0 | ||||
|
| |||
Top 10 Portfolio Holdings as of December 31, 2022 (1) (2) (3) |
| % of Net Assets | ||||
1. | ON S&P 500® Index Portfolio | 19.0 | ||
2. | ON S&P MidCap 400® Index Portfolio | 14.0 | ||
3. | ON BlackRock Advantage International Equity Portfolio | 11.0 | ||
4. | DFA International Core Equity Portfolio Institutional | 9.0 | ||
5. | ON BlackRock Advantage Large Cap Value Portfolio | 7.0 | ||
6. | ON AB Relative Value Portfolio | 6.0 | ||
7. | ON BlackRock Advantage Large Cap Core Portfolio | 6.0 | ||
8. | ON BlackRock Advantage Small Cap Growth Portfolio | 4.0 | ||
9. | DFA Emerging Markets Portfolio Institutional | 3.0 | ||
10. | ON AB Small Cap Portfolio | 3.0 | ||
| (1) | Composition of Portfolio subject to change. |
| (2) | Short-term investments have been excluded from the list of Top 10 Portfolio Holdings. |
| (3) | Top 10 Portfolio Holdings is presented at an individual security level. Total investment exposure by issuer may be higher. |
| 149 |
Ohio National Fund, Inc. | ON Growth Model Portfolio |
| Schedule of Investments in Unaffiliated Issuers | December 31, 2022 | |||
| Open-End Mutual Funds – 17.0% | Shares | Value | ||||||
| ||||||||
DFA Emerging Markets Portfolio Institutional | 393,932 | $ | 9,931,016 | |||||
DFA International Core Equity Portfolio Institutional | 2,205,259 | 29,793,048 | ||||||
PIMCO Low Duration Institutional | 364,747 | 3,319,202 | ||||||
PIMCO Total Return Institutional | 785,350 | 6,644,061 | ||||||
Vanguard International Growth Fund Admiral Class | 73,238 | 6,620,678 | ||||||
|
| |||||||
Total Open-End Mutual Funds | $ | 56,308,005 | ||||||
|
| |||||||
Total Investments in Securities of Unaffiliated Issuers – 17.0% (Cost $61,664,765) | $ | 56,308,005 | ||||||
Total Investments in Affiliates – 83.0% (Cost $314,062,534) (see schedule below) | 274,758,120 | |||||||
Liabilities in Excess of Other Assets – 0.0% | (142,939 | ) | ||||||
|
| |||||||
Net Assets – 100.0% | $ | 330,923,186 | ||||||
|
| |||||||
Percentages are stated as a percent of net assets.
The accompanying notes are an integral part of these financial statements.
| Schedule of Investments in Affiliates | December 31, 2022 | |||
| Affiliate | Value at January 1, 2022 | Cost of Purchases | Proceeds from Sales | Net Realized Gain (Loss) | Change in Unrealized Appreciation (Depreciation) | Income Distributions | Capital Gain Distributions | Shares at 2022 | Value at 2022 | |||||||||||||||||||||||||||||||
| ||||||||||||||||||||||||||||||||||||||||
Open-End Mutual Funds – 83.0% | ||||||||||||||||||||||||||||||||||||||||
Fidelity Advisor® Real Estate I | (a | ) | $ | 4,483,285 | $ | 972,734 | $ | 483,211 | $ | 72,078 | $ | (1,734,547 | ) | $ | 33,975 | $ | 476,707 | 210,715 | $ | 3,310,339 | ||||||||||||||||||||
ON AB Mid Cap Core Portfolio | (a | ) | 4,483,285 | 1,793,217 | 287,263 | (20,449 | ) | (2,658,451 | ) | 8,244 | 1,629,594 | 131,572 | 3,310,339 | |||||||||||||||||||||||||||
ON AB Relative Value Portfolio | (a | ) | 13,449,855 | 10,813,242 | 3,669,470 | (92,840 | ) | (638,754 | ) | 3,511 | 10,986 | 1,978,290 | 19,862,033 | |||||||||||||||||||||||||||
ON AB Small Cap Portfolio | (a | ) | 17,933,140 | 8,028,679 | 4,397,513 | (99,993 | ) | (11,533,297 | ) | 5,412 | 6,617,470 | 934,244 | 9,931,016 | |||||||||||||||||||||||||||
ON BlackRock Advantage International Equity Portfolio | (a | ) | 53,799,420 | 7,801,228 | 11,275,923 | (865,643 | ) | (13,045,355 | ) | 1,171,852 | 5,536,768 | 2,733,763 | 36,413,727 | |||||||||||||||||||||||||||
ON BlackRock Advantage Large Cap Core Portfolio | (a | ) | 26,899,710 | 6,022,599 | 2,118,843 | 522,698 | (11,464,131 | ) | 169,826 | 5,664,773 | 770,145 | 19,862,033 | ||||||||||||||||||||||||||||
ON BlackRock Advantage Large Cap Growth Portfolio | (a | ) | 8,966,570 | 5,819,618 | 395,344 | 47,230 | (7,817,396 | ) | — | 4,803,852 | 1,007,713 | 6,620,678 | ||||||||||||||||||||||||||||
ON BlackRock Advantage Large Cap Value Portfolio | (a | ) | 35,866,280 | 6,976,271 | 9,945,340 | 947,532 | (10,672,372 | ) | 452,041 | 6,250,756 | 1,419,876 | 23,172,371 | ||||||||||||||||||||||||||||
ON BlackRock Advantage Small Cap Growth Portfolio | (a | ) | 20,174,782 | 6,433,830 | 2,777,052 | (910,283 | ) | (9,679,922 | ) | — | 5,289,560 | 716,136 | 13,241,355 | |||||||||||||||||||||||||||
ON Bond Portfolio | (a | ) | 4,483,285 | 4,010,413 | 1,001,485 | 52 | (871,587 | ) | 118,523 | 21,530 | 409,442 | 6,620,678 | ||||||||||||||||||||||||||||
ON Federated Core Plus Bond Portfolio | (a | ) | — | 11,137,781 | 671,236 | (50,551 | ) | (484,978 | ) | 113,404 | 3,600 | 1,124,690 | 9,931,016 | |||||||||||||||||||||||||||
ON Federated High Income Bond Portfolio | (a | ) | 4,483,285 | 444,654 | 913,698 | (6,897 | ) | (697,005 | ) | 206,411 | — | 184,215 | 3,310,339 | |||||||||||||||||||||||||||
ON Janus Henderson Forty Portfolio | (a | ) | 13,449,855 | 4,292,404 | 11,051,656 | (2,887,390 | ) | (3,803,213 | ) | — | 3,212,429 | — | — | |||||||||||||||||||||||||||
ON Nasdaq-100® Index Portfolio | (a | ) | 17,933,140 | 5,474,769 | 4,513,022 | 697,903 | (9,661,774 | ) | 46,421 | 3,508,620 | 797,032 | 9,931,016 | ||||||||||||||||||||||||||||
ON S&P 500® Index Portfolio | (a | ) | 80,699,130 | 11,356,009 | 6,566,352 | 1,860,341 | (24,452,691 | ) | 775,030 | 7,621,008 | 1,928,747 | 62,896,437 | ||||||||||||||||||||||||||||
ON S&P MidCap 400® Index Portfolio | (a | ) | 51,557,777 | 15,929,016 | 6,671,169 | 1,349,643 | (15,820,524 | ) | 470,109 | 7,119,604 | 2,477,004 | 46,344,743 | ||||||||||||||||||||||||||||
|
|
|
|
|
|
|
|
|
| |||||||||||||||||||||||||||||||
Total Open-End Mutual Funds | $ | 563,431 | $ | (125,035,997 | ) | $ | 3,574,759 | $ | 57,767,257 | $ | 274,758,120 | |||||||||||||||||||||||||||||
|
|
|
|
|
|
|
|
|
| |||||||||||||||||||||||||||||||
Percentages are stated as a percent of net assets.
Footnotes:
| (a) | Pursuant to Section 2(a)(3) of the Investment Company Act of 1940, the investment meets the definition of “affiliated person”, as the Portfolio directly or indirectly owns, controls, or holds with power to vote 5 percent or more of the outstanding voting securities of the holding at December 31, 2022. |
The accompanying notes are an integral part of these financial statements.
| 150 |
| Statements of Assets and Liabilities | December 31, 2022 | |
ON Bond Portfolio | ON BlackRock Balanced Allocation Portfolio | ON BlackRock Advantage International | ON Janus Forty Portfolio | ON AB Small Cap | ON AB Mid Cap Core Portfolio | ON S&P 500® Index Portfolio | ON BlackRock Advantage Large Portfolio | ON Federated High Income Bond Portfolio | ||||||||||||||||||||||||||||
| ||||||||||||||||||||||||||||||||||||
Assets: | ||||||||||||||||||||||||||||||||||||
Investments in securities of unaffiliated issuers, at value* | $ | 212,681,240 | $ | 414,325,816 | $ | 349,132,118 | $ | 44,152,616 | $ | 112,723,024 | $ | 76,853,117 | $ | 1,007,928,904 | $ | 197,172,468 | $ | 119,770,393 | ||||||||||||||||||
Cash | 6,666,952 | 3,444,136 | 5,305,161 | 70,840 | 890,841 | 1,000,517 | 11,014,365 | 1,959,167 | 1,624,437 | |||||||||||||||||||||||||||
Cash subject to usage restrictions | — | 243,800 | 263,693 | — | — | 13,500 | 459,675 | 163,240 | — | |||||||||||||||||||||||||||
Foreign currencies, at value | — | — | 3,397 | — | — | 2,385 | — | 434,489 | — | |||||||||||||||||||||||||||
Receivable for securities sold | — | — | — | — | 20,579 | 9,625 | — | — | — | |||||||||||||||||||||||||||
Receivable for fund shares sold | 137,599 | 26,882 | 116,415 | 3,083 | 173,321 | 18,630 | 3,916,677 | 7,744 | 85,429 | |||||||||||||||||||||||||||
Dividends and accrued interest receivable | 2,170,756 | 1,554,953 | 612,968 | 20,377 | 96,096 | 77,558 | 900,418 | 342,953 | 2,215,576 | |||||||||||||||||||||||||||
Foreign tax reclaim receivable | — | — | 1,596,620 | 4,353 | — | — | — | 124,132 | — | |||||||||||||||||||||||||||
Prepaid expenses and other assets | 2,304 | 6,262 | 6,438 | 869 | 1,774 | 1,118 | 15,855 | 3,702 | 1,473 | |||||||||||||||||||||||||||
|
|
|
|
|
|
|
|
|
|
|
|
|
|
|
|
|
| |||||||||||||||||||
Total assets | 221,658,851 | 419,601,849 | 357,036,810 | 44,252,138 | 113,905,635 | 77,976,450 | 1,024,235,894 | 200,207,895 | 123,697,308 | |||||||||||||||||||||||||||
|
|
|
|
|
|
|
|
|
|
|
|
|
|
|
|
|
| |||||||||||||||||||
Liabilities: | ||||||||||||||||||||||||||||||||||||
Payable for securities purchased | — | 479,456 | — | 51,574 | 94,996 | 41,953 | — | — | — | |||||||||||||||||||||||||||
Payable for fund shares redeemed | 42,272 | 157,540 | 2,014,488 | 7,975 | 7,870 | 53,574 | 268,180 | 1,096,210 | 24,425 | |||||||||||||||||||||||||||
Payable for investment management services | 100,605 | 181,504 | 228,026 | 32,177 | 71,839 | 48,049 | 300,967 | 126,282 | 77,912 | |||||||||||||||||||||||||||
Payable for variation margin on futures contracts | — | 7,510 | 48,273 | — | — | 1,340 | 27,013 | 7,525 | — | |||||||||||||||||||||||||||
Accrued custody expense | 1,195 | 3,815 | 69,253 | 2,645 | 7,521 | 6,748 | 7,364 | 2,850 | 960 | |||||||||||||||||||||||||||
Accrued professional fees | 13,485 | 13,632 | 13,611 | 13,399 | 13,435 | 13,411 | 14,027 | 13,518 | 13,437 | |||||||||||||||||||||||||||
Accrued accounting fees | 6,897 | 13,646 | 26,841 | 2,090 | 4,354 | 4,117 | 21,864 | 6,085 | 11,748 | |||||||||||||||||||||||||||
Accrued printing and filing fees | 716 | 801 | 768 | 598 | 607 | 587 | 1,171 | 688 | 854 | |||||||||||||||||||||||||||
Other liabilities | 13,082 | 13,118 | 1,287 | 12,880 | 12,867 | 12,752 | 13,898 | 13,338 | 13,088 | |||||||||||||||||||||||||||
Withholding tax payable | — | 272 | 62,722 | — | — | 163 | 1,040 | 50 | — | |||||||||||||||||||||||||||
|
|
|
|
|
|
|
|
|
|
|
|
|
|
|
|
|
| |||||||||||||||||||
Total liabilities | 178,252 | 871,294 | 2,465,269 | 123,338 | 213,489 | 182,694 | 655,524 | 1,266,546 | 142,424 | |||||||||||||||||||||||||||
|
|
|
|
|
|
|
|
|
|
|
|
|
|
|
|
|
| |||||||||||||||||||
Net assets | $ | 221,480,599 | $ | 418,730,555 | $ | 354,571,541 | $ | 44,128,800 | $ | 113,692,146 | $ | 77,793,756 | $ | 1,023,580,370 | $ | 198,941,349 | $ | 123,554,884 | ||||||||||||||||||
|
|
|
|
|
|
|
|
|
|
|
|
|
|
|
|
|
| |||||||||||||||||||
Net assets consist of: | ||||||||||||||||||||||||||||||||||||
Paid in capital | 246,183,474 | 444,644,553 | 401,152,597 | 33,055,455 | 148,553,676 | 93,503,626 | 686,392,100 | 201,476,854 | 147,316,660 | |||||||||||||||||||||||||||
Total distributable earnings | (24,702,875 | ) | (25,913,998 | ) | (46,581,056 | ) | 11,073,345 | (34,861,530 | ) | (15,709,870 | ) | 337,188,270 | (2,535,505 | ) | (23,761,776 | ) | ||||||||||||||||||||
|
|
|
|
|
|
|
|
|
|
|
|
|
|
|
|
|
| |||||||||||||||||||
Net assets | $ | 221,480,599 | $ | 418,730,555 | $ | 354,571,541 | $ | 44,128,800 | $ | 113,692,146 | $ | 77,793,756 | $ | 1,023,580,370 | $ | 198,941,349 | $ | 123,554,884 | ||||||||||||||||||
|
|
|
|
|
|
|
|
|
|
|
|
|
|
|
|
|
| |||||||||||||||||||
*Investments in securities of unaffiliated issuers, at cost | $ | 242,097,360 | $ | 445,049,376 | $ | 346,931,867 | $ | 42,223,400 | $ | 128,849,322 | $ | 85,731,466 | $ | 720,915,325 | $ | 204,451,155 | $ | 138,814,248 | ||||||||||||||||||
|
|
|
|
|
|
|
|
|
|
|
|
|
|
|
|
|
| |||||||||||||||||||
Foreign currencies, at cost | $ | — | $ | — | $ | 3,345 | $ | — | $ | — | $ | 2,230 | $ | — | $ | 463,772 | $ | — | ||||||||||||||||||
|
|
|
|
|
|
|
|
|
|
|
|
|
|
|
|
|
| |||||||||||||||||||
Shares outstanding, par value, $1 per share | 13,698,035 | 15,306,318 | 26,618,974 | 37,085,115 | 10,695,509 | 3,091,858 | 31,387,566 | 12,188,785 | 6,877,349 | |||||||||||||||||||||||||||
|
|
|
|
|
|
|
|
|
|
|
|
|
|
|
|
|
| |||||||||||||||||||
Authorized Fund shares allocated to Portfolio | 22,000,000 | 25,000,000 | 50,000,000 | 74,000,000 | 17,000,000 | 6,000,000 | 50,000,000 | 26,000,000 | 13,000,000 | |||||||||||||||||||||||||||
|
|
|
|
|
|
|
|
|
|
|
|
|
|
|
|
|
| |||||||||||||||||||
Net asset value per share | $ | 16.17 | $ | 27.36 | $ | 13.32 | $ | 1.19 | $ | 10.63 | $ | 25.16 | $ | 32.61 | $ | 16.32 | $ | 17.97 | ||||||||||||||||||
|
|
|
|
|
|
|
|
|
|
|
|
|
|
|
|
|
| |||||||||||||||||||
The accompanying notes are an integral part of these financial statements.
151
Ohio National Fund, Inc. | ||
| Statements of Assets and Liabilities | December 31, 2022 | |
ON Nasdaq-100® Index Portfolio | ON BlackRock Advantage Large Cap Core Portfolio | ON BlackRock Advantage Small Cap Growth Portfolio | ON S&P MidCap 400® Index Portfolio | ON BlackRock Advantage Large Cap Growth Portfolio | ON Risk Managed Balanced Portfolio | ON Federated Bond | ON U.S. Low Volatility Portfolio | ON AB Relative Value Portfolio | ||||||||||||||||||||||||||||
| ||||||||||||||||||||||||||||||||||||
Assets: | ||||||||||||||||||||||||||||||||||||
Investments in securities of unaffiliated issuers, at value* | $ | 204,486,967 | $ | 308,477,380 | $ | 132,499,519 | $ | 366,140,992 | $ | 368,392,668 | $ | 1,106,628,604 | $ | 542,221,088 | $ | 731,796,759 | $ | 121,349,349 | ||||||||||||||||||
Cash | 1,984,374 | 4,277,704 | 1,987,130 | 4,100,223 | 5,091,523 | 67,790,602 | 8,404,925 | 4,987,684 | 5,237,791 | |||||||||||||||||||||||||||
Cash subject to usage restrictions | 43,438 | 265,000 | 139,200 | 157,738 | 410,800 | — | — | — | — | |||||||||||||||||||||||||||
Foreign currencies, at value | — | — | — | — | — | — | 7 | — | — | |||||||||||||||||||||||||||
Receivable for securities sold | — | — | — | — | — | 3,149,513 | 2,429,418 | 1,798,541 | — | |||||||||||||||||||||||||||
Receivable for fund shares sold | 2,068,435 | 672,001 | 437,369 | 1,475 | 1,266,832 | 229,263 | 129,079 | 13,308 | — | |||||||||||||||||||||||||||
Dividends and accrued interest receivable | 95,917 | 397,545 | 82,337 | 467,152 | 272,045 | 4,485,789 | 3,459,784 | 606,981 | 168,908 | |||||||||||||||||||||||||||
Foreign tax reclaim receivable | — | — | — | — | — | 412 | — | — | 551 | |||||||||||||||||||||||||||
Prepaid expenses and other assets | 3,481 | 4,956 | 2,045 | 5,010 | 3,991 | 15,501 | 6,347 | 11,681 | 1,603 | |||||||||||||||||||||||||||
|
|
|
|
|
|
|
|
|
|
|
|
|
|
|
|
|
| |||||||||||||||||||
Total assets | 208,682,612 | 314,094,586 | 135,147,600 | 370,872,590 | 375,437,859 | 1,182,299,684 | 556,650,648 | 739,214,954 | 126,758,202 | |||||||||||||||||||||||||||
|
|
|
|
|
|
|
|
|
|
|
|
|
|
|
|
|
| |||||||||||||||||||
Liabilities: | ||||||||||||||||||||||||||||||||||||
Payable for securities purchased | — | — | — | — | — | 41,876,742 | 4,848,778 | — | 281,569 | |||||||||||||||||||||||||||
Payable for fund shares redeemed | 64,738 | 70,461 | 14,075 | 1,214,087 | 54,781 | 233,180 | 397,121 | 377,471 | 650,600 | |||||||||||||||||||||||||||
Payable for investment management services | 68,322 | 174,393 | 90,653 | 108,564 | 214,738 | 791,152 | 236,898 | 364,874 | 70,075 | |||||||||||||||||||||||||||
Payable for variation margin on futures contracts | 1,890 | 13,438 | 7,440 | 25,460 | 5,610 | 100,138 | 2,149 | — | — | |||||||||||||||||||||||||||
Accrued custody expense | 2,840 | 3,150 | 2,728 | 7,485 | 5,987 | 15,924 | 6,780 | 3,358 | 1,624 | |||||||||||||||||||||||||||
Accrued professional fees | 13,501 | 13,566 | 13,450 | 13,572 | 13,603 | 16,980 | 20,343 | 13,824 | 13,779 | |||||||||||||||||||||||||||
Accrued accounting fees. | 5,012 | 7,050 | 4,740 | 8,633 | 5,074 | 35,045 | 22,420 | 14,872 | 3,143 | |||||||||||||||||||||||||||
Accrued printing and filing fees | 674 | 736 | 624 | 741 | 564 | 1,267 | 878 | 1,005 | 615 | |||||||||||||||||||||||||||
Other liabilities | 13,029 | 13,457 | 12,696 | 13,286 | 12,805 | 13,970 | 13,438 | 13,521 | 13,214 | |||||||||||||||||||||||||||
Withholding tax payable | 677 | 296 | — | — | 806 | 1,777 | — | — | 847 | |||||||||||||||||||||||||||
|
|
|
|
|
|
|
|
|
|
|
|
|
|
|
|
|
| |||||||||||||||||||
Total liabilities | 170,683 | 296,547 | 146,406 | 1,391,828 | 313,968 | 43,086,175 | 5,548,805 | 788,925 | 1,035,466 | |||||||||||||||||||||||||||
|
|
|
|
|
|
|
|
|
|
|
|
|
|
|
|
|
| |||||||||||||||||||
Net assets | $ | 208,511,929 | $ | 313,798,039 | $ | 135,001,194 | $ | 369,480,762 | $ | 375,123,891 | $ | 1,139,213,509 | $ | 551,101,843 | $ | 738,426,029 | $ | 125,722,736 | ||||||||||||||||||
|
|
|
|
|
|
|
|
|
|
|
|
|
|
|
|
|
| |||||||||||||||||||
Net assets consist of: | ||||||||||||||||||||||||||||||||||||
Paid in capital | 146,395,499 | 321,315,834 | 171,904,969 | 321,241,877 | 381,495,099 | 1,196,652,710 | 643,797,988 | 728,658,559 | 126,214,816 | |||||||||||||||||||||||||||
Total distributable earnings | 62,116,430 | (7,517,795 | ) | (36,903,775 | ) | 48,238,885 | (6,371,208 | ) | (57,439,201 | ) | (92,696,145 | ) | 9,767,470 | (492,080 | ) | |||||||||||||||||||||
|
|
|
|
|
|
|
|
|
|
|
|
|
|
|
|
|
| |||||||||||||||||||
Net assets | $ | 208,511,929 | $ | 313,798,039 | $ | 135,001,194 | $ | 369,480,762 | $ | 375,123,891 | $ | 1,139,213,509 | $ | 551,101,843 | $ | 738,426,029 | $ | 125,722,736 | ||||||||||||||||||
|
|
|
|
|
|
|
|
|
|
|
|
|
|
|
|
|
| |||||||||||||||||||
*Investments in securities of unaffiliated issuers, at cost | $ | 163,266,359 | $ | 319,979,596 | $ | 159,161,786 | $ | 331,636,191 | $ | 375,906,456 | $ | 1,131,668,830 | $ | 612,044,342 | $ | 723,265,948 | $ | 120,667,622 | ||||||||||||||||||
|
|
|
|
|
|
|
|
|
|
|
|
|
|
|
|
|
| |||||||||||||||||||
Foreign currencies, at cost | $ | — | $ | — | $ | — | $ | — | $ | — | $ | — | $ | 7 | $ | — | $ | — | ||||||||||||||||||
|
|
|
|
|
|
|
|
|
|
|
|
|
|
|
|
|
| |||||||||||||||||||
Shares outstanding, par value, $1 per share | 16,733,900 | 12,165,965 | 7,301,956 | 19,752,716 | 57,054,599 | 89,798,070 | 62,436,773 | 73,979,437 | 12,525,357 | |||||||||||||||||||||||||||
|
|
|
|
|
|
|
|
|
|
|
|
|
|
|
|
|
| |||||||||||||||||||
Authorized Fund shares allocated to Portfolio | 27,000,000 | 19,000,000 | 12,000,000 | 31,000,000 | 82,000,000 | 170,000,000 | 115,000,000 | 155,000,000 | 25,000,000 | |||||||||||||||||||||||||||
|
|
|
|
|
|
|
|
|
|
|
|
|
|
|
|
|
| |||||||||||||||||||
Net asset value per share | $ | 12.46 | $ | 25.79 | $ | 18.49 | $ | 18.71 | $ | 6.57 | $ | 12.69 | $ | 8.83 | $ | 9.98 | $ | 10.04 | ||||||||||||||||||
|
|
|
|
|
|
|
|
|
|
|
|
|
|
|
|
|
| |||||||||||||||||||
The accompanying notes are an integral part of these financial statements.
152
Ohio National Fund, Inc. | ||
| Statements of Assets and Liabilities | December 31, 2022 | |
ON iShares Managed Risk Balanced Portfolio | ON iShares Managed Risk Moderate Growth Portfolio | ON iShares Managed Risk Growth Portfolio | ON Moderately Conservative Model Portfolio | ON Balanced Model Portfolio | ON Moderate Growth Model Portfolio | ON Growth Model Portfolio | ||||||||||||||||||||||
Assets: | ||||||||||||||||||||||||||||
Investments in securities of unaffiliated issuers, at value* | $ | 566,900,065 | $ | 434,260,576 | $ | 385,003,028 | $ | 79,177,122 | $ | 244,830,399 | $ | 318,516,246 | $ | 56,308,005 | ||||||||||||||
Investments in affiliates, at value** | — | — | — | 134,358,252 | 543,442,563 | 1,127,177,369 | 274,758,120 | |||||||||||||||||||||
Cash | 36,425,820 | 46,727,931 | 36,152,260 | 4 | 15 | 27 | 6 | |||||||||||||||||||||
Cash subject to usage restrictions | 5,250,963 | 4,271,385 | 3,091,344 | — | — | — | — | |||||||||||||||||||||
Foreign currencies, at value | 3,667,391 | 764,419 | 1,002,026 | — | — | — | — | |||||||||||||||||||||
Receivable for securities sold | — | 5,716,960 | 1,641,080 | 1,066,031 | 2,786,228 | 5,176,134 | 1,374,142 | |||||||||||||||||||||
Receivable for fund shares sold | 29,891 | 8,244 | 16,962 | 48 | 12,660 | 777 | 715 | |||||||||||||||||||||
Dividends and accrued interest receivable | 122,511 | 111,029 | 82,703 | — | — | — | — | |||||||||||||||||||||
Prepaid expenses and other assets | 6,874 | 4,427 | 3,848 | 2,675 | 9,966 | 18,093 | 4,087 | |||||||||||||||||||||
|
|
|
|
|
|
|
|
|
|
|
|
|
| |||||||||||||||
Total assets | 612,403,515 | 491,864,971 | 426,993,251 | 214,604,132 | 791,081,831 | 1,450,888,646 | 332,445,075 | |||||||||||||||||||||
|
|
|
|
|
|
|
|
|
|
|
|
|
| |||||||||||||||
Liabilities: | ||||||||||||||||||||||||||||
Payable for securities purchased | — | — | — | 589,283 | 2,629,392 | 5,013,679 | 1,342,651 | |||||||||||||||||||||
Payable for fund shares redeemed | 78,215 | 176,975 | 58,789 | 476,800 | 169,510 | 163,258 | 32,212 | |||||||||||||||||||||
Payable for investment management services | 291,658 | 234,776 | 203,678 | 78,373 | 307,163 | 501,318 | 114,616 | |||||||||||||||||||||
Payable for variation margin on futures contracts | 360,955 | 422,255 | 136,791 | — | — | — | — | |||||||||||||||||||||
Accrued custody expense | 7,538 | 5,116 | 5,126 | 2,549 | 2,883 | 2,989 | 2,704 | |||||||||||||||||||||
Accrued professional fees | 11,391 | 10,831 | 10,791 | 7,153 | 11,521 | 11,948 | 11,232 | |||||||||||||||||||||
Accrued accounting fees | 4,109 | 3,744 | 3,744 | 3,848 | 3,860 | 3,860 | 3,852 | |||||||||||||||||||||
Accrued printing and filing fees | 736 | 748 | 808 | 673 | 1,043 | 1,454 | 742 | |||||||||||||||||||||
Other liabilities | 13,044 | 12,477 | 12,477 | 13,880 | 13,880 | 13,880 | 13,880 | |||||||||||||||||||||
|
|
|
|
|
|
|
|
|
|
|
|
|
| |||||||||||||||
Total liabilities | 767,646 | 866,922 | 432,204 | 1,172,559 | 3,139,252 | 5,712,386 | 1,521,889 | |||||||||||||||||||||
|
|
|
|
|
|
|
|
|
|
|
|
|
| |||||||||||||||
Net assets | $ | 611,635,869 | $ | 490,998,049 | $ | 426,561,047 | $ | 213,431,573 | $ | 787,942,579 | $ | 1,445,176,260 | $ | 330,923,186 | ||||||||||||||
|
|
|
|
|
|
|
|
|
|
|
|
|
| |||||||||||||||
Net assets consist of: | ||||||||||||||||||||||||||||
Paid in capital | 655,624,108 | 469,406,157 | 405,480,981 | 226,954,555 | 805,030,679 | 1,462,523,555 | 333,189,817 | |||||||||||||||||||||
Total distributable earnings | (43,988,239 | ) | 21,591,892 | 21,080,066 | (13,522,982 | ) | (17,088,100 | ) | (17,347,295 | ) | (2,266,631 | ) | ||||||||||||||||
|
|
|
|
|
|
|
|
|
|
|
|
|
| |||||||||||||||
Net assets | $ | 611,635,869 | $ | 490,998,049 | $ | 426,561,047 | $ | 213,431,573 | $ | 787,942,579 | $ | 1,445,176,260 | $ | 330,923,186 | ||||||||||||||
|
|
|
|
|
|
|
|
|
|
|
|
|
| |||||||||||||||
*Investments in securities of unaffiliated issuers, at cost | $ | 586,050,309 | $ | 411,737,385 | $ | 361,833,540 | $ | 90,312,572 | $ | 277,465,604 | $ | 354,765,741 | $ | 61,664,765 | ||||||||||||||
|
|
|
|
|
|
|
|
|
|
|
|
|
| |||||||||||||||
**Investments in affiliates, at cost | $ | — | $ | — | $ | — | $ | 147,205,852 | $ | 590,522,467 | $ | 1,261,936,467 | $ | 314,062,534 | ||||||||||||||
|
|
|
|
|
|
|
|
|
|
|
|
|
| |||||||||||||||
Foreign currencies, at cost | $ | 3,579,609 | $ | 760,608 | $ | 996,476 | $ | — | $ | — | $ | — | $ | — | ||||||||||||||
|
|
|
|
|
|
|
|
|
|
|
|
|
| |||||||||||||||
Shares outstanding, par value, $1 per share | 71,785,011 | 46,375,390 | 40,249,207 | 20,619,765 | 74,437,104 | 132,849,812 | 29,592,688 | |||||||||||||||||||||
|
|
|
|
|
|
|
|
|
|
|
|
|
| |||||||||||||||
Authorized Fund shares allocated to Portfolio | 123,000,000 | 95,000,000 | 80,000,000 | 28,000,000 | 97,000,000 | 170,000,000 | 38,000,000 | |||||||||||||||||||||
|
|
|
|
|
|
|
|
|
|
|
|
|
| |||||||||||||||
Net asset value per share | $ | 8.52 | $ | 10.59 | $ | 10.60 | $ | 10.35 | $ | 10.59 | $ | 10.88 | $ | 11.18 | ||||||||||||||
|
|
|
|
|
|
|
|
|
|
|
|
|
| |||||||||||||||
The accompanying notes are an integral part of these financial statements.
153
| Statements of Operations | For the Year Ended December 31, 2022 | |
ON Bond Portfolio | ON BlackRock Balanced Allocation Portfolio | ON BlackRock Advantage International Equity Portfolio | ON Janus Henderson Forty Portfolio | ON AB Small Cap Portfolio | ON AB Mid Cap Core Portfolio | ON S&P 500® Index Portfolio | ON BlackRock Advantage Large Cap Value Portfolio | ON Federated High Income Bond Portfolio | ||||||||||||||||||||||||||||
Investment income: | ||||||||||||||||||||||||||||||||||||
Interest | $ | 8,329,488 | $ | 4,210,505 | $ | 8,059 | $ | 5,221 | $ | 520 | $ | 733 | $ | 11,925 | $ | 3,237 | $ | 8,314,145 | ||||||||||||||||||
Dividends from unaffiliated issuers, net of taxes withheld* | 119,251 | 5,547,968 | 14,192,435 | 561,711 | 1,173,148 | 1,183,989 | 18,112,929 | 6,032,240 | 34,504 | |||||||||||||||||||||||||||
|
|
|
|
|
|
|
|
|
|
|
|
|
|
|
|
|
| |||||||||||||||||||
Total investment income | 8,448,739 | 9,758,473 | 14,200,494 | 566,932 | 1,173,668 | 1,184,722 | 18,124,854 | 6,035,477 | 8,348,649 | |||||||||||||||||||||||||||
|
|
|
|
|
|
|
|
|
|
|
|
|
|
|
|
|
| |||||||||||||||||||
Expenses: | ||||||||||||||||||||||||||||||||||||
Management fees | 1,235,269 | 2,275,975 | 2,950,206 | 621,337 | 937,969 | 600,546 | 3,738,080 | 1,802,169 | 1,026,612 | |||||||||||||||||||||||||||
Custodian fees | 7,191 | 28,213 | 415,584 | 18,346 | 40,528 | 38,663 | 56,875 | 23,578 | 5,513 | |||||||||||||||||||||||||||
Directors’ fees | 19,623 | 40,346 | 36,338 | 8,320 | 11,452 | 7,375 | 96,995 | 23,803 | 12,256 | |||||||||||||||||||||||||||
Professional fees | 22,548 | 26,738 | 25,996 | 20,003 | 20,817 | 20,027 | 38,163 | 23,423 | 21,041 | |||||||||||||||||||||||||||
Accounting fees | 45,485 | 87,762 | 165,726 | 15,668 | 27,733 | 25,615 | 141,443 | 39,906 | 75,812 | |||||||||||||||||||||||||||
Administration fees | 28,856 | 37,111 | 63,807 | 23,434 | 27,498 | 25,137 | 35,641 | 26,057 | 28,340 | |||||||||||||||||||||||||||
Printing and filing fees | 11,547 | 14,713 | 11,256 | 8,202 | 8,280 | 8,301 | 17,625 | 9,907 | 11,388 | |||||||||||||||||||||||||||
Compliance expense | 10,961 | 10,962 | 10,962 | 10,961 | 10,962 | 10,961 | 10,962 | 10,962 | 10,962 | |||||||||||||||||||||||||||
Other | 6,089 | 14,935 | 14,026 | 4,020 | 4,470 | 2,822 | 35,414 | 9,308 | 3,842 | |||||||||||||||||||||||||||
|
|
|
|
|
|
|
|
|
|
|
|
|
|
|
|
|
| |||||||||||||||||||
Total expenses | 1,387,569 | 2,536,755 | 3,693,901 | 730,291 | 1,089,709 | 739,447 | 4,171,198 | 1,969,113 | 1,195,766 | |||||||||||||||||||||||||||
|
|
|
|
|
|
|
|
|
|
|
|
|
|
|
|
|
| |||||||||||||||||||
Net investment income (loss) | 7,061,170 | 7,221,718 | 10,506,593 | (163,359 | ) | 83,959 | 445,275 | �� | 13,953,656 | 4,066,364 | 7,152,883 | |||||||||||||||||||||||||
|
|
|
|
|
|
|
|
|
|
|
|
|
|
|
|
|
| |||||||||||||||||||
Realized/unrealized gain (loss) on investments, futures contracts, and foreign currency related transactions: | ||||||||||||||||||||||||||||||||||||
Net realized gain (loss) on: | ||||||||||||||||||||||||||||||||||||
Investments in securities of unaffiliated issuers | (2,323,091 | ) | (684,035 | ) | (52,985,542 | ) | 9,326,499 | (18,086,434 | ) | (7,046,049 | ) | 48,049,025 | 2,293,614 | (3,870,351 | ) | |||||||||||||||||||||
Futures contracts | — | (827,697 | ) | (1,743,189 | ) | — | — | (16,290 | ) | (538,032 | ) | (549,608 | ) | — | ||||||||||||||||||||||
Foreign currency related transactions | — | — | (238,493 | ) | (288 | ) | — | (261 | ) | — | — | — | ||||||||||||||||||||||||
Change in unrealized appreciation/depreciation on: | ||||||||||||||||||||||||||||||||||||
Investments in securities of unaffiliated issuers | (46,010,875 | ) | (104,609,142 | ) | (22,541,172 | ) | (51,085,097 | ) | (29,906,410 | ) | (17,230,514 | ) | (294,561,001 | ) | (32,532,942 | ) | (22,246,978 | ) | ||||||||||||||||||
Futures contracts | — | (182,639 | ) | (311,863 | ) | — | — | (7,212 | ) | (437,663 | ) | (150,835 | ) | — | ||||||||||||||||||||||
Foreign currency related transactions | — | — | (60,971 | ) | (277 | ) | — | 106 | — | (53,796 | ) | — | ||||||||||||||||||||||||
|
|
|
|
|
|
|
|
|
|
|
|
|
|
|
|
|
| |||||||||||||||||||
Net realized/unrealized loss on investments, futures contracts, and foreign currency related transactions | (48,333,966 | ) | (106,303,513 | ) | (77,881,230 | ) | (41,759,163 | ) | (47,992,844 | ) | (24,300,220 | ) | (247,487,671 | ) | (30,993,567 | ) | (26,117,329 | ) | ||||||||||||||||||
|
|
|
|
|
|
|
|
|
|
|
|
|
|
|
|
|
| |||||||||||||||||||
Change in net assets from operations | $ | (41,272,796 | ) | $ | (99,081,795 | ) | $ | (67,374,637 | ) | $ | (41,922,522 | ) | $ | (47,908,885 | ) | $ | (23,854,945 | ) | $ | (233,534,015 | ) | $ | (26,927,203 | ) | $ | (18,964,446 | ) | |||||||||
|
|
|
|
|
|
|
|
|
|
|
|
|
|
|
|
|
| |||||||||||||||||||
*Taxes withheld | $ | — | $ | 472 | $ | 1,417,515 | $ | 8,746 | $ | 889 | $ | 1,528 | $ | 4,213 | $ | 423 | $ | — | ||||||||||||||||||
|
|
|
|
|
|
|
|
|
|
|
|
|
|
|
|
|
| |||||||||||||||||||
The accompanying notes are an integral part of these financial statements.
154
Ohio National Fund, Inc. | ||
| Statements of Operations | For the Year Ended December 31, 2022 | |
ON Nasdaq-100® Index Portfolio | ON BlackRock Advantage Large Cap Core Portfolio | ON BlackRock Advantage Small Cap Growth Portfolio | ON S&P MidCap 400® Index Portfolio | ON BlackRock Advantage Large Cap Growth Portfolio | ON Risk Managed Balanced Portfolio | ON Federated Core Plus Bond Portfolio | ON U.S. Low Volatility Portfolio | ON AB Relative Value Portfolio | ||||||||||||||||||||||||||||
Investment income: | ||||||||||||||||||||||||||||||||||||
Interest | $ | 3,011 | $ | 2,835 | $ | 1,155 | $ | 4,411 | $ | 3,255 | $ | 12,963,920 | $ | 13,763,557 | $ | 2,892 | $ | 3,362 | ||||||||||||||||||
Dividends from unaffiliated issuers, net of taxes withheld* | 2,295,479 | 5,882,072 | 1,351,304 | 6,210,186 | 1,544,829 | 7,747,866 | 2,819,964 | 13,794,906 | 2,227,026 | |||||||||||||||||||||||||||
|
|
|
|
|
|
|
|
|
|
|
|
|
|
|
|
|
| |||||||||||||||||||
Total investment income | 2,298,490 | 5,884,907 | 1,352,459 | 6,214,597 | 1,548,084 | 20,711,786 | 16,583,521 | 13,797,798 | 2,230,388 | |||||||||||||||||||||||||||
|
|
|
|
|
|
|
|
|
|
|
|
|
|
|
|
|
| |||||||||||||||||||
Expenses: | ||||||||||||||||||||||||||||||||||||
Management fees | 957,820 | 2,267,545 | 1,173,261 | 1,290,313 | 822,522 | 7,178,009 | 2,998,253 | 4,789,343 | 658,082 | |||||||||||||||||||||||||||
Custodian fees | 16,539 | 23,994 | 17,096 | 53,946 | 19,474 | 76,328 | 39,345 | 19,563 | 9,277 | |||||||||||||||||||||||||||
Directors’ fees | 23,751 | 31,347 | 13,521 | 31,438 | 13,203 | 70,525 | 51,498 | 72,084 | 7,828 | |||||||||||||||||||||||||||
Professional fees | 23,140 | 24,845 | 21,239 | 24,919 | 20,987 | 38,100 | 31,951 | 36,483 | 25,061 | |||||||||||||||||||||||||||
Accounting fees | 35,589 | 47,605 | 31,187 | 55,651 | 18,428 | 177,597 | 150,187 | 97,893 | 15,856 | |||||||||||||||||||||||||||
Administration fees | 24,977 | 31,808 | 25,253 | 26,990 | 21,801 | 47,840 | 35,805 | 26,734 | 22,460 | |||||||||||||||||||||||||||
Printing and filing fees | 9,717 | 10,261 | 8,879 | 10,893 | 7,535 | 14,430 | 15,578 | 14,907 | 8,913 | |||||||||||||||||||||||||||
Compliance expense | 10,962 | 10,962 | 10,961 | 10,962 | 10,961 | 10,962 | 10,961 | 10,961 | 10,962 | |||||||||||||||||||||||||||
Other | 9,358 | 11,500 | 5,277 | 11,677 | 3,251 | 47,266 | 15,075 | 24,611 | 1,373 | |||||||||||||||||||||||||||
|
|
|
|
|
|
|
|
|
|
|
|
|
|
|
|
|
| |||||||||||||||||||
Total expenses | 1,111,853 | 2,459,867 | 1,306,674 | 1,516,789 | 938,162 | 7,661,057 | 3,348,653 | 5,092,579 | 759,812 | |||||||||||||||||||||||||||
|
|
|
|
|
|
|
|
|
|
|
|
|
|
|
|
|
| |||||||||||||||||||
Net investment income | 1,186,637 | 3,425,040 | 45,785 | 4,697,808 | 609,922 | 13,050,729 | 13,234,868 | 8,705,219 | 1,470,576 | |||||||||||||||||||||||||||
|
|
|
|
|
|
|
|
|
|
|
|
|
|
|
|
|
| |||||||||||||||||||
Realized/unrealized gain (loss) on investments and futures contracts: | ||||||||||||||||||||||||||||||||||||
Net realized gain (loss) on: | ||||||||||||||||||||||||||||||||||||
Investments in securities of unaffiliated issuers | 21,476,751 | 2,430,839 | (9,240,149 | ) | 21,994,531 | 1,016,168 | (2,061,720 | ) | (39,613,889 | ) | (7,547,614 | ) | (2,644,383 | ) | ||||||||||||||||||||||
Futures contracts | (884,883 | ) | (797,077 | ) | (730,905 | ) | (98,418 | ) | 19,700 | (34,040,337 | ) | 4,736,003 | — | — | ||||||||||||||||||||||
Change in unrealized appreciation/depreciation on: | ||||||||||||||||||||||||||||||||||||
Investments in securities of unaffiliated issuers | (131,173,202 | ) | (87,215,141 | ) | (40,882,421 | ) | (83,659,527 | ) | (23,112,248 | ) | (118,038,764 | ) | (66,606,130 | ) | (71,016,377 | ) | (3,132,477 | ) | ||||||||||||||||||
Futures contracts | (56,920 | ) | (218,016 | ) | (107,371 | ) | (107,367 | ) | (349,526 | ) | (831,777 | ) | 242,991 | — | — | |||||||||||||||||||||
|
|
|
|
|
|
|
|
|
|
|
|
|
|
|
|
|
| |||||||||||||||||||
Net realized/unrealized loss on investments and futures contracts | (110,638,254 | ) | (85,799,395 | ) | (50,960,846 | ) | (61,870,781 | ) | (22,425,906 | ) | (154,972,598 | ) | (101,241,025 | ) | (78,563,991 | ) | (5,776,860 | ) | ||||||||||||||||||
|
|
|
|
|
|
|
|
|
|
|
|
|
|
|
|
|
| |||||||||||||||||||
Change in net assets from operations | $ | (109,451,617 | ) | $ | (82,374,355 | ) | $ | (50,915,061 | ) | $ | (57,172,973 | ) | $ | (21,815,984 | ) | $ | (141,921,869 | ) | $ | (88,006,157 | ) | $ | (69,858,772 | ) | $ | (4,306,284 | ) | |||||||||
|
|
|
|
|
|
|
|
|
|
|
|
|
|
|
|
|
| |||||||||||||||||||
*Taxes withheld | $ | 4,702 | $ | 508 | $ | 3,668 | $ | — | $ | 955 | $ | 17,605 | $ | — | $ | — | $ | 8,713 | ||||||||||||||||||
|
|
|
|
|
|
|
|
|
|
|
|
|
|
|
|
|
| |||||||||||||||||||
The accompanying notes are an integral part of these financial statements.
155
Ohio National Fund, Inc. | ||
| Statements of Operations | For the Year Ended December 31, 2022 | |
ON iShares Managed Risk Balanced Portfolio | ON iShares Managed Risk Moderate Growth Portfolio1 | ON iShares Managed Risk Growth Portfolio1 | ON Moderately Conservative Model Portfolio | ON Balanced Model Portfolio | ON Moderate Growth Model Portfolio | ON Growth Model Portfolio | |||||||||||||||||||||||||||||
Investment income: | |||||||||||||||||||||||||||||||||||
Interest | $ | 28,953 | $ | 30,667 | $ | 25,453 | $ | — | $ | — | $ | — | $ | — | |||||||||||||||||||||
Dividend income from unaffiliated issuers | 9,009,012 | 3,283,865 | 2,743,133 | 2,826,393 | 8,569,823 | 10,378,835 | 1,725,366 | ||||||||||||||||||||||||||||
Dividends from affililiates | — | — | — | 2,835,875 | 9,415,839 | 16,975,847 | 3,574,759 | ||||||||||||||||||||||||||||
|
|
|
|
|
|
|
|
|
|
|
|
|
| ||||||||||||||||||||||
Total investment income | 9,037,965 | 3,314,532 | 2,768,586 | 5,662,268 | 17,985,662 | 27,354,682 | 5,300,125 | ||||||||||||||||||||||||||||
|
|
|
|
|
|
|
|
|
|
|
|
|
| ||||||||||||||||||||||
Expenses: | |||||||||||||||||||||||||||||||||||
Management fees | 2,347,774 | 564,926 | 491,180 | 954,089 | 3,558,788 | 6,454,498 | 1,458,557 | ||||||||||||||||||||||||||||
Custodian fees | 29,149 | 6,395 | 6,408 | 15,272 | 17,075 | 17,537 | 15,855 | ||||||||||||||||||||||||||||
Directors’ fees | 37,450 | 11,667 | 10,149 | 20,741 | 77,839 | 141,347 | 31,946 | ||||||||||||||||||||||||||||
Professional fees | 23,719 | 18,330 | 18,048 | 20,432 | 32,012 | 44,935 | 22,691 | ||||||||||||||||||||||||||||
Accounting fees | 24,930 | 4,891 | 4,891 | 23,070 | 23,126 | 23,126 | 23,082 | ||||||||||||||||||||||||||||
Administration fees | 22,844 | 12,654 | 12,567 | 23,572 | 27,538 | 31,663 | 25,056 | ||||||||||||||||||||||||||||
Printing and filing fees | 10,834 | 5,064 | 5,064 | 9,487 | 15,610 | 22,233 | 10,697 | ||||||||||||||||||||||||||||
Compliance expense | 10,962 | 2,193 | 2,192 | 10,962 | 10,961 | 10,962 | 10,962 | ||||||||||||||||||||||||||||
Recoupment of previously reimbursed expenses | — | — | — | 25,600 | 157,500 | — | — | ||||||||||||||||||||||||||||
Other | 15,733 | 4,444 | 4,687 | 6,338 | 24,473 | 43,634 | 9,750 | ||||||||||||||||||||||||||||
|
|
|
|
|
|
|
|
|
|
|
|
|
| ||||||||||||||||||||||
Total expenses | 2,523,395 | 630,564 | 555,186 | 1,109,563 | 3,944,922 | 6,789,935 | 1,608,596 | ||||||||||||||||||||||||||||
|
|
|
|
|
|
|
|
|
|
|
|
|
| ||||||||||||||||||||||
Net investment income | 6,514,570 | 2,683,968 | 2,213,400 | 4,552,705 | 14,040,740 | 20,564,747 | 3,691,529 | ||||||||||||||||||||||||||||
|
|
|
|
|
|
|
|
|
|
|
|
|
| ||||||||||||||||||||||
Realized/unrealized gain (loss) on investments, futures contracts, foreign currency related transactions, and capital gain distributions received from underlying mutual funds: | |||||||||||||||||||||||||||||||||||
Net realized gain (loss) on: | |||||||||||||||||||||||||||||||||||
Investments in securities of unaffiliated issuers | (25,790,100 | ) | 1,424,506 | 1,122,502 | (3,411,413 | ) | (7,565,249 | ) | (11,203,731 | ) | (1,413,695 | ) | |||||||||||||||||||||||
Investments in affiliates | — | — | — | (625,455 | ) | 6,312,546 | 14,422,058 | 563,431 | |||||||||||||||||||||||||||
Futures contracts | (3,667,857 | ) | 3,180,240 | (662,858 | ) | — | — | — | — | ||||||||||||||||||||||||||
Foreign currency related transactions | (285,524 | ) | 201,227 | 339,827 | — | — | — | — | |||||||||||||||||||||||||||
Capital gain distributions received from underlying unaffiliated mutual funds | — | — | — | 114,666 | 848,078 | 1,557,735 | 366,335 | ||||||||||||||||||||||||||||
Capital gain distributions received from underlying affiliated mutual funds | — | — | — | 14,882,609 | 76,690,939 | 199,241,460 | 57,767,257 | ||||||||||||||||||||||||||||
Change in unrealized appreciation/depreciation on: | |||||||||||||||||||||||||||||||||||
Investments in securities of unaffiliated issuers | (25,046,893 | ) | 22,523,191 | 23,169,488 | (14,263,967 | ) | (55,120,308 | ) | (79,670,069 | ) | (16,572,115 | ) | |||||||||||||||||||||||
Investments in affiliates | — | — | — | (43,079,117 | ) | (202,470,997 | ) | (478,654,995 | ) | (125,035,997 | ) | ||||||||||||||||||||||||
Futures contracts | (1,862,861 | ) | (1,750,254 | ) | (1,201,052 | ) | — | — | — | — | |||||||||||||||||||||||||
Foreign currency related transactions | 163,547 | 3,810 | 5,550 | — | — | — | — | ||||||||||||||||||||||||||||
|
|
|
|
|
|
|
|
|
|
|
|
|
| ||||||||||||||||||||||
Net realized/unrealized gain (loss) on investments, futures contracts, foreign currency related transactions, and capital gain distributions received from underlying mutual funds | (56,489,688 | ) | 25,582,720 | 22,773,457 | (46,382,677 | ) | (181,304,991 | ) | (354,307,542 | ) | (84,324,784 | ) | |||||||||||||||||||||||
|
|
|
|
|
|
|
|
|
|
|
|
|
| ||||||||||||||||||||||
Change in net assets from operations | $ | (49,975,118 | ) | $ | 28,266,688 | $ | 24,986,857 | $ | (41,829,972 | ) | $ | (167,264,251 | ) | $ | (333,742,795 | ) | $ | (80,633,255 | ) | ||||||||||||||||
|
|
|
|
|
|
|
|
|
|
|
|
|
| ||||||||||||||||||||||
1 For the period from October 14, 2022 (inception) to December 31, 2022.
The accompanying notes are an integral part of these financial statements.
156
| Statements of Changes in Net Assets | ||
| ON Bond Portfolio | ON BlackRock Balanced Allocation Portfolio | ON BlackRock Advantage International Equity Portfolio | ON Janus Henderson Forty Portfolio | |||||||||||||||||||||||||||||
| Year Ended December 31, 2022 | Year Ended December 31, 2021 | Year Ended December 31, 2022 | Year Ended December 31, 2021 | Year Ended December 31, 2022 | Year Ended December 31, 2021 | Year Ended December 31, 2022 | Year Ended December 31, 2021 | |||||||||||||||||||||||||
Increase (Decrease) in net assets: | ||||||||||||||||||||||||||||||||
Operations: | ||||||||||||||||||||||||||||||||
Net investment income (loss) | $ | 7,061,170 | $ | 7,245,279 | $ | 7,221,718 | $ | 6,662,551 | $ | 10,506,593 | $ | 9,363,843 | $ | (163,359 | ) | $ | (627,331 | ) | ||||||||||||||
Net realized gain (loss) on investments, futures contracts, and foreign currency related transactions | (2,323,091 | ) | 1,323,993 | (1,511,732 | ) | 86,640,246 | (54,967,224 | ) | 75,022,858 | 9,326,211 | 60,189,730 | |||||||||||||||||||||
Change in unrealized appreciation/depreciation on investments, futures contracts, and foreign currency related transactions | (46,010,875 | ) | (12,997,451 | ) | (104,791,781 | ) | 1,540,664 | (22,914,006 | ) | (19,502,105 | ) | (51,085,374 | ) | (23,114,367 | ) | |||||||||||||||||
|
|
|
|
|
|
|
|
|
|
|
|
|
|
|
| |||||||||||||||||
Change in net assets from operations | (41,272,796 | ) | (4,428,179 | ) | (99,081,795 | ) | 94,843,461 | (67,374,637 | ) | 64,884,596 | (41,922,522 | ) | 36,448,032 | |||||||||||||||||||
|
|
|
|
|
|
|
|
|
|
|
|
|
|
|
| |||||||||||||||||
Distributions: | ||||||||||||||||||||||||||||||||
Distributions to shareholders | (8,574,425 | ) | (8,269,842 | ) | (91,138,887 | ) | (51,715,211 | ) | (63,189,251 | ) | (6,864,821 | ) | (59,319,150 | ) | (22,460,454 | ) | ||||||||||||||||
|
|
|
|
|
|
|
|
|
|
|
|
|
|
|
| |||||||||||||||||
Capital transactions: | ||||||||||||||||||||||||||||||||
Received from shares sold | 37,257,056 | 32,994,619 | 39,209,578 | 29,168,030 | 17,766,308 | 26,665,740 | 10,963,124 | 8,289,653 | ||||||||||||||||||||||||
Received from dividends reinvested | 8,574,425 | 8,269,842 | 91,138,887 | 51,715,211 | 63,189,251 | 6,864,821 | 59,319,150 | 22,460,454 | ||||||||||||||||||||||||
Paid for shares redeemed | (51,935,837 | ) | (46,195,857 | ) | (73,207,293 | ) | (105,891,073 | ) | (103,287,366 | ) | (88,499,287 | ) | (67,084,671 | ) | (106,202,973 | ) | ||||||||||||||||
|
|
|
|
|
|
|
|
|
|
|
|
|
|
|
| |||||||||||||||||
Change in net assets from capital transactions | (6,104,356 | ) | (4,931,396 | ) | 57,141,172 | (25,007,832 | ) | (22,331,807 | ) | (54,968,726 | ) | 3,197,603 | (75,452,866 | ) | ||||||||||||||||||
|
|
|
|
|
|
|
|
|
|
|
|
|
|
|
| |||||||||||||||||
Change in net assets | (55,951,577 | ) | (17,629,417 | ) | (133,079,510 | ) | 18,120,418 | (152,895,695 | ) | 3,051,049 | (98,044,069 | ) | (61,465,288 | ) | ||||||||||||||||||
Net assets: | ||||||||||||||||||||||||||||||||
Beginning of year | 277,432,176 | 295,061,593 | 551,810,065 | 533,689,647 | 507,467,236 | 504,416,187 | 142,172,869 | 203,638,157 | ||||||||||||||||||||||||
|
|
|
|
|
|
|
|
|
|
|
|
|
|
|
| |||||||||||||||||
End of year | $ | 221,480,599 | $ | 277,432,176 | $ | 418,730,555 | $ | 551,810,065 | $ | 354,571,541 | $ | 507,467,236 | $ | 44,128,800 | $ | 142,172,869 | ||||||||||||||||
|
|
|
|
|
|
|
|
|
|
|
|
|
|
|
| |||||||||||||||||
The accompanying notes are an integral part of these financial statements.
157
Ohio National Fund, Inc. | ||
| Statements of Changes in Net Assets | ||
| ON AB Small Cap Portfolio | ON AB Mid Cap Core Portfolio | ON S&P 500® Index Portfolio | ON BlackRock Advantage Large Cap Value Portfolio | |||||||||||||||||||||||||||||
| Year Ended December 31, 2022 | Year Ended December 31, 2021 | Year Ended December 31, 2022 | Year Ended December 31, 2021 | Year Ended December 31, 2022 | Year Ended December 31, 2021 | Year Ended December 31, 2022 | Year Ended December 31, 2021 | |||||||||||||||||||||||||
Increase (Decrease) in net assets: | ||||||||||||||||||||||||||||||||
Operations: | ||||||||||||||||||||||||||||||||
Net investment income (loss) | $ | 83,959 | $ | (47,782 | ) | $ | 445,275 | $ | 321,060 | $ | 13,953,656 | $ | 13,473,248 | $ | 4,066,364 | $ | 4,273,372 | |||||||||||||||
Net realized gain (loss) on investments, futures contracts, and foreign currency related transactions | (18,086,434 | ) | 76,999,076 | (7,062,600 | ) | 38,338,872 | 47,510,993 | 127,464,857 | 1,744,006 | 71,892,256 | ||||||||||||||||||||||
Change in unrealized appreciation/depreciation on investments, futures contracts, and foreign currency related transactions | (29,906,410 | ) | (62,498,852 | ) | (17,237,620 | ) | (21,875,140 | ) | (294,998,664 | ) | 178,003,338 | (32,737,573 | ) | (2,635,835 | ) | |||||||||||||||||
|
|
|
|
|
|
|
|
|
|
|
|
|
|
|
| |||||||||||||||||
Change in net assets from operations | (47,908,885 | ) | 14,452,442 | (23,854,945 | ) | 16,784,792 | (233,534,015 | ) | 318,941,443 | (26,927,203 | ) | 73,529,793 | ||||||||||||||||||||
|
|
|
|
|
|
|
|
|
|
|
|
|
|
|
| |||||||||||||||||
Distributions: | ||||||||||||||||||||||||||||||||
Distributions to shareholders | (77,449,777 | ) | (19,402,876 | ) | (38,480,179 | ) | (6,373,298 | ) | (140,988,170 | ) | (89,305,542 | ) | (61,357,541 | ) | (4,834,870 | ) | ||||||||||||||||
|
|
|
|
|
|
|
|
|
|
|
|
|
|
|
| |||||||||||||||||
Capital transactions: | ||||||||||||||||||||||||||||||||
Received from shares sold | 15,389,537 | 12,452,142 | 9,678,476 | 2,999,897 | 110,296,372 | 100,967,405 | 5,786,201 | 69,417,380 | ||||||||||||||||||||||||
Received from dividends reinvested | 77,449,777 | 19,402,876 | 38,480,179 | 6,373,298 | 140,988,170 | 89,305,542 | 61,357,541 | 4,834,870 | ||||||||||||||||||||||||
Paid for shares redeemed | (23,084,864 | ) | (40,059,599 | ) | (12,681,249 | ) | (24,326,313 | ) | (178,215,803 | ) | (323,659,964 | ) | (105,822,570 | ) | (133,570,359 | ) | ||||||||||||||||
|
|
|
|
|
|
|
|
|
|
|
|
|
|
|
| |||||||||||||||||
Change in net assets from capital transactions | 69,754,450 | (8,204,581 | ) | 35,477,406 | (14,953,118 | ) | 73,068,739 | (133,387,017 | ) | (38,678,828 | ) | (59,318,109 | ) | |||||||||||||||||||
|
|
|
|
|
|
|
|
|
|
|
|
|
|
|
| |||||||||||||||||
Change in net assets | (55,604,212 | ) | (13,155,015 | ) | (26,857,718 | ) | (4,541,624 | ) | (301,453,446 | ) | 96,248,884 | (126,963,572 | ) | 9,376,814 | ||||||||||||||||||
Net assets: | ||||||||||||||||||||||||||||||||
Beginning of year | 169,296,358 | 182,451,373 | 104,651,474 | 109,193,098 | 1,325,033,816 | 1,228,784,932 | 325,904,921 | 316,528,107 | ||||||||||||||||||||||||
|
|
|
|
|
|
|
|
|
|
|
|
|
|
|
| |||||||||||||||||
End of year | $ | 113,692,146 | $ | 169,296,358 | $ | 77,793,756 | $ | 104,651,474 | $ | 1,023,580,370 | $ | 1,325,033,816 | $ | 198,941,349 | $ | 325,904,921 | ||||||||||||||||
|
|
|
|
|
|
|
|
|
|
|
|
|
|
|
| |||||||||||||||||
The accompanying notes are an integral part of these financial statements.
158
Ohio National Fund, Inc. | ||
| Statements of Changes in Net Assets | ||
| ON Federated High Income Bond Portfolio | ON Nasdaq-100® Index Portfolio | ON BlackRock Advantage Large Cap Core Portfolio | ON BlackRock Advantage Small Cap Growth Portfolio | |||||||||||||||||||||||||||||
| Year Ended December 31, 2022 | Year Ended December 31, 2021 | Year Ended December 31, 2022 | Year Ended December 31, 2021 | Year Ended December 31, 2022 | Year Ended December 31, 2021 | Year Ended December 31, 2022 | Year Ended December 31, 2021 | |||||||||||||||||||||||||
Increase (Decrease) in net assets: | ||||||||||||||||||||||||||||||||
Operations: | ||||||||||||||||||||||||||||||||
Net investment income (loss) | $ | 7,152,883 | $ | 7,809,473 | $ | 1,186,637 | $ | 1,057,844 | $ | 3,425,040 | $ | 2,854,069 | $ | 45,785 | $ | (681,084 | ) | |||||||||||||||
Net realized gain (loss) on investments and futures contracts | (3,870,351 | ) | 395,209 | 20,591,868 | 79,939,850 | 1,633,762 | 93,508,162 | (9,971,054 | ) | 51,984,886 | ||||||||||||||||||||||
Change in unrealized appreciation/depreciation on investments and futures contracts | (22,246,978 | ) | 215,689 | (131,230,122 | ) | 10,383,620 | (87,433,157 | ) | 11,678,282 | (40,989,792 | ) | (41,385,911 | ) | |||||||||||||||||||
|
|
|
|
|
|
|
|
|
|
|
|
|
|
|
| |||||||||||||||||
Change in net assets from operations | (18,964,446 | ) | 8,420,371 | (109,451,617 | ) | 91,381,314 | (82,374,355 | ) | 108,040,513 | (50,915,061 | ) | 9,917,891 | ||||||||||||||||||||
|
|
|
|
|
|
|
|
|
|
|
|
|
|
|
| |||||||||||||||||
Distributions: | ||||||||||||||||||||||||||||||||
Distributions to shareholders | (7,915,615 | ) | (8,796,067 | ) | (81,012,020 | ) | (70,926,683 | ) | (94,014,910 | ) | (41,514,387 | ) | (49,954,225 | ) | (24,631,925 | ) | ||||||||||||||||
|
|
|
|
|
|
|
|
|
|
|
|
|
|
|
| |||||||||||||||||
Capital transactions: | ||||||||||||||||||||||||||||||||
Received from shares sold | 5,362,424 | 12,534,773 | 39,450,661 | 44,655,215 | 14,043,699 | 13,853,155 | 15,744,900 | 21,802,409 | ||||||||||||||||||||||||
Received from dividends reinvested | 7,915,615 | 8,796,067 | 81,012,020 | 70,926,683 | 94,014,910 | 41,514,387 | 49,954,225 | 24,631,925 | ||||||||||||||||||||||||
Paid for shares redeemed | (33,028,965 | ) | (26,379,122 | ) | (78,019,869 | ) | (162,516,446 | ) | (55,125,680 | ) | (103,093,056 | ) | (26,057,888 | ) | (45,272,916 | ) | ||||||||||||||||
|
|
|
|
|
|
|
|
|
|
|
|
|
|
|
| |||||||||||||||||
Change in net assets from capital transactions | (19,750,926 | ) | (5,048,282 | ) | 42,442,812 | (46,934,548 | ) | 52,932,929 | (47,725,514 | ) | 39,641,237 | 1,161,418 | ||||||||||||||||||||
|
|
|
|
|
|
|
|
|
|
|
|
|
|
|
| |||||||||||||||||
Change in net assets | (46,630,987 | ) | (5,423,978 | ) | (148,020,825 | ) | (26,479,917 | ) | (123,456,336 | ) | 18,800,612 | (61,228,049 | ) | (13,552,616 | ) | |||||||||||||||||
Net assets: | ||||||||||||||||||||||||||||||||
Beginning of year | 170,185,871 | 175,609,849 | 356,532,754 | 383,012,671 | 437,254,375 | 418,453,763 | 196,229,243 | 209,781,859 | ||||||||||||||||||||||||
|
|
|
|
|
|
|
|
|
|
|
|
|
|
|
| |||||||||||||||||
End of year | $ | 123,554,884 | $ | 170,185,871 | $ | 208,511,929 | $ | 356,532,754 | $ | 313,798,039 | $ | 437,254,375 | $ | 135,001,194 | $ | 196,229,243 | ||||||||||||||||
|
|
|
|
|
|
|
|
|
|
|
|
|
|
|
| |||||||||||||||||
The accompanying notes are an integral part of these financial statements.
159
Ohio National Fund, Inc. | ||
| Statements of Changes in Net Assets | ||
| ON S&P MidCap 400® Index Portfolio | ON BlackRock Advantage Large Cap Growth Portfolio | ON Risk Managed Balanced Portfolio | ON Federated Core Plus Bond Portfolio | |||||||||||||||||||||||||||||
| Year Ended December 31, 2022 | Year Ended December 31, 2021 | Year Ended December 31, 2022 | Year Ended December 31, 2021 | Year Ended December 31, 2022 | Year Ended December 31, 2021 | Year Ended December 31, 2022 | Year Ended December 31, 2021 | |||||||||||||||||||||||||
Increase (Decrease) in net assets: | ||||||||||||||||||||||||||||||||
Operations: | ||||||||||||||||||||||||||||||||
Net investment income (loss) | $ | 4,697,808 | $ | 4,345,697 | $ | 609,922 | $ | (92,248 | ) | $ | 13,050,729 | $ | 2,153,197 | $ | 13,234,868 | $ | 8,936,477 | |||||||||||||||
Net realized gain (loss) on investments and futures contracts | 21,896,113 | 56,712,630 | 1,035,868 | 34,961,398 | (36,102,057 | ) | 48,012,120 | (34,877,886 | ) | (508,542 | ) | |||||||||||||||||||||
Change in unrealized appreciation/depreciation on investments and futures contracts | (83,766,894 | ) | 34,882,504 | (23,461,774 | ) | (9,425,747 | ) | (118,870,541 | ) | 12,672,602 | (66,363,139 | ) | (11,035,630 | ) | ||||||||||||||||||
|
|
|
|
|
|
|
|
|
|
|
|
|
|
|
| |||||||||||||||||
Change in net assets from operations | (57,172,973 | ) | 95,940,831 | (21,815,984 | ) | 25,443,403 | (141,921,869 | ) | 62,837,919 | (88,006,157 | ) | (2,607,695 | ) | |||||||||||||||||||
|
|
|
|
|
|
|
|
|
|
|
|
|
|
|
| |||||||||||||||||
Distributions: | ||||||||||||||||||||||||||||||||
Distributions to shareholders | (59,625,654 | ) | (11,549,364 | ) | (34,740,322 | ) | (21,732,994 | ) | (52,389,384 | ) | (68,983,730 | ) | (9,465,356 | ) | (2,534,969 | ) | ||||||||||||||||
|
|
|
|
|
|
|
|
|
|
|
|
|
|
|
| |||||||||||||||||
Capital transactions: | ||||||||||||||||||||||||||||||||
Received from shares sold | 62,756,203 | 29,235,131 | 346,006,891 | 2,965,665 | 979,291,083 | 38,341,268 | 81,089,166 | 544,419,024 | ||||||||||||||||||||||||
Received from dividends reinvested | 59,625,654 | 11,549,364 | 34,740,322 | 21,732,994 | 52,389,384 | 68,983,730 | 9,465,356 | 2,534,969 | ||||||||||||||||||||||||
Paid for shares redeemed | (73,655,305 | ) | (115,866,274 | ) | (30,527,193 | ) | (63,791,521 | ) | (145,114,544 | ) | (98,038,236 | ) | (158,471,240 | ) | (65,192,656 | ) | ||||||||||||||||
|
|
|
|
|
|
|
|
|
|
|
|
|
|
|
| |||||||||||||||||
Change in net assets from capital transactions | 48,726,552 | (75,081,779 | ) | 350,220,020 | (39,092,862 | ) | 886,565,923 | 9,286,762 | (67,916,718 | ) | 481,761,337 | |||||||||||||||||||||
|
|
|
|
|
|
|
|
|
|
|
|
|
|
|
| |||||||||||||||||
Change in net assets | (68,072,075 | ) | 9,309,688 | 293,663,714 | (35,382,453 | ) | 692,254,670 | 3,140,951 | (165,388,231 | ) | 476,618,673 | |||||||||||||||||||||
Net assets: | ||||||||||||||||||||||||||||||||
Beginning of year | 437,552,837 | 428,243,149 | 81,460,177 | 116,842,630 | 446,958,839 | 443,817,888 | 716,490,074 | 239,871,401 | ||||||||||||||||||||||||
|
|
|
|
|
|
|
|
|
|
|
|
|
|
|
| |||||||||||||||||
End of year | $ | 369,480,762 | $ | 437,552,837 | $ | 375,123,891 | $ | 81,460,177 | $ | 1,139,213,509 | $ | 446,958,839 | $ | 551,101,843 | $ | 716,490,074 | ||||||||||||||||
|
|
|
|
|
|
|
|
|
|
|
|
|
|
|
| |||||||||||||||||
The accompanying notes are an integral part of these financial statements.
160
Ohio National Fund, Inc. | ||
| Statements of Changes in Net Assets | ||
| ON U.S. Low Volatility Portfolio | ON AB Relative Value Portfolio | ON iShares Managed Risk Balanced Portfolio | ON iShares Managed Risk Moderate Growth Portfolio | ON iShares Managed Risk Growth Portfolio | ||||||||||||||||||||||||||||||||||||
| Year Ended December 31, 2022 | Period from June 25, 2021 (inception) to December 31, 2021 | Year Ended December 31, 2022 | Period from December 2, 2021 (inception) to December 31, 2021 | Year Ended December 31, 2022 | Period from June 25, 2021 (inception) to December 31, 2021 | Period from October 14, 2022 (inception) to December 31, 2022 | Period from October 14, 2022 (inception) to December 31, 2022 | |||||||||||||||||||||||||||||||||
Increase (Decrease) in net assets: | ||||||||||||||||||||||||||||||||||||||||
Operations: | ||||||||||||||||||||||||||||||||||||||||
Net investment income | $ | 8,705,219 | $ | 4,437,604 | $ | 1,470,576 | $ | 22,424 | $ | 6,514,570 | $ | 2,599,006 | $ | 2,683,968 | $ | 2,213,400 | ||||||||||||||||||||||||
Net realized gain (loss) on investments, futures contracts, foreign currency related transactions, and capital gain distributions received from underlying mutual funds | (7,547,614 | ) | 19,784,812 | (2,644,383 | ) | 70,167 | (29,743,481 | ) | 668,234 | 4,805,973 | 799,471 | |||||||||||||||||||||||||||||
Change in unrealized appreciation/depreciation on investments, futures contracts, and foreign currency related transactions | (71,016,377 | ) | 79,547,188 | (3,132,477 | ) | 3,814,204 | (26,746,207 | ) | 6,149,703 | 20,776,747 | 21,973,986 | |||||||||||||||||||||||||||||
|
|
|
|
|
|
|
|
|
|
|
|
|
|
|
| |||||||||||||||||||||||||
Change in net assets from operations | (69,858,772 | ) | 103,769,604 | (4,306,284 | ) | 3,906,795 | (49,975,118 | ) | 9,416,943 | 28,266,688 | 24,986,857 | |||||||||||||||||||||||||||||
|
|
|
|
|
|
|
|
|
|
|
|
|
|
|
| |||||||||||||||||||||||||
Distributions: | ||||||||||||||||||||||||||||||||||||||||
Distributions to shareholders | (24,143,362 | ) | — | (92,591 | ) | — | (3,430,064 | ) | — | — | — | |||||||||||||||||||||||||||||
|
|
|
|
|
|
|
|
|
|
|
|
|
|
|
| |||||||||||||||||||||||||
Capital transactions: | ||||||||||||||||||||||||||||||||||||||||
Received from shares sold | 14,522,475 | 9,586,656 | 77,045,730 | 76,337,586 | 314,447,942 | 437,083,431 | 486,047,292 | 421,249,533 | ||||||||||||||||||||||||||||||||
Received from in-kind transfer (see Note 3 of Notes to Financial Statements) | — | 983,714,079 | — | — | — | — | — | — | ||||||||||||||||||||||||||||||||
Received from dividends reinvested | 24,143,362 | — | 92,591 | — | 3,430,064 | — | — | — | ||||||||||||||||||||||||||||||||
Paid for shares redeemed | (189,797,773 | ) | (113,510,240 | ) | (24,660,816 | ) | (2,600,275 | ) | (64,824,870 | ) | (34,512,459 | ) | (23,315,931 | ) | (19,675,343 | ) | ||||||||||||||||||||||||
|
|
|
|
|
|
|
|
|
|
|
|
|
|
|
| |||||||||||||||||||||||||
Change in net assets from capital transactions | (151,131,936 | ) | 879,790,495 | 52,477,505 | 73,737,311 | 253,053,136 | 402,570,972 | 462,731,361 | 401,574,190 | |||||||||||||||||||||||||||||||
|
|
|
|
|
|
|
|
|
|
|
|
|
|
|
| |||||||||||||||||||||||||
Change in net assets | (245,134,070 | ) | 983,560,099 | 48,078,630 | 77,644,106 | 199,647,954 | 411,987,915 | 490,998,049 | 426,561,047 | |||||||||||||||||||||||||||||||
Net assets: | ||||||||||||||||||||||||||||||||||||||||
Beginning of year | 983,560,099 | — | 77,644,106 | — | 411,987,915 | — | — | — | ||||||||||||||||||||||||||||||||
|
|
|
|
|
|
|
|
|
|
|
|
|
|
|
| |||||||||||||||||||||||||
End of year | $ | 738,426,029 | $ | 983,560,099 | $ | 125,722,736 | $ | 77,644,106 | $ | 611,635,869 | $ | 411,987,915 | $ | 490,998,049 | $ | 426,561,047 | ||||||||||||||||||||||||
|
|
|
|
|
|
|
|
|
|
|
|
|
|
|
| |||||||||||||||||||||||||
The accompanying notes are an integral part of these financial statements.
161
Ohio National Fund, Inc. | ||
| Statements of Changes in Net Assets | ||
| ON Moderately Conservative Model Portfolio | ON Balanced Model Portfolio | ON Moderate Growth Model Portfolio | ON Growth Model Portfolio | |||||||||||||||||||||||||||||
| Year Ended December 31, 2022 | Year Ended December 31, 2021 | Year Ended December 31, 2022 | Year Ended December 31, 2021 | Year Ended December 31, 2022 | Year Ended December 31, 2021 | Year Ended December 31, 2022 | Year Ended December 31, 2021 | |||||||||||||||||||||||||
Increase (Decrease) in net assets: | ||||||||||||||||||||||||||||||||
Operations: | ||||||||||||||||||||||||||||||||
Net investment income | $ | 4,552,705 | $ | 3,783,470 | $ | 14,040,740 | $ | 12,794,426 | $ | 20,564,747 | $ | 19,494,611 | $ | 3,691,529 | $ | 3,524,848 | ||||||||||||||||
Net realized gain on investments and capital gain distributions received from underlying mutual funds | 10,960,407 | 18,920,001 | 76,286,314 | 97,084,171 | 204,017,522 | 230,571,672 | 57,283,328 | 64,402,129 | ||||||||||||||||||||||||
Change in unrealized appreciation/depreciation on investments | (57,343,084 | ) | (506,059 | ) | (257,591,305 | ) | 7,337,016 | (558,325,064 | ) | 26,359,312 | (141,608,112 | ) | 4,869,139 | |||||||||||||||||||
|
|
|
|
|
|
|
|
|
|
|
|
|
|
|
| |||||||||||||||||
Change in net assets from operations | (41,829,972 | ) | 22,197,412 | (167,264,251 | ) | 117,215,613 | (333,742,795 | ) | 276,425,595 | (80,633,255 | ) | 72,796,116 | ||||||||||||||||||||
|
|
|
|
|
|
|
|
|
|
|
|
|
|
|
| |||||||||||||||||
Distributions: | ||||||||||||||||||||||||||||||||
Distributions to shareholders | (19,022,010 | ) | (7,363,545 | ) | (95,455,234 | ) | (21,389,350 | ) | (209,220,568 | ) | (24,866,116 | ) | (57,611,540 | ) | (5,099,763 | ) | ||||||||||||||||
|
|
|
|
|
|
|
|
|
|
|
|
|
|
|
| |||||||||||||||||
Capital transactions: | ||||||||||||||||||||||||||||||||
Received from shares sold | 17,864,580 | 15,673,436 | 13,644,093 | 22,314,492 | 39,731,207 | 27,130,316 | 6,632,256 | 5,488,152 | ||||||||||||||||||||||||
Received from dividends reinvested | 19,022,010 | 7,363,545 | 95,455,233 | 21,389,350 | 209,220,568 | 24,866,116 | 57,611,540 | 5,099,763 | ||||||||||||||||||||||||
Paid for shares redeemed | (44,216,093 | ) | (59,739,637 | ) | (150,961,325 | ) | (174,831,433 | ) | (238,136,575 | ) | (313,641,966 | ) | (43,262,790 | ) | (73,160,937 | ) | ||||||||||||||||
|
|
|
|
|
|
|
|
|
|
|
|
|
|
|
| |||||||||||||||||
Change in net assets from capital transactions | (7,329,503 | ) | (36,702,656 | ) | (41,861,999 | ) | (131,127,591 | ) | 10,815,200 | (261,645,534 | ) | 20,981,006 | (62,573,022 | ) | ||||||||||||||||||
|
|
|
|
|
|
|
|
|
|
|
|
|
|
|
| |||||||||||||||||
Change in net assets | (68,181,485 | ) | (21,868,789 | ) | (304,581,484 | ) | (35,301,328 | ) | (532,148,163 | ) | (10,086,055 | ) | (117,263,789 | ) | 5,123,331 | |||||||||||||||||
Net assets: | ||||||||||||||||||||||||||||||||
Beginning of year | 281,613,058 | 303,481,847 | 1,092,524,063 | 1,127,825,391 | 1,977,324,423 | 1,987,410,478 | 448,186,975 | 443,063,644 | ||||||||||||||||||||||||
|
|
|
|
|
|
|
|
|
|
|
|
|
|
|
| |||||||||||||||||
End of year | $ | 213,431,573 | $ | 281,613,058 | $ | 787,942,579 | $ | 1,092,524,063 | $ | 1,445,176,260 | $ | 1,977,324,423 | $ | 330,923,186 | $ | 448,186,975 | ||||||||||||||||
|
|
|
|
|
|
|
|
|
|
|
|
|
|
|
| |||||||||||||||||
The accompanying notes are an integral part of these financial statements.
162
| Financial Highlights | ||
| Selected per-share data | Ratios and supplemental data | |||||||||||||||||||||||||||||||||||||||||||||
| Operations | Distributions | Ratios to average net assets | ||||||||||||||||||||||||||||||||||||||||||||
| Ratios assuming | ||||||||||||||||||||||||||||||||||||||||||||||
| no expenses | ||||||||||||||||||||||||||||||||||||||||||||||
| reduced or | ||||||||||||||||||||||||||||||||||||||||||||||
| Ratios net of expenses reduced or | reimbursed by | |||||||||||||||||||||||||||||||||||||||||||||
| reimbursed by adviser | adviser | |||||||||||||||||||||||||||||||||||||||||||||
| Net asset value, beginning of year | Net investment income (loss) | Net realized and unrealized gain (loss) | Total from operations | Distributions to shareholders | Net asset value, end of year | Total Return# | Expenses | Net investment income (loss) | Expenses | Net assets, end of year (millions) | Portfolio turnover rate | |||||||||||||||||||||||||||||||||||
ON Bond Portfolio | ||||||||||||||||||||||||||||||||||||||||||||||
Year Ended December 31, 2022 | $19.88 | 0.58 | (3.60) | (3.02) | (0.69) | $16.17 | (15.19 | )% | 0.61 | % | 3.11% | 0.61% | $221.5 | 21 | % | |||||||||||||||||||||||||||||||
Year Ended December 31, 2021 | $20.79 | 0.54 | (0.85) | (0.31) | (0.60) | $19.88 | (1.52 | )% | 0.59 | % | 2.56% | 0.59% | $277.4 | 13 | % | |||||||||||||||||||||||||||||||
Year Ended December 31, 2020 | $19.10 | 0.55 | 1.28 | 1.83 | (0.14) | $20.79 | 9.59 | % | 0.60 | % | 2.72% | 0.60% | $295.1 | 69 | % | |||||||||||||||||||||||||||||||
Year Ended December 31, 2019 | $17.02 | 0.55 | 1.96 | 2.51 | (0.43) | $19.10 | 14.73 | % | 0.60 | % | 3.19% | 0.60% | $290.5 | 60 | % | |||||||||||||||||||||||||||||||
Year Ended December 31, 2018 | $17.56 | 0.64 | (1.18) | (0.54) | — | $17.02 | (3.08 | )% | 0.59 | % | 3.27% | 0.59% | $257.7 | 40 | % | |||||||||||||||||||||||||||||||
ON BlackRock Balanced Allocation Portfolio | ||||||||||||||||||||||||||||||||||||||||||||||
Year Ended December 31, 2022 | $42.43 | 0.50 | (8.21) | (7.71) | (7.36) | $27.36 | (18.41 | )% | 0.55 | % | 1.57% | 0.55% | $418.7 | 70 | % | |||||||||||||||||||||||||||||||
Year Ended December 31, 2021 | $39.40 | 0.58 | 6.66 | 7.24 | (4.21) | $42.43 | 19.06 | % | 0.54 | % | 1.22% | 0.54% | $551.8 | 105 | % | |||||||||||||||||||||||||||||||
Year Ended December 31, 2020 | $34.30 | 0.60 | 4.75 | 5.35 | (0.25) | $39.40 | 15.65 | % | 0.55 | % | 1.57% | 0.55% | $533.7 | 121 | % | |||||||||||||||||||||||||||||||
Year Ended December 31, 2019 | $27.85 | 0.26 | 7.85 | 8.11 | (1.66) | $34.30 | 29.29 | % | 0.59 | % | 1.77% | 0.59% | $545.2 | 97 | %(a) | |||||||||||||||||||||||||||||||
Year Ended December 31, 2018 | $32.60 | 0.40 | (5.15) | (4.75) | — | $27.85 | (14.57 | )% | 0.77 | % | 1.16% | 0.77% | $53.6 | 225 | % | |||||||||||||||||||||||||||||||
ON BlackRock Advantage International Equity Portfolio | ||||||||||||||||||||||||||||||||||||||||||||||
Year Ended December 31, 2022 | $18.44 | 0.42 | (3.11) | (2.69) | (2.43) | $13.32 | (13.47 | )% | 0.89 | % | 2.53% | 0.89% | $354.6 | 134 | % | |||||||||||||||||||||||||||||||
Year Ended December 31, 2021 | $16.47 | 0.36 | 1.86 | 2.22 | (0.25) | $18.44 | 13.49 | % | 0.89 | % | 1.84% | 0.89% | $507.5 | 196 | % | |||||||||||||||||||||||||||||||
Year Ended December 31, 2020 | $15.52 | 0.20 | 0.83 | 1.03 | (0.08) | $16.47 | 6.74 | % | 0.91 | % | 1.40% | 0.91% | $504.4 | 238 | % | |||||||||||||||||||||||||||||||
Year Ended December 31, 2019 | $13.07 | 0.34 | 2.37 | 2.71 | (0.26) | $15.52 | 20.72 | % | 0.87 | % | 2.15% | 0.87% | $474.2 | 105 | %(b) | |||||||||||||||||||||||||||||||
Year Ended December 31, 2018 | $15.08 | 0.23 | (2.24) | (2.01) | — | $13.07 | (13.33 | )% | 0.86 | % | 1.93% | 0.86% | $518.8 | 44 | % | |||||||||||||||||||||||||||||||
ON Janus Henderson Forty Portfolio | ||||||||||||||||||||||||||||||||||||||||||||||
Year Ended December 31, 2022 | $36.43 | 0.02 | (11.42) | (11.40) | (23.84) | $1.19 | (33.92 | )% | 0.85 | % | (0.19)% | 0.85% | $44.1 | 51 | % | |||||||||||||||||||||||||||||||
Year Ended December 31, 2021 | $35.13 | (0.17) | 7.07 | 6.90 | (5.60) | $36.43 | 19.70 | % | 0.78 | % | (0.33)% | 0.78% | $142.2 | 31 | % | |||||||||||||||||||||||||||||||
Year Ended December 31, 2020 | $26.06 | (0.08) | 9.87 | 9.79 | (0.72) | $35.13 | 37.87 | % | 0.79 | % | (0.24)% | 0.79% | $203.6 | 36 | % | |||||||||||||||||||||||||||||||
Year Ended December 31, 2019 | $20.97 | (—)(c) | 7.25 | 7.25 | (2.16) | $26.06 | 34.89 | % | 0.81 | % | (—)%(c) | 0.81% | $196.9 | 53 | % | |||||||||||||||||||||||||||||||
Year Ended December 31, 2018 | $19.93 | (0.03) | 1.07 | 1.04 | — | $20.97 | 5.22 | % | 0.87 | % | (0.15)% | 0.87% | $149.3 | 48 | % | |||||||||||||||||||||||||||||||
| (a) | The cost of purchases and proceeds from sales of Portfolio securities that were incurred to realign the Portfolio’s holdings subsequent to the August 23, 2019 reorganization are excluded from the portfolio turnover rate calculation. If such amounts had not been excluded, the portfolio turnover rate would have been 261%. Effective February 1, 2019, the sub-adviser for the equity portion of the ON BlackRock Balanced Allocation Portfolio changed from Suffolk Capital Management, LLC to BlackRock Investment Management, LLC. |
| (b) | Effective December 7, 2019, the sub-adviser to the ON BlackRock Advantage International Equity Portfolio changed from Lazard Asset Management LLC to BlackRock Investment Management, LLC. Costs of purchases and proceeds from sales of portfolio securities associated with the change in sub-advisers contributed to a higher portfolio turnover rate for the year ended December 31, 2019 as compared to prior years. |
| (c) | The absolute value of per share or ratio data is less than $ 0.005 per share, or 0.005%, respectively. |
# Performance does not include fees and expenses imposed by a variable annuity contract. Had those fees and expenses been included, performance would have been lower than the returns presented.
The accompanying notes are an integral part of these financial statements.
163
| Financial Highlights | ||
| Selected per-share data | Ratios and supplemental data | |||||||||||||||||||||||||||||||||||||||||||||||
| Operations | Distributions | Ratios to average net assets | ||||||||||||||||||||||||||||||||||||||||||||||
| Ratios assuming | ||||||||||||||||||||||||||||||||||||||||||||||||
| no expenses | ||||||||||||||||||||||||||||||||||||||||||||||||
| reduced or | ||||||||||||||||||||||||||||||||||||||||||||||||
| Ratios net of expenses reduced or | reimbursed by | |||||||||||||||||||||||||||||||||||||||||||||||
| reimbursed by adviser | adviser | |||||||||||||||||||||||||||||||||||||||||||||||
Net asset value, beginning of year | Net investment income (loss) | Net realized and unrealized gain (loss) | Total from operations | Distributions to shareholders | Net asset value, end of year | Total Return# | Expenses | Net investment income (loss) | Expenses | Net assets, end of year (millions) | Portfolio turnover rate | |||||||||||||||||||||||||||||||||||||
ON AB Small Cap Portfolio | ||||||||||||||||||||||||||||||||||||||||||||||||
Year Ended December 31, 2022 | $42.63 | 0.01 | (11.42 | ) | (11.41 | ) | (20.59 | ) | $10.63 | (28.73 | )% | 0.85 | % | 0.07% | 0.85% | $113.7 | 58 | % | ||||||||||||||||||||||||||||||
Year Ended December 31, 2021 | $44.52 | (0.01 | ) | 3.43 | 3.42 | (5.31 | ) | $42.63 | 8.17 | % | 0.85 | % | (0.03)% | 0.85% | $169.3 | 136 | %(a) | |||||||||||||||||||||||||||||||
Year Ended December 31, 2020 | $33.89 | (0.22 | ) | 11.55 | 11.33 | (0.70 | ) | $44.52 | 34.04 | % | 0.89 | % | (0.48)% | 0.89% | $182.5 | 26 | % | |||||||||||||||||||||||||||||||
Year Ended December 31, 2019 | $30.89 | (0.15 | ) | 8.87 | 8.72 | (5.72 | ) | $33.89 | 28.61 | % | 0.88 | % | (0.35)% | 0.88% | $170.7 | 17 | % | |||||||||||||||||||||||||||||||
Year Ended December 31, 2018 | $32.99 | (0.10 | ) | (2.00 | ) | (2.10 | ) | — | $30.89 | (6.37 | )% | 0.85 | % | (0.23)% | 0.85% | $207.4 | 33 | % | ||||||||||||||||||||||||||||||
ON AB Mid Cap Core Portfolio | ||||||||||||||||||||||||||||||||||||||||||||||||
Year Ended December 31, 2022 | $62.45 | 0.14 | (14.02 | ) | (13.88 | ) | (23.41 | ) | $25.16 | (23.31 | )% | 0.88 | % | 0.53% | 0.88% | $77.8 | 41 | % | ||||||||||||||||||||||||||||||
Year Ended December 31, 2021 | $56.98 | 0.18 | 9.18 | 9.36 | (3.89 | ) | $62.45 | 16.79 | % | 0.89 | % | 0.30% | 0.89% | $104.7 | 125 | %(a) | ||||||||||||||||||||||||||||||||
Year Ended December 31, 2020 | $48.53 | (0.06 | ) | 9.21 | 9.15 | (0.70 | ) | $56.98 | 19.15 | % | 0.98 | % | (0.12)% | 0.98% | $109.2 | 14 | % | |||||||||||||||||||||||||||||||
Year Ended December 31, 2019 | $37.36 | 0.05 | 13.54 | 13.59 | (2.42 | ) | $48.53 | 36.57 | % | 0.96 | % | 0.10% | 0.96% | $110.0 | 10 | % | ||||||||||||||||||||||||||||||||
Year Ended December 31, 2018 | $38.60 | 0.02 | (1.26 | ) | (1.24 | ) | — | $37.36 | (3.21 | )% | 0.96 | % | 0.06% | 0.96% | $102.6 | 103 | %(b) | |||||||||||||||||||||||||||||||
ON S&P 500® Index Portfolio | ||||||||||||||||||||||||||||||||||||||||||||||||
Year Ended December 31, 2022 | $46.20 | 0.47 | (8.86 | ) | (8.39 | ) | (5.20 | ) | $32.61 | (18.42 | )% | 0.38 | % | 1.27% | 0.38% | $1,023.6 | 4 | % | ||||||||||||||||||||||||||||||
Year Ended December 31, 2021 | $38.72 | 0.54 | 10.09 | 10.63 | (3.15 | ) | $46.20 | 28.25 | % | 0.37 | % | 1.05% | 0.37% | $1,325.0 | 5 | % | ||||||||||||||||||||||||||||||||
Year Ended December 31, 2020 | $33.29 | 0.54 | 5.40 | 5.94 | (0.51 | ) | $38.72 | 17.99 | % | 0.39 | % | 1.49% | 0.39% | $1,228.8 | 6 | % | ||||||||||||||||||||||||||||||||
Year Ended December 31, 2019 | $28.11 | 0.57 | 8.00 | 8.57 | (3.39 | ) | $33.29 | 30.97 | % | 0.39 | % | 1.64% | 0.39% | $1,202.6 | 7 | % | ||||||||||||||||||||||||||||||||
Year Ended December 31, 2018 | $29.52 | 0.48 | (1.89 | ) | (1.41 | ) | — | $28.11 | (4.78 | )% | 0.38 | % | 1.58% | 0.38% | $1,111.5 | 18 | % | |||||||||||||||||||||||||||||||
ON BlackRock Advantage Large Cap Value Portfolio | ||||||||||||||||||||||||||||||||||||||||||||||||
Year Ended December 31, 2022 | $23.67 | 0.38 | (2.64 | ) | (2.26 | ) | (5.09 | ) | $16.32 | (8.97 | )% | 0.73 | % | 1.51% | �� | 0.73% | $198.9 | 94 | % | |||||||||||||||||||||||||||||
Year Ended December 31, 2021 | $19.13 | 0.31 | 4.52 | 4.83 | (0.29 | ) | $23.67 | 25.39 | % | 0.73 | % | 1.25% | 0.73% | $325.9 | 153 | % | ||||||||||||||||||||||||||||||||
Year Ended December 31, 2020 | $18.75 | 0.30 | 0.35 | 0.65 | (0.27 | ) | $19.13 | 3.66 | % | 0.74 | % | 1.70% | 0.74% | $316.5 | 150 | % | ||||||||||||||||||||||||||||||||
Year Ended December 31, 2019 | $16.37 | 0.76 | 2.38 | 3.14 | (0.76 | ) | $18.75 | 19.21 | % | 0.77 | % | 3.94% | 0.77% | $320.7 | 127 | %(c) | ||||||||||||||||||||||||||||||||
Year Ended December 31, 2018 | $17.88 | 0.87 | (2.38 | ) | (1.51 | ) | — | $16.37 | (8.45 | )% | 0.76 | % | 3.88% | 0.76% | $321.8 | 18 | % | |||||||||||||||||||||||||||||||
| (a) | Effective May 1, 2021, the sub-adviser to the ON AB Small Cap Portfolio and ON AB Mid Cap Core Portfolio changed from Janus Capital Management LLC to AllianceBernstein, L.P. Costs of purchases and proceeds from sales of portfolio securities associated with the change in the sub-adviser contributed to a higher portfolio turnover rate for the year ended December 31, 2021 as compared to prior years. |
| (b) | Effective May 1, 2018, the sub-adviser changed from Goldman Sachs Asset Management, L.P. to Janus Capital Management LLC. Costs of purchases and proceeds from sales of portfolio securities associated with the change in the sub-adviser contributed to a higher portfolio turnover rate for the year ended December 31, 2018 as compared to prior years. |
| (c) | Effective December 7, 2019, the sub-adviser changed from Federated Equity Management Company of Pennsylvania to BlackRock Investment Management, LLC. Costs of purchases and proceeds from sales of portfolio securities associated with the change in the sub-adviser contributed to a higher portfolio turnover rate for the year ended December 31, 2019 as compared to prior years. |
# Performance does not include fees and expenses imposed by a variable annuity contract. Had those fees and expenses been included, performance would have been lower than the returns presented.
The accompanying notes are an integral part of these financial statements.
164
Ohio National Fund, Inc. | ||
| Financial Highlights | ||
| Selected per-share data | Ratios and supplemental data | |||||||||||||||||||||||||||||||||||||||||||
| Operations | Distributions | Ratios to average net assets | ||||||||||||||||||||||||||||||||||||||||||
| Ratios net of expenses reduced or reimbursed by adviser | Ratios assuming no expenses reduced or reimbursed by adviser | |||||||||||||||||||||||||||||||||||||||||||
| Net asset value, beginning of year | Net investment income (loss) | Net realized and unrealized gain (loss) | Total from operations | Distributions to shareholders | Net asset value, end of year | Total Return# | Expenses | Net investment income (loss) | Expenses | Net assets, end of year (millions) | Portfolio turnover rate | |||||||||||||||||||||||||||||||||
ON Federated High Income Bond Portfolio | ||||||||||||||||||||||||||||||||||||||||||||
Year Ended December 31, 2022 | $21.58 | 1.18 | (3.65) | (2.47) | (1.14 | ) | $17.97 | (11.43 | )% | 0.84 | % | 5.05% | 0.84 | % | $123.6 | 13 | % | |||||||||||||||||||||||||||
Year Ended December 31, 2021 | $21.65 | 1.05 | 0.02 | 1.07 | (1.14 | ) | $21.58 | 4.97 | % | 0.82 | % | 4.50% | 0.82 | % | $170.2 | 36 | % | |||||||||||||||||||||||||||
Year Ended December 31, 2020 | $20.69 | 1.12 | 0.16 | 1.28 | (0.32 | ) | $21.65 | 6.26 | % | 0.83 | % | 4.97% | 0.83 | % | $175.6 | 33 | % | |||||||||||||||||||||||||||
Year Ended December 31, 2019 | $18.73 | 1.14 | 1.70 | 2.84 | (0.88 | ) | $20.69 | 15.29 | % | 0.80 | % | 5.34% | 0.80 | % | $198.7 | 23 | % | |||||||||||||||||||||||||||
Year Ended December 31, 2018 | $19.36 | 1.41 | (2.04) | (0.63) | — | $18.73 | (3.25 | )% | 0.75 | % | 5.39% | 0.75 | % | $202.1 | 14 | % | ||||||||||||||||||||||||||||
ON Nasdaq-100® Index Portfolio | ||||||||||||||||||||||||||||||||||||||||||||
Year Ended December 31, 2022 | $28.58 | 0.08 | (8.66) | (8.58) | (7.54 | ) | $12.46 | (32.57 | )% | 0.43 | % | 0.46% | 0.43 | % | $208.5 | 9 | % | |||||||||||||||||||||||||||
Year Ended December 31, 2021 | $28.08 | 0.12 | 6.89 | 7.01 | (6.51 | ) | $28.58 | 26.99 | % | 0.41 | % | 0.28% | 0.41 | % | $356.5 | 7 | % | |||||||||||||||||||||||||||
Year Ended December 31, 2020 | $19.83 | 0.13 | 9.30 | 9.43 | (1.18 | ) | $28.08 | 48.32 | % | 0.42 | % | 0.49% | 0.42 | % | $383.0 | 10 | % | |||||||||||||||||||||||||||
Year Ended December 31, 2019 | $16.60 | 0.14 | 6.15 | 6.29 | (3.06 | ) | $19.83 | 38.86 | % | 0.42 | % | 0.66% | 0.42 | % | $353.0 | 8 | % | |||||||||||||||||||||||||||
Year Ended December 31, 2018 | $16.67 | 0.12 | (0.19) | (0.07) | — | $16.60 | (0.42 | )% | 0.41 | % | 0.67% | 0.41 | % | $327.6 | 22 | % | ||||||||||||||||||||||||||||
ON BlackRock Advantage Large Cap Core Portfolio | ||||||||||||||||||||||||||||||||||||||||||||
Year Ended December 31, 2022 | $44.84 | 0.30 | (8.89) | (8.59) | (10.46 | ) | $25.79 | (19.56 | )% | 0.69 | % | 0.97% | 0.69 | % | $313.8 | 90 | % | |||||||||||||||||||||||||||
Year Ended December 31, 2021 | $38.66 | 0.35 | 10.24 | 10.59 | (4.41 | ) | $44.84 | 28.49 | % | 0.69 | % | 0.66% | 0.69 | % | $437.3 | 135 | % | |||||||||||||||||||||||||||
Year Ended December 31, 2020 | $32.95 | 0.38 | 5.39 | 5.77 | (0.06 | ) | $38.66 | 17.55 | % | 0.70 | % | 1.04% | 0.70 | % | $418.5 | 137 | % | |||||||||||||||||||||||||||
Year Ended December 31, 2019 | $24.79 | 0.22 | 8.10 | 8.32 | (0.16 | ) | $32.95 | 33.60 | % | 0.74 | % | 1.28% | 0.74 | % | $430.6 | 152 | %(a) | |||||||||||||||||||||||||||
Year Ended December 31, 2018 | $30.22 | 0.20 | (5.63) | (5.43) | — | $24.79 | (17.97 | )% | 0.82 | % | 0.63% | 0.82 | % | $155.3 | 272 | % | ||||||||||||||||||||||||||||
ON BlackRock Advantage Small Cap Growth Portfolio | ||||||||||||||||||||||||||||||||||||||||||||
Year Ended December 31, 2022 | $37.99 | 0.01 | (9.57) | (9.56) | (9.94 | ) | $18.49 | (26.12 | )% | 0.86 | % | 0.03% | 0.86 | % | $135.0 | 49 | % | |||||||||||||||||||||||||||
Year Ended December 31, 2021 | $41.69 | (0.13) | 1.88 | 1.75 | (5.45 | ) | $37.99 | 4.05 | % | 0.85 | % | (0.33)% | 0.85 | % | $196.2 | 87 | % | |||||||||||||||||||||||||||
Year Ended December 31, 2020 | $31.42 | (0.06) | 10.73 | 10.67 | (0.40 | ) | $41.69 | 34.34 | % | 0.86 | % | (0.17)% | 0.86 | % | $209.8 | 87 | % | |||||||||||||||||||||||||||
Year Ended December 31, 2019 | $23.62 | 0.02 | 8.02 | 8.04 | (0.24 | ) | $31.42 | 34.07 | % | 0.91 | % | 0.11% | 0.91 | % | $204.8 | 114 | %(a) | |||||||||||||||||||||||||||
Year Ended December 31, 2018 | $24.91 | (0.26) | (1.03) | (1.29) | — | $23.62 | (5.18 | )% | 1.05 | % | (0.55)% | 1.05 | % | $25.5 | 201 | % | ||||||||||||||||||||||||||||
| (a) | The cost of purchases and proceeds from sales of Portfolio securities that were incurred to realign the Portfolios holdings subsequent to the August 23, 2019 reorganization are excluded from the portfolio turnover rate calculation. If such amounts had not been excluded, the portfolio turnover rates would have been 211% for the ON BlackRock Advantage Large Cap Core Portfolio and and 177% for the ON BlackRock Advantage Small Cap Growth Portfolio. Effective February 1, 2019, the sub-adviser to the Portfolios changed from Suffolk Capital Management, LLC to BlackRock Investment Management, LLC. |
# Performance does not include fees and expenses imposed by a variable annuity contract. Had those fees and expenses been included, performance would have been lower than the returns presented.
The accompanying notes are an integral part of these financial statements.
165
Ohio National Fund, Inc. | ||
| Financial Highlights | ||
| Selected per-share data | Ratios and supplemental data | |||||||||||||||||||||||||||||||||||||||||||||||||||||||||||
| Operations | Distributions | Ratios to average net assets | ||||||||||||||||||||||||||||||||||||||||||||||||||||||||||
| Ratios net of expenses reduced or reimbursed by adviser | Ratios assuming no expenses reduced or reimbursed by adviser | |||||||||||||||||||||||||||||||||||||||||||||||||||||||||||
Net asset value, beginning of year | Net investment income | Net realized and unrealized gain (loss) | Total from operations | Distributions to shareholders | Net asset value, end of year | Total Return# | Expenses | Net investment income (loss) | Expenses | Net assets, end of year (millions) | Portfolio turnover rate | |||||||||||||||||||||||||||||||||||||||||||||||||
ON S&P MidCap 400® Index Portfolio | ||||||||||||||||||||||||||||||||||||||||||||||||||||||||||||
Year Ended December 31, 2022 | $ | 26.22 | 0.26 | (3.79 | ) | (3.53 | ) | (3.98 | ) | $ | 18.71 | (13.40 | )% | 0.42 | % | 1.30 | % | 0.42 | % | $ | 369.5 | 26 | % | |||||||||||||||||||||||||||||||||||||
Year Ended December 31, 2021 | $ | 21.70 | 0.29 | 4.90 | 5.19 | (0.67 | ) | $ | 26.22 | 24.18 | % | 0.41 | % | 0.99 | % | 0.41 | % | $ | 437.6 | 21 | % | |||||||||||||||||||||||||||||||||||||||
Year Ended December 31, 2020 | $ | 19.25 | 0.27 | 2.27 | 2.54 | (0.09 | ) | $ | 21.70 | 13.33 | % | 0.42 | % | 1.31 | % | 0.42 | % | $ | 428.2 | 28 | % | |||||||||||||||||||||||||||||||||||||||
Year Ended December 31, 2019 | $ | 15.46 | 0.21 | 3.74 | 3.95 | (0.16 | ) | $ | 19.25 | 25.58 | % | 0.44 | % | 1.37 | % | 0.44 | % | $ | 450.9 | 39 | % | |||||||||||||||||||||||||||||||||||||||
Year Ended December 31, 2018 | $ | 17.46 | 0.10 | (2.10 | ) | (2.00 | ) | — | $ | 15.46 | (11.45 | )% | 0.51 | % | 1.32 | % | 0.51 | % | $ | 306.6 | 28 | % | ||||||||||||||||||||||||||||||||||||||
ON BlackRock Advantage Large Cap Growth Portfolio | ||||||||||||||||||||||||||||||||||||||||||||||||||||||||||||
Year Ended December 31, 2022 | $ | 33.65 | 0.01 | (9.13 | ) | (9.12 | ) | (17.96 | ) | $ | 6.57 | (32.56 | )% | 0.75 | % | 0.49 | % | 0.75 | % | $ | 375.1 | 135 | % | |||||||||||||||||||||||||||||||||||||
Year Ended December 31, 2021 | $ | 36.36 | 0.01 | 8.69 | 8.70 | (11.41 | ) | $ | 33.65 | 26.69 | % | 0.78 | % | (0.09 | )% | 0.78 | % | $ | 81.5 | 138 | % | |||||||||||||||||||||||||||||||||||||||
Year Ended December 31, 2020 | $ | 27.54 | 0.08 | 9.22 | 9.30 | (0.48 | ) | $ | 36.36 | 33.97 | % | 0.79 | % | 0.21 | % | 0.79 | % | $ | 116.8 | 143 | % | |||||||||||||||||||||||||||||||||||||||
Year Ended December 31, 2019 | $ | 20.59 | 0.16 | 7.77 | 7.93 | (0.98 | ) | $ | 27.54 | 38.68 | % | 0.80 | % | 0.62 | % | 0.80 | % | $ | 113.2 | 214 | % | |||||||||||||||||||||||||||||||||||||||
Year Ended December 31, 2018 | $ | 24.19 | 0.12 | (3.72 | ) | (3.60 | ) | — | $ | 20.59 | (14.88 | )% | 0.88 | % | 0.43 | % | 0.88 | % | $ | 87.5 | 269 | % | ||||||||||||||||||||||||||||||||||||||
ON Risk Managed Balanced Portfolio | ||||||||||||||||||||||||||||||||||||||||||||||||||||||||||||
Year Ended December 31, 2022 | $ | 17.16 | 0.09 | (3.96 | ) | (3.87 | ) | (0.60 | ) | $ | 12.69 | (22.62 | )% | 0.87 | % | 1.48 | % | 0.87 | % | $ | 1,139.2 | 124 | % | |||||||||||||||||||||||||||||||||||||
Year Ended December 31, 2021 | $ | 17.63 | 0.09 | 2.43 | 2.52 | (2.99 | ) | $ | 17.16 | 15.04 | % | 0.95 | % | 0.48 | % | 0.95 | % | $ | 447.0 | 51 | % | |||||||||||||||||||||||||||||||||||||||
Year Ended December 31, 2020 | $ | 14.81 | 0.13 | 3.12 | 3.25 | (0.43 | ) | $ | 17.63 | 22.15 | % | 0.98 | % | 0.76 | % | 0.98 | % | $ | 443.8 | 114 | %(a),(b) | |||||||||||||||||||||||||||||||||||||||
Year Ended December 31, 2019 | $ | 12.91 | 0.21 | 3.01 | 3.22 | (1.32 | ) | $ | 14.81 | 25.16 | % | 0.99 | % | 1.39 | % | 0.99 | % | $ | 403.6 | 105 | %(b) | |||||||||||||||||||||||||||||||||||||||
Year Ended December 31, 2018 | $ | 13.01 | 0.17 | (0.27 | ) | (0.10 | ) | — | $ | 12.91 | (0.77 | )% | 0.99 | % | 1.27 | % | 0.99 | % | $ | 347.1 | 131 | %(b) | ||||||||||||||||||||||||||||||||||||||
ON Federated Core Plus Bond Portfolio | ||||||||||||||||||||||||||||||||||||||||||||||||||||||||||||
Year Ended December 31, 2022 | $ | 10.30 | 0.23 | (1.54 | ) | (1.31 | ) | (0.16 | ) | $ | 8.83 | (12.78 | )% | 0.56 | % | 2.22 | % | 0.56 | % | $ | 551.1 | 81 | % | |||||||||||||||||||||||||||||||||||||
Year Ended December 31, 2021 | $ | 10.47 | 0.06 | (0.19 | ) | (0.13 | ) | (0.04 | ) | $ | 10.30 | (1.27 | )% | 0.57 | % | 1.85 | % | 0.57 | % | $ | 716.5 | 40 | % | |||||||||||||||||||||||||||||||||||||
Period From May 1, 2020 (inception) to December 31, 2020 | $ | 10.00 | 0.11 | 0.36 | 0.47 | — | $ | 10.47 | 4.70 | %* | 0.65 | %** | 1.65 | %** | 0.65 | %** | $ | 239.9 | 30 | %* | ||||||||||||||||||||||||||||||||||||||||
| * | Not annualized |
| ** | Annualized |
| (a) | Effective May 1, 2020, the sub-adviser(s) to the ON Risk Managed Balanced Portfolio changed from Janus Capital Management LLC and AnchorPath Financial, LLC to AllianceBernstein, L.P. Costs of purchases and proceeds from sales of portfolio securities associated with the change in the sub-adviser contributed to a higher portfolio turnover rate for the year ended December 31, 2020 as compared to prior years. |
| (b) | The portfolio turnover calculation in previous years includes purchases and sales from mortgage dollar roll transactions. Without the effect of mortgage dollar roll transactions, the portfolio turnover rate would have been 102% for the year ended December 31, 2020, 84% for the year ended December 31, 2019, 102% for the year ended December 31, 2018, and 63% for the year ended December 31, 2017 (see Note 2 of the Notes to Financial Statements). |
# Performance does not include fees and expenses imposed by a variable annuity contract. Had those fees and expenses been included, performance would have been lower than the returns presented.
The accompanying notes are an integral part of these financial statements.
166
Ohio National Fund, Inc. | ||
| Financial Highlights | ||
| Selected per-share data | Ratios and supplemental data | |||||||||||||||||||||||||||||||||||||||||||||||||||||||||||
| Operations | Distributions | Ratios to average net assets | ||||||||||||||||||||||||||||||||||||||||||||||||||||||||||
| Ratios net of expenses reduced or reimbursed by adviser | Ratios assuming no expenses reduced or reimbursed by adviser | |||||||||||||||||||||||||||||||||||||||||||||||||||||||||||
Net asset value, beginning of year | Net investment income | Net realized and unrealized gain (loss) | Total from operations | Distributions to shareholders | Net asset value, end of year | Total Return# | Expenses | Net investment income | Expenses | Net assets, end of year (millions) | Portfolio turnover rate | |||||||||||||||||||||||||||||||||||||||||||||||||
ON U.S. Low Volatility Portfolio | ||||||||||||||||||||||||||||||||||||||||||||||||||||||||||||
Year Ended December 31, 2022 | $ | 11.12 | 0.13 | (0.95 | ) | (0.82 | ) | (0.32 | ) | $ | 9.98 | (7.33 | )% | 0.62 | % | 1.06 | % | 0.62 | % | $ | 738.4 | 78 | % | |||||||||||||||||||||||||||||||||||||
Period from June 25, 2021 (inception) to December 31, 2021 | $ | 10.00 | 0.05 | 1.07 | 1.12 | — | $ | 11.12 | 11.20 | %* | 0.62 | %** | 0.89 | %** | 0.62 | %** | $ | 983.6 | 32 | %* | ||||||||||||||||||||||||||||||||||||||||
ON AB Relative Value Portfolio | ||||||||||||||||||||||||||||||||||||||||||||||||||||||||||||
Year Ended December 31, 2022 | $ | 10.52 | 0.12 | (0.59 | ) | (0.47 | ) | (0.01 | ) | $ | 10.04 | (4.50 | )% | 0.74 | % | 1.44 | % | 0.74 | % | $ | 125.7 | 81 | % | |||||||||||||||||||||||||||||||||||||
Period from December 2, 2021 (inception) to December 31, 2021 | $ | 10.00 | — | (a) | 0.52 | 0.52 | — | $ | 10.52 | 5.20 | %* | 1.19 | %** | 0.38 | %** | 1.19 | %** | $ | 77.6 | 5 | %* | |||||||||||||||||||||||||||||||||||||||
ON iShares Managed Risk Balanced Portfolio | ||||||||||||||||||||||||||||||||||||||||||||||||||||||||||||
Year Ended December 31, 2022 | $ | 10.23 | 0.10 | (1.72 | ) | (1.62 | ) | (0.09 | ) | $ | 8.52 | (15.84 | )% | 0.61 | %† | 1.58 | %† | 0.61 | %† | $ | 611.6 | 48 | % | |||||||||||||||||||||||||||||||||||||
Period from June 25, 2021 (inception) to December 31, 2021 | $ | 10.00 | 0.06 | 0.17 | 0.23 | — | $ | 10.23 | 2.30 | %* | 0.62 | %**,† | 1.22 | %**,† | 0.62 | %**,† | $ | 412.0 | 15 | %* | ||||||||||||||||||||||||||||||||||||||||
ON iShares Managed Risk Moderate Growth Portfolio | ||||||||||||||||||||||||||||||||||||||||||||||||||||||||||||
Period from October 14, 2022 (inception) to December 31, 2022. | $ | 10.00 | 0.06 | 0.53 | 0.59 | — | $ | 10.59 | 5.90 | %* | 0.61 | %**,† | 2.58 | %**,† | 0.61 | %**,† | $ | 491.0 | 49 | %* | ||||||||||||||||||||||||||||||||||||||||
ON iShares Managed Risk Growth Portfolio | ||||||||||||||||||||||||||||||||||||||||||||||||||||||||||||
Period from October 14, 2022 (inception) to December 31, 2022. | $ | 10.00 | 0.05 | 0.55 | 0.60 | — | $ | 10.60 | 6.00 | %* | 0.61 | %**,† | 2.45 | %**,† | 0.61 | %**,† | $ | 426.6 | 47 | %* | ||||||||||||||||||||||||||||||||||||||||
| * | Not annualized |
| ** | Annualized |
| † | The ratios presented only reflect the direct income and expenses for the Portfolio, and do not include the indirect expenses related to the underlying funds in which the Portfolio invests. |
| (a) | The absolute value of per share or ratio data is less than $0.005 per share, or 0.005%, respectively. |
# Performance does not include fees and expenses imposed by a variable annuity contract. Had those fees and expenses been included, performance would have been lower than the returns presented.
The accompanying notes are an integral part of these financial statements.
167
Ohio National Fund, Inc. | ||
| Financial Highlights | ||
| Selected per-share data | Ratios and supplemental data | |||||||||||||||||||||||||||||||||||||||||||||||||||||||
| Operations | Distributions | Ratios to average net assets | ||||||||||||||||||||||||||||||||||||||||||||||||||||||
| Ratios net of expenses reduced or reimbursed by adviser | Ratios assuming no expenses reduced or reimbursed by adviser | |||||||||||||||||||||||||||||||||||||||||||||||||||||||
Net asset value, beginning of year | Net investment income | Net realized and unrealized gain (loss) | Total from operations | Distributions to shareholders | Return of capital | Total distributions | Net asset value, end of year | Total Return# | Expenses† | Net investment income† | Expenses† | Net assets, end of year (millions) | Portfolio turnover rate | |||||||||||||||||||||||||||||||||||||||||||
ON Moderately Conservative Model Portfolio | ||||||||||||||||||||||||||||||||||||||||||||||||||||||||
Year Ended December 31, 2022 | $13.32 | 0.23 | (2.24 | ) | (2.01 | ) | (0.96 | ) | — | (0.96 | ) | $10.35 | (15.12 | )% | 0.47 | % | 1.91 | % | 0.47% | $ 213.4 | 29 | % | ||||||||||||||||||||||||||||||||||
Year Ended December 31, 2021 | $12.67 | 0.20 | 0.79 | 0.99 | (0.34 | ) | — | (0.34 | ) | $13.32 | 7.90 | % | 0.43 | % | 1.29 | % | 0.45% | $ 281.6 | 13 | % | ||||||||||||||||||||||||||||||||||||
Year Ended December 31, 2020 | $11.37 | 0.09 | 1.21 | 1.30 | — | — | — | $12.67 | 11.43 | % | 0.40 | % | 0.97 | % | 0.47% | $ 303.5 | 23 | %(a) | ||||||||||||||||||||||||||||||||||||||
Year Ended December 31, 2019 | $10.09 | 0.26 | 1.41 | 1.67 | (0.37 | ) | (0.02 | ) | (0.39 | ) | $11.37 | 16.58 | % | 0.35 | % | 2.22 | % | 0.46% | $ 223.2 | 18 | % | |||||||||||||||||||||||||||||||||||
Year Ended December 31, 2018 | $10.69 | 0.15 | (0.75 | ) | (0.60 | ) | — | — | — | $10.09 | (5.61 | )% | 0.28 | % | 1.26 | % | 0.45% | $ 237.2 | 38 | % | ||||||||||||||||||||||||||||||||||||
ON Balanced Model Portfolio | ||||||||||||||||||||||||||||||||||||||||||||||||||||||||
Year Ended December 31, 2022 | $14.22 | 0.22 | (2.46 | ) | (2.24 | ) | (1.39 | ) | — | (1.39 | ) | $10.59 | (15.75 | )% | 0.44 | % | 1.58 | % | 0.44% | $ 787.9 | 27 | % | ||||||||||||||||||||||||||||||||||
Year Ended December 31, 2021 | $13.06 | 0.18 | 1.25 | 1.43 | (0.27 | ) | — | (0.27 | ) | $14.22 | 11.03 | % | 0.42 | % | 1.14 | % | 0.43% | $1,092.5 | 12 | % | ||||||||||||||||||||||||||||||||||||
Year Ended December 31, 2020 | $11.48 | 0.08 | 1.50 | 1.58 | — | — | — | $13.06 | 13.76 | % | 0.39 | % | 0.67 | % | 0.43% | $1,127.8 | 22 | % | ||||||||||||||||||||||||||||||||||||||
Year Ended December 31, 2019 | $ 9.97 | 0.21 | 1.73 | 1.94 | (0.24 | ) | (0.19 | ) | (0.43 | ) | $11.48 | 19.46 | % | 0.36 | % | 1.82 | % | 0.43% | $1,109.5 | 22 | % | |||||||||||||||||||||||||||||||||||
Year Ended December 31, 2018 | $10.81 | 0.09 | (0.93 | ) | (0.84 | ) | — | — | — | $ 9.97 | (7.77 | )% | 0.31 | % | 0.77 | % | 0.42% | $1,146.9 | 37 | % | ||||||||||||||||||||||||||||||||||||
ON Moderate Growth Model Portfolio | ||||||||||||||||||||||||||||||||||||||||||||||||||||||||
Year Ended December 31, 2022 | $15.26 | 0.18 | (2.81 | ) | (2.63 | ) | (1.75 | ) | — | (1.75 | ) | $10.88 | (17.17 | )% | 0.42 | % | 1.27 | % | 0.42% | $1,445.2 | 32 | % | ||||||||||||||||||||||||||||||||||
Year Ended December 31, 2021 | $13.46 | 0.16 | 1.83 | 1.99 | (0.19 | ) | — | (0.19 | ) | $15.26 | 14.83 | % | 0.42 | % | 0.98 | % | 0.42% | $1,977.3 | 15 | % | ||||||||||||||||||||||||||||||||||||
Year Ended December 31, 2020 | $11.63 | 0.04 | 1.79 | 1.83 | — | — | — | $13.46 | 15.74 | % | 0.44 | % | 0.35 | % | 0.45% | $1,987.4 | 16 | % | ||||||||||||||||||||||||||||||||||||||
Year Ended December 31, 2019 | $ 9.93 | 0.16 | 2.20 | 2.36 | (0.30 | ) | (0.36 | ) | (0.66 | ) | $11.63 | 23.81 | % | 0.43 | % | 1.31 | % | 0.44% | $1,961.4 | 20 | % | |||||||||||||||||||||||||||||||||||
Year Ended December 31, 2018 | $11.05 | 0.05 | (1.17 | ) | (1.12 | ) | — | — | — | $ 9.93 | (10.14 | )% | 0.35 | % | 0.42 | % | 0.42% | $1,945.0 | 49 | % | ||||||||||||||||||||||||||||||||||||
ON Growth Model Portfolio | ||||||||||||||||||||||||||||||||||||||||||||||||||||||||
Year Ended December 31, 2022 | $16.47 | 0.15 | (3.18 | ) | (3.03 | ) | (2.26 | ) | — | (2.26 | ) | $11.18 | (18.29 | )% | 0.44 | % | 1.01 | % | 0.44% | $ 330.9 | 28 | % | ||||||||||||||||||||||||||||||||||
Year Ended December 31, 2021 | $14.17 | 0.13 | 2.35 | 2.48 | (0.18 | ) | — | (0.18 | ) | $16.47 | 17.58 | % | 0.49 | % | 0.78 | % | 0.49% | $ 448.2 | 18 | % | ||||||||||||||||||||||||||||||||||||
Year Ended December 31, 2020 | $11.94 | 0.02 | 2.21 | 2.23 | — | — | — | $14.17 | 18.68 | % | 0.46 | % | 0.16 | % | 0.47% | $ 443.1 | 11 | % | ||||||||||||||||||||||||||||||||||||||
Year Ended December 31, 2019 | $ 9.86 | 0.11 | 2.50 | 2.61 | (0.35 | ) | (0.18 | ) | (0.53 | ) | $11.94 | 26.47 | % | 0.45 | % | 0.92 | % | 0.47% | $ 433.6 | 18 | % | |||||||||||||||||||||||||||||||||||
Year Ended December 31, 2018 | $11.15 | 0.02 | (1.31 | ) | (1.29 | ) | — | — | — | $ 9.86 | (11.57 | )% | 0.31 | % | 0.17 | % | 0.43% | $ 424.2 | 62 | % | ||||||||||||||||||||||||||||||||||||
| (a) | The cost of purchases and proceeds from sales of Portfolio securities that were incurred to realign the Portfolio’s holdings subsequent to the December 4, 2020 reorganization are excluded from the portfolio turnover rate calculation. If such amounts had not been excluded, the portfolio turnover rate would have been 28%. |
# Performance does not include fees and expenses imposed by a variable annuity contract. Had those fees and expenses been included, performance would have been lower than the returns presented.
† Ratios presented only reflect the direct income and expenses for the Portfolio, and do not include the indirect expenses related to the underlying funds in which the Portfolio invests.
The accompanying notes are an integral part of these financial statements.
168
| Notes to Financial Statements | December 31, 2022 | |
| (1) | Organization |
Ohio National Fund, Inc. (the “Fund”) is a Maryland corporation registered under the Investment Company Act of 1940, as amended (the “40 Act”). The Fund is an open-end investment company and follows accounting and reporting guidance under Financial Accounting Standards Board (“FASB”) Accounting Standards Codification (“ASC”) Topic 946, “Financial Services-Investment Companies”. The Fund consists of twenty-five separate investment portfolios (the “Portfolios”) that seek the following objectives and strategies:
| ∎ | ON Bond Portfolio – High level of income and opportunity for capital appreciation consistent with preservation of capital by investing, under normal circumstances, at least 80% of its net assets in corporate debt securities. |
| ∎ | ON BlackRock Balanced Allocation Portfolio – High level of long-term total return consistent with preservation of capital by investing in stocks, bonds, and money market instruments. |
| ∎ | ON BlackRock Advantage International Equity Portfolio – Long-term growth of capital by investing, under normal circumstances, at least 80% of its net assets in non-U.S. equity securities and equity-like instruments of companies that are components of, or have characteristics similar to, the companies included in the MSCI EAFE Index (Net - USD). |
| ∎ | ON Janus Henderson Forty Portfolio – Long-term capital growth by investing primarily in domestic and foreign equity securities selected for growth potential. |
| ∎ | ON AB Small Cap Portfolio – Long-term growth of capital by investing, under normal circumstances, at least 80% of its net assets in equity securities of smaller capitalization companies with market capitalizations at the time of investment that fall within the lowest 20% of the total U.S. equity market capitalization (excluding companies with market capitalizations of less than $10 million). |
| ∎ | ON AB Mid Cap Core Portfolio – Long-term growth of capital by investing, under normal circumstances, at least 80% of its net assets in equity securities of mid-capitalization companies with public stock market capitalization at the time of investment that are within the range of market capitalizations of the companies constituting the Russell Midcap® Index. |
| ∎ | ON S&P 500® Index Portfolio – Total return approximating that of the Standard & Poor’s 500® Index (S&P 500® Index), at a risk level consistent with that of the S&P 500® Index by investing, under normal circumstances, more than 80% of its net assets in common stock and other securities of companies that are included in the S&P 500® Index. |
| ∎ | ON BlackRock Advantage Large Cap Value Portfolio – Growth of capital by investing, under normal circumstances, at least 80% of its net assets in stocks of large capitalization companies with market capitalizations at the time of investment that are within the range of market capitalizations of the companies in the Russell 1000® Value Index for the previous twelve months. |
| ∎ | ON Federated High Income Bond Portfolio – High current income by investing, under normal circumstances, at least 80% of its net assets in lower rated corporate debt obligations commonly referred to as “junk bonds”. The Portfolio’s investments are generally rated BB or lower by Standard & Poor’s or Fitch, or Ba or lower by Moody’s. |
| ∎ | ON Nasdaq-100® Index Portfolio – Long-term growth of capital by investing, under normal circumstances, more than 80% of its net assets in the common stocks of companies that are included in the Nasdaq-100® Index. |
| ∎ | ON BlackRock Advantage Large Cap Core Portfolio – Long-term growth of capital by investing, under normal circumstances, at least 80% of its net assets in common stocks of the 1,000 largest publicly traded U.S. companies in terms of market capitalization. |
| ∎ | ON BlackRock Advantage Small Cap Growth Portfolio – Long-term growth of capital by investing, under normal circumstances, at least 80% of its net assets in stocks of small capitalization companies with a market capitalization at the time of investment that is no greater than the largest market capitalization of a company in the Russell 2000® Index for the previous twelve months. |
| ∎ | ON S&P MidCap 400® Index Portfolio – Total return approximating that of the Standard & Poor’s MidCap 400® Index (S&P MidCap 400® Index), including reinvestment of dividends, at a risk level consistent with that of the S&P MidCap 400® Index by investing, under normal circumstances, more than 80% of its net assets in the common stock and other securities included in the S&P MidCap 400® Index. |
| ∎ | ON BlackRock Advantage Large Cap Growth Portfolio – Long-term growth of capital by investing, under normal circumstances, at least 80% of its net assets in stocks of large capitalization companies with market capitalizations at the time of investment that are within the range of market capitalizations of the companies in the Russell 1000® Growth Index for the previous twelve months. |
| 169 | (continued) |
Ohio National Fund, Inc. | ||
| Notes to Financial Statements (Continued) | December 31, 2022 | |
| ∎ | ON Risk Managed Balanced Portfolio – Long-term capital growth, consistent with preservation of capital and balanced by current income. The Portfolio invests in a balanced portfolio of equity and fixed-income securities and a risk management portfolio intended to enhance the risk adjusted return of the Portfolio. |
| ∎ | ON Federated Core Plus Bond Portfolio - Total return by investing, under normal circumstances, at least 80% of its net assets in fixed-income investments, primarily U.S. dollar denominated, investment-grade, fixed income securities. Investment-grade, fixed income securities are rated in one of the four highest categories (BBB- or higher) by a nationally recognized statistical rating organization (“NRSRO”). |
| ∎ | ON U.S. Low Volatility Portfolio (formerly ON Janus Henderson U.S. Low Volatility Portfolio)—Capital appreciation by investing, under normal circumstances, at least 80% of its net assets in U.S. common stocks of companies included in the S&P 500® Index. Those stocks are selected by a mathematical investment process which seeks to achieve returns similar to those of the S&P 500®Index over the long-term with lower absolute volatility. |
| ∎ | ON AB Relative Value Portfolio - Long-term growth of capital by investing primarily in the equity securities of U.S. companies that the Portfolio’s sub-adviser believes are trading at attractive valuations and that have strong or improving business models. |
| ∎ | ON iShares Managed Risk Balanced Portfolio1 - Income and capital appreciation by investing in underlying exchange traded funds (“ETFs”) and futures. Under normal market conditions, through investments in the underlying funds and derivatives, the Portfolio invests a minimum of 25% of its assets in equity investments and a minimum of 25% of its assets in fixed income investments. |
| ∎ | ON iShares Managed Risk Moderate Growth Portfolio1 - Income and capital appreciation by investing in underlying exchange traded funds (“ETFs”) and futures. Under normal market conditions, through investments in the underlying funds and derivatives, the Portfolio expects to allocate 65% of its assets in equity investments and 35% of its assets in fixed income investments. |
| ∎ | ON iShares Managed Risk Growth Portfolio1 - Income and capital appreciation by investing in underlying exchange traded funds (“ETFs”) and futures. Under normal market conditions, through investments in the underlying funds and derivatives, the Portfolio expects to allocate 85% of its assets in equity investments and 15% of its assets in fixed income investments. |
| ∎ | ON Moderately Conservative Model Portfolio2 – Current income and moderate growth of capital with a greater emphasis on current income by investing in underlying mutual funds. Under normal circumstances, the Portfolio intends to have investment exposure to various asset classes within the following target asset allocation ranges: U.S. Equity 20-40%, International Equity 5-20%, and Fixed Income 30-70%. |
| ∎ | ON Balanced Model Portfolio2 – A balance between growth of capital and current income with a greater emphasis on growth of capital by investing in underlying mutual funds. Under normal circumstances, the Portfolio intends to have investment exposure to various asset classes within the following target asset allocation ranges: U.S. Equity 25-50%, International Equity 10-25%, and Fixed Income 25-50%. |
| ∎ | ON Moderate Growth Model Portfolio2 – Growth of capital and moderate current income with a greater emphasis on growth of capital by investing in underlying mutual funds. Under normal circumstances, the Portfolio intends to have investment exposure to various asset classes within the following target asset allocation ranges: U.S. Equity 40-60%, International Equity 15-35%, and Fixed Income 10-30%. |
| ∎ | ON Growth Model Portfolio2 – Growth of capital and some current income by investing in underlying mutual funds. Under normal circumstances, the Portfolio intends to have investment exposure to various asset classes within the following target asset allocation ranges: U.S. Equity 50-80%, International Equity 15-45%, and Fixed Income 0-15%. |
| 1 | Collectively, the “ON iShares Managed Risk Portfolios”. |
| 2 | Collectively, the “ON Model Portfolios”. |
The ON iShares Managed Risk Portfolios and the ON Model Portfolios are each a “Fund of Funds”, which means each invests primarily in other open-end mutual funds or exchange traded funds (“ETFs”). Those underlying mutual funds or ETFs invest in stocks, bonds, and other securities that are consistently recorded at fair value, but involve varying amounts of potential investment risk and reward. The portfolio management team of each of those Portfolios periodically adjust the investment allocation to allow the Portfolio to achieve its investment objective.
Additional detail regarding Portfolio-specific objectives, policies, and investment strategies is provided in the Prospectuses and Statements of Additional Information of Ohio National Fund, Inc. There are no assurances that these objectives will be met. Each Portfolio, except the ON Nasdaq-100® Index Portfolio, is classified as diversified for purposes of Section 5(b) of the 40 Act.
| 170 | (continued) |
Ohio National Fund, Inc. | ||
| Notes to Financial Statements (Continued) | December 31, 2022 | |
At present, the Fund issues its shares to separate accounts of The Ohio National Life Insurance Company (“ONLIC”), Ohio National Life Assurance Corporation (“ONLAC”), and National Security Life and Annuity Company (“NSLA”) to support certain benefits under variable contracts issued by those entities, as well as for purchases by other Portfolios of the Fund. In the future, Fund shares may be used for other purposes but, unless there is a change in applicable law, they will not be sold directly to the public.
ONLIC and NSLA no longer market, nor issue, variable annuities. ONLIC and NSLA will continue to service the in-force variable annuity contracts, the variable separate accounts, and underlying subaccounts regardless of new sales.
Interest in each Portfolio is represented by a separate class of the Fund’s capital stock, par value $1. Each share of a Portfolio participates equally in the Portfolio’s dividends, distributions, net assets, and voting matters.
The Fund is authorized to issue 1.55 billion of its capital shares. Of this total, shares authorized have been allocated to specific Portfolios of the Fund as follows:
Portfolio | Authorized Shares | |||
ON Bond | 22,000,000 | |||
ON BlackRock Balanced Allocation | 25,000,000 | |||
ON BlackRock Advantage International Equity | 50,000,000 | |||
ON Janus Henderson Forty | 74,000,000 | |||
ON AB Small Cap | 17,000,000 | |||
ON AB Mid Cap Core | 6,000,000 | |||
ON S&P 500® Index | 50,000,000 | |||
ON BlackRock Advantage Large Cap Value | 26,000,000 | |||
ON Federated High Income Bond | 13,000,000 | |||
ON Nasdaq-100® Index | 27,000,000 | |||
ON BlackRock Advantage Large Cap Core | 19,000,000 | |||
ON BlackRock Advantage Small Cap Growth | 12,000,000 | |||
ON S&P MidCap 400® Index | 31,000,000 | |||
Portfolio | Authorized Shares | |||
| ON BlackRock Advantage Large Cap Growth | 82,000,000 | |||
| ON Risk Managed Balanced | 170,000,000 | |||
| ON Federated Core Plus Bond | 115,000,000 | |||
| ON U.S. Low Volatility | 155,000,000 | |||
| ON AB Relative Value | 25,000,000 | |||
| ON iShares Managed Risk Balanced | 123,000,000 | |||
| ON iShares Managed Risk Moderate Growth | 95,000,000 | |||
| ON iShares Managed Risk Growth | 80,000,000 | |||
| ON Moderately Conservative Model | 28,000,000 | |||
| ON Balanced Model | 97,000,000 | |||
| ON Moderate Growth Model | 170,000,000 | |||
| ON Growth Model | 38,000,000 | |||
The Fund’s Board of Directors (the “Board”) periodically reallocates authorized shares among the Portfolios of the Fund and may authorize additional shares as deemed necessary.
Under the Fund’s organizational documents, its Officers and Directors are indemnified against certain liabilities arising out of the performance of their duties to the Fund. In addition, in the normal course of business, the Fund enters into contracts with its vendors and others that provide for general indemnifications. The Fund’s maximum exposure under these arrangements is unknown, as this would involve future claims that may be made against the Fund. However, based on experience, the risk of loss to the Fund is expected to be remote.
| (2) | Significant Accounting Policies |
The following is a summary of significant accounting policies followed by the Fund in preparation of its financial statements:
Use of Estimates
The preparation of financial statements in conformity with U.S. generally accepted accounting principles (“U.S. GAAP”) requires management to make estimates and assumptions that affect the reported amounts of assets and liabilities and disclosure of contingent assets and liabilities at the date of the financial statements and the reported amounts of increases and decreases in net assets from operations during the reporting period. Actual results could differ from those estimates.
Security Valuation
The Board has adopted policies for the valuation of the Fund’s securities, which include guidelines for valuation when active market quotations are not readily available. The Board has delegated authority to the Fund’s adviser, Ohio National Investments, Inc. (“ONI”) to apply those guidelines in the determination of fair value, subject to oversight by the Board.
Fixed income instruments that mature in sixty days or less, and of sufficient credit quality, are valued at amortized cost. Amortized cost valuation involves valuing a security at its cost initially and thereafter amortizing to maturity any discounts or premiums on the level-yield method, regardless of the impact of fluctuating market interest rates on the value of the security. In these instances, amortized cost approximates fair value.
Investments, other than those securities aforementioned, are valued as follows:
| 171 | (continued) |
Ohio National Fund, Inc. | ||
| Notes to Financial Statements (Continued) | December 31, 2022 | |
Domestic equity securities that are traded on U.S. exchanges, other than the Nasdaq Stock Market, are valued at the last trade price reported by the primary exchange of each security (4:00 pm Eastern Time for normal trading sessions). Domestic equity securities that are listed on the Nasdaq Stock Market are valued at the Nasdaq Official Closing Price (“NOCP”). Over-the-counter domestic equity securities are valued at the last trade price reported daily as of 4:00 pm Eastern Time (normal trading sessions). If, on a particular day, a domestic equity security does not trade, or otherwise cannot be priced by independent pricing services, then a broker quotation as of the end of the current trading session, the evaluated mean between the bid and ask prices, as reported by an approved independent pricing source, or a previous last trade price may be used when appropriate.
Over-the-counter traded American Depositary Receipts (“ADRs”) may also be valued at an evaluated price based on the value of the underlying securities. If a domestic equity security is not traded on a particular day, the mean between the bid and ask prices reported at 4:00 pm Eastern Time (normal trading sessions) by the primary exchange will generally be used for valuation purposes. The principal sources for market quotations are independent pricing services that have been approved by the Board.
Fixed income securities that have a remaining maturity exceeding sixty days are generally valued at the evaluated bid price reported at 4:00 pm Eastern Time (normal trading sessions), as provided by independent pricing services approved by the Board. Many fixed income securities, including investment grade and high-yield corporate bonds, U.S. Treasury and government agency obligations, and other asset-backed instruments are not actively traded on a daily basis. As such, the approved pricing services may use asset type-specific valuation models to provide good faith determinations that the holders of securities would receive in an orderly transaction under current market conditions. The valuation models may use observable market data such as recent transaction data, benchmark yields, broker/dealer inputs, valuations and yields of comparable instruments, relative credit information, observed market movements, and market research and news. Asset-backed securities and mortgage-backed securities may use valuation models that heavily consider predicted cash flows of each tranche of an issue, benchmark spreads, and unique attributes of the tranche. The last trade or last evaluated bid may be used if an evaluated bid price is not available.
U.S exchange-traded options are valued at the composite basis last sale price as reported to a Board-approved independent pricing service by the OPRA (Options Price Reporting Authority) at 4:00 pm Eastern Time (normal trading sessions). If there are no reported trades for a trading session, the evaluated composite-basis bid price, or other method will be used for valuation purposes.
Futures contracts are valued at the daily quoted settlement prices as reported by an approved independent pricing source.
Shares of open-end mutual funds are valued at each fund’s last calculated net asset value per share.
Shares of closed-end mutual funds that are traded on U.S. exchanges are valued similarly to other domestic equity securities, typically at the last trade price reported by the primary exchange of each fund (4:00 pm Eastern Time for normal trading sessions).
Foreign equity securities are initially priced at the reported close price of the exchange on which a security is primarily traded. Securities not traded on a particular day are valued at the mean between the last reported bid and ask quotes at daily close, or the last sale price when appropriate. The principal sources for market quotations are independent pricing services that have been approved by the Board.
Equity securities that are primarily traded on foreign exchanges, other than those with close times that are consistent with the normal 4:00 pm Eastern Time close of U.S. equity markets, are further subjected to fair valuation pricing procedures provided by an independent fair valuation service. The service provides data that can be used to estimate the price of a foreign issue that would prevail in a liquid market given market information available daily at 4:00 pm Eastern Time (normal trading sessions). Multiple factors may be considered in performing this valuation, including an issue’s local close price, relevant general and sector indices, currency fluctuations, and pricing of related depository receipts, exchange traded funds, and futures. The pricing procedures are performed for each individual security for which there is a fairly large degree of certainty that the local close price is not the liquid market price at the time of U.S. market close. The procedures are performed each day there is a change in a consistently used market index from the time of local close to the U.S. market close. Backtesting analysis is performed on a quarterly basis to monitor the effectiveness of these procedures. The testing is reviewed by management of the Fund and is reported to the Board. Prior results have indicated that these procedures have been effective in reaching valuation objectives.
Restricted securities, illiquid securities, or other investments for which market quotations or other observable market inputs are not readily available are valued at an estimate of value using methods determined in good faith by the Adviser’s Pricing Committee under the supervision of the Board.
The differences between the aggregate cost and values of investments are reflected as unrealized appreciation or unrealized depreciation.
| 172 | (continued) |
Ohio National Fund, Inc. | ||
| Notes to Financial Statements (Continued) | December 31, 2022 | |
Pricing inputs used in the Fund’s determination of its investment values are categorized according to a three-tier hierarchy framework. The hierarchy is summarized in three broad levels:
| Level 1: | Quoted prices in active markets for identical securities. |
| Level 2: | Other significant observable inputs, including quoted prices for similar securities, interest rates, prepayment speeds, credit risk, etc. |
| Level 3: | Significant unobservable inputs, including the Fund’s own assumptions used to determine the value of securities. |
The following is a summary of the inputs used in valuing each of the Portfolio’s assets (liabilities) at value as of December 31, 2022:
Portfolio | Financial Instrument Type | Level 1 | Level 2 | Level 3 | ||||||||||
| ON Bond | Corporate Bonds*** | $ | — | $ | 185,023,141 | $ | — | |||||||
| U.S. Treasury Obligations | — | 22,015,820 | — | |||||||||||
| Asset-Backed Securities*** | — | 5,642,279 | — | |||||||||||
|
|
|
|
|
| |||||||||
| $ | — | $ | 212,681,240 | $ | — | |||||||||
|
|
|
|
|
| |||||||||
| ON BlackRock Balanced Allocation | Common Stocks*** | $ | 296,819,772 | $ | — | $ | — | |||||||
| Corporate Bonds*** | — | 111,817,795 | — | |||||||||||
| U.S. Treasury Obligations | — | 3,399,492 | — | |||||||||||
| Asset-Backed Securities*** | — | 2,288,757 | — | |||||||||||
|
|
|
|
|
| |||||||||
| $ | 296,819,772 | $ | 117,506,044 | $ | — | |||||||||
|
|
|
|
|
| |||||||||
| Long Futures Contracts | $ | (117,814 | ) | $ | — | $ | — | |||||||
|
|
|
|
|
| |||||||||
| ON BlackRock Advantage International Equity | Common Stocks*** | $ | 761,194 | $ | 346,478,351 | $ | — | |||||||
| Preferred Securities*** | — | 1,892,573 | — | |||||||||||
|
|
|
|
|
| |||||||||
| $ | 761,194 | $ | 348,370,924 | $ | — | |||||||||
|
|
|
|
|
| |||||||||
| Long Futures Contracts | $ | (191,413 | ) | $ | — | $ | — | |||||||
|
|
|
|
|
| |||||||||
| ON Janus Henderson Forty | Common Stocks*** | $ | 42,691,161 | $ | 861,588 | $ | — | |||||||
| Commercial Paper | — | 599,867 | — | |||||||||||
|
|
|
|
|
| |||||||||
| $ | 42,691,161 | $ | 1,461,455 | $ | — | |||||||||
|
|
|
|
|
| |||||||||
| ON AB Small Cap | Common Stocks*** | $ | 112,297,428 | $ | — | $ | — | |||||||
| Exchange Traded Funds | 425,596 | — | — | |||||||||||
|
|
|
|
|
| |||||||||
| $ | 112,723,024 | $ | — | $ | — | |||||||||
|
|
|
|
|
| |||||||||
| ON AB Mid Cap Core | Common Stocks*** | $ | 76,853,117 | $ | — | $ | — | |||||||
|
|
|
|
|
| |||||||||
| Long Futures Contracts | $ | (7,212 | ) | $ | — | $ | — | |||||||
|
|
|
|
|
| |||||||||
| ON S&P 500® Index | Common Stocks*** | $ | 1,007,729,400 | $ | — | $ | — | |||||||
| U.S. Treasury Obligations | — | 199,504 | — | |||||||||||
|
|
|
|
|
| |||||||||
| $ | 1,007,729,400 | $ | 199,504 | $ | — | |||||||||
|
|
|
|
|
| |||||||||
| Long Futures Contracts | $ | (509,228 | ) | $ | — | $ | — | |||||||
|
|
|
|
|
| |||||||||
| ON BlackRock Advantage Large Cap Value | Common Stocks*** | $ | 197,172,468 | $ | — | $ | — | |||||||
|
|
|
|
|
| |||||||||
| Long Futures Contracts | $ | (94,864 | ) | $ | — | $ | — | |||||||
|
|
|
|
|
| |||||||||
| ON Federated High Income Bond | Corporate Bonds*** | $ | — | $ | 119,607,562 | $ | — | |||||||
| Common Stocks*** | 158,990 | — | — | |||||||||||
| Rights*** | — | 3,841 | — | |||||||||||
|
|
|
|
|
| |||||||||
| $ | 158,990 | $ | 119,611,403 | $ | — | |||||||||
|
|
|
|
|
| |||||||||
| 173 | (continued) |
Ohio National Fund, Inc. | ||
| Notes to Financial Statements (Continued) | December 31, 2022 | |
Portfolio | Financial Instrument Type | Level 1 | Level 2 | Level 3 | ||||||||||
| ON Nasdaq-100® Index | Common Stocks*** | $ | 204,387,215 | $ | — | $ | — | |||||||
| U.S. Treasury Obligations | — | 99,752 | — | |||||||||||
|
|
|
|
|
| |||||||||
| $ | 204,387,215 | $ | 99,752 | $ | — | |||||||||
|
|
|
|
|
| |||||||||
| Long Futures Contracts | $ | (83,855 | ) | $ | — | $ | — | |||||||
|
|
|
|
|
| |||||||||
| ON BlackRock Advantage Large Cap Core | Common Stocks*** | $ | 308,477,380 | $ | — | $ | — | |||||||
|
|
|
|
|
| |||||||||
| Long Futures Contracts | $ | (141,087 | ) | $ | — | $ | — | |||||||
|
|
|
|
|
| |||||||||
| ON BlackRock Advantage Small Cap Growth | Common Stocks*** | $ | 132,494,569 | $ | — | $ | — | |||||||
| Rights | — | 4,950 | — | |||||||||||
|
|
|
|
|
| |||||||||
| $ | 132,494,569 | $ | 4,950 | $ | — | |||||||||
|
|
|
|
|
| |||||||||
| Long Futures Contracts | $ | (53,419 | ) | $ | — | $ | — | |||||||
|
|
|
|
|
| |||||||||
| ON S&P MidCap 400® Index | Common Stocks*** | $ | 366,041,240 | $ | — | $ | — | |||||||
| U.S. Treasury Obligations | — | 99,752 | — | |||||||||||
|
|
|
|
|
| |||||||||
| $ | 366,041,240 | $ | 99,752 | $ | — | |||||||||
|
|
|
|
|
| |||||||||
| Long Futures Contracts | $ | (69,432 | ) | $ | — | $ | — | |||||||
|
|
|
|
|
| |||||||||
| ON BlackRock Advantage Large Cap Growth | Common Stocks*** | $ | 368,392,668 | $ | — | $ | — | |||||||
|
|
|
|
|
| |||||||||
| Long Futures Contracts | $ | (340,010 | ) | $ | — | $ | — | |||||||
|
|
|
|
|
| |||||||||
| ON Risk Managed Balanced | Common Stocks*** | $ | 571,191,177 | $ | — | $ | — | |||||||
| Corporate Bonds*** | — | 182,845,020 | — | |||||||||||
| U.S. Treasury Obligations | — | 161,740,824 | — | |||||||||||
| Asset-Backed / Mortgage-Backed Securities*** | — | 71,304,836 | — | |||||||||||
| Purchased Options | 43,235,907 | 22,040,220 | — | |||||||||||
| U.S. Government Agency Mortgage-Backed Securities | — | 50,737,491 | — | |||||||||||
| Preferred Securities*** | — | 1,799,952 | — | |||||||||||
| Sovereign Debt Issues | — | 1,292,432 | — | |||||||||||
| Taxable Municipal Bonds | — | 440,745 | — | |||||||||||
|
|
|
|
|
| |||||||||
| $ | 614,427,084 | $ | 492,201,520 | $ | — | |||||||||
|
|
|
|
|
| |||||||||
| Long Futures Contracts | $ | (2,659,267 | ) | $ | — | $ | — | |||||||
|
|
|
|
|
| |||||||||
| Short Futures Contracts | $ | 3,283,478 | $ | — | $ | — | ||||||||
|
|
|
|
|
| |||||||||
| ON Federated Core Plus Bond | U.S. Treasury Obligations | $ | — | $ | 253,744,029 | $ | — | |||||||
| Corporate Bonds*** | — | 121,781,406 | — | |||||||||||
| U.S. Government Agency Mortgage-Backed Securities | — | 110,343,864 | — | |||||||||||
| Investment Companies | 34,536,316 | — | — | |||||||||||
| Asset-Backed / Mortgage-Backed Securities*** | — | 20,042,209 | — | |||||||||||
| Sovereign Debt Issues | — | 1,769,885 | — | |||||||||||
| Common Stocks*** | 3,379 | — | — | |||||||||||
|
|
|
|
|
| |||||||||
| $ | 34,539,695 | $ | 507,681,393 | $ | — | |||||||||
|
|
|
|
|
| |||||||||
| Long Futures Contracts | $ | (116,132 | ) | $ | — | $ | — | |||||||
|
|
|
|
|
| |||||||||
| 174 | (continued) |
Ohio National Fund, Inc. | ||
| Notes to Financial Statements (Continued) | December 31, 2022 | |
Portfolio | Financial Instrument Type | Level 1 | Level 2 | Level 3 | ||||||||||
| Short Futures Contracts | $ | 87,345 | $ | — | $ | — | ||||||||
|
|
|
|
|
| |||||||||
| ON U.S. Low Volatility | Common Stocks*** | $ | 731,796,759 | $ | — | $ | — | |||||||
|
|
|
|
|
| |||||||||
| ON AB Relative Value | Common Stocks*** | $ | 121,349,349 | $ | — | $ | — | |||||||
|
|
|
|
|
| |||||||||
| ON iShares Managed Risk Balanced | Exchange Traded Funds | $ | 566,900,065 | $ | — | $ | — | |||||||
|
|
|
|
|
| |||||||||
| Long Futures Contracts | $ | (1,492,769 | ) | $ | — | $ | — | |||||||
|
|
|
|
|
| |||||||||
| Short Futures Contracts | $ | (41,273 | ) | $ | — | $ | — | |||||||
|
|
|
|
|
| |||||||||
| ON iShares Managed Risk Moderate Growth | Exchange Traded Funds | $ | 434,260,576 | $ | — | $ | — | |||||||
|
|
|
|
|
| |||||||||
| Long Futures Contracts | $ | (1,750,014 | ) | $ | — | $ | — | |||||||
|
|
|
|
|
| |||||||||
| Short Futures Contracts | $ | (240 | ) | $ | — | $ | — | |||||||
|
|
|
|
|
| |||||||||
| ON iShares Managed Risk Growth | Exchange Traded Funds | $ | 385,003,028 | $ | — | $ | — | |||||||
|
|
|
|
|
| |||||||||
| Long Futures Contracts | $ | (1,200,847 | ) | $ | — | $ | — | |||||||
|
|
|
|
|
| |||||||||
| Short Futures Contracts | $ | (205 | ) | $ | — | $ | — | |||||||
|
|
|
|
|
| |||||||||
| ON Moderately Conservative Model | Open-End Mutual Funds | $ | 213,535,374 | $ | — | $ | — | |||||||
|
|
|
|
|
| |||||||||
| ON Balanced Model | Open-End Mutual Funds | $ | 788,272,962 | $ | — | $ | — | |||||||
|
|
|
|
|
| |||||||||
| ON Moderate Growth Model | Open-End Mutual Funds | $ | 1,445,693,615 | $ | — | $ | — | |||||||
|
|
|
|
|
| |||||||||
| ON Growth Model | Open-End Mutual Funds | $ | 331,066,125 | $ | — | $ | — | |||||||
|
|
|
|
|
| |||||||||
*** Each of the Portfolio’s Schedules of Investments include detailed industry descriptions.
Foreign Securities and Currency
The books and records of all the Portfolios are maintained in U.S. dollars. All investments and cash quoted in foreign currencies are valued daily in U.S. dollars on the basis of the foreign currency exchange rates provided by an independent source. These exchange rates are currently determined daily at 4:00 pm Eastern Time for normal trading sessions. Purchases and sales of foreign-denominated investments are recorded at rates of exchange prevailing on the respective dates of such transactions.
The Fund may not fully isolate that portion of the results of operations resulting from changes in foreign exchange rates from fluctuations arising from changes in market prices on foreign currency-denominated investments. For the portion that is isolated, amounts are reflected in the Statements of Operations as other foreign currency related transactions. However, for tax purposes, the Fund does fully isolate the effect of fluctuations in foreign exchange rates when determining the gain or loss upon sale or maturity of such investments to the extent required by federal income tax regulations.
All Portfolios of the Fund may invest in securities of foreign issuers. The ON BlackRock Advantage International Equity Portfolio may be invested entirely in foreign securities. Investments in securities of foreign issuers, including investments in foreign companies through the use of depositary receipts, carry certain risks not ordinarily associated with investments in securities of domestic issuers. Such risks include future political and economic developments, and the possible imposition of exchange controls or other foreign governmental laws and restrictions. In addition, with respect to certain countries, there is the possibility of expropriation of assets, confiscatory taxation, political or social instability, or diplomatic developments that could adversely affect capital investment within those countries.
Restricted Securities
Restricted securities are typically those securities purchased through a private offering and cannot be resold to the general public without prior registration under the Securities Act of 1933 (“the 1933 Act”) or pursuant to the resale limitations provided by Rule 144A under the 1933 Act, or an exemption from the registration requirements of the 1933 Act. 144A securities are issued by corporations without registration in reliance on 1933 Act provisions allowing for the private resale of unregistered securities to qualified institutional buyers. Section 4(a)(2) commercial paper is issued pursuant to Section 4(a)(2) of the 1933 Act which exempts an issue
| 175 | (continued) |
Ohio National Fund, Inc. | ||
| Notes to Financial Statements (Continued) | December 31, 2022 | |
from registration. This paper may be used to finance non-current transactions, such as acquisitions, stock repurchase programs, and other long-term assets. Investments by a Portfolio in Rule 144A and Section 4(a)(2) securities could have the effect of decreasing the liquidity of a Portfolio during any period in which qualified institutional investors were no longer interested in purchasing these securities.
Investment Transactions and Related Income
For financial reporting purposes, investment transactions are accounted for on a trade date (T+0) basis. For purposes of executing separate account shareholder transactions in the normal course of business, however, the Fund’s investment transactions are recorded no later than the first calculation on the first business day following the trade date (T+1), in accordance with Rule 2a-4 of the 40 Act. Accordingly, differences between the net asset values for financial reporting and for executing separate account shareholder transactions may arise.
Dividend income is recognized on the ex-dividend date, except in the case of those Portfolios holding foreign securities, in which dividends are recorded as soon after the ex-dividend date as the Fund’s information agents become aware of such dividends.
Interest income is accrued daily as earned and includes the amortization of premium and accretion of discount using the interest method. The period of amortization or accretion extends from the purchase date to the maturity date, except for securities that are purchased at a premium and have explicit, noncontingent call features, whereby the securities are callable at fixed prices and on pre-determined dates. The premium amounts related to those securities are generally amortized to the earliest call date. Net realized gain or loss on investments and foreign exchange transactions are determined using the specific identification method. Payments received for interest-only mortgage-backed securities are included in interest income. Because no principal is received at the maturity of an interest-only security, adjustments are made to the cost of the security until maturity. These adjustments are also included in interest income on the Statements of Operations.
Distributions to Shareholders and Federal Taxes
The Fund may satisfy its distribution requirements, as required for each of the Portfolios to qualify as a regulated investment company pursuant to Subchapter M of the Internal Revenue Code by using consent dividends or cash distributions. Consent dividends, when authorized, become taxable to the Fund’s shareholders as if they were paid in cash. The Fund has the intent to continue to comply with tax provisions pertaining to regulated investment companies and make distributions of taxable income sufficient to relieve it from substantially all federal income and excise taxes. As such, no provisions for federal income or excise taxes have been recorded. Also, no tax-related interest or penalties have been incurred or accrued. The Board’s intent is that the Fund will not initiate any realized gain distributions until any applicable capital loss carryforwards have been offset.
The character of ordinary income distributions, realized capital gains distributions, and return of capital, if any, are determined in accordance with federal income tax regulations and may differ from net investment income and realized gains for financial reporting purposes. These “book/tax” differences are either considered temporary or permanent in nature. To the extent these differences are permanent in nature, they are reclassified within the composition of net assets; temporary differences do not require such reclassification. Distributions to shareholders that exceed taxable income and net taxable realized gains are reported as return of capital distributions.
The Fund’s management and its tax agent perform an affirmative evaluation of tax positions taken or expected to be taken in the course of preparing the Fund’s tax returns to determine whether it is more-likely-than-not (i.e. greater than 50-percent) that each tax position will be sustained upon examination by a taxing authority based on the technical merits of the position. Implementation of the evaluation included a review of tax positions taken in tax years that remain subject to examination by all major tax jurisdictions, including federal tax and the state of Maryland. The determination has been made that there are no uncertain tax positions that would require the Portfolios to record a tax liability or provision.
Expense Allocation
Expenses directly attributable to a Portfolio are charged to that Portfolio. Expenses that cannot be directly attributed to a Portfolio are allocated among all the benefited Portfolios on a basis of relative net assets or other appropriate method.
Foreign Withholding Taxes
Certain Portfolios in the Fund may be subject to taxes imposed by countries in which they invest with respect to their investments in issuers existing or operating in such countries. Such taxes are generally withheld based on income earned. These Portfolios accrue such taxes as the related income is earned.
| 176 | (continued) |
Ohio National Fund, Inc. | ||
| Notes to Financial Statements (Continued) | December 31, 2022 | |
TBA Commitments
To-Be-Announced (“TBA”) commitments are agreements for the purchase or sale of mortgage-backed securities for a fixed price, with payment and delivery on an agreed upon future settlement date beyond the customary settlement period for such securities. The specific securities to be delivered are not identified at the trade date. However, delivered securities must meet specified terms, including issuer, rate and term and be within industry-accepted “good delivery” standards. When entering into TBA commitments, a Portfolio may take possession of or deliver the underlying mortgage-backed securities but can extend the settlement or roll the transaction. TBA commitments involve a risk of loss if the value of the security to be purchased or sold declines or increases, respectively, prior to settlement date.
Mortgage Dollar Rolls
A Portfolio may enter into a mortgage dollar roll (“MDR”) transaction in which the Portfolio agrees to both sell and purchase a similar, but not identical, TBA mortgage-backed security with the same issuer, rate, and term on a later date at a set price. MDRs are treated as purchases and sales, which may have the effect of increasing portfolio turnover rates, and result in realized gains and losses based on the agreed-upon fixed prices.
New Accounting Pronouncements and Regulations
In October 2020, the Securities and Exchange Commission (the “SEC”) adopted Rule 18f-4, which governs the use of derivatives by registered investment companies. Rule 18f-4 imposes limits on the amount of derivatives a fund can enter into, eliminates the asset segregation framework currently used by funds to comply with Section 18 of the 40 Act, and requires funds whose use of derivatives is greater than a limited specified amount to establish and maintain a comprehensive derivatives risk management program and appoint a derivatives risk manager. Rule 18f-4 had a compliance date of August 19, 2022. Management has implemented changes in connection with the rule and has determined that there is no material impact to the Portfolio’s financial statements.
In December 2020, the SEC adopted Rules 2a-5 and 31a-4 (the “Rules”) that clarify how investment companies may satisfy their valuation obligations under the 40 Act. The Rules permit an investment company’s board to designate a fund’s investment adviser to determine fair value, subject to the board’s oversight and certain other conditions. The Rules also create a framework for the determination of the fair value of an investment company’s investments to establish a standard baseline for valuation practices and recordkeeping. The Rules had a compliance date of September 8, 2022. Management has implemented changes in connection with the Rules and has determined that there is no material impact to the Portfolio’s financial statements.
LIBOR Transition
Payment obligations and financing terms related to certain instruments held by the Fund’s Portfolios may be tied to floating rates, such as the London Interbank Offered Rate (“LIBOR”). In 2017, the UK Financial Conduct Authority (“FCA”) announced its intention to cease compelling banks to provide the quotations needed to sustain LIBOR after 2021. ICE Benchmark Administration, the administrator of LIBOR, ceased publication of most LIBOR settings on a representative basis at the end of 2021 and is expected to cease publication of a majority of U.S. dollar LIBOR settings on a representative basis after June 30, 2023. In addition, global regulators have announced that, with limited exceptions, no new LIBOR-based contracts should be entered into after 2021. Actions by regulators have resulted in the establishment of alternative reference rates to LIBOR in most major currencies (e.g., the Secured Overnight Financing Rate for U.S. dollar LIBOR and the Sterling Overnight Interbank Average Rate for GBP LIBOR). Various financial industry groups have been planning for the transition away from LIBOR and markets are developing in response to these new rates, but questions around the liquidity of the new rates and how to appropriately adjust these rates to eliminate any economic value transfer at the time of transition remain a significant concern. It is difficult to predict the full impact of the transition away from LIBOR on affected Portfolios of the Fund. The transition process may involve, among other things, increased volatility or illiquidity in markets for instruments that continue to rely on LIBOR. The transition may also result in a reduction in the value of certain LIBOR-based investments or reduce the effectiveness of related transactions such as hedges. Any impacts of the transition away from LIBOR, as well as other unforeseen effects, could result in losses. Since the usefulness of LIBOR as a benchmark could also deteriorate during the transition period, resulting effects could occur at any time.
Subsequent Events
Management has evaluated events and transactions through the date the financial statements were issued, for purposes of recognition or disclosure in these financial statements, and there are no other subsequent events to report.
| 177 | (continued) |
Ohio National Fund, Inc. | ||
| Notes to Financial Statements (Continued) | December 31, 2022 | |
| (3) | Related Party and Other Transactions |
The Fund has an Investment Advisory Agreement with Ohio National Investments, Inc. (“ONI”), a wholly-owned subsidiary of ONLIC. Under the terms of this agreement, ONI provides portfolio management and investment advice to the Fund and administers its operations, subject to the supervision of the Board. This agreement is renewed annually upon the approval by the Board. As compensation for its services, ONI receives advisory fees from the Fund calculated on the basis of each Portfolio’s average daily net assets and the following current schedule of Board-approved annualized fee breakpoints.
ON Bond | ON S&P 500® Index | ON Risk Managed Balanced | ||
0.60% of first $100 million | 0.40% of first $100 million | 0.88% of first $500 million | ||
0.50% of next $150 million | 0.35% of next $150 million | 0.74% of next $1.3 billion | ||
0.45% of next $250 million | 0.33% over $250 million | 0.72% over $1.8 billion | ||
0.40% of next $500 million |
ON BlackRock Advantage Large Cap Value |
ON Federated Core Plus Bond | ||
0.30% of next $1 billion | 0.67% of first $500 million | 0.56% of first $100 million | ||
0.25% over $2 billion | 0.65% over $500 million | 0.54% of next $150 million | ||
ON BlackRock Balanced Allocation |
ON Federated High Income Bond | 0.50% of next $150 million | ||
0.58% of first $100 million | 0.75% of first $75 million | 0.45% of next $350 million | ||
0.50% of next $150 million | 0.70% of next $75 million | 0.43% over $750 million | ||
0.45% of next $250 million | 0.65% of next $75 million |
ON U.S. Low Volatility1 | ||
0.40% of next $500 million | 0.60% over $225 million | 0.575% of first $500 million | ||
0.30% of next $1 billion |
ON Nasdaq-100® Index | 0.555% over $500 million | ||
0.25% over $2 billion | 0.40% of first $100 million | ON AB Relative Value | ||
ON BlackRock Advantage International Equity | 0.35% of next $150 million | 0.65% of first $100 million | ||
0.72% of first $200 million | 0.33% over $250 million | 0.61% of next $200 million | ||
0.70% of next $800 million | ON BlackRock Advantage Large Cap Core | 0.59% over $300 million | ||
0.66% over $1 billion | 0.64% of first $500 million | ON iShares Managed Risk Balanced2 | ||
ON Janus Henderson Forty | 0.62% over $500 million | 0.55% of first $1.5 billion | ||
0.73% of first $100 million |
ON BlackRock Advantage Small Cap Growth | 0.53% over $1.5 billion | ||
0.68% of next $400 million | 0.78% of first $100 million |
ON iShares Managed Risk Moderate Growth2 | ||
0.63% over $500 million | 0.75% of next $400 million | 0.55% of first $1.5 billion | ||
ON AB Small Cap | 0.70% over $500 million | 0.53% over $1.5 billion | ||
0.73% of first $400 million |
ON S&P MidCap 400® Index |
ON iShares Managed Risk Growth2 | ||
0.675% of next $200 million | 0.40% of first $100 million | 0.55% of first $1.5 billion | ||
0.63% over $600 million | 0.35% of next $150 million | 0.53% over $1.5 billion | ||
ON AB Mid Cap Core | 0.33% over $250 million |
ON Model Portfolios | ||
0.715% of first $100 million | ON BlackRock Advantage Large Cap Growth | 0.40% of all net assets | ||
0.71% of next $200 million | 0.66% of first $500 million | |||
0.69% of next $200 million | 0.64% over $500 million | |||
0.66% over $500 million | ||||
| 1 | At a meeting held on May 13, 2022, the Board, including a majority of the Directors who are not “interested persons” of the Fund (the “Independent Directors”), approved the replacement of the sub-adviser to the Portfolio. Effective August 20, 2022, Intech Investment Management LLC (“Intech”) replaced the Portfolio’s previous sub-adviser, Janus Capital Management, LLC (“Janus”). In connection with this change in sub-adviser, the Board approved a revision to the Portfolio’s advisory fee breakpoint schedule, also effective August 20, 2022. Previously, the advisory fee breakpoints, based on the Portfolio’s daily net assets, were 0.60% of the first $500 million in net assets and 0.58% over $500 million. |
| 2 | At a meeting held on July 18, 2022, the Board, including a majority of the Directors who are not “interested persons” of the Fund (the “Independent Directors”), approved amendments to the Investment Advisory Agreement with the Fund’s adviser, Ohio National Investments, Inc. (“ONI”) and sub-advisory agreements between ONI and BlackRock Investment Management, LLC. (“BlackRock”). Pursuant to those amended agreements, the advisory fee and sub-advisory fee schedules for the ON iShares Managed Risk Portfolios were revised, effective October 14, 2022. Previously, the advisory fee breakpoint schedules for each of the ON iShares Managed Risk Portfolios, based on each Portfolio’s daily net assets, were 0.58% on the first $1.5 billion in net assets and 0.55% over $1.5 billion. |
Under the Investment Advisory Agreement, the Fund authorizes ONI to retain sub-advisers for all Portfolios of the Fund, subject to the approval of the Board. ONI has entered into sub-advisory agreements to manage the investment of certain Portfolios’ assets, as detailed below, subject to the supervision of ONI.
| 178 | (continued) |
Ohio National Fund, Inc. | ||
| Notes to Financial Statements (Continued) | December 31, 2022 | |
AllianceBernsterin, L.P. (“AB") |
ON AB Small Cap |
ON AB Mid Cap Core |
ON Risk Managed Balanced |
ON AB Relative Value |
BlackRock Investment Management, LLC (“BlackRock”) |
ON BlackRock Balanced Allocation |
ON BlackRock Advantage International Equity |
ON BlackRock Advantage Large Cap Value |
ON BlackRock Advantage Large Cap Core |
BlackRock (continued) |
ON BlackRock Advantage Small Cap Growth |
ON BlackRock Advantage Large Cap Growth |
ON iShares Managed Risk Balanced |
ON iShares Managed Risk Moderate Growth |
ON iShares Managed Risk Growth |
Federated Investment Management Company (“Federated”) |
ON Federated High Income Bond |
Federated (continued) |
ON Federated Core Plus Bond |
Geode Capital Management, LLC (“Geode”) |
ON S&P 500® Index |
ON Nasdaq-100® Index |
ON S&P MidCap 400® Index |
Intech Investment Management LLC (“Intech”) |
ON U.S. Low Volatility |
Janus Capital Management LLC (“Janus”) |
ON Janus Henderson Forty |
The sub-advisers receive from ONI a sub-advisory fee calculated on the basis of average daily net assets and Board-approved schedules of annualized fee breakpoints.
BlackRock receives a sub-advisory fee from ONI on the aggregate average daily net assets of the ON BlackRock Advantage Large Cap Core Portfolio, ON BlackRock Advantage Large Cap Growth Portfolio, ON BlackRock Advantage Large Cap Value Portfolio, and the sub-advised equity sleeve of the ON BlackRock Balanced Allocation Portfolio. BlackRock also receives a sub-advisory fee from ONI on the aggregate average daily net assets of the ON iShares Managed Risk Portfolios.
Pursuant to a service agreement among ONI, ONLIC, and the Fund, ONLIC has agreed to provide personnel and facilities to ONI on a cost-reimbursement basis. These personnel members include officers of the Fund. ONLIC also provides clerical and administrative services and such supplies and equipment as may be reasonably required in order for ONI to properly perform its advisory function pursuant to the Investment Advisory Agreement. ONLIC further performs duties to fulfill the transfer agent function on behalf of the Fund. Performance of these duties by ONLIC and availability of facilities, personnel, supplies, and equipment does not represent an expense to the Fund in excess of the advisory fees paid to ONI.
The Investment Advisory Agreement allows for a portion of the expenses related to ONLIC’s compliance and legal staff to be incurred by the Fund and paid from the Fund to ONI. Pursuant to the service agreement among ONI, ONLIC, and the Fund, ONLIC has provided the personnel, services, and equipment necessary for the execution of the Fund’s regulation-mandated compliance functions and ONI has reimbursed ONLIC for those costs allocated to the Fund. For the year ended December 31, 2022, the Fund incurred compliance expenses totaling $256,503, which are allocated to the Portfolios by equal dollar amounts on a daily basis. Expenses incurred by the Portfolios are reflected on the Statements of Operations as “Compliance expense”.
Pursuant to the Investment Advisory Agreement between ONI and the Fund, if the total expenses applicable to any Portfolio during any calendar quarter (excluding taxes, brokerage commissions, interest expense and management fees) exceed 1%, on an annualized basis, evaluated quarterly, of such Portfolio’s average daily net asset value, ONI will reimburse the Portfolio for such excess expenses. There were no expense reimbursements associated with this agreement during the year ended December 31, 2022.
Through an Operating Expense Limitation Agreement, ONI has contractually agreed to reimburse the Fund to the extent that the annual ordinary operating expenses of the four ON Model Portfolios, excluding: portfolio transaction and other investment related costs (including brokerage fees and commissions); taxes; borrowing costs (such as interest and dividend expenses on securities sold short); fees and expenses associated with investments in derivative instruments (including for example option and swap fees and expenses); any amounts payable pursuant to a distribution or service plan adopted in accordance with Rule 12b-1 under the 40 Act; any administrative and/or shareholder servicing fees payable pursuant to a plan approved by the Board; expenses incurred in connection with any merger or reorganization; extraordinary expenses (such as litigation expenses, indemnification of Fund officers and Directors and contractual indemnification of Portfolio service providers); and other expenses that the Directors agree have not been incurred in the ordinary course of the Portfolio’s business, exceed certain percentages of the average daily net assets.
The applicable percentages of the average daily net assets of the four ON Model Portfolios are as follows:
Portfolio | May 1, 2022 to April 30, 2023 | May 1, 2021 to April 30, 2022 | May 1, 2020 to April 30, 2021 | |||
ON Moderately Conservative Model | 1.00% | 1.00% | 1.00% | |||
ON Balanced Model | 1.00% | 1.00% | 1.00% | |||
ON Moderate Growth Model | 1.07% | 1.07% | 1.07% | |||
ON Growth Model | 1.14% | 1.14% | 1.14% |
| 179 | (continued) |
Ohio National Fund, Inc. | ||
| Notes to Financial Statements (Continued) | December 31, 2022 | |
For purposes of calculating the expenses subject to the Operating Expense Limitation Agreement, the annual operating expenses are those as presented pursuant to the Fund’s prospectus requirements. The prospectus presentation of Fund expenses includes Acquired Fund Fees and Expenses, which is a calculation of the indirect costs associated with the Portfolios’ underlying investments in other investment companies. The current Operating Expense Limitation Agreement will continue through April 30, 2023. The Operating Expense Limitation Agreement may only be terminated with the consent of the Board.
Pursuant to the current Operating Expense Limitation Agreement, as well as the prior agreements for the periods May 1, 2021 to April 30, 2022 and May 1, 2020 to April 30, 2021, ONI reimbursed the expenses of the ON Model Portfolios as follows:
Portfolio | Year Ended December 31, 2022 | Year Ended December 31, 2021 | ||
ON Moderately Conservative Model | $— | $ 64,732 | ||
ON Balanced Model | — | 137,994 |
Under the terms of the current Operating Expense Limitation Agreement and prior operating expense limitation agreements, ONI is entitled to recover expenses waived or reimbursed for a period of up to three years from the date on which ONI reimbursed excess expenses. No recoupment will occur unless a Portfolio’s operating expenses are below the expense limitation amount in effect at the time of the waiver or reimbursement and the Portfolio’s current expense limitation. For the year ended December 31, 2022, ONI recouped previously reimbursed expenses from the ON Moderately Conservative and ON Balanced Model Portfolios amounting to $25,600 and $157,500, respectively. These recouped expenses were related to expenses reimbursed by ONI during the periods May 1, 2018 to April 30, 2019 and May 1, 2019 to April 30, 2020. For the year ended December 31, 2021, ONI recouped previously reimbursed expenses from the ON Moderately Conservative, ON Balanced, ON Moderate Growth and ON Growth Model Portfolios amounting to $6,011, $92,192, $34,233 and $218,062, respectively. These recouped expenses were related to expenses reimbursed by ONI during the periods May 1, 2018 to April 30, 2019 and May 1, 2019 to April 30, 2020.
Amounts of expenses, previously reimbursed by ONI under the Operating Expense Limitation Agreement and prior operating expense limitation agreements, that are available for future recoupments at December 31, 2022 are as follows:
Portfolio | Expires April 30, 2023 | Expires April 30, 2024 | Total | |||||
ON Moderately Conservative Model | $166,396 | $178,135 | $ | 344,531 | ||||
ON Balanced Model | 551,006 | 380,376 | 931,382 | |||||
The Fund, along with ONLIC, NSLA and certain variable separate account entities affiliated with ONLIC and NSLA, was a party to an application filed with the SEC for an order of approval pursuant to Section 26(c), and an order of exemption pursuant to Section 17(b) of the 40 Act. In the application, those entities proposed to substitute shares of certain unaffiliated underlying funds currently available under certain variable contracts (the “Substitution 1 Unaffiliated Funds”) for shares of different underlying funds (the “Substitution 1 Replacement Ohio National Fund Portfolios”). The entities also requested permission to carry out in-kind security transfers in order to execute certain of the proposed substitution transactions. The proposed substitution transactions that affected the Fund were:
Substitution 1 Unaffiliated Funds | Substitution 1 Replacement Ohio National Fund Portfolios | |
Federated Hermes Managed Volatility Fund II (Primary Shares and Service Shares) | ON iShares Managed Risk Balanced Portfolio | |
Janus Henderson VIT U.S. Low Volatility Portfolio (Service Shares) | ON U.S. Low Volatility Portfolio | |
Morgan Stanley VIF Core Plus Fixed Income Portfolio (Class II) | ON Federated Core Plus Bond Portfolio | |
PIMCO Total Return Portfolio (Administrative Share Class) | ON Federated Core Plus Bond Portfolio |
On May 4, 2021, the application for the substitution transactions and in-kind transfers was approved by the SEC. The substitution transactions were effected on June 25, 2021 (the “Substitution Date”) via cash redemptions of the Substitution 1 Unaffiliated Funds and cash subscriptions to the Substitution 1 Replacement Ohio National Fund Portfolios, with the exception of the transaction involving the ON U.S. Low Volatility Portfolio. The substitution transaction involving that Portfolio was executed as an in-kind transfer of securities from the related Substitution 1 Unaffiliated Fund. The cost basis of each security transferred in-kind to the ON U.S. Low Volatility Portfolio was the fair value of that security, valued at the relevant active market exchange close price at the end of the Substitution Date. In conjunction with the substitution transactions, ONI entered into expense limitation agreements with certain of the affected Portfolios whereby, for a period of two years following the Substitution Date, the annual net operating expenses of the applicable Substitution 1 Replacement Ohio National Fund Portfolios will not exceed the annual net operating expenses of the related Substitution 1 Unaffiliated Fund for the fiscal year ended December 31, 2019. The net operating expense
| 180 | (continued) |
Ohio National Fund, Inc. | ||
| Notes to Financial Statements (Continued) | December 31, 2022 | |
limitation for each applicable Substitution 1 Replacement Ohio National Fund Portfolio, stated as a percent of average net assets, are as follows:
Portfolio | Expense Limitation | |
ON Federated Core Plus Bond | 0.86% | |
ON U.S. Low Volatility | 0.82% | |
ON iShares Managed Risk Balanced | 0.96% |
ONLIC, NSLA, and certain variable separate account entities affiliated with ONLIC and NSLA were parties to a correspondence letter filed with the SEC on March 28, 2022, which described the intent of those entities to execute a substitution of investment option pursuant to Commission Statement on Insurance Product Fund Substitution Applications, Release No. IC-34199. As outlined in the correspondence letter, those entities substituted shares of an unaffiliated fund available under certain variable contracts for shares of an affiliated fund option. In the substitution, each of ONLIC and NSLA exercised its contractual rights to substitute shares of Franklin Multi-Asset Dynamic Multi-Strategy VIT (Class I) (the “Existing Portfolio”), an external fund not affiliated with the Fund, with shares of ON Risk Managed Balanced Portfolio. The substitution transactions occurred as cash redemptions of the Existing Portfolio’s shares and cash subscriptions to the ON Risk Managed Balanced Portfolio’s shares on May 20, 2022.
In conjunction with the substitution transactions, the Fund entered into an expense limitation agreement with ONI, whereby, for a period of two years following the effective date of the substitution, the annual net operating expenses of the ON Risk Managed Balanced Portfolio will not exceed 1.01% (the annual net operating expenses of the Existing Portfolio for the fiscal year ended December 31, 2021), stated as an annualized ratio of the ON Risk Managed Balanced Portfolio’s total fund expenses as a percent of its average net assets.
ONLIC, NSLA, and certain variable separate account entities affiliated with ONLIC and NSLA were parties to a correspondence letter filed with the SEC on July 22, 2022, which described the intent of those entities to execute a substitution of investment options pursuant to Commission Statement on Insurance Product Fund Substitution Applications, Release No. IC-34199. As outlined in the correspondence letter, those entities substituted shares of four unaffiliated funds (the “Substitution 3 Unaffiliated Funds”) currently available under certain variable contracts for shares of four affiliated fund options (the “Substitution 3 Replacement Ohio National Fund Portfolios”). The substitution transactions were:
Substitution 3 Unaffiliated Funds | Substitution 3 Replacement Ohio National Fund Portfolios | |
Fidelity® VIP Contrafund® Portfolio (Service Class 2) | ON BlackRock Advantage Large Cap Growth Portfolio | |
TOPS® Managed Risk Balanced ETF Portfolio (Class 2 and Class 3 Shares) | ON iShares Managed Risk Balanced Portfolio | |
TOPS® Managed Risk Moderate Growth ETF Portfolio (Class 2 and Class 3 Shares) | ON iShares Managed Risk Moderate Growth Portfolio | |
TOPS® Managed Risk Growth ETF Portfolio (Class 2 and Class 3 Shares) | ON iShares Managed Risk Growth Portfolio |
The substitution transactions occurred as cash redemptions of each Substitution 3 Unaffiliated Fund’s shares and cash subscriptions of each Substitution 3 Replacement Ohio National Fund Portfolio’s shares on October 14, 2022. In conjunction with the substitution transactions, ONI entered into expense limitation agreements with the Substitution 3 Replacement Ohio National Fund Portfolios whereby, for a period of two years following the effective date of the substitution, the annual net operating expenses for each applicable Substitution 3 Replacement Ohio National Fund Portfolio will not exceed the annual net operating expenses of the related Substitution 3 Unaffiliated Fund for the fiscal year ended December 31, 2021. The net operating expense limitation for each Substitution 3 Replacement Ohio National Fund Portfolio, stated as a percent of average net assets, are as follows:
Portfolio | Expense Limitation | |
ON BlackRock Advantage Large Cap Growth | 0.85% | |
ON iShares Managed Risk Balanced | 0.75% | |
ON iShares Managed Risk Moderate Growth | 0.74% | |
ON iShares Managed Risk Growth | 0.74% |
There were no recorded liabilities related to any of the aforementioned expense limitation agreements at December 31, 2022.
Each director of the Board is compensated based on an annual retainer fee of $165,000, paid quarterly. The Board chair receives an additional quarterly retainer fee of $4,375, and the Audit Committee chair receives an additional quarterly retainer fee of $1,875; each paid quarterly. For the year ended December 31, 2022, directors’ compensation and reimbursement of director expenses by the Portfolios of the Fund totaled $902,842.
| 181 | (continued) |
Ohio National Fund, Inc. | ||
| Notes to Financial Statements (Continued) | December 31, 2022 | |
The accounting agent and custodian for the Fund is State Street Bank (Kansas City, MO and Boston, MA). For assets held outside of the United States, State Street Bank utilizes a foreign sub-custodian network that is subject to oversight and periodic approval of the Board.
| (4) | Capital Share Transactions |
Capital share transactions for the year ended December 31, 2022, and the year ended December 31, 2021, respectively, were as follows:
| ON Bond | ON BlackRock Balanced Allocation | ON BlackRock Advantage International Equity | ||||||||||||||||||||||
| Year Ended December 31, 2022 | Year Ended December 31, 2021 | Year Ended December 31, 2022 | Year Ended December 31, 2021 | Year Ended December 31, 2022 | Year Ended December 31, 2021 | |||||||||||||||||||
Capital shares issued on sales | 2,201,770 | 1,638,958 | 1,167,771 | 695,502 | 1,210,528 | 1,472,906 | ||||||||||||||||||
Capital shares issued on reinvested distributions | 528,633 | 409,196 | 3,284,285 | 1,295,471 | 5,141,518 | 378,436 | ||||||||||||||||||
Capital shares redeemed | (2,991,069 | ) | (2,280,423 | ) | (2,150,462 | ) | (2,530,622 | ) | (7,253,319 | ) | (4,962,157 | ) | ||||||||||||
|
|
|
|
|
|
|
|
|
|
|
| |||||||||||||
Net increase (decrease) | (260,666 | ) | (232,269 | ) | 2,301,594 | (539,649 | ) | (901,273 | ) | (3,110,815 | ) | |||||||||||||
|
|
|
|
|
|
|
|
|
|
|
| |||||||||||||
| ON Janus Henderson Forty | ON AB Small Cap | ON AB Mid Cap Core | ||||||||||||||||||||||
| Year Ended December 31, 2022 | Year Ended December 31, 2021 | Year Ended December 31, 2022 | Year Ended December 31, 2021 | Year Ended December 31, 2022 | Year Ended December 31, 2021 | |||||||||||||||||||
Capital shares issued on sales | 1,327,545 | 226,283 | 703,232 | 275,122 | 240,928 | 48,941 | ||||||||||||||||||
Capital shares issued on reinvested distributions | 47,838,024 | 618,916 | 6,990,052 | 473,472 | 1,485,148 | 107,512 | ||||||||||||||||||
Capital shares redeemed | (15,983,038 | ) | (2,739,324 | ) | (969,014 | ) | (875,705 | ) | (309,931 | ) | (397,186 | ) | ||||||||||||
|
|
|
|
|
|
|
|
|
|
|
| |||||||||||||
Net increase (decrease) | 33,182,531 | (1,894,125 | ) | 6,724,270 | (127,111 | ) | 1,416,145 | (240,733 | ) | |||||||||||||||
|
|
|
|
|
|
|
|
|
|
|
| |||||||||||||
| ON S&P 500® Index | ON BlackRock Advantage Large Cap Value | ON Federated High Income Bond | ||||||||||||||||||||||
| Year Ended December 31, 2022 | Year Ended December 31, 2021 | Year Ended December 31, 2022 | Year Ended December 31, 2021 | Year Ended December 31, 2022 | Year Ended December 31, 2021 | |||||||||||||||||||
Capital shares issued on sales | 3,047,516 | 2,304,647 | 285,237 | 3,078,143 | 273,983 | 572,042 | ||||||||||||||||||
Capital shares issued on reinvested distributions | 4,222,467 | 2,121,776 | 3,861,394 | 221,885 | 440,246 | 408,549 | ||||||||||||||||||
Capital shares redeemed | (4,563,380 | ) | (7,477,008 | ) | (5,728,349 | ) | (6,076,719 | ) | (1,723,136 | ) | (1,204,705 | ) | ||||||||||||
|
|
|
|
|
|
|
|
|
|
|
| |||||||||||||
Net increase (decrease) | 2,706,603 | (3,050,585 | ) | (1,581,718 | ) | (2,776,691 | ) | (1,008,907 | ) | (224,114 | ) | |||||||||||||
|
|
|
|
|
|
|
|
|
|
|
| |||||||||||||
| ON Nasdaq-100® Index | ON BlackRock Advantage Large Cap Core | ON BlackRock Advantage Small Cap Growth | ||||||||||||||||||||||
| Year Ended December 31, 2022 | Year Ended December 31, 2021 | Year Ended December 31, 2022 | Year Ended December 31, 2021 | Year Ended December 31, 2022 | Year Ended December 31, 2021 | |||||||||||||||||||
Capital shares issued on sales | 2,158,412 | 1,529,196 | 410,551 | 315,562 | 557,869 | 526,740 | ||||||||||||||||||
Capital shares issued on reinvested distributions | 5,870,436 | 2,696,832 | 3,581,520 | 1,014,526 | 2,601,783 | 641,791 | ||||||||||||||||||
Capital shares redeemed | (3,768,108 | ) | (5,390,952 | ) | (1,578,057 | ) | (2,402,926 | ) | (1,023,579 | ) | (1,034,313 | ) | ||||||||||||
|
|
|
|
|
|
|
|
|
|
|
| |||||||||||||
Net increase (decrease) | 4,260,740 | (1,164,924 | ) | 2,414,014 | (1,072,838 | ) | 2,136,073 | 134,218 | ||||||||||||||||
|
|
|
|
|
|
|
|
|
|
|
| |||||||||||||
| 182 | (continued) |
Ohio National Fund, Inc. | ||
| Notes to Financial Statements (Continued) | December 31, 2022 | |
| ON S&P MidCap 400® Index | ON BlackRock Advantage Large Cap Growth | ON Risk Managed Balanced | ||||||||||||||||||||||||||||
| Year Ended December 31, 2022 | Year Ended December 31, 2021 | Year Ended December 31, 2022 | Year Ended December 31, 2021 | Year Ended December 31, 2022 | Year Ended December 31, 2021 | |||||||||||||||||||||||||
Capital shares issued on sales | 3,188,763 | 1,166,192 | 52,373,466 | 84,388 | 70,287,422 | 2,152,303 | ||||||||||||||||||||||||
Capital shares issued on reinvested distributions | 3,203,958 | 477,050 | 4,745,946 | 702,651 | 4,048,639 | 4,198,645 | ||||||||||||||||||||||||
Capital shares redeemed | (3,327,876 | ) | (4,690,660 | ) | (2,485,545 | ) | (1,579,967 | ) | (10,586,383 | ) | (5,471,529 | ) | ||||||||||||||||||
|
|
|
|
|
|
|
|
|
|
|
| |||||||||||||||||||
Net increase (decrease) | 3,064,845 | (3,047,418 | ) | 54,633,867 | (792,928 | ) | 63,749,678 | 879,419 | ||||||||||||||||||||||
|
|
|
|
|
|
|
|
|
|
|
| |||||||||||||||||||
| ON Federated Core Plus Bond | ON U.S. Low Volatility | ON AB Relative Value | ||||||||||||||||||||||||||||
| Year Ended December 31, 2022 | Year Ended December 31, 2021 | Year Ended December 31, 2022 | Period from June 25, 2021 (inception) to December 31, 2021 | Year Ended December 31, 2022 | Period from December 2, 2021 (inception) to December 31, 2021 | |||||||||||||||||||||||||
Capital shares issued on sales | 8,774,734 | 52,677,628 | 1,423,502 | 913,773 | 7,638,051 | 7,633,724 | ||||||||||||||||||||||||
Capital shares issued as a result of in-kind transfer (see Note 3 of Notes to Financial Statements) | — | — | — | 98,371,408 | — | — | ||||||||||||||||||||||||
Capital shares issued on reinvested distributions | 1,057,582 | 243,513 | 2,456,090 | — | 9,777 | — | ||||||||||||||||||||||||
Capital shares redeemed | (16,942,786 | ) | (6,285,698 | ) | (18,368,512 | ) | (10,816,824 | ) | (2,505,418 | ) | (250,777 | ) | ||||||||||||||||||
|
|
|
|
|
|
|
|
|
|
|
| |||||||||||||||||||
Net increase (decrease) | (7,110,470 | ) | 46,635,443 | (14,488,920 | ) | 88,468,357 | 5,142,410 | 7,382,947 | ||||||||||||||||||||||
|
|
|
|
|
|
|
|
|
|
|
| |||||||||||||||||||
| ON iShares Managed Risk Balanced | ON iShares Managed Risk Moderate Growth | ON iShares Managed Risk Growth | ON Moderately Conservative Model | |||||||||||||||||||||||||||
| Year Ended December 31, 2022 | Period from June 25, 2021 (inception) to December 31, 2021 | Period from October 14, 2022 (inception) to December 31, 2022 | Period from October 14, 2022 (inception) to December 31, 2022 | Year Ended December 31, 2022 | Year Ended December 31, 2021 | |||||||||||||||||||||||||
Capital shares issued on sales | 38,358,228 | 43,695,081 | 48,599,284 | 42,118,412 | 1,504,508 | 1,206,062 | ||||||||||||||||||||||||
Capital shares issued on reinvested distributions | 395,169 | — | — | — | 1,829,040 | 563,393 | ||||||||||||||||||||||||
Capital shares redeemed | (7,250,837 | ) | (3,412,630 | ) | (2,223,894 | ) | (1,869,205 | ) | (3,854,482 | ) | (4,572,097 | ) | ||||||||||||||||||
|
|
|
|
|
|
|
|
|
|
|
| |||||||||||||||||||
Net increase (decrease) | 31,502,560 | 40,282,451 | 46,375,390 | 40,249,207 | (520,934 | ) | (2,802,642 | ) | ||||||||||||||||||||||
|
|
|
|
|
|
|
|
|
|
|
| |||||||||||||||||||
| ON Balanced Model | ON Moderate Growth Model | ON Growth Model | ||||||||||||||||||||||||||||
| Year Ended December 31, 2022 | Year Ended December 31, 2021 | Year Ended December 31, 2022 | Year Ended December 31, 2021 | Year Ended December 31, 2022 | Year Ended December 31, 2021 | |||||||||||||||||||||||||
Capital shares issued on sales | 1,082,295 | 1,617,055 | 3,018,771 | 1,873,210 | 533,307 | 355,476 | ||||||||||||||||||||||||
Capital shares issued on reinvested distributions | 9,039,322 | 1,546,590 | 19,300,790 | 1,693,877 | 5,185,557 | 324,206 | ||||||||||||||||||||||||
Capital shares redeemed | (12,520,197 | ) | (12,691,753 | ) | (19,035,536 | ) | (21,686,521 | ) | (3,333,707 | ) | (4,738,901 | ) | ||||||||||||||||||
|
|
|
|
|
|
|
|
|
|
|
| |||||||||||||||||||
Net increase (decrease) | (2,398,580 | ) | (9,528,108 | ) | 3,284,025 | (18,119,434 | ) | 2,385,157 | (4,059,219 | ) | ||||||||||||||||||||
|
|
|
|
|
|
|
|
|
|
|
| |||||||||||||||||||
| 183 | (continued) |
Ohio National Fund, Inc. | ||
| Notes to Financial Statements (Continued) | December 31, 2022 | |
| (5) | Investment Transactions |
Cost of purchases and proceeds from sales of investments (excluding short-term and government securities) for the year ended December 31, 2022 were as follows:
| ON Bond | ON BlackRock Balanced Allocation | ON BlackRock Advantage International Equity | ON Janus Henderson Forty | ON AB Small Cap | ||||||
Cost of purchases | $20,912,371 | $313,642,557 | $545,335,899 | $42,733,358 | $74,272,753 | |||||
Proceeds from sales | $48,061,879 | $341,386,838 | $617,753,136 | $95,939,012 | $81,572,599 | |||||
| ON AB Mid Cap Core | ON S&P 500® Index | ON BlackRock Advantage Large Cap Value | ON Federated High Income Bond | ON Nasdaq-100® Index | ||||||
Cost of purchases | $34,514,406 | $ 42,805,219 | $248,391,140 | $18,372,502 | $23,456,242 | |||||
Proceeds from sales | $37,757,356 | $109,319,157 | $345,670,687 | $35,126,895 | $63,885,629 | |||||
| ON BlackRock Advantage Large Cap Core | ON BlackRock Advantage Small Cap Growth | ON S&P MidCap 400® Index | ON BlackRock Advantage Large Cap Growth | ON Risk Managed Balanced | ||||||
Cost of purchases | $315,490,427 | $74,014,370 | $ 94,723,211 | $489,174,663 | $1,391,756,967 | |||||
Proceeds from sales | $358,663,085 | $82,248,446 | $103,444,017 | $178,968,621 | $ 736,345,273 | |||||
| ON Federated Core Plus Bond | ON U.S. Low Volatility | ON AB Relative Value | ON iShares Managed Risk Balanced | ON iShares Managed Risk Moderate Growth1 | ||||||
Cost of purchases | $164,509,011 | $634,518,426 | $132,046,122 | $428,270,966 | $632,432,547 | |||||
Proceeds from sales | $317,319,869 | $802,159,733 | $ 81,886,468 | $182,774,999 | $222,104,298 | |||||
| ON iShares Managed Risk Growth1 | ON Moderately Conservative Model | ON Balanced Model | ON Moderate Growth Model | ON Growth Model | ||||||
Cost of purchases | $547,923,218 | $69,682,944 | $241,296,259 | $543,619,219 | $129,815,182 | |||||
Proceeds from sales | $187,201,246 | $76,497,324 | $287,095,283 | $520,811,235 | $104,647,230 | |||||
| 1 | Period from October 14, 2022 (inception) to December 31, 2022. |
Cost of purchases and proceeds from sales of government securities for the year ended December 31, 2022 were as follows:
| ON Bond | ON BlackRock Balanced Allocation | ON Risk Managed Balanced | ON Federated Core Plus Bond | |||||
Cost of purchases | $26,283,867 | $3,509,922 | $482,784,349 | $307,111,410 | ||||
Proceeds from sales | $ 4,648,438 | $ — | $336,761,325 | $195,286,151 |
| (6) | Financial Instruments |
The Portfolios may trade in financial instruments with off-balance sheet risk for hedging purposes or, otherwise, in accordance with stated investment objectives. These financial instruments may include options, futures, and foreign currency contracts that may involve, to a varying degree, elements of risk in excess of the amounts recognized on financial statements.
Options
A Portfolio may buy call and put options. In purchasing call options, a Portfolio pays the seller of the call option a premium for the right of the Portfolio to buy the underlying securities from the seller at a specified exercise price prior to the expiration of the option. In purchasing put options, a Portfolio pays the seller of the put option a premium for the right of the Portfolio to sell the underlying securities to the seller at a specified exercise price prior to the expiration of the option. In order to terminate its position as the purchaser of an option, the Portfolio may enter into a “closing” transaction, which is the sale of an option on the same underlying securities and having the same exercise price and expiration date as the option previously purchased by the Portfolio.
| 184 | (continued) |
Ohio National Fund, Inc. | ||
| Notes to Financial Statements (Continued) | December 31, 2022 | |
When a Portfolio purchases a put or call option, an amount equal to the premium paid is included on the Portfolio’s Statement of Assets and Liabilities as an investment, and is subsequently marked-to-market to reflect the current market value of the option. If an option expires on the stipulated expiration date or if the Portfolio enters into a closing sale transaction, a gain or loss is realized. If a Portfolio exercises a call option on an individual security, the cost of the security acquired is increased by the premium paid for the call. If the Portfolio exercises a put option on an individual security, a gain or loss is realized from the sale of the underlying security, and the proceeds from such a sale are decreased by the premium originally paid. If the Portfolio exercises a put option on a security index, a gain or loss is realized as determined by the premium originally paid, the exercise price and the market value of the index.
The ON Risk Managed Balanced Portfolio purchased call and put options associated with the S&P 500® Index or related exchange traded fund during the year ended December 31, 2022. These instruments were used by the Risk Management Component of the Portfolio to provide for the Portfolio’s stated risk management strategy. Transactions involving purchased options by the ON Risk Managed Balanced Portfolio for the year ended December 31, 2022 were: Cost of purchases: $127.6 million, Proceeds from sales: $73.1 million.
Purchased options are non-income producing securities.
Futures Contracts
A Portfolio may buy or sell futures contracts relating to stock indices, foreign currencies, or interest rates. Stock index futures contracts are contracts developed by and traded on national commodity exchanges whereby the buyer will, on a specified future date, pay or receive a final cash payment equal to the difference between the actual value of the stock index on the last day of the contract and the value of the stock index established by the contract multiplied by the specific dollar amount set by the exchange. Futures contracts may be based on broad-based stock indices such as the S&P 500® Index or on narrow-based stock indices. A particular index will be selected according to the Adviser’s investment strategy for the particular Portfolio. Foreign currency futures contracts are contracts traded on commodity exchanges whereby the buyer will, on a specified future date, pay or receive a final cash payment equal to the difference between the value of a stated foreign currency in relation to the U.S dollar, or other currency, on the last day of the contract and the relative value of those currencies on the date of executing the contract. Foreign currency futures may be valued by exchange rates that are based on the relative value of a variety of foreign currencies. An interest rate futures contract is an agreement whereby one party agrees to sell and another party agrees to purchase a specified amount of a specified financial instrument (debt security) at a specified price at a specified date, time and place. Although interest rate futures contracts typically require actual future delivery of, and payment for, financial instruments, the contracts are usually closed out before the delivery date. A public market exists in interest rate futures contracts covering primarily the following financial instruments: U.S. Treasury bonds; U.S. Treasury notes; Government National Mortgage Association (“GNMA”) modified pass-through mortgage-backed securities; three-month U.S. Treasury bills; 90-day commercial paper; bank certificates of deposit; and Eurodollar certificates of deposit. U.S. futures contracts are traded on exchanges which have been designated “contract markets” by the Commodities Futures Trading Commission (“CFTC”) and must be executed through a futures commission merchant (“FCM”), or brokerage firm, which is a member of the relevant contract market.
The Fund, on behalf of each Portfolio, has filed with the National Futures Association, a notice claiming an exclusion from the definition of the term “commodity pool operator” under the Commodity Exchange Act, as amended, and the rules of the CFTC promulgated thereunder, with respect to each Portfolio’s operation. Accordingly, the Portfolios are not subject to registration or regulation as a commodity pool operator.
The buyer or seller of a futures contract is not required to deliver or pay for the underlying instrument unless the contract is held until the delivery date. However, both the buyer and seller are required to deposit “initial margin” for the benefit of the broker when the contract is entered into. Initial margin deposits are equal to a percentage of the contract’s value, as set by the exchange on which the contract is traded, and are similar to good faith deposits or performance bonds.
Unlike margin extended by a securities broker, initial margin payments do not constitute purchasing securities on margin for purposes of a Portfolio’s investment limitations. A Portfolio, its futures commission merchant and the Custodian retain control of the initial margin until the contract is liquidated. If the value of either party’s position declines, the party on the side of the declining position will be required to make additional “variation margin” payments to settle the change in value on a daily basis. The party that has a gain may be entitled to receive all or a portion of this amount. Variation margin is recognized as a receivable and/or payable for variation margin on futures contracts on the Statement of Assets and Liabilities. In the event of a bankruptcy of the FCM that holds margin on behalf of a Portfolio, the Portfolio may be entitled to return of margin owed to the Portfolio only in proportion to the amount received by the FCM’s other customers. ONI and the sub-advisers will attempt to minimize this risk by carefully monitoring the creditworthiness of the FCMs with which the Portfolios do business.
| 185 | (continued) |
Ohio National Fund, Inc. | ||
| Notes to Financial Statements (Continued) | December 31, 2022 | |
Portions of certain Portfolios’ securities and cash holdings, as noted on those Portfolios’ Schedules of Investments, were pledged at December 31, 2022 as collateral for the Portfolios’ futures contracts. Cash holdings pledged are noted as “Cash subject to usage restrictions” on the Statements of Assets and Liabilities. The futures contracts, except those held by the ON Risk Managed Balanced, ON Federated Core Plus Bond, and ON iShares Managed Risk Portfolios, were used for the purpose of gaining equity exposure for cash and cash equivalents, thereby seeking to lessen a performance difference between the Portfolios and their respective benchmark indices. For the ON Risk Managed Balanced and ON iShares Managed Risk Portfolios, futures contracts were used to provide for the Portfolios’ respective stated risk management strategies. For the ON Federated Core Plus Bond Portfolio, futures contracts were used by the Portfolio to manage total exposure to underlying investments, to manage interest rate risk, or to otherwise execute the Portfolio’s stated investment strategy. There were other futures contracts executed and closed in the Portfolios during the year ended December 31, 2022. Those contracts were executed for similar purposes as the contracts outstanding at December 31, 2022. For the year ended December 31, 2022, the notional values of futures contracts opened and closed prior to contract settlement date by the Portfolios were as follows:
Portfolio | Collateral Pledged | Futures Contracts Opened (in millions) | Futures Contracts Closed (in millions) | |||||||
ON BlackRock Balanced Allocation | Portions of cash holdings | $ 50.4 | $ 51.8 | |||||||
ON BlackRock Advantage International Equity | Portions of cash holdings | 115.4 | 119.0 | |||||||
ON AB Mid Cap Core | Portions of cash holdings | 5.1 | 4.8 | |||||||
ON S&P 500® Index | Portions of cash holdings and securities | 136.1 | 134.0 | |||||||
ON BlackRock Advantage Large Cap Value | Portions of cash holdings | 67.8 | 69.9 | |||||||
ON Nasdaq-100® Index | Portions of cash holdings and securities | 45.9 | 46.2 | |||||||
ON BlackRock Advantage Large Cap Core | Portions of cash holdings | 70.7 | 72.1 | |||||||
ON BlackRock Advantage Small Cap Growth | Portions of cash holdings | 52.9 | 53.7 | |||||||
ON S&P MidCap 400® Index | Portions of cash holdings and securities | 65.5 | 64.7 | |||||||
ON BlackRock Advantage Large Cap Growth | Portions of cash holdings | 399.7 | 394.6 | |||||||
ON Risk Managed Balanced | Portions of securities | 2,751.6 | 2,452.4 | |||||||
ON Federated Core Plus Bond | Portions of securities | 920.2 | 930.8 | |||||||
ON iShares Managed Risk Balanced | Portions of cash holdings | 1,112.1 | 1,062.3 | |||||||
ON iShares Managed Risk Moderate Growth(a) | Portions of cash holdings | 325.4 | 244.0 | |||||||
ON iShares Managed Risk Growth(a) | Portions of cash holdings | 372.4 | 309.9 | |||||||
| (a) | Period from October 14, 2022 (inception) to December 31, 2022. |
The values and financial statement effects of derivative instruments that were not accounted for as hedging instruments as of, and for, the year ended December 31, 2022, were as follows:
Portfolio | Instrument | Primary Risk Type | Value- Asset Derivatives | Value- Liability Derivatives | Location on Statements of Assets and Liabilities | |||||||||
ON BlackRock Balanced Allocation | Futures contracts | Equity price | $ | 4,440,150 | $ | 4,557,964 | (1) | |||||||
|
|
|
| |||||||||||
ON BlackRock Advantage International Equity | Futures contracts | Equity price | 4,970,970 | 5,162,383 | (1) | |||||||||
|
|
|
| |||||||||||
ON AB Mid Cap Core | Futures contracts | Equity price | 244,260 | 251,472 | (1) | |||||||||
|
|
|
| |||||||||||
ON S&P 500® Index | Futures contracts | Equity price | 11,969,100 | 12,478,328 | (1) | |||||||||
|
|
|
| |||||||||||
ON BlackRock Advantage Large Cap Value | Futures contracts | Equity price | 2,702,700 | 2,797,564 | (1) | |||||||||
|
|
|
| |||||||||||
ON Nasdaq-100® Index | Futures contracts | Equity price | 1,984,005 | 2,067,860 | (1) | |||||||||
|
|
|
| |||||||||||
ON BlackRock Advantage Large Cap Core | Futures contracts | Equity price | 4,826,250 | 4,967,337 | (1) | |||||||||
|
|
|
| |||||||||||
ON BlackRock Advantage Small Cap Growth | Futures contracts | Equity price | 2,125,080 | 2,178,499 | (1) | |||||||||
|
|
|
| |||||||||||
ON S&P MidCap 400® Index | Futures contracts | Equity price | 4,640,940 | 4,710,372 | (1) | |||||||||
|
|
|
| |||||||||||
ON BlackRock Advantage Large Cap Growth | Futures contracts | Equity price | 5,731,570 | 6,071,580 | (1) | |||||||||
|
|
|
| |||||||||||
ON Risk Managed Balanced | Futures contracts | Equity price | 143,650,133 | 140,387,818 | (1) | |||||||||
|
|
|
| |||||||||||
| Futures contracts | Interest rate | 393,817,688 | 396,455,792 | (1) | ||||||||||
|
|
|
| |||||||||||
| Purchased options | Equity price | 65,276,127 | — | (2) | ||||||||||
|
|
|
| |||||||||||
| 186 | (continued) |
Ohio National Fund, Inc. | ||
| Notes to Financial Statements (Continued) | December 31, 2022 | |
Portfolio | Instrument | Primary Risk Type | Value- Asset Derivatives | Value- Liability Derivatives | Location on Statements of Assets and Liabilities | |||||||||||
ON Federated Core Plus Bond | Futures contracts | Interest rate | $ | 96,895,166 | $ | 96,923,953 | (1) | |||||||||
|
|
|
| |||||||||||||
ON iShares Managed Risk Balanced | Futures contracts | Equity price | 75,271,960 | 76,408,824 | (1) | |||||||||||
|
|
|
| |||||||||||||
| Futures contracts | Interest rate | 44,561,583 | 44,915,498 | (1) | ||||||||||||
|
|
|
| |||||||||||||
| Futures contracts | Foreign currency | 12,702,698 | 12,745,961 | (1) | ||||||||||||
|
|
|
| |||||||||||||
ON iShares Managed Risk Moderate Growth | Futures contracts | Equity price | 68,276,543 | 70,025,148 | (1) | |||||||||||
|
|
|
| |||||||||||||
| Futures contracts | Interest rate | 4,700,698 | 4,700,938 | (1) | ||||||||||||
|
|
|
| |||||||||||||
| Futures contracts | Foreign currency | 6,800,640 | 6,802,049 | (1) | ||||||||||||
|
|
|
| |||||||||||||
ON iShares Managed Risk Growth | Futures contracts | Equity price | 45,817,064 | 47,015,506 | (1) | |||||||||||
|
|
|
| |||||||||||||
| Futures contracts | Interest rate | 4,029,170 | 4,029,375 | (1) | ||||||||||||
|
|
|
| |||||||||||||
| Futures contracts | Foreign currency | 11,605,440 | 11,607,845 | (1) | ||||||||||||
|
|
|
| |||||||||||||
| (1) | Total distributable earnings. The amounts represent the cumulative appreciation (depreciation) of these futures contracts as reported in the Statements of Assets and Liabilities. Only the current day’s variation margin, if any, is reported within the Statements of Assets and Liabilities as receivable (payable) for variation margin on futures contracts. Each Portfolio’s Schedule of Open Futures Contracts details the values by futures contract type. |
| (2) | Investments in securities of unaffiliated issuers, at value. |
Portfolio | Instrument | Primary Risk Type | Realized Gain (Loss) on Derivatives Recognized in Income | Change in Unrealized | Location on Statements of Operations | |||||||||||||
ON BlackRock Balanced Allocation | Futures contracts | Equity price | $ | (827,697 | ) | $ | (182,639 | ) | (1),(2) | |||||||||
|
|
|
| |||||||||||||||
ON BlackRock Advantage International Equity | Futures contracts | Equity price | (1,743,189 | ) | (311,863 | ) | (1),(2) | |||||||||||
|
|
|
| |||||||||||||||
ON AB Mid Cap Core | Futures contracts | Equity price | (16,290 | ) | (7,212 | ) | (1),(2) | |||||||||||
|
|
|
| |||||||||||||||
ON S&P 500® Index | Futures contracts | Equity price | (538,032 | ) | (437,663 | ) | (1),(2) | |||||||||||
|
|
|
| |||||||||||||||
ON BlackRock Advantage Large Cap Value | Futures contracts | Equity price | (549,608 | ) | (150,835 | ) | (1),(2) | |||||||||||
|
|
|
| |||||||||||||||
ON Nasdaq-100® Index | Futures contracts | Equity price | (884,883 | ) | (56,920 | ) | (1),(2) | |||||||||||
|
|
|
| |||||||||||||||
ON BlackRock Advantage Large Cap Core | Futures contracts | Equity price | (797,077 | ) | (218,016 | ) | (1),(2) | |||||||||||
|
|
|
| |||||||||||||||
ON BlackRock Advantage Small Cap Growth | Futures contracts | Equity price | (730,905 | ) | (107,371 | ) | (1),(2) | |||||||||||
|
|
|
| |||||||||||||||
ON S&P MidCap 400® Index | Futures contracts | Equity price | (98,418 | ) | (107,367 | ) | (1),(2) | |||||||||||
|
|
|
| |||||||||||||||
ON BlackRock Advantage Large Cap Growth | Futures contracts | Equity price | 19,700 | (349,526 | ) | (1),(2) | ||||||||||||
|
|
|
| |||||||||||||||
ON Risk Managed Balanced | Futures contracts | Equity price | 8,112,628 | 2,975,151 | (1),(2) | |||||||||||||
|
|
|
| |||||||||||||||
| Futures contracts | Interest rate | (42,152,965 | ) | (3,806,928 | ) | (1),(2) | ||||||||||||
|
|
|
| |||||||||||||||
| Purchased options | Equity price | (12,484,050 | ) | (11,897,406 | ) | (3),(4) | ||||||||||||
|
|
|
| |||||||||||||||
ON Federated Core Plus Bond | Futures contracts | Interest rate | 4,736,003 | 242,991 | (1),(2) | |||||||||||||
|
|
|
| |||||||||||||||
| 187 | (continued) |
Ohio National Fund, Inc. | ||
| Notes to Financial Statements (Continued) | December 31, 2022 | |
Portfolio | Instrument | Primary Risk Type | Realized Gain (Loss) on Derivatives Recognized in Income | Change in Unrealized Appreciation/ Depreciation on Derivatives Recognized in Income | Location on Statements of Operations | |||||||||||||||||
ON iShares Managed Risk Balanced | Futures contracts | Equity price | $ | (7,065,727 | ) | $ | (1,558,687 | ) | (1),(2) | |||||||||||||
|
|
|
| |||||||||||||||||||
| Futures contracts | Interest rate | 3,805,902 | (201,484 | ) | (1),(2) | |||||||||||||||||
|
|
|
| |||||||||||||||||||
| Futures contracts | Foreign currency | (408,032 | ) | (102,690 | ) | (1),(2) | ||||||||||||||||
|
|
|
| |||||||||||||||||||
ON iShares Managed Risk Moderate Growth(a) | Futures contracts | Equity price | 3,494,936 | (1,748,605 | ) | (1),(2) | ||||||||||||||||
|
|
|
| |||||||||||||||||||
| Futures contracts | Interest rate | (218,580 | ) | (240 | ) | (1),(2) | ||||||||||||||||
|
|
|
| |||||||||||||||||||
| Futures contracts | Foreign currency | (96,116 | ) | (1,409 | ) | (1),(2) | ||||||||||||||||
|
|
|
| |||||||||||||||||||
ON iShares Managed Risk Growth(a) | Futures contracts | Equity price | (294,958 | ) | (1,198,442 | ) | (1),(2) | |||||||||||||||
|
|
|
| |||||||||||||||||||
| Futures contracts | Interest rate | (186,564 | ) | (205 | ) | (1),(2) | ||||||||||||||||
|
|
|
| |||||||||||||||||||
| Futures contracts | Foreign currency | (181,336 | ) | (2,405 | ) | (1),(2) | ||||||||||||||||
|
|
|
| |||||||||||||||||||
| (a) | Period from October 14, 2022 (inception) to December 31, 2022. |
| (1) | Net realized gain (loss) on futures contracts. |
| (2) | Change in unrealized appreciation/depreciation on futures contracts. |
| (3) | Net realized gain (loss) on investments in securities of unaffiliated issuers. |
| (4) | Change in unrealized appreciation/depreciation on investments in securities of unaffiliated issuers. |
The Portfolios may enter into International Swaps and Derivatives Association, Inc. Master Agreements (“ISDA Master Agreement”) or similar agreements with their derivative contract counterparties whereby the Portfolios may, under certain circumstances, offset with the counterparty certain derivative financial instruments’ payables and/or receivables and create one single net payment. For financial reporting purposes, the Portfolios offset derivative assets and liabilities that are subject to netting arrangements in the Statements of Assets and Liabilities. At December 31, 2022, there were no outstanding derivative transactions subject to netting arrangements.
| (7) | Federal Income Tax Information |
The following information is presented on a federal income tax basis. Differences between amounts for financial statements and federal income tax purposes are primarily due to timing and character differences in recognizing certain gains and losses on investment transactions. Permanent differences between financial statement and federal income tax reporting are reclassified within the capital accounts based on their federal income tax treatment. Temporary differences do not require reclassification. Reclassifications related to permanent differences relate principally to consent dividends, foreign currency gains and losses, net investment losses, and distributions from real estate investment trusts and closed end mutual funds.
At December 31, 2022, the components of accumulated earnings (deficit) on a tax basis were as follows:
| Undistributed | Total | |||||||||||||||||||||||
| Undistributed | Long-Term | Accumulated | Unrealized | Accumulated | ||||||||||||||||||||
| Ordinary | Capital Gains | Accumulated | Capital and | Appreciation | Earnings | |||||||||||||||||||
Portfolio | Income | (Losses) | Earnings | Other Losses | (Depreciation)(1) | (Deficit) | ||||||||||||||||||
ON Bond | $ | 7,069,354 | $ | — | $ | 7,069,354 | $ | (2,294,349 | ) | $ | (29,477,880 | ) | $ | (24,702,875 | ) | |||||||||
ON BlackRock Balanced Allocation | 7,198,405 | — | 7,198,405 | (2,071,411 | ) | (31,040,992 | ) | (25,913,998 | ) | |||||||||||||||
ON BlackRock Advantage International Equity | 12,519,043 | — | 12,519,043 | (54,170,805 | ) | (4,929,294 | ) | (46,581,056 | ) | |||||||||||||||
ON Janus Henderson Forty | — | 10,658,675 | 10,658,675 | — | 414,670 | 11,073,345 | ||||||||||||||||||
ON AB Small Cap | 11,905 | — | 11,905 | (16,087,431 | ) | (18,786,004 | ) | (34,861,530 | ) | |||||||||||||||
ON AB Mid Cap Core | 385,899 | — | 385,899 | (5,819,845 | ) | (10,275,924 | ) | (15,709,870 | ) | |||||||||||||||
ON S&P 500® Index | 13,694,067 | 47,516,411 | 61,210,478 | — | 275,977,792 | 337,188,270 | ||||||||||||||||||
ON BlackRock Advantage Large Cap Value | 4,026,992 | 2,025,713 | 6,052,705 | — | (8,588,210 | ) | (2,535,505 | ) | ||||||||||||||||
ON Federated High Income Bond | 7,303,133 | — | 7,303,133 | (11,835,337 | ) | (19,229,572 | ) | (23,761,776 | ) | |||||||||||||||
| 188 | (continued) |
Ohio National Fund, Inc. | ||
| Notes to Financial Statements (Continued) | December 31, 2022 | |
| Undistributed | Total | |||||||||||||||||||||||
| Undistributed | Long-Term | Accumulated | Unrealized | Accumulated | ||||||||||||||||||||
| Ordinary | Capital Gains | Accumulated | Capital and | Appreciation | Earnings | |||||||||||||||||||
Portfolio | Income | (Losses) | Earnings | Other Losses | (Depreciation)(1) | (Deficit) | ||||||||||||||||||
ON Nasdaq-100® Index | $ | 1,186,637 | $ | 20,800,506 | $ | 21,987,143 | — | $ | 40,129,287 | $ | 62,116,430 | |||||||||||||
ON BlackRock Advantage Large Cap Core | 3,390,957 | 966,863 | 4,357,820 | — | (11,875,615 | ) | (7,517,795 | ) | ||||||||||||||||
ON BlackRock Advantage Small Cap Growth | 22,131 | — | 22,131 | (10,131,477 | ) | (26,794,429 | ) | (36,903,775 | ) | |||||||||||||||
ON S&P MidCap 400® Index | 4,122,231 | 20,852,122 | 24,974,353 | — | 23,264,532 | 48,238,885 | ||||||||||||||||||
ON BlackRock Advantage Large Cap Growth | 606,055 | 2,861,087 | 3,467,142 | — | (9,838,350 | ) | (6,371,208 | ) | ||||||||||||||||
ON Risk Managed Balanced | 12,979,323 | — | 12,979,323 | (51,310,067 | ) | (19,108,457 | ) | (57,439,201 | ) | |||||||||||||||
ON Federated Core Plus Bond | 13,552,610 | — | 13,552,610 | (36,209,698 | ) | (70,039,057 | ) | (92,696,145 | ) | |||||||||||||||
ON U.S. Low Volatility | 8,675,329 | — | 8,675,329 | (6,307,899 | ) | 7,400,040 | 9,767,470 | |||||||||||||||||
ON AB Relative Value | 1,393,242 | — | 1,393,242 | (1,130,992 | ) | (754,330 | ) | (492,080 | ) | |||||||||||||||
ON iShares Managed Risk Balanced | 6,229,046 | — | 6,229,046 | (22,985,719 | ) | (27,231,566 | ) | (43,988,239 | ) | |||||||||||||||
ON iShares Managed Risk Moderate Growth | — | — | — | — | 21,591,892 | 21,591,892 | ||||||||||||||||||
ON iShares Managed Risk Growth | — | — | — | — | 21,080,066 | 21,080,066 | ||||||||||||||||||
ON Moderately Conservative Model | 8,306,876 | 7,287,022 | 15,593,898 | — | (29,116,880 | ) | (13,522,982 | ) | ||||||||||||||||
ON Balanced Model | 37,378,005 | 48,283,103 | 85,661,108 | — | (102,749,208 | ) | (17,088,100 | ) | ||||||||||||||||
ON Moderate Growth Model | 85,320,714 | 123,072,823 | 208,393,537 | — | (225,740,832 | ) | (17,347,295 | ) | ||||||||||||||||
ON Growth Model | 22,630,537 | 34,475,800 | 57,106,337 | — | (59,372,968 | ) | (2,266,631 | ) | ||||||||||||||||
| (1) | The differences between book-basis and tax-basis unrealized appreciation/(depreciation) are attributed primarily to tax deferral of losses on wash sales and the realization for tax purposes of unrealized gains/(losses) on certain instruments. |
For federal income tax purposes, the following Portfolios had capital loss carryforwards as of December 31, 2022 that are available to offset future realized gains, if any:
| No | No | |||||||||||
| Total Loss | Expiration | Expiration | ||||||||||
Portfolio | Carryforward | Short Term | Long Term | |||||||||
ON Bond | $ | 2,294,349 | $ | 78,250 | $ | 2,216,099 | ||||||
ON BlackRock Balanced Allocation | 2,071,411 | 2,071,411 | — | |||||||||
ON BlackRock Advantage International Equity | 54,170,805 | 46,775,674 | 7,395,131 | |||||||||
ON AB Small Cap | 16,087,431 | 7,894,651 | 8,192,780 | |||||||||
ON AB Mid Cap Core | 5,819,845 | 2,585,296 | 3,234,549 | |||||||||
ON Federated High Income Bond | 11,835,337 | 111,954 | 11,723,383 | |||||||||
ON BlackRock Advantage Small Cap Growth | 10,131,477 | 7,841,842 | 2,289,635 | |||||||||
ON Risk Managed Balanced | 51,310,067 | 41,115,434 | 10,194,633 | |||||||||
ON Federated Core Plus Bond | 36,209,698 | 25,841,234 | 10,368,464 | |||||||||
ON U.S. Low Volatility | 6,307,899 | — | 6,307,899 | |||||||||
ON AB Relative Value | 1,130,992 | 1,116,949 | 14,043 | |||||||||
ON iShares Managed Risk Balanced | 22,985,719 | 12,168,904 | 10,816,815 | |||||||||
The cost basis for federal income tax purposes may differ from the cost basis for financial reporting purposes. The table below details the unrealized appreciation (depreciation) and aggregate cost of investments at December 31, 2022 for federal income tax purposes.
| ON BlackRock | ||||||||||||||||||||||||
| ON BlackRock | Advantage | |||||||||||||||||||||||
| Balanced | International | ON Janus | ON AB Mid Cap | |||||||||||||||||||||
| ON Bond | Allocation | Equity | Henderson Forty | ON AB Small Cap | Core | |||||||||||||||||||
Gross unrealized: | ||||||||||||||||||||||||
Appreciation | $ | 146,654 | $ | 22,134,765 | $ | 13,865,509 | $ | 4,533,164 | $ | 5,992,922 | $ | 4,843,136 | ||||||||||||
Depreciation | (29,624,534 | ) | (53,175,757 | ) | (18,744,859 | ) | (4,118,039 | ) | (24,778,926 | ) | (15,119,217 | ) | ||||||||||||
|
|
|
|
|
|
|
|
|
|
|
| |||||||||||||
Net unrealized appreciation (depreciation) | $ | (29,477,880 | ) | $ | (31,040,992 | ) | $ | (4,879,350 | ) | $ | 415,125 | $ | (18,786,004 | ) | $ | (10,276,081 | ) | |||||||
|
|
|
|
|
|
|
|
|
|
|
| |||||||||||||
Aggregate cost of investments: | $ | 242,159,120 | $ | 445,248,994 | $ | 353,820,055 | $ | 43,737,491 | $ | 131,509,028 | $ | 87,121,986 | ||||||||||||
|
|
|
|
|
|
|
|
|
|
|
| |||||||||||||
| 189 | (continued) |
Ohio National Fund, Inc. | ||
| Notes to Financial Statements (Continued) | December 31, 2022 | |
| ON BlackRock | ON Federated | ON BlackRock | ON BlackRock | |||||||||||||||||||||
| ON S&P 500® | Advantage Large | High Income | ON Nasdaq-100® | Advantage Large | Advantage Small | |||||||||||||||||||
| Index | Cap Value | Bond | Index | Cap Core | Cap Growth | |||||||||||||||||||
Gross unrealized: | ||||||||||||||||||||||||
Appreciation | $ | 330,434,400 | $ | 12,304,582 | $ | 219,734 | $ | 57,306,645 | $ | 22,293,253 | $ | 13,126,017 | ||||||||||||
Depreciation | (54,456,608 | ) | (20,855,369 | ) | (19,449,306 | ) | (17,177,358 | ) | (34,168,868 | ) | (39,920,446 | ) | ||||||||||||
|
|
|
|
|
|
|
|
|
|
|
| |||||||||||||
Net unrealized appreciation (depreciation) | $ | 275,977,792 | $ | (8,550,787 | ) | $ | (19,229,572 | ) | $ | 40,129,287 | $ | (11,875,615 | ) | $ | (26,794,429 | ) | ||||||||
|
|
|
|
|
|
|
|
|
|
|
| |||||||||||||
Aggregate cost of investments: | $ | 731,441,884 | $ | 205,628,391 | $ | 138,999,965 | $ | 164,273,825 | $ | 320,211,908 | $ | 159,240,529 | ||||||||||||
|
|
|
|
|
|
|
|
|
|
|
| |||||||||||||
| ON BlackRock | ||||||||||||||||||||||||
| ON S&P MidCap | Advantage Large | ON Risk Managed | ON Federated | ON U.S. Low | ON AB Relative | |||||||||||||||||||
| 400® Index | Cap Growth | Balanced | Core Plus Bond | Volatility | Value | |||||||||||||||||||
Gross unrealized: | ||||||||||||||||||||||||
Appreciation | $ | 51,559,467 | $ | 15,691,963 | $ | 11,836,198 | $ | 392,601 | $ | 51,068,996 | $ | 5,024,641 | ||||||||||||
Depreciation | (28,294,935 | ) | (25,530,313 | ) | (30,944,655 | ) | (70,431,658 | ) | (43,668,956 | ) | (5,778,971 | ) | ||||||||||||
|
|
|
|
|
|
|
|
|
|
|
| |||||||||||||
Net unrealized appreciation (depreciation) | $ | 23,264,532 | $ | (9,838,350 | ) | $ | (19,108,457 | ) | $ | (70,039,057 | ) | $ | 7,400,040 | $ | (754,330 | ) | ||||||||
|
|
|
|
|
|
|
|
|
|
|
| |||||||||||||
Aggregate cost of investments: | $ | 342,807,028 | $ | 377,891,008 | $ | 1,126,361,272 | $ | 612,231,358 | $ | 724,396,719 | $ | 122,103,679 | ||||||||||||
|
|
|
|
|
|
|
|
|
|
|
| |||||||||||||
| ON iShares | ON iShares | ON iShares | ON Moderately | |||||||||||||||||||||
| Managed Risk | Managed Risk | Managed Risk | Conservative | ON Balanced | ON Moderate | |||||||||||||||||||
| Balanced | Moderate Growth | Growth | Model | Model | Growth Model | |||||||||||||||||||
Gross unrealized: | ||||||||||||||||||||||||
Appreciation | $ | 5,862,283 | $ | 23,335,475 | $ | 22,271,882 | $ | 397,800 | $ | 5,520,659 | $ | 7,022,497 | ||||||||||||
Depreciation | (33,181,631 | ) | (1,747,393 | ) | (1,197,366 | ) | (29,514,680 | ) | (108,269,867 | ) | (232,763,329 | ) | ||||||||||||
|
|
|
|
|
|
|
|
|
|
|
| |||||||||||||
Net unrealized appreciation (depreciation) | $ | (27,319,348 | ) | $ | 21,588,082 | $ | 21,074,516 | $ | (29,116,880 | ) | $ | (102,749,208 | ) | $ | (225,740,832 | ) | ||||||||
|
|
|
|
|
|
|
|
|
|
|
| |||||||||||||
Aggregate cost of investments: | $ | 592,685,371 | $ | 410,922,240 | $ | 362,727,460 | $ | 242,652,254 | $ | 891,022,170 | $ | 1,671,434,447 | ||||||||||||
|
|
|
|
|
|
|
|
|
|
|
| |||||||||||||
| ON Growth Model | ||||||||||||||||||||||||
Gross unrealized: | ||||||||||||||||||||||||
Appreciation | $ | 1,426,478 | ||||||||||||||||||||||
Depreciation | (60,799,446 | ) | ||||||||||||||||||||||
|
| |||||||||||||||||||||||
Net unrealized depreciation | $ | (59,372,968 | ) | |||||||||||||||||||||
|
| |||||||||||||||||||||||
Aggregate cost of investments: | $ | 390,439,093 | ||||||||||||||||||||||
|
| |||||||||||||||||||||||
The tax character of cash distributions paid to shareholders for the year ended December 31, 2022, as well as other reclassifications of capital accounts due to permanent tax differences, were as follows (in aggregate):
| Distributions Paid to Shareholders | Other Reclassifications | |||||||||||||||||||
| Net | Total | |||||||||||||||||||
| Ordinary | Long-Term | Total | Paid-in | Distributable | ||||||||||||||||
Portfolio | Income* | Capital Gains | Distribution | Capital | Earnings | |||||||||||||||
ON Bond | $ | 7,256,311 | $ | 1,318,114 | $ | 8,574,425 | $ | (2 | ) | $ | 2 | |||||||||
ON BlackRock Balanced Allocation | 52,633,449 | 38,505,438 | 91,138,887 | — | — | |||||||||||||||
ON BlackRock Advantage International Equity | 63,189,251 | — | 63,189,251 | — | — | |||||||||||||||
ON Janus Henderson Forty | 2,974,357 | 56,344,793 | 59,319,150 | (165,609 | ) | 165,609 | ||||||||||||||
ON AB Small Cap | 11,356,613 | 66,093,164 | 77,449,777 | — | — | |||||||||||||||
ON AB Mid Cap Core | 2,157,527 | 36,322,652 | 38,480,179 | — | — | |||||||||||||||
ON S&P 500® Index | 14,735,083 | 126,253,087 | 140,988,170 | 1 | (1 | ) | ||||||||||||||
ON BlackRock Advantage Large Cap Value | 46,806,403 | 14,551,138 | 61,357,541 | — | — | |||||||||||||||
ON Federated High Income Bond | 7,915,615 | — | 7,915,615 | — | — | |||||||||||||||
ON Nasdaq-100® Index | 1,964,102 | 79,047,918 | 81,012,020 | 1 | (1 | ) | ||||||||||||||
| 190 | (continued) |
Ohio National Fund, Inc. | ||
| Notes to Financial Statements (Continued) | December 31, 2022 | |
| Distributions Paid to Shareholders | Other Reclassifications | |||||||||||||||||||
| Net | Total | |||||||||||||||||||
| Ordinary | Long-Term | Total | Paid-in | Distributable | ||||||||||||||||
Portfolio | Income* | Capital Gains | Distribution | Capital | Earnings | |||||||||||||||
ON BlackRock Advantage Large Cap Core | $ | 52,973,996 | $ | 41,040,914 | $ | 94,014,910 | $ — | $ — | ||||||||||||
ON BlackRock Advantage Small Cap Growth | 21,697,461 | 28,256,764 | 49,954,225 | — | — | |||||||||||||||
ON S&P MidCap 400® Index | 13,241,962 | 46,383,692 | 59,625,654 | (1 | ) | 1 | ||||||||||||||
ON BlackRock Advantage Large Cap Growth | 11,457,694 | 23,282,628 | 34,740,322 | 1 | (1 | ) | ||||||||||||||
ON Risk Managed Balanced | 16,255,630 | 36,133,754 | 52,389,384 | (3 | ) | 3 | ||||||||||||||
ON Federated Core Plus Bond | 9,174,157 | 291,199 | 9,465,356 | — | — | |||||||||||||||
ON U.S. Low Volatility | 24,143,362 | — | 24,143,362 | — | — | |||||||||||||||
ON AB Relative Value | 92,591 | — | 92,591 | — | — | |||||||||||||||
ON iShares Managed Risk Balanced | 2,755,661 | 674,403 | 3,430,064 | — | — | |||||||||||||||
ON Moderately Conservative Model. | 4,414,338 | 14,607,672 | 19,022,010 | — | — | |||||||||||||||
ON Balanced Model | 19,218,977 | 76,236,257 | 95,455,234 | — | — | |||||||||||||||
ON Moderate Growth Model | 35,980,513 | 173,240,055 | 209,220,568 | — | — | |||||||||||||||
ON Growth Model | 8,376,893 | 49,234,647 | 57,611,540 | — | — | |||||||||||||||
* Ordinary income consists of net taxable income derived from dividends, interest, and net short-term capital gains, if any.
The tax character of consent dividend distributions recognized, as well as other reclassifications of capital accounts due to permanent tax differences for the year ended December 31, 2022, were as follows (in aggregate):
| Consent Dividend Distribution Reclassification | Other Reclassifications | |||||||||||||||||||
| Net | Total | |||||||||||||||||||
| Ordinary | Long-Term | Total | Paid-in | Distributable | ||||||||||||||||
Portfolio | Income* | Capital Gains | Distribution | Capital | Earnings | |||||||||||||||
ON iShares Managed Risk Moderate Growth | $ | 5,677,611 | $ | 997,185 | $ | 6,674,796 | $ | 6,674,796 | $ | (6,674,796 | ) | |||||||||
ON iShares Managed Risk Growth | 3,906,791 | — | 3,906,791 | 3,906,791 | (3,906,791 | ) | ||||||||||||||
* Ordinary income consists of net taxable income derived from dividends, interest, and net short-term capital gains, if any.
The tax character of cash distributions paid to shareholders for the year ended December 31, 2021, as well as other reclassifications of capital accounts due to permanent tax differences, were as follows (in aggregate):
| Distributions Paid to Shareholders | Other Reclassifications | |||||||||||||||||||
| Net | Total | |||||||||||||||||||
| Ordinary | Long-Term | Total | Paid-in | Distributable | ||||||||||||||||
Portfolio | Income* | Capital Gains | Distribution | Capital | Earnings | |||||||||||||||
ON Bond | $ | 8,269,842 | $ | — | $ | 8,269,842 | $ | 1 | $ | (1 | ) | |||||||||
ON BlackRock Balanced Allocation | 28,527,622 | 23,187,589 | 51,715,211 | 1 | (1 | ) | ||||||||||||||
ON BlackRock Advantage International Equity | 6,864,821 | — | 6,864,821 | 915 | (915 | ) | ||||||||||||||
ON Janus Henderson Forty | 1,508,225 | 20,952,229 | 22,460,454 | — | — | |||||||||||||||
ON AB Small Cap | 2,327,746 | 17,075,130 | 19,402,876 | (562 | ) | 562 | ||||||||||||||
ON AB Mid Cap Core | 156,515 | 6,216,783 | 6,373,298 | — | — | |||||||||||||||
ON S&P 500® Index | 19,846,188 | 69,459,354 | 89,305,542 | — | — | |||||||||||||||
ON BlackRock Advantage Large Cap Value | 4,834,870 | — | 4,834,870 | — | — | |||||||||||||||
ON Federated High Income Bond | 8,796,067 | — | 8,796,067 | — | — | |||||||||||||||
ON Nasdaq-100® Index | 2,559,507 | 68,367,176 | 70,926,683 | — | — | |||||||||||||||
ON BlackRock Advantage Large Cap Core | 13,346,129 | 28,168,258 | 41,514,387 | 1 | (1 | ) | ||||||||||||||
ON BlackRock Advantage Small Cap Growth | 20,846,427 | 3,785,498 | 24,631,925 | (1 | ) | 1 | ||||||||||||||
ON S&P MidCap 400® Index | 9,594,486 | 1,954,878 | 11,549,364 | — | — | |||||||||||||||
ON BlackRock Advantage Large Cap Growth | 7,181,931 | 14,551,063 | 21,732,994 | — | — | |||||||||||||||
ON Risk Managed Balanced | 21,024,870 | 47,958,860 | 68,983,730 | — | — | |||||||||||||||
ON Federated Core Plus Bond | 2,499,839 | 35,130 | 2,534,969 | — | — | |||||||||||||||
ON U.S. Low Volatility | — | — | — | — | — | |||||||||||||||
ON AB Relative Value | — | — | — | — | — | |||||||||||||||
| 191 | (continued) |
Ohio National Fund, Inc. | ||
| Notes to Financial Statements (Continued) | December 31, 2022 | |
| Distributions Paid to Shareholders | Other Reclassifications | |||||||||||||||||||
| Net | Total | |||||||||||||||||||
| Ordinary | Long-Term | Total | Paid-in | Distributable | ||||||||||||||||
Portfolio | Income* | Capital Gains | Distribution | Capital | Earnings | |||||||||||||||
ON iShares Managed Risk Balanced | $ | — | $ | — | $ | — | $ | — | $ | — | ||||||||||
ON Moderately Conservative Model | 3,192,853 | 4,170,692 | 7,363,545 | 17,251 | (17,251 | ) | ||||||||||||||
ON Balanced Model | 9,622,752 | 11,766,598 | 21,389,350 | — | — | |||||||||||||||
ON Moderate Growth Model | 8,188,561 | 16,677,555 | 24,866,116 | — | — | |||||||||||||||
ON Growth Model | 1,118,442 | 3,981,321 | 5,099,763 | — | — | |||||||||||||||
* Ordinary income consists of net taxable income derived from dividends, interest, and net short-term capital gains, if any.
| 192 |
Report of Independent Registered Public Accounting Firm | ||
To the Shareholders and Board of Directors
Ohio National Fund, Inc.:
Opinion on the Financial Statements
We have audited the accompanying statements of assets and liabilities of the Portfolios listed in the Appendix that comprise Ohio National Fund, Inc. (each a Portfolio and collectively, the Portfolios), including the schedules of investments, as of December 31, 2022, the related statements of operations for the year or period listed in the Appendix, the statements of changes in net assets for each of the years or periods listed in the Appendix, and the related notes (collectively, the financial statements) and the financial highlights for each of the years or periods in the five-year period then ended. In our opinion, the financial statements and financial highlights present fairly, in all material respects, the financial position of each Portfolio as of December 31, 2022, the results of its operations for the year or period listed in the Appendix, the changes in its net assets for each of the years or periods listed in the Appendix, and the financial highlights for each of the years or periods in the five-year period then ended, in conformity with U.S. generally accepted accounting principles.
Basis for Opinion
These financial statements and financial highlights are the responsibility of the Portfolios’ management. Our responsibility is to express an opinion on these financial statements and financial highlights based on our audits. We are a public accounting firm registered with the Public Company Accounting Oversight Board (United States) (PCAOB) and are required to be independent with respect to the Portfolios in accordance with the U.S. federal securities laws and the applicable rules and regulations of the Securities and Exchange Commission and the PCAOB.
We conducted our audits in accordance with the standards of the PCAOB. Those standards require that we plan and perform the audit to obtain reasonable assurance about whether the financial statements and financial highlights are free of material misstatement, whether due to error or fraud. Our audits included performing procedures to assess the risks of material misstatement of the financial statements and financial highlights, whether due to error or fraud, and performing procedures that respond to those risks. Such procedures included examining, on a test basis, evidence regarding the amounts and disclosures in the financial statements and financial highlights. Such procedures also included confirmation of securities owned as of December 31, 2022, by correspondence with custodians, brokers, and transfer agents, or by other appropriate auditing procedures when replies were not received. Our audits also included evaluating the accounting principles used and significant estimates made by management, as well as evaluating the overall presentation of the financial statements and financial highlights. We believe that our audits provide a reasonable basis for our opinion.
/s/ KPMG LLP
We have served as the auditor of one or more of the Ohio National Fund, Inc. investment companies since 1969.
Columbus, Ohio
February 17, 2023
| 193 | (continued) |
Ohio National Fund, Inc. | ||
| Report of Independent Registered Public Accounting Firm (Continued) | ||
Appendix
Statement of assets and liabilities, including the schedule of investments, as of December 31, 2022, the related statement of operations for the year then ended, and the statements of changes in net assets for each of the years in the two-year period then ended.
ON Bond Portfolio
ON BlackRock Balanced Allocation Portfolio
ON BlackRock Advantage International Equity Portfolio
ON Janus Henderson Forty Portfolio
ON AB Small Cap Portfolio
ON AB Mid Cap Core Portfolio
ON S&P 500® Index Portfolio
ON BlackRock Advantage Large Cap Value Portfolio
ON Federated High Income Bond Portfolio
ON Nasdaq-100® Index Portfolio
ON BlackRock Advantage Large Cap Core Portfolio
ON BlackRock Advantage Small Cap Growth Portfolio
ON S&P MidCap 400® Index Portfolio
ON BlackRock Advantage Large Cap Growth Portfolio
ON Risk Managed Balanced Portfolio
ON Federated Core Plus Bond Portfolio
ON Moderately Conservative Model Portfolio
ON Balanced Model Portfolio
ON Moderate Growth Model Portfolio
ON Growth Model Portfolio
Statement of assets and liabilities, including the schedule of investments, as of December 31, 2022, the related statement of operations for the year then ended, and the statements of changes in net assets for the year ended December 31, 2022 and for the period June 25, 2021 (commencement of operations) through December 31, 2021.
ON U.S. Low Volatility Portfolio (formerly ON Janus Henderson U.S. Low Volatility Portfolio)
ON iShares Managed Risk Balanced Portfolio
Statement of assets and liabilities, including the schedule of investments, as of December 31, 2022, the related statement of operations for the year then ended, and the statements of changes in net assets for the year ended December 31, 2022 and for the period December 2, 2021 (commencement of operations) through December 31, 2021.
ON AB Relative Value Portfolio
Statement of assets and liabilities, including the schedule of investments, as of December 31, 2022, and the related statements of operations and changes in net assets for the period October 14, 2022 (commencement of operations) through December 31, 2022.
ON iShares Managed Risk Moderate Growth Portfolio
ON iShares Managed Risk Growth Portfolio
| 194 |
| Additional Information | December 31, 2022 (Unaudited) | |
| (1) | Review and Approval of Advisory and Sub-Advisory Agreement for ON iShares Managed Risk Balanced Portfolio, ON iShares Managed Risk Moderate Growth Portfolio and ON iShares Managed Risk Growth Portfolio |
At a meeting held on July 18, 2022, the Board of Directors (the “Board”) of Ohio National Fund, Inc. (the “Fund”), including a majority of the Directors who are not “interested persons” of the Fund, approved amendments to the Investment Advisory Agreement (the “Advisory Agreement”) between Ohio National Investments, Inc. (the “Adviser”) and the Fund and the Sub-Advisory Agreements between the Adviser and BlackRock Investment Management, LLC (the “Sub-Adviser”) for each of the ON iShares Managed Risk Balanced Portfolio, ON iShares Managed Risk Moderate Growth Portfolio and ON iShares Managed Risk Growth Portfolio (the “iShares Portfolios”) to reflect new advisory and sub-advisory fees. At the July 18, 2022, meeting, the Directors met with representatives of the Adviser to discuss the management of the iShares Portfolios.
The Board noted that it had reviewed information submitted by the Adviser and Sub-Adviser with respect to the iShares Portfolios at a meeting held on November 11, 2021. Performance and fee information submitted at the November 11, 2021 meeting was updated through May 31, 2022 and presented at the July 18, 2022 meeting. The Directors also noted that the ON iShares Managed Risk Balanced Portfolio had less than one-year of performance information and the ON iShares Managed Risk Moderate Growth Portfolio, and ON iShares Managed Risk Growth Portfolio had not yet commenced operations.
The Directors noted that the Adviser is responsible for monitoring the investment performance and other responsibilities of the Sub-Adviser, which has the responsibility for supervising and managing the assets in the iShares Portfolios on a fully discretionary basis. They also noted that the Adviser reports to the Board on its analysis of the Sub-Adviser’s performance at the regular meetings of the Board, which are held at least quarterly. Finally, the Board noted that the Adviser provides the facilities and equipment utilized by the Fund; supplies business management services to the Fund, including monitoring expenses accruals and preparing the iShares Portfolio’s financial statements; prepares and files Fund registration statements, proxies, shareholder reports and other regulatory filings; provides financial oversight; and ensures that proxies related to the Portfolio’s holdings are voted in compliance with policies approved by the Board.
In considering the amendments to the Advisory Agreement and the Sub-Advisory Agreements, the Board reviewed a significant amount of information relating to the iShares Portfolios, including the following: (1) proposed advisory and sub-advisory fee information; (2) comparative advisory fee and expense ratio information for peer groups of funds; (3) performance data for funds employing strategies similar to that of the iShares Portfolio; and (4) other information regarding the nature, extent and quality of services anticipated to be provided by the Sub-Adviser.
The Directors, including all the Independent Directors, were assisted by experienced independent legal counsel throughout the contract review process. The Independent Directors discussed the proposed amendments to the Advisory Agreement and Sub-Advisory Agreements in a private session with such counsel at which no representatives of management or the Adviser were present. The Directors, including all of the Independent Directors, relied upon the advice of independent legal counsel and their own business judgment in determining the material factors to be considered in evaluating whether to approve the amendment to the Advisory Agreement and Sub-Advisory Agreements and the weight to be given to each such factor. The conclusions reached by the Directors were based on a comprehensive evaluation of all the information provided and were not the result of any one factor. Moreover, each Director may have afforded different weight to the various factors in reaching his or her conclusions with respect to approving the amendments to the Advisory Agreement and Sub-Advisory Agreements.
Nature, Extent and Quality of Services
The Directors evaluated the nature, extent and quality of the advisory services anticipated to be provided to the iShares Portfolios by the Adviser. As part of its review, the Directors reviewed information regarding the Adviser’s operations, procedures and personnel. The Directors took into account information they received during the previous year at Board meetings in connection with the Adviser’s service to the ON iShares Managed Risk Balanced Portfolio and the other portfolios of the Fund and through periodic reports regarding the Adviser’s performance of its duties to the other portfolios. The Directors also evaluated the nature, extent and quality of the advisory services anticipated to be provided by the Sub-Adviser. The Directors noted their experience and familiarity with the Sub-Adviser as the sub-adviser for other portfolios of the Fund. As part of its review, the Board reviewed information regarding the operations, procedures and personnel of the Sub-Adviser. The Directors concluded that, overall, they were satisfied with the nature, extent and quality of services anticipated to be provided to the Portfolio by the Adviser and Sub-Adviser.
| 195 | (continued) |
Ohio National Fund, Inc. | ||
| Additional Information (Continued) | December 31, 2022 (Unaudited) | |
Investment Performance
The Directors reviewed the performance of the ON iShares Managed Risk Balanced Portfolio against the performance of its Morningstar peer group and benchmark. The Directors noted that the ON iShares Managed Risk Balanced Portfolio outperformed the benchmark and slightly underperformed the Morningstar peer group of the year-to-date period ended May 31, 2022. The ON iShares Managed Risk Moderate Growth Portfolio, and ON iShares Managed Risk Growth Portfolio had not yet commenced operations as of May 31, 2022.
Fees and Expenses
The Board considered the current and proposed fee schedules for the iShares Portfolios. The Directors noted that the proposed amended advisory fee schedule for each iShares Portfolio represented a reduction of three basis points at the top tier of the fee schedule, and two basis points at the second tier. The Directors also considered that the proposed sub-advisory fees represented a reduction of one basis point at the top tier of the fee schedule. The Directors noted that the amended advisory fees payable by the iShares Portfolios were within the range of fees payable by the iShares Portfolios’ peer groups and included fee breakpoints. The Directors acknowledged that, because the sub-advisory fees are paid by the Adviser and not by the iShares Portfolios, the Adviser is incentivized to negotiate a favorable fee. Accordingly, as to the Sub-Adviser, the cost of services provided by the Sub-Adviser and the profitability of the Sub-Adviser in connection with its relationship with the iShares Portfolios were not material factors in the Board’s deliberations. Overall, the Directors concluded that the proposed advisory and sub-advisory fees were reasonable.
Profitability and Economies of Scale
The Directors agreed that any projection of profit with respect to the iShares Portfolios would be purely speculative at this time, as the ON iShares Managed Risk Balanced Portfolio had been operational for less than one-year and the ON iShares Managed Risk Moderate Growth Portfolio, and ON iShares Managed Risk Growth Portfolio had not yet commenced operations. Accordingly, the profitability of the Adviser and Sub-Adviser in connection with their relationship with the iShares Portfolios was not a material factor in the Board’s deliberations.
Based on the above-mentioned factors and their related conclusions, with no single factor or conclusion being determinative and with each Director not necessarily attributing the same weight to each factor, the Directors unanimously concluded that approval of the amendment to the Advisory Agreement and the Sub-Advisory Agreements were in the best interests of the iShares Portfolios and their shareholders. Accordingly, the Board, including all the Independent Directors, voted unanimously to approve the amendment to the Advisory Agreement and the Sub-Advisory Agreements for the iShares Portfolios.
| (2) | Review and Approval of Investment Advisory and Sub-Advisory Agreements |
At a meeting held on November 21, 2022 the Board of Directors (the “Board” or “Directors”), including a majority of the Directors who are not “interested persons” (the “Independent Directors”) of Ohio National Fund, Inc. (the “Fund”), approved the continuation of the Investment Advisory Agreement (the “Advisory Agreement”) with Ohio National Investments, Inc. (“ONI” or “Adviser”) and, as applicable, the sub-advisory agreement (each a “Sub-Advisory Agreement”) with the sub-adviser (each a “Sub-Adviser,” and together the “Sub-Advisers”) for the Portfolios identified below. The Directors noted that the renewal of the Advisory Agreement and Sub-Advisory Agreements with respect to certain Portfolios organized in 2021 and 2022 were not required to be considered at this meeting. The Independent Directors were separately represented by independent legal counsel in connection with their consideration of the approval of the continuation of these agreements.
The Directors noted that the Adviser is responsible for monitoring the investment performance and other activities of the various Sub-Advisers that have day-to-day responsibility for the decisions made for certain of the Fund’s investment portfolios (each, a “Portfolio”). The Directors further noted that for those Portfolios operating as “funds of funds”, the Adviser bears significant responsibility and administrative burden in the monitoring and reporting required by Rule 12d1-4 under the Investment Company Act of 1940, as amended. They also noted that the Adviser reports to the Board on its analysis of each Sub-Adviser’s performance at the regular meetings of the Board, which are held at least quarterly. The Directors reviewed the compliance and operational services provided to the Portfolios by the Adviser, which includes implementing and operating the Fund’s Liquidity Risk Management and Derivatives Risk Management programs, and overseeing the valuation of portfolio securities. Finally, the Board noted that the Adviser provides the facilities and equipment utilized by the Portfolios; supplies business management services to the Fund, including monitoring expenses accruals and preparing the Portfolios’ financial statements; prepares and files Fund registration statements, proxies, shareholder reports and other regulatory filings; provides financial oversight; and ensures that proxies related to each Portfolio’s holdings are voted in compliance with policies approved by the Board.
| 196 | (continued) |
Ohio National Fund, Inc. | ||
| Additional Information (Continued) | December 31, 2022 (Unaudited) | |
In considering the Advisory Agreement and Sub-Advisory Agreements, the Board requested, received and reviewed a significant amount of information relating to each Portfolio, the Adviser and the Sub-Advisers, including the following: (1) performance data for each Portfolio for various time periods, including year-to-date, through September 30, 2022, (2) comparative performance, advisory fee, and expense ratio information for a peer group of funds in each respective Portfolio’s Morningstar category (a “peer group”), as well as management fee peer comparison charts showing where each Portfolio’s advisory and sub-advisory fees were located in the dispersion of its peer group’s advisory and sub-advisory fees; (3) comparable performance information for each Portfolio’s relevant benchmark index or indices; (4) other comparative data regarding advisory fees, including data regarding the fees charged by the Adviser and Sub-Advisers for managing other institutional funds and institutional accounts using investment strategies and techniques similar to those used in managing the Portfolios, as applicable; (5) comparative data regarding the expense ratio of each Portfolio, as compared to its peer group; (6) a profitability analysis for the Adviser with respect to each Portfolio; and (7) other information regarding the nature, extent and quality of services provided by the Adviser and the Sub-Advisers, as applicable. The Directors also took into account information regarding the services provided by the Adviser and each Sub-Adviser, and performance, fee and expense ratio information regarding each Portfolio provided to them periodically throughout the year. They also met with representatives of the Adviser to review the relative performance of each Portfolio, as compared with its benchmark index(es) and peer group.
The Directors, including all of the Independent Directors, were assisted by experienced independent legal counsel throughout the Advisory Agreement and Sub-Advisory Agreement review process. The Independent Directors discussed the proposed continuations in a private session with such counsel at which no representatives of management, the Adviser or any Sub-Adviser were present. Each Director, including each of the Independent Directors, relied upon the advice of independent legal counsel and his or her own business judgment in determining the material factors to be considered in evaluating the Advisory Agreement and each Sub-Advisory Agreement and the weight to be given to each such factor. The conclusions reached by the Directors were based on a comprehensive evaluation of all of the information provided and were not the result of any one factor. Moreover, each Director may have afforded different weight to the various factors in reaching his or her conclusions with respect to the Advisory Agreement and each Sub-Advisory Agreement.
Nature, Extent and Quality of Services
The Directors evaluated the nature, extent and quality of the advisory services provided to the Portfolios by the Adviser. As part of their review, the Directors reviewed information regarding the Adviser’s operations, procedures and personnel. The Directors took into account information they received during the previous year at Board meetings and other discussions and through periodic reports regarding the Adviser’s performance of its duties. The Directors considered the capabilities and resources that the Adviser has dedicated to performing services on behalf of the Fund and its Portfolios, as well as the quality of administrative and other services provided by the Adviser, which include monitoring each Sub-Adviser’s performance, monitoring the quality of each Sub-Adviser’s compliance program and providing other support to contract owners. The Directors also considered the quality of the Adviser’s compliance programs and the Adviser’s responsiveness to Board inquiries and requests.
For each Portfolio with a fund-of-funds structure, the Directors considered that the Adviser performs significant services to the Portfolio that are in addition to, rather than duplicative of, services provided under the advisory contracts of the underlying funds. The Directors noted the Adviser’s statements at the meeting that it performs regular reviews of each Portfolio and its underlying funds in order to confirm that the Portfolio is diversified, has the appropriate asset mix, and is performing well.
For each Portfolio subject to a Sub-Advisory Agreement, the Board considered similar criteria as applied to each Sub-Adviser, including the nature, extent and quality of the sub-advisory services provided by each Sub-Adviser. In addition to the criteria used to review the Adviser, the Directors reviewed information on each Sub-Adviser’s portfolio management and brokerage practices. The Directors also reviewed the performance record of each Portfolio managed by the applicable Sub-Adviser. The Directors determined that overall, they were satisfied with the nature, extent and quality of services provided to the Fund and each of the Portfolios.
Investment Performance
Representatives of the Adviser reviewed with the Directors each Portfolio’s performance for the year-to-date, 1-, 3- and 5-year periods ended September 30, 2022, to the extent relevant, as compared to the Portfolio’s peer group and benchmark(s). The Board also considered the Adviser’s effectiveness in monitoring the performance of each Sub-Adviser and the Adviser’s timeliness in responding to performance issues. The Directors discussed with the Adviser representatives certain Portfolios that underperformed their respective benchmarks. A Portfolio-by-Portfolio discussion of each Portfolio’s performance and the Board’s conclusions regarding that performance is set forth below.
| 197 | (continued) |
Ohio National Fund, Inc. | ||
| Additional Information (Continued) | December 31, 2022 (Unaudited) | |
Fees and Expenses
The Directors considered a summary document showing the advisory fee for each Portfolio, as well as the difference of each Portfolio’s fee from the average advisory fee for the Portfolio’s peer group and the Portfolio’s percentile ranking within the peer group. The Directors also considered separate charts showing, for each Portfolio, how the Portfolio’s advisory fees compared to the advisory fees of the funds in its peer group. The charts showed the number of funds in the peer group within each defined range of advisory fees, and the range that included the Portfolio. The Directors also reviewed the difference between each Portfolio’s overall expense ratio and that of its peer group, as well as the expense ratio’s percentile ranking within the peer group. For these purposes, the peer groups excluded funds with net assets over $1 billion, all funds identified as a fund-of-funds, and for all Portfolios other than the ON S&P 500® Index Portfolio, ON S&P MidCap 400® Index Portfolio and the ON Nasdaq-100® Index Portfolio, all index funds. Non-index funds were excluded from the Morningstar Peer Group for the ON S&P 500® Index Portfolio, ON S&P MidCap 400® Index Portfolio, and the ON Nasdaq-100® Index Portfolio.
When applicable, the Directors considered the amount of the net advisory fee retained by the Adviser, after payment of the sub-advisory fee, as well as the proportion the net fee represented of the total advisory fee, in light of the services provided by the Adviser to the Portfolio.
When applicable, the Directors also considered the fees paid to Sub-Advisers. The Directors relied to a degree on the Adviser’s negotiation of each sub-advisory agreement at an arm’s-length basis. The Directors considered the fees the Adviser and Sub-Advisers charge their separately managed institutional accounts and other accounts and expressed no concerns with those rates relative to the fees charged to the Portfolios. The Directors also recognized that it was difficult to make comparisons of advisory fees because there were variations in the services that were included in the fees paid by other funds and separately managed accounts.
Profitability
The Directors reviewed the advisory fee paid to the Adviser for each Portfolio and noted the pre-tax profit margins reported by the Adviser for each Portfolio. The Directors also noted that the Adviser, and not the Portfolios, is responsible for paying sub-advisory fees to the Sub-Advisers. The Board also evaluated whether the net advisory fee received by the Adviser for each Portfolio, after paying sub-advisory fees to the Sub-Adviser, was reasonable, given the level of the Adviser’s services to the Portfolio. The Directors took into account the fact that the Adviser had contractually agreed to limit Portfolio expenses and reimburse expenses to the extent necessary to keep total Portfolio expenses at or below a specified amount. The Directors further considered the statement of a representative of the Adviser that the profitability calculations account for all of the Adviser’s costs in providing services to the Fund, including services outside the investment advisory function (such as Fund operations and legal functions). The Directors discussed that if the Adviser’s efficiency results in enhanced profitability, the Adviser’s effective use of resources should not be penalized on a comparative basis.
In considering the reasonableness of the sub-advisory fees paid by the Adviser to each Sub-Adviser, the Directors relied on the ability of the Adviser to negotiate the sub-advisory fee at arm’s length, noting that the Adviser is not affiliated with any Sub-Adviser. The Directors also noted that the Adviser is incentivized to negotiate a favorable sub-advisory fee since it was the Adviser, not the Portfolio, that paid the sub-advisory fee. The Board discussed economies of scale and agreed it was a matter more appropriately considered at the Advisory Agreement level. The Board concluded that the profitability, fees and potential realization of economies of scale by the Portfolios from the sub-advisory arrangements with the unaffiliated Sub-Advisers should not be a material factors in its deliberations.
After considering all of the above, the Board concluded that the profitability of the Adviser with respect to each Portfolio was reasonable.
Economies of Scale
The Directors noted that all of the advisory and sub-advisory fee schedules, other than those for the ON Moderately Conservative Model Portfolio, ON Moderate Growth Portfolio, ON Growth Portfolio and ON Balanced Portfolio (collectively, the “Model Portfolios”), contain breakpoints that would reduce the applicable advisory or sub-advisory fees on assets above a specified level as the applicable Portfolio’s assets increase. The Directors also noted that a Portfolio would realize additional economies of scale if the Portfolio’s net assets increased over time proportionately more than certain other expenses. The Directors took into account that many of the Portfolios had a small amount of net assets relative to the funds in their respective peer groups. After considering each Portfolio’s current size and potential for growth, the Board concluded that each Portfolio was likely to benefit from economies of scale as the Portfolio’s net assets increased, and that the existing breakpoints are appropriate.
| 198 | (continued) |
Ohio National Fund, Inc. | ||
| Additional Information (Continued) | December 31, 2022 (Unaudited) | |
In addition to the foregoing, the Directors considered the specific factors and related conclusions set forth below with respect to each Portfolio’s performance and fees and expenses. Except as otherwise indicated, the performance data described below for each Portfolio is for periods ended September 30, 2022.
ON Bond Portfolio (Adviser – ONI). The Directors noted that the Portfolio outperformed the benchmark over the year-to-date period and its peer group for the year-to-date and 1-year period, but underperformed the benchmark for the 1-year, 3-year and 5-year periods, and underperformed its peer group for the 3-year and 5-year periods. The Directors noted that the Portfolio’s advisory fee was slightly higher than the peer group average while its net expense ratio was below the peer group average. Overall, the Board concluded that the Portfolio’s performance was acceptable, and its advisory fee was reasonable.
ON BlackRock Balanced Allocation Portfolio (Adviser – ONI, Sub-Adviser – BlackRock). The Directors acknowledged that performance before February 2019 was attributable to the prior sub-adviser. They observed that the Portfolio underperformed its benchmark index for all periods, but that it outperformed its peer group for the year-to-date, 3-year and 5-year periods. The Directors noted that the Portfolio’s advisory fee and net expense ratio were below the peer group averages. Overall, the Directors concluded that the Portfolio’s performance was acceptable and that the advisory and sub-advisory fees were reasonable.
ON BlackRock Advantage International Equity Portfolio, (Adviser – ONI, Sub-Adviser – BlackRock). The Directors focused on the year-to-date, 1-year and 3-year performance for the Portfolio, as the performance prior to December 2019 was attributable to the prior sub-adviser. The Directors observed that the Portfolio outperformed the benchmark for all periods other than the 3-year period and outperformed the peer group for all periods. The Board noted that the Portfolio’s advisory fee and net expense ratio were below the peer group averages. Overall, the Board concluded that the Portfolio’s performance was acceptable and that the advisory and sub-advisory fees were reasonable.
ON Janus Henderson Forty Portfolio (Adviser – ONI, Sub-Adviser – Janus). The Directors reviewed the Portfolio’s performance and noted that it underperformed its benchmark and peer group for all periods. The Directors noted that the underperformance was due in part to investments by the Sub-Adviser in poorly performing investments that were not included in the benchmark. The Directors concluded that the performance of the Sub-Adviser and the Portfolio should be closely monitored. The Directors noted that the Portfolio’s advisory fee was slightly above the peer group average while its net expense ratio was below the peer group average. Overall, the Board concluded that advisory and sub-advisory fees were reasonable.
ON AB Small Cap Portfolio (Adviser – ONI, Sub-Adviser – AB). The Directors focused on the year-to-date and 1-year performance for the Portfolio as the performance prior to May 2021 was attributable to the prior sub-adviser. The Directors noted that the Portfolio outperformed its benchmark index and peer group for the 5-year and 1-year periods, respectively, but underperformed both for all other periods. The Directors noted that Adviser attributed the underperformance to the small-mid cap growth sleeves of the Portfolios. The Directors also noted that Adviser’s comments regarding the Portfolio’s upside and downside capture. The Directors concluded that the Portfolio’s performance was understandable but should be monitored. The Directors noted that the Portfolio’s advisory fee and net expense ratio were below the peer group averages. Overall, the Directors concluded that the Portfolio’s performance was improving and that the advisory fee was reasonable.
ON AB Mid Cap Core Portfolio (Adviser – ONI, Sub-Adviser – AB). The Directors focused on the year-to-date and 1-year performance for the Portfolio as the performance prior to May 2021 was attributable to the prior sub-adviser. The Directors noted that the Portfolio underperformed its benchmark for all period other than the 5-year period, but outperformed its peer group for the year-to-date and 1-year periods. The Directors noted that the Adviser attributed the underperformance to the small-mid cap growth sleeves of the Portfolio and commented that in the past the Portfolio recovered after periods of underperformance. The Directors concluded that the Portfolio’s performance was understandable, but should be monitored. The Directors observed that the Portfolio’s advisory fee was on par with its peer group and the expense ratio was below the peer group average. Overall, the Directors concluded that the Portfolio’s performance was improving and that the advisory fee was reasonable.
ON S&P 500® Index Portfolio (Adviser – ONI, Sub-Adviser – Geode). The Directors observed that while the Portfolio underperformed its benchmark index across all periods, it remained above the 50th percentile versus the peer group for the 1-year, 3-year and 5-year periods, and its performance generally was in line with the index when expenses were excluded. The Directors noted that peer group performance data for index funds was generally irrelevant and did not rely on peer group comparison performance figures for the Portfolio. The Directors noted that, while the advisory fee was above the Portfolio’s peer group average, the overall expense ratio was the statistic most important to index fund shareholders, and the Portfolio’s net expense ratio was lower than the average for the peer group. Overall, the Directors concluded that the Portfolio’s performance was acceptable and that the advisory and sub-advisory fees were reasonable.
| 199 | (continued) |
Ohio National Fund, Inc. | ||
| Additional Information (Continued) | December 31, 2022 (Unaudited) | |
ON BlackRock Advantage Large Cap Value Portfolio (Adviser – ONI, Sub-Adviser – BlackRock). The Directors focused on the year-to-date, 1-year and 3-year periods for the Portfolio as the performance prior to December 2019 was attributable to the prior sub-adviser. The Directors considered that the Portfolio underperformed its benchmark and peer group for all periods. The Directors noted that the Portfolio’s advisory fee was in line with the peer group average and that the Portfolio’s expense ratio was below the peer group average. Overall, the Board concluded that the Portfolio’s performance bore monitoring and that its advisory and sub-advisory fees were reasonable.
ON Federated High Income Bond Portfolio (Adviser – ONI, Sub-Adviser – Federated). The Directors observed that the Portfolio underperformed its benchmark index for all periods and underperformed its peer group for all periods other than the 3-year period. The Directors noted that the advisory fee was above the peer group average, while the net expense ratio was in line with the peer group average. The Adviser noted that the Portfolio was smaller than most of its peers, thus not allowing the portfolio to take advantage of adviser fee break points, and that many of its peers were managed by larger fund complexes. Overall, the Board concluded that the Portfolio’s performance was acceptable, and the advisory and sub-advisory fees were reasonable.
ON Nasdaq-100® Index Portfolio (Adviser – ONI, Sub-Adviser – Geode). The Directors observed that while the Portfolio underperformed its benchmark index across all time periods shown, its performance generally was in line with the index when expenses were excluded. The Directors noted that the Portfolio outperformed its peer group across all periods but deemed peer group performance data for index funds to be generally irrelevant and did not rely on peer group comparison performance. The Directors noted that the Portfolio’s advisory fee and net expense ratio were below the peer group average. Overall, the Directors concluded that the Portfolio’s performance was acceptable and that the advisory and sub-advisory fees were reasonable.
ON BlackRock Advantage Large Cap Core Portfolio (Adviser – ONI, Sub-Adviser – BlackRock). The Directors acknowledged that performance prior to February 2019 was attributable to the prior sub-adviser and focused on the Portfolio’s year-to-date, 1-year and 3-year performance. They observed that the Portfolio underperformed its benchmark index and peer group for all periods. The Directors noted that the Sub-Adviser employs the same process across all its funds, which can cause under- or outperformance across all strategies contemporaneously. The Directors considered that the Portfolio’s advisory fee was slightly above the peer group’s average and its net expense ratio was below its peer group average. Overall, the Directors concluded that the Portfolio’s performance bore monitoring and that the advisory and sub-advisory fees were reasonable.
ON BlackRock Advantage Small Cap Growth Portfolio (Adviser – ONI, Sub-Adviser – BlackRock). The Directors acknowledged that the Portfolio’s performance prior to February 2019 was attributable to the previous sub-advisor. They observed that the Portfolio underperformed its benchmark index for the year-to-date and 1-year periods, but outperformed its peer group for the same periods. The Directors noted that the Portfolio’s advisory fee and net expense ratio were below the averages of its peer group. Overall, the Directors concluded that the Portfolio’s performance was acceptable and that the advisory and sub-advisory fees were reasonable.
ON S&P MidCap 400® Index (Adviser – ONI, Sub-Adviser – Geode). The Directors acknowledged that while the Portfolio underperformed its benchmark index, its performance generally was in line with the benchmark index when expenses were excluded. The Directors noted that the Portfolio outperformed its peer group across all periods but deemed peer group performance data for index funds to be generally irrelevant and did not rely on peer group comparison performance figures for the Portfolio. The Directors noted that, while the advisory fee was above the Portfolio’s peer group average, the overall expense ratio was the statistic most important to index fund shareholders, and the Portfolio’s net expense ratio was lower than the average for the peer group. Overall, the Directors concluded that the Portfolio’s performance was acceptable and that the advisory and sub-advisory fees were reasonable.
ON BlackRock Advantage Large Cap Growth Portfolio (Adviser – ONI, Sub-Adviser – BlackRock). The Directors recognized that the Portfolio’s performance prior to February 2019 was attributable to the prior sub-adviser. They observed that the Portfolio outperformed its peer group for all periods other than the 5-year period, but underperformed the benchmark index across all periods. The Directors noted the Adviser’s view that the Portfolio performed slightly better than other large cap growth portfolios because it has marginally less exposure to growth stocks. The Directors noted that the Portfolio’s advisory fee and net expense ratios were below the peer group averages. Overall, the Directors concluded that the Portfolio’s performance was acceptable, and the advisory fee and sub-advisory fees were reasonable.
ON Risk Managed Balanced Portfolio (Adviser – ONI, Sub-Adviser – AB). The Directors focused on the year-to-date and 1-year performance for the Portfolio as the performance prior to May 2020 was attributable to the prior sub-adviser. The Directors noted that the Portfolio trailed the benchmark and underperformed the peer group for the year-to-date and 1-year periods. The Directors observed that the Portfolio’s primary benchmark, the S&P 500, does not reflect the balanced nature of the Portfolio and noted the Portfolio is expected to underperform in a rapidly rising interest rate environment. The Directors noted that the Portfolio’s advisory fee and net expense ratio were higher than its peer group’s average but considered that the Portfolio contains a risk management overlay, which adds complexity and additional management expense. Overall, the Directors concluded that the Portfolio’s performance was acceptable and that the advisory and sub-advisory fees were reasonable.
| 200 | (continued) |
Ohio National Fund, Inc. | ||
| Additional Information (Continued) | December 31, 2022 (Unaudited) | |
ON Federated Core Plus Bond Portfolio (Adviser – ONI, Sub-Adviser – Federated). The Directors recalled that the Portfolio commenced operations in May 2020. The Directors observed that the Portfolio outperformed its benchmark and peer group over the year-to-date and 1-year periods, with a top quartile performance relative to the peer group over the year-to-date period. The Directors noted that the Portfolio’s advisory fee was on par with the peer group while its net expense ratio was below the peer group average. Overall, the Board concluded that the Portfolio’s performance was acceptable and that the advisory and sub-advisory fees were reasonable.
ON U.S. Low Volatility Portfolio (formerly the ON Janus Henderson U.S. Low Volatility Portfolio) (Adviser – ONI, Sub-Adviser –Intech). The Directors acknowledged that they initially approved the sub-advisory agreement on May 13, 2022, and therefore did not need to review it at this time. The Directors also acknowledged that the Portfolio had one year performance information. They noted that the Portfolio outperformed the benchmark and peer group average for all periods. The Directors noted that the Portfolio’s advisory fee and net expense ratio were below the peer group average. Overall, the Directors concluded that the Portfolio’s performance was acceptable and that the advisory fees were reasonable.
ON AB Relative Value Portfolio (Adviser – ONI, Sub-Adviser – AB). The Directors acknowledged that they initially approved the sub-advisory agreement on August 20, 2021, and therefore did not need to review it at this time. The Directors also acknowledged that the Portfolio launched in December 2021 and had less than one year of operating history. The Directors noted that the Portfolio outperformed the benchmark for the year-to-date period and underperformed the peer group for the same time period. The Directors noted that the Portfolio’s advisory fee was below the peer group average, and the Portfolio’s expense ratio was below the peer group average. Overall, the Directors concluded that the Portfolio’s performance was acceptable and that the advisory fees were reasonable.
ON iShares Managed Risk Balanced Portfolio (Adviser – ONI, Sub-Adviser – BlackRock). The Directors acknowledged that the Portfolio launched in June 2021 and had only one year of operating history. The Directors noted that the Portfolio significantly outperformed the benchmark index for the year-to-date period but underperformed the benchmark and peer group average for all other periods. The Directors noted that the Portfolio’s advisory fee and net expense ratio were above the peer group averages but noted the Adviser’s comments that the Portfolio’s peer group is non-homogeneous and contains funds with very low advisory fees. The Directors observed that the Adviser expects total fund operating expenses in this Portfolio to come down over time. Overall, the Directors concluded that the Portfolio’s performance was acceptable and that the advisory and sub-advisory fees were reasonable.
ON iShares Managed Risk Moderate Growth Portfolio and ON iShares Managed Risk Growth Portfolio (Adviser – ONI, Sub-Adviser – BlackRock). The Directors acknowledged that these Portfolios commenced operations in October 2022 and therefore, do not yet have a performance history. The Directors further acknowledged that they last considered the advisory and sub-advisory fees at a meeting held on July 18, 2022. The Directors noted that the advisory fees payable by the iShares Portfolios were within the range of fees payable by the iShares Portfolios’ peer groups and included fee breakpoints. Overall, the Directors concluded that the advisory and sub-advisory fees were reasonable.
The Board noted the difficulty in assembling a meaningful peer group of funds-of-funds for expense comparison purposes because, while the fund-of-funds Portfolios consist of underlying mutual funds, the funds-of-funds in the peer groups are comprised primarily of exchange traded funds, which have much lower net expense ratios. To correct for this difference, the Adviser presented information comparing the average net expense ratio for each peer group with the expense ratio of each fund-of-funds Portfolio as reported in that Portfolio’s annual report, which does not show fees and expenses of investing in underlying mutual funds.
ON Moderately Conservative Model (Adviser – ONI). The Directors noted that the Portfolio underperformed its benchmark index and the peer group for the 3-year period. The Directors observed that the Portfolio’s advisory fee was slightly higher than the peer group average, and the net expense ratio as reported in the annual shareholder report was lower than the average of its peer group. Overall, the Directors concluded that the Portfolio’s performance was acceptable and that the advisory fee was reasonable.
ON Balanced Model (Adviser – ONI). The Directors observed that while the Portfolio outperformed its benchmark index for the 3-year period, it underperformed the benchmark index for the year-to-date and 1-year periods. The Directors commented that the Portfolio outperformed its peer group median for the 1-year period. The Directors noted that the Portfolio’s advisory fee was above the peer group average and net expense ratio as reported in the annual shareholder report was lower than the average of its peer group. Overall, the Directors concluded that the Portfolio’s performance was acceptable and that the advisory fee was reasonable.
ON Moderate Growth Model (Adviser – ONI). The Directors observed that while the Portfolio underperformed its benchmark index and peer group median for the year-to-date and 1-year periods, it outperformed the benchmark and peer group for the 3-year period. The Directors also noted that the Portfolio’s advisory fee was above the peer group average and the net expense ratio as reported in the annual shareholder report was lower than the average of its peer group. Overall, the Directors concluded that the Portfolio’s performance was acceptable and that the advisory fee was reasonable.
| 201 | (continued) |
Ohio National Fund, Inc. | ||
| Additional Information (Continued) | December 31, 2022 (Unaudited) | |
ON Growth Model (Adviser – ONI). The Directors observed that while the Portfolio underperformed its benchmark index and peer group median for the year-to-date and 1-year periods, it outperformed the benchmark and peer group for the 3-year period. The Directors also noted that the Portfolio’s advisory fee was above the peer group average and the net expense ratio as reported in the annual shareholder report was lower than the average of its peer group. Overall, the Directors concluded that the Portfolio’s performance was acceptable and that the advisory fee was reasonable.
After consideration of the foregoing, the Board reached the following conclusions regarding the Advisory Agreement and, as applicable, the Sub-Advisory Agreement with respect to each Portfolio, in addition to the conclusions set forth above: (a) ONI and the Sub-Advisers demonstrated that they possessed the capability and resources to perform the duties required of them under the Advisory Agreement and applicable Sub-Advisory Agreement(s), respectively; (b) the investment philosophy, strategies and techniques of ONI (with respect to the Portfolios without a Sub-Adviser) and the Sub-Advisers were appropriate for pursuing the applicable Portfolio’s investment objective; (c) ONI (with respect to the Portfolios without a Sub-Adviser) and the Sub-Advisers were likely to execute their investment philosophy, strategies and techniques consistently over time; and (d) ONI and the Sub-Advisers maintained appropriate compliance programs. Based on all of the above-mentioned factors and their related conclusions, with no single factor or conclusion being determinative and with each Director not necessarily attributing the same weight to each factor, the Directors unanimously concluded that approval of the continuation of the Advisory Agreements and, as applicable, the Sub-Advisory Agreements was in the best interests of the Portfolios and their shareholders. Accordingly, the Board, including all of the Independent Directors, voted unanimously to approve the continuation of the Advisory Agreements and, as applicable, the Sub-Advisory Agreements for the Portfolios.
| (3) | Expense Disclosure |
An individual may not buy or own membership interests of the Fund directly. An individual acquires an indirect interest in the Fund by purchasing a variable annuity contract or variable insurance policy and allocating premiums or purchase payments to Fund Portfolios available through the separate accounts of ONLIC, ONLAC, and NSLA. Separate accounts of these entities are the shareholders of the Fund.
As a shareholder of the Fund, a separate account incurs ongoing costs, including management fees and other Fund expenses. This example is intended to help a policy/contract owner understand ongoing costs (in dollars) associated with the underlying investment in the Portfolios by the separate account shareholder and to compare these costs with the ongoing costs associated with investing in other mutual funds.
The example is based on an investment of $1,000 invested at July 1, 2022 and held through December 31, 2022.
Actual Expenses
The table below provides information about investment values and actual expenses associated with each Portfolio of the Fund. The information below, together with the amount of an underlying investment, can be used to estimate expenses paid over the period. An estimate can be obtained by simply dividing an underlying investment value by $1,000 (for example, an $8,600 investment value divided by $1,000 = 8.6), then multiplying the result by the number in the table under the heading entitled “Expenses Paid During Period”.
Beginning Investment Value | Ending Investment Value | Expenses Paid During Period* | Expense Ratio During Period 7/1/2022 – 12/31/2022 | |||||||||
Portfolio | 7/1/2022 | 12/31/2022 | 7/1/2022 – 12/31/2022 | (Annualized) | ||||||||
ON Bond | $ | 1,000.00 | $ | 986.60 | $3.10 | 0.62% | ||||||
ON BlackRock Balanced Allocation | $ | 1,000.00 | $ | 1,006.10 | $2.78 | 0.55% | ||||||
ON BlackRock Advantage International Equity | $ | 1,000.00 | $ | 1,072.30 | $4.70 | 0.90% | ||||||
ON Janus Henderson Forty | $ | 1,000.00 | $ | 1,012.70 | $4.52 | 0.89% | ||||||
ON AB Small Cap | $ | 1,000.00 | $ | 1,012.70 | $4.36 | 0.86% | ||||||
ON AB Mid Cap Core | $ | 1,000.00 | $ | 1,045.90 | $4.59 | 0.89% | ||||||
ON S&P 500® Index | $ | 1,000.00 | $ | 1,021.10 | $1.94 | 0.38% | ||||||
ON BlackRock Advantage Large Cap Value | $ | 1,000.00 | $ | 1,056.20 | $3.78 | 0.73% | ||||||
ON Federated High Income Bond | $ | 1,000.00 | $ | 1,025.90 | $4.39 | 0.86% | ||||||
ON Nasdaq-100® Index | $ | 1,000.00 | $ | 954.50 | $2.12 | 0.43% | ||||||
ON BlackRock Advantage Large Cap Core | $ | 1,000.00 | $ | 1,014.60 | $3.50 | 0.69% | ||||||
ON BlackRock Advantage Small Cap Growth | $ | 1,000.00 | $ | 1,039.80 | $4.42 | 0.86% | ||||||
ON S&P MidCap 400® Index | $ | 1,000.00 | $ | 1,078.70 | $2.20 | 0.42% | ||||||
| 202 | (continued) |
Ohio National Fund, Inc. | ||
| Additional Information (Continued) | December 31, 2022 (Unaudited) | |
| Beginning | Ending | Expense Ratio | ||||||||||
| Investment | Investment | Expenses Paid | During Period | |||||||||
| Value | Value | During Period* | 7/1/2022 – 12/31/2022 | |||||||||
Portfolio | 7/1/2022 | 12/31/2022 | 7/1/2022 – 12/31/2022 | (Annualized) | ||||||||
ON BlackRock Advantage Large Cap Growth | $ | 1,000.00 | $ | 943.90 | $3.58 | 0.73% | ||||||
ON Risk Managed Balanced | $ | 1,000.00 | $ | 971.40 | $4.22 | 0.85% | ||||||
ON Federated Core Plus Bond | $ | 1,000.00 | $ | 972.30 | $2.83 | 0.57% | ||||||
ON U.S. Low Volatility | $ | 1,000.00 | $ | 1,031.50 | $3.12 | 0.61% | ||||||
ON AB Relative Value | $ | 1,000.00 | $ | 1,089.70 | $3.85 | 0.73% | ||||||
ON iShares Managed Risk Balanced | $ | 1,000.00 | $ | 987.40 | $3.01 | 0.60% | ||||||
ON iShares Managed Risk Moderate Growth** | $ | 1,000.00 | $ | 1,059.00 | $1.36 | 0.61% | ||||||
ON iShares Managed Risk Growth** | $ | 1,000.00 | $ | 1,060.00 | $1.36 | 0.61% | ||||||
ON Moderately Conservative Model | $ | 1,000.00 | $ | 1,003.20 | $2.37 | 0.47% | ||||||
ON Balanced Model | $ | 1,000.00 | $ | 1,017.00 | $2.24 | 0.44% | ||||||
ON Moderate Growth Model | $ | 1,000.00 | $ | 1,026.80 | $2.15 | 0.42% | ||||||
ON Growth Model | $ | 1,000.00 | $ | 1,035.20 | $2.26 | 0.44% | ||||||
| * | Expenses are equal to the average account value times the Portfolio’s annualized expense ratio multiplied by the number of days in the most recent fiscal half-year (184 days) divided by the number of days in the fiscal year (365 days). Please note that the expenses shown in these tables are meant to highlight ongoing Portfolio costs only and do not reflect any contract-level expenses or Portfolio transactional costs, such as sales charges (loads) or exchange fees (if any). Therefore, these tables are useful in comparing ongoing fund costs only, and will not fully assist a policy/contract owner in determining the relative total expenses of different funds. In addition, if transactional costs were included, costs may have been higher for these Portfolios as well as for a fund being compared. |
| ** | Period from October 14, 2022 (inception) to December 31, 2022 (annualized) |
Hypothetical Example for Comparison Purposes
The table below provides information about hypothetical investment values and hypothetical expenses based on each respective Portfolio’s actual expense ratio and an assumed rate of return of 5% per year before expenses, which is not an actual return. The hypothetical investment values and expenses may not be used to estimate the actual ending investment balance or expenses actually paid for the period by the shareholders. A policy/contract holder may use this information to compare this 5% hypothetical example with the 5% hypothetical examples that appear in the shareholder reports of other funds.
| Beginning | Ending | Expense Ratio | ||||||||||
| Investment | Investment | Expenses Paid | During Period | |||||||||
| Value | Value | During Period* | 7/1/2022 – 12/31/2022 | |||||||||
Portfolio | 7/1/2022 | 12/31/2022 | 7/1/2022 – 12/31/2022 | (Annualized) | ||||||||
ON Bond | $ | 1,000.00 | $ | 1,022.08 | $3.16 | 0.62% | ||||||
ON BlackRock Balanced Allocation | $ | 1,000.00 | $ | 1,022.43 | $2.80 | 0.55% | ||||||
ON BlackRock Advantage International Equity | $ | 1,000.00 | $ | 1,020.67 | $4.58 | 0.90% | ||||||
ON Janus Henderson Forty | $ | 1,000.00 | $ | 1,020.72 | $4.53 | 0.89% | ||||||
ON AB Small Cap | $ | 1,000.00 | $ | 1,020.87 | $4.38 | 0.86% | ||||||
ON AB Mid Cap Core | $ | 1,000.00 | $ | 1,020.72 | $4.53 | 0.89% | ||||||
ON S&P 500® Index | $ | 1,000.00 | $ | 1,023.29 | $1.94 | 0.38% | ||||||
ON BlackRock Advantage Large Cap Value | $ | 1,000.00 | $ | 1,021.53 | $3.72 | 0.73% | ||||||
ON Federated High Income Bond | $ | 1,000.00 | $ | 1,020.87 | $4.38 | 0.86% | ||||||
ON Nasdaq-100® Index | $ | 1,000.00 | $ | 1,023.04 | $2.19 | 0.43% | ||||||
ON BlackRock Advantage Large Cap Core | $ | 1,000.00 | $ | 1,021.73 | $3.52 | 0.69% | ||||||
ON BlackRock Advantage Small Cap Growth | $ | 1,000.00 | $ | 1,020.87 | $4.38 | 0.86% | ||||||
ON S&P MidCap 400® Index | $ | 1,000.00 | $ | 1,023.09 | $2.14 | 0.42% | ||||||
ON BlackRock Advantage Large Cap Growth | $ | 1,000.00 | $ | 1,021.53 | $3.72 | 0.73% | ||||||
ON Risk Managed Balanced | $ | 1,000.00 | $ | 1,020.92 | $4.33 | 0.85% | ||||||
ON Federated Core Plus Bond | $ | 1,000.00 | $ | 1,022.33 | $2.91 | 0.57% | ||||||
ON U.S. Low Volatility | $ | 1,000.00 | $ | 1,022.13 | $3.11 | 0.61% | ||||||
ON AB Relative Value | $ | 1,000.00 | $ | 1,021.53 | $3.72 | 0.73% | ||||||
ON iShares Managed Risk Balanced | $ | 1,000.00 | $ | 1,022.18 | $3.06 | 0.60% | ||||||
ON iShares Managed Risk Moderate Growth** | $ | 1,000.00 | $ | 1,022.13 | $1.33 | 0.61% | ||||||
| 203 | (continued) |
Ohio National Fund, Inc. | ||
| Additional Information (Continued) | December 31, 2022 (Unaudited) | |
| Beginning | Ending | Expense Ratio | ||||||||||
| Investment | Investment | Expenses Paid | During Period | |||||||||
| Value | Value | During Period* | 7/1/2022 – 12/31/2022 | |||||||||
Portfolio | 7/1/2022 | 12/31/2022 | 7/1/2022 – 12/31/2022 | (Annualized) | ||||||||
ON iShares Managed Risk Growth** | $ | 1,000.00 | $ | 1,022.13 | $1.33 | 0.61% | ||||||
ON Moderately Conservative Model | $ | 1,000.00 | $ | 1,022.84 | $2.40 | 0.47% | ||||||
ON Balanced Model | $ | 1,000.00 | $ | 1,022.99 | $2.24 | 0.44% | ||||||
ON Moderate Growth Model | $ | 1,000.00 | $ | 1,023.09 | $2.14 | 0.42% | ||||||
ON Growth Model | $ | 1,000.00 | $ | 1,022.99 | $2.24 | 0.44% | ||||||
| * | Expenses are equal to the average account value times the Portfolio’s annualized expense ratio multiplied by the number of days in the most recent fiscal half-year (184 days) divided by the number of days in the fiscal year (365 days). Please note that the expenses shown in these tables are meant to highlight ongoing Portfolio costs only and do not reflect any contract-level expenses or Portfolio transactional costs, such as sales charges (loads) or exchange fees (if any). Therefore, these tables are useful in comparing ongoing fund costs only, and will not fully assist a policy/contract owner in determining the relative total expenses of different funds. In addition, if transactional costs were included, costs may have been higher for these Portfolios as well as for a fund being compared. |
| ** | Period from October 14, 2022 (inception) to December 31, 2022 (annualized) |
| (4) | Other Federal Tax Information |
For corporate shareholders, the percentages of the total ordinary income dividends paid in 2022, and ordinary income consent dividends that were incurred for the 2022 tax year, that qualify for the corporate dividends received deduction are as follows:
ON Bond | 0.00 | % | ||
ON BlackRock Balanced Allocation | 8.89 | % | ||
ON BlackRock Advantage International Equity | 0.00 | % | ||
ON Janus Henderson Forty | 23.36 | % | ||
ON AB Small Cap | 10.22 | % | ||
ON AB Mid Cap Core | 37.72 | % | ||
ON S&P 500® Index | 100.00 | % | ||
ON BlackRock Advantage Large Cap Value | 12.76 | % | ||
ON Federated High Income Bond | 0.24 | % | ||
ON Nasdaq-100® Index | 100.00 | % | ||
ON BlackRock Advantage Large Cap Core | 9.83 | % | ||
ON BlackRock Advantage Small Cap Growth | 4.30 | % | ||
ON S&P MidCap 400® Index | 33.88 | % |
| ON BlackRock Advantage Large Cap Growth | 5.42 | % | ||
| ON Risk Managed Balanced | 11.59 | % | ||
| ON Federated Core Plus Bond | 0.00 | % | ||
| ON U.S. Low Volatility | 29.40 | % | ||
| ON AB Relative Value | 100.00 | % | ||
| ON iShares Managed Risk Balanced | 0.00 | % | ||
| ON iShares Managed Risk Moderate Growth | 0.00 | % | ||
| ON iShares Managed Risk Growth | 0.00 | % | ||
| ON Moderately Conservative Model | 23.76 | % | ||
| ON Balanced Model | 28.33 | % | ||
| ON Moderate Growth Model | 35.00 | % | ||
| ON Growth Model | 38.58 | % |
Pursuant to Section 853 of the Internal Revenue Code, the Fund designates the following amounts as foreign taxes paid for the year ended December 31, 2022:
| Portion of Ordinary | ||||||
| Income Distribution Derived | ||||||
| Creditable Foreign | Per Share | from Foreign Sourced | ||||
| Taxes Paid | Amount | Income | ||||
ON BlackRock Advantage International Equity | $1,381,932 | $0.0519 | 95.16% | |||
ON Moderately Conservative Model | $ 63,820 | $0.0031 | 7.32% | |||
ON Balanced Model | $ 435,097 | $0.0058 | 11.26% | |||
ON Moderate Growth Model | $ 923,101 | $0.0069 | 10.89% | |||
ON Growth Model | $ 269,398 | $0.0091 | 11.70% |
Foreign taxes paid for purposes of Section 853 may be less than actual foreign taxes paid for financial statement purposes. None of the Portfolios listed above derived any income from ineligible foreign sources, as defined under Section 901(j) of the Internal Revenue Code.
| 204 | (continued) |
Ohio National Fund, Inc. | ||
| Additional Information (Continued) | December 31, 2022 (Unaudited) | |
| (5) | Liquidity Risk Management Program |
To promote effective liquidity risk management throughout the fund industry and to enhance disclosure regarding fund liquidity and redemption practices, the SEC adopted Rule 22e-4 under the 40 Act, the Investment Company Liquidity Risk Management Programs Rule. This Rule requires every registered open-end management company to establish a liquidity risk management program (the “LRMP”) that, among other things, provides for the assessment, management and review of liquidity risk, the classification of a fund’s portfolio investments into one of four liquidity buckets based upon the number of days that such investments may reasonably be expected to be converted into cash or otherwise disposed of without significantly impacting their price, the establishment of a highly liquid investment minimum where required, and the establishment of a 15% limitation on illiquid investments. Additionally, the SEC adopted Rule 30b1-10 and Form N-LIQUID, which generally requires a fund to notify the Commission when certain liquidity-related events occur.
The Board approved the Fund’s LRMP at its regular meeting on August 17, 2018, including the appointment of ONI as the administrator of the LRMP. At the Board’s regular meeting on November 21, 2022, ONI provided a report to the Board on the operation and effectiveness of the LRMP during the one-year period ending on September 30, 2022. ONI manages liquidity risks associated with the Fund’s investments by monitoring cash and cash equivalents, the use of derivatives, the concentration of investments and the appropriateness of portfolio strategies for open-end funds, and by classifying every fund investment as either highly liquid, moderately liquid, less liquid or illiquid on at least a monthly basis. To assist with the classification of Fund investments, ONI has contracted with a third party provider of liquidity monitoring services. ONI supplies this provider with portfolio-level data and certain assumptions as to reasonably anticipated trading sizes and significant price impacts, which it then uses to determine preliminary classifications. Once these preliminary classifications are received by ONI, ONI personnel review the information and compare it to classifications provided by Fund sub-advisers in determining final classifications.
The LRMP effectively managed the Fund’s liquidity risks throughout the period. During this period, no Portfolio held less than 96% of its total net assets in highly liquid investments. Because every Portfolio consisted primarily of highly liquid investments, no highly liquid investment minimum was required to be established for any portfolio, and all were well under their illiquid investment limitations. Additionally, no events that would require the filing of From N-LIQUID occurred.
| (6) | Other Disclosures |
The Statement of Additional Information of the Fund includes additional information about the the Board and is available at http://www.ohionationalfund.com or upon request, without charge, by calling 877-781-6392 (toll-free).
A description of the policies and procedures that the Fund uses in voting proxies relating to Fund securities, as well as information regarding how the Fund voted proxies during the most recent twelve-month period ended June 30, is available without charge, upon request, by calling 877-781-6392 (toll-free) and on the SEC’s website at http://www.sec.gov.
The Fund has filed its Schedules of Investments as of March 31 and September 30 with the SEC, as required, on Form N-PORT Part F. Form N-PORT Part F is required to be filed with the SEC for the first and third quarters of each fiscal year within sixty days after the end of each period and is available on the SEC website upon acceptance of each submission.
This report and the financial statements contained herein are submitted for the general information of the shareholders of the Fund. This report is not authorized for distribution to prospective investors in the Fund unless preceded or accompanied by an effective prospectus of the Fund. For a prospectus containing more complete information, including charges and expenses, please contact Ohio National Investments, Inc., One Financial Way, Cincinnati, OH 45242, telephone 877-781-6392 (toll-free).
| 205 |
| Information about Directors and Officers | December 31, 2022 (Unaudited) | |
Name and Address | Age | Position(s) with the Fund | Term of Office and Length of Time Served | Number of Portfolios in the Fund to be Overseen by Director | Principal Occupation(s) During Past Five Years and Other Directorships | |||||
Independent Directors | ||||||||||
Christopher A. Carlson One Financial Way Cincinnati, Ohio | 63 | Chair and Director, Member of Audit and Independent Directors Committees | Indefinite; Since July 2020 | 25 | President/Vice Chair and other positions: Ohio National Financial Services and subsidiaries (June 1993 - December 2018); President: Ohio National Fund, Inc. (March 2010 - May 2016). | |||||
George M. Vredeveld One Financial Way Cincinnati, Ohio | 80 | Director, Member of Audit and Independent Directors Committees* | Indefinite*; Since March 1996 | 25 | Professor Emeritus, Finance: University of Cincinnati (January 2014 - Present); Honorary Consul; Republic of Bulgaria (2019 - Present); Alpaugh Professor of Economics: Lindner College of Business, University of Cincinnati (2004 - 2013); Founder/President: Economics Center at the University of Cincinnati (1977 - 2012). | |||||
Madeleine W. Ludlow One Financial Way Cincinnati, Ohio | 68 | Director, Chair of Audit Committee and Member of Independent Directors Committee | Indefinite; Since April 2012 | 25 | Founder/Managing Director: West Capital Partners LLC (2010 - Present), General Partner: H Ventures LLC (2020 - 2021); Director: ALLETE, Inc. (2004 - Present). | |||||
Geoffrey Keenan One Financial Way Cincinnati, Ohio | 64 | Director, Member of Audit and Independent Directors Committees | Indefinite; Since January 2015 | 25 | Executive Vice President - Asset Management Operations: Acrisure LLC (May 2021 - December 2021); Executive Vice President and Chief Operating Officer: Gateway Investment Advisers, LLC (1995 - 2013). | |||||
Lawrence L. Grypp One Financial Way Cincinnati, Ohio | 74 | Director, Member of Audit and Independent Directors Committees | Indefinite; Since December 2016 | 25 | Senior Business Advisor and Board Member (January 2018 - Present); President: Goering Center for Family and Private Business (August 2008 - December 2017). | |||||
Julia W. Poston One Financial Way Cincinnati, Ohio | 62 | Director, Member of Audit and Independent Directors Committees | Indefinite; Since October 2022 | 25 | Partner; Ernst & Young LLP (June 2002 – June 2020); Independent Trustee: The James Advantage Funds (4 Portfolios) (August 2022 - Present); Director: Al. Neyer Corp. (August 2020 - Present); Director: Master Chemical Corp. (August 2021 - Present). | |||||
Officers | ||||||||||
Jeffery A. Bley Jr. One Financial Way Cincinnati, Ohio | 51 | President | Indefinite; Since May 2022 | Senior Vice President; Annuity Distribution and Sales: ONLIC (June 2022 - Present); Senior Vice President; Annuity Strategy and Sales: ONLIC (December 2021 - June 2022); Vice President; Annuity Strategy and Sales: ONLIC (May 2021 - December 2021); Vice President; National Sales, ONESCO: ONLIC (January 2015 - May 2021). | ||||||
R. Todd Brockman One Financial Way Cincinnati, Ohio | 54 | Treasurer | Indefinite; Since August 2004 | Vice President, Mutual Fund Operations: ONLIC and NSLA (February 2014 - Present); Treasurer: ONI (2004 - Present). | ||||||
| 206 | (continued) |
Ohio National Fund, Inc. | ||
| Information about Directors and Officers (Continued) | December 31, 2022 (Unaudited) | |
Name and Address | Age | Position(s) with the Fund | Term of Office and Length of Time Served | Number of Portfolios in the Fund to be Overseen by Director | Principal Occupation(s) During Past Five Years and Other Directorships | |||||||
Kimberly A. Plante One Financial Way Cincinnati, Ohio | 48 | Secretary | Indefinite; Since March 2005 | Vice President and Counsel: ONLIC (November 2017 - Present); Secretary: ONI; Officer of various other Ohio National-affiliated companies. | ||||||||
Keith Dwyer One Financial Way Cincinnati, Ohio | 50 | Chief Compliance Officer | Indefinite; Since August 2016 | Vice President, Fund Compliance: ONLIC (January 2022 - Present); Second Vice President, Fund Compliance: ONLIC (August 2016 - January 2022); Chief Compliance Officer: ONI and other Ohio National-affiliated companies (August 2016 - Present). | ||||||||
Daniel P. Leming One Financial Way Cincinnati, Ohio | 37 | Assistant Treasurer | Indefinite; Since March 2016 | Assistant Vice President; Mutual Fund Operations: ONLIC (December 2020 - Present); Director, Fund Operations and Analysis: ONLIC (July 2018 - December 2020); Assistant Director, Fund Operations and Analysis: ONLIC (December 2016 - June 2018). | ||||||||
*Retired effective 12/31/2022
| 207 |
[THIS PAGE LEFT INTENTIONALLY BLANK]
Ohio National Fund, Inc.
Post Office Box 371
Cincinnati, Ohio 45201
Form 1320 Rev. 2-23
(b) Not applicable.
| Item 2. | Code Of Ethics. |
As of the end of the period covered by this report, Ohio National Fund, Inc. (the “Fund”) has adopted a code of ethics that applies to the Fund’s principal executive officer and principal financial officer. There were no substantive amendments or waivers to the Code of Ethics during the period covered by this report.
A copy of this Code of Ethics is filed as Exhibit EX-99.CODE to this Form N-CSR and is also available, without charge, upon request, by calling 877-781-6392 toll free.
| Item 3. | Audit Committee Financial Expert. |
The Fund’s Board of Directors has determined that the Fund has an audit committee financial expert serving on its Audit Committee. The Audit Committee financial expert is Madeleine W. Ludlow, who is independent for purposes of Item 3 of Form N-CSR.
| Item 4. | Principal Accountant Fees And Services. |
The aggregate fees for each of the last two fiscal years for professional services rendered by the principal accountant for the audit of the Fund’s annual financial statements or services that are normally provided by the accountant in connection with statutory and regulatory filings or engagements for those fiscal years are listed below.
| (a) | Audit Fees. |
Audits of the Portfolios:
Fiscal year ended December 31, 2022: | $ | 401,095 | ||
Fiscal year ended December 31, 2021: | $ | 359,355 |
| (b) | Audit-Related Fees. |
Consent(s) on N-1A Annual Registration Statement(s) filed with the SEC:
Fiscal year ended December 31, 2022: | $ | 10,500 | ||
Fiscal year ended December 31, 2021: | $ | 15,500 |
| (c) | Tax Fees. |
Fiscal year ended December 31, 2022: | $ | 35,433 | ||
Fiscal year ended December 31, 2021: | $ | 152,730 |
| (d) | All Other Fees. None. |
| (e)(1) | Audit Committee Pre-Approval Policies and Procedures: |
The Fund’s Audit Committee has adopted an Audit Committee Charter that requires that the Audit Committee oversee the quality and appropriateness of the accounting methods used in the preparation of the Fund’s financial statements, and the independent audit thereof; approve the selection and compensation of the independent auditors; and pre-approve the performance, by the independent auditors, of non-audit services for the Fund, its investment adviser, or any affiliated entity controlling, controlled by or under common control with the investment adviser that provides ongoing services to the Fund.
| (e)(2) | Services Approved Pursuant to Paragraph (c)(7)(i)(C) of Rule 2-01 of Regulation S-X: |
During the fiscal years ended December 31, 2022 and 2021, there were no non-audit services provided by the Fund’s principal accountant that would have required pre-approval by the Fund’s Audit Committee. The audit-related fees aforementioned were pre-approved by the Fund’s Audit Committee, although not required by paragraph (c) (7) (ii) of Regulation S-X, as the audit-related fees were less than five percent of the total amount of revenues paid to the Fund’s principal accountant.
| (f) | Not Applicable. |
| (g) | There were no non-audit services provided by the Fund’s principal accountant, other than items disclosed in item (b) above, in which a fee was billed to the Fund, the Fund’s adviser, and any entity controlling, controlled by, or under common control with the adviser that provides ongoing services to the registrant for the last two fiscal years. |
| (h) | Not applicable, as there were no non-audit services performed by the Fund’s principal accountant that were rendered to the Fund, the Fund’s adviser, or any entity controlling, controlled by, or under common control with the adviser that provided ongoing services to the registrant that were not pre-approved for the last two fiscal years. |
| (i) | Not applicable. |
| (j) | Not applicable. |
| Item 5. | Audit Committee Of Listed Registrants. |
Not Applicable.
| Item 6. | Investments. |
Not Applicable.
| Item 7. | Disclosure Of Proxy Voting Policies And Procedures For Closed-End Management Investment Companies. |
Not Applicable.
| Item 8. | Portfolio Managers of Closed-End Management Investment Companies. |
Not Applicable.
| Item 9. | Purchases of Equity Securities by Closed-End Management Investment Company and Affiliated Purchasers. |
Not Applicable.
| Item 10. | Submission of Matters to a Vote of Security Holders. |
There were no material changes to the procedures by which shareholders may recommend nominees to the Fund’s Board of Directors.
| Item 11. | Controls and Procedures. |
| (a) | The Fund’s principal executive officer and principal financial officer have concluded, based on their evaluation conducted as of a date within 90 days of the filing of this report, that the Fund’s disclosure controls and procedures are adequately designed and are operating effectively to ensure (i) that material information relating to the Fund, including its consolidated subsidiaries, is made known to them by others within those entities, particularly during the period in which this report is being prepared; and (ii) that information required to be disclosed by the Fund on Form N-CSR is recorded, processed, summarized and reported within the time periods specified in the Securities and Exchange Commission’s rules and forms. |
| (b) | There were no changes in the Fund’s internal control over financial reporting that occurred during the period covered by this report that have materially affected, or are reasonably likely to materially affect, the Fund’s internal control over financial reporting. |
| Item 12. | Disclosure of Securities Lending Activities for Closed-End Management Investment Companies. |
Not Applicable.
| Item 13. | Exhibits. |
| (a)(1) |
| (a)(2) |
| (a)(3) |
SIGNATURES
Pursuant to the requirements of the Securities Exchange Act of 1934 and the Investment Company Act of 1940, the registrant has duly caused this report to be signed on its behalf by the undersigned, thereunto duly authorized.
Ohio National Fund, Inc. | ||
By: | /s/ Thomas G. Mooney | |
Thomas G. Mooney | ||
Interim President | ||
(Principal Executive Officer) | ||
March 6, 2023 | ||
Pursuant to the requirements of the Securities Exchange Act of 1934 and the Investment Company Act of 1940, this report has been signed below by the following persons on behalf of the registrant and in the capacities and on the dates indicated.
Ohio National Fund, Inc. | ||
By: | /s/ Thomas G. Mooney | |
Thomas G. Mooney | ||
Interim President | ||
(Principal Executive Officer) | ||
March 6, 2023 | ||
By: | /s/ R. Todd Brockman | |
R. Todd Brockman | ||
Treasurer | ||
(Principal Financial Officer) | ||
March 6, 2023 | ||