UNITED STATES
SECURITIES AND EXCHANGE COMMISSION
Washington, D.C. 20549
Washington, D.C. 20549
FORM N-CSR
CERTIFIED SHAREHOLDER REPORT OF REGISTERED
MANAGEMENT INVESTMENT COMPANIES
MANAGEMENT INVESTMENT COMPANIES
Investment Company Act file number 811-03015
AuguStarSM Variable Insurance Products Fund, Inc.
| (Exact name of registrant as specified in charter) | |
| One Financial Way, Cincinnati, Ohio | 45242 |
| (Address of principal executive offices) | (Zip Code) |
| CT Corporation 300 E. Lombard St., Suite 1400 Baltimore, MD 21202 | |
| (Name and address of agent for service) | |
Registrant’s telephone number, including area code: 513-794-6971
Date of fiscal year end: December 31
Date of reporting period: December 31, 2023
Item 1. Reports To Stockholders.
(a)
TABLE OF CONTENTS
President's Message
Dear Investor:
As we reflect on 2023, markets proved to be surprisingly resilient. We entered 2023 after an extraordinarily tumultuous 2022, in which both equities and fixed-income experienced large negative returns, inflation skyrocketed, and expectations of aggressive Federal Reserve ("Fed") action produced a palpable fear of recession. By the end of 2023, a "goldilocks" scenario or "soft landing," in which the Fed brings inflation down to a manageable level while also avoiding plunging the economy into recession, seemed much more likely compared to the start of the year.
Inflation in most developed economies reached highs in 2022. Mid-year, U.S. inflation reached a high of 9.1%, putting profound pressure on consumers to bear the price increases. Aggressive Fed action brought inflation down to 6.4% at the end of 2022, and further interest rate hikes in 2023 have brought inflation down to 3.1% at the end of the year. The speed of the hikes was dramatic, taking the Fed Funds Rate from near zero at the beginning of 2022 to a range of 5.25% to 5.50% at the end of 2023. Historically, this environment typically results in recession. However, at last check, the annualized U.S. GDP growth rate was 4.9%. Although the interest rate hikes did play a part in the dramatic first-quarter collapse of Silicon Valley Bank, Signature Bank, First Republic Bank, and UBS's acquisition of Credit Suisse, these crises were short-lived. The Fed's comments in December indicated that it may cut interest rates in 2024, which would be a welcome occurrence for many fixed-income investors weary of persistent hikes.
From a geopolitical perspective, we've experienced yet another eventful year. The conflict in Ukraine that began in 2022 has ground to a standstill, with little hope on the horizon for resolution. In October, Hamas perpetrated a horrific attack on Israeli civilians. The attack and the responses to it have further enflamed tensions in the Middle East. Looking to China, a major diplomatic crisis took place early in 2023 when the U.S. shot down a Chinese spy balloon that had traversed the U.S. This event preceded U.S./China relations hitting a low point. The relationship began to thaw towards the end of the year, with high-level visits and the re-establishment of military dialogue. The tensions around Taiwan's independence and Chinese encroachment in the South China Sea continue to simmer, even as China remains the U.S. economy's largest trading partner.
Despite the geopolitical and economic turbulence, markets performed well overall in 2023.
Equity Markets
Equity markets experienced a strong bull market during 2023. The largest rally occurred within the seven technology stocks dubbed the "magnificent seven": Apple, Microsoft, Nvidia, Amazon, Meta, Alphabet, and Tesla. Collectively, these stocks were up 111%, with the technology heavy NASDAQ-100 Index returning 55%. The equity markets, particularly larger cap indices, remained quite narrow (i.e., a small number of stocks driving return) for most of the year, with a small number of stocks pushing the entire index higher. However, towards the end of 2023, markets experienced modest broadening. Should the markets continue to broaden, that may be an advantageous environment for active managers.
Within domestic equity markets, the S&P 500®, S&P MidCap 400®, and Russell 2000® indices all posted double-digit positive returns, with +20% returns across the large capitalization spectrum. Growth stocks outperformed value stocks substantially during the year. The S&P 500® Value Index returned 22.23%, while the S&P 500® Growth Index returned
1
30.03%. The growth stock outperformance during 2023 continues a decade-long trend favoring growth stocks. Additionally, mid- and small-cap names underperformed large-cap companies. Foreign equity markets, while positive, mostly lagged U.S. indices. Emerging markets equity lagged all broad developed market indexes as those economies struggled to digest higher interest rates.
A summary of returns for key equity benchmarks is presented below:
| Index | 2023 U.S. Dollar Total Returns (price and dividend) | |
| S&P 500® | 26.29% | |
| S&P 500® Growth | 30.03% | |
| S&P 500® Value | 22.23% | |
| S&P MidCap 400® | 16.44% | |
| Russell 2000® | 16.93% | |
| MSCI All Country World Ex-USA (Net) | 15.62% | |
| MSCI Emerging Markets (Net) | 9.83% |
Fixed Income Markets
Fixed-income markets experienced moderately positive returns in 2023. This came as a relief to many bond investors, who feared a third consecutive year of negative bond returns. Interest rates rose substantially during the first half of the year, but moderated and eventually fell slightly by the end of 2023. The yield curve continues to be inverted, where long-term bond yields are lower than shorter-term yields, and has been inverted since mid-2022, making this an exceptionally long period without resolution to the inversion. During 2023, credit risk was rewarded, both in high-quality and low-quality issuers, with corporate bonds outperforming other bond indexes.
The Bloomberg U.S. Aggregate Bond Index posted a total return of 5.53% during 2023. Lower-quality indices, like the Bloomberg U.S. Corporate Bond Index and the Bloomberg U.S. Corporate High Yield Bond Index, provided total returns of 8.52% and 13.45%, respectively. The Bloomberg U.S. Securitized Index, a higher quality, shorter duration index, provided a return of 5.08% for the year. The table below illustrates the returns of the various indices.
| Index | 2023 U.S. Dollar Total Returns (price and interest) | |
| Bloomberg U.S. Aggregate Bond | 5.53% | |
| Bloomberg U.S. Treasury | 4.05% | |
| Bloomberg U.S. Securitized | 5.08% | |
| Bloomberg U.S. Corporate Bond | 8.52% | |
| Bloomberg U.S. Corporate High Yield Bond | 13.45% |
AuguStarSM Variable Insurance Products Fund, Inc.
The AuguStarSM Variable Insurance Products Fund, Inc., rebranded from Ohio National Fund, Inc., continues to offer a wide array of investment options that can be used to build a diversified portfolio. During 2023, 15 of the 22 actively managed portfolios beat their respective peer groups, substantially beating the success rate of active managers as a whole. In addition, before expenses, the returns of the three index portfolios performed in line with their respective indices during the year.
2
Looking Ahead
We started 2023 with the distinct possibility of a recession on the horizon. As we moved through the year, the prospect of a soft landing, in which inflation is controlled while avoiding recession, brightened considerably, though a recession is certainly still possible. At its December 2023 meeting, the Fed signaled the possibility of rate cuts as we move through 2024, citing the long-run effects of the previous rate hikes. The economy will likely continue to digest higher interest rates, affecting industries like housing for an extended period of time. Looking to 2024, the biggest question is whether inflation will continue to fall and meet the Fed's 2% target inflation rate. Within equity markets, many indexes are closing in on or have reached new highs. Within fixed-income markets, we continue to look for a resolution in the unusually long yield curve inversion.
Thank you for entrusting your assets with AuguStarSM Variable Insurance Products Fund, Inc. We look forward to serving your financial needs in the years ahead.
We appreciate your trust,
Thomas G. Mooney
Interim President, AuguStarSM Variable Insurance Products Fund, Inc.
Interim President, AuguStarSM Variable Insurance Products Fund, Inc.
3
AuguStarSM Variable Insurance Products Fund, Inc.
AVIP Bond Portfolio (Unaudited)
Objective/Strategy
The AVIP Bond Portfolio (formerly ON Bond Portfolio) seeks a high level of income and opportunity for capital appreciation consistent with preservation of capital by investing, under normal circumstances, at least 80% of its net assets in corporate debt securities.
Performance as of December 31, 2023
| Average Annual returns | |
| One year | 8.30% |
| Five years | 2.61% |
| Ten years | 2.74% |
Past performance does not guarantee future results. The performance data quoted represents past performance and current returns may be lower or higher. Total return figures include change in share price and reinvestment of dividends and capital gains. The investment return and principal value will fluctuate so that an investor’s shares, when redeemed, may be worth more or less than the original cost. To obtain performance information up to the most recent month end, call toll-free 1-877-781-6392.
The Portfolio is not open to direct retail investment. Beneficial interest in the Portfolio’s shares is obtained either through an allocation to the Portfolio as an investment vehicle within variable life insurance policies or annuity contracts, or as an underlying investment by the AVIP Model Portfolios. Actual performance results for variable annuity and variable universal life contracts will be lower due to contract charges. Consult your contract for applicable charges.
Total expense ratio is 0.61% per the Fund’s Prospectus dated May 1, 2023 and supplemented October 2, 2023 and December 4, 2023. Additional information pertaining to the Portfolio’s expense ratio as of December 31, 2023 can be found in the Portfolio’s Financial Highlights.
Comments from Adviser
Q. How did the Portfolio perform in comparison to its benchmark during the reporting period?
A. For the year ended December 31, 2023, the Portfolio returned 8.30% versus 8.40% for its benchmark, the ICE BofA U.S. Corporate Index.
Q. What affected the Portfolio’s performance?
A. Fixed income markets registered positive returns for 2023, despite the Federal Reserve raising the Fed Funds rate. While short term interest rates increased, overall interest rates didn’t move substantially compared to 2022. The Treasury curve actually steepened slightly from the 2 year to 30 year Treasury rate during the year. Credit spreads also declined during the period. In this environment, lower quality bonds and bonds with an intermediate maturity outperformed the benchmark, while higher quality bonds underperformed the benchmark.
The Portfolio’s performance for the year was broadly in line with the benchmark, with a slight underperformance as the end result. The allocation to lower quality bonds enhanced performance, as credit spreads tightened, and lower quality bonds outperformed the benchmark. From an industry perspective, the Portfolio’s holdings in the Materials, Consumer Discretionary, and Information Technology sectors contributed to relative performance. Holdings in Financials, and more specifically, regional bank bonds, detracted from relative performance. Security selection was slightly positive for the year, while sector allocation was slightly negative. Lastly, the Portfolio’s holdings in 2 year to 10 year bonds outperformed slightly during the year. (1)
| (1) | The Portfolio’s composition is subject to change. Holdings and weightings are as of December 31, 2023. |
Change in Value of $10,000 Investment

Hypothetical illustration based on past performance. Future performance will vary. The Portfolio’s returns reflect reinvested dividends. The Portfolio’s holdings may differ significantly from the securities in the index. The index is unmanaged and therefore does not reflect the cost of portfolio management and accounting.
The ICE BofA U.S. Corporate Index tracks the performance of all U.S. dollar-denominated, investment grade corporate public debt issued in the U.S. domestic bond market. Qualifying bonds must have an investment grade rating (based on an average of Moody’s, S&P, and Fitch). In addition, qualifying securities must have at least one year remaining term to maturity, a fixed coupon schedule, and a minimum amount outstanding of $250 million.
Past performance is no guarantee of future results. Redemption of fund shares could have tax implications unique to each shareholder.
4
(continued)
AuguStarSM Variable Insurance Products Fund, Inc.
AVIP Bond Portfolio (Unaudited) (Continued)
| Portfolio Composition as of December 31, 2023 (1) | |
| % of Net Assets | |
| Corporate Bonds (4) | 93.2 |
| Asset-Backed Securities (4) | 2.2 |
| U.S. Treasury Obligations | 1.7 |
| Other Net Assets | 2.9 |
| 100.0 | |
| Top 10 Portfolio Holdings as of December 31, 2023 (1) (2) (3) | ||
| % of Net Assets | ||
| 1. | Lear Corp. 4.250%, 05/15/2029 | 1.7 |
| 2. | Amgen, Inc. 5.600%, 03/02/2043 | 1.4 |
| 3. | Marriott International, Inc. 4.900%, 04/15/2029 | 1.3 |
| 4. | MPLX LP 5.000%, 03/01/2033 | 1.3 |
| 5. | Kinross Gold Corp. 4.500%, 07/15/2027 | 1.3 |
| 6. | Ares Capital Corp. 3.200%, 11/15/2031 | 1.3 |
| 7. | Boeing Co. / The 3.200%, 03/01/2029 | 1.3 |
| 8. | Hasbro, Inc. 3.900%, 11/19/2029 | 1.2 |
| 9. | Bank of Montreal 3.803%, 12/15/2032 | 1.2 |
| 10. | RPM International, Inc. 4.250%, 01/15/2048 | 1.1 |
| (1) | Composition of Portfolio subject to change. | |
| (2) | Short-term investments have been excluded from the list of Top 10 Portfolio Holdings. | |
| (3) | Top 10 Portfolio Holdings is presented at an individual security level. Total investment exposure by issuer may be higher. | |
| (4) | Sectors (Corporate Bonds, Asset-Backed Securities): | |
| % of Net Assets | |
| Financials | 26.6 |
| Industrials | 10.4 |
| Consumer Staples | 10.2 |
| Consumer Discretionary | 9.4 |
| Energy | 8.7 |
| Utilities | 7.8 |
| Materials | 5.8 |
| Health Care | 5.3 |
| Communication Services | 4.8 |
| Information Technology | 3.6 |
| Real Estate | 2.8 |
| 95.4 |
5
AuguStarSM Variable Insurance Products Fund, Inc.
AVIP Bond Portfolio
| Schedule of Investments | December 31, 2023 |
| Corporate Bonds–93.2% | Rate | Maturity | Face Amount | Value | |
| Communication Services–4.8% | |||||
AT&T, Inc. (Diversified Telecom. Svs.) | 4.900% | 08/15/2037 | $1,000,000 | $ 965,826 | |
Charter Communications Operating LLC / Charter Communications Operating Capital (Media) | 3.700% | 04/01/2051 | 1,000,000 | 650,430 | |
Comcast Corp. (Media) | 3.250% | 11/01/2039 | 3,000,000 | 2,430,002 | |
Meta Platforms, Inc. (Interactive Media & Svs.) | 4.950% | 05/15/2033 | 1,000,000 | 1,032,119 | |
Time Warner Cable LLC (Media) | 6.550% | 05/01/2037 | 2,000,000 | 1,970,538 | |
T-Mobile U.S.A., Inc. (Wireless Telecom. Svs.) | 3.875% | 04/15/2030 | 1,800,000 | 1,706,943 | |
Verizon Communications, Inc. (Diversified Telecom. Svs.) | 4.400% | 11/01/2034 | 1,500,000 | 1,443,126 | |
Verizon Communications, Inc. (Diversified Telecom. Svs.) | 2.875% | 11/20/2050 | 1,000,000 | 679,880 | |
| 10,878,864 | |||||
| Consumer Discretionary–9.4% | |||||
Amazon.com, Inc. (Broadline Retail) | 3.875% | 08/22/2037 | 1,000,000 | 927,935 | |
Aptiv PLC (Automobile Components) | 4.350% | 03/15/2029 | 1,000,000 | 975,267 | |
Aptiv PLC / Aptiv Corp. (Automobile Components) | 3.250% | 03/01/2032 | 2,000,000 | 1,766,792 | |
Best Buy Co., Inc. (Specialty Retail) | 1.950% | 10/01/2030 | 1,500,000 | 1,245,719 | |
Expedia Group, Inc. (Hotels, Restaurants & Leisure) | 4.625% | 08/01/2027 | 1,000,000 | 995,437 | |
Hasbro, Inc. (Leisure Products) | 3.900% | 11/19/2029 | 3,000,000 | 2,789,914 | |
Home Depot, Inc. / The (Specialty Retail) | 2.375% | 03/15/2051 | 2,000,000 | 1,262,817 | |
Lear Corp. (Automobile Components) | 4.250% | 05/15/2029 | 4,000,000 | 3,848,543 | |
Lowe's Cos., Inc. (Specialty Retail) | 3.000% | 10/15/2050 | 2,000,000 | 1,360,445 | |
M.D.C. Holdings, Inc. (Household Durables) | 3.850% | 01/15/2030 | 2,000,000 | 1,828,869 | |
Magna International, Inc. (Automobile Components) | 3.625% | 06/15/2024 | 1,000,000 | 990,503 | |
Marriott International, Inc. (Hotels, Restaurants & Leisure) | 4.900% | 04/15/2029 | 3,000,000 | 3,019,497 | |
| 21,011,738 | |||||
| Consumer Staples–10.2% | |||||
Anheuser-Busch Cos. LLC / Anheuser-Busch InBev Worldwide, Inc. (Beverages) | 4.700% | 02/01/2036 | 2,000,000 | 1,993,474 | |
Anheuser-Busch Cos. LLC / Anheuser-Busch InBev Worldwide, Inc. (Beverages) | 4.900% | 02/01/2046 | 1,000,000 | 980,241 | |
Anheuser-Busch InBev Worldwide, Inc. (Beverages) | 4.600% | 04/15/2048 | 2,000,000 | 1,892,945 | |
B.A.T. Capital Corp. (Tobacco) | 3.215% | 09/06/2026 | 1,000,000 | 956,396 | |
B.A.T. Capital Corp. (Tobacco) | 4.700% | 04/02/2027 | 2,000,000 | 1,979,617 | |
Brown-Forman Corp. (Beverages) | 4.750% | 04/15/2033 | 2,000,000 | 2,039,084 | |
Coca-Cola Co. / The (Beverages) | 3.000% | 03/05/2051 | 1,000,000 | 755,181 | |
Coca-Cola Co. / The (Beverages) | 2.500% | 03/15/2051 | 1,000,000 | 671,362 | |
Constellation Brands, Inc. (Beverages) | 5.000% | 02/02/2026 | 500,000 | 498,183 | |
Hershey Co. / The (Food Products) | 1.700% | 06/01/2030 | 1,800,000 | 1,532,110 | |
JBS U.S.A. LUX SA / JBS U.S.A. Food Co. / JBS U.S.A. Finance, Inc. (Food Products) | 5.750% | 04/01/2033 | 1,200,000 | 1,188,704 | |
Kimberly-Clark Corp. (Household Products) | 1.050% | 09/15/2027 | 2,000,000 | 1,783,258 | |
Kraft Heinz Foods Co. (Food Products) | 4.625% | 10/01/2039 | 1,200,000 | 1,115,422 | |
Philip Morris International, Inc. (Tobacco) | 3.375% | 08/15/2029 | 2,500,000 | 2,344,333 | |
Pilgrim's Pride Corp. (Food Products) | 6.250% | 07/01/2033 | 1,500,000 | 1,543,386 | |
Smithfield Foods, Inc. (Food Products) | (a) | 3.000% | 10/15/2030 | 2,000,000 | 1,641,845 |
| 22,915,541 | |||||
| Energy–8.7% | |||||
Baker Hughes Holdings LLC / Baker Hughes Co-Obligor, Inc. (Energy Equip. & Svs.) | 4.080% | 12/15/2047 | 2,000,000 | 1,691,698 | |
BP Capital Markets America, Inc. (Oil, Gas & Consumable Fuels) | 3.017% | 01/16/2027 | 1,000,000 | 957,929 | |
BP Capital Markets America, Inc. (Oil, Gas & Consumable Fuels) | 1.749% | 08/10/2030 | 1,000,000 | 846,802 | |
Chevron Corp. (Oil, Gas & Consumable Fuels) | 2.236% | 05/11/2030 | 1,800,000 | 1,594,819 | |
Energy Transfer LP (Oil, Gas & Consumable Fuels) | 4.950% | 06/15/2028 | 2,000,000 | 1,992,174 | |
Halliburton Co. (Energy Equip. & Svs.) | 4.850% | 11/15/2035 | 1,000,000 | 984,182 | |
Kinder Morgan, Inc. (Oil, Gas & Consumable Fuels) | 5.300% | 12/01/2034 | 1,000,000 | 992,287 | |
Marathon Petroleum Corp. (Oil, Gas & Consumable Fuels) | 4.750% | 09/15/2044 | 1,000,000 | 891,642 | |
MPLX LP (Oil, Gas & Consumable Fuels) | 5.000% | 03/01/2033 | 3,000,000 | 2,938,782 | |
ONEOK, Inc. (Oil, Gas & Consumable Fuels) | 5.850% | 01/15/2026 | 1,000,000 | 1,014,502 | |
ONEOK, Inc. (Oil, Gas & Consumable Fuels) | 6.000% | 06/15/2035 | 1,000,000 | 1,032,908 | |
Shell International Finance B.V. (Oil, Gas & Consumable Fuels) | 4.000% | 05/10/2046 | 1,000,000 | 867,771 | |
Tennessee Gas Pipeline Co. LLC (Oil, Gas & Consumable Fuels) | (a) | 2.900% | 03/01/2030 | 1,000,000 | 880,764 |
Texas Eastern Transmission LP (Oil, Gas & Consumable Fuels) | (a) | 4.150% | 01/15/2048 | 1,000,000 | 820,649 |
Williams Cos., Inc. / The (Oil, Gas & Consumable Fuels) | 3.750% | 06/15/2027 | 1,000,000 | 963,839 | |
Williams Cos., Inc. / The (Oil, Gas & Consumable Fuels) | 5.400% | 03/04/2044 | 1,000,000 | 968,739 | |
| 19,439,487 | |||||
| Financials–26.6% | |||||
AerCap Ireland Capital DAC / AerCap Global Aviation Trust (Financial Services) | 3.300% | 01/30/2032 | 1,500,000 | 1,305,495 | |
American Express Co. (Rate is fixed until 08/03/2032, at which point, the rate becomes SOFR + 176) (Consumer Finance) | (b) | 4.420% | 08/03/2033 | 1,800,000 | 1,733,017 |
Ares Capital Corp. (Capital Markets) | 3.200% | 11/15/2031 | 3,500,000 | 2,927,107 | |
Bank of America Corp. (Banks) | 3.875% | 08/01/2025 | 1,000,000 | 984,875 | |
6
(continued)
AuguStarSM Variable Insurance Products Fund, Inc.
AVIP Bond Portfolio (Continued)
| Schedule of Investments | December 31, 2023 |
| Corporate Bonds (Continued) | Rate | Maturity | Face Amount | Value | |
| Financials (continued) | |||||
Bank of America Corp. (Rate is fixed until 03/08/2032, at which point, the rate becomes H15T5Y + 200) (Banks) | (b) | 3.846% | 03/08/2037 | $1,000,000 | $ 878,006 |
Bank of Montreal (Rate is fixed until 12/15/2027, at which point, the rate becomes USSW5 + 143) (Banks) | (b) | 3.803% | 12/15/2032 | 2,800,000 | 2,575,775 |
BlackRock, Inc. (Capital Markets) | 2.400% | 04/30/2030 | 1,000,000 | 893,189 | |
BlackRock, Inc. (Capital Markets) | 2.100% | 02/25/2032 | 2,000,000 | 1,670,005 | |
Capital One Bank U.S.A. N.A. (Rate is fixed until 01/28/2025, at which point, the rate becomes SOFR + 91) (Consumer Finance) | (b) | 2.280% | 01/28/2026 | 1,500,000 | 1,446,567 |
Charles Schwab Corp. / The (Capital Markets) | 3.300% | 04/01/2027 | 2,000,000 | 1,902,822 | |
Citigroup, Inc. (Banks) | 3.700% | 01/12/2026 | 1,000,000 | 975,845 | |
Citigroup, Inc. (Banks) | 4.450% | 09/29/2027 | 2,000,000 | 1,954,018 | |
Credit Suisse AG (Banks) | 7.950% | 01/09/2025 | 2,000,000 | 2,044,043 | |
Discover Bank (Banks) | USISOA05 + 173 | 08/09/2028 | 2,000,000 | 1,926,380 | |
General Motors Financial Co., Inc. (Consumer Finance) | 6.400% | 01/09/2033 | 2,000,000 | 2,128,206 | |
Goldman Sachs Group, Inc. / The (Capital Markets) | 3.750% | 05/22/2025 | 2,000,000 | 1,958,776 | |
Intercontinental Exchange, Inc. (Capital Markets) | 3.750% | 12/01/2025 | 1,000,000 | 983,263 | |
Jefferies Financial Group, Inc. (Capital Markets) | 4.850% | 01/15/2027 | 1,800,000 | 1,792,713 | |
JPMorgan Chase & Co. (Banks) | 3.625% | 12/01/2027 | 2,000,000 | 1,919,171 | |
JPMorgan Chase & Co. (Rate is fixed until 05/13/2030, at which point, the rate becomes TSFR3M + 252) (Banks) | (b) | 2.956% | 05/13/2031 | 2,000,000 | 1,757,547 |
KeyCorp (Rate is fixed until 06/01/2032, at which point, the rate becomes SOFRINDX + 206) (Banks) | (b) | 4.789% | 06/01/2033 | 2,500,000 | 2,295,242 |
Marsh & McLennan Cos., Inc. (Insurance) | 3.500% | 06/03/2024 | 1,400,000 | 1,386,781 | |
Mitsubishi UFJ Financial Group, Inc. (Rate is fixed until 02/22/2033, at which point, the rate becomes H15T1Y + 163) (Banks) | (b) | 5.441% | 02/22/2034 | 2,000,000 | 2,067,055 |
Morgan Stanley (Capital Markets) | 3.950% | 04/23/2027 | 1,000,000 | 970,709 | |
Morgan Stanley (Rate is fixed until 10/18/2027, at which point, the rate becomes SOFR + 224) (Capital Markets) | (b) | 6.296% | 10/18/2028 | 2,000,000 | 2,095,078 |
PNC Bank N.A. (Banks) | 2.700% | 10/22/2029 | 2,500,000 | 2,191,448 | |
State Street Corp. (Capital Markets) | 2.200% | 03/03/2031 | 2,000,000 | 1,664,594 | |
Synchrony Financial (Consumer Finance) | 4.250% | 08/15/2024 | 1,000,000 | 989,003 | |
Synchrony Financial (Consumer Finance) | 5.150% | 03/19/2029 | 2,000,000 | 1,941,970 | |
Truist Financial Corp. (Rate is fixed until 10/28/2032, at which point, the rate becomes SOFR + 230) (Banks) | (b) | 6.123% | 10/28/2033 | 1,000,000 | 1,038,015 |
U.S. Bancorp (Banks) | 1.375% | 07/22/2030 | 2,000,000 | 1,611,991 | |
Wells Fargo & Co. (Rate is fixed until 07/25/2028, at which point, the rate becomes SOFR + 174) (Banks) | (b) | 5.574% | 07/25/2029 | 1,000,000 | 1,021,068 |
Wells Fargo & Co. (Rate is fixed until 10/30/2029, at which point, the rate becomes TSFR3M + 143) (Banks) | (b) | 2.879% | 10/30/2030 | 2,000,000 | 1,777,924 |
Wells Fargo & Co. (Rate is fixed until 04/30/2040, at which point, the rate becomes SOFR + 253) (Banks) | (b) | 3.068% | 04/30/2041 | 1,200,000 | 907,867 |
Wells Fargo & Co. (Banks) | 4.650% | 11/04/2044 | 1,000,000 | 878,007 | |
Westpac Banking Corp. (Rate is fixed until 02/04/2025, at which point, the rate becomes H15T5Y + 135) (Banks) | (b) | 2.894% | 02/04/2030 | 1,500,000 | 1,445,043 |
Westpac Banking Corp. (Rate is fixed until 11/23/2026, at which point, the rate becomes USISOA05 + 224) (Banks) | (b) | 4.322% | 11/23/2031 | 1,800,000 | 1,730,601 |
| 59,769,216 | |||||
| Health Care–5.3% | |||||
AbbVie, Inc. (Biotechnology) | 3.200% | 11/21/2029 | 1,000,000 | 934,789 | |
AbbVie, Inc. (Biotechnology) | 4.250% | 11/21/2049 | 2,000,000 | 1,782,308 | |
Amgen, Inc. (Biotechnology) | 5.600% | 03/02/2043 | 3,000,000 | 3,099,931 | |
Quest Diagnostics, Inc. (Health Care Providers & Svs.) | 2.950% | 06/30/2030 | 2,000,000 | 1,790,417 | |
Quest Diagnostics, Inc. (Health Care Providers & Svs.) | 2.800% | 06/30/2031 | 1,000,000 | 871,610 | |
Regeneron Pharmaceuticals, Inc. (Biotechnology) | 1.750% | 09/15/2030 | 1,800,000 | 1,479,975 | |
UnitedHealth Group, Inc. (Health Care Providers & Svs.) | 5.050% | 04/15/2053 | 2,000,000 | 2,020,350 | |
| 11,979,380 | |||||
| Industrials–8.2% | |||||
Air Lease Corp. (Trading Companies & Distributors) | 2.300% | 02/01/2025 | 2,000,000 | 1,929,531 | |
BAE Systems PLC (Aerospace & Defense) | (a) | 1.900% | 02/15/2031 | 2,000,000 | 1,643,758 |
Boeing Co. / The (Aerospace & Defense) | 3.200% | 03/01/2029 | 3,000,000 | 2,805,582 | |
Canadian Pacific Railway Co. (Ground Transportation) | 2.050% | 03/05/2030 | 1,300,000 | 1,112,565 | |
FedEx Corp. (Air Freight & Logistics) | 4.900% | 01/15/2034 | 2,000,000 | 2,024,659 | |
Lockheed Martin Corp. (Aerospace & Defense) | 1.850% | 06/15/2030 | 1,000,000 | 857,136 | |
Lockheed Martin Corp. (Aerospace & Defense) | 3.600% | 03/01/2035 | 1,000,000 | 915,680 | |
Northrop Grumman Corp. (Aerospace & Defense) | 2.930% | 01/15/2025 | 1,000,000 | 977,078 | |
Parker-Hannifin Corp. (Machinery) | 4.200% | 11/21/2034 | 1,400,000 | 1,342,560 | |
TTX Co. (Ground Transportation) | (a) | 5.650% | 12/01/2052 | 2,000,000 | 2,138,931 |
7
(continued)
AuguStarSM Variable Insurance Products Fund, Inc.
AVIP Bond Portfolio (Continued)
| Schedule of Investments | December 31, 2023 |
| Corporate Bonds (Continued) | Rate | Maturity | Face Amount | Value | |
| Industrials (continued) | |||||
Union Pacific Corp. (Ground Transportation) | 3.250% | 08/15/2025 | $1,000,000 | $ 977,363 | |
Waste Connections, Inc. (Commercial Svs. & Supplies) | 4.250% | 12/01/2028 | 1,800,000 | 1,790,968 | |
| 18,515,811 | |||||
| Information Technology–3.6% | |||||
Broadcom, Inc. (Semiconductors & Equip.) | (a) | 2.600% | 02/15/2033 | 2,000,000 | 1,647,698 |
Intel Corp. (Semiconductors & Equip.) | 4.875% | 02/10/2026 | 2,000,000 | 2,014,846 | |
Micron Technology, Inc. (Semiconductors & Equip.) | 6.750% | 11/01/2029 | 2,000,000 | 2,161,172 | |
VMware LLC (Software) | 2.200% | 08/15/2031 | 2,800,000 | 2,320,115 | |
| 8,143,831 | |||||
| Materials–5.8% | |||||
Anglo American Capital PLC (Metals & Mining) | (a) | 4.750% | 04/10/2027 | 1,000,000 | 986,788 |
Anglo American Capital PLC (Metals & Mining) | (a) | 4.000% | 09/11/2027 | 800,000 | 768,429 |
Dow Chemical Co. / The (Chemicals) | 4.250% | 10/01/2034 | 1,402,000 | 1,341,199 | |
Glencore Funding LLC (Metals & Mining) | (a) | 2.850% | 04/27/2031 | 2,000,000 | 1,724,601 |
Kinross Gold Corp. (Metals & Mining) | 4.500% | 07/15/2027 | 3,000,000 | 2,933,334 | |
Nutrien Ltd. (Chemicals) | 4.200% | 04/01/2029 | 1,900,000 | 1,860,772 | |
RPM International, Inc. (Chemicals) | 4.250% | 01/15/2048 | 3,000,000 | 2,488,006 | |
Steel Dynamics, Inc. (Metals & Mining) | 3.250% | 01/15/2031 | 1,000,000 | 900,995 | |
| 13,004,124 | |||||
| Real Estate–2.8% | |||||
Alexandria Real Estate Equities, Inc. (Office REITs) | 3.950% | 01/15/2028 | 1,000,000 | 959,366 | |
Healthcare Realty Holdings LP (Health Care REITs) | 3.875% | 05/01/2025 | 1,400,000 | 1,358,167 | |
Healthcare Realty Holdings LP (Health Care REITs) | 3.625% | 01/15/2028 | 1,000,000 | 921,636 | |
VICI Properties LP / VICI Note Co., Inc. (Specialized REITs) | (a) | 4.625% | 12/01/2029 | 1,300,000 | 1,224,924 |
Welltower OP LLC (Health Care REITs) | 4.250% | 04/01/2026 | 1,000,000 | 984,551 | |
Welltower OP LLC (Health Care REITs) | 2.700% | 02/15/2027 | 1,000,000 | 937,383 | |
| 6,386,027 | |||||
| Utilities–7.8% | |||||
AEP Transmission Co. LLC (Electric Utilities) | 4.000% | 12/01/2046 | 1,000,000 | 835,449 | |
AEP Transmission Co. LLC (Electric Utilities) | 3.750% | 12/01/2047 | 1,351,000 | 1,070,867 | |
Ameren Corp. (Multi-Utilities) | 3.500% | 01/15/2031 | 2,000,000 | 1,824,765 | |
Berkshire Hathaway Energy Co. (Multi-Utilities) | 3.250% | 04/15/2028 | 1,900,000 | 1,804,458 | |
Commonwealth Edison Co. (Electric Utilities) | 4.350% | 11/15/2045 | 2,000,000 | 1,749,154 | |
Connecticut Light & Power Co. / The (Electric Utilities) | 4.000% | 04/01/2048 | 1,000,000 | 848,918 | |
Duke Energy Corp. (Electric Utilities) | 3.750% | 09/01/2046 | 1,000,000 | 770,494 | |
Duke Energy Indiana LLC (Electric Utilities) | 5.400% | 04/01/2053 | 500,000 | 509,080 | |
Eversource Energy (Electric Utilities) | 3.300% | 01/15/2028 | 1,000,000 | 946,887 | |
FirstEnergy Transmission LLC (Electric Utilities) | (a) | 4.550% | 04/01/2049 | 1,800,000 | 1,555,521 |
Florida Power & Light Co. (Electric Utilities) | 3.150% | 10/01/2049 | 2,000,000 | 1,467,232 | |
Jersey Central Power & Light Co. (Electric Utilities) | (a) | 4.300% | 01/15/2026 | 900,000 | 880,354 |
NiSource, Inc. (Multi-Utilities) | 5.250% | 03/30/2028 | 2,000,000 | 2,039,233 | |
Public Service Electric & Gas Co. (Multi-Utilities) | 3.600% | 12/01/2047 | 1,500,000 | 1,204,471 | |
| 17,506,883 | |||||
Total Corporate Bonds (Cost $227,798,060) | $209,550,902 | ||||
| Asset-Backed Securities–2.2% | Rate | Maturity | Face Amount | Value | |
| Industrials–2.2% | |||||
Air Canada 2017-1 Class B Pass Through Trust | (a) | 3.700% | 01/15/2026 | $1,276,455 | $ 1,207,980 |
FedEx Corp. 2020-1 Class AA Pass Through Trust | 1.875% | 02/20/2034 | 2,518,746 | 2,092,706 | |
United Airlines 2016-1 Class B Pass Through Trust | 3.650% | 01/07/2026 | 952,083 | 901,526 | |
United Airlines 2019-2 Class AA Pass Through Trust | 2.700% | 05/01/2032 | 833,470 | 704,769 | |
Total Asset-Backed Securities (Cost $5,580,755) | $ 4,906,981 | ||||
| U.S. Treasury Obligations–1.7% | Rate | Maturity | Face Amount | Value | |
U.S. Treasury Note | 4.500% | 11/15/2025 | $2,000,000 | $ 2,006,719 | |
U.S. Treasury Note | 3.375% | 05/15/2033 | 2,000,000 | 1,919,375 | |
Total U.S. Treasury Obligations (Cost $3,917,436) | $ 3,926,094 | ||||
Total Investments – 97.1% (Cost $237,296,251) | (c) | $218,383,977 | |||
Other Assets in Excess of Liabilities – 2.9% | 6,556,475 | ||||
| Net Assets – 100.0% | $224,940,452 | ||||
Percentages are stated as a percent of net assets. |
8
(continued)
AuguStarSM Variable Insurance Products Fund, Inc.
AVIP Bond Portfolio (Continued)
| Schedule of Investments | December 31, 2023 |
| Abbreviations: | ||
| H15T1Y: | U.S. Treasury Yield Curve Rate T-Note Constant Maturity 1 Year, 4.790% at 12/31/2023 | |
| H15T5Y: | U.S. Treasury Yield Curve Rate T-Note Constant Maturity 5 Year, 3.840% at 12/31/2023 | |
| REITs: | Real Estate Investment Trusts | |
| SOFR: | Secured Overnight Financing Rate, 5.380% at 12/31/2023 | |
| SOFRINDX: | Secured Overnight Financing Rate ("SOFR") Compounded Index, 1.115% at 12/31/2023 | |
| TSFR3M: | Quarterly CME Term Secured Overnight Financing Rate ("SOFR"), 5.331% at 12/31/2023 | |
| USISOA05: | 5 Year Secured Overnight Financing Rate ("SOFR") Spread-Adjusted ICE Swap Rate, 3.821% at 12/31/2023 | |
| USSW5: | USD Swap Semi 30/360 5 Year. This rate is linked to U.S. LIBOR, which is no longer published. An alternate reference rate will be determined by the issuer prior to the date the security becomes a variable rate instrument. | |
| Footnotes: | ||
| (a) | Security exempt from registration under Regulation D of the Securities Act of 1933. These securities may be resold in transactions exempt from registration, normally to qualified buyers under Rule 144A. At December 31, 2023, the value of these securities totaled $17,122,242, or 7.6% of the Portfolio’s net assets. | |
| (b) | Security is a fixed-then-variable rate instrument in which the coupon or dividend rate is fixed until a later specified date, then is adjusted periodically. Rates stated, including interest rate caps and floors, if any, are those in effect at December 31, 2023. | |
| (c) | Represents cost for financial reporting purposes, which may differ from cost basis for federal income tax purposes. See also Note 7 of the Notes to Financial Statements. | |
The accompanying notes are an integral part of these financial statements.
9
AuguStarSM Variable Insurance Products Fund, Inc.
AVIP BlackRock Balanced Allocation Portfolio (Unaudited)
Objective/Strategy
The AVIP BlackRock Balanced Allocation Portfolio (formerly ON BlackRock Balanced Allocation Portfolio) seeks a high level of long-term total return consistent with preservation of capital by investing in stocks, bonds, and money market instruments.
Performance as of December 31, 2023
| Average Annual returns | |
| One year | 21.13% |
| Five years | 11.96% |
| Ten years | 8.67% |
Past performance does not guarantee future results. The performance data quoted represents past performance and current returns may be lower or higher. Total return figures include change in share price and reinvestment of dividends and capital gains. The investment return and principal value will fluctuate so that an investor’s shares, when redeemed, may be worth more or less than the original cost. To obtain performance information up to the most recent month end, call toll-free 1-877-781-6392.
The Portfolio is not open to direct retail investment. Beneficial interest in the Portfolio’s shares is obtained either through an allocation to the Portfolio as an investment vehicle within variable life insurance policies or annuity contracts, or as an underlying investment by the AVIP Model Portfolios. Actual performance results for variable annuity and variable universal life contracts will be lower due to contract charges. Consult your contract for applicable charges.
Total expense ratio is 0.55% per the Fund’s Prospectus dated May 1, 2023 and supplemented October 2, 2023 and December 4, 2023. Additional information pertaining to the Portfolio’s expense ratio as of December 31, 2023 can be found in the Portfolio’s Financial Highlights.
Comments from Sub-Adviser/Adviser
Q. How did the Portfolio perform in comparison to its benchmarks during the reporting period?
A. For the year ended December 31, 2023, the Portfolio returned 21.13% versus 26.29% for its benchmark, the S&P 500® Index. The Portfolio’s secondary benchmark, which is comprised of 70% S&P 500® Index and 30% ICE BofA U.S. Corporate Index, returned 20.72% for the year ended December 31, 2023.
Q. What affected the Portfolio’s performance?
A. The Portfolio’s equity and fixed income sleeves underperformed the primary benchmark for the year and the fixed income sleeve also underperformed the fixed income portion of the secondary benchmark. As equities had higher returns than fixed income securities during the year, the Portfolio’s allocation to fixed income securities was the primary driver of underperformance compared to the primary benchmark.
In the equity sleeve, underperformance for the year was driven by security selection within Health Care, followed by Consumer Staples and Industrials. Some of the underperformance was offset by selection within Information Technology, Communication Services, and Financials. Top individual contributors to relative performance were NVIDIA Corp., Exxon Mobil Corp., and NextEra Energy, Inc, while the largest detractors were The Hershey Co., Broadcom, Inc., and Bristol-Myers Squibb Co.
In the fixed income sleeve, security selection was slightly positive for the year, while sector allocation was negative. The allocation to lower quality, BBB rated bonds enhanced performance for the year, as credit spreads tightened, and lower quality bonds outperformed the benchmark. From an industry perspective, the Portfolio’s holdings in the Materials, Consumer Discretionary, Consumer Staples and Information Technology sectors contributed to relative performance vs. the fixed income sleeve of the secondary benchmark. Holdings in Financials, and
more specifically, regional bank bonds, detracted from performance. The Portfolio’s exposure to the Energy sector also detracted from performance. Lastly, the Portfolio’s holdings in 3 year to 10 year bonds outperformed slightly during the period. (1)
| (1) | The Portfolio’s composition is subject to change. Holdings and weightings are as of December 31, 2023. |
| |
Change in Value of $10,000 Investment

Hypothetical illustration based on past performance. Future performance will vary. The Portfolio’s returns reflect reinvested dividends. The Portfolio’s holdings may differ significantly from the securities in the index. The index is unmanaged and therefore does not reflect the cost of portfolio management and accounting.
The S&P 500® Index is a capitalization-weighted index designed to measure performance of the broad domestic market through changes in the aggregate market value of 500 stocks representing all major industries. The index presented includes the effects of reinvested dividends.
The ICE BofA U.S. Corporate Index tracks the performance of all U.S. dollar-denominated, investment grade corporate public debt issued in the U.S. domestic bond market. Qualifying bonds must have an investment grade rating (based on an average of Moody’s, S&P, and Fitch). In addition, qualifying securities must have at least one year remaining term to maturity, a fixed coupon schedule, and a minimum amount outstanding of $250 million.
Past performance is no guarantee of future results. Redemption of fund shares could have tax implications unique to each shareholder.
10
(continued)
AuguStarSM Variable Insurance Products Fund, Inc.
AVIP BlackRock Balanced Allocation Portfolio (Unaudited) (Continued)
| Portfolio Composition as of December 31, 2023 (1) | |
| % of Net Assets | |
| Common Stocks (4) | 71.8 |
| Corporate Bonds (4) | 23.6 |
| U.S. Treasury Obligations | 2.5 |
| Asset-Backed Securities (4) | 0.5 |
| Other Net Assets | 1.6 |
| 100.0 | |
| Top 10 Portfolio Holdings as of December 31, 2023 (1) (2) (3) | ||
| % of Net Assets | ||
| 1. | Microsoft Corp. | 5.9 |
| 2. | Apple, Inc. | 5.8 |
| 3. | Amazon.com, Inc. | 3.3 |
| 4. | NVIDIA Corp. | 3.0 |
| 5. | U.S. Treasury Note 4.500%, 11/15/2033 | 2.5 |
| 6. | Alphabet, Inc. Class A | 2.3 |
| 7. | Meta Platforms, Inc. Class A | 1.7 |
| 8. | Mastercard, Inc. Class A | 1.5 |
| 9. | Visa, Inc. | 1.3 |
| 10. | Alphabet, Inc. Class C | 1.3 |
| (1) | Composition of Portfolio subject to change. | |
| (2) | Short-term investments have been excluded from the list of Top 10 Portfolio Holdings. | |
| (3) | Top 10 Portfolio Holdings is presented at an individual security level. Total investment exposure by issuer may be higher. | |
| (4) | Sectors (Common Stocks, Corporate Bonds, Asset-Backed Securities): | |
| % of Net Assets | |
| Information Technology | 22.2 |
| Financials | 16.0 |
| Health Care | 10.3 |
| Consumer Discretionary | 9.6 |
| Industrials | 8.6 |
| Communication Services | 8.0 |
| Consumer Staples | 7.8 |
| Energy | 5.2 |
| Utilities | 3.6 |
| Materials | 2.4 |
| Real Estate | 2.2 |
| 95.9 |
11
AuguStarSM Variable Insurance Products Fund, Inc.
AVIP BlackRock Balanced Allocation Portfolio
| Schedule of Investments | December 31, 2023 |
| Common Stocks–71.8% | Shares | Value | |
| Communication Services–6.5% | |||
Alphabet, Inc. Class A (Interactive Media & Svs.) | (a) | 67,013 | $ 9,361,046 |
Alphabet, Inc. Class C (Interactive Media & Svs.) | (a) | 37,820 | 5,329,972 |
Comcast Corp. Class A (Media) | 43,121 | 1,890,856 | |
Electronic Arts, Inc. (Entertainment) | 7,721 | 1,056,310 | |
Fox Corp. Class A (Media) | 74,887 | 2,221,897 | |
Fox Corp. Class B (Media) | 1,061 | 29,337 | |
Meta Platforms, Inc. Class A (Interactive Media & Svs.) | (a) | 19,784 | 7,002,745 |
Warner Bros. Discovery, Inc. (Entertainment) | (a) | 13,207 | 150,296 |
| 27,042,459 | |||
| Consumer Discretionary–8.1% | |||
Amazon.com, Inc. (Broadline Retail) | (a) | 90,317 | 13,722,765 |
AutoNation, Inc. (Specialty Retail) | (a) | 4,929 | 740,237 |
Best Buy Co., Inc. (Specialty Retail) | 31,031 | 2,429,107 | |
Booking Holdings, Inc. (Hotels, Restaurants & Leisure) | (a) | 153 | 542,725 |
D.R. Horton, Inc. (Household Durables) | 3,380 | 513,692 | |
General Motors Co. (Automobiles) | 107,574 | 3,864,058 | |
Home Depot, Inc. / The (Specialty Retail) | 4,093 | 1,418,429 | |
McDonald's Corp. (Hotels, Restaurants & Leisure) | 3,023 | 896,350 | |
Skechers U.S.A., Inc. Class A (Textiles, Apparel & Luxury Goods) | (a) | 16,939 | 1,055,977 |
Tesla, Inc. (Automobiles) | (a) | 12,425 | 3,087,364 |
TJX Cos., Inc. / The (Specialty Retail) | 42,321 | 3,970,133 | |
Travel + Leisure Co. (Hotels, Restaurants & Leisure) | 35,105 | 1,372,255 | |
| 33,613,092 | |||
| Consumer Staples–4.5% | |||
Archer-Daniels-Midland Co. (Food Products) | 30,097 | 2,173,605 | |
Coca-Cola Co. / The (Beverages) | 55,470 | 3,268,847 | |
Colgate-Palmolive Co. (Household Products) | 11,770 | 938,187 | |
Hershey Co. / The (Food Products) | 13,001 | 2,423,907 | |
Kimberly-Clark Corp. (Household Products) | 27,261 | 3,312,484 | |
PepsiCo, Inc. (Beverages) | 23,139 | 3,929,928 | |
Sysco Corp. (Consumer Staples Distribution & Retail) | 5,500 | 402,215 | |
Walmart, Inc. (Consumer Staples Distribution & Retail) | 13,716 | 2,162,327 | |
| 18,611,500 | |||
| Energy–2.5% | |||
Chevron Corp. (Oil, Gas & Consumable Fuels) | 8,893 | 1,326,480 | |
ConocoPhillips (Oil, Gas & Consumable Fuels) | 10,116 | 1,174,164 | |
Devon Energy Corp. (Oil, Gas & Consumable Fuels) | 32,990 | 1,494,447 | |
EOG Resources, Inc. (Oil, Gas & Consumable Fuels) | 16,253 | 1,965,800 | |
Exxon Mobil Corp. (Oil, Gas & Consumable Fuels) | 9,840 | 983,803 | |
Marathon Petroleum Corp. (Oil, Gas & Consumable Fuels) | 11,636 | 1,726,317 | |
Pioneer Natural Resources Co. (Oil, Gas & Consumable Fuels) | 1,730 | 389,043 | |
Valero Energy Corp. (Oil, Gas & Consumable Fuels) | 10,309 | 1,340,170 | |
| 10,400,224 | |||
| Financials–9.1% | |||
Bank of America Corp. (Banks) | 127,984 | 4,309,221 | |
Berkshire Hathaway, Inc. Class B (Financial Services) | (a) | 4,851 | 1,730,158 |
Block, Inc. (Financial Services) | (a) | 23,949 | 1,852,455 |
Citizens Financial Group, Inc. (Banks) | 25,965 | 860,480 | |
Invesco Ltd. (Capital Markets) | 50,980 | 909,483 | |
JPMorgan Chase & Co. (Banks) | 1,469 | 249,877 | |
KeyCorp (Banks) | 42,161 | 607,118 | |
Marsh & McLennan Cos., Inc. (Insurance) | 14,691 | 2,783,504 | |
Mastercard, Inc. Class A (Financial Services) | 14,220 | 6,064,972 | |
MetLife, Inc. (Insurance) | 37,576 | 2,484,901 | |
Moody's Corp. (Capital Markets) | 7,714 | 3,012,780 | |
Nasdaq, Inc. (Capital Markets) | 44,572 | 2,591,416 | |
Regions Financial Corp. (Banks) | 26,355 | 510,760 | |
Reinsurance Group of America, Inc. (Insurance) | 4,076 | 659,415 | |
Travelers Cos., Inc. / The (Insurance) | 12,246 | 2,332,741 | |
Visa, Inc. (Financial Services) | 21,353 | 5,559,254 | |
W.R. Berkley Corp. (Insurance) | 13,903 | 983,220 | |
| 37,501,755 | |||
| Health Care–9.4% | |||
Abbott Laboratories (Health Care Equip. & Supplies) | 16,176 | 1,780,492 | |
12
(continued)
AuguStarSM Variable Insurance Products Fund, Inc.
AVIP BlackRock Balanced Allocation Portfolio (Continued)
| Schedule of Investments | December 31, 2023 |
| Common Stocks (Continued) | Shares | Value | |
| Health Care (continued) | |||
AbbVie, Inc. (Biotechnology) | 12,506 | $ 1,938,055 | |
Agilent Technologies, Inc. (Life Sciences Tools & Svs.) | 16,210 | 2,253,676 | |
Amgen, Inc. (Biotechnology) | 15,425 | 4,442,708 | |
Bristol-Myers Squibb Co. (Pharmaceuticals) | 52,406 | 2,688,952 | |
Cencora, Inc. (Health Care Providers & Svs.) | 2,321 | 476,687 | |
Cigna Group / The (Health Care Providers & Svs.) | 1,676 | 501,878 | |
Elevance Health, Inc. (Health Care Providers & Svs.) | 8,251 | 3,890,841 | |
Eli Lilly & Co. (Pharmaceuticals) | 5,643 | 3,289,418 | |
Exelixis, Inc. (Biotechnology) | (a) | 27,311 | 655,191 |
Gilead Sciences, Inc. (Biotechnology) | 12,499 | 1,012,544 | |
HCA Healthcare, Inc. (Health Care Providers & Svs.) | 5,050 | 1,366,934 | |
Hologic, Inc. (Health Care Equip. & Supplies) | (a) | 8,414 | 601,180 |
Incyte Corp. (Biotechnology) | (a) | 33,701 | 2,116,086 |
Johnson & Johnson (Pharmaceuticals) | 5,808 | 910,346 | |
Medtronic PLC (Health Care Equip. & Supplies) | 50,580 | 4,166,780 | |
Merck & Co., Inc. (Pharmaceuticals) | 3,385 | 369,033 | |
Pfizer, Inc. (Pharmaceuticals) | 47,715 | 1,373,715 | |
Regeneron Pharmaceuticals, Inc. (Biotechnology) | (a) | 1,640 | 1,440,396 |
ResMed, Inc. (Health Care Equip. & Supplies) | 2,717 | 467,378 | |
Stryker Corp. (Health Care Equip. & Supplies) | 8,417 | 2,520,555 | |
UnitedHealth Group, Inc. (Health Care Providers & Svs.) | 908 | 478,035 | |
| 38,740,880 | |||
| Industrials–6.1% | |||
A.O. Smith Corp. (Building Products) | 4,840 | 399,010 | |
AECOM (Construction & Engineering) | 15,692 | 1,450,412 | |
AMETEK, Inc. (Electrical Equip.) | 2,182 | 359,790 | |
Cintas Corp. (Commercial Svs. & Supplies) | 3,509 | 2,114,734 | |
CNH Industrial N.V. (Machinery) | 38,917 | 474,009 | |
Illinois Tool Works, Inc. (Machinery) | 6,398 | 1,675,892 | |
Lockheed Martin Corp. (Aerospace & Defense) | 8,896 | 4,032,023 | |
Old Dominion Freight Line, Inc. (Ground Transportation) | 1,952 | 791,204 | |
Oshkosh Corp. (Machinery) | 28,123 | 3,048,814 | |
Republic Services, Inc. (Commercial Svs. & Supplies) | 7,598 | 1,252,986 | |
Rockwell Automation, Inc. (Electrical Equip.) | 3,026 | 939,512 | |
Snap-on, Inc. (Machinery) | 4,729 | 1,365,924 | |
Timken Co. / The (Machinery) | 7,024 | 562,974 | |
United Parcel Service, Inc. Class B (Air Freight & Logistics) | 16,603 | 2,610,490 | |
Valmont Industries, Inc. (Construction & Engineering) | 4,521 | 1,055,699 | |
W.W. Grainger, Inc. (Trading Companies & Distributors) | 1,985 | 1,644,950 | |
Xylem, Inc. (Machinery) | 11,376 | 1,300,959 | |
| 25,079,382 | |||
| Information Technology–21.1% | |||
Adobe, Inc. (Software) | (a) | 5,898 | 3,518,747 |
Amdocs Ltd. (IT Svs.) | 6,133 | 539,029 | |
Apple, Inc. (Tech. Hardware, Storage & Periph.) | 124,908 | 24,048,536 | |
Applied Materials, Inc. (Semiconductors & Equip.) | 26,297 | 4,261,955 | |
Autodesk, Inc. (Software) | (a) | 2,811 | 684,422 |
Broadcom, Inc. (Semiconductors & Equip.) | 439 | 490,034 | |
Hewlett Packard Enterprise Co. (Tech. Hardware, Storage & Periph.) | 120,831 | 2,051,710 | |
Intel Corp. (Semiconductors & Equip.) | 41,570 | 2,088,892 | |
Lam Research Corp. (Semiconductors & Equip.) | 954 | 747,230 | |
Manhattan Associates, Inc. (Software) | (a) | 10,723 | 2,308,876 |
Micron Technology, Inc. (Semiconductors & Equip.) | 1,184 | 101,043 | |
Microsoft Corp. (Software) | 64,437 | 24,230,889 | |
NVIDIA Corp. (Semiconductors & Equip.) | 25,342 | 12,549,865 | |
Oracle Corp. (Software) | 5,609 | 591,357 | |
QUALCOMM, Inc. (Semiconductors & Equip.) | 29,536 | 4,271,792 | |
Salesforce, Inc. (Software) | (a) | 10,711 | 2,818,493 |
TE Connectivity Ltd. (Electronic Equip., Instr. & Comp.) | 13,953 | 1,960,397 | |
| 87,263,267 | |||
| Materials–1.4% | |||
Ecolab, Inc. (Chemicals) | 18,768 | 3,722,633 | |
LyondellBasell Industries N.V. Class A (Chemicals) | 12,218 | 1,161,687 | |
Nucor Corp. (Metals & Mining) | 4,123 | 717,567 | |
| 5,601,887 | |||
13
(continued)
AuguStarSM Variable Insurance Products Fund, Inc.
AVIP BlackRock Balanced Allocation Portfolio (Continued)
| Schedule of Investments | December 31, 2023 |
| Common Stocks (Continued) | Shares | Value | |
| Real Estate–1.6% | |||
Camden Property Trust (Residential REITs) | 13,042 | $ 1,294,940 | |
EastGroup Properties, Inc. (Industrial REITs) | 3,081 | 565,487 | |
Equinix, Inc. (Specialized REITs) | 700 | 563,773 | |
Equity Residential (Residential REITs) | 31,408 | 1,920,913 | |
Public Storage (Specialized REITs) | 3,159 | 963,495 | |
Simon Property Group, Inc. (Retail REITs) | 10,266 | 1,464,342 | |
| 6,772,950 | |||
| Utilities–1.5% | |||
AES Corp. / The (Ind. Power & Renewable Elec.) | 84,140 | 1,619,695 | |
CMS Energy Corp. (Multi-Utilities) | 6,133 | 356,143 | |
Evergy, Inc. (Electric Utilities) | 8,708 | 454,558 | |
Hawaiian Electric Industries, Inc. (Electric Utilities) | 31,842 | 451,838 | |
OGE Energy Corp. (Electric Utilities) | 9,539 | 333,197 | |
PPL Corp. (Electric Utilities) | 109,826 | 2,976,285 | |
| 6,191,716 | |||
Total Common Stocks (Cost $247,583,169) | $296,819,112 | ||
| Corporate Bonds–23.6% | Rate | Maturity | Face Amount | Value | |
| Communication Services–1.5% | |||||
AT&T, Inc. (Diversified Telecom. Svs.) | 4.900% | 08/15/2037 | $ 1,000,000 | $ 965,826 | |
Comcast Corp. (Media) | 3.250% | 11/01/2039 | 2,000,000 | 1,620,001 | |
Time Warner Cable LLC (Media) | 6.550% | 05/01/2037 | 1,000,000 | 985,269 | |
T-Mobile U.S.A., Inc. (Wireless Telecom. Svs.) | 3.875% | 04/15/2030 | 1,200,000 | 1,137,962 | |
Verizon Communications, Inc. (Diversified Telecom. Svs.) | 4.400% | 11/01/2034 | 1,000,000 | 962,084 | |
Verizon Communications, Inc. (Diversified Telecom. Svs.) | 2.875% | 11/20/2050 | 1,000,000 | 679,880 | |
| 6,351,022 | |||||
| Consumer Discretionary–1.5% | |||||
Amazon.com, Inc. (Broadline Retail) | 3.875% | 08/22/2037 | 1,000,000 | 927,935 | |
Best Buy Co., Inc. (Specialty Retail) | 1.950% | 10/01/2030 | 1,000,000 | 830,479 | |
Expedia Group, Inc. (Hotels, Restaurants & Leisure) | 4.625% | 08/01/2027 | 1,000,000 | 995,437 | |
Hasbro, Inc. (Leisure Products) | 3.900% | 11/19/2029 | 2,000,000 | 1,859,942 | |
Lear Corp. (Automobile Components) | 3.500% | 05/30/2030 | 1,000,000 | 890,908 | |
Lowe's Cos., Inc. (Specialty Retail) | 3.000% | 10/15/2050 | 1,000,000 | 680,222 | |
| 6,184,923 | |||||
| Consumer Staples–3.3% | |||||
Anheuser-Busch Cos. LLC / Anheuser-Busch InBev Worldwide, Inc. (Beverages) | 4.700% | 02/01/2036 | 2,000,000 | 1,993,474 | |
B.A.T. Capital Corp. (Tobacco) | 3.215% | 09/06/2026 | 1,000,000 | 956,396 | |
B.A.T. Capital Corp. (Tobacco) | 4.700% | 04/02/2027 | 1,000,000 | 989,809 | |
Coca-Cola Co. / The (Beverages) | 3.000% | 03/05/2051 | 2,000,000 | 1,510,363 | |
Diageo Capital PLC (Beverages) | 2.375% | 10/24/2029 | 2,000,000 | 1,800,593 | |
Hershey Co. / The (Food Products) | 1.700% | 06/01/2030 | 1,200,000 | 1,021,407 | |
JBS U.S.A. LUX SA / JBS U.S.A. Food Co. / JBS U.S.A. Finance, Inc. (Food Products) | 5.750% | 04/01/2033 | 800,000 | 792,469 | |
Kraft Heinz Foods Co. (Food Products) | 4.625% | 10/01/2039 | 800,000 | 743,615 | |
Philip Morris International, Inc. (Tobacco) | 3.375% | 08/15/2029 | 1,000,000 | 937,733 | |
Pilgrim's Pride Corp. (Food Products) | 6.250% | 07/01/2033 | 1,000,000 | 1,028,924 | |
Target Corp. (Consumer Staples Distribution & Retail) | 2.350% | 02/15/2030 | 2,000,000 | 1,784,478 | |
| 13,559,261 | |||||
| Energy–2.7% | |||||
Baker Hughes Holdings LLC (Energy Equip. & Svs.) | 3.337% | 12/15/2027 | 1,000,000 | 955,614 | |
BP Capital Markets America, Inc. (Oil, Gas & Consumable Fuels) | 3.017% | 01/16/2027 | 1,000,000 | 957,929 | |
Chevron Corp. (Oil, Gas & Consumable Fuels) | 2.236% | 05/11/2030 | 1,200,000 | 1,063,213 | |
Energy Transfer LP (Oil, Gas & Consumable Fuels) | 4.950% | 06/15/2028 | 1,000,000 | 996,087 | |
Halliburton Co. (Energy Equip. & Svs.) | 4.850% | 11/15/2035 | 1,000,000 | 984,182 | |
Kinder Morgan, Inc. (Oil, Gas & Consumable Fuels) | 5.300% | 12/01/2034 | 1,000,000 | 992,287 | |
MPLX LP (Oil, Gas & Consumable Fuels) | 5.000% | 03/01/2033 | 2,000,000 | 1,959,188 | |
Shell International Finance B.V. (Oil, Gas & Consumable Fuels) | 4.000% | 05/10/2046 | 1,500,000 | 1,301,656 | |
Tennessee Gas Pipeline Co. LLC (Oil, Gas & Consumable Fuels) | (b) | 2.900% | 03/01/2030 | 1,000,000 | 880,764 |
Williams Cos., Inc. / The (Oil, Gas & Consumable Fuels) | 3.750% | 06/15/2027 | 1,000,000 | 963,839 | |
| 11,054,759 | |||||
| Financials–6.9% | |||||
AerCap Ireland Capital DAC / AerCap Global Aviation Trust (Financial Services) | 4.875% | 01/16/2024 | 1,000,000 | 999,361 | |
AerCap Ireland Capital DAC / AerCap Global Aviation Trust (Financial Services) | 3.300% | 01/30/2032 | 1,000,000 | 870,330 | |
American Express Co. (Rate is fixed until 08/03/2032, at which point, the rate becomes SOFR + 176) (Consumer Finance) | (c) | 4.420% | 08/03/2033 | 1,200,000 | 1,155,345 |
14
(continued)
AuguStarSM Variable Insurance Products Fund, Inc.
AVIP BlackRock Balanced Allocation Portfolio (Continued)
| Schedule of Investments | December 31, 2023 |
| Corporate Bonds (Continued) | Rate | Maturity | Face Amount | Value | |
| Financials (continued) | |||||
Ares Capital Corp. (Capital Markets) | 3.200% | 11/15/2031 | $ 1,500,000 | $ 1,254,475 | |
Bank of Montreal (Rate is fixed until 12/15/2027, at which point, the rate becomes USSW5 + 143) (Banks) | (c) | 3.803% | 12/15/2032 | 200,000 | 183,984 |
BlackRock, Inc. (Capital Markets) | 2.100% | 02/25/2032 | 1,000,000 | 835,003 | |
Capital One Bank U.S.A. N.A. (Rate is fixed until 01/28/2025, at which point, the rate becomes SOFR + 91) (Consumer Finance) | (c) | 2.280% | 01/28/2026 | 1,000,000 | 964,378 |
Charles Schwab Corp. / The (Capital Markets) | 3.300% | 04/01/2027 | 1,000,000 | 951,411 | |
Citigroup, Inc. (Banks) | 4.125% | 07/25/2028 | 1,000,000 | 960,260 | |
Citigroup, Inc. (Rate is fixed until 11/05/2029, at which point, the rate becomes SOFR + 142) (Banks) | (c) | 2.976% | 11/05/2030 | 1,000,000 | 890,395 |
Citigroup, Inc. (Rate is fixed until 05/01/2031, at which point, the rate becomes SOFR + 117) (Banks) | (c) | 2.561% | 05/01/2032 | 2,000,000 | 1,668,656 |
Discover Bank (Banks) | 2.450% | 09/12/2024 | 1,000,000 | 976,279 | |
Discover Bank (Banks) | USISOA05 + 173 | 08/09/2028 | 250,000 | 240,797 | |
General Motors Financial Co., Inc. (Consumer Finance) | 2.700% | 06/10/2031 | 2,000,000 | 1,676,915 | |
Goldman Sachs Group, Inc. / The (Capital Markets) | 3.750% | 05/22/2025 | 1,000,000 | 979,388 | |
JPMorgan Chase & Co. (Banks) | 3.625% | 12/01/2027 | 1,000,000 | 959,586 | |
JPMorgan Chase & Co. (Rate is fixed until 05/13/2030, at which point, the rate becomes TSFR3M + 252) (Banks) | (c) | 2.956% | 05/13/2031 | 1,000,000 | 878,774 |
Morgan Stanley (Capital Markets) | 3.950% | 04/23/2027 | 1,000,000 | 970,709 | |
Morgan Stanley (Rate is fixed until 01/22/2030, at which point, the rate becomes SOFR + 114) (Capital Markets) | (c) | 2.699% | 01/22/2031 | 1,500,000 | 1,311,265 |
PNC Bank N.A. (Banks) | 4.050% | 07/26/2028 | 1,500,000 | 1,445,353 | |
State Street Corp. (Capital Markets) | 2.200% | 03/03/2031 | 1,000,000 | 832,297 | |
Synchrony Financial (Consumer Finance) | 4.250% | 08/15/2024 | 1,000,000 | 989,003 | |
Truist Bank (Rate is fixed until 09/17/2024, at which point, the rate becomes H15T5Y + 115) (Banks) | (c) | 2.636% | 09/17/2029 | 2,500,000 | 2,326,882 |
U.S. Bancorp (Banks) | 1.375% | 07/22/2030 | 1,000,000 | 805,995 | |
Wells Fargo & Co. (Rate is fixed until 07/25/2028, at which point, the rate becomes SOFR + 174) (Banks) | (c) | 5.574% | 07/25/2029 | 1,000,000 | 1,021,068 |
Wells Fargo & Co. (Rate is fixed until 04/30/2040, at which point, the rate becomes SOFR + 253) (Banks) | (c) | 3.068% | 04/30/2041 | 800,000 | 605,245 |
Westpac Banking Corp. (Rate is fixed until 02/04/2025, at which point, the rate becomes H15T5Y + 135) (Banks) | (c) | 2.894% | 02/04/2030 | 1,500,000 | 1,445,043 |
Westpac Banking Corp. (Rate is fixed until 11/23/2026, at which point, the rate becomes USISOA05 + 224) (Banks) | (c) | 4.322% | 11/23/2031 | 200,000 | 192,289 |
| 28,390,486 | |||||
| Health Care–0.9% | |||||
AbbVie, Inc. (Biotechnology) | 3.200% | 11/21/2029 | 1,000,000 | 934,790 | |
Regeneron Pharmaceuticals, Inc. (Biotechnology) | 1.750% | 09/15/2030 | 1,200,000 | 986,650 | |
UnitedHealth Group, Inc. (Health Care Providers & Svs.) | 3.875% | 12/15/2028 | 2,000,000 | 1,957,595 | |
| 3,879,035 | |||||
| Industrials–2.0% | |||||
Air Lease Corp. (Trading Companies & Distributors) | 2.300% | 02/01/2025 | 2,000,000 | 1,929,531 | |
Boeing Co. / The (Aerospace & Defense) | 3.200% | 03/01/2029 | 1,500,000 | 1,402,791 | |
FedEx Corp. (Air Freight & Logistics) | 4.900% | 01/15/2034 | 1,000,000 | 1,012,329 | |
TTX Co. (Ground Transportation) | (b) | 5.650% | 12/01/2052 | 1,000,000 | 1,069,466 |
United Rentals North America, Inc. (Trading Companies & Distributors) | 4.875% | 01/15/2028 | 1,000,000 | 976,240 | |
Waste Connections, Inc. (Commercial Svs. & Supplies) | 2.600% | 02/01/2030 | 2,000,000 | 1,794,336 | |
| 8,184,693 | |||||
| Information Technology–1.1% | |||||
Broadcom, Inc. (Semiconductors & Equip.) | (b) | 2.600% | 02/15/2033 | 1,000,000 | 823,849 |
HP, Inc. (Tech. Hardware, Storage & Periph.) | 2.650% | 06/17/2031 | 2,000,000 | 1,702,115 | |
Oracle Corp. (Software) | 4.300% | 07/08/2034 | 1,000,000 | 933,717 | |
VMware LLC (Software) | 2.200% | 08/15/2031 | 1,200,000 | 994,335 | |
| 4,454,016 | |||||
| Materials–1.0% | |||||
Dow Chemical Co. / The (Chemicals) | 4.250% | 10/01/2034 | 1,402,000 | 1,341,199 | |
Glencore Funding LLC (Metals & Mining) | (b) | 2.850% | 04/27/2031 | 2,000,000 | 1,724,601 |
Kinross Gold Corp. (Metals & Mining) | 4.500% | 07/15/2027 | 1,000,000 | 977,778 | |
| 4,043,578 | |||||
| Real Estate–0.6% | |||||
Alexandria Real Estate Equities, Inc. (Office REITs) | 3.950% | 01/15/2028 | 1,000,000 | 959,366 | |
15
(continued)
AuguStarSM Variable Insurance Products Fund, Inc.
AVIP BlackRock Balanced Allocation Portfolio (Continued)
| Schedule of Investments | December 31, 2023 |
| Corporate Bonds (Continued) | Rate | Maturity | Face Amount | Value | |
| Real Estate (continued) | |||||
American Tower Corp. (Specialized REITs) | 2.750% | 01/15/2027 | $ 1,000,000 | $ 937,338 | |
VICI Properties LP / VICI Note Co., Inc. (Specialized REITs) | (b) | 4.625% | 12/01/2029 | 700,000 | 659,574 |
| 2,556,278 | |||||
| Utilities–2.1% | |||||
AEP Transmission Co. LLC (Electric Utilities) | 4.000% | 12/01/2046 | 1,000,000 | 835,449 | |
AEP Transmission Co. LLC (Electric Utilities) | 3.750% | 12/01/2047 | 1,000,000 | 792,648 | |
Ameren Corp. (Multi-Utilities) | 3.500% | 01/15/2031 | 1,000,000 | 912,383 | |
Black Hills Corp. (Multi-Utilities) | 3.050% | 10/15/2029 | 1,000,000 | 898,389 | |
Commonwealth Edison Co. (Electric Utilities) | 4.350% | 11/15/2045 | 1,000,000 | 874,577 | |
Connecticut Light & Power Co. / The (Electric Utilities) | 4.000% | 04/01/2048 | 1,000,000 | 848,918 | |
Duke Energy Corp. (Electric Utilities) | 3.750% | 09/01/2046 | 1,500,000 | 1,155,740 | |
Duke Energy Indiana LLC (Electric Utilities) | 3.250% | 10/01/2049 | 1,000,000 | 724,806 | |
FirstEnergy Transmission LLC (Electric Utilities) | (b) | 4.550% | 04/01/2049 | 200,000 | 172,836 |
Florida Power & Light Co. (Electric Utilities) | 3.150% | 10/01/2049 | 1,000,000 | 733,616 | |
Public Service Electric & Gas Co. (Multi-Utilities) | 3.600% | 12/01/2047 | 1,000,000 | 802,981 | |
| 8,752,343 | |||||
Total Corporate Bonds (Cost $110,137,660) | $ 97,410,394 | ||||
| U.S. Treasury Obligations–2.5% | Rate | Maturity | Face Amount | Value | |
U.S. Treasury Note | 4.500% | 11/15/2033 | $10,000,000 | $ 10,498,438 | |
Total U.S. Treasury Obligations (Cost $10,540,250) | $ 10,498,438 | ||||
| Asset-Backed Securities–0.5% | Rate | Maturity | Face Amount | Value | |
| Industrials–0.5% | |||||
FedEx Corp. 2020-1 Class AA Pass Through Trust | 1.875% | 02/20/2034 | $ 1,679,164 | $ 1,395,137 | |
United Airlines 2016-1 Class B Pass Through Trust | 3.650% | 01/07/2026 | 105,787 | 100,170 | |
United Airlines 2019-2 Class AA Pass Through Trust | 2.700% | 05/01/2032 | 833,470 | 704,769 | |
Total Asset-Backed Securities (Cost $2,618,422) | $ 2,200,076 | ||||
Total Investments – 98.4% (Cost $370,879,501) | (d) | $406,928,020 | |||
Other Assets in Excess of Liabilities – 1.6% | (e) | 6,471,755 | |||
| Net Assets – 100.0% | $413,399,775 | ||||
Percentages are stated as a percent of net assets. |
| Abbreviations: | ||
| H15T5Y: | U.S. Treasury Yield Curve Rate T-Note Constant Maturity 5 Year, 3.840% at 12/31/2023 | |
| REITs: | Real Estate Investment Trusts | |
| SOFR: | Secured Overnight Financing Rate, 5.380% at 12/31/2023 | |
| TSFR3M: | Quarterly CME Term Secured Overnight Financing Rate ("SOFR"), 5.331% at 12/31/2023 | |
| USISOA05: | 5 Year Secured Overnight Financing Rate ("SOFR") Spread-Adjusted ICE Swap Rate, 3.821% at 12/31/2023 | |
| USSW5: | USD Swap Semi 30/360 5 Year. This rate is linked to U.S. LIBOR, which is no longer published. An alternate reference rate will be determined by the issuer prior to the date the security becomes a variable rate instrument. | |
| Footnotes: | ||
| (a) | Non-income producing security. | |
| (b) | Security exempt from registration under Regulation D of the Securities Act of 1933. These securities may be resold in transactions exempt from registration, normally to qualified buyers under Rule 144A. At December 31, 2023, the value of these securities totaled $5,331,090, or 1.3% of the Portfolio’s net assets. | |
| (c) | Security is a fixed-then-variable rate instrument in which the coupon or dividend rate is fixed until a later specified date, then is adjusted periodically. Rates stated, including interest rate caps and floors, if any, are those in effect at December 31, 2023. | |
| (d) | Represents cost for financial reporting purposes, which may differ from cost basis for federal income tax purposes. See also Note 7 of the Notes to Financial Statements. | |
| (e) | Includes $236,000 of cash pledged as collateral for the futures contracts outstanding at December 31, 2023. See also the following Schedule of Open Futures Contracts. | |
The accompanying notes are an integral part of these financial statements.
| Schedule of Open Futures Contracts | December 31, 2023 |
| Description | Number of contracts | Expiration Date | Notional Amount | Value | Unrealized Appreciation (Depreciation) | Variation Margin Receivable (Payable) | ||||||
| CME E-mini S&P 500 Index - Long | 20 | March 15, 2024 | $4,718,909 | $4,820,001 | $101,092 | $(10,468) |
The accompanying notes are an integral part of these financial statements.
16
AuguStarSM Variable Insurance Products Fund, Inc.
AVIP BlackRock Advantage International Equity Portfolio (Unaudited)
Objective/Strategy
The AVIP BlackRock Advantage International Equity Portfolio (formerly ON BlackRock Advantage International Equity Portfolio)seeks long-term growth of capital by investing, under normal circumstances, at least 80% of its net assets in non-U.S. equity securities and equity-like instruments of companies that are components of, or have characteristics similar to, the companies included in the MSCI EAFE Index (Net - USD).
Performance as of December 31, 2023
| Average Annual returns | |
| One year | 18.94% |
| Five years | 8.52% |
| Ten years | 3.57% |
Past performance does not guarantee future results. The performance data quoted represents past performance and current returns may be lower or higher. Total return figures include change in share price and reinvestment of dividends and capital gains. The investment return and principal value will fluctuate so that an investor’s shares, when redeemed, may be worth more or less than the original cost. To obtain performance information up to the most recent month end, call toll-free 1-877-781-6392.
The Portfolio is not open to direct retail investment. Beneficial interest in the Portfolio’s shares is obtained either through an allocation to the Portfolio as an investment vehicle within variable life insurance policies or annuity contracts, or as an underlying investment by the AVIP Model Portfolios. Actual performance results for variable annuity and variable universal life contracts will be lower due to contract charges. Consult your contract for applicable charges.
Total expense ratio is 0.89% per the Fund’s Prospectus dated May 1, 2023 and supplemented October 2, 2023 and December 4, 2023. Additional information pertaining to the Portfolio’s expense ratio as of December 31, 2023 can be found in the Portfolio’s Financial Highlights.
Comments from Sub-Adviser
Q. How did the Portfolio perform in comparison to its benchmark during the reporting period?
A. For the year ended December 31, 2023, the Portfolio returned 18.94% versus 18.24% for its benchmark, the MSCI EAFE Index (Net – USD).
Q. What affected the Portfolio’s performance?
A. Stock selection drove the Portfolio’s outperformance for the year, with fundamental insights driving gains. Traditional valuation measures that track company sales, research expenditures, and other financial statement metrics performed particularly well, as the move higher in interest rates broadly rewarded value styles. These measures aided successful stock selection and motivated overweights to domestically oriented Japanese stocks that were most exposed to an expected policy normalization by the Bank of Japan. Country allocation decisions detracted overall, but were more than offset by selection within Germany, France, and Japan, specifically.
From a sector perspective, selection within Health Care led outperformance for the year, followed by selection within Information Technology and Industrials. Allocation decisions within Consumer Discretionary and Financials detracted. Top individual contributors to relative performance for the year were Logitech International SA, Mitsubishi Corp., and SAP SE, while top detractors were AIA Group Ltd., Astellas Pharma, Inc., and British American Tobacco PLC. (1)
| (1) | The Portfolio’s composition is subject to change. Holdings and weightings are as of December 31, 2023. |
Change in Value of $10,000 Investment

Hypothetical illustration based on past performance. Future performance will vary. The Portfolio’s returns reflect reinvested dividends. The Portfolio’s holdings may differ significantly from the securities in the index. The index is unmanaged and therefore does not reflect the cost of portfolio management and accounting.
The MSCI EAFE Index (Net-USD) is a free-float-adjusted market-capitalization weighted index that is designed to measure the equity market performance of 21 developed markets, including countries in Europe, Australasia and the Far East, excluding the U.S. and Canada. The returns for this index include the effects of reinvested dividends, net of taxes, and adjustment to U.S. Dollar denomination.
Past performance is no guarantee of future results. Redemption of fund shares could have tax implications unique to each shareholder.
17
(continued)
AuguStarSM Variable Insurance Products Fund, Inc.
AVIP BlackRock Advantage International Equity Portfolio (Unaudited) (Continued)
| Portfolio Composition as of December 31, 2023 (1) | |
| % of Net Assets | |
| Common Stocks (4) (5) | 97.8 |
| Preferred Securities (4) (5) | 0.0 |
| Other Net Assets | 2.2 |
| 100.0 | |
| Top 10 Portfolio Holdings as of December 31, 2023 (1) (2) (3) | ||
| % of Net Assets | ||
| 1. | Novo Nordisk A/S Class B | 2.9 |
| 2. | Nestle SA | 2.8 |
| 3. | ASML Holding N.V. | 2.2 |
| 4. | Novartis AG | 2.2 |
| 5. | BHP Group Ltd. | 2.0 |
| 6. | SAP SE | 1.8 |
| 7. | Siemens AG | 1.8 |
| 8. | Shell PLC | 1.8 |
| 9. | Tokyo Electron Ltd. | 1.5 |
| 10. | AIA Group Ltd. | 1.4 |
| (1) | Composition of Portfolio subject to change. | |
| (2) | Short-term investments have been excluded from the list of Top 10 Portfolio Holdings. | |
| (3) | Top 10 Portfolio Holdings is presented at an individual security level. Total investment exposure by issuer may be higher. | |
| (4) | Top 10 Country Weightings (Common Stocks, Preferred Securities): | |
| % of Net Assets | |
| Japan | 21.7 |
| United Kingdom | 13.9 |
| Germany | 10.1 |
| Switzerland | 9.5 |
| France | 9.0 |
| Netherlands | 5.5 |
| Australia | 5.5 |
| Denmark | 4.2 |
| Sweden | 2.8 |
| Italy | 2.7 |
| (5) | Sectors (Common Stocks, Preferred Securities): |
| % of Net Assets | |
| Industrials | 19.8 |
| Financials | 15.1 |
| Consumer Discretionary | 13.0 |
| Health Care | 11.5 |
| Information Technology | 9.3 |
| Consumer Staples | 8.1 |
| Materials | 5.4 |
| Communication Services | 5.2 |
| Energy | 4.3 |
| Utilities | 3.7 |
| Real Estate | 2.4 |
| 97.8 |
18
AuguStarSM Variable Insurance Products Fund, Inc.
AVIP BlackRock Advantage International Equity Portfolio
| Schedule of Investments | December 31, 2023 |
| Common Stocks–97.8% | Shares | Value | |
| Japan–21.7% | |||
ANA Holdings, Inc. (Industrials) | (a)(b) | 1,800 | $ 39,007 |
Asahi Kasei Corp. (Materials) | (a) | 11,500 | 85,096 |
Astellas Pharma, Inc. (Health Care) | (a) | 184,200 | 2,208,570 |
Canon, Inc. (Information Technology) | (a) | 8,700 | 222,995 |
Central Japan Railway Co. (Industrials) | (a) | 73,900 | 1,873,764 |
Concordia Financial Group Ltd. (Financials) | (a) | 13,800 | 62,940 |
Dai-ichi Life Holdings, Inc. (Financials) | (a) | 20,900 | 443,715 |
Daito Trust Construction Co. Ltd. (Real Estate) | (a) | 2,400 | 277,808 |
Denso Corp. (Consumer Discretionary) | (a) | 39,400 | 590,958 |
DMG Mori Co. Ltd. (Industrials) | (a) | 31,700 | 604,708 |
ENEOS Holdings, Inc. (Energy) | (a) | 74,000 | 292,974 |
Fast Retailing Co. Ltd. (Consumer Discretionary) | (a) | 15,400 | 3,818,240 |
GMO Payment Gateway, Inc. (Financials) | (a) | 9,500 | 656,512 |
Hikari Tsushin, Inc. (Industrials) | (a) | 1,200 | 198,421 |
Hitachi Ltd. (Industrials) | (a) | 38,300 | 2,767,995 |
Hoya Corp. (Health Care) | (a) | 7,200 | 895,458 |
Hulic Co. Ltd. (Real Estate) | (a) | 55,700 | 581,631 |
ITOCHU Corp. (Industrials) | (a) | 19,500 | 795,977 |
J. Front Retailing Co. Ltd. (Consumer Discretionary) | (a) | 50,400 | 457,525 |
Japan Post Bank Co. Ltd. (Financials) | (a) | 32,600 | 331,860 |
Japan Post Holdings Co. Ltd. (Financials) | (a) | 281,900 | 2,515,805 |
Japan Tobacco, Inc. (Consumer Staples) | (a) | 54,200 | 1,399,051 |
Kakaku.com, Inc. (Communication Services) | (a) | 34,600 | 427,302 |
Kao Corp. (Consumer Staples) | (a) | 700 | 28,766 |
Kobayashi Pharmaceutical Co. Ltd. (Consumer Staples) | (a) | 1,300 | 62,512 |
Komatsu Ltd. (Industrials) | (a) | 40,100 | 1,044,685 |
Konica Minolta, Inc. (Information Technology) | (a)(b) | 21,100 | 61,580 |
Kubota Corp. (Industrials) | (a) | 11,200 | 168,076 |
Kyowa Kirin Co. Ltd. (Health Care) | (a) | 31,700 | 533,163 |
Lawson, Inc. (Consumer Staples) | (a) | 19,600 | 1,011,591 |
M3, Inc. (Health Care) | (a) | 7,700 | 126,805 |
Makita Corp. (Industrials) | (a) | 1,000 | 27,501 |
Marubeni Corp. (Industrials) | (a) | 17,300 | 272,216 |
Marui Group Co. Ltd. (Financials) | (a) | 21,700 | 362,710 |
Mitsubishi Chemical Group Corp. (Materials) | (a) | 126,800 | 774,825 |
Mitsubishi Corp. (Industrials) | (a) | 182,100 | 2,900,403 |
Mitsubishi Estate Co. Ltd. (Real Estate) | (a) | 105,600 | 1,450,665 |
Mitsubishi HC Capital, Inc. (Financials) | (a) | 19,500 | 130,761 |
Mitsubishi UFJ Financial Group, Inc. (Financials) | (a) | 246,900 | 2,124,747 |
Mitsui & Co. Ltd. (Industrials) | (a) | 91,600 | 3,412,937 |
Mitsui Fudosan Co. Ltd. (Real Estate) | (a) | 52,200 | 1,275,860 |
Mizuho Financial Group, Inc. (Financials) | (a) | 56,800 | 971,463 |
MS&AD Insurance Group Holdings, Inc. (Financials) | (a) | 48,200 | 1,891,609 |
Murata Manufacturing Co. Ltd. (Information Technology) | (a) | 12,300 | 259,763 |
Nexon Co. Ltd. (Communication Services) | (a) | 20,500 | 372,304 |
NGK Insulators Ltd. (Industrials) | (a) | 7,000 | 83,412 |
Nidec Corp. (Industrials) | (a) | 88,400 | 3,602,442 |
Nintendo Co. Ltd. (Communication Services) | (a) | 13,200 | 689,781 |
Nippon Express Holdings, Inc. (Industrials) | (a) | 8,400 | 476,653 |
Nippon Shinyaku Co. Ltd. (Health Care) | (a) | 2,000 | 70,722 |
| Common Stocks (Continued) | Shares | Value | |
| Japan (continued) | |||
Nissan Motor Co. Ltd. (Consumer Discretionary) | (a) | 420,300 | $ 1,640,643 |
Nomura Holdings, Inc. (Financials) | (a) | 31,600 | 142,435 |
Nomura Real Estate Holdings, Inc. (Real Estate) | (a) | 1,800 | 47,223 |
NSK Ltd. (Industrials) | (a) | 71,200 | 384,332 |
Obic Co. Ltd. (Information Technology) | (a) | 2,700 | 463,655 |
Ono Pharmaceutical Co. Ltd. (Health Care) | (a) | 34,200 | 610,859 |
Oracle Corp. (Information Technology) | (a) | 2,900 | 223,400 |
Oriental Land Co. Ltd. (Consumer Discretionary) | (a) | 20,700 | 768,842 |
ORIX Corp. (Financials) | (a) | 102,000 | 1,911,152 |
Otsuka Corp. (Information Technology) | (a) | 6,500 | 267,321 |
Panasonic Holdings Corp. (Consumer Discretionary) | (a) | 288,500 | 2,828,735 |
Park24 Co. Ltd. (Industrials) | (a)(b) | 1,900 | 24,283 |
Recruit Holdings Co. Ltd. (Industrials) | (a) | 83,200 | 3,552,083 |
Resona Holdings, Inc. (Financials) | (a) | 46,800 | 237,011 |
SCREEN Holdings Co. Ltd. (Information Technology) | (a) | 4,300 | 361,446 |
Sega Sammy Holdings, Inc. (Consumer Discretionary) | (a) | 83,400 | 1,163,046 |
Sekisui House Ltd. (Consumer Discretionary) | (a) | 47,200 | 1,045,794 |
Shiseido Co. Ltd. (Consumer Staples) | (a) | 65,800 | 1,980,909 |
Skylark Holdings Co. Ltd. (Consumer Discretionary) | (a) | 38,500 | 563,016 |
SoftBank Corp. (Communication Services) | (a) | 62,800 | 782,664 |
SoftBank Group Corp. (Communication Services) | (a) | 22,600 | 998,512 |
Sompo Holdings, Inc. (Financials) | (a) | 15,800 | 771,517 |
Sumitomo Corp. (Industrials) | (a) | 3,200 | 69,800 |
Sumitomo Electric Industries Ltd. (Consumer Discretionary) | (a) | 7,100 | 90,109 |
Sumitomo Mitsui Financial Group, Inc. (Financials) | (a) | 25,000 | 1,217,753 |
Sumitomo Mitsui Trust Holdings, Inc. (Financials) | (a) | 9,800 | 187,941 |
T&D Holdings, Inc. (Financials) | (a) | 11,200 | 177,746 |
Takeda Pharmaceutical Co. Ltd. (Health Care) | (a) | 7,200 | 206,693 |
Tokio Marine Holdings, Inc. (Financials) | (a) | 77,900 | 1,944,804 |
Tokyo Electron Ltd. (Information Technology) | (a) | 29,200 | 5,190,318 |
Tokyo Tatemono Co. Ltd. (Real Estate) | (a) | 3,500 | 52,275 |
Toyota Motor Corp. (Consumer Discretionary) | (a) | 80,100 | 1,470,378 |
Toyota Tsusho Corp. (Industrials) | (a) | 2,500 | 146,465 |
Trend Micro Inc. (Information Technology) | (a)(b) | 2,600 | 138,335 |
| 77,397,759 | |||
| United Kingdom–13.9% | |||
AstraZeneca PLC (Health Care) | (a) | 35,098 | 4,727,118 |
Auto Trader Group PLC (Communication Services) | (a) | 126,025 | 1,157,188 |
BAE Systems PLC (Industrials) | (a) | 280,798 | 3,972,697 |
Barclays PLC (Financials) | (a) | 375,993 | 732,350 |
BP PLC (Energy) | (a) | 758,568 | 4,482,771 |
British American Tobacco PLC (Consumer Staples) | (a) | 140,877 | 4,111,109 |
British Land Co. PLC / The (Real Estate) | (a) | 147,763 | 749,240 |
Bunzl PLC (Industrials) | (a) | 1,671 | 67,828 |
Compass Group PLC (Consumer Discretionary) | (a) | 2,093 | 57,191 |
ConvaTec Group PLC (Health Care) | (a) | 19,001 | 59,108 |
19
(continued)
AuguStarSM Variable Insurance Products Fund, Inc.
AVIP BlackRock Advantage International Equity Portfolio (Continued)
| Schedule of Investments | December 31, 2023 |
| Common Stocks (Continued) | Shares | Value | |
| United Kingdom (continued) | |||
easyJet PLC (Industrials) | (a)(b) | 27,679 | $ 179,708 |
GSK PLC (Health Care) | (a) | 79,996 | 1,477,630 |
Halma PLC (Information Technology) | (a) | 1,094 | 31,786 |
HSBC Holdings PLC (Financials) | (a) | 247,765 | 2,001,220 |
IG Group Holdings PLC (Financials) | (a) | 17,397 | 169,475 |
IMI PLC (Industrials) | (a) | 3,976 | 85,111 |
Imperial Brands PLC (Consumer Staples) | (a) | 13,928 | 320,063 |
Intertek Group PLC (Industrials) | (a) | 2,558 | 138,128 |
Johnson Matthey PLC (Materials) | (a) | 6,189 | 133,784 |
London Stock Exchange Group PLC (Financials) | (a) | 16,892 | 1,996,867 |
Reckitt Benckiser Group PLC (Consumer Staples) | (a) | 5,020 | 346,328 |
RELX PLC (Industrials) | (a) | 10,622 | 421,272 |
Rightmove PLC (Communication Services) | (a) | 70,822 | 517,568 |
Rio Tinto PLC (Materials) | (a) | 8,495 | 630,907 |
Shell PLC (Energy) | (a) | 191,658 | 6,226,812 |
Smiths Group PLC (Industrials) | (a) | 160,530 | 3,602,141 |
Spectris PLC (Information Technology) | (a) | 24,282 | 1,165,325 |
Standard Chartered PLC (Financials) | (a) | 91,029 | 770,011 |
Tesco PLC (Consumer Staples) | (a) | 648,384 | 2,398,411 |
Unilever PLC (Consumer Staples) | (a) | 59,539 | 2,880,729 |
Vodafone Group PLC (Communication Services) | (a) | 4,205,699 | 3,653,382 |
Weir Group PLC / The (Industrials) | (a) | 2,508 | 60,218 |
| 49,323,476 | |||
| Germany–10.1% | |||
adidas AG (Consumer Discretionary) | (a) | 2,709 | 550,845 |
BASF SE (Materials) | (a) | 55,318 | 2,978,772 |
Bayer AG (Health Care) | (a) | 1,445 | 53,644 |
Bayerische Motoren Werke AG (Consumer Discretionary) | (a) | 9,408 | 1,046,394 |
Deutsche Telekom AG (Communication Services) | (a) | 200,297 | 4,809,988 |
Evonik Industries AG (Materials) | (a) | 15,667 | 319,880 |
Infineon Technologies AG (Information Technology) | (a) | 96,268 | 4,015,201 |
LANXESS AG (Materials) | (a) | 5,453 | 170,713 |
Mercedes-Benz Group AG (Consumer Discretionary) | (a) | 65,545 | 4,526,802 |
Nemetschek SE (Information Technology) | (a) | 1,689 | 146,265 |
RWE AG (Utilities) | (a) | 82,684 | 3,759,272 |
SAP SE (Information Technology) | (a) | 42,415 | 6,524,506 |
Siemens AG (Industrials) | (a) | 34,583 | 6,486,736 |
Zalando SE (Consumer Discretionary) | (a)(b) | 22,487 | 532,469 |
| 35,921,487 | |||
| Switzerland–9.5% | |||
ABB Ltd. (Industrials) | (a) | 109,111 | 4,848,793 |
Avolta AG (Consumer Discretionary) | (a)(b) | 6,501 | 256,437 |
Glencore PLC (Materials) | (a) | 20,644 | 123,848 |
Holcim AG (Materials) | (a) | 17,123 | 1,344,630 |
Kuehne + Nagel International AG (Industrials) | (a) | 3,132 | 1,079,665 |
Nestle SA (Consumer Staples) | (a) | 85,726 | 9,921,702 |
Novartis AG (Health Care) | (a) | 77,432 | 7,818,272 |
Roche Holding Ltd. (Health Care) | (a) | 1,160 | 360,569 |
Roche Holding Ltd. NVS (Health Care) | (a) | 14,248 | 4,129,528 |
SGS SA (Industrials) | (a) | 28,024 | 2,420,290 |
Temenos AG (Information Technology) | (a) | 16,794 | 1,567,267 |
| 33,871,001 | |||
| France–9.0% | |||
Aeroports de Paris SA (Industrials) | (a) | 4,704 | 609,238 |
| Common Stocks (Continued) | Shares | Value | |
| France (continued) | |||
Air Liquide SA (Materials) | (a) | 179 | $ 34,821 |
Alstom SA (Industrials) | (a) | 1,644 | 22,138 |
Arkema SA (Materials) | (a) | 168 | 19,110 |
AXA SA (Financials) | (a) | 10,113 | 330,117 |
Bureau Veritas SA (Industrials) | (a) | 17,202 | 434,757 |
Carrefour SA (Consumer Staples) | (a) | 118,438 | 2,167,665 |
Credit Agricole SA (Financials) | (a) | 259,939 | 3,688,386 |
Dassault Aviation SA (Industrials) | (a) | 3,069 | 607,277 |
Dassault Systemes SE (Information Technology) | (a) | 61,525 | 3,011,934 |
Eiffage SA (Industrials) | (a) | 22,372 | 2,401,430 |
Engie SA (Utilities) | (a) | 118,767 | 2,088,417 |
Eurazeo SE (Financials) | (a) | 1,658 | 131,830 |
Forvia SE (Consumer Discretionary) | (a)(b) | 13,334 | 302,949 |
Gecina SA (Real Estate) | (a) | 4,924 | 601,326 |
Getlink SE (Industrials) | (a) | 21,616 | 395,532 |
Hermes International SCA (Consumer Discretionary) | (a) | 2,111 | 4,480,120 |
Legrand SA (Industrials) | (a) | 721 | 75,099 |
LVMH Moet Hennessy Louis Vuitton SE (Consumer Discretionary) | (a) | 2,468 | 2,001,857 |
Nexans SA (Industrials) | (a) | 1,282 | 112,270 |
Pernod Ricard SA (Consumer Staples) | (a) | 6,940 | 1,227,201 |
Sanofi (Health Care) | (a) | 1,398 | 138,600 |
Schneider Electric SE (Industrials) | (a) | 5,742 | 1,156,152 |
TotalEnergies SE (Energy) | (a) | 8,661 | 588,328 |
Ubisoft Entertainment SA (Communication Services) | (a)(b) | 43,996 | 1,126,023 |
Valeo SE (Consumer Discretionary) | (a) | 79,593 | 1,230,643 |
Vallourec SACA (Energy) | (a)(b) | 7,095 | 110,092 |
Veolia Environnement SA (Utilities) | (a) | 89,297 | 2,820,460 |
Vinci SA (Industrials) | (a) | 1,107 | 139,032 |
Vivendi SE (Communication Services) | (a) | 2,828 | 30,287 |
Worldline SA (Financials) | (a)(b) | 5,329 | 92,555 |
| 32,175,646 | |||
| Netherlands–5.5% | |||
ABN AMRO Bank N.V. (Financials) | (a) | 5,655 | 84,969 |
Adyen N.V. (Financials) | (a)(b) | 327 | 421,541 |
Argenx SE (Health Care) | (a)(b) | 894 | 339,729 |
ASML Holding N.V. (Information Technology) | (a) | 10,598 | 8,001,629 |
Euronext N.V. (Financials) | (a) | 1,921 | 166,804 |
ING Groep N.V. (Financials) | (a) | 212,800 | 3,185,658 |
Just Eat Takeaway.com N.V. (Consumer Discretionary) | (a)(b) | 86,490 | 1,329,942 |
Koninklijke Philips N.V. (Health Care) | (a)(b) | 26,892 | 628,040 |
NN Group N.V. (Financials) | (a) | 2,990 | 118,285 |
Prosus N.V. (Consumer Discretionary) | (a) | 58,042 | 1,730,645 |
Signify N.V. (Industrials) | (a) | 25,752 | 862,685 |
Stellantis N.V. (Consumer Discretionary) | (a) | 114,747 | 2,687,208 |
| 19,557,135 | |||
| Australia–5.5% | |||
Aristocrat Leisure Ltd. (Consumer Discretionary) | (a) | 89,316 | 2,476,393 |
BHP Group Ltd. (Materials) | (a) | 205,213 | 7,034,814 |
Brambles Ltd. (Industrials) | (a) | 145,308 | 1,345,423 |
Charter Hall Group (Real Estate) | (a) | 12,482 | 101,661 |
Cochlear Ltd. (Health Care) | (a) | 1,905 | 387,071 |
CSL Ltd. (Health Care) | (a) | 9,615 | 1,874,539 |
Flight Centre Travel Group Ltd. (Consumer Discretionary) | (a) | 21,078 | 291,512 |
Goodman Group (Real Estate) | (a) | 1,299 | 22,305 |
Lendlease Corp. Ltd. (Real Estate) | (a) | 98,505 | 499,470 |
Macquarie Group Ltd. (Financials) | (a) | 29,040 | 3,619,175 |
Sonic Healthcare Ltd. (Health Care) | (a) | 31,498 | 687,613 |
20
(continued)
AuguStarSM Variable Insurance Products Fund, Inc.
AVIP BlackRock Advantage International Equity Portfolio (Continued)
| Schedule of Investments | December 31, 2023 |
| Common Stocks (Continued) | Shares | Value | |
| Australia (continued) | |||
Transurban Group (Industrials) | (a) | 102,630 | $ 956,554 |
Woolworths Group Ltd. (Consumer Staples) | (a) | 7,501 | 189,826 |
| 19,486,356 | |||
| Denmark–4.2% | |||
AP Moller - Maersk A/S Class B (Industrials) | (a) | 320 | 575,189 |
DSV A/S (Industrials) | (a) | 19,492 | 3,428,868 |
Genmab A/S (Health Care) | (a)(b) | 1,930 | 614,765 |
Novo Nordisk A/S Class B (Health Care) | (a) | 101,284 | 10,476,294 |
| 15,095,116 | |||
| Sweden–2.8% | |||
Assa Abloy AB Class B (Industrials) | (a) | 90,532 | 2,608,174 |
Atlas Copco AB Class B (Industrials) | (a) | 40,311 | 597,597 |
Electrolux AB Class B (Consumer Discretionary) | (a)(b) | 69,303 | 744,903 |
Elekta AB Class B (Health Care) | (a) | 41,274 | 336,942 |
Essity AB Class B (Consumer Staples) | (a) | 19,326 | 478,922 |
H & M Hennes & Mauritz AB Class B (Consumer Discretionary) | (a) | 155,702 | 2,732,523 |
Investor AB Class B (Financials) | (a) | 13,230 | 307,067 |
Telefonaktiebolaget LM Ericsson Class B (Information Technology) | (a) | 7,185 | 45,406 |
Telia Co. AB (Communication Services) | (a) | 106,712 | 272,202 |
Trelleborg AB Class B (Industrials) | (a) | 44,234 | 1,481,884 |
Volvo Car AB Class B (Consumer Discretionary) | (a)(b) | 101,993 | 330,104 |
| 9,935,724 | |||
| Italy–2.7% | |||
Amplifon SpA (Health Care) | (a) | 2,188 | 75,933 |
Assicurazioni Generali SpA (Financials) | (a) | 23,090 | 487,089 |
Enel SpA (Utilities) | (a) | 606,999 | 4,517,998 |
Eni SpA (Energy) | (a) | 12,576 | 213,460 |
Ferrari N.V. (Consumer Discretionary) | (a) | 4,093 | 1,379,504 |
Intesa Sanpaolo SpA (Financials) | (a) | 361,231 | 1,054,477 |
Iveco Group N.V. (Industrials) | (a)(b) | 2,480 | 22,339 |
Moncler SpA (Consumer Discretionary) | (a) | 475 | 29,291 |
Poste Italiane SpA (Financials) | (a) | 7,381 | 83,742 |
Recordati Industria Chimica e Farmaceutica SpA (Health Care) | (a) | 9,037 | 488,069 |
UniCredit SpA (Financials) | (a) | 39,864 | 1,081,420 |
| 9,433,322 | |||
| Spain–2.5% | |||
Amadeus IT Group SA (Consumer Discretionary) | (a) | 17,716 | 1,270,592 |
Banco Santander SA (Financials) | (a) | 987,622 | 4,122,781 |
Bankinter SA (Financials) | (a) | 23,434 | 149,971 |
CaixaBank SA (Financials) | (a) | 238,897 | 983,036 |
Iberdrola SA (Utilities) | (a) | 6,886 | 90,056 |
Industria de Diseno Textil SA (Consumer Discretionary) | (a) | 26,421 | 1,152,389 |
Repsol SA (Energy) | (a) | 11,349 | 168,313 |
Telefonica SA (Communication Services) | (a) | 280,353 | 1,100,864 |
| 9,038,002 | |||
| Hong Kong–2.5% | |||
AIA Group Ltd. (Financials) | (a) | 587,200 | 5,100,070 |
Budweiser Brewing Co. APAC Ltd. (Consumer Staples) | (a) | 56,200 | 104,924 |
CK Asset Holdings Ltd. (Real Estate) | (a) | 228,000 | 1,140,194 |
CK Hutchison Holdings Ltd. (Industrials) | (a) | 6,000 | 32,294 |
| Common Stocks (Continued) | Shares | Value | |
| Hong Kong (continued) | |||
Galaxy Entertainment Group Ltd. (Consumer Discretionary) | (a) | 25,000 | $ 139,731 |
Hongkong Land Holdings Ltd. (Real Estate) | (a) | 15,200 | 52,808 |
Jardine Matheson Holdings Ltd. (Industrials) | (a) | 28,200 | 1,160,794 |
New World Development Co. Ltd. (Real Estate) | (a) | 267,000 | 412,652 |
Sino Land Co. Ltd. (Real Estate) | (a) | 40,000 | 43,611 |
Swire Properties Ltd. (Real Estate) | (a) | 42,800 | 86,296 |
Wharf Real Estate Investment Co. Ltd. (Real Estate) | (a) | 193,000 | 656,490 |
| 8,929,864 | |||
| Singapore–1.8% | |||
CapitaLand Integrated Commercial Trust (Real Estate) | (a) | 100,800 | 156,799 |
CapitaLand Investment Ltd. (Real Estate) | (a) | 77,000 | 183,722 |
DBS Group Holdings Ltd. (Financials) | (a) | 39,100 | 987,851 |
Jardine Cycle & Carriage Ltd. (Industrials) | (a) | 31,000 | 696,992 |
Singapore Airlines Ltd. (Industrials) | (a) | 207,400 | 1,027,873 |
Singapore Telecommunications Ltd. (Communication Services) | (a) | 1,370,500 | 2,561,109 |
United Overseas Bank Ltd. (Financials) | (a) | 27,400 | 589,715 |
UOL Group Ltd. (Real Estate) | (a) | 3,600 | 17,065 |
| 6,221,126 | |||
| Belgium–1.6% | |||
Groupe Bruxelles Lambert N.V. (Financials) | (a) | 8,199 | 646,185 |
KBC Group N.V. (Financials) | (a) | 34,992 | 2,270,452 |
Sofina SA (Financials) | (a) | 970 | 241,399 |
Syensqo SA (Materials) | (b)(c) | 13,486 | 1,403,331 |
UCB SA (Health Care) | (a) | 13,671 | 1,190,602 |
| 5,751,969 | |||
| Luxembourg–1.0% | |||
ArcelorMittal SA (Materials) | (a) | 124,858 | 3,540,894 |
| Norway–1.0% | |||
Equinor ASA (Energy) | (a) | 99,831 | 3,162,607 |
Yara International ASA (Materials) | (a) | 10,626 | 377,574 |
| 3,540,181 | |||
| Ireland–1.0% | |||
Experian PLC (Industrials) | (a) | 82,909 | 3,378,689 |
James Hardie Industries PLC (Materials) | (a)(b) | 3,794 | 146,441 |
| 3,525,130 | |||
| Austria–0.6% | |||
ams-OSRAM AG (Information Technology) | (a)(b) | 104,237 | 263,104 |
BAWAG Group AG (Financials) | (a) | 17,562 | 932,760 |
Erste Group Bank AG (Financials) | (a) | 22,476 | 911,924 |
OMV AG (Energy) | (a) | 3,431 | 150,826 |
Verbund AG (Utilities) | (a) | 334 | 31,052 |
| 2,289,666 | |||
| Israel–0.4% | |||
Bank Leumi Le-Israel BM (Financials) | (a) | 33,191 | 266,781 |
Nice Ltd. (Information Technology) | (a)(b) | 3,094 | 617,552 |
Teva Pharmaceutical Industries Ltd. (Health Care) | (a)(b) | 46,905 | 491,196 |
| 1,375,529 | |||
21
(continued)
AuguStarSM Variable Insurance Products Fund, Inc.
AVIP BlackRock Advantage International Equity Portfolio (Continued)
| Schedule of Investments | December 31, 2023 |
| Common Stocks (Continued) | Shares | Value | |
| Finland–0.2% | |||
Kone Oyj Class B (Industrials) | (a) | 12,017 | $ 601,359 |
UPM-Kymmene Oyj (Materials) | (a) | 1,880 | 70,718 |
| 672,077 | |||
| New Zealand–0.2% | |||
Xero Ltd. (Information Technology) | (a)(b) | 8,171 | 622,897 |
| Macao–0.1% | |||
Sands China Ltd. (Consumer Discretionary) | (a)(b) | 164,400 | 479,753 |
Total Common Stocks (Cost $316,555,428) | $348,184,110 | ||
| Preferred Securities–0.0% | Rate | Quantity | Value | |
| Germany–0.0% | ||||
| Bayerische Motoren Werke AG (Consumer Discretionary) | (a) | 9.472% (d) | 462 | $ 45,883 |
Total Preferred Securities (Cost $43,961) | $ 45,883 | |||
Total Investments – 97.8% (Cost $316,599,389) | (e) | $348,229,993 | ||
Other Assets in Excess of Liabilities – 2.2% | (f) | 7,769,746 | ||
| Net Assets – 100.0% | $355,999,739 | |||
Percentages are stated as a percent of net assets. |
| Abbreviations: | ||
| NVS: | Non Voting Shares | |
| Footnotes: | ||
| (a) | Security traded on a foreign exchange has been valued at an estimate of fair value that is different than the local market close price. These fair value estimates are determined by an independent fair valuation service that has been approved by the Board. These securities represent $346,826,662 or 97.4% of the Portfolio’s net assets. | |
| (b) | Non-income producing security. | |
| (c) | As discussed in Note 2 of the Notes to Financial Statements, not all investments that are traded on a foreign exchange are valued at an estimate that is different from the local close price. In some instances, the independent fair valuation service uses a stock’s local close price because the service’s measure of predictability related to their valuation model of a stock is below a chosen threshold. These securities represent $1,403,331 or 0.4% of the Portfolio’s net assets. Other Portfolio securities are not subjected to fair valuation procedures because they are traded on domestic or foreign exchanges that have close times that are consistent with the U.S. market close, normally 4:00 pm Eastern Time. | |
| (d) | Represents twelve-month dividend yield. Rates are determined by actual distributions, which are impacted by factors unique to each preference share such as board authorization, distributable earnings, and preferred payout features compared to other classes of equity. | |
| (e) | Represents cost for financial reporting purposes, which may differ from cost basis for federal income tax purposes. See also Note 7 of the Notes to Financial Statements. | |
| (f) | Includes $216,748 of cash pledged as collateral for the futures contracts outstanding at December 31, 2023. See also the following Schedule of Open Futures Contracts. | |
The accompanying notes are an integral part of these financial statements.
| Schedule of Open Futures Contracts | December 31, 2023 |
| Description | Number of contracts | Expiration Date | Notional Amount | Value | Unrealized Appreciation (Depreciation) | Variation Margin Receivable (Payable) | ||||||
| MSCI EAFE Index - Long | 56 | March 15, 2024 | $6,093,418 | $6,306,720 | $213,302 | $3,360 |
The accompanying notes are an integral part of these financial statements.
22
AuguStarSM Variable Insurance Products Fund, Inc.
AVIP Fidelity Institutional AM® Equity Growth Portfolio (Unaudited)
Objective/Strategy
The AVIP Fidelity Institutional AM® Equity Growth Portfolio (formerly ON Fidelity Institutional AM® Equity Growth Portfolio and, prior to July 29, 2023, ON Janus Henderson Forty Portfolio ) seeks capital appreciation by investing in common stocks of companies of any market capitalization that have above-average growth potential.
Performance as of December 31, 2023
| Average Annual returns | |
| One year | 39.39% |
| Five years | 15.44% |
| Ten years | 13.15% |
Past performance does not guarantee future results. The performance data quoted represents past performance and current returns may be lower or higher. Total return figures include change in share price and reinvestment of dividends and capital gains. The investment return and principal value will fluctuate so that an investor’s shares, when redeemed, may be worth more or less than the original cost. To obtain performance information up to the most recent month end, call toll-free 1-877-781-6392.
The Portfolio is not open to direct retail investment. Beneficial interest in the Portfolio’s shares is obtained either through an allocation to the Portfolio as an investment vehicle within variable life insurance policies or annuity contracts, or as an underlying investment by the AVIP Model Portfolios. Actual performance results for variable annuity and variable universal life contracts will be lower due to contract charges. Consult your contract for applicable charges.
Total expense ratio is 0.82% per the Fund’s Prospectus dated July 28, 2023 and supplemented October 2, 2023 and December 4, 2023. Additional information pertaining to the Portfolio’s expense ratio as of December 31, 2023 can be found in the Portfolio’s Financial Highlights.
Comments from Sub-Adviser
Q. How did the Portfolio perform in comparison to its benchmark during the reporting period?
A. For the year ended December 31, 2023, the Portfolio returned 39.39% versus 42.68% for its benchmark, the Russell 1000® Growth Index.
Effective at the end of business on July 28, 2023, FIAM LLC replaced the Portfolio’s previous sub-adviser, Janus Henderson Investors U.S. LLC (“Janus”). In conjunction with the change in sub-adviser, the name of the Portfolio was changed from ON Janus Henderson Forty Portfolio to ON Fidelity Institutional AM® Equity Growth Portfolio. The Portfolio’s benchmark was unchanged. For the period from January 1, 2023 to July 28, 2023 (the “first performance period”), the Portfolio returned 30.25% versus 33.17% for the Russell 1000® Growth Index. For the period from July 29, 2023 to December 31, 2023, (the “latter performance period”), the Portfolio returned 7.01% versus 7.14% for the Russell 1000® Growth Index.
Q. What affected the Portfolio’s performance?
A. Janus: For the first performance period, due to the concentrated nature of the Portfolio, the relative underperformance was due largely to the individual stocks held by the Portfolio rather than any market condition or investment strategy in particular.
Both security selection and sector allocation decisions worked against the Portfolio during the first performance period, with allocation having a slightly higher level of detraction than selection. At the sector level, stock selection in the Financials and Health Care sectors and an overweight allocation to the Materials sector led the Portfolio’s underperformance. From an individual stock perspective, a zero weight
to benchmark constituent Tesla, Inc., and overweights to American Tower Corp. and Deere & Co., were the top detractors from relative performance for the first performance period.
Selection within Communication Services and Industrials, as well as an underweight to Consumer Staples, offset some of the Portfolio’s underperformance for the first performance period. Overweights to Meta Platforms, Inc. Class A and Advanced Micro Devices, Inc., as well as an underweight to UnitedHealth Group, Inc, were the top individual contributors to relative performance.
A. Fidelity: For the latter performance period, cash holdings were the primary driver of the Portfolio’s slight underperformance, as both security selection and allocation decisions had positive relative impacts. Security selection drove positive relative contributions for the period, particularly within Industrials. An overweight to Uber Technologies, Inc., which performed well during the period, was the second largest individual relative contributor. The largest relative contributor for the latter performance period was our underweight position in Apple, Inc. In contrast, the largest detractor from relative performance was stock selection within Financials. Picks in Information Technology and an overweight to Energy further detracted. The top individual relative detractor for the period was an overweight position in Block Inc., while a lack of position in benchmark constituent Broadcom, Inc. also detracted significantly from relative returns. (1)
| (1) | The Portfolio’s composition is subject to change. Holdings and weightings are as of December 31, 2023. |
| |
Change in Value of $10,000 Investment

Hypothetical illustration based on past performance. Future performance will vary. The Portfolio’s returns reflect reinvested dividends. The Portfolio’s holdings may differ significantly from the securities in the index. The index is unmanaged and therefore does not reflect the cost of portfolio management and accounting.
The Russell 1000® Growth Index is a market-capitalization weighted index of those firms in the Russell 1000® Index with higher price-to-book ratios and higher forecasted growth values. The Russell 1000® Index measures the performance of the large-cap segment of the U.S. equity universe. The index presented includes the effects of reinvested dividends.
Past performance is no guarantee of future results. Redemption of fund shares could have tax implications unique to each shareholder.
23
(continued)
AuguStarSM Variable Insurance Products Fund, Inc.
AVIP Fidelity Institutional AM® Equity Growth Portfolio (Unaudited) (Continued)
| Portfolio Composition as of December 31, 2023 (1) | |
| % of Net Assets | |
| Common Stocks (4) | 100.0 |
| Other Net Assets | 0.0 |
| 100.0 | |
| Top 10 Portfolio Holdings as of December 31, 2023 (1) (2) (3) | ||
| % of Net Assets | ||
| 1. | Microsoft Corp. | 15.0 |
| 2. | NVIDIA Corp. | 7.0 |
| 3. | Amazon.com, Inc. | 5.1 |
| 4. | Alphabet, Inc. Class A | 5.0 |
| 5. | Uber Technologies, Inc. | 4.7 |
| 6. | Apple, Inc. | 4.7 |
| 7. | Eli Lilly & Co. | 2.4 |
| 8. | Boston Scientific Corp. | 2.2 |
| 9. | Universal Music Group N.V. | 2.0 |
| 10. | Netflix, Inc. | 1.9 |
| (1) | Composition of Portfolio subject to change. | |
| (2) | Short-term investments have been excluded from the list of Top 10 Portfolio Holdings. | |
| (3) | Top 10 Portfolio Holdings is presented at an individual security level. Total investment exposure by issuer may be higher. | |
| (4) | Sectors (Common Stocks): | |
| % of Net Assets | |
| Information Technology | 38.8 |
| Health Care | 15.2 |
| Industrials | 13.5 |
| Consumer Discretionary | 11.3 |
| Communication Services | 11.1 |
| Financials | 5.2 |
| Energy | 3.5 |
| Consumer Staples | 1.3 |
| Materials | 0.1 |
| 100.0 |
24
AuguStarSM Variable Insurance Products Fund, Inc.
AVIP Fidelity Institutional AM® Equity Growth Portfolio
| Schedule of Investments | December 31, 2023 |
| Common Stocks–100.0% | Shares | Value | |
| Communication Services–11.1% | |||
Alphabet, Inc. Class A (Interactive Media & Svs.) | (a) | 41,789 | $ 5,837,506 |
Meta Platforms, Inc. Class A (Interactive Media & Svs.) | (a) | 2,881 | 1,019,759 |
Netflix, Inc. (Entertainment) | (a) | 4,676 | 2,276,651 |
Universal Music Group N.V. (Entertainment) | (b) | 82,836 | 2,365,477 |
Warner Music Group Corp. Class A (Entertainment) | 40,446 | 1,447,562 | |
| 12,946,955 | |||
| Consumer Discretionary–11.3% | |||
Airbnb, Inc. Class A (Hotels, Restaurants & Leisure) | (a) | 6,297 | 857,273 |
Amazon.com, Inc. (Broadline Retail) | (a) | 38,835 | 5,900,590 |
Booking Holdings, Inc. (Hotels, Restaurants & Leisure) | (a) | 222 | 787,483 |
BYD Co. Ltd. (Automobiles) | (b) | 15,284 | 420,003 |
Flutter Entertainment PLC (Hotels, Restaurants & Leisure) | (a)(b) | 4,592 | 813,315 |
Kura Sushi U.S.A., Inc. Class A (Hotels, Restaurants & Leisure) | (a) | 1,571 | 119,396 |
LVMH Moet Hennessy Louis Vuitton SE (Textiles, Apparel & Luxury Goods) | (b) | 792 | 642,411 |
MercadoLibre, Inc. (Broadline Retail) | (a) | 796 | 1,250,946 |
PDD Holdings, Inc. – ADR (Broadline Retail) | (a) | 1,949 | 285,158 |
Samsonite International SA (Textiles, Apparel & Luxury Goods) | (a)(b) | 190,088 | 625,570 |
Savers Value Village, Inc. (Broadline Retail) | (a) | 9,863 | 171,419 |
TJX Cos., Inc. / The (Specialty Retail) | 13,701 | 1,285,291 | |
| 13,158,855 | |||
| Consumer Staples–1.3% | |||
Estee Lauder Cos., Inc. / The Class A (Personal Care Products) | 3,461 | 506,171 | |
Monster Beverage Corp. (Beverages) | (a) | 18,093 | 1,042,338 |
| 1,548,509 | |||
| Energy–3.5% | |||
Baker Hughes Co. (Energy Equip. & Svs.) | 17,152 | 586,255 | |
Cheniere Energy, Inc. (Oil, Gas & Consumable Fuels) | 10,294 | 1,757,289 | |
New Fortress Energy, Inc. (Oil, Gas & Consumable Fuels) | 7,061 | 266,412 | |
Reliance Industries Ltd. – GDR (Oil, Gas & Consumable Fuels) | 19,575 | 1,223,437 | |
Southwestern Energy Co. (Oil, Gas & Consumable Fuels) | (a) | 26,880 | 176,064 |
| 4,009,457 | |||
| Financials–5.2% | |||
Apollo Global Management, Inc. (Financial Services) | 1,197 | 111,548 | |
Ares Management Corp. Class A (Capital Markets) | 2,090 | 248,543 | |
Arthur J. Gallagher & Co. (Insurance) | 4,155 | 934,376 | |
BRP Group, Inc. Class A (Insurance) | (a) | 10,696 | 256,918 |
CME Group, Inc. (Capital Markets) | 6,019 | 1,267,601 | |
Corebridge Financial, Inc. (Financial Services) | 11,403 | 246,989 | |
Fiserv, Inc. (Financial Services) | (a) | 1,803 | 239,511 |
Global Payments, Inc. (Financial Services) | 4,579 | 581,533 | |
Mastercard, Inc. Class A (Financial Services) | 5,123 | 2,185,011 | |
| 6,072,030 | |||
| Health Care–15.2% | |||
Aclaris Therapeutics, Inc. (Pharmaceuticals) | (a) | 2,837 | 2,979 |
Agilent Technologies, Inc. (Life Sciences Tools & Svs.) | 1,701 | 236,490 | |
Alnylam Pharmaceuticals, Inc. (Biotechnology) | (a) | 4,065 | 778,082 |
| Common Stocks (Continued) | Shares | Value | |
| Health Care (continued) | |||
Arcellx, Inc. (Biotechnology) | (a) | 984 | $ 54,612 |
Arrowhead Pharmaceuticals, Inc. (Biotechnology) | (a) | 1,602 | 49,021 |
AstraZeneca PLC – ADR (Pharmaceuticals) | 8,951 | 602,850 | |
Axonics, Inc. (Health Care Equip. & Supplies) | (a) | 4,215 | 262,299 |
Beam Therapeutics, Inc. (Biotechnology) | (a) | 1,265 | 34,433 |
BioMarin Pharmaceutical, Inc. (Biotechnology) | (a) | 2,377 | 229,190 |
Bio-Techne Corp. (Life Sciences Tools & Svs.) | 3,592 | 277,159 | |
Blueprint Medicines Corp. (Biotechnology) | (a) | 635 | 58,572 |
Boston Scientific Corp. (Health Care Equip. & Supplies) | (a) | 44,525 | 2,573,990 |
Bruker Corp. (Life Sciences Tools & Svs.) | 7,405 | 544,119 | |
Cerevel Therapeutics Holdings, Inc. (Biotechnology) | (a) | 900 | 38,160 |
Chemometec A/S (Life Sciences Tools & Svs.) | (b) | 1,316 | 76,113 |
Codexis, Inc. (Life Sciences Tools & Svs.) | (a) | 19,371 | 59,082 |
Cytokinetics, Inc. (Biotechnology) | (a) | 3,254 | 271,676 |
Danaher Corp. (Life Sciences Tools & Svs.) | 4,523 | 1,046,351 | |
Eli Lilly & Co. (Pharmaceuticals) | 4,751 | 2,769,453 | |
Galapagos N.V. – ADR (Biotechnology) | (a) | 6,250 | 254,062 |
Gamida Cell Ltd. (Biotechnology) | (a) | 33,274 | 13,732 |
Glaukos Corp. (Health Care Equip. & Supplies) | (a) | 2,013 | 160,013 |
HealthEquity, Inc. (Health Care Providers & Svs.) | (a) | 15,849 | 1,050,789 |
Hookipa Pharma, Inc. (Biotechnology) | (a) | 6,797 | 5,506 |
Immunocore Holdings PLC – ADR (Biotechnology) | (a) | 2,525 | 172,508 |
Insmed, Inc. (Biotechnology) | (a) | 9,513 | 294,808 |
Inspire Medical Systems, Inc. (Health Care Equip. & Supplies) | (a) | 960 | 195,293 |
Krystal Biotech, Inc. (Biotechnology) | (a) | 293 | 36,350 |
Lantheus Holdings, Inc. (Health Care Equip. & Supplies) | (a) | 1,420 | 88,040 |
Legend Biotech Corp. – ADR (Biotechnology) | (a) | 1,204 | 72,445 |
Masimo Corp. (Health Care Equip. & Supplies) | (a) | 6,953 | 814,961 |
MaxCyte, Inc. (Life Sciences Tools & Svs.) | (a) | 13,872 | 65,198 |
Penumbra, Inc. (Health Care Equip. & Supplies) | (a) | 746 | 187,649 |
Regeneron Pharmaceuticals, Inc. (Biotechnology) | (a) | 1,193 | 1,047,800 |
Repligen Corp. (Life Sciences Tools & Svs.) | (a) | 2,628 | 472,514 |
Sarepta Therapeutics, Inc. (Biotechnology) | (a) | 856 | 82,544 |
Sartorius Stedim Biotech (Life Sciences Tools & Svs.) | (b) | 1,548 | 411,151 |
Thermo Fisher Scientific, Inc. (Life Sciences Tools & Svs.) | 1,535 | 814,763 | |
Vertex Pharmaceuticals, Inc. (Biotechnology) | (a) | 3,349 | 1,362,675 |
Vor BioPharma, Inc. (Biotechnology) | (a) | 6,484 | 14,589 |
XOMA Corp. (Biotechnology) | (a) | 4,725 | 87,413 |
| 17,669,434 | |||
| Industrials–13.5% | |||
Eaton Corp. PLC (Electrical Equip.) | 6,231 | 1,500,549 | |
Energy Recovery, Inc. (Machinery) | (a) | 4,041 | 76,133 |
Equifax, Inc. (Professional Svs.) | 7,391 | 1,827,720 | |
Ferguson PLC (Trading Companies & Distributors) | (b) | 6,165 | 1,182,480 |
General Electric Co. (Industrial Conglomerates) | 14,730 | 1,879,990 | |
Ingersoll Rand, Inc. (Machinery) | 16,939 | 1,310,062 | |
Parker-Hannifin Corp. (Machinery) | 1,814 | 835,710 | |
Ryanair Holdings PLC – ADR (Passenger Airlines) | (a) | 5,344 | 712,676 |
TransUnion (Professional Svs.) | 6,704 | 460,632 | |
Uber Technologies, Inc. (Ground Transportation) | (a) | 88,856 | 5,470,864 |
25
(continued)
AuguStarSM Variable Insurance Products Fund, Inc.
AVIP Fidelity Institutional AM® Equity Growth Portfolio (Continued)
| Schedule of Investments | December 31, 2023 |
| Common Stocks (Continued) | Shares | Value | |
| Industrials (continued) | |||
Veralto Corp. (Commercial Svs. & Supplies) | 740 | $ 60,872 | |
Westinghouse Air Brake Technologies Corp. (Machinery) | 2,607 | 330,828 | |
| 15,648,516 | |||
| Information Technology–38.8% | |||
AIXTRON SE (Semiconductors & Equip.) | (b) | 11,445 | 488,635 |
Allegro MicroSystems, Inc. (Semiconductors & Equip.) | (a) | 5,111 | 154,710 |
Apple, Inc. (Tech. Hardware, Storage & Periph.) | 28,290 | 5,446,674 | |
ASML Holding N.V. (Semiconductors & Equip.) | 1,599 | 1,210,315 | |
BE Semiconductor Industries N.V. (Semiconductors & Equip.) | (b) | 6,528 | 983,685 |
Confluent, Inc. Class A (Software) | (a) | 22,404 | 524,254 |
Gartner, Inc. (IT Svs.) | (a) | 1,187 | 535,468 |
HubSpot, Inc. (Software) | (a) | 1,596 | 926,542 |
Jabil, Inc. (Electronic Equip., Instr. & Comp.) | 6,323 | 805,550 | |
KLA Corp. (Semiconductors & Equip.) | 1,367 | 794,637 | |
Manhattan Associates, Inc. (Software) | (a) | 3,772 | 812,187 |
Marvell Technology, Inc. (Semiconductors & Equip.) | 2,200 | 132,682 | |
Microsoft Corp. (Software) | 46,382 | 17,441,487 | |
Monday.com Ltd. (Software) | (a) | 1,498 | 281,339 |
| Common Stocks (Continued) | Shares | Value | |
| Information Technology (continued) | |||
MongoDB, Inc. (IT Svs.) | (a) | 3,214 | $ 1,314,044 |
Monolithic Power Systems, Inc. (Semiconductors & Equip.) | 686 | 432,715 | |
Nice Ltd. – ADR (Software) | (a) | 1,952 | 389,444 |
NVIDIA Corp. (Semiconductors & Equip.) | 16,375 | 8,109,227 | |
ServiceNow, Inc. (Software) | (a) | 690 | 487,478 |
SiTime Corp. (Semiconductors & Equip.) | (a) | 4,443 | 542,401 |
Snowflake, Inc. Class A (IT Svs.) | (a) | 2,770 | 551,230 |
Taiwan Semiconductor Manufacturing Co. Ltd. – ADR (Semiconductors & Equip.) | 18,301 | 1,903,304 | |
Universal Display Corp. (Semiconductors & Equip.) | 3,988 | 762,745 | |
Volue ASA (Software) | (a)(b) | 19,598 | 41,020 |
| 45,071,773 | |||
| Materials–0.1% | |||
Aspen Aerogels, Inc. (Chemicals) | (a) | 7,265 | 114,642 |
Total Common Stocks (Cost $101,644,017) | $116,240,171 | ||
Total Investments – 100.0% (Cost $101,644,017) | (c) | $116,240,171 | |
Other Assets in Excess of Liabilities – 0.0% | 48,472 | ||
| Net Assets – 100.0% | $116,288,643 | ||
Percentages are stated as a percent of net assets. |
| Abbreviations: | ||
| ADR: | American Depositary Receipts | |
| GDR: | Global Depositary Receipts | |
| Footnotes: | ||
| (a) | Non-income producing security. | |
| (b) | Security traded on a foreign exchange has been valued at an estimate of fair value that is different than the local market close price. These fair value estimates are determined by an independent fair valuation service that has been approved by the Board. These securities represent $8,049,860 or 6.9% of the Portfolio’s net assets. | |
| (c) | Represents cost for financial reporting purposes, which may differ from cost basis for federal income tax purposes. See also Note 7 of the Notes to Financial Statements. | |
The accompanying notes are an integral part of these financial statements.
26
AuguStarSM Variable Insurance Products Fund, Inc.
AVIP AB Small Cap Portfolio (Unaudited)
Objective/Strategy
The AVIP AB Small Cap Portfolio (formerly ON AB Small Cap Portfolio) seeks long-term growth of capital by investing, under normal circumstances, at least 80% of its net assets in equity securities of smaller capitalization companies with market capitalizations at the time of investment that fall within the lowest 20% of the total U.S. equity market capitalization (excluding companies with market capitalizations of less than $10 million).
Performance as of December 31, 2023
| Average Annual returns | |
| One year | 17.22% |
| Five years | 9.27% |
| Ten years | 7.83% |
Past performance does not guarantee future results. The performance data quoted represents past performance and current returns may be lower or higher. Total return figures include change in share price and reinvestment of dividends and capital gains. The investment return and principal value will fluctuate so that an investor’s shares, when redeemed, may be worth more or less than the original cost. To obtain performance information up to the most recent month end, call toll-free 1-877-781-6392.
The Portfolio is not open to direct retail investment. Beneficial interest in the Portfolio’s shares is obtained either through an allocation to the Portfolio as an investment vehicle within variable life insurance policies or annuity contracts, or as an underlying investment by the AVIP Model Portfolios. Actual performance results for variable annuity and variable universal life contracts will be lower due to contract charges. Consult your contract for applicable charges.
Total expense ratio is 0.85% per the Fund’s Prospectus dated May 1, 2023 and supplemented October 2, 2023 and December 4, 2023. Additional information pertaining to the Portfolio’s expense ratio as of December 31, 2023 can be found in the Portfolio’s Financial Highlights.
Comments from Sub-Adviser
Q. How did the Portfolio perform in comparison to its benchmark during the reporting period?
A. For the year ended December 31, 2023, the Portfolio returned 17.22% versus 16.93% for its benchmark, the Russell 2000® Index.
Q. What affected the Portfolio’s performance?
A. Security selection detracted from the Portfolio’s relative returns while sector selection contributed, leading the Portfolio’s outperformance for the year. From a security selection perspective, selection within Financials, Health Care, and Consumer Staples were the largest detractors from relative returns, while selection within Information Technology, Materials and Industrials contributed. From a sector selection perspective, the Portfolio’s underweight to Utilities and overweights to Information Technology and Consumer Discretionary were the largest contributors to relative returns. During the year, small-cap growth outperformed small-cap core and small-cap value, which contributed to the Portfolio’s relative performance.
Leading contributors to the Portfolio’s relative performance for the year included Onto Innovation, Inc., Comfort Systems U.S.A., Inc., and Saia, Inc. Leading detractors from relative performance included Treace Medical Concepts, Inc., National Vision Holdings, Inc., and Driven Brands Holdings, Inc. (1)
| (1) | The Portfolio’s composition is subject to change. Holdings and weightings are as of December 31, 2023. |
Change in Value of $10,000 Investment
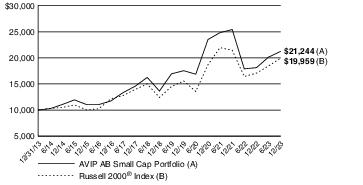
Hypothetical illustration based on past performance. Future performance will vary. The Portfolio’s returns reflect reinvested dividends. The Portfolio’s holdings may differ significantly from the securities in the index. The index is unmanaged and therefore does not reflect the cost of portfolio management and accounting.
The Russell 2000® Index measures the performance of the small-cap segment of the U.S. equity universe. The Russell 2000® Index includes the 2,000 firms from the Russell 3000® Index with the smallest market capitalizations. The Russell 3000® Index represents 98% of the investable U.S. equity market.
Past performance is no guarantee of future results. Redemption of fund shares could have tax implications unique to each shareholder.
27
(continued)
AuguStarSM Variable Insurance Products Fund, Inc.
AVIP AB Small Cap Portfolio (Unaudited) (Continued)
| Portfolio Composition as of December 31, 2023 (1) | |
| % of Net Assets | |
| Common Stocks (4) | 99.7 |
| Exchange Traded Funds | 0.2 |
| Other Net Assets | 0.1 |
| 100.0 | |
| Top 10 Portfolio Holdings as of December 31, 2023 (1) (2) (3) | ||
| % of Net Assets | ||
| 1. | Fabrinet | 1.4 |
| 2. | SPS Commerce, Inc. | 1.3 |
| 3. | Meritage Homes Corp. | 1.0 |
| 4. | Onto Innovation, Inc. | 1.0 |
| 5. | MACOM Technology Solutions Holdings, Inc. | 1.0 |
| 6. | Altair Engineering, Inc. Class A | 0.9 |
| 7. | Freshworks, Inc. Class A | 0.9 |
| 8. | Comfort Systems U.S.A., Inc. | 0.8 |
| 9. | Chefs' Warehouse, Inc. / The | 0.7 |
| 10. | Universal Display Corp. | 0.7 |
| (1) | Composition of Portfolio subject to change. | |
| (2) | Short-term investments have been excluded from the list of Top 10 Portfolio Holdings. | |
| (3) | Top 10 Portfolio Holdings is presented at an individual security level. Total investment exposure by issuer may be higher. | |
| (4) | Sectors (Common Stocks): | |
| % of Net Assets | |
| Information Technology | 18.6 |
| Industrials | 17.8 |
| Health Care | 16.3 |
| Consumer Discretionary | 15.2 |
| Financials | 13.8 |
| Consumer Staples | 4.5 |
| Real Estate | 4.0 |
| Energy | 3.8 |
| Materials | 3.3 |
| Communication Services | 1.5 |
| Utilities | 0.9 |
| 99.7 |
28
AuguStarSM Variable Insurance Products Fund, Inc.
AVIP AB Small Cap Portfolio
| Schedule of Investments | December 31, 2023 |
| Common Stocks–99.7% | Shares | Value | |
| Communication Services–1.5% | |||
AMC Networks, Inc. Class A (Media) | (a) | 3,530 | $ 66,329 |
Cargurus, Inc. (Interactive Media & Svs.) | (a) | 5,410 | 130,706 |
Cars.com, Inc. (Interactive Media & Svs.) | (a) | 5,115 | 97,032 |
Cinemark Holdings, Inc. (Entertainment) | (a) | 160 | 2,254 |
Cogent Communications Holdings, Inc. (Diversified Telecom. Svs.) | 3,530 | 268,492 | |
DISH Network Corp. Class A (Media) | (a) | 14,050 | 81,069 |
EW Scripps Co. / The Class A (Media) | (a) | 8,220 | 65,678 |
Gogo, Inc. (Wireless Telecom. Svs.) | (a) | 4,843 | 49,060 |
John Wiley & Sons, Inc. Class A (Media) | 2,630 | 83,476 | |
Lumen Technologies, Inc. (Diversified Telecom. Svs.) | (a) | 72,340 | 132,382 |
Madison Square Garden Sports Corp. (Entertainment) | (a) | 1,040 | 189,103 |
Shenandoah Telecommunications Co. (Diversified Telecom. Svs.) | 5,370 | 116,099 | |
TechTarget, Inc. (Media) | (a) | 2,320 | 80,875 |
Telephone & Data Systems, Inc. (Wireless Telecom. Svs.) | 5,400 | 99,090 | |
TripAdvisor, Inc. (Interactive Media & Svs.) | (a) | 5,512 | 118,673 |
Yelp, Inc. (Interactive Media & Svs.) | (a) | 4,550 | 215,397 |
| 1,795,715 | |||
| Consumer Discretionary–15.2% | |||
Abercrombie & Fitch Co. Class A (Specialty Retail) | (a) | 3,030 | 267,307 |
Academy Sports & Outdoors, Inc. (Specialty Retail) | 4,209 | 277,794 | |
Adtalem Global Education, Inc. (Diversified Consumer Svs.) | (a) | 3,040 | 179,208 |
Advance Auto Parts, Inc. (Specialty Retail) | 3,440 | 209,943 | |
American Eagle Outfitters, Inc. (Specialty Retail) | 10,150 | 214,774 | |
Asbury Automotive Group, Inc. (Specialty Retail) | (a) | 1,306 | 293,811 |
Bloomin' Brands, Inc. (Hotels, Restaurants & Leisure) | 2,580 | 72,627 | |
Boot Barn Holdings, Inc. (Specialty Retail) | (a) | 11,304 | 867,695 |
Buckle, Inc. / The (Specialty Retail) | 2,318 | 110,151 | |
Cava Group, Inc. (Hotels, Restaurants & Leisure) | (a) | 9,506 | 408,568 |
Cavco Industries, Inc. (Household Durables) | (a) | 270 | 93,587 |
Century Communities, Inc. (Household Durables) | 1,830 | 166,786 | |
Cheesecake Factory, Inc. / The (Hotels, Restaurants & Leisure) | 3,690 | 129,187 | |
Cracker Barrel Old Country Store, Inc. (Hotels, Restaurants & Leisure) | 1,380 | 106,370 | |
Dave & Buster's Entertainment, Inc. (Hotels, Restaurants & Leisure) | (a) | 3,360 | 180,936 |
Dorman Products, Inc. (Automobile Components) | (a) | 2,510 | 209,359 |
European Wax Center, Inc. Class A (Diversified Consumer Svs.) | (a) | 19,181 | 260,670 |
Five Below, Inc. (Specialty Retail) | (a) | 3,841 | 818,748 |
Foot Locker, Inc. (Specialty Retail) | 4,430 | 137,995 | |
Frontdoor, Inc. (Diversified Consumer Svs.) | (a) | 5,721 | 201,494 |
Golden Entertainment, Inc. (Hotels, Restaurants & Leisure) | 2,690 | 107,412 | |
Green Brick Partners, Inc. (Household Durables) | (a) | 3,212 | 166,831 |
Group 1 Automotive, Inc. (Specialty Retail) | 920 | 280,361 | |
Hanesbrands, Inc. (Textiles, Apparel & Luxury Goods) | (a) | 21,640 | 96,514 |
Hilton Grand Vacations, Inc. (Hotels, Restaurants & Leisure) | (a) | 17,092 | 686,757 |
Installed Building Products, Inc. (Household Durables) | 1,188 | 217,190 | |
| Common Stocks (Continued) | Shares | Value | |
| Consumer Discretionary (continued) | |||
iRobot Corp. (Household Durables) | (a) | 2,950 | $ 114,165 |
Jack in the Box, Inc. (Hotels, Restaurants & Leisure) | 1,400 | 114,282 | |
Kohl's Corp. (Broadline Retail) | 6,060 | 173,801 | |
Kontoor Brands, Inc. (Textiles, Apparel & Luxury Goods) | 3,960 | 247,183 | |
La-Z-Boy, Inc. (Household Durables) | 4,820 | 177,954 | |
LCI Industries (Automobile Components) | 1,390 | 174,737 | |
Leslie's, Inc. (Specialty Retail) | (a) | 9,849 | 68,057 |
LGI Homes, Inc. (Household Durables) | (a) | 1,070 | 142,481 |
Life Time Group Holdings, Inc. (Hotels, Restaurants & Leisure) | (a) | 34,637 | 522,326 |
Lithia Motors, Inc. (Specialty Retail) | 2,391 | 787,308 | |
M.D.C. Holdings, Inc. (Household Durables) | 2,610 | 144,202 | |
M/I Homes, Inc. (Household Durables) | (a) | 1,770 | 243,800 |
Meritage Homes Corp. (Household Durables) | 6,624 | 1,153,901 | |
Mister Car Wash, Inc. (Diversified Consumer Svs.) | (a) | 18,480 | 159,667 |
Monarch Casino & Resort, Inc. (Hotels, Restaurants & Leisure) | 1,660 | 114,789 | |
National Vision Holdings, Inc. (Specialty Retail) | (a) | 5,680 | 118,882 |
Newell Brands, Inc. (Household Durables) | 20,960 | 181,933 | |
Oxford Industries, Inc. (Textiles, Apparel & Luxury Goods) | 950 | 95,000 | |
Papa John's International, Inc. (Hotels, Restaurants & Leisure) | 1,800 | 137,214 | |
Savers Value Village, Inc. (Broadline Retail) | (a) | 22,811 | 396,455 |
Shake Shack, Inc. Class A (Hotels, Restaurants & Leisure) | (a) | 3,100 | 229,772 |
SharkNinja, Inc. (Household Durables) | 12,738 | 651,803 | |
Signet Jewelers Ltd. (Specialty Retail) | 2,810 | 301,401 | |
Six Flags Entertainment Corp. (Hotels, Restaurants & Leisure) | (a) | 5,473 | 137,263 |
Skyline Champion Corp. (Household Durables) | (a) | 9,774 | 725,817 |
Sonos, Inc. (Household Durables) | (a) | 9,149 | 156,814 |
Steven Madden Ltd. (Textiles, Apparel & Luxury Goods) | 3,820 | 160,440 | |
Strategic Education, Inc. (Diversified Consumer Svs.) | 1,229 | 113,523 | |
Stride, Inc. (Diversified Consumer Svs.) | (a) | 2,230 | 132,395 |
Sturm Ruger & Co., Inc. (Leisure Products) | 2,740 | 124,533 | |
Texas Roadhouse, Inc. (Hotels, Restaurants & Leisure) | 6,082 | 743,403 | |
Tri Pointe Homes, Inc. (Household Durables) | (a) | 7,833 | 277,288 |
Urban Outfitters, Inc. (Specialty Retail) | (a) | 4,130 | 147,400 |
Vista Outdoor, Inc. (Leisure Products) | (a) | 5,450 | 161,156 |
Wayfair, Inc. Class A (Specialty Retail) | (a) | 10,018 | 618,111 |
Wingstop, Inc. (Hotels, Restaurants & Leisure) | 2,236 | 573,713 | |
Winnebago Industries, Inc. (Automobiles) | 2,890 | 210,623 | |
Wolverine World Wide, Inc. (Textiles, Apparel & Luxury Goods) | 7,240 | 64,364 | |
Worthington Enterprises, Inc. (Household Durables) | 1,636 | 94,152 | |
XPEL, Inc. (Automobile Components) | (a) | 2,201 | 118,524 |
| 17,772,707 | |||
| Consumer Staples–4.5% | |||
BellRing Brands, Inc. (Personal Care Products) | (a) | 9,391 | 520,543 |
Cal-Maine Foods, Inc. (Food Products) | 2,520 | 144,623 | |
Chefs' Warehouse, Inc. / The (Consumer Staples Distribution & Retail) | (a) | 30,059 | 884,636 |
e.l.f. Beauty, Inc. (Personal Care Products) | (a) | 2,870 | 414,256 |
Edgewell Personal Care Co. (Personal Care Products) | 4,650 | 170,329 | |
Energizer Holdings, Inc. (Household Products) | 3,660 | 115,949 | |
Fresh Del Monte Produce, Inc. (Food Products) | 6,300 | 165,375 | |
29
(continued)
AuguStarSM Variable Insurance Products Fund, Inc.
AVIP AB Small Cap Portfolio (Continued)
| Schedule of Investments | December 31, 2023 |
| Common Stocks (Continued) | Shares | Value | |
| Consumer Staples (continued) | |||
Freshpet, Inc. (Food Products) | (a) | 8,423 | $ 730,779 |
Grocery Outlet Holding Corp. (Consumer Staples Distribution & Retail) | (a) | 23,472 | 632,805 |
Inter Parfums, Inc. (Personal Care Products) | 1,150 | 165,612 | |
J & J Snack Foods Corp. (Food Products) | 1,300 | 217,282 | |
MGP Ingredients, Inc. (Beverages) | 1,020 | 100,490 | |
National Beverage Corp. (Beverages) | (a) | 2,070 | 102,920 |
Simply Good Foods Co. / The (Food Products) | (a) | 4,410 | 174,636 |
TreeHouse Foods, Inc. (Food Products) | (a) | 4,709 | 195,188 |
United Natural Foods, Inc. (Consumer Staples Distribution & Retail) | (a) | 4,820 | 78,229 |
Vector Group Ltd. (Tobacco) | 13,620 | 153,634 | |
WD-40 Co. (Household Products) | 1,140 | 272,540 | |
| 5,239,826 | |||
| Energy–3.8% | |||
Archrock, Inc. (Energy Equip. & Svs.) | 12,140 | 186,956 | |
California Resources Corp. (Oil, Gas & Consumable Fuels) | 4,270 | 233,484 | |
Callon Petroleum Co. (Oil, Gas & Consumable Fuels) | (a) | 4,750 | 153,900 |
ChampionX Corp. (Energy Equip. & Svs.) | 25,465 | 743,833 | |
CONSOL Energy, Inc. (Oil, Gas & Consumable Fuels) | 2,250 | 226,192 | |
Core Laboratories, Inc. (Energy Equip. & Svs.) | 7,290 | 128,741 | |
CVR Energy, Inc. (Oil, Gas & Consumable Fuels) | 3,470 | 105,141 | |
Helmerich & Payne, Inc. (Energy Equip. & Svs.) | 6,780 | 245,572 | |
Liberty Energy, Inc. (Energy Equip. & Svs.) | 8,530 | 154,734 | |
Northern Oil & Gas, Inc. (Oil, Gas & Consumable Fuels) | 4,380 | 162,367 | |
Oceaneering International, Inc. (Energy Equip. & Svs.) | (a) | 6,440 | 137,043 |
Par Pacific Holdings, Inc. (Oil, Gas & Consumable Fuels) | (a) | 3,230 | 117,475 |
Patterson-UTI Energy, Inc. (Energy Equip. & Svs.) | 17,634 | 190,447 | |
Permian Resources Corp. (Oil, Gas & Consumable Fuels) | 31,102 | 422,987 | |
RPC, Inc. (Energy Equip. & Svs.) | 15,490 | 112,767 | |
SM Energy Co. (Oil, Gas & Consumable Fuels) | 5,500 | 212,960 | |
Southwestern Energy Co. (Oil, Gas & Consumable Fuels) | (a) | 53,904 | 353,071 |
Talos Energy, Inc. (Oil, Gas & Consumable Fuels) | (a) | 7,240 | 103,025 |
TechnipFMC PLC (Energy Equip. & Svs.) | 22,211 | 447,330 | |
| 4,438,025 | |||
| Financials–13.8% | |||
American Equity Investment Life Holding Co. (Insurance) | (a) | 4,630 | 258,354 |
Ameris Bancorp (Banks) | 3,520 | 186,736 | |
Apollo Commercial Real Estate Finance, Inc. (Mortgage REIT) | 11,680 | 137,123 | |
Arbor Realty Trust, Inc. (Mortgage REIT) | 10,954 | 166,282 | |
Artisan Partners Asset Management, Inc. Class A (Capital Markets) | 4,150 | 183,347 | |
Assured Guaranty Ltd. (Insurance) | 2,830 | 211,769 | |
Atlantic Union Bankshares Corp. (Banks) | 4,630 | 169,180 | |
Axos Financial, Inc. (Banks) | (a) | 4,330 | 236,418 |
BancFirst Corp. (Banks) | 671 | 65,308 | |
Bancorp, Inc. / The (Banks) | (a) | 3,600 | 138,816 |
Bank of Hawaii Corp. (Banks) | 2,400 | 173,904 | |
BankUnited, Inc. (Banks) | 4,090 | 132,639 | |
Banner Corp. (Banks) | 3,130 | 167,643 | |
Blackstone Mortgage Trust, Inc. Class A (Mortgage REIT) | 9,480 | 201,640 | |
Bread Financial Holdings, Inc. (Consumer Finance) | 3,242 | 106,791 | |
| Common Stocks (Continued) | Shares | Value | |
| Financials (continued) | |||
Brightsphere Investment Group, Inc. (Capital Markets) | 2,827 | $ 54,165 | |
Brookline Bancorp, Inc. (Banks) | 11,040 | 120,446 | |
Cathay General Bancorp (Banks) | 3,990 | 177,834 | |
Community Bank System, Inc. (Banks) | 4,580 | 238,664 | |
Customers Bancorp, Inc. (Banks) | (a) | 2,500 | 144,050 |
CVB Financial Corp. (Banks) | 10,890 | 219,869 | |
Dime Community Bancshares, Inc. (Banks) | 5,370 | 144,614 | |
Donnelley Financial Solutions, Inc. (Capital Markets) | (a) | 1,790 | 111,642 |
EVERTEC, Inc. (Financial Services) | 5,340 | 218,620 | |
First BanCorp (Banks) | 9,810 | 161,375 | |
First Financial Bancorp (Banks) | 7,980 | 189,525 | |
First Hawaiian, Inc. (Banks) | 11,000 | 251,460 | |
Flywire Corp. (Financial Services) | (a) | 25,192 | 583,195 |
Fulton Financial Corp. (Banks) | 10,030 | 165,094 | |
Genworth Financial, Inc. Class A (Insurance) | (a) | 27,500 | 183,700 |
Goosehead Insurance, Inc. Class A (Insurance) | (a) | 1,350 | 102,330 |
Hamilton Insurance Group Ltd. Class B (Insurance) | (a) | 17,766 | 265,602 |
Hannon Armstrong Sustainable Infrastructure Capital, Inc. (Mortgage REIT) | 5,890 | 162,446 | |
Hilltop Holdings, Inc. (Banks) | 3,760 | 132,390 | |
Houlihan Lokey, Inc. (Capital Markets) | 6,306 | 756,152 | |
Independent Bank Corp. (Banks) | 3,783 | 248,959 | |
Independent Bank Group, Inc. (Banks) | 2,520 | 128,218 | |
Jackson Financial, Inc. Class A (Financial Services) | 3,367 | 172,390 | |
Kinsale Capital Group, Inc. (Insurance) | 1,497 | 501,360 | |
KKR Real Estate Finance Trust, Inc. (Mortgage REIT) | 20 | 265 | |
Lincoln National Corp. (Insurance) | 9,330 | 251,630 | |
Moelis & Co. Class A (Capital Markets) | 4,030 | 226,204 | |
Mr Cooper Group, Inc. (Financial Services) | (a) | 3,970 | 258,526 |
Navient Corp. (Consumer Finance) | 6,040 | 112,465 | |
NBT Bancorp, Inc. (Banks) | 2,870 | 120,282 | |
NMI Holdings, Inc. Class A (Financial Services) | (a) | 3,740 | 111,003 |
Northwest Bancshares, Inc. (Banks) | 9,360 | 116,813 | |
P10, Inc. Class A (Capital Markets) | 21,885 | 223,665 | |
Pacific Premier Bancorp, Inc. (Banks) | 4,300 | 125,173 | |
Piper Sandler Cos. (Capital Markets) | 830 | 145,142 | |
PJT Partners, Inc. Class A (Capital Markets) | 1,160 | 118,169 | |
ProAssurance Corp. (Insurance) | 7,110 | 98,047 | |
PROG Holdings, Inc. (Consumer Finance) | (a) | 210 | 6,491 |
Radian Group, Inc. (Financial Services) | 9,730 | 277,792 | |
Ready Capital Corp. (Mortgage REIT) | 9,780 | 100,245 | |
Renasant Corp. (Banks) | 4,640 | 156,275 | |
RLI Corp. (Insurance) | 5,220 | 694,886 | |
Ryan Specialty Holdings, Inc. Class A (Insurance) | (a) | 11,572 | 497,827 |
Seacoast Banking Corp. of Florida (Banks) | 5,331 | 151,720 | |
ServisFirst Bancshares, Inc. (Banks) | 3,930 | 261,856 | |
Shift4 Payments, Inc. Class A (Financial Services) | (a) | 8,729 | 648,914 |
Simmons First National Corp. Class A (Banks) | 9,350 | 185,504 | |
Southside Bancshares, Inc. (Banks) | 4,430 | 138,748 | |
StepStone Group, Inc. Class A (Capital Markets) | 22,031 | 701,247 | |
Stewart Information Services Corp. (Insurance) | 3,030 | 178,013 | |
Stifel Financial Corp. (Capital Markets) | 9,041 | 625,185 | |
StoneX Group, Inc. (Capital Markets) | (a) | 2,070 | 152,828 |
Triumph Financial, Inc. (Banks) | (a) | 2,360 | 189,225 |
Trupanion, Inc. (Insurance) | (a) | 2,899 | 88,449 |
Trustmark Corp. (Banks) | 4,200 | 117,096 | |
30
(continued)
AuguStarSM Variable Insurance Products Fund, Inc.
AVIP AB Small Cap Portfolio (Continued)
| Schedule of Investments | December 31, 2023 |
| Common Stocks (Continued) | Shares | Value | |
| Financials (continued) | |||
Two Harbors Investment Corp. (Mortgage REIT) | 10,558 | $ 147,073 | |
United Community Banks, Inc. (Banks) | 8,232 | 240,868 | |
WaFd, Inc. (Banks) | 4,050 | 133,488 | |
Walker & Dunlop, Inc. (Financial Services) | 2,560 | 284,186 | |
Westamerica BanCorp (Banks) | 2,230 | 125,794 | |
WSFS Financial Corp. (Banks) | 5,151 | 236,585 | |
| 16,217,729 | |||
| Health Care–16.3% | |||
Addus HomeCare Corp. (Health Care Providers & Svs.) | (a) | 1,090 | 101,207 |
Agiliti, Inc. (Health Care Providers & Svs.) | (a) | 7,300 | 57,816 |
Akero Therapeutics, Inc. (Biotechnology) | (a) | 7,948 | 185,586 |
Alkermes PLC (Biotechnology) | (a) | 8,690 | 241,061 |
AMN Healthcare Services, Inc. (Health Care Providers & Svs.) | (a) | 2,870 | 214,906 |
Amphastar Pharmaceuticals, Inc. (Pharmaceuticals) | (a) | 3,480 | 215,238 |
Ascendis Pharma A/S – ADR (Biotechnology) | (a) | 2,995 | 377,220 |
AtriCure, Inc. (Health Care Equip. & Supplies) | (a) | 16,522 | 589,670 |
Blueprint Medicines Corp. (Biotechnology) | (a) | 6,752 | 622,804 |
Bridgebio Pharma, Inc. (Biotechnology) | (a) | 13,126 | 529,897 |
Catalyst Pharmaceuticals, Inc. (Biotechnology) | (a) | 6,422 | 107,954 |
Certara, Inc. (Health Care Technology) | (a) | 6,570 | 115,566 |
CONMED Corp. (Health Care Equip. & Supplies) | 2,520 | 275,965 | |
Corcept Therapeutics, Inc. (Pharmaceuticals) | (a) | 5,200 | 168,896 |
CorVel Corp. (Health Care Providers & Svs.) | (a) | 840 | 207,656 |
Cytokinetics, Inc. (Biotechnology) | (a) | 6,436 | 537,342 |
Disc Medicine, Inc. (Biotechnology) | (a) | 3,216 | 185,756 |
Dynavax Technologies Corp. (Biotechnology) | (a) | 7,903 | 110,484 |
Embecta Corp. (Health Care Equip. & Supplies) | 4,021 | 76,118 | |
Enhabit, Inc. (Health Care Providers & Svs.) | (a) | 3,459 | 35,801 |
Ensign Group, Inc. / The (Health Care Providers & Svs.) | 3,090 | 346,729 | |
Fortrea Holdings, Inc. (Life Sciences Tools & Svs.) | (a) | 5,295 | 184,796 |
Glaukos Corp. (Health Care Equip. & Supplies) | (a) | 2,679 | 212,954 |
Guardant Health, Inc. (Health Care Providers & Svs.) | (a) | 18,649 | 504,455 |
Halozyme Therapeutics, Inc. (Biotechnology) | (a) | 13,992 | 517,144 |
Harmony Biosciences Holdings, Inc. (Pharmaceuticals) | (a) | 3,687 | 119,090 |
Inari Medical, Inc. (Health Care Equip. & Supplies) | (a) | 11,799 | 765,991 |
Insmed, Inc. (Biotechnology) | (a) | 15,853 | 491,284 |
Integer Holdings Corp. (Health Care Equip. & Supplies) | (a) | 1,710 | 169,427 |
Intellia Therapeutics, Inc. (Biotechnology) | (a) | 7,896 | 240,749 |
Intra-Cellular Therapies, Inc. (Pharmaceuticals) | (a) | 9,259 | 663,130 |
iRhythm Technologies, Inc. (Health Care Equip. & Supplies) | (a) | 6,613 | 707,856 |
Ironwood Pharmaceuticals, Inc. (Biotechnology) | (a) | 10,510 | 120,234 |
Karuna Therapeutics, Inc. (Biotechnology) | (a) | 918 | 290,556 |
Lantheus Holdings, Inc. (Health Care Equip. & Supplies) | (a) | 9,349 | 579,638 |
Legend Biotech Corp. – ADR (Biotechnology) | (a) | 5,910 | 355,605 |
Madrigal Pharmaceuticals, Inc. (Biotechnology) | (a) | 1,735 | 401,444 |
Merit Medical Systems, Inc. (Health Care Equip. & Supplies) | (a) | 4,190 | 318,272 |
MoonLake Immunotherapeutics (Biotechnology) | (a) | 4,642 | 280,330 |
Myriad Genetics, Inc. (Biotechnology) | (a) | 6,470 | 123,836 |
Natera, Inc. (Biotechnology) | (a) | 12,983 | 813,255 |
| Common Stocks (Continued) | Shares | Value | |
| Health Care (continued) | |||
NeoGenomics, Inc. (Health Care Providers & Svs.) | (a) | 10,157 | $ 164,340 |
Omnicell, Inc. (Health Care Equip. & Supplies) | (a) | 2,490 | 93,699 |
Organon & Co. (Pharmaceuticals) | 14,034 | 202,370 | |
Owens & Minor, Inc. (Health Care Providers & Svs.) | (a) | 5,160 | 99,433 |
Pacira BioSciences, Inc. (Pharmaceuticals) | (a) | 3,660 | 123,488 |
Premier, Inc. Class A (Health Care Providers & Svs.) | 6,550 | 146,458 | |
Prestige Consumer Healthcare, Inc. (Pharmaceuticals) | (a) | 4,080 | 249,778 |
Privia Health Group, Inc. (Health Care Providers & Svs.) | (a) | 5,845 | 134,610 |
PROCEPT BioRobotics Corp. (Health Care Equip. & Supplies) | (a) | 18,031 | 755,679 |
Quanterix Corp. (Life Sciences Tools & Svs.) | (a) | 4,740 | 129,592 |
RadNet, Inc. (Health Care Providers & Svs.) | (a) | 3,880 | 134,908 |
RayzeBio, Inc. (Biotechnology) | (a) | 5,816 | 361,581 |
REGENXBIO, Inc. (Biotechnology) | (a) | 5,120 | 91,904 |
Repligen Corp. (Life Sciences Tools & Svs.) | (a) | 3,021 | 543,176 |
Select Medical Holdings Corp. (Health Care Providers & Svs.) | 5,730 | 134,655 | |
STAAR Surgical Co. (Health Care Equip. & Supplies) | (a) | 2,813 | 87,794 |
Tandem Diabetes Care, Inc. (Health Care Equip. & Supplies) | (a) | 3,980 | 117,728 |
Ultragenyx Pharmaceutical, Inc. (Biotechnology) | (a) | 6,377 | 304,948 |
Vaxcyte, Inc. (Biotechnology) | (a) | 9,813 | 616,256 |
Veradigm, Inc. (Health Care Technology) | (a) | 11,420 | 119,796 |
Vericel Corp. (Biotechnology) | (a) | 2,145 | 76,383 |
Viking Therapeutics, Inc. (Biotechnology) | (a) | 18,623 | 346,574 |
Vir Biotechnology, Inc. (Biotechnology) | (a) | 13,577 | 136,585 |
Viridian Therapeutics, Inc. (Biotechnology) | (a) | 15,149 | 329,945 |
Xenon Pharmaceuticals, Inc. (Biotechnology) | (a) | 8,391 | 386,489 |
| 19,051,887 | |||
| Industrials–17.8% | |||
AAON, Inc. (Building Products) | 3,645 | 269,256 | |
AAR Corp. (Aerospace & Defense) | (a) | 1,898 | 118,435 |
ABM Industries, Inc. (Commercial Svs. & Supplies) | 3,410 | 152,870 | |
ACV Auctions, Inc. Class A (Commercial Svs. & Supplies) | (a) | 50,638 | 767,166 |
AeroVironment, Inc. (Aerospace & Defense) | (a) | 1,930 | 243,257 |
Alamo Group, Inc. (Machinery) | 640 | 134,522 | |
Alaska Air Group, Inc. (Passenger Airlines) | (a) | 6,670 | 260,597 |
Albany International Corp. Class A (Machinery) | 2,590 | 254,390 | |
Applied Industrial Technologies, Inc. (Trading Companies & Distributors) | 2,480 | 428,271 | |
ArcBest Corp. (Ground Transportation) | 1,240 | 149,060 | |
Arcosa, Inc. (Construction & Engineering) | 2,680 | 221,475 | |
Armstrong World Industries, Inc. (Building Products) | 2,300 | 226,136 | |
AZEK Co., Inc. / The (Building Products) | (a) | 20,667 | 790,513 |
AZZ, Inc. (Building Products) | 3,380 | 196,344 | |
Boise Cascade Co. (Trading Companies & Distributors) | 2,160 | 279,418 | |
Brady Corp. Class A (Commercial Svs. & Supplies) | 2,310 | 135,574 | |
Comfort Systems U.S.A., Inc. (Construction & Engineering) | 4,501 | 925,721 | |
CSG Systems International, Inc. (Professional Svs.) | 2,350 | 125,044 | |
Curtiss-Wright Corp. (Aerospace & Defense) | 3,046 | 678,618 | |
Deluxe Corp. (Commercial Svs. & Supplies) | 5,150 | 110,468 | |
Dycom Industries, Inc. (Construction & Engineering) | (a) | 1,830 | 210,615 |
31
(continued)
AuguStarSM Variable Insurance Products Fund, Inc.
AVIP AB Small Cap Portfolio (Continued)
| Schedule of Investments | December 31, 2023 |
| Common Stocks (Continued) | Shares | Value | |
| Industrials (continued) | |||
Encore Wire Corp. (Electrical Equip.) | 820 | $ 175,152 | |
Enerpac Tool Group Corp. (Machinery) | 3,400 | 105,706 | |
Enpro, Inc. (Machinery) | 1,080 | 169,279 | |
Esab Corp. (Machinery) | 9,171 | 794,392 | |
ESCO Technologies, Inc. (Machinery) | 1,330 | 155,650 | |
Federal Signal Corp. (Machinery) | 3,350 | 257,079 | |
Forward Air Corp. (Air Freight & Logistics) | 2,420 | 152,145 | |
Franklin Electric Co., Inc. (Machinery) | 2,190 | 211,663 | |
FTI Consulting, Inc. (Professional Svs.) | (a) | 3,201 | 637,479 |
Gibraltar Industries, Inc. (Building Products) | (a) | 1,840 | 145,323 |
GMS, Inc. (Trading Companies & Distributors) | (a) | 2,500 | 206,075 |
Granite Construction, Inc. (Construction & Engineering) | 2,390 | 121,555 | |
Greenbrier Cos., Inc. / The (Machinery) | 2,400 | 106,032 | |
Griffon Corp. (Building Products) | 2,180 | 132,871 | |
Hayward Holdings, Inc. (Building Products) | (a) | 8,719 | 118,578 |
Hexcel Corp. (Aerospace & Defense) | 10,417 | 768,254 | |
Hillenbrand, Inc. (Machinery) | 4,220 | 201,927 | |
HNI Corp. (Commercial Svs. & Supplies) | 3,300 | 138,039 | |
Hub Group, Inc. Class A (Air Freight & Logistics) | (a) | 1,730 | 159,056 |
ITT, Inc. (Machinery) | 6,636 | 791,808 | |
John Bean Technologies Corp. (Machinery) | 1,755 | 174,535 | |
Kennametal, Inc. (Machinery) | 4,990 | 128,692 | |
Korn Ferry (Professional Svs.) | 2,740 | 162,619 | |
Leonardo DRS, Inc. (Aerospace & Defense) | (a) | 42,195 | 845,588 |
Marten Transport Ltd. (Ground Transportation) | 4,660 | 97,767 | |
Matson, Inc. (Marine Transportation) | 1,607 | 176,127 | |
Mercury Systems, Inc. (Aerospace & Defense) | (a) | 3,385 | 123,789 |
MillerKnoll, Inc. (Commercial Svs. & Supplies) | 4,200 | 112,056 | |
Moog, Inc. Class A (Aerospace & Defense) | 1,580 | 228,752 | |
Mueller Industries, Inc. (Machinery) | 6,180 | 291,387 | |
MYR Group, Inc. (Construction & Engineering) | (a) | 1,370 | 198,143 |
NEXTracker, Inc. Class A (Electrical Equip.) | (a) | 18,015 | 844,003 |
NV5 Global, Inc. (Professional Svs.) | (a) | 779 | 86,562 |
OPENLANE, Inc. (Commercial Svs. & Supplies) | (a) | 420 | 6,220 |
PGT Innovations, Inc. (Building Products) | (a) | 3,160 | 128,612 |
Resideo Technologies, Inc. (Building Products) | (a) | 12,440 | 234,121 |
Rush Enterprises, Inc. Class A (Trading Companies & Distributors) | 3,136 | 157,741 | |
RXO, Inc. (Ground Transportation) | (a) | 7,405 | 172,240 |
Saia, Inc. (Ground Transportation) | (a) | 1,387 | 607,811 |
Shoals Technologies Group, Inc. Class A (Electrical Equip.) | (a) | 6,395 | 99,378 |
SiteOne Landscape Supply, Inc. (Trading Companies & Distributors) | (a) | 4,198 | 682,175 |
SkyWest, Inc. (Passenger Airlines) | (a) | 2,310 | 120,582 |
SPX Technologies, Inc. (Machinery) | (a) | 7,465 | 754,040 |
Standex International Corp. (Machinery) | 740 | 117,201 | |
Tetra Tech, Inc. (Commercial Svs. & Supplies) | 4,390 | 732,823 | |
Trinity Industries, Inc. (Machinery) | 4,950 | 131,621 | |
UniFirst Corp. (Commercial Svs. & Supplies) | 1,270 | 232,296 | |
Verra Mobility Corp. (Professional Svs.) | (a) | 8,958 | 206,303 |
Vestis Corp. (Commercial Svs. & Supplies) | 6,810 | 143,963 | |
XPO, Inc. (Ground Transportation) | (a) | 7,606 | 666,210 |
| 20,889,170 | |||
| Information Technology–18.6% | |||
ACI Worldwide, Inc. (Software) | (a) | 5,916 | 181,030 |
Advanced Energy Industries, Inc. (Electronic Equip., Instr. & Comp.) | 2,190 | 238,535 | |
Agilysys, Inc. (Software) | (a) | 1,420 | 120,444 |
Alarm.com Holdings, Inc. (Software) | (a) | 3,760 | 242,971 |
Allegro MicroSystems, Inc. (Semiconductors & Equip.) | (a) | 6,228 | 188,522 |
Altair Engineering, Inc. Class A (Software) | (a) | 12,797 | 1,076,868 |
Axcelis Technologies, Inc. (Semiconductors & Equip.) | (a) | 1,810 | 234,739 |
| Common Stocks (Continued) | Shares | Value | |
| Information Technology (continued) | |||
Badger Meter, Inc. (Electronic Equip., Instr. & Comp.) | 1,780 | $ 274,779 | |
Braze, Inc. Class A (Software) | (a) | 13,903 | 738,666 |
Clearwater Analytics Holdings, Inc. Class A (Software) | (a) | 25,533 | 511,426 |
Cohu, Inc. (Semiconductors & Equip.) | (a) | 4,400 | 155,716 |
Corsair Gaming, Inc. (Tech. Hardware, Storage & Periph.) | (a) | 9,060 | 127,746 |
Diodes, Inc. (Semiconductors & Equip.) | (a) | 3,700 | 297,924 |
DoubleVerify Holdings, Inc. (Software) | (a) | 7,452 | 274,085 |
DXC Technology Co. (IT Svs.) | (a) | 11,250 | 257,287 |
Envestnet, Inc. (Software) | (a) | 2,708 | 134,100 |
Extreme Networks, Inc. (Communications Equip.) | (a) | 8,430 | 148,705 |
Fabrinet (Electronic Equip., Instr. & Comp.) | (a) | 8,514 | 1,620,470 |
Fastly, Inc. Class A (IT Svs.) | (a) | 41,814 | 744,289 |
Five9, Inc. (Software) | (a) | 9,954 | 783,280 |
FormFactor, Inc. (Semiconductors & Equip.) | (a) | 4,000 | 166,840 |
Freshworks, Inc. Class A (Software) | (a) | 43,627 | 1,024,798 |
Insight Enterprises, Inc. (Electronic Equip., Instr. & Comp.) | (a) | 1,350 | 239,207 |
Instructure Holdings, Inc. (Software) | (a) | 15,678 | 423,463 |
InterDigital, Inc. (Software) | 1,430 | 155,212 | |
Itron, Inc. (Electronic Equip., Instr. & Comp.) | (a) | 3,750 | 283,162 |
Knowles Corp. (Electronic Equip., Instr. & Comp.) | (a) | 8,500 | 152,235 |
Kulicke & Soffa Industries, Inc. (Semiconductors & Equip.) | 3,430 | 187,690 | |
Lattice Semiconductor Corp. (Semiconductors & Equip.) | (a) | 7,251 | 500,246 |
Littelfuse, Inc. (Electronic Equip., Instr. & Comp.) | 1,891 | 505,956 | |
LiveRamp Holdings, Inc. (Software) | (a) | 4,660 | 176,521 |
MACOM Technology Solutions Holdings, Inc. (Semiconductors & Equip.) | (a) | 12,127 | 1,127,205 |
Manhattan Associates, Inc. (Software) | (a) | 2,368 | 509,878 |
Monday.com Ltd. (Software) | (a) | 3,720 | 698,653 |
N-able, Inc. (Software) | (a) | 8,840 | 117,130 |
NCR Voyix Corp. (Software) | (a) | 6,829 | 115,478 |
NetScout Systems, Inc. (Communications Equip.) | (a) | 5,976 | 131,173 |
Novanta, Inc. (Electronic Equip., Instr. & Comp.) | (a) | 4,681 | 788,327 |
Onto Innovation, Inc. (Semiconductors & Equip.) | (a) | 7,420 | 1,134,518 |
OSI Systems, Inc. (Electronic Equip., Instr. & Comp.) | (a) | 920 | 118,726 |
Perficient, Inc. (IT Svs.) | (a) | 2,710 | 178,372 |
Plexus Corp. (Electronic Equip., Instr. & Comp.) | (a) | 1,470 | 158,951 |
Progress Software Corp. (Software) | 3,160 | 171,588 | |
Rogers Corp. (Electronic Equip., Instr. & Comp.) | (a) | 920 | 121,504 |
Sanmina Corp. (Electronic Equip., Instr. & Comp.) | (a) | 3,720 | 191,096 |
SiTime Corp. (Semiconductors & Equip.) | (a) | 1,000 | 122,080 |
Smartsheet, Inc. Class A (Software) | (a) | 12,175 | 582,208 |
SolarEdge Technologies, Inc. (Semiconductors & Equip.) | (a) | 2,960 | 277,056 |
SPS Commerce, Inc. (Software) | (a) | 8,210 | 1,591,426 |
TTM Technologies, Inc. (Electronic Equip., Instr. & Comp.) | (a) | 7,070 | 111,777 |
Universal Display Corp. (Semiconductors & Equip.) | 4,552 | 870,616 | |
Veeco Instruments, Inc. (Semiconductors & Equip.) | (a) | 3,540 | 109,846 |
Viasat, Inc. (Communications Equip.) | (a) | 4,730 | 132,204 |
32
(continued)
AuguStarSM Variable Insurance Products Fund, Inc.
AVIP AB Small Cap Portfolio (Continued)
| Schedule of Investments | December 31, 2023 |
| Common Stocks (Continued) | Shares | Value | |
| Information Technology (continued) | |||
Viavi Solutions, Inc. (Communications Equip.) | (a) | 19,550 | $ 196,869 |
Xerox Holdings Corp. (Tech. Hardware, Storage & Periph.) | 6,220 | 114,013 | |
| 21,837,606 | |||
| Materials–3.3% | |||
Alpha Metallurgical Resources, Inc. (Metals & Mining) | 663 | 224,704 | |
ATI, Inc. (Metals & Mining) | (a) | 7,790 | 354,211 |
Balchem Corp. (Chemicals) | 1,890 | 281,138 | |
Carpenter Technology Corp. (Metals & Mining) | 2,670 | 189,036 | |
Element Solutions, Inc. (Chemicals) | 30,186 | 698,504 | |
H.B. Fuller Co. (Chemicals) | 2,960 | 240,974 | |
Ingevity Corp. (Chemicals) | (a) | 2,070 | 97,745 |
Innospec, Inc. (Chemicals) | 1,270 | 156,515 | |
Materion Corp. (Metals & Mining) | 1,320 | 171,772 | |
Mativ Holdings, Inc. (Chemicals) | 3,890 | 59,556 | |
Minerals Technologies, Inc. (Chemicals) | 1,740 | 124,079 | |
O-I Glass, Inc. (Containers & Packaging) | (a) | 7,907 | 129,517 |
Quaker Chemical Corp. (Chemicals) | 1,100 | 234,762 | |
Sealed Air Corp. (Containers & Packaging) | 7,520 | 274,630 | |
Sensient Technologies Corp. (Chemicals) | 2,320 | 153,120 | |
Sylvamo Corp. (Paper & Forest Products) | 2,721 | 133,628 | |
Warrior Met Coal, Inc. (Metals & Mining) | 3,860 | 235,344 | |
Worthington Steel, Inc. (Metals & Mining) | (a) | 1,636 | 45,972 |
| 3,805,207 | |||
| Real Estate–4.0% | |||
American Assets Trust, Inc. (Diversified REITs) | 5,070 | 114,126 | |
Apple Hospitality REIT, Inc. (Hotel & Resort REITs) | 11,700 | 194,337 | |
CareTrust REIT, Inc. (Health Care REITs) | 8,080 | 180,830 | |
Cushman & Wakefield PLC (Real Estate Mgmt. & Development) | (a) | 10,490 | 113,292 |
DiamondRock Hospitality Co. (Hotel & Resort REITs) | 18,760 | 176,156 | |
Douglas Emmett, Inc. (Office REITs) | 10,290 | 149,205 | |
Elme Communities (Residential REITs) | 7,650 | 111,690 | |
Essential Properties Realty Trust, Inc. (Diversified REITs) | 9,500 | 242,820 | |
eXp World Holdings, Inc. (Real Estate Mgmt. & Development) | 6,330 | 98,242 | |
Four Corners Property Trust, Inc. (Specialized REITs) | 6,770 | 171,281 | |
Highwoods Properties, Inc. (Office REITs) | 5,810 | 133,398 | |
Innovative Industrial Properties, Inc. (Industrial REITs) | 2,040 | 205,673 | |
JBG SMITH Properties (Office REITs) | 8,040 | 136,760 | |
| Common Stocks (Continued) | Shares | Value | |
| Real Estate (continued) | |||
LXP Industrial Trust (Industrial REITs) | 23,230 | $ 230,441 | |
Macerich Co. / The (Retail REITs) | 13,030 | 201,053 | |
Marcus & Millichap, Inc. (Real Estate Mgmt. & Development) | 2,590 | 113,131 | |
NexPoint Residential Trust, Inc. (Residential REITs) | 1,600 | 55,088 | |
Outfront Media, Inc. (Specialized REITs) | 9,680 | 135,133 | |
Pebblebrook Hotel Trust (Hotel & Resort REITs) | 8,200 | 131,036 | |
Phillips Edison & Co., Inc. (Retail REITs) | 7,110 | 259,373 | |
Retail Opportunity Investments Corp. (Retail REITs) | 6,930 | 97,228 | |
Safehold, Inc. (Specialized REITs) | 4,830 | 113,022 | |
SITE Centers Corp. (Retail REITs) | 14,460 | 197,090 | |
SL Green Realty Corp. (Office REITs) | 3,900 | 176,163 | |
St. Joe Co. / The (Real Estate Mgmt. & Development) | 1,980 | 119,156 | |
Sunstone Hotel Investors, Inc. (Hotel & Resort REITs) | 15,043 | 161,411 | |
Tanger, Inc. (Retail REITs) | 5,790 | 160,499 | |
Uniti Group, Inc. (Specialized REITs) | 20,270 | 117,161 | |
Urban Edge Properties (Retail REITs) | 8,010 | 146,583 | |
Veris Residential, Inc. (Residential REITs) | 5,360 | 84,313 | |
Xenia Hotels & Resorts, Inc. (Hotel & Resort REITs) | 10,060 | 137,017 | |
| 4,662,708 | |||
| Utilities–0.9% | |||
American States Water Co. (Water Utilities) | 2,000 | 160,840 | |
Avista Corp. (Multi-Utilities) | 5,790 | 206,935 | |
California Water Service Group (Water Utilities) | 4,230 | 219,410 | |
Chesapeake Utilities Corp. (Gas Utilities) | 1,180 | 124,643 | |
Clearway Energy, Inc. Class C (Ind. Power & Renewable Elec.) | 4,450 | 122,063 | |
Otter Tail Corp. (Electric Utilities) | 2,681 | 227,805 | |
| 1,061,696 | |||
Total Common Stocks (Cost $106,577,614) | $116,772,276 | ||
| Exchange Traded Funds–0.2% | Shares | Value | |
iShares Core S&P Small-Cap ETF | 2,392 | $ 258,934 | |
Total Exchange Traded Funds (Cost $259,405) | $ 258,934 | ||
Total Investments – 99.9% (Cost $106,837,019) | (b) | $117,031,210 | |
Other Assets in Excess of Liabilities – 0.1% | 116,477 | ||
| Net Assets – 100.0% | $117,147,687 | ||
Percentages are stated as a percent of net assets. |
| Abbreviations: | ||
| ADR: | American Depositary Receipts | |
| ETF: | Exchange Traded Fund | |
| REITs: | Real Estate Investment Trusts | |
| Footnotes: | ||
| (a) | Non-income producing security. | |
| (b) | Represents cost for financial reporting purposes, which may differ from cost basis for federal income tax purposes. See also Note 7 of the Notes to Financial Statements. | |
The accompanying notes are an integral part of these financial statements.
33
AuguStarSM Variable Insurance Products Fund, Inc.
AVIP AB Mid Cap Core Portfolio (Unaudited)
Objective/Strategy
The AVIP AB Mid Cap Core Portfolio (formerly ON AB Mid Cap Core Portfolio) seeks long-term growth of capital by investing, under normal circumstances, at least 80% of its net assets in equity securities of mid-capitalization companies with public stock market capitalization at the time of investment that are within the range of market capitalizations of the companies constituting the Russell Midcap® Index.
Performance as of December 31, 2023
| Average Annual returns | |
| One year | 17.05% |
| Five years | 11.27% |
| Ten years | 8.48% |
Past performance does not guarantee future results. The performance data quoted represents past performance and current returns may be lower or higher. Total return figures include change in share price and reinvestment of dividends and capital gains. The investment return and principal value will fluctuate so that an investor’s shares, when redeemed, may be worth more or less than the original cost. To obtain performance information up to the most recent month end, call toll-free 1-877-781-6392.
The Portfolio is not open to direct retail investment. Beneficial interest in the Portfolio’s shares is obtained either through an allocation to the Portfolio as an investment vehicle within variable life insurance policies or annuity contracts, or as an underlying investment by the AVIP Model Portfolios. Actual performance results for variable annuity and variable universal life contracts will be lower due to contract charges. Consult your contract for applicable charges.
Total expense ratio is 0.88% per the Fund’s Prospectus dated May 1, 2023 and supplemented October 2, 2023 and December 4, 2023. Additional information pertaining to the Portfolio’s expense ratio as of December 31, 2023 can be found in the Portfolio’s Financial Highlights.
Comments from Sub-Adviser
Q. How did the Portfolio perform in comparison to its benchmark during the reporting period?
A. For the year ended December 31, 2023, the Portfolio returned 17.05% versus 17.23% for its benchmark, the Russell Midcap® Index.
Q. What affected the Portfolio’s performance?
A. Security selection was the primary detractor from the Portfolio’s relative returns for the year, while sector allocation offset some of the underperformance. Selection within Health Care was the largest detractor, followed by selection within Communication Services and Utilities. Selection within Energy, Industrials and Information Technology contributed to relative returns. From a sector allocation perspective, the Portfolio’s underweight to Utilities and overweights to Industrials and Information Technology were the largest contributors to relative returns, while overweights to Financials and Health Care detracted.
Leading contributors to relative performance for the year were Vertiv Holdings Co., First Citizens Bancshares, Inc. Class A and XPO, Inc., while top detractors from relative performance were National Vision Holdings, Inc., Driven Brands Holdings, Inc. and Silk Road Medical, Inc. (1)
| (1) | The Portfolio’s composition is subject to change. Holdings and weightings are as of December 31, 2023. |
Change in Value of $10,000 Investment

Hypothetical illustration based on past performance. Future performance will vary. The Portfolio’s returns reflect reinvested dividends. The Portfolio’s holdings may differ significantly from the securities in the index. The index is unmanaged and therefore does not reflect the cost of portfolio management and accounting.
The Russell Midcap® Index measures the performance of the mid-cap segment of the US equity universe. The Russell Midcap® Index is a subset of the Russell 1000® Index. It includes approximately 800 of the smallest securities based on a combination of their market cap and current index membership.
Past performance is no guarantee of future results. Redemption of fund shares could have tax implications unique to each shareholder.
34
(continued)
AuguStarSM Variable Insurance Products Fund, Inc.
AVIP AB Mid Cap Core Portfolio (Unaudited) (Continued)
| Portfolio Composition as of December 31, 2023 (1) | |
| % of Net Assets | |
| Common Stocks (4) | 99.1 |
| Exchange Traded Funds | 0.4 |
| Other Net Assets | 0.5 |
| 100.0 | |
| Top 10 Portfolio Holdings as of December 31, 2023 (1) (2) (3) | ||
| % of Net Assets | ||
| 1. | Builders FirstSource, Inc. | 1.0 |
| 2. | Axon Enterprise, Inc. | 0.8 |
| 3. | Dynatrace, Inc. | 0.7 |
| 4. | Five Below, Inc. | 0.7 |
| 5. | PTC, Inc. | 0.7 |
| 6. | Deckers Outdoor Corp. | 0.6 |
| 7. | Jones Lang LaSalle, Inc. | 0.6 |
| 8. | Lennox International, Inc. | 0.5 |
| 9. | NVR, Inc. | 0.5 |
| 10. | PVH Corp. | 0.5 |
| (1) | Composition of Portfolio subject to change. | |
| (2) | Short-term investments have been excluded from the list of Top 10 Portfolio Holdings. | |
| (3) | Top 10 Portfolio Holdings is presented at an individual security level. Total investment exposure by issuer may be higher. | |
| (4) | Sectors (Common Stocks): | |
| % of Net Assets | |
| Industrials | 21.2 |
| Information Technology | 16.4 |
| Financials | 14.1 |
| Consumer Discretionary | 13.1 |
| Health Care | 11.7 |
| Real Estate | 5.8 |
| Energy | 4.5 |
| Consumer Staples | 3.8 |
| Materials | 3.3 |
| Utilities | 3.0 |
| Communication Services | 2.2 |
| 99.1 |
35
AuguStarSM Variable Insurance Products Fund, Inc.
AVIP AB Mid Cap Core Portfolio
| Schedule of Investments | December 31, 2023 |
| Common Stocks–99.1% | Shares | Value | |
| Communication Services–2.2% | |||
Criteo SA – ADR (Media) | (a) | 8,040 | $ 203,573 |
Electronic Arts, Inc. (Entertainment) | 960 | 131,338 | |
Fox Corp. Class A (Media) | 2,040 | 60,527 | |
Interpublic Group of Cos., Inc. / The (Media) | 2,400 | 78,336 | |
Liberty Broadband Corp. Class A (Media) | (a) | 480 | 38,707 |
Liberty Broadband Corp. Class C (Media) | (a) | 660 | 53,189 |
Liberty Media Corp.-Liberty Formula One Class C (Entertainment) | (a) | 1,385 | 87,435 |
Match Group, Inc. (Interactive Media & Svs.) | (a) | 920 | 33,580 |
Nexstar Media Group, Inc. (Media) | 2,120 | 332,310 | |
Omnicom Group, Inc. (Media) | 930 | 80,454 | |
Pinterest, Inc. Class A (Interactive Media & Svs.) | (a) | 3,220 | 119,269 |
ROBLOX Corp. Class A (Entertainment) | (a) | 1,750 | 80,010 |
Sirius XM Holdings, Inc. (Media) | 10,060 | 55,028 | |
Spotify Technology SA (Entertainment) | (a) | 550 | 103,350 |
Take-Two Interactive Software, Inc. (Entertainment) | (a) | 470 | 75,647 |
Trade Desk, Inc. / The Class A (Media) | (a) | 1,700 | 122,332 |
Warner Bros. Discovery, Inc. (Entertainment) | (a) | 7,731 | 87,979 |
ZoomInfo Technologies, Inc. (Interactive Media & Svs.) | (a) | 1,570 | 29,029 |
| 1,772,093 | |||
| Consumer Discretionary–13.1% | |||
ADT, Inc. (Diversified Consumer Svs.) | 39,865 | 271,879 | |
Aptiv PLC (Automobile Components) | (a) | 1,100 | 98,692 |
Aramark (Hotels, Restaurants & Leisure) | 1,962 | 55,132 | |
Bath & Body Works, Inc. (Specialty Retail) | 8,930 | 385,419 | |
Best Buy Co., Inc. (Specialty Retail) | 940 | 73,583 | |
Brunswick Corp. (Leisure Products) | 3,789 | 366,586 | |
Burlington Stores, Inc. (Specialty Retail) | (a) | 264 | 51,343 |
CarMax, Inc. (Specialty Retail) | (a) | 671 | 51,493 |
Carnival Corp. (Hotels, Restaurants & Leisure) | (a) | 3,300 | 61,182 |
Cava Group, Inc. (Hotels, Restaurants & Leisure) | (a) | 5,526 | 237,507 |
Coupang, Inc. (Broadline Retail) | (a) | 3,690 | 59,741 |
D.R. Horton, Inc. (Household Durables) | 1,350 | 205,173 | |
Dana, Inc. (Automobile Components) | 12,460 | 182,041 | |
Darden Restaurants, Inc. (Hotels, Restaurants & Leisure) | 530 | 87,079 | |
Deckers Outdoor Corp. (Textiles, Apparel & Luxury Goods) | (a) | 724 | 483,943 |
Dick's Sporting Goods, Inc. (Specialty Retail) | 2,369 | 348,125 | |
Dine Brands Global, Inc. (Hotels, Restaurants & Leisure) | 3,870 | 192,146 | |
Domino's Pizza, Inc. (Hotels, Restaurants & Leisure) | 847 | 349,159 | |
DoorDash, Inc. Class A (Hotels, Restaurants & Leisure) | (a) | 1,011 | 99,978 |
DraftKings, Inc. Class A (Hotels, Restaurants & Leisure) | (a) | 1,448 | 51,042 |
eBay, Inc. (Broadline Retail) | 1,920 | 83,750 | |
Etsy, Inc. (Broadline Retail) | (a) | 484 | 39,228 |
Expedia Group, Inc. (Hotels, Restaurants & Leisure) | (a) | 570 | 86,520 |
Five Below, Inc. (Specialty Retail) | (a) | 2,551 | 543,771 |
Garmin Ltd. (Household Durables) | 610 | 78,409 | |
Gentex Corp. (Automobile Components) | 370 | 12,084 | |
Genuine Parts Co. (Distributors) | 610 | 84,485 | |
Goodyear Tire & Rubber Co. / The (Automobile Components) | (a) | 19,050 | 272,796 |
Hilton Worldwide Holdings, Inc. (Hotels, Restaurants & Leisure) | 820 | 149,314 | |
Hyatt Hotels Corp. Class A (Hotels, Restaurants & Leisure) | 690 | 89,983 | |
Lennar Corp. Class A (Household Durables) | 1,100 | 163,944 | |
Lithia Motors, Inc. (Specialty Retail) | 1,002 | 329,939 | |
LKQ Corp. (Distributors) | 1,630 | 77,898 | |
Lucid Group, Inc. (Automobiles) | (a) | 7,858 | 33,082 |
MGM Resorts International (Hotels, Restaurants & Leisure) | 1,930 | 86,232 | |
Mohawk Industries, Inc. (Household Durables) | (a) | 370 | 38,295 |
NVR, Inc. (Household Durables) | (a) | 62 | 434,028 |
Papa John's International, Inc. (Hotels, Restaurants & Leisure) | 2,770 | 211,157 | |
| Common Stocks (Continued) | Shares | Value | |
| Consumer Discretionary (continued) | |||
PulteGroup, Inc. (Household Durables) | 4,020 | $ 414,944 | |
PVH Corp. (Textiles, Apparel & Luxury Goods) | 3,550 | 433,526 | |
Ralph Lauren Corp. (Textiles, Apparel & Luxury Goods) | 2,773 | 399,867 | |
Rivian Automotive, Inc. Class A (Automobiles) | (a) | 2,290 | 53,723 |
Ross Stores, Inc. (Specialty Retail) | 1,180 | 163,300 | |
Royal Caribbean Cruises Ltd. (Hotels, Restaurants & Leisure) | (a) | 790 | 102,297 |
SharkNinja, Inc. (Household Durables) | 5,370 | 274,783 | |
Tapestry, Inc. (Textiles, Apparel & Luxury Goods) | 8,038 | 295,879 | |
Taylor Morrison Home Corp. (Household Durables) | (a) | 4,526 | 241,462 |
Tractor Supply Co. (Specialty Retail) | 470 | 101,064 | |
Ulta Beauty, Inc. (Specialty Retail) | (a) | 230 | 112,698 |
Under Armour, Inc. Class A (Textiles, Apparel & Luxury Goods) | (a) | 3,140 | 27,601 |
V.F. Corp. (Textiles, Apparel & Luxury Goods) | 1,330 | 25,004 | |
Vail Resorts, Inc. (Hotels, Restaurants & Leisure) | 1,266 | 270,253 | |
Victoria's Secret & Co. (Specialty Retail) | (a) | 386 | 10,244 |
Wayfair, Inc. Class A (Specialty Retail) | (a) | 4,605 | 284,129 |
Williams-Sonoma, Inc. (Specialty Retail) | 1,730 | 349,079 | |
Wingstop, Inc. (Hotels, Restaurants & Leisure) | 1,278 | 327,909 | |
Yum! Brands, Inc. (Hotels, Restaurants & Leisure) | 1,150 | 150,259 | |
| 10,564,179 | |||
| Consumer Staples–3.8% | |||
BellRing Brands, Inc. (Personal Care Products) | (a) | 3,647 | 202,153 |
Boston Beer Co., Inc. / The Class A (Beverages) | (a) | 60 | 20,735 |
Brown-Forman Corp. Class B (Beverages) | 1,000 | 57,100 | |
Bunge Global SA (Food Products) | 860 | 86,817 | |
Campbell Soup Co. (Food Products) | 1,600 | 69,168 | |
Celsius Holdings, Inc. (Beverages) | (a) | 6,525 | 355,743 |
Church & Dwight Co., Inc. (Household Products) | 847 | 80,092 | |
Clorox Co. / The (Household Products) | 510 | 72,721 | |
Conagra Brands, Inc. (Food Products) | 2,060 | 59,040 | |
Dollar Tree, Inc. (Consumer Staples Distribution & Retail) | (a) | 970 | 137,789 |
Freshpet, Inc. (Food Products) | (a) | 3,732 | 323,788 |
Grocery Outlet Holding Corp. (Consumer Staples Distribution & Retail) | (a) | 10,158 | 273,860 |
Hain Celestial Group, Inc. / The (Food Products) | (a) | 14,650 | 160,418 |
Hormel Foods Corp. (Food Products) | 1,650 | 52,982 | |
J.M. Smucker Co. / The (Food Products) | 580 | 73,300 | |
Kellanova (Food Products) | 1,220 | 68,210 | |
Kroger Co. / The (Consumer Staples Distribution & Retail) | 3,100 | 141,701 | |
Lamb Weston Holdings, Inc. (Food Products) | 2,930 | 316,704 | |
McCormick & Co., Inc. (Food Products) | 1,010 | 69,104 | |
Nomad Foods Ltd. (Food Products) | (a) | 15,552 | 263,606 |
Tyson Foods, Inc. Class A (Food Products) | 1,180 | 63,425 | |
W.K. Kellogg Co. (Food Products) | 305 | 4,008 | |
Walgreens Boots Alliance, Inc. (Consumer Staples Distribution & Retail) | 2,410 | 62,925 | |
| 3,015,389 | |||
| Energy–4.5% | |||
Baker Hughes Co. (Energy Equip. & Svs.) | 3,800 | 129,884 | |
Cameco Corp. (Oil, Gas & Consumable Fuels) | 7,350 | 316,785 | |
ChampionX Corp. (Energy Equip. & Svs.) | 8,380 | 244,780 | |
Cheniere Energy, Inc. (Oil, Gas & Consumable Fuels) | 980 | 167,296 | |
Chesapeake Energy Corp. (Oil, Gas & Consumable Fuels) | 690 | 53,089 | |
Coterra Energy, Inc. (Oil, Gas & Consumable Fuels) | 2,820 | 71,966 | |
Devon Energy Corp. (Oil, Gas & Consumable Fuels) | 2,370 | 107,361 | |
Diamondback Energy, Inc. (Oil, Gas & Consumable Fuels) | 650 | 100,802 | |
Halliburton Co. (Energy Equip. & Svs.) | 3,900 | 140,985 | |
Hess Corp. (Oil, Gas & Consumable Fuels) | 1,130 | 162,901 | |
36
(continued)
AuguStarSM Variable Insurance Products Fund, Inc.
AVIP AB Mid Cap Core Portfolio (Continued)
| Schedule of Investments | December 31, 2023 |
| Common Stocks (Continued) | Shares | Value | |
| Energy (continued) | |||
HF Sinclair Corp. (Oil, Gas & Consumable Fuels) | 3,724 | $ 206,943 | |
International Seaways, Inc. (Oil, Gas & Consumable Fuels) | 4,450 | 202,386 | |
Magnolia Oil & Gas Corp. Class A (Oil, Gas & Consumable Fuels) | 13,094 | 278,771 | |
Marathon Oil Corp. (Oil, Gas & Consumable Fuels) | 2,720 | 65,715 | |
ONEOK, Inc. (Oil, Gas & Consumable Fuels) | 1,810 | 127,098 | |
Ovintiv, Inc. (Oil, Gas & Consumable Fuels) | 1,180 | 51,826 | |
Permian Resources Corp. (Oil, Gas & Consumable Fuels) | 15,366 | 208,977 | |
Phillips 66 (Oil, Gas & Consumable Fuels) | 1,700 | 226,338 | |
Southwestern Energy Co. (Oil, Gas & Consumable Fuels) | (a) | 28,457 | 186,393 |
Targa Resources Corp. (Oil, Gas & Consumable Fuels) | 910 | 79,052 | |
TechnipFMC PLC (Energy Equip. & Svs.) | 10,869 | 218,902 | |
Texas Pacific Land Corp. (Oil, Gas & Consumable Fuels) | 40 | 62,898 | |
Williams Cos., Inc. / The (Oil, Gas & Consumable Fuels) | 5,010 | 174,498 | |
| 3,585,646 | |||
| Financials–14.1% | |||
Aflac, Inc. (Insurance) | 1,930 | 159,225 | |
AGNC Investment Corp. (Mortgage REIT) | 4,250 | 41,693 | |
Allstate Corp. / The (Insurance) | 940 | 131,581 | |
Ally Financial, Inc. (Consumer Finance) | 1,520 | 53,078 | |
American Financial Group, Inc. (Insurance) | 2,613 | 310,660 | |
Ameriprise Financial, Inc. (Capital Markets) | 330 | 125,344 | |
Apollo Global Management, Inc. (Financial Services) | 1,752 | 163,269 | |
Arch Capital Group Ltd. (Insurance) | (a) | 1,160 | 86,153 |
Ares Management Corp. Class A (Capital Markets) | 3,615 | 429,896 | |
Arthur J. Gallagher & Co. (Insurance) | 780 | 175,406 | |
Bank of New York Mellon Corp. / The (Capital Markets) | 2,520 | 131,166 | |
BankUnited, Inc. (Banks) | 4,870 | 157,934 | |
Block, Inc. (Financial Services) | (a) | 1,820 | 140,777 |
Brown & Brown, Inc. (Insurance) | 750 | 53,333 | |
Carlyle Group, Inc. / The (Capital Markets) | 1,790 | 72,835 | |
CBOE Global Markets, Inc. (Capital Markets) | 2,364 | 422,116 | |
Cincinnati Financial Corp. (Insurance) | 680 | 70,353 | |
Citizens Financial Group, Inc. (Banks) | 1,740 | 57,664 | |
Coinbase Global, Inc. Class A (Capital Markets) | (a) | 633 | 110,091 |
Comerica, Inc. (Banks) | 6,427 | 358,691 | |
Discover Financial Services (Consumer Finance) | 1,250 | 140,500 | |
East West Bancorp, Inc. (Banks) | 1,000 | 71,950 | |
Euronet Worldwide, Inc. (Financial Services) | (a) | 536 | 54,399 |
Everest Group Ltd. (Insurance) | 790 | 279,328 | |
FactSet Research Systems, Inc. (Capital Markets) | 120 | 57,246 | |
Fidelity National Financial, Inc. (Insurance) | 1,050 | 53,571 | |
Fidelity National Information Services, Inc. (Financial Services) | 1,990 | 119,539 | |
Fifth Third Bancorp (Banks) | 2,900 | 100,021 | |
First BanCorp (Banks) | 19,490 | 320,610 | |
First Citizens BancShares, Inc. Class A (Banks) | 300 | 425,691 | |
First Hawaiian, Inc. (Banks) | 15,205 | 347,586 | |
First Horizon Corp. (Banks) | 2,360 | 33,418 | |
FleetCor Technologies, Inc. (Financial Services) | (a) | 340 | 96,087 |
Flywire Corp. (Financial Services) | (a) | 9,417 | 218,004 |
Franklin Resources, Inc. (Capital Markets) | 2,540 | 75,667 | |
Global Payments, Inc. (Financial Services) | 960 | 121,920 | |
Globe Life, Inc. (Insurance) | 10 | 1,217 | |
Hanover Insurance Group, Inc. / The (Insurance) | 1,290 | 156,632 | |
Hartford Financial Services Group, Inc. / The (Insurance) | 1,470 | 118,159 | |
Huntington Bancshares, Inc. (Banks) | 4,980 | 63,346 | |
Invesco Ltd. (Capital Markets) | 2,820 | 50,309 | |
Jack Henry & Associates, Inc. (Financial Services) | 470 | 76,803 | |
Jefferies Financial Group, Inc. (Capital Markets) | 1,330 | 53,745 | |
Kemper Corp. (Insurance) | 3,090 | 150,390 | |
| Common Stocks (Continued) | Shares | Value | |
| Financials (continued) | |||
KeyCorp (Banks) | 3,650 | $ 52,560 | |
Kinsale Capital Group, Inc. (Insurance) | 1,010 | 338,259 | |
KKR & Co., Inc. (Capital Markets) | 2,230 | 184,756 | |
Loews Corp. (Insurance) | 670 | 46,625 | |
LPL Financial Holdings, Inc. (Capital Markets) | 280 | 63,734 | |
M&T Bank Corp. (Banks) | 520 | 71,282 | |
Markel Group, Inc. (Insurance) | (a) | 60 | 85,194 |
Moelis & Co. Class A (Capital Markets) | 4,817 | 270,378 | |
MSCI, Inc. (Capital Markets) | 329 | 186,099 | |
Nasdaq, Inc. (Capital Markets) | 1,410 | 81,977 | |
Northern Trust Corp. (Capital Markets) | 780 | 65,816 | |
NU Holdings Ltd. Class A (Banks) | (a) | 7,760 | 64,641 |
PJT Partners, Inc. Class A (Capital Markets) | 3,293 | 335,458 | |
Principal Financial Group, Inc. (Insurance) | 1,190 | 93,617 | |
Prudential Financial, Inc. (Insurance) | 1,630 | 169,047 | |
Raymond James Financial, Inc. (Capital Markets) | 870 | 97,005 | |
Regions Financial Corp. (Banks) | 3,530 | 68,411 | |
Rocket Cos., Inc. Class A (Financial Services) | (a) | 5,490 | 79,495 |
Ryan Specialty Holdings, Inc. Class A (Insurance) | (a) | 7,056 | 303,549 |
Shift4 Payments, Inc. Class A (Financial Services) | (a) | 4,291 | 318,993 |
State Street Corp. (Capital Markets) | 1,440 | 111,542 | |
Stifel Financial Corp. (Capital Markets) | 3,780 | 261,387 | |
Synchrony Financial (Consumer Finance) | 2,390 | 91,274 | |
T. Rowe Price Group, Inc. (Capital Markets) | 920 | 99,075 | |
Texas Capital Bancshares, Inc. (Banks) | (a) | 4,179 | 270,089 |
Tradeweb Markets, Inc. Class A (Capital Markets) | 940 | 85,427 | |
W.R. Berkley Corp. (Insurance) | 652 | 46,109 | |
Webster Financial Corp. (Banks) | 4,026 | 204,360 | |
Willis Towers Watson PLC (Insurance) | 330 | 79,596 | |
Wintrust Financial Corp. (Banks) | 3,150 | 292,162 | |
XP, Inc. Class A (Capital Markets) | 2,360 | 61,525 | |
Zions Bancorp N.A. (Banks) | 6,630 | 290,858 | |
| 11,307,703 | |||
| Health Care–11.7% | |||
Acadia Healthcare Co., Inc. (Health Care Providers & Svs.) | (a) | 2,320 | 180,403 |
Agilent Technologies, Inc. (Life Sciences Tools & Svs.) | 1,260 | 175,178 | |
Akero Therapeutics, Inc. (Biotechnology) | (a) | 2,433 | 56,811 |
Align Technology, Inc. (Health Care Equip. & Supplies) | (a) | 270 | 73,980 |
Alnylam Pharmaceuticals, Inc. (Biotechnology) | (a) | 540 | 103,361 |
AMN Healthcare Services, Inc. (Health Care Providers & Svs.) | (a) | 2,853 | 213,633 |
Arcus Biosciences, Inc. (Biotechnology) | (a) | 4,886 | 93,323 |
Ascendis Pharma A/S – ADR (Biotechnology) | (a) | 1,019 | 128,343 |
AtriCure, Inc. (Health Care Equip. & Supplies) | (a) | 6,145 | 219,315 |
Avantor, Inc. (Life Sciences Tools & Svs.) | (a) | 13,526 | 308,799 |
Baxter International, Inc. (Health Care Equip. & Supplies) | 1,700 | 65,722 | |
Biogen, Inc. (Biotechnology) | (a) | 500 | 129,385 |
BioMarin Pharmaceutical, Inc. (Biotechnology) | (a) | 640 | 61,709 |
Bio-Rad Laboratories, Inc. Class A (Life Sciences Tools & Svs.) | (a) | 120 | 38,747 |
Blueprint Medicines Corp. (Biotechnology) | (a) | 1,961 | 180,883 |
Bridgebio Pharma, Inc. (Biotechnology) | (a) | 3,909 | 157,806 |
Cardinal Health, Inc. (Health Care Providers & Svs.) | 950 | 95,760 | |
Cencora, Inc. (Health Care Providers & Svs.) | 630 | 129,389 | |
Charles River Laboratories International, Inc. (Life Sciences Tools & Svs.) | (a) | 230 | 54,372 |
Cooper Cos., Inc. / The (Health Care Equip. & Supplies) | 201 | 76,066 | |
DaVita, Inc. (Health Care Providers & Svs.) | (a) | 650 | 68,094 |
Dexcom, Inc. (Health Care Equip. & Supplies) | (a) | 1,480 | 183,653 |
Envista Holdings Corp. (Health Care Equip. & Supplies) | (a) | 8,200 | 197,292 |
Exact Sciences Corp. (Biotechnology) | (a) | 640 | 47,347 |
Fortrea Holdings, Inc. (Life Sciences Tools & Svs.) | (a) | 7,329 | 255,782 |
Guardant Health, Inc. (Health Care Providers & Svs.) | (a) | 6,662 | 180,207 |
Halozyme Therapeutics, Inc. (Biotechnology) | (a) | 4,027 | 148,838 |
37
(continued)
AuguStarSM Variable Insurance Products Fund, Inc.
AVIP AB Mid Cap Core Portfolio (Continued)
| Schedule of Investments | December 31, 2023 |
| Common Stocks (Continued) | Shares | Value | |
| Health Care (continued) | |||
Hologic, Inc. (Health Care Equip. & Supplies) | (a) | 1,160 | $ 82,882 |
ICON PLC (Life Sciences Tools & Svs.) | (a) | 1,436 | 406,489 |
ICU Medical, Inc. (Health Care Equip. & Supplies) | (a) | 274 | 27,329 |
IDEXX Laboratories, Inc. (Health Care Equip. & Supplies) | (a) | 350 | 194,268 |
Illumina, Inc. (Life Sciences Tools & Svs.) | (a) | 530 | 73,797 |
Inari Medical, Inc. (Health Care Equip. & Supplies) | (a) | 4,206 | 273,054 |
Incyte Corp. (Biotechnology) | (a) | 740 | 46,465 |
Insulet Corp. (Health Care Equip. & Supplies) | (a) | 271 | 58,802 |
Integra LifeSciences Holdings Corp. (Health Care Equip. & Supplies) | (a) | 6,067 | 264,218 |
Intellia Therapeutics, Inc. (Biotechnology) | (a) | 2,636 | 80,372 |
Intra-Cellular Therapies, Inc. (Pharmaceuticals) | (a) | 2,553 | 182,846 |
IQVIA Holdings, Inc. (Life Sciences Tools & Svs.) | (a) | 780 | 180,476 |
iRhythm Technologies, Inc. (Health Care Equip. & Supplies) | (a) | 2,264 | 242,339 |
Karuna Therapeutics, Inc. (Biotechnology) | (a) | 547 | 173,131 |
Laboratory Corp. of America Holdings (Health Care Providers & Svs.) | 400 | 90,916 | |
Lantheus Holdings, Inc. (Health Care Equip. & Supplies) | (a) | 3,121 | 193,502 |
Legend Biotech Corp. – ADR (Biotechnology) | (a) | 1,984 | 119,377 |
Madrigal Pharmaceuticals, Inc. (Biotechnology) | (a) | 501 | 115,921 |
Maravai LifeSciences Holdings, Inc. Class A (Life Sciences Tools & Svs.) | (a) | 1,960 | 12,838 |
Masimo Corp. (Health Care Equip. & Supplies) | (a) | 330 | 38,679 |
Mettler-Toledo International, Inc. (Life Sciences Tools & Svs.) | (a) | 90 | 109,166 |
Molina Healthcare, Inc. (Health Care Providers & Svs.) | (a) | 300 | 108,393 |
MoonLake Immunotherapeutics (Biotechnology) | (a) | 1,562 | 94,329 |
Natera, Inc. (Biotechnology) | (a) | 6,674 | 418,059 |
Neurocrine Biosciences, Inc. (Biotechnology) | (a) | 802 | 105,672 |
Pediatrix Medical Group, Inc. (Health Care Providers & Svs.) | (a) | 16,180 | 150,474 |
QIAGEN N.V. (Life Sciences Tools & Svs.) | (a) | 1,580 | 68,619 |
Quest Diagnostics, Inc. (Health Care Providers & Svs.) | 580 | 79,970 | |
Repligen Corp. (Life Sciences Tools & Svs.) | (a) | 1,561 | 280,668 |
ResMed, Inc. (Health Care Equip. & Supplies) | 590 | 101,492 | |
Revvity, Inc. (Life Sciences Tools & Svs.) | 420 | 45,910 | |
Sarepta Therapeutics, Inc. (Biotechnology) | (a) | 996 | 96,044 |
Shockwave Medical, Inc. (Health Care Equip. & Supplies) | (a) | 723 | 137,775 |
STERIS PLC (Health Care Equip. & Supplies) | 346 | 76,068 | |
Ultragenyx Pharmaceutical, Inc. (Biotechnology) | (a) | 2,878 | 137,626 |
Vaxcyte, Inc. (Biotechnology) | (a) | 2,781 | 174,647 |
Veeva Systems, Inc. Class A (Health Care Technology) | (a) | 560 | 107,811 |
Viatris, Inc. (Pharmaceuticals) | 5,730 | 62,056 | |
Viking Therapeutics, Inc. (Biotechnology) | (a) | 5,627 | 104,718 |
Vir Biotechnology, Inc. (Biotechnology) | (a) | 4,384 | 44,103 |
Waters Corp. (Life Sciences Tools & Svs.) | (a) | 253 | 83,295 |
West Pharmaceutical Services, Inc. (Life Sciences Tools & Svs.) | 300 | 105,636 | |
Xenon Pharmaceuticals, Inc. (Biotechnology) | (a) | 2,806 | 129,244 |
Zimmer Biomet Holdings, Inc. (Health Care Equip. & Supplies) | 850 | 103,445 | |
| 9,407,119 | |||
| Industrials–21.2% | |||
A.O. Smith Corp. (Building Products) | 1,130 | 93,157 | |
ABM Industries, Inc. (Commercial Svs. & Supplies) | 5,624 | 252,124 | |
AECOM (Construction & Engineering) | 670 | 61,928 | |
AGCO Corp. (Machinery) | 520 | 63,133 | |
Alaska Air Group, Inc. (Passenger Airlines) | (a) | 6,009 | 234,772 |
Allegion PLC (Building Products) | 570 | 72,213 | |
AMETEK, Inc. (Electrical Equip.) | 943 | 155,491 | |
ArcBest Corp. (Ground Transportation) | 2,337 | 280,931 | |
| Common Stocks (Continued) | Shares | Value | |
| Industrials (continued) | |||
Axon Enterprise, Inc. (Aerospace & Defense) | (a) | 2,616 | $ 675,791 |
AZEK Co., Inc. / The (Building Products) | (a) | 8,126 | 310,820 |
Booz Allen Hamilton Holding Corp. (Professional Svs.) | 420 | 53,722 | |
Broadridge Financial Solutions, Inc. (Professional Svs.) | 477 | 98,143 | |
Builders FirstSource, Inc. (Building Products) | (a) | 4,677 | 780,778 |
BWX Technologies, Inc. (Aerospace & Defense) | 2,217 | 170,110 | |
C.H. Robinson Worldwide, Inc. (Air Freight & Logistics) | 150 | 12,959 | |
Carlisle Cos., Inc. (Building Products) | 1,081 | 337,737 | |
Carrier Global Corp. (Building Products) | 3,550 | 203,948 | |
Cintas Corp. (Commercial Svs. & Supplies) | 360 | 216,958 | |
Clarivate PLC (Professional Svs.) | (a) | 4,040 | 37,410 |
Copart, Inc. (Commercial Svs. & Supplies) | (a) | 3,376 | 165,424 |
Cummins, Inc. (Machinery) | 610 | 146,138 | |
Curtiss-Wright Corp. (Aerospace & Defense) | 1,189 | 264,897 | |
Delta Air Lines, Inc. (Passenger Airlines) | 2,620 | 105,403 | |
Dover Corp. (Machinery) | 590 | 90,748 | |
Dycom Industries, Inc. (Construction & Engineering) | (a) | 3,259 | 375,078 |
Equifax, Inc. (Professional Svs.) | 490 | 121,172 | |
Expeditors International of Washington, Inc. (Air Freight & Logistics) | 540 | 68,688 | |
Fastenal Co. (Trading Companies & Distributors) | 2,350 | 152,210 | |
Ferguson PLC (Trading Companies & Distributors) | 690 | 133,218 | |
Fluor Corp. (Construction & Engineering) | (a) | 8,550 | 334,904 |
Fortive Corp. (Machinery) | 1,210 | 89,092 | |
FTI Consulting, Inc. (Professional Svs.) | (a) | 1,394 | 277,615 |
Gates Industrial Corp. PLC (Machinery) | (a) | 7,390 | 99,174 |
Generac Holdings, Inc. (Electrical Equip.) | (a) | 250 | 32,310 |
Graco, Inc. (Machinery) | 990 | 85,892 | |
HEICO Corp. Class A (Aerospace & Defense) | 170 | 24,215 | |
Herc Holdings, Inc. (Trading Companies & Distributors) | 2,403 | 357,783 | |
Hexcel Corp. (Aerospace & Defense) | 3,758 | 277,153 | |
Howmet Aerospace, Inc. (Aerospace & Defense) | 6,850 | 370,722 | |
Hubbell, Inc. (Electrical Equip.) | 180 | 59,207 | |
Huntington Ingalls Industries, Inc. (Aerospace & Defense) | 260 | 67,506 | |
IDEX Corp. (Machinery) | 350 | 75,989 | |
Ingersoll Rand, Inc. (Machinery) | 5,306 | 410,366 | |
ITT, Inc. (Machinery) | 2,638 | 314,766 | |
J.B. Hunt Transport Services, Inc. (Ground Transportation) | 260 | 51,932 | |
Jacobs Solutions, Inc. (Professional Svs.) | 500 | 64,900 | |
Knight-Swift Transportation Holdings, Inc. (Ground Transportation) | 4,935 | 284,503 | |
Korn Ferry (Professional Svs.) | 2,680 | 159,058 | |
Leidos Holdings, Inc. (Professional Svs.) | 750 | 81,180 | |
Lennox International, Inc. (Building Products) | 971 | 434,542 | |
Lyft, Inc. Class A (Ground Transportation) | (a) | 1,370 | 20,536 |
Masco Corp. (Building Products) | 1,190 | 79,706 | |
MasTec, Inc. (Construction & Engineering) | (a) | 5,113 | 387,156 |
Middleby Corp. / The (Machinery) | (a) | 2,385 | 351,000 |
Nordson Corp. (Machinery) | 360 | 95,098 | |
Old Dominion Freight Line, Inc. (Ground Transportation) | 400 | 162,132 | |
Oshkosh Corp. (Machinery) | 2,964 | 321,327 | |
Otis Worldwide Corp. (Machinery) | 1,680 | 150,310 | |
Owens Corning (Building Products) | 390 | 57,810 | |
PACCAR, Inc. (Machinery) | 2,085 | 203,600 | |
Parker-Hannifin Corp. (Machinery) | 410 | 188,887 | |
Paychex, Inc. (Professional Svs.) | 1,320 | 157,225 | |
Paycom Software, Inc. (Professional Svs.) | 170 | 35,142 | |
Quanta Services, Inc. (Construction & Engineering) | 480 | 103,584 | |
Regal Rexnord Corp. (Electrical Equip.) | 2,050 | 303,441 | |
Republic Services, Inc. (Commercial Svs. & Supplies) | 860 | 141,823 | |
Robert Half, Inc. (Professional Svs.) | 3,230 | 283,982 | |
Rockwell Automation, Inc. (Electrical Equip.) | 470 | 145,926 | |
Rollins, Inc. (Commercial Svs. & Supplies) | 2,040 | 89,087 | |
Saia, Inc. (Ground Transportation) | (a) | 643 | 281,776 |
38
(continued)
AuguStarSM Variable Insurance Products Fund, Inc.
AVIP AB Mid Cap Core Portfolio (Continued)
| Schedule of Investments | December 31, 2023 |
| Common Stocks (Continued) | Shares | Value | |
| Industrials (continued) | |||
Sensata Technologies Holding PLC (Electrical Equip.) | 6,411 | $ 240,861 | |
Shoals Technologies Group, Inc. Class A (Electrical Equip.) | (a) | 2,483 | 38,586 |
SiteOne Landscape Supply, Inc. (Trading Companies & Distributors) | (a) | 1,930 | 313,625 |
Snap-on, Inc. (Machinery) | 210 | 60,656 | |
Southwest Airlines Co. (Passenger Airlines) | 2,410 | 69,601 | |
Spirit AeroSystems Holdings, Inc. Class A (Aerospace & Defense) | (a) | 9,609 | 305,374 |
SS&C Technologies Holdings, Inc. (Professional Svs.) | 1,030 | 62,943 | |
Star Bulk Carriers Corp. (Marine Transportation) | 10,740 | 228,332 | |
Stericycle, Inc. (Commercial Svs. & Supplies) | (a) | 6,249 | 309,700 |
Tetra Tech, Inc. (Commercial Svs. & Supplies) | 1,964 | 327,851 | |
Textron, Inc. (Aerospace & Defense) | 630 | 50,665 | |
Toro Co. / The (Machinery) | 670 | 64,313 | |
Trane Technologies PLC (Building Products) | 730 | 178,047 | |
TransDigm Group, Inc. (Aerospace & Defense) | 150 | 151,740 | |
TransUnion (Professional Svs.) | 780 | 53,594 | |
U-Haul Holding Co. NVS (Ground Transportation) | 900 | 63,396 | |
United Airlines Holdings, Inc. (Passenger Airlines) | (a) | 1,100 | 45,386 |
United Rentals, Inc. (Trading Companies & Distributors) | 298 | 170,879 | |
Verisk Analytics, Inc. (Professional Svs.) | 449 | 107,248 | |
Vertiv Holdings Co. Class A (Electrical Equip.) | 1,090 | 52,353 | |
Vestis Corp. (Commercial Svs. & Supplies) | 981 | 20,738 | |
W.W. Grainger, Inc. (Trading Companies & Distributors) | 180 | 149,164 | |
Watsco, Inc. (Trading Companies & Distributors) | 120 | 51,416 | |
Westinghouse Air Brake Technologies Corp. (Machinery) | 930 | 118,017 | |
WNS Holdings Ltd. – ADR (Professional Svs.) | (a) | 3,790 | 239,528 |
XPO, Inc. (Ground Transportation) | (a) | 3,249 | 284,580 |
Xylem, Inc. (Machinery) | 730 | 83,483 | |
| 17,089,534 | |||
| Information Technology–16.4% | |||
ACI Worldwide, Inc. (Software) | (a) | 9,078 | 277,787 |
Akamai Technologies, Inc. (IT Svs.) | (a) | 660 | 78,111 |
Amdocs Ltd. (IT Svs.) | 1,000 | 87,890 | |
Amkor Technology, Inc. (Semiconductors & Equip.) | 9,710 | 323,052 | |
Amphenol Corp. Class A (Electronic Equip., Instr. & Comp.) | 1,850 | 183,390 | |
ANSYS, Inc. (Software) | (a) | 350 | 127,008 |
Aspen Technology, Inc. (Software) | (a) | 310 | 68,246 |
Avnet, Inc. (Electronic Equip., Instr. & Comp.) | 4,619 | 232,798 | |
Belden, Inc. (Electronic Equip., Instr. & Comp.) | 2,670 | 206,257 | |
Bentley Systems, Inc. Class B (Software) | 1,100 | 57,398 | |
BILL Holdings, Inc. (Software) | (a) | 490 | 39,979 |
Calix, Inc. (Communications Equip.) | (a) | 6,700 | 292,723 |
CDW Corp. (Electronic Equip., Instr. & Comp.) | 590 | 134,119 | |
Cloudflare, Inc. Class A (IT Svs.) | (a) | 900 | 74,934 |
Cognizant Technology Solutions Corp. Class A (IT Svs.) | 1,710 | 129,156 | |
CommVault Systems, Inc. (Software) | (a) | 2,949 | 235,478 |
Corning, Inc. (Electronic Equip., Instr. & Comp.) | 3,080 | 93,786 | |
Crowdstrike Holdings, Inc. Class A (Software) | (a) | 727 | 185,618 |
Datadog, Inc. Class A (Software) | (a) | 924 | 112,155 |
Dropbox, Inc. Class A (Software) | (a) | 2,970 | 87,556 |
Dynatrace, Inc. (Software) | (a) | 10,179 | 556,689 |
Enphase Energy, Inc. (Semiconductors & Equip.) | (a) | 550 | 72,677 |
Entegris, Inc. (Semiconductors & Equip.) | 680 | 81,478 | |
EPAM Systems, Inc. (IT Svs.) | (a) | 220 | 65,415 |
Fabrinet (Electronic Equip., Instr. & Comp.) | (a) | 2,177 | 414,348 |
Fair Isaac Corp. (Software) | (a) | 287 | 334,071 |
First Solar, Inc. (Semiconductors & Equip.) | (a) | 370 | 63,744 |
Five9, Inc. (Software) | (a) | 4,695 | 369,449 |
FormFactor, Inc. (Semiconductors & Equip.) | (a) | 6,620 | 276,120 |
Freshworks, Inc. Class A (Software) | (a) | 15,773 | 370,508 |
Gartner, Inc. (IT Svs.) | (a) | 250 | 112,777 |
Gen Digital, Inc. (Software) | 14,420 | 329,064 | |
| Common Stocks (Continued) | Shares | Value | |
| Information Technology (continued) | |||
GLOBALFOUNDRIES, Inc. (Semiconductors & Equip.) | (a) | 860 | $ 52,116 |
GoDaddy, Inc. Class A (IT Svs.) | (a) | 490 | 52,018 |
Hewlett Packard Enterprise Co. (Tech. Hardware, Storage & Periph.) | 5,300 | 89,994 | |
HP, Inc. (Tech. Hardware, Storage & Periph.) | 3,620 | 108,926 | |
HubSpot, Inc. (Software) | (a) | 638 | 370,384 |
Juniper Networks, Inc. (Communications Equip.) | 1,396 | 41,154 | |
Keysight Technologies, Inc. (Electronic Equip., Instr. & Comp.) | (a) | 760 | 120,908 |
Klaviyo, Inc. Class A (Software) | (a) | 8,340 | 231,685 |
Lattice Semiconductor Corp. (Semiconductors & Equip.) | (a) | 4,517 | 311,628 |
Littelfuse, Inc. (Electronic Equip., Instr. & Comp.) | 739 | 197,727 | |
Lumentum Holdings, Inc. (Communications Equip.) | (a) | 4,660 | 244,277 |
MACOM Technology Solutions Holdings, Inc. (Semiconductors & Equip.) | (a) | 4,304 | 400,057 |
Manhattan Associates, Inc. (Software) | (a) | 1,988 | 428,056 |
Marvell Technology, Inc. (Semiconductors & Equip.) | 2,880 | 173,693 | |
Microchip Technology, Inc. (Semiconductors & Equip.) | 2,046 | 184,508 | |
Monday.com Ltd. (Software) | (a) | 1,462 | 274,578 |
MongoDB, Inc. (IT Svs.) | (a) | 993 | 405,988 |
Monolithic Power Systems, Inc. (Semiconductors & Equip.) | 607 | 382,883 | |
NetApp, Inc. (Tech. Hardware, Storage & Periph.) | 670 | 59,067 | |
Novanta, Inc. (Electronic Equip., Instr. & Comp.) | (a) | 1,543 | 259,857 |
ON Semiconductor Corp. (Semiconductors & Equip.) | (a) | 1,404 | 117,276 |
Palantir Technologies, Inc. Class A (Software) | (a) | 6,290 | 107,999 |
PTC, Inc. (Software) | (a) | 2,978 | 521,031 |
Qorvo, Inc. (Semiconductors & Equip.) | (a) | 470 | 52,927 |
Skyworks Solutions, Inc. (Semiconductors & Equip.) | 680 | 76,446 | |
Smartsheet, Inc. Class A (Software) | (a) | 6,163 | 294,715 |
Splunk, Inc. (Software) | (a) | 660 | 100,551 |
Synaptics, Inc. (Semiconductors & Equip.) | (a) | 2,990 | 341,099 |
Teledyne Technologies, Inc. (Electronic Equip., Instr. & Comp.) | (a) | 175 | 78,101 |
Teradyne, Inc. (Semiconductors & Equip.) | 680 | 73,794 | |
Tyler Technologies, Inc. (Software) | (a) | 180 | 75,262 |
Unity Software, Inc. (Software) | (a) | 2,300 | 94,047 |
Universal Display Corp. (Semiconductors & Equip.) | 2,019 | 386,154 | |
VeriSign, Inc. (IT Svs.) | (a) | 410 | 84,444 |
Western Digital Corp. (Tech. Hardware, Storage & Periph.) | (a) | 1,250 | 65,462 |
Wolfspeed, Inc. (Semiconductors & Equip.) | (a) | 772 | 33,590 |
Zebra Technologies Corp. Class A (Electronic Equip., Instr. & Comp.) | (a) | 220 | 60,133 |
Zoom Video Communications, Inc. Class A (Software) | (a) | 870 | 62,562 |
Zscaler, Inc. (Software) | (a) | 370 | 81,977 |
| 13,170,855 | |||
| Materials–3.3% | |||
Albemarle Corp. (Chemicals) | 470 | 67,906 | |
Alcoa Corp. (Metals & Mining) | 894 | 30,396 | |
Amcor PLC (Containers & Packaging) | 6,490 | 62,564 | |
ATI, Inc. (Metals & Mining) | (a) | 5,130 | 233,261 |
Avery Dennison Corp. (Containers & Packaging) | 260 | 52,562 | |
Ball Corp. (Containers & Packaging) | 1,300 | 74,776 | |
Berry Global Group, Inc. (Containers & Packaging) | 4,680 | 315,385 | |
Celanese Corp. (Chemicals) | 490 | 76,131 | |
CF Industries Holdings, Inc. (Chemicals) | 221 | 17,570 | |
Corteva, Inc. (Chemicals) | 3,080 | 147,594 | |
Crown Holdings, Inc. (Containers & Packaging) | 630 | 58,017 | |
DuPont de Nemours, Inc. (Chemicals) | 1,582 | 121,703 | |
Eastman Chemical Co. (Chemicals) | 660 | 59,281 | |
Element Solutions, Inc. (Chemicals) | 12,076 | 279,439 | |
39
(continued)
AuguStarSM Variable Insurance Products Fund, Inc.
AVIP AB Mid Cap Core Portfolio (Continued)
| Schedule of Investments | December 31, 2023 |
| Common Stocks (Continued) | Shares | Value | |
| Materials (continued) | |||
International Flavors & Fragrances, Inc. (Chemicals) | 939 | $ 76,031 | |
International Paper Co. (Containers & Packaging) | 229 | 8,278 | |
LyondellBasell Industries N.V. Class A (Chemicals) | 1,050 | 99,834 | |
Martin Marietta Materials, Inc. (Construction Materials) | 250 | 124,727 | |
Mosaic Co. / The (Chemicals) | 1,320 | 47,164 | |
Nucor Corp. (Metals & Mining) | 850 | 147,934 | |
Packaging Corp. of America (Containers & Packaging) | 520 | 84,713 | |
PPG Industries, Inc. (Chemicals) | 970 | 145,063 | |
Reliance Steel & Aluminum Co. (Metals & Mining) | 190 | 53,139 | |
Sealed Air Corp. (Containers & Packaging) | 1,230 | 44,920 | |
Steel Dynamics, Inc. (Metals & Mining) | 662 | 78,182 | |
Vulcan Materials Co. (Construction Materials) | 540 | 122,585 | |
Westrock Co. (Containers & Packaging) | 1,370 | 56,882 | |
| 2,686,037 | |||
| Real Estate–5.8% | |||
Alexandria Real Estate Equities, Inc. (Office REITs) | 550 | 69,724 | |
American Homes 4 Rent Class A (Residential REITs) | 2,060 | 74,078 | |
Americold Realty Trust, Inc. (Industrial REITs) | 1,890 | 57,210 | |
Apartment Income REIT Corp. (Residential REITs) | 8,350 | 289,995 | |
AvalonBay Communities, Inc. (Residential REITs) | 570 | 106,715 | |
Boston Properties, Inc. (Office REITs) | 700 | 49,119 | |
Broadstone Net Lease, Inc. (Diversified REITs) | 10,671 | 183,755 | |
CBRE Group, Inc. Class A (Real Estate Mgmt. & Development) | (a) | 1,370 | 127,533 |
CoStar Group, Inc. (Real Estate Mgmt. & Development) | (a) | 1,620 | 141,572 |
CubeSmart (Specialized REITs) | 4,470 | 207,184 | |
Digital Realty Trust, Inc. (Specialized REITs) | 980 | 131,888 | |
Equity LifeStyle Properties, Inc. (Residential REITs) | 1,100 | 77,594 | |
Equity Residential (Residential REITs) | 1,510 | 92,352 | |
Essex Property Trust, Inc. (Residential REITs) | 270 | 66,944 | |
Extra Space Storage, Inc. (Specialized REITs) | 689 | 110,467 | |
First Industrial Realty Trust, Inc. (Industrial REITs) | 4,151 | 218,633 | |
Gaming & Leisure Properties, Inc. (Specialized REITs) | 1,640 | 80,934 | |
Healthpeak Properties, Inc. (Health Care REITs) | 2,220 | 43,956 | |
Host Hotels & Resorts, Inc. (Hotel & Resort REITs) | 210 | 4,089 | |
Invitation Homes, Inc. (Residential REITs) | 2,300 | 78,453 | |
Iron Mountain, Inc. (Specialized REITs) | 940 | 65,781 | |
Jones Lang LaSalle, Inc. (Real Estate Mgmt. & Development) | (a) | 2,484 | 469,153 |
Kimco Realty Corp. (Retail REITs) | 3,630 | 77,355 | |
| Common Stocks (Continued) | Shares | Value | |
| Real Estate (continued) | |||
Lamar Advertising Co. Class A (Specialized REITs) | 767 | $ 81,517 | |
Mid-America Apartment Communities, Inc. (Residential REITs) | 480 | 64,541 | |
NET Lease Office Properties (Office REITs) | 68 | 1,257 | |
Realty Income Corp. (Retail REITs) | 2,650 | 152,163 | |
Ryman Hospitality Properties, Inc. (Hotel & Resort REITs) | 2,522 | 277,571 | |
SBA Communications Corp. (Specialized REITs) | 420 | 106,550 | |
Simon Property Group, Inc. (Retail REITs) | 1,340 | 191,138 | |
STAG Industrial, Inc. (Industrial REITs) | 8,150 | 319,969 | |
Sun Communities, Inc. (Residential REITs) | 460 | 61,479 | |
UDR, Inc. (Residential REITs) | 1,640 | 62,796 | |
Ventas, Inc. (Health Care REITs) | 1,530 | 76,255 | |
VICI Properties, Inc. (Specialized REITs) | 3,360 | 107,117 | |
W.P. Carey, Inc. (Diversified REITs) | 1,020 | 66,106 | |
Welltower, Inc. (Health Care REITs) | 1,710 | 154,191 | |
Weyerhaeuser Co. (Specialized REITs) | 3,060 | 106,396 | |
| 4,653,530 | |||
| Utilities–3.0% | |||
Ameren Corp. (Multi-Utilities) | 1,010 | 73,063 | |
American Water Works Co., Inc. (Water Utilities) | 750 | 98,993 | |
Atmos Energy Corp. (Gas Utilities) | 530 | 61,427 | |
Avangrid, Inc. (Electric Utilities) | 1,500 | 48,615 | |
CenterPoint Energy, Inc. (Multi-Utilities) | 8,690 | 248,273 | |
CMS Energy Corp. (Multi-Utilities) | 1,180 | 68,523 | |
Consolidated Edison, Inc. (Multi-Utilities) | 1,410 | 128,268 | |
Constellation Energy Corp. (Electric Utilities) | 1,120 | 130,917 | |
DTE Energy Co. (Multi-Utilities) | 790 | 87,105 | |
Edison International (Electric Utilities) | 1,470 | 105,090 | |
Entergy Corp. (Electric Utilities) | 830 | 83,988 | |
Essential Utilities, Inc. (Water Utilities) | 1,620 | 60,507 | |
Eversource Energy (Electric Utilities) | 1,400 | 86,408 | |
FirstEnergy Corp. (Electric Utilities) | 2,210 | 81,019 | |
IDACORP, Inc. (Electric Utilities) | 2,380 | 234,002 | |
PG&E Corp. (Electric Utilities) | 7,056 | 127,220 | |
Portland General Electric Co. (Electric Utilities) | 6,120 | 265,241 | |
PPL Corp. (Electric Utilities) | 3,140 | 85,094 | |
Public Service Enterprise Group, Inc. (Multi-Utilities) | 2,070 | 126,580 | |
WEC Energy Group, Inc. (Multi-Utilities) | 1,290 | 108,579 | |
Xcel Energy, Inc. (Electric Utilities) | 2,150 | 133,106 | |
| 2,442,018 | |||
Total Common Stocks (Cost $74,235,505) | $79,694,103 | ||
| Exchange Traded Funds–0.4% | Shares | Value | |
iShares Russell Mid-Cap ETF | 4,623 | $ 359,346 | |
Total Exchange Traded Funds (Cost $343,871) | $ 359,346 | ||
Total Investments – 99.5% (Cost $74,579,376) | (b) | $80,053,449 | |
Other Assets in Excess of Liabilities – 0.5% | 372,564 | ||
| Net Assets – 100.0% | $80,426,013 | ||
Percentages are stated as a percent of net assets. |
| Abbreviations: | ||
| ADR: | American Depositary Receipts | |
| ETF: | Exchange Traded Fund | |
| NVS: | Non Voting Shares | |
| REITs: | Real Estate Investment Trusts | |
| Footnotes: | ||
| (a) | Non-income producing security. | |
| (b) | Represents cost for financial reporting purposes, which may differ from cost basis for federal income tax purposes. See also Note 7 of the Notes to Financial Statements. | |
The accompanying notes are an integral part of these financial statements.
40
AuguStarSM Variable Insurance Products Fund, Inc.
AVIP S&P 500® Index Portfolio (Unaudited)
Objective/Strategy
The AVIP S&P 500® Index Portfolio (formerly ON S&P 500® Index Portfolio) seeks total return approximating that of the Standard & Poor’s 500® Index (S&P 500® Index), at a risk level consistent with that of the S&P 500® Index by investing, under normal circumstances, more than 80% of its net assets in the common stocks and other securities of companies that are included in the S&P 500® Index.
Performance as of December 31, 2023
| Average Annual returns | |
| One year | 25.72% |
| Five years | 15.24% |
| Ten years | 11.57% |
Past performance does not guarantee future results. The performance data quoted represents past performance and current returns may be lower or higher. Total return figures include change in share price and reinvestment of dividends and capital gains. The investment return and principal value will fluctuate so that an investor’s shares, when redeemed, may be worth more or less than the original cost. To obtain performance information up to the most recent month end, call toll-free 1-877-781-6392.
The Portfolio is not open to direct retail investment. Beneficial interest in the Portfolio’s shares is obtained either through an allocation to the Portfolio as an investment vehicle within variable life insurance policies or annuity contracts, or as an underlying investment by the AVIP Model Portfolios. Actual performance results for variable annuity and variable universal life contracts will be lower due to contract charges. Consult your contract for applicable charges.
Total expense ratio is 0.38% per the Fund’s Prospectus dated May 1, 2023 and supplemented October 2, 2023 and December 4, 2023. Additional information pertaining to the Portfolio’s expense ratio as of December 31, 2023 can be found in the Portfolio’s Financial Highlights.
Comments from Sub-Adviser
Q. How did the Portfolio perform in comparison to its benchmark during the reporting period?
A. For the year ended December 31, 2023, the Portfolio returned 25.72% versus 26.29% for its benchmark, the S&P 500® Index.
Q. What affected the Portfolio’s performance?
A. The Portfolio seeks to track the underlying return of the S&P 500® Index. There were no material market events or changes in strategy during the year that materially impacted the Portfolio’s relative return. Sources of return variance were related to the cumulative impact of investing the day-to-day cash flows in the Portfolio. There was no impact from either sector allocation or stock selection that caused any significant performance variance between the Portfolio and its benchmark. Information Technology, Consumer Discretionary and Communication Services were the top contributing sectors for the year, while Utilities and Energy, were the largest detractors. Because the Portfolio weights its holdings to be similar to those utilized by the benchmark, there were no holdings that significantly contributed to, or detracted from, the Portfolio’s benchmark-relative performance. Benchmark constituents that contributed the most to Portfolio and benchmark returns for the year were Microsoft Corp., Apple, Inc., and NVIDIA Corp., while Pfizer, Inc., Chevron Corp., and NextEra Energy, Inc. were the largest detractors. (1)
| (1) | The Portfolio’s composition is subject to change. Holdings and weightings are as of December 31, 2023. |
Change in Value of $10,000 Investment

Hypothetical illustration based on past performance. Future performance will vary. The Portfolio’s returns reflect reinvested dividends. The Portfolio’s holdings may differ significantly from the securities in the index. The index is unmanaged and therefore does not reflect the cost of portfolio management and accounting. Investors cannot invest directly in an index, although they can invest in its underlying securities or funds.
The S&P 500® Index is a capitalization-weighted index designed to measure performance of the broad domestic economy through changes in the aggregate market value of 500 stocks representing all major industries. The index presented includes the effects of reinvested dividends.
Past performance is no guarantee of future results. Redemption of fund shares could have tax implications unique to each shareholder.
The S&P 500® Index is a product of S&P Dow Jones Indices LLC or its affiliates (“SPDJI”), and has been licensed for use by Ohio National Investments, Inc. (“ONI”). Standard & Poor’s® and S&P® are registered trademarks of Standard & Poor’s Financial Services LLC (“S&P”); Dow Jones® is a registered trademark of Dow Jones Trademark Holdings LLC (“Dow Jones”); and these trademarks have been licensed for use by SPDJI and sublicensed for certain purposes by ONI. The AVIP S&P 500® Index Portfolio of AuguStarSM Variable Insurance Products Fund, Inc. is not sponsored, endorsed, sold or promoted by SPDJI, Dow Jones, S&P, their respective affiliates, and none of such parties make any representation regarding the advisability of investing in such product(s) nor do they have any liability for any errors, omissions, or interruptions of the S&P 500® Index.
41
(continued)
AuguStarSM Variable Insurance Products Fund, Inc.
AVIP S&P 500® Index Portfolio (Unaudited) (Continued)
| Portfolio Composition as of December 31, 2023 (1) | |
| % of Net Assets | |
| Common Stocks (4) | 99.7 |
| U.S. Treasury Obligations | 0.0 |
| Other Net Assets | 0.3 |
| 100.0 | |
| Top 10 Portfolio Holdings as of December 31, 2023 (1) (2) (3) | ||
| % of Net Assets | ||
| 1. | Apple, Inc. | 7.0 |
| 2. | Microsoft Corp. | 7.0 |
| 3. | Amazon.com, Inc. | 3.4 |
| 4. | NVIDIA Corp. | 3.0 |
| 5. | Alphabet, Inc. Class A | 2.1 |
| 6. | Meta Platforms, Inc. Class A | 2.0 |
| 7. | Alphabet, Inc. Class C | 1.8 |
| 8. | Tesla, Inc. | 1.7 |
| 9. | Berkshire Hathaway, Inc. Class B | 1.6 |
| 10. | JPMorgan Chase & Co. | 1.2 |
| (1) | Composition of Portfolio subject to change. | |
| (2) | Short-term investments have been excluded from the list of Top 10 Portfolio Holdings. | |
| (3) | Top 10 Portfolio Holdings is presented at an individual security level. Total investment exposure by issuer may be higher. | |
| (4) | Sectors (Common Stocks): | |
| % of Net Assets | |
| Information Technology | 28.8 |
| Financials | 12.9 |
| Health Care | 12.6 |
| Consumer Discretionary | 10.8 |
| Industrials | 8.8 |
| Communication Services | 8.6 |
| Consumer Staples | 6.1 |
| Energy | 3.9 |
| Real Estate | 2.5 |
| Materials | 2.4 |
| Utilities | 2.3 |
| 99.7 |
42
AuguStarSM Variable Insurance Products Fund, Inc.
AVIP S&P 500® Index Portfolio
| Schedule of Investments | December 31, 2023 |
| Common Stocks–99.7% | Shares | Value | |
| Communication Services–8.6% | |||
Alphabet, Inc. Class A (Interactive Media & Svs.) | (a) | 174,710 | $ 24,405,240 |
Alphabet, Inc. Class C (Interactive Media & Svs.) | (a) | 147,025 | 20,720,233 |
AT&T, Inc. (Diversified Telecom. Svs.) | 211,045 | 3,541,335 | |
Charter Communications, Inc. Class A (Media) | (a) | 2,969 | 1,153,991 |
Comcast Corp. Class A (Media) | 118,560 | 5,198,856 | |
Electronic Arts, Inc. (Entertainment) | 7,226 | 988,589 | |
Fox Corp. Class A (Media) | 7,735 | 229,497 | |
Fox Corp. Class B (Media) | 3,509 | 97,024 | |
Interpublic Group of Cos., Inc. / The (Media) | 11,235 | 366,710 | |
Live Nation Entertainment, Inc. (Entertainment) | (a) | 4,206 | 393,682 |
Match Group, Inc. (Interactive Media & Svs.) | (a) | 8,079 | 294,884 |
Meta Platforms, Inc. Class A (Interactive Media & Svs.) | (a) | 65,524 | 23,192,875 |
Netflix, Inc. (Entertainment) | (a) | 12,921 | 6,290,976 |
News Corp. Class A (Media) | 11,059 | 271,498 | |
News Corp. Class B (Media) | 3,465 | 89,120 | |
Omnicom Group, Inc. (Media) | 5,833 | 504,613 | |
Paramount Global Class B (Media) | 14,237 | 210,565 | |
Take-Two Interactive Software, Inc. (Entertainment) | (a) | 4,665 | 750,832 |
T-Mobile U.S., Inc. (Wireless Telecom. Svs.) | 15,023 | 2,408,638 | |
Verizon Communications, Inc. (Diversified Telecom. Svs.) | 124,096 | 4,678,419 | |
Walt Disney Co. / The (Entertainment) | 54,019 | 4,877,376 | |
Warner Bros. Discovery, Inc. (Entertainment) | (a) | 65,471 | 745,060 |
| 101,410,013 | |||
| Consumer Discretionary–10.8% | |||
Airbnb, Inc. Class A (Hotels, Restaurants & Leisure) | (a) | 12,833 | 1,747,085 |
Amazon.com, Inc. (Broadline Retail) | (a) | 268,454 | 40,788,901 |
Aptiv PLC (Automobile Components) | (a) | 8,343 | 748,534 |
AutoZone, Inc. (Specialty Retail) | (a) | 520 | 1,344,517 |
Bath & Body Works, Inc. (Specialty Retail) | 6,761 | 291,805 | |
Best Buy Co., Inc. (Specialty Retail) | 5,750 | 450,110 | |
Booking Holdings, Inc. (Hotels, Restaurants & Leisure) | (a) | 1,030 | 3,653,637 |
BorgWarner, Inc. (Automobile Components) | 6,951 | 249,193 | |
Caesars Entertainment, Inc. (Hotels, Restaurants & Leisure) | (a) | 6,378 | 299,001 |
CarMax, Inc. (Specialty Retail) | (a) | 4,705 | 361,062 |
Carnival Corp. (Hotels, Restaurants & Leisure) | (a) | 29,857 | 553,549 |
Chipotle Mexican Grill, Inc. (Hotels, Restaurants & Leisure) | (a) | 810 | 1,852,438 |
D.R. Horton, Inc. (Household Durables) | 8,899 | 1,352,470 | |
Darden Restaurants, Inc. (Hotels, Restaurants & Leisure) | 3,565 | 585,729 | |
Domino's Pizza, Inc. (Hotels, Restaurants & Leisure) | 1,026 | 422,948 | |
eBay, Inc. (Broadline Retail) | 15,303 | 667,517 | |
Etsy, Inc. (Broadline Retail) | (a) | 3,560 | 288,538 |
Expedia Group, Inc. (Hotels, Restaurants & Leisure) | (a) | 3,929 | 596,383 |
Ford Motor Co. (Automobiles) | 116,074 | 1,414,942 | |
Garmin Ltd. (Household Durables) | 4,500 | 578,430 | |
General Motors Co. (Automobiles) | 40,428 | 1,452,174 | |
Genuine Parts Co. (Distributors) | 4,135 | 572,697 | |
Hasbro, Inc. (Leisure Products) | 3,867 | 197,449 | |
Hilton Worldwide Holdings, Inc. (Hotels, Restaurants & Leisure) | 7,572 | 1,378,785 | |
Home Depot, Inc. / The (Specialty Retail) | 29,520 | 10,230,156 | |
Las Vegas Sands Corp. (Hotels, Restaurants & Leisure) | 10,877 | 535,257 | |
Lennar Corp. Class A (Household Durables) | 7,388 | 1,101,108 | |
LKQ Corp. (Distributors) | 7,919 | 378,449 | |
Lowe's Cos., Inc. (Specialty Retail) | 17,033 | 3,790,694 | |
Lululemon Athletica, Inc. (Textiles, Apparel & Luxury Goods) | (a) | 3,398 | 1,737,363 |
| Common Stocks (Continued) | Shares | Value | |
| Consumer Discretionary (continued) | |||
Marriott International, Inc. Class A (Hotels, Restaurants & Leisure) | 7,284 | $ 1,642,615 | |
McDonald's Corp. (Hotels, Restaurants & Leisure) | 21,415 | 6,349,762 | |
MGM Resorts International (Hotels, Restaurants & Leisure) | 8,015 | 358,110 | |
Mohawk Industries, Inc. (Household Durables) | (a) | 1,558 | 161,253 |
NIKE, Inc. Class B (Textiles, Apparel & Luxury Goods) | 36,123 | 3,921,874 | |
Norwegian Cruise Line Holdings Ltd. (Hotels, Restaurants & Leisure) | (a) | 12,459 | 249,678 |
NVR, Inc. (Household Durables) | (a) | 94 | 658,042 |
O'Reilly Automotive, Inc. (Specialty Retail) | (a) | 1,746 | 1,658,840 |
Pool Corp. (Distributors) | 1,135 | 452,536 | |
PulteGroup, Inc. (Household Durables) | 6,358 | 656,273 | |
Ralph Lauren Corp. (Textiles, Apparel & Luxury Goods) | 1,182 | 170,444 | |
Ross Stores, Inc. (Specialty Retail) | 9,994 | 1,383,070 | |
Royal Caribbean Cruises Ltd. (Hotels, Restaurants & Leisure) | (a) | 6,951 | 900,085 |
Starbucks Corp. (Hotels, Restaurants & Leisure) | 33,729 | 3,238,321 | |
Tapestry, Inc. (Textiles, Apparel & Luxury Goods) | 6,766 | 249,056 | |
Tesla, Inc. (Automobiles) | (a) | 81,643 | 20,286,653 |
TJX Cos., Inc. / The (Specialty Retail) | 33,772 | 3,168,151 | |
Tractor Supply Co. (Specialty Retail) | 3,188 | 685,516 | |
Ulta Beauty, Inc. (Specialty Retail) | (a) | 1,452 | 711,465 |
V.F. Corp. (Textiles, Apparel & Luxury Goods) | 9,814 | 184,503 | |
Whirlpool Corp. (Household Durables) | 1,618 | 197,024 | |
Wynn Resorts Ltd. (Hotels, Restaurants & Leisure) | 2,834 | 258,206 | |
Yum! Brands, Inc. (Hotels, Restaurants & Leisure) | 8,278 | 1,081,603 | |
| 128,244,001 | |||
| Consumer Staples–6.1% | |||
Altria Group, Inc. (Tobacco) | 52,226 | 2,106,797 | |
Archer-Daniels-Midland Co. (Food Products) | 15,748 | 1,137,321 | |
Brown-Forman Corp. Class B (Beverages) | 5,439 | 310,567 | |
Bunge Global SA (Food Products) | 4,269 | 430,956 | |
Campbell Soup Co. (Food Products) | 5,808 | 251,080 | |
Church & Dwight Co., Inc. (Household Products) | 7,276 | 688,019 | |
Clorox Co. / The (Household Products) | 3,651 | 520,596 | |
Coca-Cola Co. / The (Beverages) | 114,856 | 6,768,464 | |
Colgate-Palmolive Co. (Household Products) | 24,309 | 1,937,670 | |
Conagra Brands, Inc. (Food Products) | 14,047 | 402,587 | |
Constellation Brands, Inc. Class A (Beverages) | 4,769 | 1,152,906 | |
Costco Wholesale Corp. (Consumer Staples Distribution & Retail) | 13,070 | 8,627,246 | |
Dollar General Corp. (Consumer Staples Distribution & Retail) | 6,476 | 880,412 | |
Dollar Tree, Inc. (Consumer Staples Distribution & Retail) | (a) | 6,164 | 875,596 |
Estee Lauder Cos., Inc. / The Class A (Personal Care Products) | 6,851 | 1,001,959 | |
General Mills, Inc. (Food Products) | 17,170 | 1,118,454 | |
Hershey Co. / The (Food Products) | 4,425 | 824,997 | |
Hormel Foods Corp. (Food Products) | 8,562 | 274,926 | |
J.M. Smucker Co. / The (Food Products) | 3,146 | 397,591 | |
Kellanova (Food Products) | 7,805 | 436,378 | |
Kenvue, Inc. (Personal Care Products) | 50,861 | 1,095,037 | |
Keurig Dr Pepper, Inc. (Beverages) | 29,707 | 989,837 | |
Kimberly-Clark Corp. (Household Products) | 9,979 | 1,212,548 | |
Kraft Heinz Co. / The (Food Products) | 23,515 | 869,585 | |
Kroger Co. / The (Consumer Staples Distribution & Retail) | 19,518 | 892,168 | |
Lamb Weston Holdings, Inc. (Food Products) | 4,260 | 460,463 | |
McCormick & Co., Inc. (Food Products) | 7,406 | 506,718 | |
43
(continued)
AuguStarSM Variable Insurance Products Fund, Inc.
AVIP S&P 500® Index Portfolio (Continued)
| Schedule of Investments | December 31, 2023 |
| Common Stocks (Continued) | Shares | Value | |
| Consumer Staples (continued) | |||
Molson Coors Beverage Co. Class B (Beverages) | 5,502 | $ 336,777 | |
Mondelez International, Inc. Class A (Food Products) | 40,172 | 2,909,658 | |
Monster Beverage Corp. (Beverages) | (a) | 21,797 | 1,255,725 |
PepsiCo, Inc. (Beverages) | 40,579 | 6,891,937 | |
Philip Morris International, Inc. (Tobacco) | 45,826 | 4,311,310 | |
Procter & Gamble Co. / The (Household Products) | 69,583 | 10,196,693 | |
Sysco Corp. (Consumer Staples Distribution & Retail) | 14,883 | 1,088,394 | |
Target Corp. (Consumer Staples Distribution & Retail) | 13,623 | 1,940,188 | |
Tyson Foods, Inc. Class A (Food Products) | 8,450 | 454,187 | |
Walgreens Boots Alliance, Inc. (Consumer Staples Distribution & Retail) | 21,248 | 554,785 | |
Walmart, Inc. (Consumer Staples Distribution & Retail) | 42,115 | 6,639,430 | |
| 72,749,962 | |||
| Energy–3.9% | |||
APA Corp. (Oil, Gas & Consumable Fuels) | 9,095 | 326,329 | |
Baker Hughes Co. (Energy Equip. & Svs.) | 29,721 | 1,015,864 | |
Chevron Corp. (Oil, Gas & Consumable Fuels) | 51,827 | 7,730,515 | |
ConocoPhillips (Oil, Gas & Consumable Fuels) | 35,055 | 4,068,834 | |
Coterra Energy, Inc. (Oil, Gas & Consumable Fuels) | 22,141 | 565,038 | |
Devon Energy Corp. (Oil, Gas & Consumable Fuels) | 18,904 | 856,351 | |
Diamondback Energy, Inc. (Oil, Gas & Consumable Fuels) | 5,285 | 819,598 | |
EOG Resources, Inc. (Oil, Gas & Consumable Fuels) | 17,217 | 2,082,396 | |
EQT Corp. (Oil, Gas & Consumable Fuels) | 12,088 | 467,322 | |
Exxon Mobil Corp. (Oil, Gas & Consumable Fuels) | 118,250 | 11,822,635 | |
Halliburton Co. (Energy Equip. & Svs.) | 26,420 | 955,083 | |
Hess Corp. (Oil, Gas & Consumable Fuels) | 8,159 | 1,176,201 | |
Kinder Morgan, Inc. (Oil, Gas & Consumable Fuels) | 57,111 | 1,007,438 | |
Marathon Oil Corp. (Oil, Gas & Consumable Fuels) | 17,192 | 415,359 | |
Marathon Petroleum Corp. (Oil, Gas & Consumable Fuels) | 11,211 | 1,663,264 | |
Occidental Petroleum Corp. (Oil, Gas & Consumable Fuels) | 19,490 | 1,163,748 | |
ONEOK, Inc. (Oil, Gas & Consumable Fuels) | 17,196 | 1,207,503 | |
Phillips 66 (Oil, Gas & Consumable Fuels) | 12,990 | 1,729,489 | |
Pioneer Natural Resources Co. (Oil, Gas & Consumable Fuels) | 6,888 | 1,548,973 | |
Schlumberger N.V. (Energy Equip. & Svs.) | 42,169 | 2,194,475 | |
Targa Resources Corp. (Oil, Gas & Consumable Fuels) | 6,610 | 574,211 | |
Valero Energy Corp. (Oil, Gas & Consumable Fuels) | 10,051 | 1,306,630 | |
Williams Cos., Inc. / The (Oil, Gas & Consumable Fuels) | 35,928 | 1,251,372 | |
| 45,948,628 | |||
| Financials–12.9% | |||
Aflac, Inc. (Insurance) | 15,705 | 1,295,663 | |
Allstate Corp. / The (Insurance) | 7,723 | 1,081,066 | |
American Express Co. (Consumer Finance) | 16,998 | 3,184,405 | |
American International Group, Inc. (Insurance) | 20,724 | 1,404,051 | |
Ameriprise Financial, Inc. (Capital Markets) | 2,988 | 1,134,932 | |
Aon PLC Class A (Insurance) | 5,910 | 1,719,928 | |
Arch Capital Group Ltd. (Insurance) | (a) | 11,018 | 818,307 |
Arthur J. Gallagher & Co. (Insurance) | 6,376 | 1,433,835 | |
Assurant, Inc. (Insurance) | 1,539 | 259,306 | |
Bank of America Corp. (Banks) | 203,251 | 6,843,461 | |
| Common Stocks (Continued) | Shares | Value | |
| Financials (continued) | |||
Bank of New York Mellon Corp. / The (Capital Markets) | 22,710 | $ 1,182,056 | |
Berkshire Hathaway, Inc. Class B (Financial Services) | (a) | 53,714 | 19,157,635 |
BlackRock, Inc. (Capital Markets) | 4,128 | 3,351,110 | |
Blackstone, Inc. (Capital Markets) | 20,974 | 2,745,916 | |
Brown & Brown, Inc. (Insurance) | 6,960 | 494,926 | |
Capital One Financial Corp. (Consumer Finance) | 11,243 | 1,474,182 | |
CBOE Global Markets, Inc. (Capital Markets) | 3,103 | 554,072 | |
Charles Schwab Corp. / The (Capital Markets) | 43,929 | 3,022,315 | |
Chubb Ltd. (Insurance) | 12,045 | 2,722,170 | |
Cincinnati Financial Corp. (Insurance) | 4,655 | 481,606 | |
Citigroup, Inc. (Banks) | 56,504 | 2,906,566 | |
Citizens Financial Group, Inc. (Banks) | 13,724 | 454,813 | |
CME Group, Inc. (Capital Markets) | 10,632 | 2,239,099 | |
Comerica, Inc. (Banks) | 3,920 | 218,775 | |
Discover Financial Services (Consumer Finance) | 7,380 | 829,512 | |
Everest Group Ltd. (Insurance) | 1,285 | 454,350 | |
FactSet Research Systems, Inc. (Capital Markets) | 1,117 | 532,865 | |
Fidelity National Information Services, Inc. (Financial Services) | 17,479 | 1,049,964 | |
Fifth Third Bancorp (Banks) | 20,081 | 692,594 | |
Fiserv, Inc. (Financial Services) | (a) | 17,723 | 2,354,323 |
FleetCor Technologies, Inc. (Financial Services) | (a) | 2,127 | 601,111 |
Franklin Resources, Inc. (Capital Markets) | 8,400 | 250,236 | |
Global Payments, Inc. (Financial Services) | 7,686 | 976,122 | |
Globe Life, Inc. (Insurance) | 2,544 | 309,656 | |
Goldman Sachs Group, Inc. / The (Capital Markets) | 9,626 | 3,713,422 | |
Hartford Financial Services Group, Inc. / The (Insurance) | 8,865 | 712,569 | |
Huntington Bancshares, Inc. (Banks) | 42,588 | 541,719 | |
Intercontinental Exchange, Inc. (Capital Markets) | 16,902 | 2,170,724 | |
Invesco Ltd. (Capital Markets) | 13,261 | 236,576 | |
Jack Henry & Associates, Inc. (Financial Services) | 2,138 | 349,371 | |
JPMorgan Chase & Co. (Banks) | 85,349 | 14,517,865 | |
KeyCorp (Banks) | 27,764 | 399,802 | |
Loews Corp. (Insurance) | 5,420 | 377,178 | |
M&T Bank Corp. (Banks) | 4,887 | 669,910 | |
MarketAxess Holdings, Inc. (Capital Markets) | 1,121 | 328,285 | |
Marsh & McLennan Cos., Inc. (Insurance) | 14,561 | 2,758,873 | |
Mastercard, Inc. Class A (Financial Services) | 24,448 | 10,427,316 | |
MetLife, Inc. (Insurance) | 18,349 | 1,213,419 | |
Moody's Corp. (Capital Markets) | 4,647 | 1,814,932 | |
Morgan Stanley (Capital Markets) | 37,304 | 3,478,598 | |
MSCI, Inc. (Capital Markets) | 2,335 | 1,320,793 | |
Nasdaq, Inc. (Capital Markets) | 10,021 | 582,621 | |
Northern Trust Corp. (Capital Markets) | 6,136 | 517,756 | |
PayPal Holdings, Inc. (Financial Services) | (a) | 31,818 | 1,953,943 |
PNC Financial Services Group, Inc. / The (Banks) | 11,761 | 1,821,191 | |
Principal Financial Group, Inc. (Insurance) | 6,457 | 507,972 | |
Progressive Corp. / The (Insurance) | 17,272 | 2,751,084 | |
Prudential Financial, Inc. (Insurance) | 10,654 | 1,104,926 | |
Raymond James Financial, Inc. (Capital Markets) | 5,541 | 617,822 | |
Regions Financial Corp. (Banks) | 27,402 | 531,051 | |
S&P Global, Inc. (Capital Markets) | 9,566 | 4,214,014 | |
State Street Corp. (Capital Markets) | 9,105 | 705,273 | |
Synchrony Financial (Consumer Finance) | 12,175 | 464,963 | |
T. Rowe Price Group, Inc. (Capital Markets) | 6,590 | ��� 709,677 | |
Travelers Cos., Inc. / The (Insurance) | 6,744 | 1,284,665 | |
Truist Financial Corp. (Banks) | 39,363 | 1,453,282 | |
U.S. Bancorp (Banks) | 45,958 | 1,989,062 | |
Visa, Inc. (Financial Services) | 47,061 | 12,252,331 | |
44
(continued)
AuguStarSM Variable Insurance Products Fund, Inc.
AVIP S&P 500® Index Portfolio (Continued)
| Schedule of Investments | December 31, 2023 |
| Common Stocks (Continued) | Shares | Value | |
| Financials (continued) | |||
W.R. Berkley Corp. (Insurance) | 5,997 | $ 424,108 | |
Wells Fargo & Co. (Banks) | 107,218 | 5,277,270 | |
Willis Towers Watson PLC (Insurance) | 3,045 | 734,454 | |
Zions Bancorp N.A. (Banks) | 4,385 | 192,370 | |
| 153,352,115 | |||
| Health Care–12.6% | |||
Abbott Laboratories (Health Care Equip. & Supplies) | 51,226 | 5,638,446 | |
AbbVie, Inc. (Biotechnology) | 52,120 | 8,077,036 | |
Agilent Technologies, Inc. (Life Sciences Tools & Svs.) | 8,631 | 1,199,968 | |
Align Technology, Inc. (Health Care Equip. & Supplies) | (a) | 2,111 | 578,414 |
Amgen, Inc. (Biotechnology) | 15,798 | 4,550,140 | |
Baxter International, Inc. (Health Care Equip. & Supplies) | 14,918 | 576,730 | |
Becton Dickinson & Co. (Health Care Equip. & Supplies) | 8,564 | 2,088,160 | |
Biogen, Inc. (Biotechnology) | (a) | 4,276 | 1,106,501 |
Bio-Rad Laboratories, Inc. Class A (Life Sciences Tools & Svs.) | (a) | 617 | 199,223 |
Bio-Techne Corp. (Life Sciences Tools & Svs.) | 4,653 | 359,025 | |
Boston Scientific Corp. (Health Care Equip. & Supplies) | (a) | 43,223 | 2,498,722 |
Bristol-Myers Squibb Co. (Pharmaceuticals) | 60,066 | 3,081,986 | |
Cardinal Health, Inc. (Health Care Providers & Svs.) | 7,267 | 732,514 | |
Catalent, Inc. (Pharmaceuticals) | (a) | 5,328 | 239,387 |
Cencora, Inc. (Health Care Providers & Svs.) | 4,925 | 1,011,496 | |
Centene Corp. (Health Care Providers & Svs.) | (a) | 15,770 | 1,170,292 |
Charles River Laboratories International, Inc. (Life Sciences Tools & Svs.) | (a) | 1,525 | 360,510 |
Cigna Group / The (Health Care Providers & Svs.) | 8,638 | 2,586,649 | |
Cooper Cos., Inc. / The (Health Care Equip. & Supplies) | 1,467 | 555,171 | |
CVS Health Corp. (Health Care Providers & Svs.) | 37,915 | 2,993,768 | |
Danaher Corp. (Life Sciences Tools & Svs.) | 19,410 | 4,490,309 | |
DaVita, Inc. (Health Care Providers & Svs.) | (a) | 1,609 | 168,559 |
DENTSPLY SIRONA, Inc. (Health Care Equip. & Supplies) | 6,278 | 223,434 | |
Dexcom, Inc. (Health Care Equip. & Supplies) | (a) | 11,403 | 1,414,998 |
Edwards Lifesciences Corp. (Health Care Equip. & Supplies) | (a) | 17,899 | 1,364,799 |
Elevance Health, Inc. (Health Care Providers & Svs.) | 6,936 | 3,270,740 | |
Eli Lilly & Co. (Pharmaceuticals) | 23,540 | 13,721,937 | |
GE HealthCare Technologies, Inc. (Health Care Equip. & Supplies) | 11,555 | 893,433 | |
Gilead Sciences, Inc. (Biotechnology) | 36,782 | 2,979,710 | |
HCA Healthcare, Inc. (Health Care Providers & Svs.) | 5,846 | 1,582,395 | |
Henry Schein, Inc. (Health Care Providers & Svs.) | (a) | 3,865 | 292,619 |
Hologic, Inc. (Health Care Equip. & Supplies) | (a) | 7,263 | 518,941 |
Humana, Inc. (Health Care Providers & Svs.) | 3,634 | 1,663,682 | |
IDEXX Laboratories, Inc. (Health Care Equip. & Supplies) | (a) | 2,452 | 1,360,983 |
Illumina, Inc. (Life Sciences Tools & Svs.) | (a) | 4,682 | 651,922 |
Incyte Corp. (Biotechnology) | (a) | 5,519 | 346,538 |
Insulet Corp. (Health Care Equip. & Supplies) | (a) | 2,066 | 448,281 |
Intuitive Surgical, Inc. (Health Care Equip. & Supplies) | (a) | 10,392 | 3,505,845 |
IQVIA Holdings, Inc. (Life Sciences Tools & Svs.) | (a) | 5,403 | 1,250,146 |
Johnson & Johnson (Pharmaceuticals) | 71,067 | 11,139,042 | |
Laboratory Corp. of America Holdings (Health Care Providers & Svs.) | 2,499 | 567,998 | |
| Common Stocks (Continued) | Shares | Value | |
| Health Care (continued) | |||
McKesson Corp. (Health Care Providers & Svs.) | 3,930 | $ 1,819,511 | |
Medtronic PLC (Health Care Equip. & Supplies) | 39,275 | 3,235,474 | |
Merck & Co., Inc. (Pharmaceuticals) | 74,809 | 8,155,677 | |
Mettler-Toledo International, Inc. (Life Sciences Tools & Svs.) | (a) | 639 | 775,081 |
Moderna, Inc. (Biotechnology) | (a) | 9,787 | 973,317 |
Molina Healthcare, Inc. (Health Care Providers & Svs.) | (a) | 1,719 | 621,092 |
Pfizer, Inc. (Pharmaceuticals) | 166,678 | 4,798,660 | |
Quest Diagnostics, Inc. (Health Care Providers & Svs.) | 3,310 | 456,383 | |
Regeneron Pharmaceuticals, Inc. (Biotechnology) | (a) | 3,163 | 2,778,031 |
ResMed, Inc. (Health Care Equip. & Supplies) | 4,338 | 746,223 | |
Revvity, Inc. (Life Sciences Tools & Svs.) | 3,667 | 400,840 | |
STERIS PLC (Health Care Equip. & Supplies) | 2,909 | 639,544 | |
Stryker Corp. (Health Care Equip. & Supplies) | 9,980 | 2,988,611 | |
Teleflex, Inc. (Health Care Equip. & Supplies) | 1,379 | 343,840 | |
Thermo Fisher Scientific, Inc. (Life Sciences Tools & Svs.) | 11,404 | 6,053,129 | |
UnitedHealth Group, Inc. (Health Care Providers & Svs.) | 27,305 | 14,375,263 | |
Universal Health Services, Inc. Class B (Health Care Providers & Svs.) | 1,813 | 276,374 | |
Vertex Pharmaceuticals, Inc. (Biotechnology) | (a) | 7,607 | 3,095,212 |
Viatris, Inc. (Pharmaceuticals) | 35,269 | 381,963 | |
Waters Corp. (Life Sciences Tools & Svs.) | (a) | 1,753 | 577,140 |
West Pharmaceutical Services, Inc. (Life Sciences Tools & Svs.) | 2,181 | 767,974 | |
Zimmer Biomet Holdings, Inc. (Health Care Equip. & Supplies) | 6,167 | 750,524 | |
Zoetis, Inc. (Pharmaceuticals) | 13,553 | 2,674,956 | |
| 149,145,268 | |||
| Industrials–8.8% | |||
3M Co. (Industrial Conglomerates) | 16,298 | 1,781,697 | |
A.O. Smith Corp. (Building Products) | 3,653 | 301,153 | |
Allegion PLC (Building Products) | 2,576 | 326,353 | |
American Airlines Group, Inc. (Passenger Airlines) | (a) | 19,512 | 268,095 |
AMETEK, Inc. (Electrical Equip.) | 6,816 | 1,123,890 | |
Automatic Data Processing, Inc. (Professional Svs.) | 12,140 | 2,828,256 | |
Axon Enterprise, Inc. (Aerospace & Defense) | (a) | 2,078 | 536,810 |
Boeing Co. / The (Aerospace & Defense) | (a) | 16,786 | 4,375,439 |
Broadridge Financial Solutions, Inc. (Professional Svs.) | 3,471 | 714,158 | |
Builders FirstSource, Inc. (Building Products) | (a) | 3,637 | 607,161 |
C.H. Robinson Worldwide, Inc. (Air Freight & Logistics) | 3,423 | 295,713 | |
Carrier Global Corp. (Building Products) | 24,764 | 1,422,692 | |
Caterpillar, Inc. (Machinery) | 15,059 | 4,452,495 | |
Ceridian HCM Holding, Inc. (Professional Svs.) | (a) | 4,627 | 310,564 |
Cintas Corp. (Commercial Svs. & Supplies) | 2,556 | 1,540,399 | |
Copart, Inc. (Commercial Svs. & Supplies) | (a) | 25,800 | 1,264,200 |
CSX Corp. (Ground Transportation) | 58,346 | 2,022,856 | |
Cummins, Inc. (Machinery) | 4,185 | 1,002,600 | |
Deere & Co. (Machinery) | 7,906 | 3,161,372 | |
Delta Air Lines, Inc. (Passenger Airlines) | 18,938 | 761,876 | |
Dover Corp. (Machinery) | 4,114 | 632,774 | |
Eaton Corp. PLC (Electrical Equip.) | 11,787 | 2,838,545 | |
Emerson Electric Co. (Electrical Equip.) | 16,827 | 1,637,772 | |
Equifax, Inc. (Professional Svs.) | 3,634 | 898,652 | |
Expeditors International of Washington, Inc. (Air Freight & Logistics) | 4,278 | 544,162 | |
Fastenal Co. (Trading Companies & Distributors) | 16,879 | 1,093,253 | |
FedEx Corp. (Air Freight & Logistics) | 6,831 | 1,728,038 | |
45
(continued)
AuguStarSM Variable Insurance Products Fund, Inc.
AVIP S&P 500® Index Portfolio (Continued)
| Schedule of Investments | December 31, 2023 |
| Common Stocks (Continued) | Shares | Value | |
| Industrials (continued) | |||
Fortive Corp. (Machinery) | 10,354 | $ 762,365 | |
Generac Holdings, Inc. (Electrical Equip.) | (a) | 1,814 | 234,441 |
General Dynamics Corp. (Aerospace & Defense) | 6,691 | 1,737,452 | |
General Electric Co. (Industrial Conglomerates) | 32,133 | 4,101,135 | |
Honeywell International, Inc. (Industrial Conglomerates) | 19,462 | 4,081,376 | |
Howmet Aerospace, Inc. (Aerospace & Defense) | 11,538 | 624,437 | |
Hubbell, Inc. (Electrical Equip.) | 1,577 | 518,723 | |
Huntington Ingalls Industries, Inc. (Aerospace & Defense) | 1,176 | 305,337 | |
IDEX Corp. (Machinery) | 2,241 | 486,543 | |
Illinois Tool Works, Inc. (Machinery) | 8,086 | 2,118,047 | |
Ingersoll Rand, Inc. (Machinery) | 11,943 | 923,672 | |
J.B. Hunt Transport Services, Inc. (Ground Transportation) | 2,397 | 478,777 | |
Jacobs Solutions, Inc. (Professional Svs.) | 3,734 | 484,673 | |
Johnson Controls International PLC (Building Products) | 20,081 | 1,157,469 | |
L3Harris Technologies, Inc. (Aerospace & Defense) | 5,595 | 1,178,419 | |
Leidos Holdings, Inc. (Professional Svs.) | 4,070 | 440,537 | |
Lockheed Martin Corp. (Aerospace & Defense) | 6,520 | 2,955,125 | |
Masco Corp. (Building Products) | 6,655 | 445,752 | |
Nordson Corp. (Machinery) | 1,603 | 423,448 | |
Norfolk Southern Corp. (Ground Transportation) | 6,675 | 1,577,836 | |
Northrop Grumman Corp. (Aerospace & Defense) | 4,185 | 1,959,166 | |
Old Dominion Freight Line, Inc. (Ground Transportation) | 2,641 | 1,070,477 | |
Otis Worldwide Corp. (Machinery) | 12,089 | 1,081,603 | |
PACCAR, Inc. (Machinery) | 15,447 | 1,508,400 | |
Parker-Hannifin Corp. (Machinery) | 3,793 | 1,747,435 | |
Paychex, Inc. (Professional Svs.) | 9,489 | 1,130,235 | |
Paycom Software, Inc. (Professional Svs.) | 1,450 | 299,744 | |
Pentair PLC (Machinery) | 4,900 | 356,279 | |
Quanta Services, Inc. (Construction & Engineering) | 4,287 | 925,135 | |
Republic Services, Inc. (Commercial Svs. & Supplies) | 6,039 | 995,891 | |
Robert Half, Inc. (Professional Svs.) | 3,132 | 275,365 | |
Rockwell Automation, Inc. (Electrical Equip.) | 3,383 | 1,050,354 | |
Rollins, Inc. (Commercial Svs. & Supplies) | 8,249 | 360,234 | |
RTX Corp. (Aerospace & Defense) | 42,446 | 3,571,406 | |
Snap-on, Inc. (Machinery) | 1,551 | 447,991 | |
Southwest Airlines Co. (Passenger Airlines) | 17,538 | 506,497 | |
Stanley Black & Decker, Inc. (Machinery) | 4,540 | 445,374 | |
Textron, Inc. (Aerospace & Defense) | 5,765 | 463,621 | |
Trane Technologies PLC (Building Products) | 6,743 | 1,644,618 | |
TransDigm Group, Inc. (Aerospace & Defense) | 1,633 | 1,651,943 | |
Uber Technologies, Inc. (Ground Transportation) | (a) | 60,749 | 3,740,316 |
Union Pacific Corp. (Ground Transportation) | 17,998 | 4,420,669 | |
United Airlines Holdings, Inc. (Passenger Airlines) | (a) | 9,750 | 402,285 |
United Parcel Service, Inc. Class B (Air Freight & Logistics) | 21,355 | 3,357,647 | |
United Rentals, Inc. (Trading Companies & Distributors) | 2,000 | 1,146,840 | |
Veralto Corp. (Commercial Svs. & Supplies) | 6,497 | 534,443 | |
Verisk Analytics, Inc. (Professional Svs.) | 4,280 | 1,022,321 | |
W.W. Grainger, Inc. (Trading Companies & Distributors) | 1,305 | 1,081,440 | |
Waste Management, Inc. (Commercial Svs. & Supplies) | 10,825 | 1,938,757 | |
| Common Stocks (Continued) | Shares | Value | |
| Industrials (continued) | |||
Westinghouse Air Brake Technologies Corp. (Machinery) | 5,286 | $ 670,793 | |
Xylem, Inc. (Machinery) | 7,106 | 812,642 | |
| 104,126,460 | |||
| Information Technology–28.8% | |||
Accenture PLC Class A (IT Svs.) | 18,529 | 6,502,011 | |
Adobe, Inc. (Software) | (a) | 13,440 | 8,018,304 |
Advanced Micro Devices, Inc. (Semiconductors & Equip.) | (a) | 47,694 | 7,030,573 |
Akamai Technologies, Inc. (IT Svs.) | (a) | 4,436 | 525,001 |
Amphenol Corp. Class A (Electronic Equip., Instr. & Comp.) | 17,670 | 1,751,627 | |
Analog Devices, Inc. (Semiconductors & Equip.) | 14,711 | 2,921,016 | |
ANSYS, Inc. (Software) | (a) | 2,561 | 929,336 |
Apple, Inc. (Tech. Hardware, Storage & Periph.) | 431,584 | 83,092,868 | |
Applied Materials, Inc. (Semiconductors & Equip.) | 24,696 | 4,002,481 | |
Arista Networks, Inc. (Communications Equip.) | (a) | 7,439 | 1,751,959 |
Autodesk, Inc. (Software) | (a) | 6,309 | 1,536,115 |
Broadcom, Inc. (Semiconductors & Equip.) | 12,958 | 14,464,367 | |
Cadence Design Systems, Inc. (Software) | (a) | 8,032 | 2,187,676 |
CDW Corp. (Electronic Equip., Instr. & Comp.) | 3,955 | 899,051 | |
Cisco Systems, Inc. (Communications Equip.) | 119,572 | 6,040,777 | |
Cognizant Technology Solutions Corp. Class A (IT Svs.) | 14,808 | 1,118,448 | |
Corning, Inc. (Electronic Equip., Instr. & Comp.) | 22,652 | 689,753 | |
Enphase Energy, Inc. (Semiconductors & Equip.) | (a) | 4,028 | 532,260 |
EPAM Systems, Inc. (IT Svs.) | (a) | 1,701 | 505,775 |
F5, Inc. (Communications Equip.) | (a) | 1,775 | 317,689 |
Fair Isaac Corp. (Software) | (a) | 729 | 848,563 |
First Solar, Inc. (Semiconductors & Equip.) | (a) | 3,169 | 545,955 |
Fortinet, Inc. (Software) | (a) | 18,811 | 1,101,008 |
Gartner, Inc. (IT Svs.) | (a) | 2,302 | 1,038,455 |
Gen Digital, Inc. (Software) | 16,593 | 378,652 | |
Hewlett Packard Enterprise Co. (Tech. Hardware, Storage & Periph.) | 37,808 | 641,980 | |
HP, Inc. (Tech. Hardware, Storage & Periph.) | 25,676 | 772,591 | |
Intel Corp. (Semiconductors & Equip.) | 124,457 | 6,253,964 | |
International Business Machines Corp. (IT Svs.) | 26,961 | 4,409,472 | |
Intuit, Inc. (Software) | 8,273 | 5,170,873 | |
Jabil, Inc. (Electronic Equip., Instr. & Comp.) | 3,762 | 479,279 | |
Juniper Networks, Inc. (Communications Equip.) | 9,440 | 278,291 | |
Keysight Technologies, Inc. (Electronic Equip., Instr. & Comp.) | (a) | 5,240 | 833,632 |
KLA Corp. (Semiconductors & Equip.) | 4,013 | 2,332,757 | |
Lam Research Corp. (Semiconductors & Equip.) | 3,891 | 3,047,665 | |
Microchip Technology, Inc. (Semiconductors & Equip.) | 15,970 | 1,440,175 | |
Micron Technology, Inc. (Semiconductors & Equip.) | 32,414 | 2,766,211 | |
Microsoft Corp. (Software) | 219,403 | 82,504,304 | |
Monolithic Power Systems, Inc. (Semiconductors & Equip.) | 1,414 | 891,923 | |
Motorola Solutions, Inc. (Communications Equip.) | 4,900 | 1,534,141 | |
NetApp, Inc. (Tech. Hardware, Storage & Periph.) | 6,143 | 541,567 | |
NVIDIA Corp. (Semiconductors & Equip.) | 72,916 | 36,109,462 | |
NXP Semiconductors N.V. (Semiconductors & Equip.) | 7,609 | 1,747,635 | |
ON Semiconductor Corp. (Semiconductors & Equip.) | (a) | 12,711 | 1,061,750 |
46
(continued)
AuguStarSM Variable Insurance Products Fund, Inc.
AVIP S&P 500® Index Portfolio (Continued)
| Schedule of Investments | December 31, 2023 |
| Common Stocks (Continued) | Shares | Value | |
| Information Technology (continued) | |||
Oracle Corp. (Software) | 46,901 | $ 4,944,772 | |
Palo Alto Networks, Inc. (Software) | (a) | 9,176 | 2,705,819 |
PTC, Inc. (Software) | (a) | 3,522 | 616,209 |
Qorvo, Inc. (Semiconductors & Equip.) | (a) | 2,877 | 323,979 |
QUALCOMM, Inc. (Semiconductors & Equip.) | 32,856 | 4,751,963 | |
Roper Technologies, Inc. (Software) | 3,154 | 1,719,466 | |
Salesforce, Inc. (Software) | (a) | 28,724 | 7,558,433 |
Seagate Technology Holdings PLC (Tech. Hardware, Storage & Periph.) | 5,721 | 488,402 | |
ServiceNow, Inc. (Software) | (a) | 6,052 | 4,275,677 |
Skyworks Solutions, Inc. (Semiconductors & Equip.) | 4,723 | 530,960 | |
Synopsys, Inc. (Software) | (a) | 4,490 | 2,311,946 |
TE Connectivity Ltd. (Electronic Equip., Instr. & Comp.) | 9,175 | 1,289,087 | |
Teledyne Technologies, Inc. (Electronic Equip., Instr. & Comp.) | (a) | 1,398 | 623,913 |
Teradyne, Inc. (Semiconductors & Equip.) | 4,499 | 488,231 | |
Texas Instruments, Inc. (Semiconductors & Equip.) | 26,812 | 4,570,374 | |
Trimble, Inc. (Electronic Equip., Instr. & Comp.) | (a) | 7,312 | 388,998 |
Tyler Technologies, Inc. (Software) | (a) | 1,246 | 520,978 |
VeriSign, Inc. (IT Svs.) | (a) | 2,612 | 537,968 |
Western Digital Corp. (Tech. Hardware, Storage & Periph.) | (a) | 9,540 | 499,610 |
Zebra Technologies Corp. Class A (Electronic Equip., Instr. & Comp.) | (a) | 1,524 | 416,555 |
| 341,110,732 | |||
| Materials–2.4% | |||
Air Products & Chemicals, Inc. (Chemicals) | 6,556 | 1,795,033 | |
Albemarle Corp. (Chemicals) | 3,476 | 502,212 | |
Amcor PLC (Containers & Packaging) | 42,396 | 408,697 | |
Avery Dennison Corp. (Containers & Packaging) | 2,388 | 482,758 | |
Ball Corp. (Containers & Packaging) | 9,342 | 537,352 | |
Celanese Corp. (Chemicals) | 2,949 | 458,186 | |
CF Industries Holdings, Inc. (Chemicals) | 5,611 | 446,075 | |
Corteva, Inc. (Chemicals) | 20,798 | 996,640 | |
Dow, Inc. (Chemicals) | 20,695 | 1,134,914 | |
DuPont de Nemours, Inc. (Chemicals) | 12,692 | 976,396 | |
Eastman Chemical Co. (Chemicals) | 3,515 | 315,717 | |
Ecolab, Inc. (Chemicals) | 7,492 | 1,486,038 | |
FMC Corp. (Chemicals) | 3,682 | 232,150 | |
Freeport-McMoRan, Inc. (Metals & Mining) | 42,322 | 1,801,648 | |
International Flavors & Fragrances, Inc. (Chemicals) | 7,521 | 608,975 | |
International Paper Co. (Containers & Packaging) | 10,168 | 367,573 | |
Linde PLC (Chemicals) | 14,315 | 5,879,314 | |
LyondellBasell Industries N.V. Class A (Chemicals) | 7,562 | 718,995 | |
Martin Marietta Materials, Inc. (Construction Materials) | 1,825 | 910,511 | |
Mosaic Co. / The (Chemicals) | 9,717 | 347,188 | |
Newmont Corp. (Metals & Mining) | 34,020 | 1,408,088 | |
Nucor Corp. (Metals & Mining) | 7,259 | 1,263,356 | |
Packaging Corp. of America (Containers & Packaging) | 2,661 | 433,504 | |
PPG Industries, Inc. (Chemicals) | 6,958 | 1,040,569 | |
Sherwin-Williams Co. / The (Chemicals) | 6,951 | 2,168,017 | |
Steel Dynamics, Inc. (Metals & Mining) | 4,477 | 528,734 | |
Vulcan Materials Co. (Construction Materials) | 3,924 | 890,787 | |
Westrock Co. (Containers & Packaging) | 7,621 | 316,424 | |
| 28,455,851 | |||
| Real Estate–2.5% | |||
Alexandria Real Estate Equities, Inc. (Office REITs) | 4,606 | 583,903 | |
American Tower Corp. (Specialized REITs) | 13,759 | 2,970,293 | |
| Common Stocks (Continued) | Shares | Value | |
| Real Estate (continued) | |||
AvalonBay Communities, Inc. (Residential REITs) | 4,194 | $ 785,201 | |
Boston Properties, Inc. (Office REITs) | 4,279 | 300,257 | |
Camden Property Trust (Residential REITs) | 3,168 | 314,551 | |
CBRE Group, Inc. Class A (Real Estate Mgmt. & Development) | (a) | 8,995 | 837,344 |
CoStar Group, Inc. (Real Estate Mgmt. & Development) | (a) | 12,054 | 1,053,399 |
Crown Castle, Inc. (Specialized REITs) | 12,809 | 1,475,469 | |
Digital Realty Trust, Inc. (Specialized REITs) | 8,940 | 1,203,145 | |
Equinix, Inc. (Specialized REITs) | 2,772 | 2,232,541 | |
Equity Residential (Residential REITs) | 10,173 | 622,181 | |
Essex Property Trust, Inc. (Residential REITs) | 1,885 | 467,367 | |
Extra Space Storage, Inc. (Specialized REITs) | 6,236 | 999,818 | |
Federal Realty Investment Trust (Retail REITs) | 2,173 | 223,928 | |
Healthpeak Properties, Inc. (Health Care REITs) | 16,206 | 320,879 | |
Host Hotels & Resorts, Inc. (Hotel & Resort REITs) | 20,709 | 403,204 | |
Invitation Homes, Inc. (Residential REITs) | 16,936 | 577,687 | |
Iron Mountain, Inc. (Specialized REITs) | 8,593 | 601,338 | |
Kimco Realty Corp. (Retail REITs) | 19,631 | 418,337 | |
Mid-America Apartment Communities, Inc. (Residential REITs) | 3,456 | 464,694 | |
Prologis, Inc. (Industrial REITs) | 27,274 | 3,635,624 | |
Public Storage (Specialized REITs) | 4,672 | 1,424,960 | |
Realty Income Corp. (Retail REITs) | 21,370 | 1,227,065 | |
Regency Centers Corp. (Retail REITs) | 4,871 | 326,357 | |
SBA Communications Corp. (Specialized REITs) | 3,183 | 807,495 | |
Simon Property Group, Inc. (Retail REITs) | 9,629 | 1,373,480 | |
UDR, Inc. (Residential REITs) | 8,966 | 343,308 | |
Ventas, Inc. (Health Care REITs) | 11,924 | 594,292 | |
VICI Properties, Inc. (Specialized REITs) | 30,552 | 973,998 | |
Welltower, Inc. (Health Care REITs) | 16,342 | 1,473,558 | |
Weyerhaeuser Co. (Specialized REITs) | 21,558 | 749,572 | |
| 29,785,245 | |||
| Utilities–2.3% | |||
AES Corp. / The (Ind. Power & Renewable Elec.) | 19,886 | 382,805 | |
Alliant Energy Corp. (Electric Utilities) | 7,491 | 384,288 | |
Ameren Corp. (Multi-Utilities) | 7,738 | 559,767 | |
American Electric Power Co., Inc. (Electric Utilities) | 15,527 | 1,261,103 | |
American Water Works Co., Inc. (Water Utilities) | 5,746 | 758,415 | |
Atmos Energy Corp. (Gas Utilities) | 4,376 | 507,178 | |
CenterPoint Energy, Inc. (Multi-Utilities) | 18,706 | 534,430 | |
CMS Energy Corp. (Multi-Utilities) | 8,572 | 497,776 | |
Consolidated Edison, Inc. (Multi-Utilities) | 10,195 | 927,439 | |
Constellation Energy Corp. (Electric Utilities) | 9,429 | 1,102,156 | |
Dominion Energy, Inc. (Multi-Utilities) | 24,698 | 1,160,806 | |
DTE Energy Co. (Multi-Utilities) | 6,083 | 670,712 | |
Duke Energy Corp. (Electric Utilities) | 22,762 | 2,208,824 | |
Edison International (Electric Utilities) | 11,318 | 809,124 | |
Entergy Corp. (Electric Utilities) | 6,233 | 630,717 | |
Evergy, Inc. (Electric Utilities) | 6,803 | 355,117 | |
Eversource Energy (Electric Utilities) | 10,277 | 634,296 | |
Exelon Corp. (Electric Utilities) | 29,390 | 1,055,101 | |
FirstEnergy Corp. (Electric Utilities) | 15,178 | 556,425 | |
NextEra Energy, Inc. (Electric Utilities) | 60,560 | 3,678,414 | |
NiSource, Inc. (Multi-Utilities) | 12,270 | 325,769 | |
NRG Energy, Inc. (Electric Utilities) | 6,709 | 346,855 | |
PG&E Corp. (Electric Utilities) | 62,995 | 1,135,800 | |
Pinnacle West Capital Corp. (Electric Utilities) | 3,369 | 242,029 | |
PPL Corp. (Electric Utilities) | 21,726 | 588,775 | |
Public Service Enterprise Group, Inc. (Multi-Utilities) | 14,692 | 898,416 | |
Sempra (Multi-Utilities) | 18,589 | 1,389,156 | |
47
(continued)
AuguStarSM Variable Insurance Products Fund, Inc.
AVIP S&P 500® Index Portfolio (Continued)
| Schedule of Investments | December 31, 2023 |
| Common Stocks (Continued) | Shares | Value | |
| Utilities (continued) | |||
Southern Co. / The (Electric Utilities) | 32,213 | $ 2,258,776 | |
WEC Energy Group, Inc. (Multi-Utilities) | 9,315 | 784,044 | |
Xcel Energy, Inc. (Electric Utilities) | 16,298 | 1,009,009 | |
| 27,653,522 | |||
Total Common Stocks (Cost $740,612,222) | $1,181,981,797 | ||
| U.S. Treasury Obligations–0.0% | Rate | Maturity | Face Amount | Value | |
| U.S. Treasury Bill | (b) | 0.000% | 02/22/2024 | $200,000 | $ 198,513 |
Total U.S. Treasury Obligations (Cost $198,470) | $ 198,513 | ||||
Total Investments – 99.7% (Cost $740,810,692) | (c) | $1,182,180,310 | |||
Other Assets in Excess of Liabilities – 0.3% | 3,484,854 | ||||
| Net Assets – 100.0% | $1,185,665,164 | ||||
Percentages are stated as a percent of net assets. |
| Abbreviations: | ||
| REITs: | Real Estate Investment Trusts | |
| Footnotes: | ||
| (a) | Non-income producing security. | |
| (b) | Security is fully pledged as collateral for the futures contracts outstanding at December 31, 2023. The value of securities pledged totaled $198,513. See also the following Schedule of Open Futures Contracts. | |
| (c) | Represents cost for financial reporting purposes, which may differ from cost basis for federal income tax purposes. See also Note 7 of the Notes to Financial Statements. | |
The accompanying notes are an integral part of these financial statements.
| Schedule of Open Futures Contracts | December 31, 2023 |
| Description | Number of contracts | Expiration Date | Notional Amount | Value | Unrealized Appreciation (Depreciation) | Variation Margin Receivable (Payable) | ||||||
| CME E-mini S&P 500 Index - Long | 15 | March 15, 2024 | $3,602,539 | $3,615,000 | $12,461 | $(12,080) |
The accompanying notes are an integral part of these financial statements.
48
AuguStarSM Variable Insurance Products Fund, Inc.
AVIP BlackRock Advantage Large Cap Value Portfolio (Unaudited)
Objective/Strategy
The AVIP BlackRock Advantage Large Cap Value Portfolio (formerly ON BlackRock Advantage Large Cap Value Portfolio) seeks growth of capital by investing under normal circumstances, at least 80% of its net assets in stocks of large capitalization companies with market capitalizations at the time of investment that are within the range of market capitalizations of the companies in the Russell 1000® Value Index for the previous twelve months.
Performance as of December 31, 2023
| Average Annual returns | |
| One year | 13.37% |
| Five years | 9.84% |
| Ten years | 8.11% |
Past performance does not guarantee future results. The performance data quoted represents past performance and current returns may be lower or higher. Total return figures include change in share price and reinvestment of dividends and capital gains. The investment return and principal value will fluctuate so that an investor’s shares, when redeemed, may be worth more or less than the original cost. To obtain performance information up to the most recent month end, call toll-free 1-877-781-6392.
The Portfolio is not open to direct retail investment. Beneficial interest in the Portfolio’s shares is obtained either through an allocation to the Portfolio as an investment vehicle within variable life insurance policies or annuity contracts, or as an underlying investment by the AVIP Model Portfolios. Actual performance results for variable annuity and variable universal life contracts will be lower due to contract charges. Consult your contract for applicable charges.
Total expense ratio is 0.73% per the Fund’s Prospectus dated May 1, 2023 and supplemented October 2, 2023 and December 4, 2023. Additional information pertaining to the Portfolio’s expense ratio as of December 31, 2023 can be found in the Portfolio’s Financial Highlights.
Comments from Sub-Adviser
Q. How did the Portfolio perform in comparison to its benchmark during the reporting period?
A. For the year ended December 31, 2023, the Portfolio returned 13.37% versus 11.46% for its benchmark, the Russell 1000® Value Index.
Q. What affected the Portfolio’s performance?
A. The Portfolio’s outperformance for the year was driven by security selection decisions, with sector allocation decisions also contributing positively. Within stock selection, outperformance was driven by fundamental measures, particularly towards the end of the year. Traditional valuation measures that track company sales, cash flow efficiency, and other financial statement metrics performed particularly well, as the move higher in interest rates broadly rewarded value styles.
Measures designed to capture business-to-business invoicing and insights capturing the enthusiasm around artificial intelligence (“AI’) both helped to correctly position the Portfolio around Information Technology names, where an overweight and security selection were the primary drivers of outperformance for the year. Selection within Financials and Communication Services were also key contributors. On a security level, top contributors were KeyCorp., Mitsubishi Corp., and SAP SE, while top detractors were AIA Group Ltd., Astellas Pharma, Inc., and British American Tobacco PLC. (1)
| (1) | The Portfolio’s composition is subject to change. Holdings and weightings are as of December 31, 2023. |
Change in Value of $10,000 Investment
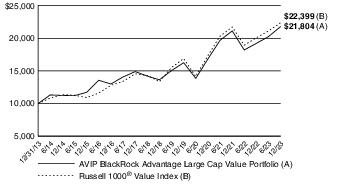
Hypothetical illustration based on past performance. Future performance will vary. The Portfolio’s returns reflect reinvested dividends. The Portfolio’s holdings may differ significantly from the securities in the index. The index is unmanaged and therefore does not reflect the cost of portfolio management and accounting.
The Russell 1000® Value Index measures the performance of the large-cap value segment of the U.S. equity universe. It includes those Russell 1000® Index companies with lower price-to-book ratios and lower expected and historical growth rates.
Past performance is no guarantee of future results. Redemption of fund shares could have tax implications unique to each shareholder.
49
(continued)
AuguStarSM Variable Insurance Products Fund, Inc.
AVIP BlackRock Advantage Large Cap Value Portfolio (Unaudited) (Continued)
| Portfolio Composition as of December 31, 2023 (1) | |
| % of Net Assets | |
| Common Stocks (4) | 98.7 |
| Other Net Assets | 1.3 |
| 100.0 | |
| Top 10 Portfolio Holdings as of December 31, 2023 (1) (2) (3) | ||
| % of Net Assets | ||
| 1. | Berkshire Hathaway, Inc. Class B | 2.2 |
| 2. | Medtronic PLC | 1.7 |
| 3. | Comcast Corp. Class A | 1.6 |
| 4. | Intel Corp. | 1.5 |
| 5. | Elevance Health, Inc. | 1.5 |
| 6. | ConocoPhillips | 1.4 |
| 7. | Chevron Corp. | 1.4 |
| 8. | Stryker Corp. | 1.4 |
| 9. | General Motors Co. | 1.4 |
| 10. | Travelers Cos., Inc. / The | 1.4 |
| (1) | Composition of Portfolio subject to change. | |
| (2) | Short-term investments have been excluded from the list of Top 10 Portfolio Holdings. | |
| (3) | Top 10 Portfolio Holdings is presented at an individual security level. Total investment exposure by issuer may be higher. | |
| (4) | Sectors (Common Stocks): | |
| % of Net Assets | |
| Financials | 20.5 |
| Health Care | 15.3 |
| Industrials | 13.2 |
| Information Technology | 10.4 |
| Consumer Staples | 7.8 |
| Energy | 7.1 |
| Consumer Discretionary | 6.1 |
| Communication Services | 5.2 |
| Real Estate | 4.7 |
| Utilities | 4.6 |
| Materials | 3.8 |
| 98.7 |
50
AuguStarSM Variable Insurance Products Fund, Inc.
AVIP BlackRock Advantage Large Cap Value Portfolio
| Schedule of Investments | December 31, 2023 |
| Common Stocks–98.7% | Shares | Value | |
| Communication Services–5.2% | |||
Alphabet, Inc. Class A (Interactive Media & Svs.) | (a) | 14,808 | $ 2,068,530 |
AT&T, Inc. (Diversified Telecom. Svs.) | 38,392 | 644,218 | |
Comcast Corp. Class A (Media) | 73,000 | 3,201,050 | |
Electronic Arts, Inc. (Entertainment) | 6,991 | 956,439 | |
Fox Corp. Class A (Media) | 68,603 | 2,035,451 | |
Fox Corp. Class B (Media) | 1,442 | 39,871 | |
Liberty Media Corp.-Liberty Formula One Class C (Entertainment) | (a) | 5,772 | 364,386 |
Liberty Media Corp.-Liberty SiriusXM Class C (Media) | (a) | 9,416 | 270,992 |
Meta Platforms, Inc. Class A (Interactive Media & Svs.) | (a) | 1,875 | 663,675 |
Warner Bros. Discovery, Inc. (Entertainment) | (a) | 6,749 | 76,804 |
| 10,321,416 | |||
| Consumer Discretionary–6.1% | |||
Amazon.com, Inc. (Broadline Retail) | (a) | 14,216 | 2,159,979 |
AutoNation, Inc. (Specialty Retail) | (a) | 2,120 | 318,382 |
Best Buy Co., Inc. (Specialty Retail) | 10,453 | 818,261 | |
Boyd Gaming Corp. (Hotels, Restaurants & Leisure) | 10,095 | 632,048 | |
D.R. Horton, Inc. (Household Durables) | 3,339 | 507,461 | |
eBay, Inc. (Broadline Retail) | 10,252 | 447,192 | |
General Motors Co. (Automobiles) | 77,403 | 2,780,316 | |
Home Depot, Inc. / The (Specialty Retail) | 816 | 282,785 | |
Leggett & Platt, Inc. (Household Durables) | 8,792 | 230,087 | |
Lululemon Athletica, Inc. (Textiles, Apparel & Luxury Goods) | (a) | 844 | 431,529 |
McDonald's Corp. (Hotels, Restaurants & Leisure) | 2,278 | 675,450 | |
Skechers U.S.A., Inc. Class A (Textiles, Apparel & Luxury Goods) | (a) | 10,268 | 640,107 |
Taylor Morrison Home Corp. (Household Durables) | (a) | 7,636 | 407,381 |
TJX Cos., Inc. / The (Specialty Retail) | 13,018 | 1,221,218 | |
Travel + Leisure Co. (Hotels, Restaurants & Leisure) | 16,705 | 652,998 | |
Under Armour, Inc. Class C (Textiles, Apparel & Luxury Goods) | (a) | 1,867 | 15,589 |
| 12,220,783 | |||
| Consumer Staples–7.8% | |||
Archer-Daniels-Midland Co. (Food Products) | 31,222 | 2,254,853 | |
Coca-Cola Co. / The (Beverages) | 43,229 | 2,547,485 | |
Colgate-Palmolive Co. (Household Products) | 7,815 | 622,934 | |
Hershey Co. / The (Food Products) | 8,556 | 1,595,181 | |
J.M. Smucker Co. / The (Food Products) | 7,329 | 926,239 | |
Kimberly-Clark Corp. (Household Products) | 17,239 | 2,094,711 | |
PepsiCo, Inc. (Beverages) | 12,542 | 2,130,133 | |
Procter & Gamble Co. / The (Household Products) | 6,837 | 1,001,894 | |
Sysco Corp. (Consumer Staples Distribution & Retail) | 6,772 | 495,236 | |
Walmart, Inc. (Consumer Staples Distribution & Retail) | 12,164 | 1,917,654 | |
| 15,586,320 | |||
| Energy–7.1% | |||
Chevron Corp. (Oil, Gas & Consumable Fuels) | 18,825 | 2,807,937 | |
ConocoPhillips (Oil, Gas & Consumable Fuels) | 24,898 | 2,889,911 | |
Devon Energy Corp. (Oil, Gas & Consumable Fuels) | 30,702 | 1,390,801 | |
EOG Resources, Inc. (Oil, Gas & Consumable Fuels) | 7,670 | 927,686 | |
| Common Stocks (Continued) | Shares | Value | |
| Energy (continued) | |||
Exxon Mobil Corp. (Oil, Gas & Consumable Fuels) | 22,847 | $ 2,284,243 | |
Marathon Oil Corp. (Oil, Gas & Consumable Fuels) | 18,150 | 438,504 | |
Marathon Petroleum Corp. (Oil, Gas & Consumable Fuels) | 11,490 | 1,704,656 | |
Pioneer Natural Resources Co. (Oil, Gas & Consumable Fuels) | 1,319 | 296,617 | |
Valero Energy Corp. (Oil, Gas & Consumable Fuels) | 11,982 | 1,557,660 | |
| 14,298,015 | |||
| Financials–20.5% | |||
Bank of America Corp. (Banks) | 80,648 | 2,715,418 | |
Berkshire Hathaway, Inc. Class B (Financial Services) | (a) | 12,140 | 4,329,852 |
Block, Inc. (Financial Services) | (a) | 19,393 | 1,500,049 |
Citigroup, Inc. (Banks) | 42,391 | 2,180,593 | |
Citizens Financial Group, Inc. (Banks) | 29,854 | 989,362 | |
Euronet Worldwide, Inc. (Financial Services) | (a) | 5,749 | 583,466 |
Fidelity National Information Services, Inc. (Financial Services) | 6,554 | 393,699 | |
Invesco Ltd. (Capital Markets) | 122,174 | 2,179,584 | |
JPMorgan Chase & Co. (Banks) | 14,811 | 2,519,351 | |
KeyCorp (Banks) | 154,189 | 2,220,322 | |
Marsh & McLennan Cos., Inc. (Insurance) | 10,855 | 2,056,697 | |
Mastercard, Inc. Class A (Financial Services) | 5,065 | 2,160,273 | |
MetLife, Inc. (Insurance) | 39,949 | 2,641,827 | |
Moody's Corp. (Capital Markets) | 5,845 | 2,282,823 | |
Nasdaq, Inc. (Capital Markets) | 41,317 | 2,402,170 | |
Regions Financial Corp. (Banks) | 12,497 | 242,192 | |
Reinsurance Group of America, Inc. (Insurance) | 11,595 | 1,875,839 | |
S&P Global, Inc. (Capital Markets) | 3,309 | 1,457,681 | |
Travelers Cos., Inc. / The (Insurance) | 14,394 | 2,741,913 | |
Unum Group (Insurance) | 8,878 | 401,463 | |
Visa, Inc. (Financial Services) | 4,720 | 1,228,852 | |
W.R. Berkley Corp. (Insurance) | 15,078 | 1,066,316 | |
Wells Fargo & Co. (Banks) | 20,711 | 1,019,396 | |
| 41,189,138 | |||
| Health Care–15.3% | |||
Abbott Laboratories (Health Care Equip. & Supplies) | 8,973 | 987,658 | |
AbbVie, Inc. (Biotechnology) | 2,803 | 434,381 | |
Agilent Technologies, Inc. (Life Sciences Tools & Svs.) | 11,779 | 1,637,634 | |
Amgen, Inc. (Biotechnology) | 8,902 | 2,563,954 | |
Bristol-Myers Squibb Co. (Pharmaceuticals) | 44,936 | 2,305,666 | |
Cigna Group / The (Health Care Providers & Svs.) | 2,468 | 739,043 | |
Edwards Lifesciences Corp. (Health Care Equip. & Supplies) | (a) | 5,054 | 385,368 |
Elevance Health, Inc. (Health Care Providers & Svs.) | 6,391 | 3,013,740 | |
Exelixis, Inc. (Biotechnology) | (a) | 27,388 | 657,038 |
Gilead Sciences, Inc. (Biotechnology) | 11,225 | 909,337 | |
HCA Healthcare, Inc. (Health Care Providers & Svs.) | 3,660 | 990,689 | |
Incyte Corp. (Biotechnology) | (a) | 24,584 | 1,543,629 |
Johnson & Johnson (Pharmaceuticals) | 16,183 | 2,536,523 | |
Medtronic PLC (Health Care Equip. & Supplies) | 40,968 | 3,374,944 | |
Merck & Co., Inc. (Pharmaceuticals) | 7,658 | 834,875 | |
Neurocrine Biosciences, Inc. (Biotechnology) | (a) | 4,977 | 655,770 |
Pfizer, Inc. (Pharmaceuticals) | 77,589 | 2,233,787 | |
51
(continued)
AuguStarSM Variable Insurance Products Fund, Inc.
AVIP BlackRock Advantage Large Cap Value Portfolio (Continued)
| Schedule of Investments | December 31, 2023 |
| Common Stocks (Continued) | Shares | Value | |
| Health Care (continued) | |||
Regeneron Pharmaceuticals, Inc. (Biotechnology) | (a) | 1,075 | $ 944,162 |
Stryker Corp. (Health Care Equip. & Supplies) | 9,285 | 2,780,486 | |
Teladoc Health, Inc. (Health Care Technology) | (a) | 39,700 | 855,535 |
West Pharmaceutical Services, Inc. (Life Sciences Tools & Svs.) | 1,142 | 402,121 | |
| 30,786,340 | |||
| Industrials–13.2% | |||
A.O. Smith Corp. (Building Products) | 12,104 | 997,854 | |
AECOM (Construction & Engineering) | 24,851 | 2,296,978 | |
AMETEK, Inc. (Electrical Equip.) | 6,295 | 1,037,983 | |
Builders FirstSource, Inc. (Building Products) | (a) | 2,230 | 372,276 |
Cintas Corp. (Commercial Svs. & Supplies) | 2,384 | 1,436,742 | |
CNH Industrial N.V. (Machinery) | 51,200 | 623,616 | |
Honeywell International, Inc. (Industrial Conglomerates) | 7,464 | 1,565,276 | |
Illinois Tool Works, Inc. (Machinery) | 5,465 | 1,431,502 | |
Johnson Controls International PLC (Building Products) | 15,985 | 921,375 | |
Lockheed Martin Corp. (Aerospace & Defense) | 4,824 | 2,186,430 | |
Old Dominion Freight Line, Inc. (Ground Transportation) | 1,542 | 625,019 | |
Oshkosh Corp. (Machinery) | 22,107 | 2,396,620 | |
Owens Corning (Building Products) | 2,767 | 410,152 | |
Republic Services, Inc. (Commercial Svs. & Supplies) | 2,270 | 374,346 | |
Rockwell Automation, Inc. (Electrical Equip.) | 2,167 | 672,810 | |
Ryder System, Inc. (Ground Transportation) | 720 | 82,843 | |
Schneider National, Inc. Class B (Ground Transportation) | 14,068 | 358,031 | |
Snap-on, Inc. (Machinery) | 5,785 | 1,670,939 | |
Textron, Inc. (Aerospace & Defense) | 9,160 | 736,647 | |
Timken Co. / The (Machinery) | 15,575 | 1,248,336 | |
United Parcel Service, Inc. Class B (Air Freight & Logistics) | 9,503 | 1,494,157 | |
Valmont Industries, Inc. (Construction & Engineering) | 3,420 | 798,604 | |
W.W. Grainger, Inc. (Trading Companies & Distributors) | 1,419 | 1,175,911 | |
Xylem, Inc. (Machinery) | 14,026 | 1,604,013 | |
| 26,518,460 | |||
| Information Technology–10.4% | |||
Amdocs Ltd. (IT Svs.) | 7,095 | 623,580 | |
Apple, Inc. (Tech. Hardware, Storage & Periph.) | 3,520 | 677,706 | |
Applied Materials, Inc. (Semiconductors & Equip.) | 12,580 | 2,038,841 | |
Dell Technologies, Inc. Class C (Tech. Hardware, Storage & Periph.) | 3,926 | 300,339 | |
Flex Ltd. (Electronic Equip., Instr. & Comp.) | (a) | 19,329 | 588,761 |
| Common Stocks (Continued) | Shares | Value | |
| Information Technology (continued) | |||
Hewlett Packard Enterprise Co. (Tech. Hardware, Storage & Periph.) | 134,081 | $ 2,276,695 | |
Intel Corp. (Semiconductors & Equip.) | 61,783 | 3,104,596 | |
Juniper Networks, Inc. (Communications Equip.) | 37,452 | 1,104,085 | |
Klaviyo, Inc. Class A (Software) | (a) | 1,123 | 31,197 |
Manhattan Associates, Inc. (Software) | (a) | 6,032 | 1,298,810 |
Microsoft Corp. (Software) | 5,805 | 2,182,912 | |
NVIDIA Corp. (Semiconductors & Equip.) | 4,174 | 2,067,048 | |
QUALCOMM, Inc. (Semiconductors & Equip.) | 10,656 | 1,541,177 | |
Salesforce, Inc. (Software) | (a) | 4,615 | 1,214,391 |
TE Connectivity Ltd. (Electronic Equip., Instr. & Comp.) | 13,399 | 1,882,560 | |
| 20,932,698 | |||
| Materials–3.8% | |||
Ecolab, Inc. (Chemicals) | 11,920 | 2,364,332 | |
LyondellBasell Industries N.V. Class A (Chemicals) | 24,592 | 2,338,207 | |
Nucor Corp. (Metals & Mining) | 4,923 | 856,799 | |
Steel Dynamics, Inc. (Metals & Mining) | 6,520 | 770,012 | |
Westlake Corp. (Chemicals) | 8,647 | 1,210,234 | |
| 7,539,584 | |||
| Real Estate–4.7% | |||
Camden Property Trust (Residential REITs) | 22,348 | 2,218,933 | |
EastGroup Properties, Inc. (Industrial REITs) | 1,540 | 282,652 | |
Equity Residential (Residential REITs) | 38,773 | 2,371,357 | |
First Industrial Realty Trust, Inc. (Industrial REITs) | 11,502 | 605,810 | |
Highwoods Properties, Inc. (Office REITs) | 17,174 | 394,315 | |
Kimco Realty Corp. (Retail REITs) | 50,950 | 1,085,744 | |
Public Storage (Specialized REITs) | 2,743 | 836,615 | |
Simon Property Group, Inc. (Retail REITs) | 11,237 | 1,602,846 | |
| 9,398,272 | |||
| Utilities–4.6% | |||
AES Corp. / The (Ind. Power & Renewable Elec.) | 63,494 | 1,222,260 | |
CMS Energy Corp. (Multi-Utilities) | 27,349 | 1,588,156 | |
DTE Energy Co. (Multi-Utilities) | 8,547 | 942,392 | |
Entergy Corp. (Electric Utilities) | 6,499 | 657,634 | |
Evergy, Inc. (Electric Utilities) | 27,671 | 1,444,426 | |
OGE Energy Corp. (Electric Utilities) | 21,229 | 741,529 | |
PPL Corp. (Electric Utilities) | 86,499 | 2,344,123 | |
UGI Corp. (Gas Utilities) | 11,487 | 282,580 | |
| 9,223,100 | |||
Total Common Stocks (Cost $187,574,544) | $198,014,126 | ||
Total Investments – 98.7% (Cost $187,574,544) | (b) | $198,014,126 | |
Other Assets in Excess of Liabilities – 1.3% | (c) | 2,677,703 | |
| Net Assets – 100.0% | $200,691,829 | ||
Percentages are stated as a percent of net assets. |
| Abbreviations: | ||
| REITs: | Real Estate Investment Trusts | |
| Footnotes: | ||
| (a) | Non-income producing security. | |
| (b) | Represents cost for financial reporting purposes, which may differ from cost basis for federal income tax purposes. See also Note 7 of the Notes to Financial Statements. | |
| (c) | Includes $155,760 of cash pledged as collateral for the futures contracts outstanding at December 31, 2023. See also the following Schedule of Open Futures Contracts. | |
The accompanying notes are an integral part of these financial statements.
52
(continued)
AuguStarSM Variable Insurance Products Fund, Inc.
AVIP BlackRock Advantage Large Cap Value Portfolio (Continued)
| Schedule of Open Futures Contracts | December 31, 2023 |
| Description | Number of contracts | Expiration Date | Notional Amount | Value | Unrealized Appreciation (Depreciation) | Variation Margin Receivable (Payable) | ||||||
| CME E-mini S&P 500 Index - Long | 12 | March 15, 2024 | $2,814,106 | $2,892,000 | $77,894 | $(15,963) |
The accompanying notes are an integral part of these financial statements.
53
AuguStarSM Variable Insurance Products Fund, Inc.
AVIP Federated High Income Bond Portfolio (Unaudited)
Objective/Strategy
The AVIP Federated High Income Bond Portfolio (formerly ON Federated High Income Bond Portfolio) seeks high current income by investing, under normal circumstances, at least 80% of its net assets in lower rated corporate debt obligations commonly referred to as “junk bonds”. The Portfolio’s investments are generally rated BB or lower by Standard & Poor’s or Fitch, or Ba or lower by Moody’s.
Performance as of December 31, 2023
| Average Annual returns | |
| One year | 12.68% |
| Five years | 5.12% |
| Ten years | 4.23% |
Past performance does not guarantee future results. The performance data quoted represents past performance and current returns may be lower or higher. Total return figures include change in share price and reinvestment of dividends and capital gains. The investment return and principal value will fluctuate so that an investor’s shares, when redeemed, may be worth more or less than the original cost. To obtain performance information up to the most recent month end, call toll-free 1-877-781-6392.
The Portfolio is not open to direct retail investment. Beneficial interest in the Portfolio’s shares is obtained either through an allocation to the Portfolio as an investment vehicle within variable life insurance policies or annuity contracts, or as an underlying investment by the AVIP Model Portfolios. Actual performance results for variable annuity and variable universal life contracts will be lower due to contract charges. Consult your contract for applicable charges.
Total expense ratio is 0.84% per the Fund’s Prospectus dated May 1, 2023 and supplemented October 2, 2023 and December 4, 2023. Additional information pertaining to the Portfolio’s expense ratio as of December 31, 2023 can be found in the Portfolio’s Financial Highlights.
Comments from Sub-Adviser
Q. How did the Portfolio perform in comparison to its benchmark during the reporting period?
A. For the year ended December 31, 2023, the Portfolio returned 12.68% versus 13.47% for its benchmark, the ICE BofA U.S. High Yield Constrained Index.
Q. What affected the Portfolio’s performance?
A. Sector allocation decisions were the primary driver of the Portfolio’s underperformance for the year. An overweight to the poor performing media industry, as well as selection within media, was a top detractor. An underweight to leisure positions, particularly cruise line companies, selection within leisure companies, and selection and allocation within retail were other top detractors. Given the strong absolute returns for the year, the Portfolio’s cash position also negatively impacted returns relative to the benchmark. Sector selection benefited relative performance, led by selection within technology & electronics and services. An underweight to telecommunications, as well as selection within the industry, specifically not owning Lumen Technologies, Inc. holdings contributed. An overweight to, and selection within, insurance also contributed. Top relative contributors at the security level were NFP Corp. 6.875% due 08/15/2028, Diamond BC BV 4.625% due 10/01/2029 and Madison IAQ LLC 5.875% due 06/30/2029. Top relative detractors at the security level were Enviva Partners LP / Enviva Partners Finance Corp., 6.500% due 01/15/2026, iHeartCommunications, Inc. 8.375% due 05/01/2027 and ARD Finance SA, 6.500%/7.250% PIK due 06/30/2027. (1)
| (1) | The Portfolio’s composition is subject to change. Holdings and weightings are as of December 31, 2023. |
Change in Value of $10,000 Investment
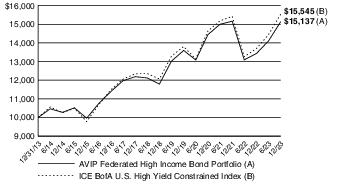
Hypothetical illustration based on past performance. Future performance will vary. All returns reflect reinvested dividends. The Portfolio’s holdings may differ significantly from the securities in the index. The index is unmanaged and therefore does not reflect the cost of portfolio management and accounting.
The ICE BofA U.S. High Yield Constrained Index tracks the performance of below investment grade, but not in default, U.S. dollar denominated corporate bonds publicly issued in the U.S. domestic market, and includes issues with a credit rating of BBB or below, as rated by Moody’s and S&P.
Past performance is no guarantee of future results. Redemption of fund shares could have tax implications unique to each shareholder.
54
(continued)
AuguStarSM Variable Insurance Products Fund, Inc.
AVIP Federated High Income Bond Portfolio (Unaudited) (Continued)
| Portfolio Composition as of December 31, 2023 (1) | |
| % of Net Assets | |
| Corporate Bonds (4) | 94.8 |
| Common Stocks (4) | 0.0 |
| Other Net Assets | 5.2 |
| 100.0 | |
| Top 10 Portfolio Holdings as of December 31, 2023 (1) (2) (3) | ||
| % of Net Assets | ||
| 1. | 1011778 B.C. ULC / New Red Finance, Inc. 4.000%, 10/15/2030 | 1.1 |
| 2. | HUB International Ltd. 7.000%, 05/01/2026 | 1.1 |
| 3. | NFP Corp. 6.875%, 08/15/2028 | 1.0 |
| 4. | Allied Universal Holdco LLC / Allied Universal Finance Corp. 9.750%, 07/15/2027 | 1.0 |
| 5. | BroadStreet Partners, Inc. 5.875%, 04/15/2029 | 1.0 |
| 6. | Clarios Global LP / Clarios U.S. Finance Co. 8.500%, 05/15/2027 | 1.0 |
| 7. | Clydesdale Acquisition Holdings, Inc. 8.750%, 04/15/2030 | 1.0 |
| 8. | McAfee Corp. 7.375%, 02/15/2030 | 0.9 |
| 9. | Garda World Security Corp. 9.500%, 11/01/2027 | 0.9 |
| 10. | Medline Borrower LP 5.250%, 10/01/2029 | 0.9 |
| (1) | Composition of Portfolio subject to change. | |
| (2) | Short-term investments have been excluded from the list of Top 10 Portfolio Holdings. | |
| (3) | Top 10 Portfolio Holdings is presented at an individual security level. Total investment exposure by issuer may be higher. | |
| (4) | Sectors (Common Stocks, Corporate Bonds): | |
| % of Net Assets | |
| Consumer Discretionary | 14.2 |
| Communication Services | 13.6 |
| Financials | 12.6 |
| Energy | 11.9 |
| Industrials | 11.2 |
| Materials | 9.3 |
| Information Technology | 7.6 |
| Health Care | 6.8 |
| Utilities | 3.4 |
| Consumer Staples | 2.9 |
| Real Estate | 1.3 |
| 94.8 |
55
AuguStarSM Variable Insurance Products Fund, Inc.
AVIP Federated High Income Bond Portfolio
| Schedule of Investments | December 31, 2023 |
| Corporate Bonds–94.8% | Rate | Maturity | Face Amount | Value | |
| Communication Services–13.6% | |||||
Audacy Capital Corp. (Acquired 03/11/2021 through 07/09/2021, Cost $357,500) (Media) | (a)(b) | 6.750% | 03/31/2029 | $ 350,000 | $ 5,250 |
Cars.com, Inc. (Interactive Media & Svs.) | (a) | 6.375% | 11/01/2028 | 375,000 | 361,579 |
CCO Holdings LLC / CCO Holdings Capital Corp. (Media) | (a) | 5.125% | 05/01/2027 | 200,000 | 193,234 |
CCO Holdings LLC / CCO Holdings Capital Corp. (Media) | (a) | 5.000% | 02/01/2028 | 650,000 | 621,909 |
CCO Holdings LLC / CCO Holdings Capital Corp. (Media) | (a) | 5.375% | 06/01/2029 | 125,000 | 117,823 |
CCO Holdings LLC / CCO Holdings Capital Corp. (Media) | (a) | 4.750% | 03/01/2030 | 1,075,000 | 982,297 |
CCO Holdings LLC / CCO Holdings Capital Corp. (Media) | (a) | 4.500% | 08/15/2030 | 250,000 | 225,371 |
CCO Holdings LLC / CCO Holdings Capital Corp. (Media) | (a) | 4.250% | 01/15/2034 | 100,000 | 81,263 |
CMG Media Corp. (Media) | (a) | 8.875% | 12/15/2027 | 650,000 | 515,534 |
CSC Holdings LLC (Media) | 5.250% | 06/01/2024 | 375,000 | 367,090 | |
CSC Holdings LLC (Media) | (a) | 5.500% | 04/15/2027 | 500,000 | 462,149 |
CSC Holdings LLC (Media) | (a) | 4.125% | 12/01/2030 | 200,000 | 152,150 |
CSC Holdings LLC (Media) | (a) | 4.625% | 12/01/2030 | 675,000 | 406,431 |
CSC Holdings LLC (Media) | (a) | 3.375% | 02/15/2031 | 200,000 | 145,915 |
CSC Holdings LLC (Media) | (a) | 4.500% | 11/15/2031 | 150,000 | 113,411 |
Directv Financing LLC / Directv Financing Co-Obligor, Inc. (Media) | (a) | 5.875% | 08/15/2027 | 425,000 | 399,320 |
DISH DBS Corp. (Media) | (a) | 5.250% | 12/01/2026 | 450,000 | 385,537 |
DISH DBS Corp. (Media) | 7.375% | 07/01/2028 | 100,000 | 59,778 | |
DISH DBS Corp. (Media) | 5.125% | 06/01/2029 | 600,000 | 309,234 | |
DISH Network Corp. (Media) | (a) | 11.750% | 11/15/2027 | 125,000 | 130,482 |
Entegris Escrow Corp. (Media) | (a) | 4.750% | 04/15/2029 | 350,000 | 337,195 |
Entegris Escrow Corp. (Media) | (a) | 5.950% | 06/15/2030 | 375,000 | 372,764 |
Gray Escrow II, Inc. (Media) | (a) | 5.375% | 11/15/2031 | 175,000 | 132,037 |
Gray Television, Inc. (Media) | (a) | 5.875% | 07/15/2026 | 550,000 | 534,991 |
Gray Television, Inc. (Media) | (a) | 7.000% | 05/15/2027 | 75,000 | 71,288 |
iHeartCommunications, Inc. (Media) | 8.375% | 05/01/2027 | 475,707 | 308,770 | |
iHeartCommunications, Inc. (Media) | (a) | 4.750% | 01/15/2028 | 100,000 | 76,931 |
Lamar Media Corp. (Media) | 4.875% | 01/15/2029 | 150,000 | 144,798 | |
Lamar Media Corp. (Media) | 3.625% | 01/15/2031 | 100,000 | 88,850 | |
Match Group Holdings II LLC (Interactive Media & Svs.) | (a) | 5.000% | 12/15/2027 | 200,000 | 195,292 |
Match Group Holdings II LLC (Interactive Media & Svs.) | (a) | 4.625% | 06/01/2028 | 75,000 | 71,813 |
Match Group Holdings II LLC (Interactive Media & Svs.) | (a) | 4.125% | 08/01/2030 | 350,000 | 317,592 |
Match Group Holdings II LLC (Interactive Media & Svs.) | (a) | 3.625% | 10/01/2031 | 150,000 | 129,603 |
Nexstar Media, Inc. (Media) | (a) | 4.750% | 11/01/2028 | 750,000 | 691,110 |
ROBLOX Corp. (Entertainment) | (a) | 3.875% | 05/01/2030 | 275,000 | 245,237 |
Scripps Escrow II, Inc. (Media) | (a) | 5.375% | 01/15/2031 | 125,000 | 91,737 |
Sinclair Television Group, Inc. (Media) | (a) | 5.500% | 03/01/2030 | 425,000 | 318,801 |
Sirius XM Radio, Inc. (Media) | (a) | 3.125% | 09/01/2026 | 225,000 | 211,426 |
Sirius XM Radio, Inc. (Media) | (a) | 5.000% | 08/01/2027 | 75,000 | 72,450 |
Sirius XM Radio, Inc. (Media) | (a) | 4.000% | 07/15/2028 | 200,000 | 184,969 |
Sirius XM Radio, Inc. (Media) | (a) | 4.125% | 07/01/2030 | 475,000 | 423,262 |
Sirius XM Radio, Inc. (Media) | (a) | 3.875% | 09/01/2031 | 300,000 | 256,646 |
Stagwell Global LLC (Media) | (a) | 5.625% | 08/15/2029 | 1,000,000 | 919,767 |
TEGNA, Inc. (Media) | 5.000% | 09/15/2029 | 450,000 | 412,294 | |
Telenet Finance Luxembourg Notes SARL (Media) | (a) | 5.500% | 03/01/2028 | 600,000 | 561,000 |
T-Mobile U.S.A., Inc. (Wireless Telecom. Svs.) | 3.375% | 04/15/2029 | 200,000 | 185,821 | |
Univision Communications, Inc. (Media) | (a) | 8.000% | 08/15/2028 | 175,000 | 180,533 |
Univision Communications, Inc. (Media) | (a) | 4.500% | 05/01/2029 | 275,000 | 245,369 |
Univision Communications, Inc. (Media) | (a) | 7.375% | 06/30/2030 | 150,000 | 149,570 |
UPC Broadband Finco B.V. (Media) | (a) | 4.875% | 07/15/2031 | 600,000 | 528,066 |
Urban One, Inc. (Media) | (a) | 7.375% | 02/01/2028 | 350,000 | 297,493 |
Virgin Media Finance PLC (Media) | (a) | 5.000% | 07/15/2030 | 200,000 | 176,332 |
Virgin Media Secured Finance PLC (Media) | (a) | 4.500% | 08/15/2030 | 200,000 | 178,060 |
Virgin Media Vendor Financing Notes IV DAC (Media) | (a) | 5.000% | 07/15/2028 | 450,000 | 422,640 |
Vmed O2 U.K. Financing I PLC (Wireless Telecom. Svs.) | (a) | 4.250% | 01/31/2031 | 200,000 | 174,649 |
Vmed O2 U.K. Financing I PLC (Wireless Telecom. Svs.) | (a) | 4.750% | 07/15/2031 | 400,000 | 357,042 |
VZ Secured Financing B.V. (Media) | (a) | 5.000% | 01/15/2032 | 400,000 | 341,489 |
WMG Acquisition Corp. (Entertainment) | (a) | 3.750% | 12/01/2029 | 125,000 | 113,746 |
WMG Acquisition Corp. (Entertainment) | (a) | 3.875% | 07/15/2030 | 75,000 | 67,856 |
Ziggo Bond Co. B.V. (Diversified Telecom. Svs.) | (a) | 6.000% | 01/15/2027 | 425,000 | 413,636 |
| 17,038,682 | |||||
| Consumer Discretionary–14.2% | |||||
1011778 B.C. ULC / New Red Finance, Inc. (Hotels, Restaurants & Leisure) | (a) | 4.000% | 10/15/2030 | 1,525,000 | 1,367,771 |
Academy Ltd. (Specialty Retail) | (a) | 6.000% | 11/15/2027 | 450,000 | 441,939 |
Acushnet Co. (Leisure Products) | (a) | 7.375% | 10/15/2028 | 50,000 | 52,164 |
Adient Global Holdings Ltd. (Automobile Components) | (a) | 4.875% | 08/15/2026 | 300,000 | 293,359 |
Adient Global Holdings Ltd. (Automobile Components) | (a) | 7.000% | 04/15/2028 | 100,000 | 103,364 |
Adient Global Holdings Ltd. (Automobile Components) | (a) | 8.250% | 04/15/2031 | 125,000 | 132,360 |
Affinity Interactive (Hotels, Restaurants & Leisure) | (a) | 6.875% | 12/15/2027 | 400,000 | 356,493 |
56
(continued)
AuguStarSM Variable Insurance Products Fund, Inc.
AVIP Federated High Income Bond Portfolio (Continued)
| Schedule of Investments | December 31, 2023 |
| Corporate Bonds (Continued) | Rate | Maturity | Face Amount | Value | |
| Consumer Discretionary (continued) | |||||
Aramark Services, Inc. (Hotels, Restaurants & Leisure) | (a) | 5.000% | 02/01/2028 | $ 100,000 | $ 97,004 |
Asbury Automotive Group, Inc. (Specialty Retail) | (a) | 4.625% | 11/15/2029 | 325,000 | 300,820 |
Asbury Automotive Group, Inc. (Specialty Retail) | (a) | 5.000% | 02/15/2032 | 200,000 | 181,761 |
Boyd Gaming Corp. (Hotels, Restaurants & Leisure) | 4.750% | 12/01/2027 | 275,000 | 264,578 | |
Boyd Gaming Corp. (Hotels, Restaurants & Leisure) | (a) | 4.750% | 06/15/2031 | 200,000 | 183,565 |
Caesars Entertainment, Inc. (Hotels, Restaurants & Leisure) | (a) | 6.250% | 07/01/2025 | 325,000 | 325,884 |
Caesars Entertainment, Inc. (Hotels, Restaurants & Leisure) | (a) | 8.125% | 07/01/2027 | 450,000 | 461,295 |
Caesars Entertainment, Inc. (Hotels, Restaurants & Leisure) | (a) | 4.625% | 10/15/2029 | 300,000 | 270,602 |
Caesars Entertainment, Inc. (Hotels, Restaurants & Leisure) | (a) | 7.000% | 02/15/2030 | 150,000 | 153,816 |
Caesars Resort Collection LLC / CRC Finco, Inc. (Hotels, Restaurants & Leisure) | (a) | 5.750% | 07/01/2025 | 225,000 | 224,976 |
Carnival Corp. (Hotels, Restaurants & Leisure) | (a) | 7.000% | 08/15/2029 | 75,000 | 78,309 |
Churchill Downs, Inc. (Hotels, Restaurants & Leisure) | (a) | 5.500% | 04/01/2027 | 175,000 | 173,164 |
Churchill Downs, Inc. (Hotels, Restaurants & Leisure) | (a) | 6.750% | 05/01/2031 | 125,000 | 126,867 |
Clarios Global LP / Clarios U.S. Finance Co. (Automobile Components) | (a) | 6.250% | 05/15/2026 | 112,000 | 112,145 |
Clarios Global LP / Clarios U.S. Finance Co. (Automobile Components) | (a) | 8.500% | 05/15/2027 | 1,250,000 | 1,254,357 |
Dana, Inc. (Automobile Components) | 4.250% | 09/01/2030 | 250,000 | 221,582 | |
Dana, Inc. (Automobile Components) | 4.500% | 02/15/2032 | 100,000 | 87,002 | |
Dornoch Debt Merger Sub, Inc. (Automobile Components) | (a) | 6.625% | 10/15/2029 | 625,000 | 563,481 |
Gap, Inc. / The (Specialty Retail) | (a) | 3.625% | 10/01/2029 | 175,000 | 149,624 |
Gap, Inc. / The (Specialty Retail) | (a) | 3.875% | 10/01/2031 | 75,000 | 61,779 |
Garda World Security Corp. (Diversified Consumer Svs.) | (a) | 9.500% | 11/01/2027 | 1,103,000 | 1,111,988 |
Gates Global LLC / Gates Corp. (Automobile Components) | (a) | 6.250% | 01/15/2026 | 950,000 | 945,250 |
Hilton Domestic Operating Co., Inc. (Hotels, Restaurants & Leisure) | (a) | 5.750% | 05/01/2028 | 50,000 | 50,019 |
Hilton Domestic Operating Co., Inc. (Hotels, Restaurants & Leisure) | 4.875% | 01/15/2030 | 75,000 | 72,687 | |
Hilton Domestic Operating Co., Inc. (Hotels, Restaurants & Leisure) | (a) | 3.625% | 02/15/2032 | 200,000 | 174,542 |
IHO Verwaltungs GmbH (Automobile Components) | (a)(c) | 4.750%, 5.500% PIK | 09/15/2026 | 400,000 | 383,000 |
IHO Verwaltungs GmbH (Automobile Components) | (a)(c) | 6.000%, 6.750% PIK | 05/15/2027 | 500,000 | 487,162 |
JB Poindexter & Co., Inc. (Automobile Components) | (a) | 8.750% | 12/15/2031 | 175,000 | 178,500 |
KFC Holding Co. / Pizza Hut Holdings LLC / Taco Bell of America LLC (Hotels, Restaurants & Leisure) | (a) | 4.750% | 06/01/2027 | 200,000 | 196,960 |
Kontoor Brands, Inc. (Textiles, Apparel & Luxury Goods) | (a) | 4.125% | 11/15/2029 | 200,000 | 180,449 |
LCM Investments Holdings II LLC (Specialty Retail) | (a) | 4.875% | 05/01/2029 | 150,000 | 139,337 |
LCM Investments Holdings II LLC (Specialty Retail) | (a) | 8.250% | 08/01/2031 | 200,000 | 208,741 |
Light & Wonder International, Inc. (Hotels, Restaurants & Leisure) | (a) | 7.250% | 11/15/2029 | 275,000 | 281,575 |
Light & Wonder International, Inc. (Hotels, Restaurants & Leisure) | (a) | 7.500% | 09/01/2031 | 150,000 | 156,458 |
MGM Resorts International (Hotels, Restaurants & Leisure) | 4.625% | 09/01/2026 | 198,000 | 193,231 | |
MGM Resorts International (Hotels, Restaurants & Leisure) | 4.750% | 10/15/2028 | 75,000 | 71,459 | |
Midwest Gaming Borrower LLC / Midwest Gaming Finance Corp. (Hotels, Restaurants & Leisure) | (a) | 4.875% | 05/01/2029 | 200,000 | 186,000 |
Mohegan Tribal Gaming Authority (Hotels, Restaurants & Leisure) | (a) | 8.000% | 02/01/2026 | 850,000 | 802,187 |
NCL Corp. Ltd. (Hotels, Restaurants & Leisure) | (a) | 8.125% | 01/15/2029 | 125,000 | 130,573 |
NCL Corp. Ltd. (Hotels, Restaurants & Leisure) | (a) | 7.750% | 02/15/2029 | 250,000 | 251,513 |
Ontario Gaming GTA LP (Hotels, Restaurants & Leisure) | (a) | 8.000% | 08/01/2030 | 275,000 | 283,594 |
Penn Entertainment, Inc. (Hotels, Restaurants & Leisure) | (a) | 5.625% | 01/15/2027 | 50,000 | 48,474 |
Penn Entertainment, Inc. (Hotels, Restaurants & Leisure) | (a) | 4.125% | 07/01/2029 | 275,000 | 235,125 |
Raptor Acquisition Corp. / Raptor Co-Issuer LLC (Hotels, Restaurants & Leisure) | (a) | 4.875% | 11/01/2026 | 50,000 | 47,658 |
Real Hero Merger Sub 2, Inc. (Automobile Components) | (a) | 6.250% | 02/01/2029 | 475,000 | 409,515 |
Royal Caribbean Cruises Ltd. (Hotels, Restaurants & Leisure) | (a) | 5.500% | 08/31/2026 | 275,000 | 272,291 |
Scientific Games Holdings LP / Scientific Games U.S. FinCo, Inc. (Hotels, Restaurants & Leisure) | (a) | 6.625% | 03/01/2030 | 400,000 | 378,172 |
SeaWorld Parks & Entertainment, Inc. (Hotels, Restaurants & Leisure) | (a) | 5.250% | 08/15/2029 | 475,000 | 444,038 |
Six Flags Entertainment Corp. (Hotels, Restaurants & Leisure) | (a) | 5.500% | 04/15/2027 | 275,000 | 268,828 |
Six Flags Theme Parks, Inc. (Hotels, Restaurants & Leisure) | (a) | 7.000% | 07/01/2025 | 25,000 | 25,108 |
Station Casinos LLC (Hotels, Restaurants & Leisure) | (a) | 4.500% | 02/15/2028 | 200,000 | 188,566 |
Station Casinos LLC (Hotels, Restaurants & Leisure) | (a) | 4.625% | 12/01/2031 | 200,000 | 180,335 |
William Carter Co. / The (Textiles, Apparel & Luxury Goods) | (a) | 5.625% | 03/15/2027 | 275,000 | 271,562 |
Yum! Brands, Inc. (Hotels, Restaurants & Leisure) | (a) | 4.750% | 01/15/2030 | 75,000 | 72,699 |
Yum! Brands, Inc. (Hotels, Restaurants & Leisure) | 4.625% | 01/31/2032 | 100,000 | 93,510 | |
Yum! Brands, Inc. (Hotels, Restaurants & Leisure) | 5.375% | 04/01/2032 | 150,000 | 147,375 | |
ZF North America Capital, Inc. (Automobile Components) | (a) | 6.875% | 04/14/2028 | 200,000 | 207,254 |
| 17,815,796 | |||||
| Consumer Staples–2.9% | |||||
Albertsons Cos., Inc. / Safeway, Inc. / New Albertsons LP / Albertsons LLC (Consumer Staples Distribution & Retail) | (a) | 5.875% | 02/15/2028 | 100,000 | 100,067 |
Albertsons Cos., Inc. / Safeway, Inc. / New Albertsons LP / Albertsons LLC (Consumer Staples Distribution & Retail) | (a) | 3.500% | 03/15/2029 | 150,000 | 136,197 |
BellRing Brands, Inc. (Personal Care Products) | (a) | 7.000% | 03/15/2030 | 550,000 | 569,234 |
Edgewell Personal Care Co. (Personal Care Products) | (a) | 5.500% | 06/01/2028 | 175,000 | 171,719 |
Edgewell Personal Care Co. (Personal Care Products) | (a) | 4.125% | 04/01/2029 | 200,000 | 182,000 |
Energizer Holdings, Inc. (Household Products) | (a) | 6.500% | 12/31/2027 | 100,000 | 100,000 |
57
(continued)
AuguStarSM Variable Insurance Products Fund, Inc.
AVIP Federated High Income Bond Portfolio (Continued)
| Schedule of Investments | December 31, 2023 |
| Corporate Bonds (Continued) | Rate | Maturity | Face Amount | Value | |
| Consumer Staples (continued) | |||||
Energizer Holdings, Inc. (Household Products) | (a) | 4.750% | 06/15/2028 | $ 250,000 | $ 231,119 |
Energizer Holdings, Inc. (Household Products) | (a) | 4.375% | 03/31/2029 | 425,000 | 380,412 |
Performance Food Group, Inc. (Consumer Staples Distribution & Retail) | (a) | 5.500% | 10/15/2027 | 150,000 | 147,798 |
Performance Food Group, Inc. (Consumer Staples Distribution & Retail) | (a) | 4.250% | 08/01/2029 | 250,000 | 229,298 |
Post Holdings, Inc. (Food Products) | (a) | 5.750% | 03/01/2027 | 230,000 | 228,194 |
Post Holdings, Inc. (Food Products) | (a) | 5.625% | 01/15/2028 | 450,000 | 445,929 |
U.S. Foods, Inc. (Consumer Staples Distribution & Retail) | (a) | 6.875% | 09/15/2028 | 225,000 | 231,606 |
U.S. Foods, Inc. (Consumer Staples Distribution & Retail) | (a) | 4.750% | 02/15/2029 | 350,000 | 332,410 |
U.S. Foods, Inc. (Consumer Staples Distribution & Retail) | (a) | 4.625% | 06/01/2030 | 175,000 | 163,093 |
| 3,649,076 | |||||
| Energy–11.9% | |||||
Antero Midstream Partners LP / Antero Midstream Finance Corp. (Oil, Gas & Consumable Fuels) | (a) | 5.750% | 03/01/2027 | 250,000 | 248,059 |
Antero Midstream Partners LP / Antero Midstream Finance Corp. (Oil, Gas & Consumable Fuels) | (a) | 5.750% | 01/15/2028 | 625,000 | 618,771 |
Antero Midstream Partners LP / Antero Midstream Finance Corp. (Oil, Gas & Consumable Fuels) | (a) | 5.375% | 06/15/2029 | 625,000 | 600,855 |
Antero Resources Corp. (Oil, Gas & Consumable Fuels) | (a) | 5.375% | 03/01/2030 | 225,000 | 215,654 |
Archrock Partners LP / Archrock Partners Finance Corp. (Oil, Gas & Consumable Fuels) | (a) | 6.875% | 04/01/2027 | 500,000 | 501,250 |
Archrock Partners LP / Archrock Partners Finance Corp. (Oil, Gas & Consumable Fuels) | (a) | 6.250% | 04/01/2028 | 450,000 | 443,250 |
Ascent Resources Utica Holdings LLC / ARU Finance Corp. (Oil, Gas & Consumable Fuels) | (a) | 7.000% | 11/01/2026 | 425,000 | 427,686 |
Ascent Resources Utica Holdings LLC / ARU Finance Corp. (Oil, Gas & Consumable Fuels) | (a) | 8.250% | 12/31/2028 | 125,000 | 125,726 |
Ascent Resources Utica Holdings LLC / ARU Finance Corp. (Oil, Gas & Consumable Fuels) | (a) | 5.875% | 06/30/2029 | 75,000 | 69,776 |
Berry Petroleum Co. LLC (Oil, Gas & Consumable Fuels) | (a) | 7.000% | 02/15/2026 | 175,000 | 169,312 |
Callon Petroleum Co. (Oil, Gas & Consumable Fuels) | 6.375% | 07/01/2026 | 125,000 | 124,406 | |
Callon Petroleum Co. (Oil, Gas & Consumable Fuels) | (a) | 7.500% | 06/15/2030 | 325,000 | 327,769 |
Cheniere Energy Partners LP (Oil, Gas & Consumable Fuels) | 4.500% | 10/01/2029 | 100,000 | 95,647 | |
Cheniere Energy Partners LP (Oil, Gas & Consumable Fuels) | 4.000% | 03/01/2031 | 325,000 | 295,471 | |
Cheniere Energy Partners LP (Oil, Gas & Consumable Fuels) | 3.250% | 01/31/2032 | 150,000 | 127,805 | |
Cheniere Energy, Inc. (Oil, Gas & Consumable Fuels) | 4.625% | 10/15/2028 | 50,000 | 48,806 | |
Chesapeake Energy Corp. (Oil, Gas & Consumable Fuels) | (a) | 5.500% | 02/01/2026 | 50,000 | 49,567 |
Chesapeake Energy Corp. (Oil, Gas & Consumable Fuels) | (a) | 5.875% | 02/01/2029 | 50,000 | 48,998 |
Chord Energy Corp. (Oil, Gas & Consumable Fuels) | (a) | 6.375% | 06/01/2026 | 75,000 | 75,000 |
Civitas Resources, Inc. (Oil, Gas & Consumable Fuels) | (a) | 8.375% | 07/01/2028 | 250,000 | 260,986 |
Civitas Resources, Inc. (Oil, Gas & Consumable Fuels) | (a) | 8.625% | 11/01/2030 | 150,000 | 159,108 |
Civitas Resources, Inc. (Oil, Gas & Consumable Fuels) | (a) | 8.750% | 07/01/2031 | 50,000 | 53,227 |
CNX Midstream Partners LP (Oil, Gas & Consumable Fuels) | (a) | 4.750% | 04/15/2030 | 650,000 | 583,689 |
Comstock Resources, Inc. (Oil, Gas & Consumable Fuels) | (a) | 6.750% | 03/01/2029 | 500,000 | 457,254 |
Comstock Resources, Inc. (Oil, Gas & Consumable Fuels) | (a) | 5.875% | 01/15/2030 | 100,000 | 86,730 |
CrownRock LP / CrownRock Finance, Inc. (Oil, Gas & Consumable Fuels) | (a) | 5.625% | 10/15/2025 | 525,000 | 524,302 |
DT Midstream, Inc. (Oil, Gas & Consumable Fuels) | (a) | 4.375% | 06/15/2031 | 275,000 | 248,059 |
Endeavor Energy Resources LP / EER Finance, Inc. (Oil, Gas & Consumable Fuels) | (a) | 5.750% | 01/30/2028 | 100,000 | 100,094 |
Energy Transfer LP (Oil, Gas & Consumable Fuels) | (a) | 8.000% | 04/01/2029 | 350,000 | 364,210 |
Energy Transfer LP (Oil, Gas & Consumable Fuels) | (a) | 7.375% | 02/01/2031 | 25,000 | 26,273 |
EQM Midstream Partners LP (Oil, Gas & Consumable Fuels) | (a) | 7.500% | 06/01/2027 | 150,000 | 154,560 |
EQM Midstream Partners LP (Oil, Gas & Consumable Fuels) | (a) | 6.500% | 07/01/2027 | 275,000 | 280,014 |
EQM Midstream Partners LP (Oil, Gas & Consumable Fuels) | 5.500% | 07/15/2028 | 225,000 | 222,937 | |
EQM Midstream Partners LP (Oil, Gas & Consumable Fuels) | (a) | 4.500% | 01/15/2029 | 100,000 | 94,473 |
EQM Midstream Partners LP (Oil, Gas & Consumable Fuels) | (a) | 4.750% | 01/15/2031 | 525,000 | 488,591 |
EQM Midstream Partners LP (Oil, Gas & Consumable Fuels) | 6.500% | 07/15/2048 | 75,000 | 76,852 | |
Hess Midstream Operations LP (Oil, Gas & Consumable Fuels) | (a) | 5.125% | 06/15/2028 | 425,000 | 410,039 |
Hess Midstream Operations LP (Oil, Gas & Consumable Fuels) | (a) | 4.250% | 02/15/2030 | 100,000 | 92,000 |
Hess Midstream Operations LP (Oil, Gas & Consumable Fuels) | (a) | 5.500% | 10/15/2030 | 100,000 | 96,786 |
HF Sinclair Corp. (Oil, Gas & Consumable Fuels) | (a) | 6.375% | 04/15/2027 | 175,000 | 176,372 |
HF Sinclair Corp. (Oil, Gas & Consumable Fuels) | (a) | 5.000% | 02/01/2028 | 300,000 | 290,942 |
Nabors Industries Ltd. (Energy Equip. & Svs.) | (a) | 7.250% | 01/15/2026 | 125,000 | 120,151 |
Nabors Industries Ltd. (Energy Equip. & Svs.) | (a) | 7.500% | 01/15/2028 | 275,000 | 237,806 |
Nabors Industries, Inc. (Oil, Gas & Consumable Fuels) | (a) | 7.375% | 05/15/2027 | 50,000 | 48,984 |
Nabors Industries, Inc. (Energy Equip. & Svs.) | (a) | 9.125% | 01/31/2030 | 50,000 | 50,203 |
PDC Energy, Inc. (Oil, Gas & Consumable Fuels) | 5.750% | 05/15/2026 | 250,000 | 249,524 | |
Permian Resources Operating LLC (Oil, Gas & Consumable Fuels) | (a) | 6.875% | 04/01/2027 | 350,000 | 349,760 |
Precision Drilling Corp. (Energy Equip. & Svs.) | (a) | 7.125% | 01/15/2026 | 183,000 | 182,160 |
Precision Drilling Corp. (Energy Equip. & Svs.) | (a) | 6.875% | 01/15/2029 | 175,000 | 168,758 |
Range Resources Corp. (Oil, Gas & Consumable Fuels) | 4.875% | 05/15/2025 | 75,000 | 74,075 | |
Range Resources Corp. (Oil, Gas & Consumable Fuels) | 8.250% | 01/15/2029 | 225,000 | 232,869 | |
Range Resources Corp. (Oil, Gas & Consumable Fuels) | (a) | 4.750% | 02/15/2030 | 125,000 | 115,549 |
Rockcliff Energy II LLC (Oil, Gas & Consumable Fuels) | (a) | 5.500% | 10/15/2029 | 200,000 | 189,023 |
Sitio Royalties Operating Partnership LP / Sitio Finance Corp. (Oil, Gas & Consumable Fuels) | (a) | 7.875% | 11/01/2028 | 100,000 | 103,622 |
SM Energy Co. (Oil, Gas & Consumable Fuels) | 6.750% | 09/15/2026 | 275,000 | 274,284 | |
SM Energy Co. (Oil, Gas & Consumable Fuels) | 6.625% | 01/15/2027 | 25,000 | 24,859 | |
58
(continued)
AuguStarSM Variable Insurance Products Fund, Inc.
AVIP Federated High Income Bond Portfolio (Continued)
| Schedule of Investments | December 31, 2023 |
| Corporate Bonds (Continued) | Rate | Maturity | Face Amount | Value | |
| Energy (continued) | |||||
SM Energy Co. (Oil, Gas & Consumable Fuels) | 6.500% | 07/15/2028 | $ 50,000 | $ 50,023 | |
Southwestern Energy Co. (Oil, Gas & Consumable Fuels) | 8.375% | 09/15/2028 | 250,000 | 258,645 | |
Southwestern Energy Co. (Oil, Gas & Consumable Fuels) | 5.375% | 03/15/2030 | 75,000 | 73,234 | |
Southwestern Energy Co. (Oil, Gas & Consumable Fuels) | 4.750% | 02/01/2032 | 75,000 | 69,391 | |
Targa Resources Partners LP / Targa Resources Partners Finance Corp. (Oil, Gas & Consumable Fuels) | 5.000% | 01/15/2028 | 300,000 | 296,281 | |
Targa Resources Partners LP / Targa Resources Partners Finance Corp. (Oil, Gas & Consumable Fuels) | 5.500% | 03/01/2030 | 375,000 | 374,932 | |
Targa Resources Partners LP / Targa Resources Partners Finance Corp. (Oil, Gas & Consumable Fuels) | 4.875% | 02/01/2031 | 75,000 | 72,856 | |
TransMontaigne Partners LP / TLP Finance Corp. (Oil, Gas & Consumable Fuels) | 6.125% | 02/15/2026 | 225,000 | 203,062 | |
U.S.A. Compression Partners LP / U.S.A. Compression Finance Corp. (Energy Equip. & Svs.) | 6.875% | 04/01/2026 | 625,000 | 622,364 | |
U.S.A. Compression Partners LP / U.S.A. Compression Finance Corp. (Energy Equip. & Svs.) | 6.875% | 09/01/2027 | 150,000 | 148,222 | |
Western Midstream Operating LP (Oil, Gas & Consumable Fuels) | 4.650% | 07/01/2026 | 50,000 | 49,124 | |
Western Midstream Operating LP (Oil, Gas & Consumable Fuels) | 5.300% | 03/01/2048 | 500,000 | 435,113 | |
| 14,936,180 | |||||
| Financials–12.6% | |||||
Alliant Holdings Intermediate LLC / Alliant Holdings Co-Issuer (Insurance) | (a) | 7.000% | 01/15/2031 | 125,000 | 131,858 |
Ally Financial, Inc. (Consumer Finance) | 5.750% | 11/20/2025 | 125,000 | 124,221 | |
AmWINS Group, Inc. (Insurance) | (a) | 4.875% | 06/30/2029 | 600,000 | 547,940 |
Ardonagh Midco 2 PLC (Insurance) | (a)(c) | 11.500%, 12.750% PIK | 01/15/2027 | 800,000 | 787,662 |
AssuredPartners, Inc. (Insurance) | (a) | 7.000% | 08/15/2025 | 550,000 | 551,016 |
AssuredPartners, Inc. (Insurance) | (a) | 5.625% | 01/15/2029 | 200,000 | 186,710 |
BroadStreet Partners, Inc. (Insurance) | (a) | 5.875% | 04/15/2029 | 1,350,000 | 1,260,156 |
Ford Motor Credit Co. LLC (Consumer Finance) | 4.063% | 11/01/2024 | 225,000 | 221,047 | |
Ford Motor Credit Co. LLC (Consumer Finance) | 5.125% | 06/16/2025 | 400,000 | 394,751 | |
Ford Motor Credit Co. LLC (Consumer Finance) | 3.375% | 11/13/2025 | 575,000 | 550,224 | |
Ford Motor Credit Co. LLC (Consumer Finance) | 2.700% | 08/10/2026 | 200,000 | 185,238 | |
Ford Motor Credit Co. LLC (Consumer Finance) | 4.271% | 01/09/2027 | 450,000 | 431,571 | |
Ford Motor Credit Co. LLC (Consumer Finance) | 7.350% | 11/04/2027 | 225,000 | 237,273 | |
Ford Motor Credit Co. LLC (Consumer Finance) | 5.113% | 05/03/2029 | 525,000 | 510,523 | |
Ford Motor Credit Co. LLC (Consumer Finance) | 4.000% | 11/13/2030 | 350,000 | 314,051 | |
GTCR AP Finance, Inc. (Insurance) | (a) | 8.000% | 05/15/2027 | 550,000 | 555,529 |
GTCR W-2 Merger Sub LLC (Financial Services) | (a) | 7.500% | 01/15/2031 | 300,000 | 317,017 |
HUB International Ltd. (Insurance) | (a) | 7.000% | 05/01/2026 | 1,350,000 | 1,355,218 |
HUB International Ltd. (Insurance) | (a) | 5.625% | 12/01/2029 | 650,000 | 620,081 |
HUB International Ltd. (Insurance) | (a) | 7.250% | 06/15/2030 | 150,000 | 158,435 |
Jones Deslauriers Insurance Management, Inc. (Insurance) | (a) | 8.500% | 03/15/2030 | 325,000 | 341,292 |
Jones Deslauriers Insurance Management, Inc. (Insurance) | (a) | 10.500% | 12/15/2030 | 300,000 | 316,171 |
Navient Corp. (Consumer Finance) | 6.750% | 06/25/2025 | 175,000 | 177,086 | |
Navient Corp. (Consumer Finance) | 6.750% | 06/15/2026 | 200,000 | 203,328 | |
Navient Corp. (Consumer Finance) | 5.500% | 03/15/2029 | 350,000 | 322,750 | |
NCR Atleos Corp. (Financial Services) | (a) | 9.500% | 04/01/2029 | 250,000 | 265,624 |
NFP Corp. (Insurance) | (a) | 6.875% | 08/15/2028 | 1,300,000 | 1,321,581 |
NFP Corp. (Insurance) | (a) | 7.500% | 10/01/2030 | 375,000 | 399,111 |
Rocket Mortgage LLC / Rocket Mortgage Co-Issuer, Inc. (Financial Services) | (a) | 3.625% | 03/01/2029 | 250,000 | 226,272 |
Rocket Mortgage LLC / Rocket Mortgage Co-Issuer, Inc. (Financial Services) | (a) | 3.875% | 03/01/2031 | 350,000 | 307,824 |
Rocket Mortgage LLC / Rocket Mortgage Co-Issuer, Inc. (Financial Services) | (a) | 4.000% | 10/15/2033 | 400,000 | 339,811 |
Ryan Specialty LLC (Insurance) | (a) | 4.375% | 02/01/2030 | 275,000 | 255,062 |
United Wholesale Mortgage LLC (Financial Services) | (a) | 5.500% | 11/15/2025 | 700,000 | 695,575 |
United Wholesale Mortgage LLC (Financial Services) | (a) | 5.750% | 06/15/2027 | 175,000 | 171,519 |
United Wholesale Mortgage LLC (Financial Services) | (a) | 5.500% | 04/15/2029 | 225,000 | 213,010 |
USI Inc. (Insurance) | (a) | 7.500% | 01/15/2032 | 775,000 | 793,445 |
| 15,789,982 | |||||
| Health Care–6.8% | |||||
AHP Health Partners, Inc. (Health Care Providers & Svs.) | (a) | 5.750% | 07/15/2029 | 375,000 | 326,371 |
Avantor Funding, Inc. (Health Care Equip. & Supplies) | (a) | 4.625% | 07/15/2028 | 450,000 | 434,916 |
Avantor Funding, Inc. (Health Care Equip. & Supplies) | (a) | 3.875% | 11/01/2029 | 300,000 | 272,435 |
Bausch Health Americas, Inc. (Pharmaceuticals) | (a) | 8.500% | 01/31/2027 | 300,000 | 164,649 |
Bausch Health Cos., Inc. (Pharmaceuticals) | (a) | 6.125% | 02/01/2027 | 200,000 | 135,000 |
Bausch Health Cos., Inc. (Pharmaceuticals) | (a) | 6.250% | 02/15/2029 | 175,000 | 77,458 |
Bausch Health Cos., Inc. (Pharmaceuticals) | (a) | 7.250% | 05/30/2029 | 350,000 | 159,577 |
Centene Corp. (Health Care Providers & Svs.) | 4.250% | 12/15/2027 | 300,000 | 289,066 | |
Centene Corp. (Health Care Providers & Svs.) | 4.625% | 12/15/2029 | 300,000 | 287,618 | |
Centene Corp. (Health Care Providers & Svs.) | 3.375% | 02/15/2030 | 50,000 | 44,862 | |
CHS / Community Health Systems, Inc. (Health Care Providers & Svs.) | (a) | 6.000% | 01/15/2029 | 50,000 | 45,006 |
CHS / Community Health Systems, Inc. (Health Care Providers & Svs.) | (a) | 6.875% | 04/15/2029 | 525,000 | 338,767 |
CHS / Community Health Systems, Inc. (Health Care Providers & Svs.) | (a) | 6.125% | 04/01/2030 | 150,000 | 97,116 |
CHS / Community Health Systems, Inc. (Health Care Providers & Svs.) | (a) | 5.250% | 05/15/2030 | 225,000 | 188,178 |
59
(continued)
AuguStarSM Variable Insurance Products Fund, Inc.
AVIP Federated High Income Bond Portfolio (Continued)
| Schedule of Investments | December 31, 2023 |
| Corporate Bonds (Continued) | Rate | Maturity | Face Amount | Value | |
| Health Care (continued) | |||||
Embecta Corp. (Health Care Equip. & Supplies) | (a) | 5.000% | 02/15/2030 | $ 150,000 | $ 127,236 |
Embecta Corp. (Health Care Equip. & Supplies) | (a) | 6.750% | 02/15/2030 | 250,000 | 217,500 |
Garden Spinco Corp. (Health Care Equip. & Supplies) | (a) | 8.625% | 07/20/2030 | 100,000 | 106,814 |
Grifols SA (Biotechnology) | (a) | 4.750% | 10/15/2028 | 725,000 | 657,481 |
HCA, Inc. (Health Care Providers & Svs.) | 3.500% | 09/01/2030 | 200,000 | 181,305 | |
HealthEquity, Inc. (Health Care Providers & Svs.) | (a) | 4.500% | 10/01/2029 | 525,000 | 487,467 |
IQVIA, Inc. (Health Care Technology) | (a) | 5.000% | 10/15/2026 | 200,000 | 198,089 |
IQVIA, Inc. (Life Sciences Tools & Svs.) | (a) | 6.500% | 05/15/2030 | 200,000 | 205,022 |
LifePoint Health, Inc. (Health Care Providers & Svs.) | (a) | 5.375% | 01/15/2029 | 50,000 | 36,973 |
Medline Borrower LP (Health Care Equip. & Supplies) | (a) | 3.875% | 04/01/2029 | 325,000 | 293,847 |
Medline Borrower LP (Health Care Equip. & Supplies) | (a) | 5.250% | 10/01/2029 | 1,150,000 | 1,083,963 |
Organon & Co. / Organon Foreign Debt Co-Issuer B.V. (Pharmaceuticals) | (a) | 5.125% | 04/30/2031 | 450,000 | 384,680 |
Prestige Brands, Inc. (Pharmaceuticals) | (a) | 3.750% | 04/01/2031 | 175,000 | 152,979 |
Tenet Healthcare Corp. (Health Care Providers & Svs.) | 4.875% | 01/01/2026 | 300,000 | 296,620 | |
Tenet Healthcare Corp. (Health Care Providers & Svs.) | 6.250% | 02/01/2027 | 125,000 | 125,613 | |
Tenet Healthcare Corp. (Health Care Providers & Svs.) | 5.125% | 11/01/2027 | 425,000 | 415,459 | |
Tenet Healthcare Corp. (Health Care Providers & Svs.) | 6.125% | 10/01/2028 | 325,000 | 324,080 | |
Tenet Healthcare Corp. (Health Care Providers & Svs.) | 4.250% | 06/01/2029 | 150,000 | 139,650 | |
Tenet Healthcare Corp. (Health Care Providers & Svs.) | (a) | 6.750% | 05/15/2031 | 125,000 | 127,756 |
| 8,423,553 | |||||
| Industrials–11.2% | |||||
Allied Universal Holdco LLC / Allied Universal Finance Corp. (Commercial Svs. & Supplies) | (a) | 6.625% | 07/15/2026 | 200,000 | 198,950 |
Allied Universal Holdco LLC / Allied Universal Finance Corp. (Commercial Svs. & Supplies) | (a) | 9.750% | 07/15/2027 | 1,300,000 | 1,273,866 |
American Airlines, Inc. / AAdvantage Loyalty IP Ltd. (Passenger Airlines) | (a) | 5.500% | 04/20/2026 | 166,667 | 165,464 |
American Airlines, Inc. / AAdvantage Loyalty IP Ltd. (Passenger Airlines) | (a) | 5.750% | 04/20/2029 | 150,000 | 146,214 |
American Builders & Contractors Supply Co., Inc. (Trading Companies & Distributors) | (a) | 4.000% | 01/15/2028 | 175,000 | 165,599 |
BCPE Empire Holdings, Inc. (Commercial Svs. & Supplies) | (a) | 7.625% | 05/01/2027 | 850,000 | 819,626 |
Beacon Roofing Supply, Inc. (Trading Companies & Distributors) | (a) | 6.500% | 08/01/2030 | 75,000 | 76,685 |
Camelot Return Merger Sub, Inc. (Building Products) | (a) | 8.750% | 08/01/2028 | 100,000 | 101,503 |
Clarivate Science Holdings Corp. (Professional Svs.) | (a) | 3.875% | 07/01/2028 | 75,000 | 70,717 |
Clarivate Science Holdings Corp. (Professional Svs.) | (a) | 4.875% | 07/01/2029 | 425,000 | 398,792 |
Cornerstone Building Brands, Inc. (Building Products) | (a) | 6.125% | 01/15/2029 | 175,000 | 143,500 |
CP Atlas Buyer, Inc. (Building Products) | (a) | 7.000% | 12/01/2028 | 525,000 | 457,028 |
Dun & Bradstreet Corp. / The (Professional Svs.) | (a) | 5.000% | 12/15/2029 | 325,000 | 303,167 |
Foundation Building Materials, Inc. (Trading Companies & Distributors) | (a) | 6.000% | 03/01/2029 | 800,000 | 719,304 |
Garda World Security Corp. (Commercial Svs. & Supplies) | (a) | 4.625% | 02/15/2027 | 175,000 | 168,733 |
Garda World Security Corp. (Commercial Svs. & Supplies) | (a) | 7.750% | 02/15/2028 | 150,000 | 155,191 |
Garda World Security Corp. (Commercial Svs. & Supplies) | (a) | 6.000% | 06/01/2029 | 300,000 | 268,913 |
GYP Holdings III Corp. (Building Products) | (a) | 4.625% | 05/01/2029 | 325,000 | 296,694 |
H&E Equipment Services, Inc. (Trading Companies & Distributors) | (a) | 3.875% | 12/15/2028 | 300,000 | 272,795 |
Interface, Inc. (Commercial Svs. & Supplies) | (a) | 5.500% | 12/01/2028 | 200,000 | 184,857 |
Madison IAQ LLC (Commercial Svs. & Supplies) | (a) | 4.125% | 06/30/2028 | 50,000 | 45,457 |
Madison IAQ LLC (Commercial Svs. & Supplies) | (a) | 5.875% | 06/30/2029 | 900,000 | 792,975 |
MIWD Holdco II LLC / MIWD Finance Corp. (Building Products) | (a) | 5.500% | 02/01/2030 | 75,000 | 66,375 |
Science Applications International Corp. (Professional Svs.) | (a) | 4.875% | 04/01/2028 | 75,000 | 71,438 |
Sensata Technologies B.V. (Electrical Equip.) | (a) | 5.875% | 09/01/2030 | 200,000 | 198,703 |
Sensata Technologies, Inc. (Electrical Equip.) | (a) | 4.375% | 02/15/2030 | 125,000 | 115,933 |
Sensata Technologies, Inc. (Electrical Equip.) | (a) | 3.750% | 02/15/2031 | 25,000 | 22,018 |
Solaris Midstream Holdings LLC (Commercial Svs. & Supplies) | (a) | 7.625% | 04/01/2026 | 400,000 | 405,381 |
SPX FLOW, Inc. (Machinery) | (a) | 8.750% | 04/01/2030 | 450,000 | 450,000 |
SS&C Technologies, Inc. (Professional Svs.) | (a) | 5.500% | 09/30/2027 | 600,000 | 591,440 |
Stena International SA (Transportation Infrastructure) | (a) | 6.125% | 02/01/2025 | 300,000 | 298,264 |
TK Elevator Holdco GmbH (Machinery) | (a) | 7.625% | 07/15/2028 | 200,000 | 196,458 |
TK Elevator U.S. Newco, Inc. (Building Products) | (a) | 5.250% | 07/15/2027 | 325,000 | 319,266 |
TransDigm, Inc. (Aerospace & Defense) | (a) | 6.250% | 03/15/2026 | 600,000 | 598,963 |
TransDigm, Inc. (Aerospace & Defense) | 5.500% | 11/15/2027 | 150,000 | 146,959 | |
TransDigm, Inc. (Aerospace & Defense) | 4.625% | 01/15/2029 | 125,000 | 117,359 | |
TransDigm, Inc. (Aerospace & Defense) | 4.875% | 05/01/2029 | 425,000 | 397,241 | |
TransDigm, Inc. (Aerospace & Defense) | (a) | 6.875% | 12/15/2030 | 725,000 | 746,750 |
United Rentals North America, Inc. (Trading Companies & Distributors) | 5.500% | 05/15/2027 | 25,000 | 25,055 | |
United Rentals North America, Inc. (Trading Companies & Distributors) | 4.875% | 01/15/2028 | 325,000 | 317,278 | |
United Rentals North America, Inc. (Trading Companies & Distributors) | 5.250% | 01/15/2030 | 75,000 | 73,847 | |
United Rentals North America, Inc. (Trading Companies & Distributors) | 3.875% | 02/15/2031 | 50,000 | 45,430 | |
United Rentals North America, Inc. (Trading Companies & Distributors) | 3.750% | 01/15/2032 | 150,000 | 132,720 | |
Watco Cos. LLC / Watco Finance Corp. (Ground Transportation) | (a) | 6.500% | 06/15/2027 | 400,000 | 400,000 |
WESCO Distribution, Inc. (Trading Companies & Distributors) | (a) | 7.125% | 06/15/2025 | 100,000 | 100,730 |
WESCO Distribution, Inc. (Trading Companies & Distributors) | (a) | 7.250% | 06/15/2028 | 250,000 | 256,956 |
White Cap Buyer LLC (Building Products) | (a) | 6.875% | 10/15/2028 | 425,000 | 411,405 |
White Cap Parent LLC (Building Products) | (a)(c) | 8.250%, 9.000% PIK | 03/15/2026 | 325,000 | 323,490 |
| 14,055,489 | |||||
60
(continued)
AuguStarSM Variable Insurance Products Fund, Inc.
AVIP Federated High Income Bond Portfolio (Continued)
| Schedule of Investments | December 31, 2023 |
| Corporate Bonds (Continued) | Rate | Maturity | Face Amount | Value | |
| Information Technology–7.6% | |||||
ams-OSRAM AG (Semiconductors & Equip.) | (a) | 12.250% | 03/30/2029 | $ 175,000 | $ 194,614 |
AthenaHealth Group, Inc. (Software) | (a) | 6.500% | 02/15/2030 | 1,150,000 | 1,043,254 |
Boxer Parent Co., Inc. (Software) | (a) | 9.125% | 03/01/2026 | 325,000 | 324,286 |
Capstone Borrower, Inc. (Software) | (a) | 8.000% | 06/15/2030 | 300,000 | 312,108 |
Central Parent LLC / CDK Global II LLC / CDK Financing Co., Inc. (Software) | (a) | 8.000% | 06/15/2029 | 125,000 | 130,470 |
Central Parent, Inc. / CDK Global, Inc. (Software) | (a) | 7.250% | 06/15/2029 | 550,000 | 560,922 |
Ciena Corp. (Communications Equip.) | (a) | 4.000% | 01/31/2030 | 75,000 | 68,254 |
Cloud Software Group, Inc. (Software) | (a) | 6.500% | 03/31/2029 | 400,000 | 380,976 |
Cloud Software Group, Inc. (Software) | (a) | 9.000% | 09/30/2029 | 350,000 | 332,659 |
Coherent Corp. (Electronic Equip., Instr. & Comp.) | (a) | 5.000% | 12/15/2029 | 675,000 | 641,085 |
Consensus Cloud Solutions, Inc. (Software) | (a) | 6.000% | 10/15/2026 | 200,000 | 190,170 |
Consensus Cloud Solutions, Inc. (Software) | (a) | 6.500% | 10/15/2028 | 325,000 | 294,793 |
Elastic N.V. (Software) | (a) | 4.125% | 07/15/2029 | 425,000 | 390,255 |
Gartner, Inc. (IT Svs.) | (a) | 3.750% | 10/01/2030 | 125,000 | 110,497 |
Go Daddy Operating Co. LLC / GD Finance Co., Inc. (IT Svs.) | (a) | 5.250% | 12/01/2027 | 225,000 | 220,479 |
Helios Software Holdings, Inc. / ION Corporate Solutions Finance SARL (Software) | (a) | 4.625% | 05/01/2028 | 450,000 | 410,517 |
McAfee Corp. (Software) | (a) | 7.375% | 02/15/2030 | 1,300,000 | 1,187,227 |
NCR Voyix Corp. (Software) | (a) | 5.000% | 10/01/2028 | 225,000 | 212,685 |
NCR Voyix Corp. (Software) | (a) | 5.125% | 04/15/2029 | 50,000 | 47,530 |
NCR Voyix Corp. (Software) | (a) | 5.250% | 10/01/2030 | 325,000 | 298,473 |
Open Text Corp. (Software) | (a) | 6.900% | 12/01/2027 | 175,000 | 181,939 |
Open Text Corp. (Software) | (a) | 3.875% | 12/01/2029 | 350,000 | 313,892 |
Rocket Software, Inc. (Software) | (a) | 6.500% | 02/15/2029 | 475,000 | 413,250 |
Seagate HDD Cayman (Tech. Hardware, Storage & Periph.) | (a) | 8.250% | 12/15/2029 | 150,000 | 161,779 |
Seagate HDD Cayman (Tech. Hardware, Storage & Periph.) | 9.625% | 12/01/2032 | 425,250 | 486,273 | |
Synaptics, Inc. (Semiconductors & Equip.) | (a) | 4.000% | 06/15/2029 | 125,000 | 112,123 |
TTM Technologies, Inc. (Electronic Equip., Instr. & Comp.) | (a) | 4.000% | 03/01/2029 | 450,000 | 408,794 |
Viavi Solutions, Inc. (Communications Equip.) | (a) | 3.750% | 10/01/2029 | 75,000 | 65,658 |
| 9,494,962 | |||||
| Materials–9.3% | |||||
ARD Finance SA (Containers & Packaging) | (a)(c) | 6.500%, 7.250% PIK | 06/30/2027 | 653,176 | 305,151 |
Ardagh Metal Packaging Finance U.S.A. LLC / Ardagh Metal Packaging Finance PLC (Containers & Packaging) | (a) | 4.000% | 09/01/2029 | 475,000 | 402,076 |
Ardagh Packaging Finance PLC / Ardagh Holdings U.S.A., Inc. (Containers & Packaging) | (a) | 5.250% | 08/15/2027 | 450,000 | 349,589 |
Ardagh Packaging Finance PLC / Ardagh Holdings U.S.A., Inc. (Containers & Packaging) | (a) | 5.250% | 08/15/2027 | 200,000 | 155,373 |
Axalta Coating Systems Dutch Holding B B.V. (Chemicals) | (a) | 7.250% | 02/15/2031 | 150,000 | 157,310 |
Axalta Coating Systems LLC (Chemicals) | (a) | 3.375% | 02/15/2029 | 175,000 | 157,050 |
Axalta Coating Systems LLC / Axalta Coating Systems Dutch Holding B B.V. (Chemicals) | (a) | 4.750% | 06/15/2027 | 150,000 | 145,767 |
Ball Corp. (Containers & Packaging) | 6.875% | 03/15/2028 | 25,000 | 25,973 | |
Ball Corp. (Containers & Packaging) | 6.000% | 06/15/2029 | 100,000 | 102,117 | |
Ball Corp. (Containers & Packaging) | 2.875% | 08/15/2030 | 325,000 | 278,845 | |
Ball Corp. (Containers & Packaging) | 3.125% | 09/15/2031 | 75,000 | 64,664 | |
Berry Global, Inc. (Containers & Packaging) | (a) | 5.625% | 07/15/2027 | 150,000 | 148,880 |
Cleveland-Cliffs, Inc. (Metals & Mining) | (a) | 4.875% | 03/01/2031 | 325,000 | 293,659 |
Clydesdale Acquisition Holdings, Inc. (Containers & Packaging) | (a) | 8.750% | 04/15/2030 | 1,300,000 | 1,212,077 |
Coeur Mining, Inc. (Metals & Mining) | (a) | 5.125% | 02/15/2029 | 400,000 | 368,048 |
Crown Americas LLC / Crown Americas Capital Corp. V (Containers & Packaging) | 4.250% | 09/30/2026 | 50,000 | 48,500 | |
Crown Americas LLC / Crown Americas Capital Corp. VI (Containers & Packaging) | 4.750% | 02/01/2026 | 275,000 | 272,387 | |
Element Solutions, Inc. (Chemicals) | (a) | 3.875% | 09/01/2028 | 300,000 | 276,191 |
Graphic Packaging International LLC (Containers & Packaging) | (a) | 4.750% | 07/15/2027 | 150,000 | 145,500 |
Graphic Packaging International LLC (Containers & Packaging) | (a) | 3.500% | 03/15/2028 | 100,000 | 92,791 |
Graphic Packaging International LLC (Containers & Packaging) | (a) | 3.500% | 03/01/2029 | 125,000 | 112,548 |
Graphic Packaging International LLC (Containers & Packaging) | (a) | 3.750% | 02/01/2030 | 25,000 | 22,505 |
H.B. Fuller Co. (Chemicals) | 4.250% | 10/15/2028 | 125,000 | 116,882 | |
Herens Holdco SARL (Chemicals) | (a) | 4.750% | 05/15/2028 | 500,000 | 410,193 |
Mauser Packaging Solutions Holding Co. (Containers & Packaging) | (a) | 7.875% | 08/15/2026 | 325,000 | 330,746 |
Mauser Packaging Solutions Holding Co. (Containers & Packaging) | (a) | 9.250% | 04/15/2027 | 250,000 | 245,389 |
OI European Group B.V. (Containers & Packaging) | (a) | 4.750% | 02/15/2030 | 225,000 | 210,422 |
Olympus Water U.S. Holding Corp. (Chemicals) | (a) | 7.125% | 10/01/2027 | 200,000 | 200,224 |
Olympus Water U.S. Holding Corp. (Chemicals) | (a) | 4.250% | 10/01/2028 | 200,000 | 179,959 |
Olympus Water U.S. Holding Corp. (Chemicals) | (a) | 9.750% | 11/15/2028 | 275,000 | 291,883 |
Olympus Water U.S. Holding Corp. (Chemicals) | (a) | 6.250% | 10/01/2029 | 400,000 | 355,264 |
Owens-Brockway Glass Container, Inc. (Containers & Packaging) | (a) | 6.375% | 08/15/2025 | 450,000 | 451,121 |
Owens-Brockway Glass Container, Inc. (Containers & Packaging) | (a) | 6.625% | 05/13/2027 | 38,000 | 38,005 |
Owens-Brockway Glass Container, Inc. (Containers & Packaging) | (a) | 7.250% | 05/15/2031 | 175,000 | 177,431 |
Polar U.S. Borrower LLC / Schenectady International Group, Inc. (Chemicals) | (a) | 6.750% | 05/15/2026 | 200,000 | 64,000 |
Sealed Air Corp. (Containers & Packaging) | (a) | 4.000% | 12/01/2027 | 200,000 | 187,714 |
Sealed Air Corp. (Containers & Packaging) | (a) | 5.000% | 04/15/2029 | 75,000 | 72,526 |
Sealed Air Corp. / Sealed Air Corp. U.S. (Containers & Packaging) | (a) | 7.250% | 02/15/2031 | 75,000 | 79,523 |
SNF Group SACA (Chemicals) | (a) | 3.375% | 03/15/2030 | 200,000 | 171,853 |
61
(continued)
AuguStarSM Variable Insurance Products Fund, Inc.
AVIP Federated High Income Bond Portfolio (Continued)
| Schedule of Investments | December 31, 2023 |
| Corporate Bonds (Continued) | Rate | Maturity | Face Amount | Value | |
| Materials (continued) | |||||
SRS Distribution, Inc. (Construction Materials) | (a) | 6.125% | 07/01/2029 | $ 200,000 | $ 189,606 |
SRS Distribution, Inc. (Construction Materials) | (a) | 6.000% | 12/01/2029 | 750,000 | 699,305 |
Standard Industries, Inc. (Construction Materials) | (a) | 5.000% | 02/15/2027 | 800,000 | 779,949 |
Standard Industries, Inc. (Construction Materials) | (a) | 4.750% | 01/15/2028 | 25,000 | 24,067 |
Trivium Packaging Finance B.V. (Containers & Packaging) | (a) | 5.500% | 08/15/2026 | 200,000 | 196,222 |
Trivium Packaging Finance B.V. (Containers & Packaging) | (a) | 8.500% | 08/15/2027 | 725,000 | 710,862 |
W.R. Grace Holdings LLC (Chemicals) | (a) | 4.875% | 06/15/2027 | 100,000 | 96,210 |
W.R. Grace Holdings LLC (Chemicals) | (a) | 5.625% | 08/15/2029 | 250,000 | 219,989 |
| 11,636,346 | |||||
| Real Estate–1.3% | |||||
Iron Mountain, Inc. (Specialized REITs) | (a) | 7.000% | 02/15/2029 | 300,000 | 308,363 |
Outfront Media Capital LLC / Outfront Media Capital Corp. (Specialized REITs) | (a) | 5.000% | 08/15/2027 | 50,000 | 48,330 |
Outfront Media Capital LLC / Outfront Media Capital Corp. (Specialized REITs) | (a) | 4.250% | 01/15/2029 | 100,000 | 90,237 |
Outfront Media Capital LLC / Outfront Media Capital Corp. (Specialized REITs) | (a) | 4.625% | 03/15/2030 | 225,000 | 200,587 |
Outfront Media Capital LLC / Outfront Media Capital Corp. (Specialized REITs) | (a) | 7.375% | 02/15/2031 | 75,000 | 78,760 |
RHP Hotel Properties LP / RHP Finance Corp. (Hotel & Resort REITs) | (a) | 7.250% | 07/15/2028 | 325,000 | 337,898 |
VICI Properties LP / VICI Note Co., Inc. (Specialized REITs) | (a) | 4.625% | 06/15/2025 | 50,000 | 49,112 |
VICI Properties LP / VICI Note Co., Inc. (Specialized REITs) | (a) | 4.250% | 12/01/2026 | 175,000 | 168,413 |
VICI Properties LP / VICI Note Co., Inc. (Specialized REITs) | (a) | 3.875% | 02/15/2029 | 50,000 | 45,932 |
VICI Properties LP / VICI Note Co., Inc. (Specialized REITs) | (a) | 4.625% | 12/01/2029 | 225,000 | 212,006 |
VICI Properties LP / VICI Note Co., Inc. (Specialized REITs) | (a) | 4.125% | 08/15/2030 | 100,000 | 91,093 |
| 1,630,731 | |||||
| Utilities–3.4% | |||||
AmeriGas Partners LP / AmeriGas Finance Corp. (Gas Utilities) | 5.875% | 08/20/2026 | 425,000 | 420,811 | |
Calpine Corp. (Ind. Power & Renewable Elec.) | (a) | 5.250% | 06/01/2026 | 50,000 | 49,336 |
Calpine Corp. (Ind. Power & Renewable Elec.) | (a) | 4.500% | 02/15/2028 | 300,000 | 285,345 |
Calpine Corp. (Ind. Power & Renewable Elec.) | (a) | 4.625% | 02/01/2029 | 150,000 | 139,324 |
Calpine Corp. (Ind. Power & Renewable Elec.) | (a) | 5.000% | 02/01/2031 | 100,000 | 91,672 |
Calpine Corp. (Ind. Power & Renewable Elec.) | (a) | 3.750% | 03/01/2031 | 300,000 | 263,125 |
Emerald Debt Merger Sub LLC (Electric Utilities) | (a) | 6.625% | 12/15/2030 | 500,000 | 510,685 |
NextEra Energy Operating Partners LP (Electric Utilities) | (a) | 7.250% | 01/15/2029 | 75,000 | 78,518 |
NRG Energy, Inc. (Electric Utilities) | 6.625% | 01/15/2027 | 76,000 | 76,163 | |
NRG Energy, Inc. (Electric Utilities) | (a) | 3.375% | 02/15/2029 | 25,000 | 22,081 |
NRG Energy, Inc. (Electric Utilities) | (a) | 3.625% | 02/15/2031 | 25,000 | 21,479 |
NRG Energy, Inc. (Electric Utilities) | (a) | 3.875% | 02/15/2032 | 70,000 | 59,924 |
Suburban Propane Partners LP / Suburban Energy Finance Corp. (Gas Utilities) | 5.875% | 03/01/2027 | 325,000 | 323,366 | |
Suburban Propane Partners LP / Suburban Energy Finance Corp. (Gas Utilities) | (a) | 5.000% | 06/01/2031 | 125,000 | 113,323 |
TerraForm Power Operating LLC (Ind. Power & Renewable Elec.) | (a) | 5.000% | 01/31/2028 | 750,000 | 728,560 |
TransAlta Corp. (Ind. Power & Renewable Elec.) | 7.750% | 11/15/2029 | 300,000 | 318,625 | |
Vistra Operations Co. LLC (Ind. Power & Renewable Elec.) | (a) | 5.500% | 09/01/2026 | 225,000 | 222,139 |
Vistra Operations Co. LLC (Ind. Power & Renewable Elec.) | (a) | 5.000% | 07/31/2027 | 250,000 | 243,400 |
Vistra Operations Co. LLC (Ind. Power & Renewable Elec.) | (a) | 7.750% | 10/15/2031 | 300,000 | 311,577 |
| 4,279,453 | |||||
Total Corporate Bonds (Cost $125,565,817) | $118,750,250 | ||||
| Common Stocks–0.0% | Shares | Value | |
| Communication Services–0.0% | |||
iHeartMedia, Inc. Class A (Media) | (d) | 7,387 | $ 19,724 |
Total Common Stocks (Cost $178,496) | $ 19,724 | ||
Total Investments – 94.8% (Cost $125,744,313) | (e) | $118,769,974 | |
Other Assets in Excess of Liabilities – 5.2% | 6,542,124 | ||
| Net Assets – 100.0% | $125,312,098 | ||
Percentages are stated as a percent of net assets. |
| Abbreviations: | ||
| PIK: | Payment-in-Kind | |
| REITs: | Real Estate Investment Trusts | |
| Footnotes: | ||
| (a) | Security exempt from registration under Regulation D of the Securities Act of 1933. These securities may be resold in transactions exempt from registration, normally to qualified buyers under Rule 144A. At December 31, 2023, the value of these securities totaled $101,654,578, or 81.1% of the Portfolio’s net assets. | |
| (b) | Represents a security that is in default and deemed to be non-income producing. | |
| (c) | Issuer of the security has the option to make coupon payments in cash or in additional par value of this bond (Payment-in-Kind). | |
| (d) | Non-income producing security. | |
| (e) | Represents cost for financial reporting purposes, which may differ from cost basis for federal income tax purposes. See also Note 7 of the Notes to Financial Statements. | |
The accompanying notes are an integral part of these financial statements.
62
AuguStarSM Variable Insurance Products Fund, Inc.
AVIP Nasdaq-100® Index Portfolio (Unaudited)
Objective/Strategy
The AVIP Nasdaq-100® Index Portfolio (formerly ON Nasdaq-100® Index Portfolio) seeks long-term growth of capital by investing, under normal circumstances, more than 80% of its net assets in the common stocks of companies that are included in the Nasdaq-100® Index.
Performance as of December 31, 2023
| Average Annual returns | |
| One year | 54.44% |
| Five years | 22.19% |
| Ten years | 17.38% |
Past performance does not guarantee future results. The performance data quoted represents past performance and current returns may be lower or higher. Total return figures include change in share price and reinvestment of dividends and capital gains. The investment return and principal value will fluctuate so that an investor’s shares, when redeemed, may be worth more or less than the original cost. To obtain performance information up to the most recent month end, call toll-free 1-877-781-6392.
The Portfolio is not open to direct retail investment. Beneficial interest in the Portfolio’s shares is obtained either through an allocation to the Portfolio as an investment vehicle within variable life insurance policies or annuity contracts, or as an underlying investment by the AVIP Model Portfolios. Actual performance results for variable annuity and variable universal life contracts will be lower due to contract charges. Consult your contract for applicable charges.
Total expense ratio is 0.43% per the Fund’s Prospectus dated May 1, 2023 and supplemented October 2, 2023 and December 4, 2023. Additional information pertaining to the Portfolio’s expense ratio as of December 31, 2023 can be found in the Portfolio’s Financial Highlights.
Comments from Sub-Adviser
Q. How did the Portfolio perform in comparison to its benchmark during the reporting period?
A. For the year ended December 31, 2023, the Portfolio returned 54.44% versus 55.13% for its benchmark, the Nasdaq-100® Index.
Q. What affected the Portfolio’s performance?
A. The Portfolio seeks to track the underlying return of the Nasdaq-100® Index. There were no material market events or changes in strategy during the year that materially impacted the Portfolio’s relative return. Sources of return variance were related to the cumulative impact of investing the day-to-day cash flows in the Portfolio. There was no impact from either sector allocation or stock selection that caused any significant performance variance between the Portfolio and its benchmark. Information Technology, Communication Services and Consumer Discretionary were the top contributing sectors for the year, while Financials, Utilities and Real Estate were the largest detractors. Because the Portfolio weights its holdings to be similar to those utilized by the benchmark, there were no holdings that significantly contributed to, or detracted from, the Portfolio’s benchmark-relative performance. Benchmark constituents that contributed the most to Portfolio and benchmark returns for the year were NVIDIA Corp., Microsoft Corp., and Apple, Inc., while Moderna, Inc., Enphase Energy, Inc., and PayPal Holdings, Inc. were the largest detractors. (1)
| (1) | The Portfolio’s composition is subject to change. Holdings and weightings are as of December 31, 2023. |
Change in Value of $10,000 Investment

Hypothetical illustration based on past performance. Future performance will vary. The Portfolio’s returns reflect reinvested dividends. The Portfolio’s holdings may differ significantly from the securities in the index. The index is unmanaged and therefore does not reflect the cost of portfolio management and accounting.
The Nasdaq-100® Index is a modified capitalization-weighted index of the 100 largest domestic and international non-financial companies listed on the NASDAQ® Stock Market. The index presented includes the effects of reinvested dividends.
Past performance is no guarantee of future results. Redemption of fund shares could have tax implications unique to each shareholder.
The Nasdaq-100®, Nasdaq-100 Index®, and Nasdaq® are registered trademarks of The NASDAQ OMX Group, Inc. (which with its affiliates is referred to as “NASDAQ OMX”). Ohio National Investments, Inc. has licensed these marks for the Portfolio’s use. NASDAQ OMX has not passed on the Portfolio’s legality or suitability. NASDAQ OMX does not sponsor, endorse, sell or promote the Portfolio. NASDAQ OMX MAKES NO WARRANTIES AND BEARS NO LIABILITY WITH RESPECT TO THE PORTFOLIO.
63
(continued)
AuguStarSM Variable Insurance Products Fund, Inc.
AVIP Nasdaq-100® Index Portfolio (Unaudited) (Continued)
| Portfolio Composition as of December 31, 2023 (1) | |
| % of Net Assets | |
| Common Stocks (4) | 99.2 |
| U.S. Treasury Obligations | 0.1 |
| Other Net Assets | 0.7 |
| 100.0 | |
| Top 10 Portfolio Holdings as of December 31, 2023 (1) (2) (3) | ||
| % of Net Assets | ||
| 1. | Apple, Inc. | 9.2 |
| 2. | Microsoft Corp. | 8.5 |
| 3. | Amazon.com, Inc. | 4.8 |
| 4. | Broadcom, Inc. | 4.1 |
| 5. | Meta Platforms, Inc. Class A | 3.8 |
| 6. | NVIDIA Corp. | 3.7 |
| 7. | Tesla, Inc. | 3.7 |
| 8. | Alphabet, Inc. Class A | 2.5 |
| 9. | Alphabet, Inc. Class C | 2.5 |
| 10. | Costco Wholesale Corp. | 2.3 |
| (1) | Composition of Portfolio subject to change. | |
| (2) | Short-term investments have been excluded from the list of Top 10 Portfolio Holdings. | |
| (3) | Top 10 Portfolio Holdings is presented at an individual security level. Total investment exposure by issuer may be higher. | |
| (4) | Sectors (Common Stocks): | |
| % of Net Assets | |
| Information Technology | 49.2 |
| Communication Services | 14.9 |
| Consumer Discretionary | 14.3 |
| Consumer Staples | 6.8 |
| Health Care | 6.6 |
| Industrials | 4.9 |
| Utilities | 1.2 |
| Financials | 0.5 |
| Energy | 0.5 |
| Real Estate | 0.3 |
| 99.2 |
64
AuguStarSM Variable Insurance Products Fund, Inc.
AVIP Nasdaq-100® Index Portfolio
| Schedule of Investments | December 31, 2023 |
| Common Stocks–99.2% | Shares | Value | |
| Communication Services–14.9% | |||
Alphabet, Inc. Class A (Interactive Media & Svs.) | (a) | 47,501 | $ 6,635,415 |
Alphabet, Inc. Class C (Interactive Media & Svs.) | (a) | 45,951 | 6,475,874 |
Charter Communications, Inc. Class A (Media) | (a) | 3,067 | 1,192,082 |
Comcast Corp. Class A (Media) | 83,249 | 3,650,469 | |
Electronic Arts, Inc. (Entertainment) | 5,579 | 763,263 | |
Meta Platforms, Inc. Class A (Interactive Media & Svs.) | (a) | 28,343 | 10,032,288 |
Netflix, Inc. (Entertainment) | (a) | 9,074 | 4,417,949 |
Sirius XM Holdings, Inc. (Media) | 79,586 | 435,335 | |
Take-Two Interactive Software, Inc. (Entertainment) | (a) | 3,526 | 567,510 |
T-Mobile U.S., Inc. (Wireless Telecom. Svs.) | 23,975 | 3,843,912 | |
Trade Desk, Inc. / The Class A (Media) | (a) | 9,252 | 665,774 |
Warner Bros. Discovery, Inc. (Entertainment) | (a) | 50,554 | 575,304 |
| 39,255,175 | |||
| Consumer Discretionary–14.3% | |||
Airbnb, Inc. Class A (Hotels, Restaurants & Leisure) | (a) | 9,013 | 1,227,030 |
Amazon.com, Inc. (Broadline Retail) | (a) | 82,946 | 12,602,815 |
Booking Holdings, Inc. (Hotels, Restaurants & Leisure) | (a) | 723 | 2,564,640 |
DoorDash, Inc. Class A (Hotels, Restaurants & Leisure) | (a) | 7,686 | 760,068 |
Lululemon Athletica, Inc. (Textiles, Apparel & Luxury Goods) | (a) | 2,517 | 1,286,917 |
Marriott International, Inc. Class A (Hotels, Restaurants & Leisure) | 6,089 | 1,373,130 | |
MercadoLibre, Inc. (Broadline Retail) | (a) | 1,048 | 1,646,974 |
O'Reilly Automotive, Inc. (Specialty Retail) | (a) | 1,226 | 1,164,798 |
PDD Holdings, Inc. – ADR (Broadline Retail) | (a) | 13,847 | 2,025,955 |
Ross Stores, Inc. (Specialty Retail) | 7,020 | 971,498 | |
Starbucks Corp. (Hotels, Restaurants & Leisure) | 23,565 | 2,262,476 | |
Tesla, Inc. (Automobiles) | (a) | 38,622 | 9,596,794 |
| 37,483,095 | |||
| Consumer Staples–6.8% | |||
Coca-Cola Europacific Partners PLC (Beverages) | 9,470 | 632,028 | |
Costco Wholesale Corp. (Consumer Staples Distribution & Retail) | 9,179 | 6,058,874 | |
Dollar Tree, Inc. (Consumer Staples Distribution & Retail) | (a) | 4,517 | 641,640 |
Keurig Dr Pepper, Inc. (Beverages) | 28,989 | 965,913 | |
Kraft Heinz Co. / The (Food Products) | 25,428 | 940,327 | |
Mondelez International, Inc. Class A (Food Products) | 28,213 | 2,043,468 | |
Monster Beverage Corp. (Beverages) | (a) | 21,570 | 1,242,648 |
PepsiCo, Inc. (Beverages) | 28,503 | 4,840,950 | |
Walgreens Boots Alliance, Inc. (Consumer Staples Distribution & Retail) | 17,910 | 467,630 | |
| 17,833,478 | |||
| Energy–0.5% | |||
Baker Hughes Co. (Energy Equip. & Svs.) | 20,860 | 712,995 | |
Diamondback Energy, Inc. (Oil, Gas & Consumable Fuels) | 3,711 | 575,502 | |
| 1,288,497 | |||
| Financials–0.5% | |||
PayPal Holdings, Inc. (Financial Services) | (a) | 22,351 | 1,372,575 |
| Health Care–6.6% | |||
Amgen, Inc. (Biotechnology) | 11,095 | 3,195,582 | |
AstraZeneca PLC – ADR (Pharmaceuticals) | 12,072 | 813,049 | |
Biogen, Inc. (Biotechnology) | (a) | 3,004 | 777,345 |
Dexcom, Inc. (Health Care Equip. & Supplies) | (a) | 8,010 | 993,961 |
| Common Stocks (Continued) | Shares | Value | |
| Health Care (continued) | |||
GE HealthCare Technologies, Inc. (Health Care Equip. & Supplies) | 9,438 | $ 729,746 | |
Gilead Sciences, Inc. (Biotechnology) | 25,832 | 2,092,650 | |
IDEXX Laboratories, Inc. (Health Care Equip. & Supplies) | (a) | 1,722 | 955,796 |
Illumina, Inc. (Life Sciences Tools & Svs.) | (a) | 3,292 | 458,378 |
Intuitive Surgical, Inc. (Health Care Equip. & Supplies) | (a) | 7,299 | 2,462,391 |
Moderna, Inc. (Biotechnology) | (a) | 7,904 | 786,053 |
Regeneron Pharmaceuticals, Inc. (Biotechnology) | (a) | 2,221 | 1,950,682 |
Vertex Pharmaceuticals, Inc. (Biotechnology) | (a) | 5,342 | 2,173,606 |
| 17,389,239 | |||
| Industrials–4.9% | |||
Automatic Data Processing, Inc. (Professional Svs.) | 8,527 | 1,986,535 | |
Cintas Corp. (Commercial Svs. & Supplies) | 2,112 | 1,272,818 | |
Copart, Inc. (Commercial Svs. & Supplies) | (a) | 19,907 | 975,443 |
CSX Corp. (Ground Transportation) | 40,968 | 1,420,361 | |
Fastenal Co. (Trading Companies & Distributors) | 11,846 | 767,265 | |
Honeywell International, Inc. (Industrial Conglomerates) | 13,667 | 2,866,107 | |
Old Dominion Freight Line, Inc. (Ground Transportation) | 2,262 | 916,856 | |
PACCAR, Inc. (Machinery) | 10,844 | 1,058,917 | |
Paychex, Inc. (Professional Svs.) | 7,489 | 892,015 | |
Verisk Analytics, Inc. (Professional Svs.) | 3,006 | 718,013 | |
| 12,874,330 | |||
| Information Technology–49.2% | |||
Adobe, Inc. (Software) | (a) | 9,439 | 5,631,307 |
Advanced Micro Devices, Inc. (Semiconductors & Equip.) | (a) | 33,491 | 4,936,908 |
Analog Devices, Inc. (Semiconductors & Equip.) | 10,288 | 2,042,785 | |
ANSYS, Inc. (Software) | (a) | 1,801 | 653,547 |
Apple, Inc. (Tech. Hardware, Storage & Periph.) | 124,833 | 24,034,098 | |
Applied Materials, Inc. (Semiconductors & Equip.) | 17,342 | 2,810,618 | |
ASML Holding N.V. (Semiconductors & Equip.) | 1,820 | 1,377,594 | |
Atlassian Corp. Class A (Software) | (a) | 3,214 | 764,482 |
Autodesk, Inc. (Software) | (a) | 4,432 | 1,079,103 |
Broadcom, Inc. (Semiconductors & Equip.) | 9,684 | 10,809,765 | |
Cadence Design Systems, Inc. (Software) | (a) | 5,640 | 1,536,167 |
CDW Corp. (Electronic Equip., Instr. & Comp.) | 2,777 | 631,268 | |
Cisco Systems, Inc. (Communications Equip.) | 84,241 | 4,255,855 | |
Cognizant Technology Solutions Corp. Class A (IT Svs.) | 10,395 | 785,134 | |
Crowdstrike Holdings, Inc. Class A (Software) | (a) | 4,719 | 1,204,855 |
Datadog, Inc. Class A (Software) | (a) | 6,264 | 760,324 |
Fortinet, Inc. (Software) | (a) | 15,920 | 931,798 |
GLOBALFOUNDRIES, Inc. (Semiconductors & Equip.) | (a) | 11,356 | 688,174 |
Intel Corp. (Semiconductors & Equip.) | 87,403 | 4,392,001 | |
Intuit, Inc. (Software) | 5,803 | 3,627,049 | |
KLA Corp. (Semiconductors & Equip.) | 2,818 | 1,638,103 | |
Lam Research Corp. (Semiconductors & Equip.) | 2,732 | 2,139,866 | |
Marvell Technology, Inc. (Semiconductors & Equip.) | 17,887 | 1,078,765 | |
Microchip Technology, Inc. (Semiconductors & Equip.) | 11,217 | 1,011,549 | |
Micron Technology, Inc. (Semiconductors & Equip.) | 22,882 | 1,952,750 | |
Microsoft Corp. (Software) | 59,655 | 22,432,666 | |
MongoDB, Inc. (IT Svs.) | (a) | 1,479 | 604,689 |
65
(continued)
AuguStarSM Variable Insurance Products Fund, Inc.
AVIP Nasdaq-100® Index Portfolio (Continued)
| Schedule of Investments | December 31, 2023 |
| Common Stocks (Continued) | Shares | Value | |
| Information Technology (continued) | |||
NVIDIA Corp. (Semiconductors & Equip.) | 19,825 | $ 9,817,737 | |
NXP Semiconductors N.V. (Semiconductors & Equip.) | 5,344 | 1,227,410 | |
ON Semiconductor Corp. (Semiconductors & Equip.) | (a) | 8,929 | 745,839 |
Palo Alto Networks, Inc. (Software) | (a) | 6,537 | 1,927,631 |
QUALCOMM, Inc. (Semiconductors & Equip.) | 23,074 | 3,337,193 | |
Roper Technologies, Inc. (Software) | 2,215 | 1,207,552 | |
Splunk, Inc. (Software) | (a) | 3,493 | 532,159 |
Synopsys, Inc. (Software) | (a) | 3,153 | 1,623,511 |
Texas Instruments, Inc. (Semiconductors & Equip.) | 18,828 | 3,209,421 | |
Workday, Inc. Class A (Software) | (a) | 4,333 | 1,196,168 |
Zscaler, Inc. (Software) | (a) | 3,075 | 681,297 |
| 129,317,138 | |||
| Real Estate–0.3% | |||
CoStar Group, Inc. (Real Estate Mgmt. & Development) | (a) | 8,466 | 739,844 |
| Common Stocks (Continued) | Shares | Value | |
| Utilities–1.2% | |||
American Electric Power Co., Inc. (Electric Utilities) | 10,902 | $ 885,461 | |
Constellation Energy Corp. (Electric Utilities) | 6,621 | 773,929 | |
Exelon Corp. (Electric Utilities) | 20,637 | 740,868 | |
Xcel Energy, Inc. (Electric Utilities) | 11,440 | 708,250 | |
| 3,108,508 | |||
Total Common Stocks (Cost $166,303,840) | $260,661,879 | ||
| U.S. Treasury Obligations–0.1% | Rate | Maturity | Face Amount | Value | |
| U.S. Treasury Bill | (b) | 0.000% | 02/22/2024 | $100,000 | $ 99,256 |
Total U.S. Treasury Obligations (Cost $99,235) | $ 99,256 | ||||
Total Investments – 99.3% (Cost $166,403,075) | (c) | $260,761,135 | |||
Other Assets in Excess of Liabilities – 0.7% | (b) | 1,938,351 | |||
| Net Assets – 100.0% | $262,699,486 | ||||
Percentages are stated as a percent of net assets. |
| Abbreviations: | ||
| ADR: | American Depositary Receipts | |
| Footnotes: | ||
| (a) | Non-income producing security. | |
| (b) | Security is fully pledged, in addition to $7,943 of the Portfolio’s cash holdings, as collateral for the futures contracts outstanding at December 31, 2023. See also the following Schedule of Open Futures Contracts. | |
| (c) | Represents cost for financial reporting purposes, which may differ from cost basis for federal income tax purposes. See also Note 7 of the Notes to Financial Statements. | |
The accompanying notes are an integral part of these financial statements.
| Schedule of Open Futures Contracts | December 31, 2023 |
| Description | Number of contracts | Expiration Date | Notional Amount | Value | Unrealized Appreciation (Depreciation) | Variation Margin Receivable (Payable) | ||||||
| CME E-mini Nasdaq-100 Index - Long | 6 | March 15, 2024 | $2,024,367 | $2,042,820 | $18,453 | $(20,888) |
The accompanying notes are an integral part of these financial statements.
66
AuguStarSM Variable Insurance Products Fund, Inc.
AVIP BlackRock Advantage Large Cap Core Portfolio (Unaudited)
Objective/Strategy
The AVIP BlackRock Advantage Large Cap Core Portfolio (formerly ON BlackRock Advantage Large Cap Core Portfolio) seeks long-term growth of capital by investing, under normal circumstances, at least 80% of its net assets in common stocks of the 1,000 largest publicly traded U.S. companies in terms of market capitalization.
Performance as of December 31, 2023
| Average Annual returns | |
| One year | 25.84% |
| Five years | 15.35% |
| Ten years | 10.82% |
Past performance does not guarantee future results. The performance data quoted represents past performance and current returns may be lower or higher. Total return figures include change in share price and reinvestment of dividends and capital gains. The investment return and principal value will fluctuate so that an investor’s shares, when redeemed, may be worth more or less than the original cost. To obtain performance information up to the most recent month end, call toll-free 1-877-781-6392.
The Portfolio is not open to direct retail investment. Beneficial interest in the Portfolio’s shares is obtained either through an allocation to the Portfolio as an investment vehicle within variable life insurance policies or annuity contracts, or as an underlying investment by the AVIP Model Portfolios. Actual performance results for variable annuity and variable universal life contracts will be lower due to contract charges. Consult your contract for applicable charges.
Total expense ratio is 0.69% per the Fund’s Prospectus dated May 1, 2023 and supplemented October 2, 2023 and December 4, 2023. Additional information pertaining to the Portfolio’s expense ratio as of December 31, 2023 can be found in the Portfolio’s Financial Highlights.
Comments from Sub-Adviser
Q. How did the Portfolio perform in comparison to its benchmark during the reporting period?
A. For the year ended December 31, 2023, the Portfolio returned 25.84% versus 26.29% for its benchmark, the S&P 500® Index.
Q. What affected the Portfolio’s performance?
A. Selection within Health Care was the primary driver of the Portfolio’s slight underperformance for the year, followed by selection within Consumer Staples and Consumer Discretionary. Consumer intent measures ultimately proved wrong footed, as insights evaluating mobile app downloads and social media data motivated an unsuccessful overweight to the automobiles industry. Selection within Communication Services, Information Technology, and Energy outperformed. On a security level, NVIDIA Corp., NextEra Energy, Inc., and Exxon Mobil Corp. were top contributors to relative performance for the year, while Broadcom, Inc., The Hersey Co., and Bristol-Myers Squibb Co. were the largest detractors. (1)
| (1) | The Portfolio’s composition is subject to change. Holdings and weightings are as of December 31, 2023. |
Change in Value of $10,000 Investment
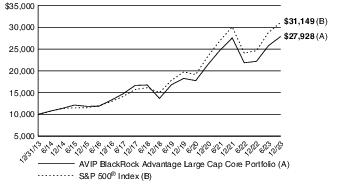
Hypothetical illustration based on past performance. Future performance will vary. The Portfolio’s returns reflect reinvested dividends. The Portfolio’s holdings may differ significantly from the securities in the index. The index is unmanaged and therefore does not reflect the cost of portfolio management and accounting.
The S&P 500® Index is a capitalization-weighted index designed to measure performance of the broad domestic economy through changes in the aggregate market value of 500 stocks representing all major industries. The index presented includes the effects of reinvested dividends.
Past performance is no guarantee of future results. Redemption of fund shares could have tax implications unique to each shareholder.
67
(continued)
AuguStarSM Variable Insurance Products Fund, Inc.
AVIP BlackRock Advantage Large Cap Core Portfolio (Unaudited) (Continued)
| Portfolio Composition as of December 31, 2023 (1) | |
| % of Net Assets | |
| Common Stocks (4) | 98.4 |
| Other Net Assets | 1.6 |
| 100.0 | |
| Top 10 Portfolio Holdings as of December 31, 2023 (1) (2) (3) | ||
| % of Net Assets | ||
| 1. | Microsoft Corp. | 8.0 |
| 2. | Apple, Inc. | 8.0 |
| 3. | Amazon.com, Inc. | 4.4 |
| 4. | NVIDIA Corp. | 4.1 |
| 5. | Alphabet, Inc. Class A | 3.2 |
| 6. | Meta Platforms, Inc. Class A | 2.3 |
| 7. | Mastercard, Inc. Class A | 2.0 |
| 8. | Visa, Inc. | 1.9 |
| 9. | Alphabet, Inc. Class C | 1.8 |
| 10. | Amgen, Inc. | 1.5 |
| (1) | Composition of Portfolio subject to change. | |
| (2) | Short-term investments have been excluded from the list of Top 10 Portfolio Holdings. | |
| (3) | Top 10 Portfolio Holdings is presented at an individual security level. Total investment exposure by issuer may be higher. | |
| (4) | Sectors (Common Stocks): | |
| % of Net Assets | |
| Information Technology | 28.9 |
| Health Care | 12.8 |
| Financials | 12.6 |
| Consumer Discretionary | 11.1 |
| Communication Services | 8.9 |
| Industrials | 8.2 |
| Consumer Staples | 6.2 |
| Energy | 3.5 |
| Real Estate | 2.2 |
| Utilities | 2.1 |
| Materials | 1.9 |
| 98.4 |
68
AuguStarSM Variable Insurance Products Fund, Inc.
AVIP BlackRock Advantage Large Cap Core Portfolio
| Schedule of Investments | December 31, 2023 |
| Common Stocks–98.4% | Shares | Value | |
| Communication Services–8.9% | |||
Alphabet, Inc. Class A (Interactive Media & Svs.) | (a) | 74,892 | $ 10,461,663 |
Alphabet, Inc. Class C (Interactive Media & Svs.) | (a) | 41,092 | 5,791,096 |
Comcast Corp. Class A (Media) | 39,291 | 1,722,910 | |
Electronic Arts, Inc. (Entertainment) | 9,365 | 1,281,226 | |
Fox Corp. Class A (Media) | 85,023 | 2,522,632 | |
Fox Corp. Class B (Media) | 1,081 | 29,890 | |
Meta Platforms, Inc. Class A (Interactive Media & Svs.) | (a) | 21,121 | 7,475,989 |
Warner Bros. Discovery, Inc. (Entertainment) | (a) | 14,175 | 161,312 |
| 29,446,718 | |||
| Consumer Discretionary–11.1% | |||
Amazon.com, Inc. (Broadline Retail) | (a) | 96,572 | 14,673,150 |
AutoNation, Inc. (Specialty Retail) | (a) | 5,204 | 781,537 |
Best Buy Co., Inc. (Specialty Retail) | 25,823 | 2,021,424 | |
Booking Holdings, Inc. (Hotels, Restaurants & Leisure) | (a) | 125 | 443,402 |
D.R. Horton, Inc. (Household Durables) | 7,634 | 1,160,215 | |
General Motors Co. (Automobiles) | 116,442 | 4,182,597 | |
Home Depot, Inc. / The (Specialty Retail) | 3,652 | 1,265,601 | |
McDonald's Corp. (Hotels, Restaurants & Leisure) | 3,969 | 1,176,848 | |
Skechers U.S.A., Inc. Class A (Textiles, Apparel & Luxury Goods) | (a) | 20,202 | 1,259,393 |
Tesla, Inc. (Automobiles) | (a) | 13,594 | 3,377,837 |
TJX Cos., Inc. / The (Specialty Retail) | 46,585 | 4,370,139 | |
Travel + Leisure Co. (Hotels, Restaurants & Leisure) | 48,950 | 1,913,455 | |
| 36,625,598 | |||
| Consumer Staples–6.2% | |||
Archer-Daniels-Midland Co. (Food Products) | 31,282 | 2,259,186 | |
Coca-Cola Co. / The (Beverages) | 62,902 | 3,706,815 | |
Colgate-Palmolive Co. (Household Products) | 9,684 | 771,911 | |
Hershey Co. / The (Food Products) | 13,697 | 2,553,669 | |
Kimberly-Clark Corp. (Household Products) | 30,139 | 3,662,190 | |
PepsiCo, Inc. (Beverages) | 25,314 | 4,299,330 | |
Sysco Corp. (Consumer Staples Distribution & Retail) | 14,784 | 1,081,154 | |
Walmart, Inc. (Consumer Staples Distribution & Retail) | 12,549 | 1,978,350 | |
| 20,312,605 | |||
| Energy–3.5% | |||
Chevron Corp. (Oil, Gas & Consumable Fuels) | 9,275 | 1,383,459 | |
ConocoPhillips (Oil, Gas & Consumable Fuels) | 12,700 | 1,474,089 | |
Devon Energy Corp. (Oil, Gas & Consumable Fuels) | 40,529 | 1,835,964 | |
EOG Resources, Inc. (Oil, Gas & Consumable Fuels) | 15,543 | 1,879,926 | |
Exxon Mobil Corp. (Oil, Gas & Consumable Fuels) | 10,934 | 1,093,181 | |
Marathon Petroleum Corp. (Oil, Gas & Consumable Fuels) | 12,618 | 1,872,006 | |
Pioneer Natural Resources Co. (Oil, Gas & Consumable Fuels) | 1,827 | 410,856 | |
Valero Energy Corp. (Oil, Gas & Consumable Fuels) | 11,136 | 1,447,680 | |
| 11,397,161 | |||
| Financials–12.6% | |||
Bank of America Corp. (Banks) | 142,993 | 4,814,574 | |
Berkshire Hathaway, Inc. Class B (Financial Services) | (a) | 5,578 | 1,989,450 |
Block, Inc. (Financial Services) | (a) | 26,148 | 2,022,548 |
Citigroup, Inc. (Banks) | 19,774 | 1,017,175 | |
Citizens Financial Group, Inc. (Banks) | 26,240 | 869,594 | |
| Common Stocks (Continued) | Shares | Value | |
| Financials (continued) | |||
First Horizon Corp. (Banks) | 41,600 | $ 589,056 | |
Invesco Ltd. (Capital Markets) | 52,041 | 928,411 | |
JPMorgan Chase & Co. (Banks) | 1,563 | 265,866 | |
KeyCorp (Banks) | 6,040 | 86,976 | |
Marsh & McLennan Cos., Inc. (Insurance) | 17,467 | 3,309,473 | |
Mastercard, Inc. Class A (Financial Services) | 15,458 | 6,592,992 | |
MetLife, Inc. (Insurance) | 40,916 | 2,705,775 | |
Moody's Corp. (Capital Markets) | 7,570 | 2,956,539 | |
Nasdaq, Inc. (Capital Markets) | 47,059 | 2,736,010 | |
Regions Financial Corp. (Banks) | 23,359 | 452,697 | |
Reinsurance Group of America, Inc. (Insurance) | 3,423 | 553,773 | |
Travelers Cos., Inc. / The (Insurance) | 12,094 | 2,303,786 | |
Visa, Inc. (Financial Services) | 24,278 | 6,320,777 | |
W.R. Berkley Corp. (Insurance) | 12,863 | 909,671 | |
| 41,425,143 | |||
| Health Care–12.8% | |||
Abbott Laboratories (Health Care Equip. & Supplies) | 17,411 | 1,916,429 | |
AbbVie, Inc. (Biotechnology) | 16,480 | 2,553,906 | |
Agilent Technologies, Inc. (Life Sciences Tools & Svs.) | 16,164 | 2,247,281 | |
Amgen, Inc. (Biotechnology) | 16,939 | 4,878,771 | |
Bristol-Myers Squibb Co. (Pharmaceuticals) | 62,097 | 3,186,197 | |
Cencora, Inc. (Health Care Providers & Svs.) | 2,298 | 471,963 | |
Cigna Group / The (Health Care Providers & Svs.) | 2,012 | 602,493 | |
Elevance Health, Inc. (Health Care Providers & Svs.) | 8,826 | 4,161,989 | |
Eli Lilly & Co. (Pharmaceuticals) | 6,750 | 3,934,710 | |
Exelixis, Inc. (Biotechnology) | (a) | 38,620 | 926,494 |
Gilead Sciences, Inc. (Biotechnology) | 13,094 | 1,060,745 | |
HCA Healthcare, Inc. (Health Care Providers & Svs.) | 4,190 | 1,134,149 | |
Hologic, Inc. (Health Care Equip. & Supplies) | (a) | 9,719 | 694,423 |
Incyte Corp. (Biotechnology) | (a) | 40,971 | 2,572,569 |
Johnson & Johnson (Pharmaceuticals) | 6,313 | 989,500 | |
Medtronic PLC (Health Care Equip. & Supplies) | 52,325 | 4,310,533 | |
Pfizer, Inc. (Pharmaceuticals) | 50,637 | 1,457,839 | |
Regeneron Pharmaceuticals, Inc. (Biotechnology) | (a) | 1,095 | 961,727 |
ResMed, Inc. (Health Care Equip. & Supplies) | 3,388 | 582,804 | |
Stryker Corp. (Health Care Equip. & Supplies) | 9,029 | 2,703,824 | |
UnitedHealth Group, Inc. (Health Care Providers & Svs.) | 760 | 400,117 | |
West Pharmaceutical Services, Inc. (Life Sciences Tools & Svs.) | 910 | 320,429 | |
| 42,068,892 | |||
| Industrials–8.2% | |||
A.O. Smith Corp. (Building Products) | 5,388 | 444,187 | |
AECOM (Construction & Engineering) | 20,446 | 1,889,824 | |
Cintas Corp. (Commercial Svs. & Supplies) | 4,105 | 2,473,919 | |
CNH Industrial N.V. (Machinery) | 54,324 | 661,666 | |
Illinois Tool Works, Inc. (Machinery) | 7,248 | 1,898,541 | |
Lockheed Martin Corp. (Aerospace & Defense) | 9,713 | 4,402,320 | |
Old Dominion Freight Line, Inc. (Ground Transportation) | 1,979 | 802,148 | |
Oshkosh Corp. (Machinery) | 29,279 | 3,174,137 | |
Republic Services, Inc. (Commercial Svs. & Supplies) | 6,109 | 1,007,435 | |
Rockwell Automation, Inc. (Electrical Equip.) | 4,710 | 1,462,361 | |
Snap-on, Inc. (Machinery) | 4,273 | 1,234,213 | |
United Parcel Service, Inc. Class B (Air Freight & Logistics) | 19,646 | 3,088,941 | |
Valmont Industries, Inc. (Construction & Engineering) | 4,221 | 985,646 | |
69
(continued)
AuguStarSM Variable Insurance Products Fund, Inc.
AVIP BlackRock Advantage Large Cap Core Portfolio (Continued)
| Schedule of Investments | December 31, 2023 |
| Common Stocks (Continued) | Shares | Value | |
| Industrials (continued) | |||
W.W. Grainger, Inc. (Trading Companies & Distributors) | 2,157 | $ 1,787,484 | |
Xylem, Inc. (Machinery) | 14,717 | 1,683,036 | |
| 26,995,858 | |||
| Information Technology–28.9% | |||
Adobe, Inc. (Software) | (a) | 6,613 | 3,945,316 |
Amdocs Ltd. (IT Svs.) | 6,893 | 605,826 | |
Apple, Inc. (Tech. Hardware, Storage & Periph.) | 136,570 | 26,293,822 | |
Applied Materials, Inc. (Semiconductors & Equip.) | 27,829 | 4,510,246 | |
Broadcom, Inc. (Semiconductors & Equip.) | 473 | 527,986 | |
Fortinet, Inc. (Software) | (a) | 7,064 | 413,456 |
Hewlett Packard Enterprise Co. (Tech. Hardware, Storage & Periph.) | 141,568 | 2,403,825 | |
Intel Corp. (Semiconductors & Equip.) | 43,740 | 2,197,935 | |
Lam Research Corp. (Semiconductors & Equip.) | 1,842 | 1,442,765 | |
Manhattan Associates, Inc. (Software) | (a) | 14,162 | 3,049,362 |
Microsoft Corp. (Software) | 70,334 | 26,448,397 | |
NVIDIA Corp. (Semiconductors & Equip.) | 27,275 | 13,507,125 | |
Oracle Corp. (Software) | 6,196 | 653,244 | |
QUALCOMM, Inc. (Semiconductors & Equip.) | 31,673 | 4,580,866 | |
Salesforce, Inc. (Software) | (a) | 10,797 | 2,841,123 |
TE Connectivity Ltd. (Electronic Equip., Instr. & Comp.) | 13,269 | 1,864,294 | |
| 95,285,588 | |||
| Materials–1.9% | |||
Ecolab, Inc. (Chemicals) | 20,073 | 3,981,479 | |
| Common Stocks (Continued) | Shares | Value | |
| Materials (continued) | |||
LyondellBasell Industries N.V. Class A (Chemicals) | 17,324 | $ 1,647,166 | |
Nucor Corp. (Metals & Mining) | 2,914 | 507,153 | |
| 6,135,798 | |||
| Real Estate–2.2% | |||
Camden Property Trust (Residential REITs) | 13,329 | 1,323,436 | |
Equinix, Inc. (Specialized REITs) | 690 | 555,719 | |
Equity Residential (Residential REITs) | 34,473 | 2,108,369 | |
Public Storage (Specialized REITs) | 4,529 | 1,381,345 | |
Simon Property Group, Inc. (Retail REITs) | 13,518 | 1,928,208 | |
| 7,297,077 | |||
| Utilities–2.1% | |||
AES Corp. / The (Ind. Power & Renewable Elec.) | 87,790 | 1,689,957 | |
CMS Energy Corp. (Multi-Utilities) | 15,471 | 898,401 | |
Evergy, Inc. (Electric Utilities) | 8,025 | 418,905 | |
IDACORP, Inc. (Electric Utilities) | 1,758 | 172,847 | |
OGE Energy Corp. (Electric Utilities) | 21,848 | 763,151 | |
PPL Corp. (Electric Utilities) | 111,549 | 3,022,978 | |
| 6,966,239 | |||
Total Common Stocks (Cost $270,394,256) | $323,956,677 | ||
Total Investments – 98.4% (Cost $270,394,256) | (b) | $323,956,677 | |
Other Assets in Excess of Liabilities – 1.6% | (c) | 5,331,122 | |
| Net Assets – 100.0% | $329,287,799 | ||
Percentages are stated as a percent of net assets. |
| Abbreviations: | ||
| REITs: | Real Estate Investment Trusts | |
| Footnotes: | ||
| (a) | Non-income producing security. | |
| (b) | Represents cost for financial reporting purposes, which may differ from cost basis for federal income tax purposes. See also Note 7 of the Notes to Financial Statements. | |
| (c) | Includes $247,800 of cash pledged as collateral for the futures contracts outstanding at December 31, 2023. See also the following Schedule of Open Futures Contracts. | |
The accompanying notes are an integral part of these financial statements.
| Schedule of Open Futures Contracts | December 31, 2023 |
| Description | Number of contracts | Expiration Date | Notional Amount | Value | Unrealized Appreciation (Depreciation) | Variation Margin Receivable (Payable) | ||||||
| CME E-mini S&P 500 Index - Long | 21 | March 15, 2024 | $4,919,873 | $5,061,000 | $141,127 | $(11,971) |
The accompanying notes are an integral part of these financial statements.
70
AuguStarSM Variable Insurance Products Fund, Inc.
AVIP BlackRock Advantage Small Cap Growth Portfolio (Unaudited)
Objective/Strategy
The AVIP BlackRock Advantage Small Cap Growth Portfolio (formerly ON BlackRock Advantage Small Cap Growth Portfolio) seeks long-term growth of capital by investing, under normal circumstances, at least 80% of its net assets in stocks of small capitalization companies with a market capitalization at the time of investment that is no greater than the largest market capitalization of a company in the Russell 2000® Index for the previous twelve months.
Performance as of December 31, 2023
| Average Annual returns | |
| One year | 20.28% |
| Five years | 10.74% |
| Ten years | 7.39% |
Past performance does not guarantee future results. The performance data quoted represents past performance and current returns may be lower or higher. Total return figures include change in share price and reinvestment of dividends and capital gains. The investment return and principal value will fluctuate so that an investor’s shares, when redeemed, may be worth more or less than the original cost. To obtain performance information up to the most recent month end, call toll-free 1-877-781-6392.
The Portfolio is not open to direct retail investment. Beneficial interest in the Portfolio’s shares is obtained either through an allocation to the Portfolio as an investment vehicle within variable life insurance policies or annuity contracts, or as an underlying investment by the AVIP Model Portfolios. Actual performance results for variable annuity and variable universal life contracts will be lower due to contract charges. Consult your contract for applicable charges.
Total expense ratio is 0.86% per the Fund’s Prospectus dated May 1, 2023 and supplemented October 2, 2023 and December 4, 2023. Additional information pertaining to the Portfolio’s expense ratio as of December 31, 2023 can be found in the Portfolio’s Financial Highlights.
Comments from Sub-Adviser
Q. How did the Portfolio perform in comparison to its benchmark during the reporting period?
A. For the year ended December 31, 2023, the Portfolio returned 20.28% versus 18.66% for its benchmark, the Russell 2000® Growth Index.
Q. What affected the Portfolio’s performance?
A. While sector allocation decisions were positive, security selection led the Portfolio’s outperformance for the year, driven by fundamental measures. Traditional valuation measures that track company sales, research expenditures, and other financial statement metrics all performed particularly well, as the move higher in interest rates broadly rewarded value styles. Macro-thematic insights also modestly contributed to performance. A new insight developed early in the year to measure bank quality proved additive amid the crisis in the sector.
Selection within Industrials, Financials and Consumer Discretionary were key contributors to relative performance for the year, but were somewhat offset by selection within Health Care, Communication Services, and Energy. At the security level, top contributors to relative performance for the year were UFP Industries, Inc., OSI Systems, Inc., and EMCOR Group, Inc., while Inspire Medical Systems, Inc., Onto Innovation, Inc., and Weatherford International PLC were top detractors. (1)
| (1) | The Portfolio’s composition is subject to change. Holdings and weightings are as of December 31, 2023. |
Change in Value of $10,000 Investment

Hypothetical illustration based on past performance. Future performance will vary. The Portfolio’s returns reflect reinvested dividends. The Portfolio’s holdings may differ significantly from the securities in the index. The index is unmanaged and therefore does not reflect the cost of portfolio management and accounting.
The Russell 2000® Growth Index measures the performance of the small-cap growth segment of the U.S. equity universe. It includes the Russell 2000® Index companies with higher price-to-value ratios and higher forecasted growth values. The Russell 2000® Index includes the 2000 firms from the Russell 3000® Index with the smallest market capitalizations. The Russell 3000® Index represents 98% of the investable U.S. equity market. The index presented includes the effects of reinvested dividends.
Past performance is no guarantee of future results. Redemption of fund shares could have tax implications unique to each shareholder.
71
(continued)
AuguStarSM Variable Insurance Products Fund, Inc.
AVIP BlackRock Advantage Small Cap Growth Portfolio (Unaudited) (Continued)
| Portfolio Composition as of December 31, 2023 (1) | |
| % of Net Assets | |
| Common Stocks (4) | 99.6 |
| Rights (4) | 0.0 |
| Other Net Assets | 0.4 |
| 100.0 | |
| Top 10 Portfolio Holdings as of December 31, 2023 (1) (2) (3) | ||
| % of Net Assets | ||
| 1. | Franklin Electric Co., Inc. | 1.3 |
| 2. | UFP Industries, Inc. | 1.3 |
| 3. | Boise Cascade Co. | 1.1 |
| 4. | Super Micro Computer, Inc. | 1.1 |
| 5. | Atkore, Inc. | 1.0 |
| 6. | Insperity, Inc. | 1.0 |
| 7. | Comfort Systems U.S.A., Inc. | 1.0 |
| 8. | Terex Corp. | 1.0 |
| 9. | EMCOR Group, Inc. | 0.9 |
| 10. | Ensign Group, Inc. / The | 0.9 |
| (1) | Composition of Portfolio subject to change. | |
| (2) | Short-term investments have been excluded from the list of Top 10 Portfolio Holdings. | |
| (3) | Top 10 Portfolio Holdings is presented at an individual security level. Total investment exposure by issuer may be higher. | |
| (4) | Sectors (Common Stocks, Rights): | |
| % of Net Assets | |
| Health Care | 23.0 |
| Industrials | 21.6 |
| Information Technology | 21.4 |
| Consumer Discretionary | 11.8 |
| Financials | 6.1 |
| Energy | 4.4 |
| Consumer Staples | 3.6 |
| Communication Services | 3.0 |
| Materials | 2.9 |
| Real Estate | 1.6 |
| Utilities | 0.2 |
| 99.6 |
72
AuguStarSM Variable Insurance Products Fund, Inc.
AVIP BlackRock Advantage Small Cap Growth Portfolio
| Schedule of Investments | December 31, 2023 |
| Common Stocks–99.6% | Shares | Value | |
| Communication Services–3.0% | |||
Bandwidth, Inc. Class A (Diversified Telecom. Svs.) | (a) | 12,048 | $ 174,335 |
Bumble, Inc. Class A (Interactive Media & Svs.) | (a) | 9,827 | 144,850 |
Cargurus, Inc. (Interactive Media & Svs.) | (a) | 28,318 | 684,163 |
Cinemark Holdings, Inc. (Entertainment) | (a) | 22,619 | 318,702 |
Eventbrite, Inc. Class A (Interactive Media & Svs.) | (a) | 9,898 | 82,747 |
EverQuote, Inc. Class A (Interactive Media & Svs.) | (a) | 3,933 | 48,140 |
IDT Corp. Class B (Diversified Telecom. Svs.) | (a) | 8,567 | 292,049 |
Integral Ad Science Holding Corp. (Media) | (a) | 14,747 | 212,209 |
Iridium Communications, Inc. (Diversified Telecom. Svs.) | 7,530 | 309,935 | |
Ooma, Inc. (Diversified Telecom. Svs.) | (a) | 7,140 | 76,612 |
Shutterstock, Inc. (Interactive Media & Svs.) | 8,642 | 417,236 | |
Yelp, Inc. (Interactive Media & Svs.) | (a) | 16,160 | 765,014 |
Ziff Davis, Inc. (Interactive Media & Svs.) | (a) | 5,779 | 388,291 |
ZipRecruiter, Inc. Class A (Interactive Media & Svs.) | (a) | 26,513 | 368,531 |
| 4,282,814 | |||
| Consumer Discretionary–11.8% | |||
1-800-Flowers.com, Inc. Class A (Specialty Retail) | (a) | 25,190 | 271,548 |
2U, Inc. (Diversified Consumer Svs.) | (a) | 27,237 | 33,502 |
Abercrombie & Fitch Co. Class A (Specialty Retail) | (a) | 12,501 | 1,102,838 |
Accel Entertainment, Inc. (Hotels, Restaurants & Leisure) | (a) | 32,387 | 332,614 |
Boot Barn Holdings, Inc. (Specialty Retail) | (a) | 4,143 | 318,017 |
Carvana Co. (Specialty Retail) | (a) | 4,234 | 224,148 |
Chegg, Inc. (Diversified Consumer Svs.) | (a) | 9,955 | 113,089 |
Crocs, Inc. (Textiles, Apparel & Luxury Goods) | (a) | 3,617 | 337,864 |
Dana, Inc. (Automobile Components) | 49,449 | 722,450 | |
Dillard's, Inc. Class A (Broadline Retail) | 1,146 | 462,583 | |
Duolingo, Inc. (Diversified Consumer Svs.) | (a) | 4,979 | 1,129,486 |
Fox Factory Holding Corp. (Automobile Components) | (a) | 5,507 | 371,612 |
Frontdoor, Inc. (Diversified Consumer Svs.) | (a) | 22,124 | 779,207 |
GoPro, Inc. Class A (Household Durables) | (a) | 57,623 | 199,952 |
Hilton Grand Vacations, Inc. (Hotels, Restaurants & Leisure) | (a) | 17,248 | 693,025 |
Installed Building Products, Inc. (Household Durables) | 3,305 | 604,220 | |
iRobot Corp. (Household Durables) | (a) | 2,822 | 109,211 |
Laureate Education, Inc. (Diversified Consumer Svs.) | 55,691 | 763,524 | |
M.D.C. Holdings, Inc. (Household Durables) | 12,450 | 687,862 | |
Malibu Boats, Inc. Class A (Leisure Products) | (a) | 7,438 | 407,751 |
Modine Manufacturing Co. (Automobile Components) | (a) | 8,951 | 534,375 |
Murphy U.S.A., Inc. (Specialty Retail) | 2,215 | 789,780 | |
Papa John's International, Inc. (Hotels, Restaurants & Leisure) | 6,510 | 496,257 | |
Patrick Industries, Inc. (Automobile Components) | 6,023 | 604,408 | |
Revolve Group, Inc. (Specialty Retail) | (a) | 11,844 | 196,374 |
Rush Street Interactive, Inc. (Hotels, Restaurants & Leisure) | (a) | 10,070 | 45,214 |
Shake Shack, Inc. Class A (Hotels, Restaurants & Leisure) | (a) | 8,817 | 653,516 |
Sonic Automotive, Inc. Class A (Specialty Retail) | 7,317 | 411,289 | |
Stitch Fix, Inc. Class A (Specialty Retail) | (a) | 14,615 | 52,176 |
Texas Roadhouse, Inc. (Hotels, Restaurants & Leisure) | 6,305 | 770,660 | |
Urban Outfitters, Inc. (Specialty Retail) | (a) | 12,294 | 438,773 |
| Common Stocks (Continued) | Shares | Value | |
| Consumer Discretionary (continued) | |||
Visteon Corp. (Automobile Components) | (a) | 7,394 | $ 923,511 |
Warby Parker, Inc. Class A (Specialty Retail) | (a) | 18,712 | 263,839 |
Wingstop, Inc. (Hotels, Restaurants & Leisure) | 2,777 | 712,523 | |
| 16,557,198 | |||
| Consumer Staples–3.6% | |||
Andersons, Inc. / The (Consumer Staples Distribution & Retail) | 6,606 | 380,109 | |
BellRing Brands, Inc. (Personal Care Products) | (a) | 10,939 | 606,349 |
Cal-Maine Foods, Inc. (Food Products) | 5,910 | 339,175 | |
Central Garden & Pet Co. Class A (Household Products) | (a) | 9,778 | 430,623 |
Coca-Cola Consolidated, Inc. (Beverages) | 528 | 490,195 | |
e.l.f. Beauty, Inc. (Personal Care Products) | (a) | 6,407 | 924,786 |
Lancaster Colony Corp. (Food Products) | 3,844 | 639,603 | |
Medifast, Inc. (Personal Care Products) | 4,164 | 279,904 | |
MGP Ingredients, Inc. (Beverages) | 6,756 | 665,601 | |
Vital Farms, Inc. (Food Products) | (a) | 20,905 | 328,000 |
| 5,084,345 | |||
| Energy–4.4% | |||
Borr Drilling Ltd. (Energy Equip. & Svs.) | 52,269 | 384,700 | |
ChampionX Corp. (Energy Equip. & Svs.) | 12,283 | 358,786 | |
CVR Energy, Inc. (Oil, Gas & Consumable Fuels) | 8,403 | 254,611 | |
Delek U.S. Holdings, Inc. (Oil, Gas & Consumable Fuels) | 17,200 | 443,760 | |
Energy Fuels, Inc. (Oil, Gas & Consumable Fuels) | (a) | 14,224 | 102,271 |
Evolution Petroleum Corp. (Oil, Gas & Consumable Fuels) | 10,048 | 58,379 | |
Helix Energy Solutions Group, Inc. (Energy Equip. & Svs.) | (a) | 44,039 | 452,721 |
Liberty Energy, Inc. (Energy Equip. & Svs.) | 43,843 | 795,312 | |
Magnolia Oil & Gas Corp. Class A (Oil, Gas & Consumable Fuels) | 29,297 | 623,733 | |
Matador Resources Co. (Oil, Gas & Consumable Fuels) | 14,048 | 798,769 | |
Murphy Oil Corp. (Oil, Gas & Consumable Fuels) | 8,632 | 368,241 | |
Oceaneering International, Inc. (Energy Equip. & Svs.) | (a) | 23,528 | 500,676 |
PBF Energy, Inc. Class A (Oil, Gas & Consumable Fuels) | 4,492 | 197,468 | |
Scorpio Tankers, Inc. (Oil, Gas & Consumable Fuels) | 4,584 | 278,707 | |
SM Energy Co. (Oil, Gas & Consumable Fuels) | 11,790 | 456,509 | |
Smart Sand, Inc. (Energy Equip. & Svs.) | (a) | 47,289 | 91,268 |
| 6,165,911 | |||
| Financials–6.1% | |||
Artisan Partners Asset Management, Inc. Class A (Capital Markets) | 12,090 | 534,136 | |
Cohen & Steers, Inc. (Capital Markets) | 6,316 | 478,311 | |
Federal Agricultural Mortgage Corp. Class C (Financial Services) | 4,184 | 800,064 | |
First Financial Bankshares, Inc. (Banks) | 12,534 | 379,780 | |
Hamilton Lane, Inc. Class A (Capital Markets) | 9,854 | 1,117,838 | |
Houlihan Lokey, Inc. (Capital Markets) | 7,418 | 889,492 | |
Kinsale Capital Group, Inc. (Insurance) | 2,140 | 716,707 | |
Mercury General Corp. (Insurance) | 10,599 | 395,449 | |
Moelis & Co. Class A (Capital Markets) | 7,339 | 411,938 | |
Pagseguro Digital Ltd. Class A (Financial Services) | (a) | 92,610 | 1,154,847 |
Selective Insurance Group, Inc. (Insurance) | 3,048 | 303,215 | |
Selectquote, Inc. (Insurance) | (a) | 8,673 | 11,882 |
73
(continued)
AuguStarSM Variable Insurance Products Fund, Inc.
AVIP BlackRock Advantage Small Cap Growth Portfolio (Continued)
| Schedule of Investments | December 31, 2023 |
| Common Stocks (Continued) | Shares | Value | |
| Financials (continued) | |||
StoneCo Ltd. Class A (Financial Services) | (a) | 55,694 | $ 1,004,163 |
Trupanion, Inc. (Insurance) | (a) | 5,319 | 162,283 |
Upstart Holdings, Inc. (Consumer Finance) | (a) | 7,403 | 302,487 |
| 8,662,592 | |||
| Health Care–23.0% | |||
ACADIA Pharmaceuticals, Inc. (Biotechnology) | (a) | 12,690 | 397,324 |
Adaptive Biotechnologies Corp. (Life Sciences Tools & Svs.) | (a) | 22,888 | 112,151 |
Agenus, Inc. (Biotechnology) | (a) | 65,236 | 54,009 |
Alector, Inc. (Biotechnology) | (a) | 11,265 | 89,895 |
Alkermes PLC (Biotechnology) | (a) | 19,203 | 532,691 |
ALX Oncology Holdings, Inc. (Biotechnology) | (a) | 1,291 | 19,223 |
Amarin Corp. PLC – ADR (Biotechnology) | (a) | 17,101 | 14,878 |
American Well Corp. Class A (Health Care Technology) | (a) | 51,120 | 76,169 |
Amicus Therapeutics, Inc. (Biotechnology) | (a) | 34,107 | 483,978 |
AMN Healthcare Services, Inc. (Health Care Providers & Svs.) | (a) | 6,486 | 485,672 |
Amphastar Pharmaceuticals, Inc. (Pharmaceuticals) | (a) | 4,323 | 267,378 |
Aptinyx, Inc. (Biotechnology) | 23,975 | 2,302 | |
Arrowhead Pharmaceuticals, Inc. (Biotechnology) | (a) | 8,746 | 267,628 |
Arvinas, Inc. (Pharmaceuticals) | (a) | 19,262 | 792,824 |
AtriCure, Inc. (Health Care Equip. & Supplies) | (a) | 7,765 | 277,133 |
Atrion Corp. (Health Care Equip. & Supplies) | 585 | 221,592 | |
Avidity Biosciences, Inc. (Biotechnology) | (a) | 5,306 | 48,019 |
Axonics, Inc. (Health Care Equip. & Supplies) | (a) | 6,527 | 406,175 |
Axsome Therapeutics, Inc. (Pharmaceuticals) | (a) | 3,039 | 241,874 |
Beam Therapeutics, Inc. (Biotechnology) | (a) | 12,388 | 337,201 |
Beyondspring, Inc. (Biotechnology) | (a) | 5,417 | 4,810 |
BioCryst Pharmaceuticals, Inc. (Biotechnology) | (a) | 27,957 | 167,462 |
Blueprint Medicines Corp. (Biotechnology) | (a) | 10,321 | 952,009 |
Bridgebio Pharma, Inc. (Biotechnology) | (a) | 5,692 | 229,786 |
CareDx, Inc. (Biotechnology) | (a) | 4,195 | 50,340 |
Catalyst Pharmaceuticals, Inc. (Biotechnology) | (a) | 17,361 | 291,838 |
Cerevel Therapeutics Holdings, Inc. (Biotechnology) | (a) | 2,995 | 126,988 |
Cerus Corp. (Health Care Equip. & Supplies) | (a) | 42,400 | 91,584 |
Codexis, Inc. (Life Sciences Tools & Svs.) | (a) | 17,805 | 54,305 |
Coherus Biosciences, Inc. (Biotechnology) | (a) | 29,534 | 98,348 |
Collegium Pharmaceutical, Inc. (Pharmaceuticals) | (a) | 15,250 | 469,395 |
Corcept Therapeutics, Inc. (Pharmaceuticals) | (a) | 33,341 | 1,082,916 |
Cytokinetics, Inc. (Biotechnology) | (a) | 12,201 | 1,018,662 |
Deciphera Pharmaceuticals, Inc. (Biotechnology) | (a) | 9,562 | 154,235 |
Denali Therapeutics, Inc. (Biotechnology) | (a) | 19,493 | 418,320 |
Dynavax Technologies Corp. (Biotechnology) | (a) | 17,383 | 243,014 |
Editas Medicine, Inc. (Biotechnology) | (a) | 20,268 | 205,315 |
Enanta Pharmaceuticals, Inc. (Biotechnology) | (a) | 3,463 | 32,587 |
Ensign Group, Inc. / The (Health Care Providers & Svs.) | 11,325 | 1,270,778 | |
Evolent Health, Inc. Class A (Health Care Technology) | (a) | 20,405 | 673,977 |
Fate Therapeutics, Inc. (Biotechnology) | (a) | 35,418 | 132,463 |
FibroGen, Inc. (Biotechnology) | (a) | 7,167 | 6,352 |
Foghorn Therapeutics, Inc. (Biotechnology) | (a) | 8,256 | 53,251 |
Glaukos Corp. (Health Care Equip. & Supplies) | (a) | 2,764 | 219,710 |
Guardant Health, Inc. (Health Care Providers & Svs.) | (a) | 24,338 | 658,343 |
Haemonetics Corp. (Health Care Equip. & Supplies) | (a) | 6,894 | 589,506 |
Halozyme Therapeutics, Inc. (Biotechnology) | (a) | 16,039 | 592,801 |
Harmony Biosciences Holdings, Inc. (Pharmaceuticals) | (a) | 5,031 | 162,501 |
| Common Stocks (Continued) | Shares | Value | |
| Health Care (continued) | |||
HealthEquity, Inc. (Health Care Providers & Svs.) | (a) | 11,673 | $ 773,920 |
Heron Therapeutics, Inc. (Biotechnology) | (a) | 34,692 | 58,976 |
Ideaya Biosciences, Inc. (Biotechnology) | (a) | 6,828 | 242,940 |
ImmunoGen, Inc. (Biotechnology) | (a) | 15,852 | 470,012 |
Immunovant, Inc. (Biotechnology) | (a) | 2,595 | 109,327 |
Inari Medical, Inc. (Health Care Equip. & Supplies) | (a) | 9,589 | 622,518 |
Inmode Ltd. (Health Care Equip. & Supplies) | (a) | 32,772 | 728,849 |
Insmed, Inc. (Biotechnology) | (a) | 15,025 | 465,625 |
Intellia Therapeutics, Inc. (Biotechnology) | (a) | 9,714 | 296,180 |
Intra-Cellular Therapies, Inc. (Pharmaceuticals) | (a) | 7,923 | 567,445 |
iRhythm Technologies, Inc. (Health Care Equip. & Supplies) | (a) | 1,936 | 207,229 |
Ironwood Pharmaceuticals, Inc. (Biotechnology) | (a) | 38,680 | 442,499 |
iTeos Therapeutics, Inc. (Biotechnology) | (a) | 9,073 | 99,349 |
Karyopharm Therapeutics, Inc. (Biotechnology) | (a) | 38,594 | 33,384 |
Kiniksa Pharmaceuticals Ltd. Class A (Biotechnology) | (a) | 17,844 | 312,984 |
Krystal Biotech, Inc. (Biotechnology) | (a) | 2,344 | 290,797 |
Kymera Therapeutics, Inc. (Biotechnology) | (a) | 1,184 | 30,145 |
Lantheus Holdings, Inc. (Health Care Equip. & Supplies) | (a) | 8,520 | 528,240 |
LivaNova PLC (Health Care Equip. & Supplies) | (a) | 1,609 | 83,250 |
MacroGenics, Inc. (Biotechnology) | (a) | 3,552 | 34,170 |
Madrigal Pharmaceuticals, Inc. (Biotechnology) | (a) | 884 | 204,540 |
Medpace Holdings, Inc. (Life Sciences Tools & Svs.) | (a) | 746 | 228,671 |
Merit Medical Systems, Inc. (Health Care Equip. & Supplies) | (a) | 11,209 | 851,436 |
MiNK Therapeutics, Inc. (Biotechnology) | (a) | 952 | 1,023 |
Mural Oncology PLC (Biotechnology) | (a) | 818 | 4,843 |
Neurogene, Inc. (Biotechnology) | (a) | 450 | 8,721 |
Nevro Corp. (Health Care Equip. & Supplies) | (a) | 3,665 | 78,871 |
NGM Biopharmaceuticals, Inc. (Pharmaceuticals) | (a) | 9,360 | 8,040 |
Omnicell, Inc. (Health Care Equip. & Supplies) | (a) | 8,954 | 336,939 |
Option Care Health, Inc. (Health Care Providers & Svs.) | (a) | 29,199 | 983,714 |
OraSure Technologies, Inc. (Health Care Equip. & Supplies) | (a) | 4,376 | 35,883 |
Pacific Biosciences of California, Inc. (Life Sciences Tools & Svs.) | (a) | 41,546 | 407,566 |
Pacira BioSciences, Inc. (Pharmaceuticals) | (a) | 4,474 | 150,953 |
PetIQ, Inc. (Health Care Providers & Svs.) | (a) | 11,688 | 230,838 |
Phreesia, Inc. (Health Care Technology) | (a) | 11,187 | 258,979 |
Prestige Consumer Healthcare, Inc. (Pharmaceuticals) | (a) | 7,602 | 465,394 |
Privia Health Group, Inc. (Health Care Providers & Svs.) | (a) | 8,041 | 185,184 |
Progyny, Inc. (Health Care Providers & Svs.) | (a) | 28,675 | 1,066,137 |
Prothena Corp. PLC (Biotechnology) | (a) | 4,922 | 178,865 |
PTC Therapeutics, Inc. (Biotechnology) | (a) | 13,290 | 366,272 |
Recursion Pharmaceuticals, Inc. Class A (Biotechnology) | (a) | 7,184 | 70,834 |
REGENXBIO, Inc. (Biotechnology) | (a) | 13,117 | 235,450 |
Relay Therapeutics, Inc. (Biotechnology) | (a) | 14,951 | 164,611 |
Revance Therapeutics, Inc. (Pharmaceuticals) | (a) | 8,096 | 71,164 |
REVOLUTION Medicines, Inc. (Biotechnology) | (a) | 11,061 | 317,230 |
Rigel Pharmaceuticals, Inc. (Biotechnology) | (a) | 88,669 | 128,570 |
Sage Therapeutics, Inc. (Biotechnology) | (a) | 6,247 | 135,373 |
Sangamo Therapeutics, Inc. (Biotechnology) | (a) | 18,515 | 10,059 |
Schrodinger, Inc. (Health Care Technology) | (a) | 6,039 | 216,196 |
74
(continued)
AuguStarSM Variable Insurance Products Fund, Inc.
AVIP BlackRock Advantage Small Cap Growth Portfolio (Continued)
| Schedule of Investments | December 31, 2023 |
| Common Stocks (Continued) | Shares | Value | |
| Health Care (continued) | |||
Scilex Holding Co. (Acquired January 06, 2023, Cost $66,789) (Pharmaceuticals) | (a)(b) | 6,373 | $ 13,001 |
Seer, Inc. (Life Sciences Tools & Svs.) | (a) | 2,905 | 5,636 |
Sorrento Therapeutics, Inc. (Biotechnology) | (a) | 45,196 | 5,582 |
SpringWorks Therapeutics, Inc. (Biotechnology) | (a) | 8,531 | 311,382 |
STAAR Surgical Co. (Health Care Equip. & Supplies) | (a) | 8,365 | 261,072 |
Supernus Pharmaceuticals, Inc. (Pharmaceuticals) | (a) | 13,978 | 404,523 |
Sutro Biopharma, Inc. (Biotechnology) | (a) | 13,219 | 56,710 |
Syndax Pharmaceuticals, Inc. (Biotechnology) | (a) | 18,182 | 392,913 |
Tactile Systems Technology, Inc. (Health Care Equip. & Supplies) | (a) | 6,253 | 89,418 |
TG Therapeutics, Inc. (Biotechnology) | (a) | 13,620 | 232,630 |
Travere Therapeutics, Inc. (Biotechnology) | (a) | 23,811 | 214,061 |
Twist Bioscience Corp. (Biotechnology) | (a) | 7,164 | 264,065 |
Vaxcyte, Inc. (Biotechnology) | (a) | 9,790 | 614,812 |
Vericel Corp. (Biotechnology) | (a) | 5,321 | 189,481 |
Viemed Healthcare, Inc. (Health Care Providers & Svs.) | (a) | 11,958 | 93,870 |
Xencor, Inc. (Biotechnology) | (a) | 9,329 | 198,055 |
Zentalis Pharmaceuticals, Inc. (Biotechnology) | (a) | 1,298 | 19,665 |
Zynex, Inc. (Health Care Equip. & Supplies) | (a) | 4,771 | 51,956 |
| 32,398,739 | |||
| Industrials–21.6% | |||
Albany International Corp. Class A (Machinery) | 4,267 | 419,105 | |
Applied Industrial Technologies, Inc. (Trading Companies & Distributors) | 6,593 | 1,138,545 | |
ASGN, Inc. (Professional Svs.) | (a) | 4,144 | 398,528 |
Atkore, Inc. (Electrical Equip.) | (a) | 9,219 | 1,475,040 |
Boise Cascade Co. (Trading Companies & Distributors) | 12,436 | 1,608,721 | |
Comfort Systems U.S.A., Inc. (Construction & Engineering) | 6,650 | 1,367,706 | |
CSG Systems International, Inc. (Professional Svs.) | 15,347 | 816,614 | |
Dycom Industries, Inc. (Construction & Engineering) | (a) | 6,153 | 708,149 |
EMCOR Group, Inc. (Construction & Engineering) | 6,161 | 1,327,264 | |
Encore Wire Corp. (Electrical Equip.) | 2,479 | 529,514 | |
EnerSys (Electrical Equip.) | 10,507 | 1,060,787 | |
ExlService Holdings, Inc. (Professional Svs.) | (a) | 40,120 | 1,237,702 |
Exponent, Inc. (Professional Svs.) | 3,501 | 308,228 | |
Fluor Corp. (Construction & Engineering) | (a) | 17,638 | 690,880 |
Franklin Covey Co. (Professional Svs.) | (a) | 19,418 | 845,266 |
Franklin Electric Co., Inc. (Machinery) | 18,870 | 1,823,785 | |
Gibraltar Industries, Inc. (Building Products) | (a) | 7,741 | 611,384 |
Herc Holdings, Inc. (Trading Companies & Distributors) | 5,878 | 875,175 | |
Insperity, Inc. (Professional Svs.) | 12,397 | 1,453,176 | |
JELD-WEN Holding, Inc. (Building Products) | (a) | 7,549 | 142,525 |
Kforce, Inc. (Professional Svs.) | 16,726 | 1,130,009 | |
Korn Ferry (Professional Svs.) | 7,395 | 438,893 | |
Manitowoc Co., Inc. / The (Machinery) | (a) | 2,982 | 49,770 |
McGrath RentCorp (Trading Companies & Distributors) | 6,214 | 743,319 | |
Moog, Inc. Class A (Aerospace & Defense) | 2,557 | 370,202 | |
Mueller Industries, Inc. (Machinery) | 14,355 | 676,838 | |
MYR Group, Inc. (Construction & Engineering) | (a) | 4,022 | 581,702 |
Parsons Corp. (Professional Svs.) | (a) | 5,344 | 335,122 |
Radiant Logistics, Inc. (Air Freight & Logistics) | (a) | 10,231 | 67,934 |
Rush Enterprises, Inc. Class A (Trading Companies & Distributors) | 8,396 | 422,319 | |
| Common Stocks (Continued) | Shares | Value | |
| Industrials (continued) | |||
Saia, Inc. (Ground Transportation) | (a) | 608 | $ 266,438 |
Shoals Technologies Group, Inc. Class A (Electrical Equip.) | (a) | 13,269 | 206,200 |
Simpson Manufacturing Co., Inc. (Building Products) | 4,219 | 835,278 | |
Sterling Infrastructure, Inc. (Construction & Engineering) | (a) | 2,143 | 188,434 |
Terex Corp. (Machinery) | 23,366 | 1,342,610 | |
TTEC Holdings, Inc. (Professional Svs.) | 6,055 | 131,212 | |
UFP Industries, Inc. (Building Products) | 14,263 | 1,790,720 | |
Watts Water Technologies, Inc. Class A (Machinery) | 3,938 | 820,443 | |
Werner Enterprises, Inc. (Ground Transportation) | 8,697 | 368,492 | |
Xylem, Inc. (Machinery) | 6,800 | 777,648 | |
| 30,381,677 | |||
| Information Technology–21.4% | |||
8x8, Inc. (Software) | (a) | 13,109 | 49,552 |
ACI Worldwide, Inc. (Software) | (a) | 21,812 | 667,447 |
Alarm.com Holdings, Inc. (Software) | (a) | 7,198 | 465,135 |
Ambarella, Inc. (Semiconductors & Equip.) | (a) | 4,857 | 297,686 |
Amkor Technology, Inc. (Semiconductors & Equip.) | 9,172 | 305,152 | |
Appfolio, Inc. Class A (Software) | (a) | 2,156 | 373,505 |
Appian Corp. Class A (Software) | (a) | 6,661 | 250,853 |
Asana, Inc. Class A (Software) | (a) | 9,833 | 186,925 |
Axcelis Technologies, Inc. (Semiconductors & Equip.) | (a) | 6,833 | 886,172 |
Bit Digital, Inc. (Software) | (a) | 119,203 | 504,229 |
BlackLine, Inc. (Software) | (a) | 6,296 | 393,122 |
Box, Inc. Class A (Software) | (a) | 29,723 | 761,206 |
Calix, Inc. (Communications Equip.) | (a) | 12,357 | 539,877 |
CommVault Systems, Inc. (Software) | (a) | 7,940 | 634,009 |
DigitalOcean Holdings, Inc. (IT Svs.) | (a) | 4,907 | 180,038 |
Domo, Inc. Class B (Software) | (a) | 2,462 | 25,334 |
Envestnet, Inc. (Software) | (a) | 4,458 | 220,760 |
ePlus, Inc. (Electronic Equip., Instr. & Comp.) | (a) | 10,415 | 831,534 |
Everbridge, Inc. (Software) | (a) | 10,820 | 263,034 |
Extreme Networks, Inc. (Communications Equip.) | (a) | 20,252 | 357,245 |
Fabrinet (Electronic Equip., Instr. & Comp.) | (a) | 3,721 | 708,218 |
Fastly, Inc. Class A (IT Svs.) | (a) | 17,550 | 312,390 |
FormFactor, Inc. (Semiconductors & Equip.) | (a) | 7,991 | 333,305 |
Hackett Group, Inc. / The (IT Svs.) | 6,448 | 146,821 | |
Ichor Holdings Ltd. (Semiconductors & Equip.) | (a) | 12,609 | 424,041 |
Insight Enterprises, Inc. (Electronic Equip., Instr. & Comp.) | (a) | 4,244 | 751,994 |
Intapp, Inc. (Software) | (a) | 4,993 | 189,834 |
Itron, Inc. (Electronic Equip., Instr. & Comp.) | (a) | 15,506 | 1,170,858 |
Klaviyo, Inc. Class A (Software) | (a) | 1,143 | 31,753 |
Lattice Semiconductor Corp. (Semiconductors & Equip.) | (a) | 6,292 | 434,085 |
Marathon Digital Holdings, Inc. (Software) | (a) | 17,063 | 400,810 |
MaxLinear, Inc. (Semiconductors & Equip.) | (a) | 13,361 | 317,591 |
MicroStrategy, Inc. Class A (Software) | (a) | 1,143 | 721,942 |
Model N, Inc. (Software) | (a) | 7,846 | 211,293 |
NETGEAR, Inc. (Communications Equip.) | (a) | 7,988 | 116,465 |
OSI Systems, Inc. (Electronic Equip., Instr. & Comp.) | (a) | 6,598 | 851,472 |
PagerDuty, Inc. (Software) | (a) | 22,096 | 511,522 |
PC Connection, Inc. (Electronic Equip., Instr. & Comp.) | 12,511 | 840,864 | |
Power Integrations, Inc. (Semiconductors & Equip.) | 14,598 | 1,198,642 | |
PROS Holdings, Inc. (Software) | (a) | 9,570 | 371,220 |
Q2 Holdings, Inc. (Software) | (a) | 24,706 | 1,072,487 |
Qualys, Inc. (Software) | (a) | 4,565 | 896,018 |
Rambus, Inc. (Semiconductors & Equip.) | (a) | 4,125 | 281,531 |
75
(continued)
AuguStarSM Variable Insurance Products Fund, Inc.
AVIP BlackRock Advantage Small Cap Growth Portfolio (Continued)
| Schedule of Investments | December 31, 2023 |
| Common Stocks (Continued) | Shares | Value | |
| Information Technology (continued) | |||
Rapid7, Inc. (Software) | (a) | 13,292 | $ 758,973 |
Sanmina Corp. (Electronic Equip., Instr. & Comp.) | (a) | 20,945 | 1,075,945 |
Silicon Laboratories, Inc. (Semiconductors & Equip.) | (a) | 6,755 | 893,484 |
Sprout Social, Inc. Class A (Software) | (a) | 10,328 | 634,552 |
SPS Commerce, Inc. (Software) | (a) | 3,962 | 767,994 |
Super Micro Computer, Inc. (Tech. Hardware, Storage & Periph.) | (a) | 5,351 | 1,521,075 |
Synaptics, Inc. (Semiconductors & Equip.) | (a) | 4,946 | 564,240 |
Tenable Holdings, Inc. (Software) | (a) | 19,065 | 878,134 |
Varonis Systems, Inc. (Software) | (a) | 26,645 | 1,206,486 |
Workiva, Inc. (Software) | (a) | 9,661 | 980,881 |
Yext, Inc. (Software) | (a) | 54,759 | 322,531 |
| 30,092,266 | |||
| Materials–2.9% | |||
Cabot Corp. (Chemicals) | 11,035 | 921,422 | |
Commercial Metals Co. (Metals & Mining) | 6,995 | 350,030 | |
Constellium SE (Metals & Mining) | (a) | 29,284 | 584,509 |
H.B. Fuller Co. (Chemicals) | 8,160 | 664,306 | |
Ingevity Corp. (Chemicals) | (a) | 4,255 | 200,921 |
Livent Corp. (Chemicals) | (a) | 26,047 | 468,325 |
Novagold Resources, Inc. (Metals & Mining) | ���(a) | 65,935 | 246,597 |
Quaker Chemical Corp. (Chemicals) | 1,818 | 387,998 | |
Schnitzer Steel Industries, Inc. Class A (Metals & Mining) | 7,765 | 234,192 | |
| 4,058,300 | |||
| Real Estate–1.6% | |||
Braemar Hotels & Resorts, Inc. (Hotel & Resort REITs) | 51,306 | 128,265 | |
| Common Stocks (Continued) | Shares | Value | |
| Real Estate (continued) | |||
COPT Defense Properties (Office REITs) | 24,692 | $ 632,856 | |
Marcus & Millichap, Inc. (Real Estate Mgmt. & Development) | 10,682 | 466,590 | |
NexPoint Residential Trust, Inc. (Residential REITs) | 18,311 | 630,448 | |
Outfront Media, Inc. (Specialized REITs) | 20,772 | 289,977 | |
Redfin Corp. (Real Estate Mgmt. & Development) | (a) | 4,977 | 51,362 |
| 2,199,498 | |||
| Utilities–0.2% | |||
Clearway Energy, Inc. Class C (Ind. Power & Renewable Elec.) | 12,471 | 342,080 | |
Total Common Stocks (Cost $140,515,520) | $140,225,420 | ||
| Rights –0.0% | Quantity | Value | |
| Health Care–0.0% | |||
Flexion Therapeutics, Inc. CVR (Biotechnology) | 6,185 | $ 3,835 | |
Prevail Therapeutics, Inc. CVR (Biotechnology) | 2,231 | 1,115 | |
Total Rights (Cost $4,950) | $ 4,950 | ||
Total Investments – 99.6% (Cost $140,520,470) | (c) | $140,230,370 | |
Other Assets in Excess of Liabilities – 0.4% | (d) | 529,807 | |
| Net Assets – 100.0% | $140,760,177 | ||
Percentages are stated as a percent of net assets. |
| Abbreviations: | ||
| ADR: | American Depositary Receipts | |
| CVR: | Contingent Value Right | |
| REITs: | Real Estate Investment Trusts | |
| Footnotes: | ||
| (a) | Non-income producing security. | |
| (b) | Represents a security deemed to be restricted. At December 31, 2023, the value of restricted securities in the Portfolio totaled $13,001, or 0.0% of the Portfolio’s net assets. | |
| (c) | Represents cost for financial reporting purposes, which may differ from cost basis for federal income tax purposes. See also Note 7 of the Notes to Financial Statements. | |
| (d) | Includes $104,000 of cash pledged as collateral for the futures contracts outstanding at December 31, 2023. See also the following Schedule of Open Futures Contracts. | |
The accompanying notes are an integral part of these financial statements.
| Schedule of Open Futures Contracts | December 31, 2023 |
| Description | Number of contracts | Expiration Date | Notional Amount | Value | Unrealized Appreciation (Depreciation) | Variation Margin Receivable (Payable) | ||||||
| CME E-mini Russell 2000 Index - Long | 16 | March 15, 2024 | $1,631,593 | $1,638,160 | $6,567 | $(3,444) |
The accompanying notes are an integral part of these financial statements.
76
AuguStarSM Variable Insurance Products Fund, Inc.
AVIP S&P MidCap 400® Index Portfolio (Unaudited)
Objective/Strategy
The AVIP S&P MidCap 400® Index Portfolio (formerly ON S&P MidCap 400® Index Portfolio) seeks total return approximating that of the Standard & Poor’s MidCap 400® Index (S&P MidCap 400® Index), including reinvestment of dividends, at a risk level consistent with that of the S&P MidCap 400® Index by investing, under normal circumstances, more than 80% of its net assets in the common stocks and other securities included in the S& P MidCap 400® Index.
Performance as of December 31, 2023
| Average Annual returns | |
| One year | 15.50% |
| Five years | 12.07% |
| Ten years | 7.48% |
Past performance does not guarantee future results. The performance data quoted represents past performance and current returns may be lower or higher. Total return figures include change in share price and reinvestment of dividends and capital gains. The investment return and principal value will fluctuate so that an investor’s shares, when redeemed, may be worth more or less than the original cost. To obtain performance information up to the most recent month end, call toll-free 1-877-781-6392.
The Portfolio is not open to direct retail investment. Beneficial interest in the Portfolio’s shares is obtained either through an allocation to the Portfolio as an investment vehicle within variable life insurance policies or annuity contracts, or as an underlying investment by the AVIP Model Portfolios. Actual performance results for variable annuity and variable universal life contracts will be lower due to contract charges. Consult your contract for applicable charges.
Total expense ratio is 0.42% per the Fund’s Prospectus dated May 1, 2023 and supplemented October 2, 2023 and December 4, 2023. Additional information pertaining to the Portfolio’s expense ratio as of December 31, 2023 can be found in the Portfolio’s Financial Highlights.
Comments from Sub-Adviser
Q. How did the Portfolio perform in comparison to its benchmark during the reporting period?
A. For the year ended December 31, 2023, the Portfolio returned 15.50% versus 16.44% for its benchmark, the S&P MidCap 400® Index.
Q. What affected the Portfolio’s performance?
A. The Portfolio seeks to track the underlying return of the S&P MidCap 400® Index. There were no material market events or changes in strategy during the year that materially impacted the Portfolio’s relative return. Sources of return variance were related to the cumulative impact of investing the day-to-day cash flows in the Portfolio. There was no impact from either sector allocation or stock selection that caused any significant performance variance between the Portfolio and its benchmark. Industrials, Consumer Discretionary and Information Technology were the top contributing sectors for the year, while Utilities, Communication Services and Health Care were the largest detractors. Because the Portfolio weights its holdings to be similar to those utilized by the benchmark, there were no holdings that significantly contributed to, or detracted from, the Portfolio’s benchmark-relative performance. Benchmark constituents that contributed the most to Portfolio and benchmark returns for the year were Builders FirstSource, Inc., Super Micro Computer, Inc., and Jabil, Inc., while First Horizon Corp., Wolfspeed, Inc., and Medical Properties Trust, Inc. were the largest detractors. (1)
| (1) | The Portfolio’s composition is subject to change. Holdings and weightings are as of December 31, 2023. |
Change in Value of $10,000 Investment

Hypothetical illustration based on past performance. Future performance will vary. The Portfolio’s returns reflect reinvested dividends. The Portfolio’s holdings may differ significantly from the securities in the index. The index is unmanaged and therefore does not reflect the cost of portfolio management and accounting.
The S&P MidCap 400® Index is a capitalization-weighted index of 400 common stocks representing all major industries in the mid-range of the U.S. stock market. The index presented includes the effects of reinvested dividends.
Past performance is no guarantee of future results. Redemption of fund shares could have tax implications unique to each shareholder.
Prior to December 19, 2016, the Portfolio was known as the Target VIP Portfolio. The strategy of the Target VIP Portfolio was to seek above average total return by investing in common stocks of companies which were identified by a model that applied separate uniquely specialized strategies.
The S&P MidCap 400® Index is a product of S&P Dow Jones Indices LLC or its affiliates (“SPDJI”), and has been licensed for use by Ohio National Investments, Inc. (“ONI”). Standard & Poor’s® and S&P® are registered trademarks of Standard & Poor’s Financial Services LLC (“S&P”); Dow Jones® is a registered trademark of Dow Jones Trademark Holdings LLC (“Dow Jones”); and these trademarks have been licensed for use by SPDJI and sublicensed for certain purposes by ONI. The AVIP S&P MidCap 400® Index Portfolio of AuguStarSM Variable Insurance Products Fund, Inc. is not sponsored, endorsed, sold or promoted by SPDJI, Dow Jones, S&P, their respective affiliates, and none of such parties make any representation regarding the advisability of investing in such product(s) nor do they have any liability for any errors, omissions, or interruptions of the S&P MidCap 400® Index.
77
(continued)
AuguStarSM Variable Insurance Products Fund, Inc.
AVIP S&P MidCap 400® Index Portfolio (Unaudited) (Continued)
| Portfolio Composition as of December 31, 2023 (1) | |
| % of Net Assets | |
| Common Stocks (4) | 99.3 |
| U.S. Treasury Obligations | 0.0 |
| Other Net Assets | 0.7 |
| 100.0 | |
| Top 10 Portfolio Holdings as of December 31, 2023 (1) (2) (3) | ||
| % of Net Assets | ||
| 1. | Deckers Outdoor Corp. | 0.7 |
| 2. | Reliance Steel & Aluminum Co. | 0.6 |
| 3. | Carlisle Cos., Inc. | 0.6 |
| 4. | GoDaddy, Inc. Class A | 0.6 |
| 5. | Graco, Inc. | 0.6 |
| 6. | Watsco, Inc. | 0.6 |
| 7. | RPM International, Inc. | 0.6 |
| 8. | Lennox International, Inc. | 0.6 |
| 9. | W.P. Carey, Inc. | 0.5 |
| 10. | Manhattan Associates, Inc. | 0.5 |
| (1) | Composition of Portfolio subject to change. | |
| (2) | Short-term investments have been excluded from the list of Top 10 Portfolio Holdings. | |
| (3) | Top 10 Portfolio Holdings is presented at an individual security level. Total investment exposure by issuer may be higher. | |
| (4) | Sectors (Common Stocks): | |
| % of Net Assets | |
| Industrials | 21.1 |
| Financials | 16.0 |
| Consumer Discretionary | 15.7 |
| Information Technology | 9.6 |
| Real Estate | 8.0 |
| Health Care | 7.8 |
| Materials | 7.1 |
| Energy | 5.0 |
| Consumer Staples | 4.1 |
| Utilities | 3.2 |
| Communication Services | 1.7 |
| 99.3 |
78
AuguStarSM Variable Insurance Products Fund, Inc.
AVIP S&P MidCap 400® Index Portfolio
| Schedule of Investments | December 31, 2023 |
| Common Stocks–99.3% | Shares | Value | |
| Communication Services–1.7% | |||
Cable One, Inc. (Media) | 974 | $ 542,119 | |
Frontier Communications Parent, Inc. (Diversified Telecom. Svs.) | (a) | 47,362 | 1,200,153 |
Iridium Communications, Inc. (Diversified Telecom. Svs.) | 26,520 | 1,091,563 | |
New York Times Co. / The Class A (Media) | 35,037 | 1,716,463 | |
Nexstar Media Group, Inc. (Media) | 6,902 | 1,081,888 | |
TEGNA, Inc. (Media) | 42,177 | 645,308 | |
TKO Group Holdings, Inc. (Entertainment) | 12,848 | 1,048,140 | |
Ziff Davis, Inc. (Interactive Media & Svs.) | (a) | 9,847 | 661,620 |
ZoomInfo Technologies, Inc. (Interactive Media & Svs.) | (a) | 63,433 | 1,172,876 |
| 9,160,130 | |||
| Consumer Discretionary–15.7% | |||
Adient PLC (Automobile Components) | (a) | 20,055 | 729,200 |
Aramark (Hotels, Restaurants & Leisure) | 55,899 | 1,570,762 | |
Autoliv, Inc. (Automobile Components) | 16,037 | 1,767,117 | |
AutoNation, Inc. (Specialty Retail) | (a) | 5,554 | 834,100 |
Boyd Gaming Corp. (Hotels, Restaurants & Leisure) | 14,878 | 931,512 | |
Brunswick Corp. (Leisure Products) | 14,735 | 1,425,611 | |
Burlington Stores, Inc. (Specialty Retail) | (a) | 13,894 | 2,702,105 |
Capri Holdings Ltd. (Textiles, Apparel & Luxury Goods) | (a) | 24,886 | 1,250,273 |
Carter's, Inc. (Textiles, Apparel & Luxury Goods) | 7,885 | 590,508 | |
Choice Hotels International, Inc. (Hotels, Restaurants & Leisure) | 5,332 | 604,116 | |
Churchill Downs, Inc. (Hotels, Restaurants & Leisure) | 14,535 | 1,961,208 | |
Columbia Sportswear Co. (Textiles, Apparel & Luxury Goods) | 7,385 | 587,403 | |
Crocs, Inc. (Textiles, Apparel & Luxury Goods) | (a) | 12,969 | 1,211,434 |
Deckers Outdoor Corp. (Textiles, Apparel & Luxury Goods) | (a) | 5,510 | 3,683,049 |
Dick's Sporting Goods, Inc. (Specialty Retail) | 13,159 | 1,933,715 | |
Five Below, Inc. (Specialty Retail) | (a) | 11,924 | 2,541,720 |
Floor & Decor Holdings, Inc. Class A (Specialty Retail) | (a) | 22,820 | 2,545,799 |
Fox Factory Holding Corp. (Automobile Components) | (a) | 9,075 | 612,381 |
GameStop Corp. Class A (Specialty Retail) | (a) | 57,518 | 1,008,291 |
Gap, Inc. / The (Specialty Retail) | 45,937 | 960,543 | |
Gentex Corp. (Automobile Components) | 49,946 | 1,631,236 | |
Goodyear Tire & Rubber Co. / The (Automobile Components) | (a) | 60,716 | 869,453 |
Graham Holdings Co. Class B (Diversified Consumer Svs.) | 767 | 534,231 | |
Grand Canyon Education, Inc. (Diversified Consumer Svs.) | (a) | 6,329 | 835,681 |
H&R Block, Inc. (Diversified Consumer Svs.) | 30,820 | 1,490,763 | |
Harley-Davidson, Inc. (Automobiles) | 27,138 | 999,764 | |
Helen of Troy Ltd. (Household Durables) | (a) | 5,084 | 614,198 |
Hilton Grand Vacations, Inc. (Hotels, Restaurants & Leisure) | (a) | 15,261 | 613,187 |
Hyatt Hotels Corp. Class A (Hotels, Restaurants & Leisure) | 9,469 | 1,234,852 | |
KB Home (Household Durables) | 16,394 | 1,023,969 | |
Lear Corp. (Automobile Components) | 12,475 | 1,761,595 | |
Leggett & Platt, Inc. (Household Durables) | 28,548 | 747,101 | |
Light & Wonder, Inc. (Hotels, Restaurants & Leisure) | (a) | 19,282 | 1,583,245 |
Lithia Motors, Inc. (Specialty Retail) | 5,893 | 1,940,447 | |
Macy's, Inc. (Broadline Retail) | 58,593 | 1,178,891 | |
Marriott Vacations Worldwide Corp. (Hotels, Restaurants & Leisure) | 7,073 | 600,427 | |
| Common Stocks (Continued) | Shares | Value | |
| Consumer Discretionary (continued) | |||
Mattel, Inc. (Leisure Products) | (a) | 75,638 | $ 1,428,045 |
Murphy U.S.A., Inc. (Specialty Retail) | 4,146 | 1,478,298 | |
Nordstrom, Inc. (Broadline Retail) | 20,772 | 383,243 | |
Ollie's Bargain Outlet Holdings, Inc. (Broadline Retail) | (a) | 13,213 | 1,002,735 |
Penn Entertainment, Inc. (Hotels, Restaurants & Leisure) | (a) | 32,496 | 845,546 |
Penske Automotive Group, Inc. (Specialty Retail) | 4,174 | 669,969 | |
Planet Fitness, Inc. Class A (Hotels, Restaurants & Leisure) | (a) | 18,295 | 1,335,535 |
Polaris, Inc. (Leisure Products) | 11,367 | 1,077,251 | |
PVH Corp. (Textiles, Apparel & Luxury Goods) | 12,939 | 1,580,111 | |
RH (Specialty Retail) | (a) | 3,310 | 964,799 |
Service Corp. International (Diversified Consumer Svs.) | 31,637 | 2,165,553 | |
Skechers U.S.A., Inc. Class A (Textiles, Apparel & Luxury Goods) | (a) | 28,607 | 1,783,360 |
Taylor Morrison Home Corp. (Household Durables) | (a) | 23,008 | 1,227,477 |
Tempur Sealy International, Inc. (Household Durables) | 36,889 | 1,880,232 | |
Texas Roadhouse, Inc. (Hotels, Restaurants & Leisure) | 14,300 | 1,747,889 | |
Thor Industries, Inc. (Automobiles) | 11,408 | 1,348,996 | |
Toll Brothers, Inc. (Household Durables) | 23,014 | 2,365,609 | |
TopBuild Corp. (Household Durables) | (a) | 6,804 | 2,546,465 |
Travel + Leisure Co. (Hotels, Restaurants & Leisure) | 15,507 | 606,169 | |
Under Armour, Inc. Class A (Textiles, Apparel & Luxury Goods) | (a) | 40,471 | 355,740 |
Under Armour, Inc. Class C (Textiles, Apparel & Luxury Goods) | (a) | 41,368 | 345,423 |
Vail Resorts, Inc. (Hotels, Restaurants & Leisure) | 8,156 | 1,741,061 | |
Valvoline, Inc. (Specialty Retail) | (a) | 29,692 | 1,115,825 |
Visteon Corp. (Automobile Components) | (a) | 5,955 | 743,779 |
Wendy's Co. / The (Hotels, Restaurants & Leisure) | 35,775 | 696,897 | |
Williams-Sonoma, Inc. (Specialty Retail) | 13,735 | 2,771,448 | |
Wingstop, Inc. (Hotels, Restaurants & Leisure) | 6,299 | 1,616,197 | |
Wyndham Hotels & Resorts, Inc. (Hotels, Restaurants & Leisure) | 17,765 | 1,428,484 | |
YETI Holdings, Inc. (Leisure Products) | (a) | 18,598 | 963,004 |
| 85,325,027 | |||
| Consumer Staples–4.1% | |||
BellRing Brands, Inc. (Personal Care Products) | (a) | 28,146 | 1,560,133 |
BJ's Wholesale Club Holdings, Inc. (Consumer Staples Distribution & Retail) | (a) | 28,636 | 1,908,876 |
Boston Beer Co., Inc. / The Class A (Beverages) | (a) | 2,015 | 696,364 |
Casey's General Stores, Inc. (Consumer Staples Distribution & Retail) | 7,980 | 2,192,425 | |
Celsius Holdings, Inc. (Beverages) | (a) | 31,749 | 1,730,955 |
Coca-Cola Consolidated, Inc. (Beverages) | 1,004 | 932,114 | |
Coty, Inc. Class A (Personal Care Products) | (a) | 80,192 | 995,985 |
Darling Ingredients, Inc. (Food Products) | (a) | 34,161 | 1,702,584 |
Flowers Foods, Inc. (Food Products) | 41,138 | 926,016 | |
Grocery Outlet Holding Corp. (Consumer Staples Distribution & Retail) | (a) | 21,256 | 573,062 |
Ingredion, Inc. (Food Products) | 13,960 | 1,515,079 | |
Lancaster Colony Corp. (Food Products) | 4,360 | 725,460 | |
Performance Food Group Co. (Consumer Staples Distribution & Retail) | (a) | 33,319 | 2,304,009 |
Pilgrim's Pride Corp. (Food Products) | (a) | 8,620 | 238,429 |
79
(continued)
AuguStarSM Variable Insurance Products Fund, Inc.
AVIP S&P MidCap 400® Index Portfolio (Continued)
| Schedule of Investments | December 31, 2023 |
| Common Stocks (Continued) | Shares | Value | |
| Consumer Staples (continued) | |||
Post Holdings, Inc. (Food Products) | (a) | 10,880 | $ 958,093 |
Sprouts Farmers Market, Inc. (Consumer Staples Distribution & Retail) | (a) | 21,747 | 1,046,248 |
U.S. Foods Holding Corp. (Consumer Staples Distribution & Retail) | (a) | 48,433 | 2,199,342 |
| 22,205,174 | |||
| Energy–5.0% | |||
Antero Midstream Corp. (Oil, Gas & Consumable Fuels) | 72,932 | 913,838 | |
Antero Resources Corp. (Oil, Gas & Consumable Fuels) | (a) | 60,494 | 1,372,004 |
ChampionX Corp. (Energy Equip. & Svs.) | 41,712 | 1,218,408 | |
Chesapeake Energy Corp. (Oil, Gas & Consumable Fuels) | 23,856 | 1,835,481 | |
Chord Energy Corp. (Oil, Gas & Consumable Fuels) | 8,839 | 1,469,307 | |
Civitas Resources, Inc. (Oil, Gas & Consumable Fuels) | 18,273 | 1,249,508 | |
CNX Resources Corp. (Oil, Gas & Consumable Fuels) | (a) | 34,015 | 680,300 |
DT Midstream, Inc. (Oil, Gas & Consumable Fuels) | 20,750 | 1,137,100 | |
Equitrans Midstream Corp. (Oil, Gas & Consumable Fuels) | 92,774 | 944,439 | |
HF Sinclair Corp. (Oil, Gas & Consumable Fuels) | 33,523 | 1,862,873 | |
Matador Resources Co. (Oil, Gas & Consumable Fuels) | 23,725 | 1,349,003 | |
Murphy Oil Corp. (Oil, Gas & Consumable Fuels) | 31,423 | 1,340,505 | |
NOV, Inc. (Energy Equip. & Svs.) | 84,351 | 1,710,638 | |
Ovintiv, Inc. (Oil, Gas & Consumable Fuels) | 54,346 | 2,386,876 | |
PBF Energy, Inc. Class A (Oil, Gas & Consumable Fuels) | 23,288 | 1,023,740 | |
Permian Resources Corp. (Oil, Gas & Consumable Fuels) | 89,010 | 1,210,536 | |
Range Resources Corp. (Oil, Gas & Consumable Fuels) | 51,671 | 1,572,865 | |
Southwestern Energy Co. (Oil, Gas & Consumable Fuels) | (a) | 235,856 | 1,544,857 |
Valaris Ltd. (Energy Equip. & Svs.) | (a) | 13,424 | 920,484 |
Weatherford International PLC (Energy Equip. & Svs.) | (a) | 15,443 | 1,510,789 |
| 27,253,551 | |||
| Financials–16.0% | |||
Affiliated Managers Group, Inc. (Capital Markets) | 7,239 | 1,096,129 | |
Ally Financial, Inc. (Consumer Finance) | 58,129 | 2,029,865 | |
American Financial Group, Inc. (Insurance) | 13,993 | 1,663,628 | |
Annaly Capital Management, Inc. (Mortgage REIT) | 107,084 | 2,074,217 | |
Associated Banc-Corp (Banks) | 31,822 | 680,673 | |
Bank OZK (Banks) | 22,530 | 1,122,670 | |
Brighthouse Financial, Inc. (Insurance) | (a) | 13,748 | 727,544 |
Cadence Bank (Banks) | 39,114 | 1,157,383 | |
Carlyle Group, Inc. / The (Capital Markets) | 46,354 | 1,886,144 | |
CNO Financial Group, Inc. (Insurance) | 24,019 | 670,130 | |
Columbia Banking System, Inc. (Banks) | 44,662 | 1,191,582 | |
Commerce Bancshares, Inc. (Banks) | 25,430 | 1,358,216 | |
Cullen / Frost Bankers, Inc. (Banks) | 13,714 | 1,487,832 | |
East West Bancorp, Inc. (Banks) | 30,177 | 2,171,235 | |
Equitable Holdings, Inc. (Financial Services) | 68,131 | 2,268,762 | |
Erie Indemnity Co. Class A (Insurance) | 5,341 | 1,788,808 | |
Essent Group Ltd. (Financial Services) | 22,860 | 1,205,636 | |
Euronet Worldwide, Inc. (Financial Services) | (a) | 9,382 | 952,179 |
Evercore, Inc. Class A (Capital Markets) | 7,422 | 1,269,533 | |
Federated Hermes, Inc. (Capital Markets) | 18,468 | 625,326 | |
| Common Stocks (Continued) | Shares | Value | |
| Financials (continued) | |||
Fidelity National Financial, Inc. (Insurance) | 55,363 | $ 2,824,620 | |
First American Financial Corp. (Insurance) | 22,094 | 1,423,737 | |
First Financial Bankshares, Inc. (Banks) | 27,502 | 833,311 | |
First Horizon Corp. (Banks) | 119,649 | 1,694,230 | |
FirstCash Holdings, Inc. (Consumer Finance) | 7,920 | 858,449 | |
FNB Corp. (Banks) | 76,836 | 1,058,032 | |
Glacier Bancorp, Inc. (Banks) | 23,742 | 981,019 | |
Hancock Whitney Corp. (Banks) | 18,447 | 896,340 | |
Hanover Insurance Group, Inc. / The (Insurance) | 7,658 | 929,834 | |
Home BancShares, Inc. (Banks) | 40,181 | 1,017,785 | |
Houlihan Lokey, Inc. (Capital Markets) | 11,052 | 1,325,245 | |
Interactive Brokers Group, Inc. Class A (Capital Markets) | 22,915 | 1,899,654 | |
International Bancshares Corp. (Banks) | 11,428 | 620,769 | |
Janus Henderson Group PLC (Capital Markets) | 28,378 | 855,597 | |
Jefferies Financial Group, Inc. (Capital Markets) | 36,047 | 1,456,659 | |
Kemper Corp. (Insurance) | 12,900 | 627,843 | |
Kinsale Capital Group, Inc. (Insurance) | 4,714 | 1,578,766 | |
MGIC Investment Corp. (Financial Services) | 59,381 | 1,145,459 | |
Morningstar, Inc. (Capital Markets) | 5,577 | 1,596,360 | |
New York Community Bancorp, Inc. (Banks) | 154,706 | 1,582,642 | |
Old National Bancorp (Banks) | 62,659 | 1,058,311 | |
Old Republic International Corp. (Insurance) | 55,835 | 1,641,549 | |
Pinnacle Financial Partners, Inc. (Banks) | 16,440 | 1,433,897 | |
Primerica, Inc. (Insurance) | 7,502 | 1,543,612 | |
Prosperity Bancshares, Inc. (Banks) | 20,067 | 1,359,138 | |
Reinsurance Group of America, Inc. (Insurance) | 14,112 | 2,283,039 | |
RenaissanceRe Holdings Ltd. (Insurance) | 11,241 | 2,203,236 | |
RLI Corp. (Insurance) | 8,597 | 1,144,433 | |
SEI Investments Co. (Capital Markets) | 21,414 | 1,360,860 | |
Selective Insurance Group, Inc. (Insurance) | 12,974 | 1,290,654 | |
SLM Corp. (Consumer Finance) | 48,451 | 926,383 | |
SouthState Corp. (Banks) | 16,288 | 1,375,522 | |
Starwood Property Trust, Inc. (Mortgage REIT) | 63,717 | 1,339,331 | |
Stifel Financial Corp. (Capital Markets) | 21,840 | 1,510,236 | |
Synovus Financial Corp. (Banks) | 31,315 | 1,179,010 | |
Texas Capital Bancshares, Inc. (Banks) | (a) | 10,282 | 664,526 |
UMB Financial Corp. (Banks) | 9,353 | 781,443 | |
United Bankshares, Inc. (Banks) | 28,893 | 1,084,932 | |
Unum Group (Insurance) | 39,259 | 1,775,292 | |
Valley National Bancorp (Banks) | 91,317 | 991,703 | |
Voya Financial, Inc. (Financial Services) | 22,370 | 1,632,115 | |
Webster Financial Corp. (Banks) | 36,838 | 1,869,897 | |
Western Union Co. / The (Financial Services) | 78,020 | 929,998 | |
WEX, Inc. (Financial Services) | (a) | 9,151 | 1,780,327 |
Wintrust Financial Corp. (Banks) | 13,112 | 1,216,138 | |
| 87,009,425 | |||
| Health Care–7.8% | |||
Acadia Healthcare Co., Inc. (Health Care Providers & Svs.) | (a) | 19,746 | 1,535,449 |
Amedisys, Inc. (Health Care Providers & Svs.) | (a) | 6,988 | 664,279 |
Arrowhead Pharmaceuticals, Inc. (Biotechnology) | (a) | 22,953 | 702,362 |
Azenta, Inc. (Life Sciences Tools & Svs.) | (a) | 12,881 | 839,068 |
Bruker Corp. (Life Sciences Tools & Svs.) | 19,857 | 1,459,092 | |
Chemed Corp. (Health Care Providers & Svs.) | 3,225 | 1,885,819 | |
Doximity, Inc. Class A (Health Care Technology) | (a) | 25,302 | 709,468 |
Encompass Health Corp. (Health Care Providers & Svs.) | 21,462 | 1,431,945 | |
Enovis Corp. (Health Care Equip. & Supplies) | (a) | 10,638 | 595,941 |
Envista Holdings Corp. (Health Care Equip. & Supplies) | (a) | 36,702 | 883,050 |
Exelixis, Inc. (Biotechnology) | (a) | 66,589 | 1,597,470 |
80
(continued)
AuguStarSM Variable Insurance Products Fund, Inc.
AVIP S&P MidCap 400® Index Portfolio (Continued)
| Schedule of Investments | December 31, 2023 |
| Common Stocks (Continued) | Shares | Value | |
| Health Care (continued) | |||
Globus Medical, Inc. Class A (Health Care Equip. & Supplies) | (a) | 24,703 | $ 1,316,423 |
Haemonetics Corp. (Health Care Equip. & Supplies) | (a) | 10,865 | 929,066 |
Halozyme Therapeutics, Inc. (Biotechnology) | (a) | 28,286 | 1,045,451 |
HealthEquity, Inc. (Health Care Providers & Svs.) | (a) | 18,335 | 1,215,610 |
Inari Medical, Inc. (Health Care Equip. & Supplies) | (a) | 10,959 | 711,458 |
Integra LifeSciences Holdings Corp. (Health Care Equip. & Supplies) | (a) | 14,564 | 634,262 |
Jazz Pharmaceuticals PLC (Pharmaceuticals) | (a) | 13,481 | 1,658,163 |
Lantheus Holdings, Inc. (Health Care Equip. & Supplies) | (a) | 14,666 | 909,292 |
LivaNova PLC (Health Care Equip. & Supplies) | (a) | 11,538 | 596,976 |
Masimo Corp. (Health Care Equip. & Supplies) | (a) | 9,504 | 1,113,964 |
Medpace Holdings, Inc. (Life Sciences Tools & Svs.) | (a) | 4,993 | 1,530,504 |
Neogen Corp. (Health Care Equip. & Supplies) | (a) | 42,150 | 847,637 |
Neurocrine Biosciences, Inc. (Biotechnology) | (a) | 21,039 | 2,772,099 |
Option Care Health, Inc. (Health Care Providers & Svs.) | (a) | 37,929 | 1,277,828 |
Patterson Cos., Inc. (Health Care Providers & Svs.) | 18,222 | 518,416 | |
Penumbra, Inc. (Health Care Equip. & Supplies) | (a) | 8,265 | 2,078,978 |
Perrigo Co. PLC (Pharmaceuticals) | 29,016 | 933,735 | |
Progyny, Inc. (Health Care Providers & Svs.) | (a) | 17,854 | 663,812 |
QuidelOrtho Corp. (Health Care Equip. & Supplies) | (a) | 10,588 | 780,336 |
R1 RCM, Inc. (Health Care Providers & Svs.) | (a) | 42,164 | 445,673 |
Repligen Corp. (Life Sciences Tools & Svs.) | (a) | 11,118 | 1,999,016 |
Shockwave Medical, Inc. (Health Care Equip. & Supplies) | (a) | 7,901 | 1,505,615 |
Sotera Health Co. (Life Sciences Tools & Svs.) | (a) | 21,181 | 356,900 |
Tenet Healthcare Corp. (Health Care Providers & Svs.) | (a) | 21,745 | 1,643,270 |
United Therapeutics Corp. (Biotechnology) | (a) | 10,050 | 2,209,894 |
| 41,998,321 | |||
| Industrials–21.1% | |||
Acuity Brands, Inc. (Electrical Equip.) | 6,627 | 1,357,408 | |
Advanced Drainage Systems, Inc. (Building Products) | 14,680 | 2,064,595 | |
AECOM (Construction & Engineering) | 29,706 | 2,745,726 | |
AGCO Corp. (Machinery) | 13,308 | 1,615,724 | |
ASGN, Inc. (Professional Svs.) | (a) | 10,107 | 971,990 |
Avis Budget Group, Inc. (Ground Transportation) | 3,956 | 701,241 | |
Brink's Co. / The (Commercial Svs. & Supplies) | 9,647 | 848,454 | |
BWX Technologies, Inc. (Aerospace & Defense) | 19,586 | 1,502,834 | |
CACI International, Inc. Class A (Professional Svs.) | (a) | 4,770 | 1,544,812 |
Carlisle Cos., Inc. (Building Products) | 10,424 | 3,256,770 | |
Chart Industries, Inc. (Machinery) | (a) | 8,991 | 1,225,743 |
Clean Harbors, Inc. (Commercial Svs. & Supplies) | (a) | 10,784 | 1,881,916 |
Comfort Systems U.S.A., Inc. (Construction & Engineering) | 7,648 | 1,572,964 | |
Concentrix Corp. (Professional Svs.) | 10,125 | 994,376 | |
Core & Main, Inc. Class A (Trading Companies & Distributors) | (a) | 29,266 | 1,182,639 |
Crane Co. (Machinery) | 10,460 | 1,235,744 | |
Curtiss-Wright Corp. (Aerospace & Defense) | 8,189 | 1,824,427 | |
Donaldson Co., Inc. (Machinery) | 25,842 | 1,688,775 | |
EMCOR Group, Inc. (Construction & Engineering) | 10,073 | 2,170,026 | |
EnerSys (Electrical Equip.) | 8,651 | 873,405 | |
| Common Stocks (Continued) | Shares | Value | |
| Industrials (continued) | |||
Esab Corp. (Machinery) | 12,131 | $ 1,050,787 | |
ExlService Holdings, Inc. (Professional Svs.) | (a) | 35,315 | 1,089,468 |
Exponent, Inc. (Professional Svs.) | 10,840 | 954,354 | |
Flowserve Corp. (Machinery) | 28,096 | 1,158,117 | |
Fluor Corp. (Construction & Engineering) | (a) | 36,482 | 1,429,000 |
Fortune Brands Innovations, Inc. (Building Products) | 27,001 | 2,055,856 | |
FTI Consulting, Inc. (Professional Svs.) | (a) | 7,604 | 1,514,337 |
GATX Corp. (Trading Companies & Distributors) | 7,602 | 913,912 | |
Genpact Ltd. (Professional Svs.) | 35,738 | 1,240,466 | |
Graco, Inc. (Machinery) | 36,143 | 3,135,767 | |
GXO Logistics, Inc. (Air Freight & Logistics) | (a) | 25,472 | 1,557,868 |
Hertz Global Holdings, Inc. (Ground Transportation) | (a) | 28,342 | 294,473 |
Hexcel Corp. (Aerospace & Defense) | 18,011 | 1,328,311 | |
Insperity, Inc. (Professional Svs.) | 7,584 | 888,997 | |
ITT, Inc. (Machinery) | 17,580 | 2,097,646 | |
KBR, Inc. (Professional Svs.) | 28,908 | 1,601,792 | |
Kirby Corp. (Marine Transportation) | (a) | 12,655 | 993,164 |
Knight-Swift Transportation Holdings, Inc. (Ground Transportation) | 34,538 | 1,991,116 | |
Landstar System, Inc. (Ground Transportation) | 7,697 | 1,490,524 | |
Lennox International, Inc. (Building Products) | 6,849 | 3,065,065 | |
Lincoln Electric Holdings, Inc. (Machinery) | 12,248 | 2,663,450 | |
ManpowerGroup, Inc. (Professional Svs.) | 10,451 | 830,541 | |
MasTec, Inc. (Construction & Engineering) | (a) | 12,943 | 980,044 |
Maximus, Inc. (Professional Svs.) | 13,016 | 1,091,522 | |
MDU Resources Group, Inc. (Construction & Engineering) | 43,605 | 863,379 | |
Middleby Corp. / The (Machinery) | (a) | 11,478 | 1,689,217 |
MSA Safety, Inc. (Commercial Svs. & Supplies) | 7,913 | 1,335,952 | |
MSC Industrial Direct Co., Inc. Class A (Trading Companies & Distributors) | 9,928 | 1,005,309 | |
nVent Electric PLC (Electrical Equip.) | 35,527 | 2,099,290 | |
Oshkosh Corp. (Machinery) | 14,007 | 1,518,499 | |
Owens Corning (Building Products) | 19,031 | 2,820,965 | |
Paylocity Holding Corp. (Professional Svs.) | (a) | 9,262 | 1,526,841 |
RBC Bearings, Inc. (Machinery) | (a) | 6,228 | 1,774,295 |
Regal Rexnord Corp. (Electrical Equip.) | 14,207 | 2,102,920 | |
Ryder System, Inc. (Ground Transportation) | 9,491 | 1,092,034 | |
Saia, Inc. (Ground Transportation) | (a) | 5,685 | 2,491,281 |
Science Applications International Corp. (Professional Svs.) | 11,335 | 1,409,167 | |
Sensata Technologies Holding PLC (Electrical Equip.) | 32,410 | 1,217,644 | |
Simpson Manufacturing Co., Inc. (Building Products) | 9,138 | 1,809,141 | |
Stericycle, Inc. (Commercial Svs. & Supplies) | (a) | 19,812 | 981,883 |
Sunrun, Inc. (Electrical Equip.) | (a) | 46,505 | 912,893 |
Terex Corp. (Machinery) | 14,411 | 828,056 | |
Tetra Tech, Inc. (Commercial Svs. & Supplies) | 11,402 | 1,903,336 | |
Timken Co. / The (Machinery) | 13,898 | 1,113,925 | |
Toro Co. / The (Machinery) | 22,236 | 2,134,434 | |
Trex Co., Inc. (Building Products) | (a) | 23,253 | 1,925,116 |
UFP Industries, Inc. (Building Products) | 13,236 | 1,661,780 | |
Valmont Industries, Inc. (Construction & Engineering) | 4,473 | 1,044,490 | |
Watsco, Inc. (Trading Companies & Distributors) | 7,252 | 3,107,264 | |
Watts Water Technologies, Inc. Class A (Machinery) | 5,860 | 1,220,872 | |
Werner Enterprises, Inc. (Ground Transportation) | 13,575 | 575,173 | |
WESCO International, Inc. (Trading Companies & Distributors) | 9,406 | 1,635,515 | |
81
(continued)
AuguStarSM Variable Insurance Products Fund, Inc.
AVIP S&P MidCap 400® Index Portfolio (Continued)
| Schedule of Investments | December 31, 2023 |
| Common Stocks (Continued) | Shares | Value | |
| Industrials (continued) | |||
Woodward, Inc. (Aerospace & Defense) | 12,937 | $ 1,761,114 | |
XPO, Inc. (Ground Transportation) | (a) | 24,833 | 2,175,123 |
| 114,413,054 | |||
| Information Technology–9.6% | |||
Allegro MicroSystems, Inc. (Semiconductors & Equip.) | (a) | 15,249 | 461,587 |
Amkor Technology, Inc. (Semiconductors & Equip.) | 22,103 | 735,367 | |
Arrow Electronics, Inc. (Electronic Equip., Instr. & Comp.) | (a) | 11,597 | 1,417,733 |
Aspen Technology, Inc. (Software) | (a) | 6,001 | 1,321,120 |
Avnet, Inc. (Electronic Equip., Instr. & Comp.) | 19,375 | 976,500 | |
Belden, Inc. (Electronic Equip., Instr. & Comp.) | 8,925 | 689,456 | |
Blackbaud, Inc. (Software) | (a) | 9,225 | 799,808 |
Calix, Inc. (Communications Equip.) | (a) | 12,553 | 548,441 |
Ciena Corp. (Communications Equip.) | (a) | 31,657 | 1,424,882 |
Cirrus Logic, Inc. (Semiconductors & Equip.) | (a) | 11,541 | 960,096 |
Cognex Corp. (Electronic Equip., Instr. & Comp.) | 36,861 | 1,538,578 | |
Coherent Corp. (Electronic Equip., Instr. & Comp.) | (a) | 28,220 | 1,228,417 |
CommVault Systems, Inc. (Software) | (a) | 9,377 | 748,753 |
Crane NXT Co. (Electronic Equip., Instr. & Comp.) | 10,338 | 587,922 | |
Dolby Laboratories, Inc. Class A (Software) | 12,752 | 1,098,967 | |
Dropbox, Inc. Class A (Software) | (a) | 54,856 | 1,617,155 |
Dynatrace, Inc. (Software) | (a) | 51,061 | 2,792,526 |
GoDaddy, Inc. Class A (IT Svs.) | (a) | 30,155 | 3,201,255 |
IPG Photonics Corp. (Electronic Equip., Instr. & Comp.) | (a) | 6,330 | 687,058 |
Kyndryl Holdings, Inc. (IT Svs.) | (a) | 49,135 | 1,021,025 |
Lattice Semiconductor Corp. (Semiconductors & Equip.) | (a) | 29,556 | 2,039,068 |
Littelfuse, Inc. (Electronic Equip., Instr. & Comp.) | 5,330 | 1,426,095 | |
Lumentum Holdings, Inc. (Communications Equip.) | (a) | 14,347 | 752,070 |
MACOM Technology Solutions Holdings, Inc. (Semiconductors & Equip.) | (a) | 11,588 | 1,077,105 |
Manhattan Associates, Inc. (Software) | (a) | 13,183 | 2,838,564 |
MKS Instruments, Inc. (Semiconductors & Equip.) | 13,461 | 1,384,733 | |
Novanta, Inc. (Electronic Equip., Instr. & Comp.) | (a) | 7,668 | 1,291,368 |
Onto Innovation, Inc. (Semiconductors & Equip.) | (a) | 10,510 | 1,606,979 |
Power Integrations, Inc. (Semiconductors & Equip.) | 12,175 | 999,689 | |
Qualys, Inc. (Software) | (a) | 7,877 | 1,546,098 |
Rambus, Inc. (Semiconductors & Equip.) | (a) | 23,021 | 1,571,183 |
Silicon Laboratories, Inc. (Semiconductors & Equip.) | (a) | 6,805 | 900,097 |
Super Micro Computer, Inc. (Tech. Hardware, Storage & Periph.) | (a) | 9,932 | 2,823,270 |
Synaptics, Inc. (Semiconductors & Equip.) | (a) | 8,394 | 957,588 |
TD SYNNEX Corp. (Electronic Equip., Instr. & Comp.) | 10,983 | 1,181,881 | |
Teradata Corp. (Software) | (a) | 20,942 | 911,186 |
Universal Display Corp. (Semiconductors & Equip.) | 9,329 | 1,784,265 | |
Vishay Intertechnology, Inc. (Electronic Equip., Instr. & Comp.) | 27,032 | 647,957 | |
Vontier Corp. (Electronic Equip., Instr. & Comp.) | 33,046 | 1,141,739 | |
Wolfspeed, Inc. (Semiconductors & Equip.) | (a) | 26,836 | 1,167,634 |
| 51,905,215 | |||
| Materials–7.1% | |||
Alcoa Corp. (Metals & Mining) | 38,216 | 1,299,344 | |
| Common Stocks (Continued) | Shares | Value | |
| Materials (continued) | |||
AptarGroup, Inc. (Containers & Packaging) | 14,086 | $ 1,741,311 | |
Ashland, Inc. (Chemicals) | 10,972 | 925,049 | |
Avient Corp. (Chemicals) | 19,520 | 811,446 | |
Axalta Coating Systems Ltd. (Chemicals) | (a) | 47,126 | 1,600,870 |
Berry Global Group, Inc. (Containers & Packaging) | 25,289 | 1,704,226 | |
Cabot Corp. (Chemicals) | 11,829 | 987,722 | |
Chemours Co. / The (Chemicals) | 31,785 | 1,002,499 | |
Cleveland-Cliffs, Inc. (Metals & Mining) | (a) | 108,106 | 2,207,525 |
Commercial Metals Co. (Metals & Mining) | 25,033 | 1,252,651 | |
Crown Holdings, Inc. (Containers & Packaging) | 25,834 | 2,379,053 | |
Eagle Materials, Inc. (Construction Materials) | 7,470 | 1,515,215 | |
Graphic Packaging Holding Co. (Containers & Packaging) | 65,535 | 1,615,438 | |
Greif, Inc. Class A (Containers & Packaging) | 5,455 | 357,793 | |
Knife River Corp. (Construction Materials) | (a) | 12,112 | 801,572 |
Livent Corp. (Chemicals) | (a) | 38,485 | 691,960 |
Louisiana-Pacific Corp. (Paper & Forest Products) | 13,742 | 973,346 | |
MP Materials Corp. (Metals & Mining) | (a) | 30,841 | 612,194 |
NewMarket Corp. (Chemicals) | 1,478 | 806,737 | |
Olin Corp. (Chemicals) | 26,242 | 1,415,756 | |
Reliance Steel & Aluminum Co. (Metals & Mining) | 12,306 | 3,441,742 | |
Royal Gold, Inc. (Metals & Mining) | 14,067 | 1,701,544 | |
RPM International, Inc. (Chemicals) | 27,586 | 3,079,425 | |
Scotts Miracle-Gro Co. / The (Chemicals) | 8,898 | 567,248 | |
Silgan Holdings, Inc. (Containers & Packaging) | 17,331 | 784,228 | |
Sonoco Products Co. (Containers & Packaging) | 20,975 | 1,171,873 | |
United States Steel Corp. (Metals & Mining) | 47,759 | 2,323,475 | |
Westlake Corp. (Chemicals) | 6,860 | 960,126 | |
| 38,731,368 | |||
| Real Estate–8.0% | |||
Agree Realty Corp. (Retail REITs) | 21,524 | 1,354,936 | |
Apartment Income REIT Corp. (Residential REITs) | 31,476 | 1,093,161 | |
Brixmor Property Group, Inc. (Retail REITs) | 64,367 | 1,497,820 | |
COPT Defense Properties (Office REITs) | 24,099 | 617,657 | |
Cousins Properties, Inc. (Office REITs) | 32,499 | 791,351 | |
CubeSmart (Specialized REITs) | 48,149 | 2,231,706 | |
EastGroup Properties, Inc. (Industrial REITs) | 9,921 | 1,820,900 | |
EPR Properties (Specialized REITs) | 16,130 | 781,499 | |
Equity LifeStyle Properties, Inc. (Residential REITs) | 39,912 | 2,815,393 | |
First Industrial Realty Trust, Inc. (Industrial REITs) | 28,324 | 1,491,825 | |
Gaming & Leisure Properties, Inc. (Specialized REITs) | 57,176 | 2,821,636 | |
Healthcare Realty Trust, Inc. (Health Care REITs) | 81,556 | 1,405,210 | |
Independence Realty Trust, Inc. (Residential REITs) | 48,117 | 736,190 | |
Jones Lang LaSalle, Inc. (Real Estate Mgmt. & Development) | (a) | 10,187 | 1,924,019 |
Kilroy Realty Corp. (Office REITs) | 22,845 | 910,145 | |
Kite Realty Group Trust (Retail REITs) | 46,977 | 1,073,894 | |
Lamar Advertising Co. Class A (Specialized REITs) | 18,753 | 1,993,069 | |
Medical Properties Trust, Inc. (Health Care REITs) | 128,264 | 629,776 | |
National Storage Affiliates Trust (Specialized REITs) | 16,545 | 686,121 | |
NNN REIT, Inc. (Retail REITs) | 39,066 | 1,683,745 | |
Omega Healthcare Investors, Inc. (Health Care REITs) | 52,460 | 1,608,424 | |
Park Hotels & Resorts, Inc. (Hotel & Resort REITs) | 44,964 | 687,949 | |
82
(continued)
AuguStarSM Variable Insurance Products Fund, Inc.
AVIP S&P MidCap 400® Index Portfolio (Continued)
| Schedule of Investments | December 31, 2023 |
| Common Stocks (Continued) | Shares | Value | |
| Real Estate (continued) | |||
Physicians Realty Trust (Health Care REITs) | 51,067 | $ 679,702 | |
PotlatchDeltic Corp. (Specialized REITs) | 16,994 | 834,405 | |
Rayonier, Inc. (Specialized REITs) | 29,214 | 976,040 | |
Rexford Industrial Realty, Inc. (Industrial REITs) | 45,202 | 2,535,832 | |
Sabra Health Care REIT, Inc. (Health Care REITs) | 49,511 | 706,522 | |
Spirit Realty Capital, Inc. (Retail REITs) | 30,263 | 1,322,190 | |
STAG Industrial, Inc. (Industrial REITs) | 38,880 | 1,526,429 | |
Vornado Realty Trust (Office REITs) | 34,233 | 967,082 | |
W.P. Carey, Inc. (Diversified REITs) | 46,824 | 3,034,663 | |
| 43,239,291 | |||
| Utilities–3.2% | |||
ALLETE, Inc. (Electric Utilities) | 12,308 | 752,757 | |
Black Hills Corp. (Multi-Utilities) | 14,559 | 785,458 | |
Essential Utilities, Inc. (Water Utilities) | 53,814 | 2,009,953 | |
IDACORP, Inc. (Electric Utilities) | 10,838 | 1,065,592 | |
National Fuel Gas Co. (Gas Utilities) | 19,661 | 986,392 | |
New Jersey Resources Corp. (Gas Utilities) | 20,891 | 931,321 | |
Northwestern Energy Group, Inc. (Multi-Utilities) | 13,114 | 667,372 | |
| Common Stocks (Continued) | Shares | Value | |
| Utilities (continued) | |||
OGE Energy Corp. (Electric Utilities) | 42,887 | $ 1,498,043 | |
ONE Gas, Inc. (Gas Utilities) | 11,874 | 756,611 | |
Ormat Technologies, Inc. (Ind. Power & Renewable Elec.) | 11,502 | 871,737 | |
PNM Resources, Inc. (Electric Utilities) | 18,380 | 764,608 | |
Portland General Electric Co. (Electric Utilities) | 21,654 | 938,484 | |
Southwest Gas Holdings, Inc. (Gas Utilities) | 12,864 | 814,934 | |
Spire, Inc. (Gas Utilities) | 11,264 | 702,198 | |
UGI Corp. (Gas Utilities) | 44,856 | 1,103,458 | |
Vistra Corp. (Ind. Power & Renewable Elec.) | 71,969 | 2,772,246 | |
| 17,421,164 | |||
Total Common Stocks (Cost $462,626,226) | $538,661,720 | ||
| U.S. Treasury Obligations–0.0% | Rate | Maturity | Face Amount | Value | |
| U.S. Treasury Bill | (b) | 0.000% | 02/22/2024 | $100,000 | $ 99,256 |
Total U.S. Treasury Obligations (Cost $99,235) | $ 99,256 | ||||
Total Investments – 99.3% (Cost $462,725,461) | (c) | $538,760,976 | |||
Other Assets in Excess of Liabilities – 0.7% | (b) | 3,691,515 | |||
| Net Assets – 100.0% | $542,452,491 | ||||
Percentages are stated as a percent of net assets. |
| Abbreviations: | ||
| REITs: | Real Estate Investment Trusts | |
| Footnotes: | ||
| (a) | Non-income producing security. | |
| (b) | Security is fully pledged, in addition to $218,843 of the Portfolio’s cash holdings, as collateral for the futures contracts outstanding at December 31, 2023. See also the following Schedule of Open Futures Contracts. | |
| (c) | Represents cost for financial reporting purposes, which may differ from cost basis for federal income tax purposes. See also Note 7 of the Notes to Financial Statements. | |
The accompanying notes are an integral part of these financial statements.
| Schedule of Open Futures Contracts | December 31, 2023 |
| Description | Number of contracts | Expiration Date | Notional Amount | Value | Unrealized Appreciation (Depreciation) | Variation Margin Receivable (Payable) | ||||||
| CME E-mini S&P MidCap 400 Index - Long | 18 | March 15, 2024 | $5,104,055 | $5,057,100 | $(46,955) | $(55,902) |
The accompanying notes are an integral part of these financial statements.
83
AuguStarSM Variable Insurance Products Fund, Inc.
AVIP BlackRock Advantage Large Cap Growth Portfolio (Unaudited)
Objective/Strategy
The AVIP BlackRock Advantage Large Cap Growth Portfolio (formerly ON BlackRock Advantage Large Cap Growth Portfolio) seeks long-term growth of capital by investing, under normal circumstances, at least 80% of its net assets in stocks of large capitalization companies with market capitalizations at the time of investment that are within the range of market capitalizations of the companies in the Russell 1000® Growth Index for the previous twelve months.
Performance as of December 31, 2023
| Average Annual returns | |
| One year | 40.78% |
| Five years | 17.45% |
| Ten years | 12.15% |
Past performance does not guarantee future results. The performance data quoted represents past performance and current returns may be lower or higher. Total return figures include change in share price and reinvestment of dividends and capital gains. The investment return and principal value will fluctuate so that an investor’s shares, when redeemed, may be worth more or less than the original cost. To obtain performance information up to the most recent month end, call toll-free 1-877-781-6392.
The Portfolio is not open to direct retail investment. Beneficial interest in the Portfolio’s shares is obtained either through an allocation to the Portfolio as an investment vehicle within variable life insurance policies or annuity contracts, or as an underlying investment by the AVIP Model Portfolios. Actual performance results for variable annuity and variable universal life contracts will be lower due to contract charges. Consult your contract for applicable charges.
Total expense ratio is 0.75% per the Fund’s Prospectus dated May 1, 2023 and supplemented October 2, 2023 and December 4, 2023. Additional information pertaining to the Portfolio’s expense ratio as of December 31, 2023 can be found in the Portfolio’s Financial Highlights.
Comments from Sub-Adviser
Q. How did the Portfolio perform in comparison to its benchmark during the reporting period?
A. For the year ended December 31, 2023, the Portfolio returned 40.78% versus 42.68% for its benchmark, the Russell 1000® Growth Index.
Q. What affected the Portfolio’s performance?
A. The Portfolio underperformed for the year due to security selection decisions. Despite outperformance in the fourth quarter, weakness throughout the remainder of the period led to the negative result. Specifically, macro-thematic insights evaluating things like the impact of rising rates as well as supplier linkages and product inventory availability struggled.
Selection within Health Care, Consumer Discretionary and Consumer Staples were key detractors to relative performance for the year. However, an underweight to Energy, followed by selection within Communication Services and an underweight to Consumer Staples, offset some of the underperformance. From a security perspective, top contributors to relative performance for the year were NVIDIA Corp., The Coca-Cola Co., and AbbVie, Inc., while top detractors were Broadcom, Inc., The Hershey Co., and Agilent Technologies, Inc. (1)
| (1) | The Portfolio’s composition is subject to change. Holdings and weightings are as of December 31, 2023. |
Change in Value of $10,000 Investment
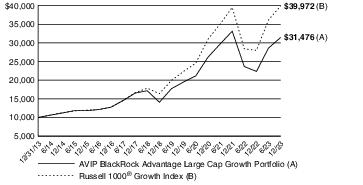
Hypothetical illustration based on past performance. Future performance will vary. The Portfolio’s returns reflect reinvested dividends. The Portfolio’s holdings may differ significantly from the securities in the index. The index is unmanaged and therefore does not reflect the cost of portfolio management and accounting.
The Russell 1000® Growth Index is a market-capitalization weighted index of those firms in the Russell 1000® Index with higher price-to-book ratios and higher forecasted growth values. The Russell 1000® Index measures the performance of the large-cap segment of the U.S. equity universe. The index presented includes the effects of reinvested dividends.
Past performance is no guarantee of future results. Redemption of fund shares could have tax implications unique to each shareholder.
84
(continued)
AuguStarSM Variable Insurance Products Fund, Inc.
AVIP BlackRock Advantage Large Cap Growth Portfolio (Unaudited) (Continued)
| Portfolio Composition as of December 31, 2023 (1) | |
| % of Net Assets | |
| Common Stocks (4) | 98.5 |
| Other Net Assets | 1.5 |
| 100.0 | |
| Top 10 Portfolio Holdings as of December 31, 2023 (1) (2) (3) | ||
| % of Net Assets | ||
| 1. | Microsoft Corp. | 12.9 |
| 2. | Apple, Inc. | 11.6 |
| 3. | NVIDIA Corp. | 4.9 |
| 4. | Amazon.com, Inc. | 4.8 |
| 5. | Meta Platforms, Inc. Class A | 4.5 |
| 6. | Alphabet, Inc. Class C | 2.9 |
| 7. | Mastercard, Inc. Class A | 2.7 |
| 8. | Tesla, Inc. | 2.4 |
| 9. | Adobe, Inc. | 2.2 |
| 10. | Eli Lilly & Co. | 2.1 |
| (1) | Composition of Portfolio subject to change. | |
| (2) | Short-term investments have been excluded from the list of Top 10 Portfolio Holdings. | |
| (3) | Top 10 Portfolio Holdings is presented at an individual security level. Total investment exposure by issuer may be higher. | |
| (4) | Sectors (Common Stocks): | |
| % of Net Assets | |
| Information Technology | 43.5 |
| Consumer Discretionary | 16.1 |
| Communication Services | 11.2 |
| Health Care | 11.0 |
| Financials | 6.7 |
| Industrials | 5.1 |
| Consumer Staples | 3.6 |
| Real Estate | 0.7 |
| Materials | 0.6 |
| 98.5 |
85
AuguStarSM Variable Insurance Products Fund, Inc.
AVIP BlackRock Advantage Large Cap Growth Portfolio
| Schedule of Investments | December 31, 2023 |
| Common Stocks–98.5% | Shares | Value | |
| Communication Services–11.2% | |||
Alphabet, Inc. Class A (Interactive Media & Svs.) | (a) | 70,947 | $ 9,910,586 |
Alphabet, Inc. Class C (Interactive Media & Svs.) | (a) | 96,407 | 13,586,638 |
Electronic Arts, Inc. (Entertainment) | 16,815 | 2,300,460 | |
Fox Corp. Class A (Media) | 73,960 | 2,194,393 | |
Meta Platforms, Inc. Class A (Interactive Media & Svs.) | (a) | 59,987 | 21,232,999 |
Netflix, Inc. (Entertainment) | (a) | 5,562 | 2,708,027 |
Spotify Technology SA (Entertainment) | (a) | 5,366 | 1,008,325 |
| 52,941,428 | |||
| Consumer Discretionary–16.1% | |||
Amazon.com, Inc. (Broadline Retail) | (a) | 151,462 | 23,013,136 |
AutoNation, Inc. (Specialty Retail) | (a) | 13,471 | 2,023,075 |
Best Buy Co., Inc. (Specialty Retail) | 27,503 | 2,152,935 | |
Booking Holdings, Inc. (Hotels, Restaurants & Leisure) | (a) | 1,714 | 6,079,935 |
Boyd Gaming Corp. (Hotels, Restaurants & Leisure) | 28,545 | 1,787,202 | |
D.R. Horton, Inc. (Household Durables) | 4,334 | 658,681 | |
eBay, Inc. (Broadline Retail) | 27,785 | 1,211,982 | |
General Motors Co. (Automobiles) | 58,512 | 2,101,751 | |
Home Depot, Inc. / The (Specialty Retail) | 18,324 | 6,350,182 | |
Lululemon Athletica, Inc. (Textiles, Apparel & Luxury Goods) | (a) | 5,482 | 2,802,892 |
McDonald's Corp. (Hotels, Restaurants & Leisure) | 6,868 | 2,036,431 | |
MercadoLibre, Inc. (Broadline Retail) | (a) | 545 | 856,489 |
PulteGroup, Inc. (Household Durables) | 7,771 | 802,123 | |
Skechers U.S.A., Inc. Class A (Textiles, Apparel & Luxury Goods) | (a) | 12,280 | 765,535 |
Starbucks Corp. (Hotels, Restaurants & Leisure) | 30,117 | 2,891,533 | |
Tesla, Inc. (Automobiles) | (a) | 45,712 | 11,358,518 |
TJX Cos., Inc. / The (Specialty Retail) | 73,643 | 6,908,450 | |
Travel + Leisure Co. (Hotels, Restaurants & Leisure) | 26,539 | 1,037,409 | |
Wayfair, Inc. Class A (Specialty Retail) | (a) | 29,044 | 1,792,015 |
| 76,630,274 | |||
| Consumer Staples–3.6% | |||
Costco Wholesale Corp. (Consumer Staples Distribution & Retail) | 1,161 | 766,353 | |
Hershey Co. / The (Food Products) | 19,183 | 3,576,479 | |
Kimberly-Clark Corp. (Household Products) | 22,721 | 2,760,829 | |
PepsiCo, Inc. (Beverages) | 39,066 | 6,634,969 | |
Walmart, Inc. (Consumer Staples Distribution & Retail) | 21,657 | 3,414,226 | |
| 17,152,856 | |||
| Financials–6.7% | |||
Block, Inc. (Financial Services) | (a) | 32,180 | 2,489,123 |
Mastercard, Inc. Class A (Financial Services) | 30,443 | 12,984,244 | |
Moody's Corp. (Capital Markets) | 10,975 | 4,286,396 | |
S&P Global, Inc. (Capital Markets) | 5,451 | 2,401,275 | |
Visa, Inc. (Financial Services) | 37,147 | 9,671,221 | |
| 31,832,259 | |||
| Health Care–11.0% | |||
AbbVie, Inc. (Biotechnology) | 26,195 | 4,059,439 | |
Agilent Technologies, Inc. (Life Sciences Tools & Svs.) | 27,790 | 3,863,644 | |
Amgen, Inc. (Biotechnology) | 23,840 | 6,866,397 | |
Bristol-Myers Squibb Co. (Pharmaceuticals) | 21,826 | 1,119,892 | |
Dexcom, Inc. (Health Care Equip. & Supplies) | (a) | 7,823 | 970,756 |
Edwards Lifesciences Corp. (Health Care Equip. & Supplies) | (a) | 15,303 | 1,166,854 |
Elevance Health, Inc. (Health Care Providers & Svs.) | 3,935 | 1,855,588 | |
| Common Stocks (Continued) | Shares | Value | |
| Health Care (continued) | |||
Eli Lilly & Co. (Pharmaceuticals) | 17,366 | $ 10,122,989 | |
HCA Healthcare, Inc. (Health Care Providers & Svs.) | 6,551 | 1,773,225 | |
IDEXX Laboratories, Inc. (Health Care Equip. & Supplies) | (a) | 1,522 | 844,786 |
Incyte Corp. (Biotechnology) | (a) | 53,625 | 3,367,114 |
Intuitive Surgical, Inc. (Health Care Equip. & Supplies) | (a) | 1,615 | 544,836 |
Medtronic PLC (Health Care Equip. & Supplies) | 17,265 | 1,422,291 | |
Mettler-Toledo International, Inc. (Life Sciences Tools & Svs.) | (a) | 575 | 697,452 |
Neurocrine Biosciences, Inc. (Biotechnology) | (a) | 14,843 | 1,955,713 |
ResMed, Inc. (Health Care Equip. & Supplies) | 6,043 | 1,039,517 | |
Stryker Corp. (Health Care Equip. & Supplies) | 13,809 | 4,135,243 | |
Teladoc Health, Inc. (Health Care Technology) | (a) | 36,825 | 793,579 |
Ultragenyx Pharmaceutical, Inc. (Biotechnology) | (a) | 37,860 | 1,810,465 |
United Therapeutics Corp. (Biotechnology) | (a) | 3,191 | 701,669 |
UnitedHealth Group, Inc. (Health Care Providers & Svs.) | 4,220 | 2,221,703 | |
Vertex Pharmaceuticals, Inc. (Biotechnology) | (a) | 2,301 | 936,254 |
| 52,269,406 | |||
| Industrials–5.1% | |||
Builders FirstSource, Inc. (Building Products) | (a) | 16,061 | 2,681,223 |
Cintas Corp. (Commercial Svs. & Supplies) | 8,544 | 5,149,127 | |
EMCOR Group, Inc. (Construction & Engineering) | 5,585 | 1,203,177 | |
Illinois Tool Works, Inc. (Machinery) | 5,916 | 1,549,637 | |
Lockheed Martin Corp. (Aerospace & Defense) | 11,220 | 5,085,353 | |
Old Dominion Freight Line, Inc. (Ground Transportation) | 1,798 | 728,783 | |
Otis Worldwide Corp. (Machinery) | 12,791 | 1,144,411 | |
Rockwell Automation, Inc. (Electrical Equip.) | 8,144 | 2,528,549 | |
United Parcel Service, Inc. Class B (Air Freight & Logistics) | 13,470 | 2,117,888 | |
W.W. Grainger, Inc. (Trading Companies & Distributors) | 2,618 | 2,169,511 | |
| 24,357,659 | |||
| Information Technology–43.5% | |||
Adobe, Inc. (Software) | (a) | 17,691 | 10,554,451 |
Apple, Inc. (Tech. Hardware, Storage & Periph.) | 285,799 | 55,024,881 | |
Applied Materials, Inc. (Semiconductors & Equip.) | 32,948 | 5,339,882 | |
Broadcom, Inc. (Semiconductors & Equip.) | 3,534 | 3,944,828 | |
Cadence Design Systems, Inc. (Software) | (a) | 5,986 | 1,630,407 |
Datadog, Inc. Class A (Software) | (a) | 8,983 | 1,090,357 |
Dell Technologies, Inc. Class C (Tech. Hardware, Storage & Periph.) | 21,040 | 1,609,560 | |
Flex Ltd. (Electronic Equip., Instr. & Comp.) | (a) | 66,936 | 2,038,871 |
Fortinet, Inc. (Software) | (a) | 24,609 | 1,440,365 |
Hewlett Packard Enterprise Co. (Tech. Hardware, Storage & Periph.) | 106,737 | 1,812,394 | |
HP, Inc. (Tech. Hardware, Storage & Periph.) | 56,119 | 1,688,621 | |
Intel Corp. (Semiconductors & Equip.) | 32,913 | 1,653,878 | |
KLA Corp. (Semiconductors & Equip.) | 1,441 | 837,653 | |
Lam Research Corp. (Semiconductors & Equip.) | 3,290 | 2,576,925 | |
Manhattan Associates, Inc. (Software) | (a) | 19,603 | 4,220,918 |
Microsoft Corp. (Software) | 162,936 | 61,270,453 | |
MongoDB, Inc. (IT Svs.) | (a) | 1,485 | 607,142 |
Monolithic Power Systems, Inc. (Semiconductors & Equip.) | 913 | 575,902 | |
NVIDIA Corp. (Semiconductors & Equip.) | 46,600 | 23,077,252 | |
Oracle Corp. (Software) | 17,135 | 1,806,543 | |
Palo Alto Networks, Inc. (Software) | (a) | 2,346 | 691,788 |
QUALCOMM, Inc. (Semiconductors & Equip.) | 53,178 | 7,691,134 | |
86
(continued)
AuguStarSM Variable Insurance Products Fund, Inc.
AVIP BlackRock Advantage Large Cap Growth Portfolio (Continued)
| Schedule of Investments | December 31, 2023 |
| Common Stocks (Continued) | Shares | Value | |
| Information Technology (continued) | |||
Salesforce, Inc. (Software) | (a) | 12,847 | $ 3,380,560 |
ServiceNow, Inc. (Software) | (a) | 5,526 | 3,904,064 |
Snowflake, Inc. Class A (IT Svs.) | (a) | 6,185 | 1,230,815 |
TE Connectivity Ltd. (Electronic Equip., Instr. & Comp.) | 30,031 | 4,219,356 | |
Teradata Corp. (Software) | (a) | 30,388 | 1,322,182 |
VeriSign, Inc. (IT Svs.) | (a) | 5,769 | 1,188,183 |
| 206,429,365 | |||
| Materials–0.6% | |||
Ecolab, Inc. (Chemicals) | 13,829 | 2,742,982 | |
| Real Estate–0.7% | |||
Camden Property Trust (Residential REITs) | 10,885 | 1,080,772 | |
| Common Stocks (Continued) | Shares | Value | |
| Real Estate (continued) | |||
Equinix, Inc. (Specialized REITs) | 932 | $ 750,623 | |
Public Storage (Specialized REITs) | 5,108 | 1,557,940 | |
Zillow Group, Inc. Class A (Real Estate Mgmt. & Development) | (a) | 80 | 4,538 |
| 3,393,873 | |||
Total Common Stocks (Cost $380,747,959) | $467,750,102 | ||
Total Investments – 98.5% (Cost $380,747,959) | (b) | $467,750,102 | |
Other Assets in Excess of Liabilities – 1.5% | (c) | 6,983,065 | |
| Net Assets – 100.0% | $474,733,167 | ||
Percentages are stated as a percent of net assets. |
| Abbreviations: | ||
| REITs: | Real Estate Investment Trusts | |
| Footnotes: | ||
| (a) | Non-income producing security. | |
| (b) | Represents cost for financial reporting purposes, which may differ from cost basis for federal income tax purposes. See also Note 7 of the Notes to Financial Statements. | |
| (c) | Includes $371,700 of cash pledged as collateral for the futures contracts outstanding at December 31, 2023. See also the following Schedule of Open Futures Contracts. | |
The accompanying notes are an integral part of these financial statements.
| Schedule of Open Futures Contracts | December 31, 2023 |
��
| Description | Number of contracts | Expiration Date | Notional Amount | Value | Unrealized Appreciation (Depreciation) | Variation Margin Receivable (Payable) | ||||||
| CME E-mini Nasdaq-100 Index - Long | 21 | March 15, 2024 | $7,006,123 | $7,149,870 | $143,747 | $(16,975) |
The accompanying notes are an integral part of these financial statements.
87
AuguStarSM Variable Insurance Products Fund, Inc.
AVIP AB Risk Managed Balanced Portfolio (Unaudited)
Objective/Strategy
The AVIP AB Risk Managed Balanced Portfolio (formerly ON Risk Managed Balanced Portfolio) seeks long-term capital growth, consistent with preservation of capital and balanced by current income. The Portfolio invests in a balanced portfolio of equity and fixed-income securities (the “Balanced Component”) and a risk management portfolio intended to enhance the risk adjusted return of the Portfolio (the “Risk Management Component”).
Performance as of December 31, 2023
| Average Annual returns | |
| One year | 12.90% |
| Five years | 8.97% |
| Since inception (5/1/14) | 7.37% |
Past performance does not guarantee future results. The performance data quoted represents past performance and current returns may be lower or higher. Total return figures include change in share price and reinvestment of dividends and capital gains. The investment return and principal value will fluctuate so that an investor’s shares, when redeemed, may be worth more or less than the original cost. To obtain performance information up to the most recent month end, call toll-free 1-877-781-6392.
The Portfolio is not open to direct retail investment. Beneficial interest in the Portfolio’s shares is obtained either through an allocation to the Portfolio as an investment vehicle within variable life insurance policies or annuity contracts, or as an underlying investment by the AVIP Model Portfolios. Actual performance results for variable annuity and variable universal life contracts will be lower due to contract charges. Consult your contract for applicable charges.
Total expense ratio is 0.88% per the Fund’s Prospectus dated May 1, 2023 and supplemented October 2, 2023 and December 4, 2023. Additional information pertaining to the Portfolio’s expense ratio as of December 31, 2023 can be found in the Portfolio’s Financial Highlights.
Comments from Sub-Adviser
Q. How did the Portfolio perform in comparison to its benchmarks during the reporting period?
A. For the year ended December 31, 2023, the Portfolio returned 12.90% versus 26.29% for its benchmark, the S&P 500® Index. The Portfolio’s secondary benchmark, which is comprised of 55% S&P 500® Index/ 45% ICE BofA U.S. Broad Market Index, returned 16.56% for the year ended December 31, 2023.
Q. What affected the Portfolio’s performance?
A. The Portfolio’s underperformance relative to the primary benchmark was largely driven by the Portfolio’s Risk Management Component, which had negative returns in a year when the primary benchmark gained 26.29%. The Portfolio’s allocation to fixed income also detracted, as the fixed income sleeve underperformed the primary benchmark but outperformed the fixed income sleeve of the blended secondary benchmark. Within the equity portion of the Portfolio, the allocation to large cap growth aided performance, as that segment outperformed. As a whole, however, the equity portion of the Portfolio still slightly underperformed the benchmark, driven by both sector allocation and security selection decisions. The Portfolio’s Risk Management Component did not enhance the Portfolio’s risk-adjusted return for the year, as the Portfolio’s return was lower than the return of the Balanced Component and the Portfolio’s annualized volatility was slightly higher than that of the Balanced Component.
The underperformance of the Portfolio’s active equity component for the year was driven primarily by an overweight to the Health Care sector. Security selection within the Consumer Discretionary and Information Technology sectors also contributed to underperformance. Top
contributors in the equity sleeve were Arista Networks, Inc, Pfizer, Inc., and Adobe, Inc. The Portfolio was negatively impacted by holding underweights to Apple, Inc. and NVIDIA Corp. and not holding benchmark constituent Tesla, Inc.
The Portfolio’s active fixed income component had a positive impact relative to the fixed income portion of the secondary benchmark due to sector positioning. Overweights to agency risk and investment grade corporates were the main drivers of sector outperformance for the year. Security selection also generated outperformance relative to the fixed income portion of the secondary benchmark, led by selection in non-investment grade corporate bonds and mortgage pass-through securities. Yield curve positioning was a slight detractor.
The Risk Management Component’s relative underperformance for the year was mainly attributable to losses in options value associated with premium decay and decreases in implied volatilities of the options held, as well as the Portfolio having lower than average equity exposure (compared to the Balanced Component) when equity markets significantly rose at the beginning of the year. The aggregate impact to the Portfolio’s absolute performance from options for the year was -91 basis points, while the impact from futures was 26 basis points. (1)
| (1) | The Portfolio’s composition is subject to change. Holdings and weightings are as of December 31, 2023. |
| |
Change in Value of $10,000 Investment

Hypothetical illustration based on past performance. Future performance will vary. The Portfolio’s returns reflect reinvested dividends. The Portfolio’s holdings may differ significantly from the securities in the index. The index is unmanaged and therefore does not reflect the cost of portfolio management and accounting.
The S&P 500® Index is a capitalization-weighted index designed to measure performance of the broad domestic economy through changes in the aggregate market value of 500 stocks representing all major industries. The index includes the effects of reinvested dividends.
The ICE BofA U.S. Broad Market Index measures the performance of U.S. dollar-denominated, investment grade debt securities, including U.S. Treasury notes and bonds, quasi-government securities, corporate securities, residential and commercial mortgage-backed securities and asset-backed securities. Securities are cap-weighted based on their amount outstanding times the market price plus accrued interest.
Past performance is no guarantee of future results. Redemption of fund shares could have tax implications unique to each shareholder.
88
(continued)
AuguStarSM Variable Insurance Products Fund, Inc.
AVIP AB Risk Managed Balanced Portfolio (Unaudited) (Continued)
| Portfolio Composition as of December 31, 2023 (1) | |
| % of Net Assets | |
| Common Stocks (4) | 49.0 |
| U.S. Treasury Obligations | 18.0 |
| Corporate Bonds (4) | 12.0 |
| Asset-Backed / Mortgage-Backed Securities (4) | 7.1 |
| U.S. Government Agency Mortgage-Backed Securities | 5.3 |
| Purchased Options | 5.3 |
| Sovereign Debt Issues | 0.1 |
| Preferred Securities (4) | 0.1 |
| Taxable Municipal Bonds | 0.0 |
| Rights (4) | 0.0 |
| Money Market Funds Less Net Liabilities | 3.1 |
| 100.0 | |
| Top 10 Portfolio Holdings as of December 31, 2023 (1) (2) (3) | ||
| % of Net Assets | ||
| 1. | Microsoft Corp. | 3.4 |
| 2. | U.S. Treasury Note 1.875%, 02/15/2032 | 2.3 |
| 3. | U.S. Treasury Note 3.375%, 05/15/2033 | 1.8 |
| 4. | Alphabet, Inc. Class C | 1.8 |
| 5. | U.S. Treasury Note 3.250%, 05/15/2042 | 1.5 |
| 6. | U.S. Treasury Note 3.875%, 08/15/2033 | 1.5 |
| 7. | UnitedHealth Group, Inc. | 1.4 |
| 8. | U.S. Treasury Note 4.125%, 07/31/2028 | 1.3 |
| 9. | Visa, Inc. | 1.3 |
| 10. | Amazon.com, Inc. | 1.2 |
| (1) | Composition of Portfolio subject to change. | |
| (2) | Short-term investments have been excluded from the list of Top 10 Portfolio Holdings. | |
| (3) | Top 10 Portfolio Holdings is presented at an individual security level. Total investment exposure by issuer may be higher. | |
| (4) | Sectors (Common Stocks, Corporate Bonds, Preferred Securities, Asset-Backed / Mortgage Backed Securities, Rights): | |
| % of Net Assets | |
| Financials | 17.4 |
| Information Technology | 14.0 |
| Health Care | 9.5 |
| Consumer Discretionary | 6.0 |
| Industrials | 5.2 |
| Communication Services | 4.6 |
| Consumer Staples | 4.4 |
| Energy | 2.7 |
| Utilities | 1.8 |
| Materials | 1.3 |
| Real Estate | 1.3 |
| 68.2 |
89
AuguStarSM Variable Insurance Products Fund, Inc.
AVIP AB Risk Managed Balanced Portfolio
| Schedule of Investments | December 31, 2023 |
| Common Stocks–49.0% | Shares | Value | |
| Communication Services–3.9% | |||
Alphabet, Inc. Class C (Interactive Media & Svs.) | (a) | 179,988 | $ 25,365,709 |
Charter Communications, Inc. Class A (Media) | (a) | 2,472 | 960,817 |
Comcast Corp. Class A (Media) | 124,811 | 5,472,962 | |
Electronic Arts, Inc. (Entertainment) | 21,619 | 2,957,695 | |
Live Nation Entertainment, Inc. (Entertainment) | (a) | 5,884 | 550,743 |
Match Group, Inc. (Interactive Media & Svs.) | (a) | 15,304 | 558,596 |
Meta Platforms, Inc. Class A (Interactive Media & Svs.) | (a) | 23,698 | 8,388,144 |
Netflix, Inc. (Entertainment) | (a) | 13,647 | 6,644,451 |
Trade Desk, Inc. / The Class A (Media) | (a) | 7,033 | 506,095 |
Verizon Communications, Inc. (Diversified Telecom. Svs.) | 98,919 | 3,729,246 | |
| 55,134,458 | |||
| Consumer Discretionary–4.4% | |||
Amazon.com, Inc. (Broadline Retail) | (a) | 111,718 | 16,974,433 |
AutoZone, Inc. (Specialty Retail) | (a) | 1,784 | 4,612,728 |
Best Buy Co., Inc. (Specialty Retail) | 6,985 | 546,786 | |
Booking Holdings, Inc. (Hotels, Restaurants & Leisure) | (a) | 707 | 2,507,884 |
Burlington Stores, Inc. (Specialty Retail) | (a) | 2,922 | 568,271 |
Caesars Entertainment, Inc. (Hotels, Restaurants & Leisure) | (a) | 11,081 | 519,477 |
Chipotle Mexican Grill, Inc. (Hotels, Restaurants & Leisure) | (a) | 1,633 | 3,734,606 |
Compass Group PLC – ADR (Hotels, Restaurants & Leisure) | 73,111 | 2,033,217 | |
Coupang, Inc. (Broadline Retail) | (a) | 32,431 | 525,058 |
eBay, Inc. (Broadline Retail) | 12,084 | 527,104 | |
Ferrari N.V. (Automobiles) | 5,815 | 1,967,970 | |
Floor & Decor Holdings, Inc. Class A (Specialty Retail) | (a) | 5,403 | 602,759 |
Ford Motor Co. (Automobiles) | 84,988 | 1,036,004 | |
General Motors Co. (Automobiles) | 28,335 | 1,017,793 | |
Home Depot, Inc. / The (Specialty Retail) | 15,179 | 5,260,282 | |
LKQ Corp. (Distributors) | 11,128 | 531,807 | |
Lowe's Cos., Inc. (Specialty Retail) | 5,054 | 1,124,768 | |
Lululemon Athletica, Inc. (Textiles, Apparel & Luxury Goods) | (a) | 10,348 | 5,290,829 |
Marriott International, Inc. Class A (Hotels, Restaurants & Leisure) | 3,394 | 765,381 | |
NIKE, Inc. Class B (Textiles, Apparel & Luxury Goods) | 32,944 | 3,576,730 | |
O'Reilly Automotive, Inc. (Specialty Retail) | (a) | 1,292 | 1,227,503 |
Tractor Supply Co. (Specialty Retail) | 9,990 | 2,148,150 | |
Ulta Beauty, Inc. (Specialty Retail) | (a) | 4,444 | 2,177,516 |
Yum! Brands, Inc. (Hotels, Restaurants & Leisure) | 12,589 | 1,644,879 | |
| 60,921,935 | |||
| Consumer Staples–3.5% | |||
Albertsons Cos., Inc. Class A (Consumer Staples Distribution & Retail) | 22,763 | 523,549 | |
Altria Group, Inc. (Tobacco) | 58,488 | 2,359,406 | |
BJ's Wholesale Club Holdings, Inc. (Consumer Staples Distribution & Retail) | (a) | 7,673 | 511,482 |
Bunge Global SA (Food Products) | 7,504 | 757,529 | |
Coca-Cola Co. / The (Beverages) | 44,346 | 2,613,310 | |
Colgate-Palmolive Co. (Household Products) | 29,848 | 2,379,184 | |
Costco Wholesale Corp. (Consumer Staples Distribution & Retail) | 12,755 | 8,419,320 | |
Keurig Dr Pepper, Inc. (Beverages) | 63,781 | 2,125,183 | |
Kimberly-Clark Corp. (Household Products) | 13,956 | 1,695,794 | |
Koninklijke Ahold Delhaize N.V. – ADR (Consumer Staples Distribution & Retail) | 57,790 | 1,658,573 | |
Kroger Co. / The (Consumer Staples Distribution & Retail) | 20,740 | 948,025 | |
Monster Beverage Corp. (Beverages) | (a) | 159,984 | 9,216,678 |
Performance Food Group Co. (Consumer Staples Distribution & Retail) | (a) | 7,618 | 526,785 |
Philip Morris International, Inc. (Tobacco) | 36,671 | 3,450,008 | |
Procter & Gamble Co. / The (Household Products) | 23,299 | 3,414,235 | |
Sysco Corp. (Consumer Staples Distribution & Retail) | 10,913 | 798,068 | |
Target Corp. (Consumer Staples Distribution & Retail) | 12,591 | 1,793,210 | |
Tyson Foods, Inc. Class A (Food Products) | 10,580 | 568,675 | |
U.S. Foods Holding Corp. (Consumer Staples Distribution & Retail) | (a) | 11,306 | 513,405 |
Walgreens Boots Alliance, Inc. (Consumer Staples Distribution & Retail) | 24,852 | 648,886 | |
Walmart, Inc. (Consumer Staples Distribution & Retail) | 22,635 | 3,568,408 | |
| 48,489,713 | |||
| Energy–1.4% | |||
APA Corp. (Oil, Gas & Consumable Fuels) | 13,765 | 493,888 | |
Cheniere Energy, Inc. (Oil, Gas & Consumable Fuels) | 9,250 | 1,579,067 | |
Chesapeake Energy Corp. (Oil, Gas & Consumable Fuels) | 6,170 | 474,720 | |
Chevron Corp. (Oil, Gas & Consumable Fuels) | 4,417 | 658,840 | |
Devon Energy Corp. (Oil, Gas & Consumable Fuels) | 15,831 | 717,144 | |
90
(continued)
AuguStarSM Variable Insurance Products Fund, Inc.
AVIP AB Risk Managed Balanced Portfolio (Continued)
| Schedule of Investments | December 31, 2023 |
| Common Stocks (Continued) | Shares | Value | |
| Energy (continued) | |||
Exxon Mobil Corp. (Oil, Gas & Consumable Fuels) | 31,157 | $ 3,115,077 | |
Halliburton Co. (Energy Equip. & Svs.) | 19,284 | 697,117 | |
Marathon Oil Corp. (Oil, Gas & Consumable Fuels) | 19,487 | 470,806 | |
Marathon Petroleum Corp. (Oil, Gas & Consumable Fuels) | 14,060 | 2,085,941 | |
Ovintiv, Inc. (Oil, Gas & Consumable Fuels) | 11,176 | 490,850 | |
Phillips 66 (Oil, Gas & Consumable Fuels) | 16,049 | 2,136,764 | |
Shell PLC – ADR (Oil, Gas & Consumable Fuels) | 63,159 | 4,155,862 | |
Valero Energy Corp. (Oil, Gas & Consumable Fuels) | 17,068 | 2,218,840 | |
| 19,294,916 | |||
| Financials–6.3% | |||
Bank of America Corp. (Banks) | 16,253 | 547,239 | |
Bank of New York Mellon Corp. / The (Capital Markets) | 29,879 | 1,555,202 | |
Berkshire Hathaway, Inc. Class B (Financial Services) | (a) | 13,369 | 4,768,188 |
Capital One Financial Corp. (Consumer Finance) | 18,995 | 2,490,624 | |
CBOE Global Markets, Inc. (Capital Markets) | 11,916 | 2,127,721 | |
Cincinnati Financial Corp. (Insurance) | 4,821 | 498,781 | |
Citizens Financial Group, Inc. (Banks) | 18,172 | 602,220 | |
Discover Financial Services (Consumer Finance) | 14,355 | 1,613,502 | |
Everest Group Ltd. (Insurance) | 10,158 | 3,591,666 | |
Fiserv, Inc. (Financial Services) | (a) | 8,350 | 1,109,214 |
Global Payments, Inc. (Financial Services) | 11,934 | 1,515,618 | |
Huntington Bancshares, Inc. (Banks) | 113,894 | 1,448,732 | |
Intercontinental Exchange, Inc. (Capital Markets) | 20,634 | 2,650,025 | |
JPMorgan Chase & Co. (Banks) | 42,934 | 7,303,073 | |
KeyCorp (Banks) | 39,996 | 575,942 | |
Loews Corp. (Insurance) | 7,050 | 490,609 | |
LPL Financial Holdings, Inc. (Capital Markets) | 5,406 | 1,230,514 | |
M&T Bank Corp. (Banks) | 10,299 | 1,411,787 | |
Markel Group, Inc. (Insurance) | (a) | 905 | 1,285,009 |
MarketAxess Holdings, Inc. (Capital Markets) | 2,064 | 604,442 | |
Marsh & McLennan Cos., Inc. (Insurance) | 17,293 | 3,276,505 | |
Mastercard, Inc. Class A (Financial Services) | 9,009 | 3,842,429 | |
MSCI, Inc. (Capital Markets) | 6,344 | 3,588,484 | |
Nasdaq, Inc. (Capital Markets) | 23,448 | 1,363,267 | |
Northern Trust Corp. (Capital Markets) | 16,338 | 1,378,600 | |
PayPal Holdings, Inc. (Financial Services) | (a) | 30,334 | 1,862,811 |
PNC Financial Services Group, Inc. / The (Banks) | 16,682 | 2,583,208 | |
Progressive Corp. / The (Insurance) | 10,530 | 1,677,218 | |
Reinsurance Group of America, Inc. (Insurance) | 3,039 | 491,649 | |
S&P Global, Inc. (Capital Markets) | 4,956 | 2,183,217 | |
State Street Corp. (Capital Markets) | 18,330 | 1,419,842 | |
Synchrony Financial (Consumer Finance) | 15,314 | 584,842 | |
T. Rowe Price Group, Inc. (Capital Markets) | 13,250 | 1,426,892 | |
Truist Financial Corp. (Banks) | 66,091 | 2,440,080 | |
U.S. Bancorp (Banks) | 59,994 | 2,596,540 | |
Unum Group (Insurance) | 11,524 | 521,115 | |
Visa, Inc. (Financial Services) | 68,137 | 17,739,468 | |
W.R. Berkley Corp. (Insurance) | 6,830 | 483,018 | |
Willis Towers Watson PLC (Insurance) | 8,022 | 1,934,906 | |
| 88,814,199 | |||
| Health Care–9.2% | |||
AbbVie, Inc. (Biotechnology) | 30,859 | 4,782,219 | |
Align Technology, Inc. (Health Care Equip. & Supplies) | (a) | 9,395 | 2,574,230 |
Avantor, Inc. (Life Sciences Tools & Svs.) | (a) | 23,397 | 534,154 |
Baxter International, Inc. (Health Care Equip. & Supplies) | 32,134 | 1,242,300 | |
Biogen, Inc. (Biotechnology) | (a) | 5,450 | 1,410,296 |
Bristol-Myers Squibb Co. (Pharmaceuticals) | 17,988 | 922,964 | |
Cencora, Inc. (Health Care Providers & Svs.) | 10,633 | 2,183,806 | |
Centene Corp. (Health Care Providers & Svs.) | (a) | 24,406 | 1,811,169 |
Charles River Laboratories International, Inc. (Life Sciences Tools & Svs.) | (a) | 2,514 | 594,310 |
Cigna Group / The (Health Care Providers & Svs.) | 8,103 | 2,426,443 | |
CVS Health Corp. (Health Care Providers & Svs.) | 33,619 | 2,654,556 | |
Edwards Lifesciences Corp. (Health Care Equip. & Supplies) | (a) | 80,239 | 6,118,224 |
Elevance Health, Inc. (Health Care Providers & Svs.) | 4,265 | 2,011,203 | |
Eli Lilly & Co. (Pharmaceuticals) | 16,742 | 9,759,247 | |
Exact Sciences Corp. (Biotechnology) | (a) | 7,743 | 572,827 |
GE HealthCare Technologies, Inc. (Health Care Equip. & Supplies) | 17,710 | 1,369,337 | |
Genmab A/S – ADR (Biotechnology) | (a) | 52,820 | 1,681,789 |
91
(continued)
AuguStarSM Variable Insurance Products Fund, Inc.
AVIP AB Risk Managed Balanced Portfolio (Continued)
| Schedule of Investments | December 31, 2023 |
| Common Stocks (Continued) | Shares | Value | |
| Health Care (continued) | |||
Gilead Sciences, Inc. (Biotechnology) | 68,381 | $ 5,539,545 | |
Henry Schein, Inc. (Health Care Providers & Svs.) | (a) | 7,426 | 562,222 |
Humana, Inc. (Health Care Providers & Svs.) | 3,590 | 1,643,538 | |
IDEXX Laboratories, Inc. (Health Care Equip. & Supplies) | (a) | 12,063 | 6,695,568 |
Incyte Corp. (Biotechnology) | (a) | 9,119 | 572,582 |
Intuitive Surgical, Inc. (Health Care Equip. & Supplies) | (a) | 23,678 | 7,988,010 |
Johnson & Johnson (Pharmaceuticals) | 12,026 | 1,884,955 | |
McKesson Corp. (Health Care Providers & Svs.) | 10,029 | 4,643,226 | |
Merck & Co., Inc. (Pharmaceuticals) | 51,934 | 5,661,845 | |
Mettler-Toledo International, Inc. (Life Sciences Tools & Svs.) | (a) | 1,365 | 1,655,690 |
Neurocrine Biosciences, Inc. (Biotechnology) | (a) | 4,250 | 559,980 |
ResMed, Inc. (Health Care Equip. & Supplies) | 6,825 | 1,174,037 | |
Royalty Pharma PLC Class A (Pharmaceuticals) | 18,306 | 514,216 | |
Teleflex, Inc. (Health Care Equip. & Supplies) | 2,196 | 547,551 | |
Thermo Fisher Scientific, Inc. (Life Sciences Tools & Svs.) | 1,376 | 730,367 | |
United Therapeutics Corp. (Biotechnology) | (a) | 2,065 | 454,073 |
UnitedHealth Group, Inc. (Health Care Providers & Svs.) | 37,878 | 19,941,631 | |
Universal Health Services, Inc. Class B (Health Care Providers & Svs.) | 3,604 | 549,394 | |
Veeva Systems, Inc. Class A (Health Care Technology) | (a) | 22,648 | 4,360,193 |
Vertex Pharmaceuticals, Inc. (Biotechnology) | (a) | 25,651 | 10,437,135 |
Waters Corp. (Life Sciences Tools & Svs.) | (a) | 4,979 | 1,639,236 |
Zoetis, Inc. (Pharmaceuticals) | 40,586 | 8,010,459 | |
| 128,414,527 | |||
| Industrials–4.5% | |||
AECOM (Construction & Engineering) | 15,429 | 1,426,102 | |
Allegion PLC (Building Products) | 4,671 | 591,769 | |
AMETEK, Inc. (Electrical Equip.) | 10,578 | 1,744,206 | |
Automatic Data Processing, Inc. (Professional Svs.) | 8,702 | 2,027,305 | |
Booz Allen Hamilton Holding Corp. (Professional Svs.) | 4,942 | 632,131 | |
Builders FirstSource, Inc. (Building Products) | (a) | 7,547 | 1,259,896 |
C.H. Robinson Worldwide, Inc. (Air Freight & Logistics) | 6,040 | 521,796 | |
Carrier Global Corp. (Building Products) | 41,010 | 2,356,025 | |
CNH Industrial N.V. (Machinery) | 46,140 | 561,985 | |
Copart, Inc. (Commercial Svs. & Supplies) | (a) | 126,488 | 6,197,912 |
Cummins, Inc. (Machinery) | 5,008 | 1,199,767 | |
Deere & Co. (Machinery) | 4,804 | 1,920,975 | |
Eaton Corp. PLC (Electrical Equip.) | 4,060 | 977,729 | |
Experian PLC – ADR (Professional Svs.) | 47,114 | 1,919,424 | |
FedEx Corp. (Air Freight & Logistics) | 8,899 | 2,251,180 | |
Ferguson PLC (Trading Companies & Distributors) | 6,651 | 1,284,109 | |
Genpact Ltd. (Professional Svs.) | 69,464 | 2,411,095 | |
Huntington Ingalls Industries, Inc. (Aerospace & Defense) | 2,091 | 542,907 | |
J.B. Hunt Transport Services, Inc. (Ground Transportation) | 2,675 | 534,305 | |
Jacobs Solutions, Inc. (Professional Svs.) | 3,896 | 505,701 | |
Johnson Controls International PLC (Building Products) | 21,900 | 1,262,316 | |
L3Harris Technologies, Inc. (Aerospace & Defense) | 6,053 | 1,274,883 | |
Lockheed Martin Corp. (Aerospace & Defense) | 10,510 | 4,763,552 | |
Masco Corp. (Building Products) | 8,184 | 548,164 | |
Otis Worldwide Corp. (Machinery) | 39,776 | 3,558,759 | |
Owens Corning (Building Products) | 3,655 | 541,781 | |
Paychex, Inc. (Professional Svs.) | 17,761 | 2,115,513 | |
Paycom Software, Inc. (Professional Svs.) | 13,034 | 2,694,389 | |
RELX PLC – ADR (Professional Svs.) | 32,035 | 1,270,508 | |
Robert Half, Inc. (Professional Svs.) | 6,045 | 531,476 | |
Rollins, Inc. (Commercial Svs. & Supplies) | 12,164 | 531,202 | |
RTX Corp. (Aerospace & Defense) | 32,870 | 2,765,682 | |
SS&C Technologies Holdings, Inc. (Professional Svs.) | 8,808 | 538,257 | |
Trex Co., Inc. (Building Products) | (a) | 17,380 | 1,438,890 |
United Airlines Holdings, Inc. (Passenger Airlines) | (a) | 12,577 | 518,927 |
United Parcel Service, Inc. Class B (Air Freight & Logistics) | 16,510 | 2,595,867 | |
Veralto Corp. (Commercial Svs. & Supplies) | 13,091 | 1,076,866 | |
Verisk Analytics, Inc. (Professional Svs.) | 15,323 | 3,660,052 | |
| 62,553,403 | |||
| Information Technology–12.8% | |||
Adobe, Inc. (Software) | (a) | 16,417 | 9,794,382 |
Amdocs Ltd. (IT Svs.) | 27,988 | 2,459,865 | |
Amphenol Corp. Class A (Electronic Equip., Instr. & Comp.) | 11,975 | 1,187,082 | |
Analog Devices, Inc. (Semiconductors & Equip.) | 7,475 | 1,484,236 | |
92
(continued)
AuguStarSM Variable Insurance Products Fund, Inc.
AVIP AB Risk Managed Balanced Portfolio (Continued)
| Schedule of Investments | December 31, 2023 |
| Common Stocks (Continued) | Shares | Value | |
| Information Technology (continued) | |||
Apple, Inc. (Tech. Hardware, Storage & Periph.) | 53,156 | $ 10,234,125 | |
Arista Networks, Inc. (Communications Equip.) | (a) | 25,966 | 6,115,253 |
ASML Holding N.V. (Semiconductors & Equip.) | 2,464 | 1,865,051 | |
Autodesk, Inc. (Software) | (a) | 12,160 | 2,960,717 |
Bentley Systems, Inc. Class B (Software) | 9,528 | 497,171 | |
Broadcom, Inc. (Semiconductors & Equip.) | 8,482 | 9,468,032 | |
Cadence Design Systems, Inc. (Software) | (a) | 7,890 | 2,148,999 |
Cisco Systems, Inc. (Communications Equip.) | 67,673 | 3,418,840 | |
Cognex Corp. (Electronic Equip., Instr. & Comp.) | 10,556 | 440,607 | |
Cognizant Technology Solutions Corp. Class A (IT Svs.) | 19,735 | 1,490,585 | |
Crowdstrike Holdings, Inc. Class A (Software) | (a) | 9,380 | 2,394,902 |
DocuSign, Inc. (Software) | (a) | 11,498 | 683,556 |
Dynatrace, Inc. (Software) | (a) | 9,254 | 506,101 |
Enphase Energy, Inc. (Semiconductors & Equip.) | (a) | 4,905 | 648,147 |
Entegris, Inc. (Semiconductors & Equip.) | 9,762 | 1,169,683 | |
EPAM Systems, Inc. (IT Svs.) | (a) | 5,555 | 1,651,724 |
Fortinet, Inc. (Software) | (a) | 109,429 | 6,404,879 |
Gartner, Inc. (IT Svs.) | (a) | 2,758 | 1,244,161 |
Gen Digital, Inc. (Software) | 150,766 | 3,440,480 | |
Hewlett Packard Enterprise Co. (Tech. Hardware, Storage & Periph.) | 29,305 | 497,599 | |
HP, Inc. (Tech. Hardware, Storage & Periph.) | 16,890 | 508,220 | |
Intuit, Inc. (Software) | 6,224 | 3,890,187 | |
KLA Corp. (Semiconductors & Equip.) | 4,396 | 2,555,395 | |
Manhattan Associates, Inc. (Software) | (a) | 9,800 | 2,110,136 |
Microchip Technology, Inc. (Semiconductors & Equip.) | 21,783 | 1,964,391 | |
Microsoft Corp. (Software) | 124,713 | 46,897,076 | |
Motorola Solutions, Inc. (Communications Equip.) | 10,828 | 3,390,138 | |
NetApp, Inc. (Tech. Hardware, Storage & Periph.) | 5,422 | 478,003 | |
Nice Ltd. – ADR (Software) | (a) | 3,896 | 777,291 |
NVIDIA Corp. (Semiconductors & Equip.) | 31,477 | 15,588,040 | |
Oracle Corp. (Software) | 31,351 | 3,305,336 | |
Palantir Technologies, Inc. Class A (Software) | (a) | 60,301 | 1,035,368 |
Pure Storage, Inc. Class A (Tech. Hardware, Storage & Periph.) | (a) | 14,877 | 530,514 |
QUALCOMM, Inc. (Semiconductors & Equip.) | 43,036 | 6,224,297 | |
Roper Technologies, Inc. (Software) | 9,685 | 5,279,971 | |
ServiceNow, Inc. (Software) | (a) | 7,293 | 5,152,432 |
Skyworks Solutions, Inc. (Semiconductors & Equip.) | 5,112 | 574,691 | |
Synopsys, Inc. (Software) | (a) | 3,927 | 2,022,052 |
Twilio, Inc. Class A (IT Svs.) | (a) | 7,662 | 581,316 |
Tyler Technologies, Inc. (Software) | (a) | 2,489 | 1,040,701 |
VeriSign, Inc. (IT Svs.) | (a) | 14,251 | 2,935,136 |
Zoom Video Communications, Inc. Class A (Software) | (a) | 7,306 | 525,374 |
| 179,572,242 | |||
| Materials–0.9% | |||
Albemarle Corp. (Chemicals) | 6,930 | 1,001,246 | |
Amcor PLC (Containers & Packaging) | 88,518 | 853,314 | |
Ball Corp. (Containers & Packaging) | 23,823 | 1,370,299 | |
Celanese Corp. (Chemicals) | 6,034 | 937,503 | |
Cleveland-Cliffs, Inc. (Metals & Mining) | (a) | 46,579 | 951,143 |
Crown Holdings, Inc. (Containers & Packaging) | 9,328 | 859,015 | |
Dow, Inc. (Chemicals) | 28,295 | 1,551,698 | |
International Paper Co. (Containers & Packaging) | 22,465 | 812,110 | |
Mosaic Co. / The (Chemicals) | 23,062 | 824,005 | |
Sherwin-Williams Co. / The (Chemicals) | 12,501 | 3,899,062 | |
| 13,059,395 | |||
| Real Estate–0.9% | |||
Boston Properties, Inc. (Office REITs) | 8,705 | 610,830 | |
Camden Property Trust (Residential REITs) | 5,490 | 545,102 | |
Crown Castle, Inc. (Specialized REITs) | 18,352 | 2,113,967 | |
CubeSmart (Specialized REITs) | 12,463 | 577,660 | |
Extra Space Storage, Inc. (Specialized REITs) | 7,365 | 1,180,831 | |
First Industrial Realty Trust, Inc. (Industrial REITs) | 17,730 | 933,839 | |
Healthpeak Properties, Inc. (Health Care REITs) | 28,611 | 566,498 | |
Mid-America Apartment Communities, Inc. (Residential REITs) | 3,981 | 535,285 | |
Public Storage (Specialized REITs) | 3,239 | 987,895 | |
Simon Property Group, Inc. (Retail REITs) | 16,338 | 2,330,452 | |
Sun Communities, Inc. (Residential REITs) | 3,831 | 512,013 | |
93
(continued)
AuguStarSM Variable Insurance Products Fund, Inc.
AVIP AB Risk Managed Balanced Portfolio (Continued)
| Schedule of Investments | December 31, 2023 |
| Common Stocks (Continued) | Shares | Value | |
| Real Estate (continued) | |||
UDR, Inc. (Residential REITs) | 14,837 | $ 568,109 | |
VICI Properties, Inc. (Specialized REITs) | 32,774 | 1,044,835 | |
| 12,507,316 | |||
| Utilities–1.2% | |||
Alliant Energy Corp. (Electric Utilities) | 9,799 | 502,689 | |
Ameren Corp. (Multi-Utilities) | 17,430 | 1,260,886 | |
American Electric Power Co., Inc. (Electric Utilities) | 59,041 | 4,795,310 | |
CenterPoint Energy, Inc. (Multi-Utilities) | 76,254 | 2,178,577 | |
Dominion Energy, Inc. (Multi-Utilities) | 27,460 | 1,290,620 | |
Entergy Corp. (Electric Utilities) | 11,060 | 1,119,161 | |
Essential Utilities, Inc. (Water Utilities) | 13,916 | 519,762 | |
Evergy, Inc. (Electric Utilities) | 9,709 | 506,810 | |
Eversource Energy (Electric Utilities) | 18,783 | 1,159,287 | |
NextEra Energy, Inc. (Electric Utilities) | 18,974 | 1,152,481 | |
NiSource, Inc. (Multi-Utilities) | 19,327 | 513,132 | |
Xcel Energy, Inc. (Electric Utilities) | 19,923 | 1,233,433 | |
| 16,232,148 | |||
Total Common Stocks (Cost $582,670,961) | $ 684,994,252 | ||
| U.S. Treasury Obligations–18.0% | Rate | Maturity | Face Amount | Value | |
U.S. Treasury Bill | 0.000% | 01/25/2024 | $11,487,600 | $ 11,448,902 | |
U.S. Treasury Bill | 0.000% | 03/14/2024 | 1,570,000 | 1,553,708 | |
U.S. Treasury Bill | 0.000% | 05/23/2024 | 14,152,100 | 13,867,416 | |
U.S. Treasury Inflation Indexed Bond | 0.250% | 07/15/2029 | 13,970,754 | 12,910,011 | |
U.S. Treasury Note | 2.250% | 11/15/2024 | 1,865,000 | 1,823,256 | |
U.S. Treasury Note | 4.125% | 10/31/2027 | 2,729,700 | 2,746,867 | |
U.S. Treasury Note | 3.875% | 11/30/2027 | 9,565,100 | 9,544,924 | |
U.S. Treasury Note | 3.625% | 03/31/2028 | 1,822,600 | 1,802,736 | |
U.S. Treasury Note | 3.500% | 04/30/2028 | 6,685,400 | 6,579,113 | |
U.S. Treasury Note | 3.625% | 05/31/2028 | 16,409,600 | 16,235,889 | |
U.S. Treasury Note | 4.125% | 07/31/2028 | 17,700,400 | 17,882,935 | |
U.S. Treasury Note | 4.625% | 09/30/2028 | 1,960,700 | 2,023,810 | |
U.S. Treasury Note | 4.875% | 10/31/2028 | 3,607,400 | 3,765,506 | |
U.S. Treasury Note | 4.375% | 11/30/2028 | 3,234,200 | 3,309,496 | |
U.S. Treasury Note | (b) | 1.875% | 02/15/2032 | 37,869,800 | 32,557,673 |
U.S. Treasury Note | 3.500% | 02/15/2033 | 1,948,400 | 1,889,415 | |
U.S. Treasury Note | 3.375% | 05/15/2033 | 26,500,000 | 25,431,719 | |
U.S. Treasury Note | 3.875% | 08/15/2033 | 20,764,300 | 20,738,345 | |
U.S. Treasury Note | 3.250% | 05/15/2042 | 24,263,600 | 21,287,518 | |
U.S. Treasury Note | 2.750% | 08/15/2042 | 1,083,100 | 878,453 | |
U.S. Treasury Note | 4.000% | 11/15/2042 | 4,422,000 | 4,297,459 | |
U.S. Treasury Note | 3.875% | 05/15/2043 | 5,624,900 | 5,362,112 | |
U.S. Treasury Note | 4.375% | 08/15/2043 | 2,998,200 | 3,060,506 | |
U.S. Treasury Note | 4.750% | 11/15/2043 | 4,140,100 | 4,440,904 | |
U.S. Treasury Note | 2.250% | 08/15/2049 | 1,246,800 | 870,520 | |
U.S. Treasury Note | 2.375% | 11/15/2049 | 338,600 | 242,945 | |
U.S. Treasury Note | 1.250% | 05/15/2050 | 3,709,900 | 1,999,143 | |
U.S. Treasury Note | 2.375% | 05/15/2051 | 338,200 | 241,337 | |
U.S. Treasury Note | 2.250% | 02/15/2052 | 15,250,700 | 10,571,833 | |
U.S. Treasury Note | 2.875% | 05/15/2052 | 1,371,700 | 1,092,109 | |
U.S. Treasury Note | 4.125% | 08/15/2053 | 9,642,900 | 9,746,863 | |
U.S. Treasury Note | 4.750% | 11/15/2053 | 1,377,600 | 1,544,849 | |
Total U.S. Treasury Obligations (Cost $257,405,155) | $ 251,748,272 | ||||
| Corporate Bonds–12.0% | Rate | Maturity | Face Amount | Value | |
| Communication Services–0.7% | |||||
AT&T, Inc. (Diversified Telecom. Svs.) | 2.250% | 02/01/2032 | $ 17,000 | $ 14,058 | |
AT&T, Inc. (Diversified Telecom. Svs.) | 2.550% | 12/01/2033 | 279,000 | 227,391 | |
AT&T, Inc. (Diversified Telecom. Svs.) | 5.400% | 02/15/2034 | 392,000 | 404,279 | |
AT&T, Inc. (Diversified Telecom. Svs.) | 4.500% | 05/15/2035 | 280,000 | 265,222 | |
AT&T, Inc. (Diversified Telecom. Svs.) | 3.650% | 09/15/2059 | 33,000 | 23,651 | |
Charter Communications Operating LLC / Charter Communications Operating Capital Corp. (Media) | 5.050% | 03/30/2029 | 519,000 | 513,498 | |
Charter Communications Operating LLC / Charter Communications Operating Capital Corp. (Media) | 6.384% | 10/23/2035 | 858,000 | 870,950 | |
Charter Communications Operating LLC / Charter Communications Operating Capital Corp. (Media) | 6.484% | 10/23/2045 | 62,000 | 60,922 | |
94
(continued)
AuguStarSM Variable Insurance Products Fund, Inc.
AVIP AB Risk Managed Balanced Portfolio (Continued)
| Schedule of Investments | December 31, 2023 |
| Corporate Bonds (Continued) | Rate | Maturity | Face Amount | Value | |
| Communication Services (continued) | |||||
Cox Communications, Inc. (Diversified Telecom. Svs.) | (c) | 5.700% | 06/15/2033 | $ 282,000 | $ 293,339 |
Discovery Communications LLC (Media) | 5.200% | 09/20/2047 | 75,000 | 64,613 | |
Discovery Communications LLC (Media) | 5.300% | 05/15/2049 | 35,000 | 30,050 | |
DISH DBS Corp. (Media) | (c) | 5.250% | 12/01/2026 | 1,021,000 | 874,742 |
DISH DBS Corp. (Media) | (c) | 5.750% | 12/01/2028 | 158,000 | 126,021 |
Entegris Escrow Corp. (Media) | (c) | 4.750% | 04/15/2029 | 209,000 | 201,353 |
Globo Comunicacao e Participacoes SA (Media) | 4.875% | 01/22/2030 | 794,000 | 685,197 | |
Interpublic Group of Cos., Inc. / The (Media) | 5.375% | 06/15/2033 | 544,000 | 552,494 | |
Level 3 Financing, Inc. (Diversified Telecom. Svs.) | (c) | 3.875% | 11/15/2029 | 309,000 | 258,015 |
Meta Platforms, Inc. (Interactive Media & Svs.) | 4.950% | 05/15/2033 | 410,000 | 423,169 | |
Tencent Holdings Ltd. (Interactive Media & Svs.) | (c) | 3.240% | 06/03/2050 | 201,000 | 133,936 |
Time Warner Cable LLC (Media) | 7.300% | 07/01/2038 | 811,000 | 836,286 | |
T-Mobile U.S.A., Inc. (Wireless Telecom. Svs.) | 2.625% | 04/15/2026 | 70,000 | 66,580 | |
T-Mobile U.S.A., Inc. (Wireless Telecom. Svs.) | 3.875% | 04/15/2030 | 399,000 | 378,372 | |
T-Mobile U.S.A., Inc. (Wireless Telecom. Svs.) | 5.050% | 07/15/2033 | 533,000 | 537,144 | |
Verizon Communications, Inc. (Diversified Telecom. Svs.) | 2.550% | 03/21/2031 | 402,000 | 346,624 | |
Verizon Communications, Inc. (Diversified Telecom. Svs.) | 4.500% | 08/10/2033 | 619,000 | 603,812 | |
Warnermedia Holdings, Inc. (Media) | 4.279% | 03/15/2032 | 1,122,000 | 1,026,859 | |
| 9,818,577 | |||||
| Consumer Discretionary–1.6% | |||||
Advance Auto Parts, Inc. (Specialty Retail) | 3.900% | 04/15/2030 | 1,335,000 | 1,196,964 | |
Alibaba Group Holding Ltd. (Broadline Retail) | 2.125% | 02/09/2031 | 200,000 | 165,769 | |
Alibaba Group Holding Ltd. (Broadline Retail) | 4.500% | 11/28/2034 | 271,000 | 254,292 | |
AutoZone, Inc. (Specialty Retail) | 3.750% | 04/18/2029 | 303,000 | 289,293 | |
AutoZone, Inc. (Specialty Retail) | 1.650% | 01/15/2031 | 1,010,000 | 819,288 | |
Bath & Body Works, Inc. (Specialty Retail) | (c) | 6.625% | 10/01/2030 | 995,000 | 1,016,942 |
Booking Holdings, Inc. (Hotels, Restaurants & Leisure) | 4.625% | 04/13/2030 | 1,302,000 | 1,311,742 | |
Caesars Entertainment, Inc. (Hotels, Restaurants & Leisure) | (c) | 7.000% | 02/15/2030 | 235,000 | 240,978 |
Cedar Fair LP / Canada's Wonderland Co. / Magnum Management Corp. / Millennium Operations LLC (Hotels, Restaurants & Leisure) | 5.375% | 04/15/2027 | 1,000,000 | 978,400 | |
Ford Motor Co. (Automobiles) | 3.250% | 02/12/2032 | 1,007,000 | 837,526 | |
Ford Motor Co. (Automobiles) | 6.100% | 08/19/2032 | 138,000 | 139,108 | |
General Motors Co. (Automobiles) | 6.125% | 10/01/2025 | 79,000 | 80,061 | |
General Motors Co. (Automobiles) | 4.200% | 10/01/2027 | 94,000 | 91,758 | |
General Motors Co. (Automobiles) | 6.800% | 10/01/2027 | 107,000 | 113,427 | |
General Motors Co. (Automobiles) | 5.000% | 10/01/2028 | 269,000 | 271,087 | |
Gohl Capital Ltd. (Hotels, Restaurants & Leisure) | 4.250% | 01/24/2027 | 518,000 | 498,387 | |
Hasbro, Inc. (Leisure Products) | 3.550% | 11/19/2026 | 1,539,000 | 1,459,302 | |
Hyundai Capital America (Automobiles) | (c) | 6.100% | 09/21/2028 | 621,000 | 645,304 |
Jaguar Land Rover Automotive PLC (Automobiles) | (c) | 5.500% | 07/15/2029 | 1,227,000 | 1,195,767 |
Las Vegas Sands Corp. (Hotels, Restaurants & Leisure) | 3.900% | 08/08/2029 | 1,829,000 | 1,685,253 | |
LKQ Corp. (Distributors) | 5.750% | 06/15/2028 | 520,000 | 532,205 | |
LKQ Corp. (Distributors) | 6.250% | 06/15/2033 | 305,000 | 318,716 | |
M.D.C. Holdings, Inc. (Household Durables) | 2.500% | 01/15/2031 | 898,000 | 738,000 | |
Marriott International, Inc. (Hotels, Restaurants & Leisure) | 5.750% | 05/01/2025 | 1,264,000 | 1,271,373 | |
Mattel, Inc. (Leisure Products) | (c) | 3.375% | 04/01/2026 | 128,000 | 121,723 |
Mattel, Inc. (Leisure Products) | (c) | 5.875% | 12/15/2027 | 1,578,000 | 1,575,914 |
McDonald's Corp. (Hotels, Restaurants & Leisure) | 3.500% | 07/01/2027 | 272,000 | 264,201 | |
McDonald's Corp. (Hotels, Restaurants & Leisure) | 2.625% | 09/01/2029 | 1,700,000 | 1,555,675 | |
McDonald's Corp. (Hotels, Restaurants & Leisure) | 3.625% | 09/01/2049 | 90,000 | 72,132 | |
MDC Holdings, Inc. (Household Durables) | 6.000% | 01/15/2043 | 1,150,000 | 1,069,042 | |
Nissan Motor Co. Ltd. (Automobiles) | (c) | 4.345% | 09/17/2027 | 430,000 | 411,330 |
Prosus N.V. (Broadline Retail) | (c) | 3.257% | 01/19/2027 | 629,000 | 581,085 |
Ross Stores, Inc. (Specialty Retail) | 4.700% | 04/15/2027 | 280,000 | 276,991 | |
Royal Caribbean Cruises Ltd. (Hotels, Restaurants & Leisure) | (c) | 8.250% | 01/15/2029 | 416,000 | 442,082 |
Tapestry, Inc. (Textiles, Apparel & Luxury Goods) | 7.050% | 11/27/2025 | 143,000 | 146,147 | |
Wynn Macau Ltd. (Hotels, Restaurants & Leisure) | (c) | 5.625% | 08/26/2028 | 292,000 | 270,428 |
| 22,937,692 | |||||
| Consumer Staples–0.9% | |||||
Albertsons Cos., Inc. / Safeway, Inc. / New Albertsons LP / Albertsons LLC (Consumer Staples Distribution & Retail) | (c) | 3.500% | 03/15/2029 | 156,000 | 141,645 |
Albertsons Cos., Inc. / Safeway, Inc. / New Albertsons LP / Albertsons LLC (Consumer Staples Distribution & Retail) | (c) | 4.875% | 02/15/2030 | 971,000 | 929,564 |
Alimentation Couche-Tard, Inc. (Consumer Staples Distribution & Retail) | (c) | 2.950% | 01/25/2030 | 77,000 | 68,926 |
Altria Group, Inc. (Tobacco) | 3.400% | 05/06/2030 | 1,934,000 | 1,764,151 | |
B.A.T. Capital Corp. (Tobacco) | 2.259% | 03/25/2028 | 1,123,000 | 1,004,844 | |
B.A.T. Capital Corp. (Tobacco) | 7.750% | 10/19/2032 | 189,000 | 213,358 | |
B.A.T. Capital Corp. (Tobacco) | 6.421% | 08/02/2033 | 349,000 | 365,156 | |
95
(continued)
AuguStarSM Variable Insurance Products Fund, Inc.
AVIP AB Risk Managed Balanced Portfolio (Continued)
| Schedule of Investments | December 31, 2023 |
| Corporate Bonds (Continued) | Rate | Maturity | Face Amount | Value | |
| Consumer Staples (continued) | |||||
Campbell Soup Co. (Food Products) | 3.950% | 03/15/2025 | $ 113,000 | $ 111,241 | |
Cargill, Inc. (Food Products) | (c) | 2.125% | 04/23/2030 | 1,301,000 | 1,131,294 |
Coca-Cola Co. / The (Beverages) | 3.375% | 03/25/2027 | 1,376,000 | 1,343,816 | |
Coca-Cola Co. / The (Beverages) | 3.450% | 03/25/2030 | 182,000 | 174,772 | |
JBS U.S.A. LUX SA / JBS U.S.A. Food Co. / JBS Luxembourg SARL (Food Products) | (c) | 6.750% | 03/15/2034 | 602,000 | 634,285 |
MARB BondCo PLC (Food Products) | 3.950% | 01/29/2031 | 613,000 | 497,648 | |
Mars, Inc. (Food Products) | (c) | 2.700% | 04/01/2025 | 113,000 | 109,947 |
Mondelez International Holdings Netherlands B.V. (Food Products) | (c) | 2.250% | 09/19/2024 | 249,000 | 243,106 |
Mondelez International, Inc. (Food Products) | 2.750% | 04/13/2030 | 19,000 | 17,162 | |
PepsiCo, Inc. (Beverages) | 2.625% | 03/19/2027 | 58,000 | 55,000 | |
Philip Morris International, Inc. (Tobacco) | 5.000% | 11/17/2025 | 602,000 | �� 604,380 | |
Philip Morris International, Inc. (Tobacco) | 4.875% | 02/13/2026 | 496,000 | 497,734 | |
Philip Morris International, Inc. (Tobacco) | 5.625% | 11/17/2029 | 109,000 | 114,298 | |
Philip Morris International, Inc. (Tobacco) | 5.375% | 02/15/2033 | 999,000 | 1,024,679 | |
Pilgrim's Pride Corp. (Food Products) | 4.250% | 04/15/2031 | 1,000,000 | 903,222 | |
Procter & Gamble Co. / The (Household Products) | 3.000% | 03/25/2030 | 68,000 | 63,678 | |
Sysco Corp. (Consumer Staples Distribution & Retail) | 2.400% | 02/15/2030 | 72,000 | 63,510 | |
| 12,077,416 | |||||
| Energy–1.3% | |||||
Apache Corp. (Oil, Gas & Consumable Fuels) | 4.250% | 01/15/2030 | 1,850,000 | 1,728,586 | |
BP Capital Markets America, Inc. (Oil, Gas & Consumable Fuels) | 4.893% | 09/11/2033 | 571,000 | 580,981 | |
BP Capital Markets America, Inc. (Oil, Gas & Consumable Fuels) | 2.939% | 06/04/2051 | 1,333,000 | 923,339 | |
Canadian Natural Resources Ltd. (Oil, Gas & Consumable Fuels) | 5.850% | 02/01/2035 | 860,000 | 875,599 | |
Cheniere Corpus Christi Holdings LLC (Oil, Gas & Consumable Fuels) | 3.700% | 11/15/2029 | 557,000 | 526,071 | |
Continental Resources, Inc. (Oil, Gas & Consumable Fuels) | (c) | 5.750% | 01/15/2031 | 1,132,000 | 1,126,860 |
Continental Resources, Inc. (Oil, Gas & Consumable Fuels) | (c) | 2.875% | 04/01/2032 | 654,000 | 530,548 |
Devon Energy Corp. (Oil, Gas & Consumable Fuels) | 5.600% | 07/15/2041 | 195,000 | 188,463 | |
Ecopetrol SA (Oil, Gas & Consumable Fuels) | 8.625% | 01/19/2029 | 575,000 | 612,782 | |
EQT Corp. (Oil, Gas & Consumable Fuels) | (c) | 3.625% | 05/15/2031 | 1,224,000 | 1,093,118 |
GNL Quintero SA (Oil, Gas & Consumable Fuels) | 4.634% | 07/31/2029 | 633,988 | 623,454 | |
Hess Corp. (Oil, Gas & Consumable Fuels) | 4.300% | 04/01/2027 | 1,806,000 | 1,786,865 | |
Marathon Oil Corp. (Oil, Gas & Consumable Fuels) | 6.800% | 03/15/2032 | 1,575,000 | 1,706,292 | |
Oleoducto Central SA (Oil, Gas & Consumable Fuels) | (c) | 4.000% | 07/14/2027 | 207,000 | 192,265 |
ONEOK Partners LP (Oil, Gas & Consumable Fuels) | 6.125% | 02/01/2041 | 975,000 | 1,017,911 | |
ONEOK, Inc. (Oil, Gas & Consumable Fuels) | 6.350% | 01/15/2031 | 127,000 | 135,635 | |
ONEOK, Inc. (Oil, Gas & Consumable Fuels) | 6.100% | 11/15/2032 | 37,000 | 39,316 | |
Ovintiv, Inc. (Oil, Gas & Consumable Fuels) | 7.375% | 11/01/2031 | 985,000 | 1,085,065 | |
Plains All American Pipeline LP / PAA Finance Corp. (Oil, Gas & Consumable Fuels) | 3.550% | 12/15/2029 | 136,000 | 125,211 | |
Suncor Energy, Inc. (Oil, Gas & Consumable Fuels) | 6.800% | 05/15/2038 | 1,561,000 | 1,707,171 | |
Var Energi ASA (Oil, Gas & Consumable Fuels) | (c) | 7.500% | 01/15/2028 | 636,000 | 674,004 |
Var Energi ASA (Oil, Gas & Consumable Fuels) | (c) | 8.000% | 11/15/2032 | 784,000 | 877,766 |
| 18,157,302 | |||||
| Financials–3.9% | |||||
AerCap Ireland Capital DAC / AerCap Global Aviation Trust (Financial Services) | 6.500% | 07/15/2025 | 271,000 | 274,434 | |
AIB Group PLC (Rate is fixed until 04/10/2024, at which point, the rate becomes QL + 187) (Banks) | (c)(d) | 4.263% | 04/10/2025 | 448,000 | 445,614 |
AIB Group PLC (Rate is fixed until 10/14/2025, at which point, the rate becomes SOFR + 346) (Banks) | (c)(d) | 7.583% | 10/14/2026 | 755,000 | 778,676 |
AIB Group PLC (Rate is fixed until 09/13/2028, at which point, the rate becomes SOFR + 233) (Banks) | (c)(d) | 6.608% | 09/13/2029 | 324,000 | 341,318 |
Ally Financial, Inc. (Rate is fixed until 06/13/2028, at which point, the rate becomes SOFR + 326) (Consumer Finance) | (d) | 6.992% | 06/13/2029 | 573,000 | 591,770 |
Argentum Netherlands B.V. for Swiss Re Ltd. (Rate is fixed until 08/15/2025, at which point, the rate becomes QL + 359) (Insurance) | (d) | 5.750% | 08/15/2050 | 1,500,000 | 1,477,770 |
Aviation Capital Group LLC (Financial Services) | (c) | 4.375% | 01/30/2024 | 50,000 | 49,920 |
Aviation Capital Group LLC (Financial Services) | (c) | 5.500% | 12/15/2024 | 114,000 | 113,368 |
Aviation Capital Group LLC (Financial Services) | (c) | 4.125% | 08/01/2025 | 3,000 | 2,912 |
Aviation Capital Group LLC (Financial Services) | (c) | 4.875% | 10/01/2025 | 57,000 | 55,864 |
Aviation Capital Group LLC (Financial Services) | (c) | 1.950% | 01/30/2026 | 181,000 | 167,758 |
Aviation Capital Group LLC (Financial Services) | (c) | 1.950% | 09/20/2026 | 2,008,000 | 1,821,981 |
Aviation Capital Group LLC (Financial Services) | (c) | 3.500% | 11/01/2027 | 50,000 | 46,057 |
Aviation Capital Group LLC (Financial Services) | (c) | 6.375% | 07/15/2030 | 70,000 | 72,067 |
Banco de Credito del Peru SA (Rate is fixed until 07/01/2025, at which point, the rate becomes H15T5Y + 300) (Banks) | (c)(d) | 3.125% | 07/01/2030 | 244,000 | 232,026 |
Banco Santander SA (Rate is fixed until 11/21/2033, at which point, the rate becomes H15T5Y + 530) (Banks) | (d) | 9.625% | Perpetual | 400,000 | 437,000 |
Banco Santander SA (Rate is fixed until 03/24/2027, at which point, the rate becomes H15T1Y + 200) (Banks) | (d) | 4.175% | 03/24/2028 | 1,800,000 | 1,732,213 |
96
(continued)
AuguStarSM Variable Insurance Products Fund, Inc.
AVIP AB Risk Managed Balanced Portfolio (Continued)
| Schedule of Investments | December 31, 2023 |
| Corporate Bonds (Continued) | Rate | Maturity | Face Amount | Value | |
| Financials (continued) | |||||
Bank of America Corp. (Rate is fixed until 03/05/2028, at which point, the rate becomes TSFR3M + 133) (Banks) | (d) | 3.970% | 03/05/2029 | $ 177,000 | $ 169,055 |
Bank of America Corp. (Rate is fixed until 04/29/2030, at which point, the rate becomes SOFR + 215) (Banks) | (d) | 2.592% | 04/29/2031 | 1,441,000 | 1,241,839 |
Bank of Ireland Group PLC (Rate is fixed until 09/16/2025, at which point, the rate becomes H15T1Y + 265) (Banks) | (c)(d) | 6.253% | 09/16/2026 | 354,000 | 357,735 |
Barclays PLC (Rate is fixed until 05/09/2033, at which point, the rate becomes SOFR + 298) (Banks) | (d) | 6.224% | 05/09/2034 | 453,000 | 469,841 |
BNP Paribas SA (Rate is fixed until 02/25/2031, at which point, the rate becomes H15T5Y + 334) (Banks) | (d) | 4.625% | Perpetual | 229,000 | 184,454 |
BNP Paribas SA (Rate is fixed until 08/19/2025, at which point, the rate becomes USSW5 + 515) (Banks) | (d) | 7.375% | Perpetual | 200,000 | 200,278 |
BNP Paribas SA (Rate is fixed until 11/19/2024, at which point, the rate becomes TSFR3M + 137) (Banks) | (c)(d) | 2.819% | 11/19/2025 | 2,170,000 | 2,114,463 |
BNP Paribas SA (Rate is fixed until 01/13/2030, at which point, the rate becomes SOFR + 151) (Banks) | (c)(d) | 3.052% | 01/13/2031 | 333,000 | 292,533 |
CaixaBank SA (Rate is fixed until 09/13/2026, at which point, the rate becomes SOFR + 208) (Banks) | (c)(d) | 6.684% | 09/13/2027 | 696,000 | 713,453 |
Capital One Financial Corp. (Rate is fixed until 03/01/2029, at which point, the rate becomes SOFR + 179) (Consumer Finance) | (d) | 3.273% | 03/01/2030 | 1,651,000 | 1,474,513 |
Citigroup, Inc. (Rate is fixed until 04/23/2028, at which point, the rate becomes TSFR3M + 145) (Banks) | (d) | 4.075% | 04/23/2029 | 212,000 | 204,036 |
Citigroup, Inc. (Rate is fixed until 03/20/2029, at which point, the rate becomes TSFR3M + 160) (Banks) | (d) | 3.980% | 03/20/2030 | 145,000 | 137,594 |
Cloverie PLC for Zurich Insurance Co. Ltd. (Rate is fixed until 06/24/2026, at which point, the rate becomes QL + 492) (Insurance) | (d) | 5.625% | 06/24/2046 | 1,116,000 | 1,094,796 |
Cooperatieve Rabobank UA (Rate is fixed until 02/28/2028, at which point, the rate becomes H15T1Y + 140) (Banks) | (c)(d) | 5.564% | 02/28/2029 | 1,027,000 | 1,042,956 |
Cooperatieve Rabobank UA (Rate is fixed until 04/10/2024, at which point, the rate becomes USSW5 + 189) (Banks) | (d) | 4.000% | 04/10/2029 | 1,000,000 | 991,810 |
Credit Agricole SA (Rate is fixed until 10/03/2028, at which point, the rate becomes SOFR + 186) (Banks) | (c)(d) | 6.316% | 10/03/2029 | 386,000 | 404,281 |
Danske Bank A/S (Rate is fixed until 04/01/2027, at which point, the rate becomes H15T1Y + 175) (Banks) | (c)(d) | 4.298% | 04/01/2028 | 1,829,000 | 1,772,436 |
Deutsche Bank AG (Rate is fixed until 07/14/2025, at which point, the rate becomes SOFR + 319) (Capital Markets) | (d) | 6.119% | 07/14/2026 | 256,000 | 258,426 |
Deutsche Bank AG (Rate is fixed until 07/13/2026, at which point, the rate becomes SOFR + 252) (Capital Markets) | (d) | 7.146% | 07/13/2027 | 396,000 | 411,042 |
Deutsche Bank AG (Rate is fixed until 01/07/2027, at which point, the rate becomes SOFR + 132) (Capital Markets) | (d) | 2.552% | 01/07/2028 | 204,000 | 187,257 |
Ford Motor Credit Co. LLC (Consumer Finance) | 2.700% | 08/10/2026 | 749,000 | 693,715 | |
General Motors Financial Co., Inc. (Consumer Finance) | 4.350% | 01/17/2027 | 99,000 | 97,016 | |
General Motors Financial Co., Inc. (Consumer Finance) | 2.400% | 10/15/2028 | 1,366,000 | 1,212,657 | |
General Motors Financial Co., Inc. (Consumer Finance) | 4.300% | 04/06/2029 | 649,000 | 625,165 | |
Global Payments, Inc. (Financial Services) | 3.200% | 08/15/2029 | 75,000 | 67,972 | |
Harley-Davidson Financial Services, Inc. (Consumer Finance) | (c) | 3.050% | 02/14/2027 | 912,000 | 847,186 |
Harley-Davidson Financial Services, Inc. (Consumer Finance) | (c) | 6.500% | 03/10/2028 | 153,000 | 158,819 |
HSBC Holdings PLC (Rate is fixed until 11/03/2025, at which point, the rate becomes SOFR + 303) (Banks) | (d) | 7.336% | 11/03/2026 | 371,000 | 385,119 |
HSBC Holdings PLC (Rate is fixed until 03/13/2027, at which point, the rate becomes TSFR3M + 181) (Banks) | (d) | 4.041% | 03/13/2028 | 265,000 | 255,278 |
HSBC Holdings PLC (Rate is fixed until 11/03/2027, at which point, the rate becomes SOFR + 335) (Banks) | (d) | 7.390% | 11/03/2028 | 682,000 | 730,788 |
HSBC Holdings PLC (Rate is fixed until 05/24/2031, at which point, the rate becomes SOFR + 119) (Banks) | (d) | 2.804% | 05/24/2032 | 334,000 | 278,827 |
HSBC Holdings PLC (Rate is fixed until 11/03/2032, at which point, the rate becomes SOFR + 425) (Banks) | (d) | 8.113% | 11/03/2033 | 781,000 | 902,518 |
ING Groep N.V. (Rate is fixed until 09/11/2026, at which point, the rate becomes SOFR + 156) (Banks) | (d) | 6.083% | 09/11/2027 | 858,000 | 875,592 |
Intesa Sanpaolo SpA (Banks) | (c) | 7.200% | 11/28/2033 | 624,000 | 665,193 |
KBC Group N.V. (Rate is fixed until 01/19/2028, at which point, the rate becomes H15T1Y + 210) (Banks) | (c)(d) | 5.796% | 01/19/2029 | 336,000 | 341,669 |
Lloyds Banking Group PLC (Rate is fixed until 09/27/2025, at which point, the rate becomes USISDA05 + 450) (Banks) | (d) | 7.500% | Perpetual | 806,000 | 789,308 |
Lloyds Banking Group PLC (Rate is fixed until 03/06/2028, at which point, the rate becomes H15T1Y + 170) (Banks) | (d) | 5.871% | 03/06/2029 | 331,000 | 339,015 |
Lloyds Banking Group PLC (Rate is fixed until 11/15/2032, at which point, the rate becomes H15T1Y + 375) (Banks) | (d) | 7.953% | 11/15/2033 | 1,717,000 | 1,962,694 |
Magyar Export-Import Bank ZRT (Banks) | (c) | 6.125% | 12/04/2027 | 825,000 | 838,753 |
97
(continued)
AuguStarSM Variable Insurance Products Fund, Inc.
AVIP AB Risk Managed Balanced Portfolio (Continued)
| Schedule of Investments | December 31, 2023 |
| Corporate Bonds (Continued) | Rate | Maturity | Face Amount | Value | |
| Financials (continued) | |||||
Mastercard, Inc. (Financial Services) | 3.350% | 03/26/2030 | $ 1,713,000 | $ 1,633,659 | |
Mizuho Financial Group, Inc. (Rate is fixed until 09/13/2029, at which point, the rate becomes TSFR3M + 157) (Banks) | (d) | 2.869% | 09/13/2030 | 1,261,000 | 1,114,288 |
Nationwide Building Society (Financial Services) | (c) | 4.000% | 09/14/2026 | 1,299,000 | 1,246,595 |
Nationwide Building Society (Rate is fixed until 02/16/2027, at which point, the rate becomes SOFR + 129) (Financial Services) | (c)(d) | 2.972% | 02/16/2028 | 368,000 | 342,226 |
NatWest Group PLC (Rate is fixed until 03/22/2024, at which point, the rate becomes QL + 176) (Banks) | (d) | 4.269% | 03/22/2025 | 560,000 | 558,013 |
Nomura Holdings, Inc. (Capital Markets) | 2.999% | 01/22/2032 | 1,330,000 | 1,121,211 | |
PayPal Holdings, Inc. (Financial Services) | 2.850% | 10/01/2029 | 1,440,000 | 1,317,146 | |
PNC Financial Services Group, Inc. / The (Rate is fixed until 01/24/2033, at which point, the rate becomes SOFR + 193) (Banks) | (d) | 5.068% | 01/24/2034 | 230,000 | 225,046 |
PNC Financial Services Group, Inc. / The (Rate is fixed until 10/20/2033, at which point, the rate becomes SOFR + 228) (Banks) | (d) | 6.875% | 10/20/2034 | 337,000 | 374,116 |
Santander Holdings U.S.A., Inc. (Rate is fixed until 01/06/2027, at which point, the rate becomes SOFR + 125) (Banks) | (d) | 2.490% | 01/06/2028 | 1,365,000 | 1,249,627 |
Santander U.K. Group Holdings PLC (Rate is fixed until 01/11/2027, at which point, the rate becomes SOFR + 122) (Banks) | (d) | 2.469% | 01/11/2028 | 1,374,000 | 1,252,101 |
Societe Generale SA (Rate is fixed until 01/12/2026, at which point, the rate becomes H15T1Y + 230) (Banks) | (c)(d) | 6.447% | 01/12/2027 | 325,000 | 330,663 |
Standard Chartered PLC (Rate is fixed until 03/30/2025, at which point, the rate becomes H15T1Y + 165) (Banks) | (c)(d) | 3.971% | 03/30/2026 | 1,839,000 | 1,793,005 |
Standard Chartered PLC (Rate is fixed until 03/15/2028, at which point, the rate becomes USISDA05 + 197) (Banks) | (c)(d) | 4.866% | 03/15/2033 | 664,000 | 624,375 |
Swedbank AB (Rate is fixed until 09/17/2024, at which point, the rate becomes H15T5Y + 413) (Banks) | (d) | 5.625% | Perpetual | 200,000 | 196,250 |
Swiss Re Finance Luxembourg SA (Rate is fixed until 04/02/2029, at which point, the rate becomes H15T5Y + 358) (Insurance) | (d) | 5.000% | 04/02/2049 | 200,000 | 191,000 |
Synchrony Financial (Consumer Finance) | 4.875% | 06/13/2025 | 696,000 | 684,112 | |
Synchrony Financial (Consumer Finance) | 3.950% | 12/01/2027 | 720,000 | 673,319 | |
Trane Technologies Financing Ltd. (Consumer Finance) | 5.250% | 03/03/2033 | 241,000 | 249,523 | |
Truist Financial Corp. (Banks) | 1.950% | 06/05/2030 | 133,000 | 110,971 | |
UBS Group AG (Rate is fixed until 11/13/2028, at which point, the rate becomes H15T5Y + 475) (Capital Markets) | (c)(d) | 9.250% | Perpetual | 277,000 | 298,821 |
UBS Group AG (Rate is fixed until 11/13/2033, at which point, the rate becomes H15T5Y + 476) (Capital Markets) | (c)(d) | 9.250% | Perpetual | 216,000 | 239,385 |
UBS Group AG (Rate is fixed until 05/12/2025, at which point, the rate becomes H15T1Y + 155) (Capital Markets) | (c)(d) | 4.488% | 05/12/2026 | 267,000 | 262,938 |
UBS Group AG (Rate is fixed until 06/05/2025, at which point, the rate becomes SOFR + 204) (Capital Markets) | (c)(d) | 2.193% | 06/05/2026 | 1,445,000 | 1,374,171 |
UBS Group AG (Rate is fixed until 07/15/2025, at which point, the rate becomes SOFR + 334) (Capital Markets) | (c)(d) | 6.373% | 07/15/2026 | 753,000 | 761,365 |
UniCredit SpA (Rate is fixed until 06/03/2031, at which point, the rate becomes H15T1Y + 155) (Banks) | (c)(d) | 3.127% | 06/03/2032 | 200,000 | 169,009 |
Visa, Inc. (Financial Services) | 1.900% | 04/15/2027 | 452,000 | 420,128 | |
Visa, Inc. (Financial Services) | 2.050% | 04/15/2030 | 220,000 | 193,310 | |
Wells Fargo & Co. (Rate is fixed until 07/25/2028, at which point, the rate becomes SOFR + 174) (Banks) | (d) | 5.574% | 07/25/2029 | 1,007,000 | 1,028,216 |
| 54,465,419 | |||||
| Health Care–0.3% | |||||
AbbVie, Inc. (Biotechnology) | 2.600% | 11/21/2024 | 165,000 | 161,188 | |
AbbVie, Inc. (Biotechnology) | 3.600% | 05/14/2025 | 1,489,000 | 1,462,036 | |
Amgen, Inc. (Biotechnology) | 3.350% | 02/22/2032 | 159,000 | 145,294 | |
Bayer U.S. Finance LLC (Pharmaceuticals) | (c) | 6.125% | 11/21/2026 | 282,000 | 286,704 |
Bristol-Myers Squibb Co. (Pharmaceuticals) | 3.400% | 07/26/2029 | 624,000 | 591,841 | |
Centene Corp. (Health Care Providers & Svs.) | 4.625% | 12/15/2029 | 376,000 | 360,481 | |
Centene Corp. (Health Care Providers & Svs.) | 3.375% | 02/15/2030 | 212,000 | 190,213 | |
Cigna Group / The (Health Care Providers & Svs.) | 3.200% | 03/15/2040 | 52,000 | 40,649 | |
Cigna Group / The (Health Care Providers & Svs.) | 3.400% | 03/15/2050 | 78,000 | 57,751 | |
CVS Health Corp. (Health Care Providers & Svs.) | 3.000% | 08/15/2026 | 33,000 | 31,533 | |
DH Europe Finance II SARL (Health Care Equip. & Supplies) | 2.200% | 11/15/2024 | 129,000 | 125,642 | |
DH Europe Finance II SARL (Health Care Equip. & Supplies) | 2.600% | 11/15/2029 | 71,000 | 64,261 | |
Medline Borrower LP (Health Care Equip. & Supplies) | (c) | 3.875% | 04/01/2029 | 240,000 | 216,995 |
Pfizer, Inc. (Pharmaceuticals) | 2.625% | 04/01/2030 | 1,080,000 | 974,109 | |
| 4,708,697 | |||||
| Industrials–0.7% | |||||
Air Lease Corp. (Trading Companies & Distributors) | 2.875% | 01/15/2026 | 28,000 | 26,675 | |
Air Lease Corp. (Trading Companies & Distributors) | 3.625% | 04/01/2027 | 15,000 | 14,185 | |
98
(continued)
AuguStarSM Variable Insurance Products Fund, Inc.
AVIP AB Risk Managed Balanced Portfolio (Continued)
| Schedule of Investments | December 31, 2023 |
| Corporate Bonds (Continued) | Rate | Maturity | Face Amount | Value | |
| Industrials (continued) | |||||
Air Lease Corp. (Trading Companies & Distributors) | 2.100% | 09/01/2028 | $ 107,000 | $ 93,640 | |
Air Lease Corp. (Trading Companies & Distributors) | 4.625% | 10/01/2028 | 883,000 | 862,684 | |
Aircastle Ltd. (Trading Companies & Distributors) | 4.125% | 05/01/2024 | 58,000 | 57,543 | |
Aircastle Ltd. (Trading Companies & Distributors) | (c) | 5.250% | 08/11/2025 | 914,000 | 900,879 |
Aircastle Ltd. (Trading Companies & Distributors) | 4.250% | 06/15/2026 | 21,000 | 20,289 | |
Aircastle Ltd. (Trading Companies & Distributors) | (c) | 2.850% | 01/26/2028 | 690,000 | 615,497 |
Carrier Global Corp. (Building Products) | 2.242% | 02/15/2025 | 21,000 | 20,350 | |
Carrier Global Corp. (Building Products) | 2.493% | 02/15/2027 | 26,000 | 24,446 | |
Delta Air Lines, Inc. / SkyMiles IP Ltd. (Passenger Airlines) | (c) | 4.500% | 10/20/2025 | 572,705 | 564,003 |
Delta Air Lines, Inc. / SkyMiles IP Ltd. (Passenger Airlines) | (c) | 4.750% | 10/20/2028 | 156,000 | 153,424 |
ENA Master Trust (Transportation Infrastructure) | (c) | 4.000% | 05/19/2048 | 203,000 | 142,191 |
Equifax, Inc. (Professional Svs.) | 2.600% | 12/01/2024 | 1,138,000 | 1,108,087 | |
Equifax, Inc. (Professional Svs.) | 2.600% | 12/15/2025 | 147,000 | 140,251 | |
Equifax, Inc. (Professional Svs.) | 3.100% | 05/15/2030 | 240,000 | 214,870 | |
ERAC U.S.A. Finance LLC (Ground Transportation) | (c) | 4.600% | 05/01/2028 | 306,000 | 304,092 |
ERAC U.S.A. Finance LLC (Ground Transportation) | (c) | 4.900% | 05/01/2033 | 715,000 | 714,036 |
Flowserve Corp. (Machinery) | 2.800% | 01/15/2032 | 1,801,000 | 1,487,658 | |
Huntington Ingalls Industries, Inc. (Aerospace & Defense) | 3.844% | 05/01/2025 | 205,000 | 200,678 | |
Lima Metro Line 2 Finance Ltd. (Ground Transportation) | 5.875% | 07/05/2034 | 486,886 | 480,660 | |
Regal Rexnord Corp. (Electrical Equip.) | (c) | 6.050% | 02/15/2026 | 824,000 | 833,108 |
Westinghouse Air Brake Technologies Corp. (Machinery) | 4.150% | 03/15/2024 | 1,125,000 | 1,120,245 | |
Westinghouse Air Brake Technologies Corp. (Machinery) | 3.200% | 06/15/2025 | 45,000 | 43,501 | |
| 10,142,992 | |||||
| Information Technology–1.2% | |||||
Apple, Inc. (Tech. Hardware, Storage & Periph.) | 1.250% | 08/20/2030 | 1,070,000 | 888,195 | |
Apple, Inc. (Tech. Hardware, Storage & Periph.) | 4.100% | 08/08/2062 | 663,000 | 590,536 | |
Broadcom, Inc. (Semiconductors & Equip.) | (c) | 4.000% | 04/15/2029 | 36,000 | 34,749 |
Broadcom, Inc. (Semiconductors & Equip.) | (c) | 4.926% | 05/15/2037 | 180,000 | 174,191 |
CDW LLC / CDW Finance Corp. (Electronic Equip., Instr. & Comp.) | 4.250% | 04/01/2028 | 1,196,000 | 1,145,384 | |
Infor, Inc. (Software) | (c) | 1.750% | 07/15/2025 | 1,696,000 | 1,598,885 |
Kyndryl Holdings, Inc. (IT Svs.) | 2.050% | 10/15/2026 | 2,046,000 | 1,862,344 | |
Lam Research Corp. (Semiconductors & Equip.) | 4.000% | 03/15/2029 | 816,000 | 805,131 | |
NXP B.V. / NXP Funding LLC (Semiconductors & Equip.) | 5.550% | 12/01/2028 | 125,000 | 128,626 | |
Oracle Corp. (Software) | 2.950% | 04/01/2030 | 1,796,000 | 1,620,973 | |
Oracle Corp. (Software) | 3.900% | 05/15/2035 | 1,039,000 | 926,441 | |
Oracle Corp. (Software) | 3.600% | 04/01/2040 | 134,000 | 106,852 | |
Oracle Corp. (Software) | 5.375% | 07/15/2040 | 43,000 | 42,250 | |
Oracle Corp. (Software) | 3.650% | 03/25/2041 | 77,000 | 61,070 | |
Skyworks Solutions, Inc. (Semiconductors & Equip.) | 3.000% | 06/01/2031 | 1,331,000 | 1,138,815 | |
VMware LLC (Software) | 4.500% | 05/15/2025 | 954,000 | 944,417 | |
VMware LLC (Software) | 4.650% | 05/15/2027 | 293,000 | 290,493 | |
Western Digital Corp. (Tech. Hardware, Storage & Periph.) | 2.850% | 02/01/2029 | 2,792,000 | 2,403,566 | |
Workday, Inc. (Software) | 3.700% | 04/01/2029 | 42,000 | 40,309 | |
Workday, Inc. (Software) | 3.800% | 04/01/2032 | 1,100,000 | 1,024,233 | |
Xiaomi Best Time International Ltd. (Tech. Hardware, Storage & Periph.) | 2.875% | 07/14/2031 | 640,000 | 532,084 | |
| 16,359,544 | |||||
| Materials–0.4% | |||||
AngloGold Ashanti Holdings PLC (Metals & Mining) | 3.750% | 10/01/2030 | 576,000 | 500,782 | |
Braskem Netherlands Finance B.V. (Chemicals) | 4.500% | 01/10/2028 | 652,000 | 533,686 | |
Celanese U.S. Holdings LLC (Chemicals) | 6.350% | 11/15/2028 | 121,000 | 126,895 | |
Celanese U.S. Holdings LLC (Chemicals) | 6.550% | 11/15/2030 | 291,000 | 307,624 | |
CSN Resources SA (Metals & Mining) | 5.875% | 04/08/2032 | 787,000 | 684,374 | |
Freeport Indonesia PT (Metals & Mining) | (c) | 4.763% | 04/14/2027 | 749,000 | 735,892 |
Freeport Indonesia PT (Metals & Mining) | 4.763% | 04/14/2027 | 350,000 | 343,875 | |
Glencore Funding LLC (Metals & Mining) | (c) | 5.400% | 05/08/2028 | 472,000 | 480,589 |
Glencore Funding LLC (Metals & Mining) | (c) | 6.500% | 10/06/2033 | 342,000 | 372,855 |
Inversiones CMPC SA (Paper & Forest Products) | 6.125% | 06/23/2033 | 242,000 | 250,503 | |
Stillwater Mining Co. (Metals & Mining) | (c) | 4.000% | 11/16/2026 | 300,000 | 266,250 |
Volcan Cia Minera S.A.A. (Metals & Mining) | (c) | 4.375% | 02/11/2026 | 31,000 | 19,261 |
W.R. Grace Holdings LLC (Chemicals) | (c) | 4.875% | 06/15/2027 | 551,000 | 530,118 |
| 5,152,704 | |||||
| Real Estate–0.4% | |||||
American Tower Corp. (Specialized REITs) | 3.650% | 03/15/2027 | 138,000 | 132,733 | |
American Tower Corp. (Specialized REITs) | 3.800% | 08/15/2029 | 1,455,000 | 1,381,289 | |
Crown Castle, Inc. (Specialized REITs) | 5.600% | 06/01/2029 | 264,000 | 269,942 | |
Crown Castle, Inc. (Specialized REITs) | 5.800% | 03/01/2034 | 279,000 | 288,765 | |
Equinix, Inc. (Specialized REITs) | 3.200% | 11/18/2029 | 1,689,000 | 1,551,232 | |
99
(continued)
AuguStarSM Variable Insurance Products Fund, Inc.
AVIP AB Risk Managed Balanced Portfolio (Continued)
| Schedule of Investments | December 31, 2023 |
| Corporate Bonds (Continued) | Rate | Maturity | Face Amount | Value | |
| Real Estate (continued) | |||||
GLP Capital LP / GLP Financing II Inc. (Specialized REITs) | 4.000% | 01/15/2031 | $ 501,000 | $ 451,217 | |
GLP Capital LP / GLP Financing II Inc. (Specialized REITs) | 3.250% | 01/15/2032 | 1,468,000 | 1,239,363 | |
| 5,314,541 | |||||
| Utilities–0.6% | |||||
AES Panama Generation Holdings SRL (Electric Utilities) | (c) | 4.375% | 05/31/2030 | 279,897 | 235,114 |
AES Panama Generation Holdings SRL (Electric Utilities) | 4.375% | 05/31/2030 | 236,685 | 198,815 | |
Alexander Funding Trust II (Electric Utilities) | (c) | 7.467% | 07/31/2028 | 118,000 | 123,904 |
Ameren Corp. (Multi-Utilities) | 3.500% | 01/15/2031 | 669,000 | 610,384 | |
American Water Capital Corp. (Water Utilities) | 2.800% | 05/01/2030 | 1,002,000 | 896,582 | |
Comision Federal de Electricidad (Electric Utilities) | (c) | 4.688% | 05/15/2029 | 221,000 | 207,629 |
Duke Energy Carolinas NC Storm Funding LLC (Electric Utilities) | 2.617% | 07/01/2041 | 200,000 | 155,349 | |
Electricite de France SA (Rate is fixed until 06/15/2033, at which point, the rate becomes H15T5Y + 541) (Electric Utilities) | (c)(d) | 9.125% | Perpetual | 253,000 | 282,452 |
Enel Chile SA (Electric Utilities) | 4.875% | 06/12/2028 | 688,000 | 679,764 | |
Enel Finance International N.V. (Electric Utilities) | (c) | 7.500% | 10/14/2032 | 800,000 | 913,260 |
Engie Energia Chile SA (Electric Utilities) | 3.400% | 01/28/2030 | 673,000 | 578,246 | |
NRG Energy, Inc. (Electric Utilities) | (c) | 3.750% | 06/15/2024 | 308,000 | 304,420 |
NRG Energy, Inc. (Electric Utilities) | (c) | 7.000% | 03/15/2033 | 760,000 | 803,286 |
Oncor Electric Delivery Co. LLC (Electric Utilities) | 3.700% | 11/15/2028 | 1,164,000 | 1,122,048 | |
Pacific Gas & Electric Co. (Electric Utilities) | 4.400% | 03/01/2032 | 985,000 | 911,111 | |
Vistra Operations Co. LLC (Ind. Power & Renewable Elec.) | (c) | 6.950% | 10/15/2033 | 812,000 | 854,578 |
| 8,876,942 | |||||
Total Corporate Bonds (Cost $168,787,937) | $ 168,011,826 | ||||
| Asset-Backed / Mortgage-Backed Securities–7.1% | Rate | Maturity | Face Amount | Value | |
| Consumer Discretionary–0.0% | |||||
Domino's Pizza Master Issuer LLC 2021-1A A2I | (c) | 2.662% | 04/25/2051 | $ 171,600 | $ 151,693 |
Great Wolf Trust 2019-WOLF C | (c) | TSFR1M + 175 | 12/15/2036 | 79,000 | 78,350 |
Hardee's Funding LLC 2018-1A A23 | (c) | 5.710% | 06/20/2048 | 126,613 | 117,664 |
Hardee's Funding LLC 2020-1A A2 | (c) | 3.981% | 12/20/2050 | 130,990 | 115,064 |
| 462,771 | |||||
| Financials–7.1% | |||||
AB Issuer LLC 2021-1 A2 | (c) | 3.734% | 07/30/2051 | 314,400 | 273,570 |
ACHV ABS TRUST 2023-3PL A | (c) | 6.600% | 08/19/2030 | 291,280 | 291,420 |
ACHV ABS TRUST 2023-4CP B | (c) | 7.240% | 11/25/2030 | 1,163,000 | 1,173,702 |
ACM Auto Trust 2023-1A A | (c) | 6.610% | 01/22/2030 | 208,213 | 208,092 |
Affirm Asset Securitization Trust 2021-Z1 A | (c) | 1.070% | 08/15/2025 | 19,441 | 19,223 |
Affirm Asset Securitization Trust 2021-Z2 A | (c) | 1.170% | 11/16/2026 | 18,588 | 18,091 |
Affirm Asset Securitization Trust 2023-B A | (c) | 6.820% | 09/15/2028 | 1,400,000 | 1,420,896 |
AGL CLO 2021-12A D | (c) | TSFR3M + 311 | 07/20/2034 | 250,000 | 243,479 |
AGL CLO 10 Ltd. 2021-10A A | (c) | TSFR3M + 139 | 04/15/2034 | 963,750 | 961,547 |
American Credit Acceptance Receivables Trust 2023-1 A | (c) | 5.450% | 09/14/2026 | 318,127 | 317,757 |
Amur Equipment Finance Receivables XI LLC 2022-2A A2 | (c) | 5.300% | 06/21/2028 | 339,427 | 338,459 |
AREIT 2022-CRE6 A | (c) | SOFR30A + 125 | 01/20/2037 | 462,684 | 453,469 |
Atalaya Equipment Leasing Trust 2021-1A C | (c) | 2.690% | 06/15/2028 | 300,000 | 287,563 |
Avant Loans Funding Trust 2021-REV1 A | (c) | 1.210% | 07/15/2030 | 133,979 | 133,025 |
Avis Budget Rental Car Funding AESOP LLC 2023-5A B | (c) | 6.120% | 04/20/2028 | 464,000 | 465,146 |
Bain Capital Credit CLO 2021-4A D | (c) | TSFR3M + 336 | 10/20/2034 | 250,000 | 231,652 |
Balboa Bay Loan Funding 2020-1A AR | (c) | TSFR3M + 138 | 01/20/2032 | 1,500,000 | 1,499,249 |
Balboa Bay Loan Funding 2021-1A D | (c) | TSFR3M + 331 | 07/20/2034 | 307,948 | 296,633 |
Ballyrock CLO 15 Ltd. 2021-1A C | (c) | TSFR3M + 336 | 04/15/2034 | 250,000 | 247,597 |
Ballyrock CLO 16 Ltd. 2021-16A C | (c) | TSFR3M + 316 | 07/20/2034 | 250,000 | 244,925 |
Ballyrock CLO 17 Ltd. 2021-17A A1A | (c) | TSFR3M + 141 | 10/20/2034 | 1,000,000 | 996,994 |
Ballyrock CLO 17 Ltd. 2021-17A C | (c) | TSFR3M + 331 | 10/20/2034 | 250,000 | 246,786 |
Battalion CLO 17 Ltd. 2021-17A A1 | (c) | TSFR3M + 152 | 03/09/2034 | 600,000 | 597,120 |
BBCMS 2020-BID A | (c) | TSFR1M + 225 | 10/15/2037 | 301,000 | 297,499 |
Bellemeade Re 2021-3A A2 | (c) | SOFR30A + 100 | 09/25/2031 | 286,223 | 284,172 |
Bellemeade Re 2022-1 M1C | (c) | SOFR30A + 370 | 01/26/2032 | 327,948 | 332,244 |
Bellemeade Re 2022-2 M1A | (c) | SOFR30A + 400 | 09/27/2032 | 959,476 | 980,837 |
BFLD Trust 2021-FPM A | (c) | TSFR1M + 171 | 06/15/2038 | 462,000 | 451,055 |
BX Commercial Mortgage Trust 2019-IMC E | (c) | TSFR1M + 220 | 04/15/2034 | 320,787 | 315,039 |
Cajun Global LLC 2021-1 A2 | (c) | 3.931% | 11/20/2051 | 60,140 | 53,358 |
Carvana Auto Receivables Trust 2021-N3 C | 1.020% | 06/12/2028 | 31,606 | 29,456 | |
Carvana Auto Receivables Trust 2021-N4 D | 2.300% | 09/11/2028 | 116,471 | 111,738 | |
Carvana Auto Receivables Trust 2023-N3 A | (c) | 6.410% | 09/10/2027 | 1,193,103 | 1,198,599 |
CIFC Funding 2020-4A A | (c) | TSFR3M + 158 | 01/15/2034 | 260,000 | 260,074 |
100
(continued)
AuguStarSM Variable Insurance Products Fund, Inc.
AVIP AB Risk Managed Balanced Portfolio (Continued)
| Schedule of Investments | December 31, 2023 |
| Asset-Backed / Mortgage-Backed Securities (Continued) | Rate | Maturity | Face Amount | Value | |
| Financials (continued) | |||||
CNH Equipment Trust 2022-C A2 | 5.420% | 07/15/2026 | $ 533,966 | $ 533,309 | |
College Ave Student Loans 2021-C C | (c) | 3.060% | 07/26/2055 | 136,800 | 118,840 |
COMM 2015-LC23 C | 4.546% | 10/10/2048 | 100,000 | 90,592 | |
Connecticut Avenue Securities Trust 2019-R04 2B1 | (c) | SOFR30A + 536 | 06/25/2039 | 761,095 | 809,692 |
Connecticut Avenue Securities Trust 2019-R06 2B1 | (c) | SOFR30A + 386 | 09/25/2039 | 904,439 | 930,313 |
Connecticut Avenue Securities Trust 2019-R07 1M2 | (c) | SOFR30A + 221 | 10/25/2039 | 1,046 | 1,046 |
Connecticut Avenue Securities Trust 2020-R02 2M2 | (c) | SOFR30A + 211 | 01/25/2040 | 74,264 | 74,828 |
Connecticut Avenue Securities Trust 2021-R01 1M2 | (c) | SOFR30A + 155 | 10/25/2041 | 462,831 | 462,533 |
Connecticut Avenue Securities Trust 2021-R03 1M2 | (c) | SOFR30A + 165 | 12/25/2041 | 117,550 | 115,899 |
Connecticut Avenue Securities Trust 2022-R01 1B1 | (c) | SOFR30A + 315 | 12/25/2041 | 305,277 | 307,456 |
Connecticut Avenue Securities Trust 2022-R02 2M1 | (c) | SOFR30A + 120 | 01/25/2042 | 189,620 | 188,983 |
Connecticut Avenue Securities Trust 2022-R02 2M2 | (c) | SOFR30A + 300 | 01/25/2042 | 960,000 | 972,874 |
Connecticut Avenue Securities Trust 2022-R03 1M1 | (c) | SOFR30A + 210 | 03/25/2042 | 979,333 | 990,784 |
Connecticut Avenue Securities Trust 2022-R03 1M2 | (c) | SOFR30A + 350 | 03/25/2042 | 253,631 | 264,982 |
Connecticut Avenue Securities Trust 2022-R04 1M2 | (c) | SOFR30A + 310 | 03/25/2042 | 63,262 | 65,269 |
Connecticut Avenue Securities Trust 2022-R05 2M2 | (c) | SOFR30A + 300 | 04/25/2042 | 599,367 | 609,896 |
Connecticut Avenue Securities Trust 2022-R06 1M1 | (c) | SOFR30A + 275 | 05/25/2042 | 1,087,092 | 1,117,603 |
Connecticut Avenue Securities Trust 2022-R07 1M1 | (c) | SOFR30A + 295 | 06/25/2042 | 929,641 | 957,291 |
Connecticut Avenue Securities Trust 2022-R08 1M1 | (c) | SOFR30A + 255 | 07/25/2042 | 878,840 | 901,331 |
Connecticut Avenue Securities Trust 2023-R01 1M1 | (c) | SOFR30A + 240 | 12/25/2042 | 707,131 | 720,708 |
Connecticut Avenue Securities Trust 2023-R02 1M1 | (c) | SOFR30A + 230 | 01/25/2043 | 1,388,664 | 1,421,630 |
Connecticut Avenue Securities Trust 2023-R03 2M1 | (c) | SOFR30A + 250 | 04/25/2043 | 1,556,601 | 1,581,024 |
Connecticut Avenue Securities Trust 2023-R04 1M1 | (c) | SOFR30A + 230 | 05/25/2043 | 1,009,906 | 1,031,153 |
CPS Auto Receivables Trust 2021-B C | (c) | 1.230% | 03/15/2027 | 49,450 | 49,183 |
CPS Auto Receivables Trust 2021-C D | (c) | 1.690% | 06/15/2027 | 210,000 | 201,548 |
CPS Auto Receivables Trust 2022-D A | (c) | 6.090% | 01/15/2027 | 453,996 | 454,175 |
CPS Auto Receivables Trust 2023-A A | (c) | 5.540% | 03/16/2026 | 206,822 | 206,571 |
Dext ABS 2021-1 C | (c) | 2.290% | 09/15/2028 | 264,000 | 242,829 |
Dext ABS 2021-1 D | (c) | 2.810% | 03/15/2029 | 133,000 | 118,093 |
Dext ABS 2023-2 A1 | (c) | 5.743% | 11/15/2024 | 247,233 | 247,247 |
Diamond Issuer 2021-1A B | (c) | 2.701% | 11/20/2051 | 271,624 | 230,327 |
Donlen Fleet Lease Funding 2021-2 C | (c) | 1.200% | 12/11/2034 | 460,000 | 441,422 |
Dryden 78 CLO Ltd. 2020-78A A | (c) | TSFR3M + 144 | 04/17/2033 | 1,500,000 | 1,493,068 |
DT Auto Owner Trust 2023-1A A | (c) | 5.480% | 04/15/2027 | 464,008 | 463,142 |
Elmwood CLO 15 Ltd. 2022-2A A1 | (c) | TSFR3M + 134 | 04/22/2035 | 1,145,062 | 1,139,838 |
Elmwood CLO IX Ltd. 2021-2A D | (c) | TSFR3M + 321 | 07/20/2034 | 250,000 | 244,712 |
Elmwood CLO VIII Ltd. 2021-1A A1 | (c) | TSFR3M + 150 | 01/20/2034 | 880,466 | 880,221 |
Enterprise Fleet Financing 2023-2 A2 | (c) | 5.560% | 04/22/2030 | 1,011,000 | 1,013,732 |
Exeter Automobile Receivables Trust 2022-6A A2 | 5.730% | 11/17/2025 | 45,681 | 45,675 | |
Fannie Mae Connecticut Avenue Securities 2015-C04 1M2 | SOFR30A + 581 | 04/25/2028 | 44,760 | 47,641 | |
Fannie Mae Connecticut Avenue Securities 2018-C05 1M2 | SOFR30A + 246 | 01/25/2031 | 576,775 | 590,373 | |
Fannie Mae Connecticut Avenue Securities 2018-C06 1M2 | SOFR30A + 211 | 03/25/2031 | 119,261 | 119,862 | |
Fannie Mae Connecticut Avenue Securities 2021-R02 2B1 | (c) | SOFR30A + 330 | 11/25/2041 | 211,036 | 212,973 |
Fannie Mae Connecticut Avenue Securities 2021-R02 2M2 | (c) | SOFR30A + 200 | 11/25/2041 | 1,000,000 | 991,557 |
FHF Issuer Trust 2023-2A A1 | (c) | 6.007% | 11/15/2024 | 246,941 | 246,973 |
FHF Trust 2021-2A A | (c) | 0.830% | 12/15/2026 | 38,432 | 37,128 |
FHF Trust 2023-1A A2 | (c) | 6.570% | 06/15/2028 | 399,724 | 398,359 |
First Investors Auto Owner Trust 2022-2A A | (c) | 6.260% | 07/15/2027 | 467,773 | 469,464 |
Flagship Credit Auto Trust 2023-1 A2 | (c) | 5.380% | 12/15/2026 | 357,268 | 356,300 |
Flagship Credit Auto Trust 2023-2 A2 | (c) | 5.760% | 04/15/2027 | 649,646 | 648,536 |
Flatiron CLO 2021-1A D | (c) | TSFR3M + 316 | 07/19/2034 | 250,000 | 245,598 |
Ford Credit Auto Owner Trust 2021-1 D | (c) | 2.310% | 10/17/2033 | 230,000 | 209,017 |
Foursight Capital Automobile Receivables Trust 2023-1 A2 | (c) | 5.430% | 10/15/2026 | 397,390 | 396,192 |
Freddie Mac Multifamily Structured Credit Risk 2021-MN1 M1 | (c) | SOFR30A + 200 | 01/25/2051 | 27,011 | 26,206 |
Freddie Mac REMICS FHR 4981 HS | (e) | SOFR30A + 599 | 06/25/2050 | 633,572 | 70,935 |
Freddie Mac STACR REMIC Trust 2020-DNA6 M2 | (c) | SOFR30A + 200 | 12/25/2050 | 1,042,711 | 1,050,791 |
Freddie Mac STACR REMIC Trust 2021-DNA3 B1 | (c) | SOFR30A + 350 | 10/25/2033 | 278,276 | 289,765 |
Freddie Mac STACR REMIC Trust 2021-DNA5 B1 | (c) | SOFR30A + 305 | 01/25/2034 | 1,000,000 | 1,009,102 |
Freddie Mac STACR REMIC Trust 2021-DNA5 M2 | (c) | SOFR30A + 165 | 01/25/2034 | 459,817 | 461,741 |
Freddie Mac STACR REMIC Trust 2021-DNA6 M2 | (c) | SOFR30A + 150 | 10/25/2041 | 996,342 | 987,625 |
Freddie Mac STACR REMIC Trust 2021-DNA7 M2 | (c) | SOFR30A + 180 | 11/25/2041 | 986,480 | �� 974,101 |
Freddie Mac STACR REMIC Trust 2021-HQA2 M1 | (c) | SOFR30A + 70 | 12/25/2033 | 68,685 | 68,498 |
Freddie Mac STACR REMIC Trust 2021-HQA3 M2 | (c) | SOFR30A + 210 | 09/25/2041 | 1,000,000 | 986,543 |
Freddie Mac STACR REMIC Trust 2021-HQA4 M2 | (c) | SOFR30A + 235 | 12/25/2041 | 1,046,349 | 1,031,199 |
Freddie Mac STACR REMIC Trust 2022-DNA1 M1B | (c) | SOFR30A + 185 | 01/25/2042 | 1,600,000 | 1,599,389 |
Freddie Mac STACR REMIC Trust 2022-DNA2 M1B | (c) | SOFR30A + 240 | 02/25/2042 | 1,437,266 | 1,454,300 |
Freddie Mac STACR REMIC Trust 2022-DNA2 M2 | (c) | SOFR30A + 375 | 02/25/2042 | 295,064 | 304,630 |
Freddie Mac STACR REMIC Trust 2022-DNA3 M1A | (c) | SOFR30A + 200 | 04/25/2042 | 905,030 | 913,256 |
Freddie Mac STACR REMIC Trust 2022-DNA3 M1B | (c) | SOFR30A + 290 | 04/25/2042 | 1,600,000 | 1,642,849 |
101
(continued)
AuguStarSM Variable Insurance Products Fund, Inc.
AVIP AB Risk Managed Balanced Portfolio (Continued)
| Schedule of Investments | December 31, 2023 |
| Asset-Backed / Mortgage-Backed Securities (Continued) | Rate | Maturity | Face Amount | Value | |
| Financials (continued) | |||||
Freddie Mac STACR REMIC Trust 2022-DNA3 M2 | (c) | SOFR30A + 435 | 04/25/2042 | $ 200,000 | $ 210,165 |
Freddie Mac STACR REMIC Trust 2022-DNA4 M1B | (c) | SOFR30A + 335 | 05/25/2042 | 1,621,038 | 1,685,618 |
Freddie Mac STACR REMIC Trust 2022-DNA5 M1B | (c) | SOFR30A + 450 | 06/25/2042 | 1,331,433 | 1,433,594 |
Freddie Mac STACR REMIC Trust 2022-DNA7 M1A | (c) | SOFR30A + 250 | 03/25/2052 | 865,621 | 879,174 |
Freddie Mac STACR REMIC Trust 2022-HQA1 M1B | (c) | SOFR30A + 350 | 03/25/2042 | 65,368 | 67,683 |
Freddie Mac STACR REMIC Trust 2022-HQA3 M1A | (c) | SOFR30A + 230 | 08/25/2042 | 1,340,623 | 1,362,975 |
Freddie Mac STACR REMIC Trust 2023-DNA1 M1A | (c) | SOFR30A + 210 | 03/25/2043 | 508,184 | 516,237 |
Freddie Mac STACR REMIC Trust 2023-HQA1 M1A | (c) | SOFR30A + 200 | 05/25/2043 | 1,096,017 | 1,106,544 |
Freddie Mac STACR Trust 2019-DNA4 M2 | (c) | SOFR30A + 206 | 10/25/2049 | 698 | 698 |
Freddie Mac Structured Agency Credit Risk Debt Notes 2022-HQA2 M1A | (c) | SOFR30A + 265 | 07/25/2042 | 1,332,461 | 1,363,410 |
Freddie Mac Structured Agency Credit Risk Debt Notes 2023-DNA2 M1A | (c) | SOFR30A + 210 | 04/25/2043 | 1,599,841 | 1,624,803 |
Freddie Mac Structured Agency Credit Risk Debt Notes 2023-HQA2 M1B | (c) | SOFR30A + 335 | 06/25/2043 | 1,200,000 | 1,266,476 |
FREED ABS Trust 2021-2 C | (c) | 1.940% | 06/19/2028 | 150,754 | 149,280 |
Galaxy 30 CLO Ltd. 2022-30A D | (c) | TSFR3M + 335 | 04/15/2035 | 400,000 | 391,978 |
GCI Funding I LLC 2021-1 A | (c) | 2.380% | 06/18/2046 | 129,391 | 113,656 |
Goldentree Loan Management U.S. CLO 7 Ltd. 2020-7A AR | (c) | TSFR3M + 133 | 04/20/2034 | 250,000 | 248,072 |
Granite Park Equipment Leasing 2023-1A A3 | (c) | 6.460% | 09/20/2032 | 544,000 | 560,080 |
Hertz Vehicle Financing III LLC 2022-1A C | (c) | 2.630% | 06/25/2026 | 220,000 | 208,502 |
HFX Funding Issuer 2017-1 | (c) | 3.620% | 03/15/2035 | 280,000 | 272,272 |
Invesco CLO 2021-1A A1 | (c) | TSFR3M + 126 | 04/15/2034 | 1,700,000 | 1,687,406 |
JPMBB Commercial Mortgage Securities Trust 2014-C21 C | 4.619% | 08/15/2047 | 295,000 | 251,406 | |
JPMBB Commercial Mortgage Securities Trust 2015-C27 AS | 3.634% | 02/15/2048 | 130,694 | 124,679 | |
Kings Park CLO Ltd. 2021-1A A | (c) | TSFR3M + 139 | 01/21/2035 | 1,518,568 | 1,512,446 |
Kubota Credit Owner Trust 2023-1A A2 | (c) | 5.400% | 02/17/2026 | 1,007,518 | 1,006,702 |
LAD Auto Receivables Trust 2022-1A A | (c) | 5.210% | 06/15/2027 | 385,715 | 383,736 |
Lendbuzz Securitization Trust 2023-1A A2 | (c) | 6.920% | 08/15/2028 | 1,178,752 | 1,184,951 |
Lendbuzz Securitization Trust 2023-2A A2 | (c) | 7.090% | 10/16/2028 | 507,398 | 510,622 |
Lendbuzz Securitization Trust 2023-3A A2 | (c) | 7.500% | 12/15/2028 | 490,000 | 496,725 |
Lobel Automobile Receivables Trust 2023-2 A | (c) | 7.590% | 04/16/2029 | 1,334,400 | 1,343,039 |
Marlette Funding Trust 2023-3A B | (c) | 6.710% | 09/15/2033 | 727,000 | 734,441 |
Morgan Stanley Capital I Trust 2018-H3 AS | 4.429% | 07/15/2051 | 270,000 | 251,958 | |
MVW 2021-2A C | (c) | 2.230% | 05/20/2039 | 225,145 | 204,798 |
Neighborly Issuer 2022-1A A2 | (c) | 3.695% | 01/30/2052 | 224,010 | 191,335 |
Neighborly Issuer 2023-1A A2 | (c) | 7.308% | 01/30/2053 | 827,745 | 826,188 |
Neighborly Issuer LLC 2021-1A A2 | (c) | 3.584% | 04/30/2051 | 123,461 | 107,130 |
Nelnet Student Loan Trust 2021-BA B | (c) | 2.680% | 04/20/2062 | 100,000 | 81,943 |
Nelnet Student Loan Trust 2021-DA C | (c) | 3.500% | 04/20/2062 | 100,000 | 77,778 |
Neuberger Berman Loan Advisers CLO 2021-42A D | (c) | TSFR3M + 306 | 07/16/2035 | 301,613 | 294,681 |
Neuberger Berman Loan Advisers CLO 43 Ltd. 2021-43A D | (c) | TSFR3M + 336 | 07/17/2035 | 250,000 | 247,516 |
NMEF Funding 2022-B A2 | (c) | 6.070% | 06/15/2029 | 268,826 | 270,266 |
NMEF Funding 2023-A A2 | (c) | 6.570% | 06/17/2030 | 1,331,000 | 1,344,089 |
Oaktown Re VII Ltd. 2021-2 M1A | (c) | SOFR30A + 160 | 04/25/2034 | 169,725 | 169,784 |
OCP CLO 2020-18A AR | (c) | TSFR3M + 135 | 07/20/2032 | 322,000 | 321,783 |
Octane Receivables Trust 2021-2A C | (c) | 2.530% | 05/21/2029 | 209,000 | 192,990 |
OneMain Direct Auto Receivables Trust 2022-1A C | (c) | 5.310% | 06/14/2029 | 1,100,000 | 1,079,216 |
Pagaya AI Debt Trust 2023-5 A | (c) | 7.179% | 04/15/2031 | 635,504 | 637,335 |
Peace Park CLO Ltd. 2021-1A D | (c) | TSFR3M + 321 | 10/20/2034 | 1,490,000 | 1,439,947 |
PMT Credit Risk Transfer Trust 2019-2R A | (c) | TSFR1M + 386 | 05/30/2025 | 97,247 | 97,304 |
Prestige Auto Receivables Trust 2022-1A A2 | (c) | 5.900% | 07/15/2025 | 220,594 | 220,488 |
Rad CLO 11 Ltd. 2021-11A D | (c) | TSFR3M + 316 | 04/15/2034 | 250,000 | 245,083 |
Regatta XIX Funding Ltd. 2022-1A A1 | (c) | TSFR3M + 132 | 04/20/2035 | 616,754 | 611,584 |
Regatta XX Funding Ltd. 2021-2A A | (c) | TSFR3M + 142 | 10/15/2034 | 450,431 | 448,384 |
Regatta XXIV Funding Ltd. 2021-5A D | (c) | TSFR3M + 336 | 01/20/2035 | 450,000 | 443,910 |
Research-Driven Pagaya Motor Asset Trust 2023-3A A | (c) | 7.130% | 01/26/2032 | 1,252,754 | 1,260,373 |
Research-Driven Pagaya Motor Asset Trust 2023-4A A | (c) | 7.540% | 03/25/2032 | 1,216,758 | 1,223,442 |
Research-Driven Pagaya Motor Asset Trust VII 2022-3A A | (c) | 5.380% | 11/25/2030 | 488,062 | 483,146 |
Rockford Tower CLO 2021-1A D | (c) | TSFR3M + 326 | 07/20/2034 | 306,626 | 294,137 |
Rockford Tower CLO 2021-2A A1 | (c) | TSFR3M + 142 | 07/20/2034 | 250,000 | 249,339 |
Santander Bank Auto Credit-Linked Notes Series 2022-A B | (c) | 5.281% | 05/15/2032 | 300,218 | 297,661 |
Santander Bank Auto Credit-Linked Notes Series 2022-B B | (c) | 5.721% | 08/16/2032 | 323,603 | 322,428 |
Santander Bank Auto Credit-Linked Notes Series 2022-C B | (c) | 6.451% | 12/15/2032 | 536,298 | 536,990 |
Santander Drive Auto Receivables Trust 2023-3 B | 5.610% | 07/17/2028 | 488,000 | 490,276 | |
SEB Funding LLC 2021-1A A2 | (c) | 4.969% | 01/30/2052 | 331,170 | 306,140 |
SG Commercial Mortgage Securities Trust 2016-C5 A4 | 3.055% | 10/10/2048 | 250,000 | 233,125 | |
Signal Peak CLO 2022-12A C | (c) | TSFR3M + 345 | 07/18/2034 | 1,115,000 | 1,115,394 |
TICP CLO XV Ltd. 2020-15A A | (c) | TSFR3M + 154 | 04/20/2033 | 1,600,000 | 1,599,887 |
U.S. Bank N.A. 2023-1 B | (c) | 6.789% | 08/25/2032 | 1,000,000 | 1,003,701 |
Upstart Securitization Trust 2021-3 B | (c) | 1.660% | 07/20/2031 | 136,812 | 134,928 |
VASA Trust 2021-VASA A | (c) | TSFR1M + 101 | 07/15/2039 | 460,000 | 415,336 |
102
(continued)
AuguStarSM Variable Insurance Products Fund, Inc.
AVIP AB Risk Managed Balanced Portfolio (Continued)
| Schedule of Investments | December 31, 2023 |
| Asset-Backed / Mortgage-Backed Securities (Continued) | Rate | Maturity | Face Amount | Value | |
| Financials (continued) | |||||
Wells Fargo Commercial Mortgage Trust 2016-C35 B | 3.438% | 07/15/2048 | $ 270,000 | $ 232,191 | |
Westlake Automobile Receivables Trust 2023-1A A2A | (c) | 5.510% | 06/15/2026 | 746,052 | 745,115 |
Westlake Automobile Receivables Trust Series 2023-P1 B | (c) | 6.110% | 03/15/2027 | 580,000 | 584,307 |
| 98,891,964 | |||||
Total Asset-Backed / Mortgage-Backed Securities (Cost $98,548,954) | $ 99,354,735 | ||||
| U.S. Government Agency Mortgage-Backed Securities–5.3% | Rate | Maturity | Face Amount | Value | |
Fannie Mae or Freddie Mac UMBS TBA | 2.000% | 01/15/2054 | $ 3,650,277 | $ 2,982,961 | |
Fannie Mae or Freddie Mac UMBS TBA | 2.500% | 01/15/2054 | 13,501,145 | 11,484,411 | |
Fannie Mae or Freddie Mac UMBS TBA | 3.000% | 01/15/2054 | 3,024,412 | 2,675,069 | |
Fannie Mae or Freddie Mac UMBS TBA | 3.500% | 01/15/2054 | 6,605,359 | 6,059,385 | |
Fannie Mae or Freddie Mac UMBS TBA | 4.000% | 01/15/2054 | 2,881,017 | 2,724,699 | |
Fannie Mae or Freddie Mac UMBS TBA | 4.500% | 01/15/2054 | 2,854,498 | 2,766,856 | |
Fannie Mae or Freddie Mac UMBS TBA | 5.500% | 01/15/2054 | 4,047,000 | 4,064,073 | |
Fannie Mae Pool FN AL5310 | 3.500% | 04/01/2044 | 1,905 | 1,791 | |
Fannie Mae Pool FN AL5887 | 4.500% | 10/01/2044 | 11,285 | 11,201 | |
Fannie Mae Pool FN AL6542 | 4.500% | 03/01/2045 | 17,658 | 17,526 | |
Fannie Mae Pool FN AL6620 | 4.500% | 08/01/2042 | 103,375 | 102,222 | |
Fannie Mae Pool FN AL6997 | 4.500% | 11/01/2042 | 7,869 | 7,859 | |
Fannie Mae Pool FN AL8855 | 3.500% | 07/01/2046 | 6,548 | 6,140 | |
Fannie Mae Pool FN AS7168 | 3.500% | 05/01/2046 | 13,762 | 12,844 | |
Fannie Mae Pool FN AS7587 | 3.500% | 07/01/2046 | 80,409 | 75,461 | |
Fannie Mae Pool FN AS7822 | 3.500% | 08/01/2046 | 155,313 | 144,693 | |
Fannie Mae Pool FN AZ9203 | 3.000% | 10/01/2045 | 12,252 | 11,201 | |
Fannie Mae Pool FN BA2885 | 3.000% | 10/01/2045 | 34,596 | 31,469 | |
Fannie Mae Pool FN BA4752 | 3.000% | 01/01/2046 | 4,868 | 4,438 | |
Fannie Mae Pool FN BC1520 | 3.500% | 08/01/2046 | 124,596 | 116,282 | |
Fannie Mae Pool FN BC2468 | 3.000% | 03/01/2046 | 89,562 | 81,308 | |
Fannie Mae Pool FN BC2488 | 3.000% | 03/01/2046 | 96,880 | 88,095 | |
Fannie Mae Pool FN BC9077 | 3.500% | 12/01/2046 | 9,147 | 8,537 | |
Fannie Mae Pool FN BH1902 | 3.500% | 12/01/2047 | 7,662 | 7,228 | |
Fannie Mae Pool FN BH3892 | 3.500% | 08/01/2047 | 19,157 | 17,850 | |
Fannie Mae Pool FN BH6940 | 3.500% | 08/01/2047 | 17,337 | 16,180 | |
Fannie Mae Pool FN BJ1692 | 3.500% | 12/01/2047 | 40,055 | 37,762 | |
Fannie Mae Pool FN BJ1695 | 3.500% | 12/01/2047 | 5,535 | 5,185 | |
Fannie Mae Pool FN BJ4558 | 3.500% | 01/01/2048 | 28,307 | 26,686 | |
Fannie Mae Pool FN BJ4559 | 3.500% | 01/01/2048 | 10,393 | 9,766 | |
Fannie Mae Pool FN BJ4566 | 4.000% | 01/01/2048 | 93,528 | 90,604 | |
Fannie Mae Pool FN BJ4567 | 4.000% | 01/01/2048 | 136,611 | 132,143 | |
Fannie Mae Pool FN BJ5170 | 3.500% | 03/01/2048 | 7,591 | 7,166 | |
Fannie Mae Pool FN BK1964 | 4.000% | 03/01/2048 | 28,640 | 27,745 | |
Fannie Mae Pool FN BK1975 | 3.500% | 03/01/2048 | 17,713 | 16,688 | |
Fannie Mae Pool FN BK3211 | 4.500% | 03/01/2048 | 31,420 | 30,979 | |
Fannie Mae Pool FN BK4157 | 4.000% | 05/01/2048 | 37,781 | 36,415 | |
Fannie Mae Pool FN BM3282 | 3.500% | 12/01/2047 | 4,896 | 4,635 | |
Fannie Mae Pool FN BM3511 | 4.500% | 02/01/2046 | 62,228 | 62,147 | |
Fannie Mae Pool FN BM3912 | 3.000% | 03/01/2047 | 99,381 | 90,512 | |
Fannie Mae Pool FN BM4427 | 3.500% | 04/01/2048 | 60,524 | 56,485 | |
Fannie Mae Pool FN BM4735 | 3.500% | 04/01/2048 | 71,002 | 66,852 | |
Fannie Mae Pool FN BM4896 | 3.000% | 02/01/2047 | 666,525 | 612,644 | |
Fannie Mae Pool FN BM5138 | 3.500% | 11/01/2048 | 130,351 | 122,982 | |
Fannie Mae Pool FN BM5334 | 3.500% | 01/01/2049 | 31,897 | 29,768 | |
Fannie Mae Pool FN BN0012 | 4.500% | 08/01/2048 | 15,103 | 14,838 | |
Fannie Mae Pool FN BO3223 | 3.000% | 10/01/2034 | 21,439 | 20,320 | |
Fannie Mae Pool FN BO4725 | 2.500% | 11/01/2034 | 37,036 | 34,426 | |
Fannie Mae Pool FN BO5957 | 3.000% | 12/01/2034 | 4,455 | 4,225 | |
Fannie Mae Pool FN BO7717 | 3.000% | 11/01/2034 | 4,870 | 4,623 | |
Fannie Mae Pool FN BU1240 | 3.000% | 03/01/2052 | 980,606 | 874,352 | |
Fannie Mae Pool FN BU1349 | 3.000% | 02/01/2052 | 764,044 | 681,462 | |
Fannie Mae Pool FN BU8919 | 2.500% | 04/01/2052 | 634,028 | 544,102 | |
Fannie Mae Pool FN BU8922 | 2.500% | 04/01/2052 | 600,088 | 513,262 | |
Fannie Mae Pool FN CA0108 | 3.500% | 08/01/2047 | 16,477 | 15,598 | |
Fannie Mae Pool FN CB1113 | 2.000% | 07/01/2051 | 1,037,963 | 849,603 | |
Fannie Mae Pool FN CB2538 | 2.500% | 01/01/2052 | 648,471 | 556,983 | |
Fannie Mae Pool FN CB3564 | 2.500% | 05/01/2052 | 545,478 | 468,551 | |
Fannie Mae Pool FN CB3565 | 2.500% | 05/01/2052 | 429,314 | 367,422 | |
Fannie Mae Pool FN FM0029 | 3.000% | 09/01/2046 | 165,840 | 152,433 | |
Fannie Mae Pool FN FM1036 | 3.000% | 05/01/2043 | 83,656 | 77,378 | |
103
(continued)
AuguStarSM Variable Insurance Products Fund, Inc.
AVIP AB Risk Managed Balanced Portfolio (Continued)
| Schedule of Investments | December 31, 2023 |
| U.S. Government Agency Mortgage-Backed Securities (Continued) | Rate | Maturity | Face Amount | Value | |
Fannie Mae Pool FN FS0967 | 2.500% | 03/01/2052 | $ 709,977 | $ 609,882 | |
Fannie Mae Pool FN MA3211 | 4.000% | 12/01/2047 | 38,673 | 37,342 | |
Fannie Mae Pool FN MA3239 | 4.000% | 01/01/2048 | 6,198 | 5,970 | |
Freddie Mac Gold Pool FG G60658 | 3.500% | 07/01/2046 | 160,434 | 151,710 | |
Freddie Mac Gold Pool FG G61360 | 3.500% | 03/01/2048 | 34,992 | 32,811 | |
Freddie Mac Gold Pool FG G61737 | 3.500% | 11/01/2048 | 140,097 | 131,470 | |
Freddie Mac Gold Pool FG Q54793 | 4.500% | 03/01/2048 | 24,714 | 24,292 | |
Freddie Mac Gold Pool FG Q55394 | 3.500% | 04/01/2048 | 10,873 | 10,203 | |
Freddie Mac Pool FR QD8682 | 3.000% | 03/01/2052 | 632,868 | 562,730 | |
Freddie Mac Pool FR QE0805 | 2.500% | 04/01/2052 | 593,195 | 506,159 | |
Freddie Mac Pool FR QE0808 | 2.500% | 04/01/2052 | 640,193 | 549,393 | |
Freddie Mac Pool FR QN0783 | 3.000% | 10/01/2034 | 25,314 | 24,008 | |
Freddie Mac Pool FR QN0786 | 3.000% | 10/01/2034 | 54,549 | 51,736 | |
Freddie Mac Pool FR QN0951 | 2.500% | 11/01/2034 | 39,174 | 36,414 | |
Freddie Mac Pool FR RA6963 | 2.000% | 03/01/2052 | 992,346 | 816,181 | |
Freddie Mac Pool FR SB0040 | 2.500% | 12/01/2033 | 170,118 | 160,512 | |
Freddie Mac Pool FR SB0116 | 2.500% | 11/01/2034 | 41,679 | 38,784 | |
Freddie Mac Pool FR SD0932 | 2.500% | 04/01/2052 | 656,310 | 562,020 | |
Freddie Mac Pool FR ZA4718 | 3.000% | 10/01/2046 | 120,849 | 109,841 | |
Freddie Mac Pool FR ZK8962 | 3.000% | 09/01/2032 | 43,527 | 41,568 | |
Freddie Mac Pool FR ZK9009 | 3.000% | 10/01/2032 | 15,743 | 15,035 | |
Freddie Mac Pool FR ZK9163 | 3.000% | 01/01/2033 | 23,488 | 22,422 | |
Freddie Mac Pool FR ZM1434 | 3.500% | 07/01/2046 | 19,160 | 18,044 | |
Freddie Mac Pool FR ZM4821 | 3.500% | 11/01/2047 | 22,239 | 20,867 | |
Freddie Mac Pool FR ZM4939 | 3.500% | 11/01/2047 | 39,483 | 37,223 | |
Freddie Mac Pool FR ZM5102 | 3.500% | 12/01/2047 | 49,436 | 46,360 | |
Freddie Mac Pool FR ZM5228 | 3.500% | 12/01/2047 | 28,429 | 26,812 | |
Freddie Mac Pool FR ZM5705 | 3.500% | 02/01/2048 | 13,083 | 12,326 | |
Freddie Mac Pool FR ZM5707 | 3.500% | 02/01/2048 | 9,179 | 8,588 | |
Freddie Mac Pool FR ZM5945 | 4.000% | 03/01/2048 | 24,742 | 23,962 | |
Freddie Mac Pool FR ZM6220 | 4.000% | 04/01/2048 | 12,749 | 12,261 | |
Freddie Mac Pool FR ZM6276 | 4.000% | 04/01/2048 | 35,331 | 34,183 | |
Freddie Mac Pool FR ZM6427 | 4.000% | 05/01/2048 | 80,058 | 77,105 | |
Freddie Mac Pool FR ZN2165 | 4.500% | 12/01/2048 | 38,402 | 38,124 | |
Freddie Mac Pool FR ZS4598 | 3.000% | 01/01/2045 | 15,360 | 14,040 | |
Freddie Mac Pool FR ZS7403 | 3.000% | 05/01/2031 | 121,800 | 117,047 | |
Freddie Mac Pool FR ZS9830 | 3.500% | 10/01/2046 | 160,361 | 149,652 | |
Freddie Mac Pool FR ZT0272 | 3.500% | 02/01/2047 | 94,156 | 87,868 | |
Freddie Mac Pool FR ZT0337 | 3.500% | 12/01/2044 | 16,140 | 15,209 | |
Freddie Mac Pool FR ZT0537 | 3.500% | 03/01/2048 | 126,237 | 118,415 | |
Freddie Mac Pool FR ZT1633 | 4.000% | 03/01/2047 | 8,591 | 8,282 | |
Ginnie Mae II Jumbo TBA | 3.000% | 01/15/2054 | 1,154,251 | 1,044,955 | |
Ginnie Mae II Jumbo TBA | 4.000% | 01/15/2054 | 2,802,682 | 2,675,692 | |
Ginnie Mae II Jumbo TBA | 4.500% | 01/15/2054 | 8,761,097 | 8,550,305 | |
Ginnie Mae II Jumbo TBA | 5.000% | 01/15/2054 | 8,131,040 | 8,073,879 | |
Ginnie Mae II Jumbo TBA | 5.500% | 01/15/2054 | 6,478,601 | 6,525,182 | |
Ginnie Mae II Pool G2 MA8801 | 5.500% | 04/20/2053 | 2,367,703 | 2,385,130 | |
Total U.S. Government Agency Mortgage-Backed Securities (Cost $74,796,996) | $ 74,788,515 | ||||
| Purchased Options–5.3% | Notional Amount | Expiration | Exercise Price | Contracts (f) | Value | |
S&P 500 Index Call Option | $14,309,490 | December 2025 | $4,400 | 30 | $ 2,525,400 | |
S&P 500 Index Call Option | 68,208,569 | December 2025 | 4,500 | 143 | 11,443,432 | |
S&P 500 Index Call Option | 40,543,555 | December 2025 | 4,600 | 85 | 6,035,935 | |
S&P 500 Index Call Option | 76,317,280 | December 2025 | 4,700 | 160 | 10,420,640 | |
S&P 500 Index Call Option | 60,576,841 | December 2025 | 4,800 | 127 | 7,556,500 | |
S&P 500 Index Call Option | 42,451,487 | December 2025 | 4,900 | 89 | 4,616,430 | |
S&P 500 Index Call Option | 47,698,300 | December 2025 | 5,000 | 100 | 4,701,200 | |
S&P 500 Index Put Option | 29,095,963 | December 2025 | 4,400 | 61 | 1,421,910 | |
S&P 500 Index Put Option | 68,208,569 | December 2025 | 4,500 | 143 | 3,691,831 | |
S&P 500 Index Put Option | 84,425,991 | December 2025 | 4,600 | 177 | 4,977,240 | |
S&P 500 Index Put Option | 76,317,280 | December 2025 | 4,700 | 160 | 5,003,200 | |
S&P 500 Index Put Option | 53,422,096 | December 2025 | 4,800 | 112 | 3,762,640 | |
S&P 500 Index Put Option | 42,451,487 | December 2025 | 4,900 | 89 | 3,276,980 | |
S&P 500 Index Put Option | 47,698,300 | December 2025 | 5,000 | 100 | 3,996,700 | |
Total Purchased Options (Cost $69,834,474) | $ 73,430,038 | |||||
104
(continued)
AuguStarSM Variable Insurance Products Fund, Inc.
AVIP AB Risk Managed Balanced Portfolio (Continued)
| Schedule of Investments | December 31, 2023 |
| Sovereign Debt Issues–0.1% | Rate | Maturity | Face Amount | Value | |
Colombia Government International Bond | 3.125% | 04/15/2031 | $ 1,868,000 | $ 1,518,944 | |
Dominican Republic International Bond | (c) | 4.875% | 09/23/2032 | 250,000 | 227,288 |
Total Sovereign Debt Issues (Cost $1,839,080) | $ 1,746,232 | ||||
| Preferred Securities–0.1% | Rate | Quantity | Value | |
| Financials–0.1% | ||||
Charles Schwab Corp. / The DR (Rate is fixed until 06/01/2026, at which point, the rate becomes H15T5Y + 317) (Capital Markets) | (d) | 4.000% | 455,000 | $ 401,073 |
Citigroup, Inc. DR (Rate is fixed until 05/15/2025, at which point, the rate becomes TSFR3M + 417) (Banks) | (d) | 5.950% | 142,000 | 138,991 |
Citigroup, Inc. (Rate is fixed until 12/10/2025, at which point, the rate becomes H15T5Y + 360) (Banks) | (d) | 4.000% | 101,000 | 92,962 |
Citigroup, Inc. (Rate is fixed until 11/15/2028, at which point, the rate becomes H15T5Y + 321) (Banks) | (d) | 7.625% | 33,000 | 33,696 |
Goldman Sachs Group, Inc. / The DR (Capital Markets) | TSFR3M + 314 | 195,000 | 195,097 | |
Goldman Sachs Group, Inc. / The DR (Rate is fixed until 11/10/2026, at which point, the rate becomes H15T5Y + 295) (Capital Markets) | (d) | 4.125% | 120,000 | 106,866 |
PNC Financial Services Group, Inc. / The DR (Banks) | TSFR3M + 330 | 283,000 | 282,270 | |
| 1,250,955 | ||||
| Utilities–0.0% | ||||
Vistra Corp. (Rate is fixed until 12/15/2026, at which point, the rate becomes H15T5Y + 574) (Ind. Power & Renewable Elec.) | (c)(d) | 7.000% | 107,000 | 105,395 |
Total Preferred Securities (Cost $1,446,858) | $ 1,356,350 | |||
| Taxable Municipal Bonds–0.0% | Rate | Maturity | Face Amount | Value | |
Ochsner LSU Health System of North Louisiana | 2.510% | 05/15/2031 | $ 230,000 | $ 158,610 | |
University of California | 3.071% | 05/15/2051 | 310,000 | 222,920 | |
Total Taxable Municipal Bonds (Cost $537,105) | $ 381,530 | ||||
| Rights –0.0% | Quantity | Value | |
| Health Care–0.0% | |||
ABIOMED, Inc. CVR (Health Care Technology) | 4,357 | $ 4,444 | |
Total Rights (Cost $4,444) | $ 4,444 | ||
| Money Market Funds–5.5% | Shares | Value | |
State Street Institutional Liquid Reserves Fund, 5.493% | (g) | 38,639,428 | $ 38,654,884 |
State Street Institutional U.S. Government Money Market Fund, 5.316% | (g) | 38,638,832 | 38,638,832 |
Total Money Market Funds (Cost $77,292,722) | $ 77,293,716 | ||
Total Investments – 102.4% (Cost $1,333,164,686) | (h) | $1,433,109,910 | |
| Liabilities in Excess of Other Assets – (2.4)% | (34,078,201) | ||
| Net Assets – 100.0% | $1,399,031,709 | ||
Percentages are stated as a percent of net assets. |
| Abbreviations: | ||
| ADR: | American Depositary Receipts | |
| CLO: | Collaterized Loan Obligation | |
| CVR: | Contingent Value Right | |
| DR: | Depositary Receipt | |
| H15T1Y: | U.S. Treasury Yield Curve Rate T-Note Constant Maturity 1 Year, 4.790% at 12/31/2023 | |
| H15T5Y: | U.S. Treasury Yield Curve Rate T-Note Constant Maturity 5 Year, 3.840% at 12/31/2023 | |
| QL: | Quarterly U.S. LIBOR Rate. This rate is linked to U.S. LIBOR, which is no longer published. An alternate reference rate will be determined by the issuer prior to the date the security becomes a variable rate instrument. | |
| REITs: | Real Estate Investment Trusts | |
| SOFR: | Secured Overnight Financing Rate, 5.380% at 12/31/2023 | |
| SOFR30A: | 30 Day Average Secured Overnight Financing Rate ("SOFR"), 5.344% at 12/31/2023 | |
| TSFR1M: | Monthly CME Term Secured Overnight Financing Rate ("SOFR"), 5.355% at 12/31/2023 | |
| TSFR3M: | Quarterly CME Term Secured Overnight Financing Rate ("SOFR"), 5.331% at 12/31/2023 | |
| UMBS TBA: | Uniform Mortgage-Backed Security To Be Announced ("TBA"); the securities backed by fixed rate mortgage loans that are delivered on a future settlement date could be issued by Fannie Mae, Freddie Mac, or a combination thereof. | |
| USISDA05: | USD ICE Swap Rate 11:00am NY 5 Year. This rate is linked to U.S. LIBOR, which is no longer published. An alternate reference rate will be determined by the issuer prior to the date the security becomes a variable rate instrument. | |
| USSW5: | USD Swap Semi 30/360 5 Year. This rate is linked to U.S. LIBOR, which is no longer published. An alternate reference rate will be determined by the issuer prior to the date the security becomes a variable rate instrument. | |
105
(continued)
AuguStarSM Variable Insurance Products Fund, Inc.
AVIP AB Risk Managed Balanced Portfolio (Continued)
| Schedule of Investments | December 31, 2023 |
| Footnotes: | ||
| (a) | Non-income producing security. | |
| (b) | Security is partially pledged as collateral for the futures contracts outstanding at December 31, 2023. The value of securities pledged totaled $25,927,720. See also the following Schedule of Open Futures Contracts. | |
| (c) | Security exempt from registration under Regulation D of the Securities Act of 1933. These securities may be resold in transactions exempt from registration, normally to qualified buyers under Rule 144A. At December 31, 2023, the value of these securities totaled $146,394,442, or 10.5% of the Portfolio’s net assets. | |
| (d) | Security is a fixed-then-variable rate instrument in which the coupon or dividend rate is fixed until a later specified date, then is adjusted periodically. Rates stated, including interest rate caps and floors, if any, are those in effect at December 31, 2023. | |
| (e) | Interest-only security | |
| (f) | 100 shares per contract. | |
| (g) | Rate represents the seven-day yield at December 31, 2023. | |
| (h) | Represents cost for financial reporting purposes, which may differ from cost basis for federal income tax purposes. See also Note 7 of the Notes to Financial Statements. | |
The accompanying notes are an integral part of these financial statements.
| Schedule of Open Futures Contracts | December 31, 2023 |
Long Futures Contracts
| Description | Number of contracts | Expiration Date | Notional Amount | Value | Unrealized Appreciation (Depreciation) | Variation Margin Receivable (Payable) | ||||||
| CME E-mini S&P 500 Index - Long | 745 | March 15, 2024 | $172,863,821 | $179,545,000 | $ 6,681,179 | $(456,313) | ||||||
| CME Micro E-mini S&P 500 Index - Long | 84 | March 15, 2024 | 1,991,197 | 2,024,400 | 33,203 | 1,094 | ||||||
| CBT 10-Year U.S. Treasury Note - Long | 3,579 | March 19, 2024 | 390,845,863 | 404,035,547 | 13,189,684 | — | ||||||
| CBT 10-Year U.S. Ultra Bond - Long | 80 | March 19, 2024 | 9,024,521 | 9,441,250 | 416,729 | (7,500) | ||||||
| CBT U.S. Long Bond - Long | 385 | March 19, 2024 | 44,257,453 | 48,100,938 | 3,843,485 | (72,187) | ||||||
| CBT U.S. Ultra Bond - Long | 2 | March 19, 2024 | 244,644 | 267,188 | 22,544 | (1,063) | ||||||
| CBT 5-Year U.S. Treasury Note - Long | 824 | March 28, 2024 | 87,756,258 | 89,629,313 | 1,873,055 | 69,610 | ||||||
| $706,983,757 | $733,043,636 | $26,059,879 | $(466,359) |
Short Futures Contracts
| Description | Number of contracts | Expiration Date | Notional Amount | Value | Unrealized Appreciation (Depreciation) | Variation Margin Receivable (Payable) | ||||||
| CBT 2-Year U.S. Treasury Note - Short | 47 | March 28, 2024 | $ (9,579,127) | $ (9,677,961) | $ (98,834) | $ 19,820 | ||||||
| Total Futures Contracts | $697,404,630 | $723,365,675 | $25,961,045 | $(446,539) |
The accompanying notes are an integral part of these financial statements.
106
AuguStarSM Variable Insurance Products Fund, Inc.
AVIP Federated Core Plus Bond Portfolio (Unaudited)
Objective/Strategy
The AVIP Federated Core Plus Bond Portfolio (formerly ON Federated Core Plus Bond Portfolio) seeks to provide total return by investing at least 80% of its net assets in fixed-income investments, primarily U.S. dollar denominated, investment-grade, fixed income securities. Investment-grade, fixed income securities are rated in one of the four highest categories (BBB- or higher) by a nationally recognized statistical rating organization (“NRSRO”).
Performance as of December 31, 2023
| Average Annual returns | |
| One year | 5.18% |
| Since inception (5/1/20) | -1.44% |
Past performance does not guarantee future results. The performance data quoted represents past performance and current returns may be lower or higher. Total return figures include change in share price and reinvestment of dividends and capital gains. The investment return and principal value will fluctuate so that an investor’s shares, when redeemed, may be worth more or less than the original cost. To obtain performance information up to the most recent month end, call toll-free 1-877-781-6392.
The Portfolio is not open to direct retail investment. Beneficial interest in the Portfolio’s shares is obtained either through an allocation to the Portfolio as an investment vehicle within variable life insurance policies or annuity contracts, or as an underlying investment by the AVIP Model Portfolios. Actual performance results for variable annuity and variable universal life contracts will be lower due to contract charges. Consult your contract for applicable charges.
Total expense ratio is 0.57% per the Fund’s Prospectus dated May 1, 2023 and supplemented October 2, 2023 and December 4, 2023. Additional information pertaining to the Portfolio’s expense ratio as of December 31, 2023 can be found in the Portfolio’s Financial Highlights.
Comments from Sub-Adviser
Q. How did the Portfolio perform in comparison to its benchmark during the reporting period?
A. For the year ended December 31, 2023, the Portfolio returned 5.18% versus 5.39% for its benchmark, the ICE BofA U.S. Broad Market Index.
Q. What affected the Portfolio’s performance?
A. The Portfolio’s slight underperformance for the year was due primarily to the Portfolio’s duration being slightly less than that of the benchmark, specifically within Treasuries and investment grade bonds. Out-of-index allocations to trade finance loans and high yield sector, along with an under-weight to U.S. Treasuries, aided relative performance. In addition, positive security selection in agency mortgage-backed-securities, emerging markets, high yield, and investment grade corporate bonds also contributed to relative performance. From an individual security perspective, the top contributors to relative performance for the year were short positions in the September 2023 and December 2023 CBT U.S. Ultra Bond futures contracts, as well a short position in the September 2023 CBT 5-Year U.S. Treasury Note futures contract. Top detractors were a long position in the September 2023 CBT 5-Year U.S. Treasury Note futures contact, followed by a long position in the September 2023 CBT 10-Year U.S. Ultra Bond futures contract and a short position in the March 2024 CBT U.S. Ultra Bond futures contract. The aggregate impact of futures on the Portfolio’s absolute return for the year was -55 basis points. (1)
| (1) | The Portfolio’s composition is subject to change. Holdings and weightings are as of December 31, 2023. |
Change in Value of $10,000 Investment
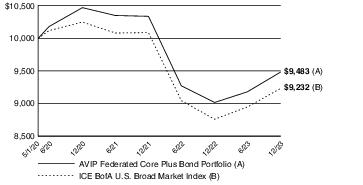
Hypothetical illustration based on past performance. Future performance will vary. The Portfolio’s returns reflect reinvested dividends. The Portfolio’s holdings may differ significantly from the securities in the index. The index is unmanaged and therefore does not reflect the cost of portfolio management and accounting.
The ICE BofA U.S. Broad Market Index measures the performance of U.S. dollar-denominated, investment grade debt securities, including U.S. Treasury notes and bonds, quasi-government securities, corporate securities, residential and commercial mortgage-backed securities and asset-backed securities. Securities are cap-weighted based on their amount outstanding times the market price plus accrued interest.
Past performance is no guarantee of future results. Redemption of fund shares could have tax implications unique to each shareholder.
107
(continued)
AuguStarSM Variable Insurance Products Fund, Inc.
AVIP Federated Core Plus Bond Portfolio (Unaudited) (Continued)
| Portfolio Composition as of December 31, 2023 (1) | |
| % of Net Assets | |
| U.S. Treasury Obligations | 35.9 |
| Corporate Bonds (4) | 26.0 |
| U.S. Government Agency Mortgage-Backed Securities | 24.6 |
| Investment Companies | 6.3 |
| Asset-Backed / Mortgage-Backed Securities (4) | 5.0 |
| Sovereign Debt Issues | 0.3 |
| Other Net Assets | 1.9 |
| 100.0 | |
| Top 10 Portfolio Holdings as of December 31, 2023 (1) (2) (3) | ||
| % of Net Assets | ||
| 1. | U.S. Treasury Note 2.875%, 05/15/2052 | 4.2 |
| 2. | Federated Hermes Core Trust III - Federated Project and Trade Finance Core Fund | 3.8 |
| 3. | U.S. Treasury Note 3.875%, 11/30/2027 | 3.5 |
| 4. | U.S. Treasury Note 0.875%, 06/30/2026 | 2.8 |
| 5. | U.S. Treasury Note 4.375%, 11/30/2030 | 2.6 |
| 6. | Federated Hermes Core Trust - Emerging Markets Core Fund | 2.4 |
| 7. | U.S. Treasury Note 2.750%, 04/30/2027 | 2.1 |
| 8. | U.S. Treasury Note 4.750%, 07/31/2025 | 1.7 |
| 9. | U.S. Treasury Note 4.125%, 07/31/2028 | 1.6 |
| 10. | U.S. Treasury Note 2.375%, 02/15/2042 | 1.6 |
| (1) | Composition of Portfolio subject to change. | |
| (2) | Short-term investments have been excluded from the list of Top 10 Portfolio Holdings. | |
| (3) | Top 10 Portfolio Holdings is presented at an individual security level. Total investment exposure by issuer may be higher. | |
| (4) | Sectors (Corporate Bonds, Asset-Backed / Mortgage Backed Securities): | |
| % of Net Assets | |
| Financials | 12.0 |
| Industrials | 3.5 |
| Health Care | 2.5 |
| Communication Services | 2.3 |
| Utilities | 2.3 |
| Energy | 2.1 |
| Consumer Staples | 1.6 |
| Information Technology | 1.5 |
| Real Estate | 1.3 |
| Consumer Discretionary | 1.0 |
| Materials | 0.9 |
| 31.0 |
108
AuguStarSM Variable Insurance Products Fund, Inc.
AVIP Federated Core Plus Bond Portfolio
| Schedule of Investments | December 31, 2023 |
| U.S. Treasury Obligations–35.9% | Rate | Maturity | Face Amount | Value | |
U.S. Treasury Note | 2.250% | 03/31/2024 | $ 2,250,000 | $ 2,233,213 | |
U.S. Treasury Note | 2.500% | 04/30/2024 | 8,400,000 | 8,323,219 | |
U.S. Treasury Note | 0.250% | 05/15/2024 | 7,500,000 | 7,365,234 | |
U.S. Treasury Note | 3.000% | 06/30/2024 | 5,000,000 | 4,947,656 | |
U.S. Treasury Note | 3.000% | 07/31/2024 | 8,000,000 | 7,905,625 | |
U.S. Treasury Note | 0.375% | 09/15/2024 | 6,000,000 | 5,810,625 | |
U.S. Treasury Note | 4.750% | 07/31/2025 | 10,000,000 | 10,045,312 | |
U.S. Treasury Note | 0.375% | 12/31/2025 | 3,000,000 | 2,780,273 | |
U.S. Treasury Note | 0.875% | 06/30/2026 | 18,000,000 | 16,645,078 | |
U.S. Treasury Note | 0.625% | 07/31/2026 | 2,400,000 | 2,198,344 | |
U.S. Treasury Note | 1.500% | 01/31/2027 | 3,500,000 | 3,248,848 | |
U.S. Treasury Note | 2.500% | 03/31/2027 | 5,900,000 | 5,638,879 | |
U.S. Treasury Note | (a) | 0.500% | 04/30/2027 | 3,200,000 | 2,856,375 |
U.S. Treasury Note | 2.750% | 04/30/2027 | 12,600,000 | 12,120,117 | |
U.S. Treasury Note | 2.625% | 05/31/2027 | 1,500,000 | 1,435,664 | |
U.S. Treasury Note | 3.875% | 11/30/2027 | 20,500,000 | 20,456,758 | |
U.S. Treasury Note | 1.250% | 03/31/2028 | 575,000 | 515,613 | |
U.S. Treasury Note | 4.125% | 07/31/2028 | 9,500,000 | 9,597,969 | |
U.S. Treasury Note | 1.500% | 11/30/2028 | 4,200,000 | 3,755,883 | |
U.S. Treasury Note | 1.375% | 12/31/2028 | 3,650,000 | 3,238,092 | |
U.S. Treasury Note | 2.375% | 03/31/2029 | 500,000 | 464,199 | |
U.S. Treasury Note | 3.875% | 11/30/2029 | 1,600,000 | 1,596,938 | |
U.S. Treasury Note | 4.375% | 11/30/2030 | 15,000,000 | 15,424,219 | |
U.S. Treasury Note | 1.125% | 02/15/2031 | 405,000 | 338,064 | |
U.S. Treasury Note | 1.875% | 02/15/2032 | 4,800,000 | 4,126,687 | |
U.S. Treasury Note | 3.375% | 05/15/2033 | 8,050,000 | 7,725,484 | |
U.S. Treasury Note | 1.375% | 11/15/2040 | 525,000 | 348,325 | |
U.S. Treasury Note | 1.875% | 02/15/2041 | 180,000 | 129,410 | |
U.S. Treasury Note | 2.375% | 02/15/2042 | 11,850,000 | 9,092,098 | |
U.S. Treasury Note | 4.000% | 11/15/2042 | 1,600,000 | 1,554,938 | |
U.S. Treasury Note | 2.000% | 02/15/2050 | 3,750,000 | 2,467,529 | |
U.S. Treasury Note | 1.875% | 02/15/2051 | 3,940,000 | 2,498,360 | |
U.S. Treasury Note | 2.875% | 05/15/2052 | 30,800,000 | 24,522,094 | |
U.S. Treasury Note | 4.000% | 11/15/2052 | 2,800,000 | 2,762,594 | |
U.S. Treasury Note | 4.125% | 08/15/2053 | 5,500,000 | 5,559,297 | |
Total U.S. Treasury Obligations (Cost $225,041,971) | $209,729,013 | ||||
| Corporate Bonds–26.0% | Rate | Maturity | Face Amount | Value | |
| Communication Services–2.3% | |||||
Alphabet, Inc. (Interactive Media & Svs.) | 2.050% | 08/15/2050 | $ 750,000 | $ 468,454 | |
America Movil S.A.B. de C.V. (Wireless Telecom. Svs.) | 2.875% | 05/07/2030 | 275,000 | 244,934 | |
AT&T, Inc. (Diversified Telecom. Svs.) | 1.700% | 03/25/2026 | 750,000 | 701,684 | |
AT&T, Inc. (Diversified Telecom. Svs.) | 3.800% | 12/01/2057 | 1,870,000 | 1,390,051 | |
Audacy Capital Corp. (Acquired 06/28/2021, Cost $77,861) (Media) | (b)(c) | 6.750% | 03/31/2029 | 75,000 | 1,125 |
Cars.com, Inc. (Interactive Media & Svs.) | (b) | 6.375% | 11/01/2028 | 50,000 | 48,211 |
CCO Holdings LLC / CCO Holdings Capital Corp. (Media) | (b) | 5.000% | 02/01/2028 | 100,000 | 95,678 |
CCO Holdings LLC / CCO Holdings Capital Corp. (Media) | (b) | 4.500% | 08/15/2030 | 125,000 | 112,686 |
CCO Holdings LLC / CCO Holdings Capital Corp. (Media) | (b) | 4.250% | 02/01/2031 | 125,000 | 109,241 |
CCO Holdings LLC / CCO Holdings Capital Corp. (Media) | (b) | 4.500% | 06/01/2033 | 75,000 | 63,460 |
Charter Communications Operating LLC / Charter Communications Operating Capital Corp. (Media) | 6.484% | 10/23/2045 | 750,000 | 736,960 | |
CMG Media Corp. (Media) | (b) | 8.875% | 12/15/2027 | 100,000 | 79,313 |
Comcast Corp. (Media) | 3.450% | 02/01/2050 | 1,450,000 | 1,112,965 | |
CSC Holdings LLC (Media) | (b) | 7.500% | 04/01/2028 | 200,000 | 149,618 |
Directv Financing LLC / Directv Financing Co-Obligor, Inc. (Media) | (b) | 5.875% | 08/15/2027 | 50,000 | 46,979 |
DISH DBS Corp. (Media) | (b) | 5.250% | 12/01/2026 | 50,000 | 42,838 |
DISH DBS Corp. (Media) | 7.375% | 07/01/2028 | 25,000 | 14,945 | |
DISH DBS Corp. (Media) | 5.125% | 06/01/2029 | 75,000 | 38,654 | |
DISH Network Corp. (Media) | (b) | 11.750% | 11/15/2027 | 25,000 | 26,096 |
Entegris Escrow Corp. (Media) | (b) | 4.750% | 04/15/2029 | 25,000 | 24,085 |
Entegris Escrow Corp. (Media) | (b) | 5.950% | 06/15/2030 | 50,000 | 49,702 |
Gray Escrow II, Inc. (Media) | (b) | 5.375% | 11/15/2031 | 75,000 | 56,587 |
Gray Television, Inc. (Media) | (b) | 4.750% | 10/15/2030 | 50,000 | 37,638 |
iHeartCommunications, Inc. (Media) | 8.375% | 05/01/2027 | 75,000 | 48,681 | |
iHeartCommunications, Inc. (Media) | (b) | 5.250% | 08/15/2027 | 50,000 | 39,729 |
Interpublic Group of Cos., Inc. / The (Media) | 5.375% | 06/15/2033 | 375,000 | 380,855 | |
Lamar Media Corp. (Media) | 4.875% | 01/15/2029 | 25,000 | 24,133 | |
Match Group Holdings II LLC (Interactive Media & Svs.) | (b) | 5.000% | 12/15/2027 | 100,000 | 97,646 |
Meta Platforms, Inc. (Interactive Media & Svs.) | 4.450% | 08/15/2052 | 580,000 | 532,904 | |
109
(continued)
AuguStarSM Variable Insurance Products Fund, Inc.
AVIP Federated Core Plus Bond Portfolio (Continued)
| Schedule of Investments | December 31, 2023 |
| Corporate Bonds (Continued) | Rate | Maturity | Face Amount | Value | |
| Communication Services (continued) | |||||
Nexstar Media, Inc. (Media) | (b) | 5.625% | 07/15/2027 | $ 75,000 | $ 72,521 |
Paramount Global (Media) | 4.200% | 05/19/2032 | 525,000 | 468,564 | |
ROBLOX Corp. (Entertainment) | (b) | 3.875% | 05/01/2030 | 50,000 | 44,589 |
Rogers Communications, Inc. (Wireless Telecom. Svs.) | 4.500% | 03/15/2042 | 465,000 | 410,182 | |
Scripps Escrow, Inc. (Media) | (b) | 5.875% | 07/15/2027 | 25,000 | 22,211 |
Sinclair Television Group, Inc. (Media) | (b) | 5.500% | 03/01/2030 | 50,000 | 37,506 |
Sirius XM Radio, Inc. (Media) | (b) | 3.875% | 09/01/2031 | 200,000 | 171,097 |
Sky Ltd. (Media) | (b) | 3.750% | 09/16/2024 | 375,000 | 370,078 |
Sprint LLC (Wireless Telecom. Svs.) | 7.625% | 03/01/2026 | 50,000 | 52,236 | |
Stagwell Global LLC (Media) | (b) | 5.625% | 08/15/2029 | 150,000 | 137,965 |
TEGNA, Inc. (Media) | (b) | 4.750% | 03/15/2026 | 25,000 | 24,316 |
TEGNA, Inc. (Media) | 4.625% | 03/15/2028 | 25,000 | 23,352 | |
TEGNA, Inc. (Media) | 5.000% | 09/15/2029 | 25,000 | 22,905 | |
T-Mobile U.S.A., Inc. (Wireless Telecom. Svs.) | 3.375% | 04/15/2029 | 50,000 | 46,455 | |
T-Mobile U.S.A., Inc. (Wireless Telecom. Svs.) | 3.500% | 04/15/2031 | 300,000 | 274,257 | |
T-Mobile U.S.A., Inc. (Wireless Telecom. Svs.) | 3.300% | 02/15/2051 | 500,000 | 361,215 | |
T-Mobile U.S.A., Inc. (Wireless Telecom. Svs.) | 5.650% | 01/15/2053 | 260,000 | 270,705 | |
Univision Communications, Inc. (Media) | (b) | 8.000% | 08/15/2028 | 50,000 | 51,581 |
Univision Communications, Inc. (Media) | (b) | 7.375% | 06/30/2030 | 50,000 | 49,857 |
UPC Broadband Finco B.V. (Media) | (b) | 4.875% | 07/15/2031 | 200,000 | 176,022 |
Urban One, Inc. (Media) | (b) | 7.375% | 02/01/2028 | 50,000 | 42,499 |
Verizon Communications, Inc. (Diversified Telecom. Svs.) | 4.000% | 03/22/2050 | 1,200,000 | 997,238 | |
Virgin Media Finance PLC (Media) | (b) | 5.000% | 07/15/2030 | 200,000 | 176,332 |
Vodafone Group PLC (Wireless Telecom. Svs.) | 4.125% | 05/30/2025 | 325,000 | 320,608 | |
Vodafone Group PLC (Wireless Telecom. Svs.) | 5.250% | 05/30/2048 | 350,000 | 341,001 | |
Walt Disney Co. / The (Entertainment) | 3.800% | 03/22/2030 | 150,000 | 145,613 | |
Walt Disney Co. / The (Entertainment) | 4.700% | 03/23/2050 | 325,000 | 315,605 | |
Walt Disney Co. / The (Entertainment) | 3.600% | 01/13/2051 | 450,000 | 361,703 | |
Warnermedia Holdings, Inc. (Media) | 4.279% | 03/15/2032 | 600,000 | 549,122 | |
Warnermedia Holdings, Inc. (Media) | 5.050% | 03/15/2042 | 620,000 | 546,580 | |
| 13,659,767 | |||||
| Consumer Discretionary–1.0% | |||||
1011778 B.C. ULC / New Red Finance, Inc. (Hotels, Restaurants & Leisure) | (b) | 4.375% | 01/15/2028 | 50,000 | 47,754 |
1011778 B.C. ULC / New Red Finance, Inc. (Hotels, Restaurants & Leisure) | (b) | 4.000% | 10/15/2030 | 175,000 | 156,957 |
Academy Ltd. (Specialty Retail) | (b) | 6.000% | 11/15/2027 | 75,000 | 73,657 |
Acushnet Co. (Leisure Products) | (b) | 7.375% | 10/15/2028 | 25,000 | 26,082 |
Adient Global Holdings Ltd. (Automobile Components) | (b) | 7.000% | 04/15/2028 | 25,000 | 25,841 |
Adient Global Holdings Ltd. (Automobile Components) | (b) | 8.250% | 04/15/2031 | 75,000 | 79,416 |
Advance Auto Parts, Inc. (Specialty Retail) | 3.900% | 04/15/2030 | 675,000 | 605,206 | |
Affinity Interactive (Hotels, Restaurants & Leisure) | (b) | 6.875% | 12/15/2027 | 75,000 | 66,843 |
Amazon.com, Inc. (Broadline Retail) | 3.875% | 08/22/2037 | 425,000 | 394,372 | |
Amazon.com, Inc. (Broadline Retail) | 2.500% | 06/03/2050 | 825,000 | 548,805 | |
Aramark Services, Inc. (Hotels, Restaurants & Leisure) | (b) | 5.000% | 04/01/2025 | 25,000 | 24,814 |
Aramark Services, Inc. (Hotels, Restaurants & Leisure) | (b) | 5.000% | 02/01/2028 | 50,000 | 48,502 |
Asbury Automotive Group, Inc. (Specialty Retail) | (b) | 5.000% | 02/15/2032 | 50,000 | 45,440 |
Boyd Gaming Corp. (Hotels, Restaurants & Leisure) | 4.750% | 12/01/2027 | 50,000 | 48,105 | |
Caesars Entertainment, Inc. (Hotels, Restaurants & Leisure) | (b) | 8.125% | 07/01/2027 | 75,000 | 76,882 |
Caesars Entertainment, Inc. (Hotels, Restaurants & Leisure) | (b) | 4.625% | 10/15/2029 | 50,000 | 45,100 |
Caesars Entertainment, Inc. (Hotels, Restaurants & Leisure) | (b) | 7.000% | 02/15/2030 | 25,000 | 25,636 |
Caesars Resort Collection LLC / CRC Finco, Inc. (Hotels, Restaurants & Leisure) | (b) | 5.750% | 07/01/2025 | 50,000 | 49,995 |
Carnival Corp. (Hotels, Restaurants & Leisure) | (b) | 7.000% | 08/15/2029 | 25,000 | 26,103 |
Churchill Downs, Inc. (Hotels, Restaurants & Leisure) | (b) | 5.500% | 04/01/2027 | 25,000 | 24,738 |
Churchill Downs, Inc. (Hotels, Restaurants & Leisure) | (b) | 6.750% | 05/01/2031 | 25,000 | 25,373 |
Clarios Global LP (Automobiles) | (b) | 6.750% | 05/15/2025 | 22,000 | 22,194 |
Clarios Global LP / Clarios U.S. Finance Co. (Automobile Components) | (b) | 8.500% | 05/15/2027 | 175,000 | 175,610 |
Daimler Truck Finance North America LLC (Automobiles) | (b) | 2.000% | 12/14/2026 | 540,000 | 496,748 |
Daimler Truck Finance North America LLC (Automobiles) | (b) | 2.375% | 12/14/2028 | 180,000 | 160,332 |
Dana Financing Luxembourg SARL (Automobile Components) | (b) | 5.750% | 04/15/2025 | 12,000 | 11,941 |
Dana, Inc. (Automobile Components) | 4.500% | 02/15/2032 | 50,000 | 43,501 | |
Dornoch Debt Merger Sub, Inc. (Automobile Components) | (b) | 6.625% | 10/15/2029 | 100,000 | 90,157 |
Expedia Group, Inc. (Hotels, Restaurants & Leisure) | 2.950% | 03/15/2031 | 115,000 | 101,211 | |
Gap, Inc. / The (Specialty Retail) | (b) | 3.625% | 10/01/2029 | 25,000 | 21,375 |
Gap, Inc. / The (Specialty Retail) | (b) | 3.875% | 10/01/2031 | 25,000 | 20,593 |
Garda World Security Corp. (Diversified Consumer Svs.) | (b) | 9.500% | 11/01/2027 | 175,000 | 176,426 |
Gates Global LLC / Gates Corp. (Automobile Components) | (b) | 6.250% | 01/15/2026 | 125,000 | 124,375 |
Hilton Domestic Operating Co., Inc. (Hotels, Restaurants & Leisure) | (b) | 5.750% | 05/01/2028 | 50,000 | 50,019 |
Hilton Domestic Operating Co., Inc. (Hotels, Restaurants & Leisure) | (b) | 3.625% | 02/15/2032 | 50,000 | 43,635 |
Home Depot, Inc. / The (Specialty Retail) | 3.300% | 04/15/2040 | 950,000 | 784,768 | |
110
(continued)
AuguStarSM Variable Insurance Products Fund, Inc.
AVIP Federated Core Plus Bond Portfolio (Continued)
| Schedule of Investments | December 31, 2023 |
| Corporate Bonds (Continued) | Rate | Maturity | Face Amount | Value | |
| Consumer Discretionary (continued) | |||||
IHO Verwaltungs GmbH (Automobile Components) | (b)(d) | 6.000%, 6.750% PIK | 05/15/2027 | $ 200,000 | $ 194,865 |
JB Poindexter & Co., Inc. (Automobile Components) | (b) | 8.750% | 12/15/2031 | 25,000 | 25,500 |
Kontoor Brands, Inc. (Textiles, Apparel & Luxury Goods) | (b) | 4.125% | 11/15/2029 | 25,000 | 22,556 |
LCM Investments Holdings II LLC (Specialty Retail) | (b) | 4.875% | 05/01/2029 | 25,000 | 23,223 |
LCM Investments Holdings II LLC (Specialty Retail) | (b) | 8.250% | 08/01/2031 | 50,000 | 52,185 |
Light & Wonder International, Inc. (Hotels, Restaurants & Leisure) | (b) | 7.250% | 11/15/2029 | 50,000 | 51,196 |
Light & Wonder International, Inc. (Hotels, Restaurants & Leisure) | (b) | 7.500% | 09/01/2031 | 25,000 | 26,076 |
Midwest Gaming Borrower LLC / Midwest Gaming Finance Corp. (Hotels, Restaurants & Leisure) | (b) | 4.875% | 05/01/2029 | 50,000 | 46,500 |
Mohegan Tribal Gaming Authority (Hotels, Restaurants & Leisure) | (b) | 8.000% | 02/01/2026 | 150,000 | 141,563 |
NCL Corp. Ltd. (Hotels, Restaurants & Leisure) | (b) | 8.125% | 01/15/2029 | 25,000 | 26,115 |
NCL Corp. Ltd. (Hotels, Restaurants & Leisure) | (b) | 7.750% | 02/15/2029 | 50,000 | 50,303 |
Ontario Gaming GTA LP (Hotels, Restaurants & Leisure) | (b) | 8.000% | 08/01/2030 | 50,000 | 51,563 |
Penn Entertainment, Inc. (Hotels, Restaurants & Leisure) | (b) | 5.625% | 01/15/2027 | 25,000 | 24,237 |
Penn Entertainment, Inc. (Hotels, Restaurants & Leisure) | (b) | 4.125% | 07/01/2029 | 25,000 | 21,375 |
Raptor Acquisition Corp. / Raptor Co-Issuer LLC (Hotels, Restaurants & Leisure) | (b) | 4.875% | 11/01/2026 | 25,000 | 23,829 |
Real Hero Merger Sub 2, Inc. (Automobile Components) | (b) | 6.250% | 02/01/2029 | 75,000 | 64,660 |
Royal Caribbean Cruises Ltd. (Hotels, Restaurants & Leisure) | (b) | 5.500% | 08/31/2026 | 50,000 | 49,507 |
Scientific Games Holdings LP / Scientific Games U.S. FinCo, Inc. (Hotels, Restaurants & Leisure) | (b) | 6.625% | 03/01/2030 | 75,000 | 70,907 |
SeaWorld Parks & Entertainment, Inc. (Hotels, Restaurants & Leisure) | (b) | 5.250% | 08/15/2029 | 50,000 | 46,741 |
Six Flags Entertainment Corp. (Hotels, Restaurants & Leisure) | (b) | 5.500% | 04/15/2027 | 50,000 | 48,878 |
Station Casinos LLC (Hotels, Restaurants & Leisure) | (b) | 4.500% | 02/15/2028 | 50,000 | 47,141 |
Station Casinos LLC (Hotels, Restaurants & Leisure) | (b) | 4.625% | 12/01/2031 | 50,000 | 45,084 |
William Carter Co. / The (Textiles, Apparel & Luxury Goods) | (b) | 5.625% | 03/15/2027 | 25,000 | 24,688 |
Yum! Brands, Inc. (Hotels, Restaurants & Leisure) | 4.625% | 01/31/2032 | 75,000 | 70,132 | |
ZF North America Capital, Inc. (Automobile Components) | (b) | 6.875% | 04/14/2028 | 150,000 | 155,440 |
| 6,192,770 | |||||
| Consumer Staples–1.6% | |||||
Albertsons Cos., Inc. / Safeway, Inc. / New Albertsons LP / Albertsons LLC (Consumer Staples Distribution & Retail) | (b) | 5.875% | 02/15/2028 | 75,000 | 75,050 |
Alimentation Couche-Tard, Inc. (Consumer Staples Distribution & Retail) | (b) | 3.800% | 01/25/2050 | 625,000 | 474,749 |
Altria Group, Inc. (Tobacco) | 3.875% | 09/16/2046 | 800,000 | 599,197 | |
Anheuser-Busch InBev Worldwide, Inc. (Beverages) | 4.350% | 06/01/2040 | 300,000 | 280,371 | |
B.A.T. Capital Corp. (Tobacco) | 4.540% | 08/15/2047 | 825,000 | 633,376 | |
BellRing Brands, Inc. (Personal Care Products) | (b) | 7.000% | 03/15/2030 | 75,000 | 77,623 |
Coca-Cola Europacific Partners PLC (Beverages) | (b) | 1.500% | 01/15/2027 | 600,000 | 541,351 |
Coca-Cola Femsa S.A.B. de C.V. (Beverages) | 2.750% | 01/22/2030 | 750,000 | 671,438 | |
Constellation Brands, Inc. (Beverages) | 3.750% | 05/01/2050 | 500,000 | 398,479 | |
Dollar General Corp. (Consumer Staples Distribution & Retail) | 3.875% | 04/15/2027 | 575,000 | 557,191 | |
Edgewell Personal Care Co. (Personal Care Products) | (b) | 5.500% | 06/01/2028 | 25,000 | 24,531 |
Edgewell Personal Care Co. (Personal Care Products) | (b) | 4.125% | 04/01/2029 | 25,000 | 22,750 |
Energizer Holdings, Inc. (Household Products) | (b) | 6.500% | 12/31/2027 | 25,000 | 25,000 |
Energizer Holdings, Inc. (Household Products) | (b) | 4.375% | 03/31/2029 | 75,000 | 67,131 |
Flowers Foods, Inc. (Food Products) | 3.500% | 10/01/2026 | 675,000 | 647,293 | |
Flowers Foods, Inc. (Food Products) | 2.400% | 03/15/2031 | 185,000 | 155,274 | |
Grupo Bimbo S.A.B. de C.V. (Food Products) | (b) | 4.875% | 06/27/2044 | 925,000 | 860,672 |
Kenvue, Inc. (Personal Care Products) | 5.050% | 03/22/2028 | 310,000 | 317,579 | |
Kenvue, Inc. (Personal Care Products) | 4.900% | 03/22/2033 | 400,000 | 412,316 | |
Keurig Dr Pepper, Inc. (Beverages) | 4.417% | 05/25/2025 | 36,000 | 35,619 | |
Kraft Heinz Foods Co. (Food Products) | 4.375% | 06/01/2046 | 425,000 | 370,935 | |
Kroger Co. / The (Consumer Staples Distribution & Retail) | 3.950% | 01/15/2050 | 425,000 | 346,340 | |
Performance Food Group, Inc. (Consumer Staples Distribution & Retail) | (b) | 4.250% | 08/01/2029 | 50,000 | 45,860 |
Philip Morris International, Inc. (Tobacco) | 3.875% | 08/21/2042 | 715,000 | 585,426 | |
Post Holdings, Inc. (Food Products) | (b) | 5.750% | 03/01/2027 | 150,000 | 148,822 |
Sysco Corp. (Consumer Staples Distribution & Retail) | 4.450% | 03/15/2048 | 725,000 | 635,713 | |
U.S. Foods, Inc. (Consumer Staples Distribution & Retail) | (b) | 4.750% | 02/15/2029 | 50,000 | 47,487 |
U.S. Foods, Inc. (Consumer Staples Distribution & Retail) | (b) | 4.625% | 06/01/2030 | 75,000 | 69,897 |
| 9,127,470 | |||||
| Energy–2.1% | |||||
Antero Midstream Partners LP / Antero Midstream Finance Corp. (Oil, Gas & Consumable Fuels) | (b) | 7.875% | 05/15/2026 | 50,000 | 51,211 |
Antero Midstream Partners LP / Antero Midstream Finance Corp. (Oil, Gas & Consumable Fuels) | (b) | 5.750% | 03/01/2027 | 25,000 | 24,806 |
Antero Midstream Partners LP / Antero Midstream Finance Corp. (Oil, Gas & Consumable Fuels) | (b) | 5.750% | 01/15/2028 | 50,000 | 49,502 |
Antero Midstream Partners LP / Antero Midstream Finance Corp. (Oil, Gas & Consumable Fuels) | (b) | 5.375% | 06/15/2029 | 75,000 | 72,103 |
111
(continued)
AuguStarSM Variable Insurance Products Fund, Inc.
AVIP Federated Core Plus Bond Portfolio (Continued)
| Schedule of Investments | December 31, 2023 |
| Corporate Bonds (Continued) | Rate | Maturity | Face Amount | Value | |
| Energy (continued) | |||||
Antero Resources Corp. (Oil, Gas & Consumable Fuels) | (b) | 5.375% | 03/01/2030 | $ 50,000 | $ 47,923 |
Archrock Partners LP / Archrock Partners Finance Corp. (Oil, Gas & Consumable Fuels) | (b) | 6.875% | 04/01/2027 | 75,000 | 75,187 |
Archrock Partners LP / Archrock Partners Finance Corp. (Oil, Gas & Consumable Fuels) | (b) | 6.250% | 04/01/2028 | 50,000 | 49,250 |
Ascent Resources Utica Holdings LLC / ARU Finance Corp. (Oil, Gas & Consumable Fuels) | (b) | 7.000% | 11/01/2026 | 25,000 | 25,158 |
Ascent Resources Utica Holdings LLC / ARU Finance Corp. (Oil, Gas & Consumable Fuels) | (b) | 5.875% | 06/30/2029 | 100,000 | 93,035 |
Boardwalk Pipelines LP (Oil, Gas & Consumable Fuels) | 3.400% | 02/15/2031 | 500,000 | 446,802 | |
BP Capital Markets America, Inc. (Oil, Gas & Consumable Fuels) | 3.588% | 04/14/2027 | 825,000 | 799,832 | |
Callon Petroleum Co. (Oil, Gas & Consumable Fuels) | (b) | 7.500% | 06/15/2030 | 25,000 | 25,213 |
Canadian Natural Resources Ltd. (Oil, Gas & Consumable Fuels) | 2.050% | 07/15/2025 | 525,000 | 500,196 | |
Cenovus Energy, Inc. (Oil, Gas & Consumable Fuels) | 4.250% | 04/15/2027 | 375,000 | 366,326 | |
Cheniere Energy Partners LP (Oil, Gas & Consumable Fuels) | 4.500% | 10/01/2029 | 50,000 | 47,823 | |
Cheniere Energy, Inc. (Oil, Gas & Consumable Fuels) | 4.625% | 10/15/2028 | 25,000 | 24,403 | |
Chevron Corp. (Oil, Gas & Consumable Fuels) | 3.078% | 05/11/2050 | 475,000 | 358,552 | |
Civitas Resources, Inc. (Oil, Gas & Consumable Fuels) | (b) | 8.375% | 07/01/2028 | 50,000 | 52,197 |
Civitas Resources, Inc. (Oil, Gas & Consumable Fuels) | (b) | 8.625% | 11/01/2030 | 25,000 | 26,518 |
CNX Midstream Partners LP (Oil, Gas & Consumable Fuels) | (b) | 4.750% | 04/15/2030 | 100,000 | 89,798 |
Comstock Resources, Inc. (Oil, Gas & Consumable Fuels) | (b) | 6.750% | 03/01/2029 | 100,000 | 91,451 |
CrownRock LP / CrownRock Finance, Inc. (Oil, Gas & Consumable Fuels) | (b) | 5.625% | 10/15/2025 | 75,000 | 74,900 |
Diamondback Energy, Inc. (Oil, Gas & Consumable Fuels) | 6.250% | 03/15/2033 | 490,000 | 523,576 | |
DT Midstream, Inc. (Oil, Gas & Consumable Fuels) | (b) | 4.375% | 06/15/2031 | 50,000 | 45,102 |
Eastern Gas Transmission & Storage, Inc. (Oil, Gas & Consumable Fuels) | 3.900% | 11/15/2049 | 150,000 | 110,522 | |
Enbridge Energy Partners LP (Oil, Gas & Consumable Fuels) | 5.500% | 09/15/2040 | 700,000 | 689,151 | |
Endeavor Energy Resources LP / EER Finance, Inc. (Oil, Gas & Consumable Fuels) | (b) | 5.750% | 01/30/2028 | 25,000 | 25,024 |
Energy Transfer LP (Oil, Gas & Consumable Fuels) | (b) | 8.000% | 04/01/2029 | 50,000 | 52,030 |
Energy Transfer LP (Oil, Gas & Consumable Fuels) | 3.750% | 05/15/2030 | 500,000 | 464,314 | |
Energy Transfer LP (Oil, Gas & Consumable Fuels) | 5.750% | 02/15/2033 | 400,000 | 412,392 | |
EQM Midstream Partners LP (Oil, Gas & Consumable Fuels) | 5.500% | 07/15/2028 | 50,000 | 49,542 | |
EQM Midstream Partners LP (Oil, Gas & Consumable Fuels) | (b) | 4.500% | 01/15/2029 | 50,000 | 47,236 |
EQM Midstream Partners LP (Oil, Gas & Consumable Fuels) | (b) | 4.750% | 01/15/2031 | 50,000 | 46,532 |
EQM Midstream Partners LP (Oil, Gas & Consumable Fuels) | 6.500% | 07/15/2048 | 75,000 | 76,852 | |
Hess Corp. (Oil, Gas & Consumable Fuels) | 5.600% | 02/15/2041 | 655,000 | 687,859 | |
Hess Midstream Operations LP (Oil, Gas & Consumable Fuels) | (b) | 5.125% | 06/15/2028 | 50,000 | 48,240 |
Hess Midstream Operations LP (Oil, Gas & Consumable Fuels) | (b) | 4.250% | 02/15/2030 | �� 25,000 | 23,000 |
HF Sinclair Corp. (Oil, Gas & Consumable Fuels) | (b) | 5.000% | 02/01/2028 | 75,000 | 72,735 |
Kinder Morgan, Inc. (Oil, Gas & Consumable Fuels) | 3.250% | 08/01/2050 | 370,000 | 247,270 | |
Marathon Petroleum Corp. (Oil, Gas & Consumable Fuels) | 4.750% | 09/15/2044 | 525,000 | 468,112 | |
MPLX LP (Oil, Gas & Consumable Fuels) | 4.950% | 03/14/2052 | 600,000 | 533,728 | |
Nabors Industries Ltd. (Energy Equip. & Svs.) | (b) | 7.250% | 01/15/2026 | 25,000 | 24,030 |
Nabors Industries Ltd. (Energy Equip. & Svs.) | (b) | 7.500% | 01/15/2028 | 25,000 | 21,619 |
Nabors Industries, Inc. (Energy Equip. & Svs.) | (b) | 9.125% | 01/31/2030 | 50,000 | 50,203 |
NuStar Logistics LP (Oil, Gas & Consumable Fuels) | 6.375% | 10/01/2030 | 25,000 | 25,044 | |
Occidental Petroleum Corp. (Oil, Gas & Consumable Fuels) | 6.450% | 09/15/2036 | 75,000 | 79,350 | |
ONEOK, Inc. (Oil, Gas & Consumable Fuels) | 2.200% | 09/15/2025 | 175,000 | 166,300 | |
ONEOK, Inc. (Oil, Gas & Consumable Fuels) | 4.500% | 03/15/2050 | 700,000 | 586,040 | |
Ovintiv, Inc. (Oil, Gas & Consumable Fuels) | 7.100% | 07/15/2053 | 350,000 | 384,729 | |
PDC Energy, Inc. (Oil, Gas & Consumable Fuels) | 5.750% | 05/15/2026 | 50,000 | 49,905 | |
Permian Resources Operating LLC (Oil, Gas & Consumable Fuels) | (b) | 6.875% | 04/01/2027 | 50,000 | 49,966 |
Phillips 66 (Oil, Gas & Consumable Fuels) | 0.900% | 02/15/2024 | 150,000 | 149,072 | |
Phillips 66 (Oil, Gas & Consumable Fuels) | 3.850% | 04/09/2025 | 300,000 | 295,146 | |
Phillips 66 (Oil, Gas & Consumable Fuels) | 4.875% | 11/15/2044 | 375,000 | 359,199 | |
Plains All American Pipeline LP / PAA Finance Corp. (Oil, Gas & Consumable Fuels) | 5.150% | 06/01/2042 | 425,000 | 384,330 | |
Precision Drilling Corp. (Energy Equip. & Svs.) | (b) | 6.875% | 01/15/2029 | 50,000 | 48,217 |
Range Resources Corp. (Oil, Gas & Consumable Fuels) | 8.250% | 01/15/2029 | 50,000 | 51,749 | |
Rockcliff Energy II LLC (Oil, Gas & Consumable Fuels) | (b) | 5.500% | 10/15/2029 | 25,000 | 23,628 |
Sitio Royalties Operating Partnership LP / Sitio Finance Corp. (Oil, Gas & Consumable Fuels) | (b) | 7.875% | 11/01/2028 | 25,000 | 25,906 |
SM Energy Co. (Oil, Gas & Consumable Fuels) | 6.750% | 09/15/2026 | 50,000 | 49,870 | |
SM Energy Co. (Oil, Gas & Consumable Fuels) | 6.500% | 07/15/2028 | 50,000 | 50,023 | |
Southwestern Energy Co. (Oil, Gas & Consumable Fuels) | 5.375% | 03/15/2030 | 25,000 | 24,411 | |
Targa Resources Corp. (Oil, Gas & Consumable Fuels) | 4.200% | 02/01/2033 | 505,000 | 464,314 | |
U.S.A. Compression Partners LP / U.S.A. Compression Finance Corp. (Energy Equip. & Svs.) | 6.875% | 04/01/2026 | 100,000 | 99,578 | |
Valero Energy Corp. (Oil, Gas & Consumable Fuels) | 4.350% | 06/01/2028 | 350,000 | 344,854 | |
Western Midstream Operating LP (Oil, Gas & Consumable Fuels) | 4.050% | 02/01/2030 | 50,000 | 46,757 | |
Western Midstream Operating LP (Oil, Gas & Consumable Fuels) | 5.300% | 03/01/2048 | 75,000 | 65,267 | |
Williams Cos., Inc. / The (Oil, Gas & Consumable Fuels) | 3.750% | 06/15/2027 | 600,000 | 578,304 | |
| 12,513,214 | |||||
| Financials–7.0% | |||||
AerCap Ireland Capital DAC / AerCap Global Aviation Trust (Financial Services) | 3.000% | 10/29/2028 | 165,000 | 150,643 | |
AIA Group Ltd. (Insurance) | (b) | 4.950% | 04/04/2033 | 260,000 | 261,792 |
112
(continued)
AuguStarSM Variable Insurance Products Fund, Inc.
AVIP Federated Core Plus Bond Portfolio (Continued)
| Schedule of Investments | December 31, 2023 |
| Corporate Bonds (Continued) | Rate | Maturity | Face Amount | Value | |
| Financials (continued) | |||||
Alliant Holdings Intermediate LLC / Alliant Holdings Co-Issuer (Insurance) | (b) | 7.000% | 01/15/2031 | $ 50,000 | $ 52,743 |
Ally Financial, Inc. (Consumer Finance) | 5.750% | 11/20/2025 | 25,000 | 24,844 | |
Ally Financial, Inc. (Rate is fixed until 01/03/2029, at which point, the rate becomes SOFR + 282) (Consumer Finance) | (e) | 6.848% | 01/03/2030 | 305,000 | 313,355 |
American Express Co. (Consumer Finance) | 3.300% | 05/03/2027 | 825,000 | 788,920 | |
American Honda Finance Corp. (Consumer Finance) | 5.800% | 10/03/2025 | 400,000 | 406,877 | |
AmWINS Group, Inc. (Insurance) | (b) | 4.875% | 06/30/2029 | 75,000 | 68,492 |
Ardonagh Midco 2 PLC (Insurance) | (b)(d) | 11.500%, 12.750% PIK | 01/15/2027 | 200,000 | 196,916 |
AssuredPartners, Inc. (Insurance) | (b) | 7.000% | 08/15/2025 | 25,000 | 25,046 |
AssuredPartners, Inc. (Insurance) | (b) | 5.625% | 01/15/2029 | 100,000 | 93,355 |
Bank of America Corp. (Rate is fixed until 02/13/2025, at which point, the rate becomes TSFR3M + 90) (Banks) | (e) | 2.015% | 02/13/2026 | 1,625,000 | 1,561,489 |
Bank of America Corp. (Rate is fixed until 04/29/2030, at which point, the rate becomes SOFR + 215) (Banks) | (e) | 2.592% | 04/29/2031 | 1,900,000 | 1,637,401 |
Bank of America Corp. (Rate is fixed until 04/22/2031, at which point, the rate becomes SOFR + 132) (Banks) | (e) | 2.687% | 04/22/2032 | 650,000 | 548,880 |
Bank of America Corp. (Rate is fixed until 04/25/2033, at which point, the rate becomes SOFR + 191) (Banks) | (e) | 5.288% | 04/25/2034 | 300,000 | 300,690 |
Bank of New York Mellon Corp. / The (Rate is fixed until 06/13/2027, at which point, the rate becomes SOFR + 115) (Capital Markets) | (e) | 3.992% | 06/13/2028 | 300,000 | 292,649 |
BlackRock, Inc. (Capital Markets) | 1.900% | 01/28/2031 | 425,000 | 358,507 | |
BroadStreet Partners, Inc. (Insurance) | (b) | 5.875% | 04/15/2029 | 200,000 | 186,690 |
Capital One Financial Corp. (Rate is fixed until 02/01/2033, at which point, the rate becomes SOFR + 260) (Consumer Finance) | (e) | 5.817% | 02/01/2034 | 350,000 | 348,294 |
Chubb INA Holdings, Inc. (Insurance) | 3.350% | 05/03/2026 | 425,000 | 413,461 | |
Citigroup, Inc. (Rate is fixed until 04/24/2024, at which point, the rate becomes TSFR3M + 116) (Banks) | (e) | 3.352% | 04/24/2025 | 825,000 | 818,680 |
Citigroup, Inc. (Rate is fixed until 01/29/2030, at which point, the rate becomes SOFR + 115) (Banks) | (e) | 2.666% | 01/29/2031 | 1,800,000 | 1,561,355 |
Citizens Bank N.A. (Banks) | 3.750% | 02/18/2026 | 725,000 | 690,119 | |
CNA Financial Corp. (Insurance) | 5.500% | 06/15/2033 | 600,000 | 618,663 | |
Comerica, Inc. (Banks) | 3.800% | 07/22/2026 | 475,000 | 446,540 | |
Corebridge Financial, Inc. (Financial Services) | 5.750% | 01/15/2034 | 320,000 | 327,093 | |
Corebridge Global Funding (Financial Services) | (b) | 5.900% | 09/19/2028 | 350,000 | 360,584 |
Fidelity National Information Services, Inc. (Financial Services) | 4.700% | 07/15/2027 | 300,000 | 299,979 | |
Fidelity National Information Services, Inc. (Financial Services) | 3.100% | 03/01/2041 | 405,000 | 300,229 | |
Fiserv, Inc. (Financial Services) | 3.500% | 07/01/2029 | 425,000 | 399,852 | |
Fiserv, Inc. (Financial Services) | 5.600% | 03/02/2033 | 170,000 | 177,458 | |
FNB Corp. (Banks) | 5.150% | 08/25/2025 | 320,000 | 317,558 | |
Ford Motor Credit Co. LLC (Consumer Finance) | 6.950% | 03/06/2026 | 500,000 | 512,227 | |
Ford Motor Credit Co. LLC (Consumer Finance) | 7.350% | 11/04/2027 | 200,000 | 210,910 | |
Ford Motor Credit Co. LLC (Consumer Finance) | 6.798% | 11/07/2028 | 200,000 | 209,273 | |
Ford Motor Credit Co. LLC (Consumer Finance) | 5.113% | 05/03/2029 | 375,000 | 364,659 | |
Ford Motor Credit Co. LLC (Consumer Finance) | 7.122% | 11/07/2033 | 200,000 | 215,487 | |
General Motors Financial Co., Inc. (Consumer Finance) | 2.900% | 02/26/2025 | 825,000 | 800,431 | |
General Motors Financial Co., Inc. (Consumer Finance) | 5.000% | 04/09/2027 | 360,000 | 359,190 | |
Goldman Sachs Group, Inc. / The (Capital Markets) | 3.500% | 04/01/2025 | 775,000 | 757,374 | |
Goldman Sachs Group, Inc. / The (Capital Markets) | 3.800% | 03/15/2030 | 1,400,000 | 1,315,402 | |
Goldman Sachs Group, Inc. / The (Rate is fixed until 01/27/2031, at which point, the rate becomes SOFR + 109) (Capital Markets) | (e) | 1.992% | 01/27/2032 | 500,000 | 403,994 |
GTCR AP Finance, Inc. (Insurance) | (b) | 8.000% | 05/15/2027 | 75,000 | 75,754 |
GTCR W-2 Merger Sub LLC (Financial Services) | (b) | 7.500% | 01/15/2031 | 200,000 | 211,344 |
HSBC Holdings PLC (Banks) | 3.900% | 05/25/2026 | 975,000 | 949,102 | |
HUB International Ltd. (Insurance) | (b) | 5.625% | 12/01/2029 | 375,000 | 357,739 |
HUB International Ltd. (Insurance) | (b) | 7.250% | 06/15/2030 | 25,000 | 26,406 |
Huntington Bancshares, Inc. (Rate is fixed until 08/04/2027, at which point, the rate becomes SOFR + 197) (Banks) | (e) | 4.443% | 08/04/2028 | 650,000 | 630,033 |
Jefferies Financial Group, Inc. (Capital Markets) | 2.750% | 10/15/2032 | 380,000 | 311,242 | |
John Deere Capital Corp. (Consumer Finance) | 5.050% | 03/03/2026 | 450,000 | 456,702 | |
John Deere Capital Corp. (Consumer Finance) | 3.450% | 03/07/2029 | 900,000 | 862,713 | |
Jones Deslauriers Insurance Management, Inc. (Insurance) | (b) | 8.500% | 03/15/2030 | 50,000 | 52,506 |
Jones Deslauriers Insurance Management, Inc. (Insurance) | (b) | 10.500% | 12/15/2030 | 50,000 | 52,695 |
JPMorgan Chase & Co. (Banks) | 3.125% | 01/23/2025 | 525,000 | 513,961 | |
JPMorgan Chase & Co. (Rate is fixed until 04/22/2030, at which point, the rate becomes SOFR + 204) (Banks) | (e) | 2.522% | 04/22/2031 | 900,000 | 778,263 |
JPMorgan Chase & Co. (Rate is fixed until 11/19/2030, at which point, the rate becomes TSFR3M + 111) (Banks) | (e) | 1.764% | 11/19/2031 | 100,000 | 81,045 |
JPMorgan Chase & Co. (Rate is fixed until 04/22/2031, at which point, the rate becomes TSFR3M + 125) (Banks) | (e) | 2.580% | 04/22/2032 | 100,000 | 84,584 |
113
(continued)
AuguStarSM Variable Insurance Products Fund, Inc.
AVIP Federated Core Plus Bond Portfolio (Continued)
| Schedule of Investments | December 31, 2023 |
| Corporate Bonds (Continued) | Rate | Maturity | Face Amount | Value | |
| Financials (continued) | |||||
JPMorgan Chase & Co. (Rate is fixed until 01/25/2032, at which point, the rate becomes SOFR + 126) (Banks) | (e) | 2.963% | 01/25/2033 | $ 1,200,000 | $ 1,028,205 |
JPMorgan Chase & Co. (Rate is fixed until 09/14/2032, at which point, the rate becomes SOFR + 258) (Banks) | (e) | 5.717% | 09/14/2033 | 300,000 | 310,410 |
JPMorgan Chase & Co. (Rate is fixed until 06/01/2033, at which point, the rate becomes SOFR + 185) (Banks) | (e) | 5.350% | 06/01/2034 | 400,000 | 405,694 |
JPMorgan Chase & Co. (Rate is fixed until 10/23/2033, at which point, the rate becomes SOFR + 181) (Banks) | (e) | 6.254% | 10/23/2034 | 100,000 | 108,399 |
Lincoln National Corp. (Insurance) | 3.400% | 01/15/2031 | 60,000 | 53,767 | |
M&T Bank Corp. (Rate is fixed until 10/30/2028, at which point, the rate becomes SOFR + 280) (Banks) | (e) | 7.413% | 10/30/2029 | 225,000 | 242,016 |
M&T Bank Corp. (Rate is fixed until 01/27/2033, at which point, the rate becomes SOFR + 185) (Banks) | (e) | 5.053% | 01/27/2034 | 400,000 | 379,001 |
Mercedes-Benz Finance North America LLC (Consumer Finance) | (b) | 4.800% | 03/30/2026 | 600,000 | 600,213 |
MetLife, Inc. (Insurance) | 5.375% | 07/15/2033 | 400,000 | 416,989 | |
Metropolitan Life Global Funding I (Insurance) | (b) | 5.150% | 03/28/2033 | 230,000 | 233,993 |
Morgan Stanley (Capital Markets) | 6.250% | 08/09/2026 | 775,000 | 799,214 | |
Morgan Stanley (Rate is fixed until 01/24/2028, at which point, the rate becomes TSFR3M + 140) (Capital Markets) | (e) | 3.772% | 01/24/2029 | 750,000 | 715,262 |
Morgan Stanley (Rate is fixed until 02/13/2031, at which point, the rate becomes SOFR + 103) (Capital Markets) | (e) | 1.794% | 02/13/2032 | 295,000 | 235,564 |
Morgan Stanley (Rate is fixed until 04/28/2031, at which point, the rate becomes SOFR + 102) (Capital Markets) | (e) | 1.928% | 04/28/2032 | 250,000 | 201,031 |
Morgan Stanley (Rate is fixed until 07/20/2032, at which point, the rate becomes SOFR + 208) (Capital Markets) | (e) | 4.889% | 07/20/2033 | 440,000 | 429,031 |
Morgan Stanley (Rate is fixed until 04/21/2033, at which point, the rate becomes SOFR + 187) (Capital Markets) | (e) | 5.250% | 04/21/2034 | 195,000 | 194,980 |
Morgan Stanley (Rate is fixed until 07/21/2033, at which point, the rate becomes SOFR + 188) (Capital Markets) | (e) | 5.424% | 07/21/2034 | 100,000 | 101,488 |
Navient Corp. (Consumer Finance) | 4.875% | 03/15/2028 | 75,000 | 69,679 | |
Navient Corp. (Consumer Finance) | 5.500% | 03/15/2029 | 50,000 | 46,107 | |
NCR Atleos Corp. (Financial Services) | (b) | 9.500% | 04/01/2029 | 50,000 | 53,125 |
NFP Corp. (Insurance) | (b) | 6.875% | 08/15/2028 | 200,000 | 203,320 |
NFP Corp. (Insurance) | (b) | 7.500% | 10/01/2030 | 25,000 | 26,607 |
Northern Trust Corp. (Capital Markets) | 6.125% | 11/02/2032 | 380,000 | 408,057 | |
PNC Bank N.A. (Banks) | 3.875% | 04/10/2025 | 475,000 | 465,019 | |
PNC Financial Services Group, Inc. / The (Rate is fixed until 06/06/2032, at which point, the rate becomes SOFRINDX + 185) (Banks) | (e) | 4.626% | 06/06/2033 | 830,000 | 782,642 |
Prudential Financial, Inc. (Insurance) | 3.700% | 03/13/2051 | 575,000 | 454,159 | |
Raymond James Financial, Inc. (Capital Markets) | 4.650% | 04/01/2030 | 100,000 | 100,764 | |
Regions Financial Corp. (Banks) | 2.250% | 05/18/2025 | 345,000 | 328,796 | |
Rocket Mortgage LLC / Rocket Mortgage Co-Issuer, Inc. (Financial Services) | (b) | 2.875% | 10/15/2026 | 50,000 | 46,125 |
Rocket Mortgage LLC / Rocket Mortgage Co-Issuer, Inc. (Financial Services) | (b) | 3.625% | 03/01/2029 | 75,000 | 67,881 |
Rocket Mortgage LLC / Rocket Mortgage Co-Issuer, Inc. (Financial Services) | (b) | 4.000% | 10/15/2033 | 50,000 | 42,476 |
Ryan Specialty LLC (Insurance) | (b) | 4.375% | 02/01/2030 | 50,000 | 46,375 |
S&P Global, Inc. (Capital Markets) | 2.900% | 03/01/2032 | 390,000 | 348,106 | |
Stifel Financial Corp. (Capital Markets) | 4.000% | 05/15/2030 | 200,000 | 181,357 | |
Synovus Bank (Banks) | 5.625% | 02/15/2028 | 300,000 | 288,239 | |
Toyota Motor Credit Corp. (Consumer Finance) | 3.950% | 06/30/2025 | 600,000 | 592,833 | |
Travelers Cos., Inc. / The (Insurance) | 5.450% | 05/25/2053 | 180,000 | 194,091 | |
Truist Financial Corp. (Rate is fixed until 10/28/2025, at which point, the rate becomes SOFR + 163) (Banks) | (e) | 5.900% | 10/28/2026 | 500,000 | 504,109 |
Truist Financial Corp. (Rate is fixed until 01/26/2033, at which point, the rate becomes SOFR + 185) (Banks) | (e) | 5.122% | 01/26/2034 | 100,000 | 96,830 |
Truist Financial Corp. (Rate is fixed until 06/08/2033, at which point, the rate becomes SOFR + 236) (Banks) | (e) | 5.867% | 06/08/2034 | 250,000 | 255,023 |
U.S. Bancorp (Rate is fixed until 07/22/2032, at which point, the rate becomes SOFR + 211) (Banks) | (e) | 4.967% | 07/22/2033 | 550,000 | 521,244 |
U.S. Bancorp (Rate is fixed until 06/10/2033, at which point, the rate becomes SOFR + 226) (Banks) | (e) | 5.836% | 06/12/2034 | 400,000 | 412,610 |
United Wholesale Mortgage LLC (Financial Services) | (b) | 5.500% | 11/15/2025 | 175,000 | 173,894 |
USI Inc. (Insurance) | (b) | 7.500% | 01/15/2032 | 125,000 | 127,975 |
Wells Fargo & Co. (Rate is fixed until 07/25/2028, at which point, the rate becomes SOFR + 174) (Banks) | (e) | 5.574% | 07/25/2029 | 250,000 | 255,267 |
Wells Fargo & Co. (Rate is fixed until 02/11/2030, at which point, the rate becomes TSFR3M + 126) (Banks) | (e) | 2.572% | 02/11/2031 | 1,550,000 | 1,339,386 |
Wells Fargo & Co. (Rate is fixed until 07/25/2032, at which point, the rate becomes SOFR + 210) (Banks) | (e) | 4.897% | 07/25/2033 | 550,000 | 535,796 |
114
(continued)
AuguStarSM Variable Insurance Products Fund, Inc.
AVIP Federated Core Plus Bond Portfolio (Continued)
| Schedule of Investments | December 31, 2023 |
| Corporate Bonds (Continued) | Rate | Maturity | Face Amount | Value | |
| Financials (continued) | |||||
Wells Fargo & Co. (Rate is fixed until 04/24/2033, at which point, the rate becomes SOFR + 202) (Banks) | (e) | 5.389% | 04/24/2034 | $ 150,000 | $ 150,652 |
Wells Fargo & Co. (Rate is fixed until 10/23/2033, at which point, the rate becomes SOFR + 206) (Banks) | (e) | 6.491% | 10/23/2034 | 200,000 | 217,578 |
| 40,733,569 | |||||
| Health Care–2.5% | |||||
Abbott Laboratories (Health Care Equip. & Supplies) | 3.750% | 11/30/2026 | 475,000 | 467,990 | |
AHP Health Partners, Inc. (Health Care Providers & Svs.) | (b) | 5.750% | 07/15/2029 | 50,000 | 43,516 |
Alcon Finance Corp. (Health Care Equip. & Supplies) | (b) | 2.600% | 05/27/2030 | 600,000 | 520,096 |
Amgen, Inc. (Biotechnology) | 5.250% | 03/02/2033 | 340,000 | 348,579 | |
Amgen, Inc. (Biotechnology) | 3.375% | 02/21/2050 | 500,000 | 372,215 | |
Amgen, Inc. (Biotechnology) | 5.650% | 03/02/2053 | 340,000 | 357,709 | |
AstraZeneca PLC (Pharmaceuticals) | 3.125% | 06/12/2027 | 710,000 | 681,968 | |
AstraZeneca PLC (Pharmaceuticals) | 1.375% | 08/06/2030 | 225,000 | 187,049 | |
Avantor Funding, Inc. (Health Care Equip. & Supplies) | (b) | 4.625% | 07/15/2028 | 75,000 | 72,486 |
Avantor Funding, Inc. (Health Care Equip. & Supplies) | (b) | 3.875% | 11/01/2029 | 25,000 | 22,703 |
Bausch Health Americas, Inc. (Pharmaceuticals) | (b) | 8.500% | 01/31/2027 | 50,000 | 27,441 |
Bausch Health Cos., Inc. (Pharmaceuticals) | (b) | 6.125% | 02/01/2027 | 25,000 | 16,875 |
Bausch Health Cos., Inc. (Pharmaceuticals) | (b) | 6.250% | 02/15/2029 | 50,000 | 22,131 |
Bayer U.S. Finance LLC (Pharmaceuticals) | (b) | 3.375% | 10/08/2024 | 775,000 | 759,380 |
Becton Dickinson & Co. (Health Care Equip. & Supplies) | 4.685% | 12/15/2044 | 264,000 | 246,700 | |
Becton Dickinson & Co. (Health Care Equip. & Supplies) | 3.794% | 05/20/2050 | 168,000 | 136,867 | |
Biogen, Inc. (Biotechnology) | 3.150% | 05/01/2050 | 825,000 | 579,284 | |
Bristol-Myers Squibb Co. (Pharmaceuticals) | 0.750% | 11/13/2025 | 245,000 | 228,627 | |
Bristol-Myers Squibb Co. (Pharmaceuticals) | 3.900% | 02/20/2028 | 925,000 | 908,934 | |
Bristol-Myers Squibb Co. (Pharmaceuticals) | 4.250% | 10/26/2049 | 275,000 | 238,636 | |
Centene Corp. (Health Care Providers & Svs.) | 4.250% | 12/15/2027 | 100,000 | 96,355 | |
CHS / Community Health Systems, Inc. (Health Care Providers & Svs.) | (b) | 5.625% | 03/15/2027 | 25,000 | 23,228 |
CHS / Community Health Systems, Inc. (Health Care Providers & Svs.) | (b) | 6.125% | 04/01/2030 | 50,000 | 32,372 |
CHS / Community Health Systems, Inc. (Health Care Providers & Svs.) | (b) | 5.250% | 05/15/2030 | 75,000 | 62,726 |
CVS Health Corp. (Health Care Providers & Svs.) | 2.875% | 06/01/2026 | 525,000 | 501,387 | |
CVS Health Corp. (Health Care Providers & Svs.) | 4.250% | 04/01/2050 | 550,000 | 459,357 | |
Danaher Corp. (Life Sciences Tools & Svs.) | 2.600% | 10/01/2050 | 770,000 | 515,920 | |
Elevance Health, Inc. (Health Care Providers & Svs.) | 4.750% | 02/15/2033 | 530,000 | 530,182 | |
Embecta Corp. (Health Care Equip. & Supplies) | (b) | 6.750% | 02/15/2030 | 50,000 | 43,500 |
Garden Spinco Corp. (Health Care Equip. & Supplies) | (b) | 8.625% | 07/20/2030 | 25,000 | 26,703 |
GE HealthCare Technologies, Inc. (Health Care Equip. & Supplies) | 6.377% | 11/22/2052 | 405,000 | 470,263 | |
Gilead Sciences, Inc. (Biotechnology) | 5.250% | 10/15/2033 | 165,000 | 171,975 | |
Grifols SA (Biotechnology) | (b) | 4.750% | 10/15/2028 | 200,000 | 181,374 |
HCA, Inc. (Health Care Providers & Svs.) | 5.375% | 09/01/2026 | 75,000 | 75,344 | |
HCA, Inc. (Health Care Providers & Svs.) | 5.200% | 06/01/2028 | 90,000 | 90,924 | |
HCA, Inc. (Health Care Providers & Svs.) | 3.500% | 07/15/2051 | 600,000 | 422,503 | |
HealthEquity, Inc. (Health Care Providers & Svs.) | (b) | 4.500% | 10/01/2029 | 75,000 | 69,638 |
LifePoint Health, Inc. (Health Care Providers & Svs.) | (b) | 5.375% | 01/15/2029 | 75,000 | 55,459 |
Medline Borrower LP (Health Care Equip. & Supplies) | (b) | 3.875% | 04/01/2029 | 50,000 | 45,207 |
Medline Borrower LP (Health Care Equip. & Supplies) | (b) | 5.250% | 10/01/2029 | 175,000 | 164,951 |
Pfizer Investment Enterprises Pte Ltd. (Pharmaceuticals) | 4.450% | 05/19/2028 | 350,000 | 349,819 | |
Pfizer Investment Enterprises Pte Ltd. (Pharmaceuticals) | 4.750% | 05/19/2033 | 350,000 | 350,786 | |
Pfizer Investment Enterprises Pte Ltd. (Pharmaceuticals) | 5.300% | 05/19/2053 | 275,000 | 280,743 | |
Prestige Brands, Inc. (Pharmaceuticals) | (b) | 5.125% | 01/15/2028 | 75,000 | 72,835 |
Regeneron Pharmaceuticals, Inc. (Biotechnology) | 2.800% | 09/15/2050 | 702,000 | 462,641 | |
Stryker Corp. (Health Care Equip. & Supplies) | 3.500% | 03/15/2026 | 450,000 | �� 438,976 | |
Takeda Pharmaceutical Co. Ltd. (Pharmaceuticals) | 2.050% | 03/31/2030 | 350,000 | 299,906 | |
Takeda Pharmaceutical Co. Ltd. (Pharmaceuticals) | 3.025% | 07/09/2040 | 650,000 | 499,560 | |
Tenet Healthcare Corp. (Health Care Providers & Svs.) | 4.875% | 01/01/2026 | 75,000 | 74,155 | |
Tenet Healthcare Corp. (Health Care Providers & Svs.) | 6.125% | 10/01/2028 | 75,000 | 74,788 | |
Tenet Healthcare Corp. (Health Care Providers & Svs.) | 4.250% | 06/01/2029 | 25,000 | 23,275 | |
Tenet Healthcare Corp. (Health Care Providers & Svs.) | (b) | 6.750% | 05/15/2031 | 25,000 | 25,551 |
Thermo Fisher Scientific, Inc. (Life Sciences Tools & Svs.) | 1.215% | 10/18/2024 | 350,000 | 338,853 | |
UnitedHealth Group, Inc. (Health Care Providers & Svs.) | 5.050% | 04/15/2053 | 500,000 | 505,088 | |
Zoetis, Inc. (Pharmaceuticals) | 3.000% | 05/15/2050 | 725,000 | 519,946 | |
| 14,595,476 | |||||
| Industrials–3.5% | |||||
Air Lease Corp. (Trading Companies & Distributors) | 5.850% | 12/15/2027 | 520,000 | 533,442 | |
Airbus SE (Aerospace & Defense) | (b) | 3.150% | 04/10/2027 | 800,000 | 764,855 |
Allegion PLC (Building Products) | 3.500% | 10/01/2029 | 825,000 | 762,173 | |
Allied Universal Holdco LLC / Allied Universal Finance Corp. (Commercial Svs. & Supplies) | (b) | 6.625% | 07/15/2026 | 50,000 | 49,737 |
Allied Universal Holdco LLC / Allied Universal Finance Corp. (Commercial Svs. & Supplies) | (b) | 6.000% | 06/01/2029 | 200,000 | 163,059 |
115
(continued)
AuguStarSM Variable Insurance Products Fund, Inc.
AVIP Federated Core Plus Bond Portfolio (Continued)
| Schedule of Investments | December 31, 2023 |
| Corporate Bonds (Continued) | Rate | Maturity | Face Amount | Value | |
| Industrials (continued) | |||||
American Builders & Contractors Supply Co., Inc. (Trading Companies & Distributors) | (b) | 4.000% | 01/15/2028 | $ 25,000 | $ 23,657 |
Ashtead Capital, Inc. (Trading Companies & Distributors) | (b) | 5.550% | 05/30/2033 | 405,000 | 400,728 |
BAE Systems PLC (Aerospace & Defense) | (b) | 3.000% | 09/15/2050 | 700,000 | 494,095 |
BCPE Empire Holdings, Inc. (Commercial Svs. & Supplies) | (b) | 7.625% | 05/01/2027 | 125,000 | 120,533 |
Beacon Roofing Supply, Inc. (Trading Companies & Distributors) | (b) | 6.500% | 08/01/2030 | 25,000 | 25,562 |
Boeing Co. / The (Aerospace & Defense) | 2.196% | 02/04/2026 | 1,025,000 | 968,509 | |
Boeing Co. / The (Aerospace & Defense) | 2.950% | 02/01/2030 | 250,000 | 225,232 | |
Boeing Co. / The (Aerospace & Defense) | 5.805% | 05/01/2050 | 350,000 | 362,443 | |
Burlington Northern Santa Fe LLC (Ground Transportation) | 3.000% | 04/01/2025 | 475,000 | 464,505 | |
Burlington Northern Santa Fe LLC (Ground Transportation) | 5.200% | 04/15/2054 | 350,000 | 364,264 | |
Camelot Return Merger Sub, Inc. (Building Products) | (b) | 8.750% | 08/01/2028 | 25,000 | 25,376 |
Canadian Pacific Railway Co. (Ground Transportation) | 1.750% | 12/02/2026 | 90,000 | 83,010 | |
Canadian Pacific Railway Co. (Ground Transportation) | 2.050% | 03/05/2030 | 175,000 | 149,768 | |
Canadian Pacific Railway Co. (Ground Transportation) | 3.000% | 12/02/2041 | 75,000 | 66,935 | |
Canadian Pacific Railway Co. (Ground Transportation) | 3.500% | 05/01/2050 | 675,000 | 518,213 | |
Carrier Global Corp. (Building Products) | (b) | 5.900% | 03/15/2034 | 130,000 | 140,607 |
Carrier Global Corp. (Building Products) | (b) | 6.200% | 03/15/2054 | 110,000 | 127,157 |
Clarivate Science Holdings Corp. (Professional Svs.) | (b) | 4.875% | 07/01/2029 | 100,000 | 93,833 |
CNH Industrial N.V. (Machinery) | 3.850% | 11/15/2027 | 625,000 | 602,073 | |
Concentrix Corp. (Professional Svs.) | 6.650% | 08/02/2026 | 245,000 | 251,126 | |
Cornerstone Building Brands, Inc. (Building Products) | (b) | 6.125% | 01/15/2029 | 25,000 | 20,500 |
CP Atlas Buyer, Inc. (Building Products) | (b) | 7.000% | 12/01/2028 | 50,000 | 43,527 |
Dun & Bradstreet Corp. / The (Professional Svs.) | (b) | 5.000% | 12/15/2029 | 50,000 | 46,641 |
Equifax, Inc. (Professional Svs.) | 2.600% | 12/15/2025 | 750,000 | 715,566 | |
ERAC U.S.A. Finance LLC (Ground Transportation) | (b) | 3.850% | 11/15/2024 | 650,000 | 640,570 |
ERAC U.S.A. Finance LLC (Ground Transportation) | (b) | 4.600% | 05/01/2028 | 150,000 | 149,065 |
ERAC U.S.A. Finance LLC (Ground Transportation) | (b) | 4.900% | 05/01/2033 | 215,000 | 214,710 |
Experian Finance PLC (Professional Svs.) | (b) | 4.250% | 02/01/2029 | 350,000 | 346,569 |
Foundation Building Materials, Inc. (Trading Companies & Distributors) | (b) | 6.000% | 03/01/2029 | 125,000 | 112,391 |
Garda World Security Corp. (Commercial Svs. & Supplies) | (b) | 4.625% | 02/15/2027 | 50,000 | 48,209 |
Garda World Security Corp. (Commercial Svs. & Supplies) | (b) | 6.000% | 06/01/2029 | 50,000 | 44,819 |
General Dynamics Corp. (Aerospace & Defense) | 1.150% | 06/01/2026 | 745,000 | 688,837 | |
GXO Logistics, Inc. (Air Freight & Logistics) | 2.650% | 07/15/2031 | 670,000 | 549,372 | |
GYP Holdings III Corp. (Building Products) | (b) | 4.625% | 05/01/2029 | 75,000 | 68,468 |
H&E Equipment Services, Inc. (Trading Companies & Distributors) | (b) | 3.875% | 12/15/2028 | 50,000 | 45,466 |
HEICO Corp. (Aerospace & Defense) | 5.350% | 08/01/2033 | 400,000 | 409,502 | |
Honeywell International, Inc. (Industrial Conglomerates) | 1.350% | 06/01/2025 | 440,000 | 420,045 | |
Honeywell International, Inc. (Industrial Conglomerates) | 2.800% | 06/01/2050 | 370,000 | 281,178 | |
Huntington Ingalls Industries, Inc. (Aerospace & Defense) | 3.483% | 12/01/2027 | 850,000 | 803,548 | |
Interface, Inc. (Commercial Svs. & Supplies) | (b) | 5.500% | 12/01/2028 | 50,000 | 46,214 |
Madison IAQ LLC (Commercial Svs. & Supplies) | (b) | 4.125% | 06/30/2028 | 25,000 | 22,729 |
Madison IAQ LLC (Commercial Svs. & Supplies) | (b) | 5.875% | 06/30/2029 | 100,000 | 88,108 |
Masco Corp. (Building Products) | 3.500% | 11/15/2027 | 350,000 | 332,141 | |
MIWD Holdco II LLC / MIWD Finance Corp. (Building Products) | (b) | 5.500% | 02/01/2030 | 25,000 | 22,125 |
Northrop Grumman Corp. (Aerospace & Defense) | 3.250% | 01/15/2028 | 825,000 | 788,352 | |
Penske Truck Leasing Co. LP / PTL Finance Corp. (Ground Transportation) | (b) | 3.450% | 07/01/2024 | 500,000 | 493,917 |
RTX Corp. (Aerospace & Defense) | 5.150% | 02/27/2033 | 680,000 | 693,019 | |
Ryder System, Inc. (Ground Transportation) | 5.250% | 06/01/2028 | 650,000 | 658,451 | |
Solaris Midstream Holdings LLC (Commercial Svs. & Supplies) | (b) | 7.625% | 04/01/2026 | 50,000 | 50,673 |
SPX FLOW, Inc. (Machinery) | (b) | 8.750% | 04/01/2030 | 75,000 | 75,000 |
SS&C Technologies, Inc. (Professional Svs.) | (b) | 5.500% | 09/30/2027 | 100,000 | 98,573 |
Textron, Inc. (Aerospace & Defense) | 3.650% | 03/15/2027 | 600,000 | 575,829 | |
TransDigm, Inc. (Aerospace & Defense) | (b) | 6.250% | 03/15/2026 | 75,000 | 74,870 |
TransDigm, Inc. (Aerospace & Defense) | 5.500% | 11/15/2027 | 200,000 | 195,945 | |
TransDigm, Inc. (Aerospace & Defense) | (b) | 6.750% | 08/15/2028 | 25,000 | 25,577 |
TransDigm, Inc. (Aerospace & Defense) | (b) | 6.875% | 12/15/2030 | 25,000 | 25,750 |
Union Pacific Corp. (Ground Transportation) | 2.375% | 05/20/2031 | 585,000 | 508,532 | |
United Parcel Service, Inc. (Air Freight & Logistics) | 4.875% | 03/03/2033 | 450,000 | 467,087 | |
United Rentals North America, Inc. (Trading Companies & Distributors) | 4.875% | 01/15/2028 | 75,000 | 73,218 | |
United Rentals North America, Inc. (Trading Companies & Distributors) | 5.250% | 01/15/2030 | 25,000 | 24,616 | |
United Rentals North America, Inc. (Trading Companies & Distributors) | 3.875% | 02/15/2031 | 25,000 | 22,715 | |
Valmont Industries, Inc. (Construction & Engineering) | 5.000% | 10/01/2044 | 40,000 | 35,976 | |
Verisk Analytics, Inc. (Professional Svs.) | 4.125% | 03/15/2029 | 600,000 | 585,301 | |
Watco Cos. LLC / Watco Finance Corp. (Ground Transportation) | (b) | 6.500% | 06/15/2027 | 50,000 | 50,000 |
WESCO Distribution, Inc. (Trading Companies & Distributors) | (b) | 7.250% | 06/15/2028 | 100,000 | 102,782 |
White Cap Buyer LLC (Building Products) | (b) | 6.875% | 10/15/2028 | 50,000 | 48,401 |
White Cap Parent LLC (Building Products) | (b)(d) | 8.250%, 9.000% PIK | 03/15/2026 | 50,000 | 49,768 |
Xylem, Inc. (Machinery) | 2.250% | 01/30/2031 | 705,000 | 603,951 | |
| 20,269,495 | |||||
116
(continued)
AuguStarSM Variable Insurance Products Fund, Inc.
AVIP Federated Core Plus Bond Portfolio (Continued)
| Schedule of Investments | December 31, 2023 |
| Corporate Bonds (Continued) | Rate | Maturity | Face Amount | Value | |
| Information Technology–1.5% | |||||
Apple, Inc. (Tech. Hardware, Storage & Periph.) | 2.900% | 09/12/2027 | $ 600,000 | $ 574,521 | |
Apple, Inc. (Tech. Hardware, Storage & Periph.) | 4.000% | 05/10/2028 | 625,000 | 623,544 | |
Apple, Inc. (Tech. Hardware, Storage & Periph.) | 2.375% | 02/08/2041 | 475,000 | 347,142 | |
AthenaHealth Group, Inc. (Software) | (b) | 6.500% | 02/15/2030 | 175,000 | 158,756 |
Boxer Parent Co., Inc. (Software) | (b) | 9.125% | 03/01/2026 | 50,000 | 49,890 |
Broadcom, Inc. (Semiconductors & Equip.) | 4.150% | 11/15/2030 | 285,000 | 272,226 | |
Broadcom, Inc. (Semiconductors & Equip.) | (b) | 3.469% | 04/15/2034 | 510,000 | 443,703 |
Broadcom, Inc. (Semiconductors & Equip.) | (b) | 3.187% | 11/15/2036 | 15,000 | 12,155 |
Capstone Borrower, Inc. (Software) | (b) | 8.000% | 06/15/2030 | 50,000 | 52,018 |
CDW LLC / CDW Finance Corp. (Electronic Equip., Instr. & Comp.) | 2.670% | 12/01/2026 | 480,000 | 449,146 | |
Central Parent LLC / CDK Global II LLC / CDK Financing Co., Inc. (Software) | (b) | 8.000% | 06/15/2029 | 50,000 | 52,188 |
Central Parent, Inc. / CDK Global, Inc. (Software) | (b) | 7.250% | 06/15/2029 | 75,000 | 76,489 |
Cloud Software Group, Inc. (Software) | (b) | 6.500% | 03/31/2029 | 50,000 | 47,622 |
Cloud Software Group, Inc. (Software) | (b) | 9.000% | 09/30/2029 | 50,000 | 47,523 |
Coherent Corp. (Electronic Equip., Instr. & Comp.) | (b) | 5.000% | 12/15/2029 | 100,000 | 94,976 |
Consensus Cloud Solutions, Inc. (Software) | (b) | 6.000% | 10/15/2026 | 25,000 | 23,771 |
Consensus Cloud Solutions, Inc. (Software) | (b) | 6.500% | 10/15/2028 | 50,000 | 45,353 |
Elastic N.V. (Software) | (b) | 4.125% | 07/15/2029 | 50,000 | 45,912 |
Fortinet, Inc. (Software) | 1.000% | 03/15/2026 | 670,000 | 614,153 | |
Go Daddy Operating Co. LLC / GD Finance Co., Inc. (IT Svs.) | (b) | 5.250% | 12/01/2027 | 25,000 | 24,498 |
Leidos, Inc. (IT Svs.) | 3.625% | 05/15/2025 | 220,000 | 214,292 | |
Leidos, Inc. (IT Svs.) | 4.375% | 05/15/2030 | 525,000 | 502,627 | |
McAfee Corp. (Software) | (b) | 7.375% | 02/15/2030 | 175,000 | 159,819 |
NCR Voyix Corp. (Software) | (b) | 5.000% | 10/01/2028 | 25,000 | 23,632 |
NCR Voyix Corp. (Software) | (b) | 5.250% | 10/01/2030 | 50,000 | 45,919 |
Open Text Corp. (Software) | (b) | 6.900% | 12/01/2027 | 25,000 | 25,991 |
Open Text Corp. (Software) | (b) | 3.875% | 12/01/2029 | 50,000 | 44,842 |
Oracle Corp. (Software) | 6.250% | 11/09/2032 | 600,000 | 652,731 | |
Oracle Corp. (Software) | 3.600% | 04/01/2050 | 700,000 | 518,495 | |
Rocket Software, Inc. (Software) | (b) | 6.500% | 02/15/2029 | 75,000 | 65,250 |
Roper Technologies, Inc. (Software) | 1.000% | 09/15/2025 | 525,000 | 490,728 | |
Seagate HDD Cayman (Tech. Hardware, Storage & Periph.) | (b) | 8.250% | 12/15/2029 | 25,000 | 26,963 |
Seagate HDD Cayman (Tech. Hardware, Storage & Periph.) | 9.625% | 12/01/2032 | 39,000 | 44,597 | |
Skyworks Solutions, Inc. (Semiconductors & Equip.) | 1.800% | 06/01/2026 | 50,000 | 46,330 | |
Trimble, Inc. (Electronic Equip., Instr. & Comp.) | 6.100% | 03/15/2033 | 350,000 | 374,570 | |
TTM Technologies, Inc. (Electronic Equip., Instr. & Comp.) | (b) | 4.000% | 03/01/2029 | 75,000 | 68,132 |
VeriSign, Inc. (IT Svs.) | 2.700% | 06/15/2031 | 660,000 | 565,662 | |
VMware LLC (Software) | 1.400% | 08/15/2026 | 240,000 | 219,524 | |
VMware LLC (Software) | 2.200% | 08/15/2031 | 190,000 | 157,436 | |
Vontier Corp. (Electronic Equip., Instr. & Comp.) | 1.800% | 04/01/2026 | 465,000 | 427,661 | |
| 8,730,787 | |||||
| Materials–0.9% | |||||
Albemarle Corp. (Chemicals) | 5.450% | 12/01/2044 | 275,000 | 256,004 | |
Anglo American Capital PLC (Metals & Mining) | (b) | 2.875% | 03/17/2031 | 775,000 | 659,091 |
ARD Finance SA (Containers & Packaging) | (b)(d) | 6.500%, 7.250% PIK | 06/30/2027 | 200,000 | 93,436 |
Ball Corp. (Containers & Packaging) | 6.875% | 03/15/2028 | 25,000 | 25,973 | |
Ball Corp. (Containers & Packaging) | 6.000% | 06/15/2029 | 25,000 | 25,529 | |
Ball Corp. (Containers & Packaging) | 3.125% | 09/15/2031 | 25,000 | 21,555 | |
Clearwater Paper Corp. (Paper & Forest Products) | (b) | 4.750% | 08/15/2028 | 100,000 | 92,700 |
Cleveland-Cliffs, Inc. (Metals & Mining) | (b) | 4.875% | 03/01/2031 | 50,000 | 45,178 |
Clydesdale Acquisition Holdings, Inc. (Containers & Packaging) | (b) | 8.750% | 04/15/2030 | 275,000 | 256,401 |
Coeur Mining, Inc. (Metals & Mining) | (b) | 5.125% | 02/15/2029 | 50,000 | 46,006 |
Crown Americas LLC / Crown Americas Capital Corp. V (Containers & Packaging) | 4.250% | 09/30/2026 | 25,000 | 24,250 | |
Element Solutions, Inc. (Chemicals) | (b) | 3.875% | 09/01/2028 | 50,000 | 46,032 |
Glencore Funding LLC (Metals & Mining) | (b) | 1.625% | 04/27/2026 | 475,000 | 440,287 |
Glencore Funding LLC (Metals & Mining) | (b) | 3.375% | 09/23/2051 | 400,000 | 281,711 |
Graphic Packaging International LLC (Containers & Packaging) | (b) | 3.500% | 03/01/2029 | 50,000 | 45,019 |
International Flavors & Fragrances, Inc. (Chemicals) | (b) | 1.832% | 10/15/2027 | 450,000 | 394,327 |
Mauser Packaging Solutions Holding Co. (Containers & Packaging) | (b) | 7.875% | 08/15/2026 | 50,000 | 50,884 |
Mauser Packaging Solutions Holding Co. (Containers & Packaging) | (b) | 9.250% | 04/15/2027 | 25,000 | 24,539 |
OI European Group B.V. (Containers & Packaging) | (b) | 4.750% | 02/15/2030 | 50,000 | 46,760 |
Olympus Water U.S. Holding Corp. (Chemicals) | (b) | 9.750% | 11/15/2028 | 200,000 | 212,279 |
Owens-Brockway Glass Container, Inc. (Containers & Packaging) | (b) | 6.625% | 05/13/2027 | 38,000 | 38,005 |
Owens-Brockway Glass Container, Inc. (Containers & Packaging) | (b) | 7.250% | 05/15/2031 | 25,000 | 25,347 |
Packaging Corp. of America (Containers & Packaging) | 3.650% | 09/15/2024 | 675,000 | 665,306 | |
Polar U.S. Borrower LLC / Schenectady International Group, Inc. (Chemicals) | (b) | 6.750% | 05/15/2026 | 25,000 | 8,000 |
RPM International, Inc. (Chemicals) | 4.550% | 03/01/2029 | 475,000 | 468,014 | |
Sealed Air Corp. (Containers & Packaging) | (b) | 4.000% | 12/01/2027 | 50,000 | 46,928 |
117
(continued)
AuguStarSM Variable Insurance Products Fund, Inc.
AVIP Federated Core Plus Bond Portfolio (Continued)
| Schedule of Investments | December 31, 2023 |
| Corporate Bonds (Continued) | Rate | Maturity | Face Amount | Value | |
| Materials (continued) | |||||
Sealed Air Corp. / Sealed Air Corp. U.S. (Containers & Packaging) | (b) | 7.250% | 02/15/2031 | $ 25,000 | $ 26,508 |
SRS Distribution, Inc. (Construction Materials) | (b) | 6.125% | 07/01/2029 | 25,000 | 23,701 |
SRS Distribution, Inc. (Construction Materials) | (b) | 6.000% | 12/01/2029 | 125,000 | 116,551 |
Standard Industries, Inc. (Construction Materials) | (b) | 5.000% | 02/15/2027 | 125,000 | 121,867 |
Trivium Packaging Finance B.V. (Containers & Packaging) | (b) | 8.500% | 08/15/2027 | 225,000 | 220,612 |
W.R. Grace Holdings LLC (Chemicals) | (b) | 4.875% | 06/15/2027 | 25,000 | 24,053 |
W.R. Grace Holdings LLC (Chemicals) | (b) | 5.625% | 08/15/2029 | 50,000 | 43,998 |
WRKCo, Inc. (Containers & Packaging) | 4.000% | 03/15/2028 | 600,000 | 578,578 | |
| 5,495,429 | |||||
| Real Estate–1.3% | |||||
Alexandria Real Estate Equities, Inc. (Office REITs) | 1.875% | 02/01/2033 | 930,000 | 723,974 | |
American Tower Corp. (Specialized REITs) | 2.700% | 04/15/2031 | 650,000 | 558,161 | |
AvalonBay Communities, Inc. (Residential REITs) | 3.350% | 05/15/2027 | 725,000 | 692,281 | |
Boston Properties LP (Office REITs) | 3.650% | 02/01/2026 | 650,000 | 625,610 | |
Crown Castle, Inc. (Specialized REITs) | 3.250% | 01/15/2051 | 800,000 | 558,996 | |
Healthcare Realty Holdings LP (Health Care REITs) | 2.000% | 03/15/2031 | 525,000 | 420,188 | |
Iron Mountain, Inc. (Specialized REITs) | (b) | 7.000% | 02/15/2029 | 50,000 | 51,394 |
Kimco Realty OP LLC (Retail REITs) | 2.700% | 10/01/2030 | 550,000 | 475,365 | |
Mid-America Apartments LP (Residential REITs) | 4.000% | 11/15/2025 | 725,000 | 712,223 | |
Outfront Media Capital LLC / Outfront Media Capital Corp. (Specialized REITs) | (b) | 5.000% | 08/15/2027 | 25,000 | 24,165 |
Outfront Media Capital LLC / Outfront Media Capital Corp. (Specialized REITs) | (b) | 4.250% | 01/15/2029 | 50,000 | 45,118 |
Outfront Media Capital LLC / Outfront Media Capital Corp. (Specialized REITs) | (b) | 7.375% | 02/15/2031 | 25,000 | 26,254 |
Piedmont Operating Partnership LP (Office REITs) | 2.750% | 04/01/2032 | 300,000 | 208,460 | |
Regency Centers LP (Retail REITs) | 2.950% | 09/15/2029 | 800,000 | 717,336 | |
RHP Hotel Properties LP / RHP Finance Corp. (Hotel & Resort REITs) | (b) | 7.250% | 07/15/2028 | 50,000 | 51,984 |
UDR, Inc. (Residential REITs) | 3.500% | 01/15/2028 | 725,000 | 682,423 | |
VICI Properties LP / VICI Note Co., Inc. (Specialized REITs) | (b) | 4.625% | 06/15/2025 | 75,000 | 73,669 |
Welltower OP LLC (Health Care REITs) | 4.250% | 04/01/2026 | 475,000 | 467,662 | |
WP Carey, Inc. (Diversified REITs) | 3.850% | 07/15/2029 | 350,000 | 328,394 | |
| 7,443,657 | |||||
| Utilities–2.3% | |||||
Ameren Corp. (Multi-Utilities) | 1.750% | 03/15/2028 | 1,000,000 | 883,438 | |
American Electric Power Co., Inc. (Electric Utilities) | 2.031% | 03/15/2024 | 335,000 | 332,247 | |
American Electric Power Co., Inc. (Electric Utilities) | 5.625% | 03/01/2033 | 380,000 | 395,880 | |
AmeriGas Partners LP / AmeriGas Finance Corp. (Gas Utilities) | 5.500% | 05/20/2025 | 50,000 | 49,298 | |
Black Hills Corp. (Multi-Utilities) | 2.500% | 06/15/2030 | 370,000 | 310,931 | |
Calpine Corp. (Ind. Power & Renewable Elec.) | (b) | 4.500% | 02/15/2028 | 25,000 | 23,779 |
Calpine Corp. (Ind. Power & Renewable Elec.) | (b) | 5.125% | 03/15/2028 | 50,000 | 47,939 |
Calpine Corp. (Ind. Power & Renewable Elec.) | (b) | 5.000% | 02/01/2031 | 50,000 | 45,836 |
Calpine Corp. (Ind. Power & Renewable Elec.) | (b) | 3.750% | 03/01/2031 | 25,000 | 21,927 |
Constellation Energy Generation LLC (Electric Utilities) | 5.800% | 03/01/2033 | 400,000 | 420,430 | |
Constellation Energy Generation LLC (Electric Utilities) | 6.125% | 01/15/2034 | 90,000 | 96,308 | |
Constellation Energy Generation LLC (Electric Utilities) | 6.500% | 10/01/2053 | 65,000 | 73,301 | |
Dominion Energy, Inc. (Multi-Utilities) | 1.450% | 04/15/2026 | 670,000 | 621,038 | |
Duke Energy Corp. (Electric Utilities) | 3.750% | 09/01/2046 | 650,000 | 500,821 | |
Duke Energy Corp. (Electric Utilities) | 4.200% | 06/15/2049 | 725,000 | 589,671 | |
Electricite de France SA (Electric Utilities) | (b) | 6.250% | 05/23/2033 | 445,000 | 481,573 |
Emera U.S. Finance LP (Electric Utilities) | 3.550% | 06/15/2026 | 400,000 | 385,392 | |
Emera U.S. Finance LP (Electric Utilities) | 4.750% | 06/15/2046 | 400,000 | 329,084 | |
Emerald Debt Merger Sub LLC (Electric Utilities) | (b) | 6.625% | 12/15/2030 | 75,000 | 76,603 |
Enel Finance International N.V. (Electric Utilities) | (b) | 2.250% | 07/12/2031 | 750,000 | 609,317 |
Eversource Energy (Electric Utilities) | 3.350% | 03/15/2026 | 670,000 | 644,011 | |
Exelon Corp. (Electric Utilities) | 4.050% | 04/15/2030 | 1,175,000 | 1,120,911 | |
Exelon Corp. (Electric Utilities) | 4.100% | 03/15/2052 | 55,000 | 44,465 | |
FirstEnergy Corp. (Electric Utilities) | 2.650% | 03/01/2030 | 250,000 | 215,982 | |
National Fuel Gas Co. (Gas Utilities) | 5.500% | 01/15/2026 | 450,000 | 450,488 | |
National Fuel Gas Co. (Gas Utilities) | 2.950% | 03/01/2031 | 270,000 | 226,014 | |
NextEra Energy Capital Holdings, Inc. (Electric Utilities) | 3.550% | 05/01/2027 | 600,000 | 577,808 | |
NextEra Energy Capital Holdings, Inc. (Electric Utilities) | 2.250% | 06/01/2030 | 600,000 | 513,257 | |
NextEra Energy Operating Partners LP (Electric Utilities) | (b) | 7.250% | 01/15/2029 | 25,000 | 26,173 |
NiSource, Inc. (Multi-Utilities) | 5.250% | 03/30/2028 | 105,000 | 107,060 | |
NiSource, Inc. (Multi-Utilities) | 5.400% | 06/30/2033 | 500,000 | 515,539 | |
NRG Energy, Inc. (Electric Utilities) | 5.750% | 01/15/2028 | 50,000 | 49,816 | |
NRG Energy, Inc. (Electric Utilities) | (b) | 3.875% | 02/15/2032 | 3,000 | 2,568 |
PPL Capital Funding, Inc. (Electric Utilities) | 3.100% | 05/15/2026 | 200,000 | 191,683 | |
Puget Energy, Inc. (Electric Utilities) | 2.379% | 06/15/2028 | 685,000 | 612,267 | |
Sempra (Multi-Utilities) | 3.700% | 04/01/2029 | 590,000 | 562,100 | |
118
(continued)
AuguStarSM Variable Insurance Products Fund, Inc.
AVIP Federated Core Plus Bond Portfolio (Continued)
| Schedule of Investments | December 31, 2023 |
| Corporate Bonds (Continued) | Rate | Maturity | Face Amount | Value | |
| Utilities (continued) | |||||
Southern Co. / The (Rate is fixed until 01/15/2026, at which point, the rate becomes H15T5Y + 373) (Electric Utilities) | (e) | 4.000% | 01/15/2051 | $ 700,000 | $ 665,590 |
Suburban Propane Partners LP / Suburban Energy Finance Corp. (Gas Utilities) | 5.875% | 03/01/2027 | 50,000 | 49,749 | |
Suburban Propane Partners LP / Suburban Energy Finance Corp. (Gas Utilities) | (b) | 5.000% | 06/01/2031 | 25,000 | 22,665 |
TerraForm Power Operating LLC (Ind. Power & Renewable Elec.) | (b) | 5.000% | 01/31/2028 | 75,000 | 72,856 |
TransAlta Corp. (Ind. Power & Renewable Elec.) | 7.750% | 11/15/2029 | 50,000 | 53,104 | |
Vistra Operations Co. LLC (Ind. Power & Renewable Elec.) | (b) | 5.500% | 09/01/2026 | 75,000 | 74,046 |
Vistra Operations Co. LLC (Ind. Power & Renewable Elec.) | (b) | 7.750% | 10/15/2031 | 50,000 | 51,929 |
WEC Energy Group, Inc. (Multi-Utilities) | 0.800% | 03/15/2024 | 220,000 | 217,755 | |
WEC Energy Group, Inc. (Multi-Utilities) | 2.200% | 12/15/2028 | 190,000 | 169,010 | |
| 13,531,659 | |||||
Total Corporate Bonds (Cost $168,365,645) | $152,293,293 | ||||
| U.S. Government Agency Mortgage-Backed Securities–24.6% | Rate | Maturity | Face Amount | Value | |
Fannie Mae Pool FN BM4333 | 3.500% | 12/01/2047 | $ 897,453 | $ 841,515 | |
Fannie Mae Pool FN BN6715 | 4.000% | 06/01/2049 | 2,618,365 | 2,518,398 | |
Fannie Mae Pool FN BP2797 | 2.500% | 05/01/2050 | 1,358,837 | 1,165,535 | |
Fannie Mae Pool FN BP6700 | 2.500% | 09/01/2050 | 3,666,537 | 3,169,716 | |
Fannie Mae Pool FN BP8188 | 2.000% | 09/01/2050 | 5,821,469 | 4,788,329 | |
Fannie Mae Pool FN BQ4558 | 2.000% | 03/01/2051 | 1,941,856 | 1,593,895 | |
Fannie Mae Pool FN BR1844 | 2.500% | 01/01/2051 | 1,060,413 | 913,594 | |
Fannie Mae Pool FN BR4390 | 2.000% | 03/01/2051 | 3,386,491 | 2,778,981 | |
Fannie Mae Pool FN BR9750 | 2.000% | 04/01/2051 | 3,425,570 | 2,806,252 | |
Fannie Mae Pool FN BT7183 | 2.500% | 08/01/2051 | 1,477,292 | 1,264,812 | |
Fannie Mae Pool FN BU3058 | 2.500% | 12/01/2051 | 5,675,333 | 4,826,234 | |
Fannie Mae Pool FN BW7264 | 5.500% | 11/01/2052 | 2,749,350 | 2,768,088 | |
Fannie Mae Pool FN BW7449 | 5.000% | 11/01/2052 | 973,284 | 963,670 | |
Fannie Mae Pool FN BW9916 | 5.000% | 10/01/2052 | 702,341 | 696,192 | |
Fannie Mae Pool FN BX5678 | 5.500% | 01/01/2053 | 1,494,424 | 1,503,285 | |
Fannie Mae Pool FN CA4819 | 4.000% | 12/01/2049 | 914,395 | 876,908 | |
Fannie Mae Pool FN CA5348 | 3.500% | 03/01/2050 | 1,407,063 | 1,309,350 | |
Fannie Mae Pool FN CA5706 | 2.500% | 05/01/2050 | 1,755,323 | 1,508,690 | |
Fannie Mae Pool FN CA6998 | 3.000% | 09/01/2050 | 2,726,721 | 2,432,070 | |
Fannie Mae Pool FN CA8118 | 2.000% | 12/01/2050 | 1,698,972 | 1,396,651 | |
Fannie Mae Pool FN CA9293 | 2.500% | 02/01/2051 | 2,250,408 | 1,930,718 | |
Fannie Mae Pool FN CA9390 | 2.500% | 03/01/2051 | 2,781,019 | 2,365,534 | |
Fannie Mae Pool FN CB1867 | 2.500% | 10/01/2051 | 5,038,465 | 4,288,662 | |
Fannie Mae Pool FN CB3026 | 3.500% | 03/01/2052 | 2,650,031 | 2,430,423 | |
Fannie Mae Pool FN CB3335 | 4.500% | 04/01/2052 | 4,524,368 | 4,461,202 | |
Fannie Mae Pool FN CB3586 | 3.000% | 05/01/2052 | 3,564,291 | 3,153,514 | |
Fannie Mae Pool FN FM2778 | 3.000% | 03/01/2050 | 1,982,423 | 1,774,764 | |
Fannie Mae Pool FN FM3734 | 3.500% | 09/01/2049 | 1,048,052 | 982,474 | |
Fannie Mae Pool FN FM3919 | 4.000% | 05/01/2049 | 644,045 | 624,741 | |
Fannie Mae Pool FN FM4122 | 2.000% | 08/01/2050 | 5,962,251 | 4,956,180 | |
Fannie Mae Pool FN FM4317 | 3.000% | 09/01/2050 | 2,568,155 | 2,291,719 | |
Fannie Mae Pool FN FM4532 | 3.000% | 09/01/2050 | 2,939,743 | 2,626,361 | |
Fannie Mae Pool FN FM6708 | 2.500% | 01/01/2051 | 2,953,223 | 2,544,339 | |
Fannie Mae Pool FN FM7293 | 2.500% | 05/01/2051 | 1,161,885 | 999,336 | |
Fannie Mae Pool FN FM7706 | 3.500% | 08/01/2050 | 2,920,564 | 2,718,513 | |
Fannie Mae Pool FN FS2041 | 2.000% | 08/01/2051 | 3,675,708 | 3,010,945 | |
Fannie Mae Pool FN FS2099 | 1.500% | 04/01/2052 | 1,241,606 | 968,408 | |
Fannie Mae Pool FN FS3024 | 4.000% | 09/01/2052 | 1,550,285 | 1,467,196 | |
Fannie Mae Pool FN FS3813 | 4.500% | 11/01/2052 | 1,147,084 | 1,112,279 | |
Fannie Mae Pool FN MA4138 | 1.500% | 09/01/2050 | 4,042,713 | 3,161,623 | |
Fannie Mae Pool FN MA4255 | 2.000% | 02/01/2051 | 1,540,064 | 1,264,823 | |
Fannie Mae Pool FN MA4593 | 4.000% | 03/01/2052 | 738,400 | 698,142 | |
Fannie Mae Pool FN MA4597 | 2.000% | 05/01/2052 | 6,667,459 | 5,455,379 | |
Fannie Mae Pool FN MA4732 | 4.000% | 09/01/2052 | 1,882,221 | 1,780,321 | |
Fannie Mae Pool FN MA4804 | 4.000% | 11/01/2052 | 774,761 | 732,758 | |
Fannie Mae Pool FN MA5167 | 6.500% | 10/01/2053 | 1,451,821 | 1,487,706 | |
Freddie Mac Pool FR QF1237 | 5.000% | 10/01/2052 | 2,563,278 | 2,538,822 | |
Freddie Mac Pool FR QF1648 | 5.000% | 10/01/2052 | 769,333 | 762,207 | |
Freddie Mac Pool FR QF2557 | 4.500% | 10/01/2052 | 258,535 | 250,690 | |
Freddie Mac Pool FR QF5585 | 4.500% | 11/01/2052 | 755,175 | 732,598 | |
Freddie Mac Pool FR RA3575 | 2.000% | 09/01/2050 | 5,396,597 | 4,435,237 | |
Freddie Mac Pool FR RA5761 | 2.000% | 06/01/2051 | 2,215,123 | 1,815,909 | |
Freddie Mac Pool FR RA7279 | 3.500% | 05/01/2052 | 2,623,729 | 2,407,369 | |
Freddie Mac Pool FR SD0451 | 3.000% | 10/01/2050 | 820,668 | 727,781 | |
119
(continued)
AuguStarSM Variable Insurance Products Fund, Inc.
AVIP Federated Core Plus Bond Portfolio (Continued)
| Schedule of Investments | December 31, 2023 |
| U.S. Government Agency Mortgage-Backed Securities (Continued) | Rate | Maturity | Face Amount | Value | |
Freddie Mac Pool FR SD0625 | 2.500% | 05/01/2051 | $ 1,985,815 | $ 1,700,019 | |
Freddie Mac Pool FR SD0977 | 3.500% | 02/01/2052 | 5,228,726 | 4,840,292 | |
Freddie Mac Pool FR SD1966 | 4.000% | 11/01/2052 | 942,817 | 891,765 | |
Freddie Mac Pool FR SD2018 | 3.000% | 11/01/2050 | 1,732,050 | 1,534,750 | |
Freddie Mac Pool FR SD7505 | 4.500% | 08/01/2049 | 674,780 | 668,074 | |
Freddie Mac Pool FR SD8104 | 1.500% | 11/01/2050 | 1,969,615 | 1,536,590 | |
Freddie Mac Pool FR SD8121 | 2.000% | 01/01/2051 | 1,516,257 | 1,246,773 | |
Freddie Mac Pool FR SD8148 | 3.000% | 05/01/2051 | 2,794,367 | 2,477,016 | |
Freddie Mac Pool FR SD8210 | 4.000% | 03/01/2052 | 744,182 | 703,950 | |
Freddie Mac Pool FR SD8211 | 2.000% | 05/01/2052 | 6,052,500 | 4,950,401 | |
Freddie Mac Pool FR SD8214 | 3.500% | 05/01/2052 | 590,538 | 541,822 | |
Freddie Mac Pool FR SD8275 | 4.500% | 12/01/2052 | 624,125 | 605,188 | |
Freddie Mac Pool FR SD8368 | 6.000% | 10/01/2053 | 1,952,832 | 1,982,835 | |
Freddie Mac Pool FR ZT1257 | 3.000% | 01/01/2046 | 661,790 | 608,262 | |
Ginnie Mae II Pool G2 MA6866 | 3.000% | 09/20/2050 | 1,251,400 | 1,138,854 | |
Ginnie Mae II Pool G2 MA8800 | 5.000% | 04/20/2053 | 3,125,494 | 3,104,935 | |
Ginnie Mae II Pool G2 MA8948 | 5.500% | 06/20/2053 | 1,477,629 | 1,488,504 | |
Ginnie Mae II Pool G2 MA8949 | 6.000% | 06/20/2053 | 975,229 | 991,844 | |
Total U.S. Government Agency Mortgage-Backed Securities (Cost $157,726,061) | $144,092,712 | ||||
| Investment Companies–6.3% | Shares | Value | |
Federated Hermes Core Trust - Bank Loan Core Fund (Acquired 06/28/2021, Cost $746,662) | (f)(g) | 77,055 | $ 674,230 |
Federated Hermes Core Trust - Emerging Markets Core Fund (Acquired 06/28/2021 through 11/13/2023, Cost $14,222,731) | (f)(g) | 1,695,869 | 13,990,915 |
Federated Hermes Core Trust III - Federated Project and Trade Finance Core Fund (Acquired 05/01/2020 through 08/28/2023, Cost $22,222,113) | (g)(h) | 2,520,211 | 22,152,653 |
Total Investment Companies (Cost $37,191,506) | $ 36,817,798 | ||
| Asset-Backed / Mortgage-Backed Securities–5.0% | Rate | Maturity | Face Amount | Value | |
| Financials–5.0% | |||||
AmeriCredit Automobile Receivables Trust 2020-2 D | 2.130% | 03/18/2026 | $ 180,000 | $ 173,664 | |
AmeriCredit Automobile Receivables Trust 2020-3 D | 1.490% | 09/18/2026 | 175,000 | 165,469 | |
BANK 2022-BNK40 A4 | 3.393% | 03/15/2064 | 660,000 | 588,483 | |
Benchmark 2020-B19 A5 | 1.850% | 09/15/2053 | 1,150,000 | 917,380 | |
Benchmark 2021-B26 A2 | 1.957% | 06/15/2054 | 520,000 | 462,257 | |
Carmax Auto Owner Trust 2021-1 D | 1.280% | 07/15/2027 | 100,000 | 94,186 | |
Chesapeake Funding II LLC 2020-1A D | (b) | 2.830% | 08/15/2032 | 150,000 | 147,260 |
Ford Credit Auto Owner Trust 2023-1 C | (b) | 5.580% | 08/15/2035 | 3,000,000 | 2,986,113 |
Freddie Mac Multifamily Structured Pass Through Certificates K108 A2 | 1.517% | 03/25/2030 | 400,000 | 339,198 | |
Freddie Mac Multifamily Structured Pass Through Certificates K109 A2 | 1.558% | 04/25/2030 | 400,000 | 338,805 | |
GM Financial Consumer Automobile Receivables Trust 2020-3 D | 1.910% | 09/16/2027 | 400,000 | 391,326 | |
GS Mortgage-Backed Securities Trust 2022-PJ3 A4 | (b) | 2.500% | 08/25/2052 | 1,789,448 | 1,464,262 |
Home Partners of America 2022-1 B | (b) | 4.330% | 04/17/2039 | 731,126 | 696,958 |
Invitation Homes 2018-SFR4 B | (b) | TSFR1M + 136 | 01/17/2038 | 2,999,862 | 2,992,548 |
J.P. Morgan Mortgage Trust 2022-1 A2 | (b) | 3.000% | 07/25/2052 | 1,316,831 | 1,121,519 |
J.P. Morgan Mortgage Trust 2023-4 1A2 | (b) | 6.000% | 11/25/2053 | 1,815,044 | 1,819,086 |
J.P. Morgan Mortgage Trust 2023-6 A2 | (b) | 6.000% | 12/26/2053 | 1,405,679 | 1,409,688 |
JP Morgan Mortgage Trust 2022-2 A3 | (b) | 2.500% | 08/25/2052 | 1,779,420 | 1,451,572 |
JP Morgan Mortgage Trust 2022-3 A3 | (b) | 2.500% | 08/25/2052 | 1,763,045 | 1,443,768 |
MMAF Equipment Finance LLC 2020-A A5 | (b) | 1.560% | 10/09/2042 | 750,000 | 663,887 |
Navient Private Education Refi Loan Trust 2020-FA A | (b) | 1.220% | 07/15/2069 | 131,402 | 119,189 |
PFS Financing Corp. 2020-G B | (b) | 1.570% | 02/15/2026 | 310,000 | 308,047 |
Progress Residential 2022-SFR1 E1 | (b) | 3.930% | 02/17/2041 | 900,000 | 779,502 |
Progress Residential 2022-SFR2 D | (b) | 3.945% | 04/17/2027 | 1,000,000 | 921,807 |
Progress Residential 2022-SFR4 B | (b) | 4.788% | 05/17/2041 | 800,000 | 766,266 |
Progress Residential 2023-SFR2 D | (b) | 4.500% | 10/17/2028 | 150,000 | 138,045 |
Progress Residential 2023-SFR2 E1 | (b) | 4.750% | 10/17/2028 | 200,000 | 181,155 |
Santander Consumer Auto Receivables Trust 2020-BA D | (b) | 2.140% | 12/15/2026 | 530,000 | 518,010 |
Santander Drive Auto Receivables Trust 2020-3 D | 1.640% | 11/16/2026 | 432,145 | 424,692 | |
Santander Drive Auto Receivables Trust 2023-1 C | 5.090% | 05/15/2030 | 2,400,000 | 2,380,499 | |
Sierra Timeshare 2020-2A A | (b) | 1.330% | 07/20/2037 | 138,135 | 131,262 |
SMB Private Education Loan Trust 2020-B A1A | (b) | 1.290% | 07/15/2053 | 323,468 | 291,773 |
World Omni Auto Receivables Trust 2023-A B | 5.030% | 05/15/2029 | 2,420,000 | 2,416,604 | |
World Omni Select Auto Trust 2020-A D | 1.700% | 10/15/2026 | 250,000 | 243,846 | |
Total Asset-Backed / Mortgage-Backed Securities (Cost $31,138,578) | $ 29,288,126 | ||||
| Sovereign Debt Issues–0.3% | Rate | Maturity | Face Amount | Value | |
Mexico Government International Bond | 3.750% | 01/11/2028 | $ 625,000 | $ 602,405 | |
120
(continued)
AVIP Federated Core Plus Bond Portfolio (Continued)
| Schedule of Investments | December 31, 2023 |
| Sovereign Debt Issues (Continued) | Rate | Maturity | Face Amount | Value | |
Mexico Government International Bond | 4.500% | 01/31/2050 | $ 775,000 | $ 632,545 | |
Republic of Poland Government International Bond | 4.000% | 01/22/2024 | 600,000 | 598,828 | |
Total Sovereign Debt Issues (Cost $2,080,471) | $ 1,833,778 | ||||
Total Investments – 98.1% (Cost $621,544,232) | (i) | $574,054,720 | |||
Other Assets in Excess of Liabilities – 1.9% | 11,042,565 | ||||
| Net Assets – 100.0% | $585,097,285 | ||||
Percentages are stated as a percent of net assets. |
| Abbreviations: | ||
| H15T5Y: | U.S. Treasury Yield Curve Rate T-Note Constant Maturity 5 Year, 3.840% at 12/31/2023 | |
| PIK: | Payment-in-Kind | |
| REITs: | Real Estate Investment Trusts | |
| SOFR: | Secured Overnight Financing Rate, 5.380% at 12/31/2023 | |
| SOFRINDX: | Secured Overnight Financing Rate ("SOFR") Compounded Index, 1.115% at 12/31/2023 | |
| TSFR1M: | Monthly CME Term Secured Overnight Financing Rate ("SOFR"), 5.355% at 12/31/2023 | |
| TSFR3M: | Quarterly CME Term Secured Overnight Financing Rate ("SOFR"), 5.331% at 12/31/2023 | |
| Footnotes: | ||
| (a) | Security is partially pledged as collateral for the futures contracts outstanding at December 31, 2023. The value of securities pledged totaled $937,248. See also the following Schedule of Open Futures Contracts. | |
| (b) | Security exempt from registration under Regulation D of the Securities Act of 1933. These securities may be resold in transactions exempt from registration, normally to qualified buyers under Rule 144A. At December 31, 2023, the value of these securities totaled $48,650,492, or 8.3% of the Portfolio’s net assets. | |
| (c) | Represents a security that is in default and deemed to be non-income producing. | |
| (d) | Issuer of the security has the option to make coupon payments in cash or in additional par value of this bond (Payment-in-Kind). | |
| (e) | Security is a fixed-then-variable rate instrument in which the coupon or dividend rate is fixed until a later specified date, then is adjusted periodically. Rates stated, including interest rate caps and floors, if any, are those in effect at December 31, 2023. | |
| (f) | Shares of this fund have not been registered and are issued in reliance on Section 4(a)(2) and Regulation D of the Securities Act of 1933. Investments in this fund may only be made by investment companies, insurance company separate accounts, common or commingled trust funds or similar organizations or entities that are “accredited investors” within the meaning of Regulation D of the 1933 Act. | |
| (g) | Represents a security deemed to be restricted. At December 31, 2023, the value of restricted securities in the Portfolio totaled $36,817,798, or 6.3% of the Portfolio’s net assets. | |
| (h) | Open-end extended payment fund. Beneficial interests in this fund are issued solely in private placement transactions which do not involve any “public offering” within the meaning of Section 4(a)(2) and Regulation D of the Securities Act of 1933. Investments in this fund may only be made by organizations or entities that are “accredited investors” within the meaning of Regulation D of the 1933 Act and that are also “qualified purchasers” as defined in Section 2(a)(51) of the Investment Company Act of 1940, as amended (“Eligible Investors”). This fund has adopted policies to limit the transfer of its shares, which may occur only pursuant to authorization by this fund's Board of Directors, and only to Eligible Investors.When a redeeming shareholder of this fund presents shares to the fund's transfer agent in proper order for redemption, the fund will have up to 31 days to make payment to the redeeming shareholder. The price of redeemed shares will be determined as of the closing net asset value of the fund 24 days after receipt of a shareholder redemption request or, if such date is a weekend or holiday, on the preceding business day. The fund's NAV is calculated each day the NYSE is open. | |
| (i) | Represents cost for financial reporting purposes, which may differ from cost basis for federal income tax purposes. See also Note 7 of the Notes to Financial Statements. | |
The accompanying notes are an integral part of these financial statements.
| Schedule of Open Futures Contracts | December 31, 2023 |
Long Futures Contracts
| Description | Number of contracts | Expiration Date | Notional Amount | Value | Unrealized Appreciation (Depreciation) | Variation Margin Receivable (Payable) | ||||||
| CBT 10-Year U.S. Treasury Note - Long | 161 | March 19, 2024 | $ 17,578,374 | $ 18,175,391 | $ 597,017 | $ — | ||||||
| CBT 10-Year U.S. Ultra Bond - Long | 141 | March 19, 2024 | 15,890,434 | 16,640,203 | 749,769 | (13,219) | ||||||
| CBT 2-Year U.S. Treasury Note - Long | 150 | March 28, 2024 | 30,658,514 | 30,887,109 | 228,595 | 18,750 | ||||||
| CBT 5-Year U.S. Treasury Note - Long | 414 | March 28, 2024 | 44,004,603 | 45,032,203 | 1,027,600 | 35,578 | ||||||
| $108,131,925 | $110,734,906 | $2,602,981 | $ 41,109 |
Short Futures Contracts
| Description | Number of contracts | Expiration Date | Notional Amount | Value | Unrealized Appreciation (Depreciation) | Variation Margin Receivable (Payable) | ||||||
| CBT U.S. Long Bond - Short | 7 | March 19, 2024 | $ (809,745) | $ (874,563) | $ (64,818) | $ 1,313 | ||||||
| CBT U.S. Ultra Bond - Short | 167 | March 19, 2024 | (20,331,055) | (22,310,156) | (1,979,101) | 88,719 |
121
(continued)
| AuguStar SM Variable Insurance Products Fund, Inc. | AVIP Federated Core Plus Bond Portfolio (Continued) |
| Schedule of Open Futures Contracts | December 31, 2023 |
Short Futures Contracts (Continued)
| Description | Number of contracts | Expiration Date | Notional Amount | Value | Unrealized Appreciation (Depreciation) | Variation Margin Receivable (Payable) | ||||||
| $(21,140,800) | $(23,184,719) | $(2,043,919) | $ 90,032 | |||||||||
| Total Futures Contracts | $ 86,991,125 | $ 87,550,187 | $ 559,062 | $131,141 |
The accompanying notes are an integral part of these financial statements.
122
AuguStarSM Variable Insurance Products Fund, Inc.
AVIP Intech U.S. Low Volatility Portfolio (Unaudited)
Objective/Strategy
The AVIP Intech U.S. Low Volatility Portfolio (formerly ON U.S. Low Volatility Portfolio) seeks capital appreciation by investing, under normal circumstances, at least 80% of its net assets in U.S. common stocks of companies included in the S&P 500® Index. Those stocks are selected by a mathematical investment process which seeks to achieve returns similar to those of the S&P 500® Index over the long-term with lower absolute volatility.
Performance as of December 31, 2023
| Average Annual returns | |
| One year | 6.59% |
| Since inception (6/25/21) | 3.79% |
Past performance does not guarantee future results. The performance data quoted represents past performance and current returns may be lower or higher. Total return figures include change in share price and reinvestment of dividends and capital gains. The investment return and principal value will fluctuate so that an investor’s shares, when redeemed, may be worth more or less than the original cost. To obtain performance information up to the most recent month end, call toll-free 1-877-781-6392.
The Portfolio is not open to direct retail investment. Beneficial interest in the Portfolio’s shares is obtained either through an allocation to the Portfolio as an investment vehicle within variable life insurance policies or annuity contracts, or as an underlying investment by the AVIP Model Portfolios. Actual performance results for variable annuity and variable universal life contracts will be lower due to contract charges. Consult your contract for applicable charges.
Total expense ratio is 0.61% per the Fund’s Prospectus dated May 1, 2023 and supplemented October 2, 2023 and December 4, 2023. Additional information pertaining to the Portfolio’s expense ratio as of December 31, 2023 can be found in the Portfolio’s Financial Highlights.
Comments from Sub-Adviser
Q. How did the Portfolio perform in comparison to its benchmark during the reporting period?
A. For the year ended December 31, 2023, the Portfolio returned 6.59% versus 26.29% for its benchmark, the S&P 500® Index.
Q. What affected the Portfolio’s performance?
A. The year was marked by a return to risk taking, highlighted by the strong outperformance of higher beta (how volatile a security is compared to the market as a whole) stocks, creating a challenging environment for defensive equity strategies. The strategy’s defensive positioning, namely the underweight to higher beta stocks (and overweight to lower beta stocks), overweight to the defensive Consumer Staples sector and underweight to the cyclical Information Technology sector, were the main drivers of the Portfolio’s significant underperformance for the year.
While the U.S. equity market recorded solid gains in 2023, market participation was particularly narrow, with the mega cap Information Technology-oriented stocks leading the market rally. Within the benchmark, only three out of eleven sectors managed to outperform and only 26% of individual stocks outperformed for the year. Given the concentration and narrow nature of the market, the strategy’s broader diversification and smaller size positioning also detracted from performance. (1)
| (1) | The Portfolio’s composition is subject to change. Holdings and weightings are as of December 31, 2023. |
Change in Value of $10,000 Investment
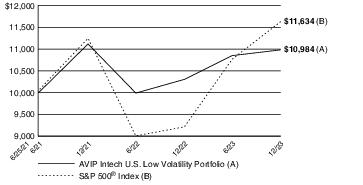
Hypothetical illustration based on past performance. Future performance will vary. The Portfolio’s returns reflect reinvested dividends. The Portfolio’s holdings may differ significantly from the securities in the index. The index is unmanaged and therefore does not reflect the cost of portfolio management and accounting.
The S&P 500® Index is a capitalization-weighted index designed to measure performance of the broad domestic economy through changes in the aggregate market value of 500 stocks representing all major industries. The index presented includes the effects of reinvested dividends.
Past performance is no guarantee of future results. Redemption of fund shares could have tax implications unique to each shareholder.
123
(continued)
AuguStarSM Variable Insurance Products Fund, Inc.
AVIP Intech U.S. Low Volatility Portfolio (Unaudited) (Continued)
| Portfolio Composition as of December 31, 2023 (1) | |
| % of Net Assets | |
| Common Stocks (4) | 98.9 |
| Other Net Assets | 1.1 |
| 100.0 | |
| Top 10 Portfolio Holdings as of December 31, 2023 (1) (2) (3) | ||
| % of Net Assets | ||
| 1. | Apple, Inc. | 5.0 |
| 2. | Microsoft Corp. | 4.7 |
| 3. | Walmart, Inc. | 3.1 |
| 4. | AbbVie, Inc. | 3.0 |
| 5. | Johnson & Johnson | 2.7 |
| 6. | Lockheed Martin Corp. | 2.6 |
| 7. | Merck & Co., Inc. | 2.5 |
| 8. | Gilead Sciences, Inc. | 2.3 |
| 9. | Electronic Arts, Inc. | 2.2 |
| 10. | McDonald's Corp. | 2.2 |
| (1) | Composition of Portfolio subject to change. | |
| (2) | Short-term investments have been excluded from the list of Top 10 Portfolio Holdings. | |
| (3) | Top 10 Portfolio Holdings is presented at an individual security level. Total investment exposure by issuer may be higher. | |
| (4) | Sectors (Common Stocks): | |
| % of Net Assets | |
| Health Care | 23.6 |
| Consumer Staples | 20.3 |
| Information Technology | 16.1 |
| Financials | 11.9 |
| Industrials | 11.3 |
| Consumer Discretionary | 7.7 |
| Communication Services | 6.5 |
| Utilities | 1.2 |
| Materials | 0.3 |
| 98.9 |
124
AuguStarSM Variable Insurance Products Fund, Inc.
AVIP Intech U.S. Low Volatility Portfolio
| Schedule of Investments | December 31, 2023 |
| Common Stocks–98.9% | Shares | Value | |
| Communication Services–6.5% | |||
Alphabet, Inc. Class A (Interactive Media & Svs.) | (a) | 35,142 | $ 4,908,986 |
Alphabet, Inc. Class C (Interactive Media & Svs.) | (a) | 33,323 | 4,696,210 |
AT&T, Inc. (Diversified Telecom. Svs.) | 84,642 | 1,420,293 | |
Electronic Arts, Inc. (Entertainment) | 106,581 | 14,581,347 | |
Take-Two Interactive Software, Inc. (Entertainment) | (a) | 17,454 | 2,809,221 |
T-Mobile U.S., Inc. (Wireless Telecom. Svs.) | 25,346 | 4,063,724 | |
Verizon Communications, Inc. (Diversified Telecom. Svs.) | 283,952 | 10,704,991 | |
| 43,184,772 | |||
| Consumer Discretionary–7.7% | |||
Amazon.com, Inc. (Broadline Retail) | (a) | 42,870 | 6,513,668 |
AutoZone, Inc. (Specialty Retail) | (a) | 2,270 | 5,869,335 |
Booking Holdings, Inc. (Hotels, Restaurants & Leisure) | (a) | 344 | 1,220,244 |
Chipotle Mexican Grill, Inc. (Hotels, Restaurants & Leisure) | (a) | 845 | 1,932,481 |
Domino's Pizza, Inc. (Hotels, Restaurants & Leisure) | 6,289 | 2,592,514 | |
Genuine Parts Co. (Distributors) | 8,564 | 1,186,114 | |
Hilton Worldwide Holdings, Inc. (Hotels, Restaurants & Leisure) | 4,191 | 763,139 | |
McDonald's Corp. (Hotels, Restaurants & Leisure) | 49,153 | 14,574,356 | |
O'Reilly Automotive, Inc. (Specialty Retail) | (a) | 9,011 | 8,561,171 |
Ulta Beauty, Inc. (Specialty Retail) | (a) | 4,523 | 2,216,225 |
Yum! Brands, Inc. (Hotels, Restaurants & Leisure) | 47,829 | 6,249,337 | |
| 51,678,584 | |||
| Consumer Staples–20.3% | |||
Altria Group, Inc. (Tobacco) | 294,936 | 11,897,718 | |
Brown-Forman Corp. Class B (Beverages) | 35,399 | 2,021,283 | |
Campbell Soup Co. (Food Products) | 22,687 | 980,759 | |
Church & Dwight Co., Inc. (Household Products) | 109,574 | 10,361,317 | |
Coca-Cola Co. / The (Beverages) | 12,487 | 735,859 | |
Colgate-Palmolive Co. (Household Products) | 56,423 | 4,497,477 | |
Conagra Brands, Inc. (Food Products) | 49,911 | 1,430,449 | |
Constellation Brands, Inc. Class A (Beverages) | 11,634 | 2,812,519 | |
Costco Wholesale Corp. (Consumer Staples Distribution & Retail) | 7,603 | 5,018,588 | |
Dollar General Corp. (Consumer Staples Distribution & Retail) | 4,275 | 581,186 | |
Dollar Tree, Inc. (Consumer Staples Distribution & Retail) | (a) | 3,971 | 564,081 |
General Mills, Inc. (Food Products) | 198,366 | 12,921,561 | |
Hershey Co. / The (Food Products) | 27,290 | 5,087,948 | |
Hormel Foods Corp. (Food Products) | 123,748 | 3,973,548 | |
J.M. Smucker Co. / The (Food Products) | 37,313 | 4,715,617 | |
Kellanova (Food Products) | 134,049 | 7,494,680 | |
Kenvue, Inc. (Personal Care Products) | 329,539 | 7,094,975 | |
Kimberly-Clark Corp. (Household Products) | 59,390 | 7,216,479 | |
Kroger Co. / The (Consumer Staples Distribution & Retail) | 245,790 | 11,235,061 | |
McCormick & Co., Inc. (Food Products) | 33,753 | 2,309,380 | |
Mondelez International, Inc. Class A (Food Products) | 53,871 | 3,901,877 | |
Monster Beverage Corp. (Beverages) | (a) | 39,761 | 2,290,631 |
PepsiCo, Inc. (Beverages) | 7,383 | 1,253,929 | |
Philip Morris International, Inc. (Tobacco) | 11,770 | 1,107,322 | |
| Common Stocks (Continued) | Shares | Value | |
| Consumer Staples (continued) | |||
Procter & Gamble Co. / The (Household Products) | 12,491 | $ 1,830,431 | |
Tyson Foods, Inc. Class A (Food Products) | 29,267 | 1,573,101 | |
Walmart, Inc. (Consumer Staples Distribution & Retail) | 133,478 | 21,042,807 | |
| 135,950,583 | |||
| Financials–11.9% | |||
Aon PLC Class A (Insurance) | 16,336 | 4,754,103 | |
Arch Capital Group Ltd. (Insurance) | (a) | 160,156 | 11,894,786 |
Arthur J. Gallagher & Co. (Insurance) | 31,577 | 7,101,036 | |
Assurant, Inc. (Insurance) | 21,231 | 3,577,211 | |
Berkshire Hathaway, Inc. Class B (Financial Services) | (a) | 38,942 | 13,889,054 |
Brown & Brown, Inc. (Insurance) | 66,967 | 4,762,023 | |
CBOE Global Markets, Inc. (Capital Markets) | 46,245 | 8,257,507 | |
CME Group, Inc. (Capital Markets) | 13,534 | 2,850,260 | |
Everest Group Ltd. (Insurance) | 3,566 | 1,260,866 | |
FactSet Research Systems, Inc. (Capital Markets) | 7,177 | 3,423,788 | |
Fiserv, Inc. (Financial Services) | (a) | 8,555 | 1,136,446 |
Globe Life, Inc. (Insurance) | 8,290 | 1,009,059 | |
Intercontinental Exchange, Inc. (Capital Markets) | 2,055 | 263,924 | |
Loews Corp. (Insurance) | 56,287 | 3,917,012 | |
Marsh & McLennan Cos., Inc. (Insurance) | 28,952 | 5,485,536 | |
Willis Towers Watson PLC (Insurance) | 24,451 | 5,897,581 | |
| 79,480,192 | |||
| Health Care–23.6% | |||
AbbVie, Inc. (Biotechnology) | 131,155 | 20,325,090 | |
Amgen, Inc. (Biotechnology) | 16,812 | 4,842,192 | |
Becton Dickinson & Co. (Health Care Equip. & Supplies) | 51,187 | 12,480,926 | |
Biogen, Inc. (Biotechnology) | (a) | 7,002 | 1,811,908 |
Boston Scientific Corp. (Health Care Equip. & Supplies) | (a) | 48,423 | 2,799,334 |
Bristol-Myers Squibb Co. (Pharmaceuticals) | 183,533 | 9,417,078 | |
Cardinal Health, Inc. (Health Care Providers & Svs.) | 23,521 | 2,370,917 | |
Cencora, Inc. (Health Care Providers & Svs.) | 34,425 | 7,070,207 | |
DaVita, Inc. (Health Care Providers & Svs.) | (a) | 1,519 | 159,130 |
Gilead Sciences, Inc. (Biotechnology) | 193,195 | 15,650,727 | |
Henry Schein, Inc. (Health Care Providers & Svs.) | (a) | 48,382 | 3,663,001 |
Hologic, Inc. (Health Care Equip. & Supplies) | (a) | 31,895 | 2,278,898 |
Humana, Inc. (Health Care Providers & Svs.) | 10,241 | 4,688,432 | |
Incyte Corp. (Biotechnology) | (a) | 85,107 | 5,343,869 |
Johnson & Johnson (Pharmaceuticals) | 113,996 | 17,867,733 | |
Laboratory Corp. of America Holdings (Health Care Providers & Svs.) | 2,272 | 516,403 | |
McKesson Corp. (Health Care Providers & Svs.) | 15,106 | 6,993,776 | |
Merck & Co., Inc. (Pharmaceuticals) | 154,520 | 16,845,770 | |
Molina Healthcare, Inc. (Health Care Providers & Svs.) | (a) | 5,168 | 1,867,250 |
Pfizer, Inc. (Pharmaceuticals) | 39,969 | 1,150,708 | |
Quest Diagnostics, Inc. (Health Care Providers & Svs.) | 49,088 | 6,768,253 | |
Regeneron Pharmaceuticals, Inc. (Biotechnology) | (a) | 9,644 | 8,470,229 |
Universal Health Services, Inc. Class B (Health Care Providers & Svs.) | 427 | 65,092 | |
125
(continued)
AuguStarSM Variable Insurance Products Fund, Inc.
AVIP Intech U.S. Low Volatility Portfolio (Continued)
| Schedule of Investments | December 31, 2023 |
| Common Stocks (Continued) | Shares | Value | |
| Health Care (continued) | |||
Vertex Pharmaceuticals, Inc. (Biotechnology) | (a) | 606 | $ 246,575 |
West Pharmaceutical Services, Inc. (Life Sciences Tools & Svs.) | 10,809 | 3,806,065 | |
| 157,499,563 | |||
| Industrials–11.3% | |||
AMETEK, Inc. (Electrical Equip.) | 31,574 | 5,206,237 | |
Boeing Co. / The (Aerospace & Defense) | (a) | 289 | 75,331 |
Carrier Global Corp. (Building Products) | 70 | 4,021 | |
Cintas Corp. (Commercial Svs. & Supplies) | 2,422 | 1,459,643 | |
Copart, Inc. (Commercial Svs. & Supplies) | (a) | 115,194 | 5,644,506 |
Fortive Corp. (Machinery) | 23,261 | 1,712,707 | |
General Electric Co. (Industrial Conglomerates) | 49,152 | 6,273,270 | |
Howmet Aerospace, Inc. (Aerospace & Defense) | 48,241 | 2,610,803 | |
Illinois Tool Works, Inc. (Machinery) | 9,733 | 2,549,462 | |
Ingersoll Rand, Inc. (Machinery) | 22,534 | 1,742,780 | |
L3Harris Technologies, Inc. (Aerospace & Defense) | 3,181 | 669,982 | |
Leidos Holdings, Inc. (Professional Svs.) | 49,074 | 5,311,770 | |
Lockheed Martin Corp. (Aerospace & Defense) | 37,946 | 17,198,645 | |
Nordson Corp. (Machinery) | 275 | 72,644 | |
Northrop Grumman Corp. (Aerospace & Defense) | 6,129 | 2,869,230 | |
Parker-Hannifin Corp. (Machinery) | 505 | 232,653 | |
Republic Services, Inc. (Commercial Svs. & Supplies) | 25,977 | 4,283,867 | |
Rollins, Inc. (Commercial Svs. & Supplies) | 33,029 | 1,442,376 | |
Snap-on, Inc. (Machinery) | 6,081 | 1,756,436 | |
Trane Technologies PLC (Building Products) | 872 | 212,681 | |
TransDigm Group, Inc. (Aerospace & Defense) | 4,954 | 5,011,466 | |
United Rentals, Inc. (Trading Companies & Distributors) | 1,782 | 1,021,834 | |
Verisk Analytics, Inc. (Professional Svs.) | 15,424 | 3,684,177 | |
W.W. Grainger, Inc. (Trading Companies & Distributors) | 340 | 281,755 | |
Waste Management, Inc. (Commercial Svs. & Supplies) | 22,947 | 4,109,808 | |
Westinghouse Air Brake Technologies Corp. (Machinery) | 634 | 80,455 | |
| 75,518,539 | |||
| Common Stocks (Continued) | Shares | Value | |
| Information Technology–16.1% | |||
Akamai Technologies, Inc. (IT Svs.) | (a) | 26,381 | $ 3,122,191 |
Apple, Inc. (Tech. Hardware, Storage & Periph.) | 173,434 | 33,391,248 | |
Fair Isaac Corp. (Software) | (a) | 8,820 | 10,266,568 |
Gen Digital, Inc. (Software) | 1,987 | 45,343 | |
International Business Machines Corp. (IT Svs.) | 59,062 | 9,659,590 | |
Microsoft Corp. (Software) | 83,065 | 31,235,763 | |
NVIDIA Corp. (Semiconductors & Equip.) | 7,362 | 3,645,810 | |
Oracle Corp. (Software) | 47,958 | 5,056,212 | |
Roper Technologies, Inc. (Software) | 8,528 | 4,649,210 | |
Teledyne Technologies, Inc. (Electronic Equip., Instr. & Comp.) | (a) | 970 | 432,901 |
VeriSign, Inc. (IT Svs.) | (a) | 29,244 | 6,023,094 |
| 107,527,930 | |||
| Materials–0.3% | |||
Air Products & Chemicals, Inc. (Chemicals) | 2,058 | 563,481 | |
Linde PLC (Chemicals) | 1,861 | 764,331 | |
Sherwin-Williams Co. / The (Chemicals) | 2,119 | 660,916 | |
| 1,988,728 | |||
| Utilities–1.2% | |||
Ameren Corp. (Multi-Utilities) | 12,844 | 929,135 | |
Atmos Energy Corp. (Gas Utilities) | 17,531 | 2,031,843 | |
CMS Energy Corp. (Multi-Utilities) | 5,287 | 307,016 | |
Consolidated Edison, Inc. (Multi-Utilities) | 26,193 | 2,382,777 | |
DTE Energy Co. (Multi-Utilities) | 20,738 | 2,286,572 | |
NiSource, Inc. (Multi-Utilities) | 14,642 | 388,745 | |
| 8,326,088 | |||
Total Common Stocks (Cost $614,069,391) | $661,154,979 | ||
Total Investments – 98.9% (Cost $614,069,391) | (b) | $661,154,979 | |
Other Assets in Excess of Liabilities – 1.1% | 7,266,004 | ||
| Net Assets – 100.0% | $668,420,983 | ||
Percentages are stated as a percent of net assets. |
| Footnotes: | ||
| (a) | Non-income producing security. | |
| (b) | Represents cost for financial reporting purposes, which may differ from cost basis for federal income tax purposes. See also Note 7 of the Notes to Financial Statements. | |
The accompanying notes are an integral part of these financial statements.
126
AuguStarSM Variable Insurance Products Fund, Inc.
AVIP AB Relative Value Portfolio (Unaudited)
Objective/Strategy
The AVIP AB Relative Value Portfolio (formerly ON AB Relative Value Portfolio) seeks long-term growth of capital by investing primarily in the equity securities of U.S. companies that the Portfolio's sub-adviser believes are trading at attractive valuations and that have strong or improving business models.
Performance as of December 31, 2023
| Average Annual returns | |
| One year | 11.71% |
| Since inception (12/2/21) | 5.70% |
Past performance does not guarantee future results. The performance data quoted represents past performance and current returns may be lower or higher. Total return figures include change in share price and reinvestment of dividends and capital gains. The investment return and principal value will fluctuate so that an investor’s shares, when redeemed, may be worth more or less than the original cost. To obtain performance information up to the most recent month end, call toll-free 1-877-781-6392.
The Portfolio is not open to direct retail investment. Beneficial interest in the Portfolio’s shares is obtained either through an allocation to the Portfolio as an investment vehicle within variable life insurance policies or annuity contracts, or as an underlying investment by the AVIP Model Portfolios. Actual performance results for variable annuity and variable universal life contracts will be lower due to contract charges. Consult your contract for applicable charges.
Total expense ratio is 0.74% per the Fund’s Prospectus dated May 1, 2023 and supplemented October 2, 2023 and December 4, 2023. Additional information pertaining to the Portfolio’s expense ratio as of December 31, 2023 can be found in the Portfolio’s Financial Highlights.
Comments from Sub-Adviser
Q. How did the Portfolio perform in comparison to its benchmark during the reporting period?
A. For the year ended December 31, 2023, the Portfolio returned 11.71% versus 11.46% for its benchmark, the Russell 1000® Value Index.
Q. What affected the Portfolio’s performance?
A. Sector allocation was the primary driver of the Portfolio’s slight outperformance for the year, but overall security selection also contributed. In terms of sector allocation, an underweight to Utilities and overweight to Information Technology contributed to relative performance for the year, while an underweight to Communication Services and overweight to Health Care detracted. With respect to security selection, selection within the Health Care and Communication Services contributed, while selection in Information Technology and Consumer Staples detracted. From a factor standpoint, the Portfolio’s overexposure to profitability and size, and underexposure to leverage contributed to relative performance for the year, while underexposure to higher volatility names and overexposure to earnings yield detracted from relative performance.
The top three individual contributors to relative performance during the year were Builders FirstSource, Inc., QUALCOMM, Inc., and Alphabet, Inc. Class C. The top three individual detractors were not holding benchmark constituent Meta Platforms, Inc. and holdings of Elevance Health, Inc., and Roche Holding AG – ADR. (1)
| (1) | The Portfolio’s composition is subject to change. Holdings and weightings are as of December 31, 2023. |
Change in Value of $10,000 Investment

Hypothetical illustration based on past performance. Future performance will vary. The Portfolio’s returns reflect reinvested dividends. The Portfolio’s holdings may differ significantly from the securities in the index. The index is unmanaged and therefore does not reflect the cost of portfolio management and accounting.
The Russell 1000® Value Index measures the performance of the large-cap value segment of the U.S. equity universe. It includes those Russell 1000® Index companies with lower price-to-book ratios and lower expected and historical growth rates.
Past performance is no guarantee of future results. Redemption of fund shares could have tax implications unique to each shareholder.
127
(continued)
AuguStarSM Variable Insurance Products Fund, Inc.
AVIP AB Relative Value Portfolio (Unaudited) (Continued)
| Portfolio Composition as of December 31, 2023 (1) | |
| % of Net Assets | |
| Common Stocks (4) | 95.9 |
| Other Net Assets | 4.1 |
| 100.0 | |
| Top 10 Portfolio Holdings as of December 31, 2023 (1) (2) (3) | ||
| % of Net Assets | ||
| 1. | Elevance Health, Inc. | 4.2 |
| 2. | JPMorgan Chase & Co. | 3.9 |
| 3. | Wells Fargo & Co. | 3.9 |
| 4. | Berkshire Hathaway, Inc. Class B | 3.8 |
| 5. | QUALCOMM, Inc. | 3.7 |
| 6. | Mastercard, Inc. Class A | 3.4 |
| 7. | Regeneron Pharmaceuticals, Inc. | 3.1 |
| 8. | Walmart, Inc. | 3.0 |
| 9. | Philip Morris International, Inc. | 2.9 |
| 10. | Fiserv, Inc. | 2.6 |
| (1) | Composition of Portfolio subject to change. | |
| (2) | Short-term investments have been excluded from the list of Top 10 Portfolio Holdings. | |
| (3) | Top 10 Portfolio Holdings is presented at an individual security level. Total investment exposure by issuer may be higher. | |
| (4) | Sectors (Common Stocks): | |
| % of Net Assets | |
| Financials | 22.7 |
| Health Care | 18.4 |
| Industrials | 15.2 |
| Information Technology | 9.7 |
| Energy | 8.2 |
| Consumer Staples | 5.8 |
| Consumer Discretionary | 5.7 |
| Communication Services | 5.5 |
| Materials | 2.4 |
| Real Estate | 2.3 |
| 95.9 |
128
AuguStarSM Variable Insurance Products Fund, Inc.
AVIP AB Relative Value Portfolio
| Schedule of Investments | December 31, 2023 |
| Common Stocks–95.9% | Shares | Value | |
| Communication Services–5.5% | |||
Alphabet, Inc. Class C (Interactive Media & Svs.) | (a) | 19,821 | $ 2,793,374 |
Comcast Corp. Class A (Media) | 55,859 | 2,449,417 | |
Electronic Arts, Inc. (Entertainment) | 12,914 | 1,766,764 | |
| 7,009,555 | |||
| Consumer Discretionary–5.7% | |||
Aptiv PLC (Automobile Components) | (a) | 10,394 | 932,550 |
BorgWarner, Inc. (Automobile Components) | 31,191 | 1,118,197 | |
D.R. Horton, Inc. (Household Durables) | 4,608 | 700,324 | |
LKQ Corp. (Distributors) | 39,063 | 1,866,821 | |
Lowe's Cos., Inc. (Specialty Retail) | 2,175 | 484,046 | |
Ross Stores, Inc. (Specialty Retail) | 16,051 | 2,221,298 | |
| 7,323,236 | |||
| Consumer Staples–5.8% | |||
Philip Morris International, Inc. (Tobacco) | 38,523 | 3,624,244 | |
Walmart, Inc. (Consumer Staples Distribution & Retail) | 24,012 | 3,785,492 | |
| 7,409,736 | |||
| Energy–8.2% | |||
Cactus, Inc. Class A (Energy Equip. & Svs.) | 5,062 | 229,815 | |
ChampionX Corp. (Energy Equip. & Svs.) | 32,635 | 953,268 | |
Chevron Corp. (Oil, Gas & Consumable Fuels) | 11,563 | 1,724,737 | |
ConocoPhillips (Oil, Gas & Consumable Fuels) | 14,328 | 1,663,051 | |
EOG Resources, Inc. (Oil, Gas & Consumable Fuels) | 17,652 | 2,135,009 | |
Helmerich & Payne, Inc. (Energy Equip. & Svs.) | 17,635 | 638,740 | |
Phillips 66 (Oil, Gas & Consumable Fuels) | 23,693 | 3,154,486 | |
| 10,499,106 | |||
| Financials–22.7% | |||
American International Group, Inc. (Insurance) | 14,664 | 993,486 | |
Axis Capital Holdings Ltd. (Insurance) | 41,593 | 2,303,004 | |
Bank OZK (Banks) | 9,500 | 473,385 | |
Berkshire Hathaway, Inc. Class B (Financial Services) | (a) | 13,586 | 4,845,583 |
Fiserv, Inc. (Financial Services) | (a) | 25,348 | 3,367,228 |
JPMorgan Chase & Co. (Banks) | 29,475 | 5,013,697 | |
Mastercard, Inc. Class A (Financial Services) | 10,279 | 4,384,096 | |
MetLife, Inc. (Insurance) | 14,981 | 990,694 | |
PayPal Holdings, Inc. (Financial Services) | (a) | 18,840 | 1,156,964 |
Raymond James Financial, Inc. (Capital Markets) | 4,473 | 498,740 | |
Wells Fargo & Co. (Banks) | 101,035 | 4,972,943 | |
| 28,999,820 | |||
| Health Care–18.4% | |||
Amgen, Inc. (Biotechnology) | 10,614 | 3,057,044 | |
Cencora, Inc. (Health Care Providers & Svs.) | 16,231 | 3,333,523 | |
Cigna Group / The (Health Care Providers & Svs.) | 2,404 | 719,878 | |
Elevance Health, Inc. (Health Care Providers & Svs.) | 11,436 | 5,392,760 | |
GE HealthCare Technologies, Inc. (Health Care Equip. & Supplies) | 10,189 | 787,813 | |
Gilead Sciences, Inc. (Biotechnology) | 38,065 | 3,083,646 | |
Quest Diagnostics, Inc. (Health Care Providers & Svs.) | 5,224 | 720,285 | |
| Common Stocks (Continued) | Shares | Value | |
| Health Care (continued) | |||
Regeneron Pharmaceuticals, Inc. (Biotechnology) | (a) | 4,534 | $ 3,982,167 |
Roche Holding AG – ADR (Pharmaceuticals) | 65,478 | 2,372,268 | |
| 23,449,384 | |||
| Industrials–15.2% | |||
Allegion PLC (Building Products) | 9,205 | 1,166,181 | |
Builders FirstSource, Inc. (Building Products) | (a) | 5,138 | 857,738 |
Curtiss-Wright Corp. (Aerospace & Defense) | 2,161 | 481,449 | |
Dover Corp. (Machinery) | 7,592 | 1,167,726 | |
EMCOR Group, Inc. (Construction & Engineering) | 5,013 | 1,079,951 | |
Emerson Electric Co. (Electrical Equip.) | 21,513 | 2,093,860 | |
Ferguson PLC (Trading Companies & Distributors) | 10,718 | 2,069,324 | |
Maximus, Inc. (Professional Svs.) | 11,087 | 929,756 | |
Middleby Corp. / The (Machinery) | (a) | 3,595 | 529,076 |
nVent Electric PLC (Electrical Equip.) | 31,461 | 1,859,031 | |
PACCAR, Inc. (Machinery) | 19,619 | 1,915,795 | |
Robert Half, Inc. (Professional Svs.) | 12,908 | 1,134,871 | |
RTX Corp. (Aerospace & Defense) | 5,889 | 495,501 | |
Sensata Technologies Holding PLC (Electrical Equip.) | 22,333 | 839,051 | |
Textron, Inc. (Aerospace & Defense) | 21,543 | 1,732,488 | |
Westinghouse Air Brake Technologies Corp. (Machinery) | 8,021 | 1,017,865 | |
| 19,369,663 | |||
| Information Technology–9.7% | |||
Accenture PLC Class A (IT Svs.) | 6,994 | 2,454,265 | |
Cisco Systems, Inc. (Communications Equip.) | 35,468 | 1,791,843 | |
EPAM Systems, Inc. (IT Svs.) | (a) | 2,348 | 698,154 |
IPG Photonics Corp. (Electronic Equip., Instr. & Comp.) | (a) | 6,714 | 728,738 |
QUALCOMM, Inc. (Semiconductors & Equip.) | 32,121 | 4,645,660 | |
Taiwan Semiconductor Manufacturing Co. Ltd. – ADR (Semiconductors & Equip.) | 15,454 | 1,607,216 | |
Telefonaktiebolaget LM Ericsson – ADR (Communications Equip.) | 83,970 | 529,011 | |
| 12,454,887 | |||
| Materials–2.4% | |||
BHP Group Ltd. – ADR (Metals & Mining) | 14,295 | 976,491 | |
LyondellBasell Industries N.V. Class A (Chemicals) | 7,784 | 740,103 | |
PPG Industries, Inc. (Chemicals) | 8,836 | 1,321,424 | |
| 3,038,018 | |||
| Real Estate–2.3% | |||
Public Storage (Specialized REITs) | 2,740 | 835,700 | |
Weyerhaeuser Co. (Specialized REITs) | 60,133 | 2,090,824 | |
| 2,926,524 | |||
Total Common Stocks (Cost $108,298,498) | $122,479,929 | ||
Total Investments – 95.9% (Cost $108,298,498) | (b) | $122,479,929 | |
Other Assets in Excess of Liabilities – 4.1% | 5,241,526 | ||
| Net Assets – 100.0% | $127,721,455 | ||
Percentages are stated as a percent of net assets. |
| Abbreviations: | ||
| ADR: | American Depositary Receipts | |
| REITs: | Real Estate Investment Trusts | |
| Footnotes: | ||
| (a) | Non-income producing security. | |
| (b) | Represents cost for financial reporting purposes, which may differ from cost basis for federal income tax purposes. See also Note 7 of the Notes to Financial Statements. | |
The accompanying notes are an integral part of these financial statements.
129
(continued)
AuguStarSM Variable Insurance Products Fund, Inc.
AVIP iShares Managed Risk Balanced Portfolio (Unaudited)
Objective/Strategy
The AVIP iShares Managed Risk Balanced Portfolio (formerly ON iShares Managed Risk Balanced Portfolio) seeks income and capital appreciation by investing in underlying exchange traded funds (“ETFs”) and futures. Under normal market conditions, through investments in the underlying funds and derivatives, the Portfolio invests a minimum of 25% of its assets in equity investments and a minimum of 25% of its assets in fixed income investments.
Performance as of December 31, 2023
| Average Annual returns | |
| One year | 13.89% |
| Since inception (6/25/21) | -0.78% |
Past performance does not guarantee future results. The performance data quoted represents past performance and current returns may be lower or higher. Total return figures include change in share price and reinvestment of dividends and capital gains. The investment return and principal value will fluctuate so that an investor’s shares, when redeemed, may be worth more or less than the original cost. To obtain performance information up to the most recent month end, call toll-free 1-877-781-6392.
The Portfolio is not open to direct retail investment. Beneficial interest in the Portfolio’s shares is obtained either through an allocation to the Portfolio as an investment vehicle within variable life insurance policies or annuity contracts. Actual performance results for variable annuity and variable universal life contracts will be lower due to contract charges. Consult your contract for applicable charges.
Total gross expense ratio is 0.69% per the Fund’s Prospectus dated May 1, 2023 and supplemented October 2, 2023 and December 4, 2023. Additional information pertaining to the Portfolio’s expense ratio as of December 31, 2023 can be found in the Portfolio’s Financial Highlights. The Portfolio’s expense ratio included in the Financial Highlights does not include Acquired Fund Fees and Expenses (AFFE), which is a major component of the expense ratio that is required to be presented in the Fund’s Prospectus.
Comments from Sub-Adviser
Q. How did the Portfolio perform in comparison to its benchmark during the reporting period?
A. For the year ended December 31, 2023, the Portfolio returned 13.89% versus 26.29% for its benchmark, the S&P 500® Index.
Q. What affected the Portfolio’s performance?
A. The Portfolio follows a top-down asset allocation process and is highly diversified, investing across a wide opportunity set of global equities, bonds, and currencies. As such, the Portfolio takes positions across multiple geographies, asset classes and time horizons. During the year, the Portfolio was invested roughly 50% in equities and 50% in fixed income.
Given the strong performance of equities during the year, the Portfolio’s fixed income exposure, including iShares Core U.S. Aggregate Bond ETF, BlackRock Ultra Short-Term Bond ETF, and iShares iBoxx $ Investment Grade Corporate Bond ETF were the largest detractors, as fixed income markets underperformed across the board when compared to the benchmark. Some of the country exposures that contributed to relative performance during the year include Taiwan, Ireland and Italy, while positioning in the U.S., China, and Canada detracted. During the year, futures contracts contributed 208 basis points of absolute return for the Portfolio in aggregate. (1)
| (1) | The Portfolio’s composition is subject to change. Holdings and weightings are as of December 31, 2023. |
Change in Value of $10,000 Investment

Hypothetical illustration based on past performance. Future performance will vary. The Portfolio’s returns reflect reinvested dividends. The Portfolio’s holdings may differ significantly from the securities in the index. The index is unmanaged and therefore does not reflect the cost of portfolio management and accounting.
The S&P 500® Index is a capitalization-weighted index designed to measure performance of the broad domestic economy through changes in the aggregate market value of 500 stocks representing all major industries. The index presented includes the effects of reinvested dividends.
The MSCI All Country World Index (Net-USD) is a free float-adjusted market capitalization weighted index that is designed to measure the combined equity market performance of developed and emerging markets. The index captures large and mid cap representation across 23 developed market and 24 emerging market countries. The returns presented for this index include the effects of reinvested dividends, net of taxes, and adjustment to U.S. Dollar denomination.
ICE BofA U.S. Broad Market Index measures the performance of U.S. dollar-denominated, investment grade debt securities, including U.S. Treasury notes and bonds, quasi-government securities, corporate securities, residential and commercial mortgage-backed securities and asset-backed securities. Securities are cap-weighted based on their amount outstanding times the market price plus accrued interest.
Past performance is no guarantee of future results. Redemption of fund shares could have tax implications unique to each shareholder.
| Portfolio Composition as of December 31, 2023 (1) | |
| % of Net Assets | |
| Exchange Traded Funds | 98.3 |
| Other Net Assets | 1.7 |
| 100.0 | |
| Top 10 Portfolio Holdings as of December 31, 2023 (1) (2) (3) | ||
| % of Net Assets | ||
| 1. | iShares Core U.S. Aggregate Bond ETF | 38.3 |
| 2. | iShares Core S&P 500 ETF | 16.4 |
| 3. | iShares Russell 1000 ETF | 11.8 |
| 4. | BlackRock Ultra Short-Term Bond ETF | 11.4 |
| 5. | iShares Core MSCI EAFE ETF | 6.3 |
| 6. | iShares MSCI EAFE ETF | 4.3 |
| 7. | iShares iBoxx $ Investment Grade Corporate Bond ETF | 4.2 |
| 8. | iShares Core MSCI Emerging Markets ETF | 2.5 |
| 9. | iShares Russell 1000 Value ETF | 2.2 |
| 10. | iShares MSCI Emerging Markets ETF | 0.9 |
130
(continued)
AuguStarSM Variable Insurance Products Fund, Inc.
AVIP iShares Managed Risk Balanced Portfolio (Unaudited) (Continued)
| (1) | Composition of Portfolio subject to change. | |
| (2) | Short-term investments have been excluded from the list of Top 10 Portfolio Holdings. | |
| (3) | Top 10 Portfolio Holdings is presented at an individual security level. Total investment exposure by issuer may be higher. | |
131
AuguStarSM Variable Insurance Products Fund, Inc.
AVIP iShares Managed Risk Balanced Portfolio
| Schedule of Investments | December 31, 2023 |
| Exchange Traded Funds–98.3% | Shares | Value | |
BlackRock Ultra Short-Term Bond ETF | 1,323,411 | $ 66,646,978 | |
iShares Core MSCI EAFE ETF | 528,539 | 37,182,719 | |
iShares Core MSCI Emerging Markets ETF | 295,530 | 14,947,907 | |
iShares Core S&P 500 ETF | 201,812 | 96,391,466 | |
iShares Core U.S. Aggregate Bond ETF | 2,263,740 | 224,676,195 | |
iShares iBoxx $ Investment Grade Corporate Bond ETF | 224,187 | 24,808,533 | |
iShares MSCI EAFE ETF | 332,276 | 25,036,997 | |
iShares MSCI Emerging Markets ETF | 138,370 | 5,563,858 | |
iShares Russell 1000 ETF | 263,153 | 69,014,506 | |
iShares Russell 1000 Value ETF | 78,890 | 13,036,572 | |
Total Exchange Traded Funds (Cost $541,242,840) | $577,305,731 | ||
Total Investments – 98.3% (Cost $541,242,840) | (a) | $577,305,731 | |
Other Assets in Excess of Liabilities – 1.7% | (b) | 9,857,140 | |
| Net Assets – 100.0% | $587,162,871 | ||
Percentages are stated as a percent of net assets. |
| Abbreviations: | ||
| ETF: | Exchange Traded Fund | |
| Footnotes: | ||
| (a) | Represents cost for financial reporting purposes, which may differ from cost basis for federal income tax purposes. See also Note 7 of the Notes to Financial Statements. | |
| (b) | Includes $5,000,212 of cash pledged as collateral for the futures contracts outstanding at December 31, 2023. See also the following Schedule of Open Futures Contracts. | |
The accompanying notes are an integral part of these financial statements.
| Schedule of Open Futures Contracts | December 31, 2023 |
Long Futures Contracts
| Description | Number of contracts | Expiration Date | Notional Amount | Value | Unrealized Appreciation (Depreciation) | Variation Margin Receivable (Payable) | ||||||
| MOD S&P TSX 60 Index - Long | 48 | March 14, 2024 | $ 8,892,617 | $ 9,204,060 | $ 311,443 | $ 11,819 | ||||||
| CME E-mini S&P 500 Index - Long | 102 | March 15, 2024 | 23,832,323 | 24,582,000 | 749,677 | (62,475) | ||||||
| EUX Euro Stoxx 50 Index - Long | 118 | March 15, 2024 | 5,954,920 | 5,917,990 | (36,930) | (2,528) | ||||||
| MSCI EAFE Index - Long | 70 | March 15, 2024 | 7,590,861 | 7,883,400 | 292,539 | 4,200 | ||||||
| MSCI Emerging Markets Index - Long | 213 | March 15, 2024 | 10,536,651 | 11,008,905 | 472,254 | 8,855 | ||||||
| AUD Currency Future - Long | 180 | March 18, 2024 | 12,043,696 | 12,294,900 | 251,204 | (36,000) | ||||||
| EUR Currency Future - Long | 98 | March 18, 2024 | 13,330,915 | 13,566,875 | 235,960 | (30,625) | ||||||
| CAD Currency Future - Long | 199 | March 19, 2024 | 14,676,672 | 15,049,375 | 372,703 | (10,945) | ||||||
| CBT 10-Year U.S. Treasury Note - Long | 327 | March 19, 2024 | 35,718,820 | 36,915,234 | 1,196,414 | — | ||||||
| $132,577,475 | $136,422,739 | $3,845,264 | $(117,699) |
Short Futures Contracts
| Description | Number of contracts | Expiration Date | Notional Amount | Value | Unrealized Appreciation (Depreciation) | Variation Margin Receivable (Payable) | ||||||
| JPY Currency Future - Short | 13 | March 18, 2024 | $ (1,136,893) | $ (1,166,100) | $ (29,207) | $ (3,413) | ||||||
| EUR Currency Future - Short | 3 | March 18, 2024 | (407,355) | (415,313) | (7,958) | 938 | ||||||
| CBT U.S. Long Bond - Short | 103 | March 19, 2024 | (11,932,636) | (12,868,563) | (935,927) | 19,313 | ||||||
| CBT U.S. Ultra Bond - Short | 89 | March 19, 2024 | (11,087,077) | (11,889,844) | (802,767) | 47,281 | ||||||
| $ (24,563,961) | $ (26,339,820) | $(1,775,859) | $ 64,119 | |||||||||
| Total Futures Contracts | $108,013,514 | $110,082,919 | $ 2,069,405 | $(53,580) |
The accompanying notes are an integral part of these financial statements.
132
(continued)
AuguStarSM Variable Insurance Products Fund, Inc.
AVIP iShares Managed Risk Moderate Growth Portfolio (Unaudited)
Objective/Strategy
The AVIP iShares Managed Risk Moderate Growth Portfolio (formerly ON iShares Managed Risk Moderate Growth Portfolio) seeks income and capital appreciation by investing in underlying exchange traded funds (“ETFs”) and futures. Under normal market conditions, through investments in the underlying funds and derivatives, the Portfolio expects to allocate 65% of its assets in equity investments and 35% of its assets in fixed income investments.
Performance as of December 31, 2023
| Average Annual returns | |
| One year | 16.15% |
| Since inception (10/14/22) | 18.60% |
Past performance does not guarantee future results. The performance data quoted represents past performance and current returns may be lower or higher. Total return figures include change in share price and reinvestment of dividends and capital gains. The investment return and principal value will fluctuate so that an investor’s shares, when redeemed, may be worth more or less than the original cost. To obtain performance information up to the most recent month end, call toll-free 1-877-781-6392.
The Portfolio is not open to direct retail investment. Beneficial interest in the Portfolio’s shares is obtained either through an allocation to the Portfolio as an investment vehicle within variable life insurance policies or annuity contracts. Actual performance results for variable annuity and variable universal life contracts will be lower due to contract charges. Consult your contract for applicable charges.
Total gross expense ratio is 0.69% per the Fund’s Prospectus dated May 1, 2023 and supplemented October 2, 2023 and December 4, 2023. Additional information pertaining to the Portfolio’s expense ratio as of December 31, 2023 can be found in the Portfolio’s Financial Highlights. The Portfolio’s expense ratio included in the Financial Highlights does not include Acquired Fund Fees and Expenses (AFFE), which is a major component of the expense ratio that is required to be presented in the Fund’s Prospectus.
Comments from Sub-Adviser
Q. How did the Portfolio perform in comparison to its benchmark during the reporting period?
A. For the year ended December 31, 2023, the Portfolio returned 16.15% versus 26.29% for its benchmark, the S&P 500® Index.
Q. What affected the Portfolio’s performance?
A. The Portfolio follows a top-down asset allocation process and is highly diversified, investing across a wide opportunity set of global equities, bonds, and currencies. As such, the Portfolio takes positions across multiple geographies, asset classes and time horizons. During the year, the Portfolio was invested roughly 65% in equities and 35% in fixed income.
Given the strong performance of domestic equities over the year, the Portfolio’s fixed income exposure was a large detractor from relative performance. Other detractors included the Portfolio’s exposure to international developed equities and to emerging markets, as these markets generally underperformed relative to the U.S. In terms of specific positioning, iShares Core U.S. Aggregate Bond ETF was the largest detractor, followed by iShares Core MSCI EAFE ETF and iShares Core MSCI Emerging Markets ETF. Strong growth and jobs data in the United States benefited the Portfolio’s increased exposure to domestic equities, particularly early in the year, as demonstrated by positive relative performances from iShares Russell 1000 ETF and iShares Core S&P 500 ETF. Some of the country exposures that contributed to relative
performance for the year include Taiwan, Japan, and Ireland, while positioning in the U.S., China, and United Kingdom detracted. During the year, futures contracts contributed 211 basis points of absolute return for the Portfolio in aggregate. (1)
| (1) | The Portfolio’s composition is subject to change. Holdings and weightings are as of December 31, 2023. |
| |
Change in Value of $10,000 Investment
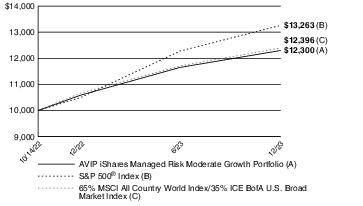
Hypothetical illustration based on past performance. Future performance will vary. The Portfolio’s returns reflect reinvested dividends. The Portfolio’s holdings may differ significantly from the securities in the index. The index is unmanaged and therefore does not reflect the cost of portfolio management and accounting.
The S&P 500® Index is a capitalization-weighted index designed to measure performance of the broad domestic economy through changes in the aggregate market value of 500 stocks representing all major industries. The index presented includes the effects of reinvested dividends.
The MSCI All Country World Index (Net-USD) is a free float-adjusted market capitalization weighted index that is designed to measure the combined equity market performance of developed and emerging markets. The index captures large and mid cap representation across 23 developed market and 24 emerging market countries. The returns presented for this index include the effects of reinvested dividends, net of taxes, and adjustment to U.S. Dollar denomination.
ICE BofA U.S. Broad Market Index measures the performance of U.S. dollar-denominated, investment grade debt securities, including U.S. Treasury notes and bonds, quasi-government securities, corporate securities, residential and commercial mortgage-backed securities and asset-backed securities. Securities are cap-weighted based on their amount outstanding times the market price plus accrued interest.
Past performance is no guarantee of future results. Redemption of fund shares could have tax implications unique to each shareholder.
| Portfolio Composition as of December 31, 2023 (1) | |
| % of Net Assets | |
| Exchange Traded Funds | 98.4 |
| Other Net Assets | 1.6 |
| 100.0 | |
133
(continued)
AuguStarSM Variable Insurance Products Fund, Inc.
AVIP iShares Managed Risk Moderate Growth Portfolio (Unaudited) (Continued)
| Top 10 Portfolio Holdings as of December 31, 2023 (1) (2) (3) | ||
| % of Net Assets | ||
| 1. | iShares Core U.S. Aggregate Bond ETF | 34.6 |
| 2. | iShares Core S&P 500 ETF | 29.3 |
| 3. | iShares Russell 1000 ETF | 10.8 |
| 4. | iShares Core MSCI EAFE ETF | 10.8 |
| 5. | iShares Core MSCI Emerging Markets ETF | 4.7 |
| 6. | iShares MSCI EAFE ETF | 2.8 |
| 7. | BlackRock Ultra Short-Term Bond ETF | 2.4 |
| 8. | iShares Russell 1000 Value ETF | 2.1 |
| 9. | iShares MSCI Emerging Markets ETF | 0.9 |
| (1) | Composition of Portfolio subject to change. | |
| (2) | Short-term investments have been excluded from the list of Top 10 Portfolio Holdings. | |
| (3) | Top 10 Portfolio Holdings is presented at an individual security level. Total investment exposure by issuer may be higher. | |
134
AuguStarSM Variable Insurance Products Fund, Inc.
AVIP iShares Managed Risk Moderate Growth Portfolio
| Schedule of Investments | December 31, 2023 |
| Exchange Traded Funds–98.4% | Shares | Value | |
BlackRock Ultra Short-Term Bond ETF | 235,963 | $ 11,883,097 | |
iShares Core MSCI EAFE ETF | 763,278 | 53,696,608 | |
iShares Core MSCI Emerging Markets ETF | 460,888 | 23,311,715 | |
iShares Core S&P 500 ETF | 305,230 | 145,787,005 | |
iShares Core U.S. Aggregate Bond ETF | 1,739,681 | 172,663,339 | |
iShares MSCI EAFE ETF | 184,758 | 13,921,515 | |
iShares MSCI Emerging Markets ETF | 115,281 | 4,635,449 | |
iShares Russell 1000 ETF | 205,454 | 53,882,366 | |
iShares Russell 1000 Value ETF | 63,657 | 10,519,319 | |
Total Exchange Traded Funds (Cost $414,842,989) | $490,300,413 | ||
Total Investments – 98.4% (Cost $414,842,989) | (a) | $490,300,413 | |
Other Assets in Excess of Liabilities – 1.6% | (b) | 8,176,277 | |
| Net Assets – 100.0% | $498,476,690 | ||
Percentages are stated as a percent of net assets. |
| Abbreviations: | ||
| ETF: | Exchange Traded Fund | |
| Footnotes: | ||
| (a) | Represents cost for financial reporting purposes, which may differ from cost basis for federal income tax purposes. See also Note 7 of the Notes to Financial Statements. | |
| (b) | Includes $3,388,679 of cash pledged as collateral for the futures contracts outstanding at December 31, 2023. See also the following Schedule of Open Futures Contracts. | |
The accompanying notes are an integral part of these financial statements.
| Schedule of Open Futures Contracts | December 31, 2023 |
Long Futures Contracts
| Description | Number of contracts | Expiration Date | Notional Amount | Value | Unrealized Appreciation (Depreciation) | Variation Margin Receivable (Payable) | ||||||
| MOD S&P TSX 60 Index - Long | 51 | March 14, 2024 | $ 9,448,406 | $ 9,779,314 | $ 330,908 | $ 12,558 | ||||||
| CME E-mini S&P 500 Index - Long | 41 | March 15, 2024 | 9,655,241 | 9,881,000 | 225,759 | (25,113) | ||||||
| EUX Euro Stoxx 50 Index - Long | 99 | March 15, 2024 | 4,996,099 | 4,965,093 | (31,006) | (2,121) | ||||||
| MSCI EAFE Index - Long | 85 | March 15, 2024 | 9,217,474 | 9,572,700 | 355,226 | 5,100 | ||||||
| MSCI Emerging Markets Index - Long | 117 | March 15, 2024 | 5,743,339 | 6,047,145 | 303,806 | 5,850 | ||||||
| AUD Currency Future - Long | 150 | March 18, 2024 | 10,038,018 | 10,245,750 | 207,732 | (30,000) | ||||||
| EUR Currency Future - Long | 78 | March 18, 2024 | 10,610,320 | 10,798,125 | 187,805 | (24,375) | ||||||
| CAD Currency Future - Long | 159 | March 19, 2024 | 11,726,587 | 12,024,375 | 297,788 | (8,745) | ||||||
| $71,435,484 | $73,313,502 | $1,878,018 | $(66,846) |
Short Futures Contracts
| Description | Number of contracts | Expiration Date | Notional Amount | Value | Unrealized Appreciation (Depreciation) | Variation Margin Receivable (Payable) | ||||||
| CBT U.S. Long Bond - Short | 85 | March 19, 2024 | $ (9,847,328) | $(10,619,688) | $ (772,360) | $ 15,938 | ||||||
| CBT U.S. Ultra Bond - Short | 72 | March 19, 2024 | (8,975,911) | (9,618,750) | (642,839) | 38,250 | ||||||
| $(18,823,239) | $(20,238,438) | $(1,415,199) | $ 54,188 | |||||||||
| Total Futures Contracts | $ 52,612,245 | $ 53,075,064 | $ 462,819 | $(12,658) |
The accompanying notes are an integral part of these financial statements.
135
(continued)
AuguStarSM Variable Insurance Products Fund, Inc.
AVIP iShares Managed Risk Growth Portfolio (Unaudited)
Objective/Strategy
The AVIP iShares Managed Risk Growth Portfolio (formerly ON iShares Managed Risk Growth Portfolio) seeks income and capital appreciation by investing in underlying exchange traded funds (“ETFs”) and futures. Under normal market conditions, through investments in the underlying funds and derivatives, the Portfolio expects to allocate 85% of its assets in equity investments and 15% of its assets in fixed income investments.
Performance as of December 31, 2023
| Average Annual returns | |
| One year | 19.62% |
| Since inception (10/14/22) | 21.61% |
Past performance does not guarantee future results. The performance data quoted represents past performance and current returns may be lower or higher. Total return figures include change in share price and reinvestment of dividends and capital gains. The investment return and principal value will fluctuate so that an investor’s shares, when redeemed, may be worth more or less than the original cost. To obtain performance information up to the most recent month end, call toll-free 1-877-781-6392.
The Portfolio is not open to direct retail investment. Beneficial interest in the Portfolio’s shares is obtained either through an allocation to the Portfolio as an investment vehicle within variable life insurance policies or annuity contracts. Actual performance results for variable annuity and variable universal life contracts will be lower due to contract charges. Consult your contract for applicable charges.
Total gross expense ratio is 0.70% per the Fund’s Prospectus dated May 1, 2023 and supplemented October 2, 2023 and December 4, 2023. Additional information pertaining to the Portfolio’s expense ratio as of December 31, 2023 can be found in the Portfolio’s Financial Highlights. The Portfolio’s expense ratio included in the Financial Highlights does not include Acquired Fund Fees and Expenses (AFFE), which is a major component of the expense ratio that is required to be presented in the Fund’s Prospectus.
Comments from Sub-Adviser
Q. How did the Portfolio perform in comparison to its benchmark during the reporting period?
A. For the year ended December 31, 2023, the Portfolio returned 19.62% versus 26.29% for its benchmark, the S&P 500® Index.
Q. What affected the Portfolio’s performance?
A. The Portfolio follows a top-down asset allocation process and is highly diversified, investing across a wide opportunity set of global equities, bonds, and currencies. As such, the Portfolio takes positions across multiple geographies, asset classes and time horizons. During the year, the Portfolio was invested roughly 85% in equities and 15% in fixed income.
Given the strong performance of domestic equities over the year, the Portfolio’s fixed income exposure was a large detractor from relative performance. Other detractors included the Portfolio’s exposure to international developed equities and to emerging markets, as these markets generally underperformed relative to the U.S. In terms of specific positioning, iShares Core U.S. Aggregate Bond ETF was the largest detractor, followed by iShares Core MSCI EAFE ETF and iShares Core MSCI Emerging Markets ETF. Strong growth and jobs data in the United States benefited the Portfolio’s increased exposure to domestic equities, particularly early in the year, as demonstrated by positive relative performances from iShares Russell 1000 ETF and iShares Core S&P 500 ETF. Some of the country exposures that contributed to relative
performance for the year include Japan, Taiwan, and Ireland, while positioning in the U.S., China, and United Kingdom detracted. During the year, futures contracts contributed 201 basis points of absolute return for the Portfolio in aggregate. (1)
| (1) | The Portfolio’s composition is subject to change. Holdings and weightings are as of December 31, 2023. |
| |
Change in Value of $10,000 Investment
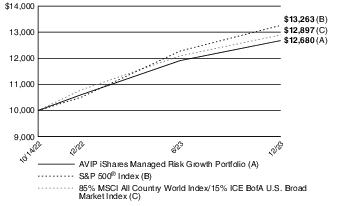
Hypothetical illustration based on past performance. Future performance will vary. The Portfolio’s returns reflect reinvested dividends. The Portfolio’s holdings may differ significantly from the securities in the index. The index is unmanaged and therefore does not reflect the cost of portfolio management and accounting.
The S&P 500® Index is a capitalization-weighted index designed to measure performance of the broad domestic economy through changes in the aggregate market value of 500 stocks representing all major industries. The index presented includes the effects of reinvested dividends.
The MSCI All Country World Index (Net-USD) is a free float-adjusted market capitalization weighted index that is designed to measure the combined equity market performance of developed and emerging markets. The index captures large and mid cap representation across 23 developed market and 24 emerging market countries. The returns presented for this index include the effects of reinvested dividends, net of taxes, and adjustment to U.S. Dollar denomination.
ICE BofA U.S. Broad Market Index measures the performance of U.S. dollar-denominated, investment grade debt securities, including U.S. Treasury notes and bonds, quasi-government securities, corporate securities, residential and commercial mortgage-backed securities and asset-backed securities. Securities are cap-weighted based on their amount outstanding times the market price plus accrued interest.
Past performance is no guarantee of future results. Redemption of fund shares could have tax implications unique to each shareholder.
| Portfolio Composition as of December 31, 2023 (1) | |
| % of Net Assets | |
| Exchange Traded Funds | 96.9 |
| Other Net Assets | 3.1 |
| 100.0 | |
136
(continued)
AuguStarSM Variable Insurance Products Fund, Inc.
AVIP iShares Managed Risk Growth Portfolio (Unaudited) (Continued)
| Top 10 Portfolio Holdings as of December 31, 2023 (1) (2) (3) | ||
| % of Net Assets | ||
| 1. | iShares Core S&P 500 ETF | 40.4 |
| 2. | iShares Core MSCI EAFE ETF | 17.1 |
| 3. | iShares Core U.S. Aggregate Bond ETF | 14.7 |
| 4. | iShares Russell 1000 ETF | 9.7 |
| 5. | iShares Core MSCI Emerging Markets ETF | 6.9 |
| 6. | BlackRock Ultra Short-Term Bond ETF | 3.3 |
| 7. | iShares Russell 1000 Value ETF | 2.1 |
| 8. | iShares MSCI EAFE ETF | 1.8 |
| 9. | iShares MSCI Emerging Markets ETF | 0.9 |
| (1) | Composition of Portfolio subject to change. | |
| (2) | Short-term investments have been excluded from the list of Top 10 Portfolio Holdings. | |
| (3) | Top 10 Portfolio Holdings is presented at an individual security level. Total investment exposure by issuer may be higher. | |
137
AuguStarSM Variable Insurance Products Fund, Inc.
AVIP iShares Managed Risk Growth Portfolio
| Schedule of Investments | December 31, 2023 |
| Exchange Traded Funds–96.9% | Shares | Value | |
BlackRock Ultra Short-Term Bond ETF | 290,579 | $ 14,633,559 | |
iShares Core MSCI EAFE ETF | 1,078,444 | 75,868,535 | |
iShares Core MSCI Emerging Markets ETF | 611,134 | 30,911,158 | |
iShares Core S&P 500 ETF | 376,157 | 179,663,868 | |
iShares Core U.S. Aggregate Bond ETF | 660,585 | 65,563,061 | |
iShares MSCI EAFE ETF | 107,703 | 8,115,421 | |
iShares MSCI Emerging Markets ETF | 94,839 | 3,813,476 | |
iShares Russell 1000 ETF | 164,834 | 43,229,365 | |
iShares Russell 1000 Value ETF | 56,164 | 9,281,101 | |
Total Exchange Traded Funds (Cost $350,724,006) | $431,079,544 | ||
Total Investments – 96.9% (Cost $350,724,006) | (a) | $431,079,544 | |
Other Assets in Excess of Liabilities – 3.1% | (b) | 13,729,075 | |
| Net Assets – 100.0% | $444,808,619 | ||
��
Percentages are stated as a percent of net assets. |
| Abbreviations: | ||
| ETF: | Exchange Traded Fund | |
| Footnotes: | ||
| (a) | Represents cost for financial reporting purposes, which may differ from cost basis for federal income tax purposes. See also Note 7 of the Notes to Financial Statements. | |
| (b) | Includes $3,654,925 of cash pledged as collateral for the futures contracts outstanding at December 31, 2023. See also the following Schedule of Open Futures Contracts. | |
The accompanying notes are an integral part of these financial statements.
| Schedule of Open Futures Contracts | December 31, 2023 |
Long Futures Contracts
| Description | Number of contracts | Expiration Date | Notional Amount | Value | Unrealized Appreciation (Depreciation) | Variation Margin Receivable (Payable) | ||||||
| MOD S&P TSX 60 Index - Long | 70 | March 14, 2024 | $13,047,361 | $13,422,588 | $ 375,227 | $ 13,215 | ||||||
| CME E-mini S&P 500 Index - Long | 78 | March 15, 2024 | 18,222,388 | 18,798,000 | 575,612 | (47,775) | ||||||
| EUX Euro Stoxx 50 Index - Long | 88 | March 15, 2024 | 4,440,862 | 4,413,416 | (27,446) | (1,885) | ||||||
| MSCI EAFE Index - Long | 57 | March 15, 2024 | 6,181,130 | 6,419,340 | 238,210 | 3,420 | ||||||
| MSCI Emerging Markets Index - Long | 84 | March 15, 2024 | 4,123,423 | 4,341,540 | 218,117 | 4,200 | ||||||
| AUD Currency Future - Long | 132 | March 18, 2024 | 8,833,456 | 9,016,260 | 182,804 | (26,400) | ||||||
| EUR Currency Future - Long | 68 | March 18, 2024 | 9,250,023 | 9,413,750 | 163,727 | (21,250) | ||||||
| CAD Currency Future - Long | 216 | March 19, 2024 | 15,930,458 | 16,335,000 | 404,542 | (11,880) | ||||||
| $80,029,101 | $82,159,894 | $2,130,793 | $(88,355) |
Short Futures Contracts
| Description | Number of contracts | Expiration Date | Notional Amount | Value | Unrealized Appreciation (Depreciation) | Variation Margin Receivable (Payable) | ||||||
| CBT U.S. Long Bond - Short | 76 | March 19, 2024 | $ (8,804,672) | $ (9,495,250) | $ (690,578) | $ 14,249 | ||||||
| CBT U.S. Ultra Bond - Short | 63 | March 19, 2024 | (7,856,854) | (8,416,406) | (559,552) | 33,469 | ||||||
| $(16,661,526) | $(17,911,656) | $(1,250,130) | $ 47,718 | |||||||||
| Total Futures Contracts | $ 63,367,575 | $ 64,248,238 | $ 880,663 | $(40,637) |
The accompanying notes are an integral part of these financial statements.
138
(continued)
AuguStarSM Variable Insurance Products Fund, Inc.
AVIP Moderately Conservative Model Portfolio (Unaudited)
Objective/Strategy
The AVIP Moderately Conservative Model Portfolio (formerly ON Moderately Conservative Model Portfolio) is a fund of funds that seeks current income and moderate growth of capital with a greater emphasis on current income by investing in underlying mutual funds. Under normal circumstances, the Portfolio intends to have investment exposure to various asset classes within the following target asset allocation ranges: U.S. Equity 20-40%, International Equity 5-20%, and Fixed Income 30-70%.
Performance as of December 31, 2023
| Average Annual returns | |
| One year | 11.77% |
| Five years | 5.87% |
| Since inception (3/1/17) | 4.39% |
Past performance does not guarantee future results. The performance data quoted represents past performance and current returns may be lower or higher. Total return figures include change in share price and reinvestment of dividends and capital gains. The investment return and principal value will fluctuate so that an investor’s shares, when redeemed, may be worth more or less than the original cost. To obtain performance information up to the most recent month end, call toll-free 1-877-781-6392.
The Portfolio is not open to direct retail investment. Beneficial interest in the Portfolio’s shares is obtained either through an allocation to the Portfolio as an investment vehicle within variable life insurance policies or annuity contracts. Actual performance results for variable annuity and variable universal life contracts will be lower due to contract charges. Consult your contract for applicable charges.
Total gross expense ratio is 1.00% per the Fund’s Prospectus dated May 1, 2023 and supplemented October 2, 2023 and December 4, 2023. Additional information pertaining to the Portfolio’s expense ratio as of December 31, 2023 can be found in the Portfolio’s Financial Highlights. The Portfolio’s expense ratio included in the Financial Highlights does not include Acquired Fund Fees and Expenses (AFFE), which is a major component of the expense ratio that is required to be presented in the Fund’s Prospectus. The Adviser has contractually agreed to make payments to the Fund to the extent necessary to maintain the Portfolio's expense ratio (including AFFE, but excluding certain other expenses) at 1.00% through April 30, 2024.
Comments from Adviser
Q. How did the Portfolio perform in comparison to its benchmark during the reporting period?
A. For the year ended December 31, 2023, the Portfolio returned 11.77% versus 10.89% for its benchmark, the Morningstar® Moderately Conservative Target Risk Index.
Q. What affected the Portfolio’s performance?
A. Equity markets provided strong positive returns in 2023. Growth stocks materially outperformed value stocks, and domestic stocks outperformed international stocks. In addition, large cap stocks outperformed small and midcap stocks. Fixed income markets also provided modest positive returns for the year. While the Federal Reserve increased the Fed Funds rate materially during the year, longer term rates didn’t change materially, and the Treasury curve actually steepened a bit from 2 years to 30 years. Credit spreads also tightened during the year. In this environment, intermediate bonds performed well, and lower quality corporate bonds outperformed higher quality bonds.
The Portfolio invests in affiliated and unaffiliated mutual funds, comprised mostly of fixed income funds, but also some equity funds. The exposure to equity funds was the primary driver of positive performance relative to the benchmark. Specifically, holdings in AVIP BlackRock
Advantage Large Cap Growth Portfolio, AVIP BlackRock Advantage Large Cap Core Portfolio and AVIP S&P 500® Index Portfolio provided positive relative performance compared to the benchmark. The largest detractors from relative performance were all fixed income funds and included AVIP Federated Core Plus Bond Portfolio, PIMCO Low Duration Institutional and PIMCO Total Return Bond Institutional. (1)
| (1) | The Portfolio’s composition is subject to change. Holdings and weightings are as of December 31, 2023. |
| |
Change in Value of $10,000 Investment

Hypothetical illustration based on past performance. Future performance will vary. The Portfolio’s returns reflect reinvested dividends. The Portfolio’s holdings may differ significantly from the securities in the index. The index is unmanaged and therefore does not reflect the cost of portfolio management and accounting.
The Morningstar® Target Risk Index Family is a series of Morningstar Indexes that provide exposure to a broad array of asset classes using Morningstar asset allocation methodology. The index family provides global equity market risk levels that are scaled to fit five equity market risk profiles: aggressive, moderately aggressive, moderate, moderately conservative, and conservative. The five levels of global equity exposure are set at 95%, 80%, 60%, 40%, and 20%, respectively, and the Morningstar® Moderately Conservative Target Risk Index exposure is set at 40%.
Past performance is no guarantee of future results. Redemption of fund shares could have tax implications unique to each shareholder.
139
(continued)
AuguStarSM Variable Insurance Products Fund, Inc.
AVIP Moderately Conservative Model Portfolio (Unaudited) (Continued)
| Portfolio Composition as of December 31, 2023 (1) | |
| % of Net Assets | |
| Open-End Mutual Funds Less Net Liabilities | 100.0 |
| 100.0 | |
| Top 10 Portfolio Holdings as of December 31, 2023 (1) (2) (3) | ||
| % of Net Assets | ||
| 1. | AVIP Federated Core Plus Bond Portfolio | 15.0 |
| 2. | AVIP S&P 500® Index Portfolio | 14.0 |
| 3. | PIMCO Total Return Institutional | 13.0 |
| 4. | PIMCO Low Duration Institutional | 12.1 |
| 5. | AVIP Bond Portfolio | 8.0 |
| 6. | Western Asset Core Plus Bond IS | 7.0 |
| 7. | AVIP S&P MidCap 400® Index Portfolio | 7.0 |
| 8. | AVIP Federated High Income Bond Portfolio | 5.0 |
| 9. | AVIP BlackRock Advantage International Equity Portfolio | 4.0 |
| 10. | AVIP BlackRock Advantage Large Cap Value Portfolio | 3.0 |
| (1) | Composition of Portfolio subject to change. | |
| (2) | Short-term investments have been excluded from the list of Top 10 Portfolio Holdings. | |
| (3) | Top 10 Portfolio Holdings is presented at an individual security level. Total investment exposure by issuer may be higher. | |
140
AuguStarSM Variable Insurance Products Fund, Inc.
AVIP Moderately Conservative Model Portfolio
| Schedule of Investments in Unaffiliated Issuers | December 31, 2023 |
| Open-End Mutual Funds–37.1% | Shares | Value | |
DFA Emerging Markets Portfolio Institutional | 71,388 | $ 1,965,298 | |
DFA International Core Equity Portfolio Institutional | 384,849 | 5,895,893 | |
PIMCO Low Duration Institutional | 2,572,635 | 23,668,244 | |
PIMCO Total Return Institutional | 2,963,009 | 25,630,026 | |
Vanguard International Growth Fund Admiral Class | 19,304 | 1,965,298 | |
Western Asset Core Plus Bond IS | 1,441,662 | 13,811,125 | |
Total Open-End Mutual Funds | $ 72,935,884 | ||
Total Investments in Securities of Unaffiliated Issuers – 37.1% (Cost $79,970,135) | $ 72,935,884 | ||
| Total Investments in Affiliates – 62.9% (Cost $123,122,153) (see schedule below) | 123,813,754 | ||
| Liabilities in Excess of Other Assets – 0.0% | (93,023) | ||
| Net Assets – 100.0% | $196,656,615 | ||
Percentages are stated as a percent of net assets. |
The accompanying notes are an integral part of these financial statements.
| Schedule of Investments in Affiliates | December 31, 2023 |
| Affiliate | Value at January 1, 2023 | Cost of Purchases | Proceeds from Sales | Net Realized Gain (Loss) | Change in Unrealized Appreciation (Depreciation) | Income Distributions | Capital Gain Distributions | Shares at December 31, 2023 | Value at December 31, 2023 | |||||
| Open-End Mutual Funds – 62.9% | ||||||||||||||
AVIP AB Mid Cap Core Portfolio | (a) | $ 2,132,671 | $ 259,022 | $ 756,824 | $ (592,659) | $ 923,088 | $ 9,049 | $ — | 67,052 | $ 1,965,298 | ||||
AVIP AB Relative Value Portfolio | (a) | 2,132,671 | 192,383 | 568,256 | 24,801 | 183,699 | 21,916 | — | 177,213 | 1,965,298 | ||||
AVIP AB Small Cap Portfolio | (a) | 2,132,671 | 324,116 | 846,683 | (1,251,943) | 1,607,137 | — | — | 157,729 | 1,965,298 | ||||
AVIP BlackRock Advantage International Equity Portfolio | (a) | 8,530,683 | 651,698 | 2,498,034 | 132,731 | 1,044,113 | 284,258 | — | 514,813 | 7,861,191 | ||||
AVIP BlackRock Advantage Large Cap Core Portfolio | (a) | 4,265,341 | 176,981 | 1,416,647 | (103,827) | 1,008,747 | 39,386 | 13,161 | 122,754 | 3,930,595 | ||||
AVIP BlackRock Advantage Large Cap Value Portfolio | (a) | 6,398,012 | 551,077 | 1,653,606 | 238,608 | 361,802 | 116,023 | 63,578 | 328,645 | 5,895,893 | ||||
AVIP Bond Portfolio | (a) | 17,061,365 | 646,209 | 2,741,283 | (189,252) | 945,342 | 505,974 | — | 927,574 | 15,722,381 | ||||
AVIP Federated Core Plus Bond Portfolio | (a) | 31,990,060 | 1,410,058 | 4,700,046 | (630,343) | 1,409,736 | 692,618 | — | 3,250,217 | 29,479,465 | ||||
AVIP Federated High Income Bond Portfolio | (a) | 10,663,353 | 675,788 | 2,133,002 | (15,462) | 635,811 | 578,882 | — | 515,556 | 9,826,488 | ||||
AVIP Nasdaq-100® Index Portfolio | (a) | 2,132,671 | 278,162 | 1,202,077 | (72,260) | 828,802 | 9,191 | 161,107 | 111,855 | 1,965,298 | ||||
AVIP S&P 500® Index Portfolio | (a) | 29,857,389 | 2,280,567 | 9,869,972 | 1,414,687 | 3,831,496 | 321,123 | 1,123,512 | 708,398 | 27,514,167 | ||||
AVIP S&P MidCap 400® Index Portfolio | (a) | 14,928,694 | 2,477,579 | 5,203,531 | 1,082,910 | 471,432 | 102,748 | 540,700 | 668,794 | 13,757,084 | ||||
Fidelity Advisor® Real Estate I | (a) | 2,132,671 | 295,046 | 641,129 | (109,286) | 287,996 | 49,750 | — | 115,334 | 1,965,298 | ||||
Total Open-End Mutual Funds | $ (71,295) | �� | $13,539,201 | $2,730,918 | $1,902,058 | $123,813,754 |
Percentages are stated as a percent of net assets. |
| Footnotes: | ||
| (a) | Pursuant to Section 2(a)(3) of the Investment Company Act of 1940, the investment meets the definition of “affiliated person”, as the Portfolio directly or indirectly owns, controls, or holds with power to vote 5 percent or more of the outstanding voting securities of the holding at December 31, 2023. | |
The accompanying notes are an integral part of these financial statements.
141
(continued)
AuguStarSM Variable Insurance Products Fund, Inc.
AVIP Balanced Model Portfolio (Unaudited)
Objective/Strategy
The AVIP Balanced Model Portfolio (formerly ON Balanced Model Portfolio) is a fund of funds that seeks a balance between growth of capital and current income with a greater emphasis on growth of capital by investing in underlying mutual funds. Under normal circumstances, the Portfolio intends to have investment exposure to various asset classes within the following target asset allocation ranges: U.S. Equity 25-50%, International Equity 10-25%, and Fixed Income 25-50%.
Performance as of December 31, 2023
| Average Annual returns | |
| One year | 13.95% |
| Five years | 7.69% |
| Since inception (3/1/17) | 5.52% |
Past performance does not guarantee future results. The performance data quoted represents past performance and current returns may be lower or higher. Total return figures include change in share price and reinvestment of dividends and capital gains. The investment return and principal value will fluctuate so that an investor’s shares, when redeemed, may be worth more or less than the original cost. To obtain performance information up to the most recent month end, call toll-free 1-877-781-6392.
The Portfolio is not open to direct retail investment. Beneficial interest in the Portfolio’s shares is obtained either through an allocation to the Portfolio as an investment vehicle within variable life insurance policies or annuity contracts. Actual performance results for variable annuity and variable universal life contracts will be lower due to contract charges. Consult your contract for applicable charges.
Total gross expense ratio is 0.99% per the Fund’s Prospectus dated May 1, 2023 and supplemented October 2, 2023 and December 4, 2023. Additional information pertaining to the Portfolio’s expense ratio as of December 31, 2023 can be found in the Portfolio’s Financial Highlights. The Portfolio’s expense ratio included in the Financial Highlights does not include Acquired Fund Fees and Expenses (AFFE), which is a major component of the expense ratio that is required to be presented in the Fund’s Prospectus. The Adviser has contractually agreed to make payments to the Fund to the extent necessary to maintain the Portfolio's expense ratio (including AFFE, but excluding certain other expenses) at 1.00% through April 30, 2024.
Comments from Adviser
Q. How did the Portfolio perform in comparison to its benchmark during the reporting period?
A. For the year ended December 31, 2023, the Portfolio returned 13.95% versus 13.22% for its benchmark, the Morningstar® Moderate Target Risk Index.
Q. What affected the Portfolio’s performance?
A. Equity markets provided strong positive returns in 2023. Growth stocks materially outperformed value stocks, and domestic stocks outperformed international stocks. In addition, large cap stocks outperformed small and midcap stocks. Fixed income markets also provided modest positive returns. While the Federal Reserve increased the Fed Funds rate materially during the year, longer term rates didn’t change materially, and the Treasury curve actually steepened a bit from 2 years to 30 years. Credit spreads also tightened during the year. In this environment, intermediate bonds performed well, and lower quality corporate bonds outperformed higher quality bonds.
The Portfolio invests in affiliated and unaffiliated mutual funds, comprised of fixed income funds and equity funds. The exposure to equity funds was the primary driver of positive performance relative to the benchmark. Specifically, holdings in AVIP Nasdaq-100® Index Portfolio, AVIP BlackRock Advantage Large Cap Growth Portfolio, AVIP
BlackRock Advantage Large Cap Core Portfolio, and AVIP S&P 500® Index Portfolio provided positive relative performance compared to the benchmark. The largest detractors from relative performance were all fixed income funds, and included AVIP Federated Core Plus Bond Portfolio, PIMCO Low Duration Institutional, and PIMCO Total Return Institutional. (1)
| (1) | The Portfolio’s composition is subject to change. Holdings and weightings are as of December 31, 2023. |
| |
Change in Value of $10,000 Investment
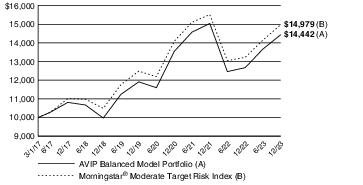
Hypothetical illustration based on past performance. Future performance will vary. The Portfolio’s returns reflect reinvested dividends. The Portfolio’s holdings may differ significantly from the securities in the index. The index is unmanaged and therefore does not reflect the cost of portfolio management and accounting.
The Morningstar® Target Risk Index Family is a series of Morningstar Indexes that provide exposure to a broad array of asset classes using Morningstar asset allocation methodology. The index family provides global equity market risk levels that are scaled to fit five equity market risk profiles: aggressive, moderately aggressive, moderate, moderately conservative, and conservative. The five levels of global equity exposure are set at 95%, 80%, 60%, 40%, and 20%, respectively, and the Morningstar® Moderate Target Risk Index exposure is set at 60%.
Past performance is no guarantee of future results. Redemption of fund shares could have tax implications unique to each shareholder.
142
(continued)
AuguStarSM Variable Insurance Products Fund, Inc.
AVIP Balanced Model Portfolio (Unaudited) (Continued)
| Portfolio Composition as of December 31, 2023 (1) | |
| % of Net Assets | |
| Open-End Mutual Funds Less Net Liabilities | 100.0 |
| 100.0 | |
| Top 10 Portfolio Holdings as of December 31, 2023 (1) (2) (3) | ||
| % of Net Assets | ||
| 1. | AVIP S&P 500® Index Portfolio | 16.0 |
| 2. | AVIP Federated Core Plus Bond Portfolio | 10.0 |
| 3. | AVIP S&P MidCap 400® Index Portfolio | 10.0 |
| 4. | PIMCO Total Return Institutional | 9.0 |
| 5. | PIMCO Low Duration Institutional | 8.0 |
| 6. | AVIP BlackRock Advantage International Equity Portfolio | 7.0 |
| 7. | AVIP Bond Portfolio | 6.0 |
| 8. | Western Asset Core Plus Bond IS | 5.0 |
| 9. | DFA International Core Equity Portfolio Institutional | 5.0 |
| 10. | AVIP BlackRock Advantage Large Cap Value Portfolio | 4.0 |
| (1) | Composition of Portfolio subject to change. | |
| (2) | Short-term investments have been excluded from the list of Top 10 Portfolio Holdings. | |
| (3) | Top 10 Portfolio Holdings is presented at an individual security level. Total investment exposure by issuer may be higher. | |
143
AuguStarSM Variable Insurance Products Fund, Inc.
AVIP Balanced Model Portfolio
| Schedule of Investments in Unaffiliated Issuers | December 31, 2023 |
| Open-End Mutual Funds–31.1% | Shares | Value | |
DFA Emerging Markets Portfolio Institutional | 563,885 | $ 15,523,757 | |
DFA International Core Equity Portfolio Institutional | 2,533,250 | 38,809,393 | |
PIMCO Low Duration Institutional | 6,773,351 | 62,314,823 | |
PIMCO Total Return Institutional | 8,101,319 | 70,076,411 | |
Vanguard International Growth Fund Admiral Class | 152,478 | 15,523,757 | |
Western Asset Core Plus Bond IS | 4,066,861 | 38,960,529 | |
Total Open-End Mutual Funds | $241,208,670 | ||
Total Investments in Securities of Unaffiliated Issuers – 31.1% (Cost $259,772,241) | $241,208,670 | ||
| Total Investments in Affiliates – 68.9% (Cost $509,533,905) (see schedule below) | 535,569,627 | ||
| Liabilities in Excess of Other Assets – 0.0% | (307,035) | ||
| Net Assets – 100.0% | $776,471,262 | ||
Percentages are stated as a percent of net assets. |
The accompanying notes are an integral part of these financial statements.
| Schedule of Investments in Affiliates | December 31, 2023 |
| Affiliate | Value at January 1, 2023 | Cost of Purchases | Proceeds from Sales | Net Realized Gain (Loss) | Change in Unrealized Appreciation (Depreciation) | Income Distributions | Capital Gain Distributions | Shares at December 31, 2023 | Value at December 31, 2023 | |||||
| Open-End Mutual Funds – 68.9% | ||||||||||||||
AVIP AB Mid Cap Core Portfolio | (a) | $ 7,875,979 | $ 659,856 | $ 2,017,254 | $(1,070,639) | $ 2,313,937 | $ 35,248 | $ — | 264,820 | $ 7,761,879 | ||||
AVIP AB Relative Value Portfolio | (a) | 31,503,917 | 1,809,991 | 5,420,507 | 238,897 | 2,915,217 | 340,743 | — | 2,799,596 | 31,047,515 | ||||
AVIP AB Small Cap Portfolio | (a) | 7,875,979 | 908,021 | 2,355,104 | (4,045,818) | 5,378,801 | — | — | 622,944 | 7,761,879 | ||||
AVIP BlackRock Advantage International Equity Portfolio | (a) | 55,131,854 | 3,352,825 | 11,862,444 | (525,291) | 8,236,206 | 1,932,606 | — | 3,558,163 | 54,333,150 | ||||
AVIP BlackRock Advantage Large Cap Core Portfolio | (a) | 15,751,958 | 394,786 | 4,033,352 | (300,925) | 3,711,290 | 153,210 | 51,195 | 484,814 | 15,523,757 | ||||
AVIP BlackRock Advantage Large Cap Growth Portfolio | (a) | 7,875,979 | 225,679 | 3,000,224 | (3,358,019) | 6,018,464 | 9,911 | 47,287 | 845,521 | 7,761,879 | ||||
AVIP BlackRock Advantage Large Cap Value Portfolio | (a) | 31,503,917 | 1,678,483 | 5,146,039 | 123,641 | 2,887,513 | 601,236 | 329,462 | 1,730,631 | 31,047,515 | ||||
AVIP BlackRock Advantage Small Cap Growth Portfolio | (a) | 15,751,958 | 1,772,022 | 5,073,077 | (2,009,653) | 5,082,507 | — | — | 698,011 | 15,523,757 | ||||
AVIP Bond Portfolio | (a) | 47,255,875 | 3,308,709 | 6,152,240 | (456,381) | 2,615,309 | 1,474,168 | — | 2,747,568 | 46,571,272 | ||||
AVIP Federated Core Plus Bond Portfolio | (a) | 78,759,792 | 6,905,726 | 10,034,030 | (1,370,091) | 3,357,389 | 1,793,587 | — | 8,557,749 | 77,618,786 | ||||
AVIP Federated High Income Bond Portfolio | (a) | 23,627,938 | 1,930,184 | 3,666,995 | 3,006 | 1,391,503 | 1,349,620 | — | 1,221,702 | 23,285,636 | ||||
AVIP Nasdaq-100® Index Portfolio | (a) | 7,875,979 | 856,218 | 3,801,428 | (2,063,966) | 4,895,076 | 35,760 | 626,827 | 441,769 | 7,761,879 | ||||
AVIP S&P 500® Index Portfolio | (a) | 126,015,667 | 8,131,520 | 32,401,092 | 5,242,170 | 17,201,793 | 1,427,888 | 4,995,755 | 3,197,478 | 124,190,058 | ||||
AVIP S&P MidCap 400® Index Portfolio | (a) | 78,759,792 | 10,086,509 | 19,428,161 | 2,210,919 | 5,989,727 | 571,894 | 3,009,536 | 3,773,397 | 77,618,786 | ||||
Fidelity Advisor® Real Estate I | (a) | 7,875,979 | 955,443 | 1,734,588 | (455,849) | 1,120,894 | 192,459 | — | 455,509 | 7,761,879 | ||||
Total Open-End Mutual Funds | $(7,837,999) | $73,115,626 | $9,918,330 | $9,060,062 | $535,569,627 |
Percentages are stated as a percent of net assets. |
| Footnotes: | ||
| (a) | Pursuant to Section 2(a)(3) of the Investment Company Act of 1940, the investment meets the definition of “affiliated person”, as the Portfolio directly or indirectly owns, controls, or holds with power to vote 5 percent or more of the outstanding voting securities of the holding at December 31, 2023. | |
The accompanying notes are an integral part of these financial statements.
144
(continued)
AuguStarSM Variable Insurance Products Fund, Inc.
AVIP Moderate Growth Model Portfolio (Unaudited)
Objective/Strategy
The AVIP Moderate Growth Model Portfolio (formerly ON Moderate Growth Model Portfolio) is a fund of funds that seeks growth of capital and moderate current income with a greater emphasis on growth of capital by investing in underlying mutual funds. Under normal circumstances, the Portfolio intends to have investment exposure to various asset classes within the following target asset allocation ranges: U.S. Equity 40-60%, International Equity 15-35%, and Fixed Income 10-30%.
Performance as of December 31, 2023
| Average Annual returns | |
| One year | 16.67% |
| Five years | 9.72% |
| Since inception (3/1/17) | 6.91% |
Past performance does not guarantee future results. The performance data quoted represents past performance and current returns may be lower or higher. Total return figures include change in share price and reinvestment of dividends and capital gains. The investment return and principal value will fluctuate so that an investor’s shares, when redeemed, may be worth more or less than the original cost. To obtain performance information up to the most recent month end, call toll-free 1-877-781-6392.
The Portfolio is not open to direct retail investment. Beneficial interest in the Portfolio’s shares is obtained either through an allocation to the Portfolio as an investment vehicle within variable life insurance policies or annuity contracts. Actual performance results for variable annuity and variable universal life contracts will be lower due to contract charges. Consult your contract for applicable charges.
Total gross expense ratio is 0.99% per the Fund’s Prospectus dated May 1, 2023 and supplemented October 2, 2023 and December 4, 2023. Additional information pertaining to the Portfolio’s expense ratio as of December 31, 2023 can be found in the Portfolio’s Financial Highlights. The Portfolio’s expense ratio included in the Financial Highlights does not include Acquired Fund Fees and Expenses (AFFE), which is a major component of the expense ratio that is required to be presented in the Fund’s Prospectus.
Comments from Adviser
Q. How did the Portfolio perform in comparison to its benchmark during the reporting period?
A. For the year ended December 31, 2023, the Portfolio returned 16.67% versus 15.98% for its benchmark, the Morningstar® Moderately Aggressive Target Risk Index.
Q. What affected the Portfolio’s performance?
A. Equity markets provided strong positive returns in 2023. Growth stocks materially outperformed value stocks, and domestic stocks outperformed international stocks. In addition, large cap stocks outperformed small and midcap stocks. Fixed income markets also provided modest positive returns. While the Federal Reserve increased the Fed Funds rate materially during the year, longer term rates didn’t change materially, and the Treasury curve actually steepened a bit from 2 years to 30 years. Credit spreads also tightened during the year. In this environment, intermediate bonds performed well, and lower quality corporate bonds outperformed higher quality bonds.
The Portfolio invests in affiliated and unaffiliated mutual funds, comprised of mostly equity funds, but also some fixed income funds. The exposure to equity funds was the primary driver of positive performance relative to the benchmark. Specifically, holdings in AVIP Nasdaq-100® Index Portfolio , AVIP BlackRock Advantage Large Cap Growth Portfolio, AVIP BlackRock Advantage Large Cap Core Portfolio and AVIP S&P 500® Index Portfolio provided positive relative performance compared to the
benchmark. The largest detractors from relative performance were all fixed income funds, and included AVIP Federated Core Plus Bond Portfolio, PIMCO Low Duration Institutional, and PIMCO Total Return Institutional. (1)
| (1) | The Portfolio’s composition is subject to change. Holdings and weightings are as of December 31, 2023. |
| |
Change in Value of $10,000 Investment
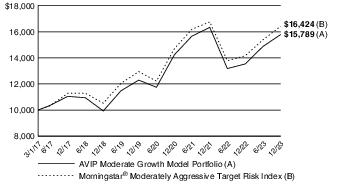
Hypothetical illustration based on past performance. Future performance will vary. The Portfolio’s returns reflect reinvested dividends. The Portfolio’s holdings may differ significantly from the securities in the index. The index is unmanaged and therefore does not reflect the cost of portfolio management and accounting.
The Morningstar® Target Risk Index Family is a series of Morningstar Indexes that provide exposure to a broad array of asset classes using Morningstar asset allocation methodology. The index family provides global equity market risk levels that are scaled to fit five equity market risk profiles: aggressive, moderately aggressive, moderate, moderately conservative, and conservative. The five levels of global equity exposure are set at 95%, 80%, 60%, 40%, and 20%, respectively, and the Morningstar® Moderately Aggressive Target Risk Index exposure is set at 80%.
Past performance is no guarantee of future results. Redemption of fund shares could have tax implications unique to each shareholder.
145
(continued)
AuguStarSM Variable Insurance Products Fund, Inc.
AVIP Moderate Growth Model Portfolio (Unaudited) (Continued)
| Portfolio Composition as of December 31, 2023 (1) | |
| % of Net Assets | |
| Open-End Mutual Funds Less Net Liabilities | 100.0 |
| 100.0 | |
| Top 10 Portfolio Holdings as of December 31, 2023 (1) (2) (3) | ||
| % of Net Assets | ||
| 1. | AVIP S&P 500® Index Portfolio | 19.0 |
| 2. | AVIP S&P MidCap 400® Index Portfolio | 12.0 |
| 3. | AVIP BlackRock Advantage International Equity Portfolio | 8.0 |
| 4. | AVIP Federated Core Plus Bond Portfolio | 7.0 |
| 5. | DFA International Core Equity Portfolio Institutional | 7.0 |
| 6. | AVIP BlackRock Advantage Large Cap Value Portfolio | 6.0 |
| 7. | PIMCO Total Return Institutional | 5.0 |
| 8. | AVIP AB Relative Value Portfolio | 5.0 |
| 9. | AVIP BlackRock Advantage Large Cap Core Portfolio | 4.0 |
| 10. | AVIP Bond Portfolio | 4.0 |
| (1) | Composition of Portfolio subject to change. | |
| (2) | Short-term investments have been excluded from the list of Top 10 Portfolio Holdings. | |
| (3) | Top 10 Portfolio Holdings is presented at an individual security level. Total investment exposure by issuer may be higher. | |
146
AuguStarSM Variable Insurance Products Fund, Inc.
AVIP Moderate Growth Model Portfolio
| Schedule of Investments in Unaffiliated Issuers | December 31, 2023 |
| Open-End Mutual Funds–22.0% | Shares | Value | |
DFA Emerging Markets Portfolio Institutional | 1,076,007 | $ 29,622,468 | |
DFA International Core Equity Portfolio Institutional | 6,767,535 | 103,678,636 | |
PIMCO Low Duration Institutional | 4,846,787 | 44,590,438 | |
PIMCO Total Return Institutional | 8,588,255 | 74,288,402 | |
Vanguard International Growth Fund Admiral Class | 290,958 | 29,622,468 | |
Western Asset Core Plus Bond IS | 4,656,208 | 44,606,476 | |
Total Open-End Mutual Funds | $ 326,408,888 | ||
Total Investments in Securities of Unaffiliated Issuers – 22.0% (Cost $334,187,390) | $ 326,408,888 | ||
| Total Investments in Affiliates – 78.0% (Cost $1,101,714,202) (see schedule below) | 1,155,276,246 | ||
| Liabilities in Excess of Other Assets – 0.0% | (504,934) | ||
| Net Assets – 100.0% | $1,481,180,200 | ||
Percentages are stated as a percent of net assets. |
The accompanying notes are an integral part of these financial statements.
| Schedule of Investments in Affiliates | December 31, 2023 |
| Affiliate | Value at January 1, 2023 | Cost of Purchases | Proceeds from Sales | Net Realized Gain (Loss) | Change in Unrealized Appreciation (Depreciation) | Income Distributions | Capital Gain Distributions | Shares at December 31, 2023 | Value at December 31, 2023 | |||||
| Open-End Mutual Funds – 78.0% | ||||||||||||||
AVIP AB Mid Cap Core Portfolio | (a) | $ 14,450,992 | $ 1,032,527 | $ 2,984,793 | $ (1,598,093) | $ 3,910,601 | $ 66,913 | $ — | 505,330 | $ 14,811,234 | ||||
AVIP AB Relative Value Portfolio | (a) | 72,254,959 | 4,300,219 | 9,867,325 | 425,360 | 6,942,957 | 808,634 | — | 6,677,743 | 74,056,170 | ||||
AVIP AB Small Cap Portfolio | (a) | 28,901,984 | 2,958,257 | 7,187,833 | (12,531,089) | 17,481,149 | — | — | 2,377,405 | 29,622,468 | ||||
AVIP BlackRock Advantage International Equity Portfolio | (a) | 115,607,935 | 7,023,753 | 20,345,256 | (1,093,266) | 17,296,705 | 4,191,326 | — | 7,759,651 | 118,489,871 | ||||
AVIP BlackRock Advantage Large Cap Core Portfolio | (a) | 57,803,968 | 1,242,607 | 12,476,201 | (1,070,572) | 13,745,134 | 581,282 | 194,236 | 1,850,248 | 59,244,936 | ||||
AVIP BlackRock Advantage Large Cap Growth Portfolio | (a) | 28,901,984 | 556,406 | 9,724,608 | (16,674,838) | 26,563,524 | 37,610 | 179,437 | 3,226,848 | 29,622,468 | ||||
AVIP BlackRock Advantage Large Cap Value Portfolio | (a) | 86,705,951 | 5,078,929 | 11,318,798 | (701,097) | 9,102,418 | 1,712,320 | 938,306 | 4,953,590 | 88,867,403 | ||||
AVIP BlackRock Advantage Small Cap Growth Portfolio | (a) | 43,352,976 | 4,194,288 | 11,676,364 | (4,471,241) | 13,034,043 | — | — | 1,997,918 | 44,433,702 | ||||
AVIP Bond Portfolio | (a) | 57,803,968 | 6,174,226 | 7,377,984 | (527,271) | 3,171,997 | 1,863,469 | — | 3,495,277 | 59,244,936 | ||||
AVIP Federated Core Plus Bond Portfolio | (a) | 101,156,943 | 13,199,412 | 13,209,711 | (1,854,464) | 4,386,457 | 2,380,817 | — | 11,430,941 | 103,678,637 | ||||
AVIP Federated High Income Bond Portfolio | (a) | 28,901,984 | 3,504,967 | 4,488,856 | (26,124) | 1,730,497 | 1,707,543 | — | 1,554,169 | 29,622,468 | ||||
AVIP Nasdaq-100® Index Portfolio | (a) | 28,901,984 | 2,845,235 | 12,594,864 | (4,641,746) | 15,111,859 | 135,629 | 2,377,431 | 1,685,969 | 29,622,468 | ||||
AVIP S&P 500® Index Portfolio | (a) | 274,568,846 | 15,771,258 | 58,213,620 | 9,622,257 | 39,664,703 | 3,215,026 | 11,248,422 | 7,245,454 | 281,413,444 | ||||
AVIP S&P MidCap 400® Index Portfolio | (a) | 173,411,903 | 20,402,555 | 34,222,272 | 3,963,353 | 14,179,268 | 1,303,419 | 6,859,109 | 8,640,487 | 177,734,807 | ||||
Fidelity Advisor® Real Estate I | (a) | 14,450,992 | 1,811,732 | 2,689,076 | (762,244) | 1,999,830 | 363,393 | — | 869,204 | 14,811,234 | ||||
Total Open-End Mutual Funds | $(31,941,075) | $188,321,142 | $18,367,381 | $21,796,941 | $1,155,276,246 |
Percentages are stated as a percent of net assets. |
| Footnotes: | ||
| (a) | Pursuant to Section 2(a)(3) of the Investment Company Act of 1940, the investment meets the definition of “affiliated person”, as the Portfolio directly or indirectly owns, controls, or holds with power to vote 5 percent or more of the outstanding voting securities of the holding at December 31, 2023. | |
The accompanying notes are an integral part of these financial statements.
147
(continued)
AuguStarSM Variable Insurance Products Fund, Inc.
AVIP Growth Model Portfolio (Unaudited)
Objective/Strategy
The AVIP Growth Model Portfolio (formerly ON Growth Model Portfolio) is a fund of funds that seeks growth of capital and some current income by investing in underlying mutual funds. Under normal circumstances, the Portfolio intends to have investment exposure to various asset classes within the following target asset allocation ranges: U.S. Equity 50-80%, International Equity 15-45%, and Fixed Income 0-15%.
Performance as of December 31, 2023
| Average Annual returns | |
| One year | 18.73% |
| Five years | 11.35% |
| Since inception (3/1/17) | 7.96% |
Past performance does not guarantee future results. The performance data quoted represents past performance and current returns may be lower or higher. Total return figures include change in share price and reinvestment of dividends and capital gains. The investment return and principal value will fluctuate so that an investor’s shares, when redeemed, may be worth more or less than the original cost. To obtain performance information up to the most recent month end, call toll-free 1-877-781-6392.
The Portfolio is not open to direct retail investment. Beneficial interest in the Portfolio’s shares is obtained either through an allocation to the Portfolio as an investment vehicle within variable life insurance policies or annuity contracts. Actual performance results for variable annuity and variable universal life contracts will be lower due to contract charges. Consult your contract for applicable charges.
Total gross expense ratio is 1.03% per the Fund’s Prospectus dated May 1, 2023 and supplemented October 2, 2023 and December 4, 2023. Additional information pertaining to the Portfolio’s expense ratio as of December 31, 2023 can be found in the Portfolio’s Financial Highlights. The Portfolio’s expense ratio included in the Financial Highlights does not include Acquired Fund Fees and Expenses (AFFE), which is a major component of the expense ratio that is required to be presented in the Fund’s Prospectus.
Comments from Adviser
Q. How did the Portfolio perform in comparison to its benchmark during the reporting period?
A. For the year ended December 31, 2023, the Portfolio returned 18.73% versus 18.30% for its benchmark, the Morningstar® Aggressive Target Risk Index.
Q. What affected the Portfolio’s performance?
A. Equity markets provided strong positive returns in 2023. Growth stocks materially outperformed value stocks, and domestic stocks outperformed international stocks. In addition, large cap stocks outperformed small and midcap stocks. Fixed income markets also provided modest positive returns. While the Federal Reserve increased the Fed Funds rate materially during the year, longer term rates didn’t change materially, and the Treasury curve actually steepened a bit from 2 years to 30 years. Credit spreads also tightened during the year. In this environment, intermediate bonds performed well, and lower quality corporate bonds outperformed higher quality bonds.
The Portfolio invests in affiliated and unaffiliated mutual funds, comprised of mostly equity funds, but also a small amount of fixed income funds. The exposure to equity funds was the primary driver of positive performance relative to the benchmark. Specifically, holdings in AVIP Nasdaq-100® Index Portfolio , AVIP BlackRock Advantage Large Cap Growth Portfolio, AVIP BlackRock Advantage Large Cap Core Portfolio and AVIP S&P 500® Index Portfolio provided positive relative performance compared to the benchmark. The largest detractors from
performance vs. the benchmark were all fixed income funds, and included AVIP Federated Core Plus Bond Portfolio, PIMCO Low Duration Institutional, and PIMCO Total Return Institutional. (1)
| (1) | The Portfolio’s composition is subject to change. Holdings and weightings are as of December 31, 2023. |
| |
Change in Value of $10,000 Investment
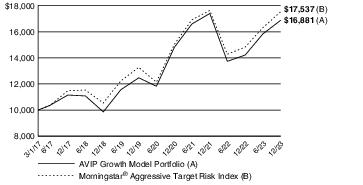
Hypothetical illustration based on past performance. Future performance will vary. The Portfolio’s returns reflect reinvested dividends. The Portfolio’s holdings may differ significantly from the securities in the index. The index is unmanaged and therefore does not reflect the cost of portfolio management and accounting.
The Morningstar® Target Risk Index Family is a series of Morningstar Indexes that provide exposure to a broad array of asset classes using Morningstar asset allocation methodology. The index family provides global equity market risk levels that are scaled to fit five equity market risk profiles: aggressive, moderately aggressive, moderate, moderately conservative, and conservative. The five levels of global equity exposure are set at 95%, 80%, 60%, 40%, and 20%, respectively, and the Morningstar® Aggressive Target Risk Index exposure is set at 95%.
Past performance is no guarantee of future results. Redemption of fund shares could have tax implications unique to each shareholder.
148
(continued)
AuguStarSM Variable Insurance Products Fund, Inc.
AVIP Growth Model Portfolio (Unaudited) (Continued)
| Portfolio Composition as of December 31, 2023 (1) | |
| % of Net Assets | |
| Open-End Mutual Funds Less Net Liabilities | 100.0 |
| 100.0 | |
| Top 10 Portfolio Holdings as of December 31, 2023 (1) (2) (3) | ||
| % of Net Assets | ||
| 1. | AVIP S&P 500® Index Portfolio | 19.0 |
| 2. | AVIP S&P MidCap 400® Index Portfolio | 14.0 |
| 3. | AVIP BlackRock Advantage International Equity Portfolio | 11.0 |
| 4. | DFA International Core Equity Portfolio Institutional | 9.0 |
| 5. | AVIP BlackRock Advantage Large Cap Value Portfolio | 7.0 |
| 6. | AVIP AB Relative Value Portfolio | 6.0 |
| 7. | AVIP BlackRock Advantage Large Cap Core Portfolio | 6.0 |
| 8. | AVIP BlackRock Advantage Small Cap Growth Portfolio | 4.0 |
| 9. | AVIP AB Small Cap Portfolio | 3.0 |
| 10. | AVIP Nasdaq-100® Index Portfolio | 3.0 |
| (1) | Composition of Portfolio subject to change. | |
| (2) | Short-term investments have been excluded from the list of Top 10 Portfolio Holdings. | |
| (3) | Top 10 Portfolio Holdings is presented at an individual security level. Total investment exposure by issuer may be higher. | |
149
AuguStarSM Variable Insurance Products Fund, Inc.
AVIP Growth Model Portfolio
| Schedule of Investments in Unaffiliated Issuers | December 31, 2023 |
| Open-End Mutual Funds–17.0% | Shares | Value | |
DFA Emerging Markets Portfolio Institutional | 374,046 | $ 10,297,498 | |
DFA International Core Equity Portfolio Institutional | 2,016,481 | 30,892,494 | |
PIMCO Low Duration Institutional | 374,402 | 3,444,502 | |
PIMCO Total Return Institutional | 796,097 | 6,886,236 | |
Vanguard International Growth Fund Admiral Class | 67,430 | 6,864,999 | |
Total Open-End Mutual Funds | $ 58,385,729 | ||
Total Investments in Securities of Unaffiliated Issuers – 17.0% (Cost $56,682,459) | $ 58,385,729 | ||
| Total Investments in Affiliates – 83.0% (Cost $272,601,521) (see schedule below) | 284,897,444 | ||
| Liabilities in Excess of Other Assets – 0.0% | (139,565) | ||
| Net Assets – 100.0% | $343,143,608 | ||
Percentages are stated as a percent of net assets. |
The accompanying notes are an integral part of these financial statements.
| Schedule of Investments in Affiliates | December 31, 2023 |
| Affiliate | Value at January 1, 2023 | Cost of Purchases | Proceeds from Sales | Net Realized Gain (Loss) | Change in Unrealized Appreciation (Depreciation) | Income Distributions | Capital Gain Distributions | Shares at December 31, 2023 | Value at December 31, 2023 | |||||
| Open-End Mutual Funds – 83.0% | ||||||||||||||
AVIP AB Mid Cap Core Portfolio | (a) | $ 3,310,339 | $ 206,143 | $ 615,942 | $ (328,034) | $ 859,993 | $ 15,489 | $ — | 117,110 | $ 3,432,499 | ||||
AVIP AB Relative Value Portfolio | (a) | 19,862,033 | 1,283,999 | 2,578,599 | 106,024 | 1,921,539 | 224,373 | — | 1,857,078 | 20,594,996 | ||||
AVIP AB Small Cap Portfolio | (a) | 9,931,016 | 950,736 | 2,296,952 | (4,328,520) | 6,041,218 | — | — | 826,445 | 10,297,498 | ||||
AVIP BlackRock Advantage International Equity Portfolio | (a) | 36,413,727 | 2,461,643 | 6,196,412 | (374,045) | 5,452,580 | 1,333,686 | — | 2,472,658 | 37,757,493 | ||||
AVIP BlackRock Advantage Large Cap Core Portfolio | (a) | 19,862,033 | 425,405 | 4,040,534 | (214,059) | 4,562,151 | 202,027 | 67,508 | 643,192 | 20,594,996 | ||||
AVIP BlackRock Advantage Large Cap Growth Portfolio | (a) | 6,620,678 | 118,446 | 2,140,141 | (5,048,376) | 7,314,392 | 8,728 | 41,640 | 747,821 | 6,864,999 | ||||
AVIP BlackRock Advantage Large Cap Value Portfolio | (a) | 23,172,371 | 1,396,017 | 2,779,805 | 12,091 | 2,226,821 | 461,795 | 253,051 | 1,339,325 | 24,027,495 | ||||
AVIP BlackRock Advantage Small Cap Growth Portfolio | (a) | 13,241,355 | 1,148,750 | 3,291,028 | (1,261,161) | 3,892,081 | — | — | 617,356 | 13,729,997 | ||||
AVIP Bond Portfolio | (a) | 6,620,678 | 1,039,394 | 1,093,487 | (61,276) | 359,690 | 215,762 | — | 405,015 | 6,864,999 | ||||
AVIP Federated Core Plus Bond Portfolio | (a) | 9,931,016 | 1,810,278 | 1,686,236 | (132,366) | 374,806 | 236,268 | — | 1,135,336 | 10,297,498 | ||||
AVIP Federated High Income Bond Portfolio | (a) | 3,310,339 | 534,907 | 606,281 | (27,303) | 220,837 | 197,708 | — | 180,089 | 3,432,499 | ||||
AVIP Nasdaq-100® Index Portfolio | (a) | 9,931,016 | 876,722 | 4,109,736 | (1,598,131) | 5,197,627 | 47,224 | 827,793 | 586,084 | 10,297,498 | ||||
AVIP S&P 500® Index Portfolio | (a) | 62,896,437 | 3,562,420 | 12,483,095 | 2,284,494 | 8,957,231 | 745,271 | 2,607,482 | 1,679,132 | 65,217,487 | ||||
AVIP S&P MidCap 400® Index Portfolio | (a) | 46,344,743 | 4,900,776 | 8,056,602 | 1,095,932 | 3,770,142 | 351,702 | 1,850,795 | 2,336,169 | 48,054,991 | ||||
Fidelity Advisor® Real Estate I | (a) | 3,310,339 | 386,037 | 542,775 | (170,331) | 449,229 | 83,970 | — | 201,438 | 3,432,499 | ||||
Total Open-End Mutual Funds | $(10,045,061) | $51,600,337 | $4,124,003 | $5,648,269 | $284,897,444 |
Percentages are stated as a percent of net assets. |
| Footnotes: | ||
| (a) | Pursuant to Section 2(a)(3) of the Investment Company Act of 1940, the investment meets the definition of “affiliated person”, as the Portfolio directly or indirectly owns, controls, or holds with power to vote 5 percent or more of the outstanding voting securities of the holding at December 31, 2023. | |
The accompanying notes are an integral part of these financial statements.
150
AuguStarSM Variable Insurance Products Fund, Inc.
| Statements of Assets and Liabilities | December 31, 2023 |
| AVIP Bond Portfolio | AVIP BlackRock Balanced Allocation Portfolio | AVIP BlackRock Advantage International Equity Portfolio | AVIP Fidelity Institutional AM® Equity Growth Portfolio | AVIP AB Small Cap Portfolio | AVIP AB Mid Cap Core Portfolio | AVIP S&P 500® Index Portfolio | AVIP BlackRock Advantage Large Cap Value Portfolio | AVIP Federated High Income Bond Portfolio | |||||||||
| Assets: | |||||||||||||||||
Investments in securities of unaffiliated issuers, at value* | $218,383,977 | $406,928,020 | $348,229,993 | $116,240,171 | $117,031,210 | $80,053,449 | $1,182,180,310 | $198,014,126 | $118,769,974 | ||||||||
Cash | 3,631,180 | 4,997,358 | 6,680,169 | 64,473 | 497,710 | 605,929 | 3,146,327 | 2,568,784 | 4,229,771 | ||||||||
Cash subject to usage restrictions | — | 236,000 | 216,748 | — | — | — | — | 155,760 | — | ||||||||
Foreign currencies, at value | — | — | 15,162 | 54,462 | — | 2,459 | — | 174 | — | ||||||||
Receivable for securities sold | — | 4,837,231 | — | — | 771,243 | 81,855 | — | 2,977,826 | — | ||||||||
Receivable for fund shares sold | 628,968 | 16,278 | 82,460 | 5,007 | 27,258 | 18,124 | 461,064 | 18,423 | 403,213 | ||||||||
Receivable for variation margin on futures contracts | — | — | 3,360 | — | — | — | — | — | — | ||||||||
Dividends and accrued interest receivable | 2,475,028 | 1,364,605 | 469,107 | 49,321 | 77,658 | 73,867 | 1,106,053 | 250,755 | 2,054,168 | ||||||||
Foreign tax reclaim receivable | — | — | 1,487,290 | — | — | — | — | 128,016 | — | ||||||||
Prepaid expenses and other assets | 2,496 | 6,317 | 5,571 | 1,706 | 1,669 | 1,086 | 18,888 | 2,938 | 1,408 | ||||||||
Total assets | 225,121,649 | 418,385,809 | 357,189,860 | 116,415,140 | 118,406,748 | 80,836,769 | 1,186,912,642 | 204,116,802 | 125,458,534 | ||||||||
| Liabilities: | |||||||||||||||||
Payable for securities purchased | — | 4,496,854 | — | — | 475,774 | 114,913 | 29,574 | 2,796,694 | — | ||||||||
Payable for fund shares redeemed | 47,214 | 262,737 | 864,025 | 30,036 | 676,852 | 212,835 | 804,417 | 468,674 | 33,637 | ||||||||
Payable for investment management services | 102,310 | 174,156 | 211,287 | 65,871 | 71,827 | 48,053 | 337,932 | 112,598 | 76,631 | ||||||||
Payable for variation margin on futures contracts | — | 10,468 | — | — | — | — | 12,080 | 15,963 | — | ||||||||
Accrued custody expense | 966 | 6,329 | 66,350 | 2,809 | 7,531 | 8,288 | 15,181 | 3,242 | 950 | ||||||||
Accrued professional fees | 10,648 | 10,723 | 10,699 | 10,607 | 10,606 | 10,592 | 11,023 | 10,639 | 10,610 | ||||||||
Accrued accounting fees | 7,335 | 12,628 | 4,501 | 3,109 | 4,239 | 3,896 | 23,605 | 4,801 | 11,395 | ||||||||
Accrued administration fees | 11,754 | 11,246 | 6,841 | 11,330 | 11,354 | 11,159 | 11,573 | 11,480 | 11,755 | ||||||||
Other liabilities | 970 | 893 | 890 | 879 | 878 | 1,020 | 927 | 882 | 1,458 | ||||||||
Withholding tax payable | — | — | 25,528 | 1,856 | — | — | 1,166 | — | — | ||||||||
Total liabilities | 181,197 | 4,986,034 | 1,190,121 | 126,497 | 1,259,061 | 410,756 | 1,247,478 | 3,424,973 | 146,436 | ||||||||
Net assets | $224,940,452 | $413,399,775 | $355,999,739 | $116,288,643 | $117,147,687 | $80,426,013 | $1,185,665,164 | $200,691,829 | $125,312,098 | ||||||||
| Net assets consist of: | |||||||||||||||||
Paid in capital | 239,380,030 | 366,478,310 | 353,609,253 | 93,704,389 | 133,143,755 | 83,950,761 | 658,288,419 | 184,313,936 | 141,679,219 | ||||||||
Total distributable earnings | (14,439,578) | 46,921,465 | 2,390,486 | 22,584,254 | (15,996,068) | (3,524,748) | 527,376,745 | 16,377,893 | (16,367,121) | ||||||||
Net assets | $224,940,452 | $413,399,775 | $355,999,739 | $116,288,643 | $117,147,687 | $80,426,013 | $1,185,665,164 | $200,691,829 | $125,312,098 | ||||||||
*Investments in securities of unaffiliated issuers, at cost | $237,296,251 | $370,879,501 | $316,599,389 | $101,644,017 | $106,837,019 | $74,579,376 | $ 740,810,692 | $187,574,544 | $125,744,313 | ||||||||
Foreign currencies, at cost | $ — | $ — | $ 15,113 | $ 54,045 | $ — | $ 2,230 | $ — | $ 178 | $ — | ||||||||
Shares outstanding, par value, $1 per share | 13,273,322 | 12,693,123 | 23,319,282 | 77,517,850 | 9,404,271 | 2,743,642 | 30,523,707 | 11,188,289 | 6,572,965 | ||||||||
Authorized Fund shares allocated to Portfolio | 22,000,000 | 20,000,000 | 35,000,000 | 134,000,000 | 17,000,000 | 6,000,000 | 50,000,000 | 21,000,000 | 13,000,000 | ||||||||
Net asset value per share | $ 16.95 | $ 32.57 | $ 15.27 | $ 1.50 | $ 12.46 | $ 29.31 | $ 38.84 | $ 17.94 | $ 19.06 |
The accompanying notes are an integral part of these financial statements.
151
AuguStarSM Variable Insurance Products Fund, Inc.
| Statements of Assets and Liabilities | December 31, 2023 |
| AVIP Nasdaq-100® Index Portfolio | AVIP BlackRock Advantage Large Cap Core Portfolio | AVIP BlackRock Advantage Small Cap Growth Portfolio | AVIP S&P MidCap 400® Index Portfolio | AVIP BlackRock Advantage Large Cap Growth Portfolio | AVIP AB Risk Managed Balanced Portfolio | AVIP Federated Core Plus Bond Portfolio | AVIP Intech U.S. Low Volatility Portfolio | AVIP AB Relative Value Portfolio | |||||||||
| Assets: | |||||||||||||||||
Investments in securities of unaffiliated issuers, at value* | $260,761,135 | $323,956,677 | $140,230,370 | $538,760,976 | $467,750,102 | $1,433,109,910 | $574,054,720 | $661,154,979 | $122,479,929 | ||||||||
Cash | 1,906,864 | 4,322,600 | — | — | 3,648,498 | 20,074,163 | 6,010,648 | 5,261,575 | 5,713,280 | ||||||||
Cash subject to usage restrictions | 7,943 | 247,800 | 104,000 | 218,843 | 371,700 | — | — | — | — | ||||||||
Receivable for securities sold | — | 5,477,287 | 2,057,699 | 5,481,281 | 7,385,633 | 1,542,284 | — | 1,562,713 | — | ||||||||
Receivable for fund shares sold | 10,900 | 349,658 | 3,292 | 79,784 | 100,592 | 2,554 | 1,454,071 | 159,223 | — | ||||||||
Receivable for variation margin on futures contracts | — | — | — | — | — | — | 131,141 | — | — | ||||||||
Dividends and accrued interest receivable | 249,061 | 276,208 | 58,726 | 714,260 | 231,502 | 5,389,404 | 3,912,828 | 921,859 | 159,950 | ||||||||
Foreign tax reclaim receivable | — | — | — | — | — | 412 | — | — | 27,290 | ||||||||
Prepaid expenses and other assets | 3,903 | 5,187 | 1,907 | 7,745 | 7,251 | 21,142 | 7,414 | 11,561 | 1,820 | ||||||||
Total assets | 262,939,806 | 334,635,417 | 142,455,994 | 545,262,889 | 479,495,278 | 1,460,139,869 | 585,570,822 | 669,071,910 | 128,382,269 | ||||||||
| Liabilities: | |||||||||||||||||
Cash overdraft | — | — | 156,017 | 417,052 | — | — | — | — | — | ||||||||
Payable for securities purchased | — | 5,053,536 | 311,483 | 691,960 | 4,280,103 | 58,720,110 | — | — | 86,117 | ||||||||
Payable for fund shares redeemed | 104,068 | 71,742 | 1,103,870 | 1,442,104 | 164,801 | 935,405 | 170,312 | 289,767 | 476,455 | ||||||||
Payable for investment management services | 81,075 | 176,689 | 91,050 | 159,216 | 263,567 | 927,193 | 248,339 | 321,989 | 68,589 | ||||||||
Payable for variation margin on futures contracts | 20,888 | 11,971 | 3,444 | 55,902 | 16,975 | 446,539 | — | — | — | ||||||||
Accrued custody expense | 4,892 | 3,858 | 3,000 | 9,434 | 4,399 | 14,623 | 4,334 | 3,030 | 1,943 | ||||||||
Accrued professional fees | 10,662 | 10,690 | 10,614 | 10,768 | 10,746 | 12,884 | 12,573 | 10,827 | 10,610 | ||||||||
Accrued accounting fees | 5,411 | 6,637 | 4,279 | 11,737 | 9,120 | 38,115 | 25,408 | 13,162 | 2,968 | ||||||||
Accrued administration fees | 11,656 | 11,607 | 11,143 | 11,327 | 11,505 | 11,135 | 11,671 | 11,248 | 11,700 | ||||||||
Other liabilities | 885 | 888 | 917 | 898 | 895 | 937 | 900 | 904 | 879 | ||||||||
Withholding tax payable | 783 | — | — | — | — | 1,219 | — | — | 1,553 | ||||||||
Total liabilities | 240,320 | 5,347,618 | 1,695,817 | 2,810,398 | 4,762,111 | 61,108,160 | 473,537 | 650,927 | 660,814 | ||||||||
Net assets | $262,699,486 | $329,287,799 | $140,760,177 | $542,452,491 | $474,733,167 | $1,399,031,709 | $585,097,285 | $668,420,983 | $127,721,455 | ||||||||
| Net assets consist of: | |||||||||||||||||
Paid in capital | 118,708,221 | 267,025,924 | 151,415,036 | 451,151,040 | 340,044,647 | 1,312,282,909 | 662,417,573 | 622,536,604 | 115,350,219 | ||||||||
Total distributable earnings | 143,991,265 | 62,261,875 | (10,654,859) | 91,301,451 | 134,688,520 | 86,748,800 | (77,320,288) | 45,884,379 | 12,371,236 | ||||||||
Net assets | $262,699,486 | $329,287,799 | $140,760,177 | $542,452,491 | $474,733,167 | $1,399,031,709 | $585,097,285 | $668,420,983 | $127,721,455 | ||||||||
*Investments in securities of unaffiliated issuers, at cost | $166,403,075 | $270,394,256 | $140,520,470 | $462,725,461 | $380,747,959 | $1,333,164,686 | $621,544,232 | $614,069,391 | $108,298,498 | ||||||||
Shares outstanding, par value, $1 per share | 14,951,963 | 10,283,873 | 6,328,559 | 26,370,173 | 51,731,312 | 98,561,128 | 64,525,341 | 63,590,837 | 11,511,630 | ||||||||
Authorized Fund shares allocated to Portfolio | 27,000,000 | 19,000,000 | 12,000,000 | 41,000,000 | 82,000,000 | 170,000,000 | 115,000,000 | 105,000,000 | 20,000,000 | ||||||||
Net asset value per share | $ 17.57 | $ 32.02 | $ 22.24 | $ 20.57 | $ 9.18 | $ 14.19 | $ 9.07 | $ 10.51 | $ 11.09 |
The accompanying notes are an integral part of these financial statements.
152
AuguStarSM Variable Insurance Products Fund, Inc.
| Statements of Assets and Liabilities | December 31, 2023 |
| AVIP iShares Managed Risk Balanced Portfolio | AVIP iShares Managed Risk Moderate Growth Portfolio | AVIP iShares Managed Risk Growth Portfolio | AVIP Moderately Conservative Model Portfolio | AVIP Balanced Model Portfolio | AVIP Moderate Growth Model Portfolio | AVIP Growth Model Portfolio | |||||||
| Assets: | |||||||||||||
Investments in securities of unaffiliated issuers, at value* | $577,305,731 | $490,300,413 | $431,079,544 | $ 72,935,884 | $241,208,670 | $ 326,408,888 | $ 58,385,729 | ||||||
Investments in affiliates, at value** | — | — | — | 123,813,754 | 535,569,627 | 1,155,276,246 | 284,897,444 | ||||||
Cash | 3,898,181 | 4,844,870 | 10,126,494 | 21 | — | — | — | ||||||
Cash subject to usage restrictions | 5,000,212 | 3,388,679 | 3,654,925 | — | — | — | — | ||||||
Foreign currencies, at value | 1,462,524 | 369,009 | 326,586 | — | — | — | — | ||||||
Receivable for securities sold | — | — | — | 323,969 | 2,858,908 | 3,555,963 | 1,211,611 | ||||||
Receivable for fund shares sold | 31,309 | 12,927 | 3,188 | 193 | 5,803 | 1,473 | 353 | ||||||
Prepaid expenses and other assets | 8,167 | 6,604 | 5,803 | 2,579 | 10,738 | 20,319 | 4,410 | ||||||
Total assets | 587,706,124 | 498,922,502 | 445,196,540 | 197,076,400 | 779,653,746 | 1,485,262,889 | 344,499,547 | ||||||
| Liabilities: | |||||||||||||
Payable for securities purchased | — | — | — | 303,587 | 2,601,375 | 3,435,893 | 1,178,837 | ||||||
Payable for fund shares redeemed | 189,372 | 174,053 | 113,486 | 20,515 | 263,088 | 121,209 | 33,135 | ||||||
Payable for investment management services | 271,095 | 229,697 | 204,665 | 66,395 | 288,124 | 495,354 | 114,411 | ||||||
Payable for variation margin on futures contracts | 53,580 | 12,658 | 40,637 | — | — | — | — | ||||||
Accrued custody expense | 3,509 | 3,009 | 2,763 | 2,780 | 3,134 | 3,170 | 2,984 | ||||||
Accrued professional fees | 9,345 | 9,712 | 9,691 | 9,193 | 9,416 | 9,684 | 9,248 | ||||||
Accrued accounting fees | 4,157 | 4,498 | 4,496 | 3,848 | 3,855 | 3,856 | 3,852 | ||||||
Accrued administration fees | 11,295 | 11,292 | 11,292 | 12,584 | 12,584 | 12,584 | 12,584 | ||||||
Other liabilities | 900 | 893 | 891 | 883 | 908 | 939 | 888 | ||||||
Total liabilities | 543,253 | 445,812 | 387,921 | 419,785 | 3,182,484 | 4,082,689 | 1,355,939 | ||||||
Net assets | $587,162,871 | $498,476,690 | $444,808,619 | $196,656,615 | $776,471,262 | $1,481,180,200 | $343,143,608 | ||||||
| Net assets consist of: | |||||||||||||
Paid in capital | 560,147,627 | 402,782,777 | 345,667,375 | 203,306,030 | 777,950,648 | 1,482,562,219 | 344,973,079 | ||||||
Total distributable earnings | 27,015,244 | 95,693,913 | 99,141,244 | (6,649,415) | (1,479,386) | (1,382,019) | (1,829,471) | ||||||
Net assets | $587,162,871 | $498,476,690 | $444,808,619 | $196,656,615 | $776,471,262 | $1,481,180,200 | $343,143,608 | ||||||
*Investments in securities of unaffiliated issuers, at cost | $541,242,840 | $414,842,989 | $350,724,006 | $ 79,970,135 | $259,772,241 | $ 334,187,390 | $ 56,682,459 | ||||||
**Investments in affiliates, at cost | $ — | $ — | $ — | $123,122,153 | $509,533,905 | $1,101,714,202 | $272,601,521 | ||||||
Foreign currencies, at cost | $ 1,445,030 | $ 381,677 | $ 331,502 | $ — | $ — | $ — | $ — | ||||||
Shares outstanding, par value, $1 per share | 61,174,381 | 40,514,599 | 35,081,558 | 18,472,121 | 72,533,328 | 136,398,481 | 31,192,345 | ||||||
Authorized Fund shares allocated to Portfolio | 123,000,000 | 70,000,000 | 65,000,000 | 28,000,000 | 107,000,000 | 200,000,000 | 48,000,000 | ||||||
Net asset value per share | $ 9.60 | $ 12.30 | $ 12.68 | $ 10.65 | $ 10.71 | $ 10.86 | $ 11.00 |
The accompanying notes are an integral part of these financial statements.
153
AuguStarSM Variable Insurance Products Fund, Inc.
| Statements of Operations | For the Year Ended December 31, 2023 |
| AVIP Bond Portfolio | AVIP BlackRock Balanced Allocation Portfolio | AVIP BlackRock Advantage International Equity Portfolio | AVIP Fidelity Institutional AM® Equity Growth Portfolio | AVIP AB Small Cap Portfolio | AVIP AB Mid Cap Core Portfolio | AVIP S&P 500® Index Portfolio | AVIP BlackRock Advantage Large Cap Value Portfolio | AVIP Federated High Income Bond Portfolio | |||||||||
| Investment income: | |||||||||||||||||
Interest | $ 9,380,072 | $ 4,131,991 | $ 326,455 | $ 46,679 | $ 66,118 | $ 33,403 | $ 333,141 | $ 137,563 | $ 8,080,445 | ||||||||
Dividends from unaffiliated issuers, net of taxes withheld* | — | 4,696,713 | 10,162,414 | 489,132 | 1,283,605 | 1,096,654 | 18,105,181 | 4,451,887 | — | ||||||||
Total investment income | 9,380,072 | 8,828,704 | 10,488,869 | 535,811 | 1,349,723 | 1,130,057 | 18,438,322 | 4,589,450 | 8,080,445 | ||||||||
| Expenses: | |||||||||||||||||
Management fees | 1,204,395 | 2,079,847 | 2,503,634 | 483,248 | 840,556 | 557,307 | 3,702,338 | 1,325,749 | 905,127 | ||||||||
Custodian fees | 5,668 | 53,291 | 417,879 | 14,265 | 48,969 | 47,807 | 84,592 | 18,979 | 5,265 | ||||||||
Directors' fees | 17,530 | 33,249 | 28,098 | 5,038 | 9,107 | 6,180 | 86,007 | 15,750 | 9,841 | ||||||||
Professional fees | 21,284 | 24,549 | 23,425 | 25,904 | 19,483 | 18,848 | 36,179 | 20,834 | 19,633 | ||||||||
Accounting fees | 45,389 | 80,340 | 61,369 | 13,951 | 26,392 | 24,248 | 140,725 | 30,685 | 69,629 | ||||||||
Administration fees | 29,079 | 34,888 | 54,281 | 20,955 | 24,228 | 24,308 | 34,196 | 24,779 | 26,802 | ||||||||
Printing and filing fees | 11,276 | 12,433 | 10,032 | 16,742 | 8,357 | 8,716 | 13,761 | 9,159 | 11,849 | ||||||||
Compliance expense | 10,260 | 10,260 | 10,260 | 10,260 | 10,260 | 10,260 | 10,260 | 10,260 | 10,260 | ||||||||
Other | 5,287 | 12,924 | 11,224 | 3,852 | 3,584 | 2,420 | 32,742 | 6,765 | 3,163 | ||||||||
Total expenses | 1,350,168 | 2,341,781 | 3,120,202 | 594,215 | 990,936 | 700,094 | 4,140,800 | 1,462,960 | 1,061,569 | ||||||||
Net investment income (loss) | 8,029,904 | 6,486,923 | 7,368,667 | (58,404) | 358,787 | 429,963 | 14,297,522 | 3,126,490 | 7,018,876 | ||||||||
| Realized/unrealized gain (loss) on investments, futures contracts, and foreign currency related transactions: | |||||||||||||||||
| Net realized gain (loss) on: | |||||||||||||||||
Investments in securities of unaffiliated issuers | (1,201,099) | 5,683,648 | 23,685,379 | 9,551,546 | (7,824,655) | (2,258,455) | 80,449,290 | 3,362,013 | (4,390,604) | ||||||||
Futures contracts | — | 737,319 | 575,048 | — | — | 11,226 | 1,645,103 | 495,932 | — | ||||||||
Foreign currency related transactions | — | — | (46,818) | 8,632 | — | 9 | — | (5,199) | — | ||||||||
| Change in unrealized appreciation/depreciation on: | |||||||||||||||||
Investments in securities of unaffiliated issuers | 10,503,846 | 66,772,079 | 29,430,353 | 12,666,938 | 26,320,489 | 14,352,422 | 154,356,039 | 17,718,269 | 12,069,516 | ||||||||
Futures contracts | — | 218,906 | 404,715 | — | — | 7,212 | 521,689 | 172,758 | — | ||||||||
Foreign currency related transactions | — | — | 73,241 | 872 | — | 74 | — | 33,163 | — | ||||||||
Net realized/unrealized gain on investments, futures contracts, and foreign currency related transactions | 9,302,747 | 73,411,952 | 54,121,918 | 22,227,988 | 18,495,834 | 12,112,488 | 236,972,121 | 21,776,936 | 7,678,912 | ||||||||
Change in net assets from operations | $17,332,651 | $79,898,875 | $61,490,585 | $22,169,584 | $18,854,621 | $12,542,451 | $251,269,643 | $24,903,426 | $14,697,788 | ||||||||
*Taxes withheld | $ — | $ 1,158 | $ 1,074,868 | $ 10,693 | $ 920 | $ 1,745 | $ 4,778 | $ — | $ — |
The accompanying notes are an integral part of these financial statements.
154
AuguStarSM Variable Insurance Products Fund, Inc.
| Statements of Operations | For the Year Ended December 31, 2023 |
| AVIP Nasdaq-100® Index Portfolio | AVIP BlackRock Advantage Large Cap Core Portfolio | AVIP BlackRock Advantage Small Cap Growth Portfolio | AVIP S&P MidCap 400® Index Portfolio | AVIP BlackRock Advantage Large Cap Growth Portfolio | AVIP AB Risk Managed Balanced Portfolio | AVIP Federated Core Plus Bond Portfolio | AVIP Intech U.S. Low Volatility Portfolio | AVIP AB Relative Value Portfolio | |||||||||
| Investment income: | |||||||||||||||||
Interest | $ 82,463 | $ 224,573 | $ 124,867 | $ 158,111 | $ 282,050 | $ 24,173,711 | $17,269,025 | $ 271,788 | $ 294,968 | ||||||||
Dividends from unaffiliated issuers, net of taxes withheld* | 2,233,254 | 4,889,784 | 1,213,819 | 7,549,300 | 3,847,122 | 11,146,845 | 2,655,870 | 13,385,948 | 2,657,236 | ||||||||
Total investment income | 2,315,717 | 5,114,357 | 1,338,686 | 7,707,411 | 4,129,172 | 35,320,556 | 19,924,895 | 13,657,736 | 2,952,204 | ||||||||
| Expenses: | |||||||||||||||||
Management fees | 898,380 | 2,062,373 | 1,054,920 | 1,500,723 | 2,814,849 | 9,598,889 | 2,826,473 | 3,997,349 | 808,812 | ||||||||
Custodian fees | 26,948 | 22,704 | 17,532 | 55,715 | 23,040 | 86,364 | 24,118 | 18,040 | 14,022 | ||||||||
Directors' fees | 19,050 | 25,654 | 10,809 | 32,453 | 33,418 | 93,723 | 44,054 | 56,382 | 10,000 | ||||||||
Professional fees | 21,647 | 22,975 | 19,833 | 25,039 | 24,831 | 41,103 | 26,037 | 29,339 | 19,693 | ||||||||
Accounting fees | 33,218 | 42,472 | 27,651 | 63,243 | 56,562 | 218,460 | 149,248 | 85,828 | 18,713 | ||||||||
Administration fees | 23,991 | 28,082 | 23,244 | 25,463 | 26,349 | 59,664 | 39,556 | 26,447 | 22,668 | ||||||||
Printing and filing fees | 8,764 | 9,276 | 8,847 | 10,195 | 9,900 | 17,433 | 14,358 | 11,510 | 8,244 | ||||||||
Compliance expense | 10,260 | 10,260 | 10,260 | 10,260 | 10,260 | 10,260 | 10,260 | 10,260 | 10,260 | ||||||||
Other | 7,255 | 9,871 | 4,430 | 11,202 | 10,580 | 95,967 | 14,455 | 22,652 | 3,613 | ||||||||
Total expenses | 1,049,513 | 2,233,667 | 1,177,526 | 1,734,293 | 3,009,789 | 10,221,863 | 3,148,559 | 4,257,807 | 916,025 | ||||||||
Net investment income | 1,266,204 | 2,880,690 | 161,160 | 5,973,118 | 1,119,383 | 25,098,693 | 16,776,336 | 9,399,929 | 2,036,179 | ||||||||
| Realized/unrealized gain (loss) on investments and futures contracts: | |||||||||||||||||
| Net realized gain (loss) on: | |||||||||||||||||
Investments in securities of unaffiliated issuers | 48,764,613 | 5,173,075 | (354,569) | 20,264,762 | 46,548,741 | 3,998,291 | (7,133,209) | (3,674,270) | (1,276,901) | ||||||||
Futures contracts | 591,401 | 709,541 | (12,646) | 269,078 | 1,859,058 | (22,198,266) | (3,636,251) | — | — | ||||||||
| Change in unrealized appreciation/depreciation on: | |||||||||||||||||
Investments in securities of unaffiliated issuers | 53,137,452 | 65,064,637 | 26,372,167 | 41,530,714 | 94,515,931 | 124,985,450 | 22,333,742 | 38,554,777 | 13,499,704 | ||||||||
Futures contracts | 102,308 | 282,214 | 59,986 | 22,477 | 483,757 | 25,336,834 | 587,849 | — | — | ||||||||
Net realized/unrealized gain on investments and futures contracts | 102,595,774 | 71,229,467 | 26,064,938 | 62,087,031 | 143,407,487 | 132,122,309 | 12,152,131 | 34,880,507 | 12,222,803 | ||||||||
Change in net assets from operations | $103,861,978 | $74,110,157 | $26,226,098 | $68,060,149 | $144,526,870 | $157,221,002 | $28,928,467 | $44,280,436 | $14,258,982 | ||||||||
*Taxes withheld | $ 4,659 | $ 986 | $ 3,337 | $ — | $ 2,017 | $ 14,444 | $ — | $ — | $ 27,916 |
The accompanying notes are an integral part of these financial statements.
155
AuguStarSM Variable Insurance Products Fund, Inc.
| Statements of Operations | For the Year Ended December 31, 2023 |
| AVIP iShares Managed Risk Balanced Portfolio | AVIP iShares Managed Risk Moderate Growth Portfolio | AVIP iShares Managed Risk Growth Portfolio | AVIP Moderately Conservative Model Portfolio | AVIP Balanced Model Portfolio | AVIP Moderate Growth Model Portfolio | AVIP Growth Model Portfolio | |||||||
| Investment income: | |||||||||||||
Interest | $ 1,324,085 | $ 1,329,202 | $ 1,083,532 | $ 23 | $ 3 | $ 4 | $ 1 | ||||||
Dividend income from unaffiliated issuers | 16,695,015 | 12,009,058 | 9,871,837 | 2,954,574 | 8,990,578 | 11,376,603 | 1,869,859 | ||||||
Dividends from affililiates | — | — | — | 2,730,918 | 9,918,330 | 18,367,381 | 4,124,004 | ||||||
Total investment income | 18,019,100 | 13,338,260 | 10,955,369 | 5,685,515 | 18,908,911 | 29,743,988 | 5,993,864 | ||||||
| Expenses: | |||||||||||||
Management fees | 3,288,656 | 2,699,174 | 2,385,261 | 816,383 | 3,112,106 | 5,821,985 | 1,343,402 | ||||||
Custodian fees | 21,704 | 18,819 | 17,836 | 16,603 | 18,301 | 18,126 | 16,284 | ||||||
Directors' fees | 47,774 | 39,026 | 34,413 | 16,366 | 62,082 | 115,686 | 26,678 | ||||||
Professional fees | 25,401 | 23,696 | 22,731 | 22,745 | 28,436 | 39,872 | 20,980 | ||||||
Accounting fees | 24,794 | 27,244 | 27,241 | 23,086 | 23,132 | 23,132 | 23,110 | ||||||
Administration fees | 25,377 | 24,456 | 23,802 | 28,061 | 31,408 | 35,334 | 28,822 | ||||||
Printing and filing fees | 11,161 | 9,954 | 9,579 | 8,876 | 11,971 | 15,384 | 9,401 | ||||||
Compliance expense | 10,260 | 10,260 | 10,260 | 10,260 | 10,260 | 10,260 | 10,260 | ||||||
Recoupment of previously reimbursed expenses | — | — | — | 5,000 | 234,000 | — | — | ||||||
Other | 44,647 | 38,741 | 45,314 | 5,231 | 19,916 | 36,293 | 8,114 | ||||||
Total expenses | 3,499,774 | 2,891,370 | 2,576,437 | 952,611 | 3,551,612 | 6,116,072 | 1,487,051 | ||||||
Net investment income | 14,519,326 | 10,446,890 | 8,378,932 | 4,732,904 | 15,357,299 | 23,627,916 | 4,506,813 | ||||||
| Realized/unrealized gain (loss) on investments, futures contracts, foreign currency related transactions, and capital gain distributions received from underlying mutual funds: | |||||||||||||
| Net realized gain (loss) on: | |||||||||||||
Investments in securities of unaffiliated issuers | (4,133,770) | 1,060,561 | 4,493,548 | (1,752,620) | (2,622,081) | (6,154,669) | (1,281,801) | ||||||
Investments in affiliates | — | — | — | (71,295) | (7,837,999) | (31,941,075) | (10,045,061) | ||||||
Futures contracts | 7,983,264 | 7,459,025 | 5,912,254 | — | — | — | — | ||||||
Foreign currency related transactions | 117,414 | 4,717 | 19,144 | — | — | — | — | ||||||
Capital gain distributions received from underlying unaffiliated mutual funds | — | — | — | 16,018 | 125,280 | 237,566 | 54,910 | ||||||
Capital gain distributions received from underlying affiliated mutual funds | — | — | — | 1,902,058 | 9,060,062 | 21,796,941 | 5,648,269 | ||||||
| Change in unrealized appreciation/depreciation on: | |||||||||||||
Investments in securities of unaffiliated issuers | 55,213,135 | 52,934,233 | 57,186,050 | 4,101,199 | 14,071,634 | 28,470,993 | 7,060,030 | ||||||
Investments in affiliates | — | — | — | 13,539,201 | 73,115,626 | 188,321,142 | 51,600,337 | ||||||
Futures contracts | 3,603,447 | 2,213,073 | 2,081,715 | — | — | — | — | ||||||
Foreign currency related transactions | (70,287) | (16,478) | (10,465) | — | — | — | — | ||||||
Net realized/unrealized gain on investments, futures contracts, foreign currency related transactions, and capital gain distributions received from underlying mutual funds | 62,713,203 | 63,655,131 | 69,682,246 | 17,734,561 | 85,912,522 | 200,730,898 | 53,036,684 | ||||||
Change in net assets from operations | $77,232,529 | $74,102,021 | $78,061,178 | $22,467,465 | $101,269,821 | $224,358,814 | $ 57,543,497 |
The accompanying notes are an integral part of these financial statements.
156
AuguStarSM Variable Insurance Products Fund, Inc.
Statements of Changes in Net Assets
| AVIP Bond Portfolio | AVIP BlackRock Balanced Allocation Portfolio | AVIP BlackRock Advantage International Equity Portfolio | AVIP Fidelity Institutional AM® Equity Growth Portfolio | ||||||||||||
| Year Ended | Year Ended | Year Ended | Year Ended | Year Ended | Year Ended | Year Ended | Year Ended | ||||||||
| December 31, 2023 | December 31, 2022 | December 31, 2023 | December 31, 2022 | December 31, 2023 | December 31, 2022 | December 31, 2023 | December 31, 2022 | ||||||||
| Increase (Decrease) in net assets: | |||||||||||||||
| Operations: | |||||||||||||||
Net investment income (loss) | $ 8,029,904 | $ 7,061,170 | $ 6,486,923 | $ 7,221,718 | $ 7,368,667 | $ 10,506,593 | $ (58,404) | $ (163,359) | |||||||
Net realized gain (loss) on investments, futures contracts, and foreign currency related transactions | (1,201,099) | (2,323,091) | 6,420,967 | (1,511,732) | 24,213,609 | (54,967,224) | 9,560,178 | 9,326,211 | |||||||
Change in unrealized appreciation/depreciation on investments, futures contracts, and foreign currency related transactions | 10,503,846 | (46,010,875) | 66,990,985 | (104,791,781) | 29,908,309 | (22,914,006) | 12,667,810 | (51,085,374) | |||||||
Change in net assets from operations | 17,332,651 | (41,272,796) | 79,898,875 | (99,081,795) | 61,490,585 | (67,374,637) | 22,169,584 | (41,922,522) | |||||||
| Distributions: | |||||||||||||||
Distributions to shareholders | (7,069,354) | (8,574,425) | (7,063,412) | (91,138,887) | (12,519,043) | (63,189,251) | (10,656,713) | (59,319,150) | |||||||
| Capital transactions: | |||||||||||||||
Received from shares sold | 20,888,041 | 37,257,056 | 14,394,034 | 39,209,578 | 12,685,880 | 17,766,308 | 63,189,595 | 10,963,124 | |||||||
Received from dividends reinvested | 7,069,354 | 8,574,425 | 7,063,412 | 91,138,887 | 12,519,043 | 63,189,251 | 10,656,713 | 59,319,150 | |||||||
Paid for shares redeemed | (34,760,839) | (51,935,837) | (99,623,689) | (73,207,293) | (72,748,267) | (103,287,366) | (13,199,336) | (67,084,671) | |||||||
Change in net assets from capital transactions | (6,803,444) | (6,104,356) | (78,166,243) | 57,141,172 | (47,543,344) | (22,331,807) | 60,646,972 | 3,197,603 | |||||||
Change in net assets | 3,459,853 | (55,951,577) | (5,330,780) | (133,079,510) | 1,428,198 | (152,895,695) | 72,159,843 | (98,044,069) | |||||||
| Net assets: | |||||||||||||||
Beginning of year | 221,480,599 | 277,432,176 | 418,730,555 | 551,810,065 | 354,571,541 | 507,467,236 | 44,128,800 | 142,172,869 | |||||||
End of year | $224,940,452 | $221,480,599 | $413,399,775 | $ 418,730,555 | $355,999,739 | $ 354,571,541 | $116,288,643 | $ 44,128,800 | |||||||
The accompanying notes are an integral part of these financial statements.
157
AuguStarSM Variable Insurance Products Fund, Inc.
Statements of Changes in Net Assets
| AVIP AB Small Cap Portfolio | AVIP AB Mid Cap Core Portfolio | AVIP S&P 500® Index Portfolio | AVIP BlackRock Advantage Large Cap Value Portfolio | ||||||||||||
| Year Ended | Year Ended | Year Ended | Year Ended | Year Ended | Year Ended | Year Ended | Year Ended | ||||||||
| December 31, 2023 | December 31, 2022 | December 31, 2023 | December 31, 2022 | December 31, 2023 | December 31, 2022 | December 31, 2023 | December 31, 2022 | ||||||||
| Increase (Decrease) in net assets: | |||||||||||||||
| Operations: | |||||||||||||||
Net investment income | $ 358,787 | $ 83,959 | $ 429,963 | $ 445,275 | $ 14,297,522 | $ 13,953,656 | $ 3,126,490 | $ 4,066,364 | |||||||
Net realized gain (loss) on investments, futures contracts, and foreign currency related transactions | (7,824,655) | (18,086,434) | (2,247,220) | (7,062,600) | 82,094,393 | 47,510,993 | 3,852,746 | 1,744,006 | |||||||
Change in unrealized appreciation/depreciation on investments, futures contracts, and foreign currency related transactions | 26,320,489 | (29,906,410) | 14,359,708 | (17,237,620) | 154,877,728 | (294,998,664) | 17,924,190 | (32,737,573) | |||||||
Change in net assets from operations | 18,854,621 | (47,908,885) | 12,542,451 | (23,854,945) | 251,269,643 | (233,534,015) | 24,903,426 | (26,927,203) | |||||||
| Distributions: | |||||||||||||||
Distributions to shareholders | — | (77,449,777) | (357,918) | (38,480,179) | (61,084,220) | (140,988,170) | (5,994,188) | (61,357,541) | |||||||
| Capital transactions: | |||||||||||||||
Received from shares sold | 9,355,330 | 15,389,537 | 4,594,051 | 9,678,476 | 142,999,531 | 110,296,372 | 6,870,804 | 5,786,201 | |||||||
Received from dividends reinvested | — | 77,449,777 | 357,918 | 38,480,179 | 61,084,220 | 140,988,170 | 5,994,188 | 61,357,541 | |||||||
Paid for shares redeemed | (24,754,410) | (23,084,864) | (14,504,245) | (12,681,249) | (232,184,380) | (178,215,803) | (30,023,750) | (105,822,570) | |||||||
Change in net assets from capital transactions | (15,399,080) | 69,754,450 | (9,552,276) | 35,477,406 | (28,100,629) | 73,068,739 | (17,158,758) | (38,678,828) | |||||||
Change in net assets | 3,455,541 | (55,604,212) | 2,632,257 | (26,857,718) | 162,084,794 | (301,453,446) | 1,750,480 | (126,963,572) | |||||||
| Net assets: | |||||||||||||||
Beginning of year | 113,692,146 | 169,296,358 | 77,793,756 | 104,651,474 | 1,023,580,370 | 1,325,033,816 | 198,941,349 | 325,904,921 | |||||||
End of year | $117,147,687 | $113,692,146 | $ 80,426,013 | $ 77,793,756 | $1,185,665,164 | $1,023,580,370 | $200,691,829 | $ 198,941,349 | |||||||
The accompanying notes are an integral part of these financial statements.
158
AuguStarSM Variable Insurance Products Fund, Inc.
Statements of Changes in Net Assets
| AVIP Federated High Income Bond Portfolio | AVIP Nasdaq-100® Index Portfolio | AVIP BlackRock Advantage Large Cap Core Portfolio | AVIP BlackRock Advantage Small Cap Growth Portfolio | ||||||||||||
| Year Ended | Year Ended | Year Ended | Year Ended | Year Ended | Year Ended | Year Ended | Year Ended | ||||||||
| December 31, 2023 | December 31, 2022 | December 31, 2023 | December 31, 2022 | December 31, 2023 | December 31, 2022 | December 31, 2023 | December 31, 2022 | ||||||||
| Increase (Decrease) in net assets: | |||||||||||||||
| Operations: | |||||||||||||||
Net investment income | $ 7,018,876 | $ 7,152,883 | $ 1,266,204 | $ 1,186,637 | $ 2,880,690 | $ 3,425,040 | $ 161,160 | $ 45,785 | |||||||
Net realized gain (loss) on investments and futures contracts | (4,390,604) | (3,870,351) | 49,356,014 | 20,591,868 | 5,882,616 | 1,633,762 | (367,215) | (9,971,054) | |||||||
Change in unrealized appreciation/depreciation on investments and futures contracts | 12,069,516 | (22,246,978) | 53,239,760 | (131,230,122) | 65,346,851 | (87,433,157) | 26,432,153 | (40,989,792) | |||||||
Change in net assets from operations | 14,697,788 | (18,964,446) | 103,861,978 | (109,451,617) | 74,110,157 | (82,374,355) | 26,226,098 | (50,915,061) | |||||||
| Distributions: | |||||||||||||||
Distributions to shareholders | (7,303,133) | (7,915,615) | (21,987,143) | (81,012,020) | (4,330,487) | (94,014,910) | — | (49,954,225) | |||||||
| Capital transactions: | |||||||||||||||
Received from shares sold | 9,258,071 | 5,362,424 | 23,001,284 | 39,450,661 | 7,424,198 | 14,043,699 | 10,590,836 | 15,744,900 | |||||||
Received from dividends reinvested | 7,303,133 | 7,915,615 | 21,987,143 | 81,012,020 | 4,330,487 | 94,014,910 | — | 49,954,225 | |||||||
Paid for shares redeemed | (22,198,645) | (33,028,965) | (72,675,705) | (78,019,869) | (66,044,595) | (55,125,680) | (31,057,951) | (26,057,888) | |||||||
Change in net assets from capital transactions | (5,637,441) | (19,750,926) | (27,687,278) | 42,442,812 | (54,289,910) | 52,932,929 | (20,467,115) | 39,641,237 | |||||||
Change in net assets | 1,757,214 | (46,630,987) | 54,187,557 | (148,020,825) | 15,489,760 | (123,456,336) | 5,758,983 | (61,228,049) | |||||||
| Net assets: | |||||||||||||||
Beginning of year | 123,554,884 | 170,185,871 | 208,511,929 | 356,532,754 | 313,798,039 | 437,254,375 | 135,001,194 | 196,229,243 | |||||||
End of year | $125,312,098 | $123,554,884 | $262,699,486 | $ 208,511,929 | $329,287,799 | $ 313,798,039 | $140,760,177 | $135,001,194 | |||||||
The accompanying notes are an integral part of these financial statements.
159
AuguStarSM Variable Insurance Products Fund, Inc.
Statements of Changes in Net Assets
| AVIP S&P MidCap 400® Index Portfolio | AVIP BlackRock Advantage Large Cap Growth Portfolio | AVIP AB Risk Managed Balanced Portfolio | AVIP Federated Core Plus Bond Portfolio | ||||||||||||
| Year Ended | Year Ended | Year Ended | Year Ended | Year Ended | Year Ended | Year Ended | Year Ended | ||||||||
| December 31, 2023 | December 31, 2022 | December 31, 2023 | December 31, 2022 | December 31, 2023 | December 31, 2022 | December 31, 2023 | December 31, 2022 | ||||||||
| Increase (Decrease) in net assets: | |||||||||||||||
| Operations: | |||||||||||||||
Net investment income | $ 5,973,118 | $ 4,697,808 | $ 1,119,383 | $ 609,922 | $ 25,098,693 | $ 13,050,729 | $ 16,776,336 | $ 13,234,868 | |||||||
Net realized gain (loss) on investments and futures contracts | 20,533,840 | 21,896,113 | 48,407,799 | 1,035,868 | (18,199,975) | (36,102,057) | (10,769,460) | (34,877,886) | |||||||
Change in unrealized appreciation/depreciation on investments and futures contracts | 41,553,191 | (83,766,894) | 94,999,688 | (23,461,774) | 150,322,284 | (118,870,541) | 22,921,591 | (66,363,139) | |||||||
Change in net assets from operations | 68,060,149 | (57,172,973) | 144,526,870 | (21,815,984) | 157,221,002 | (141,921,869) | 28,928,467 | (88,006,157) | |||||||
| Distributions: | |||||||||||||||
Distributions to shareholders | (24,997,583) | (59,625,654) | (3,467,142) | (34,740,322) | (13,033,001) | (52,389,384) | (13,552,610) | (9,465,356) | |||||||
| Capital transactions: | |||||||||||||||
Received from shares sold | 193,105,054 | 62,756,203 | 46,468,903 | 346,006,891 | 328,185,195 | 979,291,083 | 92,280,723 | 81,089,166 | |||||||
Received from dividends reinvested | 24,997,583 | 59,625,654 | 3,467,142 | 34,740,322 | 13,033,001 | 52,389,384 | 13,552,610 | 9,465,356 | |||||||
Paid for shares redeemed | (88,193,474) | (73,655,305) | (91,386,497) | (30,527,193) | (225,587,997) | (145,114,544) | (87,213,748) | (158,471,240) | |||||||
Change in net assets from capital transactions | 129,909,163 | 48,726,552 | (41,450,452) | 350,220,020 | 115,630,199 | 886,565,923 | 18,619,585 | (67,916,718) | |||||||
Change in net assets | 172,971,729 | (68,072,075) | 99,609,276 | 293,663,714 | 259,818,200 | 692,254,670 | 33,995,442 | (165,388,231) | |||||||
| Net assets: | |||||||||||||||
Beginning of year | 369,480,762 | 437,552,837 | 375,123,891 | 81,460,177 | 1,139,213,509 | 446,958,839 | 551,101,843 | 716,490,074 | |||||||
End of year | $542,452,491 | $369,480,762 | $474,733,167 | $375,123,891 | $1,399,031,709 | $1,139,213,509 | $585,097,285 | $ 551,101,843 | |||||||
The accompanying notes are an integral part of these financial statements.
160
AuguStarSM Variable Insurance Products Fund, Inc.
Statements of Changes in Net Assets
| AVIP Intech U.S. Low Volatility Portfolio | AVIP AB Relative Value Portfolio | AVIP iShares Managed Risk Balanced Portfolio | AVIP iShares Managed Risk Moderate Growth Portfolio | ||||||||||||
| Year Ended | Year Ended | Year Ended | Year Ended | Year Ended | Year Ended | Year Ended | Period from October 14, 2022 (inception) to | ||||||||
| December 31, 2023 | December 31, 2022 | December 31, 2023 | December 31, 2022 | December 31, 2023 | December 31, 2022 | December 31, 2023 | December 31, 2022 | ||||||||
| Increase (Decrease) in net assets: | |||||||||||||||
| Operations: | |||||||||||||||
Net investment income | $ 9,399,929 | $ 8,705,219 | $ 2,036,179 | $ 1,470,576 | $ 14,519,326 | $ 6,514,570 | $ 10,446,890 | $ 2,683,968 | |||||||
Net realized gain (loss) on investments, futures contracts, foreign currency related transactions, and capital gain distributions received from underlying mutual funds | (3,674,270) | (7,547,614) | (1,276,901) | (2,644,383) | 3,966,908 | (29,743,481) | 8,524,303 | 4,805,973 | |||||||
Change in unrealized appreciation/depreciation on investments, futures contracts, and foreign currency related transactions | 38,554,777 | (71,016,377) | 13,499,704 | (3,132,477) | 58,746,295 | (26,746,207) | 55,130,828 | 20,776,747 | |||||||
Change in net assets from operations | 44,280,436 | (69,858,772) | 14,258,982 | (4,306,284) | 77,232,529 | (49,975,118) | 74,102,021 | 28,266,688 | |||||||
| Distributions: | |||||||||||||||
Distributions to shareholders | (8,163,527) | (24,143,362) | (1,395,666) | (92,591) | (6,229,046) | (3,430,064) | — | — | |||||||
| Capital transactions: | |||||||||||||||
Received from shares sold | 33,075,436 | 14,522,475 | 6,190,927 | 77,045,730 | 12,537,918 | 314,447,942 | 19,208,147 | 486,047,292 | |||||||
Received from dividends reinvested | 8,163,527 | 24,143,362 | 1,395,666 | 92,591 | 6,229,046 | 3,430,064 | — | — | |||||||
Paid for shares redeemed | (147,360,918) | (189,797,773) | (18,451,190) | (24,660,816) | (114,243,445) | (64,824,870) | (85,831,527) | (23,315,931) | |||||||
Change in net assets from capital transactions | (106,121,955) | (151,131,936) | (10,864,597) | 52,477,505 | (95,476,481) | 253,053,136 | (66,623,380) | 462,731,361 | |||||||
Change in net assets | (70,005,046) | (245,134,070) | 1,998,719 | 48,078,630 | (24,472,998) | 199,647,954 | 7,478,641 | 490,998,049 | |||||||
| Net assets: | |||||||||||||||
Beginning of year | 738,426,029 | 983,560,099 | 125,722,736 | 77,644,106 | 611,635,869 | 411,987,915 | 490,998,049 | — | |||||||
End of year | $ 668,420,983 | $ 738,426,029 | $127,721,455 | $125,722,736 | $ 587,162,871 | $611,635,869 | $498,476,690 | $490,998,049 | |||||||
The accompanying notes are an integral part of these financial statements.
161
AuguStarSM Variable Insurance Products Fund, Inc.
Statements of Changes in Net Assets
| AVIP iShares Managed Risk Growth Portfolio | AVIP Moderately Conservative Model Portfolio | AVIP Balanced Model Portfolio | AVIP Moderate Growth Model Portfolio | ||||||||||||
| Year Ended | Period from October 14, 2022 (inception) to | Year Ended | Year Ended | Year Ended | Year Ended | Year Ended | Year Ended | ||||||||
| December 31, 2023 | December 31, 2022 | December 31, 2023 | December 31, 2022 | December 31, 2023 | December 31, 2022 | December 31, 2023 | December 31, 2022 | ||||||||
| Increase (Decrease) in net assets: | |||||||||||||||
| Operations: | |||||||||||||||
Net investment income | $ 8,378,932 | $ 2,213,400 | $ 4,732,904 | $ 4,552,705 | $ 15,357,299 | $ 14,040,740 | $ 23,627,916 | $ 20,564,747 | |||||||
Net realized gain (loss) on investments, futures contracts, foreign currency related transactions, and capital gain distributions received from underlying mutual funds | 10,424,946 | 799,471 | 94,161 | 10,960,407 | (1,274,738) | 76,286,314 | (16,061,237) | 204,017,522 | |||||||
Change in unrealized appreciation/depreciation on investments, futures contracts, and foreign currency related transactions | 59,257,300 | 21,973,986 | 17,640,400 | (57,343,084) | 87,187,260 | (257,591,305) | 216,792,135 | (558,325,064) | |||||||
Change in net assets from operations | 78,061,178 | 24,986,857 | 22,467,465 | (41,829,972) | 101,269,821 | (167,264,251) | 224,358,814 | (333,742,795) | |||||||
| Distributions: | |||||||||||||||
Distributions to shareholders | — | — | (15,593,898) | (19,022,010) | (85,661,107) | (95,455,234) | (208,393,538) | (209,220,568) | |||||||
| Capital transactions: | |||||||||||||||
Received from shares sold | 15,260,634 | 421,249,533 | 4,967,509 | 17,864,580 | 15,044,601 | 13,644,093 | 16,254,872 | 39,731,207 | |||||||
Received from dividends reinvested | — | — | 15,593,898 | 19,022,010 | 85,661,107 | 95,455,233 | 208,393,538 | 209,220,568 | |||||||
Paid for shares redeemed | (75,074,240) | (19,675,343) | (44,209,932) | (44,216,093) | (127,785,739) | (150,961,325) | (204,609,746) | (238,136,575) | |||||||
Change in net assets from capital transactions | (59,813,606) | 401,574,190 | (23,648,525) | (7,329,503) | (27,080,031) | (41,861,999) | 20,038,664 | 10,815,200 | |||||||
Change in net assets | 18,247,572 | 426,561,047 | (16,774,958) | (68,181,485) | (11,471,317) | (304,581,484) | 36,003,940 | (532,148,163) | |||||||
| Net assets: | |||||||||||||||
Beginning of year | 426,561,047 | — | 213,431,573 | 281,613,058 | 787,942,579 | 1,092,524,063 | 1,445,176,260 | 1,977,324,423 | |||||||
End of year | $444,808,619 | $426,561,047 | $196,656,615 | $213,431,573 | $ 776,471,262 | $ 787,942,579 | $1,481,180,200 | $1,445,176,260 | |||||||
The accompanying notes are an integral part of these financial statements.
162
AuguStarSM Variable Insurance Products Fund, Inc.
Statements of Changes in Net Assets
| AVIP Growth Model Portfolio | |||
| Year Ended | Year Ended | ||
| December 31, 2023 | December 31, 2022 | ||
| Increase (Decrease) in net assets: | |||
| Operations: | |||
Net investment income | $ 4,506,813 | $ 3,691,529 | |
Net realized gain on investments and capital gain distributions received from underlying mutual funds | (5,623,683) | 57,283,328 | |
Change in unrealized appreciation on investments | 58,660,367 | (141,608,112) | |
Change in net assets from operations | 57,543,497 | (80,633,255) | |
| Distributions: | |||
Distributions to shareholders | (57,106,337) | (57,611,540) | |
| Capital transactions: | |||
Received from shares sold | 3,619,095 | 6,632,256 | |
Received from dividends reinvested | 57,106,337 | 57,611,540 | |
Paid for shares redeemed | (48,942,170) | (43,262,790) | |
Change in net assets from capital transactions | 11,783,262 | 20,981,006 | |
Change in net assets | 12,220,422 | (117,263,789) | |
| Net assets: | |||
Beginning of year | 330,923,186 | 448,186,975 | |
End of year | $343,143,608 | $ 330,923,186 | |
The accompanying notes are an integral part of these financial statements.
163
AuguStarSM Variable Insurance Products Fund, Inc.
| Financial Highlights |
| Selected per-share data | Ratios and supplemental data | ||||||||||||
| Operations | Distributions | Ratios to average net assets | |||||||||||
| Ratios net of expenses reduced or reimbursed by adviser | Ratios assuming no expenses reduced or reimbursed by adviser | ||||||||||||
| Net asset value, beginning of year | Net investment income (loss) | Net realized and unrealized gain (loss) | Total from operations | Distributions to shareholders | Net asset value, end of year | Total Return# | Expenses | Net investment income (loss) | Expenses | Net assets, end of year (millions) | Portfolio turnover rate | ||
| AVIP Bond Portfolio | |||||||||||||
Year Ended December 31, 2023 | $16.17 | 0.62 | 0.69 | 1.31 | (0.53) | $16.95 | 8.30% | 0.61% | 3.64% | 0.61% | $224.9 | 21% | |
Year Ended December 31, 2022 | $19.88 | 0.58 | (3.60) | (3.02) | (0.69) | $16.17 | (15.19)% | 0.61% | 3.11% | 0.61% | $221.5 | 21% | |
Year Ended December 31, 2021 | $20.79 | 0.54 | (0.85) | (0.31) | (0.60) | $19.88 | (1.52)% | 0.59% | 2.56% | 0.59% | $277.4 | 13% | |
Year Ended December 31, 2020 | $19.10 | 0.55 | 1.28 | 1.83 | (0.14) | $20.79 | 9.59% | 0.60% | 2.72% | 0.60% | $295.1 | 69% | |
Year Ended December 31, 2019 | $17.02 | 0.55 | 1.96 | 2.51 | (0.43) | $19.10 | 14.73% | 0.60% | 3.19% | 0.60% | $290.5 | 60% | |
| AVIP BlackRock Balanced Allocation Portfolio | |||||||||||||
Year Ended December 31, 2023 | $27.36 | 0.58 | 5.16 | 5.74 | (0.53) | $32.57 | 21.13% | 0.56% | 1.56% | 0.56% | $413.4 | 65% | |
Year Ended December 31, 2022 | $42.43 | 0.50 | (8.21) | (7.71) | (7.36) | $27.36 | (18.41)% | 0.55% | 1.57% | 0.55% | $418.7 | 70% | |
Year Ended December 31, 2021 | $39.40 | 0.58 | 6.66 | 7.24 | (4.21) | $42.43 | 19.06% | 0.54% | 1.22% | 0.54% | $551.8 | 105% | |
Year Ended December 31, 2020 | $34.30 | 0.60 | 4.75 | 5.35 | (0.25) | $39.40 | 15.65% | 0.55% | 1.57% | 0.55% | $533.7 | 121% | |
Year Ended December 31, 2019 | $27.85 | 0.26 | 7.85 | 8.11 | (1.66) | $34.30 | 29.29% | 0.59% | 1.77% | 0.59% | $545.2 | 97% (a) | |
| AVIP BlackRock Advantage International Equity Portfolio | |||||||||||||
Year Ended December 31, 2023 | $13.32 | 0.37 | 2.11 | 2.48 | (0.53) | $15.27 | 18.94% | 0.89% | 2.09% | 0.89% | $356.0 | 153% | |
Year Ended December 31, 2022 | $18.44 | 0.42 | (3.11) | (2.69) | (2.43) | $13.32 | (13.47)% | 0.89% | 2.53% | 0.89% | $354.6 | 134% | |
Year Ended December 31, 2021 | $16.47 | 0.36 | 1.86 | 2.22 | (0.25) | $18.44 | 13.49% | 0.89% | 1.84% | 0.89% | $507.5 | 196% | |
Year Ended December 31, 2020 | $15.52 | 0.20 | 0.83 | 1.03 | (0.08) | $16.47 | 6.74% | 0.91% | 1.40% | 0.91% | $504.4 | 238% | |
Year Ended December 31, 2019 | $13.07 | 0.34 | 2.37 | 2.71 | (0.26) | $15.52 | 20.72% | 0.87% | 2.15% | 0.87% | $474.2 | 105% (b) | |
| AVIP Fidelity Institutional AM® Equity Growth Portfolio | |||||||||||||
Year Ended December 31, 2023 | $ 1.19 | (—) (c) | 0.45 | 0.45 | (0.14) | $ 1.50 | 39.39% | 0.86% | (0.08)% | 0.86% | $116.3 | 98% (d) | |
Year Ended December 31, 2022 | $36.43 | 0.02 | (11.42) | (11.40) | (23.84) | $ 1.19 | (33.92)% | 0.85% | (0.19)% | 0.85% | $ 44.1 | 51% | |
Year Ended December 31, 2021 | $35.13 | (0.17) | 7.07 | 6.90 | (5.60) | $36.43 | 19.70% | 0.78% | (0.33)% | 0.78% | $142.2 | 31% | |
Year Ended December 31, 2020 | $26.06 | (0.08) | 9.87 | 9.79 | (0.72) | $35.13 | 37.87% | 0.79% | (0.24)% | 0.79% | $203.6 | 36% | |
Year Ended December 31, 2019 | $20.97 | (—) (c) | 7.25 | 7.25 | (2.16) | $26.06 | 34.89% | 0.81% | (—)% (c) | 0.81% | $196.9 | 53% | |
| (a) | The cost of purchases and proceeds from sales of Portfolio securities that were incurred to realign the Portfolio’s holdings subsequent to the August 23, 2019 reorganization are excluded from the portfolio turnover rate calculation. If such amounts had not been excluded, the portfolio turnover rate would have been 261%. Effective February 1, 2019, the sub-adviser for the equity portion of the AVIP BlackRock Balanced Allocation Portfolio changed from Suffolk Capital Management, LLC to BlackRock Investment Management, LLC. |
| (b) | Effective December 7, 2019, the sub-adviser to the AVIP BlackRock Advantage International Equity Portfolio changed from Lazard Asset Management LLC to BlackRock Investment Management, LLC. Costs of purchases and proceeds from sales of portfolio securities associated with the change in sub-advisers may have contributed to a higher portfolio turnover rate for the year ended December 31, 2019 than for prior years. |
| (c) | The absolute value of per share or ratio data is less than $0.005 per share, or 0.005%, respectively. |
| (d) | Effective July 29, 2023, the sub-adviser to the AVIP Fidelity Institutional AM® Equity Growth Portfolio changed from Janus Henderson Investors U.S. LLC to FIAM LLC. Costs of purchases and proceeds from sales of portfolio securities associated with the change in sub-adviser may have contributed to a higher portfolio turnover rate for the year ended December 31, 2023 than for prior years. |
# Performance does not include fees and expenses imposed by a variable annuity contract. Had those fees and expenses been included, performance would have been lower than the returns presented.
The accompanying notes are an integral part of these financial statements.
164
AuguStarSM Variable Insurance Products Fund, Inc.
| Financial Highlights |
| Selected per-share data | Ratios and supplemental data | ||||||||||||
| Operations | Distributions | Ratios to average net assets | |||||||||||
| Ratios net of expenses reduced or reimbursed by adviser | Ratios assuming no expenses reduced or reimbursed by adviser | ||||||||||||
| Net asset value, beginning of year | Net investment income (loss) | Net realized and unrealized gain (loss) | Total from operations | Distributions to shareholders | Net asset value, end of year | Total Return# | Expenses | Net investment income (loss) | Expenses | Net assets, end of year (millions) | Portfolio turnover rate | ||
| AVIP AB Small Cap Portfolio | |||||||||||||
Year Ended December 31, 2023 | $10.63 | 0.04 | 1.79 | 1.83 | — | $12.46 | 17.22% | 0.86% | 0.31% | 0.86% | $ 117.1 | 59% | |
Year Ended December 31, 2022 | $42.63 | 0.01 | (11.42) | (11.41) | (20.59) | $10.63 | (28.73)% | 0.85% | 0.07% | 0.85% | $ 113.7 | 58% | |
Year Ended December 31, 2021 | $44.52 | (0.01) | 3.43 | 3.42 | (5.31) | $42.63 | 8.17% | 0.85% | (0.03)% | 0.85% | $ 169.3 | 136% (a) | |
Year Ended December 31, 2020 | $33.89 | (0.22) | 11.55 | 11.33 | (0.70) | $44.52 | 34.04% | 0.89% | (0.48)% | 0.89% | $ 182.5 | 26% | |
Year Ended December 31, 2019 | $30.89 | (0.15) | 8.87 | 8.72 | (5.72) | $33.89 | 28.61% | 0.88% | (0.35)% | 0.88% | $ 170.7 | 17% | |
| AVIP AB Mid Cap Core Portfolio | |||||||||||||
Year Ended December 31, 2023 | $25.16 | 0.17 | 4.11 | 4.28 | (0.13) | $29.31 | 17.05% | 0.90% | 0.55% | 0.90% | $ 80.4 | 46% | |
Year Ended December 31, 2022 | $62.45 | 0.14 | (14.02) | (13.88) | (23.41) | $25.16 | (23.31)% | 0.88% | 0.53% | 0.88% | $ 77.8 | 41% | |
Year Ended December 31, 2021 | $56.98 | 0.18 | 9.18 | 9.36 | (3.89) | $62.45 | 16.79% | 0.89% | 0.30% | 0.89% | $ 104.7 | 125% (a) | |
Year Ended December 31, 2020 | $48.53 | (0.06) | 9.21 | 9.15 | (0.70) | $56.98 | 19.15% | 0.98% | (0.12)% | 0.98% | $ 109.2 | 14% | |
Year Ended December 31, 2019 | $37.36 | 0.05 | 13.54 | 13.59 | (2.42) | $48.53 | 36.57% | 0.96% | 0.10% | 0.96% | $ 110.0 | 10% | |
| AVIP S&P 500® Index Portfolio | |||||||||||||
Year Ended December 31, 2023 | $32.61 | 0.48 | 7.76 | 8.24 | (2.01) | $38.84 | 25.72% | 0.38% | 1.31% | 0.38% | $1,185.7 | 12% | |
Year Ended December 31, 2022 | $46.20 | 0.47 | (8.86) | (8.39) | (5.20) | $32.61 | (18.42)% | 0.38% | 1.27% | 0.38% | $1,023.6 | 4% | |
Year Ended December 31, 2021 | $38.72 | 0.54 | 10.09 | 10.63 | (3.15) | $46.20 | 28.25% | 0.37% | 1.05% | 0.37% | $1,325.0 | 5% | |
Year Ended December 31, 2020 | $33.29 | 0.54 | 5.40 | 5.94 | (0.51) | $38.72 | 17.99% | 0.39% | 1.49% | 0.39% | $1,228.8 | 6% | |
Year Ended December 31, 2019 | $28.11 | 0.57 | 8.00 | 8.57 | (3.39) | $33.29 | 30.97% | 0.39% | 1.64% | 0.39% | $1,202.6 | 7% | |
| AVIP BlackRock Advantage Large Cap Value Portfolio | |||||||||||||
Year Ended December 31, 2023 | $16.32 | 0.30 | 1.85 | 2.15 | (0.53) | $17.94 | 13.37% | 0.74% | 1.58% | 0.74% | $ 200.7 | 91% | |
Year Ended December 31, 2022 | $23.67 | 0.38 | (2.64) | (2.26) | (5.09) | $16.32 | (8.97)% | 0.73% | 1.51% | 0.73% | $ 198.9 | 94% | |
Year Ended December 31, 2021 | $19.13 | 0.31 | 4.52 | 4.83 | (0.29) | $23.67 | 25.39% | 0.73% | 1.25% | 0.73% | $ 325.9 | 153% | |
Year Ended December 31, 2020 | $18.75 | 0.30 | 0.35 | 0.65 | (0.27) | $19.13 | 3.66% | 0.74% | 1.70% | 0.74% | $ 316.5 | 150% | |
Year Ended December 31, 2019 | $16.37 | 0.76 | 2.38 | 3.14 | (0.76) | $18.75 | 19.21% | 0.77% | 3.94% | 0.77% | $ 320.7 | 127% (b) | |
| (a) | Effective May 1, 2021, the sub-adviser to the AVIP AB Small Cap Portfolio and AVIP AB Mid Cap Core Portfolio changed from Janus Capital Management LLC to AllianceBernstein, L.P. Costs of purchases and proceeds from sales of portfolio securities associated with the change in the sub-adviser may have contributed to a higher portfolio turnover rate for the year ended December 31, 2021 than for prior years. |
| (b) | Effective December 7, 2019, the sub-adviser to the AVIP BlackRock Advantage Large Cap Value Portfolio changed from Federated Equity Management Company of Pennsylvania to BlackRock Investment Management, LLC. Costs of purchases and proceeds from sales of portfolio securities associated with the change in the sub-adviser may have contributed to a higher portfolio turnover rate for the year ended December 31, 2019 than for prior years. |
# Performance does not include fees and expenses imposed by a variable annuity contract. Had those fees and expenses been included, performance would have been lower than the returns presented.
The accompanying notes are an integral part of these financial statements.
165
AuguStarSM Variable Insurance Products Fund, Inc.
| Financial Highlights |
| Selected per-share data | Ratios and supplemental data | ||||||||||||
| Operations | Distributions | Ratios to average net assets | |||||||||||
| Ratios net of expenses reduced or reimbursed by adviser | Ratios assuming no expenses reduced or reimbursed by adviser | ||||||||||||
| Net asset value, beginning of year | Net investment income (loss) | Net realized and unrealized gain (loss) | Total from operations | Distributions to shareholders | Net asset value, end of year | Total Return# | Expenses | Net investment income (loss) | Expenses | Net assets, end of year (millions) | Portfolio turnover rate | ||
| AVIP Federated High Income Bond Portfolio | |||||||||||||
Year Ended December 31, 2023 | $17.97 | 1.13 | 1.09 | 2.22 | (1.13) | $19.06 | 12.68% | 0.86% | 5.66% | 0.86% | $125.3 | 15% | |
Year Ended December 31, 2022 | $21.58 | 1.18 | (3.65) | (2.47) | (1.14) | $17.97 | (11.43)% | 0.84% | 5.05% | 0.84% | $123.6 | 13% | |
Year Ended December 31, 2021 | $21.65 | 1.05 | 0.02 | 1.07 | (1.14) | $21.58 | 4.97% | 0.82% | 4.50% | 0.82% | $170.2 | 36% | |
Year Ended December 31, 2020 | $20.69 | 1.12 | 0.16 | 1.28 | (0.32) | $21.65 | 6.26% | 0.83% | 4.97% | 0.83% | $175.6 | 33% | |
Year Ended December 31, 2019 | $18.73 | 1.14 | 1.70 | 2.84 | (0.88) | $20.69 | 15.29% | 0.80% | 5.34% | 0.80% | $198.7 | 23% | |
| AVIP Nasdaq-100® Index Portfolio | |||||||||||||
Year Ended December 31, 2023 | $12.46 | 0.10 | 6.53 | 6.63 | (1.52) | $17.57 | 54.44% | 0.43% | 0.52% | 0.43% | $262.7 | 22% | |
Year Ended December 31, 2022 | $28.58 | 0.08 | (8.66) | (8.58) | (7.54) | $12.46 | (32.57)% | 0.43% | 0.46% | 0.43% | $208.5 | 9% | |
Year Ended December 31, 2021 | $28.08 | 0.12 | 6.89 | 7.01 | (6.51) | $28.58 | 26.99% | 0.41% | 0.28% | 0.41% | $356.5 | 7% | |
Year Ended December 31, 2020 | $19.83 | 0.13 | 9.30 | 9.43 | (1.18) | $28.08 | 48.32% | 0.42% | 0.49% | 0.42% | $383.0 | 10% | |
Year Ended December 31, 2019 | $16.60 | 0.14 | 6.15 | 6.29 | (3.06) | $19.83 | 38.86% | 0.42% | 0.66% | 0.42% | $353.0 | 8% | |
| AVIP BlackRock Advantage Large Cap Core Portfolio | |||||||||||||
Year Ended December 31, 2023 | $25.79 | 0.32 | 6.31 | 6.63 | (0.40) | $32.02 | 25.84% | 0.69% | 0.89% | 0.69% | $329.3 | 82% | |
Year Ended December 31, 2022 | $44.84 | 0.30 | (8.89) | (8.59) | (10.46) | $25.79 | (19.56)% | 0.69% | 0.97% | 0.69% | $313.8 | 90% | |
Year Ended December 31, 2021 | $38.66 | 0.35 | 10.24 | 10.59 | (4.41) | $44.84 | 28.49% | 0.69% | 0.66% | 0.69% | $437.3 | 135% | |
Year Ended December 31, 2020 | $32.95 | 0.38 | 5.39 | 5.77 | (0.06) | $38.66 | 17.55% | 0.70% | 1.04% | 0.70% | $418.5 | 137% | |
Year Ended December 31, 2019 | $24.79 | 0.22 | 8.10 | 8.32 | (0.16) | $32.95 | 33.60% | 0.74% | 1.28% | 0.74% | $430.6 | 152% (a) | |
| AVIP BlackRock Advantage Small Cap Growth Portfolio | |||||||||||||
Year Ended December 31, 2023 | $18.49 | 0.03 | 3.72 | 3.75 | — | $22.24 | 20.28% | 0.86% | 0.12% | 0.86% | $140.8 | 34% | |
Year Ended December 31, 2022 | $37.99 | 0.01 | (9.57) | (9.56) | (9.94) | $18.49 | (26.12)% | 0.86% | 0.03% | 0.86% | $135.0 | 49% | |
Year Ended December 31, 2021 | $41.69 | (0.13) | 1.88 | 1.75 | (5.45) | $37.99 | 4.05% | 0.85% | (0.33)% | 0.85% | $196.2 | 87% | |
Year Ended December 31, 2020 | $31.42 | (0.06) | 10.73 | 10.67 | (0.40) | $41.69 | 34.34% | 0.86% | (0.17)% | 0.86% | $209.8 | 87% | |
Year Ended December 31, 2019 | $23.62 | 0.02 | 8.02 | 8.04 | (0.24) | $31.42 | 34.07% | 0.91% | 0.11% | 0.91% | $204.8 | 114% (a) | |
| (a) | The cost of purchases and proceeds from sales of Portfolio securities that were incurred to realign the Portfolios holdings subsequent to the August 23, 2019 reorganization are excluded from the portfolio turnover rate calculation. If such amounts had not been excluded, the portfolio turnover rates would have been 211% for the AVIP BlackRock Advantage Large Cap Core Portfolio and and 177% for the AVIP BlackRock Advantage Small Cap Growth Portfolio. Effective February 1, 2019, the sub-adviser to the Portfolios changed from Suffolk Capital Management, LLC to BlackRock Investment Management, LLC. |
# Performance does not include fees and expenses imposed by a variable annuity contract. Had those fees and expenses been included, performance would have been lower than the returns presented.
The accompanying notes are an integral part of these financial statements.
166
AuguStarSM Variable Insurance Products Fund, Inc.
| Financial Highlights |
| Selected per-share data | Ratios and supplemental data | ||||||||||||
| Operations | Distributions | Ratios to average net assets | |||||||||||
| Ratios net of expenses reduced or reimbursed by adviser | Ratios assuming no expenses reduced or reimbursed by adviser | ||||||||||||
| Net asset value, beginning of year | Net investment income | Net realized and unrealized gain (loss) | Total from operations | Distributions to shareholders | Net asset value, end of year | Total Return# | Expenses | Net investment income (loss) | Expenses | Net assets, end of year (millions) | Portfolio turnover rate | ||
| AVIP S&P MidCap 400® Index Portfolio | |||||||||||||
Year Ended December 31, 2023 | $18.71 | 0.18 | 2.63 | 2.81 | (0.95) | $20.57 | 15.50% | 0.41% | 1.41% | 0.41% | $ 542.5 | 34% | |
Year Ended December 31, 2022 | $26.22 | 0.26 | (3.79) | (3.53) | (3.98) | $18.71 | (13.40)% | 0.42% | 1.30% | 0.42% | $ 369.5 | 26% | |
Year Ended December 31, 2021 | $21.70 | 0.29 | 4.90 | 5.19 | (0.67) | $26.22 | 24.18% | 0.41% | 0.99% | 0.41% | $ 437.6 | 21% | |
Year Ended December 31, 2020 | $19.25 | 0.27 | 2.27 | 2.54 | (0.09) | $21.70 | 13.33% | 0.42% | 1.31% | 0.42% | $ 428.2 | 28% | |
Year Ended December 31, 2019 | $15.46 | 0.21 | 3.74 | 3.95 | (0.16) | $19.25 | 25.58% | 0.44% | 1.37% | 0.44% | $ 450.9 | 39% | |
| AVIP BlackRock Advantage Large Cap Growth Portfolio | |||||||||||||
Year Ended December 31, 2023 | $ 6.57 | 0.02 | 2.65 | 2.67 | (0.06) | $ 9.18 | 40.78% | 0.71% | 0.26% | 0.71% | $ 474.7 | 97% | |
Year Ended December 31, 2022 | $33.65 | 0.01 | (9.13) | (9.12) | (17.96) | $ 6.57 | (32.56)% | 0.75% | 0.49% | 0.75% | $ 375.1 | 135% | |
Year Ended December 31, 2021 | $36.36 | 0.01 | 8.69 | 8.70 | (11.41) | $33.65 | 26.69% | 0.78% | (0.09)% | 0.78% | $ 81.5 | 138% | |
Year Ended December 31, 2020 | $27.54 | 0.08 | 9.22 | 9.30 | (0.48) | $36.36 | 33.97% | 0.79% | 0.21% | 0.79% | $ 116.8 | 143% | |
Year Ended December 31, 2019 | $20.59 | 0.16 | 7.77 | 7.93 | (0.98) | $27.54 | 38.68% | 0.80% | 0.62% | 0.80% | $ 113.2 | 214% | |
| AVIP AB Risk Managed Balanced Portfolio | |||||||||||||
Year Ended December 31, 2023 | $12.69 | 0.24 | 1.39 | 1.63 | (0.13) | $14.19 | 12.90% | 0.85% | 2.09% | 0.85% | $1,399.0 | 132% | |
Year Ended December 31, 2022 | $17.16 | 0.09 | (3.96) | (3.87) | (0.60) | $12.69 | (22.62)% | 0.87% | 1.48% | 0.87% | $1,139.2 | 124% | |
Year Ended December 31, 2021 | $17.63 | 0.09 | 2.43 | 2.52 | (2.99) | $17.16 | 15.04% | 0.95% | 0.48% | 0.95% | $ 447.0 | 51% | |
Year Ended December 31, 2020 | $14.81 | 0.13 | 3.12 | 3.25 | (0.43) | $17.63 | 22.15% | 0.98% | 0.76% | 0.98% | $ 443.8 | 114% (a), (b) | |
Year Ended December 31, 2019 | $12.91 | 0.21 | 3.01 | 3.22 | (1.32) | $14.81 | 25.16% | 0.99% | 1.39% | 0.99% | $ 403.6 | 105% (b) | |
| AVIP Federated Core Plus Bond Portfolio | |||||||||||||
Year Ended December 31, 2023 | $ 8.83 | 0.25 | 0.20 | 0.45 | (0.21) | $ 9.07 | 5.18% | 0.57% | 3.01% | 0.57% | $ 585.1 | 32% | |
Year Ended December 31, 2022 | $10.30 | 0.23 | (1.54) | (1.31) | (0.16) | $ 8.83 | (12.78)% | 0.56% | 2.22% | 0.56% | $ 551.1 | 81% | |
Year Ended December 31, 2021 | $10.47 | 0.06 | (0.19) | (0.13) | (0.04) | $10.30 | (1.27)% | 0.57% | 1.85% | 0.57% | $ 716.5 | 40% | |
Period From May 1, 2020 (inception) to December 31, 2020 | $10.00 | 0.11 | 0.36 | 0.47 | — | $10.47 | 4.70%* | 0.65%** | 1.65%** | 0.65%** | $ 239.9 | 30%* | |
| * | Not annualized |
| ** | Annualized |
| (a) | Effective May 1, 2020, the sub-adviser(s) to the AVIP AB Risk Managed Balanced Portfolio changed from Janus Capital Management LLC and AnchorPath Financial, LLC to AllianceBernstein, L.P. Costs of purchases and proceeds from sales of portfolio securities associated with the change in the sub-adviser may have contributed to a higher portfolio turnover rate for the year ended December 31, 2020 than for prior years. |
| (b) | The portfolio turnover calculation in previous years includes purchases and sales from mortgage dollar roll transactions. Without the effect of mortgage dollar roll transactions, the portfolio turnover rate would have been 102% for the year ended December 31, 2020 and 84% for the year ended December 31, 2019 (see Note 2 of the Notes to Financial Statements). |
# Performance does not include fees and expenses imposed by a variable annuity contract. Had those fees and expenses been included, performance would have been lower than the returns presented.
The accompanying notes are an integral part of these financial statements.
167
AuguStarSM Variable Insurance Products Fund, Inc.
| Financial Highlights |
| Selected per-share data | Ratios and supplemental data | ||||||||||||
| Operations | Distributions | Ratios to average net assets | |||||||||||
| Ratios net of expenses reduced or reimbursed by adviser | Ratios assuming no expenses reduced or reimbursed by adviser | ||||||||||||
| Net asset value, beginning of year | Net investment income | Net realized and unrealized gain (loss) | Total from operations | Distributions to shareholders | Net asset value, end of year | Total Return# | Expenses | Net investment income | Expenses | Net assets, end of year (millions) | Portfolio turnover rate | ||
| AVIP Intech U.S. Low Volatility Portfolio | |||||||||||||
Year Ended December 31, 2023 | $ 9.98 | 0.16 | 0.49 | 0.65 | (0.12) | $10.51 | 6.59% | 0.61% | 1.34% | 0.61% | $668.4 | 55% | |
Year Ended December 31, 2022 | $11.12 | 0.13 | (0.95) | (0.82) | (0.32) | $ 9.98 | (7.33)% | 0.62% | 1.06% | 0.62% | $738.4 | 78% | |
Period from June 25, 2021 (inception) to December 31, 2021 | $10.00 | 0.05 | 1.07 | 1.12 | — | $11.12 | 11.20%* | 0.62%** | 0.89%** | 0.62%** | $983.6 | 32%* | |
| AVIP AB Relative Value Portfolio | |||||||||||||
Year Ended December 31, 2023 | $10.04 | 0.18 | 0.99 | 1.17 | (0.12) | $11.09 | 11.71% | 0.73% | 1.62% | 0.73% | $127.7 | 71% | |
Year Ended December 31, 2022 | $10.52 | 0.12 | (0.59) | (0.47) | (0.01) | $10.04 | (4.50)% | 0.74% | 1.44% | 0.74% | $125.7 | 81% | |
Period from December 2, 2021 (inception) to December 31, 2021 | $10.00 | — (a) | 0.52 | 0.52 | — | $10.52 | 5.20%* | 1.19%** | 0.38%** | 1.19%** | $ 77.6 | 5%* | |
| AVIP iShares Managed Risk Balanced Portfolio | |||||||||||||
Year Ended December 31, 2023 | $ 8.52 | 0.25 | 0.93 | 1.18 | (0.10) | $ 9.60 | 13.89% | 0.59% † | 2.43% † | 0.59% † | $587.2 | 3% | |
Year Ended December 31, 2022 | $10.23 | 0.10 | (1.72) | (1.62) | (0.09) | $ 8.52 | (15.84)% | 0.61% † | 1.58% † | 0.61% † | $611.6 | 48% | |
Period from June 25, 2021 (inception) to December 31, 2021 | $10.00 | 0.06 | 0.17 | 0.23 | — | $10.23 | 2.30%* | 0.62%** , † | 1.22%** , † | 0.62%** , † | $412.0 | 15%* | |
| AVIP iShares Managed Risk Moderate Growth Portfolio | |||||||||||||
Year Ended December 31, 2023 | $10.59 | 0.26 | 1.45 | 1.71 | — | $12.30 | 16.15% | 0.59% † | 2.13% † | 0.59% † | $498.5 | 4% | |
Period from October 14, 2022 (inception) to December 31, 2022 | $10.00 | 0.06 | 0.53 | 0.59 | — | $10.59 | 5.90%* | 0.61%** , † | 2.58%** , † | 0.61%** , † | $491.0 | 49%* | |
| AVIP iShares Managed Risk Growth Portfolio | |||||||||||||
Year Ended December 31, 2023 | $10.60 | 0.24 | 1.84 | 2.08 | — | $12.68 | 19.62% | 0.59% † | 1.93% † | 0.59% † | $444.8 | 3% | |
Period from October 14, 2022 (inception) to December 31, 2022 | $10.00 | 0.05 | 0.55 | 0.60 | — | $10.60 | 6.00%* | 0.61%** , † | 2.45%** , † | 0.61%** , † | $426.6 | 47%* | |
| * | Not annualized |
| ** | Annualized |
| † | The ratios presented only reflect the direct income and expenses for the Portfolio, and do not include the indirect expenses related to the underlying funds in which the Portfolio invests. |
| (a) | The absolute value of per share or ratio data is less than $0.005 per share, or 0.005%, respectively. |
# Performance does not include fees and expenses imposed by a variable annuity contract. Had those fees and expenses been included, performance would have been lower than the returns presented.
The accompanying notes are an integral part of these financial statements.
168
AuguStarSM Variable Insurance Products Fund, Inc.
| Financial Highlights |
| Selected per-share data | Ratios and supplemental data | ||||||||||||||
| Operations | Distributions | Ratios to average net assets | |||||||||||||
| Ratios net of expenses reduced or reimbursed by adviser | Ratios assuming no expenses reduced or reimbursed by adviser | ||||||||||||||
| Net asset value, beginning of year | Net investment income | Net realized and unrealized gain (loss) | Total from operations | Distributions to shareholders | Return of capital | Total distributions | Net asset value, end of year | Total Return# | Expenses † | Net investment income† | Expenses † | Net assets, end of year (millions) | Portfolio turnover rate | ||
| AVIP Moderately Conservative Model Portfolio | |||||||||||||||
Year Ended December 31, 2023 | $10.35 | 0.32 | 0.85 | 1.17 | (0.87) | — | (0.87) | $10.65 | 11.77% | 0.47% | 2.32% | 0.47% | $ 196.7 | 8% | |
Year Ended December 31, 2022 | $13.32 | 0.23 | (2.24) | (2.01) | (0.96) | — | (0.96) | $10.35 | (15.12)% | 0.47% | 1.91% | 0.47% | $ 213.4 | 29% | |
Year Ended December 31, 2021 | $12.67 | 0.20 | 0.79 | 0.99 | (0.34) | — | (0.34) | $13.32 | 7.90% | 0.43% | 1.29% | 0.45% | $ 281.6 | 13% | |
Year Ended December 31, 2020 | $11.37 | 0.09 | 1.21 | 1.30 | — | — | — | $12.67 | 11.43% | 0.40% | 0.97% | 0.47% | $ 303.5 | 23% (a) | |
Year Ended December 31, 2019 | $10.09 | 0.26 | 1.41 | 1.67 | (0.37) | (0.02) | (0.39) | $11.37 | 16.58% | 0.35% | 2.22% | 0.46% | $ 223.2 | 18% | |
| AVIP Balanced Model Portfolio | |||||||||||||||
Year Ended December 31, 2023 | $10.59 | 0.27 | 1.12 | 1.39 | (1.27) | — | (1.27) | $10.71 | 13.95% | 0.46% | 1.97% | 0.46% | $ 776.5 | 9% | |
Year Ended December 31, 2022 | $14.22 | 0.22 | (2.46) | (2.24) | (1.39) | — | (1.39) | $10.59 | (15.75)% | 0.44% | 1.58% | 0.44% | $ 787.9 | 27% | |
Year Ended December 31, 2021 | $13.06 | 0.18 | 1.25 | 1.43 | (0.27) | — | (0.27) | $14.22 | 11.03% | 0.42% | 1.14% | 0.43% | $1,092.5 | 12% | |
Year Ended December 31, 2020 | $11.48 | 0.08 | 1.50 | 1.58 | — | — | — | $13.06 | 13.76% | 0.39% | 0.67% | 0.43% | $1,127.8 | 22% | |
Year Ended December 31, 2019 | $ 9.97 | 0.21 | 1.73 | 1.94 | (0.24) | (0.19) | (0.43) | $11.48 | 19.46% | 0.36% | 1.82% | 0.43% | $1,109.5 | 22% | |
| AVIP Moderate Growth Model Portfolio | |||||||||||||||
Year Ended December 31, 2023 | $10.88 | 0.23 | 1.46 | 1.69 | (1.71) | — | (1.71) | $10.86 | 16.67% | 0.42% | 1.62% | 0.42% | $1,481.2 | 9% | |
Year Ended December 31, 2022 | $15.26 | 0.18 | (2.81) | (2.63) | (1.75) | — | (1.75) | $10.88 | (17.17)% | 0.42% | 1.27% | 0.42% | $1,445.2 | 32% | |
Year Ended December 31, 2021 | $13.46 | 0.16 | 1.83 | 1.99 | (0.19) | — | (0.19) | $15.26 | 14.83% | 0.42% | 0.98% | 0.42% | $1,977.3 | 15% | |
Year Ended December 31, 2020 | $11.63 | 0.04 | 1.79 | 1.83 | — | — | — | $13.46 | 15.74% | 0.44% | 0.35% | 0.45% | $1,987.4 | 16% | |
Year Ended December 31, 2019 | $ 9.93 | 0.16 | 2.20 | 2.36 | (0.30) | (0.36) | (0.66) | $11.63 | 23.81% | 0.43% | 1.31% | 0.44% | $1,961.4 | 20% | |
| AVIP Growth Model Portfolio | |||||||||||||||
Year Ended December 31, 2023 | $11.18 | 0.22 | 1.72 | 1.94 | (2.12) | — | (2.12) | $11.00 | 18.73% | 0.44% | 1.34% | 0.44% | $ 343.1 | 8% | |
Year Ended December 31, 2022 | $16.47 | 0.15 | (3.18) | (3.03) | (2.26) | — | (2.26) | $11.18 | (18.29)% | 0.44% | 1.01% | 0.44% | $ 330.9 | 28% | |
Year Ended December 31, 2021 | $14.17 | 0.13 | 2.35 | 2.48 | (0.18) | — | (0.18) | $16.47 | 17.58% | 0.49% | 0.78% | 0.49% | $ 448.2 | 18% | |
Year Ended December 31, 2020 | $11.94 | 0.02 | 2.21 | 2.23 | — | — | — | $14.17 | 18.68% | 0.46% | 0.16% | 0.47% | $ 443.1 | 11% | |
Year Ended December 31, 2019 | $ 9.86 | 0.11 | 2.50 | 2.61 | (0.35) | (0.18) | (0.53) | $11.94 | 26.47% | 0.45% | 0.92% | 0.47% | $ 433.6 | 18% | |
| (a) | The cost of purchases and proceeds from sales of Portfolio securities that were incurred to realign the Portfolio’s holdings subsequent to the December 4, 2020 reorganization are excluded from the portfolio turnover rate calculation. If such amounts had not been excluded, the portfolio turnover rate would have been 28%. |
# Performance does not include fees and expenses imposed by a variable annuity contract. Had those fees and expenses been included, performance would have been lower than the returns presented.
† Ratios presented only reflect the direct income and expenses for the Portfolio, and do not include the indirect expenses related to the underlying funds in which the Portfolio invests.
The accompanying notes are an integral part of these financial statements.
169
AuguStarSM Variable Insurance Products Fund, Inc.
| Notes to Financial Statements | December 31, 2023 |
(1)Organization
AuguStarSM Variable Insurance Products Fund, Inc. (the “Fund”) (formerly Ohio National Fund, Inc. through December 3, 2023) is a Maryland corporation registered under the Investment Company Act of 1940, as amended (the "40 Act"). The Fund is an open-end investment company and follows accounting and reporting guidance under Financial Accounting Standards Board (“FASB”) Accounting Standards Codification (“ASC”) Topic 946, “Financial Services-Investment Companies”. On November 17, 2023, the Fund's Board of Directors (the "Board") approved a change in the name of the Fund, as well as the names of each of its Portfolios. Those name changes were effective December 4, 2023. The Fund consists of twenty-five separate investment portfolios (the “Portfolios”) that seek the following objectives and strategies:
| ■ | AVIP Bond Portfolio (formerly ON Bond Portfolio) – High level of income and opportunity for capital appreciation consistent with preservation of capital by investing, under normal circumstances, at least 80% of its net assets in corporate debt securities. |
| ■ | AVIP BlackRock Balanced Allocation Portfolio (formerly ON BlackRock Balanced Allocation Portfolio) – High level of long-term total return consistent with preservation of capital by investing in stocks, bonds, and money market instruments. |
| ■ | AVIP BlackRock Advantage International Equity Portfolio (formerly ON BlackRock Advantage International Equity Portfolio) – Long-term growth of capital by investing, under normal circumstances, at least 80% of its net assets in non-U.S. equity securities and equity-like instruments of companies that are components of, or have characteristics similar to, the companies included in the MSCI EAFE Index (Net - USD). |
| ■ | AVIP Fidelity Institutional AM® Equity Growth Portfolio (formerly ON Fidelity Institutional AM® Equity Growth Portfolio and, prior to July 29, 2023, ON Janus Henderson Forty Portfolio ) – Capital appreciation by investing in common stocks of companies of any market capitalization that have above-average growth potential. |
| ■ | AVIP AB Small Cap Portfolio (formerly ON AB Small Cap Portfolio) – Long-term growth of capital by investing, under normal circumstances, at least 80% of its net assets in equity securities of smaller capitalization companies with market capitalizations at the time of investment that fall within the lowest 20% of the total U.S. equity market capitalization (excluding companies with market capitalizations of less than $10 million). |
| ■ | AVIP AB Mid Cap Core Portfolio (formerly ON AB Mid Cap Core Portfolio) – Long-term growth of capital by investing, under normal circumstances, at least 80% of its net assets in equity securities of mid-capitalization companies with public stock market capitalization at the time of investment that are within the range of market capitalizations of the companies constituting the Russell Midcap® Index. |
| ■ | AVIP S&P 500® Index Portfolio (formerly ON S&P 500® Index Portfolio) – Total return approximating that of the Standard & Poor's 500® Index (S&P 500® Index), at a risk level consistent with that of the S&P 500® Index by investing, under normal circumstances, more than 80% of its net assets in common stock and other securities of companies that are included in the S&P 500® Index. |
| ■ | AVIP BlackRock Advantage Large Cap Value Portfolio (formerly ON BlackRock Advantage Large Cap Value Portfolio) – Growth of capital by investing, under normal circumstances, at least 80% of its net assets in stocks of large capitalization companies with market capitalizations at the time of investment that are within the range of market capitalizations of the companies in the Russell 1000® Value Index for the previous twelve months. |
| ■ | AVIP Federated High Income Bond Portfolio (formerly ON Federated High Income Bond Portfolio) – High current income by investing, under normal circumstances, at least 80% of its net assets in lower rated corporate debt obligations commonly referred to as "junk bonds". The Portfolio's investments are generally rated BB or lower by Standard & Poor’s or Fitch, or Ba or lower by Moody's. |
| ■ | AVIP Nasdaq-100® Index Portfolio (formerly ON Nasdaq-100® Index Portfolio) – Long-term growth of capital by investing, under normal circumstances, more than 80% of its net assets in the common stocks of companies that are included in the Nasdaq-100® Index. |
| ■ | AVIP BlackRock Advantage Large Cap Core Portfolio (formerly ON BlackRock Advantage Large Cap Core Portfolio) – Long-term growth of capital by investing, under normal circumstances, at least 80% of its net assets in common stocks of the 1,000 largest publicly traded U.S. companies in terms of market capitalization. |
| ■ | AVIP BlackRock Advantage Small Cap Growth Portfolio (formerly ON BlackRock Advantage Small Cap Growth Portfolio) – Long-term growth of capital by investing, under normal circumstances, at least 80% of its net assets in stocks of small capitalization companies with a market capitalization at the time of investment that is no greater than the largest market capitalization of a company in the Russell 2000® Index for the previous twelve months. |
170
(continued)
AuguStarSM Variable Insurance Products Fund, Inc.
| Notes to Financial Statements (Continued) | December 31, 2023 |
| ■ | AVIP S&P MidCap 400® Index Portfolio (formerly ON S&P MidCap 400® Index Portfolio) – Total return approximating that of the Standard & Poor’s MidCap 400® Index (S&P MidCap 400® Index), including reinvestment of dividends, at a risk level consistent with that of the S&P MidCap 400® Index by investing, under normal circumstances, more than 80% of its net assets in the common stock and other securities included in the S& P MidCap 400® Index. |
| ■ | AVIP BlackRock Advantage Large Cap Growth Portfolio (formerly ON BlackRock Advantage Large Cap Growth Portfolio) – Long-term growth of capital by investing, under normal circumstances, at least 80% of its net assets in stocks of large capitalization companies with market capitalizations at the time of investment that are within the range of market capitalizations of the companies in the Russell 1000® Growth Index for the previous twelve months. |
| ■ | AVIP AB Risk Managed Balanced Portfolio (formerly ON Risk Managed Balanced Portfolio) – Long-term capital growth, consistent with preservation of capital and balanced by current income. The Portfolio invests in a balanced portfolio of equity and fixed-income securities and a risk management portfolio intended to enhance the risk adjusted return of the Portfolio. |
| ■ | AVIP Federated Core Plus Bond Portfolio (formerly ON Federated Core Plus Bond Portfolio) – Total return by investing, under normal circumstances, at least 80% of its net assets in fixed-income investments, primarily U.S. dollar denominated, investment-grade, fixed income securities. Investment-grade, fixed income securities are rated in one of the four highest categories (BBB- or higher) by a nationally recognized statistical rating organization (“NRSRO”). |
| ■ | AVIP Intech U.S. Low Volatility Portfolio (formerly ON U.S. Low Volatility Portfolio) – Capital appreciation by investing, under normal circumstances, at least 80% of its net assets in U.S. common stocks of companies included in the S&P 500® Index. Those stocks are selected by a mathematical investment process which seeks to achieve returns similar to those of the S&P 500® Index over the long-term with lower absolute volatility. |
| ■ | AVIP AB Relative Value Portfolio (formerly ON AB Relative Value Portfolio) – Long-term growth of capital by investing primarily in the equity securities of U.S. companies that the Portfolio's sub-adviser believes are trading at attractive valuations and that have strong or improving business models. |
| ■ | AVIP iShares Managed Risk Balanced Portfolio1 (formerly ON iShares Managed Risk Balanced Portfolio) – Income and capital appreciation by investing in underlying exchange traded funds ("ETFs") and futures. Under normal market conditions, through investments in the underlying funds and derivatives, the Portfolio invests a minimum of 25% of its assets in equity investments and a minimum of 25% of its assets in fixed income investments. |
| ■ | AVIP iShares Managed Risk Moderate Growth Portfolio1 (formerly ON iShares Managed Risk Moderate Growth Portfolio) – Income and capital appreciation by investing in underlying exchange traded funds (“ETFs”) and futures. Under normal market conditions, through investments in the underlying funds and derivatives, the Portfolio expects to allocate 65% of its assets in equity investments and 35% of its assets in fixed income investments. |
| ■ | AVIP iShares Managed Risk Growth Portfolio1 (formerly ON iShares Managed Risk Growth Portfolio) – Income and capital appreciation by investing in underlying exchange traded funds (“ETFs”) and futures. Under normal market conditions, through investments in the underlying funds and derivatives, the Portfolio expects to allocate 85% of its assets in equity investments and 15% of its assets in fixed income investments. |
| ■ | AVIP Moderately Conservative Model Portfolio2 (formerly ON Moderately Conservative Model Portfolio) – Current income and moderate growth of capital with a greater emphasis on current income by investing in underlying mutual funds. Under normal circumstances, the Portfolio intends to have investment exposure to various asset classes within the following target asset allocation ranges: U.S. Equity 20-40%, International Equity 5-20%, and Fixed Income 30-70%. |
| ■ | AVIP Balanced Model Portfolio2 (formerly ON Balanced Model Portfolio) – A balance between growth of capital and current income with a greater emphasis on growth of capital by investing in underlying mutual funds. Under normal circumstances, the Portfolio intends to have investment exposure to various asset classes within the following target asset allocation ranges: U.S. Equity 25-50%, International Equity 10-25%, and Fixed Income 25-50%. |
| ■ | AVIP Moderate Growth Model Portfolio2 (formerly ON Moderate Growth Model Portfolio) – Growth of capital and moderate current income with a greater emphasis on growth of capital by investing in underlying mutual funds. Under normal circumstances, the Portfolio intends to have investment exposure to various asset classes within the following target asset allocation ranges: U.S. Equity 40-60%, International Equity 15-35%, and Fixed Income 10-30%. |
| ■ | AVIP Growth Model Portfolio2 (formerly ON Growth Model Portfolio) – Growth of capital and some current income by investing in underlying mutual funds. Under normal circumstances, the Portfolio intends to have investment exposure to various asset classes within the following target asset allocation ranges: U.S. Equity 50-80%, International Equity 15-45%, and Fixed Income 0-15%. |
171
(continued)
AuguStarSM Variable Insurance Products Fund, Inc.
| Notes to Financial Statements (Continued) | December 31, 2023 |
| 1 | Collectively, the "AVIP iShares Managed Risk Portfolios". |
| 2 | Collectively, the "AVIP Model Portfolios". |
Each of the AVIP iShares Managed Risk Portfolios and the AVIP Model Portfolios are a “Fund of Funds”, which means each Portfolio invests primarily in other open-end mutual funds or exchange traded funds (“ETFs”). Those underlying mutual funds or ETFs invest in stocks, bonds, and other securities that are consistently recorded at fair value, but involve varying amounts of potential investment risk and reward. The portfolio management team of each of those Portfolios periodically adjust the investment allocation to allow the Portfolio to achieve its investment objective.
Additional detail regarding Portfolio-specific objectives, policies, and investment strategies is provided in the Prospectuses and Statements of Additional Information of the Fund. There are no assurances that these objectives will be met. Each Portfolio, except the AVIP Nasdaq-100® Index Portfolio, is classified as diversified for purposes of Section 5(b) of the 40 Act.
The Fund issues its shares to separate accounts of AuguStarSM Life Insurance Company ("ALIC") (formerly The Ohio National Life Insurance Company (“ONLIC”) through October 2, 2023), AuguStarSM Life Assurance Corporation ("ALAC") (formerly Ohio National Life Assurance Corporation (“ONLAC”) through October 2, 2023), and National Security Life and Annuity Company (“NSLA”) to support certain benefits under variable contracts issued by those entities, as well as for purchases by other Portfolios of the Fund. In the future, Fund shares may be used for other purposes but, unless there is a change in applicable law, they will not be sold directly to the public. Effective October 2, 2023, through amended and restated Articles of Incorporation, ONLIC was renamed AuguStarSM Life Insurance Company and ONLAC was renamed AuguStarSM Life Assurance Corporation.
ALIC and NSLA, at present, do not market or issue variable annuities. ALIC and NSLA will continue to service the in-force variable annuity contracts, the variable separate accounts, and underlying subaccounts regardless of new sales.
Interest in each Portfolio is represented by a separate class of the Fund’s capital stock, par value $1. Each share of a Portfolio participates equally in the Portfolio’s dividends, distributions, net assets, and voting matters.
The Fund is authorized to issue 1.55 billion of its capital shares. Of this total, shares authorized have been allocated to specific Portfolios of the Fund as follows:
| Portfolio | Authorized Shares | Portfolio | Authorized Shares | |||
| AVIP Bond | 22,000,000 | AVIP BlackRock Advantage Large Cap Growth | 82,000,000 | |||
| AVIP BlackRock Balanced Allocation | 20,000,000 | AVIP AB Risk Managed Balanced | 170,000,000 | |||
| AVIP BlackRock Advantage International Equity | 35,000,000 | AVIP Federated Core Plus Bond | 115,000,000 | |||
| AVIP Fidelity Institutional AM® Equity Growth | 134,000,000 | AVIP Intech U.S. Low Volatility | 105,000,000 | |||
| AVIP AB Small Cap | 17,000,000 | AVIP AB Relative Value | 20,000,000 | |||
| AVIP AB Mid Cap Core | 6,000,000 | AVIP iShares Managed Risk Balanced | 123,000,000 | |||
| AVIP S&P 500® Index | 50,000,000 | AVIP iShares Managed Risk Moderate Growth | 70,000,000 | |||
| AVIP BlackRock Advantage Large Cap Value | 21,000,000 | AVIP iShares Managed Risk Growth | 65,000,000 | |||
| AVIP Federated High Income Bond | 13,000,000 | AVIP Moderately Conservative Model | 28,000,000 | |||
| AVIP Nasdaq-100® Index | 27,000,000 | AVIP Balanced Model | 107,000,000 | |||
| AVIP BlackRock Advantage Large Cap Core | 19,000,000 | AVIP Moderate Growth Model | 200,000,000 | |||
| AVIP BlackRock Advantage Small Cap Growth | 12,000,000 | AVIP Growth Model | 48,000,000 | |||
| AVIP S&P MidCap 400® Index | 41,000,000 |
The Board periodically reallocates authorized shares among the Portfolios of the Fund and may authorize additional shares as deemed necessary.
Under the Fund’s organizational documents, its Officers and Directors are indemnified against certain liabilities arising out of the performance of their duties to the Fund. In addition, in the normal course of business, the Fund enters into contracts with its vendors and others that provide for general indemnifications. The Fund’s maximum exposure under these arrangements is unknown, as this would involve future claims that may be made against the Fund. However, based on experience, the risk of loss to the Fund is expected to be remote.
172
(continued)
AuguStarSM Variable Insurance Products Fund, Inc.
| Notes to Financial Statements (Continued) | December 31, 2023 |
(2)Significant Accounting Policies
The following is a summary of significant accounting policies followed by the Fund in preparation of its financial statements:
Use of Estimates
The preparation of financial statements in conformity with U.S. generally accepted accounting principles (“U.S. GAAP”) requires management to make estimates and assumptions that affect the reported amounts of assets and liabilities and disclosure of contingent assets and liabilities at the date of the financial statements and the reported amounts of increases and decreases in net assets from operations during the reporting period. Actual results could differ from those estimates.
Cash Balance Credit Risk
The Fund may place portions of its uninvested cash with financial institutions in the United States, which are insured by the Federal Deposit Insurance Company (“FDIC”) up to $250,000 for each account holder. The Fund may be subject to credit risk to the extent amounts on deposit are in excess of the insured limits.
Security Valuation
The Board has adopted policies for the valuation of the Fund’s securities, which include guidelines for valuation when active market quotations are not readily available. The Board has delegated authority to the Fund’s adviser, Ohio National Investments, Inc. (“ONI”) to apply those guidelines in the determination of fair value, subject to oversight by the Board.
The Portfolios are valued each day the New York Stock Exchange ("NYSE") is open for unrestricted trading. The Portfolios' investments are valued as follows:
Domestic equity securities that are traded on U.S. exchanges, other than the Nasdaq Stock Market, are valued at the last trade price reported by the primary exchange of each security (4:00 pm Eastern Time for normal trading sessions). Domestic equity securities that are listed on the Nasdaq Stock Market are valued at the Nasdaq Official Closing Price (“NOCP”). Over-the-counter domestic equity securities are valued at the last trade price reported daily as of 4:00 pm Eastern Time (normal trading sessions). If, on a particular day, a domestic equity security does not trade, or otherwise cannot be priced by independent pricing services, then a broker quotation as of the end of the current trading session, the evaluated mean between the bid and ask prices, as reported by an approved independent pricing source, or a previous last trade price may be used when appropriate.
Over-the-counter traded American Depositary Receipts ("ADRs") may also be valued at an evaluated price based on the value of the underlying securities. If a domestic equity security is not traded on a particular day, the mean between the bid and ask prices reported at 4:00 pm Eastern Time (normal trading sessions) by the primary exchange will generally be used for valuation purposes. The principal sources for market quotations are independent pricing services that have been approved by the Board.
Futures contracts are valued at the daily quoted settlement prices as reported by an approved independent pricing source.
Shares of open-end mutual funds are valued at each fund’s last calculated net asset value per share.
Shares of closed-end mutual funds that are traded on U.S. exchanges are valued similarly to other domestic equity securities, typically at the last trade price reported by the primary exchange of each fund (4:00 pm Eastern Time for normal trading sessions).
Foreign equity securities are initially priced at the reported close price of the exchange on which a security is primarily traded. Securities not traded on a particular day are valued at the mean between the last reported bid and ask quotes at daily close, or the last sale price when appropriate. The principal sources for market quotations are independent pricing services that have been approved by the Board.
Equity securities that are primarily traded on foreign exchanges, other than those with close times that are consistent with the normal 4:00 pm Eastern Time close of U.S. equity markets, are further subjected to fair valuation pricing procedures provided by an independent fair valuation service. The service provides data that can be used to estimate the price of a foreign issue that would prevail in a liquid market given market information available at 4:00 pm Eastern Time (normal trading sessions) each day that the NYSE is open for trading and net asset values are calculated for the Portfolios. Multiple factors may be considered in performing this valuation, including U.S. intraday market and sector returns, currency valuations, and pricing of related depository receipts, exchange traded funds, and futures. Backtesting analysis is performed on a quarterly basis to monitor the effectiveness of these procedures. The testing is reviewed by management of the Fund and is reported to the Board. Prior results have indicated that these procedures have been effective in reaching valuation objectives.
173
(continued)
AuguStarSM Variable Insurance Products Fund, Inc.
| Notes to Financial Statements (Continued) | December 31, 2023 |
Fixed income securities that have a remaining maturity exceeding sixty days are generally valued at the evaluated bid price reported at 4:00 pm Eastern Time (normal trading sessions), as provided by independent pricing services approved by the Board. Many fixed income securities, including investment grade and high-yield corporate bonds, U.S. Treasury and government agency obligations, and other asset-backed instruments are not actively traded on a daily basis. As such, the approved pricing services may use asset type-specific valuation models to provide good faith determinations of value that the holders of securities would receive in an orderly transaction under current market conditions. The valuation models may use observable market data such as recent transaction data, benchmark yields, broker/dealer inputs, valuations and yields of comparable instruments, relative credit information, observed market movements, and market research and news. Asset-backed securities and mortgage-backed securities may use valuation models that heavily consider predicted cash flows of each tranche of an issue, benchmark spreads, and unique attributes of the tranche. The last trade or last evaluated bid may be used if an evaluated bid price is not available.
Fixed income instruments that mature in sixty days or less, and of sufficient credit quality, are valued at amortized cost. Amortized cost valuation involves valuing a security at its cost initially and thereafter amortizing to maturity any discounts or premiums on the level-yield method, regardless of the impact of fluctuating market interest rates on the value of the security. In these instances, amortized cost approximates fair value.
Restricted securities, illiquid securities, or other investments for which market quotations or other observable market inputs are not readily available are valued at an estimate of value using methods determined in good faith by ONI's Pricing Committee, which is subjected to oversight by the Board.
U.S exchange-traded options are valued at the composite basis last sale price as reported to a Board-approved independent pricing service by the OPRA (Options Price Reporting Authority). If there are no reported trades for a trading session, the evaluated composite-basis bid price or other method will be used for valuation purposes.
The differences between the aggregate cost and values of investments are reflected as unrealized appreciation or unrealized depreciation.
Pricing inputs used in the determination of investment values are categorized according to a three-tier hierarchy framework. The hierarchy is summarized in three broad levels:
| Level 1: | Quoted prices in active markets for identical securities. |
| Level 2: | Other significant observable inputs, including quoted prices for similar securities, interest rates, prepayment speeds, credit risk, etc. |
| Level 3: | Significant unobservable inputs, including the Fund’s own assumptions used to determine the value of securities. |
The following is a summary of the inputs used in valuing each of the Portfolio’s assets (liabilities) at value as of December 31, 2023:
| Portfolio | Financial Instrument Type | Level 1 | Level 2 | Level 3 | ||||
AVIP Bond | Corporate Bonds*** | $ — | $209,550,902 | $ — | ||||
| Asset-Backed Securities*** | — | 4,906,981 | — | |||||
| U.S. Treasury Obligations | — | 3,926,094 | — | |||||
| $ — | $218,383,977 | $ — | ||||||
AVIP BlackRock Balanced Allocation | Common Stocks*** | $ 296,819,112 | $ — | $ — | ||||
| Corporate Bonds*** | — | 97,410,394 | — | |||||
| U.S. Treasury Obligations | — | 10,498,438 | — | |||||
| Asset-Backed Securities*** | — | 2,200,076 | — | |||||
| $ 296,819,112 | $110,108,908 | $ — | ||||||
| Long Futures Contracts | $ 101,092 | $ — | $ — | |||||
AVIP BlackRock Advantage International Equity | Common Stocks*** | $ 1,403,331 | $346,780,779 | $ — | ||||
| Preferred Securities*** | — | 45,883 | — | |||||
| $ 1,403,331 | $346,826,662 | $ — | ||||||
| Long Futures Contracts | $ 213,302 | $ — | $ — |
174
(continued)
AuguStarSM Variable Insurance Products Fund, Inc.
| Notes to Financial Statements (Continued) | December 31, 2023 |
| Portfolio | Financial Instrument Type | Level 1 | Level 2 | Level 3 | ||||
AVIP Fidelity Institutional AM® Equity Growth | Common Stocks*** | $ 108,190,311 | $ 8,049,860 | $ — | ||||
AVIP AB Small Cap | Common Stocks*** | $ 116,772,276 | $ — | $ — | ||||
| Exchange Traded Funds | 258,934 | — | — | |||||
| $ 117,031,210 | $ — | $ — | ||||||
AVIP AB Mid Cap Core | Common Stocks*** | $ 79,694,103 | $ — | $ — | ||||
| Exchange Traded Funds | 359,346 | — | — | |||||
| $ 80,053,449 | $ — | $ — | ||||||
AVIP S&P 500® Index | Common Stocks*** | $1,181,981,797 | $ — | $ — | ||||
| U.S. Treasury Obligations | — | 198,513 | — | |||||
| $1,181,981,797 | $ 198,513 | $ — | ||||||
| Long Futures Contracts | $ 12,461 | $ — | $ — | |||||
AVIP BlackRock Advantage Large Cap Value | Common Stocks*** | $ 198,014,126 | $ — | $ — | ||||
| Long Futures Contracts | $ 77,894 | $ — | $ — | |||||
AVIP Federated High Income Bond | Corporate Bonds*** | $ — | $118,750,250 | $ — | ||||
| Common Stocks*** | 19,724 | — | — | |||||
| $ 19,724 | $118,750,250 | $ — | ||||||
AVIP Nasdaq-100® Index | Common Stocks*** | $ 260,661,879 | $ — | $ — | ||||
| U.S. Treasury Obligations | — | 99,256 | — | |||||
| $ 260,661,879 | $ 99,256 | $ — | ||||||
| Long Futures Contracts | $ 18,453 | $ — | $ — | |||||
AVIP BlackRock Advantage Large Cap Core | Common Stocks*** | $ 323,956,677 | $ — | $ — | ||||
| Long Futures Contracts | $ 141,127 | $ — | $ — | |||||
AVIP BlackRock Advantage Small Cap Growth | Common Stocks*** | $ 140,225,420 | $ — | $ — | ||||
| Rights*** | — | 4,950 | — | |||||
| $ 140,225,420 | $ 4,950 | $ — | ||||||
| Long Futures Contracts | $ 6,567 | $ — | $ — | |||||
AVIP S&P MidCap 400® Index | Common Stocks*** | $ 538,661,720 | $ — | $ — | ||||
| U.S. Treasury Obligations | — | 99,256 | — | |||||
| $ 538,661,720 | $ 99,256 | $ — | ||||||
| Long Futures Contracts | $ (46,955) | $ — | $ — | |||||
AVIP BlackRock Advantage Large Cap Growth | Common Stocks*** | $ 467,750,102 | $ — | $ — | ||||
| Long Futures Contracts | $ 143,747 | $ — | $ — |
175
(continued)
AuguStarSM Variable Insurance Products Fund, Inc.
| Notes to Financial Statements (Continued) | December 31, 2023 |
| Portfolio | Financial Instrument Type | Level 1 | Level 2 | Level 3 | ||||
AVIP AB Risk Managed Balanced | Common Stocks*** | $ 684,994,252 | $ — | $ — | ||||
| U.S. Treasury Obligations | — | 251,748,272 | — | |||||
| Corporate Bonds*** | — | 168,011,826 | — | |||||
| Asset-Backed / Mortgage-Backed Securities*** | — | 99,354,735 | — | |||||
| U.S. Government Agency Mortgage-Backed Securities | — | 74,788,515 | — | |||||
| Purchased Options | 56,612,078 | 16,817,960 | — | |||||
| Sovereign Debt Issues | — | 1,746,232 | — | |||||
| Preferred Securities*** | — | 1,356,350 | — | |||||
| Taxable Municipal Bonds | — | 381,530 | — | |||||
| Rights*** | — | 4,444 | — | |||||
| Money Market Funds | 77,293,716 | — | — | |||||
| $ 818,900,046 | $614,209,864 | $ — | ||||||
| Long Futures Contracts | $ 26,059,879 | $ — | $ — | |||||
| Short Futures Contracts | $ (98,834) | $ — | $ — | |||||
AVIP Federated Core Plus Bond | U.S. Treasury Obligations | $ — | $209,729,013 | $ — | ||||
| Corporate Bonds*** | — | 152,293,293 | — | |||||
| U.S. Government Agency Mortgage-Backed Securities | — | 144,092,712 | — | |||||
| Investment Companies | 36,817,798 | — | — | |||||
| Asset-Backed / Mortgage-Backed Securities*** | — | 29,288,126 | — | |||||
| Sovereign Debt Issues | — | 1,833,778 | — | |||||
| $ 36,817,798 | $537,236,922 | $ — | ||||||
| Long Futures Contracts | $ 2,602,981 | $ — | $ — | |||||
| Short Futures Contracts | $ (2,043,919) | $ — | $ — | |||||
AVIP Intech U.S. Low Volatility | StocCommonks*** | $ 661,154,979 | $ — | $ — | ||||
AVIP AB Relative Value | Common Stocks*** | $ 122,479,929 | $ — | $ — | ||||
AVIP iShares Managed Risk Balanced | Exchange Traded Funds | $ 577,305,731 | $ — | $ — | ||||
| Long Futures Contracts | $ 3,845,264 | $ — | $ — | |||||
| Short Futures Contracts | $ (1,775,859) | $ — | $ — | |||||
AVIP iShares Managed Risk Moderate Growth | Exchange Traded Funds | $ 490,300,413 | $ — | $ — | ||||
| Long Futures Contracts | $ 1,878,018 | $ — | $ — | |||||
| Short Futures Contracts | $ (1,415,199) | $ — | $ — | |||||
AVIP iShares Managed Risk Growth | Exchange Traded Funds | $ 431,079,544 | $ — | $ — | ||||
| Long Futures Contracts | $ 2,130,793 | $ — | $ — | |||||
| Short Futures Contracts | $ (1,250,130) | $ — | $ — | |||||
AVIP Moderately Conservative Model | Open-End Mutual Funds | $ 196,749,638 | $ — | $ — | ||||
AVIP Balanced Model | Open-End Mutual Funds | $ 776,778,297 | $ — | $ — | ||||
AVIP Moderate Growth Model | Open-End Mutual Funds | $1,481,685,134 | $ — | $ — |
176
(continued)
AuguStarSM Variable Insurance Products Fund, Inc.
| Notes to Financial Statements (Continued) | December 31, 2023 |
| Portfolio | Financial Instrument Type | Level 1 | Level 2 | Level 3 | ||||
AVIP Growth Model | Open-End Mutual Funds | $ 343,283,173 | $ — | $ — |
| *** | Each of the Portfolio's Schedules of Investments include detailed industry descriptions. |
Foreign Securities and Currency
The books and records of the Portfolios are maintained in U.S. dollars. All investments and cash quoted in foreign currencies are valued daily in U.S. dollars on the basis of the foreign currency exchange rates provided by an independent source. These exchange rates are determined daily at 4:00 pm Eastern Time for normal trading sessions. Purchases and sales of foreign-denominated investments are recorded at rates of exchange prevailing on the respective dates of such transactions.
The Fund may not fully isolate that portion of the results of operations resulting from changes in foreign exchange rates from fluctuations arising from changes in market prices on foreign currency-denominated investments. For the portion that is isolated, amounts are reflected in the Statements of Operations as other foreign currency related transactions. However, for tax purposes, the Fund does fully isolate the effect of fluctuations in foreign exchange rates when determining the gain or loss upon sale or maturity of such investments to the extent required by federal income tax regulations.
All Portfolios of the Fund may invest in securities of foreign issuers. The AVIP BlackRock Advantage International Equity Portfolio may be invested entirely in foreign securities. Investments in securities of foreign issuers, including investments in foreign companies through the use of depositary receipts, carry certain risks not ordinarily associated with investments in securities of domestic issuers. Such risks include future political and economic developments, and the possible imposition of exchange controls or other foreign governmental laws and restrictions. In addition, with respect to certain countries, there is the possibility of expropriation of assets, confiscatory taxation, political or social instability, or diplomatic developments that could adversely affect capital investment within those countries.
Restricted Securities
Restricted securities are typically those securities purchased through a private offering and cannot be resold to the general public without prior registration under the Securities Act of 1933 (“the 1933 Act”) or pursuant to the resale limitations provided by Rule 144A under the 1933 Act, or an exemption from the registration requirements of the 1933 Act. 144A securities are issued by corporations without registration in reliance on 1933 Act provisions allowing for the private resale of unregistered securities to qualified institutional buyers. Section 4(a)(2) commercial paper is issued pursuant to Section 4(a)(2) of the 1933 Act which exempts an issue from registration. This paper may be used to finance non-current transactions, such as acquisitions, stock repurchase programs, and other long-term assets. Investments by a Portfolio in Rule 144A and Section 4(a)(2) securities could have the effect of decreasing the liquidity of a Portfolio during any period in which qualified institutional investors were no longer interested in purchasing these securities.
Investment Transactions and Related Income
For financial reporting purposes, investment transactions are accounted for on a trade date (T+0) basis. For purposes of executing separate account shareholder transactions in the normal course of business, however, the Fund’s investment transactions are recorded no later than the first calculation on the first business day following the trade date (T+1), in accordance with Rule 2a-4 of the 40 Act. Accordingly, differences between the net asset values for financial reporting and for executing separate account shareholder transactions may arise.
Dividend income is recognized on the ex-dividend date, except in the case of those Portfolios holding foreign securities, in which dividends are recorded as soon after the ex-dividend date as the Fund’s information agents become aware of such dividends.
Interest income is accrued daily as earned and includes the amortization of premium and accretion of discount using the interest method. The period of amortization or accretion extends from the purchase date to the maturity date, except for securities that are purchased at a premium and have explicit, noncontingent call features, whereby the securities are callable at fixed prices and on pre-determined dates. The premium amounts related to those securities are generally amortized to the earliest call date. Net realized gain or loss on investments and foreign exchange transactions are determined using the specific identification method. Payments received for interest-only mortgage-backed securities are included in interest income. Because no principal is received at the maturity of an interest-only security, adjustments are made to the cost of the security until maturity. These adjustments are also included in interest income on the Statements of Operations.
177
(continued)
AuguStarSM Variable Insurance Products Fund, Inc.
| Notes to Financial Statements (Continued) | December 31, 2023 |
Distributions to Shareholders and Federal Taxes
The Fund may satisfy its distribution requirements, as required for each of the Portfolios to qualify as a regulated investment company pursuant to Subchapter M of the Internal Revenue Code by using consent dividends or cash distributions. Consent dividends, when authorized, become taxable to the Fund's shareholders as if they were paid in cash. The Fund has the intent to continue to comply with tax provisions pertaining to regulated investment companies and make distributions of taxable income sufficient to relieve it from substantially all federal income and excise taxes. As such, no provisions for federal income or excise taxes have been recorded. Also, no tax-related interest or penalties have been incurred or accrued. The Board's intent is that the Fund will not initiate any realized gain distributions until any applicable capital loss carryforwards have been offset.
The character of ordinary income distributions, realized capital gains distributions, and return of capital, if any, are determined in accordance with federal income tax regulations and may differ from net investment income and realized gains for financial reporting purposes. These “book/tax” differences are either considered temporary or permanent in nature. To the extent these differences are permanent in nature, they are reclassified within the composition of net assets; temporary differences do not require such reclassification. Distributions to shareholders that exceed taxable income and net taxable realized gains are reported as return of capital distributions.
The Fund’s management and its tax agent perform an affirmative evaluation of tax positions taken or expected to be taken in the course of preparing the Fund’s tax returns to determine whether it is more-likely-than-not (i.e. greater than 50-percent) that each tax position will be sustained upon examination by a taxing authority based on the technical merits of the position. Implementation of the evaluation included a review of tax positions taken in tax years that remain subject to examination by all major tax jurisdictions, including federal tax and the state of Maryland. The determination has been made that there are no uncertain tax positions that would require the Portfolios to record a tax liability or provision.
Expense Allocation
Expenses directly attributable to a Portfolio are charged to that Portfolio. Expenses that cannot be directly attributed to a Portfolio are allocated among all the benefited Portfolios on a basis of relative net assets or other appropriate method.
Foreign Withholding Taxes
Certain Portfolios in the Fund may be subject to taxes imposed by countries in which they invest with respect to their investments in issuers existing or operating in such countries. Such taxes are generally withheld based on income earned. These Portfolios accrue such taxes as the related income is earned.
TBA Commitments
To-Be-Announced (“TBA”) commitments are agreements for the purchase or sale of mortgage-backed securities for a fixed price, with payment and delivery on an agreed upon future settlement date beyond the customary settlement period for such securities. The specific securities to be delivered are not identified at the trade date. However, delivered securities must meet specified terms, including issuer, rate and term and be within industry-accepted “good delivery” standards. When entering into TBA commitments, a Portfolio may take possession of or deliver the underlying mortgage-backed securities but can extend the settlement or roll the transaction. TBA commitments involve a risk of loss if the value of the security to be purchased or sold declines or increases, respectively, prior to settlement date.
Mortgage Dollar Rolls
A Portfolio may enter into a mortgage dollar roll (“MDR”) transaction in which the Portfolio agrees to both sell and purchase a similar, but not identical, TBA mortgage-backed security with the same issuer, rate, and term on a later date at a set price. MDRs are treated as purchases and sales, which may have the effect of increasing portfolio turnover rates, and result in realized gains and losses based on the agreed-upon fixed prices.
Transition of LIBOR-linked Reference Rates
Certain Portfolios have fixed income instruments that recently transitioned from using reference rates that were directly or indirectly linked to a U.S. Dollar London Interbank Offered Rate (“LIBOR”) setting to determine payment obligations, financing terms, or investment values. The Portfolios may also have fixed income instruments with current fixed rates in which future scheduled variable rates are derived from a LIBOR rate that has yet to be transitioned by the issuer to an alternative representative reference rate. Not all existing LIBOR-based instruments may have alternative rate-setting provisions and some uncertainty remains
178
(continued)
AuguStarSM Variable Insurance Products Fund, Inc.
| Notes to Financial Statements (Continued) | December 31, 2023 |
regarding the willingness and ability of issuers to add future alternative rate-setting provisions. Parties to instruments that utilized LIBOR rates may disagree on transition rates or the application of applicable transition regulation, potentially resulting in uncertainty that could impact future performance and valuation of affected instruments.
Subsequent Events
Management has evaluated events and transactions through the date the financial statements were issued, for purposes of recognition or disclosure in these financial statements, and there are no subsequent events to report.
(3)Related Party and Other Transactions
The Fund has an Investment Advisory Agreement with ONI, a wholly-owned subsidiary of ALIC. Under the terms of this agreement, ONI provides portfolio management and investment advice to the Fund and administers its operations, subject to the supervision of the Board. This agreement is renewed annually upon the approval by the Board. As compensation for its services, ONI receives advisory fees from the Fund calculated on the basis of each Portfolio's average daily net assets and the following current schedule of Board-approved annualized fee breakpoints.
| AVIP Bond |
| 0.60% of first $100 million |
| 0.50% of next $150 million |
| 0.45% of next $250 million |
| 0.40% of next $500 million |
| 0.30% of next $1 billion |
| 0.25% over $2 billion |
| AVIP BlackRock Balanced Allocation |
| 0.58% of first $100 million |
| 0.50% of next $150 million |
| 0.45% of next $250 million |
| 0.40% of next $500 million |
| 0.30% of next $1 billion |
| 0.25% over $2 billion |
| AVIP BlackRock Advantage International Equity |
| 0.72% of first $200 million |
| 0.70% of next $800 million |
| 0.66% over $1 billion |
| AVIP Fidelity Institutional AM® Equity Growth1 |
| 0.68% of first $100 million |
| 0.65% over $100 million |
| AVIP AB Small Cap |
| 0.73% of first $400 million |
| 0.675% of next $200 million |
| 0.63% over $600 million |
| AVIP AB Mid Cap Core |
| 0.715% of first $100 million |
| 0.71% of next $200 million |
| 0.69% of next $200 million |
| 0.66% over $500 million |
| AVIP AB Risk Managed Balanced |
| 0.88% of first $500 million |
| 0.74% of next $1.3 billion |
| 0.72% over $1.8 billion |
| AVIP Federated Core Plus Bond |
| 0.56% of first $100 million |
| 0.54% of next $150 million |
| 0.50% of next $150 million |
| 0.45% of next $350 million |
| 0.43% over $750 million |
| AVIP Intech U.S. Low Volatility |
| 0.575% of first $500 million |
| 0.555% over $500 million |
| AVIP AB Relative Value |
| 0.65% of first $100 million |
| 0.61% of next $200 million |
| 0.59% over $300 million |
| AVIP iShares Managed Risk Balanced |
| 0.55% of first $1.5 billion |
| 0.53% over $1.5 billion |
| AVIP iShares Managed Risk Moderate Growth |
| 0.55% of first $1.5 billion |
| 0.53% over $1.5 billion |
| AVIP iShares Managed Risk Growth |
| 0.55% of first $1.5 billion |
| 0.53% over $1.5 billion |
| AVIP Model Portfolios |
| 0.40% of all net assets |
| AVIP S&P 500® Index |
| 0.40% of first $100 million |
| 0.35% of next $150 million |
| 0.33% over $250 million |
| AVIP BlackRock Advantage Large Cap Value |
| 0.67% of first $500 million |
| 0.65% over $500 million |
| AVIP Federated High Income Bond |
| 0.75% of first $75 million |
| 0.70% of next $75 million |
| 0.65% of next $75 million |
| 0.60% over $225 million |
| AVIP Nasdaq-100® Index |
| 0.40% of first $100 million |
| 0.35% of next $150 million |
| 0.33% over $250 million |
| AVIP BlackRock Advantage Large Cap Core |
| 0.64% of first $500 million |
| 0.62% over $500 million |
| AVIP BlackRock Advantage Small Cap Growth |
| 0.78% of first $100 million |
| 0.75% of next $400 million |
| 0.70% over $500 million |
| AVIP S&P MidCap 400® Index |
| 0.40% of first $100 million |
| 0.35% of next $150 million |
| 0.33% over $250 million |
| AVIP BlackRock Advantage Large Cap Growth |
| 0.66% of first $500 million |
| 0.64% over $500 million |
| 1 | At a meeting held on May 22, 2023, the Board, including a majority of the Directors who are not “interested persons” (the “Independent Directors”) of the Fund, approved an amendment to the Investment Advisory Agreement between the Fund and ONI and approved a new Sub-Advisory Agreement between ONI and FIAM LLC. Effective at the end of business on July 28, 2023, FIAM LLC became the sub-adviser to that Portfolio and the Portfolio’s investment strategy, as well as its advisory fee and sub-advisory fee structures, were revised as a result. On the same date, the Portfolio’s name was changed to ON Fidelity Institutional AM® Equity Growth Portfolio to reflect the change in sub-adviser. Prior to July 29, 2023, the Portfolio was named the ON Janus Henderson Forty Portfolio and its advisory fee breakpoints, based on the Portfolio's daily net assets, were 0.73% of the first $100 million, 0.68% the of next $400 million and 0.63% over $500 million. |
Under the Investment Advisory Agreement, the Fund authorizes ONI to retain sub-advisers for all Portfolios of the Fund, subject to the approval of the Board. ONI has entered into sub-advisory agreements to manage the investment of certain Portfolios’ assets, as detailed below, subject to the supervision of ONI.
179
(continued)
AuguStarSM Variable Insurance Products Fund, Inc.
| Notes to Financial Statements (Continued) | December 31, 2023 |
| AllianceBernsterin, L.P. ("AB") |
| AVIP AB Small Cap |
| AVIP AB Mid Cap Core |
| AVIP AB Risk Managed Balanced |
| AVIP AB Relative Value |
| BlackRock Investment Management, LLC ("BlackRock") |
| AVIP BlackRock Balanced Allocation |
| AVIP BlackRock Advantage International Equity |
| AVIP BlackRock Advantage Large Cap Value |
| AVIP BlackRock Advantage Large Cap Core |
| FIAM LLC ("FIAM") |
| AVIP Fidelity Institutional AM® Equity Growth |
| Geode Capital Management, LLC ("Geode") |
| AVIP S&P 500® Index |
| AVIP Nasdaq-100® Index |
| AVIP S&P MidCap 400® Index |
| Intech Investment Management LLC ("Intech") |
| AVIP Intech U.S. Low Volatility |
| BlackRock (continued) |
| AVIP BlackRock Advantage Small Cap Growth |
| AVIP BlackRock Advantage Large Cap Growth |
| AVIP iShares Managed Risk Balanced |
| AVIP iShares Managed Risk Moderate Growth |
| AVIP iShares Managed Risk Growth |
| Federated Investment Management Company ("Federated") |
| AVIP Federated High Income Bond |
| AVIP Federated Core Plus Bond |
The sub-advisers receive from ONI a sub-advisory fee calculated on the basis of average daily net assets and Board-approved schedules of annualized fee breakpoints.
BlackRock receives a sub-advisory fee from ONI on the aggregate average daily net assets of the AVIP BlackRock Advantage Large Cap Core Portfolio, AVIP BlackRock Advantage Large Cap Growth Portfolio, AVIP BlackRock Advantage Large Cap Value Portfolio, and the sub-advised equity sleeve of the AVIP BlackRock Balanced Allocation Portfolio. BlackRock also receives a sub-advisory fee from ONI on the aggregate average daily net assets of the AVIP iShares Managed Risk Portfolios.
Pursuant to a service agreement among ONI, ALIC, and the Fund, ALIC has agreed to provide personnel and facilities to ONI on a cost-reimbursement basis. These personnel members include officers of the Fund. ALIC also provides clerical and administrative services and such supplies and equipment as may be reasonably required in order for ONI to properly perform its advisory function pursuant to the Investment Advisory Agreement. ALIC further performs duties to fulfill the transfer agent function on behalf of the Fund. Performance of these duties by ALIC and availability of facilities, personnel, supplies, and equipment does not represent an expense to the Fund in excess of the advisory fees paid to ONI.
The Investment Advisory Agreement allows for a portion of the expenses related to ALIC's compliance and legal staff to be incurred by the Fund and paid from the Fund to ONI. Pursuant to the service agreement among ONI, ALIC, and the Fund, ALIC has provided the personnel, services, and equipment necessary for the execution of the Fund’s regulation-mandated compliance functions and ONI has reimbursed ALIC for those costs allocated to the Fund. For the year ended December 31, 2023, the Fund incurred compliance expenses totaling $256,500, which are allocated to the Portfolios by equal dollar amounts on a daily basis. Expenses incurred by the Portfolios are reflected on the Statements of Operations as “Compliance expense”.
Pursuant to the Investment Advisory Agreement between ONI and the Fund, if the total expenses applicable to any Portfolio during any calendar quarter (excluding taxes, brokerage commissions, interest expense and management fees) exceed 1%, on an annualized basis, evaluated quarterly, of such Portfolio’s average daily net asset value, ONI will reimburse the Portfolio for such excess expenses. There were no expense reimbursements associated with this agreement during the year ended December 31, 2023.
Through Operating Expense Limitation Agreements, ONI has contractually agreed to reimburse the Fund to the extent that the annual ordinary operating expenses of the AVIP Model Portfolios, excluding: portfolio transaction and other investment related costs (including brokerage fees and commissions); taxes; borrowing costs (such as interest and dividend expenses on securities sold short); fees and expenses associated with investments in derivative instruments (including for example option and swap fees and expenses); any amounts payable pursuant to a distribution or service plan adopted in accordance with Rule 12b-1 under the 40 Act; any administrative and/or shareholder servicing fees payable pursuant to a plan approved by the Board; expenses incurred in connection with any merger or reorganization; extraordinary expenses (such as litigation expenses, indemnification of Fund officers and Directors and contractual indemnification of Portfolio service providers); and other expenses that the Directors agree have not been incurred in the ordinary course of the Portfolio’s business, exceed certain percentages of the average daily net assets.
Expense limitations under the current Investment Advisory Agreement and prior Operating Expense Limitation Agreements, stated as percentages of the average daily net assets of the four AVIP Model Portfolios, where applicable, are as follows:
| Portfolio | May 1, 2023 to April 30, 2024 | May 1, 2022 to April 30, 2023 | May 1, 2021 to April 30, 2022 | |||
AVIP Moderately Conservative Model | 1.00% | 1.00% | 1.00% | |||
AVIP Balanced Model | 1.00% | 1.00% | 1.00% |
180
(continued)
AuguStarSM Variable Insurance Products Fund, Inc.
| Notes to Financial Statements (Continued) | December 31, 2023 |
| Portfolio | May 1, 2023 to April 30, 2024 | May 1, 2022 to April 30, 2023 | May 1, 2021 to April 30, 2022 | |||
AVIP Moderate Growth Model | * | 1.07% | 1.07% | |||
AVIP Growth Model | * | 1.14% | 1.14% |
*No limitation for this period
For purposes of calculating the expenses subject to the Operating Expense Limitation Agreement, the annual operating expenses are those as presented pursuant to the Fund's prospectus requirements. The prospectus presentation of Fund expenses includes Acquired Fund Fees and Expenses, which is a calculation of the indirect costs associated with the Portfolios' underlying investments in other investment companies. The current Operating Expense Limitation Agreement will continue through April 30, 2024 and may only be terminated with the consent of the Board.
Under the terms of the current Operating Expense Limitation Agreement and prior Operating Expense Limitation Agreements, ONI is entitled to recover expenses waived or reimbursed for a period of up to three years from the date on which ONI reimbursed excess expenses. No recoupment will occur unless a Portfolio's operating expenses are below the expense limitation amount in effect at the time of the waiver or reimbursement and the Portfolio's current expense limitation. For the year ended December 31, 2023, ONI recouped previously reimbursed expenses from the AVIP Moderately Conservative and AVIP Balanced Model Portfolios amounting to $5,000 and $234,000, respectively. These recouped expenses were related to expenses reimbursed by ONI during the periods May 1, 2019 to April 30, 2020 and May 1, 2020 to April 30, 2021. For the year ended December 31, 2022, ONI recouped previously reimbursed expenses from the AVIP Moderately Conservative and AVIP Balanced Model Portfolios amounting to $25,600 and $157,500, respectively. These recouped expenses were related to expenses reimbursed by ONI during the periods May 1, 2018 to April 30, 2019 and May 1, 2019 to April 30, 2020. There were no reimbursed expenses under the current Operating Expense Limitation Agreement for the year ended December 31, 2023 or the year ended December 31, 2022.
Amounts of expenses, previously reimbursed by ONI under the current Operating Expense Limitation Agreement and prior Operating Expense Limitation Agreements that are available for future recoupments at December 31, 2023 are as follows:
| Portfolio | Expire April 30, 2024 | |
AVIP Moderately Conservative Model | $174,635 | |
AVIP Balanced Model | $237,376 |
The Fund, along with ALIC, NSLA and certain variable separate account entities affiliated with ALIC and NSLA, was a party to an application filed with the SEC for an order of approval pursuant to Section 26(c), and an order of exemption pursuant to Section 17(b) of the 40 Act. In the application, those entities proposed to substitute shares of certain unaffiliated underlying funds currently available under certain variable contracts (the "Substitution 1 Unaffiliated Funds") for shares of different underlying funds (the "Substitution 1 Replacement AuguStarSM Variable Insurance Products Fund Portfolios"). The entities also requested permission to carry out in-kind security transfers in order to execute certain of the proposed substitution transactions. The proposed substitution transactions that affected the Fund were:
| Substitution 1 Unaffiliated Funds | Substitution 1 Replacement AuguStarSM Variable Insurance Products Fund Portfolios | |
| Morgan Stanley VIF Core Plus Fixed Income Portfolio (Class II) | AVIP Federated Core Plus Bond Portfolio | |
| PIMCO Total Return Portfolio (Administrative Share Class) | AVIP Federated Core Plus Bond Portfolio | |
| Janus Henderson VIT U.S. Low Volatility Portfolio (Service Shares) | AVIP Intech U.S. Low Volatility Portfolio | |
| Federated Hermes Managed Volatility Fund II (Primary Shares and Service Shares) | AVIP iShares Managed Risk Balanced Portfolio |
On May 4, 2021, the application for the substitution transactions and in-kind transfers was approved by the SEC. The substitution transactions were effected on June 25, 2021 (the "Substitution Date") via cash redemptions of the Substitution 1 Unaffiliated Funds and cash subscriptions to the Substitution 1 Replacement AuguStarSM Variable Insurance Products Fund Portfolios, with the exception of the transaction involving the AVIP Intech U.S. Low Volatility Portfolio. The substitution transaction involving that Portfolio was executed as an in-kind transfer of securities from the related Substitution 1 Unaffiliated Fund. The cost basis of each security transferred in-kind to the AVIP Intech U.S. Low Volatility Portfolio was the fair value of that security, valued at the relevant active market exchange close price at the end of the Substitution Date. In conjunction with the substitution transactions, ONI entered into expense limitation agreements with certain of the affected Portfolios whereby, for a period of two years following the
181
(continued)
AuguStarSM Variable Insurance Products Fund, Inc.
| Notes to Financial Statements (Continued) | December 31, 2023 |
Substitution Date, the annual net operating expenses of the applicable Substitution 1 Replacement AuguStarSM Variable Insurance Products Fund Portfolios would not exceed the annual net operating expenses of the related Substitution 1 Unaffiliated Fund for the fiscal year ended December 31, 2019. On June 25, 2023, two years after the Substitution Date, this set of expense limitations expired with no related reimbursement of expenses by ONI.
ALIC, NSLA, and certain variable separate account entities affiliated with ALIC and NSLA were parties to a correspondence letter filed with the SEC on March 28, 2022, which described the intent of those entities to execute a substitution of investment option pursuant to Commission Statement on Insurance Product Fund Substitution Applications, Release No. IC-34199. As outlined in the correspondence letter, those entities substituted shares of an unaffiliated fund available under certain variable contracts for shares of an affiliated fund option. In the substitution, each of ALIC and NSLA exercised its contractual rights to substitute shares of Franklin Multi-Asset Dynamic Multi-Strategy VIT (Class I) (the "Existing Portfolio"), an external fund not affiliated with the Fund, with shares of AVIP AB Risk Managed Balanced Portfolio. The substitution transactions occurred as cash redemptions of the Existing Portfolio's shares and cash subscriptions to the AVIP AB Risk Managed Balanced Portfolio’s shares on May 20, 2022.
In conjunction with the substitution transactions, the Fund entered into an expense limitation agreement with ONI, whereby, for a period of two years following the effective date of the substitution, the annual net operating expenses of the AVIP AB Risk Managed Balanced Portfolio will not exceed 1.01% (the annual net operating expenses of the Existing Portfolio for the fiscal year ended December 31, 2021), stated as an annualized ratio of the AVIP AB Risk Managed Balanced Portfolio’s total fund expenses as a percent of its average net assets.
ALIC, NSLA, and certain variable separate account entities affiliated with ALIC and NSLA were parties to a correspondence letter filed with the SEC on July 22, 2022, which described the intent of those entities to execute a substitution of investment options pursuant to Commission Statement on Insurance Product Fund Substitution Applications, Release No. IC-34199. As outlined in the correspondence letter, those entities substituted shares of certain unaffiliated funds (the “Substitution 3 Unaffiliated Funds”) currently available under certain variable contracts for shares of different affiliated fund options (the “Substitution 3 Replacement AuguStarSM Variable Insurance Products Fund Portfolios”). The substitution transactions were:
| Substitution 3 Unaffiliated Funds | Substitution 3 Replacement AuguStarSM Variable Insurance Products Fund Portfolios | |
| Fidelity ® VIP Contrafund® Portfolio (Service Class 2) | AVIP BlackRock Advantage Large Cap Growth Portfolio | |
| TOPS ® Managed Risk Balanced ETF Portfolio (Class 2 and Class 3 Shares) | AVIP iShares Managed Risk Balanced Portfolio | |
| TOPS ® Managed Risk Moderate Growth ETF Portfolio (Class 2 and Class 3 Shares) | AVIP iShares Managed Risk Moderate Growth Portfolio | |
| TOPS ® Managed Risk Growth ETF Portfolio (Class 2 and Class 3 Shares) | AVIP iShares Managed Risk Growth Portfolio |
The substitution transactions occurred as cash redemptions of each Substitution 3 Unaffiliated Fund's shares and cash subscriptions of each Substitution 3 Replacement AuguStarSM Variable Insurance Products Fund Portfolio's shares on October 14, 2022. In conjunction with the substitution transactions, ONI entered into expense limitation agreements with the Substitution 3 Replacement AuguStarSM Variable Insurance Products Fund Portfolios whereby, for a period of two years following the effective date of the substitution, the annual net operating expenses for each applicable Substitution 3 Replacement AuguStarSM Variable Insurance Products Fund Portfolio will not exceed the annual net operating expenses of the related Substitution 3 Unaffiliated Fund for the fiscal year ended December 31, 2021. The net operating expense limitation for each Substitution 3 Replacement AuguStarSM Variable Insurance Products Fund Portfolio, stated as a percent of average net assets, are as follows:
| Portfolio | Expense Limitation | |
AVIP BlackRock Advantage Large Cap Growth | 0.85% | |
AVIP iShares Managed Risk Balanced | 0.75% | |
AVIP iShares Managed Risk Moderate Growth | 0.74% | |
AVIP iShares Managed Risk Growth | 0.74% |
ALIC, NSLA, and certain variable separate account entities affiliated with ALIC and NSLA were parties to a correspondence letter filed with the SEC on July 10, 2023, which described the intent of those entities to execute a substitution of investment options pursuant to Commission Statement on Insurance Product Fund Substitution Applications, Release No. IC-34199. As outlined in the
182
(continued)
AuguStarSM Variable Insurance Products Fund, Inc.
| Notes to Financial Statements (Continued) | December 31, 2023 |
correspondence letter, those entities substituted shares of certain unaffiliated funds (the “Substitution 4 Unaffiliated Funds”) currently available under certain variable contracts for shares of different affiliated fund options (the “Substitution 4 Replacement AuguStarSM Variable Insurance Products Fund Portfolios”). The substitution transactions were:
| Substitution 4 Unaffiliated Funds | Substitution 4 Replacement AuguStarSM Variable Insurance Products Fund Portfolios | |
| PSF PGIM Jennison Focused Blend Portfolio (Class II) | AVIP Fidelity Institutional AM® Equity Growth Portfolio | |
| Goldman Sachs Large Cap Value Fund (Institutional Shares and Service Shares) | AVIP S&P 500® Index Portfolio | |
| PSF PGIM Jennison Growth Portfolio (Class II) | AVIP BlackRock Advantage Large Cap Growth Portfolio | |
| LVIP JPMorgan Mid Cap Value Fund (Standard Class) | AVIP S&P MidCap 400® Index Portfolio | |
| Allspring VT Discovery SMID Cap Growth Fund (Class 2) | AVIP S&P MidCap 400® Index Portfolio | |
| Invesco V.I. Balanced-Risk Allocation Fund (Series II) | AVIP AB Risk Managed Balanced Portfolio | |
| Western Asset Core Plus VIT Portfolio (Class II) | AVIP Federated Core Plus Bond Portfolio |
The substitution transactions occurred as cash redemptions of each Substitution 4 Unaffiliated Fund's shares and cash subscriptions of each Substitution 4 Replacement AuguStarSM Variable Insurance Products Fund Portfolio's shares on August 25, 2023. In conjunction with the substitution transactions, ONI entered into expense limitation agreements with the Substitution 4 Replacement AuguStarSM Variable Insurance Products Fund Portfolios whereby, for a period of two years following the effective date of the substitution, the annual net operating expenses for each applicable Substitution 4 Replacement AuguStarSM Variable Insurance Products Fund Portfolio will not exceed the annual net operating expenses of the related Substitution 4 Unaffiliated Fund for the fiscal year ended December 31, 2022. The net operating expense limitation for each Substitution 4 Replacement AuguStarSM Variable Insurance Products Fund Portfolio, stated as a percent of average net assets, are as follows:
| Portfolio | Expense Limitation | |
AVIP Fidelity Institutional AM® Equity Growth | 1.26% | |
AVIP S&P 500® Index Portfolio | 0.71% | |
AVIP S&P MidCap 400® Index | 0.73% | |
AVIP BlackRock Advantage Large Cap Growth | 1.02% | |
AVIP AB Risk Managed Balanced | 1.13% | |
AVIP Federated Core Plus Bond | 0.76% |
There were no recorded liabilities related to any of the aforementioned expense limitation agreements at December 31, 2023 or any related reimbursement of expenses for the year ended December 31, 2023.
For the year ended December 31, 2023, each Director was compensated based on an annual retainer fee of $165,000, paid quarterly. The Board chair received an additional quarterly retainer fee of $5,000, and the Audit Committee chair received an additional quarterly retainer fee of $2,500; each paid quarterly. For the year ended December 31, 2023, Directors’ compensation and reimbursement of expenses by the Portfolios of the Fund totaled $878,368.
The accounting agent and custodian for the Fund is State Street Bank (Boston, MA). For assets held outside of the United States, State Street Bank utilizes a foreign sub-custodian network that is subject to oversight and periodic approval of the Board.
Affiliated Cross-Trades
The Fund is permitted to purchase from, or sell securities to, other funds or accounts managed by ONI or the Sub-Advisers in accordance with Rule 17a-7 of the 40 Act and the Fund’s Policy Regarding Portfolio Cross Transactions, which has been approved by the Board. Rule 17a-7 and the Fund’s policy were designed to ensure that any trades between the Fund and an affiliated fund or account ("cross-trades") are effected at the then-current market price and exclude broker commissions or other compensatory fees.
For the year ended December 31, 2023, the Fund engaged in the following affiliated cross-trades:
| Portfolio | Purchases | Sales | Realized gain (loss) | |||
AVIP Fidelity Institutional AM® Equity Growth | $3,291,090 | $801,734 | $5,370 |
183
(continued)
AuguStarSM Variable Insurance Products Fund, Inc.
| Notes to Financial Statements (Continued) | December 31, 2023 |
(4)Capital Share Transactions
Capital share transactions for the year ended December 31, 2023, and the year ended December 31, 2022, respectively, were as follows:
| AVIP Bond | AVIP BlackRock Balanced Allocation | AVIP BlackRock Advantage International Equity | |||||||||
| Year Ended | Year Ended | Year Ended | Year Ended | Year Ended | Year Ended | ||||||
| December 31, 2023 | December 31, 2022 | December 31, 2023 | December 31, 2022 | December 31, 2023 | December 31, 2022 | ||||||
Capital shares issued on sales | 1,259,723 | 2,201,770 | 480,921 | 1,167,771 | 883,221 | 1,210,528 | |||||
Capital shares issued on reinvested distributions | 441,835 | 528,633 | 231,891 | 3,284,285 | 880,383 | 5,141,518 | |||||
Capital shares redeemed | (2,126,271) | (2,991,069) | (3,326,007) | (2,150,462) | (5,063,296) | (7,253,319) | |||||
Net increase (decrease) | (424,713) | (260,666) | (2,613,195) | 2,301,594 | (3,299,692) | (901,273) | |||||
| AVIP Fidelity Institutional AM® Equity Growth | AVIP AB Small Cap | AVIP AB Mid Cap Core | |||||||||
| Year Ended | Year Ended | Year Ended | Year Ended | Year Ended | Year Ended | ||||||
| December 31, 2023 | December 31, 2022 | December 31, 2023 | December 31, 2022 | December 31, 2023 | December 31, 2022 | ||||||
Capital shares issued on sales | 42,248,905 | 1,327,545 | 846,860 | 703,232 | 177,293 | 240,928 | |||||
Capital shares issued on reinvested distributions | 7,778,623 | 47,838,024 | — | 6,990,052 | 13,410 | 1,485,148 | |||||
Capital shares redeemed | (9,594,793) | (15,983,038) | (2,138,098) | (969,014) | (538,919) | (309,931) | |||||
Net increase (decrease) | 40,432,735 | 33,182,531 | (1,291,238) | 6,724,270 | (348,216) | 1,416,145 | |||||
| AVIP S&P 500® Index | AVIP BlackRock Advantage Large Cap Value | AVIP Federated High Income Bond | |||||||||
| Year Ended | Year Ended | Year Ended | Year Ended | Year Ended | Year Ended | ||||||
| December 31, 2023 | December 31, 2022 | December 31, 2023 | December 31, 2022 | December 31, 2023 | December 31, 2022 | ||||||
Capital shares issued on sales | 3,848,159 | 3,047,516 | 415,564 | 285,237 | 493,699 | 273,983 | |||||
Capital shares issued on reinvested distributions | 1,685,082 | 4,222,467 | 356,797 | 3,861,394 | 404,830 | 440,246 | |||||
Capital shares redeemed | (6,397,100) | (4,563,380) | (1,772,857) | (5,728,349) | (1,202,913) | (1,723,136) | |||||
Net increase (decrease) | (863,859) | 2,706,603 | (1,000,496) | (1,581,718) | (304,384) | (1,008,907) | |||||
| AVIP Nasdaq-100® Index | AVIP BlackRock Advantage Large Cap Core | AVIP BlackRock Advantage Small Cap Growth | |||||||||
| Year Ended | Year Ended | Year Ended | Year Ended | Year Ended | Year Ended | ||||||
| December 31, 2023 | December 31, 2022 | December 31, 2023 | December 31, 2022 | December 31, 2023 | December 31, 2022 | ||||||
Capital shares issued on sales | 1,446,326 | 2,158,412 | 262,682 | 410,551 | 548,707 | 557,869 | |||||
Capital shares issued on reinvested distributions | 1,373,338 | 5,870,436 | 144,929 | 3,581,520 | — | 2,601,783 | |||||
Capital shares redeemed | (4,601,601) | (3,768,108) | (2,289,703) | (1,578,057) | (1,522,104) | (1,023,579) | |||||
Net increase (decrease) | (1,781,937) | 4,260,740 | (1,882,092) | 2,414,014 | (973,397) | 2,136,073 | |||||
184
(continued)
AuguStarSM Variable Insurance Products Fund, Inc.
| Notes to Financial Statements (Continued) | December 31, 2023 |
| AVIP S&P MidCap 400® Index | AVIP BlackRock Advantage Large Cap Growth | AVIP AB Risk Managed Balanced | |||||||||
| Year Ended | Year Ended | Year Ended | Year Ended | Year Ended | Year Ended | ||||||
| December 31, 2023 | December 31, 2022 | December 31, 2023 | December 31, 2022 | December 31, 2023 | December 31, 2022 | ||||||
Capital shares issued on sales | 9,740,582 | 3,188,763 | 5,715,104 | 52,373,466 | 24,878,946 | 70,287,422 | |||||
Capital shares issued on reinvested distributions | 1,325,429 | 3,203,958 | 412,755 | 4,745,946 | 989,598 | 4,048,639 | |||||
Capital shares redeemed | (4,448,554) | (3,327,876) | (11,451,146) | (2,485,545) | (17,105,486) | (10,586,383) | |||||
Net increase (decrease) | 6,617,457 | 3,064,845 | (5,323,287) | 54,633,867 | 8,763,058 | 63,749,678 | |||||
| AVIP Federated Core Plus Bond | AVIP Intech U.S. Low Volatility | AVIP AB Relative Value | |||||||||
| Year Ended | Year Ended | Year Ended | Year Ended | Year Ended | Year Ended | ||||||
| December 31, 2023 | December 31, 2022 | December 31, 2023 | December 31, 2022 | December 31, 2023 | December 31, 2022 | ||||||
Capital shares issued on sales | 10,380,878 | 8,774,734 | 3,272,998 | 1,423,502 | 616,649 | 7,638,051 | |||||
Capital shares issued on reinvested distributions | 1,563,161 | 1,057,582 | 805,876 | 2,456,090 | 133,684 | 9,777 | |||||
Capital shares redeemed | (9,855,471) | (16,942,786) | (14,467,474) | (18,368,512) | (1,764,060) | (2,505,418) | |||||
Net increase (decrease) | 2,088,568 | (7,110,470) | (10,388,600) | (14,488,920) | (1,013,727) | 5,142,410 | |||||
| AVIP iShares Managed Risk Balanced | AVIP iShares Managed Risk Moderate Growth | AVIP iShares Managed Risk Growth | |||||||||
| Year Ended | Year Ended | Year Ended | Period from October 14, 2022 (inception) to | Year Ended | Period from October 14, 2022 (inception) to | ||||||
| December 31, 2023 | December 31, 2022 | December 31, 2023 | December 31, 2022 | December 31, 2023 | December 31, 2022 | ||||||
Capital shares issued on sales | 1,384,998 | 38,358,228 | 1,689,959 | 48,599,284 | 1,317,313 | 42,118,412 | |||||
Capital shares issued on reinvested distributions | 688,292 | 395,169 | — | — | — | — | |||||
Capital shares redeemed | (12,683,920) | (7,250,837) | (7,550,750) | (2,223,894) | (6,484,962) | (1,869,205) | |||||
Net increase (decrease) | (10,610,630) | 31,502,560 | (5,860,791) | 46,375,390 | (5,167,649) | 40,249,207 | |||||
| AVIP Moderately Conservative Model | AVIP Balanced Model | AVIP Moderate Growth Model | |||||||||
| Year Ended | Year Ended | Year Ended | Year Ended | Year Ended | Year Ended | ||||||
| December 31, 2023 | December 31, 2022 | December 31, 2023 | December 31, 2022 | December 31, 2023 | December 31, 2022 | ||||||
Capital shares issued on sales | 472,694 | 1,504,508 | 1,396,393 | 1,082,295 | 1,460,234 | 3,018,771 | |||||
Capital shares issued on reinvested distributions | 1,550,089 | 1,829,040 | 8,515,020 | 9,039,322 | 20,531,383 | 19,300,790 | |||||
Capital shares redeemed | (4,170,427) | (3,854,482) | (11,815,189) | (12,520,197) | (18,442,948) | (19,035,536) | |||||
Net increase (decrease) | (2,147,644) | (520,934) | (1,903,776) | (2,398,580) | 3,548,669 | 3,284,025 | |||||
| AVIP Growth Model | |||
| Year Ended | Year Ended | ||
| December 31, 2023 | December 31, 2022 | ||
Capital shares issued on sales | 316,085 | 533,307 | |
Capital shares issued on reinvested distributions | 5,576,790 | 5,185,557 | |
Capital shares redeemed | (4,293,218) | (3,333,707) | |
Net increase (decrease) | 1,599,657 | 2,385,157 | |
185
(continued)
AuguStarSM Variable Insurance Products Fund, Inc.
| Notes to Financial Statements (Continued) | December 31, 2023 |
(5)Investment Transactions
Cost of purchases and proceeds from sales of investments (excluding short-term and government securities) for the year ended December 31, 2023 were as follows:
| AVIP Bond | AVIP BlackRock Balanced Allocation | AVIP BlackRock Advantage International Equity | AVIP Fidelity Institutional AM® Equity Growth | AVIP AB Small Cap | |||||
Cost of purchases | $40,457,645 | $258,268,573 | $523,386,313 | $120,095,424 | $67,589,220 | ||||
Proceeds from sales | $25,043,491 | $344,709,985 | $577,423,381 | $ 69,631,789 | $81,480,464 |
| AVIP AB Mid Cap Core | AVIP S&P 500® Index | AVIP BlackRock Advantage Large Cap Value | AVIP Federated High Income Bond | AVIP Nasdaq-100® Index | |||||
Cost of purchases | $35,641,625 | $127,641,682 | $178,175,410 | $17,786,231 | $51,892,669 | ||||
Proceeds from sales | $44,525,580 | $188,178,362 | $198,413,922 | $26,475,594 | $97,518,926 |
| AVIP BlackRock Advantage Large Cap Core | AVIP BlackRock Advantage Small Cap Growth | AVIP S&P MidCap 400® Index | AVIP BlackRock Advantage Large Cap Growth | AVIP AB Risk Managed Balanced | |||||
Cost of purchases | $259,714,342 | $45,332,142 | $257,135,071 | $410,452,026 | $1,410,950,807 | ||||
Proceeds from sales | $314,361,824 | $63,263,567 | $145,966,919 | $452,107,695 | $1,442,965,762 |
| AVIP Federated Core Plus Bond | AVIP Intech U.S. Low Volatility | AVIP AB Relative Value | AVIP iShares Managed Risk Balanced | AVIP iShares Managed Risk Moderate Growth | |||||
Cost of purchases | $126,751,360 | $380,163,874 | $84,974,207 | $16,782,205 | $20,554,048 | ||||
Proceeds from sales | $ 67,827,277 | $485,686,158 | $96,066,425 | $57,455,868 | $18,508,974 |
| AVIP iShares Managed Risk Growth | AVIP Moderately Conservative Model | AVIP Balanced Model | AVIP Moderate Growth Model | AVIP Growth Model | |||||
Cost of purchases | $11,523,045 | $16,741,384 | $ 70,457,402 | $129,582,698 | $27,646,149 | ||||
Proceeds from sales | $27,126,104 | $49,343,606 | $158,679,247 | $272,287,570 | $62,762,606 |
Cost of purchases and proceeds from sales of government securities for the year ended December 31, 2023 were as follows:
| AVIP Bond | AVIP BlackRock Balanced Allocation | AVIP AB Risk Managed Balanced | AVIP Federated Core Plus Bond | ||||
Cost of purchases | $ 4,751,563 | $10,540,625 | $224,514,701 | $ 68,005,436 | |||
Proceeds from sales | $23,016,445 | $ 3,396,953 | $100,865,565 | $109,676,260 |
(6)Financial Instruments
The Portfolios may trade in financial instruments with off-balance sheet risk for hedging purposes or, otherwise, in accordance with stated investment objectives. These financial instruments may include options, futures, and foreign currency contracts that may involve, to a varying degree, elements of risk in excess of the amounts recognized on financial statements.
Options
A Portfolio may buy call and put options. In purchasing call options, a Portfolio pays the seller of the call option a premium for the right of the Portfolio to buy the underlying securities from the seller at a specified exercise price prior to the expiration of the option. In purchasing put options, a Portfolio pays the seller of the put option a premium for the right of the Portfolio to sell the underlying securities to the seller at a specified exercise price prior to the expiration of the option. In order to terminate its position as the purchaser of an option, the Portfolio may enter into a “closing” transaction, which is the sale of an option on the same underlying securities and having the same exercise price and expiration date as the option previously purchased by the Portfolio.
186
(continued)
AuguStarSM Variable Insurance Products Fund, Inc.
| Notes to Financial Statements (Continued) | December 31, 2023 |
When a Portfolio purchases a put or call option, an amount equal to the premium paid is included on the Portfolio’s Statement of Assets and Liabilities as an investment, and is subsequently marked-to-market to reflect the current market value of the option. If an option expires on the stipulated expiration date or if the Portfolio enters into a closing sale transaction, a gain or loss is realized. If a Portfolio exercises a call option on an individual security, the cost of the security acquired is increased by the premium paid for the call. If the Portfolio exercises a put option on an individual security, a gain or loss is realized from the sale of the underlying security, and the proceeds from such a sale are decreased by the premium originally paid. If the Portfolio exercises a put option on a security index, a gain or loss is realized as determined by the premium originally paid, the exercise price and the market value of the index.
The AVIP AB Risk Managed Balanced Portfolio held previously purchased call and put options associated with the S&P 500® Index or related exchange traded fund during the year ended December 31, 2023. These instruments were used by the Risk Management Component of the Portfolio to provide for the Portfolio’s stated risk management strategy. Transactions involving purchased options by the AVIP AB Risk Managed Balanced Portfolio for the year ended December 31, 2023 were: Cost of purchases: $69.8 million, Proceeds from sales: $50.6 million.
Purchased options are non-income producing securities.
Futures Contracts
A Portfolio may buy or sell futures contracts relating to stock indices, foreign currencies, or interest rates. Stock index futures contracts are contracts developed by and traded on national commodity exchanges whereby the buyer will, on a specified future date, pay or receive a final cash payment equal to the difference between the actual value of the stock index on the last day of the contract and the value of the stock index established by the contract multiplied by the specific dollar amount set by the exchange. Futures contracts may be based on broad-based stock indices such as the S&P 500® Index or on narrow-based stock indices. A particular index will be selected according to ONI’s investment strategy for the particular Portfolio. Foreign currency futures contracts are contracts traded on commodity exchanges whereby the buyer will, on a specified future date, pay or receive a final cash payment equal to the difference between the value of a stated foreign currency in relation to the U.S dollar, or other currency, on the last day of the contract and the relative value of those currencies on the date of executing the contract. Foreign currency futures may be valued by exchange rates that are based on the relative value of a variety of foreign currencies. An interest rate futures contract is an agreement whereby one party agrees to sell and another party agrees to purchase a specified amount of a specified financial instrument (debt security) at a specified price at a specified date, time and place. Although interest rate futures contracts typically require actual future delivery of, and payment for, financial instruments, the contracts are usually closed out before the delivery date. A public market exists in interest rate futures contracts covering primarily the following financial instruments: U.S. Treasury bonds; U.S. Treasury notes; Government National Mortgage Association ("GNMA") modified pass-through mortgage-backed securities; three-month U.S. Treasury bills; 90-day commercial paper; bank certificates of deposit; and Eurodollar certificates of deposit. U.S. futures contracts are traded on exchanges which have been designated “contract markets” by the Commodities Futures Trading Commission (“CFTC”) and must be executed through a futures commission merchant (“FCM”), or brokerage firm, which is a member of the relevant contract market.
The Fund, on behalf of each Portfolio, has filed with the National Futures Association, a notice claiming an exclusion from the definition of the term “commodity pool operator” under the Commodity Exchange Act, as amended, and the rules of the CFTC promulgated thereunder, with respect to each Portfolio's operation. Accordingly, the Portfolios are not subject to registration or regulation as a commodity pool operator.
The buyer or seller of a futures contract is not required to deliver or pay for the underlying instrument unless the contract is held until the delivery date. However, both the buyer and seller are required to deposit “initial margin” for the benefit of the broker when the contract is entered into. Initial margin deposits are equal to a percentage of the contract's value, as set by the exchange on which the contract is traded, and are similar to good faith deposits or performance bonds.
Unlike margin extended by a securities broker, initial margin payments do not constitute purchasing securities on margin for purposes of a Portfolio’s investment limitations. A Portfolio, its futures commission merchant and the Custodian retain control of the initial margin until the contract is liquidated. If the value of either party's position declines, the party on the side of the declining position will be required to make additional “variation margin” payments to settle the change in value on a daily basis. The party that has a gain may be entitled to receive all or a portion of this amount. Variation margin is recognized as a receivable and/or payable for variation margin on futures contracts on the Statement of Assets and Liabilities. In the event of a bankruptcy of the FCM that holds margin on behalf of a Portfolio, the Portfolio may be entitled to return of margin owed to the Portfolio only in proportion to the amount received by the FCM’s other customers. ONI and the sub-advisers will attempt to minimize this risk by carefully monitoring the creditworthiness of the FCMs with which the Portfolios do business.
187
(continued)
AuguStarSM Variable Insurance Products Fund, Inc.
| Notes to Financial Statements (Continued) | December 31, 2023 |
Portions of certain Portfolios’ securities and cash holdings, as noted on those Portfolios’ Schedules of Investments, were pledged at December 31, 2023 as collateral for the Portfolios’ futures contracts. Cash holdings pledged are noted as "Cash subject to usage restrictions" on the Statements of Assets and Liabilities. The futures contracts, except those held by the AVIP AB Risk Managed Balanced, AVIP Federated Core Plus Bond, and AVIP iShares Managed Risk Portfolios, were used for the purpose of gaining equity exposure for cash and cash equivalents, thereby seeking to lessen a performance difference between the Portfolios and their respective benchmark indices. For the AVIP AB Risk Managed Balanced and AVIP iShares Managed Risk Portfolios, futures contracts were used to provide for the Portfolios' respective stated risk management strategies. For the AVIP Federated Core Plus Bond Portfolio, futures contracts were used to manage total exposure to underlying investments, to manage interest rate risk, or to otherwise execute the Portfolio's stated investment strategy. There were other futures contracts executed and closed in the Portfolios during the year ended December 31, 2023. Those contracts were executed for similar purposes as the contracts outstanding at December 31, 2023. For the year ended December 31, 2023, the notional values of futures contracts opened and closed prior to contract settlement date by the Portfolios were as follows:
| Portfolio | Collateral Pledged | Futures Contracts Opened (in millions) | Futures Contracts Closed (in millions) | |||
AVIP BlackRock Balanced Allocation | Portions of cash holdings | $ 74.0 | $ 73.9 | |||
AVIP BlackRock Advantage International Equity | Portions of cash holdings | 92.2 | 91.3 | |||
AVIP AB Mid Cap Core | Portions of cash holdings | — | 0.3 | |||
AVIP S&P 500® Index | Portions of securities | 193.6 | 202.5 | |||
AVIP BlackRock Advantage Large Cap Value | Portions of cash holdings | 39.4 | 39.4 | |||
AVIP Nasdaq-100® Index | Portions of cash holdings and securities | 49.6 | 49.6 | |||
AVIP BlackRock Advantage Large Cap Core | Portions of cash holdings | 70.8 | 70.8 | |||
AVIP BlackRock Advantage Small Cap Growth | Portions of cash holdings | 41.0 | 41.6 | |||
AVIP S&P MidCap 400® Index | Portions of cash holdings and securities | 81.2 | 80.8 | |||
AVIP BlackRock Advantage Large Cap Growth | Portions of cash holdings | 120.6 | 119.7 | |||
AVIP AB Risk Managed Balanced | Portions of securities | 2,956.7 | 2,780.3 | |||
AVIP Federated Core Plus Bond | Portions of securities | 1,041.8 | 1,009.5 | |||
AVIP iShares Managed Risk Balanced | Portions of cash holdings | 843.2 | 820.4 | |||
AVIP iShares Managed Risk Moderate Growth | Portions of cash holdings | 485.8 | 477.3 | |||
AVIP iShares Managed Risk Growth | Portions of cash holdings | 493.4 | 459.7 |
The values and financial statement effects of derivative instruments that were not accounted for as hedging instruments as of, and for, the year ended December 31, 2023, were as follows:
| Portfolio | Instrument | Primary Risk Type | Value- Asset Derivatives | Value- Liability Derivatives | Location on Statements of Assets and Liabilities | |||||
AVIP BlackRock Balanced Allocation | Futures contracts | Equity price | $ 4,820,001 | $ 4,718,909 | (1) | |||||
AVIP BlackRock Advantage International Equity | Futures contracts | Equity price | 6,306,720 | 6,093,418 | (1) | |||||
AVIP S&P 500® Index | Futures contracts | Equity price | 3,615,000 | 3,602,539 | (1) | |||||
AVIP BlackRock Advantage Large Cap Value | Futures contracts | Equity price | 2,892,000 | 2,814,106 | (1) | |||||
AVIP Nasdaq-100® Index | Futures contracts | Equity price | 2,042,820 | 2,024,367 | (1) | |||||
AVIP BlackRock Advantage Large Cap Core | Futures contracts | Equity price | 5,061,000 | 4,919,873 | (1) | |||||
AVIP BlackRock Advantage Small Cap Growth | Futures contracts | Equity price | 1,638,160 | 1,631,593 | (1) | |||||
AVIP S&P MidCap 400® Index | Futures contracts | Equity price | 5,057,100 | 5,104,055 | (1) | |||||
AVIP BlackRock Advantage Large Cap Growth | Futures contracts | Equity price | 7,149,870 | 7,006,123 | (1) | |||||
AVIP AB Risk Managed Balanced | Futures contracts | Equity price | 181,569,400 | 174,855,018 | (1) | |||||
| Futures contracts | Interest rate | 561,053,363 | 541,806,700 | (1) | ||||||
| Purchased options | Equity price | 73,430,038 | — | (2) | ||||||
AVIP Federated Core Plus Bond | Futures contracts | Interest rate | 131,875,706 | 131,316,644 | (1) |
188
(continued)
AuguStarSM Variable Insurance Products Fund, Inc.
| Notes to Financial Statements (Continued) | December 31, 2023 |
| Portfolio | Instrument | Primary Risk Type | Value- Asset Derivatives | Value- Liability Derivatives | Location on Statements of Assets and Liabilities | |||||
AVIP iShares Managed Risk Balanced | Futures contracts | Equity price | $58,596,355 | $56,807,372 | (1) | |||||
| Futures contracts | Interest rate | 59,934,947 | 60,477,227 | (1) | ||||||
| Futures contracts | Foreign currency | 42,455,398 | 41,632,696 | (1) | ||||||
AVIP iShares Managed Risk Moderate Growth | Futures contracts | Equity price | 40,245,252 | 39,060,559 | (1) | |||||
| Futures contracts | Interest rate | 18,823,239 | 20,238,438 | (1) | ||||||
| Futures contracts | Foreign currency | 33,068,250 | 32,374,925 | (1) | ||||||
AVIP iShares Managed Risk Growth | Futures contracts | Equity price | 47,394,884 | 46,015,164 | (1) | |||||
| Futures contracts | Interest rate | 16,661,526 | 17,911,656 | (1) | ||||||
| Futures contracts | Foreign currency | 34,765,010 | 34,013,937 | (1) |
| (1) | Total distributable earnings. The amounts represent the cumulative appreciation (depreciation) of these futures contracts as reported in the Statements of Assets and Liabilities. Only the current day’s variation margin, if any, is reported within the Statements of Assets and Liabilities as receivable (payable) for variation margin on futures contracts. Each Portfolio's Schedule of Open Futures Contracts details the values by futures contract type. |
| (2) | Investments in securities of unaffiliated issuers, at value. |
| Portfolio | Instrument | Primary Risk Type | Realized Gain (Loss) on Derivatives Recognized in Income | Change in Unrealized Appreciation/ Depreciation on Derivatives Recognized in Income | Location on Statements of Operations | |||||
AVIP BlackRock Balanced Allocation | Futures contracts | Equity price | $ 737,319 | $ 218,906 | (1),(2) | |||||
AVIP BlackRock Advantage International Equity | Futures contracts | Equity price | 575,048 | 404,715 | (1),(2) | |||||
AVIP AB Mid Cap Core | Futures contracts | Equity price | 11,226 | 7,212 | (1),(2) | |||||
AVIP S&P 500® Index | Futures contracts | Equity price | 1,645,103 | 521,689 | (1),(2) | |||||
AVIP BlackRock Advantage Large Cap Value | Futures contracts | Equity price | 495,932 | 172,758 | (1),(2) | |||||
AVIP Nasdaq-100® Index | Futures contracts | Equity price | 591,401 | 102,308 | (1),(2) | |||||
AVIP BlackRock Advantage Large Cap Core | Futures contracts | Equity price | 709,541 | 282,214 | (1),(2) | |||||
AVIP BlackRock Advantage Small Cap Growth | Futures contracts | Equity price | (12,646) | 59,986 | (1),(2) | |||||
AVIP S&P MidCap 400® Index | Futures contracts | Equity price | 269,078 | 22,477 | (1),(2) | |||||
AVIP BlackRock Advantage Large Cap Growth | Futures contracts | Equity price | 1,859,058 | 483,757 | (1),(2) | |||||
AVIP AB Risk Managed Balanced | Futures contracts | Equity price | 4,782,964 | 3,452,067 | (1),(2) | |||||
| Futures contracts | Interest rate | (26,981,230) | 21,884,767 | (1),(2) | ||||||
| Purchased options | Equity price | (21,744,640) | 10,691,061 | (3),(4) | ||||||
AVIP Federated Core Plus Bond | Futures contracts | Interest rate | (3,636,251) | 587,849 | (1),(2) | |||||
AVIP iShares Managed Risk Balanced | Futures contracts | Equity price | 7,596,474 | 2,925,847 | (1),(2) | |||||
| Futures contracts | Interest rate | 374,471 | (188,365) | (1),(2) | ||||||
| Futures contracts | Foreign currency | 12,319 | 865,965 | (1),(2) |
189
(continued)
AuguStarSM Variable Insurance Products Fund, Inc.
| Notes to Financial Statements (Continued) | December 31, 2023 |
| Portfolio | Instrument | Primary Risk Type | Realized Gain (Loss) on Derivatives Recognized in Income | Change in Unrealized Appreciation/ Depreciation on Derivatives Recognized in Income | Location on Statements of Operations | |||||
AVIP iShares Managed Risk Moderate Growth | Futures contracts | Equity price | $4,846,595 | $ 2,933,298 | (1),(2) | |||||
| Futures contracts | Interest rate | 2,701,595 | (1,414,959) | (1),(2) | ||||||
| Futures contracts | Foreign currency | (89,165) | 694,734 | (1),(2) | ||||||
AVIP iShares Managed Risk Growth | Futures contracts | Equity price | 3,638,611 | 2,578,162 | (1),(2) | |||||
| Futures contracts | Interest rate | 2,400,748 | (1,249,925) | (1),(2) | ||||||
| Futures contracts | Foreign currency | (127,105) | 753,478 | (1),(2) |
| (1) | Net realized gain (loss) on futures contracts. |
| (2) | Change in unrealized appreciation/depreciation on futures contracts. |
| (3) | Net realized gain (loss) on investments in securities of unaffiliated issuers. |
| (4) | Change in unrealized appreciation/depreciation on investments in securities of unaffiliated issuers. |
The Portfolios may enter into International Swaps and Derivatives Association, Inc. Master Agreements (“ISDA Master Agreement”) or similar agreements with their derivative contract counterparties whereby the Portfolios may, under certain circumstances, offset with the counterparty certain derivative financial instruments’ payables and/or receivables and create one single net payment. For financial reporting purposes, the Portfolios offset derivative assets and liabilities that are subject to netting arrangements in the Statements of Assets and Liabilities. At December 31, 2023, there were no outstanding derivative transactions subject to netting arrangements.
(7)Federal Income Tax Information
The following information is presented on a federal income tax basis. Differences between amounts for financial statements and federal income tax purposes are primarily due to timing and character differences in recognizing certain gains and losses on investment transactions. Permanent differences between financial statement and federal income tax reporting are reclassified within the capital accounts based on their federal income tax treatment. Temporary differences do not require reclassification. Reclassifications related to permanent differences relate principally to consent dividends, foreign currency gains and losses, net investment losses, and distributions from real estate investment trusts and closed end mutual funds.
At December 31, 2023, the components of accumulated earnings (deficit) on a tax basis were as follows:
| Portfolio | Undistributed Ordinary Income | Undistributed Long-Term Capital Gains (Losses) | Accumulated Earnings | Accumulated Capital and Other Losses | Unrealized Appreciation (Depreciation)(1) | Total Accumulated Earnings (Deficit) | ||||||
AVIP Bond | $ 8,037,254 | $ — | $ 8,037,254 | $ (3,501,747) | $ (18,975,085) | $ (14,439,578) | ||||||
AVIP BlackRock Balanced Allocation | 8,749,206 | 4,408,852 | 13,158,058 | — | 33,763,407 | 46,921,465 | ||||||
AVIP BlackRock Advantage International Equity | 8,596,710 | — | 8,596,710 | (33,814,609) | 27,608,385 | 2,390,486 | ||||||
AVIP Fidelity Institutional AM® Equity Growth | 1,357,042 | 7,138,154 | 8,495,196 | — | 14,089,058 | 22,584,254 | ||||||
AVIP AB Small Cap | 603,831 | — | 603,831 | (23,535,416) | 6,935,517 | (15,996,068) | ||||||
AVIP AB Mid Cap Core | 423,243 | — | 423,243 | (7,320,306) | 3,372,315 | (3,524,748) | ||||||
AVIP S&P 500® Index | 15,033,638 | 81,625,867 | 96,659,505 | — | 430,717,240 | 527,376,745 | ||||||
AVIP BlackRock Advantage Large Cap Value | 6,772,786 | — | 6,772,786 | — | 9,605,107 | 16,377,893 | ||||||
AVIP Federated High Income Bond | 7,055,612 | — | 7,055,612 | (16,296,874) | (7,125,859) | (16,367,121) | ||||||
AVIP Nasdaq-100® Index | 1,314,266 | 49,750,808 | 51,065,074 | — | 92,926,191 | 143,991,265 | ||||||
AVIP BlackRock Advantage Large Cap Core | 6,654,292 | 4,223,277 | 10,877,569 | — | 51,384,306 | 62,261,875 | ||||||
AVIP BlackRock Advantage Small Cap Growth | 238,771 | — | 238,771 | (10,526,082) | (367,548) | (10,654,859) |
190
(continued)
AuguStarSM Variable Insurance Products Fund, Inc.
| Notes to Financial Statements (Continued) | December 31, 2023 |
| Portfolio | Undistributed Ordinary Income | Undistributed Long-Term Capital Gains (Losses) | Accumulated Earnings | Accumulated Capital and Other Losses | Unrealized Appreciation (Depreciation)(1) | Total Accumulated Earnings (Deficit) | ||||||
AVIP S&P MidCap 400® Index | $ 7,412,922 | $19,171,843 | $26,584,765 | $ — | $ 64,716,686 | $ 91,301,451 | ||||||
AVIP BlackRock Advantage Large Cap Growth | 40,267,473 | 8,725,229 | 48,992,702 | — | 85,695,818 | 134,688,520 | ||||||
AVIP AB Risk Managed Balanced | 25,138,053 | — | 25,138,053 | (28,891,025) | 90,501,772 | 86,748,800 | ||||||
AVIP Federated Core Plus Bond | 17,192,571 | — | 17,192,571 | (45,929,302) | (48,583,557) | (77,320,288) | ||||||
AVIP Intech U.S. Low Volatility | 9,388,310 | — | 9,388,310 | (7,600,070) | 44,096,139 | 45,884,379 | ||||||
AVIP AB Relative Value | 1,899,205 | — | 1,899,205 | (2,799,607) | 13,271,638 | 12,371,236 | ||||||
AVIP iShares Managed Risk Balanced | 14,636,740 | — | 14,636,740 | (16,326,006) | 28,704,510 | 27,015,244 | ||||||
AVIP iShares Managed Risk Moderate Growth | 15,104,679 | 5,385,086 | 20,489,765 | — | 75,204,148 | 95,693,913 | ||||||
AVIP iShares Managed Risk Growth | 15,940,462 | 4,100,377 | 20,040,839 | — | 79,100,405 | 99,141,244 | ||||||
AVIP Moderately Conservative Model | 4,732,904 | 594,076 | 5,326,980 | — | (11,976,395) | (6,649,415) | ||||||
AVIP Balanced Model | 15,357,299 | — | 15,357,299 | (1,205,717) | (15,630,968) | (1,479,386) | ||||||
AVIP Moderate Growth Model | 23,627,915 | — | 23,627,915 | (17,143,588) | (7,866,346) | (1,382,019) | ||||||
AVIP Growth Model | 4,506,813 | — | 4,506,813 | (6,775,926) | 439,642 | (1,829,471) |
| (1) | The differences between book-basis and tax-basis unrealized appreciation/(depreciation) are attributed primarily to tax deferral of losses on wash sales and the realization for tax purposes of unrealized gains/(losses) on certain instruments. |
For federal income tax purposes, the following Portfolios had capital loss carryforwards ("CLCF") as of December 31, 2023 that are available to offset future realized gains, if any:
| Portfolio | Total Loss Carryforward | No Expiration Short Term | No Expiration Long Term | CLCF Utilized | ||||
AVIP Bond | $ 3,501,747 | $ 247,801 | $ 3,253,946 | $ — | ||||
AVIP BlackRock Balanced Allocation | — | — | — | 1,962,888 | ||||
AVIP BlackRock Advantage International Equity | 33,814,609 | 29,699,764 | 4,114,845 | 20,356,196 | ||||
AVIP AB Small Cap | 23,535,416 | 8,174,524 | 15,360,892 | — | ||||
AVIP AB Mid Cap Core | 7,320,306 | 2,579,919 | 4,740,387 | — | ||||
AVIP Federated High Income Bond | 16,296,874 | 242,752 | 16,054,122 | — | ||||
AVIP BlackRock Advantage Small Cap Growth | 10,526,082 | 5,767,228 | 4,758,854 | — | ||||
AVIP AB Risk Managed Balanced | 28,891,025 | 28,891,025 | — | 22,431,695 | ||||
AVIP Federated Core Plus Bond | 45,929,302 | 24,816,558 | 21,112,744 | — | ||||
AVIP Intech U.S. Low Volatility | 7,600,070 | — | 7,600,070 | — | ||||
AVIP AB Relative Value | 2,799,607 | 1,267,845 | 1,531,762 | — | ||||
AVIP iShares Managed Risk Balanced | 16,326,006 | 6,401,323 | 9,924,683 | 6,659,713 | ||||
AVIP Balanced Model | 1,205,717 | — | 1,205,717 | — | ||||
AVIP Moderate Growth Model | 17,143,588 | 94,784 | 17,048,804 | — | ||||
AVIP Growth Model | 6,775,926 | 7,217 | 6,768,709 | — |
191
(continued)
AuguStarSM Variable Insurance Products Fund, Inc.
| Notes to Financial Statements (Continued) | December 31, 2023 |
The cost basis for federal income tax purposes may differ from the cost basis for financial reporting purposes. The table below details the unrealized appreciation (depreciation) and aggregate cost of investments at December 31, 2023 for federal income tax purposes.
| AVIP Bond | AVIP BlackRock Balanced Allocation | AVIP BlackRock Advantage International Equity | AVIP Fidelity Institutional AM® Equity Growth | AVIP AB Small Cap | AVIP AB Mid Cap Core | ||||||
| Gross unrealized: | |||||||||||
Appreciation | $ 1,152,646 | $ 52,833,281 | $ 35,722,910 | $ 14,984,281 | $ 15,542,673 | $ 9,822,381 | |||||
Depreciation | (20,127,731) | (19,069,874) | (8,137,822) | (895,640) | (8,607,156) | (6,450,295) | |||||
Net unrealized appreciation (depreciation) | $ (18,975,085) | $ 33,763,407 | $ 27,585,088 | $ 14,088,641 | $ 6,935,517 | $ 3,372,086 | |||||
Aggregate cost of investments: | $237,359,062 | $373,265,705 | $320,858,207 | $102,151,530 | $110,095,693 | $76,681,363 |
| AVIP S&P 500® Index | AVIP BlackRock Advantage Large Cap Value | AVIP Federated High Income Bond | AVIP Nasdaq-100® Index | AVIP BlackRock Advantage Large Cap Core | AVIP BlackRock Advantage Small Cap Growth | ||||||
| Gross unrealized: | |||||||||||
Appreciation | $459,865,652 | $ 24,540,552 | $ 1,141,045 | $ 96,331,038 | $ 57,887,943 | $ 27,336,267 | |||||
Depreciation | (29,148,412) | (14,931,185) | (8,266,904) | (3,404,847) | (6,503,637) | (27,703,815) | |||||
Net unrealized appreciation (depreciation) | $430,717,240 | $ 9,609,367 | $ (7,125,859) | $ 92,926,191 | $ 51,384,306 | $ (367,548) | |||||
Aggregate cost of investments: | $751,475,531 | $188,482,653 | $125,895,833 | $167,853,397 | $272,713,498 | $140,604,485 |
| AVIP S&P MidCap 400® Index | AVIP BlackRock Advantage Large Cap Growth | AVIP AB Risk Managed Balanced | AVIP Federated Core Plus Bond | AVIP Intech U.S. Low Volatility | AVIP AB Relative Value | ||||||
| Gross unrealized: | |||||||||||
Appreciation | $ 83,034,802 | $ 89,204,636 | $ 121,569,575 | $ 53,826,012 | $ 67,370,813 | $ 14,662,637 | |||||
Depreciation | (18,318,116) | (3,508,818) | (31,067,803) | (102,409,569) | (23,274,674) | (1,390,999) | |||||
Net unrealized appreciation (depreciation) | $ 64,716,686 | $ 85,695,818 | $ 90,501,772 | $ (48,583,557) | $ 44,096,139 | $ 13,271,638 | |||||
Aggregate cost of investments: | $473,997,335 | $382,198,031 | $1,368,569,183 | $ 623,197,339 | $617,058,840 | $109,208,291 |
| AVIP iShares Managed Risk Balanced | AVIP iShares Managed Risk Moderate Growth | AVIP iShares Managed Risk Growth | AVIP Moderately Conservative Model | AVIP Balanced Model | AVIP Moderate Growth Model | ||||||
| Gross unrealized: | |||||||||||
Appreciation | $ 33,837,982 | $ 75,216,816 | $ 79,105,321 | $ 5,992,900 | $ 20,731,329 | $ 95,051,133 | |||||
Depreciation | (5,150,966) | — | — | (17,969,295) | (36,362,297) | (102,917,479) | |||||
Net unrealized appreciation (depreciation) | $ 28,687,016 | $ 75,216,816 | $ 79,105,321 | $ (11,976,395) | $ (15,630,968) | $ (7,866,346) | |||||
Aggregate cost of investments: | $550,688,120 | $415,546,416 | $352,854,886 | $208,726,033 | $792,409,265 | $1,489,551,480 |
| AVIP Growth Model | |
| Gross unrealized: | |
Appreciation | $ 9,981,461 |
Depreciation | (9,541,819) |
Net unrealized appreciation | $ 439,642 |
Aggregate cost of investments: | $342,843,531 |
192
(continued)
AuguStarSM Variable Insurance Products Fund, Inc.
| Notes to Financial Statements (Continued) | December 31, 2023 |
The tax character of cash distributions paid to shareholders for the year ended December 31, 2023, as well as other reclassifications of capital accounts due to permanent tax differences, were as follows (in aggregate):
| Distributions Paid to Shareholders | Other Reclassifications | |||||||||
| Portfolio | Ordinary Income* | Net Long-Term Capital Gains | Total Distribution | Paid-in Capital | Total Distributable Earnings | |||||
AVIP Bond | $ 7,069,354 | $ — | $ 7,069,354 | $ — | $ — | |||||
AVIP BlackRock Balanced Allocation | 7,063,412 | — | 7,063,412 | — | — | |||||
AVIP BlackRock Advantage International Equity | 12,519,043 | — | 12,519,043 | — | — | |||||
AVIP Fidelity Institutional AM® Equity Growth | — | 10,656,713 | 10,656,713 | 1,962 | (1,962) | |||||
AVIP AB Small Cap | — | — | — | (10,841) | 10,841 | |||||
AVIP AB Mid Cap Core | 357,918 | — | 357,918 | (589) | 589 | |||||
AVIP S&P 500® Index | 13,578,185 | 47,506,035 | 61,084,220 | (3,052) | 3,052 | |||||
AVIP BlackRock Advantage Large Cap Value | 3,872,281 | 2,121,907 | 5,994,188 | (4,160) | 4,160 | |||||
AVIP Federated High Income Bond | 7,303,133 | — | 7,303,133 | — | — | |||||
AVIP Nasdaq-100® Index | 1,186,637 | 20,800,506 | 21,987,143 | — | — | |||||
AVIP BlackRock Advantage Large Cap Core | 3,245,873 | 1,084,614 | 4,330,487 | — | — | |||||
AVIP BlackRock Advantage Small Cap Growth | — | — | — | (22,818) | 22,818 | |||||
AVIP S&P MidCap 400® Index | 3,991,694 | 21,005,889 | 24,997,583 | — | — | |||||
AVIP BlackRock Advantage Large Cap Growth | 600,783 | 2,866,359 | 3,467,142 | — | — | |||||
AVIP AB Risk Managed Balanced | 13,033,001 | — | 13,033,001 | — | — | |||||
AVIP Federated Core Plus Bond | 13,552,610 | — | 13,552,610 | — | — | |||||
AVIP Intech U.S. Low Volatility | 8,163,527 | — | 8,163,527 | — | — | |||||
AVIP AB Relative Value | 1,395,666 | — | 1,395,666 | — | — | |||||
AVIP iShares Managed Risk Balanced | 6,229,046 | — | 6,229,046 | — | — | |||||
AVIP Moderately Conservative Model | 8,306,876 | 7,287,022 | 15,593,898 | — | — | |||||
AVIP Balanced Model | 37,378,005 | 48,283,102 | 85,661,107 | — | — | |||||
AVIP Moderate Growth Model | 85,320,715 | 123,072,823 | 208,393,538 | — | — | |||||
AVIP Growth Model | 22,630,537 | 34,475,800 | 57,106,337 | — | — | |||||
* Ordinary income consists of net taxable income derived from dividends, interest, and net short-term capital gains, if any.
The tax character of cash distributions paid to shareholders for the year ended December 31, 2022, as well as other reclassifications of capital accounts due to permanent tax differences, were as follows (in aggregate):
| Distributions Paid to Shareholders | Other Reclassifications | |||||||||
| Portfolio | Ordinary Income* | Net Long-Term Capital Gains | Total Distribution | Paid-in Capital | Total Distributable Earnings | |||||
AVIP Bond | $ 7,256,311 | $ 1,318,114 | $ 8,574,425 | $ (2) | $ 2 | |||||
AVIP BlackRock Balanced Allocation | 52,633,449 | 38,505,438 | 91,138,887 | — | — | |||||
AVIP BlackRock Advantage International Equity | 63,189,251 | — | 63,189,251 | — | — | |||||
AVIP Fidelity Institutional AM® Equity Growth | 2,974,357 | 56,344,793 | 59,319,150 | (165,609) | 165,609 | |||||
AVIP AB Small Cap | 11,356,613 | 66,093,164 | 77,449,777 | — | — | |||||
AVIP AB Mid Cap Core | 2,157,527 | 36,322,652 | 38,480,179 | — | — | |||||
AVIP S&P 500® Index | 14,735,083 | 126,253,087 | 140,988,170 | 1 | (1) | |||||
AVIP BlackRock Advantage Large Cap Value | 46,806,403 | 14,551,138 | 61,357,541 | — | — | |||||
AVIP Federated High Income Bond | 7,915,615 | — | 7,915,615 | — | — | |||||
AVIP Nasdaq-100® Index | 1,964,102 | 79,047,918 | 81,012,020 | 1 | (1) | |||||
AVIP BlackRock Advantage Large Cap Core | 52,973,996 | 41,040,914 | 94,014,910 | — | — | |||||
AVIP BlackRock Advantage Small Cap Growth | 21,697,461 | 28,256,764 | 49,954,225 | — | — | |||||
AVIP S&P MidCap 400® Index | 13,241,962 | 46,383,692 | 59,625,654 | (1) | 1 | |||||
AVIP BlackRock Advantage Large Cap Growth | 11,457,694 | 23,282,628 | 34,740,322 | 1 | (1) | |||||
AVIP AB Risk Managed Balanced | 16,255,630 | 36,133,754 | 52,389,384 | (3) | 3 | |||||
AVIP Federated Core Plus Bond | 9,174,157 | 291,199 | 9,465,356 | — | — | |||||
AVIP Intech U.S. Low Volatility | 24,143,362 | — | 24,143,362 | — | — | |||||
193
(continued)
AuguStarSM Variable Insurance Products Fund, Inc.
| Notes to Financial Statements (Continued) | December 31, 2023 |
| Distributions Paid to Shareholders | Other Reclassifications | |||||||||
| Portfolio | Ordinary Income* | Net Long-Term Capital Gains | Total Distribution | Paid-in Capital | Total Distributable Earnings | |||||
AVIP AB Relative Value | $ 92,591 | $ — | $ 92,591 | $ — | $ — | |||||
AVIP iShares Managed Risk Balanced | 2,755,661 | 674,403 | 3,430,064 | — | — | |||||
AVIP Moderately Conservative Model | 4,414,338 | 14,607,672 | 19,022,010 | — | — | |||||
AVIP Balanced Model | 19,218,977 | 76,236,257 | 95,455,234 | — | — | |||||
AVIP Moderate Growth Model | 35,980,513 | 173,240,055 | 209,220,568 | — | — | |||||
AVIP Growth Model | 8,376,893 | 49,234,647 | 57,611,540 | — | — | |||||
* Ordinary income consists of net taxable income derived from dividends, interest, and net short-term capital gains, if any.
The tax character of consent dividend distributions recognized, as well as other reclassifications of capital accounts due to permanent tax differences for the year ended December 31, 2022, were as follows (in aggregate):
| Consent Dividend Distribution Reclassification | Other Reclassifications | |||||||||
| Portfolio | Ordinary Income* | Net Long-Term Capital Gains | Total Distribution | Paid-in Capital | Total Distributable Earnings | |||||
AVIP iShares Managed Risk Moderate Growth | $5,677,611 | $997,185 | $6,674,796 | $6,674,796 | $(6,674,796) | |||||
AVIP iShares Managed Risk Growth | 3,906,791 | — | 3,906,791 | 3,906,791 | (3,906,791) | |||||
* Ordinary income consists of net taxable income derived from dividends, interest, and net short-term capital gains, if any.
194
AuguStarSM Variable Insurance Products Fund, Inc.
| Report of Independent Registered Public Accounting Firm |
To the Shareholders and Board of Directors
AuguStarSM Variable Insurance Products Fund, Inc. (formerly Ohio National Fund, Inc.):
AuguStarSM Variable Insurance Products Fund, Inc. (formerly Ohio National Fund, Inc.):
Opinion on the Financial Statements
We have audited the accompanying statements of assets and liabilities of the Portfolios listed in the Appendix that comprise AuguStarSM Variable Insurance Products Fund, Inc. (each a Portfolio and collectively, the Portfolios), including the schedules of investments, as of December 31, 2023, the related statements of operations for the year then ended, the statements of changes in net assets for each of the years or periods listed in the Appendix, and the related notes (collectively, the financial statements) and the financial highlights for each of the years or periods in the five-year period then ended. In our opinion, the financial statements and financial highlights present fairly, in all material respects, the financial position of each Portfolio as of December 31, 2023, the results of its operations for the year then ended, the changes in its net assets for each of the years or periods listed in the Appendix, and the financial highlights for each of the years or periods in the five-year period then ended, in conformity with U.S. generally accepted accounting principles.
Basis for Opinion
These financial statements and financial highlights are the responsibility of the Portfolios’ management. Our responsibility is to express an opinion on these financial statements and financial highlights based on our audits. We are a public accounting firm registered with the Public Company Accounting Oversight Board (United States) (PCAOB) and are required to be independent with respect to the Portfolios in accordance with the U.S. federal securities laws and the applicable rules and regulations of the Securities and Exchange Commission and the PCAOB.
We conducted our audits in accordance with the standards of the PCAOB. Those standards require that we plan and perform the audit to obtain reasonable assurance about whether the financial statements and financial highlights are free of material misstatement, whether due to error or fraud. Our audits included performing procedures to assess the risks of material misstatement of the financial statements and financial highlights, whether due to error or fraud, and performing procedures that respond to those risks. Such procedures included examining, on a test basis, evidence regarding the amounts and disclosures in the financial statements and financial highlights. Such procedures also included confirmation of securities owned as of December 31, 2023, by correspondence with custodians, brokers, and transfer agents, or by other appropriate auditing procedures when replies were not received. Our audits also included evaluating the accounting principles used and significant estimates made by management, as well as evaluating the overall presentation of the financial statements and financial highlights. We believe that our audits provide a reasonable basis for our opinion.
/s/ KPMG LLP
We have served as the auditor of one or more AuguStarSM Variable Insurance Products Fund, Inc. investment companies since 1969.
Columbus, Ohio
February 16, 2024
195
(continued)
AuguStarSM Variable Insurance Products Fund, Inc.
| Report of Independent Registered Public Accounting Firm (Continued) |
Appendix
Statement of assets and liabilities, including the schedule of investments, as of December 31, 2023, the related statement of operations for the year then ended, and the statements of changes in net assets for each of the years in the two-year period then ended.
AVIP Bond Portfolio (formerly ON Bond Portfolio)
AVIP BlackRock Balanced Allocation Portfolio (formerly ON BlackRock Balanced Allocation Portfolio)
AVIP BlackRock Advantage International Equity Portfolio (formerly ON BlackRock Advantage International Equity Portfolio)
AVIP BlackRock Balanced Allocation Portfolio (formerly ON BlackRock Balanced Allocation Portfolio)
AVIP BlackRock Advantage International Equity Portfolio (formerly ON BlackRock Advantage International Equity Portfolio)
AVIP Fidelity Institutional AM® Equity Growth Portfolio (formerly ON Fidelity Institutional AM® Equity Growth Portfolio and, prior to July 29, 2023, ON Janus Henderson Forty Portfolio)
AVIP AB Small Cap Portfolio (formerly ON AB Small Cap Portfolio)
AVIP AB Mid Cap Core Portfolio (formerly ON AB Mid Cap Core Portfolio)
AVIP S&P 500® Index Portfolio (formerly ON S&P 500® Index Portfolio)
AVIP BlackRock Advantage Large Cap Value Portfolio (formerly ON BlackRock Advantage Large Cap Value Portfolio)
AVIP Federated High Income Bond Portfolio (formerly ON Federated High Income Bond Portfolio)
AVIP Nasdaq-100® Index Portfolio (formerly ON Nasdaq-100® Index Portfolio)
AVIP BlackRock Advantage Large Cap Core Portfolio (formerly ON BlackRock Advantage Large Cap Core Portfolio)
AVIP BlackRock Advantage Small Cap Growth Portfolio (formerly ON BlackRock Advantage Small Cap Growth Portfolio)
AVIP S&P MidCap 400® Index Portfolio (formerly ON S&P MidCap 400® Index Portfolio)
AVIP BlackRock Advantage Large Cap Growth Portfolio (formerly ON BlackRock Advantage Large Cap Growth Portfolio)
AVIP AB Risk Managed Balanced Portfolio (formerly ON Risk Managed Balanced Portfolio)
AVIP Federated Core Plus Bond Portfolio (formerly ON Federated Core Plus Bond Portfolio)
AVIP Intech U.S. Low Volatility Portfolio (formerly ON U.S. Low Volatility Portfolio)
AVIP AB Relative Value Portfolio (formerly ON AB Relative Value Portfolio)
AVIP iShares Managed Risk Balanced Portfolio (formerly ON iShares Managed Risk Balanced Portfolio)
AVIP Moderately Conservative Model Portfolio (formerly ON Moderately Conservative Model Portfolio)
AVIP Balanced Model Portfolio (formerly ON Balanced Model Portfolio)
AVIP Moderate Growth Model Portfolio (formerly ON Moderate Growth Model Portfolio)
AVIP Growth Model Portfolio (formerly ON Growth Model Portfolio)
Statement of assets and liabilities, including the schedule of investments, as of December 31, 2023, the related statement of operations for the year then ended, and the statements of changes in net assets for the year ended December 31, 2023 and for the period October 14, 2022 (commencement of operations) through December 31, 2022.
AVIP iShares Managed Risk Moderate Growth Portfolio (formerly ON iShares Managed Risk Moderate Growth Portfolio)
AVIP iShares Managed Risk Growth Portfolio (formerly ON iShares Managed Risk Growth Portfolio)
AVIP iShares Managed Risk Growth Portfolio (formerly ON iShares Managed Risk Growth Portfolio)
196
AuguStarSM Variable Insurance Products Fund, Inc.
| Additional Information | December 31, 2023 (Unaudited) |
(1)Review and Approval of Investment Advisory and Sub-Advisory Agreements
At a meeting held on November 17, 2023, the Board of Directors (the “Board” or “Directors”), including a majority of the Directors who are not “interested persons” (the “Independent Directors”) of AuguStarSM Variable Insurance Products Fund, Inc. (formerly Ohio National Fund, Inc.) (the “Fund”), approved the continuation of the Investment Advisory Agreement (the “Advisory Agreement”) with Ohio National Investments, Inc. (“ONI” or “Adviser”) and, as applicable, the sub-advisory agreement (each a “Sub-Advisory Agreement”) with the sub-adviser (each a “Sub-Adviser,” and together the “Sub-Advisers”) for the Portfolios identified below. The Directors noted that they approved an amendment to the Advisory Agreement between the Fund and the Adviser and approved a new Sub-Advisory Agreement between the Adviser and FIAM LLC for the AVIP Fidelity Institutional AM® Equity Growth Portfolio (formerly ON Fidelity Institutional AM® Equity Growth Portfolio and, prior to July 29, 2023, ON Janus Henderson Forty Portfolio) at a meeting held on May 22, 2023, and those agreements were not required to be considered at this meeting. The Independent Directors were separately represented by independent legal counsel in connection with their consideration of the approval of the continuation of these agreements.
The Directors noted that the Adviser is responsible for monitoring the investment performance and other activities of the various Sub-Advisers that have day-to-day responsibility for the decisions made for certain of the Fund’s investment portfolios (each, a “Portfolio”). The Directors further noted that for those Portfolios operating as “funds of funds,” the Adviser bears significant responsibility and administrative burden in the monitoring and reporting required by Rule 12d1-4 under the Investment Company Act of 1940, as amended. They also noted that the Adviser reports to the Board on its analysis of each Sub-Adviser’s performance at the regular meetings of the Board, which are held at least quarterly. The Directors reviewed the compliance and operational services provided to the Portfolios by the Adviser, which includes implementing and operating the Fund’s Liquidity Risk Management and Derivatives Risk Management programs and overseeing the valuation of portfolio securities. Finally, the Board noted that the Adviser provides the facilities and equipment utilized by the Portfolios; supplies business management services to the Fund, including monitoring expense accruals and preparing the Portfolios’ financial statements; prepares and files Fund registration statements, proxies, shareholder reports and other regulatory filings; provides financial oversight; and ensures that proxies related to each Portfolio’s holdings are voted in compliance with policies approved by the Board.
In considering the Advisory Agreement and Sub-Advisory Agreements, the Board requested, received and reviewed a significant amount of information relating to each Portfolio, the Adviser and the Sub-Advisers, including the following: (1) performance data for each Portfolio for various time periods, including year-to-date, through September 30, 2023, (2) comparative performance, advisory fee, and expense ratio information for a peer group of funds in each respective Portfolio’s Morningstar category (a “peer group”), as well as management fee peer comparison charts showing where each Portfolio’s advisory and sub-advisory fees were located in the dispersion of its peer group’s advisory and sub-advisory fees; (3) comparable performance information for each Portfolio’s relevant benchmark index or indices; (4) other comparative data regarding advisory fees, including data regarding the fees charged by the Adviser and Sub-Advisers for managing other institutional funds and institutional accounts using investment strategies and techniques similar to those used in managing the Portfolios, as applicable; (5) comparative data regarding the expense ratio of each Portfolio, as compared to its peer group; (6) a profitability analysis for the Adviser with respect to each Portfolio; and (7) other information regarding the nature, extent and quality of services provided by the Adviser and the Sub-Advisers, as applicable. The Directors also took into account information regarding the services provided by the Adviser and each Sub-Adviser, and performance, fee and expense ratio information regarding each Portfolio provided to them periodically throughout the year. They also met with representatives of the Adviser to review the relative performance of each Portfolio, as compared with its benchmark index(es) and peer group.
The Directors, including all of the Independent Directors, were assisted by experienced independent legal counsel throughout the Advisory Agreement and Sub-Advisory Agreement review process. The Independent Directors discussed the proposed continuations in a private session with such counsel at which no representatives of management, the Adviser or any Sub-Adviser were present. Each Director, including each of the Independent Directors, relied upon the advice of independent legal counsel and his or her own business judgment in determining the material factors to be considered in evaluating the Advisory Agreement and each Sub-Advisory Agreement and the weight to be given to each such factor. The conclusions reached by the Directors were based on a comprehensive evaluation of all of the information provided and were not the result of any one factor. Moreover, each Director may have afforded different weight to the various factors in reaching his or her conclusions with respect to the Advisory Agreement and each Sub-Advisory Agreement.
Nature, Extent and Quality of Services
The Directors evaluated the nature, extent and quality of the advisory services provided to the Portfolios by the Adviser. As part of their review, the Directors reviewed information regarding the Adviser’s operations, procedures, and personnel. The Directors took into account information they received during the previous year at Board meetings and other discussions and through periodic reports regarding the Adviser’s performance of its duties. The Directors considered the capabilities and resources that the Adviser
197
(continued)
AuguStarSM Variable Insurance Products Fund, Inc.
| Additional Information (Continued) | December 31, 2023 (Unaudited) |
has dedicated to performing services on behalf of the Fund and its Portfolios, as well as the quality of administrative and other services provided by the Adviser, which include monitoring each Sub-Adviser’s performance, monitoring the quality of each Sub-Adviser’s compliance program, and providing other support to contract owners. The Directors also considered the quality of the Adviser’s compliance programs and the Adviser’s responsiveness to Board inquiries and requests.
For each Portfolio with a fund-of-funds structure, the Directors considered that the Adviser performs significant services to the Portfolio that are in addition to, rather than duplicative of, services provided under the advisory contracts of the underlying funds. The Directors noted the Adviser’s statements at the meeting that it performs regular reviews of each Portfolio and its underlying funds in order to confirm that the Portfolio is diversified, has the appropriate asset mix, and is performing well.
For each Portfolio subject to a Sub-Advisory Agreement, the Board considered similar criteria as applied to each Sub-Adviser, including the nature, extent and quality of the sub-advisory services provided by each Sub-Adviser. In addition to the criteria used to review the Adviser, the Directors reviewed information on each Sub-Adviser’s portfolio management and brokerage practices. The Directors also reviewed the performance record of each Portfolio managed by the applicable Sub-Adviser. The Directors determined that overall, they were satisfied with the nature, extent and quality of services provided to the Fund and each of the Portfolios.
Investment Performance
Representatives of the Adviser reviewed with the Directors each Portfolio’s performance for the year-to-date, 1-, 3- and 5-year periods ended September 30, 2023, to the extent relevant, as compared to each Portfolio’s peer group and prospectus benchmark(s). The Adviser also provided custom blended benchmarks for certain Portfolios. The Board also considered the Adviser’s effectiveness in monitoring the performance of each Sub-Adviser and the Adviser’s timeliness in responding to performance issues. The Directors discussed with the Adviser representatives certain Portfolios that underperformed their respective benchmarks. A Portfolio-by-Portfolio discussion of each Portfolio’s performance and the Board’s conclusions regarding that performance is set forth below.
Fees and Expenses
The Directors considered a summary document showing the advisory fee for each Portfolio, as well as the difference of each Portfolio’s fee from the average advisory fee for the Portfolio’s peer group and the Portfolio’s percentile ranking within the peer group. The Directors also considered separate charts showing, for each Portfolio, how the Portfolio’s advisory fees compared to the advisory fees of the funds in its peer group. The charts showed the number of funds in the peer group within each defined range of advisory fees, and the range that included the Portfolio. The Directors also reviewed the difference between each Portfolio’s overall expense ratio and that of its peer group, as well as the expense ratio’s percentile ranking within the peer group. For these purposes, the peer groups excluded funds with net assets over $1 billion (unless the Portfolio against which the peer group is compared has net assets over $1 billion), all funds identified as a fund-of-funds, and for all Portfolios other than the AVIP S&P 500® Index Portfolio, AVIP S&P MidCap 400® Index Portfolio and the AVIP Nasdaq-100® Index Portfolio, all index funds. Non-index funds were excluded from the Morningstar Peer Group for the AVIP S&P 500® Index Portfolio, AVIP S&P MidCap 400® Index Portfolio, and the AVIP Nasdaq-100® Index Portfolio. Fund of funds consisting of exchange traded funds “(ETFs”) were excluded from the peer groups for the AVIP Moderately Conservative Model, AVIP Balanced Model, AVIP Moderate Growth Model and AVIP Growth Model.
When applicable, the Directors considered the amount of the net advisory fee retained by the Adviser, after payment of the sub-advisory fee, as well as the proportion the net fee represented of the total advisory fee, in light of the services provided by the Adviser to the Portfolio.
When applicable, the Directors also considered the fees paid to Sub-Advisers. The Directors relied to a degree on the Adviser’s negotiation of each sub-advisory agreement at an arm’s-length basis. The Directors considered the fees the Adviser and Sub-Advisers charge their separately managed institutional accounts and other accounts and expressed no concerns with those rates relative to the fees charged to the Portfolios. The Directors also recognized that it was difficult to make comparisons of advisory fees because there were variations in the services that were included in the fees paid by other funds and separately managed accounts.
Profitability
The Directors reviewed the advisory fee paid to the Adviser for each Portfolio and noted the pre-tax profit margins reported by the Adviser for each Portfolio. The Directors also noted that the Adviser, and not the Portfolios, is responsible for paying sub-advisory fees to the Sub-Advisers. The Board also evaluated whether the net advisory fee received by the Adviser for each Portfolio, after paying sub-advisory fees to the Sub-Adviser, was reasonable, given the level of the Adviser’s services to the Portfolio. The Directors took into account the fact that the Adviser had contractually agreed, where applicable, to limit Portfolio expenses and reimburse
198
(continued)
AuguStarSM Variable Insurance Products Fund, Inc.
| Additional Information (Continued) | December 31, 2023 (Unaudited) |
expenses to the extent necessary to keep total Portfolio expenses at or below a specified amount. The Directors further considered the statement of a representative of the Adviser that the profitability calculations account for all of the Adviser’s costs in providing services to the Fund, including services outside the investment advisory function (such as Fund operations and legal functions). The Directors discussed that if the Adviser’s efficiency results in enhanced profitability, the Adviser’s effective use of resources should not be penalized on a comparative basis.
In considering the reasonableness of the sub-advisory fees paid by the Adviser to each Sub-Adviser, the Directors relied on the ability of the Adviser to negotiate the sub-advisory fee at arm’s length, noting that the Adviser is not affiliated with any Sub-Adviser. The Directors also noted that the Adviser is incentivized to negotiate a favorable sub-advisory fee since it was the Adviser, not the Portfolio, which paid the sub-advisory fee. The Board discussed economies of scale and agreed it was a matter more appropriately considered at the Advisory Agreement level. The Board concluded that the profitability, fees, and potential realization of economies of scale by the Portfolios from the sub-advisory arrangements with the unaffiliated Sub-Advisers should not be material factors in its deliberations.
After considering all of the above, the Board concluded that the profitability of the Adviser with respect to each Portfolio was reasonable.
Economies of Scale
The Directors noted that all of the advisory and sub-advisory fee schedules, other than those for the AVIP Moderately Conservative Model Portfolio, AVIP Moderate Growth Portfolio, AVIP Growth Portfolio and AVIP Balanced Portfolio (collectively, the “AVIP Model Portfolios”), contain breakpoints that would reduce the applicable advisory or sub-advisory fees on assets above a specified level as the applicable Portfolio’s assets increase. The Directors also noted that a Portfolio would realize additional economies of scale if the Portfolio’s net assets increased over time proportionately more than certain other expenses. The Directors took into account that many of the Portfolios had a small amount of net assets relative to the funds in their respective peer groups. After considering each Portfolio’s current size and potential for growth, the Board concluded that each Portfolio was likely to benefit from economies of scale as the Portfolio’s net assets increased, and that the existing breakpoints are appropriate.
In addition to the foregoing, the Directors considered the specific factors and related conclusions set forth below with respect to each Portfolio’s performance and fees and expenses. Except as otherwise indicated, the performance data described below for each Portfolio is for periods ended September 30, 2023.
AVIP Bond Portfolio (Adviser – ONI). The Directors noted that the Portfolio outperformed the benchmark for all periods except the 5-year period and outperformed its peer group for all periods. The Directors noted that the Portfolio’s advisory fee was slightly higher than the peer group average while its net expense ratio was below the peer group average. Overall, the Board concluded that the Portfolio’s performance was acceptable, and its advisory fee was reasonable.
AVIP BlackRock Balanced Allocation Portfolio (Adviser – ONI, Sub-Adviser – BlackRock). The Directors acknowledged that performance before February 2019 was attributable to the prior sub-adviser. They observed that the Portfolio underperformed its benchmark index for all periods, which they noted did not reflect the balanced nature of the Portfolio. The Directors observed that the Portfolio outperformed its blended benchmark for the year-to-date and 1-year periods and outperformed its peer group for all periods. The Directors noted that both the Portfolio’s advisory fee and net expense ratio were below the peer group averages. Overall, the Directors concluded that the Portfolio’s performance was acceptable and that the advisory and sub-advisory fees were reasonable.
AVIP BlackRock Advantage International Equity Portfolio, (Adviser – ONI, Sub-Adviser – BlackRock). The Directors focused on the year-to-date, 1-year and 3-year performance for the Portfolio, as the performance prior to December 2019 was attributable to the prior sub-adviser. The Directors observed that the Portfolio outperformed its peers and benchmark for the year-to-date, 1-year, 3-year and 5-year periods and reported that the portfolio’s advisory fee and net expense ratio were both below the peer group average. Overall, the Board concluded that the Portfolio’s performance was acceptable and that the advisory and sub-advisory fees were reasonable.
AVIP AB Small Cap (Adviser – ONI, Sub-Adviser – AB). The Directors focused on the year-to-date and 1-year performance for the Portfolio as the performance prior to May 2021 was attributable to the prior sub-adviser. The Directors noted that the Portfolio outperformed its benchmark index for the year-to-date and one-year periods and its peer group for the 1-year period and 3-year periods, The Directors also noted that Adviser’s comments regarding the Portfolio’s upside participation and downside protection. The Directors noted that the Portfolio’s advisory fee and net expense ratio were below the peer group averages. Overall, the Directors concluded that the Portfolio’s performance was improving and that the advisory fee was reasonable.
199
(continued)
AuguStarSM Variable Insurance Products Fund, Inc.
| Additional Information (Continued) | December 31, 2023 (Unaudited) |
AVIP AB Mid Cap Core (Adviser – ONI, Sub-Adviser – AB). The Directors focused on the year-to-date and 1-year performance for the Portfolio as the performance prior to May 2021 was attributable to the prior sub-adviser. The Directors noted that the Portfolio underperformed its benchmark for all periods and underperformed its peer group for all but the 3-year period. The Directors noted that the Adviser attributed the underperformance to an overweight in value stocks and the fact that the mid cap market in general underperformed over the same period. The Directors noted that based on the long-term performance of the strategy, the Adviser expects performance to improve over time. The Directors concluded that the Portfolio’s performance was understandable, and the sub-adviser has not had enough time to see improved performance, but that the performance should be monitored. The Directors observed that the Portfolio’s advisory fee was on par with its peer group and the expense ratio was below the peer group average. The Directors concluded that the advisory fee was reasonable.
AVIP S&P 500® Index Portfolio (Adviser – ONI, Sub-Adviser – Geode). The Directors observed that while the Portfolio underperformed its benchmark index across all periods, it outperformed its peer group for the 1-year, 3-year and 5-year periods, and its performance generally was in line with the index when expenses were excluded. The Directors noted that peer group performance data for index funds was generally irrelevant and did not rely on peer group comparison performance figures for the Portfolio. The Directors noted that, while the advisory fee was above the Portfolio’s peer group average, the overall expense ratio was the statistic most important to index fund shareholders, and the Portfolio’s net expense ratio was lower than the average for the peer group. Overall, the Directors concluded that the Portfolio’s performance was acceptable and that the advisory and sub-advisory fees were reasonable.
AVIP BlackRock Advantage Large Cap Value Portfolio (Adviser – ONI, Sub-Adviser –BlackRock). The Directors focused on the year-to-date, 1-year and 3-year periods for the Portfolio as the performance prior to December 2019 was attributable to the prior sub-adviser. The Directors considered that the Portfolio outperformed its benchmark and peer group over the year-to-date, 1-year and 5-year periods. The Directors noted that the Portfolio’s advisory fee was in line with the peer group average and that the Portfolio’s expense ratio was below the peer group average. Overall, the Board concluded that the Portfolio’s performance bore monitoring and that its advisory and sub-advisory fees were reasonable.
AVIP Federated High Income Bond Portfolio (Adviser – ONI, Sub-Adviser – Federated). The Directors observed that while the Portfolio underperformed its benchmark in all periods shown, it outperformed its peer group for the year-to-date, 1-year and 5-year periods. The Directors noted that the advisory fee was above the peer group average, while the net expense ratio was in line with the peer group average. The Adviser attributed the relatively higher fees to the higher research and trading costs associated with managing a relatively small high-yield portfolio. Overall, the Board concluded that the Portfolio’s performance was acceptable, and the advisory and sub-advisory fees were reasonable.
AVIP Nasdaq-100® Index Portfolio (Adviser – ONI, Sub-Adviser – Geode). The Directors observed that while the Portfolio underperformed its benchmark index across all time periods shown, its performance generally was in line with the index when expenses were excluded. The Directors noted that the Portfolio outperformed its peer group across all periods but deemed peer group performance data for index funds to be generally irrelevant and did not rely on peer group comparison performance. The Directors noted that the Portfolio’s advisory fee and net expense ratio were below the peer group average. Overall, the Directors concluded that the Portfolio’s performance was acceptable and that the advisory and sub-advisory fees were reasonable.
AVIP BlackRock Advantage Large Cap Core Portfolio (Adviser – ONI, Sub-Adviser – BlackRock). The Directors acknowledged that performance prior to February 2019 was attributable to the prior sub-adviser and focused on the Portfolio’s year-to-date, 1-year and 3-year performance. They observed that although the Portfolio underperformed its benchmark index for all periods, its performance is improving, and it outperformed its peer group for the year-to-date and 1-year periods. The Directors considered that the Portfolio’s advisory fee was in line with the peer group average and its net expense ratio was below the peer group average. Overall, the Directors concluded that the Portfolio’s performance bore monitoring and that the advisory and sub-advisory fees were reasonable.
AVIP BlackRock Advantage Small Cap Growth Portfolio (Adviser – ONI, Sub-Adviser – BlackRock). The Directors acknowledged that the Portfolio’s performance prior to February 2019 was attributable to the previous sub-advisor. They observed that the Portfolio outperformed its benchmark index for all periods and its peer group for the year-to-date, 1-year and 3-year periods. The Directors noted that the Portfolios advisory fee and net expense ratio were both below the peer group average. Overall, the Directors concluded that the Portfolio’s performance was acceptable and that the advisory and sub-advisory fees were reasonable.
AVIP S&P MidCap 400® Index (Adviser – ONI, Sub-Adviser – Geode). The Directors acknowledged that while the Portfolio underperformed its benchmark index, its performance generally was in line with the benchmark index when expenses were excluded. The Directors noted that the Portfolio outperformed its peer group across all periods but deemed peer group performance data for index funds to be generally irrelevant and did not rely on peer group comparison performance figures for the
200
(continued)
AuguStarSM Variable Insurance Products Fund, Inc.
| Additional Information (Continued) | December 31, 2023 (Unaudited) |
Portfolio. The Directors noted that, while the advisory fee was above the Portfolio’s peer group average, the overall expense ratio was the statistic most important to index fund shareholders, and the Portfolio’s net expense ratio was lower than the average for the peer group. Overall, the Directors concluded that the Portfolio’s performance was acceptable and that the advisory and sub-advisory fees were reasonable.
AVIP BlackRock Advantage Large Cap Growth Portfolio (Adviser – ONI, Sub-Adviser – BlackRock). The Directors recognized that the Portfolio’s performance prior to February 2019 was attributable to the prior sub-adviser. They observed that the Portfolio underperformed its benchmark for all periods but outperformed its peer group for the year-to-date and 3-year periods. The Directors noted the Adviser’s view that the Portfolio performed slightly better than other large cap growth portfolios because it has marginally less exposure to growth stocks. The Directors noted that the Portfolio’s advisory fee and net expense ratios were below the peer group averages. Overall, the Directors concluded that the Portfolio’s performance was acceptable, and the advisory fee and sub-advisory fees were reasonable.
AVIP AB Risk Managed Balanced Portfolio (Adviser – ONI, Sub-Adviser – AB). The Directors focused on the year-to-date and 1-year performance for the Portfolio as the performance prior to May 2020 was attributable to the prior sub-adviser. The Directors noted that the Portfolio trailed the benchmark and underperformed the peer group for the year-to-date and 1-year periods. The Directors observed that the Portfolio’s primary benchmark, the S&P 500® Index , does not reflect the balanced nature of the Portfolio. The Directors reviewed performance versus a balanced benchmark, which showed improved performance. The Directors also noted the Portfolio is expected to underperform in a rapidly rising interest rate environment. The Directors noted that the Portfolio’s advisory fee was higher than its peer group’s average but considered that the Portfolio contains a risk management overlay, which adds complexity and additional management expense. The Directors also noted that the Portfolio’s net expense ratio was below its peer group average. Overall, the Directors concluded that the Portfolio’s performance was acceptable and that the advisory and sub-advisory fees were reasonable.
AVIP Federated Core Plus Bond Portfolio (Adviser – ONI, Sub-Adviser – Federated). The Directors recalled that the Portfolio commenced operations in May 2020. The Directors observed that the Portfolio outperformed its benchmark and peer group for the 3-year period and slightly underperformed its benchmark and peer group for the other periods. The Directors considered that the underperformance relative to the benchmark was within the range of Portfolio’s net expenses and noted that the benchmark index does not have expenses. The Directors further noted that the Portfolio’s advisory fee was on par with the peer group while its net expense ratio was below the peer group average. Overall, the Board concluded that the Portfolio’s performance was acceptable and that the advisory and sub-advisory fees were reasonable.
AVIP Intech U.S. Low Volatility Portfolio (Adviser – ONI, Sub-Adviser – Intech). The Directors acknowledged that they initially approved the sub-advisory agreement on May 13, 2022, and therefore did not need to review it at this time. The Directors also acknowledged that the Portfolio had limited performance information. They noted that the Portfolio underperformed the benchmark and peer group average for all periods, which the Adviser attributed to the smaller capitalization companies held by the Portfolio. The Directors noted that the Portfolio’s advisory fee and net expense ratio were below the peer group average. Overall, the Directors concluded that the Portfolio’s performance bore monitoring and that the advisory fees were reasonable.
AVIP AB Relative Value Portfolio (Adviser – ONI, Sub-Adviser – AB). The Directors acknowledged that they initially approved the sub-advisory agreement on August 20, 2021, and therefore did not need to review it at this time. The Directors also acknowledged that the Portfolio launched in December 2021 and had a limited operating history. The Directors noted that the Portfolio outperformed the benchmark and peer group for the year-to-date and 1-year periods. The Directors noted that the Portfolio’s advisory fee was below the peer group average, and the Portfolio’s expense ratio was below the peer group average. Overall, the Directors concluded that the Portfolio’s performance was acceptable and that the advisory fees were reasonable.
AVIP iShares Managed Risk Balanced Portfolio (Adviser – ONI, Sub-Adviser – BlackRock). The Directors acknowledged that the Portfolio launched in June 2021 and had only a limited operating history. The Directors noted that while the Portfolio underperformed its prospectus benchmark, it performed in line with its blended benchmark and outperformed its peers for the year-to-date period and 1-year period. The Directors observed that the Portfolio’s advisory fee was above the peer group average, but noted the Adviser’s comments that the Portfolio’s peer group is non-homogeneous and contains funds with very low advisory fees. The Directors noted that the advisory fees payable by the iShares Portfolios were within the range of fees payable by the iShares Portfolios’ peer groups and included fee breakpoints. The Directors observed that the Portfolio’s net expense ratio was below the peer group average. The Directors considered that the Adviser plans to evaluate fees as the Portfolio gains scale. Overall, the Directors concluded that the Portfolio’s performance was acceptable and that the advisory and sub-advisory fees were reasonable.
AVIP iShares Managed Risk Moderate Growth Portfolio and AVIP iShares Managed Risk Growth Portfolio (Adviser – ONI, Sub-Adviser – BlackRock). The Directors acknowledged that these Portfolios commenced operations in October 2022 and therefore, do not yet have a full year performance history. The Directors noted that while the Portfolios underperformed their
201
(continued)
AuguStarSM Variable Insurance Products Fund, Inc.
| Additional Information (Continued) | December 31, 2023 (Unaudited) |
prospectus benchmarks, they performed in line with their blended benchmarks and outperformed their peers for the year-to-date period. The Directors observed that each Portfolio’s advisory fee was above the peer group average, but noted the Adviser’s comments that each Portfolio’s peer group is non-homogeneous and contains funds with very low advisory fees. The Directors observed that each Portfolio’s net expense ratio was below the peer group average. The Directors considered that the Adviser plans to evaluate fees as the Portfolios gain scale. The Directors noted that the advisory fees payable by the iShares Portfolios were within the range of fees payable by the iShares Portfolios’ peer groups and included fee breakpoints. Overall, the Directors concluded that the advisory and sub-advisory fees were reasonable.
AVIP Moderately Conservative Model (Adviser – ONI). The Directors noted that the Portfolio outperformed its benchmark index for all periods and the peer group for the year-to-date and 1-year periods. The Directors observed that the Portfolio’s advisory fee was higher than the peer group average, and the net expense ratio as reported in the annual shareholder report was lower than the average of its peer group. The Directors noted that the Adviser was evaluating the advisory fee. Overall, the Directors concluded that the Portfolio’s performance was acceptable and that the advisory fee was reasonable.
AVIP Balanced Model (Adviser – ONI). The Directors observed that while the Portfolio outperformed its benchmark index for all periods, it underperformed the peer group for the year-to-date and 3-year periods. The Directors noted that the Portfolio’s advisory fee was above the peer group average and the net expense ratio as reported in the annual shareholder report, was lower than the average of its peer group. The Directors noted that the Adviser was evaluating the advisory fee. Overall, the Directors concluded that the Portfolio’s performance was acceptable and that the advisory fee was reasonable.
AVIP Moderate Growth Model (Adviser – ONI). The Directors observed that while the Portfolio generally performed well, it underperformed its benchmark index for the 3-year period and the peer group average for the year-to-date period. The Directors also noted that the Portfolio’s advisory fee was above the peer group average and the net expense ratio as reported in the annual shareholder report was lower than the average of its peer group. The Directors noted that the Adviser was evaluating the advisory fee. Overall, the Directors concluded that the Portfolio’s performance was acceptable and that the advisory fee was reasonable.
AVIP Growth Model (Adviser – ONI). The Directors observed that while the Portfolio underperformed its benchmark index for the 3-year period and its peer group average for the for the year-to-date and 3-year periods, it outperformed the benchmark for the year-to-date and 1-year periods and the peer group for the 1-year period. The Directors also noted that the Portfolio’s advisory fee and net expense ratio were below the peer group average as reported in the annual shareholder report and was lower than the average of its peer group. Overall, the Directors concluded that the Portfolio’s performance was acceptable and that the advisory fee was reasonable.
After consideration of the foregoing, the Board reached the following conclusions regarding the Advisory Agreement and, as applicable, the Sub-Advisory Agreement with respect to each Portfolio, in addition to the conclusions set forth above: (1) the Adviser and the Sub-Advisers demonstrated that they possessed the capability and resources to perform the duties required of them under the Advisory Agreement and applicable Sub-Advisory Agreement(s), respectively; (2) the investment philosophy, strategies and techniques of the Adviser (with respect to the Portfolios without a Sub-Adviser) and the Sub-Advisers were appropriate for pursuing the applicable Portfolio’s investment objective; (3) the Adviser (with respect to the Portfolios without a Sub-Adviser) and the Sub-Advisers were likely to execute their investment philosophy, strategies and techniques consistently over time; and (4) the Adviser and the Sub-Advisers maintained appropriate compliance programs. Based on all of the above-mentioned factors and their related conclusions, with no single factor or conclusion being determinative and with each Director not necessarily attributing the same weight to each factor, the Directors unanimously concluded that approval of the continuation of the Advisory Agreement and, as applicable, the Sub-Advisory Agreements was in the best interests of the Portfolios and their shareholders. Accordingly, the Board, including all of the Independent Directors, voted unanimously to approve the continuation of the Advisory Agreement and, as applicable, the Sub-Advisory Agreements for the Portfolios.
(2)Expense Disclosure
An individual may not buy or own membership interests of the Fund directly. An individual acquires an indirect interest in the Fund by purchasing a variable annuity contract or variable insurance policy and allocating premiums or purchase payments to Fund Portfolios available through the separate accounts of ALIC, ALAC, and NSLA. Separate accounts of these entities are the shareholders of the Fund.
As a shareholder of the Fund, a separate account incurs ongoing costs, including management fees and other Fund expenses. This example is intended to help a policy/contract owner understand ongoing costs (in dollars) associated with the underlying investment in the Portfolios by the separate account shareholder and to compare these costs with the ongoing costs associated with investing in other mutual funds.
The example is based on an investment of $1,000 invested at July 1, 2023 and held through December 31, 2023.
202
(continued)
AuguStarSM Variable Insurance Products Fund, Inc.
| Additional Information (Continued) | December 31, 2023 (Unaudited) |
Actual Expenses
The table below provides information about investment values and actual expenses associated with each Portfolio of the Fund. The information below, together with the amount of an underlying investment, can be used to estimate expenses paid over the period. An estimate can be obtained by simply dividing an underlying investment value by $1,000 (for example, an $8,600 investment value divided by $1,000 = 8.6), then multiplying the result by the number in the table under the heading entitled “Expenses Paid During Period”.
| Portfolio | Beginning Investment Value 7/1/2023 | Ending Investment Value 12/31/2023 | Expenses Paid During Period* 7/1/2023 – 12/31/2023 | Expense Ratio During Period 7/1/2023 – 12/31/2023 (Annualized) | ||||
AVIP Bond | $1,000.00 | $1,050.50 | $3.15 | 0.61% | ||||
AVIP BlackRock Balanced Allocation | $1,000.00 | $1,075.30 | $2.93 | 0.56% | ||||
AVIP BlackRock Advantage International Equity | $1,000.00 | $1,053.40 | $4.50 | 0.87% | ||||
AVIP Fidelity Institutional AM® Equity Growth | $1,000.00 | $1,105.80 | $4.41 | 0.83% | ||||
AVIP AB Small Cap | $1,000.00 | $1,055.00 | $4.45 | 0.86% | ||||
AVIP AB Mid Cap Core | $1,000.00 | $1,072.00 | $4.75 | 0.91% | ||||
AVIP S&P 500® Index | $1,000.00 | $1,077.50 | $1.99 | 0.38% | ||||
AVIP BlackRock Advantage Large Cap Value | $1,000.00 | $1,076.40 | $3.87 | 0.74% | ||||
AVIP Federated High Income Bond | $1,000.00 | $1,073.10 | $4.49 | 0.86% | ||||
AVIP Nasdaq-100® Index | $1,000.00 | $1,110.40 | $2.29 | 0.43% | ||||
AVIP BlackRock Advantage Large Cap Core | $1,000.00 | $1,082.50 | $3.62 | 0.69% | ||||
AVIP BlackRock Advantage Small Cap Growth | $1,000.00 | $1,065.60 | $4.48 | 0.86% | ||||
AVIP S&P MidCap 400® Index | $1,000.00 | $1,063.50 | $2.08 | 0.40% | ||||
AVIP BlackRock Advantage Large Cap Growth | $1,000.00 | $1,099.80 | $3.76 | 0.71% | ||||
AVIP AB Risk Managed Balanced | $1,000.00 | $1,060.40 | $4.41 | 0.85% | ||||
AVIP Federated Core Plus Bond | $1,000.00 | $1,033.10 | $2.92 | 0.57% | ||||
AVIP Intech U.S. Low Volatility | $1,000.00 | $1,012.10 | $3.09 | 0.61% | ||||
AVIP AB Relative Value | $1,000.00 | $1,078.40 | $3.82 | 0.73% | ||||
AVIP iShares Managed Risk Balanced | $1,000.00 | $1,052.40 | $3.05 | 0.59% | ||||
AVIP iShares Managed Risk Moderate Growth | $1,000.00 | $1,055.80 | $3.06 | 0.59% | ||||
AVIP iShares Managed Risk Growth | $1,000.00 | $1,064.70 | $3.07 | 0.59% | ||||
AVIP Moderately Conservative Model | $1,000.00 | $1,051.70 | $2.38 | 0.46% | ||||
AVIP Balanced Model | $1,000.00 | $1,056.70 | $2.33 | 0.45% | ||||
AVIP Moderate Growth Model | $1,000.00 | $1,062.20 | $2.18 | 0.42% | ||||
AVIP Growth Model | $1,000.00 | $1,066.20 | $2.29 | 0.44% |
| * | Expenses are equal to the average account value times the Portfolio’s annualized expense ratio multiplied by the number of days in the most recent fiscal half-year (184 days) divided by the number of days in the fiscal year (365 days). Please note that the expenses shown in these tables are meant to highlight ongoing Portfolio costs only and do not reflect any contract-level expenses or Portfolio transactional costs, such as sales charges (loads) or exchange fees (if any). Therefore, these tables are useful in comparing ongoing mutual fund costs only, and will not fully assist a policy/contract owner in determining the relative total expenses of different funds. In addition, if transactional costs were included, costs may have been higher for these Portfolios as well as for a fund being compared. |
Hypothetical Example for Comparison Purposes
The table below provides information about hypothetical investment values and hypothetical expenses based on each respective Portfolio’s actual expense ratio and an assumed rate of return of 5% per year before expenses, which is not an actual return. The hypothetical investment values and expenses may not be used to estimate the actual ending investment balance or expenses actually paid for the period by the shareholders. A policy/contract holder may use this information to compare this 5% hypothetical example with the 5% hypothetical examples that appear in the shareholder reports of other funds.
| Portfolio | Beginning Investment Value 7/1/2023 | Ending Investment Value 12/31/2023 | Expenses Paid During Period* 7/1/2023 – 12/31/2023 | Expense Ratio During Period 7/1/2023 – 12/31/2023 (Annualized) | ||||
AVIP Bond | $1,000.00 | $1,022.13 | $3.11 | 0.61% |
203
(continued)
AuguStarSM Variable Insurance Products Fund, Inc.
| Additional Information (Continued) | December 31, 2023 (Unaudited) |
| Portfolio | Beginning Investment Value 7/1/2023 | Ending Investment Value 12/31/2023 | Expenses Paid During Period* 7/1/2023 – 12/31/2023 | Expense Ratio During Period 7/1/2023 – 12/31/2023 (Annualized) | ||||
AVIP BlackRock Balanced Allocation | $1,000.00 | $1,022.38 | $2.85 | 0.56% | ||||
AVIP BlackRock Advantage International Equity | $1,000.00 | $1,020.82 | $4.43 | 0.87% | ||||
AVIP Fidelity Institutional AM® Equity Growth | $1,000.00 | $1,021.02 | $4.23 | 0.83% | ||||
AVIP AB Small Cap | $1,000.00 | $1,020.87 | $4.38 | 0.86% | ||||
AVIP AB Mid Cap Core | $1,000.00 | $1,020.62 | $4.63 | 0.91% | ||||
AVIP S&P 500® Index | $1,000.00 | $1,023.29 | $1.94 | 0.38% | ||||
AVIP BlackRock Advantage Large Cap Value | $1,000.00 | $1,021.48 | $3.77 | 0.74% | ||||
AVIP Federated High Income Bond | $1,000.00 | $1,020.87 | $4.38 | 0.86% | ||||
AVIP Nasdaq-100® Index | $1,000.00 | $1,023.04 | $2.19 | 0.43% | ||||
AVIP BlackRock Advantage Large Cap Core | $1,000.00 | $1,021.73 | $3.52 | 0.69% | ||||
AVIP BlackRock Advantage Small Cap Growth | $1,000.00 | $1,020.87 | $4.38 | 0.86% | ||||
AVIP S&P MidCap 400® Index | $1,000.00 | $1,023.19 | $2.04 | 0.40% | ||||
AVIP BlackRock Advantage Large Cap Growth | $1,000.00 | $1,021.63 | $3.62 | 0.71% | ||||
AVIP AB Risk Managed Balanced | $1,000.00 | $1,020.92 | $4.33 | 0.85% | ||||
AVIP Federated Core Plus Bond | $1,000.00 | $1,022.33 | $2.91 | 0.57% | ||||
AVIP Intech U.S. Low Volatility | $1,000.00 | $1,022.13 | $3.11 | 0.61% | ||||
AVIP AB Relative Value | $1,000.00 | $1,021.53 | $3.72 | 0.73% | ||||
AVIP iShares Managed Risk Balanced | $1,000.00 | $1,022.23 | $3.01 | 0.59% | ||||
AVIP iShares Managed Risk Moderate Growth | $1,000.00 | $1,022.23 | $3.01 | 0.59% | ||||
AVIP iShares Managed Risk Growth | $1,000.00 | $1,022.23 | $3.01 | 0.59% | ||||
AVIP Moderately Conservative Model | $1,000.00 | $1,022.89 | $2.35 | 0.46% | ||||
AVIP Balanced Model | $1,000.00 | $1,022.94 | $2.29 | 0.45% | ||||
AVIP Moderate Growth Model | $1,000.00 | $1,023.09 | $2.14 | 0.42% | ||||
AVIP Growth Model | $1,000.00 | $1,022.99 | $2.24 | 0.44% |
| * | Expenses are equal to the average account value times the Portfolio’s annualized expense ratio multiplied by the number of days in the most recent fiscal half-year (184 days) divided by the number of days in the fiscal year (365 days). Please note that the expenses shown in these tables are meant to highlight ongoing Portfolio costs only and do not reflect any contract-level expenses or Portfolio transactional costs, such as sales charges (loads) or exchange fees (if any). Therefore, these tables are useful in comparing ongoing mutual fund costs only, and will not fully assist a policy/contract owner in determining the relative total expenses of different funds. In addition, if transactional costs were included, costs may have been higher for these Portfolios as well as for a fund being compared. |
(3)Other Federal Tax Information
For corporate shareholders, the percentages of the total ordinary income dividends paid in 2023, and ordinary income consent dividends that were incurred for the 2023 tax year, that qualify for the corporate dividends received deduction are as follows:
AVIP Bond | 0.00% |
AVIP BlackRock Balanced Allocation | 68.06% |
AVIP BlackRock Advantage International Equity | 0.00% |
AVIP Fidelity Institutional AM® Equity Growth | 0.00% |
AVIP AB Small Cap | 0.00% |
AVIP AB Mid Cap Core | 100.00% |
AVIP S&P 500® Index | 100.00% |
AVIP BlackRock Advantage Large Cap Value | 100.00% |
AVIP Federated High Income Bond | 0.00% |
AVIP Nasdaq-100® Index | 100.00% |
AVIP BlackRock Advantage Large Cap Core | 100.00% |
AVIP BlackRock Advantage Small Cap Growth | 0.00% |
AVIP S&P MidCap 400® Index | 100.00% |
AVIP BlackRock Advantage Large Cap Growth | 100.00% |
AVIP AB Risk Managed Balanced | 42.29% |
AVIP Federated Core Plus Bond | 0.00% |
AVIP Intech U.S. Low Volatility | 100.00% |
AVIP AB Relative Value | 100.00% |
AVIP iShares Managed Risk Balanced | 25.43% |
AVIP iShares Managed Risk Moderate Growth | 0.00% |
AVIP iShares Managed Risk Growth | 0.00% |
AVIP Moderately Conservative Model | 11.66% |
AVIP Balanced Model | 11.96% |
AVIP Moderate Growth Model | 13.06% |
AVIP Growth Model | 12.73% |
204
(continued)
AuguStarSM Variable Insurance Products Fund, Inc.
| Additional Information (Continued) | December 31, 2023 (Unaudited) |
Pursuant to Section 853 of the Internal Revenue Code, the Fund designates the following amounts as foreign taxes paid for the year ended December 31, 2023:
| Creditable Foreign Taxes Paid | Per Share Amount | Portion of Ordinary Income Distribution Derived from Foreign Sourced Income | |||
AVIP BlackRock Advantage International Equity | $1,046,480 | $0.0449 | 90.22% | ||
AVIP iShares Managed Risk Balanced | $ 266,927 | $0.0044 | 14.81% | ||
AVIP iShares Managed Risk Moderate Growth | $ 332,098 | $0.0082 | 23.47% | ||
AVIP iShares Managed Risk Growth | $ 414,628 | $0.0118 | 35.56% | ||
AVIP Moderately Conservative Model | $ 46,087 | $0.0025 | 4.54% | ||
AVIP Balanced Model | $ 315,579 | $0.0044 | 8.97% | ||
AVIP Moderate Growth Model | $ 709,669 | $0.0052 | 13.85% | ||
AVIP Growth Model | $ 222,227 | $0.0071 | 20.93% |
Foreign taxes paid for purposes of Section 853 may be less than actual foreign taxes paid for financial statement purposes. None of the Portfolios listed above derived any income from ineligible foreign sources, as defined under Section 901(j) of the Internal Revenue Code.
(4)Liquidity Risk Management Program
To promote effective liquidity risk management throughout the fund industry and to enhance disclosure regarding fund liquidity and redemption practices, the SEC adopted Rule 22e-4 under the 40 Act, the Investment Company Liquidity Risk Management Programs Rule. This Rule requires every registered open-end management company to establish a liquidity risk management program (the “LRMP”) that, among other things, provides for the assessment, management and review of liquidity risk, the classification of a fund’s portfolio investments into one of four liquidity buckets based upon the number of days that such investments may reasonably be expected to be converted into cash or otherwise disposed of without significantly impacting their price, the establishment of a highly liquid investment minimum where required, and the establishment of a 15% limitation on illiquid investments. Additionally, the SEC adopted Rule 30b1-10 and Form N-LIQUID, which generally requires a fund to notify the Commission when certain liquidity-related events occur.
The Board approved the Fund’s LRMP at its regular meeting on August 17, 2018, including the appointment of ONI as the administrator of the LRMP. At the Board’s regular meeting on August 11, 2023, ONI provided an annual report to the Board on the operation and effectiveness of the LRMP. ONI manages liquidity risks associated with the Fund’s investments by monitoring cash and cash equivalents, the use of derivatives, the concentration of investments and the appropriateness of portfolio strategies for open-end funds, and by classifying every fund investment as either highly liquid, moderately liquid, less liquid or illiquid on at least a monthly basis. To assist with the classification of Fund investments, ONI has contracted with a third party provider of liquidity monitoring services. ONI supplies this provider with portfolio-level data and certain assumptions as to reasonably anticipated trading sizes and significant price impacts, which it then uses to determine preliminary classifications. Once these preliminary classifications are received, ONI personnel review the information and compare it to classifications provided by Fund sub-advisers in determining final classifications.
The LRMP effectively managed the Fund’s liquidity risks throughout the period. During this period, no Portfolio held less than 96% of its total net assets in highly liquid investments. Because every Portfolio consisted primarily of highly liquid investments, no highly liquid investment minimum was required to be established for any portfolio, and all were well under their illiquid investment limitations. Additionally, no events that would require the filing of From N-LIQUID occurred.
(5)Other Disclosures
The Statement of Additional Information of the Fund includes additional information about the the Board and is available at http://www.augustarfund.com or upon request, without charge, by calling 877-781-6392 (toll-free).
A description of the policies and procedures that the Fund uses in voting proxies relating to Fund securities, as well as information regarding how the Fund voted proxies during the most recent twelve-month period ended June 30, is available without charge, upon request, by calling 877-781-6392 (toll-free) and on the SEC's website at http://www.sec.gov.
The Fund has filed its Schedules of Investments as of March 31 and September 30 with the SEC, as required, on Form N-PORT Part F. Form N-PORT Part F is required to be filed with the SEC for the first and third quarters of each fiscal year within sixty days after the end of each period and is available on the SEC website upon acceptance of each submission.
205
(continued)
AuguStarSM Variable Insurance Products Fund, Inc.
| Additional Information (Continued) | December 31, 2023 (Unaudited) |
This report and the financial statements contained herein are submitted for the general information of the shareholders of the Fund. This report is not authorized for distribution to prospective investors in the Fund unless preceded or accompanied by an effective prospectus of the Fund. For a prospectus containing more complete information, including charges and expenses, please contact Ohio National Investments, Inc., One Financial Way, Cincinnati, OH 45242, telephone 877-781-6392 (toll-free).
206
AuguStarSM Variable Insurance Products Fund, Inc.
| Information about Directors and Officers | December 31, 2023 (Unaudited) |
| Name and Address | Age | Position(s) with the Fund | Term of Office and Length of Time Served | Number of Portfolios in the Fund to be Overseen by Director | Principal Occupation(s) During Past Five Years and Other Directorships | |||||
| Independent Directors | ||||||||||
| Christopher A. Carlson One Financial Way Cincinnati, Ohio | 64 | Chair and Director, Member of Audit and Independent Directors Committees | Indefinite; Since July 2020 | 25 | President/Vice Chair and other positions: Ohio National Financial Services and subsidiaries (June 1993 - December 2018); President: Ohio National Fund, Inc. (March 2010 - May 2016). | |||||
| Madeleine W. Ludlow One Financial Way Cincinnati, Ohio | 69 | Director, Chair of Audit Committee and Member of Independent Directors Committee | Indefinite; Since April 2012 | 25 | Founder/Managing Director: West Capital Partners LLC (2010 - Present), General Partner: H Ventures LLC (2020 - 2021); Director: ALLETE, Inc. (2004 - Present). | |||||
| Geoffrey Keenan One Financial Way Cincinnati, Ohio | 65 | Director, Member of Audit and Independent Directors Committees | Indefinite; Since January 2015 | 25 | Executive Vice President - Asset Management Operations: Acrisure LLC (May 2021 - December 2021); Executive Vice President and Chief Operating Officer: Gateway Investment Advisers, LLC (1995 - 2013). | |||||
| Lawrence L. Grypp One Financial Way Cincinnati, Ohio | 75 | Director, Member of Audit and Independent Directors Committees | Indefinite; Since December 2016 | 25 | Senior Business Advisor and Board Member (January 2018 - Present); President: Goering Center for Family and Private Business (August 2008 - December 2017). | |||||
| Julia W. Poston One Financial Way Cincinnati, Ohio | 63 | Director, Member of Audit and Independent Directors Committees | Indefinite; Since October 2022 | 25 | Partner; Ernst & Young LLP (June 2002 – June 2020); Independent Trustee: The Royce Funds (16 Portfolios) (August 2023 - Present); Independent Trustee: The James Advantage Funds (4 Portfolios) (August 2022 - Present); Director: Al. Neyer Corp. (August 2020 - Present); Director: Master Chemical Corp. (August 2021 - Present). | |||||
| Officers | ||||||||||
| Thomas G. Mooney One Financial Way Cincinnati, Ohio | 41 | Interim President | Indefinite; Since March 2023 | Vice President: ONI (February 2023 – Present); Mutual Fund Analyst Officer: ALIC (February 2023 – Present); Fund Evaluation Analyst: ALIC (July 2022 – February 2023); Full-time Parent (November 2017 – July 2022). | ||||||
| R. Todd Brockman One Financial Way Cincinnati, Ohio | 55 | Treasurer | Indefinite; Since August 2004 | Vice President, Mutual Fund Operations: ALIC and NSLA (February 2014 - Present); Treasurer: ONI (2004 - Present). | ||||||
| Kimberly A. Plante One Financial Way Cincinnati, Ohio | 49 | Secretary | Indefinite; Since March 2005 | Vice President and Counsel: ALIC (November 2017 - Present); Secretary: ONI; Officer of various other Constellation Insurance-affiliated companies. |
207
(continued)
AuguStarSM Variable Insurance Products Fund, Inc.
| Information about Directors and Officers (Continued) | December 31, 2023 (Unaudited) |
| Name and Address | Age | Position(s) with the Fund | Term of Office and Length of Time Served | Number of Portfolios in the Fund to be Overseen by Director | Principal Occupation(s) During Past Five Years and Other Directorships | |||||
| Keith Dwyer One Financial Way Cincinnati, Ohio | 51 | Chief Compliance Officer | Indefinite; Since August 2016 | Vice President, Fund Compliance: ALIC (January 2022 - Present); Second Vice President, Fund Compliance: ALIC (August 2016 - January 2022); Chief Compliance Officer: ONI and other Constellation Insurance-affiliated companies (August 2016 - Present). | ||||||
| Daniel P. Leming One Financial Way Cincinnati, Ohio | 38 | Operations Officer and Assistant Treasurer | Indefinite; Since March 2016 | Assistant Vice President; Mutual Fund Operations: ALIC (December 2020 - Present); Director, Fund Operations and Analysis: ALIC (July 2018 - December 2020). | ||||||
| Timothy A. Abbott One Financial Way Cincinnati, Ohio | 51 | Assistant Secretary | Indefinite; Since February 2022 | Assistant Counsel: ALIC (February 2023 - Present); Senior Attorney: ALIC (March 2021 – February 2023); Compliance Consultant: ALIC (January 2017 – March 2021); Officer of various other Constellation Insurance-affiliated companies (June 2021 – Present). | ||||||
| Matthew J. Donlan One Financial Way Cincinnati, Ohio | 33 | Financial Reporting Officer | Indefinite; Since February 2023 | Director, Mutual Fund Financial Reporting: ALIC (June 2021 – Present); Assistant Director, Mutual Fund Financial Reporting: ALIC (January 2020 – June 2021); Mutual Fund Reporting Manager: ALIC (May 2017 – December 2019). |
208

(b) Not applicable.
| Item 2. | Code Of Ethics. |
| As of the end of the period covered by this report, AuguStarSM Variable Insurance Products Fund, Inc. (the “Fund”) has adopted a code of ethics that applies to the Fund’s principal executive officer and principal financial officer. There were no substantive amendments or waivers to the Code of Ethics during the period covered by this report. | |
| A copy of this Code of Ethics is filed as Exhibit EX-99.CODE to this Form N-CSR and is also available, without charge, uponrequest, by calling 877-781-6392 toll free. | |
| Item 3. | Audit Committee Financial Expert. |
| The Fund’s Board of Directors has determined that the Fund has an audit committee financial expert serving on its Audit Committee. The Audit Committee financial expert is Madeleine W. Ludlow, who is independent for purposes of Item 3 of Form N-CSR. | |
| Item 4. | Principal Accountant Fees And Services. |
| The aggregate fees for each of the last two fiscal years for professional services rendered by the principal accountant for the audit of the Fund’s annual financial statements or services that are normally provided by the accountant in connection with statutory and regulatory filings or engagements for those fiscal years are listed below. |
| (a) | Audit Fees. |
| Audits of the Portfolios: |
| Fiscal year ended December 31, 2023: | $380,500 |
| Fiscal year ended December 31, 2022: | $401,095 |
| (b) | Audit-Related Fees. |
| Consent(s) on N-1A Annual Registration Statement(s) filed with the SEC: |
| Fiscal year ended December 31, 2023: | $15,500 |
| Fiscal year ended December 31, 2022: | $10,500 |
| (c) | Tax Fees. |
| Fiscal year ended December 31, 2023: | $40,979 |
| Fiscal year ended December 31, 2022: | $35,433 |
| (d) | All Other Fees. None. |
| (e)(1) | Audit Committee Pre-Approval Policies and Procedures: |
| The Fund’s Audit Committee has adopted an Audit Committee Charter that requires that the Audit Committee oversee the quality and appropriateness of the accounting methods used in the preparation of the Fund’s financial statements, and the independent audit thereof; approve the selection and compensation of the independent auditors; and pre-approve the performance, by the independent auditors, of non-audit services for the Fund, its investment adviser, or any affiliated entity controlling, controlled by or under common control with the investment adviser that provides ongoing services to the Fund. | |
| (e)(2) | Services Approved Pursuant to Paragraph (c)(7)(i)(C) of Rule 2-01 of Regulation S-X: |
| During the fiscal years ended December 31, 2023 and 2022, there were no non-audit services provided by the Fund’s principal accountant that would have required pre-approval by the Fund’s Audit Committee. The audit-related fees aforementioned were pre-approved by the Fund’s Audit Committee, although not required by paragraph (c) (7) (ii) of Regulation S-X, as the audit-related fees were less than five percent of the total amount of revenues paid to the Fund’s principal accountant. |
| (f) | Not Applicable. |
| (g) | There were no non-audit services provided by the Fund’s principal accountant, other than items disclosed in item (b) above, in which a fee was billed to the Fund, the Fund’s adviser, and any entity controlling, controlled by, or under common control with the adviser that provides ongoing services to the registrant for the last two fiscal years. |
| (h) | Not applicable, as there were no non-audit services performed by the Fund’s principal accountant that were rendered to the Fund, the Fund’s adviser, or any entity controlling, controlled by, or under common control with the adviser that provided ongoing services to the registrant that were not pre-approved for the last two fiscal years. |
| (i) | Not Applicable. |
| (j) | Not Applicable. |
| Item 5. | Audit Committee Of Listed Registrants. |
| Not Applicable. | |
| Item 6. | Investments. |
| Not Applicable. | |
| Item 7. | Disclosure Of Proxy Voting Policies And Procedures For Closed-End Management Investment Companies. |
| Not Applicable. | |
| Item 8. | Portfolio Managers of Closed-End Management Investment Companies. |
| Not Applicable. | |
| Item 9. | Purchases of Equity Securities by Closed-End Management Investment Company and Affiliated Purchasers. |
| Not Applicable. | |
| Item 10. | Submission of Matters to a Vote of Security Holders. |
| There were no material changes to the procedures by which shareholders may recommend nominees to the Fund’s Board of Directors. | |
| Item 11. | Controls and Procedures. |
| (a) | The Fund’s principal executive officer and principal financial officer have concluded, based on their evaluation conducted as of a date within 90 days of the filing of this report, that the Fund’s disclosure controls and procedures are adequately designed and are operating effectively to ensure (i) that material information relating to the Fund, including its consolidated subsidiaries, is made known to them by others within those entities, particularly during the period in which this report is being prepared; and (ii) that information required to be disclosed by the Fund on Form N-CSR is recorded, processed, summarized and reported within the time periods specified in the Securities and Exchange Commission’s rules and forms. |
| (b) | There were no changes in the Fund’s internal control over financial reporting that occurred during the period covered by this report that have materially affected, or are reasonably likely to materially affect, the Fund’s internal control over financial reporting. |
| Item 12. | Disclosure of Securities Lending Activities for Closed-End Management Investment Companies. |
| Not Applicable. | |
| Item 13. | Exhibits. |
SIGNATURES
Pursuant to the requirements of the Securities Exchange Act of 1934 and the Investment Company Act of 1940, the registrant has duly caused this report to be signed on its behalf by the undersigned, thereunto duly authorized.
AuguStarSM Variable Insurance Products Fund, Inc.
| By: | /s/ Thomas G. Mooney |
| Thomas G. Mooney | |
| Interim President | |
| (Principal Executive Officer) | |
| Date: | March 6, 2024 |
Pursuant to the requirements of the Securities Exchange Act of 1934 and the Investment Company Act of 1940, this report has been signed below by the following persons on behalf of the registrant and in the capacities and on the dates indicated.
| By: | /s/ Thomas G. Mooney |
| Thomas G. Mooney | |
| Interim President | |
| (Principal Executive Officer) | |
| Date: | March 6, 2024 |
| By: | /s/ R. Todd Brockman |
| R. Todd Brockman | |
| Treasurer | |
| (Principal Financial Officer) | |
| Date: | March 6, 2024 |