As filed with the Securities and Exchange Commission on March 2, 2020
UNITED STATES
SECURITIES AND EXCHANGE COMMISSION
WASHINGTON, D.C. 20549
FORM N-CSR
CERTIFIED SHAREHOLDER REPORT OF REGISTERED MANAGEMENT
INVESTMENT COMPANIES
Investment Company Act file number 811-03023
FORUM FUNDS
Three Canal Plaza, Suite 600
Portland, Maine 04101
Jessica Chase, Principal Executive Officer
Three Canal Plaza, Suite 600
Portland, Maine 04101
207-347-2000
Date of fiscal year end: December 31
Date of reporting period: January 1, 2019 – December 31, 2019
ITEM 1. REPORT TO STOCKHOLDERS.
LISANTI SMALL CAP GROWTH FUND
A MESSAGE TO OUR SHAREHOLDERS (Unaudited)
DECEMBER 31, 2019
Dear Shareholder,
The equity markets continued to deliver very strong returns in the second half of 2019, following the rebound they saw in the first half of the year. All aspects of the U.S. equity market participated: the Russell 1000 Index, which is an index of the 1000 largest capitalization stocks in the United States, increased 10.59%, returning 32.59% for the full year, while the Russell 2000 Index, which is an index of the 2000 smallest capitalization stocks in the United States, increased 7.30%, returning 26.53% for the full year. The second half of 2019 saw Growth stocks maintain its leadership over Value stocks in the larger capitalization issues; the Russell 1000 Growth Index, which is an index of the 1000 largest market capitalization stocks with the highest growth rate in the United States increased 12.27%, versus the Russell 1000 Value Index which returned 8.86%. In the smaller capitalization universe that situation was reversed in the second half of 2019, with the Russell 2000 Value Index (which is an index of the 2000 smallest capitalization stocks in the United States with the lowest valuation, low price to book, etc.) returning 7.87% versus the Russell 2000 Growth Index returning 6.75%. For the year, however, the Russell 2000 Growth Index edged out the Russell 2000 Value Index, returning 28.48% versus 23.01%. The Lisanti Small Cap Growth Fund underperformed its benchmark, the Russell 2000 Growth Index, returning 25.62% versus 28.48% for the benchmark.
The shift from growth to value that occurred during the month of September was noted for the speed and strength of the shift. The style rotation was the biggest since September of 2008, with the Russell 2000 Growth Index declining 0.82% and the Russell 2000 Value index increasing 5.13% in September. The best performing sectors during the month of September were Materials and Processing, followed by Producer Durables and Real Estate; Health-Care declined significantly (almost 5%) during the month, due to fears over potential changes to the system after the 2020 election. The largest quintile by market capitalization declined significantly, although year to date it has been the strongest contributor to the Index’s return. This in part reflects the fairly large inflows seen into small cap exchange-traded funds (“ETFs”) in September; when this occurs, lower capitalization and lower quality stocks in the index tend to outperform1, these factors do not favor our investment process.
This rotation was based in part on valuation, since growth was significantly more expensive than value relative to historical measures over the past five years or more. However, we think it also reflects the fact that the earnings slowdown we have seen has been disproportionately centered on a few sectors in the economy that have been pressured by the economic slowdown in the rest of the world, and also from trade pressures. Many of those sectors began to lap the start of the slowdown in the fall; as investors became more certain about a cessation of hostilities on trade, these issues began to outperform.
The fourth quarter of 2019 was extremely unusual in that the performance of the Russell 2000 Growth Index in the quarter was driven by only two sectors out of 24—BioPharma and Health-Care Equipment/Services. This was extremely unusual — according to Furey Research partners, this has not occurred since the index
| 1 | Source: FactSet, FTSE Russell, Jefferies |
LISANTI SMALL CAP GROWTH FUND
A MESSAGE TO OUR SHAREHOLDERS (Unaudited)
DECEMBER 31, 2019
started trading almost 30 years ago. The main driver of the portfolio’s underperformance in the quarter was relative to the Russell 2000 Growth Index’s strong outperformance of Biotechnology/BioPharma stocks. For the quarter (specifically, the months of November and December) the drivers of outperformance were the most speculative stocks in that sector. What do we mean by that? Specifically, it was the smallest stocks, those below $1.0 billion in market capitalization and those with market capitalization of $500 million to $1.0 billion; stocks with little or no sales, and stocks with no products in Phase II or higher. While we invest in biotechnology stocks, as you know, we have tended to focus on companies with platform technologies, and with several products, at least one of which is past Phase II. The move in the biopharma stocks in the fourth quarter was responsible for 375 basis points of the Index’s outperformance, according to our Bloomberg attribution reports.
The move in the biopharma stocks was driven in part by M&A. Although most of the announced acquisitions focused on the larger capitalization companies in the biopharma sector, the smaller companies that had similar products moved very sharply in response to the robust takeout valuations seen for the acquired companies. While we realize there is a difference between a company with an established product and product pipeline and a company just entering a Phase I trial, and believe that a lot of the move was due to ETFs or “day traders”, we also believe there are some fundamental factors that will be supportive of the sector. It seemed clear to us that this fourth quarter marked a bit of a realization by large pharmaceutical companies that they do not have the skills for success in the next decade of drug development. They do not have the people that understand biotechnology and are good at developing targeted therapies; nor are they able to hire them; nor, even if they could develop them or hire them, could they catch the companies that have a 5-10 year head start on them. We believe the Health-Care market will increasingly move to molecularly based, targeted therapies for all sorts of health-care issues, as they are much gentler on the body and truly targeted, and therefore more effective. Thus, we believe that there will be continuous interest on the part of larger companies in acquiring companies with valuable technology. We also believe that part of the move was due to valuation disparity. The medical device/medical technology sector has performed strongly for a number of years; as a result, the valuation disparity between med-tech and biotechnology appear likely the widest we have seen it. We think that valuation gap may narrow over the coming years, as many of these newer biotechnology drugs that address very large markets become successful commercial products. We will continue to invest in biotechnology because we believe it is an increasingly valuable sector that will drive growth. (It is also almost 14% of the Russell 2000 Growth Index). We believe that our process of identifying companies with strong management teams, proprietary technology, and platform opportunities that appear likely to deliver multiple drugs over time, is a sound one that has added value, regardless of whether biopharma stocks are in or out of favor in the stock market.
Given these unusual events, we would not be surprised if one were to ask “what is going on here?” We do believe that the rise of ETFs and high frequency trading has had an impact on smaller capitalization stocks, and increased their volatility, particularly over a short term time frame. Over the longer term, however, we believe the basic tenets of successful small cap growth investing still apply, which is to identify companies that have unique characteristics (new products and services, sharp management teams, etc.) that could
LISANTI SMALL CAP GROWTH FUND
A MESSAGE TO OUR SHAREHOLDERS (Unaudited)
DECEMBER 31, 2019
enable them to grow at above average rates; if the company can execute and grow at an above average rate for some period of time, we have observed that above average returns usually follow.
Although the second half of 2019 provided a bit more volatility than investors might have expected, given the first half of 2019, to us the critical point was that the market “broadened out”—i.e., more individual smaller capitalization stocks began to outperform. They outperformed, by and large, because they met or exceeded investors’ expectations in terms of earnings and revenue growth. The third quarter of 2019, which was the last earnings period to be reported, saw a very high number of smaller companies “beat expectations”—we estimate about 70%. This has not happened in a number of years, and we take it as a bullish sign for this part of the market, particularly given an economic backdrop that remains constructive.
For the back half of 2019, our biggest contributors to performance were the Information Technology and Communications Services sectors. While we continued to be invested in the high growth Software as a Service (SaaS) stocks, we saw opportunities in semiconductors and semiconductor capital equipment companies in the summer, as our research indicated that the slowdown (caused in part by trade issues with China) was fading and that 2020 could potentially be a period of strong growth. We believe both those industries could show strong growth for a number of years. The companies we speak with believe that the advent of the 5G wireless network, and the increasing focus on Artificial Intelligence (AI) could create demand for semiconductors that is significantly greater than that created in the early 1990s, as we entered the personal computer era. If their belief proves accurate, then there is not enough semiconductor manufacturing capacity in the world. Meeting that demand could create years of opportunity. The industry (both semiconductors and semiconductor capital equipment) has also consolidated, which should improve the profitability of the remaining companies as the industry returns to growth.
Our biggest detractors in the second half of 2019 were Health-Care and Industrials. Health-Care was by far the largest detractor; this was primarily due to biopharma, which we discussed earlier in this letter. Our industrial holdings suffered from being tied to Boeing; as Boeing’s issues with the Max737 worsened, these stocks came under pressure. As we look to 2020, we have deliberately broadened our focus in the industrial space, to include clean technologies, pollution control services, business services such as consulting, etc. We believe this broadening of focus has the potential to benefit our investors.
It is said that “bull markets always climb a wall of worry”; if we add the uncertainties around impeachment to the uncertainties around trade, to the uncertainties around the election, to the uncertainties around Brexit, to the issues in the Middle East, we appear to have a fairly large “wall of worry” for investors to climb. The professional investment world seems to be divided between those who expect an “earnings recession” and those who see earnings growth accelerating. Our own personal view is that the economy remains very constructive: consumer confidence is high; unemployment is low; housing appears to be picking up; the Federal Reserve appears set to keep interest rates low for the foreseeable future, and if trade tensions between the United States and China do not accelerate further, global growth may pick up. The consensus numbers, according to Jefferies, call for smaller companies to see earnings growth that is faster than that of larger companies as we move through 2020. We believe that backdrop could be a very positive one
LISANTI SMALL CAP GROWTH FUND
A MESSAGE TO OUR SHAREHOLDERS (Unaudited)
DECEMBER 31, 2019
for investors in small cap growth stocks. We believe the story of the 2020 stock market may be broader participation on the part of many individual issues. We believe that secular trends will still dominate—for instance, we do not believe that we can make a strong investment case for your average small bank suddenly returning to strong earnings growth, or a specialty retailer that is poorly positioned for an omni-channel world suddenly seeing an acceleration in sales and earnings—but it may mean there are more opportunities for stock pickers in 2020 than there might have been in 2019. While there are sure to be issues that we did not anticipate (and probably at least one correction or two), we do believe that this backdrop will be, by and large, positive for smaller companies.
We continue to be impressed by the amount of innovation we see, across all industries, among smaller companies, and the increasing speed with which it is overtaking traditional companies in these industries. This innovation can be exceedingly disruptive—for instance, we see a number of newer financial companies offer services similar to those the banks offer, but in a non-bank format. This makes it much easier and quicker to get a loan, to pay bills, etc., and we believe these companies are creating a challenge for the smaller banks. We also see the move to the cloud as disruptive to traditional client/server software companies—the environment is so multi-faceted that it requires a completely different architecture. Given the cost advantages of moving to the cloud for corporations, as well as the convenience, we believe that the transition to cloud or hybrid cloud structures will happen much more quickly than the move from mainframes to client/server architecture did. We believe as these transitions ripple through the economy, they may be disruptive, as economic growth may not be evenly distributed across sectors, and there will be winners and losers in these change curves.
As we look to the end of 2019 and into 2020, we see an economic and political backdrop that is far more nuanced than it was even a few months ago. However, we do not see a domestic recession at this point. We continue to believe the environment will be “confusing” as the cyclical and secular trends intersect, and we see a clear dichotomy between larger capitalization stocks and the smaller, more domestically focused and more secularly well positioned companies. The Tax Reform Act was of significant benefit to many of the smaller public companies, as they tend to be among the highest corporate tax payers. We believe that this benefit will be both short term (reflecting the reduction in the actual tax rate) as well as long term, as many of the companies will, we believe, reinvest some of those benefits in their businesses to accelerate growth. However, the specter of a trade war has created a more nuanced economic backdrop, and the extent to which this escalates and its final impact is difficult to forecast. From our conversations with the managements of smaller companies, it may impact certain industries more than others. For those who rely on parts from China, it could require a restructuring of the supply chain. While the impact may be far less on smaller companies than on larger companies, there will likely still be some impact. While investor fear at this point over these issue seems quite high, it remains to be seen if the fears will translate into reality. Again, we think a more nuanced investment backdrop points towards more dispersion among returns from individual stocks, which we believe could make 2020 (once again) a stock picker’s market. As you know, our process is focused on identifying those companies whose returns are being driven by secular, structural, and transformative changes. We continue to remain prudent by focusing on reducing the volatility and earnings variability in the portfolio and on companies that are able to grow sales and earnings as a result
LISANTI SMALL CAP GROWTH FUND
A MESSAGE TO OUR SHAREHOLDERS (Unaudited)
DECEMBER 31, 2019
of secular trends, structural changes where management is consolidating an industry or improving efficiency and stocks that are trading at a reasonable multiple to earnings growth.
Sincerely,

Mary Lisanti, CFA
President & Portfolio Manager
IMPORTANT RISKS AND DISCLOSURES
An investment in the Fund is subject to risk, including the possible loss of principal amount invested. The Fund invests in smaller companies, which carry greater risk than is associated with larger companies for various reasons such as narrower markets, limited financial resources and less liquid stock. The Fund’s investments in growth securities may be more sensitive to company earnings and more volatile than the market in general. Investments in technology companies are vulnerable to factors affecting that sector, such as dependency on consumer and business acceptance as new technology evolves. Investments in the Industrial sector can be significantly affected by business cycle fluctuations, worldwide economy growth, government and corporate spending and others. Investments in Health-Care companies may be affected by government regulations and government health-care programs, changes in the cost of medical products and services, limited product lines, product liability claims, and patent protection, among other factors.
Basis points, otherwise known as bps or "bips," are a unit of measure used in finance to describe the percentage change in the value or rate of a financial instrument. One basis point is equivalent to 0.01% (1/100th of a percent) or 0.0001 in decimal form.
The views in this report were those of the Fund manager as of December 31, 2019, and may not necessarily reflect her views on the date this report is first published or anytime thereafter. These views are intended to assist shareholders in understanding the Fund’s investment methodology and do not constitute investment advice. Although the Fund manager believes she has a reasonable basis for any opinions or views expressed, actual results may differ, sometimes significantly so, from those expected or expressed. All current and future holdings of the Fund are subject to risk and are subject to change.
LISANTI SMALL CAP GROWTH FUND
PERFORMANCE CHART AND ANALYSIS (Unaudited)
DECEMBER 31, 2019
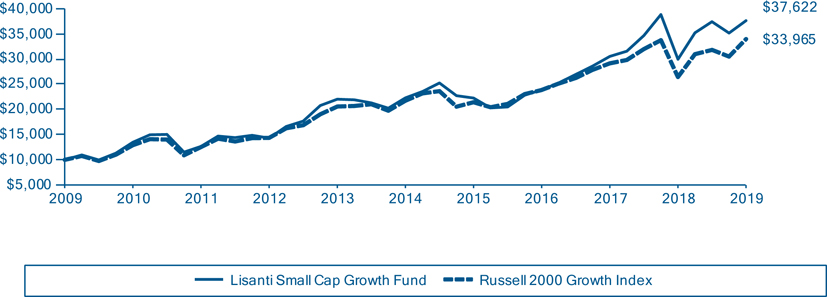
The following chart reflects the change in the value of a hypothetical $10,000 investment, including reinvested dividends and distributions, in the Lisanti Small Cap Growth Fund (the “Fund”) compared with the performance of the benchmark, Russell 2000 Growth Index (“Russell 2000 Growth”), over the past ten fiscal years. The Russell 2000 Growth, the Fund‘s primary performance benchmark, measures the performance of those Russell 2000 Growth companies with higher price-to-value ratios and higher forecasted growth values. The total return of the index includes the reinvestment of dividends and income. The total return of the Fund includes operating expenses that reduce returns, while the total return of the index does not include expenses. The Fund is professionally managed, while the index is unmanaged and is not available for investment.
Comparison of Change in Value of a $10,000 Investment
Lisanti Small Cap Growth Fund vs. Russell 2000 Growth Index
| Average Annual Total Returns | | | |
| Periods Ended December 31, 2019 | One Year | Five Year | Ten Year |
| Lisanti Small Cap Growth Fund | 25.62% | 11.03% | 14.17% |
| Russell 2000 Growth Index | 28.48% | 9.34% | 13.01% |
Performance data quoted represents past performance and is no guarantee of future results. Current performance may be lower or higher than the performance data quoted. Investment return and principal value will fluctuate so that shares, when redeemed, may be worth more or less than original cost. As stated in the Fund’s prospectus, the annual operating expense ratio (gross) is 2.32%. However, the Fund’s adviser has contractually agreed to waive its fee and/or reimburse Fund expenses to limit Total Annual Fund Operating Expenses After Fee Waiver and/or Expense Reimbursement (excluding all taxes, interest, portfolio transaction expenses, proxy expenses, and extraordinary expenses) to 1.35%, through April 30, 2020 (the “Expense Cap”). The Expense Cap may be raised or eliminated only with the consent of the Board of Trustees. The adviser may be reimbursed by the Fund for fees waived and expenses reimbursed by the adviser pursuant to the Expense Cap if such payment is made within three years of the fee waiver or expense reimbursement and does not cause the Total Annual Fund Operating Expenses After Fee Waiver and/or Expense Reimbursement to exceed the lesser of (i) the then-current Expense Cap and (ii) the Expense Cap in place at the time the fees/expenses were waived/reimbursed. Total Annual Fund Operating Expenses After Fee Waiver and/or Expense Reimbursement will increase if exclusions from the Expense Cap apply. Shares redeemed or exchanged within 30 days of purchase will be charged a 1.00% redemption fee. The performance table and graph do not reflect the deduction of taxes that a shareholder would pay on Fund distributions or the redemption of Fund shares. Returns greater than one year are annualized. For the most recent month-end performance, please call (800) 441-7031.
LISANTI SMALL CAP GROWTH FUND
SCHEDULE OF INVESTMENTS
DECEMBER 31, 2019
| Shares | | | Security Description | | Value | |
| Common Stock - 97.8% | | | | |
| Communication Services - 1.6% | | | | |
| | 6,160 | | | Cardlytics, Inc. (a) | | $ | 387,218 | |
| | 12,320 | | | EverQuote, Inc. (a) | | | 423,192 | |
| | | | | | | | 810,410 | |
| Consumer Discretionary - 18.9% | | | | |
| | 21,905 | | | Boot Barn Holdings, Inc. (a) | | | 975,430 | |
| | 12,110 | | | Callaway Golf Co. | | | 256,732 | |
| | 17,100 | | | Chegg, Inc. (a) | | | 648,261 | |
| | 24,115 | | | Crocs, Inc. (a) | | | 1,010,177 | |
| | 23,305 | | | KB Home | | | 798,662 | |
| | 5,460 | | | Lithia Motors, Inc., Class A | | | 802,620 | |
| | 7,885 | | | Papa John's International, Inc. | | | 497,938 | |
| | 10,795 | | | Planet Fitness, Inc., Class A (a) | | | 806,171 | |
| | 2,745 | | | RH (a) | | | 586,057 | |
| | 14,845 | | | Skyline Champion Corp. (a) | | | 470,587 | |
| | 9,080 | | | TopBuild Corp. (a) | | | 935,966 | |
| | 4,975 | | | Visteon Corp. (a) | | | 430,785 | |
| | 18,505 | | | Winnebago Industries, Inc. | | | 980,395 | |
| | 11,400 | | | YETI Holdings, Inc. (a) | | | 396,492 | |
| | | | | | | | 9,596,273 | |
| Consumer Staples - 1.6% | | | | |
| | 13,890 | | | Freshpet, Inc. (a) | | | 820,760 | |
| Energy - 1.1% | | | | |
| | 13,420 | | | World Fuel Services Corp. | | | 582,696 | |
| Financial Services - 1.0% | | | | |
| | 4,928 | | | Kinsale Capital Group, Inc. | | | 500,980 | |
| Financials - 3.7% | | | | |
| | 15,355 | | | Ameris Bancorp | | | 653,202 | |
| | 3,730 | | | eHealth, Inc. (a) | | | 358,378 | |
| | 20,240 | | | First Financial Bankshares, Inc. | | | 710,424 | |
| | 2,705 | | | Palomar Holdings, Inc. (a) | | | 136,576 | |
| | | | | | | | 1,858,580 | |
| Health-Care - 20.0% | | | | |
| | 14,410 | | | ACADIA Pharmaceuticals, Inc. (a) | | | 616,460 | |
| | 18,620 | | | Aimmune Therapeutics, Inc. (a) | | | 623,211 | |
| | 6,395 | | | AMN Healthcare Services, Inc. (a) | | | 398,472 | |
| | 30,310 | | | Horizon Therapeutics PLC (a) | | | 1,097,222 | |
| | 7,065 | | | Inogen, Inc. (a) | | | 482,751 | |
| | 6,730 | | | LHC Group, Inc. (a) | | | 927,125 | |
| | 8,245 | | | Natera, Inc. (a) | | | 277,774 | |
| | 5,575 | | | Nevro Corp. (a) | | | 655,286 | |
| | 10,170 | | | NuVasive, Inc. (a) | | | 786,548 | |
| | 12,660 | | | Pacira BioSciences, Inc. (a) | | | 573,498 | |
| | 2,955 | | | Penumbra, Inc. (a) | | | 485,418 | |
| | 7,990 | | | Repligen Corp. (a) | | | 739,075 | |
| | 5,475 | | | Shockwave Medical, Inc. (a) | | | 240,462 | |
| | 5,125 | | | Tactile Systems Technology, Inc. (a) | | | 345,989 | |
| Shares | | | Security Description | | Value | |
| Health-Care - 20.0% (continued) | | | | |
| | 8,285 | | | Tandem Diabetes Care, Inc. (a) | | $ | 493,869 | |
| | 9,940 | | | Teladoc Health, Inc. (a) | | | 832,177 | |
| | 19,160 | | | Veracyte, Inc. (a) | | | 534,947 | |
| | | | | | | | 10,110,284 | |
| Health-Care Biotechnology - 1.6% | | | | |
| | 1,850 | | | Arrowhead Pharmaceuticals, Inc. (a) | | | 117,345 | |
| | 2,720 | | | Biohaven Pharmaceutical Holding Co., Ltd. (a) | | | 148,077 | |
| | 1,715 | | | CRISPR Therapeutics AG (a) | | | 104,452 | |
| | 19,810 | | | Karyopharm Therapeutics, Inc. (a) | | | 379,758 | |
| | 2,210 | | | Rocket Pharmaceuticals, Inc. (a) | | | 50,300 | |
| | | | | | | | 799,932 | |
| Health-Care Equipment - 0.4% | | | | |
| | 1,330 | | | Insulet Corp. (a) | | | 227,696 | |
| Health-Care Life Sciences Tools - 0.3% | | | | |
| | 5,245 | | | NeoGenomics, Inc. (a) | | | 153,416 | |
| Health-Care Services - 2.6% | | | | |
| | 2,449 | | | Addus HomeCare Corp. (a) | | | 238,092 | |
| | 6,610 | | | Amedisys, Inc. (a) | | | 1,103,341 | |
| | | | | | | | 1,341,433 | |
| Health-Care Supplies - 2.0% | | | | |
| | 6,120 | | | SI-BONE, Inc. (a) | | | 131,580 | |
| | 24,350 | | | STAAR Surgical Co. (a) | | | 856,390 | |
| | | | | | | | 987,970 | |
| Health-Care Technology - 1.2% | | | | |
| | 8,360 | | | Inspire Medical Systems, Inc. (a) | | | 620,396 | |
| Industrials - 11.8% | | | | |
| | 24,525 | | | Builders FirstSource, Inc. (a) | | | 623,180 | |
| | 17,300 | | | Casella Waste Systems, Inc. (a) | | | 796,319 | |
| | 4,405 | | | Clean Harbors, Inc. (a) | | | 377,729 | |
| | 13,360 | | | Generac Holdings, Inc. (a) | | | 1,343,882 | |
| | 5,500 | | | Huron Consulting Group, Inc. (a) | | | 377,960 | |
| | 24,055 | | | Kornit Digital, Ltd. (a) | | | 823,403 | |
| | 11,070 | | | MasTec, Inc. (a) | | | 710,251 | |
| | 2,015 | | | RBC Bearings, Inc. (a) | | | 319,055 | |
| | 4,035 | | | Trex Co., Inc. (a) | | | 362,666 | |
| | 1,970 | | | Woodward, Inc. | | | 233,327 | |
| | | | | | | | 5,967,772 | |
| Information Technology - 8.6% | | | | |
| | 3,430 | | | Avalara, Inc. (a) | | | 251,247 | |
| | 4,065 | | | Bill.Com Holdings, Inc. (a) | | | 154,673 | |
| | 9,395 | | | Enphase Energy, Inc. (a) | | | 245,491 | |
| | 5,885 | | | Fabrinet (a) | | | 381,583 | |
| | 6,520 | | | Lumentum Holdings, Inc. (a) | | | 517,036 | |
| | 19,000 | | | MACOM Technology Solutions Holdings, Inc. (a) | | | 505,400 | |
See Notes to Financial Statements.
LISANTI SMALL CAP GROWTH FUND
SCHEDULE OF INVESTMENTS
DECEMBER 31, 2019
| Shares | | | Security Description | | Value | |
| Information Technology - 8.6% (continued) | | | | |
| | 6,100 | | | ManTech International Corp., Class A | | $ | 487,268 | |
| | 5,485 | | | Paylocity Holding Corp. (a) | | | 662,698 | |
| | 7,570 | | | Silicon Motion Technology Corp., ADR | | | 383,875 | |
| | 2,640 | | | SolarEdge Technologies, Inc. (a) | | | 251,038 | |
| | 21,155 | | | Ultra Clean Holdings, Inc. (a) | | | 496,508 | |
| | | | | | | | 4,336,817 | |
| Materials - 1.2% | | | | |
| | 26,485 | | | Summit Materials, Inc., Class A (a) | | | 632,992 | |
| Real Estate - 1.0% | | | | |
| | 12,020 | | | First Industrial Realty Trust, Inc. REIT | | | 498,950 | |
| Technology - 19.2% | | | | |
| | 6,045 | | | ACI Worldwide, Inc. (a) | | | 229,015 | |
| | 10,055 | | | Advanced Energy Industries, Inc. (a) | | | 715,916 | |
| | 4,835 | | | Anaplan, Inc. (a) | | | 253,354 | |
| | 12,530 | | | Five9, Inc. (a) | | | 821,717 | |
| | 34,290 | | | FormFactor, Inc. (a) | | | 890,511 | |
| | 11,370 | | | Inphi Corp. (a) | | | 841,607 | |
| | 13,305 | | | Itron, Inc. (a) | | | 1,116,955 | |
| | 26,745 | | | Lattice Semiconductor Corp. (a) | | | 511,899 | |
| | 8,080 | | | Methode Electronics, Inc. | | | 317,948 | |
| | 6,495 | | | MKS Instruments, Inc. | | | 714,515 | |
| | 22,235 | | | Perficient, Inc. (a) | | | 1,024,366 | |
| | 2,100 | | | Q2 Holdings, Inc. (a) | | | 170,268 | |
| | 9,125 | | | Rapid7, Inc. (a) | | | 511,183 | |
| | 2,970 | | | The Trade Desk, Inc., Class A (a) | | | 771,547 | |
| | 53,985 | | | Viavi Solutions, Inc. (a) | | | 809,775 | |
| | | | | | | | 9,700,576 | |
| Total Common Stock (Cost $44,053,682) | | | 49,547,933 | |
| Investments, at value - 97.8% (Cost $44,053,682) | | $ | 49,547,933 | |
| Other Assets & Liabilities, Net - 2.2% | | | 1,089,559 | |
| Net Assets - 100.0% | | $ | 50,637,492 | |
| ADR | American Depositary Receipt |
| PLC | Public Limited Company |
| REIT | Real Estate Investment Trust |
| (a) | Non-income producing security. |
The following is a summary of the inputs used to value the Fund's investments as of December 31, 2019.
The inputs or methodology used for valuing securities are not necessarily an indication of the risks associated with investing in those securities. For more information on valuation inputs, and their aggregation into the levels used in the table below, please refer to the Security Valuation section in Note 2 of the accompanying Notes to Financial Statements.
| Valuation Inputs | | Investments in Securities | |
| Level 1 - Quoted Prices | | $ | 49,547,933 | |
| Level 2 - Other Significant Observable Inputs | | | – | |
| Level 3 - Significant Unobservable Inputs | | | – | |
| Total | | $ | 49,547,933 | |
The Level 1 value displayed in this table is Common Stock. Refer to this Schedule of Investments for a further breakout of each security by industry.
| PORTFOLIO HOLDINGS (Unaudited) | | | |
| % of Total Investments | | | |
| Communication Services | | | 1.6 | % |
| Consumer Discretionary | | | 19.4 | % |
| Consumer Staples | | | 1.7 | % |
| Energy | | | 1.2 | % |
| Financial Services | | | 1.0 | % |
| Financials | | | 3.7 | % |
| Health-Care | | | 20.4 | % |
| Health-Care Biotechnology | | | 1.6 | % |
| Health-Care Equipment | | | 0.5 | % |
| Health-Care Life Sciences Tools | | | 0.3 | % |
| Health-Care Services | | | 2.7 | % |
| Health-Care Supplies | | | 2.0 | % |
| Health-Care Technology | | | 1.2 | % |
| Industrials | | | 12.0 | % |
| Information Technology | | | 8.8 | % |
| Materials | | | 1.3 | % |
| Real Estate | | | 1.0 | % |
| Technology | | | 19.6 | % |
| | | | 100.0 | % |
See Notes to Financial Statements.
LISANTI SMALL CAP GROWTH FUND
STATEMENT OF ASSETS AND LIABILITIES
DECEMBER 31, 2019
| ASSETS | | | |
| Investments, at value (Cost $44,053,682) | | $ | 49,547,933 | |
| Cash | | | 847,076 | |
| Receivables: | | | | |
| Fund shares sold | | | 297,330 | |
| Dividends and interest | | | 9,503 | |
| Prepaid expenses | | | 11,021 | |
| Total Assets | | | 50,712,863 | |
| | | | | |
| LIABILITIES | | | | |
| Payables: | | | | |
| Fund shares redeemed | | | 3,151 | |
| Accrued Liabilities: | | | | |
| Investment adviser fees | | | 23,487 | |
| Fund services fees | | | 9,176 | |
| Other expenses | | | 39,557 | |
| Total Liabilities | | | 75,371 | |
| | | | | |
| NET ASSETS | | $ | 50,637,492 | |
| | | | | |
| COMPONENTS OF NET ASSETS | | | | |
| Paid-in capital | | $ | 45,450,234 | |
| Distributable earnings | | | 5,187,258 | |
| NET ASSETS | | $ | 50,637,492 | |
| | | | | |
| SHARES OF BENEFICIAL INTEREST AT NO PAR VALUE (UNLIMITED SHARES AUTHORIZED) | | | 2,326,956 | |
| | | | | |
| NET ASSET VALUE, OFFERING AND REDEMPTION PRICE PER SHARE* | | $ | 21.76 | |
| * | Shares redeemed or exchanged within 30 days of purchase are charged a 1.00% redemption fee. |
See Notes to Financial Statements.
LISANTI SMALL CAP GROWTH FUND
STATEMENT OF OPERATIONS
YEAR ENDED DECEMBER 31, 2019
| INVESTMENT INCOME | | | |
| Dividend income | | $ | 55,668 | |
| Interest income | | | 10,106 | |
| Total Investment Income | | | 65,774 | |
| | | | | |
| EXPENSES | | | | |
| Investment adviser fees | | | 418,830 | |
| Fund services fees | | | 228,735 | |
| Shareholder service fees | | | 110,218 | |
| Custodian fees | | | 5,328 | |
| Registration fees | | | 29,599 | |
| Professional fees | | | 35,434 | |
| Trustees' fees and expenses | | | 4,090 | |
| Other expenses | | | 40,723 | |
| Total Expenses | | | 872,957 | |
| Fees waived | | | (277,778 | ) |
| Net Expenses | | | 595,179 | |
| | | | | |
| NET INVESTMENT LOSS | | | (529,405 | ) |
| | | | | |
| NET REALIZED AND UNREALIZED GAIN | | | | |
| Net realized gain on investments | | | 2,271,514 | |
| Net change in unrealized appreciation (depreciation) on investments | | | 7,315,554 | |
| NET REALIZED AND UNREALIZED GAIN | | | 9,587,068 | |
| INCREASE IN NET ASSETS RESULTING FROM OPERATIONS | | $ | 9,057,663 | |
See Notes to Financial Statements.
LISANTI SMALL CAP GROWTH FUND
STATEMENTS OF CHANGES IN NET ASSETS
| | | For the Years Ended December 31, | |
| | | 2019 | | | 2018 | |
| OPERATIONS | | | | | | |
| Net investment loss | | $ | (529,405 | ) | | $ | (294,230 | ) |
| Net realized gain | | | 2,271,514 | | | | 827,143 | |
| Net change in unrealized appreciation (depreciation) | | | 7,315,554 | | | | (4,171,325 | ) |
| Increase (Decrease) in Net Assets Resulting from Operations | | | 9,057,663 | | | | (3,638,412 | ) |
| | | | | | | | | |
| DISTRIBUTIONS TO SHAREHOLDERS | | | | | | | | |
| Total Distributions Paid | | | (1,076,692 | ) | | | (1,490,131 | ) |
| | | | | | | | | |
| CAPITAL SHARE TRANSACTIONS | | | | | | | | |
| Sale of shares | | | 14,463,091 | | | | 29,042,321 | |
| Reinvestment of distributions | | | 998,703 | | | | 1,422,005 | |
| Redemption of shares | | | (6,607,821 | ) | | | (5,455,798 | ) |
| Redemption fees | | | 1,741 | | | | 1,423 | |
| Increase in Net Assets from Capital Share Transactions | | | 8,855,714 | | | | 25,009,951 | |
| Increase in Net Assets | | | 16,836,685 | | | | 19,881,408 | |
| | | | | | | | | |
| NET ASSETS | | | | | | | | |
| Beginning of Year | | | 33,800,807 | | | | 13,919,399 | |
| End of Year | | $ | 50,637,492 | | | $ | 33,800,807 | |
| | | | | | | | | |
| SHARE TRANSACTIONS | | | | | | | | |
| Sale of shares | | | 683,112 | | | | 1,385,122 | |
| Reinvestment of distributions | | | 46,734 | | | | 77,199 | |
| Redemption of shares | | | (311,546 | ) | | | (293,500 | ) |
| Increase in Shares | | | 418,300 | | | | 1,168,821 | |
See Notes to Financial Statements.
LISANTI SMALL CAP GROWTH FUND
FINANCIAL HIGHLIGHTS
These financial highlights reflect selected data for a share outstanding throughout each year.
| | | For the Years Ended December 31, | |
| | | 2019 | | | 2018 | | | 2017 | | | 2016 | | | 2015 | |
| NET ASSET VALUE, Beginning of Year | | $ | 17.71 | | | $ | 18.81 | | | $ | 18.74 | | | $ | 17.75 | | | $ | 18.73 | |
| INVESTMENT OPERATIONS | | | | | | | | | | | | | | | | | | | | |
| Net investment loss (a) | | | (0.25 | ) | | | (0.21 | ) | | | (0.33 | ) | | | (0.25 | ) | | | (0.32 | ) |
| Net realized and unrealized gain (loss) | | | 4.78 | | | | (0.12 | ) | | | 5.43 | | | | 1.55 | | | | 0.28 | (b) |
| Total from Investment Operations | | | 4.53 | | | | (0.33 | ) | | | 5.10 | | | | 1.30 | | | | (0.04 | ) |
| | | | | | | | | | | | | | | | | | | | | |
| DISTRIBUTIONS TO SHAREHOLDERS FROM | | | | | | | | | | | | | | | | | | | | |
| Net realized gain | | | (0.48 | ) | | | (0.77 | ) | | | (5.03 | ) | | | (0.31 | ) | | | (0.94 | ) |
| Total Distributions to Shareholders | | | (0.48 | ) | | | (0.77 | ) | | | (5.03 | ) | | | (0.31 | ) | | | (0.94 | ) |
| | | | | | | | | | | | | | | | | | | | | |
| REDEMPTION FEES(a) | | | 0.00 | (c) | | | 0.00 | (c) | | | 0.00 | (c) | | | 0.00 | (c) | | | 0.00 | (c) |
| NET ASSET VALUE, End of Year | | $ | 21.76 | | | $ | 17.71 | | | $ | 18.81 | | | $ | 18.74 | | | $ | 17.75 | |
| TOTAL RETURN | | | 25.62 | % | | | (1.90 | )% | | | 27.78 | % | | | 7.32 | % | | | (0.18 | )% |
| | | | | | | | | | | | | | | | | | | | | |
| RATIOS/SUPPLEMENTARY DATA | | | | | | | | | | | | | | | | | | | | |
| Net Assets at End of Year (000s omitted) | | $ | 50,637 | | | $ | 33,801 | | | $ | 13,919 | | | $ | 24,022 | | | $ | 32,809 | |
| Ratios to Average Net Assets: | | | | | | | | | | | | | | | | | | | | |
| Net investment loss | | | (1.20 | )% | | | (1.02 | )% | | | (1.61 | )% | | | (1.49 | )% | | | (1.65 | )% |
| Net expenses | | | 1.35 | % | | | 1.37 | % | | | 1.80 | % | | | 1.80 | % | | | 1.80 | % |
| Gross expenses (d) | | | 1.98 | % | | | 2.32 | % | | | 3.15 | % | | | 2.48 | % | | | 2.26 | % |
| PORTFOLIO TURNOVER RATE | | | 252 | % | | | 220 | % | | | 294 | % | | | 268 | % | | | 196 | % |
| (a) | Calculated based on average shares outstanding during each year. |
| (b) | Per share amount does not accord with the amount reported in the Statement of Operations due to the timing of Fund share sales and the amount per share of realized and unrealized gains and losses at such times. |
| (c) | Less than $0.01 per share. |
| (d) | Reflects the expense ratio excluding any waivers and/or reimbursements. |
See Notes to Financial Statements.
LISANTI SMALL CAP GROWTH FUND
NOTES TO FINANCIAL STATEMENTS
DECEMBER 31, 2019
Note 1. Organization
The Lisanti Small Cap Growth Fund (the “Fund”) is a diversified portfolio of Forum Funds (the “Trust”). The Trust is a Delaware statutory trust that is registered as an open-end, management investment company under the Investment Company Act of 1940, as amended (the “Act”). Under its Trust Instrument, the Trust is authorized to issue an unlimited number of the Fund’s shares of beneficial interest without par value. The Fund commenced operations on February 27, 2004. The Fund seeks maximum capital appreciation. Prior to February 1, 2018, the Fund was named Dinosaur Lisanti Small Cap Growth Fund.
Note 2. Summary of Significant Accounting Policies
The Fund is an investment company and follows accounting and reporting guidance under Financial Accounting Standards Board (“FASB”) Accounting Standards Codification (“ASC”) Topic 946, “Financial Services – Investment Companies.” These financial statements are prepared in accordance with accounting principles generally accepted in the United States of America (“GAAP”), which require management to make estimates and assumptions that affect the reported amounts of assets and liabilities, the disclosure of contingent liabilities at the date of the financial statements, and the reported amounts of increases and decreases in net assets from operations during the fiscal year. Actual amounts could differ from those estimates. The following summarizes the significant accounting policies of the Fund:
Security Valuation – Securities are valued at market prices using the last quoted trade or official closing price from the principal exchange where the security is traded, as provided by independent pricing services on each Fund business day. In the absence of a last trade, securities are valued at the mean of the last bid and ask price provided by the pricing service. Shares of non-exchange traded open-end mutual funds are valued at net asset value (“NAV”). Short-term investments that mature in sixty days or less may be valued at amortized cost.
The Fund values its investments at fair value pursuant to procedures adopted by the Trust’s Board of Trustees if (1) market quotations are not readily available or (2) the Adviser, as defined in Note 4, believes that the values available are unreliable. The Trust’s Valuation Committee, as defined in the Fund’s registration statement, performs certain functions as they relate to the administration and oversight of the Fund’s valuation procedures. Under these procedures, the Valuation Committee convenes on a regular and ad hoc basis to review such investments and considers a number of factors, including valuation methodologies and significant unobservable inputs, when arriving at fair value.
The Valuation Committee may work with the Adviser to provide valuation inputs. In determining fair valuations, inputs may include market-based analytics that may consider related or comparable assets or liabilities, recent transactions, market multiples, book values and other relevant investment information. Adviser inputs may include an income-based approach in which the anticipated future cash flows of the investment are discounted in determining fair value. Discounts may also be applied based on the nature or duration of any restrictions on the disposition of the investments. The Valuation Committee performs regular reviews of valuation methodologies, key inputs and assumptions, disposition analysis and market activity.
LISANTI SMALL CAP GROWTH FUND
NOTES TO FINANCIAL STATEMENTS
DECEMBER 31, 2019
Fair valuation is based on subjective factors and, as a result, the fair value price of an investment may differ from the security’s market price and may not be the price at which the asset may be sold. Fair valuation could result in a different NAV than a NAV determined by using market quotes.
GAAP has a three-tier fair value hierarchy. The basis of the tiers is dependent upon the various “inputs” used to determine the value of the Fund’s investments. These inputs are summarized in the three broad levels listed below:
Level 1 - Quoted prices in active markets for identical assets and liabilities.
Level 2 - Prices determined using significant other observable inputs (including quoted prices for similar securities, interest rates, prepayment speeds, credit risk, etc.). Short-term securities with maturities of sixty days or less are valued at amortized cost, which approximates market value, and are categorized as Level 2 in the hierarchy. Municipal securities, long-term U.S. government obligations and corporate debt securities are valued in accordance with the evaluated price supplied by a pricing service and generally categorized as Level 2 in the hierarchy. Other securities that are categorized as Level 2 in the hierarchy include, but are not limited to, warrants that do not trade on an exchange, securities valued at the mean between the last reported bid and ask quotation and international equity securities valued by an independent third party with adjustments for changes in value between the time of the securities’ respective local market closes and the close of the U.S. market.
Level 3 - Significant unobservable inputs (including the Fund’s own assumptions in determining the fair value of investments).
The aggregate value by input level, as of December 31, 2019, for the Fund’s investments is included in the Fund’s Schedule of Investments.
Security Transactions, Investment Income and Realized Gain and Loss – Investment transactions are accounted for on the trade date. Dividend income is recorded on the ex-dividend date. Foreign dividend income is recorded on the ex-dividend date or as soon as possible after determining the existence of a dividend declaration after exercising reasonable due diligence. Income and capital gains on some foreign securities may be subject to foreign withholding taxes, which are accrued as applicable. Interest income is recorded on an accrual basis. Premium is amortized and discount is accreted using the effective interest method. Identified cost of investments sold is used to determine the gain and loss for both financial statement and federal income tax purposes.
Distributions to Shareholders – Distributions to shareholders of net investment income, if any, are declared and paid quarterly. Distributions to shareholders of net capital gains and foreign currency gains, if any, are declared and paid at least annually. Distributions to shareholders are recorded on the ex-dividend date. Distributions are based on amounts calculated in accordance with applicable federal income tax regulations, which may differ from GAAP. These differences are due primarily to differing treatments of income and gain
LISANTI SMALL CAP GROWTH FUND
NOTES TO FINANCIAL STATEMENTS
DECEMBER 31, 2019
on various investment securities held by the Fund, timing differences and differing characterizations of distributions made by the Fund.
Federal Taxes – The Fund intends to continue to qualify each year as a regulated investment company under Subchapter M of Chapter 1, Subtitle A, of the Internal Revenue Code of 1986, as amended (“Code”), and to distribute all of its taxable income to shareholders. In addition, by distributing in each calendar year substantially all of its net investment income and capital gains, if any, the Fund will not be subject to a federal excise tax. Therefore, no federal income or excise tax provision is required. The Fund files a U.S. federal income and excise tax return as required. The Fund’s federal income tax returns are subject to examination by the Internal Revenue Service for a period of three fiscal years after they are filed. As of December 31, 2019, there are no uncertain tax positions that would require financial statement recognition, de-recognition or disclosure.
Income and Expense Allocation – The Trust accounts separately for the assets, liabilities and operations of each of its investment portfolios. Expenses that are directly attributable to more than one investment portfolio are allocated among the respective investment portfolios in an equitable manner.
Commitments and Contingencies – In the normal course of business, the Fund enters into contracts that provide general indemnifications by the Fund to the counterparty to the contract. The Fund’s maximum exposure under these arrangements is dependent on future claims that may be made against the Fund and, therefore, cannot be estimated; however, based on experience, the risk of loss from such claims is considered remote. The Fund has determined that none of these arrangements requires disclosure on the Fund’s balance sheet.
Redemption Fees – A shareholder who redeems or exchanges shares within 30 days of purchase will incur a redemption fee of 1.00% of the current NAV of shares redeemed or exchanged, subject to certain limitations. The fee is charged for the benefit of the remaining shareholders and will be paid to the Fund to help offset transaction costs. The fee is accounted for as an addition to paid-in capital. The Fund reserves the right to modify the terms of or terminate the fee at any time. There are limited exceptions to the imposition of the redemption fee. Redemption fees incurred for the Fund, if any, are reflected on the Statements of Changes in Net Assets.
Note 3. Cash – Concentration in Uninsured Account
For cash management purposes, the Fund may concentrate cash with the Fund’s custodian. This typically results in cash balances exceeding the Federal Deposit Insurance Corporation (“FDIC”) insurance limits. As of December 31, 2019, the Fund had $597,076 at MUFG Union Bank, N.A. that exceeded the FDIC insurance limit.
LISANTI SMALL CAP GROWTH FUND
NOTES TO FINANCIAL STATEMENTS
DECEMBER 31, 2019
Note 4. Fees and Expenses
Investment Adviser – Lisanti Capital Growth, LLC (the “Adviser”) is the investment adviser to the Fund. Pursuant to an investment advisory agreement, the Adviser receives an advisory fee, payable monthly, from the Fund at an annual rate of 0.95% of the Fund’s average daily net assets.
Shareholder Service Plan – The Trust has adopted a shareholder service plan for the Fund under which the Fund may reimburse the Fund’s administrator for amounts paid by the administrator for providing shareholder service activities that are not otherwise provided by the transfer agent. The Fund’s administrator may make such payments to various financial institutions, including the Adviser, that provide shareholder servicing to their customers invested in the Fund in amounts of up to 0.25% annually of the average daily net assets of the Fund.
Distribution – Foreside Fund Services, LLC serves as the Fund’s distributor (the “Distributor”). The Fund does not have a distribution (12b-1) plan; accordingly, the Distributor does not receive compensation from the Fund for its distribution services. The Adviser compensates the Distributor directly for its services. The Distributor is not affiliated with the Adviser or Atlantic Fund Administration, LLC, a wholly owned subsidiary of Apex US Holdings, LLC (d/b/a Apex Fund Services) (“Apex”) or their affiliates.
Other Service Providers – Apex provides fund accounting, fund administration, compliance and transfer agency services to the Fund. The fees related to these services are included in Fund services fees within the Statement of Operations. Apex also provides certain shareholder report production and EDGAR conversion and filing services. Pursuant to an Apex services agreement, the Fund pays Apex customary fees for its services. Apex provides a Principal Executive Officer, a Principal Financial Officer, a Chief Compliance Officer and an Anti-Money Laundering Officer to the Fund, as well as certain additional compliance support functions.
Trustees and Officers – Each Independent Trustee’s annual retainer is $31,000 ($41,000 for the Chairman), and the Audit Committee Chairman receives an additional $2,000 annually. The Trustees and Chairman may receive additional fees for special Board meetings. Each Trustee is also reimbursed for all reasonable out-of-pocket expenses incurred in connection with his or her duties as a Trustee, including travel and related expenses incurred in attending Board meetings. The amount of Trustees’ fees attributable to the Fund is disclosed in the Statement of Operations. Certain officers of the Trust are also officers or employees of the above named service providers, and during their terms of office received no compensation from the Fund.
Note 5. Fees Waived
The Adviser has contractually agreed to waive its fee and/or reimburse expenses to limit total annual fund operating expenses (excluding all taxes, interest, portfolio transaction expenses, proxy expenses, and extraordinary expenses) to 1.35% through April 30, 2020. Other Fund service providers have voluntarily agreed to waive a portion of their fees. The contractual waivers may only be raised or eliminated with the consent of the Board and voluntary fee waivers may be reduced or eliminated at any time. For the year ended December 31, 2019, fees waived were as follows:
LISANTI SMALL CAP GROWTH FUND
NOTES TO FINANCIAL STATEMENTS
DECEMBER 31, 2019
| Investment Adviser Fees Waived | | | Other Waivers | | | Total Fees Waived | |
| $ | 150,797 | | | $ | 126,981 | | | $ | 277,778 | |
The Adviser may be reimbursed by the Fund for fees waived and expenses reimbursed by the Adviser pursuant to the Expense Cap if such payment is made within three years of the fee waiver or expense reimbursement, and does not cause the Total Annual Fund Operating Expenses After Fee Waiver and/or Expense Reimbursement to exceed the lesser of (i) the then-current expense cap and (ii) the expense cap in place at the time the fees/expenses were waived/reimbursed. As of December 31, 2019 $430,107 is subject to recapture by the Adviser.
Note 6. Security Transactions
The cost of purchases and proceeds from sales of investment securities (including maturities), other than short-term investments during the year ended December 31, 2019, totaled $114,055,555 and $106,939,450, respectively.
Note 7. Federal Income Tax
As of December 31, 2019, the cost of investments for federal income tax purposes is $44,385,546 and the components of net unrealized appreciation consists of:
| Gross Unrealized Appreciation | | $ | 5,566,786 | |
| Gross Unrealized Depreciation | | | (404,399 | ) |
| Net Unrealized Appreciation | | $ | 5,162,387 | |
Distributions paid during the fiscal years ended as noted were characterized for tax purposes as follows:
| | | 2019 | | | 2018 | |
| Ordinary Income | | $ | – | | | $ | 403,951 | |
| Long-Term Capital Gain | | | 1,076,692 | | | | 1,086,180 | |
| | | $ | 1,076,692 | | | $ | 1,490,131 | |
As of December 31, 2019, distributable earnings on a tax basis were as follows:
| Undistributed Ordinary Income | | $ | 1,052 | |
| Undistributed Long-Term Gain | | | 23,820 | |
| Capital and Other Losses | | | (1 | ) |
| Net Unrealized Appreciation | | | 5,162,387 | |
| Total | | $ | 5,187,258 | |
The difference between components of distributable earnings on a tax basis and the amounts reflected in the Statement of Assets and Liabilities are primarily due to wash sales.
LISANTI SMALL CAP GROWTH FUND
NOTES TO FINANCIAL STATEMENTS
DECEMBER 31, 2019
For tax purposes, the current year post October loss was $1 (realized during the period November 1, 2019 through December 31, 2019). This loss will be recognized for tax purposes on the first business day of the Fund’s next fiscal year, January 1, 2020.
Note 8. Subsequent Events
Subsequent events occurring after the date of this report through the date these financial statements were issued have been evaluated for potential impact, and the Fund has had no such events.
REPORT OF INDEPENDENT REGISTERED PUBLIC ACCOUNTING FIRM
To the Board of Trustees of Forum Funds
and the Shareholders of Lisanti Small Cap Growth Fund
Opinion on the Financial Statements
We have audited the accompanying statement of assets and liabilities of Lisanti Small Cap Growth Fund, a series of shares of beneficial interest in Forum Funds (the “Fund”), including the schedule of investments, as of December 31, 2019, and the related statement of operations for the year then ended, the statements of changes in net assets for each of the years in the two-year period then ended and the financial highlights for each of the years in the five-year period then ended, and the related notes (collectively referred to as the “financial statements”). In our opinion, the financial statements present fairly, in all material respects, the financial position of the Fund as of December 31, 2019, and the results of its operations for the year then ended, the changes in its net assets for each of the years in the two-year period then ended and its financial highlights for each of the years in the five-year period then ended, in conformity with accounting principles generally accepted in the United States of America.
Basis for Opinion
These financial statements are the responsibility of the Fund's management. Our responsibility is to express an opinion on the Fund's financial statements based on our audits. We are a public accounting firm registered with the Public Company Accounting Oversight Board (United States) (“PCAOB”) and are required to be independent with respect to the Fund in accordance with the U.S. federal securities law and the applicable rules and regulations of the Securities and Exchange Commission and the PCAOB.
We conducted our audits in accordance with the standards of the PCAOB. Those standards require that we plan and perform the audit to obtain reasonable assurance about whether the financial statements are free of material misstatement, whether due to error or fraud. The Fund is not required to have, nor were we engaged to perform, an audit of its internal control over financial reporting. As part of our audit we are required to obtain an understanding of internal control over financial reporting but not for the purpose of expressing an opinion on the effectiveness of the Fund’s internal control over financial reporting. Accordingly, we express no such opinion.
REPORT OF INDEPENDENT REGISTERED PUBLIC ACCOUNTING FIRM
Our audits included performing procedures to assess the risk of material misstatement of the financial statements, whether due to error or fraud, and performing procedures that respond to those risks. Such procedures included examining, on a test basis, evidence regarding the amounts and disclosures in the financial statements. Our procedures included confirmation of securities owned as of December 31, 2019 by correspondence with the custodian. Our audits also included evaluating the accounting principles used and significant estimates made by management, as well as evaluating the overall presentation of the financial statements. We believe that our audits provide a reasonable basis for our opinion.

BBD, LLP
We have served as the auditor of one or more of the Funds in the Forum Funds since 2008.
Philadelphia, Pennsylvania
February 26, 2020
LISANTI SMALL CAP GROWTH FUND
ADDITIONAL INFORMATION (Unaudited)
DECEMBER 31, 2019
Investment Advisory Agreement Approval
At the September 13, 2019 Board meeting, the Board, including the Independent Trustees, considered the continuance of the investment advisory agreement between the Adviser and the Trust pertaining to the Fund (the “Advisory Agreement”). In preparation for its deliberations, the Board requested and reviewed written responses from the Adviser to a due diligence questionnaire circulated on the Board's behalf concerning the services provided by the Adviser. The Board also discussed the materials with Fund counsel and, as necessary, with the Trust's administrator. During its deliberations, the Board received an oral presentation from the Adviser, and was assisted by the advice of Trustee counsel.
At the meeting, the Board reviewed, among other matters: (1) the nature, extent and quality of the services provided to the Fund by the Adviser, including information on the investment performance of the Fund and the Adviser; (2) the costs of the services provided and profitability to the Adviser of its relationship with the Fund; (3) the advisory fee and total expense ratio of the Fund compared to a relevant peer group of funds; (4) the extent to which economies of scale may be realized as the Fund grows and whether the advisory fee enables the Fund's investors to share in the benefits of economies of scale; and (5) other benefits received by the Adviser from its relationship with the Fund.
Nature, Extent and Quality of Services
Based on written materials received, a presentation from a senior representative of the Adviser and a discussion with the Adviser about the Adviser’s personnel, operations and financial condition, the Board considered the quality of services provided by the Adviser under the Advisory Agreement. In this regard, the Board considered information regarding the experience, qualifications and professional background of the portfolio manager and other personnel at the Adviser with principal responsibility for the Fund, as well as the investment philosophy and decision-making process of those professionals and the capability and integrity of the Adviser’s senior management and staff.
The Board considered also the adequacy of the Adviser’s resources. The Board noted the Adviser’s representation that the firm is in stable financial condition and that the Adviser has the operational capability and the necessary staffing and experience to continue providing high-quality investment advisory services to the Fund for the foreseeable future. Based on the presentation and the materials provided by the Adviser in connection with the Board’s consideration of the renewal of the Advisory Agreement, the Board concluded that, overall, it was satisfied with the nature, extent and quality of services to be provided to the Fund under the Advisory Agreement.
Performance
In connection with a presentation by the Adviser regarding its approach to managing the Fund, the Board considered the historical performance of the Fund, including the performance of the Fund compared to its primary benchmark index and an independent peer group of funds identified by Broadridge Financial Solutions, Inc. (“Broadridge”) believed to have characteristics similar to the Fund. The Board observed
LISANTI SMALL CAP GROWTH FUND
ADDITIONAL INFORMATION (Unaudited)
DECEMBER 31, 2019
that the Fund outperformed the Russell 2000 Growth Index, the Fund’s primary benchmark index, for the one-three-, five-, and 10-year periods ended June 30, 2019. The Board also observed that, based on the information provided by Broadridge, the Fund outperformed the median of its Broadridge peers over the one-, three-, and five-year periods ended June 30, 2019. The Board noted the Adviser’s representation that stock selection, namely with respect to growth stocks, coupled with the Fund’s bias toward small market capitalization stocks, were the primary drivers of outperformance for the Fund relative to the index and Broadridge peers. Based on the foregoing and other applicable considerations, the Board determined that the Fund and its shareholders could benefit from the Adviser’s continued management of the Fund.
Compensation
The Board evaluated the Adviser’s compensation for providing advisory services to the Fund and analyzed comparative information on actual advisory fee rates and actual total expense ratios of the Fund compared to those of its Broadridge peer group. The Board observed that the Adviser’s actual advisory fee rate for the Fund was lower than the median of the Broadridge peer group. The Board also observed that, although the Adviser’s actual total expense ratio for the Fund was higher than the median of the Broadridge peer group the Adviser had implemented reductions in the contractual advisory fee rate and expense cap for the Fund in 2018. Based on the foregoing and other applicable considerations, the Board concluded that the Adviser’s advisory fee rate charged to the Fund was fair and reasonable.
Cost of Services and Profitability
The Board evaluated information provided by the Adviser regarding the costs of services and its profitability with respect to the Fund. In this regard, the Board considered the Adviser’s resources devoted to the Fund, as well as the information provided by the Adviser regarding the costs and profitability of its Fund activities. The Board noted the Adviser’s representation that it did not maintain separately identifiable profit and loss information for the Fund relative to its other advisory businesses. The Board also noted the Adviser’s representation that the Adviser was subsidizing the Fund’s operations by forgoing a portion of its advisory fee. Based on these and other applicable considerations, including financial statements from the Adviser indicating its profitability and expenses from overall operations, the Board concluded that the Adviser’s costs of services and profits attributable to management of the Fund were reasonable in the context of all factors considered.
Economies of Scale
The Board evaluated whether the Fund would benefit from any economies of scale. In this respect, the Board considered the Fund’s fee structure, asset size, and net expense ratio. The Board noted the relatively small size of the Fund and the Adviser’s representation that the Fund could benefit from economies of scale as assets grow but that the Adviser had determined that breakpoints were not appropriate at this time, particularly in light of the reductions to the contractual management fee and expense cap in 2018. Based on the foregoing information and other applicable considerations, the Board concluded that the asset level
LISANTI SMALL CAP GROWTH FUND
ADDITIONAL INFORMATION (Unaudited)
DECEMBER 31, 2019
of the Fund was not consistent with the existence of economies of scale such that economies of scale were not a material factor in approving the Advisory Agreement.
Other Benefits
The Board noted the Adviser’s representation that it would be receiving a benefit arising from the use of soft dollars in connection with Fund trades for the acquisition of research that would benefit not only the Fund, but potentially other clients of the Adviser. The Board concluded that the other benefits received were not a material factor in approving the Advisory Agreement.
Conclusion
The Board did not identify any single factor as being of paramount importance, and different Trustees may have given different weight to different factors. The Board reviewed a memorandum from Fund counsel discussing the legal standards applicable to its consideration of the Advisory Agreement. Based on its review, including consideration of each of the factors referenced above, the Board determined, in the exercise of its reasonable business judgment, that the advisory arrangement, as outlined in the Advisory Agreement, was fair and reasonable in light of the services performed or to be performed, expenses incurred or to be incurred and such other matters as the Board considered relevant.
Proxy Voting Information
A description of the policies and procedures that the Fund uses to determine how to vote proxies relating to securities held in the Fund’s portfolio is available, without charge and upon request, by calling (800) 441-7031 and on the U.S. Securities and Exchange Commission's (the "SEC") website at www.sec.gov. The Fund’s proxy voting record for the most recent twelve-month period ended June 30 is available, without charge and upon request, by calling (800) 441-7031 and on the SEC’s website at www.sec.gov.
Availability of Quarterly Portfolio Schedules
The Fund files its complete schedule of portfolio holdings with the SEC for the first and third quarters of each fiscal year on Form N-Q. These filings are available, without charge and upon request on the SEC’s website at www.sec.gov or may be reviewed and copied at the SEC’s Public Reference Room in Washington, D.C. Information on the operation of the Public Reference Room may be obtained by calling (800) SEC-0330.
Shareholder Expense Example
As a shareholder of the Fund, you incur two types of costs: (1) transaction costs, including redemption fees and exchange fees, and (2) ongoing costs, including management fees and other Fund expenses. This example is intended to help you understand your ongoing costs (in dollars) of investing in the Fund, and to compare these costs with the ongoing costs of investing in other mutual funds.
LISANTI SMALL CAP GROWTH FUND
ADDITIONAL INFORMATION (Unaudited)
DECEMBER 31, 2019
The example is based on an investment of $1,000 invested at the beginning of the period and held for the entire period from July 1, 2019 through December 31, 2019.
Actual Expenses – The first line of the table below provides information about actual account values and actual expenses. You may use the information in this line, together with the amount you invested, to estimate the expenses that you paid over the period. Simply divide your account value by $1,000 (for example, an $8,600 account value divided by $1,000 = 8.6), then multiply the result by the number in the first line under the heading entitled “Expenses Paid During Period” to estimate the expenses you paid on your account during the period.
Hypothetical Example for Comparison Purposes – The second line of the table below provides information about hypothetical account values and hypothetical expenses based on the Fund’s actual expense ratio and an assumed rate of return of 5% per year before expenses, which is not the Fund’s actual return. The hypothetical account values and expenses may not be used to estimate the actual ending account balance or expenses you paid for the period. You may use this information to compare the ongoing costs of investing in the Fund and other funds. To do so, compare this 5% hypothetical example with the 5% hypothetical examples that appear in the shareholder reports of other funds.
Please note that the expenses shown in the table are meant to highlight your ongoing costs only and do not reflect any transactional costs, such as redemption fees and exchange fees. Therefore, the second line of the table is useful in comparing ongoing costs only and will not help you determine the relative total costs of owning different funds. In addition, if these transactional costs had been included, your costs would have been higher.
| | | Beginning Account Value July 1, 2019 | | | Ending Account Value December 31, 2019 | | | Expenses Paid During Period* | | | Annualized Expense Ratio* | |
| Actual | | $ | 1,000.00 | | | $ | 1,005.81 | | | $ | 6.83 | | | | 1.35 | % |
| Hypothetical (5% return before expenses) | | $ | 1,000.00 | | | $ | 1,018.40 | | | $ | 6.87 | | | | 1.35 | % |
| * | Expenses are equal to the Fund’s annualized expense ratio multiplied by the average account value over the period, multiplied by the number of days in the most recent fiscal half-year (184) divided by 365 to reflect the half-year period. |
Trustees and Officers of the Trust
The Board is responsible for oversight of the management of the Trust’s business affairs and of the exercise of all the Trust’s powers except those reserved for the shareholders. The following table provides information about each Trustee and certain officers of the Trust. Each Trustee and officer holds office until the person resigns, is removed, or is replaced. Unless otherwise noted, the persons have held their principal occupations for more than five years. The address for all Trustees and officers is Three Canal Plaza, Suite 600, Portland,
LISANTI SMALL CAP GROWTH FUND
ADDITIONAL INFORMATION (Unaudited)
DECEMBER 31, 2019
Maine 04101. The Fund’s Statement of Additional Information includes additional information about the Trustees and is available, without charge and upon request, by calling (800) 441-7031.
| Name and Year of Birth | Position with the Trust | Length of Time Served | Principal Occupation(s) During Past Five Years | Number of Series in Fund Complex Overseen By Trustee | Other Directorships Held By Trustee During Past Five Years |
| Independent Trustees |
David Tucker
Born: 1958 | Trustee; Chairman of the Board | Since 2011 and Chairman since 2018 | Director, Blue Sky Experience (a charitable endeavor) since 2008; Senior Vice President & General Counsel, American Century Companies (an investment management firm) 1998-2008. | 1 | Trustee, Forum
Funds II and U.S.
Global Investors
Funds |
| Mark D. Moyer Born: 1959 | Trustee; Chairman of the Audit Committee | Since 2018 | Chief Financial Officer, Freedom House (a NGO advocating political freedom and democracy) since 2017; independent consultant providing interim CFO services, principally to non-profit organizations, 2011-2017; Chief Financial Officer, Institute of International Education (a NGO administering international educational exchange programs), 2008-2011; Chief Financial Officer and Chief Restructuring Officer, Ziff Davis Media Inc. (an integrated media company), 2005-2008; Adjunct Professor of Accounting, Fairfield University from 2009-2012. | 1 | Trustee, Forum
Funds II and U.S.
Global Investors
Funds |
Jennifer Brown-Strabley Born: 1964 | Trustee | Since 2018 | Principal, Portland Global Advisors (a registered investment adviser), 1996-2010. | 1 | Trustee, Forum
Funds II and U.S.
Global Investors
Funds |
| Interested Trustees(1) |
| Jessica Chase Born: 1970 | Trustee | Since 2018 | Director, Apex Fund Services since 2019; Senior Vice President, Atlantic Fund Services 2008-2019. | 1 | Trustee, Forum
Funds II and U.S.
Global Investors
Funds |
| (1) | Jessica Chase is currently an interested person of the Trust, as defined in the 1940 Act, due to her affiliation with Apex Fund Services and her role as President of the Trust. Apex Fund Services is a wholly owned subsidiary of Apex US Holdings LLC. |
LISANTI SMALL CAP GROWTH FUND
ADDITIONAL INFORMATION (Unaudited)
DECEMBER 31, 2019
| Name and Year of Birth | Position with the Trust | Length of Time Served | Principal Occupation(s) During Past 5 Years |
| Officers |
Jessica Chase
Born: 1970 | President; Principal Executive Officer | Since 2015 | Director, Apex Fund Services since 2019. Senior Vice President, Atlantic Fund Services 2008-2019. |
Karen Shaw
Born: 1972 | Treasurer; Principal Financial Officer | Since 2008 | Senior Vice President, Apex Fund Services since 2019; Senior Vice President, Atlantic Fund Services 2008-2019. |
Zachary Tackett
Born: 1988 | Vice President; Secretary and Anti-Money Laundering Compliance Officer | Since 2014 | Counsel, Apex Fund Services since 2019; Counsel, Atlantic Fund Services 2014-2019. |
| Michael J. McKeen Born: 1971 | Vice President | Since 2009 | Senior Vice President, Apex Fund Services since 2019; Senior Vice President, Atlantic Fund Services 2008-2019. |
| Timothy Bowden Born: 1969 | Vice President | Since 2009 | Manager, Apex Fund Services since 2019; Manager, Atlantic Fund Services 2008-2019. |
Geoffrey Ney
Born: 1975 | Vice President | Since 2013 | Manager, Apex Fund Services since 2019; Manager, Atlantic Fund Services 2013-2019. |
Todd Proulx
Born: 1978 | Vice President | Since 2013 | Manager, Apex Fund Services since 2019; Manager, Atlantic Fund Services 2013-2019. |
Carlyn Edgar
Born: 1963 | Vice President | Since 2008 | Senior Vice President, Apex Fund Services since 2019; Senior Vice President, Atlantic Fund Services 2008-2019; Chief Compliance Officer, 2008-2016. |
Dennis Mason
Born: 1967 | Chief Compliance Officer | Since 2016 | Fund Compliance Officer, Apex Fund Services since 2019; Fund Compliance Officer, Atlantic Fund Services 2013-2019. |

Annual Report
DECEMBER 31, 2019

TABLE OF CONTENTS
| A Message to Our Shareholders (Unaudited) | 1 |
| Performance Chart and Analysis (Unaudited) | 7 |
| Schedule of Investments | 8 |
| Statement of Assets and Liabilities | 10 |
| Statement of Operations | 11 |
| Statements of Changes in Net Assets | 12 |
| Financial Highlights | 13 |
| Notes to Financial Statements | 14 |
| Report of Independent Registered Public Accounting Firm | 20 |
| Additional Information (Unaudited) | 21 |
POLARIS GLOBAL VALUE FUND
A MESSAGE TO OUR SHAREHOLDERS (Unaudited)
DECEMBER 31, 2019
Dear Fellow Shareholder,
Global markets closed the decade on a bullish note, with fourth-quarter gains marking a year of unexpected strength given the considerable trade headwinds faced. A combination of low interest rates, continued resilience of the U.S. consumer, and strong election results in the U.K. fueled higher equity prices. In a continued high-growth market, the Polaris Global Value Fund (the “Fund”) gained 22.79% for the year, while the MSCI World Index (the “benchmark”) returned 27.67%.
The Fund outperformed in the fourth quarter, but lagged the MSCI World benchmark in the prior three quarters. Much of this was attributable to the Fund’s underweight in the U.S. market, which continued to outpace most non-U.S. markets. The Fund was overweight and outperformed in the vast majority of other countries, including European developed regions of the U.K., Germany and the Nordic countries of Sweden, Norway and Finland. At the sector level, contributions came from financials, consumer discretionary, information technology (IT) and industrials. The Fund’s holdings in communications services, utilities and energy posted absolute positive gains, but underperformed the sector benchmarks.
The longest-running bull market in history celebrated its 10-year anniversary in 2019. Although such market dynamics do not typically favor disciplined value managers, we were gratified to outperform the MSCI World Index for the 10-year period. The Fund was up 10.81% vs. 9.47% for the Index over this 10-year period. Disciplined stock picking, focusing on attractively priced companies with good free cash flow, stands at the core of this long-term success.
| | 2019 | Annualized As of December 31, 2019 |
| | YTD | Q IV | Q III | Q II | Q I | 1 Yr | 3 Yrs | 5 Yrs | 10 Yrs | 15 Yrs | 20 Yrs | ITD* |
| Polaris Global Value Fund | 22.79% | 9.09% | -1.16% | 3.17% | 10.38% | 22.79% | 8.96% | 7.96% | 10.81% | 6.82% | 8.26% | 9.45% |
| MSCI World Index net dividends reinvested | 27.67% | 8.56% | 0.53% | 4.00% | 12.48% | 27.67% | 12.57% | 8.74% | 9.47% | 6.92% | 4.50% | 6.80% |
| * | Inception-to-date (Inception 7/31/1989) |
Performance data quoted represents past performance and is no guarantee of future results. Current performance may be lower or higher than the performance data quoted. Returns for more than one year are annualized. Investment return and principal value will fluctuate so that an investor's shares, when redeemed, may be worth more or less than original cost. For the most recent month end performance, please call (888) 263-5594. As stated in the current prospectus, the Fund’s total annual operating expense ratio is 1.23%. The Fund’s annual operating expense ratio has been reduced to 0.99%, through April 30, 2020, due to the Adviser’s contractual agreement to waive its fee and/or reimburse expenses to limit total Annual Fund Operating Expenses. Shares redeemed or exchanged within 180 days of purchase will be charged at 1.00% fee. Fund performance returns shown do not reflect fees; if reflected, the returns would have been lower. Short-term performance is not a good indication of the Fund's future performance, and an investment should not be made based solely on returns.
2019 PERFORMANCE ANALYSIS:
U.K. stocks contributed substantially to the Fund’s performance, with five of the top 10 holdings hailing from the region. In the third quarter of 2019, stocks started to rebound on BREXIT expectations. Then in October, the U.K. and European Union reached an agreement on the conditions of the U.K.’s departure from the EU. In December, U.K. Prime Minister Boris Johnson won the general election in a resounding victory; years of BREXIT uncertainty gave way to inevitability.
POLARIS GLOBAL VALUE FUND
A MESSAGE TO OUR SHAREHOLDERS (Unaudited)
DECEMBER 31, 2019
A revaluation of British stocks followed, as investors renewed their interest in fundamentally strong companies. Stock prices of U.K.-based Bellway PLC, Taylor Wimpey PLC, Babcock International Group and Next PLC rose markedly. On a fundamental basis, clothing retailer, Next PLC, was up after meeting market expectations with strong online and overseas sales that mitigated declines in brick-and-mortar stores. Engineering services contractor, Babcock International, confirmed full year guidance, pointing to a strong order book that included a new $1.6 billion ship building contract with the U.K. Ministry of Defense. Homebuilders recovered from late 2018 lows, citing solid forward sales indicators and strong order books in all U.K. locales outside of Central London. Taylor Wimpey subsequently released a solid trading update, outlining slightly higher volumes in home sales albeit slightly lower operating margins.
At the sector level, financials added most to portfolio performance, with 19 holdings posting double-digit returns for the year. Two German reinsurers, Hannover Rueck SE and Muenchener Rueckversicherungs-Gesellschaft AG in Muenchen, reported better-than-anticipated pricing on annual renewals, while catastrophic losses were limited in early 2019. An optimistic two-year outlook for Colombia’s economy, driven by commercial and infrastructure activity, emboldened the local stock market. Bancolombia was one beneficiary, noting consumer loan growth as well as credit and operating cost controls. Conversely, Franklin Resources declined on net asset outflows and lackluster performance due to Argentinian bond market exposure. Yet, Franklin achieved decent earnings, citing higher income on lower expenses and taxes.
Consumer discretionary was the second largest sector contributor, led by the aforementioned U.K. homebuilders and clothing retailers. Other strong gains were noted in U.S.-based children’s apparel manufacturer, Carter’s Inc., and Canada’s automotive supplier, Magna International. Carter’s advanced after third quarter 2019 earnings. Although the children’s apparel manufacturer wrote down its investment in Skip Hop, which lost key customer Toys “R” Us, the underlying sales, earnings, and margins all increased. Magna International’s results came in ahead of expectations, as sales outpaced vehicle production. The main sector detractor was L Brands, down approximately 25% for the year, as its Victoria’s Secret franchise struggled with changing consumer preferences; however, its Bath & Body Works division remained extremely strong.
In IT, Microsoft Corp. gained after reporting solid quarterly results, with revenue and operating income up more than 10% from the comparable 2018 period. Commercial cloud revenue grew 48% year-over-year, with more targeted investments slated in this space. The Western Union Co. tackled top- and bottom-line growth with 1) an extensive multi-year $100 million cost reduction initiative, reducing manual processes in favor of technology; and 2) the introduction of a cross-border platform marketed to third parties. For example, The Western Union Co. signed an agreement with TD Bank of Canada whereby TD account holders could move money cross-border through the TD mobile app, effectively doing away with a more costly and lengthy wire transfer.
U.S. protein supplier, Tyson Foods, beat analyst expectations in its quarterly results. Volume growth in its core retail lines continued to outpace other large food companies, driven primarily by product innovation. Given the magnitude of the losses in China’s pork supply due to African swine fever, global protein supply and demand fundamentals are expected to help processors like Tyson raise protein prices. These consumer staples gains were somewhat offset by KT&G Corp., the South Korean tobacco manufacturer. KT&G Corp.’s operating profits fell in the third quarter amid waning sales of e-cigarettes due to health hazard concerns.
POLARIS GLOBAL VALUE FUND
A MESSAGE TO OUR SHAREHOLDERS (Unaudited)
DECEMBER 31, 2019
Materials sector company Linde PLC recorded better profitability due to synergies achieved as a combined organization (Praxair-Linde); management focused on maximizing product pricing and tailoring capital expenditures. Linde also signed a deal to supply gas to ExxonMobil’s Singapore manufacturing complex, marking the largest gas contract in Linde’s history.
The Fund’s holdings in communication services and utilities underperformed the MSCI World Index sector benchmarks. South Korean telecom, LG Uplus, waned due to slower than expected benefits from 5G offerings and higher costs related to 5G expenses. French advertising company, Publicis Groupe, had weak organic growth and implied flat to negative organic growth for 2020. The advertising agency, which struggled with client attrition, acquired Epsilon in an attempt to improve its product offerings.
In utilities, NextEra Energy’s stock price rose more than 40% for the year, gaining momentum in renewable energy projects. Such projects have become quite profitable with lower costs and can operate on a stand-alone basis without governmental tax credits. With stable regulation for the Florida utility and a record pipeline for renewables, NextEra’s aggressive growth targets will likely be reached. Sector results were muted due to losses at Japan’s Kansai Electric Power. The Japan Nuclear Regulation Authority imposed strict anti-terrorism guidelines, likely cowing to the pressures of local anti-nuclear activists. The Authority was resolute in not issuing extensions for retrofitting nuclear reactors; Kansai and others in the industry may struggle to meet the aggressive deadlines, resulting in nuclear facility shutdowns.
During the year, Israeli-based generic drug manufacturer, Teva Pharmaceutical, was sold as it faced multiple legal battles related to allegations of drug price fixing and opioid sales. Japanese gaming company Nexon Co. was sold due to fundamental deterioration in combination with Nexon founder’s protracted sale of his NXC stake. Xerox Corp. was a top performing Fund holding, beating analyst estimates and announcing plans to restructure its business under a holding company. Steady sales and aggressive cost cutting efforts led to strong guidance; when the stock price rose to our target valuation, we sold at a profit. Proceeds were reallocated to purchase the following companies: Sumitomo Mitsui Trust Holding, the largest trust custodian bank in Japan; Asahi Group Holdings, the Japanese beer and beverage company, that had been a prior successful portfolio holding repurchased at an attractive valuation; Sparebanken Vest, a Norwegian bank with an appealing footprint and market share in the retail mortgage space; U.S.-based Cambridge Bancorp; UK-based pulp and paper company, Mondi PLC; Toronto-Dominion Bank, one of Canada’s largest banks; and Daicel Corp., the Japanese chemical company.
POLARIS GLOBAL VALUE FUND
A MESSAGE TO OUR SHAREHOLDERS (Unaudited)
DECEMBER 31, 2019
The following table shows the Fund’s asset allocation at December 31, 2019.
| | MSCI World Index | Portfolio Weight | Energy | Utilities | Materials | Industrials | Consumer Discretionary | Consumer Staples | Health Care | Financials | Info. Tech. | Comm. Services | Real Estate | Cash |
| N. America | 66.7% | 38.4% | 1.5% | 2.7% | 1.2% | 2.5% | 3.3% | 2.5% | 5.6% | 12.4% | 5.3% | 1.4% | 0.0% | 0.0% |
| Japan | 8.2% | 5.8% | 0.0% | 1.0% | 0.7% | 0.0% | 0.0% | 1.4% | 0.0% | 1.4% | 0.0% | 1.4% | 0.0% | 0.0% |
| Other Asia | 3.9% | 12.3% | 0.0% | 0.0% | 1.5% | 0.0% | 2.2% | 0.8% | 0.0% | 3.7% | 3.3% | 0.9% | 0.0% | 0.0% |
| Europe | 19.2% | 31.5% | 0.0% | 0.0% | 7.8% | 5.2% | 6.9% | 1.2% | 1.4% | 5.4% | 0.0% | 3.8% | 0.0% | 0.0% |
| Scandinavia | 2.0% | 10.0% | 0.0% | 0.0% | 1.3% | 4.0% | 0.8% | 0.0% | 0.0% | 3.9% | 0.0% | 0.0% | 0.0% | 0.0% |
| Africa & S. America | 0.0% | 1.5% | 0.0% | 0.0% | 0.0% | 0.0% | 0.0% | 0.0% | 0.0% | 1.5% | 0.0% | 0.0% | 0.0% | 0.0% |
| Cash | 0.0% | 0.4% | 0.0% | 0.0% | 0.0% | 0.0% | 0.0% | 0.0% | 0.0% | 0.0% | 0.0% | 0.0% | 0.0% | 0.4% |
| Portfolio Totals | 100.0% | 1.5% | 3.7% | 12.5% | 11.6% | 13.1% | 5.8% | 7.0% | 28.2% | 8.6% | 7.5% | 0.0% | 0.4% |
| MSCI World Weight | | 4.9% | 3.4% | 4.4% | 11.0% | 10.3% | 8.3% | 13.0% | 15.7% | 17.4% | 8.4% | 3.2% | 0.0% |
Table may not cross foot due to rounding.
INVESTMENT ENVIRONMENT AND STRATEGY:
Competing trends continue to muddle the direction of the global economy. Industrial production figures are slowing down, which indicates that industrials and similarly-positioned sectors (like materials and construction) could get weaker. Yet the service sectors, which comprise up to 75% of gross domestic product in many countries, show considerable strength. Corporate capital spending has slowed, as companies are wary of on-going U.S.-China trade frictions and weak bellwether industry metrics like industrial production and trade flow data. Yet retail spending has continued unabated, with consumers seemingly unfazed by the trade tensions. With no clear trajectory, markets may experience volatility in coming quarters, and we hope to capitalize on downturns to purchase watch list stocks.
As we enter a new decade, we are excited about the changes in technology, advances in healthcare, continued emerging market growth, and all the opportunities and disruptions that will ensue. We are also mindful of the headwinds we may face: excessive deficit spending, geopolitical upheaval, potential asset bubbles and liquidity crises to name a few. At Polaris, we remain committed to our value discipline and believe that buying good companies at attractive valuations continues to be a prudent strategy for the decades.
As always, we welcome your questions and comments.
Sincerely,

Bernard R. Horn, Jr., Shareholder and Portfolio Manager
POLARIS GLOBAL VALUE FUND
A MESSAGE TO OUR SHAREHOLDERS (Unaudited)
DECEMBER 31, 2019
As of December 31, 2019, the Fund’s largest equity holdings and the percentages they represent in the Fund’s portfolio market value were as follows and are subject to change:
| Issuer | Percentage of Total Market Value |
| Babcock International Group PLC | 2.0% |
| Hannover Rueck SE | 1.8% |
| JPMorgan Chase & Co. | 1.8% |
| The Western Union Co. | 1.7% |
| Bellway PLC | 1.7% |
| Issuer | Percentage of Total Market Value |
| Taylor Wimpey PLC | 1.7% |
| Microsoft Corp. | 1.6% |
| Mondi PLC | 1.6% |
| SKF AB, Class B | 1.6% |
| Bancolombia SA | 1.5% |
The Fund’s annual performance as compared to the benchmark has been as follows:
Historical Calendar Year Annual Returns (years ended December 31)
| | Polaris Global Value | MSCI World Index |
| 2019 | 22.79% | 27.67% |
| 2018 | -12.66% | -8.71% |
| 2017 | 20.61% | 22.40% |
| 2016 | 11.67% | 7.51% |
| 2015 | 1.55% | -0.87% |
| 2014 | 3.68% | 4.94% |
| 2013 | 36.94% | 26.68% |
| 2012 | 21.00% | 15.83% |
| 2011 | -8.16% | -5.54% |
| 2010 | 20.64% | 11.76% |
| 2009 | 35.46% | 29.99% |
| 2008 | -46.19% | -40.71% |
| 2007 | -3.97% | 9.04% |
| 2006 | 24.57% | 20.07% |
| 2005 | 10.52% | 9.49% |
| | Polaris Global Value | MSCI World Index |
| 2004 | 23.63% | 14.72% |
| 2003 | 47.06% | 33.11% |
| 2002 | 3.82% | -19.89% |
| 2001 | 2.21% | -16.82% |
| 2000 | -5.82% | -13.18% |
| 1999 | 16.50% | 24.94% |
| 1998 | -8.85% | 24.34% |
| 1997 | 34.55% | 15.76% |
| 1996 | 23.34% | 13.48% |
| 1995 | 31.82% | 20.72% |
| 1994 | -2.78% | 5.08% |
| 1993 | 25.70% | 22.50% |
| 1992 | 9.78% | -5.23% |
| 1991 | 17.18% | 18.28% |
| 1990 | -11.74% | -17.02% |
POLARIS GLOBAL VALUE FUND
A MESSAGE TO OUR SHAREHOLDERS (Unaudited)
DECEMBER 31, 2019
IMPORTANT INFORMATION
The Fund invests in securities of foreign issuers, including issuers located in countries with emerging capital markets. Investments in such securities entail certain risks not associated with investments in domestic securities, such as volatility of currency exchange rates, and in some cases, political and economic instability and relatively illiquid markets. These risks are greater for emerging markets. Options trading involves risk and is not suitable for all investors. Fund performance includes reinvestment of dividends and capital gains. During the period, some of the Fund’s fees were waived or expenses reimbursed. In the absence of these waivers and reimbursements, performance figures would be lower.
On June 1, 1998, a limited partnership managed by the adviser reorganized into the Fund. The predecessor limited partnership maintained an investment objective and investment policies that were, in all material respects, equivalent to those of the Fund. The Fund’s performance for the periods before June 1, 1998 is that of the limited partnership and includes the expenses of the limited partnership. If the limited partnership’s performance had been readjusted to reflect the second year expenses of the Fund, the Fund’s performance for all the periods would have been lower. The limited partnership was not registered under the Investment Company Act of 1940 and was not subject to certain investment limitations, diversification requirements, and other restrictions imposed by the 1940 Act and the Internal Revenue Code, which, if applicable, may have adversely affected its performance.
The MSCI World Index, net dividends reinvested measures the performance of a diverse range of global stock markets in the United States, Canada, Europe, Australia, New Zealand and the Far East. The MSCI World Index is unmanaged and includes reinvestment of dividends after deduction of withholding taxes. One cannot invest directly in an index or an average.
The views in this letter were those of the Fund manager as of December 31, 2019 and may not reflect the views of the manager after the publication date. These views are intended to assist shareholders of the Fund in understanding their investment and do not constitute investment advice.
POLARIS GLOBAL VALUE FUND
PERFORMANCE CHART AND ANALYSIS (Unaudited)
DECEMBER 31, 2019
The following chart reflects the change in the value of a hypothetical $10,000 investment, including reinvested dividends and distributions, in the Polaris Global Value Fund (the “Fund”) compared with the performance of the benchmark, MSCI World Index, over the past ten fiscal years. The MSCI World Index captures large and mid cap representation across 23 developed markets countries: Australia, Austria, Belgium, Canada, Denmark, Finland, France, Germany, Hong Kong, Ireland, Israel, Italy, Japan, the Netherlands, New Zealand, Norway, Portugal, Singapore, Spain, Sweden, Switzerland, the United Kingdom and the United States. The total return of the index includes the reinvestment of dividends and income. The total return of the Fund includes operating expenses that reduce returns, while the total return of the index does not include expenses. The Fund is professionally managed, while the index is unmanaged and is not available for investment.
Comparison of Change in Value of a $10,000 Investment
Polaris Global Value Fund vs. MSCI World Index
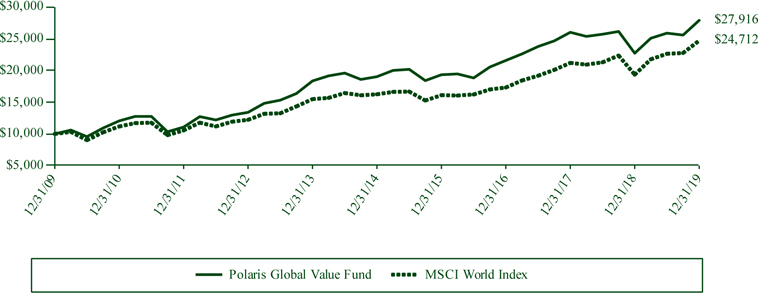
| Average Annual Total Returns Periods Ended December 31, 2019 | One Year | Five Year | Ten Year |
| Polaris Global Value Fund | 22.79% | 7.96% | 10.81% |
| MSCI World Index | 27.67% | 8.74% | 9.47% |
Performance data quoted represents past performance and is no guarantee of future results. Current performance may be lower or higher than the performance data quoted. Investment return and principal value will fluctuate so that shares, when redeemed, may be worth more or less than original cost. As stated in the Fund’s prospectus, the annual operating expense ratio (gross) is 1.23%. However, the Fund’s adviser has contractually agreed to waive its fee and/or reimburse Fund expenses to limit Total Annual Fund Operating Expenses After Fee Waiver and/or Expense Reimbursement (excluding all taxes, interest, portfolio transaction expenses, dividend and interest expense on short sales, acquired fund fees and expenses, proxy expenses and extraordinary expenses) to 0.99%, through April 30, 2020 (the “Expense Cap”). The Expense Cap may be raised or eliminated only with the consent of the Board of Trustees. During the period, certain fees were waived and/or expenses reimbursed; otherwise, returns would have been lower. Shares redeemed or exchanged within 180 days of purchase will be charged a 1.00% redemption fee. The performance table and graph do not reflect the deduction of taxes that a shareholder would pay on Fund distributions or the redemption of Fund shares. Returns greater than one year are annualized. Because of ongoing market volatility, Fund performance may be subject to substantial short-term changes. For the most recent month-end performance, please call (888) 263-5594 or visit www.polarisfunds.com.
POLARIS GLOBAL VALUE FUND
SCHEDULE OF INVESTMENTS
DECEMBER 31, 2019
| Shares | | | Security Description | | Value | |
| Common Stock - 99.8% | | | |
| Australia - 1.5% | | | |
| | 145,500 | | | BHP Group PLC, ADR | | $ | 6,839,955 | |
| Austria - 1.1% | | | |
| | 119,600 | | | ANDRITZ AG | | | 5,151,564 | |
| Belgium - 1.2% | | | |
| | 48,370 | | | Solvay SA, Class A | | | 5,604,709 | |
| Canada - 3.9% | | | |
| | 125,069 | | | Magna International, Inc. | | | 6,857,581 | |
| | 141,537 | | | Methanex Corp. | | | 5,466,159 | |
| | 103,812 | | | The Toronto-Dominion Bank | | | 5,822,362 | |
| | | | | | | | 18,146,102 | |
| Colombia - 1.5% | | | |
| | 540,300 | | | Bancolombia SA | | | 7,231,986 | |
| Finland - 1.4% | | | �� |
| | 96,721 | | | Kone Oyj, Class B | | | 6,322,910 | |
| France - 4.7% | | | |
| | 47,400 | | | Cie Generale des Etablissements Michelin SCA | | | 5,800,692 | |
| | 99,141 | | | Imerys SA | | | 4,190,259 | |
| | 66,707 | | | IPSOS | | | 2,166,191 | |
| | 88,229 | | | Publicis Groupe SA | | | 3,994,287 | |
| | 54,400 | | | Vinci SA | | | 6,041,027 | |
| | | | | | | | 22,192,456 | |
| Germany - 7.2% | | | |
| | 85,400 | | | BASF SE | | | 6,451,670 | |
| | 345,442 | | | Deutsche Telekom AG | | | 5,645,617 | |
| | 42,800 | | | Hannover Rueck SE | | | 8,271,909 | |
| | 99,516 | | | LANXESS AG | | | 6,677,533 | |
| | 22,700 | | | Muenchener Rueckversicherungs-Gesellschaft AG in Muenchen, Class R | | | 6,696,661 | |
| | | | | | | | 33,743,390 | |
| India - 1.2% | | | |
| | 526,140 | | | Infosys, Ltd., ADR | | | 5,429,765 | |
| Ireland - 1.2% | | | |
| | 1,556,441 | | | Greencore Group PLC | | | 5,523,191 | |
| Italy - 0.0% | | | |
| | 10,451 | | | TREVI - Finanziaria Industriale SpA (a) | | | 186,980 | |
| Japan - 5.8% | | | |
| | 139,100 | | | Asahi Group Holdings, Ltd. | | | 6,379,231 | |
| | 351,000 | | | Daicel Corp. | | | 3,388,698 | |
| | 217,100 | | | KDDI Corp. | | | 6,499,713 | |
| | 163,400 | | | Sumitomo Mitsui Trust Holdings, Inc. | | | 6,522,165 | |
| Shares | | | Security Description | | Value | |
| Japan - 5.8% (continued) |
| | 393,600 | | | The Kansai Electric Power Co., Inc. | | $ | 4,580,619 | |
| | | | | | | | 27,370,426 | |
| Norway - 4.0% |
| | 325,096 | | | DNB ASA | | | 6,072,892 | |
| | 464,337 | | | SpareBank 1 SR-Bank ASA | | | 5,288,998 | |
| | 140,940 | | | Sparebanken Vest | | | 1,017,803 | |
| | 148,800 | | | Yara International ASA | | | 6,189,760 | |
| | | | | | | | 18,569,453 | |
| Puerto Rico - 1.4% |
| | 113,000 | | | Popular, Inc. | | | 6,638,750 | |
| Singapore - 1.4% |
| | 341,835 | | | United Overseas Bank, Ltd. | | | 6,712,415 | |
| South Korea - 7.1% |
| | 21,600 | | | Hyundai Mobis Co., Ltd. | | | 4,781,530 | |
| | 145,200 | | | Kia Motors Corp. | | | 5,562,160 | |
| | 46,700 | | | KT&G Corp. | | | 3,787,851 | |
| | 336,300 | | | LG Uplus Corp. | | | 4,129,413 | |
| | 142,103 | | | Samsung Electronics Co., Ltd. | | | 6,856,628 | |
| | 124,200 | | | Shinhan Financial Group Co., Ltd. | | | 4,655,688 | |
| | 40,300 | | | SK Hynix, Inc. | | | 3,279,199 | |
| | | | | | | | 33,052,469 | |
| Sweden - 4.7% |
| | 257,700 | | | Duni AB, Class A | | | 3,554,729 | |
| | 121,003 | | | Loomis AB, Class B | | | 5,009,952 | |
| | 361,000 | | | SKF AB, Class B | | | 7,299,898 | |
| | 569,800 | | | Svenska Handelsbanken AB, Class A | | | 6,138,231 | |
| | | | | | | | 22,002,810 | |
| Switzerland - 2.7% |
| | 41,544 | | | Chubb, Ltd. | | | 6,466,739 | |
| | 67,600 | | | Novartis AG | | | 6,419,136 | |
| | | | | | | | 12,885,875 | |
| Thailand - 1.2% |
| | 1,433,100 | | | Siam Commercial Bank PCL | | | 5,836,939 | |
| United Kingdom - 13.4% |
| | 1,134,129 | | | Babcock International Group PLC | | | 9,455,269 | |
| | 159,888 | | | Bellway PLC | | | 8,062,754 | |
| | 2,019,100 | | | Cineworld Group PLC | | | 5,859,828 | |
| | 397,847 | | | Inchcape PLC | | | 3,720,536 | |
| | 30,313 | | | Linde PLC | | | 6,453,638 | |
| | 314,400 | | | Mondi PLC | | | 7,381,650 | |
| | 72,228 | | | Next PLC | | | 6,714,345 | |
| | 814,559 | | | Signature Aviation PLC | | | 3,422,476 | |
| | 393,437 | | | Standard Chartered PLC | | | 3,712,648 | |
| | 3,093,662 | | | Taylor Wimpey PLC | | | 7,925,269 | |
| | | | | | | | 62,708,413 | |
See Notes to Financial Statements.
POLARIS GLOBAL VALUE FUND
SCHEDULE OF INVESTMENTS
DECEMBER 31, 2019
| Shares | | | Security Description | | Value | |
| United States - 33.2% | | | | |
| | 33,900 | | | Allergan PLC | | $ | 6,480,663 | |
| | 73,100 | | | ALLETE, Inc. | | | 5,933,527 | |
| | 125,750 | | | Ameris Bancorp | | | 5,349,405 | |
| | 22,000 | | | Anthem, Inc. | | | 6,644,660 | |
| | 143,000 | | | Avnet, Inc. | | | 6,068,920 | |
| | 103,900 | | | Brookline Bancorp, Inc. | | | 1,710,194 | |
| | 14,800 | | | Cambridge Bancorp | | | 1,186,220 | |
| | 65,500 | | | Capital One Financial Corp. | | | 6,740,605 | |
| | 54,151 | | | Carter's, Inc. | | | 5,920,870 | |
| | 169,774 | | | Colony Bankcorp, Inc. | | | 2,801,271 | |
| | 123,000 | | | Dime Community Bancshares, Inc. | | | 2,569,470 | |
| | 185,000 | | | Franklin Resources, Inc. | | | 4,806,300 | |
| | 32,167 | | | General Dynamics Corp. | | | 5,672,651 | |
| | 207,000 | | | Hewlett Packard Enterprise Co. | | | 3,283,020 | |
| | 154,163 | | | International Bancshares Corp. | | | 6,639,800 | |
| | 59,200 | | | JPMorgan Chase & Co. | | | 8,252,480 | |
| | 144,400 | | | L Brands, Inc. | | | 2,616,528 | |
| | 118,082 | | | Marathon Petroleum Corp. | | | 7,114,441 | |
| | 47,500 | | | Microsoft Corp. | | | 7,490,750 | |
| | 28,844 | | | NextEra Energy, Inc. | | | 6,984,863 | |
| | 61,733 | | | Quest Diagnostics, Inc. | | | 6,592,467 | |
| | 52,500 | | | The J.M. Smucker Co. | | | 5,466,825 | |
| | 302,600 | | | The Western Union Co. | | | 8,103,628 | |
| | 68,400 | | | Tyson Foods, Inc., Class A | | | 6,227,136 | |
| | 22,468 | | | UnitedHealth Group, Inc. | | | 6,605,143 | |
| | 109,551 | | | Verizon Communications, Inc. | | | 6,726,431 | |
| | 103,938 | | | Webster Financial Corp. | | | 5,546,132 | |
| | 103,211 | | | WESCO International, Inc. (a) | | | 6,129,701 | |
| | | | | | | | 155,664,101 | |
| Total Common Stock (Cost $405,871,133) | | | 467,814,659 | |
| Investments, at value - 99.8% (Cost $405,871,133) | | $ | 467,814,659 | |
| Other Assets & Liabilities, Net - 0.2% | | | 1,067,182 | |
| Net Assets - 100.0% | | $ | 468,881,841 | |
| ADR | American Depositary Receipt |
| PCL | Public Company Limited |
| PLC | Public Limited Company |
| (a) | Non-income producing security. |
The following is a summary of the inputs used to value the Fund's investments as of December 31, 2019.
The inputs or methodology used for valuing securities are not necessarily an indication of the risks associated with investing in those securities. For more information on valuation inputs, and their aggregation into the levels used in the table below, please refer to the Security Valuation section in Note 2 of the accompanying Notes to Financial Statements.
| | | Level 1 | | | Level 2 | | | Level 3 | | | Total | |
| Investments at Value | | | | | | | | | | | | | | | | |
| Common Stock | | | | | | | | | | | | | | | | |
| Australia | | $ | 6,839,955 | | | $ | – | | | $ | – | | | $ | 6,839,955 | |
| Austria | | | 5,151,564 | | | | – | | | | – | | | | 5,151,564 | |
| Belgium | | | 5,604,709 | | | | – | | | | – | | | | 5,604,709 | |
| Canada | | | 18,146,102 | | | | – | | | | – | | | | 18,146,102 | |
| Colombia | | | 7,231,986 | | | | – | | | | – | | | | 7,231,986 | |
| Finland | | | 6,322,910 | | | | – | | | | – | | | | 6,322,910 | |
| France | | | 22,192,456 | | | | – | | | | – | | | | 22,192,456 | |
| Germany | | | 33,743,390 | | | | – | | | | – | | | | 33,743,390 | |
| India | | | 5,429,765 | | | | – | | | | – | | | | 5,429,765 | |
| Ireland | | | 5,523,191 | | | | – | | | | – | | | | 5,523,191 | |
| Italy | | | 186,980 | | | | – | | | | – | | | | 186,980 | |
| Japan | | | 27,370,426 | | | | – | | | | – | | | | 27,370,426 | |
| Norway | | | 18,569,453 | | | | – | | | | – | | | | 18,569,453 | |
| Puerto Rico | | | 6,638,750 | | | | – | | | | – | | | | 6,638,750 | |
| Singapore | | | 6,712,415 | | | | – | | | | – | | | | 6,712,415 | |
| South Korea | | | 33,052,469 | | | | – | | | | – | | | | 33,052,469 | |
| Sweden | | | 22,002,810 | | | | – | | | | – | | | | 22,002,810 | |
| Switzerland | | | 12,885,875 | | | | – | | | | – | | | | 12,885,875 | |
| Thailand | | | – | | | | 5,836,939 | | | | – | | | | 5,836,939 | |
| United Kingdom | | | 62,708,413 | | | | – | | | | – | | | | 62,708,413 | |
| United States | | | 155,664,101 | | | | – | | | | – | | | | 155,664,101 | |
| Investments at Value | | $ | 461,977,720 | | | $ | 5,836,939 | | | $ | – | | | $ | 467,814,659 | |
| PORTFOLIO HOLDINGS (Unaudited) | | | |
| % of Total Investments | | | |
| Communication Services | | | 7.5 | % |
| Consumer Discretionary | | | 13.1 | % |
| Consumer Staples | | | 5.9 | % |
| Energy | | | 1.5 | % |
| Financials | | | 28.4 | % |
| Health Care | | | 7.0 | % |
| Industrials | | | 11.7 | % |
| Information Technology | | | 8.7 | % |
| Materials | | | 12.5 | % |
| Utilities | | | 3.7 | % |
| | | | 100.0 | % |
See Notes to Financial Statements.
POLARIS GLOBAL VALUE FUND
STATEMENT OF ASSETS AND LIABILITIES
DECEMBER 31, 2019
| ASSETS | | | |
| Investments, at value (Cost $405,871,133) | | $ | 467,814,659 | |
| Cash | | | 1,094,089 | |
| Receivables: | | | | |
| Fund shares sold | | | 646,319 | |
| Dividends and interest | | | 1,770,215 | |
| Prepaid expenses | | | 12,852 | |
| Total Assets | | | 471,338,134 | |
| | | | | |
| LIABILITIES | | | | |
| Payables: | | | | |
| Fund shares redeemed | | | 1,090,079 | |
| Distributions payable | | | 918,152 | |
| Accrued Liabilities: | | | | |
| Investment adviser fees | | | 326,897 | |
| Fund services fees | | | 42,835 | |
| Other expenses | | | 78,330 | |
| Total Liabilities | | | 2,456,293 | |
| | | | | |
| NET ASSETS | | $ | 468,881,841 | |
| | | | | |
| COMPONENTS OF NET ASSETS | | | | |
| Paid-in capital | | $ | 405,954,550 | |
| Distributable earnings | | | 62,927,291 | |
| NET ASSETS | | $ | 468,881,841 | |
| | | | | |
| SHARES OF BENEFICIAL INTEREST AT NO PAR VALUE (UNLIMITED SHARES AUTHORIZED) | | | 16,916,062 | |
| | | | | |
| NET ASSET VALUE, OFFERING AND REDEMPTION PRICE PER SHARE* | | $ | 27.72 | |
| * | Shares redeemed or exchanged within 180 days of purchase are charged a 1.00% redemption fee. |
See Notes to Financial Statements.
POLARIS GLOBAL VALUE FUND
STATEMENT OF OPERATIONS
YEAR ENDED DECEMBER 31, 2019
| INVESTMENT INCOME | | | |
| Dividend income (Net of foreign withholding taxes of $1,125,517) | | $ | 15,063,872 | |
| Interest income | | | 30,856 | |
| Total Investment Income | | | 15,094,728 | |
| | | | | |
| EXPENSES | | | | |
| Investment adviser fees | | | 4,514,865 | |
| Fund services fees | | | 559,700 | |
| Custodian fees | | | 111,662 | |
| Registration fees | | | 27,980 | |
| Professional fees | | | 73,104 | |
| Trustees' fees and expenses | | | 16,941 | |
| Other expenses | | | 271,452 | |
| Total Expenses | | | 5,575,704 | |
| Fees waived | | | (1,106,016 | ) |
| Net Expenses | | | 4,469,688 | |
| | | | | |
| NET INVESTMENT INCOME | | | 10,625,040 | |
| | | | | |
| NET REALIZED AND UNREALIZED GAIN (LOSS) | | | | |
| Net realized gain (loss) on: | | | | |
| Investments | | | 6,720,448 | |
| Foreign currency transactions | | | (25,606 | ) |
| Net realized gain | | | 6,694,842 | |
| Net change in unrealized appreciation (depreciation) on: | | | | |
| Investments | | | 74,850,543 | |
| Foreign currency translations | | | 80 | |
| Net change in unrealized appreciation (depreciation) | | | 74,850,623 | |
| NET REALIZED AND UNREALIZED GAIN | | | 81,545,465 | |
| INCREASE IN NET ASSETS RESULTING FROM OPERATIONS | | $ | 92,170,505 | |
See Notes to Financial Statements.
POLARIS GLOBAL VALUE FUND
STATEMENTS OF CHANGES IN NET ASSETS
| | | For the Years Ended December 31, | |
| | | 2019 | | | 2018 | |
| OPERATIONS | | | | | | |
| Net investment income | | $ | 10,625,040 | | | $ | 8,733,846 | |
| Net realized gain | | | 6,694,842 | | | | 3,582,829 | |
| Net change in unrealized appreciation (depreciation) | | | 74,850,623 | | | | (75,125,585 | ) |
| Increase (Decrease) in Net Assets Resulting from Operations | | | 92,170,505 | | | | (62,808,910 | ) |
| | | | | | | | | |
| DISTRIBUTIONS TO SHAREHOLDERS | | | | | | | | |
| Total Distributions Paid | | | (16,913,601 | ) | | | (13,794,635 | ) |
| | | | | | | | | |
| CAPITAL SHARE TRANSACTIONS | | | | | | | | |
| Sale of shares | | | 32,560,718 | | | | 57,487,557 | |
| Reinvestment of distributions | | | 15,585,854 | | | | 12,696,301 | |
| Redemption of shares | | | (76,691,213 | ) | | | (116,204,479 | ) |
| Redemption fees | | | 8,300 | | | | 35,905 | |
| Decrease in Net Assets from Capital Share Transactions | | | (28,536,341 | ) | | | (45,984,716 | ) |
| Increase (Decrease) in Net Assets | | | 46,720,563 | | | | (122,588,261 | ) |
| | | | | | | | | |
| NET ASSETS | | | | | | | | |
| Beginning of Year | | | 422,161,278 | | | | 544,749,539 | |
| End of Year | | $ | 468,881,841 | | | $ | 422,161,278 | |
| | | | | | | | | |
| SHARE TRANSACTIONS | | | | | | | | |
| Sale of shares | | | 1,242,993 | | | | 2,160,468 | |
| Reinvestment of distributions | | | 559,936 | | | | 541,346 | |
| Redemption of shares | | | (2,917,239 | ) | | | (4,329,066 | ) |
| Decrease in Shares | | | (1,114,310 | ) | | | (1,627,252 | ) |
See Notes to Financial Statements.
POLARIS GLOBAL VALUE FUND
FINANCIAL HIGHLIGHTS
These financial highlights reflect selected data for a share outstanding throughout each year.
| | | For the Years Ended December 31, | |
| | | 2019 | | | 2018 | | | 2017 | | | 2016 | | | 2015 | |
| NET ASSET VALUE, Beginning of Year | | $ | 23.41 | | | $ | 27.71 | | | $ | 23.32 | | | $ | 21.16 | | | $ | 21.10 | |
| INVESTMENT OPERATIONS | | | | | | | | | | | | | | | | | | | | |
| Net investment income (a) | | | 0.62 | | | | 0.47 | | | | 0.37 | | | | 0.32 | | | | 0.33 | |
| Net realized and unrealized gain (loss) | | | 4.72 | | | | (3.97 | ) | | | 4.43 | | | | 2.15 | | | | 0.00 | (b)(c) |
| Total from Investment Operations | | | 5.34 | | | | (3.50 | ) | | | 4.80 | | | | 2.47 | | | | 0.33 | |
| | | | | | | | | | | | | | | | | | | | | |
| DISTRIBUTIONS TO SHAREHOLDERS FROM | | | | | | | | | | | | | | | | | | | | |
| Net investment income | | | (0.68 | ) | | | (0.77 | ) | | | (0.41 | ) | | | (0.31 | ) | | | (0.27 | ) |
| Net realized gain | | | (0.35 | ) | | | (0.03 | ) | | | – | | | | – | | | | – | |
| Total Distributions to Shareholders | | | (1.03 | ) | | | (0.80 | ) | | | (0.41 | ) | | | (0.31 | ) | | | (0.27 | ) |
| | | | | | | | | | | | | | | | | | | | | |
| REDEMPTION FEES(a) | | | 0.00 | (b) | | | 0.00 | (b) | | | 0.00 | (b) | | | 0.00 | (b) | | | 0.00 | (b) |
| NET ASSET VALUE, End of Year | | $ | 27.72 | | | $ | 23.41 | | | $ | 27.71 | | | $ | 23.32 | | | $ | 21.16 | |
| TOTAL RETURN | | | 22.79 | % | | | (12.66 | )% | | | 20.61 | % | | | 11.67 | % | | | 1.55 | % |
| | | | | | | | | | | | | | | | | | | | | |
| RATIOS/SUPPLEMENTARY DATA | | | | | | | | | | | | | | | | | | | | |
| Net Assets at End of Year (000s omitted) | | $ | 468,882 | | | $ | 422,161 | | | $ | 544,750 | | | $ | 382,336 | | | $ | 358,793 | |
| Ratios to Average Net Assets: | | | | | | | | | | | | | | | | | | | | |
| Net investment income | | | 2.35 | % | | | 1.74 | % | | | 1.45 | % | | | 1.48 | % | | | 1.52 | % |
| Net expenses | | | 0.99 | % | | | 0.99 | % | | | 0.99 | % | | | 0.99 | % | | | 0.99 | % |
| Gross expenses (d) | | | 1.23 | % | | | 1.23 | % | | | 1.24 | % | | | 1.27 | % | | | 1.27 | % |
| PORTFOLIO TURNOVER RATE | | | 10 | % | | | 22 | % | | | 48 | % | | | 33 | % | | | 5 | % |
| (a) | Calculated based on average shares outstanding during each year. |
| (b) | Less than $0.01 per share. |
| (c) | Per share amount does not accord with the amount reported in the Statement of Operations due to the timing of Fund share sales and the amount per share of realized and unrealized gains and losses at such times. |
| (d) | Reflects the expense ratio excluding any waivers and/or reimbursements. |
See Notes to Financial Statements.
POLARIS GLOBAL VALUE FUND
NOTES TO FINANCIAL STATEMENTS
DECEMBER 31, 2019
Note 1. Organization
The Polaris Global Value Fund (the “Fund”) is a diversified portfolio of Forum Funds (the “Trust”). The Trust is a Delaware statutory trust that is registered as an open-end, management investment company under the Investment Company Act of 1940, as amended (the “Act”). Under its Trust Instrument, the Trust is authorized to issue an unlimited number of the Fund’s shares of beneficial interest without par value. The Fund commenced operations June 1, 1998 after it acquired the net assets of Global Value Limited Partnership (the “Partnership”), in exchange for Fund shares. The Partnership commenced operations on July 31, 1989. The Fund seeks capital appreciation.
Note 2. Summary of Significant Accounting Policies
The Fund is an investment company and follows accounting and reporting guidance under Financial Accounting Standards Board (“FASB”) Accounting Standards Codification (“ASC”) Topic 946, “Financial Services – Investment Companies.” These financial statements are prepared in accordance with accounting principles generally accepted in the United States of America (“GAAP”), which require management to make estimates and assumptions that affect the reported amounts of assets and liabilities, the disclosure of contingent liabilities at the date of the financial statements, and the reported amounts of increases and decreases in net assets from operations during the fiscal year. Actual amounts could differ from those estimates. The following summarizes the significant accounting policies of the Fund:
Security Valuation – Securities are valued at market prices using the last quoted trade or official closing price from the principal exchange where the security is traded, as provided by independent pricing services on each Fund business day. In the absence of a last trade, securities are valued at the mean of the last bid and ask price provided by the pricing service. Forward currency contracts are generally valued based on interpolation of forward curve data points obtained from major banking institutions that deal in foreign currencies and currency dealers. Shares of non-exchange traded open-end mutual funds are valued at net asset value (“NAV”). Short-term investments that mature in sixty days or less may be valued at amortized cost.
The Fund values its investments at fair value pursuant to procedures adopted by the Trust’s Board of Trustees (the “Board”) if (1) market quotations are not readily available or (2) the Adviser, as defined in Note 4, believes that the values available are unreliable. The Trust’s Valuation Committee, as defined in the Fund’s registration statement, performs certain functions as they relate to the administration and oversight of the Fund’s valuation procedures. Under these procedures, the Valuation Committee convenes on a regular and ad hoc basis to review such investments and considers a number of factors, including valuation methodologies and significant unobservable inputs, when arriving at fair value.
The Valuation Committee may work with the Adviser to provide valuation inputs. In determining fair valuations, inputs may include market-based analytics that may consider related or comparable assets or liabilities, recent transactions, market multiples, book values and other relevant investment information. Adviser inputs may include an income-based approach in which the anticipated future cash flows of the investment are discounted in determining fair value. Discounts may also be applied based on the nature or duration of any restrictions on the disposition of the investments. The Valuation Committee performs regular reviews of valuation methodologies, key inputs and assumptions, disposition analysis and market activity.
POLARIS GLOBAL VALUE FUND
NOTES TO FINANCIAL STATEMENTS
DECEMBER 31, 2019
Fair valuation is based on subjective factors and, as a result, the fair value price of an investment may differ from the security’s market price and may not be the price at which the asset may be sold. Fair valuation could result in a different NAV than a NAV determined by using market quotes.
GAAP has a three-tier fair value hierarchy. The basis of the tiers is dependent upon the various “inputs” used to determine the value of the Fund’s investments. These inputs are summarized in the three broad levels listed below:
Level 1 - Quoted prices in active markets for identical assets and liabilities.
Level 2 - Prices determined using significant other observable inputs (including quoted prices for similar securities, interest rates, prepayment speeds, credit risk, etc.). Short-term securities with maturities of sixty days or less are valued at amortized cost, which approximates market value, and are categorized as Level 2 in the hierarchy. Municipal securities, long-term U.S. government obligations and corporate debt securities are valued in accordance with the evaluated price supplied by a pricing service and generally categorized as Level 2 in the hierarchy. Other securities that are categorized as Level 2 in the hierarchy include, but are not limited to, warrants that do not trade on an exchange, securities valued at the mean between the last reported bid and ask quotation and international equity securities valued by an independent third party with adjustments for changes in value between the time of the securities’ respective local market closes and the close of the U.S. market.
Level 3 - Significant unobservable inputs (including the Fund’s own assumptions in determining the fair value of investments).
The aggregate value by input level, as of December 31, 2019, for the Fund’s investments is included at the end of the Fund’s Schedule of Investments.
Security Transactions, Investment Income and Realized Gain and Loss – Investment transactions are accounted for on the trade date. Dividend income is recorded on the ex-dividend date. Foreign dividend income is recorded on the ex-dividend date or as soon as possible after determining the existence of a dividend declaration after exercising reasonable due diligence. Income and capital gains on some foreign securities may be subject to foreign withholding taxes, which are accrued as applicable. Interest income is recorded on an accrual basis. Premium is amortized and discount is accreted using the effective interest method. Identified cost of investments sold is used to determine the gain and loss for both financial statement and federal income tax purposes.
Foreign Currency Translations – Foreign currency amounts are translated into U.S. dollars as follows: (1) assets and liabilities at the rate of exchange at the end of the respective period; and (2) purchases and sales of securities and income and expenses at the rate of exchange prevailing on the dates of such transactions. The portion of the results of operations arising from changes in the exchange rates and the portion due to fluctuations arising from changes in the market prices of securities are not isolated. Such fluctuations are included with the net realized and unrealized gain or loss on investments.
Foreign Currency Transactions – The Fund may enter into transactions to purchase or sell foreign currency contracts and options on foreign currency. Forward currency contracts are agreements to exchange one currency for another at a future date and at a specified price. A fund may use forward currency contracts to facilitate transactions in foreign securities, to manage a fund’s foreign currency exposure and to protect the U.S. dollar value of its underlying portfolio securities against
POLARIS GLOBAL VALUE FUND
NOTES TO FINANCIAL STATEMENTS
DECEMBER 31, 2019
the effect of possible adverse movements in foreign exchange rates. These contracts are intrinsically valued daily based on forward rates, and a fund’s net equity therein, representing unrealized gain or loss on the contracts as measured by the difference between the forward foreign exchange rates at the dates of entry into the contracts and the forward rates at the reporting date, is recorded as a component of NAV. These instruments involve market risk, credit risk, or both kinds of risks, in excess of the amount recognized in the Statement of Assets and Liabilities. Risks arise from the possible inability of counterparties to meet the terms of their contracts and from movement in currency and securities values and interest rates. Due to the risks associated with these transactions, a fund could incur losses up to the entire contract amount, which may exceed the net unrealized value included in its NAV.
Distributions to Shareholders – The Fund declares any dividends from net investment income and pays them annually. Any net capital gains and foreign currency gains realized by the Fund are distributed at least annually. Distributions to shareholders are recorded on the ex-dividend date. Distributions are based on amounts calculated in accordance with applicable federal income tax regulations, which may differ from GAAP. These differences are due primarily to differing treatments of income and gain on various investment securities held by the Fund, timing differences and differing characterizations of distributions made by the Fund.
Federal Taxes – The Fund intends to continue to qualify each year as a regulated investment company under Subchapter M of Chapter 1, Subtitle A, of the Internal Revenue Code of 1986, as amended (“Code”), and to distribute all of its taxable income to shareholders. In addition, by distributing in each calendar year substantially all of its net investment income and capital gains, if any, the Fund will not be subject to a federal excise tax. Therefore, no federal income or excise tax provision is required. The Fund files a U.S. federal income and excise tax return as required. The Fund’s federal income tax returns are subject to examination by the Internal Revenue Service for a period of three fiscal years after they are filed. As of December 31, 2019, there are no uncertain tax positions that would require financial statement recognition, de-recognition or disclosure.
Income and Expense Allocation – The Trust accounts separately for the assets, liabilities and operations of each of its investment portfolios. Expenses that are directly attributable to more than one investment portfolio are allocated among the respective investment portfolios in an equitable manner.
Redemption Fees – A shareholder who redeems or exchanges shares within 180 days of purchase will incur a redemption fee of 1.00% of the current NAV of shares redeemed or exchanged, subject to certain limitations. The fee is charged for the benefit of the remaining shareholders and will be paid to the Fund to help offset transaction costs. The fee is accounted for as an addition to paid-in capital. The Fund reserves the right to modify the terms of or terminate the fee at any time. There are limited exceptions to the imposition of the redemption fee. Redemption fees incurred for the Fund, if any, are reflected on the Statements of Changes in Net Assets.
Commitments and Contingencies – In the normal course of business, the Fund enters into contracts that provide general indemnifications by the Fund to the counterparty to the contract. The Fund’s maximum exposure under these arrangements is dependent on future claims that may be made against the Fund and, therefore, cannot be estimated; however, based on experience, the risk of loss from such claims is considered remote. The Fund has determined that none of these arrangements requires disclosure on the Fund’s balance sheet.
POLARIS GLOBAL VALUE FUND
NOTES TO FINANCIAL STATEMENTS
DECEMBER 31, 2019
Note 3. Cash – Concentration in Uninsured Account
For cash management purposes, the Fund may concentrate cash with the Fund’s custodian. This typically results in cash balances exceeding the Federal Deposit Insurance Corporation (“FDIC”) insurance limits. As of December 31, 2019, the Fund had $844,089 at MUFG Union Bank, N.A. that exceeded the FDIC insurance limit.
Note 4. Fees and Expenses
Investment Adviser – Polaris Capital Management, LLC (the “Adviser”) is the investment adviser to the Fund. Pursuant to an investment advisory agreement, the Adviser receives an advisory fee, payable monthly, from the Fund at an annual rate of 1.00% of the Fund’s average daily net assets.
Shareholder Service Plan – The Trust has adopted a shareholder service plan for the Fund under which the Fund may reimburse the Fund’s administrator for amounts paid by the administrator for providing shareholder service activities that are not otherwise provided by the transfer agent. The Fund’s administrator may make such payments to various financial institutions, including the Adviser, that provide shareholder servicing to their customers invested in the Fund in amounts of up to 0.25% annually of the average daily net assets of the Fund. During the year ended December 31, 2019, the Fund did not make any payments under the shareholder service plan.
Distribution – Foreside Fund Services, LLC serves as the Fund’s distributor (the “Distributor”). The Fund does not have a distribution (12b-1) plan; accordingly, the Distributor does not receive compensation from the Fund for its distribution services. The Adviser compensates the Distributor directly for its services. The Distributor is not affiliated with the Adviser or Atlantic Fund Administration, LLC, a wholly owned subsidiary of Apex US Holdings, LLC (d/b/a Apex Fund Services) (“Apex”) or their affiliates.
Other Service Providers – Apex provides fund accounting, fund administration, compliance and transfer agency services to the Fund. The fees related to these services are included in Fund services fees within the Statement of Operations. Apex also provides certain shareholder report production and EDGAR conversion and filing services. Pursuant to an Apex services agreement, the Fund pays Apex customary fees for its services. Apex provides a Principal Executive Officer, a Principal Financial Officer, a Chief Compliance Officer and an Anti-Money Laundering Officer to the Fund, as well as certain additional compliance support functions.
Trustees and Officers – The Trust pays each independent Trustee an annual retainer of $31,000 for services to the Trust ($41,000 for the Chairman). The Audit Committee Chairman receives an additional $2,000 annually. The Trustees and Chairman may receive additional fees for special Board meetings. Each Trustee is also reimbursed for all reasonable out-of-pocket expenses incurred in connection with his or her duties as a Trustee, including travel and related expenses incurred in attending Board meetings. The amount of Trustees’ fees attributable to the Fund is disclosed in the Statement of Operations. Certain officers of the Trust are also officers or employees of the above named service providers, and during their terms of office received no compensation from the Fund.
POLARIS GLOBAL VALUE FUND
NOTES TO FINANCIAL STATEMENTS
DECEMBER 31, 2019
Note 5. Fees Waived
The Adviser has contractually agreed to waive its fee and/or reimburse Fund expenses to limit annual operating expenses to 0.99% (excluding all taxes, interest, portfolio transaction expenses, dividend and interest expense on short sales, acquired fund fees and expenses, proxy expenses and extraordinary expenses), through April 30, 2020. Other fund service providers have voluntarily agreed to waive and reimburse a portion of their fees. These voluntary fee waivers and reimbursements may be reduced or eliminated at any time. For the year ended December 31, 2019, fees waived were as follows:
| Investment Adviser Fees Waived | | | Other Waivers | | | Total Fees Waived | |
| $ | 1,053,516 | | | $ | 52,500 | | | $ | 1,106,016 | |
Note 6. Security Transactions
The cost of purchases and proceeds from sales of investment securities (including maturities), other than short-term investments during the year ended December 31, 2019, were $45,301,840 and $81,687,832, respectively.
Note 7. Federal Income Tax
As of December 31, 2019, the cost of investments for federal income tax purposes is $406,867,692 and the components of net unrealized appreciation were as follows:
| Gross Unrealized Appreciation | | $ | 87,532,969 | |
| Gross Unrealized Depreciation | | | (26,586,002 | ) |
| Net Unrealized Appreciation | | $ | 60,946,967 | |
Distributions paid during the fiscal years ended as noted were characterized for tax purposes as follows:
| | | 2019 | | | 2018 | |
| Ordinary Income | | $ | 12,000,245 | | | $ | 13,334,178 | |
| Long-Term Capital Gain | | | 4,913,356 | | | | 460,457 | |
| | | $ | 16,913,601 | | | $ | 13,794,635 | |
As of December 31, 2019, distributable earnings on a tax basis were as follows:
| Undistributed Ordinary Income | | $ | 324,240 | |
| Undistributed Long-Term Gain | | | 1,651,566 | |
| Unrealized Appreciation | | | 60,951,485 | |
| Total | | $ | 62,927,291 | |
The difference between components of distributable earnings on a tax basis and the amounts reflected in the Statement of Assets and Liabilities are primarily due to passive foreign investment company transactions and wash sales.
POLARIS GLOBAL VALUE FUND
NOTES TO FINANCIAL STATEMENTS
DECEMBER 31, 2019
Note 8. Subsequent Events
Subsequent events occurring after the date of this report through the date these financial statements were issued have been evaluated for potential impact, and the Fund has had no such events.
REPORT OF INDEPENDENT REGISTERED PUBLIC ACCOUNTING FIRM
To the Board of Trustees of Forum Funds
and the Shareholders of Polaris Global Value Fund
Opinion on the Financial Statements
We have audited the accompanying statement of assets and liabilities of Polaris Global Value Fund, a series of shares of beneficial interest in Forum Funds (the “Fund”), including the schedule of investments, as of December 31, 2019, and the related statement of operations for the year then ended, the statements of changes in net assets for each of the years in the two-year period then ended and the financial highlights for each of the years in the five-year period then ended, and the related notes (collectively referred to as the “financial statements”). In our opinion, the financial statements present fairly, in all material respects, the financial position of the Fund as of December 31, 2019, and the results of its operations for the year then ended, the changes in its net assets for each of the years in the two-year period then ended and its financial highlights for each of the years in the five-year period then ended, in conformity with accounting principles generally accepted in the United States of America.
Basis for Opinion
These financial statements are the responsibility of the Fund's management. Our responsibility is to express an opinion on the Fund's financial statements based on our audits. We are a public accounting firm registered with the Public Company Accounting Oversight Board (United States) (“PCAOB”) and are required to be independent with respect to the Fund in accordance with the U.S. federal securities law and the applicable rules and regulations of the Securities and Exchange Commission and the PCAOB.
We conducted our audits in accordance with the standards of the PCAOB. Those standards require that we plan and perform the audits to obtain reasonable assurance about whether the financial statements are free of material misstatement, whether due to error or fraud. The Fund is not required to have, nor were we engaged to perform, an audit of its internal control over financial reporting. As part of our audits we are required to obtain an understanding of internal control over financial reporting but not for the purpose of expressing an opinion on the effectiveness of the Fund’s internal control over financial reporting. Accordingly, we express no such opinion.
Our audits included performing procedures to assess the risk of material misstatement of the financial statements, whether due to error or fraud, and performing procedures that respond to those risks. Such procedures included examining, on a test basis, evidence regarding the amounts and disclosures in the financial statements. Our procedures included confirmation of securities owned as of December 31, 2019 by correspondence with the custodian and brokers. Our audits also included evaluating the accounting principles used and significant estimates made by management, as well as evaluating the overall presentation of the financial statements. We believe that our audits provide a reasonable basis for our opinion.

BBD, LLP
We have served as the auditor of one or more of the Funds in the Forum Funds since 2008.
Philadelphia, Pennsylvania
February 26, 2020
POLARIS GLOBAL VALUE FUND
ADDITIONAL INFORMATION (Unaudited)
DECEMBER 31, 2019
Proxy Voting Information
A description of the policies and procedures that the Fund uses to determine how to vote proxies relating to securities held in the Fund’s portfolio is available, without charge and upon request, by calling (888) 263-5594, on the Fund's website at www.polarisfunds.com, and on the SEC’s website at www.sec.gov. The Fund’s proxy voting record for the most recent twelve-month period ended June 30 is available, without charge and upon request, by calling (888) 263-5594, on the Fund's website at www.polarisfunds.com, and on the SEC’s website at www.sec.gov.
Availability of Quarterly Portfolio Schedules
The Fund files its complete schedule of portfolio holdings with the SEC for the first and third quarters of each fiscal year on Form N-Q. These filings are available, without charge and upon request on the SEC’s website at www.sec.gov or may be reviewed and copied at the SEC’s Public Reference Room in Washington, D.C. Information on the operation of the Public Reference Room may be obtained by calling (800) SEC-0330.
Shareholder Expense Example
As a shareholder of the Fund, you incur two types of costs: (1) transaction costs, including redemption fees and exchange fees, and (2) ongoing costs, including management fees and other Fund expenses. This example is intended to help you understand your ongoing costs (in dollars) of investing in the Fund, and to compare these costs with the ongoing costs of investing in other mutual funds.
The example is based on an investment of $1,000 invested at the beginning of the period and held for the entire period from July 1, 2019 through December 31, 2019.
Actual Expenses – The first line of the table below provides information about actual account values and actual expenses. You may use the information in this line, together with the amount you invested, to estimate the expenses that you paid over the period. Simply divide your account value by $1,000 (for example, an $8,600 account value divided by $1,000 = 8.6), then multiply the result by the number in the first line under the heading entitled “Expenses Paid During Period” to estimate the expenses you paid on your account during the period.
Hypothetical Example for Comparison Purposes – The second line of the table below provides information about hypothetical account values and hypothetical expenses based on the Fund’s actual expense ratio and an assumed rate of return of 5% per year before expenses, which is not the Fund’s actual return. The hypothetical account values and expenses may not be used to estimate the actual ending account balance or expenses you paid for the period. You may use this information to compare the ongoing costs of investing in the Fund and other funds. To do so, compare this 5% hypothetical example with the 5% hypothetical examples that appear in the shareholder reports of other funds.
Please note that the expenses shown in the table are meant to highlight your ongoing costs only and do not reflect any transactional costs, such as redemption fees and exchange fees. Therefore, the second line of the table is useful in comparing ongoing costs only and will not help you determine the relative total costs of owning different funds. In addition, if these fees were included, your costs would have been higher.
POLARIS GLOBAL VALUE FUND
ADDITIONAL INFORMATION (Unaudited)
DECEMBER 31, 2019
| | | Beginning Account Value July 1, 2019 | | | Ending Account Value December 31, 2019 | | | Expenses Paid During Period* | | | Annualized Expense Ratio* | |
| Actual | | $ | 1,000.00 | | | $ | 1,078.25 | | | $ | 5.19 | | | | 0.99 | % |
| Hypothetical (5% return before expenses) | | $ | 1,000.00 | | | $ | 1,020.21 | | | $ | 5.04 | | | | 0.99 | % |
| * | Expenses are equal to the Fund’s annualized expense ratio multiplied by the average account value over the period, multiplied by the number of days in the most recent fiscal half-year (184) divided by 365 to reflect the half-year period. |
Federal Tax Status of Dividends Declared during the Fiscal Year
For federal income tax purposes, dividends from short-term capital gains are classified as ordinary income. The Fund designates 26.86% of its income dividend distributed as qualifying for the corporate dividends-received deduction (DRD) and 100.00% for the qualified dividend rate (QDI) as defined in Section 1(h)(11) of the Code. The Fund also designates 0.17% as qualified interest income exempt from U.S. tax for foreign shareholders (QII). The Fund also designates 6.19% as short-term capital gain dividends exempt from U.S. tax for foreign shareholders (QSD).
Trustees and Officers of the Trust
The Board is responsible for oversight of the management of the Trust’s business affairs and of the exercise of all the Trust’s powers except those reserved for the shareholders. The following table provides information about each Trustee and certain officers of the Trust. Each Trustee and officer holds office until the person resigns, is removed, or is replaced. Unless otherwise noted, the persons have held their principal occupations for more than five years. The address for all Trustees and officers is Three Canal Plaza, Suite 600, Portland, Maine 04101. The Fund’s Statement of Additional Information includes additional information about the Trustees and is available, without charge and upon request, by calling (888) 263-5594 or visit the Fund's website at www.polarisfunds.com.
POLARIS GLOBAL VALUE FUND
ADDITIONAL INFORMATION (Unaudited)
DECEMBER 31, 2019
| Name and Year of Birth | Position with the Trust | Length of Time Served | Principal Occupation(s) During Past Five Years | Number of Series in Fund Complex Overseen By Trustee | Other Directorships Held By Trustee During Past Five Years |
| Independent Trustees |
David Tucker
Born: 1958 | Trustee; Chairman of the Board | Since 2011 and Chairman since 2018 | Director, Blue Sky Experience (a charitable endeavor) since 2008; Senior Vice President & General Counsel, American Century Companies (an investment management firm) 1998-2008. | 1 | Trustee, Forum
Funds II and U.S. Global Investors Funds |
Mark D. Moyer
Born: 1959 | Trustee; Chairman of the Audit Committee | Since 2018 | Chief Financial Officer, Freedom House (a NGO advocating political freedom and democracy) since 2017; independent consultant providing interim CFO services, principally to non-profit organizations, 2011-2017; Chief Financial Officer, Institute of International Education (a NGO administering international educational exchange programs), 2008-2011; Chief Financial Officer and Chief Restructuring Officer, Ziff Davis Media Inc. (an integrated media company), 2005-2008; Adjunct Professor of Accounting, Fairfield University from 2009-2012. | 1 | Trustee, Forum
Funds II and U.S. Global Investors Funds |
Jennifer Brown-Strabley Born: 1964 | Trustee | Since 2018 | Principal, Portland Global Advisors (a registered investment adviser), 1996- 2010. | 1 | Trustee, Forum
Funds II and U.S. Global Investors Funds |
| Interested Trustees(1) |
Jessica Chase
Born: 1970 | Trustee | Since 2018 | Director, Apex Fund Services since 2019; Senior Vice President, Atlantic Fund Services 2008-2019. | 1 | Trustee, Forum
Funds II and U.S. Global Investors Funds |
| (1) | Jessica Chase is currently an interested person of the Trust, as defined in the 1940 Act, due to her affiliation with Apex Fund Services and her role as President of the Trust. Apex Fund Services is a wholly owned subsidiary of Apex US Holdings LLC. |
POLARIS GLOBAL VALUE FUND
ADDITIONAL INFORMATION (Unaudited)
DECEMBER 31, 2019
| Name and Year of Birth | Position with the Trust | Length of Time Served | Principal Occupation(s) During Past 5 Years |
| Officers |
Jessica Chase
Born: 1970 | President; Principal Executive Officer | Since 2015 | Director, Apex Fund Services since 2019. Senior Vice President, Atlantic Fund Services 2008-2019. |
Karen Shaw
Born: 1972 | Treasurer; Principal Financial Officer | Since 2008 | Senior Vice President, Apex Fund Services since 2019; Senior Vice President, Atlantic Fund Services 2008-2019. |
Zachary Tackett
Born: 1988 | Vice President; Secretary and Anti- Money Laundering Compliance Officer | Since 2014 | Counsel, Apex Fund Services since 2019; Counsel, Atlantic Fund Services 2014-2019. |
Michael J. McKeen
Born: 1971 | Vice President | Since 2009 | Senior Vice President, Apex Fund Services since 2019; Senior Vice President, Atlantic Fund Services 2008-2019. |
Timothy Bowden
Born: 1969 | Vice President | Since 2009 | Manager, Apex Fund Services since 2019; Manager, Atlantic Fund Services 2008-2019. |
Geoffrey Ney
Born: 1975 | Vice President | Since 2013 | Manager, Apex Fund Services since 2019; Manager, Atlantic Fund Services 2013-2019. |
Todd Proulx
Born: 1978 | Vice President | Since 2013 | Manager, Apex Fund Services since 2019; Manager, Atlantic Fund Services 2013-2019. |
Carlyn Edgar
Born: 1963 | Vice President | Since 2008 | Senior Vice President, Apex Fund Services since 2019; Senior Vice President, Atlantic Fund Services 2008-2019; Chief Compliance Officer, 2008-2016. |
Dennis Mason
Born: 1967 | Chief Compliance Officer | Since 2016 | Fund Compliance Officer, Apex Fund Services since 2019; Fund Compliance Officer, Atlantic Fund Services 2013-2019. |
INVESTMENT ADVISER Polaris Capital Management, LLC 121 High Street Boston, MA 02110-2475 DISTRIBUTOR Foreside Fund Services, LLC Three Canal Plaza, Suite 100 Portland, ME 04101 www.foreside.com TRANSFER AGENT Apex Fund Services P.O. Box 588 Portland, ME 04112 www.theapexgroup.com This report is submitted for the general information of the shareholders of the Fund. It is not authorized for distribution to prospective investors unless preceded or accompanied by an effective prospectus, which includes information regarding the Fund’s risks, objectives, fees and expenses, experience of its management and other information. 225-ANR-1219 | |  Annual Report DECEMBER 31, 2019  |
TABLE OF CONTENTS
| A Message to Our Shareholders (Unaudited) | | | 1 | |
| Performance Chart and Analysis (Unaudited) | | | 5 | |
| Schedule of Investments | | | 6 | |
| Statement of Assets and Liabilities | | | 7 | |
| Statement of Operations | | | 8 | |
| Statements of Changes in Net Assets | | | 9 | |
| Financial Highlights | | | 10 | |
| Notes to Financial Statements | | | 11 | |
| Report of Independent Registered Public Accounting Firm | | | 15 | |
| Additional Information (Unaudited) | | | 16 | |
The views expressed in this report are those of the investment advisor of The BeeHive Fund (the “Fund”) as of December 31, 2019, and may not reflect its views on the date this report is first published or any time thereafter. These views are intended to assist shareholders of the Fund in understanding their investments in the Fund and do not constitute investment advice. The Fund is subject to various forms of risk, including the possible loss of principal. Investing in foreign securities entails risks not associated with domestic equities, including economic and political instability and currency fluctuations. Investing in fixed income securities includes the risk that rising interest rates will cause a decline in values. Focused investments in particular industries or market sectors can entail increased volatility and greater market risk than is the case with more broadly diversified investments. Investments in securities of small and mid-capitalization companies involve the possibility of greater volatility than investments in larger capitalization companies. Investments in American Depositary Receipts involve many of the same risks as investing in foreign securities.
THE BEEHIVE FUND
A MESSAGE TO OUR SHAREHOLDERS (Unaudited)
DECEMBER 31, 2019
Dear Shareholders,
The past year has been a rewarding one for investors. This was especially the case for The BeeHive Fund (the “Fund”). Your Fund outperformed sharply rising benchmarks, including the S&P 500.
In many ways, 2019 was a Reader’s Digest version of the entire decade of the 2010’s. Both periods began with markets at depressed levels following devastating declines. Worries were easily catalogued; optimism was in short supply. As it has since the great recession, the cavalry (Federal Reserve (the “Fed”)) rode to the rescue with easy monetary policy in tow. The response of financial markets over the last twelve months was eerily consistent with that of the last ten years.
As in the longer period, U.S. financial assets dominated global performance rankings (see Table 1 on page 3). The largest companies, by stock market value, outperformed middle-sized companies, which outperformed small companies. U.S.-based stocks outperformed those of other developed economies, which outperformed those of emerging markets. For each asset class, 2019 returns were significantly above longer term norms.
Likewise, 2019 was a record year for almost every fixed income asset class, as rates dipped and credit spreads tightened. Following the lead of the central bank, interest rates fell across the board. The 10-year U.S. Treasury Note began 2019 with a yield of 2.68% but ended at 1.85%. Long-term bonds (both government and corporate credits), high-yield, investment-grade and municipal bonds all posted much higher than average returns.
Reflecting on the past twelve months, or ten years, it seems logical to wonder if markets are in sync with the underlying environment. Is the U.S. economy truly strong enough to generate stock returns in excess of 30% in one year? Can the longest bull market in history (is that true?) last any longer? Given that it has been 150 years since a full decade has passed without a recession, is the U.S. not overdue?
These questions require context. Judging 2019 and the 2010’s on their own would be like measuring a journey that began by traveling some distance in the wrong direction. Most asset classes posted negative returns in 2018. The return for stocks over the last two years combined was better than average but not dangerously so. Likewise, the first decade of the millennium was one of the worst in history for markets around the world. The 20-year return for stocks is actually a bit below the longer term average. Where we have been recently is a poor guide for where we are headed.
Current Environment
As has been the case since the Great Recession, markets have been driven by monetary policy. Low interest rates and easy access to credit underpin a robust environment for financial assets. The challenge for policy makers has been, and remains, translating these benefits into the real economy. For most of the world, sustained 2% annual gross domestic product growth and a similar level of healthy inflation appears to be unreachable.
A year ago, we correctly predicted that the Fed was more likely to lower rates than to continue to raise them as it had in 2018. That was not a consensus view at the time. Today, most observers believe that U.S. monetary policy will remain easy for at least the rest of 2020. We agree. While the U.S. economy has continued to grow, fears of a recession lurk just beneath the surface. According to a survey from a business research group, The Conference Board, the number one concern of U.S. chief executives is fear of an economic decline.
China has had the highest economic growth in absolute terms (around 5%), but the rate is slowing, likely in reaction to trade tensions, high debt levels and, of course, the law of big numbers. On January 2, 2020, the People’s Bank of China announced that it would further loosen monetary policy in a bid to stimulate growth.
Europe and Japan continue to struggle. The most staggering statistic of the last decade was that the amount of negative yielding debt reached $17 trillion in August 2019. The vast majority of it is from those two economies. Just to be clear, “negative yielding debt” means that lenders are willing to make an investment that, if held to maturity, loses money. However, there may be early signs of improvement.
THE BEEHIVE FUND
A MESSAGE TO OUR SHAREHOLDERS (Unaudited)
DECEMBER 31, 2019
In December 2019, Japan’s prime minister announced a $120 billion fiscal stimulus package, the first in that country since 2016. Despite expectations of a further slowdown, the eurozone economy posted modest growth toward the end of 2019. Markets have taken notice. Since the summertime peak, total negative yielding debt outstanding has dropped precipitously, ending the year at around $11 trillion.
The BeeHive Fund
Within the Fund, patience paid off during 2019. Health Care holdings, Celgene and Allergan, whose stock prices had not kept pace with business fundamentals in past years, received takeover bids at meaningful premiums to their then-traded prices. Similarly, Ball Corp and Crown Holdings, two of the largest participants in the beverage can space, recorded outsized gains of 41.83% and 74.50% respectively, as beverage companies moved towards the aluminum can because of its environmental sustainability. Beverage-can industry fundamentals have been improving in recent years, but stock market investors took notice during 2019.
The Fund also benefited from sticking with past winners. The Fund’s holdings of Apple, Microsoft and Google all increased more than 29%, with Apple leading the way with a calendar year return of 88.97%. Shares of life science tools provider, Thermo Fisher Scientific, outpaced the S&P 500 with sustained organic growth near multi-year highs, and Danaher’s shares benefited from the acquisition of GE Health care that was announced in February of 2019.
The forward P/E multiple of the S&P 500 stood at over 18x at the end of 2019, well above long-term averages. This is perhaps warranted against a backdrop of very low interest rates but also obscures the fact that outside of certain high momentum pockets of the market, valuations are much more reasonable. During the year, the Fund was able to purchase shares of BrightView, Wyndham Hotels & Resorts, and CDK Global at very reasonable valuations on current earnings. All three have large components of recurring revenue, and we believe the companies have opportunities to reinvest and sustain growth for many years.
Outside of the U.S., the Fund took advantage of trade-related concerns to initiate a position in Alibaba. Not a household name in the U.S., Alibaba operates the largest e-commerce platform in China and also owns the leading cloud computing platform in China, the number two food-delivery business, the largest logistics network, the number three video and music platform, and a stake in the largest payment network. This market position is unlikely to be replicated by any competitor and should enable Alibaba to compound revenue and earnings at a 25%+ rate for many years to come.
Finally, the Fund initiated a position in Berkshire Hathaway during the year. Investors doubt that Berkshire will be able to deploy its enormous cash position (over $100 billion) accretively. Predicting the timing of something like this is inherently difficult, but the Fund has benefited in the past from investments in traditionally good capital allocators when investors start to doubt they will ever deploy capital accretively again.
Looking Forward
At the risk of debunking a long-held myth, there is no crystal ball at Spears Abacus. When we think about how markets will fare over the coming months and years, we start with two variables: valuation and the probable path of fundamental factors. The last year and decade were so rewarding because both were positive. Valuations were favorable at the outset and economic conditions turned out to be better than expected.
Today, our base case for the economy remains positive. We are sticking to the view that a U.S. recession is not yet on the horizon or that at worst, we are facing a short and shallow decline in economic activity. Expansions do not expire of old age. Recessions are brought on by an inflation-induced rise in interest rates or excessive speculation in some corner of the economy. Neither is apparent. We would not be surprised to see global economies continue to bump along at a 1-2% rate of growth. If this is the case, we can anticipate a continuation of easy monetary policy from the world’s central bankers.
Very low (and even negative) interest rates have a profound impact on valuation. With long-term interest rates in the U.S. clustered around 2%, it is hard to argue that stocks are overly expensive. The dividend yield alone is nearly 2% on the S&P 500. As long as rates remain in this range, long-term investors may continue to favor stocks over bonds, public company boards of directors may authorize stock buybacks or cash mergers/acquisitions, and private equity firms may use low-cost borrowings to take companies private.
THE BEEHIVE FUND
A MESSAGE TO OUR SHAREHOLDERS (Unaudited)
DECEMBER 31, 2019
What Could Change
This benignly positive scenario could be interrupted in several ways. As always, geopolitical risk is both present and unpredictable at the same time. So far, markets seem to be taking in stride escalating conflicts in the Middle East. That could change.
Europe, the U.K. and the U.S. are seeing a rise in populist politics. Brexit itself should not have a profound impact on global financial markets. However, it could prove to be an interesting laboratory to study the impact of policies that are more inwardly and less globally focused.
Rising inequality in the U.S. and Europe is a significant problem that needs to be addressed. The issues are complex, and the solutions will be difficult to identify and harder still to legislate. In the meantime, large corporations are an expedient political target. In an election year, we can expect to hear a lot about corporate greed, the high cost of health care (particularly pharmaceuticals), anti-competitive behavior of certain tech giants and other lightning-rod issues. Industries may move in or out of favor depending on which Democratic candidates gain or lose momentum. This may present opportunities to invest in businesses we admire at bargain prices but is not likely to fundamentally alter the way we look at companies.
We rarely compare ourselves to other advisors, large or small. However, we do get an opportunity to see the handiwork of our peers through the lens of the portfolios of new clients who join us. We observe that the Fund’s focus on a concentrated portfolio of predominantly large capitalization U.S. equities is relatively rare. Many practitioners follow the academic orthodoxy of broad diversification through sizable allocations to foreign markets, including emerging economies. Over the last decade, global diversification substantially diminished returns to investors. The U.S. market outperformed developed economy peers such as Europe, Japan, and Australia by about two and a half times and emerging markets by close to four times.
We never set out to achieve diversification for its own sake. We build the Fund’s portfolio one business at a time. Headquarters’ location or market capitalization are not by themselves investment criteria. Geographic exposure is an outcome of stock selection. It is worth noting that, over the past year or so, stock selection has resulted in somewhat greater exposure to smaller U.S. companies and global companies domiciled abroad. This is purely an outgrowth of our fundamental analysis. Our valuation work suggests that we will find more and more attractive opportunities outside the confines of the U.S. large cap universe. We will not hesitate to invest in those that seem the most appealing.
A year ago, just like a decade ago, investor fear was palpable. While nervousness has diminished, it has not disappeared. One needs to look no further than the amount of cash held in what may be viewed as the safe harbor of money-market funds. At year-end, money-fund balances were $3.6 trillion, close to the all-time peak of $3.9 trillion (in 2009, of course). Sooner or later, a good chunk of those balances should find its way into stocks and bonds.
Regards,
Spears Abacus
| Total Return (%) 12/31/2019 |
| Selected Indices | 12 Months | 10 Years (Annualized) |
| S&P 500 | 31.49 | 13.56 |
| S&P MidCap | 26.20 | 12.72 |
| Russell 2000 | 25.52 | 11.83 |
| MSCI World ex USA | 22.49 | 5.32 |
| MSCI Emerging Markets | 18.42 | 3.68 |
| Bloomberg Barclays Municipal Bond | 7.54 | 4.34 |
| Bloomberg Barclays US Aggregate | 8.72 | 3.75 |
THE BEEHIVE FUND
A MESSAGE TO OUR SHAREHOLDERS (Unaudited)
DECEMBER 31, 2019
You could lose money by investing in the Fund. Because the share price of the Fund will fluctuate, when you sell your shares, they may be worth more or less than what you originally paid for them. The Fund may impose a fee upon the sale of your shares or may temporarily suspend your ability to sell shares if the Fund’s liquidity falls below required minimums because of market conditions or other factors. An investment in the Fund is not insured or guaranteed by the Federal Deposit Insurance Corporation or any other government agency. The Fund’s sponsor has no legal obligation to provide financial support to the Fund, and you should not expect that the sponsor will provide financial support to the Fund at any time.
THE BEEHIVE FUND
PERFORMANCE CHART AND ANALYSIS (Unaudited)
DECEMBER 31, 2019
The following chart reflects the change in the value of a hypothetical $10,000 investment, including reinvested dividends and distributions, in The BeeHive Fund (the “Fund”) compared with the performance of the benchmark, S&P 500 Index (the "S&P 500"), since inception. The S&P 500 is a broad-based measurement of the U.S. stock market based on the performance of 500 widely held large capitalization common stocks. The total return of the S&P 500 includes the reinvestment of dividends and income. The total return of the Fund includes operating expenses that reduce returns, while the total return of the S&P 500 does not include expenses. The Fund is professionally managed, while the S&P 500 is unmanaged and is not available for investment.
Comparison of Change in Value of a $10,000 Investment
in The BeeHive Fund vs. S&P 500 Index
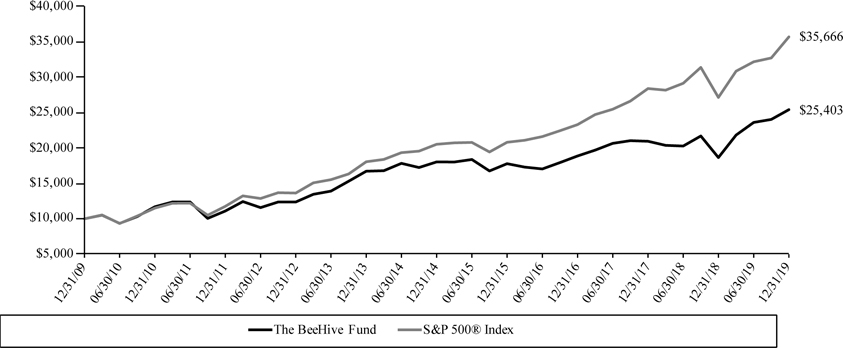
Average Annual Total Returns
Periods Ended December 31, 2019 | One Year | Five Year | Ten Year |
| The BeeHive Fund | 36.28 % | 7.10 % | 9.77 % |
| S&P 500® Index | 31.49 % | 11.70 % | 13.56 % |
Performance data quoted represents past performance and is no guarantee of future results. Current performance may be lower or higher than the performance data quoted. Investment return and principal value will fluctuate so that shares, when redeemed, may be worth more or less than original cost. As stated in the Fund’s prospectus, the annual operating expense ratio (gross) is 1.00%. However, the Fund’s advisor has contractually agreed to waive its fee and/or reimburse Fund expenses to limit Total Annual Fund Operating Expenses After Fee Waiver and/or Expense Reimbursement (excluding taxes, interest, portfolio transaction expenses and extraordinary expenses) to 0.99%, through April 30, 2020 (the “Expense Cap”). The Expense Cap may be raised or eliminated only with the consent of the Board of Trustees. The advisor may be reimbursed by the Fund for fees waived and expenses reimbursed by the advisor pursuant to the Expense Cap if such payment is made within three years of the fee waiver or expense reimbursement and does not cause the Total Annual Fund Operating Expenses After Fee Waiver and/or Expense Reimbursement to exceed the lesser of (i) the then-current Expense Cap and (ii) the Expense Cap in place at the time the fees/expenses were waived/ reimbursed. Total Annual Fund Operating Expenses After Fee Waiver and/or Expense Reimbursement will increase if exclusions from the Expense Cap apply. The performance table and graph do not reflect the deduction of taxes that a shareholder would pay on Fund distributions or the redemption of Fund shares. Returns greater than one year are annualized. For the most recent month-end performance, please call (866) 684-4915.
THE BEEHIVE FUND
SCHEDULE OF INVESTMENTS
DECEMBER 31, 2019
| Shares | | | Security Description | | Value | |
| Common Stock - 97.8% | |
| Consumer Discretionary - 14.6% | | | | |
| 14,550 | | | Alibaba Group Holding, Ltd., ADR (a) | | $ | 3,086,055 | |
| 35,760 | | | Aptiv PLC | | | 3,396,127 | |
| 98,520 | | | Comcast Corp., Class A | | | 4,430,445 | |
| 62,110 | | | General Motors Co. | | | 2,273,226 | |
| 108,720 | | | Prosus NV, ADR (a) | | | 1,619,939 | |
| 13,930 | | | Whirlpool Corp. | | | 2,055,093 | |
| 44,230 | | | Wyndham Hotels & Resorts, Inc. | | | 2,778,086 | |
| | | | | | | 19,638,971 | |
| Consumer Staples - 7.4% | | | | |
| 81,940 | | | Mondelez International, Inc., Class A | | | 4,513,255 | |
| 49,750 | | | Nestle SA, ADR | | | 5,385,935 | |
| | | | | | | 9,899,190 | |
| Energy - 3.4% | | | | |
| 59,400 | | | Royal Dutch Shell PLC, ADR, Class B | | | 3,562,218 | |
| 26,110 | | | Schlumberger, Ltd. | | | 1,049,622 | |
| | | | | | | 4,611,840 | |
| Financials - 18.2% | | | | |
| 105,250 | | | American International Group, Inc. | | | 5,402,483 | |
| 11,720 | | | Berkshire Hathaway, Inc., Class B (a) | | | 2,654,580 | |
| 36,970 | | | Chubb, Ltd. | | | 5,754,750 | |
| 51,600 | | | CIT Group, Inc. | | | 2,354,508 | |
| 49,437 | | | Citigroup, Inc. | | | 3,949,522 | |
| 31,610 | | | JPMorgan Chase & Co. | | | 4,406,434 | |
| | | | | | | 24,522,277 | |
| Health Care - 11.8% | | | | |
| 15,220 | | | Allergan PLC | | | 2,909,607 | |
| 57,745 | | | Gilead Sciences, Inc. | | | 3,752,270 | |
| 28,285 | | | Thermo Fisher Scientific, Inc. | | | 9,188,948 | |
| | | | | | | 15,850,825 | |
| Industrials - 11.2% | | | | |
| 106,770 | | | BrightView Holdings, Inc. (a) | | | 1,801,210 | |
| 57,130 | | | Danaher Corp. | | | 8,768,312 | |
| 76,820 | | | Delta Air Lines, Inc. | | | 4,492,434 | |
| | | | | | | 15,061,956 | |
| Materials - 7.4% | | | | |
| 81,370 | | | Ball Corp. | | | 5,262,198 | |
| 63,950 | | | Crown Holdings, Inc. (a) | | | 4,638,933 | |
| | | | | | | 9,901,131 | |
| Software & Services - 19.7% | | | | |
| 3,082 | | | Alphabet, Inc., Class A (a) | | | 4,128,000 | |
| 2,251 | | | Alphabet, Inc., Class C (a) | | | 3,009,632 | |
| 49,460 | | | CDK Global, Inc. | | | 2,704,473 | |
| 70,125 | | | Microsoft Corp. | | | 11,058,713 | |
| 104,780 | | | Oracle Corp. | | | 5,551,244 | |
| | | | | | | 26,452,062 | |
| Technology Hardware & Equipment - 4.1% | | | | |
| 18,930 | | | Apple, Inc. | | | 5,558,794 | |
| Total Common Stock (Cost $69,542,385) | | | 131,497,046 | |
| | | | | | | | |
| Shares | | | Security Description | | | Value | |
| Money Market Fund - 2.3% | | | | |
| 3,006,724 | | | Goldman Sachs Financial Square Treasury Instruments Fund, Institutional Shares, 1.52% (b) (Cost $3,006,724) | | | 3,006,724 | |
| Investments, at value - 100.1% (Cost $72,549,109) | | $ | 134,503,770 | |
| Other Assets & Liabilities, Net - (0.1)% | | | (88,797 | ) |
| Net Assets - 100.0% | | $ | 134,414,973 | |
| ADR | American Depositary Receipt |
| PLC | Public Limited Company |
| (a) | Non-income producing security. |
| (b) | Dividend yield changes daily to reflect current market conditions. Rate was the quoted yield as of December 31, 2019. |
| |
| The following is a summary of the inputs used to value the Fund's investments as of December 31, 2019. |
| The inputs or methodology used for valuing securities are not necessarily an indication of the risks associated with investing in those securities. For more information on valuation inputs, and their aggregation into the levels used in the table below, please refer to the Security Valuation section in Note 2 of the accompanying Notes to Financial Statements. | |
| |
| | | Investments in | |
| Valuation Inputs | | Securities | |
| Level 1 - Quoted Prices | | $ | 131,497,046 | |
| Level 2 - Other Significant Observable Inputs | | | 3,006,724 | |
| Level 3 - Significant Unobservable Inputs | | | – | |
| Total | | $ | 134,503,770 | |
| The Level 1 value displayed in this table is Common Stock. The Level 2 value displayed in this table is a Money Market Fund. Refer to this Schedule of Investments for a further breakout of each security by industry. |
| PORTFOLIO HOLDINGS (Unaudited) | | | |
| % of Total Investments | | | |
| Consumer Discretionary | | | 14.6 | % |
| Consumer Staples | | | 7.4 | % |
| Energy | | | 3.4 | % |
| Financials | | | 18.2 | % |
| Health Care | | | 11.8 | % |
| Industrials | | | 11.2 | % |
| Materials | | | 7.4 | % |
| Software & Services | | | 19.7 | % |
| Technology Hardware & Equipment | | | 4.1 | % |
| Money Market Fund | | | 2.2 | % |
| | | | 100.0 | % |
See Notes to Financial Statements.
THE BEEHIVE FUND
STATEMENT OF ASSETS AND LIABILITIES
DECEMBER 31, 2019
| ASSETS | | | |
| Investments, at value (Cost $72,549,109) | | $ | 134,503,770 | |
| Receivables: | | | | |
| Dividends | | | 82,914 | |
| Prepaid expenses | | | 5,758 | |
| Total Assets | | | 134,592,442 | |
| | | | | |
| LIABILITIES | | | | |
| Payables: | | | | |
| Distributions payable | | | 49,572 | |
| Accrued Liabilities: | | | | |
| Investment advisor fees | | | 84,525 | |
| Fund services fees | | | 16,812 | |
| Other expenses | | | 26,560 | |
| Total Liabilities | | | 177,469 | |
| | | | | |
| NET ASSETS | | $ | 134,414,973 | |
| | | | | |
| COMPONENTS OF NET ASSETS | | | | |
| Paid-in capital | | $ | 72,531,590 | |
| Distributable earnings | | | 61,883,383 | |
| NET ASSETS | | $ | 134,414,973 | |
| SHARES OF BENEFICIAL INTEREST AT NO PAR VALUE (UNLIMITED SHARES AUTHORIZED) | | | 7,905,952 | |
| NET ASSET VALUE, OFFERING AND REDEMPTION PRICE PER SHARE | | $ | 17.00 | |
See Notes to Financial Statements.
THE BEEHIVE FUND
STATEMENT OF OPERATIONS
YEAR ENDED DECEMBER 31, 2019
| INVESTMENT INCOME | | | |
| Dividend income (Net of foreign withholding taxes of $20,808) | | $ | 2,175,592 | |
| Non-cash income | | | 904,785 | |
| Total Investment Income | | | 3,080,377 | |
| | | | | |
| EXPENSES | | | | |
| Investment advisor fees | | | 936,549 | |
| Fund services fees | | | 189,382 | |
| Custodian fees | | | 13,106 | |
| Registration fees | | | 4,052 | |
| Professional fees | | | 50,613 | |
| Trustees’ fees and expenses | | | 6,573 | |
| Other expenses | | | 29,665 | |
| Total Expenses | | | 1,229,940 | |
| Fees waived | | | (5,777 | ) |
| Net Expenses | | | 1,224,163 | |
| | | | | |
| NET INVESTMENT INCOME | | | 1,856,214 | |
| | | | | |
| NET REALIZED AND UNREALIZED GAIN | | | | |
| Net realized gain on investments | | | 4,037,210 | |
| Net change in unrealized appreciation (depreciation) on investments | | | 31,168,173 | |
| NET REALIZED AND UNREALIZED GAIN | | | 35,205,383 | |
| INCREASE IN NET ASSETS RESULTING FROM OPERATIONS | | $ | 37,061,597 | |
See Notes to Financial Statements.
THE BEEHIVE FUND
STATEMENTS OF CHANGES IN NET ASSETS
| | | For the Years Ended December 31, | |
| | | 2019 | | | 2018 | |
| OPERATIONS | | | | | | |
| Net investment income | | $ | 1,856,214 | | | $ | 1,029,270 | |
| Net realized gain | | | 4,037,210 | | | | 4,126,819 | |
| Net change in unrealized appreciation (depreciation) | | | 31,168,173 | | | | (18,107,908 | ) |
| Increase (Decrease) in Net Assets Resulting from Operations | | | 37,061,597 | | | | (12,951,819 | ) |
| | | | | | | | | |
| DISTRIBUTIONS TO SHAREHOLDERS | | | | | | | | |
| Total Distributions Paid | | | (6,428,176 | ) | | | (3,665,453 | ) |
| | | | | | | | | |
| CAPITAL SHARE TRANSACTIONS | | | | | | | | |
| Sale of shares | | | 1,995,129 | | | | 3,266,141 | |
| Reinvestment of distributions | | | 6,253,232 | | | | 3,568,202 | |
| Redemption of shares | | | (9,872,543 | ) | | | (15,686,872 | ) |
| Decrease in Net Assets from Capital Share Transactions | | | (1,624,182 | ) | | | (8,852,529 | ) |
| Increase (Decrease) in Net Assets | | | 29,009,239 | | | | (25,469,801 | ) |
| | | | | | | | | |
| NET ASSETS | | | | | | | | |
| Beginning of Year | | | 105,405,734 | | | | 130,875,535 | |
| End of Year | | $ | 134,414,973 | | | $ | 105,405,734 | |
| | | | | | | | | |
| SHARE TRANSACTIONS | | | | | | | | |
| Sale of shares | | | 130,793 | | | | 208,651 | |
| Reinvestment of distributions | | | 369,229 | | | | 264,554 | |
| Redemption of shares | | | (642,004 | ) | | | (1,020,150 | ) |
| Decrease in Shares | | | (141,982 | ) | | | (546,945 | ) |
See Notes to Financial Statements.
THE BEEHIVE FUND
FINANCIAL HIGHLIGHTS
These financial highlights reflect selected data for a share outstanding throughout each year.
| | | For the Years Ended December 31, | |
| | | 2019 | | | 2018 | | | 2017 | | | 2016 | | | 2015 | |
| NET ASSET VALUE, Beginning of Year | | $ | 13.10 | | | $ | 15.23 | | | $ | 14.26 | | | $ | 13.64 | | | $ | 14.13 | |
| INVESTMENT OPERATIONS | | | | | | | | | | | | | | | | | | | | |
| Net investment income (a) | | | 0.24 | | | | 0.13 | | | | 0.10 | | | | 0.13 | | | | 0.08 | |
| Net realized and unrealized gain (loss) | | | 4.50 | | | | (1.79 | ) | | | 1.48 | | | | 0.70 | | | | (0.28 | ) |
| Total from Investment Operations | | | 4.74 | | | | (1.66 | ) | | | 1.58 | | | | 0.83 | | | | (0.20 | ) |
| | | | | | | | | | | | | | | | | | | | | |
| DISTRIBUTIONS TO SHAREHOLDERS FROM | | | | | | | | | | | | | | | | | | | | |
| Net investment income | | | (0.24 | ) | | | (0.13 | ) | | | (0.09 | ) | | | (0.13 | ) | | | (0.08 | ) |
| Net realized gain | | | (0.60 | ) | | | (0.34 | ) | | | (0.52 | ) | | | (0.08 | ) | | | (0.21 | ) |
| Total Distributions to Shareholders | | | (0.84 | ) | | | (0.47 | ) | | | (0.61 | ) | | | (0.21 | ) | | | (0.29 | ) |
| | | | | | | | | | | | | | | | | | | | | |
| NET ASSET VALUE, End of Year | | $ | 17.00 | | | $ | 13.10 | | | $ | 15.23 | | | $ | 14.26 | | | $ | 13.64 | |
| TOTAL RETURN | | | 36.28 | % | | | (10.98 | )% | | | 11.07 | % | | | 6.11 | % | | | (1.42 | )% |
| | | | | | | | | | | | | | | | | | | | | |
| RATIOS/SUPPLEMENTARY DATA | | | | | | | | | | | | | | | | | | | | |
| Net Assets at End of Year (000s omitted) | | $ | 134,415 | | | $ | 105,406 | | | $ | 130,876 | | | $ | 117,849 | | | $ | 113,313 | |
| Ratios to Average Net Assets: | | | | | | | | | | | | | | | | | | | | |
| Net investment income | | | 1.49 | % | | | 0.84 | % | | | 0.64 | % | | | 0.99 | % | | | 0.57 | % |
| Net expenses | | | 0.98 | % | | | 0.99 | % | | | 0.99 | %(b) | | | 0.99 | % | | | 0.99 | %(b) |
| Gross expenses | | | 0.98 | %(c) | | | 0.99 | %(c) | | | 0.99 | % | | | 1.00 | %(c) | | | 0.98 | % |
| PORTFOLIO TURNOVER RATE | | | 10 | % | | | 10 | % | | | 14 | % | | | 15 | % | | | 17 | % |
| (a) | Calculated based on average shares outstanding during each year. |
| (b) | Ratio includes waivers and previously waived investment advisory fees recovered. The impact of the recovered fees may cause a higher net expense ratio. |
| (c) | Reflects the expense ratio excluding any waivers and/or reimbursements. |
See Notes to Financial Statements.
THE BEEHIVE FUND
NOTES TO FINANCIAL STATEMENTS
DECEMBER 31, 2019
Note 1. Organization
The BeeHive Fund (the “Fund”) is a diversified portfolio of Forum Funds (the “Trust”). The Trust is a Delaware statutory trust that is registered as an open-end, management investment company under the Investment Company Act of 1940, as amended (the “Act”). Under its Trust Instrument, the Trust is authorized to issue an unlimited number of the Fund’s shares of beneficial interest without par value. The Fund commenced operations on September 2, 2008. The Fund seeks capital appreciation.
Note 2. Summary of Significant Accounting Policies
The Fund is an investment company and follows accounting and reporting guidance under Financial Accounting Standards Board (“FASB”) Accounting Standards Codification (“ASC”) Topic 946, “Financial Services – Investment Companies.” These financial statements are prepared in accordance with accounting principles generally accepted in the United States of America (“GAAP”), which require management to make estimates and assumptions that affect the reported amounts of assets and liabilities, the disclosure of contingent liabilities at the date of the financial statements, and the reported amounts of increases and decreases in net assets from operations during the fiscal year. Actual amounts could differ from those estimates. The following summarizes the significant accounting policies of the Fund:
Security Valuation – Securities are valued at market prices using the last quoted trade or official closing price from the principal exchange where the security is traded, as provided by independent pricing services on each Fund business day. In the absence of a last trade, securities are valued at the mean of the last bid and ask price provided by the pricing service. Shares of non-exchange traded open-end mutual funds are valued at net asset value (“NAV”). Short-term investments that mature in sixty days or less may be valued at amortized cost.
The Fund values its investments at fair value pursuant to procedures adopted by the Trust’s Board of Trustees (the “Board”) if (1) market quotations are not readily available or (2) the Advisor, as defined in Note 3, believes that the values available are unreliable. The Trust’s Valuation Committee, as defined in the Fund’s registration statement, performs certain functions as they relate to the administration and oversight of the Fund’s valuation procedures. Under these procedures, the Valuation Committee convenes on a regular and ad hoc basis to review such investments and considers a number of factors, including valuation methodologies and significant unobservable inputs, when arriving at fair value.
The Valuation Committee may work with the Advisor to provide valuation inputs. In determining fair valuations, inputs may include market-based analytics that may consider related or comparable assets or liabilities, recent transactions, market multiples, book values and other relevant investment information. Advisor inputs may include an income-based approach in which the anticipated future cash flows of the investment are discounted in determining fair value. Discounts may also be applied based on the nature or duration of any restrictions on the disposition of the investments. The Valuation Committee performs regular reviews of valuation methodologies, key inputs and assumptions, disposition analysis and market activity.
Fair valuation is based on subjective factors and, as a result, the fair value price of an investment may differ from the security’s market price and may not be the price at which the asset may be sold. Fair valuation could result in a different NAV than a NAV determined by using market quotes.
GAAP has a three-tier fair value hierarchy. The basis of the tiers is dependent upon the various “inputs” used to determine the value of the Fund’s investments. These inputs are summarized in the three broad levels listed below:
Level 1 - Quoted prices in active markets for identical assets and liabilities.
Level 2 - Prices determined using significant other observable inputs (including quoted prices for similar securities, interest rates, prepayment speeds, credit risk, etc.). Short-term securities with maturities of sixty days or less are valued at amortized cost, which approximates market value, and are categorized as Level 2 in the hierarchy. Municipal securities, long-term U.S. government obligations and corporate debt securities are valued in accordance with the evaluated price supplied by a pricing service and generally categorized as Level 2 in the hierarchy. Other securities that are categorized as Level 2 in the hierarchy include, but are not limited to, warrants that do not trade on an exchange, securities valued at the mean between the last reported bid and ask quotation and international equity securities valued by an independent third party with adjustments for changes in value between the time of the securities’ respective local market closes and the close of the U.S. market.
THE BEEHIVE FUND
NOTES TO FINANCIAL STATEMENTS
DECEMBER 31, 2019
Level 3 - Significant unobservable inputs (including the Fund’s own assumptions in determining the fair value of investments).
The aggregate value by input level, as of December 31, 2019, for the Fund’s investments is included at the end of the Fund’s Schedule of Investments.
Security Transactions, Investment Income and Realized Gain and Loss – Investment transactions are accounted for on the trade date. Dividend income is recorded on the ex-dividend date. Non-cash dividend income is recorded at the fair market value of the securities received. Foreign dividend income is recorded on the ex-dividend date or as soon as possible after determining the existence of a dividend declaration after exercising reasonable due diligence. Income and capital gains on some foreign securities may be subject to foreign withholding taxes, which are accrued as applicable. Interest income is recorded on an accrual basis. Premium is amortized and discount is accreted using the effective interest method. Identified cost of investments sold is used to determine the gain and loss for both financial statement and federal income tax purposes.
Distributions to Shareholders – The Fund declares any dividends from net investment income and pays them annually. Any net capital gains and net foreign currency gains realized by the Fund are distributed at least annually. Distributions to shareholders are recorded on the ex-dividend date. Distributions are based on amounts calculated in accordance with applicable federal income tax regulations, which may differ from GAAP. These differences are due primarily to differing treatments of income and gain on various investment securities held by the Fund, timing differences and differing characterizations of distributions made by the Fund.
Federal Taxes – The Fund intends to continue to qualify each year as a regulated investment company under Subchapter M of Chapter 1, Subtitle A, of the Internal Revenue Code of 1986, as amended (“Code”), and to distribute all of its taxable income to shareholders. In addition, by distributing in each calendar year substantially all of its net investment income and capital gains, if any, the Fund will not be subject to a federal excise tax. Therefore, no federal income or excise tax provision is required. The Fund files a U.S. federal income and excise tax return as required. The Fund’s federal income tax returns are subject to examination by the Internal Revenue Service for a period of three fiscal years after they are filed. As of December 31, 2019, there are no uncertain tax positions that would require financial statement recognition, de-recognition or disclosure.
Income and Expense Allocation – The Trust accounts separately for the assets, liabilities and operations of each of its investment portfolios. Expenses that are directly attributable to more than one investment portfolio are allocated among the respective investment portfolios in an equitable manner.
Commitments and Contingencies – In the normal course of business, the Fund enters into contracts that provide general indemnifications by the Fund to the counterparty to the contract. The Fund’s maximum exposure under these arrangements is dependent on future claims that may be made against the Fund and, therefore, cannot be estimated; however, based on experience, the risk of loss from such claims is considered remote. The Fund has determined that none of these arrangements requires disclosure on the Fund’s balance sheet.
Note 3. Fees and Expenses
Investment Advisor – Spears Abacus Advisors LLC (the “Advisor”) is the investment advisor to the Fund. Pursuant to an investment advisory agreement, the Advisor receives an advisory fee, payable monthly, from the Fund at an annual rate of 0.75% of the Fund’s average daily net assets.
Distribution – Foreside Fund Services, LLC serves as the Fund’s distributor (the “Distributor”). The Distributor is not affiliated with the Advisor or Atlantic Fund Administration, LLC, a wholly owned subsidiary of Apex US Holdings, LLC (d/b/a Apex Fund Services) (“Apex”) or their affiliates. The Fund has adopted a distribution plan in accordance with Rule 12b-1 of the Act. The Fund may pay the Distributor and/or any other entity as authorized by the Board a fee up to 0.25% of the Fund’s average daily net assets. The Fund has suspended payments under its Rule 12b-1 plan until further notice and has not paid any distribution fees to date. The Fund may remove the suspension and make payments under the Rule 12b-1 plan at any time, subject to Board approval.
Other Service Providers – Apex provides fund accounting, fund administration, compliance and transfer agency services to the Fund. The fees related to these services are included in Fund services fees within the Statement of Operations. Apex also provides certain shareholder report production and EDGAR conversion and filing services. Pursuant to an Apex services agreement, the
THE BEEHIVE FUND
NOTES TO FINANCIAL STATEMENTS
DECEMBER 31, 2019
Fund pays Apex customary fees for its services. Apex provides a Principal Executive Officer, a Principal Financial Officer, a Chief Compliance Officer and an Anti-Money Laundering Officer to the Fund, as well as certain additional compliance support functions.
Trustees and Officers – Each Independent Trustee’s annual retainer is $31,000 ($41,000 for the Chairman), and the Audit Committee Chairman receives an additional $2,000 annually. The Trustees and Chairman may receive additional fees for special Board meetings. Each Trustee is also reimbursed for all reasonable out-of-pocket expenses incurred in connection with his or her duties as a Trustee, including travel and related expenses incurred in attending Board meetings. The amount of Trustees’ fees attributable to the Fund is disclosed in the Statement of Operations. Certain officers of the Trust are also officers or employees of the above named service providers, and during their terms of office received no compensation from the Fund.
Note 4. Expense Reimbursement and Fees Waived
The Advisor has contractually agreed to waive its fee and/or reimburse Fund expenses to limit total annual Fund operating expenses after fee waiver and/or expense reimbursement (excluding taxes, interest, portfolio transaction expenses and extraordinary expenses) to 0.99% through April 30, 2020. During the year ended December 31, 2019, fees waived were $5,777.
The Advisor may be reimbursed by the Fund for fees waived and expenses reimbursed pursuant to the Expense Cap if such payment is made within three years of the fee waiver or expense reimbursement and does not cause the total annual Fund operating expenses after fee waiver and/or expense reimbursement (excluding taxes, interest, portfolio transaction expenses and extraordinary expenses) of the Fund to exceed the lesser of (i) the then-current expense cap and (ii) the expense cap in place at the time the fees/ expenses were waived/reimbursed. As of December 31, 2019, $7,630 is subject to recapture by the Advisor.
Note 5. Security Transactions
The cost of purchases and proceeds from sales of investment securities (including maturities), other than short-term investments during the year ended December 31, 2019, totaled $12,022,924 and $16,372,378, respectively.
Note 6. Federal Income Tax
As of December 31, 2019, cost for federal income tax purpose is $72,581,045 and net unrealized appreciation consists of:
| Gross Unrealized Appreciation | | $ | 63,397,102 | |
| Gross Unrealized Depreciation | | | (1,474,377 | ) |
| Net Unrealized Appreciation | | $ | 61,922,725 | |
Distributions paid during the fiscal years ended as noted were characterized for tax purposes as follows:
| | | 2019 | | | 2018 | |
| Ordinary Income | | $ | 1,872,808 | | | $ | 1,050,741 | |
| Long-Term Capital Gain | | | 4,555,368 | | | | 2,614,712 | |
| | | $ | 6,428,176 | | | $ | 3,665,453 | |
As of December 31, 2019, distributable earnings on a tax basis were as follows:
| Capital and Other Losses | | $ | (39,342 | ) |
| Net Unrealized Appreciation | | | 61,922,725 | |
| Total | | $ | 61,883,383 | |
The difference between components of distributable earnings on a tax basis and the amounts reflected in the Statement of Assets and Liabilities are primarily due to wash sales.
For tax purposes, the current year post-October loss was $39,342 (realized during the period January 1, 2019 through December 31, 2019). This loss will be recognized for tax purposes on the first business day of the Fund’s next fiscal year, January 1, 2020.
THE BEEHIVE FUND
NOTES TO FINANCIAL STATEMENTS
DECEMBER 31, 2019
On the Statement of Assets and Liabilities, as a result of permanent book to tax differences, certain amounts have been reclassified for the year ended December 31, 2019. The following reclassification was the result of taxable distributions in excess of earnings and has no impact on the net assets of the Fund.
| Distributable Earnings | | $ | 2,269 | |
| Paid-in-Capital | | | (2,269 | ) |
Note 7. Subsequent Events
Subsequent events occurring after the date of this report through the date these financial statements were issued have been evaluated for potential impact, and the Fund has had no such events.
REPORT OF INDEPENDENT REGISTERED PUBLIC ACCOUNTING FIRM
To the Board of Trustees of Forum Funds
and the Shareholders of The BeeHive Fund
Opinion on the Financial Statements
We have audited the accompanying statement of assets and liabilities of The BeeHive Fund, a series of shares of beneficial interest in Forum Funds (the “Fund”), including the schedule of investments, as of December 31, 2019, and the related statement of operations for the year then ended, the statements of changes in net assets for each of the years in the two-year period then ended and the financial highlights for each of the years in the five-year period then ended, and the related notes (collectively referred to as the “financial statements”). In our opinion, the financial statements present fairly, in all material respects, the financial position of the Fund as of December 31, 2019, and the results of its operations for the year then ended, the changes in its net assets for each of the years in the two-year period then ended and its financial highlights for each of the years in the five-year period then ended, in conformity with accounting principles generally accepted in the United States of America.
Basis for Opinion
These financial statements are the responsibility of the Fund’s management. Our responsibility is to express an opinion on the Fund’s financial statements based on our audits. We are a public accounting firm registered with the Public Company Accounting Oversight Board (United States) (“PCAOB”) and are required to be independent with respect to the Fund in accordance with the U.S. federal securities law and the applicable rules and regulations of the Securities and Exchange Commission and the PCAOB.
We conducted our audits in accordance with the standards of the PCAOB. Those standards require that we plan and perform the audits to obtain reasonable assurance about whether the financial statements are free of material misstatement, whether due to error or fraud. The Fund is not required to have, nor were we engaged to perform, an audit of its internal control over financial reporting. As part of our audits we are required to obtain an understanding of internal control over financial reporting but not for the purpose of expressing an opinion on the effectiveness of the Fund’s internal control over financial reporting. Accordingly, we express no such opinion.
Our audits included performing procedures to assess the risk of material misstatement of the financial statements, whether due to error or fraud, and performing procedures that respond to those risks. Such procedures included examining, on a test basis, evidence regarding the amounts and disclosures in the financial statements. Our procedures included confirmation of securities owned as of December 31, 2019 by correspondence with the custodian. Our audits also included evaluating the accounting principles used and significant estimates made by management, as well as evaluating the overall presentation of the financial statements. We believe that our audits provide a reasonable basis for our opinion.

BBD, LLP
We have served as the auditor of one of more of the Funds in the Forum Funds since 2008.
Philadelphia, Pennsylvania
February 26, 2020
THE BEEHIVE FUND
ADDITIONAL INFORMATION (Unaudited)
DECEMBER 31, 2019
Proxy Voting Information
A description of the policies and procedures that the Fund uses to determine how to vote proxies relating to securities held in the Fund’s portfolio is available, without charge and upon request, by calling (866) 684-4915 and on the U.S. Securities and Exchange Commission’s (the “SEC”) website at www.sec.gov. The Fund’s proxy voting record for the most recent twelve-month period ended June 30 is available, without charge and upon request, by calling (866) 684-4915 and on the SEC’s website at www.sec.gov.
Availability of Quarterly Portfolio Schedules
The Fund files its complete schedule of portfolio holdings with the SEC for the first and third quarters of each fiscal year on Form N-Q. These filings are available, without charge and upon request on the SEC’s website at www.sec.gov or may be reviewed and copied at the SEC’s Public Reference Room in Washington, D.C. Information on the operation of the Public Reference Room may be obtained by calling (800) SEC-0330.
Shareholder Expense Example
As a shareholder of the Fund, you incur ongoing costs, including management fees and other Fund expenses. This example is intended to help you understand your ongoing costs (in dollars) of investing in the Fund and to compare these costs with the ongoing costs of investing in other mutual funds.
The example is based on an investment of $1,000 invested at the beginning of the period and held for the entire period from July 1, 2019 through December 31, 2019.
Actual Expenses – The first line of the table below provides information about actual account values and actual expenses. You may use the information in this line, together with the amount you invested, to estimate the expenses that you paid over the period. Simply divide your account value by $1,000 (for example, an $8,600 account value divided by $1,000 = 8.6), then multiply the result by the number in the first line under the heading entitled “Expenses Paid During Period” to estimate the expenses you paid on your account during the period.
Hypothetical Example for Comparison Purposes – The second line of the table below provides information about hypothetical account values and hypothetical expenses based on the Fund’s actual expense ratio and an assumed rate of return of 5% per year before expenses, which is not the Fund’s actual return. The hypothetical account values and expenses may not be used to estimate the actual ending account balance or expenses you paid for the period. You may use this information to compare the ongoing costs of investing in the Fund and other funds. To do so, compare this 5% hypothetical example with the 5% hypothetical examples that appear in the shareholder reports of other funds.
Please note that the expenses shown in the table are meant to highlight your ongoing costs only. Therefore, the second line of the table is useful in comparing ongoing costs only and will not help you determine the relative total costs of owning different funds.
| | | Beginning Account Value July 1, 2019 | | | Ending Account Value December 31, 2019 | | | Expenses Paid During Period* | | | Annualized Expense Ratio* | |
| Actual | | $ | 1,000.00 | | | $ | 1,076.78 | | | $ | 5.18 | | | | 0.99 | % |
| Hypothetical (5% return before expenses) | | $ | 1,000.00 | | | $ | 1,020.21 | | | $ | 5.04 | | | | 0.99 | % |
| * | Expenses are equal to the Fund’s annualized expense ratio multiplied by the average account value over the period, multiplied by the number of days in the most recent fiscal half-year (184) divided by 365 to reflect the half-year period. |
Federal Tax Status of Dividends Declared during the Fiscal Year
For federal income tax purposes, dividends from short-term capital gains are classified as ordinary income. The Fund designates 77.88% of its income dividend distributed as qualifying for the corporate dividends-received deduction (DRD) and 100.00% for the qualified dividend rate (QDI) as defined in Section 1(h)(11) of the Code. The Fund also designates 0.76% as short-term capital gain dividends exempt from U.S. tax for foreign shareholders (QSD).
THE BEEHIVE FUND
ADDITIONAL INFORMATION (Unaudited)
DECEMBER 31, 2019
Trustees and Officers of the Trust
The Board is responsible for oversight of the management of the Trust’s business affairs and of the exercise of all the Trust’s powers except those reserved for the shareholders. The following table provides information about each Trustee and certain officers of the Trust. Each Trustee and officer holds office until the person resigns, is removed, or is replaced. Unless otherwise noted, the persons have held their principal occupations for more than five years. The address for all Trustees and officers is Three Canal Plaza, Suite 600, Portland, Maine 04101. The Fund’s Statement of Additional Information includes additional information about the Trustees and is available, without charge and upon request, by calling (866) 684-4915.
| Name and Year of Birth | Position with the Trust | Length of Time Served | Principal Occupation(s) During Past Five Years | Number of Series in Fund Complex Overseen By Trustee | Other Directorships Held By Trustee During Past Five Years |
| Independent Trustees |
David Tucker Born: 1958 | Trustee; Chairman of the Board | Since 2011 and Chairman since 2018 | Director, Blue Sky Experience (a charitable endeavor) since 2008; Senior Vice President & General Counsel, American Century Companies (an investment management firm) 1998-2008. | 1 | Trustee, Forum Funds II and U.S. Global Investors Funds |
Mark D. Moyer Born: 1959 | Trustee; Chairman of the Audit Committee | Since 2018 | Chief Financial Officer, Freedom House (a NGO advocating political freedom and democracy) since 2017; independent consultant providing interim CFO services, principally to non-profit organizations, 2011-2017; Chief Financial Officer, Institute of International Education (a NGO administering international educational exchange programs), 2008-2011; Chief Financial Officer and Chief Restructuring Officer, Ziff Davis Media Inc. (an integrated media company), 2005-2008; Adjunct Professor of Accounting, Fairfield University from 2009-2012. | 1 | Trustee, Forum Funds II and U.S. Global Investors Funds |
Jennifer Brown-Strabley Born: 1964 | Trustee | Since 2018 | Principal, Portland Global Advisors (a registered investment adviser), 1996- 2010. | 1 | Trustee, Forum Funds II and U.S. Global Investors Funds |
| Interested Trustees(1) |
Jessica Chase Born: 1970 | Trustee | Since 2018 | Director, Apex Fund Services since 2019; Senior Vice President, Atlantic Fund Services 2008-2019. | 1 | Trustee, Forum Funds II and U.S. Global Investors Funds |
| (1) | | Jessica Chase is currently an interested person of the Trust, as defined in the 1940 Act, due to her affiliation with Apex Fund Services and her role as President of the Trust. Apex Fund Services is a wholly owned subsidiary of Apex US Holdings LLC. |
THE BEEHIVE FUND
ADDITIONAL INFORMATION (Unaudited)
DECEMBER 31, 2019
| Name and Year of Birth | Position with the Trust | Length of Time Served | Principal Occupation(s) During Past 5 Years |
| Officers |
Jessica Chase Born: 1970 | President; Principal Executive Officer | Since 2015 | Director, Apex Fund Services since 2019. Senior Vice President, Atlantic Fund Services 2008-2019. |
Karen Shaw Born: 1972 | Treasurer; Principal Financial Officer | Since 2008 | Senior Vice President, Apex Fund Services since 2019; Senior Vice President, Atlantic Fund Services 2008-2019. |
Zachary Tackett Born: 1988 | Vice President; Secretary and Anti- Money Laundering Compliance Officer | Since 2014 | Counsel, Apex Fund Services since 2019; Counsel, Atlantic Fund Services 2014-2019. |
Michael J. McKeen Born: 1971 | Vice President | Since 2009 | Senior Vice President, Apex Fund Services since 2019; Senior Vice President, Atlantic Fund Services 2008-2019. |
Timothy Bowden Born: 1969 | Vice President | Since 2009 | Manager, Apex Fund Services since 2019; Manager, Atlantic Fund Services 2008-2019. |
Geoffrey Ney Born: 1975 | Vice President | Since 2013 | Manager, Apex Fund Services since 2019; Manager, Atlantic Fund Services 2013-2019. |
Todd Proulx Born: 1978 | Vice President | Since 2013 | Manager, Apex Fund Services since 2019; Manager, Atlantic Fund Services 2013-2019. |
Carlyn Edgar Born: 1963 | Vice President | Since 2008 | Senior Vice President, Apex Fund Services since 2019; Senior Vice President, Atlantic Fund Services 2008-2019; Chief Compliance Officer, 2008-2016. |
Dennis Mason Born: 1967 | Chief Compliance Officer | Since 2016 | Fund Compliance Officer, Apex Fund Services since 2019; Fund Compliance Officer, Atlantic Fund Services 2013-2019. |
THE BEEHIVE FUND
P.O Box 588
Portland, Maine 04112
(866) 684-4915 (toll free)
The report is submitted for the general information of the shareholders of the Fund. It is not authorized for distribution to prospective investors unless preceded or accompanied by an effective prospectus, which includes information regarding the Fund’s risks, objectives, fees and expenses, experience of its management and other information.
Distributor
Foreside Fund Services, LLC
Three Canal Plaza
Suite 100
Portland, Maine 04101
www.foreside.com
237-ANR-1219
ITEM 2. CODE OF ETHICS.
| (a) | As of the end of the period covered by this report, Forum Funds (the “Registrant”) has adopted a code of ethics, which applies to its Principal Executive Officer and Principal Financial Officer (the “Code of Ethics”). |
| (c) | There have been no amendments to the Registrant’s Code of Ethics during the period covered by this report. |
| (d) | There have been no waivers to the Registrant’s Code of Ethics during the period covered by this report. |
(f) (1) A copy of the Code of Ethics is being filed under Item 13(a) hereto.
ITEM 3. AUDIT COMMITTEE FINANCIAL EXPERT.
The Board of Trustees has determined that Mr. Mark Moyer is an "audit committee financial expert" as that term is defined under applicable regulatory guidelines. Mr. Moyer is a non- “interested” Trustee (as defined in Section 2(a)(19) under the Investment Company Act of 1940, as amended (the “Act”)), and serves as Chairman of the Audit Committee.
ITEM 4. PRINCIPAL ACCOUNTANT FEES AND SERVICES.
(a) Audit Fees - The aggregate fees billed for each of the last two fiscal years (the “Reporting Periods”) for professional services rendered by the Registrant’s principal accountant for the audit of the Registrant’s annual financial statements, or services that are normally provided by the principal accountant in connection with the statutory and regulatory filings or engagements for the Reporting Periods, were $44,900 in 2018 and $44,900 in 2019.
(b) Audit-Related Fees – The aggregate fees billed in the Reporting Periods for assurance and related services rendered by the principal accountant that were reasonably related to the performance of the audit of the Registrant’s financial statements and are not reported under paragraph (a) of this Item 4 were $0 in 2018 and $0 in 2019.
(c) Tax Fees - The aggregate fees billed in the Reporting Periods for professional services rendered by the principal accountant to the Registrant for tax compliance, tax advice and tax planning were $9,000 in 2018 and $9,000 in 2019. These services consisted of review or preparation of U.S. federal, state, local and excise tax returns.
(d) All Other Fees - The aggregate fees billed in the Reporting Periods for products and services provided by the principal accountant to the Registrant, other than the services reported in paragraphs (a) through (c) of this Item, were $0 in 2018 and $0 in 2019.
(e) (1) The Audit Committee reviews and approves in advance all audit and “permissible non-audit services” (as that term is defined by the rules and regulations of the Securities and Exchange Commission) to be rendered to a series of the Registrant (each, a “Series”). In addition, the Audit Committee reviews and approves in advance all “permissible non-audit services” to be provided to an investment adviser (not including any sub-adviser) of a Series, or an affiliate of such investment adviser, that is controlling, controlled by or under common control with the investment adviser and provides on-going services to the Registrant (“Affiliate”), by the Series’ principal accountant if the engagement relates directly to the operations and financial reporting of the Series. The Audit Committee considers whether fees paid by a Series’ investment adviser or an Affiliate to the Series’ principal accountant for audit and permissible non-audit services are consistent with the principal accountant’s independence.
(e) (2) No services included in (b) - (d) above were approved pursuant to paragraph (c)(7)(i)(C) of Rule 2-01 of Regulation S-X.
(f) Not applicable
(g) The aggregate non-audit fees billed by the principal accountant for services rendered to the Registrant for the Reporting Periods were $0 in 2018 and $0 in 2019. There were no fees billed in either of the Reporting Periods for non-audit services rendered by the principal accountant to the Registrant’s investment adviser or any Affiliate.
(h) During the Reporting Period, the Registrant's principal accountant provided no non-audit services to the investment advisers or any entity controlling, controlled by or under common control with the investment advisers to the series of the Registrant to which this report relates.
ITEM 5. AUDIT COMMITTEE OF LISTED REGISTRANTS.
Not applicable.
ITEM 6. INVESTMENTS.
| (a) | Included as part of report to shareholders under Item 1. |
ITEM 7. DISCLOSURE OF PROXY VOTING POLICIES AND PROCEDURES FOR CLOSED-END
MANAGEMENT INVESTMENT COMPANIES.
Not applicable.
ITEM 8. PORTFOLIO MANAGERS OF CLOSED-END MANAGEMENT INVESTMENT COMPANIES.
Not applicable.
ITEM 9. PURCHASES OF EQUITY SECURITIES BY CLOSED-END MANAGEMENT INVESTMENT COMPANY AND AFFILIATED PURCHASERS.
Not applicable.
ITEM 10. SUBMISSION OF MATTERS TO A VOTE OF SECURITY HOLDERS
The Registrant does not accept nominees to the board of trustees from shareholders.
ITEM 11. CONTROLS AND PROCEDURES
(a) The Registrant’s Principal Executive Officer and Principal Financial Officer have concluded that the Registrant’s disclosure controls and procedures (as defined in Rule 30a-3(c) under the Investment Company Act of 1940 (the “Act”)) are effective, based on their evaluation of the controls and procedures required by Rule 30a-3(b) under the Act and Rules 13a-15(b) or 15d-15(b) under the Securities Exchange Act of 1934, as of a date within 90 days of the filing date of this report.
(b) There were no changes in the Registrant’s internal control over financial reporting (as defined in
Rule 30a-3(d) under the Act) that occurred during the second fiscal quarter of the period covered by this report that have materially affected, or are reasonably likely to materially affect, the Registrant’s internal control over financial reporting.
ITEM 12. DISCLOSURE OF SECURITIES LENDING ACTIVITIES FOR CLOSED-END MANAGEMENT INVESTMENT COMPANIES.
Not applicable.
ITEM 13. EXHIBITS.
(a)(1) Code of Ethics (Exhibit filed herewith).
(a)(2) Certifications pursuant to Rule 30a-2(a) of the Act, and Section 302 of the Sarbanes-Oxley Act of 2002. (Exhibits filed herewith)
(a)(3) Not applicable.
(b) Certifications pursuant to Rule 30a-2(b) of the Act, and Section 906 of the Sarbanes-Oxley Act of 2002. (Exhibit filed herewith)
SIGNATURES
Pursuant to the requirements of the Securities Exchange Act of 1934 and the Investment Company Act of 1940, the Registrant has duly caused this report to be signed on its behalf by the undersigned, thereunto duly authorized.
Registrant Forum Funds
| By: | /s/ Jessica Chase | |
| | Jessica Chase, Principal Executive Officer | |
| | | |
| Date: | February 14, 2020 | |
Pursuant to the requirements of the Securities Exchange Act of 1934 and the Investment Company Act of 1940, this report has been signed below by the following persons on behalf of the Registrant and in the capacities and on the dates indicated.
| By: | /s/ Jessica Chase | |
| | Jessica Chase, Principal Executive Officer | |
| | | |
| Date: | February 14, 2020 | |
| By: | /s/ Karen Shaw | |
| | Karen Shaw, Principal Financial Officer | |
| | | |
| Date: | February 14, 2020 | |