AUXIER FOCUS FUND
Annual Report
June 30, 2019
Fund Adviser:
Auxier Asset Management LLC
15668 NE Eilers Road
Aurora, Oregon 97002
Toll Free: (877) 3AUXIER or (877) 328-9437
AUXIER FOCUS FUND
A MESSAGE TO OUR SHAREHOLDERS (Unaudited)
JUNE 30, 2019
Market Commentary
The US economy, while slowing, is still benefiting from a strong labor market, a stable service sector and robust consumer spending. Conversely big ticket “goods” producers are suffering from tariffs, a strong dollar and turmoil in the international markets. 39% of S&P 500 earnings in 2018 came from foreign countries (S&P Dow Jones Indices). Consumer facing franchises are generally seeing an improvement in sales trends and pricing. These include leaders in fast-food restaurants, coffee, snacks, beverages, skincare and other necessities. These businesses are reworking product offerings and utilizing technology to speed up service while enhancing the customer experience. Low fuel prices are helping to stimulate travel. This is particularly impactful for millennials who tend to value and spend on “experiences.” We continue to see strong fundamentals for businesses involved with the digital transformation of the economy, although prices for many of these businesses are getting prohibitively expensive.
Housing
The decline in the 30-year mortgage rate to 3.75% has stimulated refinancing activity. However high-end housing across the country has been softer partly due to the pull back of Chinese investment along with the limits on tax deductibility of mortgages over $750,000 and property taxes over $10,000, depending on your tax filing status. The dollar volume of homes purchased by foreigners for the 12 months ending in March was down 36%. First time buyers have been struggling to come up with down payments. Student loan debts nearing $1.6 trillion are impeding the growth of the entry level housing market.
New Technology Can Lead to Pricing
New technology disrupters garner excitement and often nosebleed valuations. A good example is the comparison of two transportation companies Uber and UPS. After 112 years UPS recently had their best quarterly performance in the history of the company. It operates in 220 countries and moves 3% of the global GDP of goods and 6% of US GDP. With profits exceeding $6.5 billion and a well-compensated workforce, it trades for a lower valuation than ride-sharing Uber which is losing $3 billion a year with a temporary workforce of drivers. FedEx is trading at ten times earnings, 40% lower than their historical valuation, over fears that Amazon will overtake them. We estimate it would cost a startup over $110 billion to get up to speed with FedEx which has been diligent in leadership through state-of-the-art logistics technology. In the late 1990s companies with great stories and no cash flow were the rage. E-toys, Webvan food delivery and Pets.com all enjoyed great momentum and sky-high valuations until reality set in and they crashed and burned. Investing comes down to the cash an investment generates not just a story. We aggressively follow industry cycles and those with the most euphoria that are going parabolic tend to be late cycle. Excitement amid a merger frenzy marked the peak in commodities in 2011 after a 118-month boom. Commodities may have finally reached bottom after a painful eight-year correction. At the peak many commodities reached prices over double their cost of production. In farming it is so tough just to cover the cost of production. Today most of the farm sector is in a deep decline with farm incomes down over 50% from their peak while many commodities are trading for less than the cost of production. The odds favor food shortages in the next few years.
Companies in Secular Decline
While we always like a bargain price many companies can appear to be statistically cheap but are actually in secular decline. Take Eastman Kodak, once a dominant blue chip. It totally missed the digital transformation in photographs. We now take over two trillion pictures a year. That is why an investor needs to be a dedicated, investigative researcher to seek out potential technological disruption that can interrupt the compounding of returns. The power of compounded knowledge is also important to surviving and thriving over the long term.
AUXIER FOCUS FUND
A MESSAGE TO OUR SHAREHOLDERS (Unaudited)
JUNE 30, 2019
Healthcare
Numerous health care stocks have lagged the market advance in 2019. Recurring adversarial headlines out of Washington DC have depressed valuations. The negative headlines drown out the exciting innovation that we see taking place that has the potential to cure many chronic diseases. Abbot is making great strides in diabetes and heart valves. Medtronic is combining data analytics and artificial intelligence. Both Alphabet and Apple are making meaningful advances. Merck’s cancer fighting drug Keytruda is making excellent progress with sales gaining over 50% this past quarter. More competition and improved efficiency via technology is needed to drive costs lower. A total government takeover of healthcare could cost $32 trillion (Committee for a Responsible Federal Budget). Socialism means less competition and higher prices. Venezuela’s state-run economic model now has inflation exceeding 10 million percent (CNBC). So much for “safe” sovereign debt. Venezuela was the number one ranked economy in Latin America in 2000.
Central Bank Distortion Negative Interest Rates
Nearly $13 trillion face amount of bonds from outside the US are priced to yield negative interest rates. If you deposit money in a savings account in a German bank you pay the bank interest. It is a form of competitive currency devaluation that gives an export advantage in the global markets. A risk is a prolonged trade/currency war. It is a man-made (central banks) distortion that leads to the misallocation of investments. It is killing European banks. Germany’s largest bank, Deutsche Bank recently dropped to less than one third of book value. Europe has relied heavily on monetary policy and has failed to make the tough policy decisions needed to restructure in order to unleash the potential of a market-based economy.
Hemp as a New Disrupter
The outlawing of hemp in 1937 (due to its relationship with its sister cannabis plant, marijuana) froze the development of the nation’s ability to understand the crop. However, with the passage of the 2018 Farm Bill, hemp was federally legalized. Through recent research, CBD effects on the body are being explored at greater lengths and scientists are finding beneficial uses across a vast array of medical applications. CBD has entered the market rapidly in accordance with recent deregulation and has created an unprecedented number of opportunities for development and investment. Due to the explosion of the hemp industry in a relatively short period of time, the supply chain has proven to be challenging. These bottlenecks are where investments could prove to be the most advantageous. CBD is positioned to eventually overshadow traditional over-the-counter pain relief (such as acetaminophen or ibuprofen). The health and wellness, beauty products, beverage and pet health industry have all championed this emerging hemp market and have benefited from this major introduction. The industrial side of hemp poses a similar number of disruptions as there is an incredible number of products that could soon be replaced by the hemp crop including certain textiles, plastics, building materials and insulation. Levi’s now makes a hemp shirt. Oregon State University, in our back yard, has some of the best research in the country allowing us to gather unrivaled data and insights for identifying attractive investments.
AUXIER FOCUS FUND
A MESSAGE TO OUR SHAREHOLDERS (Unaudited)
JUNE 30, 2019
Performance Update
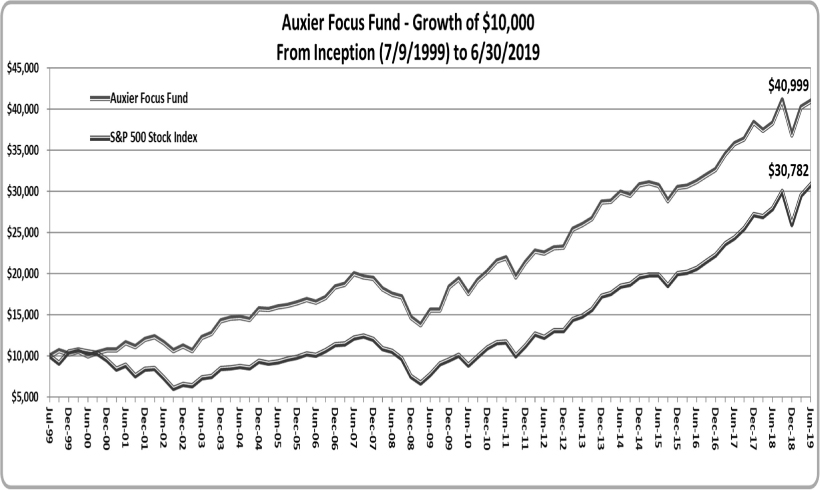
Auxier Focus Fund’s (the “Fund”) Investor Class returned 1.92% in the second quarter vs. 4.30% for the S&P 500 Index and 3.21% for the DJIA. Stocks in the Fund comprised 95% and gained 2.24%. The equity breakdown was 81% domestic and 14% foreign. Health care stocks hurt performance for the year. A hypothetical $10,000 investment in the Fund since inception in July 1999 to June 30, 2019, is now worth $40,999 vs. $30,782 for the S&P 500. The equities in the Auxier Focus Fund have returned over 450% since inception. This was achieved with an average exposure to the market of less than 79% over the entire period.
Contributors to the period: Our outlook on a cross section of portfolio positions with a positive return for the period ended 06/30/2019.
Visa
Visa Inc. saw strong performance in revenues and earnings for the quarter led by continued growth in payments volume, cross-border volume and processed transactions. During the quarter, the company repurchased 14 million shares of common stock using $2 billion of cash on hand. They have $8.3 billion of authorized funds available for further stock repurchases. Management expects revenue growth for the full-year 2019 to be in the low double-digits. Visa recently partnered with Razer to allow their 60 million users to make payments wherever Visa is accepted. This partnership will increase Visa’s reach in Southeast Asia, a region which has a large underserved population of over 438 million. Visa also launched their payment | Auxier Focus Fund – Investor Class Average Annual Total Returns (06/30/2019) Since Inception (07/09/1999) 7.32% 10-year 10.14% 5-year 6.48% 1-year 7.08% 3-month 1.92%
Performance data quoted represents past performance and is no guarantee of future results. Current performance may be lower or higher than the performance data quoted. Investment return and principal value will fluctuate so that an investor's shares, when redeemed, may be worth more or less than original cost. As stated in the current prospectus, the Fund’s Investor Class Share’s annual operating expense ratio (gross) is 1.10%. The Fund’s adviser has contractually agreed to waive a portion of its fee and/or reimburse Fund expenses to limit total annual operating expenses at 0.98%, which is in effect until October 31, 2019. Other share classes may vary. The Fund charges a 2.0% redemption fee on shares redeemed within 180 days of purchase. For the most recent month-end performance, please call (877) 328-9437 or visit the Adviser’s website at www.auxierasset.com. The recent growth rate in the stock market has helped to produce short-term returns that are not typical and may not continue in the future. |
AUXIER FOCUS FUND
A MESSAGE TO OUR SHAREHOLDERS (Unaudited)
JUNE 30, 2019
| Top Holdings on 06/30/2019 | % Assets |
| Mastercard, Inc., Class A | 5.4% |
| UnitedHealth Group, Inc. | 4.2% |
| PepsiCo., Inc. | 3.6% |
| Medtronic PLC | 3.6% |
| Microsoft Corp. | 3.4% |
| Bank of New York Mellon Corp. | 3.3% |
| Johnson & Johnson | 3.1% |
| Philip Morris International | 2.9% |
| Merk & Co., Inc. | 2.7% |
| BP PLC, ADR | 2.6% |
system called Visa B2B Connect to offer seamless and secure cross-border payment processing for businesses.
PepsiCo Inc. (PEP)
PepsiCo is showing strong performance in their snacking and international segments. Shares have increased by 20.0% in the past six months, outperforming the S&P’s increase of 17.2%. The company’s growing snack business has largely offset slight dips in the beverage industry. PepsiCo has instituted a cost savings program that could achieve $1 billion in annual savings through 2023. They expect to generate cash flows of about $9B and return $8B to shareholders in the form of dividends and share repurchases. PepsiCo has cemented itself as one of the best dividend stocks on the market with 47 consecutive years of dividend hikes.
Microsoft Corporation (MSFT)
Microsoft’s revenue increased by 14% for the quarter while earnings increased by 19%. Revenue growth was led by increased demand for Microsoft’s Azure cloud offerings. Microsoft plans to increase their investment in cloud-based systems to continue to shrink the gap between them and Amazon in the cloud service segment. Microsoft has almost doubled its market share in the public cloud infrastructure industry over the last few years. They are now #2 in the cloud industry and well ahead of other competitors. Management is very optimistic about the continued growth of the company providing guidance of double-digit revenue and operating income growth over the next year. Microsoft’s debt is dwarfed by its near $1 trillion market cap. This should give the company the flexibility to continue investments in more growth-oriented projects.
Mastercard Inc. (MA)
Mastercard, the largest holding in the fund, continued its strong performance with another quarter of solid growth. Revenues were up 9% and net earnings were up 25% for the quarter. Revenue was boosted by a 12% increase in global gross dollar volume. Mastercard returned over $2 billion to shareholders in the form of share repurchases and dividends during the quarter. Year-to-date, Mastercard stock has increased by 40% versus a 17% increase in the S&P 500. Mastercard’s underlying infrastructure means that they can continue to increase the number of total transactions they can handle with only a minimal increase in expenses. Mastercard seems likely to benefit from the continued growth in the e-commerce industry which is currently growing five-times as fast as face-to-face transactions (eMarketer).
Detractors to the period: Our outlook on a cross section of portfolio positions with a negative return for the period ended 06/30/19:
Bank of New York Mellon Corp. (BK)
After coming over from Visa in July of 2017, CEO Charles Scharf has worked to transform Bank of New York Mellon just as he did with Visa. Under Scharf Visa nearly tripled in price due particularly to his focus on improving their technology infrastructure and diversifying the company through international expansion. At Bank of New York Mellon Scharf has also focused on diversification and technology. While the diversification has hurt margins in the short-term and the investments in technology have lowered current earnings, we believe that the improvements Scharf has made will pay off in the long run. In the short-term Bank of New York Mellon continues to return capital to their shareholders with a recent 11% dividend increase and a nearly $4 billion share repurchase authorization.
Kroger Co. (KR)
In the second year of their Restock Kroger program, Kroger is continuing to invest in their technology and infrastructure to make good on their goal to “deliver anything, anytime, anywhere.” The results from Kroger’s investments can already be seen as their total sales, excluding fuel and the effect of their sale of their convenience store business, were up 2%. They have a long history of success and are trading at a steep discount of around nine times earnings. Kroger used their $1.4 billion in free cash flow in the quarter to invest in their business and reduce their debt.
AUXIER FOCUS FUND
A MESSAGE TO OUR SHAREHOLDERS (Unaudited)
JUNE 30, 2019
Philip Morris International (PM)
Philip Morris has been facing extreme currency pressure due to the strength of the US dollar. Despite the foreign exchange headwinds, they continue to dominate the international tobacco market with total market share increasing by a point to 28.4%. Their in-market sales were up 1.7% led by strong growth from their IQOS heated tobacco devices which grew by nearly 35%. IQOS has taken off in Japan and is starting to pick up steam across the rest of the globe with the EU and Russia both seeing double-digit growth. Philip Morris has marketed the IQOS devices as a substitute to traditional cigarettes that releases fewer chemicals since the tobacco is not burned. The rapid growth of IQOS is only projected to increase as local governments push this alternative.
Zimmer Biomet Holdings (ZBH)
Zimmer Biomet has faced some fixable issues with their supply chain hampering current operating results. However, they are a low-cost provider with a strong history in hip and knee replacements. Their rapidly growing S.E.T (surgical, sports medicine, extremities and trauma) and Spine & CMF (craniomaxillofacial) divisions leave them well positioned to take advantage of the growing demand for medical devices. The peak demand for hips and knees is 68 years old—just about the average age of the baby boomer today. Zimmer Biomet is planning on using their strong free cash flow generation to further reduce their debt in 2019.
Our primary focus is to take advantage of the power of compounding with businesses and management teams that appear likely to successfully navigate through the most challenging environments. We search for solid businesses and managements, priced right, that can pursue compelling returns over long periods. The explosion of data has contributed to the power of networks and platforms. With network effects businesses can leverage their users with the potential to grow returns with greater scale. By utilizing data analytics and artificial intelligence they are better able to identify customer needs. This is especially true in digital advertising, Facebook, Google Search and YouTube are a few examples. As users increase, the value of the experience or product can increase exponentially.
Shortage of Shares
Supply and demand is still favorable for publicly traded US stocks as buybacks are running close to $950 billion annualized (Standard & Poor’s). Private equity demand has exploded with over 8000 firms armed with over $2 trillion in buying power (Bain & Co.). We favor businesses with high free cash flow yields which private equity buyers seek. Industry mergers are common as well. With investors fear of volatility in public auction markets together with disclosure and regulation we think some of the best odds for success come when dealing with smaller sums of money in the markets where investors can take advantage of the periodic waves of irrational behavior to score bargains not available in the private markets.
Other misperceptions of risk include the safety of utilities and big companies. Recently the largest utility in the country, Pacific Gas and Electric, declared bankruptcy over wildfire liabilities in California. In 2007 Texas Utilities went bankrupt. In 2001 Enron was the largest bankruptcy in history, a year after Fortune magazine featured them as having industry best practices. In 2000 CFO magazine named Enron’s Andrew Fastow CFO of the year. Enron had acquired our local utility Portland General Electric and we saw the rapid buildup of off-balance sheet debt and sold the stock at $80 before it dropped to zero. Overpaying and overborrowing are the recurring sins of capital allocation.
We appreciate your trust.
Jeff Auxier
Fund returns (i) assume the reinvestment of all dividends and capital gain distributions and (ii) would have been lower during the period if certain fees and expenses had not been waived. Performance shown is for the Fund’s Investor Class shares; returns for other share classes will vary. Performance for Investor Class shares for periods prior to December 10, 2004 reflects performance of the applicable share class of Auxier Focus Fund, a series of Unified Series Trust (the “Predecessor Fund”). Prior to January 3, 2003, the Predecessor Fund was a series of Ameriprime Funds. The performance of the Fund’s Investor Class shares for the period prior to December 10, 2004 reflects the expenses of the Predecessor Fund.
The Fund may invest in value and/or growth stocks. Investments in value stocks are subject to risk that their intrinsic value may never be realized and investments in growth stocks may be susceptible to rapid price swings, especially during periods of economic uncertainty. In addition, the Fund may invest in mid-sized companies which generally carry greater risk than is customarily associated with larger companies. Moreover, if the Fund’s portfolio is overweighted in a sector, any negative development affecting
AUXIER FOCUS FUND
A MESSAGE TO OUR SHAREHOLDERS (Unaudited)
JUNE 30, 2019
that sector will have a greater impact on the Fund than a fund that is not overweighted in that sector. An increase in interest rates typically causes a fall in the value of a debt security (Fixed-Income Securities Risk) with corresponding changes to the Fund’s value.
The S&P 500 Index is a broad-based, unmanaged measurement of changes in stock market conditions based on 500 widely held common stocks. One cannot invest directly in an index or average.
The views in this shareholder letter were those of the Fund Manager as of the letter’s publication date and may not reflect his views on the date this letter is first distributed or anytime thereafter. These views are intended to assist readers in understanding the Fund’s investment methodology and do not constitute investment advice.
AUXIER FOCUS FUND
PERFORMANCE CHART AND ANALYSIS (Unaudited)
JUNE 30, 2019
The following chart reflects the change in the value of a hypothetical $10,000 investment in Investor Shares, including reinvested dividends and distributions, in the Auxier Focus Fund (the “Fund”) compared with the performance of the benchmark, the S&P 500 Index (“S&P 500”), over the past ten fiscal years. The S&P 500 is a broad-based measurement of the U.S. stock market based on the performance of 500 widely held large capitalization common stocks. The total return of the Fund's classes includes the maximum sales charge of 5.75% (A Shares only) and operating expenses that reduce returns, while the total return of the S&P 500 does not include the effect of sales charges and expenses. A Shares are subject to a 1.00% contingent deferred sales charge on shares purchased without an initial sales charge and redeemed less than one year after purchase. The total return of the index includes the reinvestment of dividends and income. The total return of the Fund includes operating expenses that reduce returns, while the total return of the index does not include expenses. The Fund is professionally managed, while the index is unmanaged and is not available for investment.
Comparison of Change in Value of a $10,000 Investment
Investor Shares vs. S&P 500 Index

| Average Annual Total Returns Periods Ended June 30, 2019 | One Year | Five Years | Ten Years | Since Inception(1) | ||||
| Investor Shares | 7.08% | 6.48% | 10.14% | 7.32% | ||||
| S&P 500® Index (Since July 9, 1999) | 10.42% | 10.71% | 14.70% | 5.79% | ||||
| A Shares (with sales charge)(2)(3) | 0.66% | 5.03% | 9.38% | 6.95% | ||||
| Institutional Shares(3) | 7.24% | 6.67% | 10.29% | 7.39% |
| (1) | Institutional, A Shares and Investor Shares commenced operations on May 9, 2012, July 8, 2005 and July 9, 1999, respectively. |
| (2) | Due to shareholder redemptions on August 21, 2005, net assets of the class were zero from the close of business on that date until September 22, 2005. Financial information presented for the period August 21, 2005 to September 22, 2005 reflects performance of Investor Shares of the Fund. |
| (3) | For Institutional Shares, performance for the 10-year and since inception periods are blended average annual returns which include the returns of the Investor Shares prior to commencement of operations of the Institutional Shares. For A Shares, performance for the since inception period is a blended average annual return which includes the return of the Investor Shares prior to commencement of operations of the A Shares. |
Performance data quoted represents past performance and is no guarantee of future results. Current performance may be lower or higher than the performance data quoted. Investment return and principal value will fluctuate so that shares, when redeemed, may be worth more or less than original cost. As stated in the Fund’s prospectus, the annual operating expense ratios (gross) for Investor Shares, A Shares and Institutional Shares are 1.10%, 1.44% and 1.10%, respectively. However, the Fund’s Adviser has contractually agreed to waive its fee and/or reimburse Fund expenses to limit Total Annual Fund Operating Expenses After Fee Waiver and/or Expense Reimbursement (excluding all taxes, interest, portfolio transaction expenses, dividend expenses on short sales, and extraordinary expenses) to 0.98%, 1.25% and 0.80% of the Investor Shares, A Shares and Institutional Shares, respectively, through October 31, 2019 (the “Expense Cap”). The Expense Cap may be raised or eliminated only with the consent of the Board of Trustees. The Adviser may be reimbursed by the Fund for fees waived and expenses reimbursed by the Adviser pursuant to the Expense Cap if such payment is made within three years of the fee waiver or expense reimbursement and does not cause the Total Annual Fund Operating Expenses After Fee Waiver and/or Expense Reimbursement to exceed the lesser of (i) the then-current Expense Cap and (ii) the Expense Cap in place at the time the fees/expenses were waived/reimbursed. Total Annual Fund Operating Expenses After Fee Waiver and/or Expense Reimbursement will increase if exclusions from the Expense Cap apply. Shares redeemed or exchanged within 180 days of purchase will be charged a 2.00% redemption fee. The performance table and graph do not reflect the deduction of taxes that a shareholder would pay on Fund distributions or the redemption of Fund shares. Returns greater than one year are annualized. For the most recent month-end performance, please call (877) 328-9437 or visit www.auxierasset.com.
Performance for Investor Shares for periods prior to December 10, 2004, reflects performance and expenses of Auxier Focus Fund, a series of Unified Series Trust (the “Predecessor Fund”). Prior to January 3, 2003, the Predecessor Fund was a series of Ameriprime Funds.
AUXIER FOCUS FUND
SCHEDULE OF INVESTMENTS
JUNE 30, 2019
| Shares | Security Description | Value | ||||||
| Equity Securities - 95.1% | ||||||||
| Common Stock - 95.1% | ||||||||
| Communication Services - 1.9% | ||||||||
| 197,175 | America Movil SAB de CV, ADR | $ | 2,870,868 | |||||
| 1,719 | Cisco Systems, Inc. | 94,081 | ||||||
| 162,738 | Telefonica SA, ADR | 1,349,098 | ||||||
| 6,845 | Viacom, Inc., Class B | 204,460 | ||||||
| 4,518,507 | ||||||||
| Consumer Cyclicals - 1.3% | ||||||||
| 1,241 | Booking Holdings, Inc. (a) | 2,326,515 | ||||||
| 13,675 | DR Horton, Inc. | 589,803 | ||||||
| 2,916,318 | ||||||||
| Consumer Discretionary - 6.7% | ||||||||
| 91,179 | Arcos Dorados Holdings, Inc., Class A | 663,783 | ||||||
| 34,000 | Becle SAB de CV | 53,380 | ||||||
| 51,460 | Comcast Corp., Class A | 2,175,729 | ||||||
| 12,465 | CVS Health Corp. | 679,218 | ||||||
| 112,077 | Discovery, Inc., Class A (a) | 3,440,764 | ||||||
| 4,641 | Discovery, Inc., Class C (a) | 132,036 | ||||||
| 16,250 | General Motors Co. | 626,112 | ||||||
| 169,545 | Lincoln Educational Services Corp. (a) | 391,649 | ||||||
| 18,550 | Lowe's Cos., Inc. | 1,871,880 | ||||||
| 5,756 | McDonald's Corp. | 1,195,291 | ||||||
| 52,302 | Sally Beauty Holdings, Inc. (a) | 697,709 | ||||||
| 1,176 | The Andersons, Inc. | 32,034 | ||||||
| 4,725 | The Home Depot, Inc. | 982,658 | ||||||
| 12,850 | Walmart, Inc. | 1,419,797 | ||||||
| 7,050 | Yum China Holdings, Inc. | 325,710 | ||||||
| 7,050 | Yum! Brands, Inc. | 780,224 | ||||||
| 15,467,974 | ||||||||
| Consumer Staples - 16.7% | ||||||||
| 65,455 | Altria Group, Inc. | 3,099,294 | ||||||
| 34,055 | British American Tobacco PLC, ADR | 1,187,498 | ||||||
| 13,200 | Coca-Cola HBC AG, ADR (a) | 498,960 | ||||||
| 4,135 | Diageo PLC, ADR | 712,543 | ||||||
| 2,214 | Lamb Weston Holdings, Inc. | 140,279 | ||||||
| 50,327 | Molson Coors Brewing Co., Class B | 2,818,312 | ||||||
| 34,800 | Monster Beverage Corp. (a) | 2,221,284 | ||||||
| 63,820 | PepsiCo., Inc. | 8,368,717 | ||||||
| 84,525 | Philip Morris International, Inc. | 6,637,748 | ||||||
| 92,280 | Tesco PLC, ADR | 803,750 | ||||||
| 51,300 | The Coca-Cola Co. | 2,612,196 | ||||||
| 2,845 | The J.M. Smucker Co. | 327,716 | ||||||
| 203,368 | The Kroger Co. | 4,415,119 | ||||||
| 9,025 | The Procter & Gamble Co. | 989,591 | ||||||
| 63,421 | Unilever NV, ADR | 3,850,923 | ||||||
| 38,683,930 | ||||||||
| Energy - 4.2% | ||||||||
| 144,810 | BP PLC, ADR | 6,038,577 | ||||||
| 7,430 | Chevron Corp. | 924,589 | ||||||
| 13,600 | ConocoPhillips | 829,600 | ||||||
| 7,800 | Phillips 66 | 729,612 | ||||||
| 14,415 | Valero Energy Corp. | 1,234,068 | ||||||
| 9,756,446 | ||||||||
| Financials - 23.4% | ||||||||
| 53,260 | Aflac, Inc. | 2,919,181 | ||||||
| 49,445 | American International Group, Inc. | 2,634,430 | ||||||
| 2,480 | Ameriprise Financial, Inc. | 359,997 | ||||||
| 201,699 | Bank of America Corp. | 5,849,271 | ||||||
| 16,545 | Berkshire Hathaway, Inc., Class B (a) | 3,526,898 | ||||||
| 67,374 | Central Pacific Financial Corp. | 2,018,525 | ||||||
| 25,975 | Citigroup, Inc. | 1,819,029 | ||||||
| 5,616 | Colliers International Group, Inc. | 402,218 | ||||||
| 132,268 | Credit Suisse Group AG, ADR | 1,583,248 | ||||||
| Shares | Security Description | Value | ||||||
| Financials - 23.4% (continued) | ||||||||
| 5,616 | FirstService Corp. | $ | 538,687 | |||||
| 63,668 | Franklin Resources, Inc. | 2,215,646 | ||||||
| 3,625 | Legg Mason, Inc. | 138,765 | ||||||
| 2,025 | Marsh & McLennan Cos., Inc. | 201,994 | ||||||
| 47,550 | Mastercard, Inc., Class A | 12,578,401 | ||||||
| 1,100 | PayPal Holdings, Inc. (a) | 125,906 | ||||||
| 171,625 | The Bank of New York Mellon Corp. | 7,577,244 | ||||||
| 18,918 | The Travelers Cos., Inc. | 2,828,619 | ||||||
| 7,350 | U.S. Bancorp | 385,140 | ||||||
| 15,249 | Unum Group | 511,604 | ||||||
| 31,600 | Visa, Inc., Class A | 5,484,180 | ||||||
| 14,350 | Waddell & Reed Financial, Inc., Class A | 239,214 | ||||||
| 4,400 | Wells Fargo & Co. | 208,208 | ||||||
| 54,146,405 | ||||||||
| Health Care - 24.7% | ||||||||
| 44,051 | Abbott Laboratories | 3,704,689 | ||||||
| 2,900 | Alkermes PLC (a) | 65,366 | ||||||
| 4,230 | Allergan PLC | 708,229 | ||||||
| 740 | Amgen, Inc. | 136,367 | ||||||
| 18,731 | Anthem, Inc. | 5,286,076 | ||||||
| 12,200 | Becton Dickinson and Co. | 3,074,522 | ||||||
| 12,190 | Biogen, Inc. (a) | 2,850,875 | ||||||
| 13,490 | Cigna Corp. | 2,125,349 | ||||||
| 51,240 | Johnson & Johnson | 7,136,707 | ||||||
| 84,318 | Medtronic PLC | 8,211,730 | ||||||
| 74,249 | Merck & Co., Inc. | 6,225,779 | ||||||
| 7,282 | Pfizer, Inc. | 315,456 | ||||||
| 22,337 | Quest Diagnostics, Inc. | 2,274,130 | ||||||
| 39,676 | UnitedHealth Group, Inc. | 9,681,341 | ||||||
| 45,400 | Zimmer Biomet Holdings, Inc. | 5,345,396 | ||||||
| 57,142,012 | ||||||||
| Industrials - 4.2% | ||||||||
| 1,240 | Caterpillar, Inc. | 169,000 | ||||||
| 122,841 | Corning, Inc. | 4,082,006 | ||||||
| 3,695 | FedEx Corp. | 606,682 | ||||||
| 18,157 | Gates Industrial Corp. PLC (a) | 207,171 | ||||||
| 88,671 | Manitex International, Inc. (a) | 541,780 | ||||||
| 11,500 | Raytheon Co. | 1,999,620 | ||||||
| 2,780 | The Boeing Co. | 1,011,948 | ||||||
| 11,595 | United Parcel Service, Inc., Class B | 1,197,416 | ||||||
| 9,815,623 | ||||||||
| Information Technology - 8.0% | ||||||||
| 1,742 | Alphabet, Inc., Class A (a) | 1,886,238 | ||||||
| 35,910 | Cerner Corp. | 2,632,203 | ||||||
| 16,675 | Cognizant Technology Solutions Corp., Class A | 1,057,028 | ||||||
| 3,155 | Facebook, Inc., Class A (a) | 608,915 | ||||||
| 57,887 | Microsoft Corp. | 7,754,543 | ||||||
| 82,320 | Oracle Corp. | 4,689,770 | ||||||
| 18,628,697 | ||||||||
| Materials - 3.6% | ||||||||
| 14,225 | Celanese Corp., Class A | 1,533,455 | ||||||
| 28,458 | Corteva, Inc. (a) | 841,503 | ||||||
| 28,458 | Dow, Inc. | 1,403,264 | ||||||
| 28,458 | DuPont de Nemours, Inc. | 2,136,342 | ||||||
| 26,505 | LyondellBasell Industries NV, Class A | 2,282,876 | ||||||
| 4,980 | The Mosaic Co. | 124,649 | ||||||
| 8,322,089 | ||||||||
| Telecommunications - 0.1% | ||||||||
| 22,075 | CenturyLink, Inc. | 259,602 | ||||||
See Notes to Financial Statements.
AUXIER FOCUS FUND
SCHEDULE OF INVESTMENTS
JUNE 30, 2019
| Shares | Security Description | Value | ||||||
| Transportation - 0.3% | ||||||||
| 2,550 | Delta Air Lines, Inc. | $ | 144,713 | |||||
| 3,110 | Union Pacific Corp. | 525,932 | ||||||
| 670,645 | ||||||||
| Total Common Stock (Cost $116,677,416) | 220,328,248 | |||||||
| Total Equity Securities (Cost $116,677,416) | 220,328,248 | |||||||
| Principal | Security Description | Rate | Maturity | Value | |||||||||
| Fixed Income Securities - 3.9% | |||||||||||||
| Corporate Non-Convertible Bonds - 0.8% | |||||||||||||
| Financials - 0.6% | |||||||||||||
| $ | 500,000 | JPMorgan Chase & Co. (callable at 100) (b)(c) | 4.63% | 11/01/22 | 485,135 | ||||||||
| 400,000 | SunTrust Banks, Inc. (callable at 100) (b)(c) | 5.13 | 12/15/27 | 392,880 | |||||||||
| 500,000 | The Goldman Sachs Group, Inc. (callable at 100) (b)(c) | 5.00 | 11/10/22 | 480,760 | |||||||||
| 1,358,775 | |||||||||||||
| Industrials - 0.2% | |||||||||||||
| 450,000 | General Electric Co. (callable at 100) (b)(c) | 5.00 | 01/21/21 | 432,351 | |||||||||
| Total Corporate Non-Convertible Bonds (Cost $1,815,432) | 1,791,126 | ||||||||||||
| U.S. Government & Agency Obligations - 3.1% | |||||||||||||
| U.S. Treasury Securities - 3.1% | |||||||||||||
| 2,000,000 | U.S. Treasury Bill (d) | 2.15 | 07/09/19 | 1,999,122 | |||||||||
| 3,200,000 | U.S. Treasury Bill (d) | 2.14 | 07/16/19 | 3,197,252 | |||||||||
| 2,000,000 | U.S. Treasury Bill (d) | 1.98 | 07/30/19 | 1,996,639 | |||||||||
| Total U.S. Government & Agency Obligations (Cost $7,193,003) | 7,193,013 | ||||||||||||
| Total Fixed Income Securities (Cost $9,008,435) | 8,984,139 | ||||||||||||
| Investments, at value - 99.0% (Cost $125,685,851) | $ | 229,312,387 | |||||||||||
| Other Assets & Liabilities, Net - 1.0% | 2,304,611 | ||||||||||||
| Net Assets - 100.0% | $ | 231,616,998 | |||||||||||
| ADR | American Depositary Receipt |
| PLC | Public Limited Company |
| (a) | Non-income producing security. |
| (b) | Variable rate security, the interest rate of which adjusts periodically based on changes in current interest rates. Rate represented is as of June 30, 2019. |
| (c) | Perpetual maturity security. |
| (d) | Zero coupon bond. Interest rate presented is yield to maturity. |
The following is a summary of the inputs used to value the Fund's investments as of June 30, 2019.
The inputs or methodology used for valuing securities are not necessarily an indication of the risks associated with investing in those securities. For more information on valuation inputs, and their aggregation into the levels used in the table below, please refer to the Security Valuation section in Note 2 of the accompanying Notes to Financial Statements.
| Level 1 | Level 2 | Level 3 | Total | |||||||||||||
| Investments at Value | ||||||||||||||||
| Common Stock | ||||||||||||||||
| Communication Services | $ | 4,518,507 | $ | – | $ | – | $ | 4,518,507 | ||||||||
| Consumer Cyclicals | 2,916,318 | – | – | 2,916,318 | ||||||||||||
| Consumer Discretionary | 15,467,974 | – | – | 15,467,974 | ||||||||||||
| Consumer Staples | 38,683,930 | – | – | 38,683,930 | ||||||||||||
| Energy | 9,756,446 | – | – | 9,756,446 | ||||||||||||
| Financials | 54,146,405 | – | – | 54,146,405 | ||||||||||||
| Health Care | 57,142,012 | – | – | 57,142,012 | ||||||||||||
| Industrials | 9,815,623 | – | – | 9,815,623 | ||||||||||||
| Information Technology | 18,628,697 | – | – | 18,628,697 | ||||||||||||
| Materials | 8,322,089 | – | – | 8,322,089 | ||||||||||||
| Telecommunications | 259,602 | – | – | 259,602 | ||||||||||||
| Transportation | 670,645 | – | – | 670,645 | ||||||||||||
| Corporate Non-Convertible Bonds | – | 1,791,126 | – | 1,791,126 | ||||||||||||
| U.S. Government & Agency Obligations | – | 7,193,013 | – | 7,193,013 | ||||||||||||
| Investments at Value | $ | 220,328,248 | $ | 8,984,139 | $ | – | $ | 229,312,387 | ||||||||
| PORTFOLIO HOLDINGS (Unaudited) | |||
| % of Total Net Assets | |||
| Communication Services | 1.9% | ||
| Consumer Cyclicals | 1.3% | ||
| Consumer Discretionary | 6.7% | ||
| Consumer Staples | 16.7% | ||
| Energy | 4.2% | ||
| Financials | 23.4% | ||
| Health Care | 24.7% | ||
| Industrials | 4.2% | ||
| Information Technology | 8.0% | ||
| Materials | 3.6% | ||
| Telecommunications | 0.1% | ||
| Transportation | 0.3% | ||
| Corporate Non-Convertible Bonds | 0.8% | ||
| U.S. Government & Agency Obligations | 3.1% | ||
| Other Assets & Liabilities, Net | 1.0% | ||
| 100.0% | |||
See Notes to Financial Statements.
AUXIER FOCUS FUND
STATEMENT OF ASSETS AND LIABILITIES
JUNE 30, 2019
| ASSETS | ||||
| Investments, at value (Cost $125,685,851) | $ | 229,312,387 | ||
| Cash | 3,593,798 | |||
| Receivables: | ||||
| Fund shares sold | 291,214 | |||
| Investment securities sold | 395,144 | |||
| Dividends and interest | 315,739 | |||
| Prepaid expenses | 22,537 | |||
| Total Assets | 233,930,819 | |||
| LIABILITIES | ||||
| Payables: | ||||
| Investment securities purchased | 2,099,770 | |||
| Fund shares redeemed | 17,136 | |||
| Accrued Liabilities: | ||||
| Investment Adviser fees | 124,105 | |||
| Trustees’ fees and expenses | 438 | |||
| Fund services fees | 23,935 | |||
| Other expenses | 48,437 | |||
| Total Liabilities | 2,313,821 | |||
| NET ASSETS | $ | 231,616,998 | ||
| COMPONENTS OF NET ASSETS | ||||
| Paid-in capital | $ | 117,106,618 | ||
| Distributable earnings | 114,510,380 | |||
| NET ASSETS | $ | 231,616,998 | ||
| SHARES OF BENEFICIAL INTEREST AT NO PAR VALUE (UNLIMITED SHARES AUTHORIZED) | ||||
| Investor Shares | 6,177,113 | |||
| A Shares | 117,351 | |||
| Institutional Shares | 3,986,891 | |||
| NET ASSET VALUE, OFFERING AND REDEMPTION PRICE PER SHARE* | ||||
| Investor Shares (based on net assets of $137,994,857) | $ | 22.34 | ||
| A Shares (based on net assets of $2,663,671) | $ | 22.70 | ||
| A Shares Maximum Public Offering Price Per Share (net asset value per share/(100%-5.75%)) | $ | 24.08 | ||
| Institutional Shares (based on net assets of $90,958,470) | $ | 22.81 | ||
| * | Shares redeemed or exchanged within 180 days of purchase are charged a 2.00% redemption fee. |
See Notes to Financial Statements.
AUXIER FOCUS FUND
STATEMENT OF OPERATIONS
YEAR ENDED JUNE 30, 2019
| INVESTMENT INCOME | ||||
| Dividend income (Net of foreign withholding taxes of $37,728) | $ | 4,975,676 | ||
| Interest income | 278,452 | |||
| Total Investment Income | 5,254,128 | |||
| EXPENSES | ||||
| Investment Adviser fees | 1,885,545 | |||
| Fund services fees | 317,267 | |||
| Transfer agent fees: | ||||
| Investor Shares | 57,165 | |||
| A Shares | 1,166 | |||
| Institutional Shares | 8,003 | |||
| Distribution fees: | ||||
| A Shares | 7,041 | |||
| Custodian fees | 24,445 | |||
| Registration fees: | ||||
| Investor Shares | 19,028 | |||
| A Shares | 5,533 | |||
| Institutional Shares | 16,550 | |||
| Professional fees | 67,865 | |||
| Trustees' fees and expenses | 10,412 | |||
| Other expenses | 193,410 | |||
| Total Expenses | 2,613,430 | |||
| Fees waived | (439,910 | ) | ||
| Net Expenses | 2,173,520 | |||
| NET INVESTMENT INCOME | 3,080,608 | |||
| NET REALIZED AND UNREALIZED GAIN (LOSS) | ||||
| Net realized gain (loss) on: | ||||
| Investments | 12,107,729 | |||
| Foreign currency transactions | (3 | ) | ||
| Net realized gain | 12,107,726 | |||
| Net change in unrealized appreciation (depreciation) on investments | 580,575 | |||
| NET REALIZED AND UNREALIZED GAIN | 12,688,301 | |||
| INCREASE IN NET ASSETS RESULTING FROM OPERATIONS | $ | 15,768,909 | ||
See Notes to Financial Statements.
AUXIER FOCUS FUND
STATEMENTS OF CHANGES IN NET ASSETS
| For the Year Ended June 30, 2019 | For the Year Ended June 30, 2018 | |||||||||||||||
| OPERATIONS | Shares | Shares | ||||||||||||||
| Net investment income | $ | 3,080,608 | $ | 2,988,968 | ||||||||||||
| Net realized gain | 12,107,726 | 9,308,895 | ||||||||||||||
| Net change in unrealized appreciation (depreciation) | 580,575 | 4,800,356 | ||||||||||||||
| Increase in Net Assets Resulting from Operations | 15,768,909 | 17,098,219 | ||||||||||||||
| DISTRIBUTIONS TO SHAREHOLDERS | ||||||||||||||||
| Investor Shares | (9,536,436 | ) | (9,691,375 | )* | ||||||||||||
| A Shares | (161,105 | ) | (145,404 | )** | ||||||||||||
| Institutional Shares | (4,612,293 | ) | (3,576,708 | )*** | ||||||||||||
| Total Distributions Paid | (14,309,834 | ) | (13,413,487 | ) | ||||||||||||
| CAPITAL SHARE TRANSACTIONS | ||||||||||||||||
| Sale of shares: | ||||||||||||||||
| Investor Shares | 8,398,246 | 380,608 | 12,207,193 | 545,032 | ||||||||||||
| A Shares | 303,403 | 13,720 | 76,206 | 3,206 | ||||||||||||
| Institutional Shares | 22,260,504 | 973,396 | 11,795,228 | 510,411 | ||||||||||||
| Reinvestment of distributions: | ||||||||||||||||
| Investor Shares | 9,152,257 | 438,980 | 9,332,848 | 415,331 | ||||||||||||
| A Shares | 156,607 | 7,387 | 140,941 | 6,189 | ||||||||||||
| Institutional Shares | 4,441,627 | 208,820 | 3,423,369 | 149,776 | ||||||||||||
| Redemption of shares: | ||||||||||||||||
| Investor Shares | (41,202,344 | ) | (1,879,232 | ) | (48,745,464 | ) | (2,169,226 | ) | ||||||||
| A Shares | (598,448 | ) | (27,043 | ) | (283,039 | ) | (11,944 | ) | ||||||||
| Institutional Shares | (8,219,687 | ) | (357,162 | ) | (3,857,324 | ) | (168,252 | ) | ||||||||
| Redemption fees: | ||||||||||||||||
| Investor Shares | 5,173 | – | 3,662 | – | ||||||||||||
| A Shares | 93 | – | 55 | – | ||||||||||||
| Institutional Shares | 2,637 | – | 1,208 | – | ||||||||||||
| Decrease in Net Assets from Capital Share Transactions | (5,299,932 | ) | (240,526 | ) | (15,905,117 | ) | (719,477 | ) | ||||||||
| Decrease in Net Assets | (3,840,857 | ) | (12,220,385 | ) | ||||||||||||
| NET ASSETS | ||||||||||||||||
| Beginning of Year | 235,457,855 | 247,678,240 | ||||||||||||||
| End of Year | $ | 231,616,998 | $ | 235,457,855 | **** | |||||||||||
| * | Distribution was the result of net investment income and net realized gain of $1,989,916 and $7,701,459, respectively, at June 30, 2018. |
| ** | Distribution was the result of net investment income and net realized gain of $22,503 and $122,901, respectively, at June 30, 2018. |
| *** | Distribution was the result of net investment income and net realized gain of $741,116 and $2,835,592, respectively, at June 30, 2018. |
| **** | Includes undistributed net investment income of $1,556,427 at June 30, 2018. The requirement to disclose the corresponding amount was eliminated as of June 30, 2019. |
See Notes to Financial Statements.
AUXIER FOCUS FUND
FINANCIAL HIGHLIGHTS
These financial highlights reflect selected data for a share outstanding throughout each year.
| For the Years Ended June 30, | ||||||||||||||||||||
| 2019 | 2018 | 2017 | 2016 | 2015 | ||||||||||||||||
| INVESTOR SHARES | ||||||||||||||||||||
| NET ASSET VALUE, Beginning of Year | $ | 22.25 | $ | 21.95 | $ | 19.69 | $ | 20.50 | $ | 20.75 | ||||||||||
| INVESTMENT OPERATIONS | ||||||||||||||||||||
| Net investment income (a) | 0.28 | 0.26 | 0.23 | 0.21 | 0.17 | |||||||||||||||
| Net realized and unrealized gain | 1.18 | 1.28 | 2.59 | 0.08 | 0.38 | |||||||||||||||
| Total from Investment Operations | 1.46 | 1.54 | 2.82 | 0.29 | 0.55 | |||||||||||||||
| DISTRIBUTIONS TO SHAREHOLDERS FROM | ||||||||||||||||||||
| Net investment income | (0.30 | ) | (0.25 | ) | (0.23 | ) | (0.20 | ) | (0.20 | ) | ||||||||||
| Net realized gain | (1.07 | ) | (0.99 | ) | (0.33 | ) | (0.90 | ) | (0.60 | ) | ||||||||||
| Total Distributions to Shareholders | (1.37 | ) | (1.24 | ) | (0.56 | ) | (1.10 | ) | (0.80 | ) | ||||||||||
| REDEMPTION FEES(a)(b) | 0.00 | 0.00 | 0.00 | 0.00 | 0.00 | |||||||||||||||
| NET ASSET VALUE, End of Year | $ | 22.34 | $ | 22.25 | $ | 21.95 | $ | 19.69 | $ | 20.50 | ||||||||||
| TOTAL RETURN | 7.08 | % | 6.97 | % | 14.55 | % | 1.58 | % | 2.69 | % | ||||||||||
| RATIOS/SUPPLEMENTARY DATA | ||||||||||||||||||||
| Net Assets at End of Year (000s omitted) | $ | 137,995 | $ | 161,032 | $ | 185,363 | $ | 203,921 | $ | 231,911 | ||||||||||
| Ratios to Average Net Assets: | ||||||||||||||||||||
| Net investment income | 1.25 | % | 1.14 | % | 1.11 | % | 1.10 | % | 0.83 | % | ||||||||||
| Net expenses | 0.98 | % | 0.98 | % | 1.03 | % | 1.14 | % | 1.24 | % | ||||||||||
| Gross expenses (c) | 1.11 | % | 1.10 | % | 1.16 | % | 1.30 | % | 1.27 | % | ||||||||||
| PORTFOLIO TURNOVER RATE | 3 | % | 3 | % | 5 | % | 6 | % | 4 | % | ||||||||||
| (a) | Calculated based on average shares outstanding during each year. |
| (b) | Less than $0.01 per share. |
| (c) | Reflects the expense ratio excluding any waivers and/or reimbursements. |
See Notes to Financial Statements.
AUXIER FOCUS FUND
FINANCIAL HIGHLIGHTS
These financial highlights reflect selected data for a share outstanding throughout each year.
| For the Years Ended June 30, | ||||||||||||||||||||
| 2019 | 2018 | 2017 | 2016 | 2015 | ||||||||||||||||
| A SHARES SHARES | ||||||||||||||||||||
| NET ASSET VALUE, Beginning of Year | $ | 22.56 | $ | 22.23 | $ | 19.90 | $ | 20.64 | $ | 20.85 | ||||||||||
| INVESTMENT OPERATIONS | ||||||||||||||||||||
| Net investment income (a) | 0.22 | 0.20 | 0.19 | 0.19 | 0.18 | |||||||||||||||
| Net realized and unrealized gain | 1.21 | 1.29 | 2.61 | 0.09 | 0.36 | |||||||||||||||
| Total from Investment Operations | 1.43 | 1.49 | 2.80 | 0.28 | 0.54 | |||||||||||||||
| DISTRIBUTIONS TO SHAREHOLDERS FROM | ||||||||||||||||||||
| Net investment income | (0.22 | ) | (0.17 | ) | (0.14 | ) | (0.12 | ) | (0.15 | ) | ||||||||||
| Net realized gain | (1.07 | ) | (0.99 | ) | (0.33 | ) | (0.90 | ) | (0.60 | ) | ||||||||||
| Total Distributions to Shareholders | (1.29 | ) | (1.16 | ) | (0.47 | ) | (1.02 | ) | (0.75 | ) | ||||||||||
| REDEMPTION FEES(a)(b) | 0.00 | 0.00 | 0.00 | 0.00 | 0.00 | |||||||||||||||
| NET ASSET VALUE, End of Year | $ | 22.70 | $ | 22.56 | $ | 22.23 | $ | 19.90 | $ | 20.64 | ||||||||||
| TOTAL RETURN(c) | 6.80 | % | 6.68 | % | 14.28 | % | 1.49 | % | 2.63 | % | ||||||||||
| RATIOS/SUPPLEMENTARY DATA | ||||||||||||||||||||
| Net Assets at End of Year (000s omitted) | $ | 2,664 | $ | 2,782 | $ | 2,797 | $ | 2,698 | $ | 5,541 | ||||||||||
| Ratios to Average Net Assets: | ||||||||||||||||||||
| Net investment income | 0.98 | % | 0.87 | % | 0.91 | % | 0.94 | % | 0.84 | % | ||||||||||
| Net expenses | 1.25 | % | 1.25 | % | 1.25 | % | 1.25 | % | 1.25 | % | ||||||||||
| Gross expenses (d) | 1.53 | % | 1.44 | % | 1.54 | % | 1.61 | % | 1.56 | % | ||||||||||
| PORTFOLIO TURNOVER RATE | 3 | % | 3 | % | 5 | % | 6 | % | 4 | % | ||||||||||
| (a) | Calculated based on average shares outstanding during each year. |
| (b) | Less than $0.01 per share. |
| (c) | Total Return does not include the effect of front end sales charge or contingent deferred sales charge. |
| (d) | Reflects the expense ratio excluding any waivers and/or reimbursements. |
See Notes to Financial Statements.
AUXIER FOCUS FUND
FINANCIAL HIGHLIGHTS
These financial highlights reflect selected data for a share outstanding throughout each year.
| For the Years Ended June 30, | ||||||||||||||||||||
| 2019 | 2018 | 2017 | 2016 | 2015 | ||||||||||||||||
| INSTITUTIONAL SHARES | ||||||||||||||||||||
| NET ASSET VALUE, Beginning of Year | $ | 22.66 | $ | 22.29 | $ | 19.96 | $ | 20.74 | $ | 20.91 | ||||||||||
| INVESTMENT OPERATIONS | ||||||||||||||||||||
| Net investment income (a) | 0.33 | 0.31 | 0.28 | 0.25 | 0.24 | |||||||||||||||
| Net realized and unrealized gain | 1.19 | 1.30 | 2.61 | 0.08 | 0.36 | |||||||||||||||
| Total from Investment Operations | 1.52 | 1.61 | 2.89 | 0.33 | 0.60 | |||||||||||||||
| DISTRIBUTIONS TO SHAREHOLDERS FROM | ||||||||||||||||||||
| Net investment income | (0.30 | ) | (0.25 | ) | (0.23 | ) | (0.21 | ) | (0.17 | ) | ||||||||||
| Net realized gain | (1.07 | ) | (0.99 | ) | (0.33 | ) | (0.90 | ) | (0.60 | ) | ||||||||||
| Total Distributions to Shareholders | (1.37 | ) | (1.24 | ) | (0.56 | ) | (1.11 | ) | (0.77 | ) | ||||||||||
| REDEMPTION FEES(a)(b) | 0.00 | 0.00 | 0.00 | 0.00 | 0.00 | |||||||||||||||
| NET ASSET VALUE, End of Year | $ | 22.81 | $ | 22.66 | $ | 22.29 | $ | 19.96 | $ | 20.74 | ||||||||||
| TOTAL RETURN | 7.24 | % | 7.20 | % | 14.72 | % | 1.74 | % | 2.93 | % | ||||||||||
| RATIOS/SUPPLEMENTARY DATA | ||||||||||||||||||||
| Net Assets at End of Year (000s omitted) | $ | 90,958 | $ | 71,644 | $ | 59,518 | $ | 42,969 | $ | 29,366 | ||||||||||
| Ratios to Average Net Assets: | ||||||||||||||||||||
| Net investment income | 1.43 | % | 1.34 | % | 1.32 | % | 1.27 | % | 1.13 | % | ||||||||||
| Net expenses | 0.80 | % | 0.80 | % | 0.86 | % | 1.00 | % | 1.00 | % | ||||||||||
| Gross expenses (c) | 1.10 | % | 1.10 | % | 1.16 | % | 1.31 | % | 1.36 | % | ||||||||||
| PORTFOLIO TURNOVER RATE | 3 | % | 3 | % | 5 | % | 6 | % | 4 | % | ||||||||||
| (a) | Calculated based on average shares outstanding during each year. |
| (b) | Less than $0.01 per share. |
| (c) | Reflects the expense ratio excluding any waivers and/or reimbursements. |
See Notes to Financial Statements.
AUXIER FOCUS FUND
NOTES TO FINANCIAL STATEMENTS
JUNE 30, 2019
Note 1. Organization
The Auxier Focus Fund (the “Fund”) is a diversified portfolio of Forum Funds (the “Trust”). The Trust is a Delaware statutory trust that is registered as an open-end, management investment company under the Investment Company Act of 1940, as amended (the “Act”). Under its Trust Instrument, the Trust is authorized to issue an unlimited number of the Fund’s shares of beneficial interest without par value.
The Fund currently offers three classes of shares: Investor Shares, A Shares and Institutional Shares. A Shares are offered at net asset value plus a maximum sales charge of 5.75%. A Shares are also subject to contingent deferred sales charge (“CDSC”) of 1.00% on purchases without an initial sales charge and redeemed less than one year after they are purchased. Investor Shares and Institutional Shares are not subject to a sales charge. Investor Shares, A Shares and Institutional Shares commenced operations on July 9, 1999, July 8, 2005 and May 9, 2012, respectively. The Fund’s investment objective is to provide long-term capital appreciation.
Note 2. Summary of Significant Accounting Policies
The Fund is an investment company and follows accounting and reporting guidance under Financial Accounting Standards Board (“FASB”) Accounting Standards Codification (“ASC”) Topic 946, “Financial Services – Investment Companies.” These financial statements are prepared in accordance with accounting principles generally accepted in the United States of America (“GAAP”), which require management to make estimates and assumptions that affect the reported amounts of assets and liabilities, the disclosure of contingent liabilities at the date of the financial statements, and the reported amounts of increases and decreases in net assets from operations during the fiscal year. Actual amounts could differ from those estimates. The following summarizes the significant accounting policies of the Fund:
Security Valuation – Securities are valued at market prices using the last quoted trade or official closing price from the principal exchange where the security is traded, as provided by independent pricing services on each Fund business day. In the absence of a last trade, securities are valued at the mean of the last bid and ask price provided by the pricing service. Debt securities may be valued at prices supplied by a fund’s pricing agent based on broker or dealer supplied valuations or matrix pricing, a method of valuing securities by reference to the value of other securities with similar characteristics such as rating, interest rate and maturity. Shares of non-exchange traded open-end mutual funds are valued at net asset value (“NAV”). Short-term investments that mature in sixty days or less may be valued at amortized cost.
The Fund values its investments at fair value pursuant to procedures adopted by the Trust’s Board of Trustees (the “Board”) if (1) market quotations are not readily available or (2) the Adviser, as defined in Note 4, believes that the values available are unreliable. The Trust’s Valuation Committee, as defined in the Fund’s registration statement, performs certain functions as they relate to the administration and oversight of the Fund’s valuation procedures. Under these procedures, the Valuation Committee convenes on a regular and ad hoc basis to review such investments and considers a number of factors, including valuation methodologies and significant unobservable inputs, when arriving at fair value.
The Valuation Committee may work with the Adviser to provide valuation inputs. In determining fair valuations, inputs may include market-based analytics that may consider related or comparable assets or liabilities, recent transactions, market multiples, book values and other relevant investment information. Adviser inputs may include an income-based approach in which the anticipated future cash flows of the investment are discounted in determining fair value. Discounts may also be applied based on the nature or duration of any restrictions on the disposition of the investments. The Valuation Committee performs regular reviews of valuation methodologies, key inputs and assumptions, disposition analysis and market activity.
Fair valuation is based on subjective factors and, as a result, the fair value price of an investment may differ from the security’s market price and may not be the price at which the asset may be sold. Fair valuation could result in a different NAV than a NAV determined by using market quotes.
GAAP has a three-tier fair value hierarchy. The basis of the tiers is dependent upon the various “inputs” used to determine the value of the Fund’s investments. These inputs are summarized in the three broad levels listed below:
Level 1 - Quoted prices in active markets for identical assets and liabilities.
AUXIER FOCUS FUND
NOTES TO FINANCIAL STATEMENTS
JUNE 30, 2019
Level 2 - Prices determined using significant other observable inputs (including quoted prices for similar securities, interest rates, prepayment speeds, credit risk, etc.). Short-term securities with maturities of sixty days or less are valued at amortized cost, which approximates market value, and are categorized as Level 2 in the hierarchy. Municipal securities, long-term U.S. government obligations and corporate debt securities are valued in accordance with the evaluated price supplied by a pricing service and generally categorized as Level 2 in the hierarchy. Other securities that are categorized as Level 2 in the hierarchy include, but are not limited to, warrants that do not trade on an exchange, securities valued at the mean between the last reported bid and ask quotation and international equity securities valued by an independent third party with adjustments for changes in value between the time of the securities’ respective local market closes and the close of the U.S. market.
Level 3 - Significant unobservable inputs (including the Fund’s own assumptions in determining the fair value of investments).
The aggregate value by input level, as of June 30, 2019, for the Fund’s investments is included at the end of the Fund’s Schedule of Investments.
Security Transactions, Investment Income and Realized Gain and Loss – Investment transactions are accounted for on the trade date. Dividend income is recorded on the ex-dividend date. Foreign dividend income is recorded on the ex-dividend date or as soon as possible after determining the existence of a dividend declaration after exercising reasonable due diligence. Income and capital gains on some foreign securities may be subject to foreign withholding taxes, which are accrued as applicable. Interest income is recorded on an accrual basis. Premium is amortized and discount is accreted using the effective interest method. Identified cost of investments sold is used to determine the gain and loss for both financial statement and federal income tax purposes.
Foreign Currency Translations – Foreign currency amounts are translated into U.S. dollars as follows: (1) assets and liabilities at the rate of exchange at the end of the respective period; and (2) purchases and sales of securities and income and expenses at the rate of exchange prevailing on the dates of such transactions. The portion of the results of operations arising from changes in the exchange rates and the portion due to fluctuations arising from changes in the market prices of securities are not isolated. Such fluctuations are included with the net realized and unrealized gain or loss on investments.
Distributions to Shareholders – The Fund declares any dividends from net investment income and pays them annually. Any net capital gains realized by the Fund are distributed at least annually. Distributions to shareholders are recorded on the ex-dividend date. Distributions are based on amounts calculated in accordance with applicable federal income tax regulations, which may differ from GAAP. These differences are due primarily to differing treatments of income and gain on various investment securities held by the Fund, timing differences and differing characterizations of distributions made by the Fund.
Federal Taxes – The Fund intends to continue to qualify each year as a regulated investment company under Subchapter M of Chapter 1, Subtitle A, of the Internal Revenue Code of 1986, as amended (“Code”), and to distribute all of its taxable income to shareholders. In addition, by distributing in each calendar year substantially all of its net investment income and capital gains, if any, the Fund will not be subject to a federal excise tax. Therefore, no federal income or excise tax provision is required. The Fund files a U.S. federal income and excise tax return as required. The Fund’s federal income tax returns are subject to examination by the Internal Revenue Service for a period of three fiscal years after they are filed. As of June 30, 2019, there are no uncertain tax positions that would require financial statement recognition, de-recognition or disclosure.
Income and Expense Allocation – The Trust accounts separately for the assets, liabilities and operations of each of its investment portfolios. Expenses that are directly attributable to more than one investment portfolio are allocated among the respective investment portfolios in an equitable manner.
The Fund's class-specific expenses are charged to the operations of that class of shares. Income and expenses (other than expenses attributable to a specific class) and realized and unrealized gains or losses on investments are allocated to each class of shares based on the class’ respective net assets to the total net assets of the Fund.
Redemption Fees – A shareholder who redeems or exchanges shares within 180 days of purchase will incur a redemption fee of 2.00% of the current NAV of shares redeemed or exchanged, subject to certain limitations. The fee is charged for the benefit of the remaining shareholders and will be paid to the Fund to help offset transaction costs. The fee is accounted for as an addition to paid-in capital. The Fund reserves the right to modify the terms of or terminate the fee at any time. There are limited exceptions to
AUXIER FOCUS FUND
NOTES TO FINANCIAL STATEMENTS
JUNE 30, 2019
the imposition of the redemption fee. Redemption fees incurred for the Fund, if any, are reflected on the Statements of Changes in Net Assets.
Commitments and Contingencies – In the normal course of business, the Fund enters into contracts that provide general indemnifications by the Fund to the counterparty to the contract. The Fund’s maximum exposure under these arrangements is dependent on future claims that may be made against the Fund and, therefore, cannot be estimated; however, based on experience, the risk of loss from such claims is considered remote. The Fund has determined that none of these arrangements requires disclosure on the Fund’s balance sheet.
Note 3. Cash – Concentration in Uninsured Account
For cash management purposes, the Fund may concentrate cash with the Fund’s custodian. This typically results in cash balances exceeding the Federal Deposit Insurance Corporation (“FDIC”) insurance limits. As of June 30, 2019, the Fund had $3,343,798 at MUFG Union Bank, N.A. that exceeded the FDIC insurance limit.
Note 4. Fees and Expenses
Investment Adviser – Auxier Asset Management LLC (the “Adviser”) is the investment Adviser to the Fund. Pursuant to an investment advisory agreement, the Adviser receives an advisory fee, payable monthly, from the Fund at an annual rate of 0.80% of the Fund’s average daily net assets.
Distribution – Foreside Fund Services, LLC serves as the Fund’s distributor (the “Distributor”). The Distributor is not affiliated with the Adviser or Atlantic Fund Administration, LLC, a wholly owned subsidiary of Apex US Holdings, LLC (d/b/a Apex Fund Services) (“Apex”) or their affiliates. The Fund has adopted a Distribution Plan (the “Plan”) for A Shares of the Fund in accordance with Rule 12b-1 of the Act. Under the Plan, the Fund pays the Distributor and/or any other entity as authorized by the Board a fee of up to 0.25% of the average daily net assets of A Shares. The Distributor has no role in determining the investment policies or which securities are to be purchased or sold by the Trust or its Funds.
For the year ended June 30, 2019, there were $11,242 front-end sales charges assessed on the sale of A Shares and no contingent deferred sales charges were assessed on the sale of A Shares. The Distributor received $1,711 of the total front-end sales charges.
Other Service Providers – Apex provides fund accounting, fund administration, compliance and transfer agency services to the Fund. The fees related to these services are included in Fund services fees within the Statement of Operations. Apex also provides certain shareholder report production and EDGAR conversion and filing services. Apex provides a Principal Executive Officer, a Principal Financial Officer, a Chief Compliance Officer and an Anti-Money Laundering Officer to the Fund, as well as certain additional compliance support functions.
Trustees and Officers – Each Independent Trustee’s annual retainer is $31,000 ($41,000 for the Chairman), and the Audit Committee Chairman receives an additional $2,000 annually. The Trustees and Chairman may receive additional fees for special Board meetings. Each Trustee is also reimbursed for all reasonable out-of-pocket expenses incurred in connection with his or her duties as a Trustee, including travel and related expenses incurred in attending Board meetings. The amount of Trustees’ fees attributable to the Fund is disclosed in the Statement of Operations. Certain officers of the Trust are also officers or employees of the above named service providers, and during their terms of office received no compensation from the Fund.
Note 5. Expense Reimbursement and Fees Waived
The Adviser has contractually agreed to waive its fee and/or reimburse Fund expenses to limit Total Annual Fund Operating Expenses After Fee Waiver and/or Expense Reimbursement (excluding all taxes, interest, portfolio transaction expenses, dividend expenses on short sales, and extraordinary expenses) to 0.98%, 1.25% and 0.80% of the Investor Shares, A Shares and Institutional Shares, respectively, through at least October 31, 2019. These contractual waivers may only be raised or eliminated with consent of the Board. Other fund service providers have voluntarily agreed to waive a portion of their fees. These voluntary reductions may be reduced or eliminated at any time. For the year ended June 30, 2019, the fees waived and expenses reimbursed were as follows:
AUXIER FOCUS FUND
NOTES TO FINANCIAL STATEMENTS
JUNE 30, 2019
| Investment Adviser Fees Waived | Investment Adviser Expenses Reimbursed | Other Waivers | Total Fees Waived and Expenses Reimbursed | |||||||||||
| $ | 207,601 | $ | 144,024 | $ | 88,285 | $ | 439,910 | |||||||
The Adviser may be reimbursed by the Fund for fees waived and expenses reimbursed by the Adviser pursuant to the Expense Cap if such payment is made within three years of the fee waiver or expense reimbursement, and does not cause the Total Annual Fund Operating Expenses After Fee Waiver and/or Expense Reimbursement to exceed the lesser of (i) the then-current expense cap, or (ii) the expense cap in place at the time the fees/expenses were waived/reimbursed. As of June 30, 2019, $1,032,795 is subject to recapture by the Adviser. Other Waivers are not eligible for recoupment.
Note 6. Security Transactions
The cost of purchases and proceeds from sales of investment securities (including maturities), other than short-term investments, during the year ended June 30, 2019, totaled $6,574,028 and $24,083,059.
Note 7. Federal Income Tax
As of June 30, 2019, cost for federal income tax purposes is $125,632,409 and net unrealized appreciation consists of:
| Gross Unrealized Appreciation | $ | 111,540,690 | ||
| Gross Unrealized Depreciation | (7,860,712 | ) | ||
| Net Unrealized Appreciation | $ | 103,679,978 |
Distributions paid during the fiscal years ended as noted were characterized for tax purposes as follows:
| 2019 | 2018 | |||||||
| Ordinary Income | $ | 3,201,085 | $ | 2,986,907 | ||||
| Long-Term Capital Gain | 11,108,749 | 10,426,580 | ||||||
| $ | 14,309,834 | $ | 13,413,487 | |||||
As of June 30, 2019, distributable earnings (accumulated loss) on a tax basis were as follows:
| Undistributed Ordinary Income | $ | 1,458,951 | ||
| Undistributed Long-Term Gain | 9,371,451 | |||
| Unrealized Appreciation | 103,679,978 | |||
| Total | $ | 114,510,380 |
The difference between components of distributable earnings on a tax basis and the amounts reflected in the Statement of Assets and Liabilities are primarily due to wash sales and equity return of capital.
Note 8. Recent Accounting Pronouncements
In August 2018, the Financial Accounting Standards Board (“FASB”) issued Accounting Standards Update No. 2018-13 “Fair Value Measurement (Topic 820): Disclosure Framework – Changes to the Disclosure Requirements for Fair Value Measurement” (“ASU 2018-13”) which includes amendments intended to improve the effectiveness of disclosures in the notes to financial statements. For example, ASU 2018-13 includes additional disclosures regarding the range and weighted average of significant unobservable inputs used to develop Level 3 fair value measurements, and clarifications to the narrative description of measurement uncertainty disclosures. ASU 2018-13 is effective for interim and annual periods beginning after December 15, 2019. Early adoption is permitted and the Fund has adopted ASU 2018-13 within these financial statements.
In September 2018, the Securities and Exchange Commission released Final Rule 33-10532 captioned “Disclosure Update and Simplification,” which includes: (i) an amendment to require presentation of the total, rather than the components, of distributable earnings on the Statement of Assets and Liabilities; and (ii) an amendment to require presentation of the total, rather than the components, of distributions to shareholders, except for tax return of capital distributions, on the Statements of Changes in Net Assets. The amendments also removed the requirement for parenthetical disclosure of undistributed net investment income on the
AUXIER FOCUS FUND
NOTES TO FINANCIAL STATEMENTS
JUNE 30, 2019
Statements of Changes in Net Assets. These changes were effective November 5, 2018. These amendments are reflected in the Fund's financial statements for the year ended June 30, 2019.
Note 9. Subsequent Events
Subsequent events occurring after the date of this report through the date these financial statements were issued have been evaluated for potential impact, and the Fund has had no such events.
REPORT OF INDEPENDENT REGISTERED PUBLIC ACCOUNTING FIRM
To the Board of Trustees of Forum Funds
and the Shareholders of Auxier Focus Fund
Opinion on the Financial Statements
We have audited the accompanying statement of assets and liabilities of Auxier Focus Fund, a series of shares of beneficial interest in Forum Funds (the “Fund”), including the schedule of investments, as of June 30, 2019, and the related statement of operations for the year then ended, the statements of changes in net assets for each of the years in the two-year period then ended and the financial highlights for each of the years in the five-year period then ended, and the related notes (collectively referred to as the “financial statements”). In our opinion, the financial statements present fairly, in all material respects, the financial position of the Fund as of June 30, 2019, and the results of its operations for the year then ended, the changes in its net assets for each of the years in the two-year period then ended and its financial highlights for each of the years in the five-year period then ended, in conformity with accounting principles generally accepted in the United States of America.
Basis for Opinion
These financial statements are the responsibility of the Fund’s management. Our responsibility is to express an opinion on the Fund’s financial statements based on our audits. We are a public accounting firm registered with the Public Company Accounting Oversight Board (United States) (“PCAOB”) and are required to be independent with respect to the Fund in accordance with the U.S. federal securities law and the applicable rules and regulations of the Securities and Exchange Commission and the PCAOB.
We conducted our audits in accordance with the standards of the PCAOB. Those standards require that we plan and perform the audits to obtain reasonable assurance about whether the financial statements are free of material misstatement, whether due to error or fraud. The Fund is not required to have, nor were we engaged to perform, an audit of its internal control over financial reporting. As part of our audits we are required to obtain an understanding of internal control over financial reporting but not for the purpose of expressing an opinion on the effectiveness of the Fund’s internal control over financial reporting. Accordingly, we express no such opinion.
Our audits included performing procedures to assess the risk of material misstatement of those financial statements, whether due to error or fraud, and performing procedures that respond to those risks. Such procedures included examining, on a test basis, evidence regarding the amounts and disclosures in the financial statements. Our procedures included confirmation of securities owned as of June 30, 2019 by correspondence with the custodian and brokers, or by other appropriate auditing procedures where replies from brokers were not received. Our audits also included evaluating the accounting principles used and significant estimates made by management, as well as evaluating the overall presentation of the financial statements. We believe that our audits provide a reasonable basis for our opinion.

BBD, LLP
Philadelphia, Pennsylvania
August 26, 2019
AUXIER FOCUS FUND
ADDITIONAL INFORMATION (Unaudited)
JUNE 30, 2019
Proxy Voting Information
A description of the policies and procedures that the Fund uses to determine how to vote proxies relating to securities held in the Fund’s portfolio is available, without charge and upon request, by calling (877) 328-9437 and on the SEC’s website at www.sec.gov. The Fund’s proxy voting record for the most recent twelve-month period ended June 30 is available, without charge and upon request, by calling (877) 328-9437 and on the SEC’s website at www.sec.gov.
Availability of Quarterly Portfolio Schedules
The Fund files its complete schedule of portfolio holdings with the SEC for the first and third quarters of each fiscal year on Form N-Q. These filings are available, without charge and upon request on the SEC’s website at www.sec.gov or may be reviewed and copied at the SEC’s Public Reference Room in Washington, D.C. Information on the operation of the Public Reference Room may be obtained by calling (800) SEC-0330.
Shareholder Expense Example
As a shareholder of the Fund, you incur two types of costs: (1) transaction costs, including sales charges (loads) on purchase payments on certain classes, redemption fees, exchange fees and CDSC fees, and (2) ongoing costs, including management fees, 12b-1 fees, and other Fund expenses. This example is intended to help you understand your ongoing costs (in dollars) of investing in the Fund, and to compare these costs with the ongoing costs of investing in other mutual funds.
The example is based on an investment of $1,000 invested at the beginning of the period and held for the entire period from January 1, 2019 through June 30, 2019.
Actual Expenses – The first line of the table below provides information about actual account values and actual expenses. You may use the information in this line, together with the amount you invested, to estimate the expenses that you paid over the period. Simply divide your account value by $1,000 (for example, an $8,600 account value divided by $1,000 = 8.6), then multiply the result by the number in the first line under the heading entitled “Expenses Paid During Period” to estimate the expenses you paid on your account during the period.
Hypothetical Example for Comparison Purposes – The second line under each share class of the table below provides information about hypothetical account values and hypothetical expenses based on the Fund’s actual expense ratio and an assumed rate of return of 5% per year before expenses, which is not the Fund’s actual return. The hypothetical account values and expenses may not be used to estimate the actual ending account balance or expenses you paid for the period. You may use this information to compare the ongoing costs of investing in the Fund and other funds. To do so, compare this 5% hypothetical example with the 5% hypothetical examples that appear in the shareholder reports of other funds.
Please note that the expenses shown in the table are meant to highlight your ongoing costs only and do not reflect any transactional costs, such as sales charges (loads) on purchase payments on certain classes, redemption fees, exchange fees, and CDSC fees. Therefore, the second line of the table is useful in comparing ongoing costs only and will not help you determine the relative total costs of owning different funds. In addition, if these transactional costs were included, your costs would have been higher.
| Beginning Account Value January 1, 2019 | Ending Account Value June 30, 2019 | Expenses Paid During Period* | Annualized Expense Ratio* | |||||||||||||
| Investor Shares | ||||||||||||||||
| Actual | $ | 1,000.00 | $ | 1,112.55 | $ | 5.13 | 0.98 | % | ||||||||
| Hypothetical (5% return before expenses) | $ | 1,000.00 | $ | 1,019.93 | $ | 4.91 | 0.98 | % | ||||||||
| A Shares | ||||||||||||||||
| Actual | $ | 1,000.00 | $ | 1,111.12 | $ | 6.54 | 1.25 | % | ||||||||
| Hypothetical (5% return before expenses) | $ | 1,000.00 | $ | 1,018.60 | $ | 6.26 | 1.25 | % | ||||||||
AUXIER FOCUS FUND
ADDITIONAL INFORMATION (Unaudited)
JUNE 30, 2019
| Beginning Account Value January 1, 2019 | Ending Account Value June 30, 2019 | Expenses Paid During Period* | Annualized Expense Ratio* | |||||||||||||
| Institutional Shares | ||||||||||||||||
| Actual | $ | 1,000.00 | $ | 1,113.22 | $ | 4.19 | 0.80 | % | ||||||||
| Hypothetical (5% return before expenses) | $ | 1,000.00 | $ | 1,020.83 | $ | 4.01 | 0.80 | % | ||||||||
| * | Expenses are equal to the Fund’s annualized expense ratio multiplied by the average account value over the period, multiplied by the number of days in the most recent fiscal half-year (181) divided by 365 to reflect the half-year period. |
Federal Tax Status of Dividends Declared during the Fiscal Year
For federal income tax purposes, dividends from short-term capital gains are classified as ordinary income. The Fund designates 100.00% of its income dividend distributed as qualifying for the corporate dividends-received deduction (DRD) and 100.00% for the qualified dividend rate (QDI) as defined in Section 1(h)(11) of the Code. The Fund also designates 4.18% of its income dividends as qualified interest income exempt from U.S. tax for foreign shareholders (QII).
Trustees and Officers of the Trust
The Board is responsible for oversight of the management of the Trust’s business affairs and of the exercise of all the Trust’s powers except those reserved for the shareholders. The following table provides information about each Trustee and certain officers of the Trust. Each Trustee and officer holds office until the person resigns, is removed, or is replaced. Unless otherwise noted, the persons have held their principal occupations for more than five years. The address for all Trustees and officers is Three Canal Plaza, Suite 600, Portland, Maine 04101. The Fund’s Statement of Additional Information includes additional information about the Trustees and is available, without charge and upon request, by calling (877) 328-9437.
AUXIER FOCUS FUND
ADDITIONAL INFORMATION (Unaudited)
JUNE 30, 2019
| Name and Year of Birth | Position with the Trust | Length of Time Served | Principal Occupation(s) During Past Five Years | Number of Series in Fund Complex Overseen By Trustee | Other Directorships Held By Trustee During Past Five Years |
| Independent Trustees | |||||
David Tucker Born: 1958 | Trustee; Chairman of the Board | Since 2011 and Chairman since 2018 | Director, Blue Sky Experience (a charitable endeavor) since 2008; Senior Vice President & General Counsel, American Century Companies (an investment management firm) 1998- 2008. | 1 | Trustee, Forum Funds II, Forum ETF Trust and U.S. Global Investors Funds |
Mark D. Moyer Born: 1959 | Trustee | Since 2018 | Chief Financial Officer, Freedom House (a NGO advocating political freedom and democracy) since 2017; independent consultant providing interim CFO services, principally to non-profit organizations, 2011-2017; Chief Financial Officer, Institute of International Education (a NGO administering international educational exchange programs), 2008-2011; Chief Financial Officer and Chief Restructuring Officer, Ziff Davis Media Inc. (an integrated media company), 2005-2008; Adjunct Professor of Accounting, Fairfield University from 2009-2012. | 1 | Trustee, Forum Funds II, Forum ETF Trust and U.S. Global Investors Funds |
Jennifer Brown-Strabley Born: 1964 | Trustee | Since 2018 | Principal, Portland Global Advisors (a registered investment adviser), 1996- 2010. | 1 | Trustee, Forum Funds II, Forum ETF Trust and U.S. Global Investors Funds |
| Interested Trustees | |||||
Stacey E. Hong(1) Born: 1966 | Trustee | Since 2018 | Director, Apex since 2008. | 1 | Trustee, Forum Funds II and U.S. Global Investors Funds |
Jessica Chase(1) Born: 1970 | Trustee | Since 2018 | Director, Apex since 2008. | 1 | None |
| (1) | Stacey E. Hong is currently treated as an interested person of the Trust, as defined in the 1940 Act, due to his affiliation with Apex. Jessica Chase is currently treated as an interested person of the Trust, as defined in the 1940 Act, due to her affiliation with Apex and her role as President of the Trust. |
AUXIER FOCUS FUND
ADDITIONAL INFORMATION (Unaudited)
JUNE 30, 2019
| Name and Year of Birth | Position with the Trust | Length of Time Served | Principal Occupation(s) During Past 5 Years |
| Officers | |||
Jessica Chase Born: 1970 | President; Principal Executive Officer | Since 2015 | Director, Apex since 2008. |
Karen Shaw Born: 1972 | Treasurer; Principal Financial Officer | Since 2008 | Senior Vice President, Apex since 2008. |
Zachary Tackett Born: 1988 | Vice President; Secretary and Anti-Money Laundering Compliance Officer | Since 2014 | Counsel, Apex since 2014. |
Michael J. McKeen Born: 1971 | Vice President | Since 2009 | Senior Vice President, Apex since 2008. |
Timothy Bowden Born: 1969 | Vice President | Since 2009 | Manager, Apex since 2008. |
Geoffrey Ney Born: 1975 | Vice President | Since 2013 | Manager, Apex since 2013. |
Todd Proulx Born: 1978 | Vice President | Since 2013 | Manager, Apex since 2013. |
Carlyn Edgar Born: 1963 | Vice President | Since 2008 | Senior Vice President, Apex since 2008; Chief Compliance Officer, 2008-2016. |
Dennis Mason Born: 1967 | Chief Compliance Officer | Since 2016 | Fund Compliance Officer, Apex since 2013. |
AUXIER FOCUS FUND
FOR MORE INFORMATION
P.O. Box 588
Portland, Maine 04112
(877) 3AUXIER
(877) 328-9437
INVESTMENT ADVISER
Auxier Asset Management LLC
15668 NE Eilers Road
Aurora, Oregon 97002
TRANSFER AGENT
Apex Fund Services
P.O. Box 588
Portland, Maine 04112
www.apexfundservices.com
DISTRIBUTOR
Foreside Fund Services, LLC
Three Canal Plaza, Suite 100
Portland, Maine 04101
www.foreside.com
This report is submitted for the general information of the shareholders of the Fund. It is not authorized for distribution to prospective investors unless preceded or accompanied by an effective prospectus, which includes information regarding the Fund’s risks, objectives, fees and expenses, experience of its management, and other information.
204-ANR-0619
 |
| ANNUAL REPORT | |
| JUNE 30, 2019 |
Beginning on January 2021, as permitted by regulations adopted by the Securities and Exchange Commission, paper copies of the Funds’ shareholder reports will no longer be sent by mail, unless you specifically request paper copies of the reports from the Funds or from your financial intermediary, such as a broker-dealer or bank. Instead, the reports will be made available on a website, and you will be notified by mail each time a report is posted and provided with a website link to access the report.
If you already elected to receive shareholder reports electronically, you will not be affected by this change and you need not take any action. You may elect to receive shareholder reports and other communications from the Funds or your financial intermediary electronically by contacting the Funds at (866) 233-3368, dfdent.ta@ apexfs.com, or by contacting your financial intermediary directly.
You may elect to receive all future reports in paper free of charge. You can inform the Funds or your financial intermediary that you wish to continue receiving paper copies of your shareholder reports by contacting the Funds at (866) 233-3368, dfdent.ta@apexfs.com, or by contacting your financial intermediary directly. Your election to receive reports in paper will apply to all funds held with DF Dent Growth Funds.
 |
DF DENT GROWTH FUNDS
TABLE OF CONTENTS
JUNE 30, 2019
| DF Dent Premier Growth Fund | |
| A Message to Our Shareholders (Unaudited) | 1 |
| Management Discussion of Fund Performance (Unaudited) | 9 |
| Performance Chart and Analysis (Unaudited) | 15 |
| Schedule of Investments | 16 |
| Statement of Assets and Liabilities | 18 |
| Statement of Operations | 19 |
| Statements of Changes in Net Assets | 20 |
| Financial Highlights | 21 |
| DF Dent Midcap Growth Fund | |
| A Message to Our Shareholders (Unaudited) | 22 |
| Performance Chart and Analysis (Unaudited) | 29 |
| Schedule of Investments | 31 |
| Statement of Assets and Liabilities | 33 |
| Statement of Operations | 34 |
| Statements of Changes in Net Assets | 35 |
| Financial Highlights | 36 |
| DF Dent Small Cap Growth Fund | |
| A Message to Our Shareholders (Unaudited) | 38 |
| Performance Chart and Analysis (Unaudited) | 44 |
| Schedule of Investments | 46 |
| Statement of Assets and Liabilities | 48 |
| Statement of Operations | 49 |
| Statements of Changes in Net Assets | 50 |
| Financial Highlights | 51 |
| DF Dent Growth Funds | |
| Notes to Financial Statements | 53 |
| Report of Independent Registered Public Accounting Firm | 60 |
| Additional Information (Unaudited) | 62 |
DF DENT PREMIER GROWTH FUND
A MESSAGE TO OUR SHAREHOLDERS (Unaudited)
JUNE 30, 2019
Dear Fellow Shareholders,
We are pleased to report that each of the three DF Dent Funds returned better than 30% for the first six months of 2019 and exceeded their respective benchmarks as indicated below. The DF Dent Premier Growth Fund was mentioned in the July 8th edition of Barron’s in an article titled “The Best Mutual Funds You’ve Never Heard Of.” In addition, the DF Dent Midcap Growth Fund was named to the Kiplinger 25 in May 2019. This unsolicited media attention has resulted in positive cash flows into the Funds.
Performance (for periods ending 6/30/2019)
| DF Dent Premier Growth Fund | DF Dent Midcap Growth Fund Institutional Shares1 | DF Dent Small Cap Growth Fund Institutional Shares1 | ||||||||||
| Benchmark | S&P 500 Index | Russell Midcap Growth Index | Russell 2000 Growth Index | |||||||||
| 6 Months | ||||||||||||
| Fund | + | 31.63% | + | 31.50% | + | 30.37% | ||||||
| Benchmark | + | 18.54% | + | 26.08% | + | 20.36% | ||||||
| Fund vs Benchmark | + | 13.09% | + | 5.42% | + | 10.01% | ||||||
| 12 Months | ||||||||||||
| Fund | + | 21.14% | + | 20.45% | + | 15.20% | ||||||
| Benchmark | + | 10.42% | + | 13.94% | - | 0.49% | ||||||
| Fund vs Benchmark | + | 10.72% | + | 6.51% | + | 15.69% | ||||||
| 3Years | ||||||||||||
| Fund | + | 22.23% | + | 20.46% | + | 16.99% | ||||||
| Benchmark | + | 14.19% | + | 16.49% | + | 14.69% | ||||||
| Fund vs Benchmark | + | 8.04% | + | 3.97% | + | 2.30% | ||||||
| 5 Years | ||||||||||||
| Fund | + | 14.12% | + | 13.39% | + | 11.51% | ||||||
| Benchmark | + | 10.71% | + | 11.10% | + | 8.63% | ||||||
| Fund vs Benchmark | + | 3.41% | + | 2.29% | + | 2.88% | ||||||
| 10 Years | ||||||||||||
| Fund | + | 16.56% | N/A | N/A | ||||||||
| Benchmark | + | 14.70% | N/A | N/A | ||||||||
| Fund vs Benchmark | + | 1.86% | N/A | N/A | ||||||||
| Since Inception | ||||||||||||
| Fund | + | 9.81% | + | 14.71% | + | 11.74% | ||||||
| Benchmark | + | 7.24% | + | 12.16% | + | 9.27% | ||||||
| Fund vs Benchmark | + | 2.57% | + | 2.55% | + | 2.47% | ||||||
| Cumulative Since Inception | ||||||||||||
| Fund | + | 436.35% | + | 199.83% | + | 87.40% | ||||||
| Benchmark | + | 250.69% | + | 150.42% | + | 65.17% | ||||||
| Fund vs Benchmark | + | 185.66% | + | 49.41% | + | 22.23% | ||||||
| Inception Date | 07/16/2001 | 07/01/2011 | 11/01/2013 | |||||||||
N/A- Periods which exceed the life of the particular fund.
| 1 | Institutional Shares commenced operations on November 29, 2017. Performance for the three year, five year and since inception periods are a blended average annual return, which include the returns of the Investor |
| DF DENT GROWTH FUNDS |
DF DENT PREMIER GROWTH FUND
A MESSAGE TO OUR SHAREHOLDERS (Unaudited)
JUNE 30, 2019
Shares prior to the commencement of the Institutional Shares. Cumulative performance reflects a blended return, too.
Performance data quoted represents past performance and is no guarantee of future results. Current performance may be lower or higher than the performance data quoted. Investment return and principal value will fluctuate so that an investor’s shares, when redeemed, may be worth more or less than original cost. For the most recent month-end performance, please call (866) 233-3368. As stated in the current prospectus, the DF Dent Premier Growth Fund’s annual operating expense ratio (gross) is 1.22%. However, D.F. Dent and Company (the Funds’ “Adviser”) has contractually agreed to waive a portion of its fees and/or reimburse Fund expenses to limit Total Annual Fund Operating Expenses After Fee Waiver and/or Expense Reimbursement (excluding all taxes, interest, portfolio transaction expenses, and extraordinary expenses) (net) to 1.10% on the first $150 million in Fund net assets. This agreement is in effect through October 31, 2019. As stated in the current prospectus, the DF Dent Midcap Growth Fund’s annual operating expense ratio (gross) is 1.31% and 1.27% for the Investor Shares and Institutional Shares, respectively. However, the Adviser has contractually agreed to waive a portion of its fees and/or reimburse Fund expenses to limit Total Annual Fund Operating Expenses After Fee Waiver and/or Expense Reimbursement (excluding all taxes, interest, portfolio transaction expenses, and extraordinary expenses) (net) of Investor Shares and Institutional Shares to 0.98% and 0.85%, respectively, through October 31, 2019. As stated in the current prospectus, the DF Dent Small Cap Growth Fund’s annual operating expense ratio (gross) is 3.09% and 2.91% for the Investor Shares and Institutional Shares, respectively. However, the Adviser has contractually agreed to waive a portion of its fees and/or reimburse Fund expenses to limit Total Annual Fund Operating Expenses After Fee Waiver and/or Expense Reimbursement (excluding all taxes, interest, portfolio transaction expenses, and extraordinary expenses) (net) of Investor Shares and Institutional Shares to 1.05% and 0.95%, respectively, through October 31, 2019. These expense caps may be changed or eliminated prior to their expiration date only with the consent of the Board of Trustees. Both the DF Dent Midcap Growth Fund and DF Dent Small Cap Growth Fund charge a 2.00% redemption fee on shares redeemed within 60 days of purchase. Fund performance returns shown do not reflect redemption fees; if reflected, the returns would have been lower. Returns greater than one year are annualized, except cumulative returns.
The DF Dent Premier Growth Fund’s (the “Fund”) return for the fiscal year ending June 30, 2019 of +21.14% exceeded the S&P 500’s (the “Index”) return of +10.42% by +10.72%. In the 18 years since inception, your Fund’s return has exceeded the Index in 13 years for a 722 “Batting Average” (13 years exceeding the index/ 18 year history = .722). Your Fund has accomplished returns in excess of 20% in seven of these 18 fiscal years. As can be observed above, the past six months have been particularly strong for the Fund versus the Index. Prior to this recent fiscal year, many of your Fund’s companies made meaningful investments in operations and market expansion at the expense of quarterly earnings comparisons. These investments bore fruit for many portfolio companies in the past year.
While exceeding the Index by 2.57% annually since inception might not seem like very much, over the 18 year history that excess annual return compounds out to 185.66% more return than the Index. With the reinvestment of all capital gain dividends an investment at $10 per share at your Fund’s inception in 2001 would have grown to $53.63 on June 30, 2019 versus $35.07 for the Index. It could be coincidental, but each of the three Funds has exceeded its respective benchmark by around 2.5% annually since their inceptions.
| DF DENT GROWTH FUNDS |
DF DENT PREMIER GROWTH FUND
A MESSAGE TO OUR SHAREHOLDERS (Unaudited)
JUNE 30, 2019
DF Dent Premier Growth Fund within mutual fund crosscurrents
I commented in last year’s Annual Report that the prior five years included a couple of years (2014 and 2016) when investors poured large amounts of money into index funds, with those funds indexed to the S&P 500 being most popular. Three years ago, when your Fund underperformed the Index for its fiscal year ending 06/30/2016, I commented that the heavy cash flows into indexed mutual funds had become a “crowded trade.”
As reported in the 2019 Investment Company Institute Fact Book, in the years from 2009 through 2018 index mutual funds and ETFs received $1.6 trillion of net inflows while actively managed domestic mutual funds experienced net outflows of $1.4 trillion. The performance from this cash flow into indexed vehicles became a self-fulfilling phenomenon as that cash flow drove up the prices of index holdings. That trend peaked in 2016 when domestic index mutual funds’ net inflows were $85 billion declining to net inflows of $70 billion in 2017 and $58 billion in 2018, still heavy net inflows. During the past three years, domestic Exchange-Traded Funds (ETFs) experienced an average annual net issuance of $355 billion. These flows into domestic index mutual funds and ETFs averaged a combined $426 billion annually and came largely at the expense of U.S. domestic actively managed mutual funds which experienced net outflows of $179 billion and $191 billion in 2017 and 2018 respectively.
What does all of this mean for shareholders? Your Fund was not exempt from redemptions during that period and experienced net outflows averaging $16.4 million in the three fiscal years from June 30, 2016 through June 30, 2018 while outperforming the Index by +1.94% annually in that period. However, your Fund experienced a net inflow of $3,696,719 in the fiscal year ending June 30, 2019. We thank our loyal shareholders for their steadfast confidence during this period.
Low cost index funds and ETFs surely have a place for many investors, and all investors in the aggregate should have market performance minus expenses because they are the market, but individual funds can outperform the market over time as your Fund has over the past 18 years. That “crowded trade” mentioned three years ago has only become more crowded, and that massive buildup concentrated in passive vehicles could be tested in the next bear market when so many elephants head for the exit door at the same time. We are happy not to be in that crowded room.
Expense Ratio Management
Your Fund’s Adviser has again agreed to maintain your Fund’s expense ratio at a net 1.10% on the first $150 million of net assets and 0.90% on net assets exceeding $150 million through October 31, 2019 by reimbursing expenses and waiving management fees. With total net assets of $212 million as of June 30, 2019, $62 million exceeds the $150 million break point and carries the lower incremental expense ratio of 0.90%. The median expense ratio for growth equity mutual funds was 1.10% in 2018 as reported in the ICI 2019 Fact Book (Figure 6.5). The record of expense reimbursement and management fee waivers for the first 18 years of your Fund is as follows:
| DF DENT GROWTH FUNDS |
DF DENT PREMIER GROWTH FUND
A MESSAGE TO OUR SHAREHOLDERS (Unaudited)
JUNE 30, 2019
| Year Ending | Expense Reimbursement | Management Fee Waived | ||||||
| 06/30/02 | $ | 60,201 | $ | 60,019 | ||||
| 06/30/03 | 38,066 | 90,163 | ||||||
| 06/30/04 | – | 129,060 | ||||||
| 06/30/05 | – | 141,907 | ||||||
| 06/30/06 | – | 142,664 | ||||||
| 06/30/07 | – | 161,128 | ||||||
| 06/30/08 | – | 95,665 | ||||||
| 06/30/09 | – | 234,053 | ||||||
| 06/30/10 | – | 204,148 | ||||||
| 06/30/11 | – | 211,784 | ||||||
| 06/30/12 | – | 240,847 | ||||||
| 06/30/13 | – | 235,380 | ||||||
| 06/30/14 | – | 220,476 | ||||||
| 06/30/15 | – | 175,996 | ||||||
| 06/30/16 | – | 135,822 | ||||||
| 06/30/17 | – | 123,930 | ||||||
| 06/30/18 | – | 146,156 | ||||||
| 06/30/19 | – | 163,859 | ||||||
| Total | $ | 98,267 | $ | 2,913,057 | ||||
Portfolio Turnover2
Annual portfolio turnover since inception has been as follows:
| 20023 | 2003 | 2004 | 2005 | 2006 | 2007 | 2008 | 2009 | 2010 | 2011 | 2012 | 2013 | 2014 | 2015 | 2016 | 2017 | 2018 | 2019 | Average | ||||||||||||||||||
| 0% | 14% | 20% | 7% | 25% | 17% | 21% | 16% | 8% | 21% | 14% | 19% | 25% | 25% | 20% | 13% | 16% | 23% | 16.9% |
| 2 | Percentage calculated based on total value of long term investments. |
| 3 | The Fund commenced operations on July 16, 2001. |
We believe these low portfolio turnover rates are consistent with our investment strategy of holding positions for long periods and minimizing transaction expenses for shareholders. Brokerage expenses for this fiscal year’s trading again amounted to less than 1 cent per share of your Fund based upon the 5.9 million shares outstanding as of June 30, 2019. Thus, trading expense remained very low owing to low portfolio turnover. Both portfolio turnover and brokerage expense are well below industry norms according to the ICI 2019 Fact Book.
Management Ownership of Fund
The Adviser’s retirement plan, employees and related family members of the Adviser collectively own 22% of the Fund as well as 14% and 39% of the DF Dent Midcap Growth and DF Dent Small Cap Growth Funds, respectively. The Fund is the largest investment of the Adviser’s retirement plan (at 26.9% of the retirement plan’s assets). 35.2% of the Adviser’s retirement plan is invested the three DF Dent Funds. We believe these positions represent conviction and alignment with shareholders’ interests.
| DF DENT GROWTH FUNDS |
DF DENT PREMIER GROWTH FUND
A MESSAGE TO OUR SHAREHOLDERS (Unaudited)
JUNE 30, 2019
Asset Allocation
| 06/30/124 | 06/30/134 | 06/30/144 | 06/30/154 | 06/30/164 | 06/30/174 | 06/30/184 | 06/30/194 | |||||||||||||||||||||||||
| Large Capitalization | 50.3 | % | 51.3 | % | 75.5 | % | 46.5 | % | 53.4 | % | 62.8 | % | 72.2 | % | 77.6 | % | ||||||||||||||||
| Mid Capitalization | 38.6 | % | 40.4 | % | 21.8 | % | 38.9 | % | 35.1 | % | 29.3 | % | 18.5 | % | 11.3 | % | ||||||||||||||||
| Small Capitalization | 11.0 | % | 5.6 | % | 2.5 | % | 12.3 | % | 11.4 | % | 7.9 | % | 9.2 | % | 8.6 | % | ||||||||||||||||
| Reserve Funds | 0.1 | % | 2.7 | % | 0.2 | % | 2.3 | % | 0.1 | % | 0.0 | % | 0.1 | % | 2.5 | % | ||||||||||||||||
| Total Fund | 100.0 | % | 100.0 | % | 100.0 | % | 100.0 | % | 100.0 | % | 100.0 | % | 100.0 | % | 100.0 | % | ||||||||||||||||
| 4 | Percentage calculated based on total value of investments. |
From the Fund’s inception (July 16, 2001) through June 30, 2014, your Adviser used a market capitalization range of $1.5 to $7.0 billion to define mid-capitalization with companies below and above this range representing small and large caps respectively. Prior to 2015, we discussed adjusting this range upwards to reflect the overall increase of market capitalization levels from 2001 to 2015. In the Fund’s 2015 Prospectus (dated November 1, 2015), we increased the market capitalization range of mid cap to $3.0 to $12.0 billion, thereby defining companies below and above this range as small and large respectively. The most recent Fund Fact Sheet indicates that medium size companies typically have market capitalizations in the range of $3 billion to $20 billion and large companies typically have market capitalizations greater than $20 billion. The result of this upward adjustment was that the asset allocation of your Fund as of June 30, 2015 was closer to the historic allocation in prior years and reflected the overall expanded level of market valuations.
Fast forward to June 30, 2019, and you can see that the same phenomenon is happening again. The large cap percentage has now increased from 46.5% on June 30, 2015 to 77.6% as of June 30, 2019, similar to the increase from 50.3% on June 30, 2012 to 75.5% on June 30, 2014. While small cap’s allocation has declined slightly, the mid cap allocation has declined from 38.9% on June 30, 2015 to 11.3% on June 30, 2019. Many portfolio companies have “graduated” to higher market cap categories as a result of good performance rather than any shift of strategy by the Fund’s Adviser. For example, Okta’s market capitalization has doubled since our initial purchase in December 2018, graduating the stock from small cap to midcap in a little more than six months.
Again, the small cap percentage has decreased on June 30, 2019 compared to two years ago just as happened in 2014. This is the result once again of portfolio companies “graduating” from midcap to large cap and small cap to midcap. In managing your Fund we attempt to recycle portfolio gains into small cap as companies from that category “graduate” into higher market capitalization categories. To accomplish this balance we purchased positions during the past year in PROS Holdings, Blackline, and Brooks Automation within the small cap category as well as Watsco, Bio-Techne, Core Laboratories, Black Knight, Healthcare Services Group, and Trimble within the mid cap category. These additions offset the “graduation” of companies from those categories whose
| DF DENT GROWTH FUNDS |
DF DENT PREMIER GROWTH FUND
A MESSAGE TO OUR SHAREHOLDERS (Unaudited)
JUNE 30, 2019
stocks performed well moving them into higher market capitalization categories. These purchases were funded by trimming positions in large cap companies.
Concentration
The trimming of large cap positions in highly appreciated stocks to recycle funds into newer investments has also reduced the portfolio’s concentration in the past year as demonstrated below:
| Top 10 Holdings | 06/30/11 | 06/30/12 | 06/30/13 | 06/30/14 | 06/30/15 | 06/30/16 | 06/30/17 | 06/30/18 | 06/30/19 | |||||||||
| % of the Fund | 52.46% | 49.35% | 44.95% | 42.36% | 42.80% | 43.92% | 43.71% | 40.89% | 38.17% | |||||||||
| Average Size Of Top 10 | 5.2% | 4.9% | 4.5% | 4.2% | 4.3% | 4.4% | 4.4% | 4.1% | 3.8% |
Our thought process is that if we invest 3% in a stock at a price of $40, should we maintain a 4.5% position in the same company when its valuation is 50% higher when the stock reaches $60? Do we want a 50% larger position at a 50% higher valuation? The answer is “No.” Thus, such stocks become trim candidates, and the gain is recycled into more attractive valuations.
By industry standards, your Fund’s holdings of 37 stocks on June 30, 2019 is considered reasonably concentrated or “focused” even though the SEC considers a mutual fund diversified if no holding represents more than 5% of the portfolio, which is the case for your Fund as Visa is, with respect to at least 75% of its holdings, the only holding greater than 5% at 6.86% of total holdings in the portfolio. The top 10 holdings generated a total contribution of 9.67% of your annual total return of 21.14%. That represents 45.74% of your total return from 38.17% of the Fund. The top holdings have fairly consistently contributed more return than their actual weightings as commented upon in the Commentary section of last year’s Annual Report. Thus, we believe that some concentration within the Fund has enhanced results.
Commentary
How well does the Fund do in good years such as the year just ended versus years of poor performance? This fiscal year’s return of 21.14% was the second best year versus the Index in the Fund’s 18 year history. Only in fiscal 2004 did your Fund beat the Index by more. However, each of these three years of our best performance beat the Index by a little less than 11%. To date that is about the best we can do in a very good year.
We have calculated your Fund’s upside capture in good markets versus its downside capture in down markets, or quite simply how does your Fund do relative to the Index in a good market and what is its relative performance in a down market? For fiscal 2019, we had both including October-December’s decline of -13.52%. In fiscal 2019, the Fund’s upside capture was 129.10%, meaning that it performed 29.10% better than the Index in the up phases, while its downside capture was 94.58%, meaning it “captured” 94.58% of the Index’s decline in the down phase of the market. Stated differently, the Fund went up 29.10% more than the market during the up
| DF DENT GROWTH FUNDS |
DF DENT PREMIER GROWTH FUND
A MESSAGE TO OUR SHAREHOLDERS (Unaudited)
JUNE 30, 2019
phase and down 5.42% less than the market in the down phase. In the three down years for the Index since inception (2002, 2008, 2009), the Fund’s downside capture has averaged 97.82%, meaning the Fund declined on average 2.18% less than the Index in down years. We like to think that this quantitative metric measures the market’s “quotient” on the quality of management, or that investors are reluctant to sell quality companies during market selloffs and anxious to commit capital to these companies in up markets.
Investors in the DF Dent Growth Funds have read in our reports that we seek to invest in “best in class”5 companies that dominate a market niche. What do we do when there are two great companies which dominate a market niche? We invest in both! Your Fund owns positions in both Visa and Mastercard, S&P Global and Moody’s, American Tower and SBA Communications. Each of these companies has made a meaningful contribution to the Fund’s return.
DF Dent Management
As mentioned at the beginning of this letter, management teams of many portfolio companies made investments in recent years that bore fruit during this past year. The Fund’s Adviser has similarly invested by expanding its research capabilities over the past year. Good investment performance comes from good research. We have added three associate analysts who are already making meaningful contributions in researching portfolio companies and potential new investments. We try to mimic the best practices of management teams we admire in managing their businesses. “Imitation is the sincerest form of flattery.”
Respectively Submitted,
 |  |  |
| Daniel F. Dent | Bruce L. Kennedy | Matthew F. Dent |
| 5 | The determination of “best-in-class” is solely the opinion of the Fund’s Adviser, and such opinion is subject to change. Those companies that hold leading market share positions, strong growth potential, historically good profitability, and management teams known for integrity and good corporate governance are generally considered to be “best-in-class”. |
IMPORTANT INFORMATION:
Investing involves risks, including the possible loss of principal. The DF Dent Premier Growth Fund may invest in small and medium size companies. Investments in these companies, especially smaller companies, carry greater risk than is customarily associated with larger companies for various reasons such as increased volatility of earnings and prospects, narrower markets, limited financial resources and less liquid stock. The Fund will typically invest in the securities of fewer issuers. If the Fund’s portfolio is over weighted in a sector, any negative
| DF DENT GROWTH FUNDS |
DF DENT PREMIER GROWTH FUND
A MESSAGE TO OUR SHAREHOLDERS (Unaudited)
JUNE 30, 2019
development affecting that sector will have a greater impact on the Fund than a fund that is not over weighted in that sector.
The DF Dent Midcap Growth Fund (“Midcap Fund”) also invests in small and medium size companies. With non-diversification risk, the Midcap Fund will typically invest in securities of a small group of issuers, which exposes the Midcap Fund to greater market risk. Investing in American Depositary Receipts (ADRs) carries risks of political and financial instability, less liquidity and greater volatility, as well as risks associated with the lack of reliable accounting and financial information. The Midcap Fund is also subject to other risks, such as Real Estate Investment Trusts (REIT) risk with possible real estate market declines, which are detailed in the Midcap Fund’s prospectus.
The DF Dent Small Cap Growth Fund (“Small Cap Fund”) invests in small size companies, which carry greater risk than is customarily associated with larger, more established companies. With non-diversification risk, the Small Cap Fund will typically invest in securities of a small group of issuers, which exposes the Small Cap Fund to greater market risk. Investing in ADRs carries risks of political and financial instability, less liquidity and greater volatility, as well as risks associated with the lack of reliable accounting and financial information. The Small Cap Fund is also subject to other risks, such as REIT risk with possible real estate market declines, which are detailed in the Small Cap Fund’s prospectus.
The S&P 500 Index is a broad-based, unmanaged measurement of changes in stock market conditions based on the average of 500 widely held stocks. The Russell Midcap Growth Index measures the performance of the mid-cap growth segment of the U.S. equity universe. It includes those Russell Midcap Index companies with higher price-to-book ratios and higher forecasted growth values. The Russell 2000 Growth Index measures the performance of the small cap growth segment of the U.S. equity universe. It includes those Russell Small Cap Index companies with higher price-to-book ratios and higher forecasted growth values. One cannot invest directly in an index.
| DF DENT GROWTH FUNDS |
DF DENT PREMIER GROWTH FUND
MANAGEMENT DISCUSSION OF FUND PERFORMANCE (Unaudited)
JUNE 30, 2019
Recent Performance
For the fiscal year ending June 30, 2019, the DF Dent Premier Growth Fund (the “Fund”) experienced a total return of +21.14% versus a total return of +10.42% for the S&P 500 Index (the “Index”), the benchmark we use for performance comparisons. Performance versus the Index for various periods ending June 30, 2019 was as follows:
| Period Ending 6/30/2019 | DF Dent Premier Growth Fund | S&P 500 Index | Outperformance (Underperformance) | ||||||
| Six Months | + | 31.63% | + | 18.54% | + | 13.09% | |||
| Twelve Months | + | 21.14% | + | 10.42% | + | 10.72% | |||
| Three Years (annualized) | + | 22.23% | + | 14.19% | + | 8.04% | |||
| Five Years (annualized) | + | 14.12% | + | 10.71% | + | 3.41% | |||
| Ten Years (annualized) | + | 16.56% | + | 14.70% | + | 1.86% | |||
| Since Inception (7/16/2001) (annualized) | + | 9.81% | + | 7.24% | + | 2.57% | |||
| Since Inception (7/16/2001) (cumulative) | + | 436.35% | + | 250.69% | + | 185.66% | |||
Past performance is not indicative of future performance.
The Fund’s net return of +21.14% for the fiscal year ending on June 30, 2019 was the third year in a row to record a total return of greater than 20%. Your Fund’s annual net return has been above 20% in seven of its 18 fiscal years and above 10% in 11 of those fiscal years while the net return was negative in 4 of those years. Your Fund’s total return performance of + 21.14% this fiscal year exceeded the Index by 10.72%. The Fund has beaten the Index in 13 years of its 18 year history. This fiscal year’s return was the third best year in the Fund’s history. As can be seen above, the most recent six months were particularly strong relative to the Index. This return was clearly above what many shareholders would normally expect as the Fund’s long-term annual return since inception has been +9.81%.
| 1. | Your Fund, as well as the U.S. stock market overall, has benefited from: |
| 2. | The longest recorded economic expansion without a recession (121 months) |
| 3. | Low interest rates (the 10 year US Treasury’s yield on June 30, 2019 was 2.0%) |
| 4. | Low inflation (below the Fed’s targeted rate of 2.5%) |
| 5. | A reduced corporate tax rate |
| 6. | Robust GDP growth (3.2% in the most recently reported quarter) |
| 7. | A strong dollar |
| 8. | Healthy employment growth and low unemployment |
| 9. | An accommodative Fed monetary policy. |
| DF DENT GROWTH FUNDS |
DF DENT PREMIER GROWTH FUND
MANAGEMENT DISCUSSION OF FUND PERFORMANCE (Unaudited)
JUNE 30, 2019
Sector Allocation and Attribution
The following bar chart presents the sector weightings of your Fund (DFDPX) versus the sector weightings of the Index as of June 30, 2019:

Source: FactSet
The Index is composed of 11 Sectors excluding Cash. Your Fund did not have holdings as of June 30, 2019 in three Sectors: Consumer Staples, Energy, and Utilities. Of the eight remaining Sectors, the Fund was under-weighted in three: Consumer Discretionary and Financials where it outperformed, and Communication Services where it underperformed as a result of its one holding-Alphabet, which had negative returns. The portfolio was over-weighted in the remaining five Sectors where it outperformed the Index in each:
| Percent of the Fund | Fund Performance vs. Index | |
| 30.7% in Information Technology | (outperformed by 30.58% compared to 18.24%) | |
| 17.9% in Industrials | (outperformed by 21.87% compared to 10.41%) | |
| 15.7% in Health Care | (outperformed by 30.61% compared to 12.84%) | |
| 7.5% in Materials | (outperformed by 44.58% compared to 3.66%) | |
| 7.1% in Real Estate | (outperformed by 29.25% compared to 16.75%) |
Your Fund outperformed the Index in each of the above Sectors where it was over-weighted, the main reason for its fiscal year outperformance. Visa, Red Hat (IBM’s tender offer), PROS Holdings, Mastercard, and Okta were leading contributors to Information Technology in 2019. Health Care enjoyed strong performance from all seven holdings with Danaher, Bio-Techne, Thermo Fisher Scientific, Illumina, and Teleflex each generating 30% plus
| DF DENT GROWTH FUNDS |
DF DENT PREMIER GROWTH FUND
MANAGEMENT DISCUSSION OF FUND PERFORMANCE (Unaudited)
JUNE 30, 2019
returns within the portfolio. We sold Celgene at a nice profit pursuant to a January premium tender offer from Bristol Myers. Materials performance was driven by a +42.21% return from Ecolab, Inc. Lastly, the Real Estate Sector’s over-weighted position was due to American Tower and SBA Communications which delivered +44.63% and +36.17% returns respectively in fiscal 2019. Although classified as Real Estate, these companies are direct beneficiaries of growing demand for digital communications.
This past fiscal year was one where companies that achieved anything less than 20% returns did not stand out to us. However, there were some companies which did underperform in fiscal 2019. LKQ, Core Labs, SEI Investments, A. O. Smith, Watsco, WageWorks, and Blackbaud performed poorly and were sold during the year to generate funds for new investment opportunities. Alphabet, Healthcare Services Group, and Tyler Technologies had negative returns in fiscal 2019 but we have held on to these positions.
Individual Stock Performance
Your Fund held 37 different stocks at fiscal year-end, 49 during the course of the fiscal year. Of the 9 losing stocks which provided a combined loss of 3.63% to the Fund as of June 30, 2019, six were eliminated. Two of the three stocks which provided negative returns for two years in a row, WageWorks and LKQ, were eliminated. The third, Healthcare Services Group, was still held as of June 30, 219 for its potential price recovery.
Those stocks with the greatest contribution (a combination of price appreciation at weighting) to the Fund are listed later under the Section of Five Best Contributors. The stocks with the best fiscal year individual performance within the portfolio were:
| 1. | Okta | + 103.6% |
| 2. | PROS Holdings | + 73.0% |
| 3. | Danaher | + 45.6% |
| 4. | American Tower | + 44.6% |
| 5. | Bio-Techne | + 41.9% |
American Tower and Bio-Techne have been long term core holdings in the Fund. Danaher and Okta were both new purchases during the year.
Your Fund has followed a policy of not investing in any derivative securities.
Market Factors and Strategy
Three of the four quarters of the fiscal year achieved positive returns with the December ending quarter down sharply. With the strong recovery during the March and June ending quarters, we took advantage of the recovery in prices to “prune” the portfolio of those holdings which we regarded as less than high conviction positions.
| DF DENT GROWTH FUNDS |
DF DENT PREMIER GROWTH FUND
MANAGEMENT DISCUSSION OF FUND PERFORMANCE (Unaudited)
JUNE 30, 2019
Proceeds from these sales were invested in additions to existing positions of Danaher, SBA Communications, and Brooks Automation, while Thermo Fisher Scientific, and Teleflex, and Vulcan Materials represented new high conviction positions in the portfolio. Each of these purchases has for both existing and new positions performed well contributing to your Fund’s fiscal year performance.
Your Fund also added to positions in two SaaS (Software as a Service) cloud-based companies, Okta and Qualys, which are involved in Identity Management and cybersecurity respectively. Many of these SaaS companies such as the Fund’s position in PROS Holdings have been very strong market performers during the past year. Your Adviser has a pipeline of additional niche-dominating SaaS companies which it has researched over the past year and is ready to make additional commitments if valuations become more reasonable in the future.
The strategies utilized in managing the Fund are constant and do not change with the vagaries of the markets. The Adviser aims to identify those few “best-in-class”* companies that have dominated attractive market niches, enjoyed good profit margins, and are run by talented and dedicated management teams of unquestioned integrity. It is your Adviser’s belief that such enterprises are best positioned to navigate the sea of changes confronting businesses today.
Best and Worst Performers
Five Best Contributors
| Investments | Fund Net Realized and Unrealized Appreciation and Income in Fiscal Year 2019 | Fund Per Share As of 06/30/19 | ||||||
| Visa Inc., Class A | $ | 3,532,749 | $ | 0.60 | ||||
| Ecolab, Inc. | 2,802,510 | 0.47 | ||||||
| PROS Holdings, Inc. | 2,531,760 | 0.43 | ||||||
| Mastercard, Inc., Class A | 2,075,100 | 0.35 | ||||||
| American Tower Corp. REIT | 2,002,380 | 0.34 | ||||||
| $ | 12,944,499 | $ | 2.19 | |||||
Visa has been on the Five Best Contributors List five years in a row. It is the only stock in the Fund’s history with this distinction. This performance has made Visa the Fund’s largest holding for the past five years despite periodic trimming. Mastercard has been a top 5 contributor for two years in a row. Together, these two card network processing companies contributed 3.27% of your Fund’s 21.14% return.
| DF DENT GROWTH FUNDS |
DF DENT PREMIER GROWTH FUND
MANAGEMENT DISCUSSION OF FUND PERFORMANCE (Unaudited)
JUNE 30, 2019
Five Worst Contributors
| Investments | Fund Net Realized and Unrealized Loss and Income In Fiscal Year 2019 | Fund Per Share As of 06/30/19 | ||||||
| Core Laboratories NV | $ | (1,702,606 | ) | $ | (0.29 | ) | ||
| WageWorks, Inc. | (777,171 | ) | (0.13 | ) | ||||
| Healthcare Services Group, Inc. | (701,075 | ) | (0.12 | ) | ||||
| Watsco, Inc. | (634,465 | ) | (0.11 | ) | ||||
| Blackbaud, Inc. | (583,591 | ) | (0.10 | ) | ||||
| $ | (4,398,908 | ) | $ | (0.75 | ) | |||
Capital Gains Distribution Policy
Your Fund is required to distribute its net realized capital gains each year. A long-term capital gain of $2.47779 per share was distributed in December 2018.
Since inception (July 16, 2001), your Fund has distributed a total of $60,235,699 or $10.51 per share in realized gains. Consequently, an original shareholder on July 16, 2001 who invested $10 a share in the Fund has received $10.51 in capital gain distributions. An investor who elected to receive these capital gain distributions in cash would have accumulated total value of $46.26 as of June 30, 2019 ($10.51 in cash distributions + $35.75 net asset value).
If a shareholder reinvested all the capital gain distributions in additional shares at the time of each capital gain distribution, the original $10 investment would now be worth $53.63 for a 9.81% annual return after fees versus $35.07 and a 7.24% annual return in the Index (before index fund fees). The $7.37 higher return for the investor reinvesting capital gain versus taking cash distributions represents the additional appreciation of the reinvested shares. Therefore, while a 9.81% return versus 7.24% in the Index may not seem like a large amount, 18 years of annual returns at that differential resulted in an additional $18.56 return over the Index on a $10 investment.
Albert Einstein has been quoted as saying, “The power of compound interest is the most powerful force in the universe.” Given the source, it’s a memorable quote. A corollary might be that “differentials of compound interest are by definition exponentially powerful.”
| DF DENT GROWTH FUNDS |
DF DENT PREMIER GROWTH FUND
MANAGEMENT DISCUSSION OF FUND PERFORMANCE (Unaudited)
JUNE 30, 2019
FIVE LARGEST EQUITY HOLDINGS
June 30, 2019
| Quantity | Security | Total Cost | Market Value | Percent of Net Assets of the Fund | Percent of Contribution to 2019 Return | |||||||||||||
| 84,000 | Visa, Inc., Class A | $ | 1,483,233 | $ | 14,578,200 | 6.88 | % | 2.05 | % | |||||||||
| 49,000 | Ecolab, Inc. | 2,781,674 | 9,674,560 | 4.56 | 1.64 | |||||||||||||
| 30,000 | Mastercard, Inc., Class A | 2,794,158 | 7,935,900 | 3.74 | 1.22 | |||||||||||||
| 34,000 | S&P Global, Inc. | 3,389,471 | 7,744,860 | 3.65 | 0.56 | |||||||||||||
| 3,800 | Amazon.com, Inc. | 2,893,106 | 7,195,794 | 3.39 | 0.31 | |||||||||||||
| $ | 13,341,642 | $ | 47,129,314 | 22.22 | % | 5.78 | % | |||||||||||
| * | The determination of “best-in-class” is solely the opinion of the Fund’s Adviser, and such opinion is subject to change. Those companies that hold leading market share positions, strong growth potential, historically good profitability, and management teams known for integrity and good corporate governance are generally considered to be “best-in-class.” |
The views in this report were those of the Fund’s Adviser as of June 30, 2019, and may not reflect the Adviser’s views on the date this report is first published or anytime thereafter. This report may contain discussions about certain investments both held and not held in the portfolio as of the report date. All current and future holdings are subject to risk and are subject to change. While these views are intended to assist shareholders in understanding their investment in the Fund, they do not constitute investment or tax advice, are not a guarantee of future performance and are not intended as an offer or solicitation with respect to the purchase or sale of any security.
| DF DENT GROWTH FUNDS |
DF DENT PREMIER GROWTH FUND
PERFORMANCE CHART AND ANALYSIS (Unaudited)
JUNE 30, 2019
The following chart reflects the change in the value of a hypothetical $10,000 investment, including reinvested dividends and distributions, in the DF Dent Premier Growth Fund (the “Fund”) compared with the performance of the benchmark, S&P 500 Index (“S&P 500”), over the past ten fiscal years. The S&P 500 is a broad-based measurement of the U.S. stock market based on the performance of 500 widely held large capitalization common stocks. The total return of the index includes the reinvestment of dividends and income. The total return of the Fund includes operating expenses that reduce returns, while the total return of the index does not include expenses. The Fund is professionally managed, while the index is unmanaged and is not available for investment.
Comparison of Change in Value of a $10,000 Investment
DF Dent Premier Growth Fund vs. S&P 500 Index

| Average Annual Total Returns Periods Ended June 30, 2019 | One Year | Five Year | Ten Year | |||
| DF Dent Premier Growth Fund | 21.14% | 14.12% | 16.56% | |||
| S&P 500 Index | 10.42% | 10.71% | 14.70% |
Performance data quoted represents past performance and is no guarantee of future results. Current performance may be lower or higher than the performance data quoted. Investment return and principal value will fluctuate so that shares, when redeemed, may be worth more or less than original cost. As stated in the Fund’s prospectus, the annual operating expense ratio (gross) is 1.22%. However, the Fund’s adviser has contractually agreed to waive its fee and/or reimburse Fund expenses to limit Total Annual Fund Operating Expenses After Fee Waiver and/or Expense Reimbursement (excluding all taxes, interest, portfolio transaction expenses, and extraordinary expenses) to 1.10% on the first $150 million in Fund net assets and to 0.90% on net assets exceeding the $150 million, through October 31, 2019 (the “Expense Cap”). The Expense Cap may be raised or eliminated only with the consent of the Board of Trustees. The adviser may be reimbursed by the Fund for fees waived and expenses reimbursed by the adviser pursuant to the Expense Cap if such payment is made within three years of the fee waiver or expense reimbursement and does not cause the Total Annual Fund Operating Expenses After Fee Waiver and/or Expense Reimbursement to exceed the lesser of (i) the then-current Expense Cap and (ii) the Expense Cap in place at the time the fees/expenses were waived/reimbursed. Total Annual Fund Operating Expenses After Fee Waiver and/or Expense Reimbursement will increase if exclusions from the Expense Cap apply. During the period, certain fees were waived and/or expenses reimbursed; otherwise, returns would have been lower. The performance table and graph do not reflect the deduction of taxes that a shareholder would pay on Fund distributions or the redemption of Fund shares. Returns greater than one year are annualized. For the most recent month-end performance, please call (866) 233-3368.
| DF DENT GROWTH FUNDS |
DF DENT PREMIER GROWTH FUND
SCHEDULE OF INVESTMENTS
JUNE 30, 2019
| Shares | Security Description | Value | ||||||
| Common Stock - 97.6% | ||||||||
| Communication Services - 3.0% | ||||||||
| 6,000 | Alphabet, Inc., Class C (a) | $ | 6,485,460 | |||||
| Consumer Discretionary - 6.3% | ||||||||
| 3,800 | Amazon.com, Inc. (a) | 7,195,794 | ||||||
| 70,000 | CarMax, Inc. (a) | 6,078,100 | ||||||
| 13,273,894 | ||||||||
| Financials - 9.2% | ||||||||
| 6,200 | Markel Corp. (a) | 6,755,520 | ||||||
| 26,000 | Moody's Corp. | 5,078,060 | ||||||
| 34,000 | S&P Global, Inc. | 7,744,860 | ||||||
| 19,578,440 | ||||||||
| Health Care - 15.8% | ||||||||
| 23,000 | Bio-Techne Corp. | 4,795,270 | ||||||
| 47,000 | Danaher Corp. | 6,717,240 | ||||||
| 18,000 | Illumina, Inc. (a) | 6,626,700 | ||||||
| 11,000 | Intuitive Surgical, Inc. (a) | 5,770,050 | ||||||
| 12,600 | Teleflex, Inc. | 4,172,490 | ||||||
| 18,200 | Thermo Fisher Scientific, Inc. | 5,344,976 | ||||||
| 33,426,726 | ||||||||
| Industrials - 17.9% | ||||||||
| 6,000 | CoStar Group, Inc. (a) | 3,324,360 | ||||||
| 164,000 | Fastenal Co. | 5,344,760 | ||||||
| 22,000 | Genesee & Wyoming, Inc., Class A (a) | 2,200,000 | ||||||
| 58,000 | Healthcare Services Group, Inc. | 1,758,560 | ||||||
| 19,000 | Roper Technologies, Inc. | 6,958,940 | ||||||
| 12,500 | TransDigm Group, Inc. (a) | 6,047,500 | ||||||
| 47,000 | Verisk Analytics, Inc. | 6,883,620 | ||||||
| 56,900 | Waste Connections, Inc. | 5,438,502 | ||||||
| 37,956,242 | ||||||||
| Information Technology - 30.8% | ||||||||
| 31,700 | ANSYS, Inc. (a) | 6,492,794 | ||||||
| 59,000 | Black Knight, Inc. (a) | 3,548,850 | ||||||
| 114,017 | Blackline, Inc. (a) | 6,101,050 | ||||||
| 130,000 | Brooks Automation, Inc. | 5,037,500 | ||||||
| 45,000 | Envestnet, Inc. (a) | 3,076,650 | ||||||
| 30,000 | Mastercard, Inc., Class A | 7,935,900 | ||||||
| 22,000 | Okta, Inc. (a) | 2,717,220 | ||||||
| 83,700 | PROS Holdings, Inc. (a) | 5,294,862 | ||||||
| 20,000 | Qualys, Inc. (a) | 1,741,600 | ||||||
| 47,000 | Trimble, Inc. (a) | 2,120,170 | ||||||
| 30,400 | Tyler Technologies, Inc. (a) | 6,567,008 | ||||||
| 84,000 | Visa, Inc., Class A | 14,578,200 | ||||||
| 65,211,804 | ||||||||
| Materials - 7.5% | ||||||||
| 49,000 | Ecolab, Inc. | 9,674,560 | ||||||
| 45,400 | Vulcan Materials Co. | 6,233,874 | ||||||
| 15,908,434 | ||||||||
| Shares | Security Description | Value | ||||||
| Real Estate - 7.1% | ||||||||
| 29,000 | American Tower Corp. REIT | $ | 5,929,050 | |||||
| 109,000 | CBRE Group, Inc., Class A (a) | 5,591,700 | ||||||
| 16,200 | SBA Communications Corp. REIT (a) | 3,642,408 | ||||||
| 15,163,158 | ||||||||
| Total Common Stock (Cost $99,935,207) | 207,004,158 | |||||||
| Investments, at value - 97.6% (Cost $ 99,935,207) | $ | 207,004,158 | ||||||
| Other Assets & Liabilities, Net - 2.4% | 4,999,978 | |||||||
| Net Assets - 100.0% | $ | 212,004,136 | ||||||
| REIT | Real Estate Investment Trust |
| (a) | Non-income producing security. |
The following is a summary of the inputs used to value the Fund's investments as of June 30, 2019.
The inputs or methodology used for valuing securities are not necessarily an indication of the risks associated with investing in those securities. For more information on valuation inputs, and their aggregation into the levels used in the table below, please refer to the Security Valuation section in Note 2 of the accompanying Notes to Financial Statements.
| Valuation Inputs | Investments in Securities | |||
| Level 1 - Quoted Prices | $ | 207,004,158 | ||
| Level 2 - Other Significant Observable Inputs | – | |||
| Level 3 - Significant Unobservable Inputs | – | |||
| Total | $ | 207,004,158 | ||
The Level 1 value displayed in this table is Common Stock. Refer to this Schedule of Investments for a further breakout of each security by industry.
| See Notes to Financial Statements. | DF DENT GROWTH FUNDS |
DF DENT PREMIER GROWTH FUND
SCHEDULE OF INVESTMENTS
JUNE 30, 2019
| PORTFOLIO HOLDINGS (Unaudited) | |
| % of Total Net Assets | |
| Communication Services | 3.0% |
| Consumer Discretionary | 6.3% |
| Financials | 9.2% |
| Health Care | 15.8% |
| Industrials | 17.9% |
| Information Technology | 30.8% |
| Materials | 7.5% |
| Real Estate | 7.1% |
| Other Assets & Liabilities, Net | 2.4% |
| 100.0% |
| See Notes to Financial Statements. | DF DENT GROWTH FUNDS |
DF DENT PREMIER GROWTH FUND
STATEMENT OF ASSETS AND LIABILITIES
JUNE 30, 2019
| ASSETS | ||||
| Investments, at value (Cost $99,935,207) | $ | 207,004,158 | ||
| Cash | 2,837,605 | |||
| Receivables: | ||||
| Fund shares sold | 2,855,784 | |||
| Dividends and interest | 61,008 | |||
| Prepaid expenses | 16,951 | |||
| Total Assets | 212,775,506 | |||
| LIABILITIES | ||||
| Payables: | ||||
| Fund shares redeemed | 274,264 | |||
| Accrued Liabilities: | ||||
| Investment adviser fees | 447,991 | |||
| Trustees’ fees and expenses | 201 | |||
| Fund services fees | 13,943 | |||
| Other expenses | 34,971 | |||
| Total Liabilities | 771,370 | |||
| NET ASSETS | $ | 212,004,136 | ||
| COMPONENTS OF NET ASSETS | ||||
| Paid-in capital | $ | 93,753,736 | ||
| Distributable earnings | 118,250,400 | |||
| NET ASSETS | $ | 212,004,136 | ||
| SHARES OF BENEFICIAL INTEREST AT NO PAR VALUE (UNLIMITED SHARES AUTHORIZED) | 5,930,319 | |||
| NET ASSET VALUE, OFFERING AND REDEMPTION PRICE PER SHARE | $ | 35.75 | ||
| See Notes to Financial Statements. | DF DENT GROWTH FUNDS |
DF DENT PREMIER GROWTH FUND
STATEMENT OF OPERATIONS
YEAR ENDED JUNE 30, 2019
| INVESTMENT INCOME | ||||
| Dividend income (Net of foreign withholding taxes of $12,470) | $ | 998,473 | ||
| Interest income | 12,024 | |||
| Total Investment Income | 1,010,497 | |||
| EXPENSES | ||||
| Investment adviser fees | 1,798,789 | |||
| Fund services fees | 219,070 | |||
| Custodian fees | 19,198 | |||
| Registration fees | 21,059 | |||
| Professional fees | 56,935 | |||
| Trustees' fees and expenses | 8,422 | |||
| Other expenses | 39,106 | |||
| Total Expenses | 2,162,579 | |||
| Fees waived | (234,031 | ) | ||
| Net Expenses | 1,928,548 | |||
| NET INVESTMENT LOSS | (918,051 | ) | ||
| NET REALIZED AND UNREALIZED GAIN (LOSS) | ||||
| Net realized gain on investments | 18,212,790 | |||
| Net change in unrealized appreciation (depreciation) on investments | 18,465,342 | |||
| NET REALIZED AND UNREALIZED GAIN | 36,678,132 | |||
| INCREASE IN NET ASSETS RESULTING FROM OPERATIONS | $ | 35,760,081 | ||
| See Notes to Financial Statements. | DF DENT GROWTH FUNDS |
DF DENT PREMIER GROWTH FUND
STATEMENTS OF CHANGES IN NET ASSETS
| For the Years Ended June 30, | ||||||||
| 2019 | 2018 | |||||||
| OPERATIONS | ||||||||
| Net investment loss | $ | (918,051 | ) | $ | (785,414 | ) | ||
| Net realized gain | 18,212,790 | 14,660,843 | ||||||
| Net change in unrealized appreciation (depreciation) | 18,465,342 | 20,987,691 | ||||||
| Increase in Net Assets Resulting from Operations | 35,760,081 | 34,863,120 | ||||||
| DISTRIBUTIONS TO SHAREHOLDERS | ||||||||
| Total Distributions Paid | (13,091,027 | ) | (13,937,936 | )* | ||||
| CAPITAL SHARE TRANSACTIONS | ||||||||
| Sale of shares | 17,827,300 | 11,550,790 | ||||||
| Reinvestment of distributions | 12,265,975 | 11,020,469 | ||||||
| Redemption of shares | (14,330,596 | ) | (16,639,823 | ) | ||||
| Increase in Net Assets from Capital Share Transactions | 15,762,679 | 5,931,436 | ||||||
| Increase in Net Assets | 38,431,733 | 26,856,620 | ||||||
| NET ASSETS | ||||||||
| Beginning of Year | 173,572,403 | 146,715,783 | ||||||
| End of Year | $ | 212,004,136 | $ | 173,572,403 | ** | |||
| SHARE TRANSACTIONS | ||||||||
| Sale of shares | 546,384 | 374,067 | ||||||
| Reinvestment of distributions | 439,169 | 377,672 | ||||||
| Redemption of shares | (456,602 | ) | (548,956 | ) | ||||
| Increase in Shares | 528,951 | 202,783 | ||||||
| * | Distribution for June 30, 2018 was the result of net realized gain. |
| ** | Includes accumulated net investment loss of $(366,479) at June 30, 2018. The requirement to disclose the corresponding amount as of June 30, 2019 was eliminated. |
| See Notes to Financial Statements. | DF DENT GROWTH FUNDS |
DF DENT PREMIER GROWTH FUND
FINANCIAL HIGHLIGHTS
These financial highlights reflect selected data for a share outstanding throughout each year.
| For the Years Ended June 30, | ||||||||||||||||||||
| 2019 | 2018 | 2017 | 2016 | 2015 | ||||||||||||||||
| NET ASSET VALUE, Beginning of Year | $ | 32.13 | $ | 28.22 | $ | 24.42 | $ | 28.32 | $ | 26.17 | ||||||||||
| INVESTMENT OPERATIONS | ||||||||||||||||||||
| Net investment loss (a) | (0.16 | ) | (0.15 | ) | (0.07 | ) | (0.13 | ) | (0.10 | ) | ||||||||||
| Net realized and unrealized gain (loss) | 6.26 | 6.91 | 4.95 | (0.45 | ) | 2.25 | ||||||||||||||
| Total from Investment Operations | 6.10 | 6.76 | 4.88 | (0.58 | ) | 2.15 | ||||||||||||||
| DISTRIBUTIONS TO SHAREHOLDERS FROM | ||||||||||||||||||||
| Net realized gain | (2.48 | ) | (2.85 | ) | (1.08 | ) | (3.32 | ) | – | |||||||||||
| Total Distributions to Shareholders | (2.48 | ) | (2.85 | ) | (1.08 | ) | (3.32 | ) | – | |||||||||||
| NET ASSET VALUE, End of Year | $ | 35.75 | $ | 32.13 | $ | 28.22 | $ | 24.42 | $ | 28.32 | ||||||||||
| TOTAL RETURN | 21.14 | % | 24.97 | % | 20.62 | % | (2.06 | )% | 8.22 | % | ||||||||||
| RATIOS/SUPPLEMENTARY DATA | ||||||||||||||||||||
| Net Assets at End of Year (000s omitted) | $ | 212,004 | $ | 173,572 | $ | 146,716 | $ | 147,003 | $ | 173,936 | ||||||||||
| Ratios to Average Net Assets: | ||||||||||||||||||||
| Net investment loss | (0.51 | )% | (0.50 | )% | (0.26 | )% | (0.52 | )% | (0.38 | )% | ||||||||||
| Net expenses | 1.07 | % | 1.09 | % | 1.10 | % | 1.09 | % | 1.06 | % | ||||||||||
| Gross expenses (b) | 1.20 | % | 1.22 | % | 1.23 | % | 1.22 | % | 1.20 | % | ||||||||||
| PORTFOLIO TURNOVER RATE | 23 | % | 16 | % | 13 | % | 20 | % | 25 | % | ||||||||||
| (a) | Calculated based on average shares outstanding during each year. |
| (b) | Reflects the expense ratio excluding any waivers and/or reimbursements. |
| See Notes to Financial Statements. | DF DENT GROWTH FUNDS |
DF DENT MIDCAP GROWTH FUND
A MESSAGE TO OUR SHAREHOLDERS (Unaudited)
JUNE 30, 2019
Dear Fellow Shareholders:
Performance
For the period July 1, 2018, through June 30, 2019, the DF Dent Midcap Growth Fund (the “Fund”) experienced a total return of +20.27% for Investor Shares and +20.45% for Institutional Shares, outperforming the total return of +13.94% for the Russell Midcap Growth Index (the “Index”), which is the benchmark we use for performance comparisons, by +6.33% and +6.51% respectively.
Expense Ratio
The gross operating expense ratio for the Fund is currently 1.31% for Investor Shares and 1.27% for Institutional Shares. Per the Fund’s prospectus, your Fund’s investment Adviser has contractually agreed to waive a portion of its fees to limit the expense ratio to 0.98% for Investor Shares and 0.85% for Institutional Shares through October 31, 2019.
Concentration
The Fund’s concentration in its top 10 holdings is as follows:
| Top 10 Holdings | 06/30/19 | |
| % of the Fund | 41.87% | |
| Average Position Size of Top 10 | 4.19% |
We believe the concentration in the Fund’s top ten positions is appropriate at its current level and has the potential to enhance long-term performance.
Management Ownership of Fund
Employees, their families, and the Adviser’s retirement plan owned approximately 14% of the Fund as of June 30, 2019. There were only management purchases and no management redemptions during the fiscal year ended June 30, 2019.
Portfolio Commentary
While pleased with the fact that the Fund out-performed the Index by over 600 basis points (6.00%) in the past 12 months, we at DF Dent are resolutely focused on the long-term. We believe good long-term investment performance can be partially attributed to a well-refined investment process executed with diligence and discipline. That is why we continue to focus on finding high quality publicly-traded companies to upgrade your portfolio, and exercising analytical and behavioral discipline to improve the Fund’s portfolio construction. Investors who have read our past reports know that we invest in “best-in-class”* companies that are managed by talented and ethical leaders, that have dominant and durable business models, and that generate significant free cash flow over time that can be prudently allocated for the potential benefit of shareholders. Regardless
| DF DENT GROWTH FUNDS |
DF DENT MIDCAP GROWTH FUND
A MESSAGE TO OUR SHAREHOLDERS (Unaudited)
JUNE 30, 2019
of whether the market goes up or down from here, we will continue to stick to our research process and do the research blocking and tackling that we believe is the only path to good long-term performance.
At D.F. Dent, we spend significant time traveling to visit companies and to meet with management teams. These trips are vital to our research process given our emphasis on finding ethical and talented management teams running high quality businesses. Going to company headquarters helps us determine if a management team is exceptional. These visits allow us to observe how they operate, interact with their team, treat employees, and think about growth opportunities.
We recently had a team of portfolio managers and analysts travel to visit two companies. They saw two very different companies managed by very different types of leaders. Company A has a strong core product that is essentially a monopoly. The company also has significant momentum in new products which expand its market and should lead to a larger, more stable, and more profitable business over time. While we have a generally favorable view of the business, we are less impressed with management. We believe management’s strategy and recent execution have been sound, but we have concerns related to ego, aggressiveness, and lack of frugality. In addition to concerns around valuation, these misgivings reduce our confidence in the stock and, as such, we have opted to pass on investing in the company.
Company B has slower growth than Company A, but we believe it is an excellent business with a wide moat. There is a secular tailwind to the business and significant share gain potential, which we believe should lead to steady, repeatable growth for many years. And importantly, the favorable view of management we have developed throughout our research was reinforced in our meeting. Management articulates a clear strategy, and their operational expertise and execution have been commendable. We are also impressed by their humility and cultivation of a strong corporate culture. They are the type of people we would be proud to tell our clients that we have entrusted with their money. This seems to be a clear D.F. Dent company, and our only question is whether current valuation offers a sufficient risk-adjusted expected return.
These road trips are valuable because they allow us visit companies and see management in person. It is a continuous process of critical thinking in comparing our existing portfolio names to companies we don’t own. The result is a portfolio of high quality growth companies run by excellent management teams we believe will outperform the general market over the long term.
The following companies are three of the best contributors to the Fund’s recent performance. We thought highlighting them would give you a sense of not only why we have invested in them on your behalf, but also why they have outperformed recently.
| • | PROS Holdings, Inc. (PRO) is a leading provider of pricing and revenue optimization software to businesses. Its stock performed well in the past year as the company continues its successful business model transition from software license sales toward a cloud-based subscription model. PRO reported strong quarterly results in the past 12 months demonstrating that business growth is accelerating after two years of slower growth caused by the business model transition. These results, combined with our favorable checks with PRO’s customers, serve as a strong validation of management’s vision for the |
| DF DENT GROWTH FUNDS |
DF DENT MIDCAP GROWTH FUND
A MESSAGE TO OUR SHAREHOLDERS (Unaudited)
JUNE 30, 2019
business’ future. While we have trimmed the position given recent multiple expansion, we continue to have confidence in PRO and see its core offerings as extraordinarily well-positioned for secular growth.
| • | Ecolab, Inc. (ECL) sells water, hygiene, and energy technologies and services into hospitality, industrial, food, energy, and healthcare markets. Ecolab’s products are designed to reduce customers’ water and energy footprint, protect customers’ brands and infrastructure, and reduce the spread of germs and illnesses. We see Ecolab’s key secular growth drivers—the needs for clean water, safe food, healthy environments, and efficient energy production—as very long lasting. We see Ecolab growing EPS in the low- to mid-teens with a modest dividend and recession-resistant business model as added value drivers. Over the last year, Ecolab’s valuation multiple expanded considerably as the company’s Earnings-per-share (“EPS”) growth returned to consistent double-digit growth and the company announced the pending spin-off of its energy business. We trimmed the position modestly on strength but continue to see Ecolab as a core holding. |
| • | Verisk Analytics, Inc. (VRSK) is a leading data analytics provider serving customers in the insurance, energy, and financial services markets. Verisk’s insurance products, which are deeply integrated into customer workflows, assist insurers in writing policy language, making better decisions when underwriting risks, and combating fraud. Verisk counts all of the top 100 U.S. P&C insurers as customers. In recent years, Verisk has expanded into data analytics offerings in the energy and financial services verticals via acquisitions. We expect Verisk to generate upper-single-digit organic revenue growth, slight margin expansion, and additional value creation via acquisitions and share repurchases. We also see the stock as having relatively little cyclicality given the sticky and subscription-based nature of its products. During the last twelve months, Verisk experienced significant multiple expansion as new CFO Lee Shavel improved Verisk’s capital allocation discipline and operating income growth in Verisk’s energy unit rebounded nicely. While we trimmed the position twice on strength, we continue to see Verisk as a core long-term holding. |
Attribution Analysis
In the 12-month period ending June 30, 2019, most of your Fund’s outperformance can be attributed to stock selection, not sector allocation.
Your Fund was over-weighted versus the Index benchmark in the Financials, Industrials, Materials, and Real Estate sectors. In Real Estate, both the over-weighting and stock selection contributed to performance. In Industrials and Materials, the over-weighting detracted slightly from performance, but stock selection contributed to performance. In Financials, the over-weighting contributed to performance and stock selection detracted from performance.
Your Fund was under-weighted versus the Index in the Consumer Discretionary, Energy, Health Care, and Information Technology sectors. In Health Care, both the under-weighting and stock selection contributed to performance. However, in Energy, both the under-weighting and stock selection detracted from performance. In Information Technology, the under-weighting detracted slightly from performance while stock selection contributed
| DF DENT GROWTH FUNDS |
DF DENT MIDCAP GROWTH FUND
A MESSAGE TO OUR SHAREHOLDERS (Unaudited)
JUNE 30, 2019
to performance. Conversely in Consumer Discretionary, the under-weighting contributed to performance while stock selection detracted from performance. Your Fund did not hold any positions in the Communication Services and Telecommunication Services sectors, which contributed slightly to performance compared to the Index. Your Fund also did not hold any positions in the Consumer Staples sector, which detracted slightly from performance compared to the Index.
Sector Weights
The following bar chart presents the sector weightings of your Fund versus the sector weightings of the Index as of June 30, 2019 (note this may differ slightly with the commentary above, which relates to average weightings as opposed to year-end weightings):

Source: FactSet
| DF DENT GROWTH FUNDS |
DF DENT MIDCAP GROWTH FUND
A MESSAGE TO OUR SHAREHOLDERS (Unaudited)
JUNE 30, 2019
Best and Worst Performers
Five Best Contributors
| Investments | Fund Net Realized and Unrealized Appreciation and Income in Fiscal Year 2019 | Fund Per Share As of 06/30/19 | ||||||
| PROS Holdings, Inc.. | $ | 1,549,921 | $ | 0.39 | ||||
| Ecolab, Inc. | 1,242,346 | 0.32 | ||||||
| Verisk Analytics, Inc. | 1,181,742 | 0.30 | ||||||
| SBA Communications Corp. | 830,018 | 0.21 | ||||||
| TransDigm Group, Inc. | 792,067 | 0.20 | ||||||
| $ | 5,596,094 | $ | 1.42 | |||||
Five Worst Contributors
| Investments | Fund Net Realized and Unrealized Loss and Income in Fiscal Year 2019 | Fund Per Share As of 06/30/19 | ||||||
| Core Laboratories N.V. | $ | (1,119,640 | ) | $ | (0.29 | ) | ||
| Healthcare Services Group, Inc. | (577,746 | ) | (0.15 | ) | ||||
| WageWorks, Inc. | (315,824 | ) | (0.08 | ) | ||||
| Watsco, Inc. | (296,476 | ) | (0.08 | ) | ||||
| LKQ Corp. | (221,488 | ) | (0.06 | ) | ||||
| $ | (2,531,174 | ) | $ | (0.66 | ) | |||
FIVE LARGEST EQUITY HOLDINGS
JUNE 30, 2019
| Quantity | Security | Total Cost | Market Value | Percent of Net Assets of the Fund | ||||||||||||
| 36,962 | Verisk Analytics, Inc. | $ | 3,464,425 | $ | 5,413,455 | 5.34 | % | |||||||||
| 26,132 | Ecolab, Inc. | 3,487,055 | 5,159,502 | 5.09 | ||||||||||||
| 20,438 | Tyler Technologies, Inc. | 3,523,471 | 4,415,017 | 4.35 | ||||||||||||
| 3,955 | Markel Corp. | 3,612,494 | 4,309,368 | 4.24 | ||||||||||||
| 30,398 | Vulcan Materials Co. | 3,563,999 | 4,173,949 | 4.11 | ||||||||||||
| $ | 17,651,444 | $ | 23,471,291 | 23.13 | % | |||||||||||
| DF DENT GROWTH FUNDS |
DF DENT MIDCAP GROWTH FUND
A MESSAGE TO OUR SHAREHOLDERS (Unaudited)
JUNE 30, 2019
As always, we acknowledge the responsibility you have conveyed by making your investment in the DF Dent Midcap Growth Fund and will work diligently on your behalf.
Respectively Submitted,
 | 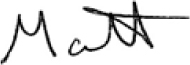 |
| Thomas F. O’Neil, Jr. | Matthew F. Dent |
 |  |
| Gary D. Mitchell | Bruce L. Kennedy |
| * | The determination of “best-in-class” is solely the opinion of the Fund’s Adviser, and such opinion is subject to change. Those companies that hold leading market share positions, strong growth potential, historically good profitability, and management teams known for integrity and good corporate governance are generally considered to be “best-in-class.” |
IMPORTANT INFORMATION:
Investing involves risks, including the possible loss of principal. The Fund invests in small- and medium- size companies, which carry greater risk than is customarily associated with larger, more established companies. With non-diversification risk, the Fund will typically invest in securities of fewer issuers, which exposes the Fund to greater market risk. Investing in American Depositary Receipts (ADRs) carries risks of political and financial instability, less liquidity and greater volatility, as well as risks associated with the lack of reliable accounting and financial information. The Fund is also subject to other risks, such as the risk associated with investing in Real Estate Investment Trusts (REITs) like possible real estate market declines, which are detailed in the Fund’s prospectus.
The Russell Midcap Growth Index measures the performance of the mid-cap growth segment of the U.S. equity universe. It includes those Russell Midcap Index companies with higher price-to-book ratios and higher forecasted growth values. One cannot invest directly in an index. Price-to-earnings (“P/E”) ratio is the valuation of a company’s current share price relative to company earnings. Earnings-per-share (“EPS”) is the portion of a company's profit allocated to each outstanding share of common stock.
| DF DENT GROWTH FUNDS |
DF DENT MIDCAP GROWTH FUND
A MESSAGE TO OUR SHAREHOLDERS (Unaudited)
JUNE 30, 2019
The views in this report contained herein were those of the Fund’s Adviser as of June 30, 2019, and may not reflect the Adviser’s views on the date this report is first published or anytime thereafter. This report may contain discussions about certain investments both held and not held in the portfolio as of the report date. All current and future holdings are subject to risk and are subject to change. While these views are intended to assist shareholders in understanding their investment in the Fund, they do not constitute investment or tax advice, are not a guarantee of future performance and are not intended as an offer or solicitation with respect to the purchase or sale of any security.
| DF DENT GROWTH FUNDS |
DF DENT MIDCAP GROWTH FUND
PERFORMANCE CHART AND ANALYSIS (Unaudited)
JUNE 30, 2019
The following chart reflects the change in the value of a hypothetical $10,000 investment, including reinvested dividends and distributions, in the DF Dent Midcap Growth Fund (the “Fund”) compared with the performance of the benchmark, the Russell Midcap Growth Index (“Russell Midcap Growth”), since inception. The Russell Midcap Growth measures the performance of the mid-cap growth segment of the U.S. equity universe. It includes those Russell Midcap Index companies with higher price-to-book ratios and higher forecasted growth values. The total return of the index includes the reinvestment of dividends and income. The total return of the Fund includes operating expenses that reduce returns, while the total return of the index does not include expenses. The Fund is professionally managed, while the index is unmanaged and is not available for investment.
Comparison of Change in Value of a $10,000 Investment
DF Dent Midcap Growth Fund vs. Russell Midcap Growth Index

| Average Annual Total Returns Periods Ended June 30, 2019 | One Year | Five Year | Since Inception (07/01/11)(1) | |||||||||
| DF Dent Midcap Growth Fund - Investor Shares | 20.27 | % | 13.35 | % | 14.68 | % | ||||||
| DF Dent Midcap Growth Fund - Institutional Shares(2) | 20.45 | % | 13.39 | % | 14.71 | % | ||||||
| Russell Midcap Growth Index | 13.94 | % | 11.10 | % | 12.16 | % | ||||||
| (1) | Investor Shares commenced operations on July 1, 2011 and Institutional Shares commenced operations on November 29, 2017. |
| (2) | Performance for the five year, and since inception periods are a blended average annual return, which include the returns of the Investor Shares prior to the commencement of the Institutional Shares. |
Performance data quoted represents past performance and is no guarantee of future results. Current performance may be lower or higher than the performance data quoted. Investment return and principal value will fluctuate so that shares, when redeemed, may be worth more or less than original cost. As stated in the Fund’s prospectus, the annual operating expense ratios (gross) for Investor Shares and Institutional Shares are 1.31% and 1.27%, respectively. However, the Fund’s adviser has contractually agreed to waive its fee and/or reimburse Fund expenses to limit Total Annual Fund Operating Expenses After Fee Waiver and/or Expense Reimbursement (excluding all taxes, interest, portfolio transaction expenses, and extraordinary expenses) to 0.98% and 0.85% of Investor Shares and Institutional Shares, respectively, through October 31, 2019 (the “Expense Cap”). The Expense Cap may be raised or eliminated only with the consent of the Board of Trustees. The adviser may be reimbursed by the Fund for fees waived and expenses reimbursed by the adviser pursuant to the Expense Cap if such payment is made within three years of the fee waiver or expense reimbursement and does not cause the Total Annual Fund Operating Expenses
| DF DENT GROWTH FUNDS |
DF DENT MIDCAP GROWTH FUND
PERFORMANCE CHART AND ANALYSIS (Unaudited)
JUNE 30, 2019
After Fee Waiver and/or Expense Reimbursement to exceed the lesser of (i) the then-current Expense Cap and (ii) the Expense Cap in place at the time the fees/expenses were waived/reimbursed. Total Annual Fund Operating Expenses After Fee Waiver and/or Expense Reimbursement will increase if exclusions from the Expense Cap apply. During the period, certain fees were waived and/or expenses reimbursed; otherwise, returns would have been lower. Shares redeemed within 60 days of purchase will be charged a 2.00% redemption fee. The performance table and graph do not reflect the deduction of taxes that a shareholder would pay on Fund distributions or the redemption of Fund shares. Returns greater than one year are annualized. For the most recent month-end performance, please call (866) 233-3368.
| DF DENT GROWTH FUNDS |
DF DENT MIDCAP GROWTH FUND
SCHEDULE OF INVESTMENTS
JUNE 30, 2019
| Shares | Security Description | Value | ||||||
| Common Stock - 94.9% | ||||||||
| Consumer Discretionary - 2.7% | ||||||||
| 31,848 | CarMax, Inc. (a) | $ | 2,765,362 | |||||
| Energy - 1.2% | ||||||||
| 22,778 | Core Laboratories NV | 1,190,834 | ||||||
| Financials - 8.5% | ||||||||
| 3,955 | Markel Corp. (a) | 4,309,368 | ||||||
| 19,009 | Moody's Corp. | 3,712,648 | ||||||
| 10,271 | SEI Investments Co. | 576,203 | ||||||
| 8,598,219 | ||||||||
| Health Care - 10.9% | ||||||||
| 16,442 | Bio-Techne Corp. | 3,427,992 | ||||||
| 9,898 | Illumina, Inc. (a) | 3,643,949 | ||||||
| 3,665 | Intuitive Surgical, Inc. (a) | 1,922,476 | ||||||
| 6,336 | Teleflex, Inc. | 2,098,166 | ||||||
| 11,092,583 | ||||||||
| Industrials - 27.3% | ||||||||
| 4,970 | CoStar Group, Inc. (a) | 2,753,678 | ||||||
| 91,981 | Fastenal Co. | 2,997,661 | ||||||
| 20,492 | Genesee & Wyoming, Inc., Class A (a) | 2,049,200 | ||||||
| 62,411 | Healthcare Services Group, Inc. | 1,892,301 | ||||||
| 10,395 | Roper Technologies, Inc. | 3,807,273 | ||||||
| 7,289 | TransDigm Group, Inc. (a) | 3,526,418 | ||||||
| 23,441 | TransUnion | 1,723,148 | ||||||
| 36,962 | Verisk Analytics, Inc. | 5,413,455 | ||||||
| 37,480 | Waste Connections, Inc. | 3,582,338 | ||||||
| 27,745,472 | ||||||||
| Information Technology - 27.9% | ||||||||
| 19,817 | ANSYS, Inc. (a) | 4,058,918 | ||||||
| 51,437 | Black Knight, Inc. (a) | 3,093,936 | ||||||
| 69,647 | Blackline, Inc. (a) | 3,726,811 | ||||||
| 75,126 | Brooks Automation, Inc. | 2,911,133 | ||||||
| 25,366 | Envestnet, Inc. (a) | 1,734,273 | ||||||
| 12,549 | Okta, Inc. (a) | 1,549,927 | ||||||
| 55,661 | PROS Holdings, Inc. (a) | 3,521,115 | ||||||
| 13,841 | Qualys, Inc. (a) | 1,205,274 | ||||||
| 45,866 | Trimble, Inc. (a) | 2,069,015 | ||||||
| 20,438 | Tyler Technologies, Inc. (a) | 4,415,017 | ||||||
| 28,285,419 | ||||||||
| Materials - 9.2% | ||||||||
| 26,132 | Ecolab, Inc. | 5,159,502 | ||||||
| 30,398 | Vulcan Materials Co. | 4,173,949 | ||||||
| 9,333,451 | ||||||||
| Shares | Security Description | Value | ||||||
| Real Estate - 7.2% | ||||||||
| 68,417 | CBRE Group, Inc., Class A (a) | $ | 3,509,792 | |||||
| 16,731 | SBA Communications Corp. REIT (a) | 3,761,798 | ||||||
| 7,271,590 | ||||||||
| Total Common Stock (Cost $68,318,890) | 96,282,930 | |||||||
| Investments, at value - 94.9% (Cost $ 68,318,890) | $ | 96,282,930 | ||||||
| Other Assets & Liabilities, Net - 5.1% | 5,174,153 | |||||||
| Net Assets - 100.0% | $ | 101,457,083 | ||||||
| REIT | Real Estate Investment Trust |
| (a) | Non-income producing security. |
The following is a summary of the inputs used to value the Fund's investments as of June 30, 2019.
The inputs or methodology used for valuing securities are not necessarily an indication of the risks associated with investing in those securities. For more information on valuation inputs, and their aggregation into the levels used in the table below, please refer to the Security Valuation section in Note 2 of the accompanying Notes to Financial Statements.
| Valuation Inputs | Investments in Securities | |||
| Level 1 - Quoted Prices | $ | 96,282,930 | ||
| Level 2 - Other Significant Observable Inputs | – | |||
| Level 3 - Significant Unobservable Inputs | – | |||
| Total | $ | 96,282,930 | ||
The Level 1 value displayed in this table is Common Stock. Refer to this Schedule of Investments for a further breakout of each security by industry.
| See Notes to Financial Statements. | DF DENT GROWTH FUNDS |
DF DENT MIDCAP GROWTH FUND
SCHEDULE OF INVESTMENTS
JUNE 30, 2019
| PORTFOLIO HOLDINGS (Unaudited) | ||||
| % of Total Net Assets | ||||
| Consumer Discretionary | 2.7 | % | ||
| Energy | 1.2 | % | ||
| Financials | 8.5 | % | ||
| Health Care | 10.9 | % | ||
| Industrials | 27.3 | % | ||
| Information Technology | 27.9 | % | ||
| Materials | 9.2 | % | ||
| Real Estate | 7.2 | % | ||
| Other Assets & Liabilities, Net | 5.1 | % | ||
| 100.0 | % | |||
| See Notes to Financial Statements. | DF DENT GROWTH FUNDS |
DF DENT MIDCAP GROWTH FUND
STATEMENT OF ASSETS AND LIABILITIES
JUNE 30, 2019
| ASSETS | ||||
| Investments, at value (Cost $68,318,890) | $ | 96,282,930 | ||
| Cash | 5,610,962 | |||
| Receivables: | ||||
| Fund shares sold | 412,382 | |||
| Dividends and interest | 14,107 | |||
| Prepaid expenses | 24,902 | |||
| Total Assets | 102,345,283 | |||
| LIABILITIES | ||||
| Payables: | ||||
| Investment securities purchased | 695,176 | |||
| Accrued Liabilities: | ||||
| Investment adviser fees | 160,457 | |||
| Trustees’ fees and expenses | 60 | |||
| Fund services fees | 7,205 | |||
| Other expenses | 25,302 | |||
| Total Liabilities | 888,200 | |||
| NET ASSETS | $ | 101,457,083 | ||
| COMPONENTS OF NET ASSETS | ||||
| Paid-in capital | $ | 72,097,771 | ||
| Distributable earnings | 29,359,312 | |||
| NET ASSETS | $ | 101,457,083 | ||
| SHARES OF BENEFICIAL INTEREST AT NO PAR VALUE (UNLIMITED SHARES AUTHORIZED) | ||||
| Investor Shares | 2,259,830 | |||
| Institutional Shares | 1,665,292 | |||
| NET ASSET VALUE, OFFERING AND REDEMPTION PRICE PER SHARE* | ||||
| Investor Shares (based on net assets of $58,367,365) | $ | 25.83 | ||
| Institutional Shares (based on net assets of $43,089,718) | $ | 25.88 | ||
| * | Shares redeemed or exchanged within 60 days of purchase are charged a 2.00% redemption fee. |
| See Notes to Financial Statements. | DF DENT GROWTH FUNDS |
DF DENT MIDCAP GROWTH FUND
STATEMENT OF OPERATIONS
YEAR ENDED JUNE 30, 2019
| INVESTMENT INCOME | ||||
| Dividend income (Net of foreign withholding taxes of $7,788) | $ | 321,114 | ||
| Interest income | 12,281 | |||
| Total Investment Income | 333,395 | |||
| EXPENSES | ||||
| Investment adviser fees | 481,450 | |||
| Fund services fees | 145,349 | |||
| Transfer agent fees: | ||||
| Investor Shares | 2,453 | |||
| Institutional Shares | 613 | |||
| Custodian fees | 7,513 | |||
| Registration fees: | ||||
| Investor Shares | 14,032 | |||
| Institutional Shares | 5,288 | |||
| Professional fees | 33,278 | |||
| Trustees' fees and expenses | 4,516 | |||
| Other expenses | 23,127 | |||
| Total Expenses | 717,619 | |||
| Fees waived | (129,786 | ) | ||
| Net Expenses | 587,833 | |||
| NET INVESTMENT LOSS | (254,438 | ) | ||
| NET REALIZED AND UNREALIZED GAIN (LOSS) | ||||
| Net realized gain on investments | 2,193,690 | |||
| Net change in unrealized appreciation (depreciation) on investments | 12,265,389 | |||
| NET REALIZED AND UNREALIZED GAIN | 14,459,079 | |||
| INCREASE IN NET ASSETS RESULTING FROM OPERATIONS | $ | 14,204,641 | ||
| See Notes to Financial Statements. | DF DENT GROWTH FUNDS |
DF DENT MIDCAP GROWTH FUND
STATEMENTS OF CHANGES IN NET ASSETS
| For the Years Ended June 30, | ||||||||
| 2019 | 2018 | |||||||
| OPERATIONS | ||||||||
| Net investment loss | $ | (254,438 | ) | $ | (205,101 | ) | ||
| Net realized gain | 2,193,690 | 2,614,485 | ||||||
| Net change in unrealized appreciation (depreciation) | 12,265,389 | 6,133,775 | ||||||
| Increase in Net Assets Resulting from Operations | 14,204,641 | 8,543,159 | ||||||
| DISTRIBUTIONS TO SHAREHOLDERS | ||||||||
| Investor Shares | (927,806 | ) | (115,823 | ) | ||||
| Institutional Shares | (870,857 | ) | (6,662 | ) | ||||
| Total Distributions Paid | (1,798,663 | ) | (122,485 | )* | ||||
| CAPITAL SHARE TRANSACTIONS | ||||||||
| Sale of shares: | ||||||||
| Investor Shares | 36,718,218 | 4,948,011 | ||||||
| Institutional Shares | 9,283,854 | 25,947,396 | ** | |||||
| Reinvestment of distributions: | ||||||||
| Investor Shares | 917,844 | 115,022 | ||||||
| Institutional Shares | 870,526 | 6,662 | ||||||
| Redemption of shares: | ||||||||
| Investor Shares | (5,315,919 | ) | (27,751,122 | )**† | ||||
| Institutional Shares | (577,514 | ) | (205,000 | ) | ||||
| Redemption fees: | ||||||||
| Investor Shares | 19,147 | 128 | ||||||
| Institutional Shares | 837 | 7 | ||||||
| Increase in Net Assets from Capital Share Transactions | 41,916,993 | 3,061,104 | ||||||
| Increase in Net Assets | 54,322,971 | 11,481,778 | ||||||
| NET ASSETS | ||||||||
| Beginning of Year | 47,134,112 | 35,652,334 | ||||||
| End of Year | $ | 101,457,083 | $ | 47,134,112 | *** | |||
| SHARE TRANSACTIONS | ||||||||
| Sale of shares: | ||||||||
| Investor Shares | 1,553,490 | 239,771 | ||||||
| Institutional Shares | 427,037 | 1,230,843 | ** | |||||
| Reinvestment of distributions: | ||||||||
| Investor Shares | 45,371 | 5,641 | ||||||
| Institutional Shares | 42,989 | 327 | ||||||
| Redemption of shares: | ||||||||
| Investor Shares | (239,339 | ) | (1,317,274 | )** | ||||
| Institutional Shares | (26,315 | ) | (9,589 | ) | ||||
| Increase in Shares | 1,803,233 | 149,719 | ||||||
| * | Distribution for June 30, 2018 was the result of net realized gain. |
| ** | The above figures include transfers of $22,215,893 and 1,061,695 and 1,061,432 shares from the Investor Shares to Institutional Shares, respectively, as a result of the newly offered share class. |
| † | This amount includes $1,278,233 from an in-kind redemption for the year ended June 30, 2018. |
| *** | Includes undistributed net investment income of $5,845 at June 30, 2018. The requirement to disclose the corresponding amount as of June 30, 2019 was eliminated. |
| See Notes to Financial Statements. | DF DENT GROWTH FUNDS |
DF DENT MIDCAP GROWTH FUND
FINANCIAL HIGHLIGHTS
These financial highlights reflect selected data for a share outstanding throughout each year.
| For the Years Ended June 30, | ||||||||||||||||||||
| 2019 | 2018 | 2017 | 2016 | 2015 | ||||||||||||||||
| INVESTOR SHARES | ||||||||||||||||||||
| NET ASSET VALUE, Beginning of Year | $ | 22.21 | $ | 18.08 | $ | 15.37 | $ | 16.27 | $ | 15.46 | ||||||||||
| INVESTMENT OPERATIONS | ||||||||||||||||||||
| Net investment loss (a) | (0.11 | ) | (0.11 | ) | (0.09 | ) | (0.11 | ) | (0.10 | ) | ||||||||||
| Net realized and unrealized gain (loss) | 4.41 | 4.30 | 2.81 | (0.31 | ) | 1.57 | ||||||||||||||
| Total from Investment Operations | 4.30 | 4.19 | 2.72 | (0.42 | ) | 1.47 | ||||||||||||||
| DISTRIBUTIONS TO SHAREHOLDERS FROM | ||||||||||||||||||||
| Net realized gain | (0.69 | ) | (0.06 | ) | (0.01 | ) | (0.48 | ) | (0.66 | ) | ||||||||||
| Total Distributions to Shareholders | (0.69 | ) | (0.06 | ) | (0.01 | ) | (0.48 | ) | (0.66 | ) | ||||||||||
| REDEMPTION FEES(a) | 0.01 | 0.00 | (b) | – | – | – | ||||||||||||||
| NET ASSET VALUE, End of Year | $ | 25.83 | $ | 22.21 | $ | 18.08 | $ | 15.37 | $ | 16.27 | ||||||||||
| TOTAL RETURN | 20.27 | % | 23.21 | % | 17.74 | % | (2.49 | )% | 9.97 | % | ||||||||||
| RATIOS/SUPPLEMENTARY DATA | ||||||||||||||||||||
| Net Assets at End of Year (000s omitted) | $ | 58,367 | $ | 19,993 | $ | 35,652 | $ | 23,963 | $ | 22,757 | ||||||||||
| Ratios to Average Net Assets: | ||||||||||||||||||||
| Net investment loss | (0.46 | )% | (0.52 | )% | (0.55 | )% | (0.71 | )% | (0.65 | )% | ||||||||||
| Net expenses | 0.98 | % | 1.01 | % | 1.10 | % | 1.10 | % | 1.10 | % | ||||||||||
| Gross expenses (c) | 1.13 | % | 1.40 | % | 1.68 | % | 1.82 | % | 1.84 | % | ||||||||||
| PORTFOLIO TURNOVER RATE | 29 | % | 32 | % | 31 | % | 29 | % | 45 | % | ||||||||||
| (a) | Calculated based on average shares outstanding during each year. |
| (b) | Less than $0.01 per share. |
| (c) | Reflects the expense ratio excluding any waivers and/or reimbursements. |
| See Notes to Financial Statements. | DF DENT GROWTH FUNDS |
DF DENT MIDCAP GROWTH FUND
FINANCIAL HIGHLIGHTS
These financial highlights reflect selected data for a share outstanding throughout each period.
| For the Year Ended June 30, 2019 | November 29, 2017 (a) Through June 30, 2018 | |||||||
| INSTITUTIONAL SHARES | ||||||||
| NET ASSET VALUE, Beginning of Period | $ | 22.22 | $ | 20.56 | ||||
| INVESTMENT OPERATIONS | ||||||||
| Net investment loss (b) | (0.08 | ) | (0.05 | ) | ||||
| Net realized and unrealized gain | 4.43 | 1.77 | ||||||
| Total from Investment Operations | 4.35 | 1.72 | ||||||
| DISTRIBUTIONS TO SHAREHOLDERS FROM | ||||||||
| Net realized gain | (0.69 | ) | (0.06 | ) | ||||
| Total Distributions to Shareholders | (0.69 | ) | (0.06 | ) | ||||
| REDEMPTION FEES(b) | 0.00 | (c) | 0.00 | (c) | ||||
| NET ASSET VALUE, End of Period | $ | 25.88 | $ | 22.22 | ||||
| TOTAL RETURN | 20.45 | % | 8.40 | %(d) | ||||
| RATIOS/SUPPLEMENTARY DATA | ||||||||
| Net Assets at End of Period (000s omitted) | $ | 43,090 | $ | 27,141 | ||||
| Ratios to Average Net Assets: | ||||||||
| Net investment loss | (0.33 | )% | (0.36 | )%(e) | ||||
| Net expenses | 0.85 | % | 0.85 | %(e) | ||||
| Gross expenses (f) | 1.11 | % | 1.27 | %(e) | ||||
| PORTFOLIO TURNOVER RATE | 29 | % | 32 | %(d) | ||||
| (a) | Commencement of operations. |
| (b) | Calculated based on average shares outstanding during each period. |
| (c) | Less than $0.01 per share. |
| (d) | Not annualized. |
| (e) | Annualized. |
| (f) | Reflects the expense ratio excluding any waivers and/or reimbursements. |
| See Notes to Financial Statements. | DF DENT GROWTH FUNDS |
DF DENT SMALL CAP GROWTH FUND
A MESSAGE TO OUR SHAREHOLDERS (Unaudited)
JUNE 30, 2019
Dear Fellow Shareholders:
Performance
For the fiscal year ended June 30, 2019, the DF Dent Small Cap Growth Fund (the “Fund”) experienced a total return of +15.01% for Investor Shares and +15.20% for Institutional Shares. This return is net of fees and represents outperformance of 15.50% and 15.69% respectively relative to the total return of -0.49% for the Russell 2000 Growth Index (the “Index”), which is the benchmark we use for performance comparisons.
Expense Ratio
The gross operating expense ratio for the Fund is currently 3.09% for Investor Shares and 2.91% for Institutional Shares which is high given the small size of Fund assets relative to certain fixed expenses. However, per the Fund’s prospectus, your Fund’s investment Adviser has contractually agreed to reimburse expenses and/or waive a portion of its fees so as to maintain your expense ratio at a net 1.05% for Investor Shares and 0.95% for Institutional Shares through October 31, 2019.
Concentration
The Fund’s concentration in its top 10 holdings is as follows:
| Top 10 Holdings | 06/30/19 | |||
| % of the Fund | 31.92 | % | ||
| Average Position Size of Top 10 | 3.19 | % | ||
We believe that the concentration in the Fund’s top 10 positions is appropriate at its current level and has the potential to enhance long-term performance.
Management Ownership of Fund
Employees, their families, and the Adviser’s retirement plan owned approximately 39% of the Fund as of June 30, 2019.
Portfolio Commentary
While pleased with the fact that the Fund out-performed the Index by over 1500 basis points (15.00%) in the past 12 months, we at DF Dent are resolutely focused on the long-term. We believe good long-term investment performance can be partially attributed to a well-refined investment process executed with diligence and discipline. That is why, we continue to focus on finding good publicly traded companies to continuously upgrade our portfolio holdings and exercising analytical and behavioral discipline to improve the Fund’s portfolio construction. Investors who have read our past reports know that we invest in “best-in-class”* companies that are managed by talented and ethical leaders, that have dominant and durable business models, and that generate significant free cash flow over time that can be prudently allocated for the potential benefit of
| DF DENT GROWTH FUNDS |
DF DENT SMALL CAP GROWTH FUND
A MESSAGE TO OUR SHAREHOLDERS (Unaudited)
JUNE 30, 2019
shareholders. Regardless of whether the market goes up or down from here, we will continue to stick to our research process and do the research blocking and tackling that we believe is the only path to good long-term performance.
At D.F. Dent, we spend significant time traveling to visit companies and to meet with management teams. These trips are vital to our research process given our emphasis on finding ethical and talented management teams running high quality businesses. Going to company headquarters helps us determine if a management team is exceptional. These visits allow us to observe how they operate, interact with their team, treat employees, and think about growth opportunities.
We recently had a team of portfolio managers and analysts travel to visit two companies. They saw two very different companies managed by very different types of leaders. Company A has a strong core product that is essentially a monopoly. The company also has significant momentum in new products which expand its market and should lead to a larger, more stable, and more profitable business over time. While we have a generally favorable view of the business, we are less impressed with management. We believe management’s strategy and recent execution have been sound, but we have concerns related to ego, aggressiveness, and lack of frugality. In addition to concerns around valuation, these misgivings reduce our confidence in the stock and, as such, we have opted to pass on investing in the company.
Company B has slower growth than Company A, but we believe it is an excellent business with a wide moat. There is a secular tailwind to the business and significant share gain potential, which we believe should lead to steady, repeatable growth for many years. Importantly, the favorable view of management we have developed throughout our research was reinforced in our meeting. Management articulates a clear strategy, and their operational expertise and execution have been commendable. We were also impressed by their humility and cultivation of a strong corporate culture. They are the type of people we would be proud to tell our clients that we have entrusted with their money. This seems to be a clear D.F. Dent company, and our only question is whether current valuation offers a sufficient risk-adjusted expected return.
These road trips are valuable because they allow us visit companies and see management in person. It is a continuous process of critical thinking comparing our existing portfolio names to companies we don’t own. The result is a portfolio of high quality growth companies run by excellent management teams, which we believe will outperform the general market over the long term.
The following companies are three of the best contributors to the Fund’s recent performance. We thought highlighting them would give you a sense of not only why we have invested in them on your behalf, but also why they have outperformed recently.
| • | PROS Holdings, Inc. (PRO) is a leading provider of pricing and revenue optimization software to businesses. Its stock performed well in the past year as the company continues its successful business model transition from software license sales toward a cloud-based subscription model. PRO reported strong quarterly results in the past 12 months demonstrating that business growth is accelerating after two years of slower growth caused the business model transition. These results, combined with our |
| DF DENT GROWTH FUNDS |
DF DENT SMALL CAP GROWTH FUND
A MESSAGE TO OUR SHAREHOLDERS (Unaudited)
JUNE 30, 2019
favorable checks with PRO’s customers, service as a strong validation of management’s vision for the business’ future. We continue to have confidence in PRO and see its core offerings as extraordinarily well-positioned for secular growth.
| • | HEICO Corp. (HEI) designs and manufactures aerospace, defense, and electronic products. The company performed well in the past year because its business has been “firing on all cylinders,” as strong organic growth, healthy profit margin expansion are combined with very active acquisition activities. In fact, management commented that the business is currently the strongest they have ever seen in the company’s 29 year history. As a result, the company reported better than expected financial results and raised its future outlook several quarters in a row, leading to strong stock performance. Over the long-term, we continue to believe HEICO is a well operated business based on proven strategies by an excellent management team. |
| • | Okta, Inc. (OKTA) is a leader in the Identity and Access Management (IAM) industry. We initiated our position in Okta in late 2018, taking advantage of a market dislocation during which many high quality technology stocks saw significant decline in share price. OKTA has since out-performed the market significantly as the company reported significant acceleration in the number of large customer signing contracts with high contract value. In addition, the rollout of new product offerings has the potential to significantly increase the company’s addressable market and sustain its trend of strong growth. Furthermore, management also executed well on Okta’s operational strategy while continuing to integrate tuck-in acquisitions that enhance customer value proposition and reduce churn. We believe Okta is very well-positioned to maintain its leadership in the nascent IAM industry and grow its revenues and earnings power at an attractive rate for a long period of time. |
Attribution Analysis
In the 12-month period ending June 30, 2019, your Fund’s outperformance can be attributed to both stock selection and sector allocation.
Your Fund was over-weighted versus the Index in the Consumer Staples, Communication Services, Industrials, and Information Technology sectors. In Industrials and Information Technology, both the over-weighting and stock selection contributed to performance. In Consumer Staples and Communication Services, over-weighting detracted from performance and stock selection contributed to performance.
Your Fund was under-weighted versus the Index in the Consumer Discretionary, Financials, and Health Care sectors. In Consumer Discretionary, the under-weighting detracted from performance but stock selection contributed to performance. In Financials and Health Care, both the under-weighting and stock selection contributed to performance. Your Fund did not hold any positions in the Energy, Materials, Communication Services sectors which contributed to its performance compared to the Index. Your Fund also did not hold any positions in the Real Estate and Utilities sectors which detracted slightly from performance compared to the Index.
| DF DENT GROWTH FUNDS |
DF DENT SMALL CAP GROWTH FUND
A MESSAGE TO OUR SHAREHOLDERS (Unaudited)
JUNE 30, 2019
Sector Weights
The following bar chart presents the sector weightings of your Fund versus the sector weightings of the Index as of June 30, 2019 (note this may differ slightly with the commentary above, which relates to average weightings as opposed to year-end weightings):
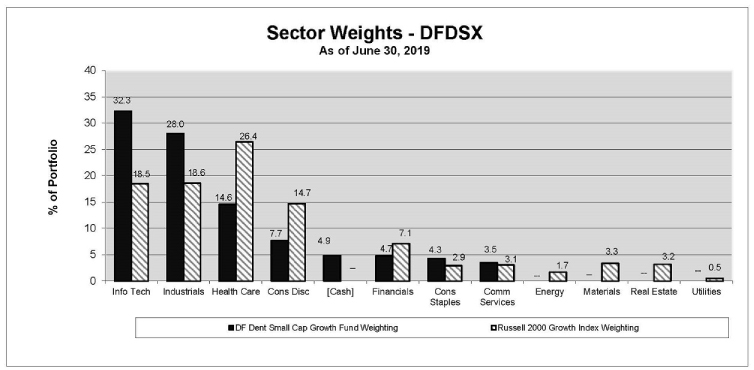
Source: FactSet
Best and Worst Performers
Five Best Contributors
| Investments | Fund Net Realized and Unrealized Appreciation and Income in Fiscal Year 2019 | Fund Per Share As of 06/30/19 | ||||||
| PROS Holdings, Inc. | $ | 353,055 | $ | 0.32 | ||||
| HEICO Corp., Class A | 313,503 | 0.28 | ||||||
| Okta, Inc. | 225,338 | 0.20 | ||||||
| Bio-Techne Corp. | 193,900 | 0.17 | ||||||
| John Bean Technologies Corp. | 192,159 | 0.17 | ||||||
| $ | 1,277,955 | $ | 1.14 | |||||
| DF DENT GROWTH FUNDS |
DF DENT SMALL CAP GROWTH FUND
A MESSAGE TO OUR SHAREHOLDERS (Unaudited)
JUNE 30, 2019
Five Worst Contributors
| Investments | Fund Net Realized and Unrealized Loss and Income in Fiscal Year 2019 | Fund Per Share As of 06/30/19 | ||||||
| Healthcare Services Group, Inc. | $ | (179,981 | ) | $ | (0.16 | ) | ||
| AAC Holdings, Inc. | (120,574 | ) | (0.11 | ) | ||||
| Carriage Services, Inc. | (98,404 | ) | (0.09 | ) | ||||
| Eventbrite, Inc., Class A | (81,556 | ) | (0.07 | ) | ||||
| Ellie Mae. Inc. | (55,380 | ) | (0.05 | ) | ||||
| $ | (535,895 | ) | $ | (0.48 | ) | |||
FIVE LARGEST EQUITY HOLDINGS
JUNE 30, 2019
| Quantity | Security | Total Cost | Market Value | Percent of Net Assets of the Fund | ||||||||||||
| 3,579 | Tyler Technologies, Inc. | $ | 534,634 | $ | 773,136 | 4.05 | % | |||||||||
| 6,718 | HEICO Corp., Class A | 216,952 | 694,440 | 3.64 | ||||||||||||
| 10,677 | PROS Holdings, Inc. | 161,036 | 675,427 | 3.54 | ||||||||||||
| 3,007 | Bio-Teche Corp. | 367,369 | 626,930 | 3.28 | ||||||||||||
| 11,225 | Blackline, Inc. | 356,727 | 600,650 | 3.15 | ||||||||||||
| $ | 1,636,718 | $ | 3,370,583 | 17.66 | % | |||||||||||
As always, we appreciate the confidence you have placed in D.F. Dent and Company and are conscious of the responsibility that you have entrusted to us. We will continue to work diligently on your behalf.
Respectively Submitted,
 |  | |
| Matthew F. Dent | Gary Wu |
| * | The determination of “best-in-class” is solely the opinion of the Fund’s Adviser, and such opinion is subject to change. Those companies that hold leading market share positions, strong growth potential, historically good profitability, and management teams known for integrity and good corporate governance are generally considered to be “best in class.” |
IMPORTANT INFORMATION:
Investing involves risks, including the possible loss of principal. The Fund invests in small- and medium-size companies, which carry greater risk than is customarily associated with larger, more established companies.
| DF DENT GROWTH FUNDS |
DF DENT SMALL CAP GROWTH FUND
A MESSAGE TO OUR SHAREHOLDERS (Unaudited)
JUNE 30, 2019
With non-diversification risk, the Fund will typically invest in securities of fewer issuers, which exposes the Fund to greater market risk. Investing in American Depositary Receipts (ADRs) carries risks of political and financial instability, less liquidity and greater volatility, as well as risks associated with the lack of reliable accounting and financial information. The Fund is also subject to other risks, such as the risk associated with Real Estate Investment Trusts (REITs) like possible real estate market declines, which are detailed in the Fund’s prospectus.
The Russell 2000 Growth Index measures the performance of the small-cap growth segment of the U.S. equity universe. One cannot invest directly in an index.
The views in this report contained herein were those of the Fund’s Adviser as of June 30, 2019, and may not reflect the Adviser’s views on the date this report is first published or anytime thereafter. This report may contain discussions about certain investments both held and not held in the portfolio as of the report date. All current and future holdings are subject to risk and are subject to change. While these views are intended to assist shareholders in understanding their investment in the Fund, they do not constitute investment or tax advice, are not a guarantee of future performance and are not intended as an offer or solicitation with respect to the purchase or sale of any security.
| DF DENT GROWTH FUNDS |
DF DENT SMALL CAP GROWTH FUND
PERFORMANCE CHART AND ANALYSIS (Unaudited)
JUNE 30, 2019
The following chart reflects the change in the value of a hypothetical $10,000 investment, including reinvested dividends and distributions, in the DF Dent Small Cap Growth Fund (the “Fund”) compared with the performance of the benchmark, the Russell 2000 Growth Index (“Russell 2000 Growth”), since inception. The Russell 2000 Growth, the Fund‘s primary performance benchmark, measures the performance of those Russell 2000 Growth companies with higher price-to-value ratios and higher forecasted growth values. The total return of the index includes the reinvestment of dividends and income. The total return of the Fund includes operating expenses that reduce returns, while the total return of the index does not include expenses. The Fund is professionally managed, while the index is unmanaged and is not available for investment.
Comparison of Change in Value of a $10,000 Investment
DF Dent Small Cap Growth Fund vs. Russell 2000 Growth Index
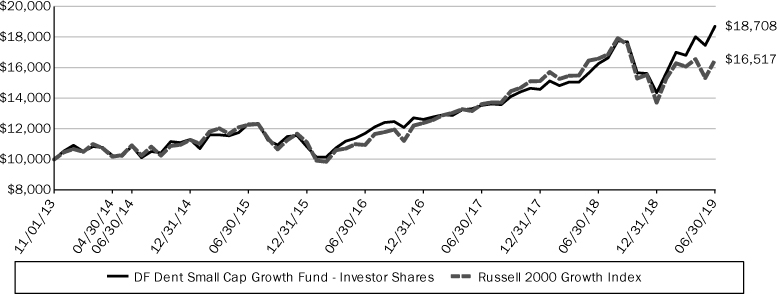
| Average Annual Total Returns Periods Ended June 30, 2019 | One Year | Five Year | Since Inception (11/01/13)(1) | |||||||||
| DF Dent Small Cap Growth Fund - Investor Shares | 15.01 | % | 11.47 | % | 11.70 | % | ||||||
| DF Dent Small Cap Growth Fund - Institutional Shares(2) | 15.20 | % | 11.51 | % | 11.74 | % | ||||||
| Russell 2000 Growth Index | -0.49 | % | 8.63 | % | 9.27 | % | ||||||
| (1) | Investor Shares commenced operations on November 1, 2013 and Institutional Shares commenced operations on November 20, 2017. |
| (2) | Performance for the five year and since inception periods are a blended average annual return, which include the returns of the Investor Shares prior to the commencement of the Institutional Shares. |
Performance data quoted represents past performance and is no guarantee of future results. Current performance may be lower or higher than the performance data quoted. Investment return and principal value will fluctuate so that shares, when redeemed, may be worth more or less than original cost. As stated in the Fund’s prospectus, the annual operating expense ratios (gross) for Investor Shares and Institutional Shares are 3.09% and 2.91%, respectively. However, the Fund’s adviser has contractually agreed to waive its fee and/or reimburse Fund expenses to limit Total Annual Fund Operating Expenses After Fee Waiver and/or Expense Reimbursement (excluding all taxes, interest, portfolio transaction expenses, and extraordinary expenses) to 1.05% and 0.95% of Investor Shares and Institutional Shares, respectively, through October 31, 2019 (the “Expense Cap”). The Expense Cap may be raised or eliminated only with the consent of the Board of Trustees. The adviser may be reimbursed by the Fund for fees waived and expenses reimbursed by the adviser pursuant to the Expense Cap if such payment is made within three years of the fee waiver or expense reimbursement and does not cause the Total Annual Fund Operating Expenses After Fee Waiver and/or Expense Reimbursement to exceed the lesser of (i) the then-current Expense Cap and (ii) the Expense Cap in place at
| DF DENT GROWTH FUNDS |
DF DENT SMALL CAP GROWTH FUND
PERFORMANCE CHART AND ANALYSIS (Unaudited)
JUNE 30, 2019
the time the fees/expenses were waived/reimbursed. Total Annual Fund Operating Expenses After Fee Waiver and/or Expense Reimbursement will increase if exclusions from the Expense Cap apply. During the period, certain fees were waived and/or expenses reimbursed; otherwise, returns would have been lower. Shares redeemed within 60 days of purchase will be charged a 2.00% redemption fee. The performance table and graph do not reflect the deduction of taxes that a shareholder would pay on Fund distributions or the redemption of Fund shares. Returns greater than one year are annualized. For the most recent month-end performance, please call (866) 233-3368.
| DF DENT GROWTH FUNDS |
DF DENT SMALL CAP GROWTH FUND
SCHEDULE OF INVESTMENTS
JUNE 30, 2019
| Shares | Security Description | Value | ||||||
| Common Stock - 95.3% | ||||||||
| Communication Services - 3.5% | ||||||||
| 8,543 | Cogent Communications Holdings, Inc. | $ | 507,112 | |||||
| 9,593 | Eventbrite, Inc., Class A (a) | 155,407 | ||||||
| 662,519 | ||||||||
| Consumer Discretionary - 7.7% | ||||||||
| 3,359 | Bright Horizons Family Solutions, Inc. (a) | 506,772 | ||||||
| 1,742 | Lithia Motors, Inc., Class A | 206,915 | ||||||
| 3,992 | Monro, Inc. | 340,518 | ||||||
| 2,882 | Wayfair, Inc., Class A (a) | 420,772 | ||||||
| 1,474,977 | ||||||||
| Consumer Staples - 4.3% | ||||||||
| 3,807 | Calavo Growers, Inc. | 368,289 | ||||||
| 4,597 | MGP Ingredients, Inc. | 304,827 | ||||||
| 943 | WD-40 Co. | 149,975 | ||||||
| 823,091 | ||||||||
| Financials - 4.8% | ||||||||
| 9,040 | Hamilton Lane, Inc., Class A | 515,822 | ||||||
| 6,254 | Trupanion, Inc. (a) | 225,957 | ||||||
| 4,100 | WSFS Financial Corp. | 169,330 | ||||||
| 911,109 | ||||||||
| Health Care - 12.5% | ||||||||
| 3,007 | Bio-Techne Corp. | 626,930 | ||||||
| 3,144 | Cantel Medical Corp. | 253,532 | ||||||
| 2,498 | DexCom, Inc. (a) | 374,300 | ||||||
| 6,535 | LeMaitre Vascular, Inc. | 182,849 | ||||||
| 9,578 | OrthoPediatrics Corp. (a) | 373,542 | ||||||
| 4,246 | Teladoc, Inc. (a) | 281,977 | ||||||
| 13,032 | Vapotherm, Inc. (a) | 299,736 | ||||||
| 2,392,866 | ||||||||
| Industrials - 28.1% | ||||||||
| 8,306 | Beacon Roofing Supply, Inc. (a) | 304,996 | ||||||
| 616 | CoStar Group, Inc. (a) | 341,301 | ||||||
| 14,189 | Douglas Dynamics, Inc. | 564,580 | ||||||
| 3,650 | Exponent, Inc. | 213,671 | ||||||
| 4,834 | Genesee & Wyoming, Inc., | |||||||
| Class A (a) | 483,400 | |||||||
| 15,122 | Healthcare Services Group, Inc. | 458,499 | ||||||
| 6,718 | HEICO Corp., Class A | 694,440 | ||||||
| 5,957 | Helios Technologies, Inc. | 276,465 | ||||||
| 4,667 | John Bean Technologies Corp. | 565,314 | ||||||
| 7,560 | SiteOne Landscape Supply, Inc. (a) | 523,908 | ||||||
| 2,700 | The Middleby Corp. (a) | 366,390 | ||||||
| 3,333 | Trex Co., Inc. (a) | 238,976 | ||||||
| 2,019 | Watsco, Inc. | 330,167 | ||||||
| 5,362,107 | ||||||||
| Shares | Security Description | Value | ||||||
| Information Technology - 34.4% | ||||||||
| 9,014 | Black Knight, Inc. (a) | $ | 542,192 | |||||
| 11,225 | Blackline, Inc. (a) | 600,650 | ||||||
| 13,966 | Brooks Automation, Inc. | 541,182 | ||||||
| 935 | Coupa Software, Inc. (a) | 118,380 | ||||||
| 4,456 | Envestnet, Inc. (a) | 304,657 | ||||||
| 7,198 | EVERTEC, Inc. | 235,375 | ||||||
| 15,523 | Evo Payments, Inc., Class A (a) | 489,440 | ||||||
| 4,603 | Guidewire Software, Inc. (a) | 466,652 | ||||||
| 1,364 | Littelfuse, Inc. | 241,305 | ||||||
| 1,612 | Mesa Laboratories, Inc. | 393,876 | ||||||
| 5,231 | Novanta, Inc. (a) | 493,283 | ||||||
| 2,811 | Okta, Inc. (a) | 347,187 | ||||||
| 10,677 | PROS Holdings, Inc. (a) | 675,427 | ||||||
| 2,162 | Qualys, Inc. (a) | 188,267 | ||||||
| 4,360 | The Descartes Systems Group, | |||||||
| Inc. (a) | 161,102 | |||||||
| 3,579 | Tyler Technologies, Inc. (a) | 773,136 | ||||||
| 6,572,111 | ||||||||
| Total Common Stock (Cost $12,480,829) | 18,198,780 | |||||||
| Investments, at value - 95.3% (Cost $12,480,829) | $ | 18,198,780 | ||||||
| Other Assets & Liabilities, Net - 4.7% | 890,337 | |||||||
| Net Assets - 100.0% | $ | 19,089,117 | ||||||
| (a) | Non-income producing security. |
The following is a summary of the inputs used to value the Fund's investments as of June 30, 2019.
The inputs or methodology used for valuing securities are not necessarily an indication of the risks associated with investing in those securities. For more information on valuation inputs, and their aggregation into the levels used in the table below, please refer to the Security Valuation section in Note 2 of the accompanying Notes to Financial Statements.
| Valuation Inputs | Investments in Securities | |||
| Level 1 - Quoted Prices | $ | 18,198,780 | ||
| Level 2 - Other Significant Observable Inputs | – | |||
| Level 3 - Significant Unobservable Inputs | – | |||
| Total | $ | 18,198,780 | ||
The Level 1 value displayed in this table is Common Stock. Refer to this Schedule of Investments for a further breakout of each security by industry.
| See Notes to Financial Statements. | DF DENT GROWTH FUNDS |
DF DENT SMALL CAP GROWTH FUND
SCHEDULE OF INVESTMENTS
JUNE 30, 2019
| PORTFOLIO HOLDINGS (Unaudited) | ||||
| % of Total Net Assets | ||||
| Communication Services | 3.5 | % | ||
| Consumer Discretionary | 7.7 | % | ||
| Consumer Staples | 4.3 | % | ||
| Financials | 4.8 | % | ||
| Health Care | 12.5 | % | ||
| Industrials | 28.1 | % | ||
| Information Technology | 34.4 | % | ||
| Other Assets & Liabilities, Net | 4.7 | % | ||
| 100.0 | % | |||
| See Notes to Financial Statements. | DF DENT GROWTH FUNDS |
DF DENT SMALL CAP GROWTH FUND
STATEMENT OF ASSETS AND LIABILITIES
JUNE 30, 2019
| ASSETS | ||||
| Investments, at value (Cost $12,480,829) | $ | 18,198,780 | ||
| Cash | 932,114 | |||
| Receivables: | ||||
| Dividends and interest | 3,543 | |||
| Prepaid expenses | 10,481 | |||
| Total Assets | 19,144,918 | |||
| LIABILITIES | ||||
| Accrued Liabilities: | ||||
| Investment adviser fees | 26,879 | |||
| Trustees’ fees and expenses | 12 | |||
| Fund services fees | 6,810 | |||
| Other expenses | 22,100 | |||
| Total Liabilities | 55,801 | |||
| NET ASSETS | $ | 19,089,117 | ||
| COMPONENTS OF NET ASSETS | ||||
| Paid-in capital | $ | 13,560,075 | ||
| Distributable earnings | 5,529,042 | |||
| NET ASSETS | $ | 19,089,117 | ||
| SHARES OF BENEFICIAL INTEREST AT NO PAR VALUE (UNLIMITED SHARES AUTHORIZED) | ||||
| Investor Shares | 395,056 | |||
| Institutional Shares | 719,962 | |||
| NET ASSET VALUE, OFFERING AND REDEMPTION PRICE PER SHARE* | ||||
| Investor Shares (based on net assets of $6,757,086) | $ | 17.10 | ||
| Institutional Shares (based on net assets of $12,332,031) | $ | 17.13 | ||
| * | Shares redeemed or exchanged within 60 days of purchase are charged a 2.00% redemption fee. |
| See Notes to Financial Statements. | DF DENT GROWTH FUNDS |
DF DENT SMALL CAP GROWTH FUND
STATEMENT OF OPERATIONS
YEAR ENDED JUNE 30, 2019
| INVESTMENT INCOME | ||||
| Dividend income (Net of foreign withholding taxes of $178) | $ | 86,999 | ||
| Interest income | 1,985 | |||
Total Investment Income | 88,984 | |||
| EXPENSES | ||||
| Investment adviser fees | 121,200 | |||
| Fund services fees | 141,484 | |||
| Transfer agent fees: | ||||
| Investor Shares | 1,834 | |||
| Institutional Shares | 179 | |||
| Custodian fees | 5,000 | |||
| Registration fees: | ||||
| Investor Shares | 2,088 | |||
| Institutional Shares | 1,129 | |||
| Professional fees | 24,857 | |||
| Trustees' fees and expenses | 3,029 | |||
| Other expenses | 16,789 | |||
| Total Expenses | 317,589 | |||
| Fees waived and expenses reimbursed | (176,223 | ) | ||
| Net Expenses | 141,366 | |||
| NET INVESTMENT LOSS | (52,382 | ) | ||
| NET REALIZED AND UNREALIZED GAIN (LOSS) | ||||
| Net realized gain on investments | 332,552 | |||
| Net change in unrealized appreciation (depreciation) on investments | 2,804,020 | |||
| NET REALIZED AND UNREALIZED GAIN | 3,136,572 | |||
| INCREASE IN NET ASSETS RESULTING FROM OPERATIONS | $ | 3,084,190 | ||
| See Notes to Financial Statements. | DF DENT GROWTH FUNDS |
DF DENT SMALL CAP GROWTH FUND
STATEMENTS OF CHANGES IN NET ASSETS
| For the Years Ended June 30, | ||||||||
| 2019 | 2018 | |||||||
| OPERATIONS | ||||||||
| Net investment loss | $ | (52,382 | ) | $ | (35,663 | ) | ||
| Net realized gain | 332,552 | 551,586 | ||||||
| Net change in unrealized appreciation (depreciation) | 2,804,020 | 1,192,163 | ||||||
| Increase in Net Assets Resulting from Operations | 3,084,190 | 1,708,086 | ||||||
| DISTRIBUTIONS TO SHAREHOLDERS | ||||||||
| Investor Shares | (361,754 | ) | – | |||||
| Institutional Shares | (344,997 | ) | – | |||||
| Total Distributions Paid | (706,751 | ) | – | |||||
| CAPITAL SHARE TRANSACTIONS | ||||||||
| Sale of shares: | ||||||||
| Investor Shares | 204,142 | 913,502 | ||||||
| Institutional Shares | 5,350,000 | 4,909,634 | * | |||||
| Reinvestment of distributions: | ||||||||
| Investor Shares | 355,477 | – | ||||||
| Institutional Shares | 344,997 | – | ||||||
| Redemption of shares: | ||||||||
| Investor Shares | (58,399 | ) | (4,629,115 | )* | ||||
| Institutional Shares | (568,816 | ) | – | |||||
| Increase in Net Assets from Capital Share Transactions | 5,627,401 | 1,194,021 | ||||||
| Increase in Net Assets | 8,004,840 | 2,902,107 | ||||||
| NET ASSETS | ||||||||
| Beginning of Year | 11,084,277 | 8,182,170 | ||||||
| End of Year | $ | 19,089,117 | $ | 11,084,277 | ** | |||
| SHARE TRANSACTIONS | ||||||||
| Sale of shares: | ||||||||
| Investor Shares | 13,144 | 62,103 | ||||||
| Institutional Shares | 405,915 | 334,924 | * | |||||
| Reinvestment of distributions: | ||||||||
| Investor Shares | 26,588 | – | ||||||
| Institutional Shares | 25,785 | – | ||||||
| Redemption of shares: | ||||||||
| Investor Shares | (3,837 | ) | (318,552 | )* | ||||
| Institutional Shares | (46,662 | ) | – | |||||
| Increase in Shares | 420,933 | 78,475 | ||||||
| * | The above figures include transfers of $4,309,633 and 295,290 shares from the Investor Shares to Institutional Shares, as a result of the newly offered share class. |
| ** | Includes accumulated net investment loss of $(1,500) at June 30, 2018. The requirement to disclose the corresponding amount as of June 30, 2019 was eliminated. |
| See Notes to Financial Statements. | DF DENT GROWTH FUNDS |
DF DENT SMALL CAP GROWTH FUND
FINANCIAL HIGHLIGHTS
These financial highlights reflect selected data for a share outstanding throughout each year.
| For the Years Ended June 30, | ||||||||||||||||||||
| 2019 | 2018 | 2017 | 2016 | 2015 | ||||||||||||||||
| INVESTOR SHARES | ||||||||||||||||||||
| NET ASSET VALUE, Beginning of Year | $ | 15.97 | $ | 13.29 | $ | 11.49 | $ | 12.22 | $ | 10.87 | ||||||||||
| INVESTMENT OPERATIONS | ||||||||||||||||||||
| Net investment loss (a) | (0.07 | ) | (0.06 | ) | (0.06 | ) | (0.01 | ) | (0.04 | ) | ||||||||||
| Net realized and unrealized gain (loss) | 2.19 | 2.74 | 1.86 | (0.61 | ) | 1.48 | ||||||||||||||
| Total from Investment Operations | 2.12 | 2.68 | 1.80 | (0.62 | ) | 1.44 | ||||||||||||||
| DISTRIBUTIONS TO SHAREHOLDERS FROM | ||||||||||||||||||||
| Net realized gain | (0.99 | ) | – | – | (0.11 | ) | (0.09 | ) | ||||||||||||
| Total Distributions to Shareholders | (0.99 | ) | – | – | (0.11 | ) | (0.09 | ) | ||||||||||||
| REDEMPTION FEES(a) | – | – | 0.00 | (b) | – | – | ||||||||||||||
| NET ASSET VALUE, End of Year | $ | 17.10 | $ | 15.97 | $ | 13.29 | $ | 11.49 | $ | 12.22 | ||||||||||
| TOTAL RETURN | 15.01 | % | 20.17 | % | 15.67 | % | (5.06 | )% | 13.41 | % | ||||||||||
| RATIOS/SUPPLEMENTARY DATA | ||||||||||||||||||||
| Net Assets at End of Year (000s omitted) | $ | 6,757 | $ | 5,734 | $ | 8,182 | $ | 7,533 | $ | 5,382 | ||||||||||
| Ratios to Average Net Assets: | ||||||||||||||||||||
| Net investment loss | (0.43 | )% | (0.43 | )% | (0.46 | )% | (0.10 | )% | (0.39 | )% | ||||||||||
| Net expenses | 1.05 | % | 1.10 | % | 1.25 | % | 1.25 | % | 1.25 | % | ||||||||||
| Gross expenses (c) | 2.30 | % | 3.12 | % | 3.25 | % | 3.60 | % | 5.16 | % | ||||||||||
| PORTFOLIO TURNOVER RATE | 44 | % | 40 | % | 45 | % | 39 | % | 38 | % | ||||||||||
| (a) | Calculated based on average shares outstanding during each year. |
| (b) | Less than $0.01 per share. |
| (c) | Reflects the expense ratio excluding any waivers and/or reimbursements. |
| See Notes to Financial Statements. | DF DENT GROWTH FUNDS |
DF DENT SMALL CAP GROWTH FUND
FINANCIAL HIGHLIGHTS
These financial highlights reflect selected data for a share outstanding throughout each period.
| For the Year Ended June 30, 2019 | November 20, 2017 (a) Through June 30, 2018 | |||||||
| INSTITUTIONAL SHARES | ||||||||
| NET ASSET VALUE, Beginning of Period | $ | 15.97 | $ | 14.04 | ||||
| INVESTMENT OPERATIONS | ||||||||
| Net investment loss (b) | (0.05 | ) | (0.02 | ) | ||||
| Net realized and unrealized gain | 2.20 | 1.95 | ||||||
| Total from Investment Operations | 2.15 | 1.93 | ||||||
| DISTRIBUTIONS TO SHAREHOLDERS FROM | ||||||||
| Net realized gain | (0.99 | ) | – | |||||
| Total Distributions to Shareholders | (0.99 | ) | – | |||||
| NET ASSET VALUE, End of Period | $ | 17.13 | $ | 15.97 | ||||
| TOTAL RETURN | 15.20 | % | 13.75 | %(c) | ||||
| RATIOS/SUPPLEMENTARY DATA | ||||||||
| Net Assets at End of Period (000s omitted) | $ | 12,332 | $ | 5,350 | ||||
| Ratios to Average Net Assets: | ||||||||
| Net investment loss | (0.32 | )% | (0.24 | )%(d) | ||||
| Net expenses | 0.95 | % | 0.95 | %(d) | ||||
| Gross expenses (e) | 2.18 | % | 2.91 | %(d) | ||||
| PORTFOLIO TURNOVER RATE | 44 | % | 40 | %(c) | ||||
| (a) | Commencement of operations. |
| (b) | Calculated based on average shares outstanding during each period. |
| (c) | Not annualized. |
| (d) | Annualized. |
| (e) | Reflects the expense ratio excluding any waivers and/or reimbursements. |
| See Notes to Financial Statements. | DF DENT GROWTH FUNDS |
DF DENT GROWTH FUNDS
NOTES TO FINANCIAL STATEMENTS
JUNE 30, 2019
Note 1. Organization
DF Dent Premier Growth Fund is a diversified portfolio of Forum Funds (the “Trust”) and DF Dent Midcap Growth Fund and DF Dent Small Cap Growth Fund (individually, a “Fund” and, collectively the “Funds”) are non-diversified portfolios of the Trust. The Trust is a Delaware statutory trust that is registered as an open-end, management investment company under the Investment Company Act of 1940, as amended (the “Act”). Under its Trust Instrument, the Trust is authorized to issue an unlimited number of each Fund’s shares of beneficial interest without par value. DF Dent Premier Growth Fund commenced operations on July 16, 2001. DF Dent Midcap Growth Fund’s Investor Shares and Institutional Shares commenced operations on July 1, 2011 and November 29, 2017, respectively. DF Dent Small Cap Growth Fund’s Investor Shares and Institutional Shares commenced operations on November 1, 2013 and November 20, 2017, respectively. The Funds seek long-term capital appreciation.
Note 2. Summary of Significant Accounting Policies
The Funds are investment companies and follow accounting and reporting guidance under Financial Accounting Standards Board (“FASB”) Accounting Standards Codification (“ASC”) Topic 946, “Financial Services – Investment Companies.” These financial statements are prepared in accordance with accounting principles generally accepted in the United States of America (“GAAP”), which require management to make estimates and assumptions that affect the reported amounts of assets and liabilities, the disclosure of contingent liabilities at the date of the financial statements, and the reported amounts of increases and decreases in net assets from operations during the fiscal year. Actual amounts could differ from those estimates. The following summarizes the significant accounting policies of each Fund:
Security Valuation – Securities are valued at market prices using the last quoted trade or official closing price from the principal exchange where the security is traded, as provided by independent pricing services on each Fund business day. In the absence of a last trade, securities are valued at the mean of the last bid and ask price provided by the pricing service. Shares of non-exchange traded open-end mutual funds are valued at net asset value (“NAV”). Short-term investments that mature in sixty days or less may be valued at amortized cost.
Each Fund values its investments at fair value pursuant to procedures adopted by the Trust's Board of Trustees (the “Board”) if (1) market quotations are not readily available or (2) the Adviser, as defined in Note 4, believes that the values available are unreliable. The Trust’s Valuation Committee, as defined in each Fund’s registration statement, performs certain functions as they relate to the administration and oversight of each Fund’s valuation procedures. Under these procedures, the Valuation Committee convenes on a regular and ad hoc basis to review such investments and considers a number of factors, including valuation methodologies and significant unobservable inputs, when arriving at fair value.
The Valuation Committee may work with the Adviser to provide valuation inputs. In determining fair valuations, inputs may include market-based analytics that may consider related or comparable assets or liabilities, recent transactions, market multiples, book values and other relevant investment information. Adviser inputs may include an income-based approach in which the anticipated future cash flows of the investment are discounted in
| DF DENT GROWTH FUNDS |
DF DENT GROWTH FUNDS
NOTES TO FINANCIAL STATEMENTS
JUNE 30, 2019
determining fair value. Discounts may also be applied based on the nature or duration of any restrictions on the disposition of the investments. The Valuation Committee performs regular reviews of valuation methodologies, key inputs and assumptions, disposition analysis and market activity.
Fair valuation is based on subjective factors and, as a result, the fair value price of an investment may differ from the security’s market price and may not be the price at which the asset may be sold. Fair valuation could result in a different NAV than a NAV determined by using market quotes.
GAAP has a three-tier fair value hierarchy. The basis of the tiers is dependent upon the various “inputs” used to determine the value of each Fund’s investments. These inputs are summarized in the three broad levels listed below:
Level 1 - Quoted prices in active markets for identical assets and liabilities.
Level 2 - Prices determined using significant other observable inputs (including quoted prices for similar securities, interest rates, prepayment speeds, credit risk, etc.). Short-term securities with maturities of sixty days or less are valued at amortized cost, which approximates market value, and are categorized as Level 2 in the hierarchy. Municipal securities, long-term U.S. government obligations and corporate debt securities are valued in accordance with the evaluated price supplied by a pricing service and generally categorized as Level 2 in the hierarchy. Other securities that are categorized as Level 2 in the hierarchy include, but are not limited to, warrants that do not trade on an exchange, securities valued at the mean between the last reported bid and ask quotation and international equity securities valued by an independent third party with adjustments for changes in value between the time of the securities’ respective local market closes and the close of the U.S. market.
Level 3 - Significant unobservable inputs (including each Fund’s own assumptions in determining the fair value of investments).
The aggregate value by input level, as of June 30, 2019, for each Fund’s investments is included at the end of each Fund’s Schedule of Investments.
Security Transactions, Investment Income and Realized Gain and Loss – Investment transactions are accounted for on the trade date. Dividend income is recorded on the ex-dividend date. Foreign dividend income is recorded on the ex-dividend date or as soon as possible after determining the existence of a dividend declaration after exercising reasonable due diligence. Income and capital gains on some foreign securities may be subject to foreign withholding taxes, which are accrued as applicable. Interest income is recorded on an accrual basis. Premium is amortized and discount is accreted using the effective interest method. Identified cost of investments sold is used to determine the gain and loss for both financial statement and federal income tax purposes.
Distributions to Shareholders – Each Fund declares any dividends from net investment income and pays them annually. Any net capital gains realized by the Funds are distributed at least annually. Distributions to shareholders are recorded on the ex-dividend date. Distributions are based on amounts calculated in accordance with applicable federal income tax regulations, which may differ from GAAP. These differences are due primarily to
| DF DENT GROWTH FUNDS |
DF DENT GROWTH FUNDS
NOTES TO FINANCIAL STATEMENTS
JUNE 30, 2019
differing treatments of income and gain on various investment securities held by each Fund, timing differences and differing characterizations of distributions made by each Fund.
Federal Taxes – Each Fund intends to continue to qualify each year as a regulated investment company under Subchapter M of Chapter 1, Subtitle A, of the Internal Revenue Code of 1986, as amended (“Code”), and to distribute all of their taxable income to shareholders. In addition, by distributing in each calendar year substantially all of their net investment income and capital gains, if any, the Funds will not be subject to a federal excise tax. Therefore, no federal income or excise tax provision is required. Each Fund files a U.S. federal income and excise tax return as required. Each Fund’s federal income tax returns are subject to examination by the Internal Revenue Service for a period of three fiscal years after they are filed. As of June 30, 2019, there are no uncertain tax positions that would require financial statement recognition, de-recognition or disclosure.
Income and Expense Allocation – The Trust accounts separately for the assets, liabilities and operations of each of its investment portfolios. Expenses that are directly attributable to more than one investment portfolio are allocated among the respective investment portfolios in an equitable manner.
The DF Dent Midcap Growth Fund's and DF Dent Small Cap Growth Fund's class-specific expenses are charged to the operations of that class of shares. Income and expenses (other than expenses attributable to a specific class) and realized and unrealized gains or losses on investments are allocated to each class of shares based on the class’ respective net assets to the total net assets of each Fund.
Redemption Fees – A shareholder who redeems shares of DF Dent Midcap Growth Fund and DF Dent Small Cap Growth Fund within 60 days of purchase may incur a redemption fee of 2.00% of the current net asset value of shares redeemed, subject to certain limitations. The fee is charged for the benefit of the remaining shareholders and will be paid to each Fund to help offset transaction costs. The fee is accounted for as an addition to paid-in capital. Each Fund reserves the right to modify the terms of or terminate the fee at any time. There are limited exceptions to the imposition of the redemption fee. Redemption fees incurred for each Fund, if any, are reflected on the Statements of Changes in Net Assets.
Commitments and Contingencies – In the normal course of business, each Fund enters into contracts that provide general indemnifications by each Fund to the counterparty to the contract. Each Fund’s maximum exposure under these arrangements is dependent on future claims that may be made against each Fund and, therefore, cannot be estimated; however, based on experience, the risk of loss from such claims is considered remote. Each Fund has determined that none of these arrangements requires disclosure on each Fund’s balance sheet.
Note 3. Cash – Concentration in Uninsured Account
For cash management purposes, each Fund may concentrate cash with each Fund’s custodian. This typically results in cash balances exceeding the Federal Deposit Insurance Corporation (“FDIC”) insurance limits. As of June 30, 2019, DF Dent Premier Growth Fund, DF Dent Midcap Growth Fund, and DF Dent Small Cap Growth
| DF DENT GROWTH FUNDS |
DF DENT GROWTH FUNDS
NOTES TO FINANCIAL STATEMENTS
JUNE 30, 2019
Fund had $2,587,605, $5,360,962, and $682,114, respectively, at MUFG Union Bank, N.A. that exceeded the FDIC insurance limit.
Note 4. Fees and Expenses
Investment Adviser – D.F. Dent and Company, Inc. (the “Adviser”) is the investment adviser to the Funds. Pursuant to an investment advisory agreement, the Adviser receives an advisory fee, payable monthly, at an annual rate of 1.00%, 0.75%, and 0.85% of the average daily net assets of DF Dent Premier Growth Fund, DF Dent Midcap Growth Fund and DF Dent Small Cap Growth Fund, respectively.
Distribution – Foreside Fund Services, LLC serves as each Fund’s distributor (the “Distributor”). The Funds do not have a distribution (12b-1) plan; accordingly, the Distributor does not receive compensation from the Funds for its distribution services. The Adviser compensates the Distributor directly for its services. The Distributor is not affiliated with the Adviser or Atlantic Fund Administration, LLC, a wholly owned subsidiary of Apex US Holdings, LLC (d/b/a Apex Fund Services) (“Apex”) or their affiliates.
Other Service Providers – Apex provides fund accounting, fund administration, compliance and transfer agency services to each Fund. The fees related to these services are included in Fund services fees within the Statements of Operations. Apex also provides certain shareholder report production and EDGAR conversion and filing services. Pursuant to an Apex services agreement, each Fund pays Apex customary fees for its services. Apex provides a Principal Executive Officer, a Principal Financial Officer, a Chief Compliance Officer and an Anti-Money Laundering Officer to each Fund, as well as certain additional compliance support functions.
Trustees and Officers – Each Independent Trustee’s annual retainer is $31,000 ($41,000 for the Chairman), and the Audit Committee Chairman receives an additional $2,000 annually. The Trustees and Chairman may receive additional fees for special Board meetings. Each Trustee is also reimbursed for all reasonable out-of-pocket expenses incurred in connection with his or her duties as a Trustee, including travel and related expenses incurred in attending Board meetings. The amount of Trustees’ fees attributable to each Fund is disclosed in the Statement of Operations. Certain officers of the Trust are also officers or employees of the above named service providers, and during their terms of office received no compensation from each Fund.
Note 5. Expense Reimbursement and Fees Waived
The Adviser has contractually agreed to waive a portion of its fee and/or reimburse expenses through October 31, 2019, for DF Dent Premier Growth Fund, to the extent that total annual operating expenses (excluding all taxes, interest, portfolio transaction expenses, and extraordinary expenses) exceed 1.10% on the first $150 million of net assets and to the extent that annual operating expenses exceed 0.90% on net assets exceeding $150 million of the Fund. Additionally, the Adviser has contractually agreed to waive a portion of its fee and/or reimburse expenses to limit total annual operating expenses (excluding all taxes, interest, portfolio transaction expenses, and extraordinary expenses) of Investor Shares and Institutional Shares to 0.98% and 0.85%, respectively, through October 31, 2019, for DF Dent Midcap Growth Fund. The Adviser has also contractually agreed to waive a portion of its fee and/or reimburse expenses to limit total annual operating
| DF DENT GROWTH FUNDS |
DF DENT GROWTH FUNDS
NOTES TO FINANCIAL STATEMENTS
JUNE 30, 2019
expenses (excluding all taxes, interest, portfolio transaction expenses, and extraordinary expenses) of Investor Shares and Institutional Shares to 1.05% and 0.95%, respectively, through October 31, 2019, for DF Dent Small Cap Growth Fund.
Other fund service providers have voluntarily agreed to waive and reimburse a portion of their fees. These voluntary fee waivers and reimbursements may be reduced or eliminated at any time. For the year ended June 30, 2019, fees waived and expenses reimbursed were as follows:
| Investment Adviser Fees Waived | Investment Adviser Expenses Reimbursed | Other Waivers | Total Fees Waived and Expenses Reimbursed | |||||||||||||
| DF Dent Premier Growth Fund | $ | 163,859 | $ | – | $ | 70,172 | $ | 234,031 | ||||||||
| DF Dent Midcap Growth Fund | 74,871 | – | 54,915 | 129,786 | ||||||||||||
| DF Dent Small Cap Growth Fund | 121,200 | 109 | 54,914 | 176,223 | ||||||||||||
The Adviser may be reimbursed by each Fund for fees waived and expenses reimbursed by the Adviser pursuant to the Expense Cap if such payment is made within three years of the fee waiver or expense reimbursement, and does not cause the Total Annual Fund Operating Expenses After Fee Waiver and/or Expense Reimbursement to exceed the lesser of (i) the then-current Expense Cap and (ii) the Expense Cap in place at the time the fees/ expenses were waived/reimbursed. As of June 30, 2019, $268,539, $148,562 and $209,684 are subject to recoupment by the Adviser for the DF Dent Premier Growth Fund, DF Dent Midcap Growth Fund and DF Dent Small Cap Growth Fund, respectively. Other Waivers are not eligible for recoupment.
Note 6. Security Transactions
The cost of purchases and proceeds from sales of investment securities (including maturities), other than short-term investments during the year ended June 30, 2019, were as follows:
| Purchases | Sales | |||||||
| DF Dent Premier Growth Fund | $ | 40,638,027 | $ | 44,136,034 | ||||
| DF Dent Midcap Growth Fund | 54,582,291 | 18,396,984 | ||||||
| DF Dent Small Cap Growth Fund | 10,286,474 | 6,179,797 | ||||||
Note 7. Federal Income Tax
As of June 30, 2019, cost for federal income tax purposes and net unrealized appreciation consists of:
| Tax Cost of Investments | Gross Unrealized Appreciation | Gross Unrealized Depreciation | Net Unrealized Appreciation | |||||||||||||
| DF Dent Premier Growth Fund | $ | 99,897,122 | $ | 107,408,572 | $ | (301,536 | ) | $ | 107,107,036 | |||||||
| DF Dent Midcap Growth Fund | 68,652,013 | 28,994,777 | (1,363,860 | ) | 27,630,917 | |||||||||||
| DF Dent Small Cap Growth Fund | 12,629,941 | 5,908,286 | (339,447 | ) | 5,568,839 | |||||||||||
| DF DENT GROWTH FUNDS |
DF DENT GROWTH FUNDS
NOTES TO FINANCIAL STATEMENTS
JUNE 30, 2019
Distributions paid during the fiscal years ended as noted were characterized for tax purposes as follows:
| Ordinary Income | Long-Term Capital Gain | Total | ||||||||||
| DF Dent Premier Growth Fund | ||||||||||||
| 2019 | $ | – | $ | 13,329,798 | $ | 13,329,798 | ||||||
| 2018 | 308,411 | 14,124,870 | 14,433,281 | |||||||||
| DF Dent Midcap Growth Fund | ||||||||||||
| 2019 | 207,485 | 1,591,178 | 1,798,663 | |||||||||
| 2018 | – | 122,485 | 122,485 | |||||||||
| DF Dent Small Cap Growth Fund | ||||||||||||
| 2019 | 325,323 | 381,428 | 706,751 | |||||||||
| 2018 | – | – | – | |||||||||
Equalization debits included in the distributions were as follows:
| Ordinary Income | Long-Term Capital Gain | Total | ||||||||||
| DF Dent Premier Growth Fund | ||||||||||||
| 2019 | $ | – | $ | 238,771 | $ | 238,771 | ||||||
| 2018 | – | 495,345 | 495,345 | |||||||||
| DF Dent Midcap Growth Fund | ||||||||||||
| 2019 | – | – | – | |||||||||
| 2018 | – | – | – | |||||||||
| DF Dent Small Cap Growth Fund | ||||||||||||
| 2019 | – | – | – | |||||||||
| 2018 | – | – | – | |||||||||
The DF Dent Premier Growth Fund used equalization accounting for tax purposes, whereby a portion of its redemption payments are treated as distributions of income or gain for tax purposes.
As of June 30, 2019, distributable earnings (accumulated loss) on a tax basis were as follows:
| Undistributed Ordinary Income | Undistributed Long-Term Gain | Capital and Other Losses | Unrealized Appreciation | Total | ||||||||||||||||
| DF Dent Premier Growth Fund | $ | – | $ | 11,598,351 | $ | (454,987 | ) | $ | 107,107,036 | $ | 118,250,400 | |||||||||
| DF Dent Midcap Growth Fund | – | 1,728,395 | – | 27,630,917 | 29,359,312 | |||||||||||||||
| DF Dent Small Cap Growth Fund | 76,276 | – | (116,073 | ) | 5,568,839 | 5,529,042 | ||||||||||||||
The difference between components of distributable earnings on a tax basis and the amounts reflected in the Statements of Assets and Liabilities are primarily due to wash sales and equity return of capital.
For tax purposes, the current year late-year ordinary loss was $454,987 for the DF Dent Premier Growth Fund (realized during the period January 1, 2019 through June 30, 2019), and the current year post-October capital loss was $116,073 for the DF Dent Small Cap Growth Fund (realized during the period November 1, 2018 through June 30, 2019). These losses will be recognized for tax purposes on the first business day of each Fund’s next fiscal year, July 1, 2019.
| DF DENT GROWTH FUNDS |
DF DENT GROWTH FUNDS
NOTES TO FINANCIAL STATEMENTS
JUNE 30, 2019
On the Statements of Assets and Liabilities, as a result of permanent book to tax differences, certain amounts have been reclassified for the year ended June 30, 2019. The following reclassifications were the result of equalization and net operating loss and have no impact on the net assets of each Fund.
| Distributable Earnings | Paid-in-Capital | |||||||
| DF Dent Premier Growth Fund | $ | (8,608 | ) | $ | 8,608 | |||
| DF Dent Midcap Growth Fund | – | – | ||||||
| DF Dent Small Cap Growth Fund | – | – | ||||||
Note 8. In-Kind Redemptions
On June 14, 2018, the DF Dent Midcap Growth Fund distributed portfolio securities rather than cash as payment for certain redemptions of fund shares (in-kind redemptions). The proceeds for the in-kind redemptions, which are included in Redemption of shares in the Statements of Changes in Net Assets, were $1,278,233 and represented 6.75% of the DF Dent Midcap Growth Fund’s net assets on June 14, 2018. For financial reporting purposes, the DF Dent Midcap Growth Fund recognized gains on the in-kind redemptions in the amount of $664,290. For tax purposes, the gains are not recognized.
Note 9. Recent Accounting Pronouncements
In August 2018, the Financial Accounting Standards Board (“FASB”) issued Accounting Standards Update No. 2018-13 “Fair Value Measurement (Topic 820): Disclosure Framework – Changes to the Disclosure Requirements for Fair Value Measurement” (“ASU 2018-13”) which includes amendments intended to improve the effectiveness of disclosures in the notes to financial statements. For example, ASU 2018-13 includes additional disclosures regarding the range and weighted average of significant unobservable inputs used to develop Level 3 fair value measurements, and clarifications to the narrative description of measurement uncertainty disclosures. ASU 2018-13 is effective for interim and annual periods beginning after December 15, 2019. Early adoption is permitted and the Funds have adopted ASU 2018-13 within these financial statements.
In September 2018, the Securities and Exchange Commission released Final Rule 33-10532 captioned “Disclosure Update and Simplification,” which includes: (i) an amendment to require presentation of the total, rather than the components, of distributable earnings on the Statements of Assets and Liabilities; and (ii) an amendment to require presentation of the total, rather than the components, of distributions to shareholders, except for tax return of capital distributions, on the Statements of Changes in Net Assets. The amendments also removed the requirement for parenthetical disclosure of undistributed net investment income on the Statements of Changes in Net Assets. These changes were effective November 5, 2018. These amendments are reflected in the Funds' financial statements for the year ended June 30, 2019.
Note 10. Subsequent Events
Subsequent events occurring after the date of this report through the date these financial statements were issued have been evaluated for potential impact, and each Fund has had no such events.
| DF DENT GROWTH FUNDS |
REPORT OF INDEPENDENT REGISTERED PUBLIC ACCOUNTING FIRM
To the Board of Trustees of Forum Funds
and the Shareholders of DF Dent Premier Growth Fund, DF Dent Midcap Growth Fund and
DF Dent Small Cap Growth Fund
Opinion on the Financial Statements
We have audited the accompanying statements of assets and liabilities of DF Dent Premier Growth Fund, DF Dent Midcap Growth Fund, and DF Dent Small Cap Growth Fund, each a series of shares of beneficial interest in Forum Funds (the “Funds”), including the schedules of investments, as of June 30, 2019, and the related statements of operations for the year then ended, the statements of changes in net assets for each of the years in the two-year period then ended and the financial highlights as noted in the table below, and the related notes (collectively referred to as the “financial statements”).
| Financial Highlights | |
| DF Dent Premier Growth Fund | For each of the years in the five-year period ended June 30, 2019 |
| DF Dent Midcap Growth Fund – Investor Shares | For each of the years in the five-year period ended June 30, 2019 |
| DF Dent Midcap Growth Fund – Institutional Shares | For the period November 29, 2017 (commencement of operations) to June 30, 2018 and for the year ended June 30, 2019 |
| DF Dent Small Cap Growth Fund – Investor Shares | For each of the years in the five-year period ended June 30, 2019 |
| DF Dent Small Cap Growth Fund – Institutional Shares | For the period November 20, 2017 (commencement of operations) to June 30, 2018 and for the year ended June 30, 2019 |
In our opinion, the financial statements present fairly, in all material respects, the financial position of the Funds as of June 30, 2019, and the results of their operations for the year then ended, the changes in their net assets for each of the years in the two-year period then ended and their financial highlights as detailed above, in conformity with accounting principles generally accepted in the United States of America.
Basis for Opinion
These financial statements are the responsibility of the Funds' management. Our responsibility is to express an opinion on the Funds’ financial statements based on our audits. We are a public accounting firm registered with the Public Company Accounting Oversight Board (United States) (“PCAOB”) and are required to be independent with respect to the Funds in accordance with the U.S. federal securities law and the applicable rules and regulations of the Securities and Exchange Commission and the PCAOB.
We conducted our audits in accordance with the standards of the PCAOB. Those standards require that we plan and perform the audits to obtain reasonable assurance about whether the financial statements are free of material misstatement, whether due to error or fraud. The Funds are not required to have, nor were we engaged to perform, an audit of their internal control over financial reporting. As part of our audits we are required to obtain an understanding of internal control over financial reporting but not for the purpose of expressing an opinion on the effectiveness of the Funds’ internal control over financial reporting. Accordingly, we express no such opinion.
| DF DENT GROWTH FUNDS |
REPORT OF INDEPENDENT REGISTERED PUBLIC ACCOUNTING FIRM
Our audits included performing procedures to assess the risk of material misstatement of the financial statements, whether due to error or fraud, and performing procedures that respond to those risks. Such procedures included examining, on a test basis, evidence regarding the amounts and disclosures in the financial statements. Our procedures included confirmation of securities owned as of June 30, 2019 by correspondence with the custodian and brokers, or by other appropriate auditing procedures where replies from brokers were not received. Our audits also included evaluating the accounting principles used and significant estimates made by management, as well as evaluating the overall presentation of the financial statements. We believe that our audits provide a reasonable basis for our opinion.

BBD, LLP
We have served as the auditor of one or more of the Funds in the Forum Funds since 2009.
Philadelphia, Pennsylvania
August 26, 2019
| DF DENT GROWTH FUNDS |
DF DENT GROWTH FUNDS
ADDITIONAL INFORMATION (Unaudited)
JUNE 30, 2019
Investment Advisory Agreement Approval
At the June 13, 2019 Board meeting, the Board, including all of the Independent Trustees, considered the approval of the continuance of the investment advisory agreement between the Adviser and the Trust pertaining to the Funds (the “Advisory Agreement”). In preparation for its deliberations, the Board requested written responses from the Adviser to a due diligence questionnaire circulated on the Board's behalf concerning the services provided by the Adviser. The Board also discussed the materials with Fund counsel and, as necessary, with the Trust's administrator, Apex Fund Services. During its deliberations, the Board received an oral presentation from the Adviser, and was assisted by the advice of Trustee counsel.
At the meeting, the Board reviewed, among other matters: (1) the nature, extent and quality of the services provided to the Funds by the Adviser, including information on the investment performance of the Funds; (2) the costs of the services provided and profitability to the Adviser with respect to its relationship with each Fund; (3) information concerning the advisory fee and total expense ratio of each Fund, including a comparison to the fees and expenses of a relevant peer group of funds; (4) the extent to which economies of scale may be realized as the Fund grows and whether the advisory fee enables investors to share in the benefits of economies of scale; and (5) other benefits received by the Adviser from its relationship with the Funds. The Board recognized that the evaluation process with respect to the Adviser was an ongoing one and, in this regard, the Board considered information provided by the Adviser at regularly scheduled meetings during the past year.
Nature, Extent and Quality of Services
Based on written materials received, a presentation from senior representatives of the Adviser and a discussion with the Adviser about the Adviser’s personnel, operations and financial condition, the Board considered the quality of services provided by the Adviser under the Advisory Agreement. In this regard, the Board considered information regarding the experience, qualifications and professional background of the portfolio managers and other personnel at the Adviser with principal responsibility for the Funds, as well as the investment philosophy and decision-making process of the Adviser and the capability and integrity of the Adviser’s senior management and staff.
The Board considered also the adequacy of the Adviser’s resources. The Board noted the Adviser’s representation that the firm is in stable financial condition, that the firm is able to meet its expense reimbursement obligations to the Funds, and that the firm has the operational capability and necessary staffing and experience to continue providing high-quality investment advisory services to the Funds. Based on the presentation and the materials provided by the Adviser in connection with the Board’s consideration of the renewal of the Advisory Agreement, the Board concluded that, overall, it was satisfied with the nature, extent and quality of services provided to the Funds under the Advisory Agreement.
Performance
In connection with a presentation by the Adviser regarding its approach to managing the Funds, the Board reviewed the performance of each Fund compared to its respective benchmark and to a peer group of funds.
| DF DENT GROWTH FUNDS |
DF DENT GROWTH FUNDS
ADDITIONAL INFORMATION (Unaudited)
JUNE 30, 2019
The Board observed that the DF Dent Premier Growth Fund outperformed its primary benchmark index, the S&P 500 Index, for the one-, three-, five-, and 10-year periods ended March 31, 2019, and for the period since the DF Dent Premier Growth Fund’s inception on July 16, 2001. The Board also considered the DF Dent Premier Growth Fund’s performance relative to an independent peer group of funds identified by Broadridge Financial Solutions, Inc. (“Broadridge”) as having characteristics similar to those of the DF Dent Premier Growth Fund. The Board observed that, based on information provided by Broadridge, the DF Dent Premier Growth Fund outperformed the median of its Broadridge peer group for the one-, three-, and five-year periods ended March 31, 2019. The Board noted the Adviser’s representation that the DF Dent Premier Growth Fund’s outperformance relative to its benchmark index and Broadridge peers could be attributed to stock selection and to the DF Dent Premier Growth Fund’s sector allocation.
With respect to the DF Dent Midcap Growth Fund, the Board observed that the Fund outperformed its primary benchmark index, the Russell Midcap Growth Index, for the one-, three-, and five-year periods ended March 31, 2019, and for the period since the DF Dent Midcap Growth Fund’s inception on July 1, 2011. The Board observed that the DF Dent Midcap Growth Fund also outperformed the median of its Broadridge peer group for the one-, three-, and five-year periods ended March 31, 2019. The Board noted the Adviser’s representation that the DF Dent Midcap Growth Fund’s outperformance relative to its benchmark index and Broadridge peers could be attributed to stock selection and to the DF Dent Midcap Growth Fund’s sector allocation.
With respect to the DF Dent Small Cap Growth Fund, the Board observed that the Fund outperformed its primary benchmark index, the Russell 2000 Growth Index, for the one-, three-, and five-year periods ended March 31, 2019, and for the period since the DF Dent Small Cap Growth Fund’s inception on November 1, 2013. The Board observed that the DF Dent Small Cap Growth Fund also outperformed the median of its Broadridge peer group over the one-, three-, and five-year periods ended March 31, 2019. The Board noted the Adviser’s representation that the DF Dent Small Cap Growth Fund’s outperformance relative to its benchmark index and Broadridge peers could be attributed to stock selection and to the DF Dent Small Cap Growth Fund’s sector allocation.
In light of the foregoing and other relevant factors, the Board concluded that the performance of each Fund was reasonable and that each Fund and its shareholders could benefit from the Adviser’s continued management.
Compensation
The Board evaluated the Adviser’s compensation for providing advisory services to each of the Funds and analyzed comparative information on actual advisory fee rates and actual total expenses of the Funds’ respective Broadridge peer groups. The Board noted the Adviser’s representation that, although each of the actual advisory fee rate and actual total expense ratio for the DF Dent Premier Growth Fund were higher than the median of its Broadridge peer group, the actual advisory fee rate was believed by the Adviser to be within a reasonable range of its peers. The Board also considered that the Adviser was proposing to lower the expense cap with respect to the DF Dent Premier Growth Fund such that the Adviser would be required to waive a greater portion of its advisory fee and/or reimburses DF Dent Premier Growth Fund expenses to ensure that the DF Dent Premier Growth Fund’s total expenses remain at a lower level. Based on the foregoing and other relevant factors, the Board concluded that the advisory fee rate charged to the DF Dent Premier Growth Fund was reasonable.
| DF DENT GROWTH FUNDS |
DF DENT GROWTH FUNDS
ADDITIONAL INFORMATION (Unaudited)
JUNE 30, 2019
With respect to the DF Dent Midcap Growth Fund and DF Dent Small Cap Growth Fund, the Board noted that each of the Adviser’s actual advisory fee rate and actual total expenses were lower than the median of their respective Broadridge peer groups. Based on the foregoing and other relevant factors, the Board concluded that the Adviser’s current advisory fee rates charged to each of the DF Dent Midcap Growth Fund and DF Dent Small Cap Growth Fund were reasonable.
Cost of Services and Profitability
The Board considered information provided by the Adviser regarding the costs of services and its profitability with respect to the Funds. In this regard, the Board considered the Adviser’s operating expenses and other resources devoted to the Funds, as well as the information provided by the Adviser regarding costs and overall profitability. The Board noted that the Adviser had in place a contractual expense waiver to ensure the expense ratios for the Funds remained at reasonable levels, and that the Adviser was proposing to lower the expense cap with respect to the DF Dent Premier Growth Fund in an effort to further reduce the expenses borne by DF Dent Premier Growth Fund shareholders. The Board further noted the Adviser’s representation that the Funds were less profitable to the Adviser than the Adviser’s overall investment management business because, although the Funds represented a relatively small percentage of the Adviser’s total assets under management, the Funds represented a relatively high percentage of the Adviser’s overall administrative, reporting, and compliance expenses. Based on these and other applicable considerations, the Board concluded that the Adviser’s profits attributable to management of the Funds were not unreasonable in the context of all factors considered.
Economies of Scale
The Board evaluated whether the Funds would benefit from any economies of scale. In this respect, the Board considered each Fund’s fee structure, asset size, and net expense ratio, giving effect to each Fund’s expense cap. The Board also considered the Adviser’s representation that the DF Dent Small Cap Growth and DF Dent Midcap Growth Funds were not currently operating at economies of scale and observed that the Adviser was proposing to lower the expense cap for the DF Dent Premier Growth Fund to share certain economies with Fund shareholders. The Trustees concluded that, although there were no advisory fee breakpoints, the asset level of each Fund was either not currently likely to lead to significant economies of scale, or that such economies were being reflected in the fee structure for the benefit of Fund shareholders.
Other Benefits
The Board noted the Adviser’s representation that, aside from its contractual advisory fees, it does not benefit in a material way from its relationship with the Funds. Based on the foregoing representation, the Board concluded that other benefits received by the Adviser from its relationship with the Funds were not a material factor to consider in approving the continuation of the Advisory Agreement.
Conclusion
The Board did not identify any single factor as being of paramount importance, and different Trustees may have given different weight to different factors. The Board reviewed a memorandum from Fund counsel discussing
| DF DENT GROWTH FUNDS |
DF DENT GROWTH FUNDS
ADDITIONAL INFORMATION (Unaudited)
JUNE 30, 2019
the legal standards applicable to its consideration of the Advisory Agreement. Based on its review, including consideration of each of the factors referenced above, and its consideration of information received throughout the year from the Adviser, the Board determined, in the exercise of its business judgment, that the advisory arrangement, as outlined in the Advisory Agreement, was fair and reasonable in light of the services performed or to be performed, expenses incurred or to be incurred and such other matters as the Board considered relevant.
Proxy Voting Information
A description of the policies and procedures that each Fund uses to determine how to vote proxies relating to securities held in each Fund’s portfolio is available, without charge and upon request, by calling (866) 233-3368 and on the SEC’s website at www.sec.gov. Each Fund’s proxy voting record for the most recent twelve-month period ended June 30 is available, without charge and upon request, by calling (866) 233-3368 and on the SEC’s website at www.sec.gov.
Availability of Quarterly Portfolio Schedules
Each Fund files its complete schedule of portfolio holdings with the SEC for the first and third quarters of each fiscal year on Form N-Q. These filings are available, without charge and upon request on the SEC’s website at www.sec.gov or may be reviewed and copied at the SEC’s Public Reference Room in Washington, D.C. Information on the operation of the Public Reference Room may be obtained by calling (800) SEC-0330.
Shareholder Expense Example
As a shareholder of the Funds, you incur two types of costs: (1) transaction costs, including redemption fees, and (2) ongoing costs, including management fees and other Fund expenses. This example is intended to help you understand your ongoing costs (in dollars) of investing in the Funds, and to compare these costs with the ongoing costs of investing in other mutual funds.
The example is based on an investment of $1,000 invested at the beginning of the period and held for the entire period from January 1, 2019 through June 30, 2019.
Actual Expenses – The first line of the table below provides information about actual account values and actual expenses. You may use the information in this line, together with the amount you invested, to estimate the expenses that you paid over the period. Simply divide your account value by $1,000 (for example, an $8,600 account value divided by $1,000 = 8.6), then multiply the result by the number in the first line under the heading entitled “Expenses Paid During Period” to estimate the expenses you paid on your account during the period.
Hypothetical Example for Comparison Purposes – The second line of the table below provides information about hypothetical account values and hypothetical expenses based on each Fund’s actual expense ratio and an assumed rate of return of 5% per year before expenses, which is not each Fund’s actual return. The hypothetical account values and expenses may not be used to estimate the actual ending account balance or expenses you paid for the period. You may use this information to compare the ongoing costs of investing in each Fund and
| DF DENT GROWTH FUNDS |
DF DENT GROWTH FUNDS
ADDITIONAL INFORMATION (Unaudited)
JUNE 30, 2019
other funds. To do so, compare this 5% hypothetical example with the 5% hypothetical examples that appear in the shareholder reports of other funds.
Please note that the expenses shown in the table are meant to highlight your ongoing costs only and do not reflect any transactional costs, such as redemption fees. Therefore, the second line of the table is useful in comparing ongoing costs only and will not help you determine the relative total costs of owning different funds. In addition, if these transactional costs were included, your costs would have been higher.
| Beginning Account Value January 1, 2019 | Ending Account Value June 30, 2019 | Expenses Paid During Period* | Annualized Expense Ratio* | |||||||||||||
| DF Dent Premier Growth Fund | ||||||||||||||||
| Actual | $ | 1,000.00 | $ | 1,316.28 | $ | 6.09 | 1.06 | % | ||||||||
| Hypothetical (5% return before expenses) | $ | 1,000.00 | $ | 1,019.54 | $ | 5.31 | 1.06 | % | ||||||||
| DF Dent Midcap Growth Fund | ||||||||||||||||
| Investor Shares | ||||||||||||||||
| Actual | $ | 1,000.00 | $ | 1,313.84 | $ | 5.62 | 0.98 | % | ||||||||
| Hypothetical (5% return before expenses) | $ | 1,000.00 | $ | 1,019.93 | $ | 4.91 | 0.98 | % | ||||||||
| Institutional Shares | ||||||||||||||||
| Actual | $ | 1,000.00 | $ | 1,315.04 | $ | 4.88 | 0.85 | % | ||||||||
| Hypothetical (5% return before expenses) | $ | 1,000.00 | $ | 1,020.58 | $ | 4.26 | 0.85 | % | ||||||||
| DF Dent Small Cap Growth Fund | ||||||||||||||||
| Investor Shares | ||||||||||||||||
| Actual | $ | 1,000.00 | $ | 1,302.35 | $ | 5.99 | 1.05 | % | ||||||||
| Hypothetical (5% return before expenses) | $ | 1,000.00 | $ | 1,019.59 | $ | 5.26 | 1.05 | % | ||||||||
| Institutional Shares | ||||||||||||||||
| Actual | $ | 1,000.00 | $ | 1,303.66 | $ | 5.43 | 0.95 | % | ||||||||
| Hypothetical (5% return before expenses) | $ | 1,000.00 | $ | 1,020.08 | $ | 4.76 | 0.95 | % | ||||||||
| * | Expenses are equal to the Fund’s annualized expense ratio multiplied by the average account value over the period, multiplied by the number of days in the most recent fiscal half-year (181) divided by 365 to reflect the half-year period. |
Federal Tax Status of Dividends Declared during the Fiscal Year
For federal income tax purposes, dividends from short-term capital gains are classified as ordinary income. The DF Dent Midcap Growth Fund designates 100.00% of its income dividend distributed as qualifying for the corporate dividends-received deduction (DRD), 100.00% for the qualified dividend rate (QDI) and 100.00% as short-term capital gain dividends exempt from U.S. tax for foreign shareholders (QSD) as defined in Section 1(h)(11) of the Code. The DF Dent Small Cap Growth Fund designates 34.35% of its income dividend distributed as qualifying for the corporate dividends-received deduction (DRD), 35.06% for the qualified dividend rate (QDI) and 100.00% as short-term capital gain dividends exempt from U.S. tax for foreign shareholders (QSD) as defined in Section 1(h)(11) of the Code.
| DF DENT GROWTH FUNDS |
DF DENT GROWTH FUNDS
ADDITIONAL INFORMATION (Unaudited)
JUNE 30, 2019
Pursuant to Section 852(b)(3) of the Internal Revenue Code, DF Dent Premier Growth Fund, DF Dent Midcap Growth Fund, and DF Dent Small Cap Growth Fund designated $13,329,798, $1,591,178 and $381,428, as long-term capital gain dividends, respectively.
Trustees and Officers of the Trust
The Board is responsible for oversight of the management of the Trust’s business affairs and of the exercise of all the Trust’s powers except those reserved for the shareholders. The following table provides information about each Trustee and certain officers of the Trust. Each Trustee and officer holds office until the person resigns, is removed, or is replaced. Unless otherwise noted, the persons have held their principal occupations for more than five years. The address for all Trustees and officers is Three Canal Plaza, Suite 600, Portland, Maine 04101. Each Fund’s Statement of Additional Information includes additional information about the Trustees and is available, without charge and upon request, by calling (866) 233-3368.
| DF DENT GROWTH FUNDS |
DF DENT GROWTH FUNDS
ADDITIONAL INFORMATION (Unaudited)
JUNE 30, 2019
| Name and Year of Birth | Position with the Trust | Length of Time Served | Principal Occupation(s) During Past Five Years | Number of Series in Fund Complex Overseen By Trustee | Other Directorships Held By Trustee During Past Five Years |
| Independent Trustees | |||||
David Tucker Born: 1958 | Trustee; Chairman of the Board | Since 2011 and Chairman since 2018 | Director, Blue Sky Experience (a charitable endeavor) since 2008; Senior Vice President & General Counsel, American Century Companies (an investment management firm) 1998-2008. | 3 | Trustee, Forum Funds II, Forum ETF Trust and U.S. Global Investors Funds |
Mark D. Moyer Born: 1959 | Trustee | Since 2018 | Chief Financial Officer, Freedom House (a NGO advocating political freedom and democracy) since 2017; independent consultant providing interim CFO services, principally to non-profit organizations, 2011-2017; Chief Financial Officer, Institute of International Education (a NGO administering international educational exchange programs), 2008-2011; Chief Financial Officer and Chief Restructuring Officer, Ziff Davis Media Inc. (an integrated media company), 2005-2008; Adjunct Professor of Accounting, Fairfield University from 2009-2012. | 3 | Trustee, Forum Funds II, Forum ETF Trust and U.S. Global Investors Funds |
Jennifer Brown-Strabley Born: 1964 | Trustee | Since 2018 | Principal, Portland Global Advisors (a registered investment adviser), 1996- 2010. | 3 | Trustee, Forum Funds II, Forum ETF Trust and U.S. Global Investors Funds |
| Interested Trustees | |||||
Stacey E. Hong(1) Born: 1966 | Trustee | Since 2018 | Director, Apex since 2008. | 3 | Trustee, Forum Funds II and U.S. Global Investors Funds |
Jessica Chase(1) Born: 1970 | Trustee | Since 2018 | Director, Apex since 2008. | 3 | None |
| (1) | Stacey E. Hong is currently treated as an interested person of the Trust, as defined in the 1940 Act, due to his affiliation with Apex. Jessica Chase is currently treated as an interested person of the Trust, as defined in the 1940 Act, due to her affiliation with Apex and her role as President of the Trust. |
| DF DENT GROWTH FUNDS |
DF DENT GROWTH FUNDS
ADDITIONAL INFORMATION (Unaudited)
JUNE 30, 2019
| Name and Year of Birth | Position with the Trust | Length of Time Served | Principal Occupation(s) During Past 5 Years |
| Officers | |||
Jessica Chase Born: 1970 | President; Principal Executive Officer | Since 2015 | Director, Apex since 2008. |
Karen Shaw Born: 1972 | Treasurer; Principal Financial Officer | Since 2008 | Senior Vice President, Apex since 2008. |
Zachary Tackett Born: 1988 | Vice President; Secretary and Anti-Money Laundering Compliance Officer | Since 2014 | Counsel, Apex since 2014. |
Michael J. McKeen Born: 1971 | Vice President | Since 2009 | Senior Vice President, Apex since 2008. |
Timothy Bowden Born: 1969 | Vice President | Since 2009 | Manager, Apex since 2008. |
Geoffrey Ney Born: 1975 | Vice President | Since 2013 | Manager, Apex since 2013. |
Todd Proulx Born: 1978 | Vice President | Since 2013 | Manager, Apex since 2013. |
Carlyn Edgar Born: 1963 | Vice President | Since 2008 | Senior Vice President, Apex since 2008; Chief Compliance Officer, 2008-2016. |
Dennis Mason Born: 1967 | Chief Compliance Officer | Since 2016 | Fund Compliance Officer, Apex since 2013. |
| DF DENT GROWTH FUNDS |
| 69 |
DF Dent Premier Growth Fund – DFDPX
DF Dent Midcap Growth Fund Investor Shares – DFDMX
DF Dent Midcap Growth Fund Institutional Shares – DFMGX
DF Dent Small Cap Growth Fund Investor Shares – DFDSX
DF Dent Small Cap Growth Fund Institutional Shares – DFSGX
INVESTMENT ADVISER
D.F. Dent and Company, Inc.
400 E. Pratt Street, 7th Floor
Baltimore, MD 21202
www.dfdent.com
TRANSFER AGENT
Apex Fund Services
P.O. Box 588
Portland, ME 04112
(866) 2DF-DENT
www.apexfundservices.com
DISTRIBUTOR
Foreside Fund Services, LLC
Three Canal Plaza, Suite 100
Portland, ME 04101
www.foreside.com
221-ANR-0619
This report is submitted for the general information of the shareholders of the Funds. It is not authorized for distribution to prospective investors unless preceded or accompanied by an effective prospectus, which includes information regarding the Funds' risks, objectives, fees and expenses, experience of its management, and other information.
| (a) | As of the end of the period covered by this report, Forum Funds (the “Registrant”) has adopted a code of ethics, which applies to its Principal Executive Officer and Principal Financial Officer (the “Code of Ethics”). |
| (c) | There have been no amendments to the Registrant’s Code of Ethics during the period covered by this report. |
| (d) | There have been no waivers to the Registrant’s Code of Ethics during the period covered by this report. |
| (e) | Not applicable. |
| (a) | Included as part of report to shareholders under Item 1. |
| (b) | Not applicable. |
| By: | /s/ Jessica Chase | |
| Jessica Chase, Principal Executive Officer | ||
| Date: | August 20, 2019 |
| By: | /s/ Jessica Chase | |
| Jessica Chase, Principal Executive Officer | ||
| Date: | August 20, 2019 |
| By: | /s/ Karen Shaw | |
| Karen Shaw, Principal Financial Officer | ||
| Date: | August 20, 2019 |