UNITED STATES
SECURITIES AND EXCHANGE COMMISSION
WASHINGTON, D.C. 20549
FORM N-CSR
CERTIFIED SHAREHOLDER REPORT OF REGISTERED MANAGEMENT
INVESTMENT COMPANIES
Investment Company Act file number 811-03023
FORUM FUNDS
Three Canal Plaza, Suite 600
Portland, Maine 04101
Zachary Tackett, Principal Executive Officer
Three Canal Plaza, Suite 600
Portland, Maine 04101
207-347-2000
Date of fiscal year end June 30
Date of reporting period: July 1, 2023 – June 30, 2024
ITEM 1. REPORT TO SHAREHOLDERS.
(a) A copy of the report transmitted to stockholders pursuant to Rule 30e-1 under the Investment Company Act, as amended (“Act”), is attached hereto.
DF Dent Premier Growth Fund
Annual Shareholder Report - June 30, 2024
This annual shareholder report contains important information about the DF Dent Premier Growth Fund for the period of July 1, 2023, to June 30, 2024. You can find additional information about the Fund at https://dfdent.com/literature/. You can also request this information by contacting us at (866) 233-3368.
What were the Fund's costs for the last year?
(based on a hypothetical $10,000 investment)
| Fund Name | Costs of a $10,000 investment | Costs paid as a percentage of a $10,000 investment |
|---|
| DF Dent Premier Growth Fund | $107 | 0.99% |
How did the Fund perform in the last year?
During the period from July 2023 to June 2024, the DF Dent Premier Growth Fund underperformed its benchmark, the S&P 500. This underperformance was influenced by both sector allocation and stock selection. Notably, the Consumer Discretionary sector contributed positively to the portfolio's performance while the Health Care sector and Information Technology sector detracted significantly from performance.
The Fund experienced fluctuating performance relative to the S&P 500, starting with a decline in the third quarter of 2023, followed by a gain in the fourth quarter of 2023, and then facing consecutive declines in the first and second quarters of 2024. Initially, the underperformance in the third quarter of 2023 was driven by negative stock selection and sector allocation effects, but the Fund rebounded in the fourth quarter with positive contributions from both stock selection and sector allocation. However, this recovery was short-lived as both stock selection and sector allocation continued to detract from performance in 2024.
The Communication Services sector and Information Technology sector were the largest contributors to the benchmark’s return. In the Fund, the Communication Services sector underperformed driven by a negative sector allocation impact partially offset by positive stock selection in the sector. Similarly, the Information Technology sector also underperformed in the portfolio, where both sector allocation and stock selection negatively impacted the performance. Despite all sectors contributing positively to the benchmark's performance, Real Estate and Utilities were the relative laggards.
SiteOne Landscape Supply, Inc.
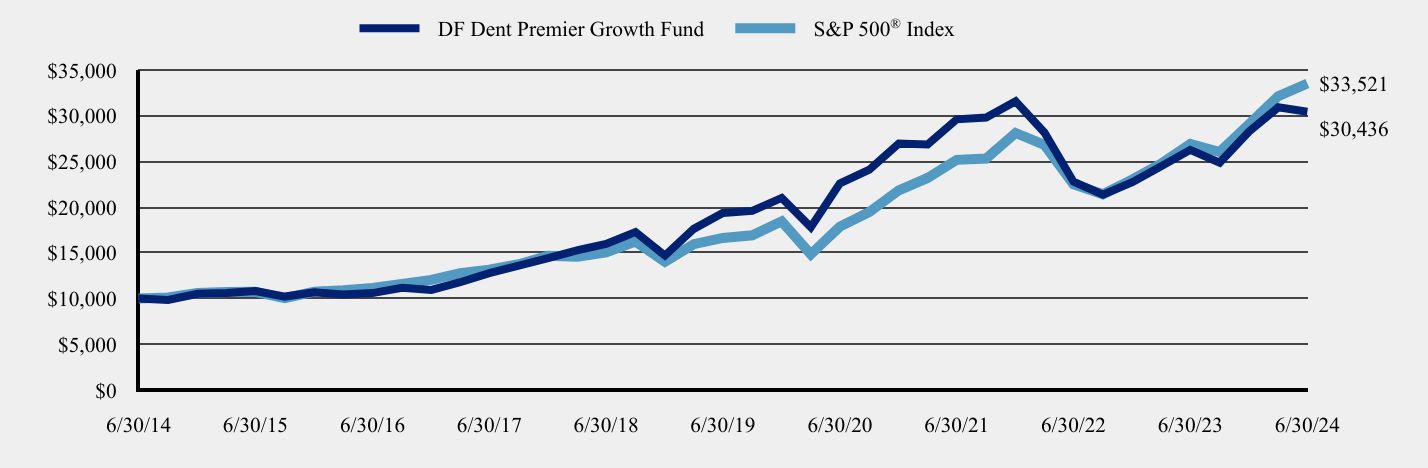
Total Return Based on a $10,000 Investment
| Date | DF Dent Premier Growth Fund | S&P 500® Index |
|---|
| 6/30/14 | $10,000 | $10,000 |
| 9/30/14 | $9,840 | $10,113 |
| 12/31/14 | $10,527 | $10,612 |
| 3/31/15 | $10,604 | $10,712 |
| 6/30/15 | $10,822 | $10,742 |
| 9/30/15 | $10,218 | $10,051 |
| 12/31/15 | $10,689 | $10,758 |
| 3/31/16 | $10,442 | $10,903 |
| 6/30/16 | $10,598 | $11,171 |
| 9/30/16 | $11,184 | $11,602 |
| 12/31/16 | $10,949 | $12,045 |
| 3/31/17 | $11,787 | $12,776 |
| 6/30/17 | $12,784 | $13,170 |
| 9/30/17 | $13,595 | $13,760 |
| 12/31/17 | $14,435 | $14,675 |
| 3/31/18 | $15,270 | $14,563 |
| 6/30/18 | $15,976 | $15,064 |
| 9/30/18 | $17,284 | $16,225 |
| 12/31/18 | $14,703 | $14,031 |
| 3/31/19 | $17,621 | $15,946 |
| 6/30/19 | $19,354 | $16,633 |
| 9/30/19 | $19,592 | $16,915 |
| 12/31/19 | $21,011 | $18,449 |
| 3/31/20 | $17,809 | $14,834 |
| 6/30/20 | $22,609 | $17,881 |
| 9/30/20 | $24,096 | $19,478 |
| 12/31/20 | $26,962 | $21,844 |
| 3/31/21 | $26,861 | $23,193 |
| 6/30/21 | $29,609 | $25,175 |
| 9/30/21 | $29,799 | $25,322 |
| 12/31/21 | $31,579 | $28,114 |
| 3/31/22 | $28,174 | $26,821 |
| 6/30/22 | $22,785 | $22,503 |
| 9/30/22 | $21,364 | $21,404 |
| 12/31/22 | $22,721 | $23,023 |
| 3/31/23 | $24,462 | $24,749 |
| 6/30/23 | $26,267 | $26,912 |
| 9/30/23 | $24,872 | $26,031 |
| 12/31/23 | $28,269 | $29,075 |
| 3/31/24 | $30,919 | $32,144 |
| 6/30/24 | $30,436 | $33,521 |
The above chart represents historical performance of a hypothetical $10,000 investment over the past 10 years.
Average Annual Total Returns
| | One Year | Five Year | Ten Year |
|---|
| DF Dent Premier Growth Fund | 15.87% | 9.48% | 11.77% |
S&P 500® Index | 24.56% | 15.05% | 12.86% |
The Fund’s past performance is not a good predictor of how the Fund will perform in the future. The graph and table do not reflect the deduction of taxes that a shareholder would pay on Fund distributions or redemption of Fund shares.
| Total Net Assets | $231,393,659 |
| # of Portfolio Holdings | 42 |
| Portfolio Turnover Rate | 19% |
| Investment Advisory Fees (Net of fees waived) | $1,983,017 |
Top Ten Holdings
(% of investments)*
| Amazon.com, Inc. | 5.31% |
| Alphabet, Inc., Class C | 4.46% |
| Mastercard, Inc., Class A | 4.26% |
| Microsoft Corp. | 4.19% |
| Visa, Inc., Class A | 4.19% |
| S&P Global, Inc. | 4.00% |
| HEICO Corp., Class A | 3.89% |
| Danaher Corp. | 3.47% |
| TransDigm Group, Inc. | 3.40% |
| Guidewire Software, Inc. | 3.35% |
* excluding cash equivalents
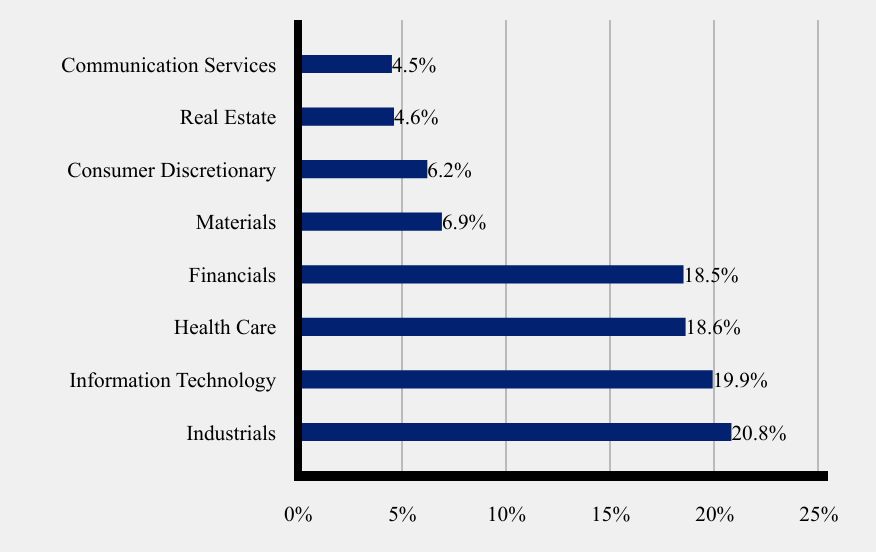
Sector Weightings
(% total investments)*
| Value | Value |
|---|
| Industrials | 20.8% |
| Information Technology | 19.9% |
| Health Care | 18.6% |
| Financials | 18.5% |
| Materials | 6.9% |
| Consumer Discretionary | 6.2% |
| Real Estate | 4.6% |
| Communication Services | 4.5% |
* excluding cash equivalents
Where can I find additional information about the fund?
The Fund is distributed by Foreside Fund Services, LLC, a wholly owned subsidiary of Foreside Financial Group, LLC (dba ACA Group). Additional information is available by scanning the QR code or at https://dfdent.com/literature/, including its:
prospectus
financial information
holdings
proxy information
DF Dent Premier Growth Fund
Annual Shareholder Report - June 30, 2024
DF Dent Midcap Growth Fund
Annual Shareholder Report - June 30, 2024
This annual shareholder report contains important information about the DF Dent Midcap Growth Fund for the period of July 1, 2023, to June 30, 2024. You can find additional information about the Fund at https://dfdent.com/literature/. You can also request this information by contacting us at (866) 233-3368.
What were the Fund's costs for the last year?
(based on a hypothetical $10,000 investment)
| Class Name | Costs of a $10,000 investment | Costs paid as a percentage of a $10,000 investment |
|---|
| Investor Shares | $92 | 0.88% |
How did the Fund perform in the last year?
During the period from July 2023 to June 2024, the DF Dent Midcap Growth Fund underperformed both of its benchmarks, the Russell 2500 Index and the Russell Midcap Growth Index.
The underperformance relative to the Russell 2500 Index was primarily driven by a negative sector allocation effect and to a lesser extent, a negative stock selection effect. Notably, the Information Technology sector and Materials sector positively contributed to the portfolio's performance. This was offset by performance in the Consumer Discretionary sector, Financials sector, and Health Care sector.
Energy was the top performing sector for the Russell 2500 benchmark. The Fund's lack of exposure to the Energy sector, resulted in a negative total effect on the portfolio. The sectors that detracted most from the benchmark's performance were Communication Services and Health Care. In contrast, the Fund's allocation to Communication Services positively contributed to the portfolio, unlike the Fund's exposure to the Health Care sector, a laggard in the benchmark, which adversely affected its performance, both with negative allocation and stock selection effects.
The underperformance relative to the Russell Midcap Growth Index was primarily driven by both stock selection and sector allocation. The largest detractors from performance were the Financials sector and Consumer Discretionary sector.
Utilities and Financials were the top performing sectors of the Russell Midcap Growth Index. The Fund's lack of exposure to the Utilities sector was a minor detractor, while stock selection in the Financials sector had a more significant impact on performance. Consumer Staples and Health Care sectors were the worst performing sectors for the benchmark. While the Fund had positive returns in Consumer Staples, both Consumer Staples and Health Care also detracted from the Fund’s performance.
Crowdstrike Holdings, Inc. Class A
WillScot Mobile Mini Holdings Corp.
Total Return Based on a $10,000 Investment
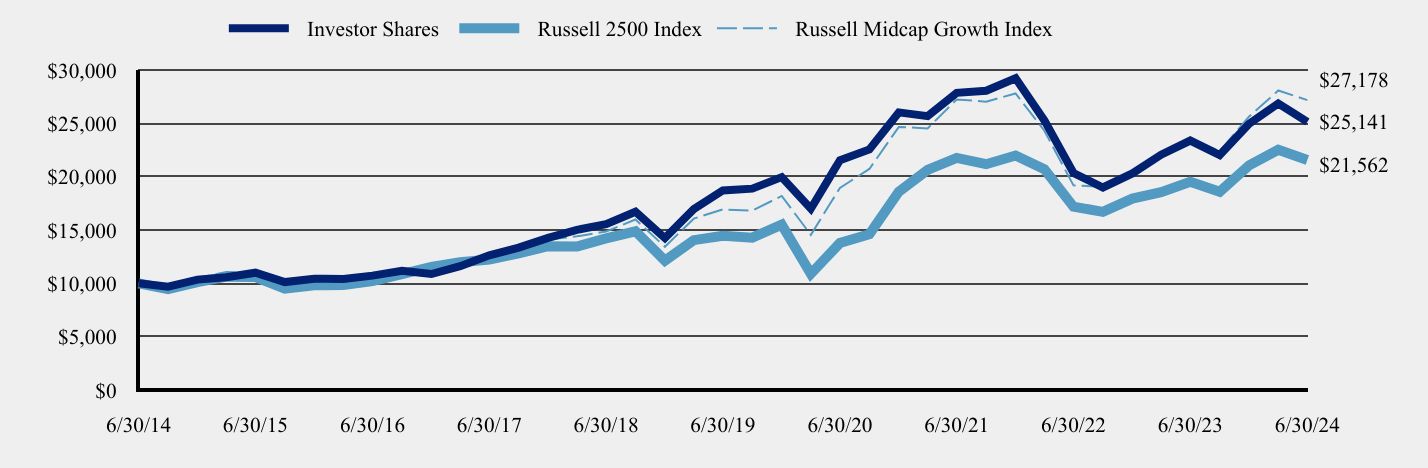
| Date | Investor Shares | Russell 2500 Index | Russell Midcap Growth Index |
|---|
| 6/30/14 | $10,000 | $10,000 | $10,000 |
| 9/30/14 | $9,690 | $9,465 | $9,927 |
| 12/31/14 | $10,348 | $10,106 | $10,507 |
| 3/31/15 | $10,565 | $10,628 | $11,072 |
| 6/30/15 | $10,997 | $10,592 | $10,945 |
| 9/30/15 | $10,118 | $9,501 | $10,071 |
| 12/31/15 | $10,430 | $9,813 | $10,486 |
| 3/31/16 | $10,409 | $9,851 | $10,546 |
| 6/30/16 | $10,723 | $10,203 | $10,711 |
| 9/30/16 | $11,176 | $10,873 | $11,203 |
| 12/31/16 | $10,872 | $11,539 | $11,254 |
| 3/31/17 | $11,605 | $11,972 | $12,030 |
| 6/30/17 | $12,625 | $12,228 | $12,537 |
| 9/30/17 | $13,351 | $12,807 | $13,199 |
| 12/31/17 | $14,266 | $13,478 | $14,098 |
| 3/31/18 | $15,016 | $13,446 | $14,404 |
| 6/30/18 | $15,555 | $14,214 | $14,859 |
| 9/30/18 | $16,710 | $14,881 | $15,985 |
| 12/31/18 | $14,240 | $12,130 | $13,428 |
| 3/31/19 | $16,963 | $14,049 | $16,063 |
| 6/30/19 | $18,708 | $14,465 | $16,930 |
| 9/30/19 | $18,875 | $14,280 | $16,816 |
| 12/31/19 | $19,955 | $15,498 | $18,191 |
| 3/31/20 | $16,996 | $10,892 | $14,545 |
| 6/30/20 | $21,540 | $13,785 | $18,947 |
| 9/30/20 | $22,549 | $14,596 | $20,723 |
| 12/31/20 | $26,026 | $18,597 | $24,664 |
| 3/31/21 | $25,674 | $20,630 | $24,525 |
| 6/30/21 | $27,858 | $21,752 | $27,240 |
| 9/30/21 | $28,056 | $21,169 | $27,033 |
| 12/31/21 | $29,228 | $21,978 | $27,804 |
| 3/31/22 | $25,276 | $20,700 | $24,306 |
| 6/30/22 | $20,345 | $17,185 | $19,184 |
| 9/30/22 | $18,987 | $16,701 | $19,059 |
| 12/31/22 | $20,307 | $17,941 | $20,374 |
| 3/31/23 | $22,056 | $18,549 | $22,236 |
| 6/30/23 | $23,384 | $19,519 | $23,622 |
| 9/30/23 | $22,026 | $18,585 | $22,388 |
| 12/31/23 | $24,960 | $21,067 | $25,644 |
| 3/31/24 | $26,860 | $22,525 | $28,080 |
| 6/30/24 | $25,141 | $21,562 | $27,178 |
The above chart represents historical performance of a hypothetical $10,000 investment over the past 10 years. Effective June 1, 2024, the Fund changed its primary benchmark index from the Russell Midcap Growth Index to the Russell 2500 Index due to regulatory requirements. The Fund retained the Russell Midcap Growth Index as a secondary benchmark because the Russell Midcap Growth Index more closely reflects the market sectors in which the Fund invests.
Average Annual Total Returns
| | One Year | Five Year | Ten Year |
|---|
| Investor Shares | 7.51% | 6.09% | 9.66% |
| Russell 2500 Index | 10.47% | 8.31% | 7.99% |
| Russell Midcap Growth Index | 15.05% | 9.93% | 10.51% |
The Fund’s past performance is not a good predictor of how the Fund will perform in the future. The graph and table do not reflect the deduction of taxes that a shareholder would pay on Fund distributions or redemption of Fund shares.
| Total Net Assets | $529,121,259 |
| # of Portfolio Holdings | 40 |
| Portfolio Turnover Rate | 29% |
| Investment Advisory Fees (Net of fees waived) | $4,011,586 |
Top Ten Holdings
(% of investments)*
| CBRE Group, Inc., Class A | 5.55% |
| Ecolab, Inc. | 5.55% |
| Veralto Corp. | 4.90% |
| Vulcan Materials Co. | 4.87% |
| HEICO Corp., Class A | 4.52% |
| Veeva Systems, Inc., Class A | 4.36% |
| Guidewire Software, Inc. | 4.27% |
| Bio-Techne Corp. | 4.15% |
| Markel Group, Inc. | 3.99% |
| Old Dominion Freight Line, Inc. | 3.61% |
* excluding cash equivalents
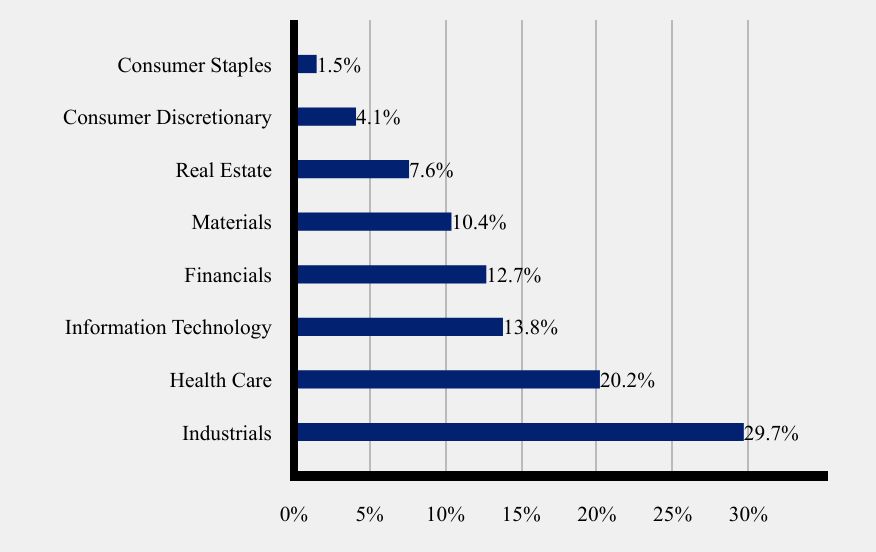
Sector Weightings
(% total investments)*
| Value | Value |
|---|
| Industrials | 29.7% |
| Health Care | 20.2% |
| Information Technology | 13.8% |
| Financials | 12.7% |
| Materials | 10.4% |
| Real Estate | 7.6% |
| Consumer Discretionary | 4.1% |
| Consumer Staples | 1.5% |
* excluding cash equivalents
Where can I find additional information about the fund?
The Fund is distributed by Foreside Fund Services, LLC, a wholly owned subsidiary of Foreside Financial Group, LLC (dba ACA Group). Additional information is available by scanning the QR code or at https://dfdent.com/literature/, including its:
prospectus
financial information
holdings
proxy information
DF Dent Midcap Growth Fund
Annual Shareholder Report - June 30, 2024
DF Dent Midcap Growth Fund
Annual Shareholder Report - June 30, 2024
This annual shareholder report contains important information about the DF Dent Midcap Growth Fund for the period of July 1, 2023, to June 30, 2024. You can find additional information about the Fund at https://dfdent.com/literature/. You can also request this information by contacting us at (866) 233-3368.
What were the Fund's costs for the last year?
(based on a hypothetical $10,000 investment)
| Class Name | Costs of a $10,000 investment | Costs paid as a percentage of a $10,000 investment |
|---|
| Institutional Shares | $88 | 0.84% |
How did the Fund perform in the last year?
During the period from July 2023 to June 2024, the DF Dent Midcap Growth Fund underperformed both of its benchmarks, the Russell 2500 Index and the Russell Midcap Growth Index.
The underperformance relative to the Russell 2500 Index was primarily driven by a negative sector allocation effect and to a lesser extent, a negative stock selection effect. Notably, the Information Technology sector and Materials sector positively contributed to the portfolio's performance. This was offset by performance in the Consumer Discretionary sector, Financials sector, and Health Care sector.
Energy was the top performing sector for the Russell 2500 benchmark. The Fund's lack of exposure to the Energy sector, resulted in a negative total effect on the portfolio. The sectors that detracted most from the benchmark's performance were Communication Services and Health Care. In contrast, the Fund's allocation to Communication Services positively contributed to the portfolio, unlike the Fund's exposure to the Health Care sector, a laggard in the benchmark, which adversely affected its performance, both with negative allocation and stock selection effects.
The underperformance relative to the Russell Midcap Growth Index was primarily driven by both stock selection and sector allocation. The largest detractors from performance were the Financials sector and Consumer Discretionary sector.
Utilities and Financials were the top performing sectors of the Russell Midcap Growth Index. The Fund's lack of exposure to the Utilities sector was a minor detractor, while stock selection in the Financials sector had a more significant impact on performance. Consumer Staples and Health Care sectors were the worst performing sectors for the benchmark. While the Fund had positive returns in Consumer Staples, both Consumer Staples and Health Care also detracted from the Fund’s performance.
Crowdstrike Holdings, Inc. Class A
WillScot Mobile Mini Holdings Corp.
Total Return Based on a $500,000 Investment
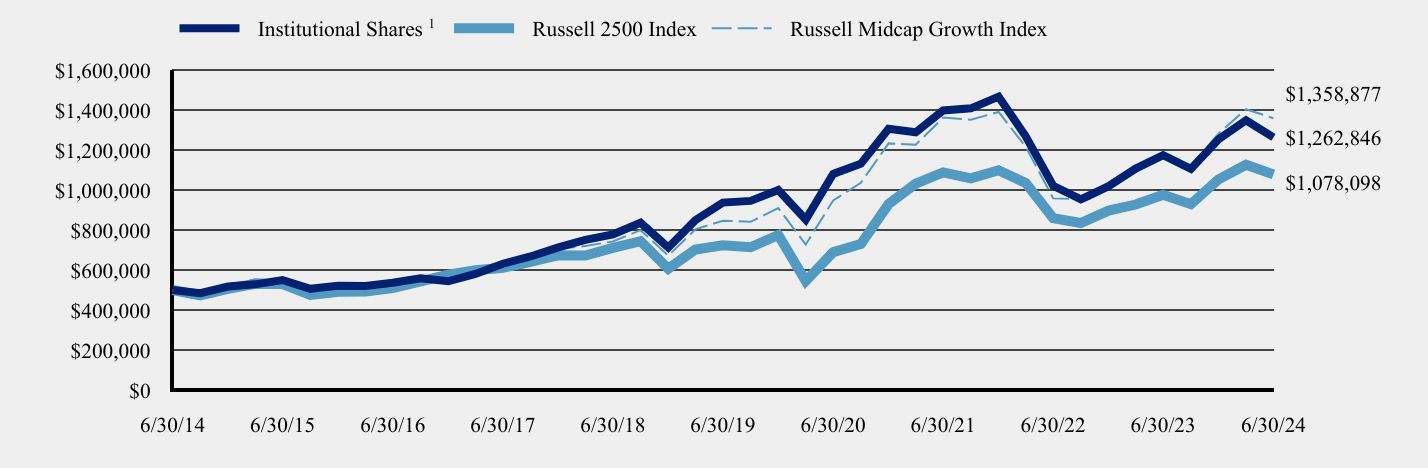
| Date | Institutional Shares Footnote Reference1 | Russell 2500 Index | Russell Midcap Growth Index |
|---|
| 6/30/14 | $500,000 | $500,000 | $500,000 |
| 9/30/14 | $484,476 | $473,273 | $496,355 |
| 12/31/14 | $517,412 | $505,299 | $525,332 |
| 3/31/15 | $528,226 | $531,415 | $553,584 |
| 6/30/15 | $549,855 | $529,597 | $547,270 |
| 9/30/15 | $505,921 | $475,066 | $503,545 |
| 12/31/15 | $521,496 | $490,637 | $524,282 |
| 3/31/16 | $520,449 | $492,565 | $527,317 |
| 6/30/16 | $536,147 | $510,161 | $535,557 |
| 9/30/16 | $558,820 | $543,642 | $560,149 |
| 12/31/16 | $543,601 | $576,936 | $562,704 |
| 3/31/17 | $580,260 | $598,606 | $601,498 |
| 6/30/17 | $631,234 | $611,383 | $626,852 |
| 9/30/17 | $667,544 | $640,373 | $659,968 |
| 12/31/17 | $713,311 | $673,921 | $704,886 |
| 3/31/18 | $750,780 | $672,310 | $720,214 |
| 6/30/18 | $778,094 | $710,691 | $742,954 |
| 9/30/18 | $836,223 | $744,068 | $799,230 |
| 12/31/18 | $712,677 | $606,516 | $671,401 |
| 3/31/19 | $849,201 | $702,452 | $803,136 |
| 6/30/19 | $937,199 | $723,251 | $846,520 |
| 9/30/19 | $945,528 | $713,976 | $840,819 |
| 12/31/19 | $1,000,248 | $774,922 | $909,544 |
| 3/31/20 | $852,293 | $544,601 | $727,272 |
| 6/30/20 | $1,080,253 | $689,273 | $947,351 |
| 9/30/20 | $1,131,398 | $729,819 | $1,036,152 |
| 12/31/20 | $1,305,985 | $929,855 | $1,233,219 |
| 3/31/21 | $1,288,396 | $1,031,477 | $1,226,249 |
| 6/30/21 | $1,397,961 | $1,087,612 | $1,362,020 |
| 9/30/21 | $1,408,221 | $1,058,445 | $1,351,670 |
| 12/31/21 | $1,466,786 | $1,098,921 | $1,390,186 |
| 3/31/22 | $1,268,500 | $1,034,997 | $1,215,296 |
| 6/30/22 | $1,021,209 | $859,244 | $959,212 |
| 9/30/22 | $952,977 | $835,034 | $952,948 |
| 12/31/22 | $1,019,324 | $897,057 | $1,018,715 |
| 3/31/23 | $1,107,158 | $927,470 | $1,111,784 |
| 6/30/23 | $1,173,881 | $975,930 | $1,181,096 |
| 9/30/23 | $1,105,650 | $929,260 | $1,119,396 |
| 12/31/23 | $1,253,422 | $1,053,354 | $1,282,225 |
| 3/31/24 | $1,348,795 | $1,126,241 | $1,403,992 |
| 6/30/24 | $1,262,846 | $1,078,098 | $1,358,877 |
| Footnote | Description |
Footnote1 | Institutional Shares commenced operations on November 29, 2017. Performance for the periods prior to November 29, 2017 are a blended average annual return which includes the returns of Investor Shares prior to the commencement of operations of Institutional Shares. |
The above chart represents historical performance of a hypothetical $500,000 investment over the past 10 years. Effective June 1, 2024, the Fund changed its primary benchmark index from the Russell Midcap Growth Index to the Russell 2500 Index due to regulatory requirements. The Fund retained the Russell Midcap Growth Index as a secondary benchmark because the Russell Midcap Growth Index more closely reflects the market sectors in which the Fund invests.
Average Annual Total Returns
| | One Year | Five Year | Ten Year |
|---|
Institutional Shares Footnote Reference1 | 7.58% | 6.15% | 9.71% |
| Russell 2500 Index | 10.47% | 8.31% | 7.99% |
| Russell Midcap Growth Index | 15.05% | 9.93% | 10.51% |
| Footnote | Description |
Footnote1 | Institutional Shares commenced operations on November 29, 2017. Performance for the 10 year period is a blended average annual return which includes the returns of Investor Shares prior to the commencement of operations of Institutional Shares. |
The Fund’s past performance is not a good predictor of how the Fund will perform in the future. The graph and table do not reflect the deduction of taxes that a shareholder would pay on Fund distributions or redemption of Fund shares.
| Total Net Assets | $529,121,259 |
| # of Portfolio Holdings | 40 |
| Portfolio Turnover Rate | 29% |
| Investment Advisory Fees (Net of fees waived) | $4,011,586 |
Top Ten Holdings
(% of investments)*
| CBRE Group, Inc., Class A | 5.55% |
| Ecolab, Inc. | 5.55% |
| Veralto Corp. | 4.90% |
| Vulcan Materials Co. | 4.87% |
| HEICO Corp., Class A | 4.52% |
| Veeva Systems, Inc., Class A | 4.36% |
| Guidewire Software, Inc. | 4.27% |
| Bio-Techne Corp. | 4.15% |
| Markel Group, Inc. | 3.99% |
| Old Dominion Freight Line, Inc. | 3.61% |
* excluding cash equivalents
Sector Weightings
(% total investments)*
| Value | Value |
|---|
| Industrials | 29.7% |
| Health Care | 20.2% |
| Information Technology | 13.8% |
| Financials | 12.7% |
| Materials | 10.4% |
| Real Estate | 7.6% |
| Consumer Discretionary | 4.1% |
| Consumer Staples | 1.5% |
* excluding cash equivalents
Where can I find additional information about the fund?
The Fund is distributed by Foreside Fund Services, LLC, a wholly owned subsidiary of Foreside Financial Group, LLC (dba ACA Group). Additional information is available by scanning the QR code or at https://dfdent.com/literature/, including its:
prospectus
financial information
holdings
proxy information
DF Dent Midcap Growth Fund
Annual Shareholder Report - June 30, 2024
DF Dent Midcap Growth Fund
: Institutional Plus Shares
Annual Shareholder Report - June 30, 2024
This annual shareholder report contains important information about the DF Dent Midcap Growth Fund for the period of July 1, 2023, to June 30, 2024. You can find additional information about the Fund at https://dfdent.com/literature/. You can also request this information by contacting us at (866) 233-3368.
What were the Fund's costs for the last year?
(based on a hypothetical $10,000 investment)
| Class Name | Costs of a $10,000 investment | Costs paid as a percentage of a $10,000 investment |
|---|
| Institutional Plus Shares | $82 | 0.78% |
How did the Fund perform in the last year?
During the period from July 2023 to June 2024, the DF Dent Midcap Growth Fund underperformed both of its benchmarks, the Russell 2500 Index and the Russell Midcap Growth Index.
The underperformance relative to the Russell 2500 Index was primarily driven by a negative sector allocation effect and to a lesser extent, a negative stock selection effect. Notably, the Information Technology sector and Materials sector positively contributed to the portfolio's performance. This was offset by performance in the Consumer Discretionary sector, Financials sector, and Health Care sector.
Energy was the top performing sector for the Russell 2500 benchmark. The Fund's lack of exposure to the Energy sector, resulted in a negative total effect on the portfolio. The sectors that detracted most from the benchmark's performance were Communication Services and Health Care. In contrast, the Fund's allocation to Communication Services positively contributed to the portfolio, unlike the Fund's exposure to the Health Care sector, a laggard in the benchmark, which adversely affected its performance, both with negative allocation and stock selection effects.
The underperformance relative to the Russell Midcap Growth Index was primarily driven by both stock selection and sector allocation. The largest detractors from performance were the Financials sector and Consumer Discretionary sector.
Utilities and Financials were the top performing sectors of the Russell Midcap Growth Index. The Fund's lack of exposure to the Utilities sector was a minor detractor, while stock selection in the Financials sector had a more significant impact on performance. Consumer Staples and Health Care sectors were the worst performing sectors for the benchmark. While the Fund had positive returns in Consumer Staples, both Consumer Staples and Health Care also detracted from the Fund’s performance.
Crowdstrike Holdings, Inc. Class A
WillScot Mobile Mini Holdings Corp.
Total Return Based on a $100,000,000 Investment

| Date | Institutional Plus Shares Footnote Reference1 | Russell 2500 Index | Russell Midcap Growth Index |
|---|
| 6/30/14 | $100,000,000 | $100,000,000 | $100,000,000 |
| 9/30/14 | $96,895,213 | $94,654,633 | $99,271,054 |
| 12/31/14 | $103,482,310 | $101,059,741 | $105,066,302 |
| 3/31/15 | $105,645,233 | $106,282,925 | $110,716,756 |
| 6/30/15 | $109,971,077 | $105,919,445 | $109,453,912 |
| 9/30/15 | $101,184,205 | $95,013,201 | $100,709,043 |
| 12/31/15 | $104,299,185 | $98,127,341 | $104,856,325 |
| 3/31/16 | $104,089,889 | $98,512,924 | $105,463,366 |
| 6/30/16 | $107,229,329 | $102,032,296 | $107,111,332 |
| 9/30/16 | $111,764,076 | $108,728,434 | $112,029,854 |
| 12/31/16 | $108,720,272 | $115,387,119 | $112,540,863 |
| 3/31/17 | $116,052,082 | $119,721,250 | $120,299,540 |
| 6/30/17 | $126,246,790 | $122,276,662 | $125,370,320 |
| 9/30/17 | $133,508,773 | $128,074,538 | $131,993,532 |
| 12/31/17 | $142,662,156 | $134,784,184 | $140,977,236 |
| 3/31/18 | $150,155,946 | $134,462,025 | $144,042,816 |
| 6/30/18 | $155,548,674 | $142,138,147 | $148,590,870 |
| 9/30/18 | $167,104,519 | $148,813,532 | $159,846,001 |
| 12/31/18 | $142,395,115 | $121,303,187 | $134,280,134 |
| 3/31/19 | $169,628,362 | $140,490,391 | $160,627,242 |
| 6/30/19 | $187,083,714 | $144,650,150 | $169,304,043 |
| 9/30/19 | $188,749,577 | $142,795,297 | $168,163,752 |
| 12/31/19 | $199,548,501 | $154,984,343 | $181,908,894 |
| 3/31/20 | $169,955,992 | $108,920,182 | $145,454,410 |
| 6/30/20 | $215,404,241 | $137,854,608 | $189,470,233 |
| 9/30/20 | $225,487,614 | $145,963,898 | $207,230,402 |
| 12/31/20 | $260,260,784 | $185,971,020 | $246,643,861 |
| 3/31/21 | $256,742,756 | $206,295,389 | $245,249,708 |
| 6/30/21 | $278,583,847 | $217,522,318 | $272,404,030 |
| 9/30/21 | $280,562,737 | $211,688,954 | $270,333,922 |
| 12/31/21 | $292,226,853 | $219,784,122 | $278,037,219 |
| 3/31/22 | $252,722,529 | $206,999,386 | $243,059,236 |
| 6/30/22 | $203,529,883 | $171,848,775 | $191,842,368 |
| 9/30/22 | $190,011,293 | $167,006,754 | $190,589,675 |
| 12/31/22 | $203,229,469 | $179,411,494 | $203,743,053 |
| 3/31/23 | $220,803,636 | $185,494,075 | $222,356,811 |
| 6/30/23 | $234,096,917 | $195,186,038 | $236,219,181 |
| 9/30/23 | $220,503,223 | $185,852,091 | $223,879,139 |
| 12/31/23 | $250,018,811 | $210,670,842 | $256,444,931 |
| 3/31/24 | $269,095,044 | $225,248,173 | $280,798,358 |
| 6/30/24 | $251,971,497 | $215,619,697 | $271,775,345 |
| Footnote | Description |
Footnote1 | Institutional Plus Shares commenced operations on November 1, 2021. Performance for the periods prior to November 1, 2021 are a blended average annual return which includes the returns of Investor Shares prior to the commencement of operations of Institutional Plus Shares. |
The above chart represents historical performance of a hypothetical $100,000,000 investment over the past 10 years. Effective June 1, 2024, the Fund changed its primary benchmark index from the Russell Midcap Growth Index to the Russell 2500 Index due to regulatory requirements. The Fund retained the Russell Midcap Growth Index as a secondary benchmark because the Russell Midcap Growth Index more closely reflects the market sectors in which the Fund invests.
Average Annual Total Returns
| | One Year | Five Year | Ten Year |
|---|
Institutional Plus Shares Footnote Reference1 | 7.64% | 6.14% | 9.68% |
| Russell 2500 Index | 10.47% | 8.31% | 7.99% |
| Russell Midcap Growth Index | 15.05% | 9.93% | 10.51% |
| Footnote | Description |
Footnote1 | Institutional Plus Shares commenced operations on November 1, 2021. Performance for the 5 year and 10 year periods is a blended average annual return which includes the returns of Investor Shares prior to the commencement of operations of Institutional Plus Shares. |
The Fund’s past performance is not a good predictor of how the Fund will perform in the future. The graph and table do not reflect the deduction of taxes that a shareholder would pay on Fund distributions or redemption of Fund shares.
| Total Net Assets | $529,121,259 |
| # of Portfolio Holdings | 40 |
| Portfolio Turnover Rate | 29% |
| Investment Advisory Fees (Net of fees waived) | $4,011,586 |
Top Ten Holdings
(% of investments)*
| CBRE Group, Inc., Class A | 5.55% |
| Ecolab, Inc. | 5.55% |
| Veralto Corp. | 4.90% |
| Vulcan Materials Co. | 4.87% |
| HEICO Corp., Class A | 4.52% |
| Veeva Systems, Inc., Class A | 4.36% |
| Guidewire Software, Inc. | 4.27% |
| Bio-Techne Corp. | 4.15% |
| Markel Group, Inc. | 3.99% |
| Old Dominion Freight Line, Inc. | 3.61% |
* excluding cash equivalents
Sector Weightings
(% total investments)*
| Value | Value |
|---|
| Industrials | 29.7% |
| Health Care | 20.2% |
| Information Technology | 13.8% |
| Financials | 12.7% |
| Materials | 10.4% |
| Real Estate | 7.6% |
| Consumer Discretionary | 4.1% |
| Consumer Staples | 1.5% |
* excluding cash equivalents
Where can I find additional information about the fund?
The Fund is distributed by Foreside Fund Services, LLC, a wholly owned subsidiary of Foreside Financial Group, LLC (dba ACA Group). Additional information is available by scanning the QR code or at https://dfdent.com/literature/, including its:
prospectus
financial information
holdings
proxy information
DF Dent Midcap Growth Fund
: Institutional Plus Shares
Annual Shareholder Report - June 30, 2024
DF Dent Small Cap Growth Fund
Annual Shareholder Report - June 30, 2024
This annual shareholder report contains important information about the DF Dent Small Cap Growth Fund for the period of July 1, 2023, to June 30, 2024. You can find additional information about the Fund at https://dfdent.com/literature/. You can also request this information by contacting us at (866) 233-3368.
What were the Fund's costs for the last year?
(based on a hypothetical $10,000 investment)
| Class Name | Costs of a $10,000 investment | Costs paid as a percentage of a $10,000 investment |
|---|
| Investor Shares | $108 | 1.04% |
How did the Fund perform in the last year?
During the period from July 2023 to June 2024, the DF Dent Small Cap Growth Fund underperformed both of its benchmarks, the Russell 2000 Index and the Russell 2000 Growth Index.
This underperformance relative to the Russell 2000 Index was primarily driven by a negative stock selection effect. Notably, the Health Care sector positively influenced the portfolio's performance while the Industrials sector was the largest detractor from performance.
The portfolio's performance relative to the Russell 2000 Growth Index was negatively impacted by stock selection, but was partially offset by a positive sector allocation. Notably stock selection and allocation to the Health Care sector, the Financials sector, and the Materials sector contributed positively to the portfolio's performance while stock selection in both the Industrials sector and the Information Technology sector were significant detractors from performance.
Energy, Financials, and Consumer Staples were the top performing sectors in the Russell 2000 benchmark. The Fund’s lack of exposure to the Energy sector, an underweight allocation in the Financials sector, and stock selection in the Consumer Staples sector detracted from performance. The benchmark sectors that notably detracted from performance included Utilities and Health Care. In the Fund, the Utilities sector showed an unexpected positive total effect due to lack of exposure. The Fund’s stock selection in the Health Care sector contributed to performance, but was partially offset by sector allocation.
Consumer Staples, Energy, and Information Technology were the top performing sectors in the Russell 2000 Growth benchmark. The Fund’s stock selection in Consumer Staples and Information Technology were headwinds to performance in addition to being underweight to the Energy sector. The sectors that detracted most from the benchmark's performance were Utilities and Health Care. In the Fund’s portfolio, Utilities had a positive total effect benefiting from the absence of portfolio allocation in this underperforming sector. Health Care, on the other hand, contributed positively to returns both in stock selection and favorable sector allocation.
Hamilton Lane, Inc., Class A
SiteOne Landscape Supply, Inc.
Sprout Social, Inc., Class A
Total Return Based on a $10,000 Investment
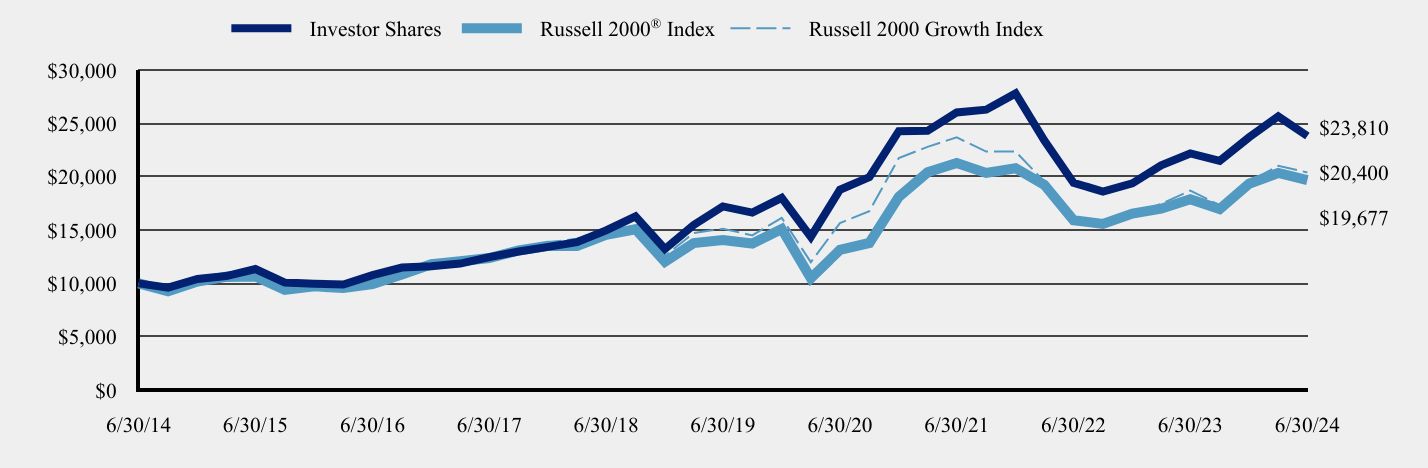
| Date | Investor Shares | Russell 2000® Index | Russell 2000 Growth Index |
|---|
| 6/30/14 | $10,000 | $10,000 | $10,000 |
| 9/30/14 | $9,595 | $9,264 | $9,387 |
| 12/31/14 | $10,403 | $10,165 | $10,331 |
| 3/31/15 | $10,682 | $10,604 | $11,016 |
| 6/30/15 | $11,341 | $10,649 | $11,234 |
| 9/30/15 | $10,069 | $9,379 | $9,767 |
| 12/31/15 | $9,970 | $9,717 | $10,189 |
| 3/31/16 | $9,895 | $9,569 | $9,711 |
| 6/30/16 | $10,767 | $9,932 | $10,026 |
| 9/30/16 | $11,479 | $10,830 | $10,951 |
| 12/31/16 | $11,610 | $11,787 | $11,342 |
| 3/31/17 | $11,854 | $12,078 | $11,948 |
| 6/30/17 | $12,454 | $12,375 | $12,473 |
| 9/30/17 | $12,988 | $13,077 | $13,248 |
| 12/31/17 | $13,419 | $13,513 | $13,856 |
| 3/31/18 | $13,859 | $13,502 | $14,174 |
| 6/30/18 | $14,965 | $14,549 | $15,200 |
| 9/30/18 | $16,277 | $15,069 | $16,039 |
| 12/31/18 | $13,215 | $12,025 | $12,566 |
| 3/31/19 | $15,469 | $13,779 | $14,721 |
| 6/30/19 | $17,211 | $14,067 | $15,125 |
| 9/30/19 | $16,627 | $13,730 | $14,494 |
| 12/31/19 | $18,017 | $15,094 | $16,145 |
| 3/31/20 | $14,361 | $10,473 | $11,986 |
| 6/30/20 | $18,773 | $13,135 | $15,651 |
| 9/30/20 | $19,958 | $13,783 | $16,772 |
| 12/31/20 | $24,266 | $18,107 | $21,737 |
| 3/31/21 | $24,298 | $20,407 | $22,797 |
| 6/30/21 | $26,019 | $21,283 | $23,690 |
| 9/30/21 | $26,280 | $20,355 | $22,351 |
| 12/31/21 | $27,805 | $20,791 | $22,353 |
| 3/31/22 | $23,393 | $19,226 | $19,530 |
| 6/30/22 | $19,430 | $15,920 | $15,770 |
| 9/30/22 | $18,608 | $15,572 | $15,808 |
| 12/31/22 | $19,377 | $16,542 | $16,461 |
| 3/31/23 | $21,054 | $16,995 | $17,461 |
| 6/30/23 | $22,175 | $17,879 | $18,692 |
| 9/30/23 | $21,470 | $16,962 | $17,324 |
| 12/31/23 | $23,692 | $19,342 | $19,533 |
| 3/31/24 | $25,658 | $20,344 | $21,014 |
| 6/30/24 | $23,810 | $19,677 | $20,400 |
The above chart represents historical performance of a hypothetical $10,000 investment over the past 10 years. Effective June 1, 2024, the Fund changed its primary benchmark index from the Russell 2000 Growth Index to the Russell 2000 Index due to regulatory requirements. The Fund retained the Russell 2000 Growth Index as a secondary benchmark because the Russell 2000 Growth Index more closely reflects the market sectors in which the Fund invests.
Average Annual Total Returns
| | One Year | Five Year | Ten Year |
|---|
| Investor Shares | 7.37% | 6.71% | 9.06% |
Russell 2000® Index | 10.06% | 6.94% | 7.00% |
| Russell 2000 Growth Index | 9.14% | 6.17% | 7.39% |
The Fund’s past performance is not a good predictor of how the Fund will perform in the future. The graph and table do not reflect the deduction of taxes that a shareholder would pay on Fund distributions or redemption of Fund shares.
| Total Net Assets | $196,745,691 |
| # of Portfolio Holdings | 45 |
| Portfolio Turnover Rate | 30% |
| Investment Advisory Fees (Net of fees waived) | $821,492 |
Top Ten Holdings
(% of investments)*
| HEICO Corp., Class A | 4.81% |
| Guidewire Software, Inc. | 4.16% |
| Murphy USA, Inc. | 4.04% |
| Core & Main, Inc., Class A | 3.92% |
| Hamilton Lane, Inc., Class A | 3.85% |
| Bio-Techne Corp. | 3.64% |
| Appfolio, Inc. | 3.41% |
| Novanta, Inc. | 3.15% |
| Manhattan Associates, Inc. | 3.06% |
| Kinsale Capital Group, Inc. | 2.93% |
* excluding cash equivalents
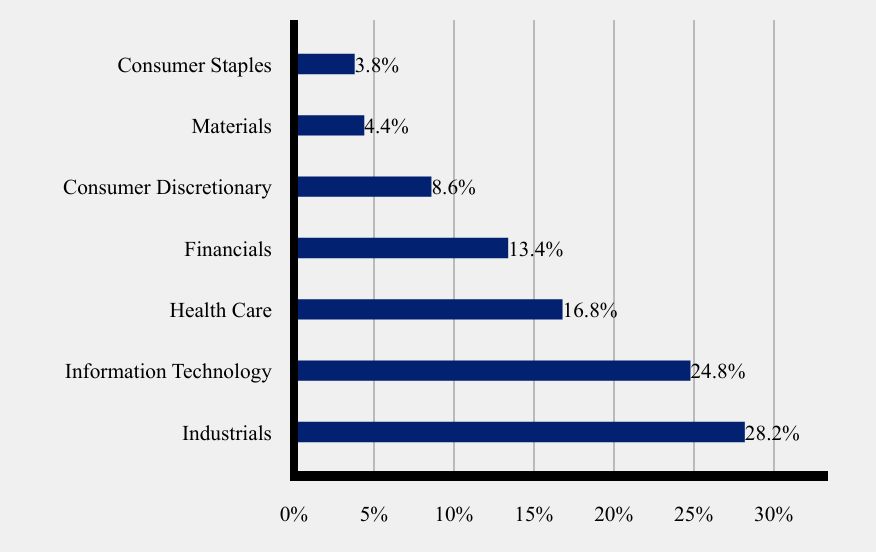
Sector Weightings
(% total investments)*
| Value | Value |
|---|
| Industrials | 28.2% |
| Information Technology | 24.8% |
| Health Care | 16.8% |
| Financials | 13.4% |
| Consumer Discretionary | 8.6% |
| Materials | 4.4% |
| Consumer Staples | 3.8% |
* excluding cash equivalents
Where can I find additional information about the fund?
The Fund is distributed by Foreside Fund Services, LLC, a wholly owned subsidiary of Foreside Financial Group, LLC (dba ACA Group). Additional information is available by scanning the QR code or at https://dfdent.com/literature/, including its:
prospectus
financial information
holdings
proxy information
DF Dent Small Cap Growth Fund
Annual Shareholder Report - June 30, 2024
DF Dent Small Cap Growth Fund
Annual Shareholder Report - June 30, 2024
This annual shareholder report contains important information about the DF Dent Small Cap Growth Fund for the period of July 1, 2023, to June 30, 2024. You can find additional information about the Fund at https://dfdent.com/literature/. You can also request this information by contacting us at (866) 233-3368.
What were the Fund's costs for the last year?
(based on a hypothetical $10,000 investment)
| Class Name | Costs of a $10,000 investment | Costs paid as a percentage of a $10,000 investment |
|---|
| Institutional Shares | $98 | 0.94% |
How did the Fund perform in the last year?
During the period from July 2023 to June 2024, the DF Dent Small Cap Growth Fund underperformed both of its benchmarks, the Russell 2000 Index and the Russell 2000 Growth Index.
This underperformance relative to the Russell 2000 Index was primarily driven by a negative stock selection effect. Notably, the Health Care sector positively influenced the portfolio's performance while the Industrials sector was the largest detractor from performance.
The portfolio's performance relative to the Russell 2000 Growth Index was negatively impacted by stock selection, but was partially offset by a positive sector allocation. Notably stock selection and allocation to the Health Care sector, the Financials sector, and the Materials sector contributed positively to the portfolio's performance while stock selection in both the Industrials sector and the Information Technology sector were significant detractors from performance.
Energy, Financials, and Consumer Staples were the top performing sectors in the Russell 2000 benchmark. The Fund’s lack of exposure to the Energy sector, an underweight allocation in the Financials sector, and stock selection in the Consumer Staples sector detracted from performance. The benchmark sectors that notably detracted from performance included Utilities and Health Care. In the Fund, the Utilities sector showed an unexpected positive total effect due to lack of exposure. The Fund’s stock selection in the Health Care sector contributed to performance, but was partially offset by sector allocation.
Consumer Staples, Energy, and Information Technology were the top performing sectors in the Russell 2000 Growth benchmark. The Fund’s stock selection in Consumer Staples and Information Technology were headwinds to performance in addition to being underweight to the Energy sector. The sectors that detracted most from the benchmark's performance were Utilities and Health Care. In the Fund’s portfolio, Utilities had a positive total effect benefiting from the absence of portfolio allocation in this underperforming sector. Health Care, on the other hand, contributed positively to returns both in stock selection and favorable sector allocation.
Hamilton Lane, Inc., Class A
SiteOne Landscape Supply, Inc.
Sprout Social, Inc., Class A
Total Return Based on a $500,000 Investment
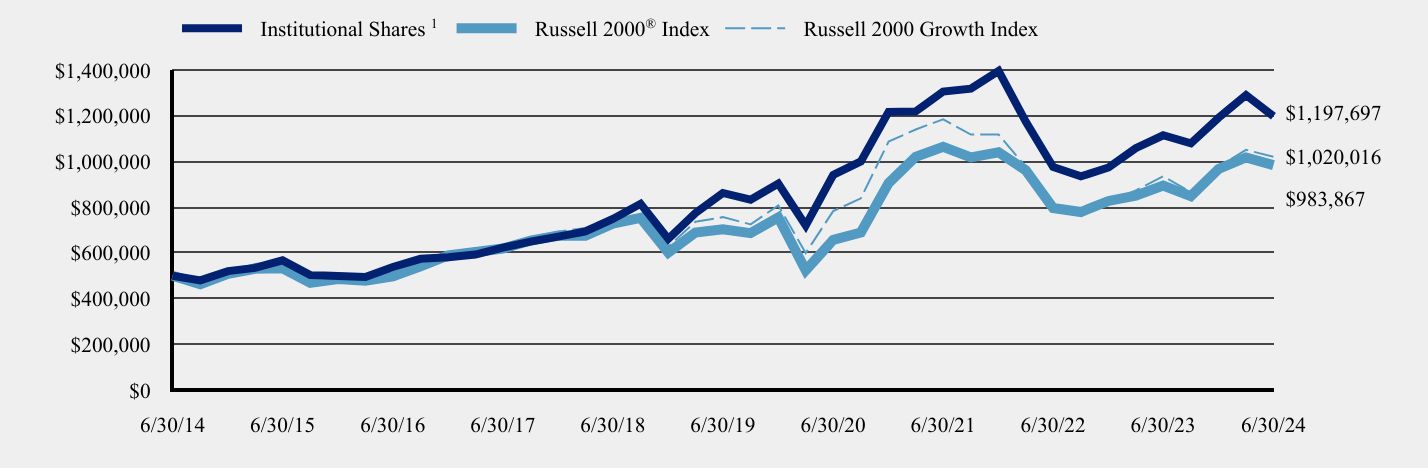
| Date | Institutional Shares Footnote Reference1 | Russell 2000® Index | Russell 2000 Growth Index |
|---|
| 6/30/14 | $500,000 | $500,000 | $500,000 |
| 9/30/14 | $479,761 | $463,202 | $469,354 |
| 12/31/14 | $520,169 | $508,263 | $516,565 |
| 3/31/15 | $534,090 | $530,196 | $550,812 |
| 6/30/15 | $567,036 | $532,428 | $561,701 |
| 9/30/15 | $503,465 | $468,974 | $488,334 |
| 12/31/15 | $498,521 | $485,828 | $509,428 |
| 3/31/16 | $494,773 | $478,450 | $485,572 |
| 6/30/16 | $538,346 | $496,592 | $501,310 |
| 9/30/16 | $573,955 | $541,513 | $547,537 |
| 12/31/16 | $580,515 | $589,348 | $567,086 |
| 3/31/17 | $592,696 | $603,881 | $597,418 |
| 6/30/17 | $622,683 | $618,758 | $623,638 |
| 9/30/17 | $649,389 | $653,832 | $662,417 |
| 12/31/17 | $670,942 | $675,672 | $692,790 |
| 3/31/18 | $693,431 | $675,103 | $708,720 |
| 6/30/18 | $748,250 | $727,448 | $759,979 |
| 9/30/18 | $814,782 | $753,464 | $801,954 |
| 12/31/18 | $661,219 | $601,253 | $628,305 |
| 3/31/19 | $774,441 | $688,940 | $736,027 |
| 6/30/19 | $862,000 | $703,374 | $756,254 |
| 9/30/19 | $832,813 | $686,487 | $724,694 |
| 12/31/19 | $902,843 | $754,722 | $807,268 |
| 3/31/20 | $719,517 | $523,666 | $599,276 |
| 6/30/20 | $940,632 | $656,775 | $782,560 |
| 9/30/20 | $1,000,379 | $689,166 | $838,575 |
| 12/31/20 | $1,216,809 | $905,371 | $1,086,844 |
| 3/31/21 | $1,218,895 | $1,020,345 | $1,139,831 |
| 6/30/21 | $1,305,475 | $1,064,144 | $1,184,483 |
| 9/30/21 | $1,318,514 | $1,017,743 | $1,117,529 |
| 12/31/21 | $1,395,800 | $1,039,538 | $1,117,654 |
| 3/31/22 | $1,174,202 | $961,304 | $976,523 |
| 6/30/22 | $975,565 | $796,006 | $788,500 |
| 9/30/22 | $934,449 | $778,596 | $790,407 |
| 12/31/22 | $973,429 | $827,093 | $823,068 |
| 3/31/23 | $1,057,797 | $849,737 | $873,051 |
| 6/30/23 | $1,114,398 | $893,968 | $934,623 |
| 9/30/23 | $1,079,156 | $848,125 | $866,221 |
| 12/31/23 | $1,191,290 | $967,111 | $976,640 |
| 3/31/24 | $1,290,608 | $1,017,208 | $1,050,687 |
| 6/30/24 | $1,197,697 | $983,867 | $1,020,016 |
| Footnote | Description |
Footnote1 | Institutional Shares commenced operations on November 20, 2017. Performance for the periods prior to November 20, 2017 are a blended average annual return which includes the returns of Investor Shares prior to the commencement of operations of Institutional Shares. |
The above chart represents historical performance of a hypothetical $500,000 investment over the past 10 years. Effective June 1, 2024, the Fund changed its primary benchmark index from the Russell 2000 Growth Index to the Russell 2000 Index due to regulatory requirements. The Fund retained the Russell 2000 Growth Index as a secondary benchmark because the Russell 2000 Growth Index more closely reflects the market sectors in which the Fund invests.
Average Annual Total Returns
| | One Year | Five Year | Ten Year |
|---|
Institutional Shares Footnote Reference1 | 7.48% | 6.80% | 9.13% |
Russell 2000® Index | 10.06% | 6.94% | 7.00% |
| Russell 2000 Growth Index | 9.14% | 6.17% | 7.39% |
| Footnote | Description |
Footnote1 | Institutional Shares commenced operations on November 20, 2017. Performance for the 10 year period is a blended average annual return which includes the returns of Investor Shares prior to the commencement of operations of Institutional Shares. |
The Fund’s past performance is not a good predictor of how the Fund will perform in the future. The graph and table do not reflect the deduction of taxes that a shareholder would pay on Fund distributions or redemption of Fund shares.
| Total Net Assets | $196,745,691 |
| # of Portfolio Holdings | 45 |
| Portfolio Turnover Rate | 30% |
| Investment Advisory Fees (Net of fees waived) | $821,492 |
Top Ten Holdings
(% of investments)*
| HEICO Corp., Class A | 4.81% |
| Guidewire Software, Inc. | 4.16% |
| Murphy USA, Inc. | 4.04% |
| Core & Main, Inc., Class A | 3.92% |
| Hamilton Lane, Inc., Class A | 3.85% |
| Bio-Techne Corp. | 3.64% |
| Appfolio, Inc. | 3.41% |
| Novanta, Inc. | 3.15% |
| Manhattan Associates, Inc. | 3.06% |
| Kinsale Capital Group, Inc. | 2.93% |
* excluding cash equivalents
Sector Weightings
(% total investments)*
| Value | Value |
|---|
| Industrials | 28.2% |
| Information Technology | 24.8% |
| Health Care | 16.8% |
| Financials | 13.4% |
| Consumer Discretionary | 8.6% |
| Materials | 4.4% |
| Consumer Staples | 3.8% |
* excluding cash equivalents
Where can I find additional information about the fund?
The Fund is distributed by Foreside Fund Services, LLC, a wholly owned subsidiary of Foreside Financial Group, LLC (dba ACA Group). Additional information is available by scanning the QR code or at https://dfdent.com/literature/, including its:
prospectus
financial information
holdings
proxy information
DF Dent Small Cap Growth Fund
Annual Shareholder Report - June 30, 2024
(b) Not applicable.
ITEM 2. CODE OF ETHICS.
(a) As of the end of the period covered by this report, Forum Funds (the “Registrant”) has adopted a code of ethics, which applies to its Principal Executive Officer and Principal Financial Officer (the “Code of Ethics”).
(c) There have been no amendments to the Registrant’s Code of Ethics during the period covered by this report.
(d) There have been no waivers to the Registrant’s Code of Ethics during the period covered by this report.
(e) Not applicable.
(f)(1) A copy of the Code of Ethics is being filed under Item 19(a)(1) hereto.
ITEM 3. AUDIT COMMITTEE FINANCIAL EXPERT.
(a)(1) The Board of Trustees has determined that the Registrant has an audit committee financial expert, as defined in Item 3 of Form N-CSR, serving on its audit committee.
(a)(2) The audit committee financial expert, Mr. Mark Moyer, is a non-“interested” Trustee (as defined in Item 3(a)(2) of Form N-CSR.
ITEM 4. PRINCIPAL ACCOUNTANT FEES AND SERVICES.
(a) Audit Fees - The aggregate fees billed for each of the last two fiscal years (the “Reporting Periods”) for professional services rendered by the Registrant’s principal accountant for the audit of the Registrant’s annual financial statements, or services that are normally provided by the principal accountant in connection with the statutory and regulatory filings or engagements for the Reporting Periods, were $41,400 in 2023 and $42,600 in 2024.
(b) Audit-Related Fees – The aggregate fees billed in the Reporting Periods for assurance and related services rendered by the principal accountant that were reasonably related to the performance of the audit of the Registrant’s financial statements and are not reported under paragraph (a) of this Item 4 were $0 in 2023 and $0 in 2024.
(c) Tax Fees - The aggregate fees billed in the Reporting Periods for professional services rendered by the principal accountant to the Registrant for tax compliance, tax advice and tax planning were $9,300 in 2023 and $9,600 in 2024. These services consisted of review or preparation of U.S. federal, state, local and excise tax returns.
(d) All Other Fees - The aggregate fees billed in the Reporting Periods for products and services provided by the principal accountant to the Registrant, other than the services reported in paragraphs (a) through (c) of this Item, were $0 in 2023 and $0 in 2024.
(e)(1) The Audit Committee reviews and approves in advance all audit and “permissible non-audit services” (as that term is defined by the rules and regulations of the U.S. Securities and Exchange Commission) to be rendered to a series of the Registrant (each, a “Series”). In addition, the Audit Committee reviews and approves in advance all “permissible non-audit services” to be provided to an investment adviser (not including any sub-adviser) of a Series, or an affiliate of such investment adviser, that is controlling, controlled by or under common control with the investment adviser and provides on-going services to the Registrant (“Affiliate”), by the Series’ principal accountant if the engagement relates directly to the operations and financial reporting of the Series. The Audit Committee considers whether fees paid by a Series’ investment adviser or an Affiliate to the Series’ principal accountant for audit and permissible non-audit services are consistent with the principal accountant’s independence.
(e)(2) No services included in (b) - (d) above were approved pursuant to paragraph (c)(7)(i)(C) of Rule 2-01 of Regulation S-X.
(f) Not applicable
(g) The aggregate non-audit fees billed by the principal accountant for services rendered to the Registrant for the Reporting Periods were $0 in 2023 and $0 in 2024. There were no fees billed in either of the Reporting Periods for non-audit services rendered by the principal accountant to the Registrant’s investment adviser or any Affiliate.
(h) During the Reporting Period, the Registrant's principal accountant provided no non-audit services to the investment advisers or any entity controlling, controlled by or under common control with the investment advisers to the series of the Registrant to which this report relates.
(i) Not applicable. The Registrant has not retained, for the preparation of the audit report on the financial statements included in the Form N-CSR, a registered public accounting firm that has a branch or office that is located in a foreign jurisdiction and that the Public Company Accounting Oversight Board (the “PCAOB”) has determined that the PCAOB is unable to inspect or investigate completely because of a position taken by an authority in the foreign jurisdiction.
(j) Not applicable. The Registrant is not a “foreign issuer,” as defined in 17 CFR 240.3b-4.
ITEM 5. AUDIT COMMITTEE OF LISTED REGISTRANTS.
Not applicable.
ITEM 6. INVESTMENTS.
(a) Included as part of financial statements filed under Item 7(a).
(b) Not applicable.
ITEM 7. FINANCIAL STATEMENTS AND FINANCIAL HIGHLIGHTS FOR OPEN-END MANAGEMENT INVESTMENT COMPANIES.
(a)
ANNUAL
FINANCIALS
AND
OTHER
INFORMATION
DF
DENT
GROWTH
FUNDS
TABLE
OF
CONTENTS
JUNE
30,
2024
DF
Dent
Premier
Growth
Fund
Schedule
of
Investments
1
Statement
of
Assets
and
Liabilities
3
Statement
of
Operations
4
Statements
of
Changes
in
Net
Assets
5
Financial
Highlights
6
DF
Dent
Midcap
Growth
Fund
Schedule
of
Investments
7
Statement
of
Assets
and
Liabilities
9
Statement
of
Operations
10
Statements
of
Changes
in
Net
Assets
11
Financial
Highlights
12
DF
Dent
Small
Cap
Growth
Fund
Schedule
of
Investments
15
Statement
of
Assets
and
Liabilities
17
Statement
of
Operations
18
Statements
of
Changes
in
Net
Assets
19
Financial
Highlights
20
DF
Dent
Growth
Funds
Notes
to
Financial
Statements
22
Report
of
Independent
Registered
Public
Accounting
Firm
28
Important
Tax
Information
(Unaudited)
29
Other
Information
(Unaudited)
30
See
Notes
to
Financial
Statements.
DF
DENT
PREMIER
GROWTH
FUND
SCHEDULE
OF
INVESTMENTS
JUNE
30,
2024
The
following
is
a
summary
of
the
inputs
used
to
value
the
Fund's investments
as
of
June
30,
2024.
The
inputs
or
methodology
used
for
valuing
securities
are
not
necessarily
an
indication
of
the
risks
associated
with
investing
in
those
securities.
For
more
information
on
valuation
inputs,
and
their
aggregation
into
the
levels
used
in
the
table
below,
please
refer
to
the
Security
Valuation
section
in
Note
2
of
the
accompanying
Notes
to
Financial
Statements.
The
Level
1
value
displayed
in
this
table
is
Common
Stock
and
a
Money
Market
Fund.
Refer
to
this
Schedule
of
Investments
for
a
further
breakout
of
each
security
by
industry.
Shares
Security
Description
Value
Common
Stock
-
100.2%
Communication
Services
-
4.5%
56,417
Alphabet,
Inc.,
Class C
$
10,348,006
Consumer
Discretionary
-
6.2%
63,761
Amazon.com,
Inc.
(a)
12,321,813
28,694
CarMax,
Inc.
(a)
2,104,418
14,426,231
Financials
-
18.5%
8,883
Kinsale
Capital
Group,
Inc.
3,422,442
3,059
Markel
Group,
Inc.
(a)
4,819,944
22,373
Mastercard,
Inc.,
Class A
9,870,073
13,656
Moody's
Corp.
5,748,220
20,824
S&P
Global,
Inc.
9,287,504
36,992
Visa,
Inc.,
Class A
9,709,290
42,857,473
Health
Care
-
18.7%
91,280
Bio-Techne
Corp.
6,540,212
32,227
Danaher
Corp.
8,051,916
15,552
Intuitive
Surgical,
Inc.
(a)
6,918,307
11,504
Thermo
Fisher
Scientific,
Inc.
6,361,712
29,670
Veeva
Systems,
Inc.,
Class A
(a)
5,429,907
20,278
West
Pharmaceutical
Services,
Inc.
6,679,370
18,481
Zoetis,
Inc.
3,203,866
43,185,290
Industrials
-
20.8%
72,984
Fastenal
Co.
4,586,315
50,854
HEICO
Corp.,
Class A
9,027,602
38,652
Old
Dominion
Freight
Line,
Inc.
6,825,943
21,000
SiteOne
Landscape
Supply,
Inc.
(a)
2,549,610
6,170
TransDigm
Group,
Inc.
(a)
7,882,854
33,000
Uber
Technologies,
Inc.
(a)
2,398,440
71,462
Veralto
Corp.
6,822,477
34,386
Waste
Connections,
Inc.
6,029,929
55,000
WillScot
Mobile
Mini
Holdings
Corp.
(a)
2,070,200
48,193,370
Information
Technology
-
20.0%
20,917
ANSYS,
Inc.
(a)
6,724,815
4,290
ASML
Holding
NV
4,387,512
8,747
Atlassian
Corp.,
Class A
(a)
1,547,169
5,673
Crowdstrike
Holdings,
Inc.,
Class A
(a)
2,173,837
56,367
Guidewire
Software,
Inc.
(a)
7,772,446
6,646
Intuit,
Inc.
4,367,818
5,400
Manhattan
Associates,
Inc.
(a)
1,332,072
21,724
Microsoft
Corp.
9,709,542
6,971
Monolithic
Power
Systems,
Inc.
5,727,931
1,600
ServiceNow,
Inc.
(a)
1,258,672
Shares
Security
Description
Value
Information
Technology
-
20.0%
(continued)
2,315
Tyler
Technologies,
Inc.
(a)
$
1,163,936
46,165,750
Materials
-
6.9%
20,997
Ecolab,
Inc.
4,997,286
13,766
The
Sherwin-Williams
Co.
4,108,187
27,500
Vulcan
Materials
Co.
6,838,700
15,944,173
Real
Estate
-
4.6%
81,856
CBRE
Group,
Inc.,
Class A
(a)
7,294,188
45,990
CoStar
Group,
Inc.
(a)
3,409,699
10,703,887
Total
Common
Stock
(Cost
$102,968,324)
231,824,180
Money
Market
Fund
-
0.0%
67,058
First
American
Treasury
Obligations
Fund,
Class X,
5.21%
(b)
(Cost
$67,058)
67,058
Investments,
at
value
-
100.2%
(Cost
$103,035,382)
$
231,891,238
Other
Assets
&
Liabilities,
Net
-
(0.2)%
(497,579)
Net
Assets
-
100.0%
$
231,393,659
(a)
Non-income
producing
security.
(b)
Dividend
yield
changes
daily
to
reflect
current
market
conditions.
Rate
was
the
quoted
yield
as
of
June
30,
2024.
Valuation
Inputs
Investments
in
Securities
Level
1
-
Quoted
Prices
$
231,891,238
Level
2
-
Other
Significant
Observable
Inputs
–
Level
3
-
Significant
Unobservable
Inputs
–
Total
$
231,891,238
See
Notes
to
Financial
Statements.
DF
DENT
PREMIER
GROWTH
FUND
SCHEDULE
OF
INVESTMENTS
JUNE
30,
2024
PORTFOLIO
HOLDINGS
(Unaudited)
%
of
Total
Net
Assets
Communication
Services
4.5%
Consumer
Discretionary
6.2%
Financials
18.5%
Health
Care
18.7%
Industrials
20.8%
Information
Technology
20.0%
Materials
6.9%
Real
Estate
4.6%
Money
Market
Fund
0.0%
Other
Assets
&
Liabilities,
Net
(0.2)%
100.0%
See
Notes
to
Financial
Statements.
DF
DENT
PREMIER
GROWTH
FUND
STATEMENT
OF
ASSETS
AND
LIABILITIES
JUNE
30,
2024
ASSETS
Investments,
at
value
(Cost
$103,035,382)
$
231,891,238
Receivables:
Fund
shares
sold
300
Dividends
49,387
Prepaid
expenses
18,923
Total
Assets
231,959,848
LIABILITIES
Payables:
Fund
shares
redeemed
28,000
Accrued
Liabilities:
Investment
adviser
fees
493,804
Fund
services
fees
10,714
Other
expenses
33,671
Total
Liabilities
566,189
NET
ASSETS
$
231,393,659
COMPONENTS
OF
NET
ASSETS
Paid-in
capital
$
83,364,408
Distributable
Earnings
148,029,251
NET
ASSETS
$
231,393,659
SHARES
OF
BENEFICIAL
INTEREST
AT
NO
PAR
VALUE
(UNLIMITED
SHARES
AUTHORIZED)
5,822,871
NET
ASSET
VALUE,
OFFERING
AND
REDEMPTION
PRICE
PER
SHARE
$
39.74
See
Notes
to
Financial
Statements.
DF
DENT
PREMIER
GROWTH
FUND
STATEMENT
OF
OPERATIONS
YEAR
ENDED
JUNE
30,
2024
INVESTMENT
INCOME
Dividend
income
(Net
of
foreign
withholding
taxes
of
$8,569)
$
1,456,339
Total
Investment
Income
1,456,339
EXPENSES
Investment
adviser
fees
2,285,190
Fund
services
fees
173,207
Custodian
fees
28,230
Registration
fees
21,206
Professional
fees
50,896
Trustees'
fees
and
expenses
13,315
Other
expenses
53,364
Total
Expenses
2,625,408
Fees
waived
(342,304)
Net
Expenses
2,283,104
NET
INVESTMENT
LOSS
(826,765)
NET
REALIZED
AND
UNREALIZED
GAIN
(LOSS)
Net
realized
gain
on
investments
30,137,857
Net
change
in
unrealized
appreciation
(depreciation)
on
investments
2,428,258
NET
REALIZED
AND
UNREALIZED
GAIN
32,566,115
INCREASE
IN
NET
ASSETS
RESULTING
FROM
OPERATIONS
$
31,739,350
See
Notes
to
Financial
Statements.
DF
DENT
PREMIER
GROWTH
FUND
STATEMENTS
OF
CHANGES
IN
NET
ASSETS
For
the
Years
Ended
June
30,
2024
2023
OPERATIONS
Net
investment
loss
$
(826,765)
$
(770,180)
Net
realized
gain
30,137,857
37,920,230
Net
change
in
unrealized
appreciation
(depreciation)
2,428,258
(2,000,808)
Increase
in
Net
Assets
Resulting
from
Operations
31,739,350
35,149,242
DISTRIBUTIONS
TO
SHAREHOLDERS
Total
Distributions
Paid
(36,525,907)
–
CAPITAL
SHARE
TRANSACTIONS
Sale
of
shares
13,503,081
5,639,980
Reinvestment
of
distributions
34,549,001
–
Redemption
of
shares
(59,143,595)
(72,453,023)
Decrease
in
Net
Assets
from
Capital
Share
Transactions
(11,091,513)
(66,813,043)
Decrease
in
Net
Assets
(15,878,070)
(31,663,801)
NET
ASSETS
Beginning
of
Year
247,271,729
278,935,530
End
of
Year
$
231,393,659
$
247,271,729
SHARE
TRANSACTIONS
Sale
of
shares
342,232
151,835
Reinvestment
of
distributions
984,863
–
Redemption
of
shares
(1,529,032)
(1,963,102)
Decrease
in
Shares
(201,937)
(1,811,267)
See
Notes
to
Financial
Statements.
DF
DENT
PREMIER
GROWTH
FUND
FINANCIAL
HIGHLIGHTS
These
financial
highlights
reflect
selected
data
for
a
share
outstanding
throughout
each
year
.
For
the
Years
Ended
June
30,
2024
2023
2022
2021
2020
NET
ASSET
VALUE,
Beginning
of
Year
$
41.04
$
35.60
$
49.79
$
38.91
$
35.75
INVESTMENT
OPERATIONS
Net
investment
loss
(a)
(0.14)
(0.11)
(0.27)
(0.25)
(0.11)
Net
realized
and
unrealized
gain
(loss)
5.74
5.55
(10.28)
12.16
5.88
Total
from
Investment
Operations
5.60
5.44
(10.55)
11.91
5.77
DISTRIBUTIONS
TO
SHAREHOLDERS
FROM
Net
realized
gain
(6.90)
–
(3.64)
(1.03)
(2.61)
Total
Distributions
to
Shareholders
(6.90)
–
(3.64)
(1.03)
(2.61)
REDEMPTION
FEES(a)
–
–
0.00(b)
0.00(b)
–
NET
ASSET
VALUE,
End
of
Year
$
39.74
$
41.04
$
35.60
$
49.79
$
38.91
TOTAL
RETURN
15.87%
15.28%
(23.05)%
30.96%
16.82%
RATIOS/SUPPLEMENTARY
DATA
Net
Assets
at
End
of
Year
(000s
omitted)
$
231,394
$
247,272
$
278,936
$
430,924
$
343,711
Ratios
to
Average
Net
Assets:
Net
investment
loss
(0.36)%
(0.30)%
(0.58)%
(0.57)%
(0.30)%
Net
expenses
0.99%
0.99%
0.99%
0.99%
1.00%
Gross
expenses
(c)
1.14%
1.13%
1.10%
1.11%
1.15%
PORTFOLIO
TURNOVER
RATE
19%
20%
18%
14%
23%
footertext
(a)
Calculated
based
on
average
shares
outstanding
during
each
year.
(b)
Less
than
$0.01
per
share.
(c)
Reflects
the
expense
ratio
excluding
any
waivers
and/or
reimbursements.
See
Notes
to
Financial
Statements.
DF
DENT
MIDCAP
GROWTH
FUND
SCHEDULE
OF
INVESTMENTS
JUNE
30,
2024
The
following
is
a
summary
of
the
inputs
used
to
value
the
Fund's investments
as
of
June
30,
2024.
The
inputs
or
methodology
used
for
valuing
securities
are
not
necessarily
an
indication
of
the
risks
associated
with
investing
in
those
securities.
For
more
information
on
valuation
inputs,
and
their
aggregation
into
the
levels
used
in
the
table
below,
please
refer
to
the
Security
Valuation
section
in
Note
2
of
the
accompanying
Notes
to
Financial
Statements.
Shares
Security
Description
Value
Common
Stock
-
97.1%
Consumer
Discretionary
-
4.0%
181,290
CarMax,
Inc.
(a)
$
13,295,809
77,896
Floor
&
Decor
Holdings,
Inc.,
Class A
(a)
7,743,641
21,039,450
Consumer
Staples
-
1.4%
453,760
Utz
Brands,
Inc.
7,550,566
Financials
-
12.4%
270,930
Goosehead
Insurance,
Inc.,
Class A
(a)
15,562,219
20,189
Kinsale
Capital
Group,
Inc.
7,778,418
13,010
Markel
Group,
Inc.
(a)
20,499,337
38,700
Moody's
Corp.
16,289,991
10,837
MSCI,
Inc.
5,220,725
65,350,690
Health
Care
-
19.6%
297,803
Bio-Techne
Corp.
21,337,585
151,446
Edwards
Lifesciences
Corp.
(a)
13,989,067
0.33
GRAIL,
Inc.
(a)
5
73,357
Illumina,
Inc.
(a)
7,657,004
22,417
Intuitive
Surgical,
Inc.
(a)
9,972,202
5,721
Mettler-Toledo
International,
Inc.
(a)
7,995,612
77,676
Repligen
Corp.
(a)
9,791,837
122,455
Veeva
Systems,
Inc.,
Class A
(a)
22,410,490
32,044
West
Pharmaceutical
Services,
Inc.
10,554,973
103,708,775
Industrials
-
28.8%
107,024
Fastenal
Co.
6,725,388
130,762
HEICO
Corp.,
Class A
23,212,870
104,934
Old
Dominion
Freight
Line,
Inc.
18,531,344
71,735
SiteOne
Landscape
Supply,
Inc.
(a)
8,709,346
13,945
TransDigm
Group,
Inc.
(a)
17,816,272
263,559
Veralto
Corp.
25,161,978
23,710
Verisk
Analytics,
Inc.
6,391,031
104,714
Waste
Connections,
Inc.
18,362,647
392,670
WillScot
Mobile
Mini
Holdings
Corp.
(a)
14,780,099
246,340
WNS
Holdings,
Ltd.
(a)
12,932,850
152,623,825
Information
Technology
-
13.4%
38,315
ANSYS,
Inc.
(a)
12,318,272
47,585
Appfolio,
Inc.
(a)
11,637,863
54,324
Atlassian
Corp.,
Class A
(a)
9,608,829
6,299
Crowdstrike
Holdings,
Inc.,
Class A
(a)
2,413,714
140,471
Endava
PLC,
ADR
(a)
4,107,372
158,900
Guidewire
Software,
Inc.
(a)
21,910,721
10,920
Tyler
Technologies,
Inc.
(a)
5,490,358
Shares
Security
Description
Value
Information
Technology
-
13.4%
(continued)
44,117
Workiva,
Inc.
(a)
$
3,220,100
70,707,229
Materials
-
10.1%
119,677
Ecolab,
Inc.
28,483,126
100,588
Vulcan
Materials
Co.
25,014,224
53,497,350
Real
Estate
-
7.4%
319,918
CBRE
Group,
Inc.,
Class A
(a)
28,507,893
143,524
CoStar
Group,
Inc.
(a)
10,640,869
39,148,762
Total
Common
Stock
(Cost
$376,577,840)
513,626,647
Money
Market
Fund
-
3.0%
16,024,103
First
American
Treasury
Obligations
Fund,
Class X,
5.21%
(b)
(Cost
$16,024,103)
16,024,103
Investments,
at
value
-
100.1%
(Cost
$392,601,943)
$
529,650,750
Other
Assets
&
Liabilities,
Net
-
(0.1)%
(529,491)
Net
Assets
-
100.0%
$
529,121,259
ADR
American
Depositary
Receipt
PLC
Public
Limited
Company
(a)
Non-income
producing
security.
(b)
Dividend
yield
changes
daily
to
reflect
current
market
conditions.
Rate
was
the
quoted
yield
as
of
June
30,
2024.
Valuation
Inputs
Investments
in
Securities
Level
1
-
Quoted
Prices
$
529,650,750
Level
2
-
Other
Significant
Observable
Inputs
–
Level
3
-
Significant
Unobservable
Inputs
–
Total
$
529,650,750
See
Notes
to
Financial
Statements.
DF
DENT
MIDCAP
GROWTH
FUND
SCHEDULE
OF
INVESTMENTS
JUNE
30,
2024
The
Level
1
value
displayed
in
this
table
is
Common
Stock
and
a
Money
Market
Fund.
Refer
to
this
Schedule
of
Investments
for
a
further
breakout
of
each
security
by
industry.
PORTFOLIO
HOLDINGS
(Unaudited)
%
of
Total
Net
Assets
Consumer
Discretionary
4.0%
Consumer
Staples
1.4%
Financials
12.4%
Health
Care
19.6%
Industrials
28.8%
Information
Technology
13.4%
Materials
10.1%
Real
Estate
7.4%
Money
Market
Fund
3.0%
Other
Assets
&
Liabilities,
Net
(0.1)%
100.0%
See
Notes
to
Financial
Statements.
DF
DENT
MIDCAP
GROWTH
FUND
STATEMENT
OF
ASSETS
AND
LIABILITIES
JUNE
30,
2024
ASSETS
Investments,
at
value
(Cost
$392,601,943)
$
529,650,750
Receivables:
Fund
shares
sold
336,474
Investment
securities
sold
756,957
Dividends
209,063
Prepaid
expenses
37,057
Total
Assets
530,990,301
LIABILITIES
Payables:
Investment
securities
purchased
357,542
Fund
shares
redeemed
445,108
Accrued
Liabilities:
Investment
adviser
fees
993,159
Fund
services
fees
24,605
Other
expenses
48,628
Total
Liabilities
1,869,042
NET
ASSETS
$
529,121,259
COMPONENTS
OF
NET
ASSETS
Paid-in
capital
$
458,526,417
Distributable
Earnings
70,594,842
NET
ASSETS
$
529,121,259
SHARES
OF
BENEFICIAL
INTEREST
AT
NO
PAR
VALUE
(UNLIMITED
SHARES
AUTHORIZED)
Investor
Shares
3,983,001
Institutional
Shares
6,544,512
Institutional
Plus
Shares
5,278,219
NET
ASSET
VALUE,
OFFERING
AND
REDEMPTION
PRICE
PER
SHARE
Investor
Shares
(based
on
net
assets
of
$132,811,392)
$
33.34
Institutional
Shares
(based
on
net
assets
of
$219,228,736)
$
33.50
Institutional
Plus
Shares
(based
on
net
assets
of
$177,081,131)
$
33.55
See
Notes
to
Financial
Statements.
DF
DENT
MIDCAP
GROWTH
FUND
STATEMENT
OF
OPERATIONS
YEAR
ENDED
JUNE
30,
2024
INVESTMENT
INCOME
Dividend
income
(Net
of
foreign
withholding
taxes
of
$23,912)
$
3,321,904
Total
Investment
Income
3,321,904
EXPENSES
Investment
adviser
fees
4,161,376
Fund
services
fees
394,481
Transfer
agent
fees:
Investor
Shares
27,898
Institutional
Shares
7,443
Institutional
Plus
Shares
4,838
Custodian
fees
63,033
Registration
fees:
Investor
Shares
16,929
Institutional
Shares
16,211
Institutional
Plus
Shares
17,918
Professional
fees
81,370
Trustees'
fees
and
expenses
23,361
Other
expenses
96,839
Total
Expenses
4,911,697
Fees
waived
(270,298)
Net
Expenses
4,641,399
NET
INVESTMENT
LOSS
(1,319,495)
NET
REALIZED
AND
UNREALIZED
GAIN
(LOSS)
Net
realized
gain
on
investments
29,664,974
Net
change
in
unrealized
appreciation
(depreciation)
on
investments
9,987,698
NET
REALIZED
AND
UNREALIZED
GAIN
39,652,672
INCREASE
IN
NET
ASSETS
RESULTING
FROM
OPERATIONS
$
38,333,177
See
Notes
to
Financial
Statements.
DF
DENT
MIDCAP
GROWTH
FUND
STATEMENTS
OF
CHANGES
IN
NET
ASSETS
For
the
Years
Ended
June
30,
2024
2023
OPERATIONS
Net
investment
loss
$
(1,319,495)
$
(1,836,407)
Net
realized
gain
(loss)
29,664,974
(62,274,420)
Net
change
in
unrealized
appreciation
(depreciation)
9,987,698
147,896,166
Increase
in
Net
Assets
Resulting
from
Operations
38,333,177
83,785,339
CAPITAL
SHARE
TRANSACTIONS
Sale
of
shares:
Investor
Shares
9,054,453
9,469,347
Institutional
Shares
15,648,066
24,238,703
Institutional
Plus
Shares
23,347,127
50,503,295
Redemption
of
shares:
Investor
Shares
(48,679,959)
(54,495,292)
Institutional
Shares
(58,573,179)
(41,357,857)
Institutional
Plus
Shares
(38,141,409)
(109,891,125)
Decrease
in
Net
Assets
from
Capital
Share
Transactions
(97,344,901)
(121,532,929)
Decrease
in
Net
Assets
(59,011,724)
(37,747,590)
NET
ASSETS
Beginning
of
Year
588,132,983
625,880,573
End
of
Year
$
529,121,259
$
588,132,983
SHARE
TRANSACTIONS
Sale
of
shares:
Investor
Shares
277,060
331,832
Institutional
Shares
475,454
855,935
Institutional
Plus
Shares
730,558
1,793,679
Redemption
of
shares:
Investor
Shares
(1,534,257)
(1,938,396)
Institutional
Shares
(1,862,941)
(1,456,723)
Institutional
Plus
Shares
(1,182,450)
(3,814,290)
Decrease
in
Shares
(3,096,576)
(4,227,963)
See
Notes
to
Financial
Statements.
DF
DENT
MIDCAP
GROWTH
FUND
FINANCIAL
HIGHLIGHTS
These
financial
highlights
reflect
selected
data
for
a
share
outstanding
throughout
each
year
.
For
the
Years
Ended
June
30,
2024
2023
2022
2021
2020
INVESTOR
SHARES
NET
ASSET
VALUE,
Beginning
of
Year
$
31.01
$
26.98
$
38.01
$
29.48
$
25.83
INVESTMENT
OPERATIONS
Net
investment
loss
(a)
(0.09)
(0.09)
(0.20)
(0.18)
(0.08)
Net
realized
and
unrealized
gain
(loss)
2.42
4.12
(9.75)
8.81
3.93
Total
from
Investment
Operations
2.33
4.03
(9.95)
8.63
3.85
DISTRIBUTIONS
TO
SHAREHOLDERS
FROM
Net
realized
gain
–
–
(1.08)
(0.11)
(0.24)
Total
Distributions
to
Shareholders
–
–
(1.08)
(0.11)
(0.24)
REDEMPTION
FEES(a)
–
–
0.00(b)
0.01
0.04
NET
ASSET
VALUE,
End
of
Year
$
33.34
$
31.01
$
26.98
$
38.01
$
29.48
TOTAL
RETURN
7.51%
14.94%
(26.97)%
29.33%
15.14%
RATIOS/SUPPLEMENTARY
DATA
Net
Assets
at
End
of
Year
(000s
omitted)
$
132,811
$
162,503
$
184,717
$
307,341
$
243,855
Ratios
to
Average
Net
Assets:
Net
investment
loss
(0.28)%
(0.33)%
(0.55)%
(0.54)%
(0.28)%
Net
expenses
0.88%
0.87%
0.85%
0.89%
0.98%
Gross
expenses
(d)
0.90%
0.89%
0.86%
0.91%(c)
1.01%(c)
PORTFOLIO
TURNOVER
RATE
29%
27%
35%
30%
31%
footertext
(a)
Calculated
based
on
average
shares
outstanding
during
each
year.
(b)
Less
than
$0.01
per
share.
(c)
Ratio
includes
recoupment,
which
amounted
to
0.03%
and
0.06%,
respectively.
(d)
Reflects
the
expense
ratio
excluding
any
waivers
and/or
reimbursements.
See
Notes
to
Financial
Statements.
DF
DENT
MIDCAP
GROWTH
FUND
FINANCIAL
HIGHLIGHTS
These
financial
highlights
reflect
selected
data
for
a
share
outstanding
throughout
each
period
.
For
the
Years
Ended
June
30,
2024
2023
2022
2021
2020
INSTITUTIONAL
SHARES
NET
ASSET
VALUE,
Beginning
of
Year
$
31.14
$
27.09
$
38.15
$
29.57
$
25.88
INVESTMENT
OPERATIONS
Net
investment
loss
(a)
(0.08)
(0.09)
(0.19)
(0.17)
(0.04)
Net
realized
and
unrealized
gain
(loss)
2.44
4.14
(9.79)
8.86
3.97
Total
from
Investment
Operations
2.36
4.05
(9.98)
8.69
3.93
DISTRIBUTIONS
TO
SHAREHOLDERS
FROM
Net
realized
gain
–
–
(1.08)
(0.11)
(0.24)
Total
Distributions
to
Shareholders
–
–
(1.08)
(0.11)
(0.24)
REDEMPTION
FEES(a)
–
–
–
0.00(b)
0.00(b)
NET
ASSET
VALUE,
End
of
Year
$
33.50
$
31.14
$
27.09
$
38.15
$
29.57
TOTAL
RETURN
7.58%
14.95%
(26.95)%
29.41%
15.26%
RATIOS/SUPPLEMENTARY
DATA
Net
Assets
at
End
of
Year
(000s
omitted)
$
219,229
$
247,019
$
231,134
$
406,489
$
122,454
Ratios
to
Average
Net
Assets:
Net
investment
loss
(0.25)%
(0.32)%
(0.53)%
(0.50)%
(0.15)%
Net
expenses
0.84%
0.85%
0.83%
0.85%
0.85%
Gross
expenses
(c)
0.88%
0.87%
0.85%
0.86%
0.94%
PORTFOLIO
TURNOVER
RATE
29%
27%
35%
30%
31%
footertext
(a)
Calculated
based
on
average
shares
outstanding
during
each
year.
(b)
Less
than
$0.01
per
share.
(c)
Reflects
the
expense
ratio
excluding
any
waivers
and/or
reimbursements.
See
Notes
to
Financial
Statements.
DF
DENT
MIDCAP
GROWTH
FUND
FINANCIAL
HIGHLIGHTS
These
financial
highlights
reflect
selected
data
for
a
share
outstanding
throughout
each
period
.
For
the
Years
Ended
June
30,
November
1,
2021
(a)
Through
June
30,
2022
2024
2023
INSTITUTIONAL
PLUS
SHARES
NET
ASSET
VALUE,
Beginning
of
Period
$
31.17
$
27.10
$
38.47
INVESTMENT
OPERATIONS
Net
investment
loss
(b)
(0.06)
(0.07)
(0.08)
Net
realized
and
unrealized
gain
(loss)
2.44
4.14
(10.21)
Total
from
Investment
Operations
2.38
4.07
(10.29)
DISTRIBUTIONS
TO
SHAREHOLDERS
FROM
Net
realized
gain
–
–
(1.08)
Total
Distributions
to
Shareholders
–
–
(1.08)
NET
ASSET
VALUE,
End
of
Period
$
33.55
$
31.17
$
27.10
TOTAL
RETURN
7.64%
15.02%
(27.53)%(c)
RATIOS/SUPPLEMENTARY
DATA
Net
Assets
at
End
of
Period
(000s
omitted)
$
177,081
$
178,611
$
210,030
Ratios
to
Average
Net
Assets:
Net
investment
loss
(0.19)%
(0.26)%
(0.44)%(d)
Net
expenses
0.78%
0.79%
0.79%(d)
Gross
expenses
(e)
0.88%
0.88%
0.90%(d)
PORTFOLIO
TURNOVER
RATE
29%
27%
35%(c)
footertext
(a)
Commencement
of
operations.
(b)
Calculated
based
on
average
shares
outstanding
during
each
period.
(c)
Not
annualized.
(d)
Annualized.
(e)
Reflects
the
expense
ratio
excluding
any
waivers
and/or
reimbursements.
See
Notes
to
Financial
Statements.
DF
DENT
SMALL
CAP
GROWTH
FUND
SCHEDULE
OF
INVESTMENTS
JUNE
30,
2024
The
following
is
a
summary
of
the
inputs
used
to
value
the
Fund's investments
as
of
June
30,
2024.
The
inputs
or
methodology
used
for
valuing
securities
are
not
necessarily
an
indication
of
the
risks
associated
with
investing
in
those
securities.
For
more
information
on
valuation
inputs,
and
their
aggregation
into
the
levels
used
in
the
table
below,
please
refer
to
the
Security
Valuation
section
in
Note
2
of
the
accompanying
Notes
to
Financial
Statements.
Shares
Security
Description
Value
Common
Stock
-
93.5%
Consumer
Discretionary
-
8.0%
21,783
Bright
Horizons
Family
Solutions,
Inc.
(a)
$
2,397,873
47,208
CarMax,
Inc.
(a)
3,462,235
24,632
Floor
&
Decor
Holdings,
Inc.,
Class A
(a)
2,448,667
15,811
Murphy
USA,
Inc.
7,422,632
15,731,407
Consumer
Staples
-
3.5%
262,700
Utz
Brands,
Inc.
4,371,328
11,680
WD-40
Co.
2,565,395
6,936,723
Financials
-
12.5%
79,281
EVERTEC,
Inc.
2,636,093
71,625
Goosehead
Insurance,
Inc.,
Class A
(a)
4,114,140
57,390
Hamilton
Lane,
Inc.,
Class A
7,092,256
13,971
Kinsale
Capital
Group,
Inc.
5,382,747
12,208
Morningstar,
Inc.
3,611,737
63,528
Trupanion,
Inc.
(a)
1,867,723
24,704,696
Health
Care
-
15.7%
5,218
Atrion
Corp.
2,360,780
93,467
Bio-Techne
Corp.
6,696,911
21,421
Charles
River
Laboratories
International,
Inc.
(a)
4,425,150
48,128
CryoPort,
Inc.
(a)
332,564
50,850
HealthEquity,
Inc.
(a)
4,383,270
44,066
LeMaitre
Vascular,
Inc.
3,625,750
12,081
Medpace
Holdings,
Inc.
(a)
4,975,560
33,326
Repligen
Corp.
(a)
4,201,076
31,001,061
Industrials
-
26.4%
33,698
Casella
Waste
Systems,
Inc.
(a)
3,343,516
147,381
Core
&
Main,
Inc.,
Class A
(a)
7,212,826
17,622
CSW
Industrials,
Inc.
4,675,293
150,162
Douglas
Dynamics,
Inc.
3,513,791
38,945
Exponent,
Inc.
3,704,448
49,900
HEICO
Corp.,
Class A
8,858,248
22,615
John
Bean
Technologies
Corp.
2,147,747
11,171
Kadant,
Inc.
3,281,816
18,435
Simpson
Manufacturing
Co.,
Inc.
3,106,851
31,035
SiteOne
Landscape
Supply,
Inc.
(a)
3,767,959
103,932
WillScot
Mobile
Mini
Holdings
Corp.
(a)
3,912,000
83,353
WNS
Holdings,
Ltd.
(a)
4,376,032
51,900,527
Shares
Security
Description
Value
Information
Technology
-
23.2%
64,586
Alarm.com
Holdings,
Inc.
(a)
$
4,103,794
25,631
Appfolio,
Inc.
(a)
6,268,574
50,400
Endava
PLC,
ADR
(a)
1,473,696
55,589
Guidewire
Software,
Inc.
(a)
7,665,167
22,831
Manhattan
Associates,
Inc.
(a)
5,631,951
35,489
Novanta,
Inc.
(a)
5,788,611
58,761
Procore
Technologies,
Inc.
(a)
3,896,442
17,152
SPS
Commerce,
Inc.
(a)
3,227,320
48,706
The
Descartes
Systems
Group,
Inc.
(a)
4,716,689
38,338
Workiva,
Inc.
(a)
2,798,291
45,570,535
Materials
-
4.2%
22,968
Eagle
Materials,
Inc.
4,994,621
407,339
Perimeter
Solutions
SA
(a)
3,189,465
8,184,086
Total
Common
Stock
(Cost
$164,404,637)
184,029,035
Money
Market
Fund
-
5.0%
9,766,296
First
American
Treasury
Obligations
Fund,
Class X,
5.21%
(b)
(Cost
$9,766,296)
9,766,296
Investments,
at
value
-
98.5%
(Cost
$174,170,933)
$
193,795,331
Other
Assets
&
Liabilities,
Net
-
1.5%
2,950,360
Net
Assets
-
100.0%
$
196,745,691
ADR
American
Depositary
Receipt
PLC
Public
Limited
Company
(a)
Non-income
producing
security.
(b)
Dividend
yield
changes
daily
to
reflect
current
market
conditions.
Rate
was
the
quoted
yield
as
of
June
30,
2024.
See
Notes
to
Financial
Statements.
DF
DENT
SMALL
CAP
GROWTH
FUND
SCHEDULE
OF
INVESTMENTS
JUNE
30,
2024
The
Level
1
value
displayed
in
this
table
is
Common
Stock
and
a
Money
Market
Fund.
Refer
to
this
Schedule
of
Investments
for
a
further
breakout
of
each
security
by
industry.
Valuation
Inputs
Investments
in
Securities
Level
1
-
Quoted
Prices
$
193,795,331
Level
2
-
Other
Significant
Observable
Inputs
–
Level
3
-
Significant
Unobservable
Inputs
–
Total
$
193,795,331
PORTFOLIO
HOLDINGS
(Unaudited)
%
of
Total
Net
Assets
Consumer
Discretionary
8.0%
Consumer
Staples
3.5%
Financials
12.5%
Health
Care
15.7%
Industrials
26.4%
Information
Technology
23.2%
Materials
4.2%
Money
Market
Fund
5.0%
Other
Assets
&
Liabilities,
Net
1.5%
100.0%
See
Notes
to
Financial
Statements.
DF
DENT
SMALL
CAP
GROWTH
FUND
STATEMENT
OF
ASSETS
AND
LIABILITIES
JUNE
30,
2024
ASSETS
Investments,
at
value
(Cost
$174,170,933)
$
193,795,331
Receivables:
Fund
shares
sold
3,038,460
Investment
securities
sold
219,256
Dividends
97,654
Prepaid
expenses
18,983
Total
Assets
197,169,684
LIABILITIES
Payables:
Fund
shares
redeemed
68,260
Accrued
Liabilities:
Investment
adviser
fees
310,425
Fund
services
fees
11,907
Other
expenses
33,401
Total
Liabilities
423,993
NET
ASSETS
$
196,745,691
COMPONENTS
OF
NET
ASSETS
Paid-in
capital
$
189,769,795
Distributable
Earnings
6,975,896
NET
ASSETS
$
196,745,691
SHARES
OF
BENEFICIAL
INTEREST
AT
NO
PAR
VALUE
(UNLIMITED
SHARES
AUTHORIZED)
Investor
Shares
1,025,633
Institutional
Shares
7,751,278
NET
ASSET
VALUE,
OFFERING
AND
REDEMPTION
PRICE
PER
SHARE
Investor
Shares
(based
on
net
assets
of
$22,859,346)
$
22.29
Institutional
Shares
(based
on
net
assets
of
$173,886,345)
$
22.43
See
Notes
to
Financial
Statements.
DF
DENT
SMALL
CAP
GROWTH
FUND
STATEMENT
OF
OPERATIONS
YEAR
ENDED
JUNE
30,
2024
INVESTMENT
INCOME
Dividend
income
(Net
of
foreign
withholding
taxes
of
$3,001)
$
706,383
Total
Investment
Income
706,383
EXPENSES
Investment
adviser
fees
953,643
Fund
services
fees
97,727
Transfer
agent
fees:
Investor
Shares
20,379
Institutional
Shares
20,995
Custodian
fees
10,909
Registration
fees:
Investor
Shares
17,436
Institutional
Shares
18,140
Professional
fees
39,910
Trustees'
fees
and
expenses
9,265
Other
expenses
54,264
Total
Expenses
1,242,668
Fees
waived
(163,512)
Net
Expenses
1,079,156
NET
INVESTMENT
LOSS
(372,773)
NET
REALIZED
AND
UNREALIZED
GAIN
(LOSS)
Net
realized
loss
on
investments
(2,649,453)
Net
change
in
unrealized
appreciation
(depreciation)
on
investments
7,765,496
NET
REALIZED
AND
UNREALIZED
GAIN
5,116,043
INCREASE
IN
NET
ASSETS
RESULTING
FROM
OPERATIONS
$
4,743,270
See
Notes
to
Financial
Statements.
DF
DENT
SMALL
CAP
GROWTH
FUND
STATEMENTS
OF
CHANGES
IN
NET
ASSETS
For
the
Years
Ended
June
30,
2024
2023
OPERATIONS
Net
investment
loss
$
(372,773)
$
(386,670)
Net
realized
loss
(2,649,453)
(3,935,756)
Net
change
in
unrealized
appreciation
(depreciation)
7,765,496
15,764,375
Increase
in
Net
Assets
Resulting
from
Operations
4,743,270
11,441,949
CAPITAL
SHARE
TRANSACTIONS
Sale
of
shares:
Investor
Shares
7,672,280
3,150,734
Institutional
Shares
106,816,162
17,206,517
Redemption
of
shares:
Investor
Shares
(4,201,324)
(5,357,981)
Institutional
Shares
(12,041,037)
(11,637,151)
Increase
in
Net
Assets
from
Capital
Share
Transactions
98,246,081
3,362,119
Increase
in
Net
Assets
102,989,351
14,804,068
NET
ASSETS
Beginning
of
Year
93,756,340
78,952,272
End
of
Year
$
196,745,691
$
93,756,340
SHARE
TRANSACTIONS
Sale
of
shares:
Investor
Shares
335,266
165,332
Institutional
Shares
4,680,496
895,548
Redemption
of
shares:
Investor
Shares
(190,911)
(279,318)
Institutional
Shares
(544,463)
(610,175)
Increase
in
Shares
4,280,388
171,387
See
Notes
to
Financial
Statements.
DF
DENT
SMALL
CAP
GROWTH
FUND
FINANCIAL
HIGHLIGHTS
JUNE
30,
2024
These
financial
highlights
reflect
selected
data
for
a
share
outstanding
throughout
each
year
.
For
the
Years
Ended
June
30,
2024
2023
2022
2021
2020
INVESTOR
SHARES
NET
ASSET
VALUE,
Beginning
of
Year
$
20.76
$
18.19
$
24.94
$
18.38
$
17.10
INVESTMENT
OPERATIONS
Net
investment
loss
(a)
(0.10)
(0.10)
(0.15)
(0.13)
(0.09)
Net
realized
and
unrealized
gain
(loss)
1.63
2.67
(6.01)
7.16
1.63
Total
from
Investment
Operations
1.53
2.57
(6.16)
7.03
1.54
DISTRIBUTIONS
TO
SHAREHOLDERS
FROM
Net
realized
gain
–
–
(0.60)
(0.48)
(0.26)
Total
Distributions
to
Shareholders
–
–
(0.60)
(0.48)
(0.26)
REDEMPTION
FEES(a)
–
–
0.01
0.01
0.00(b)
NET
ASSET
VALUE,
End
of
Year
$
22.29
$
20.76
$
18.19
$
24.94
$
18.38
TOTAL
RETURN
7.37%
14.13%
(25.32)%
38.60%
9.08%
RATIOS/SUPPLEMENTARY
DATA
Net
Assets
at
End
of
Year
(000s
omitted)
$
22,859
$
18,295
$
18,105
$
29,472
$
8,394
Ratios
to
Average
Net
Assets:
Net
investment
loss
(0.44)%
(0.54)%
(0.64)%
(0.58)%
(0.50)%
Net
expenses
1.04%
1.05%
1.05%
1.05%
1.05%
Gross
expenses
(c)
1.25%
1.30%
1.23%
1.30%
1.66%
PORTFOLIO
TURNOVER
RATE
30%
41%
46%
34%
38%
footertext
(a)
Calculated
based
on
average
shares
outstanding
during
each
year.
(b)
Less
than
$0.01
per
share.
(c)
Reflects
the
expense
ratio
excluding
any
waivers
and/or
reimbursements.
See
Notes
to
Financial
Statements.
DF
DENT
SMALL
CAP
GROWTH
FUND
FINANCIAL
HIGHLIGHTS
JUNE
30,
2024
These
financial
highlights
reflect
selected
data
for
a
share
outstanding
throughout
each
year
.
For
the
Years
Ended
June
30,
2024
2023
2022
2021
2020
INSTITUTIONAL
SHARES
NET
ASSET
VALUE,
Beginning
of
Year
$
20.87
$
18.27
$
25.03
$
18.42
$
17.13
INVESTMENT
OPERATIONS
Net
investment
loss
(a)
(0.07)
(0.08)
(0.12)
(0.11)
(0.07)
Net
realized
and
unrealized
gain
(loss)
1.63
2.68
(6.04)
7.20
1.62
Total
from
Investment
Operations
1.56
2.60
(6.16)
7.09
1.55
DISTRIBUTIONS
TO
SHAREHOLDERS
FROM
Net
realized
gain
–
–
(0.60)
(0.48)
(0.26)
Total
Distributions
to
Shareholders
–
–
(0.60)
(0.48)
(0.26)
REDEMPTION
FEES(a)
–
–
–
0.00(b)
0.00(b)
NET
ASSET
VALUE,
End
of
Year
$
22.43
$
20.87
$
18.27
$
25.03
$
18.42
TOTAL
RETURN
7.48%
14.23%
(25.27)%
38.79%
9.12%
RATIOS/SUPPLEMENTARY
DATA
Net
Assets
at
End
of
Year
(000s
omitted)
$
173,886
$
75,462
$
60,847
$
52,591
$
14,626
Ratios
to
Average
Net
Assets:
Net
investment
loss
(0.31)%
(0.43)%
(0.52)%
(0.49)%
(0.40)%
Net
expenses
0.94%
0.95%
0.95%
0.95%
0.95%
Gross
expenses
(c)
1.07%
1.12%
1.09%
1.18%
1.72%
PORTFOLIO
TURNOVER
RATE
30%
41%
46%
34%
38%
footertext
(a)
Calculated
based
on
average
shares
outstanding
during
each
year.
(b)
Less
than
$0.01
per
share.
(c)
Reflects
the
expense
ratio
excluding
any
waivers
and/or
reimbursements.
DF
DENT
GROWTH
FUNDS
NOTES
TO
FINANCIAL
STATEMENTS
JUNE
30,
2024
Note
1.
Organization
DF
Dent
Premier
Growth
Fund,
DF
Dent
Midcap
Growth
Fund,
and
DF
Dent
Small
Cap
Growth
Fund
(individually,
a
“Fund”
and
collectively,
the
“Funds”)
are
diversified
portfolios
of
Forum
Funds
(the
“Trust”).
The
Trust
is
a
Delaware
statutory
trust
that
is
registered
as
an
open-end,
management
investment
company
under
the
Investment
Company
Act
of
1940,
as
amended
(the
“Act”).
Under
its
Trust
Instrument,
the
Trust
is
authorized
to
issue
an
unlimited
number
of
each
Fund’s
shares
of
beneficial
interest
without
par
value.
DF
Dent
Premier
Growth
Fund
commenced
operations
on
July
16,
2001.
DF
Dent
Midcap
Growth
Fund’s
Investor
Shares,
Institutional
Shares,
and
Institutional
Plus
Shares
commenced
operations
on
July
1,
2011,
November
29,
2017,
and
December
3,
2021,
respectively.
DF
Dent
Small
Cap
Growth
Fund’s
Investor
Shares
and
Institutional
Shares
commenced
operations
on
November
1,
2013
and
November
20,
2017,
respectively.
The
Funds
seek
long-term
capital
appreciation.
Note
2.
Summary
of
Significant
Accounting
Policies
The
Funds
are
investment
companies
and
follow
accounting
and
reporting
guidance
under
Financial
Accounting
Standards
Board
Accounting
Standards
Codification
Topic
946,
“Financial
Services
–
Investment
Companies.”
These
financial
statements
are
prepared
in
accordance
with
accounting
principles
generally
accepted
in
the
United
States
of
America
(“GAAP”),
which
require
management
to
make
estimates
and
assumptions
that
affect
the
reported
amounts
of
assets
and
liabilities,
the
disclosure
of
contingent
liabilities
at
the
date
of
the
financial
statements,
and
the
reported
amounts
of
increases
and
decreases
in
net
assets
from
operations
during
the
fiscal
year.
Actual
amounts
could
differ
from
those
estimates.
The
following
summarizes
the
significant
accounting
policies
of
each
Fund:
Security
Valuation
–
Securities
are
valued
at
market
prices
using
the
last
quoted
trade
or
official
closing
price
from
the
principal
exchange
where
the
security
is
traded,
as
provided
by
independent
pricing
services
on
each
Fund
business
day.
In
the
absence
of
a
last
trade,
securities
are
valued
at
the
mean
of
the
last
bid
and
ask
price
provided
by
the
pricing
service.
Shares
of
non-exchange
traded
open-end
mutual
funds
are
valued
at
net
asset
value
per
share
(“NAV”).
Short-term
investments
that
mature
in
sixty
days
or
less
may
be
valued
at
amortized
cost.
Pursuant
to
Rule
2a-5
under
the
Investment
Company
Act,
the
Trust’s
Board
of
Trustees
(the
“Board”)
has
designated
the
Adviser,
as
defined
in
Note
3,
as
each
Fund’s
valuation
designee
to
perform
any
fair
value
determinations
for
securities
and
other
assets
held
by
each
Fund.
The
Adviser
is
subject
to
the
oversight
of
the
Board
and
certain
reporting
and
other
requirements
intended
to
provide
the
Board
the
information
needed
to
oversee
the
Adviser’s
fair
value
determinations.
The
Adviser
is
responsible
for
determining
the
fair
value
of
investments
for
which
market
quotations
are
not
readily
available
in
accordance
with
policies
and
procedures
that
have
been
approved
by
the
Board.
Under
these
procedures,
the
Adviser
convenes
on
a
regular
and
ad
hoc
basis
to
review
such
investments
and
considers
a
number
of
factors,
including
valuation
methodologies
and
significant
unobservable
inputs,
when
arriving
at
fair
value.
The
Board
has
approved
the
Adviser’s
fair
valuation
procedures
as
a
part
of
each
Fund’s
compliance
program
and
will
review
any
changes
made
to
the
procedures.
DF
DENT
GROWTH
FUNDS
NOTES
TO
FINANCIAL
STATEMENTS
JUNE
30,
2024
The
Adviser
provides
fair
valuation
inputs.
In
determining
fair
valuations,
inputs
may
include
market-based
analytics
that
may
consider
related
or
comparable
assets
or
liabilities,
recent
transactions,
market
multiples,
book
values
and
other
relevant
investment
information.
Adviser
inputs
may
include
an
income-based
approach
in
which
the
anticipated
future
cash
flows
of
the
investment
are
discounted
in
determining
fair
value.
Discounts
may
also
be
applied
based
on
the
nature
or
duration
of
any
restrictions
on
the
disposition
of
the
investments.
The
Adviser
performs
regular
reviews
of
valuation
methodologies,
key
inputs
and
assumptions,
disposition
analysis
and
market
activity.
Fair
valuation
is
based
on
subjective
factors
and,
as
a
result,
the
fair
value
price
of
an
investment
may
differ
from
the
security’s
market
price
and
may
not
be
the
price
at
which
the
asset
may
be
sold.
Fair
valuation
could
result
in
a
different
NAV
than
a
NAV
determined
by
using
market
quotes.
GAAP
has
a
three-tier
fair
value
hierarchy.
The
basis
of
the
tiers
is
dependent
upon
the
various
“inputs”
used
to
determine
the
value
of
each
Fund’s
investments.
These
inputs
are
summarized
in
the
three
broad
levels
listed
below:
Level
1
-
Quoted
prices
in
active
markets
for
identical
assets
and
liabilities.
Level
2
-
Prices
determined
using
significant
other
observable
inputs
(including
quoted
prices
for
similar
securities,
interest
rates,
prepayment
speeds,
credit
risk,
etc.).
Short-term
securities
with
maturities
of
sixty
days
or
less
are
valued
at
amortized
cost,
which
approximates
market
value,
and
are
categorized
as
Level
2
in
the
hierarchy.
Municipal
securities,
long-term
U.S.
government
obligations
and
corporate
debt
securities
are
valued
in
accordance
with
the
evaluated
price
supplied
by
a
pricing
service
and
generally
categorized
as
Level
2
in
the
hierarchy.
Other
securities
that
are
categorized
as
Level
2
in
the
hierarchy
include,
but
are
not
limited
to,
warrants
that
do
not
trade
on
an
exchange,
securities
valued
at
the
mean
between
the
last
reported
bid
and
ask
quotation
and
international
equity
securities
valued
by
an
independent
third
party
with
adjustments
for
changes
in
value
between
the
time
of
the
securities’
respective
local
market
closes
and
the
close
of
the
U.S.
market.
Level
3
-
Significant
unobservable
inputs
(including
each
Fund’s
own
assumptions
in
determining
the
fair
value
of
investments).
The
aggregate
value
by
input
level,
as
of
June
30,
2024,
for
each
Fund’s
investments
is
included
at
the
end
of
each
Fund’s
Schedule
of
Investments.
Security
Transactions,
Investment
Income
and
Realized
Gain
and
Loss
–
Investment
transactions
are
accounted
for
on
the
trade
date.
Dividend
income
is
recorded
on
the
ex-dividend
date.
Foreign
dividend
income
is
recorded
on
the
ex-dividend
date
or
as
soon
as
possible
after
determining
the
existence
of
a
dividend
declaration
after
exercising
reasonable
due
diligence.
Income
and
capital
gains
on
some
foreign
securities
may
be
subject
to
foreign
withholding
taxes,
which
are
accrued
as
applicable.
Interest
income
is
recorded
on
an
accrual
basis.
Premium
is
amortized
to
the
next
call
date
above
par,
and
discount
is
accreted
to
maturity
using
the
effective
interest
method.
Identified
cost
of
investments
sold
is
used
to
determine
the
gain
and
loss
for
both
financial
statement
and
federal
income
tax
purposes.
DF
DENT
GROWTH
FUNDS
NOTES
TO
FINANCIAL
STATEMENTS
JUNE
30,
2024
Distributions
to
Shareholders
–
Each
Fund
declares
any
dividends
from
net
investment
income
and
pays
them
annually.
Any
net
capital
gains
realized
by
the
Funds
are
distributed
at
least
annually.
Distributions
to
shareholders
are
recorded
on
the
ex-dividend
date.
Distributions
are
based
on
amounts
calculated
in
accordance
with
applicable
federal
income
tax
regulations,
which
may
differ
from
GAAP.
These
differences
are
due
primarily
to
differing
treatments
of
income
and
gain
on
various
investment
securities
held
by
each
Fund,
timing
differences
and
differing
characterizations
of
distributions
made
by
each
Fund.
Federal
Taxes
–
Each
Fund
intends
to
continue
to
qualify
each
year
as
a
regulated
investment
company
under
Subchapter
M
of
Chapter
1,
Subtitle
A,
of
the
Internal
Revenue
Code
of
1986,
as
amended
(“Code”),
and
to
distribute
all
of
its
taxable
income
to
shareholders.
In
addition,
by
distributing
in
each
calendar
year
substantially
all
of
their
net
investment
income
and
capital
gains,
if
any,
the
Funds
will
not
be
subject
to
a
federal
excise
tax.
Therefore,
no
federal
income
or
excise
tax
provision
is
required.
Each
Fund
recognizes
interest
and
penalties,
if
any,
related
to
unrecognized
tax
benefits
as
income
tax
expense
in
the
Statements
of
Operations.
During
the
year,
each
Fund
did
not
incur
any
interest
or
penalties.
Each
Fund
files
a
U.S.
federal
income
and
excise
tax
return
as
required.
Each
Fund’s
federal
income
tax
returns
are
subject
to
examination
by
the
Internal
Revenue
Service
for
a
period
of
three
fiscal
years
after
they
are
filed.
As
of
June
30,
2024,
there
are
no
uncertain
tax
positions
that
would
require
financial
statement
recognition,
de-recognition
or
disclosure.
Income
and
Expense
Allocation
–
The
Trust
accounts
separately
for
the
assets,
liabilities
and
operations
of
each
of
its
investment
portfolios.
Expenses
that
are
directly
attributable
to
more
than
one
investment
portfolio
are
allocated
among
the
respective
investment
portfolios
in
an
equitable
manner.
The
DF
Dent
Midcap
Growth
Fund's
and
DF
Dent
Small
Cap
Growth
Fund's
class-specific
expenses
are
charged
to
the
operations
of
that
class
of
shares.
Income
and
expenses
(other
than
expenses
attributable
to
a
specific
class)
and
realized
and
unrealized
gains
or
losses
on
investments
are
allocated
to
each
class
of
shares
based
on
the
class’
respective
net
assets
to
the
total
net
assets
of
each
Fund.
Commitments
and
Contingencies
–
In
the
normal
course
of
business,
each
Fund
enters
into
contracts
that
provide
general
indemnifications
by
each
Fund
to
the
counterparty
to
the
contract.
Each
Fund’s
maximum
exposure
under
these
arrangements
is
dependent
on
future
claims
that
may
be
made
against
each
Fund
and,
therefore,
cannot
be
estimated;
however,
based
on
experience,
the
risk
of
loss
from
such
claims
is
considered
remote.
Each
Fund
has
determined
that
none
of
these
arrangements
requires
disclosure
on
each
Fund’s
statement
of
assets
and
liabilities.
Note
3.
Fees
and
Expenses
Investment
Adviser
–
D.F.
Dent
and
Company,
Inc.
(the
“Adviser”)
is
the
investment
adviser
to
the
Funds.
Pursuant
to
an
investment
advisory
agreement,
the
Adviser
receives
an
advisory
fee,
payable
monthly,
at
an
annual
rate
of
0.99%,
0.75%,
and
0.85%
of
the
average
daily
net
assets
of
DF
Dent
Premier
Growth
Fund,
DF
Dent
Midcap
Growth
Fund
and
DF
Dent
Small
Cap
Growth
Fund,
respectively.
DF
DENT
GROWTH
FUNDS
NOTES
TO
FINANCIAL
STATEMENTS
JUNE
30,
2024
Distribution
–
Foreside
Fund
Services,
LLC,
a
wholly
owned
subsidiary
of
Foreside
Financial
Group,
LLC
(d/b/a
ACA
Group)
(the
“Distributor”),
acts
as
the
agent
of
the
Trust
in
connection
with
the
continuous
offering
of
shares
of
the
Funds.
The
Funds
do
not
have
a
distribution
(12b-1)
plan;
accordingly,
the
Distributor
does
not
receive
compensation
from
the
Funds
for
its
distribution
services.
The
Adviser
compensates
the
Distributor
directly
for
its
services.
The
Distributor
is
not
affiliated
with
the
Adviser
or
Atlantic
Fund
Administration,
LLC,
a
wholly
owned
subsidiary
of
Apex
US
Holdings
LLC
(d/b/a
Apex
Fund
Services)
(“Apex”)
or
their
affiliates.
Other
Service
Providers
–
Apex
provides
fund
accounting,
fund
administration,
compliance
and
transfer
agency
services
to
each
Fund.
The
fees
related
to
these
services
are
included
in
Fund
services
fees
within
the
Statements
of
Operations.
Apex
also
provides
certain
shareholder
report
production
and
EDGAR
conversion
and
filing
services.
Pursuant
to
an
Apex
Services
Agreement,
each
Fund
pays
Apex
customary
fees
for
its
services.
Apex
provides
a
Principal
Executive
Officer,
a
Principal
Financial
Officer,
a
Chief
Compliance
Officer
and
an
Anti-
Money
Laundering
Officer
to
each
Fund,
as
well
as
certain
additional
compliance
support
functions.
Trustees
and
Officers
–
Each
Independent
Trustee’s
annual
retainer
is
$45,000
($55,000
for
the
Chairman).
The
Audit
Committee
Chairman
receives
an
additional
$2,000
annually.
The
Trustees
and
the
Chairman
may
receive
additional
fees
for
special
Board
meetings.
Each
Trustee
is
also
reimbursed
for
all
reasonable
out-of-
pocket
expenses
incurred
in
connection
with
his
or
her
duties
as
a
Trustee,
including
travel
and
related
expenses
incurred
in
attending
Board
meetings.
The
amount
of
Trustees’
fees
attributable
to
each
Fund
is
disclosed
in
the
Statements
of
Operations.
Certain
officers
of
the
Trust
are
also
officers
or
employees
of
the
above
named
service
providers,
and
during
their
terms
of
office
received
no
compensation
from
each
Fund.
Note
4.
Expense
Reimbursement
and
Fees
Waived
The
Adviser
has
contractually
agreed
to
waive
a
portion
of
its
fee
and/or
reimburse
Fund
expenses
to
limit
Total
Annual
Fund
Operating
Expenses
(excluding
all
taxes,
interest,
portfolio
transaction
expenses,
and
extraordinary
expenses)
to
0.99%,
through
October
31,
2025
(the
“Expense
Cap”).
Additionally,
the
Adviser
has
contractually
agreed
to
waive
a
portion
of
its
fee
and/or
reimburse
Fund
expenses
to
limit
Total
Annual
Fund
Operating
Expenses
After
Fee
Waiver
and/or
Expense
Reimbursement
(excluding
all
taxes,
interest,
portfolio
transaction
expenses,
and
extraordinary
expenses)
of
Investor
Shares,
Institutional
Shares
and
Institutional
Plus
Shares
to
0.98%,
0.85%,
and
0.79%,
respectively,
through
October
31,
2025,
for
DF
Dent
Midcap
Growth
Fund.
The
Adviser
has
also
contractually
agreed
to
waive
a
portion
of
its
fee
and/or
reimburse
Fund
expenses
to
limit
Total
Annual
Fund
Operating
Expenses
After
Fee
Waiver
and/or
Expense
Reimbursement
(excluding
all
taxes,
interest,
portfolio
transaction
expenses,
and
extraordinary
expenses)
of
Investor
Shares
and
Institutional
Shares
to
1.05%
and
0.95%,
respectively,
through
October
31,
2025,
for
DF
Dent
Small
Cap
Growth
Fund.
The
Expense
Cap
may
only
be
raised
or
eliminated
with
the
consent
of
the
Board
of
Trustees.
Other
fund
service
providers
have
agreed
to
waive
a
portion
of
their
fees
and
such
waivers
may
be
changed
or
eliminated
with
the
approval
of
the
Board
of
Trustees
of
the
Trust.
For
the
year
ended
June
30,
2024
,
fees
waived
and
expenses
reimbursed
were
as
follows:
DF
DENT
GROWTH
FUNDS
NOTES
TO
FINANCIAL
STATEMENTS
JUNE
30,
2024
The
Adviser
may
be
reimbursed
by
each
Fund
for
fees
waived
and
expenses
reimbursed
by
the
Adviser
pursuant
to
the
Expense
Cap
if
such
payment
is
made
within
three
years
of
the
fee
waiver
or
expense
reimbursement,
and
does
not
cause
the
Total
Annual
Fund
Operating
Expenses
After
Fee
Waiver
and/or
Expense
Reimbursement
to
exceed
the
lesser
of
(i)
the
then-current
expense
cap,
or
(ii)
the
expense
cap
in
place
at
the
time
the
fees/
expenses
were
waived/reimbursed.
As
of
June
30,
2024
,
$994,347,
$418,770
and
$398,081
are
subject
to
recoupment
by
the
Adviser
for
the
DF
Dent
Premier
Growth
Fund,
DF
Dent
Midcap
Growth
Fund,
and
DF
Dent
Small
Cap
Growth
Fund,
respectively.
Note
5.
Security
Transactions
The
cost
of
purchases
and
proceeds
from
sales
of
investment
securities
(including
maturities),
other
than
short-
term
investments
during
the
year
ended
June
30,
2024
,
were
as
follows:
Note
6.
Federal
Income
Tax
As
of
June
30,
2024
,
cost
for
federal
income
tax
purposes
and
net
unrealized
appreciation
consists
of:
Distributions
paid
during
the
fiscal
years
ended
as
noted
were
characterized
for
tax
purposes
as
follows:
Investment
Adviser
Fees
Waived
Other
Waivers
Total
Fees
Waived
DF
Dent
Premier
Growth
Fund
$
302,173
$
40,131
$
342,304
DF
Dent
Midcap
Growth
Fund
149,790
120,508
270,298
DF
Dent
Small
Cap
Growth
Fund
132,151
31,361
163,512
Purchases
Sales
DF
Dent
Premier
Growth
Fund
$
44,344,978
$
90,782,100
DF
Dent
Midcap
Growth
Fund
156,042,225
258,170,413
DF
Dent
Small
Cap
Growth
Fund
121,237,139
32,787,419
Tax
Cost
of
Investments
Gross
Unrealized
Appreciation
Gross
Unrealized
Depreciation
Net
Unrealized
Appreciation
DF
Dent
Premier
Growth
Fund
$
103,056,315
$
129,320,148
$
(485,225)
$
128,834,923
DF
Dent
Midcap
Growth
Fund
406,157,858
150,763,941
(27,271,049)
123,492,892
DF
Dent
Small
Cap
Growth
Fund
179,314,613
25,737,640
(11,256,922)
14,480,718
Long-Term
Capital
Gain
Total
DF
Dent
Premier
Growth
Fund
2024
$
36,525,907
$
36,525,907
2023
–
–
DF
Dent
Midcap
Growth
Fund
2024
–
–
2023
–
–
DF
Dent
Small
Cap
Growth
Fund
2024
–
–
2023
–
–
DF
DENT
GROWTH
FUNDS
NOTES
TO
FINANCIAL
STATEMENTS
JUNE
30,
2024
As
of
June
30,
2024
,
distributable
earnings/accumulated
loss
on
a
tax
basis
were
as
follows:
The
difference
between
components
of
distributable
earnings/accumulated
loss
on
a
tax
basis
and
the
amounts
reflected
in
the
Statements
of
Assets
and
Liabilities
are
primarily
due
to
wash
sales
and
equity
return
of
capital.
For
tax
purposes,
the
current
year
late-year
ordinary
loss
was
$
631,990
,
$1,192,139,
and
$198,571
for
the
DF
Dent
Premier
Growth
Fund,
DF
Dent
Midcap
Growth
Fund,
and
DF
Dent
Small
Cap
Growth
Fund,
respectively,
(realized
during
the
period
January
1,
2024
through
June
30,
2024
).
These
losses
will
be
recognized
for
tax
purposes
on
the
first
business
day
of
each
Fund’s
next
fiscal
year,
July
1,
202
4
.
As
of
June
30,
2024
,
the
DF
Dent
Midcap
Growth
Fund
and
DF
Dent
Small
Cap
Growth
Fund
had
$19,323,990
and
$1,
335,237
,
respectively,
of
available
short-term
capital
loss
carryforwards
and
the
DF
Dent
Midcap
Growth
Fund
and
DF
Dent
Small
Cap
Growth
Fund
had
$32,381,921
and
$5,971,014
,
respectively,
of
available
long-
term
capital
loss
carryforwards
that
have
no
expiration
date.
On
the
Statements
of
Assets
and
Liabilities,
as
a
result
of
permanent
book
to
tax
differences,
certain
amounts
have
been
reclassified
for
the
year
ended
June
30,
2024
.
The
following
reclassifications
were
the
result
of
current
year
net
operating
loss
and
differing
book/tax
treatment
of
the
deduction
of
dividends
paid
for
tax
purpose
and
have
no
impact
on
the
net
assets
of
each
Fund.
Note
7.
Subsequent
Events
Subsequent
events
occurring
after
the
date
of
this
report
through
the
date
these
financial
statements
were
issued
have
been
evaluated
for
potential
impact,
and
each
Fund
has
had
no
such
events.
Undistributed
Long-Term
Gain
Capital
and
Other
Losses
Net
Unrealized
Appreciation
Total
DF
Dent
Premier
Growth
Fund
$
19,826,318
$
(631,990)
$
128,834,923
$
148,029,251
DF
Dent
Midcap
Growth
Fund
–
(52,898,050)
123,492,892
70,594,842
DF
Dent
Small
Cap
Growth
Fund
–
(7,504,822)
14,480,718
6,975,896
Distributable
Earnings
Paid-in-Capital
DF
Dent
Premier
Growth
Fund
$
(1,509,299)
$
1,509,299
DF
Dent
Midcap
Growth
Fund
1,387,565
(1,387,565)
DF
Dent
Small
Cap
Growth
Fund
396,190
(396,190)
REPORT
OF
INDEPENDENT
REGISTERED
PUBLIC
ACCOUNTING
FIRM
To
the
Shareholders
of
DF
Dent
Premier
Growth
Fund,
DF
Dent
Midcap
Growth
Fund
and
DF
Dent
Small
Cap
Growth
Fund
and
Board
of
Trustees
of
Forum
Funds
Opinion
on
the
Financial
Statements
We
have
audited
the
accompanying
statements
of
assets
and
liabilities,
including
the
schedules
of
investments,
of
DF
Dent
Premier
Growth
Fund,
DF
Dent
Midcap
Growth
Fund,
and
DF
Dent
Small
Cap
Growth
Fund
(the
“Funds”),
each
a
series
of
Forum
Funds,
as
of
June
30,
2024,
the
related
statements
of
operations
for
the
year
then
ended,
the
statements
of
changes
in
net
assets
and
financial
highlights
for
each
of
the
two
years
in
the
period
then
ended,
and
the
related
notes
(collectively
referred
to
as
the
“financial
statements”).
In
our
opinion,
the
financial
statements
present
fairly,
in
all
material
respects,
the
financial
position
of
the
Funds
as
of
June
30,
2024,
the
results
of
their
operations
for
the
year
then
ended,
and
changes
in
net
assets
and
the
financial
highlights
for
each
of
the
two
years
in
the
period
then
ended,
in
conformity
with
accounting
principles
generally
accepted
in
the
United
States
of
America.
The
Funds’
financial
highlights
for
the
years
ended
June
30,
2022,
and
prior,
were
audited
by
other
auditors
whose
report
dated
August
24,
2022,
expressed
an
unqualified
opinion
on
those
financial
highlights.
Basis
for
Opinion
These
financial
statements
are
the
responsibility
of
the
Funds’
management.
Our
responsibility
is
to
express
an
opinion
on
the
Funds’
financial
statements
based
on
our
audits.
We
are
a
public
accounting
firm
registered
with
the
Public
Company
Accounting
Oversight
Board
(United
States)
(“PCAOB”)
and
are
required
to
be
independent
with
respect
to
the
Funds
in
accordance
with
the
U.S.
federal
securities
laws
and
the
applicable
rules
and
regulations
of
the
Securities
and
Exchange
Commission
and
the
PCAOB.
We
conducted
our
audits
in
accordance
with
the
standards
of
the
PCAOB.
Those
standards
require
that
we
plan
and
perform
the
audits
to
obtain
reasonable
assurance
about
whether
the
financial
statements
are
free
of
material
misstatement
whether
due
to
error
or
fraud.
Our
audits
included
performing
procedures
to
assess
the
risks
of
material
misstatement
of
the
financial
statements,
whether
due
to
error
or
fraud,
and
performing
procedures
that
respond
to
those
risks.
Such
procedures
included
examining,
on
a
test
basis,
evidence
regarding
the
amounts
and
disclosures
in
the
financial
statements.
Our
procedures
included
confirmation
of
securities
owned
as
of
June
30,
2024,
by
correspondence
with
the
custodian
and
brokers;
when
replies
were
not
received
from
brokers,
we
performed
other
auditing
procedures.
Our
audits
also
included
evaluating
the
accounting
principles
used
and
significant
estimates
made
by
management,
as
well
as
evaluating
the
overall
presentation
of
the
financial
statements.
We
believe
that
our
audits
provide
a
reasonable
basis
for
our
opinion.
We
have
served
as
the
Funds’
auditor
since
2023.
COHEN
&
COMPANY,
LTD.
Philadelphia,
Pennsylvania
August
26,
2024
DF
DENT
GROWTH
FUNDS
IMPORTANT
TAX
INFORMATION
(Unaudited)
JUNE
30,
2024
Federal
Tax
Status
of
Dividends
Declared
during
the
Fiscal
Year
Pursuant
to
Section
852(b)(3)
of
the
Internal
Revenue
Code,
DF
Dent
Premier
Growth
Fund
designated
$36,525,907
as
long-term
capital
gain
dividends.
DF
DENT
GROWTH
FUNDS
OTHER
INFORMATION
(Unaudited)
JUNE
30,
2024
Changes
in
and
Disagreements
with
Accountants
(Item
8
of
Form
N-CSR)
N/A
Proxy
Disclosure
(Item
9
of
Form
N-CSR)
N/A
Remuneration
Paid
to
Directors,
Officers,
and
Others
(Item
10
of
Form
N-CSR)
Please
see
financial
statements
in
Item
7.
Statement
Regarding
the
Basis
for
the
Board’s
Approval
of
Investment
Advisory
Contract
(Item
11
of
Form
N-CSR)
At
the
June
14,
2024
Board
Meeting,
the
Board,
including
the
Independent
Trustees,
considered
the
approval
of
the
continuance
of
the
investment
advisory
agreement
between
the
Adviser
and
the
Trust
pertaining
to
the
Funds
(the
“Advisory
Agreement”).
In
preparation
for
its
deliberations,
the
Board
requested
written
responses
from
the
Adviser
to
a
due
diligence
questionnaire
circulated
on
the
Board's
behalf
concerning
the
services
provided
by
the
Adviser.
The
Board
also
discussed
the
materials
with
Fund
counsel
and,
as
necessary,
with
the
Trust's
administrator.
During
its
deliberations,
the
Board
received
an
oral
presentation
from
the
Adviser
and
was
advised
by
independent
Trustee
counsel.
At
the
meeting,
the
Board
reviewed,
among
other
matters:
(1)
the
nature,
extent
and
quality
of
the
services
provided
to
the
Funds
by
the
Adviser,
including
information
on
the
investment
performance
of
the
Funds;
(2)
the
costs
of
the
services
provided
and
profitability
to
the
Adviser
with
respect
to
its
relationship
with
each
Fund;
(3)
information
concerning
the
advisory
fee
and
total
expense
ratio
of
each
Fund,
including
a
comparison
to
the
fees
and
expenses
of
a
relevant
peer
group
of
funds;
(4)
the
extent
to
which
economies
of
scale
may
be
realized
as
each
Fund
grows
and
whether
the
advisory
fee
enables
investors
to
share
in
the
benefits
of
economies
of
scale;
and
(5)
other
benefits
received
by
the
Adviser
from
its
relationship
with
the
Funds.
The
Board
recognized
that
the
evaluation
process
with
respect
to
the
Adviser
was
an
ongoing
one
and,
in
this
regard,
the
Board
considered
information
provided
by
the
Adviser
at
regularly
scheduled
meetings
during
the
past
year.
Nature,
Extent
and
Quality
of
Services
Based
on
written
materials
received,
a
presentation
from
senior
representatives
of
the
Adviser
and
a
discussion
with
the
Adviser
about
the
Adviser’s
personnel,
operations
and
financial
condition,
the
Board
considered
the
quality
of
services
provided
by
the
Adviser
under
the
Advisory
Agreement.
In
this
regard,
the
Board
considered
information
regarding
the
experience,
qualifications
and
professional
background
of
the
portfolio
managers
and
other
personnel
at
the
Adviser
with
principal
responsibility
for
the
Funds,
as
well
as
the
investment
philosophy
and
decision-making
process
of
the
Adviser
and
the
capability
and
integrity
of
the
Adviser’s
senior
management
and
staff.
DF
DENT
GROWTH
FUNDS
OTHER
INFORMATION
(Unaudited)
JUNE
30,
2024
The
Board
considered
also
the
adequacy
of
the
Adviser’s
resources.
The
Board
noted
the
Adviser’s
representation
that
the
firm
is
in
stable
financial
condition,
that
the
firm
is
able
to
meet
its
expense
reimbursement
obligations
to
the
Funds,
and
that
the
firm
has
the
operational
capability
and
necessary
staffing
and
experience
to
continue
providing
high-quality
investment
advisory
services
to
the
Funds.
Based
on
the
presentation
and
the
materials
provided
by
the
Adviser
in
connection
with
the
Board’s
consideration
of
the
renewal
of
the
Advisory
Agreement,
the
Board
concluded
that,
overall,
it
was
satisfied
with
the
nature,
extent
and
quality
of
services
provided
to
the
Funds
under
the
Advisory
Agreement.
Performance
In
connection
with
a
presentation
by
the
Adviser
regarding
its
approach
to
managing
the
Funds,
the
Board
reviewed
the
performance
of
each
Fund
compared
to
its
respective
benchmark
and
to
a
peer
group
of
funds.
The
Board
observed
that
the
DF
Dent
Premier
Growth
Fund
underperformed
its
primary
benchmark
index,
the
S&P
500
Index,
for
the
one-,
three-,
five-,
and
10-year
periods
ended
March
31,
2024,
and
outperformed
the
S&P
500
Index
for
the
period
since
the
DF
Dent
Premier
Growth
Fund’s
inception
on
July
16,
2001.
The
Board
also
considered
the
DF
Dent
Premier
Growth
Fund’s
performance
relative
to
an
independent
peer
group
of
funds
identified
by
Strategic
Insight,
Inc.
(“Strategic
Insight”)
as
having
characteristics
similar
to
those
of
the
DF
Dent
Premier
Growth
Fund.
The
Board
observed
that,
based
on
information
provided
by
Strategic
Insight,
the
DF
Dent
Premier
Growth
Fund
underperformed
the
average
of
its
Strategic
Insight
peer
group
for
the
one-,
three-,
five-,
and
10-year
periods
ended
March
31,
2024.
The
Board
observed
that
the
DF
Dent
Midcap
Growth
Fund
underperformed
its
primary
benchmark
index,
the
Russell
Midcap
Growth
Index,
for
the
one-,
three-,
five-,
and
10-year
periods
ended
March
31,
2024,
and
outperformed
the
Russell
Midcap
Growth
Index
for
the
period
since
the
DF
Dent
Midcap
Growth
Fund’s
inception
on
July
1,
2011.
The
Board
observed
that
the
DF
Dent
Midcap
Growth
Fund
underperformed
the
average
of
its
Strategic
Insight
peer
group
for
the
one-
and
five-year
periods
ended
March
31,
2024,
and
outperformed
the
average
of
its
Strategic
Insight
peer
group
for
the
three-year
period
ended
March
31,
2024.
The
Board
observed
that
the
DF
Dent
Small
Cap
Growth
Fund
outperformed
its
primary
benchmark
index,
the
Russell
2000
Growth
Index,
for
the
one-,
three-,
five-,
and
10-year
periods
ended
March
31,
2024,
and
for
the
period
since
the
DF
Dent
Small
Cap
Growth
Fund’s
inception
on
November
1,
2013.
The
Board
observed
that
the
DF
Dent
Small
Cap
Growth
Fund
outperformed
the
average
of
its
Strategic
Insight
peer
group
for
the
one-,
three-,
and
five-year
periods
ended
March
31,
2024.
The
Board
considered
the
Adviser’s
representation
that
the
relative
underperformance
over
the
one-
and
three-
year
periods
for
each
of
the
DF
Dent
Premier
Growth
Fund
and
DF
Dent
Midcap
Growth
Fund
could
be
attributed,
in
part,
to
stock
selection
within
the
health
care
sector
and,
in
particular,
life
sciences
companies
that
benefitted
from
the
COVID-19
pandemic
but
had
begun
to
underperform
in
the
years
since
the
pandemic
subsided.
With
respect
to
the
DF
Dent
Premier
Growth
Fund,
the
Board
considered
further
the
Adviser’s
representation
that
the
DF
Dent
Premier
Growth
Fund’s
performance
was
also
negatively
impacted
by
underexposure
to
certain
mega-cap
stocks,
including
certain
of
the
“Magnificent
Seven”
stocks,
within
the
technology
sector
relative
to
DF
DENT
GROWTH
FUNDS
OTHER
INFORMATION
(Unaudited)
JUNE
30,
2024
the
index,
noting
that
such
mega-cap
stocks
drove
a
significant
portion
of
the
index’s
performance
over
recent
years.
The
Board
also
considered
the
Adviser’s
representation
that
each
of
the
Funds
is
designed
to
provide
long-term
capital
appreciation,
and
that
the
Funds
continued
to
show
the
ability
to
outperform
their
respective
benchmark
indices
over
the
long
term.
In
consideration
of
the
Adviser’s
investment
strategies
and
the
foregoing
performance
information,
among
other
considerations,
the
Board
determined
that
each
Fund
could
benefit
from
the
Adviser’s
continued
management
of
the
Funds.
Compensation
The
Board
evaluated
the
Adviser’s
compensation
for
providing
advisory
services
to
each
of
the
Funds
and
analyzed
comparative
information
on
actual
advisory
fee
rates
and
actual
total
expenses
of
the
Funds’
respective
Strategic
Insight
peer
groups.
The
Board
noted
that
the
net
advisory
fee
rate
for
each
Fund
was
higher
than
the
median
of
its
respective
Strategic
Insight
peer
group,
but
the
net
total
expense
ratio
for
each
Fund
was
less
than
the
median
of
its
respective
Strategic
Insight
peer
group.
The
Board
noted
that
the
Adviser’s
net
advisory
fee
rates
and
net
total
expense
ratios
for
each
Fund
were
within
a
reasonable
range
of
the
median
of
their
respective
peer
groups.
The
Board
also
noted
that
the
Adviser
had
in
place
a
contractual
expense
waiver
for
each
of
the
Funds,
pursuant
to
which
the
Adviser
continued
to
waive
a
portion
of
its
investment
advisory
fees
in
order
to
subsidize
the
Funds’
expenses.
Based
on
the
foregoing
and
other
relevant
factors,
the
Board
concluded
that
the
Adviser’s
current
advisory
fee
rates
charged
to
each
of
the
Funds
were
reasonable.
Cost
of
Services
and
Profitability
The
Board
considered
information
provided
by
the
Adviser
regarding
the
costs
of
services
and
its
profitability
with
respect
to
the
Funds.
In
this
regard,
the
Board
considered
the
Adviser’s
operating
expenses
and
other
resources
devoted
to
the
Funds,
as
well
as
the
information
provided
by
the
Adviser
regarding
costs
and
overall
profitability.
The
Board
noted
that
the
Adviser
had
in
place
a
contractual
expense
waiver
to
ensure
the
expense
ratios
for
the
Funds
remained
at
competitive
levels.
The
Board
also
noted
that
the
Adviser
had
committed
to
extending
the
expense
cap
arrangements
for
all
of
the
Funds
through
at
least
the
duration
of
the
current
Advisory
Agreement
renewal
period.
The
Board
further
noted
the
Adviser’s
representation
that
the
Funds
were
less
profitable
to
the
Adviser
than
the
Adviser’s
overall
investment
management
business
because,
although
the
Funds
represented
a
relatively
small
percentage
of
the
Adviser’s
total
assets
under
management,
the
Funds
represented
a
relatively
high
percentage
of
the
Adviser’s
overall
administrative,
reporting,
and
compliance
expenses.
Based
on
these
and
other
applicable
considerations,
the
Board
concluded
that
the
Adviser’s
profits
attributable
to
management
of
the
Funds
were
reasonable.
Economies
of
Scale
The
Board
evaluated
whether
the
Funds
would
benefit
from
any
economies
of
scale.
In
this
respect,
the
Board
considered
each
Fund’s
fee
structure,
asset
size,
and
net
expense
ratio,
giving
effect
to
each
Fund’s
expense
DF
DENT
GROWTH
FUNDS
OTHER
INFORMATION
(Unaudited)
JUNE
30,
2024
waiver
agreement.
The
Board
reviewed
relevant
materials
and
discussed
whether
the
use
of
breakpoints
would
be
appropriate
at
this
time,
recognizing
that
an
analysis
of
economies
of
scale
is
most
relevant
when
a
fund
has
achieved
a
substantial
size
and
has
growing
assets
and
that,
if
a
fund’s
assets
are
stable
or
decreasing,
the
significance
of
economies
of
scale
may
be
reduced.
The
Board
observed
that,
although
the
DF
Dent
Midcap
Growth
Fund
experienced
periods
of
substantial
asset
growth
in
prior
periods,
the
DF
Dent
Midcap
Growth
Fund’s
assets
were
not
at
a
level
that
reflected
meaningful
economies
of
scale,
in
part,
due
to
a
recent
decline
in
assets.
Noting
the
relatively
low
asset
levels
for
the
DF
Dent
Premier
Growth
Fund
and
DF
Dent
Small
Cap
Growth
Fund,
the
decrease
in
the
DF
Dent
Premier
Growth
Fund’s
asset
levels
over
the
past
year,
the
existence
of
the
Adviser’s
ongoing
expense
limitation
arrangements,
as
well
as
the
Adviser’s
representation
that
the
level
of
the
Funds’
assets
had
not
provided
meaningful
economies
of
scale,
among
other
relevant
considerations,
the
Board
concluded
that
any
existing
economies
of
scale
were
captured
by
the
expense
cap
structures
of
the
Funds
and
that
the
advisory
fees
for
each
Fund
remained
reasonable
in
light
of
the
current
information
provided
to
the
Board
with
respect
to
economies
of
scale.
Other
Benefits
The
Board
noted
the
Adviser’s
representation
that,
aside
from
its
contractual
advisory
fees,
it
does
not
benefit
in
a
material
way
from
its
relationship
with
the
Funds.
Based
on
the
foregoing
representation,
the
Board
concluded
that
other
benefits
received
by
the
Adviser
from
its
relationship
with
the
Funds
were
not
a
material
factor
to
consider
in
approving
the
continuation
of
the
Advisory
Agreement.
Conclusion
The
Board
did
not
identify
any
single
factor
as
being
of
paramount
importance,
and
different
Trustees
may
have
given
different
weight
to
different
factors.
The
Board
reviewed
a
memorandum
from
Fund
counsel
discussing
the
legal
standards
applicable
to
its
consideration
of
the
Advisory
Agreement.
Based
on
its
review,
including
consideration
of
each
of
the
factors
referenced
above,
and
its
consideration
of
information
received
throughout
the
year
from
the
Adviser,
the
Board
determined,
in
the
exercise
of
its
business
judgment,
that
the
advisory
arrangement,
as
outlined
in
the
Advisory
Agreement,
was
fair
and
reasonable
in
light
of
the
services
performed
or
to
be
performed,
expenses
incurred
or
to
be
incurred
and
such
other
matters
as
the
Board
considered
relevant.
DF
Dent
Premier
Growth
Fund
–
DFDPX
DF
Dent
Midcap
Growth
Fund
Investor
Shares
–
DFDMX
DF
Dent
Midcap
Growth
Fund
Institutional
Shares
–
DFMGX
DF
Dent
Midcap
Growth
Fund
Institutional
Plus
Shares
–
DFMLX
DF
Dent
Small
Cap
Growth
Fund
Investor
Shares
–
DFDSX
DF
Dent
Small
Cap
Growth
Fund
Institutional
Shares
–
DFSGX
INVESTMENT
ADVISER
D.F.
Dent
and
Company,
Inc.
400
E.
Pratt
Street,
7th
Floor
Baltimore,
MD
21202
www.dfdent.com
TRANSFER
AGENT
Apex
Fund
Services
P.O.
Box
588
Portland,
ME
04112
(866)
2DF-DENT
www.apexgroup.com
DISTRIBUTOR
Foreside
Fund
Services,
LLC
Three
Canal
Plaza,
Suite
100
Portland,
ME
04101
www.foreside.com
221-ANR-0624
This
report
is
submitted
for
the
general
information
of
the
shareholders
of
the
Funds.
It
is
not
authorized
for
distribution
to
prospective
investors
unless
preceded
or
accompanied
by
an
effective
prospectus,
which
includes
information
regarding
the
Funds'
risks,
objectives,
fees
and
expenses,
experience
of
its
management,
and
other
information.
(b) Included as part of financial statements filed under Item 7(a).
ITEM 8. CHANGES IN AND DISAGREEMENTS WITH ACCOUNTANTS FOR OPEN-END MANAGEMENT INVESTMENT COMPANIES.
Not applicable.
ITEM 9. PROXY DISCLOSURES FOR OPEN-END MANAGEMENT INVESTMENT COMPANIES.
Not applicable.
ITEM 10. REMUNERATION PAID TO DIRECTORS, OFFICERS, AND OTHERS OF OPEN-END MANAGEMENT INVESTMENT COMPANIES.
Included as part of financial statements filed under Item 7(a).
ITEM 11. STATEMENT REGARDING BASIS FOR APPROVAL OF INVESTMENT ADVISORY CONTRACT.
Included as part of other information filed under Item 7(a).
ITEM 12. DISCLOSURE OF PROXY VOTING POLICIES AND PROCEDURES FOR CLOSED-END MANAGEMENT INVESTMENT COMPANIES.
Not applicable.
ITEM 13. PORTFOLIO MANAGERS OF CLOSED-END MANAGEMENT INVESTMENT COMPANIES.
Not applicable.
ITEM 14. PURCHASES OF EQUITY SECURITIES BY CLOSED-END MANAGEMENT INVESTMENT COMPANY AND AFFILIATED PURCHASERS.
Not applicable.
ITEM 15. SUBMISSION OF MATTERS TO A VOTE OF SECURITY HOLDERS
The Registrant does not accept nominees to the Board of Trustees from shareholders.
ITEM 16. CONTROLS AND PROCEDURES
(a) The Registrant’s Principal Executive Officer and Principal Financial Officer have concluded that the Registrant’s disclosure controls and procedures (as defined in Rule 30a-3(c) under the Act are effective, based on their evaluation of the controls and procedures required by Rule 30a-3(b) under the Act and Rules 13a-15(b) or 15d-15(b) under the Securities Exchange Act of 1934, as of a date within 90 days of the filing date of this report.
(b) There were no changes in the Registrant’s internal control over financial reporting (as defined in Rule 30a-3(d) under the Act) that occurred during the Reporting Period that have materially affected, or are reasonably likely to materially affect, the Registrant’s internal control over financial reporting.
ITEM 17. DISCLOSURE OF SECURITIES LENDING ACTIVITIES FOR CLOSED-END MANAGEMENT INVESTMENT COMPANIES.
Not applicable.
ITEM 18. RECOVERY OF ERRONEOUSLY AWARDED COMPENSATION.
Not applicable.
ITEM 19. EXHIBITS.
(a)(2) Not applicable.
(a)(4) Not applicable.
(a)(5) Not applicable.
SIGNATURES
Pursuant to the requirements of the Securities Exchange Act of 1934 and the Investment Company Act of 1940, the Registrant has duly caused this report to be signed on its behalf by the undersigned, thereunto duly authorized.
Registrant Forum Funds
| By: | /s/ Zachary Tackett | |
| | Zachary Tackett, Principal Executive Officer | |
| | | |
| Date: | August 23, 2024 | |
Pursuant to the requirements of the Securities Exchange Act of 1934 and the Investment Company Act of 1940, this report has been signed below by the following persons on behalf of the Registrant and in the capacities and on the dates indicated.
| By: | /s/ Zachary Tackett | |
| | Zachary Tackett, Principal Executive Officer | |
| | | |
| Date: | August 23, 2024 | |
| By: | /s/ Karen Shaw | |
| | Karen Shaw, Principal Financial Officer | |
| | | |
| Date: | August 23, 2024 | |