Exhibit 99.1

EXCO Resources, Inc.
Investor Presentation and Financial Disclosure
July 2011
PPT – 192 – Management Presentation
PPT – 192 – Management Presentation
Cautionary Note Concerning Forecasts Prepared by the Company’s Management
EXCO Resources, Inc. (the “Company”) does not as a matter of course prepare or make publicly available long-range forecasts or projections as to future value, reserve information, operating performance, production, earnings or other results due to the unpredictability of the underlying assumptions and estimates. However, in light of the letter from the Company’s chairman and chief executive officer, Douglas H. Miller, to the Company’s board of directors indicating an interest in acquiring all of the Company’s outstanding shares of common stock not already owned by Mr. Miller for a cash price of $20.50 per share (the “Proposed Transaction”), the Company prepared and provided certain forecasts and projections as to future value, reserve information, operating performance, production, earnings and other results that are included in this presentation (the “Forecasts”) to potential investors in the Proposed Transaction and other persons interested in acquiring the Company in connection with their evaluation of the Proposed Transaction and the Company.
The Forecasts were necessarily based on a variety of assumptions and estimates. The assumptions and estimates underlying the Forecasts may not be realized and are inherently subject to significant business, economic and competitive uncertainties and contingencies, all of which are difficult to predict and many of which are beyond the Company’s control. Although presented with numerical specificity, the Forecasts are not fact and reflect numerous assumptions and estimates as to future events made by the Company’s management that the Company’s management believed were reasonable at the time the Forecasts were prepared, including assumptions and estimates regarding factors such as industry performance and general business, economic, regulatory, market and financial conditions, as well as factors specific to the Company’s businesses, such as oil and gas prices and success of production and drilling activities, all of which are difficult to predict and many of which are beyond the control of the Company’s management. In addition, the Forecasts do not take into account any circumstances or events occurring after the date that they were prepared. Accordingly, there can be no assurance that the assumptions and estimates used to prepare the Forecasts will prove to be accurate, and actual results may materially differ from the Forecasts.
The inclusion of the summary of the material Forecasts in this presentation should not be regarded as an indication that the Company considered or considers the Forecasts to be a reliable prediction of future events, and the summary of the material Forecasts should not be relied upon as such. The Company is not making any representation regarding the information contained in the Forecasts and, except as may be required by applicable securities laws, does not intend to update or otherwise revise or reconcile the Forecasts to reflect circumstances existing after the date such Forecasts were generated or to reflect the occurrence of future events even in the event that any or all of the assumptions underlying the Forecasts are shown to be in error.
The Forecasts were prepared for internal use and not prepared with a view to public disclosure. The Forecasts were not prepared with a view towards compliance with the published guidelines of the Securities and Exchange Commission (the “SEC”) or the guidelines established by the American Institute of Certified Public Accountants for preparation and presentation of prospective financial information. The Forecasts do not purport to present operations in accordance with U.S. generally accepted accounting principles (“GAAP”), and the Company’s registered public accounting firm has not examined or otherwise applied procedures to the Forecasts.
Management believes that certain non-GAAP financial metrics are meaningful and useful to investors, analysts and/or rating agencies. Earnings before interest, taxes, depreciation, depletion and amortization, or “EBITDA” represents net income adjusted to exclude interest expense, income taxes and depreciation, depletion and amortization. “Adjusted EBITDA” represents EBITDA adjusted to exclude nonrecurring other operating items, accretion of discount on asset retirement obligations, non-cash changes in the fair value of derivatives, gains from early termination of derivatives, stock-based compensation and income or losses from equity method investments. We have presented EBITDA and Adjusted EBITDA because they are a widely used measure by investors, analysts and rating agencies for valuations, peer comparisons and investment recommendations. In addition, these measures are used in covenant calculations required under our credit agreement and the indenture governing our 7.5% senior notes due September 15, 2018. Compliance with the liquidity and debt incurrence covenants included in these agreements is considered material to us. Our computations of EBITDA and Adjusted EBITDA may differ from computations of similarly titled measures of other companies due to differences in the inclusion or exclusion of items in the computations. EBITDA and Adjusted EBITDA are measures that are not prescribed by GAAP. EBITDA and Adjusted EBITDA specifically exclude changes in working capital, capital expenditures and other items that are set forth on a cash flow statement presentation of a company’s operating, investing and financing activities. As such, we encourage investors not to use these measures as substitutes for the determination of net income, net cash provided by operating activities or other similar GAAP measures. With respect to any forward-looking EBITDA or Adjusted EBITDA information contained herein, we have not provided a quantitative reconciliation to the most comparable financial measure calculated in accordance with GAAP because such reconciliation is not available without unreasonable efforts.
The Forecasts are forward-looking statements. These statements involve certain risks and uncertainties that could cause actual results to differ materially from those in the Forecasts. There can be no assurance that any projected financial information will be, or are likely to be, realized, or that the assumptions on which they are based will prove to be, or are likely to be, correct. The Forecasts do not and should not be read to update, modify or affirm any prior financial guidance issued by the Company. Information on other important potential risks and uncertainties not discussed herein may be found in the Company’s filings with the SEC, including its Annual Report on Form 10-K, as amended, for the year ended December 31, 2010 and its Quarterly Report on Form 10-Q for the quarterly period ended March 31, 2011.
In light of the foregoing factors and the uncertainties inherent in the Forecasts, stockholders are cautioned not to place undue, if any, reliance on the Forecasts provided in this presentation.
PPT – 192 – Management Presentation
Forward Looking Statements
This presentation contains forward-looking statements, as defined in Section 27A of the Securities Act and Section 21E of the Securities Exchange Act of 1934, or the Exchange Act. These forward-looking statements relate to, among other things, the following:
our future financial and operating performance and results;
our business strategy;
market prices;
our future use of derivative financial instruments; and
our plans and forecasts.
We have based these forward-looking statements on our current assumptions, expectations and projections about future events.
We use the words “may,” “expect,” “anticipate,” “estimate,” “believe,” “continue,” “intend,” “plan,” “budget” and other similar words to identify forward-looking statements. You should read statements that contain these words carefully because they discuss future expectations, contain projections of results of operations or of our financial condition and/or state other “forward-looking” information. We do not undertake any obligation to update or revise publicly any forward-looking statements, except as required by law. These statements also involve risks and uncertainties that could cause our actual results or financial condition to materially differ from our expectations in this presentation, including, but not limited to:
• fluctuations in prices of oil and natural gas;
• imports of foreign oil and natural gas, including liquefied natural gas;
• future capital requirements and availability of financing;
• continued disruption of credit and capital markets and the ability of financial institutions to honor their commitments;
• estimates of reserves and economic assumptions;
• geological concentration of our reserves;
• risks associated with drilling and operating wells;
• exploratory risks, including our Marcellus shale play in Appalachia and our Haynesville and Bossier shale plays in East Texas/North Louisiana;
• risks associated with operation of natural gas pipelines and gathering systems;
• discovery, acquisition, development and replacement of oil and natural gas reserves;
• cash flow and liquidity;
timing and amount of future production of oil and natural gas;
• availability of drilling and production equipment;
• marketing of oil and natural gas;
• developments in oil-producing and natural gas-producing countries;
• title to our properties;
• litigation;
• competition;
• general economic conditions, including costs associated with drilling and operation of our properties;
• environmental or other governmental regulations, including legislation to reduce emissions of greenhouse gases, legislation of derivative financial instruments, regulation of hydraulic fracture
stimulation and elimination of income tax incentives available to our industry;
• receipt and collectibility of amounts owed to us by purchasers of our production and counterparties to our derivative financial instruments;
• decisions whether or not to enter into derivative financial instruments;
• potential acts of terrorism;
• actions of third party co-owners of interests in properties in which we also own an interest;
• fluctuations in interest rates; and
• our ability to effectively integrate companies and properties that we acquire.
EXCO
PPT – 192 – Management Presentation
Forward Looking Statements (continued)
We believe that it is important to communicate our expectations of future performance to our investors. However, events may occur in the future that we are unable to accurately predict, or over which we have no control. You are cautioned not to place undue reliance on a forward-looking statement. When considering our forward-looking statements, keep in mind the risk factors and other cautionary statements in this presentation, and the risk factors included in our Annual Reports on Form 10-K and our Quarterly Reports on Form 10-Q.
Our revenues, operating results, financial condition and ability to borrow funds or obtain additional capital depend substantially on prevailing prices for oil and natural gas, the availability of capital from our revolving credit facility and liquidity from capital markets. Declines in oil or natural gas prices may materially adversely affect our financial condition, liquidity, ability to obtain financing and operating results. Lower oil or natural gas prices also may reduce the amount of oil or natural gas that we can produce economically. A decline in oil and/or natural gas prices could have a material adverse effect on the estimated value and estimated quantities of our oil and natural gas reserves, our ability to fund our operations and our financial condition, cash flow, results of operations and access to capital. Historically, oil and natural gas prices and markets have been volatile, with prices fluctuating widely, and they are likely to continue to be volatile.
Effective January 1, 2010, the SEC permits oil and gas companies, in their filings with the SEC, to disclose not only “proved” reserves (i.e., quantities of oil and gas that are estimated to be recoverable with a high degree of confidence), but also “probable” reserves (i.e., quantities of oil and gas that are as likely as not to be recovered) as well as “possible” reserves (i.e., additional quantities of oil and gas that might be recovered, but with a lower probability than probable reserves). In addition unless otherwise noted, certain proved reserve numbers and other reserve numbers provided herein are not SEC “case” numbers using flat commodity prices, but a management case price deck using escalating prices for a period of time. As noted above, statements of reserves are only estimates and may not correspond to the ultimate quantities of oil and gas recovered. Any reserve estimates provided in this presentation that are not specifically designated as being estimates of proved reserves may include estimated reserves not necessarily calculated in accordance with, or contemplated by, the SEC’s latest reserve reporting guidelines. Investors are urged to consider closely the disclosure in our Annual Report on Form 10-K, as amended, for the fiscal year ended December 31, 2010 and our Quarterly Report on Form 10-Q for the quarter ended March 31, 2011 available on our website at www.excoresources.com under the Investor Relations tab or by calling us at 214-368-2084.
PPT – 192 – Management Presentation
Index
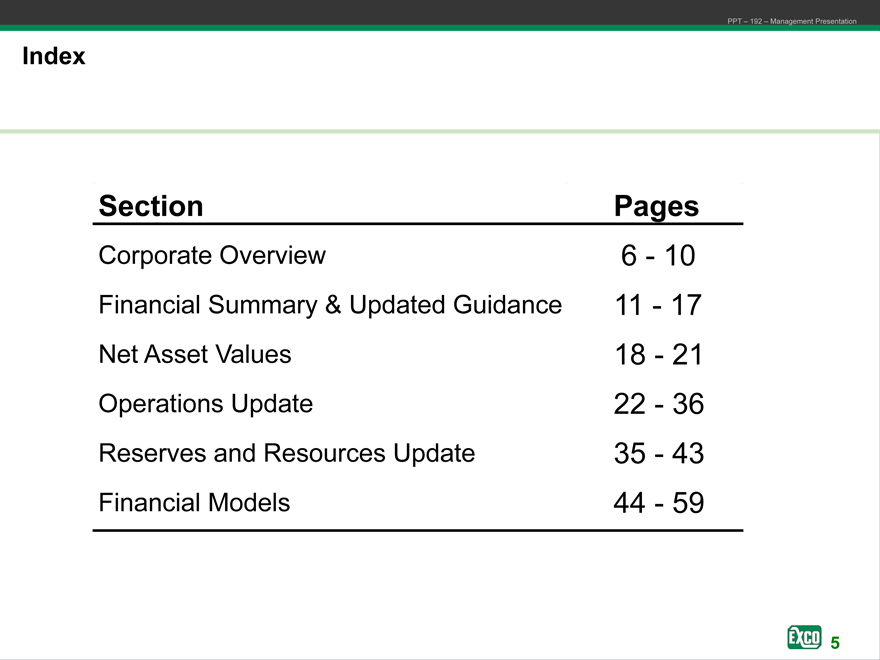
Section
Pages
Corporate Overview 6—10
Financial Summary & Updated Guidance 11 — 17
Net Asset Values 18 — 21
Operations Update 22 — 36
Reserves and Resources Update 35 — 43
Financial Models 44 — 59
Corporate Overview
July 2011
PPT – 192 – Management Presentation
PPT – 192 – Management Presentation
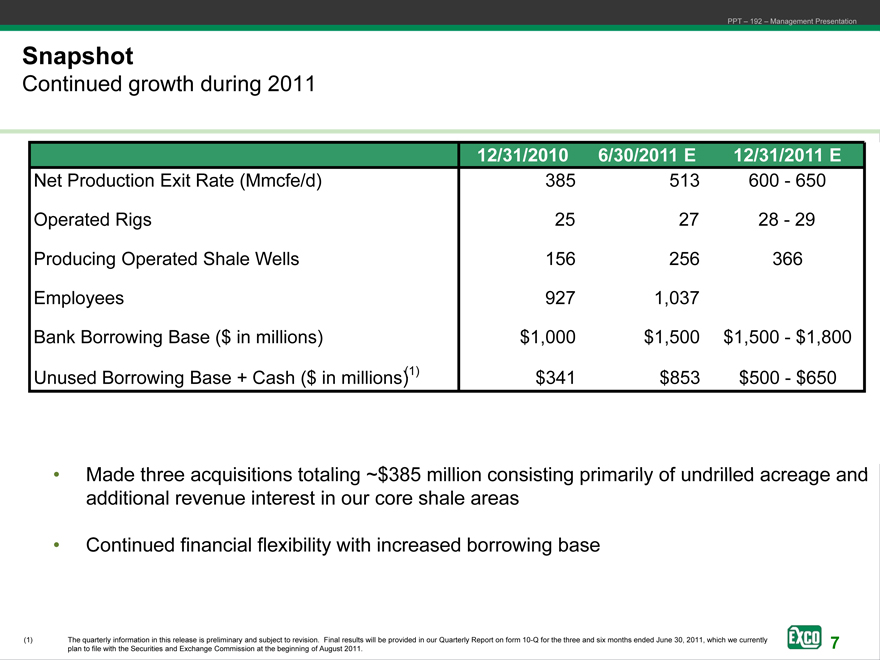
Snapshot
Continued growth during 2011
12/31/2010E 6/30/2011E 12/31/2011E
Net Production Exit Rate (Mmcfe/d) 385 513 600—650
Operated Rigs 25 27 28—29
Producing Operated Shale Wells 156 256 366
Employees 927 1,037
Bank Borrowing Base ($ in millions) $1,000 $1,500 $1,500—$1,800
Unused Borrowing Base + Cash ($ in millions)(1) $341 $853 $500—$650
• Made three acquisitions totaling ~$385 million consisting primarily of undrilled acreage and additional revenue interest in our core shale areas
• Continued financial flexibility with increased borrowing base
The quarterly information in this release is preliminary and subject to revision. Final results will be provided in our Quarterly Report on form 10-Q for the three and six months ended June 30, 2011, which we currently plan to file with the Securities and Exchange Commission at the beginning of August 2011.
PPT – 192 – Management Presentation
PPT – 192 – Management Presentation
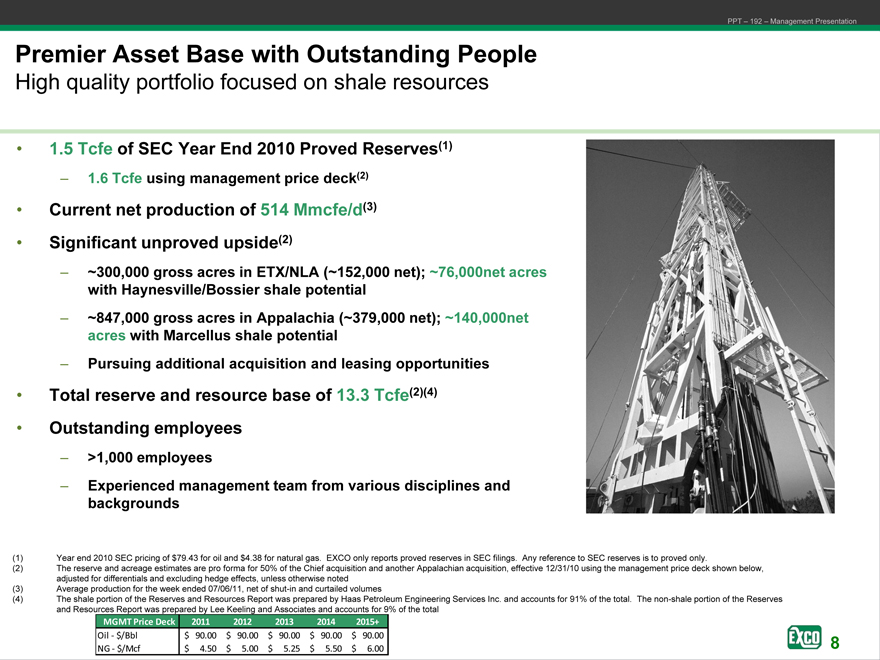
Premier Asset Base with Outstanding People
High quality portfolio focused on shale resources
1.5 Tcfe of SEC Year End 2010 Proved Reserves(1)
1.6 Tcfe using management price deck(2)
Current net production of 514 Mmcfe/d(3)
Significant unproved upside(2)
~300,000 gross acres in ETX/NLA (~152,000 net); ~76,000net acres with Haynesville/Bossier shale potential
~847,000 gross acres in Appalachia (~379,000 net); ~140,000net acres with Marcellus shale potential
Pursuing additional acquisition and leasing opportunities
Total reserve and resource base of 13.3 Tcfe(2)(4)
Outstanding employees
>1,000 employees
Experienced management team from various disciplines and backgrounds
Year end 2010 SEC pricing of $79.43 for oil and $4.38 for natural gas. EXCO only reports proved reserves in SEC filings. Any reference to SEC reserves is to proved only.
The reserve and acreage estimates are pro forma for 50% of the Chief acquisition and another Appalachian acquisition, effective 12/31/10 using the management price deck shown below, adjusted for differentials and excluding hedge effects, unless otherwise noted
Average production for the week ended 07/06/11, net of shut-in and curtailed volumes
The shale portion of the Reserves and Resources Report was prepared by Haas Petroleum Engineering Services Inc. and accounts for 91% of the total. The non-shale portion of the Reserves and Resources Report was prepared by Lee Keeling and Associates and accounts for 9% of the total
MGMT Price Deck 2011 2012 2013 2014 2015+
Oil—$/Bbl $ 90.00 $ 90.00 $ 90.00 $ 90.00 $ 90.00
NG—$/Mcf $ 4.50 $ 5.00 $ 5.25 $ 5.50 $ 6.00
PPT – 192 – Management Presentation
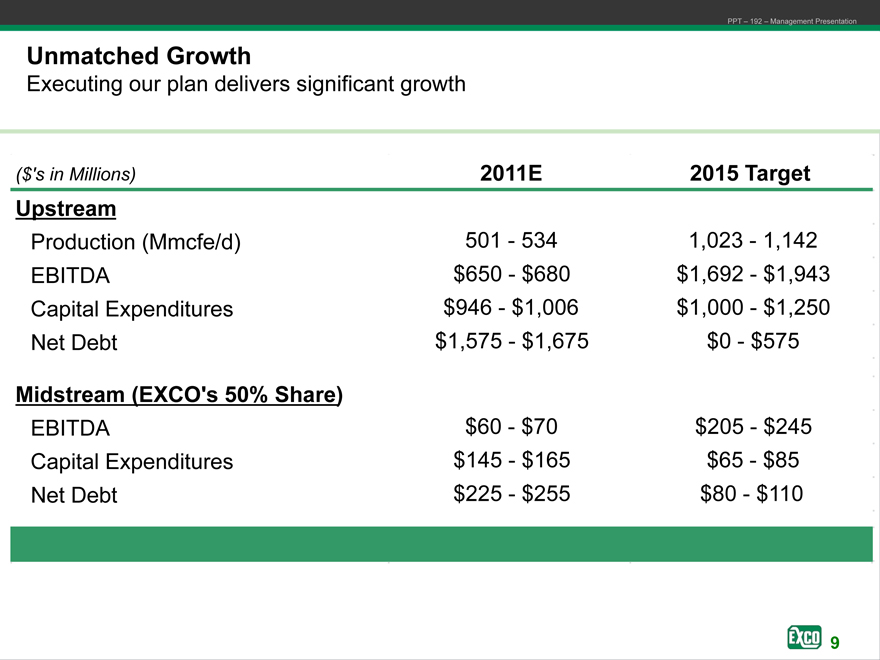
Unmatched Growth
Executing our plan delivers significant growth
($’s in Millions) 2011E 2015 Target
Upstream
Production (Mmcfe/d) 501 — 534 1,023—1,142
EBITDA $650 — $680 $1,692—$1,943
Capital Expenditures $946—$1,006 $1,000—$1,250
Net Debt $1,575 — $1,675 $0—$575
Midstream (EXCO’s 50% Share)
EBITDA $60 — $70 $205—$245
Capital Expenditures $145 — $165 $65—$85
Net Debt $225 — $255 $80—$110
9
PPT – 192 – Management Presentation
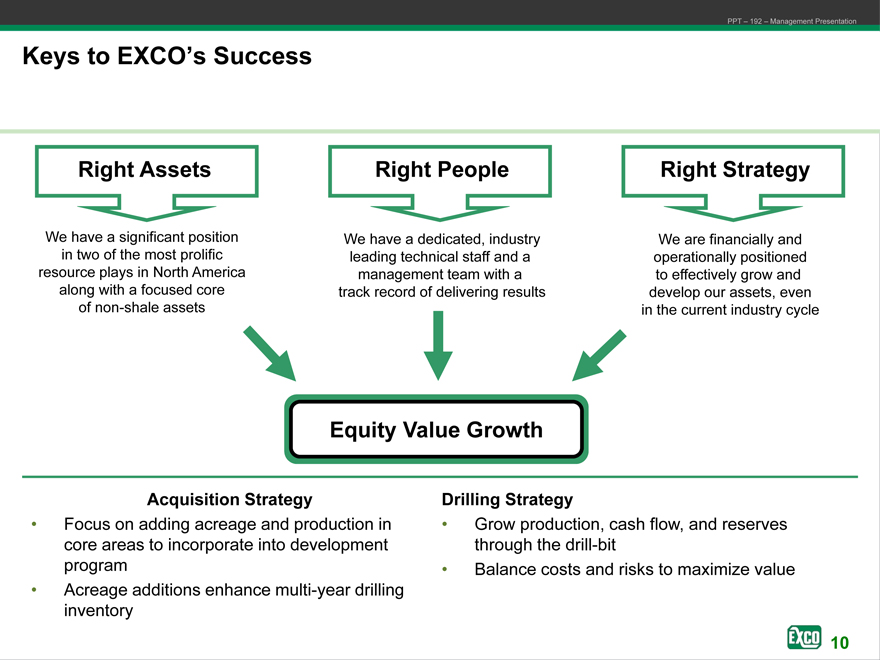
Right Assets
Right People
Right Strategy
We have a significant position in two of the most prolific resource plays in North America along with a focused core of non-shale assets
We have a dedicated, industry leading technical staff and a management team with a track record of delivering results
We are financially and operationally positioned to effectively grow and develop our assets, even in the current industry cycle
Equity Value Growth
Acquisition Strategy
• Focus on adding acreage and production in core areas to incorporate into development program
• Acreage additions enhance multi-year drilling inventory
Drilling Strategy
• Grow production, cash flow, and reserves through the drill-bit
• Balance costs and risks to maximize value
10
EXCO Resources, Inc.
EXCO
Financial Summary & Updated Guidance
July 2011
PPT – 192 – Management Presentation
11
PPT – 192 – Management Presentation
Corporate Highlights
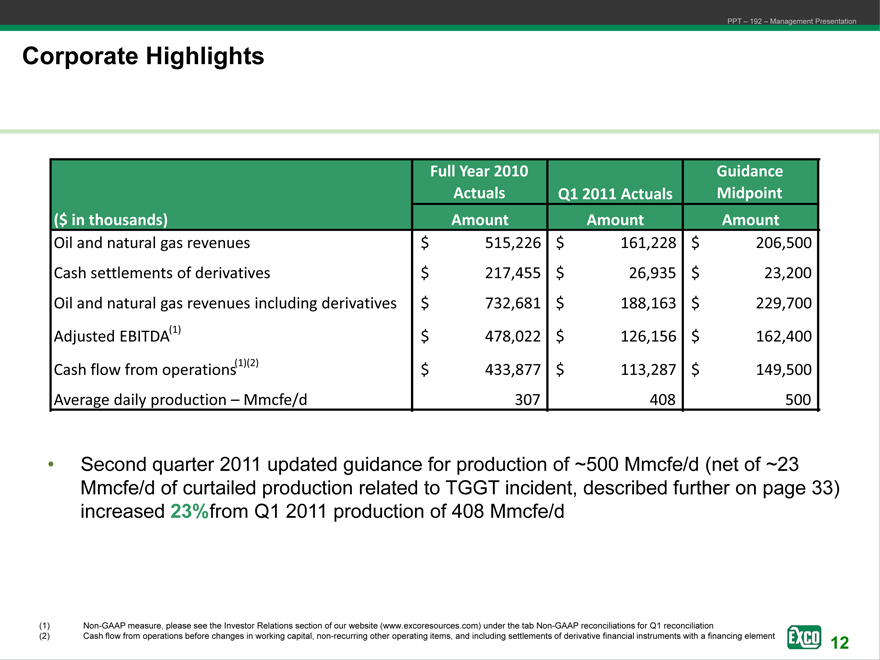
Full Year 2010 Guidance Actuals Q1 2011 Actuals Midpoint ($ in thousands) Amount Amount Amount
Oil and natural gas revenues $ 515,226 $ 161,228 $ 206,500 Cash settlements of derivatives $ 217,455 $ 26,935 $ 23,200 Oil and natural gas revenues including derivatives $ 732,681 $ 188,163 $ 229,700 Adjusted EBITDA(1) $ 478,022 $ 126,156 $ 162,400 Cash flow from operations(1)(2) $ 433,877 $ 113,287 $ 149,500 Average daily production – Mmcfe/d 307 408 500
• Second quarter 2011 updated guidance for production of ~500 Mmcfe/d (net of ~23 Mmcfe/d of curtailed production related to TGGT incident, described further on page 33) increased 23%from Q1 2011 production of 408 Mmcfe/d
(1) Non-GAAP measure, please see the Investor Relations section of our website (www.excoresources.com) under the tab Non-GAAP reconciliations for Q1 reconciliation
(2) Cash flow from operations before changes in working capital, non-recurring other operating items, and including settlements of derivative EXCO financial instruments Resources, with a financing element
EXCO
12
PPT – 192 – Management Presentation
Liquidity and Financial Position
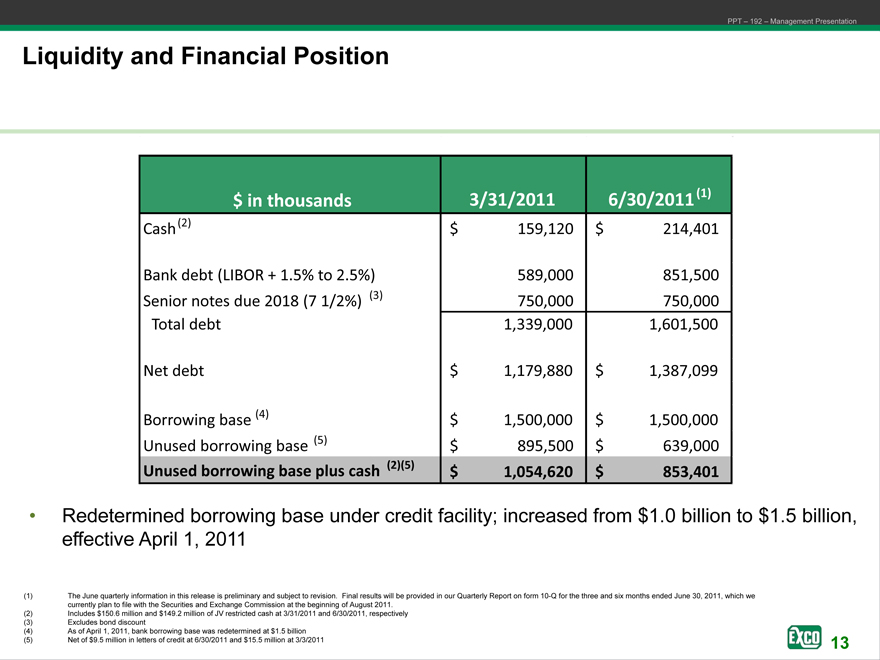
$ in thousands 3/31/2011 6/30/2011(1)
Cash(2) $ 159,120 $ 214,401
Bank debt (LIBOR + 1.5% to 2.5%) 589,000 851,500 Senior notes due 2018 (7 1/2%) (3) 750,000 750,000 Total debt 1,339,000 1,601,500
Net debt $ 1,179,880 $ 1,387,099
Borrowing base (4) $ 1,500,000 $ 1,500,000 Unused borrowing base (5) $ 895,500 $ 639,000
Unused borrowing base plus cash (2)(5) $ 1,054,620 $ 853,401
• Redetermined borrowing base under credit facility; increased from $1.0 billion to $1.5 billion, effective April 1, 2011
(1) The June quarterly information in this release is preliminary and subject to revision. Final results will be provided in our Quarterly Report on form 10-Q for the three and six months ended June 30, 2011, which we currently plan to file with the Securities and Exchange Commission at the beginning of August 2011.
(2) Includes $150.6 million and $149.2 million of JV restricted cash at 3/31/11 and 6/30/2011, respectively (3) Excludes bond discount (4) As of April 1, 2011, bank borrowing base was redetermined at $1.5 billion
(5) | | Net of $9.5 million in letters of credit at 6/30/2011 and $15.5 million at 3/3/2011 |
EXCO
13
PPT – 192 – Management Presentation
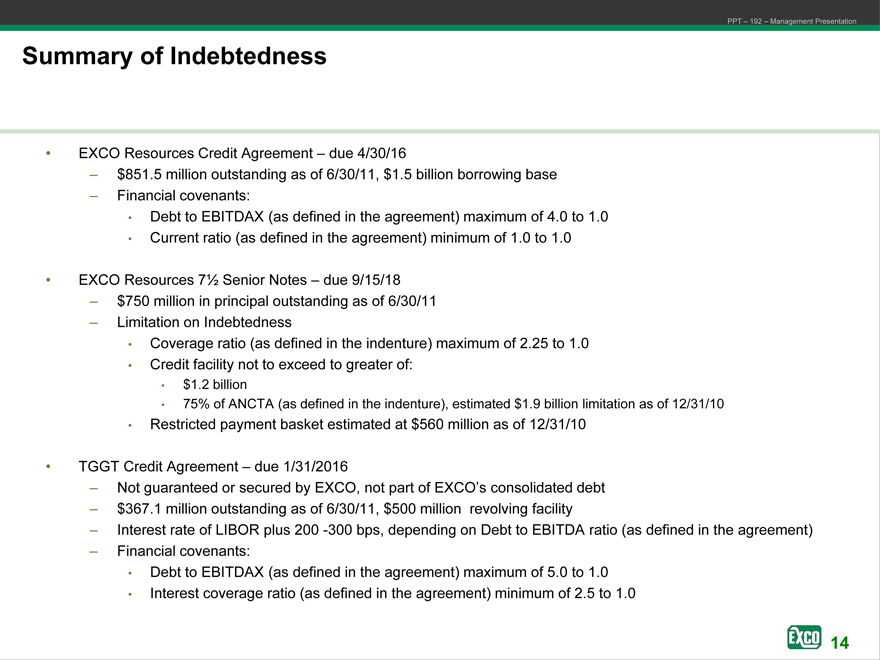
Summary of Indebtedness
• EXCO Resources Credit Agreement – due 4/30/16
– $851.5 million outstanding as of 6/30/11, $1.5 billion borrowing base
– Financial covenants:
• Debt to EBITDAX (as defined in the agreement) maximum of 4.0 to 1.0
• Current ratio (as defined in the agreement) minimum of 1.0 to 1.0
• EXCO Resources 7 1/2 Senior Notes – due 9/15/18
– $750 million in principal outstanding as of 6/30/11
– Limitation on Indebtedness
• Coverage ratio (as defined in the indenture) maximum of 2.25 to 1.0
• Credit facility not to exceed to greater of:
• $1.2 billion
• 75% of ANCTA (as defined in the indenture), estimated $1.9 billion limitation as of 12/31/10
• Restricted payment basket estimated at $560 million as of 12/31/10
• TGGT Credit Agreement – due 1/31/2016
– Not guaranteed or secured by EXCO, not part of EXCO’s consolidated debt
– $367.1 million outstanding as of 6/30/11, $500 million revolving facility
– Interest rate of LIBOR plus 200 -300 bps, depending on Debt to EBITDA ratio (as defined in the agreement)
– Financial covenants:
• Debt to EBITDAX (as defined in the agreement) maximum of 5.0 to 1.0
• Interest coverage ratio (as defined in the agreement) minimum of 2.5 to 1.0
EXCO
14
PPT – 192 – Management Presentation
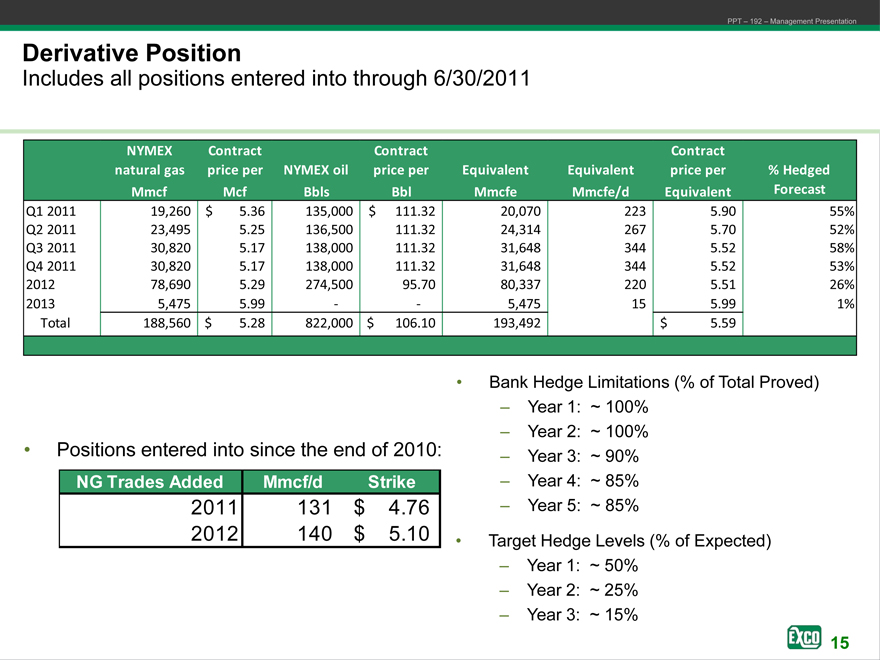
Derivative Position
Includes all positions entered into through 6/30/2011
NYMEX Contract Contract Contract natural gas price per NYMEX oil price per Equivalent Equivalent price per % Hedged Mmcf Mcf Bbls Bbl Mmcfe Mmcfe/d Equivalent Forecast
Q1 2011 19,260 $ 5.36 135,000 $ 111.32 20,070 223 5.90 55% Q2 2011 23,495 5.25 136,500 111.32 24,314 267 5.70 52% Q3 2011 30,820 5.17 138,000 111.32 31,648 344 5.52 58% Q4 2011 30,820 5.17 138,000 111.32 31,648 344 5.52 53% 2012 78,690 5.29 274,500 95.70 80,337 220 5.51 26% 2013 5,475 5.99 — — 5,475 15 5.99 1% Total 188,560 $ 5.28 822,000 $ 106.10 193,492 $ 5.59
• Bank Hedge Limitations (% of Total Proved)
– Year 1: ~ 100%
– Year 2: ~ 100%
• Positions entered into since the end of 2010: – Year 3: ~ 90%
NG Trades Added Mmcf/d Strike – Year 4: ~ 85%
2011 131 $ 4.76 – Year 5: ~ 85%
2012 140 $ 5.10 • Target Hedge Levels (% of Expected)
– Year 1: ~ 50%
– Year 2: ~ 25%
– Year 3: ~ 15%
EXCO
15
PPT – 192 – Management Presentation
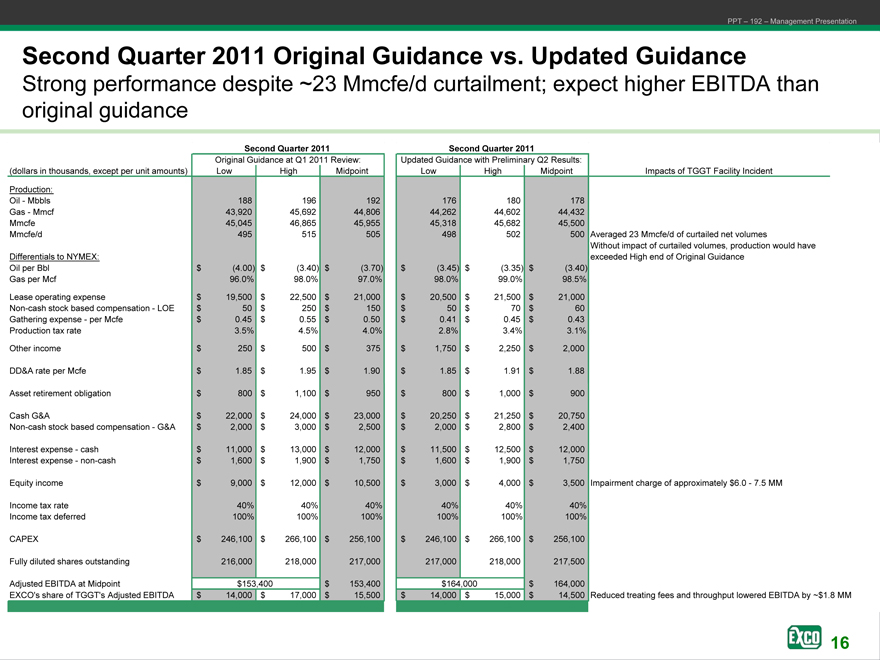
Second Quarter 2011 Original Guidance vs. Updated Guidance
Strong performance despite ~23 Mmcfe/d curtailment; expect higher EBITDA than original guidance
Second Quarter 2011 Second Quarter 2011
Original Guidance at Q1 2011 Review: Updated Guidance with Preliminary Q2 Results:
(dollars in thousands, except per unit amounts) Low High Midpoint Low High Midpoint Impacts of TGGT Facility Incident
Production:
Oil—Mbbls 188 196 192 176 180 178 Gas—Mmcf 43,920 45,692 44,806 44,262 44,602 44,432 Mmcfe 45,045 46,865 45,955 45,318 45,682 45,500
Mmcfe/d 495 515 505 498 502 500 Averaged 23 Mmcfe/d of curtailed net volumes
Without impact of curtailed volumes, production would have Differentials to NYMEX: exceeded High end of Original Guidance Oil per Bbl $ (4.00) $ (3.40) $ (3.70) $ (3.45) $ (3.35) $ (3.40) Gas per Mcf 96.0% 98.0% 97.0% 98.0% 99.0% 98.5%
Lease operating expense $ 19,500 $ 22,500 $ 21,000 $ 20,500 $ 21,500 $ 21,000 Non-cash stock based compensation—LOE $ 50 $ 250 $ 150 $ 50 $ 70 $ 60 Gathering expense—per Mcfe $ 0.45 $ 0.55 $ 0.50 $ 0.41 $ 0.45 $ 0.43 Production tax rate 3.5% 4.5% 4.0% 2.8% 3.4% 3.1%
Other income $ 250 $ 500 $ 375 $ 1,750 $ 2,250 $ 2,000 DD&A rate per Mcfe $ 1.85 $ 1.95 $ 1.90 $ 1.85 $ 1.91 $ 1.88 Asset retirement obligation $ 800 $ 1,100 $ 950 $ 800 $ 1,000 $ 900
Cash G&A $ 22,000 $ 24,000 $ 23,000 $ 20,250 $ 21,250 $ 20,750 Non-cash stock based compensation—G&A $ 2,000 $ 3,000 $ 2,500 $ 2,000 $ 2,800 $ 2,400
Interest expense—cash $ 11,000 $ 13,000 $ 12,000 $ 11,500 $ 12,500 $ 12,000 Interest expense—non-cash $ 1,600 $ 1,900 $ 1,750 $ 1,600 $ 1,900 $ 1,750
Equity income $ 9,000 $ 12,000 $ 10,500 $ 3,000 $ 4,000 $ 3,500 Impairment charge of approximately $6.0—7.5 MM
Income tax rate 40% 40% 40% 40% 40% 40% Income tax deferred 100% 100% 100% 100% 100% 100%
CAPEX $ 246,100 $ 266,100 $ 256,100 $ 246,100 $ 266,100 $ 256,100
Fully diluted shares outstanding 216,000 218,000 217,000 217,000 218,000 217,500
Adjusted EBITDA at Midpoint $153,400 $ 153,400 $164,000 $ 164,000
EXCO’s share of TGGT’s Adjusted EBITDA $ 14,000 $ 17,000 $ 15,500 $ 14,000 $ 15,000 $ 14,500 Reduced treating fees and throughput lowered EBITDA by ~$1.8 MM
EXCO
16
PPT – 192 – Management Presentation
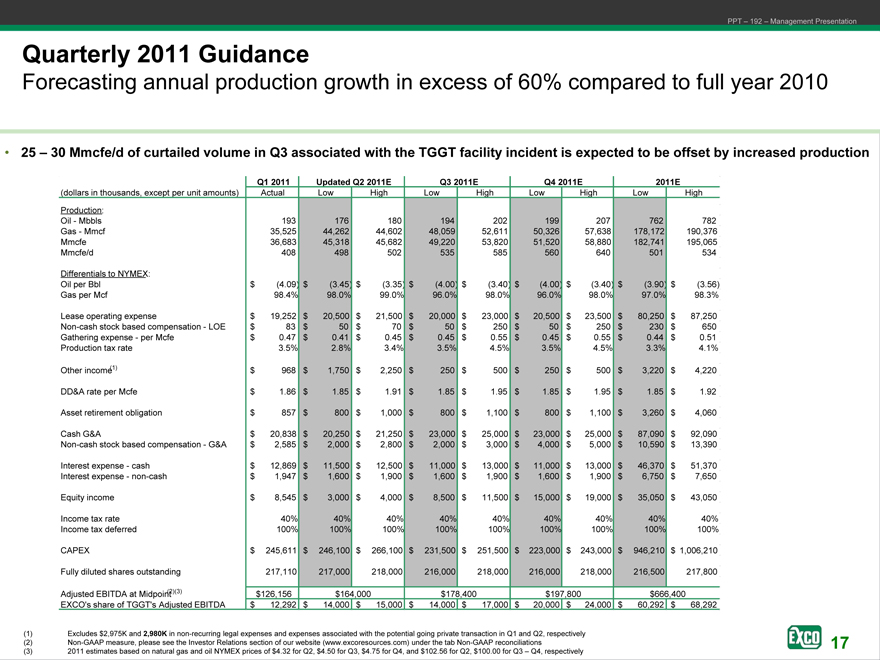
Quarterly 2011 Guidance
Forecasting annual production growth in excess of 60% compared to full year 2010
• 25 – 30 Mmcfe/d of curtailed volume in Q3 associated with the TGGT facility incident is expected to be offset by increased production
Q1 2011 Updated Q2 2011E Q3 2011E Q4 2011E 2011E
(dollars in thousands, except per unit amounts) Actual Low High Low High Low High Low High
Production:
Oil—Mbbls 193 176 180 194 202 199 207 762 782 Gas—Mmcf 35,525 44,262 44,602 48,059 52,611 50,326 57,638 178,172 190,376 Mmcfe 36,683 45,318 45,682 49,220 53,820 51,520 58,880 182,741 195,065 Mmcfe/d 408 498 502 535 585 560 640 501 534
Differentials to NYMEX:
Oil per Bbl $ (4.09) $ (3.45) $ (3.35) $ (4.00) $ (3.40) $ (4.00) $ (3.40) $ (3.90) $ (3.56) Gas per Mcf 98.4% 98.0% 99.0% 96.0% 98.0% 96.0% 98.0% 97.0% 98.3%
Lease operating expense $ 19,252 $ 20,500 $ 21,500 $ 20,000 $ 23,000 $ 20,500 $ 23,500 $ 80,250 $ 87,250 Non-cash stock based compensation—LOE $ 83 $ 50 $ 70 $ 50 $ 250 $ 50 $ 250 $ 230 $ 650 Gathering expense—per Mcfe $ 0.47 $ 0.41 $ 0.45 $ 0.45 $ 0.55 $ 0.45 $ 0.55 $ 0.44 $ 0.51 Production tax rate 3.5% 2.8% 3.4% 3.5% 4.5% 3.5% 4.5% 3.3% 4.1%
Other income (1) $ 968 $ 1,750 $ 2,250 $ 250 $ 500 $ 250 $ 500 $ 3,220 $ 4,220 DD&A rate per Mcfe $ 1.86 $ 1.85 $ 1.91 $ 1.85 $ 1.95 $ 1.85 $ 1.95 $ 1.85 $ 1.92 Asset retirement obligation $ 857 $ 800 $ 1,000 $ 800 $ 1,100 $ 800 $ 1,100 $ 3,260 $ 4,060
Cash G&A $ 20,838 $ 20,250 $ 21,250 $ 23,000 $ 25,000 $ 23,000 $ 25,000 $ 87,090 $ 92,090 Non-cash stock based compensation—G&A $ 2,585 $ 2,000 $ 2,800 $ 2,000 $ 3,000 $ 4,000 $ 5,000 $ 10,590 $ 13,390
Interest expense—cash $ 12,869 $ 11,500 $ 12,500 $ 11,000 $ 13,000 $ 11,000 $ 13,000 $ 46,370 $ 51,370 Interest expense—non-cash $ 1,947 $ 1,600 $ 1,900 $ 1,600 $ 1,900 $ 1,600 $ 1,900 $ 6,750 $ 7,650
Equity income $ 8,545 $ 3,000 $ 4,000 $ 8,500 $ 11,500 $ 15,000 $ 19,000 $ 35,050 $ 43,050
Income tax rate 40% 40% 40% 40% 40% 40% 40% 40% 40% Income tax deferred 100% 100% 100% 100% 100% 100% 100% 100% 100%
CAPEX $ 245,611 $ 246,100 $ 266,100 $ 231,500 $ 251,500 $ 223,000 $ 243,000 $ 946,210 $ 1,006,210
Fully diluted shares outstanding 217,110 217,000 218,000 216,000 218,000 216,000 218,000 216,500 217,800
Adjusted EBITDA at Midpoint (2)(3) $126,156 $164,000 $178,400 $197,800 $666,400 EXCO’s share of TGGT’s Adjusted EBITDA $ 12,292 $ 14,000 $ 15,000 $ 14,000 $ 17,000 $ 20,000 $ 24,000 $ 60,292 $ 68,292
(1) Excludes $2,975K and 2,980K in non-recurring legal expenses and expenses associated with the potential going private transaction in Q1 and Q2, respectively (2) Non-GAAP measure, please see the Investor Relations section of our website (www.excoresources.com) under the tab Non-GAAP reconciliations (3) 2011 estimates based on natural gas and oil NYMEX prices of $4.32 for Q2, $4.50 for Q3, $4.75 for Q4, and $102.56 for Q2, $100.00 for Q3 – Q4, respectively
EXCO
17

EXCO Resources, Inc.
EXCO
Net Asset Values
July 2011
PPT – 192 – Management Presentation
PPT – 192 – Management Presentation
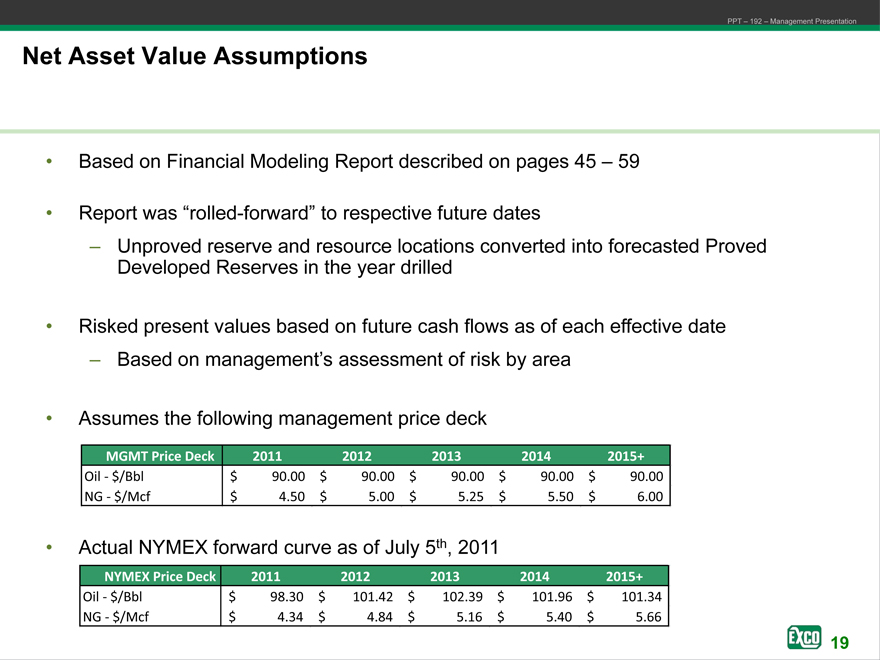
Net Asset Value Assumptions
• Based on Financial Modeling Report described on pages 45 – 59
• Report was “rolled-forward” to respective future dates
– Unproved reserve and resource locations converted into forecasted Proved Developed Reserves in the year drilled
• Risked present values based on future cash flows as of each effective date
– Based on management’s assessment of risk by area
• Assumes the following management price deck
MGMT Price Deck 2011 2012 2013 2014 2015+
Oil—$/Bbl $ 90.00 $ 90.00 $ 90.00 $ 90.00 $ 90.00 NG—$/Mcf $ 4.50 $ 5.00 $ 5.25 $ 5.50 $ 6.00
• Actual NYMEX forward curve as of July 5th, 2011
NYMEX Price Deck 2011 2012 2013 2014 2015+
Oil—$/Bbl $ 98.30 $ 101.42 $ 102.39 $ 101.96 $ 101.34 NG—$/Mcf $ 4.34 $ 4.84 $ 5.16 $ 5.40 $ 5.66
EXCO
19
PPT – 192 – Management Presentation
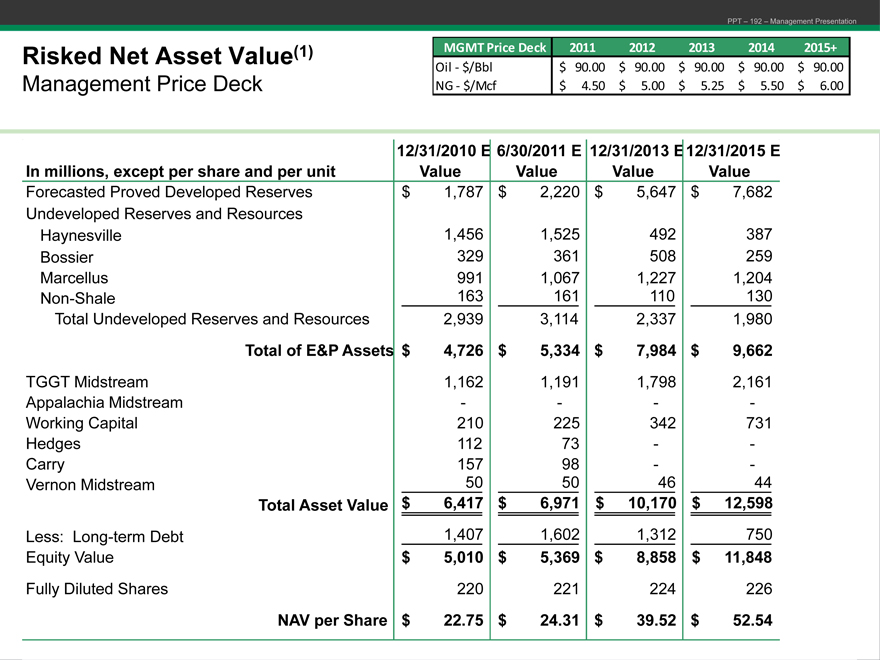
Risked Net Asset Value(1) MGMT Price Deck 2011 2012 2013 2014 2015+
Oil—$/Bbl $ 90.00 $ 90.00 $ 90.00 $ 90.00 $ 90.00
Management Price Deck NG—$/Mcf $ 4.50 $ 5.00 $ 5.25 $ 5.50 $ 6.00
12/31/2010 E 6/30/2011 E 12/31/2013 E12/31/2015 E In millions, except per share and per unit Value Value Value Value
Forecasted Proved Developed Reserves $ 1,787 $ 2,220 $ 5,647 $ 7,682 Undeveloped Reserves and Resources Haynesville 1,456 1,525 492 387 Bossier 329 361 508 259 Marcellus 991 1,067 1,227 1,204 Non-Shale 163 161 110 130 Total Undeveloped Reserves and Resources 2,939 3,114 2,337 1,980
Total of E&P Assets $ 4,726 $ 5,334 $ 7,984 $ 9,662
TGGT Midstream 1,162 1,191 1,798 2,161 Appalachia Midstream—— -Working Capital 210 225 342 731 Hedges 112 73—-Carry 157 98—-Vernon Midstream 50 50 46 44
Total Asset Value $ 6,417 $ 6,971 $ 10,170 $ 12,598
Less: Long-term Debt 1,407 1,602 1,312 750 Equity Value $ 5,010 $ 5,369 $ 8,858 $ 11,848
Fully Diluted Shares 220 221 224 226
NAV per Share $ 22.75 $ 24.31 $ 39.52 $ 52.54
(1) Forecasted reserves and resources on this page based on financial modeling report described on pages 45 – 59 of this presentation EXCO Resources, Inc.
PPT – 192 – Management Presentation
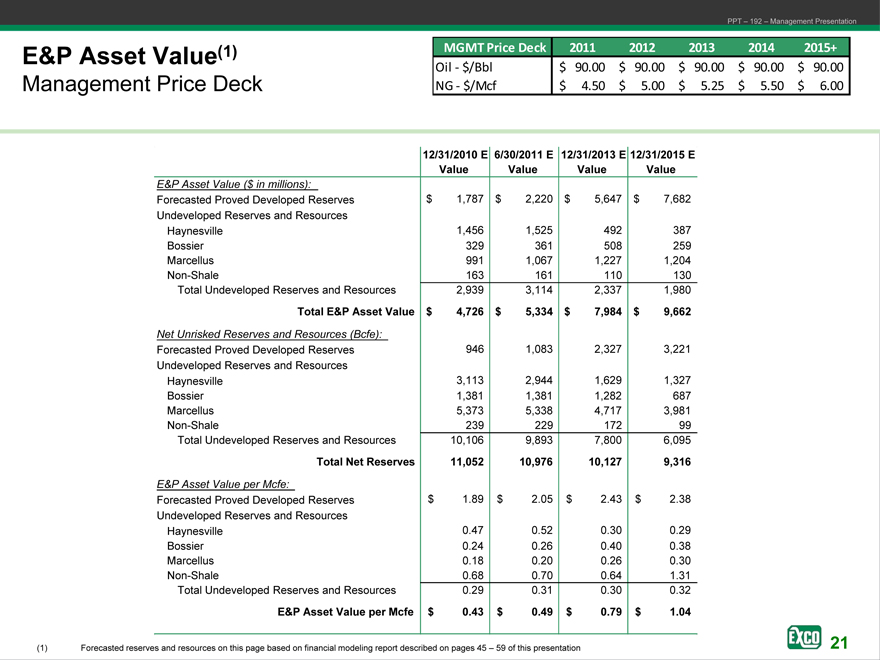
E&P Asset Value(1)
Management Price Deck
MGMT Price Deck 2011 2012 2013 2014 2015+
Oil—$/Bbl $ 90.00 $ 90.00 $ 90.00 $ 90.00 $ 90.00
NG—$/Mcf $ 4.50 $ 5.00 $ 5.25 $ 5.50 $ 6.00
12/31/2010 E 6/30/2011 E 12/31/2013 E 12/31/2015 E
Value Value Value
E&P Asset Value ($ in millions):
Forecasted Proved Developed Reserves $ 1,787 $ 2,220 $ 5,647 $ 7,682
Undeveloped Reserves and Resources
Haynesville 1,456 1,525 492 387
Bossier 329 361 508 259
991 1,067 1,227 1,204
Non-Shale 163 161 110 130
Total Undeveloped Reserves and Resources 2,939 3,114 2,337 1,980
Total E&P Asset Value $ 4,726 $ 5,334 $ 7,984 $ 9,662
Net Reserves and Resources (Bcfe):
Forecasted Proved Developed Reserves 946 1,083 2,327 3,221
Undeveloped Reserves and Resources
Haynesville 3,113 2,944 1,629 1,327
Bossier 1,381 1,381 1,282 687
Marcellus 5,373 5,338 4,717 3,981
Non-Shale 239 229 172 99
Total Undeveloped Reserves and Resources 10,106 9,893 7,800 6,095
Total Net Reserves 11,052 10,976 10,127 9,316
E&P Asset Value per Mcfe:
Forecasted Proved Developed Reserves $ 1.89 $ 2.05 $ 2.43 $ 2.38
Undeveloped Reserves and Resources
Haynesville 0.47 0.52 0.30 0.29
Bossier 0.24 0.26 0.40 0.38
Marcellus 0.18 0.20 0.26 0.30
Non-Shale 0.68 0.70 0.64 1.31
Total Undeveloped Reserves and Resources 0.29 0.31 0.30 0.32
E&P Asset Value per Mcfe $ 0.43 $ 0.49 $ 0.79 $ 1.04
(1) Forecasted reserves and resources on this page based on financial modeling report described on pages 45 – 59 of this presentation
21
Operations Update
July 2011
PPT – 192 – Management Presentation
PPT – 192 – Management Presentation
Q2 2011 Operations Highlights
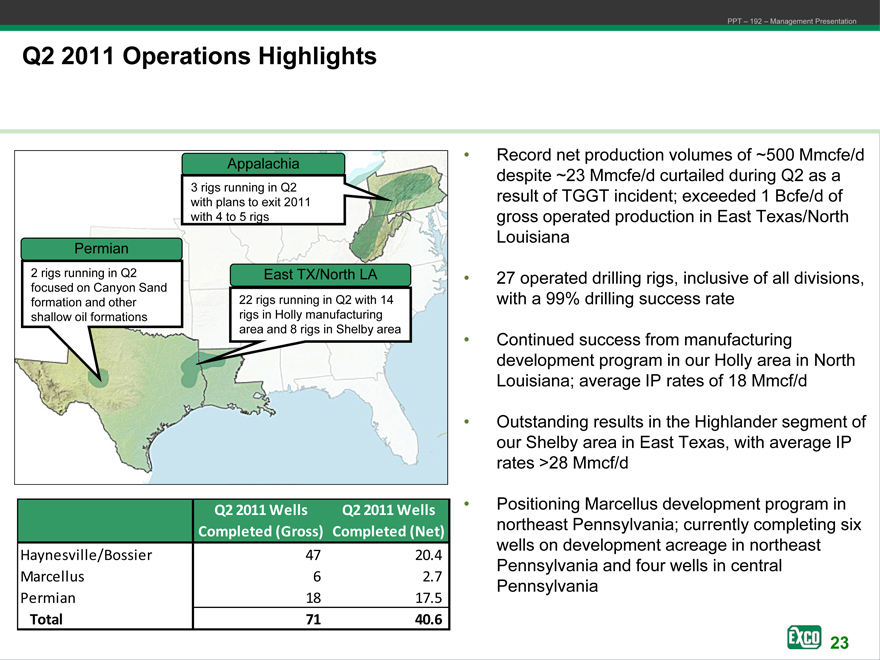
Appalachia 3 rigs running in Q2 with plans to exit 2011 with 4 to 5 rigs
Permian 2 rigs running in Q2 focused on Canyon Sand formation and other shallow oil formations
East TX/North LA 22 rigs running in Q2 with 14 rigs in Holly manufacturing area and 8 rigs in Shelby area
Q2 2011 Wells Q2 2011 Wells
Completed (Gross) Completed (Net)
Haynesville/Bossier 47 20.4
Marcellus 6 2.7
Permian 18 17.5
Total 71 40.6
• Record net production volumes of ~500 Mmcfe/d despite ~23 Mmcfe/d curtailed during Q2 as a result of TGGT incident; exceeded 1 Bcfe/d of gross operated production in East Texas/North Louisiana
• 27 operated drilling rigs, inclusive of all divisions, with a 99% drilling success rate
• Continued success from manufacturing development program in our Holly area in North Louisiana; average IP rates of 18 Mmcf/d
• Outstanding results in the Highlander segment of our Shelby area in East Texas, with average IP rates >28 Mmcf/d
• Positioning Marcellus development program in northeast Pennsylvania; currently completing six wells on development acreage in northeast
Pennsylvania and four wells in central Pennsylvania
23
PPT – 192 – Management Presentation
East Texas/North Louisiana
Continued success in our core Haynesville/Bossier development areas
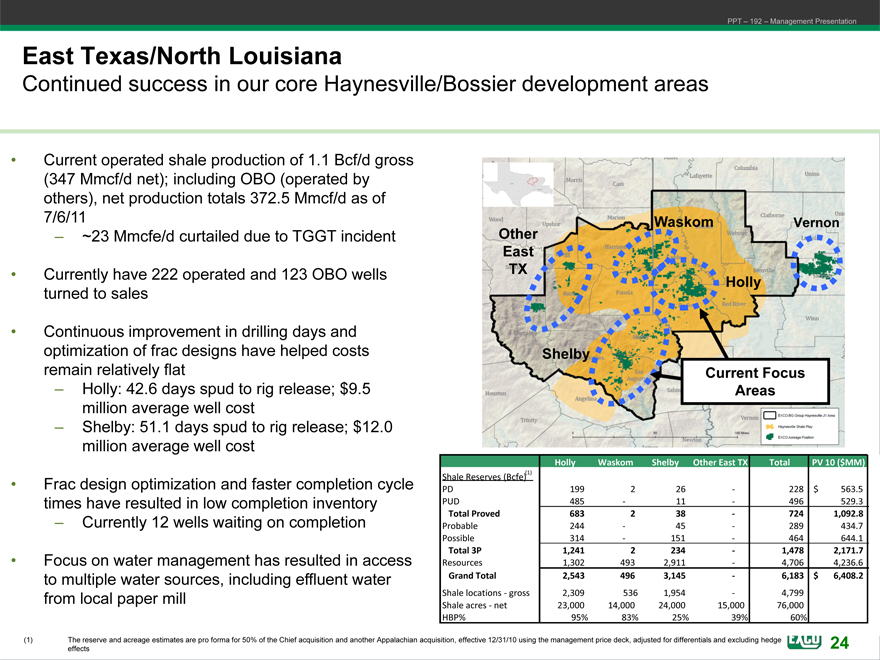
Current operated shale production of 1.1 Bcf/d gross (347 Mmcf/d net); including OBO (operated by others), net production totals 372.5 Mmcf/d as of 7/6/11
~23 Mmcfe/d curtailed due to TGGT incident
Currently have 222 operated and 123 OBO wells turned to sales
Continuous improvement in drilling days and optimization of frac designs have helped costs remain relatively flat
Holly: 42.6 days spud to rig release; $9.5 million average well cost
Shelby: 51.1 days spud to rig release; $12.0 million average well cost
Frac design optimization and faster completion cycle times have resulted in low completion inventory
Currently 12 wells waiting on completion
Focus on water management has resulted in access to multiple water sources, including effluent water from local paper mill
Waskom Vernon Other East TX Holly
Shelby
Current Focus Areas
Holly Waskom Shelby Other East TX Total PV 10 ($MM)
Shale Reserves (Bcfe)(1)
PD 199 2 26 — 228 $ 563.5
PUD 485 — 11 — 496 529.3
Total Proved 683 2 38 — 724 1,092.8
Probable 244 — 45 — 289 434.7
Possible 314 — 151 — 464 644.1
Total 3P 1,241 2 234 — 1,478 2,171.7
Resources 1,302 493 2,911 — 4,706 4,236.6
Grand Total 2,543 496 3,145 — 6,183 $ 6,408.2
Shale locations—gross 2,309 536 1,954 — 4,799
Shale acres—net 23,000 14,000 24,000 15,000 76,000
HBP% 95% 83% 25% 39% 60%
(1) The reserve and acreage estimates are pro forma for 50% of the Chief acquisition and another Appalachian acquisition, effective 12/31/10 using the management EXCO price deck, adjusted Resources, for differentials and excluding hedge effects
24
PPT – 192 – Management Presentation
East Texas/North Louisiana
Drilling efficiencies gained with long-term contracts
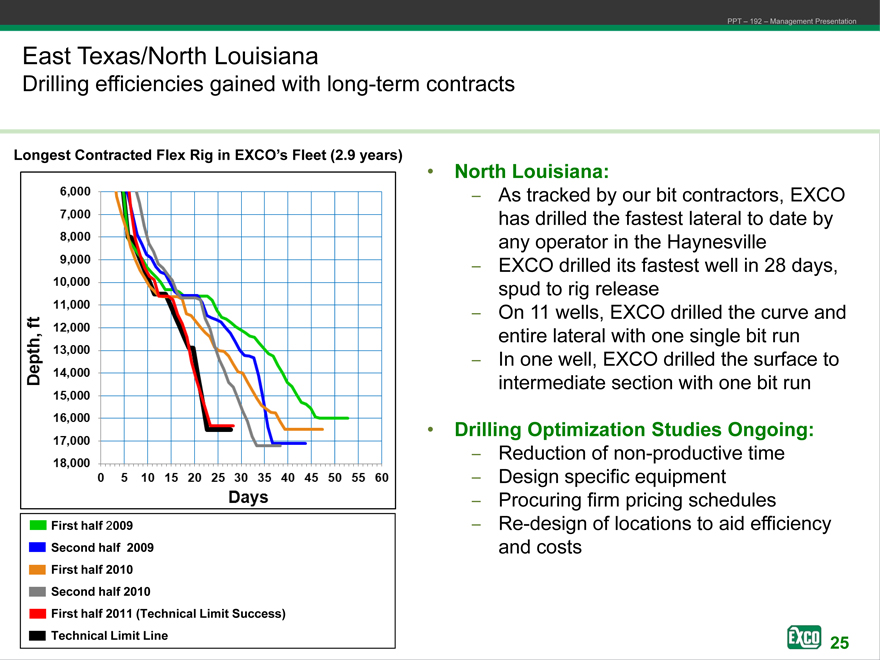
Longest Contracted Flex Rig in EXCO’s Fleet (2.9 years)
First half 2009 Second half 2009 First half 2010 Second half 2010
First half 2011 (Technical Limit Success) Technical Limit Line
• North Louisiana:
As tracked by our bit contractors, EXCO has drilled the fastest lateral to date by any operator in the Haynesville
EXCO drilled its fastest well in 28 days, spud to rig release
On 11 wells, EXCO drilled the curve and entire lateral with one single bit run
In one well, EXCO drilled the surface to intermediate section with one bit run
• Drilling Optimization Studies Ongoing:
Reduction of non-productive time
Design specific equipment
Procuring firm pricing schedules
Re-design of locations to aid efficiency and costs
25
PPT – 192 – Management Presentation
East Texas/North Louisiana
Cost saving initiatives
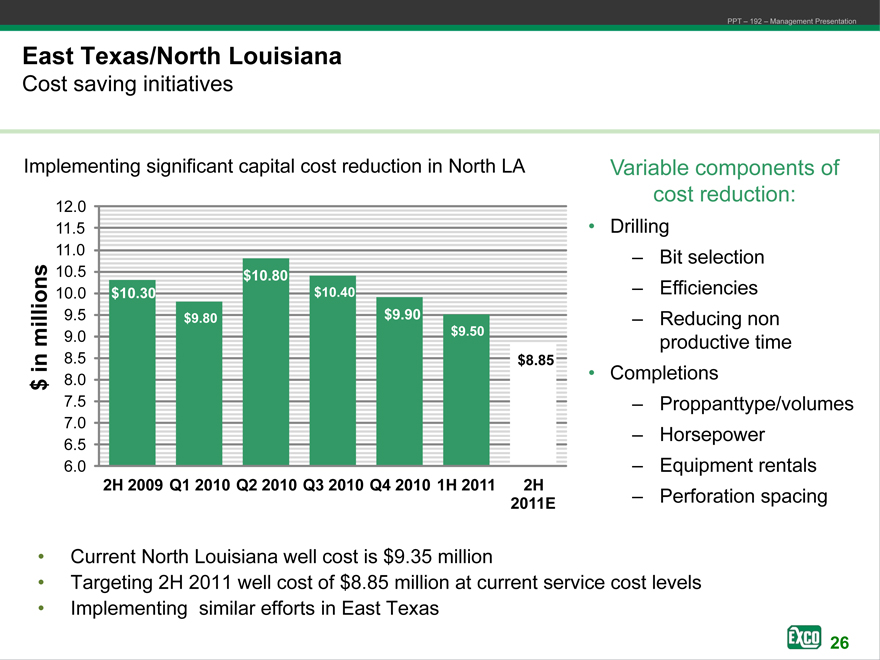
Implementing significant capital cost reduction in North LA
12.0
11.5 •
11.0 s 10.5 $10.80
10.0 $10.30 $10.40
9.5 $9.80 $9.90
million 9.0 $9.50
8.5 in $8.85
$ 8.0 •
7.5
7.0
6.5
6.0
2H 2009 Q1 2010 Q2 2010 Q3 2010 Q4 2010 1H 2011 2H
2011E
• Current North Louisiana well cost is $9.35 million
• Targeting 2H 2011 well cost of $8.85 million at current service cost levels
• Implementing similar efforts in East Texas
EXCO
Variable components of cost reduction:
• Drilling
– Bit selection
– Efficiencies
– Reducing non productive time
• Completions
– Proppanttype/volumes
– Horsepower
– Equipment rentals
– Perforation spacing
26
PPT – 192 – Management Presentation
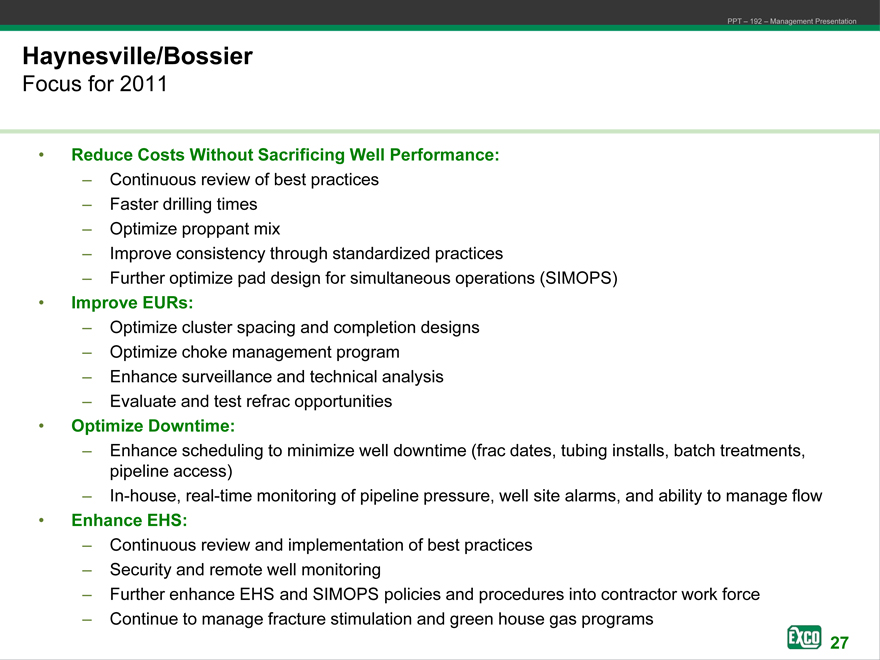
Haynesville/Bossier
Focus for 2011
Reduce Costs Without Sacrificing Well Performance:
Continuous review of best practices
Faster drilling times
Optimize proppant mix
Improve consistency through standardized practices
Further optimize pad design for simultaneous operations (SIMOPS)
Improve EURs:
Optimize cluster spacing and completion designs
Optimize choke management program
Enhance surveillance and technical analysis
Evaluate and test refrac opportunities
Optimize Downtime:
Enhance scheduling to minimize well downtime (frac dates, tubing installs, batch treatments, pipeline access)
In-house, real-time monitoring of pipeline pressure, well site alarms, and ability to manage flow
Enhance EHS:
Continuous review and implementation of best practices
Security and remote well monitoring
Further enhance EHS and SIMOPS policies and procedures into contractor work force
Continue to manage fracture stimulation and green house gas programs
EXCO Resources, Inc. 27
PPT – 192 – Management Presentation
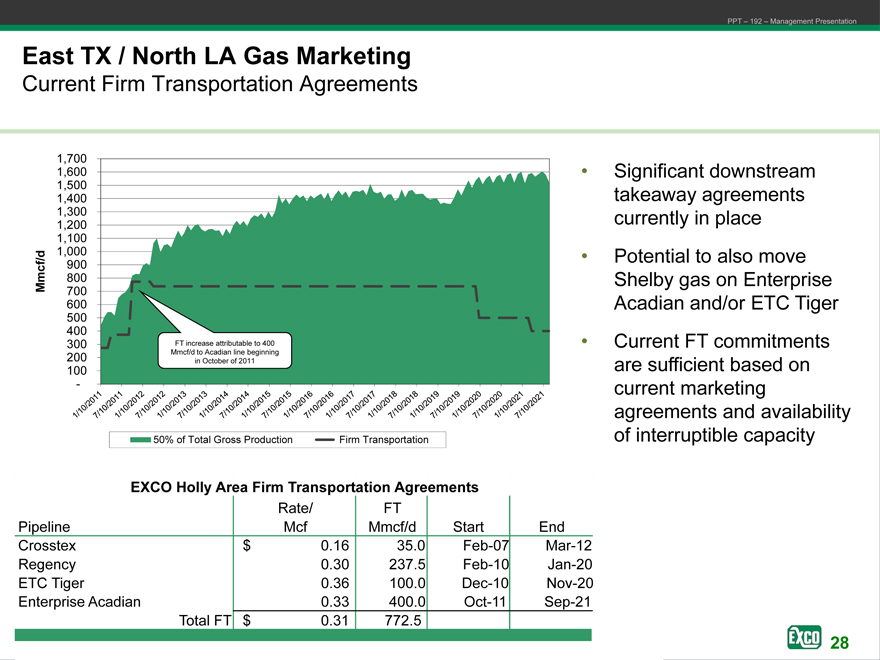
East TX / North LA Gas Marketing
Current Firm Transportation Agreements
1,700 1,600 1,500 1,400 1,300 1,200 1,100 1,000 900 mcf/d M 800 700 600 500 400
300 FT increase attributable to 400 200 Mmcf/d to Acadian line beginning 100 in October of 2011
-
50% of Total Gross Production Firm Transportation
EXCO Holly Area Firm Transportation Agreements
Rate/ FT
Pipeline Mcf Mmcf/d Start End
Crosstex $ 0.16 35.0 Feb-07 Mar-12
Regency 0.30 237.5 Feb-10 Jan-20
ETC Tiger 0.36 100.0 Dec-10 Nov-20
Enterprise Acadian 0.33 400.0 Oct-11 Sep-21
Total FT $ 0.31 772.5
Significant downstream takeaway agreements currently in place
Potential to also move
Shelby gas on Enterprise
Acadian and/or ETC Tiger
Current FT commitments are sufficient based on current marketing agreements and availability of interruptible capacity
28
PPT – 192 – Management Presentation
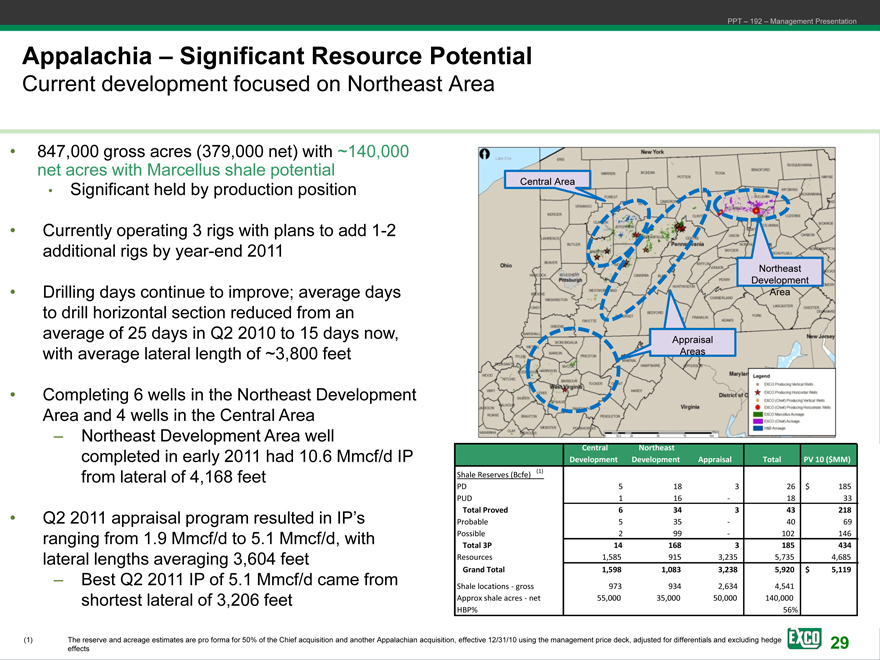
Appalachia – Significant Resource Potential
Current development focused on Northeast Area
• 847,000 gross acres (379,000 net) with ~140,000 net acres with Marcellus shale potential
• Significant held by production position
• Currently operating 3 rigs with plans to add 1-2 additional rigs by year-end 2011
• Drilling days continue to improve; average days to drill horizontal section reduced from an average of 25 days in Q2 2010 to 15 days now, with average lateral length of ~3,800 feet
• Completing 6 wells in the Northeast Development Area and 4 wells in the Central Area
– Northeast Development Area well completed in early 2011 had 10.6 Mmcf/d IP from lateral of 4,168 feet
• Q2 2011 appraisal program resulted in IP’s ranging from 1.9 Mmcf/d to 5.1 Mmcf/d, with lateral lengths averaging 3,604 feet
– Best Q2 2011 IP of 5.1 Mmcf/d came from shortest lateral of 3,206 feet
Central Area
Northeast
Development Area
Appraisal
Underway Areas
Central Northeast
Development Development Appraisal Total PV 10 ($MM)
Shale Reserves (Bcfe)(1)
PD 5 18 3 26 $ 185
PUD 1 16 — 18 33
Total Proved 6 34 3 43 218
Probable 5 35 — 40 69
Possible 2 99 — 102 146
Total 3P 14 168 3 185 434
Resources 1,585 915 3,235 5,735 4,685
Grand Total 1,598 1,083 3,238 5,920 $ 5,119
Shale locations—gross 973 934 2,634 4,541
Approx shale acres—net 55,000 35,000 50,000 140,000
HBP% 56%
(1) The reserve and acreage estimates are pro forma for 50% of the Chief acquisition and another Appalachian acquisition, effective 12/31/10 using the management EXCO price deck, adjusted Resources, for differentials and excluding hedge effects
29
PPT – 192 – Management Presentation
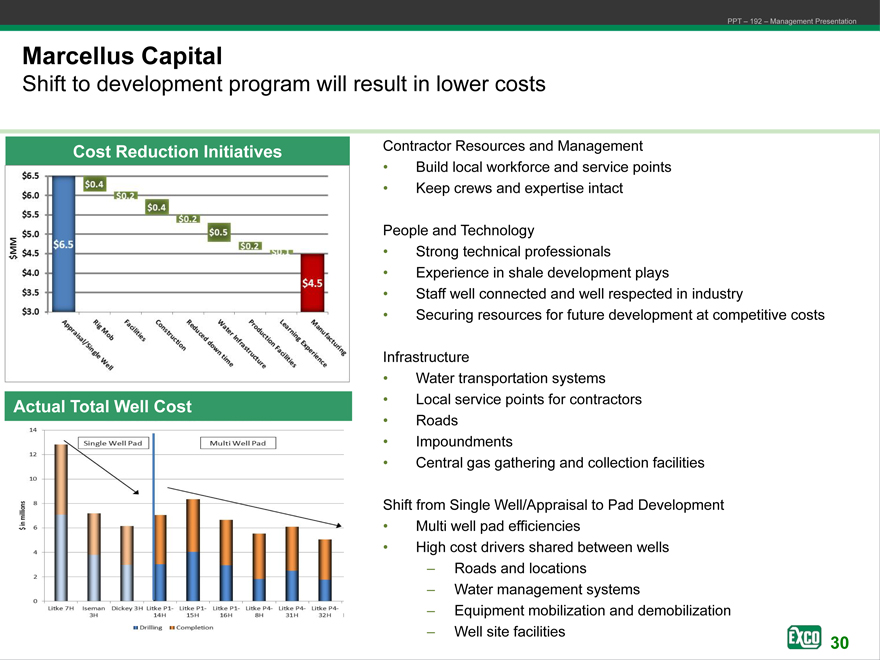
Marcellus Capital
Shift to development program will result in lower costs
Cost Reduction Initiatives
Actual Total Well Cost
Contractor Resources and Management
• Build local workforce and service points
• Keep crews and expertise intact
People and Technology
• Strong technical professionals
• Experience in shale development plays
• Staff well connected and well respected in industry
• Securing resources for future development at competitive costs
Infrastructure
• Water transportation systems
• Local service points for contractors
• Roads
• Impoundments
• Central gas gathering and collection facilities
Shift from Single Well/Appraisal to Pad Development
• Multi well pad efficiencies
• High cost drivers shared between wells
– Roads and locations
– Water management systems
– Equipment mobilization and demobilization
– Well site facilities
EXCO Resources, Inc. 30
PPT – 192 – Management Presentation
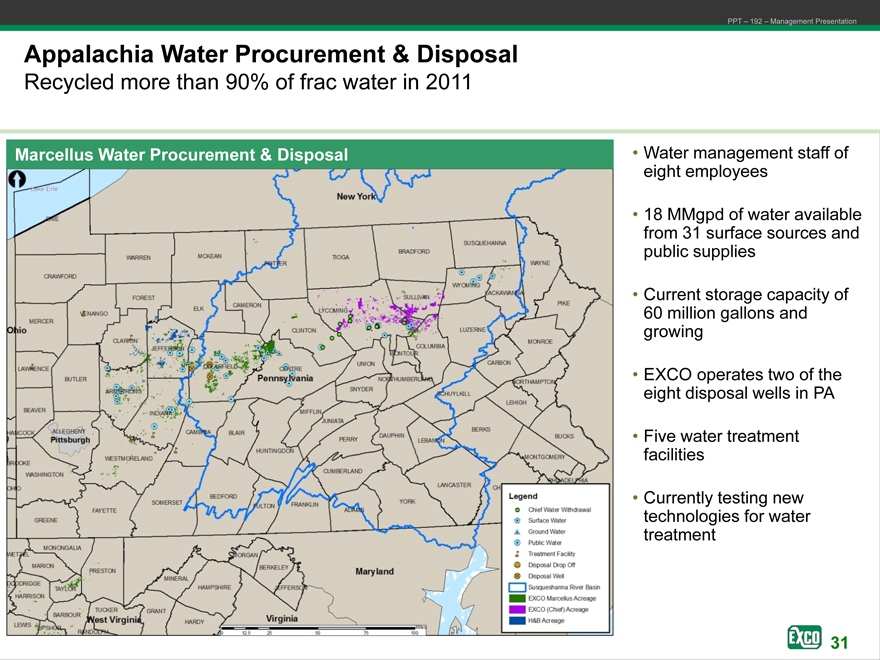
Appalachia Water Procurement & Disposal
Recycled more than 90% of frac water in 2011
Marcellus Water Procurement & Disposal
• Water management staff of eight employees
• 18 MMgpd of water available from 31 surface sources and public supplies
• Current storage capacity of 60 million gallons and growing
• EXCO operates two of the eight disposal wells in PA
• Five water treatment facilities
• Currently testing new technologies for water treatment
EXCO
31
PPT – 192 – Management Presentation
Marcellus
Focus for 2011
• Development in the Northeast Area
• Continue to improve technical understanding of the Marcellus shale play
– Pennsylvania production data available
– Competitor data trades
– In-house operational results and experience
• Identify best rock
– Significant existing acreage within best rock areas
• Two rig development program underway
– Additional acreage in areas of low industry activity
• One rig appraisal program underway (opportunity for first mover)
– Acreage in lower performing areas
• Analyzing data to determine upside potential (majority HBP, no time constraints)
• Accelerate appraisal and portfolio optimization
– Prioritized acreage to rapidly move into gas manufacturing mode in proven areas
– Maximize take away from existing infrastructure; leverage commercial and TGGT expertise
EXCO
32
PPT – 192 – Management Presentation
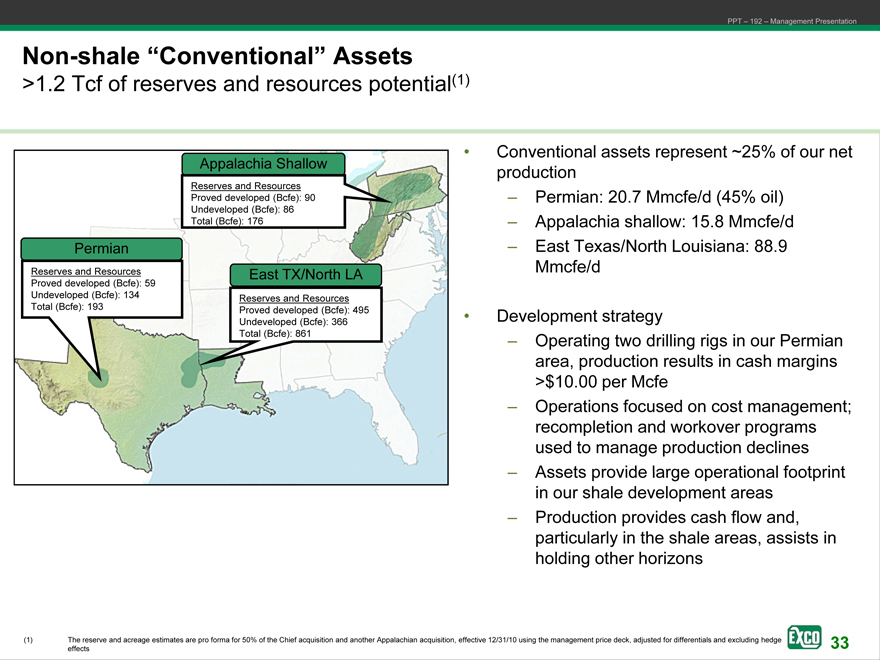
Non-shale “Conventional” Assets
>1.2 Tcf of reserves and resources potential(1)
Appalachia Shallow
Reserves and Resources
Proved developed (Bcfe): 90 Undeveloped (Bcfe): 86 Total (Bcfe): 176
Permian
Reserves and Resources
Proved developed (Bcfe): 59
Undeveloped (Bcfe): 134 Total (Bcfe): 193
East TX/North LA
Reserves and Resources Proved developed (Bcfe): 495 Undeveloped (Bcfe): 366
• Conventional assets represent ~25% of our net production
– Permian: 20.7 Mmcfe/d (45% oil)
– Appalachia shallow: 15.8 Mmcfe/d
– East Texas/North Louisiana: 88.9 Mmcfe/d
• Development strategy
– Operating two drilling rigs in our Permian area, production results in cash margins
>$10.00 per Mcfe
– Operations focused on cost management; recompletion and workover programs used to manage production declines
– Assets provide large operational footprint in our shale development areas
– Production provides cash flow and, particularly in the shale areas, assists in holding other horizons
(1) The reserve and acreage estimates are pro forma for 50% of the Chief acquisition and another Appalachian acquisition, effective 12/31/10 using the management EXCO price deck, adjusted Resources, for differentials and excluding hedge effects
EXCO
33
PPT – 192 – Management Presentation
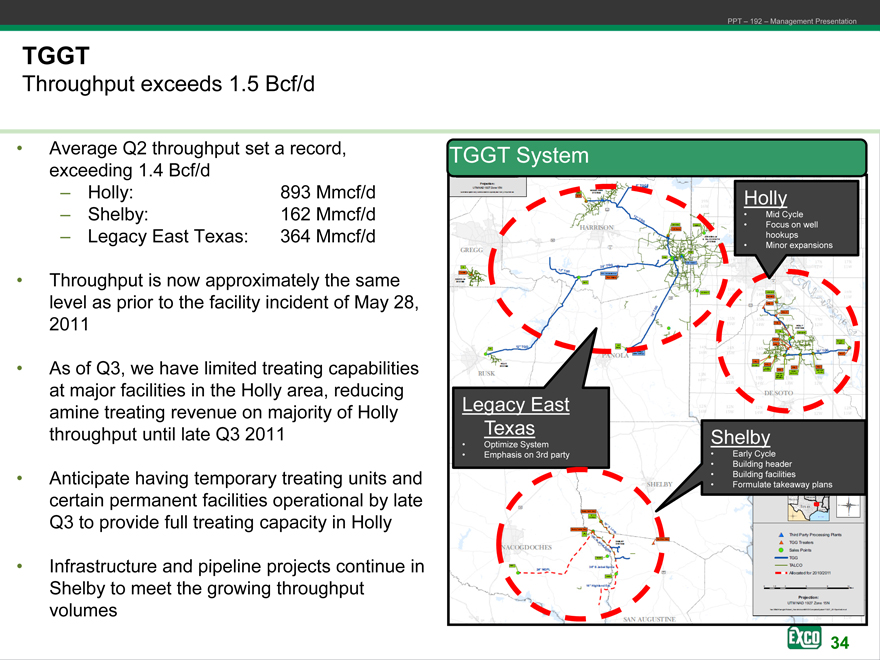
TGGT
Throughput exceeds 1.5 Bcf/d
• Average Q2 throughput set a record, exceeding 1.4 Bcf/d
– Holly: 893 Mmcf/d
– Shelby: 162 Mmcf/d
– Legacy East Texas: 364 Mmcf/d
• Throughput is now approximately the same level as prior to the facility incident of May 28, 2011
• Currently, we have limited treating capabilities at major facilities in the Holly area, reducing amine treating revenue on majority of Holly throughput until late of Q3 2011
• Anticipate having temporary treating units and certain permanent facilities operational by latee of Q3 to provide full treating capacity in Holly
• Infrastructure and pipeline projects continue in Shelby to meet the growing throughput volumes
TGGT System
Holly
• Mid Cycle
• Focus on well hookups
• Minor expansions
Legacy East Texas
Shelby
• Early Cycle
• Building header
• Building facilities
• Formulate takeaway plans
EXCO
34
PPT – 192 – Management Presentation
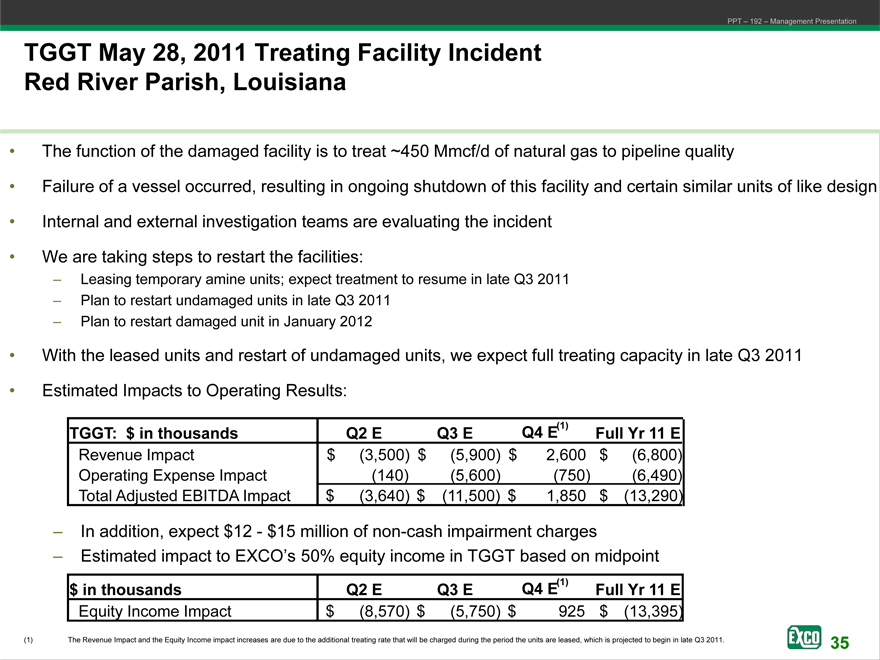
TGGT May 28, 2011 Treating Facility Incident Red River Parish, Louisiana
• The function of the damaged facility is to treat ~450 Mmcf/d of natural gas to pipeline quality
• Failure of a vessel occurred, resulting in ongoing shutdown of this facility and certain similar units of like design
• Internal and external investigation teams are evaluating the incident
• We are taking steps to restart the facilities:
– Leasing temporary amine units; expect treatment to resume in late Q3 2011
– Plan to restart undamaged units in late Q3 2011
– Plan to restart damaged unit in January 2012
• With the leased units and restart of undamaged units, we expect full treating capacity in late Q3 2011
• Estimated Impacts to Operating Results:
TGGT: $ in thousands Q2 E Q3 E Q4 E Full Yr 11 E
Revenue Impact $(3,500) $(5,900) $ 2,600 $(6,800)
Operating Expense Impact(140)(5,600)(750)(6,490)
Total Adjusted EBITDA Impact $(3,640) $(11,500) $ 1,850 $(13,290)
– In addition, expect $12—$15 million of non-cash impairment charges
– Estimated impact to EXCO’s 50% equity income in TGGT based on midpoint
$ in thousands Q2 E Q3 E Q4 E(1) Full Yr 11 E
Equity Income Impact $(8,570) $(5,750) $ 925 $(13,395)
EXCO
35
PPT – 192 – Management Presentation
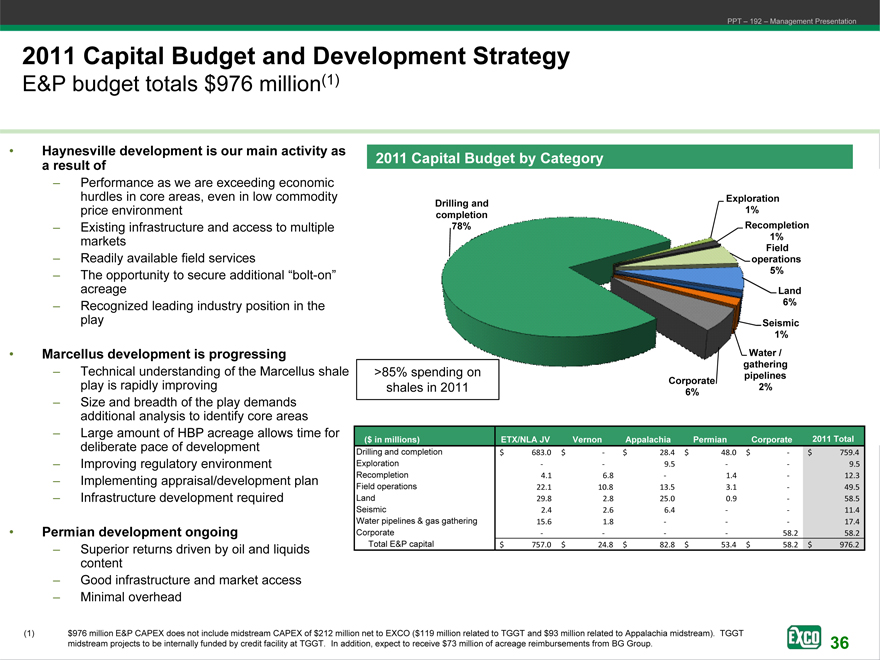
2011 Capital Budget and Development Strategy
E&P budget totals $976 million(1)
• Haynesville development is our main activity a result of
– Performance as we are exceeding economic hurdles in core areas, even in low commodity price environment
– Existing infrastructure and access to multiple markets
– Readily available field services
– The opportunity to secure additional “bolt-on” acreage
– Recognized leading industry position in the play
• Marcellus development is progressing
– Technical understanding of the Marcellus shale play is rapidly improving
– Size and breadth of the play demands additional analysis to identify core areas
– Large amount of HBP acreage allows time for deliberate pace of development
– Improving regulatory environment
– Implementing appraisal/development plan
– Infrastructure development required
• Permian development ongoing
– Superior returns driven by oil and liquids content
– Good infrastructure and market access
– Minimal overhead
(1) $976 million E&P CAPEX does not include midstream CAPEX of $212 million net to EXCO ($119 million related to TGGT and $93 million related to Appalachia midstream). TGGT midstream projects to be internally funded by credit facility at TGGT. In addition, expect to receive $73 million of acreage reimbursements EXCO from BG Group. Resources,
2011 Capital Budget by Category
Drilling and completion 78%
Exploration 1% Recompletion 1% Field operations 5%
Land 6%
Seismic 1% Water / gathering pipelines Corporate 2% 6%
2011
Drilling and completion Exploration Recompletion
Field operations
Land Seismic
Water pipelines & gas gathering Corporate Total E&P capital
EXCO
36
EXCO EXCO Resources, Inc.
Reserves and Resources Update
July 2011
PPT – 192 – Management Presentation
PPT – 192 – Management Presentation
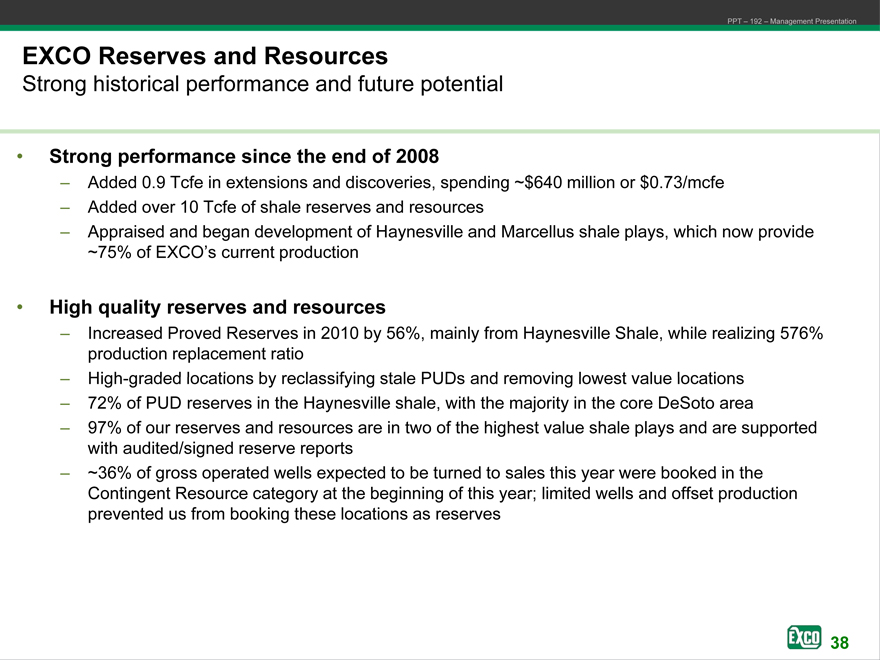
EXCO Reserves and Resources
Strong historical performance and future potential
• Strong performance since the end of 2008
– Added 0.9 Tcfe in extensions and discoveries, spending ~$640 million or $0.73/mcfe
– Added over 10 Tcfe of shale reserves and resources
– Appraised and began development of Haynesville and Marcellus shale plays, which now provide ~75% of EXCO’s current production
• High quality reserves and resources
– Increased Proved Reserves in 2010 by 56%, mainly from Haynesville Shale, while realizing 576% production replacement ratio
– High-graded locations by reclassifying stale PUDs and removing lowest value locations
– 72% of PUD reserves in the Haynesville shale, with the majority in the core DeSoto area
– 97% of our reserves and resources are in two of the highest value shale plays and are supported with audited/signed reserve reports
– ~36% of gross operated wells expected to be turned to sales this year were booked in the Contingent Resource category at the beginning of this year; limited wells and offset production prevented us from booking these locations as reserves
EXCO
38
PPT – 192 – Management Presentation
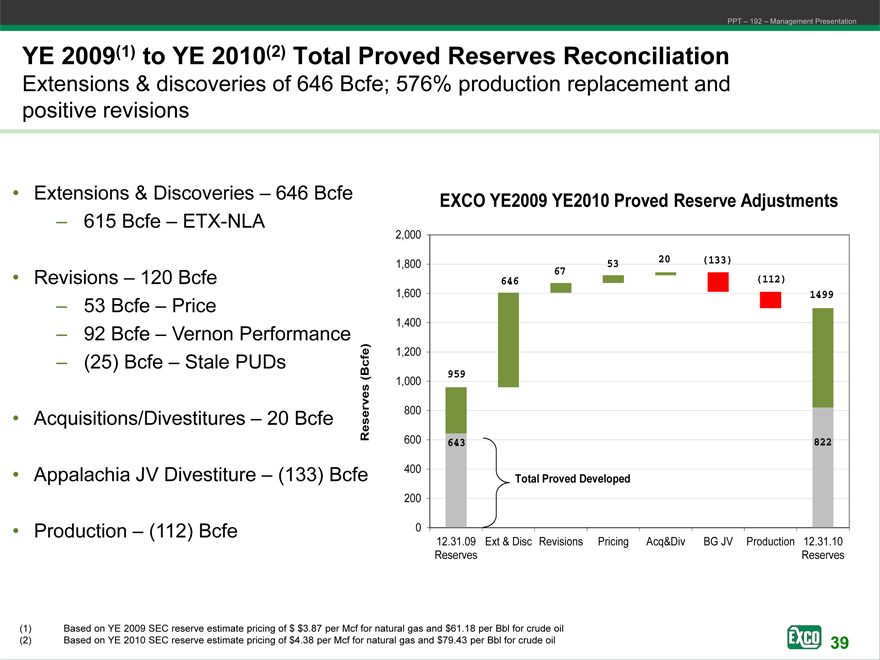
YE 2009(1) to YE 2010(2) Total Proved Reserves Reconciliation
Extensions & discoveries of 646 Bcfe; 576% production replacement and positive revisions
• Extensions & Discoveries – 646 Bcfe
– 615 Bcfe – ETX-NLA
• Revisions – 120 Bcfe
– 53 Bcfe – Price
– 92 Bcfe – Vernon Performance
– (25) Bcfe – Stale PUDs Bcfe)
(
• Acquisitions/Divestitures – 20 Bcfe Reserves
• Appalachia JV Divestiture – (133) Bcfe
• Production – (112) Bcfe
EXCO YE2009 YE2010 Proved Reserve Adjustments
(1) Based on YE 2009 SEC reserve estimate pricing of $ $3.87 per Mcf for natural gas and $61.18 per Bbl for crude oil (2) Based on YE 2010 SEC reserve estimate pricing of $4.38 per Mcf for natural gas and $79.43 per Bbl for crude oil
2,000
20 (133)
1,800 67 53
646 (112)
1,600 1499 1,400 1,200
959
1,000
800
600 643 822
400
Total Proved Developed
200
0
12.31.09 Ext & Disc Revisions Pricing Acq&Div BG JV Production 12.31.10 Reserves Reserves
EXCO
39
PPT – 192 – Management Presentation
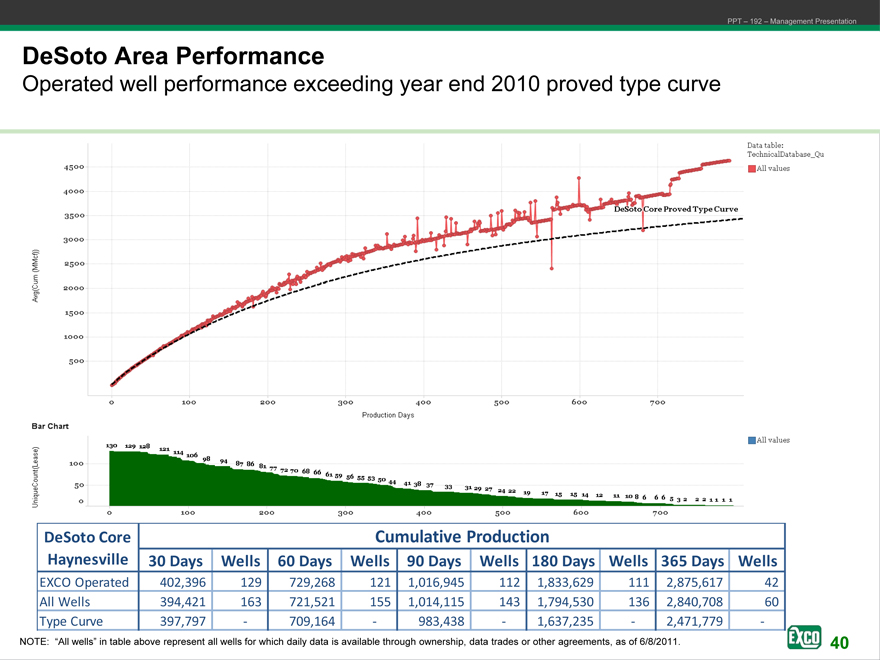
DeSoto Area Performance
Operated well performance exceeding year end 2010 proved type curve
Avg (Cum (MMcf) 4500 4000 3500 3000 2500 2000 1500 1000 500
0 100 200 300 400 500 600 700
Production Days
DeSoto Core Cumulative Production
Haynesville 30 Days Wells 60 Days Wells 90 Days Wells 180 Days Wells 365 Days Wells
EXCO Operated 402,396 129 729,268 121 1,016,945 112 1,833,629 111 2,875,617 42
All Wells 394,421 163 721,521 155 1,014,115 143 1,794,530 136 2,840,708 60
Type Curve 397,797—709,164—983,438—1,637,235—2,471,779 -
NOTE: “All wells” in table above represent all wells for which daily data is available through ownership, data trades or other agreements, EXCO as of 6/8/2011.
EXCO
40
PPT – 192 – Management Presentation
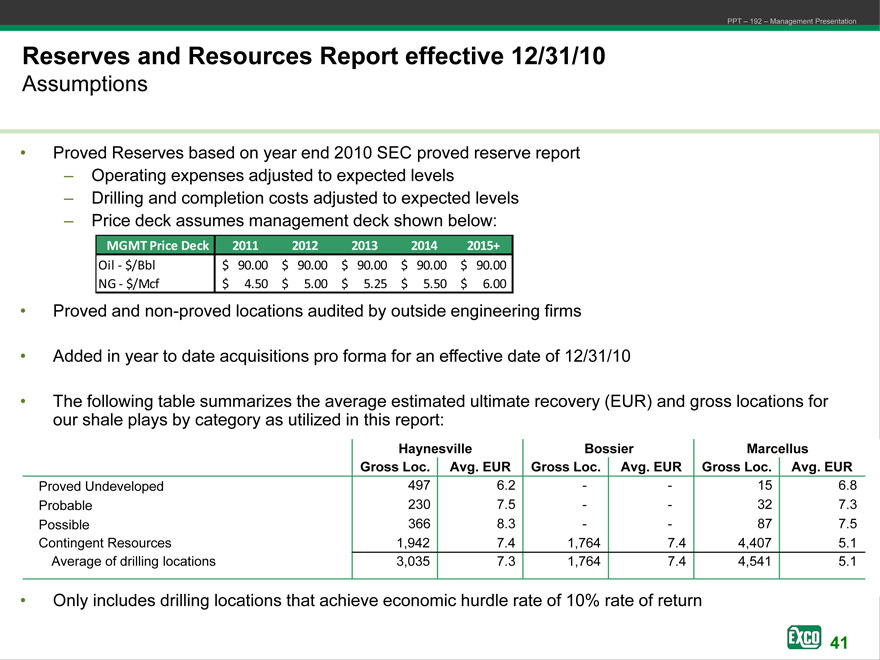
Reserves and Resources Report effective 12/31/10
Assumptions
• Proved Reserves based on year end 2010 SEC proved reserve report
– Operating expenses adjusted to expected levels
– Drilling and completion costs adjusted to expected levels
– Price deck assumes management deck shown below:
MGMT Price Deck 2011 2012 2013 2014 2015+
Oil—$/Bbl $ 90.00 $ 90.00 $ 90.00 $ 90.00 $ 90.00 NG—$/Mcf $ 4.50 $ 5.00 $ 5.25 $ 5.50 $ 6.00
• Non-proved locations audited by outside engineering firms
• Added in year to date acquisitions pro forma for an effective date of 12/31/10
• The following table summarizes the average estimated ultimate recovery (EUR) and gross locations for our shale plays by category as utilized in this report:
Haynesville Bossier Marcellus
Gross Loc. Avg. EUR Gross Loc. Avg. EUR Gross Loc. Avg. EUR
Proved Undeveloped 497 6.2—- 15 6.8
Probable 230 7.5—- 32 7.3
Possible 366 8.3—- 87 7.5
Contingent Resources 1,942 7.4 1,764 7.4 4,407 5.1
Average of drilling locations 3,035 7.3 1,764 7.4 4,541 5.1
• Only includes drilling locations that achieve economic hurdle rate of 10% rate of return
EXCO Resources, INC
41
PPT – 192 – Management Presentation
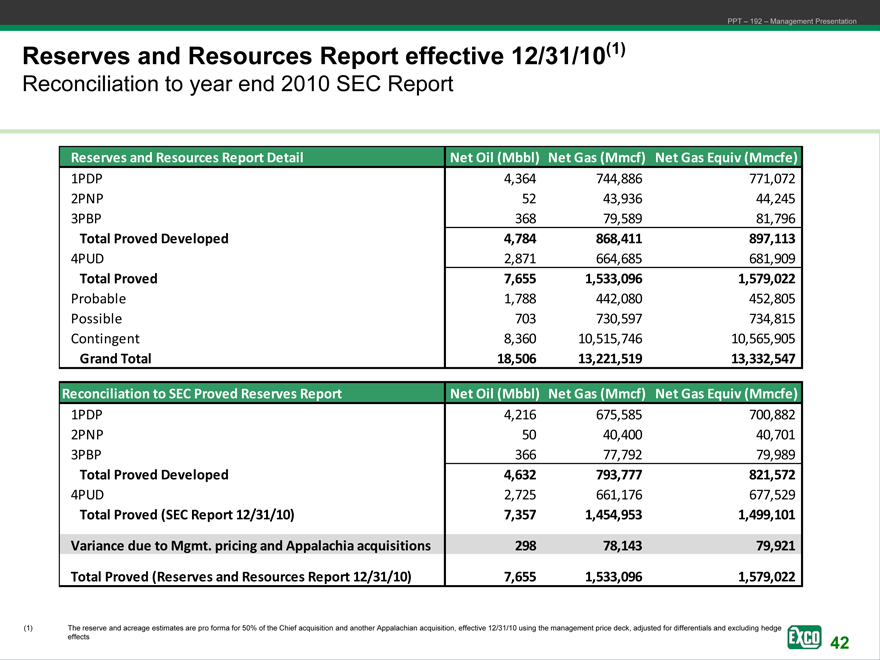
Reserves and Resources Report effective 12/31/10(1)
Reconciliation to year end 2010 SEC Report
Reserves and Resources Report Detail
Net Oil (Mbbl) Net Gas (Mmcf) Net Gas Equiv (Mmcfe)
1PDP 4,364 744,886 771,072
2PNP 52 43,936 44,245
3PBP 368 79,589 81,796
Total Proved Developed 4,784 868,411 897,113
4PUD 2,871 664,685 681,909
Total Proved 7,655 1,533,096 1,579,022
Probable 1,788 442,080 452,805
Possible 703 730,597 734,815
Contingent 8,360 10,515,746 10,565,905
Grand Total 18,506 13,221,519 13,332,547
Reconciliation to SEC Proved Reserves Report
Net Oil (Mbbl) Net Gas (Mmcf) Net Gas Equiv (Mmcfe)
1PDP 4,216 675,585 700,882
2PNP 50 40,400 40,701
3PBP 366 77,792 79,989
Total Proved Developed 4,632 793,777 821,572
4PUD 2,725 661,176 677,529
Total Proved (SEC Report 12/31/10) 7,357 1,454,953 1,499,101
Variance due to Mgmt. pricing and Appalachia acquisitions 298 78,143 79,921
Total Proved (Reserves and Resources Report 12/31/10) 7,655 1,533,096 1,579,022
(1) The reserve and acreage estimates are pro forma for 50% of the Chief acquisition and another Appalachian acquisition, effective 12/31/10 using the management price deck, adjusted for differentials and excluding hedge
effects EXCO Resources, INC
42
PPT – 192 – Management Presentation
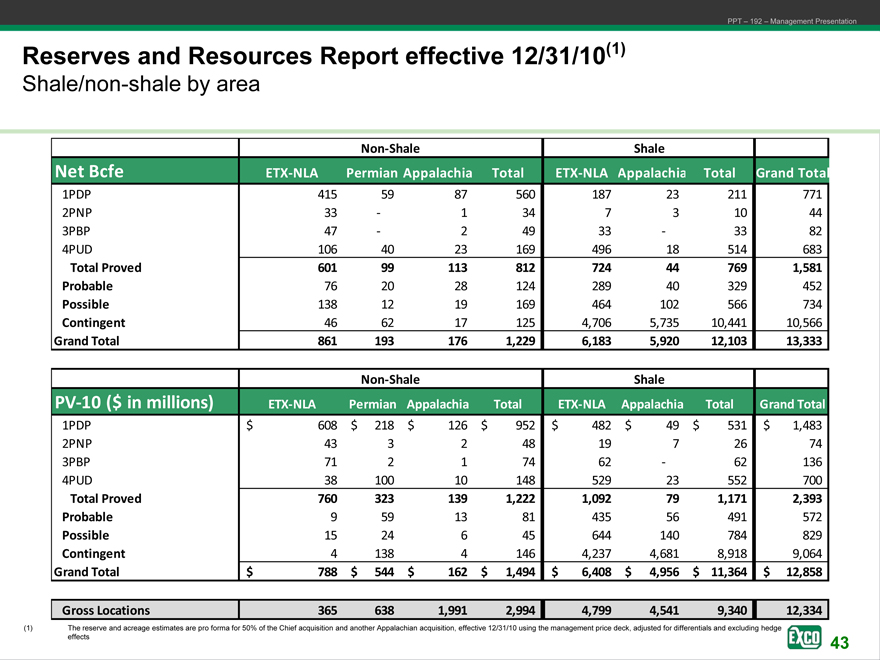
Reserves and Resources Report effective 12/31/10(1)
Shale/non-shale by area
Non-Shale Shale
Net Bcfe ETX-NLA Permian Appalachia Total ETX-NLA Appalachia Total Grand Total
1PDP 415 59 87 560 187 23 211 771
2PNP 33—1 34 7 3 10 44
3PBP 47—2 49 33—33 82
4PUD 106 40 23 169 496 18 514 683
Total Proved 601 99 113 812 724 44 769 1,581
Probable 76 20 28 124 289 40 329 452
Possible 138 12 19 169 464 102 566 734
Contingent 46 62 17 125 4,706 5,735 10,441 10,566
Grand Total 861 193 176 1,229 6,183 5,920 12,103 13,333
Gross Locations 365 638 1,991 2,994 4,799 4,541 9,340 12,334
Non-Shale Shale
PV-10 ($ in millions) ETX-NLA Permian Appalachia Total ETX-NLA Appalachia Total Grand Total
1PDP $ 608 $ 218 $ 126 $ 952 $ 482 $ 49 $ 531 $ 1,483
2PNP 43 3 2 48 19 7 26 74
3PBP 71 2 1 74 62—62 136
4PUD 38 100 10 148 529 23 552 700
Total Proved 760 323 139 1,222 1,092 79 1,171 2,393
Probable 9 59 13 81 435 56 491 572
Possible 15 24 6 45 644 140 784 829
Contingent 4 138 4 146 4,237 4,681 8,918 9,064
Grand Total $ 788 $ 544 $ 162 $ 1,494 $ 6,408 $ 4,956 $ 11,364 $ 12,858
(1) The reserve and acreage estimates are pro forma for 50% of the Chief acquisition and another Appalachian acquisition, effective 12/31/10 using the management price deck, adjusted for differentials and excluding hedge
effects EXCO Resources, INC
43

Financial Models
July 2011
PPT – 192 – Management Presentation
EXCO Resources, INC
PPT – 192 – Management Presentation
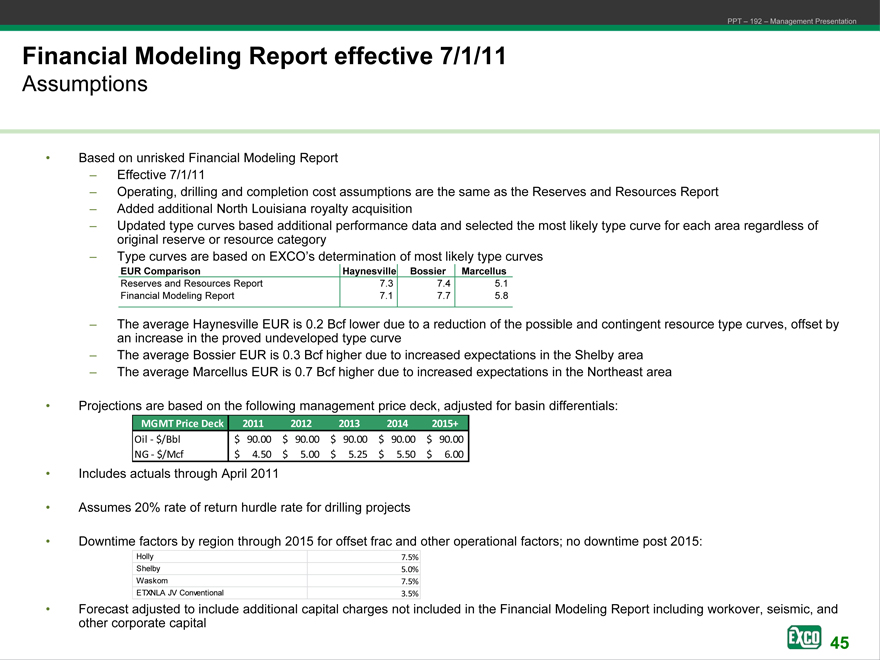
Financial Modeling Report effective 7/1/11
Assumptions
• Based on unrisked Financial Modeling Report
– Effective 7/1/11
– Operating, drilling and completion cost assumptions are the same as the Reserves and Resources Report
– Added additional North Louisiana royalty acquisition
– Updated type curves based additional performance data and selected the most likely type curve for each area regardless of original reserve or resource category
– Type curves are based on EXCO’s determination of most likely type curves
EUR Comparison Haynesville Bossier Marcellus
Reserves and Resources Report 7.3 7.4 5.1
Financial Modeling Report 7.1 7.7 5.8
– The average Haynesville EUR is 0.2 Bcf lower due to a reduction of the possible and contingent resource type curves, offset by an increase in the proved undeveloped type curve
– The average Bossier EUR is 0.3 Bcf higher due to increased expectations in the Shelby area
– The average Marcellus EUR is 0.7 Bcf higher due to increased expectations in the Northeast area
• Projections are based on the following management price deck, adjusted for basin differentials:
MGMT Price Deck 2011 2012 2013 2014 2015+
Oil—$/Bbl $ 90.00 $ 90.00 $ 90.00 $ 90.00 $ 90.00
NG—$/Mcf $ 4.50 $ 5.00 $ 5.25 $ 5.50 $ 6.00
• Includes actuals through April 2011
• Assumes 20% rate of return hurdle rate for drilling projects
• Downtime factors by region through 2015 for offset frac and other operational factors; no downtime post 2015:
Holly 7.5%
Shelby 5.0%
Waskom 7.5%
ETXNLA JV Conventional 3.5%
• Forecast adjusted to include additional capital charges not included in the Financial Modeling Report including workover, seismic, and other corporate capital
EXCO Resources, INC
45
PPT – 192 – Management Presentation
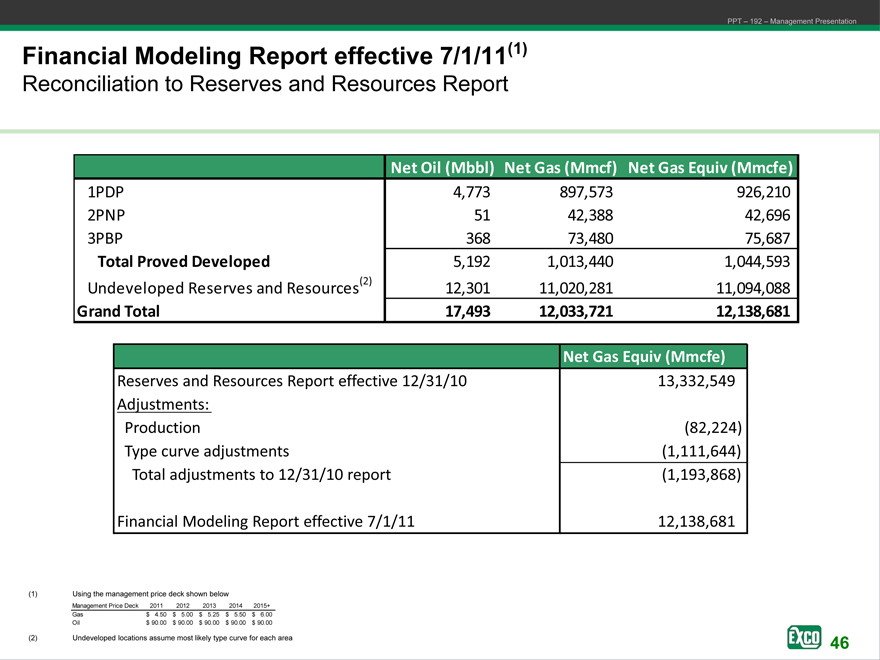
Financial Modeling Report effective 7/1/11(1)
Reconciliation to Reserves and Resources Report
Net Oil (Mbbl) Net Gas (Mmcf) Net Gas Equiv (Mmcfe)
1PDP 4,773 897,573 926,210
2PNP 51 42,388 42,696
3PBP 368 73,480 75,687
Total Proved Developed 5,192 1,013,440 1,044,593
Undeveloped Reserves and Resources(2) 12,301 11,020,281 11,094,088
Grand Total 17,493 12,033,721 12,138,681
Net Gas Equiv (Mmcfe)
Reserves and Resources Report effective 12/31/10 13,332,549
Adjustments:
Production(82,224)
Type curve adjustments(1,111,644)
Total adjustments to 12/31/10 report(1,193,868)
Financial Modeling Report effective 7/1/11 12,138,681
(1) | | Using the management price deck shown below |
Management Price Deck 2011 2012 2013 2014 2015+
Gas $ 4.50 $ 5.00 $ 5.25 $ 5.50 $ 6.00
Oil $ 90.00 $ 90.00 $ 90.00 $ 90.00 $ 90.00
(2) | | Undeveloped locations assume most likely type curve for each area |
EXCO Resources, INC
46
PPT – 192 – Management Presentation
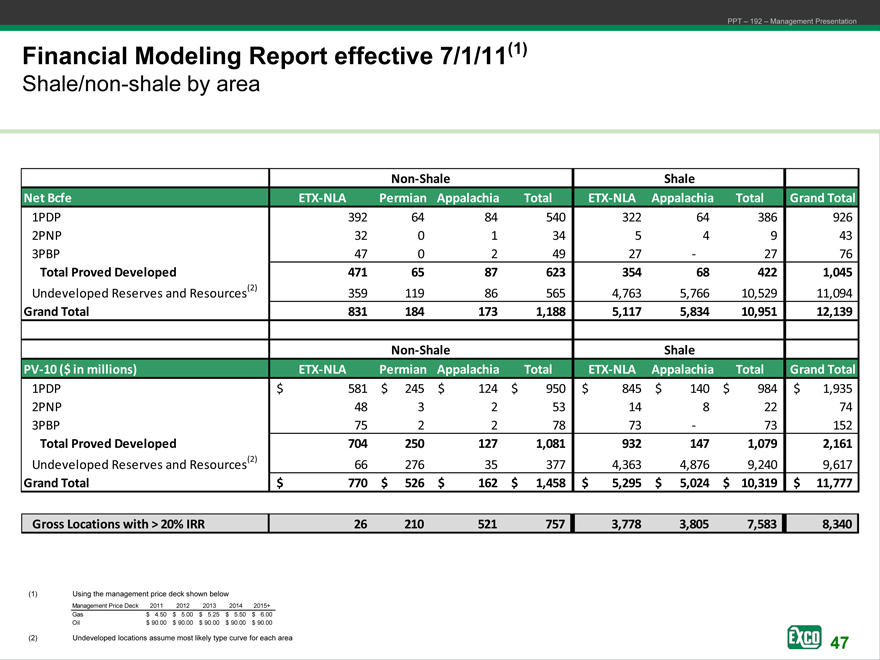
Financial Modeling Report effective 7/1/11(1)
Shale/non-shale by area
Non-Shale Shale
Net Bcfe ETX-NLA Permian Appalachia Total ETX-NLA Appalachia Total Grand Total
1PDP 392 64 84 540 322 64 386 926
2PNP 32 0 1 34 5 4 9 43
3PBP 47 0 2 49 27—27 76
Total Proved Developed 471 65 87 623 354 68 422 1,045
Undeveloped Reserves and Resources(2) 359 119 86 565 4,763 5,766 10,529 11,094
Grand Total 831 184 173 1,188 5,117 5,834 10,951 12,139
Non-Shale Shale
PV-10 ($ in millions) ETX-NLA Permian Appalachia Total ETX-NLA Appalachia Total Grand Total
1PDP $ 581 $ 245 $ 124 $ 950 $ 845 $ 140 $ 984 $ 1,935
2PNP 48 3 2 53 14 8 22 74
3PBP 75 2 2 78 73—73 152
Total Proved Developed 704 250 127 1,081 932 147 1,079 2,161
Undeveloped Reserves and Resources(2) 66 276 35 377 4,363 4,876 9,240 9,617
Grand Total $ 770 $ 526 $ 162 $ 1,458 $ 5,295 $ 5,024 $ 10,319 $ 11,777
Gross Locations with > 20% IRR 26 210 521 757 3,778 3,805 7,583 8,340
(1) | | Using the management price deck shown below |
Management Price Deck 2011 2012 2013 2014 2015+
Gas $ 4.50 $ 5.00 $ 5.25 $ 5.50 $ 6.00
Oil $ 90.00 $ 90.00 $ 90.00 $ 90.00 $ 90.00
(2) | | Undeveloped locations assume most likely type curve for each area |
EXCO Resources, INC
47
PPT – 192 – Management Presentation
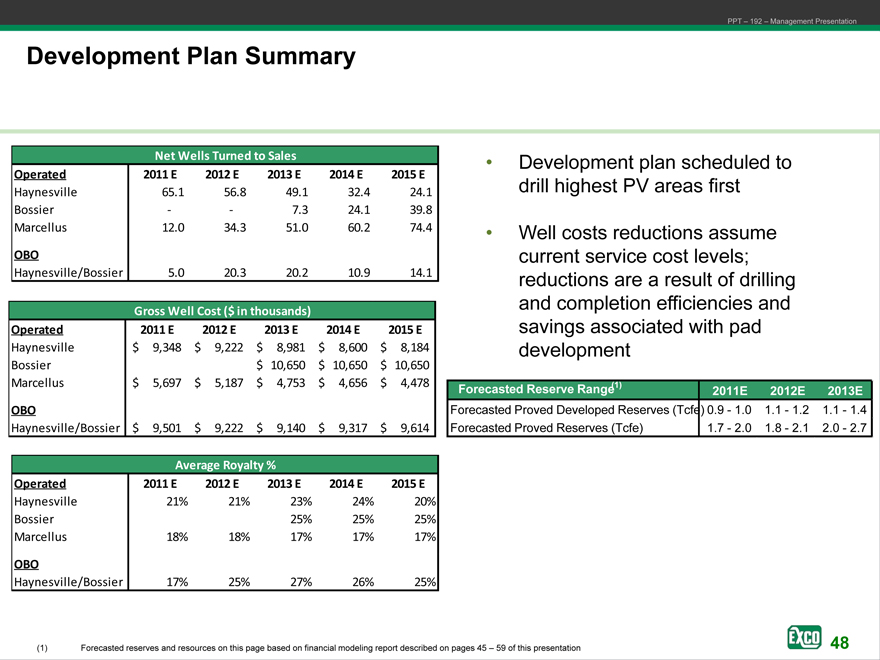
Development Plan Summary
Net Wells Turned to Sales
Operated 2011 E 2012 E 2013 E 2014 E 2015 E
Haynesville 65.1 56.8 49.1 32.4 24.1
Bossier—- 7.3 24.1 39.8
Marcellus 12.0 34.3 51.0 60.2 74.4
OBO
Haynesville/Bossier 5.0 20.3 20.2 10.9 14.1
Gross Well Cost ($ in thousands)
Operated 2011 E 2012 E 2013 E 2014 E 2015 E
Haynesville $ 9,348 $ 9,222 $ 8,981 $ 8,600 $ 8,184
Bossier $ 10,650 $ 10,650 $ 10,650
Marcellus $ 5,697 $ 5,187 $ 4,753 $ 4,656 $ 4,478
OBO
Haynesville/Bossier $ 9,501 $ 9,222 $ 9,140 $ 9,317 $ 9,614
Average Royalty %
Operated 2011 E 2012 E 2013 E 2014 E 2015 E
Haynesville 21% 21% 23% 24% 20%
Bossier 25% 25% 25%
Marcellus 18% 18% 17% 17% 17%
OBO
Haynesville/Bossier 17% 25% 27% 26% 25%
• Development plan scheduled to drill highest PV areas first
• Well costs reductions assume current service cost levels; reductions are a result of drilling and completion efficiencies and savings associated with pad development
Forecasted Reserve Range(1) 2011E 2012E 2013E
Forecasted Proved Developed Reserves (Tcfe) 0.9—1.0 1.1—1.2 1.1—1.4
Forecasted Proved Reserves (Tcfe) 1.7—2.0 1.8—2.1 2.0—2.7
(1) Forecasted reserves and resources on this page based on financial modeling report described on pages 45 – 49 of this presentation
EXCO Resources, INC
48
PPT – 192 – Management Presentation
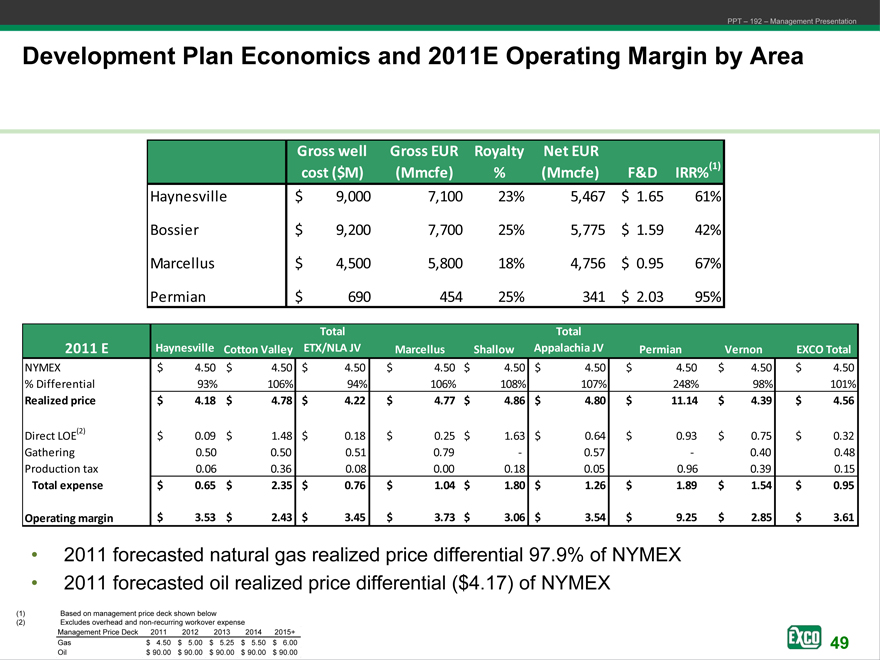
Development Plan Economics and 2011E Operating Margin by Area
Gross well Gross EUR Royalty Net EUR
cost ($M)(Mmcfe)%(Mmcfe) F&D IRR%(1)
Haynesville $ 9,000 7,100 23% 5,467 $ 1.65 61%
Bossier $ 9,200 7,700 25% 5,775 $ 1.59 42%
Marcellus $ 4,500 5,800 18% 4,756 $ 0.95 67%
Permian $ 690 454 25% 341 $ 2.03 95%
Total Total
2011 E Haynesville Cotton Valley ETX/NLA JV Marcellus Shallow Appalachia JV Permian Vernon EXCO Total
NYMEX $ 4.50 $ 4.50 $ 4.50 $ 4.50 $ 4.50 $ 4.50 $ 4.50 $ 4.50 $ 4.50
% Differential 93% 106% 94% 106% 108% 107% 248% 98% 101%
Realized price $ 4.18 $ 4.78 $ 4.22 $ 4.77 $ 4.86 $ 4.80 $ 11.14 $ 4.39 $ 4.56
Direct LOE(2) $ 0.09 $ 1.48 $ 0.18 $ 0.25 $ 1.63 $ 0.64 $ 0.93 $ 0.75 $ 0.32
Gathering 0.50 0.50 0.51 0.79—0.57—0.40 0.48
Production tax 0.06 0.36 0.08 0.00 0.18 0.05 0.96 0.39 0.15
Total expense $ 0.65 $ 2.35 $ 0.76 $ 1.04 $ 1.80 $ 1.26 $ 1.89 $ 1.54 $ 0.95
Operating margin $ 3.53 $ 2.43 $ 3.45 $ 3.73 $ 3.06 $ 3.54 $ 9.25 $ 2.85 $ 3.61
• 2011 forecasted natural gas realized price differential 97.9% of NYMEX
• 2011 forecasted oil realized price differential ($4.17) of NYMEX
(1) | | Based on management price deck shown below |
(2) | | Excludes overhead and non-recurring workover expense |
Management Price Deck 2011 2012 2013 2014 2015+
Gas $ 4.50 $ 5.00 $ 5.25 $ 5.50 $ 6.00
Oil $ 90.00 $ 90.00 $ 90.00 $ 90.00 $ 90.00
EXCO Resources, INC
49
PPT – 192 – Management Presentation
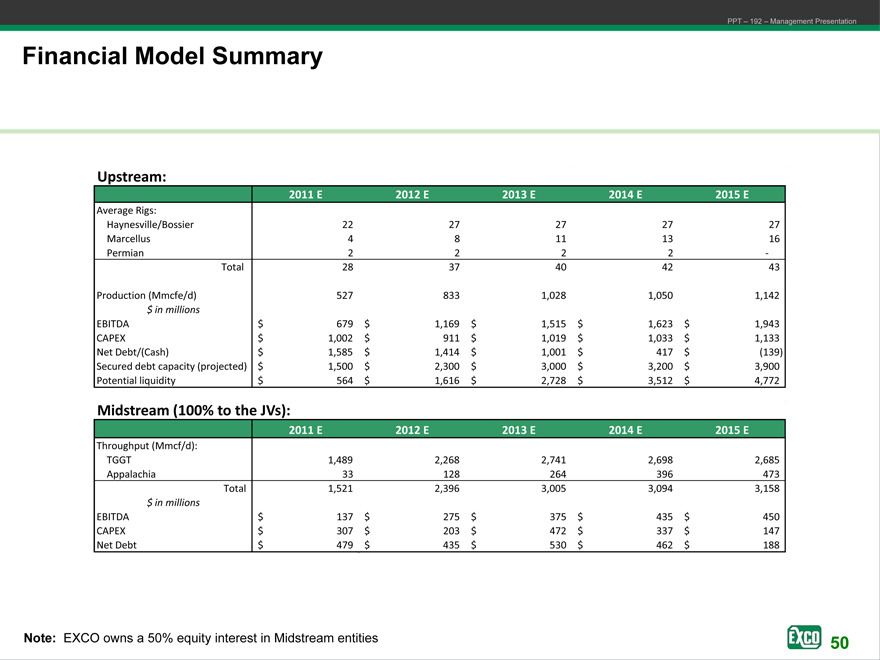
Financial Model Summary
Upstream:
2011 E 2012 E 2013 E 2014 E 2015 E
Average Rigs:
Haynesville/Bossier 22 27 27 27 27
Marcellus 4 8 11 13 16
Permian 2 2 2 2 -
Total 28 37 40 42 43
Production (Mmcfe/d) 527 833 1,028 1,050 1,142
$ in millions
EBITDA $ 679 $ 1,169 $ 1,515 $ 1,623 $ 1,943
CAPEX $ 1,002 $ 911 $ 1,019 $ 1,033 $ 1,133
Net Debt/(Cash) $ 1,585 $ 1,414 $ 1,001 $ 417 $(139)
Secured debt capacity (projected) $ 1,500 $ 2,300 $ 3,000 $ 3,200 $ 3,900
Potential liquidity $ 564 $ 1,616 $ 2,728 $ 3,512 $ 4,772
Midstream (100% to the JVs):
2011 E 2012 E 2013 E 2014 E 2015 E
Throughput (Mmcf/d):
TGGT 1,489 2,268 2,741 2,698 2,685
Appalachia 33 128 264 396 473
Total 1,521 2,396 3,005 3,094 3,158
$ in millions
EBITDA $ 137 $ 275 $ 375 $ 435 $ 450
CAPEX $ 307 $ 203 $ 472 $ 337 $ 147
Net Debt $ 479 $ 435 $ 530 $ 462 $ 188
Note: EXCO owns a 50% equity interest in Midstream entities
EXCO Resources, INC
50
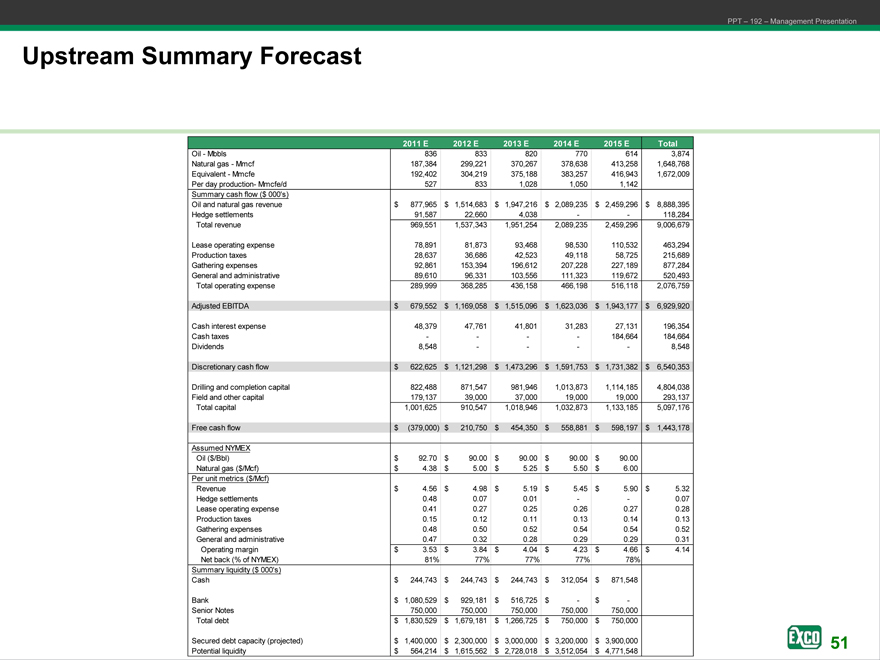
Upstream Summary Forecast
PPT – 192 – Management Presentation
2011 E 2012 E 2013 E 2014 E 2015 E Total
Oil—Mbbls 836 833 820 770 614 3,874
Natural gas—Mmcf 187,384 299,221 370,267 378,638 413,258 1,648,768
Equivalent—Mmcfe 192,402 304,219 375,188 383,257 416,943 1,672,009
Per day production- Mmcfe/d 527 833 1,028 1,050 1,142
Summary cash flow ($ 000’s)
Oil and natural gas revenue $ 877,965 $ 1,514,683 $ 1,947,216 $ 2,089,235 $ 2,459,296 $ 8,888,395
Hedge settlements 91,587 22,660 4,038 — — 118,284
Total revenue 969,551 1,537,343 1,951,254 2,089,235 2,459,296 9,006,679
Lease operating expense 78,891 81,873 93,468 98,530 110,532 463,294
Production taxes 28,637 36,686 42,523 49,118 58,725 215,689
Gathering expenses 92,861 153,394 196,612 207,228 227,189 877,284
General and administrative 89,610 96,331 103,556 111,323 119,672 520,493
Total operating expense 289,999 368,285 436,158 466,198 516,118 2,076,759
Adjusted EBITDA $ 679,552 $ 1,169,058 $ 1,515,096 $ 1,623,036 $ 1,943,177 $ 6,929,920
Cash interest expense 48,379 47,761 41,801 31,283 27,131 196,354
Cash taxes — — — — 184,664 184,664
Dividends 8,548 — — — — 8,548
Discretionary cash flow $ 622,625 $ 1,121,298 $ 1,473,296 $ 1,591,753 $ 1,731,382 $ 6,540,353
Drilling and completion capital 822,488 871,547 981,946 1,013,873 1,114,185 4,804,038
Field and other capital 179,137 39,000 37,000 19,000 19,000 293,137
Total capital 1,001,625 910,547 1,018,946 1,032,873 1,133,185 5,097,176
Free cash flow $ (379,000) $ 210,750 $ 454,350 $ 558,881 $ 598,197 $ 1,443,178
Assumed NYMEX
Oil ($/Bbl) $ 92.70 $ 90.00 $ 90.00 $ 90.00 $ 90.00
Natural gas ($/Mcf) $ 4.38 $ 5.00 $ 5.25 $ 5.50 $ 6.00
Per unit metrics ($/Mcf)
Revenue $ 4.56 $ 4.98 $ 5.19 $ 5.45 $ 5.90 $ 5.32
Hedge settlements 0.48 0.07 0.01 — — 0.07
Lease operating expense 0.41 0.27 0.25 0.26 0.27 0.28
Production taxes 0.15 0.12 0.11 0.13 0.14 0.13
Gathering expenses 0.48 0.50 0.52 0.54 0.54 0.52
General and administrative 0.47 0.32 0.28 0.29 0.29 0.31
Operating margin $ 3.53 $ 3.84 $ 4.04 $ 4.23 $ 4.66 $ 4.14
Net back (% of NYMEX) 81% 77% 77% 77% 78%
Summary liquidity ($ 000’s)
Cash $ 244,743 $ 244,743 $ 244,743 $ 312,054 $ 871,548
Bank $ 1,080,529 $ 929,181 $ 516,725 $ — $ —
Senior Notes 750,000 750,000 750,000 750,000 750,000
Total debt $ 1,830,529 $ 1,679,181 $ 1,266,725 $ 750,000 $ 750,000
Secured debt capacity (projected) $ 1,400,000 $ 2,300,000 $ 3,000,000 $ 3,200,000$ 3,900,000
Potential liquidity $ 564,214 $ 1,615,562 $ 2,728,018 $ 3,512,054 $ 4,771,548
EXCO Resources, Inc
PPT – 192 – Management Presentation
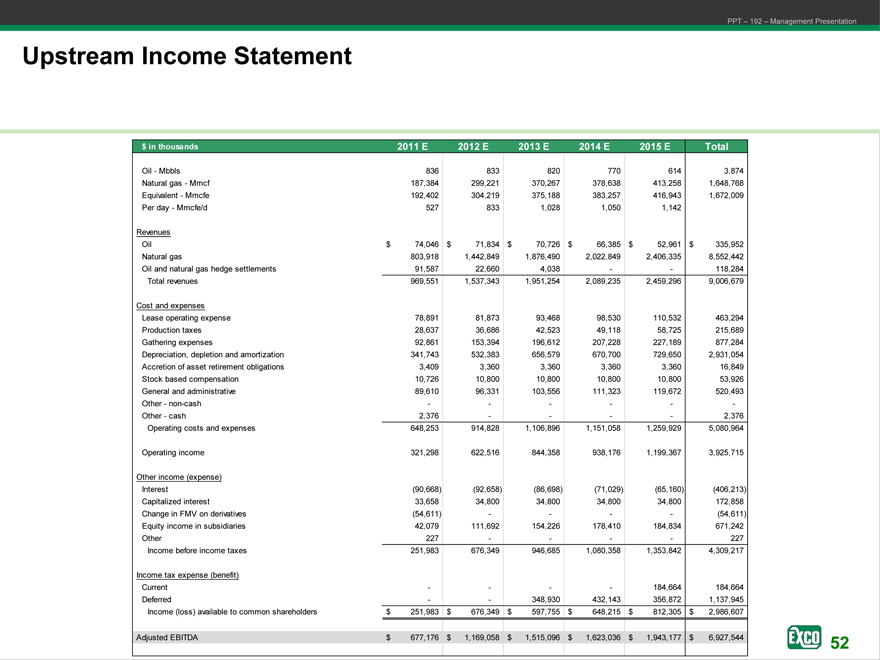
Upstream Income Statement
$ in thousands 2011 E 2012 E 2013 E 2014 E 2015 E Total
Oil—Mbbls 836 833 820 770 614 3,874
Natural gas—Mmcf 187,384 299,221 370,267 378,638 413,258 1,648,768
Equivalent—Mmcfe 192,402 304,219 375,188 383,257 416,943 1,672,009
Per day—Mmcfe/d 527 833 1,028 1,050 1,142
Revenues
Oil $ 74,046 $ 71,834 $ 70,726 $ 66,385 $ 52,961 $ 335,952
Natural gas 803,918 1,442,849 1,876,490 2,022,849 2,406,335 8,552,442
Oil and natural gas hedge settlements 91,587 22,660 4,038 — — 118,284
Total revenues 969,551 1,537,343 1,951,254 2,089,235 2,459,296 9,006,679
Cost and expenses
Lease operating expense 78,891 81,873 93,468 98,530 110,532 463,294
Production taxes 28,637 36,686 42,523 49,118 58,725 215,689
Gathering expenses 92,861 153,394 196,612 207,228 227,189 877,284
Depreciation, depletion and amortization 341,743 532,383 656,579 670,700 729,650 2,931,054
Accretion of asset retirement obligations 3,409 3,360 3,360 3,360 3,360 16,849
Stock based compensation 10,726 10,800 10,800 10,800 10,800 53,926
General and administrative 89,610 96,331 103,556 111,323 119,672 520,493
Other—non-cash — — — — — -
Other—cash 2,376 — — — — 2,376
Operating costs and expenses 648,253 914,828 1,106,896 1,151,058 1,259,929 5,080,964
Operating income 321,298 622,516 844,358 938,176 1,199,367 3,925,715
Other income (expense)
Interest (90,668) (92,658) (86,698) (71,029) (65,160) (406,213)
Capitalized interest 33,658 34,800 34,800 34,800 34,800 172,858
Change in FMV on derivatives (54,611) — — — — (54,611)
Equity income in subsidiaries 42,079 111,692 154,226 178,410 184,834 671,242
Other 227 — — — — 227
Income before income taxes 251,983 676,349 946,685 1,080,358 1,353,842 4,309,217
Income tax expense (benefit)
Current — — — — 184,664 184,664
Deferred — — 348,930 432,143 356,872 1,137,945
Income (loss) available to common shareholders $ 251,983 $ 676,349 $ 597,755 $ 648,215 $ 812,305 $ 2,986,607
Adjusted EBITDA $ 677,176 $ 1,169,058 $ 1,515,096 $ 1,623,036 $ 1,943,177 $ 6,927,544
EXCO Resources, Inc
PPT – 192 – Management Presentation
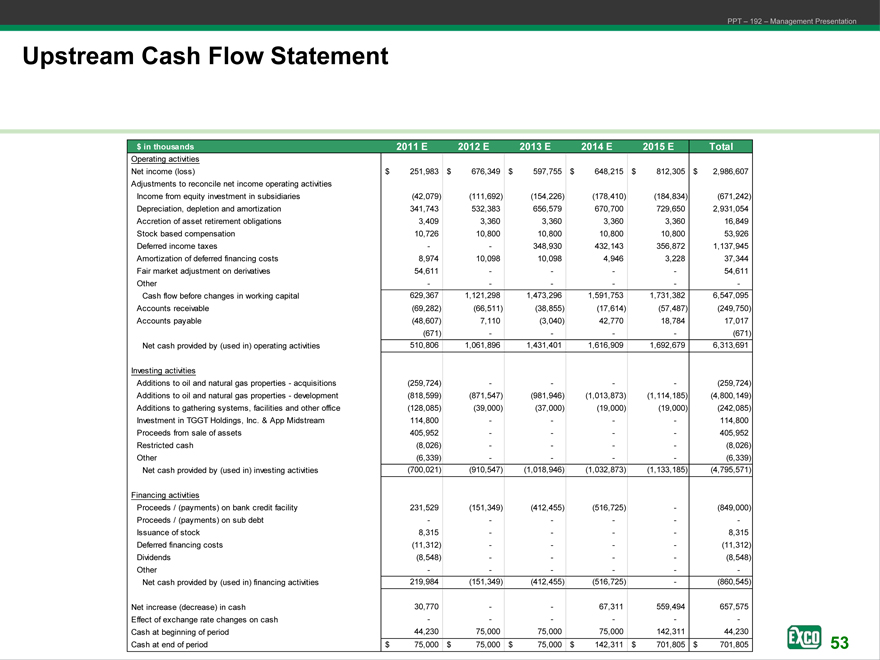
Upstream Cash Flow Statement
$ in thousands 2011 E 2012 E 2013 E 2014 E 2015 E Total
Operating activities
Net income (loss) $ 251,983 $ 676,349 $ 597,755 $ 648,215 $ 812,305 $ 2,986,607
Adjustments to reconcile net income operating activities
Income from equity investment in subsidiaries (42,079) (111,692) (154,226) (178,410) (184,834) (671,242)
Depreciation, depletion and amortization 341,743 532,383 656,579 670,700 729,650 2,931,054
Accretion of asset retirement obligations 3,409 3,360 3,360 3,360 3,360 16,849
Stock based compensation 10,726 10,800 10,800 10,800 10,800 53,926
Deferred income taxes — — 348,930 432,143 356,872 1,137,945
Amortization of deferred financing costs 8,974 10,098 10,098 4,946 3,228 37,344
Fair market adjustment on derivatives 54,611 — — —— 54,611
Other — — — —— -
Cash flow before changes in working capital 629,367 1,121,298 1,473,296 1,591,753 1,731,382 6,547,095
Accounts receivable (69,282) (66,511) (38,855) (17,614) (57,487) (249,750)
Accounts payable (48,607) 7,110 (3,040) 42,770 18,784 17,017
(671) — — —— (671)
Net cash provided by (used in) operating activities 510,806 1,061,896 1,431,401 1,616,909 1,692,679 6,313,691
Investing activities
Additions to oil and natural gas properties—acquisitions (259,724) — — —— (259,724)
Additions to oil and natural gas properties—development (818,599) (871,547) (981,946) (1,013,873) (1,114,185) (4,800,149)
Additions to gathering systems, facilities and other office (128,085) (39,000) (37,000) (19,000) (19,000) (242,085)
Investment in TGGT Holdings, Inc. & App Midstream 114,800 — — —— 114,800
Proceeds from sale of assets 405,952 — — —— 405,952
Restricted cash (8,026) — — —— (8,026)
Other (6,339) — — —— (6,339)
Net cash provided by (used in) investing activities (700,021) (910,547) (1,018,946) (1,032,873) (1,133,185) (4,795,571)
Financing activities
Proceeds / (payments) on bank credit facility 231,529 (151,349) (412,455) (516,725) — (849,000)
Proceeds / (payments) on sub debt — — — —— -
Issuance of stock 8,315 — — —— 8,315
Deferred financing costs (11,312) — — —— (11,312)
Dividends (8,548) — — —— (8,548)
Other — — — —— -
Net cash provided by (used in) financing activities 219,984 (151,349) (412,455) (516,725) — (860,545)
Net increase (decrease) in cash 30,770 — — 67,311 559,494 657,575
Effect of exchange rate changes on cash — — — —— -
Cash at beginning of period 44,230 75,000 75,000 75,000 142,311 44,230
Cash at end of period $ 75,000 $ 75,000 $ 75,000 $ 142,311 $ 701,805 $ 701,805
EXCO Resources, Inc
PPT – 192 – Management Presentation
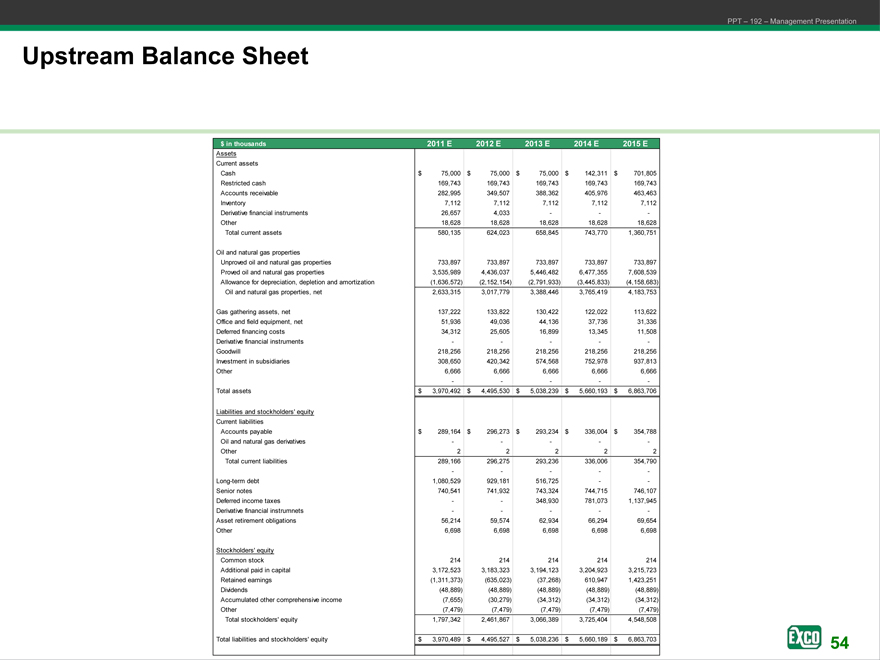
Upstream Balance Sheet
$ in thousands 2011 E 2012 E 2013 E 2014 E 2015 E
Assets
Current assets
Cash $ 75,000 $ 75,000 $ 75,000 $ 142,311 $ 701,805
Restricted cash 169,743 169,743 169,743 169,743 169,743
Accounts receivable 282,995 349,507 388,362 405,976 463,463
Inventory 7,112 7,112 7,112 7,112 7,112
Derivative financial instruments 26,657 4,033 — — -
Other 18,628 18,628 18,628 18,628 18,628
Total current assets 580,135 624,023 658,845 743,770 1,360,751
Oil and natural gas properties
Unproved oil and natural gas properties 733,897 733,897 733,897 733,897 733,897
Proved oil and natural gas properties 3,535,989 4,436,037 5,446,482 6,477,355 7,608,539
Allowance for depreciation, depletion and amortization (1,636,572) (2,152,154) (2,791,933) (3,445,833) (4,158,683)
Oil and natural gas properties, net 2,633,315 3,017,779 3,388,446 3,765,419 4,183,753
Gas gathering assets, net 137,222 133,822 130,422 122,022 113,622
Office and field equipment, net 51,936 49,036 44,136 37,736 31,336
Deferred financing costs 34,312 25,605 16,899 13,345 11,508
Derivative financial instruments — — — — -
Goodwill 218,256 218,256 218,256 218,256 218,256
Investment in subsidiaries 308,650 420,342 574,568 752,978 937,813
Other 6,666 6,666 6,666 6,666 6,666
Total assets $ 3,970,492 $ 4,495,530 $ 5,038,239 $ 5,660,193 $ 6,863,706
Liabilities and stockholders’ equity
Current liabilities
Accounts payable $ 289,164 $ 296,273 $ 293,234 $ 336,004 $ 354,788
Oil and natural gas derivatives — — — — -
Other 2 2 2 2 2
Total current liabilities 289,166 296,275 293,236 336,006 354,790
Long-term debt 1,080,529 929,181 516,725 — -
Senior notes 740,541 741,932 743,324 744,715 746,107
Deferred income taxes — — 348,930 781,073 1,137,945
Derivative financial instrumnets — — — — -
Asset retirement obligations 56,214 59,574 62,934 66,294 69,654
Other 6,698 6,698 6,698 6,698 6,698
Stockholders’ equity
Common stock 214 214 214 214 214
Additional paid in capital 3,172,523 3,183,323 3,194,123 3,204,923 3,215,723
Retained earnings (1,311,373) (635,023) (37,268) 610,947 1,423,251
Dividends (48,889) (48,889) (48,889) (48,889) (48,889)
Accumulated other comprehensive income (7,655) (30,279) (34,312) (34,312) (34,312)
Other (7,479) (7,479) (7,479) (7,479) (7,479)
Total stockholders’ equity 1,797,342 2,461,867 3,066,389 3,725,404 4,548,508
Total liabilities and stockholders’ equity $ 3,970,489 $ 4,495,527 5,038,236 $ 5,660,189 $ 6,863,703
EXCO Resources, Inc
PPT – 192 – Management Presentation
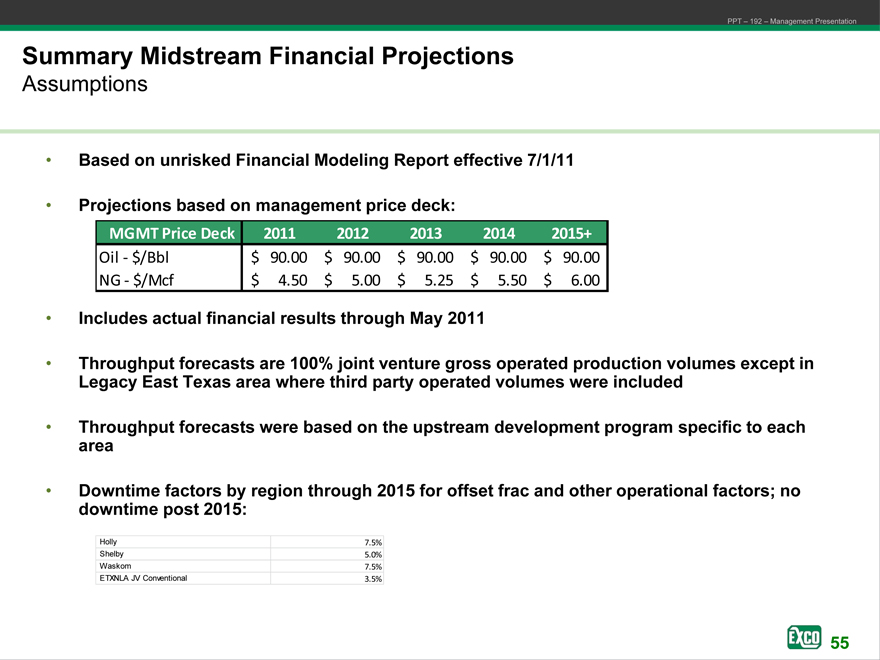
Summary Midstream Financial Projections
Assumptions
Based on unrisked Financial Modeling Report effective 7/1/11
Projections based on management price deck:
MGMT Price Deck 2011 2012 2013 2014 2015+
Oil—$/Bbl $ 90.00 $ 90.00 $ 90.00 $ 90.00 $ 90.00
NG—$/Mcf $ 4.50 $ 5.00 $ 5.25 $ 5.50 $ 6.00
Includes actual financial results through May 2011
Throughput forecasts are 100% joint venture gross operated production volumes except in Legacy East Texas area where third party operated volumes were included
Throughput forecasts were based on the upstream development program specific to each area
Downtime factors by region through 2015 for offset frac and other operational factors; no downtime post 2015:
Holly 7.5%
Shelby 5.0%
Waskom 7.5%
ETXNLA JV Conventional 3.5%
EXCO Resources, Inc
PPT – 192 – Management Presentation
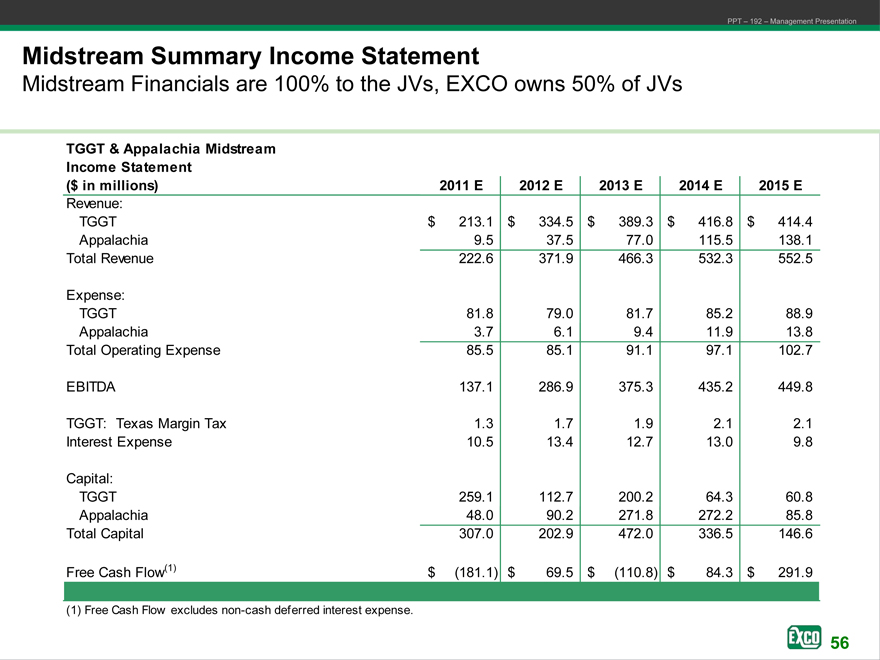
Midstream Summary Income Statement
Midstream Financials are 100% to the JVs, EXCO owns 50% of JVs
TGGT & Appalachia Midstream
Income Statement
($ in millions) 2011 E 2012 E 2013 E 2014 E 2015 E
Revenue:
TGGT $ 213.1 $ 334.5 $ 389.3 $ 416.8 $ 414.4
Appalachia 9.5 37.5 77.0 115.5 138.1
Total Revenue 222.6 371.9 466.3 532.3 552.5
Expense:
TGGT 81.8 79.0 81.7 85.2 88.9
Appalachia 3.7 6.1 9.4 11.9 13.8
Total Operating Expense 85.5 85.1 91.1 97.1 102.7
EBITDA 137.1 286.9 375.3 435.2 449.8
TGGT: Texas Margin Tax 1.3 1.7 1.9 2.1 2.1
Interest Expense 10.5 13.4 12.7 13.0 9.8
Capital:
TGGT 259.1 112.7 200.2 64.3 60.8
Appalachia 48.0 90.2 271.8 272.2 85.8
Total Capital 307.0 202.9 472.0 336.5 146.6
Free Cash Flow(1) $ (181.1) $ 69.5 $ (110.8) $ 84.3 $ 291.9
(1) | | Free Cash Flow excludes non-cash deferred interest expense. EXCO Resources, Inc |
PPT – 192 – Management Presentation
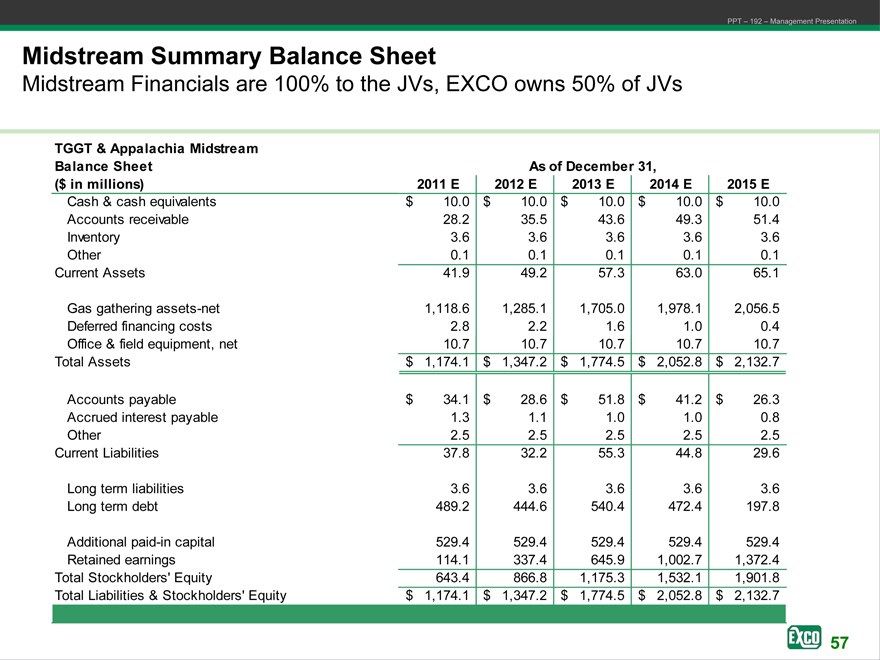
Midstream Summary Balance Sheet
Midstream Financials are 100% to the JVs, EXCO owns 50% of JVs
TGGT & Appalachia Midstream
Balance Sheet As of December 31,
($ in millions) 2011 E 2012 E 2013 E 2014 E 2015 E
Cash & cash equivalents $ 10.0 $ 10.0 $ 10.0 $ 10.0 $ 10.0
Accounts receivable 28.2 35.5 43.6 49.3 51.4
Inventory 3.6 3.6 3.6 3.6 3.6
Other 0.1 0.1 0.1 0.1 0.1
Current Assets 41.9 49.2 57.3 63.0 65.1
Gas gathering assets-net 1,118.6 1,285.1 1,705.0 1,978.1 2,056.5
Deferred financing costs 2.8 2.2 1.6 1.0 0.4
Office & field equipment, net 10.7 10.7 10.7 10.7 10.7
Total Assets $ 1,174.1 $ 1,347.2 $ 1,774.5 $ 2,052.8 $ 2,132.7
Accounts payable $ 34.1 $ 28.6 $ 51.8 $ 41.2 $ 26.3
Accrued interest payable 1.3 1.1 1.0 1.0 0.8
Other 2.5 2.5 2.5 2.5 2.5
Current Liabilities 37.8 32.2 55.3 44.8 29.6
Long term liabilities 3.6 3.6 3.6 3.6 3.6
Long term debt 489.2 444.6 540.4 472.4 197.8
Additional paid-in capital 529.4 529.4 529.4 529.4 529.4
Retained earnings 114.1 337.4 645.9 1,002.7 1,372.4
Total Stockholders’ Equity 643.4 866.8 1,175.3 1,532.1 1,901.8
Total Liabilities & Stockholders’ Equity $ 1,174.1 $ 1,347.2 $ 1,774.5 $ 2,052.8 $ 2,132.7
EXCO Resources, Inc
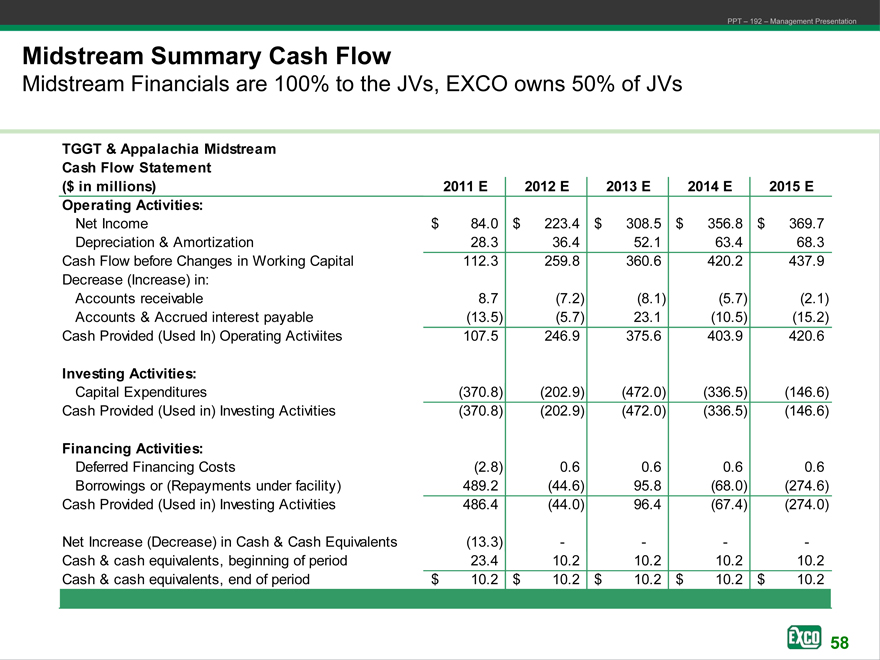
PPT – 192 – Management Presentation
Midstream Summary Cash Flow
Midstream Financials are 100% to the JVs, EXCO owns 50% of JVs
TGGT & Appalachia Midstream
Cash Flow Statement
($ in millions) 2011 E 2012 E 2013 E 2014 E 2015 E
Operating Activities:
Net Income $ 84.0 $ 223.4 $ 308.5 $ 356.8 $ 369.7
Depreciation & Amortization 28.3 36.4 52.1 63.4 68.3
Cash Flow before Changes in Working Capital 112.3 259.8 360.6 420.2 437.9
Decrease (Increase) in:
Accounts receivable 8.7 (7.2) (8.1) (5.7) (2.1)
Accounts & Accrued interest payable (13.5) (5.7) 23.1 (10.5) (15.2)
Cash Provided (Used In) Operating Activiites 107.5 246.9 375.6 403.9 420.6
Investing Activities:
Capital Expenditures (370.8) (202.9) (472.0) (336.5) (146.6)
Cash Provided (Used in) Investing Activities (370.8) (202.9) (472.0) (336.5) (146.6)
Financing Activities:
Deferred Financing Costs (2.8) 0.6 0.6 0.6 0.6
Borrowings or (Repayments under facility) 489.2 (44.6) 95.8 (68.0) (274.6)
Cash Provided (Used in) Investing Activities 486.4 (44.0) 96.4 (67.4) (274.0)
Net Increase (Decrease) in Cash & Cash Equivalents (13.3) — — — -
Cash & cash equivalents, beginning of period 23.4 10.2 10.2 10.2 10.2
Cash & cash equivalents, end of period $ 10.2 $ 10.2 $ 10.2 $ 10.2 $ 10.2
EXCO Resources, Inc
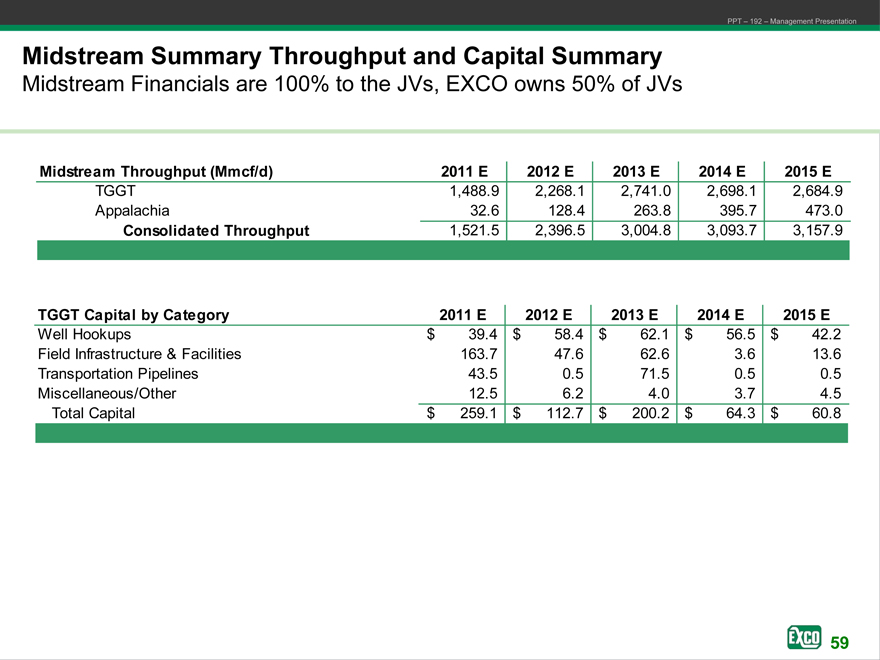
PPT – 192 – Management Presentation
Midstream Summary Throughput and Capital Summary
Midstream Financials are 100% to the JVs, EXCO owns 50% of JVs
Midstream Throughput (Mmcf/d) 2011 E 2012 E 2013 E 2014 E 2015 E
TGGT 1,488.9 2,268.1 2,741.0 2,698.1 2,684.9
Appalachia 32.6 128.4 263.8 395.7 473.0
Consolidated Throughput 1,521.5 2,396.5 3,004.8 3,093.7 3,157.9
TGGT Capital by Category 2011 E 2012 E 2013 E 2014 E 2015 E
Well Hookups $ 39.4 $ 58.4 $ 62.1 $ 56.5 $ 42.2
Field Infrastructure & Facilities 163.7 47.6 62.6 3.6 13.6
Transportation Pipelines 43.5 0.5 71.5 0.5 0.5
Miscellaneous/Other 12.5 6.2 4.0 3.7 4.5
Total Capital $ 259.1 $ 112.7 $ 200.2 $ 64.3 $ 60.8