| UNITED STATES |
| SECURITIES AND EXCHANGE COMMISSION |
| Washington, D.C. 20549 |
| |
FORM N-CSR |
| |
CERTIFIED SHAREHOLDER REPORT OF REGISTERED |
MANAGEMENT INVESTMENT COMPANIES |
| |
| |
| |
| Investment Company Act File Number: 811-2603 |
|
| |
| T. Rowe Price Prime Reserve Fund, Inc. |
|
| (Exact name of registrant as specified in charter) |
| |
| 100 East Pratt Street, Baltimore, MD 21202 |
|
| (Address of principal executive offices) |
| |
| David Oestreicher |
| 100 East Pratt Street, Baltimore, MD 21202 |
|
| (Name and address of agent for service) |
| |
| |
| Registrant’s telephone number, including area code: (410) 345-2000 |
| |
| |
| Date of fiscal year end: May 31 |
| |
| |
| Date of reporting period: November 30, 2010 |
Item 1: Report to Shareholders| Prime Reserve Fund | November 30, 2010 |

The views and opinions in this report were current as of November 30, 2010. They are not guarantees of performance or investment results and should not be taken as investment advice. Investment decisions reflect a variety of factors, and the managers reserve the right to change their views about individual stocks, sectors, and the markets at any time. As a result, the views expressed should not be relied upon as a forecast of the fund’s future investment intent. The report is certified under the Sarbanes-Oxley Act, which requires mutual funds and other public companies to affirm that, to the best of their knowledge, the information in their financial reports is fairly and accurately stated in all material respects.
REPORTS ON THE WEB
Sign up for our E-mail Program, and you can begin to receive updated fund reports and prospectuses online rather than through the mail. Log in to your account at troweprice.com for more information.
Manager’s Letter
Fellow Shareholders
Money market yields remained extremely low throughout the last six months, as they were in our previous report to shareholders. In an effort to provide support to a slow-growing U.S. economy, the Federal Reserve kept its fed funds target rate in the same ultra-low range where it has been set since late 2008. With the Fed recently introducing new stimulus measures intended to suppress longer-term interest rates, short-term rates are unlikely to rise in the foreseeable future.
ECONOMY AND INTEREST RATES
The U.S. economic recovery, which seemed to be gaining traction in the first months of 2010, showed signs of slowing as the year progressed. According to recent Commerce Department estimates, gross domestic product grew by only 1.7% in the second quarter and by 2.5% in the third quarter of 2010, notably slower than in the early stages of the rebound. In the spring, a European debt crisis centered in Greece raised concerns that austerity measures in several European countries would weigh on global growth. Corporations reported solid earnings and improved balance sheets, but a promising resumption in private sector hiring was insufficient to reduce the elevated U.S. unemployment rate, which stood at 9.8% in November. The weak job market has constrained growth in consumer spending and contributed to continued weakness in the housing market.
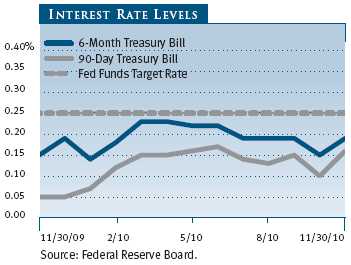
Signs of decelerating growth in the U.S. and troubles overseas delayed any tightening of monetary policy. The Fed continued to hold its key fed funds target rate in a 0.00% to 0.25% range, where it has been since December 2008, in response to subdued inflation and low capacity utilization. With no room for additional stimulus through lower short-term rates, Fed officials indicated that the central bank was prepared to take other actions, if necessary, to support the economic recovery. Investors speculated that the Fed’s next move would focus on pushing down longer-term interest rates by purchasing securities in the open market, a tool known as quantitative easing (QE) that the Fed previously employed during the depths of the 2008–2009 financial crisis. On November 3, 2010, Fed officials announced that they had agreed on a plan to buy $600 billion of longer-term Treasuries by mid-2011 at a pace of about $75 billion per month.
PORTFOLIO REVIEW
Your fund returned 0.01% in the six-month period ended November 30, 2010, in line with the Lipper Money Market Funds Average. Like many of its peers, T. Rowe Price has voluntarily waived all or a portion of the management fee it is entitled to receive from the fund in an effort to maintain a zero or positive net yield. Making short-term performance comparisons in an environment where all money funds’ returns are clustered near 0% is difficult. However, the fund’s longer-term relative returns have been attractive and have consistently placed it in the top 25% of all taxable money funds. (Based on cumulative total return, Lipper ranked the Prime Reserve Fund 127 of 281, 67 of 266, 55 of 247, and 43 of 199 money market funds for the 1-, 3-, 5-, and 10-year periods ended November 30, 2010, respectively. Results will vary for other time periods. Past performance cannot guarantee future results.)

In its November 3, 2010, statement, the Federal Open Market Committee affirmed its commitment to maintaining “exceptionally low levels of the federal funds rate for an extended period.” The Fed’s policy stance means that money market investors will continue to earn near 0% returns for some time to come. Headlines remind us daily that the financials sector still has many obstacles to overcome. Indeed, the market’s continued focus on European sovereign risk shows us that the aftershocks of the financial crisis will remain with us for a while. Accordingly, we continue to be cautious and focused on investing only in securities with the highest credit quality.

Most investment opportunities in your fund’s area of focus now offer yields that are compressed around the Fed’s target rate. Over the past six months, yields on U.S. Treasury securities in the money market space moved in a narrow range. The benchmark 90-day Treasury bill averaged about 0.13% during the period, fluctuating between 0.05% and 0.16%. The 90-day Libor—a benchmark for borrowing against which most commercial paper and certificates of deposit are priced—fell from 0.53% to 0.30% since our May 31, 2010, report. Most of the higher-quality names in which the portfolio invests are priced at yields lower than the Libor benchmark. One asset class that has averaged relatively higher yields over the past six months is municipal variable rate demand notes, which averaged a yield of 0.25%.
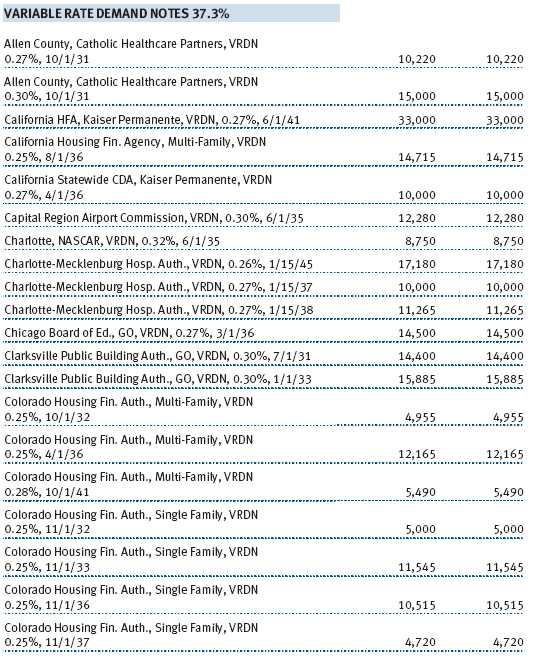
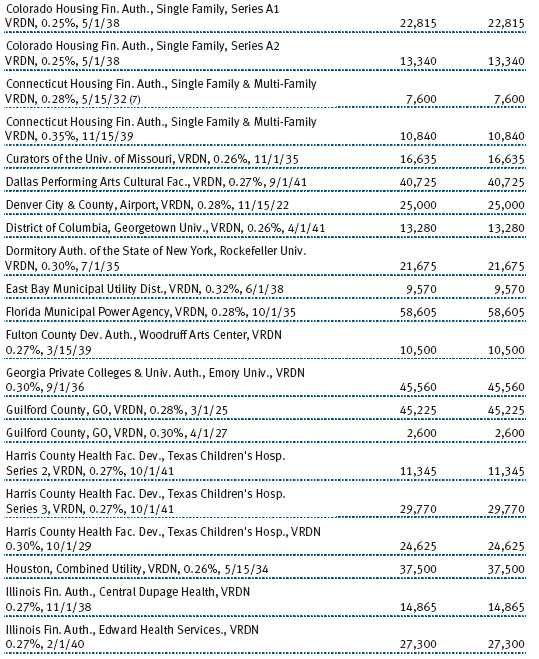
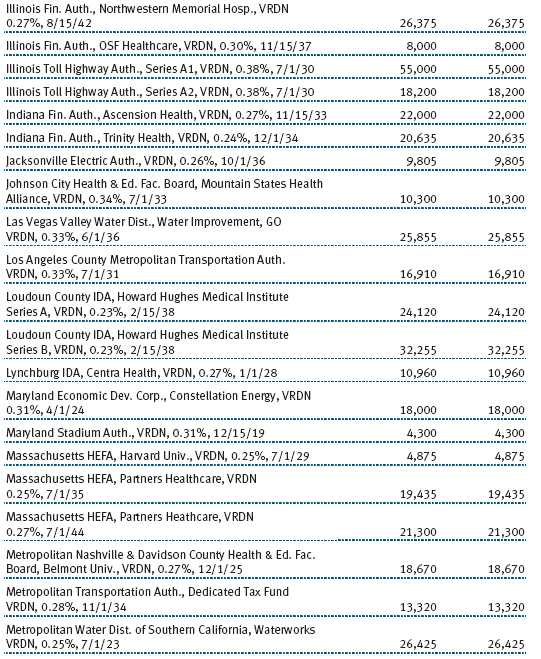
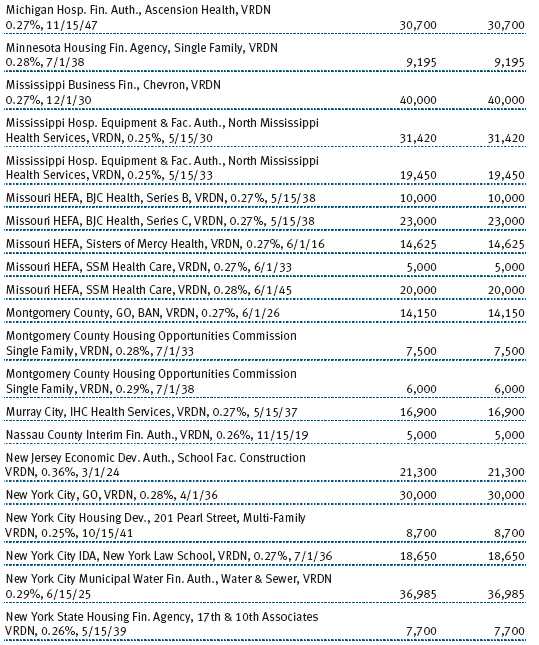
Our strategy remains relatively unchanged since the last report. With the Fed announcing its intent to begin a second round of QE, it is unlikely that money market rates will move significantly higher until at least some time in 2012. As shown in the Portfolio Characteristics table on page 3, the fund’s weighted average maturity (WAM) fell slightly over the past six months, but we continue to maintain a WAM somewhat longer than that of our peer group based on our conviction that the Fed will not soon act to raise short-term interest rates. At 46% of assets, municipal debt continues to make up a significant portion of the portfolio due to attractive rates compared with taxable debt as well as the highly liquid nature of many of these investments. The banking sector also continues to attract a high percentage of our investments; our higher-conviction names include several Canadian, Australian, and Nordic banks. Opportunities in asset-backed securities have become less attractive, causing our exposure to that sector to fall to only 2%.

The short-term markets in which we invest are changing significantly as a result of the financial crisis and new regulations such as the upcoming Basel III Accords, an updated international regulatory framework that will require banks to maintain stronger capital levels. These changes are making short-term funding less attractive to many issuers while, at the same time, slack economic demand and stronger corporate balance sheets have substantially diminished the need for short-term funding. For now, supply and demand in the short-term markets are in balance, but we are concerned about further pullbacks in demand for short-term funds—and thus the supply of short-term paper for investing. With all rates in our opportunity set hovering near 0%, we remain focused on maintaining a high-quality and highly liquid portfolio.
OUTLOOK
Recent data indicate that the broader economy is improving, though at a slower pace than many had hoped. Instability in Europe, persistently high unemployment, and subdued inflation in the U.S. mean that the Fed will likely keep short-term interest rates low for the foreseeable future. The Fed’s recent decision to undertake a second program of bond purchases underscores this view. We believe that the market environment for money fund investors will remain much as it has been for the past year. Our continuing goals in the coming months are to provide our shareholders with careful research and prudent risk management while closely watching economic developments for indications of higher future rates.
Respectfully submitted,
Joseph K. Lynagh
Chairman of the fund’s Investment Advisory Committee
December 6, 2010
The committee chairman has day-to-day responsibility for managing the portfolio and works with committee members in developing and executing the fund’s investment program.
RISKS OF INVESTING IN MONEY MARKET SECURITIES
Since money market funds are managed to maintain a constant $1.00 share price, there should be little risk of principal loss. However, there is no assurance the fund will avoid principal losses if fund holdings default or are downgraded or if interest rates rise sharply in an unusually short period. In addition, the fund’s yield will vary; it is not fixed for a specific period like the yield on a bank certificate of deposit. An investment in the fund is not insured or guaranteed by the Federal Deposit Insurance Corporation (FDIC) or any other government agency. Although a money market fund seeks to preserve the value of your investment at $1.00 per share, it is possible to lose money by investing in it.
GLOSSARY
Fed funds target rate: An overnight lending rate set by the Federal Reserve and used by banks to meet reserve requirements. Banks also use the fed funds rate as a benchmark for their prime lending rates.
Gross domestic product: The total market value of all goods and services produced in a country in a given year.
Libor: The London Interbank Offered Rate is a taxable money market benchmark.
Lipper average: Consists of all the mutual funds in a particular category as tracked by Lipper Inc.
SEC yield (7-day unsubsidized simple): A method of calculating a money fund’s yield by annualizing the fund’s net investment income for the last seven days of each period divided by the fund’s net asset value at the end of the period. Yield will vary and is not guaranteed.
Weighted average life: The dollar-weighted average maturity of a portfolio’s securities without taking into account interest rate reset dates for certain adjustable rate securities. It is a measure that reflects how a fund may react in periods when credit spreads are widening or liquidity conditions are tightening. In general, the longer the fund’s average life, the greater its exposure to interest rate fluctuations. Money funds must maintain a weighted average life of less than 120 days.
Weighted average maturity: In general, the longer the average maturity, the greater the fund’s sensitivity to interest rate changes. The weighted average maturity may take into account the interest rate readjustment dates for certain securities. Money funds must maintain a weighted average maturity of less than 60 days.
Performance and Expenses
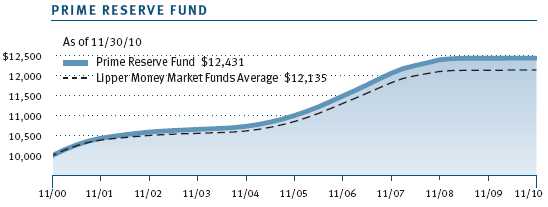
This chart shows the value of a hypothetical $10,000 investment in the fund over the past 10 fiscal year periods or since inception (for funds lacking 10-year records). The result is compared with benchmarks, which may include a broad-based market index and a peer group average or index. Market indexes do not include expenses, which are deducted from fund returns as well as mutual fund averages and indexes.

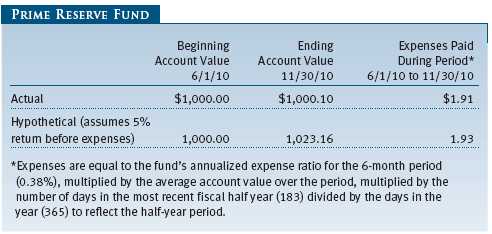
As a mutual fund shareholder, you may incur two types of costs: (1) transaction costs, such as redemption fees or sales loads, and (2) ongoing costs, including management fees, distribution and service (12b-1) fees, and other fund expenses. The following example is intended to help you understand your ongoing costs (in dollars) of investing in the fund and to compare these costs with the ongoing costs of investing in other mutual funds. The example is based on an investment of $1,000 invested at the beginning of the most recent six-month period and held for the entire period.
Actual Expenses
The first line of the following table (“Actual”) provides information about actual account values and expenses based on the fund’s actual returns. You may use the information in this line, together with your account balance, to estimate the expenses that you paid over the period. Simply divide your account value by $1,000 (for example, an $8,600 account value divided by $1,000 = 8.6), then multiply the result by the number in the first line under the heading “Expenses Paid During Period” to estimate the expenses you paid on your account during this period.
Hypothetical Example for Comparison Purposes
The information on the second line of the table (“Hypothetical”) is based on hypothetical account values and expenses derived from the fund’s actual expense ratio and an assumed 5% per year rate of return before expenses (not the fund’s actual return). You may compare the ongoing costs of investing in the fund with other funds by contrasting this 5% hypothetical example and the 5% hypothetical examples that appear in the shareholder reports of the other funds. The hypothetical account values and expenses may not be used to estimate the actual ending account balance or expenses you paid for the period.
Note: T. Rowe Price charges an annual small-account maintenance fee of $10, generally for accounts with less than $2,000 ($500 for UGMA/UTMA). The fee is waived for any investor whose T. Rowe Price mutual fund accounts total $25,000 or more, accounts employing automatic investing, and IRAs and other retirement plan accounts that utilize a prototype plan sponsored by T. Rowe Price (although a separate custodial or administrative fee may apply to such accounts). This fee is not included in the accompanying table. If you are subject to the fee, keep it in mind when you are estimating the ongoing expenses of investing in the fund and when comparing the expenses of this fund with other funds.
You should also be aware that the expenses shown in the table highlight only your ongoing costs and do not reflect any transaction costs, such as redemption fees or sales loads. Therefore, the second line of the table is useful in comparing ongoing costs only and will not help you determine the relative total costs of owning different funds. To the extent a fund charges transaction costs, however, the total cost of owning that fund is higher.

Unaudited

The accompanying notes are an integral part of these financial statements.
Unaudited


The accompanying notes are an integral part of these financial statements.
Unaudited
The accompanying notes are an integral part of these financial statements.
Unaudited

The accompanying notes are an integral part of these financial statements.
Unaudited
The accompanying notes are an integral part of these financial statements.
Unaudited
| NOTES TO FINANCIAL STATEMENTS |
T. Rowe Price Prime Reserve Fund, Inc. (the fund), is registered under the Investment Company Act of 1940 (the 1940 Act) as a diversified, open-end management investment company. The fund commenced operations on January 26, 1976. The fund seeks preservation of capital, liquidity, and, consistent with these, the highest possible current income.
NOTE 1 - SIGNIFICANT ACCOUNTING POLICIES
Basis of Preparation The accompanying financial statements were prepared in accordance with accounting principles generally accepted in the United States of America, which require the use of estimates made by fund management. Fund management believes that estimates and valuations are appropriate; however, actual results may differ from those estimates, and the valuations reflected in the accompanying financial statements may differ from the value ultimately realized upon sale or maturity.
Investment Transactions, Investment Income, and Distributions Income and expenses are recorded on the accrual basis. Premiums and discounts on debt securities are amortized for financial reporting purposes. Paydown gains and losses are recorded as an adjustment to interest income. Income tax-related interest and penalties, if incurred, would be recorded as income tax expense. Investment transactions are accounted for on the trade date. Realized gains and losses are reported on the identified cost basis. Distributions to shareholders are recorded on the ex-dividend date. Income distributions are declared daily and paid monthly.
Credits The fund earns credits on temporarily uninvested cash balances held at the custodian, which reduce the fund’s custody charges. Custody expense in the accompanying financial statements is presented before reduction for credits, which are reflected as expenses paid indirectly.
New Accounting Pronouncement On June 1, 2010, the fund adopted new accounting guidance that requires enhanced disclosures about fair value measurements in the financial statements. Adoption of this guidance had no impact on the fund’s net assets or results of operations.
NOTE 2 - VALUATION
The fund values its investments and computes its net asset value per share each day that the New York Stock Exchange is open for business. In accordance with Rule 2a-7 under the 1940 Act, securities are valued at amortized cost, which approximates fair value. Securities for which amortized cost is deemed not to reflect fair value are stated at fair value as determined in good faith by the T. Rowe Price Valuation Committee, established by the fund’s Board of Directors.
Various inputs are used to determine the value of the fund’s financial instruments. These inputs are summarized in the three broad levels listed below:
Level 1 – quoted prices in active markets for identical financial instruments
Level 2 – observable inputs other than Level 1 quoted prices (including, but not limited to, quoted prices for similar financial instruments, interest rates, prepayment speeds, and credit risk)
Level 3 – unobservable inputs
Observable inputs are those based on market data obtained from sources independent of the fund, and unobservable inputs reflect the fund’s own assumptions based on the best information available. The input levels are not necessarily an indication of the risk or liquidity associated with financial instruments at that level. For example, securities held by a money market fund are generally high quality and liquid; however, they are reflected as Level 2 because the inputs used to determine fair value are not quoted prices in an active market. On November 30, 2010, all of the fund’s financial instruments were classified as Level 2, based on the inputs used to determine their values.
NOTE 3 - OTHER INVESTMENT TRANSACTIONS
Consistent with its investment objective, the fund engages in the following practices to manage exposure to certain risks and/or to enhance performance. The investment objective, policies, program, and risk factors of the fund are described more fully in the fund’s prospectus and Statement of Additional Information.
Restricted Securities The fund may invest in securities that are subject to legal or contractual restrictions on resale. Prompt sale of such securities at an acceptable price may be difficult and may involve substantial delays and additional costs.
NOTE 4 - FEDERAL INCOME TAXES
No provision for federal income taxes is required since the fund intends to continue to qualify as a regulated investment company under Subchapter M of the Internal Revenue Code and distribute to shareholders all of its taxable income and gains. Distributions determined in accordance with federal income tax regulations may differ in amount or character from net investment income and realized gains for financial reporting purposes. Financial reporting records are adjusted for permanent book/tax differences to reflect tax character but are not adjusted for temporary differences. The amount and character of tax-basis distributions and composition of net assets are finalized at fiscal year-end; accordingly, tax-basis balances have not been determined as of the date of this report.
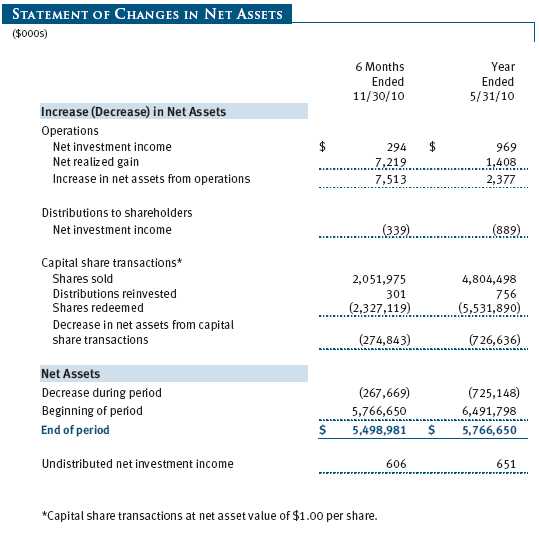
The fund intends to retain realized gains to the extent of available capital loss carryforwards. As of May 31, 2010, the fund had $7,184,000 of unused capital loss carryforwards, all expire in fiscal 2017.
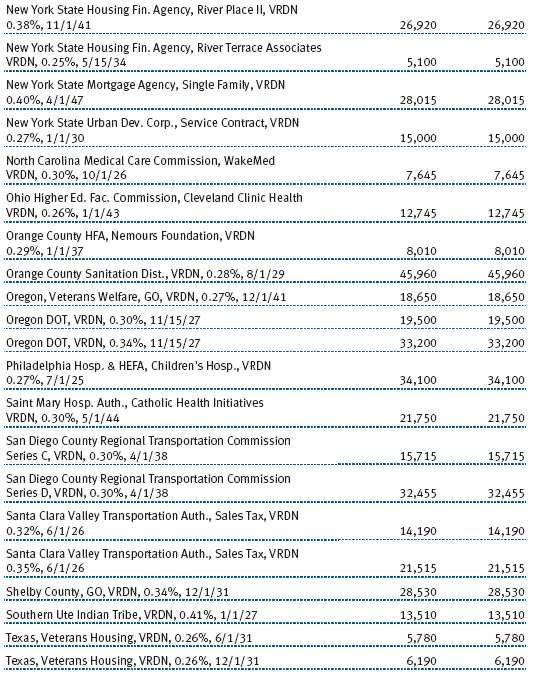
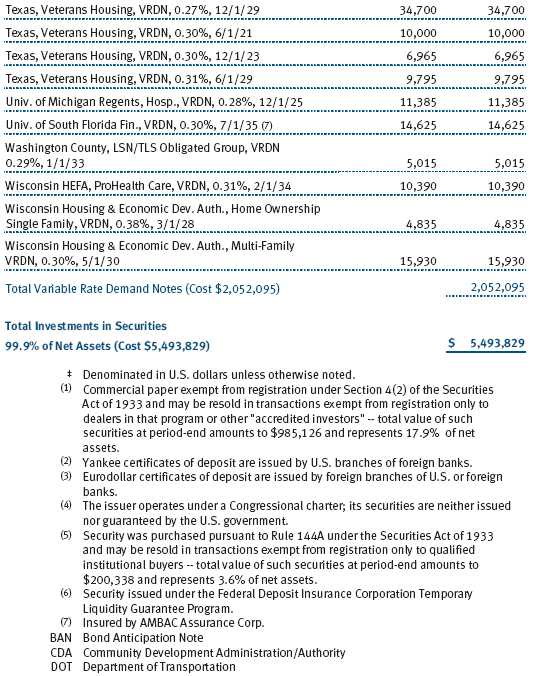
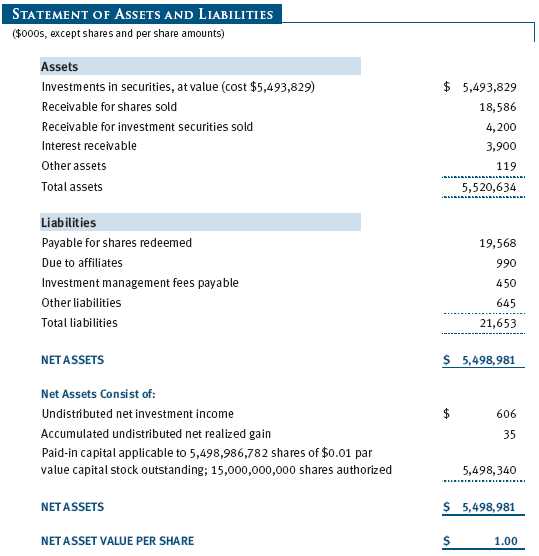
At November 30, 2010, the cost of investments for federal income tax purposes was $5,493,829,000.
NOTE 5 - RELATED PARTY TRANSACTIONS
The fund is managed by T. Rowe Price Associates, Inc. (the manager or Price Associates), a wholly owned subsidiary of T. Rowe Price Group, Inc. The investment management agreement between the fund and the manager provides for an annual investment management fee, which is computed daily and paid monthly. The fee consists of an individual fund fee, equal to 0.05% of the fund’s average daily net assets, and a group fee. The group fee rate is calculated based on the combined net assets of certain mutual funds sponsored by Price Associates (the group) applied to a graduated fee schedule, with rates ranging from 0.48% for the first $1 billion of assets to 0.285% for assets in excess of $220 billion. The fund’s group fee is determined by applying the group fee rate to the fund’s average daily net assets. At November 30, 2010, the effective annual group fee rate was 0.30%.
Price Associates may voluntarily waive all or a portion of its management fee to the extent necessary for the fund to maintain a zero or positive net yield. Any amounts waived under this voluntary agreement are not subject to repayment by the fund. Price Associates may amend or terminate this voluntary waiver at any time without prior notice. For the six months ended November 30, 2010, the total management fees waived were $5,706,000.
In addition, the fund has entered into service agreements with Price Associates and two wholly owned subsidiaries of Price Associates (collectively, Price). Price Associates computes the daily share price and provides certain other administrative services to the fund. T. Rowe Price Services, Inc., provides shareholder and administrative services in its capacity as the fund’s transfer and dividend disbursing agent. T. Rowe Price Retirement Plan Services, Inc., provides subaccounting and recordkeeping services for certain retirement accounts invested in the fund. For the six months ended November 30, 2010, expenses incurred pursuant to these service agreements were $58,000 for Price Associates; $3,018,000 for T. Rowe Price Services, Inc.; and $1,039,000 for T. Rowe Price Retirement Plan Services, Inc. The total amount payable at period-end pursuant to these service agreements is reflected as Due to Affiliates in the accompanying financial statements.
During November 2010, Price Associates contributed $6,406,000 to the fund to offset the effect of cumulative net losses realized by the fund. The payment did not affect the fund’s total return for the six months ended November 30, 2010.
As of November 30, 2010, T. Rowe Price Group, Inc., and/or its wholly owned subsidiaries owned 72,080,141 shares of the fund, representing 1% of the fund’s net assets.
NOTE 6 - INTERFUND BORROWING PROGRAM
The manager has developed a program that provides temporary liquidity under an interfund borrowing agreement between the fund and other T. Rowe Price-sponsored mutual funds. The program permits the borrowing and lending of cash at rates beneficial to both the borrowing and lending funds. Pursuant to program guidelines, the fund may lend up to 15% of its net assets and no more than 5% of its net assets may be lent to any one borrower. Loans totaling 10% or more of a borrowing fund’s total assets require collateralization at 102% of the value of the loan; loans of less than 10% are unsecured. During the six months ended November 30, 2010, the fund earned $3,000 in interest income related to loans made to other funds on six days in the average amount of $15,767,000 and at an average annual rate of 1.24%. At November 30, 2010, there were no loans outstanding.
| INFORMATION ON PROXY VOTING POLICIES, PROCEDURES, AND RECORDS |
A description of the policies and procedures used by T. Rowe Price funds and portfolios to determine how to vote proxies relating to portfolio securities is available in each fund’s Statement of Additional Information, which you may request by calling 1-800-225-5132 or by accessing the SEC’s website, sec.gov. The description of our proxy voting policies and procedures is also available on our website, troweprice.com. To access it, click on the words “Our Company” at the top of our corporate homepage. Then, when the next page appears, click on the words “Proxy Voting Policies” on the left side of the page.
Each fund’s most recent annual proxy voting record is available on our website and through the SEC’s website. To access it through our website, follow the directions above, then click on the words “Proxy Voting Records” on the right side of the Proxy Voting Policies page.
| HOW TO OBTAIN QUARTERLY PORTFOLIO HOLDINGS |
The fund files a complete schedule of portfolio holdings with the Securities and Exchange Commission for the first and third quarters of each fiscal year on Form N-Q. The fund’s Form N-Q is available electronically on the SEC’s website (sec.gov); hard copies may be reviewed and copied at the SEC’s Public Reference Room, 450 Fifth St. N.W., Washington, DC 20549. For more information on the Public Reference Room, call 1-800-SEC-0330.
Item 2. Code of Ethics.
A code of ethics, as defined in Item 2 of Form N-CSR, applicable to its principal executive officer, principal financial officer, principal accounting officer or controller, or persons performing similar functions is filed as an exhibit to the registrant’s annual Form N-CSR. No substantive amendments were approved or waivers were granted to this code of ethics during the registrant’s most recent fiscal half-year.
Item 3. Audit Committee Financial Expert.
Disclosure required in registrant’s annual Form N-CSR.
Item 4. Principal Accountant Fees and Services.
Disclosure required in registrant’s annual Form N-CSR.
Item 5. Audit Committee of Listed Registrants.
Not applicable.
Item 6. Investments.
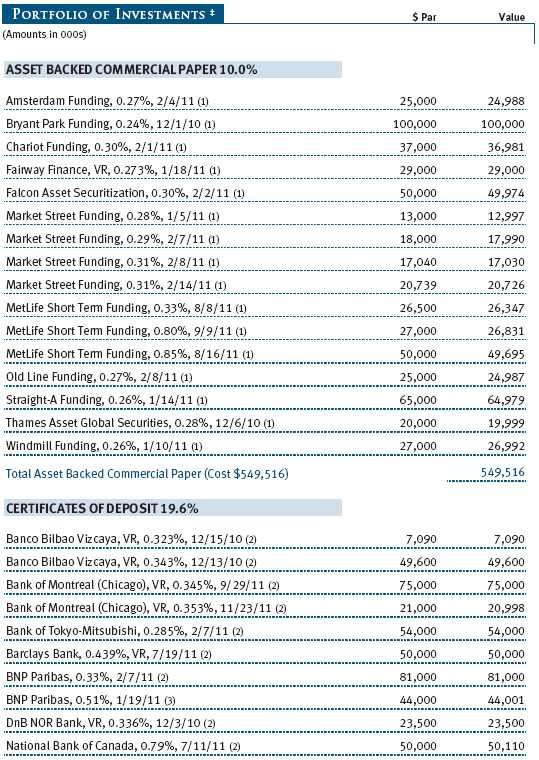
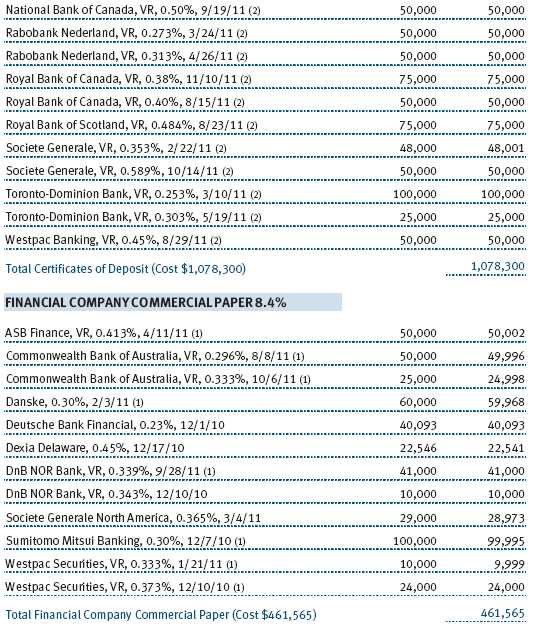
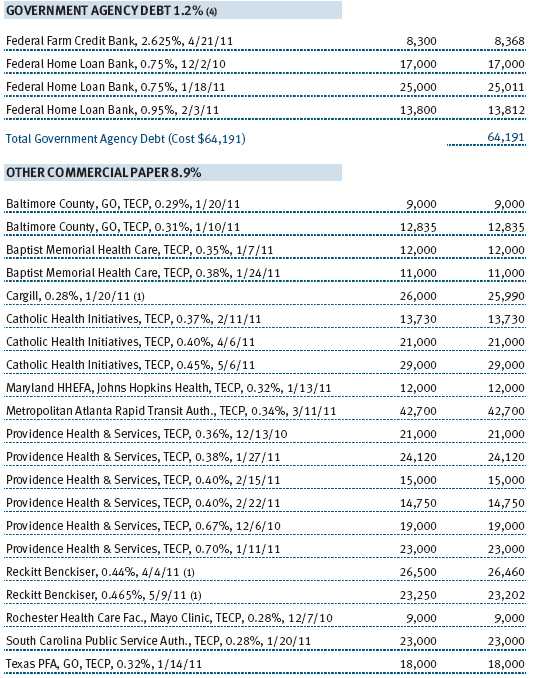
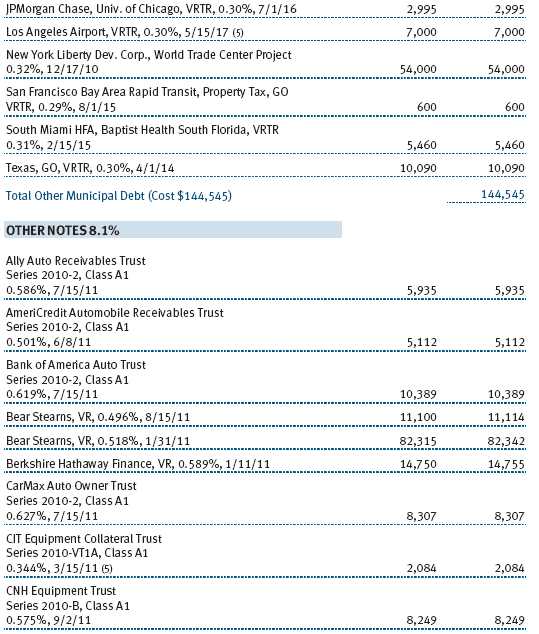
(a) Not applicable. The complete schedule of investments is included in Item 1 of this Form N-CSR.
(b) Not applicable.
Item 7. Disclosure of Proxy Voting Policies and Procedures for Closed-End Management Investment Companies.
Not applicable.
Item 8. Portfolio Managers of Closed-End Management Investment Companies.
Not applicable.
Item 9. Purchases of Equity Securities by Closed-End Management Investment Company and Affiliated Purchasers.
Not applicable.
Item 10. Submission of Matters to a Vote of Security Holders.
Not applicable.
Item 11. Controls and Procedures.
(a) The registrant’s principal executive officer and principal financial officer have evaluated the registrant’s disclosure controls and procedures within 90 days of this filing and have concluded that the registrant’s disclosure controls and procedures were effective, as of that date, in ensuring that information required to be disclosed by the registrant in this Form N-CSR was recorded, processed, summarized, and reported timely.
(b) The registrant’s principal executive officer and principal financial officer are aware of no change in the registrant’s internal control over financial reporting that occurred during the registrant’s second fiscal quarter covered by this report that has materially affected, or is reasonably likely to materially affect, the registrant’s internal control over financial reporting.
Item 12. Exhibits.
(a)(1) The registrant’s code of ethics pursuant to Item 2 of Form N-CSR is filed with the registrant’s annual Form N-CSR.
(2) Separate certifications by the registrant's principal executive officer and principal financial officer, pursuant to Section 302 of the Sarbanes-Oxley Act of 2002 and required by Rule 30a-2(a) under the Investment Company Act of 1940, are attached.
(3) Written solicitation to repurchase securities issued by closed-end companies: not applicable.
(b) A certification by the registrant's principal executive officer and principal financial officer, pursuant to Section 906 of the Sarbanes-Oxley Act of 2002 and required by Rule 30a-2(b) under the Investment Company Act of 1940, is attached.
| | |
SIGNATURES |
| |
| | Pursuant to the requirements of the Securities Exchange Act of 1934 and the Investment |
| Company Act of 1940, the registrant has duly caused this report to be signed on its behalf by the |
| undersigned, thereunto duly authorized. |
| |
| T. Rowe Price Prime Reserve Fund, Inc. |
| |
| |
| By | /s/ Edward C. Bernard |
| | Edward C. Bernard |
| | Principal Executive Officer |
| |
| Date | January 21, 2011 |
| |
| |
| |
| | Pursuant to the requirements of the Securities Exchange Act of 1934 and the Investment |
| Company Act of 1940, this report has been signed below by the following persons on behalf of |
| the registrant and in the capacities and on the dates indicated. |
| |
| |
| By | /s/ Edward C. Bernard |
| | Edward C. Bernard |
| | Principal Executive Officer |
| |
| Date | January 21, 2011 |
| |
| |
| |
| By | /s/ Gregory K. Hinkle |
| | Gregory K. Hinkle |
| | Principal Financial Officer |
| |
| Date | January 21, 2011 |