| UNITED STATES |
| SECURITIES AND EXCHANGE COMMISSION |
| Washington, D.C. 20549 |
| |
FORM N-CSR |
| |
CERTIFIED SHAREHOLDER REPORT OF REGISTERED |
MANAGEMENT INVESTMENT COMPANIES |
| |
| |
| |
| Investment Company Act File Number: 811-2603 |
|
| |
| T. Rowe Price Prime Reserve Fund, Inc. |
|
| (Exact name of registrant as specified in charter) |
| |
| 100 East Pratt Street, Baltimore, MD 21202 |
|
| (Address of principal executive offices) |
| |
| David Oestreicher |
| 100 East Pratt Street, Baltimore, MD 21202 |
|
| (Name and address of agent for service) |
| |
| |
| Registrant’s telephone number, including area code: (410) 345-2000 |
| |
| |
| Date of fiscal year end: May 31 |
| |
| |
| Date of reporting period: November 30, 2009 |
Item 1: Report to Shareholders| Prime Reserve Fund | November 30, 2009 |
The views and opinions in this report were current as of November 30, 2009. They are not guarantees of performance or investment results and should not be taken as investment advice. Investment decisions reflect a variety of factors, and the managers reserve the right to change their views about individual stocks, sectors, and the markets at any time. As a result, the views expressed should not be relied upon as a forecast of the fund’s future investment intent. The report is certified under the Sarbanes-Oxley Act, which requires mutual funds and other public companies to affirm that, to the best of their knowledge, the information in their financial reports is fairly and accurately stated in all material respects.
REPORTS ON THE WEB
Sign up for our E-mail Program, and you can begin to receive updated fund reports and prospectuses online rather than through the mail. Log in to your account at troweprice.com for more information.
Manager’s Letter
Fellow Shareholders
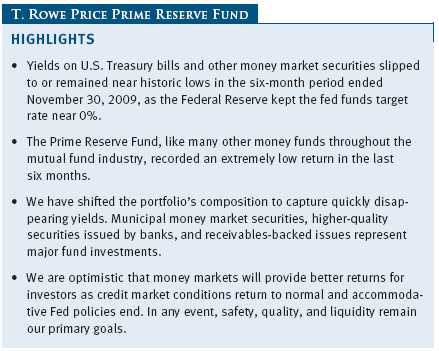
The economy showed signs of improvement in the six-month period ended November 30, 2009, but yields on U.S. Treasury bills and other money market securities slipped to or remained near historic lows during the period, as the Federal Reserve kept its fed funds target rate in an all-time low range since the end of 2008. The Prime Reserve Fund, like many other money market funds throughout the mutual fund industry, recorded an extremely low return in the last six months.
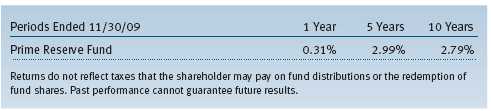
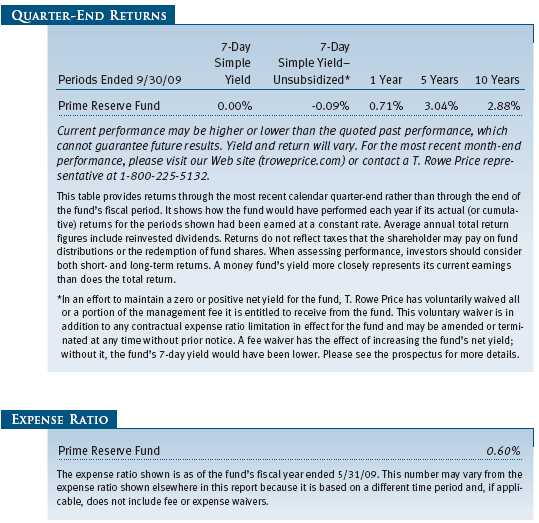
Your fund returned 0.01% in the first half of its fiscal year. As shown in the Performance Comparison table, the fund’s Lipper peer group average fared slightly better but still produced a very low return.

Despite the fund’s low absolute return in the last six months, its longer-term performance relative to its peers remains favorable. Lipper ranked the fund in the top 20% of the Lipper money market funds universe for the 5- and 10-year periods ended November 30, 2009. Lipper also ranked the fund in the top quartile for the three-year period ended November 30, 2009. (Based on cumulative total return, Lipper ranked the Prime Reserve Fund 88 out of 296, 61 out of 275, 51 out of 257, and 40 out of 202 funds for the 1-, 3-, 5-, and 10-year periods ended November 30, 2009, respectively. Results will vary for other time periods. Past performance cannot guarantee future results.)
ECONOMY AND INTEREST RATES
The longest and deepest U.S. recession since the Great Depression seems to be coming to an end. The economy, which shrank at an annualized rate of more than 5% in the fourth quarter of 2008 and in the first quarter of 2009, contracted by only 0.7% in the second quarter and grew 2.8% in the third. While national unemployment has increased to 10% and consumer spending has been restrained, job losses in recent months have been significantly lower than they were at the beginning of 2009. In addition, there are signs of stabilizing residential real estate markets in some cities, and equities have rebounded sharply from their early March lows.

As shown in the graph, Treasury bill yields have remained extremely low in the last six months, despite signs of economic improvement and heavy new issuance by the Treasury Department. Factors contributing to the low interest rate environment include continued strong demand for short-term Treasuries, low inflation, and expectations that a weak economic recovery would allow the central bank to keep short-term interest rates low. The Fed has kept the fed funds target rate in an all-time low range of 0.00% to 0.25% since the end of 2008 and seems unlikely to raise the target rate until the unemployment rate peaks and job growth resumes.
PORTFOLIO REVIEW
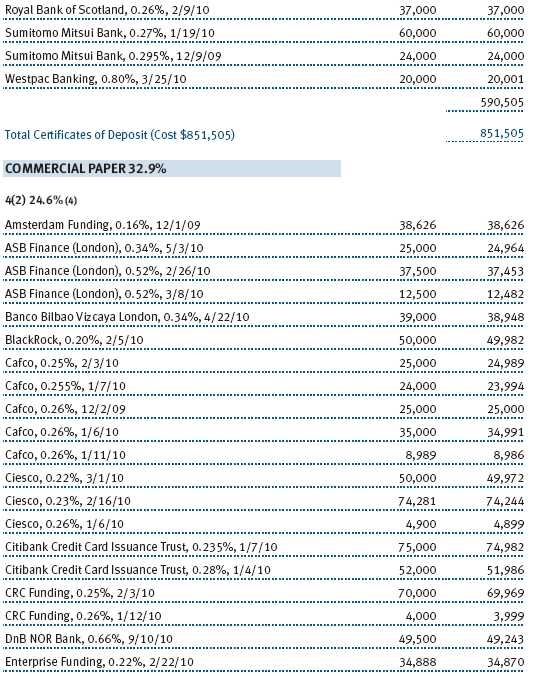
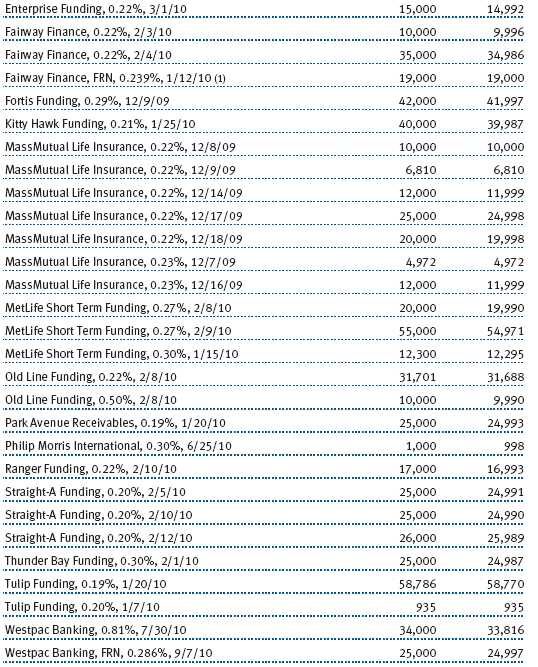
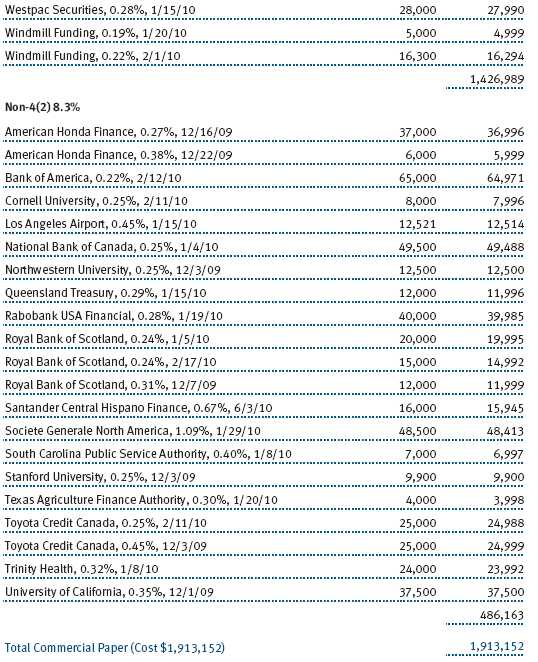
Money market yields continued their grind to lower levels as the Federal Reserve’s massively accommodative monetary policy and purchases of Treasuries, government agency debt, and agency mortgage-backed securities to support the mortgage lending market (also known as “quantitative easing”) remained firmly in place. Persistent demand in the face of falling supply continues to pressure all rates lower. As many investors still prefer the safety and liquidity of money funds, demand for money market-eligible investments remains elevated. Meanwhile, the supply of such investable assets continues to dwindle as a slowing economy creates less demand for credit. Many money market issuers have cut back on their borrowing needs, and the amount of commercial paper outstanding has fallen significantly. Even the U.S. government is expected to reduce its borrowing in the Treasury bill market in favor of longer-term financing.
A brief review of money market levels shows how low borrowing rates have fallen. Yields on Treasury bills—the most liquid of all cash investments—are most telling: 90-day Treasury bills, which six months ago yielded only 0.13%, continued to fall further and ended the period yielding 0.05% . This was also the case with 90-day agency discount notes, which fell from 0.18% to 0.06% . The market benchmark 90-day London Interbank Offered Rate (Libor) fell 40 basis points to 0.25% in the past six months. Higher-quality issues, including those in which your fund invests, trade at levels well below Libor. Thus, it is not surprising that yields on most money funds are quickly approaching or are now at 0.00%.
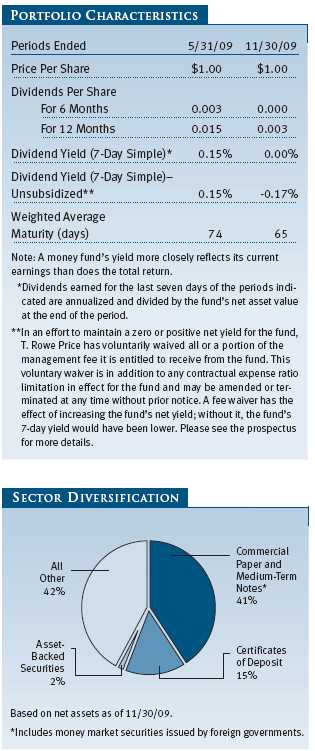
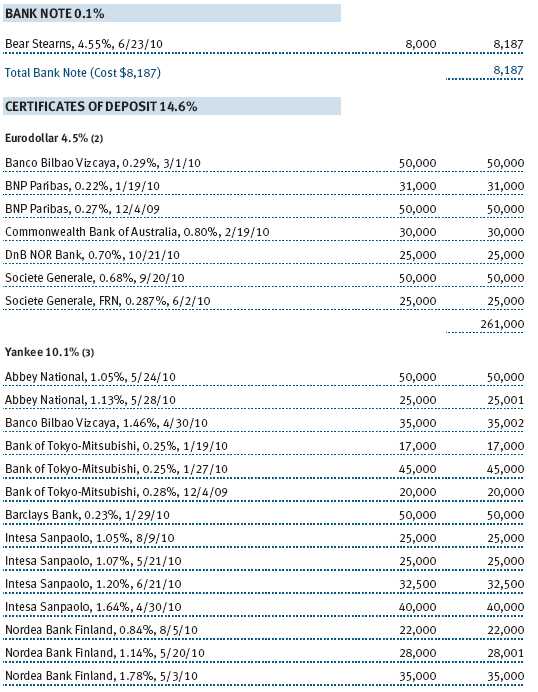
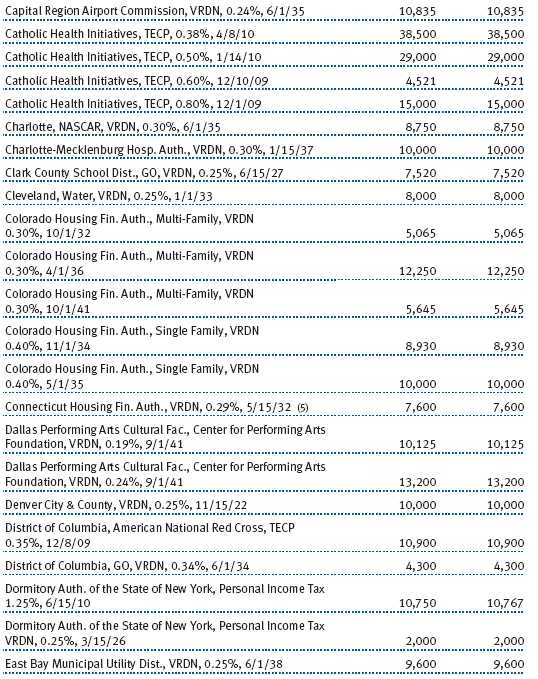
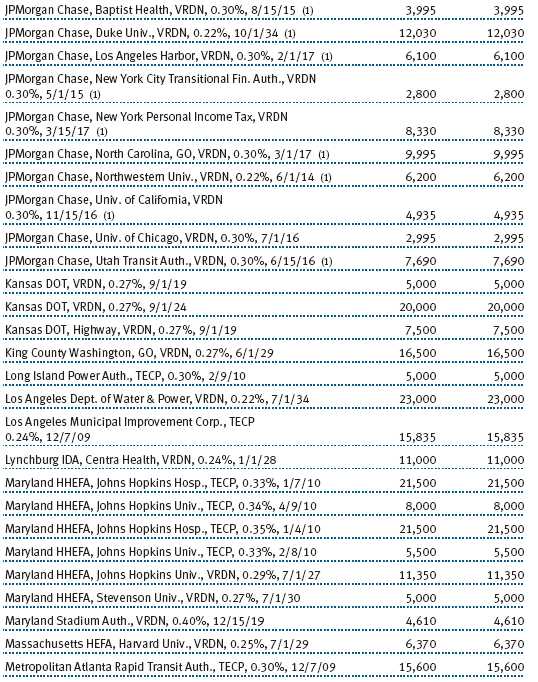
We have shifted the composition of the portfolio during the past six months to capture quickly disappearing yields. In an unusual turnabout, municipal tax-exempt yields have remained higher than most taxable yields for similar maturities. We have therefore called upon T. Rowe Price’s municipal investment analysts to invest as much as 45% of the portfolio in these opportunities. A significant portion of the portfolio is also invested in some of the higher-quality names in the banking sector, while receivables-backed issues also represent major investments.
The weighted average maturity of the portfolio remains relatively long at 65 days. This interest rate posture represents our view that the Federal Reserve will maintain exceptionally low interest rates for some time. We believe that the economy is bottoming, but outright job creation and a falling unemployment rate may be prerequisites for the Fed to begin raising short-term rates. The Fed’s massive expansion of its balance sheet through direct purchases of Treasury and agency debt has complicated the central bank’s task of ending its extraordinary support of the credit markets and the economy—the so-called “exit strategy.” How the Federal Reserve will shift from its current policy stance to one that is less accommodative remains quite uncertain, but we will be watching closely in the months to come.
OUTLOOK
As the credit crisis (hopefully) passes into history, fixed income investors will have to shift their attention from the impact of new government programs to the implications of an end of government support. We are optimistic that credit markets will be able to stand on their own, and, in the case of the money markets, that a return to normal will mean better returns for investors. In any event, we will continue to invest your fund’s assets in money market securities with the goals of safety, quality, and liquidity as paramount while seeking to maintain a level of income commensurate with those goals.
As always, thank you for investing with T. Rowe Price.
Respectfully submitted,

Joseph K. Lynagh
Chairman of the fund’s Investment Advisory Committee
December 9, 2009
The committee chairman has day-to-day responsibility for managing the portfolio and works with committee members in developing and executing the fund’s investment program.
RISKS OF INVESTING IN MONEY MARKET SECURITIES
Since money market funds are managed to maintain a constant $1.00 share price, there should be little risk of principal loss. However, there is no assurance the fund will avoid principal losses if portfolio holdings default or are downgraded or if interest rates rise sharply in an unusually short period. In addition, the fund’s yield will vary; it is not fixed for a specific period like the yield on a bank certificate of deposit. An investment in the fund is not insured or guaranteed by the Federal Deposit Insurance Corporation (FDIC) or any other government agency. Although a money market fund seeks to preserve the value of your investment at $1.00 per share, it is possible to lose money by investing in it.
GLOSSARY
Average maturity: The average of the stated maturity dates of a bond or money market portfolio’s securities. The average maturity for a money market fund is measured in days, whereas a bond fund’s average maturity is measured in years. In general, the longer the average maturity, the greater the fund’s sensitivity to interest rate changes, which means greater price fluctuation.
Fed funds target rate: An overnight lending rate set by the Federal Reserve and used by banks to meet reserve requirements. Banks also use the fed funds target rate as a benchmark for their prime lending rates.
Libor: The London Interbank Offered Rate is a taxable money market benchmark.
Lipper average: Consists of all the mutual funds in a particular category as tracked by Lipper Inc.
Performance and Expenses
This chart shows the value of a hypothetical $10,000 investment in the fund over the past 10 fiscal year periods or since inception (for funds lacking 10-year records). The result is compared with benchmarks, which may include a broad-based market index and a peer group average or index. Market indexes do not include expenses, which are deducted from fund returns as well as mutual fund averages and indexes.

| AVERAGE ANNUAL COMPOUND TOTAL RETURN |
This table shows how the fund would have performed each year if its actual (or cumulative) returns for the periods shown had been earned at a constant rate
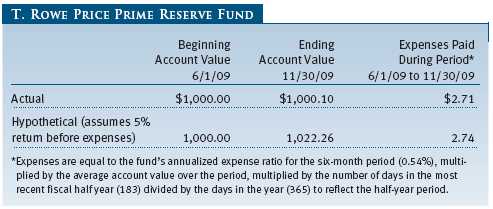
As a mutual fund shareholder, you may incur two types of costs: (1) transaction costs, such as redemption fees or sales loads, and (2) ongoing costs, including management fees, distribution and service (12b-1) fees, and other fund expenses. The following example is intended to help you understand your ongoing costs (in dollars) of investing in the fund and to compare these costs with the ongoing costs of investing in other mutual funds. The example is based on an investment of $1,000 invested at the beginning of the most recent six-month period and held for the entire period.
Actual Expenses
The first line of the following table (“Actual”) provides information about actual account values and expenses based on the fund’s actual returns. You may use the information in this line, together with your account balance, to estimate the expenses that you paid over the period. Simply divide your account value by $1,000 (for example, an $8,600 account value divided by $1,000 = 8.6), then multiply the result by the number in the first line under the heading “Expenses Paid During Period” to estimate the expenses you paid on your account during this period.
Hypothetical Example for Comparison Purposes
The information on the second line of the table (“Hypothetical”) is based on hypothetical account values and expenses derived from the fund’s actual expense ratio and an assumed 5% per year rate of return before expenses (not the fund’s actual return). You may compare the ongoing costs of investing in the fund with other funds by contrasting this 5% hypothetical example and the 5% hypothetical examples that appear in the shareholder reports of the other funds. The hypothetical account values and expenses may not be used to estimate the actual ending account balance or expenses you paid for the period.
Note: T. Rowe Price charges an annual small-account maintenance fee of $10, generally for accounts with less than $2,000 ($500 for UGMA/UTMA). The fee is waived for any investor whose T. Rowe Price mutual fund accounts total $25,000 or more, accounts employing automatic investing, and IRAs and other retirement plan accounts that utilize a prototype plan sponsored by T. Rowe Price (although a separate custodial or administrative fee may apply to such accounts). This fee is not included in the accompanying table. If you are subject to the fee, keep it in mind when you are estimating the ongoing expenses of investing in the fund and when comparing the expenses of this fund with other funds.
You should also be aware that the expenses shown in the table highlight only your ongoing costs and do not reflect any transaction costs, such as redemption fees or sales loads. Therefore, the second line of the table is useful in comparing ongoing costs only and will not help you determine the relative total costs of owning different funds. To the extent a fund charges transaction costs, however, the total cost of owning that fund is higher.
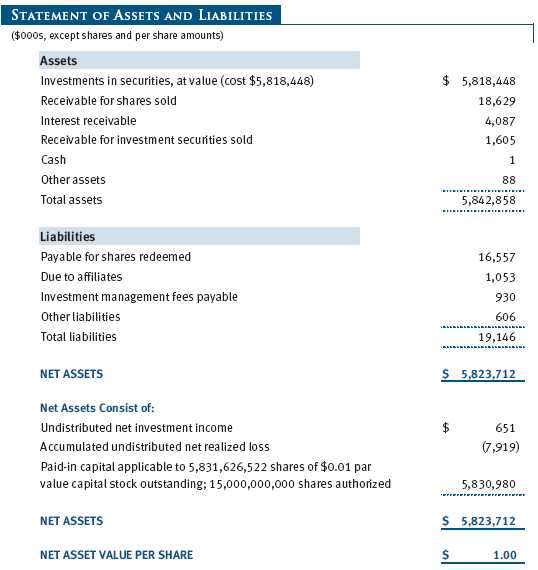
Unaudited

The accompanying notes are an integral part of these financial statements.
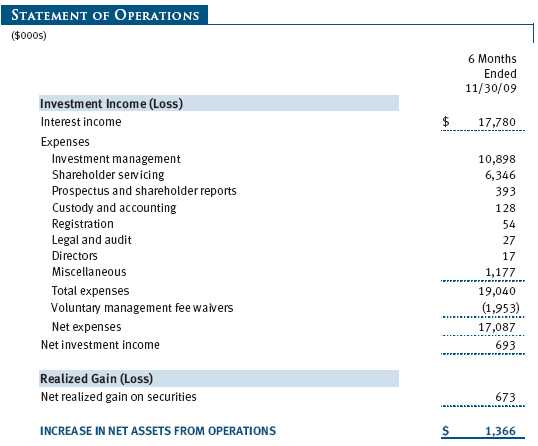
Unaudited


The accompanying notes are an integral part of these financial statements.
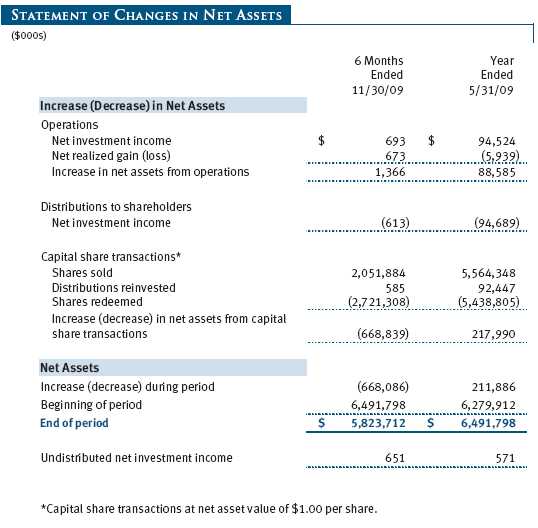
Unaudited
The accompanying notes are an integral part of these financial statements.
Unaudited
The accompanying notes are an integral part of these financial statements.
Unaudited
The accompanying notes are an integral part of these financial statements.
Unaudited
| NOTES TO FINANCIAL STATEMENTS |
T. Rowe Price Prime Reserve Fund, Inc. (the fund), is registered under the Investment Company Act of 1940 (the 1940 Act) as a diversified, open-end management investment company. The fund commenced operations on January 26, 1976. The fund seeks preservation of capital, liquidity, and, consistent with these, the highest possible current income.
NOTE 1 - SIGNIFICANT ACCOUNTING POLICIES
Basis of Preparation The accompanying financial statements were prepared in accordance with accounting principles generally accepted in the United States of America, which require the use of estimates made by fund management. Fund management believes that estimates and security valuations are appropriate; however, actual results may differ from those estimates, and the security valuations reflected in the accompanying financial statements may differ from the value the fund ultimately realizes on the securities. Further, fund management believes that no events have occurred between November 30, 2009, the date of this report, and January 22, 2010, the date of issuance of the financial statements, that require adjustment of, or disclosure in, the accompanying financial statements.
Investment Transactions, Investment Income, and Distributions Income and expenses are recorded on the accrual basis. Premiums and discounts on debt securities are amortized for financial reporting purposes. Income tax-related interest and penalties, if incurred, would be recorded as income tax expense. Investment transactions are accounted for on the trade date. Realized gains and losses are reported on the identified cost basis. Paydown gains and losses are recorded as an adjustment to interest income. Distributions to shareholders are recorded on the ex-dividend date. Income distributions are declared daily and paid monthly.
Credits The fund earns credits on temporarily uninvested cash balances held at the custodian, which reduce the fund’s custody charges. Custody expense in the accompanying financial statements is presented before reduction for credits.
NOTE 2 - VALUATION
The fund values its investments and computes its net asset value per share each day that the New York Stock Exchange is open for business. In accordance with Rule 2a-7 under the 1940 Act, securities are valued at amortized cost, which approximates fair value. Securities for which amortized cost is deemed not to reflect fair value are stated at fair value as determined in good faith by the T. Rowe Price Valuation Committee, established by the fund’s Board of Directors.
Various inputs are used to determine the value of the fund’s investments. These inputs are summarized in the three broad levels listed below:
Level 1 – quoted prices in active markets for identical securities
Level 2 – observable inputs other than Level 1 quoted prices (including, but not limited to, quoted prices for similar securities, interest rates, prepayment speeds, credit risk)
Level 3 – unobservable inputs
Observable inputs are those based on market data obtained from sources independent of the fund, and unobservable inputs reflect the fund’s own assumptions based on the best information available. The input levels are not necessarily an indication of the risk or liquidity associated with investments at that level. For example, securities held by a money market fund are generally high quality and liquid; however, they are reflected as Level 2 because the inputs used to determine fair value are not quoted prices in an active market. The fund’s investments are summarized by level, based on the inputs used to determine their values. On November 30, 2009, all of the fund’s investments were classified as Level 2.
NOTE 3 - OTHER INVESTMENT TRANSACTIONS
Consistent with its investment objective, the fund engages in the following practices to manage exposure to certain risks or to enhance performance. The investment objective, policies, program, and risk factors of the fund are described more fully in the fund’s prospectus and Statement of Additional Information.
Restricted Securities The fund may invest in securities that are subject to legal or contractual restrictions on resale. Prompt sale of such securities at an acceptable price may be difficult and may involve substantial delays and additional costs.
NOTE 4 - FEDERAL INCOME TAXES
No provision for federal income taxes is required since the fund intends to continue to qualify as a regulated investment company under Subchapter M of the Internal Revenue Code and distribute to shareholders all of its taxable income and gains. Distributions determined in accordance with federal income tax regulations may differ in amount or character from net investment income and realized gains for financial reporting purposes. Financial reporting records are adjusted for permanent book/tax differences to reflect tax character but are not adjusted for temporary differences. The amount and character of tax-basis distributions and composition of net assets are finalized at fiscal year-end; accordingly, tax-basis balances have not been determined as of November 30, 2009.
The fund intends to retain realized gains to the extent of available capital loss carryforwards. As of May 31, 2009, the fund had $8,592,000 of unused capital loss carryforwards, of which $10,000 expire in fiscal 2013, $13,000 expire in fiscal 2014, $7,000 expire in fiscal 2015, $1,000 expire in fiscal 2016, and $8,561,000 expire in fiscal 2017.
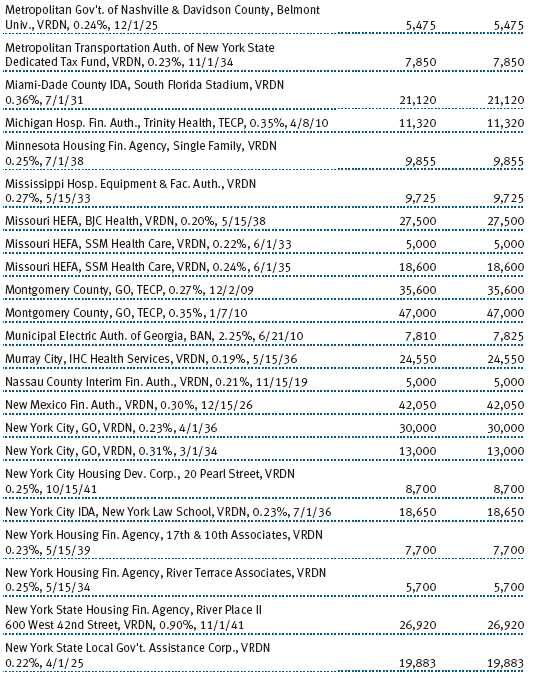
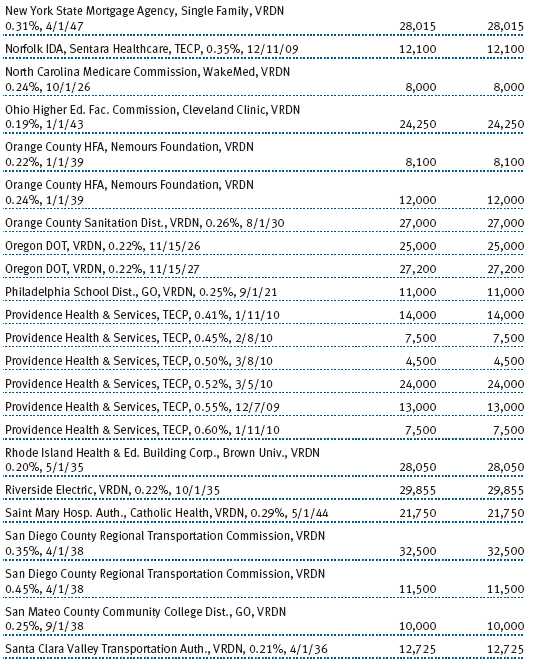
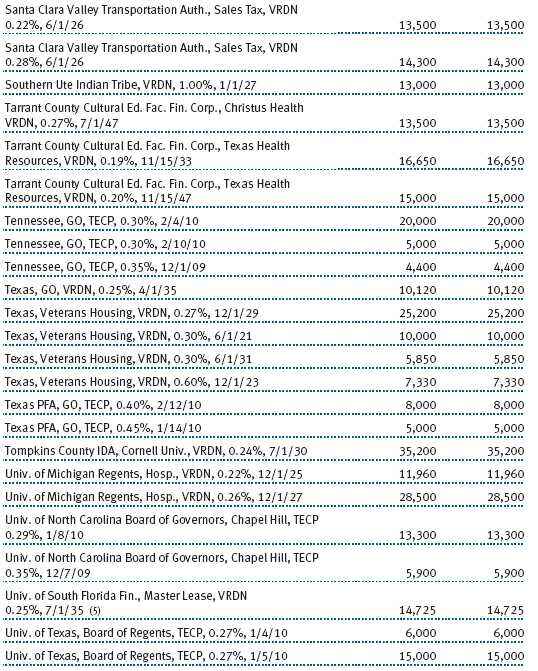
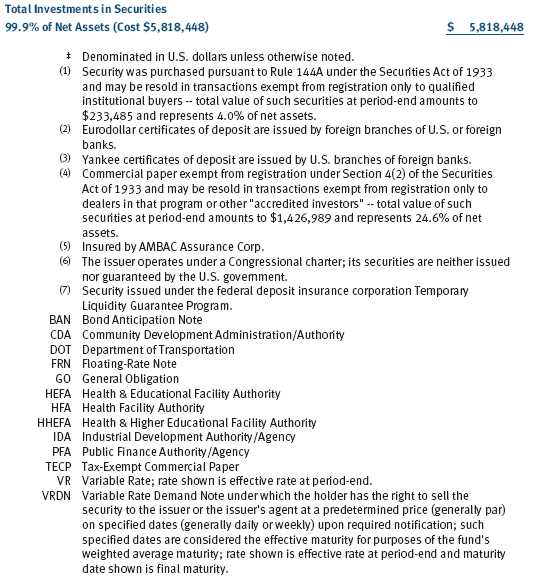
At November 30, 2009, the cost of investments for federal income tax purposes was $5,818,448,000.
NOTE 5 - RELATED PARTY TRANSACTIONS
The fund is managed by T. Rowe Price Associates, Inc. (the manager or Price Associates), a wholly owned subsidiary of T. Rowe Price Group, Inc. The investment management agreement between the fund and the manager provides for an annual investment management fee, which is computed daily and paid monthly. The fee consists of an individual fund fee, equal to 0.05% of the fund’s average daily net assets, and a group fee. The group fee rate is calculated based on the combined net assets of certain mutual funds sponsored by Price Associates (the group) applied to a graduated fee schedule, with rates ranging from 0.48% for the first $1 billion of assets to 0.285% for assets in excess of $220 billion. The fund’s group fee is determined by applying the group fee rate to the fund’s average daily net assets. At November 30, 2009, the effective annual group fee rate was 0.31%.
Price Associates may voluntarily waive all or a portion of its management fee to the extent necessary for the fund to maintain a zero or positive net yield. Any amounts waived under this voluntary agreement are not subject to repayment by the fund. Price Associates may amend or terminate this voluntary waiver at any time without prior notice. For the six months ended November 30, 2009, the total management fees waived were $1,953,000.
In addition, the fund has entered into service agreements with Price Associates and two wholly owned subsidiaries of Price Associates (collectively, Price). Price Associates computes the daily share price and provides certain other administrative services to the fund. T. Rowe Price Services, Inc., provides shareholder and administrative services in its capacity as the fund’s transfer and dividend disbursing agent. T. Rowe Price Retirement Plan Services, Inc., provides subaccounting and recordkeeping services for certain retirement accounts invested in the fund. For the six months ended November 30, 2009, expenses incurred pursuant to these service agreements were $39,000 for Price Associates; $3,042,000 for T. Rowe Price Services, Inc.; and $1,370,000 for T. Rowe Price Retirement Plan Services, Inc. The total amount payable at period-end pursuant to these service agreements is reflected as Due to Affiliates in the accompanying financial statements.
As of November 30, 2009, T. Rowe Price Group, Inc., and/or its wholly owned subsidiaries owned 104,625,126 shares of the fund, representing 2% of the fund’s net assets.
NOTE 6 - INTERFUND BORROWING PROGRAM
The manager has developed a program that provides temporary liquidity under an interfund borrowing agreement between the fund and other T. Rowe Price-sponsored mutual funds and permits the borrowing and lending of cash at rates beneficial to both the borrowing and lending funds. Pursuant to program guidelines, the fund may lend up to 15% of its net assets, of which no more than 5% of its net assets may be lent to any one borrower. Loans totaling 10% or more of a borrowing fund’s total assets are collateralized at 102% of the value of the loan; loans of less than 10% are unsecured. During the six months ended November 30, 2009, the fund earned $4,000 in interest income related to loans made to other funds on 24 days in the average amount of $5,708,000 and at an average annual rate of 1.19% . At November 30, 2009, there were no loans outstanding.
NOTE 7 - TREASURY’S TEMPORARY GUARANTEE PROGRAM
The fund’s Board of Directors approved participation in the Temporary Guarantee Program for Money Market Funds (the program), established by the U.S. Treasury Department, through September 18, 2009. Subject to certain conditions and limitations, the program guaranteed that shareholders in the fund as of the close of business on September 19, 2008, would receive $1.00 for each fund share held. Shares not guaranteed under the program would be redeemed at net asset value per share. The guarantee applied only if a participating money market fund’s net asset value per share fell below $0.995 and the fund subsequently decided to liquidate.
In total, the fund paid $3,836,000, equal 0.060% of the net asset value of the fund as of the close of business on September 19, 2008, to participate in the full 12-month term of the program that expired on September 18, 2009. The participation fees were borne by the fund and recognized in expenses ratably over the period of participation in the program.
| INFORMATION ON PROXY VOTING POLICIES, PROCEDURES, AND RECORDS |
A description of the policies and procedures used by T. Rowe Price funds and portfolios to determine how to vote proxies relating to portfolio securities is available in each fund’s Statement of Additional Information, which you may request by calling 1-800-225-5132 or by accessing the SEC’s Web site, www.sec.gov. The description of our proxy voting policies and procedures is also available on our Web site, www.troweprice.com. To access it, click on the words “Our Company” at the top of our corporate homepage. Then, when the next page appears, click on the words “Proxy Voting Policies” on the left side of the page.
Each fund’s most recent annual proxy voting record is available on our Web site and through the SEC’s Web site. To access it through our Web site, follow the directions above, then click on the words “Proxy Voting Records” on the right side of the Proxy Voting Policies page.
| HOW TO OBTAIN QUARTERLY PORTFOLIO HOLDINGS |
The fund files a complete schedule of portfolio holdings with the Securities and Exchange Commission for the first and third quarters of each fiscal year on Form N-Q. The fund’s Form N-Q is available electronically on the SEC’s Web site (www.sec.gov); hard copies may be reviewed and copied at the SEC’s Public Reference Room, 450 Fifth St. N.W., Washington, DC 20549. For more information on the Public Reference Room, call 1-800-SEC-0330.
Item 2. Code of Ethics.
A code of ethics, as defined in Item 2 of Form N-CSR, applicable to its principal executive officer, principal financial officer, principal accounting officer or controller, or persons performing similar functions is filed as an exhibit to the registrant’s annual Form N-CSR. No substantive amendments were approved or waivers were granted to this code of ethics during the registrant’s most recent fiscal half-year.
Item 3. Audit Committee Financial Expert.
Disclosure required in registrant’s annual Form N-CSR.
Item 4. Principal Accountant Fees and Services.
Disclosure required in registrant’s annual Form N-CSR.
Item 5. Audit Committee of Listed Registrants.
Not applicable.
Item 6. Investments.
(a) Not applicable. The complete schedule of investments is included in Item 1 of this Form N-CSR.
(b) Not applicable.
Item 7. Disclosure of Proxy Voting Policies and Procedures for Closed-End Management Investment Companies.
Not applicable.
Item 8. Portfolio Managers of Closed-End Management Investment Companies.
Not applicable.
Item 9. Purchases of Equity Securities by Closed-End Management Investment Company and Affiliated Purchasers.
Not applicable.
Item 10. Submission of Matters to a Vote of Security Holders.
Not applicable.
Item 11. Controls and Procedures.
(a) The registrant’s principal executive officer and principal financial officer have evaluated the registrant’s disclosure controls and procedures within 90 days of this filing and have concluded that the registrant’s disclosure controls and procedures were effective, as of that date, in ensuring that information required to be disclosed by the registrant in this Form N-CSR was recorded, processed, summarized, and reported timely.
(b) The registrant’s principal executive officer and principal financial officer are aware of no change in the registrant’s internal control over financial reporting that occurred during the registrant’s second fiscal quarter covered by this report that has materially affected, or is reasonably likely to materially affect, the registrant’s internal control over financial reporting.
Item 12. Exhibits.
(a)(1) The registrant’s code of ethics pursuant to Item 2 of Form N-CSR is filed with the registrant’s annual Form N-CSR.
(2) Separate certifications by the registrant's principal executive officer and principal financial officer, pursuant to Section 302 of the Sarbanes-Oxley Act of 2002 and required by Rule 30a-2(a) under the Investment Company Act of 1940, are attached.
(3) Written solicitation to repurchase securities issued by closed-end companies: not applicable.
(b) A certification by the registrant's principal executive officer and principal financial officer, pursuant to Section 906 of the Sarbanes-Oxley Act of 2002 and required by Rule 30a-2(b) under the Investment Company Act of 1940, is attached.
| | |
SIGNATURES |
| |
| | Pursuant to the requirements of the Securities Exchange Act of 1934 and the Investment |
| Company Act of 1940, the registrant has duly caused this report to be signed on its behalf by the |
| undersigned, thereunto duly authorized. |
| |
| T. Rowe Price Prime Reserve Fund, Inc. |
| |
| |
| |
| By | /s/ Edward C. Bernard |
| | Edward C. Bernard |
| | Principal Executive Officer |
| |
| Date | January 22, 2010 |
| |
| |
| |
| | Pursuant to the requirements of the Securities Exchange Act of 1934 and the Investment |
| Company Act of 1940, this report has been signed below by the following persons on behalf of |
| the registrant and in the capacities and on the dates indicated. |
| |
| |
| By | /s/ Edward C. Bernard |
| | Edward C. Bernard |
| | Principal Executive Officer |
| |
| Date | January 22, 2010 |
| |
| |
| |
| By | /s/ Gregory K. Hinkle |
| | Gregory K. Hinkle |
| | Principal Financial Officer |
| |
| Date | January 22, 2010 |