Item 1: Report to Shareholders| Prime Reserve Fund | November 30, 2007 |
The views and opinions in this report were current as of November 30, 2007. They are not guarantees of performance or investment results and should not be taken as investment advice. Investment decisions reflect a variety of factors, and the managers reserve the right to change their views about individual stocks, sectors, and the markets at any time. As a result, the views expressed should not be relied upon as a forecast of the fund’s future investment intent. The report is certified under the Sarbanes-Oxley Act, which requires mutual funds and other public companies to affirm that, to the best of their knowledge, the information in their financial reports is fairly and accurately stated in all material respects.
REPORTS ON THE WEB
Sign up for our E-mail Program, and you can begin to receive updated fund reports and prospectuses online rather than through the mail. Log in to your account at troweprice.com for more information.
Manager’s Letter
Fellow Shareholders
Money market instruments generally produced good returns in the six-month period ended November 30, 2007. Credit market turmoil prompted investors to seek the relative safety of Treasury securities, which sent Treasury bill yields sharply lower. The Federal Reserve reduced short-term interest rates on several occasions since mid-August to boost liquidity and keep financial market disruptions from damaging the economy. Yields on commercial paper and other non-Treasury money market instruments did not decline as much as T-bill yields, reflecting banks’ reduced willingness to lend in the current environment.
HIGHLIGHTS
• Money market instruments generally produced good returns in the six-month period ended November 30, 2007.
• The Prime Reserve Fund did better than its Lipper peer group average in the last six months. The fund’s longer-term performance relative to its peers remained favorable.
• As the subprime crisis appeared to threaten some segments of the money markets, our initial reaction was to adopt a very defensive maturity posture to ensure safety of principal and liquidity for shareholders.
• While expectations for lower short-term interest rates would generally mean longer weighted average maturities for money market funds, we may temper how long we extend our maturities given our primary objective of safety of principal and liquidity.
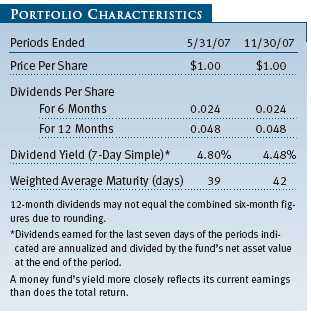
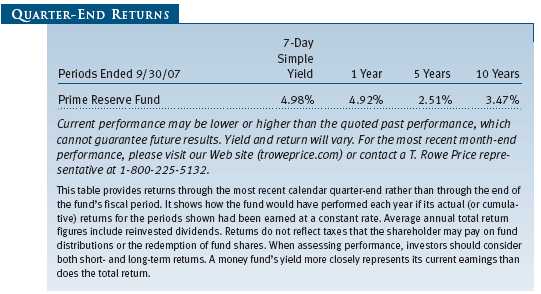
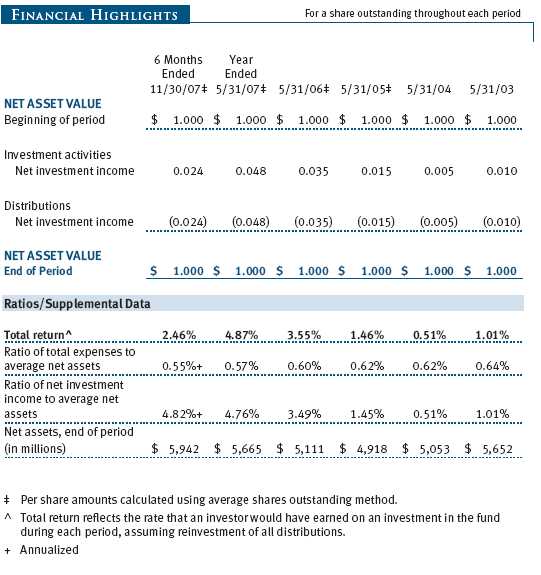
Your fund returned 2.46% in the first half of its fiscal year. As shown in the Performance Comparison table, the fund surpassed its Lipper peer group average.

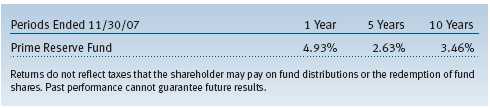
The fund’s longer-term performance relative to its peers is favorable. Lipper ranked the fund in the top 17% of the Lipper money market funds universe for the one-year period ended November 30, 2007, and in the top quartile of that universe for the 3-, 5-, and 10-year periods. (Based on cumulative total return, Lipper ranked the Prime Reserve Fund 55 out of 328, 67 out of 308, 68 out of 287, and 46 out of 186 funds for the 1-, 3-, 5-, and 10-year periods ended November 30, 2007, respectively. Results will vary for other time periods. Past performance cannot guarantee future results.)
ECONOMY AND INTEREST RATES
According to the most recent estimates, the U.S. economy expanded vigorously at an annualized rate of 4.9% in the third quarter. However, growth is expected to slow dramatically in the months ahead due to the deepening downturn in residential real estate, a slower pace of job growth, rising energy prices, and generally stricter bank lending standards.
At the beginning of the year, many subprime mortgage lenders acknowledged that customers with poor credit histories or challenging financial situations were increasingly missing or very late in making their mortgage payments. As the fallout from subprime mortgage defaults and delinquencies spread from mortgage companies to big Wall Street firms and major commercial banks, liquidity in the financial markets, particularly in the asset-backed commercial paper market, quickly evaporated during the summer and again in November. This prompted investors to seek out the relative safety of U.S. Treasury securities.
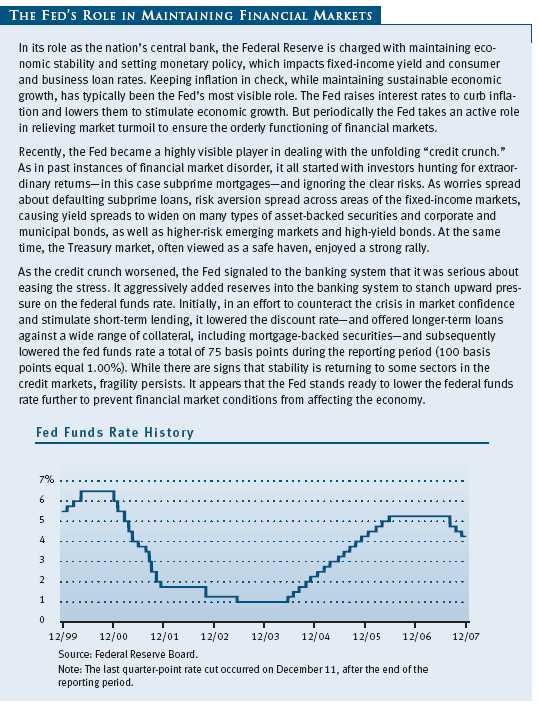
The Federal Reserve responded to this liquidity crisis by reducing the discount rate—the interest rate paid by financial institutions that borrow from the central bank—and adding billions of dollars to the banking system on several occasions starting in mid-August. The central bank also reduced the fed funds target rate, an interbank lending rate that banks also use as a benchmark for their prime lending rates, from 5.25% to 4.50% in the last three months of our reporting period. These were the first changes in the fed funds rate since June 2006 and the first rate cuts in more than four years. (After our reporting period ended, the Fed reduced the fed funds rate to 4.25% on December 11. The next day, the Fed announced that it was cooperating with four other central banks and would make $40 billion available to financial institutions through an auction process. These initiatives are intended to address year-end liquidity concerns and to help ease the credit crunch.)
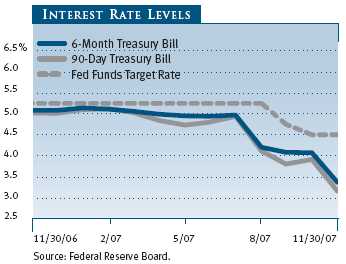
As shown in the graph on page 3, Treasury bill yields—which usually track the federal funds target rate—fell sharply in the last few months, as investors anticipated additional short-term rate cuts in the months ahead. Intermediate- and long-term interest rates fell to a lesser extent. The Treasury yield curve, which depicts the relationship between the yields and maturities of government bonds, steepened significantly, which means long-term bond investors are once again receiving greater income compensation than short-term bond investors. When the Treasury yield curve was flat, long-term Treasury bonds offered little or no income advantage over short-term Treasuries.
PORTFOLIO REVIEW
As the subprime crisis grew over the summer and appeared to threaten some segments of the money markets, our initial reaction was to adopt a very defensive maturity posture to ensure safety of principal and liquidity for shareholders. We maintained a 5% position in securities maturing overnight so that we would not need to sell longer-term securities to provide liquidity to shareholders. We also adopted a shorter weighted average maturity (WAM) target to protect the net asset value of $1.00 per share.
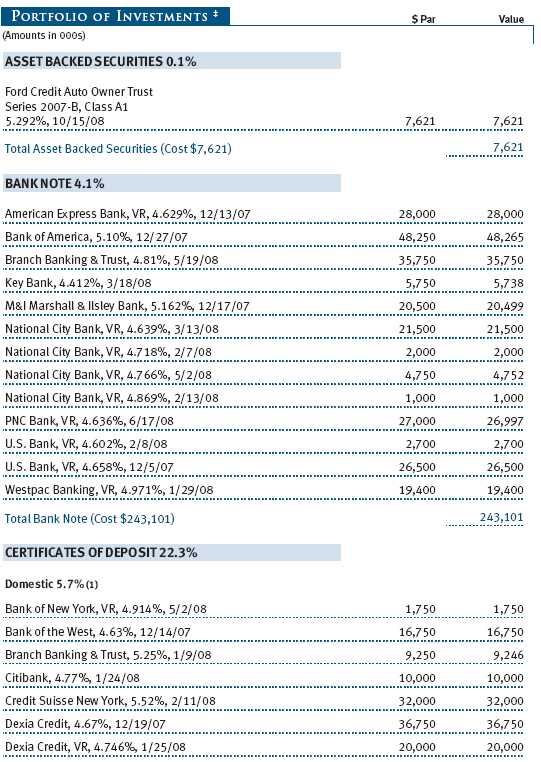
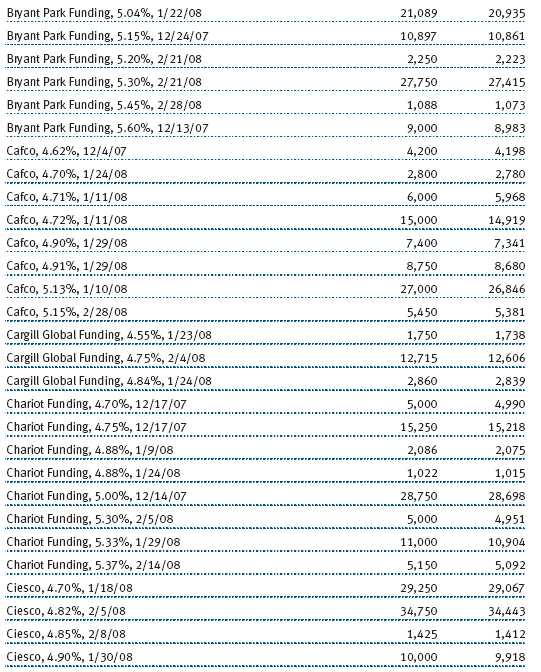
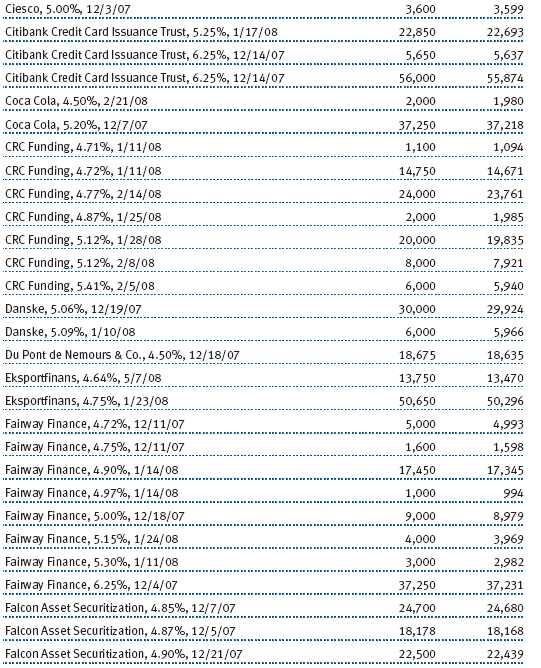
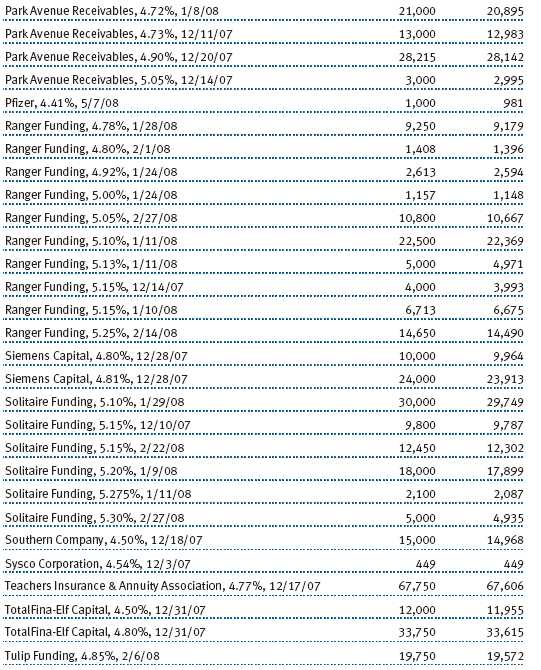
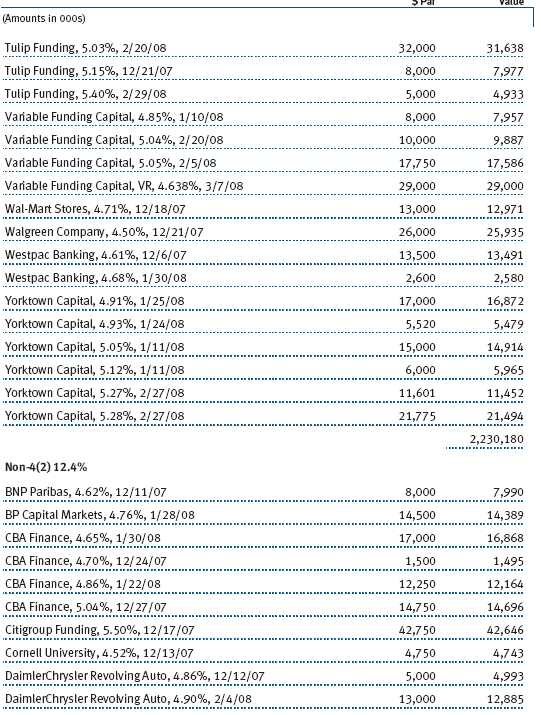
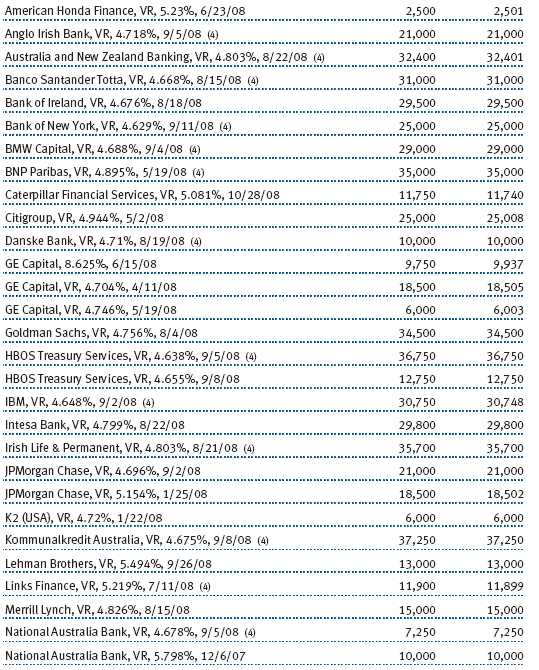
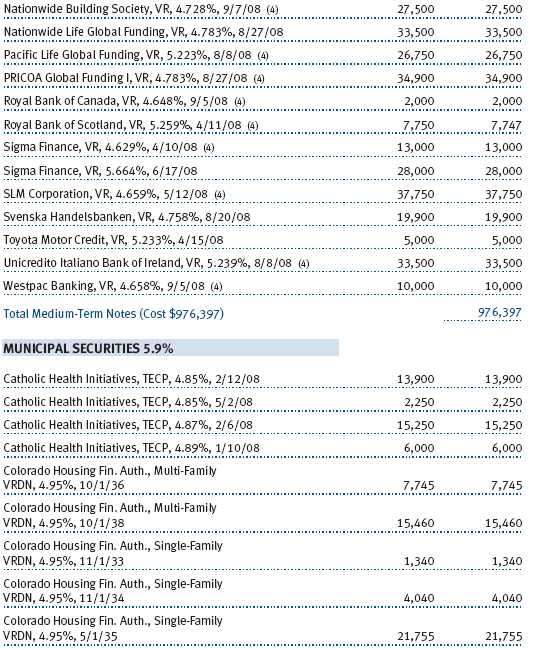
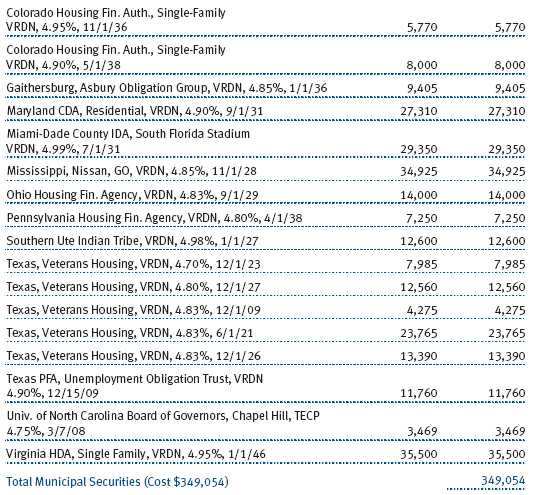
As market conditions improved and assets grew in the fund, we dropped our target of keeping 5% of assets in overnight issues and moved to a more neutral maturity posture. As of this writing, 50% of the fund’s assets mature within 30 days and on average 2% to 3% of fund assets mature every day, which should provide adequate liquidity. The fund remains very well diversified, with no single holding representing more than 1.5% of assets. Every security in the portfolio has been analyzed by the T. Rowe Price credit committee and recommended for the firm’s approved list of short-term investments.
The fund has never had any direct exposure to collateralized debt obligations (CDOs) or investments in subprime loans. At the end of November, the fund had exposure to three structured investment vehicles (SIVs), which in total represented 1.0% of assets. Our credit analysts are confident that these programs are backed by high-quality assets and will mature at par by July 11, 2008.

Money market conditions have generally improved since August, although credit concerns remain apparent. Libor rates (a measure of interbank lending rates) remain elevated relative to the federal funds target rate, which indicates that banks are somewhat hesitant to lend to each other. Still, Libor rates have retreated from the highs reached in August, indicating declining credit worries. The asset-backed commercial paper market is functioning again, although it is now more than 25% smaller than at its peak in early August.
The major sore point for our investment universe remains the market for SIVs, which was not functioning by the end of the period. We will remain especially vigilant about such issues as the market struggles to find equilibrium. The Master Liquidity Enhancement Conduit (M-LEC), a proposed superfund organized by major American banks and the U.S. Treasury, may be up and running by the end of the year and could help with an orderly unwinding of the SIVs’ longer-term assets. However, many of the details of the plan still need to be resolved.
In closing, we would like to congratulate and thank our credit research staff for doing a great job in keeping the fund invested in high-quality, appropriate investments during this difficult period for the credit markets. Although money funds are not guaranteed to maintain the price of $1.00 per share, T. Rowe Price manages credit and interest rate risk against very conservative standards in an attempt to protect fund shareholders. Money funds have existed for more than 30 years, and we believe they remain an efficient and relatively safe investment for investors’ liquidity needs, offering competitive market interest rates.
OUTLOOK
While the Fed remains somewhat concerned about the potential for higher inflation, the market is anticipating a much easier monetary stance. Fed funds futures indicate that there are as much as 75 basis points of additional easing priced into the market, which would equate to a federal funds target rate of 3.50% by this time next year. While this kind of market expectation would generally mean longer weighted average maturities for money market funds, we may temper how long we extend our maturities given our primary objective of safety of principal and liquidity.
Thank you for investing with T. Rowe Price.
Respectfully submitted,

James M. McDonald
Chairman of the fund’s Investment Advisory Committee
December 13, 2007
The committee chairman has day-to-day responsibility for managing the portfolio and works with committee members in developing and executing the fund’s investment program.
RISKS OF INVESTING IN MONEY MARKET SECURITIES
Since money market portfolios are managed to maintain a constant $1.00 share price, there should be little risk of principal loss. However, there is no assurance the portfolio will avoid principal losses if portfolio holdings default or are downgraded or if interest rates rise sharply in an unusually short period. In addition, the portfolio’s yield will vary; it is not fixed for a specific period like the yield on a bank certificate of deposit. An investment in the portfolio is not insured or guaranteed by the Federal Deposit Insurance Corporation (FDIC) or any other government agency. Although a money market portfolio seeks to preserve the value of your investment at $1.00 per share, it is possible to lose money by investing in it.
GLOSSARY
Average maturity: The average of the stated maturity dates of a bond or money market portfolio’s securities. The average maturity for a money market fund is measured in days, whereas a bond fund’s average maturity is measured in years. In general, the longer the average maturity, the greater the fund’s sensitivity to interest rate changes, which means greater price fluctuation.
Fed funds target rate: An overnight lending rate set by the Federal Reserve and used by banks to meet reserve requirements. Banks also use the fed funds rate as a benchmark for their prime lending rates.
Inflation: A sustained increase in prices throughout the economy.
Libor: A taxable money market benchmark.
Lipper average: Consists of all the mutual funds in a particular category as tracked by Lipper Inc.
Structured investment vehicle (SIV): An entity created by a financial institution that borrows in short-term fixed-income markets—such as through the issuance of commercial paper—to buy longer-term, higher-yielding assets, such as asset-backed or mortgage-backed securities.
Performance and Expenses
This chart shows the value of a hypothetical $10,000 investment in the fund over the past 10 fiscal year periods or since inception (for funds lacking 10-year records). The result is compared with benchmarks, which may include a broad-based market index and a peer group average or index. Market indexes do not include expenses, which are deducted from fund returns as well as mutual fund averages and indexes.

| AVERAGE ANNUAL COMPOUND TOTAL RETURN |
This table shows how the fund would have performed each year if its actual (or cumulative) returns for the periods shown had been earned at a constant rate.
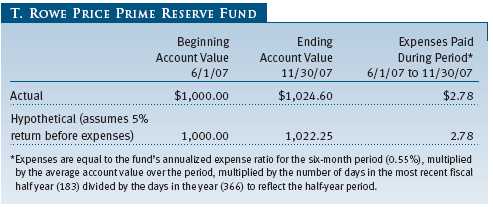
As a mutual fund shareholder, you may incur two types of costs: (1) transaction costs, such as redemption fees or sales loads, and (2) ongoing costs, including management fees, distribution and service (12b-1) fees, and other fund expenses. The following example is intended to help you understand your ongoing costs (in dollars) of investing in the fund and to compare these costs with the ongoing costs of investing in other mutual funds. The example is based on an investment of $1,000 invested at the beginning of the most recent six-month period and held for the entire period.
Actual Expenses
The first line of the following table (“Actual”) provides information about actual account values and expenses based on the fund’s actual returns. You may use the information in this line, together with your account balance, to estimate the expenses that you paid over the period. Simply divide your account value by $1,000 (for example, an $8,600 account value divided by $1,000 = 8.6), then multiply the result by the number in the first line under the heading “Expenses Paid During Period” to estimate the expenses you paid on your account during this period.
Hypothetical Example for Comparison Purposes
The information on the second line of the table (“Hypothetical”) is based on hypothetical account values and expenses derived from the fund’s actual expense ratio and an assumed 5% per year rate of return before expenses (not the fund’s actual return). You may compare the ongoing costs of investing in the fund with other funds by contrasting this 5% hypothetical example and the 5% hypothetical examples that appear in the shareholder reports of the other funds. The hypothetical account values and expenses may not be used to estimate the actual ending account balance or expenses you paid for the period.
Note: T. Rowe Price charges an annual small-account maintenance fee of $10, generally for accounts with less than $2,000 ($500 for UGMA/UTMA). The fee is waived for any investor whose T. Rowe Price mutual fund accounts total $25,000 or more, accounts employing automatic investing, and IRAs and other retirement plan accounts that utilize a prototype plan sponsored by T. Rowe Price (although a separate custodial or administrative fee may apply to such accounts). This fee is not included in the accompanying table. If you are subject to the fee, keep it in mind when you are estimating the ongoing expenses of investing in the fund and when comparing the expenses of this fund with other funds.
You should also be aware that the expenses shown in the table highlight only your ongoing costs and do not reflect any transaction costs, such as redemption fees or sales loads. Therefore, the second line of the table is useful in comparing ongoing costs only and will not help you determine the relative total costs of owning different funds. To the extent a fund charges transaction costs, however, the total cost of owning that fund is higher.
Unaudited
The accompanying notes are an integral part of these financial statements.
Unaudited


The accompanying notes are an integral part of these financial statements.
Unaudited
The accompanying notes are an integral part of these financial statements.
Unaudited
The accompanying notes are an integral part of these financial statements.
Unaudited

The accompanying notes are an integral part of these financial statements.
Unaudited
| NOTES TO FINANCIAL STATEMENTS |
NOTE 1 - SIGNIFICANT ACCOUNTING POLICIES
T. Rowe Price Prime Reserve Fund, Inc. (the fund), is registered under the Investment Company Act of 1940 (the 1940 Act) as a diversified, open-end management investment company. The fund commenced operations on January 26, 1976. The fund seeks preservation of capital, liquidity, and, consistent with these, the highest possible current income.
The accompanying financial statements were prepared in accordance with accounting principles generally accepted in the United States of America, which require the use of estimates made by fund management. Fund management believes that estimates and security valuations are appropriate; however, actual results may differ from those estimates, and the security valuations reflected in the financial statements may differ from the value the fund ultimately realizes upon sale of the securities.
Valuation Securities are valued at amortized cost. Assets and liabilities for which such valuation procedures are deemed not to reflect fair value are stated at fair value as determined in good faith by the T. Rowe Price Valuation Committee, established by the fund’s Board of Directors.
Credits The fund earns credits on temporarily uninvested cash balances at the custodian that reduce the fund’s custody charges. Custody expense in the accompanying financial statements is presented before reduction for credits, which are reflected as expenses paid indirectly.
Investment Transactions, Investment Income, and Distributions Income and expenses are recorded on the accrual basis. Premiums and discounts on debt securities are amortized for financial reporting purposes. Income tax-related interest and penalties, if incurred, would be recorded as income tax expense. Investment transactions are accounted for on the trade date. Realized gains and losses are reported on the identified cost basis. Paydown gains and losses are recorded as an adjustment to interest income. Distributions to shareholders are recorded on the ex-dividend date. Income distributions are declared on a daily basis and paid monthly.
New Accounting Pronouncements Effective November 30, 2007, the fund adopted Financial Accounting Standards Board (FASB) Interpretation No. 48 (FIN 48), Accounting for Uncertainty in Income Taxes, a clarification of FASB Statement No. 109, Accounting for Income Taxes. FIN 48 establishes financial accounting and disclosure requirements for recognition and measurement of tax positions taken or expected to be taken on an income tax return. The adoption of FIN 48 had no impact on the fund’s net assets or results of operations.
In September 2006, the FASB released the Statement of Financial Accounting Standard No. 157 (FAS 157), Fair Value Measurements. FAS 157 clarifies the definition of fair value and establishes the framework for measuring fair value, as well as proper disclosure of this methodology in the financial statements. It will be effective for the fund’s fiscal year beginning June 1, 2008. Management is evaluating the effects of FAS 157; however, it is not expected to have a material impact on the fund’s net assets or results of operations.
NOTE 2 - INVESTMENT TRANSACTIONS
Consistent with its investment objective, the fund engages in the following practices to manage exposure to certain risks or to enhance performance. The investment objective, policies, program, and risk factors of the fund are described more fully in the fund’s prospectus and Statement of Additional Information.
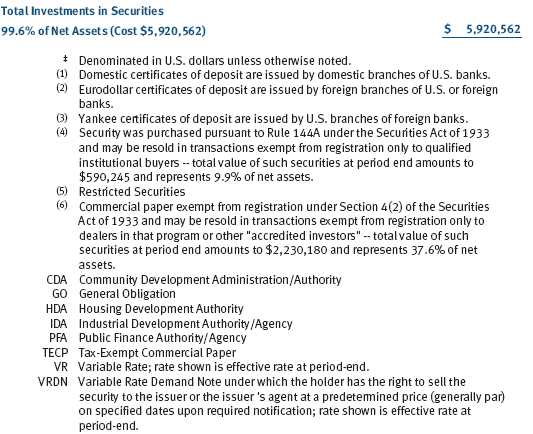
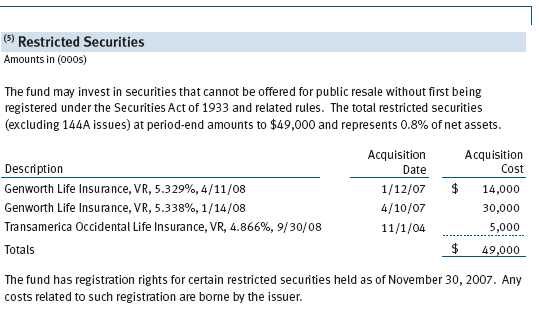
Restricted Securities The fund may invest in securities that are subject to legal or contractual restrictions on resale. Prompt sale of such securities at an acceptable price may be difficult due to substantial delays and additional costs related to their restrictions.
NOTE 3 - FEDERAL INCOME TAXES
No provision for federal income taxes is required since the fund intends to continue to qualify as a regulated investment company under Subchapter M of the Internal Revenue Code and distribute to shareholders all of its taxable income and gains. Federal income tax regulations differ from generally accepted accounting principles; therefore, distributions determined in accordance with tax regulations may differ in amount or character from net investment income and realized gains for financial reporting purposes. Financial reporting records are adjusted for permanent book/tax differences to reflect tax character. Financial records are not adjusted for temporary differences. The amount and character of tax-basis distributions and composition of net assets are finalized at fiscal year-end; accordingly, tax-basis balances have not been determined as of November 30, 2007.
The fund intends to retain realized gains to the extent of available capital loss carryforwards. As of May 31, 2007, the fund had $30,000 of unused capital loss carryforwards, of which $10,000 expire in fiscal 2013, $13,000 expire in fiscal 2014, and $7,000 expire in fiscal 2015.
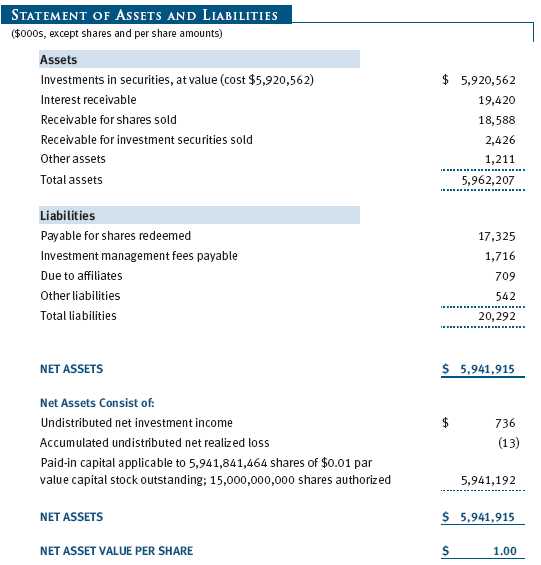
At November 30, 2007, the cost of investments for federal income tax purposes was $5,920,562,000.
NOTE 4 - RELATED PARTY TRANSACTIONS
The fund is managed by T. Rowe Price Associates, Inc. (the manager or Price Associates), a wholly owned subsidiary of T. Rowe Price Group, Inc. The investment management agreement between the fund and the manager provides for an annual investment management fee, which is computed daily and paid monthly. The fee consists of an individual fund fee, equal to 0.05% of the fund’s average daily net assets, and a group fee. The group fee rate is calculated based on the combined net assets of certain mutual funds sponsored by Price Associates (the group) applied to a graduated fee schedule, with rates ranging from 0.48% for the first $1 billion of assets to 0.285% for assets in excess of $220 billion. The fund’s group fee is determined by applying the group fee rate to the fund’s average daily net assets. At November 30, 2007, the effective annual group fee rate was 0.30%.
In addition, the fund has entered into service agreements with Price Associates and two wholly owned subsidiaries of Price Associates (collectively, Price). Price Associates computes the daily share price and provides certain other administrative services to the fund. T. Rowe Price Services, Inc., provides shareholder and administrative services in its capacity as the fund’s transfer and dividend disbursing agent. T. Rowe Price Retirement Plan Services, Inc., provides subaccounting and recordkeeping services for certain retirement accounts invested in the fund. For the six months ended November 30, 2007, expenses incurred pursuant to these service agreements were $62,000 for Price Associates, $3,070,000 for T. Rowe Price Services, Inc., and $808,000 for T. Rowe Price Retirement Plan Services, Inc. The total amount payable at period-end pursuant to these service agreements is reflected as Due to Affiliates in the accompanying financial statements.
NOTE 5 - INTERFUND BORROWING PROGRAM
Pursuant to its prospectus, the fund may borrow up to 33 1 / 3% of its total assets. The manager has developed a program that provides temporary liquidity under an interfund borrowing agreement between the fund and other T. Rowe Price-sponsored mutual funds and permits the borrowing and lending of cash at rates beneficial to both the borrowing and lending funds. Pursuant to program guidelines, loans totaling 10% or more of a borrowing fund’s total assets are collateralized at 102% of the value of the loan; loans of less than 10% are unsecured. During the six months ended November 30, 2007, the fund had outstanding borrowings on 16 days, in the average amount of $31,469,000, and at an average annual rate of 4.92%. At November 30, 2007, there were no borrowings outstanding.
| INFORMATION ON PROXY VOTING POLICIES, PROCEDURES, AND RECORDS |
A description of the policies and procedures used by T. Rowe Price funds and portfolios to determine how to vote proxies relating to portfolio securities is available in each fund’s Statement of Additional Information, which you may request by calling 1-800-225-5132 or by accessing the SEC’s Web site, www.sec.gov. The description of our proxy voting policies and procedures is also available on our Web site, www.troweprice.com. To access it, click on the words “Company Info” at the top of our homepage for individual investors. Then, in the window that appears, click on the “Proxy Voting Policy” navigation button in the top left corner.
Each fund’s most recent annual proxy voting record is available on our Web site and through the SEC’s Web site. To access it through our Web site, follow the directions above, then click on the words “Proxy Voting Record” at the bottom of the Proxy Voting Policy page.
| HOW TO OBTAIN QUARTERLY PORTFOLIO HOLDINGS |
The fund files a complete schedule of portfolio holdings with the Securities and Exchange Commission for the first and third quarters of each fiscal year on Form N-Q. The fund’s Form N-Q is available electronically on the SEC’s Web site (www.sec.gov); hard copies may be reviewed and copied at the SEC’s Public Reference Room, 450 Fifth St. N.W., Washington, DC 20549. For more information on the Public Reference Room, call 1-800-SEC-0330.
Item 2. Code of Ethics.
A code of ethics, as defined in Item 2 of Form N-CSR, applicable to its principal executive officer, principal financial officer, principal accounting officer or controller, or persons performing similar functions is filed as an exhibit to the registrant’s annual Form N-CSR. No substantive amendments were approved or waivers were granted to this code of ethics during the registrant’s most recent fiscal half-year.
Item 3. Audit Committee Financial Expert.
Disclosure required in registrant’s annual Form N-CSR.
Item 4. Principal Accountant Fees and Services.
Disclosure required in registrant’s annual Form N-CSR.
Item 5. Audit Committee of Listed Registrants.
Not applicable.
Item 6. Schedule of Investments.
Not applicable. The complete schedule of investments is included in Item 1 of this Form N-CSR.
Item 7. Disclosure of Proxy Voting Policies and Procedures for Closed-End Management Investment Companies.
Not applicable.
Item 8. Portfolio Managers of Closed-End Management Investment Companies.
Not applicable.
Item 9. Purchases of Equity Securities by Closed-End Management Investment Company and Affiliated Purchasers.
Not applicable.
Item 10. Submission of Matters to a Vote of Security Holders.
Not applicable.
Item 11. Controls and Procedures.
(a) The registrant’s principal executive officer and principal financial officer have evaluated the registrant’s disclosure controls and procedures within 90 days of this filing and have concluded that the registrant’s disclosure controls and procedures were effective, as of that date, in ensuring that information required to be disclosed by the registrant in this Form N-CSR was recorded, processed, summarized, and reported timely.
(b) The registrant’s principal executive officer and principal financial officer are aware of no change in the registrant’s internal control over financial reporting that occurred during the registrant’s second fiscal quarter covered by this report that has materially affected, or is reasonably likely to materially affect, the registrant’s internal control over financial reporting.
Item 12. Exhibits.(a)(1) The registrant’s code of ethics pursuant to Item 2 of Form N-CSR is filed with the registrant’s annual Form N-CSR.
(2) Separate certifications by the registrant's principal executive officer and principal financial officer, pursuant to Section 302 of the Sarbanes-Oxley Act of 2002 and required by Rule 30a-2(a) under the Investment Company Act of 1940, are attached.
(3) Written solicitation to repurchase securities issued by closed-end companies: not applicable.
(b) A certification by the registrant's principal executive officer and principal financial officer, pursuant to Section 906 of the Sarbanes-Oxley Act of 2002 and required by Rule 30a-2(b) under the Investment Company Act of 1940, is attached.
| | |
SIGNATURES |
| |
| | Pursuant to the requirements of the Securities Exchange Act of 1934 and the Investment |
| Company Act of 1940, the registrant has duly caused this report to be signed on its behalf by the |
| undersigned, thereunto duly authorized. |
| |
| T. Rowe Price Prime Reserve Fund, Inc. |
| |
| |
| |
| By | /s/ Edward C. Bernard |
| | Edward C. Bernard |
| | Principal Executive Officer |
| |
| Date | January 16, 2008 |
| |
| |
| |
| | Pursuant to the requirements of the Securities Exchange Act of 1934 and the Investment |
| Company Act of 1940, this report has been signed below by the following persons on behalf of |
| the registrant and in the capacities and on the dates indicated. |
| |
| |
| By | /s/ Edward C. Bernard |
| | Edward C. Bernard |
| | Principal Executive Officer |
| |
| Date | January 16, 2008 |
| |
| |
| |
| By | /s/ Joseph A. Carrier |
| | Joseph A. Carrier |
| | Principal Financial Officer |
| |
| Date | January 16, 2008 |