UNITED STATES
SECURITIES AND EXCHANGE COMMISSION
Washington, D.C. 20549
FORM N-CSR
CERTIFIED SHAREHOLDER REPORT OF REGISTERED
MANAGEMENT INVESTMENT COMPANIES
Investment Company Act File Number: 811-02603
| T. Rowe Price Government Money Fund, Inc. |
|
| (Exact name of registrant as specified in charter) |
| |
| 100 East Pratt Street, Baltimore, MD 21202 |
|
| (Address of principal executive offices) |
| |
| David Oestreicher |
| 100 East Pratt Street, Baltimore, MD 21202 |
|
| (Name and address of agent for service) |
Registrant’s telephone number, including area code: (410) 345-2000
Date of fiscal year end: May 31
Date of reporting period: May 31, 2018
Item 1. Report to Shareholders
| Government Money Fund | May 31, 2018 |
| T. ROWE PRICE GOVERNMENT MONEY FUND |
|
HIGHLIGHTS
| ■ | The Federal Reserve raised short-term interest rates three times during the 12 months ended May 31, 2018.
|
| ■ | The Government Money Fund fared slightly better than its Lipper peer group index over the last year.
|
| ■ | The fund’s weighted average maturity was positioned longer than its peers early in the period, but as Treasury supply waned and prices increased, the weighted average maturity moved closer to that of the peer group. After the federal debt ceiling was suspended in February for about one year and new supply came to the market, we extended the fund’s weighted average maturity so that it was longer than the peer group again.
|
| ■ | At the end of May, we expected the central bank to raise rates again in June (which it did) and to continue raising rates further in 2018. The fund strives to maintain a high degree of liquidity, and our focus remains on principal stability and on investments with the highest credit quality. |

Log in to your account at troweprice.com for more information.
*Certain mutual fund accounts that are assessed an annual account service fee can also save money by switching to e-delivery.
CIO Market Commentary
Dear Shareholder
Your fund’s fiscal year ended in May was marked by a broadly positive environment for most financial assets. Stocks outperformed bonds, and investors were also rewarded for taking a more aggressive stance in both of the broad asset classes—highly valued growth stocks outpaced value shares and higher-yielding, lower-quality bonds outperformed safer issues.
The synchronized global expansion, with all of the major economies growing in tandem, deserved part of the credit for the outperformance of risk assets. European economic growth remained on track as the Continent moved firmly beyond its banking crisis earlier in the decade. After notching its longest stretch of growth since the late 1980s, the Japanese economy contracted slightly in the first quarter, but most observers expect the dip to be temporary. Meanwhile, China beat elevated growth expectations even as the country’s leadership tightened environmental rules and clamped down on financial excesses.
The U.S. economy seemed to be shifting into higher gear as the period drew to a close, helped in part by fiscal stimulus from the tax cuts passed in December 2017. This proved a mixed blessing for investors, as corporate earnings were robust but long-term interest rates moved sharply higher. The yield on the benchmark 10-year Treasury note rose from around 2.40% at the start of December to almost 3% in late March, when Congress passed a spending bill that raised concerns about further increasing the federal deficit. In May, the 10-year yield briefly touched 3.12%—its highest level in seven years.
Long-term Treasury bonds performed particularly poorly as rates rose, while corporate bonds and riskier securities whose repayment depends more on healthy earnings held up somewhat better. The threat of higher rates also increased volatility in the stock market. This was particularly true in February, when a jump in wage inflation (which later proved temporary) sparked a sell-off on Wall Street and in global markets.
The prospects for faster growth in the U.S. reinforced expectations for tighter monetary policy relative to the rest of the world, which caused the gap to widen between interest rates in the U.S. and most other countries. The Federal Reserve raised official short-term interest rates three times over the past 12 months, while the Bank of Japan (BoJ) and the European Central Bank (ECB) kept rates near zero. The BoJ and ECB also continued buying long-term assets in their respective markets, keeping a lid on long-term interest rates. A notable exception was Italy, where bond yields spiked in response to worries that a new populist government might adopt less fiscally sound policies.
Relatively higher U.S. interest rates pulled in assets from other markets and contributed to a rise in the dollar relative to many other currencies in April and May, reversing a stretch of dollar weakness in 2017. The greenback’s strength could pose a problem for emerging markets by driving up import costs and making the repayment of dollar-denominated debt more difficult. Countries that are more exposed to those risks, such as Argentina and Turkey, experienced bigger downturns.
Investors clearly grew more cautious late in the period. Worries deepened in particular about a rising tide of protectionism as President Trump pivoted toward a populist trade agenda, announcing a series of new tariffs following the departures of some important free trade advocates from his administration. U.S. trading partners responded with tariffs of their own, and it remains unclear as of this writing how much further tensions will intensify. Indeed, U.S. markets fell sharply on May 31, the last day of your fund’s fiscal year, after the Trump administration announced that it would impose previously delayed aluminum and steel tariffs on Canada, Mexico, and the European Union.
The central question for investors now appears to be whether the global expansion and the related global bull market in risk assets has entered its later stages, ushering in higher interest rates and inflation, along with potentially lower profit margins. The answer is far from clear, but you can rest assured that your fund manager is drawing on the collaboration and insights of T. Rowe Price’s extensive team of worldwide investment professionals to navigate the complex currents of the global economy.
Thank you for your continued confidence in T. Rowe Price.
Sincerely,

Robert Sharps
Group Chief Investment Officer
Management’s Discussion of Fund Performance
INVESTMENT OBJECTIVE
The fund’s goals are preservation of capital, liquidity, and, consistent with these, the highest possible current income.
FUND COMMENTARY
How did the fund perform in the past 12 months?
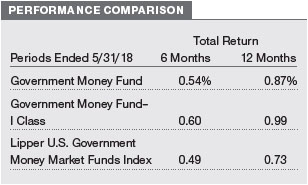
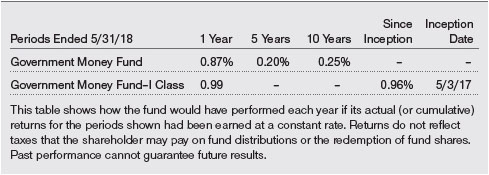
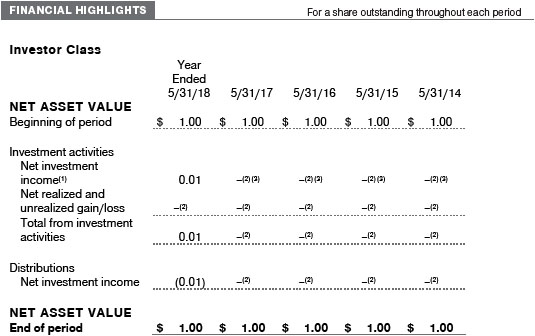
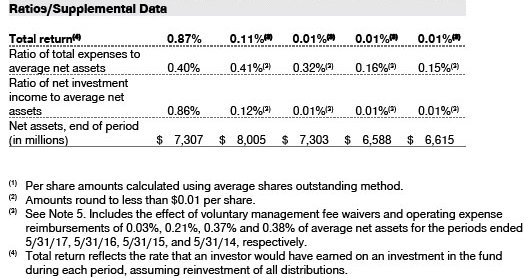
The Government Money Fund returned 0.87% in the 12-month period ended May 31, 2018, versus 0.73% for the Lipper U.S. Government Money Market Funds Index. (Performance for the fund’s I Class shares will vary due to a different fee structure. Past performance cannot guarantee future results.)
What factors influenced the fund’s performance?
The Federal Reserve remained active over the last year and raised interest rates by 25 basis points (0.25 percentage points) in June 2017, December 2017, and March 2018. By the end of May 2018, the Fed had lifted the federal funds target rate to the 1.50% to 1.75% range.
Treasury bill yields rose in accordance with the Fed’s rate hikes and in anticipation of another rate increase in June 2018, shortly after the end of our reporting period. Over the last year, the 90-day T-bill yield increased from 0.98% to 1.93%, while the six-month T-bill yield rose from 1.08% to 2.08%. By properly anticipating the Fed’s rate hikes, the fund was well positioned to take advantage of the higher rates.
How is the fund positioned?
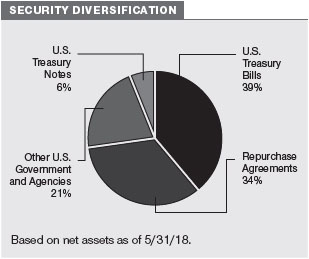
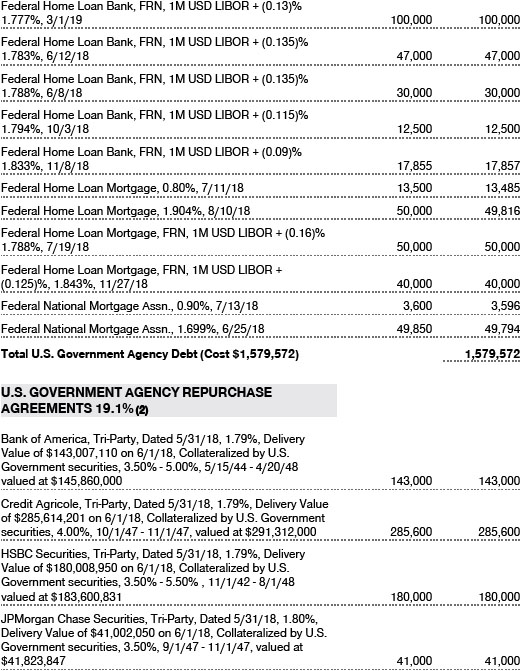
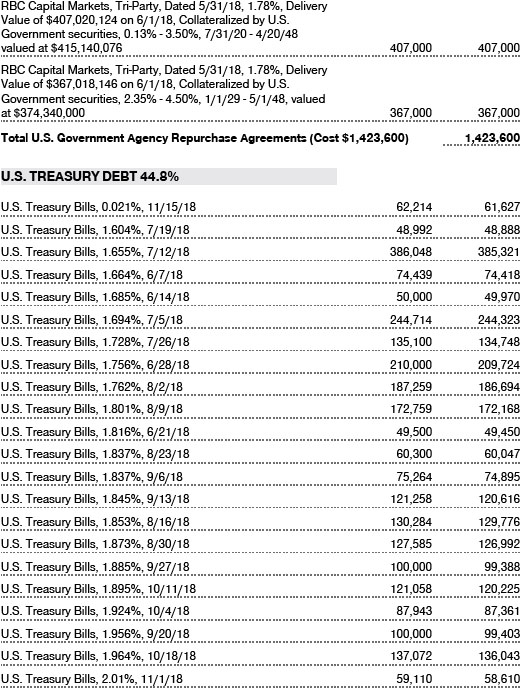
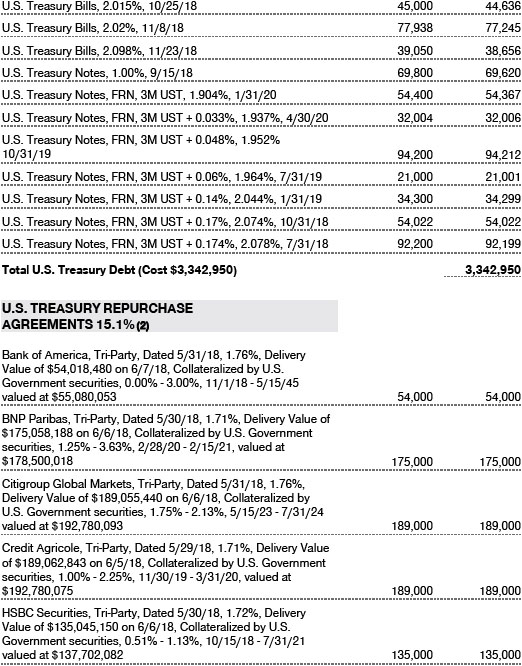
As a government money fund, the portfolio is required to invest almost exclusively in T-bills and other U.S. government securities, as well as repurchase agreements fully collateralized by government securities. Of course, the fund is not subject to the liquidity fees and redemption restrictions (also known as “gates”) that may be applied to nongovernment money funds during times of severe redemption activity. At the end of May 2018, approximately 45% of the fund’s assets were invested in Treasury bills and notes, while repurchase agreements represented 34%. Other U.S. government and agency securities accounted for the remainder.
The fund’s weighted average maturity was positioned longer than its peers early in the period, but as Treasury supply waned and prices increased, the weighted average maturity moved closer to that of the peer group. After the federal debt ceiling was suspended in February for about one year and new supply came to the market, we extended the fund’s weighted average maturity so that it was longer than the peer group again.
What is portfolio management’s outlook?
At the end of May, the Fed’s projections, and many market participants’ expectations, including ours, were for the central bank to raise rates again in June and September of this year. (After our reporting period ended, the Fed did indeed raise rates following its June 12–13 monetary policy meeting.) We now expect the Fed to raise rates again in September and in December 2018. With this forecast, the fund is maintaining a weighted average maturity that accommodates our desire to buy when securities fully price in these rate expectations. The weighted average maturity can be slightly longer than that of our average competitor because of the extended period (typically three months) between the meetings at which the Fed announces rate increases. To balance the longer average maturities, the fund strives to maintain a high degree of liquidity, and our focus remains on principal stability and on investments with the highest credit quality.
The views expressed reflect the opinions of T. Rowe Price as of the date of this report and are subject to change based on changes in market, economic, or other conditions. These views are not intended to be a forecast of future events and are no guarantee of future results.
RISKS OF INVESTING IN THE GOVERNMENT MONEY FUND
You could lose money by investing in the Fund. Although the Fund seeks to preserve the value of your investment at $1.00 per share, it cannot guarantee it will do so. An investment in the Fund is not insured or guaranteed by the Federal Deposit Insurance Corporation or any other government agency. The Fund’s sponsor has no legal obligation to provide financial support to the Fund, and you should not expect that the sponsor will provide financial support to the Fund at any time.
The potential for realizing a loss of principal in the fund could derive from:
Credit risks. An issuer of a debt instrument could suffer an adverse change in financial condition that results in a payment default, rating downgrade, or inability to meet a financial obligation. The credit quality of the securities held by the fund may change rapidly in certain market environments, which could result in significant net asset value deterioration and the inability to maintain a $1.00 share price.
Interest rate risks. A decline in interest rates may lower the fund’s yield, or a rise in the overall level of interest rates may cause a decline in the prices of fixed income securities held by the fund. The fund’s yield will vary; it is not fixed for a specific period like the yield on a bank certificate of deposit. This is a disadvantage when interest rates are falling because the fund would have to reinvest at lower interest rates. Increases in demand for government securities may cause the yield on those securities to fall or even drop to a negative rate.
Repurchase agreement risks. A counterparty to a repurchase agreement may become insolvent or fail to repurchase securities from the fund as required, which could increase the fund’s costs or prevent the fund from immediately accessing its collateral.
These are some of the principal risks of investing in this fund. For a more thorough discussion of risks, please see the fund’s prospectus.
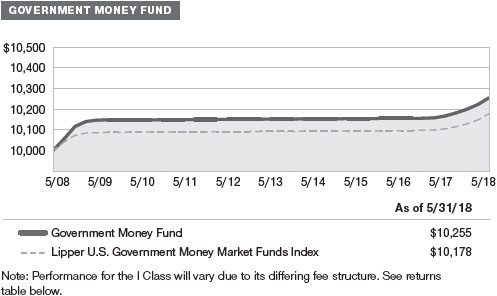
GROWTH OF $10,000
This chart shows the value of a hypothetical $10,000 investment in the fund over the past 10 fiscal year periods or since inception (for funds lacking 10-year records). The result is compared with benchmarks, which includes a broad-based market index and may also include a peer group average or index. Market indexes do not include expenses, which are deducted from fund returns as well as mutual fund averages and indexes.
AVERAGE ANNUAL COMPOUND TOTAL RETURN
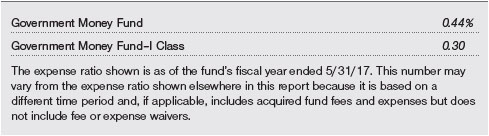
EXPENSE RATIO
FUND EXPENSE EXAMPLE
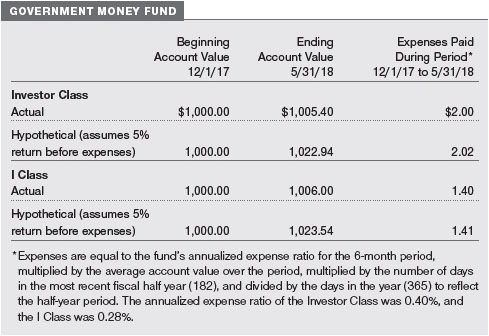
As a mutual fund shareholder, you may incur two types of costs: (1) transaction costs, such as redemption fees or sales loads, and (2) ongoing costs, including management fees, distribution and service (12b-1) fees, and other fund expenses. The following example is intended to help you understand your ongoing costs (in dollars) of investing in the fund and to compare these costs with the ongoing costs of investing in other mutual funds. The example is based on an investment of $1,000 invested at the beginning of the most recent six-month period and held for the entire period.
Please note that the fund has two share classes: The original share class (Investor Class) charges no distribution and service (12b-1) fee, and the I Class shares are also available to institutionally oriented clients and impose no 12b-1 or administrative fee payment. Each share class is presented separately in the table.
Actual Expenses
The first line of the following table (Actual) provides information about actual account values and expenses based on the fund’s actual returns. You may use the information on this line, together with your account balance, to estimate the expenses that you paid over the period. Simply divide your account value by $1,000 (for example, an $8,600 account value divided by $1,000 = 8.6), then multiply the result by the number on the first line under the heading “Expenses Paid During Period” to estimate the expenses you paid on your account during this period.
Hypothetical Example for Comparison Purposes
The information on the second line of the table (Hypothetical) is based on hypothetical account values and expenses derived from the fund’s actual expense ratio and an assumed 5% per year rate of return before expenses (not the fund’s actual return). You may compare the ongoing costs of investing in the fund with other funds by contrasting this 5% hypothetical example and the 5% hypothetical examples that appear in the shareholder reports of the other funds. The hypothetical account values and expenses may not be used to estimate the actual ending account balance or expenses you paid for the period.
Note: T. Rowe Price charges an annual account service fee of $20, generally for accounts with less than $10,000. The fee is waived for any investor whose T. Rowe Price mutual fund accounts total $50,000 or more; accounts electing to receive electronic delivery of account statements, transaction confirmations, prospectuses, and shareholder reports; or accounts of an investor who is a T. Rowe Price Personal Services or Enhanced Personal Services client (enrollment in these programs generally requires T. Rowe Price assets of at least $250,000). This fee is not included in the accompanying table. If you are subject to the fee, keep it in mind when you are estimating the ongoing expenses of investing in the fund and when comparing the expenses of this fund with other funds.
You should also be aware that the expenses shown in the table highlight only your ongoing costs and do not reflect any transaction costs, such as redemption fees or sales loads. Therefore, the second line of the table is useful in comparing ongoing costs only and will not help you determine the relative total costs of owning different funds. To the extent a fund charges transaction costs, however, the total cost of owning that fund is higher.
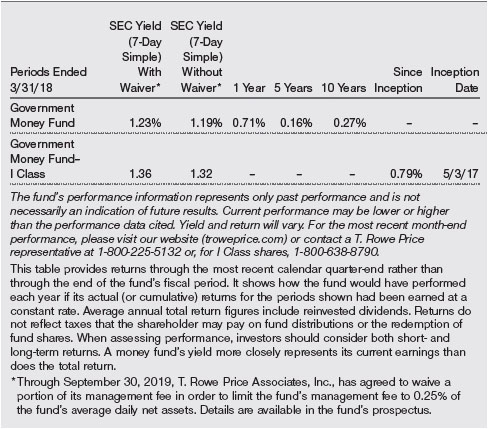
QUARTER-END RETURNS
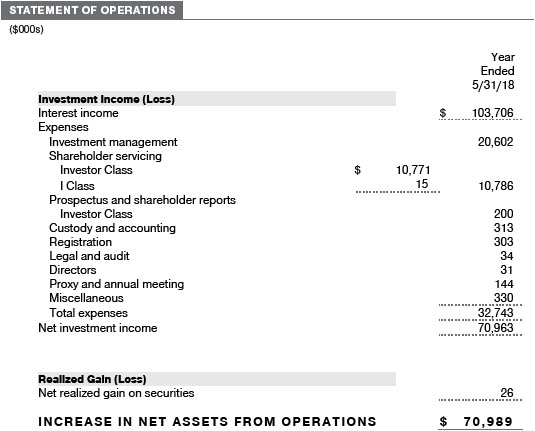
The accompanying notes are an integral part of these financial statements.
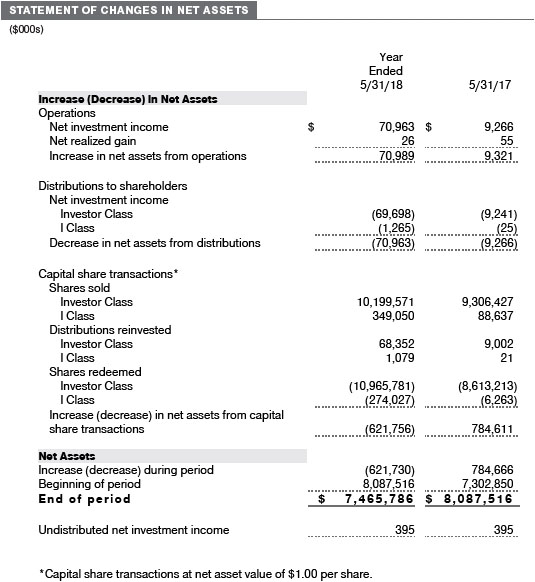
The accompanying notes are an integral part of these financial statements.

The accompanying notes are an integral part of these financial statements.
The accompanying notes are an integral part of these financial statements.
The accompanying notes are an integral part of these financial statements.
The accompanying notes are an integral part of these financial statements.
| NOTES TO FINANCIAL STATEMENTS |
T. Rowe Price Government Money Fund, Inc. (the fund), is registered under the Investment Company Act of 1940 (the 1940 Act) as a diversified, open-end management investment company. The fund seeks preservation of capital, liquidity, and, consistent with these, the highest possible current income. The fund intends to operate as a government money market fund and has no intention to voluntarily impose liquidity fees on redemptions or temporarily suspend redemptions. The fund has two classes of shares: the Government Money Fund (Investor Class) and the Government Money Fund–I Class (I Class). I Class shares generally are available only to investors meeting a $1,000,000 minimum investment or certain other criteria. Each class has exclusive voting rights on matters related solely to that class; separate voting rights on matters that relate to both classes; and, in all other respects, the same rights and obligations as the other class.
NOTE 1 - SIGNIFICANT ACCOUNTING POLICIES
Basis of Preparation The fund is an investment company and follows accounting and reporting guidance in the Financial Accounting Standards Board (FASB) Accounting Standards Codification Topic 946 (ASC 946). The accompanying financial statements were prepared in accordance with accounting principles generally accepted in the United States of America (GAAP), including, but not limited to, ASC 946. GAAP requires the use of estimates made by management. Management believes that estimates and valuations are appropriate; however, actual results may differ from those estimates, and the valuations reflected in the accompanying financial statements may differ from the value ultimately realized upon sale or maturity.
Investment Transactions, Investment Income, and Distributions Investment transactions are accounted for on the trade date basis. Income and expenses are recorded on the accrual basis. Realized gains and losses are reported on the identified cost basis. Premiums and discounts on debt securities are amortized for financial reporting purposes. Income tax-related interest and penalties, if incurred, are recorded as income tax expense. Income distributions are declared by each class daily and paid monthly. Distributions to shareholders are recorded on the ex-dividend date. A capital gain distribution may also be declared and paid by the fund annually.
Class Accounting Shareholder servicing, prospectus, and shareholder report expenses incurred by each class are charged directly to the class to which they relate. Expenses common to both classes and investment income are allocated to the classes based upon the relative daily net assets of each class’s settled shares; realized and unrealized gains and losses are allocated based upon the relative daily net assets of each class’s outstanding shares. To the extent any expenses are waived or reimbursed in accordance with an expense limitation (see Note 5), the waiver or reimbursement is charged to the applicable class or allocated across the classes in the same manner as the related expense.
New Accounting Guidance In March 2017, the FASB issued amended guidance to shorten the amortization period for certain callable debt securities held at a premium. The guidance is effective for fiscal years and interim periods beginning after December 15, 2018. Adoption will have no effect on the fund’s net assets or results of operations.
On August 1, 2017, the fund implemented amendments to Regulation S-X, issued by the Securities and Exchange Commission, which require standardized, enhanced disclosures, particularly related to derivatives, in investment company financial statements. Adoption had no effect on the fund’s net assets or results of operations.
Indemnification In the normal course of business, the fund may provide indemnification in connection with its officers and directors, service providers, and/or private company investments. The fund’s maximum exposure under these arrangements is unknown; however, the risk of material loss is currently considered to be remote.
NOTE 2 - VALUATION
The fund’s financial instruments are valued and its net asset value (NAV) per share is computed at the close of the New York Stock Exchange (NYSE), normally 4 p.m. ET, each day the NYSE is open for business. However, the NAV per share may be calculated at a time other than the normal close of the NYSE if trading on the NYSE is restricted, if the NYSE closes earlier, or as may be permitted by the SEC. The fund’s financial instruments are reported at fair value, which GAAP defines as the price that would be received to sell an asset or paid to transfer a liability in an orderly transaction between market participants at the measurement date. Assets and liabilities other than financial instruments, including short-term receivables and payables, are carried at cost, or estimated realizable value, if less, which approximates fair value. The T. Rowe Price Valuation Committee (the Valuation Committee) is an internal committee that has been delegated certain responsibilities by the fund’s Board of Directors (the Board) to ensure that financial instruments are appropriately priced at fair value in accordance with GAAP and the 1940 Act. Subject to oversight by the Board, the Valuation Committee develops and oversees pricing-related policies and procedures, including the comparison of amortized cost to market-based value, and approves all fair value determinations.
Various valuation techniques and inputs are used to determine the fair value of financial instruments. GAAP establishes the following fair value hierarchy that categorizes the inputs used to measure fair value:
Level 1 – quoted prices (unadjusted) in active markets for identical financial instruments that the fund can access at the reporting date
Level 2 – inputs other than Level 1 quoted prices that are observable, either directly or indirectly (including, but not limited to, quoted prices for similar financial instruments in active markets, quoted prices for identical or similar financial instruments in inactive markets, interest rates and yield curves, implied volatilities, and credit spreads)
Level 3 – unobservable inputs
Observable inputs are developed using market data, such as publicly available information about actual events or transactions, and reflect the assumptions market participants would use to price the financial instrument. Unobservable inputs are those for which market data are not available and are developed using the best information available about the assumptions that market participants would use to price the financial instrument. GAAP requires valuation techniques to maximize the use of relevant observable inputs and minimize the use of unobservable inputs. Input levels are not necessarily an indication of the risk or liquidity associated with financial instruments at that level but rather the degree of judgment used in determining those values. For example, securities held by a money market fund are generally high quality and liquid; however, they are reflected as Level 2 because the inputs used to determine fair value are not quoted prices in an active market.
In accordance with Rule 2a-7 under the 1940 Act, the fund values its securities at amortized cost, which approximates fair value. Securities for which amortized cost is deemed not to reflect fair value are stated at fair value as determined in good faith by the Valuation Committee. On May 31, 2018, all of the fund’s financial instruments were classified as Level 2 in the fair value hierarchy.
NOTE 3 - OTHER INVESTMENT TRANSACTIONS
Consistent with its investment objective, the fund engages in the following practices to manage exposure to certain risks and/or to enhance performance. The investment objective, policies, program, and risk factors of the fund are described more fully in the fund’s prospectus and Statement of Additional Information.
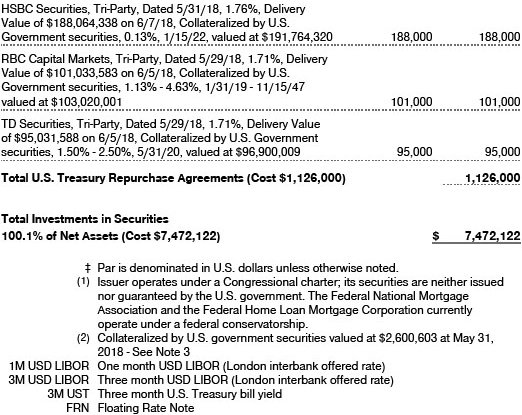
Repurchase Agreements The fund may engage in repurchase agreements, pursuant to which it pays cash to and receives securities from a counterparty that agrees to “repurchase” the securities at a specified time, typically within seven business days, for a specified price. The fund enters into such agreements with well-established securities dealers or banks that are members of the Federal Reserve System and are on Price Associates, Inc.’s approved list. All repurchase agreements are fully collateralized by U.S. government or related agency securities, which are held by the custodian designated by the agreement. Collateral is evaluated daily to ensure that its market value exceeds the delivery value of the repurchase agreements at maturity. Although risk is mitigated by the collateral, the fund could experience a delay in recovering its value and a possible loss of income or value if the counterparty fails to perform in accordance with the terms of the agreement.
NOTE 4 - FEDERAL INCOME TAXES
No provision for federal income taxes is required since the fund intends to continue to qualify as a regulated investment company under Subchapter M of the Internal Revenue Code and distribute to shareholders all of its taxable income and gains. Distributions determined in accordance with federal income tax regulations may differ in amount or character from net investment income and realized gains for financial reporting purposes. Financial reporting records are adjusted for permanent book/tax differences to reflect tax character but are not adjusted for temporary differences.
The fund files U.S. federal, state, and local tax returns as required. The fund’s tax returns are subject to examination by the relevant tax authorities until expiration of the applicable statute of limitations, which is generally three years after the filing of the tax return but which can be extended to six years in certain circumstances. Tax returns for open years have incorporated no uncertain tax positions that require a provision for income taxes.
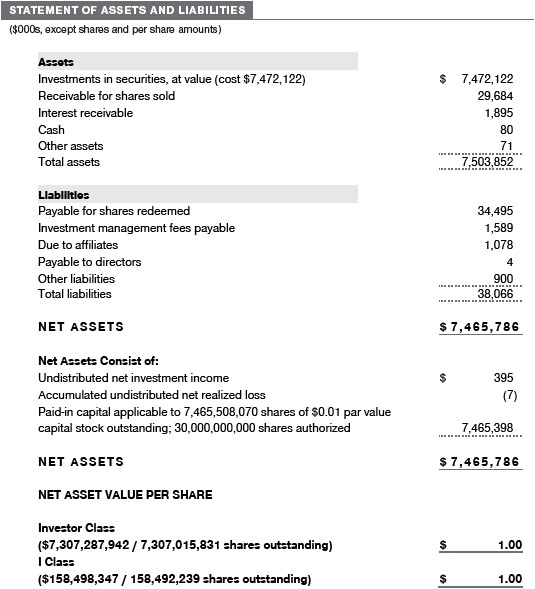
Distributions during the years ended May 31, 2018 and May 31, 2017, totaled $70,963,000 and $9,266,000, respectively, and were characterized as ordinary income for tax purposes. At May 31, 2018, the tax-basis cost of investments and components of net assets were as follows:
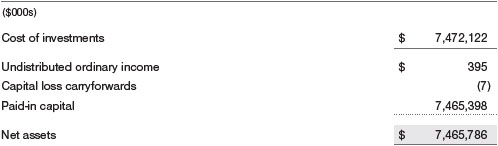
The fund intends to retain realized gains to the extent of available capital loss carryforwards. Net realized capital losses may be carried forward indefinitely to offset future realized capital gains. During the year ended May 31, 2018, the fund utilized $26,000 of capital loss carryforwards.
NOTE 5 - RELATED PARTY TRANSACTIONS
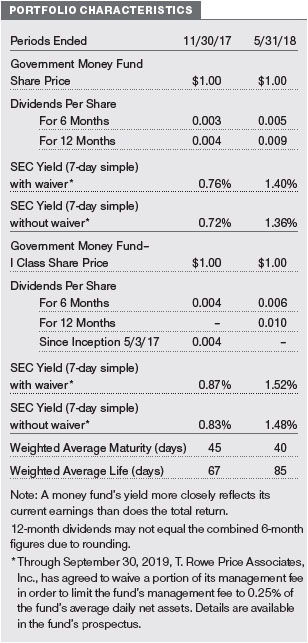
The fund is managed by T. Rowe Price Associates, Inc. (Price Associates), a wholly owned subsidiary of T. Rowe Price Group, Inc. (Price Group). The investment management agreement between the fund and Price Associates provides for an annual investment management fee, which is computed daily and paid monthly. The fee is determined by applying a group fee rate to the fund’s average daily net assets. The group fee rate is calculated based on the combined net assets of certain mutual funds sponsored by Price Associates (the group) applied to a graduated fee schedule, with rates ranging from 0.48% for the first $1 billion of assets to 0.265% for assets in excess of $650 billion. Price Associates agreed to reduce the fund’s annual investment management fee to 0.25% through September 30, 2019. This contractual arrangement will renew automatically for one-year terms thereafter and may be revised, revoked, or terminated only with approval of the fund’s Board. The fund has no obligation to repay fees reduced under this arrangement. At May 31, 2018, the effective annual group fee rate was 0.29%.
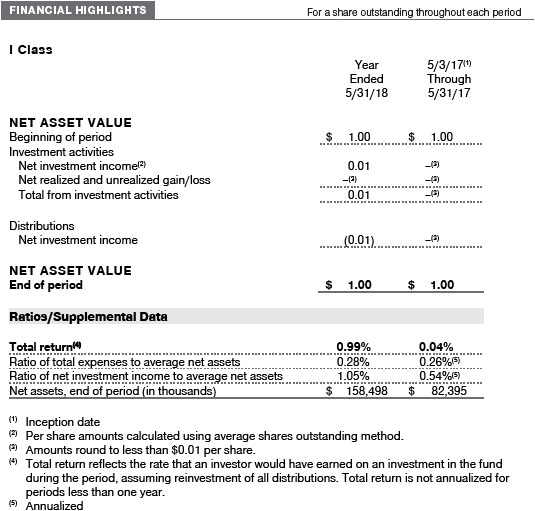
The I Class is subject to an operating expense limitation (I Class limit) pursuant to which Price Associates is contractually required to pay all operating expenses of the I Class, excluding management fees, interest, expenses related to borrowings, taxes, brokerage, and other non-recurring expenses permitted by the investment management agreement, to the extent such operating expenses, on an annualized basis, exceed 0.05% of average net assets. This agreement will continue until September 30, 2019, and may be renewed, revised, or revoked only with approval of the fund’s Board. The I Class is required to repay Price Associates for expenses previously paid to the extent the class’s net assets grow or expenses decline sufficiently to allow repayment without causing the class’s operating expenses (after the repayment is taken into account) to exceed both: (1) the expense limitation in place at the time such amounts were paid; and (2) the class’s current expense limitation. However, no repayment will be made more than three years after the date of a payment or waiver. For the year ended May 31, 2018, the I Class operated below its expense limitation.
In addition, the fund has entered into service agreements with Price Associates and two wholly owned subsidiaries of Price Associates, each an affiliate of the fund (collectively, Price). Price Associates provides certain accounting and administrative services to the fund. T. Rowe Price Services, Inc., provides shareholder and administrative services in its capacity as the fund’s transfer and dividend-disbursing agent. T. Rowe Price Retirement Plan Services, Inc., provides subaccounting and recordkeeping services for certain retirement accounts invested in the Investor Class and I Class. For the year ended May 31, 2018, expenses incurred pursuant to these service agreements were $91,000 for Price Associates; $6,847,000 for T. Rowe Price Services, Inc.; and $1,283,000 for T. Rowe Price Retirement Plan Services, Inc. All amounts due to and due from Price, exclusive of investment management fees payable, are presented net on the accompanying Statement of Assets and Liabilities.
As of May 31, 2018, T. Rowe Price Group, Inc., or its wholly owned subsidiaries owned 1,085,423,739 shares of the Investor Class, representing 15% of the Investor Class’s net assets.
The fund may participate in securities purchase and sale transactions with other funds or accounts advised by Price Associates (cross trades), in accordance with procedures adopted by the fund’s Board and Securities and Exchange Commission rules, which require, among other things, that such purchase and sale cross trades be effected at the independent current market price of the security. During the year ended May 31, 2018, the fund had no purchases or sales cross trades with other funds or accounts advised by Price Associates.
REPORT OF INDEPENDENT REGISTERED PUBLIC ACCOUNTING FIRM
To the Board of Directors and Shareholders of T. Rowe Price Government Money Fund, Inc.
Opinion on the Financial Statements
We have audited the accompanying statement of assets and liabilities, including the portfolio of investments, of T. Rowe Price Government Money Fund, Inc. (the “Fund”) as of May 31, 2018, the related statement of operations for the year ended May 31, 2018, the statement of changes in net assets for each of the two years in the period ended May 31, 2018, including the related notes, and the financial highlights for each of the periods indicated therein (collectively referred to as the “financial statements”). In our opinion, the financial statements present fairly, in all material respects, the financial position of the Fund as of May 31, 2018, the results of its operations for the year then ended, the changes in its net assets for each of the two years in the period ended May 31, 2018 and the financial highlights for each of the periods indicated therein, in conformity with accounting principles generally accepted in the United States of America.
Basis for Opinion
These financial statements are the responsibility of the Fund’s management. Our responsibility is to express an opinion on the Fund’s financial statements based on our audits. We are a public accounting firm registered with the Public Company Accounting Oversight Board (United States) (“PCAOB”) and are required to be independent with respect to the Fund in accordance with the U.S. federal securities laws and the applicable rules and regulations of the Securities and Exchange Commission and the PCAOB.
We conducted our audits of these financial statements in accordance with the standards of the PCAOB. Those standards require that we plan and perform the audit to obtain reasonable assurance about whether the financial statements are free of material misstatement, whether due to error or fraud.
Our audits included performing procedures to assess the risks of material misstatement of the financial statements, whether due to error or fraud, and performing procedures that respond to those risks. Such procedures included examining, on a test basis, evidence regarding the amounts and disclosures in the financial statements. Our audits also included evaluating the accounting principles used and significant estimates made by management, as well as evaluating the overall presentation of the financial statements. Our procedures included confirmation of securities owned as of May 31, 2018 by correspondence with the custodian. We believe that our audits provide a reasonable basis for our opinion.
PricewaterhouseCoopers LLP
Baltimore, Maryland
July 19, 2018
We have served as the auditor of one or more investment companies in the T. Rowe Price group of investment companies since 1973.
INFORMATION ON PROXY VOTING POLICIES, PROCEDURES, AND RECORDS
A description of the policies and procedures used by T. Rowe Price funds and portfolios to determine how to vote proxies relating to portfolio securities is available in each fund’s Statement of Additional Information. You may request this document by calling 1-800-225-5132 or by accessing the SEC’s website, sec.gov.
The description of our proxy voting policies and procedures is also available on our corporate website. To access it, please visit the following Web page:
https://www3.troweprice.com/usis/corporate/en/utility/policies.html
Scroll down to the section near the bottom of the page that says, “Proxy Voting Policies.” Click on the Proxy Voting Policies link in the shaded box.
Each fund’s most recent annual proxy voting record is available on our website and through the SEC’s website. To access it through T. Rowe Price, visit the website location shown above, and scroll down to the section near the bottom of the page that says, “Proxy Voting Records.” Click on the Proxy Voting Records link in the shaded box.
HOW TO OBTAIN QUARTERLY PORTFOLIO HOLDINGS
The fund files a complete schedule of portfolio holdings with the Securities and Exchange Commission for the first and third quarters of each fiscal year on Form N-Q. The fund’s Form N-Q is available electronically on the SEC’s website (sec.gov); hard copies may be reviewed and copied at the SEC’s Public Reference Room, 100 F St. N.E., Washington, DC 20549. For more information on the Public Reference Room, call 1-800-SEC-0330.
APPROVAL OF INVESTMENT MANAGEMENT AGREEMENT
Each year, the fund’s Board of Directors (Board) considers the continuation of the investment management agreement (Advisory Contract) between the fund and its investment advisor, T. Rowe Price Associates, Inc. (Advisor), on behalf of the fund. In that regard, at an in-person meeting held on March 5—6, 2018 (Meeting), the Board, including a majority of the fund’s independent directors, approved the continuation of the fund’s Advisory Contract. At the Meeting, the Board considered the factors and reached the conclusions described below relating to the selection of the Advisor and the approval of the Advisory Contract. The independent directors were assisted in their evaluation of the Advisory Contract by independent legal counsel from whom they received separate legal advice and with whom they met separately.
In providing information to the Board, the Advisor was guided by a detailed set of requests for information submitted by independent legal counsel on behalf of the independent directors. In considering and approving the Advisory Contract, the Board considered the information it believed was relevant, including, but not limited to, the information discussed below. The Board considered not only the specific information presented in connection with the Meeting but also the knowledge gained over time through interaction with the Advisor about various topics. The Board meets regularly and, at each of its meetings, covers an extensive agenda of topics and materials and considers factors that are relevant to its annual consideration of the renewal of the T. Rowe Price funds’ advisory contracts, including performance and the services and support provided to the funds and their shareholders.
Services Provided by the Advisor
The Board considered the nature, quality, and extent of the services provided to the fund by the Advisor. These services included, but were not limited to, directing the fund’s investments in accordance with its investment program and the overall management of the fund’s portfolio, as well as a variety of related activities such as financial, investment operations, and administrative services; compliance; maintaining the fund’s records and registrations; and shareholder communications. The Board also reviewed the background and experience of the Advisor’s senior management team and investment personnel involved in the management of the fund, as well as the Advisor’s compliance record. The Board concluded that it was satisfied with the nature, quality, and extent of the services provided by the Advisor.
Investment Performance of the Fund
The Board took into account discussions with the Advisor and reports that it receives throughout the year relating to fund performance. In connection with the Meeting, the Board reviewed the fund’s net annualized total returns for the 1-, 2-, 3-, 4-, 5-, and 10-year periods as of September 30, 2017, and compared these returns with the performance of a peer group of funds with similar investment programs and a wide variety of other previously agreed-upon comparable performance measures and market data, including those supplied by Broadridge, which is an independent provider of mutual fund data.
On the basis of this evaluation and the Board’s ongoing review of investment results, and factoring in the relative market conditions during certain of the performance periods, the Board concluded that the fund’s performance was satisfactory.
Costs, Benefits, Profits, and Economies of Scale
The Board reviewed detailed information regarding the revenues received by the Advisor under the Advisory Contract and other benefits that the Advisor (and its affiliates) may have realized from its relationship with the fund, including any research received under “soft dollar” agreements and commission-sharing arrangements with broker-dealers. The Board considered that the Advisor may receive some benefit from soft-dollar arrangements pursuant to which research is received from broker-dealers that execute the fund’s portfolio transactions. The Board received information on the estimated costs incurred and profits realized by the Advisor from managing the T. Rowe Price funds. The Board also reviewed estimates of the profits realized from managing the fund in particular, and the Board concluded that the Advisor’s profits were reasonable in light of the services provided to the fund.
The Board also considered whether the fund benefits under the fee levels set forth in the Advisory Contract from any economies of scale realized by the Advisor. Under the Advisory Contract, the fund pays a fee to the Advisor for investment management services composed of a group fee rate that is based on the combined average net assets of most of the T. Rowe Price funds (including the fund) that declines at certain asset levels—and the fund pays its own expenses of operations (subject to a contractual expense limitation agreed to by the Advisor with respect to the I Class). In addition, the fund has a contractual limitation in place whereby the Advisor has agreed to waive a portion of the management fee it is entitled to receive from the fund in order to limit the fund’s management fee rate to 0.25% of the fund’s average daily net assets. Any fees waived under this management fee waiver agreement are not subject to reimbursement to the Advisor by the fund. The Board concluded that the advisory fee structure for the fund continued to provide for a reasonable sharing of benefits from any economies of scale with the fund’s investors.
Fees and Expenses
The Board was provided with information regarding industry trends in management fees and expenses. Among other things, the Board reviewed data for peer groups that were compiled by Broadridge, which compared: (i) contractual management fees, total expenses, actual management fees, and nonmanagement expenses of the Investor Class of the fund to a group of competitor funds selected by Broadridge (Expense Group); and (ii) total expenses, actual management fees, and nonmanagement expenses of the Investor Class of the fund to a broader set of funds within the Lipper investment classification (Expense Universe). The Board considered the fund’s contractual management fee rate, actual management fee rate (which reflects the management fees actually received from the fund by the Advisor after any applicable waivers, reductions, or reimbursements), operating expenses, and total expenses (which reflects the net total expense ratio of the fund after any waivers, reductions, or reimbursements) in comparison with the information for the Broadridge peer groups. Broadridge generally constructed the peer groups by seeking the most comparable funds based on similar investment classifications and objectives, expense structure, asset size, and operating components and attributes and ranked funds into quintiles, with the first quintile representing the funds with the lowest relative expenses and the fifth quintile representing the funds with the highest relative expenses. The information provided to the Board indicated that the fund’s contractual management fee ranked in the third quintile (Expense Group), the fund’s actual management fee rate ranked in the third quintile (Expense Group and Expense Universe), and the fund’s total expenses ranked in the third and fourth quintiles (Expense Group) and second and third quintiles (Expense Universe).
The Board also reviewed the fee schedules for institutional accounts and private accounts with similar mandates that are advised or subadvised by the Advisor and its affiliates. Management provided the Board with information about the Advisor’s responsibilities and services provided to subadvisory and other institutional account clients, including information about how the requirements and economics of the institutional business are fundamentally different from those of the mutual fund business. The Board considered information showing that the Advisor’s mutual fund business is generally more complex from a business and compliance perspective than its institutional account business and considered various relevant factors, such as the broader scope of operations and oversight, more extensive shareholder communication infrastructure, greater asset flows, heightened business risks, and differences in applicable laws and regulations associated with the Advisor’s proprietary mutual fund business. In assessing the reasonableness of the fund’s management fee rate, the Board considered the differences in the nature of the services required for the Advisor to manage its mutual fund business versus managing a discrete pool of assets as a subadvisor to another institution’s mutual fund or for an institutional account and that the Advisor generally performs significant additional services and assumes greater risk in managing the fund and other T. Rowe Price funds than it does for institutional account clients.
On the basis of the information provided and the factors considered, the Board concluded that the fees paid by the fund under the Advisory Contract are reasonable.
Approval of the Advisory Contract
As noted, the Board approved the continuation of the Advisory Contract. No single factor was considered in isolation or to be determinative to the decision. Rather, the Board concluded, in light of a weighting and balancing of all factors considered, that it was in the best interests of the fund and its shareholders for the Board to approve the continuation of the Advisory Contract (including the fees to be charged for services thereunder).
ABOUT THE FUND’S DIRECTORS AND OFFICERS
Your fund is overseen by a Board of Directors (Board) that meets regularly to review a wide variety of matters affecting or potentially affecting the fund, including performance, investment programs, compliance matters, advisory fees and expenses, service providers, and business and regulatory affairs. The Board elects the fund’s officers, who are listed in the final table. At least 75% of the Board’s members are independent of the Boards of T. Rowe Price Associates, Inc. (T. Rowe Price), and its affiliates; “inside” or “interested” directors are employees or officers of T. Rowe Price. The business address of each director and officer is 100 East Pratt Street, Baltimore, Maryland 21202. The Statement of Additional Information includes additional information about the fund directors and is available without charge by calling a T. Rowe Price representative at 1-800-638-5660.
| INDEPENDENT DIRECTORS(a) |
| |
| Name | | |
| (Year of Birth) | | |
| Year Elected* | | |
| [Number of T. Rowe Price | | Principal Occupation(s) and Directorships of Public Companies and |
| Portfolios Overseen] | | Other Investment Companies During the Past Five Years |
| | | |
| Teresa Bryce Bazemore* | | President, Radian Guaranty (2008 to 2017); Member, Bazemore |
| (1959) | | Consulting LLC (2018 to present); Member, Chimera Investment |
| 2018 | | Corporation (2017 to present); Member, Federal Home Loan Bank of |
| [191] | | Pittsburgh (2017 to present) |
| | | |
| Ronald J. Daniels* | | President, The Johns Hopkins University(b) and Professor, Political |
| (1959) | | Science Department, The Johns Hopkins University (2009 to present); |
| 2018 | | Director, Lyndhurst Holdings (2015 to present) |
| [191] | | |
| | | |
| Anthony W. Deering** | | Chairman, Exeter Capital, LLC, a private investment firm (2004 to 2017); |
| (1945) | | Director and Advisory Board Member, Deutsche Bank North America |
| 1979 | | (2004 to 2017); Director, Vornado Real Estate Investment Trust (2004 |
| [0] | | to 2012); Director, Under Armour (2008 to 2017); Director, Brixmor Real |
| | Estate Investment Trust (2012 to 2017) |
| | | |
| Bruce W. Duncan | | Chief Executive Officer and Director (January 2009 to December 2016), |
| (1951) | | Chairman of the Board (January 2016 to present), and President |
| 2013 | | (January 2009 to September 2016), First Industrial Realty Trust, an |
| [191] | | owner and operator of industrial properties; Chairman of the Board |
| | (2005 to September 2016) and Director (1999 to September 2016), |
| | Starwood Hotels & Resorts, a hotel and leisure company; Director, |
| | Boston Properties (May 2016 to present); Director, Marriott International, |
| | Inc. (September 2016 to present) |
| | | |
| Robert J. Gerrard, Jr. | | Advisory Board Member, Pipeline Crisis/Winning Strategies, a |
| (1952) | | collaborative working to improve opportunities for young African |
| 2013 | | Americans (1997 to January 2016) |
| [191] | | |
| | | |
| Paul F. McBride | | Advisory Board Member, Vizzia Technologies (2015 to present); Board |
| (1956) | | Member, Dunbar Armored (2012 to present) |
| 2013 | | |
| [191] | | |
| | | |
| Cecilia E. Rouse, Ph.D. | | Dean, Woodrow Wilson School (2012 to present); Professor and |
| (1963) | | Researcher, Princeton University (1992 to present); Member of National |
| 2013 | | Academy of Education (2010 to present); Director, MDRC, a nonprofit |
| [191] | | education and social policy research organization (2011 to present); |
| | Research Associate of Labor Studies Program at the National Bureau |
| | of Economic Research (2011 to 2015); Board Member of the National |
| | Bureau of Economic Research (2011 to present); Chair of Committee |
| | on the Status of Minority Groups in the Economic Profession of the |
| | American Economic Association (2012 to 2017); Vice President |
| | (2015 to 2016), American Economic Association |
| | | |
| John G. Schreiber | | Owner/President, Centaur Capital Partners, Inc., a real estate investment |
| (1946) | | company (1991 to present); Cofounder, Partner, and Cochairman |
| 1992 | | of the Investment Committee, Blackstone Real Estate Advisors, L.P. |
| [191] | | (1992 to 2015); Director, General Growth Properties, Inc. (2010 to 2013); |
| | Director, Blackstone Mortgage Trust, a real estate finance company |
| | (2012 to 2016); Director and Chairman of the Board, Brixmor Property |
| | Group, Inc. (2013 to present); Director, Hilton Worldwide (2013 to |
| | present); Director, Hudson Pacific Properties (2014 to 2016); Director, |
| | Invitation Homes (2014 to present) |
| | | |
| Mark R. Tercek | | President and Chief Executive Officer, The Nature Conservancy |
| (1957) | | (2008 to present) |
| 2009 | | |
| [191] | | |
| |
| *Effective January 1, 2018, Ms. Bazemore and Mr. Daniels were elected as independent directors of the Price Funds. |
| **Mr. Deering served as an independent director of the Price Funds until November 17, 2017. |
| (a)All information about the independent directors was current as of December 31, 2017, except for the information provided for Ms. Bazemore and Mr. Daniels, which is current as of January 1, 2018. |
| (b)William J. Stromberg, president and chief executive officer of T. Rowe Price Group, Inc., the parent company of the Price Funds’ investment advisor, has served on the Board of Trustees of Johns Hopkins University since 2014 and is a member of the Johns Hopkins University Board’s Compensation Committee. |
| |
| INSIDE DIRECTORS |
| |
| Name | | |
| (Year of Birth) | | |
| Year Elected* | | |
| [Number of T. Rowe Price | | Principal Occupation(s) and Directorships of Public Companies and |
| Portfolios Overseen] | | Other Investment Companies During the Past Five Years |
| | | |
| Edward C. Bernard | | Director and Vice President, T. Rowe Price; Vice Chairman of the Board, |
| (1956) | | Director, and Vice President, T. Rowe Price Group, Inc.; Chairman of the |
| 2006 | | Board, Director, and Vice President, T. Rowe Price Investment Services, |
| [191] | | Inc., and T. Rowe Price Services, Inc.; Chairman of the Board and |
| | Director, T. Rowe Price Retirement Plan Services, Inc.; Chairman of the |
| | Board, Chief Executive Officer, Director, and President, T. Rowe Price |
| | International and T. Rowe Price Trust Company; Chairman of the Board, |
| | all funds |
| | | |
| Edward A. Wiese, CFA | | Vice President, T. Rowe Price, T. Rowe Price Group, Inc., T. Rowe Price |
| (1959) | | International, and T. Rowe Price Trust Company |
| 2015 | | |
| [56] | | |
| |
| *Each inside director serves until retirement, resignation, or election of a successor. |
| OFFICERS |
| |
| Name (Year of Birth) | | |
| Position Held With Government Money Fund | | Principal Occupation(s) |
| | | |
| Darrell N. Braman (1963) | | Vice President, Price Hong Kong, Price Singapore, |
| Vice President and Secretary | | T. Rowe Price, T. Rowe Price Group, Inc., T. Rowe |
| | Price International, T. Rowe Price Investment |
| | Services, Inc., and T. Rowe Price Services, Inc. |
| | | |
| M. Helena Condez (1962) | | Vice President, T. Rowe Price and T. Rowe Price |
| Vice President | | Group, Inc. |
| | | |
| G. Richard Dent (1960) | | Vice President, T. Rowe Price and T. Rowe Price |
| Vice President | | Group, Inc. |
| | | |
| Stephanie A. Gentile, CFA (1956) | | Vice President, T. Rowe Price; formerly, Director, |
| Vice President | | Credit Suisse Securities (to 2014) |
| | | |
| John R. Gilner (1961) | | Chief Compliance Officer and Vice President, |
| Chief Compliance Officer | | T. Rowe Price; Vice President, T. Rowe Price |
| | Group, Inc., and T. Rowe Price Investment |
| | Services, Inc. |
| | | |
| Gary J. Greb (1961) | | Vice President, T. Rowe Price, T. Rowe Price |
| Vice President | | International, and T. Rowe Trust Company |
| | | |
| Paul J. Krug, CPA (1964) | | Vice President, T. Rowe Price, T. Rowe Price |
| Vice President | | Group, Inc., and T. Rowe Price Trust Company |
| | | |
| Marcy M. Lash (1963) | | Vice President, T. Rowe Price and T. Rowe Price |
| Vice President | | Group, Inc. |
| | | |
| Alan D. Levenson, Ph.D. (1958) | | Vice President, T. Rowe Price and T. Rowe Price |
| Vice President | | Group, Inc. |
| | | |
| Joseph K. Lynagh, CFA (1958) | | Vice President, T. Rowe Price, T. Rowe Price |
| President | | Group, Inc., and T. Rowe Price Trust Company |
| | | |
| Catherine D. Mathews (1963) | | Vice President, T. Rowe Price, T. Rowe Price |
| Treasurer and Vice President | | Group, Inc., and T. Rowe Price Trust Company |
| | | |
| Cheryl A. Mickel, CFA (1967) | | Director and Vice President, T. Rowe Price Trust |
| Vice President | | Company; Vice President, T. Rowe Price and |
| | T. Rowe Price Group, Inc. |
| | | |
| David Oestreicher (1967) | | Director and Vice President, T. Rowe Price |
| Vice President | | Investment Services, Inc., T. Rowe Price Retirement |
| | Plan Services, Inc., T. Rowe Price Services, Inc., |
| | and T. Rowe Price Trust Company; Chief Legal |
| | Officer and Vice President, T. Rowe Price Group, |
| | Inc.; Vice President, T. Rowe Price and T. Rowe |
| | Price International; Vice President, Price Hong |
| | Kong and Price Singapore |
| | | |
| John W. Ratzesberger (1975) | | Vice President, T. Rowe Price, T. Rowe Price |
| Vice President | | Group, Inc., and T. Rowe Price Trust Company; |
| | formerly, North American Head of Listed |
| | Derivatives Operation, Morgan Stanley (to 2013) |
| | | |
| Shannon Hofher Rauser (1987) | | Employee, T. Rowe Price |
| Assistant Secretary | | |
| | | |
| Chen Shao (1980) | | Vice President, T. Rowe Price and T. Rowe Price |
| Vice President | | Group, Inc. |
| | | |
| Douglas D. Spratley, CFA (1969) | | Vice President, T. Rowe Price and T. Rowe Price |
| Vice President | | Group, Inc. |
| | | |
| Robert D. Thomas (1971) | | Vice President, T. Rowe Price Group, Inc., and |
| Vice President | | T. Rowe Price International |
| | | |
| Megan Warren (1968) | | Vice President, T. Rowe Price, T. Rowe Price |
| Vice President | | Group, Inc., T. Rowe Price Retirement Plan |
| | Services, Inc., T. Rowe Price Services, Inc., and |
| | T. Rowe Price Trust Company; formerly, Executive |
| | Director, JP Morgan Chase (to 2017) |
| |
| Unless otherwise noted, officers have been employees of T. Rowe Price or T. Rowe Price International for at least 5 years. |
Item 2. Code of Ethics.
The registrant has adopted a code of ethics, as defined in Item 2 of Form N-CSR, applicable to its principal executive officer, principal financial officer, principal accounting officer or controller, or persons performing similar functions. A copy of this code of ethics is filed as an exhibit to this Form N-CSR. No substantive amendments were approved or waivers were granted to this code of ethics during the period covered by this report.
Item 3. Audit Committee Financial Expert.
The registrant’s Board of Directors/Trustees has determined that Mr. Bruce W. Duncan qualifies as an audit committee financial expert, as defined in Item 3 of Form N-CSR. Mr. Duncan is considered independent for purposes of Item 3 of Form N-CSR.
Item 4. Principal Accountant Fees and Services.
(a) – (d) Aggregate fees billed for the last two fiscal years for professional services rendered to, or on behalf of, the registrant by the registrant’s principal accountant were as follows:
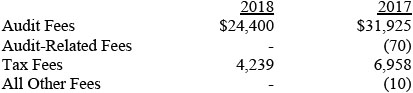
Audit fees include amounts related to the audit of the registrant’s annual financial statements and services normally provided by the accountant in connection with statutory and regulatory filings. Audit-related fees include amounts reasonably related to the performance of the audit of the registrant’s financial statements and specifically include the issuance of a report on internal controls and, if applicable, agreed-upon procedures related to fund acquisitions. Tax fees include amounts related to services for tax compliance, tax planning, and tax advice. The nature of these services specifically includes the review of distribution calculations and the preparation of Federal, state, and excise tax returns. All other fees include the registrant’s pro-rata share of amounts for agreed-upon procedures in conjunction with service contract approvals by the registrant’s Board of Directors/Trustees.
(e)(1) The registrant’s audit committee has adopted a policy whereby audit and non-audit services performed by the registrant’s principal accountant for the registrant, its investment adviser, and any entity controlling, controlled by, or under common control with the investment adviser that provides ongoing services to the registrant require pre-approval in advance at regularly scheduled audit committee meetings. If such a service is required between regularly scheduled audit committee meetings, pre-approval may be authorized by one audit committee member with ratification at the next scheduled audit committee meeting. Waiver of pre-approval for audit or non-audit services requiring fees of a de minimis amount is not permitted.
(2) No services included in (b) – (d) above were approved pursuant to paragraph (c)(7)(i)(C) of Rule 2-01 of Regulation S-X.
(f) Less than 50 percent of the hours expended on the principal accountant’s engagement to audit the registrant’s financial statements for the most recent fiscal year were attributed to work performed by persons other than the principal accountant’s full-time, permanent employees.
(g) The aggregate fees billed for the most recent fiscal year and the preceding fiscal year by the registrant’s principal accountant for non-audit services rendered to the registrant, its investment adviser, and any entity controlling, controlled by, or under common control with the investment adviser that provides ongoing services to the registrant were $1,874,000 and $1,765,000, respectively.
(h) All non-audit services rendered in (g) above were pre-approved by the registrant’s audit committee. Accordingly, these services were considered by the registrant’s audit committee in maintaining the principal accountant’s independence.
Item 5. Audit Committee of Listed Registrants.
Not applicable.
Item 6. Investments.
(a) Not applicable. The complete schedule of investments is included in Item 1 of this Form N-CSR.
(b) Not applicable.
Item 7. Disclosure of Proxy Voting Policies and Procedures for Closed-End Management Investment Companies.
Not applicable.
Item 8. Portfolio Managers of Closed-End Management Investment Companies.
Not applicable.
Item 9. Purchases of Equity Securities by Closed-End Management Investment Company and Affiliated Purchasers.
Not applicable.
Item 10. Submission of Matters to a Vote of Security Holders.
Not applicable.
Item 11. Controls and Procedures.
(a) The registrant’s principal executive officer and principal financial officer have evaluated the registrant’s disclosure controls and procedures within 90 days of this filing and have concluded that the registrant’s disclosure controls and procedures were effective, as of that date, in ensuring that information required to be disclosed by the registrant in this Form N-CSR was recorded, processed, summarized, and reported timely.
(b) During the period, the Price Funds’ accounting agent, The Bank of New York Mellon (BNYM), converted the fund’s books and records from a legacy fund accounting system / operating model to a BNYM fund accounting system / operating model.
Item 12. Exhibits.
(a)(1) The registrant’s code of ethics pursuant to Item 2 of Form N-CSR is attached.
(2) Separate certifications by the registrant's principal executive officer and principal financial officer, pursuant to Section 302 of the Sarbanes-Oxley Act of 2002 and required by Rule 30a-2(a) under the Investment Company Act of 1940, are attached.
(3) Written solicitation to repurchase securities issued by closed-end companies: not applicable.
(b) A certification by the registrant’s principal executive officer and principal financial officer, pursuant to Section 906 of the Sarbanes-Oxley Act of 2002 and required by Rule 30a-2(b) under the Investment Company Act of 1940, is attached.
SIGNATURES
Pursuant to the requirements of the Securities Exchange Act of 1934 and the Investment Company Act of 1940, the registrant has duly caused this report to be signed on its behalf by the undersigned, thereunto duly authorized.
T. Rowe Price Government Money Fund, Inc.
| By | | /s/ Edward C. Bernard |
| | | Edward C. Bernard |
| | | Principal Executive Officer |
| |
| Date | | July 19, 2018 | | | | |
Pursuant to the requirements of the Securities Exchange Act of 1934 and the Investment Company Act of 1940, this report has been signed below by the following persons on behalf of the registrant and in the capacities and on the dates indicated.
| By | | /s/ Edward C. Bernard |
| | | Edward C. Bernard |
| | | Principal Executive Officer |
| |
| Date | | July 19, 2018 | | | | |
| |
| |
| By | | /s/ Catherine D. Mathews |
| | | Catherine D. Mathews |
| | | Principal Financial Officer |
| |
| Date | | July 19, 2018 | | | | |