Item 1. Reports to Shareholders
(a) Report pursuant to Rule 30e-1.
| Government Money Fund | May 31, 2020 |
| PRRXX | Investor Class |
| TTGXX | I Class |
Beginning on January 1, 2021, as permitted by SEC regulations, paper copies of the T. Rowe Price funds’ annual and semiannual shareholder reports will no longer be mailed, unless you specifically request them. Instead, shareholder reports will be made available on the funds’ website (troweprice.com/prospectus), and you will be notified by mail with a website link to access the reports each time a report is posted to the site.
If you already elected to receive reports electronically, you will not be affected by this change and need not take any action. At any time, shareholders who invest directly in T. Rowe Price funds may generally elect to receive reports or other communications electronically by enrolling at troweprice.com/paperless or, if you are a retirement plan sponsor or invest in the funds through a financial intermediary (such as an investment advisor, broker-dealer, insurance company, or bank), by contacting your representative or your financial intermediary.
You may elect to continue receiving paper copies of future shareholder reports free of charge. To do so, if you invest directly with T. Rowe Price, please call T. Rowe Price as follows: IRA, nonretirement account holders, and institutional investors, 1-800-225-5132; small business retirement accounts, 1-800-492-7670. If you are a retirement plan sponsor or invest in the T. Rowe Price funds through a financial intermediary, please contact your representative or financial intermediary or follow additional instructions if included with this document. Your election to receive paper copies of reports will apply to all funds held in your account with your financial intermediary or, if you invest directly in the T. Rowe Price funds, with T. Rowe Price. Your election can be changed at any time in the future.
| T. ROWE PRICE GOVERNMENT MONEY FUND |
|
HIGHLIGHTS
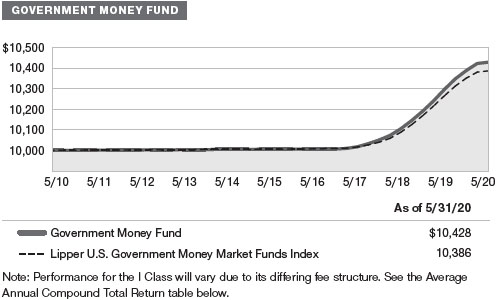
| ■ | The Government Money Fund returned 1.27% in the one-year period ended May 31, 2020, versus 1.17% for the Lipper U.S. Government Money Market Funds Index. |
| |
| ■ | The Federal Reserve reduced short-term interest rates several times during our fiscal year ended May 31, 2020. These rate cuts brought the fed funds target rate back to the 0.00% to 0.25% range, where it had been from late 2008 until late 2015. Other short-term interest rates also declined during our reporting period. |
| |
| ■ | At the end of May, the fund’s weighted average maturity was longer than that of the average competitor. Because of the Fed’s deep rate cuts in March, we extended the fund’s weighted average maturity toward the end of the reporting period to lock in higher rates before they declined. |
| |
| ■ | We expect the Fed to be on hold for the foreseeable future, as the impact of the coronavirus on the economic outlook is a strong headwind. |
Log in to your account at troweprice.com for more information.
*Certain mutual fund accounts that are assessed an annual account service fee can also save money by switching to e-delivery.
CIO Market Commentary
Dear Shareholder
Financial markets recorded mixed results during your fund’s fiscal year, the 12-month period ended May 31, 2020, as the spread of the coronavirus disrupted global economies. Although stocks and bonds experienced extraordinary volatility, historic levels of fiscal and monetary stimulus helped mitigate the losses.
As we entered January, the outlook for 2020 appeared promising. China and the U.S. completed a phase one trade deal that lowered some tariffs, and central bank stimulus in the second half of 2019 appeared to position the economy for further growth. However, market sentiment began to shift amid news of a coronavirus outbreak in China’s Hubei province.
Although the effect was initially muted, with the S&P 500 Index advancing to a record high on February 19, stocks began falling as the virus spread outside China. The major indexes continued their slide as cases mounted in the U.S. and New York City became the epicenter of the pandemic. Governments throughout the world issued stay-at-home orders to contain the virus, and some sectors, such as travel, restaurants, and shopping malls, nearly came to a halt.
Over 40 million Americans filed unemployment claims during the last 10 weeks of the period, and many measures of economic activity, including retail sales and industrial production, experienced record-setting declines. By March 23, the S&P 500 Index had fallen by about a third from the start of the year.
In response to the rapid economic contraction, global central banks took bold accommodative steps, and many governments around the world passed emergency spending packages. The Federal Reserve cut its short-term lending rate to near zero and began purchasing government and corporate bonds to stimulate the economy and supply liquidity in the fixed income market. As a result, the Fed’s balance sheet increased by nearly $3 trillion in three months.
The federal government also provided trillions of dollars in fiscal help in the form of direct payments to many Americans, expanded unemployment insurance, and subsidies to sectors, such as transportation and health care, that had been directly impacted by the pandemic. Boosted by the support, most sectors recouped some of their losses—and the Nasdaq index moved back into positive territory for the year—by the end of May.
For the 12-month period, U.S. large- and mid-cap growth stocks produced robust returns and outperformed small-caps and value shares, which lost ground. Technology and health care stocks performed best within the S&P 500, while energy stocks plunged in response to falling oil prices. A stronger U.S. dollar generally weighed on returns for U.S. investors in foreign securities, but non-U.S. markets were broadly mixed. Japanese stocks posted solid gains, while some emerging regions suffered substantial losses.
In the fixed income universe, Treasuries were the top performers as yields dropped to record lows during the period, and other U.S. investment-grade bonds were also generally positive. High yield bonds finished lower as the default rate in the sector rose to a 10-year high amid the economic downturn.
By the end of the period, markets were encouraged as local governments began to roll back shutdown orders and pharmaceutical companies were focused on developing treatments and a vaccine for the coronavirus. While we are hopeful that a recovery has begun, it is difficult to gauge just how long the acute economic disruption might last. With so much uncertainty still surrounding the pandemic, it is possible that the time frame for returning to a “normalized” environment could be longer than anticipated.
Our portfolio managers are mindful that extreme market dislocations provide opportunities but also present risks, and careful analysis will be required to seek out quality companies that have the financial strength, competitive position, and capable managements to survive the crisis and perhaps emerge even stronger.
We will be carefully monitoring developments, and I believe that our disciplined fundamental research and strategic investing approach will continue to serve our shareholders well in this uncertain environment.
Thank you for your continued confidence in T. Rowe Price.
Sincerely,

Robert Sharps
Group Chief Investment Officer
Management’s Discussion of Fund Performance
INVESTMENT OBJECTIVE
The fund’s goals are preservation of capital, liquidity, and, consistent with these, the highest possible current income.
FUND COMMENTARY
How did the fund perform in the past 12 months?
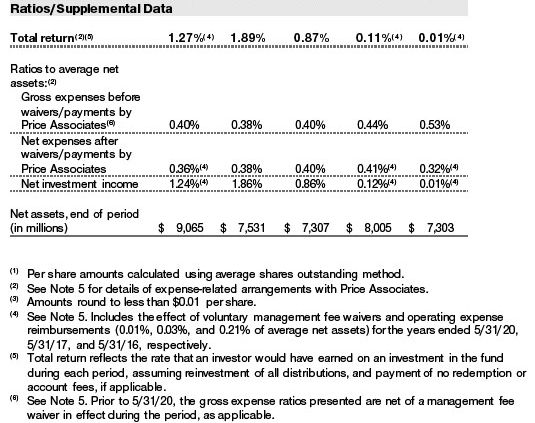
The Government Money Fund returned 1.27% in the one-year period ended May 31, 2020, versus 1.17% for the Lipper U.S. Government Money Market Funds Index. (Performance for the fund’s I Class shares will vary due to a different fee structure. Past performance cannot guarantee future results.)

What factors influenced the fund’s performance?
From late July through the end of 2019, the Federal Reserve reduced short-term interest rates three times by 25 basis points. As the calendar turned to 2020, the market was debating whether the Fed needed to cut rates further to continue the economic expansion. As COVID-19, the disease caused by the coronavirus, emerged as a global risk, institutional investors moved assets from prime money market funds into government money funds. Assets of government money funds increased, leading to higher prices in the government debt market. Institutional prime money funds, on the other hand, saw heavy outflows that put pressure on their government-regulated liquidity buckets.
With the economy decelerating rapidly due to the pandemic and related lockdowns, the Fed moved decisively to do its part in aiding a recovery. Policymakers cut rates by 50 basis points on March 3, and then by another 100 basis points at an unusual Sunday meeting on March 15. These rate cuts brought the fed funds target rate back to the 0.00% to 0.25% range, where it had been from late 2008 until late 2015.
While the U.S. government money market generally functioned well, other money market segments experienced distress. In response, the Fed also put into place several programs to allay liquidity concerns and placate the market. Specifically, they are the Commercial Paper Funding Facility for issuers to obtain direct funding from the central bank, the Primary Dealer Credit Facility for dealers to finance their inventory through the Fed, and the Money Market Mutual Fund Liquidity Facility (MMLF), which provided a vehicle for prime money funds to sell securities to the Fed. The MMLF was the most appropriate and beneficial program to resolve the impasse caused by money funds hoarding cash to maintain liquidity. It gave the market a buyer when the broker-dealers were unwilling to buy securities.
The yield on the 90-day Treasury bill plunged from 2.35% to 0.14% during the past 12 months, while the six-month Treasury bill yield dropped from 2.35% to 0.18%. Other short-term interest rates, such as the three-month London interbank offered rate, declined to a lesser extent, due in part to some lingering stresses in certain funding markets.
While government money funds’ assets increased, the supply of Treasury bills also increased due to the Treasury Department’s need to finance various new support programs. Therefore, money market rates moved lower based on the Fed’s rate cuts, not based on a supply/demand imbalance. Accordingly, the fund sold some of its repurchase agreement holdings and bought Treasury bills prior to rates declining.
How is the fund positioned?
At the end of May, the fund’s weighted average maturity was longer than that of its average competitor. Because of the Fed’s deep rate cuts in March, we extended the fund’s weighted average maturity toward the end of the reporting period to lock in higher rates before they declined.
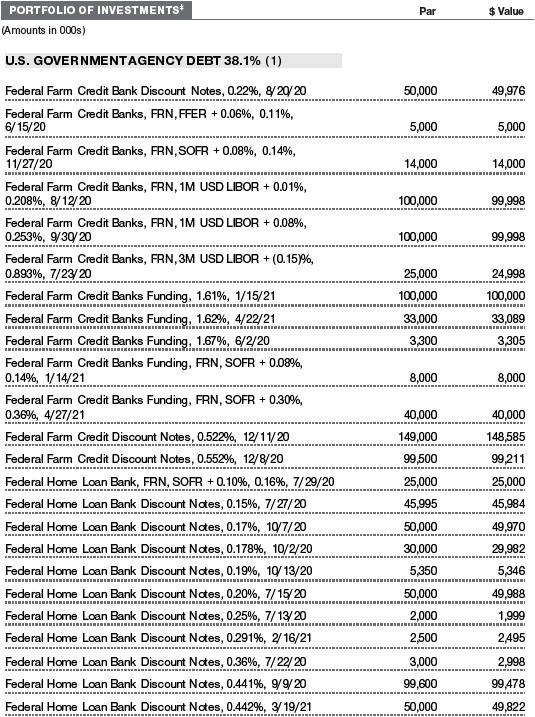
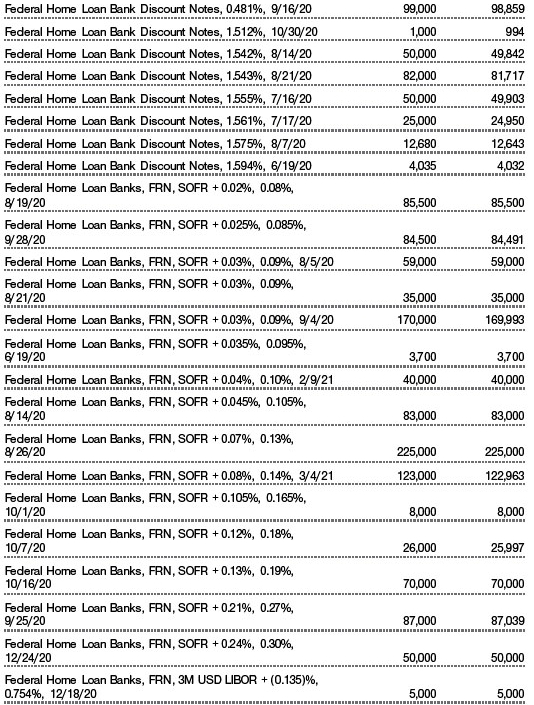
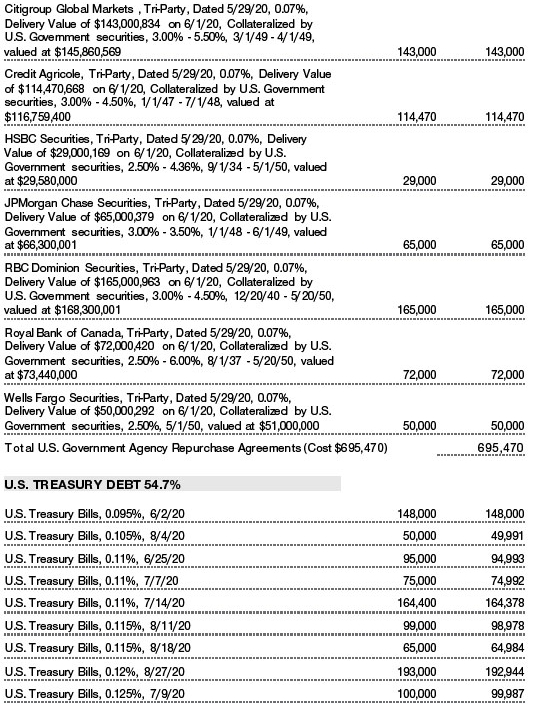
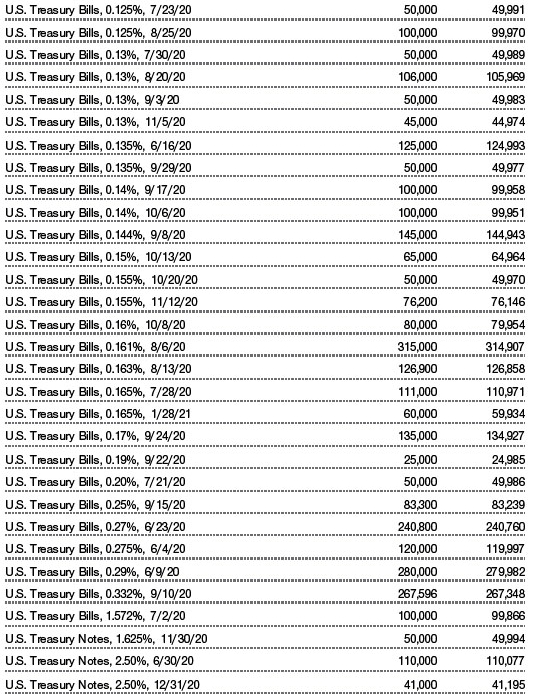
As a government money fund, the portfolio is required to invest almost exclusively in Treasury bills and other U.S. government securities, as well as repurchase agreements fully collateralized by government securities. Of course, the fund is not subject to the liquidity fees and redemption restrictions (also known as “gates”) that may be applied to nongovernment money funds during times of severe redemption activity. At the end of May 2020, about 55% of the fund’s assets were invested in Treasury bills and notes, while other U.S. government and agency securities accounted for 38%. Repurchase agreements represented about 7%.

What is portfolio management’s outlook?
The Federal Reserve’s projections, and most market participants’ expectations, including ours, are for the central bank to be on hold for the foreseeable future. The true impacts of COVID-19 on employment and growth have yet to be seen, and forecasts are dire. To balance the longer average maturities, the fund maintains a high degree of liquidity. As always, our focus remains on principal stability and on investments with the highest credit quality.
The views expressed reflect the opinions of T. Rowe Price as of the date of this report and are subject to change based on changes in market, economic, or other conditions. These views are not intended to be a forecast of future events and are no guarantee of future results.
RISKS OF INVESTING IN THE GOVERNMENT MONEY FUND
You could lose money by investing in the Fund. Although the Fund seeks to preserve the value of your investment at $1.00 per share, it cannot guarantee it will do so. An investment in the Fund is not insured or guaranteed by the Federal Deposit Insurance Corporation or any other government agency. The Fund’s sponsor has no legal obligation to provide financial support to the Fund, and you should not expect that the sponsor will provide financial support to the Fund at any time.
The potential for realizing a loss of principal in the fund could derive from:
Credit risks. An issuer of a debt instrument could suffer an adverse change in financial condition that results in a payment default, rating downgrade, or inability to meet a financial obligation. The credit quality of the securities held by the fund may change rapidly in certain market environments, which could result in significant net asset value deterioration and the inability to maintain a $1.00 share price.
Interest rate risks. A decline in interest rates may lower the fund’s yield, or a rise in the overall level of interest rates may cause a decline in the prices of fixed income securities held by the fund. The fund’s yield will vary; it is not fixed for a specific period like the yield on a bank certificate of deposit. This is a disadvantage when interest rates are falling because the fund would have to reinvest at lower interest rates. Increases in demand for government securities may cause the yield on those securities to fall or even drop to a negative rate.
Repurchase agreement risks. A counterparty to a repurchase agreement may become insolvent or fail to repurchase securities from the fund as required, which could increase the fund’s costs or prevent the fund from immediately accessing its collateral.
BENCHMARK INFORMATION
Note: Lipper, a Thomson Reuters Company, is the source for all Lipper content reflected in these materials. Copyright 2020 © Refinitiv. All rights reserved. Any copying, republication or redistribution of Lipper content is expressly prohibited without the prior written consent of Lipper. Lipper shall not be liable for any errors or delays in the content, or for any actions taken in reliance thereon.
GROWTH OF $10,000
This chart shows the value of a hypothetical $10,000 investment in the fund over the past 10 fiscal year periods or since inception (for funds lacking 10-year records). The result is compared with benchmarks, which include a broad-based market index and may also include a peer group average or index. Market indexes do not include expenses, which are deducted from fund returns as well as mutual fund averages and indexes.
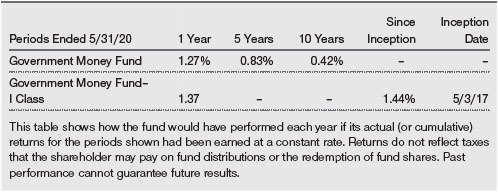
AVERAGE ANNUAL COMPOUND TOTAL RETURN
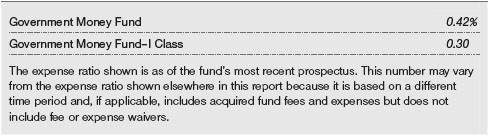
EXPENSE RATIO
FUND EXPENSE EXAMPLE
As a mutual fund shareholder, you may incur two types of costs: (1) transaction costs, such as redemption fees or sales loads, and (2) ongoing costs, including management fees, distribution and service (12b-1) fees, and other fund expenses. The following example is intended to help you understand your ongoing costs (in dollars) of investing in the fund and to compare these costs with the ongoing costs of investing in other mutual funds. The example is based on an investment of $1,000 invested at the beginning of the most recent six-month period and held for the entire period.
Please note that the fund has two share classes: The original share class (Investor Class) charges no distribution and service (12b-1) fee, and the I Class shares are also available to institutionally oriented clients and impose no 12b-1 or administrative fee payment. Each share class is presented separately in the table.
Actual Expenses
The first line of the following table (Actual) provides information about actual account values and expenses based on the fund’s actual returns. You may use the information on this line, together with your account balance, to estimate the expenses that you paid over the period. Simply divide your account value by $1,000 (for example, an $8,600 account value divided by $1,000 = 8.6), then multiply the result by the number on the first line under the heading “Expenses Paid During Period” to estimate the expenses you paid on your account during this period.
Hypothetical Example for Comparison Purposes
The information on the second line of the table (Hypothetical) is based on hypothetical account values and expenses derived from the fund’s actual expense ratio and an assumed 5% per year rate of return before expenses (not the fund’s actual return). You may compare the ongoing costs of investing in the fund with other funds by contrasting this 5% hypothetical example and the 5% hypothetical examples that appear in the shareholder reports of the other funds. The hypothetical account values and expenses may not be used to estimate the actual ending account balance or expenses you paid for the period.
Note: T. Rowe Price charges an annual account service fee of $20, generally for accounts with less than $10,000. The fee is waived for any investor whose T. Rowe Price mutual fund accounts total $50,000 or more; accounts electing to receive electronic delivery of account statements, transaction confirmations, prospectuses, and shareholder reports; or accounts of an investor who is a T. Rowe Price Personal Services or Enhanced Personal Services client (enrollment in these programs generally requires T. Rowe Price assets of at least $250,000). This fee is not included in the accompanying table. If you are subject to the fee, keep it in mind when you are estimating the ongoing expenses of investing in the fund and when comparing the expenses of this fund with other funds.
You should also be aware that the expenses shown in the table highlight only your ongoing costs and do not reflect any transaction costs, such as redemption fees or sales loads. Therefore, the second line of the table is useful in comparing ongoing costs only and will not help you determine the relative total costs of owning different funds. To the extent a fund charges transaction costs, however, the total cost of owning that fund is higher.

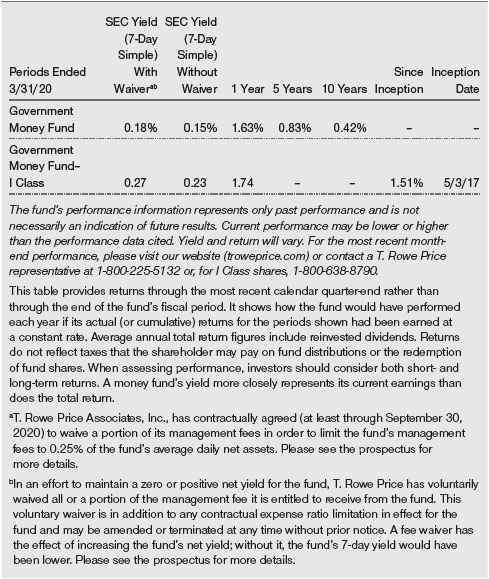
QUARTER-END RETURNS
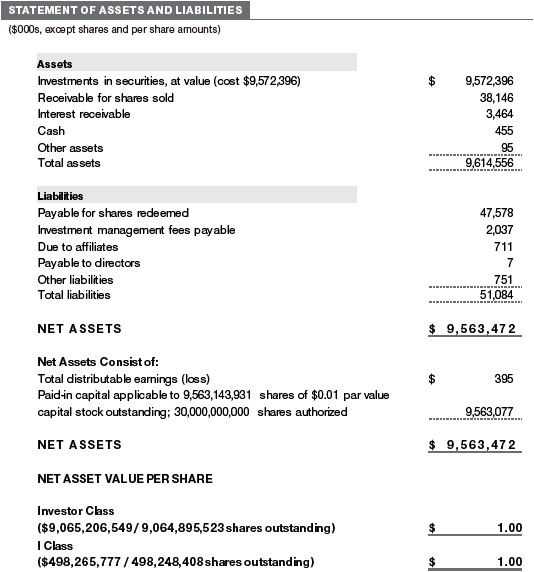
The accompanying notes are an integral part of these financial statements.
The accompanying notes are an integral part of these financial statements.
May 31, 2020


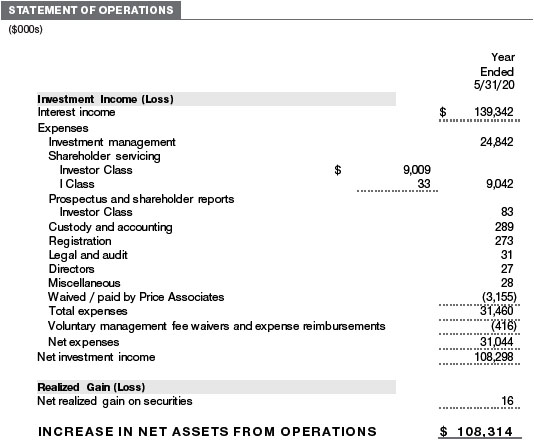
The accompanying notes are an integral part of these financial statements.
May 31, 2020
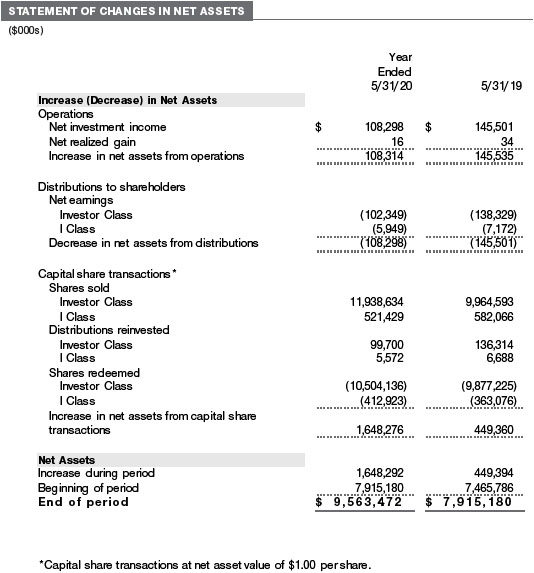
The accompanying notes are an integral part of these financial statements.
The accompanying notes are an integral part of these financial statements.
The accompanying notes are an integral part of these financial statements.
| NOTES TO FINANCIAL STATEMENTS |
T. Rowe Price Government Money Fund, Inc. (the fund) is registered under the Investment Company Act of 1940 (the 1940 Act) as a diversified, open-end management investment company. The fund seeks preservation of capital, liquidity, and, consistent with these, the highest possible current income. The fund intends to operate as a government money market fund and has no intention to voluntarily impose liquidity fees on redemptions or temporarily suspend redemptions. The fund has two classes of shares: the Government Money Fund (Investor Class) and the Government Money Fund–I Class (I Class). I Class shares require a $1 million initial investment minimum, although the minimum generally is waived for retirement plans, financial intermediaries, and certain other accounts. Each class has exclusive voting rights on matters related solely to that class; separate voting rights on matters that relate to both classes; and, in all other respects, the same rights and obligations as the other class.
NOTE 1 - SIGNIFICANT ACCOUNTING POLICIES
Basis of Preparation The fund is an investment company and follows accounting and reporting guidance in the Financial Accounting Standards Board (FASB) Accounting Standards Codification Topic 946 (ASC 946). The accompanying financial statements were prepared in accordance with accounting principles generally accepted in the United States of America (GAAP), including, but not limited to, ASC 946. GAAP requires the use of estimates made by management. Management believes that estimates and valuations are appropriate; however, actual results may differ from those estimates, and the valuations reflected in the accompanying financial statements may differ from the value ultimately realized upon sale or maturity.
Investment Transactions, Investment Income, and Distributions Investment transactions are accounted for on the trade date basis. Income and expenses are recorded on the accrual basis. Realized gains and losses are reported on the identified cost basis. Premiums and discounts on debt securities are amortized for financial reporting purposes. Income tax-related interest and penalties, if incurred, are recorded as income tax expense. Distributions to shareholders are recorded on the ex-dividend date. Income distributions are declared by each class daily and paid monthly. A capital gain distribution may also be declared and paid by the fund annually.
Class Accounting Shareholder servicing, prospectus, and shareholder report expenses incurred by each class are charged directly to the class to which they relate. Expenses common to both classes and investment income are allocated to the classes based upon the relative daily net assets of each class’s settled shares; realized and unrealized gains and losses are allocated based upon the relative daily net assets of each class’s outstanding shares.
New Accounting Guidance Effective June 1, 2019, the fund adopted FASB guidance that shortened the amortization period for certain callable debt securities held at a premium. Adoption had no effect on the fund’s net assets or results of operations.
In March 2020, the FASB issued Accounting Standards Update (ASU), ASU 2020-04, Reference Rate Reform (Topic 848) – Facilitation of the Effects of Reference Rate Reform on Financial Reporting, which provides optional, temporary relief with respect to the financial reporting of contracts subject to certain types of modifications due to the planned discontinuation of the London Interbank Offered Rate (LIBOR) and other interbank-offered based reference rates as of the end of 2021. The guidance is effective for certain reference rate-related contract modifications that occur during the period March 12, 2020 through December 31, 2022. Management is currently evaluating the impact, if any, of the ASU on the fund’s financial statements.
Indemnification In the normal course of business, the fund may provide indemnification in connection with its officers and directors, service providers, and/or private company investments. The fund’s maximum exposure under these arrangements is unknown; however, the risk of material loss is currently considered to be remote.
NOTE 2 - VALUATION
The fund’s financial instruments are valued and each class’s net asset value (NAV) per share is computed at the close of the New York Stock Exchange (NYSE), normally 4 p.m. ET, each day the NYSE is open for business. However, the NAV per share may be calculated at a time other than the normal close of the NYSE if trading on the NYSE is restricted, if the NYSE closes earlier, or as may be permitted by the SEC. The fund’s financial instruments are reported at fair value, which GAAP defines as the price that would be received to sell an asset or paid to transfer a liability in an orderly transaction between market participants at the measurement date. Assets and liabilities other than financial instruments, including short-term receivables and payables, are carried at cost, or estimated realizable value, if less, which approximates fair value. The T. Rowe Price Valuation Committee (the Valuation Committee) is an internal committee that has been delegated certain responsibilities by the fund’s Board of Directors (the Board) to ensure that financial instruments are appropriately priced at fair value in accordance with GAAP and the 1940 Act. Subject to oversight by the Board, the Valuation Committee develops and oversees pricing-related policies and procedures, including the comparison of amortized cost to market-based value, and approves all fair value determinations.
Various valuation techniques and inputs are used to determine the fair value of financial instruments. GAAP establishes the following fair value hierarchy that categorizes the inputs used to measure fair value:
Level 1 – quoted prices (unadjusted) in active markets for identical financial instruments that the fund can access at the reporting date
Level 2 – inputs other than Level 1 quoted prices that are observable, either directly or indirectly (including, but not limited to, quoted prices for similar financial instruments in active markets, quoted prices for identical or similar financial instruments in inactive markets, interest rates and yield curves, implied volatilities, and credit spreads)
Level 3 – unobservable inputs
Observable inputs are developed using market data, such as publicly available information about actual events or transactions, and reflect the assumptions market participants would use to price the financial instrument. Unobservable inputs are those for which market data are not available and are developed using the best information available about the assumptions that market participants would use to price the financial instrument. GAAP requires valuation techniques to maximize the use of relevant observable inputs and minimize the use of unobservable inputs. Input levels are not necessarily an indication of the risk or liquidity associated with financial instruments at that level but rather the degree of judgment used in determining those values. For example, securities held by a money market fund are generally high quality and liquid; however, they are reflected as Level 2 because the inputs used to determine fair value are not quoted prices in an active market.
In accordance with Rule 2a-7 under the 1940 Act, the fund values its securities at amortized cost, which approximates fair value. Securities for which amortized cost is deemed not to reflect fair value are stated at fair value as determined in good faith by the Valuation Committee. On May 31, 2020, all of the fund’s financial instruments were classified as Level 2 in the fair value hierarchy.
NOTE 3 - OTHER INVESTMENT TRANSACTIONS
Consistent with its investment objective, the fund engages in the following practices to manage exposure to certain risks and/or to enhance performance. The investment objective, policies, program, and risk factors of the fund are described more fully in the fund’s prospectus and Statement of Additional Information.
Repurchase Agreements The fund engages in repurchase agreements, pursuant to which it pays cash to and receives securities from a counterparty that agrees to “repurchase” the securities at a specified time, typically within seven business days, for a specified price. The fund enters into such agreements with well-established securities dealers or banks that are members of the Federal Reserve System and are on Price Associates’ approved list. All repurchase agreements are fully collateralized by U.S. government or related agency securities, which are held by the custodian designated by the agreement. Collateral is evaluated daily to ensure that its market value exceeds the delivery value of the repurchase agreements at maturity. Although risk is mitigated by the collateral, the fund could experience a delay in recovering its value and a possible loss of income or value if the counterparty fails to perform in accordance with the terms of the agreement.
NOTE 4 - FEDERAL INCOME TAXES
No provision for federal income taxes is required since the fund intends to continue to qualify as a regulated investment company under Subchapter M of the Internal Revenue Code and distribute to shareholders all of its taxable income and gains. Distributions determined in accordance with federal income tax regulations may differ in amount or character from net investment income and realized gains for financial reporting purposes.
The fund files U.S. federal, state, and local tax returns as required. The fund’s tax returns are subject to examination by the relevant tax authorities until expiration of the applicable statute of limitations, which is generally three years after the filing of the tax return but which can be extended to six years in certain circumstances. Tax returns for open years have incorporated no uncertain tax positions that require a provision for income taxes.
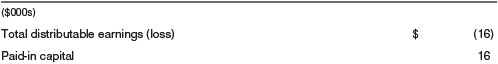
Financial reporting records are adjusted for permanent book/tax differences to reflect tax character but are not adjusted for temporary differences. The permanent book/tax adjustments have no impact on results of operations or net assets and relate primarily to a tax practice that treats a portion of the proceeds from each redemption of capital shares as a distribution of taxable net investment income or realized capital gain. For the year ended May 31, 2020, the following reclassification was recorded:
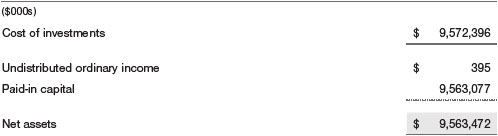
Distributions during the years ended May 31, 2020 and May 31, 2019, totaled $108,298,000 and $145,501,000, respectively, and were characterized as ordinary income for tax purposes. At May 31, 2020, the tax-basis cost of investments and components of net assets were as follows:
NOTE 5 - RELATED PARTY TRANSACTIONS
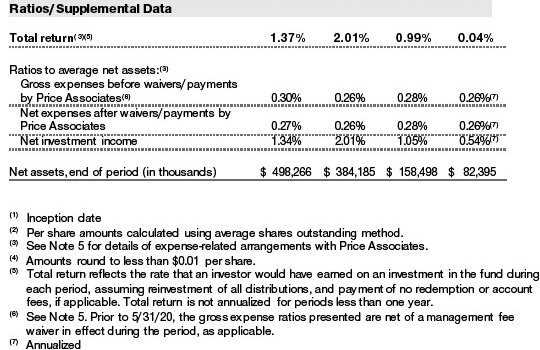
The fund is managed by T. Rowe Price Associates, Inc. (Price Associates), a wholly owned subsidiary of T. Rowe Price Group, Inc. (Price Group). The investment management agreement between the fund and Price Associates provides for an annual investment management fee, which is computed daily and paid monthly. The fee is determined by applying a group fee rate to the fund’s average daily net assets. The group fee rate is calculated based on the combined net assets of certain mutual funds sponsored by Price Associates (the group) applied to a graduated fee schedule, with rates ranging from 0.48% for the first $1 billion of assets to 0.260% for assets in excess of $845 billion. At May 31, 2020, the effective annual group fee rate was 0.29%. Effective April 1, 2017, Price Associates has contractually agreed, at least through September 30, 2020, to waive a portion of its management fee in order to limit the fund’s management fees to 0.25% of the fund’s average daily net assets. Thereafter, this agreement will automatically renew for one-year terms unless terminated or modified by the fund’s Board. Any fees waived under this agreement are not subject to reimbursement to Price Associates by the fund. The total management fees waived were $3,155,000 and allocated ratably in the amounts of $2,991,000 for the Investor Class, $164,000 for the I Class, for the year ended May 31, 2020.
The I Class is subject to an operating expense limitation (I Class Limit) pursuant to which Price Associates is contractually required to pay all operating expenses of the I Class, excluding management fees; interest; expenses related to borrowings, taxes, and brokerage; and other non-recurring expenses permitted by the investment management agreement, to the extent such operating expenses, on an annualized basis, exceed the I Class Limit. This agreement will continue through the expense limitation date indicated in the table below, and may be renewed, revised, or revoked only with approval of the fund’s Board. The I Class is required to repay Price Associates for expenses previously paid to the extent the class’s net assets grow or expenses decline sufficiently to allow repayment without causing the class’s operating expenses (after the repayment is taken into account) to exceed the lesser of: (1) the I Class Limit in place at the time such amounts were paid; or (2) the current I Class Limit. However, no repayment will be made more than three years after the date of a payment or waiver.

Price Associates may voluntarily waive all or a portion of its management fee and reimburse operating expenses to the extent necessary for the fund to maintain a zero or positive net yield (voluntary waiver). This voluntary waiver is in addition to the contractual expense limit in effect for the fund. Any amounts waived/paid by Price Associates under this voluntary agreement are not subject to repayment by the fund. Price Associates may amend or terminate this voluntary arrangement at any time without prior notice. For the year ended May 31, 2020, expenses waived/paid totaled $416,000.
In addition, the fund has entered into service agreements with Price Associates and two wholly owned subsidiaries of Price Associates, each an affiliate of the fund (collectively, Price). Price Associates provides certain accounting and administrative services to the fund. T. Rowe Price Services, Inc. provides shareholder and administrative services in its capacity as the fund’s transfer and dividend-disbursing agent. T. Rowe Price Retirement Plan Services, Inc. provides subaccounting and recordkeeping services for certain retirement accounts invested in the Investor Class. For the year ended May 31, 2020, expenses incurred pursuant to these service agreements were $71,000 for Price Associates; $6,051,000 for T. Rowe Price Services, Inc.; and $1,149,000 for T. Rowe Price Retirement Plan Services, Inc. All amounts due to and due from Price, exclusive of investment management fees payable, are presented net on the accompanying Statement of Assets and Liabilities.
As of May 31, 2020, T. Rowe Price Group, Inc., or its wholly owned subsidiaries owned 1,603,676,548 shares of the Investor Class, representing 18% of the Investor Class’s net assets.
The fund may participate in securities purchase and sale transactions with other funds or accounts advised by Price Associates (cross trades), in accordance with procedures adopted by the fund’s Board and Securities and Exchange Commission rules, which require, among other things, that such purchase and sale cross trades be effected at the independent current market price of the security. During the year ended May 31, 2020, the fund had no purchases or sales cross trades with other funds or accounts advised by Price Associates.
NOTE 6 - OTHER MATTERS
Unpredictable events such as environmental or natural disasters, war, terrorism, pandemics, outbreaks of infectious diseases, and similar public health threats may significantly affect the economy and the markets and issuers in which a fund invests. Certain events may cause instability across global markets, including reduced liquidity and disruptions in trading markets, while some events may affect certain geographic regions, countries, sectors, and industries more significantly than others, and exacerbate other pre-existing political, social, and economic risks.
These types of events may also cause widespread fear and uncertainty, and result in, among other things: quarantines and travel restrictions, including border closings; disruptions to business operations and supply chains; exchange trading suspensions and closures, and overall reduced liquidity of securities, derivatives, and commodities trading markets; reductions in consumer demand and economic output; and significant challenges in healthcare service preparation and delivery. The funds could be negatively impacted if the value of a portfolio holding were harmed by such political or economic conditions or events. In addition, the operations of the funds, their investment advisers, and the funds’ service providers may be significantly impacted, or even temporarily halted, as a result of extensive employee illnesses or unavailability, government quarantine measures, and restrictions on travel or meetings and other factors related to public emergencies. Recently, a novel strain of coronavirus (COVID-19) has resulted in disruptions to global business activity and caused significant volatility and declines in global financial markets.
Governmental and quasi-governmental authorities and regulators have in the past responded to major economic disruptions with a variety of significant fiscal and monetary policy changes, including but not limited to, direct capital infusions into companies, new monetary programs, and dramatically lower interest rates. An unexpected or quick reversal of these policies, or the ineffectiveness of these policies, could negatively impact overall investor sentiment and further increase volatility in securities markets.
REPORT OF INDEPENDENT REGISTERED PUBLIC ACCOUNTING FIRM
To the Board of Directors and Shareholders of T. Rowe Price
Government Money Fund, Inc.
Opinion on the Financial Statements
We have audited the accompanying statement of assets and liabilities, including the portfolio of investments, of T. Rowe Price Government Money Fund, Inc. (the “Fund”) as of May 31, 2020, the related statement of operations for the year ended May 31, 2020, the statement of changes in net assets for each of the two years in the period ended May 31, 2020, including the related notes, and the financial highlights for each of the periods indicated therein (collectively referred to as the “financial statements”). In our opinion, the financial statements present fairly, in all material respects, the financial position of the Fund as of May 31, 2020, the results of its operations for the year then ended, the changes in its net assets for each of the two years in the period ended May 31, 2020 and the financial highlights for each of the periods indicated therein, in conformity with accounting principles generally accepted in the United States of America.
Basis for Opinion
These financial statements are the responsibility of the Fund’s management. Our responsibility is to express an opinion on the Fund’s financial statements based on our audits. We are a public accounting firm registered with the Public Company Accounting Oversight Board (United States) (PCAOB) and are required to be independent with respect to the Fund in accordance with the U.S. federal securities laws and the applicable rules and regulations of the Securities and Exchange Commission and the PCAOB.
We conducted our audits of these financial statements in accordance with the standards of the PCAOB. Those standards require that we plan and perform the audit to obtain reasonable assurance about whether the financial statements are free of material misstatement, whether due to error or fraud.
Our audits included performing procedures to assess the risks of material misstatement of the financial statements, whether due to error or fraud, and performing procedures that respond to those risks. Such procedures included examining, on a test basis, evidence regarding the amounts and disclosures in the financial statements. Our audits also included evaluating the accounting principles used and significant estimates made by management, as well as evaluating the overall presentation of the financial statements. Our procedures included confirmation of securities owned as of May 31, 2020 by correspondence with the custodian and brokers; when replies were not received from brokers, we performed other auditing procedures. We believe that our audits provide a reasonable basis for our opinion.
PricewaterhouseCoopers LLP
Baltimore, Maryland
July 17, 2020
We have served as the auditor of one or more investment companies in the T. Rowe Price group of investment companies since 1973.
TAX INFORMATION (UNAUDITED) FOR THE TAX YEAR ENDED 5/31/20
We are providing this information as required by the Internal Revenue Code. The amounts shown may differ from those elsewhere in this report because of differences between tax and financial reporting requirements.
The fund’s distributions to shareholders included $16,000 from short-term capital gains.
For nonresident alien shareholders, $167,906,000 of income dividends are interest-related dividends.
INFORMATION ON PROXY VOTING POLICIES, PROCEDURES, AND RECORDS
A description of the policies and procedures used by T. Rowe Price funds and portfolios to determine how to vote proxies relating to portfolio securities is available in each fund’s Statement of Additional Information. You may request this document by calling 1-800-225-5132 or by accessing the SEC’s website, sec.gov.
The description of our proxy voting policies and procedures is also available on our corporate website. To access it, please visit the following Web page:
https://www.troweprice.com/corporate/en/utility/policies.html
Scroll down to the section near the bottom of the page that says, “Proxy Voting Policies.” Click on the Proxy Voting Policies link in the shaded box.
Each fund’s most recent annual proxy voting record is available on our website and through the SEC’s website. To access it through T. Rowe Price, visit the website location shown above, and scroll down to the section near the bottom of the page that says, “Proxy Voting Records.” Click on the Proxy Voting Records link in the shaded box.
HOW TO OBTAIN QUARTERLY PORTFOLIO HOLDINGS
Effective for reporting periods on or after March 1, 2019, a fund, except a money market fund, files a complete schedule of portfolio holdings with the Securities and Exchange Commission (SEC) for the first and third quarters of each fiscal year as an exhibit to its reports on Form N-PORT. Prior to March 1, 2019, a fund, including a money market fund, filed a complete schedule of portfolio holdings with the SEC for the first and third quarters of each fiscal year on Form N-Q. A money market fund files detailed month-end portfolio holdings information on Form N-MFP with the SEC each month and posts a complete schedule of portfolio holdings on its website (troweprice.com) as of each month-end for the previous six months. A fund’s Forms N-PORT, N-MFP, and N-Q are available electronically on the SEC’s website (sec.gov).
APPROVAL OF INVESTMENT MANAGEMENT AGREEMENT
Each year, the fund’s Board of Directors (Board) considers the continuation of the investment management agreement (Advisory Contract) between the fund and its investment advisor, T. Rowe Price Associates, Inc. (Advisor), on behalf of the fund. In that regard, at a meeting held on March 9–10, 2020 (Meeting), the Board, including all of the fund’s independent directors, approved the continuation of the fund’s Advisory Contract. At the Meeting, the Board considered the factors and reached the conclusions described below relating to the selection of the Advisor and the approval of the Advisory Contract. The independent directors were assisted in their evaluation of the Advisory Contract by independent legal counsel from whom they received separate legal advice and with whom they met separately.
In providing information to the Board, the Advisor was guided by a detailed set of requests for information submitted by independent legal counsel on behalf of the independent directors. In considering and approving the Advisory Contract, the Board considered the information it believed was relevant, including, but not limited to, the information discussed below. The Board considered not only the specific information presented in connection with the Meeting, but also the knowledge gained over time through interaction with the Advisor about various topics. The Board meets regularly and, at each of its meetings, covers an extensive agenda of topics and materials and considers factors that are relevant to its annual consideration of the renewal of the T. Rowe Price funds’ advisory contracts, including performance and the services and support provided to the funds and their shareholders.
Services Provided by the Advisor
The Board considered the nature, quality, and extent of the services provided to the fund by the Advisor. These services included, but were not limited to, directing the fund’s investments in accordance with its investment program and the overall management of the fund’s portfolio, as well as a variety of related activities such as financial, investment operations, and administrative services; compliance; maintaining the fund’s records and registrations; and shareholder communications. The Board also reviewed the background and experience of the Advisor’s senior management team and investment personnel involved in the management of the fund, as well as the Advisor’s compliance record. The Board concluded that it was satisfied with the nature, quality, and extent of the services provided by the Advisor.
Investment Performance of the Fund
The Board took into account discussions with the Advisor and reports that it receives throughout the year relating to fund performance. In connection with the Meeting, the Board reviewed the fund’s net annualized total returns for the 1-, 2-, 3-, 4-, 5-, and 10-year periods as of September 30, 2019, and compared these returns with the performance of a peer group of funds with similar investment programs and a wide variety of other previously agreed-upon comparable performance measures and market data, including those supplied by Broadridge, which is an independent provider of mutual fund data.
On the basis of this evaluation and the Board’s ongoing review of investment results, and factoring in the relative market conditions during certain of the performance periods, the Board concluded that the fund’s performance was satisfactory.
Costs, Benefits, Profits, and Economies of Scale
The Board reviewed detailed information regarding the revenues received by the Advisor under the Advisory Contract and other benefits that the Advisor (and its affiliates) may have realized from its relationship with the fund, including any research received under “soft dollar” agreements and commission-sharing arrangements with broker-dealers. The Board considered that the Advisor may have received some benefit from soft-dollar arrangements pursuant to which research is received from broker-dealers that execute the fund’s portfolio transactions. However, the Board also considered that, effective January 2020, the Advisor began bearing the cost of research services for all client accounts that it advises, including the T. Rowe Price funds. The Board received information on the estimated costs incurred and profits realized by the Advisor from managing the T. Rowe Price funds. The Board also reviewed estimates of the profits realized from managing the fund in particular, and the Board concluded that the Advisor’s profits were reasonable in light of the services provided to the fund.
The Board also considered whether the fund benefits under the fee levels set forth in the Advisory Contract from any economies of scale realized by the Advisor. Under the Advisory Contract, the fund pays a fee to the Advisor for investment management services composed of a group fee rate that is based on the combined average net assets of most of the T. Rowe Price funds (including the fund) that declines at certain asset levels—and the fund pays its own expenses of operations. In addition, the fund has a contractual limitation in place whereby the Advisor has agreed to waive a portion of the management fee it is entitled to receive from the fund in order to limit the fund’s management fee rate to 0.25% of the fund’s average daily net assets. Any fees waived under this management fee waiver agreement are not subject to reimbursement to the Advisor by the fund. At the Meeting, the Board approved an additional 0.005% breakpoint to the group fee schedule, effective May 1, 2020. With the new breakpoint, the group fee rate will decline to 0.260% when the combined average net assets of the applicable T. Rowe Price funds exceed $845 billion. The Board concluded that the advisory fee structure for the fund continued to provide for a reasonable sharing of benefits from any economies of scale with the fund’s investors.
Fees and Expenses
The Board was provided with information regarding industry trends in management fees and expenses. Among other things, the Board reviewed data for peer groups that were compiled by Broadridge, which compared (i) contractual management fees, total expenses, actual management fees, and nonmanagement expenses of the Investor Class of the fund with a group of competitor funds selected by Broadridge (Expense Group) and (ii) total expenses, actual management fees, and nonmanagement expenses of the Investor Class of the fund with a broader set of funds within the Lipper investment classification (Expense Universe). The Board considered the fund’s contractual management fee rate, actual management fee rate (which reflects the management fees actually received from the fund by the Advisor after any applicable waivers, reductions, or reimbursements), operating expenses, and total expenses (which reflect the net total expense ratio of the fund after any waivers, reductions, or reimbursements) in comparison with the information for the Broadridge peer groups. Broadridge generally constructed the peer groups by seeking the most comparable funds based on similar investment classifications and objectives, expense structure, asset size, and operating components and attributes and ranked funds into quintiles, with the first quintile representing the funds with the lowest relative expenses and the fifth quintile representing the funds with the highest relative expenses. The information provided to the Board indicated that the fund’s contractual management fee ranked in the fourth quintile (Expense Group), the fund’s actual management fee rate ranked in the fourth quintile (Expense Group) and third quintile (Expense Universe), and the fund’s total expenses ranked in the third and fourth quintiles (Expense Group) and second and third quintiles (Expense Universe).
The Board requested additional information from management with respect to the fund’s relative management fee and total expenses ranking in the fourth quintile and reviewed and considered the information provided relating to the fund, other funds in the peer groups, and other factors that the Board determined to be relevant.
The Board also reviewed the fee schedules for other investment portfolios with similar mandates that are advised or subadvised by the Advisor and its affiliates, including separately managed accounts for institutional and individual investors; subadvised funds; and other sponsored investment portfolios, including collective investment trusts and pooled vehicles organized and offered to investors outside the United States. Management provided the Board with information about the Advisor’s responsibilities and services provided to subadvisory and other institutional account clients, including information about how the requirements and economics of the institutional business are fundamentally different from those of the mutual fund business. The Board considered information showing that the Advisor’s mutual fund business is generally more complex from a business and compliance perspective than its institutional account business and considered various relevant factors, such as the broader scope of operations and oversight, more extensive shareholder communication infrastructure, greater asset flows, heightened business risks, and differences in applicable laws and regulations associated with the Advisor’s proprietary mutual fund business. In assessing the reasonableness of the fund’s management fee rate, the Board considered the differences in the nature of the services required for the Advisor to manage its mutual fund business versus managing a discrete pool of assets as a subadvisor to another institution’s mutual fund or for an institutional account and that the Advisor generally performs significant additional services and assumes greater risk in managing the fund and other T. Rowe Price funds than it does for institutional account clients.
On the basis of the information provided and the factors considered, the Board concluded that the fees paid by the fund under the Advisory Contract are reasonable.
Approval of the Advisory Contract
As noted, the Board approved the continuation of the Advisory Contract. No single factor was considered in isolation or to be determinative to the decision. Rather, the Board concluded, in light of a weighting and balancing of all factors considered, that it was in the best interests of the fund and its shareholders for the Board to approve the continuation of the Advisory Contract (including the fees to be charged for services thereunder).
ABOUT THE FUND’S DIRECTORS AND OFFICERS
Your fund is overseen by a Board of Directors (Board) that meets regularly to review a wide variety of matters affecting or potentially affecting the fund, including performance, investment programs, compliance matters, advisory fees and expenses, service providers, and business and regulatory affairs. The Board elects the fund’s officers, who are listed in the final table. At least 75% of the Board’s members are considered to be independent, i.e., not “interested persons” as defined in Section 2(a)(19) of the 1940 Act, of the Boards of T. Rowe Price Associates, Inc. (T. Rowe Price), and its affiliates; “inside” or “interested” directors are employees or officers of T. Rowe Price. The business address of each director and officer is 100 East Pratt Street, Baltimore, Maryland 21202. The Statement of Additional Information includes additional information about the fund directors and is available without charge by calling a T. Rowe Price representative at 1-800-638-5660.
| INDEPENDENT DIRECTORS(a) |
| |
Name
(Year of Birth)
Year Elected
[Number of T. Rowe Price
Portfolios Overseen] | | Principal Occupation(s) and Directorships of Public Companies and Other Investment Companies During the Past Five Years |
| | | |
Teresa Bryce Bazemore
(1959)
2018
[185] | | President, Radian Guaranty (2008 to 2017); Chief Executive Officer, Bazemore Consulting LLC (2018 to present); Director, Chimera Investment Corporation (2017 to present); Director, Federal Home Loan Bank of Pittsburgh (2017 to February 2019) |
| | | |
Ronald J. Daniels
(1959)
2018
[185] | | President, The Johns Hopkins University(b) and Professor, Political Science Department, The Johns Hopkins University (2009 to present); Director, Lyndhurst Holdings (2015 to present); Director, BridgeBio Pharma, Inc. (2020 to present) |
| | | |
Bruce W. Duncan
(1951)
2013
[185] | | Chief Executive Officer and Director (January 2009 to December 2016), Chairman of the Board (January 2016 to present), and President (January 2009 to September 2016), First Industrial Realty Trust, an owner and operator of industrial properties; Chairman of the Board (2005 to September 2016) and Director (1999 to September 2016), Starwood Hotels & Resorts, a hotel and leisure company; Member, Investment Company Institute Board of Governors (2017 to December 2019); Member, Independent Directors Council Governing Board (2017 to December 2019); Senior Advisor, KKR (November 2018 to present); Director, Boston Properties (May 2016 to present); Director, Marriott International, Inc. (September 2016 to present) |
| | | |
Robert J. Gerrard, Jr.
(1952)
2013
[185] | | Advisory Board Member, Pipeline Crisis/Winning Strategies, a collaborative working to improve opportunities for young African Americans (1997 to January 2016); Chairman of the Board, all funds (July 2018 to present) |
| | | |
Paul F. McBride
(1956)
2013
[185] | | Advisory Board Member, Vizzia Technologies (2015 to present); Board Member, Dunbar Armored (2012 to 2018) |
| | | |
Cecilia E. Rouse, Ph.D.
(1963)
2013
[185] | | Dean, Woodrow Wilson School (2012 to present); Professor and Researcher, Princeton University (1992 to present); Director, MDRC, a nonprofit education and social policy research organization (2011 to present); Member, National Academy of Education (2010 to present); Research Associate of Labor Studies Program at the National Bureau of Economic Research (2011 to 2015); Board Member, National Bureau of Economic Research (2011 to present); Chair of Committee on the Status of Minority Groups in the Economic Profession of the American Economic Association (2012 to 2018); Vice President (2015 to 2016) and Board Member (2018 to present), American Economic Association |
| | | |
John G. Schreiber
(1946)
1992
[185] | | Owner/President, Centaur Capital Partners, Inc., a real estate investment company (1991 to present); Cofounder, Partner, and Cochairman of the Investment Committee, Blackstone Real Estate Advisors, L.P. (1992 to 2015); Director, Blackstone Mortgage Trust, a real estate finance company (2012 to 2016); Director and Chairman of the Board, Brixmor Property Group, Inc. (2013 to present); Director, Hilton Worldwide (2007 to present); Director, Hudson Pacific Properties (2014 to 2016); Director, Invitation Homes (2014 to 2017); Director, JMB Realty Corporation (1980 to present) |
| | | |
| (a)All information about the independent directors was current as of December 31, 2019, unless otherwise indicated, except for the number of portfolios overseen, which is current as of the date of this report. |
| (b)William J. Stromberg, president and chief executive officer of T. Rowe Price Group, Inc., the parent company of the Price Funds’ investment advisor, has served on the Board of Trustees of Johns Hopkins University since 2014. |
| INSIDE DIRECTORS(a) |
| |
Name
(Year of Birth)
Year Elected
[Number of T. Rowe Price
Portfolios Overseen] | | Principal Occupation(s) and Directorships of Public Companies and Other Investment Companies During the Past Five Years |
| | | |
David Oestreicher
(1967)
2018
[185] | | Chief Legal Officer, Vice President, and Secretary, T. Rowe Price Group, Inc.; Director, Vice President, and Secretary, T. Rowe Price Investment Services, Inc., T. Rowe Price Retirement Plan Services, Inc., T. Rowe Price Services, Inc., and T. Rowe Price Trust Company; Vice President and Secretary, T. Rowe Price, T. Rowe Price Hong Kong (Price Hong Kong), and T. Rowe Price International; Vice President, T. Rowe Price Japan (Price Japan) and T. Rowe Price Singapore (Price Singapore); Principal Executive Officer and Executive Vice President, all funds |
| | | |
Robert W. Sharps, CFA, CPA
(1971)
2019
[185] | | Director and Vice President, T. Rowe Price; Vice President, T. Rowe Price Group, Inc., and T. Rowe Price Trust Company |
| | | |
| (a)All information about the inside directors was current as of December 31, 2019, unless otherwise indicated, except for the number of portfolios overseen, which is current as of the date of this report. |
| OFFICERS |
| |
Name (Year of Birth)
Position Held With Government Money Fund | | Principal Occupation(s) |
| | | |
Colin T. Bando, CFA (1987)
Vice President | | Vice President, T. Rowe Price and T. Rowe Price Group, Inc. |
| | | |
Darrell N. Braman (1963)
Vice President and Secretary | | Vice President, Price Hong Kong, Price Singapore, T. Rowe Price, T. Rowe Price Group, Inc., T. Rowe Price International, T. Rowe Price Investment Services, Inc., and T. Rowe Price Services, Inc. |
| | | |
M. Helena Condez (1962)
Vice President | | Vice President, T. Rowe Price and T. Rowe Price Group, Inc. |
| | | |
Alan S. Dupski, CPA (1982)
Principal Financial Officer, Vice President,
and Treasurer | | Vice President, T. Rowe Price and T. Rowe Price Group, Inc.; formerly, Assistant Chief Accountant, Division of Investment Management, U.S. Securities and Exchange Commission (to 2015) |
| | | |
Stephanie A. Gentile, CFA (1956)
Vice President | | Vice President, T. Rowe Price and T. Rowe Price Group, Inc. |
| | | |
John R. Gilner (1961)
Chief Compliance Officer | | Chief Compliance Officer and Vice President, T. Rowe Price; Vice President, T. Rowe Price Group, Inc., and T. Rowe Price Investment Services, Inc. |
| | | |
Gary J. Greb (1961)
Vice President | | Vice President, T. Rowe Price, T. Rowe Price International, and T. Rowe Price Trust Company |
| | | |
Paul J. Krug, CPA (1964)
Vice President | | Vice President, T. Rowe Price, T. Rowe Price Group, Inc., and T. Rowe Price Trust Company |
| | | |
Alan D. Levenson, Ph.D. (1958)
Vice President | | Vice President, T. Rowe Price and T. Rowe Price Group, Inc. |
| | | |
Joseph K. Lynagh, CFA (1958)
President | | Vice President, T. Rowe Price, T. Rowe Price Group, Inc., and T. Rowe Price Trust Company |
| | | |
Cheryl A. Mickel, CFA (1967)
Vice President | | Director and Vice President, T. Rowe Price Trust Company; Vice President, T. Rowe Price and T. Rowe Price Group, Inc. |
| | | |
Shannon H. Rauser (1987)
Assistant Secretary | | Assistant Vice President, T. Rowe Price |
| | | |
Chen Shao (1980)
Vice President | | Vice President, T. Rowe Price and T. Rowe Price Group, Inc. |
| | | |
Jeanny Silva (1975)
Vice President | | Vice President, T. Rowe Price and T. Rowe Price Group, Inc. |
| | | |
Douglas D. Spratley, CFA (1969)
Vice President | | Vice President, T. Rowe Price, T. Rowe Price Group, Inc., and T. Rowe Price Trust Company |
| | | |
Megan Warren (1968)
Vice President | | Vice President, T. Rowe Price, T. Rowe Price Group, Inc., T. Rowe Price Retirement Plan Services, Inc., T. Rowe Price Services, Inc., and T. Rowe Price Trust Company; formerly, Executive Director, JPMorgan Chase (to 2017) |
| | | |
| Unless otherwise noted, officers have been employees of T. Rowe Price or T. Rowe Price International for at least 5 years. |
Not applicable.
The registrant has adopted a code of ethics, as defined in Item 2 of Form N-CSR, applicable to its principal executive officer, principal financial officer, principal accounting officer or controller, or persons performing similar functions. A copy of this code of ethics is filed as an exhibit to this Form N-CSR. No substantive amendments were approved or waivers were granted to this code of ethics during the period covered by this report.
The registrant’s Board of Directors/Trustees has determined that Mr. Bruce W. Duncan qualifies as an audit committee financial expert, as defined in Item 3 of Form N-CSR. Mr. Duncan is considered independent for purposes of Item 3 of Form N-CSR.
(a) – (d) Aggregate fees billed for the last two fiscal years for professional services rendered to, or on behalf of, the registrant by the registrant’s principal accountant were as follows:
Audit fees include amounts related to the audit of the registrant’s annual financial statements and services normally provided by the accountant in connection with statutory and regulatory filings. Audit-related fees include amounts reasonably related to the performance of the audit of the registrant’s financial statements and specifically include the issuance of a report on internal controls and, if applicable, agreed-upon procedures related to fund acquisitions. Tax fees include amounts related to services for tax compliance, tax planning, and tax advice. The nature of these services specifically includes the review of distribution calculations and the preparation of Federal, state, and excise tax returns. All other fees include the registrant’s pro-rata share of amounts for agreed-upon procedures in conjunction with service contract approvals by the registrant’s Board of Directors/Trustees.
(e)(1) The registrant’s audit committee has adopted a policy whereby audit and non-audit services performed by the registrant’s principal accountant for the registrant, its investment adviser, and any entity controlling, controlled by, or under common control with the investment adviser that provides ongoing services to the registrant require pre-approval in advance at regularly scheduled audit committee meetings. If such a service is required between regularly scheduled audit committee meetings, pre-approval may be authorized by one audit committee member with ratification at the next scheduled audit committee meeting. Waiver of pre-approval for audit or non-audit services requiring fees of a de minimis amount is not permitted.
(2) No services included in (b) – (d) above were approved pursuant to paragraph (c)(7)(i)(C) of Rule 2-01 of Regulation S-X.
(f) Less than 50 percent of the hours expended on the principal accountant’s engagement to audit the registrant’s financial statements for the most recent fiscal year were attributed to work performed by persons other than the principal accountant’s full-time, permanent employees.
(g) The aggregate fees billed for the most recent fiscal year and the preceding fiscal year by the registrant’s principal accountant for non-audit services rendered to the registrant, its investment adviser, and any entity controlling, controlled by, or under common control with the investment adviser that provides ongoing services to the registrant were $3,671,000 and $2,684,000, respectively.
(h) All non-audit services rendered in (g) above were pre-approved by the registrant’s audit committee. Accordingly, these services were considered by the registrant’s audit committee in maintaining the principal accountant’s independence.
Not applicable.
(a) Not applicable. The complete schedule of investments is included in Item 1 of this Form N-CSR.
(b) Not applicable.
Not applicable.
Not applicable.
Not applicable.
There has been no change to the procedures by which shareholders may recommend nominees to the registrant’s board of directors.
(a) The registrant’s principal executive officer and principal financial officer have evaluated the registrant’s disclosure controls and procedures within 90 days of this filing and have concluded that the registrant’s disclosure controls and procedures were effective, as of that date, in ensuring that information required to be disclosed by the registrant in this Form N-CSR was recorded, processed, summarized, and reported timely.
(b) The registrant’s principal executive officer and principal financial officer are aware of no change in the registrant’s internal control over financial reporting that occurred during the period covered by this report that has materially affected, or is reasonably likely to materially affect, the registrant’s internal control over financial reporting.
Not applicable.
(3) Written solicitation to repurchase securities issued by closed-end companies: not applicable.